
CONSOLIDATED - Grand City Properties SA
140
NUREMBERG / FÜRTH CONSOLIDATED FINANCIAL STATEMENTS FOR THE YEAR ENDED DECEMBER 31, 2019
-
Upload
khangminh22 -
Category
Documents
-
view
2 -
download
0
Transcript of CONSOLIDATED - Grand City Properties SA

NUREMBERG / FÜRTH
CONSOLIDATED FINANCIAL STATEMENTS
FOR THE YEAR ENDED DECEMBER 31, 2019

LEIPZIG

1Board of Directors’ Report |
IMPRINT
Publisher: Grand City Properties S.A. | 1, Avenue du Bois | L-1251 Luxembourg
phone: +352 28 77 87 86 | e-mail: [email protected] | www.grandcityproperties.com
Board of Directors’ report
EPRA Performance Measures
Report of the Rèviseur d’Enterprises Agréé (Independent Auditor)
Consolidated statement of profit or loss
Consolidated statement of comprehensive income
Consolidated statement of financial position
Consolidated statement of changes in equity
Consolidated statement of cash flows
Notes to the consolidated financial statements
CONTENTS
2
60
72
76
77
78
80
82
84

2 | Board of Directors’ Report
in €’000 unless otherwise indicated Dec 2019 Dec 2018 Dec 2017
Total Assets 9,851,428 8,860,526 7,508,292
Total Equity 4,966,599 4,666,987 3,849,662
Loan-to-Value 33% 34% 36%
Equity Ratio 50% 53% 51%
in €’000 unless otherwise indicated 1–12/2019 Change 1–12/2018
Rental and operating income 560,303 3% 544,977
Net rental income 382,605 5% 364,365
EBITDA 696,741 -11% 782,313
Adjusted EBITDA 297,662 8% 275,530
FFO I 211,966 7% 197,854
FFO I per share (in €) 1.27 7% 1.19
FFO I per share after perpetual notes attribution (in €) 1.07 6% 1.01
FFO II 381,387 14% 334,456
Profit for the year 493,360 -15% 583,034
EPS (basic) (in €) 2.43 -18% 2.95
EPS (diluted) (in €) 2.30 -17% 2.76
in €’000 unless otherwise indicated NAV EPRA NAV
EPRA NAV including
perpetual notes EPRA NNNAV
Dec 2019 4,564,344 4,120,427 5,150,477 3,890,832
Dec 2019 per share (in €) 27.2 24.5 30.6 23.1
Per share growth +9% +9% +7% +3%
Dec 2018 4,162,463 3,753,022 4,783,072 3,752,781
Dec 2018 per share (in €) 24.9 22.5 28.7 22.5
2019* Change 2018
Dividend per share (in €) 0.8238 7 % 0.7735
For further clarification of the alternative performance measures please see the relevant section in this report
KEY FINANCIALS
B A L A NC E S H E E T H I G H L I G HT S
P & L H I G H L I G HT S
N AV H I G H L I G HT S
*2019 dividend is subject to the next AGM approval and based on a payout policy of 65% of FFO I per share

3Board of Directors’ Report |
COLOGNE

4 | Board of Directors’ Report
Accretive capital recycling
€500million
Disposals:52% over total costs7% over book value
Accretive acquisition of approx. €650 million in strong locations
Sale of non-core and mature assets
Value/sqm (in €/sqm)
€1,257
€1,543
€1,155
CAGR+19%
In-place rent (in €/sqm)
€6.0
Dec 2018
Dec 2018
€5.65
Dec 2017
Dec 2017
€6.8
Dec 2019
Dec 2019
CAGR+8%
2016
225
2017
248
2019
298
2018
276
Adjusted EBITDA(in € millions)
CAGR+10%
FFO I (in € millions)
2016
160
2017
178
2019
212
2018
198
CAGR+10%
2016
229
2017
204
2019
381
2018
334
FFO II(in € millions)
Over €1.1 billion realized over 4 years
+3.6%L-F-L
Total net rentgrowth
Dec 2019
+2.9%L-F-L
In-place rent growthDec 2019
+0.7%L-F-L
Occupancy growth Dec 2019
HIGHLIGHTS
Dec 2016
Dec 2016
€5.35
€924

5Board of Directors’ Report |
Low average cost of debt maintained with
long average debt maturity
8years
A v e r a g e d e b t
m a t u r i t y
1.3%A v e r a g e
c o s t o f d e b t
Interest Coverage Ratio
6.6xI C R
2 0 1 9 6.0xI C R
2 0 1 8
Unencumbered assets
Dec 2017 Dec 2018 Dec 2019
€4.1 BN
€4.8 BN
€6.5 BN
64%of
value
65%of
value
79%of
value
Low Leverage (Loan-To-Value)
Dec 2017 Dec2018 Dec 2019
36%34% 33%
45% Board of Director’s limit
Credit rating
S & P
A-
M o o d y ’ s
A3Moody’s
S & P
BBB+
Baa1L o n g - t e r m
t a rget
L o n g - t e r m t a rget
SS95THPERCENTILEIN FEB 2019
3RD CONSECUTIVE YEAR

6 | Board of Directors’ Report
HIGHLIGHTSEPRA NAV (in € millions)
FFO I per share (in €)
FFO I Yield 1)
7.3%
EPRA NAV incl. perpetual notesEPRA NAV
Dec 2016
2,541
3,208
Dec 2017
3,327
3,993
Dec 2019
5,150
4,120
Dec 2018
4,783
3,753
Total Equity (in € millions)
Dec 2016 Dec 2017 Dec 2019Dec 2018
3,065
3,850
4,9674,667
FFO I per share
FFO I per share after perpetual notes attribution
50%Equity RatioDec 2019
CAGR+17%CAGR
+17%EPRA NAV
EPRA NAV per share (in €)
EPRA NAV incl. perpetual notes per share
EPRA NAV per share
Dec 2016
16.4
20.7
Dec 2017
20.2
24.2 24.5
1) based on a share price of €17.42) 2019 dividend subject to the next AGM approval and based on a payout policy of 65% of FFO I per share
CAGR+14%
EPRA NAV per share
Dividend per share (in €)
2016 20172019 201920182016 2017 2018
0.680.73
0.82 2)
0.77
Dividend yield 1) 2)
4.7%
CAGR+6%
Dec 2018
22.5
28.7
Dec 2019
30.6
1.071.01
0.960.92
1.19
1.051.12
1.27
CAGR+7%
FFO Iper share

7Board of Directors’ Report |
BERLIN

8 | Board of Directors’ Report
LETTER OF THE MANAGEMENT BOARD
■■ In 2019 we focused on internal growth and on capital recycling, while maintaining our dis-ciplined acquisition criteria. Therefore, it is our great pleasure to present to all our stakeholders, the positive annual results in addition to some of the key achievements during the year.
Following on with our accretive capital re-cycling, we continued to enhance our invest-ment portfolio on two fronts – asset quality and portfolio diversity. During the year 2019, GCP recycled €500 million of properties at 7% over the net book values from disposals (52% profit margin on total costs). The proceeds of the cap-ital recycling were channeled into acquisitions mainly in London, and also in German cities such as Berlin and Munich. Our London port-folio reached to 13% of our portfolio as of the end of December 2019 and is focused on assets located in good middle-class neighborhoods. In particular, the portfolio is well connected with immediate access to different modes of public transport, which coupled with the quality of these assets results in strong demand for our
London portfolio. Most of the acquisitions in London were of vacant units at the final de-velopment stage before letting. As expected, we have experienced robust demand for living spaces in these areas and were able to increase the occupancy on lettable units in London to over 95%.
As of December 2019, total assets on our balance sheet amounted to almost €10 billion, up from €8.9 billion at the end of 2018. The increase is primarily due to net acquisitions of quality assets coupled with value creation across the portfolio.
GCP continues to maintain a strong bal-ance sheet by giving preference to financial discipline. As compared to the end of 2018, we were able to lower the average cost of debt from 1.6% to 1.3% while also increasing our inter-est coverage ratio from 6.0x to 6.6x during the same period. Underlining the strength of our operational profitability was the growth of 8% in GCP’s adjusted EBITDA year-over-year. The Company’s solid financial position was also ev-
Dear Stakeholder,

9Board of Directors’ Report |
ident with both S&P and Moody’s, re-affirming the investment grade credit ratings of BBB+ and Baa1 respectively. As of the end of Decem-ber 2019, GCP’s balance of cash and liquid as-sets which amounted to over €1 billion (over 10% of our Balance Sheet size), ensures that the Company is protected from a downturn scenar-io, especially considering the current unstable environment. Additionally, the strong liquidi-ty position also provides us with the financial flexibility to capture attractive opportunities as and when they arise.
With our focus largely on maximizing tenant satisfaction while also ensuring value creation for our other stakeholders, we capi-talized on our extensive experience in order to provide high quality tenant service. Our ef-forts were rewarded through the strong like-for-like rental growth of 3.6% on the back of a stronger letting activity and enhanced vacancy reduction measures. Furthermore, improved business efficiencies also led to higher oper-ating margins. The trickledown effect of these actions was especially evident with the FFO I increasing by 7% each to €212 million and to €1.27 per share for the year 2019. Based on a payout ratio of 65% and subject to the next AGM approval, our shareholders can expect a divi-dend of €0.8238, yielding 4.7% on a share price of €17.4. The capital recycling initiatives were rather successful, generating gains of approx. €169 million over total costs, which in turn re-sulted in an FFO II of €381 million. The success of our value creation efforts is also evidenced in the growing EPRA NAV per share of €24.5 which has increased 9% since December 2018.
At GCP, we recognize our commitment to the local communities we are present in and
take this commitment very seriously. We es-tablished the GCP Foundation which will invest into charitable projects which serve local com-munities. These projects will broadly be in the areas of child-welfare, education, sports, as-sistance to the elderly, and other similar proj-ects. The Company has already made efforts to invest into the lives of the next generation and has used sports as a medium to do so. GCP is the main sponsor of the FC Union Berlin Youth football team and the Company continues to sponsor different local sports teams on various levels. Such sports activities help the next gen-eration to develop useful character traits such as teamwork, communication, perseverance, discipline and leadership.
The importance of sustainable business operations cannot be overstated, and we have taken various measures in making our busi-ness far more sustainable than the year before. With regards to the environment, 90% of all landlord-obtained energy requirements have been switched to renewables or climate-neu-tral energy sources, while pool cars have been switched to an eco-friendly fuel. With the in-tention of improving the rate of recycling, we have initiated a pilot project to improve on-site separation of waste. Furthermore, we also work with our suppliers to identify and reduce ad-verse impacts to the environment within their operations.
As we look to the new year in 2020, we re-main steadfast in our commitment to the envi-ronment, the services we provide to our ten-ants, the local communities we operate in and our shareholders. Thank you for your contin-ued trust in our abilities and we look forward to serving you well for yet another year.
Christian WindfuhrCEO
Refael Zamir CFO, Chairman of the Board of Directors
Simone Runge-BrandnerMember of the Board of Directors
Daniel MalkinMember of the Board of Directors
Luxembourg, March 16, 2020

10 | Board of Directors’ Report
F I N A NC I A L P O S IT I O N H I G H L I G HT S
1) including inventories - trading properties2) including cash and cash equivalents held for sale 3) including short-term loans and borrowings, loan redemption, and financial debt held for sale
in €’000 unless otherwise indicated Dec 2019 Dec 2018
Total Assets 9,851,428 8,860,526
Investment Property 1) 7,971,744 7,243,915
Cash and liquid assets 2) 1,063,320 760,374
Total Equity 4,966,599 4,666,987
EPRA NAV 4,120,427 3,753,022
EPRA NAV including perpetual notes 5,150,477 4,783,072
Loans and borrowings 3) 558,709 870,507
Straight bonds 2,920,010 2,177,267
Convertible bond 274,908 272,246
Loan-to-Value 33% 34%
Equity Ratio 50% 53%
in €’000 unless otherwise indicated 1–12/2019 1–12/2018
Rental and operating income 560,303 544,977
Net rental income 382,605 364,365
EBITDA 696,741 782,313
Adjusted EBITDA 297,662 275,530
FFO I 211,966 197,854
FFO I per share (in €) 1.27 1.19
FFO I per share after perpetual notes attribution (in €) 1.07 1.01
FFO II 381,387 334,456
Interest Coverage Ratio 6.6x 6.0x
Debt Service Coverage Ratio 5.5x 5.1x
Profit for the year 493,360 583,034
EPS (basic) (in €) 2.43 2.95
EPS (diluted) (in €) 2.30 2.76
P R O F ITA B I L IT Y H I G H L I G HT S
11Board of Directors’ Report |
E P R A P E R F O R M A NC E M E A S U R E S
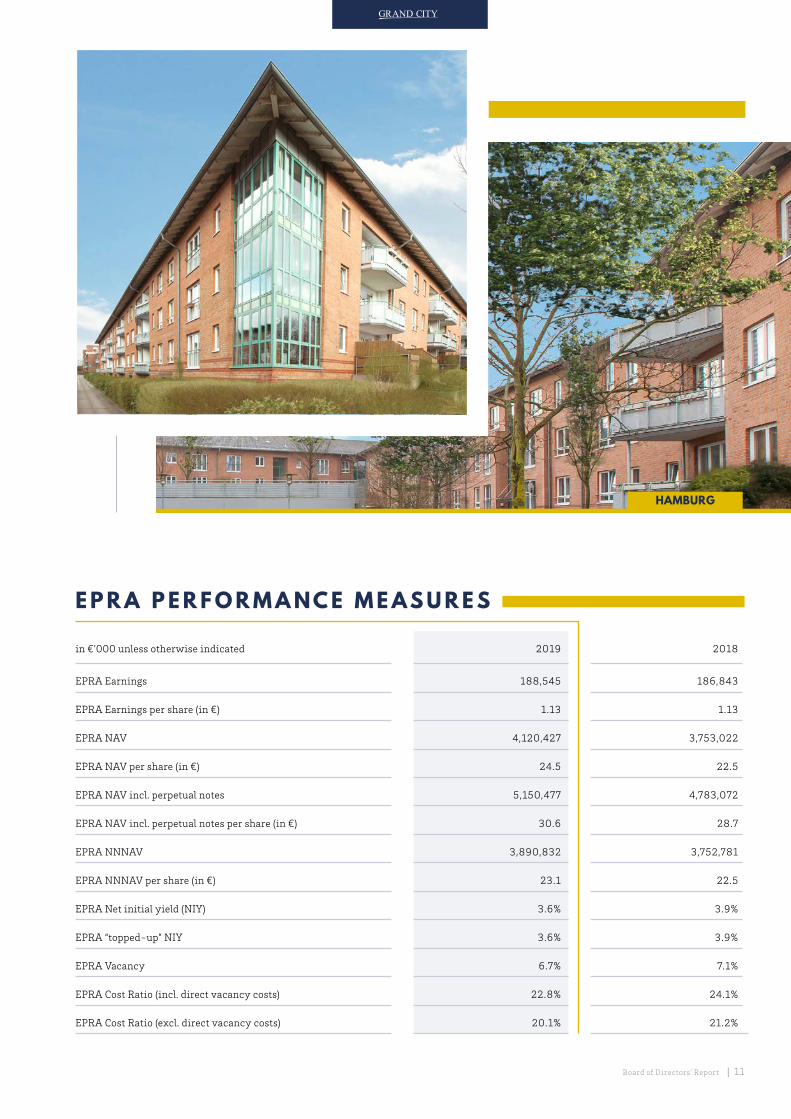
in €’000 unless otherwise indicated 2019 2018
EPRA Earnings 188,545 186,843
EPRA Earnings per share (in €) 1.13 1.13
EPRA NAV 4,120,427 3,753,022
EPRA NAV per share (in €) 24.5 22.5
EPRA NAV incl. perpetual notes 5,150,477 4,783,072
EPRA NAV incl. perpetual notes per share (in €) 30.6 28.7
EPRA NNNAV 3,890,832 3,752,781
EPRA NNNAV per share (in €) 23.1 22.5
EPRA Net initial yield (NIY) 3.6% 3.9%
EPRA “topped-up” NIY 3.6% 3.9%
EPRA Vacancy 6.7% 7.1%
EPRA Cost Ratio (incl. direct vacancy costs) 22.8% 24.1%
EPRA Cost Ratio (excl. direct vacancy costs) 20.1% 21.2%
HAMBURG

12 | Board of Directors’ Report
DORTMUND

13Board of Directors’ Report |
THE COMPANY■■ Grand City Properties S.A. (the “Company”)
and its investees (“GCP” or the “Group”) Board of Directors (the “Board”) hereby submits the an-nual report as of December 31, 2019.
The figures presented in this Board of Di-rector’s Report are based on the consolidated financial statements as of December 31, 2019, unless stated otherwise.
GCP is a specialist in residential real es-tate, investing in value-add opportunities in densely populated areas predominantly in Ger-many. The Group’s portfolio, excluding held for sale properties and properties under develop-ment, as of December 2019 consists of 77k units (hereinafter “GCP portfolio” or “the Portfolio”) located in densely populated areas with a focus on North Rhine-Westphalia, Germany’s most populous federal state, Berlin, Germany’s capi-tal, the metropolitan regions of Dresden, Leipzig and Halle and other densely populated areas as well as London.
GCP is focused on assets in densely popu-lated urban locations with robust and sustain-able economic and demographic fundamentals, and with multiple value-add drivers that it can pursue using its skills and capabilities such as vacancy reduction, increasing rents to mar-ket levels, improving operating cost efficien-cy, increasing market visibility, identifying potential for high-return capex investments, and spotting potential for significant benefits from the Company’s scale. GCP’s management has vast experience in the German real estate market with a long track record of success in repositioning properties using its tenant man-agement capabilities, tenant service reputa-tion, and highly professional and specialized employees.
In addition, GCP’s economies of scale allow for considerable benefits of a strong bargaining position, a centralized management platform supported by advanced in-house IT/software systems, and a network of professional connec-tions.
This strategy enables the Company to cre-ate significant value in its portfolio and gener-ate stable and increasing cash flows.
LONDON

14 | Board of Directors’ Report
THE PORTFOLIO
POPULATION
DENSITY
IN GERMANY
inhabitants per sqkm (2017)*
36 - 105
105 – 156
283 – 933
156 - 283
933 - 4,686
London
ATTRACTIVE PORTFOLIO CONCENTRATED IN DENSELY POPULATED
METROPOLITAN AREAS WITH VALUE-ADD POTENTIAL
■■ GCP’s well-balanced and diver-sified portfolio is composed of prop-erties in attractive locations with identified value creation potential primarily located in major German cities and urban centers.
The Group’s well-allocated port-folio provides for strong geograph-ic and tenant diversification and benefits from economies of scale, supporting the risk-averse portfo-
lio approach. GCP’s focus on dense-ly populated areas is mirrored by 24% of its Portfolio being located in NRW, 24% in Berlin, 13% in the met-ropolitan region of Dresden, Leipzig and Halle, and 13% in London, four clusters with their own distinct economic drivers. The portfolio also includes additional holdings in oth-er major urban centers with strong fundamentals such as, Nuremberg,
Munich, Mannheim, Frankfurt, Hamburg and Bremen.
The London portfolio addition over the past year follows the Com-pany’s strategy of pursuing oppor-tunities and acquiring properties with significant upside potential in densely populated areas character-ized by strong demand and robust market fundamentals.
Hamburg
Bremen
Berlin
Mainz
NRW Leipzig
Fürth
Munich
Nuremberg
Halle
Dresden
Frankfurt
Mannheim
* Based on data from Destatis

15Board of Directors’ Report |
PORTFOLIO OVERVIEW■■ GCP has assembled a portfolio of high quality assets in densely populated metropolitan regions, benefiting from diversi-
fication among dynamic markets with positive economic fundamentals and demographic developments.
DECEMBER 2019Value
(in €M)Area
(in k sqm)EPRA
vacancy
Annualized net rent (in €M)
In-place rent per
sqm (in €)Number of
unitsValue per
sqm (in €)Rental
yield
NRW 1,883 1,649 7.9% 107 5.8 24,410 1,142 5.7%
Berlin 1,678 558 5.0% 53 8.3 7,580 3,008 3.2%
Dresden/Leipzig/Halle 1,018 925 9.0% 53 5.3 15,921 1,100 5.2%
Mannheim/KL/Frankfurt/Mainz 384 225 4.1% 20 7.5 3,788 1,705 5.1%
Nuremberg/Fürth/Munich 307 117 2.9% 13 9.4 1,802 2,632 4.3%
Hamburg/Bremen 375 297 4.4% 21 6.1 4,265 1,263 5.5%
London 907 109 4.0% 40 31.9 2,134 8,349 4.4%
Others 959 989 7.7% 61 5.9 16,746 969 6.4%
Development rights and new buildings* 461
Total 7,972 4,869 6.7% 368 6.8 76,646 1,543 4.9%
* of which pre-marketed buildings in London amount to €160 million
5% Mannheim/KL/Frankfurt/Mainz
4% Nuremberg/Fürth/Munich
5% Hamburg/Bremen
Largest population and industrial center of Germany
Capital city, political center and Start-up hub
Dynamic economy driven by technology with robust demographic fundamentals
Global financial center with solid service sector attracting quality talent
DIVERSIFIED PORTFOLIO WITH DISTINCT ECONOMIC DRIVERS
13% London
24% NRW
24%Berlin
13%Dresden/Leipzig/
Halle
12%Others
NRW
BERLIN
DRESDEN/LEIPZIG/HALLE
LONDON

16 | Board of Directors’ Report
NORTH RHINE-WESTPHALIA
Well positioned in the largest metropolitan area in Germany
■■ The portfolio distribu-tion in NRW is focused on cit-ies with strong fundamentals within the region. 23% of the NRW portfolio is located in Co-logne, the largest city in NRW, 9% in Duisburg, 8% in Dort-mund and 7% in Essen.
19% O t hers
5% Bon n
23%Colog ne
9%D u isbu rg 8%
Dor t mu nd
3% Sol i ngen
2% Rec kl i ngh ausen
2% M a rl
4% Erk rat h
3% Mönc hengl adbac h
4% Gel sen k i rc hen
4% Boc hu m
5% Wupper tal
2% Her ne
7% Essen
4th largest city in
Germany
24% of GCP’s portfolio
DECEMBER 2019Value
(in €M)Area
(in k sqm)EPRA
vacancy
Annualized net rent (in €M)
In-place rent per
sqm (in €)Number of
unitsValue per
sqm (in €)Rental
yield
NRW 1,883 1,649 7.9% 107 5.8 24,410 1,142 5.7%
Most densely populated state in Germany
Home to 18 of the 2000 Largest Public Companies
in the world as per the Forbes 2000 Global Ranking
2019, including 9 DAX Companies (as of Jan 2020)
Industrial center of Germany
contributing 21% to the national GDP
21%of
Germany’stotal
GDP
Key drivers
18million
inhabitants

17Board of Directors’ Report |
1. Cologne2. Duisburg3. Gelsenkirchen4. Dortmund5. Essen6. Bochum7. Wuppertal8. Mönchengladbach9. Erkrath10. Velbert11. Solingen12. Recklinghausen13. Marl14. Herne15. Bonn
DUISBURG DORTMUND
ESSENCOLOGNE
Population density in NRW
inhabitants per sqkm (2017)*
36 - 105
105 – 156
283 – 933
156 - 283
933 - 4,686
* Based on data from Destatis
4
13 12
352
10
87
911
14
6
115

18 | Board of Directors’ Report
BERLIN PORTFOLIO - BEST IN CLASSQuality locations in top tier Berlin neighborhoods
Mitte
PankowReinickendorf
Spandau
Charlottenburg-Wilmersdorf
Steglitz-Zehlendorf
Tempelhof-Schöneberg
Friedrichshain-Kreuzberg
Neukölln Treptow-Köpenick
Marzahn-Hellersdorf
Lichtenberg
Teltow
Potsdam
LudwigsfeldeRangsdorf Königs-Wusterhausen
Fürstenwalde/Spree
Bad Saarow
Erkner
Rüdersdorf
Schönefeld
Strausberg
Bad Freienwalde (Oder)
Eberswalde
Bernau
Oranienburg
Liebenwalde
Velten
Hennigsdorf
2/3 of the Berlin portfolio is located in top tier neighborhoods: Charlottenburg, Wilmersdorf, Mitte, Kreuzberg, Friedrichshain, Lichtenberg, Neukölln, Schöneberg, Steglitz and Potsdam.
1/3 is well located located primarily in Reinickendorf, Treptow, Köpenick and Marzahn-Hellersdorf.
24% of GCP’s portfolio
DECEMBER 2019Value
(in €M)Area
(in k sqm)EPRA
vacancy
Annualized net rent (in €M)
In-place rent per
sqm (in €)Number of
unitsValue per
sqm (in €)Rental
yield
Berlin 1,678 558 5.0% 53 8.3 7,580 3,008 3.2%
Key drivers
Largest city by population with the highest
population growth (in absolute terms)
in Germany (HWWI)
Political & Start-up hub with high quality talent
attracting growing companies and organizations
Lowest home ownership rate
in Germany
BERLIN
19Board of Directors’ Report |
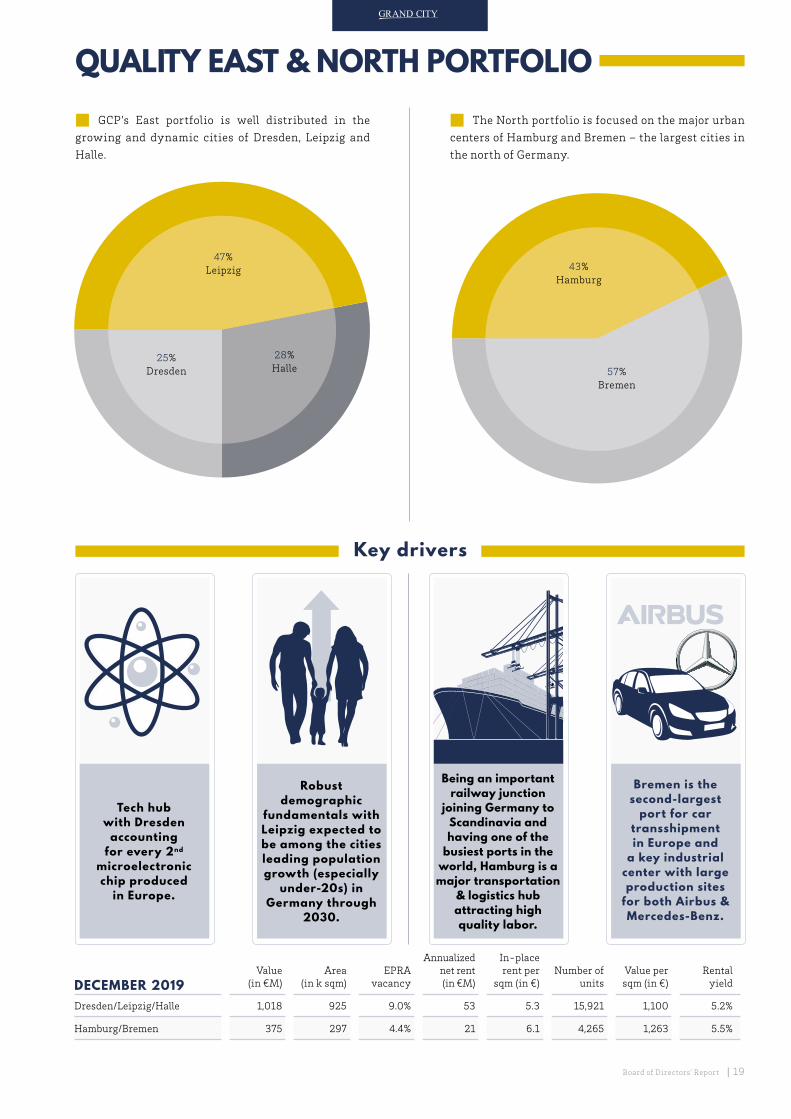
QUALITY EAST & NORTH PORTFOLIO
■■ GCP’s East portfolio is well distributed in the growing and dynamic cities of Dresden, Leipzig and Halle.
■■ The North portfolio is focused on the major urban centers of Hamburg and Bremen – the largest cities in the north of Germany.
47%Leipzig
28%Halle
25%Dresden
DECEMBER 2019Value
(in €M)Area
(in k sqm)EPRA
vacancy
Annualized net rent (in €M)
In-place rent per
sqm (in €)Number of
unitsValue per
sqm (in €)Rental
yield
Dresden/Leipzig/Halle 1,018 925 9.0% 53 5.3 15,921 1,100 5.2%
Hamburg/Bremen 375 297 4.4% 21 6.1 4,265 1,263 5.5%
Key drivers
Tech hub with Dresden
accounting for every 2nd
microelectronic chip produced
in Europe.
Being an important railway junction
joining Germany to Scandinavia and having one of the
busiest ports in the world, Hamburg is a major transportation
& logistics hub attracting high quality labor.
Robust demographic
fundamentals with Leipzig expected to be among the cities leading population growth (especially
under-20s) in Germany through
2030.
Bremen is the second-largest
port for car transshipment in Europe and
a key industrial center with large production sites
for both Airbus & Mercedes-Benz.
43%Hamburg
57%Bremen

20 | Board of Directors’ Report
LONDONHigh quality assets located in strong middle class neighborhoods
DECEMBER 2019Value
(in €M)Area
(in k sqm)EPRA
vacancy
Annualized net rent (in €M)
In-place rent per
sqm (in €)Number of
unitsValue per
sqm (in €)Rental
yield
London 907 109 4.0% 40 31.9 2,134 8,349 4.4%
Largest concentration of higher education
universities in Europe
Growing share of self-employed persons
supporting the existing strong service sector in
London
No. 1 Global City according to the AT Kearney 2019
Global Cities Report which assesses 4 metrics
- personal well-being, economics, innovation and
governance
Key drivers
Hillingdon
Harrow
Ealing
Hounslow Richmond upon Thames
Kingston upon Thames
Merton
Wandsworth
SuttonCroydon
Bromley
LambethSouthwark
Lewisham
GreenwichBexley
Havering
Barking andDagenham
Redbridge
NewhamTowerHamlets
WalthamForest
Hackney
Isling- ton
Camden
CityWestminster
Brent
Barnet
Enfield
Haringey
Hamm
ersmith and
FulhamKensington and
Chelsea
■■ The total London portfolio, including pre-marketed units, amounts to ca. 2,600 units and approx. €1.1 billion value. As of December 2019, over 2,100 units were lettable, with an occupancy of 96%.
■■ Over 90% of the portfolio is situated within a short walking distance to an underground/overground station.
underground stationoverground/train station
asset location
airportThe map represents over 90% of the London Portfolio
#1

21Board of Directors’ Report |
LONDON

22 | Board of Directors’ Report
STRONG FINANCIAL POSITION
Hedging structure
■■ GCP’s bank loans are spread across many loans from many different financial institutions that are non-re-course and have no cross-collateral or cross-default pro-visions.
In accordance with the Company’s conservative capi-tal structure, 93% of its interest is hedged.
As part of GCP’s conservative financial policy, bonds issued in foreign currencies are hedged to Euro until ma-turity.
Moody'sS&P
Feb 2013 Nov 2013 Feb 2014 Nov 2014 Jul 2015 Nov 2016Feb 2015 Sep 2017
A-/A3
Goal
BB-
BB
BB+
BBB-
BBB
BBB+
Baa2
Baa1
88% Fixed & Swapped
7% Variable
5% Capped
Credit rating
GCP maintains investment-grade credit ratings from both Standard & Poor’s (S&P) and Moody’s Investors Ser-vice (Moody’s), with current long-term issuer ratings of BBB+ and Baa1, respectively. Additionally, S&P assigned GCP a short-term rating of A-2. The Company has a long-term goal of achieving an A-/A3 credit rating, an import-
ant component of its financial policy, and to that effect the Board of Directors has decided to implement policies as well as management and financial strategies to achieve that target.
The Company has established a strong track record of achieving rating improvements owing to continuous im-provements in its business and financial profile.
Conservative financial policy
GCP follows a financial policy in order to maintain and improve its strong capital structure:
• Strive to achieve A- global rating in the long term
• LTV limit at 45%
• Debt to debt plus equity ratio at 45% (or lower) on a sustainable basis
• Maintaining conservative financial ratios with a strong ICR
• Unencumbered assets above 50% of total assets
• Long debt maturity profile
• Good mix of long-term unsecured bonds and non-recourse bank loans
• Dividend distribution of 65% of FFO I per share
As part of the conservative financial approached adopted by management the Company continuously maintains high liquid-ity, with €1.1 billion in cash and liquid assets. €50 million in unused credit facilities as of December 31, 2019, providing for valuable financial flexibility.
December 2019

23Board of Directors’ Report |
Financing sources mix
An important component of GCP’s financial structure is a strong diversification of funding sources, reducing the reliance on any single source and resulting in a diversi-fied financing mix. This is enabled by the Company’s wide reach and proven track record in issuing instruments across various capital markets: straight bonds, convert-ible bonds, perpetual notes and equity capital. Moreover, GCP’s diversity is further improved through issuances in various currencies, issuing straight bonds in CHF, JPY and HKD. All foreign currency issuances are swapped into Euro until maturity. Issuances in various currencies increase the investor base and provide expansion into a wider range of markets to attract funding.
In addition, the Company maintains lasting relation-ships with dozens of banks and financial institutions, providing for access to bank financing.
Loan-to-value
Unencumbered assets
The Company maintains as part of its conservative fi-nancial policy a high proportion of unencumbered assets to provide additional financial flexibility and contribute to a strong credit profile, with €6.5 billion in unencum-bered assets as of December 2019, representing 79% of the total portfolio value.
GCP strategically maintains its strong financial pro-file characterized by long debt maturities, hedged interest rates, excellent financial coverage ratios, and a low LTV. The LTV as of December 31, 2019 is at 33%, below the man-agement limit of 45%
Low Leverage (Loan-To-Value) Coverage Ratios (FY 2019)
58% 59% 57%
7%
21%
14%
27% 34%
11% 6%
3% 3%
ICR DSCR
6.6x
5.5x
Bank debt
Straight bonds
Convertible bond
Equity
Perpetual Notes
36%34% 33%
45% Board of Director’s limit
Debt and interest coverage ratios
GCP’s financial flexibility remains strong over time due to its high profitability, which is reflected in consis-tently high debt cover ratios. For the year 2019, the Inter-est Coverage Ratio was 6.6x and the Debt Service Coverage Ratio was 5.5x
Dec 2017 Dec 2018 Dec 2019
Dec 2017
Dec 2017
Dec 2018
Dec 2018
Dec 2019
Dec 2019
€4.1 BN
€4.8 BN
€6.5 BN
64%of
value
65%of
value
79%of
value

24 | Board of Directors’ Report
F O C US O N VA L U E -
A D D O P P O RT U N IT I E S
I N AT T R AC T IV E ,
D E NS E LY P O P U L AT E D
R E G I O NS , W H I L E
K E E P I N G A
C O NS E R VAT IV E
F I N A NC I A L P O L IC Y
A N D I NV E ST M E NT
G R A D E R AT I N G
1
2 5
6
43
TAKEOVER
COMPANY STRATEGY AND BUSINESS MODEL
For its acquisitions, the Company adheres to the following specific criteria:
• Acquisition in densely populated areas and major cities
• High cash flow generating asset
• Vacancy reduction potential
• Rent level per sqm below market level (under-rented), upside potential and low downside risk
• Purchase price below replacement costs and/or below market values
• Potential to reduce the operating cost per sqm
■■ GCP’s investment focus is on the German residential markets that it perceives to benefit from favorable fundamentals that will support sta-ble profit and growth opportunities in the foreseeable future. The Group’s current portfolio is predominantly focused on North Rhine-Westpha-lia, Berlin, the metropolitan regions of Leipzig, Dresden and Halle and London, as well as other major cities and urban centers in Germany.
The Company believes its plat-form has the right abilities and sys-tems in place to continue its strong performance and to further realize on the high upside potential embed-ded in the portfolio, while support-ing external growth.
Deal-sourcing network
established since 2004.
Due Diligence &
negotiation of best
possible deal terms
Repositioning + Capex
Increase: Rent + occupancy.
Decrease operating costs
and non-recoverable costs.
Improve tenant satisfaction
In-house proprietary
IT Software
Acquisition.
Yield & Value increase.
Long-term asset
financing
90%Long
term
hold
Up to 10% p.a.
Sale on
opportunistic
basis at
high capital
gains and
channel into
high quality
properties
%

25Board of Directors’ Report |
*TÜV approved Service Center*
FRANKFURT
Cash flow improvements through focus on rental income and cost discipline
■■ GCP seeks to maximize cash flows from its portfo-lio through the effective management of its assets by in-creasing rent, occupancy and cost efficiency. This process is initiated during the due diligence phase of each acqui-sition, through the development of a specific plan for each asset. Once taken over, and the initial business plan is re-alized, GCP regularly assesses the merits of ongoing im-provements to its properties to further enhance the yield on its portfolio by increasing the quality and appearance of the properties, raising rents and further increasing oc-cupancy. GCP also applies significant scrutiny to its costs, systematically reviewing ways to increase efficiency and thus increase cash flows.
Maximize tenant satisfaction
■■ A key pillar of the overall success of GCP is tenant satisfaction. The GCP Service Center ensures prompt re-sponses to queries with the longest time to a response be-ing 24hrs. Urgent cases are taken care of within a time frame of under an hour. The quality of the Service Center offering was validated with the ISO 9001:2015 re-audit certification received in February 2020. GCP’s continuous improvement processes which are integral to business op-erations received a special mention in the re-audit certifi-cation. The Company places strong emphasis on enhancing the living quality and environment of its tenants through various measures. GCP strives to develop a community feeling amongst its tenants by installing playgrounds, im-proving accessibility at the properties, organizing fami-ly-friendly events, supporting local associations as well
as through various other initiatives. Some of the Compa-ny’s regularly organized tenant events include Santa Claus celebrations for Christmas, Easter egg-searching events as well as different summer events, such as the dozens of “GCP Summer Games” parties that are organized annually. The Company has also worked towards providing children with study areas, organizing youth programs, mother-ba-by groups, and even senior citizen meeting points in order to establish a pleasant environment within the communi-ty. In addition, GCP identifies opportunities to work with local authorities to improve the existing infrastructure in the community, contributing to increased demand for the neighborhood.
Operations supported by centralized IT/software
■■ The Group’s proprietary and centralized IT / software plays a significant role in enabling GCP to achieve its ef-ficiency objectives. The key to this system is the detailed information that it provides for all aspects, which staff can access on and off the road. This all-encompassing data processing enables the Group to track and respond to mar-ket rent trends, spot opportunities for rent increases, and manage re-letting risks on a daily basis. GCP’s IT/software provides management with the detailed information nec-essary to monitor everything from costs to staff perfor-mance.

26 | Board of Directors’ Report
CAPITAL MARKETS
Placement Frankfurt Stock Exchange
Market segment Prime Standard
First listing Q2 2012
Number of shares (as of 31 December 2019) 167,895,560
ordinary shares with a par value of EUR 0.10 per share
Nominal share capital(as of 31 December 2019) 16,789,556.00 EUR
Number of shares on a fully diluted basis(as of 31 December 2019)
180,695,402
ISIN LU0775917882
WKN A1JXCV
Symbol GYC
Key index memberships
MDAXFTSE EPRA/NAREIT Index SeriesSTOXX Europe 600MSCI Index SeriesGPR 250DIMAX
Market capitalisation(as of 31 December 2019) 3.6 bn EUR
Shareholder structure(as of 31 December 2019)
Freefloat: 60.6%- of which EdgePoint: 5.0%Edolaxia Group 39.4%
Investor relations activities supporting the strong capital markets position
■■ The Company continues to proactively present its business strategy and thus enhance perception, as well as awareness, of the Company among capital market inves-tors. GCP seizes opportunities to present a platform for open dialogue, meeting hundreds of investors in dozens of conferences around the globe as well as hosting investors at the Company’s offices. The improved perception leads to a better understanding of GCP’s business model, operating platform and competitive advantage, and leads to strong confidence from investors. GCP’s strong position in equity capital markets is reflected through its membership in key stock market indices, including the MDAX of the Deutsche Börse, the STOXX Europe 600 index, the FTSE EPRA/NA-REIT Global Index series, GPR 250, DIMAX and the MSCI index series. These index memberships are the result of many years of success in equity markets and the strong investor perception of the Company.

27Board of Directors’ Report |
BERLIN

28 | Board of Directors’ Report
■■ The Company has established over the years an im-pressive track record in capital markets, continuously ac-cessing various markets through its strong relationships with the leading investment banks in the market. Sup-ported by two investment-grade credit ratings (BBB+ from S&P and Baa1 from Moody’s), GCP is able to quickly and efficiently source funds at attractive interest rates, sig-nificantly contributing to its low average cost of debt (of currently 1.3%). Since 2012, GCP has issued over €6 billion
through dozens of issuances of straight bonds, convertible bonds, equity and perpetual notes. The Company launched an EMTN programme, providing significant convenience and flexibility by enabling the issuance in a short of time of financial instruments of various kinds, sizes, curren-cies and maturities. Through its strong access to capital markets, GCP is able to proactively and effectively manage its debt structure, contributing to a long average debt ma-turity of 8 years.
Vast and proven track record in capital markets
Analyst Recommendations
First Berlin
10.03.2020
Deutsche Bank
20.02.2020
Citigroup
29.01.2020
Barclays09.01.2020
UBS02.03.2020
Hauck & Aufhäuser
11.09.2019
Goldman Sachs
16.01.2020
Oddo BHF
12.03.2020
Jefferies
18.11.2019
Kempen & Co.
14.01.2020
Bank of America Merrill Lynch
18.11.2019
21
Nord LB05.12.2019
21 2120
19
23 22.7
2928
27.5
31.7
27
J.P.Morgan
16.01.2020
HSBC15.07.2019
Kepler Chevreux
18.11.2019
Credit Suisse
29.10.2019
Berenberg
29.01.2020
24.5 24.123
25 2525.225.5
Commerzbank
27.02.2020
Bankhaus Lampe
11.03.2020
DZ Bank16.01.2020
21

29Board of Directors’ Report |
30
25
20
15
10
5
0
Share price performance and total return comparison since first equity placement (19.07.2012)
Straight bond Series D and E – Spread over mid-€-swapSeries D: remaining 1.5 years | Series E: remaining 5 years
3.0
2.5
2.0
1.5
1.0
0.5
0.0
3.75% perpetual notes spread over mid-€-swapFirst call date: February 2022
Q3Q3 Q3 Q4Q4 Q4 Q1Q1 Q1 Q1 Q2 Q2 Q3 Q4 Q1Q1 Q1Q1 Q2Q2 Q2 Q2 Q3 Q4
Q2 Q2 Q3 Q4 Q1Q3 Q4
Q2 Q3Q3 Q3Q4Q4 Q4
201720162015201420132012 2018 2019 2020
Q3 Q4 Q1 Q1 Q1Q1Q1 Q2 Q2Q2 Q3 Q3Q4Q4 Q4
2017201620152014 2018
2015
Q3 Q4 Q1 Q1 Q1Q1Q2 Q2 Q2 Q2 Q3 Q4 Q1Q3 Q4Q3 Q3Q4 Q4
2016 2017
2019 2020
2018 2019 2020
FTSE EPRA/NAREIT Germany Index (EPGR) (rebased) +157% total return
Grand City Properties S.A. (GYC) +625% total return
MDAX (rebased) +93% total returnissue price €2.75
Current spread Series D: 0.51%
Current spread: 3.35 %
Jul 15: S&P rating upgrade
to BBB
Nov 16:
S&P rating upgrade
to BBB+
Feb 15: Moody’s assignment of Baa2 rating
Sep 17:
Moody s rating upgrade
to Baa1
May 2017: Uplisting to Prime Standard
Nov 16:
S&P rating upgrade
to BBB+
Sep 17:
Moody s rating upgrade
to Baa1
issuance spread at 3.90%
6.0
5.0
4.0
3.0
2.0
1.0
0.0
Current spread Series E: 1.00%Series D issuance spread at 2.01%
Nov 14: S&P rating upgrade to BBB-
Series E issuance spread at 1.73%
Dec 2017: STOXX inclusion
Sep 2017: MDAX inclusion

30 | Board of Directors’ Report
S
S
■■ As a large organization with a broad footprint from various operational activities, it is of crucial importance to Grand City Properties S.A. to maintain and improve the sustainable nature of its operations and properties there-by sustaining a high standard of responsibility to all its stakeholders, including tenants, employees, sharehold-ers, creditors, suppliers, the environment as well as the communities in which the Company operates. The social cohesiveness and wellbeing of the neighborhoods around GCP’s assets is important for the Company to achieve its goal of creating affordable communities where people wish to live and stay. A favorable macroeconomic background as well as stable social and institutional conditions in the cities where GCP invests, along with unchanging climat-ic conditions, together support the Company’s long-term business interests. During the year 2019, the Company set up the GCP Foundation in order to focus efforts of the or-ganization towards charitable projects involving children, education, sports and the elderly, to mention a few.
GCP considers ESG to be pivotal for the overall success of the organization and incorporates this into the various functions of the Company. The annual Corporate Respon-sibility Report for 2019 will be published in April 2020 and will feature efforts and initiatives undertaken in 2019. The report will be available for download on GCP’s website.
GCP’s commitment to sustainability measures was recognized in February 2019 by Sustainalytics, a leading sustainability rating agency, which ranked GCP in the 95th percentile among 300 global real estate peers, as well as noting GCP as a leader in its peer group.
In September 2019, for the third year in a row, GCP was awarded the EPRA BPR Gold Award as well as the EPRA Sustainability Best Practices Recommendations (sBPR) Gold Award for its EPRA sBPR reporting, underlining the Company’s commitment to the highest standards of trans-parency and reporting.
ESG – ENVIRONMENTAL, SOCIAL AND GOVERNANCE
95THPERCENTILEIN FEB 2019
RECEIVED THE GOLD AWARD IN BOTH CATEGORIES
FOR THE 3RD CONSECUTIVE YEAR

31Board of Directors’ Report |
■■ There is scientific consensus that the climate is changing considerably, and that global biodiversity and natural resources are being rapidly depleted. GCP takes its responsibility to safeguard the natural environment and mitigate adverse impacts not only on our business but also on other stakeholders very seriously. As a responsible corporate citizen, that invests into the portfolio and mod-ernizes with the aim of achieving higher levels of effi-ciency, there is an opportunity for us to position ourselves as a positive contributor to the low carbon economy.
GCP pays great attention to the environmental aspects of the repositioning process and consistently improves upon various environmental measures in this regard. The Company sees the implementation of environmentally friendly measures as both an important environmental is-sue as well as an integral part of the optimization of its cost structure. Robust technical due diligence studies identify measures that should be pursued based on, whether or not measures make a strong economic business case, lead to higher tenant satisfaction as well as generate other envi-ronmental benefits.
GCP sets aside considerable resources in order to en-sure the proper oversight of various initiatives in connec-tion with the preservation of the environment. Manage-ment reviews of the environmental policies are coupled with the ongoing monitoring of environmental perfor-mance such as the use of energy and water as well as the reduction of carbon emissions and waste management. Through the year 2019, the Company switched 90% of electricity obtained by the Company to renewables or cli-mate-neutral energy sources, thereby reducing GCP’s car-
bon-footprint. GCP has continued efforts towards mod-ernizing heating systems, moving to climate-neutral gas systems so as to reduce its environmental footprint. Fur-thermore, the Company has initiated a pilot project with the help of an external partner, in order to improve the on-site separation of waste from our tenants. This is expected to not only increase recycling rates but also avoid costs on the disposal of non-recyclable waste.
Looking ahead, GCP will identify pilot sites for the implementation of an Energy Investment Program. This will aim to utilise renewable sources of energy thereby making the neighborhoods where GCP is located far more attractive and sustainable in the long run.
The Company maintains its reporting processes in line with the EPRA sBPR (Sustainability Best Practice Recommendations) guidelines and has also published its second full annual Corporate Responsibility Report in 2019, with the published environmental data being ex-ternally assured by GUT Certifizierungsgesellschaft für Managementsysteme.
GCP’s Green Procurement Policy defines the basis on which various contracting decisions should be made and is communicated to all employees with purchasing re-sponsibilities. Suppliers are expected to reduce any neg-ative impact on the environment and position their oper-ations towards the ISO 14001 environmental management standard. The Company maintains a proactive approach and regularly engages with suppliers to identify areas of improvement with regards to sustainability and the en-vironment.
ENVIRONMENTAL RESPONSIBILITY
“ Moving into 2020, we are enthusiastic about some promising projects we are embarking on at the asset level – from identifying buildings that fulfil our criteria for on-site renewable energy installations to working with local organizations to establish new services that support our communities. These projects will make the neighborhoods where we invest more attractive and sustainable in the long-term, thereby enhancing the value of our assets and supporting strong and stable returns for our business as high occupancy in appealing homes and surroundings converts into rental income. ” ———— Christian Windfuhr, CEO

32 | Board of Directors’ Report
Tenants & the society
■■ As an asset owner and property manager, GCP has the unique opportunity to enhance the quality of life in a community through various improvements to the living conditions therein. The Company recognizes this and po-sitions a number of its activities in order to create fami-ly-friendly living environments. A number of community facilities such as indoor and outdoor playgrounds, fitness trails, BBQ areas and tenant libraries allow for tenants to congregate and foster strong relationships within the community. GCP places a high value on direct interaction and dialogue with its tenants and to that end boasts of a high-quality service center, available 24 hours a day, sev-en days a week, each day of the year.
During the year, selected employees participated in Social Days during the year, where groups of employees visited the community for an entire day in order to serve the needs of the community. Employees were involved with different activities such as - renovation work at non-profit organizations, gardening, organizing summer & Christmas celebrations for day care centers and also or-ganizing activities for children in the local communities.
GCP is the main sponsor of the FC Union Berlin Youth football team, while it also sponsors on different levels, other local sports clubs and teams. For the year 2020, the Company has agreed to sponsor in through multiple means, BG Hagen, a basketball team as well as SSV Buer and FC Azadi Bochum, both football teams.
Sports have an uncanny knack of providing the next generation with disciplines that will hold them in good stead while also bringing the local community together.
Employees & diversity
■■ As a responsible employer, GCP provides its employees with different opportunities for personal development and internal advancement. The Company’s ongoing Leader-ship Program and employee support are examples of such opportunities and have been rather effective in building leaders for tomorrow. The Company cares for the well-be-ing of its employees and to that end provides them with a fitness center at its operational headquarters in Berlin free of charge. The fitness center is managed by qualified trainers, who develop and supervise individual training programs for those who wish to take advantage of this ser-vice. Additionally, yoga and aerobic classes are offered by specialized coaches.
Not only does GCP view its cultural diversity as be-ing essential to its success, but also values and respects perspectives of its employees from different nationalities, ages, genders, ethnicities, races, cultures, religions, ide-ologies, sexual identities and physical abilities. Discrim-ination based on any of these aspects is strictly prohibited within the Company. All employees are provided with a diversity training on joining the organization. The Com-pany’s commitment to diversity is overseen by a Diversi-ty Committee, made up of representation across different levels of the organization.
Corporate Responsibility Steering Committee
■■ The Company’s CR Steering Committee is made up of the heads of all relevant departments and is chaired by the CEO, Mr Christian Windfuhr. The Committee discusses various developments and CR topics routinely and is re-sponsible for ensuring that CR related developments are aligned with the company’s integrated sustainable busi-ness strategy. The CR department works closely with all related departments to ensure operational implementation of CR topics.
SOCIAL RESPONSIBILITY

33Board of Directors’ Report |
■■ GCP emphasizes the importance of corporate gov-ernance with a high standard of transparency, executed by the Board of Directors with a majority of independent directors and the management. The Company directs its efforts in maintaining the high trust it receives from its shareholders and bondholders. GCP is proud of the high confidence of its investors, which is reflected in the im-pressive placement of funds by major global investment banks. GCP’s shares and bonds are regularly placed with international leading institutional investors and major global investment and sovereign funds.
In order to maintain high corporate governance and transparency standards, the Company has implemented the Advisory Board, the Risk Committee, the Audit Com-mittee, the Nomination Committee and the Remuneration Committee.
Furthermore, the Company ensures that its Board of Directors and its senior executives have vast experience and skills in the areas relevant to its business. The Compa-ny has quarterly reporting standards and updates its cor-porate presentation on a continuous basis.
The Company has a very strict Code of Conduct which applies to all business partnerships as well as employees. The Code of Conduct addresses issues related to corrup-tion, conflicts of interest, bribery, human rights abuses as well as discrimination based on a range of factors such as age, gender, ethnicity, race, culture, religion, ideology, sexual identity, physical disabilities among others. The Code also clearly lays down a reporting framework for any violations. Additionally, it also provides for investigations and disciplinary measures as may be required in case of violations. The Code has been recently updated with a fo-cus on improved transparency in its reporting lines, which are now supported by the Compliance Department and the whistleblower system.
The Company is not subject to any compulsory corpo-rate governance code of conduct or respective statutory legal provisions. In particular, the Company is currently not required to adhere to the “Ten Principles of Corporate Governance” of the Luxembourg Stock Exchange or to the German corporate governance regime, the latter which are only applicable to listed companies incorporated in Ger-many. Nevertheless, the Company intends to voluntarily comply with the “Ten Principles of Corporate Governance” of the Luxembourg Stock Exchange in the future and is currently evaluating the necessary measures to implement the principles and recommendations of the “Ten Princi-ples of Corporate Governance” of the Luxembourg Stock Exchange and continues to take steps to implement envi-ronmental, social and corporate governance best practices throughout its business.
Annual General Meeting
■■ The Annual General Meeting of the shareholders of Grand City Properties S.A. for 2020 is expected to take place on June 24, 2020 in Luxembourg. The meeting will resolve on, among others, the amount of the dividend for the 2019 fiscal year to be distributed to shareholders of the Company.
Compliance and Code of Conduct
■■ The Company considers reputational risk as a signifi-cant risk and has therefore incorporated a high compliance with statutory laws as well as Company guidelines into the corporate management and culture. Employees are pro-vided with initial as well as on-going training related to issues connected with the Code of Conduct. The GCP com-pliance and risk management framework includes the cor-responding internal audit procedures and covers all areas of the business including acquisitions, asset management, administrative and operative functions.
Internally, the Company’s Code of Conduct for Em-ployees is a mandatory component for all employment contracts and includes policies such as, Anti-Corruption Policy, Anti-discrimination Policy, Whistle-blowing Pol-icy, Data Protection Declaration, User Policy for dealing with digital content & devices as well as a Green Procure-ment Policy. Externally, business partners are required to adhere to the strict Code of Conduct for Business Partners. This Code of Conduct lays out the legal and ethical frame-work to be followed and includes references to a number of important issues such as prohibition of corruption and bribery, conflicts of interest, health and safety of employ-ees, environmental protection, money laundering practic-es, respect of basic human rights of employees, prevention of child labour as well as forced labour, data protection and recognition of employees’ rights pertaining to freedom of association.
The Company s Code of Conduct includes the prohibi-tion of insider dealing. The Company is subject to several obligations under Regulation (EU) No. 596/2014 (Market Abuse Regulation, “MAR”). Therefore, it has set up a com-pany s insider register and a process to ensure that per-sons on such list acknowledge their duties and are aware of sanctions. The Company notifies pursuant to Article 19 para. 5 subpara. 1 sentence 1 of MAR all person discharg-ing managerial responsibilities of their obligations in the context of managers’ transactions. Memorandums, notifi-cations and information are distributed regularly.
One of GCP’s important objectives has been to ensure the best-possible protection of personal data from manip-ulation or abuse. In this regard, various modern IT systems with high standards of data privacy are a key technical
CORPORATE GOVERNANCE

34 | Board of Directors’ Report
solution utilized by the Company. At the same time, staff are sensitized to the topic of data protection through video training modules as well as seminars with legal experts. Displaying its proactive nature, the Company has also prepared clearly communicated standard operating pro-cedures (SOPs) which assist all stakeholders in their daily operations involving data as well as ensure the effective protection of data.
Board of Directors
■■ The Company is administered by a Board of Directors that is vested with the powers to perform and manage in the Company’s best interests.
The Board of Directors represents the shareholders as a whole and makes decisions solely in the Company’s best interests and independently of any conflicts of interest. The Board of Directors and senior management regularly evaluate the effective fulfillment of their remit and com-pliance with strong corporate governance standards. This evaluation is also performed by the Audit Committee and the Risk Committee.
The members of the Board of Directors are elected by the shareholders at the annual general meeting for a term not exceeding six years and are eligible for re-election. The directors may be dismissed with or without any cause
at any time and at the sole discretion of the shareholders at the annual general meeting. The Board of Directors, a ma-jority of whom are independent, resolves on matters on the basis of a simple majority, in accordance with the articles of incorporation. The Board of Directors chooses amongst the directors a chairperson who shall have a casting vote. All directors have been appointed and the mandate re-newed at AGM 2019 until AGM 2021.
Name Position
Mr. Refael Zamir Director, chairman, CFO
Ms. Simone Runge-Brandner Independent Director
Mr. Daniel Malkin Independent Director
Members of the Board of Directors
CEO
■■ The Board of Directors resolved to delegate the daily management of the Company to Mr. Christian Windfuhr, as Daily Manager (administrateur-délégué) of the Com-pany, under the endorsed denomination (Zusatzbezeich-nung) Chief Executive Officer (CEO) for an undetermined period.
MUNICH

35Board of Directors’ Report |
Advisory Board
■■ The Board of Directors established an Advisory Board to provide expert advice and assistance to the Board of Directors. The Board of Directors decides on the composi-tion, tasks, and term of the Advisory Board as well as the appointment and dismissal of its members. The Advisory Board has no statutory powers under Luxembourg law or the articles of incorporation of the Company but applies rules adopted by the Board of Directors. The Advisory Board is an important source of guidance for the Board of Directors when making strategic decisions.
Audit Committee
■■ The Board of Directors established an Audit Commit-tee and decides on the composition, tasks and term of the Audit Committee as well as the appointment and dismiss-al of its members. The responsibilities of the Audit Com-mittee relate to the integrity of the consolidated financial statements, including reporting to the Board of Directors on its activities and the adequacy of internal systems con-trolling the financial reporting processes, and monitoring the accounting processes.
The Audit Committee provides guidance to the Board of Directors on the auditing of the annual consolidated financial statements of the Company and, in particular, shall monitor the independence of the approved indepen-dent auditor, the additional services rendered by such au-ditor, the issuing of the audit mandate to the auditor, the determination of auditing focal points, and the fee agree-ment with the auditor.
Risk Committee
■■ The Board of Directors established a Risk Committee to assist and provide expert advice to the Board of Direc-tors in fulfilling its oversight responsibilities relating to the different types of risks the Company is exposed to, recommend a risk management structure including its organization and processes, as well as assess and moni-tor effectiveness of the overall risk management. The Risk Committee provides advice on actions of compliance, in particular by reviewing the Company’s procedures for de-tecting risk, the effectiveness of the Company’s risk man-agement and internal control systems and by assessing the scope and effectiveness of the systems established by the management to identify, assess and monitor risks.
Remuneration Commitee
■■ The Board of Directors established a Remuneration Committee. The Remuneration Committee shall submit proposals regarding the remuneration of executive man-agers to the Board, ensuring that these proposals are in accordance with the remuneration policy adopted by the Company and the performance evaluation results of the persons concerned. To that end, the committee shall be in-formed of the total remuneration paid to each member of the executive management by other companies affiliated with the group.
Nomination Committee
■■ The Board of Directors established a Nomination Committee. The Nomination Committee shall be composed of a majority of Non-Executive Directors. For every sig-nificant position to be filled, the committee will make an evaluation of the existing and required skills, knowledge and experience. Based on this assessment, a description of the role, together with the skills, knowledge and experi-ence required shall be drawn up. As such, the committee shall act in the best interests of the Company, and among others, prepare plans for succession of Directors, evaluate existing and required skills, knowledge, and experience, consider proposals from shareholders, the Board and ex-ecutive management, and suggest candidates to the Board.
Internal controls and risk management systems
■■ The Company closely monitors and manages poten-tial risks and sets appropriate measures in order to mit-igate the occurrence of possible failures to a minimum. The risk management is led by the Risk Committee, which constructs the risk management structure, organization, and processes. The Risk Committee monitors the effec-tiveness of risk management functions throughout the organization, ensures that infrastructure, resources, and systems are in place for risk management and are adequate to maintain a satisfactory level of risk management dis-cipline. The Company categorizes the risk management systems into two main categories: internal risk mitigation and external risk mitigation.

36 | Board of Directors’ Report
Internal risk mitigation
■■ Internal controls are constructed from five main ele-ments:
• Risk assessment – set by the Risk Committee and guided by an ongoing analysis of the organizational structure and by identifying potential weaknesses.
• Control discipline – based on the organizational structure and supported by employee and manage-ment commitments. The discipline is erected on the foundations of integrity and ethical values.
• Control features – the Company sets physical controls, compliance checks, and verifications such as cross departmental checks. Grand City Properties S.A. puts strong emphasis on separation of duties, as approval and payments are done by at least two separate par-ties. Payment verification is cross checked and con-firmed with the budget and the contract. Any payment exceeding a certain set threshold amount requires ad-ditional approval by the head of the department as a condition for payment.
• Monitoring procedures – the Company monitors and tests unusual entries, mainly through a detailed monthly actual vs. budget analysis and check. Strong and sustainable control and organizational systems reduce the probability of errors and mistakes signifi-cantly. The management places significant value in constantly improving all measures, adjusting to mar-ket changes and organizational dynamics.
• ESG risk-related expenditures – the Group has in-cluded identification of potential financial liabilities and future expenditures linked to ESG risks in the organizational risk assessment. Future expenditures on ESG matters and opportunities are included in the financial budget.
External risk mitigation
■■ Through ordinary course of business, the Company is exposed to various external risks. The Risk Committee is constantly determining whether the infrastructure, re-sources, and systems are in place and adequate to main-tain a satisfactory level of risk. The potential risks and exposures are related, inter alia, to volatility of interest rate risks, liquidity risks, credit risks, regulatory and legal risks, collection and tenant deficiencies, the need for un-expected capital investments, and market downturn risk.
Grand City Properties S.A. sets direct and specific guidelines and boundaries to mitigate and address each risk, hedging and reducing to a minimum the occurrence of failure or potential default.
Brexit
■■ On 29 March 2017, the United Kingdom (UK) informed the European Council about its intention to withdraw from the European Union (EU). Following extended negotia-tions between all stakeholders as well as a fresh election in the country, the UK parliament voted in favor of the withdrawal from the EU and officially withdrew from the EU on 31st January 2020 and enters a transitionary peri-od during which time the nature of the relationship with the EU will be negotiated. The uncertainty of the outcome of these negotiations could lead to volatilities in financial markets which may adversely impact GCP’s ability to re-finance its debt and/or gain access to new financing while also resulting in decreasing prices and rents in the UK and in particular, London. Barriers to trade in the region could also lead to an economic downturn in the UK and/or the EU.
GCP maintains a diversified portfolio supported by in-vestments in locations with their own distinct econom-ic drivers. The London portfolio constitutes only 13% of the investment portfolio and is located in strong middle-class neighborhoods with over 90% of assets situated within a short walking distance from public transport resulting in a strong demand for residential units.
Coronavirus
■■ The Coronavirus (COVID-19) pandemic started in De-cember 2019 and as of the date of this report the impact of the virus on the global economy is negative. The virus has been affecting over 100 countries, including Germany. Due to the focus of GCP on residential properties, the Com-pany does not anticipate any substantial direct impact to its internal operations due to the virus since operations are not significantly reliant on a supply chain of any sort. However, the Coronavirus pandemic could have an adverse impact on tenant’s incomes and on the general economic situation in Germany, which in turn could be strain on the Company’s top-line. GCP’s diversified portfolio acts as an effective buffer in such a scenario along with the fact that the portfolio is under-rented and thereby relatively lesser of a burden on tenants. The resulting uncertainty from the outbreak has also led to a significant decline in financial markets however, in the Company s opinion, the German residential space is a resilient asset class in such times making it an attractive investment option. In response to this outbreak, GCP has prohibited travel to regions con-sidered as high risk regions while also putting on hold participation in business events and fairs. All employees have been advised to take necessary precautions and fol-low guidelines prescribed by authorities. However, in case of a wider spread of the virus within Germany, GCP could consider various options including but not limited to, rec-ommending employees self-isolate and work from home.

37Board of Directors’ Report |
Regardless of these risks, GCP is of the opinion that, any downside is expected to be temporary in nature. The Company s strong liquidity position amounting to over €1 bn as of December 2019 in combination with GCP’s con-servative financial policy, would enable the Company to maintain stable operations with the aim of achieving the 2020 guidance.
Berlin Mietendeckel (rent cap)
■■ On January 30, 2020 the Berlin state parliament (Landtag) passed the Berlin Mietendeckel law which ef-fectively not only capped rent levels but also reversed rents based on the age, location and quality of the apartment. The rent levels for different kinds of apartments are spec-ified in a rent table published with the law, which became effective starting February 23, 2020. Most importantly, as per the law, landlords will be required to reduce rents that are above 120% of the limits of the rent table. Reletting of new apartments will be carried at 100% of the rent table or previous rent, whichever is lower. These limits may be exceeded if the unit was extensively modernized or if the unit included additional elements such as – elevator, fitted kitchen, low energy consumption, high-quality flooring and/or sanitary equipment. From 2022, the Berlin Senate will be required to adjust the rent table according to real wages, however, rents may increase by no more than 1.3%.
GCP’s management shares the opinion of other legal minds with respect to the unconstitutional nature of this law and views such measures as being counter productive and detrimental to the housing shortage in Berlin. Short-ening the building permit approval process, freeing up land and building rights within city limits and introduc-ing incentives to support construction of subsidized units, are measures which the Company considers to be the only solution to Berlin’s housing scarcity. As far as GCP’s busi-ness operations are concerned, the downside is limited to €3 million per annum on an absolute basis which translates to less than 1% of the entire portfolio’s annualized rent as of December 2019. GCP’s portfolio remains well-diversi-fied with 86% of the annualized rent contributed by loca-tions other than Berlin.
Shareholders‘ rights
■■ The Company respects the rights of all sharehold-ers and ensures that they receive equal treatment. All shareholders have equal voting rights and all corporate publications are transmitted through general publication channels and are also available in a specific section on the Company’s website. The Company discloses its share own-ership and additionally discloses any shareholder position above 5% when it is informed by the respective shareholder.
The shareholders of Grand City Properties S.A. exer-cise their voting rights at the Annual General Meeting of the shareholders, whereby each share is granted one vote. The Annual General Meeting of the shareholders takes place on the last Wednesday of the month of June at 11:00 a.m. at the registered office of the Company, or at such oth-er place as may be specified in the notice of the meeting. If such day is a legal holiday, the Annual General Meeting of the shareholders shall be held on the following business day. At the Annual General Meeting of the shareholders the Board of Directors presents, among others, the man-agement report as well as the statutory and consolidated financial statements to the shareholders.
The Annual General Meeting resolves, among others, on the statutory and consolidated financial statements of Grand City Properties S.A., the allocation of the statuto-ry financial results, the appointment of the approved in-dependent auditor, and the discharge to the (re-)election of the members of the Board of Directors. The convening notice for the Annual General Meeting of the shareholders contains the agenda and is publicly announced twice, with a minimum interval of eight days, and eight days before the meeting in the Mémorial, in a Luxembourg newspaper, and on the Company’s website.
Compliance to the transparency law
■■ The company is in line with the Transparency Law and in particular in relation to the disclosure requirements i.e. disclosure to the public of regulated information within the meaning of article 1 (10) of the Transparency Law. The Com-pany provides public equal and timely access to such infor-mation and fulfills the complex disclosure obligations. The quarterly and annual financial reports and investor presen-tations press releases and ad-hoc notifications are available in English language on Company s website. The Company provides on its website information about the organization, its management and upcoming and past shareholder meet-ings, such as its annual general meetings. The Company s website provides a financial calendar announcing the fi-nancial reporting dates as well as other important events. The financial calendar is published before the beginning of a year and regularly updated.
The individual Grand City Properties S.A. financial statements, based on Luxembourg GAAP, is published an-nually on the same day of Grand City Properties S.A. con-solidated report.

38 | Board of Directors’ Report
Shareholder name Amount of Shares 1) Percentage of voting rights
Edolaxia Group Ltd 66,158,377 39.4%
EdgePoint Investment Group Inc. 8,340,416 5.0%
Information according to article 11(2) of the Luxembourg takeover law
■■ The following disclosure is provided pursuant to arti-cle 11 of the Luxembourg law of 19 May 2006 transposing Directive 2004/25/EC of the European Parliament and of the Council of 21 April 2004 on takeover bids, as amended (the “Takeover Law”):
a) With regard to article 11 (1) (a) and (c) of the Takeover Law (capital structure), the relevant information is available on pages 26, 37, and note 18 on pages 115, 116 of this annual report. In addition, the Company’s shareholding structure showing each shareholder owning 5% or more of the Company’s share capital is available on page 26 of this annual report and on the Company’s website, where the shareholding structure is updated monthly.
b) With regard to article 11 (1) (b) of the Takeover Law, the ordinary shares issued by the Company are admit-ted to trading on the regulated market of the Frank-furt Stock Exchange (Prime Standard) and are freely transferable according to the Company’s articles of association (the “Articles of Association”).
c) In accordance with the requirements of Article 11 (1) c of the Takeover Law, the following significant share-holdings were reported to the Company, as of 31 Decem-
ber 2019:
1) Total number of Grand City Properties S.A. shares as of 31 December 2019: 167,895,560
d) With regard to article 11 (1) (d) of the Takeover Law, each ordinary share of the Company gives right to one vote according to article 8 of the Articles of Associa-tion. There are no special control rights attaching to the shares.
e) With regard to article 11 (1) (e) of the Takeover Law, control rights related to the issue of shares are direct-ly exercised by the relevant employees. The key terms and conditions in relation to the Company’s incentive share plan are described on page 116, note 19.1 of this annual report.
LEIPZIG

39Board of Directors’ Report |
f) With regard to article 11 (1) (f) of the Takeover Law, the Articles of Association impose no voting rights limitations. However, the sanction of suspension of voting rights automatically applies, subject to the Luxembourg law of 11 January 2008 on transparency requirements for issuers, as amended (the “Transpar-ency Law”) to any shareholder (or group of sharehold-ers) who has (or have) crossed the thresholds set out in the Transparency Law but have not notified the Com-pany accordingly. In this case, the exercise of voting rights relating to the shares exceeding the fraction that should have been notified is suspended. The sus-pension of the exercise of voting rights is lifted the moment the shareholder makes the notification.
g) With regard to article 11 (1) (g) of the Takeover Law, as of December 31, 2019, the Company was not aware of any agreements between shareholders that would lead to a restriction on the transfer of shares or voting rights .
h) With regard to article 11 (1) (h) of the Takeover Law, according to article 9 of the Articles of Association, the members of the board of directors of the Compa-ny (the “Board”) shall be elected by the shareholders at their annual general meeting by a simple majority vote of the shares present or represented. The term of the office of the members of the Board shall not ex-ceed six years, but they are eligible for re-election. Any member of the Board may be removed from of-fice with or without specifying a reason at any time. In the event of a vacancy in the office of a member of the Board because of death, retirement or otherwise, this vacancy may be filled out on a temporary basis until the next meeting of shareholders, by observing the applicable legal prescriptions. Further details on the rules governing the appointment and replacement of a member of the Board are set out in pages 34 of this annual report.
According to article 18 of the Articles of Association, any amendment to the Articles of Association made by the general meeting of shareholders shall be ad-opted with a quorum and majority pursuant to arti-cle 450-3 of the law of 10 August 1915 on commercial companies, as amended amended (the “1915 Law”).
i) With regard to article 11 (1) (i) of the Takeover Law, the Board of Directors is endowed with wide-ranging powers to exercise all administrative tasks in the in-terest of the Company including the establishment of an Advisory Board, an Audit Committee, a Risk Com-mittee, a Remuneration Committee and a Nomination Committee. Further details on the powers of the Board are described on pages 34, 35 and page 73 of this an-nual report.
Pursuant to article 5.2 of the Articles of Association, the Board is authorized to issue shares under the au-thorised share capital as detailed on page 115 note 18.1. and pages 116, 117, note 19 of this annual report. According to article 5.1 of the Articles of Association, the Company may redeem its own shares to the extent and under the terms permitted by law. The sharehold-ers’ meeting did not authorise yet the Board to acquire own shares pursuant to articles 430-15 (1) of the 1915 Law.
j) With regard to article 11 (1) (j) of the Takeover Law,
the Company’s (listed on pages 118, 119 and note 20.2) convertible bonds, hybrid bonds and security issu-ances under the EMTN programme contain change of control provisions that provide noteholders with the right to require the Company to repurchase their notes upon a change of control of the issuer. The Com-pany’s ISDA master agreement securing derivate transactions with regard to its listed debts contains a termination right if the Company is financially weak-er after a takeover.
k) With regard to article 11 (1) (k) of the Takeover Law, there are no agreements between the Company and members of the Board or employees according to which, in the event of a takeover bid, the Company may be held liable for compensation arrangements if the employment relationship is terminated without good reason or due to a takeover bid.

40 | Board of Directors’ Report
Selected consolidated statement of profit or loss
For the year ended December 31, 2019 2018
€’000
Rental and operating income 560,303 544,977
Net rental income 382,605 364,365
Property revaluations and capital gains 401,132 506,553
Property operating expenses (255,734) (262,684)
Administrative & other expenses (12,892) (10,515)
Operating profit 692,869 779,737
Adjusted EBITDA 297,662 275,530
Finance expenses (45,041) (45,929)
Other financial results (33,193) (35,786)
Current tax expenses (37,062) (29,845)
Deferred tax expenses (84,213) (85,143)
Profit for the year 493,360 583,034
FFO I 211,966 197,854
FFO II 381,387 334,456
NOTES ON BUSINESS PERFORMANCE

41Board of Directors’ Report |
For the year ended December 31, 2019 2018
€’000
Net rental income 382,605 364,365
Operating and other income* 177,698 180,612
Rental and operating income 560,303 544,977
Revenue from sale of apartments* - 250
Revenue 560,303 545,227
Revenue
■■ Over the year 2019, GCP pro-gressively developed its top line, re-porting a revenue of €560 million for the year, which has increased by 3% as compared to the €545 million for the year 2018. Rental and operating income, the primary revenue driver, was higher as a result of the solid op-erational performance of the busi-ness. This growth was due to the in-creased net rental income, which at €383 million, was 5% higher as com-pared to 2018. The portfolio’s strong organic growth was instrumental in increasing the net rental income, with the like-for-like rent grow-ing by 3.6%, of which 2.9% was due
to in-place rent increases and 0.7% was due to occupancy increases. Additionally, accretive acquisitions of approx. €650 million, coupled with the full year effect of acquisi-tions in 2018, further supported the net rental income increase. Offset-ting these increases were disposals of non-core and/or mature assets amounting to approx. €500 million during the year as well as the full year effect of disposals in the previ-ous year. GCP is executing a capital recycling initiatives of disposing properties which are non-core and/or are mature where the majority of the potential has been lifted and
channeling the disposal funds into new acquisitions with strong qual-ity in order to improve the overall portfolio quality.
The annualized net rent of the current portfolio as at the end of De-cember 2019 amounts to €368 mil-lion. This amount does not include €8 million the net rent generated by the held for sale portfolio, as well as the rent expected to be generated from pre-marketed buildings valued at €160 million which are expected to generate rent gradually in the next periods.
Net rental income annual development (in € millions)
20182016 2017 2019
285
328
364383
CAGR2016 – 2019
+10%
+3.6%L-F-L
Total net rentgrowth Over the last
12 months
*defined as revenue from contracts with customers under note 6
+5%

42 | Board of Directors’ Report
Property revaluations and capital gains
■■ Property revaluations and capi-tal gains for 2019 amounted to €401 million as compared to €507 million for the previous year. The manage-ment’s ability to identify accretive acquisitions in good locations with robust fundamentals has been in-strumental in building a portfolio with a significant growth poten-tial. Complementing these measures, GCP’s successful repositioning mea-sures and operational improvements are key factors which help to unlock the portfolio’s value potential and generate value gains. Additionally, strong market fundamentals such
as the continued high demand for and low supply of living spaces in GCP’s portfolio locations have driv-en increasing market rents and have further supported higher property valuations.
During the year 2019, the Com-pany disposed approx. €500 million of non-core and/or mature assets at gains of €31 million resulting in a 7% gain over their net book values. These disposals form part of a stra-tegic capital recycling initiatives employed by the management in order to maximize the potential for value creation within the portfolio
while crystalizing gains achieved thus far. The strong gains on dispos-als are testament to the conservative valuations of the portfolio.
The fair values of the properties are externally appraised by inde-pendent and certified valuators at least once a year. The external val-uators involved are professional in-ternational valuators, mainly Jones Lang La-Salle (JLL). As of December 2019, the average value per sqm was €1,543 compared to €1,257 as of the end of December 2018. This trans-lates to a net rental yield of 4.9%.
For the year ended December 31, 2019 2018
€’000
Property revaluations 369,987 489,151
Capital gains 31,145 17,402
Property revaluations and capital gains 401,132 506,553
NOTES ON BUSINESS PERFORMANCE
DÜSSELDORF

43Board of Directors’ Report |
Disposal analysis
■■ GCP periodically evaluates the strategic composition of its portfo-lio and identifies assets which are at a mature stage as well as those which are no longer central to the business strategy. In addition, GCP maintains open channels of com-munication within the market and disposes properties on an opportu-nistic basis, when an attractive offer
arises. The proceeds are reinvested into new acquisitions fulfilling the acquisition criteria and providing a high upside potential. Over the year 2019, the Company disposed approx. €500 million, generating a profit over total costs of €169 million (profit margin of 52%), as well as a 7% gain over the net book values. These disposals were located in NRW, Hal-
le, Kaiserslautern and Berlin and are comprised of non-core as well as mature assets where the majority of the value potential has been lift-ed. GCP’s consistent value creation successes as well as its conservative valuations are both illustrated in the solid gains on disposals in 2019.
For the year ended December 31, 2019 2018
€’000
Acquisition cost including capex of disposed property 326,001 362,354
Total revaluation gains on disposed investment property since acquisition 138,276 119,144
Book Value (IFRS) 464,277 481,498
Disposal value 495,422 498,900
Capital gains 31,145 17,402
Premium over net book value 7% 4%
Disposal value 495,422 498,900
Acquisition cost including capex of disposed property (326,001) (362,354)
Realized profit from disposal 169,421 136,546
Disposal profit margin 52% 38%
Revenue from sale of apartments - 250
Cost of buildings sold - (194)
Result on the disposal of buildings sold - 56
Disposal profit margin on buildings sold - 29%
Total result from disposal of property 169,421 136,602
Total disposal profit margin on property 52% 38%

44 | Board of Directors’ Report
Property operating expenses
For the year ended December 31, 2019 2018
€’000
Purchased services (180,523) (187,390)
Maintenance and refurbishment (33,488) (34,494)
Personnel expenses (24,628) (22,434)
Depreciation and amortization (2,350) (1,991)
Other operating costs (14,745) (16,375)
Property operating expenses (255,734) (262,684)
■■ GCP recorded €256 million un-der property operating expenses for the year 2019, as compared to the previous year’s level of €263 million. Purchased services make up the largest part of property operating expenses and amounted to €181 mil-lion for 2019, 4% lower as compared to 2018. These services are mainly in relation to various ancillary ser-vices, the cost of which are recov-erable from tenants. The ancillary services provided to tenants include heating, water, waste disposal and cleaning, among others. The pur-chased services items decreased between 2018 and 2019 as a mixed result of GCP’s ability to decrease recoverable expenses and the result of acquisitions of properties with lower level of expenses coupled with
disposals of properties of higher re-coverable expenses, offset by gener-al cost inflation.
As maximizing tenant satisfac-tion continues to be a vital compo-nent of the business proposition, the Company has also put in place mea-sures to further improve its services in line with the integrated sustain-able business strategy. According-ly, efforts have been made to im-prove waste management, increase awareness among tenants as well as improve efficiency of heating sys-tems. GCP’s Service Center received the ISO 9001:2015 re-audit cer-tification with a positive mention regarding the continuous improve-ment process followed by the team. The certification further demon-strates the high standard of accessi-
bility and quality maintained by the Service Center which is available to tenants 24 hours a day, 7 days a week all through the year.
Personnel expenses for the year 2019 were €25 million, as compared to €22 million for 2018. Other oper-ating costs, which includes various marketing costs related to letting and promotional activities as well as transportation and communication expenses was 10% lower at €15 mil-lion for the year 2019.
As a result of the first-time im-plementation of IFRS 16 in 2019, there has also been an offsetting ef-fect, due to the reclassification of an expense of €3 million from property operating expenses to finance ex-penses.
NOTES ON BUSINESS PERFORMANCE
BERLIN

45Board of Directors’ Report |
Maintenance, capex and modernization
■■ GCP makes efforts to maintain the high quality of as-sets in its portfolio. These efforts take the form of a va-riety of maintenance and refurbishment measures, which together result in higher tenant satisfaction, increasing rents, decreasing vacancies, stronger tenant structures and improved operational efficien-cies.
Maintenance and refurbishment expenses include costs which are re-quired in order to preserve the qual-ity of the assets as well as retain the high standard of living for tenants. The Company’s 24/7 Service Center is a key factor in this process as it serves as the main contact point for tenants. GCP’s Service Center pro-vides its tenants with multiple chan-nels of communication in several languages, thereby making the pro-cess of service requests convenient and simple. For the year 2019, main-tenance and refurbishment expenses amounted to €33 million or €6.3 per average sqm, marginally lower as compared to the previous financial year, 2018.
During the year 2019, GCP in-vested €76 million into repositioning capex and €11 million into modern-ization capex. Units in the portfolio are periodically evaluated to iden-tify requirements for reposition-ing and/or modernization. All capex measures carried out are monitored carefully in order to optimize cash flows and asset quality.
Repositioning capex refers to costs incurred in order to enhance the quality of the property as well as its value proposition to tenants. This is achieved through various means such as apartment refurbishments, renovation of stair-cases and corridors, fire and life safety upgrades as well as other technical projects. Besides this, the Company also works at improving the adjoining areas of these properties through the enhancement of playgrounds, meeting areas,
barbeque pits and other such common areas which help to foster a community feeling among the tenants, further supporting the value of these properties. Over the year 2019, GCP incurred €14.9 per average sqm of repositioning capex, which compares to €13.9 per average sqm in 2018. The slight increase in the repositioning capex between 2019 and 2018 is also associated to cost inflation. Com-
bined with the increase in letting activities and strong demand, this resulted in an increased occupan-cy like-for-like of 0.7% in 2019, up from 0.3% in 2018.
Modernization capex are in-vestments meant to improve the standard of the apartment as well as their energy efficiency levels. Such measures are useful in enabling rent increases as a result of the asset im-provements through the addition of balconies, renovation to windows, the façade, interior overhauls as well as energy efficiency improve-ments. During the year 2019, the Company recorded €2.2 per average sqm of modernization capex, which in turn has directly contributed to like-for-like net rental growth of 0.2%. Modernization capex is car-ried on an opportunistic basis and is done in cases where a high return is achieved. The year 2019 saw fewer opportunities for accretive mod-ernization capex which passed the Company’s investment criteria, re-sulting in a decrease in moderniza-tion capex during the year from €21 million in 2018.
Furthermore, GCP invested €6 million of pre-letting modifications during the year 2019. These invest-ments were primarily connected to the completion of properties which were acquired in their final stages of
construction as well as the re-opening of renovated prop-erties in London prior to these units being leased, these investments are included in the initial cost analysis of the relevant properties at acquisition.
Maintenance and capex development (€/sqm)
2018 2019
20.321.2
13.9
14.9
M a i n t e n a n c e p e r s q m
R e p o s i t i o n i n g c a p e x p e r s q m
6.4 6.3

46 | Board of Directors’ Report
For the year ended December 31, 2019 2018
€’000
Finance expenses (45,041) (45,929)
For the year ended December 31, 2019 2018
€’000
Personnel expenses (4,664) (4,191)
Audit and accounting costs (2,519) (1,733)
Legal and professional consultancy fees (2,068) (1,822)
Depreciation and amortization (1,522) (585)
Marketing and other expenses (2,119) (2,184)
Administrative and other expenses (12,892) (10,515)
■■ Administrative and other ex-penses amounted to €13 million for the year 2019 and increased in com-parison to the €11 million reported
for the previous financial year. This increase was primarily a result of increased depreciation and amor-tization which is not a cash item,
higher audit and accounting costs and non recurring equity settled compensation for employees.
Administrative and other expenses
Finance expenses
■■ GCP reported finance expens-es of €45 million for the year 2019, marginally lower than the €46 mil-lion reported during the previous year. The lower level of finance ex-penses is a product of the proactive approach of the management in op-timizing the Company’s debt profile. As a result, although the absolute amount of debt increased year-over-year, during the same period, fi-nance expenses has decreased mar-
ginally on the back of a lower cost of debt. During the year 2019, GCP was successful in lowering its average cost of debt to 1.3% from 1.6% as of year-end 2018 and has maintained a long average debt maturity of 8 years. Reducing the cost of debt was achieved by prepaying near-term, higher interest bank loans amount-ing to over €300 million and by is-suing over €700 million debt at his-torically low rates.
The Company’s low average cost of debt, long average debt maturity and strong coverage ratios (ICR of 6.6x and DSCR of 5.5x) demonstrate its solid credit standing, which is also seen in the investment grade credit ratings from S&P (BBB+) and Moody’s (Baa1). This has provided GCP with a wide access to capital markets and therefore the ability to raise capital on favorable terms.
NOTES ON BUSINESS PERFORMANCE

47Board of Directors’ Report |
For the year ended December 31, 2019 2018
€’000
Change in fair value of financial assets and liabilities, net (15,757) (28,527)
Finance-related costs (17,436) (7,259)
Other financial results (33,193) (35,786)
Other financial results
COLOGNE
■■ For the year 2019, the Company reported an expense of €33 million as other financial results, lower as compared to €36 million reported for the previous year. Other financial results comprise of the change in the fair values of financial assets and derivatives as well as costs in con-
nection with refinancing, loan pre-payments, debt issuances and other financing activities, of which most are one-off expenses and therefore do not follow a specific trend.
GCP issued several straight bonds during the year 2019, amounting to over €700 million, in-
cluding foreign currency issuances with currency hedges in place to the euro. Additionally, the Company also prepaid near-term and higher in-terest bank loans amounting to over €300 million. Additionally this item includes loan brokerage fees and fees related to ratings of new bonds.
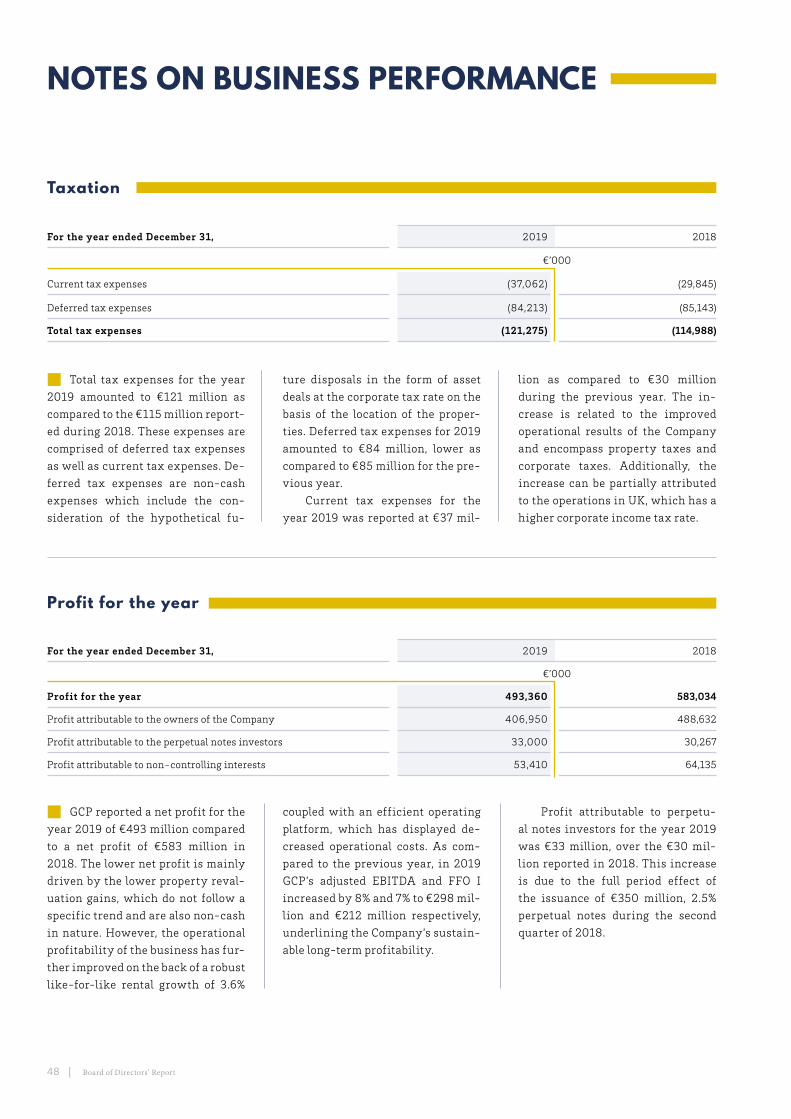
48 | Board of Directors’ Report
For the year ended December 31, 2019 2018
€’000
Profit for the year 493,360 583,034
Profit attributable to the owners of the Company 406,950 488,632
Profit attributable to the perpetual notes investors 33,000 30,267
Profit attributable to non-controlling interests 53,410 64,135
Profit for the year
■■ GCP reported a net profit for the year 2019 of €493 million compared to a net profit of €583 million in 2018. The lower net profit is mainly driven by the lower property reval-uation gains, which do not follow a specific trend and are also non-cash in nature. However, the operational profitability of the business has fur-ther improved on the back of a robust like-for-like rental growth of 3.6%
coupled with an efficient operating platform, which has displayed de-creased operational costs. As com-pared to the previous year, in 2019 GCP’s adjusted EBITDA and FFO I increased by 8% and 7% to €298 mil-lion and €212 million respectively, underlining the Company’s sustain-able long-term profitability.
Profit attributable to perpetu-al notes investors for the year 2019 was €33 million, over the €30 mil-lion reported in 2018. This increase is due to the full period effect of the issuance of €350 million, 2.5% perpetual notes during the second quarter of 2018.
■■ Total tax expenses for the year 2019 amounted to €121 million as compared to the €115 million report-ed during 2018. These expenses are comprised of deferred tax expenses as well as current tax expenses. De-ferred tax expenses are non-cash expenses which include the con-sideration of the hypothetical fu-
ture disposals in the form of asset deals at the corporate tax rate on the basis of the location of the proper-ties. Deferred tax expenses for 2019 amounted to €84 million, lower as compared to €85 million for the pre-vious year.
Current tax expenses for the year 2019 was reported at €37 mil-
lion as compared to €30 million during the previous year. The in-crease is related to the improved operational results of the Company and encompass property taxes and corporate taxes. Additionally, the increase can be partially attributed to the operations in UK, which has a higher corporate income tax rate.
For the year ended December 31, 2019 2018
€’000
Current tax expenses (37,062) (29,845)
Deferred tax expenses (84,213) (85,143)
Total tax expenses (121,275) (114,988)
Taxation
NOTES ON BUSINESS PERFORMANCE

49Board of Directors’ Report |
For the year ended December 31, 2019 2018
Basic earnings per share (in €) 2.43 2.95
Diluted earnings per share (in €) 2.30 2.76
Weighted average number of ordinary shares (basic) in thousands 167,246 165,624
Weighted average number of ordinary shares (diluted) in thousands 178,736 178,229
Earnings per share
■■ GCP reported a basic earnings per share of €2.43 and a diluted earnings per share of €2.30 for the year 2019. In comparison, the Com-pany generated in 2018 a basic earn-ings per share and a diluted earnings per share of €2.95 and €2.76 respec-tively. Over the year 2019, GCP’s operational profitability increased as is evident from the 7% year-over-
year growth in FFO I, however, the relatively lower property reval-uation gains recorded during the year offset this increase, leading to a lower earnings per share. Addi-tionally, the issuance of new shares through the scrip dividend pertain-ing to the financial year 2018 as well as share-based payments during the year have led to an increase in the
weighted average share count and have resulted in a further drag on the basic and diluted earnings per share. Diluted earnings per share consid-ers dilutive effects like the poten-tial future conversion of the Series F convertible bonds, which are out-of-the-money as of the date of this report.
BERLIN

50 | Board of Directors’ Report
For the year ended December 31, 2019 2018
€’000
Operating profit 692,869 779,737
Depreciation and amortization 3,872 2,576
EBITDA 696,741 782,313
Property revaluations and capital gains (401,132) (506,553)
Results on the disposal of inventories - trading properties - (56)
Share of profit from investments in equity-accounted investees (60) (1,350)
Other adjustments 2,113 1,176
Adjusted EBITDA 297,662 275,530
Finance expenses 1) (45,041) (45,929)
Current tax expenses (37,062) (29,845)
Contribution to minorities (3,593) (1,902)
FFO I 211,966 197,854
Weighted average number of ordinary shares (basic) in thousands 2) 167,246 165,624
FFO I per share (in €) 1.27 1.19
Adjusted EBITDA and Funds From Operations (FFO I)
■■ The adjusted EBITDA is an in-dustry standard figure displaying the Company’s recurring opera-tional profits before interest, tax expenses, depreciation and amorti-zation, excluding the effects of cap-ital gains, revaluations, and other non-operational income statement items such as profits from disposal of inventories, share of profit/loss from investment in equity-account-ed investees and other adjustments. During the year 2019, GCP generated an adjusted EBITDA of €298 million, an increase of 8% when compared to the €276 million during the previous year. The robust operational profit-ability of the Company demonstrates the strength of GCP’s portfolio as well as the capacity of the management to extract the reversionary potential of the portfolio. The Company’s top-line grew by 3.6% on a like-for-like basis, with 2.9% coming from in-
place rent increases and 0.7% com-ing from occupancy increases. Over the year, GCP’s efficient operating platform was successful in preserv-ing a disciplined cost base, resulting in improved operating margins and supporting the business’ core prof-itability. Furthermore, the full-year effect of accretive acquisitions in 2018 positively impacted the ad-justed EBITDA for the current year, however this was partially offset as a result of the capital recycling mea-sures of the last two years.
Funds From Operations I (FFO I) is an industry-wide standard mea-sure of the recurring operational cash flow of a real estate company, often utilized as a key bottom line industry performance indicator. It is calculated by deducting finance expenses, current tax expenses and the contribution to minorities from the adjusted EBITDA. GCP generated
an FFO I of €212 million for the year 2019, 7% higher as compared to the €198 million in 2018. The slightly lower finance expenses resulting from the hands-on approach of the Company to optimize its debt pro-file along with the further improved operating margins, have together been instrumental in the higher FFO I level. The lower level of finance expenses is a product of the proac-tive approach of the management in optimizing the Company’s debt pro-file. During the year 2019, GCP was successful in lowering its average cost of debt to 1.3% from 1.6% as of year-end 2018 and has maintained a long average debt maturity of 8 years. Reducing the cost of debt was achieved by prepaying near-term, higher interest bank loans amount-ing to over €300 million and by is-suing over €700 million debt at his-torically low rates.
1) including the effects of IFRS 162) not considering the dilution effect of the management share plan as it is immaterial
NOTES ON BUSINESS PERFORMANCE

51Board of Directors’ Report |
FFO I per share
■■ GCP reported an FFO I per share of €1.27 for the year 2019, higher by 7% over €1.19 for the previous year. This growth was primarily a result of the increase in FFO I for the year, offset to some extent due to the rise
in the average share count from the previous year. Based on a share price of €17.4 (as of 13 March 2020), the Company’s FFO I yield reflecting its 2019 result is 7.3%, positioning GCP as an attractive investment propo-
sition with strong returns flowing directly to the investor through the dividend payout policy of 65% of FFO I per share.
FFO I annual development (in € millions)
FFO I per share development (in €)
FFO I per share
FFO I per share after
perpetual notes attribution
FFO IYield1)
7.3%
Dividend Yield1) 2)
4.7%
20172016 2018 2019
2018 201920172016
0.92
1.050.96
1.12
1.01
1.191.07
1.27
160
178
212
198
1) based on a share price of €17.42) 2019 dividend subject to the
next AGM approval and based on a payout policy of 65% of FFO I per share
FFO Iper shareCAGR
2016 – 2019
+7%
CAGR2016 – 2019
+10%
FFO I +7%

52 | Board of Directors’ Report
For the year ended December 31, 2019 2018
€’000
FFO I 211,966 197,854
Adjustment for accrued perpetual notes attribution (33,000) (30,267)
FFO I after perpetual notes attribution 178,966 167,587
Weighted average number of ordinary shares (basic) in thousands* 167,246 165,624
FFO I per share after perpetual notes attribution (in €) 1.07 1.01
FFO I per share after perpetual notes attribution
Adjusted Funds From Operations (AFFO)
■■ According to IFRS accounting treatment, attribution to perpetual notes are recorded through chang-es in equity and not as a financial expense and thus not reflected in the FFO I. In order to provide en-hanced transparency, GCP addi-tionally reports its FFO I per share
after deducting the share of profit attributable to the Company’s per-petual notes investors. GCP reported an FFO I per share after perpetu-al notes attribution of €1.07 for the year 2019, higher by 6% as compared to the €1.01 for the previous year. This increase was primarily driven
by the robust core profitability of the business, partially offset as a result of the full-period effect of the €350 million perpetual note issuance in April 2018 with a coupon of 2.5% as well as the higher average share count at the end of the year 2019.
■■ Adjusted Funds from Opera-tions (AFFO) is another indicator for the Company’s recurring oper-ational cash flow and is derived by subtracting the repositioning capex from the Company’s FFO I. GCP pro-vides a further division of its capi-tal expenditures into repositioning capex, modernization capex and pre-letting modifications which are
treated in different ways. Among these three types of capex, modern-ization capex is aimed at directly in-creasing rents, therefore it is treated in a similar manner to the acquisi-tion of properties, as is the case with pre-letting modifications. However, repositioning capex targets value creation and improving the asset quality of the portfolio, which GCP
deems as being relevant for its AFFO calculation. GCP’s AFFO for the year 2019 was €136 million, rising by 11% above the €122 million reported for the previous year. This increase was on the back of an increase in the Company’s core profitability coupled with a stable level of repositioning capex during the current year.
*not considering the dilution effect of the management share plan as it is immaterial
For the year ended December 31, 2019 2018
€’000
FFO I 211,966 197,854
Repositioning capex (76,017) (75,487)
AFFO 135,949 122,367
NOTES ON BUSINESS PERFORMANCE

53Board of Directors’ Report |
For the year ended December 31, 2019 2018
€’000
FFO I 211,966 197,854
Result from disposal of properties* 169,421 136,602
FFO II 381,387 334,456
FFO II
■■ FFO II is a supplementary per-formance measure that includes the disposal effects on top of FFO I. The result from disposal of properties refers to the excess amount of the sale price to cost price plus capex of disposed properties. GCP generat-
ed a solid FFO II of €381 million for 2019, as a result of the strategic cap-ital recycling measures during the year. During the year, GCP disposed approx. €500 million worth of non-core and/or mature properties at a profit margin of 52% over total costs.
These gains, amounting to an excess of €169 million over costs, reflect the strong value creation achieved on these assets, which has subsequent-ly been crystalized and deployed into new accretive acquisitions.
*the excess amount of the sale price to total cost plus capex of the disposed properties
BERLIN

54 | Board of Directors’ Report
■■ Net cash provided by operat-ing activities for the year 2019 was €249 million, higher by 11% as com-pared to 2018 and was in line with the strong performance of the busi-ness. This increase was aided by in-creasing rents coupled with higher operating margins flowing from im-proved operating efficiency.
Net cash used in investing ac-tivities during 2019 amounted to €53 million, as compared to €718 million invested in 2018. GCP is ex-ecuting a strategic capital recycling initiatives where non-core and/or mature properties are disposed and the resulting capital is reinvested into strong assets, effectively en-hancing the asset quality of the en-tire portfolio. During the year, the Company disposed approx. €500
million of non-core and/or mature assets which was offset by accretive acquisitions amounting to approx. €650 million. It should be noted that the investments and disposals included debt and other liabilities, therefore the cash effect is not fully in line with the balance movement.
Net cash provided by financing activities in 2019 was €115 mil-lion as compared to €785 million in 2018. GCP issued over €700 mil-lion of straight bonds in 2019, while also prepaying over €300 million of near-term, higher interest bank loans during the year. These mea-sures have been instrumental in re-ducing the average cost of debt from 1.6%, down to 1.3% and effectively decreasing the Company’s recurring costs while also maintaining a long
average debt maturity of 8 years. Besides these, dividend distribu-tion during 2019 amounted to €107 million together with interest and perpetual payments, partially offset the net cash provided from debt is-suances.
The net change in cash and cash equivalents was an increase of over €300 million reflecting the sus-tainable and robust nature of the business. As of the end of December 2019, GCP had a substantial balance of cash and liquid assets amounting to €1.1 billion as well as €50 million in undrawn credit facilities, which is further complemented by approx. €6.5 billion in unencumbered assets, providing the Company with sub-stantial downside protection and fi-nancial flexibility.
Cash flow
NOTES ON BUSINESS PERFORMANCE
DRESDEN
For the year ended December 31, 2019 2018
€’000
Net cash provided by operating activities 249,491 224,524
Net cash used in investing activities (53,125) (718,426)
Net cash provided by financing activities 114,800 785,478
Net increase in cash and cash equivalents 311,166 291,576

55Board of Directors’ Report |
Assets
■■ As of the end of December 2019, GCP’s total assets amounted to €9.9 billion, growing by 11% from the €8.9 billion reported at the end of the previous year. This increase in total assets was as a result of net ac-quisitions during the year, as well as higher valuations of investment property complemented by GCP’s strong liquidity position.
Non-current assets at the end of the year 2019 was reported at €8.2 billion, growing 8% from the €7.6 billion reported as of the end of De-cember 2018. The main contribu-tor to this increase was the value of investment properties, which has grown by 10% over the €7.2 bil-lion at the end of 2018. The growth of investment properties has been as a result of the success of accre-tive acquisitions, net of disposals of non-core and/or mature properties, as well as the continuous process of value creation within GCP’s portfo-lio. The success of the value creation process is illustrated in €370 million revaluation gains on the investment property portfolio.
During the year 2019, GCP ac-quired approx. 1,800 units at an average multiple of 21x mainly in London, Berlin and Munich, and an additional approx. 500 units in London which are currently in the pre-letting stage and are like-ly to be let out shortly. The Compa-ny also disposed around 7,500 units amounting to approx. €500 million, classified as non-core and/or mature in nature resulting in a premium of 7% over their last appraised book values. After the reporting period an additional approx. €260 million of non-core and mature properties were disposed.
Additionally, investment prop-
erty at the end of December 2019 consists of a value of €87 million re-lating to the effect of the first year of implementing IFRS 16.
The fair values of the properties are externally appraised by inde-pendent, certified valuators at least once a year. The external valuators are professional international val-uators, mainly Jones Lang La-Salle (JLL). The primary valuation ap-proach is based on the discounted cash flow (DCF) model based on a certain time period (predominantly 10-years). The below table summa-rizes the key valuation parameters used by external independent valu-ators.
1) including inventories – trading properties2) including cash and cash equivalents held for sale
Average Valuation Parameters 2019 2018
Rental multiple 20.4 18.9
Value per sqm €1,543 €1,257
Market rental growth p.a. 1.4% 1.5%
Management cost per unit p.a. €262 €258
Ongoing maintenance cost per sqm €8.5 €8.4
Average discount rate 5.3% 5.3%
Average cap rate 4.5% 4.6%
HALLE
Dec 2019 Dec 2018
€’000
Non-current assets 8,222,645 7,622,911
Investment property 1) 7,971,744 7,243,915
Current assets 1,628,783 1,237,615
Cash and liquid assets 2) 1,063,320 760,374
Total Assets 9,851,428 8,860,526

56 | Board of Directors’ Report
Current assets as of year-end 2019 stood at €1.6 billion, 32% high-er than year-end 2018. The higher current assets balance is broadly due to the stronger liquidity position as well as the increase in the value of assets held for sale. Assets held for sale as of year-end 2019 has in-creased to €201 million as compared to €136 million at the end of Decem-ber 2018 as a result of the reclassifi-cation of assets which are in prepa-
ration of being sold. The held for sale item increased during 2019 and amounted to over €440 million in September 2019 and has decreased in the last quarter due to disposals. GCP expects to continue and dis-pose the held for sale portfolio and the current balance as of December 2019 is anticipated to be sold within a year.
GCP’s balance of cash and other liquid assets as of the end of Decem-
ber 2019 was at €1.1 billion, as com-pared to €0.8 billion as of year-end 2018. This solid liquidity position was made possible by the broad cap-ital market access that GCP enjoys, the robust cash generating capaci-ty of the business including capital recycling measures, partially offset by acquisitions and proactive debt optimization measures such as bank loan pre-payments.
NOTES ON BUSINESS PERFORMANCE
BERLIN
DECEMBER 2019Value
(in €M)Area
(in k sqm)EPRA
vacancy
Annualized net rent (in €M)
In-place rent per
sqm (in €)Number of
unitsValue per
sqm (in €)Rental
yield
NRW 1,883 1,649 7.9% 107 5.8 24,410 1,142 5.7%
Berlin 1,678 558 5.0% 53 8.3 7,580 3,008 3.2%
Dresden/Leipzig/Halle 1,018 925 9.0% 53 5.3 15,921 1,100 5.2%
Mannheim/KL/Frankfurt/Mainz 384 225 4.1% 20 7.5 3,788 1,705 5.1%
Nuremberg/Fürth/Munich 307 117 2.9% 13 9.4 1,802 2,632 4.3%
Hamburg/Bremen 375 297 4.4% 21 6.1 4,265 1,263 5.5%
London 907 109 4.0% 40 31.9 2,134 8,349 4.4%
Others 959 989 7.7% 61 5.9 16,746 969 6.4%
Development rights and new buildings 2) 461
Total 7,972 4,869 6.7% 368 6.8 76,646 1,543 4.9%
1) including inventories - trading property2) of which pre-marketed buildings in London amount to €160 million
Investment Property 1)

57Board of Directors’ Report |
Dec 2019 Dec 2018
€’000
Loans and borrowings 1) 558,709 870,507
Straight bonds 2,920,010 2,177,267
Convertible bond 274,908 272,246
Deferred tax liabilities 2) 601,139 525,278
Other long-term liabilities and derivative financial instruments 3) 184,106 69,224
Current liabilities 4) 345,957 279,017
Total Liabilities 4,884,829 4,193,539
1) including short-term loans and borrowings, loan redemption, and financial debt held for sale2) including deferred tax liabilities of assets held for sale3) including short-term derivative financial instruments4) excluding current liabilities included in the items above
Liabilities
■■ Total Liabilities as of the end of 2019 amounted to €4.9 billion, as compared to €4.2 billion as of De-cember 2018. The higher balance of straight bonds has been the main driver for the increase in the value of Total Liabilities. Over the course of 2019, GCP issued above €700 mil-lion in straight bonds including €88 million through Series N straight bonds, €15 million through Series O straight bonds, HKD 290 mil-lion (equivalent to approx. €33 mil-
lion, with a full currency hedge to EUR until maturity) through Series P straight bonds, CHF 130 million (equivalent to approx. €116 million, with a currency hedge to EUR of the notional amount until maturity) through Series Q straight bonds, €40 million through Series R straight bonds, €60.5 million through Se-ries S straight bonds, €168 million through a tap issuance of Series J straight bonds, €52 million through Series T straight bonds, €80 mil-
lion through Series U straight bonds and €70 million through Series V straight bonds. Offsetting the new straight bond issuances in the year was the prepayment of over €330 million in near-term and/or higher interest bearing bank loans. Both, the bond issuances as well as bank loan prepayments have been in-strumental in reducing the average cost of debt to 1.3% as compared to 1.6% as of the end of December 2018, while also maintaining a long aver-age debt maturity period of 8 years. Additionally, an item of significance under this section is deferred tax li-abilities, amounting to 12% of total liabilities. Deferred tax liabilities at the end of 2019 amounted to €601 million as compared to the €525 mil-lion recorded as of December 2018 and are driven by the strong value creation of the Company.
The first-time implementation of IFRS 16 in 2019 has resulted in an increase in the value of finance lease liability to €61 million, from €3 mil-lion as of the end of 2018.
■■ Total equity at the end of De-cember 2019 was €5.0 billion, higher by €300 million as compared to the €4.7 billion as of December 2018. The increase in equity is led by the prof-it generated during the year, which amounted to €493 million. GCP’s strong business profitability as a result of a robust top-line growth coupled with improved operating margins and revaluation gains have helped to support the Company’s consistent equity growth. Dividend distribution during the year, per-taining to the financial year 2018, offset the profit generation to the extent of €107 million.
GCP’s solid equity platform re-
mains the mainstay of the Compa-ny’s conservative capital structure, which in turn provides the Company with sufficient headroom and fi-nancial flexibility. Non-controlling interests as of the end of December 2019 amounted to €444 million, as
compared to €409 million at the end of December 2018. This increase is mostly the result of profit generation during the year.
As of the year-end of 2019, GCP’s equity ratio is 50% as compared to 53% as at year-end 2018.
Dec 2019 Dec 2018
€’000
Total Equity 4,966,599 4,666,987
of which equity attributable to the owners of the Company 3,492,632 3,227,496
of which equity attributable to Perpetual notes investors 1,030,050 1,030,050
of which non-controlling interests 443,917 409,441
Equity

58 | Board of Directors’ Report
■■ The Company maintains a con-servative financial structure pro-viding the business with an optimal level of debt as well as liquidity. This ensures GCP can deal with unfore-seen situations all the while stay-ing within the boundaries estab-lished by the Board of Directors. As at year-end 2019, GCP had an LTV of
33%, which is below the Board of Di-rectors mandated limit of 45%.
GCP’s success in executing a conservative financial structure was once again vindicated through the solid credit metrics reported for the year 2019, such as a low LTV, strong and rising interest cover-age ratio, lower cost of debt and a
long average debt maturity period. During the year, both S&P (BBB+) and Moody’s (Baa1) reaffirmed the investment grade ratings of the Company, further bolstering GCP’s financial management credentials.
Dec 2019 Dec 2018
€’000
Investment property 1) 7,909,693 7,298,879
Investment properties of assets held for sale 196,432 132,137
Equity-accounted investees 21,020 26,207
Total value 8,127,145 7,457,223
Total debt 2) 3,753,627 3,320,020
Cash and liquid assets 3) 1,063,320 760,374
Net debt 2,690,307 2,559,646
LTV 33% 34%
Loan-To-Value
Lowering leverage while increasing profitability
Debt Financing KPIs
1) including advanced payments for investment property and inventories – trading properties, and excluding right-of-use assets2) including loans and borrowings held for sale 3) including cash and cash equivalents held for sale
Dec 2019 Dec 2018
€’000
Unencumbered Assets 6,484,583 4,777,824
Total Investment properties * 8,168,176 7,376,052
Unencumbered Assets Ratio 79% 65%
For the year ended December 31, 2019 2018
€’000
Adjusted EBITDA 297,662 275,530
Finance Expenses 45,041 45,929
Interest Coverage Ratio 6.6x 6.0x
For the year ended December 31, 2019 2018
€’000
Adjusted EBITDA 297,662 275,530
Finance Expenses 45,041 45,929
Amortization of loans from financial institutions 9,178 8,597
Debt Service Coverage Ratio 5.5x 5.1x
* including investment property held for sale and inventories - trading properties
NOTES ON BUSINESS PERFORMANCE
Dec 2017 Dec 2018 Dec 2019
36%34% 33%
45% Board of Director’s limit
Unencumbered Assets
Debt Service Coverage Ratio (DSCR)
Interest Coverage Ratio (ICR)
GCP’s ability to continuously identify avenues to op-timize its financial structure is not only evident in the de-creasing average cost of debt from 1.6% to 1.3% but is also clear in the solid and increasing coverage ratios which the business displays. For the year 2019, the Company has an ICR of 6.6x and a DSCR of 5.5x, which were support-ed by increased operational profitability reflected in a 8% growth in adjusted EBITDA.
Additionally, as of December 2019, the value of unencum-bered assets within GCP’s portfolio amounts to €6.5 billion comprising 79% of the total investment properties. Prepay-ments during the year, of near-term, higher interest bank loans associated with encumbered assets have led to an increase in the level of unencumbered assets as of December 2019.

59Board of Directors’ Report |
LONDON

60 | Board of Directors’ Report
■■ The European Public Real Estate Association (EPRA) is the widely recognized market standard guid-ance and benchmark provider for the European real estate industry. EPRA’s Best Practices Recommen-dations prescribe the ongoing re-porting of a set of performance met-rics which are meant to enhance the
quality of reporting by bridging the gap between the regulated IFRS re-porting presented and specific anal-ysis relevant to the European real estate industry. These standard-ized EPRA Performance Measures provide additional perspective on earnings, balance sheet and opera-tional metrics, and facilitate for the
simple and effective comparison of performance-related information across different companies. The in-formation presented below is based on the materiality and importance of information. For example, as GCP has no material properties under de-velopment those are not taken into consideration.
EPRA PERFORMANCE MEASURES
2019 2018
€’000
EPRA Earnings 188,545 186,843
EPRA Earnings per share (in €) 1.13 1.13
EPRA NAV 4,120,427 3,753,022
EPRA NAV per share (in €) 24.5 22.5
EPRA NNNAV 3,890,832 3,752,781
EPRA NNNAV per share (in €) 23.1 22.5
EPRA Net initial yield (NIY) 3.6% 3.9%
EPRA "topped-up" NIY 3.6% 3.9%
EPRA Vacancy 6.7% 7.1%
EPRA Cost Ratio (incl. direct vacancy costs) 22.8% 24.1%
EPRA Cost Ratio (excl. direct vacancy costs) 20.1% 21.2%
HANNOVER

61Board of Directors’ Report |
For the year ended December 31, 2019 2018
€’000
Earnings per IFRS income statement 493,360 583,034
Property revaluations and capital gains (401,132) (506,553)
Result on the disposal of inventories - trading properties - (56)
Change in fair value of financial assets and liabilities, net 15,757 28,527
Deferred tax expenses 84,213 85,143
Share in profit from investment in equity-accounted investees (60) (1,350)
Contribution to minorities (3,593) (1,902)
EPRA Earnings 188,545 186,843
Weighted average number of ordinary shares (basic) in thousands* 167,246 165,624
EPRA Earnings per share (in €) 1.13 1.13
Bridge to FFO I
Add back: Depreciation 3,872 2,576
Add back: Finance-related costs 17,436 7,259
Add back: Other adjustments 2,113 1,176
FFO I 211,966 197,854
FFO I per share (in €) 1.27 1.19
EPRA Earnings
GCP’s EPRA Earnings for the year 2019 was €189 million, or €1.13 on a per share basis, as compared to €187 million on an absolute basis, or €1.13 on a per share basis for the previous year. The year-over-year increase in EPRA Earnings on an absolute basis, despite the higher finance-related costs incurred during the year which were the result of the optimization of GCP’s debt profile, has demonstrated the strength of the core profitability growth. The bridge to FFO I demonstrates that excluding one-off and non-cash costs, GCP’s core profitability has in fact increased by 7% on an absolute basis as well as on a per share basis.
■■ The EPRA Earnings indicator is intended to serve as a key indicator of the fundamental operational prof-its for the year within the context of a real estate company, intended to measure the extent to which the
Company’s dividend distribution is covered by its operational income. GCP also provides a reconciliation of the EPRA Earnings to the FFO I, another widely-recognized and key performance measure, as it believes
it to be a better measure of recurring operational profits and given that its dividend payout policy is based on the FFO I, supporting its importance and relevance.
*not considering the dilution effect of the management share plan as it is immaterial

62 | Board of Directors’ Report
Dec 2019 Dec 2018
€’000 € per share €’000 € per share
Equity per the financial statements 4,966,599 4,666,987
Equity attributable to perpetual notes investors (1,030,050) (1,030,050)
Equity excluding perpetual notes 3,936,549 3,636,937
Fair value measurements of derivative financial instruments, net 26,656 2) 248
Deferred tax liabilities 1) 601,139 525,278
NAV 4,564,344 27.2 4,162,463 24.9
Non-controlling interests (443,917) (409,441)
EPRA NAV 4,120,427 24.5 3,753,022 22.5
Equity attributable to perpetual notes investors 1,030,050 1,030,050
EPRA NAV incl. perpetual notes 5,150,477 30.6 4,783,072 28.7
Basic number of shares including in-the-money dilution effects (in thousands) 168,087 166,903
EPRA NAV
1) including balances held for sale2) not including net change in fair value of derivative financial instruments which offset by foreign exchange changes in assets and liabilities
■■ The EPRA NAV is defined by EPRA as the net asset value of the Company adjusted to include real es-tate properties and other investment interests at fair values and exclude certain items that are not expected to materialize in a long-term real es-
tate business model. The purpose of the EPRA NAV is to adjust the IFRS NAV in order to provide stakeholders with the most relevant information on the Group’s balance sheet items in the context of a true real estate in-vestment company with a long-term
oriented investment strategy. As perpetual notes are classified as eq-uity in accordance with IFRS treat-ment, GCP additionally reports the EPRA NAV including the perpetual notes.
As of December 2019, GCP’s EPRA NAV amounted to €4.1 billion and €24.5 per share, higher by 10% over €3.8 billion on an absolute basis and higher by 9% over €22.5 on a per share basis respectively, as of year-end 2018. This increase was largely as a result of the profit generation
during the year, partially offset due to the dividend distribution of €107 million pertaining to the previous financial year. With the operational platform generating robust returns and the accretive acquisitive strate-gy vindicated in the strong disposal and revaluation gains of the portfo-
lio, GCP has once again delivered on value creation results. EPRA NAV including perpetual notes as of De-cember 2019 was €5.2 billion and €30.6 on a per share basis, increas-ing by 8% and 7% from €4.8 billion and €28.7 per share, respectively as of the end of the December 2018.
EPRA PERFORMANCE MEASURES

63Board of Directors’ Report |
Dec 2019 Dec 2018
€’000 € per share €’000 € per share
EPRA NAV 4,120,427 24.5 3,753,022 22.5
Fair value measurements of derivative financial instruments (26,656) 2) (248)
Adjustment to reflect fair value of debt (169,511) 29,217
Deferred tax liabilities 1) (33,428) (29,210)
EPRA NNNAV 3,890,832 23.1 3,752,781 22.5
Basic number of shares including in-the-money dilution effects 168,087 166,903
EPRA NAV development (in € millions)
EPRA NNNAV
■■ The EPRA NNNAV is derived by adjusting the EPRA NAV by marking to market the values of the Company’s financial debt, derivative financial instruments and deferred taxes. The purpose of the EPRA NNNAV is to provide stakeholders with the most relevant information on the Company’s financial liabilities by reporting them at their fair values as of the end of the period.
GCP reported an EPRA NNNAV as of the end of December 2019 of €3.9 billion and €23.1 per share up by 4% and 3% as compared to €3.8 billion and €22.5 per share respectively, at the end of 2018. Over the course of 2019, GCP’s bonds have performed well which is reflected in their prices. This is especially evident in the EPRA NNNAV, which considers debt at market prices.
1) adjustment based on the Company’s corporate structure and from actual transactions2) not including net change in fair value of derivative financial instruments which offset by foreign exchange changes in assets and liabilities
2013 20172014 20182015 2019 2019
incl
perpetuals
2012 2016
322
799
1,349
1,924
2,541
3,327
3,753
4,120
5,150
CAGR2012 – 2019
incl. perpetuals
+49%

64 | Board of Directors’ Report
For the year ended December 31, 2019 2018
€’000
Investment property 7,956,034 7,227,290
Investment properties of assets held for sale 196,432 132,137
Inventories - trading properties 15,710 16,625
Less: Classified as development rights and new buildings (461,077) (519,134)
Complete property portfolio 7,707,099 6,856,918
Allowance for estimated purchasers’ costs 624,900 560,778
Gross up complete property portfolio valuation 8,331,999 7,417,696
End of period annualized net rental income 1) 376,000 367,000
Operating costs 2) (72,884) (80,071)
Annualized net rent, after non-recoverable 303,116 286,929
Notional rent expiration of rent-free periods or other lease incentives N/A N/A
Topped-up net annualized rent 303,116 286,929
EPRA NIY 3.6% 3.9%
EPRA “topped-up” NIY 3.6% 3.9%
EPRA Net Initial Yield (NIY) and EPRA ‘topped-up’ NIY
1) including net rental income from assets held for sale2) to reach annualized operating costs, cost margins were used for each respective period
■■ The EPRA Net Initial Yield (NIY) is intended to serve as a standard-ized portfolio valuation indicator. It is calculated by subtracting the passing non-recoverable operating costs from the passing net rental in-
come as of the end of the period, and dividing the result by the fair value of the full property portfolio (includ-ing held-for-sale properties and in-ventories – trading properties) plus an allowance for estimated purchas-
ers’ costs. EPRA ‘topped-up’ NIY is an additional calculation that fac-tors into consideration the effects of rent-free periods and other lease incentives.
The EPRA NIY of the GCP port-folio as of December 2019 was 3.6%, lower as compared to 3.9% as of the end of December 2018 as a result of the positive valuation effect of GCP’s
portfolio due to the increase in the quality of the portfolio, driven by operational and margin improve-ments as well as the net acquisitions of higher quality properties. Addi-
tionally, strong fundamentals in the Company’s major locations support-ed the decrease in the yields.
EPRA PERFORMANCE MEASURES
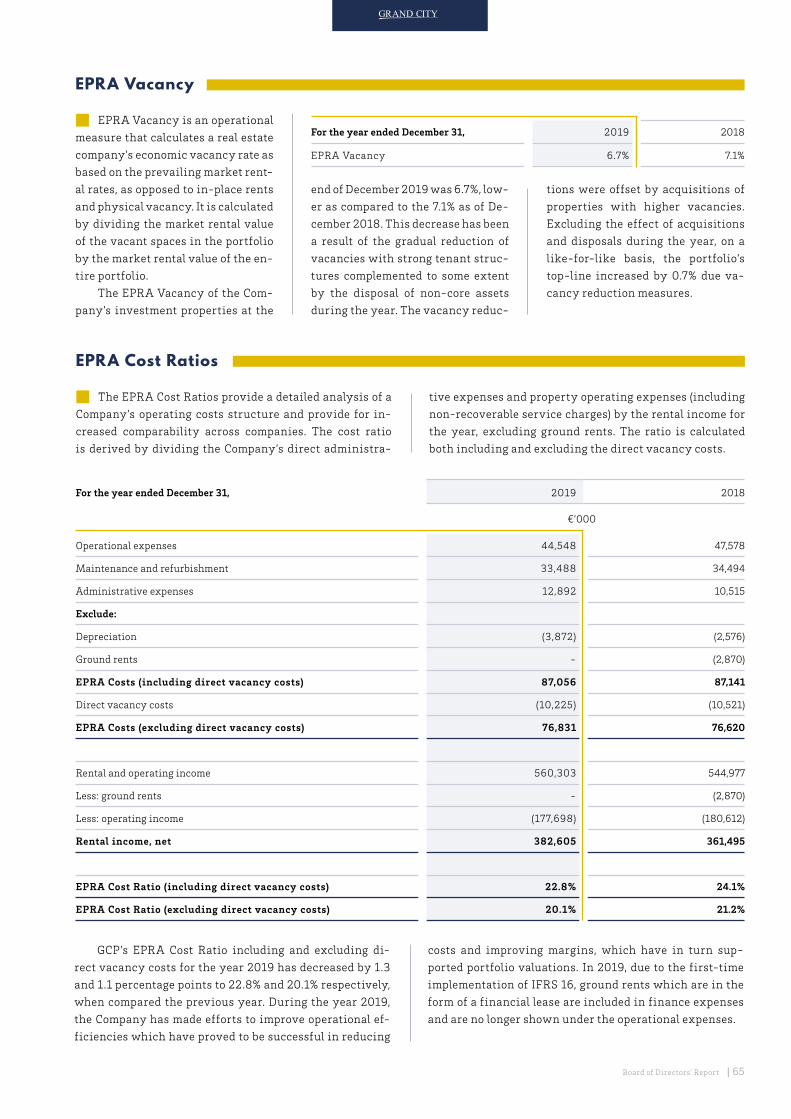
65Board of Directors’ Report |
EPRA Vacancy
EPRA Cost Ratios
■■ The EPRA Cost Ratios provide a detailed analysis of a Company’s operating costs structure and provide for in-creased comparability across companies. The cost ratio is derived by dividing the Company’s direct administra-
tive expenses and property operating expenses (including non-recoverable service charges) by the rental income for the year, excluding ground rents. The ratio is calculated both including and excluding the direct vacancy costs.
GCP’s EPRA Cost Ratio including and excluding di-rect vacancy costs for the year 2019 has decreased by 1.3 and 1.1 percentage points to 22.8% and 20.1% respectively, when compared the previous year. During the year 2019, the Company has made efforts to improve operational ef-ficiencies which have proved to be successful in reducing
costs and improving margins, which have in turn sup-ported portfolio valuations. In 2019, due to the first-time implementation of IFRS 16, ground rents which are in the form of a financial lease are included in finance expenses and are no longer shown under the operational expenses.
For the year ended December 31, 2019 2018
€’000
Operational expenses 44,548 47,578
Maintenance and refurbishment 33,488 34,494
Administrative expenses 12,892 10,515
Exclude:
Depreciation (3,872) (2,576)
Ground rents - (2,870)
EPRA Costs (including direct vacancy costs) 87,056 87,141
Direct vacancy costs (10,225) (10,521)
EPRA Costs (excluding direct vacancy costs) 76,831 76,620
Rental and operating income 560,303 544,977
Less: ground rents - (2,870)
Less: operating income (177,698) (180,612)
Rental income, net 382,605 361,495
EPRA Cost Ratio (including direct vacancy costs) 22.8% 24.1%
EPRA Cost Ratio (excluding direct vacancy costs) 20.1% 21.2%
For the year ended December 31, 2019 2018
EPRA Vacancy 6.7% 7.1%
■■ EPRA Vacancy is an operational measure that calculates a real estate company’s economic vacancy rate as based on the prevailing market rent-al rates, as opposed to in-place rents and physical vacancy. It is calculated by dividing the market rental value of the vacant spaces in the portfolio by the market rental value of the en-tire portfolio.
The EPRA Vacancy of the Com-pany’s investment properties at the
end of December 2019 was 6.7%, low-er as compared to the 7.1% as of De-cember 2018. This decrease has been a result of the gradual reduction of vacancies with strong tenant struc-tures complemented to some extent by the disposal of non-core assets during the year. The vacancy reduc-
tions were offset by acquisitions of properties with higher vacancies. Excluding the effect of acquisitions and disposals during the year, on a like-for-like basis, the portfolio’s top-line increased by 0.7% due va-cancy reduction measures.

66 | Board of Directors’ Report
FFO I reconciliation
Reconciliation of FFO I after perpetual notes attribution
■■ In line with the IFRS standards, GCP recognizes per-petual notes as equity in its balance sheets. Therefore, at-tributions to this item is recorded through changes in eq-uity. GCP reports FFO I after perpetual notes attribution for enhanced transparency. In this case, GCP deducts the Adjustment for accrued perpetual notes attribution from the FFO I.
FFO I after perpetual notes attribution reconciliation
Reconciliation of Adjusted EBITDA
■■ The adjusted EBITDA is an industry standard figure indicative of the Company’s recurring operational prof-its before interest and tax expenses, excluding the effects of capital gains, revaluations, and other non-operation-al income statement items such as profits from disposal of inventories, share of profit/(loss) from investment in equity-accounted investees and other adjustments. GCP starts from its Operating profit and adds back the item Depreciation and amortization to arrive at EBITDA value. Non-recurring and non-operational items are deducted such as the Capital gains, property revaluations and oth-er income, Result on the disposal of inventories-trading properties and Share in profit/loss from investment in eq-uity-accounted investees. Further adjustments are labeled as Other adjustments which are equity settled share-based payments since these are non-cash expenses.
Adjusted EBITDA reconciliation
Reconciliation of Adjusted Funds From Operat ions (AFFO)
■■ The Adjusted Funds From Operations (AFFO) is an additional measure of comparison which factors into the FFO I, the Company’s repositioning capex, which targets value enhancement and quality increase in the portfolio. Modernization and pre-letting capex are not included in the AFFO as they are considered as additional investment programs, similar to the property acquisitions, which are conducted at the Company’s discretion. Therefore, in line with the industry practices, GCP deducts the Reposition-ing capex from the FFO I to arrive at the AFFO. As a result, AFFO is another widely-used indicator which tries to as-sess residual cash flow for the shareholders by adjusting FFO I for recurring expenditures that are capitalized.
Reconciliation of Funds From Operations I (FFO I)
■■ Funds From Operations I (FFO I) is an industry-wide standard measure of the recurring operational cash flow of a real estate company, often utilized as a key industry performance indicator. It is calculated by deducting the Finance expenses, Current tax expenses, Contribution to minorities from the Adjusted EBITDA.
Operating Profit
(+) Depreciation and amortization
(=) EBITDA
(-) Capital gains, property revaluations and other income
(-) Result on the disposal of inventories - trading properties
(-) Share in profit from investment in equity-accounted investees
(+) Other adjustments
(=) Adjusted EBITDA
Adjusted EBITDA
(-) Finance expenses
(-) Current tax expenses
(-) Contribution to minorities
(=) FFO I
FFO I
(-) Adjustment for accrued perpetual notes attribution
(=) FFO I after perpetual notes attribution
■■ In this section, GCP provides an overview of the use of its alternative performance measures.For enhanced transparency and more industry specific comparative basis, the Company provides market and industry
standard performance indicators. GCP provides a set of measures that can be utilized to assess the Company’s operational earnings, net value of the Company, leverage position, debt coverage abilities as well as liquidity headroom. Following mea-surements apply to the real estate industry’s specifications and include adjustments where necessary that are in compliance with the standards.
ALTERNATIVE PERFORMANCE MEASURES

67Board of Directors’ Report |
AFFO reconciliation
Reconciliation of EPRA Earnings
■■ The EPRA Earnings indicator is intended to serve as a key indicator of the underlying operational profits for the year in the context of a real estate company, intended to measure the extent to which the Company’s dividend dis-tribution is covered by its operational income. GCP com-putes EPRA Earnings by excluding from its IFRS Earnings, property revaluations and capital gains, results on the dis-posal of properties identified as trading properties, chang-es in the fair value of financial assets and liabilities (net), deferred tax expenses, its share in profit from investments in equity-accounted investees and the contribution to mi-norities.
GCP also provides a reconciliation of the EPRA Earn-ings to the FFO I, another widely-recognized and key per-formance measure, as it believes it to be a better measure of recurring operational profits and given that its dividend payout policy is based on the FFO I, supporting its impor-tance and relevance.
Reconciliation of Funds From Operat ions I I (FFO I I)
■■ FFO II additionally incorporates on top of the FFO I the results from asset disposals, calculated as the difference between the disposal values and the property acquisition costs plus capex, reflecting the economic profit generated on the sale of the assets. Although, property disposals are non-recurring, disposal activities provide further cash inflow that increase the liquidity levels. As a result, this measure is an indicator to evaluate operational cash flow of a company including the effects of disposals.
FFO II reconciliation
FFO I
(-) Repositioning capex
(=) AFFO
FFO I
(+) Result from disposal of properties*
(=) FFO II
EPRA Earnings
Earnings per IFRS income statement
Excluding:
Property revaluations and capital gains
Result on the disposal of inventories - trading properties
Change in fair value of financial assets and liabilities, net
Deferred tax expenses
Share in profit from investment in equity-accounted investees
Contribution to minorities
EPRA Earnings
Bridge to FFO I
Including:
Depreciation
Finance-related costs
Other adjustments
FFO I
* the excess amount of the sale price to total cost plus capex of the disposed properties
EPRA Earnings Reconciliation
Reconciliation of the Net Asset Value according to EPRA (EPRA NAV)
■■ The EPRA NAV is defined by EPRA as the net asset value of the Company adjusted to include real estate prop-erties and other investment interests at fair values and exclude certain items that are not expected to materialize in a long-term real estate business model. The purpose of the EPRA NAV is to adjust the IFRS NAV in order to pro-vide stakeholders with the most relevant information on the Group’s balance sheet items in the context of a true real estate investment company with a long-term oriented in-vestment strategy. As perpetual notes are classified as eq-uity in accordance with IFRS treatment, GCP additionally reports the EPRA NAV including the perpetual notes.
The reconciliation of the EPRA NAV starts from the Equity per the financial statements and deducts the Equity attributable to perpetual notes investors to get to the Equity excluding perpetual notes. Adding the Fair value measure-ments of derivative financial instruments and the Deferred tax liabilities which include balances from held for sale re-sults into the NAV. Both of these items are added back in line with EPRA standards since they are not expected to materialize in a long-term basis. Finally, equity that is at-tributable to the Non-controlling interests is deducted from the NAV to derive at the EPRA NAV. Adding to the EPRA NAV the balance of the Equity attributable to perpetual in-vestors results in the EPRA NAV including perpetual notes.

68 | Board of Directors’ Report
EPRA Net Initial Yield (NIY) and EPRA ‘topped-up’ NIY
■■ The EPRA Net Initial Yield (NIY) is intended to serve as a standardized portfolio valuation indicator. It is calcu-lated by subtracting the passing non-recoverable operat-ing costs from the passing net rental income as of the end of the period, and dividing the result by the fair value of the full property portfolio (including held-for-sale prop-erties and inventories – trading properties and excluding assets classified as development rights and new buildings) plus an allowance for estimated purchasers’ costs. EPRA ‘topped-up’ NIY is an additional calculation that factors into consideration the effects of rent-free periods and oth-er lease incentives.
The fair value of the full property portfolio is the sum of investment property, investment properties from assets held for sale as well as the inventories of trading properties and excluding assets classified as development rights and new buildings. In addition, this sum is grossed up with an allowance for estimated purchaser’s cost. The annualized net rental income is arrived by subtracting non-recover-able property operating costs based on cost margins for comparability.
EPRA NAV reconciliation
EPRA NIY and ‘topped-up’ NIY reconciliation
Equity per the financial statements
(-) Equity attributable to perpetual notes investors
(=) Equity excluding perpetual notes
(+) Fair value measurements of derivative financial instruments, net
(+) Deferred tax liabilities*
(=) NAV
(-) Non-controlling interests
(=) EPRA NAV
(+) Equity attributable to perpetual investors
(=) EPRA NAV incl. perpetual notes
EPRA Net Initial Yield (NIY) and EPRA 'topped-up' NIY
(+) Investment property
(+) Investment properties of assets held for sale
(+) Inventories - trading properties
(-) Classified as development rights and new buildings
Complete property portfolio
(+) Allowance for estimated purchasers’ costs
(A) Gross up complete property portfolio valuation
(+) End of period annualized net rental income 1)
(+) Operating costs 2)
(B) Annualized net rent, after non-recoverable
(+) Notional rent expiration of rent-free periods or other lease incentives
(C) Topped-up net annualized rent
(B/A) EPRA NIY
(C/A) EPRA “topped-up” NIY
* including balances held for sale
Reconciliation of the Triple Net Asset Value according to EPRA (EPRA NNNAV)
■■ The EPRA NNNAV is derived by adjusting the EPRA NAV by marking to market the values of the Company’s financial debt, derivative financial instruments and de-ferred taxes. The purpose of the EPRA NNNAV is to pro-vide stakeholders with the most relevant information on the Company’s financial liabilities by reporting them at their fair values as of the end of the period. Accordingly, to derive at the EPRA NNNAV, the Fair value measurements of derivative financial instruments is deducted from the EPRA NAV as well as an Adjustment to reflect fair value of debt. The adjustment is the difference between the mar-ket value of debt and book value of debt, adjusted for taxes. Lastly, Deferred tax liabilities, which according to EPRA’s best practice recommendations should be based on evi-dence observed in the market, are deducted to reach to the EPRA NNNAV.
EPRA NNNAV reconciliation
EPRA NAV
(-) Fair value measurements of derivative financial instruments
(-) Adjustment to reflect fair value of debt
(-) Deferred tax liabilities*
(=) EPRA NNNAV
1) including net rental income from assets held for sale2) to reach annualized operating costs, cost margins were used for each
respective period
* adjustment based on the Company’s corporate structure and from actual transactions
ALTERNATIVE PERFORMANCE MEASURES

69Board of Directors’ Report |
Reconciliation of Unencumbered Assets Ratio
■■ The unencumbered assets ratio is a liquidity measure as it reflects the Company’s ability to raise secure debt over these assets and thus provides an additional layer of financial flexibility and liquidity. Moreover, the unen-cumbered assets ratio is important for unsecured bond-holders, providing them with an asset backed security. Hence, the larger the ratio is, the more flexibility a firm has in terms of headroom and comfort to its debtholders. Unencumbered assets ratio is calculated by dividing the Unencumbered investment property of the portfolio by the Total investment properties which is the sum of Investment property, Inventories - trading property and Investment property of assets held for sale.
Unencumbered Assets Ratio reconciliation
EPRA Cost Ratios
■■ EPRA Cost Ratio is a key measure to enable mean-ingful measurement of the changes in a company’s oper-ating costs as well as comparability between companies. EPRA Costs (including direct vacancy costs) is the sum of non-recoverable operational expenses, maintenance and refurbishment expenses and administrative expenses. De-preciation and Ground rent costs are excluded. EPRA Costs (excluding direct vacancy costs) eliminate direct vacancy costs from the EPRA Costs (including direct vacancy costs).
EPRA Cost Ratios
(+) Operational expenses
(+) Maintenance and refurbishment
(+) Administrative expenses
Excluding:
Depreciation
Ground rents
(A) EPRA Costs (including direct vacancy costs)
Including:
Direct vacancy costs
(B) EPRA Costs (excluding direct vacancy costs)
Rental and operating income
Less: ground rents
Less: operating income
(C) Rental income, net
(A/C) EPRA Cost Ratio (including direct vacancy costs)
(B/C) EPRA Cost Ratio (excluding direct vacancy costs)
EPRA Cost Ratios reconciliation
Reconciliation of Loan-to-Value (LTV)
■■ LTV ratio is an acknowledged measurement of the leverage position of a given firm in the real estate industry. This ratio highlights to which extent financial liabilities are covered by the Company’s real estate asset value as well as how much headroom of the fair value of real estate port-folio is available compared to the net debt. Following the industry specifications, GCP calculates the LTV ratio by dividing the total net debt to the total value at the balance sheet date. Total value of the portfolio is a combination of the Investment property which includes the Advanced payments for real estate transactions and inventories - trading properties, Investment properties of assets held for
sale and the Equity-accounted investees and excludes the effects of IFRS 16. For the calculation of net debt, total Cash and liquid assets are deducted from the Straight bonds, Convertible Bonds and Total loan and borrowings. Total loan and borrowings include the Short-term loans and borrow-ings, loan redemption, and Financial debt held for sale while Straight bonds include the Bond redemption. Cash and liq-uid assets is the sum of Cash and cash equivalents, Traded securities at fair value through profit and loss, and Cash and cash equivalents held for sale.
Loan-To-Value reconciliation
(+) Investment property 1
(+) Investment property of assets held for sale
(+) Investment in equity-accounted investees
(=) (a) Total value
(+) Total debt 2
(-) Cash and liquid assets 3
(=) (b) Net debt
(=) (b/a) LTV
1) including advanced payments for investment properties and inventories - trading properties, and excluding right-of-use assets
2) including loans and borrowings held for sale3) including cash and cash equivalents held for sale
(a) Unencumbered assets
(b) Total investment properties*
(=) (a/b) Unencumbered Assets Ratio
* including investment properties, investment properties of assets held for sale and inventories - trading property

70 | Board of Directors’ Report
Reconciliation of ICR and DSCR
■■ Two widely-recognized debt metrics Interest Cover-age Ratio (ICR) and Debt Service Coverage Ratio (DSCR) are utilized to demonstrate the strength of GCP’s credit pro-file. These metrics are often used to see the extent to which interest and debt servicing are covered by recurring op-erational profits and provides implications on how much of cash flow is available after debt obligations. Therefore, ICR is calculated by dividing the Adjusted EBITDA by the Finance expenses and DSCR is calculated by dividing the Adjusted EBITDA by Finance expenses plus Amortization of loans from financial institutions. With this ratio, GCP is able to show that with its high profitability and long-term oriented conservative financial structure, GCP consis-tently exhibits high debt cover ratios.
ICR reconciliation
DSCR reconciliation
(a) Finance expenses
(b) Adjusted EBITDA
(=) (b/a) ICR
(a) Finance expenses
(b) Amortization of loans from financial institutions
(c) Adjusted EBITDA
(=) [c/(a+b)] DSCR
ALTERNATIVE PERFORMANCE MEASURES
(a) Total Equity
(b) Total Assets
(=) (a/b) Equity Ratio
Reconciliation of Equity Ratio
■■ The Equity ratio is an accepted measure to under-stand and gauge the financing structure of a firm. This ratio shows what proportion of the company’s assets are funded by equity shares. Further, it also shows how much shareholders would receive in the event of a com-pany-wide liquidation.
Unencumbered Assets Ratio reconciliation
BREMEN

71Board of Directors’ Report |
RESPONSIBILITY STATEMENT■■ To the best of our knowledge, the annual consolidated financial statements of Grand City Properties S.A., prepared in
accordance with the applicable reporting principles for financial statements, give a true and fair view of the assets, liabil-ities, financial position and profit and loss of the Group and the management report of the Group includes a fair view of the development of the business, and describes the main opportunities, risks, and uncertainties associated with the Group.
DISCLAIMER
By order of the Board of Directors,Luxembourg, March 16, 2020
■■ The financial data and results of the Group are affected by financial and operating results of its subsidiaries. Signifi-cance of the information presented in this report is examined from the perspective of the Company including its portfolio with the joint ventures. In several cases, additional information and details are provided in order to present a comprehen-sive representation of the subject described, which in the Group’s view is essential to this report.
Refael Zamir CFO, Chairman of the Board of Directors
Simone Runge-BrandnerMember of the Board of Directors
Daniel MalkinMember of the Board of Directors

72 | Report of the Réviseur d’Enterprises Agréé (Independent auditor)
REPORT OF THE RÉVISEUR D‘ENTERPRISES AGRÉÉReport on the audit of the consolidated financial statements
Opinion
We have audited the consolidated financial statements of Grand City Properties S.A. and its subsidiaries (the “Group”), which comprise the consolidated statement of financial position as at 31 December 2019 and the consoli-dated statement of profit or loss, consolidated statement of comprehensive income, consolidated statement of changes in equity and consolidated statement of cash flows for the year then ended, and notes to the consolidated financial statements, including a summary of significant account-ing policies.
In our opinion, the accompanying consolidated finan-cial statements give a true and fair view of the consolidat-ed financial position of the Group as at 31 December 2019 and of its consolidated financial performance and its con-solidated cash flows for the year then ended in accordance with International Financial Reporting Standards (IFRSs) as adopted by the European Union.
Basis for opinion
We conducted our audit in accordance with the EU Regulation N° 537/2014, the Law of 23 July 2016 on the au-dit profession (the “Law of 23 July 2016”) and with Inter-national Standards on Auditing (ISAs) as adopted for Lux-embourg by the “Commission de Surveillance du Secteur Financier” (the “CSSF”). Our responsibilities under those Regulation, Law and standards are further described in the “Responsibilities of the “Réviseur d’Entreprises agréé” for the audit of the consolidated financial statements” sec-tion of our report. We are also independent of the Group in accordance with the International Ethics Standards Board for Accountants’ Code of Ethics for Professional Accoun-tants (the “IESBA Code”) as adopted for Luxembourg by the CSSF together with the ethical requirements that are rele-vant to our audit of the consolidated financial statements, and have fulfilled our other ethical responsibilities under those ethical requirements. We believe that the audit ev-idence we have obtained is sufficient and appropriate to provide a basis for our opinion.
Key audit matters
Key audit matters are those matters that, in our pro-fessional judgment, were of most significance in our audit of the consolidated financial statements of the current pe-riod. These matters were addressed in the context of the audit of the consolidated financial statements as a whole, and in forming our opinion thereon, and we do not provide a separate opinion on these matters.
Valuation of Investment Properties
a) Why the matter was considered to be one of most significant in our audit of the consolidated financial state-ments?
We refer to the accounting policy 2.3 “Significant ac-counting judgements, estimates and assumptions” on page 85, 3.10 “Investment Property” and 3.12 “Non-current as-sets held for sale” on page 94, Note 16 “Investment Proper-ty” on page 113 and Note 25.2 “Disposal group held for sale” on the page 124 in the consolidated financial statements of Grand City Properties S.A.
As at 31 December 2019 the Group held a portfolio of investment properties with a fair value of TEUR 7,956,034 (31 December 2018: TEUR 7,227,290) and investment prop-erties within Assets classified as held for sale with a fair value of TEUR 196,432 (31 December 2018: TEUR 132,137).
The valuation of investment properties is a signif-icant judgement area and is underpinned by a number of assumptions.
The fair value measurement of investment property is inherently subjective and requires valuation experts and the Group’s management to use certain assumptions re-garding rates of return on the Group’s assets, future rent, occupancy rates, contract renewal terms, the probability of leasing vacant areas, asset operating expenses, the ten-ants’ financial stability and the implications of any in-vestments made for future development purposes in order to assess the future expected cash flows from the assets. Any change in the assumptions used to measure the in-vestment property could cause a significant change on the resulting fair value.
To the Shareholders of Grand City Properties S.A.1, Avenue du BoisL-1251 Luxembourg

73Report of the Réviseur d’Enterprises Agréé (Independent auditor) |
The Group uses external valuation reports issued by external independent professionally qualified valuers to determine the fair value of its investment properties.
The external valuers were engaged by management, and performed their work in compliance with the Royal Institute of Chartered Surveyors (“RICS”) Valuation – Pro-fessional Standards, TEGoVA European Valuations Stan-dards and IVSC International Valuation Standard. The Valuers used by the Group have considerable experience of the markets in which the Group operates. In determining a property’s valuation, the valuers take into account prop-erty-specific characteristics and information such as the current tenancy agreements and rental income. They apply assumptions for yields and estimated market rent, which are influenced by prevailing market yields and comparable market transactions, to arrive at the final valuation.
The significance of the estimates and judgments in-volved, coupled with the fact that only a small percentage difference in individual property valuations, when ag-gregated, could result in a material misstatement in the consolidated statement of profit or loss and consolidated statement of financial position, warrants specific audit focus in this area..
b) How the matter was addressed during the audit?
Our procedures over valuation of investment proper-ties include but are not limited to the following:
• We tested the design and implementation of the key controls around the determination and monitoring of the fair value measurement of the investment prop-erties;
• We assessed the competence, capabilities, qualifica-tions, independence and integrity of the external val-uers and read their terms of engagement by Grand City Properties S.A. to determine whether there were any matters that might have affected their objectivity or may have imposed scope limitations on their work;
• We assessed that that the valuation approach applied by the external valuer is in accordance with relevant valuation and accounting standards and suitable for use in determining the carrying value in the consoli-dated statement of financial position;
• We tested the integrity, accuracy and completeness of inputs used by the external valuers, as well as ap-propriateness of valuation parameters used, such as discount capitalisation rates, market rents per square meter and capital expenditure, vacancy rates, com-parable price per square meter and development cost; and
•
• We assessed the valuation process and significant assumptions and critical judgement areas by bench-marking the key assumptions to external industry data and comparable property transactions, in partic-ular the yields applied.
Other information
The Board of Directors is responsible for the other in-formation. The other information comprises the informa-tion stated in the consolidated annual report including the Board of Directors’ report, EPRA Performance Measures, Alternative Performance Measures, the Corporate Gov-ernance Statement and Corporate Social Responsibility statement but does not include the consolidated financial statements and our report of the “Réviseur d’Entreprises agréé” thereon.
Our opinion on the consolidated financial statements does not cover the other information and we do not express any form of assurance conclusion thereon.
In connection with our audit of the consolidated fi-nancial statements, our responsibility is to read the other information and, in doing so, consider whether the other information is materially inconsistent with the consoli-dated financial statements or our knowledge obtained in the audit or otherwise appears to be materially misstated. If, based on the work we have performed, we conclude that there is a material misstatement of this other information we are required to report this fact. We have nothing to re-port in this regard.
Responsibilities of the Board of Directors and Those Charged with Governance for the consolidated financial statements
The Board of Directors is responsible for the prepa-ration and fair presentation of the consolidated financial statements in accordance with IFRSs as adopted by the European Union, and for such internal control as the Board of Directors determines is necessary to enable the prepa-ration of consolidated financial statements that are free from material misstatement, whether due to fraud or error.
In preparing the consolidated financial statements, the Board of Directors is responsible for assessing the Group’s ability to continue as a going concern, disclosing, as applicable, matters related to going concern and using the going concern basis of accounting unless the Board of Directors either intends to liquidate the Group or to cease operations, or has no realistic alternative but to do so.
Those charged with governance are responsible for overseeing the Group’s financial reporting process.

74 | Report of the Réviseur d’Enterprises Agréé (Independent auditor)
Responsibilities of the Réviseur d’Entreprises agréé for the audit of the consolidated financial statements
The objectives of our audit are to obtain reasonable assurance about whether the consolidated financial state-ments as a whole are free from material misstatement, whether due to fraud or error, and to issue a report of the “Réviseur d’Entreprises agréé” that includes our opinion. Reasonable assurance is a high level of assurance, but is not a guarantee that an audit conducted in accordance with the EU Regulation N° 537/2014, the Law of 23 July 2016 and with ISAs as adopted for Luxembourg by the CSSF will always detect a material misstatement when it exists. Misstatements can arise from fraud or error and are con-sidered material if, individually or in the aggregate, they could reasonably be expected to influence the economic decisions of users taken on the basis of these consolidated financial statements.
As part of an audit in accordance with the EU Regu-lation N° 537/2014, the Law of 23 July 2016 and with ISAs as adopted for Luxembourg by the CSSF, we exercise pro-fessional judgment and maintain professional skepticism throughout the audit. We also:
• Identify and assess the risks of material misstatement of the consolidated financial statements, whether due to fraud or error, design and perform audit procedures responsive to those risks, and obtain audit evidence that is sufficient and appropriate to provide a basis for our opinion. The risk of not detecting a material mis-statement resulting from fraud is higher than for one resulting from error, as fraud may involve collusion, forgery, intentional omissions, misrepresentations, or the override of internal control.
• Obtain an understanding of internal control relevant to the audit in order to design audit procedures that are appropriate in the circumstances, but not for the purpose of expressing an opinion on the effectiveness of the Group’s internal control.
• Evaluate the appropriateness of accounting policies used and the reasonableness of accounting estimates and related disclosures made by the Board of Direc-tors.
• Conclude on the appropriateness of Board of Direc-tors’ use of the going concern basis of accounting and, based on the audit evidence obtained, whether a ma-terial uncertainty exists related to events or condi-tions that may cast significant doubt on the Group’s ability to continue as a going concern. If we conclude that a material uncertainty exists, we are required to draw attention in our report of the “Réviseur d’Entre-
prises agréé” to the related disclosures in the consol-idated financial statements or, if such disclosures are inadequate, to modify our opinion. Our conclusions are based on the audit evidence obtained up to the date of report of the “Réviseur d’Entreprises agréé”. How-ever, future events or conditions may cause the Group to cease to continue as a going concern.
• Evaluate the overall presentation, structure and con-tent of the consolidated financial statements, includ-ing the disclosures, and whether the consolidated financial statements represent the underlying trans-actions and events in a manner that achieves fair pre-sentation.
• Obtain sufficient appropriate audit evidence regard-ing the financial information of the entities and busi-ness activities within the Group to express an opinion on the consolidated financial statements. We are re-sponsible for the direction, supervision and perfor-mance of the Group audit. We remain solely responsi-ble for our audit opinion.
We communicate with those charged with governance regarding, among other matters, the planned scope and timing of the audit and significant audit findings, includ-ing any significant deficiencies in internal control that we identify during our audit.
We also provide those charged with governance with a statement that we have complied with relevant ethical requirements regarding independence, and to commu-nicate with them all relationships and other matters that may reasonably be thought to bear on our independence, and where applicable, related safeguards.
From the matters communicated with those charged with governance, we determine those matters that were of most significance in the audit of the consolidated finan-cial statements of the current period and are therefore the key audit matters. We describe these matters in our report unless law or regulation precludes public disclosure about the matter.
Report on other legal and regulatory requirements
We have been appointed as “Réviseur d’Entreprises agréé” by the General Meeting of the Shareholders on 26 June 2019 and the duration of our uninterrupted engage-ment, including previous renewals and reappointments, is 8 years.
The Board of Directors’ report is consistent with the consolidated financial statements and has been prepared in accordance with applicable legal requirements.

75Report of the Réviseur d’Enterprises Agréé (Independent auditor) |
The accompanying Corporate Governance Statement is presented on pages 33 to 39. The information required by Article 68ter paragraph (1) letters c) and d) of the law of 19 December 2002 on the commercial and companies reg-ister and on the accounting records and annual accounts of undertakings, as amended, is consistent with the con-solidated financial statements and has been prepared in accordance with applicable legal requirements.
We confirm that the audit opinion is consistent with the additional report to the audit committee or equivalent.
We confirm that the prohibited non-audit services re-ferred to in the EU Regulation N° 537/2014 were not pro-vided and that we remained independent of the Group in conducting the audit.
Luxembourg, 16 March 2020
KPMG LuxembourgSociété coopérativeCabinet de révision agréé
39, Avenue John F. KennedyL - 1835 Luxembourg
Alessandro Raone

76 The notes on pages 84 to 134 form an integral part of these consolidated financial statements
For the year ended 31 December
2019 2018
Note €’000
Revenue 6 560,303 545,227
Property revaluations and capital gains 7 401,132 506,553
Share of profit from investments in equity-accounted investees 14 60 1,350
Property operating expenses 8 (255,734) (262,684)
Cost of buildings sold - (194)
Administrative and other expenses 9 (12,892) (10,515)
Operating profit 692,869 779,737
Finance expenses 10.1 (45,041) (45,929)
Other financial results 10.2 (33,193) (35,786)
Profit before tax 614,635 698,022
Current tax expenses 11.2 (37,062) (29,845)
Deferred tax expenses 11.3 (84,213) (85,143)
Profit for the year 493,360 583,034
Profit attributable to:
Owners of the Company 406,950 488,632
Perpetual notes investors 33,000 30,267
Non-controlling interests 53,410 64,135
493,360 583,034
Net earnings per share attributable to the owners of the Company (in euro):
Basic earnings per share 12.1 2.43 2.95
Diluted earnings per share 12.2 2.30 2.76
CONSOLIDATED STATEMENT OF PROFIT OR LOSS

77Consolidated statetment of comprehensive income |The notes on pages 84 to 134 form an integral part of these consolidated financial statements
CONSOLIDATED STATEMENT OF COMPREHENSIVE INCOME
For the year ended 31 December
2019 2018
€’000
Profit for the year 493,360 583,034
Other comprehensive loss
Items that may be reclassified to profit or loss in subsequent periods, net of tax:
Foreign currency translation, net of investment hedges of foreign operations (912) (9,160)
Cost of hedging (9,834) (39)
Total other comprehensive loss for the year, net of tax (10,746) (9,199)
Total comprehensive income 482,614 573,835
Total comprehensive income attributable to:
Owners of the company 396,204 479,433
Perpetual notes investors 33,000 30,267
Non-controlling interests 53,410 64,135
482,614 573,835

78 The notes on pages 84 to 134 form an integral part of these consolidated financial statements
CONSOLIDATED STATEMENT OF FINANCIAL POSITION
As at 31 December
2019 2018
Note €’000
Assets
Equipment and intangible assets 15 27,233 24,065
Investment property 16 7,956,034 7,227,290
Advanced payment for real estate transactions 25,106 54,964
Investment in equity-accounted investees 14 21,020 26,207
Derivative financial assets 27 25,808 7,517
Other non-current assets 13 125,099 246,192
Deferred tax assets 11.3 42,345 36,676
Non-current assets 8,222,645 7,622,911
Cash and cash equivalents 914,054 603,158
Financial assets at fair value through profit and loss 148,706 156,822
Inventories - trading property 15,710 16,625
Trade and other receivables 17 342,285 319,465
Derivative financial assets 27 6,699 5,060
Assets held for sale 25.2 201,329 136,485
Current assets 1,628,783 1,237,615
Total assets 9,851,428 8,860,526

79Consolidated statetment of financial position |The notes on pages 84 to 134 form an integral part of these consolidated financial statements
Refael Zamir CFO, Chairman of the Board of Directors
Simone Runge-BrandnerMember of the Board of Directors
Daniel MalkinMember of the Board of Directors
As at 31 December
2019 2018
Note €’000
Equity Share capital 18.1 16,790 16,672
Share premium 18.4 566,680 673,288
Other reserves 18.5 16,802 27,258
Retained earnings 2,892,360 2,510,278
Total equity attributable to the owners of the Company 3,492,632 3,227,496
Equity attributable to perpetual notes investors 1,030,050 1,030,050
Total equity attributable to the owners and perpetual notes investors 4,522,682 4,257,546
Non-controlling interests 443,917 409,441
Total equity 4,966,599 4,666,987
LiabilitiesLoans and borrowings 20.1 521,110 845,646
Convertible bond 20.2 274,908 272,246
Straight bonds 20.2 2,920,010 2,177,267
Derivative financial liabilities 27 18,488 12,825
Other non-current liabilities 22 103,757 56,399
Deferred tax liabilities 11.3 592,274 523,097
Non-current liabilities 4,430,547 3,887,480
Current portion of long-term loans 20.1 12,136 12,934
Loan redemption 20.1 21,126 8,687
Trade and other payables 21 287,664 242,320
Derivative financial liabilities 27 61,861 -
Tax payable 15,599 8,220
Provisions for other liabilities and charges 23 39,394 25,011
Liabilities held for sale 25.2 16,502 8,887
Current liabilities 454,282 306,059
Total liabilities 4,884,829 4,193,539
Total equity and liabilities 9,851,428 8,860,526
■■ The Board of Directors of Grand City Properties S.A. authorised these consolidated financial statements to be issued on 16 March 2020

80 The notes on pages 84 to 134 form an integral part of these consolidated financial statements
CONSOLIDATED STATEMENT OF CHANGES IN EQUITY
Equity attributable to the owners of the Company
€’000Share
capitalShare
Premium
Equity compo-nent of
convertible bond
Cost of hedgingreserve
Foreign exchange
translation reserves,
netOther
reservesRetained earnings
Total equity
attribut-able to the
owners of the
company
Equity at-tributable to perpet-
ual notes investors
Equity attribut-
able to the
owners of the
Company and
perpetual notes
investors
Non-controlling
interestsTotal
equity
Balance as at 31 December 2018 16,672 673,288 12,657 (39) (9,555) 24,195 2,510,278 3,227,496 1,030,050 4,257,546 409,441 4,666,987
Adjustment on initial application of IFRS 16, net of tax (*) - - - - - - 13,333 13,333 - 13,333 - 13,333
Restated balance as at 1 January 2019 16,672 673,288 12,657 (39) (9,555) 24,195 2,523,611 3,240,829 1,030,050 4,270,879 409,441 4,680,320
Profit for the year - - - - - - 406,950 406,950 33,000 439,950 53,410 493,360
Other comprehensive loss for the year - - - (9,834) (912) - - (10,746) - (10,746) - (10,746)
Total comprehensive income (loss)for the year - - - (9,834) (912) - 406,950 396,204 33,000 429,204 53,410 482,614
Dividend distribution 112 (107,379) - - - - - (107,267) - (107,267) - (107,267)
Share-based payment 6 771 - - - 290 - 1,067 - 1,067 - 1,067
Transactions with non-controlling interests - - - - - - (38,201) (38,201) - (38,201) (18,934) (57,135)
Payment to perpetual notes investors - - - - - - - - (33,000) (33,000) - (33,000)
Balance as at 31 December 2019 16,790 566,680 12,657 (9,873) (10,467) 24,485 2,892,360 3,492,632 1,030,050 4,522,682 443,917 4,966,599
(*) see note 3.1.

81Consolidated statetment of changes in equity |The notes on pages 84 to 134 form an integral part of these consolidated financial statements
Equity attributable to the owners of the Company
€’000Share
capitalShare
Premium
Equity compo-nent of
convertible bond
Cost of hedgingreserve
Foreign exchange
translation reserves,
netOther
reservesRetained earnings
Total equity
attribut-able to the
owners of the
company
Equity at-tributable to perpet-
ual notes investors
Equity attribut-
able to the
owners of the
Company and
perpetual notes
investors
Non-controlling
interestsTotal
equity
Balance as at 31 December 2017 16,479 753,226 20,284 - (511) 24,069 2,005,755 2,819,302 665,871 3,485,173 364,489 3,849,662
Adjustment on initial application of IFRS 9, net of tax - - - - - - (8,394) (8,394) - (8,394) - (8,394)
Restated balance as at 1 January 2018 16,479 753,226 20,284 - (511) 24,069 1,997,361 2,810,908 665,871 3,476,779 364,489 3,841,268
Profit for the year - - - - - - 488,632 488,632 30,267 518,899 64,135 583,034
Other comprehensive loss for the year - - - (39) (9,160) - - (9,199) - (9,199) - (9,199)
Total comprehensive income (loss) for the year - - - (39) (9,160) - 488,632 479,433 30,267 509,700 64,135 573,835
Buyback of convertible bond F - (375) (7,627) - - - - (8,002) - (8,002) - (8,002)
Dividend distribution 187 (79,560) - - - - - (79,373) - (79,373) - (79,373)
Share-based payment 6 (3) - - - 126 - 129 - 129 - 129
Disposal of foreign operation - - - - 116 - - 116 - 116 - 116
Transaction with non-controlling interests - - - - - - 24,285 24,285 - 24,285 (19,183) 5,102
Issuance of perpetual notes - - - - - - - - 340,891 340,891 - 340,891
Amount due to perpetual notes investors - - - - - - - - (6,979) (6,979) - (6,979)
Balance as at 31 December 2018 16,672 673,288 12,657 (39) (9,555) 24,195 2,510,278 3,227,496 1,030,050 4,257,546 409,441 4,666,987

82 The notes on pages 84 to 134 form an integral part of these consolidated financial statements
CONSOLIDATED STATEMENT OF CASH FLOWS
For the year ended 31 December
2019 2018
Note €’000
Cash flows from operating activities:
Profit for the year 493,360 583,034
Adjustments for the profit:
Depreciation and amortisation 15 3,872 2,576
Property revaluations and capital gains 7 (401,132) (506,553)
Share of profit from investments in equity-accounted investees 14 (60) (1,350)
Net finance expenses 10 78,234 81,715
Current and deferred tax expenses 11 121,275 114,988
Equity settled share-based payment 19.2 2,113 1,176
Change in working capital (20,084) (22,768)
277,578 252,818
Tax paid (28,087) (28,294)
Net cash provided by operating activities 249,491 224,524
Cash flows from investing activities:
Acquisition of equipment and intangible assets, net (7,090) (6,441)
Acquisition of investment property, capex and advances paid, net (413,974) (*) (572,337)
Disposals of investment property, net 220,101 (*) 71,715
Acquisition of investees and loans, net of cash acquired (202,811) (*) (362,437)
Disposal of investees and loans, net of cash disposed 233,577 (*) 250,838
Disposal (investment) of (in) financial and other non-current assets, net 117,072 (99,764)
Net cash used in investing activities (53,125) (718,426)
(*) reclassified

83Consolidated statetment of cash flows |The notes on pages 84 to 134 form an integral part of these consolidated financial statements
For the year ended 31 December
2019 2018
Note €’000
Cash flows from financing activities:
Amortisation of loans from financial institutions 20.3 (9,178) (8,597)
Net repayment of loans from financial institutions 20.3 (348,292) (*) (14,913)
Proceeds from straight bonds, net 20.3 721,482 928,680
Proceeds (payment) from (to) perpetual notes investors, net (33,000) 312,254
Repayment straight bond CHF - (49,934)
Buyback of straight bond series D - (163,628)
Buyback of convertible bond series F - (170,892)
Transactions with non-controlling interests (55,268) 78,000
Dividend distributed to the shareholders (107,245) (79,393)
Repayment of lease liabilities 20.3 (4,176) -
Interest and other financial expenses, net 20.3 (49,523) (*) (46,099)
Net cash provided by financing activities 114,800 785,478
Net increase in cash and cash equivalents 311,166 291,576
Change in cash and cash equivalent held for sale 25.2 (166) 453
Cash and cash equivalents at the beginning of the year 603,158 312,058
Effect of foreign exchange rate changes (104) (929)
Cash and cash equivalents at the end of the year 914,054 603,158
(*) reclassified

84 | Notes to the consolidated financial statements
NOTES TO THE CONSOLIDATED FINANCIAL STATEMENTS
1. General
1.1. Incorporation and principal activities■■ Grand City Properties S.A. (“the Company”) was incor-
porated in Luxembourg on December 16, 2011 as a Société Anonyme (public limited liability company). Its registered office is at 1, Avenue du Bois L-1251 Luxembourg.
The Company is a specialist in residential real estate, investing in value-add opportunities in densely populat-ed areas, mainly in Germany. The Company’s strategy is to improve its properties through targeted modernization and intensive tenant management, and create value by subsequently raising occupancy and rental levels.
These consolidated financial statements for the year ended 31 December 2019 comprise the Company and its investees (“the Group” or “GCP”).
1.2. Listing on the Frankfurt Stock Exchange■■ Since 2012, the Company’s shares are listed on the
Frankfurt Stock Exchange. On 9 May 2017 the Company’s shares were uplisted to the Prime Standard of the Frank-furt Stock Exchange.
Effective 18 September 2017, the Company’s shares were included in the MDAX index of the Deutsche Börse.
As at 31 December 2019, the issued share capital con-sists 167,895,560 shares with a par value of euro 0.10 per share.
1.3. Capital and bond increases■■ Since 2012, the Company undertook several capital
market transactions which include the issuance of straight bonds, convertible bonds, perpetual notes and equity.
In addition, the Company established euro Medium Term Notes Programme (“the EMTN programme”).
For more information see notes 18 and 20.2.
1.4. Group rating■■ On 23 November 2016, S&P upgraded its long-term
corporate credit rating of the Company to ‘BBB+’ with a stable outlook from ‘BBB’. In addition, S&P has revised the ratings of the senior unsecured debt of the Company to ‘BBB+’ from ‘BBB’ and on its subordinated perpetual notes to ‘BBB-‘ from ‘BB+’.
On 21 December 2016, S&P assigned the Company a short-term corporate credit rating of ‘A-2’.
In September 2017, Moody’s Investors Service (“Moody’s”) upgraded to ‘Baa1’ from ‘Baa2’ the long-term issuer rating of the Company. Concurrently, Moody’s up-
graded to ‘Baa1’ from ‘Baa2’ the Company’s senior unse-cured debt and to ‘Baa3’ from ‘Ba1’ the subordinated per-petual notes.
As at December 2019, the Group’s credit rating was re-affirmed by both rating agencies, as described above.
1.5 Definitions■■ In these consolidated financial statements:
2. Basis Of Preparation
2.1. Statement of compliance■■ These consolidated financial statements have been
prepared in accordance with the International Financial Reporting Standards (IFRS) as adopted by the European Union.
Certain consolidated statement of profit or loss, con-solidated statement of financial position and consolidated statement of cash flows’ items related to the year ended 31 December 2018 have been reclassified to enhance compa-rability with 2019 figures and are marked as “reclassified”.
The consolidated financial statements were autho-rised for issue by the Company’s board of directors on 16 March 2020.
The Company Grand City Properties S.A.
The Group The Company and its investees
GCP ltd Grandcity Property Limited
Subsidiaries
Companies that are controlled by the Company (as defined in IFRS 10) and whose financial state-ments are consolidated with those of the Company
Associates
Companies over which the Com-pany has significant influence (as defined in IAS 28) and that are not subsidiaries. The Company’s investment therein is included in the consolidated financial statements of the Company using equity method of accounting
Investees Subsidiaries, jointly controlled entities and associates
Related parties As defined in IAS 24

85 Notes to the consolidated financial statements |
2.2. Basis of measurement■■ The consolidated financial statements have been pre-
pared on a going concern basis, applying the historical cost convention, except for the measurement of the following:
• Financial assets at fair value through profit or loss;
• Investment properties are measured at fair value;
• Investment in equity-accounted investees;
• Derivative financial assets and liabilities;
• Assets and liabilities classified as held for sale;
• Deferred tax liability on fair value gain on investment property and derivative financial instruments.
2.3. Significant accounting judgements, estimates and assumptions
■■ The preparation of consolidated financial statements in accordance with IFRS requires from management the exercise of judgment, to make estimates and assumptions that influence the application of accounting principles and the related amounts of assets and liabilities, income and expenses. The estimates and underlying assumptions are based on historical experience and various other factors that are deemed to be reasonable based on current knowl-edge available at that time. Actual results may differ from such estimates.
The estimates and underlying assumptions are re-vised on a regular basis. Revisions in accounting estimates are recognised in the period during which the estimate is revised, if the estimate affects only that period, or in the period of the revision and future periods, if the revision affects the present as well as future periods.
JudgementsIn the process of applying the Group’s accounting policies, management has made the following judgements, which have the most significant effect on the amounts recognised in the consolidated financial statements:
Leases
• Property lease classification (the Group as lessor) - The Group has entered into property leases on its investment property portfolio. The Group has deter-mined, based on an evaluation of the terms and condi-tions of the arrangements, such as the lease terms not constituting a major part of the economic life of the properties and the present value of the minimum lease payments not amounting to substantially all of the fair value of the properties, that it retains substantially all the risks and rewards incidental to ownership of these properties and accounts for the contracts as operating leases.
Revenue from contracts with customers
• Determination of performance obligations - In rela-tion to the services provided to tenants of investment property as part of the lease agreements into which the Group enters as a lessor, the Group has determined that the promise is the overall property management service and that the service performed each day is distinct and substantially the same. Although the individual activities that comprise the performance obligation vary significantly throughout the day and from day to day, the nature of the overall promise to provide management service is the same from day to day. Therefore, the Group has concluded that the ser-vices to tenants represent a series of daily services that are individually satisfied over time, using a time-elapsed measure of progress, because tenants simul-taneously receive and consume the benefits provided by the Group. With respect to the sale of property, the Group concluded the goods and services transferred in each contract constitute a single performance obliga-tion.
• Principal versus agent considerations (services to tenants) - The Group arranges for certain services provided to tenants of investment property included in the contract the Group enters into as a lessor, to be provided by third parties. The Group has determined that it controls the services before they are trans-ferred to tenants, because it has the ability to direct the use of these services and obtain the benefits from them. In making this determination, the Group has considered that it is primarily responsible for fulfill-ing the promise to provide these specified services because it directly deals with tenants’ complaints and it is primarily responsible for the quality or suitabil-ity of the services. Therefore, the Group has conclud-ed that it is the principal in these contracts. In addi-tion, the Group has concluded that it transfers control of these services over time, as services are rendered by the third-party service providers, because this is when tenants receive and, at the same time, consume the benefits from these services.
• Determining the timing of revenue recognition on the sale of property - The Group has evaluated the timing of revenue recognition on the sale of property based on a careful analysis of the rights and obligations un-der the terms of the contract and legal advice from the Group’s external counsels in various jurisdictions. The Group has generally concluded that contracts re-lating to the sale of completed property are recognised at a point in time when control transfers. For uncon-ditional exchanges of contracts, control is generally expected to transfer to the customer together with the legal title. For conditional exchanges, this is expected

86 | Notes to the consolidated financial statements
to take place when all the significant conditions are satisfied.
Business combinations
• The Group acquires subsidiaries that own real es-tate. At the time of acquisition, the Group considers whether each acquisition represents the acquisition of a business or the acquisition of an asset. The Group accounts for an acquisition as a business combination where an integrated set of activities and assets, in-cluding property, is acquired. More specifically, con-sideration is given to the extent to which significant processes are acquired and, in particular, the extent of services provided by the subsidiary. When the ac-quisition of subsidiaries does not represent a business combination, it is accounted for as an acquisition of a group of assets and liabilities. The cost of the acquisi-tion is allocated to the assets and liabilities acquired based upon their relative fair values, and no goodwill or deferred tax is recognised.
Estimates and assumptionsThe key assumptions concerning future and other
key sources of estimation uncertainty at the reporting date, that have a significant risk of causing a material ad-justment to the carrying amounts of assets and liabilities within the next financial year, are described below. The Group based its assumptions and estimates on parame-ters available when the consolidated financial statements were prepared. Existing circumstances and assumptions about future developments, however, may change due to market changes or circumstances arising that are beyond the control of the Group. Such changes are reflected in the assumptions when they occur.
• Valuation of investment property - The Group uses external valuation reports issued by independent professionally qualified valuers to determine the fair value of its investment properties. The fair value measurement of investment property requires valu-ation experts and the Company’s management to use certain assumptions regarding rates of return on the Group’s assets, future rent, occupancy rates, contract renewal terms, the probability of leasing vacant areas, asset operating expenses, the tenants’ financial sta-bility and the implications of any investments made for future development purposes in order to assess the future expected cash flows from the assets. Any change in the assumptions used to measure the in-vestment property could affect its fair value.
• Taxes - Significant judgment is required in determin-ing the provision for income taxes. There are transac-tions and calculations for which the ultimate tax de-termination is uncertain during the ordinary course of business. The Group recognises liabilities for antic-ipated tax audit issues based on estimates of whether additional taxes will be due. Where the final tax out-come of these matters is different from the amounts that were initially recorded, such differences will impact the income tax and deferred tax provisions in the period in which such determination is made. De-ferred tax assets are recognised for unused tax losses to the extent that it is probable that taxable profit will be available against which the losses can be utilised. Significant management judgement is required to de-termine the amount of deferred tax assets that can be recognised, based upon the likely timing and the lev-el of future taxable profits, together with future tax planning strategies.
• Impairment of financial assets assets measured at amortised cost - When measuring expected credit loss (ECL) the Group uses reasonable and supportable forward-looking information, which is based on as-sumptions for the future movement of different eco-nomic drivers and how these drivers will affect each other. Loss given default is an estimate of the loss arising on default. It is based on the difference be-tween the contractual cash flows due and those that the lender would expect to receive, taking into ac-count cash flows from collateral and integral credit enhancements.
• Impairment of non-financial assets (equipment and intangible assets) - When there is an indication that an asset may be impaired or when annual impairment testing for an asset is required, the Group estimates the asset’s recoverable amount. An asset’s recoverable amount is the higher of an asset’s or Cash Generating Unit (CGU)’s fair value less costs of disposal and its value in use. The recoverable amount is determined for an individual asset, unless the asset does not gen-erate cash inflows that are largely independent of those from other assets or groups of assets. In assess-ing value in use, the estimated future cash flows are discounted to their present value using a pretax dis-count rate that reflects current market assessments of the time value of money and the risks specific to the asset. In determining fair value less costs of disposal, recent market transactions are taken into account. If no such transactions can be identified, an appropri-ate valuation model is used. A previously recognised impairment loss is reversed only if there has been a change in the assumptions used to determine the as-set’s recoverable amount since the last impairment loss was recognised.

87 Notes to the consolidated financial statements |
• Property leases - estimating the incremental bor-rowing rate - The Group cannot readily determine the interest rate implicit in leases where it is the lessee, therefore, it uses its incremental borrowing rate (IBR) to measure lease liabilities. The IBR is the rate of in-terest that the Group would have to pay to borrow over a similar term, and with a similar security, the funds necessary to obtain an asset of a similar value to the right-of-use asset in a similar economic environment. The IBR therefore reflects what the Group ‘would have to pay’, which requires estimation when no observ-able rates are available. The Group estimates the IBR based on the properties’ yields.
2.4. Functional and presentation currency
■■ The Group’s consolidated financial statements are presented in euros, which is also the Company’s functional currency, and rounded to the nearest thousand (€’000) un-less stated otherwise.
For each entity, the Group determines the functional currency and items included in the financial statements of each entity are measured using that functional currency.
Transactions and balancesTransactions in foreign currencies are initially re-
corded by the Group’s entities at their respective func-tional currency spot rates at the date the transaction first qualifies for recognition.
Monetary assets and liabilities denominated in for-eign currencies are translated at the functional currency spot rates of exchange at the reporting date.
Differences arising on settlement or translation of monetary items are recognised in profit or loss, with the exception of monetary items that are designated as part of the hedge of the Group’s net investment of a foreign opera-tion. These are recognised in other comprehensive income until the net investment is disposed of, at which time, the cumulative amount is reclassified to profit or loss. Tax charges and credits attributable to exchange differences on those monetary items are also recognised in other com-prehensive income.
Non-monetary items that are measured in terms of historical cost in a foreign currency are translated using the exchange rates at the dates of the initial transactions. Non-monetary items measured at fair value in a foreign currency are translated using the exchange rates at the date when the fair value is determined.
The gain or loss arising on translation of non-mone-tary items measured at fair value is treated in line with the recognition of gain or loss on change in fair value of the item (i.e., translation differences on items whose fair value
gain or loss is recognised in other comprehensive income or profit or loss are also recognised in other comprehensive income or profit or loss, respectively).
In determining the spot exchange rate to use on initial recognition of the related asset, liability, expense or in-come (or part of it) on the derecognition of a non-monetary asset or non-monetary liability relating to advance con-sideration, the date of the transaction is the date on which the Group initially recognises the non-monetary asset or non-monetary liability arising from the advance consid-eration. If there are multiple payments or receipts in ad-vance, the Group determines the transaction date for each payment or receipt of advance consideration.
Group companiesOn consolidation, the assets and liabilities of foreign
operations are translated into euros at the rate of exchange prevailing at the reporting date and their statements of profit or loss are translated at the average exchange rates for the period, unless exchange rates fluctuated signifi-cantly during the period, in which case the exchange rates prevailing at the dates of the transactions are used. The exchange differences arising on translation for consoli-dation are recognised in other comprehensive income and accumulated in a separate component of equity under the header of foreign currency translation reserve. On dispos-al of a foreign operation, the component of other compre-hensive income relating to that particular foreign opera-tion is reclassified to profit or loss.
Any goodwill arising on the acquisition of a foreign operation and any fair value adjustments to the carrying amounts of assets and liabilities arising on the acquisition are treated as assets and liabilities of the foreign operation and translated at the spot rate of exchange at the reporting date.
In addition, as at 31 December 2019, the Company has financial instruments in Sterling Pound (GBP), Hong Kong Dollar (HKD), Swiss Franc (CHF) and Japanese Yen (JPY).
The main exchange rates versus the euro were as follows:
EUR/
GBP
EUR/
HKD
EUR/
CHF
EUR/
JPY
As of 31 December 2019 0.851 8.747 1.085 121.940
As of 31 December 2018 0.895 8.968 1.127 125.850
Change (%) (4.89%) (2.46%) (3.68%) (3.11%)
Average exchange rate during the year 0.878 8.772 1.112 122.006

88 | Notes to the consolidated financial statements
3. Significant Accounting Policies
3.1. Changes in accounting policies and disclosures
■■ The accounting policies adopted and methods of com-putation followed are consistent with those of the previous financial year, except for items disclosed below. Specifi-cally, the Group applied IFRS 16 for the first time. The na-ture and effect of the changes as a result of adoption of this new accounting standard is described below.
IFRS 16 LeasesIFRS 16 supersedes IAS 17 Leases, IFRIC 4 Determin-
ing whether an Arrangement contains a Lease, SIC-15 Op-erating Leases-Incentives and SIC-27 Evaluating the Sub-stance of Transactions Involving the Legal Form of a Lease. The standard sets out the principles for the recognition, measurement, presentation and disclosure of leases and requires lessees to recognise most leases on the balance sheet.
Lessor accounting under IFRS 16 is substantially un-changed from IAS 17. Lessors continue to classify leases as either operating or finance leases using similar principles as in IAS 17. Therefore, IFRS 16 did not have an impact for leases where the Group is the lessor.
The Group adopted IFRS 16 using the modified retro-spective method of adoption with the date of initial ap-plication of 1 January 2019. Under this method, the stan-dard is applied retrospectively with the cumulative effect of initially applying the standard recognised in retained earnings at the date of initial application. Accordingly, comparative information for 2018 has not been restated and presented as previously reported under IAS 17 and re-lated interpretations.
The effect of adoption IFRS 16 as at 1 January 2019 (increase/(decrease)) is, as follows:
Before the adoption of IFRS 16, the Group classified each of its leases (as lessee) at the inception date as either a finance lease or an operating lease.
Upon adoption of IFRS 16, the Group applied a single recognition and measurement approach for all leases ex-cept for short-term leases and leases of low-value assets. The standard provides specific transition requirements and practical expedients, which have been applied by the Group.
The Group recognised right-of-use assets and lease liabilities at the date of initial application for leases pre-viously classified as an operating lease applying IAS 17, except for short-term leases and leases of low-value assets.
The lease liabilities were measured at the present val-ue of the remaining lease payments, discounted using the Group’s incremental borrowing rate at the date of initial application. The right-of-use assets were initially mea-sured at an amount equal to the lease liability, adjusted by the amount of any prepaid or accrued lease payments relating to that lease recognised in the consolidated state-ment of financial position immediately before the date of initial application, and then remeasured at fair value at the date of initial application. Deferred tax liabilities were recognised because of the remeasurement of the right-of-use asset at fair value.
The Group also applied the available practical expedi-ents wherein it:
• Used a single discount rate to a portfolio of leases with reasonably similar characteristics
• Relied on its assessment of whether leases are onerous immediately before the date of initial application
• Applied the short-term leases exemption to leases with lease term that ends within 12 months of the date of initial application and the ‘ low-value’ exemption for assets that are considered to be low value.
• Excluded the initial direct costs from the measure-ment of the right-of-use asset at the date of initial ap-plication
• Used hindsight in determining the lease term where the contract contained options to extend or terminate the lease
Based on the above, as at 1 January 2019:
• Right-of-use assets for which the underlying asset meets the definition of investment property under IAS 40 Investment Property were recognised and presented as ‘Investment property” in the consoli-dated statement of financial position. These leases were previously classified as operating leases and the Group did not classify and account for any property held under an operating lease as investment property.
In € thousands
Assets
Investment property 68,678
Liabilities
Other non-current liabilities 52,812
Deferred tax liabilities 2,533
Equity
Retained earnings 13,333
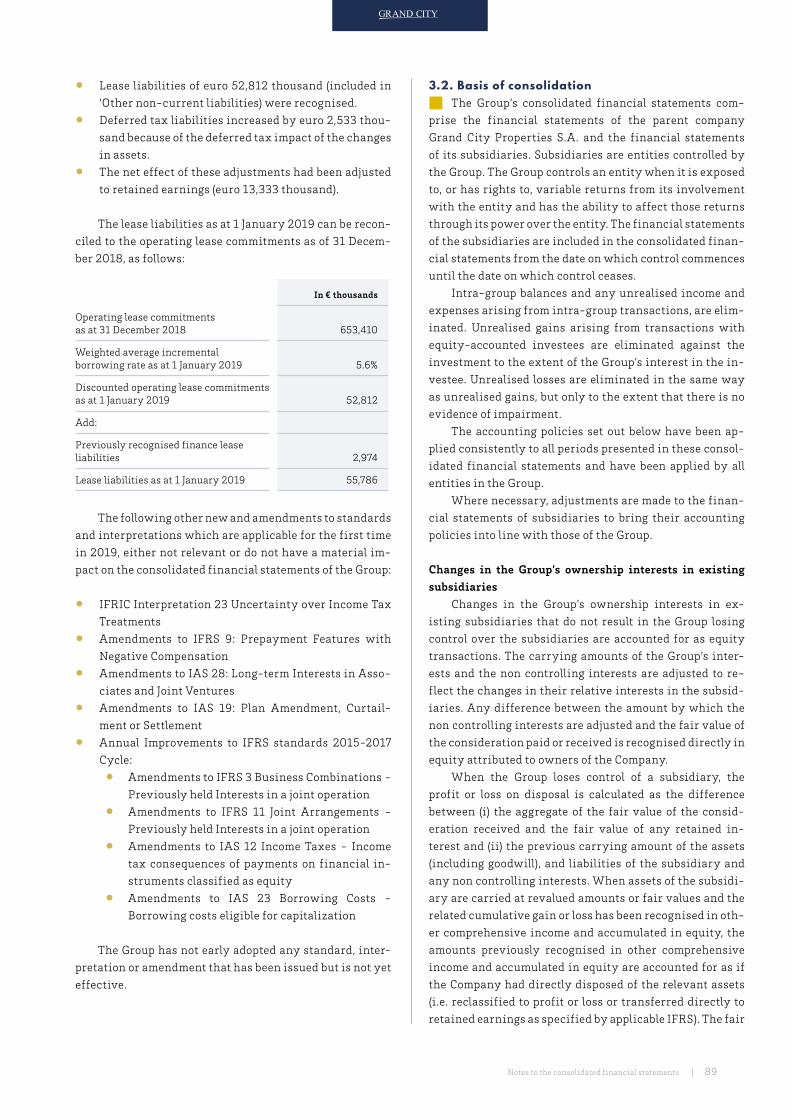
89 Notes to the consolidated financial statements |
• Lease liabilities of euro 52,812 thousand (included in ‘Other non-current liabilities) were recognised.
• Deferred tax liabilities increased by euro 2,533 thou-sand because of the deferred tax impact of the changes in assets.
• The net effect of these adjustments had been adjusted to retained earnings (euro 13,333 thousand).
The lease liabilities as at 1 January 2019 can be recon-ciled to the operating lease commitments as of 31 Decem-ber 2018, as follows:
The following other new and amendments to standards and interpretations which are applicable for the first time in 2019, either not relevant or do not have a material im-pact on the consolidated financial statements of the Group:
• IFRIC Interpretation 23 Uncertainty over Income Tax Treatments
• Amendments to IFRS 9: Prepayment Features with Negative Compensation
• Amendments to IAS 28: Long-term Interests in Asso-ciates and Joint Ventures
• Amendments to IAS 19: Plan Amendment, Curtail-ment or Settlement
• Annual Improvements to IFRS standards 2015-2017 Cycle:
• Amendments to IFRS 3 Business Combinations - Previously held Interests in a joint operation
• Amendments to IFRS 11 Joint Arrangements - Previously held Interests in a joint operation
• Amendments to IAS 12 Income Taxes - Income tax consequences of payments on financial in-struments classified as equity
• Amendments to IAS 23 Borrowing Costs - Borrowing costs eligible for capitalization
The Group has not early adopted any standard, inter-pretation or amendment that has been issued but is not yet effective.
3.2. Basis of consolidation■■ The Group’s consolidated financial statements com-
prise the financial statements of the parent company Grand City Properties S.A. and the financial statements of its subsidiaries. Subsidiaries are entities controlled by the Group. The Group controls an entity when it is exposed to, or has rights to, variable returns from its involvement with the entity and has the ability to affect those returns through its power over the entity. The financial statements of the subsidiaries are included in the consolidated finan-cial statements from the date on which control commences until the date on which control ceases.
Intra-group balances and any unrealised income and expenses arising from intra-group transactions, are elim-inated. Unrealised gains arising from transactions with equity-accounted investees are eliminated against the investment to the extent of the Group’s interest in the in-vestee. Unrealised losses are eliminated in the same way as unrealised gains, but only to the extent that there is no evidence of impairment.
The accounting policies set out below have been ap-plied consistently to all periods presented in these consol-idated financial statements and have been applied by all entities in the Group.
Where necessary, adjustments are made to the finan-cial statements of subsidiaries to bring their accounting policies into line with those of the Group.
Changes in the Group’s ownership interests in existing subsidiaries
Changes in the Group’s ownership interests in ex-isting subsidiaries that do not result in the Group losing control over the subsidiaries are accounted for as equity transactions. The carrying amounts of the Group’s inter-ests and the non controlling interests are adjusted to re-flect the changes in their relative interests in the subsid-iaries. Any difference between the amount by which the non controlling interests are adjusted and the fair value of the consideration paid or received is recognised directly in equity attributed to owners of the Company.
When the Group loses control of a subsidiary, the profit or loss on disposal is calculated as the difference between (i) the aggregate of the fair value of the consid-eration received and the fair value of any retained in-terest and (ii) the previous carrying amount of the assets (including goodwill), and liabilities of the subsidiary and any non controlling interests. When assets of the subsidi-ary are carried at revalued amounts or fair values and the related cumulative gain or loss has been recognised in oth-er comprehensive income and accumulated in equity, the amounts previously recognised in other comprehensive income and accumulated in equity are accounted for as if the Company had directly disposed of the relevant assets (i.e. reclassified to profit or loss or transferred directly to retained earnings as specified by applicable IFRS). The fair
In € thousands
Operating lease commitments as at 31 December 2018 653,410
Weighted average incremental borrowing rate as at 1 January 2019 5.6%
Discounted operating lease commitments as at 1 January 2019 52,812
Add:
Previously recognised finance lease liabilities 2,974
Lease liabilities as at 1 January 2019 55,786

90 | Notes to the consolidated financial statements
value of any investment retained in the former subsidiary at the date when control is lost is regarded as the fair val-ue on initial recognition for subsequent accounting under IFRS 9 Financial Instruments or IAS 28 Investments in Associates and Joint Ventures.
3.3. Business combinations
■■ Acquisitions of businesses are accounted for using the acquisition method, i.e. when control is transferred to the Group. The consideration transferred in a business combi-nation is measured at fair value, which is calculated as the sum of the acquisition date fair values of the assets trans-ferred by the Group, liabilities incurred by the Group to the former owners of the acquiree and the equity interests is-sued by the Group in exchange for control of the acquiree.
At the acquisition date, the identifiable assets ac-quired and the liabilities assumed are recognised at their fair value at the acquisition date, except that:
• deferred tax assets or liabilities and liabilities or as-sets related to employee benefit arrangements are recognised and measured in accordance with IAS 12 Income Taxes and IAS 19 Employee Benefits respec-tively;
• liabilities or equity instruments related to share based payment arrangements of the acquiree or share based payment arrangements of the Group entered into to replace share based payment arrangements of the ac-quiree are measured in accordance with IFRS 2 Share based Payment at the acquisition date; and
• Assets (or disposal groups) that are classified as held for sale in accordance with IFRS 5 Non current Assets Held for Sale and Discontinued Operations are mea-sured in accordance with that standard.
Goodwill is initially measured as the excess of the sum of the consideration transferred, the fair value of any non controlling interests in the acquiree, and the fair value of the acquirer’s previously held equity interest in the ac-quiree (if any) over the net of the acquisition date amounts of the identifiable assets acquired and the liabilities as-sumed. If, after reassessment, the net of the acquisition date amounts of the identifiable assets acquired and li-abilities assumed exceeds the sum of the consideration transferred, the amount of any non controlling interests in the acquiree and the fair value of the acquirer’s previ-ously held interest in the acquiree (if any), the excess is recognised immediately in the consolidated income state-ment as a bargain purchase gain.
Non controlling interests that are present ownership interests and entitle their holders to a proportionate share of the entity’s net assets in the event of liquidation may be initially measured either at fair value or at the non con-
trolling interests’ proportionate share of the recognised amounts of the acquiree’s identifiable net assets. The choice of measurement basis is made on a transaction by transaction basis. Other types of non controlling interests are measured at fair value or, when applicable, on the basis specified in another IFRS.
When the consideration transferred by the Group in a business combination includes assets or liabilities re-sulting from a contingent consideration arrangement, the contingent consideration is measured at its acquisition date fair value and included as part of the consideration transferred in a business combination. Changes in the fair value of the contingent consideration that qualify as mea-surement period adjustments are adjusted retrospectively, with corresponding adjustments against goodwill. Mea-surement period adjustments are adjustments that arise from additional information obtained during the ‘mea-surement period’ (which cannot exceed one year from the acquisition date) about facts and circumstances that ex-isted at the acquisition date.
The subsequent accounting for changes in the fair value of the contingent consideration that do not qualify as measurement period adjustments depends on how the contingent consideration is classified. Contingent con-sideration that is classified as equity is not remeasured at subsequent reporting dates and its subsequent settlement is accounted for within equity. Contingent consideration that is classified as an asset or a liability is remeasured at subsequent reporting dates in accordance with IFRS 9, or IAS 37 Provisions, Contingent Liabilities and Contingent Assets, as appropriate, with the corresponding gain or loss being recognised in consolidated statement of profit or loss.
If the initial accounting for a business combination is incomplete by the end of the reporting period in which the combination occurs, the Group reports provisional amounts for the items for which the accounting is incom-plete. Those provisional amounts are adjusted during the measurement period (see above), or additional assets or liabilities are recognised, to reflect new information ob-tained about facts and circumstances that existed at the acquisition date that, if known, would have affected the amounts recognised at that date.
Where a transaction or other event does not meet the definition of a business combination due to the acquiree not meeting the definition of a business, the Group iden-tifies and recognises the individual identifiable assets ac-quired and liabilities assumed, and allocates the cost of the group of assets and liabilities to the individual identifi-able assets and liabilities on the basis of their relative fair values at the date of purchase. Such a transaction or event does not give rise to goodwill.

91 Notes to the consolidated financial statements |
3.4. Investments in associates and equity - accounted investees
■■ An associate is an entity over which the Group has significant influence and that is neither a subsidiary nor an interest in a joint venture. Significant influence is the power to participate in the financial and operating policy decisions of the investee but is not control or joint control over those policies. A jointly controlled entity is an entity in which two or more parties have interest.
The results and assets and liabilities of associates and equity-accounted investees are incorporated in these consolidated financial statements using the equity meth-od of accounting, except when the investment is classi-fied as held for sale, in which case it is accounted for in accordance with IFRS 5 Non current Assets Held for Sale and Discontinued Operations. Under the equity method, an investment in an associate is initially recognised in the consolidated statement of financial position at cost and adjusted thereafter to recognise the Group’s share of the consolidated income statement and other comprehen-sive income of the associate. When the Group’s share of losses of an associate exceeds the Group’s interest in that associate (which includes any long term interests that, in substance, form part of the Group’s net investment in the associate), the Group discontinues recognizing its share of further losses. Additional losses are recognised only to the extent that the Group has incurred legal or constructive obligations or made payments on behalf of the associate.
Any excess of the cost of acquisition over the Group’s share of the net fair value of the identifiable assets, liabil-ities and contingent liabilities of an associate recognised at the date of acquisition is recognised as goodwill, which is included within the carrying amount of the investment. Any excess of the Group’s share of the net fair value of the identifiable assets, liabilities and contingent liabilities over the cost of acquisition, after reassessment, is rec-ognised immediately in profit or loss.
The requirements of IAS 36 are applied to determine whether it is necessary to recognise any impairment loss with respect to the Group’s investment in an associate. When necessary, the entire carrying amount of the in-vestment (including goodwill) is tested for impairment in accordance with IAS 36 Impairment of Assets as a single asset by comparing its recoverable amount (higher of val-ue in use and fair value less costs to sell) with its carrying amount; any impairment loss recognised forms part of the carrying amount of the investment. Any reversal of that impairment loss is recognised in accordance with IAS 36 to the extent that the recoverable amount of the invest-ment subsequently increases.
When an entity in the Group transacts with its associ-ate, profits and losses resulting from the transactions with the associate are recognised in the Group’s consolidated financial statements, however only to the extent of inter-ests in the associate that are not related to the Group.
3.5. Revenue recognition■■ The Group’s key sources of income include:
• Rental income
• Revenue from contracts with customers:
• Services to tenants including management charges and other expenses recoverable from tenants
• Sale of properties – inventories and investment prop-erty
The accounting for each of these elements is discussed below:
Rental incomeThe Group earns revenue from acting as a lessor in oper-ating leases which do not transfer substantially all of the risks and rewards incidental to ownership of an invest-ment property.
Rental income arising from operating leases on in-vestment property is accounted for on a straight-line ba-sis over the lease term and is included in revenue in the consolidated statement of profit or loss due to its operating nature, except for contingent rental income which is rec-ognised when it arises. Initial direct costs incurred in ne-gotiating and arranging an operating lease are capitalised to the investment property and recognised as an expense over the lease term on the same basis as the lease income.
Lease incentives that are paid or payable to the lessee are deducted from lease payments. Accordingly, tenant lease incentives are recognised as a reduction of rental revenue on a straight-line basis over the term of the lease. The lease term is the non-cancellable period of the lease together with any further term for which the tenant has the option to continue the lease, where, at the inception of the lease, the Group is reasonably certain that the tenant will exercise that option.
Revenue from services to tenantsFor investment property held primarily to earn rental in-come, the Group enters as a lessor into lease agreements that fall within the scope of IFRS 16. These agreements include certain ancillary services offered to tenants (i.e., customers). The consideration charged to tenants for these services includes fees and reimbursement of certain ex-penses incurred. These services are specified in the lease agreements and separately invoiced. The Group has deter-mined that these services constitute distinct non-lease components (transferred separately from the right to use the underlying asset) and are within the scope of IFRS 15. The Group allocates the consideration in the contract to the separate lease and revenue (non-lease) components on a relative stand-alone selling price basis.
In respect of the revenue component, these services represent a series of daily services that are individually satisfied over time because the tenants simultaneously

92 | Notes to the consolidated financial statements
receive and consume the benefits provided by the Group. The Group applies the time elapsed method to measure progress.
The Group arranges for third parties to provide cer-tain of these services to its tenants. The Group concluded that it acts as a principal in relation to these services as it controls the specified services before transferring them to the customer. Therefore, the Group records revenue on a gross basis.
Sale of property The Group enters into contracts with customers to sell properties that are either complete or under development.
The sale of completed property constitutes a single performance obligation and the Group has determined that this is satisfied at the point in time when control trans-fers. For unconditional exchange of contracts, this gener-ally occurs when legal title transfers to the customer. For conditional exchanges, this generally occurs when all sig-nificant conditions are satisfied.
For contracts relating to the sale of properties under development, the Group is responsible for the overall man-agement of the project and identifies various goods and services to be provided. In such contracts, the goods and services are not distinct and are generally accounted for as a single performance obligation. Depending on the terms of each contract, the Group will determine whether control is transferred at a point in time or over time.
The Group has elected to make use of the following practical expedients:
• Contract costs incurred related to contracts with an amortization period of less than one year have been expensed as incurred.
• The Group applies the practical expedient in para-graph 121 of IFRS 15 and does not disclose information about remaining performance obligations for con-tracts in which the Group has a right to consideration from tenants in an amount that corresponds directly with the value to the tenant of the Group’s perfor-mance completed to date.
• The Group does not adjust the transaction price for the effects of significant financing component since at contract inception it is expected that the period be-tween when the entity transfers the services to ten-ants and when the tenants pay for these services will be one year or less.
3.6. Finance income and expenses and other financial results
■■ Finance income comprises interest income on funds invested.
Finance expenses comprise interest expense on bank loans, third party borrowings and bonds.
Other financial results represent changes in the time value of provisions, changes in the fair value of traded securities, gains or losses on derivative financial instru-ments, borrowing and redemption costs, loan arrangement fees, dividend income and other one-time payments.
Financial expenses are recognised as they are in-curred in the consolidated statement of profit or loss, using the effective interest method.
3.7. Taxes
■■ Current taxCurrent income tax assets and liabilities are measured at the amount expected to be recovered from or paid to tax-ation authorities. The tax rates and tax laws used to com-pute the amount are those that are enacted, or substan-tively enacted, at the reporting date in the countries where the Group operates and generates taxable income.
Current income tax relating to items recognised di-rectly in other comprehensive income or equity is rec-ognised in other comprehensive income (OCI) or in equi-ty and not in the statement of profit or loss. Management periodically evaluates positions taken in tax returns with respect to situations in which applicable tax regulations are subject to interpretation and establishes provisions where appropriate.
Current tax also includes taxes on the holding of real estate property and construction.
Deferred taxDeferred tax is provided using the liability method on temporary differences between the tax bases of assets and liabilities and their carrying amounts for financial re-porting purposes at the reporting date.
Deferred tax liabilities are recognised for all taxable temporary differences, except:
• When the deferred tax liability arises from the initial recognition of goodwill or of an asset or liability in a transaction that is not a business combination and, at the time of the transaction, affects neither accounting profit nor taxable profit or loss
• In respect of taxable temporary differences associ-ated with investments in subsidiaries, branches and associates and interests in joint arrangements, when the timing of the reversal of the temporary differences can be controlled and it is probable that the temporary differences will not reverse in the foreseeable future
Deferred tax assets are recognised for all deductible temporary differences, the carryforward of unused tax credits and any unused tax losses. Deferred tax assets are

93 Notes to the consolidated financial statements |
recognised to the extent that it is probable that taxable profit will be available against which the deductible tem-porary differences, and the carryforward of unused tax credits and unused tax losses can be utilised, except:
• When the deferred tax asset relating to the deductible temporary difference arises from the initial recogni-tion of an asset or liability in a transaction that is not a business combination and, at the time of the transac-tion, affects neither the accounting profit nor taxable profit or loss.
• In respect of deductible temporary differences asso-ciated with investments in subsidiaries, branches and associates and interests in joint arrangements, de-ferred tax assets are recognised only to the extent that it is probable that the temporary differences will re-verse in the foreseeable future and taxable profit will be available against which the temporary differences can be utilised.
The carrying amount of deferred tax assets is re-viewed at each reporting date and reduced to the extent that it is no longer probable that sufficient taxable profit will be available to allow all or part of the deferred tax asset to be utilised. Unrecognised deferred tax assets are re-as-sessed at each reporting date and are recognised to the ex-tent that it has become probable that future taxable profits will allow the deferred tax asset to be recovered.
Deferred tax assets and liabilities are measured at the tax rates that are expected to apply in the year when the asset is realised or the liability is settled, based on tax rates (and tax laws) that have been enacted or substantively en-acted at the reporting date.
In accounting for the deferred tax relating to the lease, the Group considers both the lease asset and liability sepa-rately. The Group separately accounts for the deferred tax-ation on the taxable temporary difference and the deduct-ible temporary difference, which upon initial recognition, are equal and offset to zero. Deferred tax is recognised on subsequent changes to the taxable and temporary differ-ences.
Deferred tax relating to items recognised outside profit or loss is recognised outside profit or loss. Deferred tax items are recognised in correlation to the underlying transaction either in OCI or directly in equity.
Tax benefits acquired as part of a business combina-tion, but not satisfying the criteria for separate recog-nition at that date, are recognised subsequently if there is new information about changes in facts and circum-stances. The adjustment is either treated as a reduction in goodwill (as long as it does not exceed goodwill) if it was incurred during the measurement period or recognised in profit or loss.
The Group offsets deferred tax assets and deferred tax liabilities if, and only if, it has a legally enforceable right to set off current tax assets and current tax liabilities and the deferred tax assets and deferred tax liabilities relate to in-come taxes levied by the same taxation authority on either the same taxable entity or different taxable entities which intend either to settle current tax liabilities and assets on a net basis, or to realise the assets and settle the liabilities simultaneously, in each future period in which significant amounts of deferred tax liabilities or assets are expected to be settled or recovered.
3.8. Equipment and intangible assets
■■ Equipment is measured at cost less accumulated de-preciation and impairment losses.
Depreciation is recognised in profit or loss using the straight line method over the useful lives of each part of an item of equipment. The annual depreciation rates used for the current and comparative periods are as follows:
Furniture, fixtures and office equipment
Depreciation methods, useful lives and residual values are reassessed at the reporting date.
Where the carrying amount of an asset is greater than its estimated recoverable amount, the asset is written down immediately to its recoverable amount.
Expenditure for repairs and maintenance of equip-ment is charged to profit or loss of the year in which it is incurred. The cost of major renovations and other subse-quent expenditure are included in the carrying amount of the asset when it is probable that future economic benefits in excess of the originally assessed standard of perfor-mance of the existing asset will flow to the Group. Major renovations are depreciated over the remaining useful life of the related asset.
An item of equipment is derecognised upon disposal or when no future economic benefits are expected to arise from the continued use of the asset. Any gain or loss aris-ing on the disposal or retirement of an item of property, plant and equipment is determined as the difference be-tween the sales proceeds and the carrying amount of the asset and is recognised in the consolidated statement of comprehensive income.
The intangible assets of the Group consist of goodwill and software. Goodwill arising on the acquisition of sub-sidiaries is measured at cost less accumulated impairment losses.
Other intangible assets that are acquired by the Group and have finite useful lives are measured at cost less accu-mulated amortization, and any accumulated impairment losses.
%
10-50
94 | Notes to the consolidated financial statements
3.9. Deferred income■■ Deferred income represents income which relates to
future periods.
• Prepayments - The Group receives prepayments from tenants for ancillary services and other charges on a monthly basis. Once a year, the prepayments received from tenants are settled against the operating cost re-ceivables
• Tenancy deposits - Tenancy deposits are paid to en-sure the tenant occupied real estate is returned in good condition. The tenancy deposits can also be used if a loss of rent occurs.
3.10. Investment property
■■ Investment property comprises property that is held, to earn rentals or for capital appreciation or both. Proper-ty held under a lease is classified as investment property when it is held to earn rentals or for capital appreciation or both, rather than for sale in the ordinary course of busi-ness or for use in production or administrative functions.
Investment property comprises principally properties that are not occupied substantially for use by, or in the op-erations of, the Group, nor for sale in the ordinary course of business, but are held primarily to earn rental income and capital appreciation. These buildings are substantially rented to tenants and not intended to be sold in the ordi-nary course of business.
Investment property is measured initially at cost, in-cluding directly attributable expenditure such as transfer taxes, professional fees for legal services and other trans-action costs.
Subsequent to initial recognition, investment proper-ty is stated at fair value, which reflects market conditions at the reporting date. Gains or losses arising from changes in the fair values of investment property are included in profit or loss in the period in which they arise, including the corresponding tax effect.
Transfers are made to (or from) investment property only when there is evidence of a change in use (such as commencement of development or inception of an operat-ing lease to another party). For a transfer from investment property to inventories, the deemed cost for subsequent accounting is the fair value at the date of change in use. If an inventory property becomes an investment property, the difference between the fair value of the property at the date of transfer and its previous carrying amount is rec-ognised in profit or loss. The Group considers as evidence the commencement of development with a view to sale (for a transfer from investment property to inventories) or in-ception of an operating lease to another party (for a trans-fer from inventories to investment property).
Investment property is derecognised either when it
has been disposed of (i.e., at the date the recipient obtains control of the investment property in accordance with the requirements for determining when a performance obli-gation is satisfied in IFRS 15) or when it is permanently withdrawn from use and no future economic benefit is ex-pected from its disposal. The difference between the net disposal proceeds and the carrying amount of the asset is recognised in ‘Property revaluations and capital gains” in the consolidated statement of profit or loss in the period of derecognition. In determining the amount of consid-eration to be included in the gain or loss arising from the derecognition of investment property, the Group consid-ers the effects of variable consideration, the existence of a significant financing component, noncash consideration, and consideration payable to the buyer (if any) in accor-dance with the requirements for determining the transac-tion price in IFRS 15.
Refer to the note 3.12 “Non-current assets held for sale” on the accounting for investment property classified by held for sale.
3.11. Trading property (Inventories)
■■ Property acquired or being constructed for sale in the ordinary course of business, rather than to be held for rental or capital appreciation, is held as inventory proper-ty and is measured at the lower of cost and net realisable value (NRV).
Cost incurred in bringing each property to its present location and condition includes:
• Freehold and leasehold rights for land
• Amounts paid to contractors for development
• Planning and design costs, costs of site preparation, professional fees for legal services, property transfer taxes, development overheads and other related costs
NRV is the estimated selling price in the ordinary course of the business, based on market prices at the re-porting date, less estimated costs of completion and the estimated costs necessary to make the sale.
When an inventory property is sold, the carrying amount of the property is recognised as an expense in the period in which the related revenue is recognised. The carrying amount of inventory property recognised in profit or loss is determined with reference to the direct-ly attributable costs incurred on the property sold and an allocation of any other related costs based on the relative size of the property sold.
3.12. Non-current assets held for sale
■■ The Group classifies non-current assets (principally investment property) and disposal groups as held for sale if their carrying amounts will be recovered principally

95 Notes to the consolidated financial statements |
through a sale transaction rather than through continu-ing use. Non-current assets and disposal groups classified as held for sale (except for investment property measured at fair value) are measured at the lower of their carrying amount and fair value less costs to sell. Costs to sell are the incremental costs directly attributable to the disposal of an asset (disposal group), excluding finance costs and in-come tax expense.
The criteria for held for sale classification is regarded as met only when the sale is highly probable and the as-set or disposal group is available for immediate sale in its present condition. Actions required to complete the sale should indicate that it is unlikely that significant changes to the sale will be made or that the decision to sell will be withdrawn. Management must be committed to the plan to sell the asset and the sale is expected to be completed with-in one year from the date of the classification.
Investment property held for sale continues to be mea-sured at fair value. Assets and liabilities classified as held for sale are presented separately in the statement of finan-cial position.
When the Group is committed to a sale plan involving loss of control of a subsidiary, all of the assets and liabili-ties of that subsidiary are classified as held for sale when the criteria described above are met, regardless of whether the Group will retain a non-controlling interest in its for-mer subsidiary after the sale.
3.13. Financial instruments
■■ A financial instrument is any contract that gives right to a financial asset of one entity and a financial liability or equity instrument of another entity.
I. Financial assets
i. Initial recognition and measurementFinancial assets are classified at initial recogni-
tion as subsequently measured at amortised cost, fair value through other comprehensive income (OCI), or fair value through profit or loss.
The classification of financial assets at initial recognition depends on the financial asset’s contrac-tual cash flow characteristics and the Group’s busi-ness model for managing them. With the exception of trade receivables that do not contain a significant fi-nancing component or for which the Group has applied the practical expedient, the Group initially measures a financial asset at its fair value plus, in the case of a financial asset not at fair value through profit or loss, transaction costs. Trade receivables that do not con-tain a significant financing component or for which the Group has applied the practical expedient are measured at the transaction price determined under IFRS 15. See note 3.5.
In order for a financial asset to be classified and measured at amortised cost or fair value through OCI, it needs to give rise to cash flows that are ‘solely pay-ments of principal and interest (SPPI)’ on the principal amount outstanding. This assessment is referred to as the SPPI test and is performed at an instrument level.
The Group’s business model for managing finan-cial assets refers to how it manages its financial assets in order to generate cash flows. The business model determines whether cash flows will result from col-lecting contractual cash flows, selling the financial assets, or both.
Purchases or sales of financial assets that require delivery of assets within a time frame established by regulation or convention in the marketplace (regular way trades) are recognised on the trade date, i.e., the date that the Group commits to purchase or sell the as-set.
ii. Subsequent measurementFor the purposes of subsequent measurement, finan-cial assets are classified in four categories:
1 . Financial assets at amortised cost (debt instru-ments)
2. Financial assets at fair value through OCI with recycling of cumulative gains and losses (debt in-struments)
3. Financial assets designated at fair value through OCI with no recycling of cumulative gains and losses upon de-recognition (equity instruments)
4. Financial assets at fair value through profit or loss
Financial assets at amortised cost (debt instruments)
This category is the most relevant to the Group. The Group measures financial assets at amortised cost if both of the following conditions are met:
• The financial asset is held within a business model with the objective to hold financial assets in order to collect contractual cash flows, and
• The contractual terms of the financial asset give rise on specified dates to cash flows that are solely payments of principal and interest on the princi-pal amount outstanding.
Financial assets at amortised cost are subse-quently measured using the effective interest (EIR) method and are subject to impairment. Gains or loss-es are recognised in profit or loss when the asset is derecognised, modified or impaired refer to expected credit loss model in determined impairment.
Financial assets at fair value through OCI (debt instruments)

96 | Notes to the consolidated financial statements
The Group measures debt instruments at fair val-ue through OCI if both of the following conditions are met:
• The financial asset is held within a business model with the objective of both holding to collect con-tractual cash flows and selling, and
• The contractual terms of the financial asset give rise on specified dates to cash flows that are solely payments of principal and interest on the princi-pal amount outstanding.
For debt instruments at fair value through OCI, interest income, foreign exchange revaluation and impairment losses or reversals are recognised in con-solidated statement of profit or loss and computed in the same manner as for financial assets measured at amortised cost. The remaining fair value changes are recognised in OCI. Upon de-recognition, the cumula-tive fair value change recognised in OCI is recycled to profit or loss.
Financial assets at fair value through OCI (equity instruments)
Upon initial recognition, the Group can elect to classify irrevocably its equity investments as equi-ty instruments designated at fair value through OCI when they meet the definition of equity under IAS 32 and are not held for trading. The classification is de-termined on an instrument-by-instrument basis.
Gains and losses on these financial assets are nev-er recycled to profit or loss. Dividends are recognised as other financial results in the consolidated state-ment of profit or loss when the right of payment has been established, except when the Group benefits from such proceeds as a recovery of part of the cost of the financial asset, in which case, such gains are record-ed in OCI. Equity instruments designated at fair value through OCI are not subject to impairment assessment.
Financial assets at fair value through profit or loss
Financial assets at fair value through profit or loss include financial assets held for trading, financial as-sets designated upon initial recognition at fair value through profit or loss, or financial assets mandatorily required to be measured at fair value. Financial assets are classified as held for trading if they are acquired for the purpose of selling or repurchasing in the near term. Derivatives, including separated embedded de-rivatives, are also classified as held for trading unless they are designated as effective hedging instruments.
Financial assets with cash flows that are not solely payments of principal and interest are classified and measured at fair value through profit or loss, irre-spective of the business model. Notwithstanding the criteria for debt instruments to be classified at am-ortised cost or at fair value through OCI, as described above, debt instruments may be designated at fair val-ue through profit or loss on initial recognition if doing so eliminates, or significantly reduces, an accounting mismatch.
Financial assets at fair value through profit or loss are carried in the consolidated statement of financial position at fair value with net changes in fair value recognised in the consolidate statement of profit or loss.
Dividends on listed equity instruments are also recognised as other financial results in the consoli-dated statement of profit or loss when the right of pay-ment has established.
A derivative embedded in a hybrid contract, with a financial liability or non-financial host, is separated from the host and accounted for as a separate deriva-tive if: the economic characteristics and risks are not closely related to the host; a separate instrument with the same terms as the embedded derivative would meet the definition of a derivative; and the hybrid contract is not measured at fair value through profit or loss. Embedded derivatives are measured at fair value with changes in fair value recognised in profit or loss. Reassessment only occurs if there is either a change in the term of the contract that significantly modifies the cash flows that would otherwise be required or a re-classification of a financial asset out of the fair value through profit or loss category.
A derivative embedded within a hybrid contract containing a financial asset host is not accounted for separately. The financial asset host together with the embedded derivative is required to be classified en-tirely as a financial asset at fair value through profit or loss.
iii. De-recognitionFinancial asset (or, where applicable, part of a fi-
nancial asset or part of a group of similar financial assets) is primarily de-recognised (i.e., removed from the Group’s consolidated statement of financial posi-tion) when:
• The rights to receive cash flows from the asset have expired, or
• The Group has transferred its rights to receive cash flows from the asset or has assumed an obligation to pay the received cash flows in full without ma-

97 Notes to the consolidated financial statements |
terial delay to a third party under a ‘pass-through’ arrangement; and either (a) the Group has trans-ferred substantially all the risks and rewards of the asset, or (b) the Group has neither transferred nor retained substantially all the risks and rewards of the asset, but has transferred control of the asset.
When the Group has transferred its rights to re-ceive cash flows from an asset or has entered into a pass-through arrangement, it evaluates if, and to what extent, it has retained the risks and rewards of own-ership. When it has neither transferred nor retained substantially all of the risks and rewards of the asset, nor transferred control of the asset, the Group con-tinues to recognise the transferred asset to the extent of its continuing involvement. In that case, the Group also recognises an associated liability. The transferred asset and the associated liability are measured on the basis that reflects the rights and obligations that the Group has retained.
Continuing involvement that takes the form of a guarantee over the transferred asset is measured at the lower of the original carrying amount of the asset and the maximum amount of consideration that the Group could be required to repay.
iv. Impairment of financial assetsThe Group recognises an allowance for expected
credit losses (ECLs) for all debt instruments not held at fair value through profit or loss. ECLs are based on the difference between the contractual cash flows due in accordance with the contract and all the cash flows that the Group expects to receive, discounted at an approximation of the original effective interest rate. The expected cash flows will include cash flows from the sale of collateral held or other credit enhancements that are integral to the contractual terms.
ECLs are recognised in two stages. For credit ex-posures for which there has not been a significant increase in credit risk since initial recognition, ECLs are provided for credit losses that result from defaults events that are possible within the next 12 months (a 12-month ECL). For those credit exposures for which there has been a significant increase in credit risk since initial recognition, a loss allowance is required for credit losses expected over the remaining life of the exposure, irrespective of the timing of the default (a lifetime ECL). The Group presumes that the credit risk on a financial asset has increased significantly since initial recognition when contractual payments are more than 30 days past due, unless the Group has reasonable and supportable information that demon-strates otherwise.
Lifetime ECL represents the expected credit loss-es that will result from all possible default events over the expected life of a financial instrument. In contrast, 12-month ECL represents the portion of lifetime ECL that is expected to result from default events on a fi-nancial instrument that are possible within 12 months after the reporting date.
For trade receivables, the Group applies a simpli-fied approach in calculating ECLs. Therefore, the Group does not track changes in credit risk, but instead rec-ognises a loss allowance based on lifetime ECLs at each reporting date. The Group has established a provision that is based on its historical credit loss experience, adjusted for forward-looking factors specific to the debtors and the economic environment.
The Group considers a financial asset to be in de-fault when internal or external information indicates that the Group is unlikely to receive the outstanding contractual amounts in full before taking into account any credit enhancements held by the Group or when there is a breach of financial covenants by the debtor. Irrespective of the above analysis, the Group consid-ers that default has occurred when a financial asset is more than 90 days past due unless the Group has rea-sonable and supportable information to demonstrate that a more lagging default criterion is more appropri-ate. A financial asset is written off when there is no reasonable expectation of recovering the contractual cash flows.
II. Financial liabilitiesi. Initial recognition and measurementFinancial liabilities are classified, at initial rec-
ognition, as financial liabilities at fair value through profit or loss, loans and borrowings, payables or as derivatives designated as hedging instruments in an effective hedge, as appropriate.
All financial liabilities are recognised initially at fair value and, in the case of loans and borrowings and payables, net of directly attributable transaction costs.
ii. Subsequent measurementThe measurement of financial liabilities depends
on their classification, as described below:Financial liabilities at fair value through profit or
lossFinancial liabilities at fair value through profit or
loss include financial liabilities held for trading and financial liabilities designated upon initial recogni-tion as at fair value through profit or loss.
Financial liabilities are classified as held for trading if they are incurred for the purpose of repur-chasing in the near term. This category also includes

98 | Notes to the consolidated financial statements
derivative financial instruments entered into by the Group that are not designated as hedging instruments in hedge relationships as defined by IFRS 9. Separat-ed embedded derivatives are also classified as held for trading unless they are designated as effective hedg-ing instruments.
Gains or losses on liabilities held for trading are recognised in the consolidated statement of profit or loss.
Financial liabilities designated upon initial rec-ognition at fair value through profit or loss are desig-nated at the initial date of recognition, and only if the criteria in IFRS 9 are satisfied. The Group has not des-ignated any financial liability as at fair value through profit or loss.
Financial liabilities at amortised costThis is the category most relevant to the Group.
After initial recognition, interest-bearing loans and borrowings are subsequently measured at amor-tised cost using the EIR method. Gains and losses are recognised in profit or loss when the liabilities are de-recognised as well as through the EIR amortization process.
Amortised cost is calculated by taking into ac-count any discount or premium on acquisition and fees or costs that are an integral part of the EIR.
iii. De-recognitionA financial liability is de-recognised when the
obligation under the liability is discharged or can-celled or expires. When an existing financial liability is replaced by another from the same lender on sub-stantially different terms, or the terms of an existing liability are substantially modified, such an exchange or modification is treated as the de-recognition of the original liability and the recognition of a new liability. The difference in the respective carrying amounts is recognised in the consolidated statement of profit or loss.
III. Offsetting of financial instrumentsFinancial assets and financial liabilities are off-
set and the net amount is reported in the consolidat-ed statement of financial position if there is a cur-rently enforceable legal right to offset the recognised amounts and there is an intention to settle on a net basis, or to realise the assets and settle the liabilities simultaneously.
IV. Share capitalOrdinary shares are classified as equity. Incre-
mental costs directly attributable to the issue of ordi-nary shares are recognised as a deduction from equity, net of any tax effects.
V. Convertible bondsConvertible bonds, that can be converted to share
capital at the option of the holder and the number of shares to be issued is fixed are separated into liability and equity component based on the terms of the con-tract.
On issuance of the convertible bonds, the fair val-ue of the liability component is determined using a market rate for an equivalent non-convertible instru-ment. This amount is classified as a financial liability measured at amortised cost (net of transaction costs) until it is extinguished on conversion or redemption.
The remainder of the proceeds is allocated to the conversion option that is recognised and included in equity. Transaction costs are deducted from equity, net of associated income tax. The carrying amount of the conversion option is not re-measured in subse-quent years.
Transaction costs are apportioned between the liability and equity components of the convertible bonds, based on the allocation of the proceeds to the li-ability and equity components when the instruments are initially recognised.
On conversion, the financial liability is reclassi-fied to equity and no gain or loss is recognised in the consolidated statement of profit or loss.
VI. Perpetual notesPerpetual notes have no maturity date and may
be redeemed by the Company, at its sole discretion, on certain dates. The Perpetual notes are recognised as equity attributable to its holders, which forms part of the total equity of the Group. The Company may, at its sole discretion, elect to defer the payment of in-terest on the notes (referred to as Arrears of Interest). Arrears of Interest must be paid by the Company upon the occurrence of certain events, including but not limited to, dividends, distributions or other payments made to instruments such as the Company’s ordinary shares, which rank junior to the Perpetual notes. Upon occurrence of such an event, any Arrears of Interest would be re-classified as a liability in the Group’s con-solidated financial statements. The deferred amounts shall not bear interest.
3.14. Derivative financial instruments and hedge accounting■■ Initial recognition and subsequent measurement
The Group uses derivative financial instruments, such as forward currency contracts, interest rate swap and cross-currency swap contracts, to hedge its foreign cur-rency risks, interest rate risks and fair value risks. Such derivative financial instruments are initially recognised at fair value on the date on which a derivative contract

99 Notes to the consolidated financial statements |
is entered into and are subsequently re-measured at fair value. Derivatives are carried as financial assets when the fair value is positive and as financial liabilities when the fair value is negative.
For the purpose of hedge accounting, hedges are clas-sified as:
• Fair value hedges when hedging the exposure to changes in the fair value of a recognised asset or lia-bility or an unrecognised commitment.
• Cash flow hedges when hedging the exposures to variability in cash flows that is either attributable to a particular risk associated with a recognised asset or liability or a highly probable forecast transaction or the foreign currency risk in an unrecognised firm commitment.
• Hedges of a net investment in a foreign operation.
At the inception of a hedge relationship, the Group formally designates and documents the hedge relationship to which it wishes to apply hedge accounting and the risk management objective and strategy for undertaking the hedge.
Beginning 1 January 2018, the documentation includes identification of the hedging instrument, the hedged item, the nature of the risk being hedged and how the Group will assess whether the hedging relationship meets the hedge effectiveness requirements (including the analysis of sources of hedge ineffectiveness and how the hedge ration is determined). A hedging relationship qualifies for hedge accounting if it meets all of the following effectiveness re-quirements:
• There is ‘an economic relationship’ between the hedged item and the hedging instrument.
• The effect of credit risk does not ‘dominate the value changes’ that result from that economic relationship.
• The hedge ratio of the hedging relationship is the same as that resulting from the quantity of the hedged item that the Group actually hedges and the quantity of the hedging instrument that the Group actually uses to hedge that quantity of hedge item. Hedges that meet all the qualifying criteria for hedge accounting are ac-counted for and further described below:
• Fair value hedgesThe change in the fair value of a hedging instrument is
recognised in the consolidated statement of profit or loss. The change in the fair value of the hedged item attributable to the risk hedged is recorded as part of the carrying value of the hedged item and is also recognised in the consoli-dated statement of profit or loss.
The Group designates only the spot element as a hedg-ing instrument. The forward element is recognised in OCI and accumulated in a separate component of equity under cost of hedging reserve as time period related element and amortised to the consolidated statement of profit or loss over the hedged period.
If the hedged item is derecognised, the unamortised fair value is recognised immediately in profit or loss.
• Hedge of net investments in foreign operationsHedges of a net investment in a foreign operation, in-
cluding a hedge of monetary item that is accounted for as part of the net investment, are accounted for as follows:
• The Group designate only the spot element as a hedging instrument. The forward element is recognised in OCI and accumulated in a sepa-rate component of equity under cost of hedging reserve as time period related element and am-ortised to the consolidated statement of profit or loss over the hedged period.
• Gains or losses on the hedging instrument relat-ing to the effective portion of the hedge are rec-ognised as OCI while any gains or losses relating to the ineffective portion are recognised in the consolidated statement of profit or loss.
• On disposal of the foreign operation, the cumula-tive value of any such gains or losses recorded in equity is transferred to the consolidated state-ment of profit or loss.
3.15. Property operating expenses
■■ This item includes operating costs that can be re-charged to the tenants and direct management costs of the properties. Maintenance expenses for the upkeep of the property in its current condition, as well as expenditure for repairs are charged to the consolidated income state-ment. Refurbishment that takes place subsequent to the property valuation, thus excluded in its additional value, will also be stated in this account, until the next property valuation.
3.16. Operating segments
■■ The Group has one reportable operating segment which refers to rental income from owned investment properties.
An operating segment is a component of the Group that meets the following three criteria:
• Is engaged in business activities from which it may earn revenues and incur expenses, including revenues and expenses relating to intragroup transactions;
• whose operating results are regularly reviewed by the Group’s chief operating decision maker to make de-cisions about resources to be allocated to the segment and assess its performance; and
• For which separate financial information is available.

100 | Notes to the consolidated financial statements
3.17. Comparatives■■ Where necessary, comparative figures have been ad-
justed to conform to changes in presentation in the current period.
3.18. Earnings per share
■■ Earnings per share are calculated by dividing the net profit attributable to owners of the Company by the weighted number of Ordinary shares outstanding during the period. Basic earnings per share only include shares that were actually outstanding during the period. Po-tential Ordinary shares (convertible securities such as convertible debentures, warrants and employee options) are only included in the computation of diluted earnings per share when their conversion decreases earnings per share or increases loss per share from continuing opera-tions. Further, potential Ordinary shares that are convert-ed during the period are included in diluted earnings per share only until the conversion date and from that date in basic earnings per share. The Company’s share of earnings of investees is included based on the earnings per share of the investees multiplied by the number of shares held by the Company.
3.19. Share-based payment transactions
■■ The grant-date fair value of equity-settled share-based payment awards granted to employees is generally recognised as an expense, with a corresponding increase in equity, over the vesting period of the awards. The amount recognised as an expense is adjusted to reflect the number of awards for which the related service and non-market performance conditions are expected to be met, such that the amount ultimately recognised is based on the number of awards that meet the related service and non-market performance conditions at the vesting date.
3.20. Provisions for other liabilities and charges
■■ Provisions are recognised when there is a present ob-ligation, either legal or constructive, vis-à-vis third par-ties as a result of a past event, if it is probable that a claim will be asserted, and the probable amount of the required provision can be reliably estimated. Provisions are re-viewed regularly and adjusted to reflect new information or changed circumstances.
Provisions include provisions for operating and ad-ministrative liabilities, as well as accruals of interest on straight and convertible bonds which have not become payable as at the reporting date.
3.21. Leased assets
■■ The Group assesses at contract inception whether a contract is, or contains, a lease. That is, if the contract con-veys the right to control the use of an identified asset for a period of time in exchange for consideration.
Group as a lessee
The Group applies a single recognition and measurement approach for all leases, except for short-term leases and leases of low-value assets. The Group recognises lease li-abilities to make lease payments and right-of-use assets representing the right to use the underlying assets.
i) Right-of-use assetsThe Group recognises right-of-use assets at the com-
mencement date of the lease (i.e., the date the underlying asset is available for use). Right-of-use assets are measured at cost, less any accumulated depreciation and impairment losses, and adjusted for any remeasurement of lease liabil-ities. The cost of right-of-use assets includes the amount of lease liabilities recognised, initial direct costs incurred, and lease payments made at or before the commencement date less any lease incentives received. Right-of-use assets are depreciated on a straight-line basis over the shorter of the lease term and the estimated useful lives of the assets. If ownership of the leased asset transfers to the Group at the end of the lease term or the cost reflects the exercise of a purchase option, depreciation is calculated using the es-timated useful life of the asset. The right-of-use assets are also subject to impairment. Refer to accounting policies on impairment on non-financial assets in this note.
The Group leases properties that meet the definition of investment property. These right-of-use assets are clas-sified and presented as part of the line item ‘Investment property’ in the statement of financial position and subse-quently measured at fair value.
ii) Lease liabilitiesAt the commencement date of the lease, the Group rec-
ognises lease liabilities measured at the present value of lease payments to be made over the lease term. The lease payments include fixed payments (including in-substance fixed payments) less any lease incentives receivable, vari-able lease payments that depend on an index or a rate, and amounts expected to be paid under residual value guaran-tees. The lease payments also include the exercise price of a purchase option reasonably certain to be exercised by the Group and payments of penalties for terminating the lease, if the lease term reflects the Group exercising the option to terminate. Variable lease payments that do not depend on an index or a rate are recognised as expenses (unless they are incurred to produce inventories) in the period in which the event or condition that triggers the payment occurs.
In calculating the present value of lease payments, the Group uses its incremental borrowing rate at the lease commencement date because the interest rate implicit in the lease is not readily determinable. After the commence-ment date, the amount of lease liabilities is increased to reflect the accretion of interest and reduced for the lease

101 Notes to the consolidated financial statements |
payments made. In addition, the carrying amount of lease liabilities is remeasured if there is a modification, a change in the lease term, a change in the lease payments (e.g., changes to future payments resulting from a change in an index or rate used to determine such lease payments) or a change in the assessment of an option to purchase the underlying asset. IFRS 16 requires certain adjustments to be expensed, while others are added to the cost of the relat-ed right-of-use asset.
iii) Short-term leases and leases of low-value assetsThe Group applies the short-term lease recognition
exemption to short-term leases of equipment (i.e., those leases that have a lease term of 12 months or less from the commencement date and do not contain a purchase option). It also applies the lease of low-value assets recognition ex-emption to leases of office equipment that are considered to be low value. Lease payments on short-term leases and leases of low-value assets are recognised as expense on a straight-line basis over the lease term.
Group as a lessor
Refer to accounting policies on rental income in note 3.5.
3.22. Standards Issued But Not Yet Effective
■■ The new and amended standards and interpretations that are issued, but not yet effective, up to the date of issu-ance of the Group’s financial statements are disclosed be-low, if they are expected to have an impact on the Group’s financial statements. The Group intends to adopt these new and amended standards and interpretations, if appli-cable, when they become effective.
Amendments to IFRS 3 – Definition of a BusinessIn October 2018, the IASB issued amendments to the
definition of a business in IFRS 3 Business Combinations to help entities determine whether an acquired set of ac-tivities and assets is a business or not.
The amendments mainly include:
• Clarification that, to be considered a business, an ac-quired set of activities and assets must include, at a minimum, an input and a substantive process that to-gether significantly contribute to the ability to create outputs
• Removal of the assessment of whether market partic-ipants are capable of replacing any missing outputs or processes and continuing to produce outputs
• Adding guidance and illustrative examples to help en-tities assess whether a substantive process has been acquired
• Narrowing the definitions of business and outputs by focusing on goods or services provided to customers and by removing the reference to an ability to reduce costs
• Adding an optional concentration test that permits a simplified assessment of whether an acquired set of activities and assets is not a business
The amendments must be applied to transactions that are either business combinations or asset acquisitions for which the acquisition date is on or after the first annu-al reporting period beginning on or after 1 January 2020. The amendments will, therefore, not impact the Group’s consolidated financial statements when they become ef-fective. The Group expects that the amendments will re-duce the number of transactions that are accounted for as a business combination.
Amendments to IAS 1 and IAS 8: Definition of Material In October 2018, the IASB issued amendments to IAS 1
Presentation of Financial Statements and IAS 8 Account-ing Policies, Changes in Accounting Estimates and Errors to align the definition of ‘material’ across the standards and to clarify certain aspects of the definition. The new definition states that, ’Information is material if omitting, misstating or obscuring it could reasonably be expected to influence decisions that the primary users of general pur-pose financial statements make on the basis of those fi-nancial statements, which provide financial information about a specific reporting entity.’ The amendments to the definition of material is not expected to have a significant impact on the Group’s consolidated financial statements.
The Group has not early adopted any standards, inter-pretations or amendments that have been in issued but are not yet effective and adopted by the EU.
BRAUNSCHWEIG

102 | Notes to the consolidated financial statements
Fair value hierarchy
Level 1: the fair value of financial instruments trad-ed in active markets (such as debt and equity securities) is based on quoted market prices at the end of the reporting period.
Level 2: the fair value of financial instruments that are not traded in an active market (for example, over-the-counter derivatives) is determined using valuation tech-niques which maximise the use of observable market data and rely as little as possible on entity-specific estimates. If all significant input required to fair value of financial instrument are observable, the instrument is included in level 2.
Level 3: if one or more of the significant inputs is not based on observable market data, the instrument is in-cluded in level 3.
The Group’s policy is to recognise transfers into and transfers out of fair value hierarchy levels as at the end of the reporting period.
The Group also has a number of financial instruments which are not measured at fair value in the consolidated statement of financial position. For the majority of these instruments, the fair values are not materially different to their carrying amounts, since interest receivable/payable is either close to current market rates or the instruments are short-term in nature. Significant differences were identified for the following instruments as at 31 December 2019 and 31 December 2018:
4. Fair value measurement of financial instruments
As at 31 December 2019 As at 31 December 2018
Fair value measurement using Fair value measurement using
Carrying amount
Total fair value
Quoted prices
in active market
(Level 1)
Signifi-cant ob-servable
inputs (Level 2)
Signif-icant
unob-servable
inputs (Level 3)
Carrying amount
Total fair value
Quoted prices
in active market
(Level 1)
Significant observable
inputs(Level 2)
Significant unobserv-able inputs
(Level 3)
€’000
Financial assets
Financial assets at fair val-ue through profit or loss (*)
162,220
162,220
139,274
22,946 -
156,822
156,822
96,145
60,677 -
Derivative financial assets 32,507
32,507
-
32,507 -
12,577
12,577 -
12,577 -
Total financial assets 194,727 194,727 139,274 55,453 - 169,399 169,399 96,145 73,254 -
Financial liabilities
Derivative financial liabilities
80,349
80,349 -
80,349 -
12,825
12,825 -
12,825 -
Total financial liabilities
80,349
80,349
-
80,349 -
12,825
12,825 -
12,825 -
■■ The following table presents the Group’s financial assets and financial liabilities measured and recognised at fair value at 31 December 2019 and 31 December 2018 on a recurring basis:
(*) including non-current financial assets at fair value through profit or loss, see note 13.

103 Notes to the consolidated financial statements |
As at 31 December 2019 As at 31 December 2018
Fair value measurement using Fair value measurement using
Carrying amount
Total fair value
Quoted prices
in active market
(Level 1)
Signifi-cant ob-servable
inputs (Level 2)
Signif-icant
unob-servable
inputs (Level 3)
Carrying amount
Total fair value
Quoted prices
in active market
(Level 1)
Signifi-cant ob-servable
inputs(Level 2)
Significant unobserv-able inputs
(Level 3)
€’000
Financial liabilities
Straight bonds 2,920,010 3,115,599 2,924,039 191,560 - 2,177,267 2,109,045 1,950,640 158,405 -
Convertible bond 274,908 299,942 299,942 - - 272,246 292,523 292,523 - -
Total financial liabilities
3,194,918
3,415,541
3,223,981
191,560 -
2,449,513
2,401,568
2,243,163 158,405 -
When the fair value of financial assets and financial liabilities recorded in the consolidated statement of finan-cial position cannot be measured based on quoted prices in active markets, their fair value is measured using valua-tion techniques including the discounted cash flows (DCF) model. The inputs to these models are taken from observ-able markets where possible, but where this is not feasi-ble, a degree of judgement is required in establishing fair values. Judgements include considerations of input such as liquidity risk, credit risk and volatility. Changes in assumptions relating to these factors could affect the re-ported fair value of financial instruments and is discussed further below.
Valuation methods assumptionsThe following methods and assumptions were used to es-timate the fair values:
• The fair values of the quoted bonds are based on price quotations at the reporting date. The fair value of un-quoted bonds is measured using the discounted cash flows method with observable inputs.
• There is an active market for the Group’s listed equity investments and quoted debt instruments.
• Hybrid instruments are measured using a combina-tion of a discount cash flows method for the host con-
tract and a call pricing model for the embedded de-rivative (i.e., the conversion option). The models use observable inputs such as market price of the under-lying asset and swap rate curve.
• The Group enters into derivative financial instru-ments with various counterparties, principally fi-nancial institutions with investment grade credit ratings. Interest rate and foreign exchange swap and forward, collar and cap contracts are valued using valuation techniques, which employ the use of market observable inputs. The most frequently applied val-uation technique include forward pricing and swap models using present value calculations. The models incorporate various inputs including the credit qual-ity of counterparties, foreign exchange spot and for-ward rates, yield curves of the respective currencies,
During the year, several straight bonds issued by the Company were quoted in active markets. As it became pos-sible to determine the fair value of these straight bonds us-ing quoted prices, they have been reclassified from level 2 into level 1.
According to the Group’s policy, these transfers were recognised at the end of the relevant interim reporting pe-riods.

104 | Notes to the consolidated financial statements
5. Acquisition Of Subsidiaries And Non-Controlling Interests
■■ Duringhe year, the Group obtained control over sev-eral portfolios through acquisitions of companies. The transactions did not meet the definition of business com-bination. The purchases of these companies were treated as acquisition of a group of assets and liabilities.
Therefore, the total purchase costs amounted to euro 214 million were allocated between the assets and liabili-ties based on their relative fair value at the purchase date, without recognition of goodwill.
As part of the acquisition, the Group initially consol-idated investment property of euro 292 million, loans and borrowings of euro 64 million and recognised euro 8 mil-lion non-controlling interests.
■■ During the year, the Group changed its holdings rates in several subsidiaries without losing control. The car-rying amount of the Group’s interest and non-controlling interests was adjusted to reflect the changes in their rela-tive interest in the subsidiaries, in the amount of euro 17.9 million (2018: 16.9 million) and is presented in the consol-idated statement of changes in equity. The results of the transactions are recognised directly in equity attributed to the owners of the Company.
HALLE

105 Notes to the consolidated financial statements |
6. Revenue
6.1 Disaggregation of revenue from contracts with customers
6.2 Geographical information
Year ended 31 December
2019 2018
€’000
Net rental income 382,605 364,365
Revenue from contracts with customers 177,698 180,862
560,303 545,227
Year ended 31 December
2019 2018
€’000
Revenue
Germany 529,364 534,817
United Kingdom 29,658 10,410
Others 1,281 -
560,303 545,227
Year ended 31 December
2019 2018
€’000
Revenue from goods or services transferred to customers over time:
Operating and other income 177,698 180,612
Revenue from goods or services transferred to customers at a point in time:
Revenue from sale of apartments - 250
177,698 180,862
The Group is not exposed to significate revenue derived from an individual customer.
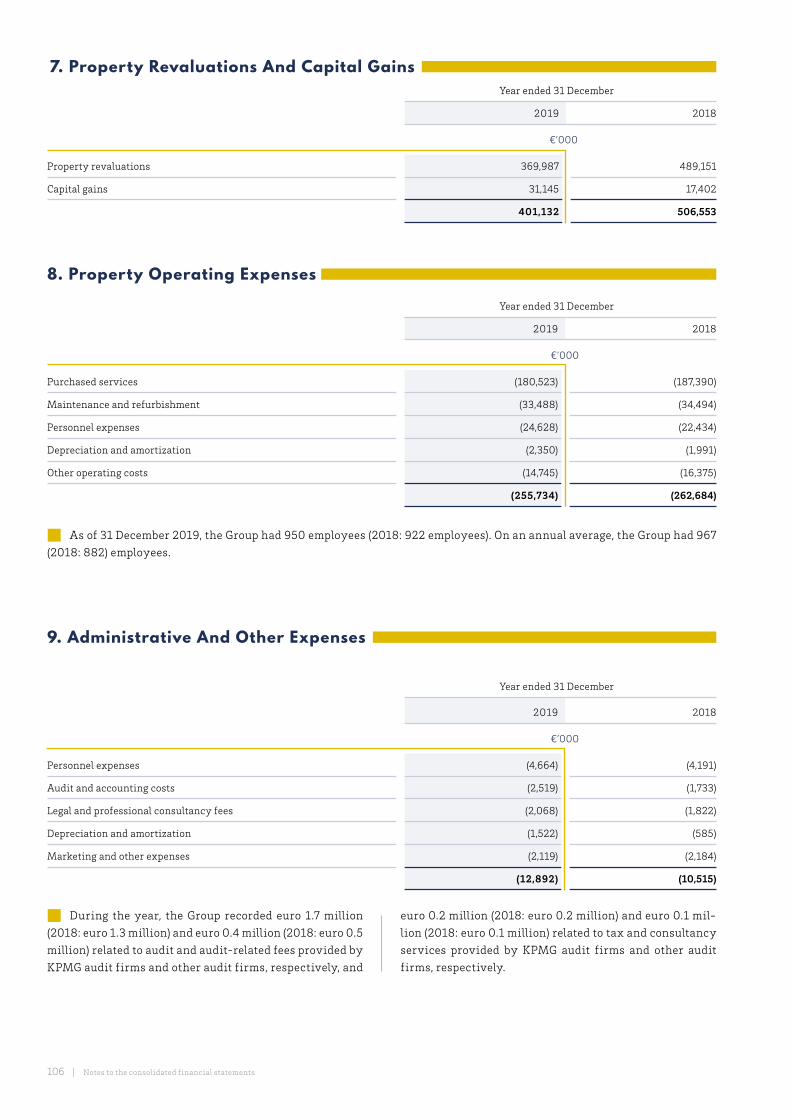
106 | Notes to the consolidated financial statements
7. Property Revaluations And Capital Gains Year ended 31 December
2019 2018
€’000
Property revaluations 369,987 489,151
Capital gains 31,145 17,402
401,132 506,553
8. Property Operating Expenses
Year ended 31 December
2019 2018
€’000
Purchased services (180,523) (187,390)
Maintenance and refurbishment (33,488) (34,494)
Personnel expenses (24,628) (22,434)
Depreciation and amortization (2,350) (1,991)
Other operating costs (14,745) (16,375)
(255,734) (262,684)
9. Administrative And Other Expenses
Year ended 31 December
2019 2018
€’000
Personnel expenses (4,664) (4,191)
Audit and accounting costs (2,519) (1,733)
Legal and professional consultancy fees (2,068) (1,822)
Depreciation and amortization (1,522) (585)
Marketing and other expenses (2,119) (2,184)
(12,892) (10,515)
■■ During the year, the Group recorded euro 1.7 million (2018: euro 1.3 million) and euro 0.4 million (2018: euro 0.5 million) related to audit and audit-related fees provided by KPMG audit firms and other audit firms, respectively, and
euro 0.2 million (2018: euro 0.2 million) and euro 0.1 mil-lion (2018: euro 0.1 million) related to tax and consultancy services provided by KPMG audit firms and other audit firms, respectively.
■■ As of 31 December 2019, the Group had 950 employees (2018: 922 employees). On an annual average, the Group had 967 (2018: 882) employees.

107 Notes to the consolidated financial statements |
10. Net Finance Expenses
BERLIN
Year ended 31 December
10.1 Finance expenses 2019 2018
€’000
Finance expenses from financial institutions and third parties, net (7,659) (11,122)
Finance expenses from straight and convertible bonds, net (37,382) (34,807)
(45,041) (45,929)
Year ended 31 December
10.2 Other financial results 2019 2018
€’000
Changes in fair value of financial assets and liabilities, net (15,757) (28,527)
Finance-related costs (17,436) (7,259)
(33,193) (35,786)

108 | Notes to the consolidated financial statements
11.1 Tax rates applicable to the group
■■ The Company is subject to taxation under the laws of Luxembourg. The corporation tax rate for Luxembourg companies is 24.94% (2018: 26.01%). The change in the corporation tax rate does not have a significant effect on current and deferred tax assets and liabilities.
The German subsidiaries with property are subject to taxation under the laws of Germany. Income taxes are calculated using a federal corporate tax of 15% as of 31 De-cember 2019 (2018: 15%), plus an annual solidarity sur-charge of 5.5% on the amount of federal corporate taxes payable (aggregated tax rate: 15.825%).
German property taxation includes taxes on the hold-ing of real estate property.
The Cypriot subsidiaries are subject to taxation under the laws of Cyprus. The corporation tax rate for Cypriot companies is 12.5% (2018: 12.5%).
Under certain conditions interest income of the Cy-priot companies may be subject to defense contribution at the rate of 30% (2018: 30%). In such cases this interest will be exempt from corporation tax.
In certain cases, overseas dividend income of Cyprus tax resident companies may be subject to special defense contribution at a flat rate of 17%. In such case, this div-idend income will be exempt from Cyprus income (cor-
poration) tax. Under certain conditions, dividend income earned from Cyprus tax resident companies is exempt from special defense contribution and Cyprus income (corporation) tax.
The United Kingdom subsidiaries with property are subject to taxation under the laws of the United Kingdom. Income taxes are calculated using a federal corporate tax (that includes capital gains) of 19.0% for 31 December 2019 (2018: 19%).
The United Kingdom government approved reduction of the corporate income tax rate to 17% in 2020.
Subsidiaries in other jurisdictions are subject to cor-porate tax rate of up to 30%.
Year ended 31 December
2019 2018
€’000
Corporate income tax (18,574) (12,940)
Property tax (18,488) (16,905)
Charge for the year (37,062) (29,845)
11. Taxation
11.2 Current tax in consolidated statement of profit and loss
GELSENKIRCHEN

109 Notes to the consolidated financial statements |
■■ As at 31 December 2019 the Group has unused tax losses for which no deferred tax assets have been rec-ognised as it is not considered probable that there will be future taxable profits available. These deferred tax assets which have not been recognised amounted to approximate euro 28 million (of which euro 10 million and euro 18 mil-lion are related unused tax losses that can be carried for-ward indefinitely and for a maximum period of 17 years, respectively).
The Group has applied the initial recognition excep-tion on acquisitions of investment property which did not meet the definition of a business combination. As at 31 December 2019, the deferred tax liabilities which have not been recognised in the consolidated financial statement of financial position amounted to euro 56 million.
Year ended 31 December
2019 2018
€’000
Profit before tax 614,635 698,022
Statutory tax rate 24.94% 26.01%
Tax computed at the statutory tax rate 153,290 181,556
Decrease in taxes on income result-ing from the following factors:
Group's share of earnings from companies accounted for at equity (15) (351)
Effect of different tax rates of subsidiaries operating in other jurisdictions (56,067) (74,583)
Others 24,067 8,366
Tax and deferred tax expenses 121,275 114,988
11.4 Reconciliation of effective tax rate
11.3 Movement in deferred tax assets (liabilities) net
€’000
Fair value gains on investment
property, net
Derivative financial
instruments, net
Loss carried forward Other Total
Balance as at 31 December 2017 (499,674) 1,469 21,005 5,270 (471,930)
Credit (charge) to profit or loss for the year (95,283) 241 9,773 126 (85,143)
Credit (charge) to other comprehensive income for the year (*) 1,711 13 - - 1,724
Transfer (323) - 5,564 (5,241) -
Deferred tax disposed from deconsolidation 70,142 - (1,405) (155) 68,582
Change in liabilities/assets held for sale 330 - 16 - 346
Balance as at 31 December 2018 (523,097) 1,723 34,953 - (486,421)
Opening balance adjustment for initial application of IFRS 16 (2,533) - - - (2,533)
Credit (charge) to profit or loss for the year (87,602) (5,210) 8,117 482 (84,213)
Credit (charge) to other comprehensive income for the year (4,622) 4,598 - - (24)
Transfer 10,165 - - (10,165) -
Deferred tax disposed from deconsolidation 16,233 - (1,606) - 14,627
Change in liabilities/assets held for sale 8,865 - (230) - 8,635
Balance as at 31 December 2019 (582,591) 1,111 41,234 (9,683) (549,929)
(*) reclassified

110 | Notes to the consolidated financial statements
12. Net Earnings Per Share Attributable To The Owners Of The Company
12.1 Basic earnings per share
■■ The calculation of basic earnings per share as of 31 December 2019 is based on the profit attributable to ordinary share-holders of euro 406,950 thousand (2018: euro 488,632 thousand), and a weighted average number of ordinary shares out-standing of 167,246 thousand (2018: 165,624 thousand), calculated as follows:
12.2 Diluted earnings per share
■■ The calculation of diluted earnings per share at 31 December 2019 is based on profit attributable to ordinary sharehold-ers of euro 410,315 thousand (2018: euro 492,256 thousand), and a weighted average number of ordinary shares outstanding after adjustment for the effects of all dilutive potential ordinary shares of 178,736 thousand (2018: 178,229 thousand), cal-culated as follows:
Year ended 31 December
Profit attributed to ordinary shareholders (basic) 2019 2018
€’000
Profit for the year, attributable to the owners of the Company 406,950 488,632
Year ended December 31,
Weighted average number of ordinary shares (basic) 2019 2018
In thousands of shares
Issued ordinary shares on January 1 166,718 164,789
Capital increase 528 835
Weighted average number of ordinary shares as at 31 December 167,246 165,624
Basic earnings per share (euro) 2.43 2.95
Year ended 31 December
Profit attributed to ordinary shareholders (diluted) 2019 2018
€’000
Profit for the year, attributable to the owners of the Company (basic) 406,950 488,632
Interest expense on convertible bonds 3,365 3,624
Profit for the year, attributable to the owners of the Company (diluted) 410,315 492,256

111 Notes to the consolidated financial statements |
13. Other Non-Current Assets
14. Investment In Equity-Accounted Investees
■■ The Group has interests in a number of individually immaterial associates.The following table analyses, in aggregate, the carrying amount of the Group’s interests in these associates (including
loans invested in these associates) and the share of profit for the year in these associates.
* Including interest on loans to investees.
Year ended 31 December
Weighted average number of ordinary shares (diluted) 2019 2018
In thousands of shares
Issued ordinary shares on January 1 166,718 164,789
Capital increase 528 835
Effect of exercise of convertible bond “Series F” 10,994 12,158
Effect of warrants 240 213
Effect of equity settle share-based payment 256 234
Weighted average number of ordinary shares as at 31 December 178,736 178,229
Diluted earnings per share (euro) 2.30 2.76
As at 31 December
2019 2018
€’000
Tenancy deposit (a) 41,119 39,459
Investment in other long-term assets (b) 65,586 201,647
Finance lease asset - 2,995
Financial assets at fair value through profit and loss 13,514 -
Others 4,880 2,091
125,099 246,192
2019 2018
€’000
Carrying amount of the interests in investees as at 31 December 21,020 26,207
Share of profit from investees for the year ended 31 Decemebr (*) 60 1,350
(a) Tenancy deposits mainly include 1-3 months net rent from the tenants which is paid at the beginning of the lease. The deposits are considered as a security payment by the tenant and the Group can use those funds mainly if the tenant has unpaid debts or causes damages to the property. Past experience shows that the majority of the leases are long term and therefore the deposits are presented as long term assets.
(b) Include non-current prepayments, Group’s loans as a seller as well as loans connected with future real-estate transactions.
During the year the Group recognised a profit from reversal of allowance for expected credit losses in the amount of euro 1,375 thousand.

112 | Notes to the consolidated financial statements
15. Equipment And Intangible Assets
Furniture, fixtures and office equipment
Goodwill, softwares and other intangible
assets Total
€’000
Cost
Balance as at 1 January 2018 14,044 12,304 26,348
Additions 1,716 4,694 6,410
Equipment and intangible assets arising from initial consolidation 582 - 582
Balance as at 31 December 2018 16,342 16,998 33,340
Additions, net 5,626 3,619 9,245
Equipment and intangible assets arising from initial consolidation, net 22 - 22
Deconsolidation (71) (2,156) (2,227)
Balance as at 31 December 2019 21,919 18,461 40,380
Depreciation/Amortisation
Balance as at 1 January 2018 5,032 1,667 6,699
Depreciation/Amortisation for the year 1,991 585 2,576
Balance as at 31 December 2018 7,023 2,252 9,275
Depreciation/Amortisation for the year 2,350 1,522 3,872
Balance as at 31 December 2019 9,373 3,774 13,147
Carrying amounts
Balance as at 31 December 2019 12,546 14,687 27,233
Balance as at 31 December 2018 9,319 14,746 24,065

113 Notes to the consolidated financial statements |
As at 31 December
2019 2018
€’000
Investment property (*)
Germany 6,803,282 6,599,895
United Kingdom 1,073,701 627,395
Others 79,051 -
7,956,034 7,227,290
16.3 Measurement of fair value
■■ The fair value of the properties of the Group is deter-mined at least once a year by external, independent and certified valuators, who are specialist in valuing real es-tate properties. The prime valuator, responsible for the major part of the portfolio is Jones Lang LaSalle GmbH (JLL) and is considered as one of the market leading valuators in the European real estate market. The fair value of the properties was prepared in accordance with the RICS Val-uation- Professional Standards (current edition) published by the Royal Institution of Chartered Surveyors (RICS) as well as the standards contained within the TEGoVA Euro-pean Valuations Standards, and in accordance with IVSC International Valuation Standard (IVS), the International Accounting Standard (IAS), International Financial Re-porting Standards (IFRS) as well as the current guidelines of the European Securities and Market Authority (ESMA) based on the Market Value. This is included in the General Principles and is adopted in the preparation of the valu-ations reports of JLL. Therefore, the valuation is based on internationally recognized standards.
As part of the engagement, the Company and the valu-ators confirm that there is no actual or potential conflict of interest that may have influenced the valuators status as external and independent. The valuation fee is determined on the scope and complexity of the valuation report.
The fair value of the investment property is deter-mined using the following valuation methods:
• Discounted cash flow (DCF) methodUnder the DCF method, fair value is estimated using
assumptions regarding the benefits and liabilities of own-ership over the asset’s life including an exit or terminal value. This method involves the projection of a series of cash flows on a real property interest. To this projected cash flow series, an appropriate, market derived discount rate is applied to establish the present value of the income stream associated with the asset. The exit yield is normally separately determined and differs from the discount rate.
The duration of the cash flows and the specific timing of inflows and outflows are determined by events such as rent reviews, lease renewal and related re-letting, rede-velopment, and refurbishment. The appropriate durations are typically driven by market behaviour that is a charac-teristic of the class of real property.
Periodic cash flows are typically estimated as gross income less vacancy, non-recoverable expenses, collec-tion losses on future rents, lease incentives, maintenance cost, agent and commission costs and other operating and management expenses. The series of periodic net operat-ing income, along with an estimate of the terminal value anticipated at the end of the projection period, is then dis-counted.
16.2 Geographical information
■■ As at 31 December 2019 and 2018, the fair values of the properties are based on valuations performed by accredit-ed independent valuers.
As at 31 December 2019, approximately 21% (2018: 35%) of the Group’s investment properties were encum-bered to bank loans and therefore subject to certain re-strictions on the realisability of the properties.
2019 (*) 2018
(**) Level 3 (**) Level 3
€’000
As at 1 January 7,227,290 6,376,224
Plus: investment property classified as held for sale 132,137 117,246
Total investment property 7,359,427 6,493,470
Adjustment for initial application of IFRS 16, see note 3.1 68,678 -
Acquisitions of investment property 681,465 743,289
Capital expenditure on investment property 92,949 116,564
Disposals of investment property (464,277) (477,663)
Fair value adjustment 369,987 489,151
Effect of foreign currency exchange differences 46,017 (5,384)
Transfers from/to investment property (1,780) -
Total investment property 8,152,466 7,359,427
Less: investment property classified as held for sale (196,432) (132,137)
As at 31 December 7,956,034 7,227,290
(*) reclassified(**) classified in accordance with the fair value hierarchy. Since one or
more of the significant inputs is not based on observable market data, the fair value measurement is included in level 3.
(*) not including properties held for sale.
16. Investment Property
16.1 Reconciliation of investment property

114 | Notes to the consolidated financial statements
Valuation technique
Significant unobservable inputs
As of 31 December
2019 2018
Range (weighted average)
DCF method
Rent growth p.a. (%)
0.3 – 3.0 (1.4)
0.2 - 3.0 (1.5)
Long-term vacancy rate (%)
0.0 – 7.0 (4.9)
0.0 – 7.0 (5.4)
Discount rate (%)
2.8 – 9.4 (5.3)
2.8 - 11.7 (5.3)
Capitalization rate (%)
2.1 – 7.5 (4.5)
2.1 - 9.0 (4.6)
Market compara-ble approach
Price per sqm (in euro)
4,300 – 13,700 (8,600)
3,900 – 12,900 (8,200)
Residual value approach
Sale price per sqm (in euro)
4,000 - 8,100 (6,600)
4,000 - 8,100 (6,200)
Rent price per sqm (in euro)
11.3 – 20.8 (15.6)
12.2 – 22.5 (15.6)
Development cost per sqm (in euro)
2,066 – 6,502 (2,782)
1,480 – 6,871 (2,789)
Developer margin (%)
7.5 - 18.0 (10.9%)
6.0 - 10.0 (9.2)
• Comparable approachProperties in UK were generally valued using the mar-
ket comparable approach, due to a high volume of transac-tions involving comparable property in the area during the year. Under the market comparable approach, a property’s fair value is estimated based on comparable transactions. The market comparable approach is based upon the princi-ple of substitution under which a potential buyer will not pay more for the property than it will cost to buy a compa-rable substitute property. The unit of comparison applied by the Group is the price per square metre (sqm).
In general, enquiries have been made of the valuers and public databases, local sales offices and recent trans-actions. The main components of the valuation are the lo-cation of the property, the condition of the property with its units; provision of concierge and residents facilities, provision and layout of accommodation, as well as market sentiment and how the individual units would be received by the market. The most recent sales data for individu-al units within the subject property and comparable ev-idence within the immediate area will be taken into ac-count and adjusted by premium according to the specifics of the property and its units. The achieved market sales price per sqm will be multiplied by the area of the property to achieve the property specific market value.
• Residual value approachThe residual value assesses the various factors associ-
ated with a conversion or a new development of a property. The goal of this method is to calculate an objective value for the site, which is either undeveloped or suboptimally utilised. The residual value is determined by first calcu-lating the net capital value of the property after completion of the planned development project. This figure is derived by subtracting the non-recoverable operating costs (e.g. maintenance and management costs) from the potential gross sale value. In order to determine the net capital value, the purchaser’s costs have to be deducted. The costs for the assumed development are subtracted from the net capital value, resulting in the remainder (residuum). These costs include building fees as well as other required fees, which are necessary for the construction of a building, depending on its type of use.
The additional construction costs are also part of the total development costs. The following additional costs are common for constructions: planning, construction, of-ficial review and approval costs as well as financing re-quired immediately for construction. The amount of addi-tional construction costs depends on the type of building, its finishes and the location. All of the construction and additional building costs as well as other project costs including financing costs and developer’s profit are sub-tracted from the calculated gross sale value of the complet-ed development. The difference of the gross sale value and the development costs results in the remainder (residuum).
In order to acquire the residual value, financing and addi-tional purchasing costs for the property are deducted from this remainder. The residual value represents the amount, which an investor would spend for the development of the property under specific economic conditions.
As at 31 December 2019, 85% of investment property have been valued using the discounted cash flows method, 12% comparable approach and 3% residual value approach.
The key assumptions used to determine the fair value of the investment properties are further discussed below.
Significant increases (decreases) in estimated rental value and rent growth per annum in isolation would re-sult in a significantly higher (lower) fair value of the prop-erties. Significant increases (decreases) in the long-term vacancy rate and discount rate (and exit yield) in isolation would result in a significantly lower (higher) fair value.
Generally, a change in the assumption made for the estimated rental value is accompanied by a directionally similar change in the rent growth per annum and discount rate (and exit yield), and an opposite change in the long-term vacancy rate.
For additional fair value measurement disclosures for investment properties see note 4.2.
Highest and best useAs at 31 December 2019, the current use of all invest-
ment property is considered the highest and best use, ex-cept for 7% (2018: 2%) of the investment properties, for which the Group determined that fair value based the de-velopment and the sale of such properties is the highest and best use. These properties are currently being used to earn rental income, in line with the Group’s business model of buying and holding investment property to earn rent-al income. By increasing the rental income and improving these properties, the value of these properties will grow and reach the level of properties being sold.

115 Notes to the consolidated financial statements |
As at 31 December
2019 2018
Number of shares €’000
Number of shares €’000
Authorised
Ordinary shares of euro 0.10 each 400,000,000 40,000 400,000,000 40,000
Issued and fully paid
Balance as of 1 January 166,718,395 16,672 164,788,883 16,479
Issuance of new ordinary share as part of scrip dividend 18.3.1 1,118,687 112 1,870,948 187
Issuance of new ordinary shares as part of share-based payment 18.3.2 58,478 6 58,564 6
Balance on 31 December 167,895,560 16,790 166,718,395 16,672
18.1 Share capital
18. Equity
17. Trade And Other ReceivablesAs at 31 December
2019 2018
€’000
Operating cost receivables (*) 174,685 182,489
Rent and other receivables 88,009 75,714
Prepaid expenses 4,466 2,320
Other short-term assets 75,125 58,942
342,285 319,465
18.2 Authorised capitalOn 9 August 2016 at the Extraordinary General Meeting of the Company, it was decided to increase its existing authorised share capital from its present amount of euro 20,000,000 to euro 40,000,000.
18.3 Issued capital during 2018-201918.3.1 On 22 July 2019, the company issued 1,118,687
(2018: 1,870,948) new shares in total value of euro 22 million (2018: euro 41 million) in con-nection with the scrip dividend. See note 18.6.
18.3.2 In June 2019, the Company issued 58,478 (2018: 58,564) new shares in total value of euro 1.8 million (2018: euro 1.3 million) in connection with incentive share plan. See note 19.
18.3.3 As at 31 December 2019, the subscribed and ful-ly paid-up share capital amounts to euro 16,790 thousand, represented by 167,895,560 ordinary shares with par value of euro 0.10 per share. The Company did not acquire its own shares.
18.4 Share premiumThe share premium derives directly from the capital in-creases which were affected since the date of incorpora-tion and from conversions of bonds into shares.
18.5 Other reservesThe other reserves include shareholders loan that have been converted to equity and therefore can be distributed at any time, and proceeds from financial instruments and share-based payments reserves which temporarily cannot be distributed.
(*) Operating costs receivables represent an unconditional right to consideration in exchange for services that the Group has transferred to tenants. The Group recognises an operating income based on contractual rights to consideration for providing ancillary services to tenants and for other charges billed to tenants, as the performance obligations are satisfied, that
is, as services are rendered. Once a year, the operating cost receivables are settled against advances received from tenants (see note 21).
During the year, the Group recognised a loss allowance for expected credit losses on trade and other receivables in total amount of euro 6,918 thousand (2018: euro 8,359 thousand).

116 | Notes to the consolidated financial statements
18.6 Resolution of dividend distributionAs part of the shareholders’ annual meetings it was resolved
upon the distribution of cash dividend for the following years:
The proposed dividend for the year 2019, based on the Company’s dividend policy and subject to the sharehold-ers’ annual general meeting which will take place on 24 June 2020, is euro 0.8238 per share. The proposed divi-dend has not been recognised as a liability in the consoli-dated financial statements.
The dividend distributions are paid out of the share pre-mium.
18.7 Issuance of Perpetual notesOn 24 April 2018, the Company successfully placed euro 350 million in aggregate principal amounts of perpetual notes. These notes were issued at a price of 98.125% of the principal amount. These Perpetual notes are of unlimited duration and can only be called back by the Company only on certain contractually fixed dates or occasions. Up until the first call date in October 2023, the perpetual notes shall bear a coupon rate of 2.5% p.a. In case the Company does not exercise its call right at that point, the coupon rate applied until the next call date (October 2028) shall correspond to the five-year swap rate plus a margin of 243.2 basis points p.a. The mark-up will increase by 25 basis points (to 268.3 basis points p.a.) as of October 2028 and by another 75 ba-sis points (to 343.3 basis points p.a.) as of October 2043.
These perpetual notes are presented in the consolidat-ed statement of financial position as equity reserve attrib-utable to its holders, which is part of the total equity of the Group. The coupon is deferrable until payment resolution of a dividend to the shareholders. The deferred amounts shall not bear interest.
18.8 Non-controlling interestsThe majority of the non-controlling interests is held by Edolaxia Group ltd.
19.1 Description of share-based payment arrangements
■■ As of 31 December 2019, the Group had the following share-based payment arrangements:
• Incentive Share PlanThe annual general meeting has approved to authorize
the Board of Directors to issue up to one million shares for an incentive program for the directors, key management personnel and senior employees. The incentive plan has up to four years vesting period with fix and specific mile-stones to enhance management’s long-term commitment to the Company’s strategic targets. Main strategic targets are long-term improvement in operational and financial targets such as increasing NAV per share, FFO per share and further improvement in the Group’s rating to A-.
• The key terms and conditions related to the programs are as follows:
19. Share-based payment agreements
Grant dateNumber of
sharesWeighted
vesting periodContractual life
of the shares
January 1, 2016 – September 30,
2023 383,696 2 years Up to 4 years
For the yearAmount
per share (in cents)
Gross amount(€’000)
Ex-date Payment date
2014 20.00 24,344 25 June 2015 3 July 2015
2015 25.00 38,447 30 June 2016 1 July 2016
2016 68.25 112,468 29 June 2017 1 July 2017
2017 73.00 120,296 30 June 2018 17 July 2018
2018 77.35 (*) 129,002 27 June 2019 22 July 2019
(*) On 26 June 2019, the annual general meeting of shareholders of the Company has resolved upon the distribution of a dividend of EUR 0.7735 (gross) per share (in total euro 129,002 thousand) to the holders of record on 28 June 2019. The company has also provided shareholders with the option to receive their dividend through a scrip dividend. From 27 June 2019 to 9 July 2019, shareholders of the Company could elect to receive up to 85% of their dividend in the form of shares of the Company, with the reminder paid in cash. Shareholders who did not elect to participate in the scrip dividend have received their dividend in cash. The cash dividend has been paid in July 2019, and the Company issued 1.1 million new shares in total value of euro 21,757 thousand on 22 July 2019.
LONDON

117 Notes to the consolidated financial statements |
Weighted average interest rate (*) Maturity (*) As at 31 December
2019 2018
€’000
Non-current
Bank loans 1.6% 2021-2068 521,110 845,646
Total non-current 521,110 845,646
Current
Current portion long-term loans 1.6% 2020 12,136 12,934
Loan redemption 1.6% 2020 21,126 8,687
Total current 33,262 21,621
20. Loans and borrowings, straight and convertible bonds
20.1 Loans and borrowings
(*) as at 31 December 2019
Approx. euro 1.7 Billion (2018: euro 2.6 Billion) of investment properties are encumbered.
All bank loans are generally non-recourse loans with the related assets serving, among others, as a security. As at 31 December 2019 under the existing loan agreements, the Group is fully compliant with its obligations and loan covenants to the financing banks.
19.2 Reconciliation of outstanding share options
■■ The number and weighted average of shares under the share incentive program and replacement awards were as follows:
2019 2018
Number of shares
Number of shares
’000
Outstanding on January 1 251 325.5
Granted (forfeited) during the year 241 30.5
Exercised during the year (*) (108) (105.0)
Outstanding on 31 December 384 251
(*) In accordance with the terms and conditions of the incentive share plan, the Group withheld 50 thousand (2018: 46 thousand) shares equal to the monetary value of the employees’ tax obligation from the total number of shares exercised. As a result, only 58 thousand (2018: 59 thousand) shares were issued. See note 18.1.
During the year, the total amount recognised as share-based payment was euro 2,113 thousand (2018: euro 1,176 thousand). It was presented as Property operating ex-penses and as Administrative and other expenses in the consolidated statement of profit or loss and as share-based payment reserve in the consolidated statement of changes in equity.
WUPPERTAL

118 | Notes to the consolidated financial statements
20.2 Straight and convertible bonds
Composition
NoteNominal amount
outstanding Effective coupon (*) Maturity
As at 31 December
2019 2018
€’000 €’000
Convertible bond
Non - current
Convertible bond series F (a) EUR 280,800 0.25% Mar-2022 274,908 272,246
Current
Accrued interest on con-vertible bond (**) 231 231
275,139 272,477
Straight bonds
Non-current
Straight bond series D (b) EUR 25,000 2.00% Oct-2021 24,649 24,467
Straight bond series E EUR 550,000 1.50% Apr-2025 529,893 526,216
Straight bond series G EUR 600,000 1.38% Aug-2026 582,422 579,933
Straight bond series H (c) EUR 255,000 2.00% Oct-2032 241,045 239,957
Straight bond series I (d) HKD 900,000 (*) 1.00% Feb-2028 102,266 99,694
Straight bond series J (e) EUR 667,600 1.50% Feb-2027 658,934 484,478
Straight bond series K (f) CHF 125,000 0.96% Sep-2026 114,594 110,295
Straight bond series L (g) JPY 7,500,000 1.40% Jun-2038 59,606 57,654
Straight bond series M (h) EUR 55,000 (*) 1.70% Jul-2033 53,883 54,573
Straight bond series N (i) EUR 88,000 (*) 3M Euribor + 1.71% Feb-2039 84,479 -
Straight bond series O (j) EUR 15,000 (*) 3M Euribor + 1.68% Feb-2034 14,622 -
Straight bond series P (k) HKD 290,000 (*) 3M Euribor + 1.38% Mar-2029 32,450 -
Straight bond series Q (l) CHF 130,000 0.57% Jun-2024 119,301 -
Straight bond series R (m) EUR 40,000 2.50% Jun-2039 39,775 -
Straight bond series S (n) EUR 60,500 0.00% Jan-2021 60,414 -
Straight bond series T (o) EUR 52,000 3M Euribor + 0.60% Jul-2021 51,959 -
Straight bond series U (p) EUR 80,000 0.75% Jul-2025 79,777 -
Straight bond series V (q) EUR 70,000 (*) 1.50% Aug-2034 69,941 -
2,920,010 2,177,267
Current
Accrued interest straight bonds (**) 24,400 16,799
2,944,410 2,194,066
(*) including hedging impact.(**) presented in provisions and other charges in the consolidated statement of financial position.

119 Notes to the consolidated financial statements |
As of 31 December 2019, the weighted average interest rate on the
outstanding loans, borrowings and bonds, after taking into account hedg-
ing impact, is 1.3% (2018: 1.6%)
In July 2017, the Company established a euro 1.5 billion EMTN pro-
gramme. Notes issued under the EMTN programme will be guaranteed by
the Company. The base prospectus for the EMTN programme was dated
July 2017.
In February 2018 the board of directors has resolved to increase the
program to EUR 10 billion.
(a) On 22 February 2018 the Company bought back euro 169.2 million
principal amount of convertible bond series F for a purchase price of
101 per cent of the principal amount excluding any accrued interest.
As a result of the dividend distribution in June 2018 the conversion
price has been adjusted from euro 26.1844 to euro 25.5419. As a result
of the dividend distribution in June 2019 the conversion price has
been adjusted from euro 25.5419 to euro 24.8141.
(b) During 2018, the Company bought back principal amount of euro
40.6 million and euro 113.8 million of straight bond series D for a
purchase price of 106.129 per cent and 105.454 per cent of the prin-
cipal amount excluding any accrued interest, respectively.
(c) On 7 March 2018, the Company successfully completed with the tap
placement of additional euro 145 million (nominal value) of straight
bond series H, for a consideration that reflected 93.369% of their
principal amount. The total aggregated principal amount of the
straight bond series H increased to euro 255 million (nominal value).
(d) On 2 February 2018, under the EMTN Programme, the Company is-
sued Hong Kong Dollars (HKD) 900 million (euro 93 million) due 2028
straight bond series I. The Company hedged the currency risk of the
principal amount and the interest. The effective euro coupon is 1% for
the first 5 years and 6M Euribor + 1.1725% for the following 5 years.
(e) On 22 February 2018, under the EMTN Programme, the Company
issued euro 500 million 1.5% due 2027 straight bond series J, at an
issue price of 97.115% of the principal amount. On 24 July 2019, under
the EMTN Programme, the Company issued euro 167.6 million tap up
straight bond series J due 2027, at an issue price of 103.328% of the
principal amount with euro coupon 1.5%.
(f) On 21 February 2018 under the EMTN Programme, the Company is-
sued Swiss Franc (CHF) 125 million (euro 108 million) 0.956% coupon
due 2026 straight bond series K. The Company hedged the currency
risk of the principal amount.
(g) On 5 June 2018 under the EMTN Programme, the Company issued
Japanese yen (JPY) 7.5 Billion (euro 57 million) 1.4% coupon due 2038
straight bond series L. The Company hedged the currency risk of the
principal amount.
(h) On 26 June 2018, under the EMTN Programme, the Company issued
euro 40 million Straight bond series M due 2033 at an issue price
of 100% of the principal amount. The Company hedged the interest
payments. The effective interest rate for the first 5 years is 1.7% and
for the next 10 years 1.355% +6m Euribor. In addition, on 5 July 2018
the Company successfully completed the tap placement of additional
euro 15 million of Straight bond series M. The effective interest rate
of the tap for the first 5 years is 1.7% and for the next 10 years 1.593%
+6m Euribor. Settlement date was on 10 July 2018.
(i) On 25 February 2019, under the EMTN Programme, the Company
issued euro 88 million straight bond series N due 2039, at an issue
price of 95.822% of the principal amount with effective euro coupon
1.707% + 3m Euribor.
(j) On 25 February 2019, under the EMTN Programme, the Company is-
sued euro 15 million Straight bond series O due 2034, at an issue price
of 97.327% of the principal amount with effective euro coupon 1.677%
+ 3m Euribor.
(k) On 19 March 2019, under the EMTN Programme, the Company issued
Hong Kong Dollars (HKD) 290 million (euro 33 million) straight bond
series P due 2029, at an issue price of 100% of the principal amount.
The Company hedged the currency risk of the principal amount and
the interest payments. The effective euro coupon is 1.382% plus 3M
Euribor.
( l) On 24 June 2019, under the EMTN Programme, the Company issued
Swiss Franc (CHF) 130 million (euro 116 million) straight bond series
Q due 2024, at an issue price of 100% of the principal amount. The
Company hedged the currency risk of the principal amount. The CHF
coupon is 0.57%.
(m) On 27 June 2019, under the EMTN Programme, the Company issued
euro 40 million straight bond series R due 2039, at an issue price of
100% of the principal amount. The euro coupon is 2.5%.
(n) On 23 July 2019, under the EMTN Programme, the Company issued
euro 60.5 million straight bond series S due 2021, at an issue price of
100% of the principal amount with euro coupon 0%.
(o) On July 24, 2019, under the EMTN Programme, the Company issued
euro 52 million straight bond series T due 2021, at an issue price of
100% of the principal amount with euro coupon 0.6% + 3m Euribor.
(p) On 25 July 2019, under the EMTN Programme, the Company issued
euro 80 million straight bond series U due 2025, at an issue price of
100% of the principal amount with euro coupon 0.75%.
(q) On 8 August 2019, under the EMTN Programme, the Company issued
euro 70 million straight bond series V due 2034, at an issue price of
100% of the principal amount. The effective interest rate for the first
5 years is 1.5% and for the next 10 years 1.472% + 6m Euribor.

120 | Notes to the consolidated financial statements
Covenants
■■ Under its outstanding bond series, the Company has covenanted, among other things, the following (capitalised terms have the meanings set forth in the relevant bond se-ries):
1. The Company undertakes that it will not, and will procure that none of its subsidiaries will, up to (and including) the Final Discharge Date, incur any In-debtedness if, immediately after giving effect to the incurrence of such additional Indebtedness and the application of the net proceeds of such incurrence:
a. The sum of: (i) the Consolidated Indebtedness (less Cash and Cash Equivalents) as at the Last Report-ing Date; and (ii) the Net Indebtedness (less Cash and Cash Equivalents) incurred since the Last Reporting Date would exceed 60% of the sum of (without duplication): (i) the Total Assets (less Cash and Cash Equivalents) as at the Last Report-ing Date; (ii) the purchase price of any Real Estate Property acquired or contracted for acquisition by the Group since the Last Reporting Date; and (iii) the proceeds of any Indebtedness incurred since the Last Reporting Date (but only to the extent that such proceeds were not used to acquire Real Estate Property or to reduce Indebtedness); and
b. Thesum of: (i) the Consolidated Secured Indebted-ness (excluding the Series D Bonds, the Series E Bonds and any further secured bonds of any series and less Cash and Cash Equivalents) as at the Last Reporting Date; and (ii) the Net Secured Indebted-ness (excluding the Series D Bonds and the Series E Bonds and any further secured bonds of any se-ries and less Cash and Cash Equivalents) incurred since the Last Reporting Date shall not exceed 45% of the sum of (without duplication): (i) the Total As-sets (less Cash and Cash Equivalents) as at the Last Reporting Date; (ii) the purchase price of any Real Estate Property acquired or contracted for acqui-sition by the Group since the Last Reporting Date; and (iii) the proceeds of any Indebtedness incurred since the Last Reporting Date (but only to the ex-tent that such proceeds were not used to acquire Real Estate Property or to reduce Indebtedness);
2. The Company undertakes that, on each Reporting Date, the Consolidated Coverage Ratio will be at least 2.0;
3. The Company undertakes that the sum of: (i) the Un-encumbered Assets (less Cash and Cash Equivalents) as at the Last Reporting Date; and (ii) the Net Unen-cumbered Assets (less Cash and Cash Equivalents) newly recorded since the Last Reporting Date will at
no time be less than 125% of the sum of: (i) the Unse-cured Indebtedness (less Cash and Cash Equivalents) at the Last Reporting Date; and (ii) the Net Unsecured Indebtedness (less Cash and Cash Equivalents) in-curred since the Last Reporting Date;
The Company has covenanted, among other things, the following under its EMTN Programme (capitalised terms having the meaning set forth in the EMTN Programme):
1. The Company undertakes that it will not, and will procure that none of its Subsidiaries will, up to (and including) the Final Discharge Date, incur any Indebt-edness (other than any Refinancing Indebtedness) if, immediately after giving effect to the incurrence of such additional Indebtedness and the application of the net proceeds of such incurrence, the sum of:
a. (i) the Consolidated Indebtedness (less Cash and
Cash Equivalents) as at the Last Reporting Date; and (ii) the Net Indebtedness (less Cash and Cash Equivalents) incurred since the Last Reporting Date would exceed 60 per cent. of the sum of (with-out duplication): (i) the Total Assets (less Cash and Cash Equivalents) as at the Last Reporting Date; (ii) the value of all assets acquired or contract-ed for acquisition by the Group, as determined at the relevant time in accordance with IFRS and the accounting principles applied by the Issuer in the latest Financial Statements as certified by the au-ditors of the Issuer, since the Last Reporting Date; and (iii) the proceeds of any Indebtedness incurred since the Last Reporting Date (but only to the ex-tent that such proceeds were not used to acquire Real Estate Property or to reduce Indebtedness); and
b. (i) the Consolidated Secured Indebtedness (exclud-ing the Secured Notes (if any) and less Cash and Cash Equivalents) as at the Last Reporting Date; and (ii) the Net Secured Indebtedness (excluding the Secured Notes (if any) and less Cash and Cash Equivalents) incurred since the Last Reporting Date would exceed 45 per cent. of the sum of (with-out duplication): (i) the Total Assets (less Cash and Cash Equivalents) as at the Last Reporting Date; (ii) the value of all assets acquired or contract-ed for acquisition by the Group, as determined at the relevant time in accordance with IFRS and the accounting principles applied by the Issuer in the latest Financial Statements as certified by the au-ditors of the Issuer, since the Last Reporting Date; and (iii) the proceeds of any Indebtedness incurred since the Last Reporting Date (but only to the ex-tent that such proceeds were not used to acquire Real Estate Property or to reduce Indebtedness).

121 Notes to the consolidated financial statements |
2. The Issuer undertakes that the sum of: (i) the Unen-cumbered Assets (less Cash and Cash Equivalents) as at the Last Reporting Date; and (ii) the Net Unencum-bered Assets (less Cash and Cash Equivalents) newly recorded since the Last Reporting Date will at no time be less than 125 per cent. of the sum of: (i) the Unse-cured Indebtedness (less Cash and Cash Equivalents) at the Last Reporting Date; and (ii) the Net Unsecured
Indebtedness (less Cash and Cash Equivalents) in-curred since the Last Reporting Date.
3. Up to and including the Final Discharge Date, the Issu-er undertakes that, on each Reporting Date, the Con-solidated Coverage Ratio will be at least 1.8.
As at 31 December 2019 Under its outstanding bond series the Group is fully compliant with its covenants.
20.3 Reconciliation of movement of liabilities to cash flow arising from financing activities
The table below details changes in the Group’s liabilities from financing activities, including both cash and non-cash changes. Liabilities arising from financing activities are those for which cash flows, or future cash flows will be, classified in the Group’s consolidated statement of cash flows from financing activities.
€’000
31 December
2018
Finance expenses
paid (1)Other cash
flows
Non-cash changes
Other changes (2)
31 December
2019
Acquisition (disposal) of
subsidiar-ies, net
Initial application
of IFRS 16
Foreign exchange
effect
Change in liabilities
held for sale Other (1)
Convertible bond (3) 272,477 (703) - - - - - 2,662 703 275,139
Straight bonds (3) 2,194,066 (35,587) 721,482 - - 12,560 - 8,966 43,156 2,944,643
Loan and borrowings (4) 867,267 (12,900) (350,824) 35,621 - - (1,097) 16,305 554,372
Lease liabilities 2,974 (3,065) (4,176) 7,628 52,812 - - - 4,829 61,002
Derivative fi-nancial liabilities (assets), net (5) 2,136 2,732 (6,646) - - - - (12,241) - (14,019)
3,338,920 (49,523) 359,836 43,249 52,812 12,560 (1,097) (613) 64,993 3,821,137
€’000
31 December
2017
Finance expenses
paid (1)Other cash
flows
Non-cash changes
Other changes (2)
31 December
2018
Acquisition (disposal) of
subsidiar-ies, net
Foreign exchange
effect
Change in liabilities
held for sale Other (1)
Convertible bond (3) 432,447 (702) (170,892) - - - 2,861 8,763 272,477
Straight bonds (3) 1,430,071 (25,334) 715,118 - 12,789 - 12,611 48,811 2,194,066
Loan and borrowings (4) 936,365 (19,839) (26,776) (54,097) - 1,077 - 30,537 867,267
Lease liabilities 3,001 (224) - - - - - 197 2,974
Derivative fi-nancial liabilities (assets), net (5) 5,885 - 3,266 - - - (7,015) - 2,136
2,807,769 (46,099) 520,716 (54,097) 12,789 1,077 8,457 88,308 3,338,920
Finance cash flows
Finance cash flows
(1) other non-cash changes include discount and issuance cost amortisation for the bonds and unrealised changes in fair value of derivative financial instruments.(2) other changes include interest accruals and expenses from on early repayment of debt (in 2018: also loss from buyback of straight bonds series D and F).(3) including accrued interest. see note 20.2.(4) other cash flows include net repayment and amortisation of bank loans and exclude repayment of derivatives linked to the repayment of bank loans of 6,646 thousand (2018: euro 3,266 thousand).(5) not including derivative financial instruments designated in net investment hedge in foreign operation (see note 27).

122 | Notes to the consolidated financial statements
22. Other Non-Current Liabilities
As at 31 December
2019 2018
€’000
Tenancy deposits 42,328 41,460
Finance lease liability (see note 29.2) 61,002 2,974
Others 427 11,965
103,757 56,399
€’000
Balance as at 1 January 2018 20,232
Movement during the year 4,779
Balance as at 31 December 2018 25,011
Movement during the year 14,383
Balance as at 31 December 2019 39,394
23. Provisions For Other Liabilities And Charges
21. Trade And Other Payables
As at 31 December
2019 2018
€’000
Trade and other payables 38,795 34,280
Prepayments received from tenants (*) 163,418 173,061
Deferred income 15,997 12,826
Other liabilities (**) 69,454 22,153
287,664 242,320
(*) The Group receives prepayments from tenants for ancillary services and other charges on a monthly basis. Once a year, the prepayments received from tenants are settled against the operating cost receivables.
(**) Including mainly seller loans.

123 Notes to the consolidated financial statements |
E x e c u t iv e M a n a g e m e n t I n d e p e n d e n t D i r e c t o r s
€’000
Christian Windfuhr
(CEO)
Refael Zamir
(CFO - Director)
Daniel Malkin
Simone Runge-Brandner Total
Fix remuneration (*) 198 (*) 519 112 112 941
Fixed and variable incentive (**) 340 236 - - 576
Total remuneration 538 755 112 112 1,517
For the year ended 31 December 2019
(*) including salary, director fee and supplementary payment based on employer cost.(**) multi-year share incentive program
For the year ended 31 December
2019 2018
€’000
Rental and operating income 1,133 1,001
Interest income on loans to equity-accounted investees (*) 484 948
Consulting services income 500 375
Consulting services expenses (500) (300)
1,617 2,024
(*) As of 31 December 2019, the Group’s investment in loans to equity-accounted investees amounted to euro 17 million.
24. Related Party Transaction
24.1. Directors and executive management personnel remuneration
24.2 Other related party transactions
The Group’s transactions and arrangements with related parties and their effect on the consolidated financial statements are stated below:
There were no other transactions between the Group and its directors and executive management during the year. For further information on the share incentive program see note 19.
€’000

124 | Notes to the consolidated financial statements
25. Disposals
As at 31 December
2019 2018
€’000
Assets classified as held for sale
Investment property 196,432 132,137
Cash and cash equivalents 560 394
Other assets 4,337 3,954
Total assets classified as held for sale 201,329 136,485
Liabilities classified as held for sale
Loans and borrowings 4,337 3,240
Other liabilities 12,165 5,647
Total liabilities classified as held for sale 16,502 8,887
Investment property 464,277
Working capital (including cash and cash equivalents) 13,954
Loan borrowings (28,156)
Deferred tax liabilities, net (14,627)
Total net assets disposed 435,448
Non-controlling interests disposed 3,399
Total consideration 463,194
Profit from disposal of subsidiaries 31,145
25.2 Disposal group held for sale
■■ The Group resolved an intention to sell several proper-ties. These properties were identified by the Group as ei-ther non-core, primarily due to the location of the proper-ties, or mature properties with lower than average upside potential in their current condition. The intention of the Group to dispose non-core and mature properties is part of its capital recycling plan of is following a strategic deci-sion to increase the quality of its portfolio
Some properties are expected to be disposed through sale of subsidiaries. Accordingly, assets and liabilities re-lating to these subsidiaries (“Disposal Group”) and some properties which are expected to be disposed through as-set deals are presented as assets held for sale and as liabili-ties held for sale in the consolidated statement of financial position.
Efforts to sell the properties have started and a sale is expected within twelve months.
The major classes of assets and liabilities comprising the Disposal Group classified as held for sale are as follows:
25.1 Disposals of investment property during the year
■■ During the year, the Group has completed the sale of several investment properties.
The following table describes the amounts of assets and liabilities disposed:
ESSEN

125 Notes to the consolidated financial statements |
26.1 Financial assets
Set out below, is an overview of financial assets, held by the Group as at 31 December 2019 and 31 December 2018:
26. Financial Instruments And Risk Management
As at 31 December
2019
As at 31 December
2018
€’000
Financial assets at amortised cost:
Cash and cash equivalent (a) 914,614 603,552
Trade and other receivables (a) 345,452 323,222
Other non-current assets (b) 111,585 243,231
Financial assets at fair value through profit or loss:
Financial assets at fair value through profit or loss (c) 162,220 156,822
Derivative financial assets (d) 102 (*) 801
Total 1,533,973 1,327,628
(*) reclassified.(a) including assets held for sale.(b) excluding finance lease assets and non-current financial assets at fair value through
profit or loss.(c) including non-current financial assets at fair value through profit or loss included in
other non-current assets (see note 13).(d) excluding derivative financial assets designated as hedging instruments in hedge
relationships (see note 27).
26.2 Financial liabilities
Set out below, is an overview of financial liabilities, held by the Group as at 31 December 2019 and 31 December 2018:
As at 31 December
2019
As at 31 December
2018
€’000
Financial liabilities at amortised cost:
Trade and other payables (a) 290,685 245,713
Tax payable 15,599 8,220
Loans and borrowings (b) 558,709 870,507
Straight bonds (c) 2,920,010 2,177,267
Accrued interest on straight bonds 24,400 16,799
Convertible bond 274,908 272,246
Accrued interest on convertible bonds 231 231
Other long-term liabilities (a) 104,029 56,460
Financial liabilities at fair value through profit or loss:
Derivative financial liabilities (d) 6,018 8,887
Total 4,194,589 3,656,330
(a) including liabilities held for sale.(b) including liabilities held for sale and loan redemption.(c) including bond redemption.(d) excluding derivative financial liabilities designated as hedging instruments in hedge
relationships (see note 27).
26.3 Risks management objectives and polices
■■ The Group’s principal financial liabilities, other than derivatives, comprise loans and borrowings, convertible and straight bonds, trade and other payable, tax payable and non-current liabilities. The Group’s principal finan-cial assets include trade and other receivables, cash and cash equivalent and other non-current asset. The Group also holds investments in debt and equity instruments and enters into derivative transactions.
The Group is exposed to market risk, credit risk and liquidity risk. The Board of Directors has overall respon-sibility for the establishment and oversight of the Compa-ny’s risk management framework. The board of directors is supported by a risk committee that advices on finan-cial risks and the appropriate financial risk governance framework for the Group. The Group’s risk management policies are established to identify and analyze the risks faced by the Group, to set appropriate risk limits and con-
trols, and monitor risks and adherence to limits. Risk management policies and systems are reviewed regularly to reflect changes in market conditions and in the Group’s activities.
26.3.1 Market risk
Market risk is the risk that the fair value or future cash flows of a financial instrument will fluctuate because of changes in market prices. Market risk comprises three types of risk: interest rate risk, currency risk and other price risk, such as equity price risk.
Interest rate riskThe Group’s exposure to the risk of changes in market
interest rates relates primarily to the Group’s long-term debt obligations with floating interest rates. The Group manages its interest rate risk by hedging long-term debt with floating rate using swap, collar and cap contracts. For additional information see note 27.

126 | Notes to the consolidated financial statements
As at 31 December 2019, after taking into account the effect of the hedging, the interest profile of the Group’s in-terest-bearing debt was as follows:
Interest rate sensitivityThe following table demonstrates the sensitivity to a
reasonably possible change in interest rates on that por-tion of long-term debt affected, after the impact of hedg-ing. With all other variables held constant, the Group’s profit before tax is affected through the impact on floating rate long-term debt, as follows:
Foreign currency risk The Group’s exposure to the risk of changes in foreign
exchange rates relates primarily to the Group’s net invest-ment in foreign subsidiaries and to several straight bonds issued in a foreign currency.
During the year, the Company issued several straight bonds in different currencies and in fixed and floating in-terest. The Company used cross currency swap contracts to hedge the fair value risk derived from the changes in exchange rates and interest rates as explained in note 27.
Due to the hedging above there is no material residual foreign currency risk.
In addition, the Company used forwards contracts to hedge the fair value of its net investment in foreign oper-ation which operates in British pound (GBP) as explained in note 27.
Equity price riskThe Group’s listed and non-listed equity investments
are susceptible to market price risk arising from uncer-tainties about future values of the investment securities. The Group manages the equity risk through diversifica-tion and by placing limits on individual and total equity instruments. Reports on the equity portfolio are submitted to the Group’s senior management on a regular basis.
As at 31 December 2019, the exposure to listed equity instruments was 98,933 (2018: euro 49,860 thousand).
26.3.2 Credit risk
Credit risk is the risk that a counterparty will not meet its obligations under a financial instrument or customer contract, leading to a financial loss. The Group is exposed to credit risk from its operating activities (primarily trade and other receivables) and from its financing activities, including cash and cash equivalents held in banks, deriv-atives and other financial instruments.
Trade and other receivablesCustomer credit risk is managed by the property man-
agers subject to the Group’s established policy, procedures and control relating to customer credit risk management. Outstanding customer receivables are regularly moni-tored.
An impairment analysis is performed at each report-ing date using a provision to measure expected credit loss. The calculation reflects the probability-weighted outcome, the time value of money and reasonable and supportable information that is available at the reporting date about past events, current conditions and forecasts of future economic conditions. The assessment of the correlation between historical observed default rates, forecast eco-nomic conditions and ECLs is a significant estimate. The amount of ECLs is sensitive to changes in circumstances and of forecast economic conditions. The Group’s histor-ical credit loss experience and forecast of economic con-dition may also not be representative of customer’s actual default in the future.
The Group has no significant concentration of credit risk.
The maximum exposure to credit risk at the reporting date is the carrying value of each class of financial assets disclosed in note 26.1
The aging of rent receivables at the end of the report-ing period that were not impaired was as follows:
Nominal amount outstanding as at 31 December
2019 2018
€’000
Fixed rate 3,370,370 3,116,442
Capped rate 207,584 260,916
Floating rate 262,155 30,574
3,840,109 3,407,932
Increase/decrease
in basis points
Effect on profit before tax and
pre-tax equity
€’000
2019 +100 (3,352)
-100 2,224
2018 +100 (1,809)
-100 -
As at 31 December
2019 2018
€’000
Neither past due and past due 1–30 days 13,383 16,033
Past due 31–90 days 9,587 7,228
Past due above 90 days 7,255 3,999
30,225 27,260

127 Notes to the consolidated financial statements |
Management believes that the unimpaired amounts that are past due by more than 30 days are still collectible in full, based on the historical payment behavior and ex-tensive analysis of customer credit risk, including under-lying customers’ credit ratings if they are available.
Financial instruments and cash and cash equivalentsCredit risk from balances with banks and financial in-
stitutions is managed by the Group’s treasury department in accordance with the Group’s policy. Investments of sur-plus funds are made only with approved counterparties
and within credit limits assigned to each counterparty. The limits are set to minimise the concentration of risks and therefore mitigate financial loss through a counter-party’s potential failure to make payments.
The Group’s investment in debt instruments at fair value through profit or loss consist of quoted debt securi-ties that are graded in the investment category.
The Group holds its cash and cash equivalents and its derivative financial instruments with high-rated banks and financial institutions with high credit ratings. Con-centration risk is mitigated by not limiting the exposure to a single counter party.
BERLIN

128 | Notes to the consolidated financial statements
Contractual cash flows including interest
As at 31 December 2018Carrying
amount Total2 months
or less2-12
months 1-2 years 2-3 yearsMore than
3 years
€’000
Financial liabilities
Bank loans (a) 870,507 970,293 15,689 29,278 207,777 172,321 545,228
Straight bonds (b) 2,177,267 2,576,516 8,426 25,668 34,094 58,286 2,450,043
Convertible bond F 272,246 283,257 - 702 702 702 281,151
Trade and other payables 34,280 34,280 5,713 28,567 - - -
Total 3,354,300 3,864,346 29,828 84,215 242,573 231,309 3,276,422
Contractual cash flows including interest (a)
As at 31 December 2019Carrying
amount Total2 months
or less2-12
months 1-2 years 2-3 yearsMore than
3 years
€’000
Financial liabilities
Bank loans (b) 558,709 628,646 1,849 45,685 20,689 106,034 454,389
Straight bonds 2,920,010 3,326,563 12,334 28,481 178,278 40,194 3,067,276
Convertible bond F 274,908 282,555 - 702 702 281,151 -
Lease liabilities 61,002 968,294 - 3,539 3,539 3,539 957,677
Trade and other payables 287,664 287,664 47,944 239,720 - - -
Total 4,102,293 5,493,722 62,127 318,127 203,208 430,918 4,479,342
a) Net of hedging impact.b) Including bank loans held for sale.
a) Net of hedging impact.b) Including bank loans held for sale.
26.3.3 Liquidity risk
Liquidity risk is the risk that arises when the maturi-ty of assets and liabilities does not match. An unmatched position potentially enhances profitability, but can also increase the risk of loss. The Group has procedures with the objective of minimizing such losses such as maintain-ing sufficient cash and other highly liquid current assets
and by having available an adequate amount of committed credit facilities.
The following are the remaining contractual matur-ities at the end of the reporting period and at the end of 2018 of financial liabilities, including estimated interest payments, the impact of derivatives and excluding the im-pact of netting agreements:

129 Notes to the consolidated financial statements |
26.3.3 Operating risk
Operational risk is the risk that derives from the defi-ciencies relating to the Group’s information technology and control systems as well as the risk of human error and natu-ral disasters. The Group’s systems are evaluated, maintained and upgraded continuously.
26.3.3 Other risks
The general economic environment prevailing inter-nationally may affect the Group’s operations to a great ex-tent. Economic conditions such as inflation, unemployment, and development of the gross domestic product are directly linked to the economic course of every country and any vari-ation in these and the economic environment in general may create chain reactions in all areas, hence affecting the Group.
The Group’s portfolio is located in major cities and strong markets throughout Germany and London. The current re-gional distribution structure enables the Group on one hand to benefit of economic scale, and on the other provides a di-verse, well allocated and risk-averse portfolio.
BrexitOn 29 March 2017, the United Kingdom (UK) informed
the European Council about its intention to withdraw from the European Union (EU). Following extended negotiations between all stakeholders as well as a fresh election in the country, the UK parliament voted in favor of the withdrawal from the EU and officially withdrew from the EU on 31 Jan-uary 2020 and enters a transitionary period during which time the nature of the relationship with the EU will be nego-tiated. The uncertainty of the outcome of these negotiations could lead to volatilities in financial markets which may ad-versely impact the Group’s ability to refinance its debt and/or gain access to new financing while also resulting in de-creasing prices and rents in the UK and in particular, London. Barriers to trade in the region could also lead to an economic downturn in the UK and/or the EU.
The Group maintains a diversified portfolio supported by investments in locations with their own distinct econom-ic drivers. The London portfolio constitutes only 13% of the investment portfolio and is located in strong middle-class neighborhoods with over 90% of assets situated within a short walking distance from public transport resulting in a strong demand for residential units.
27. Hedging Activities And Derivatives
■■ The Group is exposed to certain risks relating to its ongoing business operations. The primary risks managed using derivative instruments is interest rate risk and cur-rency risk.
The Group’s risk management strategy and how it is applied to manage risk are explained in note 26.3.
As at 31 December
2019 2018
’000
Derivative financial assets
Derivatives that are designated as hedging instruments in fair value hedge 27.1 32,405 9,887
Derivatives that are designated as hedging instruments in net investment hedge 27.2 - 1,889
Derivatives that are not designated in hedge accounting relationships 27.2 102 801
32,507 12,577
Derivative financial liabilities
Derivatives that are designated as hedging instruments in fair value hedge 27.1 12,470 3,938
Derivatives that are designated as hedging instruments in net investment hedge 27.2 61,861 -
Derivatives that are not designated in hedge accounting relationships 27.3 6,018 8,887
80,349 12,825

130 | Notes to the consolidated financial statements
27.1 Derivatives designated as hedging instruments in fair value hedge
As at 31 December 2019, the Group had foreign ex-change rate and interest rate swap agreements in place, as follows:
In addition, the Group has entered into several interest rate swap agreements. For further information regarding the effective coupon rate see note 20.2.
The swaps are being used to hedge the exposure to changes in fair value of the Group’s straight bonds which arise from foreign exchange rate and interest rate risks.
There is an economic relationship between the hedged items and the hedging instruments as the terms of foreign exchange rate and interest rate swaps match the terms of the hedged items as described above. The Group has estab-lished a hedge ratio of 1:1 for the hedging relationships as the underlying risk of the foreign exchange rate and the interest rate swaps is identical to hedged risk component. To test the hedge effectiveness, the Group uses the hy-pothetical derivative method and compares the changes in the fair value of the hedging instruments against the changes in fair value of the hedged items attributable to the hedged risk.
The hedge ineffectiveness can arise from:
• Different foreign exchange and interest rates’ curve applied to the hedge items and hedging instruments
• Differences in timing of cash flows of the hedged items and hedging instruments
• The counterparties’ credit risk differently impacting the fair value movements of the hedging instruments and hedged items
Hedging instru-ment
Group receives Group pays
€’000
Swap HKD 900,000 Euro 92,631
Swap CHF 125,000 Euro 116,233
Swap JPY 7,500,000 Euro 75,500
Swap HKD 290,000 Euro 32,768
Swap CHF 130,000 Euro 119,441
(*) all swaps are linked to bonds’ maturity
Carrying amount
Risk category Assets Liabilities
Line item in the con-
solidated financial
statements
Net change in fair value
used for measuring
ineffective-ness for the
period
As at 31 December 2019
Foreign exchange rate and interest rate swaps 32,405 12,470
Derivative financial
assets/ liabilities 28,404
As at 31 December 2018
Foreign exchange rate and interest rate swaps 9,887 3,938
Derivative financial
assets/ liabilities 12,614
Carrying amount
Line item in the consolidated
financial state-ments
Net change in fair value used for measuring
ineffectiveness for the period
€000 €000
As at 31 December 2019
Straight bonds 651,143 Straight bonds 26,750
As at 31 December 2018
Straight bonds 322,216 Straight bonds 12,556
The impact of the hedging instruments on the consolidated statement of financial position is, as follows:
The impact of the hedged items on the consolidated state-ment of financial position is, as follows:
The ineffectiveness recognised in the consolidated state-ment of profit or loss was euro 1,654 (2018: 58) thousand.
€’000 €’000 €’000

131 Notes to the consolidated financial statements |
Carrying amount
Risk category
Notional amount
outstand-ing Assets
Liabili-ties
Line item in the con-
solidated financial
statements
Net change in fair value
used for measuring
ineffective-ness for the
period
GB£000 €000 €000 €000
As at 31 December 2019
Foreign currency forward contracts 1,025,000 - 61,861
Derivative financial liabilities 48,568
As at 31 December 2018
Foreign currency forward contracts 400,000 1,889 -
Derivative financial
assets 8
27.2 Derivatives designated as hedging instru-ments in net investment in foreign operation
The Group uses foreign exchange forward contracts as a hedge of its exposure to foreign exchange risk on its in-vestments in foreign subsidiaries.
The foreign exchange forward contracts are being used to hedge the Group’s exposure to the GBP foreign ex-change risk on these investments. Gains or losses on the retranslation of the forward contracts are transferred to OCI to offset any gains or losses on translation of the net investments in the subsidiaries.
There is an economic relationship between the hedged item and the hedging instruments as the net investment creates a translation risk that will match the foreign ex-change risk on the forward contracts. The hedge ineffec-tiveness will arise when the amount of the investment in the foreign subsidiaries becomes lower than the amount of the fixed rate borrowing.
The impact of the hedging instruments on the consoli-dated statement of financial position is, as follows:
27.3 Derivatives not designated as hedging instruments
The Group uses interest rate swaps, collars, caps and floors to manage its exposure to interest rate movements on its bank borrowings. These derivative financial instru-ments are linked to the bank loans maturity (see note 20.1).
28. Capital management
■■ The Group manages its capital to ensure that it will be able to continue as a going concern while increasing the return to owners through striving to keep a low debt to equity ratio. The management closely monitors Loan to Value ratio (LTV), which is calculated, on an entity level or portfolio level, where applicable, in order to ensure that it remains within its quantitative banking covenants and maintain a strong credit rating. The Group seeks to pre-serve its conservative capital structure with a LTV to re-main at a target below 45%. As at 31 December 2019 and 2018 the LTV ratio was 33% and 34%, respectively, and the Group did not breach any of its loan covenants, nor did it default on any other of its obligations under its loan agree-ments. LTV covenant ratio may vary between the subsid-iaries of the Group. The Company regularly reviews com-pliance with Luxembourg and local regulations regarding restrictions on minimum capital. During the years covered by these consolidated financial statements, the Company complied with all externally imposed capital requirements.
Foreign currency translation reserves
Change in fair value used for
measuring ineffectiveness
€000 €000
As at 31 December 2019
Net investment in foreign subsidiaries 44,261 48,568
As at 31 December 2018
Net investment in foreign subsidiaries 3,626 8
The impact of the hedged item on the consolidated statement of financial position is, as follows:
The hedging gains and losses recognised in OCI before tax are equal to the change in fair value used for measur-ing effectiveness. There is no ineffectiveness recognised in profit or loss.

132 | Notes to the consolidated financial statements
29. Leases
29.1. Group as a lessor
■■ The Group has also entered into long-term rent agree-ments as a lessor of some of its investment property. The future minimum rental income receivable under non-can-cellable operating leases is as follows:
29.2. Group as a lessee
■■ The Group has certain leasehold property that it clas-sifies as investment property. As at 31 December 2019, all lease liabilities related to right-of-use assets accounted for as investment property.
Set out below are the carrying amounts of investment property (right-of-use assets) recognised and the move-ments during the year:
As at 31 December
2019 2018
€’000
Less than a year 34,065 39,715
Between one to five years 98,515 112,752
More than five years 90,597 100,594
223,177 253,061
2019
€’000
As at 1 January -
Initial application of IFRS 16 68,678
Additions, net 11,769
Revaluation gains 6,710
As at 31 December 87,157
2019
€’000
As at 1 January 2,974
Initial application of IFRS 16 52,812
Additions, net 4,106
Expenses 4,175
Payments (3,065)
As at 31 December 61,002
BERLIN
Set out below are the carrying amounts of lease liabil-ities and the movements during the period:
30. Commitments
■■ As at the reporting date, the Group had several finan-cial obligations in total amount of up to euro 50 million.
31. Contingent Assets And Liabilities
■■ The Group does not have significant contingent assets and liabilities as at 31 December 2019.

133 Notes to the consolidated financial statements |
As at 31 December
Place of incorporation Principal activities
2019Holding
%
2018Holding
%
Significant subsidiaries held directly by Grandcity Property Ltd.:
Gutburg holding Limited Cyprus Holding of investments 100% 100%
Satemol Limited Cyprus Holding of investments 100% 100%
GCP Holdings GmbH Germany Holding of investments 100% 100%
Sparol Limited Cyprus Holding of investments 94% 94%
Carmiliana Limited Cyprus Holding of investments 100% 100%
GCP Real Estate Holdings GmbH Germany Holding of investments 100% 100%
Seperole Limited Cyprus Holding of investments 100% 100%
Gretesia Limited Cyprus Holding of investments 100% 100%
Bunavento Limited Cyprus Holding of investments 100% 100%
As at 31 December
Place of incorporation Principal activities
2019Holding
%
2018Holding
%
Significant subsidiaries held directly by the Company:
Grandcity Property Ltd. Cyprus Holding of investments 94.8% 94.856%
Grandcity Holdings Ltd. Cyprus Holding of investments 100% 100%
32. Group significant holdings
The details of the significant holdings of the Group are as follows:
As at 31 December
Place of incorporation Principal activities
2019Holding
%
2018Holding
%
Significant subsidiaries held directly by Grandcity Holdings Ltd.:
Grandcity Towers Ltd Cyprus Holding of investments 100% 100%
Significant Group entities re-ferring to investing in real estate properties in Germany and their mother companies.
The holding percentage in each entity equals to the voting rights the holder has in it.
There are no restrictions on the ability of the Group to access or use the assets of its subsidiaries to settle the liabilities of the Group.

134 | Notes to the consolidated financial statements
• The Coronavirus (COVID-19) outbreak started in De-cember 2019 and as of the date of this report the im-pact of the virus on the global economy is unclear. The virus has been affecting over 100 countries, including Germany. As such, the Group does not anticipate any substantial impact to its internal operations due to the virus since the Group’s operations are not signifi-cantly reliant on a supply chain of any sort. However, the outbreak of the Coronavirus could have an adverse impact on tenant’s incomes and on the general eco-nomic situation in Germany, which in turn could be strain on the Group’s top-line. The Group’s diversified portfolio acts as an effective buffer in such a scenario along with the fact that the portfolio is under-rented and thereby relatively lesser of a burden on tenants. The resulting uncertainty from the outbreak has also led to a significant decline in financial markets, how-ever, in the Company’s opinion the German residential space has proved to be a resilient asset class in such times making it an attractive investment option. In response to this outbreak, the Group has prohibit-ed travel to regions considered as high-risk regions while also putting on hold participation in business events and fairs. All employees have been advised to take necessary precautions and follow guidelines prescribed by authorities. However, in case of a wider spread of the virus within Germany, the Group could consider various options including but not limited to, recommending employees self-isolate and work from home.
Regardless of these risks, the Company is of the opinion that any downside is expected to be tempo-rary in nature. the Group’s strong liquidity position amounting to over euro 1 billion as of December 2019 in combination with the Group’s conservative finan-cial policy, would enable the Group to maintain stable operations with the aim of achieving the 2020 guid-ance.
• On 30 January 2020, the Berlin state parliament (Landtag) passed the Berlin Mietendeckel law which effectively not only capped rent levels but also re-versed rents based on the age, location and quality of the apartment. The rent levels for different kinds of apartments are specified in a rent table published with the law, which became effective starting 23 February 2020. Most importantly, as per the law, landlords will be required to reduce rents that are above 120% of the limits of the rent table. Reletting of new apartments will be carried at 100% of the rent table or previous rent, whichever is lower. These limits may be exceed-ed if the unit was extensively modernized or if the unit included additional elements such as – elevator, fitted kitchen, low energy consumption, high-quality
flooring and/or sanitary equipment. From 2022, the Berlin Senate will be required to adjust the rent table according to real wages, however, rents may increase by no more than 1.3%.
The Group’s management shares the opinion of other legal minds with respect to the unconstitutional nature of this law and views such measures as being counter-productive and detrimental to the housing shortage in Berlin. Shortening the building permit approval process, freeing up land and building rights within city limits and introducing incentives to sup-port construction of subsidized units, are measures which the Group considers to be the only solution to Berlin’s housing scarcity. As far as the Group’s busi-ness operations are concerned, the downside is lim-ited to euro 3 million per annum on an absolute basis which translates to less than 1% of the entire portfo-lio’s annualized rent as of December 2019. The Group’s portfolio remains well-diversified with 86% of the annualized rent contributed by locations other than Berlin.
• After the reporting period, the Group completed the sale of non-core and mature properties of approx. euro 260 million.
33. Events After The Reporting Period
LONDON

135 Notes to the consolidated financial statements |
DORTMUND

136 | Notes to the consolidated financial statements
BERLIN

137 Notes to the consolidated financial statements |

HALLE