An update of the Angiosperm Phylogeny Group classification ...
Upload
independentCategory
view
1download
0
Article
Conservation and Functional Element Discovery in20 Angiosperm Plant GenomesDaniel Hupalo*,1 and Andrew D. Kern2
1Department of Biological Sciences, Dartmouth College, Hanover, New Hampshire2Department of Genetics, Rutgers University
*Corresponding author: E-mail: [email protected].
Associate editor: Hideki Innan
Abstract
Here, we describe the construction of a phylogenetically deep, whole-genome alignment of 20 flowering plants, alongwith an analysis of plant genome conservation. Each included angiosperm genome was aligned to a reference genome,Arabidopsis thaliana, using the LASTZ/MULTIZ paradigm and tools from the University of California–Santa Cruz GenomeBrowser source code. In addition to the multiple alignment, we created a local genome browser displaying multiple tracksof newly generated genome annotation, as well as annotation sourced from published data of other research groups.An investigation into A. thaliana gene features present in the aligned A. lyrata genome revealed better conservation ofstart codons, stop codons, and splice sites within our alignments (51% of features from A. thaliana conserved withoutinterruption in A. lyrata) when compared with previous publicly available plant pairwise alignments (34% of featuresconserved). The detailed view of conservation across angiosperms revealed not only high coding-sequence conservationbut also a large set of previously uncharacterized intergenic conservation. From this, we annotated the collection ofconserved features, revealing dozens of putative noncoding RNAs, including some with recorded small RNA expression.Comparing conservation between kingdoms revealed a faster decay of vertebrate genome features when compared withangiosperm genomes. Finally, conserved sequences were searched for folding RNA features, including but not limitedto noncoding RNA (ncRNA) genes. Among these, we highlight a double hairpin in the 50-untranslated region (50-UTR) ofthe PRIN2 gene and a putative ncRNA with homology targeting the LAF3 protein.
Key words: Arabidopsis, alignment, conservation, comparative genomics, ultraconserved elements, angiosperm,RNA folding.
IntroductionWithin the past decade, a flood of whole-genome data hasenabled a comparative genomics approach to functional el-ement discovery. The construction of phylogenetically deep,whole-genome multiple alignments in models such ashumans (Miller et al. 2007; Rhead et al. 2010; Fujita et al.2011), Drosophila (Drosophila 12 Genomes Consortiumet al. 2007), and yeast (Kellis et al. 2003) has allowed theresearch community to understand each genome in a com-parative framework. These alignments have bridged annota-tion between similar species, and subsequent investigationsin each individual organism have utilized these resourcesto discover a variety of functional genomic elements andgenome characteristics (Pedersen et al. 2006; Stark et al.2007; Friedman et al. 2009; Kim et al. 2009; Stojanovic 2009).
Comparative genomic methods that use sequence similar-ity, protein alignments, and whole-genome alignmentsbetween two and five species have been widely applied byplant scientists to rice and Arabidopsis. Initially, these inves-tigations into angiosperms focused primarily on syntenyrelationships between species (Acarkan et al. 2000; Ku et al.2000; Gebhardt et al. 2003; Tang, Bowers, et al. 2008; Tang,Wang, et al. 2008), but have subsequently expanded intoobservations of lineage specific protein-coding genes
(Campbell et al. 2007; Yang et al. 2009), RNA genes(Michaud et al. 2011), miRNAs (Zhang et al. 2006; Lenzet al. 2011), and of particular note, conserved noncoding se-quences (Kaplinsky 2002; Guo 2003; Inada et al. 2003; Thomaset al. 2007; Wang et al. 2009; Kritsas et al. 2012). As the avail-ability of sequenced species increases, comparative genomicsin plants may now be performed using the same powerfulframeworks and methodologies that have been applied toother model systems.
The wealth of genetic resources available for work onArabidopsis thaliana, combined with its compact genome,has made it the prime target for comparative genomicsresearch within plants (Schmidt 2002). Currently, there existdozens of sequenced angiosperm genomes, along with alarge number of sequenced Arabidopsis genomes. Thiswealth of data, in conjunction with the detailed molecularbiological characterization of plant genes available fromThe Arabidopsis Information Resource (TAIR) (Lameschet al. 2011), has the potential to reveal a more completeset of functional elements in the A. thaliana genome throughthe use of sequence comparison. One major axis of motiva-tion for this research is the need to bridge biological knowl-edge gained from study of Arabidopsis to agricultural plants(Morrell et al. 2011); comparative genomics can be a potenttool toward these ends.
� The Author 2013. Published by Oxford University Press on behalf of the Society for Molecular Biology and Evolution. All rights reserved. For permissions, pleasee-mail: [email protected]
Mol. Biol. Evol. 30(7):1729–1744 doi:10.1093/molbev/mst082 Advance Access publication May 2, 2013 1729
by guest on July 6, 2016http://m
be.oxfordjournals.org/D
ownloaded from

For some time now, many pairwise and small-scale multi-ple plant genome alignments have been available, mainlybased on the VISTA comparative genomics pipeline(Dubchak et al. 2000; Frazer et al. 2004). This system hasutilized the LAGAN alignment tool (Brudno et al. 2003) togenerate dozens of Arabidopsis-based pairwise alignments,as well as create five-way multiple alignments in modelorganisms (Brudno et al. 2007). Yet, no attempt is knownto have been made to create or analyze a deep mergeddata set that can assess general conservation across genera,in similar treatment to that seen in all other kingdoms of life.To address this, we have used the University of California–Santa Cruz (UCSC) source tree (Kent et al. 2002) in combi-nation with a LASTZ/MULTIZ paradigm (Blanchette et al.2004; Harris 2007) to create a 20way plant alignment thatreaches nearly to single-nucleotide resolution of conservation;we have provided that information in its entirety to theplant community via a plant genome browser available atgenome.genetics.rutgers.edu.
A major goal for our research is to characterize patternsof global conservation within angiosperms and leverageconservation data for functional element discovery.A recent analysis of a 105 kb syntenic segment of sequencebetween five Solanaceae demonstrated that measuringthe conservation of DNA in plants can be a potent methodof investigation for coding and noncoding sequence (Wanget al. 2008). This look into the nightshade family, alongwith investigations in fruit flies (Drosophila 12 GenomesConsortium et al. 2007), humans (Miller et al. 2007; Rheadet al. 2010; Fujita et al. 2011), and yeast (Kellis et al. 2003), has
made clear the utility of a comparative genomics perspectiveon genome function. Identifying and combining conservedregions of the A. thaliana genome with known annotationfrom the plant community will help identify novel highlyconserved features and provide insight into contrastingevolutionary histories among the kingdoms of life.
Results
Alignment of Angiosperms to an A. thalianaReference Genome
We have assembled the largest comparative genomic data setin plants to date, using whole-genome sequence data span-ning the breadth of flowering plants. Choice of species toinclude in the alignment was based on data availability,and, in some cases, by simplicity of genome architecture.The wheat genome, for example, was excluded due to itssize and complexity. The included species span all angio-sperms, with representatives from four monocot Poaceae(Goff et al. 2002; Paterson et al. 2009; Schnable et al. 2009;Vogel et al. 2010), as well as 16 eudicots including fourBrassicales (Arabidopsis Genome Initiative 2000; Ming et al.2008; Hu et al. 2011; Wang et al. 2011), one Malvale (Argoutet al. 2011), two Malpighiales (Tuskan et al. 2006; Chan et al.2010), four Fabales (Retzel et al. 2007; Sato et al. 2008; Kim et al.2010; Schmutz et al. 2010), one Cucurbitale (Huang et al. 2009),two Rosales (Velasco et al. 2010; Shulaev et al. 2011), one Vitale(Velasco et al. 2007), and one Solanaceae (Xu et al. 2011).The common names and genome details can be reviewed intable 1, sorted by their alignment coverage of A. thaliana.
Table 1. Species Information and Alignment Coverage for Each Included Species in the 20way Comparison.
Name CommonName
Type Nucleotides Assembly Date TotalAlign(%)
CDSAlign(%)
Subs/Sitea
Arabidopsis thaliana Thale cress Pseudochromosomes 119 Mbp February 2009 TAIRv9 — — —
Arabidopsis lyrata Lyrate rockcress Pseudochromosomes 206 Mbp May 2011 77.82 98.16 0.09
Brassica rapa Chinese cabbage Scaffold 274 Mbp August 2011 65.85 96.78 0.35
Carica papaya Linnaeus Papaya Scaffold 342 Mbp December 2007 34.84 79.70 1.04
Theobroma cacao Cocoa Scaffold 290 Mbp August 2010 36.59 83.28 1.11
Vitis vinifera Grape Pseudochromosomes 497 Mbp March 2010 32.21 75.93 1.19
Populus trichocarpa Poplar Scaffold 417 Mbp March 2011 35.41 81.40 1.21
Malus� domestica Borkh. Apple Scaffold 881 Mbp November 2009 35.07 80.89 1.24
Ricinius communis Castor bean Scaffold 350 Mbp February 2009 34.31 80.78 1.25
Fragaria vesca Strawberry Scaffold 214 Mbp June 2010 34.43 80.30 1.28
Glycine max Soybean Pseudochromosomes 973 Mbp January 2010 36.77 78.67 1.33
Glycine soja Wild soybean Sequence Reads 973 Mbp — 36.06 78.94 1.33
Lotus japonica Birdsfood trefoil Pseudochromosomes 301 Mbp May 2008 25.92 62.84 1.43
Cucumis sativus var. sativus L. Cucumber Scaffold 203 Mbp January 2010 32.54 76.79 1.47
Medicago truncatula Clover Scaffold 307 Mbp August 2007 28.40 67.49 1.51
Solanum tuberosum Potato Scaffold 727 Mbp July 2011 34.88 77.77 1.52
Sorghum bicolor Sorghum Pseudochromosomes 738 Mbp January 2007 26.24 63.93 1.92
Oryza sativa L. ssp. Japonica Rice Pseudochromosomes 373 Mbp January 2009 25.33 63.39 1.94
Brachypodium distachyon Purple false brome Scaffold 271 Mbp December 2009 25.37 63.68 1.95
Zea mays ssp. Mays Corn Pseudochromosomes 2.06 Gbp March 2010 25.96 62.93 1.96
aThe “Substitutions per Site” column lists the divergence from A. thaliana based on the neutral tree of figure 1.
1730
Hupalo and Kern . doi:10.1093/molbev/mst082 MBE by guest on July 6, 2016
http://mbe.oxfordjournals.org/
Dow
nloaded from

There is a diverse set of methods available for whole-genome alignment, including both open-source and com-mercial packages. Our goal was both to create a deep multiplealignment and to make that data set available for communityuse. The success in the alignment of vertebrate genomes, andtheir subsequent browsable alignment, demonstrated thatboth these goals can be achieved in an integrated open-source manner (Miller et al. 2007; Rhead et al. 2010; Fujitaet al. 2011). Following this example, we created a mirror of theUCSC genome browser (genome.genetics.rutgers.edu) andbuilt within its framework databases for multiple plant spe-cies. Currently, A. thaliana is the model browser for eudicotspecies, using TAIR version 9 annotations, and an additionalbrowser with a TAIR version 8 assembly for legacy support.Each of the 20 genomes was aligned in a pairwise fashionusing tuned parameters (see Materials and Methods), fol-lowed by chaining and conversion to pairwise alignmentfiles. A phylogenetic tree covering all included species, with-out branch lengths, was drawn from an angiosperm supertree(Davies et al. 2004) and used to guide the MULTIZ’s(Blanchette et al. 2004) merging of pairwise alignments.Using the 20-way alignment, branch lengths for a neutraltree based on 4-fold degenerate sites were computed usingthe PHAST package (Hubisz et al. 2011) and are displayed infigure 1. Other analyses of eudicots and angiosperms haveconstructed phylogenies with similar substitutions per site asthose seen in the neutral tree used in this investigation (Yanget al. 1999; Tang, Wang, et al. 2008).
Base pair coverage for the whole genome and for codingDNA sequence (CDS) regions is presented in table 1 sortedby divergence from A. thaliana based on a neutral phyloge-netic tree. Genomes included in the alignment vary greatlyin terms of genome architecture, sequence quality, size, and
phylogenetic distance from the reference. The coverageshows generally similar patterns compared with numbersgathered from mammalian alignments (Miller et al. 2007;Rhead et al. 2010; Fujita et al. 2011). It is informative to com-pare alignment coverage at various evolutionary distancesbetween vertebrate alignments (Miller et al. 2007; Rheadet al. 2010; Fujita et al. 2011) and plant alignments. For in-stance, A. thaliana and Brassica rapa are roughly as divergentas humans and the galago Otolemur garnettii at 0.35 and 0.33substitutions per 4D-site, respectively. At this level of diver-gence, our plant alignment shows a greater proportion ofaligned bases (65.8% vs. 44.3% aligned, respectively). Codingregion alignments in this comparison follow suit with 96%versus 80% aligned base pairs in plants versus animals.Looking at the most diverged species comparison in our anal-ysis, A. thaliana to Zea mays (1.96 substitutions per site), wefind this is roughly proportional to the amount of divergencebetween Human and Xenopus tropicalis (1.97 substitutionsper site). In this comparison, vertebrates lose a greateramount of overall alignment (26% vs. 8% aligned); however,the coding regions are more conserved (62% vs. 87% aligned).Despite the differences seen in one to one comparisons, weobserve a shared pattern that as distance increases, coverageby whole-genome sequence drops precipitously, bottomingat roughly 35% across eudicots and 26% across monocots.Unsurprisingly, protein-coding sequence shows higherconservation, never dropping below 62%.
Coverage and Gene Feature Comparisons in theArabidopsis Genus
The VISTA genome browser has made available for publicuse a number of precomputed whole-genome alignmentsof plant genomes (Frazer et al. 2004; Brudno et al. 2007).
Malus x domestica Fragaria vesca
Cucumis sativus
Medicago trunculaLotus japonica
Glycine sojaGlycine max
Ricinus communisPopulus trichocarpa
Arabidopsis thalianaArabidopsis lyrata
Brassica rapa
Carica papayaTheobroma cacao
Oryza sativa
Brachypodium distachyon
Zea maysSorghum bicolor
Vitis viniferaSolanum tuberosum
0.1 Subst/site
Eudicot
Monocot
FIG. 1. A phylogenetic tree of the relationships between species included in the 20way angiosperm alignment and used to guide MULTIZ merging ofpairwise alignments. The neutral tree is based on 4-fold degenerate sites sampled from each chromosome with branches proportional to the listed scale,with substitutions per site determined by the PhyloFit software. Average trees for conserved and nonconserved regions with branch lengths are availablein supplementary figure S5, Supplementary Material online.
1731
Conservation in 20 Plant Genomes . doi:10.1093/molbev/mst082 MBE by guest on July 6, 2016
http://mbe.oxfordjournals.org/
Dow
nloaded from

These alignments range from pairwise up to 4way andhave been used by the scientific community for comparisonsbetween angiosperm genomes (Swarbreck et al. 2008; Zelleret al. 2009). We used one of these alignments created by theVISTA pipeline comparing A. thaliana to A. lyrata as a bench-mark for the quality of our pairwise alignments, whichused the LASTZ/MULTIZ and axtChain methodology(Kent et al. 2003; Blanchette et al. 2004; Harris 2007).This VISTA A. thaliana vs. A. lyrata (Ath/Aly) alignmentis available on the araTha8 genome browser, along with itscorresponding conservation track and TAIR version 8 geneannotation.
To evaluate nucleotide coverage, several types of basealignment were measured, including the number of exactbase pair matches, the number of mismatched nucleotides,the number of gaps, RepeatMasked regions, and regionswhere no relationship between the two genomes was as-signed, which is equivalent to a gap (fig. 2A, supplementarytable S1, Supplementary Material online). The number ofexact matches and mismatches between the VISTA align-ments and our alignment was close to identical, witheach covering 65% and 66% of the A. thaliana genome,respectively. Large differences can be seen in the amount ofmasking applied to both the reference and query genome.Comparing the RepeatMasker track created during our mask-ing of A. thaliana to the VISTA alignment track on the TAIRv8 genome browser, it is evident that, although the VISTAalignment employs some masking, it is limited, and repeatregions are often gapped. This results in a comparativelyhigher proportion of gapped sequences within the VISTAalignment. Both methods result in raw coverage, which iswithin 10% of other pairwise alignments of Ath/Aly (Huet al. 2011).
With coverage numbers comparable to previous align-ments, we wanted to investigate how the constituent partsin A. thaliana are affected by the process of multiple align-ment. Base-by-base coverage numbers may conceal errorsin reading frame or poorly aligned functional sites such assplice sites. We used TAIR protein coding gene annotation(Lamesch et al. 2011) and the cleanGenes program in thePHAST package (Hubisz et al. 2011) to locate and evaluatestart codons, stop codons, and splice sites, and to identifyframeshift/nonsense mutations. Annotated gene regionscontaining all the listed functional elements without inter-ruptions between an A. thaliana and A. lyrata alignment were16% greater (5,240) in our alignments, compared with theVISTA alignments (fig. 2B). Features listed as having no align-ment have an excess of gaps obscuring any measurementof features. Gene regions with no alignment occur morethan twice as often in the VISTA data set. In the subsequentobservations, there were marginal increases in failed tests ofgene features for our alignments, attributable to a greaterproportion of features passing the initial “no alignment”test. The cleanGenes software also examines full exonslisted in the annotation for the A. thaliana genome.Using this function, we tabulated the number of exons withuninterrupted alignment in an Ath/Aly alignment. Over4,000 more conserved exons with no gaps in alignmentwere identified in our alignments, compared with theVISTA alignments (supplementary table S1, SupplementaryMaterial online).
To further address whether our methods are creating suit-able alignments beyond pairwise comparisons to A. lyrata, weinvestigated gene conservation in two additional species pre-sent in the alignment. Alignments created using LASTZ/MULTIZ for Vitis vinifera and Glycine max were compared
VISTA Ath/Aly
20way Ath/Aly
0
8000
16000
A B
Features Passing All
Tests
NoAlignment
FailedStart
Codon
Failed Stop
Codon
Failed 5' SpliceSite
Failed 3' Splice Site
Nonsense Mutation
Frameshift Mutation
Exact65%
Mismatch7%
Gap13%
1%
No Align14%
Exact66%
Mismatch
Gap5%
Masked14%
No Align7%
Masked
8%
FIG. 2. Alignment coverage and quality comparison between our implementation of the LASTZ/MULTIZ paradigm and a publicly available alignmenthosted by the VISTA genome browser using a Lagan-based alignment. (A) Coverage statistics as tabulated by the mafCoverage utility for eachmethodology detailing exact nucleotide matches, alignment with mismatched nucleotides, gapped sequence, sequence intentionally removed dueto repeats, and regions where no relationship between the two genomes was assigned (equivalent to a gap). (B) Results from the cleanGenes utility thattakes a TAIR v8 annotation and measures whether a given alignment has conserved the gene feature and maintained its protein coding ability. If thegene alignment between the two genomes is not cleanly conserved, the type of error is recorded.
1732
Hupalo and Kern . doi:10.1093/molbev/mst082 MBE by guest on July 6, 2016
http://mbe.oxfordjournals.org/
Dow
nloaded from

with existing VISTA pairwise alignments created using theLAGAN pipeline. Similar to the results observed when com-paring A. thaliana with A. lyrata, our alignments outper-formed existing alignments. As detailed in supplementarytable S2, Supplementary Material online, LASTZ was ableto cleanly align nearly twice (801/427) the number of fea-tures compared with LAGAN when comparing Arabidopsisto wine grape. The same result was found in the A. thaliana/G. Max alignment, which found more than twice the numberof gene features cleanly conserved when compared withLAGAN (837/336). This difference can be attributed to thepreservation of start/stop codons and splice sites during thealignment process.
Base-by-Base Conservation and Discrete ConservedElements among Angiosperms
To predict conserved regions in our multiple alignment,we used the phyloHMM method of Siepel et al. (2005),which searched for conserved elements within four differentgroups of organisms: vertebrates, insects, worms, andyeast. This phyloHMM scores general conservation acrossan alignment and also creates a smaller set of discreteelements, representing the most highly conserved blocks ofsequence (mostCons).
The normal composition of genome features in A. thali-ana is illustrated in figure 3A and serves as a reference towhich the predicted conserved regions can be compared.The composition of all scored conserved elements (fig. 3B)can be contrasted with the normal distribution, revealing anexpansion in the proportion of protein-coding sequence andunannotated intergenic sequence. Annotations specific toregions not associated with protein-coding genes, such asnoncoding RNAs and translational RNAs, only represent afraction of the larger conserved region data set. This con-trasts with the relatively higher proportion of conservedRNAs observed in previous analyses in organismal groupssuch as vertebrates (Siepel et al. 2005). Using this previousdata, and reproducing the analysis for angiosperm genomes,we observe a greater amount of CDS conservation in angio-sperms (42%) than seen in vertebrate (18%) and insect(26%) conservation but less than that seen in worms(55%) and yeast (86%). In general, when comparing the pat-terns of element conservation and diversity seen in angio-sperm genomes to the same distributions previouslymapped in reference vertebrate, yeast, insect, and wormgenomes, we find that angiosperms most closely resemblethe distribution of conserved elements seen in nematodessuch as Caenorhabditis elegans.
PhastCons produces a set of discrete regions that are themost conserved within the alignment and is graphed byannotation type in figure 3C. To further isolate regionswith the deepest phylogenetic conservation, we selectedthe top 10% of this mostCons set, as defined by having alogarithm of the odds (LOD) score greater than 88. Themajority of the mostCons set and the tail of its distributionare annotated as protein-coding sequence. Despite filteringfor only the highest scoring regions in the mostCons set,elements mapping to intergenic regions are still represented.
These intergenic regions do not include any known DNA-level annotation; this suggests that there is substantial undis-covered functionality present in A. thaliana and other plantgenomes. Cis-regulatory elements are equally representedamong the normal composition, conserved, and most-con-served regions. Although using short sequence motifs toidentify regulatory elements may accrue false-positive re-gions that share sequence identity but are nonfunctional,the deep conservation of many of these sites demonstratesthat most are likely functional in some way. In general, themostCons data set serves as the starting point for furtheranalysis and annotation of conserved regions withinangiosperms.
One way of characterizing the conserved portion of thegenome is to ask what functional annotations are enrichedamong identified conserved elements. Figure 3D providessuch a view of the conserved portion of plant genomes.In particular, translational RNAs are the most enriched anno-tation among conserved regions, followed by protein-codingsequences. Following these two groups, we observe thatRNAs that regulate transcription, such as miRNAs, are en-riched among conserved sequences. We observed that thisannotation set of miRNA and noncoding RNA (ncRNA) an-notations was diverse in its alignment depth. It includedRNAs present in many, if not all the 20 included species,and RNAs with alignment to only Brassicales. This wide var-iation in the depth of conservation of RNAs makes their mildenrichment unsurprising. In addition to the enrichment ofregulatory RNAs, regions tentatively annotated as bindingtranscription factors. As a control, transposable elementsare drastically under-represented, as being highly repetitivethey do not align well nor should they be conserved inmost cases between species. Comparing the enrichment ofangiosperm annotations among conserved regions to verte-brate annotation enriched in conserved regions determinedby the 46way vertebrate conservation track showed nearlythe same ordering of enriched annotation types (supplemen-tary fig. S1, Supplementary Material online). Vertebrate en-richment values trended higher in all categories comparedwith angiosperm enrichment.
Previous investigations into conservation between verte-brate species have looked into the alignability (i.e., percentageof bp with aligned sequence to a reference) of differentcomponents of the genome as a function of evolutionarydivergence (Miller et al. 2007). To compare and contrastthe animal results of Miller et al. (2007) with conservationwithin plant species, we recapitulated their analysis usingthe 46way alignment information (Fujita et al. 2011) andoverlaid the trend lines on selected angiosperm results(fig. 3F). Comparing conservation of RefSeq CDS regionsfrom vertebrates to conservation of TAIR CDS regionswithin angiosperms showed a faster decline of alignabilityin vertebrate species. Similarly, a faster decline in vertebratealignability was observed when comparing angiospermsto vertebrate cis-regulatory sites as seen in the trend lineof figure 3F. This may be due to ORegAnno annotationbeing biochemically validated compared with our initial setof regulatory sites that are bioinformatically predicted.
1733
Conservation in 20 Plant Genomes . doi:10.1093/molbev/mst082 MBE by guest on July 6, 2016
http://mbe.oxfordjournals.org/
Dow
nloaded from

AB
CD
G
E
ncR
NA
Hom
olog
y40
ES
T26
Pse
udog
ene
Hom
olog
y78 tR
NA
100
rRN
A17
Tran
spos
able
Ele
men
tH
omol
ogy
533
snR
NA
/sno
RN
AH
omol
ogy
77
tRN
A +
Evo
Fol
d52
Sm
all R
NA
E
xpre
sion
185
5353
30E
xons
Fla
nkin
g C
onse
rvat
ion
266
Con
serv
ed R
egio
ns w
ith
Hom
olog
y to
Kno
wn
Pro
tein
s17
87
8
Evo
Fol
dS
econ
dary
Str
uctu
re12
0
No
Hom
olog
y28
5
Sm
all R
NA
30
Evo
Fol
d27
4
Con
serv
ed R
egio
ns w
ith
Hom
olog
y to
Kno
wn
Pro
tein
s17
87 -
Tot
al
Sm
all R
NA
E
xpre
sion
Exo
ns F
lank
ing
Con
serv
atio
n
Evo
Fol
dS
econ
dary
S
truc
ture
Goo
dO
RF
27
23
7
2912
0
58
43
724
18
1
302
127
154
85
3.55
2.28
1.33
1.27
0.39
0.04
Tran
slatio
nal R
NAs
CDS
Regula
tory
RNAs
cis-R
egula
tory
Elem
ents
Intro
ns
Tran
spos
able
Elemen
ts
Conserved Region Enrichment
17.5
4x
4.08
x3.
0x
1.64
x1.
23x
0.41
x0.
07x
Conserved Secondary StructureEnrichment
**
***
***
**
**
**
****
**1.
07
Pseud
ogen
es
CD
S30
%
Tran
spos
able
E
lem
ents
29%
Inte
rgen
ic21
%
Intr
on16
%
cis-
Reg
ulat
ory
Oth
er1%
3%
CD
S42
% Tran
spos
able
Ele
men
ts1%
Una
nnot
ated
Con
serv
atio
n33
%
Inte
rgen
ic
Intr
on19
%
cis-
Reg
ulat
ory
Oth
er1%
3%
Mos
t Con
serv
ed
Top
10%
Mos
t Con
serv
edTr
ansp
osab
le Elem
ents
Intro
ns
Pseud
ogen
es
cis-R
egula
tory
Elem
ents
Regula
tory
RNAs
Tran
slatio
nal R
NAs
CDS
F
tRN
A
CD
S
Intr
on
Cis
Reg
Reg
ulat
ory
RN
As
UT
R
TE
tRN
A
CD
S
Cis
Reg
Reg
ulat
ory
RN
As
UT
R
TE
Ver
tebr
ates
Exo
ns
Cis
Reg
Lyra
taR
apa
Oth
er E
udic
tos
Mon
ocot
s
Dis
tanc
e (S
ubst
itutio
ns P
er S
ite)
Alignability
.51
1.5
2
1
0.8
0.6
0.4
0.2
FIG
.3.
An
anal
ysis
ofco
nse
rvat
ion
inth
e20
way
pla
nt
alig
nm
ent
com
par
edto
.(A
)T
heco
mp
osit
ion
ofth
eA
rabi
dops
isth
alia
nage
nom
eso
urce
dfr
omT
AIR
v9an
dn
ewly
gen
erat
edan
not
atio
ns.
“Oth
er”
con
tain
sn
cRN
As,
miR
NA
s,tR
NA
s,rR
NA
s,sm
alln
ucle
arR
NA
s(s
nRN
As)
/sm
alln
ucle
olar
RN
As
(sn
oRN
As)
,an
dp
seud
ogen
es.(
B)Ph
astC
ons-
pre
dict
edco
nse
rved
elem
ents
sort
edby
ann
otat
ion.
(C)
The
disc
rete
“mos
tCon
s”re
gion
sp
redi
cted
byp
hast
Con
san
dth
e10
%hi
ghes
tsc
orin
gta
ilof
the
dist
ribu
tion
ofco
nse
rvat
ion
scor
esfo
rm
ostC
ons
regi
ons.
Col
oran
dse
gmen
tpo
siti
onco
rres
pon
dto
ann
otat
ion
typ
ede
scri
bed
in(A
)an
d(B
).(D
)En
rich
men
tof
con
serv
edel
emen
tsw
ithi
ndi
ffere
nt
feat
ure
typ
es.S
ign
ifica
nce
was
dete
rmin
edby
aFi
sche
r’sex
act
test
wit
hsi
ngl
est
ars
den
otin
gP<
0.05
and
doub
lest
ars
P<
0.01
.(E)
Enri
chm
ent
ofEv
oFol
d-p
redi
cted
seco
nda
ryst
ruct
ures
indi
ffere
nt
typ
esof
gen
ome
feat
ures
.(F)
Alig
nab
ility
ofA
.tha
liana
gen
ome
feat
ures
toco
rres
pon
din
gfe
atur
esin
pla
nts
atin
crea
sin
gp
hylo
gen
etic
dist
ance
s.A
lso
plo
tted
are
pro
por
tion
altr
end
lines
ofve
rteb
rate
alig
nab
ility
ofci
s-re
gula
tory
site
san
dex
ons
draw
nfr
om46
vert
ebra
tesp
ecie
s(F
ujit
aet
al.2
011)
.The
dist
ance
issc
aled
acco
rdin
gto
subs
titu
tion
spe
rsi
tedr
awn
from
a4-
fold
dege
ner
ate
neu
tral
tree
.(G
)BL
AST
hom
olog
yan
not
atio
nof
unan
not
ated
inte
rgen
icco
nse
rved
elem
ents
from
(B).
An
not
atio
nca
tego
ries
are
show
nas
pro
por
tion
alar
eas
wit
hsu
bset
ssh
own
asV
enn
diag
ram
s.R
egio
ns
are
labe
led
wit
hth
eir
put
ativ
ean
not
atio
nty
pe
and
tota
lnum
ber
ofel
emen
tsid
enti
fied.
1734
Hupalo and Kern . doi:10.1093/molbev/mst082 MBE by guest on July 6, 2016
http://mbe.oxfordjournals.org/
Dow
nloaded from
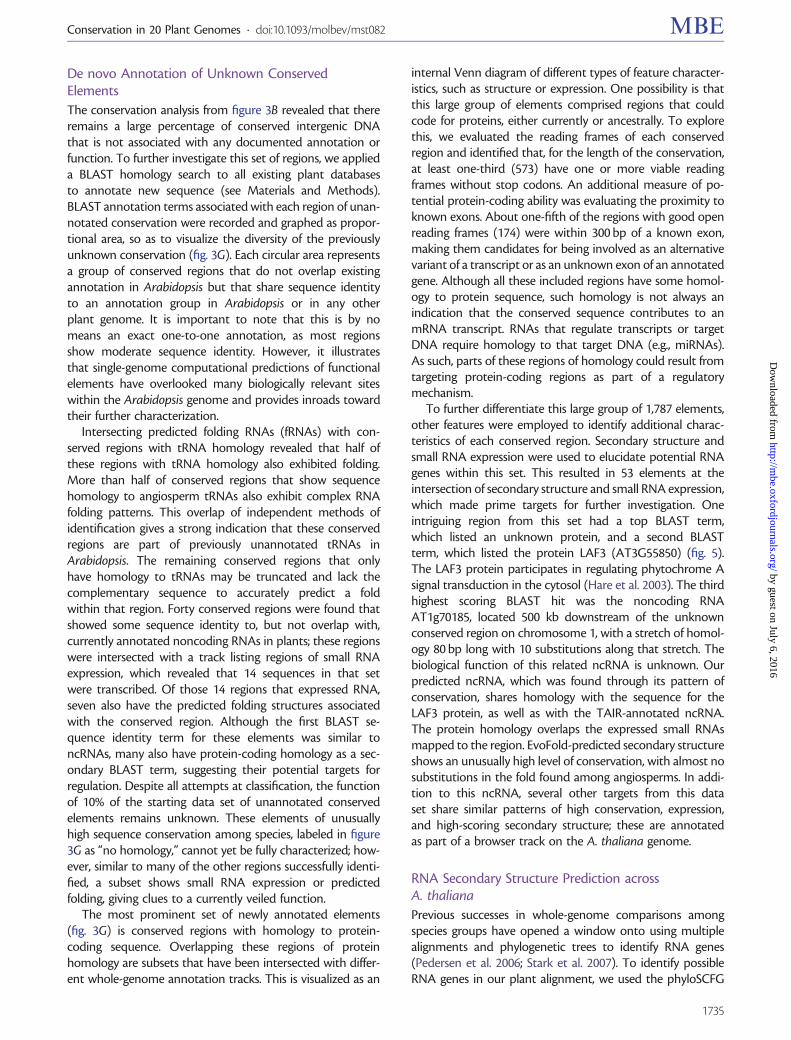
De novo Annotation of Unknown ConservedElements
The conservation analysis from figure 3B revealed that thereremains a large percentage of conserved intergenic DNAthat is not associated with any documented annotation orfunction. To further investigate this set of regions, we applieda BLAST homology search to all existing plant databasesto annotate new sequence (see Materials and Methods).BLAST annotation terms associated with each region of unan-notated conservation were recorded and graphed as propor-tional area, so as to visualize the diversity of the previouslyunknown conservation (fig. 3G). Each circular area representsa group of conserved regions that do not overlap existingannotation in Arabidopsis but that share sequence identityto an annotation group in Arabidopsis or in any otherplant genome. It is important to note that this is by nomeans an exact one-to-one annotation, as most regionsshow moderate sequence identity. However, it illustratesthat single-genome computational predictions of functionalelements have overlooked many biologically relevant siteswithin the Arabidopsis genome and provides inroads towardtheir further characterization.
Intersecting predicted folding RNAs (fRNAs) with con-served regions with tRNA homology revealed that half ofthese regions with tRNA homology also exhibited folding.More than half of conserved regions that show sequencehomology to angiosperm tRNAs also exhibit complex RNAfolding patterns. This overlap of independent methods ofidentification gives a strong indication that these conservedregions are part of previously unannotated tRNAs inArabidopsis. The remaining conserved regions that onlyhave homology to tRNAs may be truncated and lack thecomplementary sequence to accurately predict a foldwithin that region. Forty conserved regions were found thatshowed some sequence identity to, but not overlap with,currently annotated noncoding RNAs in plants; these regionswere intersected with a track listing regions of small RNAexpression, which revealed that 14 sequences in that setwere transcribed. Of those 14 regions that expressed RNA,seven also have the predicted folding structures associatedwith the conserved region. Although the first BLAST se-quence identity term for these elements was similar toncRNAs, many also have protein-coding homology as a sec-ondary BLAST term, suggesting their potential targets forregulation. Despite all attempts at classification, the functionof 10% of the starting data set of unannotated conservedelements remains unknown. These elements of unusuallyhigh sequence conservation among species, labeled in figure3G as “no homology,” cannot yet be fully characterized; how-ever, similar to many of the other regions successfully identi-fied, a subset shows small RNA expression or predictedfolding, giving clues to a currently veiled function.
The most prominent set of newly annotated elements(fig. 3G) is conserved regions with homology to protein-coding sequence. Overlapping these regions of proteinhomology are subsets that have been intersected with differ-ent whole-genome annotation tracks. This is visualized as an
internal Venn diagram of different types of feature character-istics, such as structure or expression. One possibility is thatthis large group of elements comprised regions that couldcode for proteins, either currently or ancestrally. To explorethis, we evaluated the reading frames of each conservedregion and identified that, for the length of the conservation,at least one-third (573) have one or more viable readingframes without stop codons. An additional measure of po-tential protein-coding ability was evaluating the proximity toknown exons. About one-fifth of the regions with good openreading frames (174) were within 300 bp of a known exon,making them candidates for being involved as an alternativevariant of a transcript or as an unknown exon of an annotatedgene. Although all these included regions have some homol-ogy to protein sequence, such homology is not always anindication that the conserved sequence contributes to anmRNA transcript. RNAs that regulate transcripts or targetDNA require homology to that target DNA (e.g., miRNAs).As such, parts of these regions of homology could result fromtargeting protein-coding regions as part of a regulatorymechanism.
To further differentiate this large group of 1,787 elements,other features were employed to identify additional charac-teristics of each conserved region. Secondary structure andsmall RNA expression were used to elucidate potential RNAgenes within this set. This resulted in 53 elements at theintersection of secondary structure and small RNA expression,which made prime targets for further investigation. Oneintriguing region from this set had a top BLAST term,which listed an unknown protein, and a second BLASTterm, which listed the protein LAF3 (AT3G55850) (fig. 5).The LAF3 protein participates in regulating phytochrome Asignal transduction in the cytosol (Hare et al. 2003). The thirdhighest scoring BLAST hit was the noncoding RNAAT1g70185, located 500 kb downstream of the unknownconserved region on chromosome 1, with a stretch of homol-ogy 80 bp long with 10 substitutions along that stretch. Thebiological function of this related ncRNA is unknown. Ourpredicted ncRNA, which was found through its pattern ofconservation, shares homology with the sequence for theLAF3 protein, as well as with the TAIR-annotated ncRNA.The protein homology overlaps the expressed small RNAsmapped to the region. EvoFold-predicted secondary structureshows an unusually high level of conservation, with almost nosubstitutions in the fold found among angiosperms. In addi-tion to this ncRNA, several other targets from this dataset share similar patterns of high conservation, expression,and high-scoring secondary structure; these are annotatedas part of a browser track on the A. thaliana genome.
RNA Secondary Structure Prediction acrossA. thaliana
Previous successes in whole-genome comparisons amongspecies groups have opened a window onto using multiplealignments and phylogenetic trees to identify RNA genes(Pedersen et al. 2006; Stark et al. 2007). To identify possibleRNA genes in our plant alignment, we used the phyloSCFG
1735
Conservation in 20 Plant Genomes . doi:10.1093/molbev/mst082 MBE by guest on July 6, 2016
http://mbe.oxfordjournals.org/
Dow
nloaded from

algorithm implemented in the EvoFold software package(Pedersen et al. 2006), in addition to the RNAalifold program(Bernhart et al. 2008). These previous RNA structure analyseshave highlighted the inherent high rates of false positives infolding prediction. Using these two independent predictionmethods provided the opportunity to evaluate each fRNAfrom multiple perspectives; this helped to eliminate falsepositives that may have resulted from characteristics thatare unique to a particular algorithm. An example of thisapproach can be seen in predictions such as those illustratedin figure 4E, where the two algorithms overlap in theirannotation of a fold.
The combined predictions of the two approaches identi-fied 86,000 sites that could potentially fold. Short folds of lessthan 15 bp were found to be the majority of predictions,though longer folds were also found in large numbers(fig. 4A). To assess the accuracy in determining fRNA fromhighly conserved alignments, the set of TAIR annotations fortransfer RNAs consisting of 689 sites was used as a positivecontrol for fRNA prediction. Our fold classifications predict97% (637) of these established fRNAs, figure 4B. The remain-ing 3% of annotated tRNAs were not identified, due topoor alignment or low conservation. This suggests accurateprediction of known, conserved fRNAs, on par with previousinvestigations into fRNA genes in other organisms.
Secondary structure in RNAs can take many physicalforms; we quantified this variation in shape by recordingthe type of matching seen in both long and short folds(fig. 4C). The hairpin type dominates among shorter folds.Long folds show much higher diversity in shape, includingcomplex folds that have more than three hairpins in thefolded structure. Both long and short regions show a greaterproportion of folds comprising two hairpins in angiosperms,compared with the distribution observed among folds in thehuman genome (Pedersen et al. 2006) that observed thatdouble hairpins are more rare in primates. The types ofannotation that overlap regions which fold are describedin figure 4D for long and short folds. In vertebrates, nearlyhalf of all known folds are intergenic, with the remainderbeing associated with introns and CDS. In contrast, angio-sperms have few intergenic folds, with 70% or more occurringwithin coding sequence. This difference mirrors the differ-ences seen in the type of conservation of all sequencebetween species. The data set used for both analyses,the “mostCons” (most-conserved regions identified byphastCons), impacts the distribution of folds among anno-tation types. As a result, we see that the mostCons compo-sition in figure 3C is similar to the composition of foldsdetected in figure 4D.
As a vignette describing one of the types of folds detectedin this analysis, we selected a previously undescribed con-served high-scoring double hairpin within the 50-untranslatedregion of the plastid redox insensitive 2 (PRIN2) gene (fig. 4E).PRIN2 is a nuclear-encoded chloroplast-localized proteinwhose expression levels are altered by light (Kindgren et al.2011). The PRIN2 protein was also found to interact with theplastid-encoded RNA polymerase-altering expression andtherefore is thought to be a nonessential regulator of plastid
gene expression. The folded RNA structure is highly con-served among all flowering plants, with few mismatchingbase pairs (fig. 4F). The consensus fold shows two stronglyconserved hairpins joined by a more variable region (fig. 4G).The gene shows two transcripts scored 3 and 4 stars by TAIR,differing only in the length of the 50-untranslated region(50-UTR): one with the predicted folds and one without.Interestingly, in the longer transcript, the hairpins directlyoverlap the ribosome initiation site that begins at the 50-cap. Additionally, we detected two cis-regulatory motifs:one near, and one within, the UTR regions (as seen in fig.4E). The first cis-regulatory element, a “sequence overrepre-sented in light repressed promoters number 3” (SORLREP3)motif has previously been found to occur near promoterswhose transcript levels are reduced under a continuous redlight stimulus (Hudson and Quail 2003). The second motif,found within the 50-UTR of both transcripts, is an I-box and isknown to exist in the promoter regions of light-regulatedgenes (Giuliano et al. 1988). How these two cis-regulatoryelements contribute to expression levels of each of the alter-native PRIN2 transcripts is unknown, but observed regulatorypattern fits with previous knowledge about stimuli associatedwith PRIN2 expression. Their presence flanking the predictedfolds may indicate that different expression patterns of thegene are possible, depending on transcription factor binding.Although these new predictions need further validation, theyhighlight the ability of these genome-wide data sets to addvalue to existing gene investigations.
Uninterrupted Conservation in Angiosperms
One peculiarity found in the genomes of mammals and in-sects is long stretches of uninterrupted conservation(Bejerano et al. 2004). These ultraconserved elements(UCEs) were originally located by a comparative genomicsearch between human, mouse, and rat, which showed evi-dence of deep phylogenetic conservation, as well as ongoingpurifying selection in the human genome (Bejerano et al.2004; Katzman et al. 2007; Chiang et al. 2008). UCEs canextend to lengths of more than 500 bp and can be best de-scribed as the extreme tail of the distribution of genome-wideconserved elements. There is a degree of controversy asto whether they exist within plant genomes, with someresearchers reporting their discovery and others remainingskeptical (Zheng and Zhang 2008; Freeling andSubramaniam 2009). More recent research has used BLASTsearches across multiple plant genomes, identifying regionsthat have been termed ultraconserved-like elements (ULEs)(Kritsas et al. 2012). ULEs have unusually high levels of con-servation, and negative selection acting on their sequence,but lack the uninterrupted segments and extreme purifyingselection that are found in mammals.
To explore whether flowering plants contain even mod-estly extended stretches of uninterrupted conservationseen in mammals and insects, we conducted a search usingmethods mirroring those used to detect these regions inmammals (Bejerano et al. 2004; Glazov et al. 2005). Theseapproaches use whole-genome multiple alignment todetect blocks of conservation. Specifically, the algorithm
1736
Hupalo and Kern . doi:10.1093/molbev/mst082 MBE by guest on July 6, 2016
http://mbe.oxfordjournals.org/
Dow
nloaded from

Fol
d Le
ngth
s
- F
old
- F
old
- F
old
71%
22%
87%
8%
Sho
rt 6
3%(5
4981
)
Long
37%
(396
81)
88%
11%
25%
44%
21%
10%
97%
(63
7)C
over
age
ofK
now
n tR
NA
Acc
urac
yS
cale
chr1
:20
0 ba
ses
3469
600
3469
650
3469
700
3469
750
3469
800
3469
850
3469
900
3469
950
3470
000
3470
050
3470
100
3470
150
Use
r S
uppl
ied
Tra
ckT
AIR
9 P
rote
in-C
odin
g G
enes
Put
ativ
e C
is-R
egul
ator
y E
lem
ents
RN
Aal
ifold
and
Evo
fold
Pre
dict
ions
of R
NA
Sec
onda
ry S
truc
ture
20 W
ay M
ultiz
Ang
iosp
erm
Gen
ome
Alig
nmen
t
AT
1G10
522.
1A
T1G
1052
2.2
SO
RLR
EP
3I B
ox
vf_1
_142
172
ef_1
_142
172
vf_1
_142
175
Con
serv
atio
n
5’U
TR
GAACAGG
AU C U G U U C
UAUA
GG
CU
C GUA
CCU
C U G U U U C C U U G AUU
UCUAAGGAGACAG 0
1
5’
araTha9.chr1 ACGACCTTACTTGAACAGGATCTGTTCTATAGGCTCGTACCTCTGTTTCCTTGATTTCTAAGGAGACAG
lyrata ACGACCTTACTTGAACAGGATCTGTTCTATAGGCTCGTACCTCTGTTTCCTTGATTTCTAAGGAGACAG
rapa ACGACCTTACTTGAACAGGATCTGTTCTATAGGA-AGTACCTCTGTATCCTTGATTTCTAAGGAG-CAG
papaya ACGACCTTACTTGAACAGGATCTGTTCTATAGGTTCGTACCTCTGTTTCCTGGAGTTCGAAGGAGACAG
cacao ACGACCTTACTTGAACAGGATCTGTTCTATAGGCTCGTACCTCTGTATCCTTTAGCACAAAGGAGACAG
glycineMax ACGACCTTACTTGAACAGGATCTGTTCTATAGGCTCGTACCTCTGTGTCCTTGAGTTCTAAGGAGACAG
glycineSoja ACGACCTTACTTGAACAGGATCTGTTCTATAGGCTCGTACCTCTGTGTCCTTGAGTTCTAAGGAGACAG
malus ACGACCTTACTTGAACAGGATCTGTTCTATAGGATCGTACCTCTGTATCCTTGATTTCTAAGGAGACAG
fragaria ACGACCTTACTTGAACAGGATCTGTTCTATAGGATCGTACCTCTGTATCCTTGACTTCTAAGGAGACAG
cucumis ACGACCTTACTTGAACAGGATCTGTTCTATAGG-TTGTACATCTGTGTCCTTGAGTTCTAAGGAGACAA
ricinus ACGACCTTACTTGAACAGGATCTGTTCTATAGGCTCGTACCTCTGTGTCCTTTATCACAAAGGAGACAG
populus ACGACCTTACTTGAACAGGATCTGTTCTATAGGATCGTACCTCTGTATCCTTAATCACTAAGGAGACAG
vitis ACGACCTTACTTGAACAGGATCTATTCTATAGA-TTGTACCTCTGTATCCTTGAGTTCTAAGGAGACAG
tuberosum ACGACCTTACTTGAACAGGATCTGTTCTATAGGCTCGTACCACTGAATCCTTGATTTCTAAGGAGACAG
sorghum ACGACCTTACTTGAACAGGATCTGTTCTATAGGATCGTACCGCTGCATCCTTGATTAATAAGGAGGCAA
zea ACGACCTTACTTGAACAGGATCTGTTCTATAGGATCGTACTGTTGTATCCTTGATTGATAAGGAGGCAA
oryza ACGACCTTACTTGAACAGGATCTGTTCTATAGGCTCGTACCGTTGCATCCTTGACTAATAAGGAGGCAA
brachypodium ACGACCTTACTTGAACAGGATCTGTTCTATAGGATCGTACCGCTACATCCTTTACCAAAAAGGAGGCAA
SS anno (((((((.....((((((...))))))...))).))))....((((.((((((.....)))))).))))
pair symbol abcdefg hijklm mlkjih gfe dcba abcd efghij jihgfe dcba
Com
plex
Fol
d
Long
Fol
dsS
hort
Fol
ds (
<15
bp)
CD
S
Inte
rgen
ic
UT
R
RN
As
Oth
er
Intr
on
AB
C D
E
F
G
FIG
.4.
Pred
icte
dse
con
dary
stru
ctur
eba
sed
ona
20w
ayan
gios
per
mal
ign
men
tus
ing
EvoF
old
and
RN
Aal
ifold
.(A
)Fo
ldle
ngt
hsse
par
ated
into
shor
t(<
15bp
)or
lon
gfo
lds.
(B)
Cov
erag
eof
know
ntR
NA
sin
ters
ecte
dw
ith
fold
pre
dict
ion
s.R
emai
nin
g3%
(21)
offo
lds
wer
edu
eto
low
con
serv
atio
nor
poo
ral
ign
men
t.(C
)Fo
ldst
ruct
ure
for
both
lon
gan
dsh
ort
fRN
Ase
ts.T
hen
umbe
rof
hair
pin
sw
asco
unte
din
asi
ngl
efo
ld,a
nd
clas
sifie
dba
sed
onth
efo
ld’s
stru
ctur
e.(D
)T
ype
ofov
erla
ppin
gan
not
atio
nfo
rbo
thlo
ng
and
shor
tda
tase
ts.(
E)U
CSC
gen
ome
brow
ser
scre
ensh
otof
pre
dict
edha
irp
ins
inth
ePR
IN2
(AT
1G10
522)
gene
that
isin
volv
edin
pla
stid
gen
etr
ansc
rip
tion
,an
dis
alte
rnat
ivel
ysp
liced
.The
hair
pin
sw
ere
pre
dict
edby
both
Evof
old
and
RN
Aal
ifold
,an
dov
erla
pth
eri
boso
mal
init
iati
onsi
te.A
lso
pic
ture
dar
eci
s-re
gula
tory
pre
dict
ion
s,a
TA
IRge
ne
trac
k,an
dth
ep
hast
Con
sco
nse
rvat
ion
trac
k(g
)20
way
alig
nm
ent
ofth
ere
gion
colo
red
blue
whe
reth
ere
isa
sin
gle
subs
titu
tion
com
pati
ble
wit
hth
ean
not
ated
pai
r,gr
een
wit
ha
com
pat
ible
doub
lesu
bsti
tuti
on,a
nd
red
whe
reth
ere
isa
subs
titu
tion
not
com
pat
ible
wit
hth
ean
not
ated
pai
r.(F
)C
onse
nsu
sV
ien
na
RN
Afo
ldp
redi
cted
MFE
stru
ctur
eof
the
high
light
ed50
-UT
Rre
gion
.
1737
Conservation in 20 Plant Genomes . doi:10.1093/molbev/mst082 MBE by guest on July 6, 2016
http://mbe.oxfordjournals.org/
Dow
nloaded from

identifies UCEs by starting with a conserved alignment col-umn and stringing together subsequent preserved columnsuntil this pattern breaks due to any kind of nucleotide change.Constraining this algorithm are two parameters: the numberof genomes within the alignment and the minimum thresh-old for declaring an UCE. Using all 20 aligned species to searchfor regions of consistent alignment column conservation re-turns no regions when using a cutoff of �18 bp. One possi-bility is that gaps in alignment could be due to alignment orassembly quality errors. To better account for this, we limitedthe search space by using three-way alignments to A. thaliana.The alignment of G. max and V. vinifera to A. thalianareturned the largest number of uninterrupted regions greaterthan 18 bp. Using TAIR annotation and BLAST homology,we annotated 1,600 uninterrupted regions detected inthis 3way alignment and determined they all fall withinknown types of genome features (supplementary fig. S2,Supplementary Material online). Considering that novelmetazoan-type uninterrupted conservation has not beenfound, it can be concluded that metazoan-like UCEs arenot present in angiosperm genomes at the investigated phy-logenetic depths. As suggested by Kritsas et al., plant genomesmay contain features that may serve a similar purpose butwith altered or reduced conservation characteristics.
DiscussionIs the evolution of plant genomes distinct from that of ani-mals? Here, we construct a phylogenetically deep alignmentof angiosperm genomes, to ask how sequence conservation inangiosperms compares to groups of species in other king-doms of life. Relating the entirety of currently sequenced ge-nomes can reveal a more complete story on how similar plantgenomes are and on what features they “value” as part of ashared evolutionary history. Additionally, conservation of se-quence has been shown to quickly and clearly identify func-tional regions which might otherwise have been overlooked.
As such, by analyzing genome conservation in floweringplants, we have been able to add new annotations basedon patterns of conservation and identify novel features withsecondary structure and potential target sequences.
Information content of multiple alignments increases asthe number of species and the breadth of the phylogenyincrease. Although this is true for the first few included spe-cies, there are diminishing returns as further species areadded. To better quantify this, some have looked into howmany genomes are necessary to reach the nucleotide-levelresolution of conservation in comparative studies (Cooperet al. 2003; Eddy 2005). Although these investigations focuson the number of mammalian genomes, they still providepotent rules of thumb for estimating how many genomes areneeded for high resolution. Depending on the phylogeneticrelationships, anywhere between 15 and 40 genomes may benecessary. Our choice of how many genomes to include waslargely dictated by availability, as roughly 20 genomes wereavailable to us for use. Although plant alignments could ben-efit from further inclusion of comparative data of close phy-logenetic distance to A. thaliana, this phylogenetically broad20way alignment is a large step toward nucleotide-level iden-tification of conserved sequences in angiosperm genomes.
Aligning plant genomes inevitably leads to the question ofhow recent polyploid events impact the construction of datasets and their analysis. Arabidopsis thaliana is one of thesmallest sequenced plant genomes; as a result, alignmentsgenerated with an A. thaliana reference will be equally min-imal. In instances where the reference (Arabidopsis) only has asingle copy, species aligned to this compact reference willexclude regions of less conserved paralogs within the querygenome. This method has worked well for broad use in lessdynamic whole-genome comparative data sets such as verte-brates. In light of the complex ploidy history of plant ge-nomes, we want our inference to be conservative, relativeto the influence of polyploidy; thus, we focus attention only
01
lyratarapa
papayacacaoricinus
populusmalus
fragariacucumis
medicagolotus
glycineMaxglycineSoja
vitistuberosum
oryzabrachypodium
sorghumzea
Scalechr1:
Protein Homology
smallRNAs
50 bases26891600 26891650
vf_1_107594ef_1_107594
Conservation
FIG. 5. A screenshot from the Arabidopsis thaliana genome browser displaying tracks overlaid on a putative noncoding RNA, detected due to its highconservation and expression. Tracks include conservation for each of the 20 included species, a track showing conserved regions BLAST-annotated ashaving protein homology, a track showing secondary structure computed with EvoFold and RNAalifold with dark green denoting fold predictions andlight green nonfolding regions, and a track from the Arabidopsis Small RNA Project Database showing small RNA expression overlapping the conservedregions. Also shown is the consensus Vienna RNAfold predicted MFE structure of the putative ncRNA.
1738
Hupalo and Kern . doi:10.1093/molbev/mst082 MBE by guest on July 6, 2016
http://mbe.oxfordjournals.org/
Dow
nloaded from

on questions of genome conservation within the A. thalianagenome. A modified alignment process, using high-qualitychromosome data to resolve genome duplications events be-fore the LASTZ alignment step, could produce alignmentswithout such a complex composite nature. However, asparse number of genomes have such data available.
Our investigation into coding-sequence conservationdemonstrates that we are generating quality whole-genomealignments, which preserve essential gene features in alignedregions. Our approach also implemented a new platform forvisualizing and accessing alignment data for plants; such toolshave long been available for other model species, but this isthe first instance a deep comparative browser for plants. Theresults from benchmarking the gene quality of the alignment(fig. 2) was surprising in that almost half of A. thaliana geneannotations contained a change that would disrupt functionwhen aligned to A. lyrata. This is despite the two sharing thelarge majority of A. thaliana’s coding sequence, with A. lyratahaving alignments for 98% of the coding sequence present inA. thaliana. This stands in stark contrast to start/stop codonconservation comparisons in vertebrate species, where evendistant mammals such as platypus retain more than 60% ofthese essential sites (Miller et al. 2007). One explanation forthis observation could be that the alignment process createscomposite genes by aligning multiple copies of A. lyrata genesonto single copy genes in the A. thaliana reference. This hy-pothesis, however, does not fully explain the number of dis-ruptions in aligned genes. The majority of genes between thetwo species occur colinearly, with a minority being duplicated(Hu et al. 2011). If alignment errors from paralogs were cre-ating all these observed disruptions, then we would expectthem to occur at a similar rate to the proportion of dupli-cated genes overall. More likely, there is a mix of causes, withonly some being false positives due to poor alignment. Eventaking these potential false positives into consideration, wesee a trend that is markedly different from the gene featureconservation seen in vertebrate species.
The proportion of conserved genome features, such ascoding sequence, introns, and UTRs, relative to the completeset of detected conserved elements within a referencegenome, has been previously investigated for vertebrates, in-sects, worms, and yeasts (Siepel et al. 2005). Specifically, thiscomparison shows a trend relating an increase in the com-plexity of the conserved element set to an increase in overallorganismal complexity. Reproducing this analysis (fig. 3B) forangiosperms revealed that the proportion of gene featuresamong the complete set of conserved elements most closelyparallels the proportions observed in worms such as C. ele-gans. Both nematodes and plants are known to exhibit a widedegree of phenotypic plasticity, making drastic alterations tobody structure due to environmental stress (Sultan 2000;Sommer and Ogawa 2011). The observations that both an-giosperms and nematodes share a common distribution ofconserved elements, and that they both make use of a moreflexible phenotypic landscape, may imply that this less diversecomposition of conserved elements is necessary for environ-mentally induced large phenotypic changes. Moreover, itcould be that the developmental plans of plants are relatively
flexible in comparison to animals, and thus, this developmen-tal lability is reflected in genomic architecture and evolution.
It is clear that angiosperm coding sequence and essentialRNAs can be reliably aligned and identified, even across pro-tracted phylogenetic timelines. However, these componentsrepresent only a fraction of genome features. The question ofthe phylogenetic distance at which we lose sequence identityfor rapidly diverging features in plants can help make in-formed decisions in experimental design. Comparing align-ability in vertebrates to angiosperm species reveals a fasterdecay in vertebrates compared with plant species. Both be-tween closely related species and phylogenetic comparisonsbeyond the Brassicales, the alignability of coding sequence tothe A. thaliana reference was greater than equally distantvertebrates to a human reference (fig. 3F). Similarly, the align-ment coverage of reference genome coding sequence be-tween equally distant vertebrate and plant species showeda trend of higher coverage in plant species that were recentlyand distantly diverged. The implication of this result is thatalthough plant genomes can be highly variable intergenically,essential features such as coding sequences are highly con-served between species. It is more difficult to draw definitiveconclusions about the alignability of cis-regulatory modulesbetween kingdoms due to differing quality of annotations.However, we do observe a substantial difference in alignabilitywhen comparing the two kingdoms of life.
The preservation of conserved elements with no knownannotation, even in the most stringently filtered sets, wassurprising. This pattern illustrates that there are still segmentsof the A. thaliana genome, which are conceivably functional,but which are as yet uncharacterized. Our first-pass annota-tion of these conserved regions (fig. 3G) has shed light on thetype of function associated with this DNA. Although we de-tected several types of features, the highlight is the identifi-cation of dozens of new potential RNA genes. These regions,found by partial BLAST homology to existing ncRNAs, oralternatively by finding protein homology with overlappingsmall RNA expression, may represent a previously unknownsource of regulation in A. thaliana. However, the homology-based method used to annotate conserved regions is simpleand broad and as a result cannot produce truly definitiveannotations. These new annotation groups, however, aresmall enough for future manual refinement. Ultimately, func-tion can only truly be assigned as a result of validationthrough benchwork that verifies RNA expression and effectson phenotype. The vignettes of novel folding regions high-lighted here demonstrate the ability to quickly identify novelgenome features and can serve as a guide for bench scientiststo probe deeper into their gene families of choice with thehelp of our genome browser. Novel putative ncRNAs, such asthat described in figure 5, are promising but require furtherinvestigation to confirm the paradigm that conservationimplies function.
Beyond identifying new annotations via conservation, wehave added depth to existing annotation by layering it withRNA folding and cis-regulatory information. In doing so, wehave characterized on a genome-wide scale how RNA genesfold in flowering plants. Our leveraging of two independent
1739
Conservation in 20 Plant Genomes . doi:10.1093/molbev/mst082 MBE by guest on July 6, 2016
http://mbe.oxfordjournals.org/
Dow
nloaded from

algorithms, to precompute RNA folds and display themgenome-wide, gives researchers an instant second opinionon a methodology, which is often subject to high false dis-covery rates and intense computational time (Gorodkin et al.2010). This folding information, combined with TAIR genetracks, conservation, and cis-regulatory motifs, was able toidentify a potential fold, which may well control regulationof a gene (fig. 4E).
This study articulated a few avenues for investigation into acomparative alignment. Most of the analyses presented canbe viewed as tracks on the Arabidopsis genome browser;many can be reconstituted using the genome browser andtable browser web tools. Plant comparative genomics hasunique challenges due to the architecture of genomes inthis kingdom of life. Continued accrual of sequence informa-tion and annotation will help empower further analysis ofthese complex organisms. At both the gene level and thegenome level, this integration of plant DNA informationwill help inform decisions and formulate targets for investi-gation to gain further insight about plant evolution.
Materials and Methods
Pairwise Alignment
In this analysis, we included only those angiosperm genomesthat have been published on previously, following the guide-lines of the Ft. Lauderdale agreement on rapid data release.The 20 genomes that were included in this analysis and theirversion numbers are listed in table 1, sorted by coverage. Totalalign refers to the number of nucleotides aligned to A. thali-ana determined by the mafCoverage software. CDS alignrefers to the overlap of alignment with existing A. thalianaCDS annotation as determined by intersections using thefeatureBits software, both programs are part of the UCSCsource tree (Kent et al. 2002).
A pairwise alignment pipeline was used to generate whole-genome alignments against a version 9 A. thaliana referencegenome sequence assembled by TAIR (Swarbreck et al. 2008).All sequences were obtained as scaffolds or pseudochromo-somes from the web repositories of the respective sequencinggroups with the exception of the G. soja genome. Sequencedata for G. soja were obtained from the Sequence ReadArchive and mapped to G. max using Maq (Li et al. 2008),following the methods of the sequencing group (Kim et al.2010). Masking was employed to remove lineage-specific re-petitive regions; resulting in improved BLAST results, this wasaccomplished using the RepeatMasker (Smit and Hubley2004) software suite. Each query genome was split into re-gions of 1 million base pairs or less, whereas the referencegenome, A. thaliana, was split into its seven pseudochromo-somes. The alignment then proceeded using the LASTZprogram (Harris 2007), a local alignment algorithm optimizedfor whole-genome alignment, which locally compared theA. thaliana reference genome sequence against all sequencesin each query genome. This process was parallelized across acomputer cluster to efficiently generate alignments from largedata sets. LASTZ output relating query to reference was thenlinked into longer chains of contiguous alignment using
axtChain (Kent et al. 2003). The alignment chains weresorted using chainNet, which filters only the single best-aligned chain, and maximizes coverage across the referencegenome. Converting the nets to multiple alignment files fol-lowed this. The resulting pairwise alignments of each querygenome to the A. thaliana reference were joined usingMULTIZ (Blanchette et al. 2004) and guided by the tree to-pology in figure 1. Postprocessing of the alignments includedinserting annotations for alignment breaks and gaps using themafAddIrows tool, and identifying regions removed byRepeatMasker.
Evaluating Alignment Quality and Refining Parameters
To determine whether the alignment process is producingreliable sequence relationships, alignments were evaluatedbased on base coverage and on annotation-specific quality.To measure the number of raw bases aligned, the number ofexact base matches, the number of base mismatches, and thecoverage the mafCoverage program, part of the UCSC sourcetree was used. Starting with default parameters for all pro-grams, each step in the alignment process was tuned to max-imize coverage and minimize mismatch. The LASTZalignment algorithm proved to be robust; even without anytuned parameters, the software produced pairwise align-ments between A. thaliana and A. lyrata with coverageonly 5% less than pairwise alignments made by theA. lyrata genome sequencing project. The final LASTZ param-eters were as follows for all alignments: inner = 2,000,xdrop = 9,400, gappedthresh = 3,000, hspthresh = 2,200.Using these parameters, for example, coverage was increasedby 4% between Ath/Aly compared with the default parame-ter baseline.
Evaluating Gene Quality
To judge the conservation of known A. thaliana gene featuresin pairwise aligned genomes beyond simple coverage num-bers, the program cleanGenes (part of the PHAST package)was used to evaluate feature conservation. Using version 9genome annotation from TAIR, gene-feature coordinateswere extracted and located in pairwise alignments, and con-servation was assessed. The types of features evaluated in-cluded start sites, stop sites, splice sites, frameshifts, andnonsense mutations; these were searched for “cleanly” con-served exons without gaps or mutations. Features were talliedas passing or failing after evaluating the features conservationin a pairwise alignment.
To compare our alignment pipeline to previously availablewhole-genome plant alignments created for the VISTAgenome browser, an alignment using TAIR version 8 A. thali-ana sequence was aligned to A. lyrata, so that we couldbenchmark our alignments against previously released pub-licly available alignments. Additional more recent alignmentsof A. thaliana/V. vinifera and A. thaliana/G. max, which uti-lized a TAIR10 reference, were used for additional compari-sons. VISTA alignments were incompatible with genomebrowser tools; thus, the mfa alignments were convertedinto MAF block format using a custom Python script. The
1740
Hupalo and Kern . doi:10.1093/molbev/mst082 MBE by guest on July 6, 2016
http://mbe.oxfordjournals.org/
Dow
nloaded from

resulting MAF format alignments for Ath/Aly were uploadedto a TAIR version 8 genome browser as browser MAF tracks.This allowed mafCoverage, as well as cleanGenes results fromVISTA alignments, to be directly compared with alignmentsfrom the LASTZ/MULTIZ pipeline.
Scoring Conservation
To compute conservation tracks for the multiple alignment,phyloFit (Siepel and Haussler 2004) (a component of thePHAST package) was used to fit a phylogenetic model to4-fold-degenerate sites found on each chromosome of theMULTIZ alignment as an initial starting sample (as describedin the PHAST documentation). The resulting phyloge-netic model was used in conjunction with the phastCons(Siepel et al. 2005) tool to create conserved and noncon-served phylogenetic trees. The phastCons program requiresseveral iterations to refine parameters that predict conser-vation as part of its phylo-HMM. Starting with parametersfor expected coverage and expected length gathered from aprevious conservation analysis focusing on Solanaceae(Wang et al. 2008), the phastCons run was tuned to fitpredefined criteria. Similar to previous studies analyzing con-servation, our criteria was 60% coverage of the annotatedcoding regions by predicted conserved elements, as well asphylogenetic information threshold score close to 10 bitsmeasured by the consEntropy software. The resulting pa-rameters that fit our criteria were an expected coverage of0.2 and an expected length of 80. Wig format data files wereused to create a conservation track on the A. thalianagenome browser, which visualizes conservation scores asa continuous variable. Resulting conserved region lengthsare graphed in supplementary figure S3, SupplementaryMaterial online.
Conserved regions were classified using A. thaliana anno-tation tracks based on TAIR version 9 GFF files. Intersectionsand enrichment values of the annotation tracks versus theconserved region track were achieved using the featureBitscommand line tool, part of the UCSC source tree. Significancewas determined by Fischer’s exact test, using values gatheredby featureBits, to determine whether certain groups wereover-represented versus the normal composition. Normalcomposition of the A. thaliana genome was determinedusing the same methodology. Vertebrate conserved elementenrichment was determined using featureBits and thephastConsElements46way track with annotation drawnfrom UCSC (Fujita et al. 2011).
To evaluate and compare the conservation ofspecific genome features between species, the tool maf_in-terval_alignability.py was employed. This tool, part of the bx-python package and utilized in Miller et al. (2007), scoresalignments to annotated features by measuring presence orabsence of aligned sequence. Specifically, the program pro-ceeds by tabulating the number of bases covered by a queryspecies, compared with the number of bases within an inter-val that have missing alignment information. The alignabilityvalue is the number of bases with alignment divided by thesum of the number of positions with and without alignment.The graph in figure 3F displays mean values of alignability for
annotation groups in select species. The columns of meanalignability values for each species are then scaled based onphylogenetic distance, as determined by substitutions per sitedrawn from a 4-fold degenerate neutral tree. Trend lines forvertebrate data were recapitulated using the latest alignmentinformation drawn from the phastCons46way alignment(Fujita et al. 2011) to confirm the previously observed pattern.Annotation for cis-regulatory sites in the 46way alignmentwas drawn from the ORegAnno track annotation (Griffithet al. 2008).
Building the Browser
To visualize alignments, and make use of the collection ofbrowser genomics tools, a mirror of the UCSC genome brow-ser (Kent et al. 2002) was installed at local facilities and re-mains available at genome.genetics.rutgers.edu. The focus ofthis browser is to host comparative genomics data forDrosophila and plant species. We selected Oryza sativa andA. thaliana as reference genome browsers for monocotsand eudicots, respectively, due to their extensive annotationand high-quality pseudochromosomes. Development hasfocused on the A. thaliana browser tracks as a prototypefor a plant comparative genomics browser. These tracksinclude a bed file-based display of regions identified byRepeatMasker as repetitive sequence and gene tracks basedon known genome annotations. Specifically, the foundationof the browser is gff3 format annotation created by TAIR,filtered for a single coverage of genes across each genome,and then converted to gene prediction (genePred) formatand uploaded to the browser MySQL database. An alternativegene prediction track, created using Gnomon gene predictionsoftware as part of a recent TAIR release (Lamesch et al. 2011),was also included as part of the browser.
Cis-regulatory elements were predicted based on regularexpressions of A. thaliana transcription factor binding sites aslisted in the AGRIS cis-regulatory database (Yilmaz et al. 2011).To create a browser-compatible track of elements, putativebinding sites were called using GREP according to TAIR ver-sion 9 chromosomes and then mapped using BLAT (Kent2002). The resulting coordinates were formatted into an ex-tended bed genome-browser track, labeling the type of motifand its coordinates.
Identifying Uninterrupted Conservation
To locate regions within the A. thaliana genome that are alsofound in all other sequenced and aligned angiosperm ge-nomes in an uninterrupted block, a Python program basedon mafUltras was written. This software was used to identifyultraconserved elements in vertebrates and has been adaptedfor use here with the 20way alignment. Unlike a phastConsconservation analysis, this search method is dependent on auser-defined threshold; specifically, the threshold is the min-imum length of uninterrupted alignment columns. Whensearching the human genome, this threshold was defined as100 bp. To maximize inclusion of highly conserved elementsand account for the overall shorter length of plant conservedelements, this threshold was set to 18 bp for the search inthe 20way alignment. This was chosen because in general
1741
Conservation in 20 Plant Genomes . doi:10.1093/molbev/mst082 MBE by guest on July 6, 2016
http://mbe.oxfordjournals.org/
Dow
nloaded from

angiosperm-conserved regions are substantially shorterthan their mammalian counterparts (supplementary fig. S4,Supplementary Material online) and that 18 bp is the shortestlength an expected noncoding RNA might be. We expect thatthis shortening of the threshold compared with mammals,from 100 to 18 bp, is an inclusive estimate rather than exclu-sive. Any detected elements were sorted according to overlapof known A. thaliana annotation from TAIR. Regions that didnot map to known annotation were de novo annotatedbased on BLAST homology.
Computing Secondary Structure
Computing folding structure of RNA molecules can beinformed by conservation between related genomes. To iden-tify secondary structure conservation, EvoFold was imple-mented to predict folding given a MAF block and aphylogenetic tree. As with similar EvoFold studies (Pedersenet al. 2006; Stark et al. 2007), conserved regions predicted byPhastCons were first joined to any neighboring conservedregion at a distance no greater than 30 bp. These extendedregions were subsequently split into lengths no greater than750 bp. MAF blocks were extracted from the 20way align-ment using the MafFrag utility, part of the UCSC softwarepackage, and postprocessed to be compatible with EvoFoldalignment format. The 20 species newick tree used for allEvoFold runs was sourced from the PhastCons conservationrun. EvoFold predictions were distributed across a computecluster using default values in the control file provided in theEvoFold source code. Folds with scores below an LOD of 100and folds with overlap of repetitive elements were filteredout. Result files were formatted into a BED6 structure, adher-ing to the file format used for previously implemented UCSCgenome browser EvoFold tracks, and uploaded to a MySQLdatabase for use as a browser track. Resulting fold lengths aregraphed in supplementary figure S3, Supplementary Materialonline.
A similar approach was taken to predict secondary struc-ture in RNAs using the RNAalifold algorithm, part of theVienna RNA package (Hofacker et al. 2002; Bernhart et al.2008). This method uses the same data set described earlier,which contains conserved elements identified by PhastConsand processed for length and format. Results were filteredusing the same thresholds as above and postprocessed tocreate a genome browser track. Secondary structure enrich-ment was found by intersecting the EvoFold annotationtrack with other annotation tracks using the featureBitscommand line tool. A final browser track was createdcontaining the composite scores of both independent pre-diction methods. This data set was used for the results infigure 4.
The control data set used to verify the accuracy of predic-tions was sourced from TAIR annotation of tRNAs, whichproduced 658 annotations. Predicted fRNAs overlap 637of the 658 annotations. The enrichment of predicted fRNAsin the set of existing annotation for the A. thaliana ge-nome can be seen in figure 3E. As would be expected, trans-lational related RNAs (including tRNAs, rRNAs, snRNAs, andsnoRNAs) are significantly enriched for having folding regions,
more than triple the enrichment (17.52x) of the next nearestcategory, regulatory RNAs (4.08x).
Annotating Conserved Noncoding Regions
To characterize unannotated conserved regions scored byphastCons as most conserved within flowering plants, werelied on BLAST-based homology searches with defaultsearch parameters. The top 10% of the distribution ofmost-conserved elements was focused on for annotation,so as to limit a considerably large data set to only the mosthighly conserved regions. A first-pass search for homologywas performed using the BLAST algorithm to scan TAIR ver-sion 10 genome-wide annotation. BLAST results from this firstpass search were parsed using a custom script, to which wereextracted the top scoring search term for any result with an e-value cutoff of 0.1 or less. Regions with no homology withinknown A. thaliana annotation were then searched for homol-ogy to any known plant annotation contained in the PlantGenome Database, using an e-value cutoff of 0.1 or less(Duvick et al. 2007). In each case, the top BLAST searchterm was used as its tentative annotation. Further annotationwas achieved by intersecting bed files containing coordinatesof conserved regions annotated by BLAST homology withsecondary structure browser tracks, proximity to exons, andexisting small RNA expression databases sourced from theASRP (Backman et al. 2008). Evaluating exon proximity wasdetermined by searching for coordinates that were within164 bp of an annotated exon, the average intron length inA. thaliana.
Programming and Data
All programs were written in the Python and the C program-ming language. All custom software used in the developmentand analyses are available upon request. All data sets of con-served elements and annotations have been made available asfiles and tracks on the A. thaliana genome browser (araTha9)located at genome.genetics.rutgers.edu.
Supplementary MaterialSupplementary tables S1 and S2 and figures S1–S5 areavailable at Molecular Biology and Evolution online (http://www.mbe.oxfordjournals.org/).
Acknowledgments
This work was supported by two grants to A.D.K., NSFMCB-1052148 and DOE/USDA 124336, as well as theHuman Genetics Institute of New Jersey.
ReferencesAcarkan A, Rossberg M, Koch M, Schmidt R. 2000. Comparative genome
analysis reveals extensive conservation of genome organisation forArabidopsis thaliana and Capsella rubella. Plant J. 23:55–62.
Arabidopsis Genome Initiative. 2000. Analysis of the genomesequence of the flowering plant Arabidopsis thaliana. Nature 408:796–815.
Argout X, Salse J, Aury J-M, et al. (61 co-authors). 2011. The genome ofTheobroma cacao. Nat Genet. 43:101–108.
Backman TWH, Sullivan CM, Cumbie JS, Miller ZA, Chapman EJ,Fahlgren N, Givan SA, Carrington JC, Kasschau KD. 2008. Update
1742
Hupalo and Kern . doi:10.1093/molbev/mst082 MBE by guest on July 6, 2016
http://mbe.oxfordjournals.org/
Dow
nloaded from

of ASRP: the Arabidopsis small RNA project database. Nucleic AcidsRes. 36:D982–D985.
Bejerano G, Pheasant M, Makunin I, Stephen S, Kent WJ, Mattick JS,Haussler D. 2004. Ultraconserved elements in the human genome.Science 304:1321–1325.
Bernhart SH, Hofacker IL, Will S, Gruber AR, Stadler PF. 2008. RNAalifold:improved consensus structure prediction for RNA alignments.BMC Bioinformatics 9:474.
Blanchette M, Kent WJ, Riemer C, et al. (12 co-authors). 2004. Aligningmultiple genomic sequences with the threaded blockset aligner.Genome Res. 14:708–715.
Brudno M, Do CB, Cooper GM, Kim MF, Davydov E, NISC ComparativeSequencing Program, Green ED, Sidow A, Batzoglou S. 2003. LAGANand Multi-LAGAN: efficient tools for large-scale multiple alignmentof genomic DNA. Genome Res. 13:721–731.
Brudno M, Poliakov A, Minovitsky S, Ratnere I, Dubchak I. 2007. Multiplewhole genome alignments and novel biomedical applications at theVISTA portal. Nucleic Acids Res. 35:W669–W674.
Campbell MA, Zhu W, Jiang N, Lin H, Ouyang S, Childs KL, Haas BJ,Hamilton JP, Buell CR. 2007. Identification and characterizationof lineage-specific genes within the Poaceae. Plant Physiol. 145:1311–1322.
Chan AP, Crabtree J, Zhao Q, et al. (18 co-authors). 2010. Draft genomesequence of the oilseed species Ricinus communis. Nat Biotechnol.28:951–956.
Chiang CWK, Derti A, Schwartz D, Chou MF, Hirschhorn JN, Wu C-T.2008. Ultraconserved elements: analyses of dosage sensitivity, motifsand boundaries. Genetics 180:2277–2293.
Cooper GM, Brudno M, NISC Comparative Sequencing Program., GreenED, Batzoglou S, Sidow A. 2003. Quantitative estimates of sequencedivergence for comparative analyses of mammalian genomes.Genome Res. 13:813–820.
Davies TJ, Barraclough TG, Chase MW, Soltis PS, Soltis DE, Savolainen V.2004. Darwin’s abominable mystery: insights from a supertree ofthe angiosperms. Proc Natl Acad Sci U S A. 101:1904–1909.
Drosophila 12 Genomes Consortium, Clark AG, Eisen MB, et al.(418 co-authors). 2007. Evolution of genes and genomes on theDrosophila phylogeny. Nature 450:203–218.
Dubchak I, Brudno M, Loots GG, Pachter L, Mayor C, Rubin EM,Frazer KA. 2000. Active conservation of noncoding sequencesrevealed by three-way species comparisons. Genome Res. 10:1304–1306.
Duvick J, Fu A, Muppirala U, Sabharwal M, Wilkerson MD, Lawrence CJ,Lushbough C, Brendel V. 2007. PlantGDB: a resource for compara-tive plant genomics. Nucleic Acids Res. 36:D959–D965.
Eddy SR. 2005. A model of the statistical power of comparative genomesequence analysis. PLoS Biol. 3:e10.
Frazer KA, Pachter L, Poliakov A, Rubin EM, Dubchak I. 2004. VISTA:computational tools for comparative genomics. Nucleic Acids Res.32:W273–W279.
Freeling M, Subramaniam S. 2009. Conserved noncoding sequences(CNSs) in higher plants. Curr Opin Plant Biol. 12:126–132.
Friedman RC, Farh KK-H, Burge CB, Bartel DP. 2009. Most mammalianmRNAs are conserved targets of microRNAs. Genome Res. 19:92–105.
Fujita PA, Rhead B, Zweig AS, et al. (27 co-authors). 2011. The UCSCGenome Browser database: update 2011. Nucleic Acids Res. 39:D876–D882.
Gebhardt C, Walkemeier B, Henselewski H, Barakat A, Delseny M, StuberK. 2003. Comparative mapping between potato (Solanum tubero-sum) and Arabidopsis thaliana reveals structurally conserveddomains and ancient duplications in the potato genome. Plant J.34:529–541.
Giuliano G, Pichersky E, Malik VS, Timko MP, Scolnik PA, Cashmore AR.1988. An evolutionarily conserved protein binding sequenceupstream of a plant light-regulated gene. Proc Natl Acad SciU S A. 85:7089–7093.
Glazov EA, Pheasant M, McGraw EA, Bejerano G, Mattick JS. 2005.Ultraconserved elements in insect genomes: a highly conserved
intronic sequence implicated in the control of homothoraxmRNA splicing. Genome Res. 15:800–808.
Goff SA, Ricke D, Lan T-H, et al. (55 co-authors). 2002. A draft sequenceof the rice genome (Oryza sativa L. ssp. japonica). Science 296:92–100.
Gorodkin J, Hofacker IL, Torarinsson E, Yao Z, Havgaard JH, Ruzzo WL.2010. De novo prediction of structured RNAs from genomicsequences. Trends Biotechnol. 28:9–19.
Griffith O, Montgomery SB, Bernier B, et al. (27 co-authors). 2008.ORegAnno: an open-access community-driven resource for regula-tory annotation. Nucleic Acids Res. 36:D107–D113.
Guo H. 2003. Conserved Noncoding sequences among cultivated cerealgenomes identify candidate regulatory sequence elements andpatterns of promoter evolution. Plant Cell 15:1143–1158.
Hare PD, Moller SG, Huang L-F, Chua N-H. 2003. LAF3, a novel factorrequired for normal phytochrome A signaling. Plant Physiol. 133:1592–1604.
Harris RS. 2007. Improved pairwise alignment of genomic DNA.[PhD thesis]. [University Park (PA)]: The Pennsylvania StateUniversity.
Hofacker IL, Fekete M, Stadler PF. 2002. Secondary structure predictionfor aligned RNA sequences. J Mol Biol. 319:1059–1066.
Hu TT, Pattyn P, Bakker EG, et al. (30 co-authors). 2011. The Arabidopsislyrata genome sequence and the basis of rapid genome size change.Nat Genet. 43:476–481.
Huang S, Li R, Zhang Z, et al. (96 co-authors). 2009. The genome of thecucumber, Cucumis sativus. L. Nat Genet. 41:1275–1281.
Hubisz MJ, Pollard KS, Siepel A. 2011. PHAST and RPHAST: phylogeneticanalysis with space/time models. Brief Bioinform. 12:41–51.
Hudson ME, Quail PH. 2003. Identification of promoter motifs involvedin the network of phytochrome A-regulated gene expression bycombined analysis of genomic sequence and microarray data.Plant Physiol. 133:1605–1616.
Inada DC, Bashir A, Lee C, Thomas BC, Ko C, Goff SA, Freeling M. 2003.Conserved noncoding sequences in the grasses. Genome Res. 13:2030–2041.
Kaplinsky NJ. 2002. Utility and distribution of conserved noncodingsequences in the grasses. Proc Natl Acad Sci U S A. 99:6147–6151.
Katzman S, Kern AD, Bejerano G, Fewell G, Fulton L, Wilson RK, SalamaSR, Haussler D. 2007. Human genome ultraconserved elements areultraselected. Science 317:915.
Kellis M, Patterson N, Endrizzi M, Birren B. 2003. Sequencing and com-parison of yeast species to identify genes and regulatory elements.Nature 423:241–254.
Kent WJ. 2002. BLAT—the BLAST-like alignment tool. Genome Res. 12:656–664.
Kent WJ, Baertsch R, Hinrichs A, Miller W, Haussler D. 2003. Evolution’scauldron: duplication, deletion, and rearrangement in the mouseand human genomes. Proc Natl Acad Sci U S A. 100:11484–11489.
Kent WJ, Sugnet CW, Furey TS, Roskin KM, Pringle TH, Zahler AM,Haussler D. 2002. The human genome browser at UCSC. GenomeRes. 12:996–1006.
Kim J, He X, Sinha S. 2009. Evolution of regulatory sequences in12 Drosophila species. PLoS Genet. 5:e1000330.
Kim MY, Lee S, Van K, et al. (29 co-authors). 2010. Whole-genomesequencing and intensive analysis of the undomesticated soybean(Glycine soja Sieb. and Zucc.) genome. Proc Natl Acad Sci U S A. 107:22032–22037.
Kindgren P, Kremnev D, Blanco NE, de Dios Barajas Lopez J, FernandezAP, Tellgren-Roth C, Small I, Strand A. 2011. The plastid redoxinsensitive 2 mutant of Arabidopsis is impaired in PEP activity andhigh light-dependent plastid redox signalling to the nucleus. Plant J.70:279–291.
Kritsas K, Wuest SE, Hupalo D, Kern AD, Wicker T, Grossniklaus U. 2012.Computational analysis and characterization of UCE-like elements(ULEs) in plant genomes. Genome Res. 22:2455–2466.
Ku HM, Vision T, Liu J, Tanksley SD. 2000. Comparing sequencedsegments of the tomato and Arabidopsis genomes: large-scaleduplication followed by selective gene loss creates a network ofsynteny. Proc Natl Acad Sci U S A. 97:9121–9126.
1743
Conservation in 20 Plant Genomes . doi:10.1093/molbev/mst082 MBE by guest on July 6, 2016
http://mbe.oxfordjournals.org/
Dow
nloaded from

Lamesch P, Berardini T, Li D. 2011. The Arabidopsis InformationResource (TAIR): improved gene annotation and new tools.Nucleic Acids Res. 21:1–9.
Lenz D, May P, Walther D. 2011. Comparative analysis of miRNAs andtheir targets across four plant species. BMC Res Notes. 4:483.
Li H, Ruan J, Durbin R. 2008. Mapping short DNA sequencing reads andcalling variants using mapping quality scores. Genome Res. 18:1851–1858.
Michaud M, Cognat V, Duchene A-M, Marechal-Drouard L. 2011.A global picture of tRNA genes in plant genomes. Plant J. 66:80–93.
Miller W, Rosenbloom K, Hardison RC, et al. (26 co-authors). 2007.28-way vertebrate alignment and conservation track in the UCSCGenome Browser. Genome Res. 17:1797–1808.
Ming R, Hou S, Feng Y, et al. (85 co-authors). 2008. The draft genome ofthe transgenic tropical fruit tree papaya (Carica papaya Linnaeus).Nature 452:991–996.
Morrell PL, Buckler ES, Ross-Ibarra J. 2011. Crop genomics: advances andapplications. Nat Rev Genet. 13:85–96.
Paterson AH, Bowers JE, Bruggmann R, et al. (45 co-authors). 2009. TheSorghum bicolor genome and the diversification of grasses. Nature457:551–556.
Pedersen JS, Bejerano G, Siepel A, Rosenbloom K, Lindblad-Toh K,Lander ES, Kent J, Miller W, Haussler D. 2006. Identification andclassification of conserved RNA secondary structures in thehuman genome. PLoS Comput Biol. 2:e33.
Retzel EF, Johnson JE, Crow JA, Lamblin AF, Paule CE. 2007.Legume resources: MtDB and Medicago.Org. Methods Mol Biol.406:261–274.
Rhead B, Karolchik D, Kuhn RM, et al. (20 co-authors). 2010. The UCSCGenome Browser database: update 2010. Nucleic Acids Res. 38:D613–D619.
Sato S, Nakamura Y, Kaneko T, et al. (29 co-authors). 2008. Genomestructure of the legume, Lotus japonicus. DNA Res. 15:227–239.
Schmutz J, Cannon SB, Schlueter J, et al. (45 co-authors). 2010. Genomesequence of the palaeopolyploid soybean. Nature 463:178–183.
Schmidt R. 2002. Plant genome evolution: lessons from comparativegenomics at the DNA level. Plant Mol Biol. 48:21–37.
Schnable PS, Ware D, Fulton RS, et al. (157 co-authors). 2009. The B73maize genome: complexity, diversity, and dynamics. Science 326:1112–1115.
Shulaev V, Sargent DJ, Crowhurst RN, et al. (71 co-authors). 2011. Thegenome of woodland strawberry (Fragaria vesca). Nat Genet. 43:109–116.
Siepel A, Bejerano G, Pedersen JS, et al. (16 co-authors). 2005.Evolutionarily conserved elements in vertebrate, insect, worm, andyeast genomes. Genome Res. 15:1034–1050.
Siepel A, Haussler D. 2004. Phylogenetic estimation of context-dependent substitution rates by maximum likelihood. Mol BiolEvol. 21:468–488.
Smit A, Hubley R. 2004. RepeatMasker Open-3.0. 1996–2010 [Internet].Institute for Systems Biology. Available from: http://www.repeatmasker.org
Sommer RJ, Ogawa A. 2011. Hormone signaling and phenotypicplasticity in nematode development and evolution. Curr OpinBiol. 21:R758–66.
Stark A, Lin MF, Kheradpour P, et al. (44 co-authors). 2007. Discovery offunctional elements in 12 Drosophila genomes using evolutionarysignatures. Nature 450:219–232.
Stojanovic N. 2009. A study of the distribution of phylogeneticallyconserved blocks within clusters of mammalian homeobox genes.Genet Mol Biol. 32:666–673.
Sultan SE. 2000. Phenotypic plasticity for plant development, functionand life history. Trends Plant Sci. 5:537–542.
Swarbreck D, Wilks C, Lamesch P, et al. (16 co-authors). 2008.The Arabidopsis Information Resource (TAIR): gene structure andfunction annotation. Nucleic Acids Res. 36:D1009–D1014.
Tang H, Bowers JE, Wang X, Ming R, Alam M, Paterson AH. 2008.Synteny and collinearity in plant genomes. Science 320:486–488.
Tang H, Wang X, Bowers JE, Ming R, Alam M, Paterson AH. 2008.Unraveling ancient hexaploidy through multiply-aligned angio-sperm gene maps. Genome Res. 18:1944–1954.
Thomas BC, Rapaka L, Lyons E, Pedersen B, Freeling M. 2007. Arabidopsisintragenomic conserved noncoding sequence. Proc Natl Acad SciU S A. 104:3348–3353.
Tuskan GA, Difazio S, Jansson S, et al. (110 co-authors). 2006. Thegenome of black cottonwood, Populus trichocarpa (Torr. & Gray).Science 313:1596–1604.
Velasco R, Zharkikh A, Affourtit J, et al. (86 co-authors). 2010. Thegenome of the domesticated apple (Malus � domestica Borkh.).Nat Genet. 42:833–839.
Velasco R, Zharkikh A, Troggio M, et al. (57 co-authors). 2007. A highquality draft consensus sequence of the genome of a heterozygousgrapevine variety. PLoS One 2:e1326.
Vogel J, Garvin D, Mockler T, Schmutz J. 2010. Genome sequencing andanalysis of the model grass Brachypodium distachyon. Nature 463:763–768.
Wang X, Haberer G, Mayer KF. 2009. Discovery of cis-elements betweensorghum and rice using co-expression and evolutionary conserva-tion. BMC Genomics 10:284.
Wang XX, Wang HHH, Wang JJJ, et al. (110 co-authors). 2011. Thegenome of the mesopolyploid crop species Brassica rapa. NatGenet. 43:1035–1039.
Wang Y, Diehl A, Wu F, Vrebalov J, Giovannoni J, Siepel A, Tanksley SD.2008. Sequencing and comparative analysis of a conserved syntenicsegment in the Solanaceae. Genetics 180:391–408.
Xu X, Pan S, Cheng S, et al. (98 co-authors). 2011. Genome sequenceand analysis of the tuber crop potato. Nature 475:189–195.
Yang X, Jawdy S, Tschaplinski T. 2009. Genome-wide identification oflineage-specific genes in Arabidopsis, Oryza and Populus. Genomics93:473–480.
Yang Y-W, Lai K-N, Tai P-Y, Li W-H. 1999. Rates of nucleotide substi-tution in angiosperm mitochondrial DNA sequences and dates ofdivergence between Brassica and other angiosperm lineages. J MolEvol. 48:597–604.
Yilmaz A, Mejia-Guerra MK, Kurz K, Liang X, Welch L, Grotewold E.2011. AGRIS: the Arabidopsis Gene Regulatory Information Server,an update. Nucleic Acids Res. 39:D1118–D1122.
Zeller G, Henz SR, Widmer CK, Sachsenberg T, Ratsch G, Weigel D,Laubinger S. 2009. Stress-induced changes in the Arabidopsis thali-ana transcriptome analyzed using whole-genome tiling arrays.Plant J. 58:1068–1082.
Zhang B, Pan X, Cannon C, Cobb G. 2006. Conservation and divergenceof plant microRNA genes. Plant J. 46:243–259.
Zheng W-X, Zhang C-T. 2008. Ultraconserved elements between thegenomes of the plants Arabidopsis thaliana and rice. J Biomol StructDyn. 26:1–8.
1744
Hupalo and Kern . doi:10.1093/molbev/mst082 MBE by guest on July 6, 2016
http://mbe.oxfordjournals.org/
Dow
nloaded from
Copyright © 2022 FDOKUMEN