Connectomics in Brain Aging and Dementia - Frontiers
13
METHODS published: 07 October 2021 doi: 10.3389/fnagi.2021.669490 Edited by: Yong Liu, Beijing University of Posts and Telecommunications (BUPT), China Reviewed by: Kun Xiong, Central South University, China Miao Cao, Fudan University, China *Correspondence: Ann D. Cohen [email protected] Received: 18 February 2021 Accepted: 06 September 2021 Published: 07 October 2021 Citation: Cohen AD, Bruña R, Chang Y-F, Cheng Y, Doman J, Huppert T, Kim T, Maestu F, Roush RE, Snitz BE and Becker JT (2021) Connectomics in Brain Aging and Dementia – The Background and Design of a Study of a Connectome Related to Human Disease. Front. Aging Neurosci. 13:669490. doi: 10.3389/fnagi.2021.669490 Connectomics in Brain Aging and Dementia – The Background and Design of a Study of a Connectome Related to Human Disease Ann D. Cohen 1 * , Ricardo Bruña 2 , Yue-Fang Chang 3 , Yu Cheng 4,5 , Jack Doman 1 , Ted Huppert 6 , Tae Kim 7 , Fernando Maestu 2 , Rebecca E. Roush 8 , Beth E. Snitz 8 and James T. Becker 1,8,9 On behalf of the Connectomics in Brain Aging and Dementia Research Team 1 Department of Psychiatry, The University of Pittsburgh, Pittsburgh, PA, United States, 2 Department of Experimental Psychology, Universidad Complutense de Madrid, Pozuelo de Alarcón, Madrid, Spain, 3 Department of Neurosurgery, The University of Pittsburgh, Pittsburgh, PA, United States, 4 Department of Statistics, The University of Pittsburgh, Pittsburgh, PA, United States, 5 Department of Biostatistics, The University of Pittsburgh, Pittsburgh, PA, United States, 6 Department of Electrical Engineering, The University of Pittsburgh, Pittsburgh, PA, United States, 7 Department of Radiology, The University of Pittsburgh, Pittsburgh, PA, United States, 8 Department of Neurology, The University of Pittsburgh, Pittsburgh, PA, United States, 9 Department of Psychology, The University of Pittsburgh, Pittsburgh, PA, United States The natural history of Alzheimer’s Disease (AD) includes significant alterations in the human connectome, and this disconnection results in the dementia of AD. The organizing principle of our research project is the idea that the expression of cognitive dysfunction in the elderly is the result of two independent processes — the neuropathology associated with AD, and second the neuropathological changes of cerebrovascular disease. Synaptic loss, senile plaques, and neurofibrillary tangles are the functional and diagnostic hallmarks of AD, but it is the structural changes as a consequence of vascular disease that reduce brain reserve and compensation, resulting in an earlier expression of the clinical dementia syndrome. This work is being completed under the auspices of the Human Connectome Project (HCP). We have achieved an equal representation of Black individuals (vs. White individuals) and enrolled 60% Women. Each of the participants contributes demographic, behavioral and laboratory data. We acquire data relative to vascular risk, and the participants also undergo in vivo amyloid imaging, and magnetoencephalography (MEG). All of the data are publicly available under the HCP guidelines using the Connectome Coordinating Facility and the NIMH Data Archive. Locally, we use these data to address specific questions related to structure, function, AD, aging and vascular disease in multi-modality studies leveraging the differential advantages of magnetic resonance imaging (MRI), functional magnetic resonance imaging (fMRI), MEG, and in vivo beta amyloid imaging. Keywords: aging, MRI, amyloid PET imaging, magnetoencepalography, Connectome Related to Human Disease, neuropsychology Frontiers in Aging Neuroscience | www.frontiersin.org 1 October 2021 | Volume 13 | Article 669490
-
Upload
khangminh22 -
Category
Documents
-
view
1 -
download
0
Transcript of Connectomics in Brain Aging and Dementia - Frontiers
fnagi-13-669490 October 7, 2021 Time: 11:15 # 1
METHODSpublished: 07 October 2021
doi: 10.3389/fnagi.2021.669490
Edited by:Yong Liu,
Beijing University of Postsand Telecommunications (BUPT),
China
Reviewed by:Kun Xiong,
Central South University, ChinaMiao Cao,
Fudan University, China
*Correspondence:Ann D. Cohen
Received: 18 February 2021Accepted: 06 September 2021
Published: 07 October 2021
Citation:Cohen AD, Bruña R, Chang Y-F,
Cheng Y, Doman J, Huppert T, Kim T,Maestu F, Roush RE, Snitz BE and
Becker JT (2021) Connectomicsin Brain Aging and Dementia –
The Background and Design of aStudy of a Connectome Related
to Human Disease.Front. Aging Neurosci. 13:669490.
doi: 10.3389/fnagi.2021.669490
Connectomics in Brain Aging andDementia – The Background andDesign of a Study of a ConnectomeRelated to Human DiseaseAnn D. Cohen1* , Ricardo Bruña2, Yue-Fang Chang3, Yu Cheng4,5, Jack Doman1,Ted Huppert6, Tae Kim7, Fernando Maestu2, Rebecca E. Roush8,Beth E. Snitz 8 and James T. Becker1,8,9 On behalf of the Connectomics inBrain Aging and Dementia Research Team
1 Department of Psychiatry, The University of Pittsburgh, Pittsburgh, PA, United States, 2 Department of ExperimentalPsychology, Universidad Complutense de Madrid, Pozuelo de Alarcón, Madrid, Spain, 3 Department of Neurosurgery,The University of Pittsburgh, Pittsburgh, PA, United States, 4 Department of Statistics, The University of Pittsburgh,Pittsburgh, PA, United States, 5 Department of Biostatistics, The University of Pittsburgh, Pittsburgh, PA, United States,6 Department of Electrical Engineering, The University of Pittsburgh, Pittsburgh, PA, United States, 7 Department of Radiology,The University of Pittsburgh, Pittsburgh, PA, United States, 8 Department of Neurology, The University of Pittsburgh,Pittsburgh, PA, United States, 9 Department of Psychology, The University of Pittsburgh, Pittsburgh, PA, United States
The natural history of Alzheimer’s Disease (AD) includes significant alterations inthe human connectome, and this disconnection results in the dementia of AD.The organizing principle of our research project is the idea that the expression ofcognitive dysfunction in the elderly is the result of two independent processes — theneuropathology associated with AD, and second the neuropathological changes ofcerebrovascular disease. Synaptic loss, senile plaques, and neurofibrillary tangles arethe functional and diagnostic hallmarks of AD, but it is the structural changes as aconsequence of vascular disease that reduce brain reserve and compensation, resultingin an earlier expression of the clinical dementia syndrome. This work is being completedunder the auspices of the Human Connectome Project (HCP). We have achievedan equal representation of Black individuals (vs. White individuals) and enrolled 60%Women. Each of the participants contributes demographic, behavioral and laboratorydata. We acquire data relative to vascular risk, and the participants also undergo in vivoamyloid imaging, and magnetoencephalography (MEG). All of the data are publiclyavailable under the HCP guidelines using the Connectome Coordinating Facility and theNIMH Data Archive. Locally, we use these data to address specific questions related tostructure, function, AD, aging and vascular disease in multi-modality studies leveragingthe differential advantages of magnetic resonance imaging (MRI), functional magneticresonance imaging (fMRI), MEG, and in vivo beta amyloid imaging.
Keywords: aging, MRI, amyloid PET imaging, magnetoencepalography, Connectome Related to Human Disease,neuropsychology
Frontiers in Aging Neuroscience | www.frontiersin.org 1 October 2021 | Volume 13 | Article 669490

fnagi-13-669490 October 7, 2021 Time: 11:15 # 2
Cohen et al. Brain Aging and Dementia
INTRODUCTION
The natural history of Alzheimer’s Disease (AD) includessignificant alterations in the human connectome, and thisdisconnection results in the dementia of the Alzheimer’s type(DAT). Data from structural and functional magnetic resonanceimaging (MRI) (Dai and He, 2014; Prescott et al., 2014), as wellas magnetoencephalopathy (MEG) (Lopez-Sanz et al., 2019) andelectroencephalography (Maestu et al., 2019; Babiloni et al., 2020)all demonstrate significant changes in neural networks even priorto the onset of clinical dementia. While such changes are notexplicit in the popular A/T/N (amyloid/tau/neurodegeneration)model of AD (Jack et al., 2016), they appear to be an earlyconsequence of the accumulation of beta amyloid (Busche andKonnerth, 2016; Nakamura et al., 2017), and thus may be an earlywarning sign of impending neurodegeneration. Indeed, modelsof the natural history of AD that propose that the loss of synapsesis one of the first pathological stages of AD (Selkoe, 2002), implychanges in the connectome.
In 2016 the University of Pittsburgh was awarded funds bythe National Institute on Aging under the Connectomes Relatedto Human Disease1 of the Human Connectome Project.2 Ourproject is organized around the idea that the natural history of ADis affected by multiple independent factors (Ewers et al., 2011),and that the expression of cognitive dysfunction is the resultof independent processes including AD and vascular-relatedneuropathology. Here we describe the general organization of theConnectomics in Brain Aging and Dementia project, the samplingframe, a brain imaging protocols, and the behavioral/cognitivedata that were acquired as part of the study. All of the study dataare currently being uploaded to the Connectome CoordinationFacility3 and the NIMH National Data Archive.4
To accomplish the study goals, we acquiredneuropsychological data, as well as brain structural andfunctional (functional MRI, MEG) imaging, and positronemission tomography (PET) imaging of in vivo of brain amyloidwith Pittsburgh Compound B (PET-PiB). We used differentmeasures of brain function because fMRI and MEG rely onfundamentally different biological processes to generate “signal”(Tsvetanov et al., 2015), and this has the potential to providecritical information about the uncoupling of the neural andvascular components in AD (and possibly in normal aging)(Zlokovic, 2011). Because the MEG signal is derived frompost-synaptic currents, and fMRI signal also includes a vascularresponse, they may expose different sources of the disconnection(i.e., degeneration vs. vascular). We also acquire a direct measureof cerebrovascular function – an MRI-based measure of cerebralblood flow, as well as a direct measure of AD pathology usingin vivo amyloid imaging. These data provide the opportunity toexamine the relationship between amyloid deposition and localand distant connectivity (Zhou et al., 2015) among individualswith and without cognitive impairment.
1https://grants.nih.gov/grants/guide/pa-files/par-14-281.html2https://en.wikipedia.org/wiki/Human_Connectome_Project3https://www.humanconnectome.org/4https://nda.nih.gov/
METHODS
Study DesignThis is a longitudinal, community-based study of brain structuraland functional connectivity among cognitively normal andcognitively impaired individuals aged 50–89 years.
Recruitment SourcesThere are currently two primary portals of entry into thestudy: the University of Pittsburgh Alzheimer’s Disease ResearchCenter5 and the Pitt +Me web portal (primarily to recruit Blackindividuals and Whites without college education).6 Additionalindividuals were identified through active links with the HeartSCORE Study (Bambs et al., 2011), the Long Life Family Study(Newman et al., 2011), and by word of mouth.
Study ProtocolAll study participants are tested/scanned over three days. OnDay One, all study enrollees complete the informed consentprocess and the intake forms. They are then escorted to the MRResearch Center (MRRC) and where they complete the two fMRItasks (motor, working memory), and the structural imaging.Following a break, the individuals complete the behavioral teststhat are not components of the NIH Toolbox. On Day Two,the participants undergo a brief exam and fasting blood tests.They are then taken back to the MRRC where they undergodiffusion imaging, task free fMRI and the language/math taskfMRI; they then complete all the NIH Toolbox tests. On DayThree the participants undergo MEG and PET-PiB scanning; thisis scheduled approximately 1 week after the last MRI scanningsession (to avoid any interference of the MRI on the MEGdata). The participants are escorted to the Center for AdvancedBrain Magnetic Source Imaging7 where they are prepared for theMEG scan, and complete task training. Once in the magneticallyshielded room, the individuals complete task free MEG, and onetask MEG (working memory). Individuals will then take for ashort break and for the placement of the electrodes for the motorstimulation; then they will complete the Language/Math andMotor MEG task scans. Following a break for either a snack orlunch, the participants are escorted to the UPMC PET Facilityfor their PiB scan.
Diagnostic EvaluationEach participant undergoes a brief neuropsychological testbattery for group classification purposes. The test batteryis based on that of the ADRC and includes the MontrealCognitive Assessment (MoCA) (Nasreddine et al., 2005), verbalfluency, a 30-item visual naming test (Saxton et al., 2000),Trailmaking (Reitan, 1958; Reitan and Wolfson, 1994), verbalfree recall (Welsh et al., 1991, 1994), and the Rey-OsterreithComplex Figure (Rey, 1941). Classification decisions were madeindependently by JTB, and BES and any differences were resolved
5https://www.adrc.pitt.edu/6https://pittplusme.org/studyarms/publicdetails?guid=abdb4de3-0e00-49e6-b0a0-a3ca2d6e7c2a7http://www.neurology.upmc.edu/cabmsi/
Frontiers in Aging Neuroscience | www.frontiersin.org 2 October 2021 | Volume 13 | Article 669490
fnagi-13-669490 October 7, 2021 Time: 11:15 # 3
Cohen et al. Brain Aging and Dementia
in a group discussion. We use the ADRC classification scheme(Lopez et al., 2000) for AD, MCI (both amnestic and non-amnestic), and Subjective Cognitive Complaints (SCC).
Neuropsychological Tests and QuestionnairesThe individual tests and questionnaires that serve asoutcome variables include items from the NIH Toolbox,8
the Promis battery,9 and additional paper-and-pencil tests(see Supplementary Tables 1–3). The questionnaires coversymptomatology, personality, diet, and exercise.
Brain ImagingMagnetic Resonance Imaging ScanningWe use Siemens Prisma 3-Tesla 64-channel systems equippedwith Connectome level gradients operating at 80mT/m. They areequipped with fMRI presentation systems including E-Prime, aMR compatible video projector, and Celeritas response gloves.
The MRI scanning is completed in two 90-min sessionsover two days. The scan sequences include: T1-weighted MP-RAGE, T2-weighted SPACE image, FLAIR, susceptibilityweighted imaging, diffusion tensor imaging, task-freefunctional MRI, task-based fMRI, and arterial spin labeling(see Supplementary Table 4).
The tasks used were those described for the HCP and, with oneexception, used the stimuli provided by the HCP; the exceptionwas the N-back task. For that task all of the original photographsof faces were of White individuals; we substituted photos of Blackindividuals so that half of all of the N-back trials used White faces,and half Black faces. The same race was used for all of the stimuliwithin a trial (i.e., race could not be used to select responses).
All the MRI data are processed locally through the HCPpipeline, as modified to work in the local environment. The rawdata are stored on an XNAT server10 and pushed to a receivingserver at Washington University in St. Louis for processing bythe Connectome Coordination Facility and eventual upload tothe on-line, public HCP database.
Magnetoencephalopathy RecordingMagnetoencephalography (MEG) studies are completed on anElekta-Neuromag Vectorview 306 MEG system. The whole-scalpneuromagnetic measurement system uses 102 triple sensors –102 magnetometers and 204 planar gradiometers – in ahelmet-shaped array. The locations of three cardinal anatomicallandmarks (nasion, and two preauricular points) and of fourhead localization coils are digitized prior to each MEG studyusing a 3D-digitizer (ISOTRAK; Polhemus, Inc., Colchester VT)to define the subject-specific Cartesian head coordinate system.30–50 anatomical points are digitized on the head surface toprovide for more accurate co-registration of the MEG data withthe reconstructed volumetric MR image. Eye movements aremeasured and recorded simultaneously with the MEG. The MEGsensor unit, the floor-mounted gantry, the subject chair and bed,together with the patient audio-visual monitoring and stimulusdelivery systems are contained in a magnetically shielded room.
8http://www.healthmeasures.net/explore-measurement-systems/nih-toolbox9http://www.healthmeasures.net/explore-measurement-systems/promis10https://www.xnat.org/
Once a subject is comfortably positioned in the MEG machine,a short electrical signal is sent to the head coils enabling theirlocalization with respect to the MEG sensor array. The MEG dataare acquired at a sampling rate of 1 kHz, with on-line filtering of0.10–330 Hz. The acquisition includes two memory tasks, as wellas 10 min of “resting state” data – 5 min with eyes open followedby 5 min with eyes closed. At the end of the scan, we collect 2 minof “empty room” data to assess the validity of any signal in thetest conditions.
Recordings were filtered offline using a tempo-spatial filteringalgorithm (tSSS, correlation window 0.9, time window 10 s)(Taulu and Simola, 2006) to eliminate magnetic noise originatingoutside the head and to compensate for head movements.
The raw data are stored on an XNAT server and are pushed tothe NDA for eventual inclusion in the study database (C3159).
Positron Emission Tomography Amyloid ImagingThe PET amyloid tracer, Pittsburgh Compound B (PiB) issynthesized by a simplified radiosynthetic method based on thecaptive solvent method (Wilson et al., 2000; Price et al., 2005).High specific activity (> 0.50 Ci/µmol at time of injection) PiB(15 mCi) is injected over 20 s and the participant then relaxesquietly in a chair for ∼25 min, after which they are positioned inthe scanner. A windowed transmission scan (10 min) is acquiredfor attenuation correction, followed by a 30 min PiB PET study(6× 300 s frames).
The Siemens/CTI ECAT HR + scanner gantry is equippedwith a Neuro-insert (CTI PET Systems) to reduce thecontribution of scattered photon events (Weinhard, 1998).Positron emission tomography data are reconstructedusing filtered back-projection (Fourier rebinning and 2Dbackprojection with Hann filter: kernel FWHM = 3 mm). Dataare corrected for photon attenuation, scatter (Watson et al.,1997), and radioactive decay. The final reconstructed PET imageresolution is ∼ 6 mm (transverse and axial) based on in-housepoint source measurements.
The raw data are stored on an XNAT server and are pushed tothe NDA for inclusion in the study database (C3159). The datainclude the dynamic images as well as a single SUV image.
Imaging Data Processing (Local)All the MRI data are pushed to the HCP CCF XNAT server wherethey are processed using standard quality control measures, andanalysis via the HCP Pipeline. The processed data are madeavailable by the CCF. The MEG and PET data are saved to theNIMH Data Archive as.FIF files (MEG) and DICOM images(PET SUV images). What follows below is the description of thelocal processing of these data.
Magnetic Resonance Imaging Structural Image ProcessingWe briefly describe here the HCP Minimal Processing Pipelinesthat are implemented at the CCF prior to the release of thedata [See Glasser, et alia (Glasser et al., 2013) for details]. Thereare three main components to the structural data processing. Inthe first steps, the goal is to produce a “native” structural spacefor each subject, align the T1 and T2 images, perform a biasfield correction, and co-register the structural volumes into MNIspace. The second component which uses FreeSurfer extensively,
Frontiers in Aging Neuroscience | www.frontiersin.org 3 October 2021 | Volume 13 | Article 669490

fnagi-13-669490 October 7, 2021 Time: 11:15 # 4
Cohen et al. Brain Aging and Dementia
segments these volumes into predefined subcortical and corticalregions. It also reconstructs cortical surfaces and performs thestandard surface registration to the FreeSurfer atlas. Finally, inthe third step all the NIFTI and GIFTI surface files are createdthat can then be used in the Connectome Workbench.
In addition, we also process all the MP-RAGE data throughComputational Anatomy Toolbox (CAT12) for SPM.11 Thisprocess provides the basis for a range of morphological analysismethods, including voxel-based morphometry, surface-basedmorphometry, deformation-based morphometry, and region- orlabel-based morphometry.
Positron Emission Tomography ProcessingThe PET data are processed using PMOD12 and Freesurfersoftware packages. Correction for subject motion during themulti-frame PET scan is performed using frame-to-frameregistration procedure. The PET data are averaged to generateimages that correspond to the 50–70 min post-injection uptake.The anatomical T1-weighted MR image is reoriented along theanterior-posterior commissure and the averaged PET images areco-registered to the reoriented MR image. Freesurfer software isused for MR bias field correction, automated ROI parcellationand tissue segmentation. The Freesurfer ROI parcellations areconverted into an ROI template and ROI sampling of thePET images is performed to include anterior cingulate, frontalcortex, parietal, precuneus, lateral temporal cortex, primaryvisual cortex, hippocampus, anterior ventral striatum, thalamus,pons, and cerebellum.
Regional standardized uptake value (SUV) measures arecomputed for PiB by normalizing tissue uptake to the injectedradioligand dose and body mass. Each regional SUV isnormalized to a reference ROI in the cerebellum to generatethe SUV ratio (SUVR). Cortical SUVRs were measured inanterior cingulate cortex, the superior frontal cortex, orbitalfrontal cortex, lateral temporal cortex, parietal lobe, precuneus,and the anterior ventral striatum regions and averaged acrosshemispheres. The volume-weighted average of these seven SUVRvalues constituted the Global SUVR. The SUVR in each areais compared to a region-specific cut-off determined by sparsek-means clustering; those scores above the cut-off are considered“positive”. If any of the regions was considered “PiB Positive,”then the Global rating was set to positive (Cohen et al., 2013).
Magnetoencephalography Signal ProcessingOcular, muscular and jump artifacts are identified using anautomatic procedure from the Fieldtrip package (Oostenveldet al., 2011). The remaining data are segmented into 4 s epochsof artifact-free activity using only the magnetometer data (Garceset al., 2017). An ICA-based procedure is used to remove theelectrocardiographic component.
Source Reconstruction. Artifact-free epochs are filtered between2 and 40 Hz, to remove both low frequency noise and networkline artifact. The epochs are padded with 2 s of real signal fromboth sides prior to the filtering to prevent edge effects insidethe data. The source model consists of 2459 sources placed in
11http://www.neuro.uni-jena.de/cat/12http://www.pmod.com
a homogeneous grid of 1 cm in MNI template, then linearlytransformed to subject space by warping the subject T1-weightedMRI into the MNI template. The lead field is calculated using asingle shell (the brain-skull interface) generated from the T1 MRIusing Fieldtrip13 and a modified spherical solution (Nolte, 2003).A Linearly Constrained Minimum Variance beamformer (VanVeen et al., 1997) is used to obtain the source time series by usingthe computed lead field and building the beamforming filter withthe epoch-averaged covariance matrix and a regularization factorof 5% of the average channel power.
Spectral Analysis. The estimated spatial filters are used toreconstruct the source-space time series for each epoch andsource location. MEG power spectra are calculated between 2 and40 Hz for every clean epoch using a Hann taper, with 0.25 Hzsteps. The resulting spectra for each trial are averaged to build thefinal spectrum for each source. The obtained power is normalizedwith the overall power in Rey (1941), Reitan (1958), Welsh et al.(1991, 1994), Reitan and Wolfson (1994), Van Veen et al. (1997),Watson et al. (1997), Weinhard (1998), Lopez et al. (2000), Saxtonet al. (2000), Wilson et al. (2000), Selkoe (2002), Nolte (2003),Nasreddine et al. (2005), Price et al. (2005), Rosano et al. (2005),Schinka et al. (2005), Taulu and Simola (2006), Erickson et al.(2010, 2013), Bambs et al. (2011), Ewers et al. (2011), Newmanet al. (2011), Oostenveld et al. (2011), Zlokovic (2011), Cohenet al. (2013), Glasser et al. (2013), Lambert et al. (2013), Prescottet al. (2014), Hughes et al. (2015), Tsvetanov et al. (2015), Zhouet al. (2015), Busche and Konnerth (2016), Jack et al. (2016),Garces et al. (2017), Nakamura et al. (2017), Lopez-Sanz et al.(2019), Maestu et al. (2019), and Babiloni et al. (2020) Hz. Thenormalized spectra of all the sources in each brain lobe wereaveraged, obtaining one value per frequency step, brain lobe andsubject. Last, we calculated the relative power per lobe in each ofthe standard frequency bands: Delta (2–4 HZ), Theta (4–8 Hz),Alpha (8–12 Hz), Beta (12–30 Hz), and Gamma (30–40 Hz).
GenotypingWe are genotyping each study participant for 21 previouslyidentified susceptibility genes (Lambert et al., 2013)including APOE∗4 (see Supplementary Table 5). The geneticinformation is also uploaded to the NDA but requires specialpermissions for access.
Measures Related to Risk/Protection From CognitiveImpairmentEach of the study subjects provides additional data related torisk for and protection from cognitive impairment based onstudies from our prior research. With regard to exercise andmotor function, each subject wears an activity monitor (Ericksonet al., 2010, 2013) for five days, and we query them about theamount of walking per week, estimate the number of kilocaloriesburned per week, and measure gait speed (Rosano et al., 2005)(in addition to the motor tasks used by the NIH Toolbox). Eachparticipant completes the Florida Cognitive Activities scale toobtain a measure of activities that might affect cognitive and brainhealth (Schinka et al., 2005; Hughes et al., 2015).
13http://surfer.nmr.mgh.harvard.edu
Frontiers in Aging Neuroscience | www.frontiersin.org 4 October 2021 | Volume 13 | Article 669490

fnagi-13-669490 October 7, 2021 Time: 11:15 # 5
Cohen et al. Brain Aging and Dementia
On Day Two, we measure blood pressure, height, weight,and waist-hip ratio (Mukamal et al., 2003). Laboratory measuresinclude a fasting lipid profile (Wong et al., 2010), cystatin-c, homocysteine (Longstreth et al., 2004), and inflammatorymarkers (Tracy et al., 1997; Fornage et al., 2008; Braskie et al.,2014).
Quality Control/Assurance ProceduresQuality ControlMagnetic Resonance Imaging Scanner. The MRRC has QC/QAprocedures and American College of Radiology certification inplace for all scanners. These include daily signal stability scans forecho planar imaging (1% maximum RMS over a continuous 30-min acquisition with a 64 × 64 matrix size) and daily signal-to-noise measurements with the standard RF head coil. In additionto the daily QC testing of the MRI scanner, each imaging protocolis examined visually prior to submitting it to the local dataarchive. The scans are checked immediately by a member of theImaging Team and repeated if necessary.
Positron Emission Tomography Scanner. QC/QA procedures arerun according to the University of Pittsburgh PET FacilityStandard Operating Procedures HR + Quality Assurance TaskSchedule. The “Daily QC” protocol runs a scan that is comparedto the last standard that was written into the database. That is, thestandard that was written by the Norm 2D and ECF (Customer)protocol. The resulting deviation between scans must be less than2.5. The protocol uses the internal rod sources of the gantry, sono phantoms are used.
Magnetoencephalography Scanner. The operating status ofthe Elekta NeuroMag system is tested daily. This includesdetermining that there is a sufficient level of liquid helium,calibrating and tuning the sensors, determining the properfunctioning of the magnetic shielding producing a sufficientlylow ambient magnetic interference level.
Neuropsychological Testing. Clinical Team Leader Dr. Snitz trainsthe staff who are responsible for administering and/or scoringquestionnaires or paper-and-pencil tests as she does within theADRC.
Quality AssuranceMagnetic Resonance Imaging Scanner. We use the ADNIphantom as a reference tool for our structural and functionalimages.
Positron Emission Tomography Scanner. The 68Ge phantom isrun at on a weekly basis to check for changes in the scannercalibration or changes in uniformity. Four times each year thefollowing procedures are performed in order: Full ASIC BucketSetup; System Normalization; Daily QC; and, Scanner/WellCounter Cross Calibration.
Magnetoencephalography Scanner. Prior to and after every scanwe record 2 min of empty room data to measure ambientmagnetic noise. We complete a simple spectral analysis and thensave the raw data and spectra. This allows for monitoring thenoise level and system status over time to help identify changesin the background environment.
Neuropsychological Testing. Dr. Snitz reviews the scoring of allquestionnaires and paper-and-pencil tests. Every six months asample of ten protocols will be “double scored” to ensure inter-rater reliability. Five of these protocols will be repeated annuallyto check for scoring drift.
PRELIMINARY RESULTS
The data acquired through this protocol are and will continueto be uploaded to the CCF and NDA. However, the team hascompleted some initial analyses to help to better explicate theparticipants who had enrolled in the study by March 31, 2020.The data provides critical information about the relationshipbetween the breakdown in functional and structural connectivityand the expression of cognitive impairment along the AD-pathology continuum. Because of our unique sampling frame,we have data from participants who are less likely to enroll inbiomedical research studies, and this has revealed several aspectsof the normal/pathological aging spectrum that were previouslyunder-appreciated.
The study was reviewed and approved by the University ofPittsburgh Human Research Protection Office. All participantssigned written statements of Informed Consent prior to initiationof any research procedures.
SubjectsA total of 472 individuals inquired about the study and of these,208 either chose not to enroll or failed the initial screeningquestions related to MR compatibility (e.g., metal implants) ormedical history (e.g., clinical stroke). Twenty-seven individualswere excluded after having signed an informed consent form; asof 31 March 2020, 227 individuals had enrolled in the study.
Of these participants, 13 had been diagnosed with DAT;these individuals are not described in this report. Sixty-sevenstudy participants (31%) entered via the ADRC; 97 (45%) camethrough Pitt + Me, and 27 (13%) were volunteers from thecommunity. Twenty-one participants (10%) entered throughHeartScore or the LLFS.
We compared the characteristics of the participants initiallyclassified as having normal cognition to those with some degreeof impairment. There were two subgroups among the CognitivelyNormal participants: those who reported no limitations intheir cognition and those who reported significant concerns[Subjective Cognitive Complaints (SCC)]. There were also twosubgroups among the cognitively impaired participants: thosewho reported no concerns or loss of abilities [Impaired WithoutComplaints (IWOC)], and those who reported loss of abilities(i.e., MCI) (see Tables 1–3).
The proportion of Black individuals was greater within thecognitively impaired group, as was the proportion reportingbeing left-handed. As would be expected, the Crystallizedand Fluid Intelligence measures from the NIH Toolbox weresignificantly lower among the impaired participants.
The two subgroups of individuals who were cognitivelynormal did not differ in terms of age, years of education,distribution of men and women, race, or handedness (see
Frontiers in Aging Neuroscience | www.frontiersin.org 5 October 2021 | Volume 13 | Article 669490
fnagi-13-669490 October 7, 2021 Time: 11:15 # 6
Cohen et al. Brain Aging and Dementia
TABLE 1 | Characteristics of study participants as a function of initial classification.
Study groups Effect size1
Normalcognition
Impairedcognition
Number 121 93
Age 65.6 (8.0) 62.8 (9.7) 0.03*
Education 16.0 (3.1) 13.9 (2.8) 0.13*
Sex [Percent (N) Male] 30.6 (37) 30.4 (32) 0.04
Race [Percent (N) Caucasian] 59.5 (72) 34.4 (32) 0.29*
Handedness [Percent (N) Right] 95.7 (112) 90.0 (81) 0.11*
APOE*4 Present [Percent(N)] 26.1 (29) 34.9 (30) 0.10
Montreal Cognitive Assessment 26.5 (2.3) 23.4 (2.7) 0.44*
Wide Range Achievement Test – 4 63.8 (5.1) 59.1 (7.8) 0.18*
Walk Endurance – 2min distance 544.4 (177.2) 502.1 (87.0) 0.02
Gait Speed – 4meter walk – time 3.4 (0.5) 3.4 (0.7) 0.001
Oral reading 6.9 (3.6) 4.6 (2.8_ 0.12*
DCCS 29.3 (1.0) 28.2 (2.0) 0.13*
Flanker Inhibitory Control 19.9 (0.8) 19.9 (0.6) 0.00
Pattern Comparison 41.7 (6.3) 38.5 (7.6) 0.05*
Picture Sequence Memory 11.7 (6.8) 7.3 (4.7) 0.14*
Crystalized Cognition 113.5 (9.3) 105.0 (9.1) 0.21
Fluid Cognition 97.5 (9.1) 88.4 (9.2) 0.25*
Total Cognition 105.8 (8.8) 95.4 (7.4) 0.40*
Promis Abilities 30.8 (7.2) 28.1 (8.0) 0.03*
Promis Concerns 16.1 (7.3) 17.0 (7.5) 0.004
Life Satisfaction 19.9 (7.4) 20.1 (10.7) 0.000
Meaning 29.2 (15.3) 30.1 (14.7) 0.001
Positive Affect 18.8 (13.1) 21.2 (15.6) 0.01
Sadness 8.9 (2.4) 9.2 (2.2) 0.004
Self-Efficacy 19.6 (9.4) 18.5 (9.7) 0.003
1Cramer’s V for categorical data; Cohen’s f2 for continuous data. ∗p < 0.05.
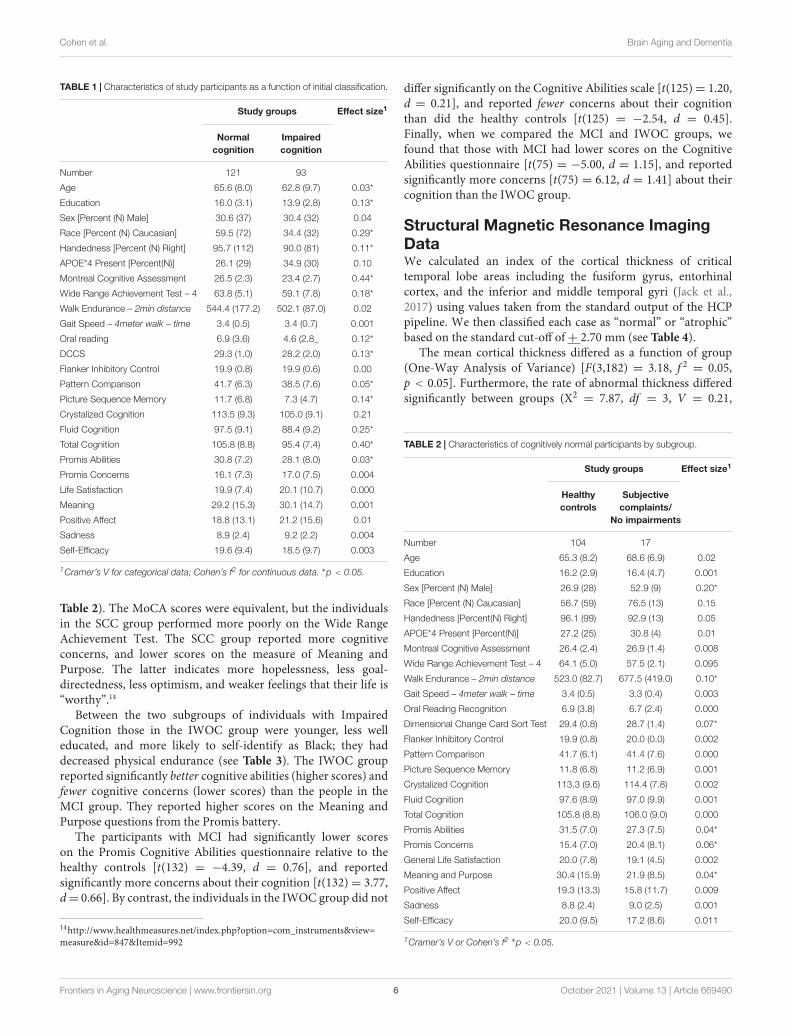
Table 2). The MoCA scores were equivalent, but the individualsin the SCC group performed more poorly on the Wide RangeAchievement Test. The SCC group reported more cognitiveconcerns, and lower scores on the measure of Meaning andPurpose. The latter indicates more hopelessness, less goal-directedness, less optimism, and weaker feelings that their life is“worthy”.14
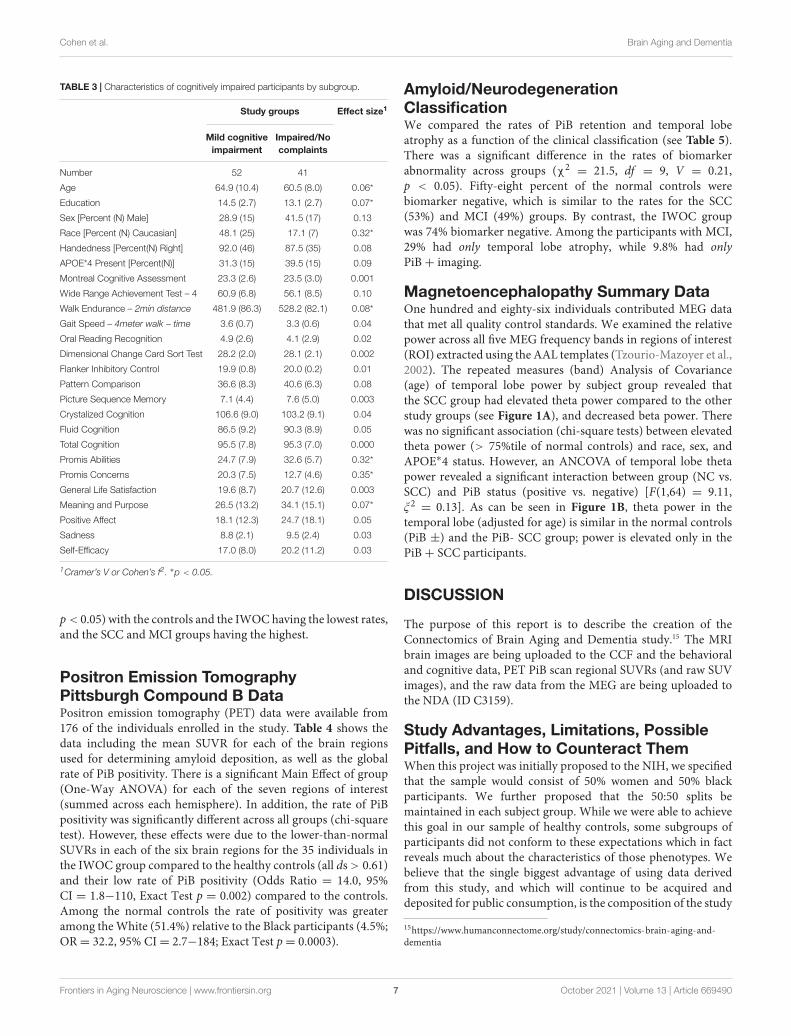
Between the two subgroups of individuals with ImpairedCognition those in the IWOC group were younger, less welleducated, and more likely to self-identify as Black; they haddecreased physical endurance (see Table 3). The IWOC groupreported significantly better cognitive abilities (higher scores) andfewer cognitive concerns (lower scores) than the people in theMCI group. They reported higher scores on the Meaning andPurpose questions from the Promis battery.
The participants with MCI had significantly lower scoreson the Promis Cognitive Abilities questionnaire relative to thehealthy controls [t(132) = −4.39, d = 0.76], and reportedsignificantly more concerns about their cognition [t(132)= 3.77,d= 0.66]. By contrast, the individuals in the IWOC group did not
14http://www.healthmeasures.net/index.php?option=com_instruments&view=measure&id=847&Itemid=992
differ significantly on the Cognitive Abilities scale [t(125)= 1.20,d = 0.21], and reported fewer concerns about their cognitionthan did the healthy controls [t(125) = −2.54, d = 0.45].Finally, when we compared the MCI and IWOC groups, wefound that those with MCI had lower scores on the CognitiveAbilities questionnaire [t(75) = −5.00, d = 1.15], and reportedsignificantly more concerns [t(75) = 6.12, d = 1.41] about theircognition than the IWOC group.
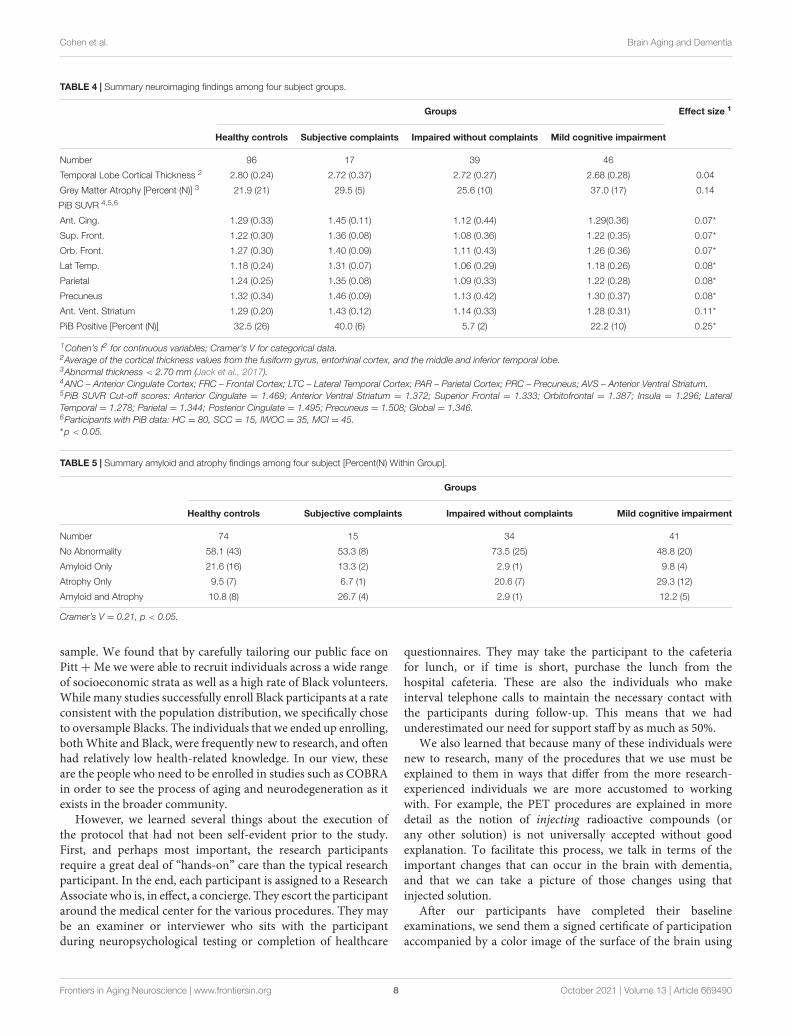
Structural Magnetic Resonance ImagingDataWe calculated an index of the cortical thickness of criticaltemporal lobe areas including the fusiform gyrus, entorhinalcortex, and the inferior and middle temporal gyri (Jack et al.,2017) using values taken from the standard output of the HCPpipeline. We then classified each case as “normal” or “atrophic”based on the standard cut-off of+ 2.70 mm (see Table 4).
The mean cortical thickness differed as a function of group(One-Way Analysis of Variance) [F(3,182) = 3.18, f 2
= 0.05,p < 0.05]. Furthermore, the rate of abnormal thickness differedsignificantly between groups (X2
= 7.87, df = 3, V = 0.21,
TABLE 2 | Characteristics of cognitively normal participants by subgroup.
Study groups Effect size1
Healthycontrols
Subjectivecomplaints/
No impairments
Number 104 17
Age 65.3 (8.2) 68.6 (6.9) 0.02
Education 16.2 (2.9) 16.4 (4.7) 0.001
Sex [Percent (N) Male] 26.9 (28) 52.9 (9) 0.20*
Race [Percent (N) Caucasian] 56.7 (59) 76.5 (13) 0.15
Handedness [Percent(N) Right] 96.1 (99) 92.9 (13) 0.05
APOE*4 Present [Percent(N)] 27.2 (25) 30.8 (4) 0.01
Montreal Cognitive Assessment 26.4 (2.4) 26.9 (1.4) 0.008
Wide Range Achievement Test – 4 64.1 (5.0) 57.5 (2.1) 0.095
Walk Endurance – 2min distance 523.0 (82.7) 677.5 (419.0) 0.10*
Gait Speed – 4meter walk – time 3.4 (0.5) 3.3 (0.4) 0.003
Oral Reading Recognition 6.9 (3.8) 6.7 (2.4) 0.000
Dimensional Change Card Sort Test 29.4 (0.8) 28.7 (1.4) 0.07*
Flanker Inhibitory Control 19.9 (0.8) 20.0 (0.0) 0.002
Pattern Comparison 41.7 (6.1) 41.4 (7.6) 0.000
Picture Sequence Memory 11.8 (6.8) 11.2 (6.9) 0.001
Crystalized Cognition 113.3 (9.6) 114.4 (7.8) 0.002
Fluid Cognition 97.6 (8.9) 97.0 (9.9) 0.001
Total Cognition 105.8 (8.8) 106.0 (9.0) 0.000
Promis Abilities 31.5 (7.0) 27.3 (7.5) 0.04*
Promis Concerns 15.4 (7.0) 20.4 (8.1) 0.06*
General Life Satisfaction 20.0 (7.8) 19.1 (4.5) 0.002
Meaning and Purpose 30.4 (15.9) 21.9 (8.5) 0.04*
Positive Affect 19.3 (13.3) 15.8 (11.7) 0.009
Sadness 8.8 (2.4) 9.0 (2.5) 0.001
Self-Efficacy 20.0 (9.5) 17.2 (8.6) 0.011
1Cramer’s V or Cohen’s f2 ∗p < 0.05.
Frontiers in Aging Neuroscience | www.frontiersin.org 6 October 2021 | Volume 13 | Article 669490
fnagi-13-669490 October 7, 2021 Time: 11:15 # 7
Cohen et al. Brain Aging and Dementia
TABLE 3 | Characteristics of cognitively impaired participants by subgroup.
Study groups Effect size1
Mild cognitiveimpairment
Impaired/Nocomplaints
Number 52 41
Age 64.9 (10.4) 60.5 (8.0) 0.06*
Education 14.5 (2.7) 13.1 (2.7) 0.07*
Sex [Percent (N) Male] 28.9 (15) 41.5 (17) 0.13
Race [Percent (N) Caucasian] 48.1 (25) 17.1 (7) 0.32*
Handedness [Percent(N) Right] 92.0 (46) 87.5 (35) 0.08
APOE*4 Present [Percent(N)] 31.3 (15) 39.5 (15) 0.09
Montreal Cognitive Assessment 23.3 (2.6) 23.5 (3.0) 0.001
Wide Range Achievement Test – 4 60.9 (6.8) 56.1 (8.5) 0.10
Walk Endurance – 2min distance 481.9 (86.3) 528.2 (82.1) 0.08*
Gait Speed – 4meter walk – time 3.6 (0.7) 3.3 (0.6) 0.04
Oral Reading Recognition 4.9 (2.6) 4.1 (2.9) 0.02
Dimensional Change Card Sort Test 28.2 (2.0) 28.1 (2.1) 0.002
Flanker Inhibitory Control 19.9 (0.8) 20.0 (0.2) 0.01
Pattern Comparison 36.6 (8.3) 40.6 (6.3) 0.08
Picture Sequence Memory 7.1 (4.4) 7.6 (5.0) 0.003
Crystalized Cognition 106.6 (9.0) 103.2 (9.1) 0.04
Fluid Cognition 86.5 (9.2) 90.3 (8.9) 0.05
Total Cognition 95.5 (7.8) 95.3 (7.0) 0.000
Promis Abilities 24.7 (7.9) 32.6 (5.7) 0.32*
Promis Concerns 20.3 (7.5) 12.7 (4.6) 0.35*
General Life Satisfaction 19.6 (8.7) 20.7 (12.6) 0.003
Meaning and Purpose 26.5 (13.2) 34.1 (15.1) 0.07*
Positive Affect 18.1 (12.3) 24.7 (18.1) 0.05
Sadness 8.8 (2.1) 9.5 (2.4) 0.03
Self-Efficacy 17.0 (8.0) 20.2 (11.2) 0.03
1Cramer’s V or Cohen’s f2. ∗p < 0.05.
p< 0.05) with the controls and the IWOC having the lowest rates,and the SCC and MCI groups having the highest.
Positron Emission TomographyPittsburgh Compound B DataPositron emission tomography (PET) data were available from176 of the individuals enrolled in the study. Table 4 shows thedata including the mean SUVR for each of the brain regionsused for determining amyloid deposition, as well as the globalrate of PiB positivity. There is a significant Main Effect of group(One-Way ANOVA) for each of the seven regions of interest(summed across each hemisphere). In addition, the rate of PiBpositivity was significantly different across all groups (chi-squaretest). However, these effects were due to the lower-than-normalSUVRs in each of the six brain regions for the 35 individuals inthe IWOC group compared to the healthy controls (all ds> 0.61)and their low rate of PiB positivity (Odds Ratio = 14.0, 95%CI = 1.8−110, Exact Test p = 0.002) compared to the controls.Among the normal controls the rate of positivity was greateramong the White (51.4%) relative to the Black participants (4.5%;OR= 32.2, 95% CI= 2.7−184; Exact Test p= 0.0003).
Amyloid/NeurodegenerationClassificationWe compared the rates of PiB retention and temporal lobeatrophy as a function of the clinical classification (see Table 5).There was a significant difference in the rates of biomarkerabnormality across groups (χ2
= 21.5, df = 9, V = 0.21,p < 0.05). Fifty-eight percent of the normal controls werebiomarker negative, which is similar to the rates for the SCC(53%) and MCI (49%) groups. By contrast, the IWOC groupwas 74% biomarker negative. Among the participants with MCI,29% had only temporal lobe atrophy, while 9.8% had onlyPiB+ imaging.
Magnetoencephalopathy Summary DataOne hundred and eighty-six individuals contributed MEG datathat met all quality control standards. We examined the relativepower across all five MEG frequency bands in regions of interest(ROI) extracted using the AAL templates (Tzourio-Mazoyer et al.,2002). The repeated measures (band) Analysis of Covariance(age) of temporal lobe power by subject group revealed thatthe SCC group had elevated theta power compared to the otherstudy groups (see Figure 1A), and decreased beta power. Therewas no significant association (chi-square tests) between elevatedtheta power (> 75%tile of normal controls) and race, sex, andAPOE∗4 status. However, an ANCOVA of temporal lobe thetapower revealed a significant interaction between group (NC vs.SCC) and PiB status (positive vs. negative) [F(1,64) = 9.11,ξ 2= 0.13]. As can be seen in Figure 1B, theta power in the
temporal lobe (adjusted for age) is similar in the normal controls(PiB ±) and the PiB- SCC group; power is elevated only in thePiB+ SCC participants.
DISCUSSION
The purpose of this report is to describe the creation of theConnectomics of Brain Aging and Dementia study.15 The MRIbrain images are being uploaded to the CCF and the behavioraland cognitive data, PET PiB scan regional SUVRs (and raw SUVimages), and the raw data from the MEG are being uploaded tothe NDA (ID C3159).
Study Advantages, Limitations, PossiblePitfalls, and How to Counteract ThemWhen this project was initially proposed to the NIH, we specifiedthat the sample would consist of 50% women and 50% blackparticipants. We further proposed that the 50:50 splits bemaintained in each subject group. While we were able to achievethis goal in our sample of healthy controls, some subgroups ofparticipants did not conform to these expectations which in factreveals much about the characteristics of those phenotypes. Webelieve that the single biggest advantage of using data derivedfrom this study, and which will continue to be acquired anddeposited for public consumption, is the composition of the study
15https://www.humanconnectome.org/study/connectomics-brain-aging-and-dementia
Frontiers in Aging Neuroscience | www.frontiersin.org 7 October 2021 | Volume 13 | Article 669490
fnagi-13-669490 October 7, 2021 Time: 11:15 # 8
Cohen et al. Brain Aging and Dementia
TABLE 4 | Summary neuroimaging findings among four subject groups.
Groups Effect size 1
Healthy controls Subjective complaints Impaired without complaints Mild cognitive impairment
Number 96 17 39 46
Temporal Lobe Cortical Thickness 2 2.80 (0.24) 2.72 (0.37) 2.72 (0.27) 2.68 (0.28) 0.04
Grey Matter Atrophy [Percent (N)] 3 21.9 (21) 29.5 (5) 25.6 (10) 37.0 (17) 0.14
PiB SUVR 4,5,6
Ant. Cing. 1.29 (0.33) 1.45 (0.11) 1.12 (0.44) 1.29(0.36) 0.07*
Sup. Front. 1.22 (0.30) 1.36 (0.08) 1.08 (0.36) 1.22 (0.35) 0.07*
Orb. Front. 1.27 (0.30) 1.40 (0.09) 1.11 (0.43) 1.26 (0.36) 0.07*
Lat Temp. 1.18 (0.24) 1.31 (0.07) 1.06 (0.29) 1.18 (0.26) 0.08*
Parietal 1.24 (0.25) 1.35 (0.08) 1.09 (0.33) 1.22 (0.28) 0.08*
Precuneus 1.32 (0.34) 1.46 (0.09) 1.13 (0.42) 1.30 (0.37) 0.08*
Ant. Vent. Striatum 1.29 (0.20) 1.43 (0.12) 1.14 (0.33) 1.28 (0.31) 0.11*
PiB Positive [Percent (N)] 32.5 (26) 40.0 (6) 5.7 (2) 22.2 (10) 0.25*
1Cohen’s f2 for continuous variables; Cramer’s V for categorical data.2Average of the cortical thickness values from the fusiform gyrus, entorhinal cortex, and the middle and inferior temporal lobe.3Abnormal thickness < 2.70 mm (Jack et al., 2017).4ANC – Anterior Cingulate Cortex; FRC – Frontal Cortex; LTC – Lateral Temporal Cortex; PAR – Parietal Cortex; PRC – Precuneus; AVS – Anterior Ventral Striatum.5PiB SUVR Cut-off scores: Anterior Cingulate = 1.469; Anterior Ventral Striatum = 1.372; Superior Frontal = 1.333; Orbitofrontal = 1.387; Insula = 1.296; LateralTemporal = 1.278; Parietal = 1.344; Posterior Cingulate = 1.495; Precuneus = 1.508; Global = 1.346.6Participants with PiB data: HC = 80, SCC = 15, IWOC = 35, MCI = 45.∗p < 0.05.
TABLE 5 | Summary amyloid and atrophy findings among four subject [Percent(N) Within Group].
Groups
Healthy controls Subjective complaints Impaired without complaints Mild cognitive impairment
Number 74 15 34 41
No Abnormality 58.1 (43) 53.3 (8) 73.5 (25) 48.8 (20)
Amyloid Only 21.6 (16) 13.3 (2) 2.9 (1) 9.8 (4)
Atrophy Only 9.5 (7) 6.7 (1) 20.6 (7) 29.3 (12)
Amyloid and Atrophy 10.8 (8) 26.7 (4) 2.9 (1) 12.2 (5)
Cramer’s V = 0.21, p < 0.05.
sample. We found that by carefully tailoring our public face onPitt+Me we were able to recruit individuals across a wide rangeof socioeconomic strata as well as a high rate of Black volunteers.While many studies successfully enroll Black participants at a rateconsistent with the population distribution, we specifically choseto oversample Blacks. The individuals that we ended up enrolling,both White and Black, were frequently new to research, and oftenhad relatively low health-related knowledge. In our view, theseare the people who need to be enrolled in studies such as COBRAin order to see the process of aging and neurodegeneration as itexists in the broader community.
However, we learned several things about the execution ofthe protocol that had not been self-evident prior to the study.First, and perhaps most important, the research participantsrequire a great deal of “hands-on” care than the typical researchparticipant. In the end, each participant is assigned to a ResearchAssociate who is, in effect, a concierge. They escort the participantaround the medical center for the various procedures. They maybe an examiner or interviewer who sits with the participantduring neuropsychological testing or completion of healthcare
questionnaires. They may take the participant to the cafeteriafor lunch, or if time is short, purchase the lunch from thehospital cafeteria. These are also the individuals who makeinterval telephone calls to maintain the necessary contact withthe participants during follow-up. This means that we hadunderestimated our need for support staff by as much as 50%.
We also learned that because many of these individuals werenew to research, many of the procedures that we use must beexplained to them in ways that differ from the more research-experienced individuals we are more accustomed to workingwith. For example, the PET procedures are explained in moredetail as the notion of injecting radioactive compounds (orany other solution) is not universally accepted without goodexplanation. To facilitate this process, we talk in terms of theimportant changes that can occur in the brain with dementia,and that we can take a picture of those changes using thatinjected solution.
After our participants have completed their baselineexaminations, we send them a signed certificate of participationaccompanied by a color image of the surface of the brain using
Frontiers in Aging Neuroscience | www.frontiersin.org 8 October 2021 | Volume 13 | Article 669490

fnagi-13-669490 October 7, 2021 Time: 11:15 # 9
Cohen et al. Brain Aging and Dementia
FIGURE 1 | (A) Estimated mean power in the five cortical regions adjusted for mean age of the group. The bars represent values for the Normal Controls, IWOC,SCC, and MCI groups, respectively. (B) Estimated theta band power in the temporal lobes adjusted for mean age. The open bars are those individuals classified asPiB−, and the cross-hatched bars are for those individuals who are PiB+.
the Freesurfer parcellations. Frequently, this results in ourgetting telephone calls being asked to explain “what it means.”One of the Investigators always returns these calls; it is criticallyimportant to “give back” to the communities. We also attend
monthly gatherings at local Community Engagement Centers –just being present increases our familiarity to the community.
We also found that it was important to pay close attentionto transportation needs. Many of our participants live in
Frontiers in Aging Neuroscience | www.frontiersin.org 9 October 2021 | Volume 13 | Article 669490

fnagi-13-669490 October 7, 2021 Time: 11:15 # 10
Cohen et al. Brain Aging and Dementia
neighborhoods where public transportation is less than ideal(e.g., two or more transfers needed for a 60-min one-way trip).Consequently, we had to develop relationships with ridesharingservices to obtain the quality of service that we wanted for ourparticipants. Everyone is met at the door to the hospital by their“concierge,” and from there escorted to all of the tasks that theywill do during the day. At the end of the day the ride is scheduled,and the “concierge” takes the volunteer back to the lobby andawaits the arrival of the car.
Finally, while all imaging researchers are familiar with theproblem of incidental findings, the quality of those findingsin a study such as this is different than that which we haveencountered in the past. Many of the individuals in the studyhad limited healthcare resources which might have identifiedpotential problems; many participants do not have a regularannual physical. However, we have also had instances of moresevere brain injury that was a consequence of the participantsliving environment. One individual, for example, had suffereda severe closed head injury, and the sequalae were evidenton the scan. However, there was no mention of this eventdespite multiple opportunities during screening and interview.The individual seemed surprised that spending more than threedays in the hospital, much of the time in coma, would resultin brain damage. This view is likely due in part due to lack ofawareness of health-related issues.
Comments on Preliminary DataA significant proportion of the participants in this study havenever been involved in biomedical research. Thus, our samplelikely includes individuals who are typically under-representedin academic research studies and may be more representativeof the population at-risk for cognitive impairment. This hasresulted in the identification of a group of study participants whowere cognitively impaired but had no complaints or concernsabout their cognitive abilities. Further, we found that the rateof amyloid deposition among those individuals with cognitiveimpairment (i.e., MCI and IWOC) was lower than expectedbased on prior analyses (Wolk et al., 2009). Among the MCIparticipants 4/10 individuals (40%) recruited from the ADRCwere amyloid positive, whereas only 1/16 among the individuals(6%) recruited via Pitt + Me were amyloid positive (OddsRatio = 10.0, 95% Confidence Interval = 0.92 – 108, p = 0.055)[cf., (Wolk et al., 2009)].
We had assumed when the project began that participantsrecruited from the community would be, on average, cognitivelynormal; the cognitively impaired participants (and thosewith subjective complaints) would enroll through the ADRC.However, experience revealed a more nuanced picture. Thegroup of individuals with impaired cognition, but who didnot complain of changes in their behavior or cognitiondeserve special mention. The participants in this group werepredominantly Black (85%) which contrasts sharply with theNC (41.7%) and SCC (14.3%) groups. Their performance onthe tests used for classification was equivalent to that of theMCI participants, but without the complaints necessary forthat classification. Indeed, on average the IWOC participantsreported better cognitive abilities, and fewer cognitive concerns
than did the cognitively normal controls. The near absence ofPiB retention means that these individuals were not as yet,on the AD pathology spectrum; although with a mean ageof 60 years, the amyloid cascade may not be well developed,or perhaps other non-amyloid factors may be in play [e.g.,(Selkoe, 2002)].
Given the age range of the IWOC group there is also ahigh likelihood that these individuals (as well as other Blackparticipants in the study) are the children or grandchildrenof the people who migrated from the rural South to citieslike Pittsburgh. Growing up Black in a northern city in the1950s and 1960s was likely associated with poorer educationalquality, poor access to medical care and health maintenance,as well as a range of psychosocial consequences of explicit andimplicit discrimination. It may be that any racial inequitiesin the development of cognitive impairments are drivenby pervasive institutionalized inequities that shape risk anddisadvantage individuals at multiple levels, including biological,environmental, behavioral, sociocultural (Hill et al., 2015).Although these factors have often been referred to as “modifiableindividual risk factors,” this term fails to recognize that individualrisk is influenced by racism and social determinants thatare outside of an individual’s control. At a population level,Black communities experience racism and more adverse socialdeterminants of health, including negative work, living andeducational conditions, that can lead to long-term negativebiological consequences (Shonkoff et al., 2009; Braveman P. et al.,2011; Braveman P.A. et al., 2011). Indeed, neighborhood-leveldisadvantage was associated with an increased likelihood of ADneuropathology at autopsy (Powell et al., 2020). While thereare established diagnostic hallmarks of AD, little attention hasbeen paid to the possibility that factors such as neighborhoodcontext may directly and indirectly impact brain changes thatalter the connectome, thus resulting in earlier expression ofthe dementia. To date, little attention has been paid to thepossibility that early social structural and social determinantsmay affect brain structure and function, alter the connectome,and reduce brain reserve and compensation resulting in theearlier expression of DAT and an apparent increased incidenceof dementia among Blacks [see also Wilkins et al., 2020]. Indeed,there needs to be a paradigm shift in the field to focus oncollecting the contextual and environmental data that may helpdisentangle apparent differences due to race; “analyzing findingsby race/ethnicity without appropriate contextual data couldlead to inaccurate, misleading, or stigmatizing conclusions thatmay detract from the overall goals of diversity in research: toenhance the accuracy, utility, and generalizability of scientificevidence” (Wilkins et al., 2020). This view is supported by thedecades of research that argue that racial and socioeconomicinequities are not the result of individual behavior or biologicalfactors but rather are due to the structures, institutionalpractices, and policies which contribute to adverse outcomesand susceptibilities (Fuller-Thomson et al., 2009; Nuru-Jeteret al., 2009; Mendez et al., 2014a,b; Bailey et al., 2017;Hardeman et al., 2018).
The data included in this project provides investigatorsaround the world with the opportunity to investigate
Frontiers in Aging Neuroscience | www.frontiersin.org 10 October 2021 | Volume 13 | Article 669490
fnagi-13-669490 October 7, 2021 Time: 11:15 # 11
Cohen et al. Brain Aging and Dementia
the spectrum of aging and AD effects on the brain andcognition using true-multimodal imaging, and detailedcognitive/behavioral evaluations. Genetic analyses will becompleted starting at the end of 2020, and those restricteddata will be available directly from the study investigators.Longitudinal follow-up of the individuals in the study isunderway, and there are plans to enrich the sample of pre-DATparticipants and continue follow-up. These data, combined withthe main HCP dataset, the HCP Lifespan and Aging datasets, andthe other CRHD project related to AD provide richest and mostcomprehensive resource for the neurobiological study of AD andrelated dementias.
CONCLUSION
The study has two unique characteristics. First, the data areacquired using standard and standardized procedures that areshared by other CRHD studies, including the HCP LifespanStudy (Bookheimer et al., 2019). This provides an international,accessible database for all investigators. Second, and moreimportant, are the characteristics of the study sample. We usedmultiple portals of entry, including customized web sites thatallowed to achieve our goal of ∼50% Black participants, andreaching people who were participating in their first researchstudy. This, we believe, at least partly explains why our measuredrates of AD pathology are lower than those in more typicalresearch samples [e.g., (Wolk et al., 2009)]. In addition, weidentified a group of participants whose test performance wasas poor as that of the MCI participants, but who reports fewconcerns about their cognition [c.f., (Antinori et al., 2007)]; thisgroup is predominately Black.
This leads us to what we believe is the most importantimplication of our data, and which is a weakness of the studyas currently described. Specifically, we, like many others, makethe mistake of “analyzing [our] findings by race/ethnicity withoutappropriate contextual data [which] could lead to inaccurate,misleading, or stigmatizing conclusions that may detract fromthe overall goals of diversity in research: to enhance the accuracy,utility, and generalizability of scientific evidence” (Wilkins et al.,2020). Race is a socially determined construct that is notbiologically or genetically based (Cooper and David, 1986). Inaddition to strong data suggesting there are no biologicallydetermined differences between races (Serre and Paabo, 2004),defining race as a social construct has the advantage of capturingthe concept of racism more precisely (Jones, 2000). Racism isthus better defined as a system that structures opportunity basedon race, providing unfair advantages and disadvantages basedon race.
There is still considerable disagreement on the factorscontributing to disparities in many AD- related outcomes, e.g.,dementia onset and course. Much of this is likely due tothe focus on individual behavior or “lifestyle factors” withoutconsideration for the social, physical, and policy environmentsthat are inextricably linked to the individual and are key tounderstanding health disparities (Cooper et al., 2015). Perhapsa better way to place the factors related to AD and dementiainto the NIA Health Disparities Framework is to study the
interplay between social determinants of health, racism, andAD and dementia (Hill et al., 2015). Aside from the moredirect effects racism on risk factors, we also believe that racismmay have the moderating effect of reducing the impact of thepositive social determinants of health (SDOH) (e.g., education,access to health care) and increasing the impact of negativeSDOH (e.g., poverty, social isolation). Significant advances inAD and dementia prevention and management will be madeas we accumulate more information SDOH and how racismaffects their relationship with resilience, diagnosis, prognosis, andresponse to treatment.
THE CoBRA STUDY TEAM
The CoBRA Study team includes: Ann D. Cohen, Beth E. Snitz,Ted Huppert, Tae Kim, Yue-Fang Chang, Yu Cheng, Jack Doman,Ricardo Bruña, Fernando Maestu, Avniel Ghuman, Anto Bagic,Ilyas Kamboh, Anne Newman, Steven Reis, Rebecca Roush, LaraFatukasi, Leslie Kovach, Katey Potopenko, Howard J. Aizenstein,Lewis H. Kuller, William E. Klunk, Caterina Rosano, Oscar L.Lopez, and James T. Becker.
With the exceptions of AC and JB, the order of the authorsis alphabetical.
DATA AVAILABILITY STATEMENT
The datasets presented in this study can be found in onlinerepositories. The names of the repository/repositories andaccession number(s) can be found below: HCP ConnectomeCentral Facility https://www.humanconnectome.org/study/connectomics-brain-aging-and-dementia; NIMH Data Archivehttps://nda.nih.gov/edit_collection.html?id=3159.
ETHICS STATEMENT
The studies involving human participants were reviewed andapproved by Human Research Protection Office; Universityof Pittsburgh. The patients/participants provided their writteninformed consent to participate in this study.
AUTHOR CONTRIBUTIONS
AC and JB made the initial draft of the work while the remainingauthors revised it for important intellectual content. All authorsmade substantial contributions to the conception and designof the work, as well as the acquisition, analysis, interpretationof data for the work, and had final approval of the versionto be published.
FUNDING
This research and the preparation of this manuscript wassupported by funds from the National Institute on Aging(UF1-AG051197), as well as the Neuroimaging Core of the
Frontiers in Aging Neuroscience | www.frontiersin.org 11 October 2021 | Volume 13 | Article 669490
fnagi-13-669490 October 7, 2021 Time: 11:15 # 12
Cohen et al. Brain Aging and Dementia
Alzheimer’s Disease Research Center (P50-AG005133 and P30-AG066468).
ACKNOWLEDGMENTS
We are grateful for the support from the Heart StrategiesConcentrating on Risk Evaluation (Heart SCORE) study (R01-HL089292) and the Long Life Family Study (U01-AG23744), and
the Clinical and Translational Science Institute at the Universityof Pittsburgh (UL1-TR001857) for managing Pitt+Me.
SUPPLEMENTARY MATERIAL
The Supplementary Material for this article can be foundonline at: https://www.frontiersin.org/articles/10.3389/fnagi.2021.669490/full#supplementary-material
REFERENCESAntinori, A., Arendt, G., Becker, J. T., Brew, B. J., Byrd, D. A., Cherner, M.,
et al. (2007). Updated research nosology for HIV-associated neurocognitivedisorders. Neurology 69, 1789–1799. doi: 10.1212/01.WNL.0000287431.88658.8b
Babiloni, C., Blinowska, K., Bonanni, L., Cichocki, A., De Haan, W., Del Percio,C., et al. (2020). What electrophysiology tells us about Alzheimer’s disease: awindow into the synchronization and connectivity of brain neurons. Neurobiol.Aging 85, 58–73. doi: 10.1016/j.neurobiolaging.2019.09.008
Bailey, Z. D., Krieger, N., Agenor, M., Graves, J., Linos, N., and Bassett, M. T. (2017).Structural racism and health inequities in the USA: evidence and interventions.Lancet 389, 1453–1463. doi: 10.1016/S0140-6736(17)30569-X
Bambs, C., Kip, K. E., Dinga, A., Mulukutla, S. R., Aiyer, A. N., and Reis, S. E.(2011). Low prevalence of “ideal cardiovascular health” in a community-based population: the heart strategies concentrating on risk evaluation (HeartSCORE) study. Circulation 123, 850–857. doi: 10.1161/CIRCULATIONAHA.110.980151
Bookheimer, S. Y., Salat, D. H., Terpstra, M., Ances, B. M., Barch, D. M., Buckner,R. L., et al. (2019). The lifespan human connectome project in aging: anoverview. Neuroimage 185, 335–348. doi: 10.1016/j.neuroimage.2018.10.009
Braskie, M. N., Boyle, C. P., Rajagopalan, P., Gutman, B. A., Toga, A. W., Raji,C. A., et al. (2014). Physical activity, inflammation, and volume of the agingbrain. Neuroscience 273, 199–209. doi: 10.1016/j.neuroscience.2014.05.005
Braveman, P., Egerter, S., and Williams, D. R. (2011). The social determinants ofhealth: coming of age. Annu. Rev. Public Health 32, 381–398. doi: 10.1146/annurev-publhealth-031210-101218
Braveman, P. A., Egerter, S. A., and Mockenhaupt, R. E. (2011). Broadening thefocus: the need to address the social determinants of health. Am. J. Prev. Med.40, S4–S18. doi: 10.1016/j.amepre.2010.10.002
Busche, M. A., and Konnerth, A. (2016). Impairments of neural circuit functionin Alzheimer’s disease. Philos. Trans. R. Soc. Lond. B Biol. Sci. 371:20150429.doi: 10.1098/rstb.2015.0429
Cohen, A. D., Mowrey, W., Weissfeld, L. A., Aizenstein, H. J., McDade, E., Mountz,J. M., et al. (2013). Classification of amyloid-positivity in controls: comparisonof visual read and quantitative approaches. Neuroimage 71, 207–215. doi:10.1016/j.neuroimage.2013.01.015
Cooper, L. A., Ortega, A. N., Ammerman, A. S., Buchwald, D., Paskett, E. D.,Powell, L. H., et al. (2015). Calling for a bold new vision of health disparitiesintervention research. Am. J. Public Health 105(Suppl. 3), S374–S376. doi:10.2105/AJPH.2014.302386
Cooper, R., and David, R. (1986). The biological concept of race and its applicationto public health and epidemiology. J. Health Polit. Policy Law 11, 97–116.doi: 10.1215/03616878-11-1-97
Dai, Z., and He, Y. (2014). Disrupted structural and functional brain connectomesin mild cognitive impairment and Alzheimer’s disease. Neurosci. Bull. 30,217–232. doi: 10.1007/s12264-013-1421-0
Erickson, K. I., Barr, L. L., Weinstein, A. M., Banducci, S. E., Akl, S. L., Santo, N. M.,et al. (2013). Measuring physical activity using accelerometry in a communitysample with dementia. J. Am. Geriatr. Soc. 61, 158–159. doi: 10.1111/jgs.12050
Erickson, K. I., Raji, C. A., Lopez, O. L., Becker, J. T., Rosano, C., Newman, A. B.,et al. (2010). Physical activity predicts gray matter volume in late adulthood:the Cardiovascular Health Study. Neurology 75, 1415–1422. doi: 10.1212/WNL.0b013e3181f88359
Ewers, M., Frisoni, G. B., Teipel, S. J., Grinberg, L. T., Amaro, E. Jr., Heinsen,H., et al. (2011). Staging Alzheimer’s disease progression with multimodality
neuroimaging. Prog. Neurobiol. 95, 535–546. doi: 10.1016/j.pneurobio.2011.06.004
Fornage, M., Chiang, Y. A., O’Meara, E. S., Psaty, B. M., Reiner, A. P., Siscovick,D. S., et al. (2008). Biomarkers of inflammation and MRI-defined small vesseldisease of the brain: the Cardiovascular Health Study. Stroke 39, 1952–1959.doi: 10.1161/STROKEAHA.107.508135
Fuller-Thomson, E., Nuru-Jeter, A., Minkler, M., and Guralnik, J. M. (2009). Black-White disparities in disability among older Americans: further untangling therole of race and socioeconomic status. J. Aging Health 21, 677–698. doi: 10.1177/0898264309338296
Garces, P., Lopez-Sanz, D., Maestu, F., and Pereda, E. (2017). Choice ofmagnetometers and gradiometers after signal space separation. Sensors 17:2926.doi: 10.3390/s17122926
Glasser, M. F., Sotiropoulos, S. N., Wilson, J. A., Coalson, T. S., Fischl, B.,Andersson, J. L., et al. (2013). The minimal preprocessing pipelines forthe Human Connectome Project. Neuroimage 80, 105–124. doi: 10.1016/j.neuroimage.2013.04.127
Hardeman, R. R., Murphy, K. A., Karbeah, J., and Kozhimannil, K. B.(2018). Naming institutionalized racism in the public health literature: asystematic literature review. Public Health Rep. 133, 240–249. doi: 10.1177/0033354918760574
Hill, C. V., Perez-Stable, E. J., Anderson, N. A., and Bernard, M. A. (2015). TheNational Institute on aging health disparities research framework. Ethn. Dis. 25,245–254. doi: 10.18865/ed.25.3.245
Hughes, T. F., Becker, J. T., Lee, C. W., Chang, C. C., and Ganguli, M. (2015).Independent and combined effects of cognitive and physical activity on incidentMCI. Alzheimers Dement. 11, 1377–1384. doi: 10.1016/j.jalz.2014.11.007
Jack, C. R. Jr., Bennett, D. A., Blennow, K., Carrillo, M. C., Feldman, H. H., Frisoni,G. B., et al. (2016). A/T/N: An unbiased descriptive classification scheme forAlzheimer disease biomarkers. Neurology 87, 539–547. doi: 10.1212/WNL.0000000000002923
Jack, C. R. Jr., Wiste, H. J., Weigand, S. D., Therneau, T. M., Lowe, V. J., Knopman,D. S., et al. (2017). Defining imaging biomarker cut points for brain aging andAlzheimer’s disease. Alzheimers Dement. 13, 205–216. doi: 10.1016/j.jalz.2016.08.005
Jones, C. P. (2000). Levels of racism: a theoretic framework and a gardener’s tale.Am. J. Public Health 90, 1212–1215. doi: 10.2105/AJPH.90.8.1212
Lambert, J. C., Ibrahim-Verbaas, C. A., Harold, D., Naj, A. C., Sims, R.,Bellenguez, C., et al. (2013). Meta-analysis of 74,046 individuals identifies 11new susceptibility loci for Alzheimer’s disease. Nat. Genet. 45, 1452–1458. doi:10.1038/ng.2802
Longstreth, W. T. Jr., Katz, R., Olson, J., Bernick, C., Carr, J. J., Malinow, M. R.,et al. (2004). Plasma total homocysteine levels and cranial magnetic resonanceimaging findings in elderly persons: the Cardiovascular Health Study. Arch.Neurol. 61, 67–72. doi: 10.1001/archneur.61.1.67
Lopez, O. L., Becker, J. T., Klunk, W., Saxton, J., Hamilton, R. L., Kaufer, D. I.,et al. (2000). Research evaluation and diagnosis of possible Alzheimer’s diseaseover the last two decades: II. Neurology 55, 1863–1869. doi: 10.1212/WNL.55.12.1863
Lopez-Sanz, D., Bruna, R., de Frutos-Lucas, J., and Maestu, F. (2019).Magnetoencephalography applied to the study of Alzheimer’s disease. Prog.Mol. Biol. Transl. Sci. 165, 25–61. doi: 10.1016/bs.pmbts.2019.04.007
Maestu, F., Cuesta, P., Hasan, O., Fernandez, A., Funke, M., and Schulz, P. E.(2019). The importance of the validation of M/EEG with current biomarkersin Alzheimer’s Disease. Front Hum Neurosci 13:17. doi: 10.3389/fnhum.2019.00017
Frontiers in Aging Neuroscience | www.frontiersin.org 12 October 2021 | Volume 13 | Article 669490
fnagi-13-669490 October 7, 2021 Time: 11:15 # 13
Cohen et al. Brain Aging and Dementia
Mendez, D. D., Doebler, D. A., Kim, K. H., Amutah, N. N., Fabio, A., and Bodnar,L. M. (2014a). Neighborhood socioeconomic disadvantage and gestationalweight gain and loss. Matern. Child Health J. 18, 1095–1103. doi: 10.1007/s10995-013-1339-1
Mendez, D. D., Hogan, V. K., and Culhane, J. F. (2014b). Institutional racism,neighborhood factors, stress, and preterm birth. Ethn. Health 19, 479–499.doi: 10.1080/13557858.2013.846300
Mukamal, K. J., Kuller, L. H., Fitzpatrick, A. L., Longstreth, W. T. Jr., Mittleman,M. A., and Siscovick, D. S. (2003). Prospective study of alcohol consumptionand risk of dementia in older adults. JAMA 289, 1405–1413. doi: 10.1001/jama.289.11.1405
Nakamura, A., Cuesta, P., Kato, T., Arahata, Y., Iwata, K., Yamagishi, M., et al.(2017). Early functional network alterations in asymptomatic elders at risk forAlzheimer’s disease. Sci. Rep. 7:6517. doi: 10.1038/s41598-017-06876-8
Nasreddine, Z. S., Phillips, N. A., Bedirian, V., Charbonneau, S., Whitehead, V.,Collin, I., et al. (2005). The Montreal Cognitive Assessment, MoCA: a briefscreening tool for mild cognitive impairment. J. Am. Geriatr. Soc. 53, 695–699.doi: 10.1111/j.1532-5415.2005.53221.x
Newman, A. B., Glynn, N. W., Taylor, C. A., Sebastiani, P., Perls, T. T., Mayeux, R.,et al. (2011). Health and function of participants in the Long Life Family Study:A comparison with other cohorts. Aging 3, 63–76. doi: 10.18632/aging.100242
Nolte, G. (2003). The magnetic lead field theorem in the quasi-static approximationand its use for magnetoencephalography forward calculation in realistic volumeconductors. Phys. Med. Biol. 48, 3637–3652. doi: 10.1088/0031-9155/48/22/002
Nuru-Jeter, A., Dominguez, T. P., Hammond, W. P., Leu, J., Skaff, M., Egerter, S.,et al. (2009). “It’s the skin you’re in”: African-American women talk about theirexperiences of racism. an exploratory study to develop measures of racism forbirth outcome studies. Matern. Child Health J. 13, 29–39. doi: 10.1007/s10995-008-0357-x
Oostenveld, R., Fries, P., Maris, E., and Schoffelen, J. M. (2011). FieldTrip:open source software for advanced analysis of MEG, EEG, and invasiveelectrophysiological data. Comput. Intell. Neurosci. 2011:156869. doi: 10.1155/2011/156869
Powell, W. R., Buckingham, W. R., Larson, J. L., Vilen, L., Yu, M., Salamat,M. S., et al. (2020). Association of neighborhood-level disadvantage withalzheimer disease neuropathology. JAMA Netw. Open 3:e207559. doi: 10.1001/jamanetworkopen.2020.7559
Prescott, J. W., Guidon, A., Doraiswamy, P. M., Roy Choudhury, K., Liu, C.,Petrella, J. R., et al. (2014). The Alzheimer structural connectome: changes incortical network topology with increased amyloid plaque burden. Radiology273, 175–184. doi: 10.1148/radiol.14132593
Price, J. C., Klunk, W. E., Lopresti, B. J., Lu, X., Hoge, J. A., Ziolko, S. K., et al.(2005). Kinetic modeling of amyloid binding in humans using PET imagingand Pittsburgh compound-B. J. Cereb. Blood Flow Metab. 25, 1528–1547. doi:10.1038/sj.jcbfm.9600146
Reitan, R. M. (1958). Validity of the Trail Making test as an indicator of organicbrain damage. Percep. Mot. Skills 8, 271–276. doi: 10.2466/pms.1958.8.3.271
Reitan, R. M., and Wolfson, D. (1994). A selective and critical review ofneuropsychological deficits and the frontal lobe. Neuropsychol. Rev. 4, 161–198.doi: 10.1007/BF01874891
Rey, A. (1941). L’examinen psychologie dans les cas d’encephalopathietraumatique. Arch. Psychol. 30, 286–340.
Rosano, C., Kuller, L. H., Chung, H., Arnold, A. M., Longstreth, W. T. Jr.,and Newman, A. B. (2005). Subclinical brain magnetic resonance imagingabnormalities predict physical functional decline in high-functioning olderadults. J. Am. Geriatr. Soc. 53, 649–654.
Saxton, J., Ratcliff, G., Munro, C. A., Coffey, E. C., Becker, J. T., Fried, L., et al.(2000). Normative data on the Boston Naming Test and two equivalent 30-itemshort forms. Clin. Neuropsychol. 14, 526–534.
Schinka, J. A., McBride, A., Vanderploeg, R. D., Tennyson, K., Borenstein,A. R., and Mortimer, J. A. (2005). Florida Cognitive Activities Scale: initialdevelopment and validation. J. Int. Neuropsychol. Soc. JINS 11, 108–116.
Selkoe, D. J. (2002). Alzheimer’s disease is a synaptic failure. Science 298, 789–791.Serre, D., and Paabo, S. (2004). Evidence for gradients of human genetic diversity
within and among continents. Genome Res. 14, 1679–1685.Shonkoff, J. P., Boyce, W. T., and McEwen, B. S. (2009). Neuroscience, molecular
biology, and the childhood roots of health disparities: building a new frameworkfor health promotion and disease prevention. JAMA 301, 2252–2259.
Taulu, S., and Simola, J. (2006). Spatiotemporal signal space separation methodfor rejecting nearby interference in MEG measurements. Phys. Med. Biol. 51,1759–1768.
Tracy, R. P., Lemaitre, R. N., Psaty, B. M., Ives, D. G., and Evans, R. W. (1997).Relationship of c-reactive protein to risk of cardiovascular disease in the elderly.Results from the Cardiovascular Health Study and the Rural Health PromotionProject. Arterioscler. Thromb. Vasc. Biol. 17, 1121–1127.
Tsvetanov, K. A., Henson, R. N., Tyler, L. K., Davis, S. W., Shafto, M. A., Taylor,J. R., et al. (2015). The effect of ageing on fMRI: Correction for the confoundingeffects of vascular reactivity evaluated by joint fMRI and MEG in 335 adults.Hum. Brain Mapp. 36, 2248–2269.
Tzourio-Mazoyer, N., Papathanassiou, D., Crivello, F., Etard, O., Delcroix, N.,Mazoyer, B., et al. (2002). Automated anatomical labeling of activations in SPMusing a macroscopic anatomical parcellation of the MNI MRI single-subjectbrain. NeuroImage 15, 273–289.
Van Veen, B. D., van Drongelen, W., Yuchtman, M., and Suzuki, A. (1997).Localization of brain electrical activity via linearly constrained minimumvariance spatial filtering. IEEE Trans. Biomed. Eng. 44, 867–880.
Watson, C. C., Newport, D. F., Casey, M. E., DeKemp, R. A., Beanlands, R. S., andSchmand, M. (1997). Evaluation of simulation-based scatter correction for 3DPET cardiac imaging. IEEE Trans. Nucl. Sci. 44, 90–97.
Weinhard, K. (1998). “Applications of 3D PET,” in The Theory and Practice of 3DPET, ed. B. Bendriem (Boston: Kluwer Academic Publishers), 133–167.
Welsh, K., Butters, N., Hughes, J., Mohs, R., and Heyman, A. (1991). Detection ofabnormal memory decline in mild cases of Alzheimer’s disease using CERADneuropsychological measures. Arch. Neurol. 48, 278–281.
Welsh, K. A., Butters, N., Mohs, R. C., Beekly, D., Edland, S., Fillenbaum, G., et al.(1994). The consortium to establish a registry for Alzheimer’s disease (CERAD).Part V. A normative study of the neuropsychological battery. Neurology 44,609–614.
Wilkins, C. H., Schindler, S. E., and Morris, J. C. (2020). Addressing healthdisparities among minority populations: why clinical trial recruitment is notenough. JAMA Neurol. 77, 1063–1064.
Wilson, A. A., Garcia, A., Jin, L., and Houle, S. (2000). Radiotracer synthesis from[(11)C]-iodomethane: a remarkably simple captive solvent method. Nucl. Med.Biol. 27, 529–532.
Wolk, D. A., Price, J. C., Saxton, J., Snitz, B., James, J. A., Lopez, O. L., et al.(2009). Amyloid imaging in mild cognitive impairment subtypes. Ann. Neurol.65, 557–568.
Wong, N. D., Lopez, V. A., Roberts, C. S., Solomon, H. A., Burke, G. L., Kuller, L.,et al. (2010). Combined association of lipids and blood pressure in relation toincident cardiovascular disease in the elderly: the cardiovascular health study.Am. J. Hypertens. 23, 161–167.
Zhou, Y., Yu, F., Duong, T. Q., and The Alzheimer’s Disease NeuroimagingInitiative (2015). White matter lesion load is associated with resting statefunctional MRI activity and amyloid PET but not FDG in mild cognitiveimpairment and early Alzheimer’s disease patients. J. Magn. Reson. Imaging 41,102–109.
Zlokovic, B. V. (2011). Neurovascular pathways to neurodegeneration inAlzheimer’s disease and other disorders. Nat. Rev. Neurosci. 12, 723–738.
Conflict of Interest: The authors declare that the research was conducted in theabsence of any commercial or financial relationships that could be construed as apotential conflict of interest.
Publisher’s Note: All claims expressed in this article are solely those of the authorsand do not necessarily represent those of their affiliated organizations, or those ofthe publisher, the editors and the reviewers. Any product that may be evaluated inthis article, or claim that may be made by its manufacturer, is not guaranteed orendorsed by the publisher.
Copyright © 2021 Cohen, Bruña, Chang, Cheng, Doman, Huppert, Kim, Maestu,Roush, Snitz and Becker. This is an open-access article distributed under the termsof the Creative Commons Attribution License (CC BY). The use, distribution orreproduction in other forums is permitted, provided the original author(s) and thecopyright owner(s) are credited and that the original publication in this journalis cited, in accordance with accepted academic practice. No use, distribution orreproduction is permitted which does not comply with these terms.
Frontiers in Aging Neuroscience | www.frontiersin.org 13 October 2021 | Volume 13 | Article 669490