
Prenatal, Perinatal, and Postnatal Risk Factors in Obsessive–Compulsive Disorder
Upload
independentCategory
view
6download
0
r Human Brain Mapping 00:00–00 (2012) r
Connectomics Signatures of Prenatal CocaineExposure Affected Adolescent Brains
Kaiming Li,1,2† Dajiang Zhu,1,2† Lei Guo,1 Zhihao Li,3 Mary Ellen Lynch,4
Claire Coles,4 Xiaoping Hu,3* and Tianming Liu2*
1Department of Automatic Control, School of Automation, Northwestern Polytechnic University,Xi’an, China
2Department of Computer Science and Bioimaging Research Center,The University of Georgia, Athens, Georgia
3Department of Biomedical Engineering, Emory University, Atlanta, Georgia4Department of Psychiatry and Behavioral Sciences, Emory University, Atlanta, Georgia
r r
Abstract: Recent in vivo neuroimaging studies revealed that several brain networks are altered inprenatal cocaine exposure (PCE) affected adolescent brains. However, due to a lack of dense and corre-sponding cortical landmarks across individuals, the systematical alterations of functional connectivitiesin large-scale brain networks and the alteration of structural brain architecture in PCE affected brainare largely unknown. In this article, we adopted a newly developed data-driven strategy to build alarge set of cortical landmarks that are consistent and corresponding across PCE adolescents and theirmatched controls. Based on these landmarks, we constructed large-scale functional connectomes andapplied the well-established approaches of deriving genomics signatures in genome-wide gene expres-sion studies to discover functional connectomics signatures for the characterization of PCE adolescentbrains. Results derived from experimental data demonstrated that 10 structurally disrupted landmarkswere identified in PCE, and more importantly, the discovered informative functional connectomicssignatures among consistent landmarks distinctively differentiate PCE brains from their matched con-trols. Hum Brain Mapp 00:000–000, 2012. VC 2012 Wiley Periodicals, Inc.
Keywords: connectome; diffusion tensor imaging; resting state fMRI
r r
INTRODUCTION
The epidemic of cocaine use [Elliot and Coker, 1991] hasraised significant public attention to adolescents prenatally
exposed to cocaine [Derauf et al., 2009; Frank et al., 2001;Lester and Padbury, 2009; Shankaran et al., 2007]. Prenatalcocaine exposure (PCE) affected adolescents are associatedwith deficits in intelligence, language skills, executive
Additional Supporting Information may be found in the onlineversion of this article.yK.L. and D.Z. equally contributed to this article.
Contract grant sponsor: NIH Career Award; Contract grantnumber: NIH EB 006878; Contract grant sponsor: NIH; Contractgrant numbers: R01 HL087923-03S2, RO1 DA17795; Contract grantsponsor: The University of Georgia start-up research funding andChina Government Scholarship.
*Correspondence to: XiaopingHu, Department of Biomedical Engineer-ing, Emory University, Atlanta, GA. E-mail: [email protected] or
Tianming Liu, Department of Computer Science and BioimagingResearch Center, The University of Georgia, Athens, GA. E-mail: [email protected]
Received for publication 23 November 2011; Revised 11 February2012; Accepted 15 February 2012
DOI: 10.1002/hbm.22082Published online inWiley Online Library (wileyonlinelibrary.com).
VC 2012 Wiley Periodicals, Inc.

functioning, impulse control and attention, and evidenceof internalizing and externalizing behavioral traits [Deraufet al., 2009; Frank et al., 2001; Lester and Padbury, 2009;Shankaran et al., 2007]. In general, PCE affected brains arecharacterized with widespread structural [Avants et al.,2007; Cohen et al., 1994; Dixon and Bejar, 1989; Dow-Edwards et al., 2006; Gieron-Korthals et al., 1994; Gomez-Anson et al., 1994; Heier et al., 1991; Kliegman et al.,1994;Rivkin et al., 2008; Warner et al., 2006] and functionalalterations [Cortese et al., 2006; Dow-Edwards et al., 2006;Emmalee et al., 2002; Hurt et al., 2008; Li et al., 2009b;Miller-Loncar et al., 2005; Rose-Jacobs et al.., 2009; Shein-kopf et al., 2009; Volpe, 1987], caused by decreased num-ber of neurons [Lidow and Song, 2001a,b], cocaine’svasoconstrictive effects [Bassett and Hanson, 1998; Jensenet al., 1987; Koegler et al., 1991; Lipton et al., 2002; Volpe,1987; Woods et al., 1987], and/or alterations in the monoa-minergic neurotransmitter systems [Levitt et al., 1997;Lidow and Song, 2001a,b; Malanga and Kosofsky, 1999;Meier et al., 1991]. Recent in vivo neuroimaging studies[Cortese et al., 2006; Dow-Edwards et al., 2006; Emmaleeet al., 2002; Lester et al., 2010; Li et al., 2009b, 2011; Miller-Loncar et al., 2005; Rose-Jacobs et al.., 2009; Volpe, 1987]have shown that several brain networks including arousalregulation [Li et al., 2009b], working memory [Hurt et al.,2008; Li et al., 2009b; Santhanam et al., 2009], language[Emmalee et al., 2002], executive function [Rose-Jacobset al., 2009], motor [Miller-Loncar et al., 2005], attention[Dow-Edwards et al., 2006], default mode [Santhanamet al., 2011], and vision [Dow-Edwards et al., 2006; Liet al., 2008] systems, are altered in PCE affected brains.Despite significant findings in neuroimaging of PCE[Cortese et al., 2006; Dow-Edwards et al., 2006; Emmaleeet al., 2002; Li et al., 2009b, 2011; Miller-Loncar et al., 2005;Rose-Jacobs et al., 2009; Volpe, 1987], alterations of func-tional connectivities in large-scale brain networks and thealteration of structural brain architecture in PCE affectedadolescents are largely unknown.
When mapping structural and/or functional brain con-nectivity, network nodes, or regions of interests (ROIs),provide the structural underpinnings for measuring con-nectivities within individual brains and for comparingconnectivities across populations [Liu, 2011]. Thus, identi-fication of robust, reproducible, and accurate ROIs thatare consistent and correspondent across different brainsis critically important for the success of connectivity map-ping [Li et al., 2010b 2012; Liu, 2011; Zhu et al., 2011,2012, in press]. However, from our perspective, determi-nation of corresponding brain ROIs in different brains isperhaps one of the foremost challenges in human brainmapping [Liu, 2011], due to four critical reasons. (1) Thefunctional and/or cytoarchitectural boundaries betweencortical regions are vague [Cabeza and Kingstone, 2006;Liu, 2011; Van Essen and Dierker, 2007]. (2) The individ-ual variability of cortical structure and function isremarkable [Brett et al., 2002; Liu, 2011). (3) The proper-ties of ROIs are highly nonlinear [Li et al., 2010b, 2012;
Liu, 2011; Zhu et al., 2011, 2012, in press]. For instance, aslight change to the size or location of an ROI might dra-matically alter its structural and/or functional connectiv-ity profiles [Li et al., 2010b, 2012; Zhu et al., 2011, 2012].(4) It is very challenging to identify accurate ROIs inPCE affected brains as the brain architecture might havebeen altered during neurodevelopment [Chen et al., 2011;Coles et al., 2011; Li et al., 2008, 2011; Santhanam et al.,2009, 2011].
Current methods for identifying ROIs in brain imagingcan be broadly classified into four categories [Li et al.,2009a; Liu, 2011]. The first method is manual labeling byexperts based on their domain knowledge [Biswal et al.,2010]. Although it has been widely used, this methodmight be vulnerable to inter- and intra-subject variation,its reproducibility may be low [Amunts et al., 2000], and itis impractical to define a large set of ROIs in large data-sets. The second method is to cluster ROIs from the brainimage itself and is data-driven [Beckmann et al., 2005; Cal-houn et al., 2004; Hyvarinen and Oja, 2000; Zang et al.,2004]. However, data-driven approaches might be sensi-tive to the clustering parameters used, and their neuro-science interpretation might not be immediately clear. Thethird one is to predefine ROIs in a template brain andregister them to the individual space using image registra-tion algorithms [Andersson et al., 2008; Avants et al., 2008;Jenkinson and Smith, 2001; Liu et al., 2004; Shen andDavatzikos, 2002]. The accuracy of these atlas-based regis-tration methods is limited due to the variability of neuro-anatomy across different brains. The fourth method usestask-based fMRI paradigms to identify activated brainregions as network ROIs [e.g., Faraco et al., 2011], which isregarded as the benchmark approach for ROI identifica-tion. However, task-based fMRI is demanding and time-consuming [Jack et al., 2010; Li et al., 2011], and it isimpractical to acquire extensive fMRI data for large-scalebrain networks, e.g., for PCE affected adolescents. Assuch, the major barrier to the quantitative assessment oflarge-scale structural and functional connectivities in PCEadolescents and matched control brains is the lack ofdense, consistent, and correspondent brain landmarksacross brains, based on which connectivity mapping isconducted.
Recently, we developed and validated 358 DICCCOLs(Dense Individualized and Common Connectivity-basedCortical Landmarks, publicly available at http://dicccol.cs.uga.edu), each of which was optimized to possess maxi-mal groupwise consistency of DTI-derived fiber shape pat-terns [Zhu et al., 2011, in press] as shown in Figure 1. Theneuroscience basis is that the close relationship betweenstructural connection pattern and brain function [Li et al.,2010b, 2012; Passingham et al., 2002; Zhang et al., 2011;Zhu et al., 2011, 2012, in press]. DICCCOL effectively andsimultaneously deals with three aforementioned challenges[Liu, 2011] in ROI identification in the following ways[Zhu et al., in press]. (1) Individual structural and func-tional variability is effectively addressed by seeking the
r Li et al. r
r 2 r

maximization of groupwise consistent fiber connection pat-terns. (2) Nonlinearity of cortical connection properties isappropriately addressed by a global optimization andsearch procedure, in which groupwise consistency is usedas an effective constraint. (3) The unclear boundaries ofcortical regions are suitably addressed by the simultaneousoptimization of cortical region locations and sizes, thusachieving reasonable boundaries defined by the optimizedcortical regions. Extensive validations indicate the 358DICCCOLs possess intrinsically established structural and
functional correspondences across individuals [Zhu et al.,in press], providing natural structural substrates for theconstruction of structural and functional connectomes.
In this work, we investigated if our existing 358 DICC-COL ROIs discovered from healthy adult brains (Fig. 1)can be optimized and tailored for the construction andrepresentation of connectomes in PCE affected brains.Given each PCE subject with DTI data, we predicted theDICCCOLs in the individual’s brain via our novel ROIprediction framework [Zhang et al., 2011]. The predicted
AQ1
Figure 1.
(a) Left precuneus (by the red sphere) in three subjects. (b) Fiber connection profiles of the pre-
cuneus in three subjects. (c) The 358 DICCCOL landmarks [Zhu et al., in press]. (d–h) Similar
fibers connected to the five landmarks, represented by enlarged bubbles in (c), in two separate
groups of five subjects (in two rows), respectively. [Color figure can be viewed in the online
issue, which is available at wileyonlinelibrary.com.]
r Connectomics Signatures of PCE Affected Adolescent Brains r
r 3 r
358 DICCCOLs in the PCE and control brains were furtheroptimized and tailored to maximize the consistency ofeach ROI’s emanating fiber connection patterns across agroup of PCE/control subjects, resulting in the DICCCOL-PCE in this article.
Based on the optimized DICCCOL-PCE, the structuraland functional connectomes for each subject were con-structed [Zhu et al., in press]. In particular, the well-estab-lished approaches for genomics signatures discoveryapproaches [Alizadeh et al., 2000] in the bioinformaticsand computational biology fields were borrowed here toidentify functional connectomics signatures for characteri-zation of PCE affected brains. One of the prominentlysimilar features between connectomics attributes andgenome-wide gene expressions is that the increased ordecreased functional connectivity/interaction in connec-tomics is corresponding to the upregulated or downregu-lated gene expression. As a result, the effective clusteringalgorithms and tree-view visualization approaches [Aliza-deh et al., 2000] that have been widely used and validatedin genomics signature discovery studies were adopted inour connectomics signature discoveries in this article.Our experimental results demonstrated that informative androbust connectomics signatures were discovered to distinc-tively characterize PCE brains from their healthy controls.
The major contributions of this article include: (1) webuilt a large set of cortical landmarks that are consistentand correspondent across PCE adolescents and their nor-mal controls. These DICCCOL-PCE landmarks possessintrinsic structural and functional correspondences, pro-viding the substrates for large-scale connectome mappingof PCE adolescents. (2) We systematically investigated thediscrepant brain regions of PCE affected adolescents onthe whole cortex and identified 10 DICCCOL-PCE ROIsthat exhibit significant differences between PCE brains andcontrol brains. (3) We leveraged and adopted the well-established approaches of deriving genomics signatures ingenome-wide gene expression studies to discover connec-tomics signatures for the characterization of PCE and iden-tified functional connectome signatures that were able todifferentiate PCE brains from their matched controls.
MATERIALS AND METHODS
Data Acquisition and Preprocessing
Participants were adolescents (12–18 years old) recruitedfrom cohorts identified originally as part of two longitudi-nal studies of PCE on infant development [Brown et al.,1998; Coles et al., 1992], led by the Dr. Coles. Both cohortswere drawn from a low income, predominantly African-American population with infants delivered at an urbanhospital during 1987–1994. PCE was determined by mater-nal self-report and/or positive urine screen at recruitmentpostpartum [Brown et al., 1998; Coles et al., 1992]. Positivematernal urine screens at labor and delivery and duringpregnancy noted in the medical record were also accepted
as evidence of use. We have imaging data collected fromthese adolescents at two time points �2 years in between.At Time point 1, 78 adolescents were scanned, including13 controls and 21 PCE subjects in the old (DOB: 1987–1990) and 17 controls and 27 PCE subjects in the young(DOB: 1992–1994) cohort. At Time point 2, 55 adolescentswere scanned, comprising of seven controls and 13 PCEsubjects in the old and 14 controls and 21 PCE subjects inthe young cohort.
This dataset was collected during an NIH/NIDA fundedR01 project awarded to the Drs. Hu and Coles. High reso-lution T1-weighted three-dimensional (3D) anatomicalimages were acquired using an MPRAGE sequence (192sagittal slices) on a 3 T Siemens Trio Scanner at EmoryUniversity. The anatomical scan protocol had a 3D field ofview of 256 � 224 � 192 mm3 and a 3D matrix of 256 �224 � 192 resulting in an isotropic resolution of 1 mm. ForDTI scan, diffusion gradients were applied in 12 directionswith b-value of 1,000 s/mm2. Contiguous axial slices (34with 2.5 mm thickness) were acquired. For resting statefMRI (R-fMRI), we scanned 210 volumes, matrix ¼ 64 �64, 20 axial slices without gap, thickness ¼ 4 mm, andTR/TE ¼ 2,000 ms/30 ms. For task-based fMRI, we em-bedded task-irrelevant emotional distracters in a workingmemory task to examine the interaction of emotionalarousal and memory in PCE and nonexposed adolescents[Li et al., 2009b]. In the task-based fMRI, we used a verbalworking memory task with two memory loads in the acti-vation fMRI so that the signal difference between thememory loads could be used to identify default modedeactivations [Li et al., 2009b]. More details of the imagingsettings were described elsewhere [Li et al., 2009b, 2011].Our existing analysis on this dataset was preliminary [Liet al., 2009b, 2011], and we performed systematic and com-prehensive analysis of large-scale connectivities in PCEbrain using our recent novel approaches [Zhu et al., 2011,2012, in press] in this article.
We adopted well-established approaches and algorith-mic pipelines [Fillard and Gerig, 2003; Jenkinson andSmith, 2001; Liu et al., 2007, 2008, 2011] for preprocessingof the above multimodal DTI and fMRI datasets in thisarticle. Specifically, we used DTI image space to definelandmark ROIs, and fMRI data were mapped to the DTIspace via a affine registration algorithm [Jenkinson andSmith, 2001]. Our rationale is that both fMRI and DTIuse EPI sequences, and their distortions tend to be simi-lar [Li et al., 2010a]. As a result, the misalignmentbetween DTI and R-fMRI images is much less than thatbetween T1 and R-fMRI images [Li et al., 2010a]. By per-forming brain tissue segmentation on DTI data [Liuet al., 2007], we derived a DTI image segmented intothree compartments corresponding to gray matter, whitematter, and cerebrospinal fluid. Our cortical surfacereconstruction algorithm [Liu et al., 2008] was applieddirectly to the DTI-derived tissue maps, and then, thecortical surface was reconstructed. Fiber tracts weretracked via MEDINRIA [Fillard and Gerig, 2003] and
r Li et al. r
r 4 r

mapped onto the cortical surface via our approaches inLi et al. [2010a,b]. Based on the cortical surface recon-structed from DTI data, we preprocessed fMRI signals [Liet al., 2010a] and then mapped them onto the corticalsurface. To ensure robustness, we applied anatomical andconnectional constraints [Li et al., 2010a] to the mappingprocess. Other fMRI preprocessing steps included brainskull removal, motion correction, spatial smoothing, tem-poral prewhitening, slice time correction, global drift re-moval, and band pass filtering [Li et al., 2010a; Lv et al.,2010].
Prediction of DICCCOLs in PCE/Control Brains
As mentioned before, we discovered a set of 358 DICC-COL ROIs [Zhu et al., in press; DICCCOLs are publicavailable at http://dicccol.cs.uga.edu; screenshots forDICCCOL-PCE are available at http://dicccol.cs.uga.edu/pce.tar.gz) that possess intrinsic and accurate structuraland functional correspondence across individuals. These358 DICCCOL ROIs have been replicated in six independ-ent datasets on over 240 human brains of different agegroups and have been extensively validated using large-scale functional MRI data including 121 functional regionsderived from nine functional networks (i.e., attention,auditory, default mode network, emotion, empathy, fear,semantic decision making, working memory, and visualnetwork) [Zhu et al., 2011, in press]. One particular featureof DICCCOLs is that they can be accurately and efficientlypredicted in a new, single brain with DTI data. The predic-tion of DICCCOLs in PCE/control brains was similar to ourrecently published algorithm [Zhang et al., 2011]. For detailsabout the DICCCOL, please refer to Zhang et al. [2011] andthe Supporting Information.
In consideration of the possible greater variabilityexpected in PCE affected brains, a larger candidate regionwas used during the DICCCOL prediction procedure. Thecandidate region of a certain DICCCOL landmark is about50% larger for PCE group than that of normal brains. Thereason is that there are both normal and discrepant ROIsfor PCE group, and even the localization of normal ROIsmight be affected by the discrepant ones. Thus, a largercandidate region during prediction helps locate these nor-mal ROIs.
Optimization of DICCCOL-PCE
After DICCCOL PREDICTION
The predicted DICCCOLs in the above section reflectthe common architecture of normal human brain and havebeen precisely replicated on over 240 human brains [Zhuet al., 2011, in press], However, as PCE affected brainsmay have altered structural architectures compared withnormal controls [Avants et al., 2007; Cohen et al., 1994;Dixon and Bejar, 1989; Dow-Edwards et al., 2006; Gieron-Korthals et al., 1994; Gomez-Anson et al., 1994; Heier
et al., 1991; Kliegman et al., 1994; Rivkin et al., 2008;Warner et al., 2006], the above collection of 358 predictedDICCCOLs in PCE need to be further optimized to maxi-mize the consistency of each ROI’s emanating fiber con-nection patterns across a group of PCE/control subjects.This optimization procedure was formulated and solvedas an energy minimization problem in a similar way as wepreviously described [Zhu et al., in press; see SupportingInformation for details].
This optimization procedure together with the predictionprocedure in Prediction of DICCCOLs in PCE/controlbrains section plays important roles in adaption of DICC-COLs from normal brains to PCE affected ones. First, alarger candidate region in prediction procedure helps dealwith the possible larger variability in DICCCOL location forPCE brains. Second, with the prediction as initialization, thefollowing optimization procedure tackles the possible largervariability in structural connectivity pattern. This two-stepstrategy tailored the DICCCOLs discovered from healthyadult brains to PCE and control brains specifically, resultingin the DICCCOL-PCE in this article. Our extensive examina-tions demonstrated that the above optimization proceduresignificantly improved some individual subjects’ DICCCOLprediction accuracy, though this optimization would not al-ter the groupwise fiber connection patterns. As an example,Figure 2a,b show the fiber connection patterns of two ran-domly selected DICCCOL ROIs for PCE affected brainsbefore and after the optimization procedure.
In addition to visual examination, quantitative compari-sons of fiber connection patterns in the optimized DICCCOLlandmarks in PCE/control datasets with those in templateDICCCOLs [Zhu et al., 2011, in press] were conductedbased on their trace-map distances. For a specific landmark,distance between the corresponding trace-maps in PCE sub-jects and template subjects were statistically compared withthat between control subjects and templates. If the distanceis significantly different, the landmark was declared as adiscrepant one. Otherwise, it was considered as a commonlandmark. Both of our qualitative and quantitative assess-ments demonstrated that a majority of DICCCOL ROIs (348out of 358) successfully found their correspondences in thePCE affected brains and their controls. In the following con-nectomics signature discovery procedure, only those com-mon DICCCOL ROIs were used for connectomeconstruction, and those 10 discrepant ROIs were discarded.
Discovering Connectomics Signatures of PCE
We leveraged and adopted the well-establishedapproaches of deriving genomics signatures in genome-wide gene expression studies [Alizadeh et al., 2000] todiscover connectomics signatures for the characterizationof PCE. Specifically, a hierarchical clustering algorithm[Alizadeh et al., 2000] was used to group connectivities(equivalent to genes in genome-wide microarray data) onthe basis of similarity in the pattern, where their connec-tion strength (equivalent to gene expression) varied over
r Connectomics Signatures of PCE Affected Adolescent Brains r
r 5 r

Figure 2.
Two examples of fiber connection patterns of DICCCOL ROIs
before and after optimization. (a) The first case; (b) The second
case. For each case, the five visualizations in the top row are
from template brains, the five visualizations in the middle row are
the predicted DICCCOL ROIs in PCE brains, and the five visual-
izations in the bottom row are the results after optimization.
The within-group tracemap distances for the two examples are:
(a) 2.30/1.67 (prediction/optimization) and (b) 3.86/1.92 (predic-
tion/optimization). The orange arrows highlight the cases that
exhibited significantly improved DICCCOL optimization results.
[Color figure can be viewed in the online issue, which is available
at wileyonlinelibrary.com.]
r Li et al. r
r 6 r

all brains (equivalent to samples). One of the prominentlysimilar features between connectomics attributes andgenome-wide gene expressions is that the increased or
decreased functional connectivity in connectomics isequivalent to the upregulated or downregulated geneexpression. As a result, the effective clustering algorithms
Figure 3.
An example of DICCCOL-PCE prediction and optimization. (a)
The fiber bundles of the DICCCOL (represented by yellow
sphere). The top row are five models from UGA dataset [Zhu
et al., in press]; the middle row are the predicted DICCCOLs in
five PCE affected brains; the bottom are optimized DICCCOLs for
the same five PCE affected brains after prediction. (b) The corre-
sponding trace-maps in Figure 3a. The within-group tracemap
distances for this DICCCOL is 1.60/1.40 (prediction/optimization).
[Color figure can be viewed in the online issue, which is available
at wileyonlinelibrary.com.]
r Connectomics Signatures of PCE Affected Adolescent Brains r
r 7 r

that have been widely used in genomics signature discov-ery studies were readily adopted in our connectomics sig-nature discoveries in this article. The same clusteringprocedure can be used to group brain conditions and con-trol brains on the basis of similarities in the strengths ofthese connectivities. Before the actual clustering procedure,we applied a preprocessing step of statistical t test toremove those connectivities that do not exhibit significancedifference between brain conditions and controls. Thus,the clustering procedure can not only be significantlyspeeded up but also be less prone to the possible noises inthe connectivities.
For visual examination and interpretation, the connectom-ics signatures are shown in a matrix format, with each columnrepresenting the strengths from all brains for a single connec-tion element of the connectome (equivalent to expression lev-els for all genes in a single sample), and each rowrepresenting the measured strengths for all connections in asingle brain (equivalent to the whole array in microarraydata). To visualize the results, the connection strength are rep-resented by a color ranging from 0 to 1, with red representing
higher strength, and green representing lower strength. Theexamples of visualizations are shown in Functional connec-tome signatures section. The steps we used for the connectom-ics signature discovery are summarized as below.
1. The 358 DICCCOL ROIs were predicted in each indi-vidual brain of the PCE and control subjects based onDTI data.
2. The predicted DICCCOLs were tailored to fit the PCEdataset via optimization. Discrepant DICCCOL-PCEsare removed from the following analysis.
3. The structural and functional connectomes were con-structed using the DICCCOL-PCEs as network nodesfrom the multimodal DTI and R-fMRI.
4. Preprocessing of t tests was performed to removethose functional connectivities that do not show sig-nificant differences between PCE affected brains andnormal controls.
5. The remaining functional connectivities for each sub-ject was composed into a row connectomics attributevector. All these row vectors were arranged into a
Figure 4.
Groupwise consistency comparison for DICCCOL-PCE ROIs. (a) PCE subjects. The average
trace-map distance drops by 31.8% after optimization and the standard deviation drops by
30.1%. (b) Control subjects. The average trace-map distance drops by 29.8% after optimization
and the standard deviation drops by 27.7%. [Color figure can be viewed in the online issue,
which is available at wileyonlinelibrary.com.]
r Li et al. r
r 8 r
connectomics attribute matrix, where PCE brainswere at the upper part of the matrix, while the nor-mal controls were at the lower part.
6. A hierarchical clustering algorithm or other clusteringalgorithms such as k-means clustering algorithms[Alizadeh et al., 2000] were applied to cluster the col-umns of connectomics attributes into informative con-nectomics signatures.
7. The clustered columns were compared with the func-tional annotations of DICCCOL ROIs, and the connec-tivities in each connectomics signature were mappedinto the brain networks for results interpretation.
RESULTS
DICCCOL-PCE Prediction and Optimization
In addition to the two examples of DICCCOL-PCE predic-tion and optimization in Figure 2, we provided an additionalexample of DICCCOL-PCE (yellow sphere in Fig. 3a) and thecorresponding trace-maps in Figure 3b. As can be seen fromthe figure, the prediction (middle row in Fig. 3a) has a decentperformance in terms of fiber shape consistency with themodels (top row in Fig. 3a); furthermore, the optimization
procedure (bottom row in Fig. 3a) further improved the con-sistency of emanating fiber bundles of predicted DICCCOL-PCE ROIs, as highlighted by the green and yellow arrows.This is further demonstrated and confirmed by the corre-sponding trace-maps in Figure 3b. It is apparent that afteroptimization, the trace-maps (bottom row in Fig. 3b) havebetter groupwise consistency (top row in Fig. 3b) than theprediction (middle row in Fig. 3b). For additional compari-sons, screenshots for fiber bundles of 358 DICCCOLs arereleased online at: http://dicccol.cs.uga.edu/pce.tar.gz.
Also, we quantitatively measured the trace-map distanceof DICCCOL-PCE ROIs before and after optimization. Itturned out that the optimization step substantiallyimproved the consistency of fiber connection patterns ofDICCCOL-PCE ROIs. Figure 4 shows the quantitativeresults for both PCE affected brains and their healthy con-trols. In general, the average trace-map distance droppedby 31.8% after optimization and the standard deviationdropped by 30.1% for PCE affected brains; and for thecontrols, the average trace-map distance dropped by 29.8%after optimization and the standard deviation drops by27.7%. This further demonstrates that the optimizationprocedure generated ROIs with accurate structural corre-spondence for PCE affected brains.
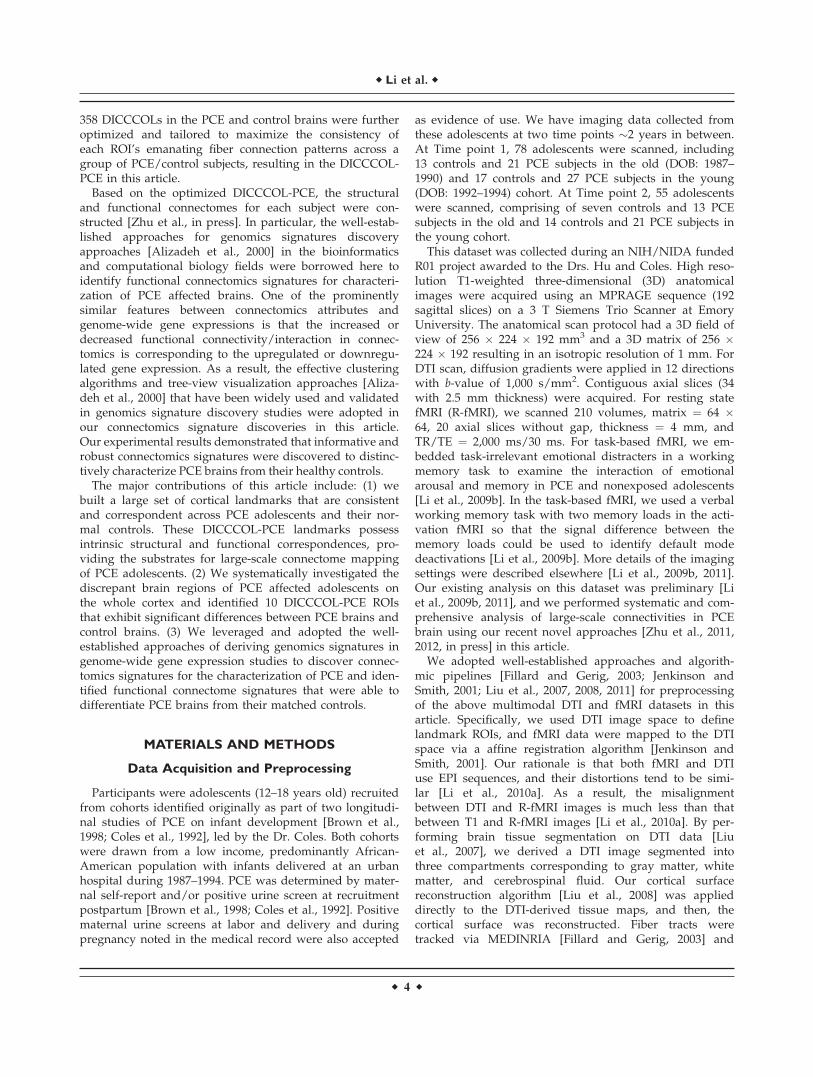
Figure 5.
Discrepant DICCCOL-PCE ROIs (represented by red spheres) in three different views:
(a) Dorsal view; (b) left lateral view; and (c) right lateral view. [Color figure can be viewed in
the online issue, which is available at wileyonlinelibrary.com.]
r Connectomics Signatures of PCE Affected Adolescent Brains r
r 9 r

Discrepant DICCCOL-PCE ROIs
In this section, we describe the results of the identifica-tion of structurally disrupted DICCCOL-PCE ROIs bymeasuring the similarities between their fiber connectivitypatterns and those in the template brains. A null hypothe-sis assuming equal similarity of fiber connectivity patternto that in the template brains and equal variance betweenPCE affected brains and their normal controls was intro-duced and tested by a student t statistics in a two-tailed
manner. In total, we identified 10 discrepant DICCCOL-PCE ROIs (P-value < 0.003). The locations of these 10ROIs were indicated by red spheres in Figure 5. Their spe-cific anatomic locations and possible functional roles in theatlas space were assessed via meta-analysis using Brain-Map database [Laird et al., 2009], and the results are sum-marized in Table I. It is interesting to see that most of the10 ROIs are involved in brain networks reported to exhibitdifferent patterns in PCE affected brains from their normalcontrols in a variety of literature papers, including working
TABLE I. Meta-analysis of the 10 discrepant DICCCOL-PCE ROIs using BrainMap dataset
ID Paper ID and behavioral domain Coordinates and atlas labels
14 30011 Cognition.Memory.Explicit;30263 Cognition.Memory.Explicit;30268 Perception.Vision.Motion;7070192 Cognition;7090248 Emotion.Sadness, Emotion.Disgust;7090272 Cognition.Attention;7120359 Emotion, Cognition;8020072 Cognition.Memory.Explicit;9020032 Cognition.Language, Action.Observation;
11.68037 �83.2299 �3.47047;Right Cerebrum.Occipital Lobe.Lingual Gyrus.Gray Matter.BA Talairach 1988 - SPM95
15 30218 Perception.Vision.Color, Perception.Vision.Motion; 10030056 Cognition.Memory.Explicit; 10080195 Action.Observation;60100158 Cognition.Memory.Explicit;
�22.1781 �87.6926 22.47955,MNI - SPM97 Short Description:SPM97, Left Cerebrum.Occipital Lobe.Middle Occipital Gyrus.Gray Matter.BA 18;
24 30124 Perception.Vision.Motion;5120251 Perception.Vision.Motion,Action.Execution;10060114 Cognition.Memory.Working,Action.Inhibition;
38.45195 �79.1752 4.158508; (Talairach 1967:HD6 Origin:Mid AC-PC) Right Cerebrum.Occipital Lobe.Middle OccipitalGyrus.Gray Matter.BA 19;
42 30407 Emotion.Disgust;6080137 Cognition.Memory.Working;7080205 Emotion.Anxiety, Emotion.Disgust;8110272 Cognition;
�33.5922 �69.2125 35.09035 Left Cerebrum.Parietal Lobe.Precuneus.Gray Matter.BA 39;
64 30200 Perception.Vision.Shape;30257 Cognition.Language.Semantic;7010010 Cognition.Language.Semantics;7060159 Stroop Task;8110257 Perception.Somesthesis.Pain;9020031 Cognition.Language;
48.91525 �52.6243 �12.7873; Right Cerebrum.Temporal Lobe.Fusiform Gyrus.Gray Matter.BA 37;
70 6080112 Cognition.Attention;9010013 Emotion.Happiness.Humor,Cognition.Social Cognition;
26.96596 �45.5451 �0.80388; Right Cerebrum.Temporal Lobe.Sub-Gyral.Gray Matter.Hippocampus
166 30227 Cognition.Language.Semantics, Cognition.Language.Speech;8020068 Action.Execution;
�52.9439 �17.002 33.87145; Left Cerebrum.Parietal Lobe.Postcentral Gyrus.Gray Matter.BA 2
167 30028 Emotion.Happiness;9040069 Cognition.Memory.Working, Cognition.Attention;9090094 Perception.Vision;60100153 Cognition.Attention;
18.56391 �12.0095 �14.0449; Right Cerebrum.Limbic Lobe.Parahippocampal Gyrus.Gray Matter.BA area 28
170 60100175 Action.Execution; �34.1947 �4.86563 70.76629;Left Cerebrum.Frontal Lobe.Precentral Gyrus.Gray Matter.BA 6
352 30267 Cognition.Language.Orthography,Cognition.Attention;
�20.0753 62.93266 �5.43791 Talairach 1988 Left Cerebrum.Frontal Lobe.Superior Frontal Gyrus.Gray Matter.BA 10
r Li et al. r
r 10 r

memory [Hurt et al., 2008; Li et al., 2009b; Santhanam et al.,2009], language [Emmalee et al., 2002], executive function[Rose-Jacobs et al., 2009], motor [Miller-Loncar et al., 2005],attention [Dow-Edwards et al., 2006; Li et al., 2009b], andvision [Dow-Edwards et al., 2006; Li et al., 2008] network.This consistency demonstrated that our new method iscapable of systematically exploring the structural disrup-tions of PCE affected brains in a large scale.
As an example, we depicted the discrepant DICCCOL-PCE ROI (ID #352 in Table I) at the superior frontal gyrusin Figure 6. This DICCCOL-PCE ROI was highlighted byyellow spheres. The top row shows the fiber bundles ema-nating from this ROI for five model subjects [Zhu et al.,2011, in press], the middle row shows the fiber bundlesemanating from the predicted ROIs for five PCE affectedbrains, and the bottom row depicts the fiber bundles ema-nating from the optimized ROIs for the same five PCEaffected brains. The disrupted fiber tracts emanating fromthis ROI were highlighted by the colored arrows. As canbe seen from the figure, it is apparent that the PCEaffected brains have disrupted fiber connections from thesuperior frontal gyrus to the visual cortex in occipitallobes, suggesting that our analysis method is able to dis-cover and differentiate the discrepant DICCCOL-PCE ROIsin PCE brains from their normal controls.
Consistent DICCCOL-PCE ROIs
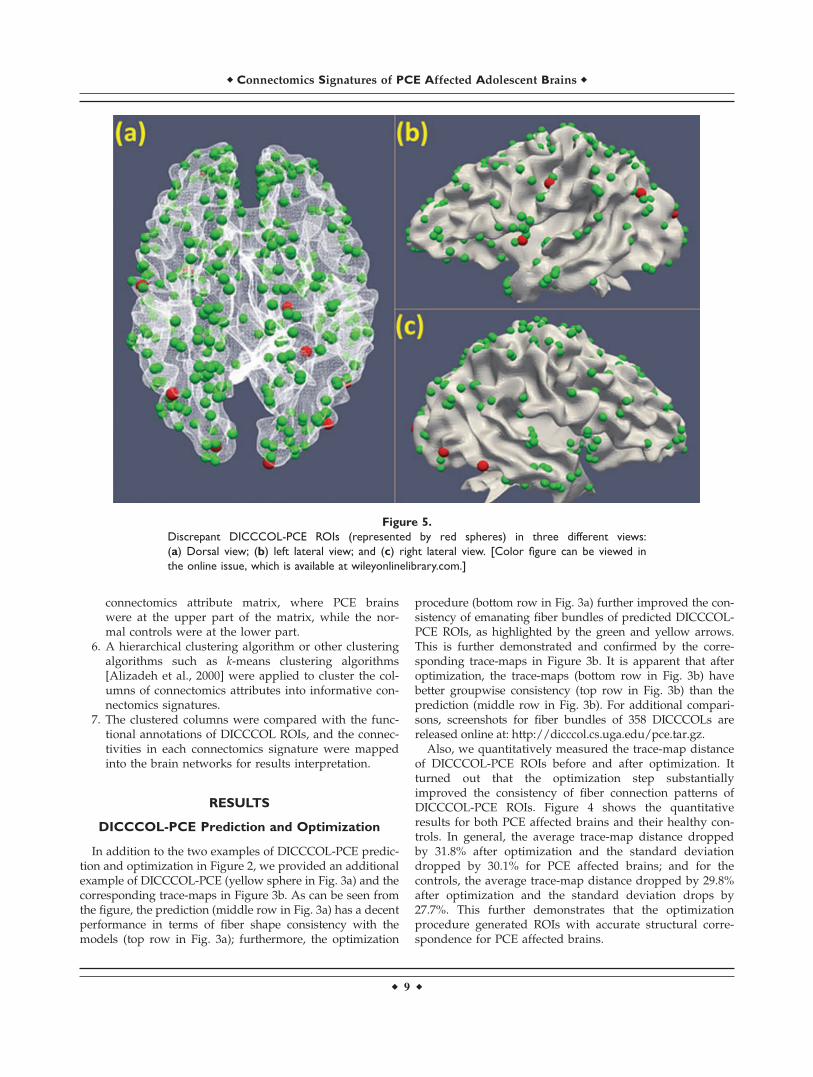
Although there are 10 discrepant ROIs in PCE affectedbrains differentiated from normal controls, most ROIs (348out of 358) still exhibited quite consistent fiber connectionpatterns as matched controls and the templates [Zhu et al.,in press]. In Figure 7, we randomly chose three consistentDICCCOL-PCE ROIs and visualized them and their fiberbundles on the cortical surface as examples. These ROIscorresponded to DICCCOL #80, #90, and #95, respectively.The rest of DICCCOL-PCE ROIs are available online athttp://dicccol.cs.uga.edu/pce.tar.gz.
As can be seen from Figure 7 and other online screen-shots (http://dicccol.cs.uga.edu/pce.tar.gz), these ROIspossessed accurate structural correspondences across indi-viduals, indicating that the DICCCOL-PCE ROIs tend torepresent the common brain architecture in PCE/controlbrains. As such, these DICCCOL-PCE ROIs will be used asstructural substrates to construct large connectomes [Zhuet al., in press] and explore functional connectome signa-tures of PCE brains in the following section.
Functional Connectome Signatures
We reconstructed functional connectomes using the rest-ing state fMRI data based on the 348 DICCCOL-PCE ROIs
Figure 6.
One example of discrepant DICCCOL-PCE ROI at the superior frontal gyrus (represented by
yellow spheres). Top row: five model subjects [Zhu et al., in press]; Middle row: five PCE affected
subjects with predicted ROIs; Bottom row: the same five PCE brains with optimized ROIs. [Color
figure can be viewed in the online issue, which is available at wileyonlinelibrary.com.]
r Connectomics Signatures of PCE Affected Adolescent Brains r
r 11 r
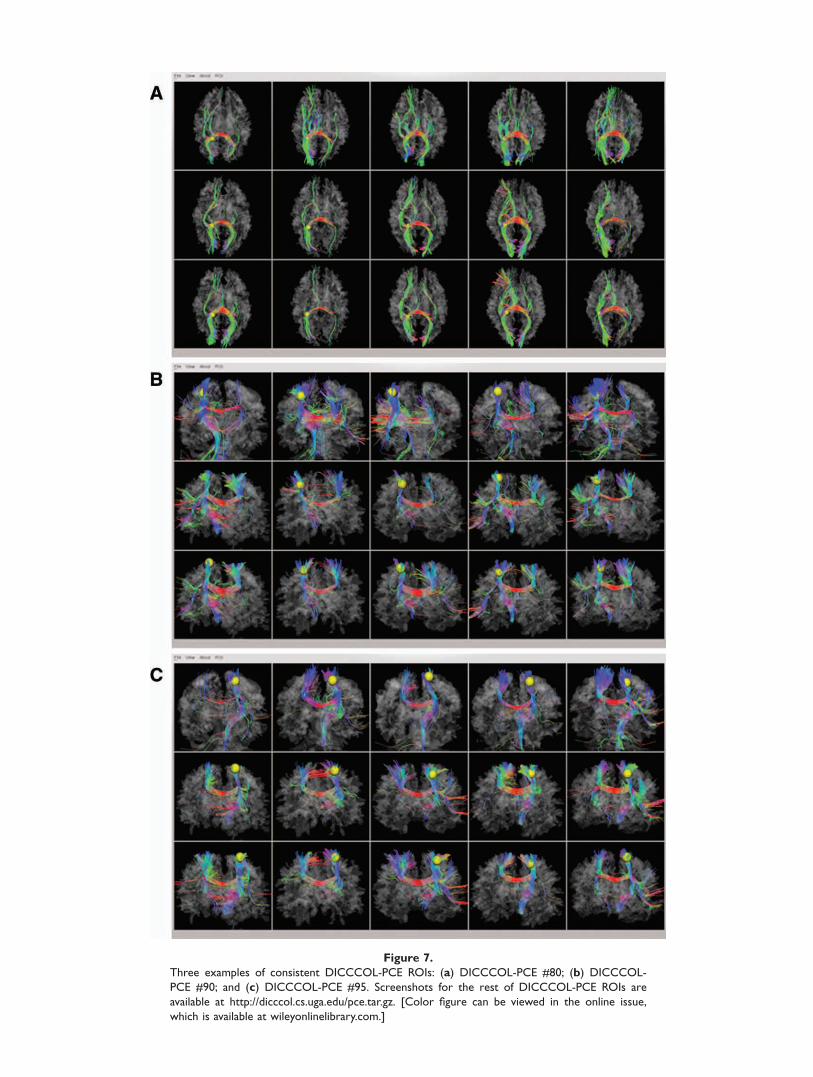
Figure 7.
Three examples of consistent DICCCOL-PCE ROIs: (a) DICCCOL-PCE #80; (b) DICCCOL-
PCE #90; and (c) DICCCOL-PCE #95. Screenshots for the rest of DICCCOL-PCE ROIs are
available at http://dicccol.cs.uga.edu/pce.tar.gz. [Color figure can be viewed in the online issue,
which is available at wileyonlinelibrary.com.]

for 29 PCE subjects and 22 matched controls described inData acquisition and preprocessing section. From a total of60,378 functional connections, a simple t test (P-value ¼0.005) was first used to identify those with significant dif-ferences between PCE and healthy controls, resulting in845 altered connections as shown in Figure 8a. Subse-quently, a hierarchical clustering algorithm [Alizadehet al., 2000] was used to group functional connectivities onthe basis of similarity in the pattern with which their con-nection strength varied over all PCE/control brains.Totally, we identified 362 consistently decreased and330 consistently increased functional connections in PCEsubjects, as shown in Figure 8b,c. As the hypo- or hyper-functional connectivity patterns in 29 PCE subjects, incomparison with 22 healthy controls, are quite consistentacross individuals, we named the two patterns as func-tional connectomics signatures of PCE.
To interpret the connectomics signatures of PCE, Figure8d,e illustrate the hypo- or hyper-connectivities in PCE ona cerebral cortical surface. It is evident that both decreased
and increased functional connectivities in PCE are wide-spread across the entire cortex, suggesting that PCE causeslarge-scale functional connection alterations. Quantita-tively, the percentages of increase/decreased connectivitiesconnected to the left frontal, left parietal, left temporal, leftoccipital, right frontal, right parietal, right temporal, andright occipital lobes are 28.3%/27.2%, 13.5%/11.7%, 7.0%/8.9%, 2.2%/3.7%, 24.8%/25.7%, 7.0%/4.7%, 10.0%/13.6%,and 7.4%/5.6%, respectively. It can be clearly seen that thefrontal lobes exhibit substantially more functional connec-tivity alterations than other lobes, e.g., the occipital lobes.Furthermore, we annotated the 358 DICCCOLs into 55functional networks via task-based fMRI and/or via meta-analysis in the BrainMap (http://brainmap.org/) databasethat integrated the activations of 2,114 fMRI papers and9,994 fMRI experiments [Laird et al., 2009]. We visualizedthe top 22 functional networks that are most frequentlyinvolved in the two connectomics signatures of PCE brainsin this article in Figure 9a,b. The names and colors of these22 networks are presented in Figure 9c. Quantitatively, the
Figure 8.
Connectomics signatures for characterization of PCE. (a) Each
connectome is represented by a row of 845 connections
(selected from 60,378 connections via t test, P-value ¼ 0.005)
and each column stands for 29 PCE and 22 control subjects.
Red and green stand for hyper- and hypo-connectivities. Two
connectomics signatures were discovered, as shown in more
details in (b) and (c). The spatial distributions of these connec-
tomics signatures on the cortical surfaces are provided in (d)
and (e). [Color figure can be viewed in the online issue, which
is available at wileyonlinelibrary.com.]
r Connectomics Signatures of PCE Affected Adolescent Brains r
r 13 r

top five functional networks that exhibit increased func-tional connectivity alterations are attention, executive func-tion, language speech, language semantic, and languageemotion, and their relative contributions to the totalaltered connections are 21.7%, 10.0%, 9.1%, 7.8%, and7.4%, respectively. At the same time, the top five networksthat exhibit decreased connectivities are attention, emotion,executive function, language speech, and inhibition, andtheir alterations represent 21.5%, 7.9%, 7.5%, 6.5%, and6.1%, respectively, of the total alterations. Apparently, the
attention network is the most affected in terms of alteredconnectivities. In addition, it is interesting that the atten-tion, executive function, language speech, and emotionnetworks are among the top five networks with bothdecreased and increased connectivities. These results arein the line with literature reports [Dow-Edwards et al.,2006; Emmalee et al., 2002; Li et al., 2009b; Rose-Jacobset al., 2009], and systematically and comprehensively eluci-dated the widespread functional connectivity alterationsvia connectomics signatures.
Figure 9.
Result interpretation of connectomics signatures of PCE. For the
visualization scheme in (a) and (b), 358 DICCCOL-PCE ROIs are
represented by an inner ring of color-coded nodes, connections
(corresponding to those in Figure 8d,e) are represented by lines,
and 22 functional networks are represented by 22 outer rings of
colored nodes. All of the colored nodes in each ring of 358 nodes
stand for a functional network. The names and colors for 22 net-
works and their corresponding rings are shown in (c). (a)
Increased functional connectivities in PCE in comparison with con-
trols. (b) Decreased functional connectivities in PCE in comparison
with controls. (c) Names and colors of top 22 functional networks
that are most frequently involved in the hypo- or hyper-functional
connectivities in this article. [Color figure can be viewed in the
online issue, which is available at wileyonlinelibrary.com.]
r Li et al. r
r 14 r

DISCUSSION AND CONCLUSION
In this article, we described a novel framework to identifya large set of cortical landmarks in PCE affected adolescentsand their matched controls, named DICCCOL-PCEs thatpossess accurate structural correspondences across individu-als. This computational framework mainly consisted of aDICCCOL ROI prediction step and a following ROI optimi-zation step. With these 358 DICCCOL-PCEs, we systemati-cally assessed the structural disruption on the cortex for PCEbrains and identified 10 discrepant DICCCOL-PCE land-marks. Interestingly, meta-analysis demonstrates that mostof these 10 discrepant landmarks are involved in brain net-works reported in the literature to be involved responsiblefor working memory, language, executive function, motor,attention, and vision networks. Also, we determined 348 con-sistent DICCCOL ROIs that are corresponding in both PCEaffected brains and matched controls, which provided thestructural substrates for connectome construction and extrac-tion of functional connectomics signatures in PCE. Then, weborrowed the well-established approaches of derivinggenomics signatures in genome-wide gene expression stud-ies to discover connectomics signatures for the characteriza-tion of PCE and identified functional connectome signaturesthat are able to distinctively differentiate PCE brains fromtheir matched controls. Our results demonstrated that thereare widespread functional connectivity alterations, eitherincreasing or decreasing, in the PCE affected adolescentsbrains in comparisonwith their healthy controls.
In the future, the work in this article could be extendedand enhanced in the following directions. First, the discov-ered connectomics signatures in Figure 9 should be repli-cated and crossvalidated in separate datasets by differentresearch laboratories. In that scenario, our DICCCOL-PCEidentification and optimization framework in Materialsand methods section can be applied in such independentmultimodal DTI/R-fMRI datasets for the purpose of resultreplication. Second, the predicted and optimized DICC-COL-ROIs should be further validated via benchmarktask-based fMRI datasets that consistently activate corre-sponding functional brain areas in both PCE and controlbrains. Such independent validations can further supportthe findings in DICCCOL-PCE prediction and optimizationsection and Consistent DICCCOL-PCE ROIs section. Third,the discovered functional connectomics signatures in Func-tional connectome signatures section can be correlatedwith the PCE clinical and behavior parameters, e.g., verbalIQ and performance IQ and analyzed at both individualand group levels. Such studies could possibly generate acollection of connectomics-based markers that are predic-tive of PCE clinical and behavior measurements.
ACKNOWLEDGMENTS
The authors thank the anonymous reviewers for theirvaluable comments that have helped to significantlyimprove the article.
REFERENCES
Alizadeh AA, Eisen MB, Davis RE, Ma C, Lossos IS, RosenwaldA, Boldrick JC, Sabet H, Tran T, Yu X, Powell JI, Yang L, MartiGE, Moore T, Hudson J Jr, Lu L, Lewis DB, Tibshirani R, Sher-lock G, Chan WC, Greiner TC, Weisenburger DD, ArmitageJO, Warnke R, Levy R, Wilson W, Grever MR, Byrd JC, Bot-stein D, Brown PO, Staudt LM (2000): Distinct types of diffuselarge B-cell lymphoma identified by gene expression profiling.Nature 403:503–511.
Amunts K, Malikovic A, Mohlberg H, Schormann T, Zilles K(2000): Brodmann’s areas 17 and 18 brought into stereotaxicspace-where and how variable? Neuroimage 11:66–84.
Andersson J, Smith S, Jenkinson M (2008): FNIRT—FMRIB’s non-linear image registration tool. In Fourteenth Annual Meetingof the Organization for Human Brain Mapping—HBM.
Avants BB, Hurt H, Giannetta JM, Epstein CL, Shera DM, Rao H,Wang J, Gee JC (2007): Effects of heavy in utero cocaine expo-sure on adolescent caudate morphology. Pediatr Neurol37:275–279.
Avants BB, Epstein CL, Grossman M, Gee JC (2008): Symmetricdiffeomorphic image registration with cross-correlation: Evalu-ating automated labeling of elderly and neurodegenerativebrain. Med Image Anal 12:26–41.
Bassett JM, Hanson C (1998): Catecholamines inhibit growth infetal sheep in the absence of hypoxemia. Am J Physiol 274(Pt 2):R1536–R1545.
Beckmann CF, DeLuca M, Devlin JT, Smith SM (2005): Investiga-tions into resting-state connectivity using independent compo-nent analysis. Philos Trans R Soc Lond B Biol Sci 360:1001–1013.
Biswal BB, Mennes M, Zuo XN, Gohel S, Kelly C, Smith SM, Beck-
mann CF, Adelstein JS, Buckner RL, Colcombe S, Dogonowski
A-M, Ernst M, Fair D, Hampson M, Hoptman MJ, Hyde JS,
Kiviniemi VJ, Kotter R, Li S-J, Lin C-P, Lowe MJ, Mackay C,
Madden DJ, Madsen KH, Margulies DS, Mayberg HS, McMa-
hon K, Monk CS, Mostofsky SH, Nagel BJ, Pekar JJ, Peltier SJ,
Petersen SE, Riedl V, Rombouts SARB, Rypma B, Schlaggar
BL, Schmidt S, Seidler RD, Siegle GJ, Sorg C, Teng G-J, Veijola
J, Villringer A, Walter M, Wang L, Weng X-C, Whitfield-Gabri-
eli S, Williamson P, Windischberger C, Zang Y-F, Zhang H-Y,
Castellanos FX, Milham MP (2010): Toward discovery science
of human brain function. Proc Natl Acad Sci USA 107:4734–
4739.Brett M, Johnsrude IS, Owen AM (2002): The problem of functional
localization in the human brain. Nat Rev Neurosci 3:243–249.Brown JV, Bakeman R, Coles CD, Sexson WR, Demi AS (1998):
Maternal drug use during pregnancy: Are preterm and full-term infants affected differently? Dev Psychol 34:540–554.
Cabeza R, Kingstone A (2006): Handbook of Functional Neuroi-maging of Cognition, 2nd ed. The MIT Press.
Calhoun VD, Pekar JJ, Pearlson GD (2004): Alcohol intoxication
effects on simulated driving: Exploring alcohol-dose effects on
brain activation using functional MRI. Neuropsychopharmacol-
ogy 29:2097–3017.
Chen XC, Coles CD, Lynch ME, Hu X: Understanding specific
effects of prenatal alcohol exposure on brain structure in
young adults. Hum Brain Mapp. 2011 Jun 20. doi: 10.1002/
hbm.21313.
Cohen HL, Sloves JH, Laungani S, Glass L, DeMarinis P (1994):
Neurosonographic findings in full-term infants born to mater-
nal cocaine abusers: Visualization of subependymal and peri-
ventricular cysts. J Clin Ultrasound 22:327–333.
r Connectomics Signatures of PCE Affected Adolescent Brains r
r 15 r

Coles CD, Platzman KA, Smith I, James ME, Falek A (1992): Effects
of cocaine and alcohol use in pregnancy on neonatal growth and
neurobehavioral status. Neurotoxicol Teratol 14:23–33.
Coles CD, Goldstein FC, Lynch ME, Chen X, Kable JA, JohnsonKC, Hu X (2011): Memory and brain volume in adults prena-tally exposed to alcohol. Brain Cogn 75:67–77.
Cortese BM, Moore GJ, Bailey BA, Jacobson SW, Delaney-Black V,
Hannigan JH (2006): Magnetic resonance and spectroscopic
imaging in prenatal alcohol-exposed children: Preliminary find-
ings in the caudate nucleus. Neurotoxicol Teratol 28:597–606.
Derauf C, Kekatpure M, Neyzi N, Lester B, Kosofskyb B (2009):Neuroimaging of children following prenatal drug exposure.Semin Cell Dev Biol 20:441–454.
Dixon SD, Bejar R (1989): Echoencephalographic findings in neonatesassociated with maternal cocaine and methamphetamine use:Incidence and clinical correlates. J Pediatr 115(Pt 1): 770–778.
Dow-Edwards DL, Benveniste H, Behnke M, Bandstra ES, SingerLT, Hurd YL, Stanford LR (2006): Neuroimaging of prenataldrug exposure. Neurotoxicol Teratol 28:386–402.
Elliot KT, Coker DR (1991): Crack babies: Here they come, readyor not. J Instruct Psychol 18:60–64.
Bandstra ES, Morrow CE, Vogel AL, Fifer RC, Ofir AY, Dausa AT,Xue L, Anthony JC (2002): Longitudinal influence of prenatalcocaine exposure on child language functioning. NeurotoxicolTeratol 24:297–308.
Faraco CC, Unsworth N, Lagnely J, Terry D, Li K, Zhang D, LiuT, Miller LS (2011): Complex span tasks and hippocampalrecruitment during working memory. Neuroimage 55:773–787.
Frank DA, Augustyn M, Knight WG, Pell T, Zuckerman B (2001):Growth, development, and behavior in early childhood follow-ing prenatal cocaine exposure: A systematic review. JAMA285:1613–1625.
Gieron-Korthals MA, Helal A, Martinez CR (1994): Expandingspectrum of cocaine induced central nervous system malfor-mations. Brain Dev 16:253–256.
Gomez-Anson B, Ramsey RG (1994): Pachygyria in a neonate withprenatal cocaine exposure: MR features. J Comput AssistTomogr 18:637–639.
Fillard P, Gerig G (2003): Analysis tool for diffusion tensor MRI.Lect Notes Comput Sci 2879:967–968.
Heier LA, Carpanzano CR, Mast J, Brill PW, Winchester P,Deck MD (1991): Maternal cocaine abuse: The spectrum ofradiologic abnormalities in the neonatal CNS. AJNR Am JNeuroradiol 12:951–956; 1369–1377.
Hurt H, Giannetta JM, Korczykowski M, Hoang A, Tang KZ,Betancourt L, Brodsky NL, Shera DM, Farah MJ, Detre JA(2008): Functional magnetic resonance imaging and workingmemory in adolescents with gestational cocaine exposure.J. Pediatr 152:371–377.
Hyvarinen A, Oja E (2000): Independent component analysis:Algorithms and applications. Neural Network 13:411–430.
Jack CR Jr, Bernstein MA, Borowski BJ, Gunter JL, Fox NC,Thompson PM, Schuff N, Krueger G, Killiany RJ, Decarli CS,Dale AM, Carmichael OW, Tosun D, Weiner MW; Alzheimer’sDisease Neuroimaging Initiative (2010): Update on the mag-netic resonance imaging core of the Alzheimer’s disease neuro-imaging initiative. Alzheimers Dement 6:212–220.
Jenkinson M, Smith SM (2001): A global optimisation method forrobust affine registration of brain images. Med Image Anal5:143–156.
Jensen A, Hohmann M, Kunzel W (1987): Redistribution of fetalcirculation during repeated asphyxia in sheep: Effects on skin
blood flow, transcutaneous PO2, and plasma catecholamines.J Dev Physiol 9:41–55.
Kliegman RM, Madura D, Kiwi R, Eisenberg I, Yamashita T
(1994): Relation of maternal cocaine use to the risks of prema-
turity and low birth weight. J Pediatr 124(Pt 1):751–756.Koegler SM, Seidler FJ, Spencer JR, Slotkin TA (1991): Ischemia
contributes to adverse effects of cocaine on brain development:Suppression of ornithine decarboxylase activity in neonatal rat.Brain Res Bull 27:829–834.
Laird AR, Eickhoff SB, Kurth F, Fox PM, Uecker AM, Turner JA,Robinson JL, Lancaster JL, Fox PT (2009): ALE meta-analysisworkflows via the BrainMap database: Progress towards aprobabilistic functional brain atlas. Neuroinformatics 3:11.
Lester B, Padbury JF (2009): The third pathophysiology of prenatalcocaine exposure. Dev Neurosci 31:23–35.
Lester BM, LaGasse LL, Shankaran S, Bada HS, Bauer CR, Lin R,Das A, Higgins R (2010): Prenatal cocaine exposure related tocortisol stress reactivity in 11-year-old children. J Pediatr157:288–295.
Levitt P, Harvey JA, Friedman E, Simansky K, Murphy EH (1997):New evidence for neurotransmitter influences on brain devel-opment. Trends Neurosci 20:269–274.
Li Z, Coles CD, Lynch ME, Ma X, Peltier S, Hu X (2008): Occipi-tal-temporal reduction and sustained visual attention deficit inprenatal alcohol exposed adults. Brain Imaging Behav 2:38–48.
Li K, Guo L, Nie J, Li G, Liu T (2009a) Review of methods forfunctional brain connectivity detection using fMRI. ComputMed Imaging Graph 33:131–139.
Li Z, Coles CD, Lynch ME, Hamann S, Peltier S, LaConte S, Hu X(2009b) Prenatal cocaine exposure alters emotional arousal reg-ulation and its effects on working memory. Neurotoxicol Tera-tol 31:342–348.
Li K, Guo L, Li G, Nie J, Faraco C, Zhao Q, Miller LS, Liu T(2010a):. In Proceedings of ISBI; pp 656–659.
Li K, Guo L, Faraco C, Zhu D, Deng F, Zhang T, Jiang X, ZhangDG, Chen H, Hu X, Miller LS, Liu T (2010b): IndividualizedROI optimization via maximization of group-wise consistencyof structural and functional profiles. Adv Neural Info ProcSyst23.
Li Z, Santhanam P, Coles CD, Lynch ME, Hamann S, Peltier S,Hu X (2011): Increased ‘‘Default Mode’’ activity in adoles-cents prenatally exposed to cocaine. Hum Brain Mapp32:759–770.
Li K, Guo L, Zhu D, Hu X, Han J, Liu T: Individual functionalROI optimization via maximization of group-wise consistencyof structural and functional profiles. Neuroinformatics 2012Jan 28.
Lidow MS, Song ZM (2001a) Primates exposed to cocaine in uterodisplay reduced density and number of cerebral cortical neu-rons. J Comp Neurol 435:263–275.
LidowMS, Song ZM (2001b) Effect of cocaine on cell proliferation inthe cerebral wall of monkey fetuses. Cereb Cortex 11: 545–551.
Lipton JW, Vu TQ, Ling Z, Gyawali S, Mayer JR, Carvey PM
(2002): Prenatal cocaine exposure induces an attenuation of
uterine blood flow in the rat. Neurotoxicol Teratol 24:143–148.
Liu T (2011): A few thoughts on brain ROIs. Brain Imaging Behav
5:189–202.
Liu T, Shen D, Davatzikos C (2004): Deformable registration of
cortical structures via hybrid volumetric and surface warping.
NeuroImage 22:1790–1801.Liu T, Li H, Wong K, Tarokh A, Guo L, Wong ST (2007): Brain tis-
sue segmentation based on DTI data. Neuroimage 38:114–123.
r Li et al. r
r 16 r

Liu T, Nie J, Tarokh A, Guo L, Wong ST (2008): Reconstruction ofcentral cortical surface from MRI brain images: Method andapplication. Neuroimage 40:991–1002.
Lv J, Guo L, Hu X, Zhang T, Li K, Zhang D, Yang J, Liu T (2010):Fiber-centered analysis of brain connectivities using DTI andresting state FMRI data. Med Image Comput Comput AssistInterv 13(Pt 2):143–150.
Malanga CJ III, Kosofsky BE (1999): Mechanisms of action ofdrugs of abuse on the developing fetal brain. Clin Perinatol26:17–37.
Meier E, Hertz L, Schousboe A (1991): Neurotransmitters as devel-opmental signals. Neurochem Int 19:1–15.
Miller-Loncar C, Lester BM, Seifer R, Lagasse LL, Bauer CR, Shan-karan S, Bada HS, Wright LL, Smeriglio VL, Bigsby R, Liu J(2005): Predictors of motor development in children prenatallyexposed to cocaine. Neurotoxicol Teratol 27:213–220.
Passingham RE, Stephan KE, Kotter R (2002): The anatomical ba-sis of functional localization in the cortex. Nat Rev Neurosci3:606–616.
Rivkin MJ, Davis PE, Lemaster JL, Cabral HJ, Warfield SK, Mul-kern RV, Robson CD, Rose-Jacobs R, Frank DA (2008): Volu-metric MRI study of brain in children with intrauterineexposure to cocaine, alcohol, tobacco, and marijuana. Pedia-trics 121:741–750.
Rose-Jacobs R, Waber D, Beeghly M, Cabral H, Appugleise D,Heeren T, Marani J, Frank DA (2009): Intrauterine cocaine ex-posure and executive functioning in middle childhood. Neuro-toxicol Teratol 31:159–168.
Santhanam P, Li Z, Hu X, Lynch ME, Coles CD (2009): Effects ofprenatal alcohol exposure on brain activation during an arith-metic task: An fMRI study. Alcohol Clin Exp Res 33:1901–1908.
Santhanam P, Coles CD, Li Z, Li L, Lynch ME, Hu X (2011):Default mode network dysfunction in adults with prenatalalcohol exposure. Psychiatry Res 194:354–362.
Shankaran S, Lester BM, Das A, Bauer CR, Bada HS, Lagasse L,Higgins R (2007): Impact of maternal substance use during
pregnancy on childhood outcome. Semin Fetal Neonatal Med12:143–150.
Sheinkopf SJ, Lester BM, Sanes JN, Eliassen JC, Hutchison E, Sei-fer R, LaGasse L, Durston S, Casey BJ (2009): Functional MRIand response inhibition in children exposed to cocaine inutero: Preliminary findings. Dev Neurosci 31:159–166.
Shen D, Davatzikos C (2002): HAMMER: Hierarchical attributematching mechanism for elastic registration. IEEE Trans MedImaging 21:1421–1439.
Van Essen DC, Dierker DL (2007): Surface-based and probabilisticatlases of primate cerebral cortex. Neuron 56:209–225.
Volpe JJ (1987): Neurology of the Newborn. Philadelphia, PA:W.B. Saunders, Co.
Warner TD, Behnke M, Eyler FD, Padgett K, Leonard C, Hou W,Garvan CW, Schmalfuss IM, Blackband SJ (2006): Diffusiontensor imaging of frontal white matter and executive function-ing in cocaine-exposed children. Pediatrics 118:2014–2024.
Woods JR Jr, Plessinger MA, Clark KE (1987): Effect of cocaine onuterine blood flow and fetal oxygenation. JAMA 257:957–961.
Zang Y, Jiang T, Lu Y, He Y, Tian L (2004): Regional homogeneityapproach to fMRI data analysis. Neuroimage 22:394–400.
Zhang T, Guo L, Li K, Jing C, Yin Y, Zhu D, Cui G, Li L, Liu T(2011): Predicting functional cortical ROIs via DTI-derivedfiber shape models. Cereb. Cortex, doi: 10.1093/cercor/bhr152.
Zhu D, Zhang D, Faraco C, Li K, Deng F, Chen H, Jiang X, GuoL, Miller LS, Liu T (2011): Discovering dense and consistentlandmarks in the brain. Inf Process Med Imaging 22:97–110.
Zhu D, Li K, Faraco CC, Deng F, Zhang D, Guo L, Miller LS, LiuT (2012): Optimization of functional brain ROIs via maximiza-tion of consistency of structural connectivity profiles. Neuro-image 59:1382–1393.
Zhu D, Li K, Guo L, Jiang X, Zhang T, Zhang D, Chen H, Deng F,Faraco C, Jin C, Wee CY, Yuan Y, Lv P, Yin Y, Hu XL, DuanL, Hu XT, Han J, Wang L, Shen D, Miller LS, Li LJ, Liu T:.DICCCOL: Dense individualized and common connectivity-based cortical landmarks (in press).
r 17 r
r Connectomics Signatures of PCE Affected Adolescent Brains r
Copyright © 2022 FDOKUMEN