Quantitative complexity analysis in multi-channel intracranial EEG recordings form epilepsy brains
14
Quantitative complexity analysis in multi-channel intracranial EEG recordings form epilepsy brains Chang-Chia Liu, Department of Industrial and Systems Engineering, Biomedical Engineering, University of Florida, 303 Weil Hall, P.O. Box 116595, Gainesville, FL 32611-6595, USA Panos M. Pardalos, Department of Industrial and Systems Engineering, Biomedical Engineering, University of Florida, 303 Weil Hall, P.O. Box 116595, Gainesville, FL 32611-6595, USA W. Art Chaovalitwongse (✉) , Department of Industrial and Systems Engineering, Rutgers University, 96 Frelinghuysen Rd., Piscataway, NJ 08854, USA Deng-Shan Shiau, Optima Neuroscience, Inc., Downtown Technology Center, 101 SE 2nd Place, Suite 201-A, Gainesville, FL 32601, USA Georges Ghacibeh, Northeast Regional Epilepsy Group, 20 Prospect Ave., Suite 800, Hackensack, NJ 07601, USA Wichai Suharitdamrong, and Department of Industrial and Systems Engineering, University of Florida, 303 Weil Hall, P.O. Box 116595, Gainesville, FL 32611-6595, USA J. Chris Sackellares Optima Neuroscience, Inc., Downtown Technology Center, 101 SE 2nd Place, Suite 201-A, Gainesville, FL 32601, USA Abstract Epilepsy is a brain disorder characterized clinically by temporary but recurrent disturbances of brain function that may or may not be associated with destruction or loss of consciousness and abnormal behavior. Human brain is composed of more than 10 to the power 10 neurons, each of which receives electrical impulses known as action potentials from others neurons via synapses and sends electrical impulses via a sing output line to a similar (the axon) number of neurons. When neuronal networks are active, they produced a change in voltage potential, which can be captured by an electroencephalogram (EEG). The EEG recordings represent the time series that match up to neurological activity as a function of time. By analyzing the EEG recordings, we sought to evaluate the degree of underlining dynamical complexity prior to progression of seizure onset. Through the utilization of the dynamical measurements, it is possible to classify the state of the brain according to the underlying dynamical properties of EEG recordings. The results from two patients with temporal lobe epilepsy (TLE), the degree of complexity start converging to lower value prior to the epileptic seizures was observed from epileptic regions as well as non-epileptic regions. The dynamical measurements appear to reflect the changes of EEG’s dynamical structure. We suggest (✉) e-mail: [email protected] Chang-Chia Liu, e-mail: [email protected]; Panos M. Pardalos, e-mail: [email protected]; Deng-Shan Shiau, e-mail: [email protected]; Georges Ghacibeh, e-mail: [email protected]; Wichai Suharitdamrong e-mail: [email protected]; J. Chris Sackellares, e-mail: [email protected] NIH Public Access Author Manuscript J Comb Optim. Author manuscript; available in PMC 2008 December 10. Published in final edited form as: J Comb Optim. 2008 April ; 15(3): 276–286. doi:10.1007/s10878-007-9118-9. NIH-PA Author Manuscript NIH-PA Author Manuscript NIH-PA Author Manuscript
Transcript of Quantitative complexity analysis in multi-channel intracranial EEG recordings form epilepsy brains

Quantitative complexity analysis in multi-channel intracranialEEG recordings form epilepsy brains
Chang-Chia Liu,Department of Industrial and Systems Engineering, Biomedical Engineering, University of Florida,303 Weil Hall, P.O. Box 116595, Gainesville, FL 32611-6595, USA
Panos M. Pardalos,Department of Industrial and Systems Engineering, Biomedical Engineering, University of Florida,303 Weil Hall, P.O. Box 116595, Gainesville, FL 32611-6595, USA
W. Art Chaovalitwongse(✉),Department of Industrial and Systems Engineering, Rutgers University, 96 Frelinghuysen Rd.,Piscataway, NJ 08854, USA
Deng-Shan Shiau,Optima Neuroscience, Inc., Downtown Technology Center, 101 SE 2nd Place, Suite 201-A,Gainesville, FL 32601, USA
Georges Ghacibeh,Northeast Regional Epilepsy Group, 20 Prospect Ave., Suite 800, Hackensack, NJ 07601, USA
Wichai Suharitdamrong, andDepartment of Industrial and Systems Engineering, University of Florida, 303 Weil Hall, P.O. Box116595, Gainesville, FL 32611-6595, USA
J. Chris SackellaresOptima Neuroscience, Inc., Downtown Technology Center, 101 SE 2nd Place, Suite 201-A,Gainesville, FL 32601, USA
AbstractEpilepsy is a brain disorder characterized clinically by temporary but recurrent disturbances of brainfunction that may or may not be associated with destruction or loss of consciousness and abnormalbehavior. Human brain is composed of more than 10 to the power 10 neurons, each of which receiveselectrical impulses known as action potentials from others neurons via synapses and sends electricalimpulses via a sing output line to a similar (the axon) number of neurons. When neuronal networksare active, they produced a change in voltage potential, which can be captured by anelectroencephalogram (EEG). The EEG recordings represent the time series that match up toneurological activity as a function of time. By analyzing the EEG recordings, we sought to evaluatethe degree of underlining dynamical complexity prior to progression of seizure onset. Through theutilization of the dynamical measurements, it is possible to classify the state of the brain accordingto the underlying dynamical properties of EEG recordings. The results from two patients withtemporal lobe epilepsy (TLE), the degree of complexity start converging to lower value prior to theepileptic seizures was observed from epileptic regions as well as non-epileptic regions. Thedynamical measurements appear to reflect the changes of EEG’s dynamical structure. We suggest
(✉)e-mail: [email protected] Liu, e-mail: [email protected]; Panos M. Pardalos, e-mail: [email protected]; Deng-Shan Shiau, e-mail:[email protected]; Georges Ghacibeh, e-mail: [email protected]; Wichai Suharitdamrong e-mail: [email protected]; J.Chris Sackellares, e-mail: [email protected]
NIH Public AccessAuthor ManuscriptJ Comb Optim. Author manuscript; available in PMC 2008 December 10.
Published in final edited form as:J Comb Optim. 2008 April ; 15(3): 276–286. doi:10.1007/s10878-007-9118-9.
NIH
-PA Author Manuscript
NIH
-PA Author Manuscript
NIH
-PA Author Manuscript
that the nonlinear dynamical analysis can provide a useful information for detecting relative changesin brain dynamics, which cannot be detected by conventional linear analysis.
KeywordsDynamical system; Complexity analysis; Electroencephalogram (EEG); Minimum embeddingdimension
1 IntroductionEpilepsy is a brain disorder characterized clinically by temporary but recurrent disturbancesof brain function that may or may not be associated with destruction or loss of consciousnessand abnormal behavior. Human brain is composed of more than 10 to the power 10 neurons,each of which receives electrical impulses (known as action potentials) from others neuronsvia synapses and sends electrical impulses via a sing output line to a similar (the axon) numberof neurons (Shatz 1981). When neuronal networks are active, they produce a change in voltagepotential, which can be captured by an electroencephalogram (EEG). The EEG recordingsrepresent the time series that match up to neurological activity as a function of time. Thestructure of EEG recordings represent the inter activities among the groups of neurons. Manyinvestigators have applied nonlinear dynamical methods in a broad range of medicalapplications. More recent nonlinear dynamical methods have shown the abilities to explainsome underlining mechanisms of brain functions (Babloyantz and Destexhe 1986, 1987;Babloyantz 1988; Babloyantz et al. 1985). Roschke and Aldenhoff (1991); Fell et al. (1993)have reported the chaotic behavior of the human EEG during sleep changed as the sleep stagechanged (Iasemidis and Sackellares 1991; Iasemidis and Sackellares 1996). Iasemidis andSackellares et al. have shown that the nonlinear dynamical methods have the abilities to findout the abnormal activity in EEG recordings from epilepsy patients (Iasemidis and Sackellares1991; Iasemidis and Sackellares 1996; Iasemidis et al. 1990, 1996).
In this present study, we used nonlinear dynamical measurements to investigate the behaviorof underlining dynamical complexity of EEG recordings from patients with epilepsy. Moreparticularly, we sought to evaluate the degree of underlining dynamical complexity prior toinitiation of seizure onsets. Several previous studies have shown the presences of nonlinearityin the EEG recordings acquired from epilepsy patients. Casdagli et al. (1996) reported thepresence of nonlinearity in the invasive EEG recordings from epileptic regions of patients.Palus (1996); Thelier and Rapp (1996) have also shown the weak nonlinearities in the EEGrecordings from normal human volunteers using surrogate data methods.
It is known that a dynamical system with d degree of freedom may evolve on a manifold witha lower dimension, so that only portions of the total number of degree of freedom are actuallyactive. For a simple system with limit cycles, it is obvious that time-delay embedding producean equivalent reconstruction of the true state. According to embedding theorem from Whitney(1936), an arbitrary D-dimension curved space can be mapped into a Cartesian (rectangular)space of 2D + 1 dimensions without having any self intersections, hence satisfying theuniqueness condition for an embedding. Sauer et al. (1991) generalized Whitney’s theorem tofractural attractors with dimension Df and showed the embedding space only need to have adimension greater than 2Df. Although it is possible for a fractal to be embedded in anotherfractal, we only consider the integer embeddings. Takens’ delay embedding theorem (Takens1981) also provided that the time lagged variables constitute an adequate embedding providedthe measured variables is smooth and couples to all the variables, and number of time lags isat least 2D + 1.
Liu et al. Page 2
J Comb Optim. Author manuscript; available in PMC 2008 December 10.
NIH
-PA Author Manuscript
NIH
-PA Author Manuscript
NIH
-PA Author Manuscript

For the above reasons, we employed a method proposed by Cao (1997) to estimate theminimum embedding dimension of EEG time series. Like some other exiting methods, Cao’smethod is also under the concepts of “false-nearest-neighbors” (Kennel et al. 1992). The “false-nearest-neighbors” utilized on the fact that if the reconstruction space has not enoughdimensions, the reconstruction will perform a projection, and hence will not be an embeddingof the desired system. As a of result of giving a to low embedding dimension while processingthe embedding procedure, two points which is far away in the true state space will be mappedinto close neighbor in the reconstruction space. These are then the “false neighbors”. Cao’smethod overcomes the drawbacks of the exiting algorithms. It does not require huge amountof data points, is not subjective and it is not time-consuming find the optimal minimumembedding dimension. The EEG recordings was divided into non-overlapping single electrodesegments of 10.24 s duration, each of which was estimated for the minimum embeddingdimension. Under the assumption “the EEG recordings within each 10.24 s duration wasapproximately stationary (Iasemidis et al. 1993)”, we evaluated the underlining dynamicalbehavior by looking at the minimum embedding dimension over time.
The remaining of this paper is organized as follows. In Sects. 2 and 3, we describe the datainformation and explain the algorithms for the minimum embedding dimension estimation.The results from two patients with a total number of six temporal lobe epilepsy (TLE) are givenin Sect. 4. In Sect. 5, we discuss the results of our findings with respect the use of this algorithmand the function of nonlinear dynamical measurements in the area of seizure control.
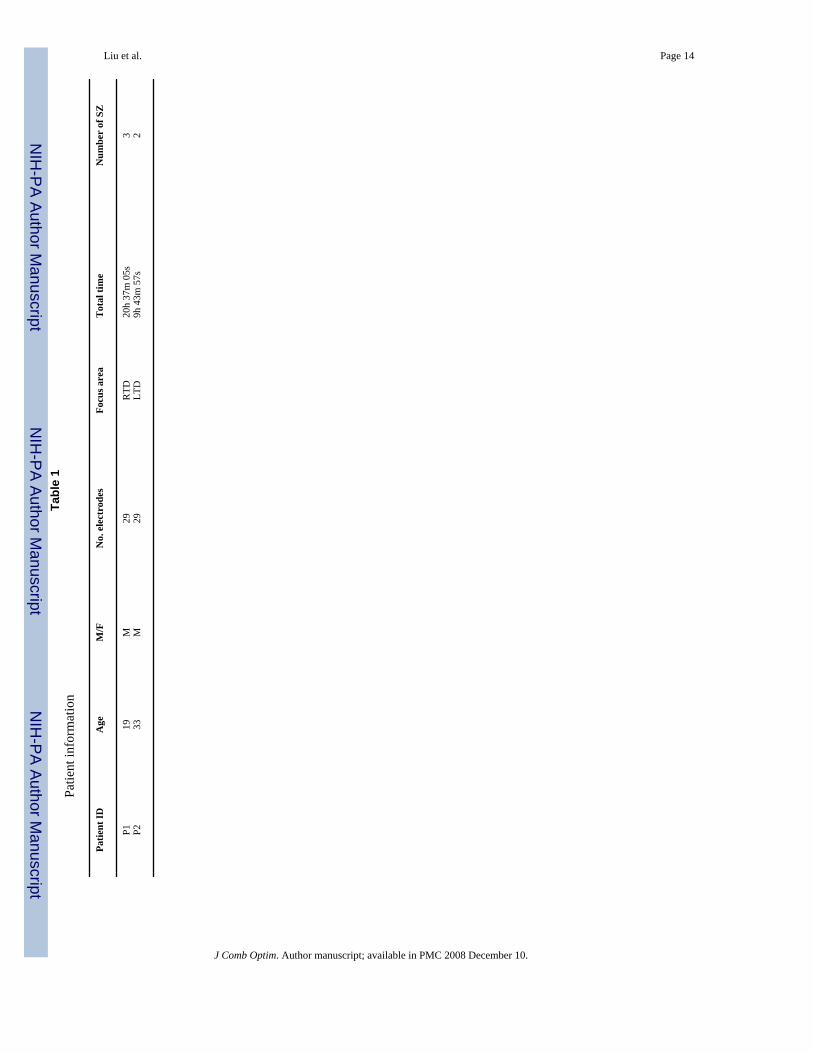
2 Data informationElectrographic (EEG) recordings from bilaterally placed depth and subdural electrodes inpatients with medically refractory partial seizures of mesial temporal origin were analyzed inthis study (Casdagli et al. 1997). A typical epileptic electrode montage for such recordings isshown in Fig. 1. The EEG recording data for epilepsy patients were obtained as part of pre-surgical clinical evaluation. They had been obtained using a Nicolet BMSI 4000 and 5000recording system, using s 0.1 Hz highpass and a 70 Hz low pass filter. Each record included atotal of 28 to 32 intracranial electrodes (8 subdural and 6 hippocampal depth electrodes foreach cerebral hemisphere). Prior to storage, the signals were sampled at 200 Hz using an analogto digital converter with 10 bits quantization. The recordings were stored digitally onto highfidelity video type. Two epilepsy patients (see Table 1) were included in this study.
3 Methods3.1 Nonstationarity
Nonstationarity is an inhered problem for analyzing biological time series analysis. As resultof nonstationarity in a measured biological time series, no invariant measures would able tocarry out. Nonstationarity will also cause errors for many measurements to invalid on theassumption and produce bias results. To avoid the above situations, one can try to remove thenonstationarity by using linear filter (i.e. differencing, bleaching or spectral filtering) ordividing time series into a number of shorter windows and assume the underlining dynamicsto be approximately statistically stationary within each small divided window. In this study,EEG recordings were divided into non-overlapping segmentation of 10.24 s duration to dealwith inhered nonstationarity property in EEG. The same divided method has also been previousused by Iasemidis et al. (1993). Such segmentation technique is usually applied for biologicaltime series, by performing calculation on each 10.24 s windows, the changes of the dynamicalproperties over time could be detected.
Liu et al. Page 3
J Comb Optim. Author manuscript; available in PMC 2008 December 10.
NIH
-PA Author Manuscript
NIH
-PA Author Manuscript
NIH
-PA Author Manuscript

3.2 Proper time delayWe used the mutual information function to estimate the proper time delay between successivecomponents in delay vectors. In theory, the time delay used for time delay vector reconstructionis not the subject of the embedding theorem. Since the data are assumed to have infiniteprecision, from mathematical point of view delay time can be chosen arbitrary. On the otherhand, it is essential to have a good estimation for proper time delay when dealing with noneartificial data. For none artificial data, the time delay parameter can affect the dynamicalproperties under studying, if time delay is very large, the different coordinates may be almostuncorrelated. In this case, the attractor may become very complicated, even if the underlying“true” attractor is simple. If delay is too small, there is almost no difference between thedifferent components between delay vectors, such that all points are accumulated around thebisectrix in the embedding space.
Therefore, it is suggested to look for the first minimum of the time delay mutual informationFraser and Swinney (1986). The concept of mutual information is given as below Martinerieet al. (1992). Consider system S and Q consisting of discrete sets of possible messages {s1,s2, . . . , sn} and {q1, q2, . . . , qn with associated probabilities {Ps(s1), . . . , Ps(Sn)} and{Pq(q1), . . . , Pq(qm)}. The }entropy H(S) is the average amount of information gained froma measurement of S
is defined at the same notation as H(S).
The mutual information of S and Q system is denoted by I(Q,S). Given a measurement of s, I(Q,S) is the number of bits of q on average, that can be predicated,
where H(Q) and H(S) are entropies of system Q and system S, respectively. H(S,Q) is the joinentropy function. H(S,Q) is denoted the average amount of information gained from measuring(s, q) pairs, where the joint-probability distribution, denoted Psq(si; qj), is the probability thats = si and q = qi,
Suppose a variable v is investigated by being sampled with sampling interval Ts. Let suchprocess be the context of system S and system Q, let s be the measurement of v at time t, andlet q be the measurement at time t + Ts. Using these measurement to define systems S and Q,mutual information I(Q,S) can be calculated. Thus, mutual information becomes a function ofTs. For this problem, mutual information will be the number of bits of v(t + Ts) that can bepredicated, on average, when v(t) is known. One wants to pick Ts should be chosen so that v(t + Ts) is as unpredictable as possible. Maximum unpredictability occurs at minimum ofpredictability; that is, at the minimum in the mutual information. Because of the exponentialdivergence of chaotic trajectories, the first local minimum of I(Q,S), rather than somesubsequent minimum, should probably be chosen for the sampling interval Ts.
3.3 The minimum embedding dimensionDynamical systems processing d degree of freedom which may choose to proceed on a manifoldof much lower dimension, so that only small portions of the degrees of freedom are actuallyactive. In such case it is useful to estimate the behaviors of degrees of freedom over a periodof time, and it is obvious that this information can be obtained from that dimension of attractorfrom the corresponding system. If one chooses the embedding dimension too low this results
Liu et al. Page 4
J Comb Optim. Author manuscript; available in PMC 2008 December 10.
NIH
-PA Author Manuscript
NIH
-PA Author Manuscript
NIH
-PA Author Manuscript

in points that are far apart in the original phase space being moved closer together in thereconstruction space. Taken’s delay embedding theorem (Takens 1981) states that a pseudo-state space can be reconstructed from infinite noiseless time series (when one choose d >2dA) is often been used when reconstructing the delay vector. There are several classicalalgorithms (Grassberger and Procaccia 1983; Kennel et al. 1992; Broomhead and King 1986)used to obtain the minimum embedding dimension. The classical approaches usually requirehuge computation power and vast among of data. Another limitation of these algorithms is thatthey usually subjective to different types of data. We evaluated the minimum embeddingdimension of the attractors from the EEG by using Cao’s method (Cao 1997). The notions herefollowed “Practical method for determining the minimum embedding dimension of a scalartime series” (Cao 1997). Suppose that we have a time series {x1, x2, x3 , . . . , xN}. By applyingthe method of delay we obtain the time delay vector. The time-delay vector is as follows:
where d is the embedding dimension and τ is the time-delay and yi(d) means the ithreconstructed vector with embedding dimension d. Similar to the idea of the false neighbormethods [ ], defining
where || · || is some measurement of Euclidian distance and is given in this paper by maximumnorm. Define the mean value of all a(i, d)’s as
E(d) is dependent only on the dimension d and the time delay τ. The minimum embeddingdimension is founded when E1(d) = E(d + 1)/E(d) saturated when d is larger than some valued0 if the time series comes from an attractor. The value d0 + 1 is the estimated minimumembedding dimension.
4 Data analysisThe first step in the data analysis was to divide the EEG data into non-overlapping windowsof 10.24 seconds in duration for nonstationarity purposes. This procedure was to ensure thatthe underlining dynamical properties were approximately stationary. For each divided window,the first step of estimating the minimum embedding dimension is to construct the delaycoordinates using method of delay proposed by Takens (1981). The time delay τ was obtainedfrom the first local minimum of the mutual information function. We used these time delayvectors as inputs to Cao’s method for the minimum embedding dimension estimation. Theminimum embedding dimension was calculated over time for EEG recordings with 29electrodes at six brain regions (RTD, RST, ROF, LTD, LST, and LOF) from epilepsy patients.Each brain region contains 4-6 electrodes; the average of the minimum embedding dimensionda is taken as representation to the underlining brain dynamics. We shall study the minimumembedding dimension in the following three different time periods: Inter-Ictal, lctal and Post-Ictal. These three different time periods are defined as follows:
1. Inter-Ictal period: 1 hour data length and 1 hour away before seizure onset
2. Ictal period: 2 minutes data length after seizure onset
3. Post-Ictal period: 1 hour data length and 1 hour after the ictal period
Figures 2, 3, 4, 5 and 6 exhibits the minimum embedding dimension over time correspondingfive seizures. One can observe that behavior of the average minimum embedding dimension
Liu et al. Page 5
J Comb Optim. Author manuscript; available in PMC 2008 December 10.
NIH
-PA Author Manuscript
NIH
-PA Author Manuscript
NIH
-PA Author Manuscript
over time from six recording regions. The minimum embedding dimension behaved stableduring the Inter-Ictal period. In other words, the underlying degree of freedomly is uniformlydistributed over the Inter-Ictal period in the EEG recordings. The results indicated that thelowest values of the minimum embedding dimension were observed from the epileptic zoneduring Inter-Ictal period (the RST electrodes in Figs. 2, 3, and 4; the LTD electrodes in Figs.5 and 6). The complexity of the EEG recordings from the epileptic region is lower than thatfrom the normal regions. The values of the minimum embedding dimension from all brainregions start decreasing and converging to a lower value as the patient proceed from Inter-Ictal to Ictal period. The underlining dynamical changes before entering Ictal period wereconsistently detected by our algorithm.
5 DiscussionWe study the underlining dynamical behaviors in the EEG recordings by estimating theminimum embedding dimension. The algorithm we use for the minimum embeddingestimation is faster and requires less data points to obtain accurate results. It is computationallyefficient and certainly less time consuming compared to some classical procedures forestimating embedding dimension estimation. The drawback of employing this algorithm is thatit does not adopt with the noise in the EEG recordings. In the cases 2 and 3, after the seizureonset the decreases in the minimum embedding dimension was due to artificial noise in theEEG recordings. This drawback can certainly be overcome by carefully exam the EEGrecordings before the minimum embedding dimension estimation. Our results are compatiblewith the findings about the nature of transitions to Ictal period in invasive EEG recordings frompatients with seizures of mesial temporal origin. Iasemidis and Sackellares et al., have alsoreported that the order of the EEG recordings start decreasing when that period of the patientis close to Ictal period. The complexity of underlining dynamical system drops lead to the orderof the EEG recordings increase. The decrease and converge in the minimum embeddingdimension can be used to detect seizure onset by developing more sophisticated mechanism.Further studies on a larger sample of patients to validate these results are warranted. Successof this study will provide more much helpful information to guide patients and epileptologiststo improve the likelihood of successful seizure control.
AcknowledgementsThis research is supported by the National Institute of Biomedical Imaging and Bioengineering (NIBIB) via aBioengineering Research Partnership grant for Brain Dynamics (8R01EB002089-03). The facilities used for thisresearch were the Brain Dynamics Laboratories at the University of Florida, Gainesville, FL.
ReferencesBabloyantz, A. Chaotic dynamics in brain activity. In: Basar, E., editor. Dynamics of sensory and
cognitive processing by the brain. Springer; Berlin: 1988. p. 196-202.Babloyantz A, Destexhe A. Low dimension chaos in an instance of epilepsy. Proc Natl Acad Sci USA
1986;83:3513–3517. [PubMed: 3085091]Babloyantz, A.; Destexhe, A. The Creutizfeld-Jacob disease in the hierarchy of chaotic attractor. In:
Markus, M.; Muller, S., editors. From chemical to biological organization. Springer; Berlin: 1987. p.307-316.
Babloyantz A, Salazar JM, Nicolis C. Evidence of chaotic dynamics of brain activity during the sleepcycle. Phys Lett A 1985;III:152–156.
Broomhead DS, King GP. Physica D 1986;20:217.Cao L. Practical method for determining the minimum embedding dimension of a scalar time series.
Physica D 1997;110:43–50.
Liu et al. Page 6
J Comb Optim. Author manuscript; available in PMC 2008 December 10.
NIH
-PA Author Manuscript
NIH
-PA Author Manuscript
NIH
-PA Author Manuscript
Casdagli MC, Iasemidis LD, Sackellares JC, Roper SN, Gilmore RL, Savit RS. Characterizingnonlinearity in invasive EEG recordings from temporal lobe epilepsy. Physica D 1996;99(23):381–399.
Casdagli MC, Iasemidis LD, Savit RS, Gilmore RL, Roper SN, Sackellares JC. Non-linearity in invasiveEEG recordings from patients with temporal lobe epilepsy. Electroenceph Clin Neurophysiol1997;102:98–105. [PubMed: 9060860]
Fell J, Roschke J, Beckmann P. The calculation of the first positive Lyapunov exponent in sleep EEGdata. Electroenceph Clin Neurophysiol 1993;86:348–357. [PubMed: 7685269]
Fraser AM, Swinney HL. Independent coordinates for strange attractors from mutual information. PhysRev A 1986;33:1134–1140. [PubMed: 9896728]
Grassberger P, Procaccia I. Measuring the strangeness of strange attractors. Physica D 1983;9:189–208.Iasemidis, LD.; Sackellares, JC. The evolution with time of the spatial distribution of largest Lyapunov
exponent on the human epileptic cortex. In: Duke, D.; Pritchard, W., editors. Measuring chaos in thehuman brain. World Scientific; Singapore: 1991. p. 49-82.
Iasemidis LD, Sackellares JC. Chaos theory and epilepsy. Neuroscientist 1996;2:118–126.Iasemidis LD, Sackellares JC, Zaveri H, Williams WJ. Phase space topography and Lyapunov exponent
of electrocardiograms in partial seizures. Brain Topogr 1990;2:297–201.Iasemidis, LD.; Sackellares, JC.; Savit, RS. Quantification of hidden time dependencies in the EEG within
the framework of non-linear dynamics. In: Jansen, BH.; Brandt, ME., editors. Nonlinear dynamicalanalysis of the EEG. 1990. World Scientific; Singapore: 1993. p. 30-47.
Iasemidis, LD.; Principe, JC.; Czaolewski, JM.; Gilmore, RL.; Roper, SN.; Sackellares, JC.Spatiotemporal transition to epileptic seizures: a non-linear dynamical analysis of scalp andintracranial EEG recordings. In: Lopes da Silva, F.; Principe, JC.; Almeida, LB., editors.Spatiotemporal models in biological and artificial systems. IOS; Amsterdam: 1996. p. 81-88.
Kennel MB, Brown R, Abarbanel HDI. Determining embedding dimension for phase-spacereconstruction using a geometrical construction. Phys Rev A 1992;45:3403–3411. [PubMed:9907388]
Martinerie JM, Albano AM, Mees AI, Rapp PE. Phys Rev A 1992;45:7058–7064. [PubMed: 9906777]Palus M. Nonlinearity in normal human EEG: cycles, temporal asymmetry, nonstationarity and
randomness, not chaos. Biol Cybern 1996;75(5):389–396. [PubMed: 8983161]Roschke J, Aldenhoff J. The dimensionality of human’s electroencephalogram during sleep. Biol Cybern
1991;64:307–313. [PubMed: 2025664]Sauer T, Yorke JA, Casdagli MC. Embedology. J Stat Phys 1991;65:579–616.Shatz CJ. Brain Sci 1981;214(4521):652–653.Takens, F. Detecting strange attractors in fluid turbulence. In: Rand, D.; Young, L-S., editors. Dynamical
systems and turbulence. Springer; Berlin: 1981. p. 366-381.Thelier J, Rapp P. Re-examination of the evidence for low-dimensional, non-linear structure in the human
electroencephalogram. Electroenceph Clin Neurophysiol 1996;98(3):213–22. [PubMed: 8631281]Whitney H. Differentiable manifolds. Ann Math 1936;37:645.
Liu et al. Page 7
J Comb Optim. Author manuscript; available in PMC 2008 December 10.
NIH
-PA Author Manuscript
NIH
-PA Author Manuscript
NIH
-PA Author Manuscript

Fig. 1.Electrode placement. A Inferior transverse and B lateral views of the brain, illustratingapproximate depth and subdural electrode placement for EEG recordings are depicted.Subdural electrode srips are placed over the left orbitfrontal (LOF), right orbitofrontal (ROF),left subtemporal (LST), and right subtemporal (RST) cortex. Depth electrodes are placed inthe left temporal depth (LTD) and right temporal depth (RTD) to record hippocampal activity
Liu et al. Page 8
J Comb Optim. Author manuscript; available in PMC 2008 December 10.
NIH
-PA Author Manuscript
NIH
-PA Author Manuscript
NIH
-PA Author Manuscript
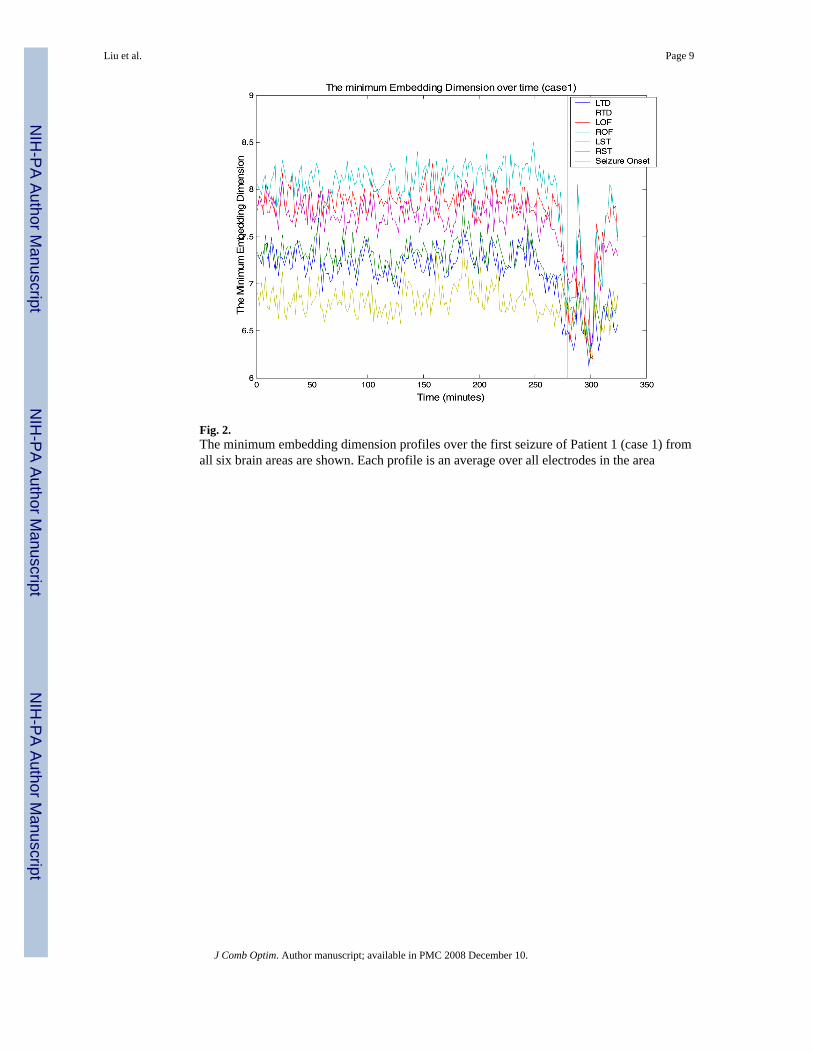
Fig. 2.The minimum embedding dimension profiles over the first seizure of Patient 1 (case 1) fromall six brain areas are shown. Each profile is an average over all electrodes in the area
Liu et al. Page 9
J Comb Optim. Author manuscript; available in PMC 2008 December 10.
NIH
-PA Author Manuscript
NIH
-PA Author Manuscript
NIH
-PA Author Manuscript

Fig. 3.The minimum embedding dimension profiles over the second seizure of Patient 1 (case 2) fromall six areas of the brain are shown. Each profile is an average over all electrodes in the area
Liu et al. Page 10
J Comb Optim. Author manuscript; available in PMC 2008 December 10.
NIH
-PA Author Manuscript
NIH
-PA Author Manuscript
NIH
-PA Author Manuscript
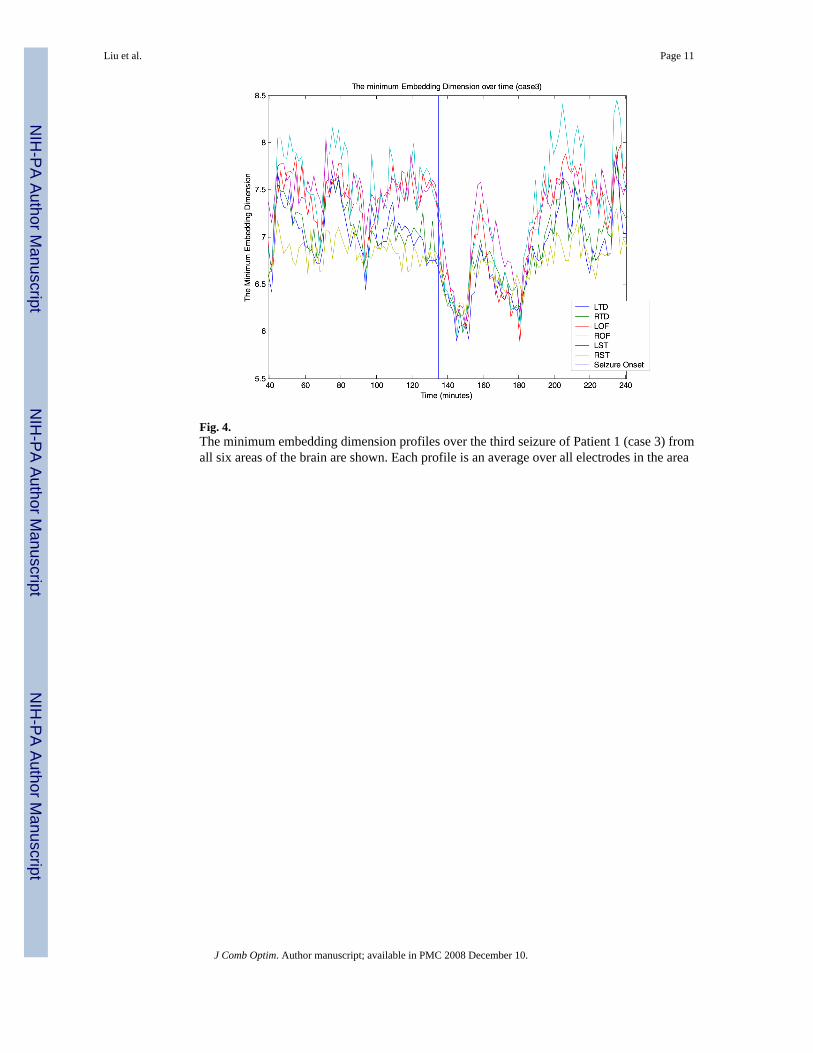
Fig. 4.The minimum embedding dimension profiles over the third seizure of Patient 1 (case 3) fromall six areas of the brain are shown. Each profile is an average over all electrodes in the area
Liu et al. Page 11
J Comb Optim. Author manuscript; available in PMC 2008 December 10.
NIH
-PA Author Manuscript
NIH
-PA Author Manuscript
NIH
-PA Author Manuscript

Fig. 5.The minimum embedding dimension profiles over the first seizure of Patient 2 (case 4) fromall six areas of the brain are shown. Each profile is an average over all electrodes in the area
Liu et al. Page 12
J Comb Optim. Author manuscript; available in PMC 2008 December 10.
NIH
-PA Author Manuscript
NIH
-PA Author Manuscript
NIH
-PA Author Manuscript
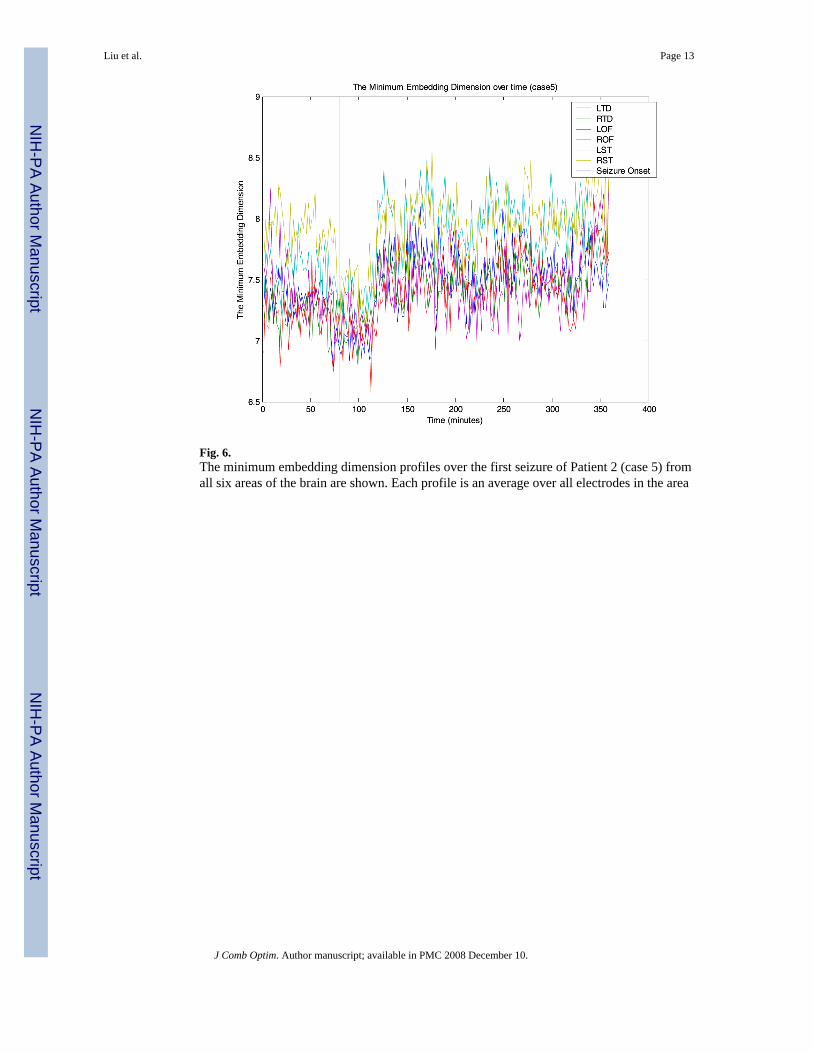
Fig. 6.The minimum embedding dimension profiles over the first seizure of Patient 2 (case 5) fromall six areas of the brain are shown. Each profile is an average over all electrodes in the area
Liu et al. Page 13
J Comb Optim. Author manuscript; available in PMC 2008 December 10.
NIH
-PA Author Manuscript
NIH
-PA Author Manuscript
NIH
-PA Author Manuscript
NIH
-PA Author Manuscript
NIH
-PA Author Manuscript
NIH
-PA Author Manuscript
Liu et al. Page 14Ta
ble
1Pa
tient
info
rmat
ion
Patie
nt ID
Age
M/F
No.
ele
ctro
des
Focu
s are
aT
otal
tim
eN
umbe
r of
SZ
P119
M29
RTD
20h
37m
05s
3P2
33M
29LT
D9h
43m
57s
2
J Comb Optim. Author manuscript; available in PMC 2008 December 10.