Concepts for Large Scale Hydrogen Production - NTNU Open
145
Concepts for Large Scale Hydrogen Production Daniel Jakobsen Vegar Åtland Master of Science in Mechanical Engineering Supervisor: Petter Nekså, EPT Co-supervisor: David Berstad, SINTEF Energy Research Øivind Wilhelmsen, SINTEF Energy Research Department of Energy and Process Engineering Submission date: June 2016 Norwegian University of Science and Technology
-
Upload
khangminh22 -
Category
Documents
-
view
1 -
download
0
Transcript of Concepts for Large Scale Hydrogen Production - NTNU Open
Concepts for Large Scale HydrogenProduction
Daniel JakobsenVegar Åtland
Master of Science in Mechanical Engineering
Supervisor: Petter Nekså, EPTCo-supervisor: David Berstad, SINTEF Energy Research
Øivind Wilhelmsen, SINTEF Energy Research
Department of Energy and Process Engineering
Submission date: June 2016
Norwegian University of Science and Technology

i
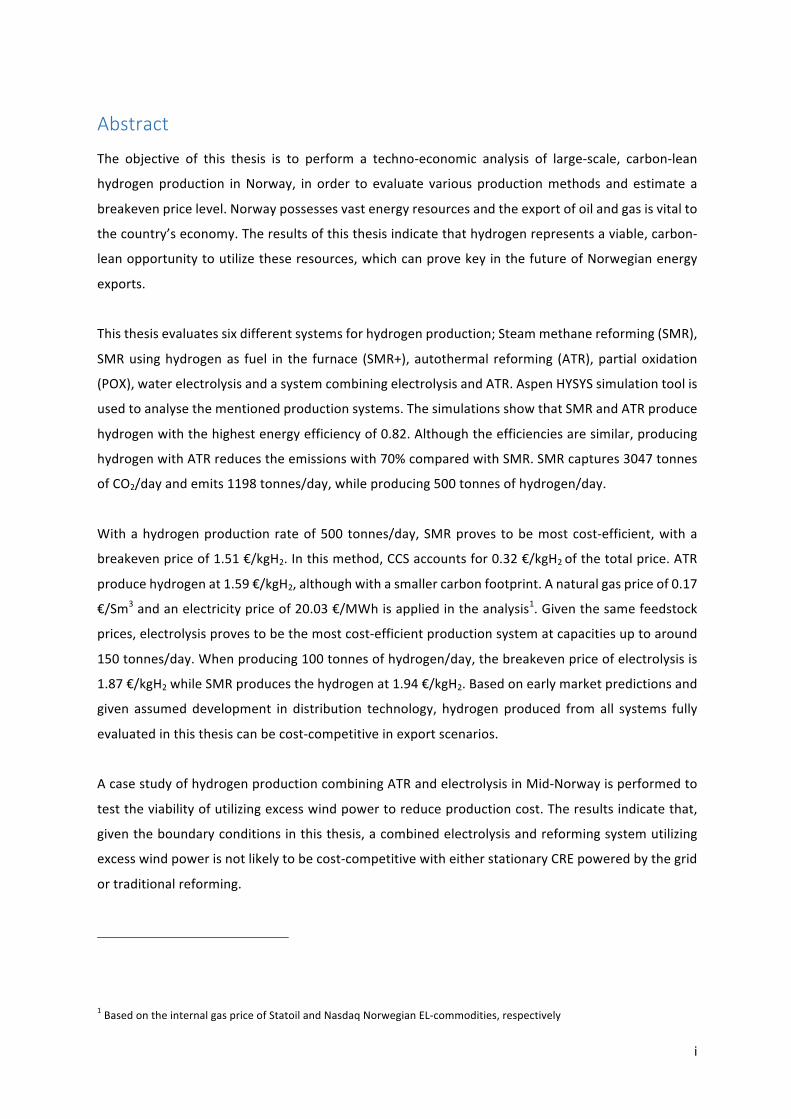
Abstract
The objective of this thesis is to perform a techno-economic analysis of large-scale, carbon-lean
hydrogenproduction inNorway, in order to evaluate variousproductionmethods andestimate a
breakevenpricelevel.Norwaypossessesvastenergyresourcesandtheexportofoilandgasisvitalto
thecountry’seconomy.Theresultsofthisthesisindicatethathydrogenrepresentsaviable,carbon-
leanopportunitytoutilizetheseresources,whichcanprovekeyinthefutureofNorwegianenergy
exports.
Thisthesisevaluatessixdifferentsystemsforhydrogenproduction;Steammethanereforming(SMR),
SMRusinghydrogenas fuel in the furnace (SMR+),autothermal reforming (ATR),partialoxidation
(POX),waterelectrolysisandasystemcombiningelectrolysisandATR.AspenHYSYSsimulationtoolis
usedtoanalysethementionedproductionsystems.ThesimulationsshowthatSMRandATRproduce
hydrogenwiththehighestenergyefficiencyof0.82.Althoughtheefficienciesaresimilar,producing
hydrogenwithATRreducestheemissionswith70%comparedwithSMR.SMRcaptures3047tonnes
ofCO2/dayandemits1198tonnes/day,whileproducing500tonnesofhydrogen/day.
Withahydrogenproduction rateof500 tonnes/day,SMRproves tobemostcost-efficient,witha
breakevenpriceof1.51€/kgH2.Inthismethod,CCSaccountsfor0.32€/kgH2ofthetotalprice.ATR
producehydrogenat1.59€/kgH2,althoughwithasmallercarbonfootprint.Anaturalgaspriceof0.17
€/Sm3andanelectricitypriceof20.03€/MWhisappliedintheanalysis1.Giventhesamefeedstock
prices,electrolysisprovestobethemostcost-efficientproductionsystematcapacitiesuptoaround
150tonnes/day.Whenproducing100tonnesofhydrogen/day,thebreakevenpriceofelectrolysisis
1.87€/kgH2whileSMRproducesthehydrogenat1.94€/kgH2.Basedonearlymarketpredictionsand
given assumeddevelopment in distribution technology, hydrogen produced from all systems fully
evaluatedinthisthesiscanbecost-competitiveinexportscenarios.
AcasestudyofhydrogenproductioncombiningATRandelectrolysisinMid-Norwayisperformedto
testtheviabilityofutilizingexcesswindpowertoreduceproductioncost.Theresultsindicatethat,
giventheboundaryconditionsinthisthesis,acombinedelectrolysisandreformingsystemutilizing
excesswindpowerisnotlikelytobecost-competitivewitheitherstationaryCREpoweredbythegrid
ortraditionalreforming.
1BasedontheinternalgaspriceofStatoilandNasdaqNorwegianEL-commodities,respectively

ii
iii
SammendragMålet med denne avhandlingen er å gjennomføre en tekno-økonomisk analyse av storskala
hydrogenproduksjonmedredusertCO2-utlippiNorge,foråkartleggeulikeproduksjonsmetoderog
estimereetprisnivå.Norgeinneharenormeenergiressurserogeksportenavoljeoggassersentralfor
landets økonomi. Resultatene i denne avhandlingen indikerer at hydrogenmed reduserte utslipp
representererenlevedyktig,alternativutnyttelseavdisseressursene,noesomkanvisesegviktigfor
fremtidentilnorskenergieksport.
Avhandlingen undersøker seks ulike hydrogenproduksjonssystemer; Dampreformering (SMR),
dampreformering hvor hydrogen erstatter naturgass i forbrenningskammeret (SMR+), Delvis
forbrenning(POX),Autotermiskreformering(ATR),elektrolyse(EL)ogetkombinasjonssystemmed
ATR og EL. Karbonfangst og lagring (CCS) er forutsatt i alle produksjonsanleggene. De nevnte
systemeneer simulertmedprosessverktøyetAspenHYSYS,og simuleringeneviser at SMRogATR
produsererhydrogenmedhøyestenergieffektivitet,0.82.Tiltrossforlikvirkningsgrad,operererATR
med70%mindreCO2-utslippsammenlignetmedSMR.Produksjonav500tonnhydrogen/dagmed
SMRmedførerfangstav3047tonnCO2/dagogutslippav1198tonnCO2/dag.
Gitt en produksjonskapasitet på 500 tonn hydrogen/dag viser SMR seg å være det mest
kostnadseffektivealternativet,medennullpunktsprispå1.51€/kgH2.MeddennemetodenstårCCS
for0.32€/kgH2avdentotaleprisen.ATRerberegnettil1.59€/kgH2,dogmedetbetydeligmindre
karbonfotavtrykk.Ennaturgassprispå0.17€/Sm3ogenelektrisitetsprispå20.03€/MWherbenyttet
ianalysen2.Gittdesammeråvarekostnadene,fremstårELsomdetmestkostnadseffektivealternativet
foranleggopptilrundt150tonnhydrogen/dag.Gittenproduksjonskapasitetpå100tonnhydrogen
omdagen,enderELogSMRmedennullpunktsprispåhenholdsvis1.87€/kgH2og1.94€/kgH2.Basert
påtilgjengeligemarkedsanalyseroggittantattteknologiutvikling,kanhydrogenprodusertfraallede
evaluertesystemeneidenneavhandlingenværekonkurransedyktigeieksportscenarioer.
EtstudieavkombinasjonsanleggetmedATRogELblegjennomførtiMidt-Norge,foråtestehvordan
utnyttelsen av overskuddsstrøm fra vindkraft kan redusere den totale produksjonskostnaden.
Resultateneviseratutnyttelsenavoverskuddsstrømsannsynligvisikkevilgibedrelønnsomhetenn
stasjonærproduksjon fraentennetteller tradisjonell reformering,gittgrensebetingelsene idenne
avhandlingen.
2BasertpåhenholdsvisStatoilsinternegassprisogNasdaqsstrøm-objekterENOYR17-19.

iv

v
Preface
The present thesis was carried out at the Department of Energy and Process Engineering at the
NorwegianUniversityofScienceandTechnology(NTNU)fromJanuarytoJune2016.Oursupervisors
wereProfessor IIPetterNekså (NTNUandSINTEFEnergyResearch),DavidBerstad (SINTEFEnergy
Research)andØivindWilhelmsen(SINTEFEnergyResearch).

vi

vii
Acknowledgements
Thisthesishasbeenrealizedwithhelpfromseveralknowledgeablepeople,bothinternallyatNTNU
andexternally.WewouldespeciallyliketothankoursupervisorsDavidBerstad,ØivindWilhelmsen
andProfessorPetterNekså.Wearegratefulforthetimetheyspentandfortheirinsightsandvaluable
contributionsthroughouttheprojectperiod.
WewouldalsoliketothankProfessorMagnusKorpåsforhisassistancewithinrenewablepowersystemsandenergystorage.

viii
ix
TableofContentsAbstract..........................................................................................................................................i
Sammendrag.................................................................................................................................iii
Preface...........................................................................................................................................v
Acknowledgements......................................................................................................................vii
ListofFigures..............................................................................................................................xiii
ListofTables................................................................................................................................xvi
Listofabbreviations:....................................................................................................................xix
1 Introduction:...........................................................................................................................1
1.1 ScopeoftheThesis:................................................................................................................2
2 ConceptsforLarge-ScaleHydrogenProductionfromNaturalGas...........................................3
2.1 NaturalgasPre-treatment.....................................................................................................3
2.2 ReformingProcesses...............................................................................................................3
2.2.1 Pre-Reformer:.................................................................................................................4
2.2.2 SteamMethaneReforming(SMR)..................................................................................5
2.2.3 PartialOxidation(POX)...................................................................................................6
2.2.4 AutothermalReforming(ATR)........................................................................................7
2.2.5 Otherreformingprocesses.............................................................................................8
2.3 WaterGasShift(WGS)...........................................................................................................8
2.4 ConceptsforCO2Separation..................................................................................................9
2.4.1 PressureSwingAdsorption(PSA)...................................................................................9
2.4.2 Absorption......................................................................................................................9
2.4.3 MembraneSeparation.................................................................................................10
2.4.4 CryogenicSeparation....................................................................................................10
2.5 HydrogenPurificationProcesses..........................................................................................10
2.5.1 PressureSwingAdsorption(PSA):................................................................................10
2.5.2 MembraneSeparation.................................................................................................11
3 NorwegianHydrogenMarkets,andthePotentialforLarge-scaleProduction........................13
3.1 TransportationSector...........................................................................................................13
3.2 IndustrySector......................................................................................................................14
3.3 IsThereaPotentialforCentralizedHydrogenProductioninNorway?................................14
3.4 Whattodowith500TonnesofHydrogen?..........................................................................15
x
4 TechnicalAnalysisofLarge-scaleHydrogenProduction.........................................................16
4.1 Introduction:.........................................................................................................................16
4.2 CasePresentations...............................................................................................................16
4.2.1 System1:Streammethanereforming–SMR..............................................................16
4.2.2 System2:SteamMethaneReformingwithReducedCO2Emissions–SMR+..............17
4.2.3 System3:PartialOxidation–POX................................................................................18
4.2.4 System4:AutothermalReforming–ATR.....................................................................18
4.2.5 System5:Electrolysis–EL............................................................................................18
4.2.6 System6:CombinedReformingandElectrolysis–CRE...............................................19
4.3 MethodologyandSimulationofLarge-scaleHydrogenProduction.....................................19
4.3.1 GeneralDesignBasisandSimulationMethodology.....................................................20
4.3.2 SteamMethaneReforming(SMR)................................................................................21
4.3.3 SteamMethaneReforming,Improved(SMR+)............................................................24
4.3.4 PartialOxidation(POX).................................................................................................26
4.3.5 AutothermalReforming(ATR)......................................................................................28
4.3.6 ElectrolysisofWater(EL)..............................................................................................31
4.3.7 CombinedReformingandElectrolysis(CRE)................................................................31
4.4 TechnicalResultsandDiscussion..........................................................................................33
4.4.1 EnergyEfficiency..........................................................................................................34
4.4.2 CO2emissions...............................................................................................................34
4.4.3 SMRResultsandDiscussion.........................................................................................35
4.4.4 SMR+ResultsandDiscussion.......................................................................................40
4.4.5 POXResultsandDiscussion..........................................................................................43
4.4.6 ATRResultsandDiscussion..........................................................................................46
4.4.7 CREResultsandDiscussion..........................................................................................49
5 FinancialAnalysisofLarge-scaleHydrogenProduction.........................................................53
5.1 FinancialRisk........................................................................................................................53
5.1.1 DiscountRate...............................................................................................................53
5.2 WhatIsthePriceTargetofCarbon-leanHydrogenProducedinNorway?...........................54
5.3 CostAnalysis.........................................................................................................................55
5.3.1 CostBreakdownSMR...................................................................................................57
5.3.2 CostBreakdownSMR+.................................................................................................58
5.3.3 CostBreakdownATR....................................................................................................59
5.3.4 CostBreakdownCRE....................................................................................................60
xi
5.3.5 EnergyInputCosts........................................................................................................61
5.3.6 ProductionFacilityCosts..............................................................................................61
5.3.7 CarbonCaptureandStorageCosts...............................................................................62
5.4 BreakevenPriceofHydrogen...............................................................................................62
5.5 CostComparisonwithH2AReportbyNationalRenewableEnergyLaboratory...................64
5.6 EnvironmentalImpact..........................................................................................................67
5.6.1 CO₂Emissions...............................................................................................................67
5.7 SensitivityAnalysis................................................................................................................69
5.7.1 OptimisticCaseandConservativeCaseScenarios.......................................................69
5.7.2 ChangesinenergyinputCost.......................................................................................70
5.7.3 CarbonTax....................................................................................................................73
5.7.4 SystemDesignVariations.............................................................................................74
5.7.5 FinancialMarketChanges............................................................................................76
5.8 Techno-EconomicEvaluationofLarge-scaleHydrogenProductioninNorway....................77
6 ACaseStudyApproachtoHydrogenProductionCombiningGasReformingandElectrolysis.80
6.1.1 TjeldbergoddenIndustrialComplex.............................................................................81
6.1.2 FosenandSnillfjordenWindFarm...............................................................................81
6.2 StationaryProduction...........................................................................................................81
6.2.1 StationaryCase1,NaturalGas-basedCo-productionofHydrogen:............................81
6.2.2 StationaryCase2,Wind-basedCo-productionofHydrogen:.......................................83
6.3 FluctuatingProduction:........................................................................................................84
6.3.1 FluctuatingCase1:PartlyFlexibleElectrolysis.............................................................84
6.3.2 FluctuationCase2:FlexibleElectrolysis.......................................................................85
6.4 IsCombinedReformingandElectrolysisaCompetitiveSolution?........................................86
7 Conclusion............................................................................................................................89
8 ProposalsforFurtherWork...................................................................................................91
8.1.1 Proposalsforfurtherresearchwithinthehydrogenproductionprocesses:...............91
8.1.2 Proposalsforresearchwithintheexportvaluechain:.................................................92
References...................................................................................................................................93
Appendices..................................................................................................................................97
A. FinancialAnalysis–elaboration............................................................................................98
B. TechnicalAnalysis...............................................................................................................103

xii
C. WindData..........................................................................................................................120
xiii
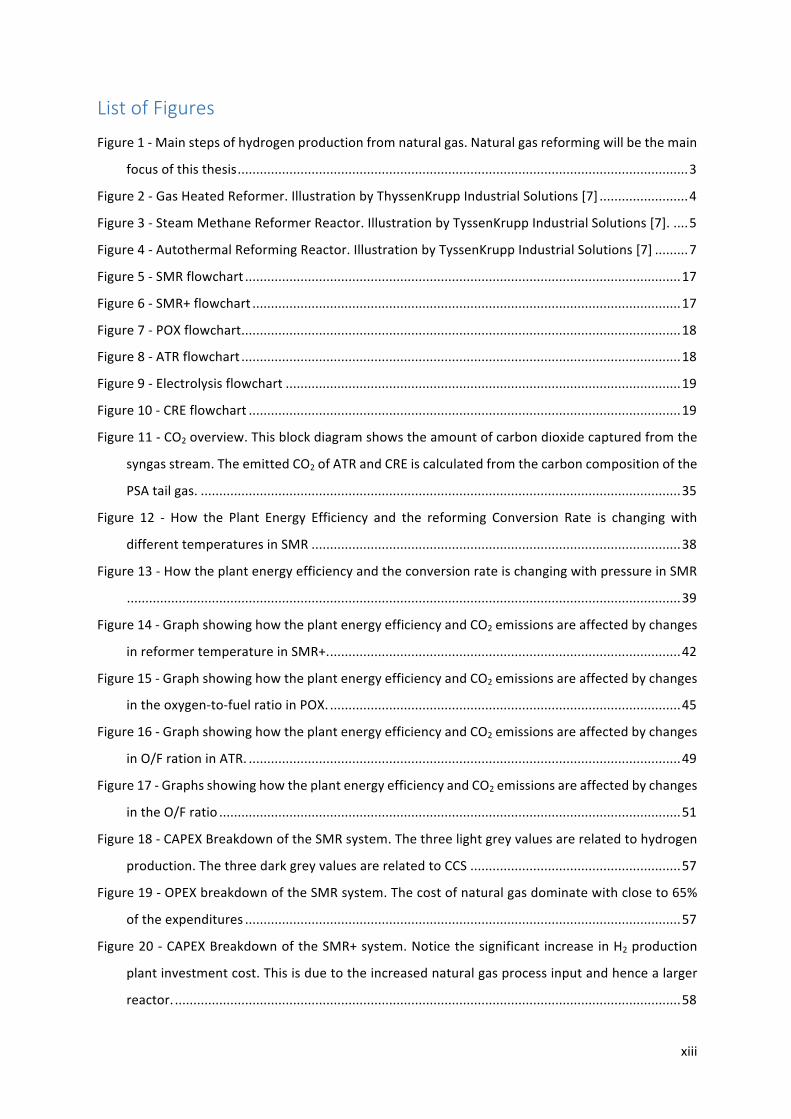
ListofFigures
Figure1-Mainstepsofhydrogenproductionfromnaturalgas.Naturalgasreformingwillbethemain
focusofthisthesis..........................................................................................................................3
Figure2-GasHeatedReformer.IllustrationbyThyssenKruppIndustrialSolutions[7]........................4
Figure3-SteamMethaneReformerReactor.IllustrationbyTyssenKruppIndustrialSolutions[7].....5
Figure4-AutothermalReformingReactor.IllustrationbyTyssenKruppIndustrialSolutions[7].........7
Figure5-SMRflowchart......................................................................................................................17
Figure6-SMR+flowchart....................................................................................................................17
Figure7-POXflowchart.......................................................................................................................18
Figure8-ATRflowchart.......................................................................................................................18
Figure9-Electrolysisflowchart...........................................................................................................19
Figure10-CREflowchart.....................................................................................................................19
Figure11-CO2overview.Thisblockdiagramshowstheamountofcarbondioxidecapturedfromthe
syngasstream.TheemittedCO2ofATRandCREiscalculatedfromthecarboncompositionofthe
PSAtailgas...................................................................................................................................35
Figure 12 - How the Plant Energy Efficiency and the reforming Conversion Rate is changing with
differenttemperaturesinSMR....................................................................................................38
Figure13-HowtheplantenergyefficiencyandtheconversionrateischangingwithpressureinSMR
......................................................................................................................................................39
Figure14-GraphshowinghowtheplantenergyefficiencyandCO2emissionsareaffectedbychanges
inreformertemperatureinSMR+................................................................................................42
Figure15-GraphshowinghowtheplantenergyefficiencyandCO2emissionsareaffectedbychanges
intheoxygen-to-fuelratioinPOX................................................................................................45
Figure16-GraphshowinghowtheplantenergyefficiencyandCO2emissionsareaffectedbychanges
inO/FrationinATR......................................................................................................................49
Figure17-GraphsshowinghowtheplantenergyefficiencyandCO2emissionsareaffectedbychanges
intheO/Fratio.............................................................................................................................51
Figure18-CAPEXBreakdownoftheSMRsystem.Thethreelightgreyvaluesarerelatedtohydrogen
production.ThethreedarkgreyvaluesarerelatedtoCCS.........................................................57
Figure19-OPEXbreakdownoftheSMRsystem.Thecostofnaturalgasdominatewithcloseto65%
oftheexpenditures......................................................................................................................57
Figure20-CAPEXBreakdownoftheSMR+system.NoticethesignificantincreaseinH2production
plantinvestmentcost.Thisisduetotheincreasednaturalgasprocessinputandhencealarger
reactor..........................................................................................................................................58
xiv
Figure 21 -OPEX Breakdown of the SMR+ system. The natural gas cost dominate as in SMR. The
generalcostlevelhasincreasedevenly.......................................................................................58
Figure 22 - CAPEX Breakdown of the ATR system. Differs from SMRmainly on the less expensive
reformerandtheinclusionofanairseparationunit...................................................................59
Figure23-OPEXBreakdownoftheATRsystem.Thenaturalgasdominateamongtheexpenditures,
buthere,costofelectricityimpactstoalargerextent................................................................59
Figure24-CAPEXbreakdownofthecombinedreformingandelectrolysissystem............................60
Figure25 -OPEXbreakdownof thecombinedreformingandelectrolysissystem.Here, thecostof
naturalgasandelectricityareclosetoequal...............................................................................60
Figure26-Blockdiagramshowingthebreakevenpriceofcarbon-leanhydrogen.Includesallauxiliary
components, including CCS. 500 tonnes of H2 daily, delivered at 20 bar. The blue and green
colours indicate the share of which OPEX and CAPEX contribute throughout the lifetime,
respectively.10%discountrateand25yearslifetime.................................................................63
Figure 27 - Block diagram showing the breakeven price of carbon-lean hydrogen, highlighting the
additionalcostCCSrepresentsinthedifferentsystems.KeepinmindtheamountofCO2captures
isdifferentforeachsystem..........................................................................................................64
Figure28-ResultsoftheH2Aanalysisofhydrogenproductionmethods.TheFutureestimationsare
based on 2025 projections [31]. Keep in mind that the values are displayed in 2005$. The
conversionfactorto2016$is1.225[40]......................................................................................65
Figure29-RangeofBreakevenpriceofhydrogenproduction...........................................................70
Figure30-Breakevenpriceofhydrogenwithchangesintheelectricityprice...................................71
Figure31-Breakevenpriceofhydrogenvs.naturalgasprice............................................................72
Figure32-Breakevenpriceofproducedhydrogen,givennaturalgasandelectricitypricesfluctuateat
thesamerate...............................................................................................................................72
Figure33-Breakevenpriceofhydrogenvs.costofCO2emissions.SMRwithoutCCSisaddedinorder
to see how high the carbon price must be in order for carbon-lean hydrogen to be cost-
competitive..................................................................................................................................74
Figure34-Breakevenpriceofhydrogenvs.productioncapacity.Mindthechangeonthex-axisfrom
100to500tonnes/day.................................................................................................................75
Figure35-Breakevenpriceofhydrogenvs.energyefficiencyoftheelectrolysisplant.....................76
Figure36 -BreakevenpriceofCarbon-leanHydrogen.Calm financialmarket.7%discount rate.30
yearslifetime................................................................................................................................76
Figure37-BreakevenpriceofCarbon-leanHydrogen.Strictfinancialmarket.15%discountrate.20
yearslifetime................................................................................................................................76

xv
Figure38-ThemapshowsthelocationoftheFosen/Snillfjordenwindfarms.Thereddotmarksthe
locationofTjeldbergodden IndustrialComplexandtheHeidrungas-receiving terminal.Photo:
Statkraft[45]................................................................................................................................80
Figure39 -Graphshowinghowtheelectricityprice required to reach the referencepriceand the
powersuppliedbythewindfarmareaffectedbychangesinthedesignedelectrolysercapacity.
......................................................................................................................................................87
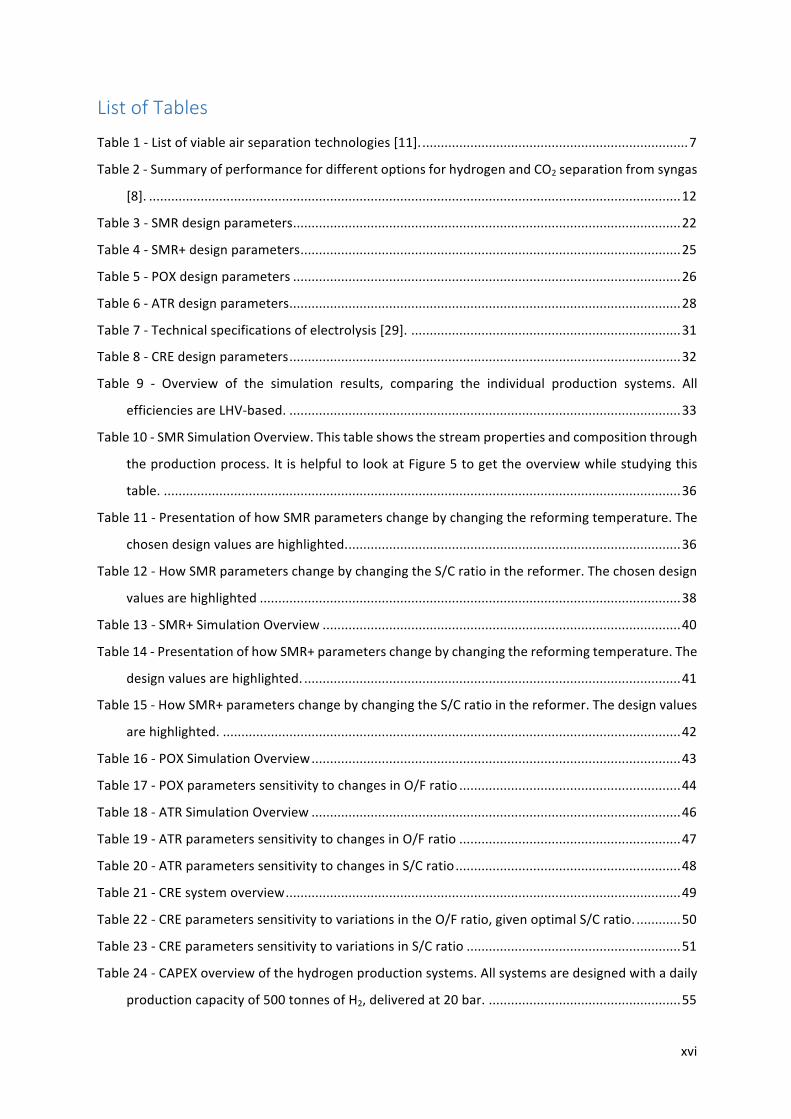
xvi
ListofTables
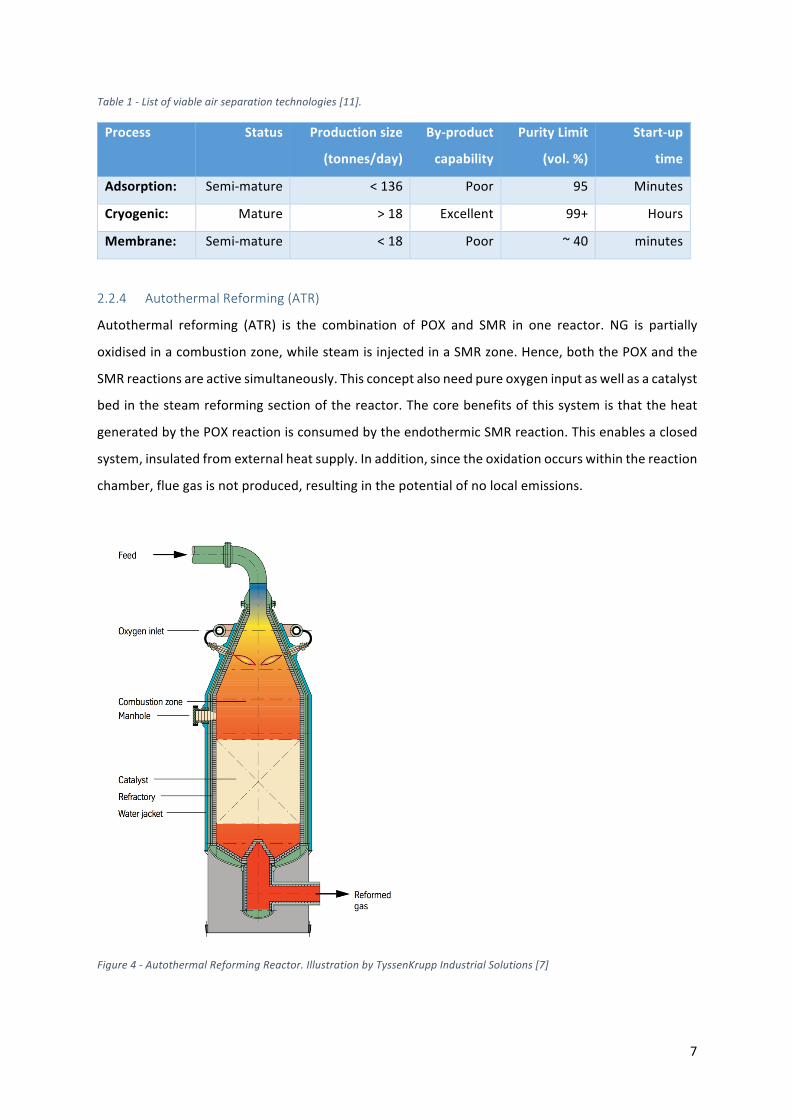
Table1-Listofviableairseparationtechnologies[11].........................................................................7
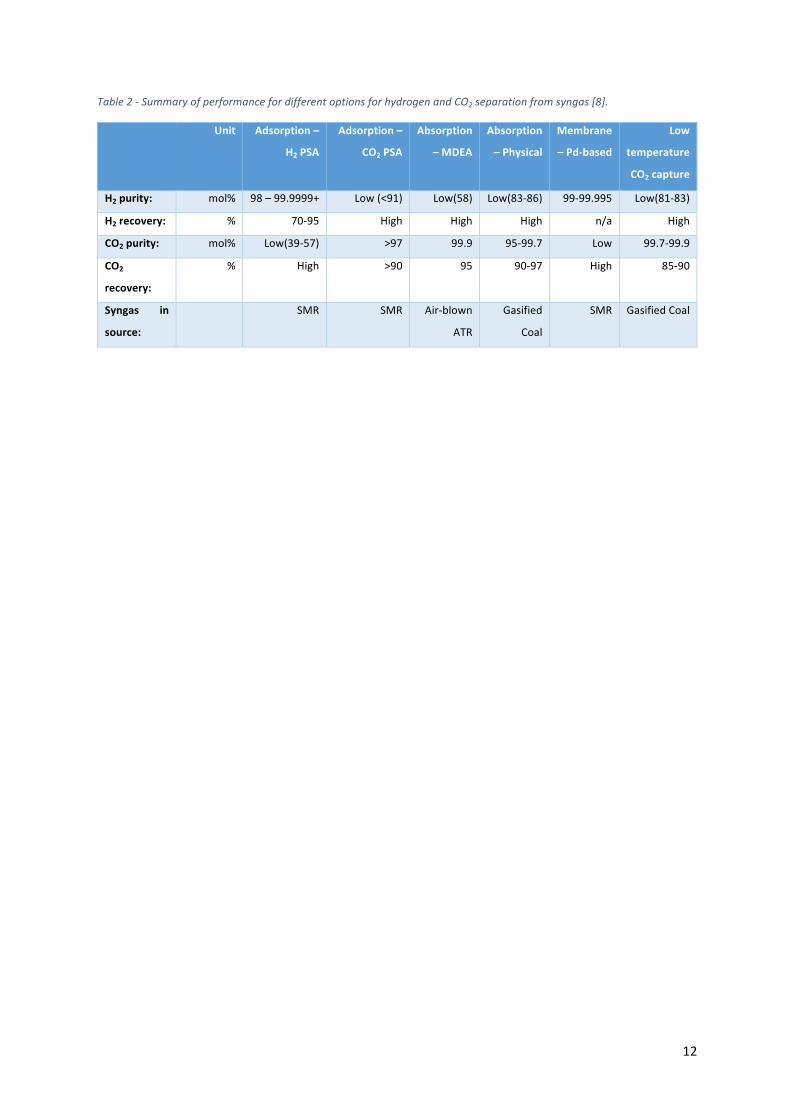
Table2-SummaryofperformancefordifferentoptionsforhydrogenandCO2separationfromsyngas
[8].................................................................................................................................................12
Table3-SMRdesignparameters.........................................................................................................22
Table4-SMR+designparameters.......................................................................................................25
Table5-POXdesignparameters.........................................................................................................26
Table6-ATRdesignparameters..........................................................................................................28
Table7-Technicalspecificationsofelectrolysis[29]..........................................................................31
Table8-CREdesignparameters..........................................................................................................32
Table 9 - Overview of the simulation results, comparing the individual production systems. All
efficienciesareLHV-based...........................................................................................................33
Table10-SMRSimulationOverview.Thistableshowsthestreampropertiesandcompositionthrough
theproductionprocess.ItishelpfultolookatFigure5togettheoverviewwhilestudyingthis
table.............................................................................................................................................36
Table11-PresentationofhowSMRparameterschangebychangingthereformingtemperature.The
chosendesignvaluesarehighlighted...........................................................................................36
Table12-HowSMRparameterschangebychangingtheS/Cratiointhereformer.Thechosendesign
valuesarehighlighted..................................................................................................................38
Table13-SMR+SimulationOverview.................................................................................................40
Table14-PresentationofhowSMR+parameterschangebychangingthereformingtemperature.The
designvaluesarehighlighted.......................................................................................................41
Table15-HowSMR+parameterschangebychangingtheS/Cratiointhereformer.Thedesignvalues
arehighlighted.............................................................................................................................42
Table16-POXSimulationOverview....................................................................................................43
Table17-POXparameterssensitivitytochangesinO/Fratio............................................................44
Table18-ATRSimulationOverview....................................................................................................46
Table19-ATRparameterssensitivitytochangesinO/Fratio............................................................47
Table20-ATRparameterssensitivitytochangesinS/Cratio.............................................................48
Table21-CREsystemoverview...........................................................................................................49
Table22-CREparameterssensitivitytovariationsintheO/Fratio,givenoptimalS/Cratio.............50
Table23-CREparameterssensitivitytovariationsinS/Cratio..........................................................51
Table24-CAPEXoverviewofthehydrogenproductionsystems.Allsystemsaredesignedwithadaily
productioncapacityof500tonnesofH2,deliveredat20bar.....................................................55
xvii
Table25-OPEXoverviewofthehydrogenproductionsystems.Allsystemsaredesignedwithadaily
productioncapacityof500tonnesofH2,deliveredat20bar.....................................................56
Table 26 - Cost comparison of this thesis with the results of H2A. Here, the breakeven price of
hydrogenfromH2Aisconvertedfrom2005$to2016€,basedonthestandardcurrencyexchange
rateusedaswellasaUSinflationcalculator[40],[31]...............................................................66
Table27-AnnuallyCO₂CapturedandAvoided...................................................................................68
Table28-CO₂emittedperkWhelectricityproduced.........................................................................68
Table29-ThistableshowshowthebreakevenpriceofATRwilldifferwhenvaryingtheCCScapacity.
ATR2isacasewithsimilarcarboncaptureasSMR.ATR3hassimilaremissionlevelasSMR...69
Table30-Keyfiguresfromthetechnicalandfinancialanalyses.........................................................78
Table31-Stationarycase1results.Thefullnaturalgascapacityisused,withelectrolyserssupplying
oxygenaswellasproducingadditionalhydrogen.......................................................................82
Table32 - Stationary case1:Benchmarkbreakevenpriceofhydrogenproduction, given the same
feedstockdemands......................................................................................................................82
Table33-Stationarycase2results.Thesystemisdesignedbasedontheannualaveragepowersupply
fromthewindfarm.TheparallelATRsystemisdesignedbasedontheproducedoxygen.........83
Table 34 - Stationary case 2: Benchmark breakeven price of hydrogen production, given same
feedstockdemands......................................................................................................................84
Table 35 - Fluctuating case 1: Partly flexible electrolysis with an electrolysis capacity of 600MW.
Highlightsfromthesimulationispresentedhere.ShowingtheBreakevenpriceofthehydrogen
producedaswellastherequiredelectricitypricetoequalthereferencepriceofstationarycase
2....................................................................................................................................................85
Table 36 - Fluctuating case 2: Flexible electrolysis,with capacity of 1000MW.Highlights from the
simulationispresentedhere.ShowingtheBreakevenpriceofthehydrogenproducedaswellas
therequiredelectricitypricetoequalthereferencepriceofstationarycase2..........................86
Table37-Currencytable-AveragesFebruary-March2016................................................................98
Table38-Definitionoftheoptimistic,baseandconservativecaresimulationsforSMR...................98
Table39-Definitionoftheoptimistic,baseandconservativecaresimulationsforATR....................99
Table40-Definitionoftheoptimistic,baseandconservativecaresimulationsforElectrolysis......100
Table41-Listofinputsusedforthecost-estimationsandnetpresentvaluecalculationsinEXCEL100
Table42-TestofEOS,withagivennaturalgasinputtotheSMRprocess.......................................103
Table43-Electrolysisplantpowerconsumption..............................................................................104
Table44-HeatdemandandheatavailableinSMR...........................................................................105
Table45-HeatdemandandsourcesinSMR+...................................................................................105
xviii
Table46-HeatdemandandheatavailableinPOX...........................................................................106
Table47-HeatdemandandheatavailableinATR............................................................................106
Table48-HeatdemandandheatavailableinCRE............................................................................107
Table49-NaturalGascompositionandproperties.MeanValuesfromHeidrungasfield[51]........107
Table50-Airdesignparameters.......................................................................................................108
Table51-Waterdesignparameters..................................................................................................108
Table52-Oxygendesignparameters................................................................................................108
Table53-HeatersandCoolersmodellingparameters......................................................................108
Table54-Compressorsmodellingparameters.................................................................................108
Table55-Expandersmodellingparameters......................................................................................109
Table56-Pumpsmodellingparameters...........................................................................................109
Table57-GHRmodellingparameters...............................................................................................109
Table58-SMRmodellingparameters...............................................................................................110
Table59-Furnacemodellingparameters.........................................................................................111
Table60-POXmodellingparameters................................................................................................111
Table61-ATRmodellingparameters................................................................................................112
Table62-WGSmodellingparameters...............................................................................................112
Table63-Separatormodellingparameters.......................................................................................113
Table64-CO2Absorptionmodellingparameters..............................................................................113
Table65-PSAmodellingparameters................................................................................................114
Table66-WinddatatextfileusedintheMatlabscript.Onlythefirst30of8058entriesisshowedin
thetable.Thewinddataiscapturedoverayearat3differentlocationsinMid-Norway........120
xix
ListofAbbreviations:
ATR–AutothermalReforming
CAPEX–Capitalexpenditures
CCGT-CombinedCycleGasTurbines
CCS–CarbonCaptureandStorage
CRE–CombinedReformingandElectrolysis
EJ-Exajoule
EL–Electrolysis
FCV–FuelCellVehicles
GHR–GasHeatedReformer
HHV–HigherHeatingValue
HTS–HighTemperatureShift
IEA–InternationalEnergyAgency
LHV–LowerHeatingValue
LNG–LiquidNaturalGas
LTS–LowTemperatureShift
MDEA-MethylDiethanolamine
MEA–Monoethanolamine
NG–NaturalGas
O/F–Oxygen-to-Fuel
OPEX–OperationalExpenditures
PEMFC–ProtonExchangeMembraneFuelCell
POX–PartialOxidation
PR–Peng-Robinson
PSA–PressureswingAdsorption
S/C–Steam-to-Carbon
SMR–SteamMethaneReforming
WGS–Water-gasShift

xx
1
1 Introduction:
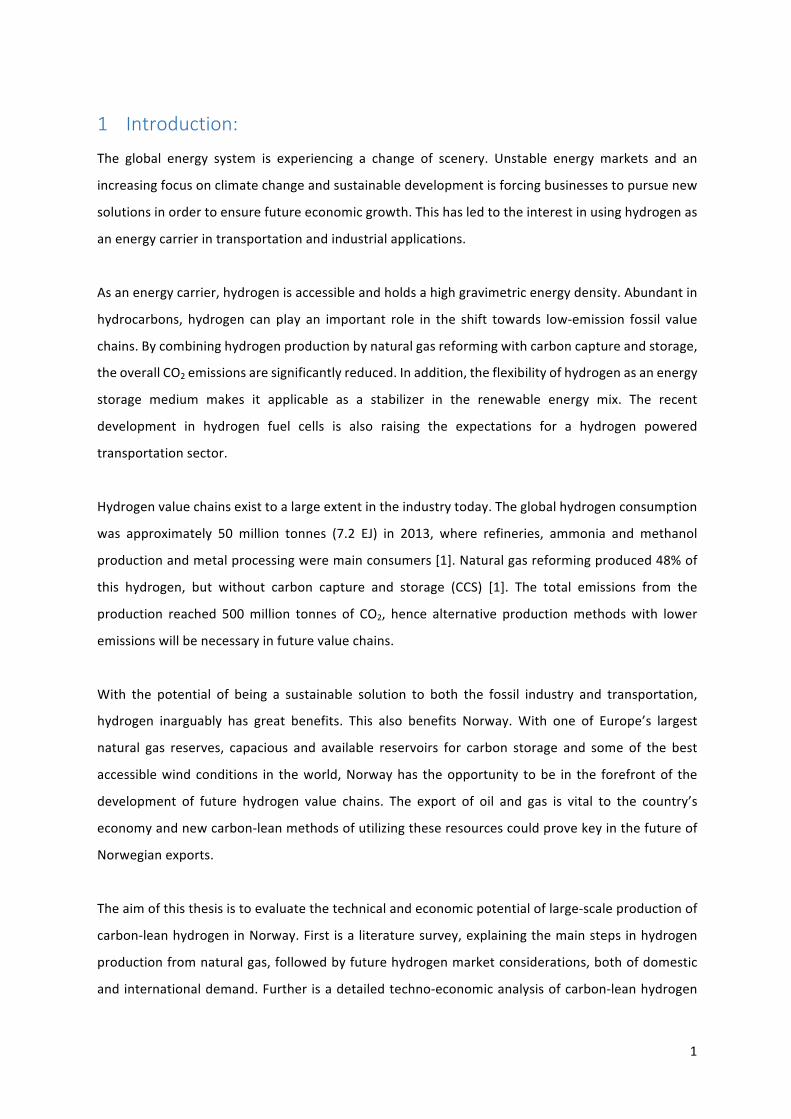
The global energy system is experiencing a change of scenery. Unstable energy markets and an
increasingfocusonclimatechangeandsustainabledevelopmentisforcingbusinessestopursuenew
solutionsinordertoensurefutureeconomicgrowth.Thishasledtotheinterestinusinghydrogenas
anenergycarrierintransportationandindustrialapplications.
Asanenergycarrier,hydrogenisaccessibleandholdsahighgravimetricenergydensity.Abundantin
hydrocarbons, hydrogen can play an important role in the shift towards low-emission fossil value
chains.Bycombininghydrogenproductionbynaturalgasreformingwithcarboncaptureandstorage,
theoverallCO2emissionsaresignificantlyreduced.Inaddition,theflexibilityofhydrogenasanenergy
storage medium makes it applicable as a stabilizer in the renewable energy mix. The recent
development in hydrogen fuel cells is also raising the expectations for a hydrogen powered
transportationsector.
Hydrogenvaluechainsexisttoalargeextentintheindustrytoday.Theglobalhydrogenconsumption
was approximately 50 million tonnes (7.2 EJ) in 2013, where refineries, ammonia and methanol
productionandmetalprocessingweremainconsumers[1].Naturalgasreformingproduced48%of
this hydrogen, but without carbon capture and storage (CCS) [1]. The total emissions from the
production reached 500million tonnes of CO2, hence alternative productionmethodswith lower
emissionswillbenecessaryinfuturevaluechains.
With the potential of being a sustainable solution to both the fossil industry and transportation,
hydrogen inarguably has great benefits. This also benefits Norway.With one of Europe’s largest
natural gas reserves, capacious and available reservoirs for carbon storage and some of the best
accessiblewindconditions in theworld,Norwayhas theopportunity tobe in the forefrontof the
development of future hydrogen value chains. The export of oil and gas is vital to the country’s
economyandnewcarbon-leanmethodsofutilizingtheseresourcescouldprovekeyinthefutureof
Norwegianexports.
Theaimofthisthesisistoevaluatethetechnicalandeconomicpotentialoflarge-scaleproductionof
carbon-leanhydrogeninNorway.First isa literaturesurvey,explainingthemainstepsinhydrogen
productionfromnaturalgas,followedbyfuturehydrogenmarketconsiderations,bothofdomestic
andinternationaldemand.Further isadetailedtechno-economicanalysisofcarbon-leanhydrogen
2
production, evaluating strengths and weaknesses of the individual processes in the context of
Norwegianhydrogenproductionforexport.Thelastpartconsistsofdifferentcasestudies,evaluating
specificprocessdesignscombiningtheutilizationofstrandednaturalgasandexcesswindpowerin
Mid-Norway.
Whatdifferentiatesthisthesisfromotherstudiesonlarge-scalehydrogenproductionismainlytwo
factors:ThepresenceofNorwegianenergyresourcesandCCSopportunities,aswellasa focuson
reducedCO2emissions.ThebreakevenpriceofhydrogenproducedinNorway,withthecurrentcost
ofelectricityandnaturalgasmayproveexceptionalcomparedwithcountrieslikeGermany,U.K.or
Japan.Theopportunitieshydrogenrepresentsinthefutureeconomyprovidesthemotivationfora
more extensive study of the techno-economic conditions for Norwegian, large-scale hydrogen
production.
1.1 ScopeoftheThesis:
In order to conduct an analysis to this extent, a defined scope is necessary. Listed are themain
boundaryconditionsandtechnicalassumptionsinthethesis.
1. Desulfurized natural gas and electricity are the only energy inputs used in this thesis.
Hydrogencanbeproducedfromalargeselectionoffeedstocklikecoalorbiogas,butthatis
not included. Biogas may be a viable alternative in the future, but coal is irrelevant in a
Norwegianhydrogenproductionchain.
2. Onlymature, commercially available technologies for large-scale hydrogen production are
considered.
3. Carboncaptureisaprerequisiteinthereformingprocessesandonlypre-combustionCCSis
evaluated. Carbon capture from flue gaswith lowpartial pressures is not included in this
thesis, due to lackof commercial availability. Carbon captureathighpartial pressures are
currentlyinoperationatboththeSleipneroilfieldandatMelkøya[2][3].
4. Carbontransportandstoragetechnologyisoutofscope.ThecostoftheentireCCSchainis
included,butnotechnicalanalysisisdoneoneithertransportorstoragealternatives.
5. The scale of the hydrogen production evaluated in this report is motivated by export
scenarios.
3
2 ConceptsforLarge-ScaleHydrogenProductionfromNaturalGas
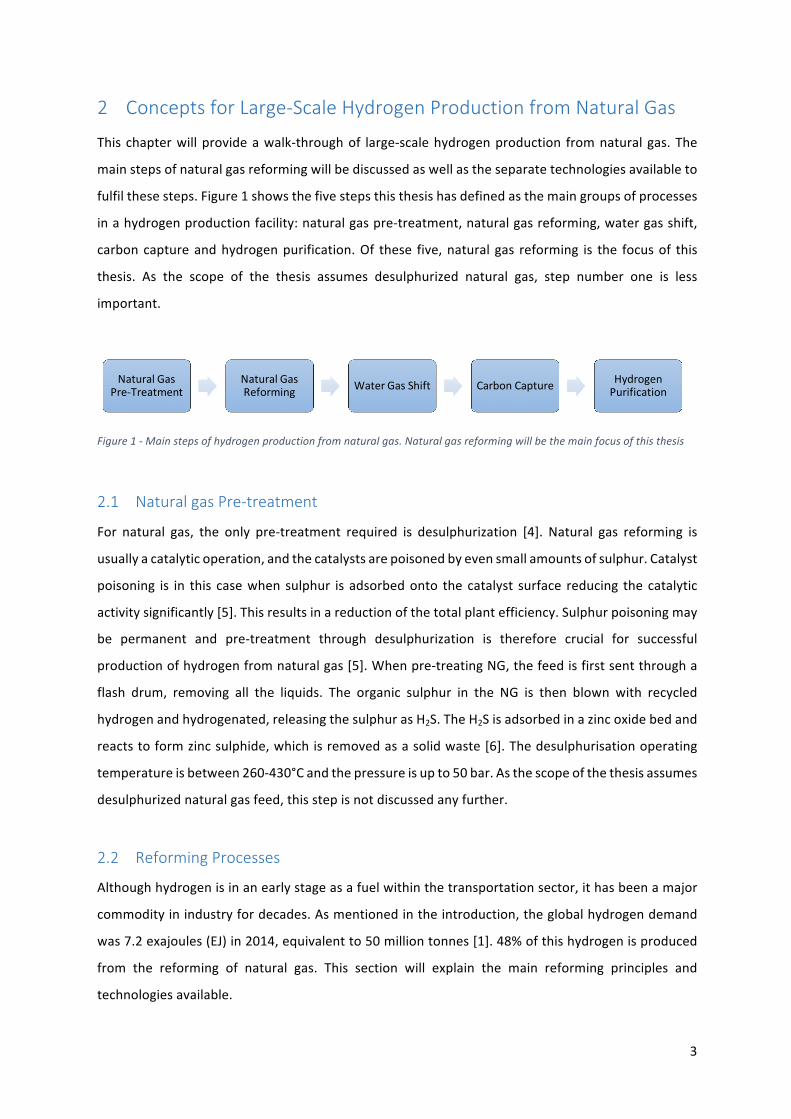
This chapterwillprovideawalk-throughof large-scalehydrogenproduction fromnaturalgas.The
mainstepsofnaturalgasreformingwillbediscussedaswellastheseparatetechnologiesavailableto
fulfilthesesteps.Figure1showsthefivestepsthisthesishasdefinedasthemaingroupsofprocesses
inahydrogenproductionfacility:naturalgaspre-treatment,naturalgasreforming,watergasshift,
carboncaptureandhydrogenpurification.Of these five,natural gas reforming is the focusof this
thesis. As the scope of the thesis assumes desulphurized natural gas, step number one is less
important.
Figure1-Mainstepsofhydrogenproductionfromnaturalgas.Naturalgasreformingwillbethemainfocusofthisthesis
2.1 NaturalgasPre-treatment
For natural gas, the only pre-treatment required is desulphurization [4]. Natural gas reforming is
usuallyacatalyticoperation,andthecatalystsarepoisonedbyevensmallamountsofsulphur.Catalyst
poisoning is in this casewhensulphur isadsorbedonto thecatalyst surface reducing thecatalytic
activitysignificantly[5].Thisresultsinareductionofthetotalplantefficiency.Sulphurpoisoningmay
be permanent and pre-treatment through desulphurization is therefore crucial for successful
productionofhydrogenfromnaturalgas[5].Whenpre-treatingNG,thefeedisfirstsentthrougha
flash drum, removing all the liquids. The organic sulphur in the NG is then blown with recycled
hydrogenandhydrogenated,releasingthesulphurasH2S.TheH2Sisadsorbedinazincoxidebedand
reactstoformzincsulphide,whichisremovedasasolidwaste[6].Thedesulphurisationoperating
temperatureisbetween260-430°Candthepressureisupto50bar.Asthescopeofthethesisassumes
desulphurizednaturalgasfeed,thisstepisnotdiscussedanyfurther.
2.2 ReformingProcesses
Althoughhydrogenisinanearlystageasafuelwithinthetransportationsector,ithasbeenamajor
commodityinindustryfordecades.Asmentionedintheintroduction,theglobalhydrogendemand
was7.2exajoules(EJ)in2014,equivalentto50milliontonnes[1].48%ofthishydrogenisproduced
from the reforming of natural gas. This section will explain the main reforming principles and
technologiesavailable.
Natural GasPre-Treatment
Natural GasReforming WaterGasShift CarbonCapture Hydrogen
Purification
4
2.2.1 Pre-Reformer:
Theprincipleofthepre-reformeristoconvertheavierhydrocarbonstomethanepriortothemain
reformingreactor.Thepre-reformingreactorusuallycontainsanickelcatalystbedandisbasicallya
lowtemperatureadiabaticsteamreformingunit.Thetemperatureisnormallyintherangefrom350
–550°C[4].Thereareseveralbenefitstopre-reforming,butmostimportantistheenablingofprocess
optimization of methane reforming. This results in lower feed consumption and hence a smaller
reactorsize.
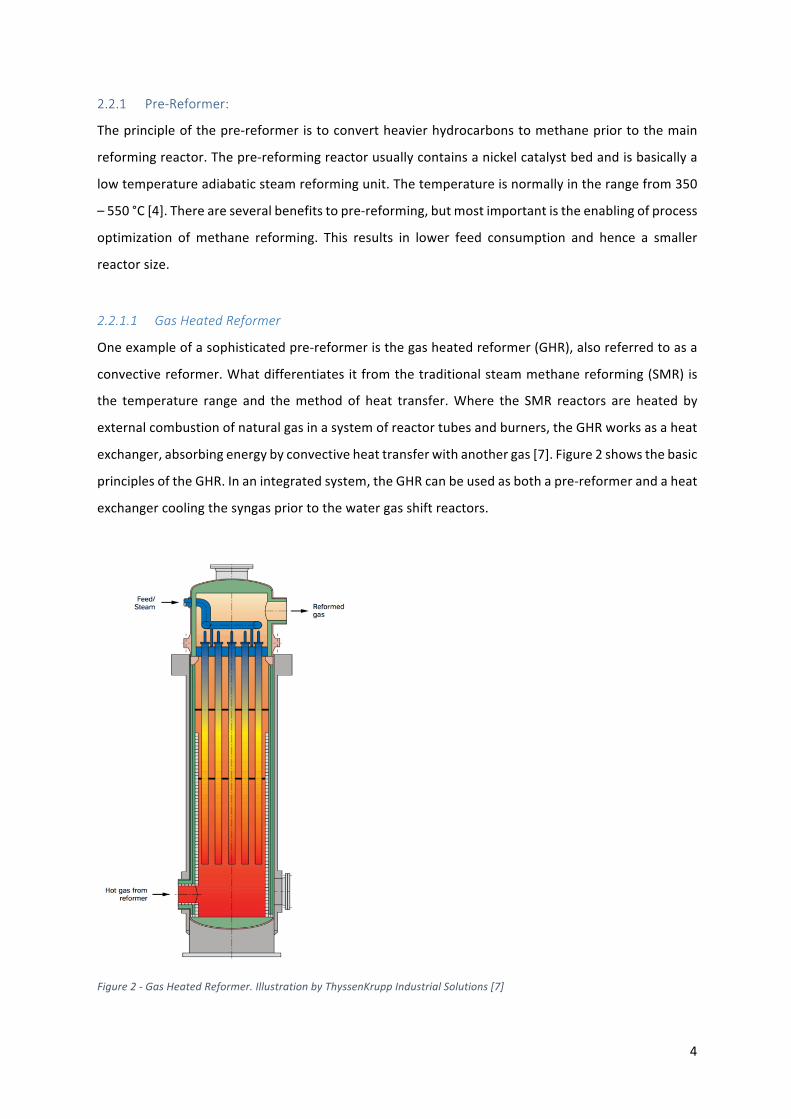
2.2.1.1 GasHeatedReformer
Oneexampleofasophisticatedpre-reformeristhegasheatedreformer(GHR),alsoreferredtoasa
convectivereformer.Whatdifferentiatesitfromthetraditionalsteammethanereforming(SMR)is
the temperature range and themethod of heat transfer.Where the SMR reactors are heated by
externalcombustionofnaturalgasinasystemofreactortubesandburners,theGHRworksasaheat
exchanger,absorbingenergybyconvectiveheattransferwithanothergas[7].Figure2showsthebasic
principlesoftheGHR.Inanintegratedsystem,theGHRcanbeusedasbothapre-reformerandaheat
exchangercoolingthesyngaspriortothewatergasshiftreactors.
Figure2-GasHeatedReformer.IllustrationbyThyssenKruppIndustrialSolutions[7]
5
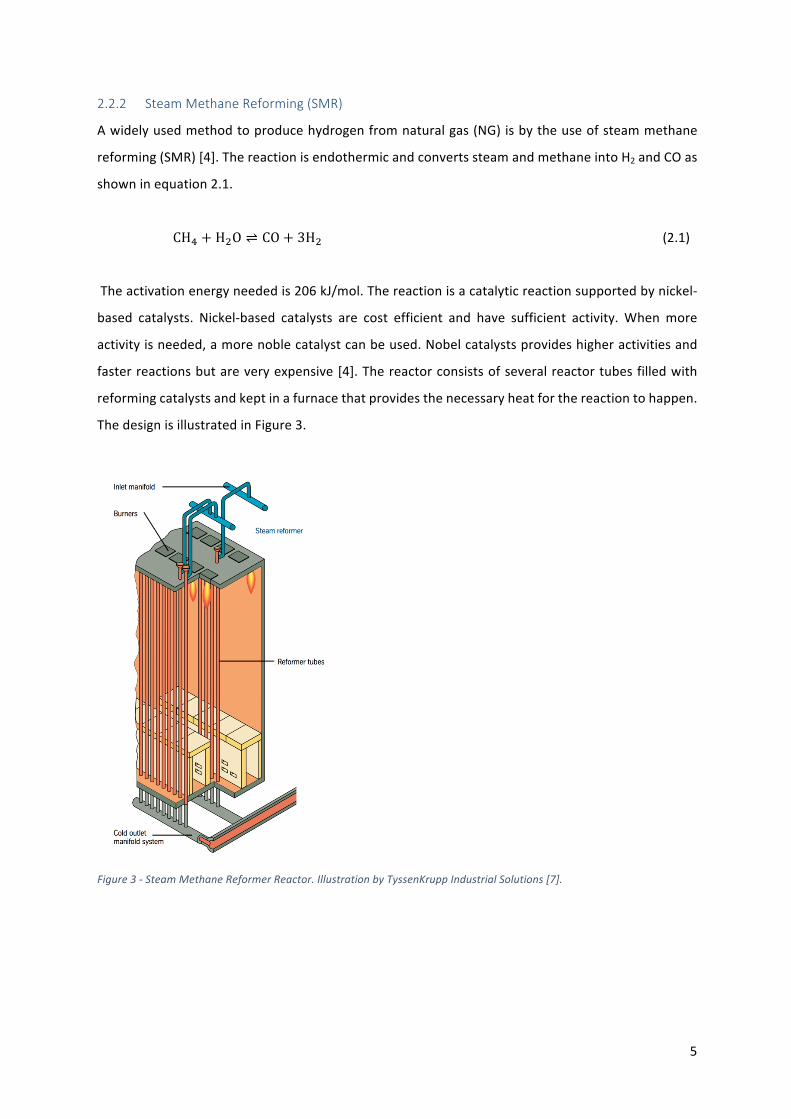
2.2.2 SteamMethaneReforming(SMR)
Awidelyusedmethodtoproducehydrogenfromnaturalgas(NG)isbytheuseofsteammethane
reforming(SMR)[4].ThereactionisendothermicandconvertssteamandmethaneintoH2andCOas
showninequation2.1.
CH# + H%O ⇌ CO + 3H% (2.1)
Theactivationenergyneededis206kJ/mol.Thereactionisacatalyticreactionsupportedbynickel-
based catalysts. Nickel-based catalysts are cost efficient and have sufficient activity. Whenmore
activityisneeded,amorenoblecatalystcanbeused.Nobelcatalystsprovideshigheractivitiesand
fasterreactionsbutareveryexpensive[4].Thereactorconsistsofseveralreactortubesfilledwith
reformingcatalystsandkeptinafurnacethatprovidesthenecessaryheatforthereactiontohappen.
ThedesignisillustratedinFigure3.
Figure3-SteamMethaneReformerReactor.IllustrationbyTyssenKruppIndustrialSolutions[7].
6
Thereactionisnormallycarriedoutatpressuresabove20bar,steam-to-carbon(S/C)ratioof3-43on
amolarbasisandtemperaturesbetween500-900°C[8].AhigherS/Cratioispartiallytoreducethe
riskofcarbondepositiononthecatalystsurface[4].Highconversionisthermodynamicallyfavoured
bylowpressures,highS/Cratioandhightemperatures.Fromanenergyefficiencyandeconomicpoint
of view, lowS/C ratio is preferred andmodern SMR-plants havebeendesign towithstandhigher
temperatures.Theuppertemperaturelimitisduetomateriallimitations.SMRusuallyoperatesatan
energyefficiencyupto80-85%andgenerallyproducesmorehydrogenpercarbonthanbothPOXand
ATR[9].H2/COratioistypicallybetween3.5and5.5inthereformedproduct[10].
2.2.3 PartialOxidation(POX)
Afundamentallydifferentmethodofproducinghydrogen fromnaturalgas isby theuseofpartial
oxidation(POX).Thereactionisexothermic,incontrasttothehighlyendothermicSMRreaction.By
burningthenaturalgaswithalimitedoxygensupply,theproductsareH2andCO,asshowninequation
(2.2).Thismethodcanintheorybeappliedtoanyhydrocarbon,henceitisamethodforavarietyof
feedstock.
C)H* +m
2O% ⇌ mCO +
n
2H% (2.2)
Ascanbeseenbythereaction(eq.2.2),aPOXreactorhasahydrocarbonandanoxygeninput.Most
large-scalesystemsincludeanairseparationplantinordertosupplycleanoxygen.Thisdoesnotonly
reducethenecessarysizeofthereactor,butalsoincreasethepurityoftheoutput[4].Thecaseswhere
air-blown reactors are used, nitrogen is favourable in the product, as is the case for ammonia
production.TheenergyefficiencyofPOXisaround70-80%withthereactorsusuallyoperatingat
temperaturesbetween1150-1500°C[4].
2.2.3.1 Airseparationunits
Sincethisthesisisfocusingonfuelcell-gradehydrogenproduction,closetopureoxygenisneededin
thepartialoxidation.Manydifferentsystemsforairseparationisavailable,butiftheoxygenpurityis
expectedat>99.99%onlycryogenicairseparationisaviableoptioninalarge-scalefacility.Themost
availabletechnologiesusedforairseparationarelistedinTable1.
3InterviewwithSINTEFResearchScientistRahoulAnantharaman
7
Table1-Listofviableairseparationtechnologies[11].
Process Status Productionsize
(tonnes/day)
By-product
capability
PurityLimit
(vol.%)
Start-up
time
Adsorption: Semi-mature <136 Poor 95 Minutes
Cryogenic: Mature >18 Excellent 99+ Hours
Membrane: Semi-mature <18 Poor ~40 minutes
2.2.4 AutothermalReforming(ATR)
Autothermal reforming (ATR) is the combination of POX and SMR in one reactor. NG is partially
oxidisedinacombustionzone,whilesteamisinjectedinaSMRzone.Hence,boththePOXandthe
SMRreactionsareactivesimultaneously.Thisconceptalsoneedpureoxygeninputaswellasacatalyst
bedinthesteamreformingsectionofthereactor.Thecorebenefitsofthissystemisthattheheat
generatedbythePOXreactionisconsumedbytheendothermicSMRreaction.Thisenablesaclosed
system,insulatedfromexternalheatsupply.Inaddition,sincetheoxidationoccurswithinthereaction
chamber,fluegasisnotproduced,resultinginthepotentialofnolocalemissions.
Figure4-AutothermalReformingReactor.IllustrationbyTyssenKruppIndustrialSolutions[7]
8
TheATRreactorsusuallyoperateattemperaturesbetween900-1150°C,withpressurelevelsinthe
range1to80barexistingtoday[4].Figure4showstheprinciplesoftheATRreactor,withthedifferent
inputsandreactionzones.NospecificrangewasfoundforthetypicalenergyefficiencyofATR,butit
shouldoperatewithlowerenergyefficiencythanSMR[12].
2.2.5 Otherreformingprocesses
ThepaperbyMariVoldsund,KristinJordalandRahulAnantharaman,“HydrogenProductionwithCO2
Capture”isusedactivelywhenlookingatotherreformingprocesses[8].
2.2.5.1 MembraneReactors
Whenproducinghydrogeninmembranereactors,achemicalreactionliketheonesinSMR,POXor
ATR,mentioned in section 2.2.2 to 2.2.4, take place inside a reactor where either H2 or CO2 are
selectivelyremovedbyamembrane[8].Thisshiftstheequilibriumofthereactions,whichresultsin
higherconversion,and/orallowsreformingofhydrogenatmilderthermalconditions[8].H2-selective
reactorshaveahighereffecton the reaction conversion rate compared toCO2-selective reactors,
thereforefarmoreresearchisdoneontheH2-selectivereactors[8].Thesemembranereactorsare
currentlyinadevelopingphaseandarenotcommerciallyavailable.
2.2.5.2 Sorption-enhancedhydrogenproduction
Sorption-enhancedhydrogenproductionistouseadsorbentsinthereactortoselectivelyremoveone
ormoreoftheproductsreformed.Thiswill,similartomembranereactors,shifttheequilibriumofthe
reactions,resultinginhigherconversionand/orthepossibilitytoreformhydrogenatmilderthermal
conditions[8].Sorption-enhancedhydrogenproductionisinprinciplecombiningtraditionalhydrogen
production(SMR,POXandATR)withhydrogenpurification(PSA).Thistechnologyisalsocurrentlyin
adevelopingphaseandisnotcommerciallyavailable[8].
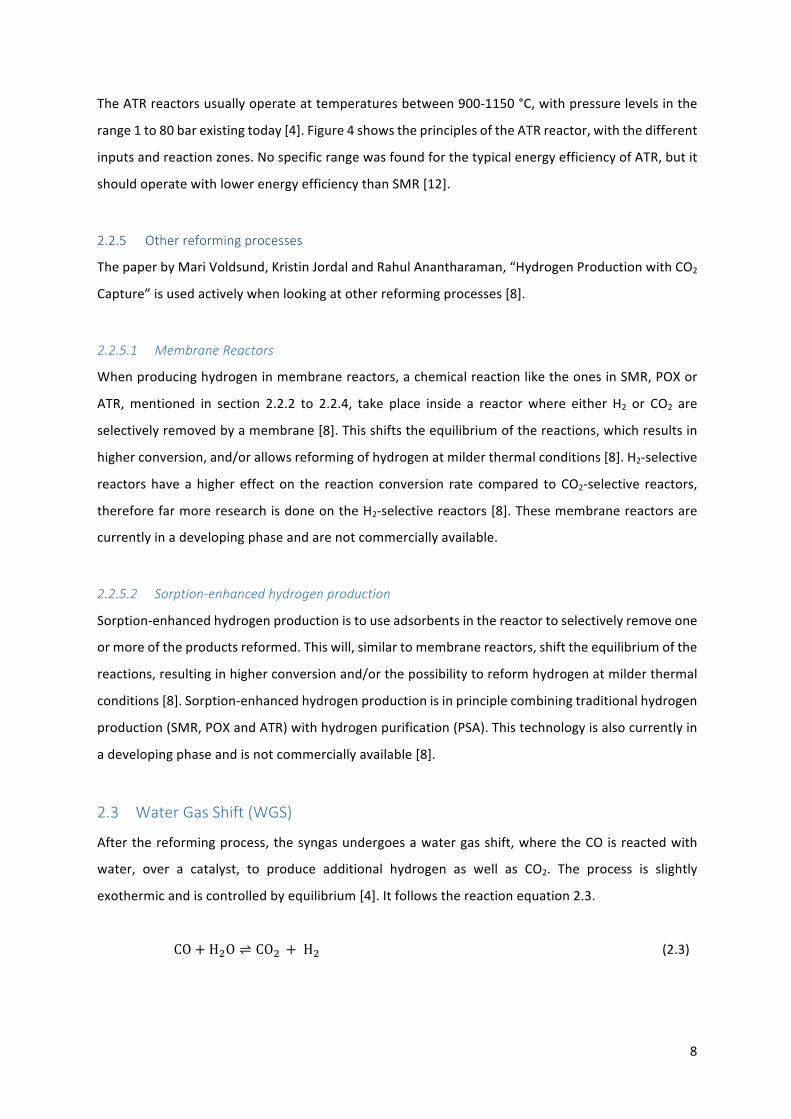
2.3 WaterGasShift(WGS)
Afterthereformingprocess,thesyngasundergoesawatergasshift,wheretheCOisreactedwith
water, over a catalyst, to produce additional hydrogen as well as CO2. The process is slightly
exothermicandiscontrolledbyequilibrium[4].Itfollowsthereactionequation2.3.
CO + H%O ⇌ CO% + H% (2.3)
9
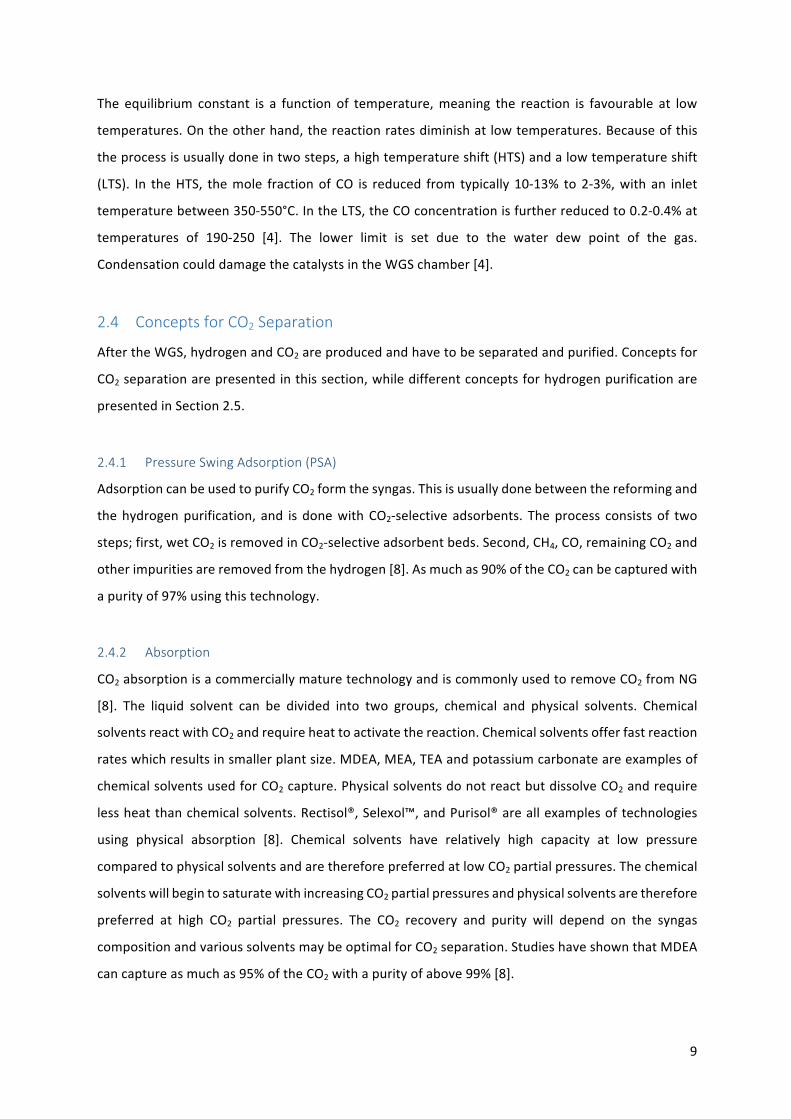
The equilibrium constant is a function of temperature,meaning the reaction is favourable at low
temperatures.Ontheotherhand,thereactionratesdiminishatlowtemperatures.Becauseofthis
theprocessisusuallydoneintwosteps,ahightemperatureshift(HTS)andalowtemperatureshift
(LTS). In theHTS, themole fractionofCO is reduced from typically10-13% to2-3%,withan inlet
temperaturebetween350-550°C.IntheLTS,theCOconcentrationisfurtherreducedto0.2-0.4%at
temperatures of 190-250 [4]. The lower limit is set due to the water dew point of the gas.
CondensationcoulddamagethecatalystsintheWGSchamber[4].
2.4 ConceptsforCO2Separation
AftertheWGS,hydrogenandCO2areproducedandhavetobeseparatedandpurified.Conceptsfor
CO2separationarepresentedinthissection,whiledifferentconceptsforhydrogenpurificationare
presentedinSection2.5.
2.4.1 PressureSwingAdsorption(PSA)
AdsorptioncanbeusedtopurifyCO2formthesyngas.Thisisusuallydonebetweenthereformingand
thehydrogenpurification, and isdonewithCO2-selectiveadsorbents. Theprocess consistsof two
steps;first,wetCO2isremovedinCO2-selectiveadsorbentbeds.Second,CH4,CO,remainingCO2and
otherimpuritiesareremovedfromthehydrogen[8].Asmuchas90%oftheCO2canbecapturedwith
apurityof97%usingthistechnology.
2.4.2 Absorption
CO2absorptionisacommerciallymaturetechnologyandiscommonlyusedtoremoveCO2fromNG
[8]. The liquid solvent can be divided into two groups, chemical and physical solvents. Chemical
solventsreactwithCO2andrequireheattoactivatethereaction.Chemicalsolventsofferfastreaction
rateswhichresultsinsmallerplantsize.MDEA,MEA,TEAandpotassiumcarbonateareexamplesof
chemicalsolventsusedforCO2capture.PhysicalsolventsdonotreactbutdissolveCO2andrequire
lessheatthanchemicalsolvents.Rectisol®,Selexol™,andPurisol®areallexamplesoftechnologies
using physical absorption [8]. Chemical solvents have relatively high capacity at low pressure
comparedtophysicalsolventsandarethereforepreferredatlowCO2partialpressures.Thechemical
solventswillbegintosaturatewithincreasingCO2partialpressuresandphysicalsolventsaretherefore
preferred at high CO2 partial pressures. The CO2 recovery and purity will depend on the syngas
compositionandvarioussolventsmaybeoptimalforCO2separation.StudieshaveshownthatMDEA
cancaptureasmuchas95%oftheCO2withapurityofabove99%[8].
10
2.4.3 MembraneSeparation
TherearegreatchallengesseparatingCO2fromahydrogenrichgaswithmembraneduetohydrogen
molecules been significantly smaller than CO2. Current CO2-selective membranes are based on
solution-diffusionmechanismorfacilitatedtransportmechanism[8].Anexampleofsuchmembrane
ispolymericCO2-selectivemembranes.ThereexistotherCO2-selectivemembranesaswell suchas
mixedmatrixmembranesandporousinorganicmembranes.Thecurrent,commercial,CO2-selective
membraneshavelowselectivityandoperateatlowtemperatures[8].MoreresearchonCO2-selective
membranesisneededtodevelopanefficientmembranewithhighCO2selectivity.
2.4.4 CryogenicSeparation
Cryogenic,orlow-temperatureseparation,istheprocesswheregasiscooleddownandthedifference
inboilingpointisusedtoseparatethegascomponents.Thegasisseparatedusingaseparatorcolumn.
WhenseparatingCO2fromsyngas,thesyngasisfirstcompressedto90-115barandthencooleddown
andcondensedattemperaturesaround-55°C[8].CO2puritiesof99.7-99.9%witharecoveryof85-
90%canbeobtained[13].Anadvantagewithlow-temperatureseparationofCO2isthattheCO2ina
liquidstate,costefficientlycanbepressurizedandtransported.Cryogenicseparationcanalsobeused
toseparatehydrogen,butproduceshydrogenwithalowpurity.
2.5 HydrogenPurificationProcesses
Toliquefyhydrogenandtouseitinafuelcell,apurityofabove99%isrequired[8].Therearecurrently
onlytwohydrogenpurificationprocesseswiththeabilitytoproducehydrogenwithapurityofabove
99%andonlythesewillbecoveredinthissection.
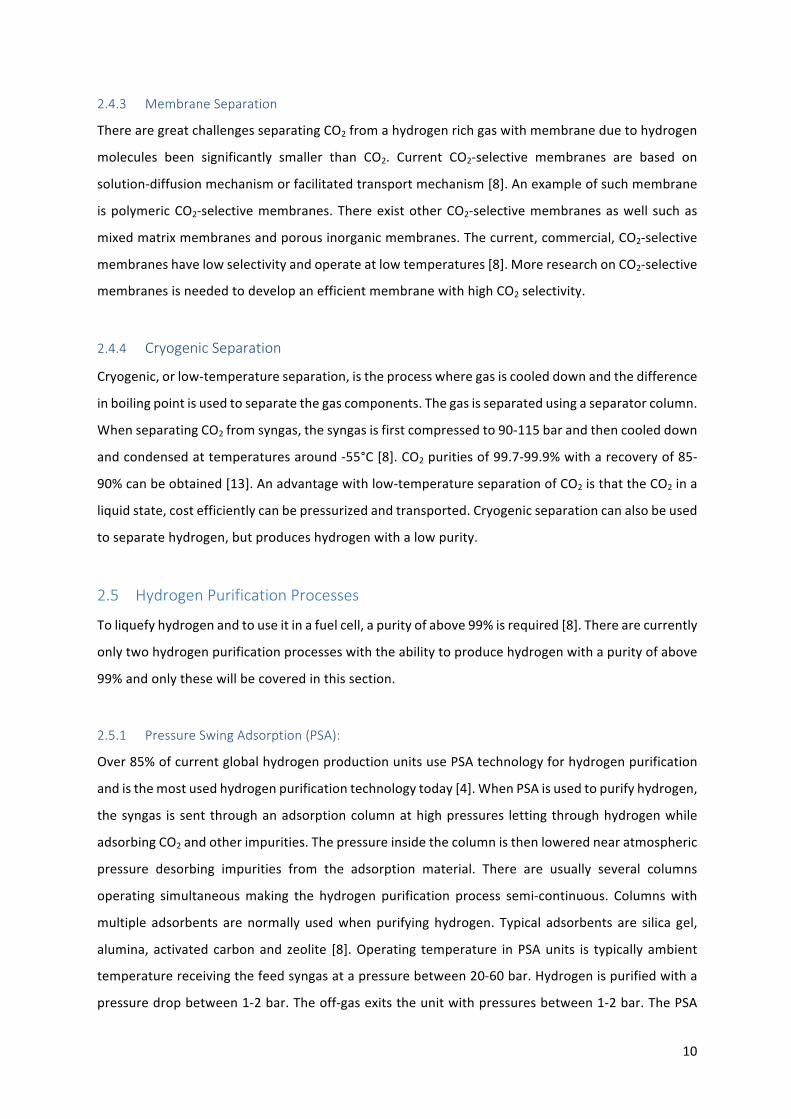
2.5.1 PressureSwingAdsorption(PSA):
Over85%ofcurrentglobalhydrogenproductionunitsusePSAtechnologyforhydrogenpurification
andisthemostusedhydrogenpurificationtechnologytoday[4].WhenPSAisusedtopurifyhydrogen,
thesyngas issent throughanadsorptioncolumnathighpressures lettingthroughhydrogenwhile
adsorbingCO2andotherimpurities.Thepressureinsidethecolumnisthenlowerednearatmospheric
pressure desorbing impurities from the adsorption material. There are usually several columns
operating simultaneousmaking the hydrogen purification process semi-continuous. Columnswith
multiple adsorbents arenormally usedwhenpurifyinghydrogen. Typical adsorbents are silica gel,
alumina,activatedcarbonand zeolite [8].Operating temperature inPSAunits is typicallyambient
temperaturereceivingthefeedsyngasatapressurebetween20-60bar.Hydrogenispurifiedwitha
pressuredropbetween1-2bar.Theoff-gasexitstheunitwithpressuresbetween1-2bar.ThePSA
11
unitproduceshydrogenwithapurityupto99.9999%andwithahydrogenrecoverybetween60-95%
[8]. The hydrogen recovery decreases with an increase in the hydrogen purity demand. Where
methane,CO2andCOareeasilyadsorbed,oxygen,argonandnitrogenaremoredifficulttoadsorb
andmayreducethepurityoftheproducedhydrogen.
2.5.2 MembraneSeparation
Membranes are ideal for separation purposes as they are selective barriers and only let through
certaincomponents.Theessentialcharacteristicsformembranesarehighselectivity,highflux,low
cost,highmechanicalstability,highchemicalstability[8].Thetransportedfluidoverthemembraneis
drivenbythedifferenceinpressure.Thecurrentlymostmaturemembranesforhydrogenseparation
are polymeric membranes. These membranes have an operating temperature of 100°C and are
relativelyinexpensive,howeverpolymericmembraneshavelowhydrogenselectivityandhydrogen
flux.Polymericmembranescanthereforenotproducehydrogenwithhydrogenpurityof99%.There
aremanyhigh-temperaturemembranescurrentlyunderdevelopment.Suchasmetallicmembranes
(300-700°C),microporousceramicmembranes(200-600°C),porouscarbonmembranes(500-900°C)
anddenseceramicmembranes(600-900°C).Thesehigh-temperaturemembraneshavepossibilities
toofferhigherhydrogenfluxandselectivity.Themoststudiedmembraneforhydrogenpurificationis
metallicmembranes,mostoftenmadeofpalladium.Palladiummembraneshaveaninfiniteselectivity
andcanproducehydrogenwithapurityof99.999%.Thechallengeswiththepalladiummembranes
is themechanical strength and chemical stability. There arepalladiummembraneson themarket
today,buttheseareexpensiveandtodense(Lowflux).ReinertsenASarecurrentlydevelopingaless
densepalladiummembraneandstatesthatthismembranewillbecomecostefficient,deliverhigh
purity of hydrogen, havehighhydrogen recovery andhave a lifetimeof 10 years. Themembrane
ReinertsenASaredevelopingwillbesold inmodulesandcaneasilybescaledup fora large-scale
hydrogenproductionplant4.
4InterviewwithFrodeRoness,ReinertsenAS
12
Table2-SummaryofperformancefordifferentoptionsforhydrogenandCO2separationfromsyngas[8].
Unit Adsorption–
H2PSA
Adsorption–
CO2PSA
Absorption
–MDEA
Absorption
–Physical
Membrane
–Pd-based
Low
temperature
CO2capture
H2purity: mol% 98–99.9999+ Low(<91) Low(58) Low(83-86) 99-99.995 Low(81-83)
H2recovery: % 70-95 High High High n/a High
CO2purity: mol% Low(39-57) >97 99.9 95-99.7 Low 99.7-99.9
CO2
recovery:
% High >90 95 90-97 High 85-90
Syngas in
source:
SMR SMR Air-blown
ATR
Gasified
Coal
SMR GasifiedCoal
13
3 Norwegian Hydrogen Markets, and the Potential for Large-scale
Production
InNorway,CO2emissionsaredistributedevenlybetween transportation,oil andgas industry and
generalindustry.Producinghydrogenfromrenewableenergycanfacilitateacompletelycarbonfree
valuechain.Inaddition,environmentalfriendlysolutionsforreformingoffossilresourcescanprovide
costcompetitivealternativesinamarketpenetrationperiodforgreenhydrogen.Carboncaptureand
storage(CCS)enableslargereductionsintheoilandgassector.Thistechnologyisalreadyutilizedat
theSleipnerfieldandinHammerfest,accountingforanannualstorageof1.7milliontonnesofCO2
[14]. Producing hydrogen from natural gas enables a brilliant solution for the industry and
transportationsectortobenefitfromCCSaswell.TheNationaltransportplan,releasedinFebruary
2016highlightshydrogenasanimportantpartofalow-emissiontransportationsystem.Inaddition,
thecompanyGreenstatsignedaletterofintenttodeliveralarge-scalehydrogenproductionfacility
toTizirinTyssedal,redesigningthesmeltingovenfromacoal-basedtohydrogen-basedreduction.
This section will provide an overview of the developments in the hydrogen demand of the
transportationandindustrysectoraswellasdiscussingthepotentialforhydrogenexport.
3.1 TransportationSector
Thetransportationsectoraccountsforapproximately36%oftheannualCO2emissionsinNorway,
closeto17.2milliontonnesofCO2equivalents[15].Inthisthesis,thetransportationsectorincludes
allroadtraffic,aswellasdomesticairandmarinetraffic.Theneedforlow-emissionsolutionsacross
theentirerangeofutilitiesisurgent.Asanenergycarrier,hydrogencomplimentsthebatteriesinthe
more energy demanding and time consuming tasks, with longer range and short refuelling time.
Therefore,hydrogencanprovetobethefavourablecarbon-leansolutionforheavytransport,busses,
trains, ferries, and eventually airplanes. In a recent study done by SINTEF, different scenarios for
marketintroductionofhydrogenwithintheNorwegiantransportationsectorispresented[16].The
totalhydrogendemandinthetransportationsectorrangesfrom9500–61000tonnesperyearin
2030,mostlydependingonpoliciesand implementation inpublictransportationandfleetvehicles
likebussesandtaxis.
Amaster’sthesisperformedattheNorwegianSchoolofEconomicsevaluatesthepotentialofusing
hydrogenfuelinferriesalongtheNorwegiancoastline[17].Theprojectconcludesthathydrogenthat
withfurthercostcompression,hydrogencanpotentiallybeaneconomicallyviablefuelfortheferry
14
sector.Inordertoquantifythepotentialmarked,assumeallroutesexceeding10kilometresand30
minutesoftraveltimearefuelledbyhydrogen.Withafuelcellefficiencyof50%thetotalhydrogen
demandwouldbeapproximately15000tonnesannually,or41tonnesperday.
3.2 IndustrySector
Theglobal industrialhydrogendemandismainlywithinthechemicalandrefining industries[9]. In
Norway,theinformationregardingindustrialdemandforhydrogenislimited,butingeneral,themetal
andchemical industriesconsumesubstantialamountsofhydrogen invarioussiliconandammonia
productionprocesses.Asignificantgrowthindemandcanbeachievedifpolicyrequirementsenforce
aswitch tohydrogenconsumingprocesses inorder to reduceemissions.Asmentionedearlier,an
exampleofthisistheletterofintentsignedbyTizirandGreenstatinthefallof2015[18].Theproject
isafeasibilitystudyregardingthereplacementofcoalwithhydrogeninthereductionprocessinthe
ferrosiliconproductionfacility.Pre-studiesshowthathydrogenwillreduceproductioncostsaswellas
eliminating 23 000 tonnes of CO2 emissions annually from the smelting oven. The total hydrogen
demandofthisfacilityisexpectedtobe30tonnesperday,equalto11000tonnesannually.Compared
tothemarkedestimationsofhydrogeninthetransportationsectorthisfacilityaloneexceedsthelow-
casedemand.Thisshowswhyindustry,bothdomesticandinternational,ismostlikelytobethetarget
for centralized large-scale hydrogen production facilities. A feasibility study, similar to Tizir, is
conducted in Sweden by Vättenfall among others [19]. Here, the aim is to produce steel using
hydrogeninaprocesscalleddirectreduction.
3.3 IsThereaPotentialforCentralizedHydrogenProductioninNorway?
BasedonlyontheoverviewofthetransportationmarketinNorway,acentralizedproductionofmore
than 100 tonnes per day will be sufficient to supply more than 50% of even optimistic market
estimations.IfaScandinaviandistributionsystemisdeveloped,large-scalehydrogenproductionfor
industrialuseholdsamoreviablepotential.ThefeasibilitystudybyTizirwillbeacrucialnextstepfor
Norwegian,industrialhydrogen.Withthisinmind,alarge-scalehydrogenproductionfacilitywitha
capacity in the scaleofabove100 tonnesperdaywillbemore suited forexport ina carbon-lean
energytrade.
The internationaldemandforcarbon-leanhydrogen isestimatedto increaserapidly in thecoming
years[20].InWesternEurope,dominatedbyUKandGermany,thedemandforhydrogenisexpected
toreachmorethan9milliontonnesperdayin2030,withcarbon-leanhydrogenrepresenting15%in
aCO2policydrivenscenario[21].InJapan,concreteplansforhydrogenimportisonthetable.Already
15
in2012,Kawasakireleasedastrategyrelatedtoimportinghydrogenbasedonbrowncoalgasification
inAustralia,770tonnesperday[22].
Thisthesisusesaproductioncapacityof500tonnesofhydrogen/dayasalarge-scalebasescenario.
In an export scenario, this production size can supply around 10% of the estimated carbon-lean
hydrogenmarketinEuropein2030[20].
3.4 Whattodowith500TonnesofHydrogen?
Eventhoughhydrogenisafamiliarcompoundinindustry,thegeneralunderstandingofitasanenergy
carrierislimited.500tonnesofhydrogenhold19.7GWhofenergy.347daysofproductionaddsup
toatotalof6.8TWh,equalto0.2%oftheenergyconsumptionwithinroadtransportationinEU[23].
Incomparison,thetotalelectricityproductioninNorwayin2014was142.3TWh[24].Kawasakiare
developingliquidhydrogencarriersforlarge-scaleimport.Theassumedtankvolumeis160000m3,
abletohold11328tonnesofhydrogen5[25].Thisequals22daysofproductioninaplantwith500
tonnesperdaycapacity.
BasedonthespecificationofToyotaMirai,afuelcellelectricvehicle(FCEV)runsapproximately100
kmperkgofhydrogen[26].WithanaveragetraveldistanceofpersonalvehiclesinNorwayof12289
kmannually,500tonnesofhydrogenperdaycanpower1.4millioncars[27].Onahigherheating
valuebasis,1kgofhydrogenequalsapproximatelythesameamountofenergyas4litresofpetrol.
5Liquidhydrogendensityof70.8kg/m3
16
4 TechnicalAnalysisofLarge-scaleHydrogenProduction
4.1 Introduction:
This chapter will provide a technical analysis of the different systems converting natural gas to
hydrogen.Thesystemswillbedefinedandmodelled,andtheresultswillbepresentedinordertodo
acomparativeanalysis.Thescopeoftheprojectlimitsthehydrogenproductiontobebasedonnatural
gaswithCCS,aswellasitcomparestheresultstonon-fossilhydrogenproductionbyelectrolysisof
water.Thefollowinghydrogenproductionsystemswillbeevaluatedinthisthesis:
1. SteamMethaneReforming–SMR
2. SteamMethaneReforming,withreducedemissions–SMR+
3. PartialOxidation–POX
4. AutothermalReforming–ATR
5. Electrolysis–EL
6. CombinedAutothermalReformingandElectrolysis–CRE
Eachsystemisdesignedandoptimizedbasedonasteadystate,chemicalprocessmodel,simulatedin
thesoftwareAspenHYSYS.Thesystemsaredesignedforaproductioncapacityof500tonnesofpure,
carbon-leanhydrogeneveryday.
Throughoutthischapter,emphasiswillbeputonthefollowingparameters:EnergyefficiencyandCO2
emissions.Withincreasingpowerconsumption,theefficiencyofenergysystemsrequiresattention
althoughitisoftenrelatedtoincreasedinvestmentcosts.Withafixedhydrogenproductioncapacity,
ahighenergyefficiencycanbekeytoreduceoperationalexpenditures,aswellasCO2emissions.
4.2 CasePresentations
Thissectionpresentsthedifferentsystemsdefinedinthisthesis,inordertogetanoverviewofthe
individualdesigns.EachsystemwillbeexplainedindetailinSection4.3.
4.2.1 System1:Streammethanereforming–SMR
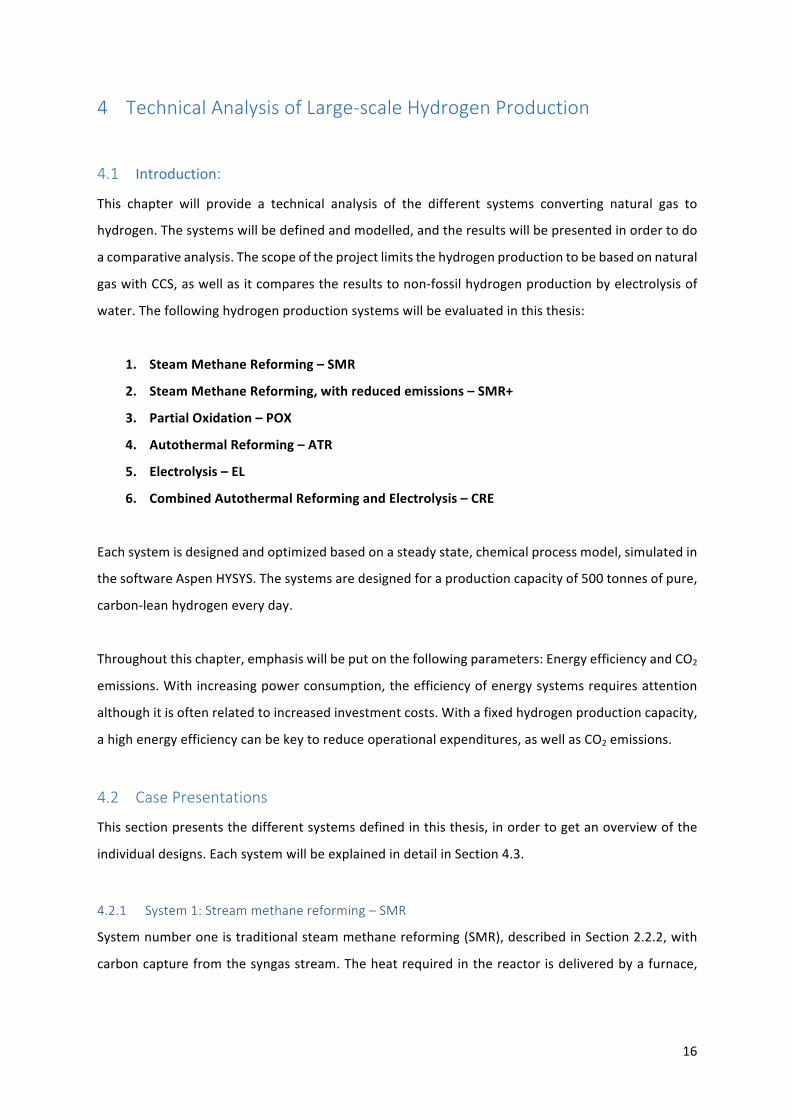
Systemnumberoneistraditionalsteammethanereforming(SMR),describedinSection2.2.2,with
carboncapturefromthesyngasstream.Theheatrequiredinthereactorisdeliveredbyafurnace,
17
burningtheprocesstailgasaswellasadditionalnaturalgasifneeded.Asystemflowchartispresented
inFigure5.
Figure5-SMRflowchart
4.2.2 System2:SteamMethaneReformingwithReducedCO2Emissions–SMR+
Becauseoftheexternalcombustion,CCSislimitedtoapproximately70%oftheCO2producedinSMR,
disregardingcarboncapturefromthefluegas.Therefore,anewSMRdesign,replacingthenaturalgas
feed in the furnacewithhydrogen, is defined inorder to reach close to90%carbon capture. The
systemisnamedSMR+andpresentedinFigure6.
Figure6-SMR+flowchart
18
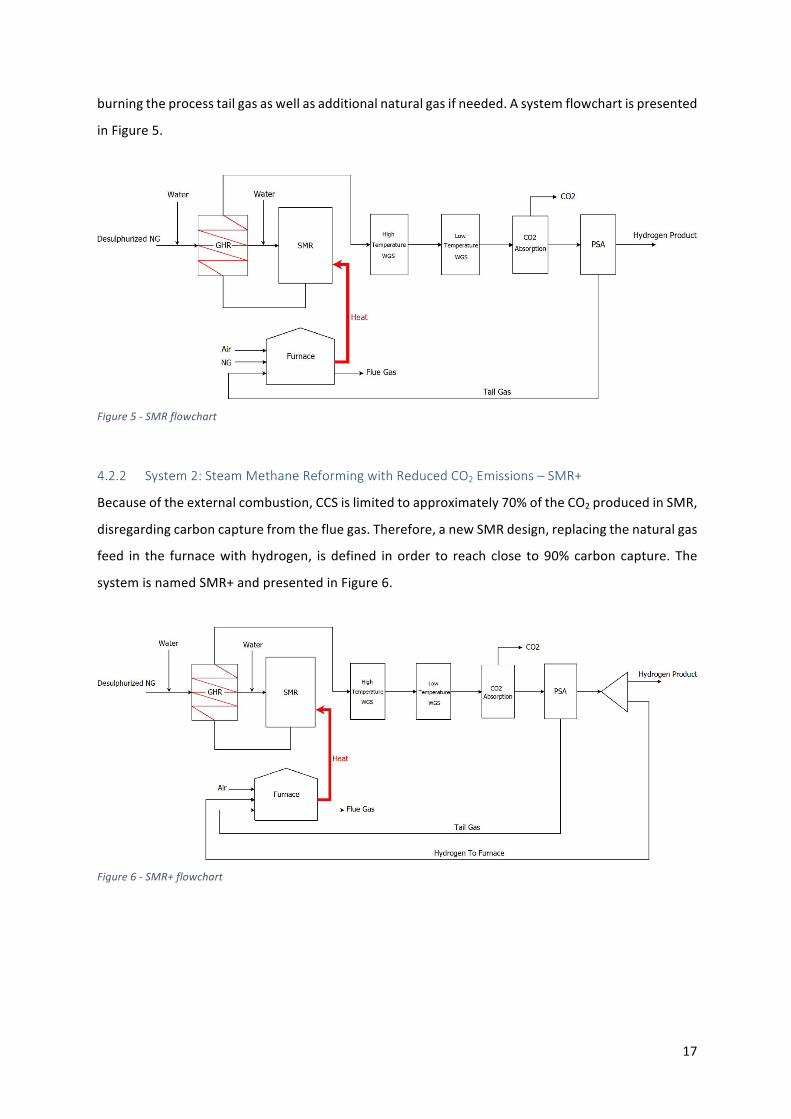
4.2.3 System3:PartialOxidation–POX
The third systemanalysed in this thesis is partial oxidation (POX), described in Section2.2.3. POX
differsfromSMRbyutilizingtheexothermiccombustionofnaturalgaswithlimitedoxygensupply,
producinghydrogenandCO,insteadofwaterandCO2.Figure7showsthesystemlayout.
Figure7-POXflowchart
4.2.4 System4:AutothermalReforming–ATR
ATR, described in Section 2.2.4, utilize the heat produced from the exothermic POX to fuel the
endothermicSMR,resulting inanefficientsystemwith internalcombustion.Thisdesignallowsfor
extensiveCCS,without compromisingonefficientoperation. The flowchartofATR ispresented in
Figure8.
Figure8-ATRflowchart
4.2.5 System5:Electrolysis–EL
Fundamentallydifferentfromnaturalgasreformingiselectrolysisofwater.Bysupplyingasignificant
amountofelectricity,ELsplitswaterintohydrogenandoxygen.Acompletelycarbon-freeprocess.No
19
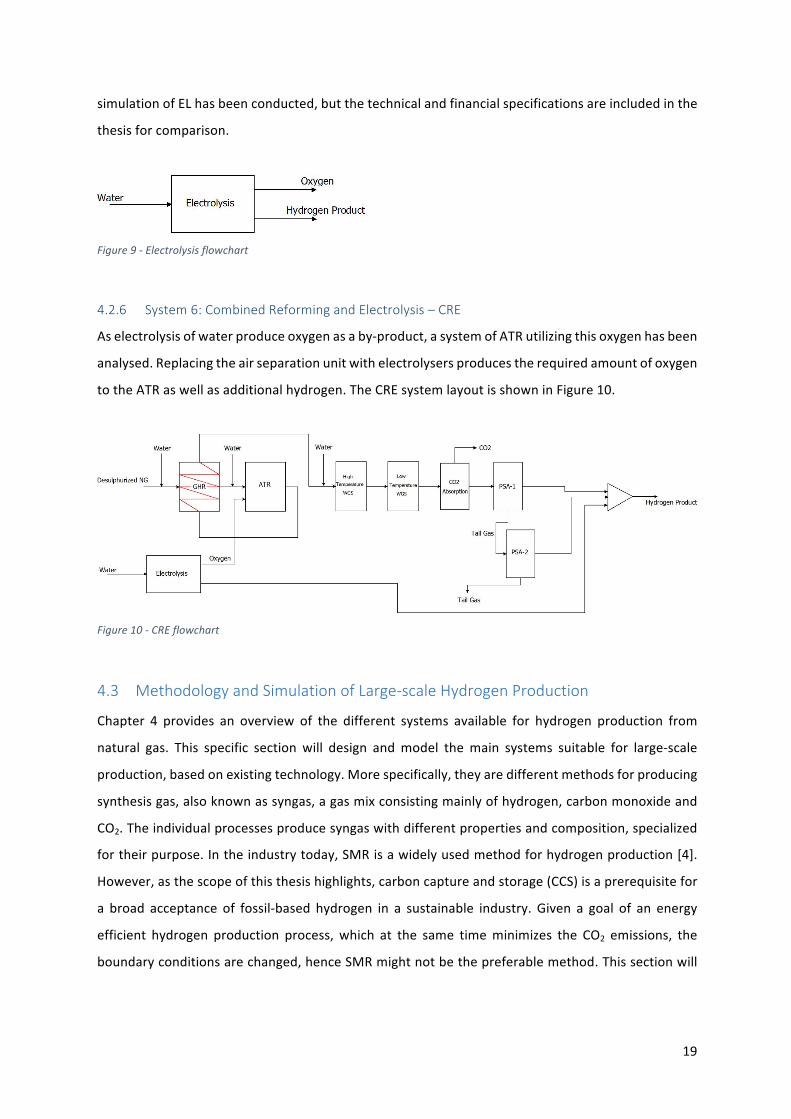
simulationofELhasbeenconducted,butthetechnicalandfinancialspecificationsareincludedinthe
thesisforcomparison.
Figure9-Electrolysisflowchart
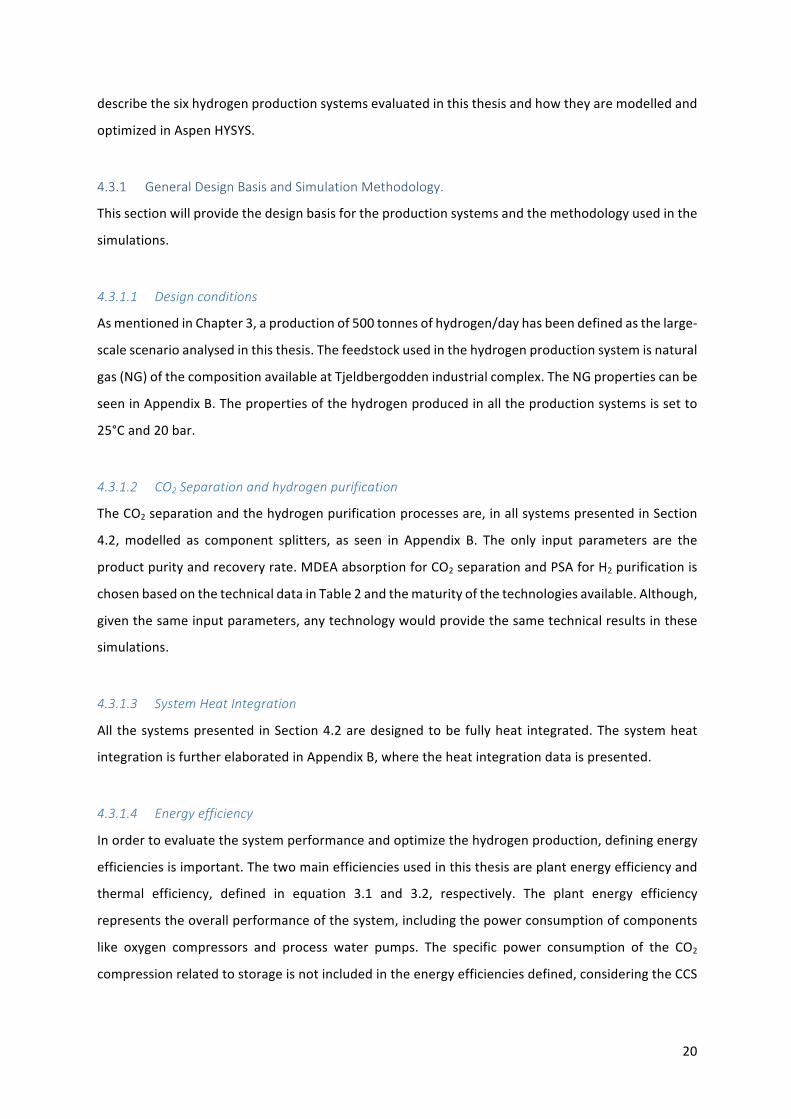
4.2.6 System6:CombinedReformingandElectrolysis–CRE
Aselectrolysisofwaterproduceoxygenasaby-product,asystemofATRutilizingthisoxygenhasbeen
analysed.Replacingtheairseparationunitwithelectrolysersproducestherequiredamountofoxygen
totheATRaswellasadditionalhydrogen.TheCREsystemlayoutisshowninFigure10.
Figure10-CREflowchart
4.3 MethodologyandSimulationofLarge-scaleHydrogenProduction
Chapter 4 provides an overview of the different systems available for hydrogen production from
natural gas. This specific section will design andmodel themain systems suitable for large-scale
production,basedonexistingtechnology.Morespecifically,theyaredifferentmethodsforproducing
synthesisgas,alsoknownassyngas,agasmixconsistingmainlyofhydrogen,carbonmonoxideand
CO2.Theindividualprocessesproducesyngaswithdifferentpropertiesandcomposition,specialized
fortheirpurpose.Intheindustrytoday,SMRisawidelyusedmethodforhydrogenproduction[4].
However,asthescopeofthisthesishighlights,carboncaptureandstorage(CCS)isaprerequisitefor
a broad acceptance of fossil-based hydrogen in a sustainable industry. Given a goal of an energy
efficient hydrogen production process, which at the same timeminimizes the CO2 emissions, the
boundaryconditionsarechanged,henceSMRmightnotbethepreferablemethod.Thissectionwill
20
describethesixhydrogenproductionsystemsevaluatedinthisthesisandhowtheyaremodelledand
optimizedinAspenHYSYS.
4.3.1 GeneralDesignBasisandSimulationMethodology.
Thissectionwillprovidethedesignbasisfortheproductionsystemsandthemethodologyusedinthe
simulations.
4.3.1.1 Designconditions
AsmentionedinChapter3,aproductionof500tonnesofhydrogen/dayhasbeendefinedasthelarge-
scalescenarioanalysedinthisthesis.Thefeedstockusedinthehydrogenproductionsystemisnatural
gas(NG)ofthecompositionavailableatTjeldbergoddenindustrialcomplex.TheNGpropertiescanbe
seeninAppendixB.Thepropertiesofthehydrogenproducedinalltheproductionsystemsissetto
25°Cand20bar.
4.3.1.2 CO2Separationandhydrogenpurification
TheCO2separationandthehydrogenpurificationprocessesare,inallsystemspresentedinSection
4.2,modelled as component splitters, as seen in Appendix B. The only input parameters are the
productpurityandrecoveryrate.MDEAabsorptionforCO2separationandPSAforH2purificationis
chosenbasedonthetechnicaldatainTable2andthematurityofthetechnologiesavailable.Although,
giventhesameinputparameters,anytechnologywouldprovidethesametechnicalresultsinthese
simulations.
4.3.1.3 SystemHeatIntegration
All thesystemspresented inSection4.2aredesignedtobefullyheat integrated.Thesystemheat
integrationisfurtherelaboratedinAppendixB,wheretheheatintegrationdataispresented.
4.3.1.4 Energyefficiency
Inordertoevaluatethesystemperformanceandoptimizethehydrogenproduction,definingenergy
efficienciesisimportant.Thetwomainefficienciesusedinthisthesisareplantenergyefficiencyand
thermal efficiency, defined in equation 3.1 and 3.2, respectively. The plant energy efficiency
representstheoverallperformanceofthesystem,includingthepowerconsumptionofcomponents
like oxygen compressors and process water pumps. The specific power consumption of the CO2
compressionrelatedtostorageisnotincludedintheenergyefficienciesdefined,consideringtheCCS
21
system isoutof scope in this thesis.Expenditures related to investmentandoperationof theCCS
facilityis,ontheotherhand,includedinthefinancialanalysisinChapter5.
Plantenergyefficiency-/0:
12 = 4567% ∗ 97%
456:; ∗ 9:; +<=>?
(3.1)
ThermalEfficiency-/@:
1A = 4567% ∗ 97%
456:; ∗ 9:;
(3.2)
WhereLHVisthelowerheatingvalue,97Bisthemassflowrateoftheproducthydrogenand9:; is
the totalNG inlet, including both process feed and eventual furnace feed.<=>? is the net power
consumptionoftheproductionprocess.ThededicatedpowerconsumptionoftheCCSisnotincluded
intheefficiencies,sincethevalueshouldenableacomparisonoftheproductionprocessesspecifically.
Thethermalefficiencyisaratiodescribingtheenergypreservedintheproducthydrogencompared
totheNGfeed.AsallexcessheatissuppliedbyadditionalNG,aplantenergyefficiencysimilartothe
thermalefficiencyimpliesaprocesswithlittlepowerdemand.
4.3.1.5 AspenHYSYSSimulation
Thehydrogenproduction systems aremodelledwith the chemical process softwareAspenHYSYS
version8.6.HYSYSisspecializedinhydrocarbonprocessinganditisacomprehensivetool,enabling
designandoptimizationofsteadystateprocesses.Peng-Robinson(PR)ischosenastheequationof
state, which, similar to Soave-Redlich-Kwong, is well known for high performance in gas and
condensate systems. PR and all theHYSYS components used is further defined and elaborated in
AppendixB.
4.3.2 SteamMethaneReforming(SMR)
Asmentioned in Section 2.2.2, steammethane reforming is awidely usedmethod for converting
natural gas to syngas for hydrogen production. The SMR design and production results is further
22
elaboratedandanalysed in this section. TheHYSYSmodel and componentdesigns canbe seen in
AppendixB.
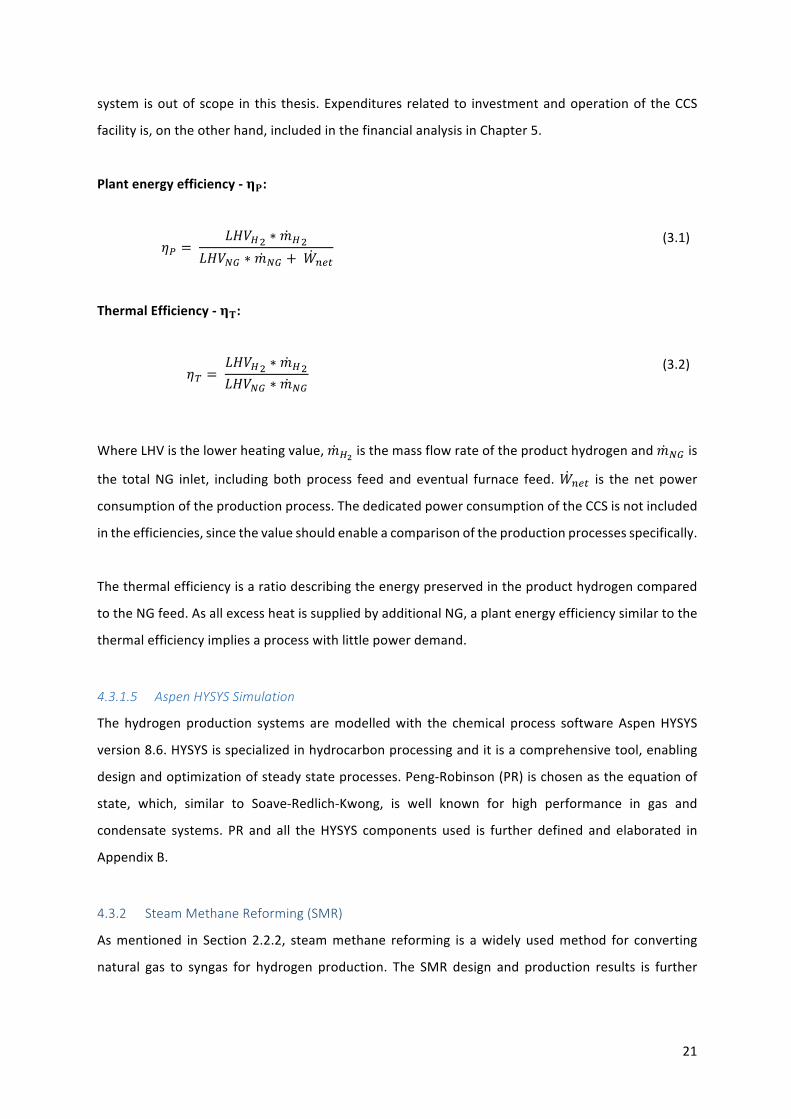
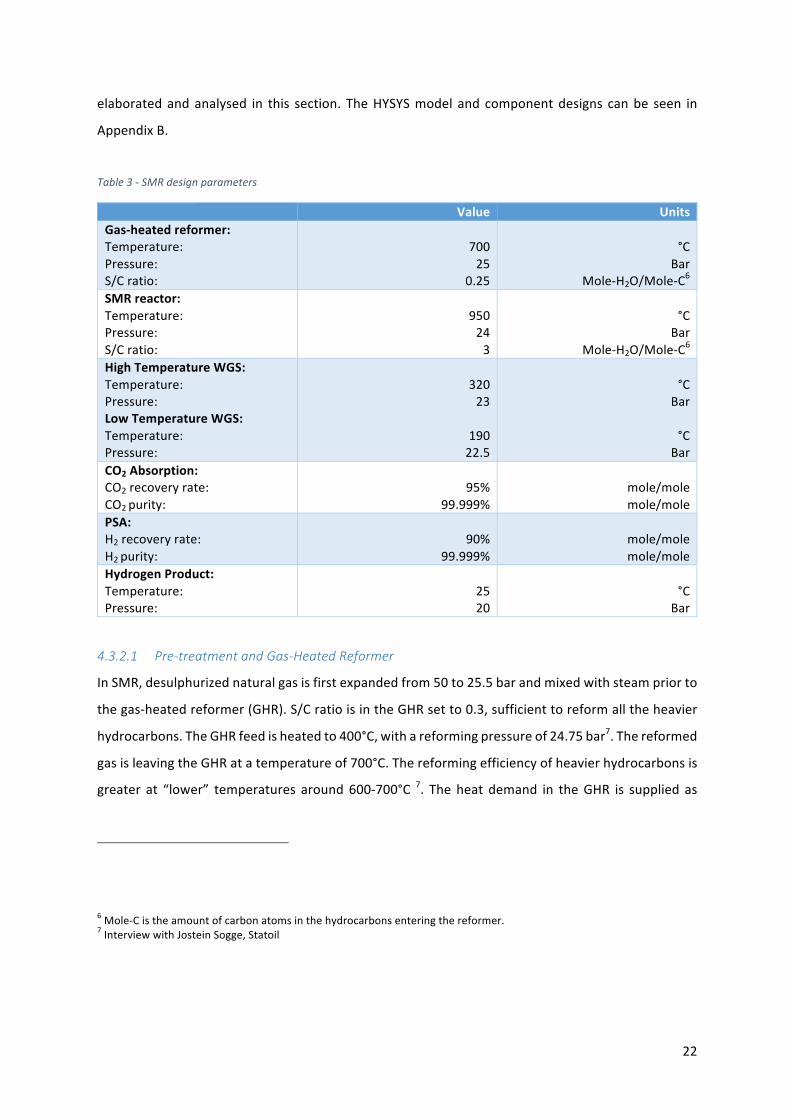
Table3-SMRdesignparameters
Value UnitsGas-heatedreformer:Temperature:Pressure:S/Cratio:
70025
0.25
°C
BarMole-H2O/Mole-C6
SMRreactor:Temperature:Pressure:S/Cratio:
950243
°C
BarMole-H2O/Mole-C6
HighTemperatureWGS:Temperature:Pressure:LowTemperatureWGS:Temperature:Pressure:
32023
19022.5
°C
Bar
°CBar
CO2Absorption:CO2recoveryrate:CO2purity:
95%
99.999%
mole/molemole/mole
PSA:H2recoveryrate:H2purity:
90%
99.999%
mole/molemole/mole
HydrogenProduct:Temperature:Pressure:
2520
°C
Bar
4.3.2.1 Pre-treatmentandGas-HeatedReformer
InSMR,desulphurizednaturalgasisfirstexpandedfrom50to25.5barandmixedwithsteampriorto
thegas-heatedreformer(GHR).S/CratioisintheGHRsetto0.3,sufficienttoreformalltheheavier
hydrocarbons.TheGHRfeedisheatedto400°C,withareformingpressureof24.75bar7.Thereformed
gasisleavingtheGHRatatemperatureof700°C.Thereformingefficiencyofheavierhydrocarbonsis
greater at “lower” temperatures around600-700°C 7. Theheat demand in theGHR is supplied as
6Mole-Cistheamountofcarbonatomsinthehydrocarbonsenteringthereformer.7InterviewwithJosteinSogge,Statoil
23
mentionedinSection2.2.1fromtheSMRproduct.AftertheGHRprocess,thegasisagainmixedwith
steampriortotheSMR,asseenfromthesystemflowchartinFigure5.S/Cratioissetto3,thistoget
anefficientreformingandtoavoidcarbonformationonthereformercatalysts8.Thegasisheatedto
700°CpriortotheSMRcolumns.
4.3.2.2 SMRReactor
TheSMRprocessisreformingnaturalgasat950°Cand24bar.AsmentionedinSection2.2.2,thegas
conversion rate is in SMR favouredby lowpressures andhigh temperatures. SMRbecomesmore
expensiveatlowerpressuresduetohighervolumeflowsandtheneedoflargerreactorcolumns.The
pressure used in industrial processing plants are therefore between 20-35 bar [8]. The reformer
temperaturereaches950°CandtherequiredheatissuppliedbyafurnaceburningNGandthePSA
tailgaswithair.ThereformedgasleavesthereformerwithH2/COratioofaround4.3.Thereformer
productisthencooleddownto320°CbeforeenteringtheWGScolumn.Thecoolingindonebyheat
exchangingtheSMRproductstreamwiththeGHRasmentioned,andbyheatingthewaterinputin
boththeGHRandSMR.
4.3.2.3 WGSandHydrogenPurification
WGSconversion is asmentioned in Section2.3 favouredby low temperatures,while the reaction
kineticsisfavouredbyhightemperatures[8].TheWGSisconductedintwostages,ahightemperature
shift(320°C)forfastreactionsandalowtemperatureshift(190°C)forhighconversion.WGSisthelast
gasconversionstepintheSMRprocessandthegasconsistsofmainlyH2andCO2.TheWGSproduct
iscooleddowntoafavourable25°CpriortotheCO2absorptionandthePSA.Separatorsareinstalled
priortotheCO2absorptioncolumnandthePSAtoavoidcondensateintheprocesses.CO2isremoved
inanabsorptioncolumnwitharecoveryrateof95%andleaveswithapurityof99.99%.Further,the
PSArecovers90%ofthehydrogen,withapurityof99.999%,asdescribedinSection2.5.1[8].The
pressuredropofthepurifiedhydrogenthroughthePSAis2barandthehydrogenproductleavesthe
PSAwithapressureof20barandatemperatureof25°C.Thetailgascontainingalltheremaining
hydrocarbons,nitrogen,waterandhydrogenexitsthePSAatapressureof2.5barand25°C.Thetail
gasisthenheatedupto500°Candfedasfueltothefurnace.
8InterviewwithRahoulAnantharaman,SINTEFEnergyResearch
24
4.3.2.4 Furnace
ThefurnaceisasmentionedsupplyingtheSMRwiththerequiredheatbyburningNGandthetailgas
withair.Therequiredairisheatedandsuppliedatatemperatureof335°Candapressureof1.2bar
while theNG and tail gas is heated to a temperature of 500°C before entering the furnace. Post
combustion,thefluegasleavesthefurnaceatatemperatureof1000°Candatatmosphericpressure.
Thefluegasiscooleddownto100°Csupplyingheattothereformingsystem.
4.3.2.5 ProcessOptimization–SMR
Inthisthesis,anoptimizedsystemhasasatisfyingenergyefficiency,naturalgasdemandandlowCO2
emissions,aswellasbeingcost-effective.TherearethreemainvariablestoadjustinSMRinorderto
achieve the desired specifications: reformer temperature, reformer pressure and S/C ratio in the
reformerfeed.Asmentionedearlierinthissection,SMRconversionisfavouredbyhightemperatures,
lowpressuresandhighS/Cratios.Ontheotherhand,highertemperatureandmoresteamimpliesa
higherheatdemand inthereactor.A lowerpressureresults in increasedvolumetric flowrateand
lower recovery rate in the PSA. In addition, there are technical boundary conditions in the
optimization.Duetotheriskofcarbonformationonthereformingcatalyst,S/Cratioof3issetasa
minimumvalue9.Thereformeroperatesatamaximumof950°Cduetomateriallimitations9.Pressure
levelsbetween20–35bariscommoninSMRplants,aswellasaminimumof20barisrequiredfora
satisfyinghydrogenrecoveryrateinthePSA[4].
Theoptimaltemperaturewasfoundtobeatthemaximum950°C,duetothesuperiorconversionrate.
Further,aS/Cratioof3wassetaswellasareactorpressureof24bar,theminimumvaluesufficient
tokeepthePSApressureat20bar.ThesystemwasfullyheatintegratedbyutilizingtheSMRproduct
andhotfluegastoproducesteampre-heatthefeedstreamsofthereactorandfurnace.Thisreduced
theNGdemand,henceincreasedtheplantefficiency.Sensitivitytodeviationfromoptimalconditions
isdiscussedin4.4.3.
4.3.3 SteamMethaneReforming,Improved(SMR+)
Inordertofurtherreducethecarbonemissions,thenaturalgasfeedtothefurnaceisreplacedby
producedhydrogen.Thus,theCO2emissionsperproducedhydrogenisfurtherreducedby60percent.
9InterviewwithSINTEFResearchScientistRahoulAnantharaman
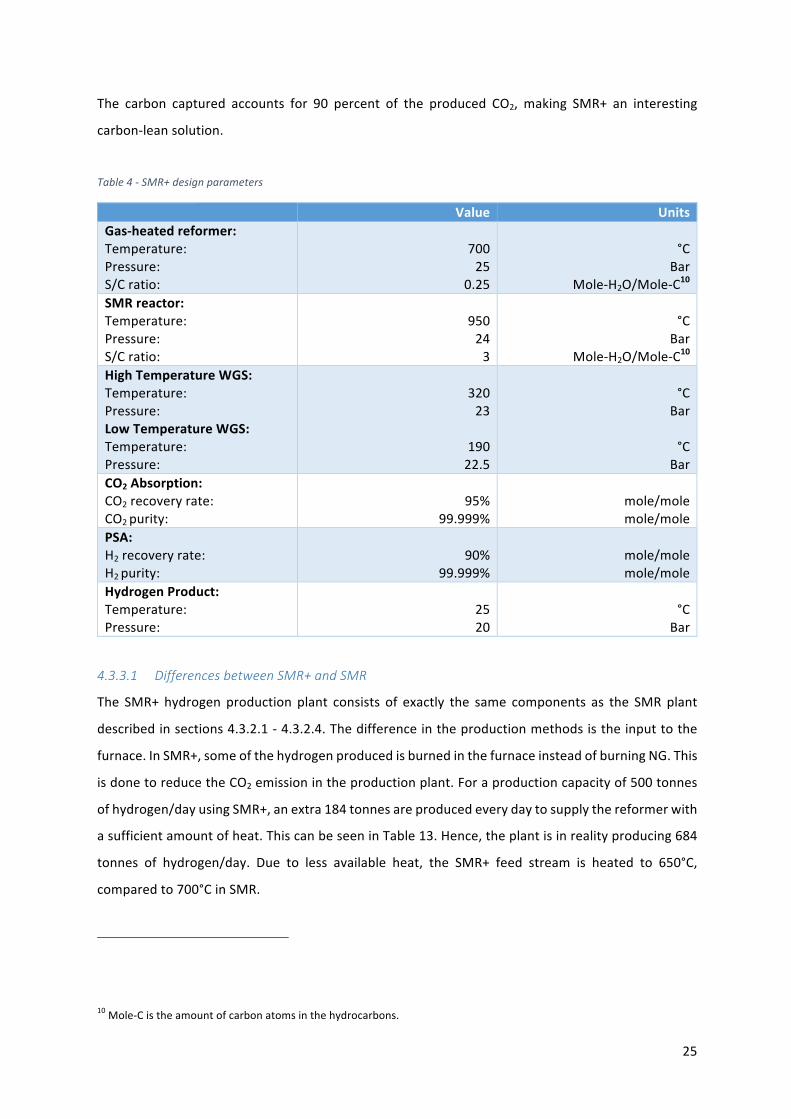
25
The carbon captured accounts for 90 percent of the produced CO2, making SMR+ an interesting
carbon-leansolution.
Table4-SMR+designparameters
Value UnitsGas-heatedreformer:Temperature:Pressure:S/Cratio:
70025
0.25
°C
BarMole-H2O/Mole-C10
SMRreactor:Temperature:Pressure:S/Cratio:
950243
°C
BarMole-H2O/Mole-C10
HighTemperatureWGS:Temperature:Pressure:LowTemperatureWGS:Temperature:Pressure:
32023
19022.5
°C
Bar
°CBar
CO2Absorption:CO2recoveryrate:CO2purity:
95%
99.999%
mole/molemole/mole
PSA:H2recoveryrate:H2purity:
90%
99.999%
mole/molemole/mole
HydrogenProduct:Temperature:Pressure:
2520
°C
Bar
4.3.3.1 DifferencesbetweenSMR+andSMR
The SMR+ hydrogen production plant consists of exactly the same components as the SMRplant
describedinsections4.3.2.1-4.3.2.4.Thedifferenceintheproductionmethodsistheinputtothe
furnace.InSMR+,someofthehydrogenproducedisburnedinthefurnaceinsteadofburningNG.This
isdonetoreducetheCO2emissionintheproductionplant.Foraproductioncapacityof500tonnes
ofhydrogen/dayusingSMR+,anextra184tonnesareproducedeverydaytosupplythereformerwith
asufficientamountofheat.ThiscanbeseeninTable13.Hence,theplantisinrealityproducing684
tonnes of hydrogen/day. Due to less available heat, the SMR+ feed stream is heated to 650°C,
comparedto700°CinSMR.
10Mole-Cistheamountofcarbonatomsinthehydrocarbons.
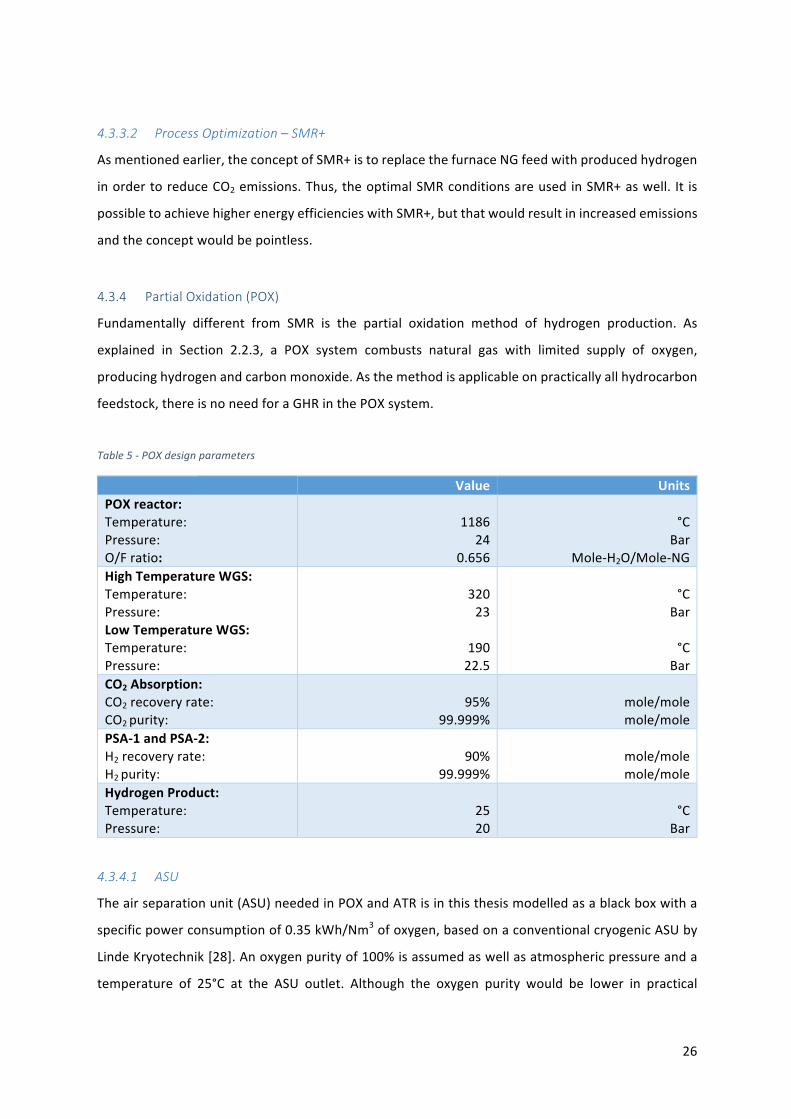
26
4.3.3.2 ProcessOptimization–SMR+
Asmentionedearlier,theconceptofSMR+istoreplacethefurnaceNGfeedwithproducedhydrogen
inordertoreduceCO2emissions.Thus,theoptimalSMRconditionsareusedinSMR+aswell. It is
possibletoachievehigherenergyefficiencieswithSMR+,butthatwouldresultinincreasedemissions
andtheconceptwouldbepointless.
4.3.4 PartialOxidation(POX)
Fundamentally different from SMR is the partial oxidation method of hydrogen production. As
explained in Section 2.2.3, a POX system combusts natural gas with limited supply of oxygen,
producinghydrogenandcarbonmonoxide.Asthemethodisapplicableonpracticallyallhydrocarbon
feedstock,thereisnoneedforaGHRinthePOXsystem.
Table5-POXdesignparameters
Value UnitsPOXreactor:Temperature:Pressure:O/Fratio:
1186
240.656
°C
BarMole-H2O/Mole-NG
HighTemperatureWGS:Temperature:Pressure:LowTemperatureWGS:Temperature:Pressure:
32023
19022.5
°C
Bar
°CBar
CO2Absorption:CO2recoveryrate:CO2purity:
95%
99.999%
mole/molemole/mole
PSA-1andPSA-2:H2recoveryrate:H2purity:
90%
99.999%
mole/molemole/mole
HydrogenProduct:Temperature:Pressure:
2520
°C
Bar
4.3.4.1 ASU
Theairseparationunit(ASU)neededinPOXandATRisinthisthesismodelledasablackboxwitha
specificpowerconsumptionof0.35kWh/Nm3ofoxygen,basedonaconventionalcryogenicASUby
LindeKryotechnik[28].Anoxygenpurityof100%isassumedaswellasatmosphericpressureanda
temperature of 25°C at the ASU outlet. Although the oxygen purity would be lower in practical
27
applications,nitrogenandotherinertgasesarenotaffectingthesimulations,hencetheirinclusionis
notnecessary.
4.3.4.2 POX
First,thenaturalgas(NG)isexpandedfrom50to24.5barandheatedupto500°CpriortothePOX
reformer. There is no need for desulphurizationwhen producing hydrogenwith POX, due to the
reformingprocessbeingnon-catalyticandhencesulphurwillnotdamagethereactor.Thereisalsono
needforapre-reformerduetoPOX’sabilitytoreformheavierhydrocarbons.Oxygenproducedinthe
ASUisheatedto250°Candcompressedintwostagesto24.5barbeforefedintothePOXreformer.
The reformer is modelled as an adiabatic reactor, and since the POX reaction is exothermic, the
reforming product leaves the reformer at a temperature of 1186°C. All theNG hydrocarbons are
reformed, asdescribed in Section2.2.3, resulting inmainlyH2, CO,H2O leaving the reformer. The
productstreamiscooleddownto320°CpriortoWGS.
4.3.4.3 WGSandPurification
WGSis,asinSMRandSMR+,doneintwotemperaturestages.This,asmentionedinSection4.3.2.3,
togetfastreactionsandhighconversion.Thetwotemperaturestagesconvertthegasat320°Cand
190°Catapressureof23and22.5bar.ThefluidleavingtheWGSisthencooleddownto25°Cpriorto
theCO2absorptionandPSA.TheCO2absorptionisalsodonesimilarlytoSMRandSMR+andabsorb
CO2witharecoveryrateof95%andwithapurityof99.999%.Aseparator is installedpriortothe
absorption column and the PSA to prevent condensate entering the columns. The hydrogen
purificationisdonewithtwoPSAstages,inordertorecovermoreofthehydrogenproduced.Thetail
gasafterthefirstPSAisstillcontainingmuchhydrogen,andsincethetailgasisnotutilisedinPOXas
inSMR(furnace) thetailgas is fedtoanotherPSAandmorehydrogen is recovered.BoththePSA
stagespurifyhydrogenwitharecoveryrateof90%andproduceshydrogenwithapurityof99.999%.
The PSA systems are operating and delivering hydrogen at a temperature of 25°C and at 20 bar.
Producedtailgasisburnedinafurnacetoprovideadditionalheattothesystem,resultinginsome
CO2emissions.
4.3.4.4 ProcessOptimization–POX
InPOX,theoxygen-to-fuel(O/F)ratiodecidesthetemperatureinthereactor,notanexternalheat
supply. Therefore, the system is optimized by varying oxygen flow rate and pressure level in the
reactor. In this thesis, the “fuel” valueused in theO/F ratio is the flow rateof themainNG feed
enteringthesystem.ThereisnodedicatedsteamfeedintothePOXreactor,althoughsomesteamis
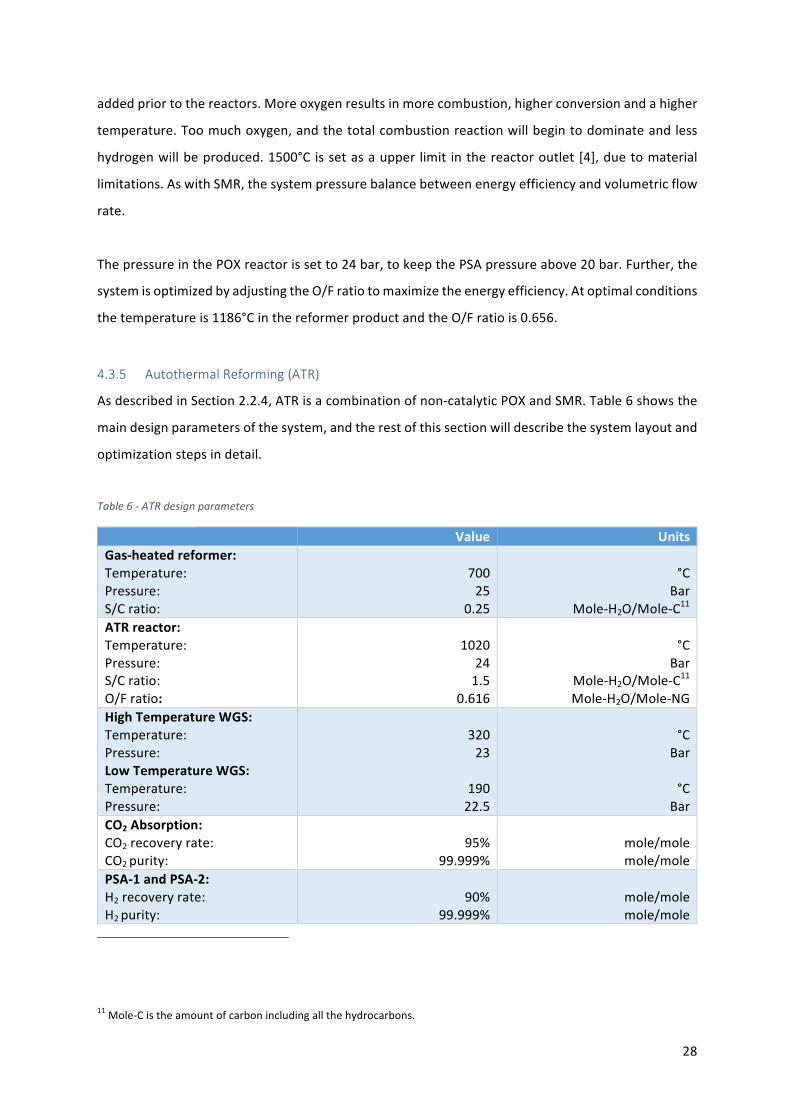
28
addedpriortothereactors.Moreoxygenresultsinmorecombustion,higherconversionandahigher
temperature.Toomuchoxygen,andthetotalcombustionreactionwillbegintodominateandless
hydrogenwillbeproduced.1500°C issetasaupper limit inthereactoroutlet [4],duetomaterial
limitations.AswithSMR,thesystempressurebalancebetweenenergyefficiencyandvolumetricflow
rate.
ThepressureinthePOXreactorissetto24bar,tokeepthePSApressureabove20bar.Further,the
systemisoptimizedbyadjustingtheO/Fratiotomaximizetheenergyefficiency.Atoptimalconditions
thetemperatureis1186°CinthereformerproductandtheO/Fratiois0.656.
4.3.5 AutothermalReforming(ATR)
AsdescribedinSection2.2.4,ATRisacombinationofnon-catalyticPOXandSMR.Table6showsthe
maindesignparametersofthesystem,andtherestofthissectionwilldescribethesystemlayoutand
optimizationstepsindetail.
Table6-ATRdesignparameters
Value UnitsGas-heatedreformer:Temperature:Pressure:S/Cratio:
70025
0.25
°C
BarMole-H2O/Mole-C11
ATRreactor:Temperature:Pressure:S/Cratio:O/Fratio:
1020
241.5
0.616
°C
BarMole-H2O/Mole-C11Mole-H2O/Mole-NG
HighTemperatureWGS:Temperature:Pressure:LowTemperatureWGS:Temperature:Pressure:
32023
19022.5
°C
Bar
°CBar
CO2Absorption:CO2recoveryrate:CO2purity:
95%
99.999%
mole/molemole/mole
PSA-1andPSA-2:H2recoveryrate:H2purity:
90%
99.999%
mole/molemole/mole
11Mole-Cistheamountofcarbonincludingallthehydrocarbons.
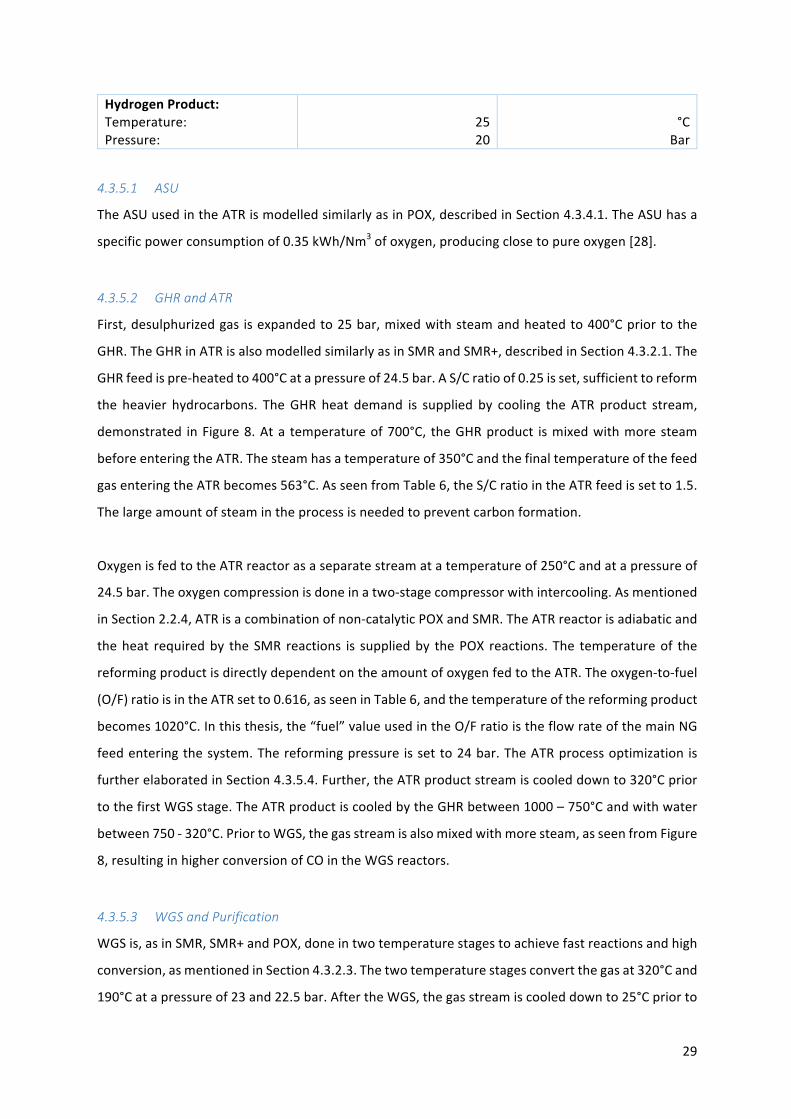
29
HydrogenProduct:Temperature:Pressure:
2520
°C
Bar
4.3.5.1 ASU
TheASUusedintheATRismodelledsimilarlyasinPOX,describedinSection4.3.4.1.TheASUhasa
specificpowerconsumptionof0.35kWh/Nm3ofoxygen,producingclosetopureoxygen[28].
4.3.5.2 GHRandATR
First,desulphurizedgas isexpandedto25bar,mixedwithsteamandheatedto400°Cpriortothe
GHR.TheGHRinATRisalsomodelledsimilarlyasinSMRandSMR+,describedinSection4.3.2.1.The
GHRfeedispre-heatedto400°Catapressureof24.5bar.AS/Cratioof0.25isset,sufficienttoreform
the heavier hydrocarbons. TheGHR heat demand is supplied by cooling the ATR product stream,
demonstrated inFigure8.Ata temperatureof700°C, theGHRproduct ismixedwithmoresteam
beforeenteringtheATR.Thesteamhasatemperatureof350°Candthefinaltemperatureofthefeed
gasenteringtheATRbecomes563°C.AsseenfromTable6,theS/CratiointheATRfeedissetto1.5.
Thelargeamountofsteamintheprocessisneededtopreventcarbonformation.
OxygenisfedtotheATRreactorasaseparatestreamatatemperatureof250°Candatapressureof
24.5bar.Theoxygencompressionisdoneinatwo-stagecompressorwithintercooling.Asmentioned
inSection2.2.4,ATRisacombinationofnon-catalyticPOXandSMR.TheATRreactorisadiabaticand
theheat requiredby theSMR reactions is suppliedby thePOX reactions. The temperatureof the
reformingproductisdirectlydependentontheamountofoxygenfedtotheATR.Theoxygen-to-fuel
(O/F)ratioisintheATRsetto0.616,asseeninTable6,andthetemperatureofthereformingproduct
becomes1020°C.Inthisthesis,the“fuel”valueusedintheO/FratioistheflowrateofthemainNG
feedenteringthesystem.Thereformingpressure issetto24bar.TheATRprocessoptimizationis
furtherelaboratedinSection4.3.5.4.Further,theATRproductstreamiscooleddownto320°Cprior
tothefirstWGSstage.TheATRproductiscooledbytheGHRbetween1000–750°Candwithwater
between750-320°C.PriortoWGS,thegasstreamisalsomixedwithmoresteam,asseenfromFigure
8,resultinginhigherconversionofCOintheWGSreactors.
4.3.5.3 WGSandPurification
WGSis,asinSMR,SMR+andPOX,doneintwotemperaturestagestoachievefastreactionsandhigh
conversion,asmentionedinSection4.3.2.3.Thetwotemperaturestagesconvertthegasat320°Cand
190°Catapressureof23and22.5bar.AftertheWGS,thegasstreamiscooleddownto25°Cpriorto
30
theCO2absorptionandPSA.TheCO2absorptionisdoneinthesamewayasinSMR,SMR+andPOX,
witharecoveryrateof95%andwithapurityof99.999%,asseenfromTable6.Aseparatorisinstalled
priortoboththeabsorptioncolumnandthePSAtopreventcondensateenteringthecolumns.The
hydrogenpurificationinATR,aswellasinPOX,donewithtwoPSAcolumns,thistorecovermoreof
thehydrogenproduced.ThetailgasafterthefirstPSAis,asinPOX,compressedandfedtoasecond
PSAtorecovermorehydrogen.ThesystemflowchartcanbeseeninFigure7.BoththePSAcolumns
purifyhydrogenwitharecoveryrateof90%andproduceshydrogenwithapurityof99.999%.The
PSAsareoperatinganddeliveringhydrogenat25°Cand20bar.AswithPOX,thefinaltailgasstream
isburnedinafurnacetoproduceadditionalheattothesystem.
4.3.5.4 ProcessOptimization-ATR
ThemainprocessdesignvariablesinATRaretheO/Fratio,theS/Cratioandpressure,affectingthe
overallsystemsimilarlyasinSMRandPOX.Moreoxygenfavoursmorepartialoxidation,providing
more heat for the steam reforming reactions. Toomuch oxygen results in total combustion, less
hydrogenproductionandtemperaturesaboveamaximumof1150°C[4].Duetosootformation,aS/C
ratiobelow1.5 isnotpossiblewithcurrent technology12.Thesamepressure limitationsas inSMR
existsinATR,witharequiredPSApressureabove20bar.
Allvariablesisadjustedinordertoachieveamaximizedplantenergyefficiency,definedinSection
4.3.1.4. An important notewith ATR is that, regardless of oxygen flow rate, the globalmaximum
energy efficiency was found at a S/C ratio below 1.5, which is a minimum value due to reactor
operation.Hence,theS/Cratiowassetto1.5andtheprocesswasthenoptimizedbyadjustingthe
oxygen flow rate. The O/F ratio was found to be 0.616 on amole basis. Because of the internal
combustion,theoxygenratioalsodeterminesthereactortemperature,at1020°C.SimilartoSMR,the
reforminginATRisalsofavouredbylowpressures.Therefore,thepressurehasbeensettoaminimum
of24barinordertokeeptheprocessstreamabove20barinthefinalPSAunit.
Furtheroptimizationof thesystem, lookingat thepossibilityof recompressing theprocessstream
afterthereactor,wouldopenforpressuresbelow24bar.Thisisnotdoneinthisthesisduetolimited
costdataofsuchacompression,asitwouldimplyasignificantincreaseofthevolumetricflowratein
thereactor.
12InterviewwithSINTEFResearchScientistRahoulAnantharaman
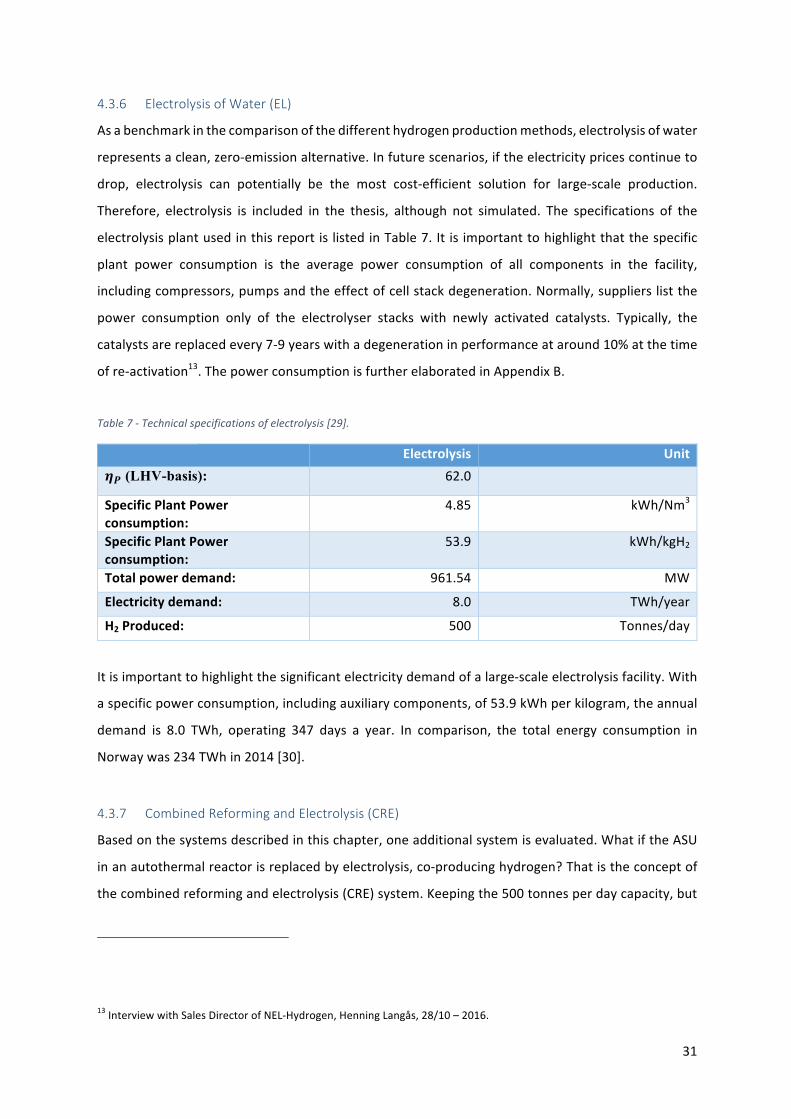
31
4.3.6 ElectrolysisofWater(EL)
Asabenchmarkinthecomparisonofthedifferenthydrogenproductionmethods,electrolysisofwater
representsaclean,zero-emissionalternative.Infuturescenarios,iftheelectricitypricescontinueto
drop, electrolysis can potentially be the most cost-efficient solution for large-scale production.
Therefore, electrolysis is included in the thesis, although not simulated. The specifications of the
electrolysisplantusedinthisreportislistedinTable7.Itisimportanttohighlightthatthespecific
plant power consumption is the average power consumption of all components in the facility,
includingcompressors,pumpsandtheeffectofcellstackdegeneration.Normally,supplierslistthe
power consumption only of the electrolyser stacks with newly activated catalysts. Typically, the
catalystsarereplacedevery7-9yearswithadegenerationinperformanceataround10%atthetime
ofre-activation13.ThepowerconsumptionisfurtherelaboratedinAppendixB.
Table7-Technicalspecificationsofelectrolysis[29].
Electrolysis UnitCD (LHV-basis): 62.0
SpecificPlantPowerconsumption:
4.85 kWh/Nm3
SpecificPlantPowerconsumption:
53.9 kWh/kgH2
Totalpowerdemand: 961.54 MW
Electricitydemand: 8.0 TWh/year
H2Produced: 500 Tonnes/day
Itisimportanttohighlightthesignificantelectricitydemandofalarge-scaleelectrolysisfacility.With
aspecificpowerconsumption,includingauxiliarycomponents,of53.9kWhperkilogram,theannual
demand is 8.0 TWh, operating 347 days a year. In comparison, the total energy consumption in
Norwaywas234TWhin2014[30].
4.3.7 CombinedReformingandElectrolysis(CRE)
Basedonthesystemsdescribedinthischapter,oneadditionalsystemisevaluated.WhatiftheASU
inanautothermalreactorisreplacedbyelectrolysis,co-producinghydrogen?Thatistheconceptof
thecombinedreformingandelectrolysis(CRE)system.Keepingthe500tonnesperdaycapacity,but
13InterviewwithSalesDirectorofNEL-Hydrogen,HenningLangås,28/10–2016.
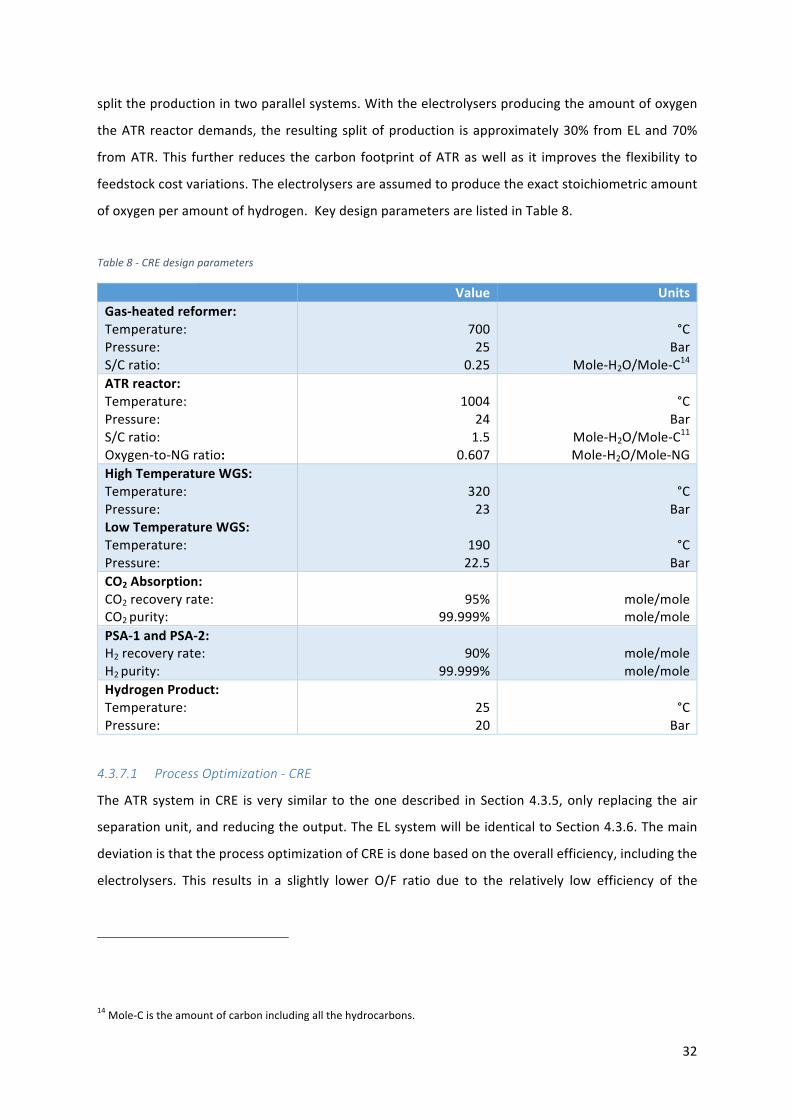
32
splittheproductionintwoparallelsystems.Withtheelectrolysersproducingtheamountofoxygen
theATRreactordemands, theresultingsplitofproduction isapproximately30%fromELand70%
fromATR.This further reduces thecarbon footprintofATRaswellas it improves the flexibility to
feedstockcostvariations.Theelectrolysersareassumedtoproducetheexactstoichiometricamount
ofoxygenperamountofhydrogen.KeydesignparametersarelistedinTable8.
Table8-CREdesignparameters
Value UnitsGas-heatedreformer:Temperature:Pressure:S/Cratio:
70025
0.25
°C
BarMole-H2O/Mole-C14
ATRreactor:Temperature:Pressure:S/Cratio:Oxygen-to-NGratio:
1004
241.5
0.607
°C
BarMole-H2O/Mole-C11Mole-H2O/Mole-NG
HighTemperatureWGS:Temperature:Pressure:LowTemperatureWGS:Temperature:Pressure:
32023
19022.5
°C
Bar
°CBar
CO2Absorption:CO2recoveryrate:CO2purity:
95%
99.999%
mole/molemole/mole
PSA-1andPSA-2:H2recoveryrate:H2purity:
90%
99.999%
mole/molemole/mole
HydrogenProduct:Temperature:Pressure:
2520
°C
Bar
4.3.7.1 ProcessOptimization-CRE
TheATR system inCRE is very similar to theonedescribed inSection4.3.5,only replacing theair
separationunit,andreducingtheoutput.TheELsystemwillbeidenticaltoSection4.3.6.Themain
deviationisthattheprocessoptimizationofCREisdonebasedontheoverallefficiency,includingthe
electrolysers. This results in a slightly lower O/F ratio due to the relatively low efficiency of the
14Mole-Cistheamountofcarbonincludingallthehydrocarbons.
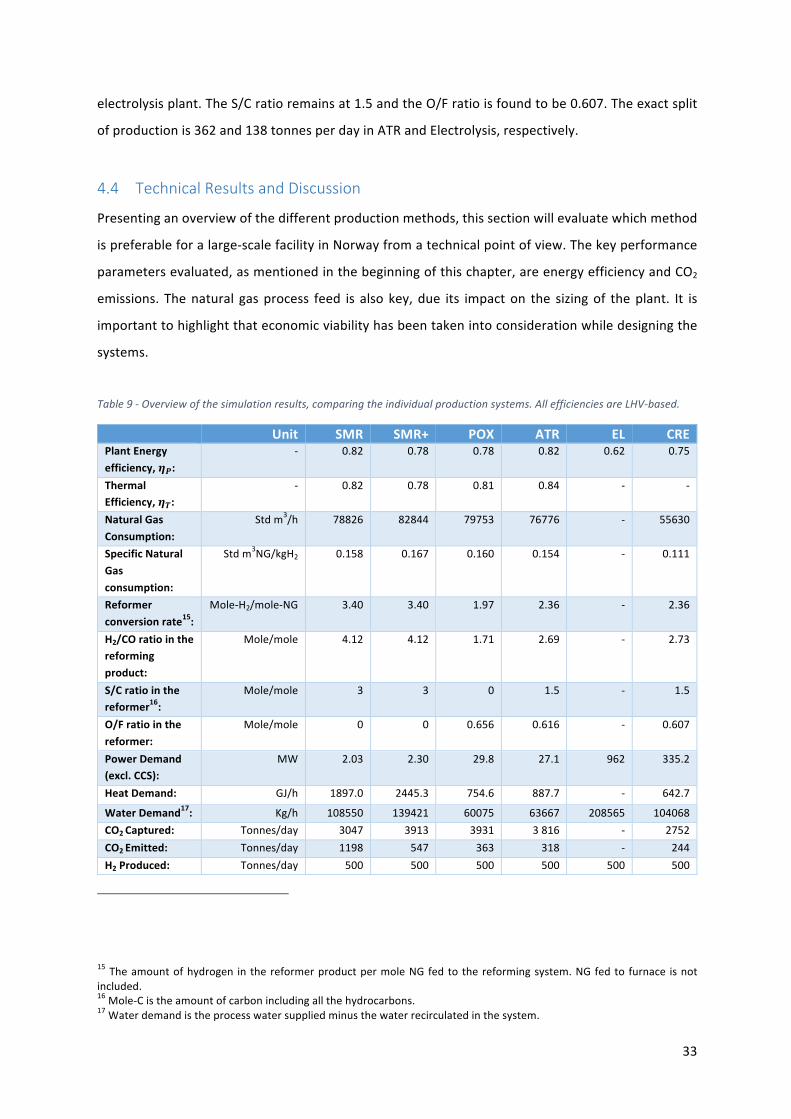
33
electrolysisplant.TheS/Cratioremainsat1.5andtheO/Fratioisfoundtobe0.607.Theexactsplit
ofproductionis362and138tonnesperdayinATRandElectrolysis,respectively.
4.4 TechnicalResultsandDiscussion
Presentinganoverviewofthedifferentproductionmethods,thissectionwillevaluatewhichmethod
ispreferableforalarge-scalefacilityinNorwayfromatechnicalpointofview.Thekeyperformance
parametersevaluated,asmentionedinthebeginningofthischapter,areenergyefficiencyandCO2
emissions. Thenatural gasprocess feed is also key, due its impacton the sizingof theplant. It is
importanttohighlightthateconomicviabilityhasbeentakenintoconsiderationwhiledesigningthe
systems.
Table9-Overviewofthesimulationresults,comparingtheindividualproductionsystems.AllefficienciesareLHV-based.
Unit SMR SMR+ POX ATR EL CREPlantEnergyefficiency,CD:
- 0.82 0.78 0.78 0.82 0.62 0.75
ThermalEfficiency,CE:
- 0.82 0.78 0.81 0.84 - -
NaturalGasConsumption:
Stdm3/h 78826 82844 79753 76776 - 55630
SpecificNaturalGasconsumption:
Stdm3NG/kgH2 0.158 0.167 0.160 0.154 - 0.111
Reformerconversionrate15:
Mole-H2/mole-NG 3.40 3.40 1.97 2.36 - 2.36
H2/COratiointhereformingproduct:
Mole/mole 4.12 4.12 1.71 2.69 - 2.73
S/Cratiointhereformer16:
Mole/mole 3 3 0 1.5 - 1.5
O/Fratiointhereformer:
Mole/mole 0 0 0.656 0.616 - 0.607
PowerDemand(excl.CCS):
MW 2.03 2.30 29.8 27.1 962 335.2
HeatDemand: GJ/h 1897.0 2445.3 754.6 887.7 - 642.7
WaterDemand17: Kg/h 108550 139421 60075 63667 208565 104068CO2Captured: Tonnes/day 3047 3913 3931 3816 - 2752CO2Emitted: Tonnes/day 1198 547 363 318 - 244H2Produced: Tonnes/day 500 500 500 500 500 500
15Theamountofhydrogen in thereformerproductpermoleNGfedtothereformingsystem.NGfedto furnace isnotincluded.16Mole-Cistheamountofcarbonincludingallthehydrocarbons.17Waterdemandistheprocesswatersuppliedminusthewaterrecirculatedinthesystem.
34
4.4.1 EnergyEfficiency
With regards to plant energy efficiency, ATR and SMR represent the best alternatives. Here, it is
importanttomentionthegeneralconsensusregardingSMRasthemostenergyefficientmethodto
producehydrogenfromnaturalgas.OursimulationsshowthatATRisequallyefficient.Onepossible
explanationtothisisthat,aswithPOX,thenon-catalyticpartialoxidationoccurringwithinthereactor
chamberdoesnotnecessarilyreachequilibriuminrealoperation.HYSYS,ontheotherhand,assumes
instantequilibrium.Notachievingequilibrium,moreoxygenwouldbenecessarytoprovideenough
heat for the steam reforming and the efficiency would drop. SMR+ shows a decrease in energy
efficiencyinordertoincreasetheCO2capture.Comparedtonaturalgasreformingelectrolysishasa
considerablylowerenergyefficiency.CombinedwithATR,theresultimproves,butisstillinferior.Itis
importanttohighlightthattheuseoflowerheatingvalue(LHV)inthecalculationofefficienciesaffect
thevalueinelectrolysismorethaninthereformingprocesses,duetothefactthatthefeedNGalso
use LHV. On a HHV-basis, SMR and electrolysis have a plant energy efficiency of 0.87 and 0.73,
respectively.
4.4.2 CO2emissions
AscanbeseeninFigure11,ATRrepresentsthetraditionalnaturalgasreformingalternativewiththe
lowestcarbondioxideemissions.AlthoughSMRandATRproducesasimilaramountofCO2theinternal
combustion of ATR enables superior carbon capture and hence a significantly reduced footprint,
comparedtoSMR.SMR+andPOXalsoseemtobegoodalternativestoproducecarbon-leanhydrogen
with a significant reduction from the standard SMR. The alternatives involving electrolysis are
naturallyproducingfarlessCO2,butareontheotherhandconsumingmoreelectricity.Asaresultof
Norway’svasthydropowerresources,electricityisconsideredzero-emissionenergy,asshowedinthe
figure.Elsewherethisisnotnecessarilythecase,affectingtheviabilityofthesolution.
Inordertofurtherreduceemissions,improvementoftheCO2recoveryrateintheabsorptioncolumn
canbeimportant.95%isusedinthisanalysis,leavingroomforimprovement,especiallyinATR,SMR+
andPOX,wheretheonlyemissionscomefromtheburnedtailgas.InSMR,post-combustionCCSwill
beimportantinthefuture,toapproachzero-emission.Pre-combustionCCSislimitedtoaround70%
captureinenergyefficientSMR.
Mitigatingclimatechangeisoneofthemainreasonsastowhyhydrogenproductionisaninteresting
prospect.Hence,targetingclosetozeroemissionsisimportant.Ontheotherhand,thetechnology
has to be economically viable in order to be implemented. Aswill be highlighted in the financial
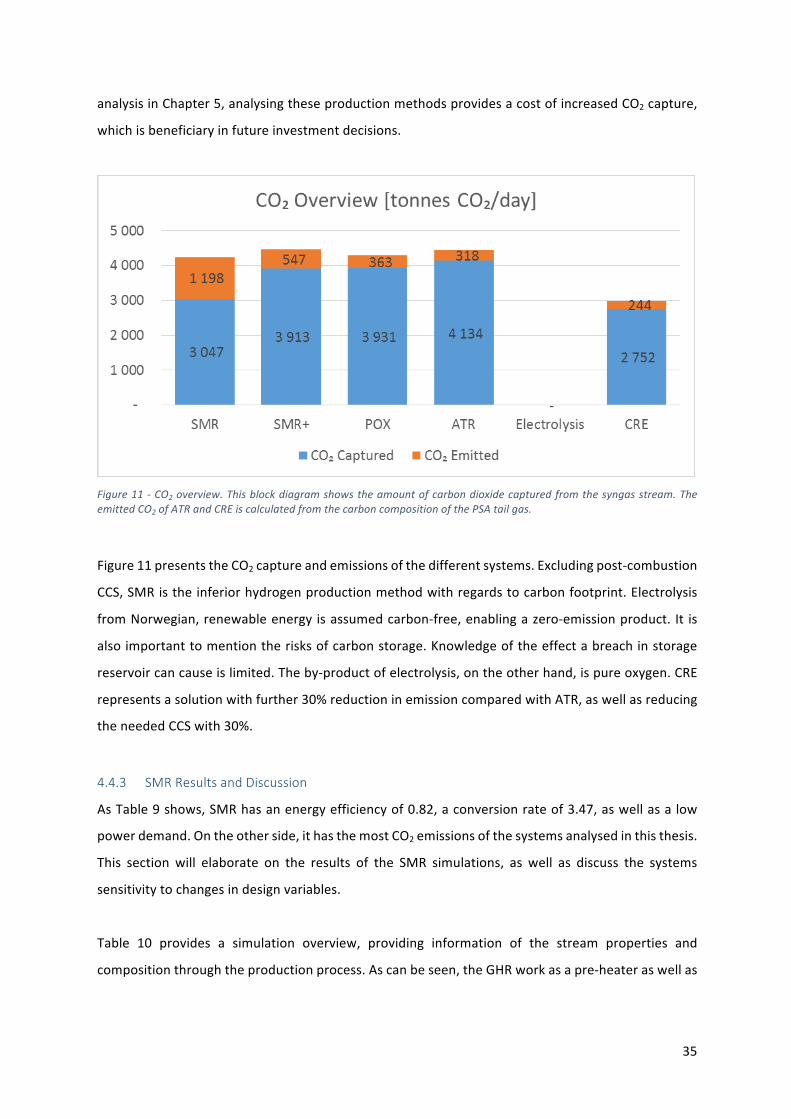
35
analysisinChapter5,analysingtheseproductionmethodsprovidesacostofincreasedCO2capture,
whichisbeneficiaryinfutureinvestmentdecisions.
Figure11-CO2overview.Thisblockdiagramshowstheamountofcarbondioxidecapturedfromthesyngasstream.TheemittedCO2ofATRandCREiscalculatedfromthecarboncompositionofthePSAtailgas.
Figure11presentstheCO2captureandemissionsofthedifferentsystems.Excludingpost-combustion
CCS,SMRistheinferiorhydrogenproductionmethodwithregardstocarbonfootprint.Electrolysis
fromNorwegian,renewableenergy isassumedcarbon-free,enablingazero-emissionproduct. It is
alsoimportanttomentiontherisksofcarbonstorage.Knowledgeoftheeffectabreachinstorage
reservoircancauseislimited.Theby-productofelectrolysis,ontheotherhand,ispureoxygen.CRE
representsasolutionwithfurther30%reductioninemissioncomparedwithATR,aswellasreducing
theneededCCSwith30%.
4.4.3 SMRResultsandDiscussion
AsTable9shows,SMRhasanenergyefficiencyof0.82,aconversionrateof3.47,aswellasalow
powerdemand.Ontheotherside,ithasthemostCO2emissionsofthesystemsanalysedinthisthesis.
This section will elaborate on the results of the SMR simulations, as well as discuss the systems
sensitivitytochangesindesignvariables.
Table 10 provides a simulation overview, providing information of the stream properties and
compositionthroughtheproductionprocess.Ascanbeseen,theGHRworkasapre-heateraswellas
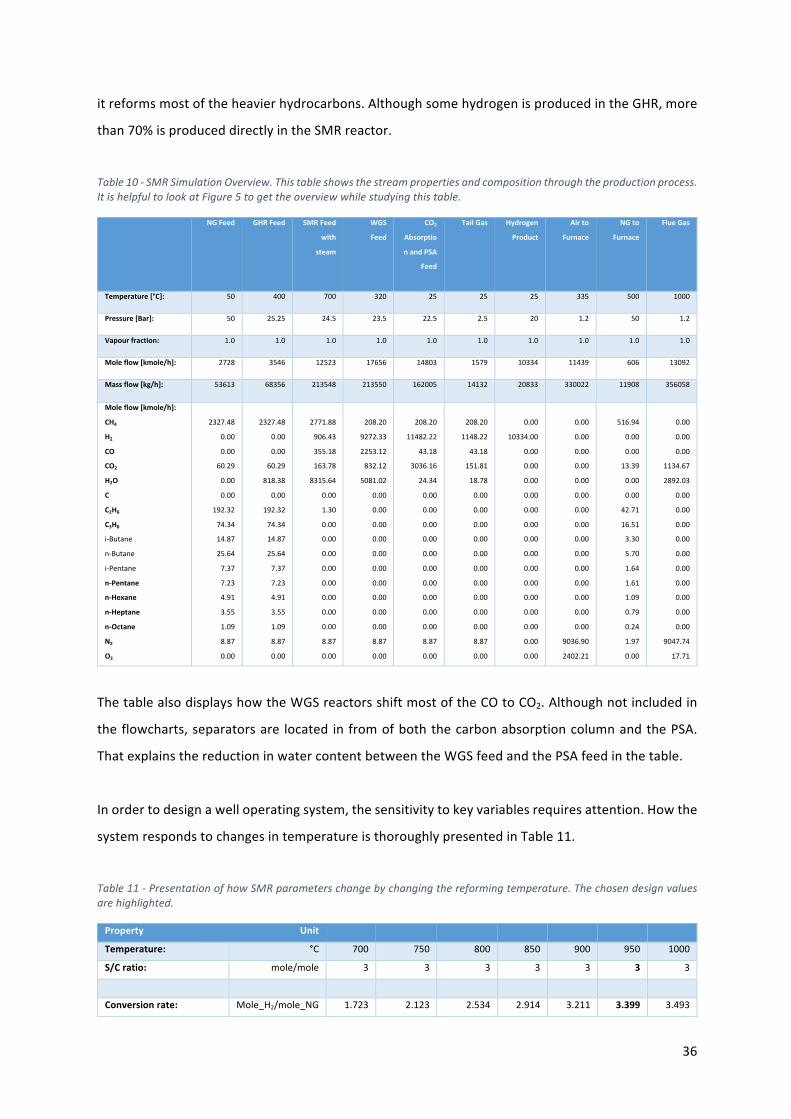
36
itreformsmostoftheheavierhydrocarbons.AlthoughsomehydrogenisproducedintheGHR,more
than70%isproduceddirectlyintheSMRreactor.
Table10-SMRSimulationOverview.Thistableshowsthestreampropertiesandcompositionthroughtheproductionprocess.ItishelpfultolookatFigure5togettheoverviewwhilestudyingthistable.
NGFeed GHRFeed SMRFeed
with
steam
WGS
Feed
CO2
Absorptio
nandPSA
Feed
TailGas Hydrogen
Product
Airto
Furnace
NGto
Furnace
FlueGas
Temperature[°C]: 50 400 700 320 25 25 25 335 500 1000
Pressure[Bar]: 50 25.25 24.5 23.5 22.5 2.5 20 1.2 50 1.2
Vapourfraction: 1.0 1.0 1.0 1.0 1.0 1.0 1.0 1.0 1.0 1.0
Moleflow[kmole/h]: 2728 3546 12523 17656 14803 1579 10334 11439 606 13092
Massflow[kg/h]: 53613 68356 213548 213550 162005 14132 20833 330022 11908 356058
Moleflow[kmole/h]:
CH4
H2
CO
CO2
H2O
C
C2H6
C3H8
i-Butane
n-Butane
i-Pentane
n-Pentane
n-Hexane
n-Heptane
n-Octane
N2
O2
2327.48
0.00
0.00
60.29
0.00
0.00
192.32
74.34
14.87
25.64
7.37
7.23
4.91
3.55
1.09
8.87
0.00
2327.48
0.00
0.00
60.29
818.38
0.00
192.32
74.34
14.87
25.64
7.37
7.23
4.91
3.55
1.09
8.87
0.00
2771.88
906.43
355.18
163.78
8315.64
0.00
1.30
0.00
0.00
0.00
0.00
0.00
0.00
0.00
0.00
8.87
0.00
208.20
9272.33
2253.12
832.12
5081.02
0.00
0.00
0.00
0.00
0.00
0.00
0.00
0.00
0.00
0.00
8.87
0.00
208.20
11482.22
43.18
3036.16
24.34
0.00
0.00
0.00
0.00
0.00
0.00
0.00
0.00
0.00
0.00
8.87
0.00
208.20
1148.22
43.18
151.81
18.78
0.00
0.00
0.00
0.00
0.00
0.00
0.00
0.00
0.00
0.00
8.87
0.00
0.00
10334.00
0.00
0.00
0.00
0.00
0.00
0.00
0.00
0.00
0.00
0.00
0.00
0.00
0.00
0.00
0.00
0.00
0.00
0.00
0.00
0.00
0.00
0.00
0.00
0.00
0.00
0.00
0.00
0.00
0.00
0.00
9036.90
2402.21
516.94
0.00
0.00
13.39
0.00
0.00
42.71
16.51
3.30
5.70
1.64
1.61
1.09
0.79
0.24
1.97
0.00
0.00
0.00
0.00
1134.67
2892.03
0.00
0.00
0.00
0.00
0.00
0.00
0.00
0.00
0.00
0.00
9047.74
17.71
ThetablealsodisplayshowtheWGSreactorsshiftmostoftheCOtoCO2.Althoughnotincludedin
theflowcharts,separatorsare located infromofboththecarbonabsorptioncolumnandthePSA.
ThatexplainsthereductioninwatercontentbetweentheWGSfeedandthePSAfeedinthetable.
Inordertodesignawelloperatingsystem,thesensitivitytokeyvariablesrequiresattention.Howthe
systemrespondstochangesintemperatureisthoroughlypresentedinTable11.
Table11-PresentationofhowSMRparameterschangebychangingthereformingtemperature.Thechosendesignvaluesarehighlighted.
Property Unit
Temperature: °C 700 750 800 850 900 950 1000
S/Cratio: mole/mole 3 3 3 3 3 3 3
Conversionrate: Mole_H2/mole_NG 1.723 2.123 2.534 2.914 3.211 3.399 3.493
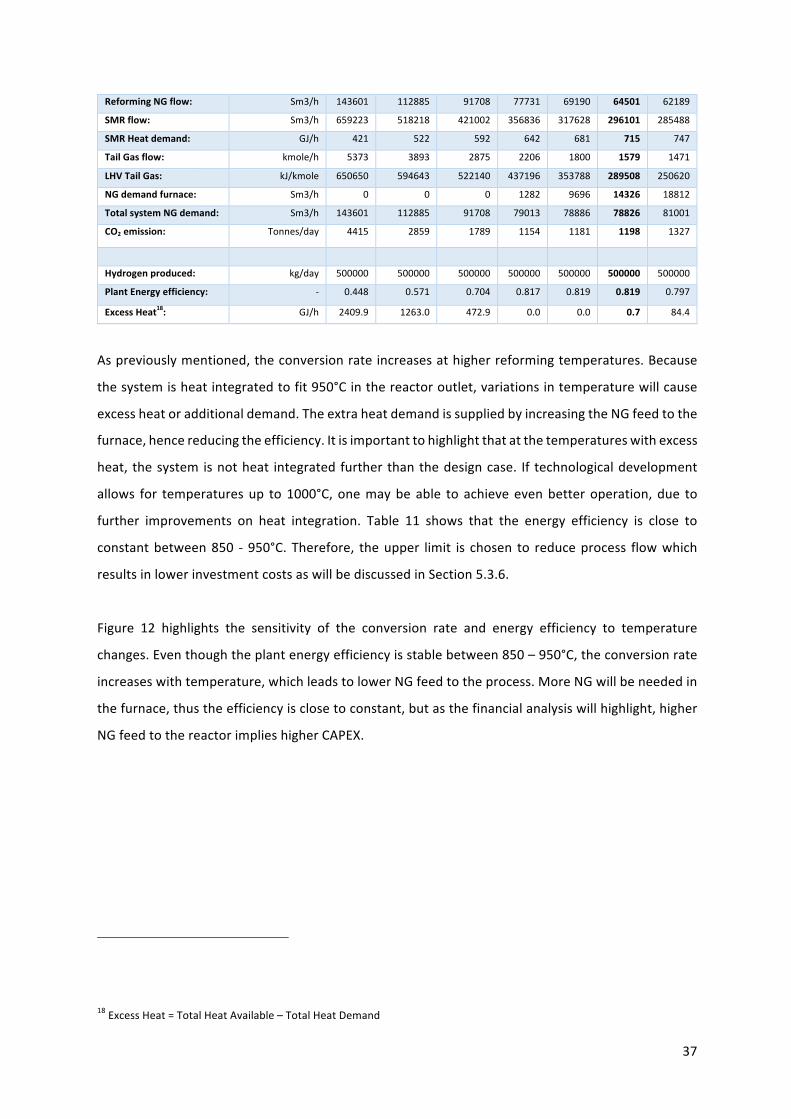
37
ReformingNGflow: Sm3/h 143601 112885 91708 77731 69190 64501 62189
SMRflow: Sm3/h 659223 518218 421002 356836 317628 296101 285488
SMRHeatdemand: GJ/h 421 522 592 642 681 715 747
TailGasflow: kmole/h 5373 3893 2875 2206 1800 1579 1471
LHVTailGas: kJ/kmole 650650 594643 522140 437196 353788 289508 250620
NGdemandfurnace: Sm3/h 0 0 0 1282 9696 14326 18812
TotalsystemNGdemand: Sm3/h 143601 112885 91708 79013 78886 78826 81001
CO2emission: Tonnes/day 4415 2859 1789 1154 1181 1198 1327
Hydrogenproduced: kg/day 500000 500000 500000 500000 500000 500000 500000
PlantEnergyefficiency: - 0.448 0.571 0.704 0.817 0.819 0.819 0.797
ExcessHeat18: GJ/h 2409.9 1263.0 472.9 0.0 0.0 0.7 84.4
Aspreviouslymentioned,theconversionrateincreasesathigherreformingtemperatures.Because
thesystemisheatintegratedtofit950°Cinthereactoroutlet,variationsintemperaturewillcause
excessheatoradditionaldemand.TheextraheatdemandissuppliedbyincreasingtheNGfeedtothe
furnace,hencereducingtheefficiency.Itisimportanttohighlightthatatthetemperatureswithexcess
heat, thesystemisnotheat integratedfurtherthanthedesigncase. If technologicaldevelopment
allows for temperaturesup to1000°C,onemaybeable to achieveevenbetteroperation,due to
further improvements on heat integration. Table 11 shows that the energy efficiency is close to
constantbetween850 -950°C.Therefore, theupper limit is chosen to reduceprocess flowwhich
resultsinlowerinvestmentcostsaswillbediscussedinSection5.3.6.
Figure 12 highlights the sensitivity of the conversion rate and energy efficiency to temperature
changes.Eventhoughtheplantenergyefficiencyisstablebetween850–950°C,theconversionrate
increaseswithtemperature,whichleadstolowerNGfeedtotheprocess.MoreNGwillbeneededin
thefurnace,thustheefficiencyisclosetoconstant,butasthefinancialanalysiswillhighlight,higher
NGfeedtothereactorimplieshigherCAPEX.
18ExcessHeat=TotalHeatAvailable–TotalHeatDemand
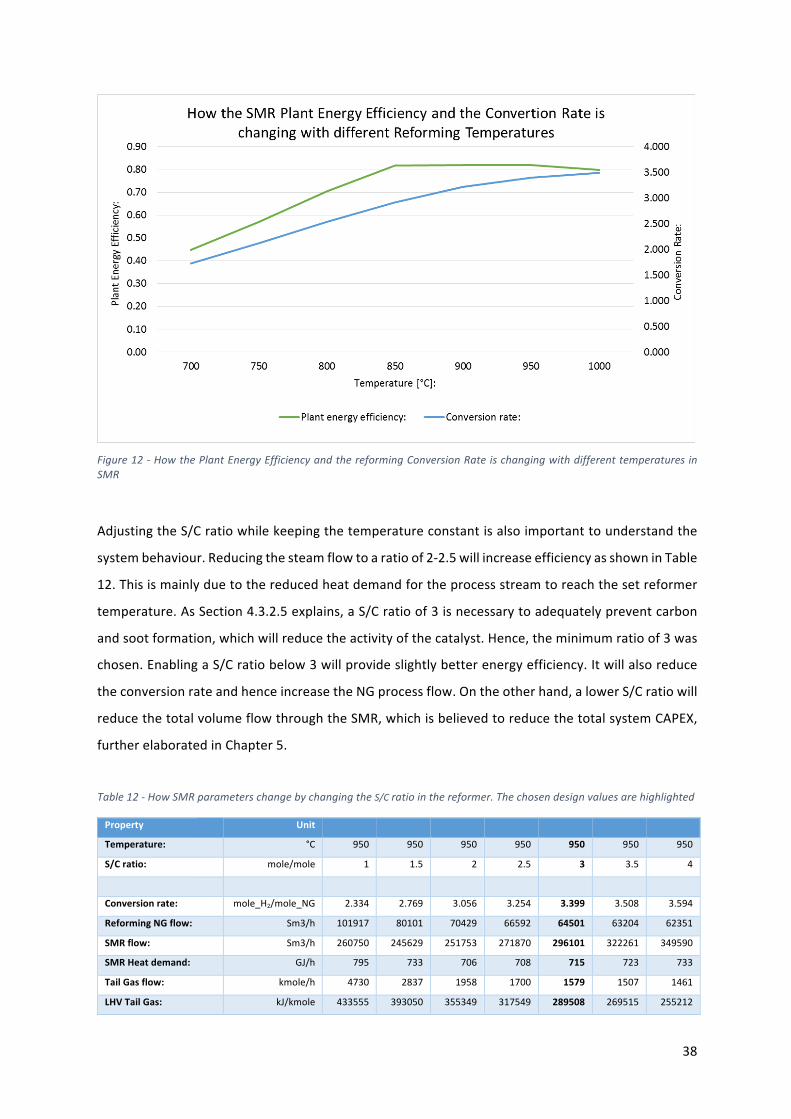
38
Figure12-HowthePlantEnergyEfficiencyandthereformingConversionRateischangingwithdifferenttemperaturesinSMR
AdjustingtheS/Cratiowhilekeepingthetemperatureconstantisalsoimportanttounderstandthe
systembehaviour.Reducingthesteamflowtoaratioof2-2.5willincreaseefficiencyasshowninTable
12.Thisismainlyduetothereducedheatdemandfortheprocessstreamtoreachthesetreformer
temperature.AsSection4.3.2.5explains,aS/Cratioof3isnecessarytoadequatelypreventcarbon
andsootformation,whichwillreducetheactivityofthecatalyst.Hence,theminimumratioof3was
chosen.EnablingaS/Cratiobelow3willprovideslightlybetterenergyefficiency.Itwillalsoreduce
theconversionrateandhenceincreasetheNGprocessflow.Ontheotherhand,alowerS/Cratiowill
reducethetotalvolumeflowthroughtheSMR,whichisbelievedtoreducethetotalsystemCAPEX,
furtherelaboratedinChapter5.
Table12-HowSMRparameterschangebychangingtheS/Cratiointhereformer.Thechosendesignvaluesarehighlighted
Property Unit
Temperature: °C 950 950 950 950 950 950 950
S/Cratio: mole/mole 1 1.5 2 2.5 3 3.5 4
Conversionrate: mole_H2/mole_NG 2.334 2.769 3.056 3.254 3.399 3.508 3.594
ReformingNGflow: Sm3/h 101917 80101 70429 66592 64501 63204 62351
SMRflow: Sm3/h 260750 245629 251753 271870 296101 322261 349590
SMRHeatdemand: GJ/h 795 733 706 708 715 723 733
TailGasflow: kmole/h 4730 2837 1958 1700 1579 1507 1461
LHVTailGas: kJ/kmole 433555 393050 355349 317549 289508 269515 255212
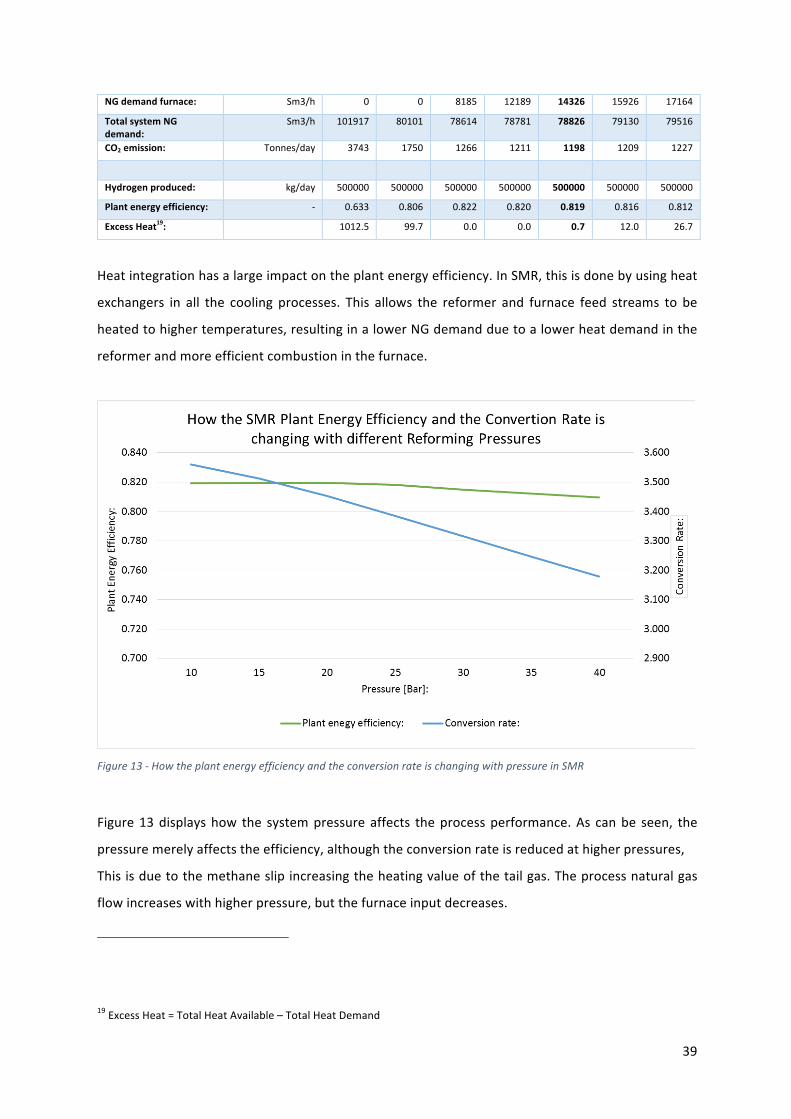
39
NGdemandfurnace: Sm3/h 0 0 8185 12189 14326 15926 17164
TotalsystemNGdemand:
Sm3/h 101917 80101 78614 78781 78826 79130 79516
CO2emission: Tonnes/day 3743 1750 1266 1211 1198 1209 1227
Hydrogenproduced: kg/day 500000 500000 500000 500000 500000 500000 500000
Plantenergyefficiency: - 0.633 0.806 0.822 0.820 0.819 0.816 0.812
ExcessHeat19: 1012.5 99.7 0.0 0.0 0.7 12.0 26.7
Heatintegrationhasalargeimpactontheplantenergyefficiency.InSMR,thisisdonebyusingheat
exchangers in all the cooling processes. This allows the reformer and furnace feed streams to be
heatedtohighertemperatures,resultinginalowerNGdemandduetoalowerheatdemandinthe
reformerandmoreefficientcombustioninthefurnace.
Figure13-HowtheplantenergyefficiencyandtheconversionrateischangingwithpressureinSMR
Figure13displayshow the systempressureaffects theprocessperformance.As canbe seen, the
pressuremerelyaffectstheefficiency,althoughtheconversionrateisreducedathigherpressures,
Thisisduetothemethaneslipincreasingtheheatingvalueofthetailgas.Theprocessnaturalgas
flowincreaseswithhigherpressure,butthefurnaceinputdecreases.
19ExcessHeat=TotalHeatAvailable–TotalHeatDemand
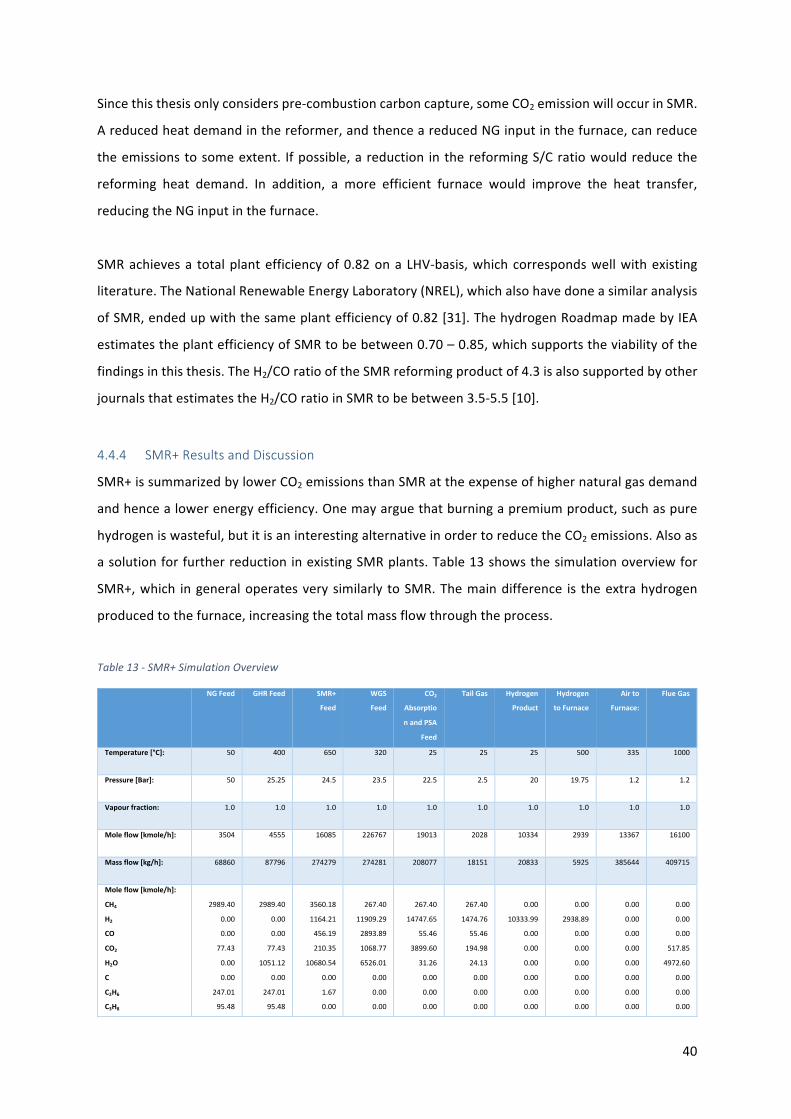
40
Sincethisthesisonlyconsiderspre-combustioncarboncapture,someCO2emissionwilloccurinSMR.
Areducedheatdemandinthereformer,andthenceareducedNGinputinthefurnace,canreduce
theemissionstosomeextent. Ifpossible,areduction inthereformingS/Cratiowouldreducethe
reforming heat demand. In addition, a more efficient furnace would improve the heat transfer,
reducingtheNGinputinthefurnace.
SMRachievesa totalplantefficiencyof0.82onaLHV-basis,whichcorrespondswellwithexisting
literature.TheNationalRenewableEnergyLaboratory(NREL),whichalsohavedoneasimilaranalysis
ofSMR,endedupwiththesameplantefficiencyof0.82[31].ThehydrogenRoadmapmadebyIEA
estimatestheplantefficiencyofSMRtobebetween0.70–0.85,whichsupportstheviabilityofthe
findingsinthisthesis.TheH2/COratiooftheSMRreformingproductof4.3isalsosupportedbyother
journalsthatestimatestheH2/COratioinSMRtobebetween3.5-5.5[10].
4.4.4 SMR+ResultsandDiscussion
SMR+issummarizedbylowerCO2emissionsthanSMRattheexpenseofhighernaturalgasdemand
andhencealowerenergyefficiency.Onemayarguethatburningapremiumproduct,suchaspure
hydrogeniswasteful,butitisaninterestingalternativeinordertoreducetheCO2emissions.Alsoas
asolutionforfurtherreductioninexistingSMRplants.Table13showsthesimulationoverviewfor
SMR+,which ingeneraloperatesverysimilarly toSMR.Themaindifference is theextrahydrogen
producedtothefurnace,increasingthetotalmassflowthroughtheprocess.
Table13-SMR+SimulationOverview
NGFeed GHRFeed SMR+
Feed
WGS
Feed
CO2
Absorptio
nandPSA
Feed
TailGas Hydrogen
Product
Hydrogen
toFurnace
Airto
Furnace:
FlueGas
Temperature[°C]: 50 400 650 320 25 25 25 500 335 1000
Pressure[Bar]: 50 25.25 24.5 23.5 22.5 2.5 20 19.75 1.2 1.2
Vapourfraction: 1.0 1.0 1.0 1.0 1.0 1.0 1.0 1.0 1.0 1.0
Moleflow[kmole/h]: 3504 4555 16085 226767 19013 2028 10334 2939 13367 16100
Massflow[kg/h]: 68860 87796 274279 274281 208077 18151 20833 5925 385644 409715
Moleflow[kmole/h]:
CH4
H2
CO
CO2
H2O
C
C2H6
C3H8
2989.40
0.00
0.00
77.43
0.00
0.00
247.01
95.48
2989.40
0.00
0.00
77.43
1051.12
0.00
247.01
95.48
3560.18
1164.21
456.19
210.35
10680.54
0.00
1.67
0.00
267.40
11909.29
2893.89
1068.77
6526.01
0.00
0.00
0.00
267.40
14747.65
55.46
3899.60
31.26
0.00
0.00
0.00
267.40
1474.76
55.46
194.98
24.13
0.00
0.00
0.00
0.00
10333.99
0.00
0.00
0.00
0.00
0.00
0.00
0.00
2938.89
0.00
0.00
0.00
0.00
0.00
0.00
0.00
0.00
0.00
0.00
0.00
0.00
0.00
0.00
0.00
0.00
0.00
517.85
4972.60
0.00
0.00
0.00
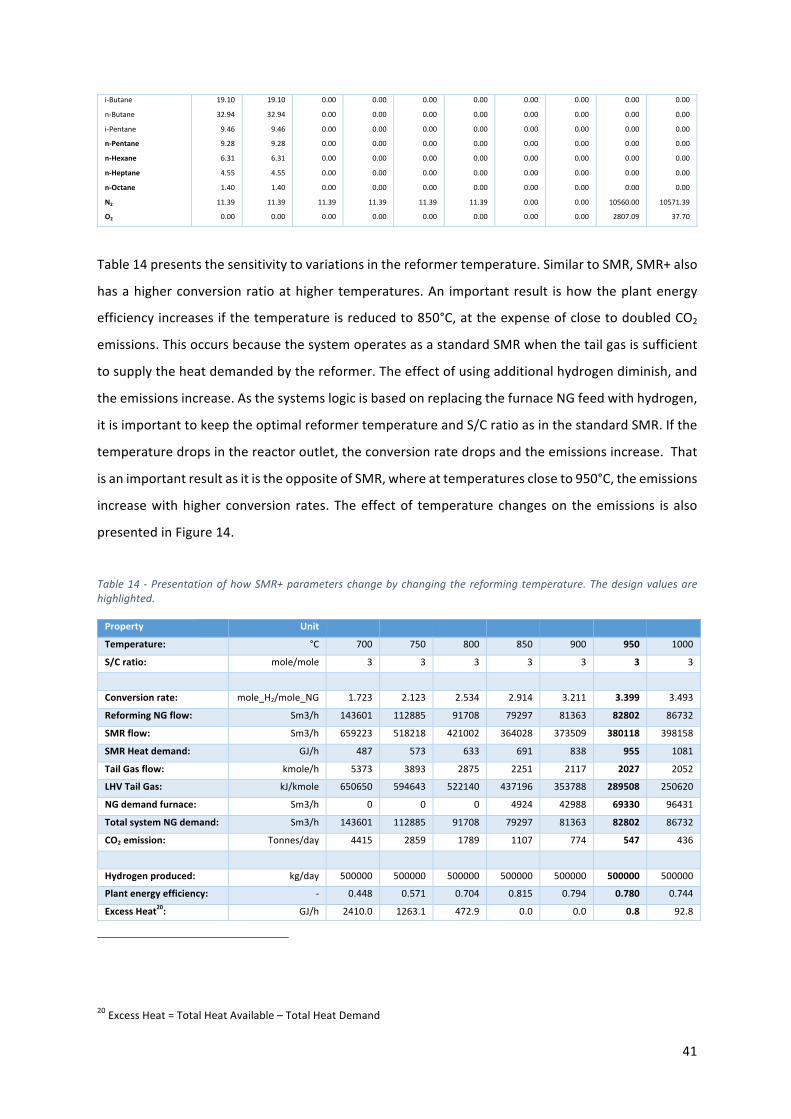
41
i-Butane
n-Butane
i-Pentane
n-Pentane
n-Hexane
n-Heptane
n-Octane
N2
O2
19.10
32.94
9.46
9.28
6.31
4.55
1.40
11.39
0.00
19.10
32.94
9.46
9.28
6.31
4.55
1.40
11.39
0.00
0.00
0.00
0.00
0.00
0.00
0.00
0.00
11.39
0.00
0.00
0.00
0.00
0.00
0.00
0.00
0.00
11.39
0.00
0.00
0.00
0.00
0.00
0.00
0.00
0.00
11.39
0.00
0.00
0.00
0.00
0.00
0.00
0.00
0.00
11.39
0.00
0.00
0.00
0.00
0.00
0.00
0.00
0.00
0.00
0.00
0.00
0.00
0.00
0.00
0.00
0.00
0.00
0.00
0.00
0.00
0.00
0.00
0.00
0.00
0.00
0.00
10560.00
2807.09
0.00
0.00
0.00
0.00
0.00
0.00
0.00
10571.39
37.70
Table14presentsthesensitivitytovariationsinthereformertemperature.SimilartoSMR,SMR+also
hasahigherconversionratioathighertemperatures.An importantresult ishowtheplantenergy
efficiencyincreasesifthetemperatureisreducedto850°C,attheexpenseofclosetodoubledCO2
emissions.ThisoccursbecausethesystemoperatesasastandardSMRwhenthetailgasissufficient
tosupplytheheatdemandedbythereformer.Theeffectofusingadditionalhydrogendiminish,and
theemissionsincrease.AsthesystemslogicisbasedonreplacingthefurnaceNGfeedwithhydrogen,
itisimportanttokeeptheoptimalreformertemperatureandS/CratioasinthestandardSMR.Ifthe
temperaturedropsinthereactoroutlet,theconversionratedropsandtheemissionsincrease.That
isanimportantresultasitistheoppositeofSMR,whereattemperaturescloseto950°C,theemissions
increasewithhigher conversion rates.Theeffectof temperaturechangeson theemissions isalso
presentedinFigure14.
Table14 -PresentationofhowSMR+parameterschangebychangingthereformingtemperature.Thedesignvaluesarehighlighted.
Property Unit
Temperature: °C 700 750 800 850 900 950 1000
S/Cratio: mole/mole 3 3 3 3 3 3 3
Conversionrate: mole_H2/mole_NG 1.723 2.123 2.534 2.914 3.211 3.399 3.493
ReformingNGflow: Sm3/h 143601 112885 91708 79297 81363 82802 86732
SMRflow: Sm3/h 659223 518218 421002 364028 373509 380118 398158
SMRHeatdemand: GJ/h 487 573 633 691 838 955 1081
TailGasflow: kmole/h 5373 3893 2875 2251 2117 2027 2052
LHVTailGas: kJ/kmole 650650 594643 522140 437196 353788 289508 250620
NGdemandfurnace: Sm3/h 0 0 0 4924 42988 69330 96431
TotalsystemNGdemand: Sm3/h 143601 112885 91708 79297 81363 82802 86732
CO2emission: Tonnes/day 4415 2859 1789 1107 774 547 436
Hydrogenproduced: kg/day 500000 500000 500000 500000 500000 500000 500000
Plantenergyefficiency: - 0.448 0.571 0.704 0.815 0.794 0.780 0.744
ExcessHeat20: GJ/h 2410.0 1263.1 472.9 0.0 0.0 0.8 92.8
20ExcessHeat=TotalHeatAvailable–TotalHeatDemand
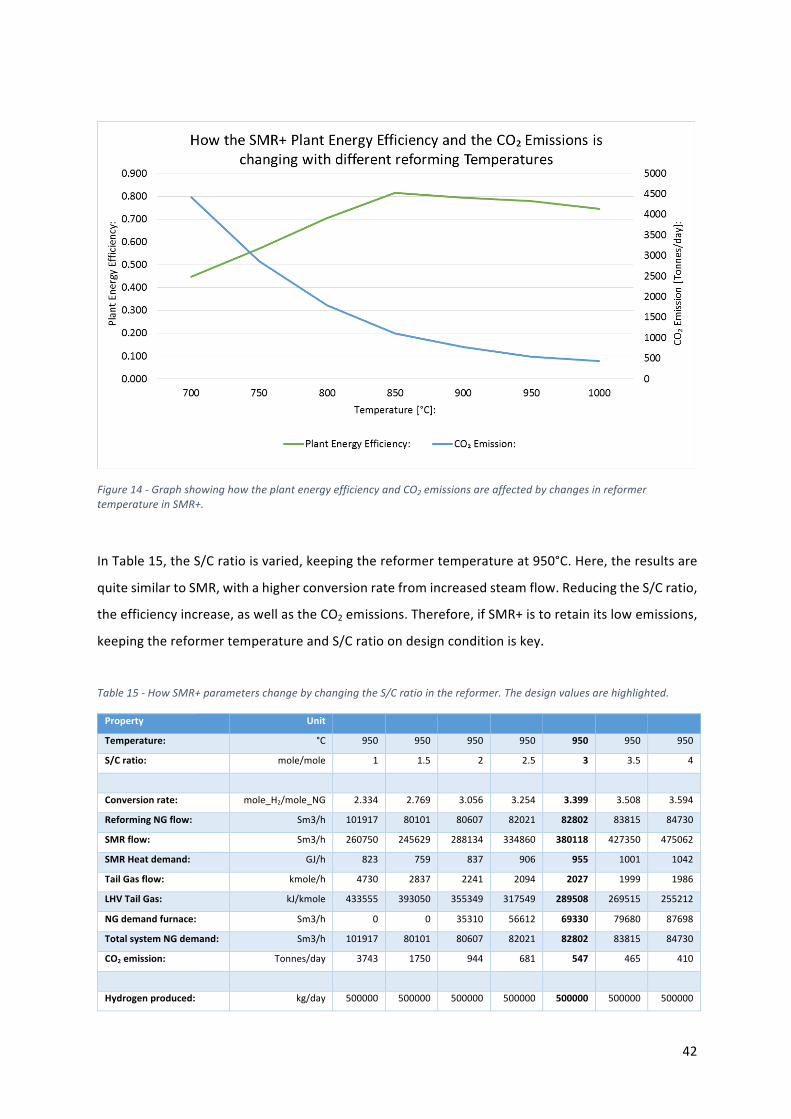
42
Figure14-GraphshowinghowtheplantenergyefficiencyandCO2emissionsareaffectedbychangesinreformertemperatureinSMR+.
InTable15,theS/Cratioisvaried,keepingthereformertemperatureat950°C.Here,theresultsare
quitesimilartoSMR,withahigherconversionratefromincreasedsteamflow.ReducingtheS/Cratio,
theefficiencyincrease,aswellastheCO2emissions.Therefore,ifSMR+istoretainitslowemissions,
keepingthereformertemperatureandS/Cratioondesignconditioniskey.
Table15-HowSMR+parameterschangebychangingtheS/Cratiointhereformer.Thedesignvaluesarehighlighted.
Property Unit
Temperature: °C 950 950 950 950 950 950 950
S/Cratio: mole/mole 1 1.5 2 2.5 3 3.5 4
Conversionrate: mole_H2/mole_NG 2.334 2.769 3.056 3.254 3.399 3.508 3.594
ReformingNGflow: Sm3/h 101917 80101 80607 82021 82802 83815 84730
SMRflow: Sm3/h 260750 245629 288134 334860 380118 427350 475062
SMRHeatdemand: GJ/h 823 759 837 906 955 1001 1042
TailGasflow: kmole/h 4730 2837 2241 2094 2027 1999 1986
LHVTailGas: kJ/kmole 433555 393050 355349 317549 289508 269515 255212
NGdemandfurnace: Sm3/h 0 0 35310 56612 69330 79680 87698
TotalsystemNGdemand: Sm3/h 101917 80101 80607 82021 82802 83815 84730
CO2emission: Tonnes/day 3743 1750 944 681 547 465 410
Hydrogenproduced: kg/day 500000 500000 500000 500000 500000 500000 500000
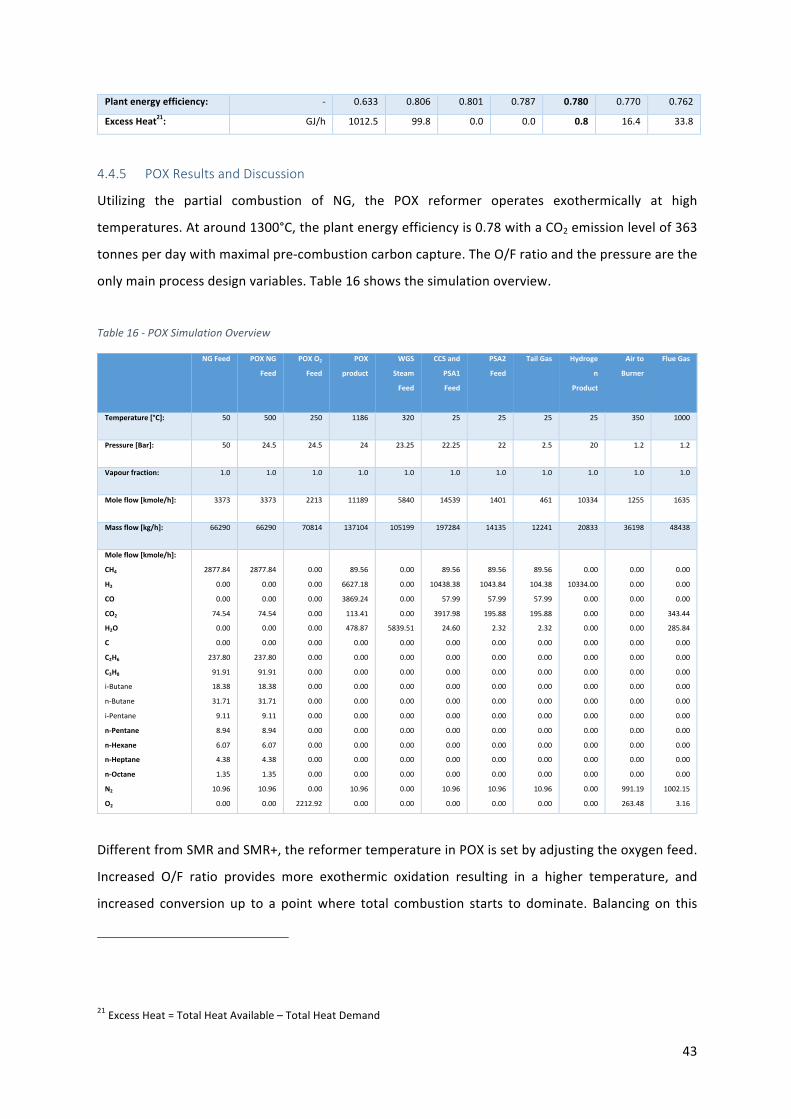
43
Plantenergyefficiency: - 0.633 0.806 0.801 0.787 0.780 0.770 0.762
ExcessHeat21: GJ/h 1012.5 99.8 0.0 0.0 0.8 16.4 33.8
4.4.5 POXResultsandDiscussion
Utilizing the partial combustion of NG, the POX reformer operates exothermically at high
temperatures.Ataround1300°C,theplantenergyefficiencyis0.78withaCO2emissionlevelof363
tonnesperdaywithmaximalpre-combustioncarboncapture.TheO/Fratioandthepressurearethe
onlymainprocessdesignvariables.Table16showsthesimulationoverview.
Table16-POXSimulationOverview
NGFeed POXNG
Feed
POXO2
Feed
POX
product
WGS
Steam
Feed
CCSand
PSA1
Feed
PSA2
Feed
TailGas Hydroge
n
Product
Airto
Burner
FlueGas
Temperature[°C]: 50 500 250 1186 320 25 25 25 25 350 1000
Pressure[Bar]: 50 24.5 24.5 24 23.25 22.25 22 2.5 20 1.2 1.2
Vapourfraction: 1.0 1.0 1.0 1.0 1.0 1.0 1.0 1.0 1.0 1.0 1.0
Moleflow[kmole/h]: 3373 3373 2213 11189 5840 14539 1401 461 10334 1255 1635
Massflow[kg/h]: 66290 66290 70814 137104 105199 197284 14135 12241 20833 36198 48438
Moleflow[kmole/h]:
CH4
H2
CO
CO2
H2O
C
C2H6
C3H8
i-Butane
n-Butane
i-Pentane
n-Pentane
n-Hexane
n-Heptane
n-Octane
N2
O2
2877.84
0.00
0.00
74.54
0.00
0.00
237.80
91.91
18.38
31.71
9.11
8.94
6.07
4.38
1.35
10.96
0.00
2877.84
0.00
0.00
74.54
0.00
0.00
237.80
91.91
18.38
31.71
9.11
8.94
6.07
4.38
1.35
10.96
0.00
0.00
0.00
0.00
0.00
0.00
0.00
0.00
0.00
0.00
0.00
0.00
0.00
0.00
0.00
0.00
0.00
2212.92
89.56
6627.18
3869.24
113.41
478.87
0.00
0.00
0.00
0.00
0.00
0.00
0.00
0.00
0.00
0.00
10.96
0.00
0.00
0.00
0.00
0.00
5839.51
0.00
0.00
0.00
0.00
0.00
0.00
0.00
0.00
0.00
0.00
0.00
0.00
89.56
10438.38
57.99
3917.98
24.60
0.00
0.00
0.00
0.00
0.00
0.00
0.00
0.00
0.00
0.00
10.96
0.00
89.56
1043.84
57.99
195.88
2.32
0.00
0.00
0.00
0.00
0.00
0.00
0.00
0.00
0.00
0.00
10.96
0.00
89.56
104.38
57.99
195.88
2.32
0.00
0.00
0.00
0.00
0.00
0.00
0.00
0.00
0.00
0.00
10.96
0.00
0.00
10334.00
0.00
0.00
0.00
0.00
0.00
0.00
0.00
0.00
0.00
0.00
0.00
0.00
0.00
0.00
0.00
0.00
0.00
0.00
0.00
0.00
0.00
0.00
0.00
0.00
0.00
0.00
0.00
0.00
0.00
0.00
991.19
263.48
0.00
0.00
0.00
343.44
285.84
0.00
0.00
0.00
0.00
0.00
0.00
0.00
0.00
0.00
0.00
1002.15
3.16
DifferentfromSMRandSMR+,thereformertemperatureinPOXissetbyadjustingtheoxygenfeed.
Increased O/F ratio provides more exothermic oxidation resulting in a higher temperature, and
increased conversion up to a pointwhere total combustion starts to dominate. Balancing on this
21ExcessHeat=TotalHeatAvailable–TotalHeatDemand
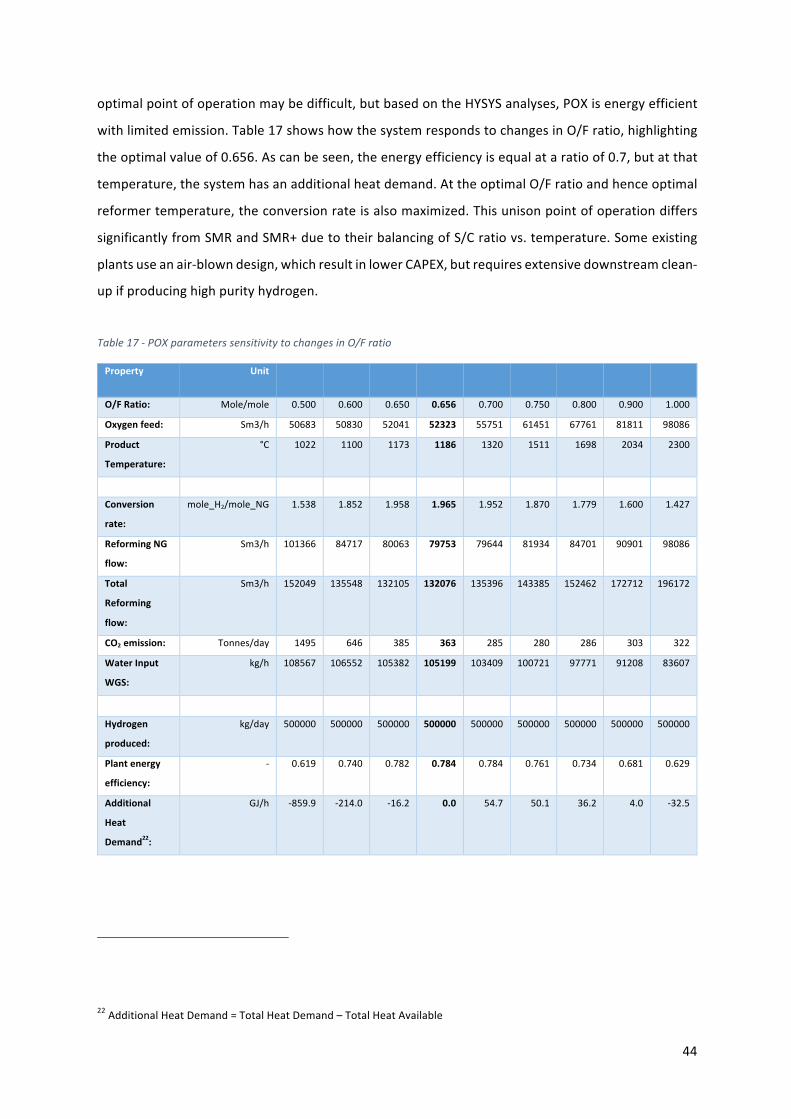
44
optimalpointofoperationmaybedifficult,butbasedontheHYSYSanalyses,POXisenergyefficient
withlimitedemission.Table17showshowthesystemrespondstochangesinO/Fratio,highlighting
theoptimalvalueof0.656.Ascanbeseen,theenergyefficiencyisequalataratioof0.7,butatthat
temperature,thesystemhasanadditionalheatdemand.AttheoptimalO/Fratioandhenceoptimal
reformertemperature,theconversionrateisalsomaximized.Thisunisonpointofoperationdiffers
significantlyfromSMRandSMR+duetotheirbalancingofS/Cratiovs.temperature.Someexisting
plantsuseanair-blowndesign,whichresultinlowerCAPEX,butrequiresextensivedownstreamclean-
upifproducinghighpurityhydrogen.
Table17-POXparameterssensitivitytochangesinO/Fratio
Property Unit
O/FRatio: Mole/mole 0.500 0.600 0.650 0.656 0.700 0.750 0.800 0.900 1.000
Oxygenfeed: Sm3/h 50683 50830 52041 52323 55751 61451 67761 81811 98086
Product
Temperature:
°C 1022 1100 1173 1186 1320 1511 1698 2034 2300
Conversion
rate:
mole_H2/mole_NG 1.538 1.852 1.958 1.965 1.952 1.870 1.779 1.600 1.427
ReformingNG
flow:
Sm3/h 101366 84717 80063 79753 79644 81934 84701 90901 98086
Total
Reforming
flow:
Sm3/h 152049 135548 132105 132076 135396 143385 152462 172712 196172
CO2emission: Tonnes/day 1495 646 385 363 285 280 286 303 322
WaterInput
WGS:
kg/h 108567 106552 105382 105199 103409 100721 97771 91208 83607
Hydrogen
produced:
kg/day 500000 500000 500000 500000 500000 500000 500000 500000 500000
Plantenergy
efficiency:
- 0.619 0.740 0.782 0.784 0.784 0.761 0.734 0.681 0.629
Additional
Heat
Demand22:
GJ/h -859.9 -214.0 -16.2 0.0 54.7 50.1 36.2 4.0 -32.5
22AdditionalHeatDemand=TotalHeatDemand–TotalHeatAvailable
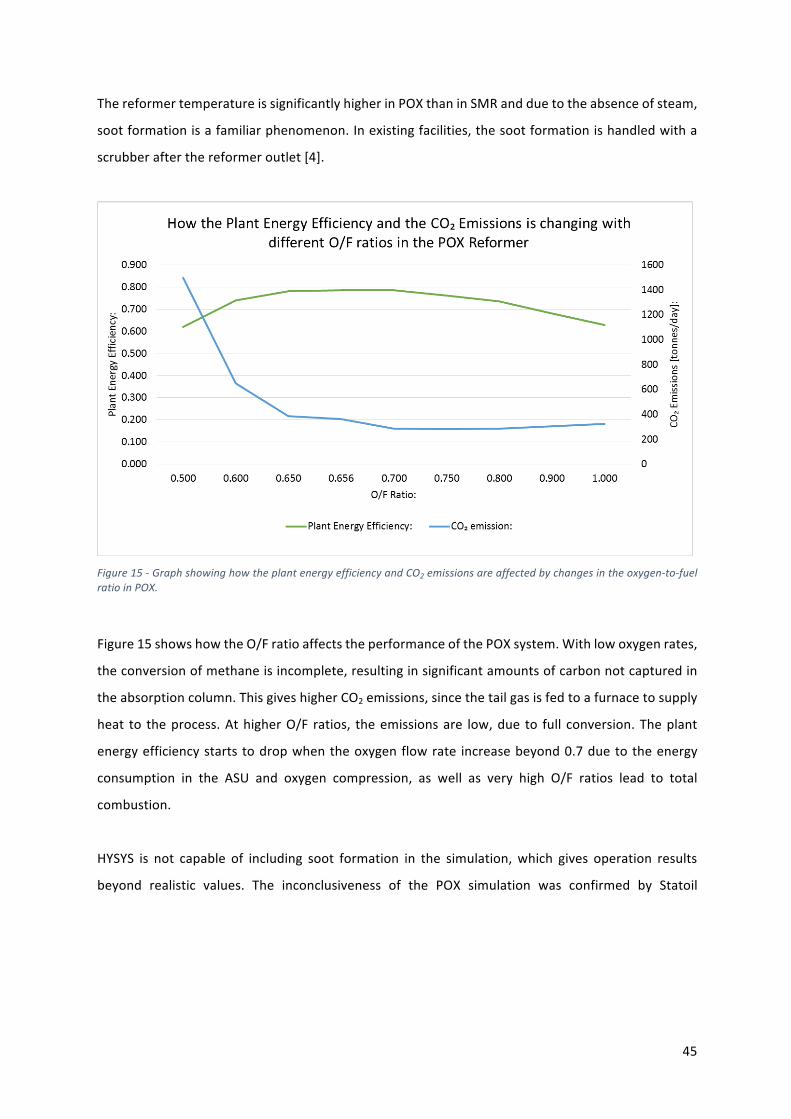
45
ThereformertemperatureissignificantlyhigherinPOXthaninSMRandduetotheabsenceofsteam,
sootformationisafamiliarphenomenon.Inexistingfacilities,thesootformationishandledwitha
scrubberafterthereformeroutlet[4].
Figure15-GraphshowinghowtheplantenergyefficiencyandCO2emissionsareaffectedbychangesintheoxygen-to-fuelratioinPOX.
Figure15showshowtheO/FratioaffectstheperformanceofthePOXsystem.Withlowoxygenrates,
theconversionofmethaneisincomplete,resultinginsignificantamountsofcarbonnotcapturedin
theabsorptioncolumn.ThisgiveshigherCO2emissions,sincethetailgasisfedtoafurnacetosupply
heat to theprocess.AthigherO/F ratios, theemissionsare low,due to full conversion.Theplant
energyefficiencystartstodropwhentheoxygenflowrate increasebeyond0.7duetotheenergy
consumption in the ASU and oxygen compression, as well as very high O/F ratios lead to total
combustion.
HYSYS is not capable of including soot formation in the simulation,which gives operation results
beyond realistic values. The inconclusiveness of the POX simulation was confirmed by Statoil
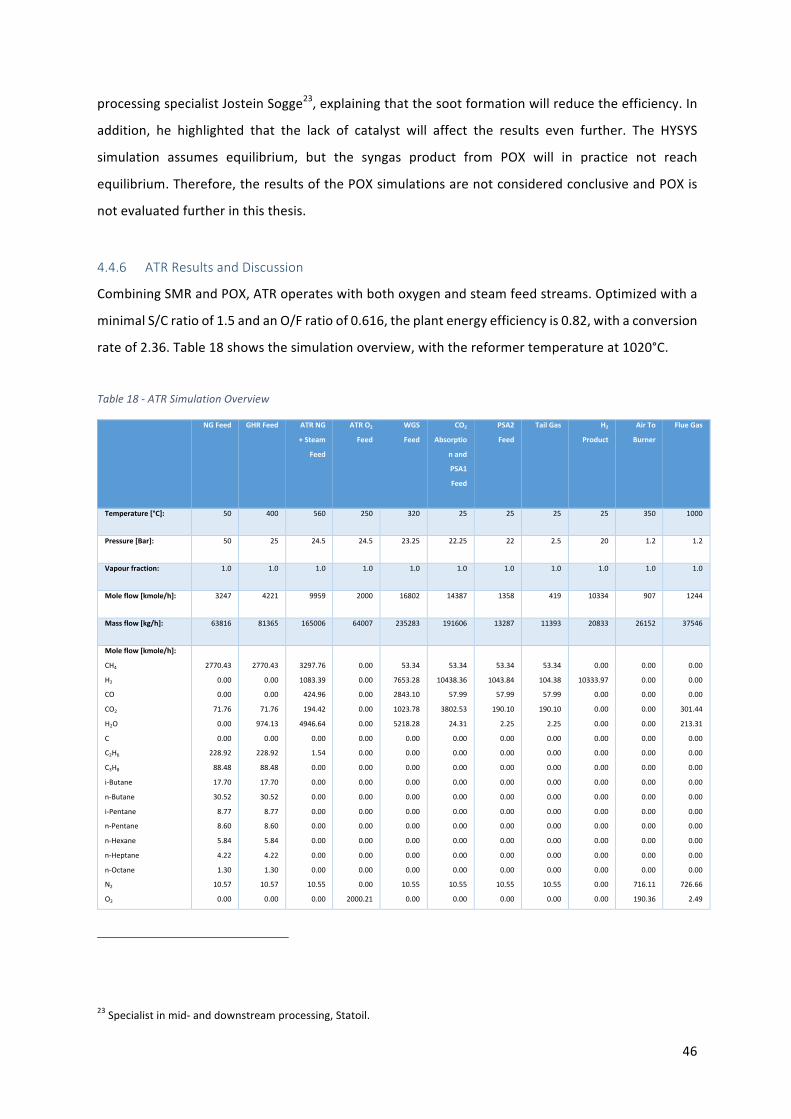
46
processingspecialistJosteinSogge23,explainingthatthesootformationwillreducetheefficiency.In
addition, he highlighted that the lack of catalyst will affect the results even further. The HYSYS
simulation assumes equilibrium, but the syngas product from POX will in practice not reach
equilibrium.Therefore,theresultsofthePOXsimulationsarenotconsideredconclusiveandPOXis
notevaluatedfurtherinthisthesis.
4.4.6 ATRResultsandDiscussion
CombiningSMRandPOX,ATRoperateswithbothoxygenandsteamfeedstreams.Optimizedwitha
minimalS/Cratioof1.5andanO/Fratioof0.616,theplantenergyefficiencyis0.82,withaconversion
rateof2.36.Table18showsthesimulationoverview,withthereformertemperatureat1020°C.
Table18-ATRSimulationOverview
NGFeed GHRFeed ATRNG
+Steam
Feed
ATRO2
Feed
WGS
Feed
CO2
Absorptio
nand
PSA1
Feed
PSA2
Feed
TailGas H2
Product
AirTo
Burner
FlueGas
Temperature[°C]: 50 400 560 250 320 25 25 25 25 350 1000
Pressure[Bar]: 50 25 24.5 24.5 23.25 22.25 22 2.5 20 1.2 1.2
Vapourfraction: 1.0 1.0 1.0 1.0 1.0 1.0 1.0 1.0 1.0 1.0 1.0
Moleflow[kmole/h]: 3247 4221 9959 2000 16802 14387 1358 419 10334 907 1244
Massflow[kg/h]: 63816 81365 165006 64007 235283 191606 13287 11393 20833 26152 37546
Moleflow[kmole/h]:
CH4
H2
CO
CO2
H2O
C
C2H6
C3H8
i-Butane
n-Butane
i-Pentane
n-Pentane
n-Hexane
n-Heptane
n-Octane
N2
O2
2770.43
0.00
0.00
71.76
0.00
0.00
228.92
88.48
17.70
30.52
8.77
8.60
5.84
4.22
1.30
10.57
0.00
2770.43
0.00
0.00
71.76
974.13
0.00
228.92
88.48
17.70
30.52
8.77
8.60
5.84
4.22
1.30
10.57
0.00
3297.76
1083.39
424.96
194.42
4946.64
0.00
1.54
0.00
0.00
0.00
0.00
0.00
0.00
0.00
0.00
10.55
0.00
0.00
0.00
0.00
0.00
0.00
0.00
0.00
0.00
0.00
0.00
0.00
0.00
0.00
0.00
0.00
0.00
2000.21
53.34
7653.28
2843.10
1023.78
5218.28
0.00
0.00
0.00
0.00
0.00
0.00
0.00
0.00
0.00
0.00
10.55
0.00
53.34
10438.36
57.99
3802.53
24.31
0.00
0.00
0.00
0.00
0.00
0.00
0.00
0.00
0.00
0.00
10.55
0.00
53.34
1043.84
57.99
190.10
2.25
0.00
0.00
0.00
0.00
0.00
0.00
0.00
0.00
0.00
0.00
10.55
0.00
53.34
104.38
57.99
190.10
2.25
0.00
0.00
0.00
0.00
0.00
0.00
0.00
0.00
0.00
0.00
10.55
0.00
0.00
10333.97
0.00
0.00
0.00
0.00
0.00
0.00
0.00
0.00
0.00
0.00
0.00
0.00
0.00
0.00
0.00
0.00
0.00
0.00
0.00
0.00
0.00
0.00
0.00
0.00
0.00
0.00
0.00
0.00
0.00
0.00
716.11
190.36
0.00
0.00
0.00
301.44
213.31
0.00
0.00
0.00
0.00
0.00
0.00
0.00
0.00
0.00
0.00
726.66
2.49
23Specialistinmid-anddownstreamprocessing,Statoil.
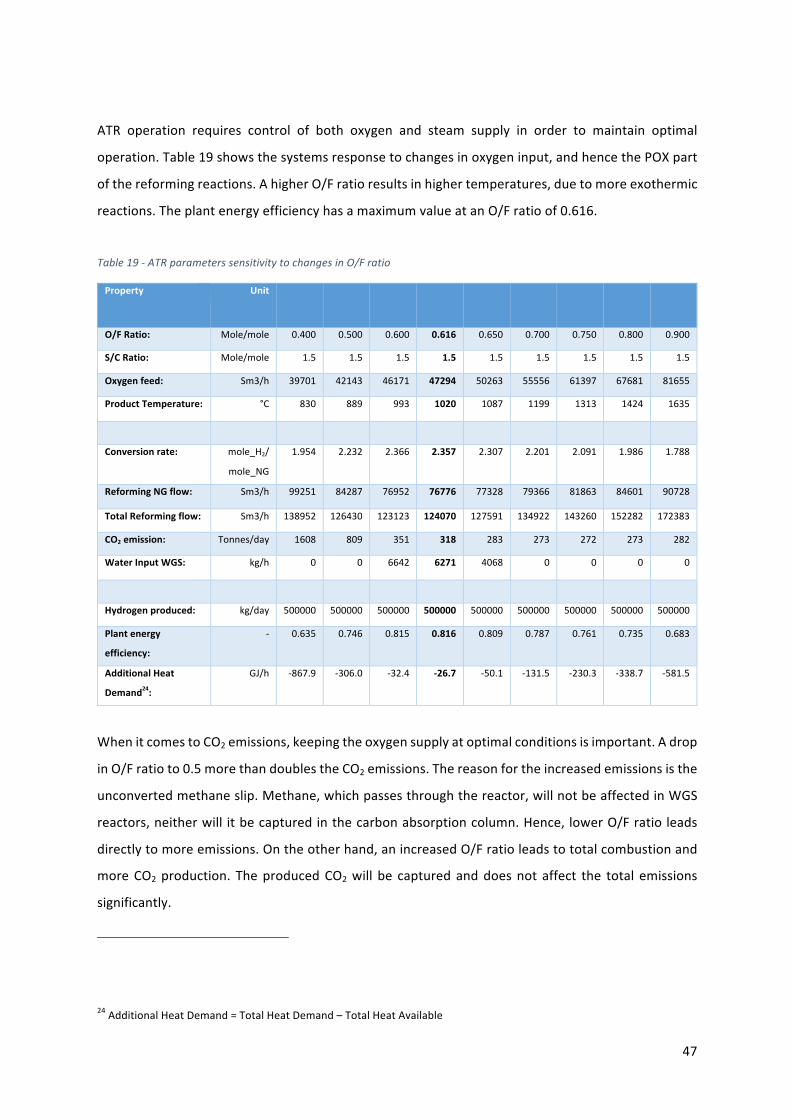
47
ATR operation requires control of both oxygen and steam supply in order to maintain optimal
operation.Table19showsthesystemsresponsetochangesinoxygeninput,andhencethePOXpart
ofthereformingreactions.AhigherO/Fratioresultsinhighertemperatures,duetomoreexothermic
reactions.TheplantenergyefficiencyhasamaximumvalueatanO/Fratioof0.616.
Table19-ATRparameterssensitivitytochangesinO/Fratio
Property Unit
O/FRatio: Mole/mole 0.400 0.500 0.600 0.616 0.650 0.700 0.750 0.800 0.900
S/CRatio: Mole/mole 1.5 1.5 1.5 1.5 1.5 1.5 1.5 1.5 1.5
Oxygenfeed: Sm3/h 39701 42143 46171 47294 50263 55556 61397 67681 81655
ProductTemperature: °C 830 889 993 1020 1087 1199 1313 1424 1635
Conversionrate: mole_H2/
mole_NG
1.954 2.232 2.366 2.357 2.307 2.201 2.091 1.986 1.788
ReformingNGflow: Sm3/h 99251 84287 76952 76776 77328 79366 81863 84601 90728
TotalReformingflow: Sm3/h 138952 126430 123123 124070 127591 134922 143260 152282 172383
CO2emission: Tonnes/day 1608 809 351 318 283 273 272 273 282
WaterInputWGS: kg/h 0 0 6642 6271 4068 0 0 0 0
Hydrogenproduced: kg/day 500000 500000 500000 500000 500000 500000 500000 500000 500000
Plantenergy
efficiency:
- 0.635 0.746 0.815 0.816 0.809 0.787 0.761 0.735 0.683
AdditionalHeat
Demand24:
GJ/h -867.9 -306.0 -32.4 -26.7 -50.1 -131.5 -230.3 -338.7 -581.5
WhenitcomestoCO2emissions,keepingtheoxygensupplyatoptimalconditionsisimportant.Adrop
inO/Fratioto0.5morethandoublestheCO2emissions.Thereasonfortheincreasedemissionsisthe
unconvertedmethaneslip.Methane,whichpassesthroughthereactor,willnotbeaffectedinWGS
reactors,neitherwill itbecapturedinthecarbonabsorptioncolumn.Hence, lowerO/Fratioleads
directlytomoreemissions.Ontheotherhand,anincreasedO/Fratioleadstototalcombustionand
moreCO2production. TheproducedCO2will be capturedanddoesnot affect the total emissions
significantly.
24AdditionalHeatDemand=TotalHeatDemand–TotalHeatAvailable
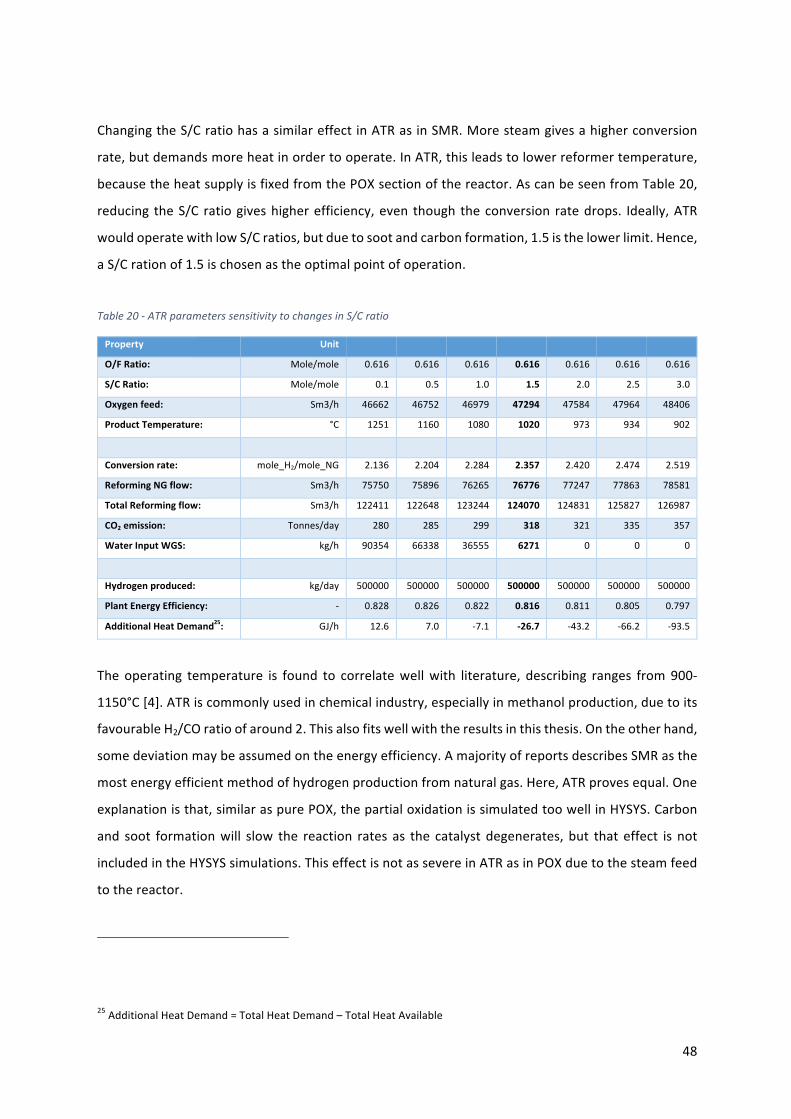
48
ChangingtheS/CratiohasasimilareffectinATRasinSMR.Moresteamgivesahigherconversion
rate,butdemandsmoreheatinordertooperate.InATR,thisleadstolowerreformertemperature,
becausetheheatsupplyisfixedfromthePOXsectionofthereactor.AscanbeseenfromTable20,
reducing theS/C ratiogiveshigherefficiency,even though theconversion ratedrops. Ideally,ATR
wouldoperatewithlowS/Cratios,butduetosootandcarbonformation,1.5isthelowerlimit.Hence,
aS/Crationof1.5ischosenastheoptimalpointofoperation.
Table20-ATRparameterssensitivitytochangesinS/Cratio
Property Unit
O/FRatio: Mole/mole 0.616 0.616 0.616 0.616 0.616 0.616 0.616
S/CRatio: Mole/mole 0.1 0.5 1.0 1.5 2.0 2.5 3.0
Oxygenfeed: Sm3/h 46662 46752 46979 47294 47584 47964 48406
ProductTemperature: °C 1251 1160 1080 1020 973 934 902
Conversionrate: mole_H2/mole_NG 2.136 2.204 2.284 2.357 2.420 2.474 2.519
ReformingNGflow: Sm3/h 75750 75896 76265 76776 77247 77863 78581
TotalReformingflow: Sm3/h 122411 122648 123244 124070 124831 125827 126987
CO2emission: Tonnes/day 280 285 299 318 321 335 357
WaterInputWGS: kg/h 90354 66338 36555 6271 0 0 0
Hydrogenproduced: kg/day 500000 500000 500000 500000 500000 500000 500000
PlantEnergyEfficiency: - 0.828 0.826 0.822 0.816 0.811 0.805 0.797
AdditionalHeatDemand25: GJ/h 12.6 7.0 -7.1 -26.7 -43.2 -66.2 -93.5
The operating temperature is found to correlatewellwith literature, describing ranges from900-
1150°C[4].ATRiscommonlyusedinchemicalindustry,especiallyinmethanolproduction,duetoits
favourableH2/COratioofaround2.Thisalsofitswellwiththeresultsinthisthesis.Ontheotherhand,
somedeviationmaybeassumedontheenergyefficiency.AmajorityofreportsdescribesSMRasthe
mostenergyefficientmethodofhydrogenproductionfromnaturalgas.Here,ATRprovesequal.One
explanationisthat,similaraspurePOX,thepartialoxidationissimulatedtoowellinHYSYS.Carbon
and soot formationwill slow the reaction rates as the catalyst degenerates, but that effect is not
includedintheHYSYSsimulations.ThiseffectisnotassevereinATRasinPOXduetothesteamfeed
tothereactor.
25AdditionalHeatDemand=TotalHeatDemand–TotalHeatAvailable
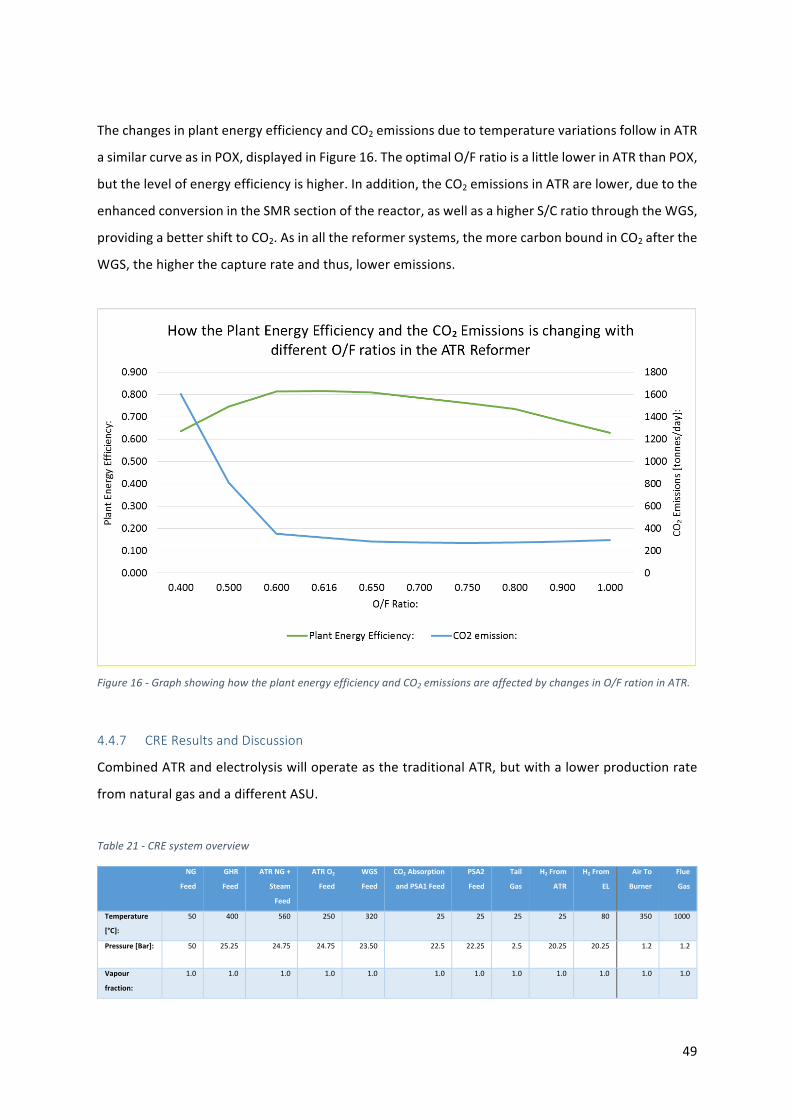
49
ThechangesinplantenergyefficiencyandCO2emissionsduetotemperaturevariationsfollowinATR
asimilarcurveasinPOX,displayedinFigure16.TheoptimalO/FratioisalittlelowerinATRthanPOX,
butthelevelofenergyefficiencyishigher.Inaddition,theCO2emissionsinATRarelower,duetothe
enhancedconversionintheSMRsectionofthereactor,aswellasahigherS/CratiothroughtheWGS,
providingabettershifttoCO2.Asinallthereformersystems,themorecarbonboundinCO2afterthe
WGS,thehigherthecapturerateandthus,loweremissions.
Figure16-GraphshowinghowtheplantenergyefficiencyandCO2emissionsareaffectedbychangesinO/FrationinATR.
4.4.7 CREResultsandDiscussion
CombinedATRandelectrolysiswilloperateasthetraditionalATR,butwithalowerproductionrate
fromnaturalgasandadifferentASU.
Table21-CREsystemoverview
NG
Feed
GHR
Feed
ATRNG+
Steam
Feed
ATRO2
Feed
WGS
Feed
CO2Absorption
andPSA1Feed
PSA2
Feed
Tail
Gas
H2From
ATR
H2From
EL
AirTo
Burner
Flue
Gas
Temperature
[°C]:
50 400 560 250 320 25 25 25 25 80 350 1000
Pressure[Bar]: 50 25.25 24.75 24.75 23.50 22.5 22.25 2.5 20.25 20.25 1.2 1.2
Vapour
fraction:
1.0 1.0 1.0 1.0 1.0 1.0 1.0 1.0 1.0 1.0 1.0 1.0
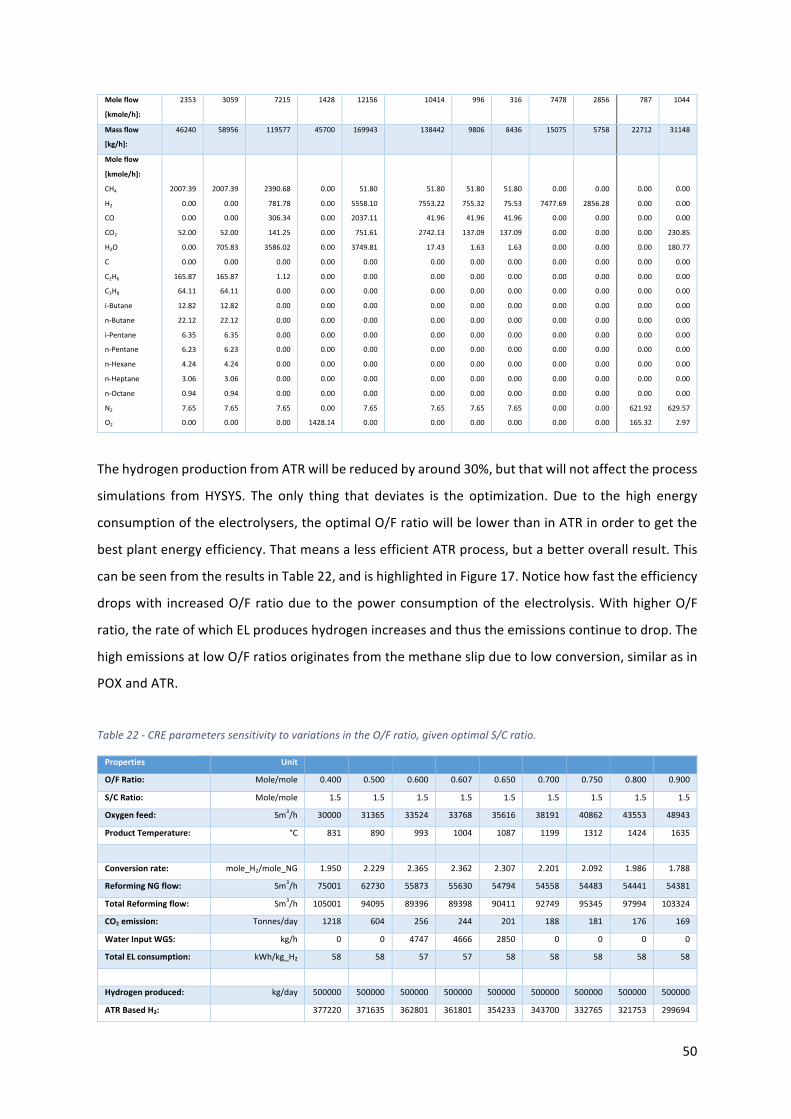
50
Moleflow
[kmole/h]:
2353 3059 7215 1428 12156 10414 996 316 7478 2856 787 1044
Massflow
[kg/h]:
46240 58956 119577 45700 169943 138442 9806 8436 15075 5758 22712 31148
Moleflow
[kmole/h]:
CH4
H2
CO
CO2
H2O
C
C2H6
C3H8
i-Butane
n-Butane
i-Pentane
n-Pentane
n-Hexane
n-Heptane
n-Octane
N2
O2
2007.39
0.00
0.00
52.00
0.00
0.00
165.87
64.11
12.82
22.12
6.35
6.23
4.24
3.06
0.94
7.65
0.00
2007.39
0.00
0.00
52.00
705.83
0.00
165.87
64.11
12.82
22.12
6.35
6.23
4.24
3.06
0.94
7.65
0.00
2390.68
781.78
306.34
141.25
3586.02
0.00
1.12
0.00
0.00
0.00
0.00
0.00
0.00
0.00
0.00
7.65
0.00
0.00
0.00
0.00
0.00
0.00
0.00
0.00
0.00
0.00
0.00
0.00
0.00
0.00
0.00
0.00
0.00
1428.14
51.80
5558.10
2037.11
751.61
3749.81
0.00
0.00
0.00
0.00
0.00
0.00
0.00
0.00
0.00
0.00
7.65
0.00
51.80
7553.22
41.96
2742.13
17.43
0.00
0.00
0.00
0.00
0.00
0.00
0.00
0.00
0.00
0.00
7.65
0.00
51.80
755.32
41.96
137.09
1.63
0.00
0.00
0.00
0.00
0.00
0.00
0.00
0.00
0.00
0.00
7.65
0.00
51.80
75.53
41.96
137.09
1.63
0.00
0.00
0.00
0.00
0.00
0.00
0.00
0.00
0.00
0.00
7.65
0.00
0.00
7477.69
0.00
0.00
0.00
0.00
0.00
0.00
0.00
0.00
0.00
0.00
0.00
0.00
0.00
0.00
0.00
0.00
2856.28
0.00
0.00
0.00
0.00
0.00
0.00
0.00
0.00
0.00
0.00
0.00
0.00
0.00
0.00
0.00
0.00
0.00
0.00
0.00
0.00
0.00
0.00
0.00
0.00
0.00
0.00
0.00
0.00
0.00
0.00
621.92
165.32
0.00
0.00
0.00
230.85
180.77
0.00
0.00
0.00
0.00
0.00
0.00
0.00
0.00
0.00
0.00
629.57
2.97
ThehydrogenproductionfromATRwillbereducedbyaround30%,butthatwillnotaffecttheprocess
simulations fromHYSYS. The only thing that deviates is the optimization. Due to the high energy
consumptionoftheelectrolysers,theoptimalO/FratiowillbelowerthaninATRinordertogetthe
bestplantenergyefficiency.ThatmeansalessefficientATRprocess,butabetteroverallresult.This
canbeseenfromtheresultsinTable22,andishighlightedinFigure17.Noticehowfasttheefficiency
dropswith increasedO/Fratioduetothepowerconsumptionof theelectrolysis.WithhigherO/F
ratio,therateofwhichELproduceshydrogenincreasesandthustheemissionscontinuetodrop.The
highemissionsatlowO/Fratiosoriginatesfromthemethaneslipduetolowconversion,similarasin
POXandATR.
Table22-CREparameterssensitivitytovariationsintheO/Fratio,givenoptimalS/Cratio.
Properties Unit
O/FRatio: Mole/mole 0.400 0.500 0.600 0.607 0.650 0.700 0.750 0.800 0.900
S/CRatio: Mole/mole 1.5 1.5 1.5 1.5 1.5 1.5 1.5 1.5 1.5
Oxygenfeed: Sm3/h 30000 31365 33524 33768 35616 38191 40862 43553 48943
ProductTemperature: °C 831 890 993 1004 1087 1199 1312 1424 1635
Conversionrate: mole_H2/mole_NG 1.950 2.229 2.365 2.362 2.307 2.201 2.092 1.986 1.788
ReformingNGflow: Sm3/h 75001 62730 55873 55630 54794 54558 54483 54441 54381
TotalReformingflow: Sm3/h 105001 94095 89396 89398 90411 92749 95345 97994 103324
CO2emission: Tonnes/day 1218 604 256 244 201 188 181 176 169
WaterInputWGS: kg/h 0 0 4747 4666 2850 0 0 0 0
TotalELconsumption: kWh/kg_H₂ 58 58 57 57 58 58 58 58 58
Hydrogenproduced: kg/day 500000 500000 500000 500000 500000 500000 500000 500000 500000
ATRBasedH₂: 377220 371635 362801 361801 354233 343700 332765 321753 299694
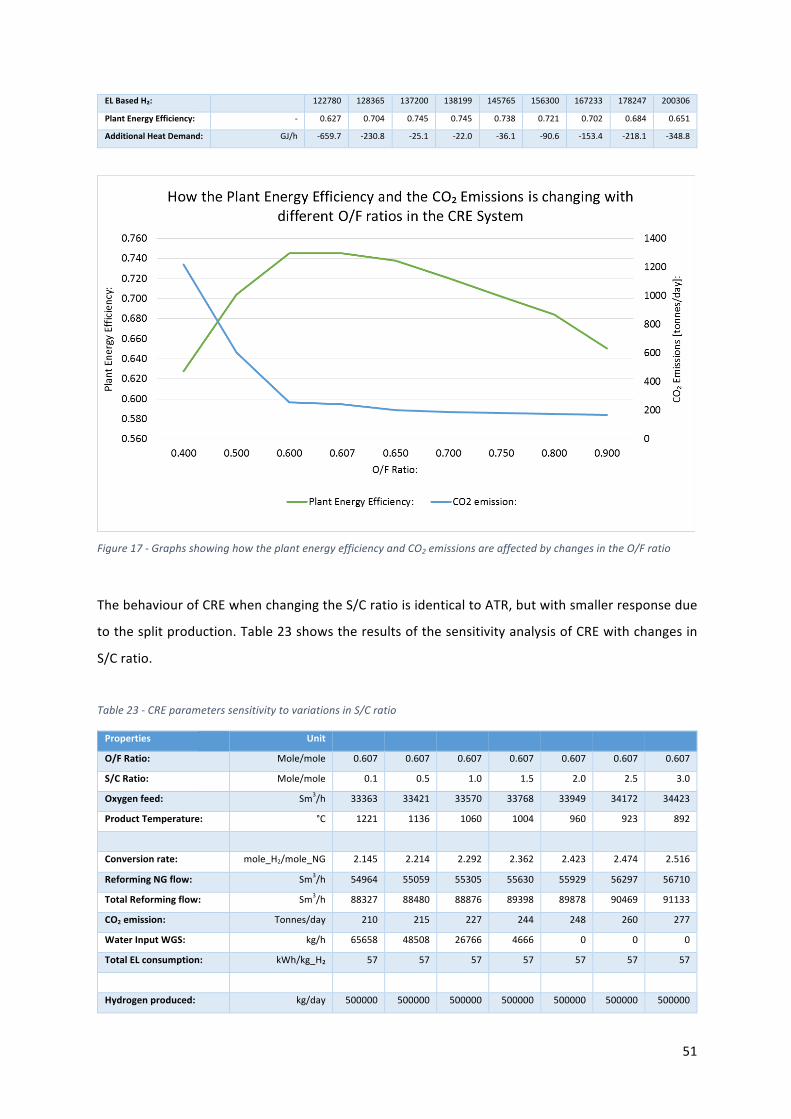
51
ELBasedH₂: 122780 128365 137200 138199 145765 156300 167233 178247 200306
PlantEnergyEfficiency: - 0.627 0.704 0.745 0.745 0.738 0.721 0.702 0.684 0.651
AdditionalHeatDemand: GJ/h -659.7 -230.8 -25.1 -22.0 -36.1 -90.6 -153.4 -218.1 -348.8
Figure17-GraphsshowinghowtheplantenergyefficiencyandCO2emissionsareaffectedbychangesintheO/Fratio
ThebehaviourofCREwhenchangingtheS/CratioisidenticaltoATR,butwithsmallerresponsedue
tothesplitproduction.Table23showstheresultsofthesensitivityanalysisofCREwithchangesin
S/Cratio.
Table23-CREparameterssensitivitytovariationsinS/Cratio
Properties Unit
O/FRatio: Mole/mole 0.607 0.607 0.607 0.607 0.607 0.607 0.607
S/CRatio: Mole/mole 0.1 0.5 1.0 1.5 2.0 2.5 3.0
Oxygenfeed: Sm3/h 33363 33421 33570 33768 33949 34172 34423
ProductTemperature: °C 1221 1136 1060 1004 960 923 892
Conversionrate: mole_H2/mole_NG 2.145 2.214 2.292 2.362 2.423 2.474 2.516
ReformingNGflow: Sm3/h 54964 55059 55305 55630 55929 56297 56710
TotalReformingflow: Sm3/h 88327 88480 88876 89398 89878 90469 91133
CO2emission: Tonnes/day 210 215 227 244 248 260 277
WaterInputWGS: kg/h 65658 48508 26766 4666 0 0 0
TotalELconsumption: kWh/kg_H₂ 57 57 57 57 57 57 57
Hydrogenproduced: kg/day 500000 500000 500000 500000 500000 500000 500000
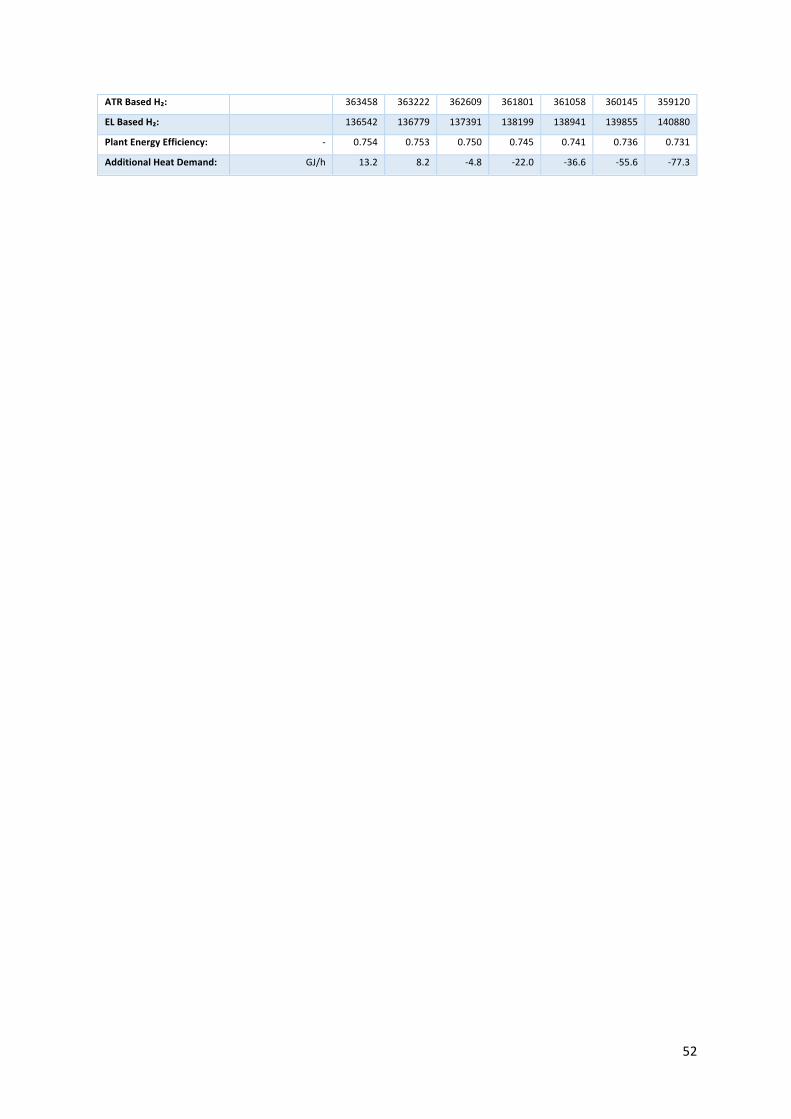
52
ATRBasedH₂: 363458 363222 362609 361801 361058 360145 359120
ELBasedH₂: 136542 136779 137391 138199 138941 139855 140880
PlantEnergyEfficiency: - 0.754 0.753 0.750 0.745 0.741 0.736 0.731
AdditionalHeatDemand: GJ/h 13.2 8.2 -4.8 -22.0 -36.6 -55.6 -77.3

53
5 FinancialAnalysisofLarge-scaleHydrogenProduction
Inorder to evaluate the systemsdefined inChapter 4 to assist a potential investmentdecision, a
financialanalysisisnecessary.Improvedthermodynamicefficiencyandoperationisoftenrelatedto
increased investment cost and higher operation expenditures. There are few journals or reports
comparing the cost of various hydrogen productionmethods to this level. Therefore, a variety of
different sourceshasprovided the informationneeded to compose thisoverview.Theaimof this
chapteristoestablishabenchmarkproductioncostofcarbon-leanhydrogen.Byperformingacost
analysis,theCAPEXandOPEXofeachsystemwillbedecomposedinordertohighlightdifferencesin
how the individual designs affect the overall viability. A sensitivity analysiswill highlight how the
individualsystemsareaffectedbyvariationsinfeedstockcost,financialmarketsituationsandfacility
design.Finally,thechapterwillconcludewithadiscussionofwhichsystemisbestsuitedforlarge-
scaleoperationinNorway.AllfinancialandtechnicalinputsusedinthisanalysisarelistedinAppendix
A.
Due to the technical analysis and limited information on investment cost and operational
expenditures,POXisnotincludedinthefinancialanalysis.
5.1 FinancialRisk
Ifalarge-scaleproductionplantistobebuilt,thebusinesscasecarriesconsiderablerisk,seenfroma
2016perspective.Significantuncertaintiesarerelatedtothemarketdevelopmentofinfrastructure
and political incentives for a greener transportation sector and CO2 emission reductions in the
industry.Becauseofadiversemarket,withopportunitieswithintransportationandindustry,therisk
ofsubstitutetechnologysuchasimprovedbatteriesorbiofuel,isreduced.Economiesofscalerelated
tothefuelcellindustryisimportantinorderforthatmarketsegmenttoreachadequatelevels.The
natural gas reforming technology itself ismature,with several facilitiesexisting today. Theoverall
performance risk could be greatly reduced by running a small-scale demo project prior to the
investmentdecision.
5.1.1 DiscountRate
Theprojectdiscountratehasbeensetto10%fortheinvestmentscenariosinthisthesis.Thediscount
rate is both describing the time value of money and the risk premium attached to this specific
investment. The risk free returnon capital is estimatedby theaverage long-term interest rateon
Norwegiangovernmentbondsof1.57%in2015[32].Thecostofcapitalofgreenenergyprojectsin
Europewasapproximately6%in2015[33,17].Thisimpliesariskpremiumofaround4.5%.Because
54
ofalarge-scalehydrogenexportprojecttoanuncertainmarketholdssignificantlyhigherrisk,therisk
premiumisclosetodoubled,resultinginadiscountrateof10%.Tofurtherjustifytherate,feed-in-
tariffsorothersubsidiesarenot includedintherevenuestream,eventhoughit isvery likelyfora
projectsimilartothatdescribedinthisthesistoreceivesubstantialsupport.Especiallyconsideringthe
combinationofCO2emissionreductionsandtechnologydevelopment.
As a comment, the discount rate chosen for this analysis does not necessarily reflect the actual
requireddiscountratepriortotheinvestmentdecisionatalaterstage.
5.2 WhatIsthePriceTargetofCarbon-leanHydrogenProducedinNorway?
AsthisthesisaimtoprovideabenchmarkforthecostofproducinghydrogeninNorway,animportant
question arises: At what level must the breakeven price of hydrogen be in order to be cost
competitive?
Duringtheprojectworkdoneinthefallof2015,acompetitiveanalysisontheproductionofhydrogen
inGermanyandUKwasconductedinordertoprovideatargetfortheproductionandexportcost.It
wasestimatedthatthecostsofliquefaction,storageandtransportationwouldbeintherangefrom
0.9€/kgH2ofhydrogenproducedto1.9€/kgH2in2030[20].Themarketanalysisdoneinthesame
studyconcludedthatamarginalcosttomarketofbetween2-4€/kgH2iswhatcanbeexpectedof
domestic production of hydrogen in UK and Germany, including traditional hydrogen production
withoutCCS[20].Hence,basedontheconservativeliquefaction,storageandtransportationcosts,a
productionpricebelow2.1€/kgH2isnecessaryinordertobecompetitiveinalarge-scaleEuropean
exportscenario.Onecanseefromtheestimations,thatinascenariowheredomesticproductionin
UKorGermanyis2€/kgH2andtransportationcostsarehigh,exporttothosemarketswillnotbea
viablebusinesscase.
TheJapanesegovernmenthasreleasedanimporttargetpriceofimportedhydrogenof30yen/Nm3
whichequals2.7€/kgH226[22].IfexportedtoJapan,thetransportcostwillincreasebysomefactor,
but this only accounts for a small part of the total cost.Hence, given a conservative liquefaction,
storageandtransportationcost,export to Japandoesnotseemviable in the future.Ontheother
261€=123.7Yen,Exchangerateof30.05.2016
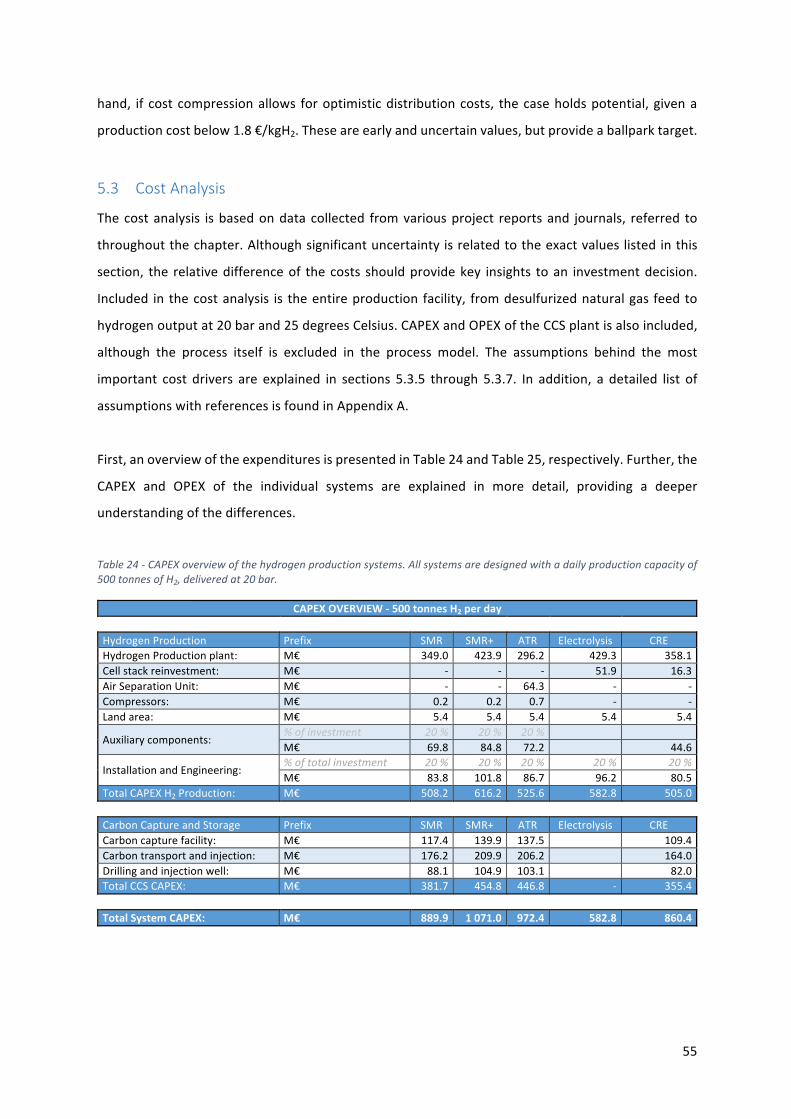
55
hand, if costcompressionallows foroptimisticdistributioncosts, thecaseholdspotential,givena
productioncostbelow1.8€/kgH2.Theseareearlyanduncertainvalues,butprovideaballparktarget.
5.3 CostAnalysis
Thecostanalysis isbasedondatacollected fromvariousproject reportsand journals, referred to
throughoutthechapter.Althoughsignificantuncertaintyisrelatedtotheexactvalueslistedinthis
section, the relativedifferenceof thecosts shouldprovidekey insights toan investmentdecision.
Included in thecostanalysis is theentireproduction facility, fromdesulfurizednaturalgasfeedto
hydrogenoutputat20barand25degreesCelsius.CAPEXandOPEXoftheCCSplantisalsoincluded,
although the process itself is excluded in the process model. The assumptions behind the most
important cost drivers are explained in sections 5.3.5 through 5.3.7. In addition, a detailed list of
assumptionswithreferencesisfoundinAppendixA.
First,anoverviewoftheexpendituresispresentedinTable24andTable25,respectively.Further,the
CAPEX and OPEX of the individual systems are explained in more detail, providing a deeper
understandingofthedifferences.
Table24-CAPEXoverviewofthehydrogenproductionsystems.Allsystemsaredesignedwithadailyproductioncapacityof500tonnesofH2,deliveredat20bar.
CAPEXOVERVIEW-500tonnesH2perday HydrogenProduction Prefix SMR SMR+ ATR Electrolysis CREHydrogenProductionplant: M€ 349.0 423.9 296.2 429.3 358.1Cellstackreinvestment: M€ - - - 51.9 16.3AirSeparationUnit: M€ - - 64.3 - -Compressors: M€ 0.2 0.2 0.7 - -Landarea: M€ 5.4 5.4 5.4 5.4 5.4
Auxiliarycomponents:%ofinvestment 20% 20% 20% M€ 69.8 84.8 72.2 44.6
InstallationandEngineering:%oftotalinvestment 20% 20% 20% 20% 20%M€ 83.8 101.8 86.7 96.2 80.5
TotalCAPEXH2Production: M€ 508.2 616.2 525.6 582.8 505.0 CarbonCaptureandStorage Prefix SMR SMR+ ATR Electrolysis CRECarboncapturefacility: M€ 117.4 139.9 137.5 109.4Carbontransportandinjection: M€ 176.2 209.9 206.2 164.0Drillingandinjectionwell: M€ 88.1 104.9 103.1 82.0TotalCCSCAPEX: M€ 381.7 454.8 446.8 - 355.4 TotalSystemCAPEX: M€ 889.9 1071.0 972.4 582.8 860.4
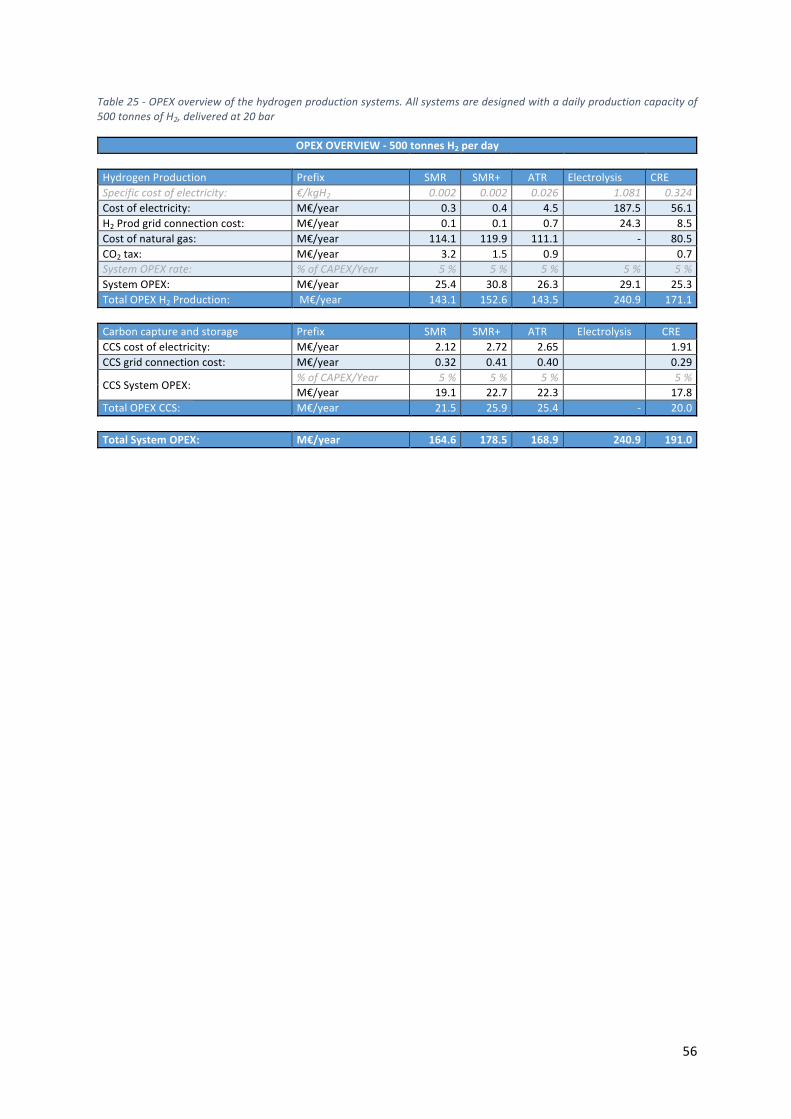
56
Table25-OPEXoverviewofthehydrogenproductionsystems.Allsystemsaredesignedwithadailyproductioncapacityof500tonnesofH2,deliveredat20bar
OPEXOVERVIEW-500tonnesH2perday HydrogenProduction Prefix SMR SMR+ ATR Electrolysis CRESpecificcostofelectricity: €/kgH2 0.002 0.002 0.026 1.081 0.324Costofelectricity: M€/year 0.3 0.4 4.5 187.5 56.1H2Prodgridconnectioncost: M€/year 0.1 0.1 0.7 24.3 8.5Costofnaturalgas: M€/year 114.1 119.9 111.1 - 80.5CO2tax: M€/year 3.2 1.5 0.9 0.7SystemOPEXrate: %ofCAPEX/Year 5% 5% 5% 5% 5%SystemOPEX: M€/year 25.4 30.8 26.3 29.1 25.3TotalOPEXH2Production: M€/year 143.1 152.6 143.5 240.9 171.1 Carboncaptureandstorage Prefix SMR SMR+ ATR Electrolysis CRECCScostofelectricity: M€/year 2.12 2.72 2.65 1.91CCSgridconnectioncost: M€/year 0.32 0.41 0.40 0.29
CCSSystemOPEX:%ofCAPEX/Year 5% 5% 5% 5%M€/year 19.1 22.7 22.3 17.8
TotalOPEXCCS: M€/year 21.5 25.9 25.4 - 20.0 TotalSystemOPEX: M€/year 164.6 178.5 168.9 240.9 191.0
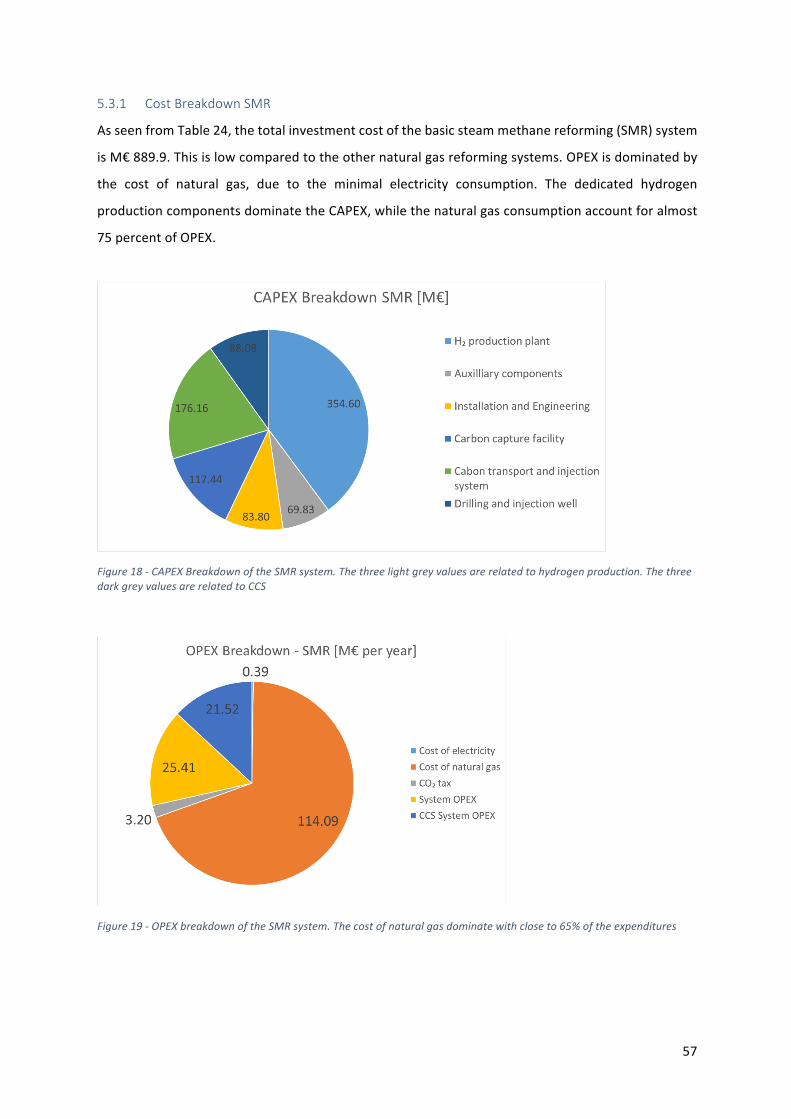
57
5.3.1 CostBreakdownSMR
AsseenfromTable24,thetotalinvestmentcostofthebasicsteammethanereforming(SMR)system
isM€889.9.Thisislowcomparedtotheothernaturalgasreformingsystems.OPEXisdominatedby
the cost of natural gas, due to the minimal electricity consumption. The dedicated hydrogen
productioncomponentsdominatetheCAPEX,whilethenaturalgasconsumptionaccountforalmost
75percentofOPEX.
Figure18-CAPEXBreakdownoftheSMRsystem.Thethreelightgreyvaluesarerelatedtohydrogenproduction.ThethreedarkgreyvaluesarerelatedtoCCS
Figure19-OPEXbreakdownoftheSMRsystem.Thecostofnaturalgasdominatewithcloseto65%oftheexpenditures
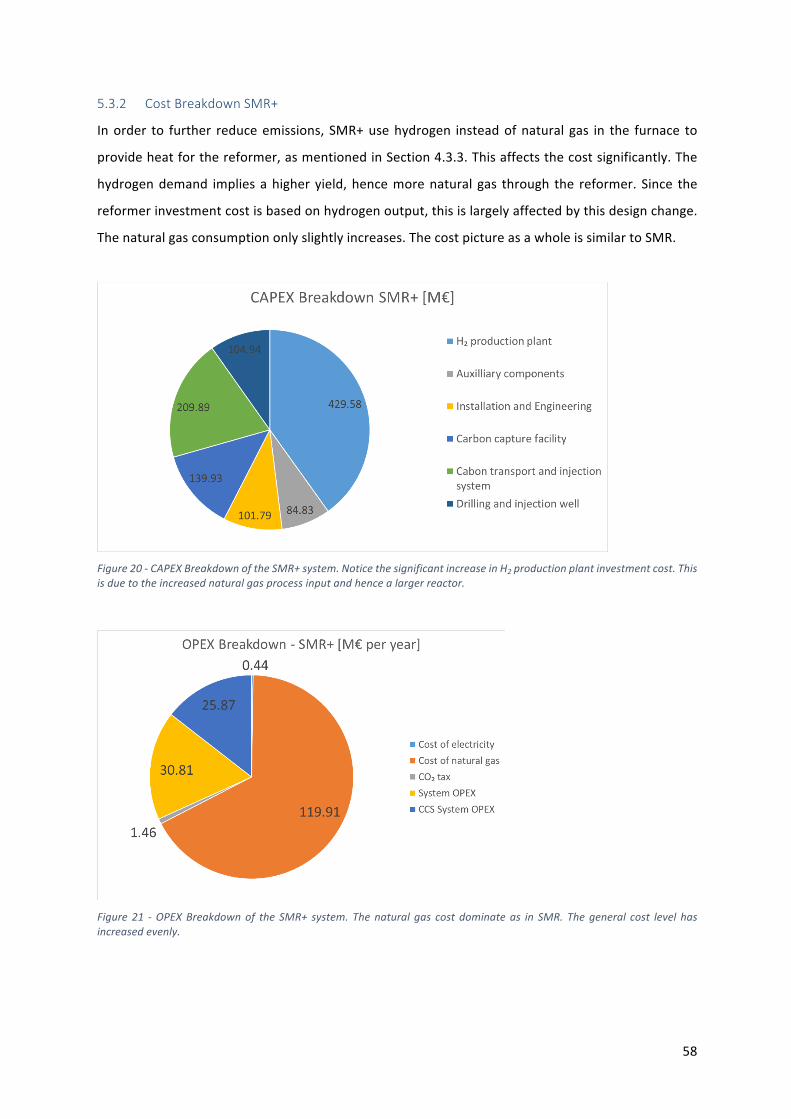
58
5.3.2 CostBreakdownSMR+
Inorder to further reduceemissions, SMR+usehydrogen insteadofnatural gas in the furnace to
provideheatforthereformer,asmentionedinSection4.3.3.Thisaffectsthecostsignificantly.The
hydrogendemand impliesahigher yield,hencemorenatural gas through the reformer. Since the
reformerinvestmentcostisbasedonhydrogenoutput,thisislargelyaffectedbythisdesignchange.
Thenaturalgasconsumptiononlyslightlyincreases.ThecostpictureasawholeissimilartoSMR.
Figure20-CAPEXBreakdownoftheSMR+system.NoticethesignificantincreaseinH2productionplantinvestmentcost.Thisisduetotheincreasednaturalgasprocessinputandhencealargerreactor.
Figure 21 -OPEXBreakdownof the SMR+ system. Thenatural gas cost dominateas in SMR. Thegeneral cost level hasincreasedevenly.
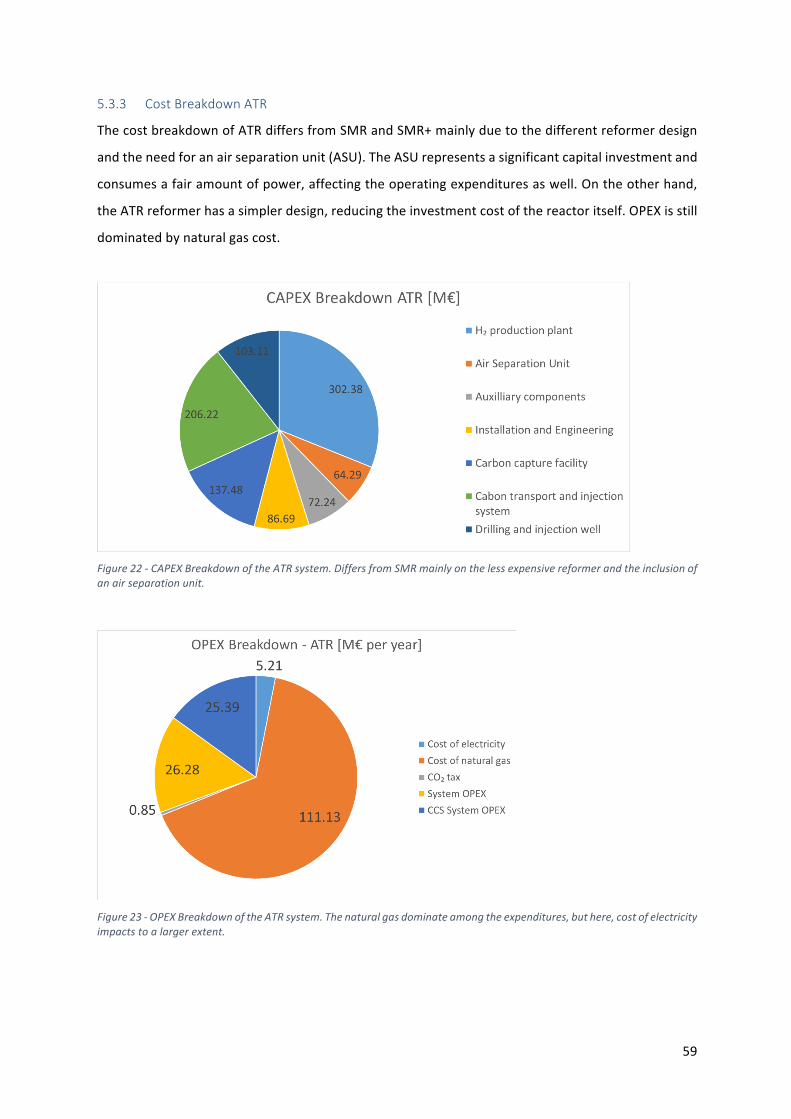
59
5.3.3 CostBreakdownATR
ThecostbreakdownofATRdiffersfromSMRandSMR+mainlyduetothedifferentreformerdesign
andtheneedforanairseparationunit(ASU).TheASUrepresentsasignificantcapitalinvestmentand
consumesafairamountofpower,affectingtheoperatingexpendituresaswell.Ontheotherhand,
theATRreformerhasasimplerdesign,reducingtheinvestmentcostofthereactoritself.OPEXisstill
dominatedbynaturalgascost.
Figure22-CAPEXBreakdownoftheATRsystem.DiffersfromSMRmainlyonthelessexpensivereformerandtheinclusionofanairseparationunit.
Figure23-OPEXBreakdownoftheATRsystem.Thenaturalgasdominateamongtheexpenditures,buthere,costofelectricityimpactstoalargerextent.
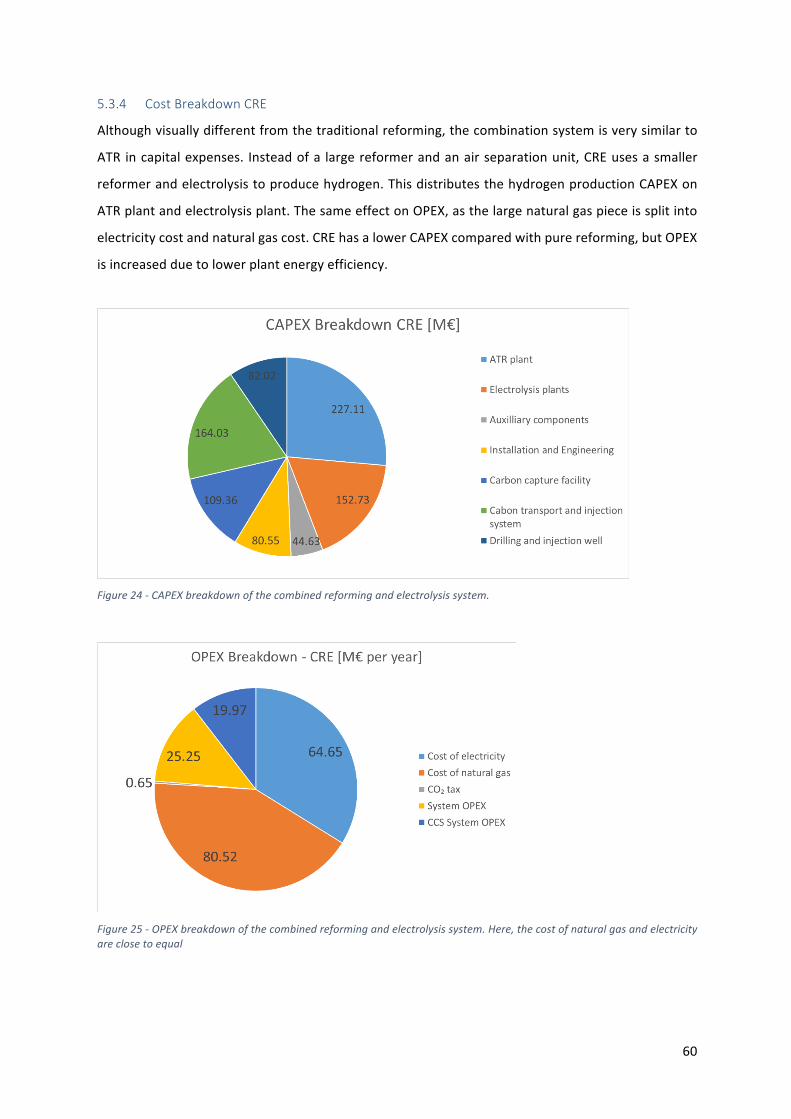
60
5.3.4 CostBreakdownCRE
Althoughvisuallydifferentfromthetraditionalreforming,thecombinationsystemisverysimilarto
ATR incapitalexpenses. Insteadofa largereformerandanairseparationunit,CREusesasmaller
reformerandelectrolysistoproducehydrogen.ThisdistributesthehydrogenproductionCAPEXon
ATRplantandelectrolysisplant.ThesameeffectonOPEX,asthelargenaturalgaspieceissplitinto
electricitycostandnaturalgascost.CREhasalowerCAPEXcomparedwithpurereforming,butOPEX
isincreasedduetolowerplantenergyefficiency.
Figure24-CAPEXbreakdownofthecombinedreformingandelectrolysissystem.
Figure25-OPEXbreakdownofthecombinedreformingandelectrolysissystem.Here,thecostofnaturalgasandelectricityareclosetoequal
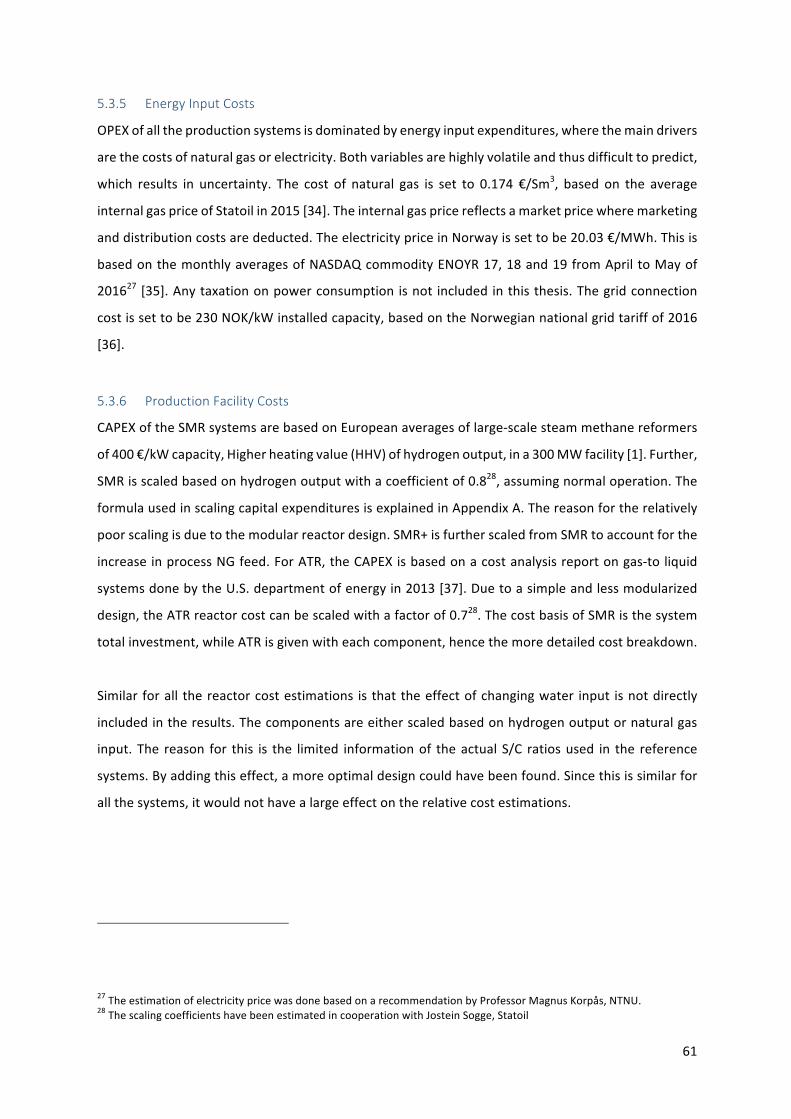
61
5.3.5 EnergyInputCosts
OPEXofalltheproductionsystemsisdominatedbyenergyinputexpenditures,wherethemaindrivers
arethecostsofnaturalgasorelectricity.Bothvariablesarehighlyvolatileandthusdifficulttopredict,
which results in uncertainty. The cost of natural gas is set to 0.174 €/Sm3, based on the average
internalgaspriceofStatoilin2015[34].Theinternalgaspricereflectsamarketpricewheremarketing
anddistributioncostsarededucted.TheelectricitypriceinNorwayissettobe20.03€/MWh.Thisis
basedonthemonthlyaveragesofNASDAQcommodityENOYR17,18and19fromApriltoMayof
201627[35].Anytaxationonpowerconsumptionisnot includedinthisthesis.Thegridconnection
costissettobe230NOK/kWinstalledcapacity,basedontheNorwegiannationalgridtariffof2016
[36].
5.3.6 ProductionFacilityCosts
CAPEXoftheSMRsystemsarebasedonEuropeanaveragesoflarge-scalesteammethanereformers
of400€/kWcapacity,Higherheatingvalue(HHV)ofhydrogenoutput,ina300MWfacility[1].Further,
SMRisscaledbasedonhydrogenoutputwithacoefficientof0.828,assumingnormaloperation.The
formulausedinscalingcapitalexpendituresisexplainedinAppendixA.Thereasonfortherelatively
poorscalingisduetothemodularreactordesign.SMR+isfurtherscaledfromSMRtoaccountforthe
increaseinprocessNGfeed.ForATR,theCAPEXisbasedonacostanalysisreportongas-toliquid
systemsdonebytheU.S.departmentofenergyin2013[37].Duetoasimpleandlessmodularized
design,theATRreactorcostcanbescaledwithafactorof0.728.ThecostbasisofSMRisthesystem
totalinvestment,whileATRisgivenwitheachcomponent,hencethemoredetailedcostbreakdown.
Similar forall thereactorcostestimations is thattheeffectofchangingwater input isnotdirectly
includedintheresults.Thecomponentsareeitherscaledbasedonhydrogenoutputornaturalgas
input.The reason for this is the limited informationof theactual S/C ratiosused in the reference
systems.Byaddingthiseffect,amoreoptimaldesigncouldhavebeenfound.Sincethisissimilarfor
allthesystems,itwouldnothavealargeeffectontherelativecostestimations.
27TheestimationofelectricitypricewasdonebasedonarecommendationbyProfessorMagnusKorpås,NTNU.28ThescalingcoefficientshavebeenestimatedincooperationwithJosteinSogge,Statoil
62
ThecostoftheelectrolysisplantisbasedontheavailabledatafromNEL-Hydrogen,600€/kWinstalled
capacityofa50MWplantproducing26tonnesperdayat15bar[38].Becauseofstrictmodularity,
theelectrolysisplantisscaledbyafactorof0.9.
Similarforallreformingsystemsisanadditional20percentaddedtocoverauxiliarycomponentse.g.
watersystems,heatintegrationandpowersystem.Thisisnotincludedintheelectrolysersystem,due
to the overall cost used in the thesis is listed as a total plant investment cost. Installation and
engineering costs account for an additional 20% of system CAPEX. OPEX related to the hydrogen
productionotherthanNGandelectricityisastandard5%ofCAPEX.
5.3.7 CarbonCaptureandStorageCosts
CCSisaprerequisiteforthesuccessoffossil-basedhydrogenproduction.Thetechnologyisusedin
the Norwegian oil and gas sector already, storing extracted CO2 from reservoir gas. The cost
estimations are based on approximate investment costs of the CCS system at Hammerfest LNG,
providedbyProfessor II and Statoil researcher JosteinPettersen.At the gas field “Snøhvit” in the
BarentsSeaaround700000tonnesofCO2 iscapturedandsequestratedannually.TheCCS-system
consists of a separating unit followed by a compression stage. CO2 is then transferred through a
pipelinetoasubseainjectionunit.Allthecomponentsareincludedinthecostanalysis,includingthe
investmentinthedrillingofaninjectionwell.Theprofessorestimatedthetotalinvestmentcosttobe
2600M€forthereferencecase,withOPEXequalling5%ofthetotalinvestment,annually.Thecost
isscaledtothedifferentCO2withacoefficientof0.7,alsoprovidedbytheprofessor.
Theaveragecarbonemissionpriceof2016is69.98NOK/tonneCO2,wherefurtherspecificemission
tax is excludeddue to theoverall emission reductiona facilityof this scale represents [39]. Some
expectthatamoreintensivetaxationofcarbonemissionswillbeintroducedinthefuture,inorderto
meet emission reduction targets. How the different systemswill respond to that, is presented in
Section5.7.3.
5.4 BreakevenPriceofHydrogen
Inordertodeterminethemostcost-efficienthydrogenproductionmethod,thebreakevenprice is
estimatedforeachsystem.Thebreakevenpriceisalsoknownasthelevelizedcostofhydrogenand
definedinthefollowingway:
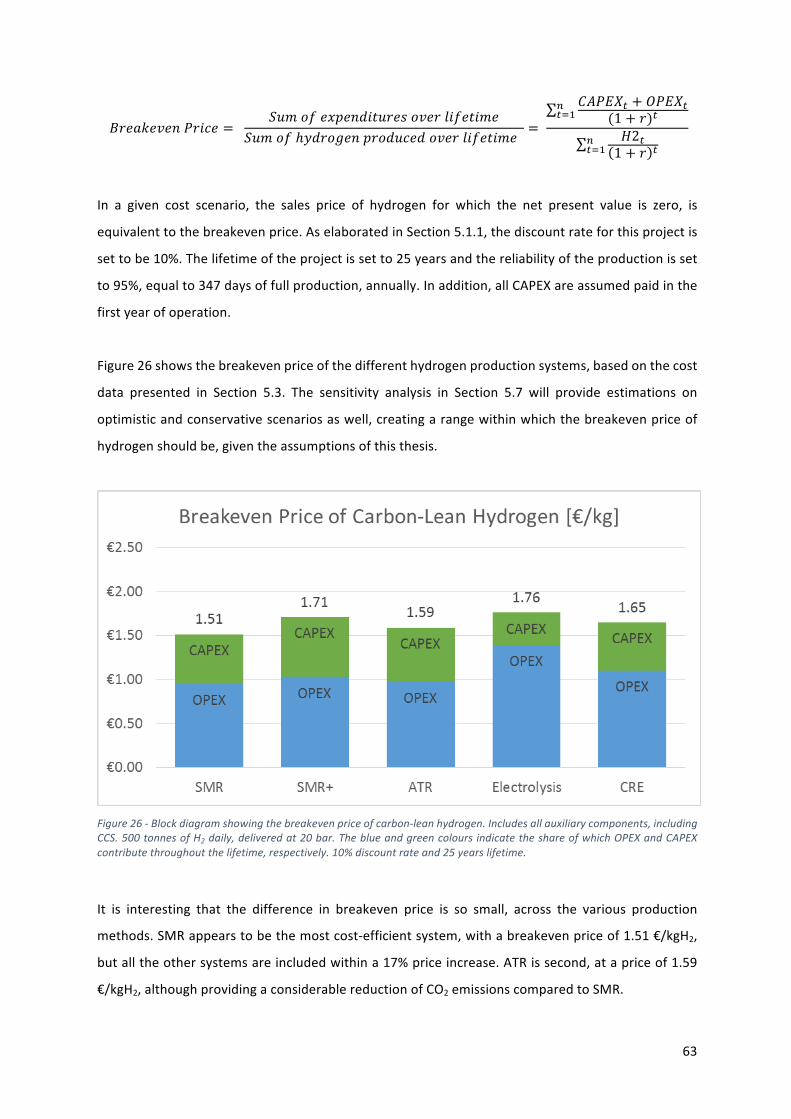
63
FGHIJHKHLMGNOH = PQ9RSHTUHLVNWQGHXRKHGYNSHWN9H
PQ9RSℎ[VGR\HLUGRVQOHVRKHGYNSHWN9H=
]^M_`? + aM_`?(1 + G)?
=?ef
52?1 + G ?
=?ef
In a given cost scenario, the sales price of hydrogen for which the net present value is zero, is
equivalenttothebreakevenprice.AselaboratedinSection5.1.1,thediscountrateforthisprojectis
settobe10%.Thelifetimeoftheprojectissetto25yearsandthereliabilityoftheproductionisset
to95%,equalto347daysoffullproduction,annually.Inaddition,allCAPEXareassumedpaidinthe
firstyearofoperation.
Figure26showsthebreakevenpriceofthedifferenthydrogenproductionsystems,basedonthecost
data presented in Section 5.3. The sensitivity analysis in Section 5.7 will provide estimations on
optimisticandconservativescenariosaswell,creatingarangewithinwhichthebreakevenpriceof
hydrogenshouldbe,giventheassumptionsofthisthesis.
Figure26-Blockdiagramshowingthebreakevenpriceofcarbon-leanhydrogen.Includesallauxiliarycomponents,includingCCS.500tonnesofH2daily,deliveredat20bar.TheblueandgreencoloursindicatetheshareofwhichOPEXandCAPEXcontributethroughoutthelifetime,respectively.10%discountrateand25yearslifetime.
It is interesting that the difference in breakeven price is so small, across the various production
methods.SMRappearstobethemostcost-efficientsystem,withabreakevenpriceof1.51€/kgH2,
butalltheothersystemsareincludedwithina17%priceincrease.ATRissecond,atapriceof1.59
€/kgH2,althoughprovidingaconsiderablereductionofCO2emissionscomparedtoSMR.
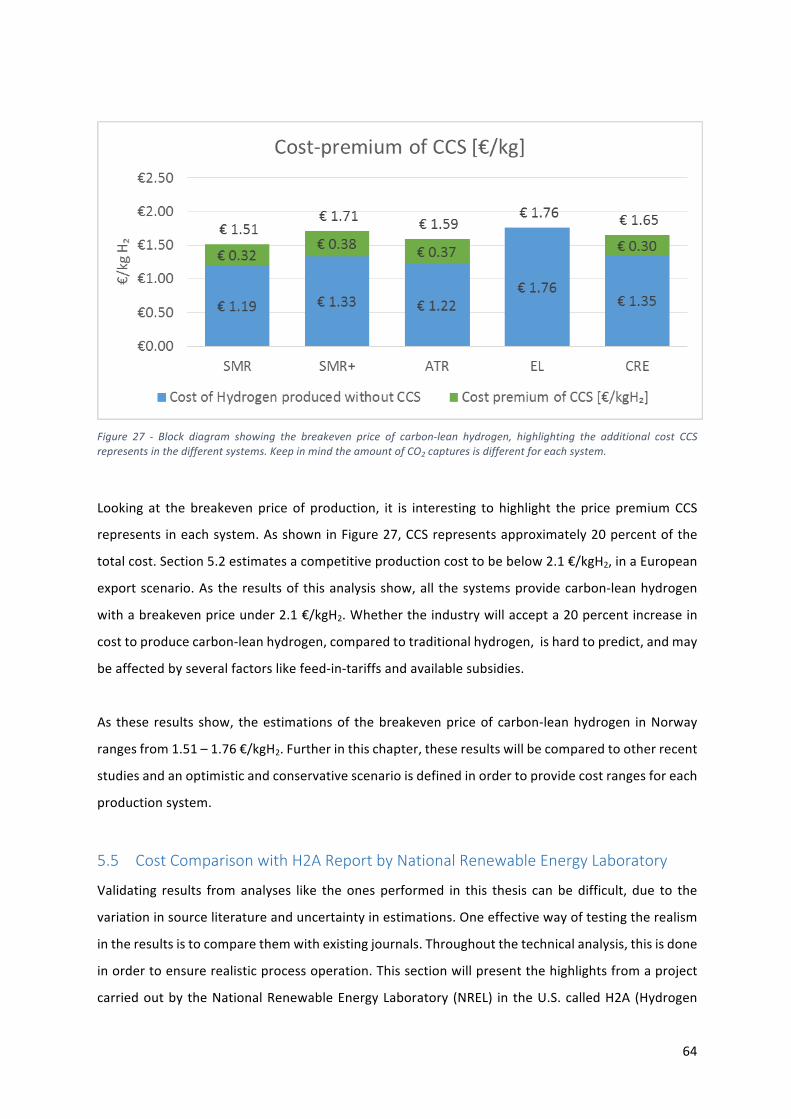
64
Figure 27 - Block diagram showing the breakeven price of carbon-lean hydrogen, highlighting the additional cost CCSrepresentsinthedifferentsystems.KeepinmindtheamountofCO2capturesisdifferentforeachsystem.
Looking at thebreakevenpriceof production, it is interesting to highlight theprice premiumCCS
represents ineachsystem.AsshowninFigure27,CCSrepresentsapproximately20percentofthe
totalcost.Section5.2estimatesacompetitiveproductioncosttobebelow2.1€/kgH2,inaEuropean
exportscenario.Astheresultsofthisanalysisshow,all thesystemsprovidecarbon-leanhydrogen
withabreakevenpriceunder2.1€/kgH2.Whethertheindustrywillaccepta20percentincreasein
costtoproducecarbon-leanhydrogen,comparedtotraditionalhydrogen,ishardtopredict,andmay
beaffectedbyseveralfactorslikefeed-in-tariffsandavailablesubsidies.
As these results show, theestimationsof thebreakevenpriceof carbon-leanhydrogen inNorway
rangesfrom1.51–1.76€/kgH2.Furtherinthischapter,theseresultswillbecomparedtootherrecent
studiesandanoptimisticandconservativescenarioisdefinedinordertoprovidecostrangesforeach
productionsystem.
5.5 CostComparisonwithH2AReportbyNationalRenewableEnergyLaboratory
Validating results fromanalyses like theonesperformed in this thesis canbedifficult, due to the
variationinsourceliteratureanduncertaintyinestimations.Oneeffectivewayoftestingtherealism
intheresultsistocomparethemwithexistingjournals.Throughoutthetechnicalanalysis,thisisdone
inordertoensurerealisticprocessoperation.Thissectionwillpresentthehighlightsfromaproject
carriedoutbytheNationalRenewableEnergyLaboratory (NREL) in theU.S.calledH2A(Hydrogen
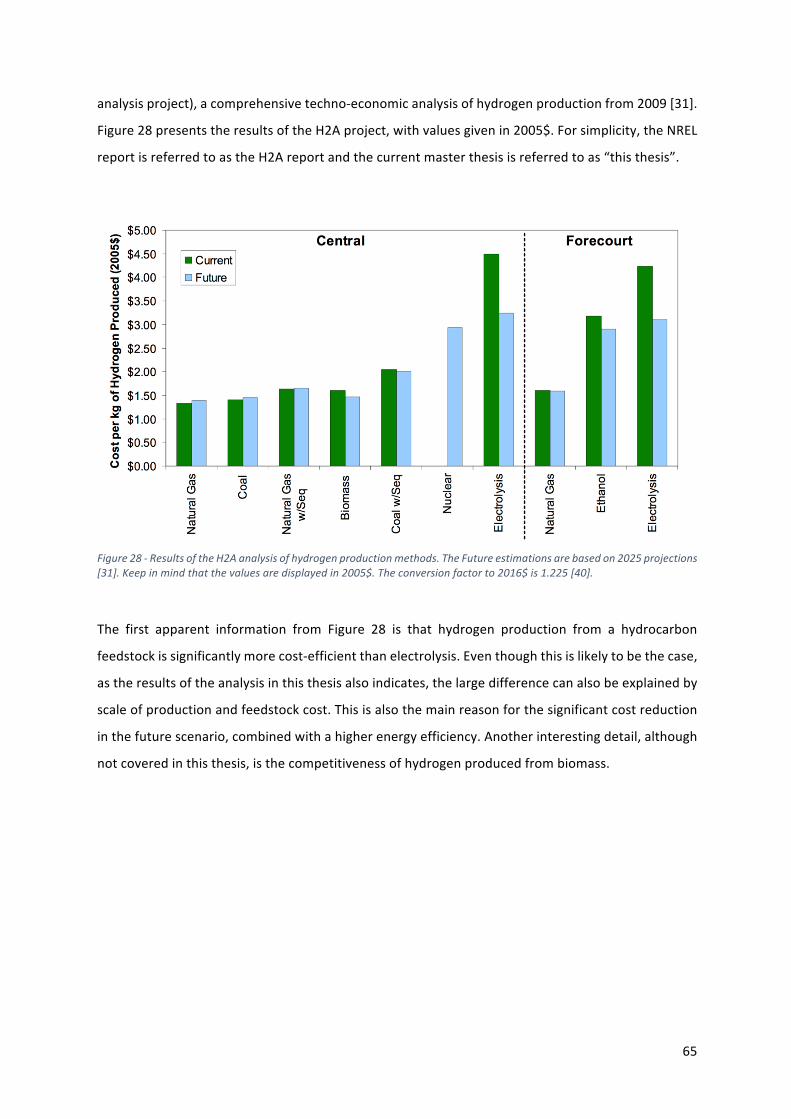
65
analysisproject),acomprehensivetechno-economicanalysisofhydrogenproductionfrom2009[31].
Figure28presentstheresultsoftheH2Aproject,withvaluesgivenin2005$.Forsimplicity,theNREL
reportisreferredtoastheH2Areportandthecurrentmasterthesisisreferredtoas“thisthesis”.
Figure28-ResultsoftheH2Aanalysisofhydrogenproductionmethods.TheFutureestimationsarebasedon2025projections[31].Keepinmindthatthevaluesaredisplayedin2005$.Theconversionfactorto2016$is1.225[40].
The first apparent information from Figure 28 is that hydrogen production from a hydrocarbon
feedstockissignificantlymorecost-efficientthanelectrolysis.Eventhoughthisislikelytobethecase,
astheresultsoftheanalysisinthisthesisalsoindicates,thelargedifferencecanalsobeexplainedby
scaleofproductionandfeedstockcost.Thisisalsothemainreasonforthesignificantcostreduction
inthefuturescenario,combinedwithahigherenergyefficiency.Anotherinterestingdetail,although
notcoveredinthisthesis,isthecompetitivenessofhydrogenproducedfrombiomass.
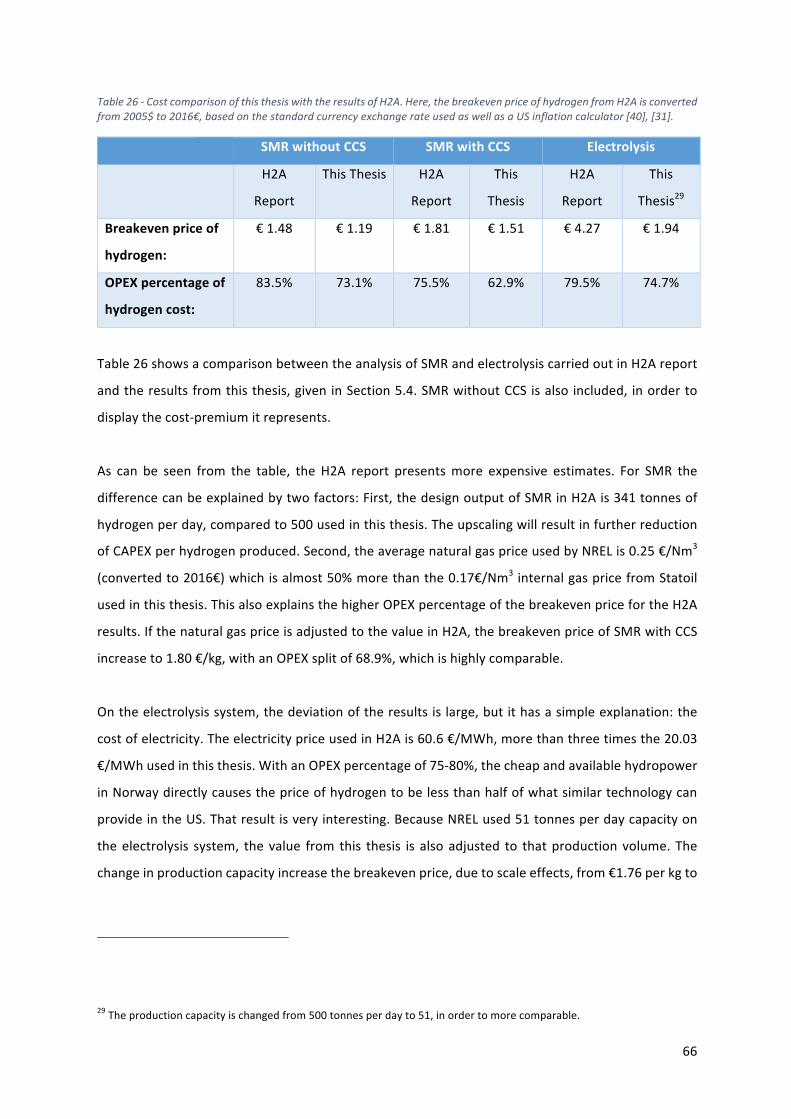
66
Table26-CostcomparisonofthisthesiswiththeresultsofH2A.Here,thebreakevenpriceofhydrogenfromH2Aisconvertedfrom2005$to2016€,basedonthestandardcurrencyexchangerateusedaswellasaUSinflationcalculator[40],[31].
SMRwithoutCCS SMRwithCCS Electrolysis
H2A
Report
ThisThesis H2A
Report
This
Thesis
H2A
Report
This
Thesis29
Breakevenpriceof
hydrogen:
€1.48 €1.19 €1.81 €1.51 €4.27 €1.94
OPEXpercentageof
hydrogencost:
83.5% 73.1% 75.5% 62.9% 79.5% 74.7%
Table26showsacomparisonbetweentheanalysisofSMRandelectrolysiscarriedoutinH2Areport
andtheresultsfromthisthesis,giveninSection5.4.SMRwithoutCCSisalsoincluded, inorderto
displaythecost-premiumitrepresents.
As can be seen from the table, the H2A report presentsmore expensive estimates. For SMR the
differencecanbeexplainedbytwofactors:First,thedesignoutputofSMRinH2Ais341tonnesof
hydrogenperday,comparedto500usedinthisthesis.Theupscalingwillresultinfurtherreduction
ofCAPEXperhydrogenproduced.Second,theaveragenaturalgaspriceusedbyNRELis0.25€/Nm3
(convertedto2016€)whichisalmost50%morethanthe0.17€/Nm3internalgaspricefromStatoil
usedinthisthesis.ThisalsoexplainsthehigherOPEXpercentageofthebreakevenpricefortheH2A
results.IfthenaturalgaspriceisadjustedtothevalueinH2A,thebreakevenpriceofSMRwithCCS
increaseto1.80€/kg,withanOPEXsplitof68.9%,whichishighlycomparable.
Ontheelectrolysissystem,thedeviationoftheresultsislarge,butithasasimpleexplanation:the
costofelectricity.TheelectricitypriceusedinH2Ais60.6€/MWh,morethanthreetimesthe20.03
€/MWhusedinthisthesis.WithanOPEXpercentageof75-80%,thecheapandavailablehydropower
inNorwaydirectlycausesthepriceofhydrogentobelessthanhalfofwhatsimilartechnologycan
provideintheUS.Thatresultisveryinteresting.BecauseNRELused51tonnesperdaycapacityon
theelectrolysis system, thevalue from this thesis is alsoadjusted to thatproductionvolume.The
changeinproductioncapacityincreasethebreakevenprice,duetoscaleeffects,from€1.76perkgto
29Theproductioncapacityischangedfrom500tonnesperdayto51,inordertomorecomparable.
67
€1.94.If60.6€/MWhisusedinthisthesis,thebreakevenpriceofhydrogenfromelectrolysisis4.13
€/kg,only3percentlessthanH2A.
ThissectionshowsthatthecostestimationsofSMRandelectrolysisarecomparabletosimilarstudies
carried out in the past, improving the viability of the results. A very interesting discovery is the
immenseeffectthelow-cost,Norwegianenergyresourceshaveontheproductioncostofhydrogen.
5.6 EnvironmentalImpact
Producing hydrogen brings socio-economic benefits, which create an added value not taken into
accountinthecostanalysis.TheNorwegianhydrogenproductionpresentedinthisthesis,canreduce
global CO₂ emissions, contribute to technology development and create jobs. In the cost analysis
Section5.3,thevalueoflarge-scalehydrogenproductionwasassessedfromabusinessperspective
whilethevalueofavoidedCO₂emissionsarenotfullytakenintoaccount.Thischapterwilldiscussthe
value of reduced carbon emissions andwhether the project has sufficient positive impact on the
environmenttooutweighthecostofCCS.
5.6.1 CO₂Emissions
Mostof thehydrogenproduction today isbasedonconversionof fossil resourceswithoutcarbon
capture and storage (CCS) [1]. All the CO₂ produced is therefore vented out in the atmosphere
contributing to globalwarming. InDecember 12th 2015more than 200 countries signed the Paris
climateagreementandhavecommittedtostartthetransitiontowardsalow-emissionsociety.The
solutionpresented in this thesiscancontributetoachievetheemissiontargetas itcost-efficiently
produces CO₂-lean hydrogen. Governments need concrete, large-scale projects in order to meet
targets,andasTable27shows,eventheproductionmethodwiththehighestCO2emissionsstudied
inthisthesiscancutglobalemissionsby2.98milliontonnesperyear.Theunavoidableemissionsfrom
theSMRplantaddsup to23.9gramsofCO2perkm inaToyotaMirai,assuming100kmperkgof
hydrogen30.Incomparison,thenewvehicleemissiontargetofEUin2021is95g/km,andanextremely
low-emittingvehicleisdefinedasbelow50g/km[41].
30Someemissionsmaybecausedbydistribution,butastheprojectworkof2015showed,notalargeaddition.
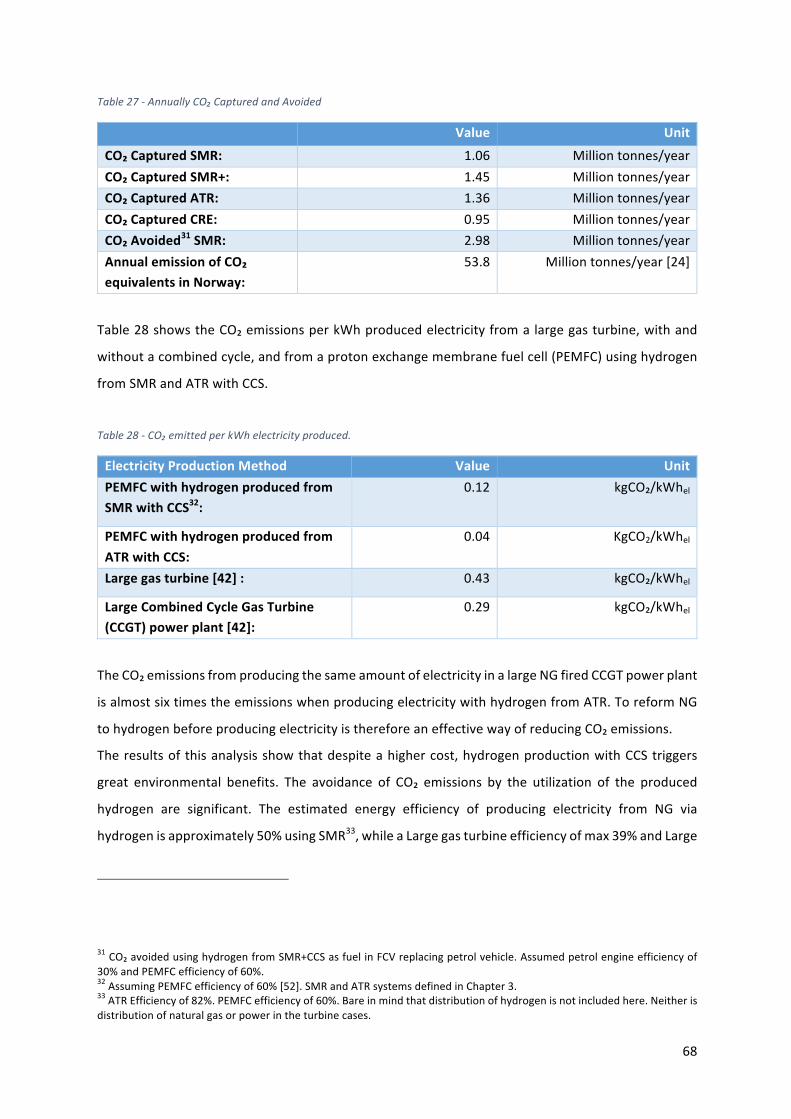
68
Table27-AnnuallyCO₂CapturedandAvoided
Value UnitCO₂CapturedSMR: 1.06 Milliontonnes/yearCO₂CapturedSMR+: 1.45 Milliontonnes/yearCO₂CapturedATR: 1.36 Milliontonnes/yearCO₂CapturedCRE: 0.95 Milliontonnes/yearCO₂Avoided31SMR: 2.98 Milliontonnes/yearAnnualemissionofCO₂equivalentsinNorway:
53.8 Milliontonnes/year[24]
Table28showstheCO₂emissionsperkWhproducedelectricityfromalargegasturbine,withand
withoutacombinedcycle,andfromaprotonexchangemembranefuelcell(PEMFC)usinghydrogen
fromSMRandATRwithCCS.
Table28-CO₂emittedperkWhelectricityproduced.
ElectricityProductionMethod Value UnitPEMFCwithhydrogenproducedfromSMRwithCCS32:
0.12 kgCO₂/kWhel
PEMFCwithhydrogenproducedfromATRwithCCS:
0.04
KgCO2/kWhel
Largegasturbine[42]: 0.43 kgCO₂/kWhel
LargeCombinedCycleGasTurbine(CCGT)powerplant[42]:
0.29 kgCO₂/kWhel
TheCO₂emissionsfromproducingthesameamountofelectricityinalargeNGfiredCCGTpowerplant
isalmostsixtimestheemissionswhenproducingelectricitywithhydrogenfromATR.ToreformNG
tohydrogenbeforeproducingelectricityisthereforeaneffectivewayofreducingCO₂emissions.
Theresultsofthisanalysisshowthatdespiteahighercost,hydrogenproductionwithCCStriggers
great environmental benefits. The avoidance of CO₂ emissions by the utilization of the produced
hydrogen are significant. The estimated energy efficiency of producing electricity from NG via
hydrogenisapproximately50%usingSMR33,whileaLargegasturbineefficiencyofmax39%andLarge
31CO₂avoidedusinghydrogenfromSMR+CCSasfuelinFCVreplacingpetrolvehicle.Assumedpetrolengineefficiencyof30%andPEMFCefficiencyof60%.32AssumingPEMFCefficiencyof60%[52].SMRandATRsystemsdefinedinChapter3.33ATREfficiencyof82%.PEMFCefficiencyof60%.Bareinmindthatdistributionofhydrogenisnotincludedhere.Neitherisdistributionofnaturalgasorpowerintheturbinecases.
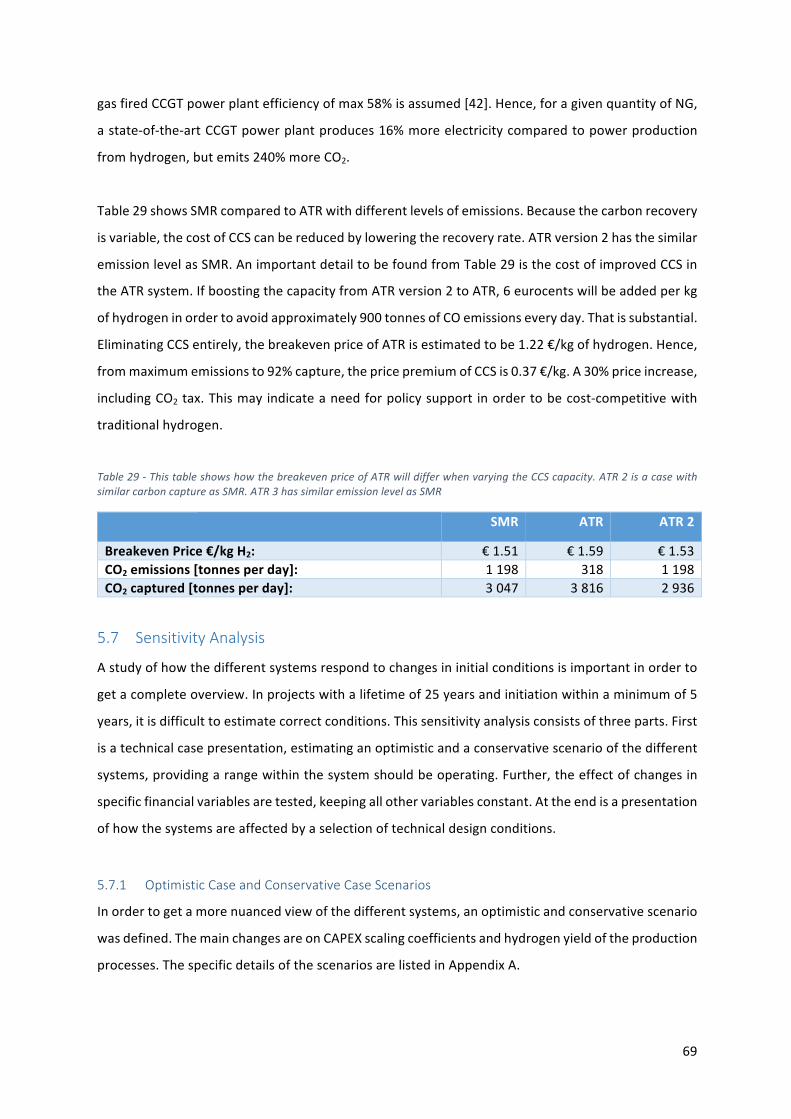
69
gasfiredCCGTpowerplantefficiencyofmax58%isassumed[42].Hence,foragivenquantityofNG,
astate-of-the-artCCGTpowerplantproduces16%moreelectricitycomparedtopowerproduction
fromhydrogen,butemits240%moreCO2.
Table29showsSMRcomparedtoATRwithdifferentlevelsofemissions.Becausethecarbonrecovery
isvariable,thecostofCCScanbereducedbyloweringtherecoveryrate.ATRversion2hasthesimilar
emissionlevelasSMR.AnimportantdetailtobefoundfromTable29isthecostofimprovedCCSin
theATRsystem.IfboostingthecapacityfromATRversion2toATR,6eurocentswillbeaddedperkg
ofhydrogeninordertoavoidapproximately900tonnesofCOemissionseveryday.Thatissubstantial.
EliminatingCCSentirely,thebreakevenpriceofATRisestimatedtobe1.22€/kgofhydrogen.Hence,
frommaximumemissionsto92%capture,thepricepremiumofCCSis0.37€/kg.A30%priceincrease,
includingCO2tax.Thismayindicateaneedforpolicysupport inordertobecost-competitivewith
traditionalhydrogen.
Table29-ThistableshowshowthebreakevenpriceofATRwilldifferwhenvaryingtheCCScapacity.ATR2isacasewithsimilarcarboncaptureasSMR.ATR3hassimilaremissionlevelasSMR
SMR ATR ATR2
BreakevenPrice€/kgH2: €1.51 €1.59 €1.53CO2emissions[tonnesperday]: 1198 318 1198CO2captured[tonnesperday]: 3047 3816 2936
5.7 SensitivityAnalysis
Astudyofhowthedifferentsystemsrespondtochangesininitialconditionsisimportantinorderto
getacompleteoverview.Inprojectswithalifetimeof25yearsandinitiationwithinaminimumof5
years,itisdifficulttoestimatecorrectconditions.Thissensitivityanalysisconsistsofthreeparts.First
isatechnicalcasepresentation,estimatinganoptimisticandaconservativescenarioofthedifferent
systems,providingarangewithinthesystemshouldbeoperating.Further,theeffectofchangesin
specificfinancialvariablesaretested,keepingallothervariablesconstant.Attheendisapresentation
ofhowthesystemsareaffectedbyaselectionoftechnicaldesignconditions.
5.7.1 OptimisticCaseandConservativeCaseScenarios
Inordertogetamorenuancedviewofthedifferentsystems,anoptimisticandconservativescenario
wasdefined.ThemainchangesareonCAPEXscalingcoefficientsandhydrogenyieldoftheproduction
processes.ThespecificdetailsofthescenariosarelistedinAppendixA.
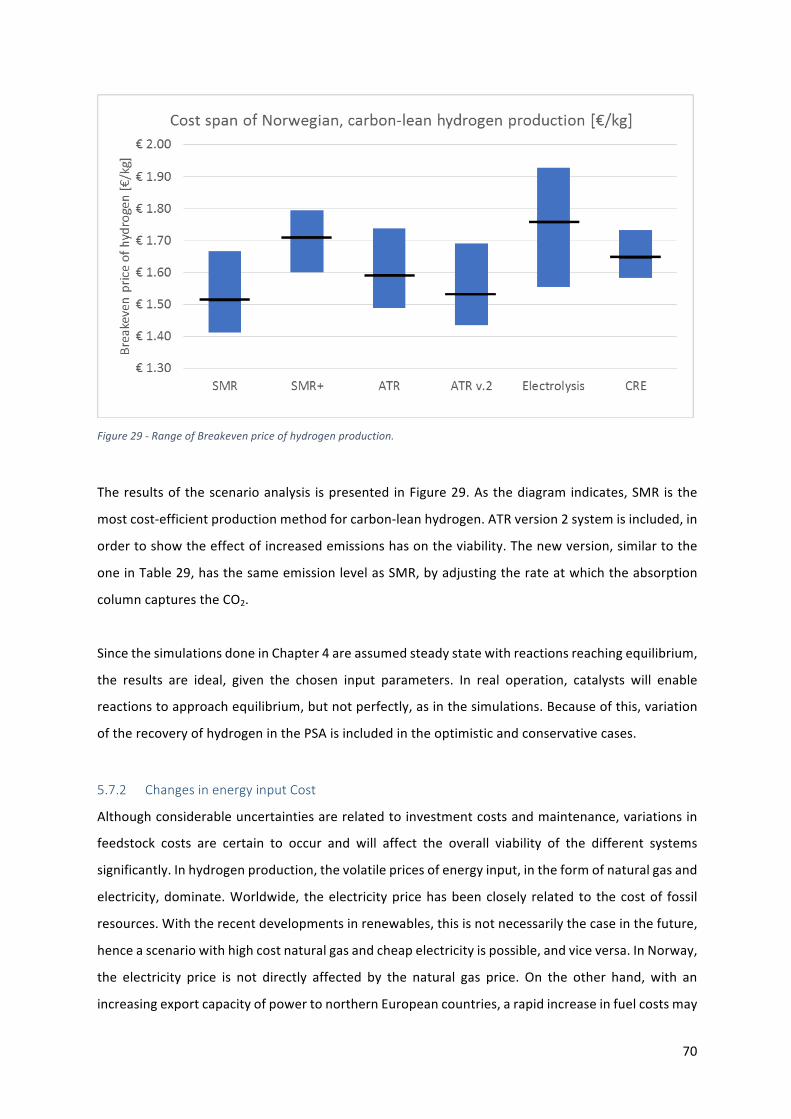
70
Figure29-RangeofBreakevenpriceofhydrogenproduction.
Theresultsofthescenarioanalysis ispresented inFigure29.Asthediagramindicates,SMRisthe
mostcost-efficientproductionmethodforcarbon-leanhydrogen.ATRversion2systemisincluded,in
ordertoshowtheeffectofincreasedemissionshasontheviability.Thenewversion,similartothe
oneinTable29,hasthesameemissionlevelasSMR,byadjustingtherateatwhichtheabsorption
columncapturestheCO2.
SincethesimulationsdoneinChapter4areassumedsteadystatewithreactionsreachingequilibrium,
the results are ideal, given the chosen input parameters. In real operation, catalysts will enable
reactionstoapproachequilibrium,butnotperfectly,asinthesimulations.Becauseofthis,variation
oftherecoveryofhydrogeninthePSAisincludedintheoptimisticandconservativecases.
5.7.2 ChangesinenergyinputCost
Althoughconsiderableuncertaintiesarerelatedtoinvestmentcostsandmaintenance,variationsin
feedstock costs are certain to occur and will affect the overall viability of the different systems
significantly.Inhydrogenproduction,thevolatilepricesofenergyinput,intheformofnaturalgasand
electricity,dominate.Worldwide, theelectricitypricehasbeenclosely related to thecostof fossil
resources.Withtherecentdevelopmentsinrenewables,thisisnotnecessarilythecaseinthefuture,
henceascenariowithhighcostnaturalgasandcheapelectricityispossible,andviceversa.InNorway,
the electricity price is not directly affected by the natural gas price. On the other hand, with an
increasingexportcapacityofpowertonorthernEuropeancountries,arapidincreaseinfuelcostsmay
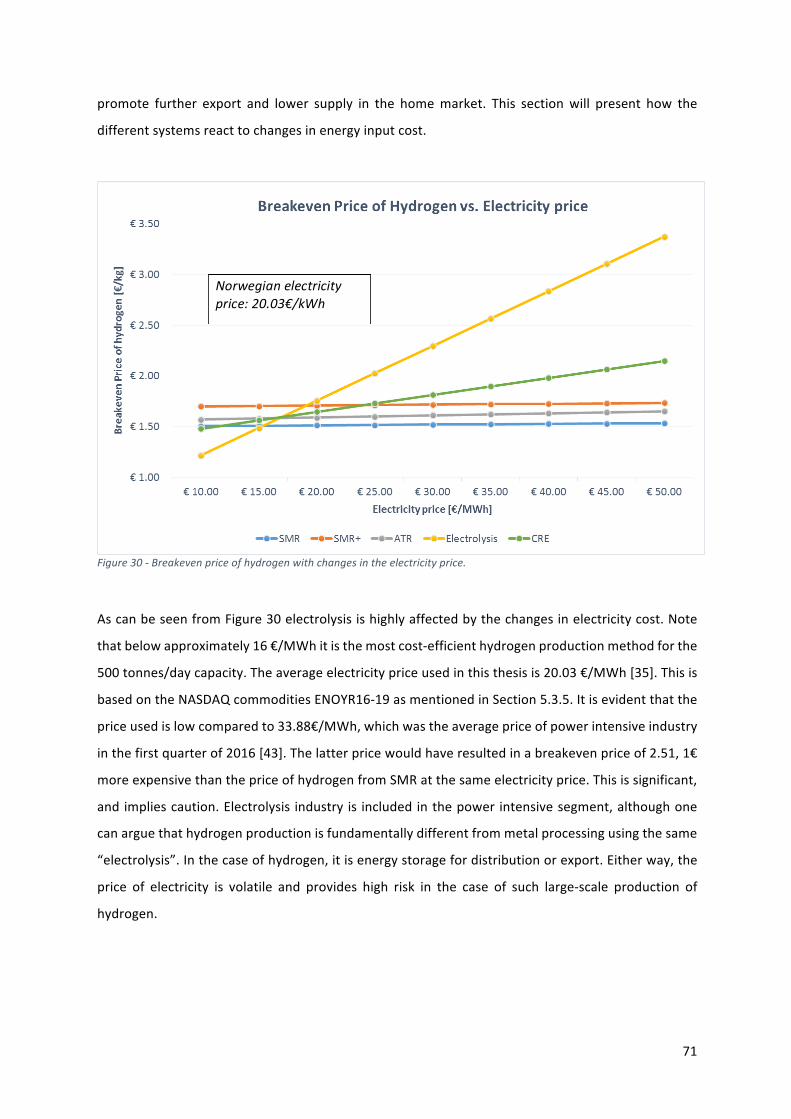
71
promote further export and lower supply in the homemarket. This sectionwill present how the
differentsystemsreacttochangesinenergyinputcost.
Figure30-Breakevenpriceofhydrogenwithchangesintheelectricityprice.
AscanbeseenfromFigure30electrolysisishighlyaffectedbythechangesinelectricitycost.Note
thatbelowapproximately16€/MWhitisthemostcost-efficienthydrogenproductionmethodforthe
500tonnes/daycapacity.Theaverageelectricitypriceusedinthisthesisis20.03€/MWh[35].Thisis
basedontheNASDAQcommoditiesENOYR16-19asmentionedinSection5.3.5.Itisevidentthatthe
priceusedislowcomparedto33.88€/MWh,whichwastheaveragepriceofpowerintensiveindustry
inthefirstquarterof2016[43].Thelatterpricewouldhaveresultedinabreakevenpriceof2.51,1€
moreexpensivethanthepriceofhydrogenfromSMRatthesameelectricityprice.Thisissignificant,
andimpliescaution.Electrolysis industry is includedinthepower intensivesegment,althoughone
canarguethathydrogenproductionisfundamentallydifferentfrommetalprocessingusingthesame
“electrolysis”.Inthecaseofhydrogen,itisenergystoragefordistributionorexport.Eitherway,the
price of electricity is volatile and provides high risk in the case of such large-scale production of
hydrogen.
Norwegianelectricityprice:20.03€/kWh
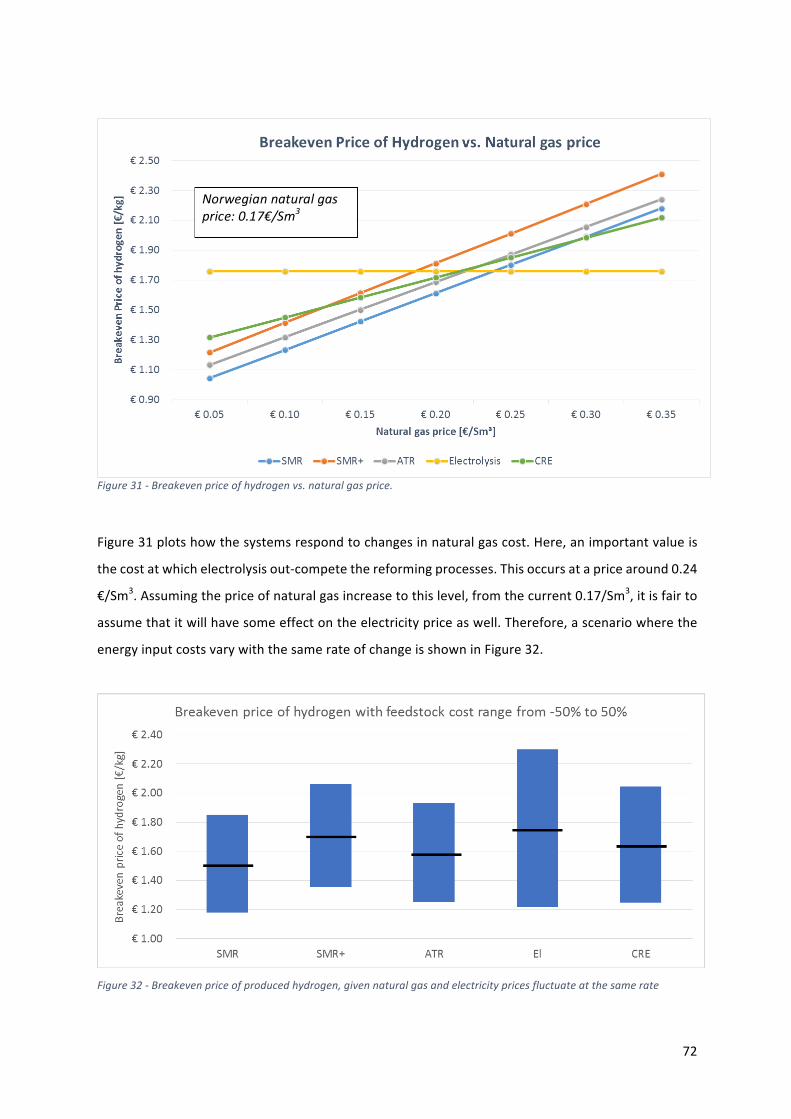
72
Figure31-Breakevenpriceofhydrogenvs.naturalgasprice.
Figure31plotshowthesystemsrespondtochangesinnaturalgascost.Here,animportantvalueis
thecostatwhichelectrolysisout-competethereformingprocesses.Thisoccursatapricearound0.24
€/Sm3.Assumingthepriceofnaturalgasincreasetothislevel,fromthecurrent0.17/Sm3,itisfairto
assumethatitwillhavesomeeffectontheelectricitypriceaswell.Therefore,ascenariowherethe
energyinputcostsvarywiththesamerateofchangeisshowninFigure32.
Figure32-Breakevenpriceofproducedhydrogen,givennaturalgasandelectricitypricesfluctuateatthesamerate
Norwegiannaturalgasprice:0.17€/Sm3
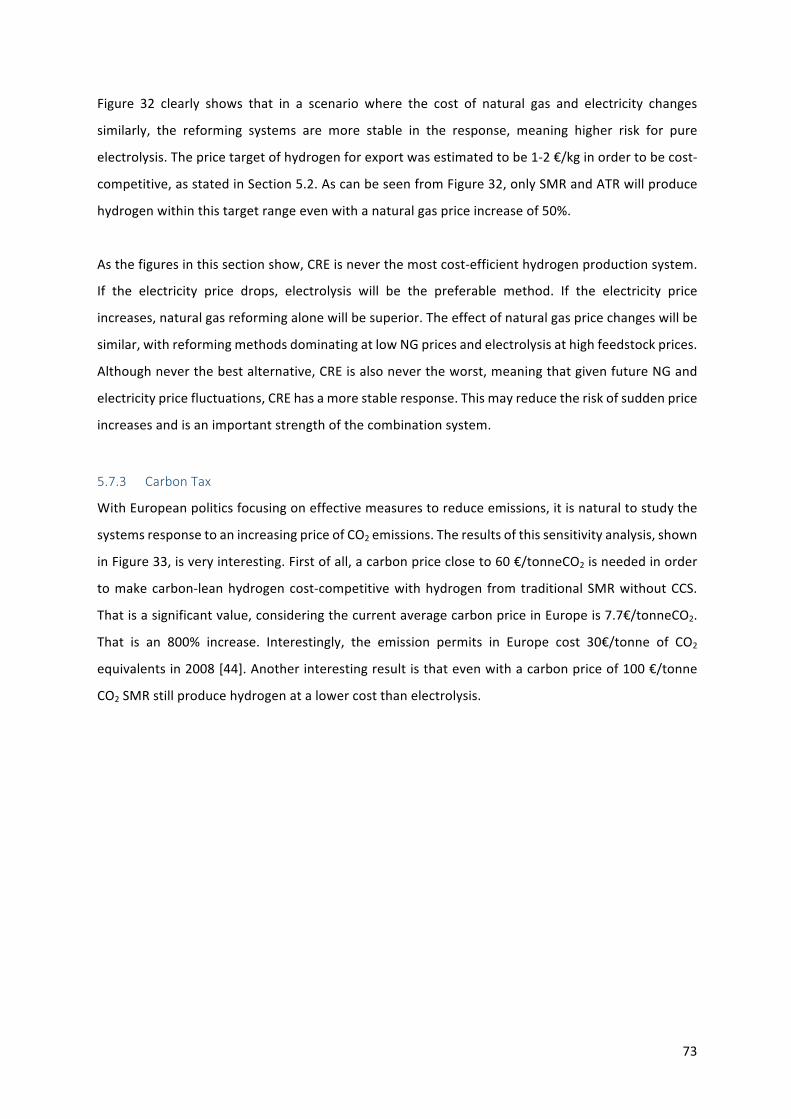
73
Figure 32 clearly shows that in a scenario where the cost of natural gas and electricity changes
similarly, the reforming systems are more stable in the response, meaning higher risk for pure
electrolysis.Thepricetargetofhydrogenforexportwasestimatedtobe1-2€/kginordertobecost-
competitive,asstatedinSection5.2.AscanbeseenfromFigure32,onlySMRandATRwillproduce
hydrogenwithinthistargetrangeevenwithanaturalgaspriceincreaseof50%.
Asthefiguresinthissectionshow,CREisneverthemostcost-efficienthydrogenproductionsystem.
If the electricity price drops, electrolysis will be the preferable method. If the electricity price
increases,naturalgasreformingalonewillbesuperior.Theeffectofnaturalgaspricechangeswillbe
similar,withreformingmethodsdominatingatlowNGpricesandelectrolysisathighfeedstockprices.
Althoughneverthebestalternative,CREisalsonevertheworst,meaningthatgivenfutureNGand
electricitypricefluctuations,CREhasamorestableresponse.Thismayreducetheriskofsuddenprice
increasesandisanimportantstrengthofthecombinationsystem.
5.7.3 CarbonTax
WithEuropeanpoliticsfocusingoneffectivemeasurestoreduceemissions,itisnaturaltostudythe
systemsresponsetoanincreasingpriceofCO2emissions.Theresultsofthissensitivityanalysis,shown
inFigure33,isveryinteresting.Firstofall,acarbonpricecloseto60€/tonneCO2isneededinorder
tomakecarbon-leanhydrogencost-competitivewithhydrogen fromtraditionalSMRwithoutCCS.
Thatisasignificantvalue,consideringthecurrentaveragecarbonpriceinEuropeis7.7€/tonneCO2.
That is an 800% increase. Interestingly, the emission permits in Europe cost 30€/tonne of CO2
equivalentsin2008[44].Anotherinterestingresultisthatevenwithacarbonpriceof100€/tonne
CO2SMRstillproducehydrogenatalowercostthanelectrolysis.
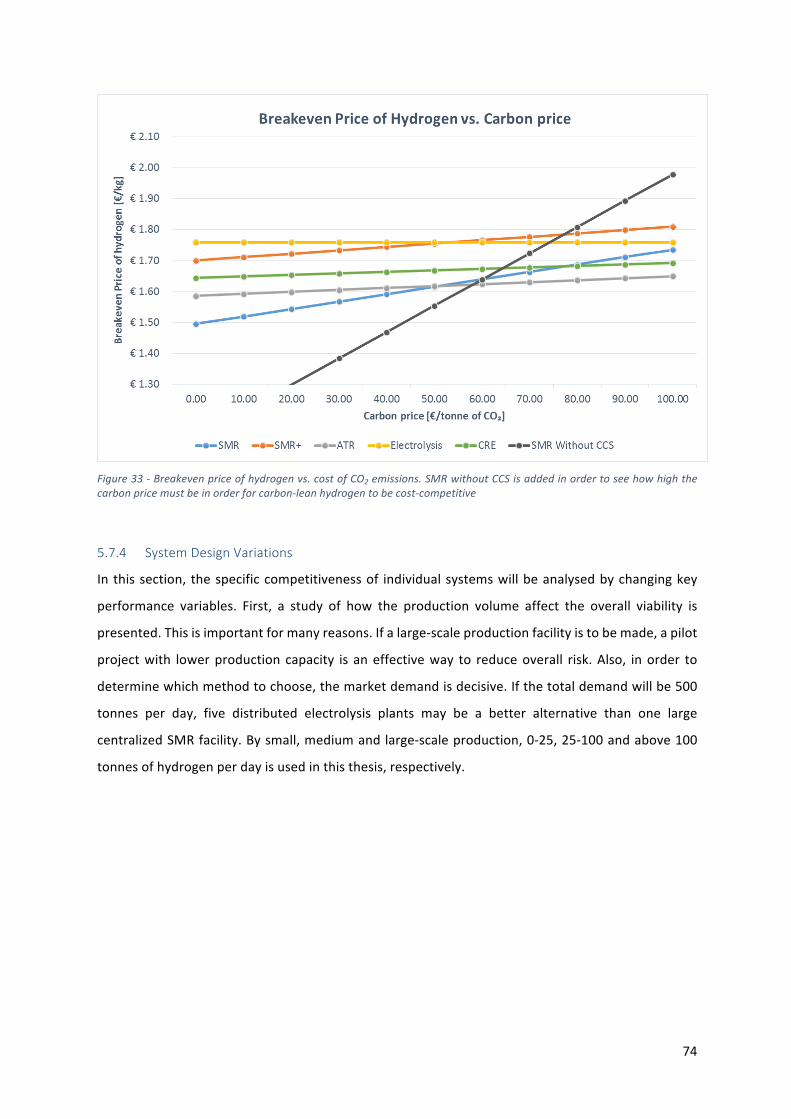
74
Figure33-Breakevenpriceofhydrogenvs.costofCO2emissions.SMRwithoutCCSisaddedinordertoseehowhighthecarbonpricemustbeinorderforcarbon-leanhydrogentobecost-competitive
5.7.4 SystemDesignVariations
In thissection, thespecificcompetitivenessof individualsystemswillbeanalysedbychangingkey
performance variables. First, a study of how the production volume affect the overall viability is
presented.Thisisimportantformanyreasons.Ifalarge-scaleproductionfacilityistobemade,apilot
projectwith lowerproductioncapacity is aneffectiveway to reduceoverall risk.Also, inorder to
determinewhichmethodtochoose,themarketdemandisdecisive.Ifthetotaldemandwillbe500
tonnes per day, five distributed electrolysis plants may be a better alternative than one large
centralizedSMRfacility.Bysmall,mediumandlarge-scaleproduction,0-25,25-100andabove100
tonnesofhydrogenperdayisusedinthisthesis,respectively.
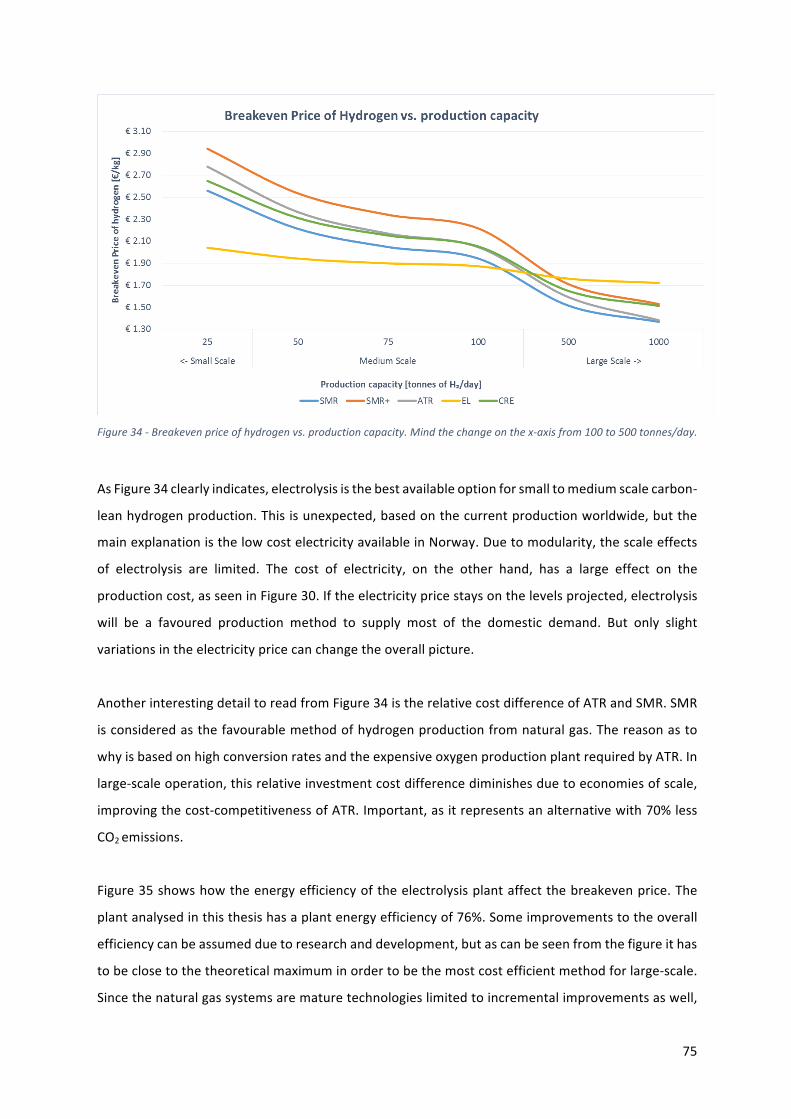
75
Figure34-Breakevenpriceofhydrogenvs.productioncapacity.Mindthechangeonthex-axisfrom100to500tonnes/day.
AsFigure34clearlyindicates,electrolysisisthebestavailableoptionforsmalltomediumscalecarbon-
leanhydrogenproduction.Thisisunexpected,basedonthecurrentproductionworldwide,butthe
mainexplanationisthelowcostelectricityavailableinNorway.Duetomodularity,thescaleeffects
of electrolysis are limited. The cost of electricity, on the other hand, has a large effect on the
productioncost,asseeninFigure30.Iftheelectricitypricestaysonthelevelsprojected,electrolysis
will be a favoured production method to supply most of the domestic demand. But only slight
variationsintheelectricitypricecanchangetheoverallpicture.
AnotherinterestingdetailtoreadfromFigure34istherelativecostdifferenceofATRandSMR.SMR
isconsideredasthefavourablemethodofhydrogenproductionfromnaturalgas.Thereasonasto
whyisbasedonhighconversionratesandtheexpensiveoxygenproductionplantrequiredbyATR.In
large-scaleoperation,thisrelativeinvestmentcostdifferencediminishesduetoeconomiesofscale,
improvingthecost-competitivenessofATR.Important,asitrepresentsanalternativewith70%less
CO2emissions.
Figure35showshowtheenergyefficiencyoftheelectrolysisplantaffectthebreakevenprice.The
plantanalysedinthisthesishasaplantenergyefficiencyof76%.Someimprovementstotheoverall
efficiencycanbeassumedduetoresearchanddevelopment,butascanbeseenfromthefigureithas
tobeclosetothetheoreticalmaximuminordertobethemostcostefficientmethodforlarge-scale.
Sincethenaturalgassystemsarematuretechnologieslimitedtoincrementalimprovementsaswell,
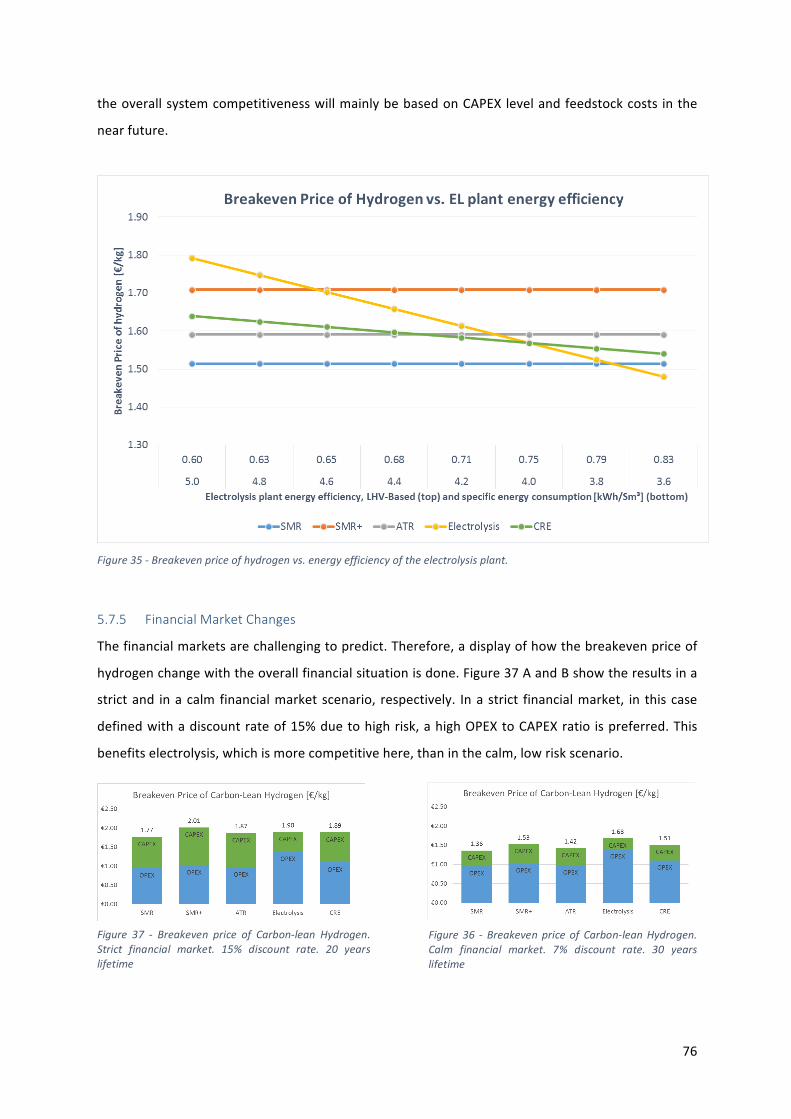
76
theoverallsystemcompetitivenesswillmainlybebasedonCAPEXlevelandfeedstockcosts inthe
nearfuture.
Figure35-Breakevenpriceofhydrogenvs.energyefficiencyoftheelectrolysisplant.
5.7.5 FinancialMarketChanges
Thefinancialmarketsarechallengingtopredict.Therefore,adisplayofhowthebreakevenpriceof
hydrogenchangewiththeoverallfinancialsituationisdone.Figure37AandBshowtheresultsina
strictand inacalmfinancialmarketscenario, respectively. Inastrict financialmarket, in thiscase
definedwithadiscountrateof15%duetohighrisk,ahighOPEXtoCAPEXratio ispreferred.This
benefitselectrolysis,whichismorecompetitivehere,thaninthecalm,lowriskscenario.
Figure 37 - Breakeven price of Carbon-lean Hydrogen.Strict financial market. 15% discount rate. 20 yearslifetime
Figure36 - Breakevenprice of Carbon-leanHydrogen.Calm financial market. 7% discount rate. 30 yearslifetime
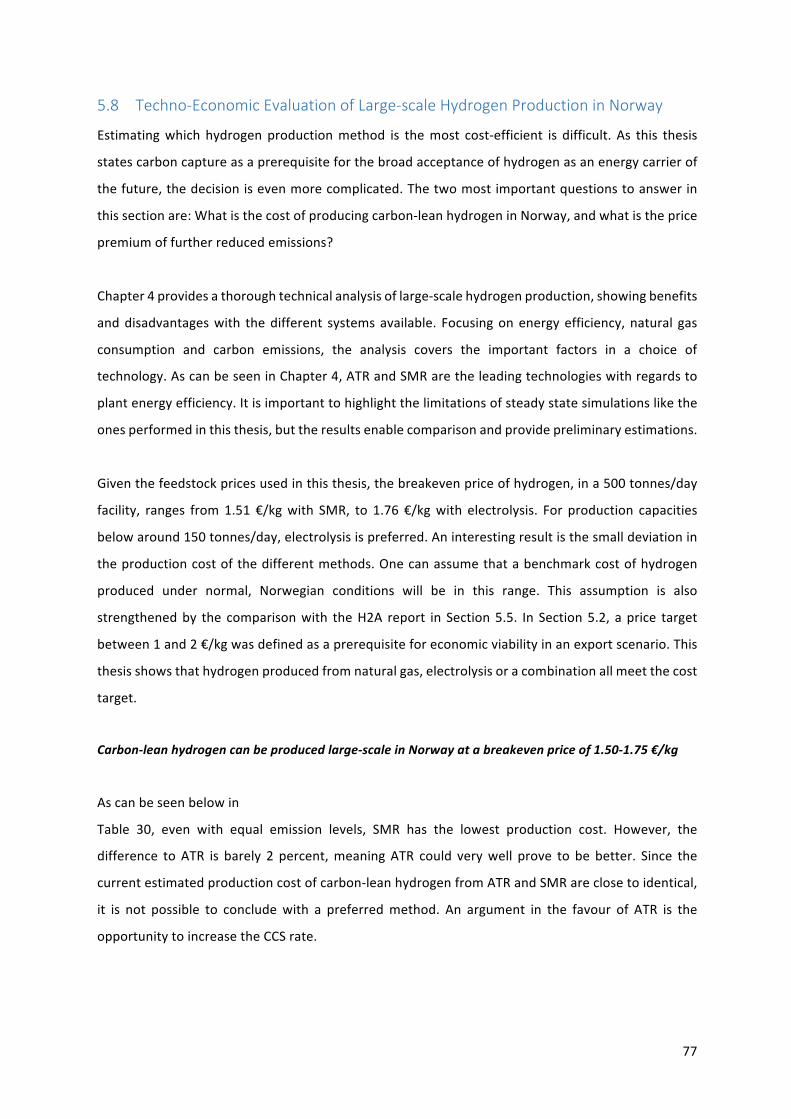
77
5.8 Techno-EconomicEvaluationofLarge-scaleHydrogenProductioninNorway
Estimatingwhich hydrogenproductionmethod is themost cost-efficient is difficult. As this thesis
statescarboncaptureasaprerequisiteforthebroadacceptanceofhydrogenasanenergycarrierof
thefuture,thedecisionisevenmorecomplicated.Thetwomostimportantquestionstoanswerin
thissectionare:Whatisthecostofproducingcarbon-leanhydrogeninNorway,andwhatistheprice
premiumoffurtherreducedemissions?
Chapter4providesathoroughtechnicalanalysisoflarge-scalehydrogenproduction,showingbenefits
anddisadvantageswith thedifferent systemsavailable. Focusingonenergyefficiency,natural gas
consumption and carbon emissions, the analysis covers the important factors in a choice of
technology.AscanbeseeninChapter4,ATRandSMRaretheleadingtechnologieswithregardsto
plantenergyefficiency.Itisimportanttohighlightthelimitationsofsteadystatesimulationslikethe
onesperformedinthisthesis,buttheresultsenablecomparisonandprovidepreliminaryestimations.
Giventhefeedstockpricesusedinthisthesis,thebreakevenpriceofhydrogen,ina500tonnes/day
facility, ranges from1.51 €/kgwith SMR, to 1.76 €/kgwith electrolysis. For production capacities
belowaround150tonnes/day,electrolysisispreferred.Aninterestingresultisthesmalldeviationin
theproductioncostofthedifferentmethods.Onecanassumethatabenchmarkcostofhydrogen
produced under normal, Norwegian conditions will be in this range. This assumption is also
strengthenedby the comparisonwith theH2A report in Section5.5. In Section5.2, aprice target
between1and2€/kgwasdefinedasaprerequisiteforeconomicviabilityinanexportscenario.This
thesisshowsthathydrogenproducedfromnaturalgas,electrolysisoracombinationallmeetthecost
target.
Carbon-leanhydrogencanbeproducedlarge-scaleinNorwayatabreakevenpriceof1.50-1.75€/kg
Ascanbeseenbelowin
Table 30, even with equal emission levels, SMR has the lowest production cost. However, the
difference toATR is barely 2 percent,meaningATR could verywell prove to be better. Since the
currentestimatedproductioncostofcarbon-leanhydrogenfromATRandSMRareclosetoidentical,
it is not possible to concludewith a preferredmethod. An argument in the favour of ATR is the
opportunitytoincreasetheCCSrate.
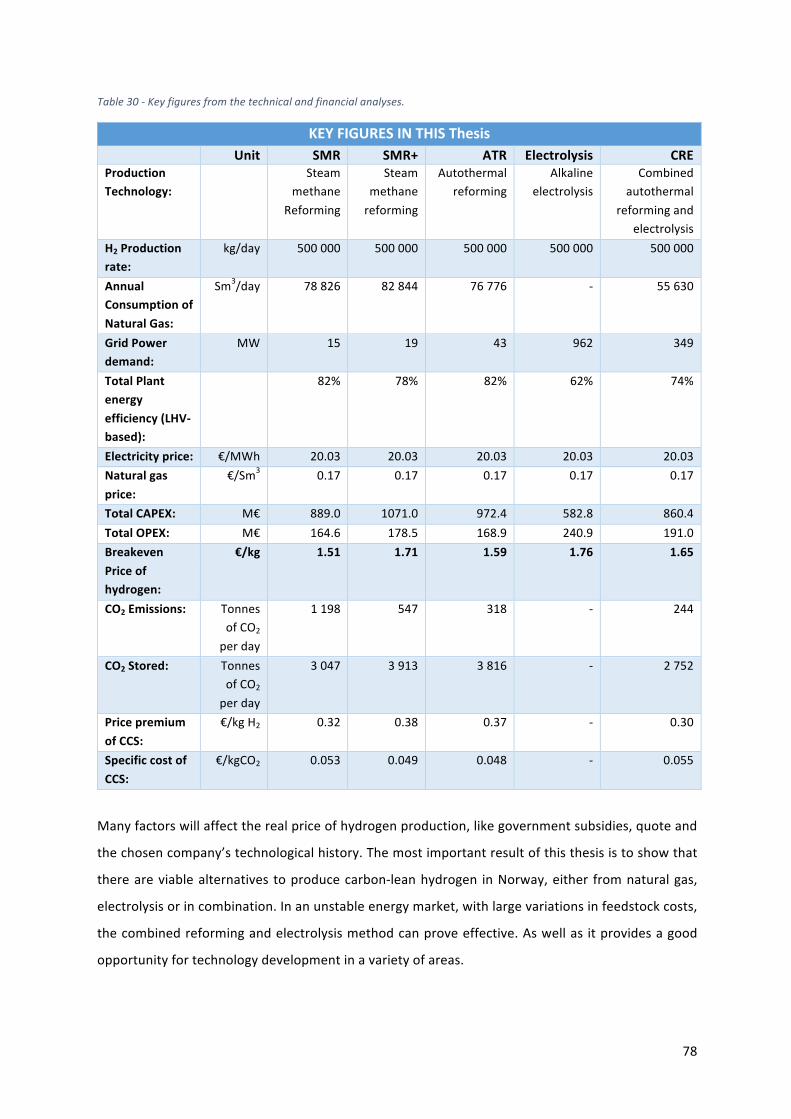
78
Table30-Keyfiguresfromthetechnicalandfinancialanalyses.
KEYFIGURESINTHISThesis Unit SMR SMR+ ATR Electrolysis CREProductionTechnology:
Steammethane
Reforming
Steammethanereforming
Autothermalreforming
Alkalineelectrolysis
Combinedautothermal
reformingandelectrolysis
H2Productionrate:
kg/day 500000 500000 500000 500000 500000
AnnualConsumptionofNaturalGas:
Sm3/day 78826 82844 76776 - 55630
GridPowerdemand:
MW 15 19 43 962 349
TotalPlantenergyefficiency(LHV-based):
82% 78% 82% 62% 74%
Electricityprice: €/MWh 20.03 20.03 20.03 20.03 20.03Naturalgasprice:
€/Sm3 0.17 0.17 0.17 0.17 0.17
TotalCAPEX: M€ 889.0 1071.0 972.4 582.8 860.4TotalOPEX: M€ 164.6 178.5 168.9 240.9 191.0BreakevenPriceofhydrogen:
€/kg 1.51 1.71 1.59 1.76 1.65
CO2Emissions: TonnesofCO2perday
1198 547 318 - 244
CO2Stored: TonnesofCO2perday
3047 3913 3816 - 2752
PricepremiumofCCS:
€/kgH2 0.32 0.38 0.37 - 0.30
SpecificcostofCCS:
€/kgCO2 0.053 0.049 0.048 - 0.055
Manyfactorswillaffecttherealpriceofhydrogenproduction,likegovernmentsubsidies,quoteand
thechosencompany’stechnologicalhistory.Themostimportantresultofthisthesisistoshowthat
thereareviablealternatives toproducecarbon-leanhydrogen inNorway,either fromnaturalgas,
electrolysisorincombination.Inanunstableenergymarket,withlargevariationsinfeedstockcosts,
thecombinedreformingandelectrolysismethodcanproveeffective.Aswellas itprovidesagood
opportunityfortechnologydevelopmentinavarietyofareas.

79
Inorder tominimizecarbon footprint,ATR,CREorpureelectrolysis represents thebest solutions.
AlthoughSMRrepresentsasolutionwithmoreCO2emissions,givennopostcombustionCCS,itwill
alsocontributetoasignificantemissionreductionintheenergyvaluechain.ATRhasahighflexibility
withregardstoCCScapacity,enablinganimpressive92%captureratesolelywithpre-combustion,
andstillprovingeconomicallyviable.ThepricepremiumofcarboncaptureislowestinSMR,asseen
in
Table30,butthatistheresultoflimitedcapture.Alevelizedcostof0.048€perkgofcapturedCO2in
ATRprovestheeffectivenesshydrogenrepresentsasameantocutemissions.Andthatvaluedoes
notincludetheavoidedCO2theuseofhydrogenwouldimplyifreplacingotherenergycarriers.
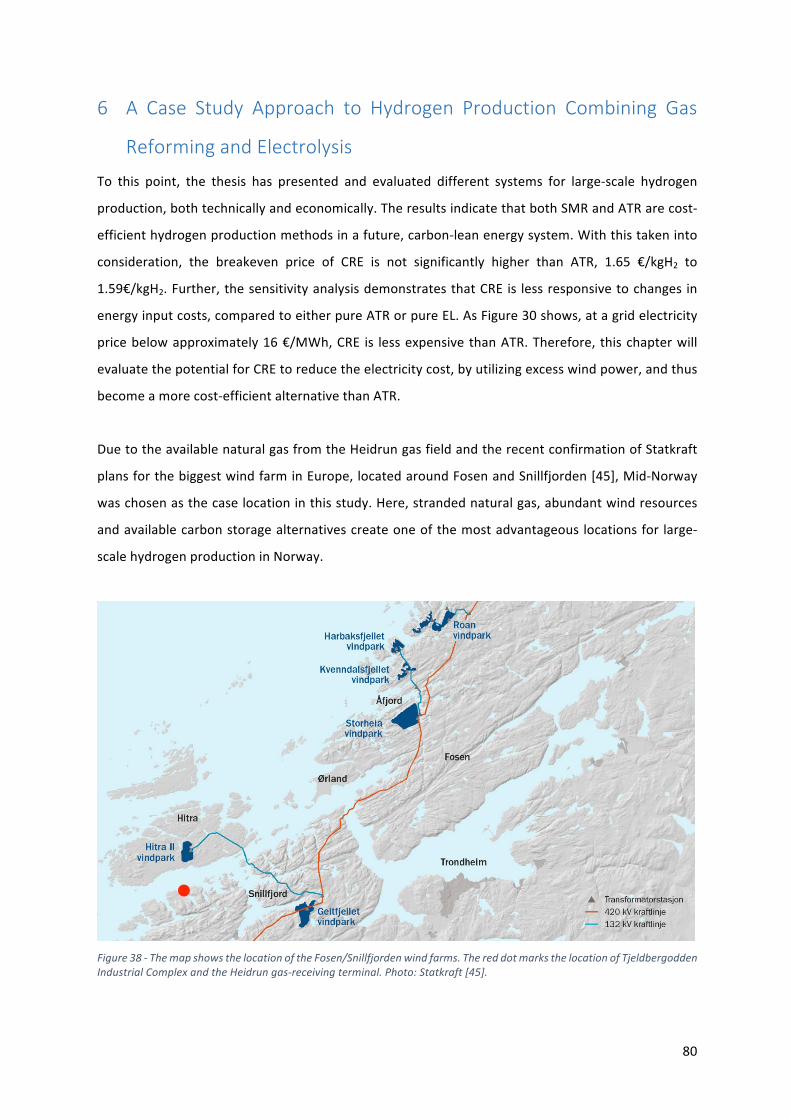
80
6 A Case Study Approach to Hydrogen Production Combining Gas
ReformingandElectrolysis
To this point, the thesis has presented and evaluated different systems for large-scale hydrogen
production,bothtechnicallyandeconomically.TheresultsindicatethatbothSMRandATRarecost-
efficienthydrogenproductionmethodsinafuture,carbon-leanenergysystem.Withthistakeninto
consideration, the breakeven price of CRE is not significantly higher than ATR, 1.65 €/kgH2 to
1.59€/kgH2.Further,thesensitivityanalysisdemonstratesthatCRE is lessresponsivetochanges in
energyinputcosts,comparedtoeitherpureATRorpureEL.AsFigure30shows,atagridelectricity
pricebelowapproximately16€/MWh,CRE is lessexpensivethanATR.Therefore, thischapterwill
evaluatethepotentialforCREtoreducetheelectricitycost,byutilizingexcesswindpower,andthus
becomeamorecost-efficientalternativethanATR.
DuetotheavailablenaturalgasfromtheHeidrungasfieldandtherecentconfirmationofStatkraft
plansforthebiggestwindfarminEurope,locatedaroundFosenandSnillfjorden[45],Mid-Norway
waschosenasthecaselocationinthisstudy.Here,strandednaturalgas,abundantwindresources
andavailablecarbonstoragealternativescreateoneofthemostadvantageous locationsfor large-
scalehydrogenproductioninNorway.
Figure38-ThemapshowsthelocationoftheFosen/Snillfjordenwindfarms.ThereddotmarksthelocationofTjeldbergoddenIndustrialComplexandtheHeidrungas-receivingterminal.Photo:Statkraft[45].
81
Hydrogenstoragehasnotbeenincluded,specifically, inboththetechnicalandfinancialanalysisof
these cases, due to the use of themodels evaluated in Chapter 4 and 5, but the implications of
hydrogenstorageisdiscussedintheendofthischapter.
Following, two sets of cases will be evaluated; a set of stationary production cases and a set of
fluctuating production cases. The stationary cases will provide the reference values in order to
measurethepotentialgainofallowingfluctuations.Theonlyfeedstockboundaryofthecasestudies
isthecapacityofnaturalgasfromtheHeidrunfieldavailable.Powerdemandbeyondthecapacityof
thewindfarmwillbesuppliedbythegrid.
6.1.1 TjeldbergoddenIndustrialComplex
Tjeldbergoddenindustrialcomplexconsistsofthreeparts;anaturalgasreceivingterminalfromthe
Heidrun field, amethanol plant and an air separation facility [46]. Tjeldbergodden has an annual
productioncapacityofapproximately900000tonnesofmethanol,an impressive25%of thetotal
Europeancapacity.An importantfactorforchoosingthis locationforthecasestudy istheexisting
syngasproductionalreadyinoperation.Themethanolplantutilizesatwo-stepreformingbenefitting
fromboththecost-efficiencyofSMR,aswellastheflexibleH2/COratioofATR[47].Theprocessing
facilityatTjeldbergoddenisnotutilizingthefullNGcapacityoftheHaltenpipepipelinefromHeidrun.
The maximum NG capacity is 7 MSm³/day where approximately 2.2 MSm³/day are used in the
methanolplant[48][20].Hence,around4.8MSm³/daypotentialcapacityisavailableforotheruse.
6.1.2 FosenandSnillfjordenWindFarm
In2020,thelargestonshorewindprojectinEuropewillbeinoperation.Distributedatsixlocations
along the coast ofMid-Norway, the Fosen and Snillfjorden wind farm will represent an installed
capacityof1000.8MW,deliveredby278individual3.6MWwindturbines[45].Thetotalscheduled
productionis3400GWh,implyingacapacityfactorof0.388[49].
6.2 StationaryProduction
6.2.1 StationaryCase1,NaturalGas-basedCo-productionofHydrogen:
Stationarycase1willusethemaximumavailableNGatTjeldbergoddeninthehydrogenproduction.
UsingtheCREsystem,additionalhydrogenisproducedbyelectrolysis,whileprovidingtherequired
oxygen to the reformer. In this case study, all powerwill be supplied by the grid, at the average
electricitypriceusedthroughoutthethesis.TheresultsofthestudyarelistedinTable31.
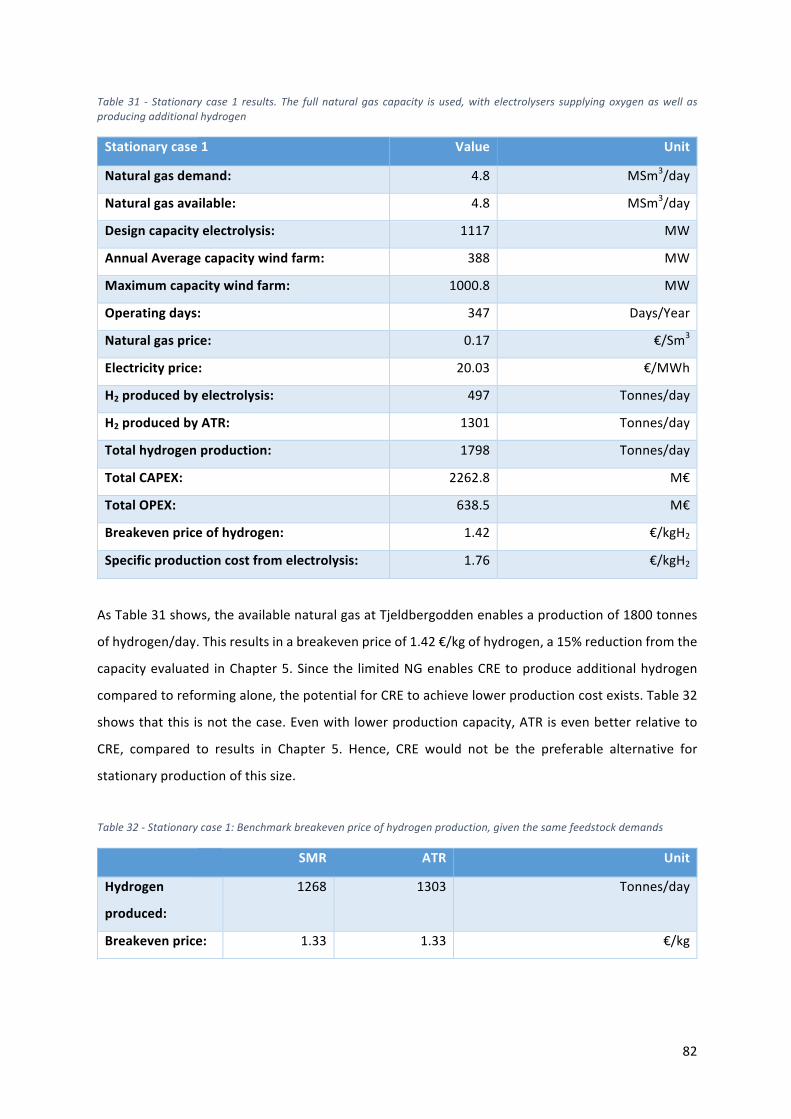
82
Table31 - Stationary case1 results. The full naturalgas capacity is used,withelectrolysers supplyingoxygenaswell asproducingadditionalhydrogen
Stationarycase1 Value Unit
Naturalgasdemand: 4.8 MSm3/day
Naturalgasavailable: 4.8 MSm3/day
Designcapacityelectrolysis: 1117 MW
AnnualAveragecapacitywindfarm: 388 MW
Maximumcapacitywindfarm: 1000.8 MW
Operatingdays: 347 Days/Year
Naturalgasprice: 0.17 €/Sm3
Electricityprice: 20.03 €/MWh
H2producedbyelectrolysis: 497 Tonnes/day
H2producedbyATR: 1301 Tonnes/day
Totalhydrogenproduction: 1798 Tonnes/day
TotalCAPEX: 2262.8 M€
TotalOPEX: 638.5 M€
Breakevenpriceofhydrogen: 1.42 €/kgH2
Specificproductioncostfromelectrolysis: 1.76 €/kgH2
AsTable31shows,theavailablenaturalgasatTjeldbergoddenenablesaproductionof1800tonnes
ofhydrogen/day.Thisresultsinabreakevenpriceof1.42€/kgofhydrogen,a15%reductionfromthe
capacityevaluated inChapter5.Sincethe limitedNGenablesCREtoproduceadditionalhydrogen
comparedtoreformingalone,thepotentialforCREtoachievelowerproductioncostexists.Table32
showsthatthisisnotthecase.Evenwithlowerproductioncapacity,ATRisevenbetterrelativeto
CRE, compared to results in Chapter 5. Hence, CRE would not be the preferable alternative for
stationaryproductionofthissize.
Table32-Stationarycase1:Benchmarkbreakevenpriceofhydrogenproduction,giventhesamefeedstockdemands
SMR ATR Unit
Hydrogen
produced:
1268
1303
Tonnes/day
Breakevenprice: 1.33 1.33 €/kg
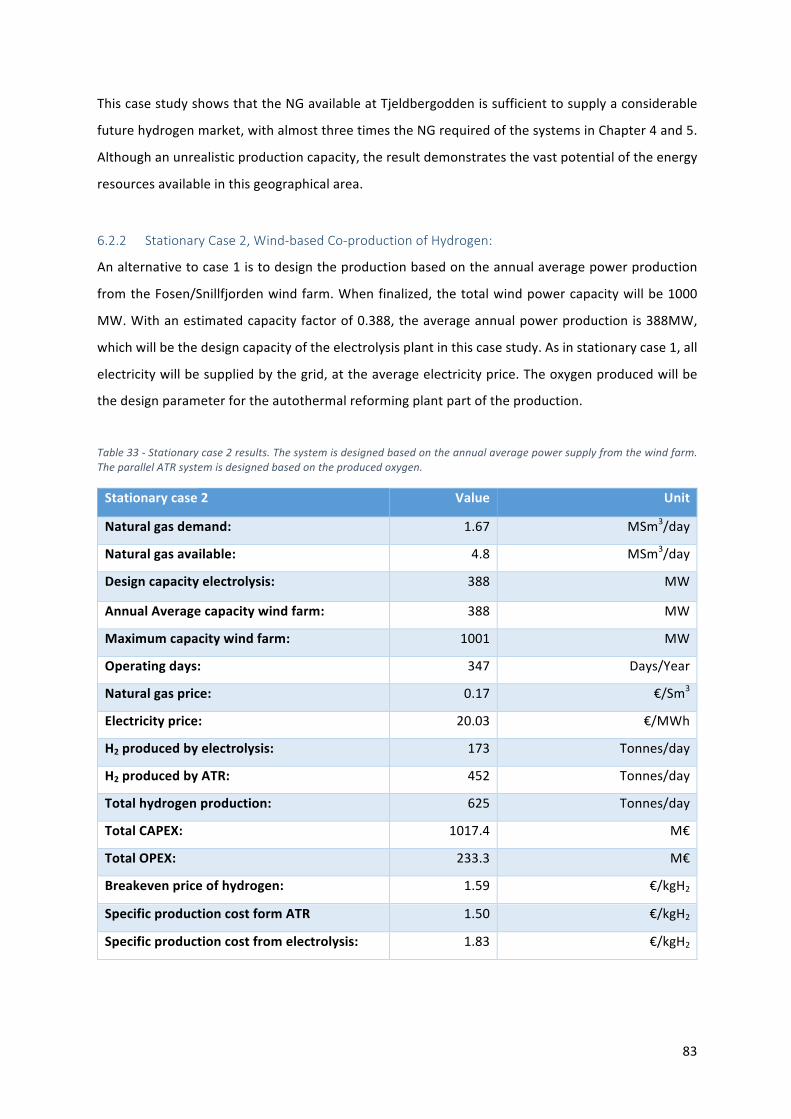
83
ThiscasestudyshowsthattheNGavailableatTjeldbergoddenissufficienttosupplyaconsiderable
futurehydrogenmarket,withalmostthreetimestheNGrequiredofthesystemsinChapter4and5.
Althoughanunrealisticproductioncapacity,theresultdemonstratesthevastpotentialoftheenergy
resourcesavailableinthisgeographicalarea.
6.2.2 StationaryCase2,Wind-basedCo-productionofHydrogen:
Analternativetocase1istodesigntheproductionbasedontheannualaveragepowerproduction
fromtheFosen/Snillfjordenwindfarm.Whenfinalized,thetotalwindpowercapacitywillbe1000
MW.Withanestimatedcapacityfactorof0.388,theaverageannualpowerproductionis388MW,
whichwillbethedesigncapacityoftheelectrolysisplantinthiscasestudy.Asinstationarycase1,all
electricitywillbesuppliedbythegrid,attheaverageelectricityprice.Theoxygenproducedwillbe
thedesignparameterfortheautothermalreformingplantpartoftheproduction.
Table33-Stationarycase2results.Thesystemisdesignedbasedontheannualaveragepowersupplyfromthewindfarm.TheparallelATRsystemisdesignedbasedontheproducedoxygen.
Stationarycase2 Value Unit
Naturalgasdemand: 1.67 MSm3/day
Naturalgasavailable: 4.8 MSm3/day
Designcapacityelectrolysis: 388 MW
AnnualAveragecapacitywindfarm: 388 MW
Maximumcapacitywindfarm: 1001 MW
Operatingdays: 347 Days/Year
Naturalgasprice: 0.17 €/Sm3
Electricityprice: 20.03 €/MWh
H2producedbyelectrolysis: 173 Tonnes/day
H2producedbyATR: 452 Tonnes/day
Totalhydrogenproduction: 625 Tonnes/day
TotalCAPEX: 1017.4 M€
TotalOPEX: 233.3 M€
Breakevenpriceofhydrogen: 1.59 €/kgH2
SpecificproductioncostformATR 1.50 €/kgH2
Specificproductioncostfromelectrolysis: 1.83 €/kgH2
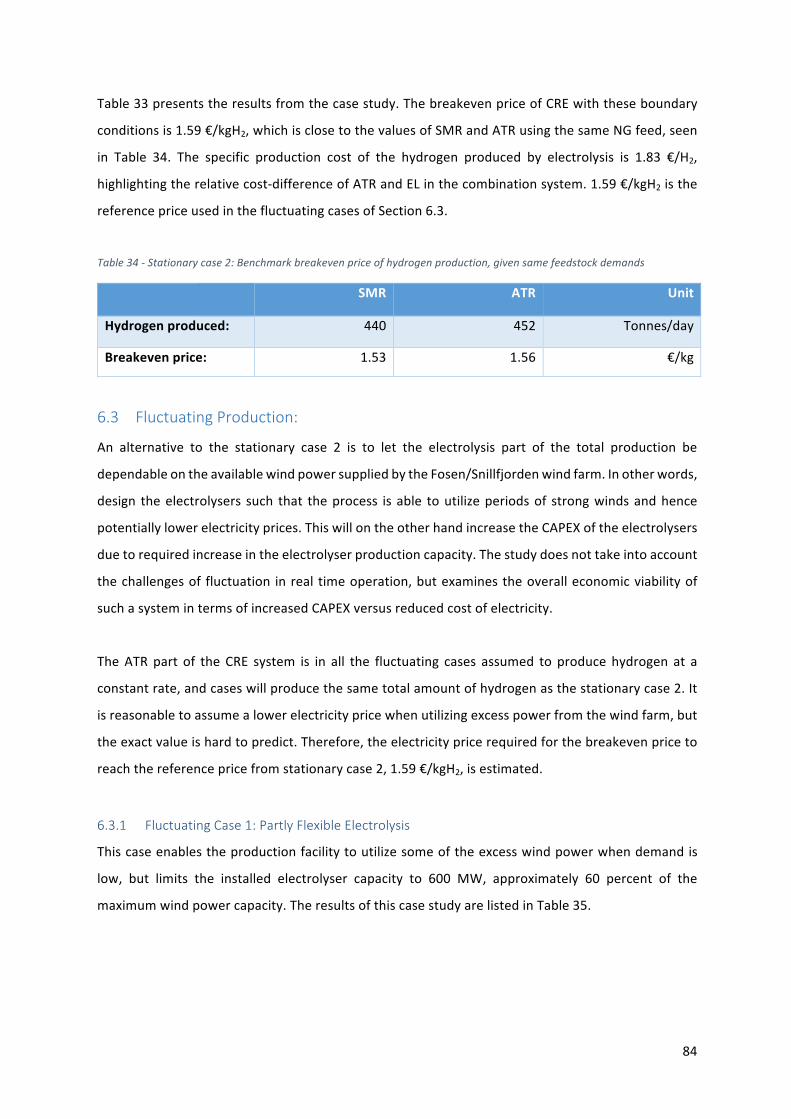
84
Table33presentstheresultsfromthecasestudy.ThebreakevenpriceofCREwiththeseboundary
conditionsis1.59€/kgH2,whichisclosetothevaluesofSMRandATRusingthesameNGfeed,seen
in Table 34. The specific production cost of the hydrogen produced by electrolysis is 1.83 €/H2,
highlightingtherelativecost-differenceofATRandELinthecombinationsystem.1.59€/kgH2isthe
referencepriceusedinthefluctuatingcasesofSection6.3.
Table34-Stationarycase2:Benchmarkbreakevenpriceofhydrogenproduction,givensamefeedstockdemands
SMR ATR Unit
Hydrogenproduced: 440 452 Tonnes/day
Breakevenprice: 1.53 1.56 €/kg
6.3 FluctuatingProduction:
An alternative to the stationary case 2 is to let the electrolysis part of the total production be
dependableontheavailablewindpowersuppliedbytheFosen/Snillfjordenwindfarm.Inotherwords,
design theelectrolysers such that theprocess is able toutilizeperiodsof strongwindsandhence
potentiallylowerelectricityprices.ThiswillontheotherhandincreasetheCAPEXoftheelectrolysers
duetorequiredincreaseintheelectrolyserproductioncapacity.Thestudydoesnottakeintoaccount
thechallengesof fluctuation inreal timeoperation,butexaminestheoveralleconomicviabilityof
suchasystemintermsofincreasedCAPEXversusreducedcostofelectricity.
TheATRpart of the CRE system is in all the fluctuating cases assumed to produce hydrogen at a
constantrate,andcaseswillproducethesametotalamountofhydrogenasthestationarycase2.It
isreasonabletoassumealowerelectricitypricewhenutilizingexcesspowerfromthewindfarm,but
theexactvalueishardtopredict.Therefore,theelectricitypricerequiredforthebreakevenpriceto
reachthereferencepricefromstationarycase2,1.59€/kgH2,isestimated.
6.3.1 FluctuatingCase1:PartlyFlexibleElectrolysis
Thiscaseenablestheproductionfacilitytoutilizesomeoftheexcesswindpowerwhendemandis
low, but limits the installed electrolyser capacity to 600 MW, approximately 60 percent of the
maximumwindpowercapacity.TheresultsofthiscasestudyarelistedinTable35.
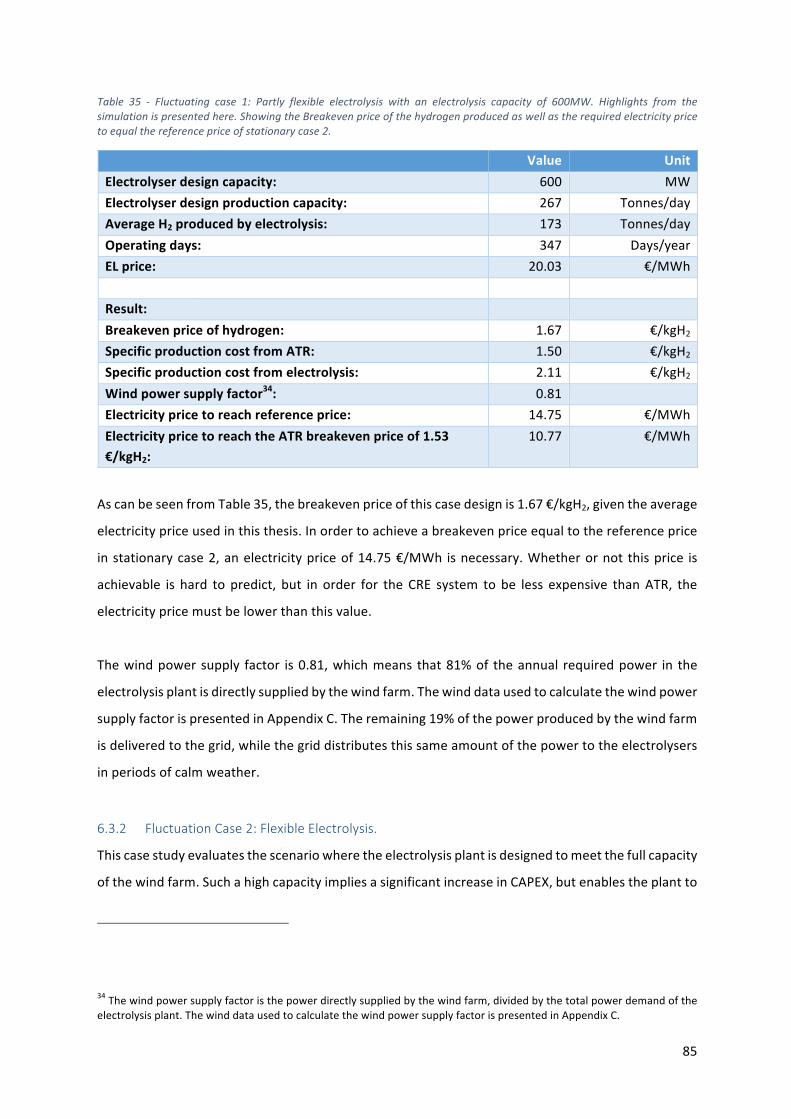
85
Table 35 - Fluctuating case 1: Partly flexible electrolysis with an electrolysis capacity of 600MW. Highlights from thesimulationispresentedhere.ShowingtheBreakevenpriceofthehydrogenproducedaswellastherequiredelectricitypricetoequalthereferencepriceofstationarycase2.
AscanbeseenfromTable35,thebreakevenpriceofthiscasedesignis1.67€/kgH2,giventheaverage
electricitypriceusedinthisthesis.Inordertoachieveabreakevenpriceequaltothereferenceprice
instationarycase2,anelectricitypriceof14.75€/MWh isnecessary.Whetherornot thisprice is
achievable is hard to predict, but in order for theCRE system to be less expensive thanATR, the
electricitypricemustbelowerthanthisvalue.
Thewindpowersupply factor is0.81,whichmeans that81%of theannual requiredpower in the
electrolysisplantisdirectlysuppliedbythewindfarm.Thewinddatausedtocalculatethewindpower
supplyfactorispresentedinAppendixC.Theremaining19%ofthepowerproducedbythewindfarm
isdeliveredtothegrid,whilethegriddistributesthissameamountofthepowertotheelectrolysers
inperiodsofcalmweather.
6.3.2 FluctuationCase2:FlexibleElectrolysis.
Thiscasestudyevaluatesthescenariowheretheelectrolysisplantisdesignedtomeetthefullcapacity
ofthewindfarm.SuchahighcapacityimpliesasignificantincreaseinCAPEX,butenablestheplantto
34Thewindpowersupplyfactoristhepowerdirectlysuppliedbythewindfarm,dividedbythetotalpowerdemandoftheelectrolysisplant.ThewinddatausedtocalculatethewindpowersupplyfactorispresentedinAppendixC.
Value UnitElectrolyserdesigncapacity: 600 MWElectrolyserdesignproductioncapacity: 267 Tonnes/dayAverageH2producedbyelectrolysis: 173 Tonnes/dayOperatingdays: 347 Days/yearELprice: 20.03 €/MWh Result: Breakevenpriceofhydrogen: 1.67 €/kgH2SpecificproductioncostfromATR: 1.50 €/kgH2Specificproductioncostfromelectrolysis: 2.11 €/kgH2Windpowersupplyfactor34: 0.81 Electricitypricetoreachreferenceprice: 14.75 €/MWhElectricitypricetoreachtheATRbreakevenpriceof1.53€/kgH2:
10.77 €/MWh
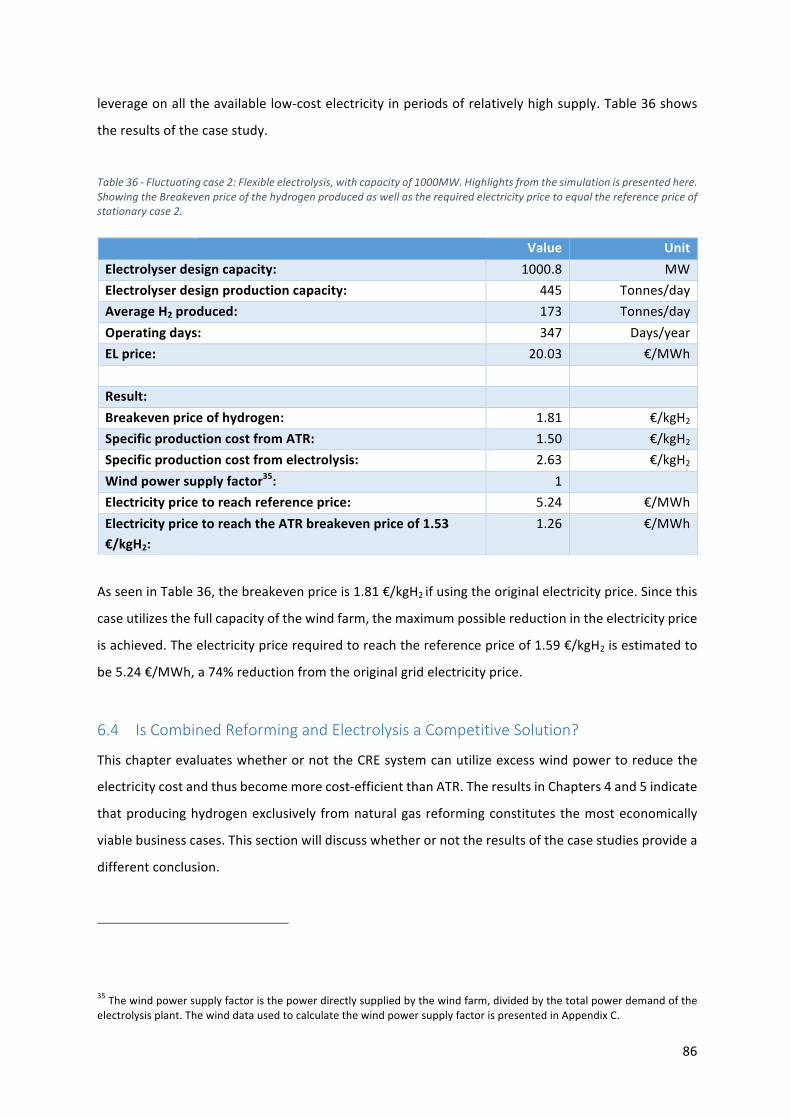
86
leverageonalltheavailablelow-costelectricityinperiodsofrelativelyhighsupply.Table36shows
theresultsofthecasestudy.
Table36-Fluctuatingcase2:Flexibleelectrolysis,withcapacityof1000MW.Highlightsfromthesimulationispresentedhere.ShowingtheBreakevenpriceofthehydrogenproducedaswellastherequiredelectricitypricetoequalthereferencepriceofstationarycase2.
AsseeninTable36,thebreakevenpriceis1.81€/kgH2ifusingtheoriginalelectricityprice.Sincethis
caseutilizesthefullcapacityofthewindfarm,themaximumpossiblereductionintheelectricityprice
isachieved.Theelectricitypricerequiredtoreachthereferencepriceof1.59€/kgH2isestimatedto
be5.24€/MWh,a74%reductionfromtheoriginalgridelectricityprice.
6.4 IsCombinedReformingandElectrolysisaCompetitiveSolution?
ThischapterevaluateswhetherornottheCREsystemcanutilizeexcesswindpowertoreducethe
electricitycostandthusbecomemorecost-efficientthanATR.TheresultsinChapters4and5indicate
thatproducinghydrogenexclusively fromnaturalgasreformingconstitutesthemosteconomically
viablebusinesscases.Thissectionwilldiscusswhetherornottheresultsofthecasestudiesprovidea
differentconclusion.
35Thewindpowersupplyfactoristhepowerdirectlysuppliedbythewindfarm,dividedbythetotalpowerdemandoftheelectrolysisplant.ThewinddatausedtocalculatethewindpowersupplyfactorispresentedinAppendixC.
Value UnitElectrolyserdesigncapacity: 1000.8 MWElectrolyserdesignproductioncapacity: 445 Tonnes/dayAverageH2produced: 173 Tonnes/dayOperatingdays: 347 Days/yearELprice: 20.03 €/MWh Result: Breakevenpriceofhydrogen: 1.81 €/kgH2SpecificproductioncostfromATR: 1.50 €/kgH2Specificproductioncostfromelectrolysis: 2.63 €/kgH2Windpowersupplyfactor35: 1 Electricitypricetoreachreferenceprice: 5.24 €/MWhElectricitypricetoreachtheATRbreakevenpriceof1.53€/kgH2:
1.26 €/MWh
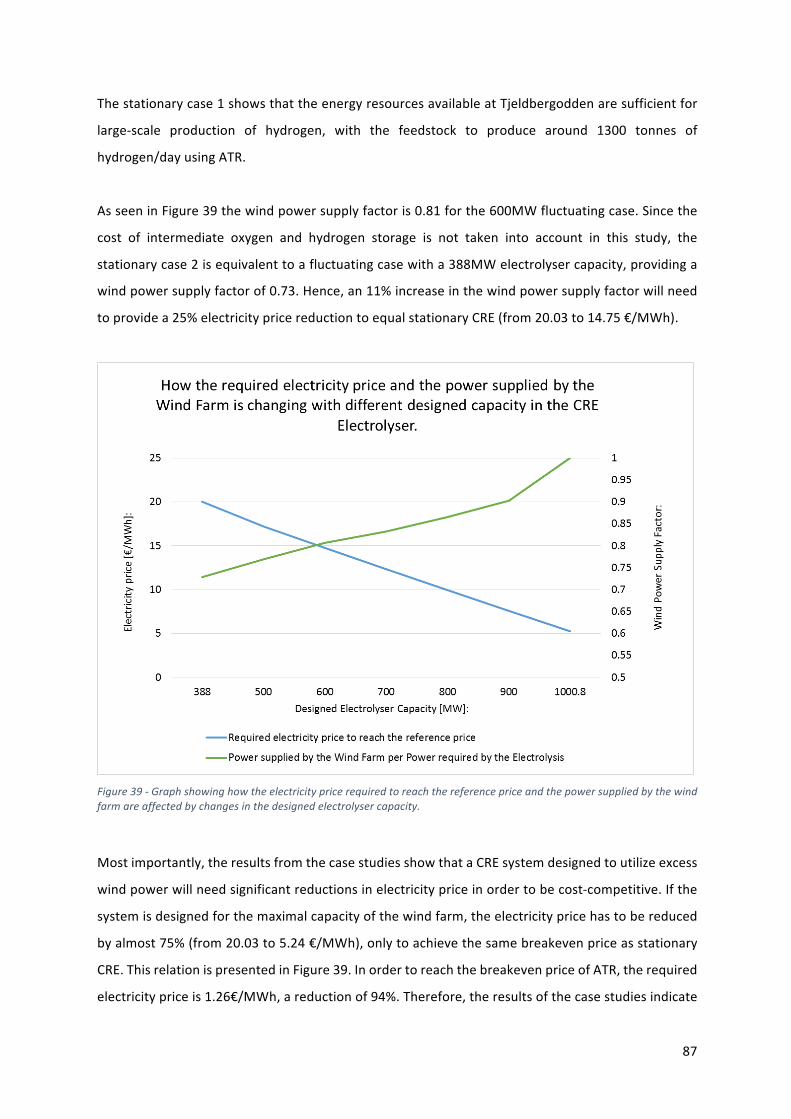
87
Thestationarycase1showsthattheenergyresourcesavailableatTjeldbergoddenaresufficientfor
large-scale production of hydrogen, with the feedstock to produce around 1300 tonnes of
hydrogen/dayusingATR.
AsseeninFigure39thewindpowersupplyfactoris0.81forthe600MWfluctuatingcase.Sincethe
cost of intermediate oxygen and hydrogen storage is not taken into account in this study, the
stationarycase2isequivalenttoafluctuatingcasewitha388MWelectrolysercapacity,providinga
windpowersupplyfactorof0.73.Hence,an11%increaseinthewindpowersupplyfactorwillneed
toprovidea25%electricitypricereductiontoequalstationaryCRE(from20.03to14.75€/MWh).
Figure39-Graphshowinghowtheelectricitypricerequiredtoreachthereferencepriceandthepowersuppliedbythewindfarmareaffectedbychangesinthedesignedelectrolysercapacity.
Mostimportantly,theresultsfromthecasestudiesshowthataCREsystemdesignedtoutilizeexcess
windpowerwillneedsignificantreductionsinelectricitypriceinordertobecost-competitive.Ifthe
systemisdesignedforthemaximalcapacityofthewindfarm,theelectricitypricehastobereduced
byalmost75%(from20.03to5.24€/MWh),onlytoachievethesamebreakevenpriceasstationary
CRE.ThisrelationispresentedinFigure39.InordertoreachthebreakevenpriceofATR,therequired
electricitypriceis1.26€/MWh,areductionof94%.Therefore,theresultsofthecasestudiesindicate

88
that,giventheboundaryconditionsinthisthesis,acombinedelectrolysisandreforming(CRE)system
utilizingexcesswindpowerisnotlikelytobecost-competitivewitheitherstationaryCREpoweredby
thegridortraditionalreforming.
Itisimportanttohighlightthattheestimatedelectricitypricereductionsdonotincludethecostof
intermediate oxygen and hydrogen storage required in the fluctuating production facilities. The
constantnaturalgas reformingoccurringsimultaneously,demandsasteady flowofoxygen,which
impliesaneedforastoragesystem.Thiswouldincreasethecostevenfurthermakingthefluctuating
casesevenlessviable.
89
7 Conclusion
Hydrogen is a promising energy carrier with the potential to reduce CO2 emissions from fossil
resources,integraterenewableswithsocietyandreplacefossilfuelsinthetransportationsector.The
idea of a hydrogen-based energy chain is not new, but with recent developments in renewable
industriesandpoliticalsupport,theconditionsareimprovingsignificantly.
Thisthesisprovidesatechnicalandafinancialanalysisofavailable,maturesystemscapableoflarge-
scaleoperation,inordertoevaluatethepotentialoflarge-scaleproductionofhydrogeninNorway.It
isdifficulttoprovidegeneralconclusionstobusinesscaseswithsuchuncertainboundaryconditions,
especiallywith regards to feedstockcostandmarketdevelopment,butbasedon theassumptions
thoroughlystatedthroughthethesis,thefollowingpointssummarizethekeyfindings.
Keyfindingsinthethesis:
Ø ATRandSMRarethemostenergyefficientalternativesforcarbon-leanhydrogenproduction,bothwithaplantenergyefficiencyof82%.ATRhas themostpotentialof furtheremissionreductions.
Ø SMRisthemostcost-efficientmethodforlarge-scaleoperationinNorway,producingcarbon-leanhydrogenatabreakevenpriceof1.51€/kgina500tonnes/dayfacility
Ø Thepricepremiumof72%reduction inCO2emissionsusingSMRwithCCS is0.32€/kgH2.ComparedtoSMR,ATRrepresentsanadditionalcostof0.08€/kgH2inordertofurtherreducetheCO2emissionswith70%.
Ø Given the assumed feedstock prices, electrolysis is the most cost-efficient alternative forproduction rates up to around 150 tonnes of hydrogen per day, while SMR is the bestalternativeforlarge-scaleproduction.
Ø Combined electrolysis and reforming (CRE) is not likely to become the most cost-efficientalternative,butislesssensitivetovariationsinfeedstockcosts.
Ø Theresultsof thecasestudies indicatethat,giventheboundaryconditions in this thesis,acombinedelectrolysisandreforming(CRE)systemutilizingexcesswindpowerisnotlikelytobecost-competitivewitheitherstationaryCREpoweredbythegridortraditionalreforming.
Fivesystemswerefullyevaluatedinthisthesis:SMR,SMR+,ATR,ElectrolysisandCRE.Allprovedto
beeconomicallyviablefordomesticconsumptionaswellasforexportscenarios,giventheassumed
costlevel.Duetokeytechnicalfactorsnotsimulatedandlackoffinancialdata,POXwasnotincluded
90
in the financial analysis. Electrolysis is the only zero emission alternative evaluated, and it proves
superiorinsmalltomediumscaleproductionplantsupto150tonnesofhydrogenperday,giventhat
thepriceofelectricityandnaturalgasremainsatthelevelusedinthisthesis.
Acasestudyofhydrogenproductionusingthecombinedreformingandelectrolysis(CRE)systemat
Tjeldbergoddenwasconducted.Theresultsshowedthattheenergyresourcesavailableisenoughto
produce1800tonnesperday.Amoreimportantresultfromthecasestudieswasthatutilizingexcess
power from a wind farm is not likely to reduce the electricity cost sufficiently in order to be
economicallyviable.
Theresultsofthisthesisindicatethathydrogenproductioncanutilizethevastenergyresourcesand
CCSpossibilitiesinNorwaytocreateviable,low-carbonenergyvaluechains.
91
8 ProposalsforFurtherWork
Multiplelarge-scalehydrogenproductionplantsexistaroundtheworldtoday,butthecombinationof
low-costresourcesinNorwayaswellasafocusonminimizingCO2emissionscreatesnewchallenges.
Themotivation for this thesiswas theopportunityof refiningNorwegian resources to create low-
emissionvaluechainsandinorderforthattobecomeareality,significantresearchremains.Inthe
caseofsmall-scaleproduction intendedfordomesticconsumption,therequiredtechnologiesexist
today,althoughthemarketisyettodevelop.Forlarge-scaleproductionintendedforexport,storage
andtransportationtechnologiesareunderdevelopment,buttheystillrequireconsiderableattention.
Thissectionwillprovidespecificproposalsforfurtherresearchintwocategories:Onegroupofspecific
areaswithin theproductionprocess,which require in-depth researchor cost-estimation, andone
groupofareaswithintheexportvaluechain.
8.1.1 Proposalsforfurtherresearchwithinthehydrogenproductionprocesses:
Ø Processcontrolandoff-designanalysis.Thisthesisassumesabasecasereliabilityof95%,
meaning that the plant operates at full capacity 347 days of the year. Both reactor
temperature and steam-to-carbon ratio requires intelligent control systems in order to
operateoptimally.Howdoesthesystemoperateinoff-designconditions?Transientoperation
mayalsooccur,especiallyduetothedirectconnectiontothegas-receivingterminal.Howcan
thesystemhandlestartandstop?
Ø Batchprocesssimulation.Theconnectionbetweenthecarbonabsorptioncolumnandthe
PSA,bothbatchprocesses,isnotsimulatedinthisthesis.Bothsystemsareassumed“black
boxes” with a base-case 95% recovery rate in the absorption and 90% in the PSA. These
systemsareveryimportantinordertoprovidehighcaptureandhighyield.Deviationsfrom
thebasecasewillresultinlargeresponseinthebusinesscase.
Ø Production design, sizing andplanning. Detailed cost-estimation of the entire facility and
evaluation of possible policy support and governmental subsidies. An export focus seems
most viable, resulting in the need for inclusion of a liquefaction plant, storage and an
offloadingterminal.Allofwhichincludedevelopingtechnologies.
92
Ø Demoplant.Constructionofademofacilitycantoprovidekeyoperationalexperienceand
reduce the risks related to full-scaleoperation.Combinedwith the fuellingofa ferryor in
cooperationwithATBinMid-Norway,thiscouldalsoassistinthepursuitoffurtherindustrial
andgovernmentalsupport.
8.1.2 Proposalsforresearchwithintheexportvaluechain:
Ø Hydrogenstorageandtransportation.Severalstudiesondifferenttechnologiesandmethods
forhydrogenstorageandtransportationhavebeenconducted,butawellstructuredoverview
of the alternatives is difficult to apprehend. In the case of Norwegian export, SINTEF
conductedapaperin2008,whichcanbeusedasinspiration.Onegoalcanbetoperforma
techno-economic analysis in order to benchmark the cost of storage and transport from
NorwaytoEuropeorJapan.Anothercanbeamoredetailedtechnicalstudyofthedifferent
alternatives,estimatingenergyefficiencies,carbonfootprint,viabilityandoptimization.
Ø Market studyof futurehydrogenconsumption inNorway.Although transportation is the
mostvisiblefutureconsumerthroughmedia,theannual,industrialdemandforhydrogenwas
more than 50million worldwide in 2015, emittingmore than 500million tonnes of CO2.
Projects likeTizir smeltingplant inTyssedal isanexampleofemergingpotentialhydrogen
demandintheNorwegianindustryaswell.Astudyoftheexistingindustrialhydrogendemand
inNorway,aswellasestimatingafuturecarbon-leanhydrogendemandcanbeanimportant
partofthedevelopmentofproductiontechnologyintheyearstocome.
93
References
[1] IEA,“TechnologyRoadmap-HydrogenandFuelCells,”OECD/IEA,2015.
[2] Global CCS Institute, “www.globalccsinstitute.com,” 17 12 2015. [Online]. Available:
http://www.globalccsinstitute.com/projects/sleipner%C2%A0co2-storage-project. [Accessed
10062016].
[3] Global CCS Institute, “www.globalccsinstitute.com,” 17 12 2015. [Online]. Available:
http://www.globalccsinstitute.com/projects/sn%C3%B8hvit-co2-storage-project. [Accessed
10062016].
[4] K. Liu, C. Song and V. Subramani, Hydrogen and Syngas Production and Purification
Technologies,USA:Wiley,2010.
[5] J.Dunleavy,“SulfurasaCatalystPoison,”JohnsonMatthey,Billingham,2006.
[6] J.C.MolburgandD.R.D., “Hydrogen fromSteam-MethaneReformingwithCO2Capture,”
AnnualInternationalPittsburghCoalConference,Pittsburgh,2003.
[7] ThyssenKrupp Industrial Solutions, “Thyssenkrupp-industrial-solutions.com,” 2016. [Online].
Available: http://www.thyssenkrupp-industrial-
solutions.com/fileadmin/documents/brochures/uhde_brochures_pdf_en_7.pdf. [Accessed
2016].
[8] M. Voldsund, K. Jordal and R. Anantharaman, “Hydrogen production with CO2 capture,”
ScienceDirect.
[9] InternationalEnergyAgency, “HydrogenProduction&Distribution,” IEAEnergyTechnology
Essentials,2007.
[10] IEA Greenhouse - "SMR, POX and ATR", “ieaghg.org/,” March 2015. [Online]. Available:
http://www.ieaghg.org/docs/General_Docs/IEAGHG_Presentations/18_-
_S._Santos_IEAGHGSECURED.pdf.[Accessed07Des2015].
[11] A. Smith and J. Klosek, “A review of air separation technologies and their integrationwith
energyconversionprocesses,”FuelProcessingtechnology70,2001.
[12] R.Chaubey,S.Satanand,O.J.OlusolaandM.Sudip,“Areviewondevelopmentofindustrial
processes and emerging techniques for production of hydrogen from renewable and
sustainablesources,”RenewableandSustainableEnergyReviews-Elsevier,2013.
[13] D. Berstad, R. Anantharaman and P.Nekså, “Low-Temperature CO2 capture technologies -
Applicationsandpotential,”SINTEFEnergyResearch,Trondheim,2013.
94
[14] Statoil, “Statoil.com,” 10 12 2013. [Online]. Available:
http://www.statoil.com/no/TechnologyInnovation/NewEnergy/Co2CaptureStorage/Pages/de
fault.aspx.[Accessed15032016].
[15] Miljødirektoratet, “Miljøstatus.no,” [Online]. Available:
http://www.miljostatus.no/tema/klima/norske-klimagassutslipp/co2-utslipp/. [Accessed
2016].
[16] Sintef, NTNU, “Nasjonale rammebetingelser og potensial for hydrogensatsingen i Norge,”
Sintef,2016.
[17] K. H. Storaker and A. Goodwin, “Hydrogen in the Maritime Sector,” Norwegian School of
Economics,Bergen,2015.
[18] Sysla Grønn, “Syslagronn.no,” 2015. [Online]. Available:
http://syslagronn.no/2015/10/16/syslagronn/startskudd-for-storskala-
hydrogenproduksjon_64587/.[Accessed2016].
[19] L. Nohrstedt, “nyteknik.se,” 04 04 2016. [Online]. Available:
http://www.nyteknik.se/energi/nya-satsningen-stal-utan-kol-6537738. [Accessed 23 05
2016].
[20] V. Åtland and D. Jakobsen, “Value chains for hydrogen export from Norway,” NTNU,
Trondheim,2015.
[21] NewEnergyWorld,“Genericestimationscenariosofmarketpenetrationanddemandforecast
for“premium”greenhydrogeninshort,midandlongterm,”2015.
[22] KawasakiHeavyIndustries,“FeasibilityStudyofCO2freehydrogenchain,”Kawasaki,2012.
[23] EEA,“eea.europa.eu,”14122015.[Online].Available:http://www.eea.europa.eu/data-and-
maps/indicators/transport-final-energy-consumption-by-mode/assessment-5. [Accessed 15
122015].
[24] Statistisk sentralbyrå, “ssb.no,”09022015. [Online].Available:https://www.ssb.no/energi-
og-industri/statistikker/elektrisitet/maaned/2015-02-09.[Accessed15122015].
[25] Green car congress, “www.grenncarcongress.com,” 14 03 2016. [Online]. Available:
http://www.greencarcongress.com/2016/03/20160314-khi.html.[Accessed30052016].
[26] Toyota,“2016ToyotaMiraiProductInformation,”Toyota,2015.
[27] SSB, “SSB.no,” 22 04 2016. [Online]. Available: https://www.ssb.no/transport-og-
reiseliv/statistikker/klreg/aar/2016-04-22.[Accessed22052016].
[28] LindeKryotechnik,“EnhancedCryogenicAirSeparation,”LindeGroup,2009.
95
[29] NELHydrogen,“Efficientelectrolysersforhydrogenproduction,”Nel-HydrogenAS,Notodden,
2016.
[30] SSB, “SSB.no,” 06 05 2015. [Online]. Available: https://www.ssb.no/energi-og-
industri/statistikker/energiregn/aar-forelopige/2015-05-06.[Accessed12052016].
[31] T. Ramsden, D. Steward and J. Zuboy, “Analyzing the Levelized cost of Centralized and
Distributed Hydrogen Production Using the H2A production Model, Version 2,” National
RenewableEnergyLaboratory,Virginia,2009.
[32] Norges Bank, “Norges-bank.no,” 06 06 2016. [Online]. Available: http://www.norges-
bank.no/Statistikk/Rentestatistikk/Statsobligasjoner-Rente-Arsgjennomsnitt-av-daglige-
noteringer/.[Accessed06062016].
[33] Damodoran Online, “pages.stern.nyu.edu,” 05 01 2015. [Online]. Available:
http://pages.stern.nyu.edu/~adamodar/New_Home_Page/datacurrent.html.[Accessed0905
2016].
[34] Statoil ASA, “Statoil.com,” 01 10 2015. [Online]. Available:
http://www.statoil.com/no/InvestorCentre/AnalyticalInformation/InternalGasPrice/Pages/de
fault.aspx.[Accessed09122015].
[35] Nasdaq, “nasdaqomx.com,” 13 05 2016. [Online]. Available:
http://www.nasdaqomx.com/commodities/market-prices.[Accessed13052016].
[36] Statnett,“www.statnett.no,”25092015.[Online].Available:http://www.statnett.no/Drift-og-
marked/Nettleie-og-tariffstrategi/Tariffer-i-sentralnettet/.[Accessed20052016].
[37] U.S.DepartmentofEnergy,“AnalysisofNaturalGas-toLiquidTransportationFuelsviaFischer-
Tropsch,”DOE,2013.
[38] NEL-Hydrogen,“50MWHydrogenPlant,”NEL-HydrogenAS,Notodden,2016.
[39] Norges Miljøverndirektorat, “miljodirektoratet.no,” [Online]. Available:
http://www.miljodirektoratet.no/no/Tema/klima/CO2-priskompensasjon/Kvotepris-for-
stottearet-2014/.[Accessed30052016].
[40] Coin News media group LLC, “usinflationcalculator.com,” 17 05 2016. [Online]. Available:
http://www.usinflationcalculator.com.[Accessed21052016].
[41] EuropeanCommission-"ReducingCO2emissionsfrompassengercars",“ec.europa.eu,”1012
2015. [Online]. Available:
http://ec.europa.eu/clima/policies/transport/vehicles/cars/index_en.htm. [Accessed 17 12
2015].
96
[42] EurelectricandVGB,“EfficiencyinElectricityGeneration,”Eurelectric&VGB,2003.
[43] StatistiskSentralbyrå,“ssb.no,”31052016.[Online].Available:http://www.ssb.no/elkraftpris.
[Accessed04062016].
[44] Reuters, “Reuters.com,” 04 05 2016. [Online]. Available:
http://www.reuters.com/article/europe-carbon-germany-idUSL5N181906. [Accessed 30 05
2016].
[45] TekniskUkeblad,“www.tu.no,”23022016.[Online].Available:http://www.tu.no/artikler/na-
skjer-det-europas-storste-vindkraftanlegg-bygges-pa-fosen/277306.[Accessed05052016].
[46] Statoil, “Statoil.com,” 14 08 2008. [Online]. Available:
http://www.statoil.com/en/OurOperations/TerminalsRefining/Tjeldbergodden/Pages/default
.aspx.[Accessed06052016].
[47] P.J.Dahl,T.S.Christensen,S.Winter-MadsenandS.M.King,“Provenautothermalreforming
technologyformodernlarge-scalemethanolplants,”HaldorTopsøeA/S,Copehagen,2014.
[48] Gassco, “www.gassco.no,” [Online]. Available: https://www.gassco.no/en/our-
activities/pipelines-and-platforms/haltenpipe/.[Accessed06052016].
[49] Statkraft,“FaktaarkFosenVind,”Statkraft,2016.
[50] L. Nord, “Pre-combustion CO2 capture: Analysis of integrated reforming combined cycle,”
NTNU,Trondheim,2010.
[51] H.M.KvamsdalandM.Thor,“Tjeldbergoddenpower/methanol-CO2reductioneffortsSP2:
CO2captureandtransport,”SINTEF,2005.
[52] InternationalEnergyAgency,“TechnologyRoadmap-HydrogenandFuelCells,”International
energyAgency,Paris,2015.

97
Appendices
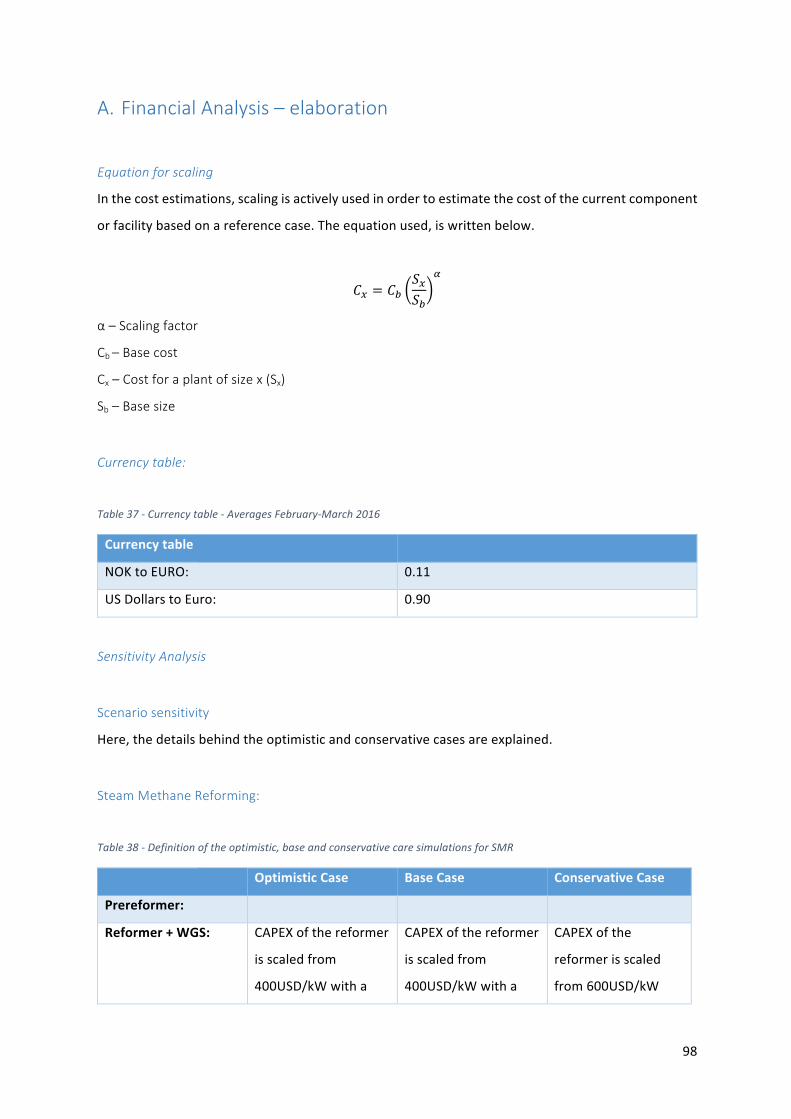
98
A. FinancialAnalysis–elaboration
Equationforscaling
Inthecostestimations,scalingisactivelyusedinordertoestimatethecostofthecurrentcomponent
orfacilitybasedonareferencecase.Theequationused,iswrittenbelow.
]g = ]hPg
Ph
i
α–Scalingfactor
Cb–Basecost
Cx–Costforaplantofsizex(Sx)
Sb–Basesize
Currencytable:
Table37-Currencytable-AveragesFebruary-March2016
Currencytable
NOKtoEURO: 0.11
USDollarstoEuro: 0.90
SensitivityAnalysis
Scenariosensitivity
Here,thedetailsbehindtheoptimisticandconservativecasesareexplained.
SteamMethaneReforming:
Table38-Definitionoftheoptimistic,baseandconservativecaresimulationsforSMR
OptimisticCase BaseCase ConservativeCase
Prereformer:
Reformer+WGS: CAPEXofthereformer
isscaledfrom
400USD/kWwitha
CAPEXofthereformer
isscaledfrom
400USD/kWwitha
CAPEXofthe
reformerisscaled
from600USD/kW
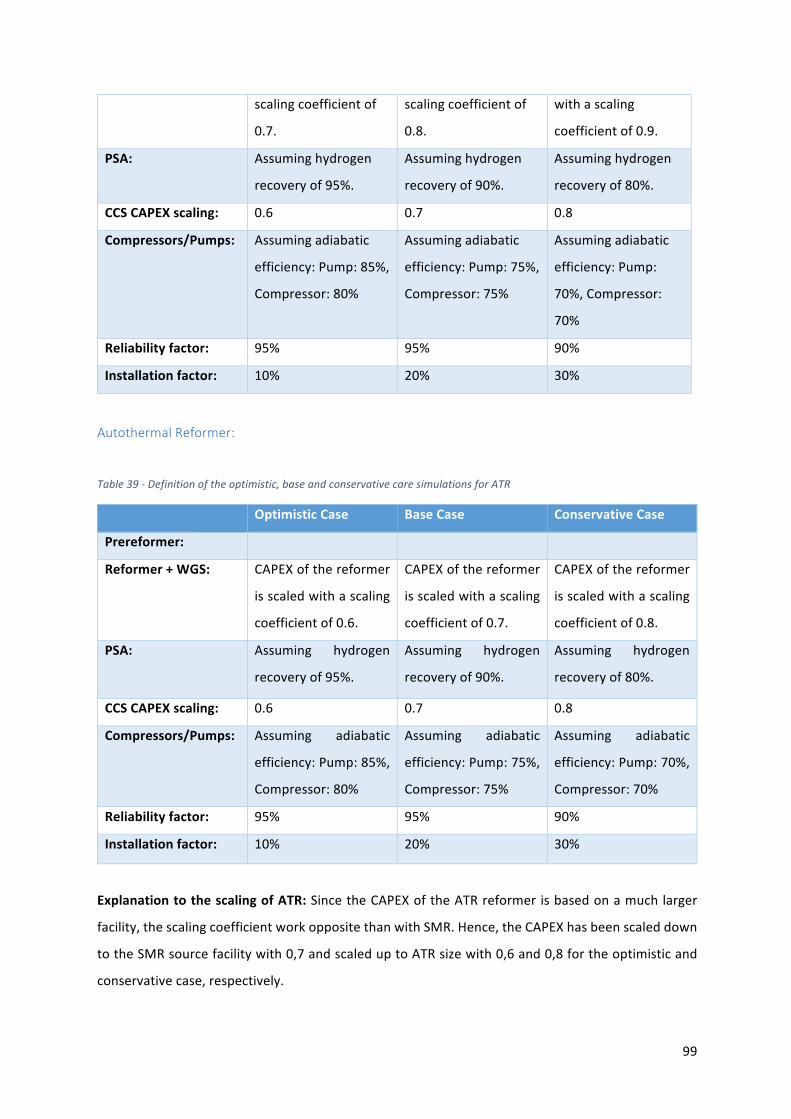
99
scalingcoefficientof
0.7.
scalingcoefficientof
0.8.
withascaling
coefficientof0.9.
PSA: Assuminghydrogen
recoveryof95%.
Assuminghydrogen
recoveryof90%.
Assuminghydrogen
recoveryof80%.
CCSCAPEXscaling: 0.6 0.7 0.8
Compressors/Pumps: Assumingadiabatic
efficiency:Pump:85%,
Compressor:80%
Assumingadiabatic
efficiency:Pump:75%,
Compressor:75%
Assumingadiabatic
efficiency:Pump:
70%,Compressor:
70%
Reliabilityfactor: 95% 95% 90%
Installationfactor: 10% 20% 30%
AutothermalReformer:
Table39-Definitionoftheoptimistic,baseandconservativecaresimulationsforATR
OptimisticCase BaseCase ConservativeCase
Prereformer:
Reformer+WGS: CAPEXofthereformer
isscaledwithascaling
coefficientof0.6.
CAPEXofthereformer
isscaledwithascaling
coefficientof0.7.
CAPEXofthereformer
isscaledwithascaling
coefficientof0.8.
PSA: Assuming hydrogen
recoveryof95%.
Assuming hydrogen
recoveryof90%.
Assuming hydrogen
recoveryof80%.
CCSCAPEXscaling: 0.6 0.7 0.8
Compressors/Pumps: Assuming adiabatic
efficiency:Pump:85%,
Compressor:80%
Assuming adiabatic
efficiency:Pump:75%,
Compressor:75%
Assuming adiabatic
efficiency:Pump:70%,
Compressor:70%
Reliabilityfactor: 95% 95% 90%
Installationfactor: 10% 20% 30%
ExplanationtothescalingofATR:SincetheCAPEXoftheATRreformerisbasedonamuchlarger
facility,thescalingcoefficientworkoppositethanwithSMR.Hence,theCAPEXhasbeenscaleddown
totheSMRsourcefacilitywith0,7andscaleduptoATRsizewith0,6and0,8fortheoptimisticand
conservativecase,respectively.
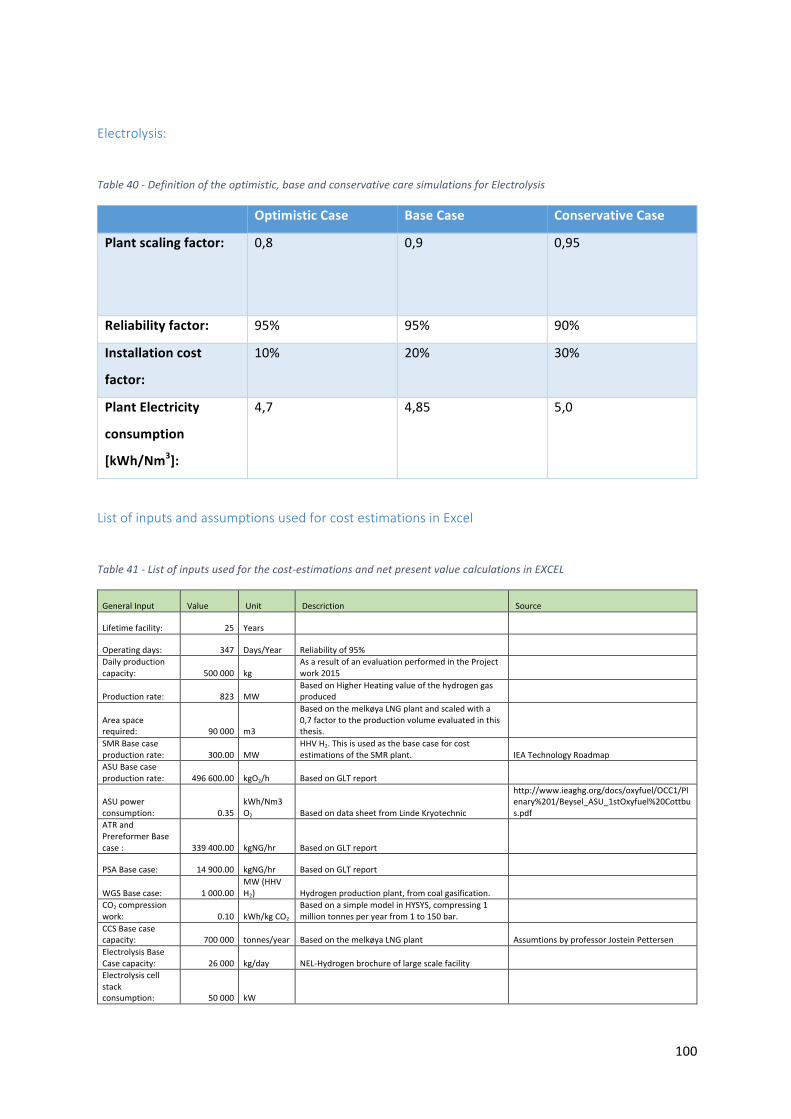
100
Electrolysis:
Table40-Definitionoftheoptimistic,baseandconservativecaresimulationsforElectrolysis
OptimisticCase BaseCase ConservativeCase
Plantscalingfactor: 0,8 0,9 0,95
Reliabilityfactor: 95% 95% 90%
Installationcost
factor:
10% 20% 30%
PlantElectricity
consumption
[kWh/Nm3]:
4,7 4,85 5,0
ListofinputsandassumptionsusedforcostestimationsinExcel
Table41-Listofinputsusedforthecost-estimationsandnetpresentvaluecalculationsinEXCEL
GeneralInput Value Unit Descriction Source
Lifetimefacility: 25 Years
Operatingdays: 347 Days/Year Reliabilityof95% Dailyproductioncapacity: 500000 kg
AsaresultofanevaluationperformedintheProjectwork2015
Productionrate: 823 MWBasedonHigherHeatingvalueofthehydrogengasproduced
Areaspacerequired: 90000 m3
BasedonthemelkøyaLNGplantandscaledwitha0,7factortotheproductionvolumeevaluatedinthisthesis.
SMRBasecaseproductionrate: 300.00 MW
HHVH2.ThisisusedasthebasecaseforcostestimationsoftheSMRplant. IEATechnologyRoadmap
ASUBasecaseproductionrate: 496600.00 kgO2/h BasedonGLTreport
ASUpowerconsumption: 0.35
kWh/Nm3O2 BasedondatasheetfromLindeKryotechnic
http://www.ieaghg.org/docs/oxyfuel/OCC1/Plenary%201/Beysel_ASU_1stOxyfuel%20Cottbus.pdf
ATRandPrereformerBasecase: 339400.00 kgNG/hr BasedonGLTreport
PSABasecase: 14900.00 kgNG/hr BasedonGLTreport
WGSBasecase: 1000.00MW(HHVH2) Hydrogenproductionplant,fromcoalgasification.
CO2compressionwork: 0.10 kWh/kgCO2
BasedonasimplemodelinHYSYS,compressing1milliontonnesperyearfrom1to150bar.
CCSBasecasecapacity: 700000 tonnes/year BasedonthemelkøyaLNGplant AssumtionsbyprofessorJosteinPettersenElectrolysisBaseCasecapacity: 26000 kg/day NEL-Hydrogenbrochureoflargescalefacility Electrolysiscellstackconsumption: 50000 kW
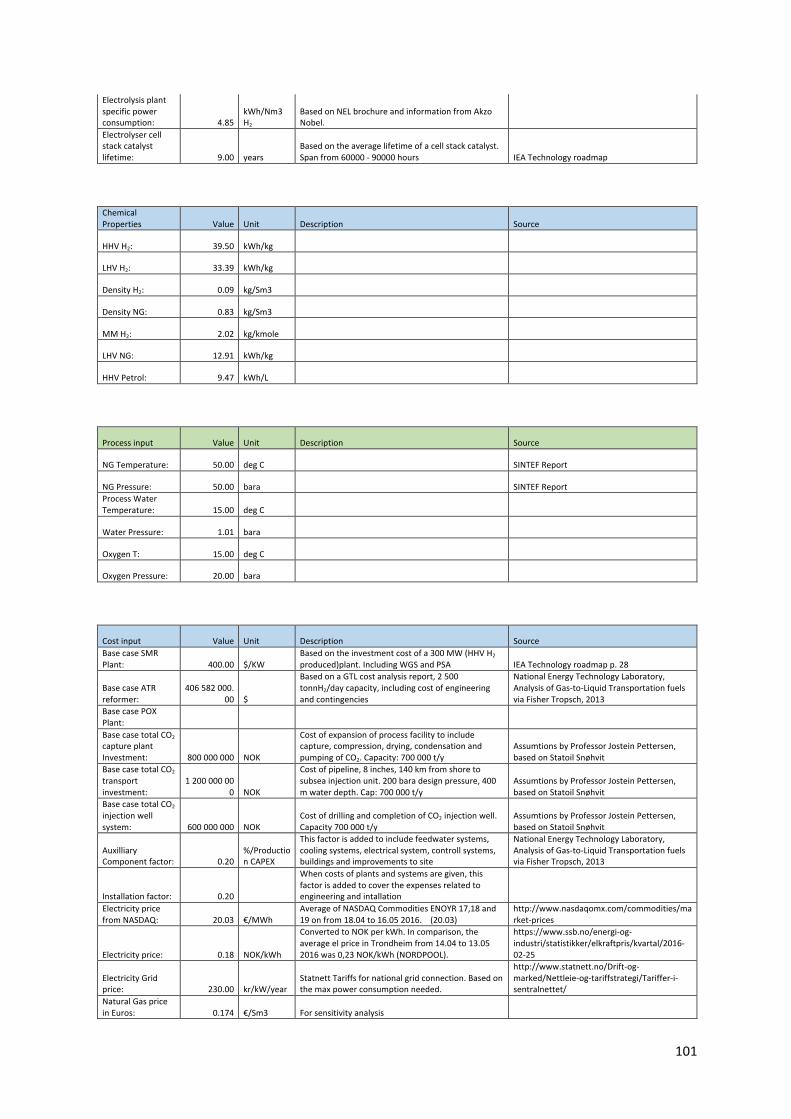
101
Electrolysisplantspecificpowerconsumption: 4.85
kWh/Nm3H2
BasedonNELbrochureandinformationfromAkzoNobel.
Electrolysercellstackcatalystlifetime: 9.00 years
Basedontheaveragelifetimeofacellstackcatalyst.Spanfrom60000-90000hours IEATechnologyroadmap
ChemicalProperties Value Unit Description Source
HHVH2: 39.50 kWh/kg
LHVH2: 33.39 kWh/kg
DensityH2: 0.09 kg/Sm3
DensityNG: 0.83 kg/Sm3
MMH2: 2.02 kg/kmole
LHVNG: 12.91 kWh/kg
HHVPetrol: 9.47 kWh/L
Processinput Value Unit Description Source
NGTemperature: 50.00 degC SINTEFReport
NGPressure: 50.00 bara SINTEFReportProcessWaterTemperature: 15.00 degC
WaterPressure: 1.01 bara
OxygenT: 15.00 degC
OxygenPressure: 20.00 bara
Costinput Value Unit Description SourceBasecaseSMRPlant: 400.00 $/KW
Basedontheinvestmentcostofa300MW(HHVH2produced)plant.IncludingWGSandPSA IEATechnologyroadmapp.28
BasecaseATRreformer:
406582000.
00 $
BasedonaGTLcostanalysisreport,2500tonnH2/daycapacity,includingcostofengineeringandcontingencies
NationalEnergyTechnologyLaboratory,AnalysisofGas-to-LiquidTransportationfuelsviaFisherTropsch,2013
BasecasePOXPlant: BasecasetotalCO2captureplantInvestment: 800000000 NOK
Costofexpansionofprocessfacilitytoincludecapture,compression,drying,condensationandpumpingofCO2.Capacity:700000t/y
AssumtionsbyProfessorJosteinPettersen,basedonStatoilSnøhvit
BasecasetotalCO2transportinvestment:
120000000
0 NOK
Costofpipeline,8inches,140kmfromshoretosubseainjectionunit.200baradesignpressure,400mwaterdepth.Cap:700000t/y
AssumtionsbyProfessorJosteinPettersen,basedonStatoilSnøhvit
BasecasetotalCO2injectionwellsystem: 600000000 NOK
CostofdrillingandcompletionofCO2injectionwell.Capacity700000t/y
AssumtionsbyProfessorJosteinPettersen,basedonStatoilSnøhvit
AuxilliaryComponentfactor: 0.20
%/ProductionCAPEX
Thisfactorisaddedtoincludefeedwatersystems,coolingsystems,electricalsystem,controllsystems,buildingsandimprovementstosite
NationalEnergyTechnologyLaboratory,AnalysisofGas-to-LiquidTransportationfuelsviaFisherTropsch,2013
Installationfactor: 0.20
Whencostsofplantsandsystemsaregiven,thisfactorisaddedtocovertheexpensesrelatedtoengineeringandintallation
ElectricitypricefromNASDAQ: 20.03 €/MWh
AverageofNASDAQCommoditiesENOYR17,18and19onfrom18.04to16.052016.(20.03)
http://www.nasdaqomx.com/commodities/market-prices
Electricityprice: 0.18 NOK/kWh
ConvertedtoNOKperkWh.Incomparison,theaverageelpriceinTrondheimfrom14.04to13.052016was0,23NOK/kWh(NORDPOOL).
https://www.ssb.no/energi-og-industri/statistikker/elkraftpris/kvartal/2016-02-25
ElectricityGridprice: 230.00 kr/kW/year
StatnettTariffsfornationalgridconnection.Basedonthemaxpowerconsumptionneeded.
http://www.statnett.no/Drift-og-marked/Nettleie-og-tariffstrategi/Tariffer-i-sentralnettet/
NaturalGaspriceinEuros: 0.174 €/Sm3 Forsensitivityanalysis
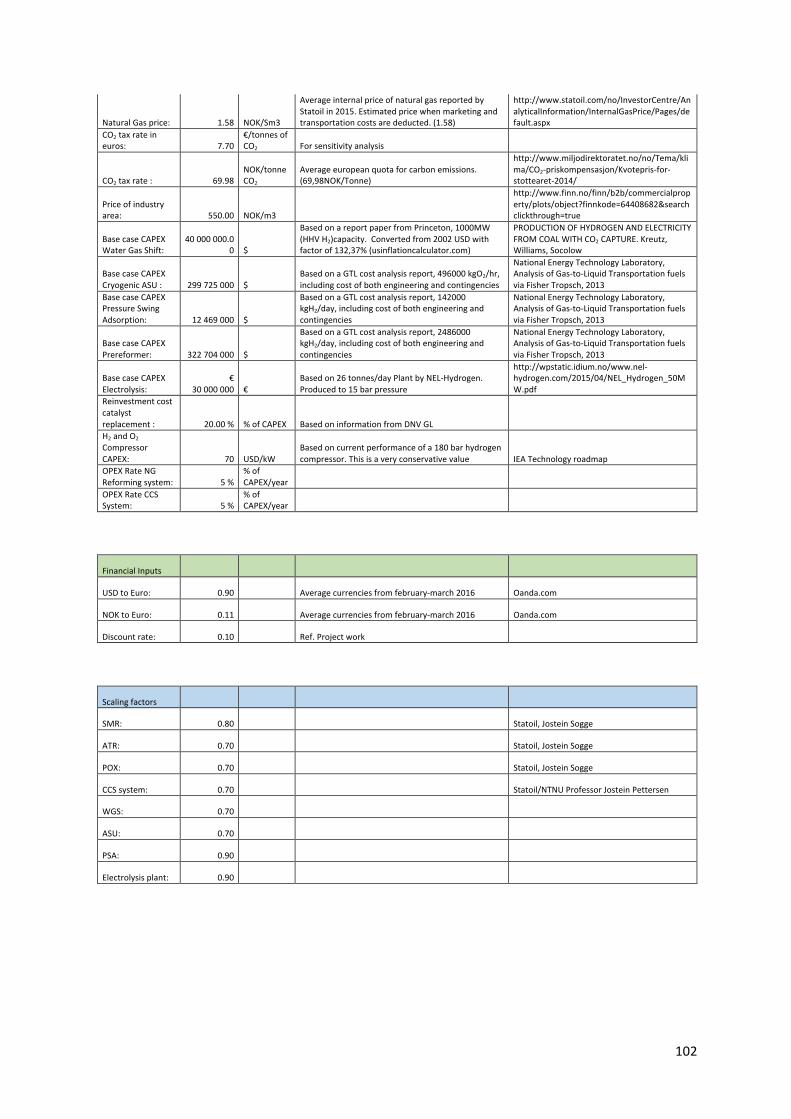
102
NaturalGasprice: 1.58 NOK/Sm3
AverageinternalpriceofnaturalgasreportedbyStatoilin2015.Estimatedpricewhenmarketingandtransportationcostsarededucted.(1.58)
http://www.statoil.com/no/InvestorCentre/AnalyticalInformation/InternalGasPrice/Pages/default.aspx
CO2taxrateineuros: 7.70
€/tonnesofCO2 Forsensitivityanalysis
CO2taxrate: 69.98NOK/tonneCO2
Averageeuropeanquotaforcarbonemissions.(69,98NOK/Tonne)
http://www.miljodirektoratet.no/no/Tema/klima/CO2-priskompensasjon/Kvotepris-for-stottearet-2014/
Priceofindustryarea: 550.00 NOK/m3
http://www.finn.no/finn/b2b/commercialproperty/plots/object?finnkode=64408682&searchclickthrough=true
BasecaseCAPEXWaterGasShift:
40000000.0
0 $
BasedonareportpaperfromPrinceton,1000MW(HHVH2)capacity.Convertedfrom2002USDwithfactorof132,37%(usinflationcalculator.com)
PRODUCTIONOFHYDROGENANDELECTRICITYFROMCOALWITHCO2CAPTURE.Kreutz,Williams,Socolow
BasecaseCAPEXCryogenicASU: 299725000 $
BasedonaGTLcostanalysisreport,496000kgO2/hr,includingcostofbothengineeringandcontingencies
NationalEnergyTechnologyLaboratory,AnalysisofGas-to-LiquidTransportationfuelsviaFisherTropsch,2013
BasecaseCAPEXPressureSwingAdsorption: 12469000 $
BasedonaGTLcostanalysisreport,142000kgH2/day,includingcostofbothengineeringandcontingencies
NationalEnergyTechnologyLaboratory,AnalysisofGas-to-LiquidTransportationfuelsviaFisherTropsch,2013
BasecaseCAPEXPrereformer: 322704000 $
BasedonaGTLcostanalysisreport,2486000kgH2/day,includingcostofbothengineeringandcontingencies
NationalEnergyTechnologyLaboratory,AnalysisofGas-to-LiquidTransportationfuelsviaFisherTropsch,2013
BasecaseCAPEXElectrolysis:
€30000000 €
Basedon26tonnes/dayPlantbyNEL-Hydrogen.Producedto15barpressure
http://wpstatic.idium.no/www.nel-hydrogen.com/2015/04/NEL_Hydrogen_50MW.pdf
Reinvestmentcostcatalystreplacement: 20.00% %ofCAPEX BasedoninformationfromDNVGL H2andO2CompressorCAPEX: 70 USD/kW
Basedoncurrentperformanceofa180barhydrogencompressor.Thisisaveryconservativevalue IEATechnologyroadmap
OPEXRateNGReformingsystem: 5%
%ofCAPEX/year
OPEXRateCCSSystem: 5%
%ofCAPEX/year
FinancialInputs
USDtoEuro: 0.90 Averagecurrenciesfromfebruary-march2016 Oanda.com
NOKtoEuro: 0.11 Averagecurrenciesfromfebruary-march2016 Oanda.com
Discountrate: 0.10 Ref.Projectwork
Scalingfactors
SMR: 0.80 Statoil,JosteinSogge
ATR: 0.70 Statoil,JosteinSogge
POX: 0.70 Statoil,JosteinSogge
CCSsystem: 0.70 Statoil/NTNUProfessorJosteinPettersen
WGS: 0.70
ASU: 0.70
PSA: 0.90
Electrolysisplant: 0.90
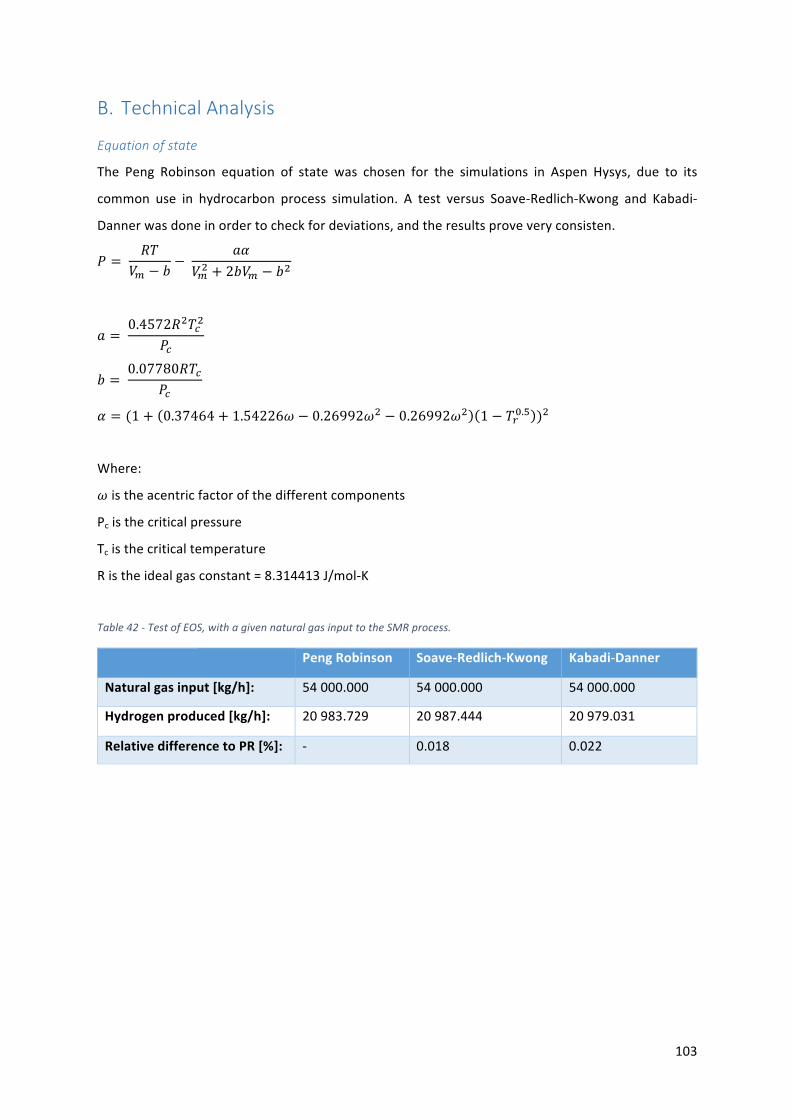
103
B. TechnicalAnalysisEquationofstate
The Peng Robinson equation of state was chosen for the simulations in Aspen Hysys, due to its
common use in hydrocarbon process simulation. A test versus Soave-Redlich-Kwong and Kabadi-
Dannerwasdoneinordertocheckfordeviations,andtheresultsproveveryconsisten.
M = jk
6l − n−
Io
6l% + 2n6l − n%
I = 0.4572j%ku
%
Mu
n = 0.07780jku
Mu
o = (1 + 0.37464 + 1.54226x − 0.26992x% − 0.26992x% 1 − kz{.| )%
Where:
xistheacentricfactorofthedifferentcomponents
Pcisthecriticalpressure
Tcisthecriticaltemperature
Ristheidealgasconstant=8.314413J/mol-K
Table42-TestofEOS,withagivennaturalgasinputtotheSMRprocess.
PengRobinson Soave-Redlich-Kwong Kabadi-Danner
Naturalgasinput[kg/h]: 54000.000 54000.000 54000.000
Hydrogenproduced[kg/h]: 20983.729 20987.444 20979.031
RelativedifferencetoPR[%]: - 0.018 0.022
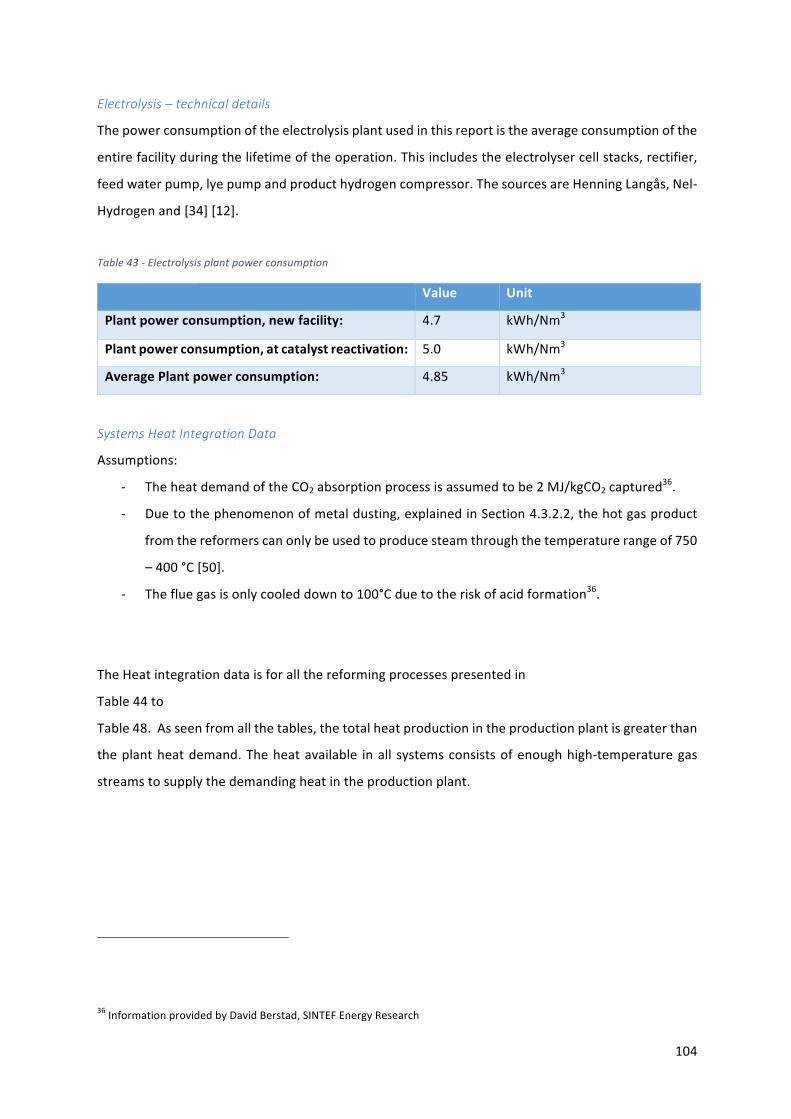
104
Electrolysis–technicaldetails
Thepowerconsumptionoftheelectrolysisplantusedinthisreportistheaverageconsumptionofthe
entirefacilityduringthelifetimeoftheoperation.Thisincludestheelectrolysercellstacks,rectifier,
feedwaterpump,lyepumpandproducthydrogencompressor.ThesourcesareHenningLangås,Nel-
Hydrogenand[34][12].
Table43-Electrolysisplantpowerconsumption
Value Unit
Plantpowerconsumption,newfacility: 4.7 kWh/Nm3
Plantpowerconsumption,atcatalystreactivation: 5.0 kWh/Nm3
AveragePlantpowerconsumption: 4.85 kWh/Nm3
SystemsHeatIntegrationData
Assumptions:
- TheheatdemandoftheCO2absorptionprocessisassumedtobe2MJ/kgCO2captured36.
- Duetothephenomenonofmetaldusting,explainedinSection4.3.2.2,thehotgasproduct
fromthereformerscanonlybeusedtoproducesteamthroughthetemperaturerangeof750
–400°C[50].
- Thefluegasisonlycooleddownto100°Cduetotheriskofacidformation36.
TheHeatintegrationdataisforallthereformingprocessespresentedin
Table44to
Table48.Asseenfromallthetables,thetotalheatproductionintheproductionplantisgreaterthan
theplantheatdemand.Theheatavailable inall systemsconsistsofenoughhigh-temperaturegas
streamstosupplythedemandingheatintheproductionplant.
36InformationprovidedbyDavidBerstad,SINTEFEnergyResearch
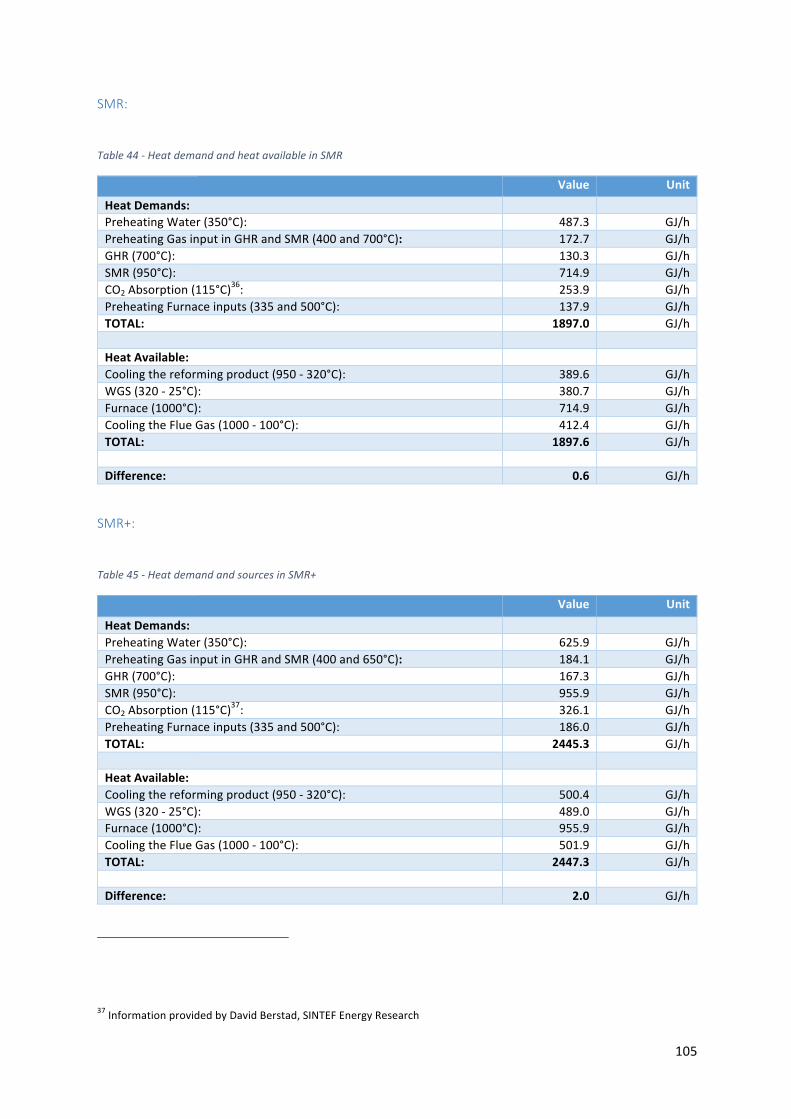
105
SMR:
Table44-HeatdemandandheatavailableinSMR
Value UnitHeatDemands: PreheatingWater(350°C): 487.3 GJ/hPreheatingGasinputinGHRandSMR(400and700°C): 172.7 GJ/hGHR(700°C): 130.3 GJ/hSMR(950°C): 714.9 GJ/hCO2Absorption(115°C)
36: 253.9 GJ/hPreheatingFurnaceinputs(335and500°C): 137.9 GJ/hTOTAL: 1897.0 GJ/h HeatAvailable: Coolingthereformingproduct(950-320°C): 389.6 GJ/hWGS(320-25°C): 380.7 GJ/hFurnace(1000°C): 714.9 GJ/hCoolingtheFlueGas(1000-100°C): 412.4 GJ/hTOTAL: 1897.6 GJ/h Difference: 0.6 GJ/h
SMR+:
Table45-HeatdemandandsourcesinSMR+
Value Unit
HeatDemands: PreheatingWater(350°C): 625.9 GJ/hPreheatingGasinputinGHRandSMR(400and650°C): 184.1 GJ/hGHR(700°C): 167.3 GJ/hSMR(950°C): 955.9 GJ/hCO2Absorption(115°C)
37: 326.1 GJ/hPreheatingFurnaceinputs(335and500°C): 186.0 GJ/hTOTAL: 2445.3 GJ/h HeatAvailable: Coolingthereformingproduct(950-320°C): 500.4 GJ/hWGS(320-25°C): 489.0 GJ/hFurnace(1000°C): 955.9 GJ/hCoolingtheFlueGas(1000-100°C): 501.9 GJ/hTOTAL: 2447.3 GJ/h Difference: 2.0 GJ/h
37InformationprovidedbyDavidBerstad,SINTEFEnergyResearch
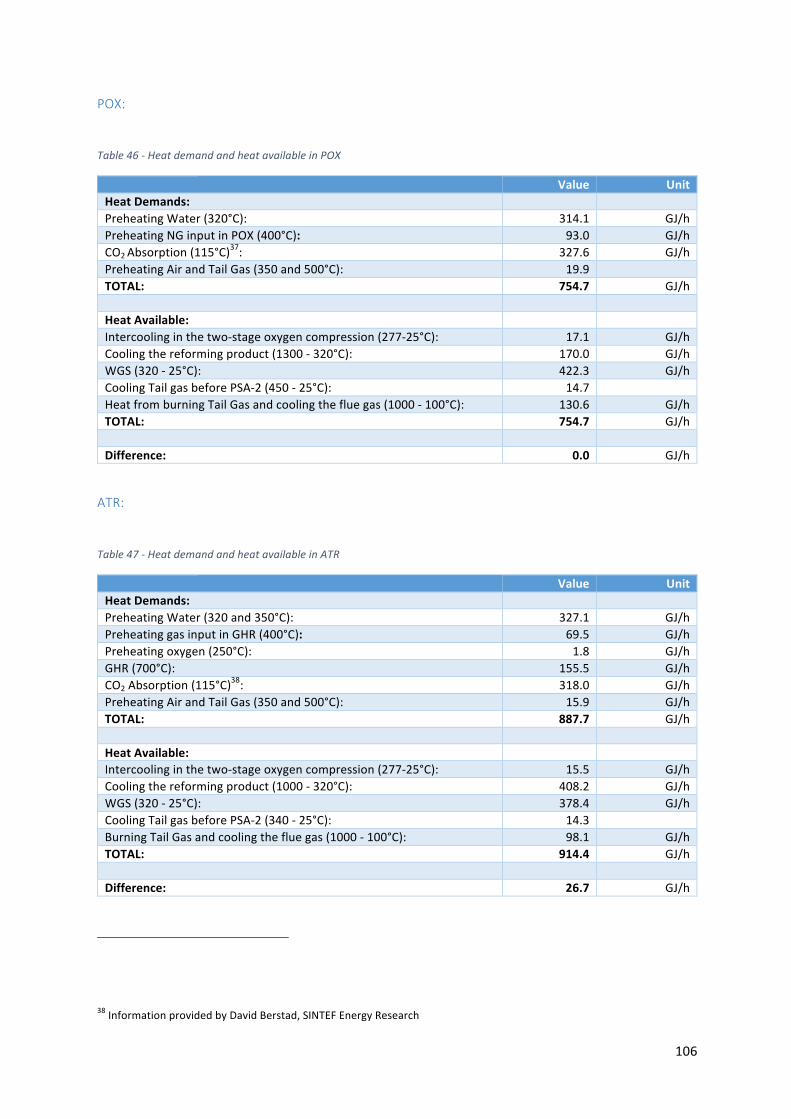
106
POX:
Table46-HeatdemandandheatavailableinPOX
Value UnitHeatDemands: PreheatingWater(320°C): 314.1 GJ/hPreheatingNGinputinPOX(400°C): 93.0 GJ/hCO2Absorption(115°C)
37: 327.6 GJ/hPreheatingAirandTailGas(350and500°C): 19.9 TOTAL: 754.7 GJ/h HeatAvailable: Intercoolinginthetwo-stageoxygencompression(277-25°C): 17.1 GJ/hCoolingthereformingproduct(1300-320°C): 170.0 GJ/hWGS(320-25°C): 422.3 GJ/hCoolingTailgasbeforePSA-2(450-25°C): 14.7 HeatfromburningTailGasandcoolingthefluegas(1000-100°C): 130.6 GJ/hTOTAL: 754.7 GJ/h Difference: 0.0 GJ/h
ATR:
Table47-HeatdemandandheatavailableinATR
Value UnitHeatDemands: PreheatingWater(320and350°C): 327.1 GJ/hPreheatinggasinputinGHR(400°C): 69.5 GJ/hPreheatingoxygen(250°C): 1.8 GJ/hGHR(700°C): 155.5 GJ/hCO2Absorption(115°C)
38: 318.0 GJ/hPreheatingAirandTailGas(350and500°C): 15.9 GJ/hTOTAL: 887.7 GJ/h HeatAvailable: Intercoolinginthetwo-stageoxygencompression(277-25°C): 15.5 GJ/hCoolingthereformingproduct(1000-320°C): 408.2 GJ/hWGS(320-25°C): 378.4 GJ/hCoolingTailgasbeforePSA-2(340-25°C): 14.3 BurningTailGasandcoolingthefluegas(1000-100°C): 98.1 GJ/hTOTAL: 914.4 GJ/h Difference: 26.7 GJ/h
38InformationprovidedbyDavidBerstad,SINTEFEnergyResearch
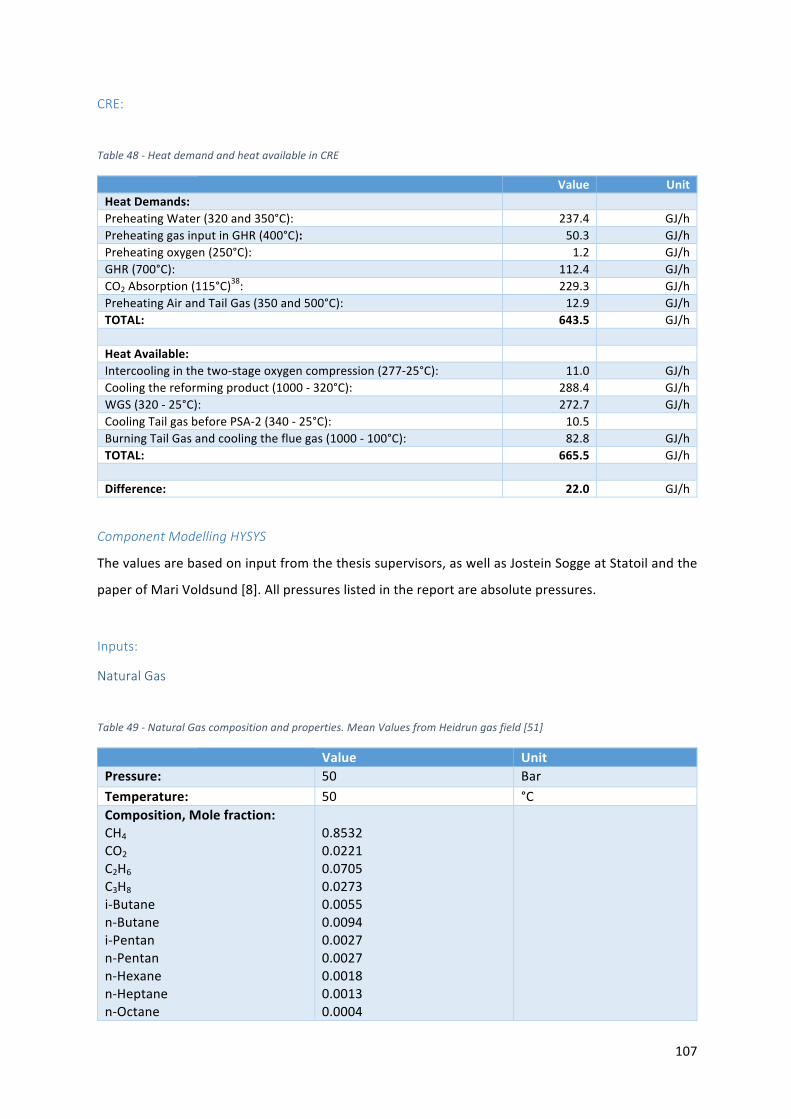
107
CRE:
Table48-HeatdemandandheatavailableinCRE
Value UnitHeatDemands: PreheatingWater(320and350°C): 237.4 GJ/hPreheatinggasinputinGHR(400°C): 50.3 GJ/hPreheatingoxygen(250°C): 1.2 GJ/hGHR(700°C): 112.4 GJ/hCO2Absorption(115°C)
38: 229.3 GJ/hPreheatingAirandTailGas(350and500°C): 12.9 GJ/hTOTAL: 643.5 GJ/h HeatAvailable: Intercoolinginthetwo-stageoxygencompression(277-25°C): 11.0 GJ/hCoolingthereformingproduct(1000-320°C): 288.4 GJ/hWGS(320-25°C): 272.7 GJ/hCoolingTailgasbeforePSA-2(340-25°C): 10.5 BurningTailGasandcoolingthefluegas(1000-100°C): 82.8 GJ/hTOTAL: 665.5 GJ/h Difference: 22.0 GJ/h
ComponentModellingHYSYS
Thevaluesarebasedoninputfromthethesissupervisors,aswellasJosteinSoggeatStatoilandthe
paperofMariVoldsund[8].Allpressureslistedinthereportareabsolutepressures.
Inputs:
NaturalGas
Table49-NaturalGascompositionandproperties.MeanValuesfromHeidrungasfield[51]
Value UnitPressure: 50 BarTemperature: 50 °CComposition,Molefraction:CH4CO2
C2H6
C3H8
i-Butanen-Butanei-Pentann-Pentann-Hexanen-Heptanen-Octane
0.85320.02210.07050.02730.00550.00940.00270.00270.00180.00130.0004
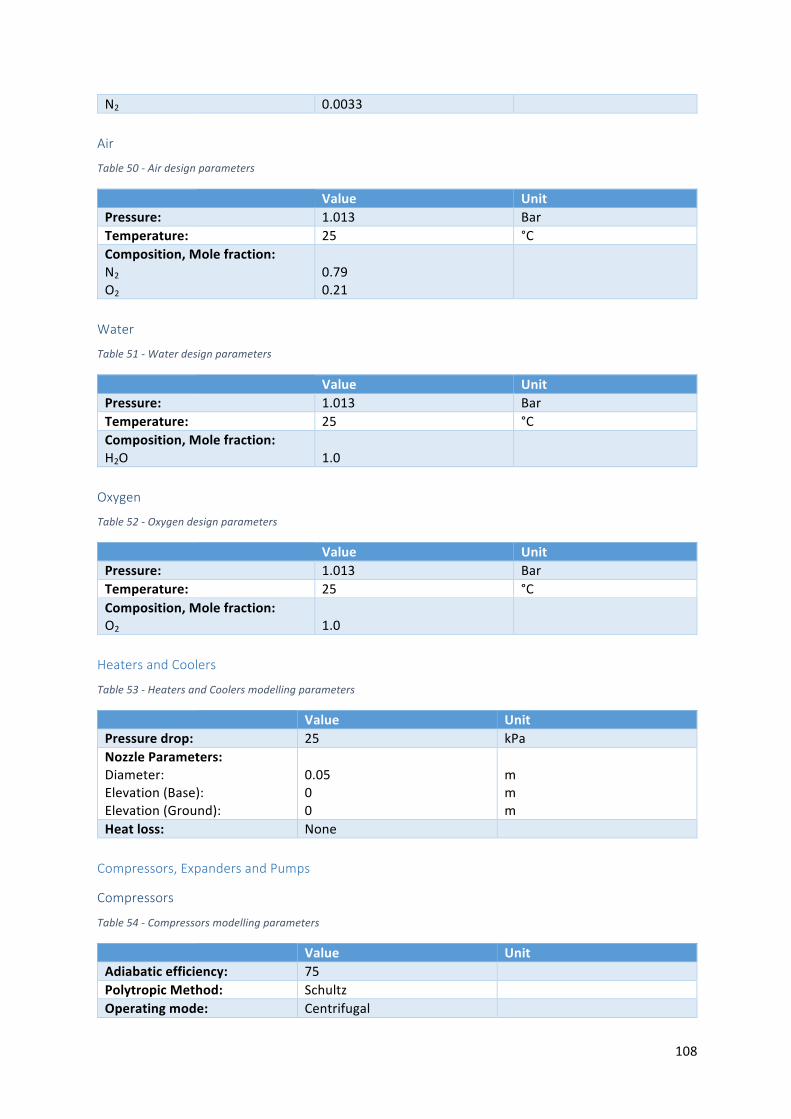
108
N2 0.0033Air
Table50-Airdesignparameters
Value UnitPressure: 1.013 BarTemperature: 25 °CComposition,Molefraction:N2
O2
0.790.21
Water
Table51-Waterdesignparameters
Value UnitPressure: 1.013 BarTemperature: 25 °CComposition,Molefraction:H2O
1.0
Oxygen
Table52-Oxygendesignparameters
Value UnitPressure: 1.013 BarTemperature: 25 °CComposition,Molefraction:O2
1.0
HeatersandCoolers
Table53-HeatersandCoolersmodellingparameters
Value UnitPressuredrop: 25 kPaNozzleParameters:Diameter:Elevation(Base):Elevation(Ground):
0.0500
mmm
Heatloss: None Compressors,ExpandersandPumps
Compressors
Table54-Compressorsmodellingparameters
Value UnitAdiabaticefficiency: 75 PolytropicMethod: Schultz Operatingmode: Centrifugal
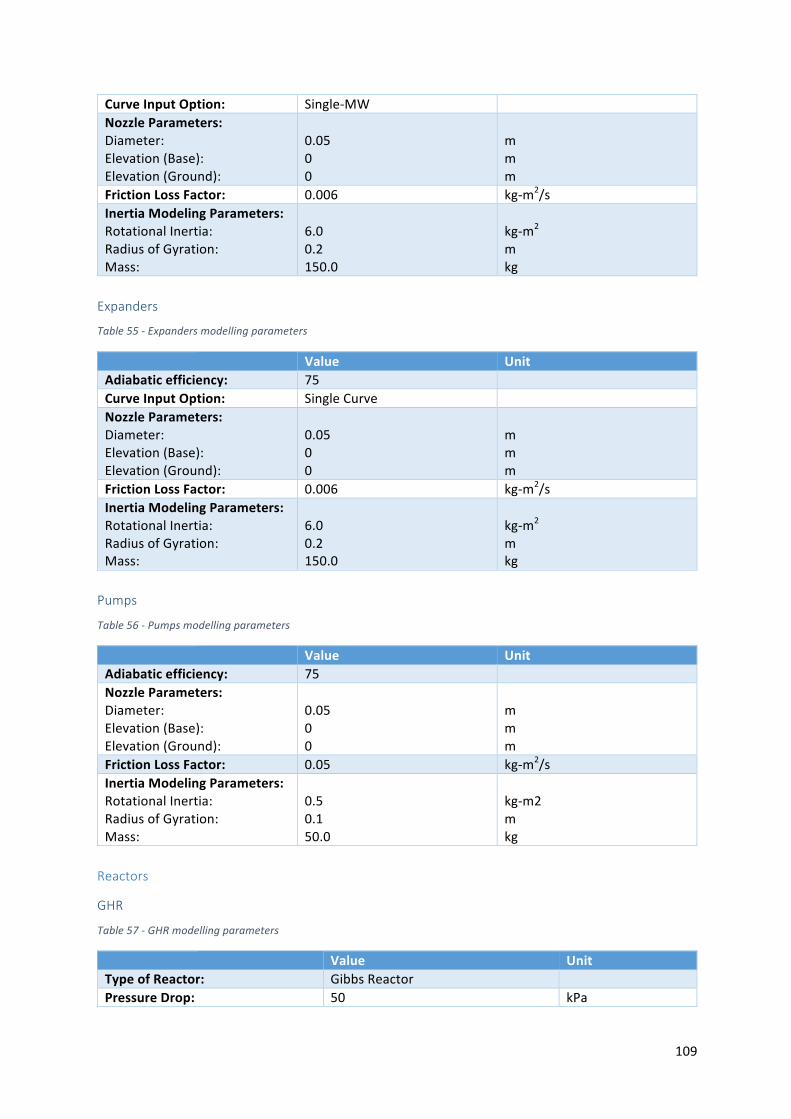
109
CurveInputOption: Single-MW NozzleParameters:Diameter:Elevation(Base):Elevation(Ground):
0.0500
mmm
FrictionLossFactor: 0.006 kg-m2/sInertiaModelingParameters:RotationalInertia:RadiusofGyration:Mass:
6.00.2150.0
kg-m2
mkg
Expanders
Table55-Expandersmodellingparameters
Value UnitAdiabaticefficiency: 75 CurveInputOption: SingleCurve NozzleParameters:Diameter:Elevation(Base):Elevation(Ground):
0.0500
mmm
FrictionLossFactor: 0.006 kg-m2/sInertiaModelingParameters:RotationalInertia:RadiusofGyration:Mass:
6.00.2150.0
kg-m2
mkg
Pumps
Table56-Pumpsmodellingparameters
Value UnitAdiabaticefficiency: 75 NozzleParameters:Diameter:Elevation(Base):Elevation(Ground):
0.0500
mmm
FrictionLossFactor: 0.05 kg-m2/sInertiaModelingParameters:RotationalInertia:RadiusofGyration:Mass:
0.50.150.0
kg-m2mkg
Reactors
GHR
Table57-GHRmodellingparameters
Value UnitTypeofReactor: GibbsReactor PressureDrop: 50 kPa
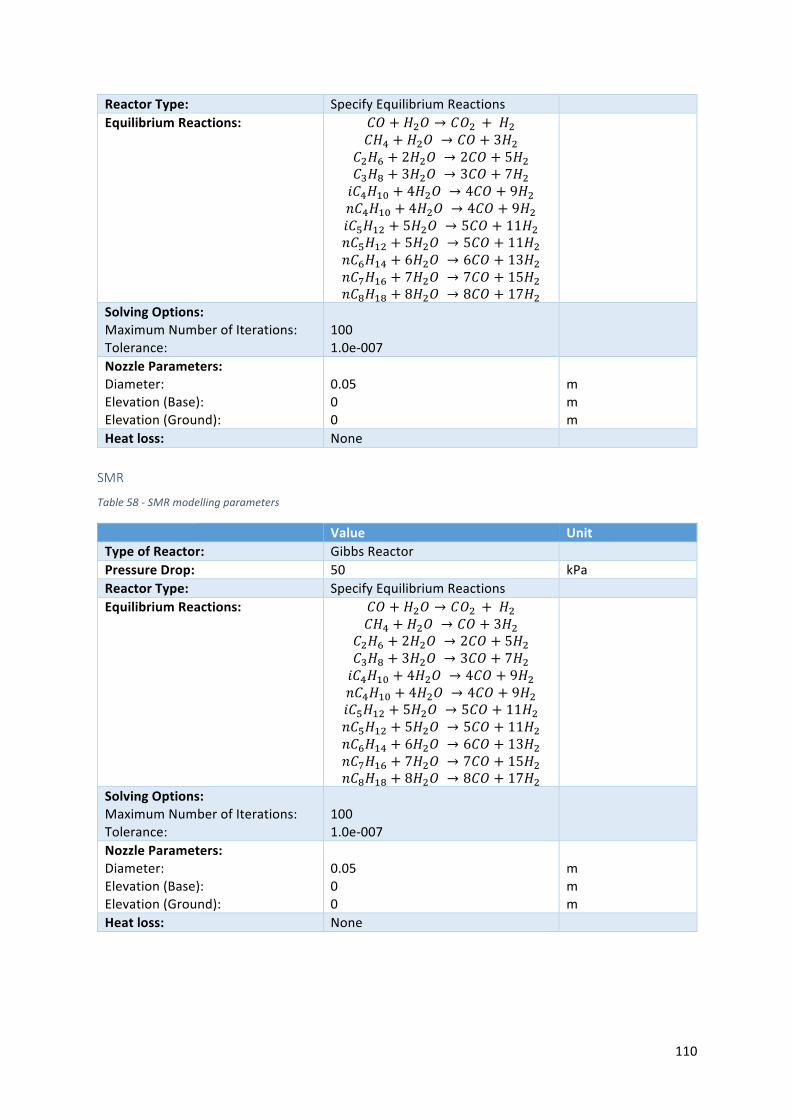
110
ReactorType: SpecifyEquilibriumReactions EquilibriumReactions: ]a + 5%a → ]a% + 5%
]5# + 5%a → ]a + 35%]%5~ + 25%a → 2]a + 55%]�5Ä + 35%a → 3]a + 75%N]#5f{ + 45%a → 4]a + 95%L]#5f{ + 45%a → 4]a + 95%N]|5f% + 55%a → 5]a + 115%L]|5f% + 55%a → 5]a + 115%L]~5f# + 65%a → 6]a + 135%L]Å5f~ + 75%a → 7]a + 155%L]Ä5fÄ + 85%a → 8]a + 175%
SolvingOptions:MaximumNumberofIterations:Tolerance:
1001.0e-007
NozzleParameters:Diameter:Elevation(Base):Elevation(Ground):
0.0500
mmm
Heatloss: None SMR
Table58-SMRmodellingparameters
Value UnitTypeofReactor: GibbsReactor PressureDrop: 50 kPaReactorType: SpecifyEquilibriumReactions EquilibriumReactions: ]a + 5%a → ]a% + 5%
]5# + 5%a → ]a + 35%]%5~ + 25%a → 2]a + 55%]�5Ä + 35%a → 3]a + 75%N]#5f{ + 45%a → 4]a + 95%L]#5f{ + 45%a → 4]a + 95%N]|5f% + 55%a → 5]a + 115%L]|5f% + 55%a → 5]a + 115%L]~5f# + 65%a → 6]a + 135%L]Å5f~ + 75%a → 7]a + 155%L]Ä5fÄ + 85%a → 8]a + 175%
SolvingOptions:MaximumNumberofIterations:Tolerance:
1001.0e-007
NozzleParameters:Diameter:Elevation(Base):Elevation(Ground):
0.0500
mmm
Heatloss: None
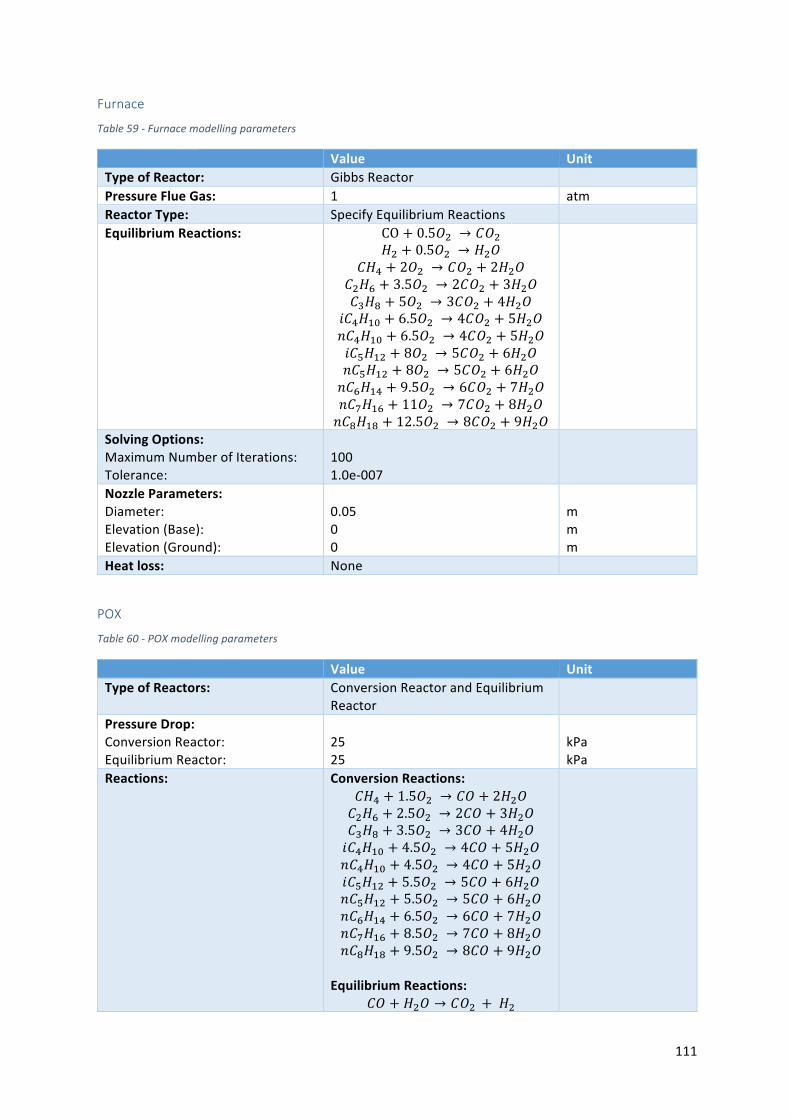
111
Furnace
Table59-Furnacemodellingparameters
Value UnitTypeofReactor: GibbsReactor PressureFlueGas: 1 atmReactorType: SpecifyEquilibriumReactions EquilibriumReactions: CO + 0.5a% → ]a%
5% + 0.5a% → 5%a]5# + 2a% → ]a% + 25%a
]%5~ + 3.5a% → 2]a% + 35%a]�5Ä + 5a% → 3]a% + 45%a
N]#5f{ + 6.5a% → 4]a% + 55%aL]#5f{ + 6.5a% → 4]a% + 55%aN]|5f% + 8a% → 5]a% + 65%aL]|5f% + 8a% → 5]a% + 65%aL]~5f# + 9.5a% → 6]a% + 75%aL]Å5f~ + 11a% → 7]a% + 85%aL]Ä5fÄ + 12.5a% → 8]a% + 95%a
SolvingOptions:MaximumNumberofIterations:Tolerance:
1001.0e-007
NozzleParameters:Diameter:Elevation(Base):Elevation(Ground):
0.0500
mmm
Heatloss: None
POX
Table60-POXmodellingparameters
Value UnitTypeofReactors: ConversionReactorandEquilibrium
Reactor
PressureDrop:ConversionReactor:EquilibriumReactor:
2525
kPakPa
Reactions: ConversionReactions:]5# + 1.5a% → ]a + 25%a]%5~ + 2.5a% → 2]a + 35%a]�5Ä + 3.5a% → 3]a + 45%aN]#5f{ + 4.5a% → 4]a + 55%aL]#5f{ + 4.5a% → 4]a + 55%aN]|5f% + 5.5a% → 5]a + 65%aL]|5f% + 5.5a% → 5]a + 65%aL]~5f# + 6.5a% → 6]a + 75%aL]Å5f~ + 8.5a% → 7]a + 85%aL]Ä5fÄ + 9.5a% → 8]a + 95%a
EquilibriumReactions:
]a + 5%a → ]a% + 5%
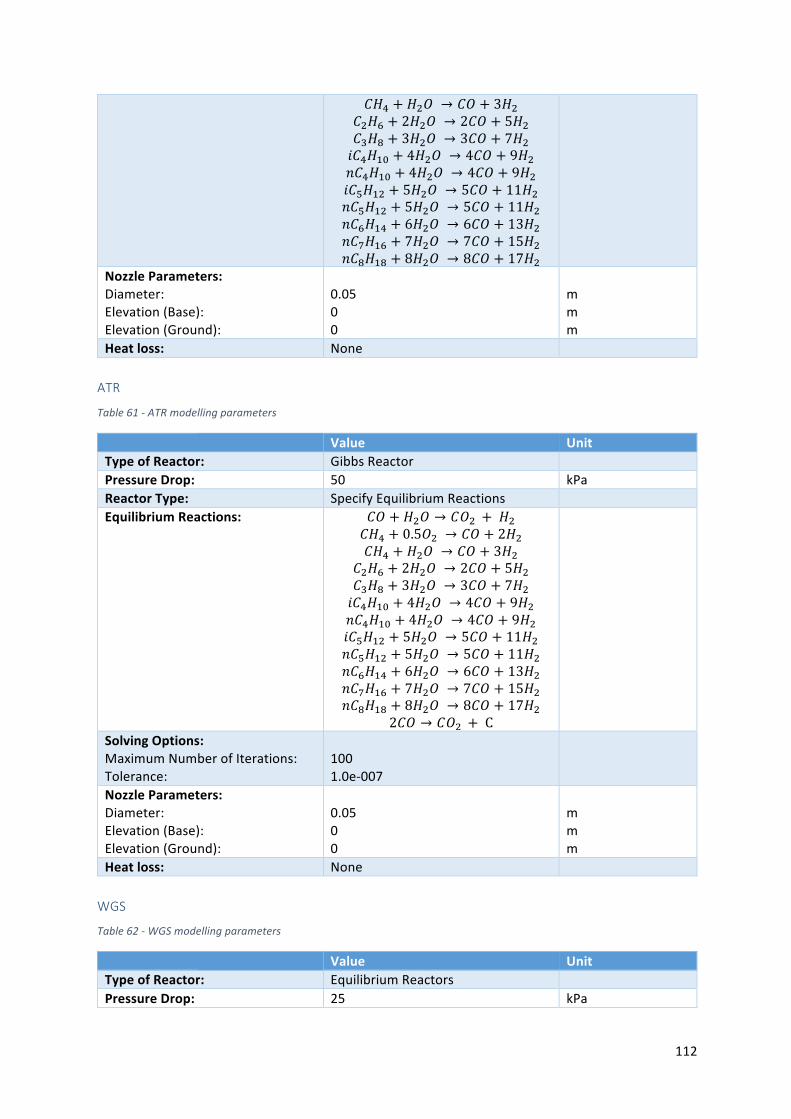
112
]5# + 5%a → ]a + 35%]%5~ + 25%a → 2]a + 55%]�5Ä + 35%a → 3]a + 75%N]#5f{ + 45%a → 4]a + 95%L]#5f{ + 45%a → 4]a + 95%N]|5f% + 55%a → 5]a + 115%L]|5f% + 55%a → 5]a + 115%L]~5f# + 65%a → 6]a + 135%L]Å5f~ + 75%a → 7]a + 155%L]Ä5fÄ + 85%a → 8]a + 175%
NozzleParameters:Diameter:Elevation(Base):Elevation(Ground):
0.0500
mmm
Heatloss: None ATR
Table61-ATRmodellingparameters
Value UnitTypeofReactor: GibbsReactor PressureDrop: 50 kPaReactorType: SpecifyEquilibriumReactions EquilibriumReactions: ]a + 5%a → ]a% + 5%
]5# + 0.5a% → ]a + 25%]5# + 5%a → ]a + 35%
]%5~ + 25%a → 2]a + 55%]�5Ä + 35%a → 3]a + 75%N]#5f{ + 45%a → 4]a + 95%L]#5f{ + 45%a → 4]a + 95%N]|5f% + 55%a → 5]a + 115%L]|5f% + 55%a → 5]a + 115%L]~5f# + 65%a → 6]a + 135%L]Å5f~ + 75%a → 7]a + 155%L]Ä5fÄ + 85%a → 8]a + 175%
2]a → ]a% + C
SolvingOptions:MaximumNumberofIterations:Tolerance:
1001.0e-007
NozzleParameters:Diameter:Elevation(Base):Elevation(Ground):
0.0500
mmm
Heatloss: None WGS
Table62-WGSmodellingparameters
Value UnitTypeofReactor: EquilibriumReactors PressureDrop: 25 kPa
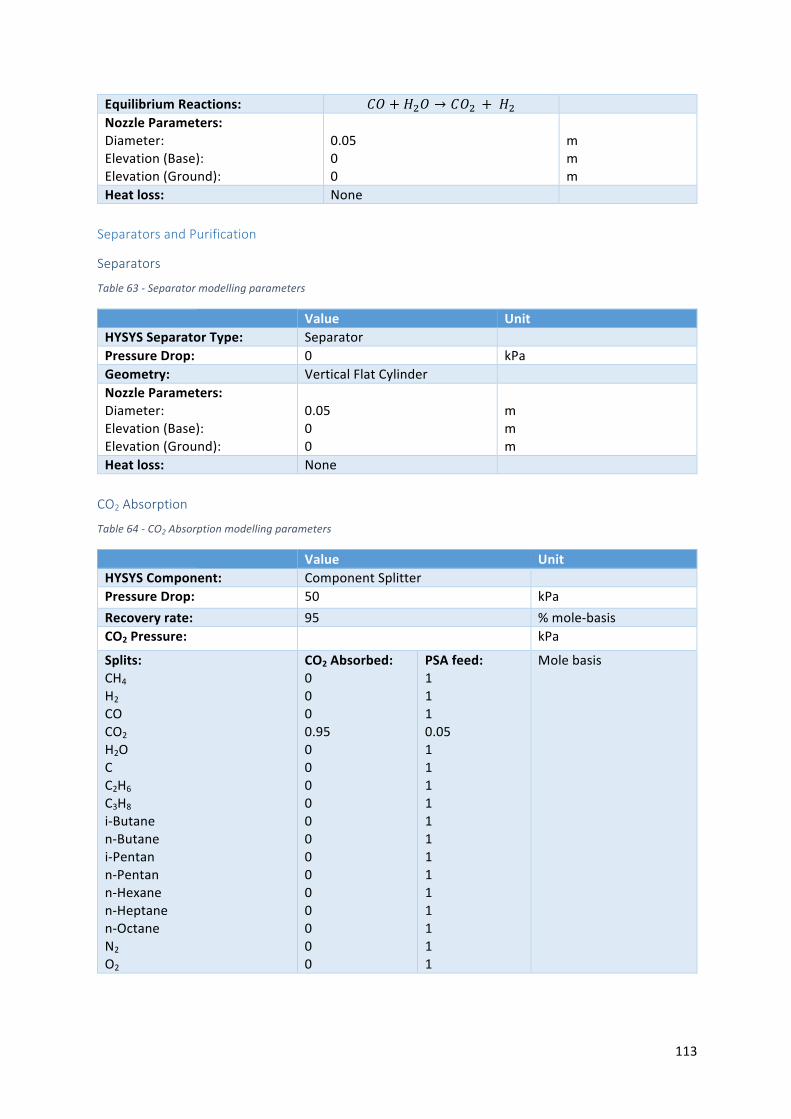
113
EquilibriumReactions: ]a + 5%a → ]a% + 5% NozzleParameters:Diameter:Elevation(Base):Elevation(Ground):
0.0500
mmm
Heatloss: None SeparatorsandPurification
Separators
Table63-Separatormodellingparameters
Value UnitHYSYSSeparatorType: Separator PressureDrop: 0 kPaGeometry: VerticalFlatCylinder NozzleParameters:Diameter:Elevation(Base):Elevation(Ground):
0.0500
mmm
Heatloss: None CO2Absorption
Table64-CO2Absorptionmodellingparameters
Value UnitHYSYSComponent: ComponentSplitter PressureDrop: 50 kPaRecoveryrate: 95 %mole-basisCO2Pressure: kPa
Splits:CH4H2
COCO2
H2OCC2H6
C3H8
i-Butanen-Butanei-Pentann-Pentann-Hexanen-Heptanen-OctaneN2
O2
CO2Absorbed:0000.950000000000000
PSAfeed:1110.051111111111111
Molebasis
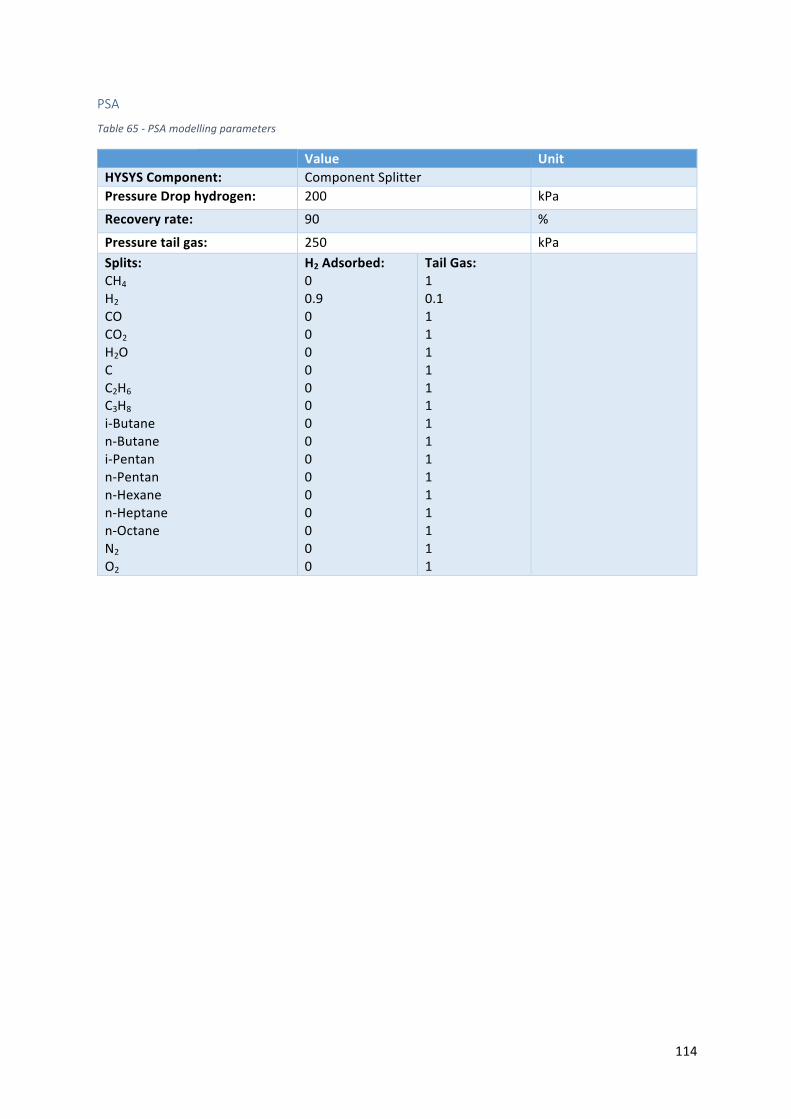
114
PSA
Table65-PSAmodellingparameters
Value UnitHYSYSComponent: ComponentSplitter PressureDrophydrogen: 200 kPaRecoveryrate: 90 %
Pressuretailgas: 250 kPaSplits:CH4H2
COCO2
H2OCC2H6
C3H8
i-Butanen-Butanei-Pentann-Pentann-Hexanen-Heptanen-OctaneN2
O2
H2Adsorbed:00.9000000000000000
TailGas:10.1111111111111111
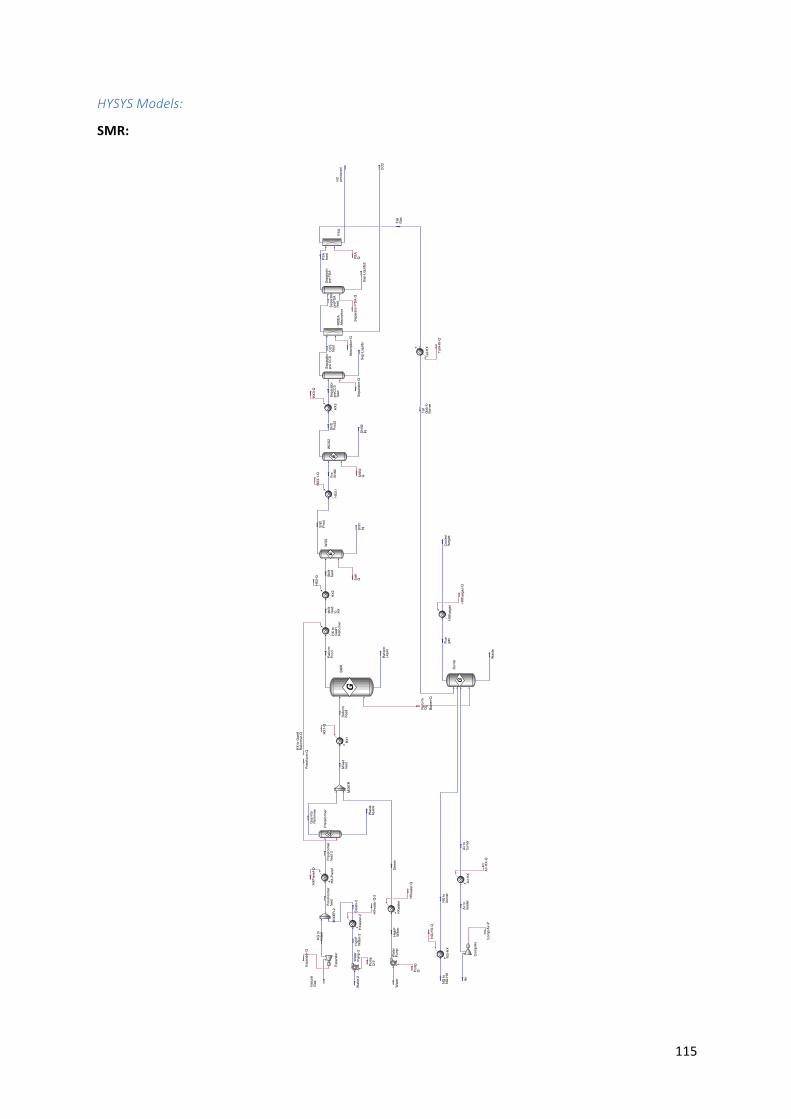
115
HYSYSModels:
SMR:
Tue
May
24
13:3
0:18
201
6Ca
se: C
:\Use
rs\V
egar
\Doc
umen
ts\S
kole
\Sem
este
r 10\
Mas
tero
ppga
ve\H
ysys
\Fer
dige
Mod
elle
r\Mod
el P
hoto
\SM
R ph
oto.
hsc
Flow
shee
t: Ca
se (M
ain)
Gas
into
Refo
rmer
Stea
m
MIX
ERM
ixed
feed
HX1
HX1-
Q
Refo
rmFe
ed
Refo
rmPr
od
Refo
rmLi
quid
Refo
rmQ
HX2
HX2-
Q Shift
feed
WG
SE
Shift
Prod
Shift
liq
Shift
Q
HX3
HX3-
Q
PSA
Tail
Gas
WG
S2E
Shift
Prod
2
Shift
2Q
Shift
2liq
HX3.
1
HX3.
1-Q
Pre
Shift
2CC
Sfe
edH2 pr
oduc
ed
PSA
Q
Natu
ral
Gas
Wat
erHX
wate
rW
ater
Pum
pHi
ghP
Wat
er
Pum
pQ
HXwa
ter-Q
MDE
AAb
sorp
tion
CO2
Sepa
rato
rpr
ePSA
feed
Abso
rptio
n-Q
Burn
er
G
Was
te
Flue
gas
Burn
er-Q
Air
Prer
efor
mer
G
Was
teliq
uids
Wat
er-2
HXwa
ter-2
Wat
erPu
mp-
2Hi
ghP
Wat
er-2
Pum
pQ
-2HX
wate
r-Q-2
Stea
m-2
HXflu
egas
HXflu
egas
-Q
Cool
edflu
egas
Expa
nder
Expa
nder
-Q
NG to
NG-H
X
Sepa
rato
rpr
e CC
SSe
para
tor
preC
CSfe
ed Sepa
rato
r-Q
Sepa
rato
rpr
e PS
A
PSA
feed
Sepa
rato
r-PSA
-Q
Sep-
Liqu
ids2
Sep-
Liqu
ids
NG to
mixe
r
MIX
ER-2
Prer
efor
mer
feed
HX-P
rere
f
HXPr
eref
-Q
Prer
efor
mer
feed
2
Prer
efor
m-Q
SMR
G
Air-H
X
Air-H
X-Q
Air t
obu
rner
Com
prAi
r
Air t
ohe
ater
Com
prAi
r-P
NG-H
X
NG-H
X-Q
NG to
burn
er
HX to
Gas
HRe
form
er
HX to
Gas
HRe
form
er-Q
shift
feed
to HX
Tail-H
X
Tail-H
X-Q
Tail
Gas
toBu
rner
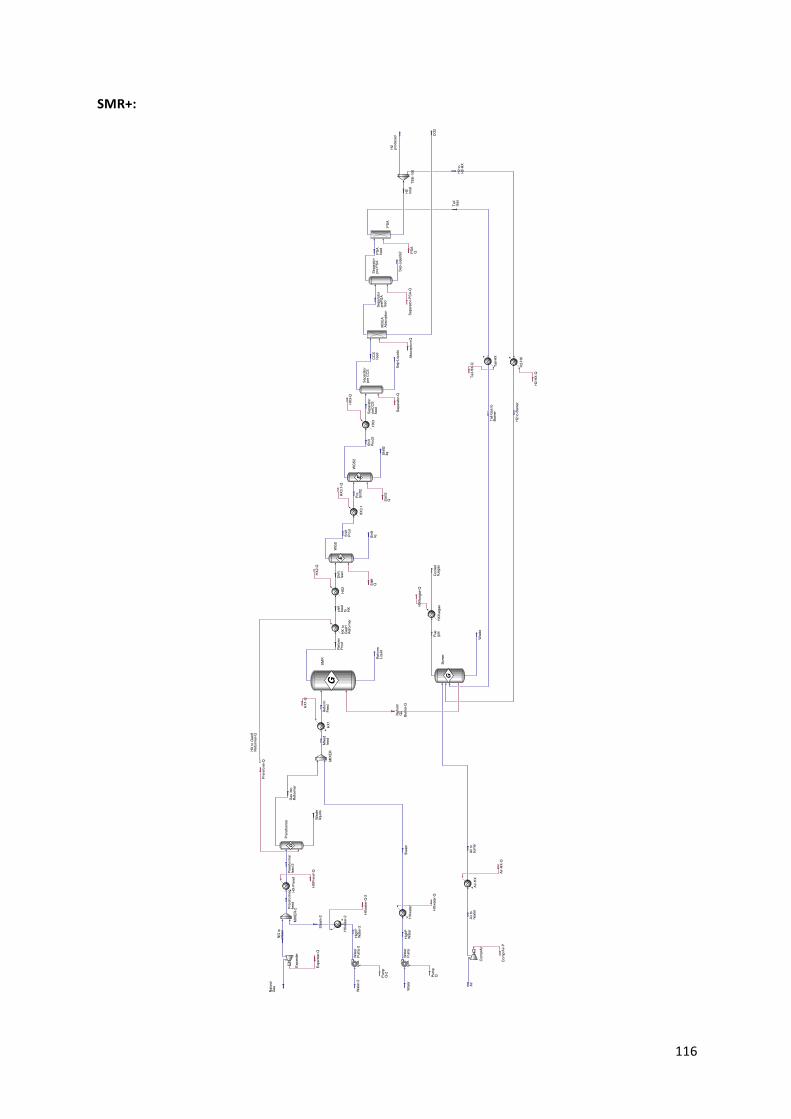
116
SMR+:
Tue
May
24
12:4
1:45
201
6Ca
se: C
:\Use
rs\V
egar
\Doc
umen
ts\S
kole
\Sem
este
r 10\
Mas
tero
ppga
ve\H
ysys
\Fer
dige
Mod
elle
r\Mod
el P
hoto
\SM
R+ p
hoto
.hsc
Flow
shee
t: Ca
se (M
ain)
Gas
into
Refo
rmer
Stea
m
MIX
ERM
ixed
feed
HX1
HX1-
Q
Refo
rmFe
ed
Refo
rmPr
od
Refo
rmLi
quid
Refo
rmQ
HX2
HX2-
Q
Shift
feed
WG
SE
Shift
Prod
Shift
liqSh
iftQ
HX3
HX3-
Q
PSA
Tail
Gas
WG
S2E
Shift
Prod
2
Shift
2Q
Shift
2liq
HX3.
1
HX3.
1-Q
Pre
Shift
2
CCS
feed
H2 prod
uced
PSA
Q
Natu
ral
Gas W
ater
HXwa
ter
Wat
erPu
mp
High
PW
ater
Pum
pQ
HXwa
ter-Q
MDE
AAb
sorp
tion
CO2
Sepa
rato
rpr
ePSA
feed
Abso
rptio
n-Q
Burn
erG
Was
te
Flue
gas
Burn
er-Q
Air
Prer
efor
mer
G
Was
teliq
uids
Wat
er-2
HXwa
ter-2
Wat
erPu
mp-
2Hi
ghP
Wat
er-2
Pum
pQ
-2
HXwa
ter-Q
-2
Stea
m-2
HXflu
egasHX
flueg
as-Q
Cool
edflu
egas
Expa
nder
Expa
nder
-Q
Sepa
rato
rpr
e CC
SSe
para
tor
preC
CSfe
ed Sepa
rato
r-Q
Sepa
rato
rpr
e PS
APS
Afe
ed
Sepa
rato
r-PSA
-Q
Sep-
Liqu
ids2
Sep-
Liqu
ids
NG to
mixe
r
MIX
ER-2Pr
eref
orm
erfe
edHX
-Pre
ref
HXPr
eref
-QPrer
efor
mer
feed
2
Prer
efor
m-Q
SMR
G
Air-H
X
Air-H
X-Q
Air t
obu
rner
Com
prAi
r
Air t
ohe
ater
Com
prAi
r-P
HX to
Gas
HRe
form
er
HX to
Gas
HRe
form
er-Q
shift
feed
to HX
H2 tota
lTE
E-10
0 H2 to
H2-H
X
H2-H
X
H2-H
X-Q
H2 to
Bur
ner
Tail-H
X
Tail-H
X-Q
Tail G
as to
Burn
er
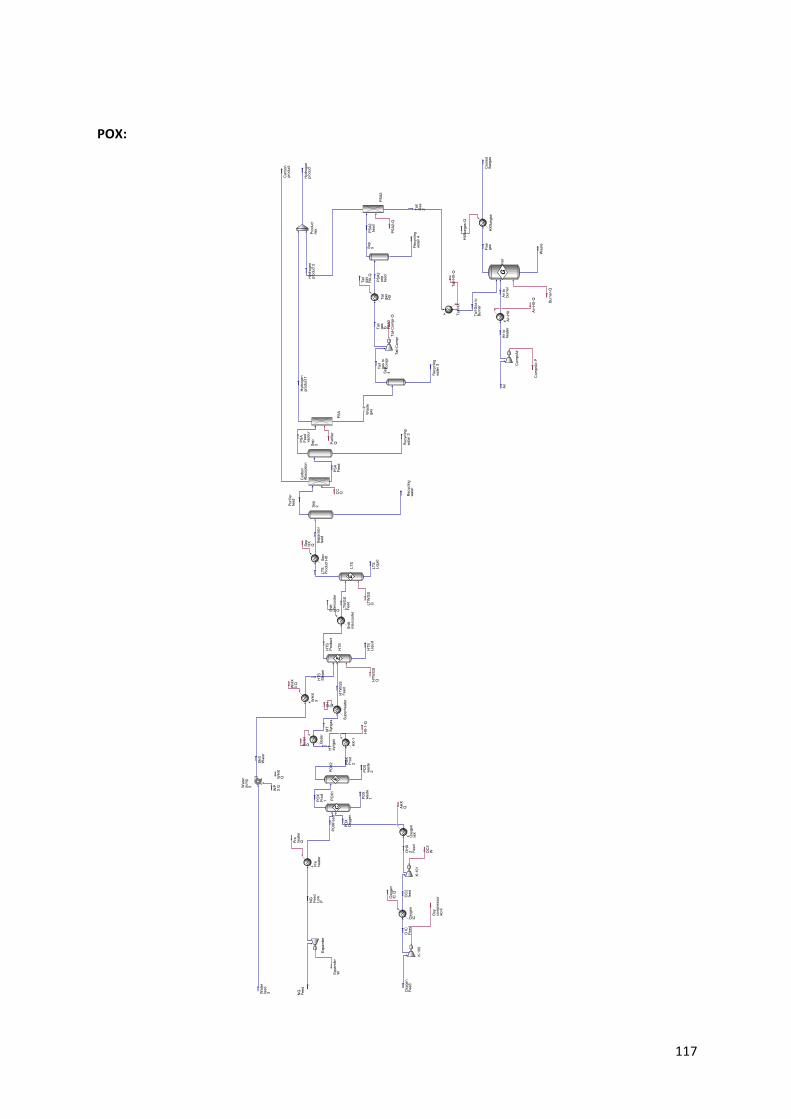
117
POX:
Tue
May
24
13:4
3:47
201
6Ca
se: C
:\Use
rs\V
egar
\Doc
umen
ts\S
kole
\Sem
este
r 10\
Mas
tero
ppga
ve\H
ysys
\Fer
dige
Mod
elle
r\Mod
el P
hoto
\PO
X ph
oto.
hsc
Flow
shee
t: Ca
se (M
ain)
Oxy
gen
Feed
Oxy
gen
HX
WH
XQ
AHX
Q
POX
Oxy
gen
POX
Prod
2
HTS
E
HTS
Liqu
id
HTS
Prod
uct
HTW
GS
Feed
HTW
GS
Q
LTW
GS
Feed
LTS
E
LTS
Prod
uct
LTW
GS
Q
NG
Feed
PSA
Purif
ier
Q
K-10
0
O IC
Feed
Oxy
com
pres
sor
work
Purif
ier
feed
Rec
yclin
gwa
ter
Sep
2
LTS
Liqu
id
Sepa
rato
rfe
ed
Car
bon
Abso
rptio
n
PSA
Feed
Car
bon
prod
uct
CC
Q
Wat
erpu
mp
3
WH
X3
Wat
erfe
ed3
Shift
Wat
er
WP
3 Q
WH
X3
Q
Oxy
gen
IC
Oxy
gen
IC Q OC
2fe
ed
K-10
1
OH
X2 Fe
ed
OC
2W
Sep
3
PSA
Feed
vapo
ur
Rec
yclin
gwa
ter 2
Was
tega
s
Boile
r
Shift
inte
rcoo
ler
Sep
HX
Sep
HX
QPr
ehe
ater
Pre
heat
erQ
POXF
eed
Expa
nder
NG
Feed
Low
P
Expa
nder
W
Boile
rQ
Supe
rhea
ter
MT
Syng
asSH Q
Hyd
roge
npr
oduc
t
Tail-
Com
pr
Tail
gas
to PSA2
Sep
4
Tail
gas
toC
ompr
Rec
yclin
gwa
ter 3
Tail
gas
HX
Tail
gas
HX-
QSe
p5
PSA2
sep
feed
PSA2
feed
Rec
yclin
gwa
ter 4
PSA2
Hyd
roge
npr
oduc
t 2
Tail
Gas
2
PSA2
-Q
Hyd
roge
npr
oduc
t 1Pr
oduc
tm
ix
Tail-
Com
pr-Q
HTS
Stea
m
Shift
inte
rcoo
ler
Q
HX-
1
HX-
1-Q
HT
syng
asPO
X1C
POX
wast
e1PO
X Pr
od1
POX2
E
POX
wast
e2
Burn
erG
Was
te
Flue
gas
Air
HXf
luega
s
Air-H
X Air-H
X-Q
Air t
obu
rner
Com
prAi
r
Air t
ohe
ater
Com
prAi
r-P
Burn
er-Q
Coo
led
flueg
as
HXf
luega
s-Q
Tail-
HX
Tail-
HX-
Q
Tail G
as to
Burn
er
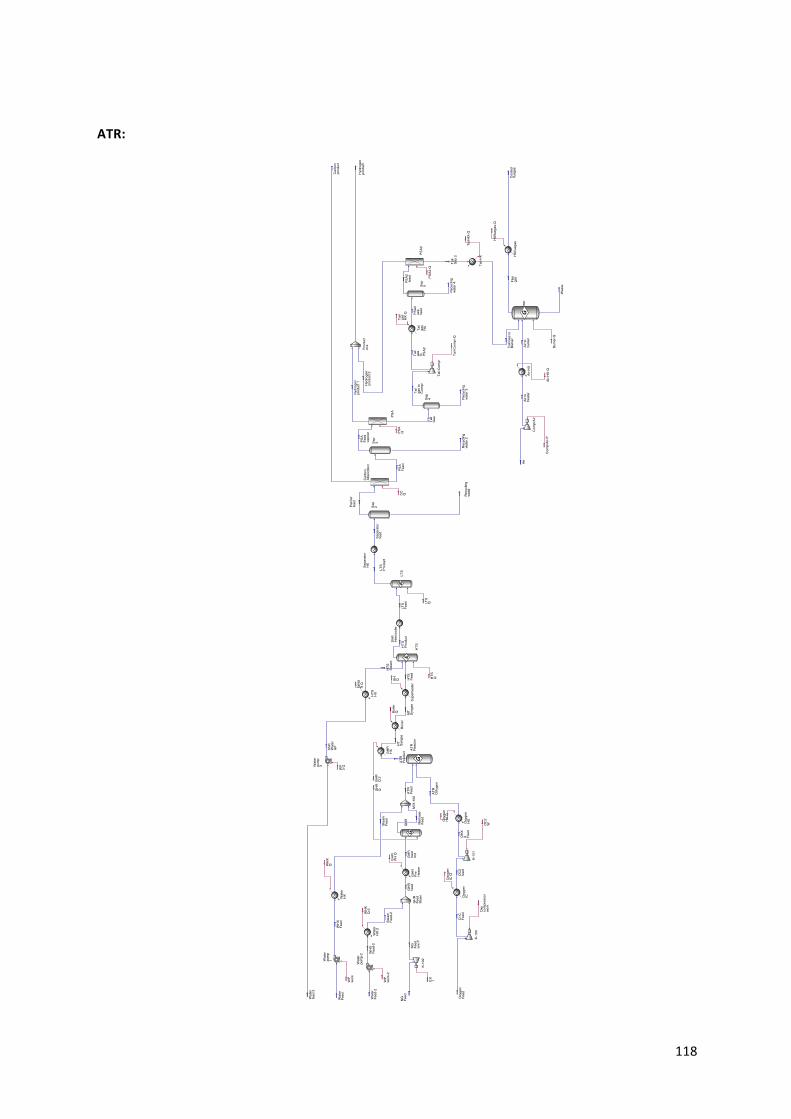
118
ATR:
Tue
May
24
13:4
5:29
201
6C
ase:
C:\U
sers
\Veg
ar\D
ocum
ents
\Sko
le\S
emes
ter 1
0\M
aste
ropp
gave
\Hys
ys\F
erdi
ge M
odel
ler\M
odel
Pho
to\A
TR p
hoto
.hsc
Flow
shee
t: C
ase
(Mai
n)
Met
hane
Feed
Oxy
gen
Feed
Wat
erFe
edW
ater
HX
Oxy
gen
HX
WH
XQ
Stea
mFe
ed Oxy
gen
HX
Q
ATR
OXy
gen
ATR
Prod
uct
HTS
EH
TSPr
oduc
tH
TSFe
ed
HTS
Q
LTS
Feed
LTS
E
LTS
Prod
uct
LTS
Q
ATR
Rea
ctor
G
NG
Feed
PSA
Hyd
roge
npr
oduc
t
PSA
Q
K-10
0
O IC
Feed
Oxy
com
pres
sor
work
WH
XFe
ed
WP
work
Purif
ier
feed
Rec
yclin
gwa
ter
Sep
2
Sepa
rato
rH
X
Sepa
rato
rfe
ed
Shift
Inte
rcoo
ler
GH
RG
HT
Syng
as
GH
RQ
2
GH
RH
X
Wat
erFe
ed-2
Wat
erpu
mp-
2
Wat
erH
X-2
WH
XFe
ed-2
WP
work
-2St
eam
Feed
-2WH
XQ
-2
Wat
erpu
mp
1
Car
bon
Abso
rptio
n
PSA
Feed
Car
bon
prod
uct
CC
Q
Wat
erpu
mp
3
HTS
HX
Wat
erfe
ed 3
WP
3 Q
Shift
Wat
erH
P
WH
X3
Q
Oxy
gen
IC
Oxy
gen
IC Q O
C2
feed
K-10
1
OH
X2 Fe
ed
OC
2W
K-10
2
NG
Feed
low
P
EX 1
Sep
3PSA
Feed
vapo
ur
Rec
yclin
gwa
ter 2
Tail
Gas
GH
RFe
edM
ixer
GH
Rfe
edG
HR
Pre
Hea
ter
GH
Rfe
edho
t
GH
RPH
Q
Tail-
Com
pr
Tail-
Com
pr-Q
Tail
gas
to PSA2
Sep
4
Tail
gas
toC
ompr
Rec
yclin
gwa
ter 3
Tail
gas
HX
Tail
gas
HX-
Q
Sep
5
PSA2
sep
feed
PSA2
feed
Rec
yclin
gwa
ter 4
PSA2
Hyd
roge
npr
oduc
t 2
PSA2
-Q
Hyd
roge
npr
oduc
t 1Pr
oduc
tm
ix
Boile
r
Boile
rQ
GH
RQ
Supe
rhea
ter
MT
Syng
as
SH Q
HTS
Stea
m
MIX
-100
ATR
Feed
Burn
erG
Was
te
Flue
gas
Air
HXf
luega
s
Air-H
X
Air-H
X-Q
Air t
obu
rner
Com
prAi
r
Air t
ohe
ater
Com
prAi
r-P
Burn
er-Q
Coo
led
flueg
as
HXf
luega
s-Q
Tail-
HX
Tail-
HX-
Q
Tail G
as to
Burn
er
Tail
Gas
2
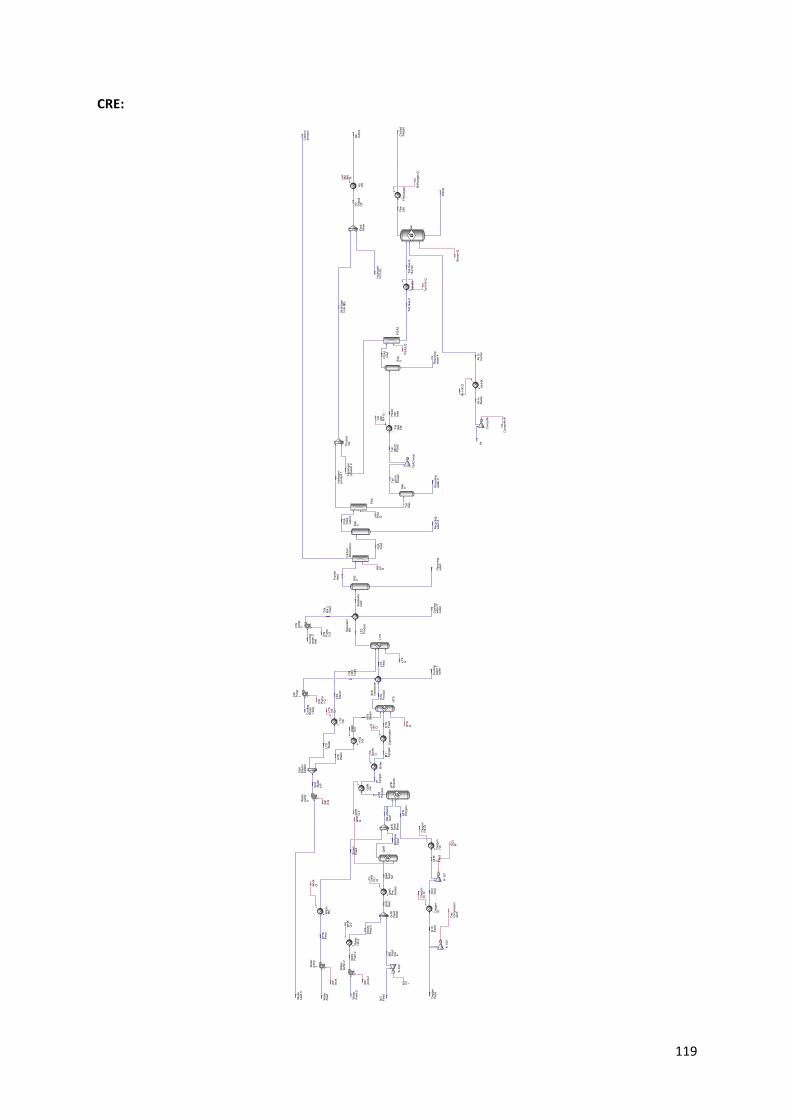
119
CRE:
Wed
May
25
11:4
2:01
201
6Ca
se: C
:\Use
rs\V
egar
\Doc
umen
ts\S
kole
\Sem
este
r 10\
Mas
tero
ppga
ve\H
ysys
\Fer
dige
Mod
elle
r\Mod
el P
hoto
\CRE
pho
to.h
scFl
owsh
eet:
Case
(Mai
n)
Met
hane
Feed
Oxy
gen
Feed
Wat
erFe
edW
ater
HX
Oxy
gen
HX
WH
XQ
Stea
mFe
ed
Oxy
gen
HX
Q
ATR
OXy
gen
ATR
Prod
uct
HTS
EH
TSPr
oduc
tH
TSFe
ed
HTS
Q
LTS
Feed
LTS
E
LTS
Prod
uct
LTS
Q
ATR
Rea
ctor
G
NG
Feed
PSA
PSA
Q
K-10
0
O IC
Feed
Oxy
com
pres
sor
work
WH
XFe
ed
WP
work
Purif
ier
feed
Rec
yclin
gwa
ter
Sep
2
Sepa
rato
rH
X
Sepa
rato
rfe
ed
Coo
ling
wate
r 2in
let
Coo
ling
wate
r 2ou
tlet
Shift
Inte
rcoo
ler
Coo
ling
Wat
er1
Inle
t
Coo
ling
wate
r 1ou
tlet
GH
RG
HT
Syng
as
ATR
Feed
Mixe
r
NG
+Ste
amfe
ed
GH
RQ
2
GH
RH
X
Wat
erFe
ed-2
Wat
erpu
mp-
2
Wat
erH
X-2
WH
XFe
ed-2
WP
work
-2St
eam
Feed
-2WH
XQ
-2
Wat
erpu
mp
1
Car
bon
Abso
rptio
n
PSA
Feed
Car
bon
prod
uct
CC
Q
CW
Pum
p1
CW
HX1
Feed
CW
Pum
p1
Q
CW
pum
p2
CW
HX
2Fe
ed
CW
Pum
p2
Q
Wat
erpu
mp
3
HTS
HX
Wat
erfe
ed 3
WP
3 Q
Shift
Wat
erH
P
WH
X3
Q
Oxy
gen
IC
Oxy
gen
IC Q O
C2
feed
K-10
1
OH
X2 Fe
ed
OC
2W
HTS
Wat
erLT
SSt
eam
K-10
2
NG
Feed
low
P
EX 1
Shift
Stea
mSp
litter
Sep
3PSA
Feed
vapo
ur
Rec
yclin
gwa
ter 2
Tail
Gas
GH
RFe
edM
ixer
GH
Rfe
edG
HR
Pre
Hea
ter
GH
Rfe
edho
t
GH
RPH Q
H2
HX
Hyd
roge
nfro
m N
GH
2H
XQ
Tail-
Com
pr
Tail
gas
toPS
A2Se
p4
Tail
gas
toC
ompr
Rec
yclin
gwa
ter 3
Tail
gas
HX
Tail
gas
HX-
Q
Sep
5
PSA2
sep
feed
PSA2
feed
Rec
yclin
gwa
ter 4
PSA2
Hyd
roge
npr
oduc
t 2
PSA2
-Q
Hyd
roge
npr
oduc
t 1Pr
oduc
tm
ix
Boile
r
Boile
rQ
GH
RQ
Supe
rhea
ter
MT
Syng
as
SH Q
HTS
Stea
m
LTS
HX
LTS
HX
Q
LTS
Wat
er
Hyd
roge
nfro
m E
L
Fina
lM
ixer
H2
Out
put
HT
H2
Out
put
Burn
erG
Was
te
Flue
gas
Air
HXf
luega
s
Air-H
X
Air-H
X-Q
Air t
obu
rner
Com
prAi
r
Air t
ohe
ater
Com
prAi
r-P
Burn
er-Q
Coo
led
flueg
as
HXf
luega
s-Q
Tail-
HX
Tail-
HX-
Q
Tail G
as to
Burn
erTa
il Gas
2
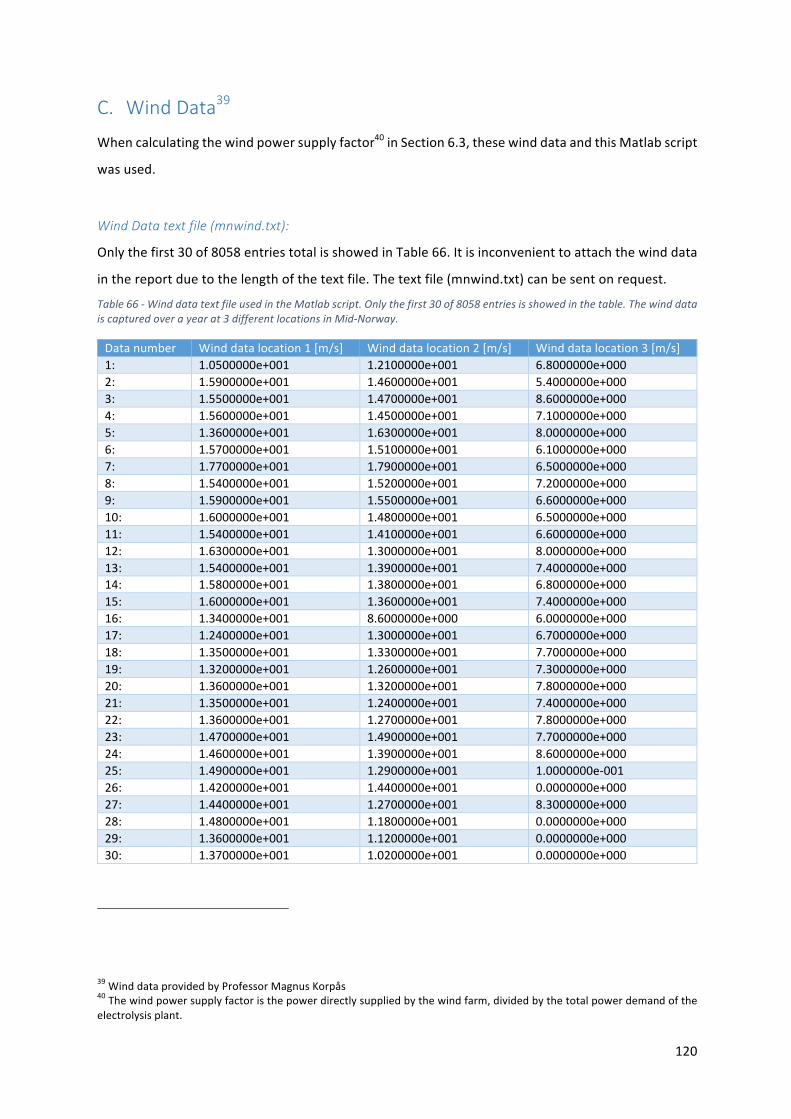
120
C. WindData39
Whencalculatingthewindpowersupplyfactor40inSection6.3,thesewinddataandthisMatlabscript
wasused.
WindDatatextfile(mnwind.txt):
Onlythefirst30of8058entriestotalisshowedinTable66.Itisinconvenienttoattachthewinddata
inthereportduetothelengthofthetextfile.Thetextfile(mnwind.txt)canbesentonrequest.
Table66-WinddatatextfileusedintheMatlabscript.Onlythefirst30of8058entriesisshowedinthetable.Thewinddataiscapturedoverayearat3differentlocationsinMid-Norway.
Datanumber Winddatalocation1[m/s] Winddatalocation2[m/s] Winddatalocation3[m/s]1: 1.0500000e+001 1.2100000e+001 6.8000000e+0002: 1.5900000e+001 1.4600000e+001 5.4000000e+0003: 1.5500000e+001 1.4700000e+001 8.6000000e+0004: 1.5600000e+001 1.4500000e+001 7.1000000e+0005: 1.3600000e+001 1.6300000e+001 8.0000000e+0006: 1.5700000e+001 1.5100000e+001 6.1000000e+0007: 1.7700000e+001 1.7900000e+001 6.5000000e+0008: 1.5400000e+001 1.5200000e+001 7.2000000e+0009: 1.5900000e+001 1.5500000e+001 6.6000000e+00010: 1.6000000e+001 1.4800000e+001 6.5000000e+00011: 1.5400000e+001 1.4100000e+001 6.6000000e+00012: 1.6300000e+001 1.3000000e+001 8.0000000e+00013: 1.5400000e+001 1.3900000e+001 7.4000000e+00014: 1.5800000e+001 1.3800000e+001 6.8000000e+00015: 1.6000000e+001 1.3600000e+001 7.4000000e+00016: 1.3400000e+001 8.6000000e+000 6.0000000e+00017: 1.2400000e+001 1.3000000e+001 6.7000000e+00018: 1.3500000e+001 1.3300000e+001 7.7000000e+00019: 1.3200000e+001 1.2600000e+001 7.3000000e+00020: 1.3600000e+001 1.3200000e+001 7.8000000e+00021: 1.3500000e+001 1.2400000e+001 7.4000000e+00022: 1.3600000e+001 1.2700000e+001 7.8000000e+00023: 1.4700000e+001 1.4900000e+001 7.7000000e+00024: 1.4600000e+001 1.3900000e+001 8.6000000e+00025: 1.4900000e+001 1.2900000e+001 1.0000000e-00126: 1.4200000e+001 1.4400000e+001 0.0000000e+00027: 1.4400000e+001 1.2700000e+001 8.3000000e+00028: 1.4800000e+001 1.1800000e+001 0.0000000e+00029: 1.3600000e+001 1.1200000e+001 0.0000000e+00030: 1.3700000e+001 1.0200000e+001 0.0000000e+000
39WinddataprovidedbyProfessorMagnusKorpås40Thewindpowersupplyfactoristhepowerdirectlysuppliedbythewindfarm,dividedbythetotalpowerdemandoftheelectrolysisplant.

121
MatlabScript(windproduction.m):
%Script for generating wind power production time series wspeed = load('mnwind.txt'); %Wind speed time series for three locations [Nsteps, Nsites] = size(wspeed); Pw_rat = [1 1 1]; %Installed wind power capacity wspeed_factor = [1 1 1]; %Multiplication factor for adjusting wind speed %Enercon E70 with storm control Power_Curve = [0 0;1 0;2 2;3 18;4 56;5 127;6 240;7 400;8 626;9 892; 10 1223;11 1590;12 1900;13 2080;14 2230;15 2300;25 2300;30 0;100 0]; Power_Curve(:,2)=Power_Curve(:,2)./max(Power_Curve(:,2)); % Normalised power curve %% Create wind power output for each time step for each wind site Pw = zeros(size(wspeed)); for i=1:Nsites Pw(:,i) = interp1(Power_Curve(:,1),Power_Curve(:,2),wspeed_factor(i)*wspeed(:,i)).*Pw_rat(i); end Pw(Pw<0)=0; WPSF = (1-sum(Pw(:,1)>0)/length(Pw(:,1))+1-sum(Pw(:,2)>0)/length(Pw(:,2))+1 sum(Pw(:,3)>0)/length(Pw(:,3)))/3;