Concentrations of Urinary Phthalate Metabolites Are Associated with Increased Waist Circumference...
40
National Institutes of Health U.S. Department of Health and Human Services ENVIRONMENTAL HEALTH PERSPECTIVES ENVIRONMENTAL HEALTH PERSPECTIVES ehponline.org Concentrations of Urinary Phthalate Metabolites are Associated with Increased Waist Circumference and Insulin Resistance in Adult U.S. Males Richard W Stahlhut, Edwin van Wijngaarden, Timothy D Dye, Stephen Cook and Shanna H Swan doi:10.1289/ehp.9882 (available at http://dx.doi.org/) Online 14 March 2007
Transcript of Concentrations of Urinary Phthalate Metabolites Are Associated with Increased Waist Circumference...
National Institutes of HealthU.S. Department of Health and Human Services
ENVIRONMENTALHEALTHPERSPECTIVES
ENVIRONMENTALHEALTHPERSPECTIVES
ehponline.org
Concentrations of Urinary PhthalateMetabolites are Associated with Increased
Waist Circumference and Insulin Resistance inAdult U.S. Males
Richard W Stahlhut, Edwin van Wijngaarden, Timothy D Dye,Stephen Cook and Shanna H Swan
doi:10.1289/ehp.9882 (available at http://dx.doi.org/)Online 14 March 2007
1
Concentrations of Urinary Phthalate Metabolites are Associated with Increased
Waist Circumference and Insulin Resistance in Adult U.S. Males
Richard W Stahlhut1
Edwin van Wijngaarden1
Timothy D Dye1,2
Stephen Cook3
Shanna H Swan4
1 Department of Community and Preventive Medicine, University of Rochester School of
Medicine and Dentistry, Rochester, NY
2 Department of Research and Evaluation, Axios International, Paris, France
3 Department of Pediatrics, University of Rochester School of Medicine and Dentistry,
Rochester, NY
4 Department of Obstetrics and Gynecology, University of Rochester School of Medicine
and Dentistry, Rochester, NY
Corresponding author:
Richard W. Stahlhut, MD, MPH
Department of Community and Preventive Medicine
601 Elmwood Avenue, Box 644
Rochester, New York 14642
2
Running Title: Phthalates, Waist Circumference, and Insulin Resistance
Article descriptor: Endocrine
Keywords: androgens, homeostatic model assessment, insulin resistance, obesity,
phthalates
Acknowledgements:
We would like to thank Diana Fernandez, Paul Winters, and Peggy Auinger for their
study design advice; Jeffrey DeWester for alerting RS to links between testosterone,
obesity, and diabetes in the mid-1990s; and our anonymous reviewers for their
thoughtful comments. The authors declare they have no competing financial interests.
Abbreviations and definitions:
ALT = alanine aminotransferase
BBzP = butylbenzyl phthalate
CDC = Centers for Disease Control and Prevention
DBP = dibutyl phthalates (di-n-butyl phthalate + di-isobutyl phthalate)
DEHP = di(2-ethylhexyl) phthalate
DEP = diethyl phthalate
DiNP = di-isononyl phthalate
GFR = glomerular filtration rate
GGT = gamma glutamyl transferase
HOMA = homeostatic model assessment
LOD = limit of detection
MBP = monobutyl phthalates (mono-n-butyl phthalate + mono-isobutyl phthalate)
MBzP = monobenzyl phthalate
3
MEHHP = mono(2-ethyl-5-hydroxyhexyl) phthalate
MEHP = mono(2-ethylhexyl) phthalate
MEOHP = mono(2-ethyl-5-oxohexyl) phthalate
MEP = monoethyl phthalate
MiNP = mono-isononyl phthalate
NCHS = National Center for Health Statistics
NHANES = National Health and Nutrition Examination Survey
NOEL = no observed effect level
PCB = polychlorinated biphenyls
PPAR = peroxisome proliferator-activated receptor
PVC = polyvinylchloride

4
Section Headers:
Abstract
Background
Methods
Study Population
Abdominal Obesity
Insulin Resistance
Phthalate Exposure
Potential Confounders
Statistical Analysis
Results
Discussion
References
Tables
Figure Legend
Figure
5
Abstract
Background: Phthalates impair rodent testicular function and have been associated
with antiandrogenic effects in humans, including decreased testosterone levels. Low
testosterone in adult human males has been associated with increased prevalence of
obesity, insulin resistance, and diabetes.
Objectives: To investigate phthalate exposure and its associations with abdominal
obesity and insulin resistance.
Methods: Subjects were adult U.S. male participants in NHANES 1999-2002. Six
phthalate metabolites with prevalent exposure and known or suspected antiandrogenic
activity were modeled as predictors of waist circumference and log-transformed HOMA
(a measure of insulin resistance) using multiple linear regression, adjusted for age,
race/ethnicity, fat and total calorie consumption, physical activity level, serum cotinine,
and urine creatinine (model 1); and adjusted for model 1 covariates plus measures of
renal and hepatic function (model 2). Metabolites were mono-butyl phthalates (MBP),
mono-ethyl phthalate (MEP), mono-(2-ethyl)-hexyl phthalate (MEHP), mono-benzyl
phthalate (MBzP), mono-(2-ethyl-5-hydroxyhexyl) phthalate (MEHHP) and mono-(2-
ethyl-5-oxohexyl) phthalate (MEOHP).
Results: In model 1, four metabolites were associated with increased waist
circumference (MBzP, MEHHP, MEOHP, MEP; p-values ≤ 0.013) and three with
increased HOMA (MBP, MBzP, MEP; p-values ≤ 0.011). When additionally adjusted for
renal and hepatic function, parameter estimates declined, but all significant results
remained so except HOMA-MBP.
Conclusions: In this national cross section of U.S. men, concentrations of several
prevalent phthalate metabolites showed statistically significant correlations with
abdominal obesity and insulin resistance. If confirmed by longitudinal studies, our

6
findings would suggest that exposure to these phthalates may contribute to the
population burden of obesity, insulin resistance, and related clinical disorders.
7
Background
Obesity, insulin resistance, and type 2 diabetes are interrelated metabolic disorders
whose prevalence has increased substantially in the past two decades. Corresponding
increases in premature morbidity and mortality are expected (Adams et al. 2006;
Fujimoto 2000; Haffner et al. 1998; Poirier et al. 2006; Zimmet et al. 2001). Insulin
resistance is said to occur when increasing amounts of insulin are required to correctly
regulate transport of plasma glucose into peripheral tissues. While the precise
mechanism is unclear, insulin resistance is commonly accompanied by central (visceral)
obesity, which by elevating levels of free fatty acids in serum may provoke insulin
resistance and disrupt lipid metabolism. Initially, the beta cells of the pancreas can fully
compensate for mild insulin resistance by increasing insulin production. As the disease
progresses, beta cells decompensate resulting in elevated serum glucose levels and the
subsequent development of type 2 diabetes.
Testosterone affects body fat distribution and insulin sensitivity in men. Experimental
studies in males have shown testosterone administration reduces lipid uptake by intra-
abdominal fat (Mårin et al. 1996), and also reduces visceral fat and improves insulin
sensitivity (Mårin 1995; Mårin et al. 1993; Mårin et al. 1992). A 2005 meta-analysis
found testosterone administration reduces total fat mass (Isidori et al. 2005). Men
undergoing androgen deprivation therapy for prostate cancer have increased serum
glucose, total fat, and prevalence of metabolic syndrome (Braga-Basaria et al. 2006;
Sharifi et al. 2005). Epidemiological studies often support these findings (Ding et al.
2006; Selvin et al. 2007), though sometimes not (Oh et al. 2002) .
8
Humans are commonly exposed to man-made chemicals that have the potential to
reduce androgen (e.g., testosterone) production or function. One such class of
chemicals is phthalates, which are used in a variety of products, including cosmetics,
shampoos, soaps, lubricants, pesticides, paints, and as a softener of polyvinylchloride
(PVC). More than 75% of the US population has measurable levels of several phthalate
metabolites in the urine (Silva et al. 2004). Unlike polychlorinated biphenyls (PCBs) and
dioxins, phthalates are quickly metabolized and excreted (Hauser and Calafat 2005).
The half-life of di(2-ethylhexyl)phthalate (DEHP), one of the most widely used and
studied phthalates, is less than 24 hours (Koch et al. 2004).
Phthalates are known antiandrogens in experimental animal models, with consistent
results dating back several decades. Testicular steroid hormone synthesis and
reproductive system development in males have been adversely affected by exposure,
especially neonatal exposure, to certain phthalates, including DEHP, di-butyl (DBP),
benzyl-butyl (BzBP), and di-isononyl (DiNP) phthalate (Bell 1982; Fisher 2004; Parks et
al. 2000).
Associations between certain phthalate metabolites and antiandrogenic effects have
also been found in humans at much lower exposure levels than those used in rodent
experiments. Suspected metabolites include mono-benzyl (MBzP), mono-ethyl (MEP),
mono-isononyl (MiNP), mono-methyl, and mono-butyl phthalates (MBP). Urinary
phthalate metabolites in pregnant mothers have been found to correlate with subtle
genital changes in their infant males (Swan et al. 2005), while breast milk phthalate
metabolites were correlated with shifts in reproductive hormones in infant males (Main et
al. 2006).
9
Although fetuses and infants are thought more susceptible to environmental insult than
adults, Duty, Hauser, and colleagues found diminished sperm quality associated with
urinary phthalate metabolites in adult males as well (Duty et al. 2003; Hauser et al.
2006). If their findings reflect true antiandrogenic effects of phthalates or their
metabolites at current exposure levels, then one may reasonably predict that these
exposures could increase the prevalence of metabolic disorders that are worsened by
diminished androgen production or function.
In this study, we examined the association between phthalate exposure and two key
metabolic abnormalities associated with hypoandrogenism: abdominal obesity and
insulin resistance. Although these conditions are closely related, they represent key
precursors, alone or in combination, to the development of type 2 diabetes and
cardiovascular disease (Janssen et al. 2004; Reaven 1988). Our hypothesis was that
increased phthalate exposure would be associated with increased abdominal obesity
and insulin resistance.
Methods
Study population
Data from the 1999-2002 National Health and Nutrition Examination Survey (NHANES)
were used for this analysis. NHANES, conducted by the National Center for Health
Statistics (NCHS) of the Centers for Disease Control and Prevention (CDC), is a
multistage, stratified, clustered design that selects a representative sample of the
civilian, noninstitutionalized U.S. population. Certain subgroups, such as older adults,
Mexican-Americans, non-Hispanic blacks, and low-income persons, were sampled at a
higher rate than other demographic groups, thus necessitating the use of sample
10
weights in analysis. Data from NHANES subjects are acquired through household
interviews and standardized examinations at mobile examination centers throughout the
United States. Detailed methods have been published elsewhere (NCHS 2006b)
We limited our analysis to men, age > 18, with complete data for the measures
described below. Men on insulin, oral hypoglycemic agents, or sex hormone
agonists/antagonists were excluded, because these medications may affect the
biological mechanisms of interest. Men were also excluded from the insulin resistance
analyses if they reported to NCHS that they failed to fast for eight to 24 hours prior to
collection of fasting blood samples.
In NHANES 1999-2002, a random one-third subsample was selected for urinary
phthalate metabolite measurements, and a separate random, but overlapping, one-third
subsample for fasting glucose and insulin (used to compute insulin resistance). Of the
5094 adult men available in NHANES, 1451 men had both phthalate and obesity
measurements for crude analyses after exclusions. Forty-five percent of these men
(N=651) also had fasting measurements. Two of the phthalate metabolites, mono-(2-
ethyl-5-hydroxyhexyl) (MEHHP) and mono-(2-ethyl-5-oxohexyl) phthalate (MEOHP),
were only available for the years 2001-2, reducing sample size for these metabolites by
about half (waist circumference, N=781; insulin resistance, N=344). Missing data
reduced sample sizes for fully adjusted models (vs. crude) by 11% for waist
circumference and 4.5% for insulin resistance (see Potential Confounders below).
11
Abdominal obesity
Waist circumference was chosen as the best available measure of abdominal obesity.
As a predictor of insulin resistance, waist circumference has been found to be an
equivalent and, in some cases, a better measure than body-mass index (Farin et al.
2006; Janssen et al. 2004). Waist circumference was measured at the high point of the
iliac crest at minimal respiration to the nearest 1 mm.
Insulin resistance
We estimated insulin resistance using HOMA (homeostatic model assessment). HOMA
is epidemiologically practical, widely used, and correlates acceptably (R = 0.73 to 0.88)
with the hyperinsulinemic-euglycemic clamp test, which is generally considered to be the
gold standard (Matthews et al. 1985; Wallace et al. 2004). HOMA was calculated from
fasting plasma glucose and insulin measures as (Matthews et al. 1985):
HOMA = (fasting insulin [µU/ml] * fasting glucose [mmol/l])/22.5. [1]
Plasma glucose was determined by an enzymatic reaction (Cobas Miras assay); plasma
insulin was determined using a radioimmunoassay with the double-antibody batch
method.
Phthalate exposure
Phthalate data were collected in NHANES as urinary metabolites, rather than
unmetabolized phthalates in serum, to eliminate contamination during collection and
analysis (Latini 2005). Laboratory methods have been previously described (Silva et al.
2004). Seven metabolites were measured throughout the four-year period, with five
additional metabolites measured in 2001-2002 subjects only. NCHS assigned
12
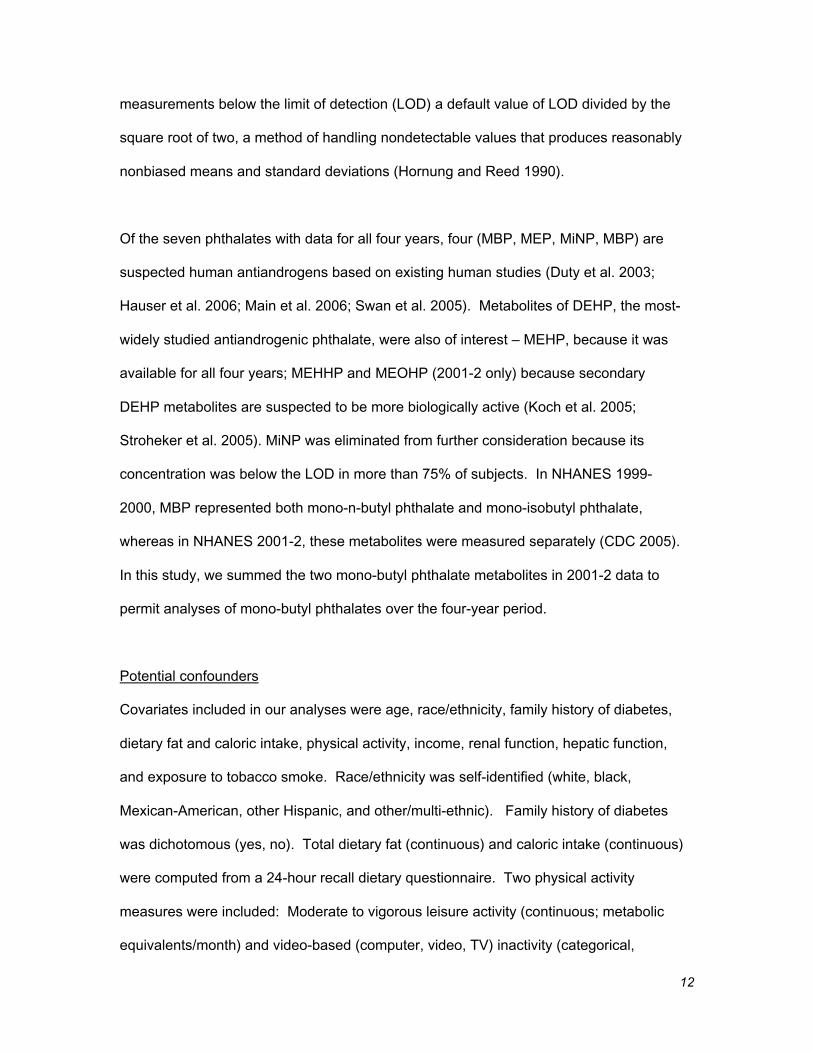
measurements below the limit of detection (LOD) a default value of LOD divided by the
square root of two, a method of handling nondetectable values that produces reasonably
nonbiased means and standard deviations (Hornung and Reed 1990).
Of the seven phthalates with data for all four years, four (MBP, MEP, MiNP, MBP) are
suspected human antiandrogens based on existing human studies (Duty et al. 2003;
Hauser et al. 2006; Main et al. 2006; Swan et al. 2005). Metabolites of DEHP, the most-
widely studied antiandrogenic phthalate, were also of interest – MEHP, because it was
available for all four years; MEHHP and MEOHP (2001-2 only) because secondary
DEHP metabolites are suspected to be more biologically active (Koch et al. 2005;
Stroheker et al. 2005). MiNP was eliminated from further consideration because its
concentration was below the LOD in more than 75% of subjects. In NHANES 1999-
2000, MBP represented both mono-n-butyl phthalate and mono-isobutyl phthalate,
whereas in NHANES 2001-2, these metabolites were measured separately (CDC 2005).
In this study, we summed the two mono-butyl phthalate metabolites in 2001-2 data to
permit analyses of mono-butyl phthalates over the four-year period.
Potential confounders
Covariates included in our analyses were age, race/ethnicity, family history of diabetes,
dietary fat and caloric intake, physical activity, income, renal function, hepatic function,
and exposure to tobacco smoke. Race/ethnicity was self-identified (white, black,
Mexican-American, other Hispanic, and other/multi-ethnic). Family history of diabetes
was dichotomous (yes, no). Total dietary fat (continuous) and caloric intake (continuous)
were computed from a 24-hour recall dietary questionnaire. Two physical activity
measures were included: Moderate to vigorous leisure activity (continuous; metabolic
equivalents/month) and video-based (computer, video, TV) inactivity (categorical,
13
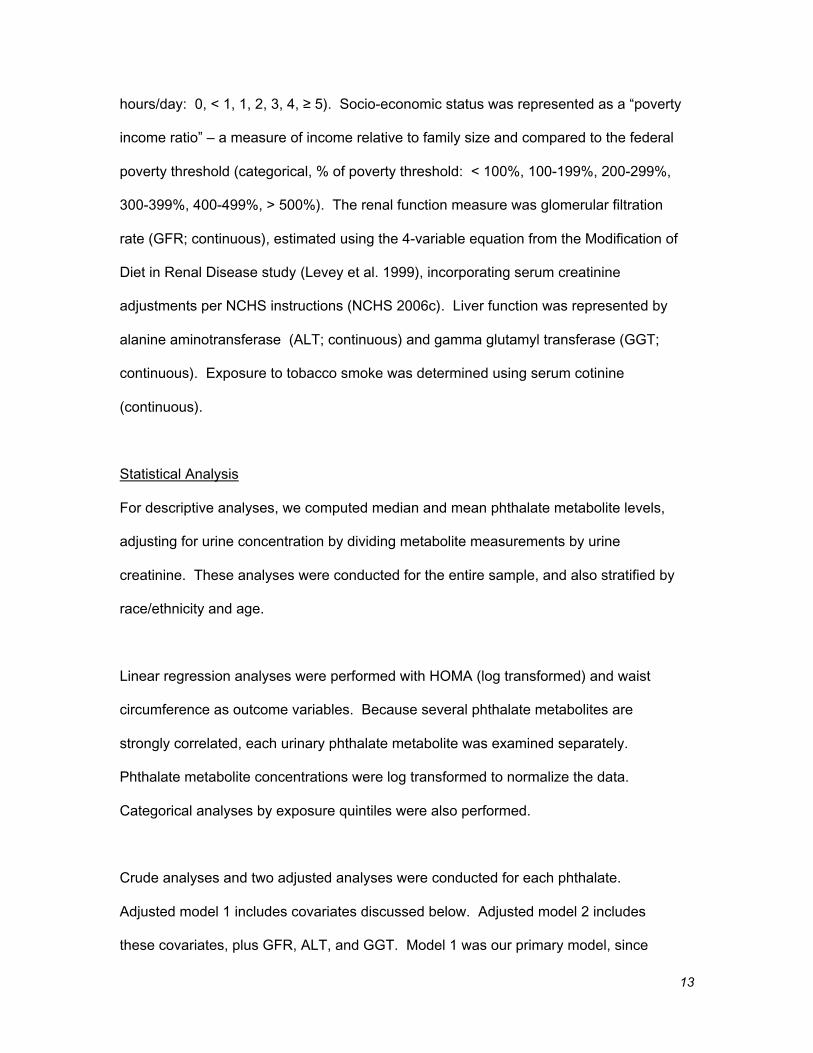
hours/day: 0, < 1, 1, 2, 3, 4, ≥ 5). Socio-economic status was represented as a “poverty
income ratio” – a measure of income relative to family size and compared to the federal
poverty threshold (categorical, % of poverty threshold: < 100%, 100-199%, 200-299%,
300-399%, 400-499%, > 500%). The renal function measure was glomerular filtration
rate (GFR; continuous), estimated using the 4-variable equation from the Modification of
Diet in Renal Disease study (Levey et al. 1999), incorporating serum creatinine
adjustments per NCHS instructions (NCHS 2006c). Liver function was represented by
alanine aminotransferase (ALT; continuous) and gamma glutamyl transferase (GGT;
continuous). Exposure to tobacco smoke was determined using serum cotinine
(continuous).
Statistical Analysis
For descriptive analyses, we computed median and mean phthalate metabolite levels,
adjusting for urine concentration by dividing metabolite measurements by urine
creatinine. These analyses were conducted for the entire sample, and also stratified by
race/ethnicity and age.
Linear regression analyses were performed with HOMA (log transformed) and waist
circumference as outcome variables. Because several phthalate metabolites are
strongly correlated, each urinary phthalate metabolite was examined separately.
Phthalate metabolite concentrations were log transformed to normalize the data.
Categorical analyses by exposure quintiles were also performed.
Crude analyses and two adjusted analyses were conducted for each phthalate.
Adjusted model 1 includes covariates discussed below. Adjusted model 2 includes
these covariates, plus GFR, ALT, and GGT. Model 1 was our primary model, since
14
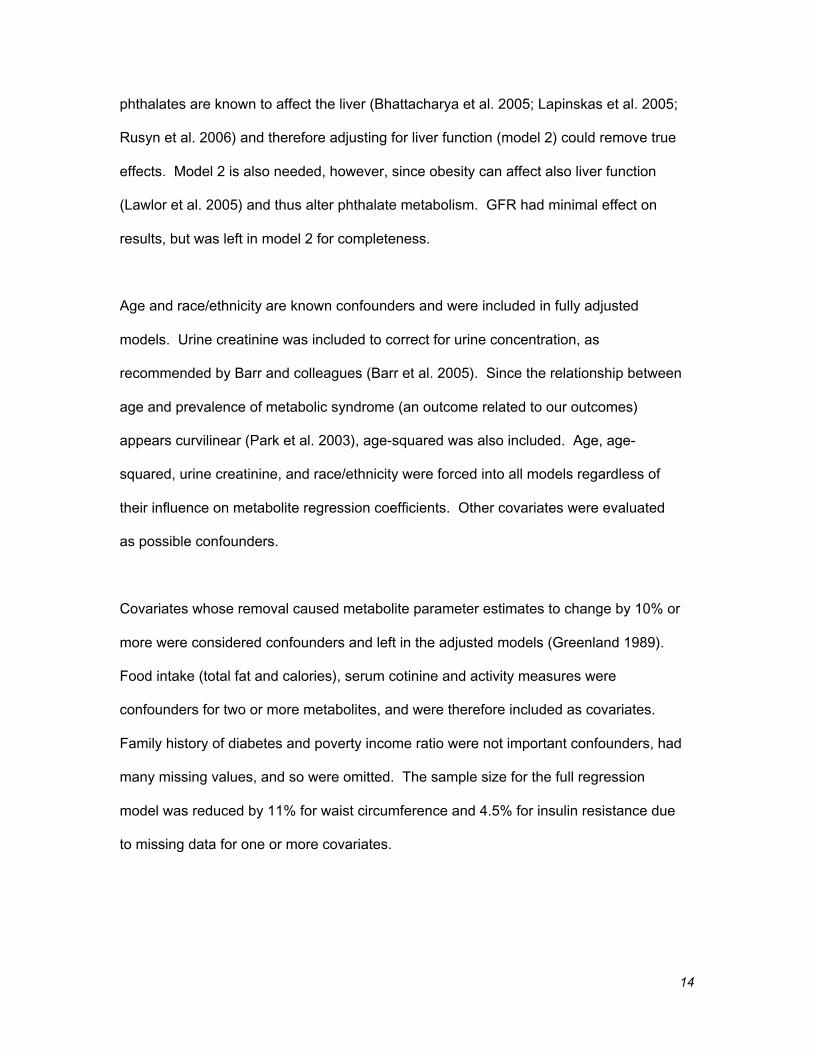
phthalates are known to affect the liver (Bhattacharya et al. 2005; Lapinskas et al. 2005;
Rusyn et al. 2006) and therefore adjusting for liver function (model 2) could remove true
effects. Model 2 is also needed, however, since obesity can affect also liver function
(Lawlor et al. 2005) and thus alter phthalate metabolism. GFR had minimal effect on
results, but was left in model 2 for completeness.
Age and race/ethnicity are known confounders and were included in fully adjusted
models. Urine creatinine was included to correct for urine concentration, as
recommended by Barr and colleagues (Barr et al. 2005). Since the relationship between
age and prevalence of metabolic syndrome (an outcome related to our outcomes)
appears curvilinear (Park et al. 2003), age-squared was also included. Age, age-
squared, urine creatinine, and race/ethnicity were forced into all models regardless of
their influence on metabolite regression coefficients. Other covariates were evaluated
as possible confounders.
Covariates whose removal caused metabolite parameter estimates to change by 10% or
more were considered confounders and left in the adjusted models (Greenland 1989).
Food intake (total fat and calories), serum cotinine and activity measures were
confounders for two or more metabolites, and were therefore included as covariates.
Family history of diabetes and poverty income ratio were not important confounders, had
many missing values, and so were omitted. The sample size for the full regression
model was reduced by 11% for waist circumference and 4.5% for insulin resistance due
to missing data for one or more covariates.
15
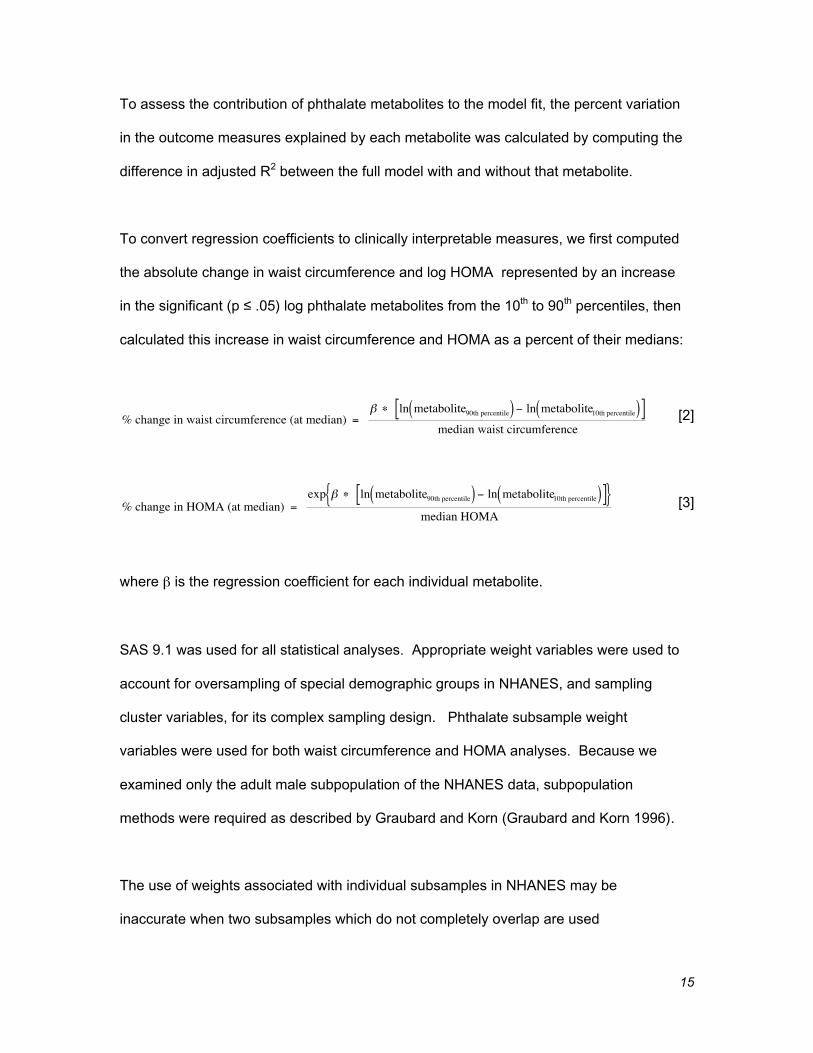
To assess the contribution of phthalate metabolites to the model fit, the percent variation
in the outcome measures explained by each metabolite was calculated by computing the
difference in adjusted R2 between the full model with and without that metabolite.
To convert regression coefficients to clinically interpretable measures, we first computed
the absolute change in waist circumference and log HOMA represented by an increase
in the significant (p ≤ .05) log phthalate metabolites from the 10th to 90th percentiles, then
calculated this increase in waist circumference and HOMA as a percent of their medians:
€
% change in waist circumference (at median) = β ∗ ln metabolite90th percentile( ) − ln metabolite10th percentile( )[ ]
median waist circumference[2]
€
% change in HOMA (at median) = exp β ∗ ln metabolite90th percentile( ) − ln metabolite10th percentile( )[ ]{ }
median HOMA[3]
where β is the regression coefficient for each individual metabolite.
SAS 9.1 was used for all statistical analyses. Appropriate weight variables were used to
account for oversampling of special demographic groups in NHANES, and sampling
cluster variables, for its complex sampling design. Phthalate subsample weight
variables were used for both waist circumference and HOMA analyses. Because we
examined only the adult male subpopulation of the NHANES data, subpopulation
methods were required as described by Graubard and Korn (Graubard and Korn 1996).
The use of weights associated with individual subsamples in NHANES may be
inaccurate when two subsamples which do not completely overlap are used
16
simultaneously in an analysis (NCHS 2006a). Our waist circumference analyses used
only one subsample (phthalates) and are unaffected; however, HOMA analyses used
both fasting and phthalate subsamples, which only overlap by 50%. Consequently, the
use of phthalate weights in our HOMA analyses could affect validity of these findings.
Nevertheless, use of fasting subsample weights, phthalate weights, and no weights did
not substantially alter our interpretation of the HOMA results, which also demonstrated
similar patterns as our waist circumference analyses. This suggests that the use of two
partially overlapping subsamples did not significantly impact our findings.
Results
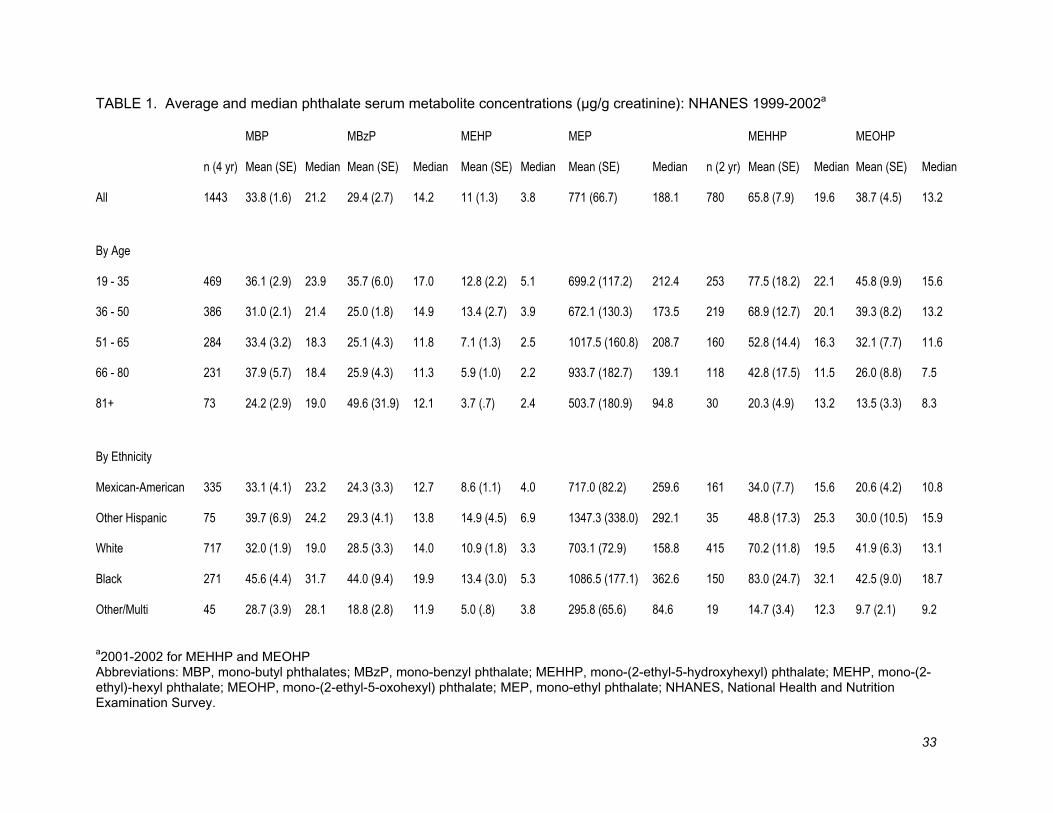
Table 1 shows the median and mean phthalate levels in the U.S. population, overall and
stratified by age and race/ethnicity. Exposure levels vary widely by phthalate metabolite,
with MEHP having the lowest concentration among the six we analyzed, and MEP the
highest. Concentrations varied somewhat by age, with greater median levels usually
found in younger age groups. For all phthalate metabolites but MEHP, more than 95%
of subjects were at or above the limit of detection (LOD); for MEHP, 80% of subjects
were ≥ LOD.
Concentrations also varied by race/ethnicity. Blacks had higher levels of exposure than
whites and Mexican-Americans for all phthalate metabolites. Mexican-Americans had
somewhat higher levels than whites for MBP, MEP, and MEHP.
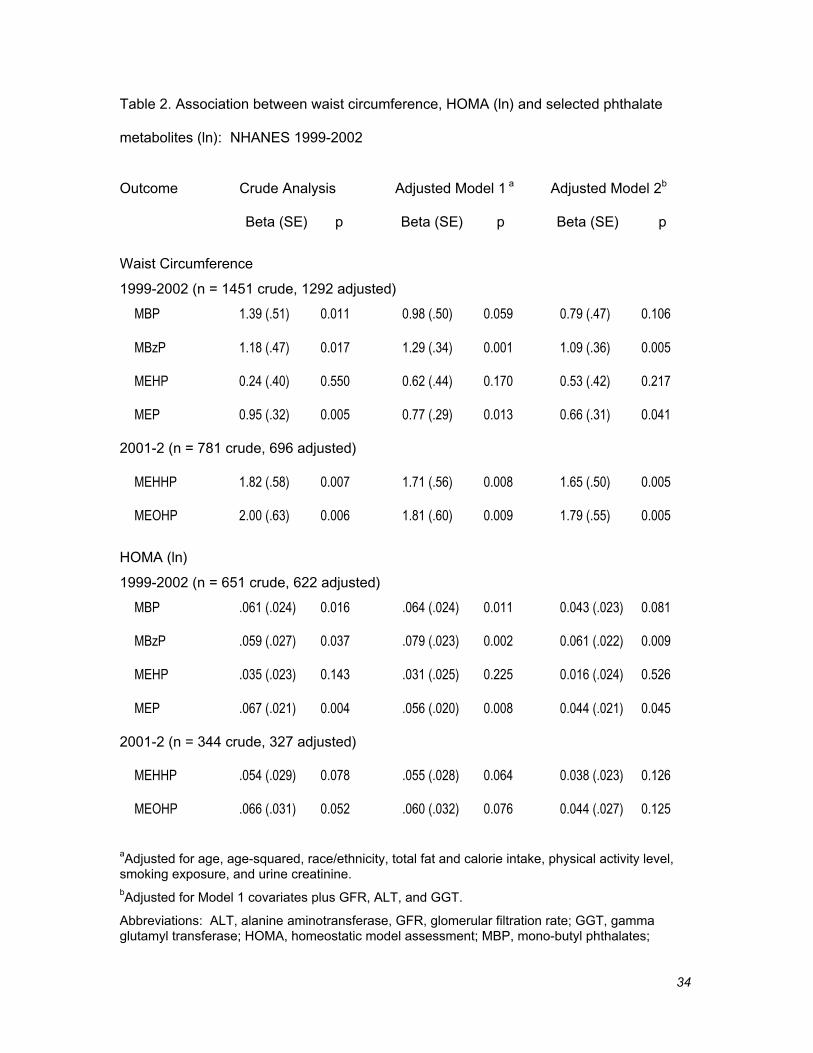
Table 2 shows the regression results for crude analysis (adjusting only for urinary
creatinine) and fully adjusted models. In the adjusted model 1, increasing
concentrations of MBzP, MEHHP and MEOHP were statistically significantly associated
17
with greater waist circumference, while concentrations of MBP, MBzP, and MEP were
significantly associated with increased log HOMA. Adjusted model 2, which adjusted
for renal and hepatic function, showed declines in parameter estimates, but all significant
results remained so except HOMA-MBP.
Adjusted model 1 HOMA results were gave similar parameter estimates whether
calculated with phthalate or fasting subsample weights (< 5% difference for analyses
with significant p-values). For further verification, an unweighted HOMA analysis was
also conducted (data not shown) with somewhat larger changes in parameter estimates.
However, MBP, MEP, and MBzP were still significantly associated and MEHP was again
not significant. MEHHP and MEOHP gained significance in the unweighted analysis.
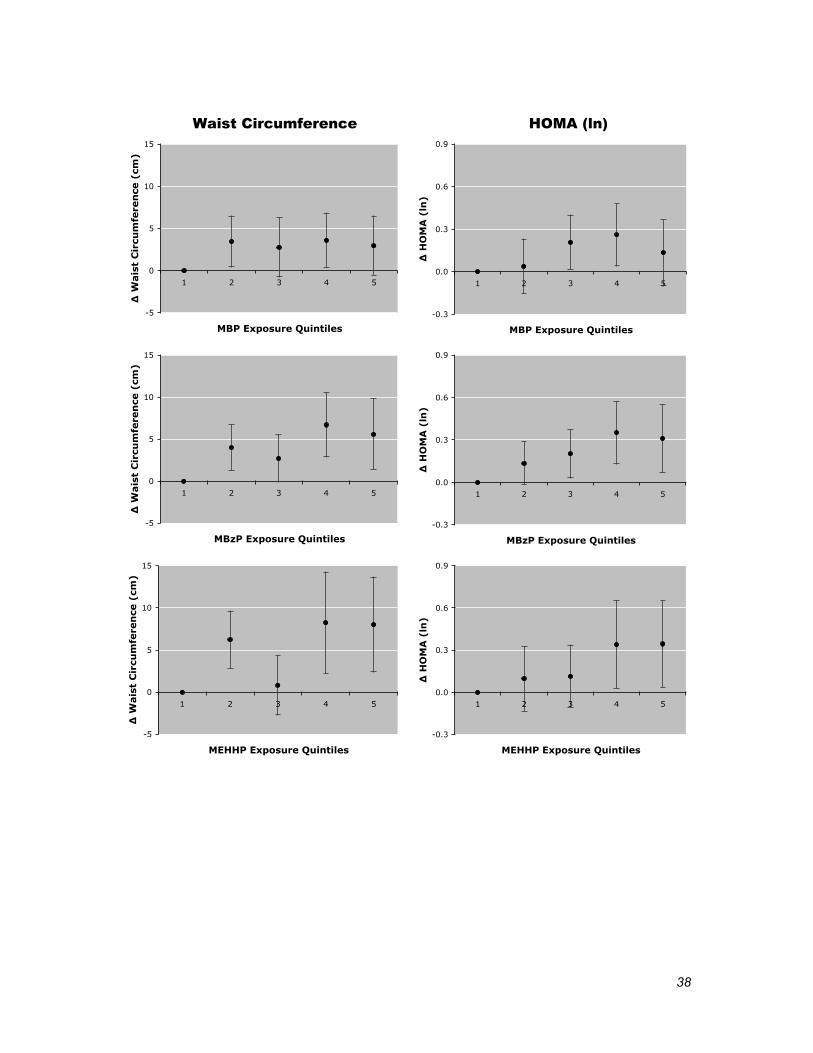
Categorical dose-response analyses demonstrated that the assumption of linearity was
not strongly violated, although the curves appeared to level off, or perhaps decline, at
higher metabolite concentrations (Figure 1).
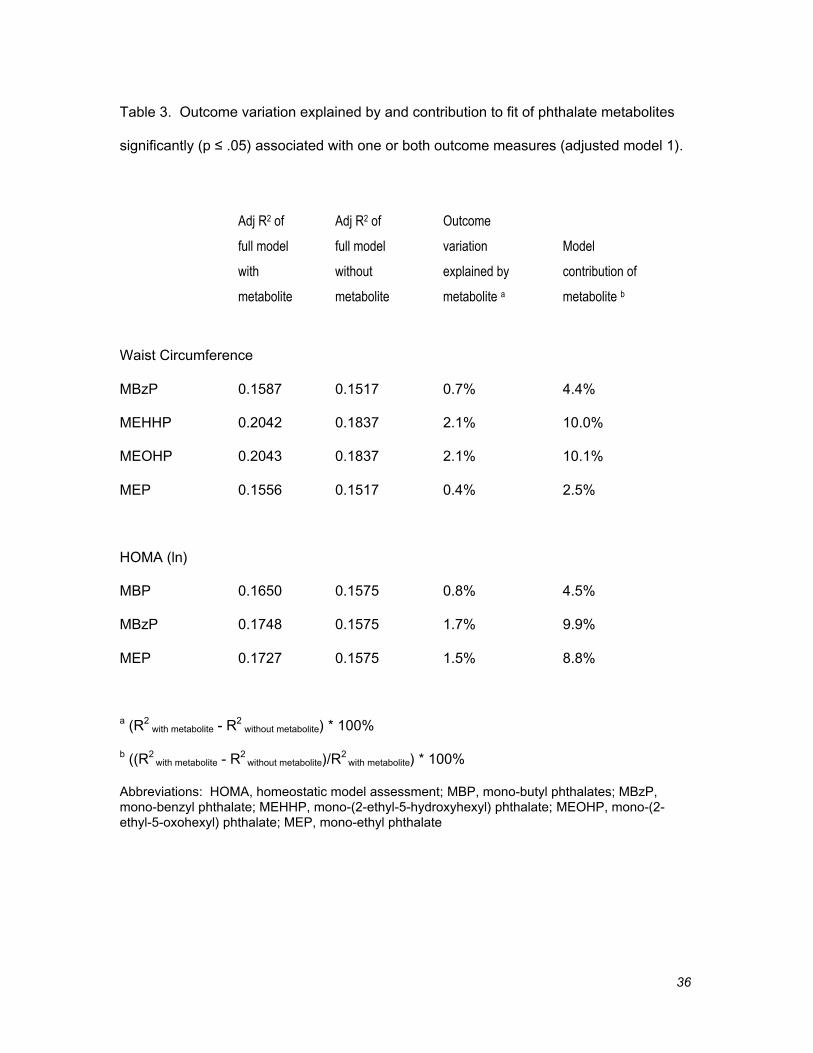
The contribution of phthalate metabolites to model fit is displayed in Table 3. Adjusted
R2 of the full model ranged from 15 to 20% for both outcome measures. The addition of
significant phthalate metabolites explained 0.4 - 2.1% of outcome variability. Compared
to the overall explanatory power of the full model, individual metabolites contributed
between 2.5 to 10.1% of the model fit.
To convert regression coefficients to clinically interpretable measures, we computed the
change in waist circumference and HOMA represented by an increase in significant
phthalate metabolites from the 10th to 90th percentiles in adjusted model 1. Waist
circumference increased 3.9 to 7.8 cm (4.0-8.0% of the 97.0 cm median) for four
18
significant metabolites – MEP (3.9 cm), MBzP (5.8 cm), MEHHP (7.3 cm), and MEOHP
(7.8 cm). HOMA (at the 2.50 median) increased 1.3 to 1.4 (52-57% of median) in
association with three metabolites – MBP (1.3), MEP (1.3), and MBzP (1.4).
Discussion
Obesity, insulin resistance, and diabetes have increased substantially in prevalence over
the past three decades. Many plausible causes have been described, such as perinatal
exposures, reduced physical activity, food marketing strategies, poor city planning, and
thrifty genes (Ebbeling et al. 2002). However, if bioavailable testosterone levels in
American men have declined considerably in recent years, as recently reported by
Travison and colleagues (Travison et al. 2007), then hypoandrogenism could be another
contributor to the epidemic of obesity and related disorders. Hormonally active agents
such as phthalates could be one source of this decline in testosterone level, or, perhaps
independently, to a decline in androgen function.
In our study, we found that the log-transformed concentrations of several phthalate
metabolites were positively and significantly correlated with abdominal obesity (MBzP,
MEHHP, MEOHP, MEP) and insulin resistance (MBP, MBzP, MEP) in adult U.S. males.
Categorical analysis of these metabolites by exposure quintiles yielded dose-response
curves consistent with this interpretation. Although wide confidence intervals preclude
strong assertions, the HOMA analyses curves suggest the inverted-U shaped, non-
monotonic dose-response sometimes seen with hormonally-active agents, including
phthalates (Andrade et al. 2006; Lehmann et al. 2004; Takano et al. 2006; Welshons et
al. 2003).
19
Adjustment for renal function had minimal effect. Adjustment for liver function
moderated most associations, but only eliminated statistical significance for HOMA-
MBP. Whether this adjustment for liver function was entirely appropriate is unclear,
however. Adjustment could be appropriate since obesity can affect liver function, and
thus may alter phthalate metabolism. Conversely, adjusting for liver function could
falsely attenuate real effects if phthalate exposure was partially responsible for elevation
of liver enzymes.
Among the DEHP metabolites available, MEHP showed substantially weaker
associations compared to the oxidative metabolites MEHHP and MEOHP. This was not
unexpected, since a recent study has shown MEHHP and MEOHP more active in animal
models than MEHP (Stroheker et al. 2005). Further, MEHP has a shorter serum half-life
than these other DEHP metabolites, thus reducing the correlation of MEHP
measurements with DEHP exposure (Koch et al. 2005).
To our knowledge, ours is the first human study to examine associations between
phthalate metabolites and either abdominal obesity or insulin resistance. In one animal
study, however, female rats exposed to DEHP were found to have increased serum
glucose and decreased insulin, as well as thyroid and adrenocortical dysfunction
(Gayathri et al. 2004). The decreased insulin in their study, though, points to impaired
beta cell function in the pancreas as found in type 1, or later in the course of type 2,
diabetes.
Like our study, others have found associations with outcomes that might follow from
antiandrogenic effects of MBP (Duty et al. 2003; Hauser et al. 2006; Main et al. 2006;
Swan et al. 2005) and MEP (Jönsson et al. 2005; Main et al. 2006; Swan et al. 2005),
20
and found no association with MEHP (Duty et al. 2003; Hauser et al. 2006; Jönsson et
al. 2005; Main et al. 2006; Swan et al. 2005). Results for MBzP, MEHHP, and MEOHP
were less consistent. Assuming these associations represent true effects, differences
between our results and others could be due to our larger sample sizes and increased
power. Phthalates might also affect adult males differently than fetuses, or they may
interact directly with energy balance or glucose metabolism pathways in addition to
antiandrogenic effects.
In our study, individual phthalate exposures only explained 2.1% or less of the variability
of our outcomes (abdominal obesity and insulin resistance). The full model, however,
explained only 15-20%, despite including the well-accepted covariates of age,
race/ethnicity, fat and calorie intake, activity levels and smoking. In part, this
demonstrates the difficulty of predicting the presence of this complex, multi-factorial
clinical syndrome. In addition, humans are exposed to multiple phthalates
simultaneously and in combination with other potential environmental toxicants that may
add together to produce adverse effects. For example, PCBs, dioxins, and
organochlorine pesticides have also been associated with diabetes prevalence in adult
humans (Lee et al. 2006; Rylander et al. 2005). Combinations of phthalates and other
potential antiandrogens have been shown in animal models to act in a dose additive
manner (Gray et al. 2006; Hotchkiss et al. 2004); in humans, Hauser et al. found greater
than additive effects between MBP and PCB-153 on semen quality (Hauser et al. 2005).
Although individual phthalate exposures in humans are generally asserted to be below
the no-observed-effect level (NOEL), combinations of man-made estrogenic chemicals,
individually below NOEL concentrations, have been shown to exert considerable effect
in a yeast reporter gene assay using the human estrogen receptor α (Rajapakse et al.
2002).
21
Estrogenic exposures might also add to antiandrogenic exposures, since some authors
have found the estradiol/testosterone (total) ratio correlated more strongly with fasting
glucose and insulin than testosterone (free or total) or estradiol alone (Phillips et al.
2003). Among xenoestrogens, bisphenol-A (currently unmeasured in NHANES) would
be important to investigate, since it has recently been shown to act in a manner similar
to estrogen on insulin production in mouse pancreatic beta cells (Alonso-Magdalena et
al. 2006).
Our findings should be considered in light of several important limitations. First, as a
cross-sectional study, it cannot examine changes over time. Second, HOMA is a static
measure of insulin resistance, unlike the hyperinsulinemic-euglycemic clamp, which
limits its ability to detect abnormalities in insulin secretion or peripheral glucose disposal.
This may have reduced our ability to observe associations. Third, NHANES 1999-2002
contains no measures of sex hormones, gonadotropins, or sex hormone binding globulin
in men, which limits our ability to examine the mechanism of action proposed in this
study. Fourth, our HOMA analyses are less generalizable to the population since
specially calculated sample weights for the combined use of phthalate and fasting
subsamples are not available.
Fifth, our study was restricted to adult males. Children and adolescents were excluded
from our study because fasting glucose and insulin were not available in NHANES 1999-
2002 for subjects less than 12 years old, and because in adolescents, hormone levels
vary greatly with stage of puberty. Women were excluded due to the high degree of
pre-menopausal fluctuations in sex hormones, and the change in risk profile at
menopause. Also, women appear to respond differently than men to low testosterone
22
levels; in women, low testosterone has been associated with reduced prevalence of
obesity, insulin resistance, and diabetes (Ding et al. 2006; Kalish et al. 2003; Oh et al.
2002). An analysis of the adult women in this dataset indeed gave dissimilar results
from men and deserves further study (results not shown).
Sixth, the one-time spot urine samples used in this study are limited measures of long-
term exposure to phthalates. If phthalates are exerting antiandrogenic effects, one might
expect this effect to manifest over months to years. No study has yet examined the
correlation between a spot urine phthalate measurement and year-long exposure
patterns. Hauser et al., however, found that a single spot urine predicted the highest
tercile of phthalate exposure over three months with sensitivities from 0.56-0.67 and
specificities from 0.83-0.87 among the phthalates in our study (Hauser et al. 2004b).
Hauser also notes that urine creatinine may not be the best way to correct for variation in
urine dilution, and that specific gravity (unavailable in NHANES) may be a better
approach. These flaws in exposure classification also reduced our ability to observe
associations.
Seventh, people with obesity or insulin resistance may be exposed to more phthalates
than people who do not have these conditions. A few FDA-licensed medications
incorporate phthalates to modify drug delivery (Schettler 2006), and this exposure can
sometimes be quite large (Hauser et al. 2004a). Since people with disease are also
more likely to take medications, some of the associations we have observed, particularly
with MBP and MEP (metabolites of DBP and DEP), may be falsely strengthened through
reverse causality. Adjustment for this possible confounder would be difficult, however.
Phthalates are considered inert ingredients, and we are not aware of a comprehensive
23
database of inert ingredients for prescription and over-the-counter medications, herbals,
and vitamins.
Our study has several important strengths, based primarily on strengths of NHANES
data. Our sample was large, nationally representative, and multi-ethnic. Biomarkers
were used for both exposures and outcomes, and a number of relevant covariates could
be controlled.
Although we based our study on the premise that phthalates are acting as
antiandrogens, the relationships between phthalate metabolites, abdominal obesity, and
insulin resistance may be complicated by other mechanisms. For example, phthalates
can act as thyroid hormone receptor antagonists (Sugiyama et al. 2005). Some
phthalate metabolites are also known to interact with peroxisome proliferator-activated
receptors (PPARs), which are not only important regulators of lipid and glucose
homeostasis (Evans et al. 2004), but also mediate some effects of phthalates on
testicular and hepatic function (Corton and Lapinskas 2005; Lapinskas et al. 2005).
Activation of PPARs appear to have generally beneficial effects on lipid and glucose
homeostasis, though medications which activate PPAR gamma improve insulin
sensitivity while simultaneously increasing non-visceral fat mass (Semple et al. 2006).
Several research paths would help determine the importance of our findings. Animal
studies conducted in human exposure ranges, as well as human cross-sectional studies,
could explore the capacity of combinations of hormonally active agents to create
metabolic disturbances such as those we have examined here. Similar studies as ours
could be extended to women, children, and adolescents, or to related conditions like
metabolic syndrome. Measurement of sex hormones, unavailable for males in NHANES
24
1999-2002, might suggest possible mechanisms. Examination of lipid effects could help
tease out PPAR contributions. Ultimately, longitudinal studies will be required to provide
more definitive answers.
In conclusion, in this large national cross-sectional sample, several phthalate
metabolites showed statistically significant positive correlations with abdominal obesity
and insulin resistance in adult U.S. males. If confirmed by longitudinal studies, these
associations would suggest that phthalates, a widely used family of chemicals, may
contribute to the prevalence of obesity, insulin resistance, and related clinical disorders.
Since phthalates are rapidly metabolized, unlike PCBs and other persistent organic
contaminants, such confirmation could prompt effective actions to reduce phthalate
exposure in the population.
25
References
Adams KF, Schatzkin A, Harris TB, Kipnis V, Mouw T, Ballard-Barbash R, et al. 2006.
Overweight, obesity, and mortality in a large prospective cohort of persons 50 to 71 years
old. N Engl J Med 355(8):763-778.
Alonso-Magdalena P, Morimoto S, Ripoll C, Fuentes E, Nadal A. 2006. The estrogenic effect of
bisphenol A disrupts pancreatic beta-cell function in vivo and induces insulin resistance.
Environ Health Perspect 114(1):106-112.
Andrade AJ, Grande SW, Talsness CE, Grote K, Chahoud I. 2006. A dose-response study
following in utero and lactational exposure to di-(2-ethylhexyl)-phthalate (DEHP): Non-
monotonic dose-response and low dose effects on rat brain aromatase activity. Toxicology
227(3):185-192.
Barr DB, Wilder LC, Caudill SP, Gonzalez AJ, Needham LL, Pirkle JL. 2005. Urinary creatinine
concentrations in the U.S. population: implications for urinary biologic monitoring
measurements. Environ Health Perspect 113(2):192-200.
Bell FP. 1982. Effects of phthalate esters on lipid metabolism in various tissues, cells and
organelles in mammals. Environ Health Perspect 45:41-50.
Bhattacharya N, Dufour JM, Vo MN, Okita J, Okita R, Kim KH. 2005. Differential effects of
phthalates on the testis and the liver. Biol Reprod 72(3):745-754.
Braga-Basaria M, Dobs AS, Muller DC, Carducci MA, John M, Egan J, et al. 2006. Metabolic
syndrome in men with prostate cancer undergoing long-term androgen-deprivation therapy.
J Clin Oncol 24(24):3979-3983.
CDC (Centers for Disease Control and Prevention). 2005. Third National Report on Human
Exposure to Environmental Chemicals. Available: http://www.cdc.gov/exposurereport/
[accessed 20 Dec 2006].
Corton JC, Lapinskas PJ. 2005. Peroxisome proliferator-activated receptors: mediators of
phthalate ester-induced effects in the male reproductive tract? Toxicol Sci 83(1):4-17.
26
Ding EL, Song Y, Malik VS, Liu S. 2006. Sex differences of endogenous sex hormones and risk
of type 2 diabetes: a systematic review and meta-analysis. JAMA 295(11):1288-1299.
Duty SM, Singh NP, Silva MJ, Barr DB, Brock JW, Ryan L, et al. 2003. The relationship between
environmental exposures to phthalates and DNA damage in human sperm using the
neutral comet assay. Environ Health Perspect 111(9):1164-1169.
Ebbeling CB, Pawlak DB, Ludwig DS. 2002. Childhood obesity: public-health crisis, common
sense cure. Lancet 360(9331):473-482.
Evans RM, Barish GD, Wang YX. 2004. PPARs and the complex journey to obesity. Nat Med
10(4):355-361.
Farin HM, Abbasi F, Reaven GM. 2006. Body mass index and waist circumference both
contribute to differences in insulin-mediated glucose disposal in nondiabetic adults. Am J
Clin Nutr 83(1):47-51.
Fisher JS. 2004. Environmental anti-androgens and male reproductive health: focus on
phthalates and testicular dysgenesis syndrome. Reproduction 127(3):305-315.
Fujimoto WY. 2000. The importance of insulin resistance in the pathogenesis of type 2 diabetes
mellitus. Am J Med 108 Suppl 6a:9S-14S.
Gayathri NS, Dhanya CR, Indu AR, Kurup PA. 2004. Changes in some hormones by low doses of
di (2-ethyl hexyl) phthalate (DEHP), a commonly used plasticizer in PVC blood storage
bags & medical tubing. Indian J Med Res 119(4):139-144.
Graubard BI, Korn EL. 1996. Survey inference for subpopulations. Am J Epidemiol 144(1):102-
106.
Gray LE, Jr., Wilson VS, Stoker T, Lambright C, Furr J, Noriega N, et al. 2006. Adverse effects of
environmental antiandrogens and androgens on reproductive development in mammals.
Int J Androl 29(1):96-104; discussion 105-108.
Greenland S. 1989. Modeling and variable selection in epidemiologic analysis. Am J Public
Health 79(3):340-349.
27
Haffner SM, Lehto S, Rönnemaa T, Pyörälä K, Laakso M. 1998. Mortality from coronary heart
disease in subjects with type 2 diabetes and in nondiabetic subjects with and without prior
myocardial infarction. N Engl J Med 339(4):229-234.
Hauser R, Calafat AM. 2005. Phthalates and human health. Occup Environ Med 62(11):806-818.
Hauser R, Duty S, Godfrey-Bailey L, Calafat AM. 2004a. Medications as a source of human
exposure to phthalates. Environ Health Perspect 112(6):751-753.
Hauser R, Meeker JD, Duty S, Silva MJ, Calafat AM. 2006. Altered semen quality in relation to
urinary concentrations of phthalate monoester and oxidative metabolites. Epidemiology.
Hauser R, Meeker JD, Park S, Silva MJ, Calafat AM. 2004b. Temporal variability of urinary
phthalate metabolite levels in men of reproductive age. Environ Health Perspect
112(17):1734-1740.
Hauser R, Williams P, Altshul L, Calafat AM. 2005. Evidence of interaction between
polychlorinated biphenyls and phthalates in relation to human sperm motility. Environ
Health Perspect 113(4):425-430.
Hornung RW, Reed LD. 1990. Estimation of average concentration in the presence of
nondetectable values. App Occup Environ Hyg 5:46-51.
Hotchkiss AK, Parks-Saldutti LG, Ostby JS, Lambright C, Furr J, Vandenbergh JG, et al. 2004. A
mixture of the "antiandrogens" linuron and butyl benzyl phthalate alters sexual
differentiation of the male rat in a cumulative fashion. Biol Reprod 71(6):1852-1861.
Isidori AM, Giannetta E, Greco EA, Gianfrilli D, Bonifacio V, Isidori A, et al. 2005. Effects of
testosterone on body composition, bone metabolism and serum lipid profile in middle-aged
men: a meta-analysis. Clin Endocrinol (Oxf) 63(3):280-293.
Janssen I, Katzmarzyk PT, Ross R. 2004. Waist circumference and not body mass index explains
obesity-related health risk. Am J Clin Nutr 79(3):379-384.
28
Jönsson BA, Richthoff J, Rylander L, Giwercman A, Hagmar L. 2005. Urinary phthalate
metabolites and biomarkers of reproductive function in young men. Epidemiology
16(4):487-493.
Kalish GM, Barrett-Connor E, Laughlin GA, Gulanski BI. 2003. Association of endogenous sex
hormones and insulin resistance among postmenopausal women: results from the
Postmenopausal Estrogen/Progestin Intervention Trial. J Clin Endocrinol Metab
88(4):1646-1652.
Koch HM, Bolt HM, Angerer J. 2004. Di(2-ethylhexyl)phthalate (DEHP) metabolites in human
urine and serum after a single oral dose of deuterium-labelled DEHP. Arch Toxicol
78(3):123-130.
Koch HM, Bolt HM, Preuss R, Angerer J. 2005. New metabolites of di(2-ethylhexyl)phthalate
(DEHP) in human urine and serum after single oral doses of deuterium-labelled DEHP.
Arch Toxicol 79(7):367-376.
Lapinskas PJ, Brown S, Leesnitzer LM, Blanchard S, Swanson C, Cattley RC, et al. 2005. Role of
PPARalpha in mediating the effects of phthalates and metabolites in the liver. Toxicology
207(1):149-163.
Latini G. 2005. Monitoring phthalate exposure in humans. Clin Chim Acta 361(1-2):20-29.
Lawlor DA, Sattar N, Smith GD, Ebrahim S. 2005. The associations of physical activity and
adiposity with alanine aminotransferase and gamma-glutamyltransferase. Am J Epidemiol
161(11):1081-1088.
Lee DH, Lee IK, Song K, Steffes M, Toscano W, Baker BA, et al. 2006. A strong dose-response
relation between serum concentrations of persistent organic pollutants and diabetes:
results from the National Health and Examination Survey 1999-2002. Diabetes Care
29(7):1638-1644.
29
Lehmann KP, Phillips S, Sar M, Foster PM, Gaido KW. 2004. Dose-dependent alterations in gene
expression and testosterone synthesis in the fetal testes of male rats exposed to di (n-
butyl) phthalate. Toxicol Sci 81(1):60-68.
Levey AS, Bosch JP, Lewis JB, Greene T, Rogers N, Roth D. 1999. A more accurate method to
estimate glomerular filtration rate from serum creatinine: a new prediction equation.
Modification of Diet in Renal Disease Study Group. Ann Intern Med 130(6):461-470.
Main KM, Mortensen GK, Kaleva MM, Boisen KA, Damgaard IN, Chellakooty M, et al. 2006.
Human breast milk contamination with phthalates and alterations of endogenous
reproductive hormones in infants three months of age. Environ Health Perspect
114(2):270-276.
Matthews DR, Hosker JP, Rudenski AS, Naylor BA, Treacher DF, Turner RC. 1985. Homeostasis
model assessment: insulin resistance and beta-cell function from fasting plasma glucose
and insulin concentrations in man. Diabetologia 28(7):412-419.
Mårin P. 1995. Testosterone and regional fat distribution. Obes Res 3 Suppl 4:609S-612S.
Mårin P, Holmang S, Gustafsson C, Jonsson L, Kvist H, Elander A, et al. 1993. Androgen
treatment of abdominally obese men. Obes Res 1(4):245-251.
Mårin P, Holmang S, Jonsson L, Sjostrom L, Kvist H, Holm G, et al. 1992. The effects of
testosterone treatment on body composition and metabolism in middle-aged obese men.
Int J Obes Relat Metab Disord 16(12):991-997.
Mårin P, Lönn L, Andersson B, Odén B, Olbe L, Bengtsson BA, et al. 1996. Assimilation of
triglycerides in subcutaneous and intraabdominal adipose tissues in vivo in men: effects of
testosterone. J Clin Endocrinol Metab 81(3):1018-1022.
NCHS (National Center for Health Statistics). 2006a. Current NHANES Web Tutorial. Available:
http://www.cdc.gov/nchs/tutorials/currentnhanes/index.htm [accessed 29 Jan 2007].
NCHS (National Center for Health Statistics). 2006b. National Health and Nutrition Examination
Survey. Available: http://www.cdc.gov/nchs/nhanes.htm [accessed 1 Nov 2006].
30
NCHS (National Center for Health Statistics). 2006c. Note for Correction of Serum Creatinine for
NHANES III, NHANES 1999-2000, 2001-2002 and 2003-2004. Available:
http://www.cdc.gov/nchs/data/nhanes/nhanes_03_04/general_%20note_for_serum_creatin
ine.pdf [accessed 17 Jan 2007].
Oh JY, Barrett-Connor E, Wedick NM, Wingard DL. 2002. Endogenous sex hormones and the
development of type 2 diabetes in older men and women: the Rancho Bernardo study.
Diabetes Care 25(1):55-60.
Park YW, Zhu S, Palaniappan L, Heshka S, Carnethon MR, Heymsfield SB. 2003. The metabolic
syndrome: prevalence and associated risk factor findings in the US population from the
Third National Health and Nutrition Examination Survey, 1988-1994. Arch Intern Med
163(4):427-436.
Parks LG, Ostby JS, Lambright CR, Abbott BD, Klinefelter GR, Barlow NJ, et al. 2000. The
plasticizer diethylhexyl phthalate induces malformations by decreasing fetal testosterone
synthesis during sexual differentiation in the male rat. Toxicol Sci 58(2):339-349.
Phillips GB, Jing T, Heymsfield SB. 2003. Relationships in men of sex hormones, insulin,
adiposity, and risk factors for myocardial infarction. Metabolism 52(6):784-790.
Poirier P, Giles TD, Bray GA, Hong Y, Stern JS, Pi-Sunyer FX, et al. 2006. Obesity and
cardiovascular disease: pathophysiology, evaluation, and effect of weight loss: an update
of the 1997 American Heart Association Scientific Statement on Obesity and Heart
Disease from the Obesity Committee of the Council on Nutrition, Physical Activity, and
Metabolism. Circulation 113(6):898-918.
Rajapakse N, Silva E, Kortenkamp A. 2002. Combining xenoestrogens at levels below individual
no-observed-effect concentrations dramatically enhances steroid hormone action. Environ
Health Perspect 110(9):917-921.
Reaven GM. 1988. Banting lecture 1988. Role of insulin resistance in human disease. Diabetes
37(12):1595-1607.
31
Rusyn I, Peters JM, Cunningham ML. 2006. Modes of action and species-specific effects of di-(2-
ethylhexyl)phthalate in the liver. Crit Rev Toxicol 36(5):459-479.
Rylander L, Rignell-Hydbom A, Hagmar L. 2005. A cross-sectional study of the association
between persistent organochlorine pollutants and diabetes. Environ Health 4:28.
Schettler T. 2006. Human exposure to phthalates via consumer products. Int J Androl 29(1):134-
139; discussion 181-135.
Selvin E, Feinleib M, Zhang L, Rohrmann S, Rifai N, Nelson WG, et al. 2007. Androgens and
Diabetes in Men: Results from the Third National Health and Nutrition Examination Survey
(NHANES III). Diabetes Care 30(2):234-238.
Semple RK, Chatterjee VK, O'Rahilly S. 2006. PPAR gamma and human metabolic disease. J
Clin Invest 116(3):581-589.
Sharifi N, Gulley JL, Dahut WL. 2005. Androgen deprivation therapy for prostate cancer. JAMA
294(2):238-244.
Silva MJ, Barr DB, Reidy JA, Malek NA, Hodge CC, Caudill SP, et al. 2004. Urinary levels of
seven phthalate metabolites in the U.S. population from the National Health and Nutrition
Examination Survey (NHANES) 1999-2000. Environ Health Perspect 112(3):331-338.
Stroheker T, Cabaton N, Nourdin G, Régnier JF, Lhuguenot JC, Chagnon MC. 2005. Evaluation
of anti-androgenic activity of di-(2-ethylhexyl)phthalate. Toxicology 208(1):115-121.
Sugiyama S, Shimada N, Miyoshi H, Yamauchi K. 2005. Detection of thyroid system-disrupting
chemicals using in vitro and in vivo screening assays in Xenopus laevis. Toxicol Sci
88(2):367-374.
Swan SH, Main KM, Liu F, Stewart SL, Kruse RL, Calafat AM, et al. 2005. Decrease in anogenital
distance among male infants with prenatal phthalate exposure. Environ Health Perspect
113(8):1056-1061.
32
Takano H, Yanagisawa R, Inoue K, Ichinose T, Sadakane K, Yoshikawa T. 2006. Di-(2-
ethylhexyl) phthalate enhances atopic dermatitis-like skin lesions in mice. Environ Health
Perspect 114(8):1266-1269.
Travison TG, Araujo AB, O'Donnell AB, Kupelian V, McKinlay JB. 2007. A population-level
decline in serum testosterone levels in American men. J Clin Endocrinol Metab 92(1):196-
202.
Wallace TM, Levy JC, Matthews DR. 2004. Use and abuse of HOMA modeling. Diabetes Care
27(6):1487-1495.
Welshons WV, Thayer KA, Judy BM, Taylor JA, Curran EM, vom Saal FS. 2003. Large effects
from small exposures. I. Mechanisms for endocrine-disrupting chemicals with estrogenic
activity. Environ Health Perspect 111(8):994-1006.
Zimmet P, Alberti KG, Shaw J. 2001. Global and societal implications of the diabetes epidemic.
Nature 414(6865):782-787.
33
TABLE 1. Average and median phthalate serum metabolite concentrations (µg/g creatinine): NHANES 1999-2002a
MBP MBzP MEHP MEP MEHHP MEOHP
n (4 yr) Mean (SE) Median Mean (SE) Median Mean (SE) Median Mean (SE) Median n (2 yr) Mean (SE) Median Mean (SE) Median
All 1443 33.8 (1.6) 21.2 29.4 (2.7) 14.2 11 (1.3) 3.8 771 (66.7) 188.1 780 65.8 (7.9) 19.6 38.7 (4.5) 13.2
By Age
19 - 35 469 36.1 (2.9) 23.9 35.7 (6.0) 17.0 12.8 (2.2) 5.1 699.2 (117.2) 212.4 253 77.5 (18.2) 22.1 45.8 (9.9) 15.6
36 - 50 386 31.0 (2.1) 21.4 25.0 (1.8) 14.9 13.4 (2.7) 3.9 672.1 (130.3) 173.5 219 68.9 (12.7) 20.1 39.3 (8.2) 13.2
51 - 65 284 33.4 (3.2) 18.3 25.1 (4.3) 11.8 7.1 (1.3) 2.5 1017.5 (160.8) 208.7 160 52.8 (14.4) 16.3 32.1 (7.7) 11.6
66 - 80 231 37.9 (5.7) 18.4 25.9 (4.3) 11.3 5.9 (1.0) 2.2 933.7 (182.7) 139.1 118 42.8 (17.5) 11.5 26.0 (8.8) 7.5
81+ 73 24.2 (2.9) 19.0 49.6 (31.9) 12.1 3.7 (.7) 2.4 503.7 (180.9) 94.8 30 20.3 (4.9) 13.2 13.5 (3.3) 8.3
By Ethnicity
Mexican-American 335 33.1 (4.1) 23.2 24.3 (3.3) 12.7 8.6 (1.1) 4.0 717.0 (82.2) 259.6 161 34.0 (7.7) 15.6 20.6 (4.2) 10.8
Other Hispanic 75 39.7 (6.9) 24.2 29.3 (4.1) 13.8 14.9 (4.5) 6.9 1347.3 (338.0) 292.1 35 48.8 (17.3) 25.3 30.0 (10.5) 15.9
White 717 32.0 (1.9) 19.0 28.5 (3.3) 14.0 10.9 (1.8) 3.3 703.1 (72.9) 158.8 415 70.2 (11.8) 19.5 41.9 (6.3) 13.1
Black 271 45.6 (4.4) 31.7 44.0 (9.4) 19.9 13.4 (3.0) 5.3 1086.5 (177.1) 362.6 150 83.0 (24.7) 32.1 42.5 (9.0) 18.7
Other/Multi 45 28.7 (3.9) 28.1 18.8 (2.8) 11.9 5.0 (.8) 3.8 295.8 (65.6) 84.6 19 14.7 (3.4) 12.3 9.7 (2.1) 9.2
a2001-2002 for MEHHP and MEOHPAbbreviations: MBP, mono-butyl phthalates; MBzP, mono-benzyl phthalate; MEHHP, mono-(2-ethyl-5-hydroxyhexyl) phthalate; MEHP, mono-(2-ethyl)-hexyl phthalate; MEOHP, mono-(2-ethyl-5-oxohexyl) phthalate; MEP, mono-ethyl phthalate; NHANES, National Health and NutritionExamination Survey.
34
Table 2. Association between waist circumference, HOMA (ln) and selected phthalate
metabolites (ln): NHANES 1999-2002
Outcome Crude Analysis Adjusted Model 1 a Adjusted Model 2b
Beta (SE) p Beta (SE) p Beta (SE) p
Waist Circumference
1999-2002 (n = 1451 crude, 1292 adjusted)
MBP 1.39 (.51) 0.011 0.98 (.50) 0.059 0.79 (.47) 0.106
MBzP 1.18 (.47) 0.017 1.29 (.34) 0.001 1.09 (.36) 0.005
MEHP 0.24 (.40) 0.550 0.62 (.44) 0.170 0.53 (.42) 0.217
MEP 0.95 (.32) 0.005 0.77 (.29) 0.013 0.66 (.31) 0.041
2001-2 (n = 781 crude, 696 adjusted)
MEHHP 1.82 (.58) 0.007 1.71 (.56) 0.008 1.65 (.50) 0.005
MEOHP 2.00 (.63) 0.006 1.81 (.60) 0.009 1.79 (.55) 0.005
HOMA (ln)
1999-2002 (n = 651 crude, 622 adjusted)
MBP .061 (.024) 0.016 .064 (.024) 0.011 0.043 (.023) 0.081
MBzP .059 (.027) 0.037 .079 (.023) 0.002 0.061 (.022) 0.009
MEHP .035 (.023) 0.143 .031 (.025) 0.225 0.016 (.024) 0.526
MEP .067 (.021) 0.004 .056 (.020) 0.008 0.044 (.021) 0.045
2001-2 (n = 344 crude, 327 adjusted)
MEHHP .054 (.029) 0.078 .055 (.028) 0.064 0.038 (.023) 0.126
MEOHP .066 (.031) 0.052 .060 (.032) 0.076 0.044 (.027) 0.125
aAdjusted for age, age-squared, race/ethnicity, total fat and calorie intake, physical activity level,smoking exposure, and urine creatinine.bAdjusted for Model 1 covariates plus GFR, ALT, and GGT.
Abbreviations: ALT, alanine aminotransferase, GFR, glomerular filtration rate; GGT, gammaglutamyl transferase; HOMA, homeostatic model assessment; MBP, mono-butyl phthalates;

35
MBzP, mono-benzyl phthalate; MEHHP, mono-(2-ethyl-5-hydroxyhexyl) phthalate; MEHP, mono-(2-ethyl)-hexyl phthalate; MEOHP, mono-(2-ethyl-5-oxohexyl) phthalate; MEP, mono-ethylphthalate; NHANES, National Health and Nutrition Examination Survey.
36
Table 3. Outcome variation explained by and contribution to fit of phthalate metabolites
significantly (p ≤ .05) associated with one or both outcome measures (adjusted model 1).
Adj R2 of Adj R2 of Outcome
full model full model variation Model
with without explained by contribution of
metabolite metabolite metabolite a metabolite b
Waist Circumference
MBzP 0.1587 0.1517 0.7% 4.4%
MEHHP 0.2042 0.1837 2.1% 10.0%
MEOHP 0.2043 0.1837 2.1% 10.1%
MEP 0.1556 0.1517 0.4% 2.5%
HOMA (ln)
MBP 0.1650 0.1575 0.8% 4.5%
MBzP 0.1748 0.1575 1.7% 9.9%
MEP 0.1727 0.1575 1.5% 8.8%
a (R2 with metabolite - R
2 without metabolite) * 100%
b ((R2 with metabolite - R
2 without metabolite)/R
2 with metabolite) * 100%
Abbreviations: HOMA, homeostatic model assessment; MBP, mono-butyl phthalates; MBzP,mono-benzyl phthalate; MEHHP, mono-(2-ethyl-5-hydroxyhexyl) phthalate; MEOHP, mono-(2-ethyl-5-oxohexyl) phthalate; MEP, mono-ethyl phthalate
37
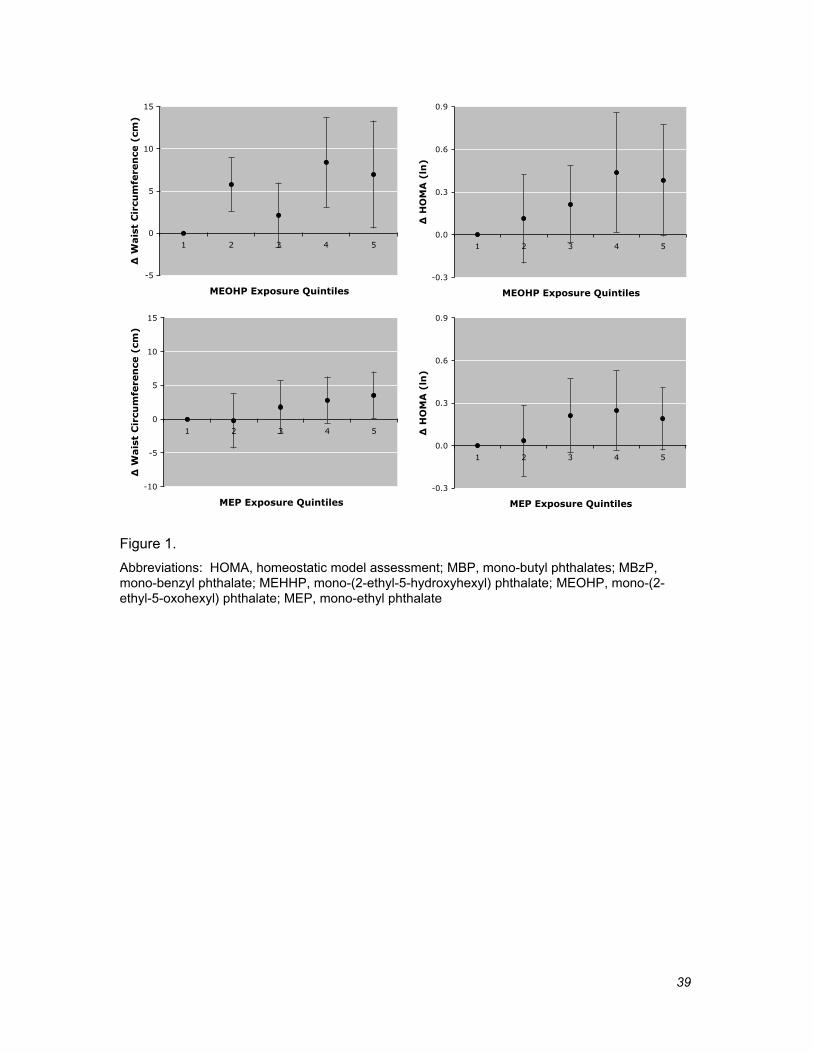
Figure Legend
Figure 1. Fully-adjusted associations (adjusted model 1) between changes in outcomes
and exposure quintiles (quintile 1 is reference) for metabolites with significant / near-
significant (p ≤ .10) continuous regression coefficients. Error bars are 95% confidence
intervals.
38
Waist Circumference HOMA (ln)
-5
0
5
10
15
1 2 3 4 5
MBP Exposure Quintiles
∆ W
ais
t C
ircu
mfe
ren
ce (
cm)
-0.3
0.0
0.3
0.6
0.9
1 2 3 4 5
MBP Exposure Quintiles
∆ H
OM
A (
ln)
-5
0
5
10
15
1 2 3 4 5
MBzP Exposure Quintiles
∆ W
ais
t C
ircu
mfe
ren
ce (
cm)
-0.3
0.0
0.3
0.6
0.9
1 2 3 4 5
MBzP Exposure Quintiles
∆ H
OM
A (
ln)
-5
0
5
10
15
1 2 3 4 5
MEHHP Exposure Quintiles
∆ W
ais
t C
ircu
mfe
ren
ce (
cm)
-0.3
0.0
0.3
0.6
0.9
1 2 3 4 5
MEHHP Exposure Quintiles
∆ H
OM
A (
ln)
39
-5
0
5
10
15
1 2 3 4 5
MEOHP Exposure Quintiles
∆ W
ais
t C
ircu
mfe
ren
ce (
cm)
-0.3
0.0
0.3
0.6
0.9
1 2 3 4 5
MEOHP Exposure Quintiles
∆ H
OM
A (
ln)
-10
-5
0
5
10
15
1 2 3 4 5
MEP Exposure Quintiles
∆ W
ais
t C
ircu
mfe
ren
ce (
cm)
-0.3
0.0
0.3
0.6
0.9
1 2 3 4 5
MEP Exposure Quintiles
∆ H
OM
A (
ln)
Figure 1.
Abbreviations: HOMA, homeostatic model assessment; MBP, mono-butyl phthalates; MBzP,mono-benzyl phthalate; MEHHP, mono-(2-ethyl-5-hydroxyhexyl) phthalate; MEOHP, mono-(2-ethyl-5-oxohexyl) phthalate; MEP, mono-ethyl phthalate