Comparison of waist circumference, body mass index, percent body fat and other measure of adiposity...
13
Comparison of Waist Circumference, Body Mass Index, Percent Body Fat and Other Measure of Adiposity in Identifying Cardiovascular Disease Risks among Thai Adults Linda Paniagua 1 , Vitool Lohsoonthorn 1,2 , Somrat Lertmaharit 2 , Wiroj Jiamjarasrangsi 2 , and Michelle A. Williams 1 1 Department of Epidemiology, Multidisciplinary International Research Training Program, University of Washington School of Public Health and Community Medicine, Seattle, Washington, USA 2 Department of Preventive and Social Medicine, Faculty of Medicine, Chulalongkorn University, Bangkok, Thailand Abstract Objective—To compare the abilities of body mass index (BMI), percent body fat (%BF), waist circumference (WC), waist-hip ratio (WHR) and waist-height ratio (WHtR) to identify cardiovascular disease risk factors. Methods—This cross-sectional study is comprised of 1,391 Thai participants (451 men and 940 women) receiving annual health check-ups. Spearman’s rank correlation was used to determine the association of the five anthropometric indices with metabolic parameters including fasting plasma glucose, triglyceride, high density lipoprotein and blood pressure. The prevalence of cardiovascular disease risk factors was determined according to tertile of each anthropometric measure. Receiver operating characteristic (ROC) curves were plotted to compare anthropometric measure as predictors of the prevalence of cardiovascular risk factors. Results—Metabolic parameters were more strongly associated with %BF and WHR and least correlated with BMI in men. Among women, BMI was most strongly correlated with metabolic parameters. In both genders, the prevalence of cardiovascular disease risk factors increased across successive tertiles for each anthropometric measure. Review of ROC curves indicated that %BF and WHR performed slightly better than other measures in identifying differences in CVD risk factors among men. BMI performed at least as well or better than other measures of adiposity among women. Conclusions—These findings confirm high correlations between anthropometric measures and metabolic parameters. BMI, WC and other measures were not materially different in identifying cardiovascular disease risk factors. Although small differences were observed, the magnitudes of those differences are not likely to be of public health or clinical significance. Keywords Epidemiology; Body Mass Index; Body Fat; Waist Circumference; Waist-Hip Ratio; Waist-Height Ratio; Cardiovascular Risk Factors Corresponding Author: Dr. Vitool Lohsoonthorn, MIRT Program, Department of Epidemiology, University of Washington, 1959 NE Pacific Street, Seattle, WA, 98195, USA, Phone: (206) 543-7559, Fax: (206) 543-8525, [email protected]. NIH Public Access Author Manuscript Obes Res Clin Pract. Author manuscript; available in PMC 2013 April 16. Published in final edited form as: Obes Res Clin Pract. 2008 September 1; 2(3): 215–223. doi:10.1016/j.orcp.2008.05.003. NIH-PA Author Manuscript NIH-PA Author Manuscript NIH-PA Author Manuscript
-
Upload
independent -
Category
Documents
-
view
4 -
download
0
Transcript of Comparison of waist circumference, body mass index, percent body fat and other measure of adiposity...
Comparison of Waist Circumference, Body Mass Index, PercentBody Fat and Other Measure of Adiposity in IdentifyingCardiovascular Disease Risks among Thai Adults
Linda Paniagua1, Vitool Lohsoonthorn1,2, Somrat Lertmaharit2, Wiroj Jiamjarasrangsi2, andMichelle A. Williams1
1Department of Epidemiology, Multidisciplinary International Research Training Program,University of Washington School of Public Health and Community Medicine, Seattle, Washington,USA 2Department of Preventive and Social Medicine, Faculty of Medicine, ChulalongkornUniversity, Bangkok, Thailand
AbstractObjective—To compare the abilities of body mass index (BMI), percent body fat (%BF), waistcircumference (WC), waist-hip ratio (WHR) and waist-height ratio (WHtR) to identifycardiovascular disease risk factors.
Methods—This cross-sectional study is comprised of 1,391 Thai participants (451 men and 940women) receiving annual health check-ups. Spearman’s rank correlation was used to determinethe association of the five anthropometric indices with metabolic parameters including fastingplasma glucose, triglyceride, high density lipoprotein and blood pressure. The prevalence ofcardiovascular disease risk factors was determined according to tertile of each anthropometricmeasure. Receiver operating characteristic (ROC) curves were plotted to compare anthropometricmeasure as predictors of the prevalence of cardiovascular risk factors.
Results—Metabolic parameters were more strongly associated with %BF and WHR and leastcorrelated with BMI in men. Among women, BMI was most strongly correlated with metabolicparameters. In both genders, the prevalence of cardiovascular disease risk factors increased acrosssuccessive tertiles for each anthropometric measure. Review of ROC curves indicated that %BFand WHR performed slightly better than other measures in identifying differences in CVD riskfactors among men. BMI performed at least as well or better than other measures of adiposityamong women.
Conclusions—These findings confirm high correlations between anthropometric measures andmetabolic parameters. BMI, WC and other measures were not materially different in identifyingcardiovascular disease risk factors. Although small differences were observed, the magnitudes ofthose differences are not likely to be of public health or clinical significance.
KeywordsEpidemiology; Body Mass Index; Body Fat; Waist Circumference; Waist-Hip Ratio; Waist-HeightRatio; Cardiovascular Risk Factors
Corresponding Author: Dr. Vitool Lohsoonthorn, MIRT Program, Department of Epidemiology, University of Washington, 1959 NEPacific Street, Seattle, WA, 98195, USA, Phone: (206) 543-7559, Fax: (206) 543-8525, [email protected].
NIH Public AccessAuthor ManuscriptObes Res Clin Pract. Author manuscript; available in PMC 2013 April 16.
Published in final edited form as:Obes Res Clin Pract. 2008 September 1; 2(3): 215–223. doi:10.1016/j.orcp.2008.05.003.
NIH
-PA Author Manuscript
NIH
-PA Author Manuscript
NIH
-PA Author Manuscript

IntroductionObesity has reached epidemic levels with at least 400 million adults classified as beingobese in 2005 (1). Cardiovascular diseases (CVD) have been the leading cause of death inThailand since 1987. Between 1985 and 1997 the prevalence of heart disease in Thailandtripled to 168 per 100,000 population (2). Obesity has been proven to be a strong andconsistent risk factor for CVD, though the best way to measure obesity in the context ofclinical and population-based studies has become increasingly controversial (3–5). Currentworldwide guidelines suggest that overweight be defined as a body mass index (BMI) of 25kg/m2 to 29.9 kg/m2 and obesity as a BMI of 30 kg/m2 or more (1). This classification hasbeen recommended for people of all races, genders and ages. Waist circumference (WC),waist-hip ratio (WHR) and waist-height ratio (WHtR) are used as measures of centralobesity, while BMI and %BF are generally used as measures of overall obesity.
Although BMI is the most commonly used anthropometric measure in epidemiologicstudies, the specificity and predictive value of this measure has been questioned (3). BMIhas proven in numerous studies not to be the most accurate indicator for predicting obesity-related diseases among all groups (6–8). Increasingly, investigators have identifiedlimitations of employing measures and thresholds of obesity from studies of Caucasianpopulation to studies of Asians (9–12). For instance, an WHO expert panel concluded thatthe BMI cut-off point for observed risk of CVD and type 2 diabetes in different Asianpopulations varies from 22 kg/m2 to 25 kg/m2 while for high risk it varies from 26 kg/m2 to31 kg/m2 (4). Notably, Asians tend to have higher %BF for a given level of BMI (8, 12), inpart, because of their smaller body frames (13, 14).
Elevations in measures of overall obesity and central fat distribution, including BMI, waistcircumference (WC), percentage body fat (%BF), waist-hip ratio (WHR), and waist-heightratio (WHtR) are known to be positively associated with the prevalence (6, 7, 15) andincidence (16, 17) of CVD and type 2 diabetes. There has been considerable heterogeneityin results from studies that compare associations of CVD and CVD risk factors withmeasures of overall obesity and central obesity (3, 18–21). In their study of 1,010 African-American and Caucasian participants in the CARDIA study, Shen et al. reported that WCwas more strongly associated with health risk indicators than BMI and %BF. LikewiseAekplakorn et al, in their study of 5,305 Thai adults, reported that measures of centralobesity (i.e., WC, WHR and WHtR) were slightly more strongly associated with CVD riskfactors than the overall adiposity measure, BMI (18). Conversely, Zhu et al reported thatWC is a better indicator of CVD risk than BMI in their study of 10,969 participants from 3different race-ethnicity groups (22).
Heterogeneity in study findings may be attributable to differences in race/ethnicity, age andgender distributions of participants across study populations. A number of investigators havenow reported differences in the predictive value of obesity indicators according to ethnicity(8, 11, 23). In a meta-analysis of 32 published reports, investigators noted that centralobesity was a stronger predictor of incident type 2 diabetes than were measures of total bodyfat (3). However, measures of overall obesity were better predictor of type 2 diabetes in USand European Caucasian (24).
In light of the heterogeneity in previous study findings and potential contraindications ofgeneralizing results across populations, we sought to examine the relationship of measuresof overall obesity (BMI and %BF) and central obesity (WC, WHR and WHtR) with CVDrisk factors among Thai adults.
Paniagua et al. Page 2
Obes Res Clin Pract. Author manuscript; available in PMC 2013 April 16.
NIH
-PA Author Manuscript
NIH
-PA Author Manuscript
NIH
-PA Author Manuscript

MethodsStudy Population
The study population comprised 1,608 people (536 men and 1072 women) who participatedin annual health examinations at the Mobile Health Checkup Unit of King ChulalongkornMemorial Hospital in Bangkok, Thailand during the period of December 2006 throughFebruary 2007. Each year, Chulalongkorn Memorial Hospital provides on-site annual healthexaminations for professional and office workers of approximately 45 private companiesand governmental agencies in and around Bangkok. Given that blood chemistry evaluationsare not routinely measured on all participants under the age of 35 years, this research wasrestricted to those participants who were ≥35 years of age at the time of annual healthexamination. Eligible participants were asked to provide information about their age, maritalstatus, occupation, educational attainment, medical history, use of anti-hypertensive, anti-diabetic, or lipid lowering medications, smoking status, alcohol consumption habits, andphysical activity. Participants underwent routine clinical physical examinations whichincluded collection of venous blood samples after an overnight fast, and measurement ofheight, weight, waist circumference, hip circumference and resting blood pressures. Patientstaking anti-hypertensive, anti-diabetic, or lipid lowering medications were excluded fromfurther consideration. Hence a total of 1,391 participants (451 men and 940 women)remained for analysis. All participants provided informed consent and the research protocolwas reviewed and approved by the Ethical Committee of Faculty of Medicine,Chulalongkorn University, and the Human Subjects Division, University of Washington.
Body CompositionAnthropometric measures were taken while participants were lightly clothed and wore noshoes. Body weight was measured to the nearest 0.1 kg using an automatic calibratedelectronic scale (Seca Inc., Hamburg, Germany). Standing height was measured withoutshoes to the nearest 0.5 centimeter using the height rod attached to the scale. Body massindex (BMI) was calculated as weight (kg) divided by height squared (m2). Circumferenceswere measured with a heavy-duty inelastic plastic fiber tape measure to the nearest 0.5 cmwhile the subject stood balanced on both feet, with the feet touching each other and botharms hanging freely. Waist circumference were taken midway between the inferior marginof the last rib and the iliac crest at the end of expiration (25). Hip circumference wasmeasured around the largest portion of the buttocks (25). The waist to hip ratio (WHR) andwaist to height ratio (WHtR) were then calculated. Percent body fat (%BF) estimates weredetermined using the Tanita bioelectrical impedance analysis (BIA) system (Tanita ModelBC 532, Tokyo, Japan). The BIA system was routinely calibrated, and quality controlmeasures were followed as recommended by the manufacturer. Systolic and diastolic bloodpressures, measured using an automatic sphygmomanometer (UDEX-IIα, UEDA, Corp.,Tokyo, Japan), were taken from the right arm in the seated position after participants restedfor at least 5 minutes.
Laboratory AnalysesFasting plasma glucose, serum lipids and lipoprotein concentrations were evaluated atclinical chemistry laboratories, King Chulalongkorn Memorial Hospital. Plasma glucose(FPG) concentrations were determined using the hexokinase method. Serum triglyceride(TG) concentrations were determined using standardized enzymatic glycerol phosphateoxidase assay procedures. High density lipoprotein-cholesterol (HDL-C) was measured by achemical precipitation technique using dextran sulfate. All assays were completed withoutknowledge of participants’ medical history. Lipid, lipoprotein and FPG concentrations werereported as mmol/L.
Paniagua et al. Page 3
Obes Res Clin Pract. Author manuscript; available in PMC 2013 April 16.
NIH
-PA Author Manuscript
NIH
-PA Author Manuscript
NIH
-PA Author Manuscript

Analytical Variable SpecificationCardiovascular risk factors were defined using the ATP III guideline (26). Elevated bloodpressure is defined as systolic blood pressure (SBP) ≥130 mmHg or diastolic blood pressure≥85 mmHg. High triglyceride (TG) is defined as TG ≥1.7 mmol/L (≥150 mg/dl). Low high-density lipoprotein-cholesterol (HDL-C) is defined as HDL-C <1.0 mmol/L (<40 mg/dl) inmen or <1.3 mmol/L (<50 mg/dl) in women. Elevated fasting plasma glucose (FPG) isdefined as FPG ≥5.6 mmol/L (≥100 mg/dl).
Statistical AnalysesAll statistical analysis was performed separately for men and women. Frequencydistributions of socio-demographic, behavioral and clinical characteristics were examined.Continuous variables were expressed as means ± standard deviation (SD). Spearman’s rankcorrelation coefficients were calculated to quantify associations between anthropometricmeasures (BMI, %BF, WC, WHR and WHtR) and cardiovascular disease risk factors (FPG,TG, HDL-C, systolic and diastolic blood pressure). Anthropometric variables werecategorized into tertiles and frequencies of cardiovascular risk factors were evaluated foreach measure. Receiver operating characteristic (ROC) curves were plotted to compareanthropometric measure as predictors of the prevalence of cardiovascular risk factors. Wecalculated the area under the curve as a summary estimate of discrimination. All statisticalanalyses were performed using SPSS (version 14.0, SPSS Inc. Chicago, IL, USA) software.All reported p-values are two tailed, and confidence intervals were calculated at the 95%level.
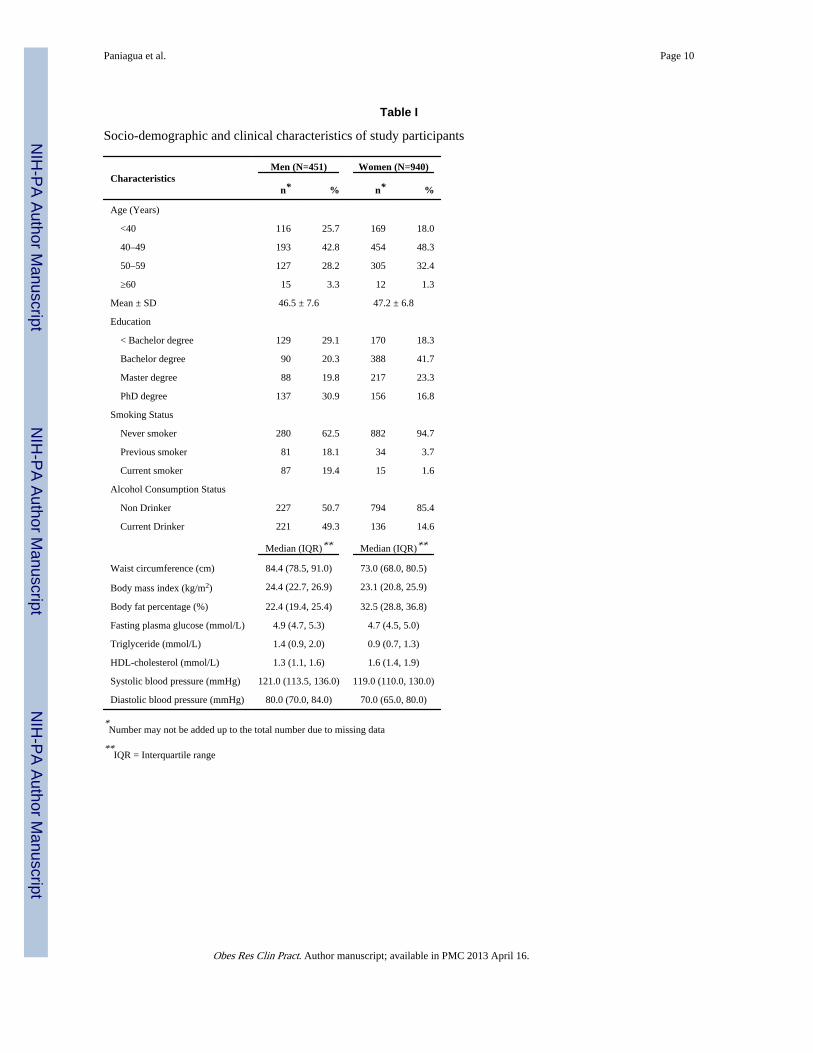
ResultsThe socio-demographics and clinical characteristics of the study population are presented inTable 1. Results are summarized separately for men and women. The correlations among theindividual anthropometric variables and metabolic parameters (fasting plasma glucose,triglyceride, high density lipoprotein-cholesterol and blood pressure) are presented in Table2. Overall, among men, three of the metabolic parameters (i.e., triglyceride (r=0.374), highdensity lipoprotein-cholesterol (r=−0.377) and systolic blood pressure (r=0.318)) were moststrongly correlated with %BF. Fasting plasma glucose (r=0.291) and diastolic blood pressure(r=0.272) were most strongly correlated with waist-hip ratio. Body mass index among menwas least correlated with fasting plasma glucose (r=0.178), systolic (r=0.287) and diastolic(r=0.222) blood pressure. In contrast to men, BMI, a measure of overall adiposity, was moststrongly associated with 3 metabolic parameters (high density lipoprotein (r=−0.380),systolic (r=0.371) and diastolic blood pressure (r=0.325)) in women. Conversely, among theremaining four measures of adiposity, waist-hip ratio was least correlated with metabolicparameters.
The prevalence of CVD risk factors according to tertile for each measure of adiposity aresummarized in Table 3. As expected, the prevalence of elevated fasting plasma glucose,elevated triglyceride concentrations, low high density lipoprotein-cholesterol concentrations,and elevated blood pressure were increased across successive tertiles for each measures ofobesity. These patterns were evident for both men and women.
In addition, the frequencies of CVD risk factors were similar across the tertiles of eachmeasure (for both men and women). For example, the prevalence of elevated fasting plasmaglucose among men in the upper tertiles of the distribution of each measure of adipositywere as follows: BMI ≥ 25.7 kg/m2 (19.7%); %BF ≥ 24.2% (21.7%); WC ≥ 88 cm (20.0%);WHR ≥ 0.89 (22.8%); WHtR ≥ 0.52 (22.1%). The corresponding prevalence estimatesamong women in the upper tertile of each measure of adiposity were: BMI ≥ 24.7 kg/m2
Paniagua et al. Page 4
Obes Res Clin Pract. Author manuscript; available in PMC 2013 April 16.
NIH
-PA Author Manuscript
NIH
-PA Author Manuscript
NIH
-PA Author Manuscript

(16.0%); %BF ≥35.1% (16.1%); WC ≥ 78cm (16.7%); WHR ≥ 0.80 (14.2%); WHtR ≥ 0.50(16.7%).
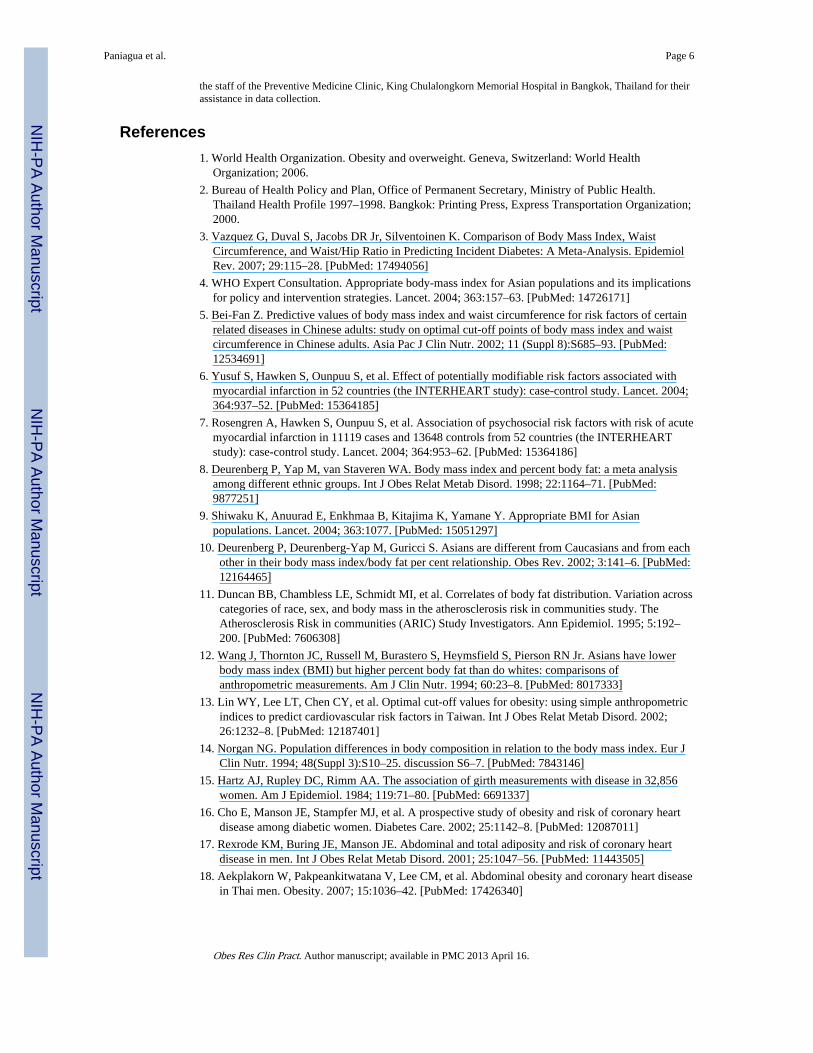
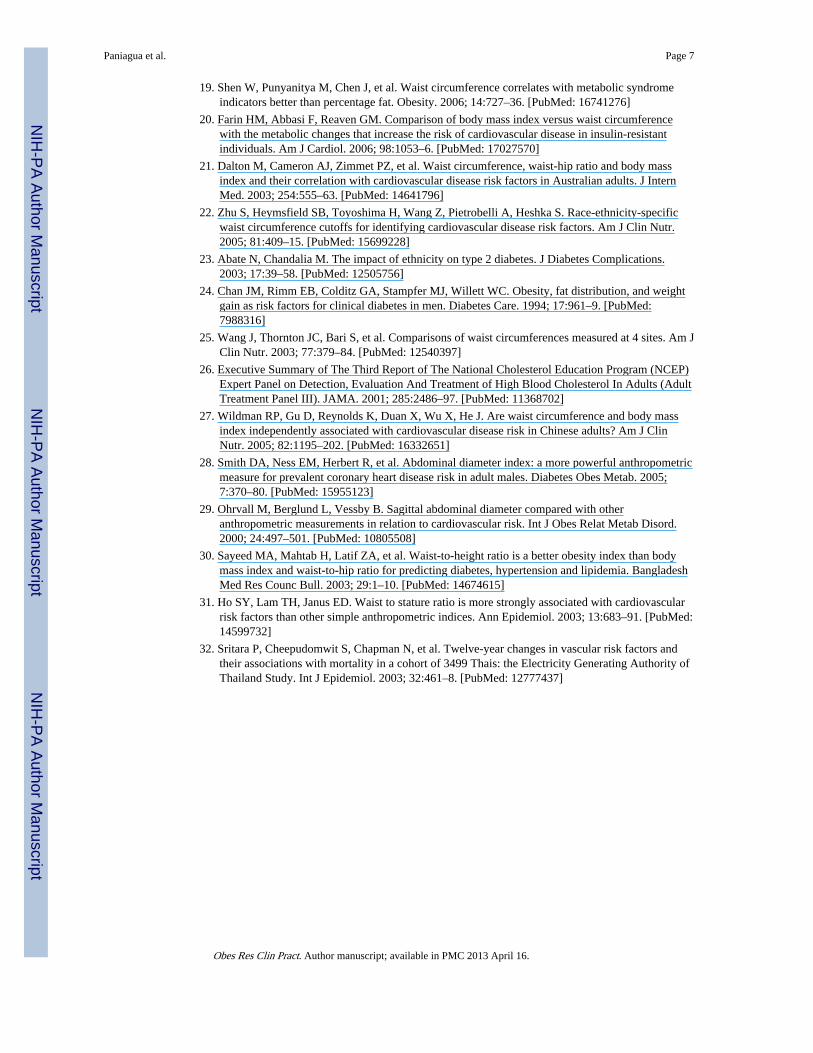
Review of ROC curves (Figure 1) indicated that BMI performed at least as well as the othermeasures of adiposity in identifying risk of dyslipidemia and elevated blood pressure amongmen. BMI was slightly less predictive of elevated fasting plasma glucose (AUC = 62%, 95%CI 54–69%) than were %BF (AUC = 66%, 95% CI 59–73%) and WHR (AUC = 69%, 95%CI 63–75%). In women, BMI performed at least as well as, or better than, other criteria inpredicting all CVD risk factors investigated in this study. The AUC for WHR wereconsistently lower than that for the other measures of adiposity (Figure 2).
DiscussionA number of cross-sectional studies have investigated the relationship between CVD riskfactors according to multiple measures of adiposity (22, 27–29). However, there has yet tobe consensus as to which anthropometric measure best predicts obesity-related disorders,particularly among Asians. In our study we observed that BMI was slightly more stronglyassociated with CVD risk factors in women, and that %BF and WHR were slightly morestrongly associated with CVD risk factors in men. Collectively, observed small differencesare not likely to be of public health or clinical significance.
Other investigators have reported that WHtR is the best predictor of CVD risk than otheranthropometric measurements (18, 30, 31). Yet, others have reported that WC and BMI areequally predictive of CVD risk (27), or that WC is a better indicator of CVD risk than isBMI (22). Results from a recent meta-analysis (3), however, suggest that measures ofoverall obesity (BMI) and measures of central obesity (waist-hip ratio and waistcircumference) performed equally well in predicting incident type 2 diabetes. Our studyfindings are largely similar to those reported by Vazquez et al (3).
Results from our study should be interpreted in light of several potential limitations. First,our study was conducted among a largely well educated population of employed office andprofessional workers, and so may not be generalizable to the broader Thai population.Second, the cross-sectional design of our study with only single measures of adiposity(taken at one point in time) may not accurately reflect participants’ long-term adipositystatus. Lastly, some error in reporting of smoking history, physical activity and othercovariates may have occurred. The concordance of our findings with other studies, however,serves to attenuate some concerns about these potential study limitations.
Mortality from cardiovascular disease in Thailand has increased over the last two decades.The increased mortality appears to exceed those expected from aging of the population alone(32), and many cases may be attributable to the increased prevalence of obesity among Thaiadults. In light of these important trends, more studies designed to systematically andrigorously evaluate the predictive performance of different measures of overall and centraladiposity are warranted. In the meantime, however, a simple measure of overall obesity,such as BMI, appears to be a reasonable measure for epidemiological studies of CVD andCVD risk factors.
AcknowledgmentsThis research was supported by the Rachadapiseksompoj Faculty of Medicine Research Fund, ChulalongkornUniversity. This research was completed while Ms. Linda Paniagua was a research training fellow in theMultidisciplinary International Research Training (MIRT) Program of the University of Washington, School ofPublic Health and Community Medicine. The MIRT Program is supported by an award from the National Institutesof Health, National Center on Minority Health and Health Disparities (T37-MD001449). The authors wish to thank
Paniagua et al. Page 5
Obes Res Clin Pract. Author manuscript; available in PMC 2013 April 16.
NIH
-PA Author Manuscript
NIH
-PA Author Manuscript
NIH
-PA Author Manuscript
the staff of the Preventive Medicine Clinic, King Chulalongkorn Memorial Hospital in Bangkok, Thailand for theirassistance in data collection.
References1. World Health Organization. Obesity and overweight. Geneva, Switzerland: World Health
Organization; 2006.
2. Bureau of Health Policy and Plan, Office of Permanent Secretary, Ministry of Public Health.Thailand Health Profile 1997–1998. Bangkok: Printing Press, Express Transportation Organization;2000.
3. Vazquez G, Duval S, Jacobs DR Jr, Silventoinen K. Comparison of Body Mass Index, WaistCircumference, and Waist/Hip Ratio in Predicting Incident Diabetes: A Meta-Analysis. EpidemiolRev. 2007; 29:115–28. [PubMed: 17494056]
4. WHO Expert Consultation. Appropriate body-mass index for Asian populations and its implicationsfor policy and intervention strategies. Lancet. 2004; 363:157–63. [PubMed: 14726171]
5. Bei-Fan Z. Predictive values of body mass index and waist circumference for risk factors of certainrelated diseases in Chinese adults: study on optimal cut-off points of body mass index and waistcircumference in Chinese adults. Asia Pac J Clin Nutr. 2002; 11 (Suppl 8):S685–93. [PubMed:12534691]
6. Yusuf S, Hawken S, Ounpuu S, et al. Effect of potentially modifiable risk factors associated withmyocardial infarction in 52 countries (the INTERHEART study): case-control study. Lancet. 2004;364:937–52. [PubMed: 15364185]
7. Rosengren A, Hawken S, Ounpuu S, et al. Association of psychosocial risk factors with risk of acutemyocardial infarction in 11119 cases and 13648 controls from 52 countries (the INTERHEARTstudy): case-control study. Lancet. 2004; 364:953–62. [PubMed: 15364186]
8. Deurenberg P, Yap M, van Staveren WA. Body mass index and percent body fat: a meta analysisamong different ethnic groups. Int J Obes Relat Metab Disord. 1998; 22:1164–71. [PubMed:9877251]
9. Shiwaku K, Anuurad E, Enkhmaa B, Kitajima K, Yamane Y. Appropriate BMI for Asianpopulations. Lancet. 2004; 363:1077. [PubMed: 15051297]
10. Deurenberg P, Deurenberg-Yap M, Guricci S. Asians are different from Caucasians and from eachother in their body mass index/body fat per cent relationship. Obes Rev. 2002; 3:141–6. [PubMed:12164465]
11. Duncan BB, Chambless LE, Schmidt MI, et al. Correlates of body fat distribution. Variation acrosscategories of race, sex, and body mass in the atherosclerosis risk in communities study. TheAtherosclerosis Risk in communities (ARIC) Study Investigators. Ann Epidemiol. 1995; 5:192–200. [PubMed: 7606308]
12. Wang J, Thornton JC, Russell M, Burastero S, Heymsfield S, Pierson RN Jr. Asians have lowerbody mass index (BMI) but higher percent body fat than do whites: comparisons ofanthropometric measurements. Am J Clin Nutr. 1994; 60:23–8. [PubMed: 8017333]
13. Lin WY, Lee LT, Chen CY, et al. Optimal cut-off values for obesity: using simple anthropometricindices to predict cardiovascular risk factors in Taiwan. Int J Obes Relat Metab Disord. 2002;26:1232–8. [PubMed: 12187401]
14. Norgan NG. Population differences in body composition in relation to the body mass index. Eur JClin Nutr. 1994; 48(Suppl 3):S10–25. discussion S6–7. [PubMed: 7843146]
15. Hartz AJ, Rupley DC, Rimm AA. The association of girth measurements with disease in 32,856women. Am J Epidemiol. 1984; 119:71–80. [PubMed: 6691337]
16. Cho E, Manson JE, Stampfer MJ, et al. A prospective study of obesity and risk of coronary heartdisease among diabetic women. Diabetes Care. 2002; 25:1142–8. [PubMed: 12087011]
17. Rexrode KM, Buring JE, Manson JE. Abdominal and total adiposity and risk of coronary heartdisease in men. Int J Obes Relat Metab Disord. 2001; 25:1047–56. [PubMed: 11443505]
18. Aekplakorn W, Pakpeankitwatana V, Lee CM, et al. Abdominal obesity and coronary heart diseasein Thai men. Obesity. 2007; 15:1036–42. [PubMed: 17426340]
Paniagua et al. Page 6
Obes Res Clin Pract. Author manuscript; available in PMC 2013 April 16.
NIH
-PA Author Manuscript
NIH
-PA Author Manuscript
NIH
-PA Author Manuscript
19. Shen W, Punyanitya M, Chen J, et al. Waist circumference correlates with metabolic syndromeindicators better than percentage fat. Obesity. 2006; 14:727–36. [PubMed: 16741276]
20. Farin HM, Abbasi F, Reaven GM. Comparison of body mass index versus waist circumferencewith the metabolic changes that increase the risk of cardiovascular disease in insulin-resistantindividuals. Am J Cardiol. 2006; 98:1053–6. [PubMed: 17027570]
21. Dalton M, Cameron AJ, Zimmet PZ, et al. Waist circumference, waist-hip ratio and body massindex and their correlation with cardiovascular disease risk factors in Australian adults. J InternMed. 2003; 254:555–63. [PubMed: 14641796]
22. Zhu S, Heymsfield SB, Toyoshima H, Wang Z, Pietrobelli A, Heshka S. Race-ethnicity-specificwaist circumference cutoffs for identifying cardiovascular disease risk factors. Am J Clin Nutr.2005; 81:409–15. [PubMed: 15699228]
23. Abate N, Chandalia M. The impact of ethnicity on type 2 diabetes. J Diabetes Complications.2003; 17:39–58. [PubMed: 12505756]
24. Chan JM, Rimm EB, Colditz GA, Stampfer MJ, Willett WC. Obesity, fat distribution, and weightgain as risk factors for clinical diabetes in men. Diabetes Care. 1994; 17:961–9. [PubMed:7988316]
25. Wang J, Thornton JC, Bari S, et al. Comparisons of waist circumferences measured at 4 sites. Am JClin Nutr. 2003; 77:379–84. [PubMed: 12540397]
26. Executive Summary of The Third Report of The National Cholesterol Education Program (NCEP)Expert Panel on Detection, Evaluation And Treatment of High Blood Cholesterol In Adults (AdultTreatment Panel III). JAMA. 2001; 285:2486–97. [PubMed: 11368702]
27. Wildman RP, Gu D, Reynolds K, Duan X, Wu X, He J. Are waist circumference and body massindex independently associated with cardiovascular disease risk in Chinese adults? Am J ClinNutr. 2005; 82:1195–202. [PubMed: 16332651]
28. Smith DA, Ness EM, Herbert R, et al. Abdominal diameter index: a more powerful anthropometricmeasure for prevalent coronary heart disease risk in adult males. Diabetes Obes Metab. 2005;7:370–80. [PubMed: 15955123]
29. Ohrvall M, Berglund L, Vessby B. Sagittal abdominal diameter compared with otheranthropometric measurements in relation to cardiovascular risk. Int J Obes Relat Metab Disord.2000; 24:497–501. [PubMed: 10805508]
30. Sayeed MA, Mahtab H, Latif ZA, et al. Waist-to-height ratio is a better obesity index than bodymass index and waist-to-hip ratio for predicting diabetes, hypertension and lipidemia. BangladeshMed Res Counc Bull. 2003; 29:1–10. [PubMed: 14674615]
31. Ho SY, Lam TH, Janus ED. Waist to stature ratio is more strongly associated with cardiovascularrisk factors than other simple anthropometric indices. Ann Epidemiol. 2003; 13:683–91. [PubMed:14599732]
32. Sritara P, Cheepudomwit S, Chapman N, et al. Twelve-year changes in vascular risk factors andtheir associations with mortality in a cohort of 3499 Thais: the Electricity Generating Authority ofThailand Study. Int J Epidemiol. 2003; 32:461–8. [PubMed: 12777437]
Paniagua et al. Page 7
Obes Res Clin Pract. Author manuscript; available in PMC 2013 April 16.
NIH
-PA Author Manuscript
NIH
-PA Author Manuscript
NIH
-PA Author Manuscript
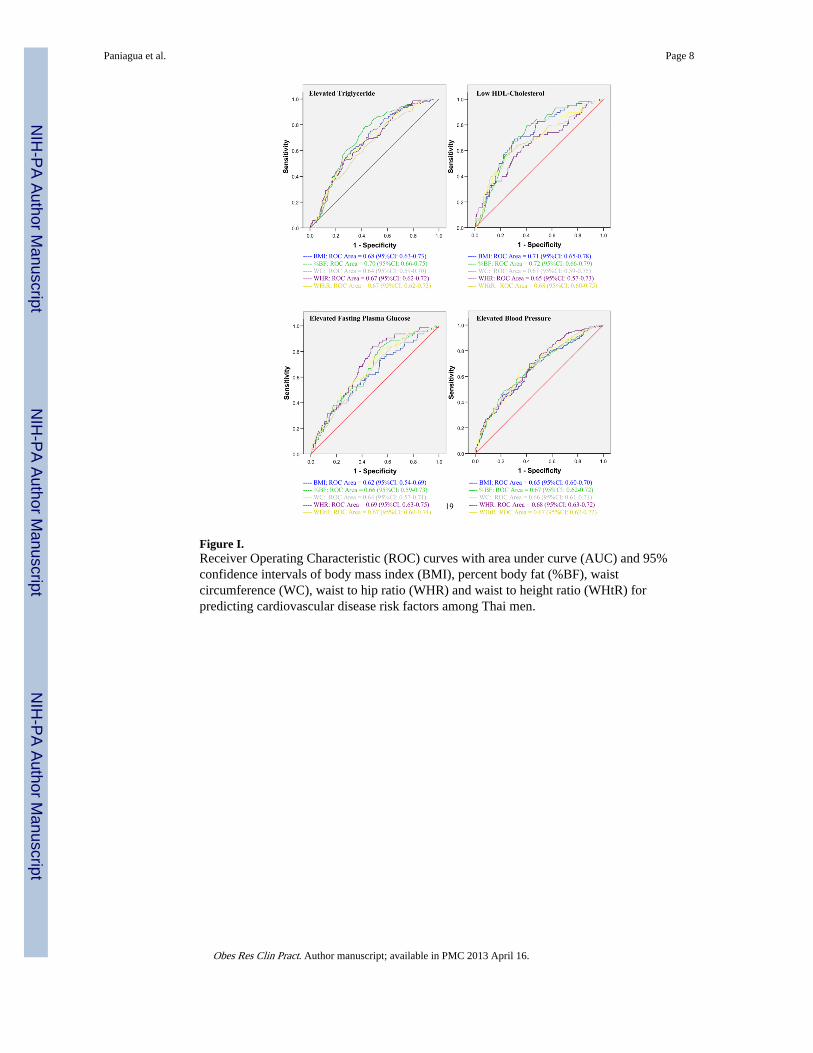
Figure I.Receiver Operating Characteristic (ROC) curves with area under curve (AUC) and 95%confidence intervals of body mass index (BMI), percent body fat (%BF), waistcircumference (WC), waist to hip ratio (WHR) and waist to height ratio (WHtR) forpredicting cardiovascular disease risk factors among Thai men.
Paniagua et al. Page 8
Obes Res Clin Pract. Author manuscript; available in PMC 2013 April 16.
NIH
-PA Author Manuscript
NIH
-PA Author Manuscript
NIH
-PA Author Manuscript

Figure II.Receiver Operating Characteristic (ROC) curves with area under curve (AUC) and 95%confidence intervals of body mass index (BMI), percent body fat (%BF), waistcircumference (WC), waist to hip ratio (WHR) and waist to height ratio (WHtR) forpredicting cardiovascular disease risk factors among Thai women.
Paniagua et al. Page 9
Obes Res Clin Pract. Author manuscript; available in PMC 2013 April 16.
NIH
-PA Author Manuscript
NIH
-PA Author Manuscript
NIH
-PA Author Manuscript
NIH
-PA Author Manuscript
NIH
-PA Author Manuscript
NIH
-PA Author Manuscript
Paniagua et al. Page 10
Table I
Socio-demographic and clinical characteristics of study participants
CharacteristicsMen (N=451) Women (N=940)
n* % n* %
Age (Years)
<40 116 25.7 169 18.0
40–49 193 42.8 454 48.3
50–59 127 28.2 305 32.4
≥60 15 3.3 12 1.3
Mean ± SD 46.5 ± 7.6 47.2 ± 6.8
Education
< Bachelor degree 129 29.1 170 18.3
Bachelor degree 90 20.3 388 41.7
Master degree 88 19.8 217 23.3
PhD degree 137 30.9 156 16.8
Smoking Status
Never smoker 280 62.5 882 94.7
Previous smoker 81 18.1 34 3.7
Current smoker 87 19.4 15 1.6
Alcohol Consumption Status
Non Drinker 227 50.7 794 85.4
Current Drinker 221 49.3 136 14.6
Median (IQR)** Median (IQR)**
Waist circumference (cm) 84.4 (78.5, 91.0) 73.0 (68.0, 80.5)
Body mass index (kg/m2) 24.4 (22.7, 26.9) 23.1 (20.8, 25.9)
Body fat percentage (%) 22.4 (19.4, 25.4) 32.5 (28.8, 36.8)
Fasting plasma glucose (mmol/L) 4.9 (4.7, 5.3) 4.7 (4.5, 5.0)
Triglyceride (mmol/L) 1.4 (0.9, 2.0) 0.9 (0.7, 1.3)
HDL-cholesterol (mmol/L) 1.3 (1.1, 1.6) 1.6 (1.4, 1.9)
Systolic blood pressure (mmHg) 121.0 (113.5, 136.0) 119.0 (110.0, 130.0)
Diastolic blood pressure (mmHg) 80.0 (70.0, 84.0) 70.0 (65.0, 80.0)
*Number may not be added up to the total number due to missing data
**IQR = Interquartile range
Obes Res Clin Pract. Author manuscript; available in PMC 2013 April 16.

NIH
-PA Author Manuscript
NIH
-PA Author Manuscript
NIH
-PA Author Manuscript
Paniagua et al. Page 11
Tabl
e II
Spea
rman
’s r
ank
corr
elat
ion
coef
fici
ents
for
ant
hrop
omet
ric
mea
sure
men
ts a
nd c
ardi
ovas
cula
r di
seas
e ri
sk f
acto
rs.
BM
I (k
g/m
2 )%
BF
(%
)W
C (
cm)
WH
RW
HtR
Men
Fast
ing
Plas
ma
Glu
cose
(m
mol
/L)
0.17
80.
215
0.20
20.
291
0.22
4
Tri
glyc
erid
e (m
mol
/L)
0.31
20.
374
0.28
20.
330
0.32
9
HD
L-C
(m
mol
/L)
−0.
370
−0.
377
−0.
350
−0.
299
−0.
358
Syst
olic
Blo
od P
ress
ure
(mm
Hg)
0.28
70.
318
0.31
50.
306
0.31
2
Dia
stol
ic B
lood
Pre
ssur
e (m
mH
g)0.
222
0.27
10.
229
0.27
20.
249
Wom
en
Fast
ing
Plas
ma
Glu
cose
(m
mol
/L)
0.32
00.
329
0.33
90.
300
0.32
7
Tri
glyc
erid
e (m
mol
/L)
0.38
90.
404
0.41
90.
382
0.42
0
HD
L-C
(m
mol
/L)
−0.
380
−0.
362
−0.
357
−0.
289
−0.
351
Syst
olic
Blo
od P
ress
ure
(mm
Hg)
0.37
10.
358
0.36
80.
286
0.35
8
Dia
stol
ic B
lood
Pre
ssur
e (m
mH
g)0.
325
0.32
40.
314
0.22
40.
300
All
corr
elat
ion
coef
fici
ents
are
sig
nifi
cant
at t
he 0
.001
leve
l.
Obes Res Clin Pract. Author manuscript; available in PMC 2013 April 16.

NIH
-PA Author Manuscript
NIH
-PA Author Manuscript
NIH
-PA Author Manuscript
Paniagua et al. Page 12
Tabl
e III
Prev
alen
ce o
f ca
rdio
vasc
ular
dis
ease
ris
k fa
ctor
s in
rel
atio
n to
var
ying
deg
ree
of a
dipo
sity
as
asse
ssed
usi
ng d
iffe
rent
ant
hrop
omet
ric
mea
sure
s.
Mea
sure
men
t of
Obe
sity
Car
diov
ascu
lar
Dis
ease
Ris
k F
acto
rs
Ele
vate
d F
PG
Hig
h T
GL
ow H
DL
-CE
leva
ted
BP
%%
%%
Am
ong
Men
Bod
y m
ass
inde
x (k
g/m
2 )
T
ertil
e 1 (
<23
.3)
8.8
14.3
4.8
32.0
T
ertil
e 2 (
23.3
–25.
7)14
.234
.59.
544
.6
T
ertil
e 3 (
>25
.7)
19.7
46.9
25.2
64.4
Bod
y fa
t per
cent
age
(%)
T
ertil
e 1 (
<20
.8)
4.7
12.2
2.7
33.3
T
ertil
e 2 (
20.8
–24.
2)17
.133
.611
.041
.5
T
ertil
e 3 (
>24
.2)
21.7
50.0
25.7
66.0
Wai
st c
ircu
mfe
renc
e (c
m)
T
ertil
e 1 (
<81
.0)
7.0
16.9
7.7
31.9
T
ertil
e 2 (
81.0
–87.
9)16
.034
.77.
643
.1
T
ertil
e 3 (
≥88)
20.0
43.1
23.1
64.2
Wai
st to
hip
rat
io
T
ertil
e 1 (
<0.
85)
4.1
18.4
9.5
29.3
T
ertil
e 2 (
0.85
–0.8
9)16
.729
.38.
049
.7
T
ertil
e 3 (
>0.
89)
22.8
48.3
22.1
62.2
Wai
st to
hei
ght r
atio
T
ertil
e 1 (
<0.
48)
6.8
16.3
7.5
29.1
T
ertil
e 2 (
0.48
–0.5
1)14
.030
.78.
051
.7
T
ertil
e 3 (
≥0.5
2)22
.149
.024
.160
.5
Am
ong
Wom
en
Obes Res Clin Pract. Author manuscript; available in PMC 2013 April 16.

NIH
-PA Author Manuscript
NIH
-PA Author Manuscript
NIH
-PA Author Manuscript
Paniagua et al. Page 13
Mea
sure
men
t of
Obe
sity
Car
diov
ascu
lar
Dis
ease
Ris
k F
acto
rs
Ele
vate
d F
PG
Hig
h T
GL
ow H
DL
-CE
leva
ted
BP
%%
%%
Bod
y m
ass
inde
x (k
g/m
2 )
T
ertil
e 1 (
<21
.5)
1.6
3.2
7.8
16.2
T
ertil
e 2 (
21.5
–24.
7)5.
510
.316
.227
.1
T
ertil
e 3 (
>24
.7)
16.0
20.6
25.7
47.4
Bod
y fa
t per
cent
age
(%)
T
ertil
e 1 (
<30
.1)
2.3
2.9
6.6
17.4
T
ertil
e 2 (
30.1
–35.
1)4.
410
.418
.626
.5
T
ertil
e 3 (
>35
.1)
16.1
21.2
24.4
46.6
Wai
st c
ircu
mfe
renc
e (c
m)
T
ertil
e 1 (
<70
.0)
3.6
2.3
7.2
16.1
T
ertil
e 2 (
70.0
–77.
9)2.
610
.517
.025
.7
T
ertil
e 3 (
≥78)
16.7
21.8
25.6
48.9
Wai
st to
hip
rat
io
T
ertil
e 1 (
<0.
75)
4.2
2.3
10.0
17.5
T
ertil
e 2 (
0.75
–0.8
0)4.
511
.014
.929
.6
T
ertil
e 3 (
>0.
80)
14.2
21.7
25.2
43.7
Wai
st to
hei
ght r
atio
T
ertil
e 1 (
<0.
44)
2.9
2.6
7.5
16.6
T
ertil
e 2 (
0.44
–0.4
9)3.
09.
717
.426
.4
T
ertil
e 3 (
≥0.5
0)16
.721
.524
.647
.2
FPG
= F
astin
g Pl
asm
a G
luco
se; T
G =
Tri
glyc
erid
e; H
DL
-C =
Hig
h D
ensi
ty L
ipop
rote
in-C
hole
ster
ol; B
P =
Blo
od P
ress
ure
Obes Res Clin Pract. Author manuscript; available in PMC 2013 April 16.