Assessment of undernutrition among male Bhumijs of West Bengal, India: A comparison of body mass...
10
Human Biology Review (ISSN 2277 4424) 4 (2) 2015 ©Human Biology Review Original scientific paper (Ghosh and Bose pp 140-149) www.humanbiologyjournal.com Revised and Accepted on February 27, 2015 140 Assessment of undernutrition among male Bhumijs of West Bengal, India: A comparison of body mass index and mid-upper arm circumference M. Ghosh 1 and K. Bose 2 Citation: Ghosh M and Bose K. 2015. Assessment of undernutrition among male Bhumijs of West Bengal, India: A comparison of body mass index and mid-upper arm circumference. Human Biology Review, 4 (2), 140-149. 1 Mihir Ghosh, Research Scholar, Department of Anthropology, Vidyasagar University, Midnapore, West Bengal, India. Email: [email protected] 2 Kaushik Bose, Professor, Department of Anthropology, Vidyasagar University, Midnapore, West Bengal, India. e-mail: [email protected] . [email protected] Corresponding Author: Kaushik Bose, Professor, Department of Anthropology, Vidyasagar University, Midnapore, West Bengal, India. . e-mail: [email protected] . [email protected] ABSTRACT Background. Undernutrition among rural population, especially the underprivileged tribal people is a major health problem in India. Objectives. To assess nutritional status and to compare the utility of two different anthropometric indicators of chronic energy deficiency (CED) among adult Bhumij males. Methods. A cross-sectional study of 195 male adult individuals was conducted. The body mass index (BMI) and mid-upper-arm circumference (MUAC) were used to evaluate CED (BMI < 18.5 kg/m 2 ). Results: the prevalence of CED was 52.3% and of undernutrition based on MUAC < 23.0 cm was 48.2%, respectively. Both of these prevalence comes under the very high-prevalence category (≥ 40%) indicating a critical situation according to World Health Organization recommendations. Among the low MUAC (<23.0 cm) individuals, the rate of CED was significantly (p<0.001, x 2 =57.93) higher (79.79%) than among the normal MUAC (≥ 23.0 cm) individuals (20.21%). Conclusion: This tribal population was facing severe nutritional stress. With limited resources and in the absence of skilled manpower, it may be more appropriate to use MUAC for human population surveys, particularly among tribal population of developing countries. Keywords: West Bengal; Tribal; Bhumij; Anthropometry; Undernutrition
-
Upload
mgmahavidyalaya -
Category
Documents
-
view
4 -
download
0
Transcript of Assessment of undernutrition among male Bhumijs of West Bengal, India: A comparison of body mass...
Human Biology Review (ISSN 2277 4424) 4 (2) 2015
©Human Biology Review Original scientific paper (Ghosh and Bose pp 140-149)
www.humanbiologyjournal.com Revised and Accepted on February 27, 2015
140
Assessment of undernutrition among male Bhumijs of West Bengal, India:
A comparison of body mass index and mid-upper arm circumference
M. Ghosh
1 and K. Bose
2
Citation: Ghosh M and Bose K. 2015. Assessment of undernutrition among male Bhumijs of West Bengal, India: A
comparison of body mass index and mid-upper arm circumference. Human Biology Review, 4 (2), 140-149.
1Mihir Ghosh, Research Scholar, Department of Anthropology, Vidyasagar University, Midnapore, West
Bengal, India.
Email: [email protected]
2Kaushik Bose, Professor, Department of Anthropology, Vidyasagar University, Midnapore, West
Bengal, India. e-mail: [email protected]. [email protected]
Corresponding Author: Kaushik Bose, Professor, Department of Anthropology, Vidyasagar University,
Midnapore, West Bengal, India. . e-mail: [email protected]. [email protected]
ABSTRACT
Background. Undernutrition among rural population, especially the underprivileged tribal people is a
major health problem in India.
Objectives. To assess nutritional status and to compare the utility of two different anthropometric
indicators of chronic energy deficiency (CED) among adult Bhumij males.
Methods. A cross-sectional study of 195 male adult individuals was conducted. The body mass index
(BMI) and mid-upper-arm circumference (MUAC) were used to evaluate CED (BMI < 18.5 kg/m2).
Results: the prevalence of CED was 52.3% and of undernutrition based on MUAC < 23.0 cm was 48.2%,
respectively. Both of these prevalence comes under the very high-prevalence category (≥ 40%) indicating
a critical situation according to World Health Organization recommendations. Among the low MUAC
(<23.0 cm) individuals, the rate of CED was significantly (p<0.001, x2 =57.93) higher (79.79%) than
among the normal MUAC (≥ 23.0 cm) individuals (20.21%).
Conclusion: This tribal population was facing severe nutritional stress. With limited resources and in the
absence of skilled manpower, it may be more appropriate to use MUAC for human population surveys,
particularly among tribal population of developing countries.
Keywords: West Bengal; Tribal; Bhumij; Anthropometry; Undernutrition

Undernutrition among male Bhumijis: Ghosh and Bose (2015) pp. 140-149
141
INTRODUCTION:
Notwithstanding some inherent limitations, anthropometry remains the most practical tool for a
rapid assessment of nutritional status at individual as well as community level, particularly in resource
constrained circumstances in developing countries such as India. Body mass index (BMI) is widely
accepted as one of the best indicators of nutritional status in adults (WHO, 1995). Many studies have
shown that BMI is a reasonable anthropometric measure of total body fat or storage of energy in the body
(Deurenberg et al., 1991; Bose, 1996). Although adult nutritional status can be evaluated in several ways,
the BMI is the most widely used because it is simple, inexpensive, safe and suitable for large scale
surveys (Lohman et al, 1988; Ferro-Luzzi et al., 1992; James et al., 1994; Lee & Nieman, 2003). BMI
reflects not only the nutritional status but also the socio-economic condition of a population, especially,
the adult population in developing countries (Ferro-Luzzi et al., 1992; Shetty & James, 1994; Nube et al.,
1998; Khongsdier, 2002; Mosha, 2003). A BMI<18.5 kg/m2 is widely used as a practical measure of
chronic energy deficiency (CED) i.e a ‘steady’ state of underweight in which an individual is in an energy
balance irrespective of a loss in body weight or body energy stores (Khongsdier, 2005). Such a ‘steady’
underweight is likely to be associated with morbidity or other physiological and functional impairments
(James et al, 1988; Shetty & James, 1994; WHO, 1995). CED is caused by inadequate intake of energy
accompanied by high level of physical activities and infections for a considerably long period of life
(Shetty & James, 1994; Shetty et al., 1994). It is associated with reduced work capacity (Pryer, 1993;
Durnin, 1994), poor work performance and productivity (Kennedy & Garcia, 1994), increased morbidity
due to suppressed immune function (Garcia & Kennedy, 1994; Shetty & James, 1994; Strickland &
Ulijiastek, 1994) and behavioral changes (Kusin et al., 1994).
On the other hand, mid-upper arm circumference (MUAC) is another anthropometric measure
used to evaluate adult nutritional status (James et al., 1994). It is simpler measure than BMI, requires
minimum equipment and may predict morbidity and mortality as accurately as underweight (Briend et al.,
1989). An extensive study using data from 8 countries (Mali, India, Senegal, Zimbabwe, Somalia,
Ethiopia, Papua New Guinea and China) suggested that MUAC could be used as a simple screening tool
for assessment of nutritional status. MUAC has been suggested as a substitute for BMI when the rapid
screening of an adult population is required as a prelude to targeting the provision of assistance to those
who are undernourished (James et al., 1994).
Until recently, there has been little attempt to assess the prevalence of under-nutrition among
adults living in developing countries despite the widespread concern about world hunger and food
insecurity (Griffiths et al., 2001). In spite of the economic development in the region, undernutrition

Human Biology Review (ISSN 2277 4424) 4(2) Ghosh and Bose (2015) pp 140-149
142
remains an important public problem in many Asian countries (Wickramasinghe et al., 2004). India being
one of the poorest countries in the world and adopting several recent community level measures to lift up
the nutritional status of its people, improvements during the last two to decades have not been impressive
(Griffiths et al., 2001). More than half of the world’s undernourished people lived at the end of 20th
century in India (Krishnaswami, 2000). Moreover, the tribal populations are among the most
underprivileged people in India.
The 2001 census of India recorded more than 84 million tribal populations who constitute 8.2%
of total population (Census of India, 2001). India probably has the largest number of tribal communities
in the world (Topal & Samal, 2001). The vast majority of the tribal populations resides in rural areas of
the country and is socially and economically underprivileged (Mittal & Srivastava, 2006; Ghosh &
Bharati, 2006). The Bhumij is one such tribe being the fourth largest (7.5% in 2001 census) tribal group
in West Bengal state. The term ‘Bhumij’ means owner of the soil. They inhabit rugged forested terrains,
speak an Austro-Asiatic language and are divided into several exogamous clans. Settled agriculture is the
predominant occupation supplemented with occasional hunting and trapping of birds and small wild
animals. Many work as labourers in agriculture and other sectors. More than 95% of the Bhumij follow
some traits of Hinduism along with their traditional religious practices (Mandal et al. 2002).
Information on nutritional status of Bhumij, nevertheless, is extremely scanty (Bose et al., 2008) and there
is no study concerning BMI and MUAC together to assess undernutrition among the adult population of
the tribe. In view of this context, the present study was conducted to report the prevalence of CED as well
as undernutrition based on MUAC cut of value among the adult male Bhumij villagers of the Paschim
Medinipur District in West Bengal, India.
MATERIALS AND METHODS:
Data for this cross sectional study were collected from four villages in the West Midnapore
district of West Bengal, namely, Bhimchawk, Bhatapukur, Sajowal and Tetuldanga. These were located
within 5 km radius from Kharagpur, which is an important Railway Station under South-Eastern
Railways, located approximately 115 km from Kolkata, the state capital of West Bengal. The villagers
were communicated about the study and a total 195 adult male Bhumij residents aged above 18 years in
those villages were included in the study. The response rate was little below 82%. The vast majority of
the subjects were illiterate and very low-waged manual laborers belonging to low socio-economic status.
Ethical considerations were guided by the Helsinki Declaration (Goodyear et al., 2007). The
district level and local administrative relevant authorities and the community leaders were informed about

Undernutrition among male Bhumijis: Ghosh and Bose (2015) pp. 140-149
143
the objective of the field work. Verbal informed consent was obtained from each participant in their own
language prior to each interview and measurement procedure. The first Author (MG) took anthropometric
measurements following the standard techniques of Lohman et al (1988). Both height and mid-upper arm
circumference were recorded to the nearest 1 mm and weight to nearest 500 g. BMI was computed as
weight (kg)/ Height (m2).
Nutritional status was evaluated using internationally accepted BMI guidelines (WHO 1995) as
follow:
1) CED : BMI<18.5 kg/m2
2) Normal : BMI=18.5-24.99 kg/m2
3) Overweight : BMI≥25.0 kg/m2
We followed the World Health Organization’s classification (1995) of the public health problem of
low BMI, based on adult populations worldwide. This classification categorizes prevalence according to
percentage of a population with BMI< 18.5 kg/m2.
1) Low (5-9%): warning sign, monitoring required.
2) Medium (10-19%): poor situation.
3) High (20-39%): serious situation.
4) Very high (≥40%): critical situation.
Mid-upper arm circumference (MUAC) can be used for evaluating nutritional status studies among
third world adults.
The following cut-off points were used:
Nutritional Status Among Men
Under-nutrition MUAC < 23.0 cm
Normal MUAC ≥ 23.0 cm
Mean and Standard Deviation were calculated to describe the age and anthropometric parameters.
Percentage was used to calculate the prevalence rates. Chi square statistics was used to assess the
significance of differences in prevalence rates between groups. Odds ratio (OR) with its 95% confidence
interval (95% CI) was also calculated to estimate the likelihood of occurrence of certain condition, e.g.,
undernutrition). All statistical analyses were undertaken using the SPSS statistical package, statistical
significance was set at p < 0.05.

Human Biology Review (ISSN 2277 4424) 4(2) Ghosh and Bose (2015) pp 140-149
144
RESULTS
Table 1 shows the anthropometric characteristics of the studied subjects. The mean and standard
deviation of MUAC and BMI were 23.0 ± 2.1 cm and 18.6 ± 2.4 kg/m2, respectively. Table 2 presents the
nutritional status of the subjects based on BMI. Overall the extent of malnutrition was 53.8%; among
them 52.3% were undernourished. The rates of CED-Grades III, II and I were 13.3%, 6.7% and 32.3%,
respectively. Table 3 presents the nutritional status of the subjects based on MUAC. The rates of under-
nutrition are 48.2% and normal is 51.8%. It is nearest to the rates of low BMI (52.3%). Table 4 showed
the relationship between prevalence of CED and under nutrition assessed by BMI and MUAC,
respectively. Overall 48.2% under-nutrition based on MUAC and 52.3% under-nutrition based on BMI.
Among the low MUAC (<23 cm) individual, the rates of under-nutrition is greater than that of normal
MUAC (79.8% vs. 20.2%) based on BMI. This low MUAC was statistically highly significant (x2=57.93,
p<0.01,) with low BMI. The result reveals that low MUAC had 10.82 fold greater risks for chronic energy
deficiency.
Table 1. Age and anthropometric characteristics of the studied sample
Variable Mean ±SD
Age (years) 36.6 ±15.9
Weight (kg) 47.5 ± 7.2
Height (cm) 159.8 ± 6.7
MUAC (cm) 23.0 ± 2.1
BMI (kg/m2) 18.6 ± 2.4
Table 2. Nutritional status of the subjects based on body mass index (BMI).
BMI(kg/ m2) Category Frequency Percentage (%)
< 16.0 CED Grade-III 26 13.3
16 - 16.99 CED Grade-II 13 6.7
17 - 18.49 CED Grade-I 63 32.3
18.5 - 24.99 Normal 90 46.2
≥25.0 Overweight 03 1.5
≥ 30.0 Obese 00 00
Total 195 100

Undernutrition among male Bhumijis: Ghosh and Bose (2015) pp. 140-149
145
Table 3. Nutritional status of the subjects based on Mid-upper arm circumference (MUAC).
MUAC (cm) Category Frequency Percentage (%)
<23.0 Under-nutrition 94 48.2
≥23.0 Normal 101 51.8
Total 195 100
Table 4. Relationship between body mass index (BMI) and mid-upper arm circumference (MUAC).
Nutritional Status by BMI (row)
and MUAC (column)
Under-nutrition
BMI < 18.5 kg/m2
(n, %)
Normal
BMI ≥ 18.5 kg/m2
(n, %)
Total
(n, %)
Under-nutrition (MUAC <23 cm) 75 (79.8) 19 (20.2) 94 (48.2)
Normal (MUAC≥23 cm) 27 (26.7) 74 (73.3) 101 (51.8)
Total 102 (52.3) 93 (47.7) 195 (100)
Chi-square =57.93, p <0.001. OR=10.82 (95%CI: 5.24-22.59).
DISCUSSION:
Several recent studies from India (Yadav et al., 1999; Gogoi & Sengupta, 2002; Sahani, 2003;
Bose & Chakrabarty, 2005; Bose et al., 2006a) have utilized BMI to study under-nutritional status of
tribal populations. Therefore, the use of BMI and its cut-off points recommended by WHO for the
evaluation of CED are valid for use among tribal populations of India.
The economic and health burden of high frequencies of adult CED has been well documented
(Ferro-Luzzi et al., 1992; Cambell et al., 1994; James et al., 1994; Naidu & Rao, 1994; Khongsdier,
2005). The functional and economic significance of a high prevalence of CED has already been
established (Ferro-Luzzi et al. 1992). Therefore, efforts must be made to investigate the consequences of
the functional impairments commonly associated with low BMI in various ethnic groups. It is also
essential to ascertain the relationship of the high prevalence of under-nutrition with morbidity and
mortality among adults.
The outcome of the present study clearly indicated that the prevalence of CED among adult
Bhumij male was very high on the basis of either BMI (52.3%) or MUAC (48.2%). Both of these
percentages are greater than 40% placing the populations in the critical situation according to WHO
recommendation. High rates of CED have also been reported from other tribal populations of West
Human Biology Review (ISSN 2277 4424) 4(2) Ghosh and Bose (2015) pp 140-149
146
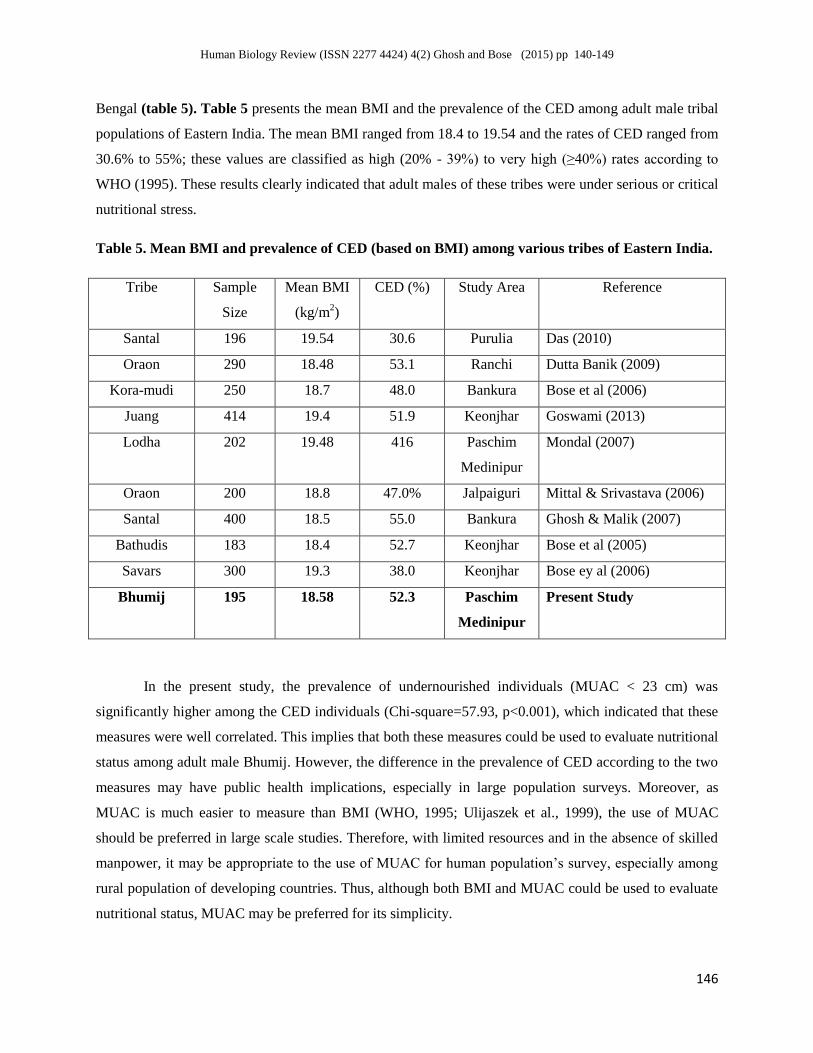
Bengal (table 5). Table 5 presents the mean BMI and the prevalence of the CED among adult male tribal
populations of Eastern India. The mean BMI ranged from 18.4 to 19.54 and the rates of CED ranged from
30.6% to 55%; these values are classified as high (20% - 39%) to very high (≥40%) rates according to
WHO (1995). These results clearly indicated that adult males of these tribes were under serious or critical
nutritional stress.
Table 5. Mean BMI and prevalence of CED (based on BMI) among various tribes of Eastern India.
Tribe Sample
Size
Mean BMI
(kg/m2)
CED (%) Study Area Reference
Santal 196 19.54 30.6 Purulia Das (2010)
Oraon 290 18.48 53.1 Ranchi Dutta Banik (2009)
Kora-mudi 250 18.7 48.0 Bankura Bose et al (2006)
Juang 414 19.4 51.9 Keonjhar Goswami (2013)
Lodha 202 19.48 416 Paschim
Medinipur
Mondal (2007)
Oraon 200 18.8 47.0% Jalpaiguri Mittal & Srivastava (2006)
Santal 400 18.5 55.0 Bankura Ghosh & Malik (2007)
Bathudis 183 18.4 52.7 Keonjhar Bose et al (2005)
Savars 300 19.3 38.0 Keonjhar Bose ey al (2006)
Bhumij 195 18.58 52.3 Paschim
Medinipur
Present Study
In the present study, the prevalence of undernourished individuals (MUAC < 23 cm) was
significantly higher among the CED individuals (Chi-square=57.93, p<0.001), which indicated that these
measures were well correlated. This implies that both these measures could be used to evaluate nutritional
status among adult male Bhumij. However, the difference in the prevalence of CED according to the two
measures may have public health implications, especially in large population surveys. Moreover, as
MUAC is much easier to measure than BMI (WHO, 1995; Ulijaszek et al., 1999), the use of MUAC
should be preferred in large scale studies. Therefore, with limited resources and in the absence of skilled
manpower, it may be appropriate to the use of MUAC for human population’s survey, especially among
rural population of developing countries. Thus, although both BMI and MUAC could be used to evaluate
nutritional status, MUAC may be preferred for its simplicity.
Undernutrition among male Bhumijis: Ghosh and Bose (2015) pp. 140-149
147
However, it must be mentioned here that some limitations of the present study were the small
sample size and the non-available of data on dietary intake. From the public health perspectives of
paramount importance is the immediate initiation of appropriate nutritional intervention programmers
among this ethnic group. Future investigations should emphasize on determining different methods for
the estimation of under nutrition. Appropriate proposals should also be given to tackle the problem of
under nutrition in India, especially among tribal populations.
ACKNOWLEDGEMENT:
All subjects who participated in this study are gratefully acknowledged. Partha Sarathi Mondal,
Arup Majumder, Piyali Biswas and Moumita Adhikary helped in data collection. Dr. Raja Chakraborty
is gratefully acknowledged for his help and guidance.
REFERENCES:
Bose K, Bisai S, Mondal PS, Ghosh M. 2008. Body mass index and chronic energy deficiency
among adult male Lodhas and Bhumijs: a comparison with other tribal populations of West
Bengal, India. J Pub Health (Springer) 16: 117-121.
Bose K, Ganguli S, Mamtaz H, Mukhopadyay A, Bhadra M. 2006a. High prevalence of
undernutrition among adult Kora Mudi tribals of Bankura District, West Bengal. India.
Anthropol Sci 114:65-8.
Bose K, Chakraborty F. 2005. Anthropometric characteristics and nutritional status based on
body mass index of adult Bathudis: A tribal population of Keonjhar District,Orissa, India. Asia
Pac J Clin Nutr 14: 80-82.
Bose K, 1996. Generalised Obesity and Regional Adiposity in Adult White and Migrant Muslim
Males from Pakistan in Peterborough. J Roy Soc Prom Health 116:161-167.
Briend A, Garenne M, Maire B, Fontaine O, Dieng K. 1989. Nutritional status, age and survival:
the muscle mass hypothesis. Eur J Clinl Nutr 43: 715-716.
Campbell P, Ulijaszek SJ. 1994. Relationship between anthropometry retrospective morbidity in
poor men in Calcutta, India. Eur J Clinl Nutr 48:507-12.
Deurenberg P, Weststrate JA, Seidell JC. 1991. Body mass index as a measure of body fatness:
age and sex specific prediction formulas. Brit J Nutr. 65:105-14.
Durnin JVGA. 1994. Low body mass index, physical work capacity and physical activity levels.
Eur J Clin Nutr 48 (suppl3) ; s39-s44.

Human Biology Review (ISSN 2277 4424) 4(2) Ghosh and Bose (2015) pp 140-149
148
Ferro-Luzzi A, Sette S, Franklin M, James WPT. 1992. A simplified approach of assessing adult
chronic deficiency. Eur J Clin Nutr 46: 173-186.
Ghosh R, Bharati P. 2006. Nutritional status of adults among Munda and Pod populations in a
peri urban area of Kolkata City, India. Asia Pac J Pub Health 18(2):12–20.
Griffiths PL, Bently ME. 2001. The Nutrition transition is underway in India. J Nutr 131:2692-
700.
Gogoi G, Sengupta S. 2002. Body mass index among the Dibongiya Deoris of Assam, India. J
Hum Ecol. 13: 271-273.
Goodyear MDE, Krleza-Jeric K, Lemmens T. 2007. The Declaration of Helsinki. BMJ 335: 624-
625.
James WPT, Ferro-Luzzi A, Waterlow JC. 1988. Definition of Chronic energy deficiency of
adults. Report of a working party of the International Dietary Energy Consultative Group. Eur J
Clin Nutr 42: 969-981.
James WPT, Mascie Taylor CGN, Norgan NG, Bristrian BR, Shetty P, Ferro-Luzzi PA. 1994.
The value of arm circumference measurements in assessing chronic energy deficiency in Third
World adults. Eur J Clin Nutr 48:883-894.
Kennedy E, Garcia M. 1994. Body mass index and economic productivity. Eur J Clin Nutr 56:
484-489.
Khongsdier R. 2002. Body mass index and morbidity in adult males of the War Khasi in
Northeast India. Eur J Clin Nutr 56: 329-43.
Khongsdier R. 2005. BMI and morbidity in relation to body composition: a cross-sectional study
of a rural community in North East India. Br J Nutr 93: 101-107.
Krishnaswami K. 2000. Country profile: India. Nutritional disorders- old and changing. Lancet
351: 1268-9.
Kusin JA, Kardjati S, Rengvist UH. 1994. Maternal body mass index: The functional
significance during reproduction. Eur J Clin Nutr 48 (suppl 3): S56-S67.
Lee RD, Nieman DC. 2003. Nutritional Assessment. New York: Mc Graw Hill.
Lohman TG, Roche AF, Martorell R.1988. Anthropometric Standardization Reference Manual.
Chicago: Human Kinetics Books.
Mandal H, Mukherjee S, Datta A. 2002. India: An illustrated Atlas of Tribal World. Kolkata:
Anthropological Survey of India.
Undernutrition among male Bhumijis: Ghosh and Bose (2015) pp. 140-149
149
Mittal PC, Srivastava S. 2006. Diet Nutritional Status and Food related tradition of Oraon tribes
of New Mal (West Bengal), India. Rural Remote Health, 6 (1): 385.
Mosha TCE. 2003. Prevalence of obesity and chronic energy deficiency (CED) among females
in Morogoro district, Tanzania. Ecol Food Nutr 42:37-67.
Naidu AN & Rao N. 1994. Body mass index: a measure of the nutritional status in Indian populations. Eur J Clin Nutr 48, 5131-5140.
Nube M, Asenso-Okyere WK, Van Den Bloom GJM. 1998. Body mass index as an indicator of
standard of living in developing countries. Eur J Clin Nutr 77: 1186-1191.
Pryer JA. 1993. Body mass index and work disabling morbidity: Result from a Bengladesh case
study. Eur J Clin Nutr 47: 653-657.
Sahani R. 2003. Nutritional and health status of the Jarawas: A preliminary report. J Anthropol
Survey of India. 52: 47-65.
Shetty PS, James WPT. 1994. Report of the Food and Agricultural Organization: Body Mass
Index: Its relationship to basal metabolic rates and energy requirements”. Eur J Clin Nutr
48(suppl 3): S28-S38.
Strickland SS, Ulijaszek SJ. 1994. Body mass index and illness in Sarawak. Eur J Clin Nutr
48(suppl 3): S98-S109.
Topal YS, Samal PK. 2001. Causes for variation in social and economic condition among tribes
of Indian Central Himalaya: A comparative study. Man in India. 81: 87-88.
Ulijaszek SJ, Kerr DA. Anthropometric measurement error and the assessment of nutritional
status. Br J Nutr. 1999; 82: 165-77.
Wickramasinghe VP, Lamabadusuriya SP, Atapattu N, Sathyadas G, Kuruparanantha S,
Karunarathne P. 2004. Nutritional status of schoolchildren in an urban area of Sri Lanka, Ceylon
Med J 49: 114-118.
World Health Organization. 1995. Physical status: the use and Interpretation of Anthropology.
Technical Report Series no. 854. Geneva: World Health Organization.
Yadav YS, Singh P, Kumar A. 1999. Nutritional status of tribals and non-tribals in Bihar. Ind J
Prev Socl Med.30:101-106.