Carbon-13 nuclear magnetic relaxations and chain local motions of poly(vinyl chloride) in dibutyl...
8
Macromolecules 1993,26, 1445-1452 1445 I3C Nuclear Magnetic Relaxations and Chain Local Motions of Poly(viny1 chloride) in Dibutyl Phthalate and Tetrachloroethane Solutions T. Radiotis and G. R. Brown* Department of Chemistry, McGill University, 801 Sherbrooke Street West, Montreal, Qukbec, Canada H3A 2K6 Photis Dais* Department of Chemistry, University of Crete, P.O. Box 1470, 71409 Zraklion, Crete, Greece Received September 25, 1992; Revised Manuscript Received December I, 1992 ABSTRACT: Carbon-13 spin-lattice relaxation times and NOE values were measured as a function of temperature at two magnetic fields for poly(viny1 chloride) (PVC) in two solvents, dibutyl phthalate (DBP) and 1,1,2,2-tetrachloroethane-d2 (TCE-d2). The relaxation data were interpreted in terms of chain local motions by using various dynamic models. Among these, the Dejean-Laupr6tre-Monnerie correlation function appears to be the most appropriate to describe the chain segmental motions of PVC. Simulation parameters from this model were found to differ for PVC in the two solvents; e.g., the half-angles of the librational motion of the C-H vector for the methine carbon were found to be 27 and 30" in DBP and in TCE-dZ, respectively. This can be rationalized by assuming a specific interaction between DBP and the CHCl group of PVC. In addition, the activation energies for cooperative segmental motions were found to be 9.2 kJ/mol for PVC in DBP as compared to 13.7 kJ/molwhen the polymer is in the TCE-d2 solvent. This difference can be attributed to effects that arise from the relative solvent quality. Introduction In recent years considerable effort has been devoted to the study of macromolecular dynamics as determined from 13C nuclear magnetic relaxation parameters. The main advantage of this spectroscopictechnique is that it provides a detailed analysis of molecular motion at the atomic level. Several re~iewsl-~ are available describing the various models developed for the interpretation of nuclear spin relaxation data for polymers in solution. Initial attempts to quantitatively interpret polymer dynamics led to the use of distribution models and especially the so-called log x2 distribution of Schaefer.6 This model utilizes a broad asymmetric distribution of correlation times for the molecular motions with a tail toward the high end of the scale; however, it lacks the detailed insight into the nature of the chain motions. More promising models have been developed which are based on a molecular description of segmental motions. These include the three-bond jump model developed by Jones and Stockmayer' (JS model) and the conformational jump model of Hall, Weber, and Helfandavg (HWH model). Recently, Dejean, Lauprbtre, and Monnerie'O (DLM model) modified the HWH model by taking into consid- eration a fast libration of the C-H vectors in addition to segmental motion. On the basis of the present relaxation data for poly- (vinyl chloride) (PVC) in dibutyl phthalate (DBP) and 1,1,2,2-tetrachloroethane-d2 (TCE-dz),a critical evaluation of these four models will be made regarding their ability to describe the local motions of the PVC chain. In addition, a comparison of the dynamics of PVC in the two solvents will be made in search of discernible differences in local motion, apart from the effects of solvent viscosity. The goal of this study was to obtain insight into the chain local motions of PVC dissolved in DBP, a phthalate diester. Such studies are important from an academic as well as an industrial point of view since phthalates are used extensively as primary plasticizers, to convert the rigid PVC resin into workable and flexible compounds that exhibit a wide range of properties depending on the 0024-9297/9312226- 1445$04.00/ 0 type and concentration of plasticizer. Although the technology of plasticization is well developed,11J2 the mechanism of plasticization of PVC and its interactions with the plasticizer are not well understood at the molecular level. For comparison, a parallel studywas made for solutions of PVC in TCE-d2. Experimental Section Polymer. The poly(viny1 chloride) used in this study was an Esso 366 industrial resin for which the following characteristics were quoted: M,, = 46 OOO; M, = 83 000; density = 1.39 g/cm3 and [a] = 0.98 dL/g in chlorobenzene at 25 "C. The glass transition temperature, Tg, as determined by a Perkin-Elmer DSC-2C was 87 "C. Prior to use the PVC sample was dissolved in THF and precipitated with cold methanol in order to remove impuritiesand low molecular weight species. Studies by 13C NMR indicated an essentially atactic polymer with P, = 0.45, as determined from the methine triad sequence distribution. Viscosity. Viscosity measurements were carried out by means of calibrated Ubbelodhe-type viscometers having various capillary sizes (SGA Scientific Inc.) immersed in a thermostated water bath, regulated to h0.02 "C. Dilute solutions of PVC in DBP (0.06-0.20 g/dL) and in TCE (0.04-0.20 g/dL) were prepared with solvents purchased from Aldrich Co. All viscosity mea- surements were repeated at least twice. The effect of concen- tration on the viscosity of dilute polymer solutions can be described by Huggins:13 (1) tlsdc = ttl1 + kH[vIZc ln(tl,)/c = [TI + k~[tll'C and Kraemer:I4 (2) where vsp is the specific viscosity, tlr is the relative viscosity, and c is the concentration in g/dL. Values of intrinsic viscosity, [TI, and Huggins, kH, and Kraemer, kK, constants for PVC in DBP at 30 "C were found to be 0.89 dL/g, 0.36, and -0.13, respectively, and 0.74 dL/g, 0.74, and0.19 for PVC in TCE. Activation energies for the solvent viscosity, AHv, obtained from the slopes of the plots of ln(q) as a function of 1/T were found to be 24.2 and 10.2 kJ/mol in DBP and TCE, respectively, over the temperature range 20-90 "C. NMR. In the NMR experiments, the polymer was studied as 5% w/v solutions in both DBP (Aldrich Co.) and TCE-dp (MSD 0 1993 American Chemical Society
-
Upload
independent -
Category
Documents
-
view
1 -
download
0
Transcript of Carbon-13 nuclear magnetic relaxations and chain local motions of poly(vinyl chloride) in dibutyl...
Macromolecules 1993,26, 1445-1452 1445
I3C Nuclear Magnetic Relaxations and Chain Local Motions of Poly(viny1 chloride) in Dibutyl Phthalate and Tetrachloroethane Solutions
T. Radiotis and G. R. Brown* Department of Chemistry, McGill University, 801 Sherbrooke Street West, Montreal, Qukbec, Canada H3A 2K6
Photis Dais* Department of Chemistry, University of Crete, P.O. Box 1470, 71409 Zraklion, Crete, Greece
Received September 25, 1992; Revised Manuscript Received December I, 1992
ABSTRACT: Carbon-13 spin-lattice relaxation times and NOE values were measured as a function of temperature a t two magnetic fields for poly(viny1 chloride) (PVC) in two solvents, dibutyl phthalate (DBP) and 1,1,2,2-tetrachloroethane-d2 (TCE-d2). The relaxation data were interpreted in terms of chain local motions by using various dynamic models. Among these, the Dejean-Laupr6tre-Monnerie correlation function appears to be the most appropriate to describe the chain segmental motions of PVC. Simulation parameters from this model were found to differ for PVC in the two solvents; e.g., the half-angles of the librational motion of the C-H vector for the methine carbon were found to be 27 and 30" in DBP and in TCE-dZ, respectively. This can be rationalized by assuming a specific interaction between DBP and the CHCl group of PVC. In addition, the activation energies for cooperative segmental motions were found to be 9.2 kJ/mol for PVC in DBP as compared to 13.7 kJ/molwhen the polymer is in the TCE-d2 solvent. This difference can be attributed to effects that arise from the relative solvent quality.
Introduction In recent years considerable effort has been devoted to
the study of macromolecular dynamics as determined from 13C nuclear magnetic relaxation parameters. The main advantage of this spectroscopic technique is that it provides a detailed analysis of molecular motion at the atomic level. Several re~iewsl-~ are available describing the various models developed for the interpretation of nuclear spin relaxation data for polymers in solution.
Initial attempts to quantitatively interpret polymer dynamics led to the use of distribution models and especially the so-called log x2 distribution of Schaefer.6 This model utilizes a broad asymmetric distribution of correlation times for the molecular motions with a tail toward the high end of the scale; however, it lacks the detailed insight into the nature of the chain motions. More promising models have been developed which are based on a molecular description of segmental motions. These include the three-bond jump model developed by Jones and Stockmayer' (JS model) and the conformational jump model of Hall, Weber, and Helfandavg (HWH model). Recently, Dejean, Lauprbtre, and Monnerie'O (DLM model) modified the HWH model by taking into consid- eration a fast libration of the C-H vectors in addition to segmental motion.
On the basis of the present relaxation data for poly- (vinyl chloride) (PVC) in dibutyl phthalate (DBP) and 1,1,2,2-tetrachloroethane-d2 (TCE-dz), a critical evaluation of these four models will be made regarding their ability to describe the local motions of the PVC chain. In addition, a comparison of the dynamics of PVC in the two solvents will be made in search of discernible differences in local motion, apart from the effects of solvent viscosity.
The goal of this study was to obtain insight into the chain local motions of PVC dissolved in DBP, a phthalate diester. Such studies are important from an academic as well as an industrial point of view since phthalates are used extensively as primary plasticizers, to convert the rigid PVC resin into workable and flexible compounds that exhibit a wide range of properties depending on the
0024-9297/9312226- 1445$04.00/ 0
type and concentration of plasticizer. Although the technology of plasticization is well developed,11J2 the mechanism of plasticization of PVC and its interactions with the plasticizer are not well understood at the molecular level. For comparison, a parallel study was made for solutions of PVC in TCE-d2.
Experimental Section Polymer. The poly(viny1 chloride) used in this study was an
Esso 366 industrial resin for which the following characteristics were quoted: M,, = 46 OOO; M, = 83 000; density = 1.39 g/cm3 and [a] = 0.98 dL/g in chlorobenzene a t 25 "C. The glass transition temperature, Tg, as determined by a Perkin-Elmer DSC-2C was 87 "C. Prior to use the PVC sample was dissolved in T H F and precipitated with cold methanol in order to remove impuritiesand low molecular weight species. Studies by 13C NMR indicated an essentially atactic polymer with P, = 0.45, as determined from the methine triad sequence distribution.
Viscosity. Viscosity measurements were carried out by means of calibrated Ubbelodhe-type viscometers having various capillary sizes (SGA Scientific Inc.) immersed in a thermostated water bath, regulated to h0.02 "C. Dilute solutions of PVC in DBP (0.06-0.20 g/dL) and in TCE (0.04-0.20 g/dL) were prepared with solvents purchased from Aldrich Co. All viscosity mea- surements were repeated a t least twice. The effect of concen- tration on the viscosity of dilute polymer solutions can be described by Huggins:13
(1) tlsdc = ttl1 + kH[vIZc
ln(tl,)/c = [TI + k ~ [ t l l ' C
and Kraemer:I4
(2) where vsp is the specific viscosity, tlr is the relative viscosity, and c is the concentration in g/dL. Values of intrinsic viscosity, [TI, and Huggins, kH, and Kraemer, kK, constants for PVC in DBP a t 30 "C were found to be 0.89 dL/g, 0.36, and -0.13, respectively, and 0.74 dL/g, 0.74, and0.19 for PVC in TCE. Activation energies for the solvent viscosity, AHv, obtained from the slopes of the plots of ln(q) as a function of 1/T were found to be 24.2 and 10.2 kJ/mol in DBP and TCE, respectively, over the temperature range 20-90 "C. NMR. In the NMR experiments, the polymer was studied as
5% w/v solutions in both DBP (Aldrich Co.) and TCE-dp (MSD
0 1993 American Chemical Society
1446 Radiotis e t al.
Isotopes). The lock signal for the PVC solution in the protonated DBP solvent was obtained either by using an external tube containing a solution of DBP in TCE-& or by placing a coaxial tube containing deuterated solvent inside the 10-mm tube. No differences in relaxation parameters were observed by using these two techniques.
Carbon-13 spin-lattice times, Ti, and nuclear Overhauser enhancements, NOE, values were measured using Varian XL- 200 and XL-300 spectrometers operating a t 50.3 and 75.4 MHz, respectively, for the carbon nucleus. The temperature was controlled to within k0.5 "C, as indicated by a precalibrated copper-constantan thermocouple in the probe insert. Spin- lattice relaxation times were measured by the standard inversion recovery method (PD-18Oo-t~-9O0-AT) with a repetition time longer than 5TI. A total of 500-2000 transients, depending on solvent and temperature, was accumulated for each set of 12-14 "arrayed" t~ values. Values of T I were determined by a three- parameter nonlinear procedure with a rms uncertainty of less than *5%. l ; C NOE experiments were carried out by reverse gated decoupling, a t least three experiments being performed a t each temperature. Delays of at least 10 times the longest TI were used between the 90° pulses.
Numerical Analysis. The correlation times were calculated using a modified15J6 version of the MOLDYNI7 program which includes the JS, HWH, and DLMmotional models. Experimental relaxation data (TI and NOE values) for the methine, CH, and/ or methylene, CH?, carbons of PVC, determined a t both field strengths for a given temperature, were used as the input data. Using a Simplex routine, the best fit relaxation data were calculated by varying one or more simulation parameters, depending on the model, until the target function, F, described by eq 3 as the sum of the squares of the relative deviations between the experimental and calculated TI and NOE values was a minimum
Macromolecules, Vol. 26, No. 6, 1993
of TI and NOE values for the CH? carbon at both field strengths over the whole temperature range were performed by entering T ~ , 70 /7 l , and rl/r2 parameters obtained for the CH carbon at a given temperature and the angle O C H ~ .
Theoretical Background
Assuming a purely 13C-lH dipolar relaxation mecha- nism,'* t h e spin-lattice relaxation time, 7'1, and the nuclear Overhauser enhancement, NOE, can be expressed in t e rms of t h e spectral density function, Ji(oi), as follows (in the SI s y s t e m ) l g ~ ~ ~
(3)
where S = TI andior NOE, and n represents the number of experimental relaxation parameters. Throughout this paper differences between the experimental and calculated values are described by the function u, defined as the root mean square of the relative deviations,
u = *in (4)
Initially, calculations using the log x 2 distribution were performed by entering the relaxation data for the methine carbon, determined a t both fields strengths, a t the temperature where the TI exhibits a minimum value. The optimum correlation time i was determined by varying the distribution width p, in steps of unity, until a minimum F value was obtained. The methylene relaxation data were then calculated using the optimized values of i andp from the methine carbon. In the HWH and JS models, TI and NOE values of the CH and CH? carbons, for both field strengths at a temperature corresponding to the TI minimum, were entered simultaneously through a geometry file that included a nonbonded dipolar relaxation mechanism. In the former model, T~ and r1 were optimized simultaneously, while for the latter model w i was optimized and the parameter 2m - 1 was varied manually in steps of unity until a minimum F value was obtained. No significant deviations between experimental and calculated relaxation data were found when the data for CH and CH2 carbons were entered separately or using a geometry file which embodied nonbonded I1C-lH dipolar interactions.
For the DLM model, relaxation data for the CH carbon at the minimum of the plot of TI as a function of li T were used as input values and the optimized values for the correlation time for cooperative motion 71 and the angle BCH were determined by varying r0/rl and q / r 2 manually in steps of 1 and 10 units, respectively, until a minimum Fvalue was obtained. The factors OCH, r O / r l , and T I / Q were then kept constant over the whole temperature range while r1 was optimized. The half-angle, &,, of the librational motion of the C-H vector for the CH2 carbon w a ~ calculated from experimental relaxation data a t the minimum and r I , ~ ( , i i ~ , , and 71/72 values from the CH carbon. Calculations
where yc and YH are t h e magnetogyric ratios of 13C and 'H nuclei, respectively, clo is the vacuum magnetic per- meability, h = h / 2 ~ where h is Planck's constant, N is t h e number of directly bonded protons, r is the C-H inter- nuclear distance, and wc and WH a r e the 13C and 'H Larmor frequencies, respectively.
The spectral densi ty function, which is a measure of the dis t r ibut ion of motional frequencies and their intensity, is obtained by Fourier transformation of a time correlation function, G(t) , that embodies all of the information about mechanisms and rates of motions
Obtaining G ( t ) is t h e crucial point for a quant i ta t ive interpretat ion of the relaxation data. For the simple case of isotropic rotational diffusion, the time correlation function is a single exponential function decaying with a t ime constant , TC, the molecular correlation t ime
G ( t ) = e-fiTc (8) Substi tuting e q 8 into eq 7 and integrating yield the familiar expression for the spectral densi ty
(9)
A polymer chain can experience a variety of motions, such as local conformational changes, rotation of the whole chain or tumbling of large segments of the chain at much lower frequencies than the backbone local rearrangements, and motions of penden t groups, e.g., methyl or phenyl. In view of the wide variety of motions with different rates and mechanisms, i t is not surprising that e q 9 is an unrealistic model for describing the actual spectral density function for a flexible polymer chain, as is well documented in t h e literat~re.'-3,~921
Since t h e models describing segmental dynamics in flexible polymer chains have been reviewed very com- prehensively by H e a t l e ~ , l - ~ only a shor t description of t h e models a n d the associated spectral densities is given below. Log x2 Distribution Model. T h i s is one of the earliest
models interpreting polymeric relaxation data in t e rms of a distribution of correlation t imes associated with corre- la ted interactions between repeat units, as well as corre- lation t imes in t h e extreme narrowing region. T h e spectral
7 C J ( w ) z 1 + W2Tc2
Macromolecules, Vol. 26, No. 6, 1993
density function for this model is given by6
F(s)?(b5 - 1) J i (w i ) = so+” ds (10)
( b - 1) ( 1 + w ??2 [ 51 z ,
where
is a normalized distribution function. The parameter p is related to the width of the distribution, ? is the average correlation time that defines the center of the distribution, and is the gamma function of p and represents a normalization factor. Owing to the use of a logarithmic scale, the variable s is defined by
(12) The logarithmic base is described by the parameter b (usually set to 1000). For p 1 100 this model reduces to the single correlation time model. Note that the distri- bution function is asymmetric, having a greater density for long correlation times.
Jones-Stockmayer (JS) Model. The JS model orig- inates from the general “tetrahedral or diamond lattice” model first proposed by Valeur and collaborators (VGJM
The VGJM model is based on three- and four- bond motions, i.e., “crankshaft” motions which are allowed to occur in a polymer chain embedded in a tetrahedral lattice. In solving the lattice equation, which describes the three-bond motion, Valeur et a1.22 used a continuous limit approximation that led to an expression with an unrealistic infinite slope of the resulting time correlation function at t = 0. Jones and Stockmayer removed this shortcoming by introducing an arbitrary truncation of the coupling of the motion along the chain. In the absence of overall tumbling and internal rotations of pendent groups the spectral density function of the JS model is given by7
s = log,(l + ( b - 1)7/?)
(?k)-’ = w3hk 8 = (m + 1)/2 where hk and Gk are found from the sharp cutoff solution of the three-bond jump equation as
(14)
( (2k (15) Gk = - + cos 1 2s-’
s Sq=l
where y = In 9. The two adjustable parameters in this model are w3, the characteristic frequency or rate of occurrence for a three-bond jump, that is usually expressed as the harmonic mean correlation time, 7 h = (2w3)-l, and m, the number of bonds involved in the cooperative motion, or the quantity, 2m- 1, which stands for the chain segment expressed in bonds that are coupled to the central bonds. No correlated motions are assumed outside that segment. The parameter 2m - 1 represents the breadth of the distribution of correlation times and ensures the afore- mentioned truncation.
Hall-Weber-Helfand (HWH) Model. This model takes into account correlated pair transitions and isolated transitions occurring with correlation times 71 and 70,
respectively. The pair transitions ensure the propagation along the chain, while isolated, i.e., single-bond transitions,
PVC in Dibutyl Phthalate and Tetrachloroethane-& 1447
&H
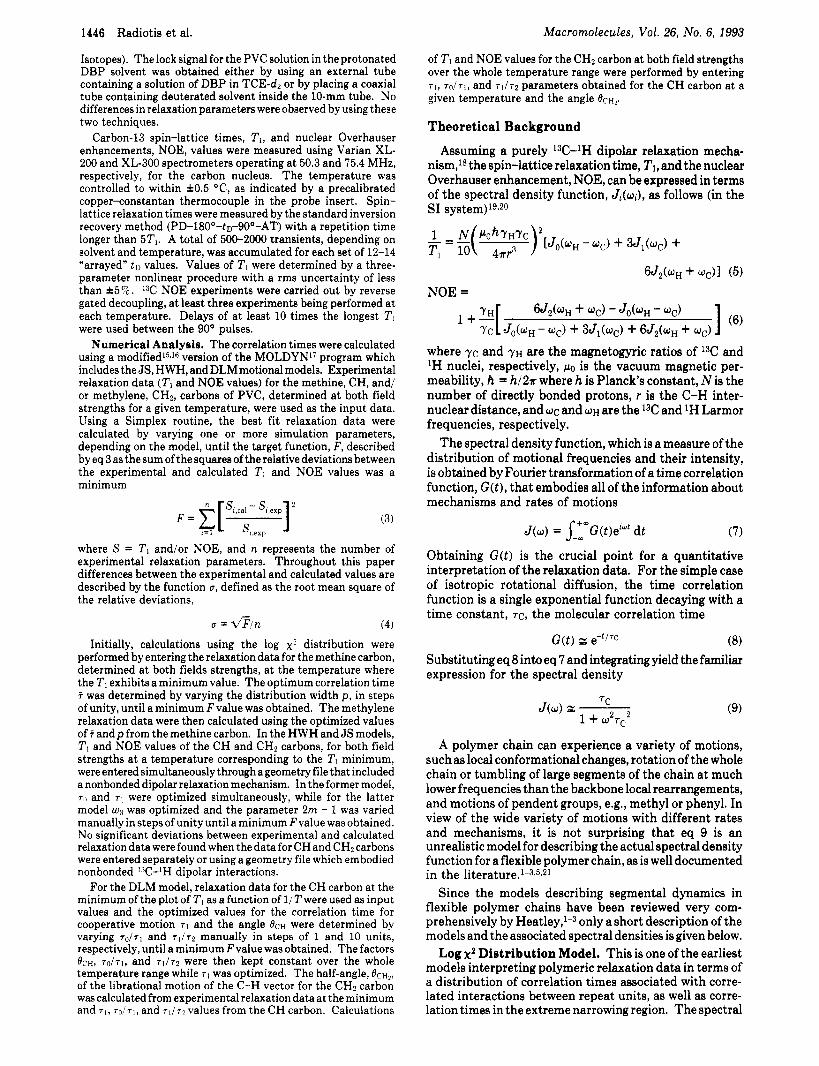
\/\/ Figure 1. Depiction of the librational motion as described in terms of a random anisotropic fast reorientation of the C-H vector, with a characteristic correlation time 72, inside a cone of half- angle, 0, the axis of which is the rest position of the 13C-lH bond.
are responsible for damping. The HWH spectral density is given by8,9
a = 7 1 2 2 + - - wi p = -2wi(; + $) 7 0 7071
Dejean-Lauprbtre-Monnerie (DLM) Model. While the HWH model represented a significant advance in describing polymer chain local motions, in many cases it was found to underestimate the value of TI at the minimum. Furthermore, it could not account for the different local dynamics observed at different carbon sites of a polymer chain.1°J6 The DLM model, which is a clever modification of the HWH model, corrects for these deficiencies by introducing an additional independent motion. This motion is superimposed on the backbone rearrangement, as described by the HWH model, and has been attributed to molecular librations of limited extent of the C-H vector inside a cone of half-angle, 0, the axis of which is the rest position of the C-H bond (Figure 1). This type of librational motion, which must be faster and more local than the orientational diffusion along the chain has been described independently by H ~ w a r t h . ~ ~ Com- bining these two models, the composite DLM spectral density islo
with
l - A = [ c o s ~ - c o s ~ ~ ] ~ 2(1- COS e)
where 7 2 is the correlation time for the librational motion and parameters Q and have been defined in the HWH model.
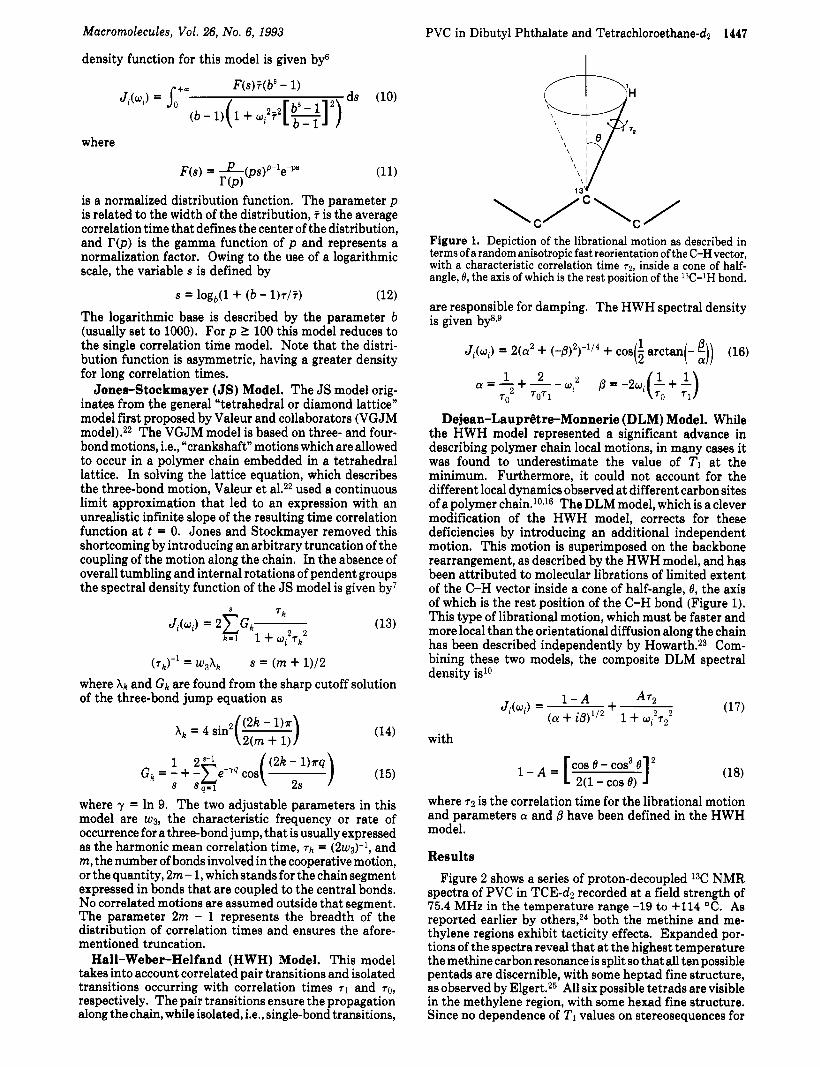
Results Figure 2 shows a series of proton-decoupled 13C NMR
spectra of PVC in TCE-dz recorded at a field strength of 75.4 MHz in the temperature range -19 to +114 “C. As reported earlier by others,24 both the methine and me- thylene regions exhibit tacticity effects. Expanded por- tions of the spectra reveal that a t the highest temperature the methine carbon resonance is split so that all ten possible pentads are discernible, with some heptad fine structure, as observed by Elgert.25 All six possible tetrads are visible in the methylene region, with some hexad fine structure. Since no dependence of TI values on stereosequences for
1448 Radiotis et al. Macromolecules, Vol. 26, No. 6, 1993
-CH. n
-CH2- I
60 56 Y Y u) a i m u m m sm Y P Y) u a m u
Figure 2. Series of I T ! NMR spectra of 5% (wiv) PVC in TCE-dz in the temperature range -19 to +114 "C recorded at a magnetic field of 75.4 MHz.
Table I Experimental Carbon-13 Spin-Lattice Relaxation Times (TI, ms) and NOE Values8 of Methine and Methylene Carbons of PVC in DBP and TCE-dz as a Function of
Temperature at Two Magnetic Fields 50.3 MHz 75.4 MHz
temp, "C CH CHz CH CHz PVC in DBP
20 160 (1.43) 83 (1.38) 307 (1.31) 167 (1.28) 41 132 (1.56) 71 (1.50) 226 (1.36) 127 (1.43) 61 136 (1.75) 77 (1.72) 202 (1.54) 114 (1.50) 82 165 (2.06) 92 (2.10) 219 (1.77) 126 (1.79) 91 181 (2.18) 99 (2.16) 241 (1.85) 133 (1.84)
114 264 (2.45) 149 (2.46) 325 (2.16) 183 (2.11) 137 389 (2.54) 222 (2.50) 432 (2.33) 243 (2.23)
-19 -1 20 41 61 81
101 114
PVC in TCE-dz 182 (1.49) 100 (1.55) 290 (1.48) 147 (1.55) 81 (1.61) 235 (1.47) 147 (1.72) 81 (1.71) 214 (1.59) 172 (1.93) 95 (1.95) 221 (1.66) 211 (2.18) 115 (2.18) 255 (1.89) 275 (2.44) 155 (2.51) 315 (1.99) 374 (2.61) 215 (2.70) 415 (2.18) 464 (2.65) 266 (2.65) 498 (2.44)
163 (1.47) 131 (1.49) 115 (1.58) 124 (1.71) 142 (1.96) 179 (2.12) 232 (2.33) 285 (2.47)
a Values in parentheses.
poly(viny1 chloride) was found in either solvent and overlapping peaks were observed at low temperatures, average values of 2'1 and NOE of the methine and methylene resonances are reported.
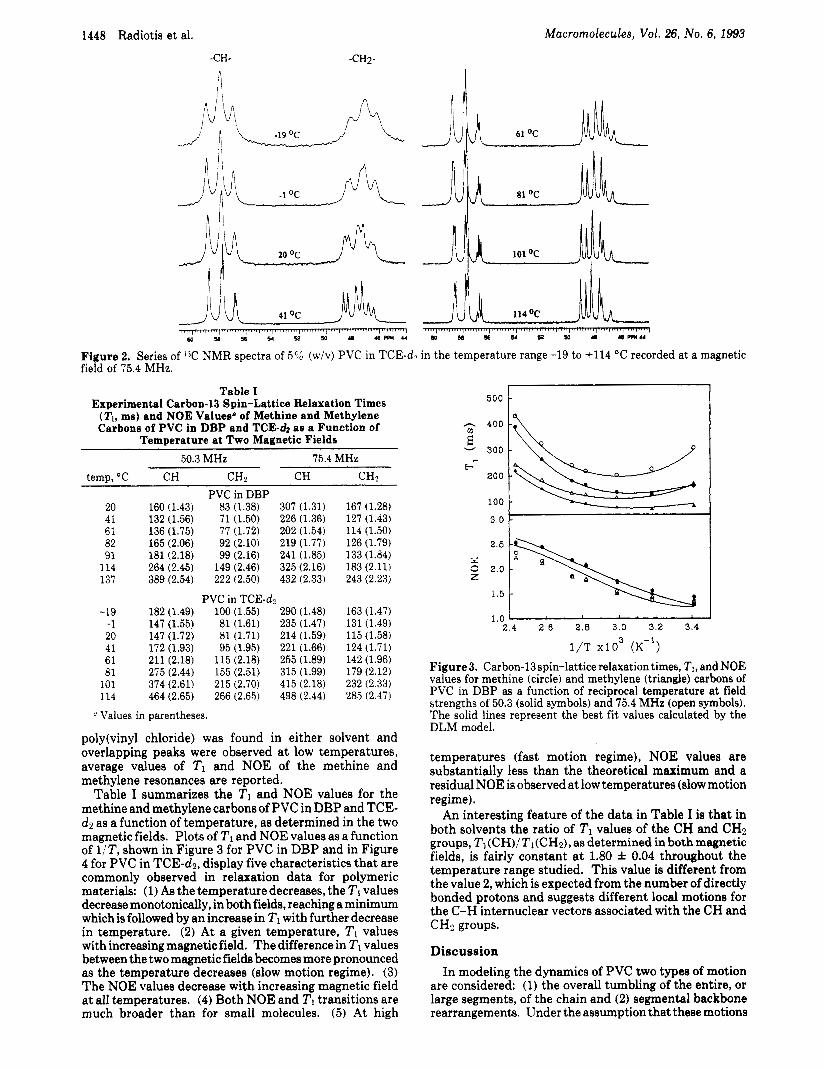
Table I summarizes the 2'1 and NOE values for the methine and methylene carbons of PVC in DBP and TCE- d2 as a function of temperature, as determined in the two magnetic fields. Plots of TI and NOE values as a function of UT, shown in Figure 3 for PVC in DBP and in Figure 4 for PVC in TCE-d2, display five characteristics that are commonly observed in relaxation data for polymeric materials: (1) As the temperature decreases, the TI values decrease monotonically, in both fields, reaching a minimum which is followed by an increase in TI with further decrease in temperature. (2) At a given temperature, TI values with increasing magnetic field. The difference in 2'1 values between the two magnetic fields becomes more pronounced as the temperature decreases (slow motion regime). (3) The NOE values decrease with increasing magnetic field at all temperatures. (4) Both NOE and TI transitions are much broader than for small molecules. (5) A t high
500
n 400
i - 300 H
200
100
3.0
i
2 . 5
w 0 2.0 2
1.5
1 9
1.0 ' " ' ' ' ' ~ ' ' J 2.4 2.6 2.6 3.0 3.2 3.4
I/T x 1 ~ 3 (K-')
Figure . . 3. Carbon-13 spin-lattice relaxation times, TI, and NOE values for methine (circle) and methylene (triangle) carbons of PVC in DBP as a function of reciprocal temperature at field strengths of 50.3 (solid symbols) and 75.4 MHz (open symbols). The solid lines represent the best fit values calculated by the DLM model.
temperatures (fast motion regime), NOE values are substantially less than the theoretical maximum and a residual NOE is observed at low temperatures (slow motion regime).
An interesting feature of the data in Table I is that in both solvents the ratio of TI values of the CH and CH2 groups, Tl(CH)/Tl(CHz), as determined in bothmagnetic fields, is fairly constant a t 1.80 f 0.04 throughout the temperature range studied. This value is different from the value 2, which is expected from the number of directly bonded protons and suggests different locd motions for the C-H internuclear vectors associated with the CH and CH2 groups.
Discussion In modeling the dynamics of PVC two types of motion
are considered: (1) the overall tumbling of the entire, or large segments, of the chain and (2) segmental backbone rearrangements. Under the assumption that these motions

Macromolecules, Vol. 26, No. 6, 1993
500
n 400
i - 300
h 200
100
3.0
2.5
,-4
g 2.0 2
1.5
1.0
\\
2.8 2.8 3.0 3.2 3.4 3.8 3.8 4.0
i / ~ x 1 ~ 3 (K-') Figure 4. Carbon-13 spin-lattice relaxation times, TI, and NOE values for methine (circle) and methylene (triangle) carbons of PVC in TCE-d2 as a function of reciprocal temperature a t field strengths of 50.3 (solid symbols) and 75.4 MHz (open symbols). The solid lines represent the best fit values calculated by the DLM model.
act as independent sources of motional modulation of the dipole-dipole interaction, the composite autocorrelation function can be written as a product of the correlation functions associated with each motion. In the event that the overall motion is much slower than the chain local motions, which is usually the case for sufficiently high molecular weight polymers, the overall motion makes a negligible contribution to the relaxation of the backbone carbons.
The correlation time for the overall tumbling of the entire PVC chain, TR, at infinite dilution can be estimated from knowledge of the molecular weight, M, and the intrinsic viscosity, [VI, of the polymer solution in a given solvent with viscosity 70 through the hydrodynamic equation26
TR = ~ M V I V O / ~ R T (19) They were found to be 2.5 X s in DBP and 2.4 X 10⁻⁶ s in TCE at 30 OC. Such long correlation times guarantee that the local segmental motions are the major source of relaxation for the protonated carbons of PVC in both solvents.
Backbone rearrangement is the second type of motion that modulates dipolar interaction which, as discussed previously, has been modeled by the log x2 distribution and HWH, JS, and DLM correlation functions. These four models are evaluated below in their ability to describe the local motions of the PVC chain.
Comparison of Relaxation Data at the TI Minimum with Predictions of Motional Models. The first cri- terion for the validity of any model is the existence of a good fit of relaxation data a t the minimum of the curve of T1 plotted as a function of UT, which corresponds to temperatures of 61 and 20 OC for PVC in DBP and TCE- dz, respectively. Table I1 shows the experimentally determined relaxation data for PVC in DBP and TCE-d2, for the two magnetic fields at a temperature where TI exhibits a minimum value, and the calculated relaxation data derived by using the log x2, HWH, JS, and DLM correlation functions. The simulation parameters for the four models that best reproduce the relaxation data for both solvents at these temperatures are summarized in Table 111.
PVC in Dibutyl Phthalate and Tetrachloroethane-d2 1449
Table I1 Experimental and Calculateds (log xZ, HWH, JS, and DLM Models) Carbon-13 Spin-Lattice Relaxation Times (TI, ms)
and NOE Valuesb of Methine and Methylene Carbons of PVC in DBP and TCE-d2 for Two Magnetic Fields at a Temperature at Which 2'1 Exhibits a Minimum Value
50.3 MHz 75.4 MHz CH2 a ( % ) CH CHz CH
PVC in DBP, 61 "C expt 136 (1.75) 77 (1.72) 202 (1.54) 114 (1.50) log x 2 135 (1.68) 68 (1.68) 206 (1.61) 103 (1.61) 2.3 HWH 106 (1.82) 54 (1.82) 154 (1.61) 79 (1.61) 6.8 JS 107 (1.83) 55 (1.83) 154 (1.62) 79 (1.62) 6.7 DLM 136 (1.74) 77 (1.74) 202 (1.55) 114 (1.55) 0.4
PVC in TCE-dz, 20 OC expt 147 (1.72) 81 (1.71) 214 (1.59) 115 (1.58) log x 2 143 (1.69) 72 (1.69) 218 (1.63) 109 (1.63) 1.7 HWH 109 (1.91) 56 (1.91) 156 (1.71) 80 (1.71) 7.6 JS 107 (1.81) 55 (1.81) 154 (1.60) 79 (1.60) 7.6 DLM 146 (1.75) 80 (1.75) 215 (1.57) 117 (1.57) 0.5
rentheses. Refer to Table I11 for simulation parameters. Values in pa-
As seen in Table 11, for the log x2 distribution u values of 2.3 and 1.7 % are obtained for PVC in DBP and in TCE- d2, respectively. Although these u values suggest a good fit, a closer examination reveals that this model is unable to account for the relaxation data of both the CH and CH2 carbons. For example, for PVC in DBP, a distribution width of p = 11 yields good agreement between the experimental and calculated data for the CH group whereas the T1(CHz) values are underestimated. On the other hand, a distribution width of p = 10 results in a better fit for the CH2 group at the expense of a worse fit for the CH data. This pattern is also followed for the relaxation data of PVC in TCE-d2. To obtain a good fit for both the CH and CH2 groups, different p values must be used. This corresponds to a slightly different breadth of correlation times for the CH and CHZ groups and is the only way that this model can account for the fact that the T1(CH)/Tl- (CH2) ratio is less than 2. Although this is not a recommended method for fitting the data, it does suggest that these groups may be experiencing different local dynamics. Because this model cannot account for the fact that the T1(CH)/T1(CHz) ratio is less than 2 and models of this type do not provide any precise description of the involved phenomena, it will not be investigated further.
As seen from the high u values in Table 11, it is clear that the HWH and JS models are inadequate in describing the segmental motion of PVC. The high u values arise from the fact that these models grossly underestimate the value of T1 at the minimum, and it was mainly for this reason that the DLM model was developed.
The DLM model gives an excellent fit (a = 0.5%) between experimental and calculated TI and NOE values for both the CH and CH2 groups at both fields, making it the best model, by far, in describing the dynamics of PVC in the two solvents. Hence, this model will be used for all further calculations of the relaxation data over the whole temperature range.
PVC Motions According to the DLM Model. The best fit TI and NOE data over the whole temperature range for CH and CH2 carbons of PVC in DBP and in TCE-dz are shown graphically in Figures 3 and 4, respec- tively. It is clear from these plots that very good agreement between experimental and calculated values is obtained from this model throughout the entire temperature range studied. The sole exception is in the values of NOES at a field strength of 75.4 MHz at the high-temperature
1450 Radiotis et al. Macromolecules, Vol. 26, No. 6, 1993
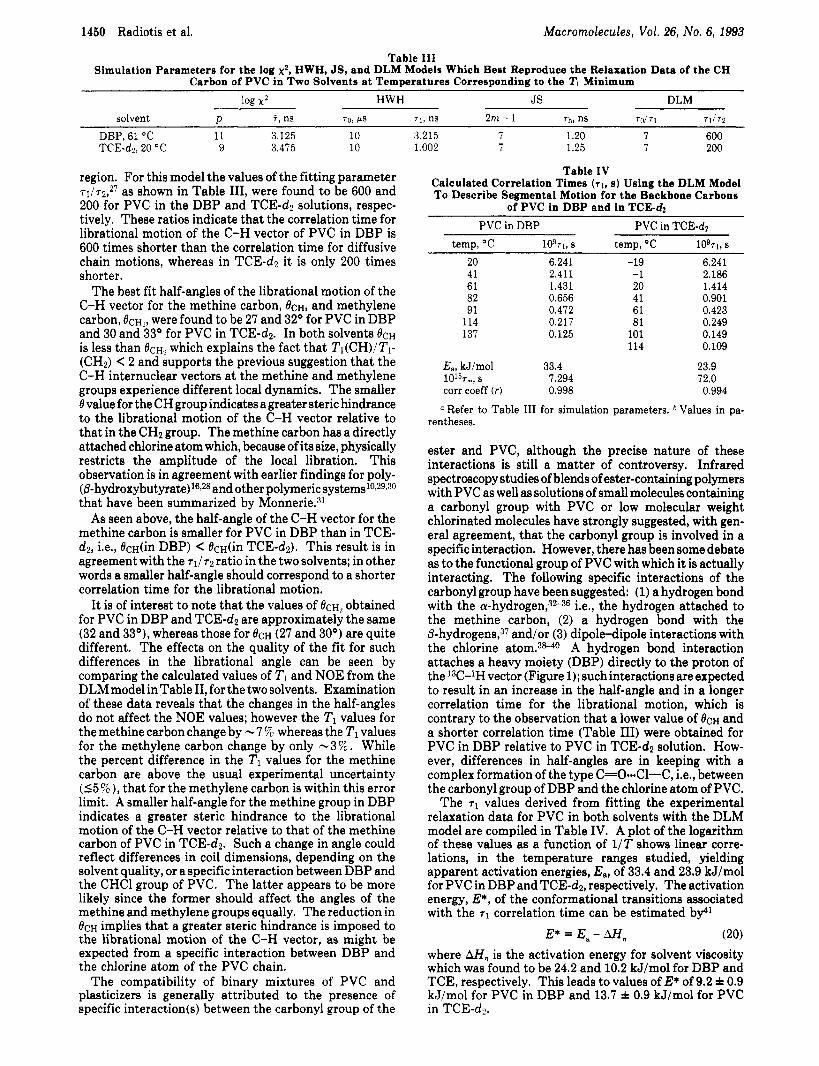
Table I11 Simulation Parameters for the log xz, HWH, JS, and DLM Models Which Best Reproduce the Relaxation Data of the CH
Carbon of PVC in Two Solvents at Temperatures Corresponding to the TI Minimum log x2 HWH JS DLM
solvent P i , ns 7 0 , !Js 71, ns 2m- 1 +h, ns TO171 71/72
DBP, 61 "C 11 3.125 10 TCE-d?, 20 "C 9 3.475 10
region. For this model the values of the fitting parameter 71/~2,*~ as shown in Table 111, were found to be 600 and 200 for PVC in the DBP and TCE-dz solutions, respec- tively. These ratios indicate that the correlation time for librational motion of the C-H vector of PVC in DBP is 600 times shorter than the correlation time for diffusive chain motions, whereas in TCE-d2 it is only 200 times shorter.
The best fit half-angles of the librational motion of the C-H vector for the methine carbon, OCH, and methylene carbon, dCHL, were found to be 27 and 32' for PVC in DBP and 30 and 33' for PVC in TCE-d2. In both solvents eCH is less than O C H ~ which explains the fact that Tl(CH)/Tl- (CH2) < 2 and supports the previous suggestion that the C-H internuclear vectors a t the methine and methylene groups experience different local dynamics. The smaller I9 value for the CH group indicates a greater steric hindrance to the librational motion of the C-H vector relative to that in the CHZ group. The methine carbon has a directly attached chlorine atom which, because of its size, physically restricts the amplitude of the local libration. This observation is in agreement with earlier findings for poly- (p-hydroxybutyrate)16,26 and other polymeric systems10~29~30 that have been summarized by M ~ n n e r i e . ~ ~
As seen above, the half-angle of the C-H vector for the methine carbon is smaller for PVC in DBP than in TCE- dz, Le., OcH(in DBP) < OcH(in TCE-d2). This result is in agreement with the 71/72 ratio in the two solvents; in other words a smaller half-angle should correspond to a shorter correlation time for the librational motion.
It is of interest to note that the values of O C H ~ obtained for PVC in DBP and TCE-dz are approximately the same (32 and 33'1, whereas those for eCH (27 and 30') are quite different. The effects on the quality of the fit for such differences in the librational angle can be seen by comparing the calculated values of T I and NOE from the DLM model in Table 11, for the two solvents. Examination of these data reveals that the changes in the half-angles do not affect the NOE values; however the T1 values for the methine carbon change by -7 96 whereas the T1 values for the methylene carbon change by only -3 % . While the percent difference in the TI values for the methine carbon are above the usual experimental uncertainty (SI%), that for the methylene carbon is within this error limit. A smaller half-angle for the methine group in DBP indicates a greater steric hindrance to the librational motion of the C-H vector relative to that of the methine carbon of PVC in TCE-d2. Such a change in angle could reflect differences in coil dimensions, depending on the solvent quality, or a specific interaction between DBP and the CHCl group of PVC. The latter appears to be more likely since the former should affect the angles of the methine and methylene groups equally. The reduction in 6CH implies that a greater steric hindrance is imposed to the librational motion of the C-H vector, as might be expected from a specific interaction between DBP and the chlorine atom of the PVC chain.
The compatibility of binary mixtures of PVC and plasticizers is generally attributed to the presence of specific interactionb) between the carbonyl group of the
3.215 7 1.20 7 600 1.002 7 1.25 7 200
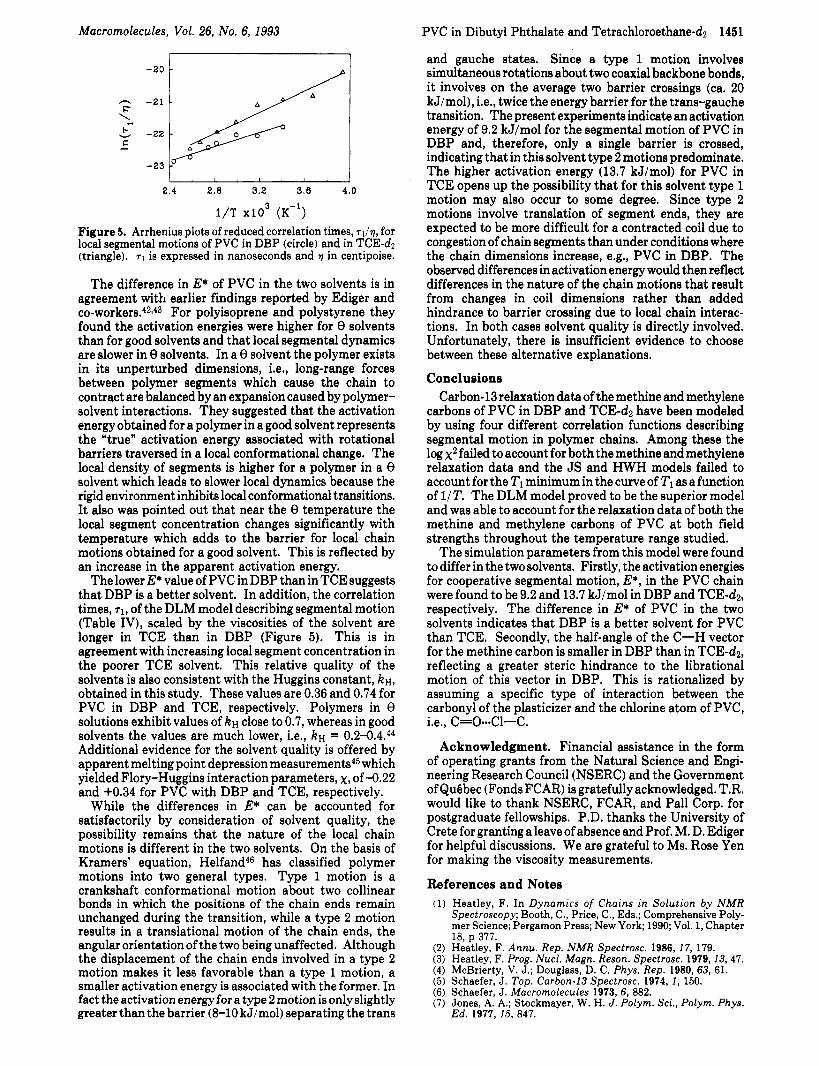
Table IV Calculated Correlation Times ( T I , s) Using the DLM Model To Describe Segmental Motion for the Backbone Carbons
of PVC in DBP and in TCE-Q PVC in DBP PVC in TCE-d2
temp, "C 1O9rl, s temp, "C log7,, s 20 6.241 -19 41 2.411 -1 61 1.431 20 82 0.656 41 91 0.472 61
114 0.217 81 137 0.125 101
114
E,, kJ/mol 33.4 1015~,, s 7.294 corr coeff ( r ) 0.998
6.241 2.186 1.414 0.901 0.423 0.249 0.149 0.109
23.9 72.0 0.994
Refer to Table I11 for simulation parameters. b Values in pa- rentheses.
ester and PVC, although the precise nature of these interactions is still a matter of controversy. Infrared spectroscopy studies of blends of ester-containing polymers with PVC as well as solutions of small molecules containing a carbonyl group with PVC or low molecular weight chlorinated molecules have strongly suggested, with gen- eral agreement, that the carbonyl group is involved in a specific interaction. However, there has been some debate as to the functional group of PVC with which it is actually interacting. The following specific interactions of the carbonyl group have been suggested: (1) a hydrogen bond with the a - h y d r ~ g e n , ~ ~ - ~ ~ Le., the hydrogen attached to the methine carbon, (2) a hydrogen bond with the P-hydr~gens ,~~ and/or (3) dipole-dipole interactions with the chlorine A hydrogen bond interaction attaches a heavy moiety (DBP) directly to the proton of the 13C-lH vector (Figure 1); such interactions are expected to result in an increase in the half-angle and in a longer correlation time for the librational motion, which is contrary to the observation that a lower value of 6CH and a shorter correlation time (Table 111) were obtained for PVC in DBP relative to PVC in TCE-d2 solution. How- ever, differences in half-angles are in keeping with a complex formation of the type C=O..Cl-C, Le., between the carbonyl group of DBP and the chlorine atom of PVC.
The 7 1 values derived from fitting the experimental relaxation data for PVC in both solvents with the DLM model are compiled in Table IV. A plot of the logarithm of these values as a function of 1/T shows linear corre- lations, in the temperature ranges studied, yielding apparent activation energies, E,, of 33.4 and 23.9 kJ/mol for PVC in DBP and TCE-d2, respectively. The activation energy, E*, of the conformational transitions associated with the 71 correlation time can be estimated b y 1
(20) where AH,, is the activation energy for solvent viscosity which was found to be 24.2 and 10.2 kJ/mol for DBP and TCE, respectively. This leads to values of E* of 9.2 * 0.9 kJ/mol for PVC in DBP and 13.7 * 0.9 kJ/mol for PVC in TCE-d2.
E* = E, - AH,,
Macromolecules, Vol. 26, No. 6, 1993 PVC in Dibutyl Phthalate and Tetrachloroethane-dl 1451
and gauche states. Since a type 1 motion involves simultaneous rotations about two coaxial backbone bonds, it involves on the average two barrier crossings (ca. 20 kJ/mol), Le., twice the energy barrier for the trans-gauche transition. The present experiments indicate an activation energy of 9.2 kJ/mol for the segmental motion of PVC in DBP and, therefore, only a single barrier is crossed, indicating that in this solvent type 2 motions predominate. The higher activation energy (13.7 kJ/mol) for PVC in TCE opens up the possibility that for this solvent type 1 motion may also occur to some degree. Since type 2 motions involve translation of segment ends, they are expected to be more difficult for a contracted coil due to congestion of chain segments than under conditions where the chain dimensions increase, e.g., PVC in DBP. The observed differences in activation energy would then reflect differences in the nature of the chain motions that result from changes in coil dimensions rather than added hindrance to barrier crossing due to local chain interac- tions. In both cases solvent quality is directly involved. Unfortunately, there is insufficient evidence to choose between these alternative explanations.
Conclusions Carbon-13 relaxation data of the methine and methylene
carbons of PVC in DBP and TCE-d2 have been modeled by using four different correlation functions describing segmental motion in polymer chains. Among these the log x2 failed to account for both the methine and methylene relaxation data and the JS and HWH models failed to account for the TI minimum in the curve of TI as a function of 1/T. The DLM model proved to be the superior model and was able to account for the relaxation data of both the methine and methylene carbons of PVC at both field strengths throughout the temperature range studied.
The simulation parameters from this model were found to differ in the twosolvents. Firstly, the activation energies for cooperative segmental motion, E*, in the PVC chain were found to be 9.2 and 13.7 kJ/mol in DBP and TCE-d2, respectively. The difference in E* of PVC in the two solvents indicates that DBP is a better solvent for PVC than TCE. Secondly, the half-angle of the C-H vector for the methine carbon is smaller in DBP than in TCE-&, reflecting a greater steric hindrance to the librational motion of this vector in DBP. This is rationalized by assuming a specific type of interaction between the carbonyl of the plasticizer and the chlorine atom of PVC, Le., C=O-.Cl-C.
Acknowledgment. Financial assistance in the form of operating grants from the Natural Science and Engi- neering Research Council (NSERC) and the Government of Quebec (Fonds FCAR) is gratefully acknowledged. T.R. would like to thank NSERC, FCAR, and Pall Corp. for postgraduate fellowships. P.D. thanks the University of Crete for granting a leave of absence and Prof. M. D. Ediger for helpful discussions. We are grateful to Ms. Rose Yen for making the viscosity measurements.
References and Notes (1) Heatley, F. In Dynamics of Chains in Solution by NMR
Spectroscopy; Booth, C., Price, C., Eds.; Comprehensive Poly- mer Science; Pergamon Press; New York; 1990; Vol. 1, Chapter 18, p 377.
(2) Heatley, F. Annu. Rep. NMR Spectrosc. 1986, 17, 179. (3) Heatley, F. Prog. Nucl. Mugn. Reson. Spectrosc. 1979, 13,47. (4) McBrierty, V. J.; Douglas, D. C. Phys. Rep. 1980, 63, 61. (5) Schaefer, J. Top. Carbon-13 Spectrosc. 1974, 1 , 150. (6) Schaefer, J. Mucromolecules 1973,6, 882. (7) Jones, A. A.; Stockmayer, W. H. J. Polym. Sci., Polym. Phys.
Ed. 1977, 15, 847.
- - 2 1 P
-23 I 2.4 2.8 3.2 3.6 4.0
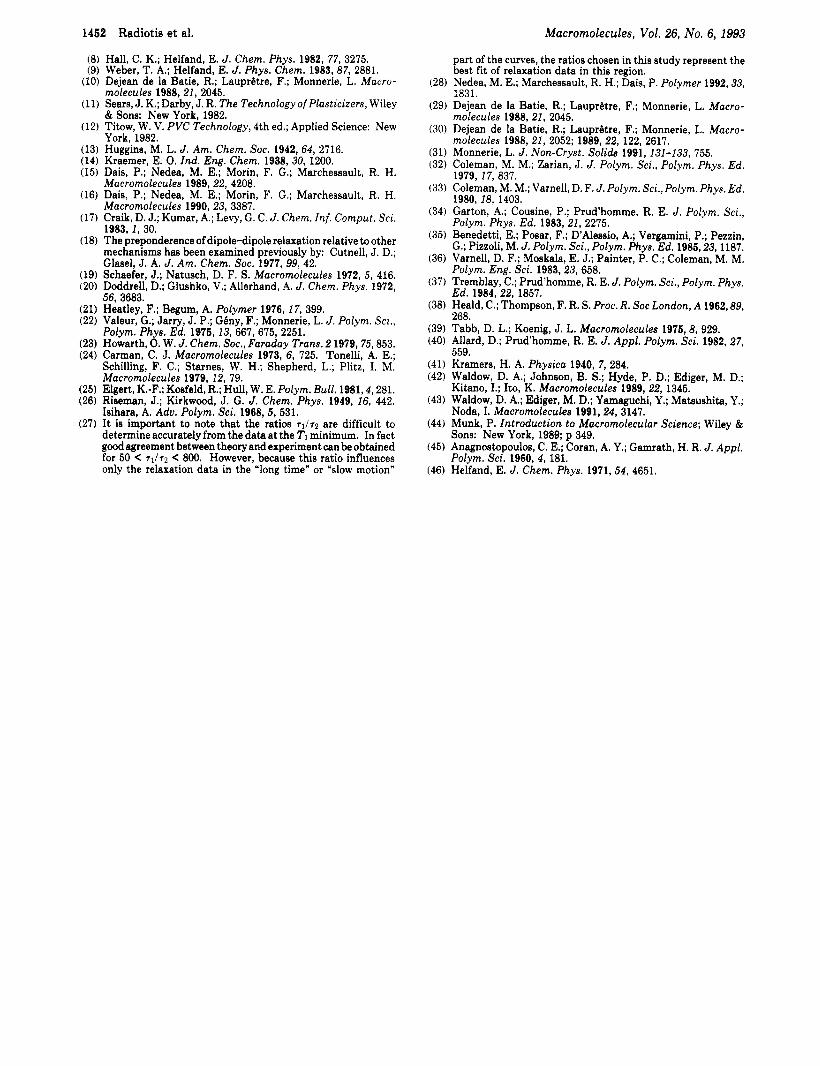
I/T x 1 ~ 3 (K-') Figure 5. Arrhenius plots of reduced correlation times, TI/^, for local segmental motions of PVC in DBP (circle) and in TCE-dz (triangle). i1 is expressed in nanoseconds and 7 in centipoise.
The difference in E* of PVC in the two solvents is in agreement with earlier findings reported by Ediger and CO-workers.42343 For polyisoprene and polystyrene they found the activation energies were higher for 8 solvents than for good solvents and that local segmental dynamics are slower in 8 solvents. In a 8 solvent the polymer exists in its unperturbed dimensions, Le., long-range forces between polymer segments which cause the chain to contract are balanced by an expansion caused by polymer- solvent interactions. They suggested that the activation energy obtained for a polymer in a good solvent represents the "true" activation energy associated with rotational barriers traversed in a local conformational change. The local density of segments is higher for a polymer in a 8 solvent which leads to slower local dynamics because the rigid environment inhibits local conformational transitions. It also was pointed out that near the 8 temperature the local segment concentration changes significantly with temperature which adds to the barrier for local chain motions obtained for a good solvent. This is reflected by an increase in the apparent activation energy.
The lower E* value of PVC in DBP than in TCE suggests that DBP is a better solvent. In addition, the correlation times, q, of the DLM model describing segmental motion (Table IV), scaled by the viscosities of the solvent are longer in TCE than in DBP (Figure 5) . This is in agreement with increasing local segment concentration in the poorer TCE solvent. This relative quality of the solvents is also consistent with the Huggins constant, k ~ , obtained in this study. These values are 0.36 and 0.74 for PVC in DBP and TCE, respectively. Polymers in 8 solutions exhibit values of kH close to 0.7, whereas in good solvents the values are much lower, Le., k~ = 0.2-0.4.44 Additional evidence for the solvent quality is offered by apparent melting point depression measurement^^^ which yielded Flory-Huggins interaction parameters, x, of -0.22 and +0.34 for PVC with DBP and TCE, respectively.
While the differences in E* can be accounted for satisfactorily by consideration of solvent quality, the possibility remains that the nature of the local chain motions is different in the two solvents. On the basis of Kramers' equation, Helfand46 has classified polymer motions into two general types. Type 1 motion is a crankshaft conformational motion about two collinear bonds in which the positions of the chain ends remain unchanged during the transition, while a type 2 motion results in a translational motion of the chain ends, the angular orientation of the two being unaffected. Although the displacement of the chain ends involved in a type 2 motion makes it less favorable than a type 1 motion, a smaller activation energy is associated with the former. In fact the activation energyfor a type 2 motion is onlyslightly greater than the barrier (8-10 kJ/mol) separating the trans
1452 Radiotis et al. Macromolecules, Vol. 26, No. 6, 1993
part of the curves, the ratios chosen in this study represent the best fit of relaxation data in this region.
(28) Nedea, M. E.; Marchessault, R. H.; Dais, P. Polymer 1992,33, 1831.
(29) Dejean de la Batie, R.; Lauprbtre, F.; Monnerie, L. Macro- molecules 1988, 21, 2045.
(30) Dejean de la Batie, R.; LauprBtre, F.; Monnerie, L. Macro- molecules 1988,21, 2052; 1989, 22, 122, 2617.
(31) Monnerie, L. J. Non-Cryst. Solids 1991, 131-133, 755. (32) Coleman, M. M.; Zarian, J. J. Polym. Sci., Polym. Phys. Ed.
1979, 17, 837. (33) Coleman, M. M.; Varnell, D. F. J. Polym. Sci., Polym. Phys. Ed.
1980,18, 1403. (34) Garton, A.; Cousine, P.; Prud’homme, R. E. J. Polym. Sci.,
Polym. Phys. Ed. 1983,21, 2275. (35) Benedetti, E.; Posar, F.; D’Alessio, A.; Vergamini, P.; Pezzin,
G.; Pizzoli, M. J. Polym. Sci., Polym. Phys. Ed. 1985,23,1187. (36) Varnell, D. F.; Moskala, E. J.; Painter, P. C.; Coleman, M. M.
Polym. Eng. Sci. 1983, 23, 658. (37) Tremblay, C.; Prud’homme, R. E. J. Polym. Sci., Polym. Phys.
Ed. 1984, 22, 1857. (38) Heald, C.; Thompson, F. R. S. Proc. R. Soc London, A 1962,89,
268. (39) Tabb, D. L.; Koenig, J. L. Macromolecules 1975,8, 929. (40) Allard, D.; Prud’homme, R. E. J. Appl. Polym. Sci. 1982,27,
(41) Kramers, H. A. Physica 1940, 7, 284. (42) Waldow, D. A.; Johnson, B. S.; Hyde, P. D.; Ediger, M. D.;
(43) Waldow, D. A.; Ediger, M. D.; Yamaguchi, Y.; Matsushita, Y.;
(44) Munk, P. Introduction to Macromolecular Science; Wiley &
(45) Anagnostopoulos, C. E.; Coran, A. Y.; Gamrath, H. R. J. Appl.
(46) Helfand, E. J. Chem. Phys. 1971,54, 4651.
559.
Kitano, I.; Ito, K. Macromolecules 1989,22, 1345.
Noda, I. Macromolecules 1991,24, 3147.
Sons: New York, 1989; p 349.
Polym. Sci. 1960, 4, 181.
(8) Hall, C. K.; Helfand, E. J. Chem. Phys. 1982, 77, 3275. (9) Weber, T. A.; Helfand, E. J. Phys. Chem. 1983,87, 2881.
(10) Dejean de la Batie, R.; Lauprbtre, F.; Monnerie, L. Macro-
(11) Sears, J. K.; Darby, J. R. The Technology of Plasticizers, Wiley
(12) Titow, W. V. PVC Technology, 4th ed.; Applied Science: New
(13) Huggins, M. L. J. Am. Chem. SOC. 1942, 64, 2716. (14) Kraemer, E. 0. Ind. Eng. Chem. 1938, 30,1200.
molecules 1988,21, 2045.
& Sons: New York, 1982.
York, 1982.
1 Dais, P.; Nedea, M. E.; Morin, F. G.; Marchessault, R. H. Macromolecules 1989,22, 4208. Dais. P.: Nedea. M. E.: Morin. F. G.: Marchessault. R. H. Macromolecules’ 1990, 23, 3387.‘ Craik, D. J.; Kumar, A.; Levy, G. C. J. Chem. Inf. Comput. Sci. 1983, I, 30. The preponderence of dipole-dipole relaxation relative to other mechanisms has been examined previously by: Cutnell, J. D.; Glasel, J. A. J. Am. Chem. SOC. 1977, 99, 42. Schaefer, J.; Natusch, D. F. S. Macromolecules 1972, 5, 416. Doddrell, D.; Glushko, V.; Allerhand, A. J. Chem. Phys. 1972, 56, 3683. Heatlev, F.: Begum, A. Polymer 1976.17, 399. Valeuri G.; JUG, J.’P.; GBny, F.; Monnerie, L. J. Polym. Sci., Pol-ym. Ph.ys. Ed. 1975, 13, 667, 675, 2251. Howarth, 0. W. J. Chem. Soc., Faraday Trans. 2 1979,75,853. Carman, C. J. Macromolecules 1973, 6, 725. Tonelli, A. E.; Schilling, F. C.; Starnes, W. H.; Shepherd, L.; Plitz, I. M. Macromolecules 1979, 12, 79. Elgert, K.-F.; Kosfeld, R.; Hull, W. E. Polym. Bull. 1981,4,281. Riaeman, J.; Kirkwood, J. G. J. Chem. Phys. 1949, 16, 442. Isihara, A. Adv. Polym. Sci. 1968, 5, 531. It is important to note that the ratios T I / Q are difficult to determine accurately from the data a t the T1 minimum. In fact good agreement between theory and experiment can be obtained for 50 < T I / T Z < 800. However, because this ratio influences only the relaxation data in the ‘long time” or “slow motion”