Composition dependent structural modulations in transparent poly(vinyl alcohol) hydrogels
6
This article appeared in a journal published by Elsevier. The attached copy is furnished to the author for internal non-commercial research and education use, including for instruction at the authors institution and sharing with colleagues. Other uses, including reproduction and distribution, or selling or licensing copies, or posting to personal, institutional or third party websites are prohibited. In most cases authors are permitted to post their version of the article (e.g. in Word or Tex form) to their personal website or institutional repository. Authors requiring further information regarding Elsevier’s archiving and manuscript policies are encouraged to visit: http://www.elsevier.com/copyright
-
Upload
independent -
Category
Documents
-
view
0 -
download
0
Transcript of Composition dependent structural modulations in transparent poly(vinyl alcohol) hydrogels

This article appeared in a journal published by Elsevier. The attachedcopy is furnished to the author for internal non-commercial researchand education use, including for instruction at the authors institution
and sharing with colleagues.
Other uses, including reproduction and distribution, or selling orlicensing copies, or posting to personal, institutional or third party
websites are prohibited.
In most cases authors are permitted to post their version of thearticle (e.g. in Word or Tex form) to their personal website orinstitutional repository. Authors requiring further information
regarding Elsevier’s archiving and manuscript policies areencouraged to visit:
http://www.elsevier.com/copyright

Author's personal copy
Colloids and Surfaces B: Biointerfaces 74 (2009) 186–190
Contents lists available at ScienceDirect
Colloids and Surfaces B: Biointerfaces
journa l homepage: www.e lsev ier .com/ locate /co lsur fb
Composition dependent structural modulations in transparentpoly(vinyl alcohol) hydrogels
Siddhi Gupta, Ashit Kumar Pramanik, Ansu Kailath, Trilochan Mishra, Avijit Guha,Suprabha Nayar, Arvind Sinha ∗
National Metallurgical Laboratory (Council of Scientific and Industrial Research), Jamshedpur, 831007, India
a r t i c l e i n f o
Article history:Received 27 May 2009Received in revised form 9 July 2009Accepted 13 July 2009Available online 21 July 2009
Keywords:Poly(vinyl alcohol)HydrogelsFreeze–thawing
a b s t r a c t
Transparent and stable Poly(vinyl alcohol) hydrogels were synthesized from polymer aqueous solutionwithout resorting to a mixed solvent such as dimethyl sulfoxide and water. Contrary to the reportedmethods involving hydrogen bond induced physical crosslinking by repeated freeze–thawing at −20 ◦C,the present process demonstrates the gelation taking place at relatively higher temperature, i.e. 0 ◦C.While maintaining transparency in all the synthesized hydrogels, the present paper reports systematicstructural and morphological variations in the hydrogels as a function of polymer concentration.
© 2009 Elsevier B.V. All rights reserved.
1. Introduction
Hydrogels are three-dimensional crosslinked polymeric net-works that imbibe large quantities of water (20% to up to thousandtimes their dry weight) while themselves remaining insolublebecause of the presence of crosslinks [1–3]. The crosslinks canbe physical, chemical or photoinduced. Physical crosslinks can behydrogen bonds or simply entanglements. Physical crosslinkingprovides higher mechanical strength in comparison with othermodes of crosslinking, which are chemical and photoinducedcrosslinking [4,5]. Physical crosslinking is preferred as: (i) it pro-vides higher mechanical strength as the mechanical load getsdistributed along the crystallites of the three-dimensional struc-ture and (ii) it does not require any additional chemical crosslinker.Hydrogels, being classified as soft materials, have provided a newtool to materials scientists to design and synthesize tailor madebiomaterials suitable for a spectrum of biomedical applicationsranging from tissue engineering to targeted drug delivery andwound dressing [6–8]. The fact that optical properties of polymerhydrogels can be tuned as per design requirement, transparenthydrogels have been studied as materials for cornea scaffold, pro-vided it is supported by a suitable microstructure and surfacechemistry conducive for its mechanical stability and cell interac-tions [9–11].
∗ Corresponding author.E-mail addresses: [email protected], [email protected] (A. Sinha).
Poly(vinyl alcohol) (PVA) hydrogels are known for theirclose proximity with biological tissues. The functionality of PVAhydrogels stems from non-toxic chemistry, hydrophilic nature,mechanical stability, formation of inter and intramolecular hydro-gen bonds and biocompatibility [12,13]. While going through theliterature, we have noted that freeze–thawing is one of the mostattractive techniques to produce physical gels of PVA. This pro-cess is not only capable of producing three-dimesional structuressuitable for various applications; it does save the hydrogels fromthe toxic effect of an additional chemical crosslinker [14–18].Our group has recently demonstrated that PVA physical hydro-gel can be simultaneously in situ mineralized to produce hybridnanocomposites suitable for mesenchymal cells adhesion, pro-liferation and differentiation into bone forming osteoblast cells[19,20].
Generally, freeze–thawing of PVA hydrogel is carried out by peri-odic thermal cycling of polymer solution in the temperature rangefrom −20 ◦C (or even below) to room temperature (RT) [21–24].Freeze–thaw process creates a two-phase hydrogel structure, com-prising PVA rich and PVA depleted regions. Repeated freezing leadsto the formation of secondary crystallites in the PVA rich phase,which results in the increased stability of hydrogels [25,26].
Freeze–thawing induces randomly distributed heterogeneity inthe structure creating cloudy/opaque PVA hydrogels which are notsuitable for ophthalmic applications. As per available literature,transparent PVA hydrogels could only be synthesized by using amixed solvent comprising water and dimethyl sulfoxide (DMSO)[27–31]. This process not only involves a highly toxic chemical inthe form of mixed solvent but the step of cryo-processing at −20 ◦C
0927-7765/$ – see front matter © 2009 Elsevier B.V. All rights reserved.doi:10.1016/j.colsurfb.2009.07.015

Author's personal copy
S. Gupta et al. / Colloids and Surfaces B: Biointerfaces 74 (2009) 186–190 187
is a real harsh condition if the gelation is carried out with cellssuch as corneal fibroblasts. In the present paper, we demonstratethat one can produce transparent PVA hydrogels from a pure aque-ous PVA solution (without invoking DMSO) by carrying out thefreeze–thawing experiment in the temperature range from 0 ◦C toRT and ruling out the need of lowering the temperature as lowas −20 ◦C. The present paper also establishes that keeping all theprocess parameters constant, a systematic change in the polymerconcentration has its systematic bearing on the crystallinity, poros-ity, glass transition temperature and swelling of the hydrogels.
2. Experimental
PVA was purchased from Acros Organics (Mw 95,000, degree ofhydrolysis 90%). Aqueous solutions of PVA were prepared by dis-solving PVA in distilled water (continuous stirring and heating at80 ◦C) with concentrations (8%, 10%, 12% and 14% w/v). The solu-tions were kept at room temperature until the bubbles disappeared.Then the solutions were poured into the moulds and subjected torepeated freeze–thawing cycles consisting of 8 h freezing 0 ◦C fol-lowed by a 16 h thawing at RT step (37 ± 2 ◦C). All the samples weregiven 15 cycles each. All the hydrogels were 27.31 mm in diameterand 2.17 mm thick.
Characterization was done immediately after the last cycle soas to avoid the effects of ageing (ageing means storage of thesynthesized hydrogels at room temperature. Ageing induces struc-tural variations in the hydrogels in the form of increased degree ofcrystallinity and size of the crystals). Wide angle X-ray diffractionprofiles (XRD) of PVA powder and the hydrogels were collected atroom temperature with a diffractometer (D8 DISCOVER, BRUKER)using Cu K� radiation. The hydrogel samples with a flat surface weremounted on slide pieces and then XRD was conducted. The 2� rangefor the samples was 10–60◦. The average crystallite size was calcu-lated by the Scherrer’s formula (� = K �/ˇ cos �, where � = averagecrystallite size, K = shape factor (0.89 rad), � = wavelength of X-rays(1.54 A◦), ˇ = full width at half maximum and � = Bragg angle), whiledegree of crystallinity has been computed by the normalized area ofthe diffraction peaks. Fourier Transformed Infra Red Spectroscopy(FTIR-410 JASCO) was used as a tool to observe any possible changein the transmittance of hydrogels having different PVA concentra-tions. The hydrogels were in the wet condition and the range givenwas 4000–400 cm−1. Scanning electron microscopy (SEM) of thePVA hydrogels was carried out using JEOL 840 A. Hydrogel sampleswere mounted on stubs and gold coated. Atomic Force Microscopy(AFM) was conducted using SPA 300, Seiko to get the topographi-cal images of the hydrogel samples. The images were taken by thenon-contact mode of the dynamic force microscopy. The swellingbehavior of PVA hydrogels was studied by calculating the equilib-rium water content of each hydrogel. This was done by putting the
Fig. 1. Transparent PVA hydrogel synthesized in our laboratory.
samples in distilled water for over a period of 2 h and the calcu-lations were done by the formula: Eq = (Wf − Wi) × 100/Wi (whereWi = initial weight of the hydrogel, Wf = final weight of the hydro-gel and Eq = Equilibrium water content). The PVA hydrogels werethermally characterized by using differential scanning calorimeter(DSC, model SDT, Q 600, USA). In the experiment, 10 mg of the sam-ple was put in an alumina pan and the heating rate was maintainedat 5 ◦C/min from 40 to 250 ◦C.
3. Results and discussion
Transparent PVA hydrogel synthesized by us is shown in the fig-ure (Fig. 1). It is well known that small crystallites formed duringfreeze–thawing become the nodal point for crosslinking. The X-raydiffraction profile of PVA powder is shown in Fig. 2a. The strongcrystalline reflection at 2� = 19.88◦ and 20.18◦ (d = 4.46 and 4.39,respectively) are characteristic of PVA representing reflections from(1 0 1) and (1 0 1̄) from a monoclinic unit cell [32]. Such a diffrac-tion pattern has been correlated with the atactic PVA trans planarconformation [33]. However, the four PVA hydrogels did not exhibitsuch sharp diffraction peaks and in contrast, manifested a relativelybroad peak at 2� = 22.5◦ (Fig. 2b). Such diffraction patterns of PVAhydrogels may be attributed to the presence of very small degree ofcrystallinity coupled with a large amount of diffuse scattering indi-cating the co-existence of small PVA nanocrystalline phase withthe bulk amorphous phase. A closer look of the diffraction profilesrevealed that with increase in PVA concentration from 8% to 14%,there is a systematic increase in the sharpness of diffraction peak.Although the full width at half maximum approach (Scherrer’sformula) is generally used in determining the average crystallinesize and degree of crystallinity of the phases showing well defineddiffraction peaks, we also applied the same in present case afterdoing base line correction to get a coarse estimate of the two param-
Fig. 2. (a) X-ray diffraction pattern of pure PVA powder and (b) X-ray diffraction pattern of PVA hydrogels.
Author's personal copy
188 S. Gupta et al. / Colloids and Surfaces B: Biointerfaces 74 (2009) 186–190
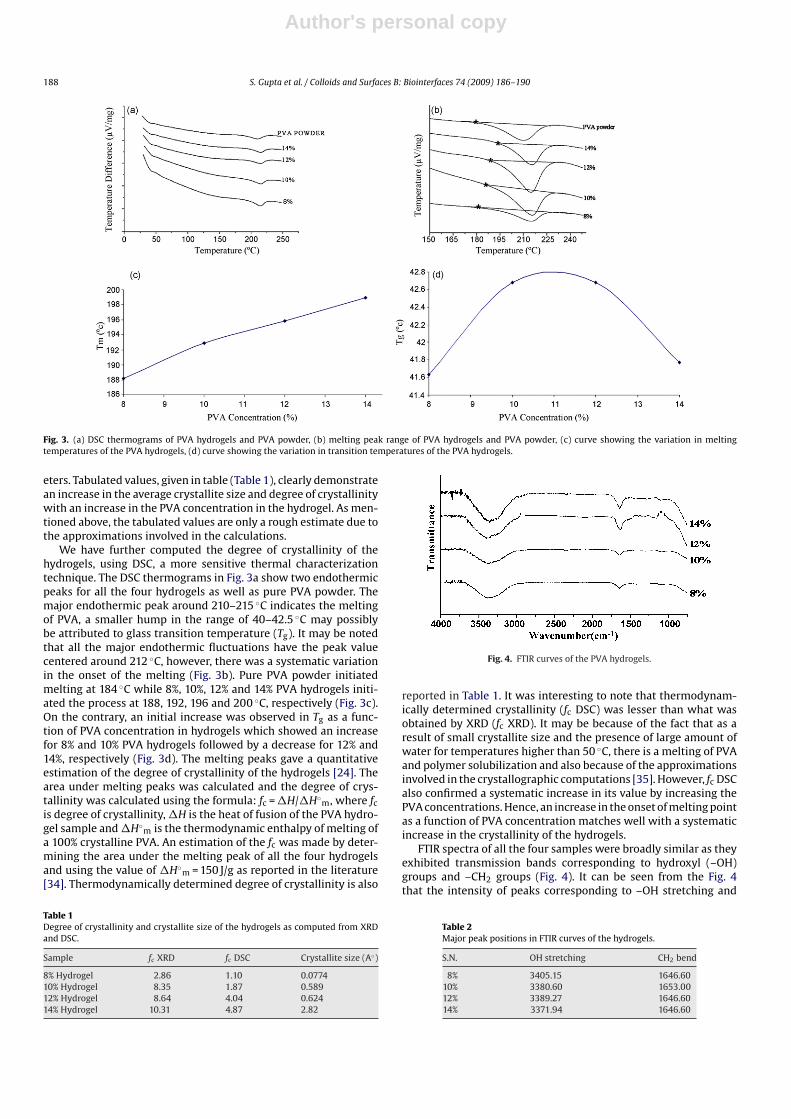
Fig. 3. (a) DSC thermograms of PVA hydrogels and PVA powder, (b) melting peak range of PVA hydrogels and PVA powder, (c) curve showing the variation in meltingtemperatures of the PVA hydrogels, (d) curve showing the variation in transition temperatures of the PVA hydrogels.
eters. Tabulated values, given in table (Table 1), clearly demonstratean increase in the average crystallite size and degree of crystallinitywith an increase in the PVA concentration in the hydrogel. As men-tioned above, the tabulated values are only a rough estimate due tothe approximations involved in the calculations.
We have further computed the degree of crystallinity of thehydrogels, using DSC, a more sensitive thermal characterizationtechnique. The DSC thermograms in Fig. 3a show two endothermicpeaks for all the four hydrogels as well as pure PVA powder. Themajor endothermic peak around 210–215 ◦C indicates the meltingof PVA, a smaller hump in the range of 40–42.5 ◦C may possiblybe attributed to glass transition temperature (Tg). It may be notedthat all the major endothermic fluctuations have the peak valuecentered around 212 ◦C, however, there was a systematic variationin the onset of the melting (Fig. 3b). Pure PVA powder initiatedmelting at 184 ◦C while 8%, 10%, 12% and 14% PVA hydrogels initi-ated the process at 188, 192, 196 and 200 ◦C, respectively (Fig. 3c).On the contrary, an initial increase was observed in Tg as a func-tion of PVA concentration in hydrogels which showed an increasefor 8% and 10% PVA hydrogels followed by a decrease for 12% and14%, respectively (Fig. 3d). The melting peaks gave a quantitativeestimation of the degree of crystallinity of the hydrogels [24]. Thearea under melting peaks was calculated and the degree of crys-tallinity was calculated using the formula: fc = �H/�H◦
m, where fc
is degree of crystallinity, �H is the heat of fusion of the PVA hydro-gel sample and �H◦
m is the thermodynamic enthalpy of melting ofa 100% crystalline PVA. An estimation of the fc was made by deter-mining the area under the melting peak of all the four hydrogelsand using the value of �H◦
m = 150 J/g as reported in the literature[34]. Thermodynamically determined degree of crystallinity is also
Table 1Degree of crystallinity and crystallite size of the hydrogels as computed from XRDand DSC.
Sample fc XRD fc DSC Crystallite size (A◦)
8% Hydrogel 2.86 1.10 0.077410% Hydrogel 8.35 1.87 0.58912% Hydrogel 8.64 4.04 0.62414% Hydrogel 10.31 4.87 2.82
Fig. 4. FTIR curves of the PVA hydrogels.
reported in Table 1. It was interesting to note that thermodynam-ically determined crystallinity (fc DSC) was lesser than what wasobtained by XRD (fc XRD). It may be because of the fact that as aresult of small crystallite size and the presence of large amount ofwater for temperatures higher than 50 ◦C, there is a melting of PVAand polymer solubilization and also because of the approximationsinvolved in the crystallographic computations [35]. However, fc DSCalso confirmed a systematic increase in its value by increasing thePVA concentrations. Hence, an increase in the onset of melting pointas a function of PVA concentration matches well with a systematicincrease in the crystallinity of the hydrogels.
FTIR spectra of all the four samples were broadly similar as theyexhibited transmission bands corresponding to hydroxyl (–OH)groups and –CH2 groups (Fig. 4). It can be seen from the Fig. 4that the intensity of peaks corresponding to –OH stretching and
Table 2Major peak positions in FTIR curves of the hydrogels.
S.N. OH stretching CH2 bend
8% 3405.15 1646.6010% 3380.60 1653.0012% 3389.27 1646.6014% 3371.94 1646.60
Author's personal copy
S. Gupta et al. / Colloids and Surfaces B: Biointerfaces 74 (2009) 186–190 189
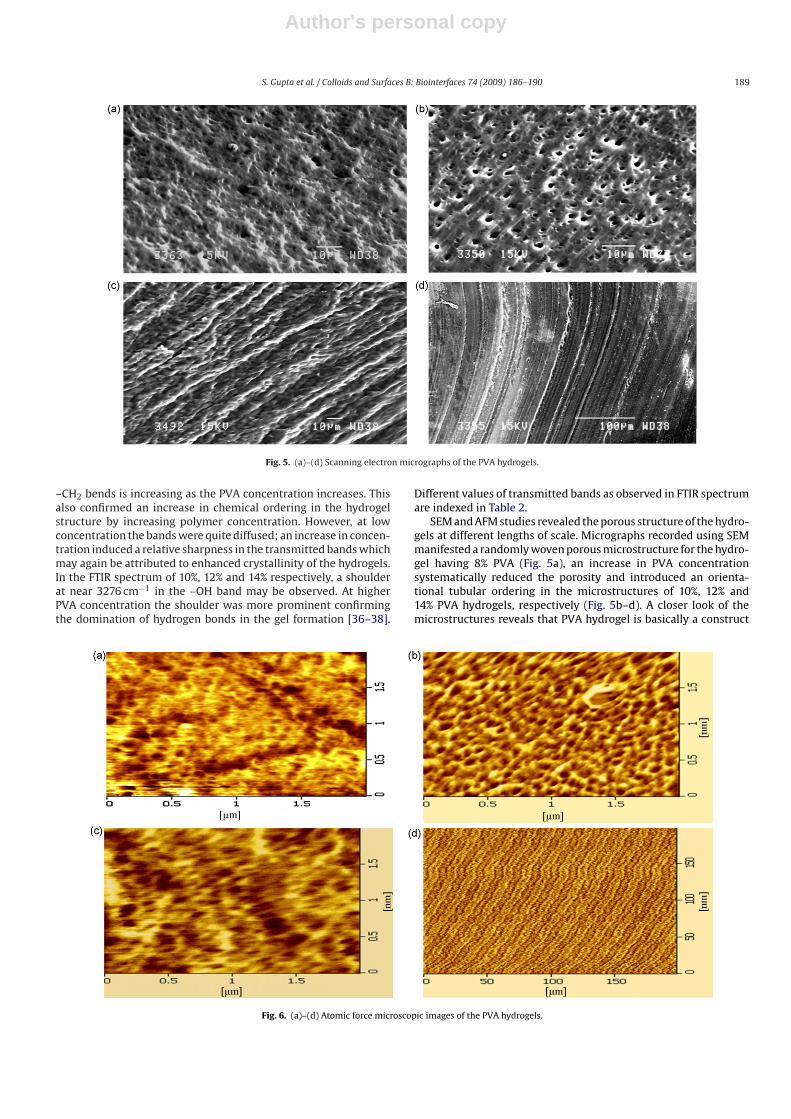
Fig. 5. (a)–(d) Scanning electron micrographs of the PVA hydrogels.
–CH2 bends is increasing as the PVA concentration increases. Thisalso confirmed an increase in chemical ordering in the hydrogelstructure by increasing polymer concentration. However, at lowconcentration the bands were quite diffused; an increase in concen-tration induced a relative sharpness in the transmitted bands whichmay again be attributed to enhanced crystallinity of the hydrogels.In the FTIR spectrum of 10%, 12% and 14% respectively, a shoulderat near 3276 cm−1 in the –OH band may be observed. At higherPVA concentration the shoulder was more prominent confirmingthe domination of hydrogen bonds in the gel formation [36–38].
Different values of transmitted bands as observed in FTIR spectrumare indexed in Table 2.
SEM and AFM studies revealed the porous structure of the hydro-gels at different lengths of scale. Micrographs recorded using SEMmanifested a randomly woven porous microstructure for the hydro-gel having 8% PVA (Fig. 5a), an increase in PVA concentrationsystematically reduced the porosity and introduced an orienta-tional tubular ordering in the microstructures of 10%, 12% and14% PVA hydrogels, respectively (Fig. 5b–d). A closer look of themicrostructures reveals that PVA hydrogel is basically a construct
Fig. 6. (a)–(d) Atomic force microscopic images of the PVA hydrogels.
Author's personal copy
190 S. Gupta et al. / Colloids and Surfaces B: Biointerfaces 74 (2009) 186–190
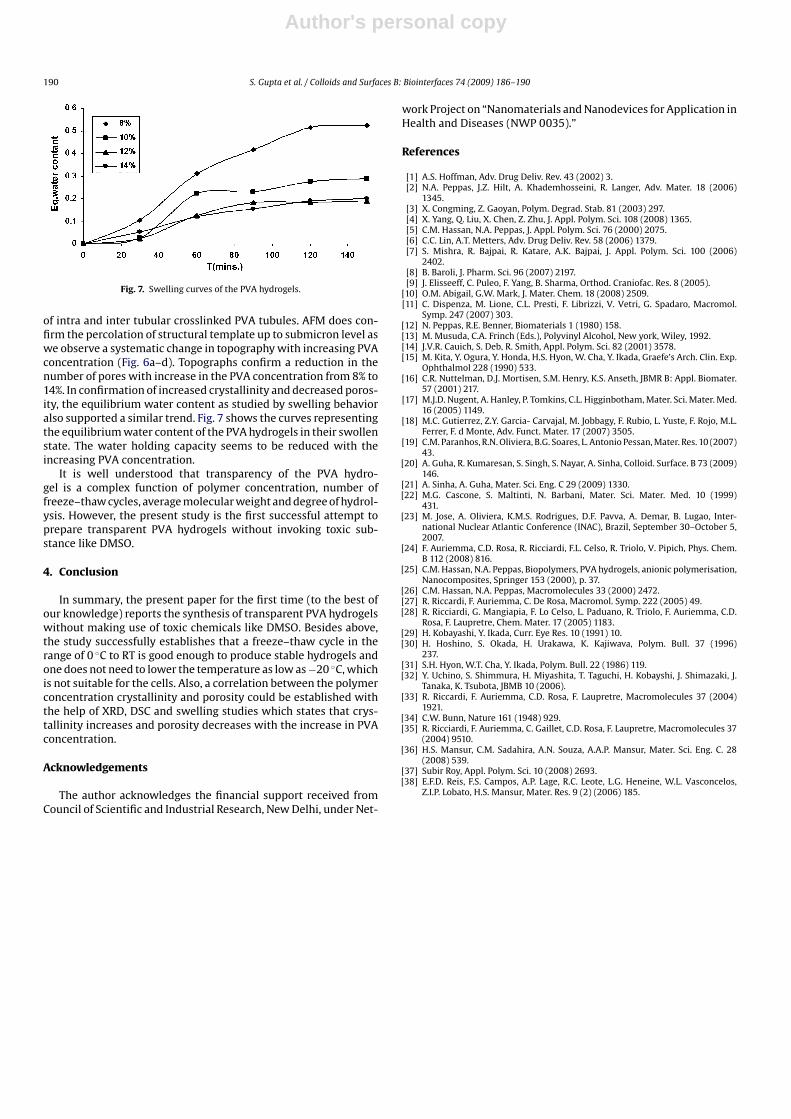
Fig. 7. Swelling curves of the PVA hydrogels.
of intra and inter tubular crosslinked PVA tubules. AFM does con-firm the percolation of structural template up to submicron level aswe observe a systematic change in topography with increasing PVAconcentration (Fig. 6a–d). Topographs confirm a reduction in thenumber of pores with increase in the PVA concentration from 8% to14%. In confirmation of increased crystallinity and decreased poros-ity, the equilibrium water content as studied by swelling behavioralso supported a similar trend. Fig. 7 shows the curves representingthe equilibrium water content of the PVA hydrogels in their swollenstate. The water holding capacity seems to be reduced with theincreasing PVA concentration.
It is well understood that transparency of the PVA hydro-gel is a complex function of polymer concentration, number offreeze–thaw cycles, average molecular weight and degree of hydrol-ysis. However, the present study is the first successful attempt toprepare transparent PVA hydrogels without invoking toxic sub-stance like DMSO.
4. Conclusion
In summary, the present paper for the first time (to the best ofour knowledge) reports the synthesis of transparent PVA hydrogelswithout making use of toxic chemicals like DMSO. Besides above,the study successfully establishes that a freeze–thaw cycle in therange of 0 ◦C to RT is good enough to produce stable hydrogels andone does not need to lower the temperature as low as −20 ◦C, whichis not suitable for the cells. Also, a correlation between the polymerconcentration crystallinity and porosity could be established withthe help of XRD, DSC and swelling studies which states that crys-tallinity increases and porosity decreases with the increase in PVAconcentration.
Acknowledgements
The author acknowledges the financial support received fromCouncil of Scientific and Industrial Research, New Delhi, under Net-
work Project on “Nanomaterials and Nanodevices for Application inHealth and Diseases (NWP 0035).”
References
[1] A.S. Hoffman, Adv. Drug Deliv. Rev. 43 (2002) 3.[2] N.A. Peppas, J.Z. Hilt, A. Khademhosseini, R. Langer, Adv. Mater. 18 (2006)
1345.[3] X. Congming, Z. Gaoyan, Polym. Degrad. Stab. 81 (2003) 297.[4] X. Yang, Q. Liu, X. Chen, Z. Zhu, J. Appl. Polym. Sci. 108 (2008) 1365.[5] C.M. Hassan, N.A. Peppas, J. Appl. Polym. Sci. 76 (2000) 2075.[6] C.C. Lin, A.T. Metters, Adv. Drug Deliv. Rev. 58 (2006) 1379.[7] S. Mishra, R. Bajpai, R. Katare, A.K. Bajpai, J. Appl. Polym. Sci. 100 (2006)
2402.[8] B. Baroli, J. Pharm. Sci. 96 (2007) 2197.[9] J. Elisseeff, C. Puleo, F. Yang, B. Sharma, Orthod. Craniofac. Res. 8 (2005).
[10] O.M. Abigail, G.W. Mark, J. Mater. Chem. 18 (2008) 2509.[11] C. Dispenza, M. Lione, C.L. Presti, F. Librizzi, V. Vetri, G. Spadaro, Macromol.
Symp. 247 (2007) 303.[12] N. Peppas, R.E. Benner, Biomaterials 1 (1980) 158.[13] M. Musuda, C.A. Frinch (Eds.), Polyvinyl Alcohol, New york, Wiley, 1992.[14] J.V.R. Cauich, S. Deb, R. Smith, Appl. Polym. Sci. 82 (2001) 3578.[15] M. Kita, Y. Ogura, Y. Honda, H.S. Hyon, W. Cha, Y. Ikada, Graefe’s Arch. Clin. Exp.
Ophthalmol 228 (1990) 533.[16] C.R. Nuttelman, D.J. Mortisen, S.M. Henry, K.S. Anseth, JBMR B: Appl. Biomater.
57 (2001) 217.[17] M.J.D. Nugent, A. Hanley, P. Tomkins, C.L. Higginbotham, Mater. Sci. Mater. Med.
16 (2005) 1149.[18] M.C. Gutierrez, Z.Y. Garcia- Carvajal, M. Jobbagy, F. Rubio, L. Yuste, F. Rojo, M.L.
Ferrer, F. d Monte, Adv. Funct. Mater. 17 (2007) 3505.[19] C.M. Paranhos, R.N. Oliviera, B.G. Soares, L. Antonio Pessan, Mater. Res. 10 (2007)
43.[20] A. Guha, R. Kumaresan, S. Singh, S. Nayar, A. Sinha, Colloid. Surface. B 73 (2009)
146.[21] A. Sinha, A. Guha, Mater. Sci. Eng. C 29 (2009) 1330.[22] M.G. Cascone, S. Maltinti, N. Barbani, Mater. Sci. Mater. Med. 10 (1999)
431.[23] M. Jose, A. Oliviera, K.M.S. Rodrigues, D.F. Pavva, A. Demar, B. Lugao, Inter-
national Nuclear Atlantic Conference (INAC), Brazil, September 30–October 5,2007.
[24] F. Auriemma, C.D. Rosa, R. Ricciardi, F.L. Celso, R. Triolo, V. Pipich, Phys. Chem.B 112 (2008) 816.
[25] C.M. Hassan, N.A. Peppas, Biopolymers, PVA hydrogels, anionic polymerisation,Nanocomposites, Springer 153 (2000), p. 37.
[26] C.M. Hassan, N.A. Peppas, Macromolecules 33 (2000) 2472.[27] R. Riccardi, F. Auriemma, C. De Rosa, Macromol. Symp. 222 (2005) 49.[28] R. Ricciardi, G. Mangiapia, F. Lo Celso, L. Paduano, R. Triolo, F. Auriemma, C.D.
Rosa, F. Laupretre, Chem. Mater. 17 (2005) 1183.[29] H. Kobayashi, Y. Ikada, Curr. Eye Res. 10 (1991) 10.[30] H. Hoshino, S. Okada, H. Urakawa, K. Kajiwava, Polym. Bull. 37 (1996)
237.[31] S.H. Hyon, W.T. Cha, Y. Ikada, Polym. Bull. 22 (1986) 119.[32] Y. Uchino, S. Shimmura, H. Miyashita, T. Taguchi, H. Kobayshi, J. Shimazaki, J.
Tanaka, K. Tsubota, JBMB 10 (2006).[33] R. Riccardi, F. Auriemma, C.D. Rosa, F. Laupretre, Macromolecules 37 (2004)
1921.[34] C.W. Bunn, Nature 161 (1948) 929.[35] R. Ricciardi, F. Auriemma, C. Gaillet, C.D. Rosa, F. Laupretre, Macromolecules 37
(2004) 9510.[36] H.S. Mansur, C.M. Sadahira, A.N. Souza, A.A.P. Mansur, Mater. Sci. Eng. C. 28
(2008) 539.[37] Subir Roy, Appl. Polym. Sci. 10 (2008) 2693.[38] E.F.D. Reis, F.S. Campos, A.P. Lage, R.C. Leote, L.G. Heneine, W.L. Vasconcelos,
Z.I.P. Lobato, H.S. Mansur, Mater. Res. 9 (2) (2006) 185.