concentration factor of in-plane stresses beyond elastic limit in ...
15
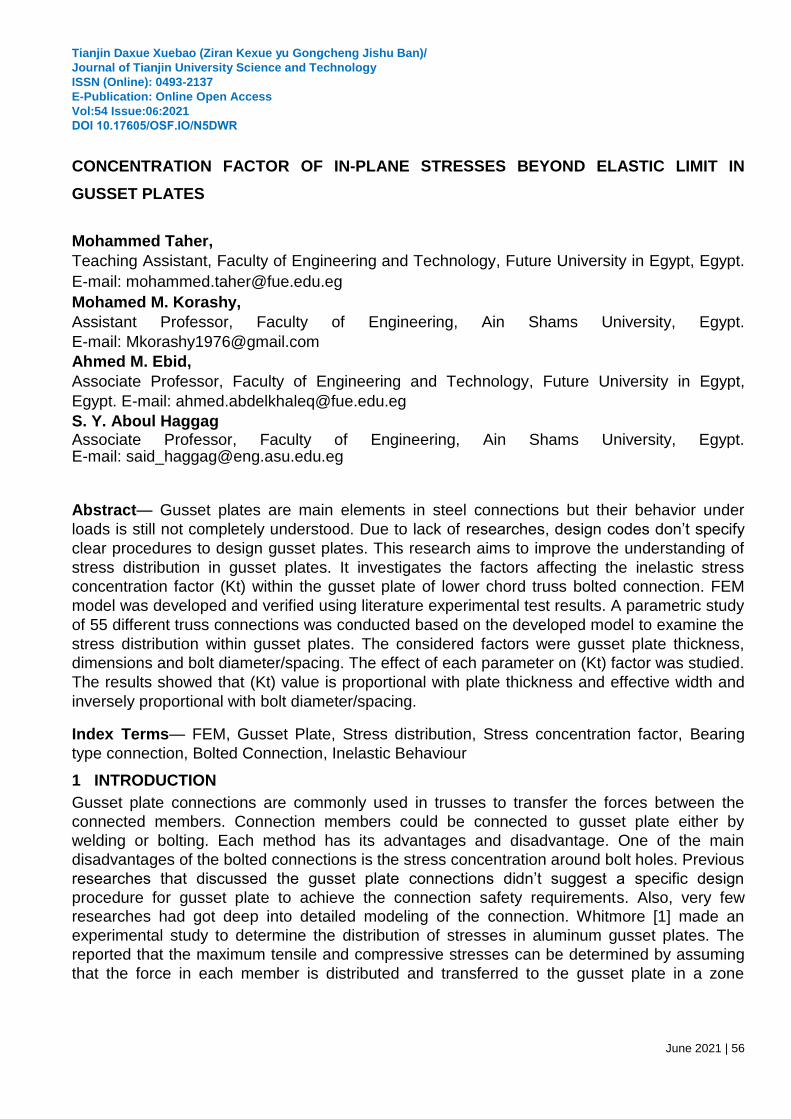
June 2021 | 56 CONCENTRATION FACTOR OF IN-PLANE STRESSES BEYOND ELASTIC LIMIT IN GUSSET PLATES Mohammed Taher, Teaching Assistant, Faculty of Engineering and Technology, Future University in Egypt, Egypt. E-mail: [email protected] Mohamed M. Korashy, Assistant Professor, Faculty of Engineering, Ain Shams University, Egypt. E-mail: [email protected] Ahmed M. Ebid, Associate Professor, Faculty of Engineering and Technology, Future University in Egypt, Egypt. E-mail: [email protected] S. Y. Aboul Haggag Associate Professor, Faculty of Engineering, Ain Shams University, Egypt. E-mail: [email protected] Abstract— Gusset plates are main elements in steel connections but their behavior under loads is still not completely understood. Due to lack of researches, design codes don’t specify clear procedures to design gusset plates. This research aims to improve the understanding of stress distribution in gusset plates. It investigates the factors affecting the inelastic stress concentration factor (Kt) within the gusset plate of lower chord truss bolted connection. FEM model was developed and verified using literature experimental test results. A parametric study of 55 different truss connections was conducted based on the developed model to examine the stress distribution within gusset plates. The considered factors were gusset plate thickness, dimensions and bolt diameter/spacing. The effect of each parameter on (Kt) factor was studied. The results showed that (Kt) value is proportional with plate thickness and effective width and inversely proportional with bolt diameter/spacing. Index Terms— FEM, Gusset Plate, Stress distribution, Stress concentration factor, Bearing type connection, Bolted Connection, Inelastic Behaviour 1 INTRODUCTION Gusset plate connections are commonly used in trusses to transfer the forces between the connected members. Connection members could be connected to gusset plate either by welding or bolting. Each method has its advantages and disadvantage. One of the main disadvantages of the bolted connections is the stress concentration around bolt holes. Previous researches that discussed the gusset plate connections didn’t suggest a specific design procedure for gusset plate to achieve the connection safety requirements. Also, very few researches had got deep into detailed modeling of the connection. Whitmore [1] made an experimental study to determine the distribution of stresses in aluminum gusset plates. The reported that the maximum tensile and compressive stresses can be determined by assuming that the force in each member is distributed and transferred to the gusset plate in a zone Tianjin Daxue Xuebao (Ziran Kexue yu Gongcheng Jishu Ban)/ Journal of Tianjin University Science and Technology ISSN (Online): 0493-2137 E-Publication: Online Open Access Vol:54 Issue:06:2021 DOI 10.17605/OSF.IO/N5DWR
-
Upload
khangminh22 -
Category
Documents
-
view
2 -
download
0
Transcript of concentration factor of in-plane stresses beyond elastic limit in ...
June 2021 | 56
CONCENTRATION FACTOR OF IN-PLANE STRESSES BEYOND ELASTIC LIMIT IN
GUSSET PLATES
Mohammed Taher,
Teaching Assistant, Faculty of Engineering and Technology, Future University in Egypt, Egypt.
E-mail: [email protected]
Mohamed M. Korashy,
Assistant Professor, Faculty of Engineering, Ain Shams University, Egypt.
E-mail: [email protected]
Ahmed M. Ebid,
Associate Professor, Faculty of Engineering and Technology, Future University in Egypt,
Egypt. E-mail: [email protected]
S. Y. Aboul Haggag Associate Professor, Faculty of Engineering, Ain Shams University, Egypt. E-mail: [email protected]
Abstract— Gusset plates are main elements in steel connections but their behavior under
loads is still not completely understood. Due to lack of researches, design codes don’t specify
clear procedures to design gusset plates. This research aims to improve the understanding of
stress distribution in gusset plates. It investigates the factors affecting the inelastic stress
concentration factor (Kt) within the gusset plate of lower chord truss bolted connection. FEM
model was developed and verified using literature experimental test results. A parametric study
of 55 different truss connections was conducted based on the developed model to examine the
stress distribution within gusset plates. The considered factors were gusset plate thickness,
dimensions and bolt diameter/spacing. The effect of each parameter on (Kt) factor was studied.
The results showed that (Kt) value is proportional with plate thickness and effective width and
inversely proportional with bolt diameter/spacing.
Index Terms— FEM, Gusset Plate, Stress distribution, Stress concentration factor, Bearing
type connection, Bolted Connection, Inelastic Behaviour
1 INTRODUCTION
Gusset plate connections are commonly used in trusses to transfer the forces between the
connected members. Connection members could be connected to gusset plate either by
welding or bolting. Each method has its advantages and disadvantage. One of the main
disadvantages of the bolted connections is the stress concentration around bolt holes. Previous
researches that discussed the gusset plate connections didn’t suggest a specific design
procedure for gusset plate to achieve the connection safety requirements. Also, very few
researches had got deep into detailed modeling of the connection. Whitmore [1] made an
experimental study to determine the distribution of stresses in aluminum gusset plates. The
reported that the maximum tensile and compressive stresses can be determined by assuming
that the force in each member is distributed and transferred to the gusset plate in a zone
Tianjin Daxue Xuebao (Ziran Kexue yu Gongcheng Jishu Ban)/
Journal of Tianjin University Science and Technology
ISSN (Online): 0493-2137
E-Publication: Online Open Access
Vol:54 Issue:06:2021
DOI 10.17605/OSF.IO/N5DWR
June 2021 | 57
obtained by an effective width that is perpendicular to the axis of the steel member in the
gusset plate. Kirsch [2] presented a study for stress distribution in infinite isotropic plate with a
circular hole under uniaxial tensile stresses. He proved that within elastic stress range, the
maximum stress around the hole is between 2 to 3 times the average stresses in the plate.
Walbridge et al. [3] prepared an analytical study for the tensile behavior of steel gusset plates
considering the effect of inelasticity of material, stiffness of member, large displacement and
the initial imperfections. He concluded that gusset plate’s behavior does not influence by
shortening in tensile capacity. C. Chou and P. Chen [4] investigated the behavior of the central
gusset plates in buckling-restrained braced frames. Different variables were considered such
as gusset plate thickness, geometry and utilizing of free-edge stiffeners. They concluded that
the ultimate capacity of the gusset plate increased with using stiffeners along gusset free
edges. Y. Cui et al. [5] presented a study on four welded gusset plate connections, using FE
analysis in order to investigate the ultimate strength of the welded connections subjected to
tensile stresses. The considered Parameters were the size of the gusset plate, brace
eccentricity, and the angle of brace. Results showed that welds in Whitmore zone transferred
forces from the connected members to the gusset plate. The effective length of weld was
governed by size of the gusset plate, angle of brace and the brace eccentricity. Fang et al. [6]
presented an experimental and numerical study on the gusset plate behavior under
eccentrically compressive loads applied. Studied parameters included size and thickness of
gusset plate and connection layout. It was observed that the mode of failure was due to the
splice member yielding, while stiffened splice member exhibited better behavior. Y. Zeynali et
al. [7] prepared a study of the influence for slip-critical connections in gusset bolted plates
using 28 samples of double gusset plates. The considered variables were material properties,
number of bolts, type of connections, and friction coefficient value. It was demonstrated that the
ratio of the ultimate stress of slip-critical connections to ultimate stress of bearing connections
increases with increasing of friction coefficient and decreasing of both thickness and material
resistance. K. S. Vivek et al. [8] presented a study on the inelastic performance of the mild-
steel gusset plates connected to a diagonal brace subjected to a tensile force. Non-linear finite
element analysis was performed considering inclination angle of the brace, hardening type and
bolt diameter. It was found that gusset plates with under estimated thicknesses will fail by
excessive yielding due to stress concentration at holes. Sh. Maleki and M. Ghaderi-Garekani
[9] studied the geometry effect of gusset plate on the block shear strength of welded
connections by using a nonlinear FEM under combined loading. Obtained results indicated that
the inclined planes of failure are expected for the combined loading conditions, and the state of
stress of these planes was a combination of shear and tensile stresses. They used these
results to describe the behavior of the planes of block shear rupture in such cases and
provided a better estimation for block shear strength in welded connections subjected to
combined loads. They produced a new equation to consider the effect of the ruptured block on
gusset plate.
Tianjin Daxue Xuebao (Ziran Kexue yu Gongcheng Jishu Ban)/
Journal of Tianjin University Science and Technology
ISSN (Online): 0493-2137
E-Publication: Online Open Access
Vol:54 Issue:06:2021
DOI 10.17605/OSF.IO/N5DWR
June 2021 | 58
2 OBJECTIVE OF RESEARCH
The main objective of this research is to investigate the effect of considered parameters
(gusset plate thickness, dimensions, bolt diameter/spacing) on the stress concentration factor
of truss lower cord connection’s bolted gusset plate. The stress concentration factor (Kt) is
defined as the ratio between the maximum Von Mises stresses within gusset plate calculated
from FEM to the average normal stresses in the gusset plate calculated using Whitmore’s
effective width method. Non-pretension high strength bearing type bolts were considered in this
study. Cross sections of connected members and diameter of connecting bolt were selected to
prevent any failure outside the gusset plate.
3 RESEARCH METHODOLGY
In order to achieve the descripted objective, the research is divided into two phases. The first
phase aimed to select the geometrical and loading configurations for the tested connections,
while the second phase aimed to study the stress distribution within the selected connections
under the selected loading conditions. The first phase was carried out considering linear
analysis using SAP2000 V20 software, while the second phase was carried out considering
nonlinear and large deformations analysis using ANSYS V15.0 software.
3.1 1st Phase – Truss models using SAP2000 A parametric study was carried out to select the most critical geometrical and loading
configurations for the tested connections. The study consisted of nine symmetrical simply
supported N-trusses with different selected geometrical configurations to satisfy the following
conditions:
• Inclination angle of diagonal members is ranged between 30o and 60o.
• Truss span is ranged between 8 and 16 times its maximum height.
• The slope of the upper cord is ganged between 0 and 1:10.
• Subdivides were used when panel width exceeds 2m.
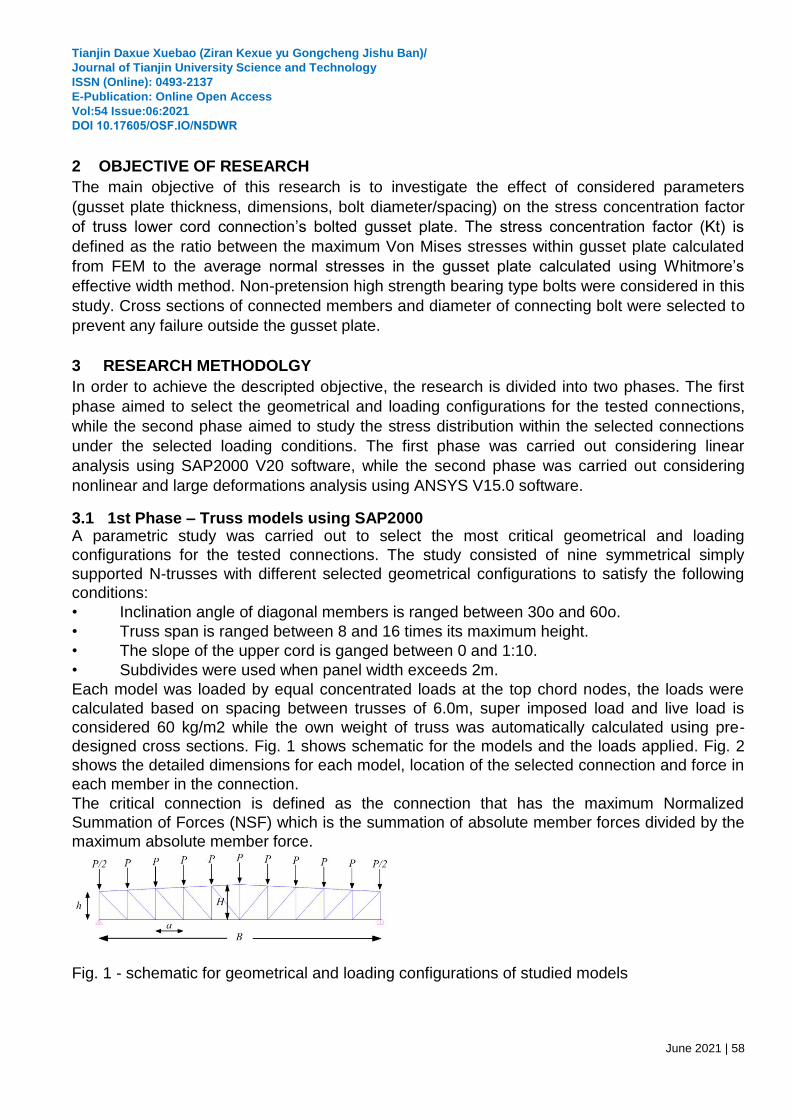
Each model was loaded by equal concentrated loads at the top chord nodes, the loads were
calculated based on spacing between trusses of 6.0m, super imposed load and live load is
considered 60 kg/m2 while the own weight of truss was automatically calculated using pre-
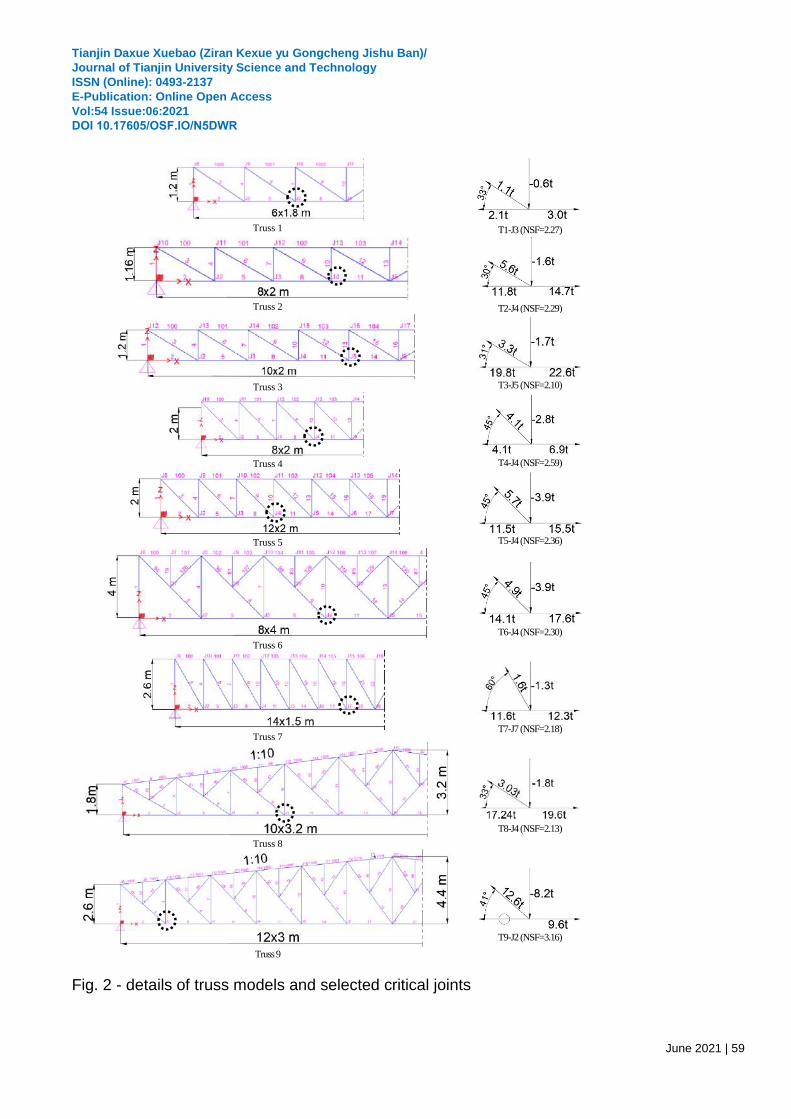
designed cross sections. Fig. 1 shows schematic for the models and the loads applied. Fig. 2
shows the detailed dimensions for each model, location of the selected connection and force in
each member in the connection.
The critical connection is defined as the connection that has the maximum Normalized
Summation of Forces (NSF) which is the summation of absolute member forces divided by the
maximum absolute member force.
Fig. 1 - schematic for geometrical and loading configurations of studied models
Tianjin Daxue Xuebao (Ziran Kexue yu Gongcheng Jishu Ban)/
Journal of Tianjin University Science and Technology
ISSN (Online): 0493-2137
E-Publication: Online Open Access
Vol:54 Issue:06:2021
DOI 10.17605/OSF.IO/N5DWR
June 2021 | 59
Fig. 2 - details of truss models and selected critical joints
Truss 1
T1-J3 (NSF=2.27)
Truss 2
T2-J4 (NSF=2.29)
Truss 3
T3-J5 (NSF=2.10)
Truss 4
T4-J4 (NSF=2.59)
Truss 5
T5-J4 (NSF=2.36)
Truss 6
T6-J4 (NSF=2.30)
Truss 7
T7-J7 (NSF=2.18)
Truss 8
T8-J4 (NSF=2.13)
Truss 9
T9-J2 (NSF=3.16)
Tianjin Daxue Xuebao (Ziran Kexue yu Gongcheng Jishu Ban)/
Journal of Tianjin University Science and Technology
ISSN (Online): 0493-2137
E-Publication: Online Open Access
Vol:54 Issue:06:2021
DOI 10.17605/OSF.IO/N5DWR
June 2021 | 60
3.2 2nd Phase – Joint models using ANSYS V15 The aim of this phase is to study the each one of the selected truss joints considering different
gusset plate thickness and different bolts spacing. To achieve this goal, a reliable FEM model
should be developed to figure out the optimum technique to simulate each element in the joint
considering its material properties and the interface between elements. This preliminary model
must be verified by experimental test results. Accordingly, this phase is divided into two stages,
the first stage is to develop and verify the preliminary model and the second stage is to
generate the parametric study models based on the verified preliminary model.
3.2.1 1st Stage - Develop and verify the preliminary FE model
Zeynali Y et al. [7] investigated a bearing bolted gusset plate specimen subjected to tensile
loading. The specimen was a double gusset plate connected to a thick steel plate which was
used to load the specimen. Full detailed geometries and material properties were presented in
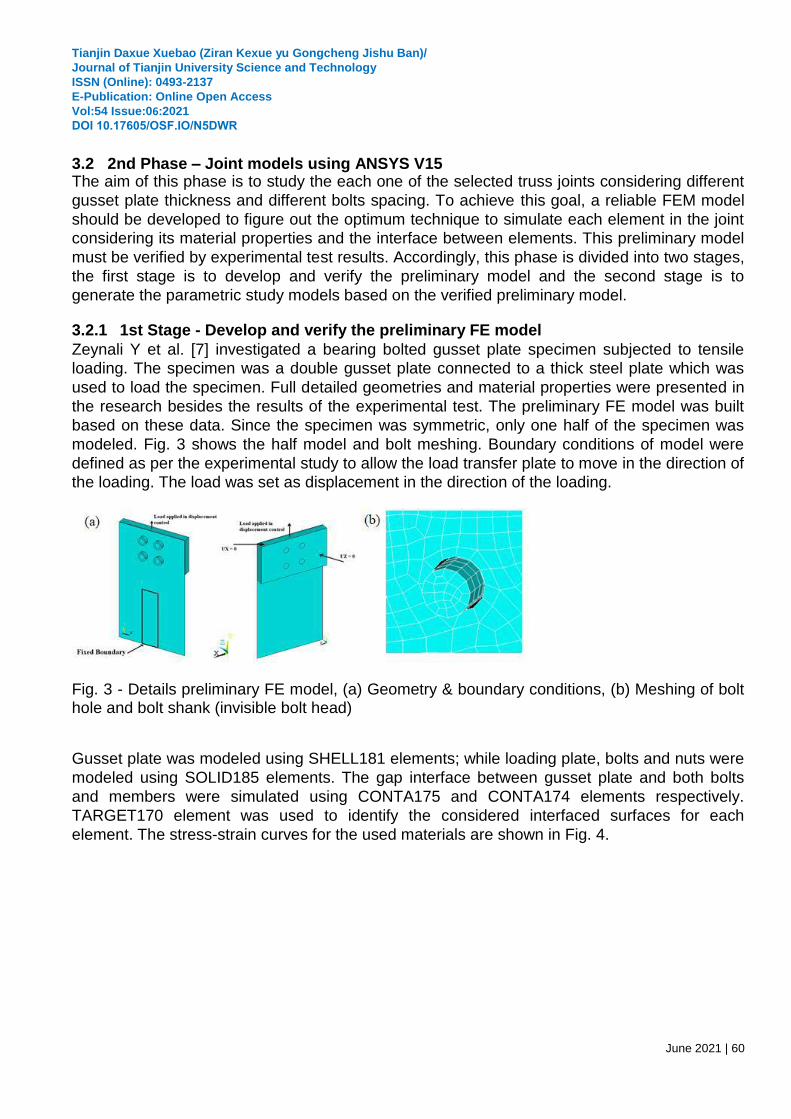
the research besides the results of the experimental test. The preliminary FE model was built
based on these data. Since the specimen was symmetric, only one half of the specimen was
modeled. Fig. 3 shows the half model and bolt meshing. Boundary conditions of model were
defined as per the experimental study to allow the load transfer plate to move in the direction of
the loading. The load was set as displacement in the direction of the loading.
Fig. 3 - Details preliminary FE model, (a) Geometry & boundary conditions, (b) Meshing of bolt hole and bolt shank (invisible bolt head)
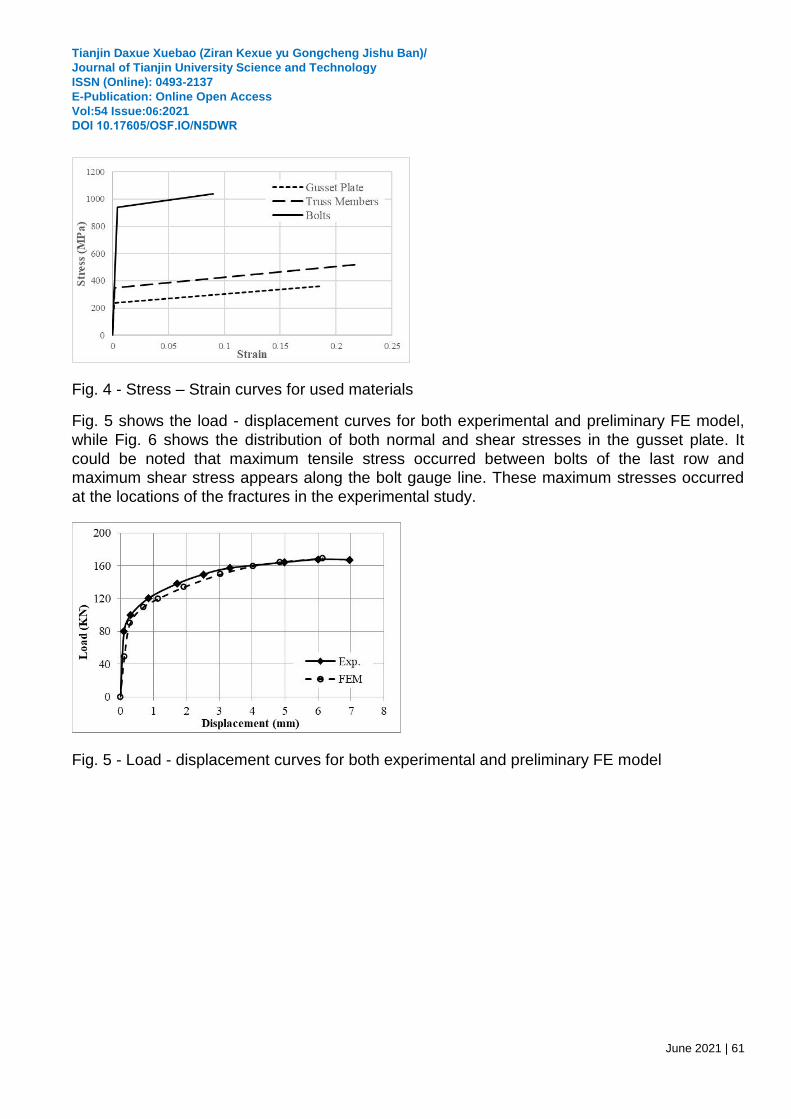
Gusset plate was modeled using SHELL181 elements; while loading plate, bolts and nuts were
modeled using SOLID185 elements. The gap interface between gusset plate and both bolts
and members were simulated using CONTA175 and CONTA174 elements respectively.
TARGET170 element was used to identify the considered interfaced surfaces for each
element. The stress-strain curves for the used materials are shown in Fig. 4.
Tianjin Daxue Xuebao (Ziran Kexue yu Gongcheng Jishu Ban)/
Journal of Tianjin University Science and Technology
ISSN (Online): 0493-2137
E-Publication: Online Open Access
Vol:54 Issue:06:2021
DOI 10.17605/OSF.IO/N5DWR
June 2021 | 61
Fig. 4 - Stress – Strain curves for used materials
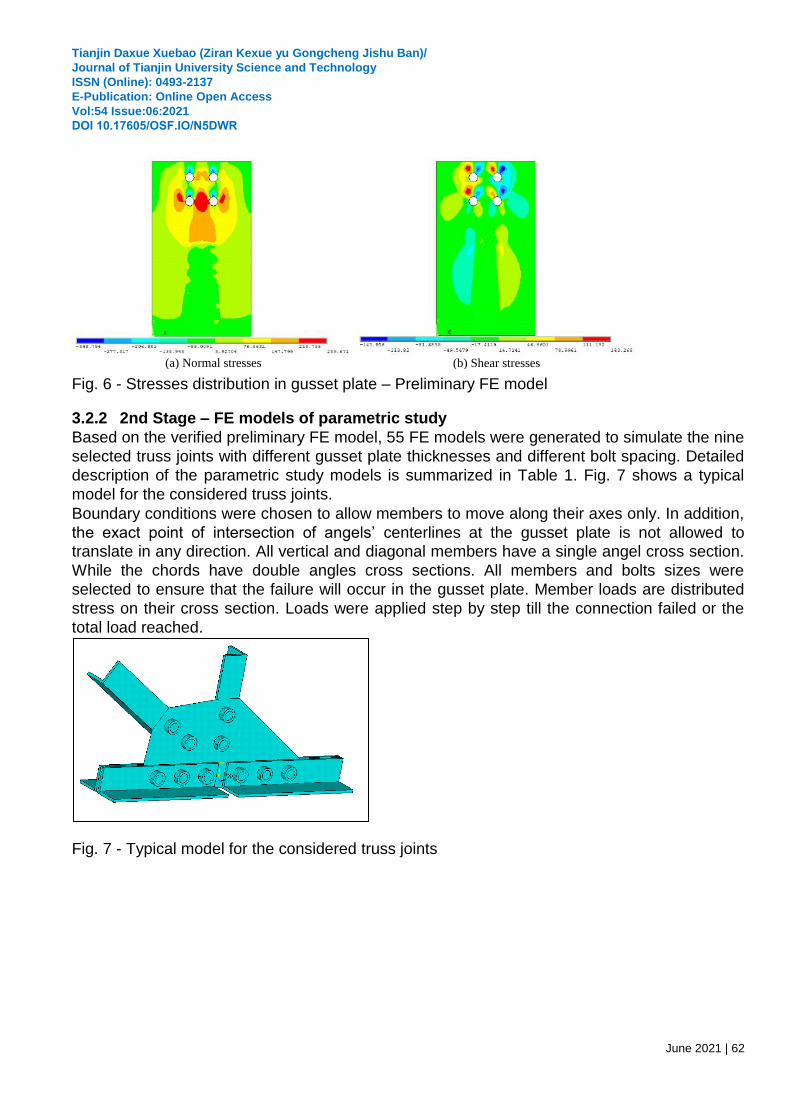
Fig. 5 shows the load - displacement curves for both experimental and preliminary FE model,
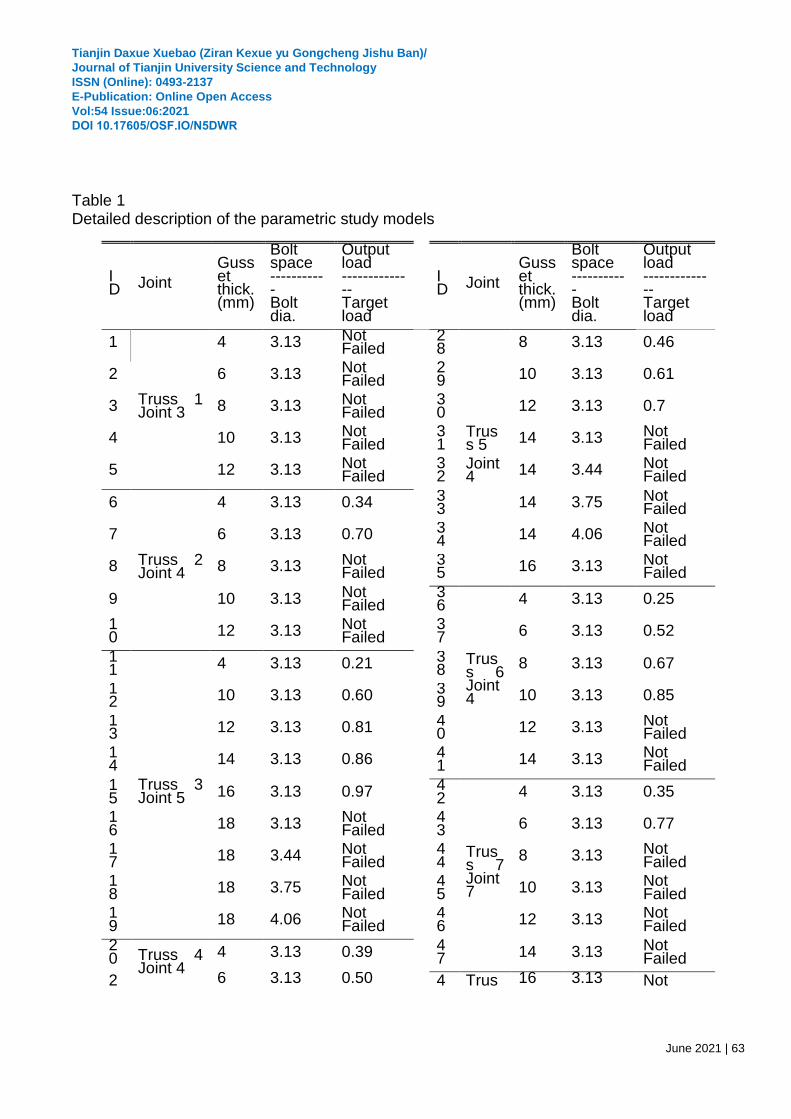
while Fig. 6 shows the distribution of both normal and shear stresses in the gusset plate. It
could be noted that maximum tensile stress occurred between bolts of the last row and
maximum shear stress appears along the bolt gauge line. These maximum stresses occurred
at the locations of the fractures in the experimental study.
Fig. 5 - Load - displacement curves for both experimental and preliminary FE model
Tianjin Daxue Xuebao (Ziran Kexue yu Gongcheng Jishu Ban)/
Journal of Tianjin University Science and Technology
ISSN (Online): 0493-2137
E-Publication: Online Open Access
Vol:54 Issue:06:2021
DOI 10.17605/OSF.IO/N5DWR
June 2021 | 62
Fig. 6 - Stresses distribution in gusset plate – Preliminary FE model
3.2.2 2nd Stage – FE models of parametric study
Based on the verified preliminary FE model, 55 FE models were generated to simulate the nine
selected truss joints with different gusset plate thicknesses and different bolt spacing. Detailed
description of the parametric study models is summarized in Table 1. Fig. 7 shows a typical
model for the considered truss joints.
Boundary conditions were chosen to allow members to move along their axes only. In addition,
the exact point of intersection of angels’ centerlines at the gusset plate is not allowed to
translate in any direction. All vertical and diagonal members have a single angel cross section.
While the chords have double angles cross sections. All members and bolts sizes were
selected to ensure that the failure will occur in the gusset plate. Member loads are distributed
stress on their cross section. Loads were applied step by step till the connection failed or the
total load reached.
Fig. 7 - Typical model for the considered truss joints
(a) Normal stresses
(b) Shear stresses
Tianjin Daxue Xuebao (Ziran Kexue yu Gongcheng Jishu Ban)/
Journal of Tianjin University Science and Technology
ISSN (Online): 0493-2137
E-Publication: Online Open Access
Vol:54 Issue:06:2021
DOI 10.17605/OSF.IO/N5DWR
June 2021 | 63
Table 1 Detailed description of the parametric study models
ID Joint
Gusset thick. (mm)
Bolt space ----------- Bolt dia.
Output load -------------- Target load
ID Joint
Gusset thick. (mm)
Bolt space ----------- Bolt dia.
Output load -------------- Target load
1
Truss 1 Joint 3
4 3.13 Not Failed
28
Truss 5 Joint 4
8 3.13 0.46
2 6 3.13 Not Failed
29 10 3.13 0.61
3 8 3.13 Not Failed
30 12 3.13 0.7
4 10 3.13 Not Failed
31 14 3.13 Not
Failed
5 12 3.13 Not Failed
32 14 3.44 Not
Failed
6
Truss 2 Joint 4
4 3.13 0.34
33 14 3.75 Not
Failed
7 6 3.13 0.70
34 14 4.06 Not
Failed
8 8 3.13 Not Failed
35 16 3.13 Not
Failed
9 10 3.13 Not Failed
36
Truss 6 Joint 4
4 3.13 0.25
10 12 3.13 Not
Failed 37 6 3.13 0.52
11
Truss 3 Joint 5
4 3.13 0.21
38 8 3.13 0.67
12 10 3.13 0.60
39 10 3.13 0.85
13 12 3.13 0.81
40 12 3.13 Not
Failed 14 14 3.13 0.86
41 14 3.13 Not
Failed
15 16 3.13 0.97
42
Truss 7 Joint 7
4 3.13 0.35
16 18 3.13 Not
Failed 43 6 3.13 0.77
17 18 3.44 Not
Failed 44 8 3.13 Not
Failed 18 18 3.75 Not
Failed 45 10 3.13 Not
Failed 19 18 4.06 Not
Failed 46 12 3.13 Not
Failed
20 Truss 4
Joint 4 4 3.13 0.39
47 14 3.13 Not
Failed
2 6 3.13 0.50 4 Trus 16 3.13 Not
Tianjin Daxue Xuebao (Ziran Kexue yu Gongcheng Jishu Ban)/
Journal of Tianjin University Science and Technology
ISSN (Online): 0493-2137
E-Publication: Online Open Access
Vol:54 Issue:06:2021
DOI 10.17605/OSF.IO/N5DWR
June 2021 | 64
1 8 s 8 Joint 4
Failed 22 8 3.13 Not
Failed 49 16 3.44 Not
Failed 23 10 3.13 Not
Failed 50 16 3.75 Not
Failed 24 12 3.13 Not
Failed 51 16 4.06 0.96
25 12 3.44 Not
Failed 52
Truss 9 Joint 2
14 3.13 Not Failed
26 12 3.75 Not
Failed 53 14 3.44 Not
Failed 27 12 4.06 Not
Failed 54 14 3.75 Not
Failed
Note: 16mm diameter bolts are used in all models
55 14 4.06 Not
Failed
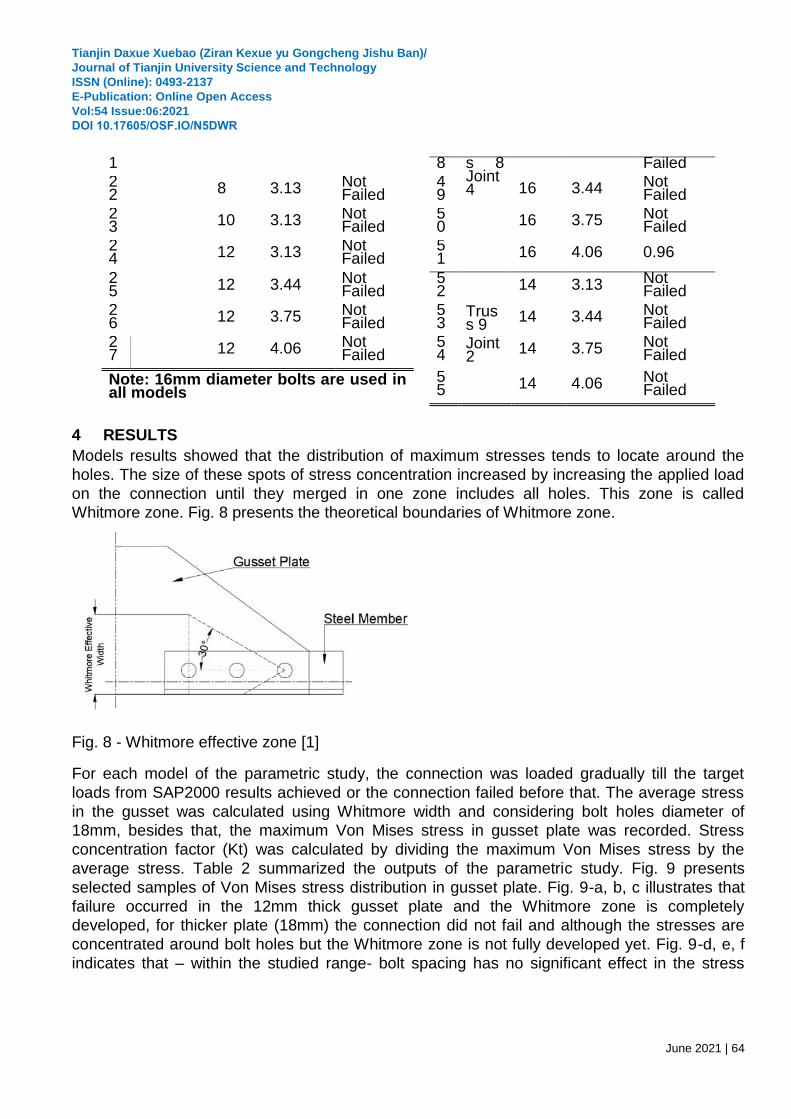
4 RESULTS
Models results showed that the distribution of maximum stresses tends to locate around the
holes. The size of these spots of stress concentration increased by increasing the applied load
on the connection until they merged in one zone includes all holes. This zone is called
Whitmore zone. Fig. 8 presents the theoretical boundaries of Whitmore zone.
Fig. 8 - Whitmore effective zone [1]
For each model of the parametric study, the connection was loaded gradually till the target
loads from SAP2000 results achieved or the connection failed before that. The average stress
in the gusset was calculated using Whitmore width and considering bolt holes diameter of
18mm, besides that, the maximum Von Mises stress in gusset plate was recorded. Stress
concentration factor (Kt) was calculated by dividing the maximum Von Mises stress by the
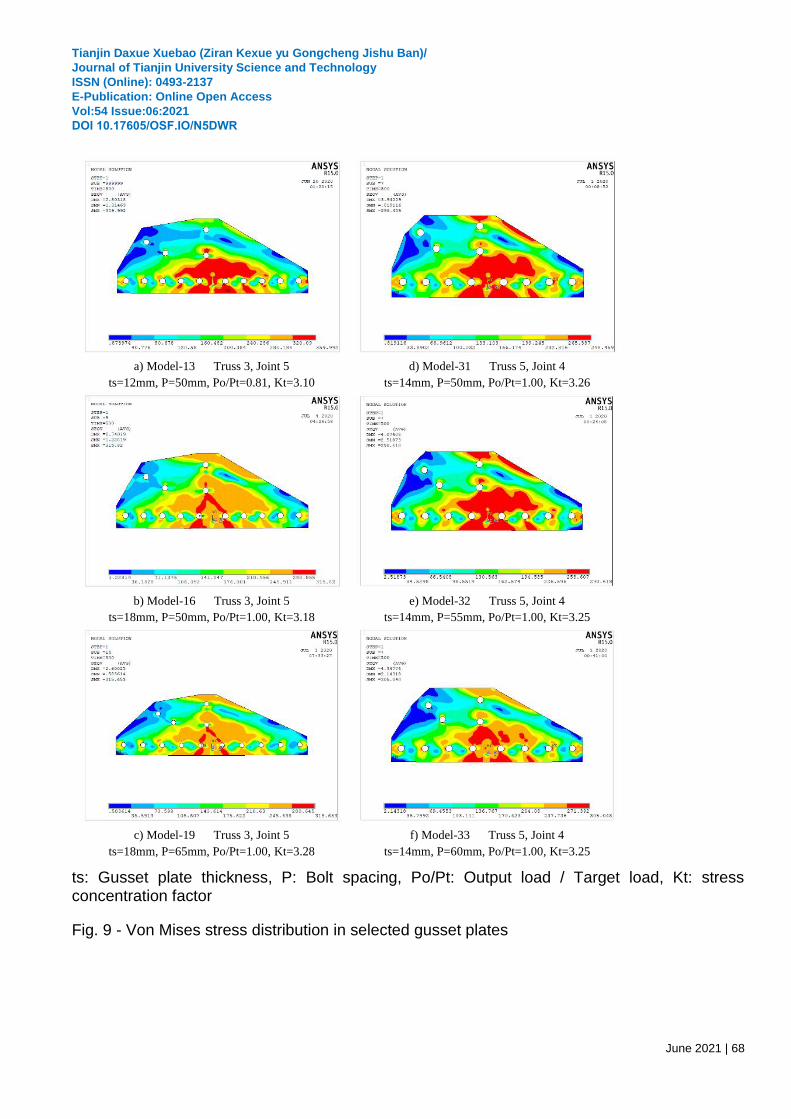
average stress. Table 2 summarized the outputs of the parametric study. Fig. 9 presents
selected samples of Von Mises stress distribution in gusset plate. Fig. 9-a, b, c illustrates that
failure occurred in the 12mm thick gusset plate and the Whitmore zone is completely
developed, for thicker plate (18mm) the connection did not fail and although the stresses are
concentrated around bolt holes but the Whitmore zone is not fully developed yet. Fig. 9-d, e, f
indicates that – within the studied range- bolt spacing has no significant effect in the stress
Tianjin Daxue Xuebao (Ziran Kexue yu Gongcheng Jishu Ban)/
Journal of Tianjin University Science and Technology
ISSN (Online): 0493-2137
E-Publication: Online Open Access
Vol:54 Issue:06:2021
DOI 10.17605/OSF.IO/N5DWR
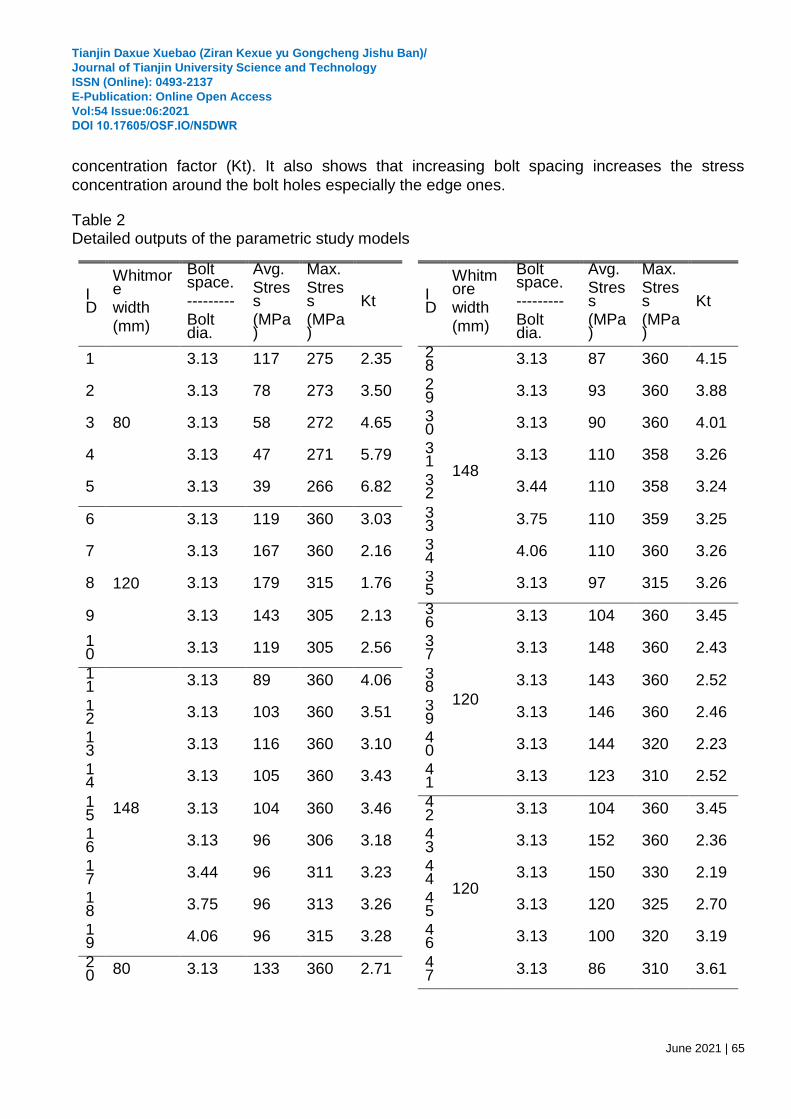
June 2021 | 65
concentration factor (Kt). It also shows that increasing bolt spacing increases the stress
concentration around the bolt holes especially the edge ones.
Table 2 Detailed outputs of the parametric study models
ID
Whitmore width (mm)
Bolt space. --------- Bolt dia.
Avg. Stress (MPa)
Max. Stress (MPa)
Kt
ID
Whitmore width (mm)
Bolt space. --------- Bolt dia.
Avg. Stress (MPa)
Max. Stress (MPa)
Kt
1
80
3.13 117 275 2.35
28
148
3.13 87 360 4.15
2 3.13 78 273 3.50
29 3.13 93 360 3.88
3 3.13 58 272 4.65
30 3.13 90 360 4.01
4 3.13 47 271 5.79
31 3.13 110 358 3.26
5 3.13 39 266 6.82
32 3.44 110 358 3.24
6
120
3.13 119 360 3.03
33 3.75 110 359 3.25
7 3.13 167 360 2.16
34 4.06 110 360 3.26
8 3.13 179 315 1.76
35 3.13 97 315 3.26
9 3.13 143 305 2.13
36
120
3.13 104 360 3.45
10 3.13 119 305 2.56
37 3.13 148 360 2.43
11
148
3.13 89 360 4.06
38 3.13 143 360 2.52
12 3.13 103 360 3.51
39 3.13 146 360 2.46
13 3.13 116 360 3.10
40 3.13 144 320 2.23
14 3.13 105 360 3.43
41 3.13 123 310 2.52
15 3.13 104 360 3.46
42
120
3.13 104 360 3.45
16 3.13 96 306 3.18
43 3.13 152 360 2.36
17 3.44 96 311 3.23
44 3.13 150 330 2.19
18 3.75 96 313 3.26
45 3.13 120 325 2.70
19 4.06 96 315 3.28
46 3.13 100 320 3.19
20 80 3.13 133 360 2.71
47 3.13 86 310 3.61
Tianjin Daxue Xuebao (Ziran Kexue yu Gongcheng Jishu Ban)/
Journal of Tianjin University Science and Technology
ISSN (Online): 0493-2137
E-Publication: Online Open Access
Vol:54 Issue:06:2021
DOI 10.17605/OSF.IO/N5DWR
June 2021 | 66
21
3.13 115 360 3.12
48
150
3.13 93 303 3.28
22 3.13 173 292 1.69
49 3.44 93 311 3.36
23 3.13 139 280 2.02
50 3.75 93 309 3.34
24 3.13 115 275 2.38
51 4.06 89 360 4.06
25 3.44 115 277 2.40
52
80
3.13 54 241 4.45
26 3.75 115 279 2.42
53 3.44 54 241 4.45
27 4.06 115 281 2.43
54 3.75 54 243 4.49
Note: 16mm diameter bolts are used in all models
55 4.06 54 243 4.49
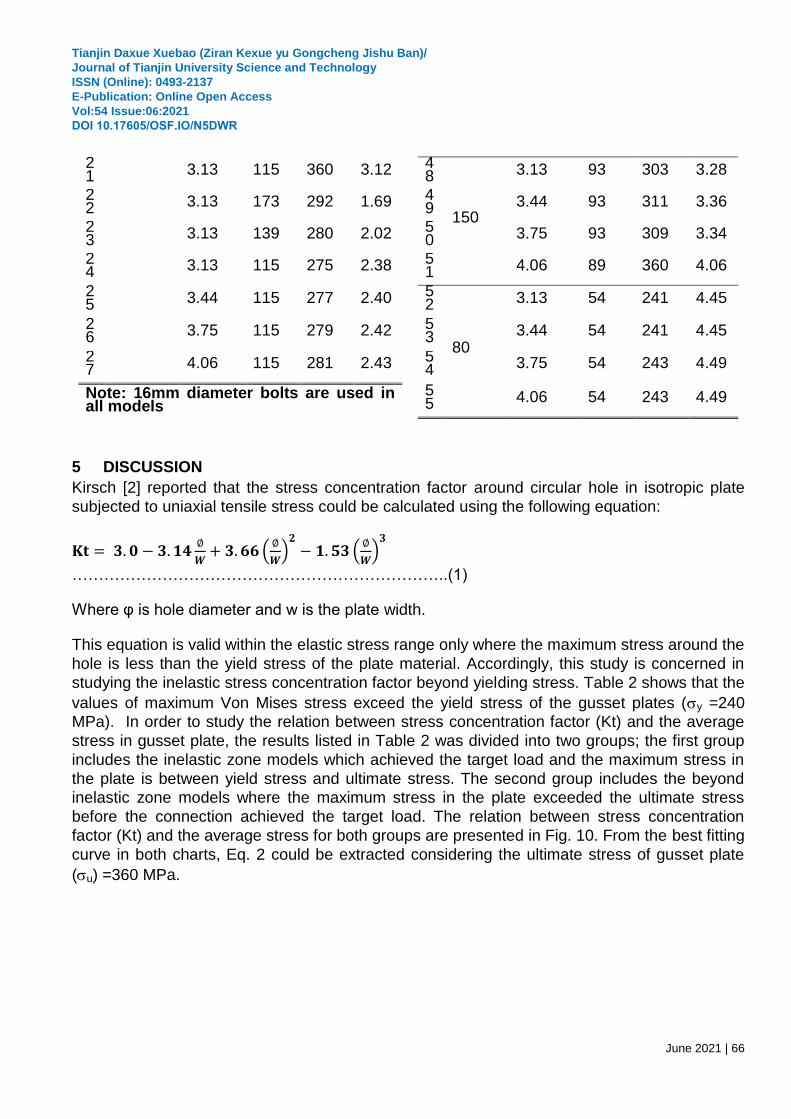
5 DISCUSSION
Kirsch [2] reported that the stress concentration factor around circular hole in isotropic plate
subjected to uniaxial tensile stress could be calculated using the following equation:
(
)
(
)
……………………………………………………………..(1)
Where φ is hole diameter and w is the plate width.
This equation is valid within the elastic stress range only where the maximum stress around the
hole is less than the yield stress of the plate material. Accordingly, this study is concerned in
studying the inelastic stress concentration factor beyond yielding stress. Table 2 shows that the
values of maximum Von Mises stress exceed the yield stress of the gusset plates (y =240
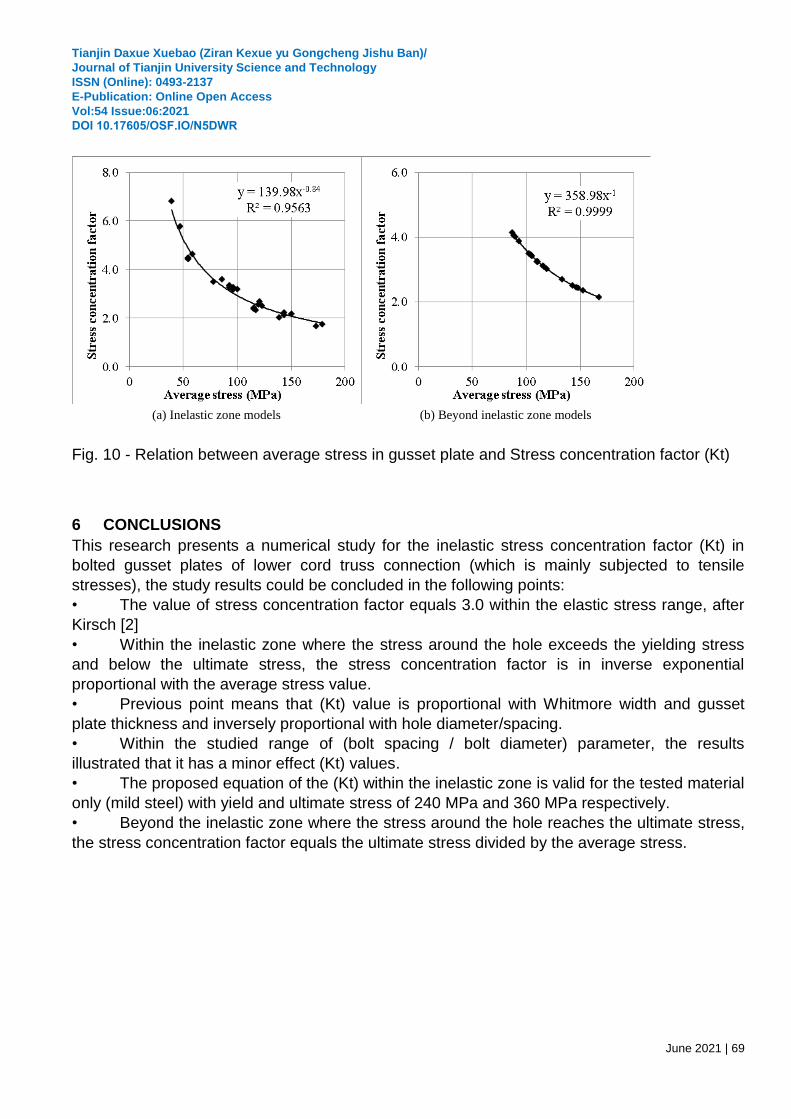
MPa). In order to study the relation between stress concentration factor (Kt) and the average
stress in gusset plate, the results listed in Table 2 was divided into two groups; the first group
includes the inelastic zone models which achieved the target load and the maximum stress in
the plate is between yield stress and ultimate stress. The second group includes the beyond
inelastic zone models where the maximum stress in the plate exceeded the ultimate stress
before the connection achieved the target load. The relation between stress concentration
factor (Kt) and the average stress for both groups are presented in Fig. 10. From the best fitting
curve in both charts, Eq. 2 could be extracted considering the ultimate stress of gusset plate
(u) =360 MPa.
Tianjin Daxue Xuebao (Ziran Kexue yu Gongcheng Jishu Ban)/
Journal of Tianjin University Science and Technology
ISSN (Online): 0493-2137
E-Publication: Online Open Access
Vol:54 Issue:06:2021
DOI 10.17605/OSF.IO/N5DWR
June 2021 | 67
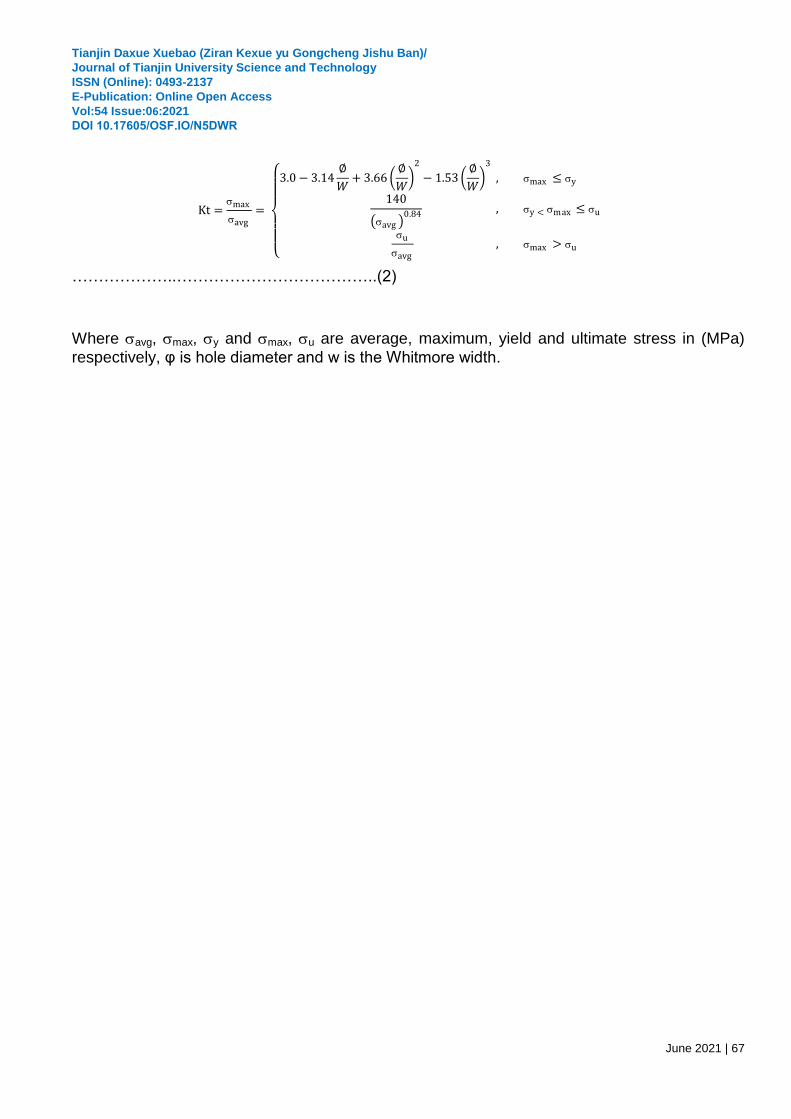
………………..………………………………..(2)
Where avg, max, y and max, u are average, maximum, yield and ultimate stress in (MPa)
respectively, φ is hole diameter and w is the Whitmore width.
Kt =max
avg=
3.0 3.14
𝑊+ 3.66
𝑊
2
1.53
𝑊
3
, max ≤ y
140
avg 0.84 , y < max ≤ u
u
avg , max > u
Tianjin Daxue Xuebao (Ziran Kexue yu Gongcheng Jishu Ban)/
Journal of Tianjin University Science and Technology
ISSN (Online): 0493-2137
E-Publication: Online Open Access
Vol:54 Issue:06:2021
DOI 10.17605/OSF.IO/N5DWR
June 2021 | 68
ts: Gusset plate thickness, P: Bolt spacing, Po/Pt: Output load / Target load, Kt: stress concentration factor
Fig. 9 - Von Mises stress distribution in selected gusset plates
a) Model-13 Truss 3, Joint 5
ts=12mm, P=50mm, Po/Pt=0.81, Kt=3.10
d) Model-31 Truss 5, Joint 4
ts=14mm, P=50mm, Po/Pt=1.00, Kt=3.26
b) Model-16 Truss 3, Joint 5
ts=18mm, P=50mm, Po/Pt=1.00, Kt=3.18
e) Model-32 Truss 5, Joint 4
ts=14mm, P=55mm, Po/Pt=1.00, Kt=3.25
c) Model-19 Truss 3, Joint 5
ts=18mm, P=65mm, Po/Pt=1.00, Kt=3.28
f) Model-33 Truss 5, Joint 4
ts=14mm, P=60mm, Po/Pt=1.00, Kt=3.25
Tianjin Daxue Xuebao (Ziran Kexue yu Gongcheng Jishu Ban)/
Journal of Tianjin University Science and Technology
ISSN (Online): 0493-2137
E-Publication: Online Open Access
Vol:54 Issue:06:2021
DOI 10.17605/OSF.IO/N5DWR
June 2021 | 69
Fig. 10 - Relation between average stress in gusset plate and Stress concentration factor (Kt)
6 CONCLUSIONS
This research presents a numerical study for the inelastic stress concentration factor (Kt) in
bolted gusset plates of lower cord truss connection (which is mainly subjected to tensile
stresses), the study results could be concluded in the following points:
• The value of stress concentration factor equals 3.0 within the elastic stress range, after
Kirsch [2]
• Within the inelastic zone where the stress around the hole exceeds the yielding stress
and below the ultimate stress, the stress concentration factor is in inverse exponential
proportional with the average stress value.
• Previous point means that (Kt) value is proportional with Whitmore width and gusset
plate thickness and inversely proportional with hole diameter/spacing.
• Within the studied range of (bolt spacing / bolt diameter) parameter, the results
illustrated that it has a minor effect (Kt) values.
• The proposed equation of the (Kt) within the inelastic zone is valid for the tested material
only (mild steel) with yield and ultimate stress of 240 MPa and 360 MPa respectively.
• Beyond the inelastic zone where the stress around the hole reaches the ultimate stress,
the stress concentration factor equals the ultimate stress divided by the average stress.
(a) Inelastic zone models (b) Beyond inelastic zone models
Tianjin Daxue Xuebao (Ziran Kexue yu Gongcheng Jishu Ban)/
Journal of Tianjin University Science and Technology
ISSN (Online): 0493-2137
E-Publication: Online Open Access
Vol:54 Issue:06:2021
DOI 10.17605/OSF.IO/N5DWR
June 2021 | 70
REFERENCES
[1] R. E. Whitmore, Experimental investigation of stresses in gusset plates, Bulletin No.16, University of Tennessee, USA, 1952. [2] Kirsch, 1898, Die Theorie der Elastizität und die Bedürfnisse der Festigkeitslehre. Zeitschrift des Vereines deutscher Ingenieure, 42, 797–807. [3] Walbridge S., Grondin G. and Cheng J., “Gusset Plate Connections under Monotonic and Cyclic Loading.” Canadian Journal of Civil Engineering, NRC Research Press 32(5) (2005), pp. 981–995. [4] Chou Ch. and Chen P., “Compressive Behavior of Central Gusset Plate Connections for a Buckling-Restrained Braced Frame”, Journal of Constructional Steel, Research 65 (2009), pp. 1138–1148. [5] Cui Y., Asada H., Kishiki Sh. and Yamada S., “Ultimate Strength of Gusset Plate Connections with Fillet Welds”, Journal of Constructional Steel, Research 75 (2012), pp. 104–115. [6] Fang Ch., Yam M., Cheng J. and Zhang Y., “Compressive Strength and Behaviour of Gusset Plate Connections with Single-Sided Splice Members”, Journal of Constructional Steel, Research 106 (2015), pp. 166–183. [7] Zeynali Y., Samimi M., Mazroei A., Marnani J. and Rohanimanesh M., “Experimental and Numerical Study of Frictional Effects on Block Shear Fracture of Steel Gusset Plates with Bolted Connections”, Thin-Walled Structures 121 (2017) Elsevier Journal, pp. 8–24. [8] Vivek K., Priyanka U., Reddy C. and Ram K., “Non – Linear Finite Element Analysis of Mild Steel Gusset Plates”, Materials Today: Proceedings 18 (2019) Elsevier Journal, pp. 3726–3732.
Tianjin Daxue Xuebao (Ziran Kexue yu Gongcheng Jishu Ban)/
Journal of Tianjin University Science and Technology
ISSN (Online): 0493-2137
E-Publication: Online Open Access
Vol:54 Issue:06:2021
DOI 10.17605/OSF.IO/N5DWR
[9] Maleki Sh. and Ghaderi-Garekani M., “Block shear failure in welded gusset plates under combined loading”, Journal of Constructional Steel Research 170 (2020), 106079.