
COMSA 2015 Proceedings - repo unpas
145
April 29 to May 1, 2015 at the Mitsui Garden Hotel Hiroshima, Japan ISSN: 2189-2229 Sponsored by: COMSA 2015 Proceedings The Inaugural Conference on Management and Sustainability in Asia The PRESDA Foundation of Japan www.presdafoundation.org
-
Upload
khangminh22 -
Category
Documents
-
view
0 -
download
0
Transcript of COMSA 2015 Proceedings - repo unpas

April 29 to May 1, 2015 at the Mitsui Garden Hotel Hiroshima, Japan
ISSN: 2189-2229
Sponsored by:
COMSA 2015 Proceedings
The Inaugural Conference on Management and Sustainability in Asia
The PRESDA Foundation of Japan
www.presdafoundation.org

Managing Editor: Professor John Latzo
For the PRESDA Foundation and the COMSA 2015 Advisory Committee
Program Committee
Takayuki Yamada, Chairperson, The PRESDA Foundation of Japan
Professor Michael Sasaoka, Academic Director, TIERA A, ESD Focus, Japan
Professor Alan Brady, Kwansei Gakuin University, Japan
Professor John Latzo, POSTECH University, Korea
Professor Salvador Peniche-Camps, Dept. of Economics, University of Guadalajara, Mexico
Professor Martin G. Romero, Dept. of Economics, University of Guadalajara, Mexico
Professor Bhimaraya A. Metri, The International Management Institute, India
Professor William Kittredge, Cervelet Management and Strategy Consultants, Thailand
The Inaugural Conference on Management and Sustainability in Asia
Hiroshima, Japan, 2015
Official Conference Proceedings
ISSN: 2189-2229

Proceedings Index
I. Contents (Indexed according to PDF page numbers)
II. Managing Editor and Program Committee
III. Schedule and Agenda: pages 4-27
IV. Conference Abstracts: pages 29-38
V. Full Papers: pages 39-144
Elyasuddin Jalal and Shoshi Mizokami 0606: pages 40-46
Yenny Maya Dora 0614: pages 47-53
Melfa Andraini Agatha and Resha Nuzul Safitri 0617: pages 54-57
Arpita Dutta 0626: pages 58-74
Chien-Huei Wu, Wei-Ying Chen and Feng-Shang Wu 0627: pages 75-100
Jatuwit Khieochaum and Uthai Tanlamai 0633: pages 101-106
Nguyen Hoang Duy Phuong 0634: pages 107-114
Lakshika Meetiyagoda and Susantha Amarawickrama 0637: pages 115-122
Ani Setiani 0639: pages 123-130
Isniar Budiarti 0640: pages 131-137
Sun Linlin, Edwin H. W. Chan and Zhu Dajian 0641: pages 138-144


The Inaugural Conference on Management and Sustainability in Asia
The Inaugural Conference on Disaster Response and Management in Asia April 29-May 1, 2015 at the Mitsui Garden Hotel, Hiroshima, Japan

Dear COMSA/DREAM Colleagues,
Welcome to the Conference on Management and Sustainability in Asia and the Asian Conference on
Disaster Response and Management sponsored by the PRESDA Foundation.
We gather here today united by our determination and shared vision of a better world in which
management and sustainability take center stage. And it is through this intersection of interests that
meaningful discourse and change arise. Your commitment to these objectives and gathering here at the
Mitsui Garden Hotel in Hiroshima bring renewed hope and ideas to a continent.
We sincerely thank you for you for your participation in COMSA/DREAM and for broadening the
intellectual scope and understanding of disaster response and management as well as management and
sustainability in Asia and elsewhere. We hope you enjoy your stay in Hiroshima as well as the city’s rich
cultural heritage while advancing our shared goals.
Sincerely,
Takayuki Yamada
Chairman, Board of Governors, The PRESDA Foundation (Japan)
T.M. Desmond
Executive Director, Board of Governors, The PRESDA Foundation (Japan)
John Latzo
Chairperson, Editorial Committee
Professor, Division of Humanities, POSTECH (Korea)
Michael Sasaoka
Program Director, COMSA/DREAM 2015
Academic Director, TIER A Research Center (Japan)

The Inaugural Conference on Management and Sustainability in Asia
The Inaugural Conference on Disaster Response and Management in Asia April 29-May 1, 2015 at the Mitsui Garden Hotel, Hiroshima, Japan

The Inaugural Conference on Management and Sustainability in Asia
The Inaugural Conference on Disaster Response and Management in Asia
April 29- May 1, 2015 at the Mitsui Garden Hotel Hiroshima, Japan
Sponsored by The PRESDA Foundation www.presdafoundation.org
Program Committee
Takayuki Yamada, Chairperson, The PRESDA Foundation of Japan
Professor Michael Sasaoka, Academic Director, TIERA A, ESD Focus, Japan
Professor Alan Brady, Kwansei Gakuin University, Japan
Professor John Latzo, POSTECH University, Korea
Professor Salvador Peniche-Camps, Dept. of Economics, University of Guadalajara, Mexico
Professor Martin G. Romero, Dept. of Economics, University of Guadalajara, Mexico
Professor Bhimaraya A. Metri, The International Management Institute, India
Professor William Kittredge, Cervelet Management and Strategy Consultants, Thailand
About the Host Organizer
The Pacific Rim Education for Sustainable Development Alliance (PRESDA) was established in 2010.
We are an alliance of grassroots non-profit organizations, teachers, business people, and concerned
citizens from around Asia and beyond who wish to make a difference. Incorporated under the laws of
Japan, the PRESDA Foundation is an independent, not-for-profit foundation helping to fulfill the
Millennium Development Goals by the year 2015.
For more information about the PRESDA Foundation and our projects, please visit our homepage at www.presdafoundation.org
Proceedings
In consideration of the environment and our efforts to be carbon-neutral, the proceedings will be
published in electronic format only. Normally, the proceedings are published post-conference. An
announcement and a downloading link will be sent to all participants when the proceedings are
available.
COMSA/DREAM 2015 Acknowledgements
On behalf of the organizing committee we wish to express our deepest appreciation to the following
institutions and people:
Host Organization
The PRESDA Foundation of Japan and ESD Focus
Institutional Affiliates
The Venture Greenhouse of Dominican University of California, USA
The Wine Business Institute, Sonoma State University, USA
The Hiroshima Peace Institute, Hiroshima City University, Japan
The Faculty of Agriculture, Maejo University, Thailand
The Department of Economics, University of Guadalajara, Mexico
The proceedings for this conference have been approved and assigned an International Standard Serial Number (ISSN) through the Japanese National Centre for ISSN under the auspices of the National Diet
Library.
The National Diet Library, which acquires national serial publications exhaustively as the only national
and deposit library in Japan, plays a role as the Japanese National Centre for ISSN:
COMSA 2015 Proceedings ISSN: 2189-2229
DREAM 2015 Proceedings ISSN: 2189-213x
Miscellaneous Information
ATM
Most convenience stores around Hiroshima have ATMs. Please note that not all ATMs will accept
international debit or credit cards. Please see the ATM placard for details.

The Inaugural Conference on Management and Sustainability in Asia
The Inaugural Conference on Disaster Response and Management in Asia
April 29- May 1, 2015 at the Mitsui Garden Hotel Hiroshima, Japan
Sponsored by The PRESDA Foundation www.presdafoundation.org
Dress
The expected dress code for the conference is business casual.
Climate
Hiroshima has a humid subtropical climate that is mild with no dry season (rainfall is generally year-
round). Summers tend to be hot and muggy with thunderstorms. Winters are mild with precipitation.
Seasonality is moderate.
Equipment
Oral and virtual presentation rooms are equipped with a screen, projector and a computer. The
computer has Windows OS. Sound equipment and speakers are also available as is technical support.
Poster presenters will be provided with an easel, poster-board, tape and thumb pins. Posters must be
size A0 (A Zero). Common dimensions for posters are A0 47 x 33 inches (118cm x 84cm).
Please be mindful of panel presentation start and finish times, so that the next presenter has adequate
time to prepare.
Internet
Wi-Fi Internet access is available on the presentation 3rd floor of the Mitsui Garden Hotel. If you are
having difficulty with the Wi-Fi please inform the hotel. The organizers have no control over the Wi-Fi
access.
Printing / Photocopying
The Family Mart and 7-11 convenience stores next to the hotel both have photocopy machines. Also,
there is a copier in the Mitsui Garden Hotel lobby. Printing and photocopying charges will apply.
Banks / Exchanging Money
In Japan, all banks are open Monday to Friday from 9:00 a.m. to 3:00 p.m. Please check with the front
desk for directions to the nearest bank, which suits your needs.
Designated Hotel
All sessions will be held at the Hiroshima Mitsui Garden Hotel
Address: 9-12 Nakamachi, Naka Ward, Hiroshima City, Hiroshima Prefecture, Japan 730-0037
TEL: 082-240-1131 / FAX: 082-242-3001
URL: http://www.gardenhotels.co.jp/eng/hiroshima/access/
Access
15 minutes from Fukuromachi stop by streetcar from JR Hiroshima Station.
10 minutes on foot from the Hiroshima City Bus Center
Session Time Moderators
The organizers will arbitrarily select two time moderators per panel to make sure that each presenter
starts and finishes on time. The session time moderator only needs to alert the presenter when five
minutes is remaining in the presentation. It is not necessary for the time moderator to introduce the
presenters.
Session Panel Guidelines
Session times are clearly marked on the schedule. Presentations should be given in the order indicated.
If a presenter is absent or arrives late, the session time moderators should allow the next presenter to
start. Those arriving late will be given an opportunity to present at the end of the session, only if extra
time remains.

The Inaugural Conference on Management and Sustainability in Asia
The Inaugural Conference on Disaster Response and Management in Asia
April 29-May 1, 2015 at the Mitsui Garden Hotel, Hiroshima, Japan

The Inaugural Conference on Management and Sustainability in Asia
The Inaugural Conference on Disaster Response and Management in Asia April 29-May 1, 2015 at the Mitsui Garden Hotel Hiroshima, Japan
1
Sponsored by The PRESDA Foundation www.presdafoundation.org
Conference Schedule Overview

The Inaugural Conference on Management and Sustainability in Asia
The Inaugural Conference on Disaster Response and Management in Asia April 29-May 1, 2015 at the Mitsui Garden Hotel Hiroshima, Japan
2
Sponsored by The PRESDA Foundation www.presdafoundation.org
Introduction by the host organizer (The PRESDA Foundation)
Host Organizer Chairperson, Takayuki Yamada
17:30 to 19:30 Welcome Dinner Reception Restaurant is a short walk from the Mitsui Garden Hotel. We will depart from the 1st
floor lobby at 17:15. Please wear your conference name badge to dinner.
*Due to limited seating, the dinner reception is only open to registered participants
Day 1: Wednesday, April 29, 2015
Commencement will be held in Moegi
14:30 to 15:45 Participant Check-in
(Program, Official Receipt and Name Badge)
Location: Mitsui Garden Hotel 3rd Floor Lobby
16:00 to 16:45 COMSA/DREAM Commencement
Held in the Moegi room on the 3rd floor

The Inaugural Conference on Management and Sustainability in Asia
The Inaugural Conference on Disaster Response and Management in Asia April 29-May 1, 2015 at the Mitsui Garden Hotel Hiroshima, Japan
3
Sponsored by The PRESDA Foundation www.presdafoundation.org
Day 2: Thursday, April 30, 2015
All sessions will be held in the Moegi, Asagi and Hakuho West rooms
08:30 to 09:00 Participant Check-in
(Program, Official Receipt and Name Badge)
Location: Mitsui Garden Hotel 3rd Floor Lobby
09:00 to 10:30 Oral Session A: Urban Planning and Risk Management Issues
Room: Asagi
Presenters: 0606, 0628, 0641
09:00 to 10:30 Oral Session B: Perspectives on Management and Sustainability
Room: Moegi
Presenters: 0638, 0635, 0623
10:45 to 12:15 Oral Session C: Perspectives on Disaster Response and Management
Room: Asagi
Presenters: 0505, 0507, 0521
10:45 to 12:15 Oral Session D: Economics and Sustainable Innovations
Room: Moegi
Presenters: 0633, 0624, 0615
12:30 to 13:30 Lunch at the Confrere Restaurant
Location: 25th Floor, Mitsui Garden Hotel
*An additional charge of JPY1900 will be required for non-registered guests
13:30 to 13:45 Recess
13:45 to 15:45 Oral Session E: Disaster Relief, Resilience and Research
Room: Asagi
Presenters: 0502, 0514, 0516, 0524
13:45 to 15:45 Oral Session F: Perspectives on Environmental Management and CSR
Room: Moegi
Presenters: 0616, 0609, 0626, 0631
16:00 to 17:00 Poster/ Networking Session
Room: Hakuho West
Presenters: 0509, 0525, 0617, 0627, 0634
Reception will serve hors d’oeuvres, coffee, water and tea

The Inaugural Conference on Management and Sustainability in Asia
The Inaugural Conference on Disaster Response and Management in Asia April 29-May 1, 2015 at the Mitsui Garden Hotel Hiroshima, Japan
4
Sponsored by The PRESDA Foundation www.presdafoundation.org
Day 3: Friday, May 1, 2015
All sessions will be held in Moegi and Asagi Rooms
08:00 to 9:00 Virtual Panel I: Management and Sustainability
Room: Asagi
Presenters: 0614, 0630, 0637, 0639, 0640, 0645
08:00 to 9:00 Virtual Panel II: Disaster Response and Management
Room: Moegi
Presenters: 0506, 0508, 0522
9:00 to 9:30 Featured Presentation: Dag Petersson, Royal Academy of Fine Arts, Denmark
Room: Moegi
9:30 to 9:40 Questions and Answers
9:40 to 09:50 Closing Remarks
10:00 to 16:00 UNESCO World Heritage tour of the ‘Shrine Island’ (Miyajima)*
*Includes round trip transportation, park fee, cake and tea and guidance in English
Departing from the Mitsui Garden Lobby at 10:00
About Miyajima Island “The Shrine Island”
Miyajima Island is the popular name of Itsuku-shima Island, situated in Hatsukaichi
City in southwestern Hiroshima. It is a scenic site in which the mountains, sea, and
red shrine buildings blend together in harmony. The entire island is designated as a
UNESCO World Heritage Site. It is said to be one of the three most beautiful sights
in Japan, along with Matsushima in Miyagi Prefecture and Ama-no-hashidate in
Kyoto. The origin of Miyajima is said to date back to when the Itsuku-shima-jinja
Shrine was built in 593 during the reign of Empress Suiko; however, the island of
Miyajima itself has had a long history of being an object of worship, especially its
Mt. Mi-sen that rises up at the center of the island.

The Inaugural Conference on Management and Sustainability in Asia
The Inaugural Conference on Disaster Response and Management in Asia April 29-May 1, 2015 at the Mitsui Garden Hotel Hiroshima, Japan
5
Sponsored by The PRESDA Foundation www.presdafoundation.org
Day 1: Wednesday, April 29, 2015
Opening Remarks and Welcome Dinner
14:30 to 15:45
Participant Check-in (Program, Official Receipt and Name Badge)
Location: Mitsui Garden Hotel 3rd Floor Lobby
16:00 to 16:45
COMSA/DREAM Commencement
Held in the Moegi room on the 3rd floor
Introduction by the host organizer (The PRESDA Foundation)
Host Organizer Chairperson, Takayuki Yamada
17:30 to 19:00
Welcome Dinner Reception
Restaurant is a short walk from the Mitsui Garden Hotel. We will depart from the 1st
floor lobby at 17:15. Please wear your conference name badge to dinner.
*Due to limited seating, the dinner reception is only open to registered participants

The Inaugural Conference on Management and Sustainability in Asia
The Inaugural Conference on Disaster Response and Management in Asia April 29-May 1, 2015 at the Mitsui Garden Hotel Hiroshima, Japan
6
Sponsored by The PRESDA Foundation www.presdafoundation.org
Day 2: Thursday, April 30, 2015
09:00 to 10:30
Oral Session A: Urban Planning and Risk Management Issues
Room: Asagi
Presenters: 0606, 0628, 0641
Session Time Moderators: Elysauddin Jalal and Linlin Sun
09:00 to 09:30
0606 Overview of Urban Management in Kabul, Afghanistan
Elyasuddin Jalal, Dept. of Civil and Environmental Eng., Kumamoto University1
Shoshi Mizokami, Dept. of Civil and Environmental Eng., Kumamoto University2
09:30 to 10:00 0628 The Business Model Innovation for Carbon Capture and Storage
Chun-Chiao Yeh , National Taipei University, Republic of China (Taiwan)1
Chien-Ming Lee, National Taipei University, Republic of China (Taiwan)2
10:00 to 10:30
0641 The Issues of Urban NIMBY Conflict Management in China
Linlin Sun, The Polytechnic University, Hong Kong1
Edwin H.W. Chan,The Polytechnic University, Hong Kong2
Dajian Zhu, Tongji University, Shanghai, P.R. China3

The Inaugural Conference on Management and Sustainability in Asia
The Inaugural Conference on Disaster Response and Management in Asia April 29-May 1, 2015 at the Mitsui Garden Hotel Hiroshima, Japan
7
Sponsored by The PRESDA Foundation www.presdafoundation.org
Day 2: Thursday, April 30, 2015
09:00 to 10:30
Oral Session B: Perspectives on Management and Sustainability
Room: Moegi
Presenters: 0638, 0635, 0623
Session Time Moderators: Erik Armundito and Sergei Krivov
09:00 to 09:30
0638 Baseline Analysis of Productivity Changes with and without Considering Carbon Dioxide
Emissions in the Indonesia’s Manufacturing Sector
Erik Armundito, Hiroshima University, Japan1 Shinji Kaneko, Hiroshima University, Japan2
09:30 to 10:00
0635 Developing a Double Sampling Plan Based on Cost Model
Ching- Ho Yen, Huafan University, Taiwan1
10:00 to 10:30 0623 The Policy of Multiculturalism in the Countries of South-east Asia: Opportunities of
Practical Applications
Sergei Krivov, Lobachevsy State University, Russian Federation1

The Inaugural Conference on Management and Sustainability in Asia
The Inaugural Conference on Disaster Response and Management in Asia April 29-May 1, 2015 at the Mitsui Garden Hotel Hiroshima, Japan
8
Sponsored by The PRESDA Foundation www.presdafoundation.org
Day 2: Thursday, April 30, 2015
10:45 to 12:15
Oral Session C: Perspectives on Disaster Response and Management
Room: Asagi
Presenters: 0505, 0507, 0521
Session Time Moderators: Yu-Min Wang and Abhay Joshi
10:45 to 11:15
0505 Unmanned Aerial Vehicles for riverbed material monitoring at Shi-wen River, Taiwan
Yu-Min Wang, National Pingtung University of Science and Technology, Taiwan1
Samkele Tfwala, National Pingtung University of Science and Technology, Taiwan2
11:15 to 11:45
0507 Disaster Risk Reduction Management in Region XI: Issues and Challenges
Maribel S. Lanticse, Jose Maria College, Philippines1
11:45 to 12:15 0521 Post Tsunami Aid and Pre-tsunami Community Role for Government Led Relocation
Policies. A Case Study of Tamail Nadu State India
Abhay Joshi, Kanazawa Seiryo University, Kanazawa, Japan1 Megumi Nishimura, Kanazawa Seiryo University, Kanazawa, Japan2

The Inaugural Conference on Management and Sustainability in Asia
The Inaugural Conference on Disaster Response and Management in Asia April 29-May 1, 2015 at the Mitsui Garden Hotel Hiroshima, Japan
9
Sponsored by The PRESDA Foundation www.presdafoundation.org
10:45 to 11:15 0633 The Effects of Financial Statements’ Reliability and Risk Attitude to Cost of Debt for the
SMEs Loan: Evidence from Thailand.
Jatuwit Khieochaum, Chulalongkorn University, Thailand1 Uthai Tanlamai, Chulalongkorn University, Thailand2
11:15 to 11:45
0624 Innovation Quantity and Quality: Firm-Level Evidence in Taiwan
Chia-Hui Huang, Aletheia University, Taiwan1 Tony Chieh-Tse Hou, National Dong Hwa University, Taiwan2
11:45 to 12:15 0615 The Scientific Linkage between Patents and Firm Productivity: Evidence from Taiwanese
Electronics Firm Level Panel Data
Jong-Rong Chen, Professor Graduate Institute of Industrial Economics National Central University
Chungli, Taiwan and Joint Appointment Research Fellow Research Certer for Humanities and Social
Sciences Academia Sinica Taipei, Taiwan1
Day 2: Thursday, April 30, 2015
10:45 to 12:15
Oral Session D: Economics and Sustainable Innovations
Room: Moegi
Presenters: 0633, 0624, 0615
Session Time Moderators: Jatuwit Khieochaum and Chia-Hui Huang
Welcome Lunch
12:30 to 13:30
Join us for a buffet style lunch at the Confrere French restaurant located on the 25th floor of the Mitsui
Garden Hotel.

The Inaugural Conference on Management and Sustainability in Asia
The Inaugural Conference on Disaster Response and Management in Asia April 29-May 1, 2015 at the Mitsui Garden Hotel Hiroshima, Japan
10
Sponsored by The PRESDA Foundation www.presdafoundation.org
Day 2: Thursday, April 30, 2015
13:45 to 15:45
Oral Session E: Disaster Relief, Resilience and Research
Room: Asagi
Presenters: 0502, 0514, 0516, 0524
Session Time Moderators: Yoko Kobayashi and Siegfried Kiel Sañez
13:45 to 14:15
0502 Research of Development Program which Develops Energy to Fight against Adverse
Circumstances
Yoko Kobayashi,University of Tsukuba, Japan1 Tsunetsugu Munakata, University of Tsukuba, Japan2
14:15 to 14:45
0514 Psychosocial Support in Disaster Situations in the Philippines and Indonesia: A Critical
Literature Review
Fuad Hamsyah, Universitas Gadjah Mada, Indonesia1
14:45 to 15:15
0516 Healing and Recovery: Art in the Time of Disaster
Joseph Sedfrey S. Santiago, Ateneo de Manila University, Philippines1
15:15 to 15:45 0524 Two Years after Tropical Storm Washi: Implications of Shared Responsibility for Disaster
Recovery on Post-disaster Resettlementes
Siegfried Kiel B. Sañez, Ateneo de Manila University, Philippines1 Marion Lara L. Tan, Ateneo de Manila University, Philippines2
Wilfred S. Manuela, Jr., Ateneo de Manila University, Philippines3
J. Sedfrey S. Santiago, Ateneo de Manila University, Philippines4

The Inaugural Conference on Management and Sustainability in Asia
The Inaugural Conference on Disaster Response and Management in Asia April 29-May 1, 2015 at the Mitsui Garden Hotel Hiroshima, Japan
11
Sponsored by The PRESDA Foundation www.presdafoundation.org
Day 2: Thursday, April 30, 2015
13:45 to 15:45
Oral Session F: Perspectives on Environmental Management and CSR
Room: Moegi
Presenters: 0616, 0609, 0626, 0631
Session Time Moderators: Nares Chuersuwan and Caroline S.L. Tan
13:45 to 14:15
0616 The Energy-efficiency Analysis of Companies in Korea Using DEA
Ha Na Moon, Ewha Womans University, Korea1
Dai-ki Min, Ewha Womans University, Korea2
14:15 to 14:45 0609 Air Emission Inventory at Municipality Level in Thailand: The Basis of Air Quality
Management Nares Chuersuwan, Suranaree University of Technology, Thailand1
14:45 to 15:15
0626 Green Technology for Sustainable Development
Arpita Dutta, AMA International University, Bahrain1
15:15 to 15:45
0631 Food Related CSR Initiatives Post-3.11: When Risk and Trust Affect Consumer Behavior
Caroline S.L. Tan, University of Tsukuba, Japan1
3

The Inaugural Conference on Management and Sustainability in Asia
The Inaugural Conference on Disaster Response and Management in Asia April 29-May 1, 2015 at the Mitsui Garden Hotel Hiroshima, Japan
12
Sponsored by The PRESDA Foundation www.presdafoundation.org
Day 2: Thursday, April 30, 2015
16:00 to 17:00
Poster Session A
Room: Hakuho West
Presenters: 0509, 0525, 0617, 0627, 0634
*Posters for Session A should be setup between 15:30 and 16:00. Poster boards, tape and tacks will be
provided.
School Disaster Management
Strategic Management
0634 Acculturation and Job Satisfaction among Vietnamese Graduates Working in Japan
Nguyen Hoang Duy Phuong, Ritsumeikan Asia Pacific University, Japan1
0509 Study on the Context of School Disaster Management in Taiwan
Jieh-Jiuh Wang, Ming Chuan University, Taiwan1
Disaster Response and Management 0525 Public Hospital Emergency Unit (ER) Preparedness to Manage External Disasters in
Denpasar District – Bali, Indonesia
Edwind Rakatama Fahlevie, Udayana University, Indonesia1
Muhammad Faisal P Utomo, Udayana University, Indonesia2
Pande Mirah Dwi Anggreni, Udayana University, Indonesia3
Ni Kadek Nita Utami, Udayana University, Indonesia4
Social Sustainability
0617 SPR (Livestock School Public) as Form by Student To Reach Social Sustainibility
Melfa Andraini Agatha, Bogor Agricultural University, Indonesia1
Resha Nuzul Safitri, Bogor Agricultural University, Indonesia2
Sustainability Reporting 0627 Measuring and Explaining Government Performance in Developing Solar Electricity
Markets Wei-Ying Chen, National Chengchi University, Taiwan1
The Inaugural Conference on Management and Sustainability in Asia
The Inaugural Conference on Disaster Response and Management in Asia April 29-May 1, 2015 at the Mitsui Garden Hotel Hiroshima, Japan
13
Sponsored by The PRESDA Foundation www.presdafoundation.org
Supply Chain Management
0630 Necessity of Reverse Supply Chains for a Sustainable Modern Economy- A Review
Chetan V. Hiremath, Kirloskar Institute of Advanced Managment Studies,Harihar, India1
Patil S.C, Rani Chennamma University, Belagavi, India2
Urban Planning and Management
0637 Planners' Role Need to be Theorized?
Lakshika Meetiyagoda, University of Moratuwa, Sri Lanka1
Susantha Amarawickrama, University of Moratuwa, Sri Lanka2
Human Resource Management
0639 The Development of Climate Models Based Organization Sundanese Cultural Values
Ani Setiani, Pasundan University, Indonesia1
Human Resource Management
0640 The Development of Dimensions Organization Culture
Isniar Budiarti, University Computer Indonesia1
Day 3: Friday, May 1, 2015
08:00 to 9:00
Virtual Panel I
Room: Asagi
Management and Sustainability: 0614, 0630, 0637, 0639, 0640, 0645
Sustainable Business
0614 The Development Concept of Value, Value Creation and Customer Value Creation
Yenny Maya Dora, Widyatama University, Indonesia1
Sustainable Development 0645 Analysis of Regional Cooperation for a Greener South Asian Economy: A Game Theoretic
Approach
Saleh Reza, Daffodil International University, Bangladesh1 Rabiul Islam Rabi, University of Dhaka, Bangladesh2
Sazid Raihan, North South University, Bangladesh3

The Inaugural Conference on Management and Sustainability in Asia
The Inaugural Conference on Disaster Response and Management in Asia April 29-May 1, 2015 at the Mitsui Garden Hotel Hiroshima, Japan
14
Sponsored by The PRESDA Foundation www.presdafoundation.org
Role of Media in Disaster Response and Management 0508 CyberHaiyanihan: The Use of #RescuePH and #ReliefPH in Twitter during Super
Typhoon Haiyan (a.k.a. Yolanda)
Mariam Jayne Agonos, University of the Philippines, Diliman1 Pauline Jane Celerio, University of the Philippines, Diliman2
Eunice Francesca Elazegui,University of the Philippines, Diliman3
Karisha Anne Cruz (Graduate), University of the Philippines, Diliman4
Disaster Response and Management 0522 Evacu…wait?: A Study on the Reception of Evacuation-related Information
Angelo de Jesus, University of the Philippines Diliman, Philippines1
Marrhon Mangalus, University of the Philippines Diliman, Philippines2
Isabella Perez, University of the Philippines Diliman, Philippines3
Kara Gengania, University of the Philippines Diliman, Philippines4
Mark Vincent Sing, University of the Philippines Diliman, Philippines5
Day 3: Friday, May 1, 2015
08:00 to 9:00
Virtual Panel II
Room: Moegi
Disaster Response and Management: 0506, 0508, 0522
Disaster ICT and Emergency Communications
0506 Application of Information Technology in Emergency and Natural Disaster Management
Zijadin Krasniqi , Tax Administration of Kosovo, Kosovo1

The Inaugural Conference on Management and Sustainability in Asia
The Inaugural Conference on Disaster Response and Management in Asia April 29-May 1, 2015 at the Mitsui Garden Hotel Hiroshima, Japan
15
Sponsored by The PRESDA Foundation www.presdafoundation.org
Day 3: Friday, May 1, 2015
9:00 to 9:30
Featured Presentation
Room: Moegi
0510 Rethinking Disaster Sciences: A Philosophical Approach
Dag Petersson, Royal Academy of Fine Arts, Copenhagen, Denmark1
Coffee, tea, water and light snacks will be served
9:30 to 9:40
Questions and Answers
9:40 to 9:50
Closing Remarks
10:00 to 16:00
Miyajima Tour
*Included with your registration fee
Sponsored by the PRESDA Foundation
www.presdafoundation.org
Miyajima is considered one of the top three views of Japan and a must-see for visitors to Hiroshima.
The tour includes round trip transportation, entrance fee and guidance in English by a professional,
bilingual tour guide. In addition, participants will visit a Japanese teahouse on the island for a cup of
hot green tea and traditional Japanese cake.
Please come to the Asagi room at 9:30 to receive your train pass and information. The tour will depart
from the Mitsui Garden Hotel 1st floor lobby at 10:00.
We suggest that you wear comfortable walking shoes and a hat.
Please note that the tour does not include lunch. We suggest purchasing food and drinks at the 7-11
convenience store next to Miyajima Port or you can eat at one of the many restaurants on the island.
About Miyajima Island “The Shrine Island”
Miyajima Island is the popular name of Itsuku-shima Island, situated in Hatsukaichi City in
southwestern Hiroshima. It is a scenic site in which the mountains, sea, and red shrine buildings blend
together in harmony. The entire island is designated as a UNESCO World Heritage Site. It is said to be
one of the three most beautiful sights in Japan, along with Matsushima in Miyagi Prefecture and Ama-
no-hashidate in Kyoto. The origin of Miyajima is said to date back to when the Itsuku-shima-jinja
Shrine was built in 593 during the reign of Empress Suiko; however, the island of Miyajima itself has
had a long history of being an object of worship, especially Mt. Mi-sen which rises up at the center of
the island.

The Inaugural Conference on Management and Sustainability in Asia
The Inaugural Conference on Disaster Response and Management in Asia April 29-May 1, 2015 at the Mitsui Garden Hotel Hiroshima, Japan
16
Sponsored by The PRESDA Foundation www.presdafoundation.org

The Inaugural Conference on Management and Sustainability in Asia
The Inaugural Conference on Disaster Response and Management in Asia April 29-May 1, 2015 at the Mitsui Garden Hotel Hiroshima, Japan
17
Sponsored by The PRESDA Foundation www.presdafoundation.org
Index of Presenters
Agonos, Mariam Jayne, University of the Philippines Diliman, Page 14
Agatha, Melfa Andraini, Bogor Agricultural University, Page 12
Armundito, Erik, Hiroshima University, Page 7
Budiarti, Isniar, University Computer Indonesia, Page 13
Chen, Jong-Rong, National Central University and Academia Sinica, Page 9
Chen, Wei-Ying, National Chengchi University, Page 12
Chuersuwan, Nares, Suranaree University of Technology, Page 11
Dutta, Arpita, AMA International University, Page 11
Fahlevie, Edwind Rakatama, Udayana University, Page 12
Hamsyah, Fuad, Universitas Gadjah Mada, Page 10
Hiremath, Chetan V, Kirlsokar Institute of Advanced Managment Studies, Page 13
Huang, Chia Hui, Aletheia University, Page 9
Jalal, Elyasuddin, Kumamoto University, Page 6
Joshi, Abhay, Kanazawa Seiryo University, Page 8
Khieochaum, Jatuwit, Chulalongkorn University, Page 9
Kobayashi, Yoko, University of Tsukuba, Page 10
Krasniqi, Zijadin, Tax Administration of Kosovo, Page 14
Krivov, Sergei, Lobachevsky State University of Nizhny Novgorod, Page 7
Lakshika, Meetiyagoda, University of Moratuwa, Page 13
Lanticse, Maribel, Jose Maria College, Page 8
Mangalus, Marrhon, University of the Philippines Diliman, Page 14
Maya Dora, Yenny, Widyatama University, Page 13
Moon, Ha Na, Ewha Womans University, Page 11
Nguyen, Phuong, Ritsumeikan Asia Pacific University, Page 12
Perez, Isabella, University of the Philippines Diliman, Page 14
Petersson, Dag, The Royal Danish Academy of Fine Arts, Page 15
Rabi, Rabiul Islam, Daffodil International University, Page 13
Raihan, Sazid, Daffodil International University, Page 13
Reza, Saleh, Daffodil International University, Page 13
Safitri, Resha Nuzul, Bogor Agricultural University, Page 12
Sañez, Siegfried Kiel, Ateneo de Manila University, Page 10
Santiago, Joseph Sedfrey, Ateneo de Manila University, Page 10
Setiani, Ani, Pasundan University, Page 13
Sing, Mark Vincent, University of the Philippines Diliman, Page 14
Sun, Linlin, The Hong Kong Polytechnic University, Page 6
Tan, Caroline S.L., University of Tsukuba, Page 11
Utomo, Muhammad Faisal P, Udayana University, Page 12
Wang, Jieh-Jiuh, Ming Chuan University, Page 12
Wang, Yu-Min, National Pingtung University of Science and Technology, Page 8
Yeh, Chun Chiao, National Taipei University, Page 6
Yen, Ching-Ho, Huafan University, Page 7


Conference Abstracts
COMSA
Official Proceedings

The Inaugural Conference on Management and Sustainability in Asia Hiroshima, Japan April 29- May 1, 2015
ISSN: 2189-2229
0606 Overview of Urban Management in Kabul, Afghanistan
Elyasuddin Jalal, Kumamoto University, Japan1
Shoshi Mizokami, Dept. of Civil and Environmental Eng., Kumamoto University2
Kabul city (capital of Afghanistan) has recovered from the three decades of war. In addition, the city’s
population has increased dramatically in the last decade and managing such a city is a challenge by
itself. US and International community has largely focused on urban reconstruction of the post conflict
Kabul city. However, In order to bring about sustainable development, sound urban management is
essential. This paper reviews the current state of urban management in Kabul city, with a specific focus
on the relationship between governmental authorities and methodology for master plan’s
implementation. It investigates each urban governmental authority and earlier developed master plans
of the city, consequently identifies the major gaps in the city’s urban management. The overall analysis
suggests that there is a serious need for an alternative urban administrative structure as well as
introducing land use regulations and gradually building up the capacity of urban government
institutions. In addition this paper highlights the two discussing alternatives for a viable administrative
structure namely Kabul metropolitan development council (KMDC) and Kabul metropolitan
government (KMG). The findings of this paper should provide a clear guideline to the city’s
responsible authorities on how to strengthen and reform urban management institutions plus what are
the important steps to be taken in their city planning. Though urban management is not a simple
exercise and criteria of accountability is supreme across all these areas but this study will open the
hidden puzzle for further research.
0609 Air Emission Inventory at Municipality Level in Thailand: The Basis of Air Quality
Management
Nares Chuersuwan, Suranaree University of Technology, Thailand1
Air emissions from point, area, road, and non-road sources were estimated for the first time in the fifth
largest municipality in Thailand, Nakhon Ratchasima Municipality (NRM). Local specific data were
acquired directly from relevant sources. Supplemental data were used when no local data were
available. Point sources included industry, waste incinerator, boiler, and crematorium. Area sources
were petrol station, shrine, construction, agricultural burning, household and commercial sources. Road
transport sources composed of vehicle emissions from highway, main road, side street, and bus depot
while a non-road source was train. The estimation of road transport source was performed with
MOBILEV program that have been used in governmental agency in Europe but the emission data
based on Thailand vehicle emission data. The concerned pollutants were particulate matter, oxide of
nitrogen, carbon monoxide, sulfur dioxide and non-methane hydrocarbon. Source survey, questionnaire,
and traffic count were the primary mean of data gathering while emission factors were acquired based
primarily on local data coupled with international database from U.S. EPA, AP-42, and EU,
CORINAIR. The results showed that road source was the largest contributor of carbon monoxide
(16,146 ton/yr), oxide of nitrogen (1,873 ton/yr), and non-methane hydrocarbon (3,298 ton/yr).
Industrial point source emitted high particulate matter (283 ton/yr) and sulfur dioxide (8 ton/yr). Local
administrators were informed and the local public was consulted with this scientific information as part
of the process of air quality management plan. Implementation of a public transportation system was
introduced as a sustainable alternative for NRM including source control.

The Inaugural Conference on Management and Sustainability in Asia Hiroshima, Japan April 29- May 1, 2015
ISSN: 2189-2229
0614 The Development Concept of Value, Value Creation and Customer Value Creation
Yenny Maya Dora, Widyatama University, Indonesia1
The purpose of this paper to see the development of the definition of the concept of value, value
creation and customer value creation that has been published in journals indexed and generate new
concepts of value, value creation and customer value creation. Formulation of the problem of this paper
is to compare the concept of value creation that is used in research to identify the ten (10) of the journal
contains an explanation of value creation, value and customer value creation during the period 1997-
2014. The approach used to assess the concept of value creation is to compare the concept of value
creation of some experts that have been tested in the study. Implications to be derived from this
analysis is the concept of value creation that is more oriented to the ability of the company's sustainable
competitive advantage. The original contribution of this paper will generate a new concept concerning
the definition of the concept of value, value creation and customer value creation. Keywords: Value,
Value creation, Customer Value Creation, competitiveness, and concepts.
0615 The Scientific Linkage between Patents and Firm Productivity: Evidence from Taiwanese
Electronics Firm Level Panel Data
Jong-Rong CHEN Professor Graduate Institute of Industrial Economics National Central University Chungli, Taiwan and Joint Appointment Research Fellow Research Certer for Humanities and Social
Sciences Academia Sinica Taipei, Taiwan1
Using a unique panel data of the electronics firms listed on the Taiwan Stock Exchange, this paper
explores the scientific linkages between patents held by the firm and its productivity performance. That
is, if the increases in knowledge spillovers from academia to the private sector bring about a
contribution to firm productivity? From the previous studies, it can be seen that knowledge spillovers
from academia to industry have an influence on firms’ abilities of technological innovation. However,
there is not a great body of research regarding how a firm’s patent citations to scientific publications
impact its productivity. Most of the existing studies explore how scientific linkages affect a firm’s
inventive productivity. In this study, there are five models of citation variables defined according to
different citation information. In addition, four levels of scientific linkage can be defined according to
scientific contents for the first four models where citation variables include scientific publications. As
for the econometric consideration, we adopt a two stage least square (2SLS) method with instrumental
variables to reduce the bias caused by the endogenous problem of patent citation data. The empirical
results confirm that the firms’ lagged internal liquidity constraints are good instrumental variables and
that the scientific publications cited by the patents contribute significantly to the firms’ productivity,
especially the publications which are found in the ISI-Web of Science database.
0616 The Energy-efficiency Analysis of Companies in Korea Using DEA
Ha Na Moon, Ewha Womans University, Korea1
Dai-ki Min, Ewha Womans University, Korea2
This paper suggests energy efficiency which can be the foundation on corporate profit and effective
energy management following by change of global climate and of energy-related regulations. Using
comparable financial information and information related to energy use, an DEA(Data Envelopment
Analysis) model has been used to identify energy efficiency with DMU(Decision Making Unit)s which
are Korean companies subjected to reduce greenhouse gas emission in 2009 and 2010 by the law of
Korean GHG and Energy Target Management. Through this research, different from existing
researches, environmental variables which can influence on energy efficiency are identified. The
results show as follows. First, most of companies follow IRS(Increasing Returns to Scale), which
means scale of economy exists among units so that they have more opportunity to increase efficiency
by increasing scale of inputs. Second, this research identified that depending on the difference of
environmental characters such as the emission structure and the size of enterprises, energy efficiency of
the companies turns out differently. Emission structure is specified and tested as different kinds of
emission like as direct, indirect, and process emission and so on. This gives relative managers or
executives some idea that they can have different energy strategies according to their own
environmental condition.

The Inaugural Conference on Management and Sustainability in Asia Hiroshima, Japan April 29- May 1, 2015
ISSN: 2189-2229
0617 SPR (Livestock School Public) as Form by Student To Reach Social Sustainibility
Melfa Andraini Agatha, Bogor Agricultural University, Indonesia1
Resha Nuzul Safitri, Bogor Agricultural University, Indonesia2
Indonesia is one of the richest country with the natural resources. Most of them is potential area and
that is abundant where in remote areas and didn’t optimalized by society. Livestock School Public or
we called SPR ( Sekolah Peternakan Rakyat ) is one of institutions that facilitating in learning process
which is applicative, participatory, systematic and structured to achieving independence and
sovereignty rancher the people by way of provision of access to information science and technology
and strengthening control production and post livestock production. In this achievements , SPR make
the program which is develop and provided assistance through expert and college students .The student
organisations that have a role in its upward course SPR is SMART ( Social Movement on to Animal
Research and Teaching ) which is located in the Faculty of Animal Science Bogor Agricultural
University Indonesia. The form of assistance as SMART action is expected to develop and attract more
interest the breeders in this is particularly students as the agent of change. Students have important
roles in the social sustainibility and food security because student as the facilitators in the life of
community empowerment programs in the village and society. Keyword: SPR, smart, livestock
commodities, the sustainability of social student
0623 The Policy of Multiculturalism in the Countries of South-east Asia: Opportunities of
Practical Applications
Sergei Krivov, Lobachevsy State University, Russian Federation1
Since the mid-1960`s there is a socio-political concept of multiculturalism. In the early 1970’s in
Australia and Canada, and then in a number of European countries, this approach has practical
application. On the basis of this doctrine was developed some practical technologies for managing
diversity. Despite the growing criticism of multiculturalism in Western countries, some scientists assert
the possibility of their use in non-Western societies. Among them: Sudanese scientist Abdullahi
Ahmed an-Na'im, Malaysian Anwar Ibrahim and Indonesian Abdurrahman Wahid. In 1969, Malaysia
was the first in the region attempted to pursue domestic political course based on a policy of diversity
management. Since that time, have continued discussions on the prospects of such approaches in the
various countries of the region. First, as a "crossroads of civilizations", South-East Asia has very
complex religious-cultural landscape. With the widespread growth of the activity of religious
movements existing trouble spots could develop into a zone of open political conflict. Second,
economic growth and modernization in the region contribute to the growth of migration flows. In these
circumstances, the host society must have the mechanisms of adaptation of the newcomers. The main
conclusion is that capacity and the expected degree of such policy effectiveness in the region will
depend on the willingness of the countries of the region to social and political innovation.

The Inaugural Conference on Management and Sustainability in Asia Hiroshima, Japan April 29- May 1, 2015
ISSN: 2189-2229
0624 Innovation Quantity and Quality: Firm-Level Evidence in Taiwan
Chia-Hui Huang, Aletheia University, Taiwan1
Tony Chieh-Tse Hou, National Dong Hwa University, Taiwan2
Taiwan has become one of the most successful NIEs in the world over the past three decades regarding
technological performance. In the technological development process, the Statute for Upgrading
Industries (SUI), which applies tax incentives, subsidies, and supporting measures to assist firm
performance, is considered one of the most significant policies for Taiwan’s industrial technology
firms. However, the tax credit policy that forms part of the SUI expired at the end of 2009. Whether
Taiwan’s innovative capability has declined have important implications for Taiwan, because it helps
the government to make new technology policy to encourage innovations, and then contribute to the
sustainable growth. Therefore, the primary aim of this paper is an analysis of the determinants of
innovation output and the trend of innovation productivity during 2007-2012 for Taiwanese
manufacturing firms. We employ the number of patent count and invention patent to be the innovation
output, and also use the number of patent citation to be the innovation quality. The empirical results
show that firm R&D, firm size and capital intensity have significantly positive effect on firm
innovation output. Moreover, from quantity perspective, innovation productivity is steady increase;
while from the quality perspective, the Taiwanese firms innovation productivity is decrease. We also
find the quality of innovation productivity is decrease sharply after the end of 2009, it implies that the
expiration of SUI has significantly negative impact for firm innovation capability. Therefore, Taiwan
government should continuance to promote a good tax assist policy to help firms’ innovation activities.
0626 Green Technology for Sustainable Development
Arpita Dutta, AMA International University, Bahrain1
After two centuries of unprecedented growth and economic expansion, our planet is bearing the fruits
of rapid industrialization and excessive urban development, in the form of global warming, climate
change and increasing pollution levels. Sustainable Development has emerged as the most viable and
practical model for human activity, that ensures the protection as well as progress of the three main
stakeholders i.e., the economy, the ecology and the community. Green Technology is at the fore-front
of this global movement towards Sustainable Development, and is particularly relevant in the case of
the Kingdom of Bahrain. The main goal of this research is to understand the status and level of
effectiveness of the implementation of Green Technology among the selected companies in the
Kingdom of Bahrain. The study also uncovers the difference in perception about the status and the
actual effectiveness in the implementation. The results showed that whilst respondents attached a high
level of importance to the status of Green Technology, the level of effectiveness was gauged to be not
very effective. Several problems and challenges were brought forth which are hampering the process of
effective implementation of Green technology projects. The study confirmed the hypothesis that there
was very less difference in the perception amongst the respondents pertaining to status and level and
effectiveness of implementation of Green Technology among the selected companies in the Kingdom
of Bahrain.

The Inaugural Conference on Management and Sustainability in Asia Hiroshima, Japan April 29- May 1, 2015
ISSN: 2189-2229
0627 Measuring and Explaining Government Performance in Developing Solar Electricity
Markets
Wei-Ying Chen, National Chengchi University, Taiwan1
This paper evaluates the productivity of solar power markets in countries with developing solar power
markets. It does so by investigating the extent to which governments can decrease support while
maintaining electricity utilization levels, and increase solar power generation while decreasing CO2
emissions. To address both issues with a view to improving energy utilization efficiency, this paper
evaluates the performances of 25 selected countries against a Non-Separable DEA model (a DEA
measure with non-separable desirable and undesirable outputs for evaluating efficiency). Panel data
covering the period 2009 - 2012 reveals that in terms of pure technical efficiency, developing countries
are slightly better of, on average, than developed countries, though in terms of overall efficiency,
developed countries appear to be significantly more efficient. The findings of this paper highlight that
inefficient countries could catch up with their peer groups and become more efficient by (1)
stimulating liberalization of electricity markets and competition in a regulated-network environment
and (2) increasing the complementary service infrastructure in conjunction with incentive mechanisms.
0628 The Business Model Innovation for Carbon Capture and Storage
Chun-Chiao Yeh, National Taipei University, Republic of China (Taiwan)1
Chien-Ming Lee, National Taipei University, Republic of China (Taiwan)2
Carbon capture and storage (CCS) is an effective clean coal technology for mitigating greenhouse gas
emissions around the world. However, the cause of uncertainty of carbon price and investment
irreversibility will postpone investment activities known as investment paradox. The purpose of this
research is to establish an innovative business model for stimulating CCS investment activities. This
study uses real options to assess the efficiency of business model under carbon price uncertainty. The
results are as following: 1. The operation grant is the most efficient policy for encouraging CCS
investment to overcome the investment paradox. 2. We should adopt CO2 utilization strategy under a
high carbon price scenario. 3. We should adopt a low carbon power rate strategy under a low carbon
price scenario. 4. The reasonable prices for CCS commercial operations are NT$ 318 per ton for CO2
utilization and NT$ 0.90 per kWh for low carbon power rate.
0630 Necessity of Reverse Supply Chains for a Sustainable Modern Economy- A Review
Chetan V. Hiremath, Kirloskar Institute of Advanced Managment Studies, India1
Patil S.C, Rani Chennamma University,Belagavi,India2
The challenges of market economy have forced companies to design not only better products but also
better delivery and distribution networks. Over a period of time companies started using the same
networks to collect defective parts and products from end customers, in a reverse direction. These
networks not only transport used-products for reuse, repairing, remanufacturing or recycling, but also
have service components like repairs, maintenances, recalls, etc. (Álvarez et al 2007;Harrison & Van
Hoek 2008). Today these networks have emerged as a fully integrated closed loop networks. The most
recently amended scope of logistics and supply chain management by the Council of Supply Chain
Management Professionals (CSCMP 2009) includes both the forward and reverse goods flow. Also,
such networks have helped organisations fulfil their regulatory requirements and environmental
concerns. Though costlier to establish such closed loop networks, they help in increasing the overall
business profitability and make companies “greener” (Brodin 2002 as cited in Yin Wei 2011;
Blumberg 2005). Today even the city municipalities are using these networks to convert “waste into
wealth”. This paper reviews the evolution and applications of these closed loop supply chains, which
are also popularly referred to as reverse logistics and supply chains.

The Inaugural Conference on Management and Sustainability in Asia Hiroshima, Japan April 29- May 1, 2015
ISSN: 2189-2229
0631 Food Related CSR Initiatives Post-3.11: When Risk and Trust Affect Consumer Behavior
Caroline S.L. Tan, University of Tsukuba, Japan1
Corporate social responsibility has long become a necessity for corporations as it responds to
stakeholders’ pressure for being socially responsible. Nielsen conducted a corporate social
responsibility study in 2014 and the results showed that 64% of the Asia-Pacific respondents indicated
their willingness to pay extra for products and services that are committed to positive social and
environmental impact. In 2013, Yoshinoya announced that it will start cultivating rice and other
vegetables through a joint-venture with local farmers in Fukushima with an investment of ¥10 million
beginning 2014. Seven-Eleven and other food companies switched to using produce from Fukushima.
This move was aimed at lowering costs and improving the supply chain and at the same time contribute
to the reconstruction of Fukushima post 3.11. Using the Theory of Planned Behavior this study
examines consumers’ attitude towards such CSR initiatives and its impact on consumer behavior.
While previous studies show that CSR initiatives has been found to be positively influencing consumer
behavior, the findings of this study proved otherwise. The results indicate that factors of trust and
perceived risk play a major role in determining consumption and purchase decisions. Interestingly, the
element of personal impact and implication influenced the consumers’ decisions and showed that
unlike the majority of CSR initiatives that proved to be success stories, such decision could bring about
both a positive and negative effect.
Keywords
Corporate Social Responsibility, Trust, Perceived Risk, Consumer Behavior, Theory of Planned
Behavior
0633 The Effects of Financial Statements’ Reliability and Risk Attitude to Cost of Debt for the
SMEs Loan: Evidence from Thailand
Jatuwit Khieochaum, Chulalongkorn University, Thailand1
Uthai Tanlamai, Chulalongkorn University, Thailand2
This study examines whether financial statements’ reliability, which are measured by type of auditor’s
report, and the risk attitude of credit officers have the combine effect to their decision on cost of debt.
We conduct 3x3 between-subjects experiment, three levels of the financial statements’ reliability
(which are unqualified, emphasis and qualified auditor opinion) and three levels of the risk attitude
(risk lover, risk neutral and risk averse). The result show that, there are very few risk lover credit
officers, thus further analyse was based on 3x2 between-subjects experiment. The results suggest that
risk attitude influences the credit officers’ decision on cost of debt of the loan. However, there is no
significant difference being found in cost of debt granted among 3 types of auditor’s report. The study
findings suggest that information content in auditor’s report has limited communicate from auditors to
credit officers in the SMEs lending process environment in Thailand.

The Inaugural Conference on Management and Sustainability in Asia Hiroshima, Japan April 29- May 1, 2015
ISSN: 2189-2229
0634 Acculturation and Job Satisfaction among Vietnamese Graduates Working in Japan
Nguyen Hoang Duy Phuong, Ritsumeikan Asia Pacific University, Japan1
In the world, the empirical researches regarding the relation between acculturation and job satisfaction
of expatriates working in the host countries are diverse. Nevertheless, the research on Vietnamese
workers in Japan is currently unavailable. Even though the number of Vietnamese students successfully
getting the job in Japan is very impressive, there is the lack of feedback and information about their job
satisfaction and career life after graduation. The substantial differences in culture, language, social
manner and organizational behaviors are predicted to be the hinder for them to get accustomed to their
workplaces. Based on the case of Vietnamese students graduating from Ritsumeikan Asian Pacific
University (APU), this research firstly aims to examine the acculturation process of Vietnamese APU
graduates in their Japanese workplaces. Secondly, the research also aims at figuring out how
acculturation influences job satisfaction among the Vietnamese graduates. In order to assess the
correlation between two variables of acculturation and job satisfaction in this research, acculturation
and job satisfaction theory will be applied using quantitative methodology. Acculturation is measured
by adopting the unidimensional model, while job satisfaction is measured by utilizing the short form of
the Minnesota Satisfaction Questionnaire. The survey of a sample of 40 Vietnamese APU graduates is
on the progress to produce useful information for Japanese domestic companies and organizations to
manage better their Vietnamese employees. The research will be presented in the COMSA 2015 under
the format of poster presentation with the full paper submission.
0635 Developing a Double Sampling Plan Based on Cost Model
Ching- Ho Yen, Huafan University, Taiwan1
Sampling plan is a judgmental tool used to decide whether accepting or rejecting a lot based on the
information obtained from the samples. Therefore, how to design an economical criterion for lot
sentencing is essential. For different sampling plans, the single sampling plan and double sampling
plan are currently the most widely used in the manufacturing industries. In this study, we design a
double sampling plan considering the view of cost based on the cost model of single sampling plan
proposed by Hsu (2009) and a comparison is made with Hsu (2009). Given producer's risk, consumer’s
risk and the corresponding quality level, we find the relevant parameters and corresponding total costs
of the two sampling plans by minimizing the costs of sampling plan. The results found in this study
indicate that our proposed methodology has the advantage of smaller costs than that of Hsu (2009). In
addition, in order to understand the extent the cost parameters affect the total cost, we consider changes
in specific cost parameters and changes in all cost parameters simultaneously to implement the
sensitivity analysis of total cost. The results of study find that the unit inspection cost has the most
significant impact on the total cost, followed by the unit external failure cost, and the unit internal
failure cost as the least
0637 Contemporary Planning Practice need to be theorized?
Lakshika Meetiyagoda, University of Moratuwa, Sri Lanka1
Susantha Amarawickrama, University of Moratuwa, Sri Lanka2
Planners' role need to be theorized? Lakshika Meetiyagoda* [email protected] Susantha
Amarawickrama* [email protected] * Lecturer, Department of Town & Country Planning,
University of Moratuwa, Sri Lanka Contemporarily, it has mostly accepted the communicative
planning theory and consider planners are persuaded to be in favour of public participation and work
based on information than numbers. However, the planners' role is still ill-defined based on their
contextual values and expectations of people by urban theorists. In this context, this paper aims to
examine whether planners' values and choice is determined the context and values of people and how it
impacts to project success. Apart from the observations and informal discussions, interviews are done
to get the perception of planners and people's perception about the project and process is collected
through questionnaire surveys. Two resettlement projects from Sri Lanka and Hong Kong contexts are
selected as case studies to compare and contrast the situations. Content aalysis (interviews) and SPSS
analysis (questionnaire) are used and the research findings highlight that according to the context and
people's values and choice, planners' values are changing and that flexibility produce a successful
project outcomes. Keywords: Planners, Values, Theory
The Inaugural Conference on Management and Sustainability in Asia Hiroshima, Japan April 29- May 1, 2015
ISSN: 2189-2229
0638 Baseline Analysis of Productivity Changes with and without Considering Carbon Dioxide
Emissions in the Indonesia’s Manufacturing Sector
Erik Armundito, Hiroshima University, Japan1 Shinji Kaneko, Hiroshima University, Japan2
This paper provides a baseline analysis of TFP growth over time without and with CO2 emissions
using four periods of the Indonesia’s manufacturing sector firm-level panel data: 1990-1995, 1998-
2000, 2003-2006, and 2008-2010. It is assumed that carbon regulations have been imposed so as the
undesirable outputs are weakly disposable. Malmquist productivity index is employed to estimate TFP
growth without CO2 emissions and Malmquist Luenberger productivity index is applied to estimate
TFP growth with CO2 emissions. Furthermore, environmental productivity and the influent of energy
factors on environmental are also investigated in this paper. The results show that on average, TFP
growth is higher when considering CO2 emissions as undesirable outputs in productivity measurement,
particularly for the first, second, and fourth periods. Technical progress is the basis of productivity
growth after energy subsidy removal and the change of environmental productivity is associated with
the adjusted energy prices. Constructive policy designs can be derived from this paper are: (i) CO2
emissions as undesirable outputs can be considered in measuring productivity growth to obtain an
actual TPF growth, (ii) carbon regulations are feasible to be implemented on the Indonesia’s
manufacturing sector to response climate policy, and (iii) technological improvements should be a
major concern for the manufacturing firms’ long-term strategic planning.
0639 The Development of Climate Models Based Organization Sundanese Cultural Values
Ani Setiani, Pasundan University, Indonesia1
The Development of Climate Models Based Organization Sundanese Cultural Values By Ani Setiani
Lecturer Pasundan University Bandung Indonesia Abstract Research with the primary purpose of
generating a sufficiently climate models based organization Sundanese cultural values that has a
special character and tested so it deserves to be used in preserving local knowledge. This research is
motivated by a number of companies who stand in society without looked Sunda local wisdom in him.
With climate models organizations accurate, is expected to contribute to the society around in
preserving their local wisdom. Formulation of the problem this paper is how to develop climate models
based organizations Sundanese cultural values. This paper will be implemented with the design of
research and development (Research and Development / R & D) approach Sunda chiefs. Implications
to be derived from this research is the development of climate models based organization Sundanese
cultural values. The original contribution of this paper will generate a new model based on
organizational climate Sundanese cultural values. Keywords: Models, Organizational Climate,
Sundanese Cultural Values, Local Wisdom
0640 The Development of Dimensions Organization Culture
Isniar Budiarti, University Computer Indonesia, Indonesia1
The purpose of this paper to determine the development of the concept of organizational culture
dimensions were published in journals indexed from 2003 - 2013. And the new construct for generating
organizational culture dimensions. Formulation of the problem this paper analyzes the concept of
organizational culture dimensions to produce the dimensions of the concept. Studies done by
identifying the organizational culture dimensions of organizational culture. . The approach used to
assess this literature is to compare the concept of organizational culture of 10 (ten) experts who have
been tested in the study. Implications to be derived from this analysis is the dimension of
organizational culture is oriented to the internal organization to generate new dimensions of
organizational culture construct that can be used by the management organization The original
contribution of this paper will generate a new construct of organizational culture dimensions.
Keywords: organizational culture, Dimensions, management, and construct.

The Inaugural Conference on Management and Sustainability in Asia Hiroshima, Japan April 29- May 1, 2015
ISSN: 2189-2229
0641 The Issues of Urban NIMBY Conflict Management in China
Linlin Sun, The Polytechnic University, Hong Kong1 Edwin H.W. Chan,The Polytechnic University, Hong Kong2
Dajian Zhu, Tongji University, Shanghai, P.R. China3
This paper aims to examine the issues of urban NIMBY conflict in China. Since 1970s, NIMBY (Not-
In-My-Back-Yard) syndrome has become a worldwide challenge for urban development. Since 2007,
urban NIMBY conflict events have frequently occurred in China. With the rapid urbanization in China,
experts have predicted that in the next decade NIMBY phenomenon would appear frequently. However
urban NIMBY conflict management research is on the initial study stage in China and western scholars
also doubt whether the western theory applicable. This study first constructs a general framework
based on the PSR (press-state-response) framework to analyze urban NIMBY conflict. NIMBY facility
type, the interaction between local government and the residents and the management strategies are the
variables in the analysis framework. Based on the four case studies that represent the NIMBY conflicts
arousing by four kinds of NIMBY facilities, the issues of urban NIMBY conflict in China are identified.
The results show that few windows for public participation to NIMBY facility decision making, EIA
report of the planning stage and the project EIA report are not access to public, local government’s
stability maintenance approach response intensify public opposition to NIMBY facilities in China. In-
depth analysis on the causes behind the issues found in this paper needs to be studied in the future.
0645 Analysis of Regional Cooperation for a Greener South Asian Economy: A Game Theoretic
Approach
Saleh Reza, Daffodil International University, Bangladesh1
Rabiul Islam Rabi, University of Dhaka, Bangladesh2
Sazid Raihan, North South University, Bangladesh3
This paper explores the necessity of engaging in regional cooperation to combat climate change in
South Asia as an agenda for greening the South Asian Economy. Using a game theoretic approach, this
paper aims to reflect certain situations where mutual cooperation leads to a pareto-efficient outcome.
Climate change has become a core issue for South Asia as the entire region is vulnerable to the impact
of environmental degradation and regional collaborative efforts to mitigate the impacts of climate
change have gained prominence. Various measures for greening the South Asian Economy like-
providing capital for low-carbon technologies, a massive regional afforestation and reforestation
campaign, future plans to protect archaeological monuments, strengthen understanding of shared
oceans, biodiversity, mountain ecosystems, monsoon initiative, and plan for disaster risk reduction-
calls for a wide scale regional cooperation. Analyzing different game situations, this papers aims to
delineate certain circumstances when regional cooperation can lead to the pareto-efficient outcome.

Full Papers
COMSA
Official Proceedings

Hiroshima, Japan
April 29- May 1, 2015 The Inaugural Conference on Management and Sustainability in Asia
ISSN: 2189-2229
OVERVIEW OF URBAN MANAGEMENT IN KABUL, AFGHANISTAN
ELYASUDDIN JALAL Civil and Environmental Engineering
Kumamoto University, Japan
Prof. Shoshi Mizokami Civil and Environmental Engineering
Kumamoto University, Japan
……..
ABSTRACT
Kabul city (capital of Afghanistan) is heading towards recovering from the devastations of
past three decades of war. In addition, the city’s population has increased dramatically in the last
decade and managing such a city is a challenge by itself. The US and International community have
mainly focused on urban reconstruction of the post conflict Kabul city. However, in order to
investments bring about sustainable development, sound urban management is essential.
This paper reviews the current state of urban management in Kabul city, with a specific
concentration on the relationship between governmental authorities and the methodology for master
plan’s implementation. It investigates each urban governmental authority and earlier developed
master plans of the city, consequently identifies the major gaps in the city’s urban management.
The overall analysis suggests that there is a dire need for an alternative urban administrative
structure. Also, the necessity for land use regulations and gradually enhancing the capacity of urban
government institutions. In addition this paper highlights the two discussing alternatives for a viable
administrative structure namely Kabul metropolitan development council (KMDC) and Kabul
metropolitan government (KMG).
The findings of this paper should provide a clear guideline to the city’s responsible authorities
on how to strengthen and reform urban management institutions. Meanwhile, it aids them to know
important steps to purse for their city planning. Despite the fact that, neither the urban management
is a simple exercise, nor the criteria of accountability are petty across all these areas, yet this study
will open the hidden puzzle for further researches.
Keywords: Kabul, urban, planning, management.
1 INTRODUCTION
Kabul is the capital of the Islamic Republic of Afghanistan. The largest city of the country,
Kabul is a very historic area of the region. It’s located in the eastern section of Afghanistan.
Kabul becomes the capital of Afghanistan in 1773 under the reign of Timur Shah, who move
the capital from Kandahar province. Kabul city showed its first urban movements in 1950’s, during
which Jadayi Maywand Road was constructed together with the Kabul University and Maiwand
Hospital. Kabul city’s first master plan was prepared in 1962 for the 800,000 population and then
revised in 1978 for a population of 2 million. By 1967, the city had ninety-seven secondary,
technical and vocational schools and a university.
The population of Kabul city was 2,268,300 in 2005 as estimated by Central Statistics Office
for the older city area consisting of 14 districts. The jurisdiction of the Kabul Municipality area was
expanded in January 2005 to 22 districts and the population increased to 2.4 million. The
population of Kabul city was estimated 4.22 million in 2008 by Japan International Cooperation
Agency (JICA) study team and the municipality area was expanded to 1022.7 km2. This great city

Hiroshima, Japan
April 29- May 1, 2015 The Inaugural Conference on Management and Sustainability in Asia
ISSN: 2189-2229
is now suffering from its rapid population growth and needs an adequate urban management to
guide it towards sustainability. 1
Islamic Republic of Afghanistan has considered Urban Management as the 12th pillar of the
National Development Plan. Progressively the Afghan government is concentrating on its urban
reconstruction and development hand to hand with international donors, though without a sound
management and effective administrative systems, outcomes can’t be viable.
2 KABUL URBAN ADMINISTRATIONS:
Afghanistan is a highly centralized government which specifies the power of all provincial
and local governments. The world is moving towards promoting greater decentralization; in
addition centralized governments are so problematic and found mostly in less developed countries.
Afghanistan government is ultimately supreme and any administrative division exercises only
powers that their central government chooses to delegate.
Kabul municipality has the status of a ministry and mayor is selected by the president and
reports directly to the president. Kabul Municipality is part of the national government and it is
responsible for a) Implementing master plan, b) Housing, roads and parks construction and
maintenance c) canals and ditches construction d) Distribution of land plots e) Cultural services f)
Expansion and maintenance of markets g) City cleaning and garbage collection. Municipal revenue
collection is regulated by the ministry of finance and rates for all taxes and fees collected are set in
Kabul. The Kabul municipality’s budget is made of accustomed budget and advancement budget.
Accustomed budget is based on its own revenues and is spent for salary and maintenance.
Advancement budget is given from the ministry of finance and it is spent for infrastructure
development.2 As the result of centralized government Kabul municipality is not responsible for
Kabul city “education, health, water supply and public transportation”.
Ministry of Urban Development is established in 1992. Ministry of Urban Development
Affairs has the responsibility of planning and leadership of urban policy, supporting municipalities,
urban development and the provision of urban master plans according to the National Development
Strategy. It is also responsible for housing activity guidance and policy making as well as actual
urban construction, maintenance and management. MoUD has it’s headquarter office in Kabul and
7 offices in Jalalabad, Kunduz, Mazar-i-sharif, Herat, Kandahar, Khost and Bamyan cities. Kabul
Municipality has lost its all authorities to approve plans to the MoUD. This has caused a great deal
of frustration among municipal bureaucrats. They argue that they themselves should be in charge
of the city. Kabul municipality and Ministry of Urban Development (MoUD) both claims the
master plan reviving responsibility. 3
Electoral law for municipalities was passed in 2003 in order to manage the electoral affairs of
the municipalities and their districts. According to this law, mayors, members of municipal councils
and district associations are to be elected for a term of three years with the mayor being elected
indirectly from among municipal council members on the basis of a secret ballot. 4 The constitution,
adopted by all 502 delegates of the Loya Jirga on 3 Jan 2004 states that “To administer city affairs,
municipalities shall be established, the mayor and members of municipal councils shall be elected
through free, general, secret and direct elections.” 5 This is in line with government commitment to
install democratically elected governments at the national and local levels. In addition despite the
fact that city mayors should be elected by people, at the present time the Kabul mayor is selected
directly by president of Islamic republic of Afghanistan.
Implementing Kabul urban planning will be a back-breaking task because of the
uncoordinated urban administrations, unstandardized jurisdiction and lack of capable human
resources for urban development and management in Afghanistan. The present obstacles will be
elevated in forthcoming future by rapid population growth and attachment of new cities in the
Kabul metropolitan area. In addition the latest master plan for the Kabul metropolitan area has
indicated the need for a new Kabul city in Dehsabz and Barikab. Change is the only answer for
Kabul urban administrations corresponding to its management problems, urban population growth
and urbanization area expansion.

Hiroshima, Japan
April 29- May 1, 2015 The Inaugural Conference on Management and Sustainability in Asia
ISSN: 2189-2229
Metropolitan governments are varied worldwide according to their territory, jurisdiction,
institutional depth and democratic intensity. This paper has overviewed the urban administration
forms that Kabul urban administration can take to confront the challenges in politics, economics
and society. 6 Thus recommends that best alternative for the present Kabul urban administrative
structure can be Kabul metropolitan development council (KMDC) or Kabul metropolitan
government (KMG).
The Kabul metropolitan development council (KMDC) is a joint group from the local
governments. At first local governments select the KMDC members, and then KMDC members
select their executive manager from among them. In this procedure the power of local governments
still remains the same and by consultation in this association local governments can formulate their
common policies and implement them individually. This type of coordinating councils can be found
in most metropolitan areas, for example the metropolitan Washington Council of Governments
(WASHCOG), was created in 1957 for the Washington metropolitan area. The same structure is
also found in El Salvador in the Council of Mayors for the Metropolitan area of San Salvador.
The Kabul Metropolitan Government (KMG) is a more integrated and powerful authority.
The governor of the KMG is directly selected by people. KMG will be a single metropolitan
government to govern and manage the region of Kabul metropolitan area. The existing Kabul city
and the new cities will have its own municipalities and will work under coordinated, transparent
and qualified Kabul metropolitan government. This is the case in Tokyo and in Toronto. [ 7, 8, 9]
Figure 1: Proposed Urban Administrations for Kabul City
Kabul Metropolitan Government (KMG), Kabul metropolitan development council (KMDC)
Great Afghanistan demands flexible structures to coordinate local participation around target
initiatives. Change is the only absolute and changing gradually is the key to success for the post
conflict Kabul city. Achieving a cooperative, effective and united urban administration needs
initiations in administrative structures, merging adjoining municipalities and expanding the
jurisdictions in accordance with population growth and urbanization area expansion. Kabul
metropolitan development council can be an easier option though the Kabul metropolitan
government can be considered as a long term achievement. These options needs more discussion
and investigations, it can be controversial but after all nothing will began without initiating any
action.
3 KABUL URBAN PLANS
The Four master plans are formulated to shape the urbanization of Kabul city. First master
plan was prepared in 1962 by Afghan and USSR experts for 800,000 inhabitants in the area of
23,780 ha. The second and third master plans were prepared in 1970 and 1978 for the population of
1.4 million and 2.0 million respectively, both were the revised versions of the first master plan.
These master plans of the Kabul Municipality were composed of a general plan, 10 structure plans

Hiroshima, Japan
April 29- May 1, 2015 The Inaugural Conference on Management and Sustainability in Asia
ISSN: 2189-2229
and many detail plans. It represents a unitary type urban planning system to include both basic
broad development and detail district plans. The master plan includes the three sorts of regulation
provisions: 1) regulations on implementation project, 2) regulations on land acquisition, and 3)
regulations on distribution and sales of land plots and buildings. These regulations provide very
general descriptions and plausible procedures to be taken in master planning. [10, 11]
In 2007 and 2008 planning studies were carried out by Consultancy Services for Preparation
of Development Plan for Kabul, Afghanistan (ICT) supported by the World Bank. Kabul
Metropolitan Area Urban Development (KMAUD) master plan covering the existing Kabul city
and New City Development area (Dehsabz) was prepared by support of Japan International
Cooperation Agency (JICA) in 2008 and 2009. The ICT study was aiming to identify development
projects for Kabul City, while the KMAUD Master Plan was to formulate a regional development
plan. 12
Figure 2: Estimation of Existing Population for Kabul City by Various Studies
Consultancy Services for Preparation of Development Plan for Kabul, Afghanistan (ICT), Japan
International Cooperation Agency Master Plan (JICA MP), and Central Statistics Office (CS0)
(Source: Kabul city Master Plan,2011)
In 2011 JICA established “Kabul City Master Plan” by fully utilizing the results of the ICT
Study and the KMAUD Master Plan. This master plan replaced the third Kabul city master plan
which was the last master of Kabul City approved in 1978. The target area of this master plan is the
entire territory of the Kabul municipality, consisting of 22 districts and approximately 1023 km2.
The target year of this master plan is 2025 and ICT estimated at 4.5 million for the existing
population in 2008 and 8.0 million for the planning year of 2023 and the JICA study team estimated
4.1 million in 2008 and 6.7 million for the metropolitan area, including 1.5 million for the new city,
toward 2025.
The latest Kabul City Master Plan prepared by JICA has an overview of natural and
socioeconomic conditions including population of the Kabul Municipality area. In this master plan
major policies and planning conditions are formulated, most importantly Land Use Map for the
Kabul municipality area and land development policies and strategies are initiated. This master plan
has composed the transport infrastructure development plan and utilities development plans for
water supply, drainage, sewerage, power distribution, information and communication technology
network and solid waste management. 13 The Kabul city master plan assigns a primary vision for
the future of Kabul city, though the structure plan and detailed plans of the former master plan are
not revised and municipality will face to some dilemmas in implementation of the master plan.
6000
5000
4936 4533
4007 4307
4000 3365
3000 2727 2991 3052
2000
CSO-16 Districts
CSO-22 Districts
JICA MP
ICT
1000
0
2008 2010
Po
pu
lati
on
(1
00
0)

Hiroshima, Japan
April 29- May 1, 2015 The Inaugural Conference on Management and Sustainability in Asia
ISSN: 2189-2229
Mostly master plans setup the macroscopic planning and broad urban policies. Master plans
are not responsible for all matters related to urban planning, and land use regulations from broad
developments plans to very detail plans. Smoothly
implementation of Kabul Master Plan (KMP) can be done by the establishment of Kabul Land Use
Regulations (KLR) closely coordinated with of Afghanistan Building Codes (ABC) beside the
Kabul Master Plan.
Figure 3: Land Use Map of Kabul City
(Source: Ministry of Urban Development)
Former Master Plan had the full authority to shape the Kabul city. It was consist of general
plans, structural plans and detail plans. All the urban obstacles were concentrated on former
individual detail plans. Therefore it was creating barriers for the development of Kabul city and
discouraged the motivation and participation in urban development activities of private sector. The
current Kabul Master Plan (KMP) will give the full opportunity for fully using the people and
private sector’s creativity.14, 15 The people, private developers and constructors should make
concrete plans of urban development for individual sites, complying with Kabul Land Use
Regulations and Afghanistan Building Codes (ABC).
It is found that up to date there is no Land Use Regulations for Kabul city, which is the most
fundamental, laws of urban planning. Land Use Map of Kabul city are categorized to Residential,
commercial and Industrial zones by JICA’S latest master plan. The main Land Use Regulations
which are very necessary are the height control, types of buildings, building density and provision
of greenery.
In view of improving Kabul urban management Land Use Regulations and detailed plans will
be candidate tools to provide a solid basis for guiding urbanization and individual urban
development activities. Land Use Mapping provides open and clear criteria for citizens. The Land
Use Mapping system and regulatory mechanism have strong advantage of stimulating the private
sector’s motivation and commitment for urban development activities and achieving their novelty
and originality in planning and developments. Provided that Land Use Mapping is used as main
regulatory framework for land use, it is not necessary to define detailed land use for the whole area
by many detail plans. It will enable to save time and energy of the public sector.
Lack of skilled professional staff is another obstacle for effective urban governance, smooth implementation process of master plan and overall better urban management of Kabul city. There is

Hiroshima, Japan
April 29- May 1, 2015 The Inaugural Conference on Management and Sustainability in Asia
ISSN: 2189-2229
no any program for urban studies in Afghanistan’s education system. Faculty on urban studies is
highly recommended either in Kabul University or Kabul Polytechnic University, which are the
leading universities of Kabul city. At the other hand the new urban regulatory system of Kabul city
should be educated to public urban administrations and private company engineers and architects.
Public sector should learn how to supervise, manage and govern the Kabul city by using Master
plan of Kabul city, Land Use regulations and Afghanistan Building Codes (ABC). Private
company’s engineers and architects should also learn how to design their projects to meet the new
urban standards. Otherwise our initiatives won’t achieve long term sustainability.
4 CONCLUSION
To conclude, this composition articulates the overall urban management of Kabul city. The
main result indicates that initiations are required in urban administration, planning and capacity
building. This paper recommends two alternatives for urban administrations of Kabul city; for short
term plan, the Kabul Metropolitan Development Council (KMDC) and for long term plan, the
Kabul Metropolitan Government (KMG).
Consequently, to achieve the principles of Kabul Master Plan, Land Use Regulations should
be formulated in coordination with the Afghanistan Building Codes (ABC). Also, to implement any
new regulatory system extensively, the public and private sectors should be educated on its
application.
Data gathering is time and effort consuming in Afghanistan. The reason behind this is the lack
of coordination between governmental authorities and inaccessibility of data on the Internet.
Finally, this composition will provide some holistic ideas to the city authorities on
strengthening the Kabul urban administrations. Strong and decisive urban planning, laws and
regulations will assure the implementation of the city’s master plan.
Additional researches are required to further study the details of the above results.
REFERENCES
[1] Central Statistics Office (CSO), Estimated Population of Kabul City by District and Sex, 2008-09 Afghanistan.
[2] JICA study for the development of the master plan for the Kabul metropolitan area in the Islamic republic of
Afghanistan, Urban Planning and Related Institutions, September 2009, Kabul Municipality, Afghanistan. Page 2-
6 to 2-11.
[3] Article 5 of Municipal Law of Afghanistan and Kabul city Implementation Rule for Master Plan decree No.29,
1379.
[4] Transitional Islamic state of Afghanistan, Ministry of Justice, Electoral law for municipalities, official gazette no.
814, December 2003.
[5] Article 141, 2004 constitution, adopted by all 502 delegates of the Loya Jirga on 3 Jan 2004.
[6] Urban Indicators for Managing Cities- Asian Development Bank- Matthew S. Westfall and Victoria A. de Villa,
Chapter 1, Page 3-15.
[7] United Cities and Local Governments, Metropolitan Governance- Jefferey Sellers, Vincent Hoffmann- Martinot,
Page 254- 278
[8] Rethinking Sustainable Development: Urban Management, Engineering, and Design. Tan Yigitcanlar, Suharto
Teriman, Severince Mayere, Queensland University of Technology, Australia. Chapter 1- Sustainable Urban
Development: An integrated Framework for Urban Planning and Development.
[9] Shaping Urban Features- Challenges to Governing and Managing Afghan Cities- Jo Beall and Daniel Esser.
March 2005, Page 15-45
[10] JICA study for the development of the master plan for the Kabul metropolitan area in the Islamic republic of
Afghanistan, Urban Planning and Related Institutions, September 2009, Kabul Municipality, Afghanistan. Page 2-
1 to 2-3

Hiroshima, Japan
April 29- May 1, 2015 The Inaugural Conference on Management and Sustainability in Asia
ISSN: 2189-2229
[11] Draft Kabul City Master Plan- Sub Project for Revise the Kabul City Master Plan, Japan International Cooperation
Agency (JICA). Kabul Municipality, Afghanistan. Page S-1 to S-12.
[12] Land Use Policy, Department of Urban Planning, Kabul Municipality. Page 3-11
[13] Draft Kabul City Master Plan- Sub Project for Revise the Kabul City Master Plan, Japan International Cooperation
Agency (JICA). Kabul Municipality, Afghanistan. Page 1-1 to 1-3
[14] Zoning and Land Use Regulation- William A. Fischel- Professor of Economics, Dartmouth College. Page 403-
412.
[15] Kabul Urban Policy Notes Series n.3, “Should Kabul grow by expanding a new town or by building up its existing
suburbs?” Page 4-8.

Hiroshima, Japan
April 29- May 1, 2015 The Inaugural Conference on Management and Sustainability in Asia
ISSN: 2189-2229
THE DEVELOPMENT CONCEPT OF VALUE, VALUE CREATION AND CUSTOMER VALUE CREATION
Yenny Maya Dora
Lecturer Faculty of Business and Management Widyatama University Students Doctoral Program In Business And Management Padjadjaran University
Bandung - Indonesia [email protected]
……..
Abstract
The purpose of this paper to see the development of the definition of the concept of value,
value creation and customer value creation that has been published in journals indexed and
generate new concepts of value, value creation and customer value creation. Formulation of
the problem of this paper is to compare the concept of value creation that is used in research
to identify the ten (10) of the journal contains an explanation of value creation, value and
customer value creation during the period 1997-2014. The approach used to assess the
concept of value creation is to compare the concept of value creation of some experts that
have been tested in the study. Implications to be derived from this analysis is the concept of
value creation that is more oriented to the ability of the company's sustainable competitive
advantage. The original contribution of this paper will generate a new concept concerning the
definition of the concept of value, value creation and customer value creation.
Keywords: Value, Value creation, Customer Value Creation, competitiveness, and
concepts.

Hiroshima, Japan
April 29- May 1, 2015 The Inaugural Conference on Management and Sustainability in Asia
ISSN: 2189-2229
Background
Value creation is essential for sustainable competitive sustainability. However, in defining
the concept of value creation is still experiencing confusion. Where is the common concept of
value creation refers to the concept of customer value creation process. Problems still vague
definition related to the number of terms used. This is what needs to be clarified to avoid
confusion.
The concept of value creation has been studied by many experts, including: Gummesson
(1998), Vargo and Lusch, (2004, 2008), Christian Grönroos and Annika Ravald,
(2011), Normann and Ramirez, 1993; Holbrook, 1996; Ravald and Grönroos,
1996; Vandermerwe, 1996; Wikstrom, 1996; Woodruff and Gardial, 1996; Normann,
2001; Prahalad, 2004; Vargo and Lusch, 2004;Grönroos, 2000, 2006, 2008; Lusch et al.,
2007; Ravald, 2008), Varga and Morgan (2005).
In the opinion of Grönroos 2008; cf. Varga, Maglio and Akaka (2008), ... the creation of
value has been recognized as a process that enhances the welfare of customers through user
be better in some ways.
Referring to the opinion Voima, Heinonen and Strandvik (2010) on Grönroos and Ravald
2010, when the conceptualization of questionable value creation what it values, and where,
how, by whom and when value is created, the complexity of the concept of value becomes
apparent.
This paper refers to the results of research conducted by Christian Grönroos and Annika
Ravald, 2010, "Service as business logic: implications for value creation and marketing.
In research and Ravald Grönroos, 2010, to discuss the scope of the analyzes, creation of
value, Grönroos and Ravald 2010
While the purpose of this paper only produce a new concept of value creation in order to
avoid further confusion about the concept of adding value to the value of, or with the addition
of customer value.
Literature Review
In order to understand the concept of value creation by better, then we will study first the
concept of value, value creation and customer value.
Following the definition of the value in the opinion of some experts who have made an
assessment of the concept of value:

Hiroshima, Japan
April 29- May 1, 2015 The Inaugural Conference on Management and Sustainability in Asia
ISSN: 2189-2229
Bowman and Ambrosini (2000, P.5), " value is created by action organization members, who
joined to change value for that organization already acquired. Vargo and Lusch (2004, P.),
" value is special, experience, contextual, and full of meaning. Vargo and Lusch (2007,
P.146), " Value is always unique and phenomenological specified by receiver.
" Vargo, Maglio, Akaka, (2008, p.145)," value is fundamental from and set used integration
and application source power in context particular - not in stock - b ertanam the output of the
company and be arrested according to price. " Pitelis, (2008, P.6)," value as Price giverise
to problem awareness consumer and presence product substitute by competitors –
because problem promotion and marketing and strategy to compete. " Vargo, Akaka,
(2009, P.16), " value is phenomenological and contextual by receiver services (ie, customers).
" Giner, (2009, P.19), " value is often be made in phase others, particularly stage R & D "
Bakutyte, Grundey, (2012, P.108), value is basic from all activity marketing and value
consumer is source main creation value for organization and the functionary interests. "
Lautermann (2013, P.192), "Value as value wear, made by User for use source power,
process (and / or result them). " Leat and Revoredo-Giha, (2013, P1487), " Value is
produced in case enhancement security
supply from quality guaranteed and ability to communicate with the supply
base they Pigmeat."
The definition of value creation, according to some experts.
While the following is the definition of value creation in the opinion of the experts who have
conducted research related partnered with the creation of value:
RAPHAEL Amit1 * and CHRISTOPH ZOTT, (2001, P.509), "present value creation in e-
business, namely efficiency, complete, lock, and novelty."
Bowman and Ambrosini (2007), "the creation of value is the value creation process from the
perspective of the company and the level of business strategy by considering whether
additional activities can be tightly or loosely." Foster (2007, P.) Value creation is the process
of a research agreement between producers and consumers." Stefanie Bro ¨ ring (2008, P. 76),
"the creation of value is a collaboration with partners in other industries that have
complementary competencies." Bowman and Ambrosini (2007, P.), "is the value creation
process from the perspective of value creation and enterprise level business strategies by
considering whether this activity can be tightly or loosely coupled." DP Lepak, KG Smith,
and MS Taylor, (2007, P. 180-194), "creation value considered as a dynamic
process create product or valuable services to subjective will be
Valued by Userbased User criteria value." Stephen L. Vargo a, Paul P. Maglio b, *, Melissa
Archpru Akaka A, (2008, P. 146), "the creation of values often considered as series activities
carried out by company. " Pitelis, CN, (2008, P. 6), "adding value iterms The 'value added
'together with 'creation value
and worthiness beperceived additional do through price reduced or plus differentiation. "

Hiroshima, Japan
April 29- May 1, 2015 The Inaugural Conference on Management and Sustainability in Asia
ISSN: 2189-2229
Vargo and Akaka (2009, p. 39) is the process of creating value-use of these resources.
Christian Gro ¨ nroos and Annika Ravald (2010, P.7), "Value creation is the process of
creating value-in-use of these resources." Chatain, O., & Zemsky, P. (2011, p.35), " value
creation appear as interaction strategic results. " Saeed Gholami, (2011, P 150), "The creation
of value should be as basic principles to design the competitiveness of top management
strategy." Lautermann (2013, P.192), "the creation of value as a way conducive to achieving
a good life, a wide variety of goods - goods that can be traded to make their materials or
goods aesthetic, cultural, spiritual and material - produced by subsistence activities such as
gardening or community work, must be taken into account. " Leat (2013, P.) "value creation
is an ongoing challenge, especially in a difficult economic environment. " Tamer Madi,
Zulkhairi Dahalin, Fauziah Baharom, 2013, (P. 1138), "creation value is
encouraging research this to build value Model of co-creation in context agile,
capableprovide product devices soft with superior value as high as company devices soft and
the user desires. "
The definition of customer value creation of the opinion of some experts:
Here's the opinion of some experts who have conducted research on customer value creation:
Fontenot and Wilson, (1997, P.15-12), "creation value customer is considered have impact
positive to he satisfaction and loyalty as variable result relational.
Narver, JC (2000, P.), Creation value customer is constitute prerequisite to excellence
competitive, and creation of values to customers created when benefit to customer Related
with product or service exceed charge offer to customers. Christian Gro ¨ nroos and Annika
Ravald, (2010 P.5), "created value customer is a process consisting ed
multilan from two subprocess conceptual different. "
Discussion
Defining the Concept of Value Analysis
From the above definition can be found there are a variety of definitions are expressed, such
as:
Vargo and Lusch (2004 & 2007) a study in Factory Astra Honda Motor, Object Part
marketing research, Lautermann (2013), the research focus on social value creation and social
innovation. Bakutyte, Grundey, (2012), the focus of research at the university of value
creation, Leat and Revoredo-Giha, (2013), research on the company Vion Food Group Ltd.,
the Scottish Pig Producers Ltd, the focus of research: the creation of sustainable value in the
supply chain, Giner, (2009, P.19), "A study Agrofood sector of OECD member countries, the
focus of research innovation or value creation in the company Agrofood, Gro ¨ nroos and
Ravald, (2010) research on Astra car, the object of research on supply chain in the industry,
the focus of the research service logic of value creation in supplier relationships with
customers, Vargo, Maglio, Akaka, (2008), the research focus of the service system and

Hiroshima, Japan
April 29- May 1, 2015 The Inaugural Conference on Management and Sustainability in Asia
ISSN: 2189-2229
service logic perfective, Pitelis, (2008), Research Focus on sustainable value creation, Vargo,
Akaka, (2009, P.16), " The focus of research on service science, service and service roles,
Bowman and Ambrosini, (2000) place the company manufacturing or research focus on R
and D.
Some similarity definitions submitted by experts, among others:
Vargo and Lusch (2007, P.146, Vargo and Lusch (2004, P.), " value is special, experience,
contextual, and full of meaning. Lautermann (2013, P.192), "Vargo and Lusch (2007,
P.146) determined by receiver. "And with Bakutyte, Grundey, (2012,
P.108)," the functionary interests. " Gro ¨ nroos and Ravald, (2010, P.5), Giner, (2009, P.19),
" value is often be made in Another stage. Vargo, Akaka, (2009, P.16), Vargo and Lusch
(2007, P.146), " Value is always unique andphenomenological specified by receiver. "
Based on the study of the similarities in the opinion of the experts on the author makes a
definition of the concept of value. Hope the author of this definition gives meaning even
though their exact value of some the different focus. Values are unique or special,
phenomenological, contextual, experience, and full of meaning specified by the recipient
or the stakeholders. "
Analysis Defining the Concept of Value Creation.
The opinion of experts who have in common to the definition of the concept of value
creation:
Bowman and Ambrosini (2007), "the process of value creation from the perspective of
enterprise level. Foster (2007, P.) the process of cooperation between producers and
consumers. "Stefanie Bro¨ring (2008, P. 76)," a collaboration with partners in other industries
who have the competence and complementary. "
DP Lepak, KG Smith, and MS Taylor, (2007, P. 180-194), "Value creation is a dynamic
process of creating valuable products or services valued by users based on the criteria of
value." Stephen L. Vargo a, Paul P. Maglio b, *, Melissa Archpru Akaka A, (2008, P146), "a
series of activities undertaken by the company."
Pitelis, CN, (2008, P6), "adding perceived value through price reduced or increased
differentiation." Same with Chatain, O., & Zemsky, P. (2011, p35), "the creation of value
appears as the interaction strategic outcome. " Vargo and Akaka (2009, p39) is the process of
creating value-use of resources. Same with Christian Grönroos and Annika Ravald (2010,
P.7), "the process of creating value-in-use of resources."
Tamer Madi, Zulkhairi Dahalin, Fauziah Baharom, 2013, (P1138), "value creation is to
encourage research to build value co-creation model in the context of agile, able to deliver

Hiroshima, Japan
April 29- May 1, 2015 The Inaugural Conference on Management and Sustainability in Asia
ISSN: 2189-2229
superior value the company and the user desires." Same with Leat (2013, "ongoing challenge,
especially in a difficult economic environment. "
Based on the above authors develop a definition of new value concept is the combination of
expert opinion is: Value creation is a process or series of dynamic activities to create
products / services performed by the company valuable to use its resources and
collaborating with partners in other industries who have the competence
complementary to achieve a better life. "
Analysis defining customer value creation
From the description of the definition of experts then we can see that the same expert opinion
as follows:
Narver, JC (2000, P.), "The creation of customer value is a prerequisite for competitive
advantage, and the creation of customer value is created when the benefits to the customer
associated with a product or service exceeds the cost of supply to customers. Same with
Fontenot and Wilson, (1997, P.15-12) The creation of customer value is considered to have a
positive impact on satisfaction and loyalty as relational outcome variables.
From the study of the definition of the concept of customer value creation authors construct a
new definition of customer value creation as follows:
Customer value creation is multilaned process, consists of two conceptually different
subprocesses associated with the products/services exceeds the cost of bidding for
customer satisfaction and loyalty for competitive advantage
Conclusion
The results of the analysis of the definition of the author's definition of Value Creation as
follows:
Value creation is a process or series of dynamic activity of creating valuable products or
services performed by the company to use its resources and collaborating with other
industry partners who have complementary competencies to achieve a better life. "
Suggestion
Fore can do more in-depth analysis that the definition of the concept of value, value creation
and customer value creation can be arranged to be easily understood.

Hiroshima, Japan
April 29- May 1, 2015 The Inaugural Conference on Management and Sustainability in Asia
ISSN: 2189-2229
Reference
Andersson, Harri; Harju, Taneli; Larjomaa, Timo, "Value creation - it is time to get serious PPI;Feb 2002; 44,
2; ProQuest Agriculture Journals, pg. 33
Cliff Bowman and Ambrosini Ve'ronique (2007), "Firm value and levels of Creation Strategy," Management
Decision Vol. 45 No. 3, 2007, pp. 360-371
Christian Grönroos and Annika Ravald, "Service as business logic: implications for value creation and
marketing," Journal of Service Management Vol. 22 No. 1, 2011, pp. 5-22 q Emerald Group Publishing 1757-
5818.
Christian Lautermann, "The ambiguities of (social) value creation: towards an extended understanding of
entrepreneurial value creation for society", Social Enterprise Journal Vol. 9 No.2, 2013 pp. 184-202 q Emerald
Group Publishing 1750-8614
Gholami, "Value Creation Model through Corporate Social Responsibility (CSR)," International Journal of
Business and Management Vol. 6, No. 9; September 2011
Jonikas, “ VALUE CREATION THROUGH CSR AT STAKEHOLDERS LEVEL,” ECONOMICS AND
MANAGEMENT: 2012. 17 (2) ISSN 2029-9338 (ONLINE) ISSN 1822-6515 (CD-ROM)
Leat and Giha, "In search of differentiation and the creation of value: the quest of the Scottish pig supply chain,"
the British Food Journal, Vol. 115 No. 10, 2013, pp. 1487-1504
Pitelis, CN, "Value capture from organizational advantages and sustainable value creation," These papers are
produced by the Judge Business School, University of Cambridge, 2008
Russell-Bennett, Rebekah and Previte, Josephine and Zainuddin, Nadia (2009) conceptualising value creation
for social change management. Australasian Marketing Journal, 17 (4). pp. 211-218.
Simona Bakutyte, Dainora Grundey,” Identifying the Gap in Value Creation at Universities: the Consumer’s
Perspective”, Economics & Sociology, Vol. 5, No 1, 2012,
pp. 96-110.
Tamer Madi, Zulkhairi Dahalin, Fauziah Baharom, "TOWARDS A USER VALUE CO-CREATION MODEL
FOR WEB DEVELOPMENT AGILE APPROACH", Special Issue-Agile Symposium, Malaysia, ISSN 1013-
5316; Coden: Sinte 8
Vargo and Akaka: Service-Dominant Logic as a Foundation for Service Science: ClarificationsService Science
1 (1), pp. 32-41, 2009 SSG

Hiroshima, Japan
April 29- May 1, 2015 The Inaugural Conference on Management and Sustainability in Asia
ISSN: 2189-2229
SPR (LIVESTOCK SCHOOL PUBLIC) AS FORM BY STUDENT TO REACH SOCIAL SUSTAINIBILITY
Melfa Andraini Agatha Nutrition and Food Technology Bogor Agricultural University
Resha Nuzul Safitri Communication and Community Development
Bogor Agricultural University
……..
ABSTRACT
Indonesia is one of the richest country with the natural resources. Most of them is potential
area and that is abundant where in remote areas and didn’t optimalized by society. Livestock School
Public or we called SPR ( Sekolah Peternakan Rakyat ) is one of institutions that facilitating in
learning process which is applicative, participatory, systematic and structured to achieving
independence and sovereignty rancher the people by way of provision of access to information
science and technology and strengthening control production and post livestock production. In this
achievements , SPR make the program which is develop and provided assistance through expert and
college students .The student organisations that have a role in its upward course SPR is SMART
( Social Movement on to Animal Research and Teaching ) which is located in the Faculty of
Animal Science Bogor Agricultural University Indonesia. The form of assistance as SMART action
is expected to develop and attract more interest the breeders in this is particularly students as the
agent of change. Students have important roles in the social sustainibility and food security because
student as the facilitators in the life of community empowerment programs in the village and
society.
Keywords: SPR, smart, livestock commodities, the sustainability of social student
1 INTRODUCTION
Indonesia is a country rich in natural resources. Most of the abundant potential in isolated
areas and still can not be optimally utilized by rural communities. This is because of the lack of
access by the public, such as the low level of development in the village. So that Indonesian
government seeks to improve rural development through empowerment of rural communities.
Under the 2014 Act 6 of the Village, that the empowerment of rural communities is an attempt to
develop the independence and well-being of the community by enhancing the knowledge, attitudes,
skills, behavior, ability, awareness, and utilizing resources through the establishment of policies,
programs, activities, mentoring in accordance with the essence of the problem and the priority
needs of rural communities.

Hiroshima, Japan
April 29- May 1, 2015 The Inaugural Conference on Management and Sustainability in Asia
ISSN: 2189-2229
SPR (livestock school People) is a container that facilitates the learning process is
applicable, participatory, systematic, structured to achieve independence and sovereignty of the
people by giving farmers access to information, science, and technology, as well as strengthening
the control of livestock production and post-production. In achieving this, SPR create mentoring
programs through expert of experts and students. The student organizations that participate in the
implementation of the SPR is SMART (Social Movement Research and Teaching on animal) which
is housed in the Faculty of Animal Husbandry and collaboration with community development
experts from the Faculty of Human Ecology.
Although it has been several times conducted outreach activities and down the village, the
application of science and farm management and organization in the village can not be done
continuously, so that the implementation of mentoring or counseling should remain running as
monitoring for the intellectual community that is sustainable with the activities of SMART Action.
Forms of assistance such as SMART Action this is expected to grow and attract more interest
of farmers in this particular student as a change agent (agent of change). Students have an important
role in the social sustainability and food security because the student is driving and facilitator in the
course of development programs in rural communities. This paper attempts to analyze the role of
the students in a container Schools Ranch People in order to achieve social sustainability.
Problems of Farmers
Problems of farmers in Indonesia is the first that if calculated on the average farmer in
Indonesia only has 2 to 3 head of cattle and they do not understand how to breed true. Suppose not
been able to take advantage of available feed from natural, agricultural waste can not be used
because not understand how manage be feed quality. Nearly 98% of farmers prsen experience it. 2)
good cows slaughtered and sold productive female sold because it requires money and also the lack
of knowledge that the great sires that is the flasmanutfa. 3) Indonesia has not paid much attention to
aspects of the farm, the SPR system only began to take shape in favor to the breeder and not a
project which aims for profit alone. 4) Due to raising only as a byproduct, and not a profession or
not a business so that people only see as a regular activity and only serve as a side not to go into
business or profession remains. 5) The procedure for opening the farm is very complicated and
requires a very long time as well as the problem of uniting the people of fellow farmers who have
one goal (personal communication with the original conceptor)
The formation of the House of Representatives in the various regions where livestock has
been running since 2013. One of the villages that have nurtured and established SPR is a village
Distance, District Wonosalam, Jombang. Village consisting of seven hamlets, there are
organizations SPR Distance Makmur Sejahtera which has stood on May 25, 2013 with DPPT
(Livestock Owner's Representative Council) which is the seventh head of the hamlet of the village.
Village Distance has germplasm particularly promising farm commodities namely goats
Peranakan Etawa (PE). Livestock is not outplayed by goats Peranakan Etawa (PE) Kaligesing so
very unfortunate if the seeds are good out of the area (sold to the market). Data Collection and
installation of eartag for female goats have been implemented by IPB students who joined in an
organization SMART on 23 January to 3 February 2015. The preservation program feed, waste
treatment and processing of livestock has also been done on the activities of the village down.
Role of Students
The college is a unit of education higher education providers; college students called the
student; whereas college educators called lecturers. Sugiharto explained that in Indonesia has three
roles of university campuses known as Tridarma universities: education; research; and community
service. Thus, universities are expected, as stated in HELTS 2003-2010, produces (i) graduates who
have the intellectual capability to be a responsible citizen and able to contribute to the

Hiroshima, Japan
April 29- May 1, 2015 The Inaugural Conference on Management and Sustainability in Asia
ISSN: 2189-2229
competitiveness of nations; (Ii) research that is capable of functioning as an incubator that helps the
development of a knowledge-based economic system that is able to adapt and sustainable, and
integration of advanced technology to maximize the access and application of cutting-edge
technology; and (iii) contribute to the development of a democratic society, civilized, open, and
meet the criteria for public accountability. Then it can be said that the college next task is to print
the academic community which has a characteristic sense of crisis and always develop themselves.
Students are expected to have a sense of crisis that can be taken to mean that a student must be
sensitive to the surrounding environment and understanding of what they should do, especially
finding the right solutions to resolve the problem. Academia should always develop themselves, so
that they are able to become the nation's next generation of robust and able to face the challenges of
the future.
1. Bridging
Student Activities in doing bridging can be shown with the role of students in
connecting or in this case is the bridge between the parties with the other party. In the case
of the school's farm people, can be shown to students in a bridging role between the parties
that in fact the government authorities, the private sector that in fact the owners of capital,
and farmers as farm technicians.
2. Bonding
Students play a role in the strengthening of Human Resources or in the case of the
people are farmers in farm schools directly. Form of reinforcement in question is providing
more knowledge about the system and good management of livestock.
3. Creating
Activity of students in the role of creating a system within the community together. In the
creation of such a system should involve all stakeholders such as the Institute of Education (Institut
Pertanian Bogor), Government (National Animal Husbandry Department) to be implemented in a
sustainable and continuous.
Conceptual Empowerment
Community empowerment is done in a sustainable manner by utilizing the role of rural
communities, especially farmers folk. Students perform its obligations as intellectuals who have
high ideals and has a commendable character is expected to be a model for other communities.
Especially in this case is about the management of the farm, so that people can understand and can
apply beternakn way properly and in accordance with existing rules. The community development
activities were students down the village to bring some programs related to peternakn and social
systems. In the field peternkan students to share knowledge that has been gained diperkulihan by
providing examples of direct and assist the communities to carry out these activities. These
activities are the manufacture of fertilizer from waste products such as feces and urine peternkan,
manufacture of fermented feed such as silage and other types of fermented feed, about the handling
of livestock diseases, and all activities associated with other peternakna. while the social system we
provide usualan so villagers can form an organization that is able to unify thinking and can achieve
the same goal together.

Hiroshima, Japan
April 29- May 1, 2015 The Inaugural Conference on Management and Sustainability in Asia
ISSN: 2189-2229
Conclusion
With the passage of SPR and sustainable system then all these problems could be overcome.
Because the SPR has a role especially in the unification goals by means of passing communication,
meaning that the communication means the transfer of knowledge so that a system of continuing
education and created a community development. SPR is penompang 98% of the population and the
needs of Indonesian national meat, and this is what should be developed and constructed, so that
this system continues and is not brittle.
References Sugiharto, T. Tanpa tahun. Peran Perguruan Tinggi dalam Meningkatkan Pertumbuhan Ekonomi Melalui Pasar
Modal: Is Entrepreneurial University the Answer?. Jakarta (ID) : Fakultas Ekonomi Universitas Gunadarma.
personal communication with the original conceptor (Prof. Muladno)

Hiroshima, Japan
April 29- May 1, 2015 The Inaugural Conference on Management and Sustainability in Asia
ISSN: 2189-2229
Green Technology for Sustainable Development Arpita Dutta1
College of Administrative and Financial Sciences AMA International University
Kingdom of Bahrain
……..
Abstract
Sustainable Development has emerged as the most viable and practical model for
human activity, that ensures the protection as well as progress of the three main stakeholders
i.e., the economy, the ecology and the community and green technology is at the fore-front of
this global movement towards Sustainable Development. It is particularly relevant in the case
of the Kingdom of Bahrain. As the need for green products and services rise, partly mandated
by governmental regulations, more and more entrepreneurs will jump into the green
technology bandwagon and a positive cycle of new and more efficient green products will be
created. Now days it is not just IT majors that are pumping in millions of dollars to focus on
green technologies and environmental conservation, but also retailers and investment bankers
have pooled resources to make their contribution.
The main goal of this research is to understand the status and level of effectiveness of the
implementation of Green Technology among the selected consultancy companies in the
Kingdom of Bahrain. The study also uncovers the difference in perception about the status
and the actual effectiveness in the implementation. The study was conducted using surveys
questionnaires and personal interviews, with a respondents group selected from eight
different organizations that are actively involved in Green Technology implementation in the
Kingdom of Bahrain.
The results showed that whilst respondents attached a high level of importance to the status
of Green Technology, the level of effectiveness was gauged to be not very effective. Several
problems and challenges were brought forth which are hampering the process of effective
implementation of Green technology projects. The study confirmed the hypothesis that there
was very less difference in the perception amongst the respondents pertaining to status and
level and effectiveness of implementation of Green Technology among the selected
companies in the Kingdom of Bahrain.
The study put forward details of some of the recommendations made by the respondents,
which included a need for greater governmental support, investment in indigenous research
and development capabilities, creating public awareness and improving access to newer
technologies in the field of Green technology.
1 Corresponding author: (Arpita Dutta, PHD.)

Hiroshima, Japan
April 29- May 1, 2015 The Inaugural Conference on Management and Sustainability in Asia
ISSN: 2189-2229
Keywords: Green Technology, Sustainable Development, Economy, Ecology and the
Community
Introduction
With the easy availability of innovative technologies, people have become more
competent in doing things more cleverly , which was not probable before. Now a days, for
preservation of natural environment and resources, which can satisfy the needs of the present
generation and can also be retained for the future, green technology is used. Indeed a
substitute to develop the national economy without causing harm to the environment. Further,
as population continues to increase in a country, it needs more power day by day, to satisfy
the daily demand as well as sustain the economic growth. So provisioning for human life
using the current technology is expected to be unfeasible. For this Green Technology (GT) is
helpful to achieve a noteworthy expansion in renewable energy for reducing CO2 emissions.
As CO2 emission is to be blamed for climate change; due to which the earth’s average
temperature has escalated by 0.7 degree Celsius.[ 1]. Green Technology for the sustainable
development of the human beings in this regard is an essential requirement in today’s era.
Green Technology is known as environmental curative technology that stops environmental
degradation created by the commodities and technologies for peoples’ conveniences[2]. A
few organizations have taken the initiative in the implementation of Green Technology
products, services and solutions that can help alleviate some of the major environmental
issues facing Bahrain. In a nutshell, Green Technology is the application of innovative
products, equipment and systems used to protect the natural environment and assets which in
turn brings down the negative impact of human. [3, 4]
Therefore, Green Technology proved to be an alternative to develop the national
economy without destruction to the environment. It is a new national development concept
that creates new growth engines. In fact, the fundamental concern of any technology is its
sustainability. Sustainable development can be briefly defined as the development which
meets the needs of the present age group as well as of the future generations.[5] The
fundamental ideas that are behind sustainable measures are: living within certain limits of the
earth’s capacity to maintain life; understanding the interactions among economy, society and
environment; and maintaining a fair distribution of resources and opportunities for the next
generation[6].
The idea of using Green Technology is central to the Sustainable Development
initiative and it has its roots in the United Nations Conference on Human Environment (1972),
in Stockholm, which highlighted the link between the environment and development in the
Earth’s context. The World Commission on Environment and Development defined it in their
publication ‘Our Common Future’ as “development that meets the needs of the present
without compromising the ability of future generations to meet their own needs”. For
economic progress and environmental conservation to go hand in hand, it requires a unifying
and holistic factor to integrate the myriad interactive components into a functional whole, and
that unifying factor can be the intensive application of Green Technology[7].
The Middle East is undergoing a heavy, multifaceted turmoil and crises, especially
in the last few years. The rising oil prices may have come as a relief, but the financial crisis
has left major industries in the region gasping for breath. This was further exacerbated by the
fact that the region was betting on industries such as finance, investments, tourism and
manufacturing etc., which were all affected deeply. The Gulf States are beginning to pay
closer attention to sustainable energy and other aspects which they feel will create long term
Hiroshima, Japan
April 29- May 1, 2015 The Inaugural Conference on Management and Sustainability in Asia
ISSN: 2189-2229
stability, generate jobs and address the rising discontent and flagging economic growth in the
region.
The Kingdom of Bahrain with a population size of 1.2 million people may not
face many of the issues and challenges that over populated cities like Beijing, Mumbai,
Djakarta etc. face with their over-stretched utilities, burgeoning population densities and
unplanned growth but never the less, green technology is of vital importance to the Kingdom
of Bahrain as it holds the key for environmental conservation and the general safety and
wellbeing of all the residents of the Kingdom of Bahrain. Access to clean, renewable and
cheap sources of energy is one of the biggest requirements for this country.
The researcher undertook the study on 5 prominent organizations based in Bahrain,
namely: (a) Atkins, (b) Mott MacDonald(c) Creative Line , (d) Joz Group WLL (e) Hyder
Consulting Middle East.
The study was undertaken to understand the status and level of effectiveness in the
implementation of Green Technology among the 5 selected consultancy companies in the
Kingdom of Bahrain.
Review of Literature
'Green isn't hard to do-it is just a different way to look at things'. At some quarters a
change is already underway as we can see how so many companies have voluntarily put in
place several environmentally friendly practices and many have also done so after they
realized the fact that the various manufactured products and services are going to come under
the purview of environmental regulation. Most major corporations now have systems and
policies in place to gauge the negative effects of the output, be it in the form of the final
product, by-product or the waste generated in the process[8]. Another study found that 25
Green Technologies That Will Electrify Your Future', that fossil fuels have pretty much been
the major source of energy since the technological developments in the early 19th century
that allowed us to generate electricity and use it for a diverse range of personal and
commercial applications.[9] The author cautions that this is turning into a major crisis as on
the one hand this is an energy source that is neither renewable nor abundantly available, and
on the other hand the extensive usage has contributed to major damage to the earth’s
ecosystems in the long run. The author also encourages discussions that take the issues of
environment conservation, resource utilization and the commercial aspects together while
evaluating the way forward. Similarly, in the article titled ‘Bringing the Environment Down
To Earth’, Forest L. ,[10]makes several poignant points. He states that while environmental
problems are primarily issues of corporate social responsibility and that through green
technologies, they can have strong economic benefits, if pursued correctly, however, these
issues cannot be perceived as just money making enterprises as that will lead to failures and
unanticipated risks. On the other end of this discussion, environmental issues should not be
source of pessimism or that it should be viewed as another means to incur additional costs
and expenditure. The author states that just like in business, these issues, while seeming to be
an adversity, actually can be sources of enormous opportunities and they should be addressed
likewise and that investment in green technologies is not a zero sum game. Another
significant aspect covered by in the book ‘Green Technology Strategies’ is about the
significant green technology solutions that can be developed by embracing, enabling and
capitalizing from the Information, Communications and Technology (ICT) aspect[11,12].
Such systems improve efficiency, reduce energy consumption and help streamline business

Hiroshima, Japan
April 29- May 1, 2015 The Inaugural Conference on Management and Sustainability in Asia
ISSN: 2189-2229
and all processes and workflow. They do so by using accurate and up to date information to
replace actual movement of goods and through deploying technology to improve every aspect
to business. They can also help reduce the carbon footprint by facilitating business activities
that do not require consumption of energy to do normal and daily tasks. However one of the
studies substantiates the previous authors’ view by stating that it will be green technology
that saves human civilization and the planet as it replaces conventional technologies with
more environmentally benign ones.[13] In his book ‘Green Technology: An A-To-Z Guide’,
he postulates on the constant evolution in the interrelationship that exists between humans
and the environment and that a time will come when it is possible that technologies can be
deployed to make that relationship more sustainable. As technological advancements
continue, driven by innovation and funded by growing investments and funding from diverse
sources, resource utilization promises to be highly efficient with extremely low levels of
wastage[13].
The Middle East is undergoing a heavy, multifaceted turmoil and crises, especially
in the last few years. The rising oil prices may have come as a relief, but the financial crisis
has left major industries in the region gasping for breath. This was further exacerbated by the
fact that the region was betting on industries such as finance, investments, tourism and
manufacturing etc., which were all affected deeply. The Gulf States are beginning to pay
closer attention to sustainable energy and other aspects which they feel will create long term
stability, generate jobs and address the rising discontent and flagging economic growth in the
region.
Gulf States are vocal supporters of new and alternative energy sources. As per a
recent article titled, 'The new frontier?' there is several reasons for the regional push for
renewable energy.[14] First, it makes sense to sell the oil products as an export product than
to consume a major chunk internally. Secondly, as population and usage of energy intensive
electronic items increase, the demand for electricity will undoubtedly shoot up. And thirdly,
while the Middle East is rich in Fossil fuels, it has an energy source that it receives far more
abundantly, solar energy. With consumption rising at four to five per cent annually, many
believe that the Gulf States may very well end up becoming the major importer in addition to
being the biggest exporters of oil and gas products. The author sates how four of the top (per
capita) electricity users are GCC countries - Kuwait at fifth place, Qatar at sixth, the UAE at
eighth and Bahrain at ninth position. The bottom line of the article is that time is running out
for the Gulf countries to amend their current energy mix and to take radical steps to address
pressing issues of both energy requirements as well as to take steps to reduce their carbon-
footprint and work towards environmental conservation. A large supply of oil resources may
have cushioned these economies from the debilitating effects of the huge resources needed
for energy generation, but that has changed.
Research Methodology
Sampling Design
The study utilized purposive sampling as the company is very strict in giving out
data. Purposive sampling was used to ensure that people who have expertise in the area of
study were the only ones who will answer the questions and thereby gives accurate responses.
Purposive sampling, according to the SAGE Dictionary of Social Research Methods
(Victor, 2006) is a form of sampling technique which is non probabilistic whereby the

Hiroshima, Japan
April 29- May 1, 2015 The Inaugural Conference on Management and Sustainability in Asia
ISSN: 2189-2229
decision on who will be the respondents depends on the criteria set by the researcher. Criteria
may include the degree of knowledge and expertise on the topic that is being researched.
The respondents were drawn from the following selected companies: (a) Atkins, (b)
Mott MacDonald(c) Creative Line , (d) Joz Group WLL (e) Hyder Consulting Middle East.
Table 1: Respondents Distribution.
DESIGNATION / WORK PROFILE
Manager 20 14 70%
Engineer/Consultant 35 13 37.1%
Supervisor 15 13 86.6%
Total 70 40 57.1%
Research Instruments
In order to collect data for the study, the researcher made use of two research instruments,
survey and personal interviews. The questionnaire consisted of four parts. Part A examined
the existing status of the implementation of Green Technology by the identified companies in
the Kingdom of Bahrain. Part B focused on the level of effectiveness of implementation of
Green technology by the identified companies. In part 3 the various problems faced by the
respondents in the implementation of Green Technology were answered. The final part of the
questionnaire dealt with the recommendations and suggestions offered by the respondents to
address the issues involved in the effective implementation of green technology in the
respective organizations. Personal interviews were conducted with the relevant personnel as
there are several aspects in the study that required access to personal and candid views and
opinions about several aspects of the green technology business including governmental
support, marketing challenges that are specific to the Kingdom of Bahrain and future trends
and prospects of these technologies in the region.
Likert numeric scales are attached to each question for finding out the qualitative data.
Data Processing and Statistical Treatment
All the data acquired through the questionnaires was collected, organized, processed and
analyzed by the researcher, with the help of computer software-based statistical tools. The
qualitative scales were assigned corresponding weights and the weighted mean of each item
within the questionnaire was calculated. A hypothetical mean range was assigned to the
scales for the purpose of attaining a definitive interpretation of each item.
The mean. t- test, N, standard deviation, mean difference, Sig(2 tailed) and the decision etc,
were the tools used in statistical treatment of the study. SPSS was used to undertake statistical
treatment of the collected data.
Theoretical Framework

Hiroshima, Japan
April 29- May 1, 2015 The Inaugural Conference on Management and Sustainability in Asia
ISSN: 2189-2229
The theoretical framework considered in this study, encompass three major points of view:
economic, social, and environmental which are considered to be the three important pillars of
Sustainable Development.[15]
Figure 1: Sustainable Development Model by Munasinghe(Source: Pearce, 1999)
Sustainability in terms of economic growth can be seen as the highest flow of income
that could be generated while at least maintaining the stock of assets (or capital) which yields
those benefits.
The social pillar of sustainability focuses on people, and plays an important role on
maintaining stability of social and cultural systems, and reduction of civil wars. Equity is also
anther criteria that are given importance. Conservation of cultural variety and cultural capital
across the world, and the better use of sustainable development practices are highly desirable.
There is a real need for present society to encourage and integrate pluralism and grass-root
participation in decision-making for socially sustainable development.
The third pillar of sustainable development, environmental protection focuses on
creating a balance between biological and physical systems. Again, 'natural' systems and
habitats may be interpreted generally to take into consideration man-made environments such

Hiroshima, Japan
April 29- May 1, 2015 The Inaugural Conference on Management and Sustainability in Asia
ISSN: 2189-2229
as cities. Natural resource exploitation, pollution and loss of biodiversity decrease system
resilience.
Understanding these three pillars and making them operational means that the
achievement of sustainable development is a difficult job, since all three elements must be
given balanced consideration.
Results and Discussions
The status and level of effectiveness of Green Technology for sustainable
development was found from the variables, namely; Economic Growth, Environmental
Protection and Social Development, which are the three pillars of sustainable development .
The data collected from the respondents have been tabulated and are presented below,
followed by the discussion of the outcome of the data analysis.
PART A: Status of implementation of Green Technology among the selected companies
in the Kingdom of Bahrain in terms of:
1.1 Economic Growth
Indicators Engg Mgrs Sup Composite
WM Interpretation
1 Role of Green Technology in contributing towards green economy
4.00 4.46 3.56 4.00 Important
2 Role of Green Technology in enhancing economic gains due to application of green solution
3.54 4.15 3.64 3.77 Important
3 Role of Green technology in contributing towards
efficiency/productivity and reducing wastage/errors of an organization
4.05
4.46
3.93
4.14
Important
4 Role of green technology in enhancing Market share due enhanced positive perception
3.46 3.92 3.79 3.72 Important
5 Role of Green Technology in improving product and services quality and the consequent increase in
sales and customer satisfaction.
3.69
4.15
3.79
3.87
Important
OVERALL WEIGHTED MEAN 3.74 4.22 3.74
3.80 Important
Table 4: Status of implementation of Green Technology among the selected companies, in
terms of Economic Growth
The concept of the green economy has gathered importance as it provides a solution to the
multiple crises that the world has been experiencing currently – the climate, food and
economic crises – with a different idea that offers the assurance of development while
Hiroshima, Japan
April 29- May 1, 2015 The Inaugural Conference on Management and Sustainability in Asia
ISSN: 2189-2229
protecting the earth’s ecosystems and, in turn, contributing to poverty reduction. In this sense,
the conversion to a green economy will necessitate moving away from these crises to a
system that positively addresses and avert them[16]
This study found out that most respondents have a positive perception pertaining to Green
Technology's contribution towards sustaining competitive advantage, increasing bottom-line
profits, improving efficiency/productivity, expanding the market share and in improving the
quality/sales/customer satisfaction levels. The data provided insights on the perception levels
of the respondents and how they valued the importance of Green Technology for the
economic growth aspect with a with a weighted mean of 4.00 The contribution of Green
Technology was considered to be Important with a mean of 3.77 in its contribution towards
sustaining competitive advantage. In some ways competitive advantage may be the
accumulation of strengths in the areas of bottom-line profits, market share, quality of the
products and services etc.
It has also been noticed in some studies the existence of quite a few risks that may be
associated with the misuse of the idea of the green economy [17]. The first risk is the
“environmental “one. The second risk is “one size fits all” approach, in which all countries
are treated in the same way. There are also risks linked to the trading system. Utilizing of
environment for trade protection; of gaining market admission; of subsidized production in
developing countries; of not encouraging the developing countries to promote their own
green economy sectors. And finally, the enforcement of new condition on developing
countries in terms of green economy for aid, loans, and debt rescheduling or debt relief is not
a fair practice[17]
Furthermore it has been found that , political situation, protection and support of the local
identity and cultural ideals, competitiveness, pressure for sustainable actions, and,
anticipations of consumers are the external drivers for sustainable activities within a company
Whereas , increase of profit or closing a market gap, improvement of reputation could be
identified as internal drivers[18] Therefore the attitude and interest of the top management of
a company has a big role to play for sustainable activities within an organization.
The expectation of direct financial benefits or competitive advantages influences Sustainable
development strategies. This is in accordance with a study which found that firms generally
look out for environmentally or socially desirable activities if and only if there is a direct
effect on the economic gains for the company.[19] Here, the companies’ capacity to harness
new prospects becomes essential, as postulated in the dynamic capability approach by Teece,
According to the author, dynamic capabilities is meant by the firm’s ability to incorporate,
make, and reconfigure internal and external capability to tackle dynamic environments.
Therefore it reflects a firm’s capability to attain different forms of competitive advantage.
The validity of Barney’s, Resource Based View becomes questionable about sticking to core
resources and competencies of the company for a long time because of changing
environments. For carrying out sustainable management practices, it is usually felt that the
societal awareness for these issues are not there and hence might be short lived. As has been
shown above, relying on sustainable suppliers may be both costly both in terms of time and
capital [20].

Hiroshima, Japan
April 29- May 1, 2015 The Inaugural Conference on Management and Sustainability in Asia
ISSN: 2189-2229
Environmental protection
Indicators Engg Mgrs Sup Composite
WM Interpretatio
n
1 Role of Green Technology in meeting present needs without making any compromises .
4.40 4.33 4.50 4.41 Important
2 Role of green technology in making products that can be fully reclaimed or reused.
4.40 4.00 4.73 4.37 Important
3 Role of green technology helps in introducing
sustainable living, develop renewable energy and reduce waste.
4.50
4.63
3.23
4.12 Important
4 Developing alternative technologies to prevent any damage to health and the environment.
3.78 4.70 3.65 4.04 Important
5 Green technology is essential in reduction of global warming risks and rising energy costs
4.88 4.78 3.58 4.40 Important
OVERALL WEIGHTED MEAN 4.4 4.9 3.9 4.3 Important
Table 5: Status of implementation of Green Technology among the selected
companies, in terms of Environmental Protection
The very idea of sustainable management inspires company’s both public and private to
become better custodians of the environment. Green Technology here plays an vital position
in creating the options that permit sustainability by creating processes, products, and systems
that are environmentally suitable , more energy- and resource-efficient and often more cost-
effective[8]
With a mean of 4.30, respondents hailed the role of Green technology in its
contribution to the environmental protection. All the respondents agreed that green
technology will promote the optimal utilization of resources using a systems approach. A
rating of 4.12, more than what they perceived was the contribution made to economic growth,
makes us aware that most aspects of environmental protection including reducing carbon
footprint, reducing wastage, achieving organization's environmental goals, reducing nature-
extracted raw materials and the improvement of the quality, safety and hygiene of the
products offered by reducing toxic and chemical products etc were considered to be
important. Clearly the respondents appreciate the fact that the environment is definitely the
primary beneficiary when it came to Green technology. Developing alternative technologies
can help in preventing damages done in matters of health and the environment
All over the world organizations need to change the production processes to end poverty and
prevent the likely the severe impacts of climate change and environmental degradation. [20]
states that “Without adoption of green technologies, it will not be possible to reverse the

Hiroshima, Japan
April 29- May 1, 2015 The Inaugural Conference on Management and Sustainability in Asia
ISSN: 2189-2229
ongoing environmental degradation and provide secured and decent livelihood for all of
humankind, at present and also in the future,” Furthermore, with half of the earth’s forests a
gone, groundwater resources are getting depleted, huge losses in biodiversity have already
occurred, and climate change threatens the stability of all ecosystems[20]. This calls for
government policies to reformulated based on improvement of energy efficiency , supporting
use of efficient green technologies in specific places; providing support for research and
development initiatives; and applying superior governance and accountability strategies in
energy-related technological development than at present[21].
Social Development
Indicators Engg Mgrs Sup Composite
WM Interpretatio
n
1 Role of Green Technology concepts in
helping the organization contribute towards
its Social Development goals and
objectives.
4.65
4.00
3.40
4.02
Important
2 Role of green technology in improving
human and productive capacities to enable
them to participate in a global green
economy which will lead to economic
diversification, and generate employment.
4.00
4.23
3.93
4.05
Important
3 Role of green technology in playing a
central role in long-term holistic community
development programs
3.56
4.00
3.50
3.69
Important
4 Role of organizations in tapping into locally
available renewable energy resources .
3.36
4.53
3.80
3.9
Important
5 Organizations create sustainable
communities. Residents are exposed to less
pollution and have more opportunities to be
physically active and have access to healthy
4.35
4.30
3.95
4.2
Important

Hiroshima, Japan
April 29- May 1, 2015 The Inaugural Conference on Management and Sustainability in Asia
ISSN: 2189-2229
food choices.
OVERALL WEIGHTED MEAN 4.00 4.2 3.71 4.00 Important
Table 6: Status of implementation of Green Technology among the selected companies, in
terms of Social Development
The contribution of Green technology towards the social development was also judged to be
important. Respondents gave the highest mean of 4.05 towards the role of green technology
in making a more sustained and measurable effort towards contributing to community
development . This could be because respondents perceived that organizations are not driven
purely by an increase in profits to take social and social initiatives. Developing new green
infrastructure for the institution and in the community – such as new green technologies,
alternative local energy sources, recycling systems and built environment retrofitting –
creates new jobs locally and encourages business development and growth. More efficient
use of resources through new green development further reduces cost and ensures
institutional security[22].
A rating of 4.2 clearly indicates that developing green initiatives in collaboration with local
community groups and leaders will ensure that anchor institution strategies address actual
community need and work to create real and long-lasting improvements for community
residents. Anchor institutions can partner with local community organizations to provide
training programs, educational opportunities and hands-on workshops in green development
or lend their expertise in green programs to building developments and rehabilitations [23].
PART B: The level of effectiveness in the implementation of Green Technology in the
Kingdom of Bahrain in terms of:
2.1 Economic growth
Indicators Engg Mgrs Sup Composite
WM Interpretatio
n
1 Level of effectiveness of implementation of Green
Technology in contributing towards green economy.
2.80
3.45
3.23
3.16 Somewhat
Effective
2 Capacity of the implemented Green Technology concepts in enhancing economic gains due to
3.55 3.35 3.00 3.3 Somewhat

Hiroshima, Japan
April 29- May 1, 2015 The Inaugural Conference on Management and Sustainability in Asia
ISSN: 2189-2229
application of green solution Effective
3 Implementation of Green Technology in
contributing towards efficiency/productivity and reducing wastage/errors of an organization
3.75
3.50
3.35
3.5 Effective
4 Green Technology concepts implemented improved Market share due enhanced positive perception
3.92 3.50 3.43 3.6 Effective
5 Green Technology implementation improved
product and services quality and the consequent
increase in sales and customer satisfaction.
3.64
3.00
3.78
3.5 Somewhat
Effective
OVERALL WEIGHTED MEAN 3.5 3.4 3.4 3.4
Somewhat
Effective
Table 7: Level of effectiveness in the implementation of Green Technology among the
selected companies, in terms of Economic growth
From an economic growth point of view, the respondents deemed the effectiveness of Green
technology in Kingdom of Bahrain ,only somewhat effective with a composite mean of 3.4.
This shows the near negative perception respondents hold towards the implementation of
such technologies towards the economic growth. As will showcased later in this chapter, the
respondents have substantiated this view for economic, ecological as well as social
development aspect, by stating the various issue faced in the process of implementation of
Green technologies. With a mean of 3.3, respondents felt that the level of effectiveness of the
technologies in enhancing economic gains was really not enough.
2.2 Environmental protection
Engg Mgrs Sup Composite
WM Interpretatio
n
Effectiveness in meeting present needs without making any compromises .
3.62 3.50 3.30 3.47 Effective
Green Technology implementation helped in making products that can be fully reclaimed or
reused.
3.54
3.15
3.43
3.37 Somewhat
Effective
Implementation of Green Technology concepts introduced sustainable living, developed renewable
energy and reduced waste.
3.65
3.21
3.15
3.34 Somewhat
Effective
Implementation allowed the development of
alternative technologies to prevent any damage to health and the environment.
4.27
3.15
3.57
3.66 Effective
Implementing of Green Technology concepts
essentially helped in reduction of global warming
risks and rising energy costs
3.50
3.35
3.00
3.28 Effective

Hiroshima, Japan
April 29- May 1, 2015 The Inaugural Conference on Management and Sustainability in Asia
ISSN: 2189-2229
ED MEAN 3.71 3.27 3.29 3.4 Effective
Table 5: Level of effectiveness in the implementation of Green Technology among the
selected companies, in terms of Environmental protection
The perception was equally attractive for the environmental protection perspective.
Respondents gave consistently lower rates, a mean of 3.40 for what they felt was a lackluster
level of effectiveness in implementation of Green technology projects that could benefit the
environmental protection. The lowest mean of 3.28, was attributed to the implementation
instances wherein Green technologies have allowed for the reduction in the usage and
procurement of raw material that is extracted directly from natural resources and have helped
in making products that can be fully reclaimed or reused. None of the 5 points under
environmental protection possessed a mean of over 4.00.
2.3 Social Development
Indicators Engg Mgrs Sup Composite
WM Interpretatio
n
1 Effectiveness of the organization in contributing
towards its Social Development goals and objectives.
3.54
3.49
3.63
3.55 Effective
2 Application of green technology in improving
human and productive capacities to enable them to participate in a global green economy
3.62
3.46
3.71
3.6 Effective
3 Application of Green Technology played a central role in long-term holistic community development
programs
3.15
3.30
3.08
3.18 Somewhat
Effective
4 Effectiveness in tapping into locally available
renewable energy resources
3.40
3.55
3.48
3.48 Somewhat
Effective
5 Implementation created sustainable communities.
Residents are exposed to less pollution and have
more opportunities to be physically active and have access to healthy food choices..
3.63
3.50
3.78
3.64
Effective
OVERALL WEIGHTED MEAN 3.5 3.5 3.5 3.5
Somewhat Effective
Table 9: Level of effectiveness in the implementation of Green Technology among the
selected companies, in terms of Social Development

Hiroshima, Japan
April 29- May 1, 2015 The Inaugural Conference on Management and Sustainability in Asia
ISSN: 2189-2229
Implementation of Green Technology concepts as a means to social and social
development was found to be somewhat effective. The highest mean score was at 3.60 which
is again a reflection of what the respondents felt previously about the status of Green
technology, wherein it gave the organization the capacity and impetus to expand its social
development objectives and activities. They felt that green technology was quite effective in
improving human and productive capacities and community has started participating in
contributing towards global green economy.
3. Is there a significant difference on the perception of the respondents on the level of
effectiveness in the implementation of Green Technology in the Kingdom of Bahrain
when grouped according to their functions?
Sum of
Squares
df Mean
Square
F
Sig.
Economic growth
Between Groups .650 2 .340 .476 .625
Within Groups 26.424 37 .714
Total 27.104 39
Environmental protection
Between Groups 2.545 2 1.422 1.561 .223
Within Groups 33.714 37 .911
Total 36.559 39
Social development
Between Groups .044 2 .022 .025 .973
Within Groups 29.075 37 .756
Total 29.119 39
Table 10: Level of effectiveness in the implementation of Green Technology among the
selected companies, when grouped according to their functions
Presented in the table is the analysis on the perception of the respondents on the level of
implementation of the green technology in the kingdom of Bahrain when grouped according
to functions. Using F-test at .05 level of significance, it was found out that there is a
comparable state of perception on the indicators set forth for this study: F-values of .476,
1.561 and .025, and p-values of .625, .223 and .973, respectively for economic growth,
environmental protection and social development. This means that there is no significant
difference on their perception. Hence, the null hypothesis of no significant difference on the
perception of the respondents on the level of implementation on the green technology in the
Kingdom of Bahrain is hereby accepted.

Hiroshima, Japan
April 29- May 1, 2015 The Inaugural Conference on Management and Sustainability in Asia
ISSN: 2189-2229
Findings
The concept of sustainability inspires public and private organizations to become
better stewards of the environment. Green Technology here plays an important role in
creating the options that enable sustainability by developing chemicals, processes, products,
and systems that are environmentally preferable, more energy- and resource-efficient, and
often more cost-effective. In this study it was found that most respondents have confirmed
that Green Technology's plays a very important role sustaining competitive advantage,
increasing bottom-line profits, improving efficiency/productivity, expanding the market share
and in improving the quality/sales/customer satisfaction levels. The contribution of Green
technology in its reservation of environment was agreed by all the respondents . Most
aspects of environmental protection including reducing carbon footprint, reducing wastage,
achieving organization's environmental goals, reducing nature-extracted raw materials and
the improvement of the quality, safety and hygiene of the products offered by reducing toxic
and chemical products etc were considered to be important. Respondents noticed a constant
evolution in the interrelationship that exists between humans and the environment and that a
time will come when it is possible that technologies can be deployed to make that
relationship more sustainable. As technological advancements continue, driven by innovation
and funded by growing investments and funding from diverse sources, resource utilization
promises to be highly efficient with extremely low levels of wastage. The social concept of
sustainability is people-oriented, and relates to the maintenance of the stability of social and
cultural systems, including the reduction of destructive conflicts. Respondents realized that
equity is an important consideration from this perspective. The contribution of Green
technology towards the social development was also judged to be important. Preservation of
cultural diversity and cultural capital across the globe, and the better use of knowledge
concerning sustainable practices embedded in less dominant cultures, are seen as desirable.
The study found that there is a perceived need for modern society to encourage and
incorporate pluralism and grass-root participation into a more effective decision-making
framework for socially sustainable development. The results show that there is indeed a
realization amongst the people about the significance of Green technology from an economic,
ecological and social perspective. From an economic growth point of view, the respondents
deemed the effectiveness of Green technology concepts only somewhat effective though they
felt that transition to a green economy will entail moving away from the system that allowed,
and at times generated, these crises to a system that proactively addresses and prevents them
The respondents have substantiated this view for economic, ecological as well as social
development aspect, by stating the various obstacles faced in the process of implementation
of Green technologies. The perception was equally unattractive for the environmental
protection perspective. Respondents gave consistently lower grades for what they felt was a
lackluster level of effectiveness in implementation of Green technology projects that could
benefit the environmental protection. Implementation of Green Technology as a means to
social and social development was found to be somewhat effective. There is no significant
difference on their perception among the respondents. Hence, the null hypothesis of no
significant difference on the perception of the respondents on the level of implementation of
Green Technology in the Kingdom of Bahrain is hereby accepted. The respondents also
raised several challenges that were faced during the implementation of Green Technology in
the Kingdom of Bahrain. The biggest problems were related to cost factor and Governmental
support. The respondents also voices their problems with regards the lack of awareness of
Green technology and its benefits, and also with regards the lack of access of the latest
technologies and methods in the country.

Hiroshima, Japan
April 29- May 1, 2015 The Inaugural Conference on Management and Sustainability in Asia
ISSN: 2189-2229
Conclusion
There is a green contribution by the selected firms in the Kingdom of Bahrain. In fact, green
technology can be considered as one of the vital factors which help in boosting economic
growth, environmental protection and social development in a sustainable manner. As the
economy diversifies, it will be prudent to engage in Sustainable Development initiatives that
ensure that the economy, ecology and social, the three important stakeholders, are protected
and not at the cost of economic growth and economic expansion.
Unemployment and Poverty Reduction can also be reduced Respondents have also presented
the renewable energy sources and the merits of the same and the urgency of having clean
energy in the kingdom of Bahrain. But the study revealed the fact that the current level of
effectiveness of implementation of Green technology was not up to the expectations in the
Kingdom of Bahrain. More awareness about benefits is needed amongst the local
communities.
Respondents have also the emerging challenges faced in the development of the GT in
Kingdom of Bahrain and recommendations to cope up with the same. The challenges such as
lack of economic initiatives, industry benefits to promote Green technology and the absence
of a coherent Government policy that promotes and strengthens a Green technology-intensive
industry are really hampering sustainable development in the Kingdom of Bahrain.
Recommendations
• A requirement for achieving a change in economic belief is understanding of the
concept of sustainable development and being aware of it, as well as the relation
between the multiple crises to unsustainable economic actions. It might bring about a
re-orientation of principles and attitudes and has to cover a variety of actors, ranging
from the consumers, to policy makers and corporations.
- Therefore, it calls for strengthening of cooperation between the various actors , the
setting up of strong linkages between the private sector and international and public
organisations in order to achieve common goals of sustainable development in the
Kingdom of Bahrain. Investment in adequate research and development in the field of
Green technologies is the need of the hour. The kingdom of Bahrain must take steps
to initiate extensive research and development activities to encourage indigenous
creation of Green Technologies.
• The most important and immediate action needed is contribution to challenging the
citizens to reduce exploitation of natural environmental resources such as oil and gas,
and to introduce and promote more alternative energy sources and energy efficient
technologies, to serve the wellbeing of future generations. Education will create
awareness and this in turn will encourage citizens to address climate change and
energy efficiency in universities, offices and homes. Also significant changes will
take place in behavior and decision-making processes on issues of sustainable
development. This will promote economic growth, social development and also
reduction in the negative impacts on the environment.
References

Hiroshima, Japan
April 29- May 1, 2015 The Inaugural Conference on Management and Sustainability in Asia
ISSN: 2189-2229
[1].Josti N.V. K., Sharma A. and Kodali R., Lean to green supply chain management : A case study, J. Environ.
Res. Develop., 6(3A), 890- 899, (2012).
[2]. Meisen P., President, Global Energy Network Institute (GENI), A report on overview of sustainable
renewable energy potential of India, January, www.geni.org, (2010).
[ 3]. Silivarajoo P., Technology a driver towards sustainable development, IGEM, 1-17, October, (2010).
[4]. Manimozhi K. and Gayathri D., Eco friendly approaches for sustainable agriculture, J. Environ. Res.
Develop., 7(1), 166-173, (2012)
[5]. Kates R. W.and Thomas M. P., An article Science and policy for sustainable development, 47(3), 8–21,
(2005).
[6] Mensah, Sustainable Development: A contreadiction?,Centre for Development Research (2004)
[7] www.un.org/esa/sustdev/documents/WSSD_POI.../WSSD_PlanImpl.pdf
[8] Webber, Larry; Webber, Lawrence; Wallace, Michael. 2009. Green Tech. 1st Ed, pg. 10. Amacom, NY,
USA.
[9] Haven, Kendall. 2011. Green Electricity: 25 Green Technologies That Will Electrify Your Future.
Greenwood Publishing Group, CA, USA.
[10] Reinhardt, Forest L. 2009.Bringing The Environment Down to Earth. Harvard Business Review; on
Business and Environment. 7th ed. Harvard Business School Press, Boston, MA, USA.
[11] Worthington, Tom. 2009. Green Technology Strategies. 1st ed.TomW Communications, Belconnen,
Australia.
[12] Mulvaney, Dustin. 2011. Green Technology: An A-To-Z Guide. Sage Publications Inc., CA, USA.
[14] Michaelides, Efstathios E. 2012. Alternative Energy Sources.1st ed. Springer Heidelberg Dordrecht,
London, UK.
[15] Pearce(1999), The Science and Engineering of Sustainability: A Primer, Tech paper produced for Institute
of Sustainable Technology and Development, Georgia Institute of Technology, Atlanta , GA
[16] http:// www.unep.org/green economy
[17] Khor , Martin (2003) Sustainable agriculture: Critical, ecological, social and economic issues. TWN briefing
paper 5
[18] Reinhardt, Forest L. (2009). Bringing the Environment Down to Earth. Harvard Business Review; on
Business and Environment. 7th ed. Harvard Business School Press, Boston, MA, USA.
[19] http://www.ifama.org/files/IFAMR/Vol%2017/Issue%203/20140017_1.pdf.
[20] Rob Vos, The World Economic and Social Survey 2011: The Great Green Technological Transformation
[21] http://www.un.org/en/development/desa/news/policy/wess-2011.html
[22] Webber, Larry; Webber, Lawrence; Wallace, Michael (2009). Green Tech. 1st Ed, pg. 10. Amacom, NY,
USA
[23] http://community-wealth.org/policy-brief/Environmentally-Sustainable-Practices-to-Achieve-Community-
Development-Goals

Hiroshima, Japan
April 29- May 1, 2015 The Inaugural Conference on Management and Sustainability in Asia
ISSN: 2189-2229
Measuring and Explaining Government Performance in Developing
Solar Power Markets
Chien-Huei Wua, Wei-Ying Chenb,*, Feng-Shang Wub a Institute of European and American Studies, Academia Sinica, Taipei City, Taiwan (R.O.C.)
b Graduate Institute of Technology, Innovation & Intellectual Property Management, College of Commerce, National Chengchi University, Taipei City, Taiwan (R.O.C.)
……..
Abstract
This paper evaluates the productivity of solar power markets in countries with
developing solar power markets. It does so by investigating the extent to which
governments can decrease support while maintaining electricity utilization levels, and
increase solar power generation while decreasing CO2 emissions. To address both
issues with a view to improving energy utilization efficiency, this paper evaluates the
performances of 25 selected countries against a Non-Separable DEA model (a DEA
measure with non-separable desirable and undesirable outputs for evaluating
efficiency). Panel data covering the period 2009 – 2012 reveals that in terms of pure
technical efficiency, developing countries are slightly better of, on average, than
developed countries, though in terms of overall efficiency, developed countries appear
to be significantly more efficient. The findings of this paper highlight that inefficient
countries could catch up with their peer groups and become more efficient by (1)
reducing total expenditures and investments, days for getting electricity, total
electricity generation, and CO2 emissions for a given output; and (2) increasing the
proportion of solar electric generation.
Keywords: Renewable energy policy; Solar power; Undesirable DEA model
E-mail address: *Corresponding author: [email protected] (Wei-Ying Chen); [email protected] (Chien-Huei Wu); [email protected] (Feng-Shang Wu).

Hiroshima, Japan
April 29- May 1, 2015 The Inaugural Conference on Management and Sustainability in Asia
ISSN: 2189-2229
1. Introduction
In most countries, renewable energy (RE) policies have been advocated in support of the
transition to a low-carbon economy – a transition officially proposed in the Kyoto Protocol
with a view to meeting the environmental challenges associated with carbon emissions.
Strategies to further this transformation include supporting RE generation, improvements in
energy efficiency, and reducing rates of deforestation. Since the publication of the Kyoto
Protocol Report in 1997, the low-carbon transformation has attracted attention from scholars,
policy-makers, and managers [1, 2]. Over roughly the same period, the energy crisis of the
2000s demonstrated that, worldwide, traditional energy resources are becoming more difficult
and expensive to access, with obvious economic consequences. Thus, the development of RE
resources has been recognized as integral to future-oriented policies on the economy, energy,
and the environment; solar energy technologies have been identified as innovative means of
moderating the impact of energy systems on climate change, and for countries to decrease
their dependence on foreign energy sources. These developments have given a boost to solar
energy-related research and industrial policies. Germany, for example, invested 10.3% of
public R&D expenditures in solar power between 2006 and 2010, while Australia invested
14.5% between 2007 and 2011 [3, 4].
Despite the investment of public and private funds over many years, the experiences of
numerous countries demonstrate that advances in the research, development and
demonstration (RD&D) of solar power require slow, tedious efforts [5]. The lack of progress
has been attributed to financial and technical barriers, a lack of government policy support,
high capital costs, and poor impressions of the value of RE. In an effort to overcome these
barriers, many countries have implemented a series of supports to make solar power more
attractive [6-8], including incentives such as renewable portfolio standards (RPS), feed in

Hiroshima, Japan
April 29- May 1, 2015 The Inaugural Conference on Management and Sustainability in Asia
ISSN: 2189-2229
tariffs (FITs), tradable green certifications (TGCs), and banking and insurance services.
Previous studies have investigated the effectiveness of adopting such incentives at the
national level [6, 9-14], mostly by focusing on the consequences and implications of such
supports in order to identify which are optimal for specific countries given their particular
circumstances. The efficiency and efficacy of such incentives for the solar power industry
remain open to question, and, at present, the installed renewable generation capacities are far
from sufficient to meet post-Kyoto targets.
The costs of incentives, energy subsidies, and infrastructure, in all their forms, are
heavily dependent on government intervention, without which planning electricity supply in
dominant electricity markets is chiefly characterized by profit-maximization and/or cost-
minimization [15]. Effective government intervention would encourage more investment in
solar power by hastening solar power utilization in the short term and improving national
economic growth in the long term, with less intervention needed to achieve targets in cases of
more efficient investments. These supports may be estimated for by referencing
governmental annual expenditure and investment reports. Hence, we address two systemic
issues: the extent to which governments can decrease support while maintaining electricity
utilization levels, and the extent to which governments should strive to simultaneously
increase solar power generation and decrease emissions of CO2. To these ends, a few
advances in data envelopment analysis (DEA) provide a suitable analytic tool for comparing
relative performance across energy markets [17, 18].
The DEA approach designates each country as a decision-making unit (DMU); each
DMU is taken to represent the amount that all outputs could be increased at a given input
level, or all inputs reduced at a given output level. Under normal circumstances, undesirable
outputs, such as environmental pollutants, are inevitably produced. In such cases, the

Hiroshima, Japan
April 29- May 1, 2015 The Inaugural Conference on Management and Sustainability in Asia
ISSN: 2189-2229
maximum-output efficiency evaluation of the traditional DEA model is not a suitable
analytical tool; undesirable outputs need to be specially dealt with by expanding the
traditional DEA approach [19-21]. Inspired by the integration of the energy policy and
efficiency evaluation fields, this study investigates government interventions in 25 national
markets by utilizing an extended DEA approach to measure inter-country efficiency within a
given period. The most important contribution of this study is that it provides a clear
description of the indicators of the efficiency of government intervention in RE development.
At the same time, this study provides a detailed evaluation of national performance, and of
differences among the sampled countries.
2. Methodology
2.1. The incentives for solar power markets
In accordance with the Kyoto Protocol, a number of national governments recently set
out aggressive RE policies suggesting that the greater proportion of energy should be derived
from renewable sources in order to meet their policy goals in such areas as energy security,
energy efficiency, and reductions in carbon emissions. In the context of solar power
promotion, the research literature refers to building large-scale solar electric generation
facilities as one of the most efficient approaches to implement renewable electricity policy
[22]. Solangi, Islam [14] note a trend, in various countries, favoring the adoption of solar
power policies promoting easier access to assessment and reference materials to design
suitable incentives [23]. They describe a shift in the control of energy markets from a
conventional energy system to an emergent renewable system propped up by attractive
support instruments in order to sustain energy production, distribution, and consumption [14,
23-25]. There are extensive studies investigating the merits of various solar power policy
instruments and their impacts on solar power utilization [12, 13, 26, 27].

Hiroshima, Japan
April 29- May 1, 2015 The Inaugural Conference on Management and Sustainability in Asia
ISSN: 2189-2229
The principal drivers of solar power policy utilization are government interventions and
commitments in RE development. As Cansino, Pablo-Romero [24] recently pointed out,
strong government support contributes much to stimulating solar electric markets. Countries
have been keen to make use of supportive instruments – such as RPS, FITs, and TGCs – to
stimulate solar power markets, and, in recent years, have found it necessary to pay greater
attention to the efficiency of incentives in terms appropriate to the particular national
economic situation. Previous studies have analyzed contemporary supportive instruments
using a common set of criteria with a view to identifying the most effective instruments, and
with reference to specific countries and/or technologies [28, 29]. However, none of
instruments would be sufficient, in themselves, to transform a conventional energy system
into a renewable one without negative consequences; some other supportive instruments,
corresponding to the particular circumstances and objectives of a given country developing
its solar power market, have to be positively integrated into existing regulatory frameworks
to reduce existing handicaps [14, 23, 30, 31].
Questions of the efficiency of governmental investment have attracted attention from
scholars interested in developing solar power markets. Researchers have analyzed the
economic, environmental and employment impacts of RE markets, exploring diverse fields in
order to calculate, and predict, their effects. Some researchers aim to present and discuss
quantitative assessments of these new regulatory mechanisms with respect to their
attractiveness to investors, effectiveness in launching new energy markets, cost efficiency,
and guarantees to overcome investment-based risks accompanying increased governmental
investments [32-35]. Their conclusions suggest that promoting solar power will benefit the
overall economy.
2.2. The infrastructures for solar power development

Hiroshima, Japan
April 29- May 1, 2015 The Inaugural Conference on Management and Sustainability in Asia
ISSN: 2189-2229
Physical and service infrastructures related to solar power markets have received
relatively limited attention from scholars, and yet, for emerging solar power industries to
succeed requires reliable infrastructures to support everyday operations and long-term
developments. Service infrastructure and high-quality ICT infrastructure are particularly
important for new technologies. We differentiate the following elements [36, 37]:
● Physical infrastructures including communications, energy, high-speed ICT
infrastructure, broadband, telephone, electrical grid, etc.
● Service infrastructures including knowledge and technical capacities, scientific and
applied knowledge and skills, testing facilities, possibilities for knowledge
transformation, banking, security and insurance services, patent protection, training,
education, etc.
In general, the physical infrastructure needed for electrical supply is characterized by
large scale, inseparability, and long periods of operation. The infrastructure required for the
provision of solar power is based on the same physical infrastructure, meaning that additional
costs can often be avoided, smoothing the way for investment by private interests. In this
study, we emphasize the importance of an adequate service infrastructure as a necessary
condition for supporting developed and/or incubating solar power markets.
2.3. Measuring the efficiency of governmental investment with a DEA approach
To measure efficiency, data envelopment analysis (DEA) can be applied to a wide swath
of practical issues, including the efficiency of national energy markets. For example, an
evaluation of energy utility efficiency in regions of China from 2000 to 2003 was carried out
by Hu and Lee [38]. In that study, the inputs include labor, capital stock, gas and oil
consumption and electricity consumption, while real gross domestic production (real GDP) is

Hiroshima, Japan
April 29- May 1, 2015 The Inaugural Conference on Management and Sustainability in Asia
ISSN: 2189-2229
the single output. Further discussion is offered by Honma and Hu [39], Honma and Hu [40]],
who assess the relationship between extended inputs (including labor, private and
government capital stock, and 11 energy factors) and a single the same output factor, real
GDP. They use the DEA model to evaluate relative energy efficiencies and productivity
growth in Japanese regions by employing panel data from 1993 to 2003.
Researchers regard energy efficiency as an important measure of relative national
performance. Hawdon [41] employs DEA to study simultaneously the impacts of various
policy developments on the relative performance of gas industries among 33 developed and
developing countries. In this study, gas consumption and the number of customers are
outputs; employment and length of pipelines are the inputs. Hu and Kao [42] adopt the DEA
model to produce an environmental energy index for APEC countries from 1991 to 2000.
Their study took labor, capital stock, energy consumption and CO2 emissions as the inputs,
and GDP as the only output.
Undesirable outputs, such as environmental pollutants, are inevitably produced as
electricity is produced, transmitted, and consumed. Thus, evaluating maximum-output
efficiency using the traditional DEA model does not suit this situation as undesirable outputs
need to be specially dealt with by expanding the traditional DEA model. Fare, Grosskopf [19]
propose the first extended DEA model to evaluate environmental efficiency while
considering undesirable outputs with weak disposability. Now, most researchers focus on
economic and financial efficiency, while also acknowledging and evaluating the importance
of environmental efficiency. Zaim and Taskin [20] conduct cross-sectional comparisons of
production processes in OECD countries, treating polluting emissions with a non-parametric
approach. Talluri and Sarkis [21] summarize the various applications of the DEA model in
research on environmental efficiency. Based on indicators in the DEA model proposed by

Hiroshima, Japan
April 29- May 1, 2015 The Inaugural Conference on Management and Sustainability in Asia
ISSN: 2189-2229
Esty, Levy [43], namely, total final energy consumption, RE consumption and CO2
emissions, Zhou, Ang [44] construct a sustainable energy index to determine the efficiency of
sustainable energy development in APEC countries. They employ an efficiency analysis
method based on the environmental DEA technique and non-radial DEA model for
investigating carbon emissions within several countries [45, 46]. Gomes and Lins [47]
develop zero sum DEA to evaluate the carbon emissions of 64 countries with reference to the
Kyoto Protocol statement. Sozen and Alp [48] compare differences in environmental
protection efficiency between Turkey and the EU countries by applying the values of
emissions (such as CO2 and SO2) and pollutants as the outputs in the DEA model. Yeh, Chen
[49] further integrate GDP, CO2 and SO2 emissions as positive and negative outputs to assess
energy efficiency by representing the inputs for labor, capital stock and energy consumption
in China and Taiwan from 2002 to 2007.
From the perspective of solar power promotion, the amount of electricity generated from
solar resources increases as the efficiency of the generating capacity approaches established
policy targets [7, 17, 18]. Previous studies applied the number of customers, the scope of
service area, and electricity sales, as outputs in order to analyze the productivity of electricity
generating industries in domestic markets; the inputs employed include the number of
employees, length of the transmission network, and network losses [50, 51]. Zhou, Wang [7]
employ a bi-level optimization approach to investigate cost efficiency by measuring the
interventions of policy-makers. Deshmukh, Bharvirkar [17] maintain that governments adopt
efficiency policies not only to fulfill targets, but to drive technological improvements and
reduce the cost of solar power generation. In previous studies, it has been argued that FITs
schemes would contribute so much to domestic fiscal burdens that governments should
amend their policies on the basis of their particular economic situation in order to limit
subsidies for the installation of solar power generation facilities. However, del Rio and Mir-

Hiroshima, Japan
April 29- May 1, 2015 The Inaugural Conference on Management and Sustainability in Asia
ISSN: 2189-2229
Artigues [8] note that under such circumstances, limiting the subsidies available for new
installations can encourage the use of more efficient technologies at existent installations.
In sum, researchers have constructed a variety of DEA efficiency models to consider:
the impacts of desirable and undesirable outputs; levels of productivity; technical efficiency
improvements; environmental performance evaluations; pollution emission assessments; and
shadow prices of pollution estimates. Ekins [52] argues that price incentives are likely to be
an important instrument for improving RE efficiency, and that the RE promotion may be
successful in practical terms. Thus, Ekins asks, “How necessary are price increases to
encourage behavior change (and reduced absolute levels of emissions) in a context of rising
incomes?” An important element Song, An [53] consider is the impact of environmental
pollutants and other undesirable outputs associated with resources invested in the production
process, which increase or decrease with the level of desirable outputs. They also point out
that when a decision-making unit improves efficiency one can increase desirable outputs
while at the same time reducing undesirable outputs. In fact, the previous study demonstrates
that within OECD countries, if the disposability of carbon emissions were strictly restricted
by environmental regulations, overall GDP would fall as carbon emissions were reduced
[20].
As Rayp and Van De Sijpe [54] write, there is no agreed upon means of evaluating
governmental performance. This implies that in order to evaluate improvements to RE
performance, first we must derive an estimate for governmental performance for RE. For this
purpose, we opt for the data envelopment analysis (DEA) approach. The DEA model
estimates the efficiency by ‘enveloping’ the data according to the assumption that the
production possibility set is the smallest set that satisfies convexity and free disposability,
while containing all observed combinations of multiple inputs and outputs. Next, ‘efficiency’

Hiroshima, Japan
April 29- May 1, 2015 The Inaugural Conference on Management and Sustainability in Asia
ISSN: 2189-2229
is measured as the distance from the constructed production possibility frontier that indicates
which outputs can be expanded given fixed inputs. The efficiency scores of DMUs are
obtained by estimating the efficient frontier under the assumptions of (1) the constant returns-
to-scale (CRS) which is known as a measure overall technical efficiency, and (2) the variable
returns-to-scale (VRS) which represents pure technical efficiency.
As a result of greater environmental awareness and conservation in recent years,
undesirable outputs (e.g. air pollutants and hazardous wastes) have aroused strong concerns
[46, 55]. Thus, developing technologies that produce fewer undesirable outputs is crucially
important in every field of production. For this reason, researchers assume that producing
more desirable outputs relative to inputs, and fewer undesirable outputs, are important criteria
of efficiency. In previous studies, researchers have proposed means of measuring such
outcomes [19, 47, 56-58]. However, evaluating efficiency via the traditional DEA model of
maximizing outputs or minimizing inputs is not well-suited to measuring reductions of
undesirable byproducts as these need to be specially dealt with by expanding the traditional
DEA model. Fare, Grosskopf [19] propose the first extended DEA model to evaluate
environmental efficiency by considering undesirable outputs with weak disposability, and
considering energy field studies, using undesirable DEA models; they designate DMUs with
multiple inputs and outputs with reference to the studies of Fare, Grosskopf [19].
In the current study, we assume that certain undesirable outputs are not separable from
the corresponding desirable outputs. Hence, reducing undesirable outputs is inevitably
accompanied by a reduction in desirable outputs. Additionally, we observe that specific
undesirable outputs are non-separable from specific corresponding inputs. In this study, for
electrical utilization, carbon emissions are proportional to the energy resource consumption
on the input side. The non-separable DEA model can deal with this situation after
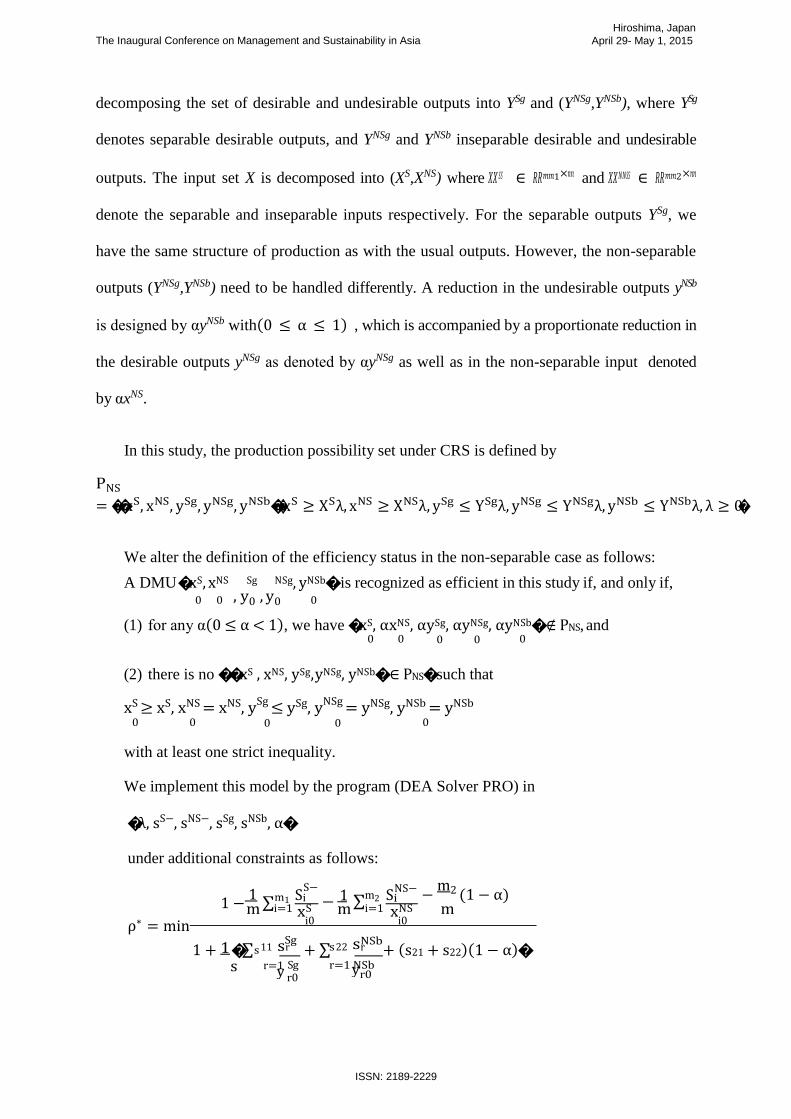
Hiroshima, Japan
April 29- May 1, 2015 The Inaugural Conference on Management and Sustainability in Asia
ISSN: 2189-2229
y y
1
decomposing the set of desirable and undesirable outputs into YSg and (YNSg,YNSb), where YSg
denotes separable desirable outputs, and YNSg and YNSb inseparable desirable and undesirable
outputs. The input set X is decomposed into (XS,XNS) where 𝑋𝑋 𝑆𝑆 ∈ 𝑅𝑅𝑚𝑚1×𝑛𝑛 and 𝑋𝑋𝑁𝑁𝑆𝑆 ∈ 𝑅𝑅𝑚𝑚2×𝑛𝑛
denote the separable and inseparable inputs respectively. For the separable outputs YSg, we
have the same structure of production as with the usual outputs. However, the non-separable
outputs (YNSg,YNSb) need to be handled differently. A reduction in the undesirable outputs yNSb
is designed by αyNSb with(0 ≤ α ≤ 1) , which is accompanied by a proportionate reduction in
the desirable outputs yNSg as denoted by αyNSg as well as in the non-separable input denoted
by αxNS.
In this study, the production possibility set under CRS is defined by
PNS
= ��xS, xNS, ySg, yNSg, yNSb��xS ≥ XSλ, xNS ≥ XNSλ, ySg ≤ YSgλ, yNSg ≤ YNSgλ, yNSb ≤ YNSbλ, λ ≥ 0�
We alter the definition of the efficiency status in the non-separable case as follows:
A DMU �xS, xNS Sg NSg, yNSb� is recognized as efficient in this study if, and only if, 0 0 , y0 , y0 0
(1) for any α(0 ≤ α < 1), we have �xS, αxNS, αySg, αyNSg, αyNSb� ∉ PNS, and 0 0 0 0 0
(2) there is no ��xS , xNS, ySg, yNSg, yNSb� ∈ PNS� such that
xS ≥ xS, xNS = xNS, ySg ≤ ySg, yNSg = yNSg, yNSb = yNSb
0 0 0 0 0
with at least one strict inequality.
We implement this model by the program (DEA Solver PRO) in
�λ, sS−, sNS−, sSg, sNSb, α�
under additional constraints as follows:
1 − 1 ∑m1
S− i − ∑m2
NS− i
− m2 (1 − α)
m i=1 xS m i=1 xNS m ρ∗ = min i0 i0
1 s sSg s sNSb
1 + �∑ 11 r + ∑ 22 r + (s21 + s22)(1 − α)� s r=1 Sg
r0 r=1 NSb
r0
S S

Hiroshima, Japan
April 29- May 1, 2015 The Inaugural Conference on Management and Sustainability in Asia
ISSN: 2189-2229
0
0
0
0
0
ySg
Subject to
xS = XSλ + sS−
αxNS = XNSλ + sNS−
ySg = YSg − sSg
αyNSg ≤ YNSgλ
αyNSb = YNSbλ + sNSb
∑s11 �ySg
+ sSg� + α ∑
s21 yNSg
= ∑s11 y
Sg + ∑
s21 yNSg
(a) r=1 r0 r
sSg
r=1 r0 r=1 r0 r=1 r0
r ≤ U(∀r) (b) r0
sS−, sNS−, sSg, sNSb, λ ≥ 0,0 ≤ α ≤ 1,
where s11, s21, s22 are numbers of the elements in Sg, NSg and NSb respectively, and
s = s11 + s21 + s22. The constraint (a) is added in order to ensure that the total number of
desirable outputs remains unchanged. The constraint (b) is added in order to restrict to a
reasonable range the expansion of separable, desirable outputs.
yNSg ⇐ yNSg + sNSg∗
0 0
yNSb ⇐ yNSb − sNSb∗
0 0
Furthermore, we decompose
Finally, let an optimal solution of the above program be
�ρ∗, λ∗, sS−∗, sNS−∗, sSg∗, sNSg∗, sNSb∗, α∗�, then we have 0 < ρ∗ ≤ 1, and it holds that ρ∗ = 1 if, and only if, the DMU is efficient under conditions. If the DMU is inefficient, it can be
improved and made efficient by the projection below:
xS ⇐ xS − sS−∗
0 0
xNS ⇐ α∗xNS − sNS−∗
0 0
ySg ⇐ ySg + sSg∗
0 0
this overall efficiency into the respective inefficiencies as follows:
1−∑m1 α1i−∑
m2 α2i
ρ∗ = s11 i=1 s21 i=1 s22
1+∑r=1 β1r+∑r=1 β2r+∑r=1 β3r
Where

Hiroshima, Japan
April 29- May 1, 2015 The Inaugural Conference on Management and Sustainability in Asia
ISSN: 2189-2229
1S
s y
s
s yNSb
1
s
α1i = 1 sS−∗
i (i = 1, … , m ) (Separable inputs) m xi0
α2i =
1 (1 − α∗) + 1 sNS−∗
i NS (i = 1, … , m2) (Non-separable inputs) m
1 sSg∗
m xi0
β = r (r = 1, … , s ) (Separable desirable outputs) 1r Sg 11
r0
β2r = 1
(1 − α∗) (r = 1, … , s21 (Non-separable desirable outputs)
Β3r =
NSb∗
(1 − α∗) + r (r = 1, … , s22)(Non-separable undesirable outputs) r0
2.3.1. Indicators
2.3.1.1. Electricity utilization indicators: DEA inputs
Electricity markets can be organized through various governmental interventions, such as
the creation of electricity markets, by considering the various resources and infrastructures
needed. In this study, solar power is defined as electricity generated solely from solar
irradiation via solar photovoltaic and/or solar thermal installations. Governments implement
regulatory policies and cover the costs associated with the incentives and expenditures
required to create a new market in solar power. In general terms, the public electrical
infrastructure should be recognized as contributing importantly to the quality of the
electricity supply. Three approaches are available for measuring renewable electricity
utilization. Under the first approach, governments introduce incentives to help establish
emergent market mechanisms, and RPS, FIT schemes and other incentives are included in the
budget as an annual government expenditure [7-9, 12, 31]. Under the second, we employ
gross fixed capital formation as a proxy for investment in the national infrastructure for
electricity utilization [7-9, 12, 31]. From the viewpoint of electricity consumption, all
electricity users have to submit an application to the utility for the installation and
transportation of conventional electricity and/or renewable electricity. The time required for
1
s

Hiroshima, Japan
April 29- May 1, 2015 The Inaugural Conference on Management and Sustainability in Asia
ISSN: 2189-2229
connection to the grid to get electricity from the generating utility depends on the state of the
electrical infrastructure, including the application processes, grid intensity, electrical
generation and stock capabilities. Third, price indices of the means of electricity production
are composed of several categories, including RE resources, clean energy resources, and
conventional energy resources. For some major markets in renewables, researchers observed
that, as a practical matter, users will absorb extra expenses; these are the added cost of
purchasing renewable electricity and additional administrative charges levied by the utilities.
Thus, it can be assumed that renewable electricity markets mature as national incomes
increase [7-9, 12, 31].
Therefore, we propose using four electricity utilization indicators as DEA inputs. These
are total government expenditure (EXP), gross fixed capital formation (GFCF), total income
per capita (INC), and days required getting electricity (DAY). Here, days required getting
electricity is recognized as a non-separable input for measuring electricity utilization in terms
of generation, transportation, and supply, and needs to be taken into consideration when users
apply to use electricity.
2.3.1.2. Electricity consumption indicators: DEA outputs
An electricity utilization output indicator(s) can be defined as economic and/or
environmental indicator(s) reflecting performance in the market. It is obvious that the
indicators (1) make developed-solar-market countries easy to understand in terms of how
near electricity utilization is to achieving the supra-national and/or intra-national targets, and
(2) assist countries with newly established solar markets in spurring on market development.
National energy, economic, and environmental output indicators are frequently used in such
literature as the IEA survey and practices embodied in the Directives [2, 12, 39, 43, 53, 55].
These indicators are: gross domestic production, solar power as a percentage of total

Hiroshima, Japan
April 29- May 1, 2015 The Inaugural Conference on Management and Sustainability in Asia
ISSN: 2189-2229
electricity consumption, total electricity consumption, and CO2 emissions.
(1) Gross domestic production (GDP): The most comprehensive measure of national
output associated with the implementation of a renewable electricity policy.
(2) Solar power generation as a percentage of total electricity consumption (PRE): A
target common to several countries is increasing the percentage of total electricity generated
by solar power. The percentage of electricity generated by solar installations is based on
government-set RE development targets. For example, in German, Spain and France,
countries with advanced RE installations, production targets are set at 18% to 23% of total
energy consumption by 2020; in China, Taiwan, Malaysia and Indonesia – latecomers to RE
markets – the targets range from 10% to 24%. Roughly speaking, the average target is 20%
by some point between 2020 and 2030.1 Here, the target is solar power as carbon emissions
over the lifecycle of the infrastructure, from manufacturing through to recycling, are nearly
zero. To reduce carbon emissions, governments can incentivize private parties to install solar
power generators. Thus, in this study, this output (PRE) is positively non-separated with
undesirable outputs described below (4).
(3) Ratio of total electricity generation (TEG): A measure of electricity utilization that
includes renewable, clean, and conventional electricity generation. Increasing the share of
solar power generation contributes directly to meeting government conservation and
emissions targets, and as such is recognized as a desirable outcome.
(4) CO2 emissions relative to GDP (COE): A form of air pollution derived from
national economic activity. Several governments concerned with the impact of carbon
emissions have begun considering reducing carbon emissions by implementing RE
1 See the details of other countries in the website of International Energy Agency (IEA): http://www.iea.org/policiesandmeasures/renewableenergy/

Hiroshima, Japan
April 29- May 1, 2015 The Inaugural Conference on Management and Sustainability in Asia
ISSN: 2189-2229
generation and/or advocating energy conservation. The researcher considers undesirable
outputs inseparable from the corresponding desirable outputs [59], and reductions in
undesirable outputs as unavoidably accompanied by reductions in desirable outputs. The
inseparability of desirable and undesirable outputs should be taken into account in applying
the DEA model.
3. Results
Although there is relatively little research on solar power production and investment,
some information is available on costs and productive inputs for making international
comparisons. This study uses country-level data derived from estimating the performance of
the solar power policies of these 25 countries (See Appendix A). This study employs seven
variables as inputs and outputs. Inputs include EXP, GFCF, INC and DAY; outputs include
GDP, PRE, TEG and COE. The data is derived from World Development Indicators and the
Doing Business Database of the World Bank, the Statistical Review of World Energy of the
British Petroleum Company, and the National Statistics of Taiwan’s Statistical Bureau.
The data on solar power markets sampled in this study are drawn from 25 countries over
a four-year period. Summary statistics are shown in Table 2 for the solar power markets. For
the given years, average percentages of government total expenditure and investment to GDP
are approximately 42 and 22, and the standard deviations are much lower than the averages,
indicating that governments are devoting similar percentages of GDP to developing solar
power markets. However, the standard deviations for CO2 emissions and total electricity
generation are both much higher than average, implying that some countries’ CO2 emissions
and total electricity generation, for example, in 2009, are much lower than the reported 625
tons and 399 tons, while others are significantly higher.
Table 3 lists the results of correlation analysis between inputs and outputs. The

Hiroshima, Japan
April 29- May 1, 2015 The Inaugural Conference on Management and Sustainability in Asia
ISSN: 2189-2229
correlation analysis shows clearly that most of the correlation coefficients between outputs
and inputs are significant. In this study, the first step in the DEA model involves determining
the positive/negative relationship between inputs and outputs. Here, we employ a Pearson
correlation analysis to test for isotonicity, that is, the positive and negative directions of the
relationships between inputs and outputs. Based on the results of the inter-correlation
analysis, the correlation coefficient between INC, EXP and PRE is significantly positive,
meaning when a government gives greater financial support to develop and bolster the
incomes derived from solar power generation, its proportion increases; the correlation
coefficient (COE) between GFCF and TEG is significantly positive, meaning that as
government investment in infrastructure increases, total electricity generation and CO2
emissions will also increase. The correlation coefficients DAY and PRE are significantly
negative, meaning that the increase in the required days for getting electricity supply will
decrease the proportion of electricity derived from solar resources.
The DEA analysis of the data presented in Table 4 was performed using the DEA Solver
Pro software package. The efficiency scores of countries in various years (year-country) are
examined according to the CRS and VRS assumptions separately. The efficiencies of the
various countries show that in developing solar power markets, some countries are relatively
more competitive than others.
Table 4 shows that, at points between 2009 and 2012, 46 of 100 DMUs may be
considered to have been efficient markets (in terms of the GDP and PRE) under the CRS
assumption. The efficient countries were: in 2009, Austria (AUT), Denmark (DNK), France
(FRA), Germany (DEU), Portugal (PRT), Spain (ESP), Sweden (SWE), Switzerland (CHE),
and Japan (JPN); in 2010, Austria, Belgium (BEL), Czech Republic (CZE), Denmark,
France, Germany, Portugal, Spain, Sweden, Switzerland, Australia (AUS), and Japan; in

Hiroshima, Japan
April 29- May 1, 2015 The Inaugural Conference on Management and Sustainability in Asia
ISSN: 2189-2229
2011, Czech Republic, Denmark, France, Germany, Greece (GRC), Italy (ITA), Spain,
Sweden, Switzerland, Australia, and Japan; in 2012, Austria, Belgium, Bulgaria (BGR),
Czech Republic, Denmark, France, Germany, Greece, Italy, Spain, Sweden, Switzerland,
Australia, and Japan. When VRS is assumed, about three-quarters of the countries may be
considered efficient (see details in Table 4). As expected, the VRS efficiencies, which
measure pure technical efficiencies and exclude effects due to the scale of the operations, are
larger than the corresponding CRS efficiencies. For instance, the CRS efficiencies of India
(IND) are between 0.65 and 0.71 during the given time frame, but their scores increase to 1
under the VRS assumption. The CRS efficiency score is lower because this country does not
operate at the best possible scale. The ratio of CRS and VRS is the scale efficiency. For
example, in each year, the scale efficiency of Mexico is lower than 0.1, meaning that the
country is unable to reach unit efficiency because it is not operating at the most productive
scale, and at present the size of its operations reduces its pure technical efficiency (i.e. the
VRS efficiency) by 99%. When VRS is assumed, Mexico, Greece, Bulgaria, Portugal, Israel,
and India, in some of the given years, may be considered efficient. This suggests that the
CRS inefficiencies of these four countries are due to the fact that they are not operating at the
best possible scale.
In 2009 and 2010, pure technical efficiencies in Italy were inefficient, which led to
overall inefficiencies, but the total efficiencies in 2011 and 2012 increased to 1.
Government resource managers and policy-makers are interested in estimating how
much a particular desirable output can be increased, and/or an input reduced, in the process of
improving energy efficiency. Great efficiency in the use of specific inputs is necessary if solar
electric markets are to operate most efficiently. In order to discover how increases in
desirable outputs could be achieved with lower levels of resource inputs, we turn to

Hiroshima, Japan
April 29- May 1, 2015 The Inaugural Conference on Management and Sustainability in Asia
ISSN: 2189-2229
differences between solar electric markets across the 25 sampled countries. After applying
DEA to the efficiency evaluation, each country is assigned benchmark peer(s) on the basis of
efficiency. For example, Taiwan’s peers in 2012 are Germany, Switzerland, China and Japan,
meaning that Taiwan in 2012 could attempt to emulate these four countries (as far as the
proportion of solar power is considered) in order to improve the efficiency of solar electric
utilization to the point that Taiwan could be considered the best in the DEA study. Similarly,
less efficient countries can set target values for projections for both input and output. Tables 5
and 6 report on improvements with the potential to increase total efficiency under the CRS
and VRS assumptions respectively: less efficient countries can improve efficiency by
decreasing resource inputs, undesirable outputs, and/or increasing desirable outputs. For each
less efficient country, we break down their inefficiencies in terms of specific outputs and
inputs, in percentage terms calculated by “(target value of projection – initial value) divided
by initial value” of each input and output. Tables 5 and 6 answer the questions: (1) to what
extent can governments further decrease the support on offer while maintaining electricity
utilization at the current level?; and (2) to what extent can governments increase solar power
generation and simultaneously decrease CO2 emissions?
Referring to Tables 5 or 6, policy makers can select a peer country to serve as a model
for improving the performance of less efficient countries based on their preferences. For
instance, in terms of total efficiency under the CRS assumption (see Table 5), total
government expenditure and investment, days for getting electricity, total electricity
generation and CO2 emissions in Taiwan, in 2012, (12TWN) should be reduced by 0.9%,
1.6%, 0.7%, 0.7%, and 0.7%, respectively, and its proportion of solar power should be
increased by 20%. After those improvements, 12TWN would be as efficient as other
countries in its peer group. In terms of the total efficiencies of all the sampled countries, the
average potential improvements are: total expenditure, -19.8%; gross fixed capital formation,
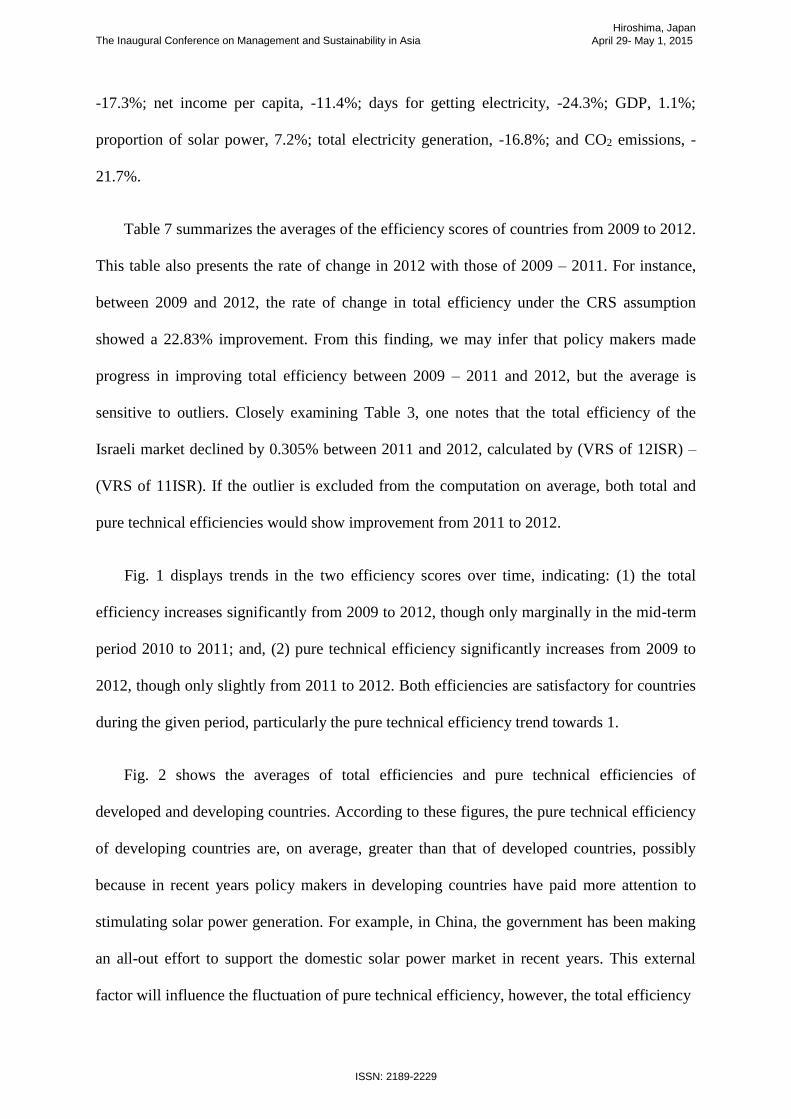
Hiroshima, Japan
April 29- May 1, 2015 The Inaugural Conference on Management and Sustainability in Asia
ISSN: 2189-2229
-17.3%; net income per capita, -11.4%; days for getting electricity, -24.3%; GDP, 1.1%;
proportion of solar power, 7.2%; total electricity generation, -16.8%; and CO2 emissions, -
21.7%.
Table 7 summarizes the averages of the efficiency scores of countries from 2009 to 2012.
This table also presents the rate of change in 2012 with those of 2009 – 2011. For instance,
between 2009 and 2012, the rate of change in total efficiency under the CRS assumption
showed a 22.83% improvement. From this finding, we may infer that policy makers made
progress in improving total efficiency between 2009 – 2011 and 2012, but the average is
sensitive to outliers. Closely examining Table 3, one notes that the total efficiency of the
Israeli market declined by 0.305% between 2011 and 2012, calculated by (VRS of 12ISR) –
(VRS of 11ISR). If the outlier is excluded from the computation on average, both total and
pure technical efficiencies would show improvement from 2011 to 2012.
Fig. 1 displays trends in the two efficiency scores over time, indicating: (1) the total
efficiency increases significantly from 2009 to 2012, though only marginally in the mid-term
period 2010 to 2011; and, (2) pure technical efficiency significantly increases from 2009 to
2012, though only slightly from 2011 to 2012. Both efficiencies are satisfactory for countries
during the given period, particularly the pure technical efficiency trend towards 1.
Fig. 2 shows the averages of total efficiencies and pure technical efficiencies of
developed and developing countries. According to these figures, the pure technical efficiency
of developing countries are, on average, greater than that of developed countries, possibly
because in recent years policy makers in developing countries have paid more attention to
stimulating solar power generation. For example, in China, the government has been making
an all-out effort to support the domestic solar power market in recent years. This external
factor will influence the fluctuation of pure technical efficiency, however, the total efficiency

Hiroshima, Japan
April 29- May 1, 2015 The Inaugural Conference on Management and Sustainability in Asia
ISSN: 2189-2229
of developed countries appears to be significantly greater than that of developing countries,
as expected.
4. Discussion and Conclusions
The transformation of an economy driven by conventional energy into one based on RE
is an attractive option for many countries, despite the inevitability of environmental
pollutants as undesirable byproducts. With 25 solar power markets examined here, this study
provides a means of ranking solar power stimulus programs in terms of environmental
protection and economic growth.
This study evaluates productivity performances of countries with panel data covering the
period of 2009 – 2012. According to the case study results, although the pure technical
efficiencies of developing countries is, on average, greater than that of developed countries,
the total efficiencies of developed countries appear significantly greater than those of
developing countries. From the results of examining the average potential improvements, in
the future, “days for getting electricity” should be tackled first, and then policy makers
should reduce the percentage of total expenditures devoted to subsidizing deployment and
generation; also, they should pay particular attention to reducing CO2 emissions during the
generation phase. In evaluating two types of efficiency associated with solar power
development with the Non-Separable DEA model, two options for energy, environmental,
and economic policy-making emerge. One focuses on increasing the competition of their
electricity markets with liberalization and to scale back their interventions and fiscal supports
for the solar power production. The other focuses on targeting the infrastructures necessary
for solar power utilization. The advocacy efforts shaped the objective (here is outputs) and its
policy processing framework (in this study, we consider inputs as proxies of fiscal support)

Hiroshima, Japan
April 29- May 1, 2015 The Inaugural Conference on Management and Sustainability in Asia
ISSN: 2189-2229
importantly clue to understanding the advantage and drawback of incentives for solar power.
Below we elaborate how some key principles contributed in practice to shaping the policy
based on the policy framework in the three developed EU countries and then illustrate the
extension for solar power diffusion in developing countries.
4.1. Liberalization of electricity markets and competition in a regulated-network
environment
From our results, the efficiencies in some countries, such as Spain and Germany,
remained efficient in the period from 2009 to 2012, despite the termination or scaling back of
the financial supports provided by the governments prior to 2008. This implies that solar
power markets in these developed countries have been able to operate according to existing
market structures and mechanisms without any need for governmental intervention. With the
implementation of Directive 96/92/EC, the EU Member States have liberalized their
electricity markets and created full competition in some Member States, which subsequently
brings about efficient electricity transaction and more efficient investment decision-making.
For example, since Lisbon European Council held on 23 and 24 March 2000 when the EU
pronounced the need to develop RE, the cumulative installed capacity in Germany had grown
significantly. In view of the full competition market in Germany, all suppliers could freely
deliver solar power to their customers with a competitive price, which contributes to the
growth of the market share of solar power in electricity markets.
Therefore, a sound and competitive electricity market would contribute to the efficiency
of solar power production and open a window of opportunity for the governments to scale
back their subsidies. This lesson may be helpful for latecomers in solar power, such as
Taiwan and China. Thanks to the maturity of the solar equipment industries and the rapidity
with which they achieved a significant production capacity, efficiencies in Taiwan and China,

Hiroshima, Japan
April 29- May 1, 2015 The Inaugural Conference on Management and Sustainability in Asia
ISSN: 2189-2229
regardless of their late arrival in the solar power markets, are relatively high. Differing from
electricity market in Germany and Italy, electricity markets in Taiwan and China, just as most
developing countries, are highly regulated and not yet liberalized. This highly regulated
nature of electricity markets may discourage the private from investing costly solar power
deployments. Thus, the task for policy-makers is to enhance the competition of electricity
markets, by way of liberalization or other policy tools, with due consideration of their local
contexts.
4.2. Complementary service infrastructures in conjunction with incentive mechanisms
In this study, we find that service infrastructures play important roles. Less efficient
latecomers can improve efficiency by infrastructural capacity building. For example, Italy did
not opt for feed-in-tariffs; nonetheless, its solar power production was among the efficient
group. This may be attributed to Italian service infrastructure which is associated with the
tradable green certifications (TGCS) and net metering of RE by GSE 2 from 2009. The
fluctuation of TGCs price in Italy according to the production of other RE resources implies
that in the case where expected revenues are high enough to encourage electricity generation
from wind turbines or biomass plants, the solar power systems also receive high revenue. By
contrast, in the absence of production from other RE resources, TGCs might be temporarily
worthless due to the competition among solar power deployments during the period. The
public-owned company in Italy enables TGCs within the private electricity market to operate:
the company has to guarantee to purchase back unsold solar power in order to overcome
barriers and risks of investors. As another solution to deal with the surplus of production
capacity may be to sell the certificated electricity within the electricity markets by mutual
agreements in the future.
2 GSE is the government-owned company with the mission of promoting RE.

Hiroshima, Japan
April 29- May 1, 2015 The Inaugural Conference on Management and Sustainability in Asia
ISSN: 2189-2229
That is, incentive subsidy and other schemes such as TGCs can be mutually supportive
and contribute to the currently cost-ineffective solar power technology to develop and diffuse
in the long run. For developing followers such as Taiwan, a latecomer to the solar power
market, the technology advantage of solar equipment production has to be premeditated when
the policy-makers plan or revise the existing Renewable Development Act. In this way, the
policy-makers need to systematically consider the information of technology evolution and
the experiences from advanced countries measuring the framework we employed.
Summing up, it can be concluded that the design elements (total government
expenditure, gross fixed capital formation, total income per capita and days required getting
electricity) of the support mechanisms are by far the most important criteria with respect to
the solar power research, development and demonstration and their foreseeable future subject
to conditions of developing followers. In this study, we obtain some experiences from some
main countries of the EU. From perspective of stimulating the solar power market in some
followers, Germany is just considered as a unique benchmark in the worldwide electricity
market through promoting solar power with capitalistic incentives. The policy-makers should
modify the original incentives by referring to their contexts and/or referring the similar
market to localize the instruments efficiently.
Reference
[1] Komor P, Bazilian M. Renewable energy policy goals, programs, and technologies. Energ Policy
2005;33:1873-81.
[2] Patlitzianas KD, Doukas H, Kagiannas AG, Psarras J. Sustainable energy policy indicators: Review and
recommendations. Renew Energ 2008;33:966-73.
[3] IEA. Tracking Clean Energy Progress 2013. 2013.
[4] KPMG. Taxes and incentives for renewable energy 2012. KPMG International; 2012.
[5] del Rio P, Unruh G. Overcoming the lock-out of renewable energy technologies in Spain: the cases of wind
and solar electricity. Renewable and Sustainable Energy Reviews 2007;11:1498-513.
[6] Dusonchet L, Telaretti E. Economic analysis of different supporting policies for the production of electrical
energy by solar photovoltaics in eastern European Union countries. Energ Policy 2010;38:4011-20.
[7] Zhou Y, Wang LZ, McCalley JD. Designing effective and efficient incentive policies for renewable energy in
generation expansion planning. Appl Energ 2011;88:2201-9.
[8] del Rio P, Mir-Artigues P. Support for solar PV deployment in Spain: Some policy lessons. Renew Sust
Energ Rev 2012;16:5557-66.
[9] Toke D. Renewable financial support systems and cost-effectiveness. J Clean Prod 2007;15:280-7.
Hiroshima, Japan
April 29- May 1, 2015 The Inaugural Conference on Management and Sustainability in Asia
ISSN: 2189-2229
[10] Loiter JM, Norberg-Bohm V. Technology policy and renewable energy: public roles in the development of
new energy technologies. Energ Policy 1999;27:85-97.
[11] Nemet GF, Baker E. Demand Subsidies Versus R&D: Comparing the Uncertain Impacts of Policy on a Pre-
commercial Low-carbon Energy Technology. Energ J 2009;30:49-80.
[12] Oikonomou V, Flamos A, Gargiulo M, Giannakidis G, Kanudia A, Spijker E, et al. Linking least-cost
energy system costs models with MCA: An assessment of the EU renewable energy targets and supporting
policies. Energ Policy 2011;39:2786-99.
[13] Fouquet D, Johansson TB. European renewable energy policy at crossroads-Focus on electricity support
mechanisms. Energ Policy 2008;36:4079-92.
[14] Solangi KH, Islam MR, Saidur R, Rahim NA, Fayaz H. A review on global solar energy policy. Renew
Sust Energ Rev 2011;15:2149-63.
[15] Antunes CH, Martins AG, Brito IS. A multiple objective mixed integer linear programming model for
power generation expansion planning. Energy 2004;29:613-27.
[16] BOE. Framework of Taiwan's Sustainable Energy Policy. 2012. [17] Deshmukh R, Bharvirkar R, Gambhir A, Phadke A. Changing Sunshine: Analyzing the dynamics of solar
electricity policies in the global context. Renew Sust Energ Rev 2012;16:5188-98.
[18] EC. Directive on the promotion of the use of energy from renewable sources and amending and
subsequently repealing Directives 2001/77/EC and 2003/30/EC. 2009.
[19] Fare R, Grosskopf S, Lovell CAK, Yaisawarng S. Derivation of Shadow Prices for Undesirable Outputs - a
Distance Function-Approach. Rev Econ Stat 1993;75:374-80.
[20] Zaim O, Taskin F. Environmental efficiency in carbon dioxide emissions in the OECD: A non-parametric
approach. J Environ Manage 2000;58:95-107.
[21] Talluri S, Sarkis J. ECOEFFICIENCY MEASUREMENT USING DATA ENVELOPMENT ANALYSIS:
RESEARCH AND PRACTITIONER ISSUES. Journal of Environmental Assessment Policy and Management
2004;06:91-123.
[22] Abdullah MA, Muttaqi KM, Agalgaonkar AP. Sustainable energy system design with distributed renewable
resources considering economic, environmental and uncertainty aspects. Renew Energ 2015;78:165-72.
[23] Papadopoulos AM, Karteris MM. An assessment of the Greek incentives scheme for photovoltaics. Energ
Policy 2009;37:1945-52.
[24] Cansino JM, Pablo-Romero MD, Roman R, Yniguez R. Tax incentives to promote green electricity: An
overview of EU-27 countries. Energ Policy 2010;38:6000-8.
[25] Nilsson M, Nilsson LJ, Ericsson K. The rise and fall of GO trading in European renewable energy policy:
The role of advocacy and policy framing. Energ Policy 2009;37:4454-62.
[26] Haas R, Eichhammer W, Huber C, Langniss O, Lorenzoni A, Madlener R, et al. How to promote renewable
energy systems successfully and effectively. Energ Policy 2004;32:833-9.
[27] Midttun A, Gautesen K. Feed in or certificates, competition or complementarity? Combining a static
efficiency and a dynamic innovation perspective on the greening of the energy industry. Energ Policy
2007;35:1419-22.
[28] Agnolucci P. Use of economic instruments in the German renewable electricity policy. Energ Policy
2006;34:3538-48.
[29] Wang Y. Renewable electricity in Sweden: an analysis of policy and regulations. Energ Policy
2006;34:1209-20.
[30] Parker P. Residential solar photovoltaic market stimulation: Japanese and Australian lessons for Canada.
Renew Sust Energ Rev 2008;12:1944-58.
[31] Shum KL, Watanabe C. Network externality perspective of feed-in-tariffs (FIT) instruments-Some
observations and suggestions. Energ Policy 2010;38:3266-9.
[32] Cetin M, Egrican N. Employment impacts of solar energy in Turkey. Energ Policy 2011;39:7184-90.
[33] Danchev S, Maniatis G, Tsakanikas A. Returns on investment in electricity producing photovoltaic systems
under de-escalating feed-in tariffs: The case of Greece. Renew Sust Energ Rev 2010;14:500-5.
[34] Kaldellis JK. Critical evaluation of financial supporting schemes for wind-based projects: Case study
Greece. Energ Policy 2011;39:2490-500.
[35] Poullikkas A. Parametric cost-benefit analysis for the installation of photovoltaic parks in the island of
Cyprus. Energ Policy 2009;37:3673-80.
[36] Edquist C. Systems of innovation. The Oxford handbook of innovation 2005:181-208. [37] Daugeliene R. The Streamline of Research and Experimental Development's Infrastructure in Lithuanian
National Innovation System. Inz Ekon 2008:61-9.
[38] Hu J-L, Lee Y-C. Efficient three industrial waste abatement for regions in China. Int J Sust Dev World
2008;15:132-44.
[39] Honma S, Hu JL. Total-factor energy productivity growth of regions in Japan. Energ Policy 2009;37:3941-
50.

Hiroshima, Japan
April 29- May 1, 2015 The Inaugural Conference on Management and Sustainability in Asia
ISSN: 2189-2229
[40] Honma S, Hu JL. Total-factor energy efficiency of regions in Japan. Energ Policy 2008;36:821-33. [41] Hawdon D. Efficiency, performance and regulation of the international gas industry - a bootstrap DEA
approach. Energ Policy 2003;31:1167-78.
[42] Hu JL, Kao CH. Efficient energy-saving targets for APEC economies. Energ Policy 2007;35:373-82.
[43] Esty DC, Levy MA, Kim CH, de Sherbinin A, Srebotnjak T, Mara V. Environmental performance index.
New Haven: Yale Center for Environmental Law and Policy 2006.
[44] Zhou P, Ang BW, Poh KL. A mathematical programming approach to constructing composite indicators.
Ecol Econ 2007;62:291-7.
[45] Zhou P, Poh KL, Ang BW. A non-radial DEA approach to measuring environmental performance. Eur J
Oper Res 2007;178:1-9.
[46] Zhou P, Ang BW, Poh KL. Measuring environmental performance under different environmental DEA
technologies. Energ Econ 2008;30:1-14.
[47] Gomes EG, Lins MPE. Modelling undesirable outputs with zero sum gains data envelopment analysis
models. J Oper Res Soc 2008;59:616-23.
[48] Sozen A, Alp I. Comparison of Turkey's performance of greenhouse gas emissions and local/regional
pollutants with EU countries. Energ Policy 2009;37:5007-18.
[49] Yeh TL, Chen TY, Lai PY. A comparative study of energy utilization efficiency between Taiwan and China.
Energ Policy 2010;38:2386-94.
[50] Pacudan R, de Guzman E. Impact of energy efficiency policy to productive efficiency of electricity
distribution industry in the Philippines. Energ Econ 2002;24:41-54.
[51] Azadeh A, Ghaderi SF, Omrani H, Eivazy H. An integrated DEA-COLS-SFA algorithm for optimization
and policy making of electricity distribution units. Energ Policy 2009;37:2605-18.
[52] Ekins P. Step changes for decarbonising the energy system: research needs for renewables, energy
efficiency and nuclear power. Energ Policy 2004;32:1891-904.
[53] Song ML, An QX, Zhang W, Wang ZY, Wu J. Environmental efficiency evaluation based on data
envelopment analysis: A review. Renew Sust Energ Rev 2012;16:4465-9.
[54] Rayp G, Van De Sijpe N. Measuring and explaining government efficiency in developing countries. J Dev
Stud 2007;43:360-81.
[55] Guo XD, Zhu L, Fan Y, Xie BC. Evaluation of potential reductions in carbon emissions in Chinese
provinces based on environmental DEA. Energ Policy 2011;39:2352-60.
[56] Chiu YH, Wu MF. Environmental Efficiency Evaluation in China: Application of 'Undesirable' Data
Envelopment Analysis. Pol J Environ Stud 2010;19:1159-69.
[57] Pan SC, Liu SY, Peng CJ, Wu PC. Local government efficiency evaluation: Consideration of undesirable
outputs and super-efficiency. Afr J Bus Manage 2011;5:4746-54.
[58] Seiford LM, Zhu J. Modeling undesirable factors in efficiency evaluation. Eur J Oper Res 2002;142:16-20.
[59] Tone K. Dealing with undesirable outputs in DEA: a Slacks-Based Measure (SBM) approach. Nippon
Opereshonzu, Risachi Gakkai Shunki Kenkyu Happyokai Abusutorakutoshu 2004;2004:44-5.

Hiroshima, Japan
April 29- May 1, 2015 The Inaugural Conference on Management and Sustainability in Asia
ISSN: 2189-2229
The Effects of Financial Statements’ Reliability and Risk Attitude on Cost of Debt for the SMEs Loan: Evidence from Thailand
Jatuwit Khieochaum Department of Accounting
Faculty of Commerce and Accountancy, Chulalongkorn University
Uthai Tanlamai Department of Accounting
Faculty of Commerce and Accountancy, Chulalongkorn University
……..
ABSTRACT
This study examines whether financial statements’ reliability, which is measured by type of
auditor’s report, and the risk attitude of a credit officer will have combine effect towards individual
decision on cost of debt. We conduct a 3x3 between-subjects experiment with three levels of
financial statements’ reliability (unqualified, unqualified with the emphasis of matter paragraph and
qualified auditor opinion) and three levels of risk attitude (risk lover, risk neutral and risk averse).
The results show that there are very few risk lover credit officers, thus, subsequent analyses of the
experiment are based on three levels of reliability and two levels of risk attitude. The results suggest
that risk attitude influences the credit officers’ decision on cost of debt for SME’s loans. However,
no significant difference was found in the cost of debt granted among 3 types of auditor’s report.
The preliminary findings suggest that auditor's report does not convey the information content the
auditor intends to communicate to users, in this case, the credit officers who engage in SMEs
lending process in Thai environment.
Keywords: Financial statements’ reliability, Auditor’s report, Risk attitude, Credit officers, Cost of
debt
1 INTRODUCTION
To promote SMEs as part of the country’s sustainable economic development becomes an
important policy to respond to financial crisis by many countries, including Thailand. SMEs play a
significant role in several economy. They are the key generators of employment and income and
drivers of innovation and growth. In 2013, Thai SMEs accounted for the GDP value of 4,454,939.6
million Baht or 37.4% of the entire country’s GDP [1]. To survive and continue growing, SMEs
rely on banks for their source of funds which is in the form of indirect financing or effectively the
loans from commercial banks. Banks, on the other hand, have a formal loan evaluation process
where the credit analyst will assess the creditworthiness of an SME using its audited financial
statements and related auditor’s report during the credit approval process. Thus, auditor’s report and
financial statements play a major role in loan decision process.
The mainstream research about the usefulness of auditor’s reports in credit approval process
prevails in North America and other industrialized countries but the findings are still inconclusive.
In Thailand, we found few researches in this stream even though loans from commercial banks are
important to SMEs’ source of funds. This study focuses on the financial statements’ reliability,
which are measured by type of auditor’s report, and the variable that affects a person’s decision
which is the risk attitude of a credit analyst.

Hiroshima, Japan
April 29- May 1, 2015 The Inaugural Conference on Management and Sustainability in Asia
ISSN: 2189-2229
H1: The financial statements’ reliability has the effect on credit analyst’s decision.
2 LITERLATURE REVIEW AND HYPOTHESIS DEVELOPMENT
Accounting information in the financial statements is employed in many business decisions,
including the very important area of loan decision process [2]. Therefore, credit analysts are one of
the most important user groups, especially in bank-based economy countries. Nonetheless, financial
statements are not always accurate. Accompanying each set of financial statements is an auditor’s
report which typically reflects the reliability of the statement. Auditors use an auditor’s report to
communicate the results of their audit processes to the users of financial statements and other
interested parties.
When a financial statement is audited using the Generally Accepted Auditing Standards
(GAAS) and is recognized to be without any material misstatement according to the Generally
Accepted Accounting Principles (GAAP), an unqualified opinion will be issued. However, if there
is a material misstatement in the financial statements, or if there is a restriction in the scope of audit
work as required by the GAAS, the auditor may issue a qualified opinion. The qualified opinion
will be issued only if such material misstatement and/or scope of audit work does not have
pervasive effect on the financial statements. Furthermore, the auditor must issue an adverse opinion
if the material misstatement has pervasive effect on the financial statements. If a restriction in the
scope of audit work has pervasive effect on the financial statements or there is a significant
uncertainty around the audit engagement, a disclaimer of opinion will then be issued. Finally, if
there is some matter necessary to draw users’ attention (but has no effect on the opinion); the
emphasis of matter paragraph should be added immediately after the opinion paragraph [3].
Although there are 4 audit opinions, the unqualified and qualified are most commonly applied in
practice [4].
The findings of prior studies related to the usefulness of auditor’s reports are still
inconclusive. Some of them found the usefulness and/or relevance of the information content in the
audit’s report [5-7]. However, other studies find no effect of the information content in the audit’s
report, especially those dealing with the credit analysts' decisions [4, 8-11]. In Thailand, there are
limited numbers of studies addressing the understanding of auditor's reports by financial statement
users. The results showed that users’ attention was likely to increase when the emphasis of matter
paragraphs was in the auditor’s report. The emphasis paragraphs negatively affected user's decision
making [12]. Based on previous findings, the first hypothesis to be investigated in this study is
specified as follows:
Decisions may be influenced by individual characteristics (or personality-like variables). One
such characteristic is a person’s risk attitude. Risk attitude is formally modeled as the shape of a
decision maker’s utility profile [13]. In the expected utility (EU) theory [14], three alternative views
concerning the choice between a risky outcome and a certain outcome, risk averse, risk neutral, and
risk lover. Some people prefer to avoid risk (risk averse), others enjoy engaging in risk (risk lover),
and still others are indifferent (risk neutral). Since loan decision process involves protection against
risk of loss, credit analysts may be influenced by theirs risk attitude: individuals who are risk averse
might prefer to grant high interest premium. Previous empirical and experiment studies assume that
most people are risk averse. Thus, a number of studies have ignored risk attitude variable, especially
in the experimental studies, which used randomization to level out the effect of this variable across
treatments. Consequently, rarely any experimental accounting studies included risk attitude variable
in their settings [15]. Among these rare studies, Greer [16] found that management decision process
violated managers’ risk attitude. Using standard gamble to assess risk attitude of audit partners,
Newton [17] found the effect of risk attitude on materiality decisions. Hilton, Swieringa [18]
compared the risk neutral and risk averse student subjects. They found that the risk neutral students

Hiroshima, Japan
April 29- May 1, 2015 The Inaugural Conference on Management and Sustainability in Asia
ISSN: 2189-2229
H2: The risk attitude has the effect on credit analyst’s decision.
H3: The financial statements’ reliability and risk attitude have an effect on a credit analyst’s
decision.
were more complied with the theory of the firm than the risk averse students. To the best of our
knowledge, no study to date has examined the risk attitude of a credit analyst. Thus, the second
hypothesis to be investigated in this study is specified as follows:
Combining H1 and H2, the third hypothesis to be investigated in this study is as follows:
3 RESEARCH METHODOLOGY
Laboratory experiment implying conditions that allow researchers to directly control all or
nearly all important factors that may affect the experimental result [19] was employed in this study.
The mock-up cases written for the experiment were drawn from the actual credit approval process
of a commercial bank.
3.1 The Research Instrument
The data collection instrument used in this research was designed by the researchers. A
customized web-based application was developed to be used with the Personal Area Network
(P.A.N.) configuration.
The risk attitude test used in the study is a refinement of existing instruments to fit Thai
setting. Thirty items from Domain-Specific Risk Taking (DOSPERT) [13] and 25 items from
Passive Risk Taking (PRT) [20] were translated with back translation technique. The DOSPERT
scale assesses risk taking in five content domains. The PRT scale, in contrary, measures personal
tendency for passive risk taking - risk brought on or magnified by inaction - in three.
The final risk attitude test instrument includes two development steps. The first online self-
report questionnaire with 55 items was sent to general public asking about the appropriate of each
item within Thai environment. The top 30 items (7 items from DOSPERT and 23 items from PRT)
remain. The second online self-report questionnaire uses a psychometric scale to divide people into
3 groups depending on their risk attitude scores. This second online questionnaire uses a 5 points
Likert’s scale ranging from 1 (very unlikely) to 5 (very likely) asking the respondents to assess how
likely they are to act in the way to describe in each item. With 394 respondents, the exploratory
Factor Analysis was applied and 13 items (from 30 items), that had loading > 0.3 were chosen with
an overall Cronbach’s alpha at 0.71. Using the method from Weber, Blais [13], individuals were
classified as risk lover if the score is more than one standard deviation above the mean, as risk
averse if their score is more than one standard deviation below the mean, and as risk neutral if their
score is in between.
Mockup cases, based on a real company, were developed by the first author. The case
company was set for the medium-sized enterprise only. This is because during the pre-study stage,
the experts agreed that small-sized enterprises often lack good accounting system which makes their
financial statements unreliable [1]. Credit scoring model in the mockup cases was developed by
basing on the Sample Credit Scoring Model developed by USAID Jordan Economic Development
Project [21] to assist Jordanian banks in developing an SME scoring model. Cases and the sample
model were commented and revised by two credit managers from two Thai commercial banks to
ensure the valid use for Thai SMEs.
The auditor’s report and financial statements were developed by the first author and reviewed
for the reasonableness of audit opinion by 3 audit partners from 2 Big4. Three types of auditor’s

Hiroshima, Japan
April 29- May 1, 2015 The Inaugural Conference on Management and Sustainability in Asia
ISSN: 2189-2229
reports are manipulated in this study: unqualified audit opinion, unqualified with the emphasis of
matter paragraph, and qualified audit opinion.
3.2 The Sample
The population of this study are credit analysts working in 14 Thai commercial banks that
have experience in granting loan to SMEs. Forty one credit analysts (from 3 Thai commercial
banks) participated in this present study.
3.3 The Task
There are 5 sections in Customized Application as follow:
Figure 1: Experiment Flow
Each subject was given (1) Personal laptop with Customized Application Software and (2) a
booklet containing instructions and experiment flow. In the application, the tutorial VDO was
presented to the subjects before section 1. In section 2, the subject would answer the 13 items risk
attitude assessment questionnaire. Depending on his or her score, the subject was classified as being
risk lover (RL), risk neutral (RN) or risk averse (RA). In section 3, one of 3 types of auditor’s report
(Unqualified, unqualified with the emphasis of matter paragraph and qualified audit opinion) was
assigned by the software. In section 4, the subject was asked to complete the credit scoring model
by calculating 5 financial ratios (Debt-to-Equity Ratio, Quick Ratio, Sales Growth Ratio, Net
Margin, and Inventory Turnover). Finally, the subject was asked to make the interest premium
decision.
4 RESULTS
This paper presents a preliminary result from 41 credit analysts (from 3 commercial banks).
Since there are only 2 risk lovers participated, further analyses are based on 3x2 between-subjects
experiment with 39 credit analysts.
Table 1, Panel A presents the descriptive statistics on the interest premium and Panel B
provides the ANOVA analysis with adjusted R2 = 0.191. The main effect of Report is not statically
significant (p = 0.241), but the Risk is (p = 0.002). The interaction effect, Report x Risk, is not
statically significant (p = 0.321).
Test of simple main effects indicate that the financial statements’ reliability have no effect on
credit analyst’s decision, H1 is rejected. In contrast, the risk attitude has the effect on credit
analyst’s decision, H2 cannot be rejected. The estimated marginal mean of interest premium are
graphed in Figure 2. For H3, the combine effect of the financial statements’ reliability and risk
attitude does not have any effect on credit analyst’s decision, H3 is rejected.
The results suggest that auditor's report does not convey the information content the auditor
intends to communicate to users. In this study, risk attitude is the only important variable in loan
decision process.

Hiroshima, Japan
April 29- May 1, 2015 The Inaugural Conference on Management and Sustainability in Asia
ISSN: 2189-2229
Panel A: H1 Panel A: H2
Figure 2: Graphical Representation of Results
5 CONCLUSION
Using the initial credit approval process context, we conduct an experiment to investigate the
effects of financial statements’ reliability and risk attitude of credit analysts on their decision. We
find the only effect from the risk attitude. Our findings suggest that financial statements’ reliability
via auditor's report does not have any bearing on the analyst’s decision during the loan approval
processing. One possible explanation regards to the no effect of auditor’s report on analysts’

Hiroshima, Japan
April 29- May 1, 2015 The Inaugural Conference on Management and Sustainability in Asia
ISSN: 2189-2229
decision is a relatively small sample size. The second explanation could be that the misstatement
information in qualified audit opinion is not significant in the eyes of credit analyst. Future research
should make a greater effort in acquiring a larger sample size since it can definitely increase the
power of analyses.
This study addresses issue relating to credit analysts who are an important group of financial
statement users during their initial credit approval process. Since accounting research within bank
lending context is rare, the research contributes to both academic and practical fields.
Acknowledgements
This research was supported by “Integrated Innovation Academic Center: IIAC”
Chulalongkorn University Centenary Academic Development Project and University of the Thai
Chamber of Commerce. We wish to thank the credit analysts from various commercial banks in
Thailand who volunteered to do the experiment and had made this study possible.
REFERENCES
[1] The Office of SMEs Promotion. SMEs White Paper 2014. 2015 [cited 2015 1 April]; Available from:
http://www.sme.go.th/eng/index.php/data-alert/alert/report-smes-year/report-year.
[2] Danos, P., D.L. Holt, and E.A. Imhoff Jr, The use of accounting information in bank lending decisions.
Accounting, Organizations and Society, 1989. 14(3): p. 235-246. [3] International Federation of Accountants (IFAC), Handbook of International Quality Control, Auditing, Review,
Other Assurance, and Related Services Pronouncements. 2014.
[4] Lin, Z.J., Q. Tang, and J. Xiao, An experimental study of users’ responses to qualified audit reports in China.
Journal of International Accounting, Auditing and Taxation, 2003. 12(1): p. 1-22.
[5] Geiger, M., Audit disclosures of consistency: An analysis of loan officer reaction to SAS 58. Advances in
accounting, 1992. 10: p. 77-90.
[6] Bamber, E.M. and R.A. Stratton, The information content of the uncertainty-modified audit report: Evidence
from bank loan officers. Accounting Horizons, 1997. 11: p. 1-11.
[7] Duréndez Gómez-Guillamón, A., The usefulness of the audit report in investment and financing decisions. Managerial Auditing Journal, 2003. 18(6/7): p. 549-559.
[8] Estes, R. and M. Reimer, A Study of the Effect of Qualified Auditors ‘Opinions on Bankers’ Lending Decisions.
Accounting and Business Research, 1977. 7(28): p. 250-259.
[9] Libby, R., Bankers' and auditors' perceptions of the message communicated by the audit report. Journal of
Accounting Research, 1979: p. 99-122.
[10] Houghton, K.A., Audit reports: Their Impact on the loan decision process and outcome: An experiment.
Accounting and Business Research, 1983. 14(53): p. 15-20. [11] Johnson, D.A. and K. Pany, Forecasts, auditor review, and bank loan decisions. Journal of Accounting
Research, 1984: p. 731-743.
[12] Jessadawut, W., Opinions on Emphasis of Matter Paragraphs in the Auditor's Report. 2005, Chulalongkorn
University, Bangkok, Thailand.
[13] Weber, E.U., A.R. Blais, and N.E. Betz, A domain‐specific risk‐attitude scale: Measuring risk perceptions
and risk behaviors. Journal of behavioral decision making, 2002. 15(4): p. 263-290.
[14] Von Neumann, J. and O. Morgenstern, Theory of games and economic behavior (60th Anniversary
Commemorative Edition). 2007: Princeton university press.
[15] Bonner, S.E., Judgment and Decision Making in Accounting. 2007, Upper Saddle River, New Jersey: Prentice-
Hall.
[16] Greer, W.R., Theory versus practice in risk analysis: An empirical study. Accounting Review, 1974: p. 496-
505.
[17] Newton, L.K., The risk factor in materiality decisions. Accounting Review, 1977: p. 97-108. [18] Hilton, R.W., R.J. Swieringa, and M.J. Turner, Product pricing, accounting costs and use of product-costing
systems. Accounting Review, 1988: p. 195-218.
[19] Zikmund, W., et al., Business research methods. 2012: Cengage Learning. [20] Keinan, R. and Y. Bereby-Meyer, “Leaving it to chance”—Passive risk taking in everyday life. Judgment and
Decision Making, 2012. 7(6): p. 705-715.
[21] O’Brien, K. Sample Scoring Model with Comments to Assess SME Loan Requests. 2008 [cited 2014
December]; Available from: http://pdf.usaid.gov/pdf_docs/PNADS903.pdf.

Hiroshima, Japan
April 29- May 1, 2015 The Inaugural Conference on Management and Sustainability in Asia
ISSN: 2189-2229
Acculturation and Job Satisfaction among Vietnamese Graduates
Working in Japan
Nguyen Hoang Duy Phuong
College of International Management
Ritsumeikan Asia Pacific University
…….
ABSTRACT
At present, much empirical research regarding the relation between acculturation and job
satisfaction of expatriates working in the host countries has been carried out. Nevertheless, the
research on Vietnamese workers in Japan is currently unavailable. Even though the number of
Vietnamese students successfully getting jobs in Japan is very impressive, there is the lack of
feedback and information about their job satisfaction and career life after graduation. The
substantial differences in culture, language, social manner and organizational behaviors are
predicted to be a hinderance for them in getting accustomed to their workplaces. Based on the case
of Vietnamese students graduating from Ritsumeikan Asian Pacific University (APU), this research
firstly aims to examine the acculturation process of Vietnamese APU graduates in their Japanese
workplaces. Secondly, the research also aims at figuring out how acculturation influences job
satisfaction among the Vietnamese graduates. In order to assess the correlation between the two
variables of acculturation and job satisfaction in this research, acculturation and job satisfaction
theory will be applied using quantitative methodology. Acculturation is measured by adopting the
unidimensional model, while job satisfaction is measured by utilizing the short form of the
Minnesota Satisfaction Questionnaire. The survey of a sample of 41 Vietnamese APU graduates is
expected to produce useful information for Japanese domestic companies and organizations to
better manage their Vietnamese employees.
Keywords: acculturation, job satisfaction, Vietnamese graduates, APU.
1. INTRODUCTION
Acculturation and job satisfaction were the two significant variables usually utilized in
examining expatriate workers’ performance, commitment, professional growth and psychological
health in their workplace (Applebaum, Fowler, Fiedler, Osinubi, & Robson, 2010). Much empirical
research regarding the relation between acculturation and job satisfaction of expatriates working in
the host countries has heen conducted (Au, Garey, Bermas, & Chan, 1998; Reyes & Cohen, 2013).
Nevertheless, the research on Vietnamese workers in Japan is currently unavailable.
From the above observation, based on the case of Vietnamese students graduating from
Ritsumeikan Asian Pacific University (APU) who are currently working in Japan, this research aims
to examine the question “What is the relation between the work-related acculturation process of
Vietnamese APU graduates and job satisfaction in their Japanese workplaces?” On the one hand, the
research will focus on figuring out the features found in Vietnamese expatriates’ behavioral plus

Hiroshima, Japan
April 29- May 1, 2015 The Inaugural Conference on Management and Sustainability in Asia
ISSN: 2189-2229
psychological changes and adaption toward the Japanese language, the Japanese management style
and Japanese workplace manners. Additionally, this research will evaluate their job satisfaction
level. The results from the two examinations will be linked together to figure out whether or not
there is a relation between these two factors.
2. ACCULTURATION
Acculturation is defined as the interaction of two or more cultural groups leading to the
cultural modification of either one or two parties (Berry, Kim, Minde & Mok, 1987; Pooyan, 1984).
Specifically, work-related acculturation refers to the comfort degree of expatriates in a new
environment with different work values, work manner, performance standards and so on in the host
country. Expatriates who have adapted to their host cultures tend to be eager to absorb the host
culture (Church, 1982). As a result, they tend to perform their work properly, leading to a better
degree of job satisfaction (Black & Mendenhall, 1990; Naumann, 1993).
Through various empirical studies, there have been several acculturation models
introduced to examine the acculturation process, such as the unidimensional and bi-dimensional
model (Nguyen & von Eye, 2002; Berry, 1997). The unidimensional model, which is also called the
assimilation model or bipolar model, presumes acculturation as a one-way process in which
individuals move from one cultural identity to the other (Gordon, 1964). The unidimensional model
is conceptualized as a cultural identity shift along a single continuum from adherence to original
culture to adaptation to the host dominant culture. According to Nguyen and von Eye (2002), the
unidimensional model is simple to apply yet can capture the basic acculturation process of
expatriates.
3. JOB SATISFACTION
In general, job satisfaction is the degree to which an employee feels “a pleasurable or
positive emotional state resulting from the appraisal of one’s job or job experience” (Locke, 1976, p.
1304). Job satisfaction is one of the most popular topics in management; however, studies on job
satisfaction of expatriates, especially in relation to acculturation, are limited. Some studies assumed
that less acculturated immigrants experience less job satisfaction. For example, Leong (2001), using
this hypothesis, pointed out that Asian Americans with low acculturation suffer a low level of job
satisfaction. By contrast, other research by Mace and Carr (2005) has shown that immigrants who
are willing to adapt to host culture in New Zealand have higher levels of job satisfaction. Other
studies by Au at al. (1998) and by Ea, Griffin, L’Eplattenier and Fitzpatrick (2008) also found that
there is a positive correlation between acculturation and job satisfaction of Chinese and Filipino
expatriates in New York and in the USA, respectively.
4. METHOD
4.1. Sample

Hiroshima, Japan
April 29- May 1, 2015 The Inaugural Conference on Management and Sustainability in Asia
ISSN: 2189-2229
In this study, participants were 41 APU Alumni from Vietnam, currently working in Japan.
In order to strengthen the consistency and reliability of the collected data, the target participants
were selected to all share the same background of being born and raised in Vietnam until finishing
high school. Futhermore, they all have been working less than five years in Japan.
4.2. Instrument
In order to measure the level of acculturation and job satisfaction, a survey consisting of 10
statements assessing acculturation and 10 statements assessing job satisfaction was distributed to
the participants. While the content of the statements are modified from the summary of instruments
for measuring acculturation by Taras (2008), job satisfaction is measured by utilizing the short form
of the Minnesota Satisfaction Questionnaire. All the statements were evaluated based on a five point
Likert scale ranging horizontally from “strongly disagree” to “strongly agree”. All the scores are
then added to produce a final number ranging from 10 to 50 for each variable. The validity and
reliability of this instrument is shown by Weiss, Davis, England and Lofquiest (1967, as cited in Au
et al., 1998).
5. RESULTS
The survey was distributed online to 55 Vietnamese APU graduates working in Japan.
There were 41 people who completed the survey, which meets the initial target of participant
number (see table 1).
Table 1
Demographic Characteristic of the Sample (N=41)
n
%
Acculturation Average Score by
group
(Max. 50)
Gender
Females 26 63.4 32.31
Males 15 36.6 34.60
Number of working
years 27 65.9 32.56
Less than 3 14 34.1 34.28
years
From 3 to 5
years
To evaluate how Vietnamese graduates acculturate to their workplaces and their job

Hiroshima, Japan
April 29- May 1, 2015 The Inaugural Conference on Management and Sustainability in Asia
ISSN: 2189-2229
satisfaction, the individual total scores for acculturation and job satisfaction are divided into 5 levels
(see table 2). Ranging from 10 to 50 along the continuum scale, each level accounts for 8 units. The
lowest level of acculturation is regarded as “almost un-acculturated” while the highest level
represents being “fully acculturated”. The level classification for job satisfaction is similar with the
lowest being “very dissatisfied” and the highest being “fully satisfied”. Based on this classification,
the survey has shown that Vietnamese APU graduates only possess a moderate degree of
acculturation to Japanese work-related culture with a mean score of 33.15. The score for job
satisfaction is a little bit higher at 34.46, which is very close to the acculturation score and shows a
high degree of satisfaction (see table 3).
Table 2
Classification of Acculturation levels and Job satisfaction levels with corresponding
scores (ranging from 10 to 50)
Table 3
Statistics on Acculturation and Job satisfaction of the Vietnamese graduates
working in Japan
Correlating the acculturation mean score with the corresponding job satisfaction mean
score by group in the ascending order, we can see there is a quite clear positive correlation between
these two variables. When people have a higher score for acculturation, moving from a slight
acculturation level, to a moderate and then a high acculturation level, their corresponding job
satisfaction scores also increase respectively (see table 4). This result has confirmed that
acculturation and job satisfaction among Vietnamese graduates working in Japan are positively
correlated; the more Vietnamese graduates accept and adhere to Japanese work-related culture, the
more satisfied they will feel toward their jobs. However, it must be acknowledged that a small
number of 41 partipants (4.88%) do not follow above trend. This will require further research.
Table 4
Correlation statistics between Acculturation and Job satisfaction of the Vietnamese
graduates working in Japan
10 ≤ a ≤ 18 18 < a ≤ 26 26 < a ≤ 34 34 < a ≤ 42 42 < a ≤ 50
Almost
un-acculturated
Slightly
acculturated
Moderately
acculturated
Highly
acculturated
Fully
acculturated
Very
dissatisfied
Slightly
satisfied
Moderately
Satisfied
Highly
satisfied
Fully
satisfied
Mean ± StdDev Range
Acculturation 33.15 ± 5.53 24 ~ 48
Job satisfaction 34.46 ± 5.94 20 ~ 46
N=41 Acculturation Job satisfaction

Hiroshima, Japan
April 29- May 1, 2015 The Inaugural Conference on Management and Sustainability in Asia
ISSN: 2189-2229
n % mean score mean score
Almost un-acculturated 0 0 0 0
Slightly acculturated 7 17.07 25.43 28.85
Moderately acculturated 19 46.34 31.37 34.37
Highly acculturated 13 31.71 38.00 37.92
Fully acculturated 2 4.88 45.50 32.50
5. DISCUSSION
5.1. Factors that affect the acculturation process of the Vietnamese graduates
The uniqueness and extreme difference in language and cultural factors with other
countries have made Japan an interesting host country in cultural adjustment studies. Therefore, the
salient features in Japanese culture, such as collectivism, verticality, uncertainty avoidance and
Japanese language, could be used to explain the moderate level in acculturation seen in the
Vietnamese graduates working in Japan.
The high orientation toward collectivism of Japanese people is manifested by their group-
oriented behavior and their significant obedience to group norms (Nakane, 1972; Caudill, 1973).
Consequently, this leads to the transparent division between in-group members and out-group
members, causing indifferent treatment or discrimination respectively to each kind of member
(Napier & Tayler, 1995). For instance, Japanese people tend to offer foreigners the “red-carpet
treatment by being polite on the surface but distinguishing them clearly as out-group members”
(Ebuchi, 1991, as cited in Peltokorpi & Froese, 2009). This could be the reason why more than half
of the Vietnamese graduates from the survey revealed an uncomfortable and conservative attitude
toward having discussion or working in groups with their domestic colleagues. Furthermore, with
the top-down orientation, decision making in Japanese workplaces is described as lengthy and
“receiver-centered communication”, which is another reason for anxiety and frustration among
many expatriates (Peltokorpi, 2007). Following this observation, the Vietnamese graduates are also
uncomfortable with the decision-making process in their Japanese companies. More than 80% of
them expressed an uncomfortable feeling toward the decision-making procedure, with 37% of them
even showing a strong disagreement with this lengthy decision-making in their organizations.
Throughout numerous empirical studies, another reason for expatriates to struggle in
workplace adjustment comes from the high level of uncertainty avoidance found in Japanese
companies (Peltokorpi, 2007). In Vietnamese culture, people have a very low sense of uncertainty
avoidance (Hofstede, 2001). They are comfortable with breaking the rules and think the schedule
should be flexible. This significant contrast between the two cultures could be one of the main
obstacles for the Vietnamese to adapt themselves well to the Japanese workplaces. It is also pointed
out that more than half of the Vietnamese graduates showed a low level of comfort with obeying the
rules, policies or regulations in their Japanese organizations. What is more, the high-context culture
of Japanese people is an additional hinderance for expatriates to work adjustment. The way
Japanese people hesitate to express their ideas, especially different or opposite opinions, is often

Hiroshima, Japan
April 29- May 1, 2015 The Inaugural Conference on Management and Sustainability in Asia
ISSN: 2189-2229
misinterpreted by expatriates (Peltokorpi, 2006). Even though Vietnam is grouped as a high context
culture like Japan (Hall, 1976), it seems to be not true for the new Vietnamese generation anymore.
Especially for the Vietnamese students graduating from an international university such as APU,
they seem to be more open-minded and more transparent in their communication style. From the
survey, 85% of them admitted that they do not have the same way of thinking, or even have an
extremely different way of thinking, as their Japanese co-workers. This could easily make them
misunderstand their Japanese counterparts’ thinking and intentions.
Last but not least, the Japanese language is one of the toughest challenges for expatriates to
adapt themselves functionally to the workplace. It has been proved that Japanese language
proficiency is a great tool for behaving and performing properly in Japanses workplaces (Peltokorpi,
2006). However, in the context of the Vietnamese graduates working in Japan, the Japanese
language is not a big obstacle to their acculturation process. On the contrary, it is an important
factor helping to raise their average acculturation score. From the survey, it was found that 93% of
the Vietnamese graduates have a level of Japanese language ability from intermediate and above,
and perform well linguistically in their workplaces.
5.2. Influences of acculturation on job satisfaction
With a mean score of 34.46 out of 50, the Vietnamese graduates are regarded as having a
moderately high level of job satisfaction. When correlated with their level of acculturation, this
level of job satisfaction among the Vietnamese graduates can be explained by several features of
their cultural adjustment to Japanese organizations. Firstly, all of the Vietnamese graduates could be
defined as self-initiated expatriates (SIEs), which defers for ones who make the decision to work
abroad by themselves rather than being assigned to work abroad by their home companies
(Peltokorpi & Froese, 2009). According to Peltokorpi and Froese (2009), SIEs are likely to have
high motivation to tolerate and to cope with “behavioral differences during intercultural
interactions”. In the case of the Vietnamese graduates, this observation might be strongly applicable.
Since they worked really hard during the job-hunting period to seek out positions as foreign
workers in a Japanese company, where they would be a minority, even though they would face
many difficulties in work-related adjustment, the Vietnamese graduates might still hold a strong
motivation to acculturate. This assumption is reflected in their strong sense of wanting to belong to
the Japanese community. From the survey, 88% of them showed from a fair to a high satisfaction
with their chances to be someone in the community at their workplaces. In other words, even
though the Vietnamese graduates have to struggle with many different cultural values at work, in
order to become a part of their Japanese organizations, the more they try to adjust themselves and
acculturate, the more satisfied they would be.
Besides the positive effects, negative effects of acculturation on job satisfaction should not
be ignored. In a society with extreme uncertainty avoidance like Japan, critics and innovation are
not welcomed. In the business environment, Japanese people are also conservative toward new
ideas or changes, which makes many foreign workers frustrated (Peltokorpi, 2007). In the case of

Hiroshima, Japan
April 29- May 1, 2015 The Inaugural Conference on Management and Sustainability in Asia
ISSN: 2189-2229
the Vietnamese graduates, majority of them also have low satisfaction due to this feature. 61% of
the survey participants admitted that they have less freedom to use their own judgments in their
work, of which 20% of them are extremely pessimistic about this fact. In addition, with the
significant collectivist feature, many expatriates in Japan might have to reluctantly conform to the
majority’s code of action or the company’s rules. The survey data supports this pattern, with 63.4%
of the Vietnamese expatriates being fairly disappointed because they have to do things that go
against their conscience. As long as it is stated as the company’s rule, policy or regulation, they
must obey no matter what, even though it is against their belief. As a result, job satisfaction among
the Vietnamese graduates might be negatively affected by these phenomena.
6. LIMITATION AND FUTHER RESEARCH
This research has highlighted some major characteristics of the acculturation process
among the Vietnamese graduates working in Japan and its influences on their job satisfaction.
Nevertheless, this research acknowledges some limitations. Firstly, regarding the reliability of the
research, the sample size is considered to be small. In order to reach a more concrete conclusion for
the general population of Vietnamese expatriates, much wider nationwide research in Japan is
recommended. Secondly, the results from the survey have revealed the potential for job satisfaction
to influence acculturation in an adverse way. Through the survey, Vietnamese graduates showed a
high degree of satisfaction toward working conditions and salary. These factors are anticipated to be
one of the significant stimuli for their acculturation process, which needs further researches.
REFERENCE
Applebaum, D., Fowler, S., Fiedler, N., Osinubi, O., & Robson, M. (2010). The impact of environmental factors on
nursing stress, job satisfaction and turnover intention. The Journal of Nursing Administration, 40(8), 323-328.
Au, A. Y. W., Garey, J. G., Bermas, N., & Chan, M. M. (1998). The relationship between acculturation and job
satisfaction among Chinese immigrants in the New York city restaurant business. Hospitality Management, 17,
11–21.
Berry, J.W., Kim, U., Minde, T., & Mok, D. (1987). Comparative studies of acculturative stress. International Migration
Review, 21(3), 491-511.
Black, J. S., & Mendenhall, M. (1990). Cross-cultural training effectiveness: A review and a theoretical framework for
future research. Academy of Management Review, 15, 113-136.
Caudill, W. (1973). The influence of social structure and culture on human behavior in modern Japan. Ethos, 1,
343-382.
Church, A. T. (1982). Sojourner adjustment. Psychological Bulletin, 91, 540-572.
Ea, E. E., Griffin, M. Q., L’Eplattenier, N., & Fitzpatrick, J. J. (2008). Job satisfaction and acculturation among Filipino
registered nurses. Journal of Nursing Scholarship, 40, 46-51.
Ebuchi, K. (1991). Zai niti ryugakusei to ibunkakan kyoiku. Ibunkakan Kyoiku, 5, 4-20.
Gordon, M. M. (1964). Assimilation in American life. New York: Oxford University Press.

Hiroshima, Japan
April 29- May 1, 2015 The Inaugural Conference on Management and Sustainability in Asia
ISSN: 2189-2229
Hall, E. T. (1976). Beyond culture. New York: Anchor Press/Doubleday.
Hofstede, G. (2001).Culture’s consequences: Comparing values, behaviors, institutions, and organizations across
nations. Thousand Oaks, CA: Sage Publications, Second Edition.
Leong, F. T. L. (2001). The role of acculturation in the career adjustment of Asian American workers: A test of Leong
and Chou’s (1994) formulations. Cultural Diversity and Ethnic Minority Psychology, 7, 262-273.
Locke, E. A. (1976). The nature and causes of job satisfaction. In M.D. Dunnette (Ed.), Handbook of industrial and
organizational psychology. Chicago: Rand McNally.
Mace, K. A., & Carr, S. C. (2005). Immigrant job hunting, labour market experiences, and feelings about occupational
satisfaction in New Zealand: An exploratory study. New Zealand Journal of Psychology, 34, 97-109.
Nakane, C. (1972). Japanese society. Berkeley, CA: University of Berkeley Press.
Napier, N.K., & Taylor, S. (1995). Western women working in Japan. Westport, CT: Quorum Books
Naumann, E. (1993). Organizational predictors of expatriate job satisfaction. Journal of International Business Studies,
24, 61 – 79.
Nguyen, H. H., & von Eye, A. (2002). The acculturation scale for Vietnamese adolescents (ASVA): A bidimensional
perspective. International Journal of Behavioral Development, 26, 202-213.
Peltokorpi, V. (2006). The impact of relational diversity and socio-cultural context on interpersonal communication:
Nordic subsidiaries in Japan. Asian Business & Management, 5, 333-356.
Peltokorpi, V. (2007). Intercultural communication patterns and strategies: Nordic expatriates in Japan. International
Business Review, 161, 68-82.
Peltokorpi, V., & Froese, F. J. (2009). Organizational expatriates and self-initiated expartiates: who adjusts better to
work and life in Japan? The International Journal of Human Resource Management, 20(5), 1096-1112.
Reyes, L. O., & Cohen, J. (2013). Nursing in a new land: acculturation and job satisfaction among Fillipino registered
nurses working in skilled nursing facilities. Online Jounral of Cultural Competence in Nursing and Healthcare,
3 (1), 16-25. Doi: 10.9730/oj ccnh.org/v3n1a2
Taras, V. (2008). Instruments for measuring acculturation. Retrieved March 23, 2015 from
http://people.ucalgary.ca/~taras/_private/Acculturation_Survey_Catalogue.pdf
Weiss, D. J., Davis, R. V., England, G., & Lofquiest, L. (1967). Manual for the Minnesota satisfaction questionnaire.
University of Minnesota: Minneapolis.

Hiroshima, Japan
April 29- May 1, 2015 The Inaugural Conference on Management and Sustainability in Asia
ISSN: 2189-2229
Contemporary Planning Practice need to be theorized?
Lakshika Meetiyagoda Dept. of Town & Country Planning, University of Moratuwa, Sri Lanka
Susantha Amarawickrama Dept. of Town & Country Planning, University of Moratuwa, Sri Lanka
……..
ABSTRACT
Some theorists show that the theories on contemporary planning tradition (communicative
planning) spotlight only on planner. They stress the importance of deriving planning theory
based on the planning contexts and outcomes as it is helpful to produce a more pragmatic
planning theory. Although there are practice based research attempts at planning domain, this
paper aims to further understand planning theory in the light of planner’s role, the context and
the outcomes of planning practice. To achieve this, it uses in-depth interviews and case based
research methods. Resettlement projects from Sri Lanka and Hong Kong contexts have been
selected as case studies to compare and contrast the context based situations. The research
findings indicate that although the ultimate aim of planning projects is similar, planners’ role can
be changed in the sphere of the context and people’s values and it may reflect in the project
outcomes.
Keywords: Planner’s role, Outcomes, Planning context
1 INTRODUCTION
According to Campbell & Fainstein (2003) ‘Planning Theory is often the area where the
field of planning reassesses itself’. Thus, literature related to planning theories mentions the
planner’s role, planning process, planning goals and extent of involvement of people for the
planning decision making. Accordingly, it has emerged and evolve traditions such as synoptic
planning theory, incrementalism, advocacy planning theory, radical planning theory, equity
theory and so forth (Sager, 2009). The communicative theory is accepted as contemporary
tradition, which contains some deficiencies. Fainstein (2000) mentions, ‘as the communicative
theorists make the role of the planner the central element of discussion, both the context in which
planners work and the outcome of planning fade from view’. To examine the validity of that
argument and to strengthen the contemporary theory in the light of practice, this research
explores the interrelation of the planner’s role, context and the outcomes of planning practice.
The two case studies dealt here are similar in terms of task and located in different contexts.
They are selected from Hong Kong and Sri Lanka based on low and middle income community
resettlement to provide better housing. The research methods are centered on interviews and
comparative case studies.
Both planners’ and people’s views were taken into consideration to examine the planning
process and the role of the planners as well as to identify and people’s interest and their

Hiroshima, Japan
April 29- May 1, 2015 The Inaugural Conference on Management and Sustainability in Asia
ISSN: 2189-2229
perception about the project’s outcome. Consequently, we conclude that the planners’ role in
practice will be determined context and it impacts on project outcomes.
2 PLANNING THEORIES, PRACTICES AND PLANNER’S ROLE
John Forester’s writings emphasise the role of planning practice which lead to the
formation of the theory (Forester, 1999). And Watson (2002) mentions the planning practice
does not necessarily produce generalized ideologies, but those activities bridge the gap between
theory and practice. This section discuss the classification of planning traditions, which includes
rational comprehensive planning, incremental planning, advocacy planning, radical planning and
communicative action planning. It is vital to identify the shifts in planning approaches and the
subsequent definition of planner’s role in the light of the contemporary ideologies to understand
the current dilemma.
In the context of rational comprehensive theory, planning profession assumes a universal
public interest exists and this public interest is manifested through reason or rationality.
Therefore, Planner is a rational decision maker who mostly worked with statistical analysis.
Lindblom (1959) introduces incremental planning which states that it should not be carried out
analysis based on predetermined goals, but strategic analysis needs to be done to simplify the
complex policy problems. He stresses the requirement of the bargaining process between free
market and democratic political economy to understand the policy decision and therefore, the
planner’s role is identified that of a coordinator. Davidoff (1965) is the pioneer of the advocacy
planning movement and called for distribution of planning services in low-income, minority
neighborhoods through a cadre of advocate planners. The advocacy plan proposed that planners
represent the public interest by speaking for those who do not typically have a voice in planning.
Therefore, the advocate planners are famous among not only social groups, but also among
environmental groups, and trade associations. Radical approaches to planning to show the dark
side of advocacy planning practice, therefore the literature contains more critique rather than a
road map. But, it impacts on progressive experimentation based planning movement with the
concepts of equality, participation and legitimacy and the planner is identified as a change agent
(Hudson, et al 1979).
A contemporary tradition of planning theory is communicative action planning. As
Fainstein (2000) explains, the object of analysis in the legal theory is about the relationship
between the legal system and society and medical theories’ concern is the human body,
communicative theory spotlight on the planner. The role of the planner is perceived as a
facilitator for discussions and the mediator to emphasis participation (Campbell and Marshall,
1999). Fainstein (2000) reinterprets the Habermas (1990) ideas and according to this theory
planner’s primary function is to act as an experiential learner than a technocratic leader. Thus,
planner mostly provides information to participants and convinces people to agree on particular
planning content. Further, Fainstein (2000) pinpoints the deficiencies of this theory when he
remarks that the communicative theorists make the role of the planner the central element of
discussion, as it might lead to diminish the importance of the context in which planner’s work
and the outcome of planning. She interprets it as identification of subject without the object and
proves that communicative planning theory has neglected the issue of universalism by
developing a general procedural ethic without substantive content.
Consequently, there is a need of extensive practice based research from different contexts
to refine the contemporary planning theory.

Hiroshima, Japan
April 29- May 1, 2015 The Inaugural Conference on Management and Sustainability in Asia
ISSN: 2189-2229
3 METHOD OF STUDY
Watson (2002) suggests the two possible methods to understand what planners do in
practice. One is the more ethnographic approach based on in-depth interviews with individual
planners. The second one places the understanding within the context of fully elaborated case
studies. Hence, this study adopts in-depth interviews of two senior planners who are involved in
low or middle income resettlement projects, namely Sahasrapura Resettlement Project in Sri
Lanka and Kwun Lung Lau Housing Scheme in Hong Kong. Although the case studies are not
quite comprehensive, data collected by means of questionnaires from 150 respondents of two
resettlement projects. It would help to comprehend and compare the nature of the project and its
outcome under eight indicators identified in the literature review.
Figure 1: Sahaspura Housing Scheme, Sri Lanka Figure 2: Kuwn Lung Lau, Hong Kong
4 ANALYSIS AND FINDINGS
4.1 Sri Lankan Planner’s Practice
Sahaspura is the first high rise solution for the low income housing problem in the country.
Therefore, the Executive Director of Planning & Marketing for the Sahaspura project is the
selected interviewer. The Planner stressed that the main principle he follows is sustainability.
He outlined some specific values related to the project in a newspaper article,
‘… release the underutilized lands for more profit generating activities,
make an equitable society by providing due recognition to people, provide
educational and employment opportunities and make gender equity by
allowing women to participate in decision making…’ (Mirihagalle, Daily
News, 2007).
In some instances, he used a rational approach to justify the highest and best use of land
utilization concept, but, the interview reveals that, he wanted to advocate people to establish the
equity. The vision of the project was to make a world class city which sounds a more political
statement. However, its the goal aimed to ‘elevate urban poor into the mainstream’; was more a
people oriented statement and its objectives were combinations of both ideologies, namely,
‘deliver high density housing for slum dwellers’ and ‘release prime lands liberated through re-
settlement for alternative development’.
Hiroshima, Japan
April 29- May 1, 2015 The Inaugural Conference on Management and Sustainability in Asia
ISSN: 2189-2229
The discussion proceeds to reveal that the planning process is more collaborative than
scientific. The project initiated with an enumeration survey to gather socio-physical information
of low income settlements in the city of Colombo. The data tabulation, preparation of maps,
measure the land area covered by low income settlements and their densities also has been
undertaken to compile the plan with more rational outlook.
The planner has worked closely with people in the detail planning phase to design the
project. Even the contract was awarded to the tenderer who has secured the highest number of
votes from beneficiary households. Not only during the planning and design stage, but also
during the construction stage social marketing workshops had carried out a survey
(mobilization) among the beneficiary households to educate about the opportunities. Finally,
Management Corporation has been established to be in charge of for maintenance and to provide
security to the housing scheme. He mentioned that the decisions were not taken individually. A
panel consisting of a planner, a lawyer, an administrator and an independent community leader
was the setup to prevent troubleshooting during the phase of implementation. Getting the
involvement of the community leader is a wise decision as it reflects the democracy,
participation and transparency.
As mentioned elsewhere, social equity was a major principle of this planning attempt.
Therefore, a few special housing units were constructed on the ground floor for extremely
disabled people and ramps were built in main accesses and accesses to corridors. Eight lifts are
provided and special kind of floor tactile guide paths were laid.
However, planner accepts the fact that the main role was played by professionals than by
people. He said ‘even though the role of professionals is relatively strong in high rise housing,
beneficiary households in this project were given maximum opportunities to get involved in the
entire process’.
4.2 Hong Kong Planner’s Practice
The Hong Kong Planning system counts a long term experience in the sphere of high-rise
housing development. It was a challenging task for policy makers in the late 1950s to get
themselves adopt to this policy decision, but, by now there are no negative ideologies about
living high. The government’s vision is “providing adequate and affordable housing for each and
every family in Hong Kong public rental housing (PRH) for the grass roots the Home Ownership
Scheme (HOS) and other forms of subsidized housing for the lower to middle-income group and
young and first-time home buyers; a stable private property market with priority accorded to
meeting the housing needs of Hong Kong people to facilitate those who can afford the home
ownership”. The planner who got involved in the selected case study tries to adopt this vision
provided by the government, but his argument is “PRH is not the way of efficient use of public
resources because statistics suggest that subsidies are provided to more households than
necessary. But HOS can play a significant role in provisioning housing for the middle and lower
middle income groups and in stabilizing the market”. But both these views reveal the scientific
and logical justifications for decision making. Nevertheless, Hong Kong Housing Society, which
is the organization responsible for the construction of Kwun Lung Lau, started as a voluntary
community organization to help those in need of housing in the late 1940s as a non-profit making
organization.
The housing development process was also a systematic and more rigid statutory process.
The requirements of housing were assessed with quantitative evaluations and decided the
owners and delivery also decided on a system based on income and asset limit. As they have not

Hiroshima, Japan
April 29- May 1, 2015 The Inaugural Conference on Management and Sustainability in Asia
ISSN: 2189-2229
decided the prospective occupants before constructing the housing scheme, public consultancy
mechanism remained weak. Though there are provisions for the amendments according to the
suggestions of the design committee, but values of the people’s were overlooked. However,
sophisticated data bases, maps and all the other required sources were used for the analysis.
Moreover, the planner mentioned that Planning and Engineering Feasibility Study was targeted
to gather people’s views and allow any stakeholder to articulate their views. But, he accepted
that there is no provisions for multicultural needs or any other intangible and sensitive issues as
those are not matters pertaining to the housing provision. But, they tried their best to provide all
necessary infrastructure, including the disability needs and priority has been given only to elderly
communities. Consequently, it has been highlighted that the role of planners in Hong Kong,
mainly relied mainly on rational comprehensive planning theory, while showing some concern
on equity and differently abled communities.
5 DISCUSSION
As per the in-depth interviews, it depicts that planners involved in the two projects do not rigidly
follow one tradition of planning, but depend on the contexts and people’s demands, thus their the
roles differ from one another. However, Sri Lankan planner prefers the combined approach of
advocacy planning and communicative planning and Hong Kong planner has worked on a mix
of rational comprehensive planning and equity concepts due to top down nature of planning. Yet,
according to the questionnaire analysis about 83% of Kwun Lung Lau residents and 85% of
Sahaspura residents are satisfied with their housing schemes. It reveals the fact that both housing
projects are successful, though the the planners’ roles are different. This section is denoted to
discuss specifically what those changes are and also the reason behind such a difference.
Table 1 Summery of People’s Perception
Indicator Sahaspura, Sri Lanka Kwun Lung Lau, Hong Kong
Tenure Security Freehold 86%
ownership Leasehold 100%
Reconstruction of Income –
37%
Decrease
39%
Not 24%
Increase
changed
20%
Economy
80%
Community Oriented and
Participatory
Participation for planning
Participated all stages
60%
Not participated for public
participation 84%
Reconstruction of Association with neighbours Not associate with neighbours
Community 60% 58% Members of Community Based
Organizations
89%
Self -Selection Satisfaction on the
location of 84%
the flat
83%

Hiroshima, Japan
April 29- May 1, 2015 The Inaugural Conference on Management and Sustainability in Asia
ISSN: 2189-2229
Satisfaction of the size of the flat
25%
75%
Attitude of Community
Members to New Location
Satisfaction on the design of the scheme
31%
92%
Convenience of the New
Location
Access to public
Transportation 70%
100%
Safety and Privacy 89% 100%
Overall satisfaction 85% 83%
Source: Indicators are derived based on Fenster, 1993, Yuen, 2006; Cernea, & McDowell (Eds.).
2000
In Sri Lanka, although, government is involved in the provision of housing as a welfare
measure, it is a challenge to compromise with beneficiary communities as they compare the
situation with the rest of their countrymen who are enjoying the better housing and
infrastructure. In that background, planning without proper public consultation could be a
nightmare. Therefore, there is no any rigid planning process for housing development, and
planners to envisage a system incorporating the participatory process. As a result, 60% of
respondents revealed that they have participated in all four stages. As 84% of Kwun Lung Lau
residents have no idea about their participation in planning and decision making, and it has no
impact on success of the project or people’s satisfaction.
Further, the basic requirement of Sri Lankan from the resettlement is a property ownership
(86% became entitled to freehold ownership due to this project). On the other hand, Hong Kong
is one of a most densely populated city where the land ownership is vested with the government.
The government does have a certain autonomy (Althusser, 1968, a,b) and its involvement in
housing provision is an advantage for Hong Kong’s development as if the laissez faire system
would exist, some people might have no place to live due to high competition and income
inequality. Thus, people are aware of these constraints and the government’s power over the
mode of operation is acceptable to the community.
According to the research findings people have indicated less priority (58% not satisfied
with social relationships) on social values within the neighbourhood in Hong Kong. On the other
hand, Sri Lankan community refuses the resettlement if it causes breakdown of social
relationship. Thus, the challenge for the planner is to design the resettlement ensuring that no
disruption occurs in their social relationships. That aspect is somewhat fulfilled in Sahaspura as
more than 80% of people are members of CBOs and sharing the relationships by attending
different events.
Considering the Hong Kong people’s positive reaction of high rise living and its design
quality (92% satisfied), this project is in conformity with their understanding and level of
adaptation to the circumstances. Although the situation is more or less same in Sri Lanka, people
are inclined to reject the design aspect based on both interior and exterior quality of the housing
scheme, as the community is more concerned to maintain uniqueness in terms of design (69%
not satisfied). So, public consultation is a compulsory task from the initial stages of planning.

Hiroshima, Japan
April 29- May 1, 2015 The Inaugural Conference on Management and Sustainability in Asia
ISSN: 2189-2229
6 CONCLUSION
Although, there are several theoretical expositions that to elaborate the planning tasks and
planners’ role, in reality planning is a complex exercise involving inherent, context specific
structure and people’s values. According to scholars, this complexity has not well elaborated in
communicative planning theory as it mostly explains the role of planner than elucidates the
pragmatic content based on the context and outcomes of particular planning practice. The
findings highlight the flexibility of planner’s role to cater the people’s values and context
specific socio-political environs, and how that flexibility leads to make successful project
outcomes. Further, it is precisely a mix of diverse planning traditions designated to achieve the
project outcome. Therefore, it proves the importance of interpreting the planning practice based
on planner’s role, context and outcomes. Further pragmatic research is desirable in future to learn
lessons from cases that would contribute to policy debates and strengthen the contemporary
planning theories In ths sense, such interrelated research attempts may lead to minimise the gap
between theory and practice.
REFERENCE
[1] Bäcklund, P., & Mäntysalo, R. (2010), Agonism and institutional ambiguity: Ideas on democracy and the role
of participation in the development of planning theory and practice-the case of Finland, Planning Theory, 9(4),
333-350.
[2] Campbell, H., & Marshall, R. (1999), Ethical frameworks and planning theory, International Journal of Urban
and Regional Research, 23(3), 464-478.
[3] Campbell, S., & Fainstein, S. S. (Eds.). (2003), Readings in planning theory, Malden, MA: Blackwell.
[4] Davidoff, P. (1965), Advocacy and pluralism in planning, Journal of the American Institute of Planners, 31(4),
331-338.
[5] Cernea, M. M., & McDowell, C. (Eds.). (2000), Risks and reconstruction: Experiences of resettlers and
refugees, World Bank Publications.
[6] Fainstein, S. S. (2000), New directions in planning theory, Urban affairs review,35(4), 451-478.
[7] Forester, J. (1988), Planning in the Face of Power, Univ of California Press.
[8] Fenster, T. (1993), Settlement planning and participation under principles of pluralism, Progress in
planning, 39, 167-242.
[9] Forester, J. (1999), Reflections on the future understanding of planning practice, International Planning
Studies, 4(2), 175-193.
[10] Hudson, B. M., Galloway, T. D., & Kaufman, J. L. (1979), Comparison of current planning theories:
counterparts and contradictions, Journal of the American Planning Association, 45(4), 387-398.
[11] Lindblom, C. E. (1959), The science of" muddling through", Public administration review, 79-88.
[12] Mirihagalle, L. (2007), Homes for People and Land for Urban Development; A revolutionary Strategy for
Housing the Urban Poor, Daily News, 15 November 2007
[13] Rahder, B. (2010), When rationality is unreasonable: planning theory in Sri Lanka, Bhúmi, the Planning
Research Journal, vol. 02, no. 02. Dept. of Town & Country Planning.
[14] Sager, T. (2009), Planners' role: torn between dialogical ideals and neo-liberal realities, European planning
studies, 17(1), 65-84.
[15] Scott, M. (1969), American city planning since 1890: A history commemorating the fiftieth anniversary of the
American Institute of Planners (No. 3). Univ of California Press.
[16] Watson, V. (2002), Do we learn from planning practice? The contribution of the practice movement to
planning theory, Journal of Planning Education and Research, 22(2), 178-187.

Hiroshima, Japan
April 29- May 1, 2015 The Inaugural Conference on Management and Sustainability in Asia
ISSN: 2189-2229
[17] Yuen, B., Yeh, A., Appold, S. J., Earl, G., Ting, J., & Kwee, L. K. (2006), High-rise living in Singapore public
housing, Urban Studies, 43(3), 583-600.

Hiroshima, Japan
April 29- May 1, 2015 The Inaugural Conference on Management and Sustainability in Asia
ISSN: 2189-2229
Development of Climate Model Organization based on sundanese moral values
Ani Setiani
Lecturer of Universitas Pasundan Bandung-Indonesia [email protected]
……..
Abstract
The qualitative research with the title Development of climate model
organization based on sundanese moral value in the Bandung City was formed the
background by the condition increasingly faded him the values of the Sundanese
culture. The aim of this research was formulated by the development of climate
model organization based on sundanese moral values took the form of training
equipment that could fill the problem faded him the values sundanese in the
tertiary institution environment in Bandung city.
This research including in the development Research (Research and
Development) that was served descriptively. This research was done in four stages,
that is: (1) the documentary Study. (2) Develop istrumen the research was based
on the analysis of the requirement (need assesment) to development the climate
of the based organization of the sundanese value that could satisfy the local
requirement for the tertiary institution in Bandung City, (3) carried out the netting
of the data and information was based on the instrument that was developed
through the study of the bibliography, the poll, the questionnaire, the interview
and Focus Group Discussion (FGD) from various related sides, 4) carried out the
processing, the interpretation and discussions as well as the pulling of the
conclusion, the suggestion and the recommendation on the findings that were
successful in could. Results of the research show that: 1) the implementation of
the sundanese values was poured in the form of the regional regulation no.9 in
2012 and was had follow-up in the Mayors regulation that at this time still in the
process of the finishing, nevertheless was based on information from various sides
in the FGD forum, the available policy both the policy that was dismissed by the
government ate Bandung city and the West Javanese Province. 2) Policies
developed regarding sundanese value in the city are more likely to socialize. In
fact if you look at the problems faced by the appropriate organizational climate
with the problems of sundanese values in the city is organizational climate with
local wisdom form of social reconstruction, namely organizational climate that
emphasizes the importance of the development of the individual as a person and
as a member of the community who preserve the sundanese value 3)
Implementation value in colleges around the city of Bandung by the city
government in order to overcome the problem of waning sundanese values are
applied in every college in the city is still not optimal.
Keyword: The Climate Of The Organization, The Values Of Sundanese
Culture

Hiroshima, Japan
April 29- May 1, 2015 The Inaugural Conference on Management and Sustainability in Asia
ISSN: 2189-2229
1. Introduction
In the middle of the globalization flow, the development and the change that
happened in social life, had a nation, and were national in Indonesia that was not
free from the influence of the global change, the development of science,
technology, art, and the culture. The feeling, the desire and the work of human
were the inheritance that formed the cultural system that always developed and
was developed through the dynamics of the life of human. UNESCO programs in
maintaining the culture Inheritance Be very important to give change that was
basic towards the perception and the community's global attitude towards the
culture and the cultural inheritance. Also very important in promoting and
protecting the diversity of the culture that could help created the peaceful world.
Therefore in carrying out his activity, human that worked in the organization must
maintain the culture that was received environment of institution. The tertiary
institution must create the climate of the based organisation his regional culture,
in creating the climate of this organisation was needed by social relations that
were harmonious between the fellow worker and his environment. Social relations
included good communication vertical and horizontal, the co-operation between
the workers and culture around that was mentioned with his local wisdom, carried
out the based activities the values of culture that created the happiness enviroment
of the tertiary institution. Many programs were launched by the regional
government to strengthen local culture. Starting from when being applied by him
the program on Wednesday spoke Sunda or was known on Wednesday Nyunda,
to the use of typical Sundanese clothes. Moreover the Body of The community's
conference Sunda West Java asked the Service of education West Java to increase
the local cargo curriculum the Sundanese language to mulok the Sundanese
culture. This was reinforced with the condition increasingly faded him the
Sundanese culture. (Kompasiana).
The culture critic, Hawe Setiawan explained, generally had 3 cultural groups
among them the culture that still was remaining or resibioculture, the culture that
still was dominant or dominant culture (lived and influenced many circles), and
the culture that was growing or energizing culture. This was information that must
be strengthened especially on environment the organization, that was reinforced
by the available climate. The climate that was pleasant for the officials (Davis &
Newstrom, 2001, hlm. 24) was if they did something that was useful and caused
the feeling to be valuable, got responsibility and the opportunity of being
successful, listen to and was needed as the valuable person.
Has been the obligation in each scope of the organization in the government's
environment or Bandung city private enterprise created the climate of the
organzsation thatheld the sundanese values. Therefore, to be created relations that
were harmonious between the community and the tertiary institution was needed
by the co-operation, where the community accepted the benefit of the presence of

Hiroshima, Japan
April 29- May 1, 2015 The Inaugural Conference on Management and Sustainability in Asia
ISSN: 2189-2229
the tertiary institution in his area to maintain based local wisdom the values of
Sundanese Culture.
2. Climate of Organitation
Sub Organization the system that was most important in an organization was the
human sub-system because according to Muhammad (2005: 39) human as the
organisation member was to be the core of the organisation. The human factor
must in the organization receive attention and could not be ignored. This was
caused was or not successful the organization achieved the aim and maintained his
existence more often was determined by his human factor. Therefore in carrying
out his activity, human that worked in this organization necessary disubstitusi
with various stimuli and facilities that could increase the motivation and his work
passion.
The conducive climate could encourage and maintain the motivation of the
officials. Therefore the climate of the organization must be created in such a way
as the official felt comfortable in carrying out the task of his work. The climate of
the conducive organization will push the official to more high-achieving optimally
in accordance with the interest and his capacity.
Owens (in Burhanuddin, 2002, page 91), said that the climate of the organization
showed in: “to perceptions of persons in the organization that reflect those norms,
assumptions, and beliefs”. Whereas according to Randy at.all. (2002, page 132-
133) suggested that, “The climate within organization Is an important factor in
human resource development success. Ss. If the climate Is the note conductive to
human resource development, designing and implementing a Will's program be
difficult”. (the climate in the organisation was the important factor in the success
of the development of human resources. He. If the climate was not conducive for
the development of human resources, the plan and the implementation of the
program will become was difficult).
Stinger (in wirawan, 2007) defined that the climate of the organization as the
collection and the pattern of the decisive environment the motivation emergence
as well as focussed on perceptions that made sense or could be considered, so as
to have the direct influence on the achievement of the organization member.
From the three understandings on the climate of the organization could be
interpreted as a series of characteristic of the organization that was felt and was
influential towards the achievement of the employee. The understanding above
contained the meaning that:
a. The climate of the organization was a collection characteristics that explained
about this organization. Because the level of from each characteristic that was
owned by each different organization, then the climate of the organization that
one with the climate of the other organization became different.
b. The climate of the organization was the internal atmosphere in an organisation
that was felt by each individual who worked in this organization. Because of

Hiroshima, Japan
April 29- May 1, 2015 The Inaugural Conference on Management and Sustainability in Asia
ISSN: 2189-2229
this when the climate of his organization was conducive, then the achievement
of the employee will increase.
c. The climate of the organization was the dynamic concept (the system was open).
Because of this the climate of the organization will only take place for the
certain periode.
The climate of the organization if being connected with teachers in co-operating
carried out the condition limgkungan the organization of the school where
teachers carried out his task. Hoy & Miskel (2001, hlm. 430) added that the work
environment that was not more supportive like the physical environment the work
and relations were in disharmony between someone in an other manner took part
in causing the achievement to be bad.
Hoy & Miskel (2001, hlm. 431), suggested that: “the Climate of the organisation
was the quality of the environment that took place relatively that was experienced
by employee efect his attitudes and that be based on to the interests together about
the attitude in the institution. Nstitusi. A climate emerged through the interaction
from the member and the exchange of the feeling around them the climate of the
organization was the indentity.
a) The Climate of oriented Organization the Achievement
The climate of the oriented organization the Achievement was the environment
in the organization that stressed the achievement of the teacher and affected the
teacher in the implementation of his task. As for his dimensions covered:
a. The structure of the task
b. The production of the Decision
c. The pressure on the achievement
d. The acknowledgment and feedback
e. The exercise and the Development
The climate that was pleasant for the officials (Davis & Newstrom, 2005, hlm.
24) was if they did something that was useful and caused the feeling to be
valuable, got responsibility and the opportunity of being successful, listen to
and was needed as the valuable person. The existence of the positive climate,
that was pleasant could bring the positive influence in the achievement
someone. The climate that was oriented to human will produce the
achievement and higher job satisfaction. The officials felt that the organization
really paid attention to the requirement and their problem, when which climate
was useful for the requirement for the individual (for example, paid attention to
the interests of the worker and was oriented towards the achievement), then
could hope for the behaviour to the side of the high aim. On the other hand,
when the climate that emerged was compatible with the aim, the requirement
and the personal motivation, the achievement and satisfaction could decrease.
b. The Dimensions Climate of Organization
Stringer (in wirawan, 2007) mentioned that the characteristics or the dimension
of the climate of the organization could influence the motivation of the

Hiroshima, Japan
April 29- May 1, 2015 The Inaugural Conference on Management and Sustainability in Asia
ISSN: 2189-2229
organization member to behave certain. He also said six dimensions that were
needed, that is:
1. The structure. The structure reflected the feeling that the employee was
organised well and had the definition that was clear concerning the role and
their responsibility. Covered the position of the employee in the company.
2. The standards. Measured the feeling of the pressure of improving the
achievement and the level of pride that was owned by the employee in
carrying out his work well. Covered the condition for the work that was
experienced by the employee in the company.
3. Responsibility. Reflected the feeling of the employee that they became the
management himself and had not asked for the opinion concerning his
decision from the other person. Other. Covered autonomy in completing the
work.
4. The acknowledgment. The feeling of the employee was given by the
repayment that was appropriate after completing his work well. Covered the
repayment or the pay that received the employee after completing the work.
5. The support. Reflected the feeling of the employee concerning the belief
and supported each other that were current dikelompok the work. Covered
relations with the other workmate.
6. The commitment. Reflected the feeling of pride and the commitment as the
organisation member. Covered the understanding of the employee
concerning the aim that wanted to be achieved by the company.
When being connected with the problem of the research, the Hoy opinion
and Miskel more gave hope for the development of the parameter about the
climate of the organisation to the employee diperusahaan the Bandung City
that was based thought-nilia Sundanese culture.
b. The Moral value of Sundanese Culture
In undergoing his life the Sundanese ethnic group based itself on the
human love that akhlakul karimah that is humankind that always based on
principles in keseimbagan between the religion, social and economics.
Kartawinata, (1995:13) said that the balance formed the living teaching like:
1. The just attitude towards the peer
2. The balance between the right and the obligation
3. Honored the person's other rights
4. Like to give help so that the person who was helped also to be able to be
independent
5. Work hard
6. Appreciated the other person
In the formulation results of workshop tranformation the Sundanese value of the
culture (2001) was mentioned that the Sundanese value of the culture was the

Hiroshima, Japan
April 29- May 1, 2015 The Inaugural Conference on Management and Sustainability in Asia
ISSN: 2189-2229
values that were owned by human and community Sunda chance him so as to
cause the determination to human and the Sundanese community to bring about
him. Inside was contained by the concept of the foundation about the life that was
formed by human and the Sundanese community. Yus Rusyana (2001)
systematically depicted like the value gemah, ripah, repeh, rapih that tried to be
realised by the West Javanese government.
The other value like proper, merenah and tumaninah also believed by chance him
and could take part in forming the life that was wanted. In other words that the life
community Sunda that was wanted could be formed by investing the values that
were owned and believed in by human and the Sundanese community personally.
a. The values of Sundanese Culture.
Each kind of normal human will have the awareness as the valuable creature. This
awareness was proven with efforts to be able to live with better than the situation
beforehand. Human will need the value to lead the movement, the step and his
feeling. According to the principle of the public, the good value was all the
matters that gave the contribution towards the opening and the progress of the life
of human of the capacities, where as that was regarded as negative was all the
matters that killed the life and paralysed human creativity. In Encyclopedia
Britanica, was stated that value Is a determination or quality of an object which
involves any sort or appriciation or inters. Rs. (Frondizi, 2001: 8). 8). Saw reality
that the Indonesian nation was the plural nation then will be seen also by the
existence of various ethnic groups in Indonesia. Each ethnic group that afterwards
had the typical characteristics of different culture- the difference. The Sundanese
ethnic group was one of the available ethnic groups in Java. As one of the ethnic
groups in Indonesia, the Sundanese ethnic group had caracteristic that
distinguished him from the other ethnic group. The uniqueness caracteristic this
Sundanese ethnic group was reflected from culture that was owned by them good
from the aspect of the religion, the livelihood, art et cetera. Gotten by the values
from each kind of his culture that continued in held and was developed by the
following generation. Applied the values of Sundanese culture was an obligation
so that his conservation.
b. Metodologi
This research including in the development Research (Research and
Development) that will be served descriptively. This research was done in two
stages, that is: First, carried out the documentary study towards various policies of
being related to the concept, the contents of the development, and other matters
that were related to the implementation of the development of the climate of the
based organization of the sundanese values in the Bandung city. Secondly,
developed the instrument of the research and his implementation. The
development activity of the instrument was preceeded with the compilation of the
instrument spoke of the research that was based on the analysis of the requirement
(need assesment) to each sample of the research, afterwards clarified him in the
form of the instrument that was compiled in detail and comprehensive for all the
objects that will be taken by the source of the data and his information to

Hiroshima, Japan
April 29- May 1, 2015 The Inaugural Conference on Management and Sustainability in Asia
ISSN: 2189-2229
development the climate of the based organization of the sundanese values that
could satisfy the local requirement for the Bandung City. The implementation of
the use of the instrument was against all the informants carried out through the
poll, the questionnaire, the interview and discussions (through the activity of
Focus Group Discussion-FGD). Thirdly, carried out the netting of the data and
information was based on the instrument that was developed good through the
study of the bibliography (the documentary study), observation, the poll, the
questionnaire, the interview and Focus Group Discussion (FGD) from various
related sides. Afterwards carried out the processing and the interpretation of the
data produced by the implementation of the instrument of the research. Choose,
sorted and processed the data produced by the research in the form of tables was
based on various categories afterwards discussed him by paying attention to the
concept and the theory as well as the real condition that happened in the field.
Fourthly, studied each result.
4. Conclusion
based on results of the analysis of the data and discussions that were raised before,
then results of this research could be concluded by matters as follows: First, the
implementation of the sundanese values was poured in the form of the regional
regulation no. 9 in 2012 and was had follow up in the Mayors regulation Bandung
that at this time still in the process of the finishing. Where this regulation must be
implementation in each agency and the company in Bandung city. Never the less
was based on information from many side in the FGD forum, the available policy
both the policy that was dismissed by the government of the Bandung city and the
West Javanese Province was not yet supported by the clear policy. The
implementation of a policy ideally also was followed by a series of other policy
like the existence of the implementation guide or the technical guidance of the
implementation, activity monitoring and the supervision as well as the instrument
of his evaluation. That has been carried out just to the socialisation, while the
process of monitoring and the supervision were not yet carried out. This
condition made the lecturers, the official as well as the student in the field still the
difficulty in implementation the sundanese values in Bandung city. Secondly,
the development of the climate of the based organisation of the sundanese values
better be developed with the aim and the base filsofis that was clear. The policy
that was developed concerning the sundanese values in Bandung city more
tended to the socialisation. In fact if seeing the problem that was dealt with then
the climate of the organization that in accordance with the problem of the
sundanese values the Bandung city was the climate of the organization. Therefore,
the tertiary institution was an organisation that was present in the middle of the
community, that each one of his activities was hoped for held and conserved the
sundanese values . So, the lecturers, the official and the student received the
emphasis in every activity. This did not mean to ignore essence from the
available aim in each tertiary institution.
Thirdly, the implementation of the sundanese values in the tertiary institution
around Bandung city by the government of t Bandung city on the occasion of to
overcome the problem faded him the sundanese values that was applied by each

Hiroshima, Japan
April 29- May 1, 2015 The Inaugural Conference on Management and Sustainability in Asia
ISSN: 2189-2229
agency and the tertiary institution in Bandung city still was not yet optimal. The
implementation conserved the sundanese values this not yet concerning the target.
Because, not all the tertiary institutions or the agency gaze at implementation the
sundanese values in the tertiary institution not something that was important, of
only an addition and did not become the aim of the core. The tertiary institution
still could not also coordinate the implementation of the sundanese values in the
climate of the organization by involving various stakeholders both internal and
external. The success of the implementation of the sundanese values in a tertiary
institution was supported by various aspects in the activity in the tertiary
institution, the policy, headed by, the infrastructure, the operational standard of
the tertiary institution, the employee and stake holders played an important role in
the achievement of the aim of the climate creation of the based organization the
sundanese values .
5. REFERENCES
Davis, Keith &Newstrom, John W. 2001. Perilaku dalam Organisasi. Penerjemah Agus Dhanna,
Edisi kedua. Jilid I. Jakarta: Penerbit Erlangga.
Gall, Meredith. D., Joice P. Gall, Walter R. Borg. 2003. Educatinal Research: an Introduction.
7th Ed. Pearson Education, Inc.Boston, New York, San Francisco, Mexico City,
Montreal, Toronto, Madris, Munich, Paris, Hongkong, Singapore, Toko, Cape Town,
Sidney.
Sugiyono. 2008. Metode Penelitian Kuantitatif, Kualitatif dan R&D. Cet-5. Bandung: CV
Alfabeta.
Frondizi, Risieri. 2001. Filsafat nilai. Jogjakarta : pustaka pelajar. Turmudzi, Didi. 2003. Teori Kebudayaan : Perspektif antropolgi dan sosiologi. Bandung : Unpas
Pres.
Devi, T,D, Dkk. 2013. Seni Budaya. Bandung : Konsorsium Sertifikasi Guru. Suyanto,B. Narwoko, D. 2006. Sosiologi, teks pengantar dan terapan. Jakarta : Kencana Prenada
Media Group.
http://sosbud.kompasiana.com/2013/11/30/lunturnya-nilai-kesundaan-612473.html

Hiroshima, Japan
April 29- May 1, 2015 The Inaugural Conference on Management and Sustainability in Asia
ISSN: 2189-2229
THE DEVELOPMENT OF DIMENSIONS OF ORGANIZATIONAL CULTURE
Isniar Budiarti
A Lecturer of Faculty of Economics, Universitas Komputer Indonesia, Bandung - Indonesia A Doctoral Student of Management, Universitas Padjadjaran Bandung - Indonesia
……..
Abstract
The paper undertakes a development of dimension concepts of organizational culture. It begins
with a comprehensive review of those concepts close parallel with research and writings
published on academic journals purporting to be indexed issued from 2003 to 2013, reporting
innovative constructs of dimensions of organizational culture. The issue then focuses on those
concepts that derive particular dimensions. An analysis of this organizational culture is measured
using identification of its dimensions. Added to this is the approach applied in this extensive
literature review, showing comparative dimension concepts of organizational culture from ten
scientists’ ideas that have already been examined in a comprehensive research. The analysis
yields the implication that dimensions of organizational culture are concerned primarily with
internal organization to form an innovative construct of dimensions of organizational culture.
The construct is argued to assist organizational management to attain competitive advantage.
Following the claim, this innovative construct of organizational culture is proposed to be an
original contribution of the paper.
Keywords: Organizational Culture, Dimension, Management, and Constructs
I. INTRODUCTION
The notion of culture has been important in the study of anthropology for the past decade.
Equally, it has attracted a great deal of attention for the growing issue on organizational
behaviour. In spite of disagreement over some elements of definition and measurement, culture
appears to be a main dimension to understand the concept of organizational behaviour (Hofstede
1986). Schein (1984) examines that numerous latest studies seem to argue organizational culture
as a key to achieve competitive advantage. In other words, the organizational culture is
concerned with organizational performance.
Understanding a culture with its values and perceptions comprehensively, established in a
particular group, seems to require understanding basic assumptions that lead to the way in which
people unconsciously perceive, think and feel on something. These assumptions may be a natural
reaction learned from espoused values. Since the values derive behaviour and behaviour become
a prerequisite to solution, they have been transformed into basic assumptions on how something
is originally seen. In fact, when the basic assumptions have been adapted naturally,
consciousness is denied. Similarly, the difference between assumptions from values is the fact
whether those values are arguable. Had they been taken for granted, the values is called
assumptions. However, the term of values seems to be more acceptable when they may be still
arguable (Schein 1991).
Concerning organizational culture, there are some valuable theories widely adapted by theorists
and practitioners. The theory proposed by Kluckhon-Strodtbeck (in Robbins 1996), as a
highlighted, describes six dimensions of basic culture; each provides distinctive variations for
every culture. The first dimension illustrates the relationship belonging to the environment that
shows domination over environment, harmony with environment and dominated by environment.
The second dimension determines time as an orientation; that involves past, present and future.
The last dimension is designed to clarify a nature or basic characteristics of human beings. The
characteristics demonstrate human values of being good, bad or in between.

Hiroshima, Japan
April 29- May 1, 2015 The Inaugural Conference on Management and Sustainability in Asia
ISSN: 2189-2229
II. LITERATURE REVIEW
Numerous researchers have proposed various definition of organizational culture. Robbins
(1996), in one hand, has defined organizational culture as “shared values among membership in a
group; the values conceptualized as a system of collaboration notion.” On the other hand, Schein
(1991) supports to the concept on how culture is developed, managed and even changed if the
adaptation is necessary to maintain eligibility of an organization. As a result, he has developed a
widely accepted theory that covers every dynamic force influencing on a developed and
changeable culture,
"a pattern of basic assumptions that a given group has invented, discovered, or
developed in learning to cope with its problems of external adaptation and
internal integration, and that have worked well enough to be considered valid,
and therefore, to perceive, think, and feel in relation to those problems.
Furthermore, Cushway and Lodge (GE: 2000) opined that organizational culture is the system
of organizational values which effect the behaviours of members of the organization and the way
in which such a work is performed. From the various definitions, conclusion drawn for the study
is that organizational culture describes the system of organizational values that is shared among
membership in a group and effects the behaviours of members. Moreover, organizational culture
is the system believed and developed by the organization to guide its members’ behaviours
(Wood, Wallace, Zeffane, Schermerhorn, Hunt, Osborn, 2001:391).
Concerning to the levels of basic assumptions, Schein describes seven basic assumptions of
organizational culture to measure the organizational values. He developed shared assumptions as
followed:
1. Organization/Environment relations. The issue focuses on the nature harmony; the linkage
of beings, nature and environment.
2. The nature of reality and truth. This aspect relates to members’ perspectives on rules of
linguistics and behaviours determining reality empirically, facts vs. opinion. In addition,
morals and pragmatism are considered to validate truth whether it is discovered or invented.
3. The nature of human nature. Human nature involves perspectives on human in nature, along
with attributes called intrinsic or peak.
4. The nature of human activity. This nature illustrates the acceptable way in which humans act
in relation to their environment. They promote the accepted values derived from basic
assumptions on reality, environment and human nature, whether they should be active,
passive, self-improved or fatalistic.
5. The nature of human relationships. It is concerned with the acceptable way in which humans
interact to delegate a social power.
6. The nature of time. Time illustrates a fundamental symbol to show orderliness of social life.
It respects a perspective of members on the time orientation.
7. The nature of space. Space relates to the way in which members of organization perceive the
concept of space. It may cover distance, placement, and position.
Not surprisingly, some characteristics of organizational culture are highly important to the
dimension. Luthan (1998) mentions those characteristics as,
1. Rules of behaviour. They are identified as language, terminology and a ritual generally used
by members of organization.
2. Norm. Standardized behaviours guide members of organization to behave. In society, they are
recognized as religious values, moral values, social norm, and normative rules of ethics etc.
3. Dominant values. They are main values that are favourable to be believed and accepted by
members of organization, such as the high quality of product, the lowest level of absence, the
high level of productivity and efficiency and that of discipline.
4. Philosophy. The philosophy is defined as policies and goals inferring the interest of
employees and customers. The example of philosophy may be “Your satisfaction is our
achievement.”
5. Rules. They are strict limitations controlled by organization to manage its members. In this
case, the new comers ought to learn these rules to adapt in new environment.
6. Organizational climate (also called corporate climate). It is a set of “properties” of the work
environment, involving physical issues such as social interaction of the members and self-
control of the members in dealing with customers or other parties.

Hiroshima, Japan
April 29- May 1, 2015 The Inaugural Conference on Management and Sustainability in Asia
ISSN: 2189-2229
Building an Organizational Culture
Robbins (2008) argues that it will take a long time to build an organizational culture. Once
created, it tends to be held firmly and it will be difficult for any managers to change it.
The organizational culture, firstly reflecting organizational founder’s philosophy, may determine
behaviour norm. The employees should behave in accordance to organizational basic
assumptions. Consequently, this behaviour norm eliminates ones who do not fit to it. In other
words, a process of selection is involved.
The explicit aims of the selection process are to identify and to employ individuals who provide
themselves with knowledge, skills and abilities of managing tasks successfully in the
organization. In this case, socialization is a organizational strategy to manipulate employees to
adapt organizational values (the things are highly valued). Alternatively, in this process
newcomers are transformed from outsiders to members who participate effectively. Focusing on
this strategy, socialization covers three levels in its process,
1. Anticipatory socialization.
All of the learning process occurs before a newcomer’s first day on the job. He learns about
values of organization and the congruence of his abilities to demands of the job.
2. Encounter.
The newcomer may clarify the organization associated with the job and experiences the real
situation in which expectation may clash with realities.
3. Change and Acquisition (Metamorphosis)
In this level, the newcomer starts to master the demands of the job and to adapt to the job,
group of work and organization. Simply, he starts being an organizational insider.
Importantly, some dimensions introduce to shape organizational culture. Donald R. Brown and
Don Harvey classify dimensions of organizational culture into six characteristics as followed.
1. Individual Autonomy. It describes the level of opportunity, freedom and responsibility of
organizational members to do initiative.
2. Sensitivity to customer and employee’s needs. The characteristic is recognized as
responsiveness to change of needs.
3. Supports. It covers assistance and acceptance reflected on leadership.
4. Interested in supporting employee whose initiative reflects new ideas. In this sense,
employees are stimulated to improve their quality and productivity to the higher level.
5. Openness to access various valuable communicative Medias. The characteristic illustrates a
free will to communicate with other employees, teams and leaders.
6. Confrontation. It illustrates a behaviour of taking a risk. It means that organizational members
are stimulated to respond aggressively and innovatively; they challenge a change.
Attaining Brown and Harvey’s characteristics as dimensions of organizational culture valued,
Stephen Robbins proposes seven main characteristics as stated here.
1. Innovation and Challenge to take a risk. It is the level in which employees are supported to
believe in being innovative and in having courage to take a risk.
2. Concern with details. The employees are expected to perform the job accurately and
analytically, and to be concerned with details.
3. Result orientation. Management focuses on the result or output rather than technical issue and
the process.
4. Human orientation. Consideration to the effects on organizational members is prioritized
while management makes a decision.
5. Team orientation. Teamwork is more favourable than individual to manage organizational
activities.

Hiroshima, Japan
April 29- May 1, 2015 The Inaugural Conference on Management and Sustainability in Asia
ISSN: 2189-2229
6. Aggressivity. It is organizational members’ behaviours of being aggressive and competitive.
7. Stability. Organizational activities emphasize on maintaining status quo.
III. Discussion and Construct
As a “latent-variable”, a measurement of organizational culture is conceptualized to make culture
“manifest-variable”, an analyzable variable. The dimensionalities operated on variables of
questions may be implemented to assess the culture. Analyzing from the extant studies,
dimensions are formulated in different perspectives.
Romualdas and Vida (2006) performed twelve dimensions that may be described as: (1)
involvement, (2) cooperation (collaboration), (3) transmission of information, (4) learning, (5)
care about clients, (6) adaptability, (7) strategic direction, (8) reward and incentive system, (9)
system of control, (10) communication, (11) agreement, (12) coordination and integration.
Extrapolating from Romualdas and Vida’s dimensions, written by Maggy and Allan (2008),
evaluates the culture using six dimensions: (1) Process Oriented vs. Results Oriented, (2)
Employee Oriented vs. Job Oriented, (3) Parochial vs. Professional Open, (4) System vs. Closed
System, (5) Loose Control vs. Tight Control and (6) Normative vs. Pragmatic.
Meanwhile, Dodi Wirawan (2009) adapted the dimensions of Triandis (2004) and Hofstede
(2006) to assess the organizational culture that is developed and maintained in organizations in
Indonesia. The dimensions cover: (1) Group collectivism, (2) Power distance, (3) Humane
orientation, (4) Uncertainty avoidance, (5) Institutional collectivism, (6) Future orientation,
(7) Performance orientation, (8) Assertiveness, and (9) Gender egalitarianism.
The research of Mujeeb and Tahir (2011) applied dimensions: (1) Involvement Culture, (2)
Consistency Culture, (3) Adaptability Culture, (4) Mission Culture to measure the organizational
culture. The measurement was formulated using the research results of Denison (1990) and
Denison & Mishra (1995).
Then, Anuradha (2011) applied four dimensions developed by Hofstede (2000) to assess the
culture. Those dimensions were: (1) Power distance (distribution of power), (2)
Individualism/Collectivism, (3) Uncertainty avoidance, and (4) Masculinity and Long term
orientation.
Fakhar and Rana (2012) implemented Classification approach to organizational culture. The
culture is assessed using union model developed by Rousseau (1991).
Figure 1. Organizational Culture union model
In classification approach, organizational culture is considered as onion based on different layers.
Norms and values are the invisible but most important aspect of the organizational culture.
Different from Fakhar and Rana, Kęstutis (2013) used Hostede’s dimensions and compared
them with other dimensions developed by House et. al. (2004). Hostede’s dimensions
describe Power distance, Uncertainty avoidance, Individualism– collectivism, Masculinity-
femininity and Long-term – short-term orientation to analyze the organizational culture. In order
to examine culture through values and practice, those dimensions were compared with House
et. al.’s dimensions resulted in from a ten-year research program known as GLOBE. They
presented cultural dimensions: Uncertainty avoidance, Individualism - collectivism dimension,
Masculinity - femininity dimension, Long-term-short-term, Power distance, Uncertainty

Hiroshima, Japan
April 29- May 1, 2015 The Inaugural Conference on Management and Sustainability in Asia
ISSN: 2189-2229
avoidance, Focus on the future, The institutional collectivism, Group collectivism, Orientation
to humanity, Performance orientation, Gender equality, Assertiveness.
Furthermore, Muge (2014) measured organizational culture using five dimensions: Power
distance, Uncertainty avoidance, Individualism, Masculinity, and Long term (Hofstede 1984-
1997-2001; Hofstede and Bond, 1988; S Hermerhorn, 2010). Power distance is defined as “the
extent to which the less powerful members of institutions and organizations within a country
expect and accept that power is distributed unequally.” Individualism is the degree to which
society emphasizes self-interest and individual accomplishment versus the interest of groups and
collective accomplishment. Masculinity focuses on the degree masculine values such as
competitiveness rather than feminine values like relationship buildings. Uncertainty avoidance
(from strong to weak) is the level of tolerance for uncertainty situation like risk, change. Time
orientation (formerly called Confucian work dynamics) is the degree which a culture emphasizes
long-term or short-term thinking.
Finally, Dimitrios and Athanasios (2014) assessed organizational culture where the interest is on
four dimensions developed by Harrison (1975). The dimensions cover orientation to power, roles,
tasks and individuals. The figure 2 illustrates the matrix of Organizational Culture Dimension,
which later generates new construct of organizational culture.
No.
Organizational Culture
Dimension
Rom
ual
das
& V
ida
2006
Mag
gy d
an A
llan
(2008)
Dodi
Wir
awan
2009
Muje
eb&
Tahir
2011
Anura
dha
2011
Fak
har
& R
ana
2012
Kęs
tuti
s 201
3
Muge
2014
Dim
itri
os
&
Ath
anas
ios,
2014
1 Involvement
2 Cooperation
3 Learning
4 Care About Clients
5 Adaptability
6 Strategic Direction
7 Reward And Incentive System
8 System Of Control
9 Agreement
10 Coordination And Integration.
11 Parochial Vs. Professional Open
12 Normative Vs. Pragmatic
13 Power Distance
14 Uncertainty Avoidance
15 Institutional Collectivism
16 Performance Orientation
17 Mission Culture
18 Masculinity
19 Symbol
20 Long-Term – Short Term Orientation
21 Consistency Culture,
22 Individualism
Figure 2. Organizational Culture Dimension Matrix
The construct is synthesized by referring to the most frequency of implementation of dimensions.
Referring to the figure, there are seven constructs generated from twenty-two dimensions applied.
They are:
1. Power Distance

Hiroshima, Japan
April 29- May 1, 2015 The Inaugural Conference on Management and Sustainability in Asia
ISSN: 2189-2229
Power distance - is associated with request or non-request of inequality in society, as well as
with dependence and interdependence levels. This dimension shows how many people
recognize that over their management hierarchy are those within power.
2. System Of Control
Control Systems are the reward systems and measurement system, which help, uncover the
organization’s areas of importance and focus, (Maggy dan Allan, 2008).
3. Uncertainty Avoidance
The degree to which people prefer structured over unstructured situations (Dodi, 2009).
4. Adaptability
Ironically, organizations that are well integrated are often the most difficult ones to change.
Internal integration and external adaptation can often be at odds (Mujeeb and Tahir 2011).
5. Strategic Direction
The degree to which individuals in organizations engage in future-orientated behaviour (Dodi,
2009).
6. Reward And Incentive System
the degree to which individuals in organization encourage and reward individuals for acts of
fairness, altruism, friendliness, generosity, caring, etc. (Dodi, 2009).
7. Involvement
Effective organizations empower their people, build their organizations around teams, and
develop human capability at all levels (Lawler, 1996; Mujeeb and Tahir 2011)
IV. CONCLUSION
Organizational culture is a set of perceptions or values that are shared by members of an
organization. These underlying values have a significant influence on the behaviour of
organizational members; they guide members to solve problems and to make decisions. It is also
suggested that culture influences employee attitudes for adaptation and assembly. In other words,
organizational culture is conceptualized as dimensions that may affect employee attitudes.
Despite of the origin of its usage in anthropology, organizational culture is argued to
independently link to organizational performance.
The analysis of concepts close parallel with research and writings published on academic
journals purporting to be indexed issued from 2003 to 2013 yields the innovative constructs of
organizational culture. They are (1) Power Distance, (2) System Of Control, (3) Uncertainty
Avoidance, (4) Adaptability, (5) Strategic Direction, (6) Reward And Incentive System, and (7)
Involvement.
V. REFERENCES
Anuradha Reddy, Cultural Dimensions & Impact On Performance Management, , Zenith International
Journal of Multidisciplinary Research, Research Scholar, Kakatiya University, Warangal, AP, India., Vol.1
Issue 6, October 2011, ISSN 2231 5780 www.zenithresearch.org.in 300,
Dimitrios Belias, Athanasios Koustelios, Organizational Culture And Job Satisfaction: A Review, International
Review of Management and Marketing, Vol. 4, No. 2, 2014, pp.132-149 ISSN: 2146-4405
www.econjournals.com
Dodi Wirawan Irawanto, An Analysis Of National Culture And Leadership Practices In Indonesia, Journal of
Diversity Management – Second Quarter 2009 Volume 4, Number 2
Donald R. Brown and Donald F. Harvey, An Experiential Approach to Organization Development, Seventh
Edition (Delhi : Pearson Education Inc., 2006) p.463.
Fakhar Shahzad, Rana Adeel Luqman, Ayesha Rashid Khan, Lalarukh Shabbir, impact of organizational culture on
organizational performance: an overview, Interdisciplinary Journal Of Contemporary Research In Business
Copy Right © 2012 Institute Of Interdisciplinary Business Research 975 January 2012 Vol 3, No 9
Kęstutis Peleckis, International Business Negotiations: Culture, Dimensions, Context, Vilnius Gediminas
Technical University Saulėtekio al. 11, LT–10223 Vilnius, Lithuania, International Journal of Business,
Humanities and Technology Vol. 3 No. 7; September 2013
Kim S. Cameron and Robert E. Quinn, Diagnosing and Changin Organizational Culture : Based on the
Competing Values Framework, Revised Edition (San Fransisco : Joh Wiley & Sons, Inc., 2006) p.16
Maggie Beshay, Alan Sixsmith, Dimensions of Culture: A Project Perspective, Communications of the IBIMA,
Volume 5, 2008, Faculty of IT University of Technology, Sydney email: [email protected],
Ressam Namık Ismail Sokak, Müge Leyla YILDIZ, The Effects of Organizational Culture on Corporate
Entrepreneurship, Bahcelievler, Istanbul, 34180, Turkey, International Journal of Business and Social
Science Vol. 5, No. 5(1); April 2014
Romualdas Ginevičius & Vida Vaitkūnaite, Analysis of organizational culture dimensions impacting performance,
Journal of Business Economics and Management, Publication Details, Including Instructions For Authors
And Subscription Information: http://www.tandfonline.com/loi/tbem20,
Richard A. Swanson, Analysis for Improving Performance (San Fransisco : Berrett-Koehler Publishers, Inc., 2007)
p.114.

Hiroshima, Japan
April 29- May 1, 2015 The Inaugural Conference on Management and Sustainability in Asia
ISSN: 2189-2229
Seyed Ali Akbar Ahmadi, Yashar Salamzadeh, Mohammadreza Daraei, Jamshid Akbari, Relationship Between
Organizational Culture And Strategy Implementation: Typologies And Dimensions, Global Business and
Management Research: An International Journal (2012)Vol. 4, No. 3 & 4, Corresponding Author’s Email:
Stephen P. Robbins, Organizational Behavior : Concept, Controversies, Applications, Seventh Edition (Prentice-
Hall International, 1996). p.681-2.
Ul Mujeeb Ehtesham, Tahir Masood Muhammad, Shakil Ahmad Muhammad, Relationship between Organizational
Culture and Performance Management Practices: A Case of University in Pakistan

Hiroshima, Japan
April 29- May 1, 2015 The Inaugural Conference on Management and Sustainability in Asia
ISSN: 2189-2229
The Issues of Urban NIMBY Conflict in China
SUN Linlin Department of Building and Real Estate Department
The Hong Kong Polytechnic University
Edwin H. W. Chan Department of Building and Real Estate Department
The Hong Kong Polytechnic University
ZHU Dajian Department of Public Management
Tongji University
……..
ABSTRACT
This paper aims to examine the issues of urban NIMBY conflict in China. Since 1970s,
NIMBY (Not-In-My-Back-Yard) syndrome has become a worldwide challenge for urban
development. Since 2007, urban NIMBY conflict events have frequently occurred in China. With
the rapid urbanization in China, experts have predicted that in the next decade NIMBY
phenomenon would appear frequently. However urban NIMBY conflict management research is on
the initial study stage in China and western scholars also doubt whether the western theory
applicable. This study first constructs a general framework based on the PSR (press-state-response)
framework to analyze urban NIMBY conflict. NIMBY facility type, the interaction between local
government and the residents and the management strategies are the variables in the analysis
framework. Based on the four case studies that represent the NIMBY conflicts arousing by four
kinds of NIMBY facilities, the issues of urban NIMBY conflict in China are identified. The results
show that few windows for public participation to NIMBY facility decision making, EIA report of
the planning stage and the project EIA report are not access to public, local government’s stability
maintenance approach response intensify public opposition to NIMBY facilities in China. In-depth
analysis on the causes behind the issues found in this paper needs to be studied in the future.
Keywords: NIMBY conflict, public participation, EIA, China
1 INTRODUCTION
NIMBY (an acronym for the phrase Not In My Back Yard) phenomenon is defined as a
public opposition to some public facilities in urban development. These facilities such as landfills,
incinerators, substations, power plants, highways, waste treatment facilities, hospitals are named
NIMBY facilities. NIMBY facilities may bring negative effects such as environmental, health,
safety, and economic and social impacts to the nearby community but benefits to the wider public
(Lake, 1993; Inhaber, 1998). Local residents raise serious concerns to the NIMBY facilities that
often lead to protest and opposition some even lead to conflicts with local governments.
NIMBY conflict has become a challenge for local government. Different countries and areas
have taken a variety of measures to resolving this conflict. Public participation, information
disclosure and transparency have been studied as strategies on relieving public risk perceptions to
NIMBY facility (Wolsink, 2007; Wolsink & Devilee, 2009; Wright & Boudet, 2012).

Hiroshima, Japan
April 29- May 1, 2015 The Inaugural Conference on Management and Sustainability in Asia
ISSN: 2189-2229
However, the relationship between local government and residents during the management
process of NIMBY facilities seems to be getting worse. Empirical research shows that the NIMBY
facilities siting make residents lose trust to the government (Wolsink, 2007; O’Garra et al., 2008;
Botetzagias & Karamichas, 2009). The existing literature has studied the issues of different kinds of
NIMBY facilities, however few focus on the common issues of NIMBY facilities. On the other side,
with the rapid urbanization, NIMBY conflict occurs frequently in China and the city managers face
serious challenges. Although Scholars have studied most on the NIMBY conflict in Western
countries, China urban NIMBY conflict management research is on the initial study stage.
This paper aims to examine the issues of urban NIMBY conflict in China. First, it reviews the
literature on the types of NIMBY facilities and causes of and strategies to NIMBY conflict. Base on
the PSR model, it constructed a framework to analyze NIMBY conflict management. Second,
according to the types of NIMBY facilities, four cases were selected to analyze the interaction
between local government and residents during the NIMBY conflict management. Finding and
discussions are in the third part. In the last part, conclusion is provided.
2 LITERATURE REVIEW
2.1 The types of NIMBY conflict
Based on the facility function and sustainability perspective, Sun & Zhu (2014) divided
NIMBY facilities into four types, waste NIMBY facility, energy and relative infrastructure NIMBY
facility, welfare and relative infrastructure facility and transport and relative infrastructure facility
(Table1). This paper follows this categorize and chooses representatives of three types of the
NIMBY facility to do further research.
Table 1: The types of NIMBY facilities (Sun & Zhu, 2014)
The types of NIMBY facilities Examples
Waste NIMBY facility Waste incinerator, landfills
Energy and relative infrastructure NIMBY
facility
Power plant, substation
Welfare NIMBY facility Funeral, welfare hospital
Transport and relative infrastructure NIMBY
facility
Airport, highway
2.2 The causes of NIMBY conflict
At present there are mainly two aspects to research on the factors of NIMBY conflict, one
aspect is to focus on the nearby residents and the other is to focus on the facility siting.
The research on the local residents mainly focuses on the mood of those living in the
community of the NIMBY facility. The micro-level is research on their attitudes (Halstead, 1993;
Hampton, 1996; Piat, 2000; Eser and Luloff, 2003; Bell, 2005; Ferreira and Gallagher, 2010).
Hampton (1996) surveyed public attitude to NIMBY facilities from social, environmental and
economic dimensions. It shows that the risk perception of community residents was the main reason
affecting public attitude. The risks perceived included environmental risk, health risk, safety risk,
life quality risk, property devaluation risk, unfair treatment risk and the distance from the
community to the facility.
The earliest siting selection method referred to the least-cost technical standard, using the
criteria such as the existence of flat and stable terrain, the availability of cooling water, a relatively
low population density, accessibility to transportation routes, and proximity to major load centers,

Hiroshima, Japan
April 29- May 1, 2015 The Inaugural Conference on Management and Sustainability in Asia
ISSN: 2189-2229
then used scores to site the least –cost candidate sites (Jopling, 1974). Because of NIMBY
syndrome, city managers gradually began to consider the social impact when planning facility siting
(Tang, Wong, & Lau, 2008).
2.3 The strategies to reduce NIMBY conflict
Although the causes of NIMBY conflict have been most studied in the existing literature, in
practice the relationship between local government and the residents became increasingly tense, so
the research gradually changed direction from research on the attitude of local residents to how to
govern NIMBY conflict (Tao & Tong, 2010). Public participation, transparency and EIA were
taken by government as a response to citizens’ environmental worries and access to information of
NIMBY facility decision-making. However, recently the experience of scholars and practitioners
showed that public participation did not tend to make citizens accept the facility, and had little
impact on government decision making.
From the above literature review, the research questions in this paper are as followed,
1 Do the residents in China also opposite to these four kinds of facilities?
2 Why NIMBY conflict occur in China?
3 How do the local government interact with residents for the NIMBY facilities?
4 Whether public participation, EIA and transparency are the contentious points of urban
NIMBY conflict management in China?
2.4 Framework to analyse urban NIMBY conflict management
In order to analyze the issues of urban NIMBY conflict management, this paper developed a
framework from the PSR (Press-State-Response) model. PSR model, which was proposed by
OECD and UNEP, was a conceptual model used as a tool to analyze sustainable development
policies. This model provided a policy analysis approach according to the causal relationship that
explained, “what happened, what is the current situation and how we can deal with” these three
basic issues in the policy analysis process (ZHU, 2010). Base on the PSR model, this study develop
a simplified framework (Figure 1) that identifies key variables including the types of NIMBY
facility, the interaction between local government and the residents and the strategies response to
governing NIMBY conflict. This paper used this approach to understand what are the current
NIMBY conflict situation in China, what are the factors that lead to this situation and what can be
done in order to solve this conflict.
3 METHODOLOGY
Review from the literature above, case study has been the primary strategies for scholars
studying on the issues of urban NIMBY conflict. Data sources are interviews with nearby residents,
government documents and website information relative to the cases. 4 Public managers, 7 nearby
residents and 10 experts were interviewed from December, 2013 to January, 2014, and from July,
2014 to August, 2014.
Table 2 shows the background of the selected cases in this study. They are Shanghai
Hongyang Substation, Shanghai Hongqiao airport, Guangzhou Panyu incinerator and Xuzhou
round-city highway. These four cases are selected according to the types of NIMBY facilities in the
literature review and each represents the conflict arising from energy facility, transportation facility,
waste facility. Because NIMBY conflict arising by welfare facility is hard for authors to investigate
so the welfare facility is not included in this study.
Table 2: The selected four cases conflict between local government and residents
Cases Types of Causes of Government The The

Hiroshima, Japan
April 29- May 1, 2015 The Inaugural Conference on Management and Sustainability in Asia
ISSN: 2189-2229
NIMBY
facility
NIMBY
conflict
response
strategies
response of
the residents
to the
measures
takes by
local
government
outcome of
the
interaction
Xuzhou
Municipal
round-city
highway
Transporta
tion
facility
Highway
closely to
the nearby
community
Extent the
distance
between the
highway and
the community
Accepted the
revised
proposal by
the district
government
Highway
has been
operating
and relieve
the NIMBY conflict
Shanghai
Hongqiao
airport
runway
extension
project
Transporta
tion
facility
Aircraft
noise
pollution
and its take
off altitude
causing a
security risk
Conducted
noise reduce
project to the
impacted
community
The nearby
community
not satisfy
with the
noise reduce
project
Airport
runway has
been
operating
while
NIMBY
conflict still
existing
Guangzho
u panyu
incinerato
r
Waste
facility
Nearby
residents
worried
about the
distance
causing air
pollution,
health risk
and real
estate
devaluation.
Under the
strong social
pressure,
local
government
stated, ’If the
EIA was not
passed and
public did not
accept then
the project
would not be
passed.’
Accepted the
response
strategy
adopted by
the local
government
Facility
resiting was
passed
Shanghai
Hongyang
substation
Energy
facility
Nearby
residents
didn’t know
the
substation
until they
moved in
the
community
and they
worries
about the
safety,
health risk
and real
estate
devaluation.
Invite experts
and public
officials to
defend and
take social
stability
maintenance
(ssm)
approach
Not satisfy
with
government’s
response and
ssm intensify
the degree of
satisfaction
Distrust
district
government
and NIMBY
conflict still
existing

Hiroshima, Japan
April 29- May 1, 2015 The Inaugural Conference on Management and Sustainability in Asia
ISSN: 2189-2229
4 FINDINGS AND DISCUSSIONS
4.1 Few windows for public participation
Few windows for public participation to NIMBY facility decision making in China. In the
case of Shanghai Hongyang substation, a resident said, ‘If the neighborhood cadre living in our
community didn’t tell us the substation information, we couldn’t know it. Until we confirmed
through the hot line with city mayor, we finally accepted the fact that there really would be a
substation to be built besides our community’ (Interview with resident, Shanghai, 30 August, 2014).
Local governments usually adopt the ‘decide-announce-defend’ (DAD) approach in China. Political
elite and expert elite are the main decision makers. ‘It is not necessary to engage public to make the
siting decision. They don’t have expertise knowledge’, one public staff claimed for their planning
decision making (Interview with public officials, Shanghai, December, 2013). In China public
participation laws are limited. At present public participation are ruled in the project planning and
project EIA phrase. However in practice before the public consultation stage, public seldom know
the project. Arnstein (1969) provided a citizen participation ladder with eight degrees of public
participation, from bottom to up three levels, non-participation, tokenism and citizen power. An
expert stated, ‘there is no public participation in China except the protest action’ (Interview with
expert, Hong Kong, April, 2015). In the case of Honghang substation, public participation became a
doubt point and the right the residents asked for. However in the case of Guangzhou Panyu
incinerator, government resiting planning engaging public finally make public accept the new
location.
From the four cases it finds that the issues of NIMBY conflict not only arise of environmental,
safety and real estate devaluation risks. In the cases of Shanghai Hongyang substation and
Hongqiao airport runway, issues such as land use,information transparency and distrust are also
the key issues residents cared most. However it finds that these issues are relative to many public
sectors not only the responsibility of Environment Protect Department.
4.2 EIA report of the planning stage and the project EIA report
EIA system, which was created by the United States, has developed for more than 40 years.
The EIA system plays a role in protecting environment in varying degrees. However, an
environmental impact assessment practice is also controversial. On the one hand, some experts
believe that from the perspective of institutional change, environmental impact assessment is one of
the most successful environmental protection systems, on the other hand, some scholars pointed out
that the environmental impact assessment is a professional package of the political regime, which
might not represent the broad public interest (Tang & Chiu, 2010). Except the case of Xuzhou
round-city highway, it finds that EIA is also the controversial issue in the other cases. In China
environmental NIMBY conflicts are significant. Citizens more and more care of the living
environment quality. In the western countries, EIA report is open to public but in China EIA report
is not completely provided to public just a simple report. In the case of Shanghai Hongyang
substation, one EIA expert administration meeting record providing by local government led strong
doubt by the residents. A interviewed resident said, ‘Environment impact assessment needs to be
assessed by the experts major in environment science. But why an expert major in xinfang (visit
and letter) can be the member’ (Interview with resident, Shanghai, August, 2014). ‘NIMBY
phenomenon is a conflict of social issue but in China local governments prefer to use political
approach to press it (Interview with one expert, Shanghai, December, 2013).

Hiroshima, Japan
April 29- May 1, 2015 The Inaugural Conference on Management and Sustainability in Asia
ISSN: 2189-2229
4.3 The stability maintenance measure further intensified the conflict
Stability maintenance measure is the characterized political approach usually used by local
governments in China. In China, stability maintenance (wei wen) is a governance task for different
levels of governments, which is a measure to maintain the social stability and sustained economic
development. In order to maintain social stability, some local government who do not support these
activities suppressed tough attitude to the local residents, which is the meaning of stability
maintenance. In the case of Shanghai Hongyang substation, the nearby residents showed strong
dissatisfaction to the measures taken by the government. Interviewees said that the government
dispatched police to stop residents’ collective action at the community gate and monitored their
behaviour and even gave pressure to the companies at which the residents worked and made their
employer persuade them (The work places of the persuaded residents are state-owed company or
public sectors)(Interview with residents, Shanghai, August, 2014). However this stability
maintenance strategy cannot solve the root problem of this kind of NIMBY conflict. The
government does not expect people to “stroll on the street” and then followed by other people. In
China, stability maintenance indicator has been added to the performance of government officials
(National Petition Regulations, 2005).
5 CONCLUSION
This study examined the issues of urban NIMBY conflict management in China. Based on
the selected cases, it was found that public participation, EIA and transparency are the key factors
impacting urban NIMBY conflict in China. Specifically, few windows for public participation to
NIMBY facility decision making, EIA report of the planning stage and the project EIA report are
not access to public, local governments’ stability maintenance response intensify public opposition
to NIMBY facilities in China. The findings verify the analysis framework for urban NIMBY
conflict management and the western NIMBY theory is also available in China scenario. Welfare
facilities and in-depth analysis on the causes behind the issues found in this paper needs to be
studied in the future.
REFERENCES
[1] Arnstein, Sherry R. (1969). A ladder of citizen participation. Journal of the American Institute of planners, 35(4),
216-224.
[2] Botetzagias, Iosif, & Karamichas, John. (2009). Grassroots mobilisations against waste disposalsites in Greece.
Environmental Politics, 18(6), 939-959. doi: 10.1080/09644010903345702
[3] Hampton, G. (1996). Attitudes to the social, environmental and economic impacts of the construction of an
armaments complex. Journal of environmental management, 48(2), 155-167.
[4] Inhaber, H. (1998). Slaying the NIMBY dragon. Transaction Publishers.
[5] Jopling, David G. (1974). Plant Site Evaluation Using Numerical Ratings. Power Eng, 78(3), 56.
[6] Lake, Robert W. (1993). Planners' alchemy transforming NIMBY to YIMBY: Rethinking NIMBY.Journal of the
American Planning Association, 59(1), 87-93.
[7] National Petition Regulations of People’s Republic of China. (2005). Available from
http://www.gov.cn/gongbao/content/2005/content_63338.htm
[8] O'Garra, Tanya, Mourato, Susana, & Pearson, Peter. (2008). Investigating attitudes to hydrogen refuelling
facilities and the social cost to local residents. Energy Policy, 36(6), 2074-2085. doi:
10.1016/j.enpol.2008.02.026
[9] Sun, L. L., & Zhu, D. J., (2014). The Causes, Status Quo, and Response Strategies for Urban NIMBY Events and
the Directions of Their Future Research. Public Administration and Policy Review, 3(2), 28-36.

Hiroshima, Japan
April 29- May 1, 2015 The Inaugural Conference on Management and Sustainability in Asia
ISSN: 2189-2229
[10] Tang, C. P., & Chiu, C. Y. (2010). Professionalism and Democracy: The Operation and Adaptation of
Environmental Impact Assessment in Taiwan. Journal of Public Administration, 35, 1-28
[11] Tao, P.& Tong, X. (2010) Governance of Mass Disturbance which Caused by NIMBY. Nanjing Social Science,
(008): 63-68.
[12] Wolsink, Maarten. (2007b). Wind power implementation: The nature of public attitudes: Equity and fairness
instead of 'backyard motives'. Renewable & Sustainable Energy Reviews, 11(6), 1188-1207. doi:
10.1016/j.rser.2005.10.005
[13] Wolsink, Maarten, & Devilee, Jeroen. (2009). The motives for accepting or rejecting waste infrastructure facilities.
Shifting the focus from the planners' perspective to fairness and community commitment. Journal of
Environmental Planning and Management, 52(2), 217-236. doi: 10.1080/09640560802666552
[14] Wright, R. A., & Boudet, H. S. (2012). To Act or Not to Act: Context, Capability, and Community Response to
Environmental Risk. American Journal of Sociology, 118(3), 728-777. doi: 10.1086/667719
[15] Zhu, D. J, Wang, H.M et al. (2010). A PSR Model Analysis on the Public Service Management. Research on
Economics and Management, 4, 75-82.

PRESDA Foundation Education for Sustainable Development—People, Planet, Profit