Computer-aided techniques for chromogenic immunohistochemistry: Status and directions
25
Post print (i.e. final draft post-refereeing) version of an article published on Computers in Biology and Medicine. Beyond the journal formatting, please note that there could be minor changes from this document to the final published version. The final published version is accessible from here: http://dx.doi.org/10.1016/j.compbiomed.2012.08.004 This document has made accessible through PORTO, the Open Access Repository of Politecnico di Torino (http://porto.polito.it), in compliance with the Publisher’s copyright policy as reported in the SHERPA-ROMEO website: http://www.sherpa.ac.uk/romeo/issn/0010-4825/ Computer-aided techniques for Chromogenic Immunohistochemistry: Status and Directions Santa Di Cataldo, Elisa Ficarra, and Enrico Macii Department of Control and Computer Engineering Politencnico di Torino, Italy Keywords Immunohistochemistry, image processing, protein expression, tissue segmentation, cell segmentation, scoring Abstract Although immunohistochemistry (IHC) is a popular imaging technique, the quantitative analysis of IHC images via computer-aided methods is an emerging field that is gaining more and more importance thanks to the new developments in digital high-throughput scanners. In this paper, we discuss the main steps of IHC and review the techniques for computer-aided chromogenic IHC analysis, including methods to determine the location of interest of the antigens and quantify their activations. Moreover, we discuss the issues arising from the standardization of the immunostaining process, that are generally overlooked by current literature, and finally provide requirements for reliable computer-aided IHC quantification. 1
Transcript of Computer-aided techniques for chromogenic immunohistochemistry: Status and directions

Post print (i.e. final draft post-refereeing) version of an article published on Computers in Biology and Medicine.Beyond the journal formatting, please note that there could be minor changes from this document to the finalpublished version. The final published version is accessible from here:http://dx.doi.org/10.1016/j.compbiomed.2012.08.004This document has made accessible through PORTO, the Open Access Repository of Politecnico di Torino(http://porto.polito.it), in compliance with the Publisher’s copyright policy as reported in the SHERPA-ROMEOwebsite:http://www.sherpa.ac.uk/romeo/issn/0010-4825/
Computer-aided techniques for ChromogenicImmunohistochemistry: Status and Directions
Santa Di Cataldo, Elisa Ficarra, and Enrico Macii
Department of Control and Computer EngineeringPolitencnico di Torino, Italy
Keywords Immunohistochemistry, image processing, protein expression, tissue segmentation, cellsegmentation, scoring
Abstract Although immunohistochemistry (IHC) is a popular imaging technique, the quantitativeanalysis of IHC images via computer-aided methods is an emerging field that is gaining more andmore importance thanks to the new developments in digital high-throughput scanners. In this paper,we discuss the main steps of IHC and review the techniques for computer-aided chromogenic IHCanalysis, including methods to determine the location of interest of the antigens and quantify theiractivations. Moreover, we discuss the issues arising from the standardization of the immunostainingprocess, that are generally overlooked by current literature, and finally provide requirements for reliablecomputer-aided IHC quantification.
1

1 Introduction
The continuous developments in bioimaging technologies (especially microscopy) have established theultimate proliferation of computer-aided biological imaging techniques as an e!ective way of extractingclinical and functional information from molecules and tissues [1] [2]. Pathologists are relying moreand more on microscopy image analysis to assess the presence and activity of target antigens in thetissues, with important applications in the diagnosis and assessment of tumors as well as for severalresearch purposes.
The analysis in situ of the activation of specific proteins provides critical information about multi-factorial genetic pathologies and tumors [3] [4], supports the design of personalized targeted thera-pies [5], allows to define a group of potential candidates to protein family-inhibiting therapies [3] [6][7].
One of the most popular imaging techniques in this field is immunohistochemistry (IHC), thatuses marked antibodies to link specific proteins in situ, as well as their ligands; the evaluation ofthe colored stains at the specific sub-cellular regions where the markers are localized (i.e. nucleus,cellular membrane, cytoplasm) provides information about the presence and the activation of thetarget proteins in the tissue, and therefore it is useful for the assessment of important pathologies [3][4]. Immunohistochemistry is widely used in clinical and research laboratories since the early seventiesfor the qualitative assessment of the tissue specimens, and it has acquired a central role in pathologythanks to its wide availability, low cost, easy and long preservation of the stained slides [8]. In thelast few years, with the continuing developments in digital, high-throughput tissue slide scanners, IHCis gaining more and more importance as a technique able to provide not just qualitative but alsosemi-quantitative or quantitative measurements of protein activations. Nevertheless, this shift fromqualitative to quantitative raises a lot of issues about the robustness of the IHC assay; moreover thereliability of the results obtained through visual evaluation of the specimens, inherently subjective, isheavily questioned [9].
The automation of the image analysis task through computer-aided techniques is acknowledged forbeing a possible solution towards the standardization of the IHC test and the extraction of reliablequantitative measurements of protein activation [10] [11] [12]. On top of that, the new demands ofmodern pathology and personalized medicine require precise and highly localized measures of proteinactivations, at cellular and sub-cellular level [11], which is not feasible with simple visual evaluation.This has determined a growing e!ort in the development of automated techniques for the segmentationand the analysis of IHC tissue images, able to recognize and measure the antigens’ activations withintheir specific regions of interest [13].
Di!erent tissue images associated with di!erent diseases may exhibit unique characteristics, bothin terms of tissue morphology and evaluation procedure, demanding specific image analysis pipeline.However, several image analysis components remain common in most of the applications, so that itis possible to identify a typical work-flow for computer-aided IHC analysis. This work-flow containssequential segmentation steps with the aim of identifying the specific regions of interest of the studiedantigens, followed by the quantification of the antigens’activation.
After introducing the background of digital pathology and immunohistochemical analysis, in thispaper we provide a critical overview of the image analysis techniques applied to the main steps of IHC,analysing potentials and limitations of the di!erent approaches, and we discuss the open challengesfor a standardized quantification of protein expression.
2 Digital microscopy image analysis
Digital microscopy is the e!ective integration of digital imaging and light microscopy, where a com-prehensive platform combining optical, electronic, mechanical, image processing and computer tech-nologies assists the pathologist in acquiring, observing, analysing and sharing pathology image datain digital form [14]. In the past few years, the digital revolution in the field of bioimaging has rapidly
2

transformed the work of the pathologists, traditionally limited to the microscopic observation of thesamples, into a completely digital work-flow. This has determined the definite rise of quantitative overqualitative analysis of the images.
Main categories of digital microscopy analysis can be identified according to their object of study,or either according to the technologies that are employed to acquire and analyze the images.
A first categorization distinguishes digital pathology into cytology, that is the study of isolated cellsor cells clusters, and histopathology, that is the microscopic evaluations of pathological tissue sections,where di!erent tissue components are dyed with two or more stains. Traditionally, the most widelyused dyes for histological analysis are Hematoxylin and Eosin (H&E), where H stains nuclei blue andE stains cytoplasm and connective tissue pink [15]. Another widespread technique in histopathology isImmunohistochemistry (IHC), that uses labelled antibodies to localize specific activations of antigensor proteins in the tissue sections.
A second categorization distinguishes digital pathology images based on the type of microscopythat is employed for image acquisition. Together with classic light microscopy, several image modalitieshave been established, including fluorescence and immunofluorescence microscopy, confocal microscopy,multispectral microscopy and electron microscopy [15] [16]. All these modalities have seen huge tech-nological advancements in the last few years, with the main consequence being a real explosion ofnumber and density of image data.
The technological advancement is accompanied by the proliferation of more and more sophisticatedmethods for analyzing this massive quantity of image data: comprehensive CAD systems for digitalpathology have been recently proposed, with analysis modules including preprocessing, image segmen-tation, feature extraction, classification and postprocessing (see [15] and [16] for reviews). Most of theimage analysis methods can be applied with minor modifications to di!erent types of images, whileothers (for example, spectral deconvolution techniques [17] [13]) are taylored to a specific imagingtechnology. As di!erent imaging technologies extract di!erent information from the tissue sections, arecent challenge of computer-aided analysis is also the e!ective integration of these data to providemore insights about the pathological process. As such, the research on multimodal data fusion hasbeen very active, including H&E and IHC slide registration [18][19].
While digital pathology o!ers very interesting and dense information, the correct analysis andinterpretation of these data is still an open problem, especially in the field of IHC. In the next sectionsof this paper we will provide more insights about this problem with special regards to chromogenic IHC,that is the most widely di!used in standard laboratories and addressed by literature. Fluorescencemicroscopy and multiple labelling strategies are, on the other hand, increasing in popularity and willrapidly emerge as a prime alternative to chromogenic approaches. More details about these techniquescan be found in [15] and [16].
3 Immunohistochemistry: fundamentals
Immunohistochemistry (or IHC) is a widespread procedure in digital pathology that refers to theprocess of localizing antigens (e.g. proteins) in the tissue; the localization is obtained exploiting theprinciple of antibodies binding specifically to antigens [20]: the tissue is stained with the labeledantibodies that selectively bind to the antigens under investigation.
Immunohistochemical staining is widely used in the diagnosis of abnormal cells such as thosefound in tumors. Specific molecular markers are characteristic of particular cellular events such asproliferation or cell death (apoptosis). IHC is also widely used in basic research to understand thedistribution and localization of biomarkers and di!erentially expressed proteins in di!erent parts of atissue [20].
The visualization of antibody-antigen interactions can be accomplished in a number of ways andmethods based on the type of tissue under investigation and on the degree of sensitivity that is requiredby the specific application. In the most common instance, an antibody is conjugated to an enzyme,such as peroxidase, that can catalyse a colour-producing reaction; alternatively, the antibody can also
3

be tagged to a fluorophore, such as fluorescein or rhodamine.The typical IHC work-flow prior to microscope evaluation consists of two main steps, namely
preparation of the sample and immunostaining (see Fig. 1); each of them implies a complex sequenceof mechanical and chemical procedures having a major impact on the quality and processability of theIHC images and on the repeatability of IHC quantifications. In this work, we provide an overview ofthe typical IHC work-flow and discuss the problems related to the standardization of its main steps.
Figure 1: Main steps of a typical IHC procedure [20].
In the classical protocols, after surgical explantation the tissue specimen is immersed in a fixativein order to ensure the preservation of tissue architecture and cell morphology. Aldehydes are the mostcommonly used fixatives in routine histological laboratories, including formaldehyde (either derivedfrom formalin or depolymerization of paraformaldehyde), glutaraldehyde or a mixture of the two [21].After fixation the specimen is usually embedded in a material with similar mechanical properties (e.g.para"n or plastic resin) and sectioned in thin slices by means of a microtome. Pre-embedding withagar or agarose, routinely performed to encapsulate cells from cell suspension, can be even useful withtissues in order to achieve the right orientation and position of the samples and to protect them fromdrying and wounding [21].
Some antigens would not survive aldehyde fixation and para"n embedding: in this case, tissuescan be rapidly fresh frozen and undergo cryosectioning. Cryosectioning has some disadvantages overpara"n or plastic embedding, including poor morphology of the tissues, poor resolution at highermagnifications and need of special storage for the specimens. Another alternate technique is vibratomesectioning, that can be applied either to fixed or unfixed tissues and does not require embedding oftissue in wax or resin. It has the advantage of preserving 3D structures well, but the sectioning processis slow and di"cult with soft and poorly fixed tissues, and might produce artifacts in the sections inthe form of chatter marks or vibratome lines [22].
Vibratome sectioning is able to produce thick tissue sections (>20 µm) which can be imaged toreveal the structure of the underlying tissues. This is very useful in many applications, such as theassessment of bio-compatibility of implanted devices [23]. Nevertheless, the penetration capability ofstandard optical technologies is generally limited, placing severe constraints on the maximum thick-ness of the tissue sections that have to be imaged. Accordingly, the largest proportion of material forimmunohistochemistry is in thin slices (3 to 10 µm). Recent works propose methods able to overcomethis limitation leveraging on non-standard microscopy techniques such as optical projection tomogra-phy (OPT) [24], or using aqueous reagents to render the samples optically transparent [25]. Thesetechniques can image samples with a thickness in the range of several millimeters.
4

After the sectioning, the sample is de-embedded and optionally treated with antigen retrievalreagents in order to enhance the antibody-antigen binding, that might be inhibited due to the fixationand para"nization process. Incubation with blocking agents (e.g. serum proteins) prevents non-specificbinding of the primary antibody.
Staining methods can either be direct or indirect [20]. Direct method, rarely used due to verylittle signal amplification, involves the incubation with only one labelled antibody reacting directlywith the antigen in the tissue sections, whereas indirect method involves a first layer of unlabelledprimary antibody reacting with the tissue antigen, and a second layer of labelled secondary antibodyreacting with primary antibody. Compared to direct method, indirect staining method shows a highersensitivity due to signal amplification through several secondary antibody reactions with di!erentantigenic sites on the primary antibody.
The labelling of the secondary antibody is obtained with a fluorescent dye (i.e. indirect immunoflu-orescence method) or either with an enzyme such as peroxidase, alkaline phosphatase or glucose ox-idase (i.e. indirect immunoenzyme method). The enzyme in turn reacts with a chromogen such asDAB (3,3’-Diaminobenzidine), which produces an intense brown staining that localizes the primary-secondary antibody reaction. Optionally, a counter staining can be accomplished with a contrastingcolour to highlight the components that are not made visible by the principal stain (e.g. hematoxilincounter staining, responsible for the blue colour of nuclei in H-DAB stained specimens). Other typicalstaining protocols other than H-DAB include staining with Haematoxylin and Eosin (H&E), FeulgenLight Green, Giemsa, Fast Red-Fast Blue-DAB, Methyl green and DAB, Haematoxylin, Eosin andDAB (H&E DAB), Haematoxylin and AEC (H AEC), Azan-Mallory, etc.
After being stained, the specimens are mounted to be observed on the microscope (see Fig. 1).Only when using hydrophobic mounting media, the specimens need to be pre-emptively dehydrated inalcohols. More details about the preparation of the samples are provided in [20].
Methods and protocols used to prepare the specimen introduce a series of critical sources of vari-ability (e.g. type and duration of fixation, consistency and thickness of the sections, temperatures,pH, enzyme concentration and incubation times), a!ecting the morphology of the tissue, the intensityof the stains, as well as the number of cells demonstrating a positive staining reaction. Therefore allthese variables need to be standardized and controlled accurately in order to assure the consistency ofIHC evaluation.
In the last few years many e!orts have been made towards an improved control of the overallprocedure; moreover, nowadays the market o!ers highly specialized programmable systems that areable to handle the main steps of the process - from embedding and sectioning of the specimen to anti-bodies incubation and immunostaining - in a semi-automated or fully-automated way: this minimizesdramatically the sources of variability that a!ect the quality of the staining, giving boost to the risingof standardized quantitative IHC [26].
4 The standardization issue and the role of automated imageanalysis
The need for standardization in IHC has been stressed as a major critical issue since the late 70s. Infact for a long time this widespread technique, despite being extensively used for either diagnostic andresearch purposes, has been relegated to a secondary role because of the extreme variability of theresults. This variability covers all the aspects of the assay, from sample preparation to image analysis.
The most important contributions to IHC standardization come from the works of Clive R. Taylor,which published a number of papers addressing this issue. In particular, in 1992 he proposed theso-called total-test approach [27], a comprehensive procedure covering for the first time all the majoraspects of the immunohistochemical protocol and lately summarized the main requirements for IHCstandardization in three major points [11] [28]:
1. follow staining protocols carefully avoiding any possible source of variability (e.g. staining con-
5

ditions, timing, storage, etc.);
2. validate experimentally every new reagent which may represent an unknown source of variationin the IHC assay;
3. use positive-control tissues, fixed and processed at the very same way as the specimens underinvestigation, to validate each reagent and protocol.
The latter point is particularly critical for quantitative IHC, as positive controls can provide informationabout the quantity of analyte per specific cell types, before and after fixation treatments, and mayserve as calibration points for the antigen’s quantification.
In the last decade many attempts have been made to introduce reliable positive control tissues,including cell line standards processed simultaneously with the specimen (e.g. Quicgel method [29]),short constrained peptides used as antibody targets directly to the glass slide [30], protein-embeddingtechniques [31] as well as IHC standardization through Antigen Retrieval [28]. More recent works evenproposed internal controls consisting in tissue components that are present in the same tissue sectionas the target antigen when tested by IHC [32], or either in the same tissue microarray [33].
As quantitative IHC implies to measure the target antigen in comparison with a reliable positivestandard serving as a reference [28], a ever-increasing number of investigators believe that computer-aided analysis is the obvious answer to IHC standardization [34] [35] [36] [37] [12]. In fact, digitalimage analysis allows to quantify antigen’s activation either from the specimens and the controlsdirectly from the features of the digitalized images acquired in the same conditions; it follows thatin principle computer-aided analysis is able to avert the variability and subjectivity that traditionallya!ect IHC.
On the other hand, computer-assisted image analysis relies on the calibration and standardizationof the immunostaining process, and therefore needs to be structurally integrated into a controlledand reproducible immunohistochemical assay (see Fig. 2). The reason is twofold: firstly, because areproducible immunostaining process decreases the sources of variability that a!ect the quality and theprocessability of the digitalized images; secondly, because the positive controls can be used to assessthe relation between antigen activation and the features measured on the digitalized images, servingas calibration points.
Figure 2: Main requirements for standardization, covering all aspects of the IHC assay.
It follows that standardized quantitative IHC and computerized image analysis are strongly andunavoidably interconnected, as a natural evolution of the ”total test approach” proposed by Clive R.Taylor in 1992. As reported in Fig. 2, the ideal IHC assay leverages on three major solutions: (i)internal reference controls processed simultaneously with the specimen, to calibrate the entire IHCwork-flow; (ii) standardized and controlled IHC protocols, to assure the quality, processability andrepeatability of the IHC images; (iii) automated image analysis techniques, to provide repeatablequantitative measures of the biological phenomena of interest.
The primary role of automated image analysis has been recently strengthened by the growingdemand for cell and sub-cell specific analysis. In fact, as recently acknowledged by modern pathology,for maximum significance immunohistochemistry should address per cell rather than per tissue analysis
6

of the target proteins: in fact, cells have been ultimately recognized as the fundamental units ofbehaviour in multiple molecular pathways at the basis of pathology and cancer biology, so that therelevant metric in cancer development relies on their specific individual phenotypes [11]. This impliesthat the analytes should not be assessed on average in the whole tissue but in identifiable individualcells, which is definitely not compatible with traditional visual evaluation. For this purpose, there isa growing demand for automated image processing techniques able to identify cell by cell the specificlocation of interest of the studied receptors.
5 Computer aided IHC analysis
With the growing awareness that computer-assisted technologies are the best solution to reduce thevariability of pathologists evaluation and provide highly specific per-cell information, the market nowa-days provides a good number of image analysis systems for IHC. The availability of such systems inpathology laboratories, very limited at the beginning due to high costs of acquisition and maintenance,is now starting to become wider especially in the US thanks to the intervention of medical association,that are pushing for the use of image analysis tools that can help the pathologists with the accuracyand consistency of their IHC results [38] [39]. The American Medical Association (AMA) even createda specific reimbursement code for such computer-aided systems, namely CPT 88361.
Di!erent categories of IHC image analysis may apply specific pipelines to obtain di!erent out-comes. Nevertheless, a typical work-flow of computer-aided IHC analysis can be identified, containinga sequence of image analysis modules that apply to most of the categories. This work-flow is shownin Fig. 3. On the left of the work-flow, we report a list of main categories of IHC analysis, includingthe study of cell proliferation or angiogenesis for tumor assessment, the analysis of tissue composition,the detection of rare events, and multi-stain quantification; on the right we report a few examples ofquantitative outputs obtained applying each category of computer-aided analysis.
Figure 3: Typical work-flow of computer-aided IHC analysis. On the left, main categories of IHCimage analysis; on the right, examples of correspondent quantitative outputs.
First of all, the input image is separated via hardware or software into the separate contributionsof the di!erent labels, so that the specific information carried by each colored dye can be evaluatedand processed separately; in applications that require multi-stain quantifications, this module allowsto distinguish and measure the contributions of several antigens in the tissue. The approach dependson the imaging technology.
Tissue compartmentalization is then generally needed in order to determine tissue composition(e.g. for therapy assessment or in-situ characterization of implanted devices), or either to limit theregion of interest to the only parts of the specimen that are occupied by the antigen of interest,disregarding non interesting areas such as stroma and blood vessels. Mostly used techniques for tissue
7

compartmentalization are generally based on classification or clustering of features extracted fromthe image (either morphological or color-based features). Tissue classification/clustering and patternrecognition techniques are also used for the detection of rare events such as micromethastasis or therecognition of microvessels in tumor angiogenesis analysis.
The following step after tissue compartmentalization is cell segmentation, i.e. the identification ofthe sub-cellular region that is targeted by the studied antigen. This is important because di!erentantigens are expressed in di!erent portions of the cell, such as the nucleus, the cellular membrane orthe cytoplasm (see Fig. 4); since the interested areas may be very little compared to the overall areaof the cell, the analysis needs to be restricted to the sub-cellular portion of the cell that is targeted bythe antigen. For example, membrane protein activity can be quantified on the base of the membranestain continuity, in terms of rate of stained membrane pixels [40]. This requires to delineate thewhole cellular membrane and then to di!erentiate between its stained and unstained pixels. Otherantigens may be activated in the nuclei, or in the cytoplasm of the cell: this calls for techniques able toprovide fully-automated segmentations of all the compartments of the cells. Segmentation approachesmay vary from ad-hoc solutions to the most popular Computer Vision techniques such as watersheds,active contours, multiscale analysis and Markov random fields. More details will be provided in thenext sections.
Figure 4: H-DAB images of lung tissue, respectively with membrane, cytoplasm and nuclear activa-tions. The brown dye (DAB) highlights positive activations of the antigen; the blue dye (H) is usedfor counterstaining.
The intrinsic complexity and variability of IHC tissue images make the segmentation task par-ticularly challenging. Sources of noise and variability may arise from the sample preparation andimmunostaining process, as well as from the pathological process itself, with unpredictable e!ects oncells’ morphology and proliferation.
Summarizing, the main features of IHC images that are responsible for making the segmentationchallenging are the following:
1. The presence in the image of tissue components that may be not of interest for the analysis (e.g.lymphoids, blood vessels, stroma, etc.), representing a major source of noise for the quantification.
2. The superposition of di!erent tissue slices, due to the unidealities of the sample preparationprocess; this superposition may generate considerable artifacts such as incomplete or clusteredcells.
3. The colocalization of di!erent stains, resulting in a poor separation of the contribution of thedyes.
4. The presence of clustered or touching cells.
5. The non-predictable morphological variations of the tissue induced by the pathology.
8

6. The lack of signal coming from inactivated portions of the cells, that interfere with the segmen-tation process (e.g. in case of membrane protein staining, as discussed in Section 7.3).
7. The heterogeneity (in terms of both intensity gradient and color) of the regions to be recognized.This is mainly due to uneven activation, dyes superposition or variation of illumination.
These heterogeneities are partly intrinsic of IHC technique, and therefore unavoidable. Never-theless, major improvements in the quality and processability of the images can be achieved with thestandardization of IHC assay [11]. In particular, the imposition of well-defined standards for the prepa-ration of the specimens (e.g. type and duration of fixation, consistency and thickness of the sections,etc.) leads to a better consolidation of image features such as stains’ intensity and the localization,definitely serving the purpose of tissue and cell segmentation.
After the specific locations of the antigens have been determined by the segmentation techniques,it is possible to extract the quantitative parameters from the images, which may vary depending onthe disease or the application (see Fig. 3 for a few examples). Widely used quantification approachesinclude counting of stained cells, calculation of the stained areas and the evaluation of the stainingcontinuity. The extracted parameters can also be used to classify the specimens into a set of pre-definedclasses or scores of positivity.
Thanks to the ever-growing popularity of computer-aided IHC, commercial microscopy softwareare nowadays available covering most of the work-flow steps [41] [26]. The available computer-aidedsolutions usually allow the user to select the sub-cellular location of interest for protein activity quantifi-cation in a semi-automated or automated way; nevertheless, these tools are based on simple approachesthat su!er due over-generalization, and most of the times require extensive user interaction, so thatthe objectivity of the result tends to be lost [8] [10] [41]. In particular, a number of commercialproducts require the user to select manually the areas that are richest in the cells targeted by thestudied antigen [42] [43], to set intensity thresholds or levels to distinguish the cellular patterns fromthe background [44] [45] or to outline a set of representative cells [46] [47].
As a consequence of that, the demand for IHC automatization, especially related to the steps of tis-sue compartmentalization and cell segmentation, is not entirely addressed by the available commercialsolutions, which opens the field to extensive and continuous research in this area.
In the following sections the main approaches for computer-aided IHC analysis are reviewed, cov-ering the main steps of the work-flow shown in Fig. 3.
6 Separation of label contributions
The first step after image acquisition and digitalization is the separation of the contributions of thedi!erent labels (see Fig. 3). In this phase the contributions of the main chromogen (labelling the testantigen) and of the counter stain are distinguished so that their specific information can be processedseparately.
Specific spectral deconvolution and unmixing approaches are applied in case of multispectral mi-croscopy images [17] [13]. Multispectral imaging is an advanced imaging technique that acquires imageswhere each pixel contains a spectrum (intensity as a function of wavelength) of the collected light atthat location, rather than the typical 3 data points (red, green and blue) found in RGB images. Thesesolutions are generally hardware-based, and will not be addressed by this survey.
Multi-channel fluorescence microscopy [48] allows to acquire the stains information already onseparate channels. Even in this case color separation of fluorescence emission is achieved in hardwareby using a set of optical bandpass filters that select di!erent parts of the emission signals for everyimage channel [48].
Most of the IHC analysis in the standard clinical practice are usually performed through conven-tional light microscopy and digital RGB cameras, so that specific software solutions are needed toseparate the stains’ contributions directly from the RGB image. Literature reports several approachesincluding colors classification methods, that associate each pixel of the image to a di!erent stain
9

based on thresholds in the HSI (Hue-Saturation-Intensity) space [49], as well as color deconvolutionmethods based on geometrical transformation from RGB space to the chromogen and counterstainspace [50]. The latter approach has been demonstrated to yield to better stains’ separation in presenceof colocalization or spectral superposition of the dyes (e.g. for H-DAB stained images).
7 Selection of the location of the target antigen
Several segmentation and image classification techniques are applied to the aim of selecting regions ofinterest in the images, depending on the specific tissue or cell locations targeted by the studied antigens(see Fig. 3). These techniques can be categorized based on the anatomical region of interest they aretarget at. Tissue compartmentalization is generally aimed at classifying the specimen into two or morebroad tissue areas, while cell segmentation techniques identify the main sub-cellular compartments ofthe cells. These techniques are reviewed and discussed in the following subsections.
7.1 Tissue Compartmentalization
The compartmentalization of di!erent types of tissue is a critical step for histopathology, with aimsincluding the study of tissue composition, the identification of cancerous vs. normal tissue areas, theidentification of tissues of interest in the specimen, or the categorization of the tissue into severalprognostic groups.
Human visual representation and recognition system is inherently object-based, as opposed to thepixel-based representation of the digital images [51]. As such, humans tend to understand and describeimages in terms of abstract objects, and the human brain categorizes the images on the base of thesehigh-level abstractions. This high-level representation is renowned for being extremely e"cient withrespect to the recognition and classification task, comparing to exhaustive pixel-based representation.Therefore, image processing methods try to mimic human-like object level representation of the im-ages in several applications, including the task of tissue segmentation in histopathological imaging.The process of extracting such object level features from the images is universally known as featureextraction.
The majority of image features in the field of tissue classification are based on tissue morphol-ogy [52], [53], including area of the tissue, elongation, eccentricity, feret diameter, etc. Another impor-tant set of features commonly used in tissue classification are based on texture [54] [55], [56] which isgenerally defined as complex visual instances composed of entities, or patterns. These patterns showcharacteristics of brightness, color, shape, scale, etc. with perceived properties such as uniformity,roughness, regularity, periodicity, frequency, phase, directionality, coarseness, randomness, fineness,smoothness, etc. Texture analysis is a widespread methodology in medical image analysis, especiallyin histopathological image analysis, due to the highly textured appearance of cellular and extra-cellularstructures.
Another set of features that are less extensively used but useful in some tissue classification applica-tions are spatially related (i.e, topological) features. They are based on graph theoretical representationmodelling di!erent tissue components as well as their spatial arrangement [57].
After feature extraction, the tissue recognition/classification step is usually exploited. The mostwidely used approaches can be roughly categorized in two main groups:
1. supervised approaches, where the output is inferred through machine learning techniques (e.g.active contours, Bayesian learning, kernel-based techniques [58]) by a pre-labelled set of traininginstances; this requires the learning algorithm to generalize from the training data to unseensituations in a ”reasonable” way.
2. unsupervised approaches, where the learning algorithm is given only unlabelled examples, andneeds to extrapolate the output from the data characteristics [59].
10
Among the supervised techniques, some of the most popular approaches are Bayesian learning [56]and Suppport Vector Machines (SVM) [60] [61]. Unsupervised approaches, on the other side, includeSelf Organizing Maps (SOM) [62], hierarchical clustering [63], as well as k-means clustering [64]. Themost suited approach needs to be chosen based on the morphological/textural characteristics of thetissues that have to be compartmentalized. The unsupervised methods are generally to be preferredwhen the features of the tissues may considerably vary from specimen to specimen [65].
7.2 Segmentation of nuclei
The accurate segmentation of the nuclei is one of the most important steps for quantitative IHC imageanalysis. Characteristics of the nuclei such as nuclear size, poleomorphism and chromatic appearanceand texture have been extensively validated as prognostic markers of tissue malignancy in severalcytological applications [66]. The assessment of nuclear antigens such as the fraction of Ki-67-positivetumor cells (the Ki-67 labelling index) is often correlated with the clinical course of cancer. The best-studied examples in this context are carcinomas of the lung, prostate, brain and the breast, wherethe prognostic value for survival and tumor recurrence have been repeatedly proven in uni- as well asmultivariate analysis [67].
On the other hand, nuclear segmentation has been proven to be important even in applicationsaimed at assessing membrane and cytoplasmic markers and features. In fact, the nuclei are the mostused spatial reference for the segmentation of the other cellular compartments and the whole cell ingeneral. Therefore the accuracy of nuclear segmentation often reflects on the accuracy of the delineationof other parts of the cell and on the quality of IHC quantification in general.
The simplest approach for segmenting nuclei is a global thresholding [68], where a single intensitythreshold is used to distinguish the nuclei from the background. The value of the threshold can beadjusted manually or either determined based on image histogram [69] [70]. Such methods work reason-ably well in high-contrast images, but they are not suitable at all for most of IHC tissue applications,showing varying features and inhomogeneous illumination. Adaptive local thresholding techniques,which utilize local content information to separate background from foreground, produce significantlybetter results in this context [65].
Other popular approaches for nuclear detection are flooding algorithms such as watersheds [71],that can be e!ectively used to separate clustered nuclei [72] [73] [74] [75]. A major drawback of thesetechniques is that they often result in over-segmentations and multiple watershed lines, especially inpresence of texture or staining inhomogeneities. On the other hand, the attempt to overcome over-segmentation through seeded watersheds [75] presents problems in obtaining only one seed per objectand often resorts to extensive user-interaction.
Widely used in nuclear segmentation methods are also edge-based techniques (e.g. Canny [76][77]) and active contours [78] [79] [80] [81] [82] [83] [84] [72]; nevertheless, these approaches su!er dueto remarkable intensity variations within as well as outwards nuclei. In particular, active contoursperformance [78] [79] [80] [81] [82] [83] [84] [72] is highly impacted by the noise conditions and themassive presence of foreign particles which may deviate the initial curve from the target boundary.Edge-based techniques include also multi-scale analysis [85], that can handle intensity variations butis led to errors by overlapping nuclei with weak edge information.
Another category of nuclear segmentation techniques based on geometrical templates or on fixedmodels of the tissue morphology, such as in [86] [87], su!er due over generalization because of the nonpredictable shape and size variations of the cells; these variations are induced by the pathology as wellas by the mechanical and thermal stress related to the preparation of the sample.
Alternative approaches include graph-cuts methods [88] [13] and Markov random fields [90], thaton the other hand often su!er due under-segmentation. Graph-cut methods have the disadvantage ofrequiring good initialization, therefore they are most e!ective when used in combination with othermethods. For example, [89] proposed a hybrid approach where the initial segmentation is obtainedwith binarization based on multi-scale Laplacian of Gaussian filtering and subsequently refined usingthe graph-cuts algorithm.
11

In conclusion, nuclear segmentation is still a challenging task, so that one single approach is notsu"cient to obtain satisfactory results; therefore the most successful segmentation techniques are rathera pipeline or combination of several approaches, where several segmentation techniques are tailored tothe specific issues of IHC images. Most of the proposed pipelines apply local or adaptive binarizationto distinguish the nuclei from the background, improved watersheds techniques to separate clusterednuclei, and either active contours, graph cuts or extensive morphological post-processing to regularizethe shapes and refine the nuclear boundaries [65] [91] [89]. Nevertheless, manual intervention is stillnecessary to set-up the parameters of the segmentation or to resolve the most di"cult/ambiguouscases.
7.3 Segmentation of cellular membranes
The cell-by-cell segmentation of cellular membranes in immunostained tissues is one of the most criticaltasks in the work-flow of computer-aided IHC, especially in chromogenic images. The most challengingissue is related to the reconstruction of the membranes in the portions that are negative to the targetreceptors (i.e. where the target antigen is not present), that are not revealed by the stain and thennot visible.
The lack of intensity or gradient magnitude variations in the unstained parts of the membranes aswell as the staining heterogeneity that is instrinsic of IHC imaging invalidate segmentation methodsdetecting intensity or gradient variations between the background and the pattern to be segmented [73].Active contours approaches [78] [79] [80] on the other hand overcome the problem of connecting brokencontour lines by modelling the target pattern with a closed curve; however they are in general extremelysensitive to initialization as well as to staining artifacts which may attract them far from the targetmembrane.
The largest amount of literature in the field of cellular membrane segmentation addresses fluores-cence or confocal microscopy images, where most of the challenges are related to the non-uniformityof the fluorescence signal, which may create variations and gaps in the membrane continuity. Inter-esting approaches have been proposed in this field: [92] presented a method based on Voronoi regionswith a metric controlled by local image properties; [93] recently presented a generalized version of theSubjective Surfaces technique, while [94] used iterative tangential voting to enhance the protein boundsignal followed by evolving fronts.
Fewer techniques deal with automated membrane segmentation in chromogenic IHC, where di!er-ent and additional challenges arise due to the noise generated by the superposition and di!usion ofdi!erent stains over the sample and to the presence of unstained portions of the tissues (i.e. wherethe membranes are negative to the target receptor, or either discontinuously stained). The work pre-sented by [95] is a two-step procedure that first approximates the location of cellular membranes withimproved Voronoi, using nuclear boundary as spatial reference, and then refines the segmentation bydetecting the nearest stained portions of the membranes by color filtering. Other works use nuclearmembranes as reference for approximate localization of the cellular membrane, too, but they rely onsimple approximation of membranes’ shape: [91] approximate cellular membranes with ellipse, while awork by [96] defines rectangular bounding boxes around the nuclei. The drawback of simple membraneapproximation is the lack of robustness with respect to variation of the membranes’ shapes, that im-pacts on the accuracy of membrane protein quantification. Finally, in a recent work by [97] intensitythresholding followed by morphological skeletonization is used to detect the membrane regions in theIHC image, although this is not on a cell by cell basis. The membrane regions are then categorizedinto two groups: regions with continuous membrane staining and regions with incomplete or weakmembrane staining.
Most of the other cell by cell approaches are generally semi-automated in that they need a certainamount of user-intervention to add control points close to the target membrane boundary [98] [99].
12

8 IHC quantification and semi-quantification
The final step of the IHC workflow is the quantification of the activation of the target antigens (seeFig. 3).
As we anticipated in Section 3, the immunohistochemical test has traditionally been qualitative,consisting in simple observation of the presence and darkness of specific stains within the tissue.However, the rapid evolution of the technique as a valid diagnostic and prognostic tool for tumormarker identification and cancer assessment has rapidly shifted the aim of the IHC test from qualitativeto semi-quantitative or quantitative evaluation [10]. Moreover, the availability of computer-aidedsystems able to extract quantitative information from the images in a fast and reproducible way iscontributing to make this shift technically feasible. However, there are still many open issues relatedto the e!ectiveness and validity of the obtained information.
The quantitative information extracted from IHC images may be expressed in several ways, includ-ing percentages of positively stained cells, intensity of the staining, or either morphological charac-teristics such as cell size, cell density, and textural features. These features are often used to classifythe specimens into a specific number of categories, or scores. Literature provides a plethora of scoringmethods, but each laboratory in the standard practice uses its own criteria of evaluation, so that theobtained results are most of the times not comparable at all [100].
A remarkable example for tissue scoring is IHC testing for breast cancer, where the assessment ofHER2 (Human Epidermal growth factor Receptor 2) overexpression is widely used to determine theeligibility of the patient for trastuzumab therapy [101]. The American Society of Clinical Oncology andthe College of American Pathologists [38] recently published a guideline (later reviewed by the CanadianNational Consensus Meeting on HER2/neu testing in breast cancer [39]) containing a recommendedalgorithm which classifies the specimens tested for HER2 in four classes (0 to 3+) based on bothqualitative and semi-quantitative IHC features including uniformity and darkness of membrane stainingand percentage of invasive tumor cells.
Several other IHC grading systems have been proposed for the assessment of antibodies relatedto breast cancer as well as of other pathologies, taking into account features that are generally quan-titative or that imply a quantitative or semi-quantitative evaluation of staining intensity, continuityand distribution over the tissue [11]. Among the others, the J-Score [102], the Allred Score [103], theHScore [104], and the scores proposed by [97] and [105].
Although the guidelines are very useful as an attempt of putting some order in the heterogeneity ofprotocols and clinical trials regarding IHC testing, the way for a standardized quantification appearsstill long. The judgement about what has to be called ”intense” or ”weak” intensity, ”positive” or”negative” activation, as well as the threshold discriminating between complete and an incompletestaining is generally left to the experience and the subjectivity of the investigator. On the otherhand, crisp thresholds are provided in terms of percentages of stained cells, which is not feasiblewithout automated image processing. Consequently, even supposing that all the laboratories followthe guidelines literally, the results obtained by visual evaluation so far are most of the times notcomparable [100].
It is widely acknowledged that automated computer-aided techniques have the potential to over-come the subjectivity of visual evaluation, obtaining quantitative features related to the assessment ofthe antibody directly from the images [11]. The most popular approaches for automated IHC quantifi-cation aim at reproducing the decisional process of the pathologist in scoring the tissue slides. Theseworks generally propose two-step procedures including feature extraction techniques, which measurethe features of the images that are relevant for the IHC scoring, and a classification step that assignsthe score to the sample based on the aforementioned features. The features vary on the base of thetype of tissue, generally including rate of positive cells and intensity of staining, as specified by theguidelines for IHC scoring.
The classification is obtained through machine learning techniques, where classifiers are typicallyimplemented and trained on ground truth consisting in scores provided by the pathologists’ visualevaluation. The classifier performance is again measured based on agreement with the pathologist’s
13

evaluation, in terms of capability of the classifier to reproduce the visual scoring provided by the human.The proposed approaches are several: [106] classified texture parameters derived from image analysisusing a quadratic classifier trained with pathologist’s scores. [107] applied gaussian process ordinalregression and supervised neural networks to predict the scores of immunostained tissue microarrayspots. [86] and [91] distinguished membrane stained specimens into 1+, 2+ and 3+ scores throughMinimum Cluster Distance Classifier with parameters learnt on a pre-scored training dataset. [108]proposed an automated procedure that faithfully replicates the guidelines of the American Societyof Clinical Oncology and the College of American Pathologists [38], using SVMs trained with visualscores to distinguish between 2+ and 3+ samples. [40] defined a measure of membrane connectivityand trained a classifier to match automated HER2 scoring with manual scoring performed by fiveexperienced assessors. A recent work by [97] defined its own automated HER2 score based on additivemodel of membrane connectivity and membrane instensity, and then derived the score cut-o!s from atraining set of manually scored samples.
Although most of the aforementioned techniques claim a good agreement with the scores providedby the experts, their weakness is the attempt to replicate a decision process that is inherently subjective:in fact, the techniques rely on the pathologists evaluation as ground truth for the scoring, but the scoresof the pathologists have been extensively proven to be subjective and a!ected by extreme inter- andintra-operator variability [100]. As a consequence of that, the proposed gold standard is not robust.
In order to investigate the problem, we run experiments on a pre-scored dataset of seventy H-DABstained NSCLC (Non-Small-Cell-Lung-Carcinoma) images with cytoplasm activations (see Fig.5 forexamples).
Figure 5: H-DAB stained images of NSCLC samples, with score provided by pathologist.
The scoring features were extracted after tissue and cell segmentation and consisted in rate ofpositive (i.e. brown stained) cells and average intensity of the brown stain in the positive areas of thesample, in agreement with the guidelines for IHC scoring [38]. The data, grouped by the pathologist’score, are displayed as a collection of points in the scatter-plot of Fig. 6.
As it is shown in Fig. 6, the scatter plot su!ers significant overlap of 0 and 1+ HER2 scores, as wellas equivocal cases of 2+ scoring (see red and yellow circles, respectively). Even more severe overlapswere experienced by [86] and [91] in images with membrane staining. This definitely confirms theconcerns about the the opportunity of using the scores of the pathologist as a golden stardard for theautomated quantification techniques.
Several works in literature claim good quantification accuracy based on machine learning meth-
14

100 110 120 130 140 150 160 170 180 1900
10
20
30
40
50
60
70
80
90
Stain intensity (0 255)
Rat
e of
pos
itive
cel
ls (%
)
0
1+
2+
3+
Figure 6: Image features grouped by IHC score (overlaps of di!erent scores in red, ambiguous cases inyellow).
ods that are capable of learning from the visual evaluations of the pathologists [106] [107] [86] [91][108]. Thanks to the capability of machine learning techniques to capture and replicate the scoringmechanisms of the training data, this approach is generally able to provide a good agreement withthe pathologists’ evaluations (see Table 1); nevertheless, the results are non-generalizable because theunderlying classification model is based on a golden standard, the visual evaluation of the operator,that is inherently not robust.
Table 1: Agreement with pathologist’s scoring of some machine learning approaches, in terms of per-centage of instances equally classified by the automated technique and the human expert. Agreementwas calculated on the NSCLC data shown in Fig. 6 by 10-fold cross-validation.
Classification agreement withapproach pathologist
Multilayer perceptron 92.96%SVM, linear kernel 91.55%
Naive Bayes 90.14%RBFNetwork 88.73%
fuzzy neural networks 73.30%SVM, gaussian radial basis function 66.20%
Another major issue related to the automated quantification approaches generally proposed byliterature is the significance of the measures of stain intensity. In fact, despite all the guidelinesproposing the intensity of the stain as an indicator of the amount of protein activation (in terms of”weak”, ”medium” or ”strong” staining), the translation of this qualitative concept into a quantitativemeasure extracted from digitalized image is far from being straightforward.
The measurements of staining intensity are generally based on the strong assumption that ”n-timesdarker means m-times more expression”; unfortunately this rather simple relation does not hold in thepractice, because the darkness of the stain is determined not only by the Antibody-Antigen reaction perse, but also by a number of other factors that are related to the multiple steps of amplification inherentto immunostaining (see Section 3). As the Antibody-Antigen reactions involve no covalent bonding,it is extremely di"cult to isolate and quantify the magnitude of the binding a"nity and avidity;moreover temperature, time of incubation, fixation, concentration of Antibodies, batch of Antibodies,crossreactivity and background staining are important factors in determining the relation betweenantigen activation and immunostaining, therefore they necessarily need to be taken into account in thequantification [11].
This seriously questions the significance of the traditional scoring procedures as proposed by the
15

guidelines, invalidating the practice of measuring stain intensity from the digitalized images as a directand absolute indicator of protein expression.
On top of that, the optical characteristics of DAB, the most widely used stain in IHC, are suchthat there is no linear relationship between the absorbance of the stain when exposed to light andits concentration in the tissue, as expressed by Lambert-Beer law [109]. Densitometrical experimentsshow that DAB is not a true absorber of light, but rather a scatterer of light [110]; as a consequence,darkly stained DAB has a di!erent spectral characteristics of lightly stained DAB: this implies a highlynon-linear behaviour that must be taken into account when interpreting the IHC data.
As a consequence of this, stain-specific calibration charts describing the relation between antibodyconcentration and stain intensity are necessary for reliable quantitative analysis.
9 Recommendations for reliable automated quantitative IHC
The opinions about the feasibility of a full standardization of IHC is still controversial, because of themany variables that need to be controlled. However, in the last few years there have been extensivee!orts towards the solution of the problem. We here try to summarize the main points and provide afew recommendations in this sense.
First of all, a profound re-education of the laboratories and pathologists performing the IHC analysisis needed. In fact, in spite of the remarkable improvements of reagents and of the automation of thesample preparation process, the studies still note extreme inconsistency in the quality of the assays.Moreover, it is pointed out that the main responsibility for such inconsistency rests with the lackof attention to following the most basic directives of the quality assurance programs by a consistentnumber of laboratories.
Fortunately, the IHC community seems to be now fully aware of the dimension of this problem,and the required actions are being taken. Several consensus conferences have been held in the pastfew years in order to identify the main causative factors of inconsistency, and to categorize theminto pre-analytical, analytical and post-analytical issues [111]. A conference held in late 2006 triedto merge the outcome of the previous meetings with input coming from the laboratories. The resultwas a series of practical recommendations on how to put the quality standards into practice in theevery-day laboratory environment [111].
It is also encouraging that leading providers of antibodies and reagents for IHC are actively partic-ipating to the standardization e!orts, hosting the consensus conferences and sponsoring internationalhands-on meetings and practical courses for the pathologists [111].
Provided that the pre-analytical and analytical factors are taken care of, computer-aided analysis isessential to overcome the subjectivity and variability of visual evaluations. As discussed in the previousparagraphs, the technologists have been extensively working on the automation of the image analysispart, but the most common approach is the replication of the interpretation of the human pathologistby means of artificial intelligence or machine learning techniques. As such, the human evaluation(inherently subjective) is used as a golden standard. This is a major limitation: first, because themechanisms of this scoring process is questionable and not robust; second because this would not fulfilthe real potentials of IHC as a valid diagnostic and prognostic tool for tumor marker identificationand cancer assessment, able to provide precise and highly localized measures of antigen activations.
As a matter of fact, the only robust way to obtain quantifiable information about stain intensityhinges upon the development of computer-aided techniques that leverage on stain-specific calibrationcharts. These charts should clearly define the analytical relation between the concentration of theantibody in the tissue and the measured intensity of the stain, taking all the possible e!ects of theimmunostaining amplification steps under control. In absence of this, the only quantification allowed islimited to image features that can be reliably correlated to the pathological process (e.g. morphologicalfeatures of the positive cells such as nuclear size, cellular size, nuclear-cytoplasm ratio, nuclear density,etc.).
To the best of our knowledge, a full calibration of the IHC process is not achieved yet. Nevertheless,
16
the research towards the creation of reliable reference standards for IHC is continuous and encouraging.For example, a recent work by [112] experimentally validated the use of peptide controls attacheddirectly to the glass slide as an instrument for practical clinical laboratory quality control. Theseresults suggest that this technology may be valuable in creating fully-standardized controls to quantifyIHC analytical variability, including antigen retrieval.
The integration of computer-aided image analysis into a fully-controlled and calibrated immunos-taining chain would allow highly accurate quantification of protein expression. This opens much morepossibilities to fully-personalized diagnosis and therapy design compared to the current clinical prac-tice, that is still limited to rough discrimination into three to four classes of positivity. Obviously, thefulfilment of this ambitious set of goals requires a more strict collaboration of technologists and imagescientists with the pathologists as well as the suppliers of antibody and immunostaining systems; thelatters are in fact the ones in charge of implementing the staining calibration process.
On a final note, computer-aided image analysis systems are not meant to replace the expertiseof the pathologist. As wisely pointed out by [113], the primary purpose of the automated and semi-automated tools is to complement and support the human expert, that is always expected to providethe final feedback on the performance and trust-wordiness of the automated system. As a consequenceof that, the role of the pathologist is far from being diminished by the advent of digital era. Assuch, it is extremely important that the automated image analysis systems are developed in strict andcontinuous collaboration with clinical and research pathologists.
10 Conclusions
In the last few years biologists and pathologists are relying more and more on image analysis, andimmunohistochemistry (IHC) is nowadays one of the most popular imaging techniques to analyze thepresence and activity of target antigens in the tissues, with important applications in the diagnosis andassessment of tumors as well as for several research purposes. However, immunohistochemistry hasbeen traditionally a!ected by lack of reproducibility due to technological variabilities as well as to theinherent subjectivity of the visual observation; thus the analysis has been limited to qualitative eval-uation of the presence and darkness of the target stains within the tissues. The rapid evolution of thetechnique as a valid diagnostic and prognostic tool has ultimately shifted the aim from qualitative toquantitative; this stressed the demand for the standardization of the overall IHC assay and for the ex-traction of objective and repeatable measures of protein activity from the IHC images. Computer-aidedimage analysis has been universally acknowledged for having a fundamental role in solving the IHCstandardization issue. In particular, tissue and cell segmentation techniques are precious instrumentsto identify the regions of interest of the target antigens in the specimens, allowing fully-automatedand repeatable measurements at cellular and sub-cellular level. The segmentation approaches varydepending on the specific application and on the morphological and color characteristics of the tissuespecimens. In this paper, we provided a critical overview of the techniques proposed by literature.
In theory, provided that the location of interest of the antigens is correctly identified, the problemof quantifying the activation of the antigens by digital image analysis is trivial. Nevertheless, therobustness of immunohistochemical staining raises a number of problems that are generally overlookedin current literature: in fact many of the available techniques for automated IHC scoring are basedon weak assumptions. First, in interpreting stain intensity as a direct indicator of protein expressionthey do not consider the multiple steps of amplification in the immunostaining process. Without afull control of these technological and chemical variabilities, any derived data is misleading. Moreover,the non-linear relation between darkness and real concentration in the tissues of widely used dyes (e.g.DAB) is often unconsidered. Second, they use as a golden standard the scoring of the human experts,that can be subjective and biased by many sources of variability.
In conclusion, computer-aided image analysis has all the potential to lead to a standardized quanti-tative IHC, but only provided that it is integrated into a fully-controlled and calibrated immunostainingflow. An e!ective calibration requires the combined e!orts of the computer scientists and the providers
17

of immunostaining systems, and to the best of our knowledge this is not fully available yet. Thesefindings open wide opportunities of further research in the field of quantitative IHC, towards the ef-fective integration of the image processing techniques into the IHC work-flow, and motivate the futuree!orts of the computer scientists in the field of immunohistochemistry.
11 Conflict of interest statement
None declared.
Acknowledgement
The authors acknowledge Dr. Marco Volante and his collaborators of Hospital S. Luigi of Orbassano,Torino, Italy for the helpful discussion.
References
[1] C. Vonesch, F. Aguet, J.-L. Vonesch, M. Unser, The colored revolution of bioimaging, IEEE SignalProcessing Magazine 23 (3) (2006) 20–31.
[2] P. Soda, G. Iannello, The relevance of Computer-Aided-Diagnosis Systems in Microscopy Appli-cations to Medicine and Biology 3, Information Science Reference, IGI Global (2008) 1175–1182.
[3] T. K. Taneja, S. Sharma, Markers of small cell lung cancer, World Journal of Surgical Oncology2 (2004) 10.
[4] D. J. Brennan, D. P. O’Connor, E. Rexhepaj, F. Ponten, W. M. Gallagher, Antibody-basedproteomics: fast-tracking molecular diagnostics in oncology, Nat Rev Cancer 10 (9) (2010) 605–617.
[5] J. Slodkowska, M. G. Rojo, Digital pathology in personalized cancer therapy, Folia Histochemicaet Cytobiologica 49 (4) (2011) 570–578.
[6] M. J. Borad, R. Penny, M. Bittner, J. Gardner, S. Shack, E. Campbell, D. Taverna, R. Love,J. Trent, D. Von Ho!, Molecular profiling using immunohistochemistry (ihc) and dna microarray(dma) as a tool to determine potential therapeutic targets in patients who have progressed onmultiple prior therapies, AACR Meeting Abstracts 2006 (2) (2006) B82.
[7] E. Ficarra, G. De Micheli, S. Yoon, L. Benini, E. Macii, Joint co-clustering: Co-clustering ofgenomic and clinical bioimaging data, Comput. Math. Appl. 55 (2008) 938–949.
[8] Z. Theodosiou, I. N. Kasampalidis, G. Livanos, M. Zervakis, I. Pitas, K. Lyroudia, Automatedanalysis of FISH and immunohistochemistry images: a review., Cytometry. Part A : the journalof the International Society for Analytical Cytology 71 (7) (2007) 439–450.
[9] M. Lacroix-Triki, S. Mathoulin-Pelissier, J.-P. Ghnassia, G. Macgrogan, A. Vincent-Salomon,V. Brouste, M.-C. Mathieu, P. Roger, F. Bibeau, J. Jacquemier, F. Penault-Llorca, L. Arnould,High inter-observer agreement in immunohistochemical evaluation of her-2/neu expression inbreast cancer: a multicentre gefpics study., Eur J Cancer 42 (17) (2006) 2946–53.
[10] M. Cregger, A. J. Berger, D. L. Rimm, Immunohistochemistry and quantitative analysis of proteinexpression, Archives of Pathology & Laboratory Medicine 130 (7) (2006) 1026–1030.
[11] C. R. Taylor, R. M. Levenson, Quantification of immunohistochemistry–issues concerning meth-ods, utility and semiquantitative assessment ii., Histopathology 49 (4) (2006) 411–24.
18

[12] L. Dobson, C. Conway, A. Hanley, A. Johnson, S. Costello, A. OGrady, Y. Connolly, H. Magee,D. OShea, M. Je!ers, E. Kay, Image analysis as an adjunct to manual HER-2 immunohisto-chemical review: a diagnostic tool to standardize interpretation, Histopathology 57 (1) (2010)27–38.
[13] Y. Al-Kofahi, W. Lassoued, K. Grama, S. K. Nath, J. Zhu, R. Oueslati, M. Feldman, W. M. F.Lee, B. Roysam, Cell-based quantification of molecular biomarkers in histopathology specimens,Histopathology 59 (1) (2011) 40–54.
[14] B. Mccullough, X. Ying, T. Monticello, M. Bonnefoi, Digital Microscopy Imaging and New Ap-proaches in Toxicologic Pathology, Toxicologic Pathology 32 (S2) (2004), 49–58.
[15] M. Gurcan, L. Boucheron, A. Can, A. Madabhushi, N. Rajpoot, B. Yener, Histopathologicalimage analysis: A review, IEEE Reviews in Biomedical Engineering, 2 (2009) 147–171.
[16] L. He, L.R. Long, S. Antani, G.R. Thoma, Histology image analysis for carcinoma detection andgrading, Computer Methods and Programs in Biomedicine, (2012).
[17] C. M. Gilbert, A. Parwani, The use of multispectral imaging to distinguish reactive urotheliumfrom neoplastic urothelium., J Pathol Inform 1 (2010) 23.
[18] D. Mueller, D. Vossen, B. Hulsken, Real-time deformable registration of multi-modal whole slidesfor digital pathology, Computerized Medical Imaging and Graphics, 35 (2011) 542–556.
[19] L. Cooper, O. Sertel, J. Kong, G. Lozanski, K. Huang, M. Gurcan, Feature-based registration ofhistopathology images with di!erent stains: An application for computerized follicular lymphomaprognosis, Computer Methods and Programs in Biomedicine, 96 (2009) 182–192.
[20] J. A. Ramos-Vara, Technical aspects of immunohistochemistry., Vet Pathol 42 (4) (2005) 405–426.
[21] S. Marttila, K. Santn, Practical aspects of immunomicroscopy on plant material, Modern researchand educational topics in microscopy, (2007) 101521.
[22] T.S. Ward, G.D. Rosen, C.S. von Bartheld, Optical disector counting in cryosections and vi-bratome sections underestimates particle numbers: e!ects of tissue quality, Microsc Res Tech.71(1) (2008) 60–8.
[23] A.J. Woolley, H.A. Desai, M.A. Steckbeck, N.K. Patel, K.J. Otto, In situ characterization ofthe brain-microdevice interface using Device Capture Histology, J Neurosci Methods. 30;201(1)(2011) 67–77.
[24] J. Sharpe, U. Ahlgren, P. Perry, B. Hill, A. Ross, J. Hecksher-Sorensen, R. Baldock, D. Davidson,Optical projection tomography as a tool for 3D microscopy and gene expression studies, Science296(5567) (2002) 541–5.
[25] H. Hama, H. Kurokawa, H. Kawano, R. Ando, T. Shimogori, H. Noda, K. Fukami, A. Sakaue-Sawano, A. Miyawaki, Scale: a chemical approach for fluorescence imaging and reconstruction oftransparent mouse brain, Nat Neurosci 30 (2011) 1481-1488.
[26] M. G. Rojo, G. Bueno, J. Slodkowska, Review of imaging solutions for integrated quantitativeimmunohistochemistry in the Pathology daily practice., Folia histochemica et cytobiologica PolishAcademy of Sciences Polish Histochemical and Cytochemical Society 47 (3) (2009) 349–354.
[27] C. R. Taylor, Quality assurance and standardization in immunohistochemistry. a proposal for theannual meeting of the biological stain commission, june, 1991, Biotech Histochem 67 (2) (1992)110–117.
19
[28] S.-R. Shi, C. Liu, C. R. Taylor, Standardization of immunohistochemistry for formalin-fixed,para"n-embedded tissue sections based on the antigen-retrieval technique: From experiments tohypothesis, Journal of Histochemistry & Cytochemistry 55 (2) (2007) 105–109.
[29] J. Riera, J. F. Simpson, R. Tamayo, H. Battifora, Use of cultured cells as a control for quantitativeimmunocytochemical analysis of estrogen receptor in breast cancer. the quicgel method., Am JClin Pathol 111 (3) (1999) 329–35.
[30] S. R. Sompuram, V. Kodela, K. Zhang, H. Ramanathan, G. Radcli!e, P. Falb, S. A. Bogen, A novelquality control slide for quantitative immunohistochemistry testing, Journal of Histochemistry &Cytochemistry 50 (11) (2002) 1425–1433.
[31] S.-R. Shi, C. Liu, J. Perez, C. R. Taylor, Protein-embedding technique: A potential approach tostandardization of immunohistochemistry for formalin-fixed, para"n-embedded tissue sections,Journal of Histochemistry & Cytochemistry 53 (9) (2005) 1167–1170.
[32] A. S. Y. Leong, Quantitation in immunohistology: Fact or fiction?: A discussion of variables thatinfluence results, Applied Immunohistochemistry & Molecular Morphology 12 (1) (2004) 1–7.
[33] Y. Moon, G. Park, K. Han, C.-S. Kang, W. Lee, Mouse spleen tissue as a staining intensityreference for immunohistochemistry, Ann Clin Lab Sci 38 (3) (2008) 215–220.
[34] L. K. Diaz, N. Sneige, Estrogen receptor analysis for breast cancer: Current issues and keys toincreasing testing accuracy, Advances in Anatomic Pathology 12 (1) (2005) 10–19.
[35] S. Umemura, J. Itoh, H. Itoh, A. Serizawa, Y. Saito, Y. Suzuki, Y. Tokuda, T. Tajima, R. Os-amura, Immunohistochemical evaluation of hormone receptors in breast cancer: which scoringsystem is suitable for highly sensitive procedures?, Applied immunohistochemistry & molecularmorphology : AIMM / o"cial publication of the Society for Applied Immunohistochemistry 12 (1)(2004) 8–13.
[36] S. S. Cross, Observer accuracy in estimating proportions in images: implications for the semi-quantitative assessment of staining reactions and a proposal for a new system, Journal of ClinicalPathology 54 (5) (2001) 385–390.
[37] H. A. Lehr, T. W. Jacobs, H. Yaziji, S. J. Schnitt, A. M. Gown, Quantitative evaluation of HER-2/neu status in breast cancer by fluorescence in situ hybridization and by immunohistochemistrywith image analysis., American Journal of Clinical Pathology 115 (6) (2001) 814–822.
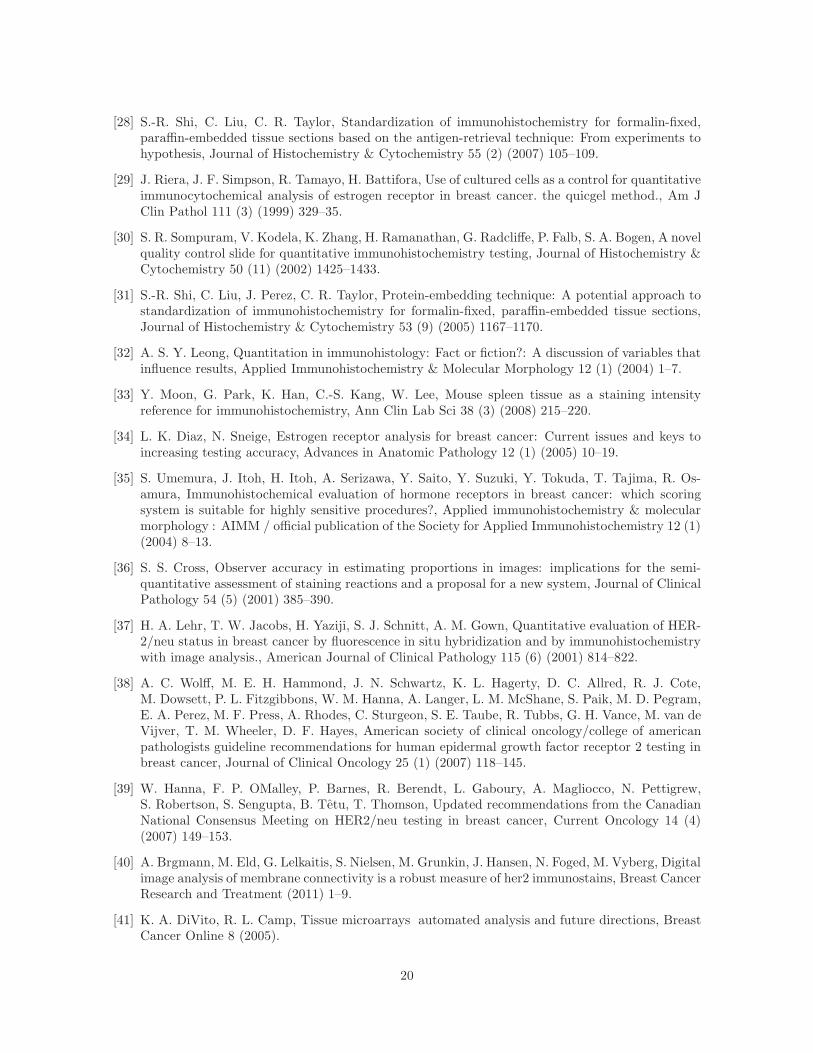
[38] A. C. Wol!, M. E. H. Hammond, J. N. Schwartz, K. L. Hagerty, D. C. Allred, R. J. Cote,M. Dowsett, P. L. Fitzgibbons, W. M. Hanna, A. Langer, L. M. McShane, S. Paik, M. D. Pegram,E. A. Perez, M. F. Press, A. Rhodes, C. Sturgeon, S. E. Taube, R. Tubbs, G. H. Vance, M. van deVijver, T. M. Wheeler, D. F. Hayes, American society of clinical oncology/college of americanpathologists guideline recommendations for human epidermal growth factor receptor 2 testing inbreast cancer, Journal of Clinical Oncology 25 (1) (2007) 118–145.
[39] W. Hanna, F. P. OMalley, P. Barnes, R. Berendt, L. Gaboury, A. Magliocco, N. Pettigrew,S. Robertson, S. Sengupta, B. Tetu, T. Thomson, Updated recommendations from the CanadianNational Consensus Meeting on HER2/neu testing in breast cancer, Current Oncology 14 (4)(2007) 149–153.
[40] A. Brgmann, M. Eld, G. Lelkaitis, S. Nielsen, M. Grunkin, J. Hansen, N. Foged, M. Vyberg, Digitalimage analysis of membrane connectivity is a robust measure of her2 immunostains, Breast CancerResearch and Treatment (2011) 1–9.
[41] K. A. DiVito, R. L. Camp, Tissue microarrays automated analysis and future directions, BreastCancer Online 8 (2005).
20
[42] Bioimagene innovative digital pathology, http://www.bioimagene.com (2011).
[43] H. D. Cualing, E. Zhong, L. Moscinski, virtual flow cytometry of immunostained lymphocyteson microscopic tissue slides: ihcflowTM tissue cytometry, Cytometry Part B: Clinical Cytometry72B (1) (2007) 63–76.
[44] Tissuegnostics image analysis system, http://www.tissuegnostics.com (2001).
[45] Q. Huang, C. Yu, M. Klein, J. Fang, R. K. Goyal, DNA index determination with AutomatedCellular Imaging System (ACIS) in Barrett’s esophagus: comparison with CAS 200., BMC clinicalpathology 5 (1) (2005).
[46] Cambridge research inc., http://www.cri-inc.com (2011).
[47] Aperio scanscope, http://www.aperio.com (2011).
[48] M. E. Dickinson, G. Bearman, S. Tille, R. Lansford, S. E. Fraser, Multi-spectral imaging and linearunmixing add a whole new dimension to laser scanning fluorescence microscopy., Biotechniques31 (6) (2001).
[49] E. M. Brey, Z. Lalani, C. Johnston, M. Wong, L. V. McIntire, P. J. Duke, C. W. Patrick, Auto-mated selection of dab-labeled tissue for immunohistochemical quantification, Journal of Histo-chemistry & Cytochemistry 51 (5) (2003) 575–584.
[50] A. C. Ruifrok, D. A. Johnston, Quantification of histochemical staining by color deconvolution.,Analytical and quantitative cytology and histology / the International Academy of Cytology [and]American Society of Cytology 23 (4) (2001) 291–299.
[51] P. Pietrini, M. L. Furey, E. Ricciardi, M. I. Gobbini, W.-H. C. Wu, L. Cohen, M. Guazzelli, J. V.Haxby, Beyond sensory images: Object-based representation in the human ventral pathway.,Proceedings of the National Academy of Sciences of the United States of America 101 (15) (2004)5658–63.
[52] J.-P. Thiran, B. Macq, Morphological feature extraction for the classification of digital images ofcancerous tissues, IEEE Transactions on Biomedical Engineering 46 (10) (1996) 1011–1029.
[53] A. H. Beck, A. R. Sangoi, S. Leung, R. J. Marinelli, T. O. Nielsen, M. J. van de Vijver, R. B.West, M. van de Rijn, D. Koller, Systematic analysis of breast cancer morphology uncovers stromalfeatures associated with survival, Science Translational Medicine 3 (108) (2011) 108–113.
[54] J. Kong, O. Sertel, H. Shimada, K. L. Boyer, J. H. Saltz, M. N. Gurcan, Computer-aided evaluationof neuroblastoma on whole-slide histology images: Classifying grade of neuroblastic di!erentiation,Pattern Recogn. 42 (2009) 1080–1092.
[55] S. Doyle, S. Agner, A. Madabhushi, M. Feldman, J. Tomaszewski, Automated grading of breastcancer histopathology using spectral clustering with textural and architectural image features, in:Biomedical Imaging: From Nano to Macro, 2008. ISBI 2008. 5th IEEE International Symposiumon, 2008, pp. 496 –499.
[56] C.-W. W. Wang, Robust automated tumour segmentation on histological and immunohistochem-ical tissue images., PloS one 6 (2) (2011).
[57] C. Demir, S. H. Gultekin, B. Yener, Augmented cell-graphs for automated cancer diagnosis,Bioinformatics 21 (suppl 2) (2005) ii7–ii12.
[58] S. B. Kotsiantis, Supervised machine learning: A review of classification techniques, in: Proceed-ing of the 2007 conference on Emerging Artificial Intelligence Applications in Computer Engi-neering: Real Word AI Systems with Applications in eHealth, HCI, Information Retrieval andPervasive Technologies, IOS Press, 2007, pp. 3–24.
21
[59] N. Grira, M. Crucianu, N. Boujemaa, Unsupervised and semi-supervised clustering: a brief survey,in: in A Review of Machine Learning Techniques for Processing Multimedia Content, Report ofthe MUSCLE European Network of Excellence (FP6), 2004.
[60] H. Wannous, S. Treuillet, Y. Lucas, Supervised tissue classification from color images for a com-plete wound assessment tool, in: Engineering in Medicine and Biology Society, 2007. EMBS 2007.29th Annual International Conference of the IEEE, 2007, pp. 6031–6034.
[61] E. Zacharaki, S. Kanterakis, R. Bryan, C. Davatzikos, Measuring brain lesion progression with asupervised tissue classification system, in: D. Metaxas, L. Axel, G. Fichtinger, G. Szkely (Eds.),Medical Image Computing and Computer-Assisted Intervention MICCAI 2008, Vol. 5241 ofLecture Notes in Computer Science, Springer Berlin / Heidelberg, 2008, pp. 620–627.
[62] M. Datar, D. Padfield, H. Cline, Color and texture based segmentation of molecular pathologyimages usING HSOMS, Biomedical Imaging: From Nano to Macro, 2008. ISBI 2008. 5th IEEEInternational Symposium on (2008) 292–295.
[63] N. A. Makretsov, D. G. Huntsman, T. O. Nielsen, E. Yorida, M. Peacock, M. C. U. Cheang, S. E.Dunn, M. Hayes, M. van de Rijn, C. Bajdik, C. B. Gilks, Hierarchical clustering analysis of tissuemicroarray immunostaining data identifies prognostically significant groups of breast carcinoma,Clinical Cancer Research 10 (18) (2004) 6143–6151.
[64] M. D. Gustavson, B. Bourke-Martin, D. M. Reilly, M. Cregger, C. Williams, G. Tedeschi,R. Pinard, J. Christiansen, Development of an unsupervised pixel-based clustering algorithm forcompartmentalization of immunohistochemical expression using automated quantitative analysis,Applied Immunohistochemistry & Molecular Morphology 17 (4) (2009).
[65] S. Di Cataldo, E. Ficarra, A. Acquaviva, E. Macii, Automated segmentation of tissue images forcomputerized ihc analysis, Computer Methods and Programs in Biomedicine 100 (1) (2010) 1 –15.
[66] L. D. Hai-Shan Wu, J. Gil, Segmentation of microscopic nuclear images-a review, Recent Res.Devel. Electr 2 (2004) 1–15.
[67] T. Scholzen, J. Gerdes, The Ki-67 protein: from the known and the unknown., Journal of CellularPhysiology 182 (3) (2000) 311–22.
[68] N. Otsu, A threshold selection method from gray-level histograms, IEEE Transactions on Systems,Man and Cybernetics 9 (1) (1979) 62–66.
[69] Y. J. Kim, B. F. Romeike, J. Uszkoreit, W. Feiden, Automated nuclear segmentation in thedetermination of the Ki-67 labeling index in meningiomas., Clinical neuropathology 25 (2) (2006)67–73.
[70] F. Long, H. Peng, E. Myers, Automatic segmentation of nuclei in 3d microscopy images ofc.elegans, in: Biomedical Imaging: From Nano to Macro, 2007. ISBI 2007. 4th IEEE Interna-tional Symposium on, 2007, pp. 536 –539.
[71] J. B. T. M. Roerdink, A. Meijster, The watershed transform: definitions, algorithms and paral-lelization strategies, Fundam. Inf. 41 (2000) 187–228.
[72] J. Cheng, J. Rajapakse, Segmentation of clustered nuclei with shape markers and marking func-tion, Biomedical Engineering, IEEE Transactions on 56 (3) (2009) 741 –748.
[73] N. Malpica, C. O. De Solorzano, J. J. Vaquero, A. Santos, I. Vallcorba, J. M. Garcıa-Sagredo,F. Del Pozo, Applying watershed algorithms to the segmentation of clustered nuclei., Cytometry28 (4) (1997) 289–297.
22

[74] G. Landini, I. E. Othman, Estimation of tissue layer level by sequential morphological reconstruc-tion, Journal of Microscopy 209 (2) (2003).
[75] A. Pinidiyaarachchi, C. Wahlby, Seeded Watersheds for Combined Segmentation and Tracking ofCells, 2005, pp. 336–343.
[76] J. Canny, A computational approach to edge detection, IEEE Trans. Pattern Anal. Mach. Intell.8 (1986) 679–698.
[77] T. Fuchs, T. Lange, P. Wild, H. Moch, J. Buhmann, Weakly supervised cell nuclei detection andsegmentation on tissue microarrays of renal clear cell carcinoma, in: G. Rigoll (Ed.), PatternRecognition, Vol. 5096 of Lecture Notes in Computer Science, Springer Berlin / Heidelberg, 2008,pp. 173–182.
[78] L. Yang, P. Meer, D. Foran, Unsupervised segmentation based on robust estimation and coloractive contour models, Information Technology in Biomedicine, IEEE Transactions on 9 (3) (2005)475 –486.
[79] D. P. Mukherjee, S. Member, N. Ray, S. T. Acton, S. Member, Level set analysis for leukocytedetection and tracking, IEEE Transactions on Image Processing 13 (2004) 562–572.
[80] A. Elmoataz, S. Schupp, R. Clouard, P. Herlin, D. Bloyet, Using active contours and mathematicalmorphology tools for quantification of immunohistochemical images, Signal Process. 71 (1998)215–226.
[81] A. Garrido, Applying deformable templates for cell image segmentation, Pattern Recognition33 (5) (2000) 821–832.
[82] C. O. De Solorzano, R. Malladi, S. A. Lelievre, S. J. Lockett, Segmentation on nuclei and cellsusing membrane related protein markers, Journal of Microscopy 222 (1) (2006) 67–67.
[83] M. Jacob, T. Blu, M. Unser, E"cient energies and algorithms for parametric snakes, ImageProcessing, IEEE Transactions on 13 (9) (2004) 1231 –1244.
[84] B. Zhang, C. Zimmer, J.-C. Olivo-Marin, Tracking fluorescent cells with coupled geometric activecontours, in: Biomedical Imaging: Nano to Macro, 2004. IEEE International Symposium on,Vol. 1, 2004, pp. 476 – 479.
[85] P. R. Gudla, K. Nandy, J. Collins, K. J. Meaburn, T. Misteli, S. J. Lockett, A high-throughputsystem for segmenting nuclei using multiscale techniques., Cytometry Part A the journal of theInternational Society for Analytical Cytology 73 (5) (2008) 451–466.
[86] M. Gavrielides, H. Masmoudi, N. Petrick, K. Myers, S. Hewitt, Automated evaluation of her-2/neu immunohistochemical expression in breast cancer using digital microscopy, in: BiomedicalImaging: From Nano to Macro, 2008. ISBI 2008. 5th IEEE International Symposium on, 2008,pp. 808 –811.
[87] S. Naik, S. Doyle, S. Agner, A. Madabhushi, M. Feldman, J. Tomaszewski, Automated glandand nuclei segmentation for grading of prostate and breast cancer histopathology, in: BiomedicalImaging: From Nano to Macro, 2008. ISBI 2008. 5th IEEE International Symposium on, 2008,pp. 284–287.
[88] Y. Boykov, G. Funka-Lea, Graph cuts and e"cient n-d image segmentation, Int. J. Comput.Vision 70 (2006) 109–131.
[89] Y. Al-Kofahi, W. Lassoued, W. Lee, B. Roysam, Improved Automatic Detection and Segmentationof Cell Nuclei in Histopathology Images, IEEE Trans Biomed Eng. 57(4) (2010) 841–52
23

[90] B. Luck, K. Carlson, A. Bovik, R. Richards-Kortum, An image model and segmentation algorithmfor reflectance confocal images of in vivo cervical tissue, Image Processing, IEEE Transactions on14 (9) (2005) 1265 –1276.
[91] H. Masmoudi, S. Hewitt, N. Petrick, K. Myers, M. Gavrielides, Automated quantitative assess-ment of her-2/neu immunohistochemical expression in breast cancer, Medical Imaging, IEEETransactions on 28 (6) (2009) 916 –925.
[92] T. R. Jones, A. Carpenter, P. Goll, Voronoi-based segmentation of cells on image manifolds, in: inProc. ICCVWorkshop on Computer Vision for Biomedical Image Applications, 2005, pp. 535–543.
[93] C. Zanella, M. Campana, B. Rizzi, C. Melani, G. Sanguinetti, P. Bourgine, K. Mikula,N. Peyrieras, A. Sarti, Cells segmentation from 3-d confocal images of early zebrafish embryoge-nesis, Trans. Img. Proc. 19 (2010) 770–781.
[94] J. Han, H. Chang, K. Andarawewa, P. Yaswen, M. H. Barcellos-Ho!, B. Parvin, Multidimen-sional profiling of cell surface proteins and nuclear markers, IEEE/ACM Trans. Comput. Biol.Bioinformatics 7 (2010) 80–90.
[95] E. Ficarra, S. Di Cataldo, A. Acquaviva, E. Macii, Automated segmentation of cells with ihcmembrane staining, Biomedical Engineering, IEEE Transactions on 58 (5) (2011) 1421 –1429.
[96] L. Sing Cheong, A. Jean, T. S. Tan, W. Kong, S. Y. Tan, Automated Segmentation and Mea-surement for Cancer Classification of HER2/neu Status in Breast Carcinomas, in: BIOTECHNO2011 : The Third International Conference on Bioinformatics, Biocomputational Systems andBiotechnologies, 2011, pp. 43–48.
[97] V. J. Tuominen, T. T. Tolonen, J. Isola, ImmunoMembrane: a publicly available web applicationfor digital image analysis of HER2 immunohistochemistry, Histopathology (2012).
[98] C. Sun, P. Vallotton, D. Wang, J. Lopez, Y. Ng, D. James, Membrane boundary extraction usingcircular multiple paths, Pattern Recogn. 42 (2009) 523–530.
[99] D. Baggett, M. A. Nakaya, M. McAuli!e, T. P. Yamaguchi, S. Lockett, Whole cell segmentationin solid tissue sections, Cytometry Part A 67A (2) (2005) 137–143.
[100] E. C. W. G. on Breast Screening Pathology, J. P. Sloane, I. Amendoeira, N. Apostolikas, J. P.Bellocq, S. Bianchi, W. Boecker, G. Bussolati, D. Coleman, C. E. Connolly, P. Dervan, V. Eusebi,C. D. Miguel, M. Drijkoningen, C. W. Elston, D. Faverley, A. Gad, J. Jacquemier, M. Lacerda,J. Martinez-Penuela, C. Munt, J. L. Peterse, F. Rank, M. Sylvan, V. Tsakraklides, B. Zafrani,Consistency achieved by 23 european pathologists in categorizing ductal carcinoma in situ of thebreast using five classifications, Human Pathology 29 (10) (1998) 1056 – 1062.
[101] L. Mo"tt, Cancer control 8 (1) (2001).
[102] M. Kurosumi, Immunohistochemical assessment of hormone receptor status using a new scoringsystem (j-score) in breast cancer, Breast Cancer 14 (2007) 189–193.
[103] A. Queschi, S. Pervez, Allred scoring for er reporting and it’s impact in clearly distinguishing ernegative from er positive breast cancers, J Pak Med Assoc 60 (2010) 350–353.
[104] J. L. Flowers, E. B. Cox, K. R. Geisinger, G. V. Burton, K. S. S. Mccarty, K. S. J. Mccarty, G. A.Dent, Use of monoclonal antiestrogen receptor antibody to evaluate estrogen receptor content infine needle aspiration breast biopsies, Annals of Surgery 203 (3) (1986).
[105] K. R. Choudhury, K. J. Yagle, P. E. Swanson, K. A. Krohn, J. G. Rajendran, A robust automatedmeasure of average antibody staining in immunohistochemistry images, Journal of Histochemistry& Cytochemistry 58 (2) (2010) 95–107.
24

[106] S. Petushi, F. Garcia, M. Haber, C. Katsinis, A. Tozeren, Large-scale computations on histologyimages reveal grade-di!erentiating parameters for breast cancer, BMC Medical Imaging 6 (1)(2006) 14.
[107] T. Amaral, S. J. McKenna, K. Robertson, A. Thompson, Scoring of breast tissue microarrayspots through ordinal regression., in: VISSAPP (2)’09, 2009, pp. 243–248.
[108] Y.-L. Kuo, C.-C. Ko, J.-Y. Lai, Automated assessment in her-2/neu immunohistochemical ex-pression of breast cancer, in: Computer Communication Control and Automation (3CA), 2010International Symposium on, Vol. 2, 2010, pp. 585 –588.
[109] J. D. Ingle, S. R. Crouch, Spectrochemical Analysis, 1st Edition, Prentice Hall, 1988.
[110] C. M. v. d. Loos, Multiple immunoenzyme staining: Methods and visualizations for the obser-vation with spectral imaging, Journal of Histochemistry & Cytochemistry 56 (4) (2008) 313–328.
[111] N.S. Goldstein, S.M. Hewitt, C.R. Taylor, H. Yaziji, D.G. Hicks, Recommendations for improvedstandardization of immunohistochemistry, Appl Immunohistochem Mol Morphol. 15(2) (2007)124–33.
[112] S.A. Bogen, K. Vani, B. McGraw, V. Federico, I. Habib, R. Zeheb, E. Luther, C. Tristram,S.R. Sompuram, Experimental validation of peptide immunohistochemistry controls, Appl Im-munohistochem Mol Morphol.17(3) (2009) 239–46.
[113] A. Madabhushi, Digital pathology image analysis: opportunities and challenges, Imaging Med.1(1) (2009) 7–10.
25