Computational modeling and experimental validation of odor detection behaviors of classically...
11
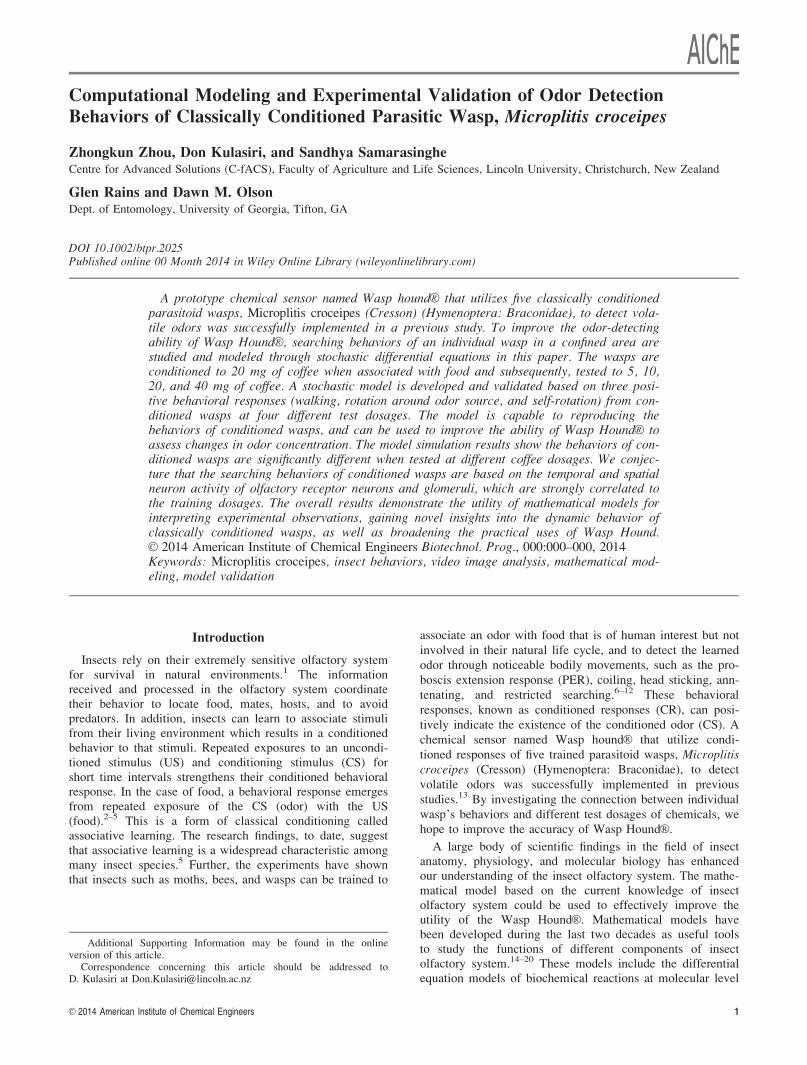
Computational Modeling and Experimental Validation of Odor Detection Behaviors of Classically Conditioned Parasitic Wasp, Microplitis croceipes Zhongkun Zhou, Don Kulasiri, and Sandhya Samarasinghe Centre for Advanced Solutions (C-fACS), Faculty of Agriculture and Life Sciences, Lincoln University, Christchurch, New Zealand Glen Rains and Dawn M. Olson Dept. of Entomology, University of Georgia, Tifton, GA DOI 10.1002/btpr.2025 Published online 00 Month 2014 in Wiley Online Library (wileyonlinelibrary.com) A prototype chemical sensor named Wasp hound V R that utilizes five classically conditioned parasitoid wasps, Microplitis croceipes (Cresson) (Hymenoptera: Braconidae), to detect vola- tile odors was successfully implemented in a previous study. To improve the odor-detecting ability of Wasp Hound V R , searching behaviors of an individual wasp in a confined area are studied and modeled through stochastic differential equations in this paper. The wasps are conditioned to 20 mg of coffee when associated with food and subsequently, tested to 5, 10, 20, and 40 mg of coffee. A stochastic model is developed and validated based on three posi- tive behavioral responses (walking, rotation around odor source, and self-rotation) from con- ditioned wasps at four different test dosages. The model is capable to reproducing the behaviors of conditioned wasps, and can be used to improve the ability of Wasp Hound V R to assess changes in odor concentration. The model simulation results show the behaviors of con- ditioned wasps are significantly different when tested at different coffee dosages. We conjec- ture that the searching behaviors of conditioned wasps are based on the temporal and spatial neuron activity of olfactory receptor neurons and glomeruli, which are strongly correlated to the training dosages. The overall results demonstrate the utility of mathematical models for interpreting experimental observations, gaining novel insights into the dynamic behavior of classically conditioned wasps, as well as broadening the practical uses of Wasp Hound. V C 2014 American Institute of Chemical Engineers Biotechnol. Prog., 000:000–000, 2014 Keywords: Microplitis croceipes, insect behaviors, video image analysis, mathematical mod- eling, model validation Introduction Insects rely on their extremely sensitive olfactory system for survival in natural environments. 1 The information received and processed in the olfactory system coordinate their behavior to locate food, mates, hosts, and to avoid predators. In addition, insects can learn to associate stimuli from their living environment which results in a conditioned behavior to that stimuli. Repeated exposures to an uncondi- tioned stimulus (US) and conditioning stimulus (CS) for short time intervals strengthens their conditioned behavioral response. In the case of food, a behavioral response emerges from repeated exposure of the CS (odor) with the US (food). 2–5 This is a form of classical conditioning called associative learning. The research findings, to date, suggest that associative learning is a widespread characteristic among many insect species. 5 Further, the experiments have shown that insects such as moths, bees, and wasps can be trained to associate an odor with food that is of human interest but not involved in their natural life cycle, and to detect the learned odor through noticeable bodily movements, such as the pro- boscis extension response (PER), coiling, head sticking, ann- tenating, and restricted searching. 6–12 These behavioral responses, known as conditioned responses (CR), can posi- tively indicate the existence of the conditioned odor (CS). A chemical sensor named Wasp hound V R that utilize condi- tioned responses of five trained parasitoid wasps, Microplitis croceipes (Cresson) (Hymenoptera: Braconidae), to detect volatile odors was successfully implemented in previous studies. 13 By investigating the connection between individual wasp’s behaviors and different test dosages of chemicals, we hope to improve the accuracy of Wasp Hound V R . A large body of scientific findings in the field of insect anatomy, physiology, and molecular biology has enhanced our understanding of the insect olfactory system. The mathe- matical model based on the current knowledge of insect olfactory system could be used to effectively improve the utility of the Wasp HoundV R . Mathematical models have been developed during the last two decades as useful tools to study the functions of different components of insect olfactory system. 14–20 These models include the differential equation models of biochemical reactions at molecular level Additional Supporting Information may be found in the online version of this article. Correspondence concerning this article should be addressed to D. Kulasiri at [email protected] V C 2014 American Institute of Chemical Engineers 1
-
Upload
lincoln-nz -
Category
Documents
-
view
4 -
download
0
Transcript of Computational modeling and experimental validation of odor detection behaviors of classically...
Computational Modeling and Experimental Validation of Odor Detection
Behaviors of Classically Conditioned Parasitic Wasp, Microplitis croceipes
Zhongkun Zhou, Don Kulasiri, and Sandhya SamarasingheCentre for Advanced Solutions (C-fACS), Faculty of Agriculture and Life Sciences, Lincoln University, Christchurch, New Zealand
Glen Rains and Dawn M. OlsonDept. of Entomology, University of Georgia, Tifton, GA
DOI 10.1002/btpr.2025Published online 00 Month 2014 in Wiley Online Library (wileyonlinelibrary.com)
A prototype chemical sensor named Wasp houndVR that utilizes five classically conditionedparasitoid wasps, Microplitis croceipes (Cresson) (Hymenoptera: Braconidae), to detect vola-tile odors was successfully implemented in a previous study. To improve the odor-detectingability of Wasp HoundVR , searching behaviors of an individual wasp in a confined area arestudied and modeled through stochastic differential equations in this paper. The wasps areconditioned to 20 mg of coffee when associated with food and subsequently, tested to 5, 10,20, and 40 mg of coffee. A stochastic model is developed and validated based on three posi-tive behavioral responses (walking, rotation around odor source, and self-rotation) from con-ditioned wasps at four different test dosages. The model is capable to reproducing thebehaviors of conditioned wasps, and can be used to improve the ability of Wasp HoundVR toassess changes in odor concentration. The model simulation results show the behaviors of con-ditioned wasps are significantly different when tested at different coffee dosages. We conjec-ture that the searching behaviors of conditioned wasps are based on the temporal and spatialneuron activity of olfactory receptor neurons and glomeruli, which are strongly correlated tothe training dosages. The overall results demonstrate the utility of mathematical models forinterpreting experimental observations, gaining novel insights into the dynamic behavior ofclassically conditioned wasps, as well as broadening the practical uses of Wasp Hound.VC 2014 American Institute of Chemical Engineers Biotechnol. Prog., 000:000–000, 2014Keywords: Microplitis croceipes, insect behaviors, video image analysis, mathematical mod-eling, model validation
Introduction
Insects rely on their extremely sensitive olfactory systemfor survival in natural environments.1 The informationreceived and processed in the olfactory system coordinatetheir behavior to locate food, mates, hosts, and to avoidpredators. In addition, insects can learn to associate stimulifrom their living environment which results in a conditionedbehavior to that stimuli. Repeated exposures to an uncondi-tioned stimulus (US) and conditioning stimulus (CS) forshort time intervals strengthens their conditioned behavioralresponse. In the case of food, a behavioral response emergesfrom repeated exposure of the CS (odor) with the US(food).2–5 This is a form of classical conditioning calledassociative learning. The research findings, to date, suggestthat associative learning is a widespread characteristic amongmany insect species.5 Further, the experiments have shownthat insects such as moths, bees, and wasps can be trained to
associate an odor with food that is of human interest but not
involved in their natural life cycle, and to detect the learned
odor through noticeable bodily movements, such as the pro-
boscis extension response (PER), coiling, head sticking, ann-
tenating, and restricted searching.6–12 These behavioral
responses, known as conditioned responses (CR), can posi-
tively indicate the existence of the conditioned odor (CS). A
chemical sensor named Wasp houndVR that utilize condi-
tioned responses of five trained parasitoid wasps, Microplitiscroceipes (Cresson) (Hymenoptera: Braconidae), to detect
volatile odors was successfully implemented in previous
studies.13 By investigating the connection between individual
wasp’s behaviors and different test dosages of chemicals, we
hope to improve the accuracy of Wasp HoundVR .
A large body of scientific findings in the field of insectanatomy, physiology, and molecular biology has enhancedour understanding of the insect olfactory system. The mathe-matical model based on the current knowledge of insectolfactory system could be used to effectively improve theutility of the Wasp HoundVR . Mathematical models havebeen developed during the last two decades as useful toolsto study the functions of different components of insectolfactory system.14–20 These models include the differentialequation models of biochemical reactions at molecular level
Additional Supporting Information may be found in the onlineversion of this article.
Correspondence concerning this article should be addressed toD. Kulasiri at [email protected]
VC 2014 American Institute of Chemical Engineers 1
in the olfactory receptor neuron, neural network models ofinter-neuron activities, and olfactory coding within the anten-nal lobe, and Hodgkin–Huxley differential equation modelsof ionic currents in the mushroom body. However, stochasticmodels have not been extensively used to study insect olfac-tory components: especially, a stochastic model thatdescribes how behavioral responses change based on sensoryinputs after associative learning. Can we use a stochasticmodel to mimic bodily movements of a conditioned waspunder various test dosages? A model that predicts behaviorsbased on sensory inputs could also be used conversely topredict odorant properties based on behavioral observations.The present article is an attempt to improve the odor-detecting ability of Wasp HoundVR through stochastic model-ing of the behavior of conditioned wasps under different testdosages. Improved detection of changes in concentration andodor quality would increase the utility of the Wasp Hound.
In this article, the behavioral response of classically condi-tioned M. croceipes in a confined area (a circular area with50 mm diameter) is chosen as a model to investigate the con-nection between individual wasp’s behaviors and different testdosages of coffee odor. First, the wasps are conditioned to20 mg of coffee when associated with food and subsequently,tested to 5, 10, 20, and 40 mg of coffee. The experiments arerecorded by camera for the purpose of data analysis andmodel development. Second, the behavioral data are extractedfrom the experimental data and analyzed, a stochastic modelis developed based on three major behavioral responses (walk-ing, rotation around odor source, and self-rotation) from con-ditioned wasps at four test dosages. Third, the model isreliably validated through objective and subjective approachesat each of test dosages by comparing the model simulatedwasp behaviors with experimentally measured behaviors. Themodel has reproduced the behaviors of conditioned waspsunder four different test dosages. To interpret the dynamics ofwasp’s searching behaviors based on the knowledge of infor-mation processing mechanism in the insect olfactory system,we conjecture that the searching behaviors of conditionedwasps are based on the temporal and spatial neuron activityof olfactory receptor neurons and glomeruli, which arestrongly formed during training.
Material and Methods
Experiment design
To model the bodily movements of the conditioned insectat various test conditions, we used a parasitic wasp M. cro-ceipes as our modeling target (the basic research alreadyconducted illustrates the positive features of their sensitiveolfactory organs21). The experiments are all recorded using avideo camera in the USDA-ARS Biological Control Labora-tory at Tifton, GA. First, the M. croceipes are individuallyhand conditioned to coffee odor at 20 mg dosage; they aretested to 5, 10, 20, and 40 mg coffee dosage. In order tostudy the wasp’s behavior at each test dosage, quantitativedata are extracted from the experimental video files usingthe video tracking software TrackerVR and stored in a Micro-soft Excel database for further analysis.
Experiment implementation
Insects. A parasitic wasp, M. croceipes (Hymenoptera:Bracibudae), is used for this study. The Helicoverpa zea(corn earworm) are used as the larval hosts for rearing
M. croceipes.22 The breeding stock are fed with honey andwater, and kept in a 30 3 30 3 17 cm Plexiglas cage at28�C, with 50 to 70% relative humidity, and followed by a16 h light plus 8 h dark photocycle. The test specimens are2-day-old wasps with only water feeding and without ovipo-sition. Two days of food deprivation is previously found tostrengthen the hunger state and provide a stronger relation-ship between the odor and food during conditioning.23
Coffee Conditioning Procedure. An odor delivery stageis prepared for conditioning each wasp. Twenty milligrams ofground coffee is placed in a 200 mL glass jar and coveredwith a piece of aluminium foil. A 2 3 2 mm paper saturatedwith 50% sucrose-water is put in the centre of aluminium foil.Six 1 mm diameter holes are created closely around thesucrose-water soaked paper after the glass jar is closed withaluminium foil for a minimum of 15 min. M. croceipes iscaptured and placed in a separate vial. Next, it is removedfrom its vial using a pair of forceps and individually allowedto feed on the sucrose-water soaked paper for 10 s. The coffeeodorant diffuse through the holes around the sucrose waterand over the wasp’s antennae while feeding. After feeding forten seconds, the wasp is placed back in its vial for approxi-mately 1 to 2 min. To fully condition the wasp, we repeat theconditioning process such that the wasp has three 10 s feedingand 1 to 2 min resting interval between each feeding.23
Testing Procedure. Four different coffee samples are pre-pared for the testing, 5, 10, 20, and 40 mg. First, a filter discis loaded with a particular amount of coffee. Next, the filterdisc is put in a 250 mL glass jar, which is then covered andsecured by a 10 cm filter paper on top of the jar. A push pinis used to create one 1 mm diameter hole in the centre of thefilter paper 15 min after placing the filter paper over the topof the jar. There are two circles centred on the hole. One is25 mm in diameter and the other is 50 mm in diameter. Test-ing is performed under the same fume hood as is used in thetraining. A digital camcorder is placed over top of the test jarunder the fume hood. During testing, all light sources withinthe room, except the overhead fluorescent room lights, areturned off, or covered up, resulting in an average light inten-sity of 295 lux at the top of the test sample. The digital cam-corder is placed so that the tip of the camera is approximately5 cm above the top of the filter disc. Conditioned wasps areplaced on the surface of each test sample separately, 12.5 mmfrom the hole emitting the coffee odor, and their movementscaptured by camcorder at five frames per second and 480 3
640 resolution. Behavior is recorded until the wasp stopsresponding to the odor diffusing from the jar.
Model development
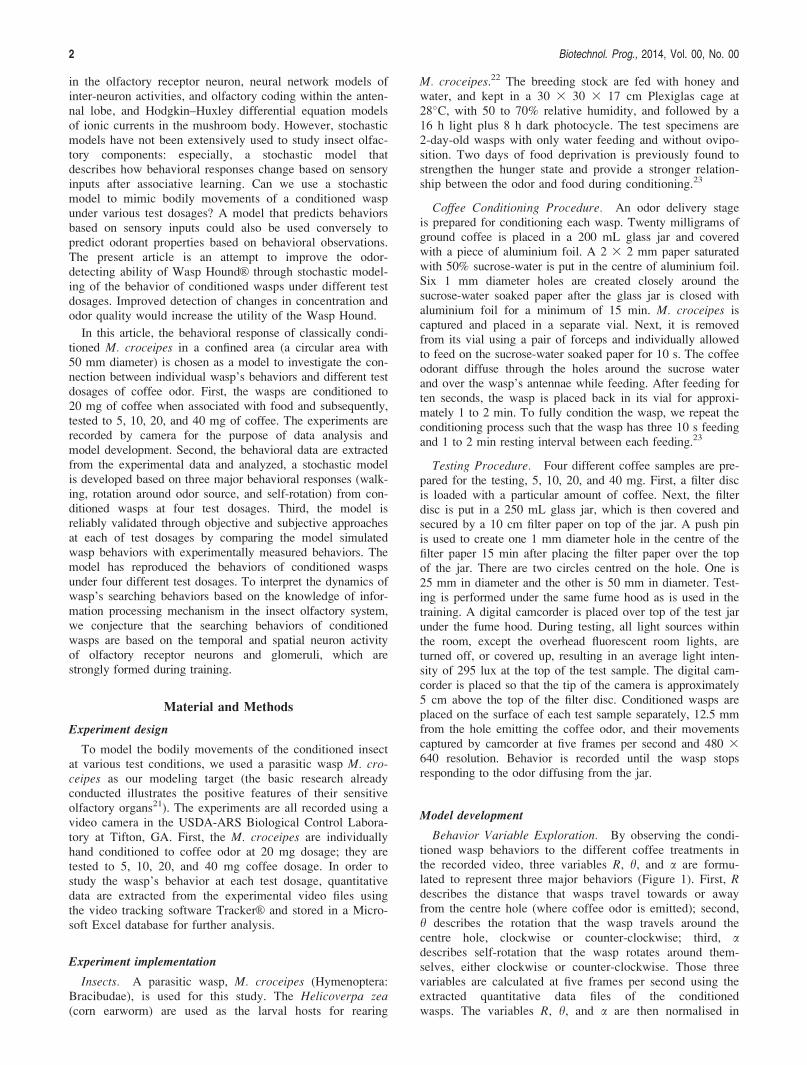
Behavior Variable Exploration. By observing the condi-tioned wasp behaviors to the different coffee treatments inthe recorded video, three variables R, h, and a are formu-lated to represent three major behaviors (Figure 1). First, Rdescribes the distance that wasps travel towards or awayfrom the centre hole (where coffee odor is emitted); second,h describes the rotation that the wasp travels around thecentre hole, clockwise or counter-clockwise; third, adescribes self-rotation that the wasp rotates around them-selves, either clockwise or counter-clockwise. Those threevariables are calculated at five frames per second using theextracted quantitative data files of the conditionedwasps. The variables R, h, and a are then normalised in
2 Biotechnol. Prog., 2014, Vol. 00, No. 00
non-dimensional form by introducing the following variablesu, c, b.
u5Rn
L: (1)
where L 5 the diameter of the inner circle from the surfaceof the testing jar which is a constant value of 25 mm.Rn. 5 the distance of wasp head from the centre when timeis n.
c5hn2h0
2p: (2)
where h0. 5 the initial rotation in radians when time is 0.hn. 5 the rotation (radians) when time is tn.
b5an2a0
2p: (3)
where a0 5 the initial self-rotation in radians when time is 0.an 5 the self-rotation (radians) when time is tn.
We have used two independent data sets: one for themodel development and the other for the model validation ateach dosage level (Table 1).
By using variables u, c, and b, we can make a reasonablecomparison of a wasp’s response between each conditionedwasp under different dosages. Similar analyzes are conductedin our previous study except for the derivation and imple-mentation variable u.24 An exponential relationship existsfor variable u with an approximately constant variance, anda strong linear relationship is found for variables c and bwith increasing variance (Figure 2).
Model Assumptions. The model describes the behavioraldynamics of conditioned wasps based on three major bodilymovements, which we assume to be independent of eachother to simplify the modeling. Particularly, the model isbuilt to compute the distance, rotation, and self-rotationacross various test dosages as a function of time.
The main assumptions of the model are as follows:
i. The major searching behaviors of the wasps (linearmovement, self-rotation, and rotation around centre) arerelated and affected by the conditioning and testingtreatments.
ii. The odor concentration diffused through the centre holeis assumed to be constant throughout the test.
iii. The minor movements of the wasp’s head, antennae,wings, and legs are ignored at this stage. Only threemajor movements are investigated in this study, and it isassumed that the three behaviors captured by three varia-bles previously described are correlated with the testtreatment.
iv. All the wasp data analyzed in this study are from thosewho had searching behaviors that lasted at least 20 s ormore during the test.
v. Only the data during the first 20 s are analyzed due tothe various reaction times of each wasp during the test.The wasps that searched for fewer than 20 s during thetest are not included in the model development.
Model Equations. The model is based on a deterministicequation for behavior variable u (Eq. 4), and two stochasticdifferential equations for c and b (Eqs. 10 and 11).
Model equation for variable u. The model equation forvariable u is an exponential decaying process because weassume the variance value is constant.
uðtÞ5A0e2kt1B0: (4)
where A0, k, and B0 are parameters calculated from the meanof Eq. 1.
Model equations for variable c and b. The equations forc and b are developed using the theory of stochastic differ-ential equations based on Ito calculus (Klebaner, 1998).25
We only give the relevant derivations for our model devel-opment in this section.
If yðtÞ is a stochastic process, and the related stochasticdifferential equation (SDE) in the integral form can be writ-ten as follows:
y tð Þ5ðt
t0
ldt1
ðt
t0
rdwðtÞ: (5)
where t is time, t0 is initial time, l is the drift coefficient, ris the diffusion coefficient and wðtÞ is the standard Wienerprocess with zero mean and variance t. Equation 5 isusually written in the differential form but it can only beinterpreted in the integral form.25 As the Weiner process isMarkovian (memory less property), y(t) is Markovian withmartingale properties.25 The differential form of Eq. 5 canbe written as,
dyðtÞ5ldt1rdwðtÞ: (5a)
As wðtÞ is a nondifferentiable function, the second termon the right hand side of Eq. 5 should be interpreted as an
Figure 1. Schematic diagram of variables R, h, and a.
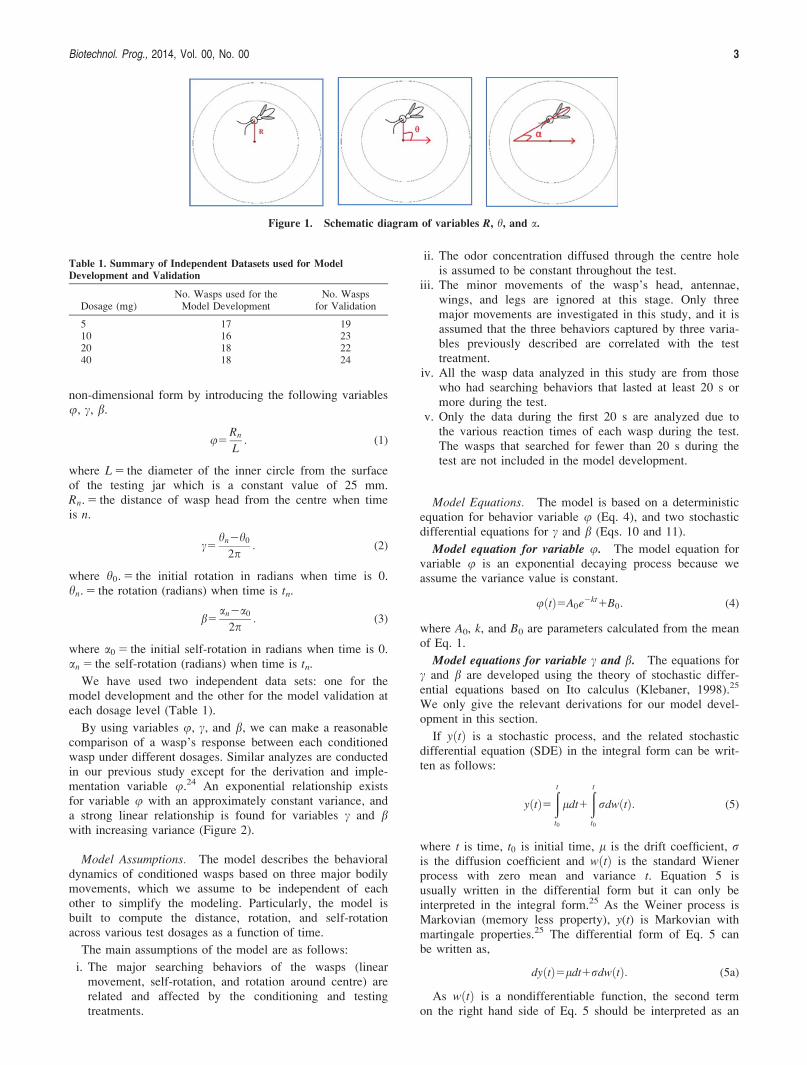
Table 1. Summary of Independent Datasets used for Model
Development and Validation
Dosage (mg)No. Wasps used for the
Model DevelopmentNo. Wasps
for Validation
5 17 1910 16 2320 18 2240 18 24
Biotechnol. Prog., 2014, Vol. 00, No. 00 3

Ito integral.25 In this derivation we assume l and r to beconstants. The expectation of Eq. 5 can be written as:
E½y tð Þ�5E
ðtt0
ldt
24
351E
ðtt0
rdw tð Þ
24
35:
Using the fact that E½dw tð Þ�50,
E y tð Þ½ �5lt1C0: (6)
where C0 is a constant. Then the variance of y(t) can beobtained:
Var y tð Þ½ �5E y tð Þ2E y tð Þ½ �ð Þ2h i
:
5E y2 tð Þ� �
2ðE½yðtÞ�Þ2:
E y2 tð Þ� �
5E
ðtt0
ldt1
ðtt0
rdwðtÞ
24
35
28<:
9=;:
5E ððt
t0
ldtÞ212
ðt
t0
ldt
0@
1A ðt
t0
rdwðtÞ
0@
1A1ð
ðt
t0
rdwðtÞÞ28<:
9=;:
From isometry property,25 Eððt
t0
rdw tð ÞÞ25
ðt
t0
r2dt,therefore
E½y2ðtÞ�5E ðlt1C0Þ212ðlt1C0Þðt
t0
rdt
� �1
ðt
t0
r2dt
� �
5
ðt
t0
r2dt5r2t1C1
(7)
where C1 is a constant.
If y tð Þ is given by Eq. 5 then the mean and variance of ytð Þ are linear functions of t provided that l and r are con-
stants. Conversely, if any stochastic variable is found tohave mean and variance as linear functions of time, then thatvariable can be approximated as obeying a SDE in the formof Eq. 5.
Therefore, we can write
c tð Þ5ðt
0
m1dt1
ðt
0
ffiffiffiffiffiffim2
pdwðtÞ: (8)
b tð Þ5ðt
0
m3dt1
ðt
0
ffiffiffiffiffiffim4
pdw tð Þ (9)
Now we can develop the differential equations of the vari-able c (rotation around the centre point) and the variable b(self-rotation) as stochastic (Markov) processes withincreased mean and variance values from Eqs. 8 and 9.
c t1dtð Þ5 c tð Þ1 m1dt1m21=2dwðtÞ: (10)
b t1dtð Þ5 b tð Þ1 m3dt1m41=2dwðtÞ: (11)
where m1; m2; m3; and m4 are parameters calculatedfrom the experimental mean and variance of Eqs. 2 and 3.dw(t) is the increments of the standard Wiener process w(t).w(t) is normally distributed with zero mean and Dt. variance,for dw mean value is 0, variance is Dt ð50:0001Þ., standarddeviation is
ffiffiffiffiffiDtp
ð50:01).
Parameter Estimation. The specific set of parametersgiven in Table 2 is experimentally measured. The parametervalues A0, k, and B0 for u (Eq. 4) are estimated using non-linear regression that gives the equation with the best good-ness of fit for the experimental data for u. The parametervalues m1 and m2 for c (Eq. 10), and the parameter valuesm3 and m4 for b (Eq. 11) are estimated using linear regres-sion. In addition, we further fine-turned the parameters bycomparing the simulation output to a new dataset which
Figure 2. Mean u, c, and b and variance for 20 mg dosagedata.
Table 2. The Parameters of Model Equations for each Test Dosage
After Validation
Testing Dosage (mg)
Parameters 5 10 20 40
A0 0.429274 0.347566 0.378202k 0.680581 0.267232 0.73531B0 0.127259 0.0657882 0.112158m1 20.0213 0.0092 0.0392m2 0.0853 0.0553 0.0666 0.0381m3 20.0113 0.0142 0.0207 20.0054m4 0.0561 0.0447 0.0353 0.0357
4 Biotechnol. Prog., 2014, Vol. 00, No. 00
gives the best coefficient of determination value. R2 valuesfor each parameter are given in Table 3.
Model Validation Approaches. Various validationapproaches are applied to improve the confidence in theacceptance of the model equations u, c, and b. For the deter-ministic equation u, the coefficient of determination is usedto validate the model. For stochastic equations c and b, wehave used both subjective and objective validationapproaches. The face validity test (subjective approach) isused to validate the behavior of the model visually, or onthe “surface.” The 95% confidence interval and the student’st-test are applied for objective validation.
Results
Parameter analysis
A local sensitivity analysis (LSA) can be used to under-stand the effects of an individual parameter on each variable.The parameter value at the conditioning dosage (20 mg) istaken as the standard condition, and then, the model equationis simulated by increasing or decreasing each individualparameter up to 50% from the standard value while keepingothers at their standard values.
Parameter Analysis of Model Equation u. First, theparameter A0 affects the initial value of u, which is related
to the initial position of the wasp during the test. Second,parameter k affects the decreasing rate of u, which is relatedto the time taken for the wasp to reach the centre point dur-ing the test. Lastly, parameter B0 affects the minimum valueof u, which is related to the searching area after the waspreaches the centre point. The results from LSA are consistentwith the parameter plots in Figure 3. From Figure 3A wecan see that the value of parameter A0 ranges from 0.34 to0.43; and the parameter is minimally affected by the fourtest dosages due to the similar initial position of the wasp.However, the minor differences between the average valuesof A0 indicate that the wasp can only be placed at an approx-imate initial position due to the mobility of the wasp. Figure3B shows that the general trend of parameter k increasesslightly from 0.68 to 0.95 as the test dosage increases from5 to 40 mg. Figure 3C shows that the parameter B0 slightlydecreases from 0.12 to 0.07 as the test dosage increasesfrom 5 to 40 mg. However, there is a discrepancy at 10 mgdosage for parameter k and B0 as their values (0.26 and0.06) are well below the trendline. The reason for this differ-ence at the 10 mg dosage is not known. It is possiblybecause the test dosage is close to the training dosage 20 mg(10 mg lower than training dosage), wasp may not be able todistinguish this dosage from the training dosage. In future,additional tests at 30 mg dosage (10 mg higher than trainingdosage) are needed to compare with the wasp data at 10 mgdosage.
Parameter Analysis of Model Equation c and b. Due tothe characteristic of randomness in stochastic differentialequations for c and b, we compared their mean and variancefrom 1,000 model realizations that are generated using vari-ous parameter values. The results reveal that: first, parame-ters m1 and m3 only affect the rates of change of the averagec and b, respectively; second, parameters m2 and m4 onlyaffect the variation of c and b at each time point. The
Table 3. R2 Value for the Parameters
Testing Dosage (mg)
R2 Value for Parameters 5 10 20 40
A0; k; B0 0.9264 0.9085 0.8439 0.8193m1 0.7076 0.8187 0.9356 0.8991m2 0.9197 0.9602 0.8745 0.9159m3 0.6517 0.6833 0.8771 0.86m4 0.9605 0.8537 0.9031 0.9036
Figure 3. Parameter plots from model equation u versus various test dosages. (A) Plot of parameter A0 with R2 5 0.413. (B) Plot ofparameter k with R2 5 0.8075. (C) Plot of parameter B0 with R2 5 0.585.
Biotechnol. Prog., 2014, Vol. 00, No. 00 5

parameter values of the model equation c and b at four dif-ferent test dosages are plotted in Figure 4. From Figures4A,C, we can see that parameters m1 and m3 fit a second-order polynomial function with its peak value near the20 mg dosage. The comparison between the m1 values at the5 mg and 40 mg dosages suggests that the rotation of wasparound centre point is less affected from the large test dos-age (greater than the training dosage), and is more affectedfrom the test dosage which is less than the training dosage.Figures 4B,D show that the general trend of parameterm2 .and m4 is a negative linear correlation as the test dos-age increases from 5 mg to 40 mg. This indicates that thevariation of c decreases as the wasp is exposed to higher testdosage, which means that the range of the rotation values ateach time point became smaller as the test dosage increases.
Validation Results
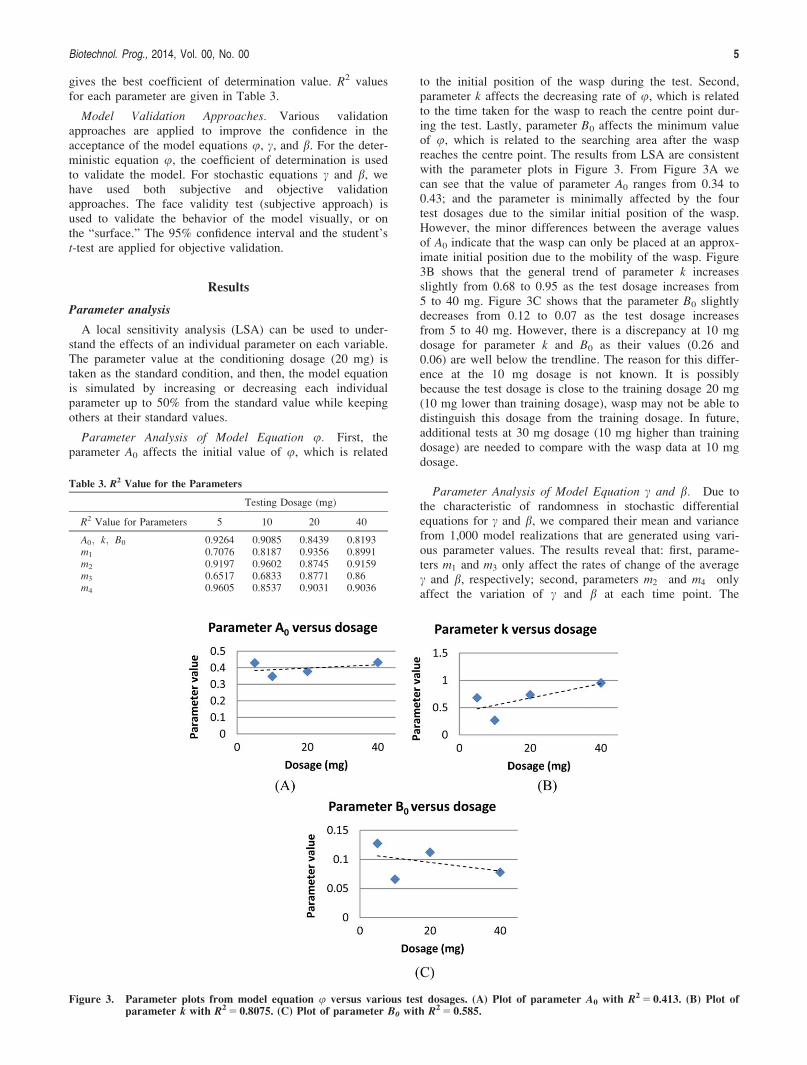
Validation Results for u. The coefficient of determina-tion R2 is determined for the purpose of validating modelequation u. The validation plot in Figure 5 indicates a stronggoodness of fit between the model simulation results andexperimental data. The R2 value ranges from 0.81 to 0.92for each test dosage.
Validation Results for c and b. There is no standardtheory on stochastic model validation. We first use a subjec-tive validation approach, a face validity test, to validate thebehavior of the model on the “surface.” Then two objectiveapproaches, the 95% confidence interval (CI) and the stu-dent’s t-test, are applied for a thorough statistical validationthat uses the same validation dataset but different model
simulations. (Please note that the validation dataset is inde-pendent to the datasets used for model development.)
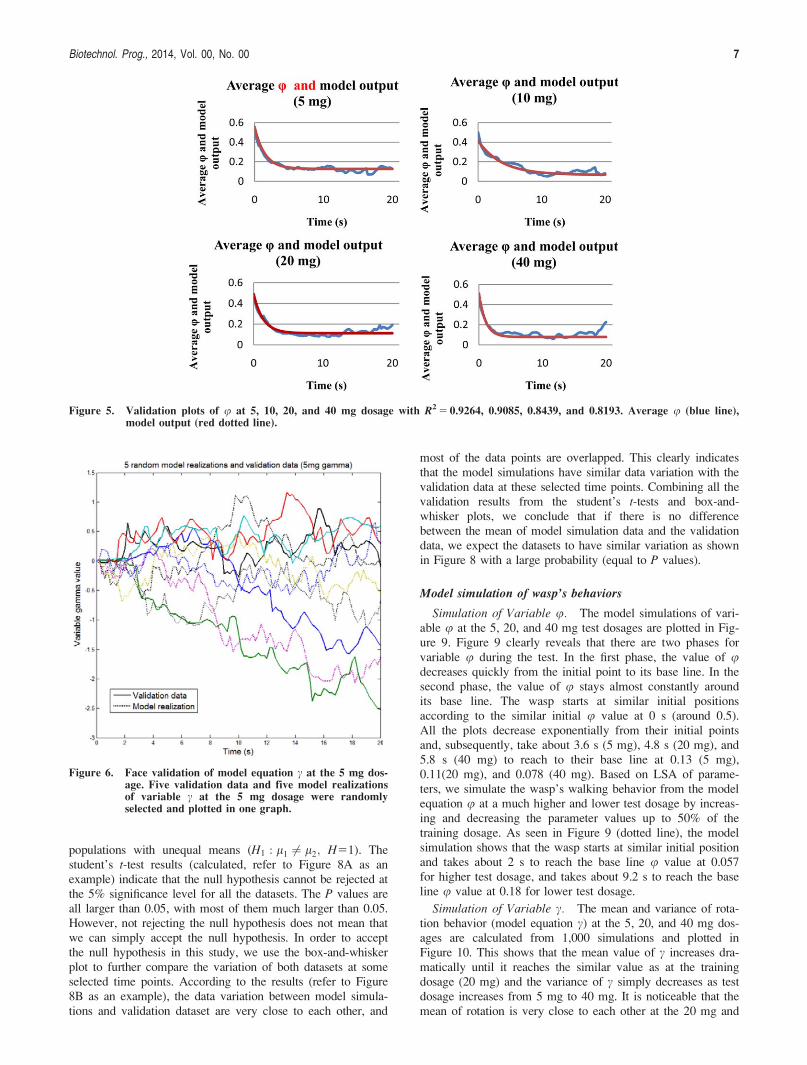
Face validity test. Five random model simulations andfive random validation datasets are plotted together and visu-ally compared at each test dosage. Taking the validation plotof c at 5 mg dosage as an example (Figure 6) shows thatthere is no obvious classification between the model simula-tion data (dotted line) and validation data (solid line). Byvisually inspecting all the validation plots, we conclude thatthe model simulations and validation data for c and b behavein a similar fashion (see Supporting Information for the plotsfor other dosages).
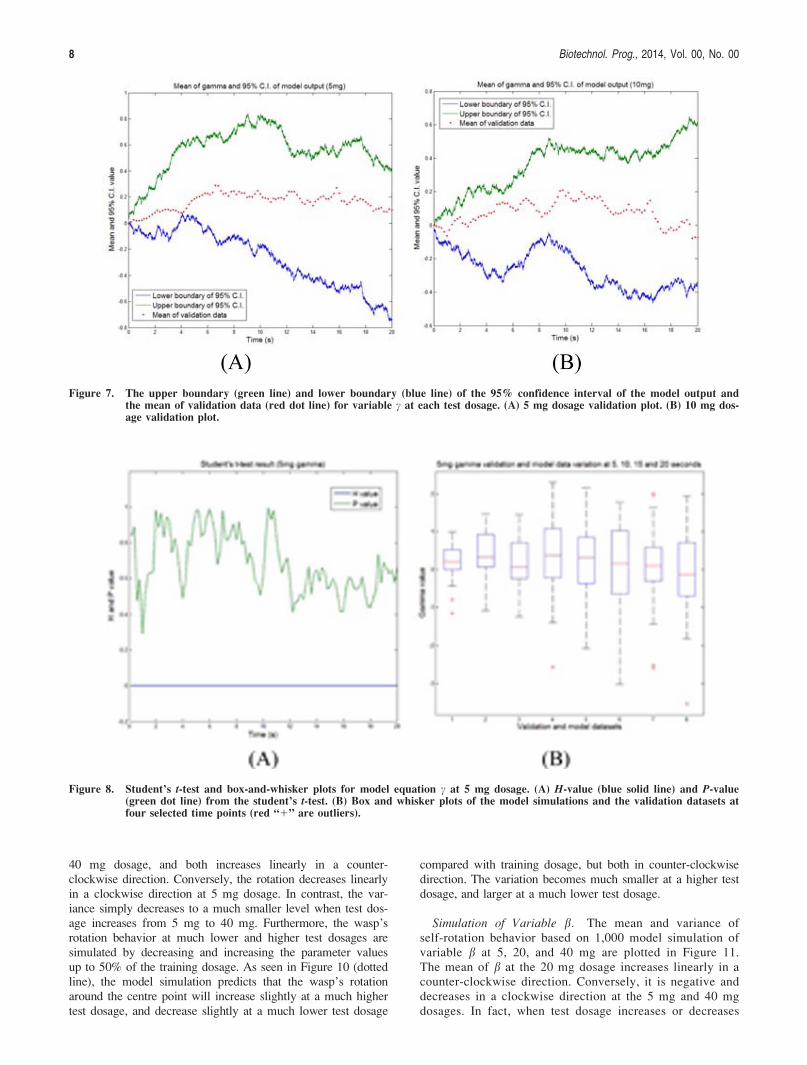
The 95% confidence interval. The 95% confidence inter-vals of the mean values from the model simulations is calcu-lated and compared with the mean values of the validationdataset at each test dosage for c and b. The validation plotsof c at 5 and 10 mg dosage (Figure 7) are listed here as arepresentative analysis. It shows that the mean values of val-idation dataset fall well within the 95% confidence intervalof the model means. The rest of validation results are all inthe range of the 95% confidence intervals of the model simu-lation means for c and b.
Student’s t-test validation. A student’s t-test for c and bare conducted by using the ttest2 function in MATLAB tocheck if the mean of model simulations and validation dataset(the same as the one used for 95% CI test) are significantlydifferent from each other at the same time point (every 0.2 sfor 20 s). The null hypothesis tested here is that the modelsimulation data and the validation data come from normal dis-tributions with equal means and equal but unknown variances(H0 : l15l2; H50). The alternative hypothesis is that themodel simulation data and the validation data come from
Figure 4. Parameter plots from model equation c and b versus various test dosages. (A) Plot of parameter m1 with R2 5 0.9947. (B)Plot of parameter m2 with R2 5 0.689. (C) Plot of parameter m3 with R2 5 0.9116. (D) Plot of parameter m4 withR2 5 0.6272.
6 Biotechnol. Prog., 2014, Vol. 00, No. 00
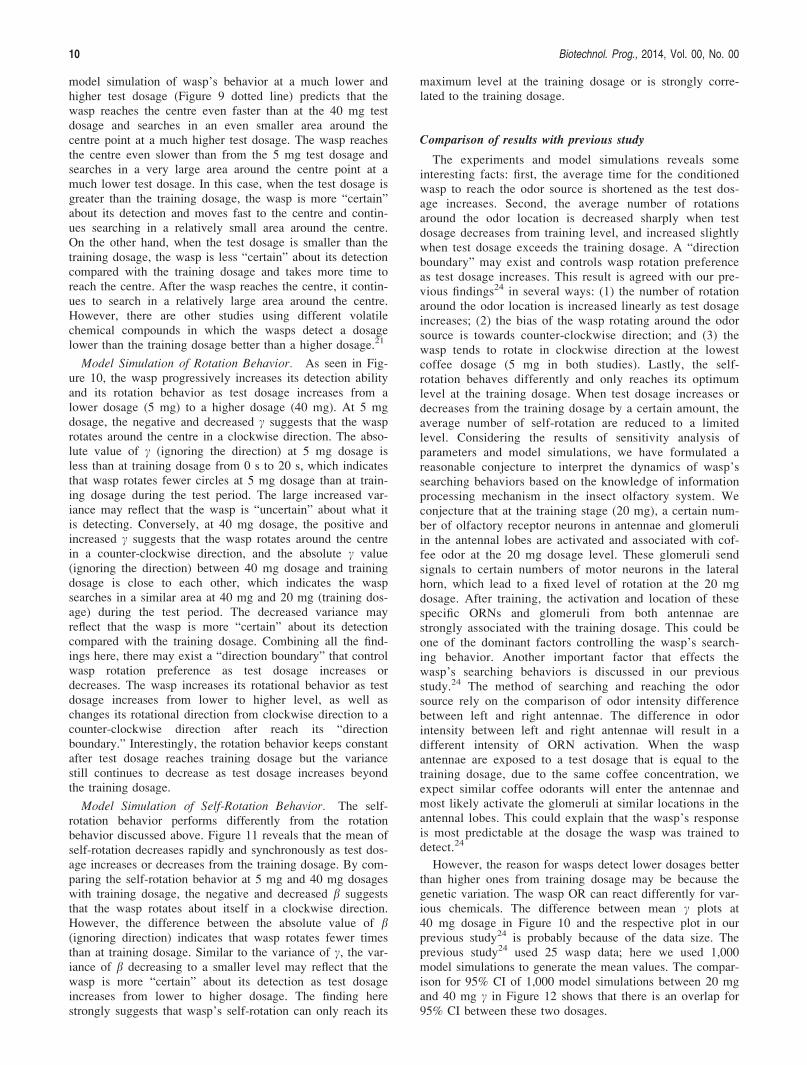
populations with unequal means (H1 : l1 6¼ l2; H51). Thestudent’s t-test results (calculated, refer to Figure 8A as anexample) indicate that the null hypothesis cannot be rejected atthe 5% significance level for all the datasets. The P values areall larger than 0.05, with most of them much larger than 0.05.However, not rejecting the null hypothesis does not mean thatwe can simply accept the null hypothesis. In order to acceptthe null hypothesis in this study, we use the box-and-whiskerplot to further compare the variation of both datasets at someselected time points. According to the results (refer to Figure8B as an example), the data variation between model simula-tions and validation dataset are very close to each other, and
most of the data points are overlapped. This clearly indicatesthat the model simulations have similar data variation with thevalidation data at these selected time points. Combining all thevalidation results from the student’s t-tests and box-and-whisker plots, we conclude that if there is no differencebetween the mean of model simulation data and the validationdata, we expect the datasets to have similar variation as shownin Figure 8 with a large probability (equal to P values).
Model simulation of wasp’s behaviors
Simulation of Variable u. The model simulations of vari-able u at the 5, 20, and 40 mg test dosages are plotted in Fig-ure 9. Figure 9 clearly reveals that there are two phases forvariable u during the test. In the first phase, the value of udecreases quickly from the initial point to its base line. In thesecond phase, the value of u stays almost constantly aroundits base line. The wasp starts at similar initial positionsaccording to the similar initial u value at 0 s (around 0.5).All the plots decrease exponentially from their initial pointsand, subsequently, take about 3.6 s (5 mg), 4.8 s (20 mg), and5.8 s (40 mg) to reach to their base line at 0.13 (5 mg),0.11(20 mg), and 0.078 (40 mg). Based on LSA of parame-ters, we simulate the wasp’s walking behavior from the modelequation u at a much higher and lower test dosage by increas-ing and decreasing the parameter values up to 50% of thetraining dosage. As seen in Figure 9 (dotted line), the modelsimulation shows that the wasp starts at similar initial positionand takes about 2 s to reach the base line u value at 0.057for higher test dosage, and takes about 9.2 s to reach the baseline u value at 0.18 for lower test dosage.
Simulation of Variable c. The mean and variance of rota-tion behavior (model equation c) at the 5, 20, and 40 mg dos-ages are calculated from 1,000 simulations and plotted inFigure 10. This shows that the mean value of c increases dra-matically until it reaches the similar value as at the trainingdosage (20 mg) and the variance of c simply decreases as testdosage increases from 5 mg to 40 mg. It is noticeable that themean of rotation is very close to each other at the 20 mg and
Figure 5. Validation plots of u at 5, 10, 20, and 40 mg dosage with R2 5 0.9264, 0.9085, 0.8439, and 0.8193. Average u (blue line),model output (red dotted line).
Figure 6. Face validation of model equation c at the 5 mg dos-age. Five validation data and five model realizationsof variable c at the 5 mg dosage were randomlyselected and plotted in one graph.
Biotechnol. Prog., 2014, Vol. 00, No. 00 7
40 mg dosage, and both increases linearly in a counter-clockwise direction. Conversely, the rotation decreases linearlyin a clockwise direction at 5 mg dosage. In contrast, the var-iance simply decreases to a much smaller level when test dos-age increases from 5 mg to 40 mg. Furthermore, the wasp’srotation behavior at much lower and higher test dosages aresimulated by decreasing and increasing the parameter valuesup to 50% of the training dosage. As seen in Figure 10 (dottedline), the model simulation predicts that the wasp’s rotationaround the centre point will increase slightly at a much highertest dosage, and decrease slightly at a much lower test dosage
compared with training dosage, but both in counter-clockwisedirection. The variation becomes much smaller at a higher testdosage, and larger at a much lower test dosage.
Simulation of Variable b. The mean and variance ofself-rotation behavior based on 1,000 model simulation ofvariable b at 5, 20, and 40 mg are plotted in Figure 11.The mean of b at the 20 mg dosage increases linearly in acounter-clockwise direction. Conversely, it is negative anddecreases in a clockwise direction at the 5 mg and 40 mgdosages. In fact, when test dosage increases or decreases
Figure 7. The upper boundary (green line) and lower boundary (blue line) of the 95% confidence interval of the model output andthe mean of validation data (red dot line) for variable c at each test dosage. (A) 5 mg dosage validation plot. (B) 10 mg dos-age validation plot.
Figure 8. Student’s t-test and box-and-whisker plots for model equation c at 5 mg dosage. (A) H-value (blue solid line) and P-value(green dot line) from the student’s t-test. (B) Box and whisker plots of the model simulations and the validation datasets atfour selected time points (red “1” are outliers).
8 Biotechnol. Prog., 2014, Vol. 00, No. 00

from the training dosage, the mean value of b decreasesrapidly. Interestingly, the variance of variable b is exactlylike the variance of variable c that decreases linearly as thetest dosage increases from 5 mg to 40 mg dosages. Fur-thermore, we simulate the wasp’s self-rotation behavior ata much lower and higher dosage by decreasing andincreasing the parameter values up to 50% from the train-ing dosage through model simulation for b. As seen in Fig-ure 11 (dotted line), the model simulation predicts that thewasp’s self-rotation will decrease as test dosage decreasesor increases from the training dosage, but the self-rotationdirection remains in counter-clockwise direction. The vari-ation between each wasp simply decreases to a smallerrange as the test dosage increases from lower to higherlevels.
Discussion
Behavioral change according to parameter analysis
The LSA of parameters from model equations clearly sug-gests that if the wasp has the same initial position (or anequal distance from its initial position to the centre point), itwill reach to the centre faster and search in a relativelysmaller area around the centre as the test dosage increases.The wasp’s rotation and self-rotation behaviors reach itsoptimum searching capability at the training dosage. How-ever, when the test dosage increases from the training dos-age, the wasp’s rotational behavior is only reduced in arelatively small range. Conversely, if the test dosagedecreases from the training dosage, the wasp’s rotationbehavior is reduced. In contrast, the wasp’s self-rotationbehavior is reduced equally according to the test dosagechanges from the training dosage.
Model simulation discussion
Model Simulation of Walking Behavior.. Figure 9 clearlysuggests that there are two phases for the conditioned waspbehavior during the test. In the first phase, the wasp movesquickly toward the centre point. In the second phase, thewasp continues to search around the centre point within aconstant area mainly rotating around the centre point androtate around itself, instead of searching by walking a dis-tance to or from the centre hole. It also reveals that the waspmoves to the centre fast at the 40 mg dosage, and thesmaller base line indicates that the wasp’s searching area inthe centre is smaller at the 40 mg dosage than the 20 mgdosage. Conversely, the wasp moves to the centre slower atthe 5 mg dosage than the 20 mg dosage, and the larger baseline indicates that the wasp’s searching area in the centre isbigger at the 5 mg dosage than the 20 mg dosage. The
Figure 9. Model output of variable u from lower to higherlevel dosage.
Figure 10. The mean and variance of model simulation c fromlower to higher level dosage.
Figure 11. The mean and variance of model simulation b fromlower to higher level dosage.
Biotechnol. Prog., 2014, Vol. 00, No. 00 9
model simulation of wasp’s behavior at a much lower andhigher test dosage (Figure 9 dotted line) predicts that thewasp reaches the centre even faster than at the 40 mg testdosage and searches in an even smaller area around thecentre point at a much higher test dosage. The wasp reachesthe centre even slower than from the 5 mg test dosage andsearches in a very large area around the centre point at amuch lower test dosage. In this case, when the test dosage isgreater than the training dosage, the wasp is more “certain”about its detection and moves fast to the centre and contin-ues searching in a relatively small area around the centre.On the other hand, when the test dosage is smaller than thetraining dosage, the wasp is less “certain” about its detectioncompared with the training dosage and takes more time toreach the centre. After the wasp reaches the centre, it contin-ues to search in a relatively large area around the centre.However, there are other studies using different volatilechemical compounds in which the wasps detect a dosagelower than the training dosage better than a higher dosage.21
Model Simulation of Rotation Behavior. As seen in Fig-ure 10, the wasp progressively increases its detection abilityand its rotation behavior as test dosage increases from alower dosage (5 mg) to a higher dosage (40 mg). At 5 mgdosage, the negative and decreased c suggests that the wasprotates around the centre in a clockwise direction. The abso-lute value of c (ignoring the direction) at 5 mg dosage isless than at training dosage from 0 s to 20 s, which indicatesthat wasp rotates fewer circles at 5 mg dosage than at train-ing dosage during the test period. The large increased var-iance may reflect that the wasp is “uncertain” about what itis detecting. Conversely, at 40 mg dosage, the positive andincreased c suggests that the wasp rotates around the centrein a counter-clockwise direction, and the absolute c value(ignoring the direction) between 40 mg dosage and trainingdosage is close to each other, which indicates the waspsearches in a similar area at 40 mg and 20 mg (training dos-age) during the test period. The decreased variance mayreflect that the wasp is more “certain” about its detectioncompared with the training dosage. Combining all the find-ings here, there may exist a “direction boundary” that controlwasp rotation preference as test dosage increases ordecreases. The wasp increases its rotational behavior as testdosage increases from lower to higher level, as well aschanges its rotational direction from clockwise direction to acounter-clockwise direction after reach its “directionboundary.” Interestingly, the rotation behavior keeps constantafter test dosage reaches training dosage but the variancestill continues to decrease as test dosage increases beyondthe training dosage.
Model Simulation of Self-Rotation Behavior. The self-rotation behavior performs differently from the rotationbehavior discussed above. Figure 11 reveals that the mean ofself-rotation decreases rapidly and synchronously as test dos-age increases or decreases from the training dosage. By com-paring the self-rotation behavior at 5 mg and 40 mg dosageswith training dosage, the negative and decreased b suggeststhat the wasp rotates about itself in a clockwise direction.However, the difference between the absolute value of b(ignoring direction) indicates that wasp rotates fewer timesthan at training dosage. Similar to the variance of c, the var-iance of b decreasing to a smaller level may reflect that thewasp is more “certain” about its detection as test dosageincreases from lower to higher dosage. The finding herestrongly suggests that wasp’s self-rotation can only reach its
maximum level at the training dosage or is strongly corre-lated to the training dosage.
Comparison of results with previous study
The experiments and model simulations reveals someinteresting facts: first, the average time for the conditionedwasp to reach the odor source is shortened as the test dos-age increases. Second, the average number of rotationsaround the odor location is decreased sharply when testdosage decreases from training level, and increased slightlywhen test dosage exceeds the training dosage. A “directionboundary” may exist and controls wasp rotation preferenceas test dosage increases. This result is agreed with our pre-vious findings24 in several ways: (1) the number of rotationaround the odor location is increased linearly as test dosageincreases; (2) the bias of the wasp rotating around the odorsource is towards counter-clockwise direction; and (3) thewasp tends to rotate in clockwise direction at the lowestcoffee dosage (5 mg in both studies). Lastly, the self-rotation behaves differently and only reaches its optimumlevel at the training dosage. When test dosage increases ordecreases from the training dosage by a certain amount, theaverage number of self-rotation are reduced to a limitedlevel. Considering the results of sensitivity analysis ofparameters and model simulations, we have formulated areasonable conjecture to interpret the dynamics of wasp’ssearching behaviors based on the knowledge of informationprocessing mechanism in the insect olfactory system. Weconjecture that at the training stage (20 mg), a certain num-ber of olfactory receptor neurons in antennae and glomeruliin the antennal lobes are activated and associated with cof-fee odor at the 20 mg dosage level. These glomeruli sendsignals to certain numbers of motor neurons in the lateralhorn, which lead to a fixed level of rotation at the 20 mgdosage. After training, the activation and location of thesespecific ORNs and glomeruli from both antennae arestrongly associated with the training dosage. This could beone of the dominant factors controlling the wasp’s search-ing behavior. Another important factor that effects thewasp’s searching behaviors is discussed in our previousstudy.24 The method of searching and reaching the odorsource rely on the comparison of odor intensity differencebetween left and right antennae. The difference in odorintensity between left and right antennae will result in adifferent intensity of ORN activation. When the waspantennae are exposed to a test dosage that is equal to thetraining dosage, due to the same coffee concentration, weexpect similar coffee odorants will enter the antennae andmost likely activate the glomeruli at similar locations in theantennal lobes. This could explain that the wasp’s responseis most predictable at the dosage the wasp was trained todetect.24
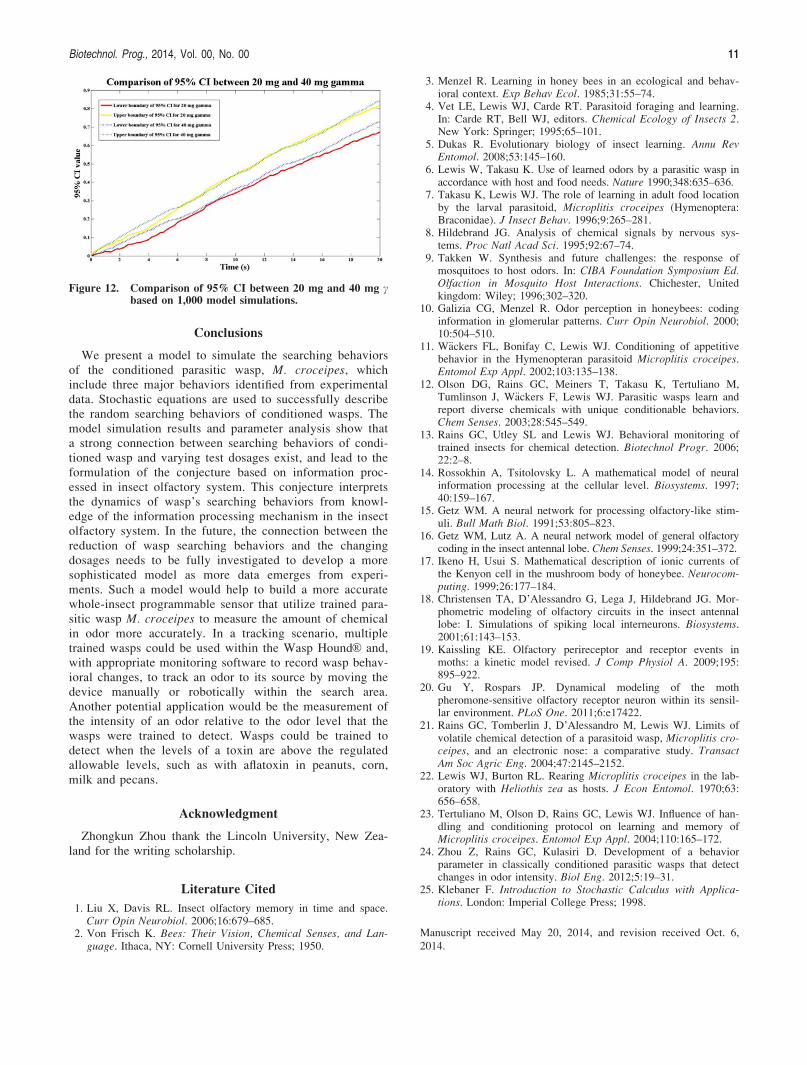
However, the reason for wasps detect lower dosages betterthan higher ones from training dosage may be because thegenetic variation. The wasp OR can react differently for var-ious chemicals. The difference between mean c plots at40 mg dosage in Figure 10 and the respective plot in ourprevious study24 is probably because of the data size. Theprevious study24 used 25 wasp data; here we used 1,000model simulations to generate the mean values. The compar-ison for 95% CI of 1,000 model simulations between 20 mgand 40 mg c in Figure 12 shows that there is an overlap for95% CI between these two dosages.
10 Biotechnol. Prog., 2014, Vol. 00, No. 00
Conclusions
We present a model to simulate the searching behaviorsof the conditioned parasitic wasp, M. croceipes, whichinclude three major behaviors identified from experimentaldata. Stochastic equations are used to successfully describethe random searching behaviors of conditioned wasps. Themodel simulation results and parameter analysis show thata strong connection between searching behaviors of condi-tioned wasp and varying test dosages exist, and lead to theformulation of the conjecture based on information proc-essed in insect olfactory system. This conjecture interpretsthe dynamics of wasp’s searching behaviors from knowl-edge of the information processing mechanism in the insectolfactory system. In the future, the connection between thereduction of wasp searching behaviors and the changingdosages needs to be fully investigated to develop a moresophisticated model as more data emerges from experi-ments. Such a model would help to build a more accuratewhole-insect programmable sensor that utilize trained para-sitic wasp M. croceipes to measure the amount of chemicalin odor more accurately. In a tracking scenario, multipletrained wasps could be used within the Wasp HoundVR and,with appropriate monitoring software to record wasp behav-ioral changes, to track an odor to its source by moving thedevice manually or robotically within the search area.Another potential application would be the measurement ofthe intensity of an odor relative to the odor level that thewasps were trained to detect. Wasps could be trained todetect when the levels of a toxin are above the regulatedallowable levels, such as with aflatoxin in peanuts, corn,milk and pecans.
Acknowledgment
Zhongkun Zhou thank the Lincoln University, New Zea-land for the writing scholarship.
Literature Cited
1. Liu X, Davis RL. Insect olfactory memory in time and space.Curr Opin Neurobiol. 2006;16:679–685.
2. Von Frisch K. Bees: Their Vision, Chemical Senses, and Lan-guage. Ithaca, NY: Cornell University Press; 1950.
3. Menzel R. Learning in honey bees in an ecological and behav-ioral context. Exp Behav Ecol. 1985;31:55–74.
4. Vet LE, Lewis WJ, Carde RT. Parasitoid foraging and learning.In: Carde RT, Bell WJ, editors. Chemical Ecology of Insects 2.New York: Springer; 1995;65–101.
5. Dukas R. Evolutionary biology of insect learning. Annu RevEntomol. 2008;53:145–160.
6. Lewis W, Takasu K. Use of learned odors by a parasitic wasp inaccordance with host and food needs. Nature 1990;348:635–636.
7. Takasu K, Lewis WJ. The role of learning in adult food locationby the larval parasitoid, Microplitis croceipes (Hymenoptera:Braconidae). J Insect Behav. 1996;9:265–281.
8. Hildebrand JG. Analysis of chemical signals by nervous sys-tems. Proc Natl Acad Sci. 1995;92:67–74.
9. Takken W. Synthesis and future challenges: the response ofmosquitoes to host odors. In: CIBA Foundation Symposium Ed.Olfaction in Mosquito Host Interactions. Chichester, Unitedkingdom: Wiley; 1996;302–320.
10. Galizia CG, Menzel R. Odor perception in honeybees: codinginformation in glomerular patterns. Curr Opin Neurobiol. 2000;10:504–510.
11. W€ackers FL, Bonifay C, Lewis WJ. Conditioning of appetitivebehavior in the Hymenopteran parasitoid Microplitis croceipes.Entomol Exp Appl. 2002;103:135–138.
12. Olson DG, Rains GC, Meiners T, Takasu K, Tertuliano M,Tumlinson J, W€ackers F, Lewis WJ. Parasitic wasps learn andreport diverse chemicals with unique conditionable behaviors.Chem Senses. 2003;28:545–549.
13. Rains GC, Utley SL and Lewis WJ. Behavioral monitoring oftrained insects for chemical detection. Biotechnol Progr. 2006;22:2–8.
14. Rossokhin A, Tsitolovsky L. A mathematical model of neuralinformation processing at the cellular level. Biosystems. 1997;40:159–167.
15. Getz WM. A neural network for processing olfactory-like stim-uli. Bull Math Biol. 1991;53:805–823.
16. Getz WM, Lutz A. A neural network model of general olfactorycoding in the insect antennal lobe. Chem Senses. 1999;24:351–372.
17. Ikeno H, Usui S. Mathematical description of ionic currents ofthe Kenyon cell in the mushroom body of honeybee. Neurocom-puting. 1999;26:177–184.
18. Christensen TA, D’Alessandro G, Lega J, Hildebrand JG. Mor-phometric modeling of olfactory circuits in the insect antennallobe: I. Simulations of spiking local interneurons. Biosystems.2001;61:143–153.
19. Kaissling KE. Olfactory perireceptor and receptor events inmoths: a kinetic model revised. J Comp Physiol A. 2009;195:895–922.
20. Gu Y, Rospars JP. Dynamical modeling of the mothpheromone-sensitive olfactory receptor neuron within its sensil-lar environment. PLoS One. 2011;6:e17422.
21. Rains GC, Tomberlin J, D’Alessandro M, Lewis WJ. Limits ofvolatile chemical detection of a parasitoid wasp, Microplitis cro-ceipes, and an electronic nose: a comparative study. TransactAm Soc Agric Eng. 2004;47:2145–2152.
22. Lewis WJ, Burton RL. Rearing Microplitis croceipes in the lab-oratory with Heliothis zea as hosts. J Econ Entomol. 1970;63:656–658.
23. Tertuliano M, Olson D, Rains GC, Lewis WJ. Influence of han-dling and conditioning protocol on learning and memory ofMicroplitis croceipes. Entomol Exp Appl. 2004;110:165–172.
24. Zhou Z, Rains GC, Kulasiri D. Development of a behaviorparameter in classically conditioned parasitic wasps that detectchanges in odor intensity. Biol Eng. 2012;5:19–31.
25. Klebaner F. Introduction to Stochastic Calculus with Applica-tions. London: Imperial College Press; 1998.
Manuscript received May 20, 2014, and revision received Oct. 6,
2014.
Figure 12. Comparison of 95% CI between 20 mg and 40 mg cbased on 1,000 model simulations.
Biotechnol. Prog., 2014, Vol. 00, No. 00 11