Computational Characterization of Diguanylate Cyclase PleD
141
Protein Allostery: Computational Characterization of Diguanylate Cyclase PleD Inauguraldissertation zur Erlangung der Würde eines Doktors der Philosophie vorgelegt der Philosophisch–Naturwissenschaftlichen Fakultät der Universität Basel von Franziska F.-F. Schmid aus Wittnau, AG Basel, 2009
-
Upload
khangminh22 -
Category
Documents
-
view
4 -
download
0
Transcript of Computational Characterization of Diguanylate Cyclase PleD

Protein Allostery:Computational Characterization of
Diguanylate Cyclase PleD
Inauguraldissertation
zur
Erlangung der Würde eines Doktors der Philosophie
vorgelegt der
Philosophisch–Naturwissenschaftlichen Fakultät
der Universität Basel
von
Franziska F.-F. Schmid
aus Wittnau, AG
Basel, 2009

Genehmigt von der Philosophisch-Naturwissenschaftlichen Fakultät
auf Antrag von:
Prof. Dr. Markus MeuwlyProf. Dr. Lennart Nilsson
Basel, den 11. November 2008 Prof. Dr. E. Parlow (Dekan)

Acknowledgment
I would like to thank my supervisor Prof. Markus Meuwly for providing me withthis very interesting project. I appreciate his guidance and the helpful discussionsthroughout my PhD study. I would also like to thank Profs. Urs Jenal and TilmanSchirmer who initiated the collaboration and provided the protein structure and bio-chemical data. It has been a wonderful experience to see the joint effort of differentscientific fields to shed light on the c-di-GMP puzzle.
I would also like to thank Prof. Lennart Nilsson who kindly accepted to act as exter-nal examiner.
It has been a pleasure to work with the members of the Meuwly group. In particular,I am indebted to Dr. David Nutt for introducing me to the world of computationalscience and I enjoyed sharing the office with Manuela Koch. English proof-reading ofthe thesis by Dr. Michael Devereux is acknowledged. Further, I would like to thankDr. Vincent Zoete, Dr. Polina Banushkina, Dr. Sven Lammers, Dr. Jonas Danielsson,Dr. Antony Fouqueau, Dr. Ivan Tubert-Brohman, Dr. Sabyashachi Mishra, Hólm-fríður Ðorsteinsdóttir, Nuria Plattner, Stephan Lutz, Jing Huang, Tobias Schmidt andMaurus Schmid.
I would like to thank Matthias and Beat Christen for their stimulating discussionsand their efforts in teaching molecular biology.
Last but not least I would like to thank my family for their unconditional support.
i

ii

Abstract
In biology, accurate cellular regulation in response to environmental signals is crucialfor the fitness of organisms. On the molecular level the modulation of protein activityis often achieved by the binding of a signaling molecule or by covalent modificationssuch as phosphorylation by kinases. Protein allostery, that is signal propagation froma distant allosteric site to functional sites to regulate the output, has long been rec-ognized but the views and perspectives have been strongly influenced by differentscientific fields and the continuous development of new methods. In particular, com-putational approaches are suited to bridge the gap between structure and dynamicsand provide insight at an atomic level.
After reviewing experimental and theoretical methods to study allostery, results fromcomputational methods applied to the diguanylate cyclase PleD are presented. First,structural and dynamical aspects of the communication between the allosteric inhi-bition site and the active site are highlighted by energy calculations and moleculardynamics simulations. Ligand binding may trigger a balance-like movement of theconserved strand β2 that potentially displaces residues required for catalysis. In ad-dition, dynamical coupling between the functional sites, i.e. simultaneous quenchingof motion upon ligand binding, is found from normal mode analysis. Furthermore,two possible communication pathways connecting the inhibition with the active siteare proposed. Second, processes involved in PleD dimerization were elucidated. Indynamics simulations the spontaneous active-to-inactive transition is observed andimplies changes in the D1/D2 interface together with a slight decrease in the dimer-ization contact area. In the proposed model the β4-α4 loop repositioning is followedby adjustments in the α4-β5-α5 face that are amplified by the extended helix α5 by aleverage effect.
iii

iv

Contents
Acknowledgment i
Abstract iii
Abbreviations vii
1 Introduction 1
2 Protein Allostery 3
3 Methods Survey 9
3.1 Elucidating biological function and pathways . . . . . . . . . . . . . . . 93.2 Structure determination . . . . . . . . . . . . . . . . . . . . . . . . . . . 13
3.2.1 X-ray crystallography . . . . . . . . . . . . . . . . . . . . . . . . 153.2.2 Cryo-electron microscopy . . . . . . . . . . . . . . . . . . . . . . 16
3.3 Protein dynamics . . . . . . . . . . . . . . . . . . . . . . . . . . . . . . . 173.3.1 Nuclear magnetic resonance (NMR) spectroscopy . . . . . . . . 183.3.2 Fluorescence-resonance energy transfer (FRET) . . . . . . . . . 21
3.4 Thermodynamics . . . . . . . . . . . . . . . . . . . . . . . . . . . . . . . 243.4.1 Isothermal titration calorimetry (ITC) . . . . . . . . . . . . . . . 24
3.5 Computational contributions to mechanistic understanding . . . . . . 243.5.1 Root-mean square deviation (RMSD) . . . . . . . . . . . . . . . 253.5.2 Root-mean square fluctuation (RMSF) . . . . . . . . . . . . . . . 263.5.3 Dynamic cross-correlated motion . . . . . . . . . . . . . . . . . . 273.5.4 Normal mode analysis (NMA) . . . . . . . . . . . . . . . . . . . 283.5.5 Biased molecular dynamics simulations . . . . . . . . . . . . . . 313.5.6 Domain identification . . . . . . . . . . . . . . . . . . . . . . . . 333.5.7 Calculation of energy contributions and hot-spot residue iden-
tification . . . . . . . . . . . . . . . . . . . . . . . . . . . . . . . . 35
v

3.5.8 Bioinformatics: sequence-structure relationship . . . . . . . . . 35
4 Bacterial Second Messenger c-di-GMP and PleD as Model System 41
4.1 Ubiquitous bacterial second messenger c-di-GMP . . . . . . . . . . . . 414.2 PleD activity under allosteric control . . . . . . . . . . . . . . . . . . . . 43
5 Results 49
5.1 Allosteric control of cyclic di-GMP signaling . . . . . . . . . . . . . . . 495.2 All-atom simulations of structures and energetics of c-di-GMP bound
and free PleD . . . . . . . . . . . . . . . . . . . . . . . . . . . . . . . . . 685.3 PleD dimerization process . . . . . . . . . . . . . . . . . . . . . . . . . . 90
6 Discussion 105
7 Future Directions 109
Appendix 129
vi

Abbreviations
A-site active siteATD anisotropic thermal diffusionc-di-GMP bis-(3’-5’)-cyclic dimeric guanosine monophosphateCheY chemotaxis protein YDCCM dynamical cross-correlation mapDGC diguanylate cyclaseDgcA diguanylate cyclase A (CC3285)EAL domain Glu-Ala-Leu domain harboring c-di-GMP specific PDE activityEM electron microscopyENM elastic network modelFRET fluorescence resonance energy transferGGDEF domain Gly-Gly-Asp-Glu-Phe domain harboring DGC activityGNM Gaussian network modelGTP guanosine triphosphateI-site inhibition siteITC isothermal titration calorimetryKNF Koshland, Nemethy and FilmerMD molecular dynamicsMWC Monod, Wyman and ChangeuxNM(A) normal mode (analysis)NMR nuclear magnetic resonanceNOE nuclear Overhause effectPDB protein data bankPDE phosphodiesterasePleD DGC protein involved in lifecycle of C. crescentus
RDC residual dipolar couplingREC receiver domainRMSD root mean-square deviationRMSF root mean-square fluctuation
vii

RR response regulatorSMD steered molecular dynamics simulationsTMD targeted molecular dynamics simulationswt wildtype
viii

1 Introduction
In biology, cellular regulation and control is crucial for organisms to be able to re-spond to drastic changes in their extracellular environments, e.g. nutrient availabil-ity, and requires adaptive responses to altered conditions. On the molecular level, thismodulation of protein activity is often achieved by binding of an effector molecule,i.e. signaling molecules which enhance or inhibit the function of a certain protein.Local perturbation by the ligand binding to the protein at an allosteric site influencesthe activity of another, often spatially distant site. Protein allostery is the processof propagating a structural and/or dynamical change from a specific site through-out the protein and thereby regulating its output, e.g. catalytic activity or furtherprotein-molecule interactions. Detailed understanding of protein function, includingthe processes of information transfer in protein allostery, is important in order to ma-nipulate signaling cascades and provide a basis for finding new potential targets inantimicrobial drug development.
Protein allostery has long been recognized and has been studied extensively in thelast decades with a variety of experimental and theoretical techniques developed inthe fields of physics, biology, chemistry and computer sciences. In the course of timethe views on protein allostery have changed and were substantially extended dueto influences from various scientific fields. The old-established notion of a changein protein shape, based on the induced-fit concept, and mechanistic structure rear-rangement is supported by the comparison of available structures of liganded andunliganded proteins. Yet, increasing data from nuclear magnetic resonance (NMR)studies and time-resolved methods emphasize the importance of protein motion anddynamics. In chapter 2 opinions on protein allostery are summarized and a survey ofmethods, describing the specific contributions and advantages of numerous experi-mental and theoretical tools, is given in chapter 3. The different approaches to studysignal transduction and allosteric mechanisms are illustrated with examples. Themain focus is on the impact of computational investigation procedures in assistingthe elucidation of protein function at a molecular level.
1

1 Introduction
In this thesis, the allosteric regulation of the diguanylate cyclase PleD of C. crescentus,which synthesizes the bacterial second messenger c-di-GMP implicated in motility,biofilm formation and pathogenicity, is characterized by molecular dynamics sim-ulations. In particular, PleD activity control via product inhibition is investigatedby studying the liganded, c-di-GMP present in the inhibition site, and unligandedprotein by means of structure and dynamics and results thereof are reported in thepublication "Schmid and Meuwly 2007" (section 5.2). Biochemical studies discoveredan additional level of PleD control, which is phosphorylation-mediated dimerization.Computational methods are applied to probe the sequence of events in the dimeriza-tion process, i.e. the local conformational loop rearrangement characteristic to CheY-like receiver domains, reorientation of the domains and the final tightening of thedimerization interface.
2

2 Protein Allostery
Allostery describes the phenomenon that a change at one site, the allosteric site, af-fects the activity at another, and in turn controls processes such as signal transmission,catalysis and turning genes on or off. Various processes such as binding of ligands,modifications via phosphorylation or glycosilation, change in pH, may trigger al-lostery. It is fascinating how nature propagates information from the allosteric site tofunctional parts of the molecule many tens of Ångströms away. Despite decades of re-search on allostery and the proposition of many mechanisms and models, presentedin the following, the detailed molecular characteristic underlying the communicationbetween distant sites is still not completely understood (see Figure 1).
Structure-function paradigm
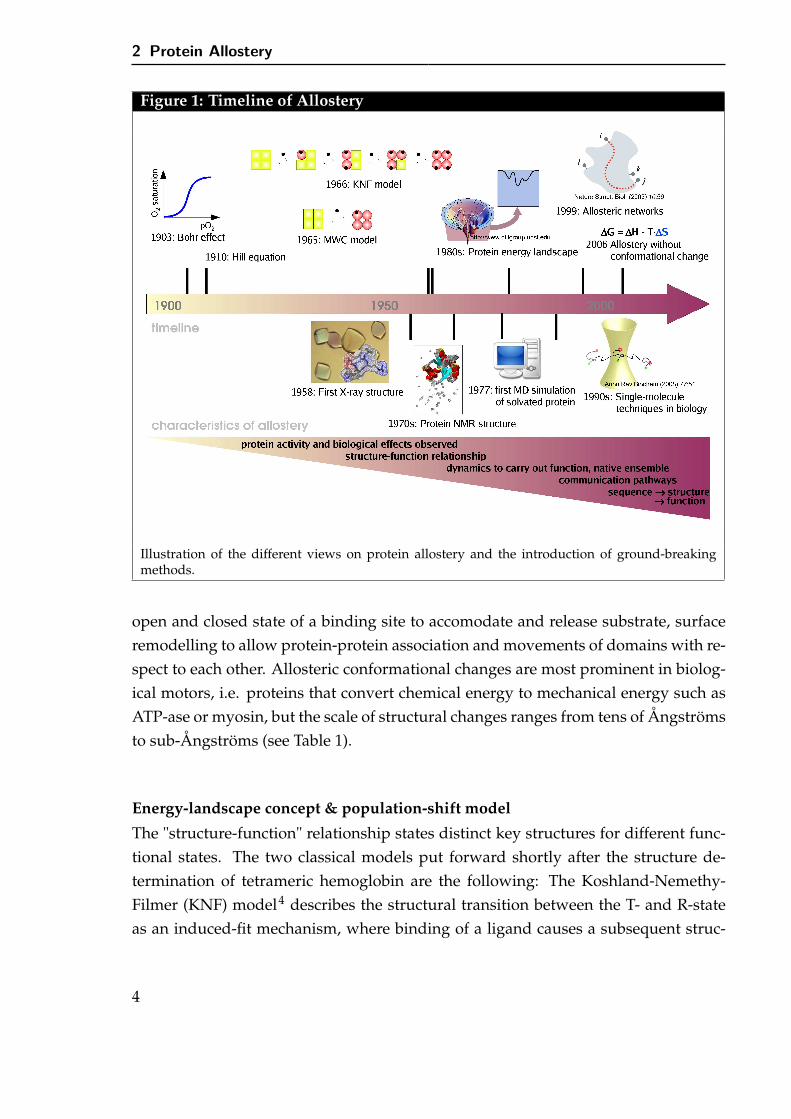
Before three-dimensional structures of biomolecular systems became available, al-lostery was investigated by measuring binding/reaction rates. Methods were devel-oped to explain the measured enzymatic reaction rates, e.g. the Hill coefficient1 toquantify cooperativity or Michaelis-Menten kinetics assuming the enzyme to be non-allosteric. Indeed, the sigmoidal oxygen binding curve of hemoglobin was measuredin 1904 by C. Bohr, long before the first structure was solved. With the determinationof the liganded and unliganded structure of hemoglobin the concentration depen-dence of the O2 binding affinity was explained by the existence of two quaternarystructures, the low-affinity deoxy T-state and the high-affinity oxy R-state.2,3 Sincethen X-ray crystallography and NMR methods have steadily improved, and now-adays high-resolution three-dimensional structures are available for approximately50,000 proteins and still growing. This increasing wealth of structural data, espe-cially if a protein is solved in different states of activation or with/without boundligand(s), allows the elucidation of structural features characteristic of a specific state.In most allostery-regulated systems a change of shape between the two distinct stateswas observed visually and hence allostery became tightly associated with a structuralchange. Even today, protein function is often explained via structural changes, e.g.
3
2 Protein Allostery
Figure 1: Timeline of Allostery
Illustration of the different views on protein allostery and the introduction of ground-breakingmethods.
open and closed state of a binding site to accomodate and release substrate, surfaceremodelling to allow protein-protein association and movements of domains with re-spect to each other. Allosteric conformational changes are most prominent in biolog-ical motors, i.e. proteins that convert chemical energy to mechanical energy such asATP-ase or myosin, but the scale of structural changes ranges from tens of Ångströmsto sub-Ångströms (see Table 1).
Energy-landscape concept & population-shift model
The "structure-function" relationship states distinct key structures for different func-tional states. The two classical models put forward shortly after the structure de-termination of tetrameric hemoglobin are the following: The Koshland-Nemethy-Filmer (KNF) model4 describes the structural transition between the T- and R-stateas an induced-fit mechanism, where binding of a ligand causes a subsequent struc-
4

2 Protein Allostery
Table 1: Amplitudes and timescales of protein motions
The complex process of allostery involves subtle sub-Ångström structural changes to large-scaledomain motions and protein-ligand associations occurring on a timescale of femtoseconds to hourswhich requires many different techniques for detection.
tural change. The subunits of hemoglobin switch independently but cooperativelyfacilitate further transitions to the high-affinity state. In contrast, the main idea ofthe Monod-Wyman-Changeux (MWC) model5 is the existence of different intercon-vertible states, e.g. all subunits of hemoglobin must exist in either the T- or R-state.Binding of a ligand leads to a shift in the thermal equilibrium towards one state. Sup-port for the latter model comes from nuclear magnetic resonance (NMR) studies thatdemonstrate the co-existence of different conformations.6,7 Even in the absence of anallosteric trigger both functional states are observed, although differently populated.Hence, ligand binding favors a pre-existing structure and the allosteric process can beviewed as a shift in the thermal equilibrium. The different co-existing conformationscan be attributed to local minima on an energy landscape8,9, a model originally devel-oped for protein folding, that are divided by energy barriers. The energy landscapeis defined as the potential energy of the system as a function of all coordinates. Inthis concept, the allosteric process changes the energy landscape by either loweringthe end state minima or lowering the energy barriers, thereby allowing transitions toother conformations.
5

2 Protein Allostery
Role of dynamics
A complete description of proteins includes not only an ensemble of conformationalstates, but also information about the dynamics, i.e. the interchange of the popu-lations.10,11 Static structures representing different functional states are so prevalentthat it is easy to forget that proteins are dynamic molecular machines and rates ofligand binding or release may be governed by conformational gating owing to theintramolecular dynamics. Advances in nuclear magentic resonance (NMR) methodsprovided data on exchange rates, populations and differences in chemical shift.10,12–14
In addition, real-time dynamics can be observed by single-molecule fluorescence res-onance energy transfer (FRET)15, a "spectroscopic ruler" to monitor distances, andmore recently using time-resolved X-ray experiments16–18 which allows the occupa-tion of intermediate states and the kinetics of conformational changes to be followedat atomic level. Such studies reveal that proteins are highly flexible, not only throughmovements of surface loops and sidechains, but also by collective motion of the corestructure.
Since the energy landscape is an intrinsic property of a protein and determines thedynamics of the system, efforts are made to map out this complex energy-landscapewhich contains the necessary information about the conformation ensembles, energybarrier heights and transition pathways. In particular, computational approachesto complement experimental data can prove very useful in providing links betweenstructure, energy and dynamics. The phenomenal increase in computer power, par-ticularly through the development of massively parallel machines, allows the studyof biomolecular systems in explicit solvent approaching microsecond timescales. Inaddition, methods exist to sample the conformational space19, to probe the instrinsicflexibility inherent in the shape of the molecule20–24 and combine experimental NMRparameters with simulations7,25.
Enthalpy vs. entropy
An allosteric event such as ligand binding changes the energy landscape and thesubsequent change in free energy governs the equilibrium shift. The free energy in-volves enthalpic and entropic contributions: structural changes and protein-ligandinteractions contribute to the enthalpic term whereas changes in protein flexibilityand dynamics alter the system’s entropy. Taking this into consideration, Tsai et al.26
proposed three types of allosteric proteins based on the protein’s main driving force:
6

2 Protein Allostery
First, proteins showing large structural rearrangements and being dominantly gov-erned by enthalpy. Second, entropy driven systems where protein motion rather thanstructure is affected, and third proteins where both enthalpy and entropy contribute.There exist numerous examples for structural changes, evident from the acceptanceof the "structure-function" relationship. Yet, a first example of a biological systemwhere allostery is mediated exclusively by the change in protein motions was discov-ered.27. Thus, allostery surely is not restricted to a "change in shape"28 and it waseven proposed that every protein has allosteric potential29.
How to get a signal from one site to the other?
Knowledge of functional key structures, their interconversion rates and protein flex-ibility are accumulating. The next major challenge is to elucidate low-energy path-ways connecting the different known stable conformations of a system and to iden-tify motions or structural features crucial for protein function. It is believed that lo-cal fluctuations (ps to ns timescale) modulate global structural transitions (µs to mstimescale) and indeed, normal mode analysis (NMA) indicates that motions driv-ing the allosteric conformational change already exist in the (crystallographic) endstates.23,30–32 Hence, analysis of these usually low-frequency modes assists the eluci-dation of functional motion. Collective motion of distant parts potentially indicatesdynamical coupling of the remote sites and domain reorientations can often be de-scribed by a hinge or shear mechanism.
It is believed that pathways connecting conformational substates are not random butpredefined and inherent to the protein because biological function is the result of evo-lutionary selection. Analysis of co-evolved residues33,34 and tracking of the energyflow through the protein35,36 highlight a communication network and argue for theexistence of specific signal transduction pathways, a concept further corroborated bymutagenesis experiments.
Understanding how a signal is communicated through a protein is a major challengein structural biology. Albeit crystallographic structures are silent about the nature ofthe transitions from one state to the other and the forces involved, increasing time-resolved data start to shed light on the dynamic processes. A complete insight intoallostery requires not only to highlight structural changes, but also the knowledgeof when and where they occur and whether these changes are correlated or sequen-tial. A useful tool to detect direct causality and coupling in allosteric processes is todrive conformational changes and watch the protein structure respond to the pertur-
7

2 Protein Allostery
bation.37–40
Clearly, protein allostery has many different aspects41 that are all to some extent ob-served in biological systems, and which need to be reconciled in a comprehensivemodel.37,42 Yet, to fully understand allostery, a continuous information exchange be-tween experimentalists and theoreticians is necessary. Based on combined data fromsimulations and experiment, mechanistic models can be proposed which in turn needverification by further experiments. In addition, advances and innovation of methodsin different scientific fields will have a considerable impact.
Views on protein allostery:
• functional states have different conformations, e.g. opening/closing of activesite
• the signal propagates along a predefined communication network which isconsistent with the sequential KNF model
• co-existing conformations on an energy landscape with ligand binding in-ducing a population-shift and being related to the concerted MWC model
• enthalpy or entropy driven protein allostery
8

3 Methods Survey
Methods were developed and/or adopted from the fields of biochemistry, physicsand computer science to get insight into protein function, regulation and allostericcontrol. The many techniques collect complementary data, such as structure, kinetics,dynamics and pathways at different levels of resolution. Together they give a morecomplete picture of how biological systems work. The following survey presentscommon tools with emphasis on the contribution of computational methods. Thelist is far from being exhaustive, but should rather illustrate aspects of signal transferfrom past successes.
3.1 Elucidating biological function and pathways
Allostery, a change in structure or dynamics induced by a modulator, is involvedin the cellular response to signals and regulation of metabolic pathways. Biologicalfunction is the complex consequence of the action of a large number of molecules thatinteract in many different ways. Comprehensive characterization and identificationof intracellular proteins, metabolites, and description of their interplay in biochemicalpathways requires analysis at the transcriptome, proteome, metabolome, and pheno-typic level (see Figure 2).
Genomics
Genomics includes the intensive efforts to determine the entire DNA sequence of or-ganisms and the investigation of single genes, their functions and roles. Understand-ing of the latter is essential and involves genetic manipulation, e.g. gene deletion orgene overexpression, followed by the determination of changes in the phenotype andmetabolism. Microarray technology is commonly used for genetic screens, a proce-dure to identify and select individuals who possess a phenotype of interest. Genomesequencing has showed that there exist conserved functional units and the study of
9

3 Methods Survey
Figure 2: Biological levels to understand cellular function
Schematic illustration of the different levels of cell control giving rise to a specific phenotype, heresurface attached bacterial community (bottom left) vs. motile individual cell (bottom right) whichis regulated by the bacterial second messenger c-di-GMP. Genomics studies the genetic informationincluding evolutionary relationships. Common manipulation tools are gene deletion or overex-pression and introducing mutations. The process of purification, identification and assessing offunction of the expressed protein is called proteomics and involves in vitro experiments and kineticstudies. Information from genomics and proteomics are then integrated into complex metabolicpathways eventually providing the basis to understand and influence the phenotype.
homologous proteins can help to find a common mechanism, a concept utilized inbioinformatics. Evolutionary relationships can also assist in finding interaction part-ners assuming two interacting proteins evolved by gene fusion and separation there-after.43 In the laboratory, genetic techniques are useful to produce a large amount ofa specific protein and even allow to introduce point mutations in defined locations.Alanine scanning mutagenesis and site directed mutagenesis are key experimentaltools to probe or confirm the importance of a specific residue involved in signal trans-
10

3 Methods Survey
fer, binding or enzymatic activity. However, it is a very time-consuming process andsuggestions coming from computational methods could narrow the search.
Proteomics
Proteins are the main components of the physiological metabolic pathways of cellsand proteomics is considered the next step in the study of biological systems, aftergenomics.
Determine the existence of proteins in complex mixtures. Cell lysis is followed by gel elec-trophoresis of the sample separating proteins according to their characteristics, suchas charge or molecular weight. The distinct bands can be visualized with either un-specific dyes, e.g. Coomassie blue, or the protein of interest can be detected with anti-bodies specific to the target protein carrying a radioactive label or a reporter enzymesuch as horseradish peroxidase. The latter approach, enzyme-linked immunosorbentassay (ELISA) is a common tool in biochemistry and cell biology studies and allowsquantitative determination of protein amounts. In addition, chromatographic sepa-ration methods including gas chromatography (GC), high-performance liquid chro-matography (HPLC) and capillary electrophoresis (CE) can be used. The presence ofthe target protein is then identified using mass spectrometry techniques.
In vitro testing for protein functionality. The study of enzyme kinetics can help us under-stand the function and regulation of enzymes. The most simple experiment is to mea-sure the enzyme velocity at different substrate concentrations and fit the data to theMichaelis-Menten model assuming steady-state conditions.44 The maximum enzymevelocity, vmax, and the concentration of substrate needed to get half-maximal velocity,Km, are easily extracted from graphical representations such as the Lineweaver-Burkplot45 or the Eadie-Hofstee diagram46 or nowadays calculated more accurately bynon-linear regression analysis. More importantly, the effect of small molecules andprotein modifications such as phosphorylation or glycosylation on the enzymatic ac-tivity of a protein is readily detected by kinetics measurements. A modulator can actas activator or inhibitor and can bind to the same site as the substrate (competitive)or to another allosteric site (non-competitive, uncompetitive) and measurements atseveral concentrations of inhibitor help to distinguish between the models of enzymeinhibition. If the modulator is identical to the substrate the term feedback control isused. If the enzyme has cooperative subunits a sigmoidal curve is observed and theadditional parameter h, the Hill coefficient, is introduced.1 A value of h = 1 corre-sponds to no cooperativity and is identical to the standard Michaelis-Menten equa-
11
3 Methods Survey
tion, while h > 1.0 and h < 1.0 correspond to positive and negative cooperativitywhere the binding of a molecule is facilitated or hindered.
Protein selection, identification and characterization of enzymatic properties enablesthe assignment of protein function. With the knowledge of substrate and productcompounds as well as allosteric mediator molecules the protein can be integratedinto a metabolic network.
Protein-protein interactions
Most proteins only function in collaboration with other proteins, RNA molecules orother small ligands. They may even require protein modifications to become a targetfor binding or interacting with a distinct set of other proteins. It is especially usefulto determine potential partners in cell signaling cascades, and methods to detect andanalyze protein-protein interactions have been reviewed.47
The yeast two-hybrid screen is a traditional method to detect protein-protein interac-tions and was originally developed by Fields and Song in 1989.48 In brief, the tran-scription factor is split into two separate fragments, the binding domain and the acti-vating domain. A "bait" protein to be tested for interaction is fused to a DNA-bindingdomain, while a library of proteins (the "prey") are fused to the activation domainand transformed into yeast. An interaction between "bait" and "prey" brings the twofragments in close proximity and initiates transcription of a reporter gene. Utilizinggenetically engineered strands that allow positive or negative selection, i.e. cells withsuccessful protein interactions live or die on the provided media, allows easy read-out. After this selection the proteins displaying the appropriate characteristics need tobe determined. This method has since been extended to detect DNA/RNA-bindingproteins and molecules that disrupt protein interactions.
In crosslinking experiments49 a covalent bond is introduced and transient interactingpartners can be identified. Exposure to UV light causes an incorporated photoreac-tive group to covalently link to nearby molecules, thus "freezing" in place any inter-acting protein as a complex. Subsequent digestion and mass spectrometric detectionof linked fragments identifies the position of binding and assists in the determinationof multimeric states.
Protein-protein interactions are of central importance for virtually every process in aliving cell. To study associations and elucidate signal transduction networks, high-throughput screening techniques were developed. Recent advances in microscopyhave begun to visualize their dynamic behavior and the localization of specific pro-
12

3 Methods Survey
teins within the cell.
Phenotype determination and establishing biochemical pathways
The phenotype is any detectable characteristic of an organism which is determined byits genotype and environment e.g. morphology, development or physiological prop-erties. To detect changes in the cellular response coming from genetic manipulation,assays have to be designed to screen for the presence or absence of the function in-vestigated. Finally, combined gene and protein information must be correlated withparticular phenotypic settings and a network of metabolic reactions can be devised,though it is a difficult task because the outputs of one enzymatic chemical reaction areinputs to other chemical reactions, creating very complex cellular signaling pathways.
All three levels - genomics, proteomics and phenotype - are interweaved and requiredto draw conclusions. In the case of the bacterial signaling molecule c-di-GMP whichcontrols motility and biofilm formation, its presence or absence is easily tested by thedetermination of the morphology of the colony, the attachment to surfaces and cel-lulose production. The protein domains synthesizing and degrading the compoundwere confirmed by in vitro studies, and genome screens for these domains discoveredthe ubiquity in bacteria. Detailed information on the function and regulation of thesecond messenger c-di-GMP is given in section 4.
Biochemical and genetics techniques
• identify the molecule of interest, e.g. protein or signaling compound, deter-mining a specific phenotype
• detect interacting partners and effects on functionality when bound
• in particular evolutionary relationships assist in elucidating common regula-tion mechanisms
3.2 Structure determination
Biochemical and genetics techniques determine the interaction partner(s) of a givenprotein, highlight the ultimate cellular characteristics known as phenotype, and at-tempt to describe the inter-relations of functional modules in biochemical pathways.
13
3 Methods Survey
However, the knowledge that a molecule binds to a protein and thereby modulatesits function gives no information on how the protein exerts function or what mech-anisms are involved in allosteric control. Thus, three-dimensional (3D) structuraldata is invaluable and has contributed tremendously to our understanding of proteinfunction at an atomic level.
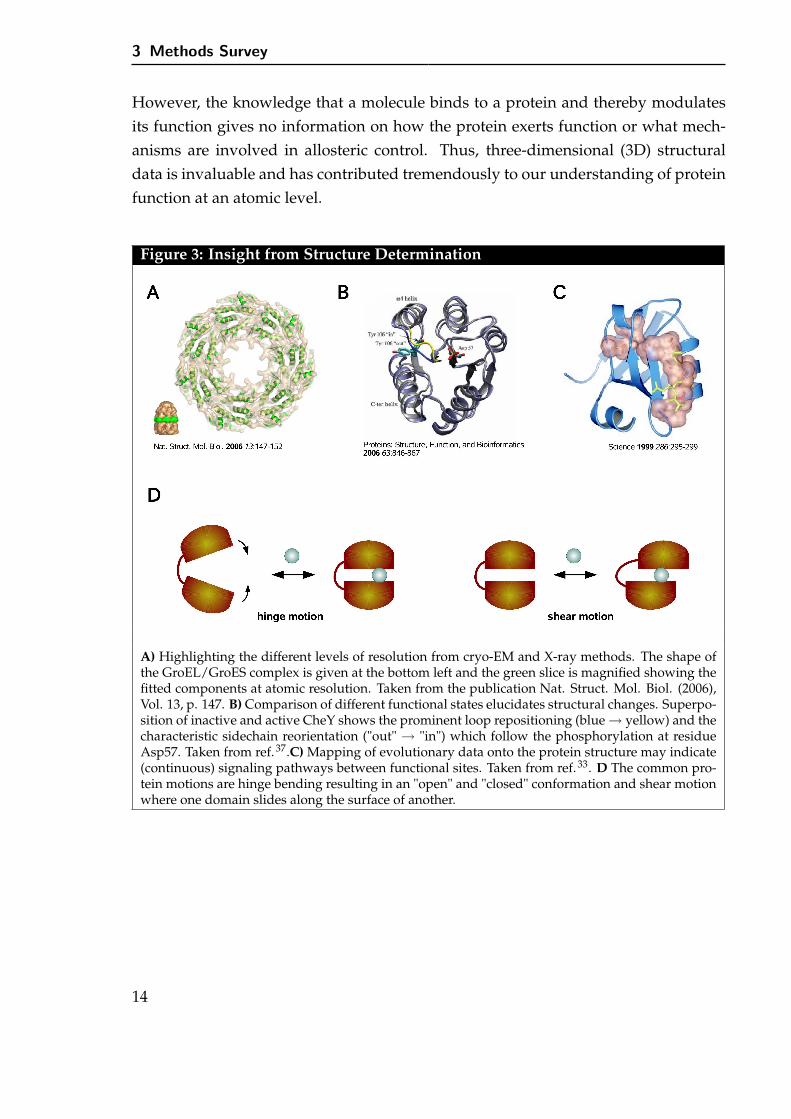
Figure 3: Insight from Structure Determination
A) Highlighting the different levels of resolution from cryo-EM and X-ray methods. The shape ofthe GroEL/GroES complex is given at the bottom left and the green slice is magnified showing thefitted components at atomic resolution. Taken from the publication Nat. Struct. Mol. Biol. (2006),Vol. 13, p. 147. B) Comparison of different functional states elucidates structural changes. Superpo-sition of inactive and active CheY shows the prominent loop repositioning (blue → yellow) and thecharacteristic sidechain reorientation ("out" → "in") which follow the phosphorylation at residueAsp57. Taken from ref.37.C) Mapping of evolutionary data onto the protein structure may indicate(continuous) signaling pathways between functional sites. Taken from ref.33. D The common pro-tein motions are hinge bending resulting in an "open" and "closed" conformation and shear motionwhere one domain slides along the surface of another.
14

3 Methods Survey
3.2.1 X-ray crystallography
Obtaining high-resolution structures
X-ray crystallography is the traditional method to elucidate structure at high reso-lution (≤ 3 Å). A beam of X-rays is directed at a crystalline sample and the diffrac-tion pattern is then interpreted to produce a 3D model of the protein. Using thismethod, the structures of numerous proteins and complexes, e.g. protein-protein,protein-small molecules, protein-DNA/RNA were solved, and it has become the ma-jor source of structural information (85% of all PDB entries). However, it is limitedto molecules that form regular crystals, hence structural information on membraneproteins and flexible fibril-like proteins is scarce. Although structural features maybe distorted by unphysiological crystallization conditions or lattice contacts, X-raycrystallography proved useful in identifying structural changes such as large-scaledomain motions or more subtle loop and sidechain reorientations that are related toprotein function. Web-based programs offer analysis and visualization of potentiallyfunctional motions for two protein conformations provided (see section 3.5.6).
CheY is the response regulator of bacterial chemotaxis and serves as a model systemfor receiver domains. Comparison of two functional states of CheY – an inactive andBeF−
3 -activated state – first revealed repositioning of the β4-α4 loop together with thecoupled sidechain movement of residues T87 and Y106 which is now a commonlyaccepted characteristic of the activation process.50 These changes are subtle and theRMSD is of a few Ångströms only. Although key structural changes were identifiedtheir exact role in the allosteric process is still under investigation and requires in-put from further methods. Another example where structural knowledge assistedin establishing a mechanistic model of function is the diguanylate cyclase PleD.51,52
Allosteric product inhibition of PleD involves cross-linking of two domains by theligand thereby frustrating domain flexibility and blocking productive encounter oftwo active sites (the model is depicted in Figure 6 B). Moreover, the structure allowedlocalization and characterization of ligand binding.
Watching a protein function
In general, X-ray crystallography provides static snapshots of the system. Time-independent acquisition of diffraction data of short-lived intermediates can be ob-tained by chemical trapping or freeze-trapping, where molecular motion is frozen bysubstantially lowering the temperature. In this case the time resolution is defined bythe offset between the reaction initiation and the flash-cooling conserving the current
15
3 Methods Survey
conformation. Advancement to true time-dependent crystallography, where pump-probe methods are used and the time progress is studied, leaving very short time fordata collection, required various technical efforts.53,54 First, triggering of the studiedreaction must be very fast (fs to ns pulse) and uniform throughout the entire crystal,e.g. adding substrate or photoactivation. Second, data acquisition time must be re-duced whilst maintaining high completeness in covering the reciprocal space. Andthird, sampled intermediate structures must be extracted from the time-dependentdata.
Although still in its early days, the technique of time-resolved protein crystallogra-phy, i.e. the capturing of a sequence of pictures allowing to "watch" the protein as itexecutes its function, has demonstrated its capability to detect quite subtle but essen-tial structural changes in myoglobin following the ligand photodissociation.16,17 Re-cently, the allosteric R-to-T transition upon ligand dissociation in dimeric hemoglobinof the mollusk Scapharca inaequivalvis was followed with time-resolved X-ray.18 Onthe timescale of microseconds, a two-step mechanism was observed: Structuralchanges in the heme region, rearrangements in the neighboring F-helix and CD-loopregion as well as disruption of the water molecule network facilitate the sidechainreorientation of residue F97 and the subsequent structural transition. Hence, time-resolved crystallography clearly provides the unique opportunity to obtain high-resolution structure information as the protein undergoes structural changes. Theconformational changes must, however, be accomodated within the crystal.
3.2.2 Cryo-electron microscopy
Cryo-electron microscopy (EM)55,56 uses a transmission electron microscope to ex-amine frozen hydrated samples providing low-resolution structures (≥ 7 Å) of largecomplexes and agglomerates. The 3D pictures indicate the overall shape and arebest suited for analysis of secondary, tertiary and quarternary structure, the levels atwhich structure-activity relationships operate. The possibility to image the shape oflarge assemblies renders cryo-EM a complementary tool to X-ray and NMR. A mostpromising approach to structural analysis is then to combine the high-resolution withthe low-resolution data. Atomic resolution structures of individual components arefitted into the EM density maps offering a more complete picture at various levels ofdetail.57
16

3 Methods Survey
The now routine collection of 3D structural information mainly using X-ray, NMRand more recently cryo-EM remains essential to characterize potentially importantstructural features and binding modes leading to mechanistic proposals for pro-tein function. Furthermore, biochemical and genetics information such as mutationsor residue conservation can be mapped onto the protein structure, establishing thestructure-function relationship. Atomic structures then provide a basis for compu-tational simulations. Additional information on time-dependent changes in struc-ture and the observation of transient intermediates will help to clarify protein mech-anisms, especially pathways between resolved structures.
Based on the three-dimensional structure
• mechanistic models are proposed from comparison of different functionalstates,
• interaction sites and binding modes are identified and characterized,
• biochemical and genetics data can be integrated to study structure-functionrelationships.
• very recently, time-resolved X-ray provides motion picture of processes.
3.3 Protein dynamics
With more and more stuctures of proteins known with high accuracy, one can eas-ily forget that proteins are dynamic machines and flex to function. Many proteinsundergo thermally driven transitions, so-called conformational changes, betweentwo or more equilibrium structures: The transitions have important functional con-sequences for binding affinities and switching of regulatory proteins. Yet, little isknown about the dynamics of these macromolecules, although growing evidence forthe population-shift model stems from nuclear magnetic resonance (NMR) spectro-copy studies. In the following, advances in NMR to characterize dynamic processes,and fluorescence-resonance energy transfer (FRET) visualizing motion in real-timeare reported.
17

3 Methods Survey
Figure 4: "Watching" proteins move
A) The exchange between two conformational states A and B can be characterized with NMR, yield-ing thermodynamics, kinetics and structural information simultaneously. If they do not exchange,their relative population is given directly by the peak integral, and the chemical shifts providestructural data. The rate of interconversion, kex, can be deduced from the lineshape distinguishingfast and slow exchange. B) Hydrogen/deuterium exchange is rapid for solvent exposed sites anddetects changes in the solvent exposed surface. The time scale of the protein motion observed isgiven by the time between quenching and analysis, often ranging from subseconds to hours. C)Fluorescence-resonance energy transfer (FRET) spectroscopy provides real-time data of distancesbetween two labeled sites. However, single-molecule resolution is required and limits the observa-tion time period.
3.3.1 Nuclear magnetic resonance (NMR) spectroscopy
Initially, nuclear magnetic resonance (NMR) experiments, a spectroscopic methodthat takes advantage of the nucleus magnetic moment by alignment with the electro-magnetic field, were applied to elucidate the solution structure of small proteins up to
18

3 Methods Survey
100 kDa. The time-consuming crystallization process required for X-ray crystallogra-phy is avoided, but the structure needs to be deduced from chemical shifts describingthe local structure and nuclear Overhauser effect (NOE) data measuring short inter-atomic distances. However, NMR can be used beyond pure structural descriptionoffering site-specific information about protein motions over a very wide range oftimescales, from picoseconds to hours. Recent advances in NMR relaxation methodsand chemical exchange measurements allow characterization of both fast, picosec-ond to nanosecond, and slow, millisecond to microsecond, protein motion.12–14,58
Slow motions are of considerable interest to allosteric transitions and ligand bind-ing, whereas fast motions have an effect on the entropy of the system.
NMR spin relaxation is an indicator of internal motion
Relaxation rates, i.e. the time needed for excited nuclear spins to return to their origi-nal equilibrium state, contain information about intramolecular dynamics at specificatomic sites. Specialized relaxation dispersion experiments have been developed,allowing determination of exchange rates between conformational states (kex), theirpopulation (pA and pB) and backbone dynamics.14,58 The dynamics information is en-coded in the intensities or lineshapes of the resonance signals, shown in Figure 4 A,but unfortunately does not provide direct structural information about the differentconformational states. To simultaneously obtain structure and dynamics, experimen-tal structural information from NOEs together with NMR relaxation data are used asrestraints in ensemble-averaged simulations.7,25 Thus, computational methods pro-vide a means to link these spatial and dynamic characteristics. This approach success-fully demonstrated that the opening movement of the two EF hands in each domainis coupled via correlated motion of the helices. Structural fluctuations in free calmod-ulin overlap with complex-like substates.7
Two distinct populations that interchange. NMR results strongly support the population-shift model,the co-existence of two different states with redistribution of their popu-lation during the allosteric event.6,7 If the exchange rate, kex, is sufficiently slow thenresonances from both states are observed and can be analyzed in terms of structure.The relative population, pA to pB, of exchanging species is given by the ratio of thepeak integrals and provides thermodynamics information. As the exchange becomesfaster, the two individual peaks disappear and a single averaged resonance line isobserved at the population-weighted average shift.
Identification of binding sites. Differences in 15N relaxation dispersion values reflect
19

3 Methods Survey
variations in the chemical shift between the two protein states, and can identifyresidues which are affected directly by ligand binding. This equilibrium perturbationNMR method proved effective in the regulatory unit of protein kinase A to identifythe known phosphate binding cassette region and hot-spot sites found previously.59
In addition, in paramagnetic NMR relaxation enhancement effects (PRE), an unpairedelectron increases the relaxation rate of other nuclei in an r−6 distance-dependentmanner, and will detect all residues within a 15 − 35 Å radius of the spin label.60 Re-cent work involves site-directed spin labels in which the label has been inserted intoproteins at a specific position to confirm, for example, conformational changes30.
Long-range information from residual dipolar couplings (RDC)
A traditional weakness of NMR is that all the structural restraints are short-rangein terms of distance, e.g. NOE restraints are only between atoms < 5 Å apart. Forlarge macromolecules the uncertainties will add up and the overall structure willbe poor even though individual regions of the structure are well defined. Residualdipolar coupling (RDC) measurements of macromolecules that are partially alignedin diulte liquid crystal solution, preventing complete averaging of the dipolar in-teraction, yield long-range angular information. This method proved useful to ac-curately define the relative orientation of individual parts with known structure inthe overall system, e.g. domains, secondary structure or subunits of complexes, andthe graphical rigid-body modelling program "Module" facilitates the reorientation ofuser-defined protein parts into a common display frame.61
Slow correlated motion. In addition to providing global structural information, RDCsalso comprise dynamics data, specifically at slow timescales in the submicro to mil-lisecond range at which allosteric processes occur. The 3D-Gaussian axial fluctua-tion (GAF) model was used to interpret the dynamics of the peptide plane in theIg-binding domain of streptococcal protein G.62 A long-range network of slow corre-lated motion transmitted across interstrand hydrogen-bonds was found. This prop-agation of slow motion across the entire β-sheet clearly has implications for under-standing collective motions and long-range information transfer in proteins in gen-eral. Furthermore, the ability to measure scalar couplings across hydrogen bonds63
allows unambiguous identification of the donor and acceptor atom, measures thestrength of interaction and can even be related to geometry64.
20

3 Methods Survey
H/D exchange studies to observe motions on the subsecond to hours timescale
Hydrogen-deuterium (H/D) exchange is a chemical reaction in which a covalentlybonded hydrogen atom is replaced by a deuterium atom when rapidly changing thesolvent from from H2O to D2O, or vice versa (illustrated in Figure 4). Usually theexamined protons belong to the amides in the protein backbone. Based on the as-sumption that the exchange rate reflects the exposure of a particular amide to thesolvent, changes in local dynamics are observed from changes in the exchange rate,e.g. upon partial unfolding or conformational changes altering the solvent accessiblesurface. H/D exchange is followed using NMR or mass spectrometry and the timescale of milliseconds to hours, inaccessible using relaxation methods, is given by theelapsed time between initiation and analysis. In NMR the disappearance or appear-ance of signals is observed by measuring multiple spectra. It is a powerful methodnot only to track slow conformational changes, but also protein-protein interactionsand protein folding.
NMR spectroscopy is an exceptionally versatile technique having exquisite time andspatial resolution, and providing the time scale of transitions, the population ofthe different states and the atomic resolution structure. NMR confirmed the co-existence of different functional states underpinning the protein energy landscapeand population-shift model to explain allostery, and is also valuable to map bindingsites. However, raw experimental data needs to be combined with additional infor-mation for interpretation. Often structure ensembles that satisfy the experimentalNMR restraints are generated with molecular dynamics simulations7,25, and NMRdata can serve to improve force fields65,66.
3.3.2 Fluorescence-resonance energy transfer (FRET)
Spectroscopy measures the interaction between light and matter, i.e. absorbance andemission. Besides time-resolved infrared (IR) and Raman spectroscopy, fluorescence-resonance energy transfer (FRET) experiments prove very promising to discover pro-tein motions, particularly in view of single-molecule resolution.
Single-molecule techniques show details of individual molecules
Recently, new techniques have been developed to measure and manipulate singlebiomolecules.67 Specific particles can be identified and tracked, and protein interac-
21

3 Methods Survey
tions or conformational changes can be observed which lead to new insights. Study-ing a single molecule, information can be obtained that otherwise would disappearin the ensemble-average, e.g. two conformations such as open and closed show dif-ferent distances but average out to a medium length in the ensemble. Moreover, itmay help validate models from molecular dynamics simulations, and even ensem-ble properties can be reconstructed from many single-molecule observations usingoccurrence-histograms.
A "spectroscopic ruler"
Fluorescence-resonance energy transfer (FRET) is based on the observation by T. För-ster in 1948 that energy is transferred non-radiatively from an excited chromophore(the donor, D) to another chromophore (the acceptor, A) by means of intermolecularlong-range dipole-dipole coupling.68 The efficiency of energy transfer (E) stronglydepends on the sixth power of the distance r between D and A,
E =1
1 + ( rR0
)6 =photons transferred from D to A
photons absorbed by D(3.1)
where R0 is the Förster radius an intrinsic property of the fluorophore. Hence, FRETis a sensitive reporter of distances in the range of 10-100 Å and often quoted as a"spectroscopic ruler" (see Figure 4 C). Improvements in site-specific attachment of flu-orescent molecules, in addition to the use of the intrinsic fluorophores Tyrosine andTryptophane, allow the measurement of specific spatial distances that are suggestedto change during protein function or allosteric processes. Suitable FRET pairs are cho-sen based on their overlap integral, excitation/fluorescence wavelength and the dis-tance of interest, being around the Förster distance R0, to have maximum sensitivity.After labeling, the functionality and proper structure of biomolecules must be con-firmed because bulky fluorophores might disturb the system. The observation timeof single-molecule fluorescence is in the range of milliseconds, and is limited by pho-tobleaching processes and the diffusion time through the observation volume if noimmobilization is used. E is generally measured using ratiometric intensity measure-ments characterizing pair distances over time (see Equation 3.1) or fluorescence life-time measurements. FRET is a popular tool for accurate measuring of single-moleculedistances applied to monitor protein movement, complex formation and to detect en-zymatic turnover.69,70 If the timescale of interconversion between an open and closedconformation is of the order of the residence time of the molecule in focus or slower,
22

3 Methods Survey
two separate E distributions are observed. One example for real-time observationof conformational motion is the demonstration of the three-step rotary movement ofthe γ subunit in F0F1-ATP synthase during catalysis.15 The detailed topological in-formation provided from FRET confirmed the opposite direction of γ rotation duringATP synthesis and hydrolysis, respectively. In addition, the duration of the FRETstates were shown to correspond to the timescale of the catalytic event. Furthermore,labeling of each interaction partner will give information on complex formation andtheir respective orientation. In FRET-based bioassays enzymatic cleavage releases thedonor and acceptor moiety separately into the solution, and the donor fluorescenceis no longer quenched. Fluorescence lifetime imaging microscopy (FLIM) providesthe localization of labeled particles within a cell, e.g. the membrane or the nucleus,which is of particular importance in in vitro studies.
FRET provides accurate spatial information over the course of time and has become avery useful tool of structural biology, indeed. Due to the fact that distances are mea-sured, structure is needed to relate them to corresponding conformational changes.The remaining challenge is to find appropriate labeling sites that characterize func-tional motion in proteins.
Protein dynamics
• NMR yields
1. populations together with their structure
2. timescale of exchanging states
3. identifies residues involved in binding molecules that show structural ordynamics changes
• single-molecule techniques detect characteristics of individual molecules other-wise hidden in the population average
• FRET detects distance changes in real-time
23

3 Methods Survey
3.4 Thermodynamics
3.4.1 Isothermal titration calorimetry (ITC)
Calorimetry measures the heat of chemical reactions or physical changes and is oftenused to study the thermodynamics of ligand binding. Isothermal titration calorimetry(ITC) directly determines binding affinity (Ka), enthalpy changes (∆H) and bindingstoichiometry (n). The association free energy ∆G and the entropic component canthereby be calculated using the formula
∆G = −RTlnK = ∆H − T∆S. (3.2)
Known amounts of ligand are titrated into the sample cell causing a temperaturein-/decrease in the case of exothermic or endothermic reactions, respectively. Theheat needed to maintain constant temperature is usually plotted as a function of timeshowing spikes at every ligand injection. The calculated total heat as a function ofthe molar ligand-protein ratio eventually yields thermodynamic information aboutthe binding process. Knowledge about the enthalpic and entropic components tobinding affinity became particularly relevant in view of protein dynamics governingallostery.27
Thermodynamics
• yields information about the total free energy change (∆G) which is related tothe binding affinity
• extracts separate contribution from enthalpy (∆H) and entropy (∆S), i.e. struc-ture and dynamics of the biomolecular system
3.5 Computational contributions to mechanistic
understanding
Computational approaches serve as a link between structure and dynamics.71–73 Thewidely used classical molecular dynamics (MD) simulations start from a given atom-istic structure, provided by X-ray crystallography, NMR spectroscopy or homology
24

3 Methods Survey
modeling, and numerically calculate the motion of each atom according to Newton’sequations of motion. Atoms are assigned van der Waals radii and atomic partialcharges. The interaction potential between the atoms is given by a so-called "forcefield", which contains bonded and non-bonded terms (electrostatic and van der Waalsforces). The level of accuracy of the force field depends on the question being ad-dressed and the CPU resources available. Besides classical empirical models74, forcefields containing quantum mechanics suitable to simulate chemical reactions75,76, po-larizability77 and more recently reactive force fields78,79 were developed.
The phenomenal advances in computer technology in the last decades, especiallyhigh-performance parallel computing, has opened the possibility to investigate largeprotein systems in explicit solvent for timescales reaching microseconds, and cul-minated in the simulation of an entire virus.80 However, following full atomisticmotions in biomolecules in the time range of microsecond to seconds at which in-terconversion of allosteric subconformations take place is still not feasible with con-ventional simulations. Methods have been devised to tackle the time limitations,for example coarse-graining, the use of multiple-timescales, normal mode analysis,steered/targeted MD or Monte-Carlo sampling.
Computational approaches not only provide direct insight into protein dynamics atan atomic level, but also give energetic information. Atomic motions are easily vi-sualized, and following the propagation of structural changes often results in theproposal of mechanistic models for protein function, highlighting the role of variousstructural motifs. Lately, the transition between known structural states is increas-ingly addressed in terms of causality, i.e. a sequence of events, and changes in pro-tein flexibility. In addition, it is relatively straightforward to introduce mutations,to generate and characterize short-lived intermediates or to perturb the system andmonitor subsequent changes, the latter being important to study signal transfer as inallostery. Computational methods are complementary to experiments insofar as po-tential mechanistic models based on simulations need verification with experimentaldata, while computations can assist in interpreting these data.
3.5.1 Root-mean square deviation (RMSD)
The root-mean square deviation (RMSD) is a quantitative measure of the distancebetween two superimposed structures, for example X-ray structures of different con-formations.
25

3 Methods Survey
RMSD =
√
√
√
√
1N
N
∑i=1
(ri − r0i )
2 (3.3)
N is the total number of atoms and ri is the current position of atom i while r0i denotes
the reference position. In MD simulations, the RMSD with respect to the initial start-ing structure is often plotted as a function of time, and is used to assess the extentof structural relaxation in the equilibration phase and to ensure the stability of thesystem throughout the entire simulation. Generally, the RMSD for backbone atoms isof the order of a few Ångströms. Large distortions from the experimental structuremay be prevented by energy minimization using position constraints prior to molec-ular dynamics simulations. Prominent structural changes during the trajectory arereadily observed as a sudden in- or decrease in RMSD simultaneously indicating thetimescale.
Before calculating the RMSD the two structures need to be aligned with care to re-move contributions from translation and rotation of the entire molecule. In multido-main proteins this process is especially delicate. Reorientation of domains with re-spect to each other can be detected by fitting on one domain but calculating the RMSDfor the entire protein. Corresponding hinge axes can be identified using additionalmethods (details in section 3.5.6). One possible drawback of calculating RMSDs isthe fact that it is an overall property, i.e. the same overall RMSD is obtained for rear-rangement of "rigid-like" domains and structural changes within the domains with-out affecting their global orientation.
3.5.2 Root-mean square fluctuation (RMSF)
Root mean-square fluctuations (RMSF) correspond to the time-averaged fluctuationsof the atom position around a reference position, e.g. average structure or initialstructure, and characterize the atom’s mobility. Superposition of all snapshots is nec-essary to exclude rotational and translational motion of the molecule occuring duringthe simulation, thereby restricting analysis to internal motions of the molecule only.Calculated RMSF values can be related to B-factors from X-ray experiments:
B−factor =8π2
3· RMSF2 (3.4)
RMSF and B−factors are a measure of flexibility, e.g. regions of high RMSF values
26

3 Methods Survey
correspond to very flexible regions, and agreement between the pattern of flexibleand rigid regions obtained from theory and experiment corroborates the usefulnessof MD simulations. However, it should be noted that crystal contacts have a poten-tial influence. Comparing the RMSF profile for free and ligand-bound proteins canindicate changes in protein dynamics that may be related to protein function suchas providing the necessary flexibility to orient residues allowing enzyme reactions orligand accomodation, and having entropic consequences.
3.5.3 Dynamic cross-correlated motion
Analysis of correlated motion is important to highlight regions of the protein thatmove in a concerted manner, that is sites which are motionally coupled and possiblycould communicate signals.81,82 Correlation maintained during simulations denotescontact between structural parts and that a change in one site is reflected by residuesat another. After removing rotational and translational motion by superpositioningeach snapshot, the cross-correlation coefficient Cij between two atoms i and j is de-fined as
Cij =〈∆ri∆rj〉
√
〈∆ri〉2 · 〈∆rj〉2(3.5)
where ∆ri is the displacement from the mean position of atom i, for a specific pe-riod of time. The trajectory is usually divided into successive blocks to examine thetime-dependence of the correlation, Cij is determined for each block and then aver-aged. The value of Cij ranges from +1 to -1, for fully correlated and anti-correlatedmotions, respectively. If the motions of atoms i and j are random with respect toeach other, Cij is equal to 0. Commonly, cross-correlation matrices, also called dy-namic cross-correlation maps (DCCM), are used to visualize individual residues orsecondary structure elements that move in a concerted manner. In contrast to thedetection of long-range couplings implying distant communication, coupled motiondue to secondary structure, i.e. spatial or sequence proximity, present as broadeningof the diagonal for α-helices and off-diagonal for β-sheets is less interesting. Unfortu-nately, correlation coefficients do not show any information about the magnitude orthe direction of the motion.
27

3 Methods Survey
Elucidating signaling pathways based on correlated motion
Cross-correlated motion analysis was applied successfully to the elucidation of sig-nal transduction in immunoglobulin G.82 A small β-sheet (NC sheet) was identifiedas the key structure to transmit conformational changes between domain V and C.A further example is the observation of ligand induced changes of correlated motionin PleD detected even at long distances from the binding site.81 Enhancement of thecoupling between domains D2 and DGC is easily explained by the presence of c-di-GMP linking the two domains. In contrast, stronger correlation between the remotedomains D1 and D2 in free PleD seems to be allostery based and potentially influ-ences the dimerization behavior. From a more detailed analysis, two communicationpathways connecting correlated motion of the inhibition and active site can be envis-aged.
Identification of compact entities
Correlation maps can outline movements of protein parts that are strongly correlated,forming a "rigid" entity, and are often used in conjunction with normal mode analy-sis. Low-frequency normal modes describe large-scale motions which are likely func-tionally important motions, and it is desirable to dissect these into structural motifsmoving concomitantly in the same or opposite direction. Even so, careful analysisis vital and one should note that coupling of structural motifs in a small numberof low-frequency modes does not necessary imply that perturbation at one site willpropagate to the others. Many low-frequency modes must be considered to obtainproper convergence of the dynamics correlation.83
3.5.4 Normal mode analysis (NMA)
The now classic method of normal mode analysis (NMA) is a powerful approachto analyze dynamical features of biological systems, particularly in characterizinglarge-scale conformational changes and granting valuable insight at timescales of mi-croseconds or longer.20–22,31,32,84,85 Normal modes approximate the motion of the sys-tem as harmonic vibrations around a local minimum on the potential energy surface.The essential tasks to calculate normal modes are first protein minimization, and sec-ond diagonalization of the second derivatives, often called the Hessian, to yield thenormal modes and their frequencies which are the eigenvectors and eigenvalues, re-spectively.86 The most difficulties arise from the diagonalization of the 3Nx3N Hes-
28

3 Methods Survey
sian matrix, where N is the number of atoms. Storage of the Hessian requires largeamounts of computer memory, and full-scale diagonalization is often not feasible formedium to large biomolecular systems. However, several methods have been put for-ward to reduce the size of calculation considerably without sacrificing the accuracy ofthe low-frequency modes, e.g. diagonalization in a mixed basis (DIMB)87,88and blocknormal mode (BNM)22,89. Further simplifications, e.g. the elastic network model(ENM)90, where the protein is modeled as a network of oscillators (Cα-atoms) cou-pled together by uniform harmonic springs (within a given distance cutoff) are com-putationally inexpensive but still capture the system’s intrinsic flexibility reasonablywell. As long as the Hessian matrix is maintained, low-frequency modes are deter-mined by the protein shape and are largely robust against coarse-graining levels andthe potential function.23 NMA provided useful insight into the nature of collectivemotions in proteins and its usefulness and limitations are described in a comprehen-sive review.24
Simplification of complex protein motion
One of the main attractions of normal mode analysis is that the complex proteinmotion is simplified as a "superposition" of orthogonal, i.e. independent of eachother, harmonic normal modes. Each normal mode (NM) coordinate specifies a set ofatomic displacements at a specific frequency which can be analyzed separately. Low-frequency NMs are thermally well accessible and often correspond to functionallyrelevant motions. However, in no case does the lowest frequency NM correspond tosuch a functional mode and the challenge is to identify those involved in biologicalfunction.
Involvement coefficient In for specific transition. If two functional conformations areknown, e.g. active and inactive state or liganded and unliganded structure, the con-tribution of each NM to this transition can be calculated.
In =
−→X1 −
−→X2
|−→X1 −
−→X2|
·−−→EVn (3.6)
The involvement coefficient In quantifies the geometrical similarity between the n-th NM and the structural change, while
−→X1 −
−→X2 is the displacement vector between
the two conformations and−−→EVn the eigenvector of the n-th NM. Thus, one can sort
the modes in terms of their contributions and concentrate on only those with thelargest contributions. Statistically the motion lies most often along the direction of
29

3 Methods Survey
Table 2: Web-based programs to retrieve normal modes
El Némo91
http://igs-server.cnrs-mrs.fr/elnemo/start.htmlElastic network model that provides several models based on low-frequencyNMs together with their visualization.Requires conformation, if two conformations are given the contribution tothe transition is calculated additionally.
WEBnm92
http://services.cbu.uib.no/tools/normalmodesRequires conformation.
NOMAD (Normal Mode Analysis Deformation, and Definement)
http://lorentz.immstr.pasteur.fr/overlap/overlap_submission.phpUses elastic network model to calculate the overlap between the differencevectors of the two forms and each set of eigenvectors of lowest frequencynormal modes.Requires two structure superposed conformations.
oGNM (Normal Mode Analysis Deformation, and Definement)
http://ignm.ccbb.pitt.edu/GNM_Online_Calculation.htmRequires conformation.
AD-ENM Webserver
http://enm.lobos.nih.gov/Uses elastic network model.Requires conformation.DC-ENM 93 - builds a structural model for a protein in an unknown state byusing NMA and distance constraints.PATH-ENM 94 - generates transition path between two given structures.
two modes. Though, to obtain few significant low-frequency modes the two confor-mations must differ substantially in structure which is the case for motor proteins, i.e.proteins that convert chemical to structural energy, but not in signaling proteins thatundergo only subtle structural changes. Characterization of the NMs implicated inthe conformational change give hints regarding hinge regions and collectively mov-ing substructures.
NM frequency
The NM frequencies can be related to experimental spectroscopy techniques, suchas infrared and Raman spectroscopy. Though one must be aware that the har-monic approximation may not provide an adequate physical model of a biologicalmolecule under physiological conditions. In any case the frequency is an indicatorof the entropy of the system. High frequencies describe a stiff system, whereas low-
30

3 Methods Survey
frequencies are soft and involve many atoms being most relevant to allostery.
NMA provides motions that are easily accessible by the protein in a given conforma-tion, i.e. around an energy minimum, although approximated by the use of harmonicfunctions. Even so, biologically interesting motions can be explored without themuch more computationally expensive and time-consuming MD simulations. Defi-nitely, NMA has provided a great deal of insight into the nature of collective motionsin proteins.
3.5.5 Biased molecular dynamics simulations
Introducing a biased force into the conventional force field can significantly speedup processes that are not feasible yet with equilibrium MD simulations, e.g. lig-and binding/unbinding processes.38,40,95 The thereby sampled intermediate struc-tures are events that presumably happen naturally on longer time scales and revealdetails of molecular interactions such as sidechain rearrangements and H-bond net-works. In addition, thermodynamic potentials can in principle be reconstructed evenfrom irreversible processes.96,97
Steered molecular dynamics (SMD)
Steered MD simulations require "knowledge" of the direction in which the pullingforce is exerted and is at best a straight line. Recording of ligand positions and ap-plied forces reveal important structural information about binding pathways and in-teractions. In the avidin-biotin complex the ligand moves in discrete steps due to for-mation and rupture of a H-bond network.95 It should be noted that the choice of thepulling force or speed must be chosen carefully and may be guided from experimen-tal results, e.g. data from atomic force microscopy or optical tweezer experiments.
Targeted molecular dynamics (TMD)
Structural transition paths between two known conformations, an initial and a de-sired target structure, can be explored by the targeted MD method. To drive thesystem from one known state to another constraints of the form
V = k · (x − xtarget)2 (3.7)
where k is the force constant and x and xtarget are the atomic coordinates of the cur-
31

3 Methods Survey
rent and target structure, are used. The protein’s response to the induced changeis analyzed. Biased simulations driving the repositioning of the β4-α loop and thesidechain of residue Y106 were used to elucidate temporal relation and causality inthe allosteric "Y-T coupling" mechanism in CheY.37 It is essential to drive initial to endstate transitions in both directions to ensure consistence of observed binding events.If a structural change is truly cooperative similar effects are expected if the inducedand observed change are exchanged.
Umbrella sampling to construct potential of mean force (PMF)
Potential of mean force (PMF) is the energy profile along a predefined pathway.Along a meaningful reaction coordinate introduction of a harmonic potential ensuresextensive sampling at a specific point, commonly termed umbrella sampling. Mov-ing the position of the biased potential along the path while ensuring the windowsare overlapping, data of interest is acquired rapidly, even sampling events that areotherwise rare. From these data free energy barriers of conformational transitions arecalculated using the weighted histogram analysis method (WHAM). The energy bar-riers found can be compared to kinetics data and help to model the system’s energylandscape.
Anisotropic thermal diffusion (ATD) / pump-probe MD
The mechanism of signal transduction in allostery is still heavily under investigation.The propagation of local perturbations may either be transmitted through coupledmotion relying on global dynamics which are intrinsic to the protein shape and canbe explored using NMA (see section 3.5.4), or the signal may follow a defined commu-nication pathway. The latter is probed by visualizing the flow of excess energy froma specific site throughout the protein. The general idea is to introduce a perturbationat a specific residue or protein part, e.g. adding excess heat energy35 or introducinga driving force36,and to monitor the propagation through the protein. Thermal diffu-sion can be observed if the protein is first equilibrated at low temperature, freezingatomic motion (T = 10 K, RMSD < 0.05 Å), and then coupling a selection to a hightemperature bath (T = 300 K).35 The energy flow is monitored by conformational dis-tortions from the starting structure after several time-delays, taking into considera-tion the elapsed time for a signal to travel through proteins. For good path resolutionthe use of implicit solvent, using a distance dependent dielectric, is necessary. Theuse of non-equilibrium simulations greatly enhances signal-to-noise and simultane-
32

3 Methods Survey
ously decreases the simulation time needed (< 10 ps). The found diffusion processis highly non-isotropic highlighting a residue network. Results for the PDZ domainfamily are in remarkable agreement with previous co-evolution studies33, but addi-tionally indicated that van der Waals interactions is the main component of signaltransduction. Thus fast and efficient intramolecular energy propagation relies on theprecise positioning of residues and is sensitive to point mutations or minor structuralchanges such as sidechain orientations. Computational approaches are vital, provid-ing a physical basis for signal propagation.
The main application of biased MD simulations is to drive the system through somespecific transition or sequence of events which are not yet accessible to conventionalMD. Using these techniques the protein’s response to perturbation can be followed,and temporal relation and coupling of events in allosteric processes can be detectedand even energetic information can be deduced. However, the remaining challengeis to find suitable reaction coordinates to obtain meaningful information. This prob-lem is circumvented in the pump-probe approach where the flow of excess energyfrom a specific site throughout the protein directly highlights possible communica-tion routes.
3.5.6 Domain identification
A key concept to study protein structure is the domain, a compactly folded regionof a protein that has independent stability and is relatively rigid, which is jointed toother domains by flexible regions and can move relative to them. For example, theopening-closing mechanism to accomodate a substrate is a long-known functionalmotion emphasizing the structure-function relationship. Databases98–100 store collec-tions of potentially functional motions. Common protein motions identified are hingebending resulting in an "open" and "closed" conformation, shear motion where onedomain slides along the surface of another, and partial un-/refolding of the protein,the first two being illustrated in Figure 3 D.
Difference-distance plots and graph theoretic methods101 are commonly used to iden-tify rigid regions in proteins. Residues of rigid parts in the protein have small differ-ence changes in distance between two conformations. Although easy to implementand fast, this method does not provide information about the geometric proximity ofresidues. In the graph theoretic method the protein is represented as a graph whose
33

3 Methods Survey
vertices are atoms and whose edges are distance constraints described by strong localforces. Rigidity theory determines the rigid clusters and the flexible joints connectingthem, and has the advantage of requiring only a single conformation. In addition,web-based programs offer analysis and (animated) visualization for two conforma-tions provided.
Table 3: Web-based programs to highlight structural changes
DynDom102,103
http://fizz.cmp.uea.ac.uk/dyndom/Automatically determines domains, hinge axes and hinge bending residuesin proteins.Requires two structural conformations.Output: domains and hinge residues colored, axis indicated by arrow.
MolMovDB98,99 (Database of Macromolecular Movements)
http://www.molmovdb.org/Information on protein motion for given Protein Data Bank ID.Morph Server – generates and animates chemically realistic interpolationsbetween two conformations.Hinge Prediction – predicts hinge locations in a single protein structure.
DomainFinder104 (Database of Macromolecular Movements)
http://dirac.cnrs-orleans.fr/DomainFinder/Variant of normal mode analysis based on deformation energy.Free download of program.Requires single structure (PDB format).
DomainParser101 (Database of Macromolecular Movements)
http://compbio.ornl.gov/structure/domainparser/Based on network flow problem.Requires Protein Data Bank ID.
Characterization of conformational changes in terms of hinge axes, rotation pointsand shifting along surfaces offers a basis for mechanistic description of functionalmotion and critical residues for flexibility and interaction, e.g. hinge residues or H-bond networks, can be identified. The availability of web-based programs indicatedin the list below, particularly animated movies describing a possible pathway be-tween two structural conformations, has encouraged this approach to study proteinallostery.
34

3 Methods Survey
3.5.7 Calculation of energy contributions and hot-spot residue
identification
The interactions between proteins and other molecules are critical to many processesin biology, and estimations of binding free energies are desirable. Approaches for esti-mating either relative or absolute binding free energies at different levels of accuracyand computational requirements have been developed. A widely applied techniqueis the molecular mechanics generalized Born surface area (MM-GBSA) model105
which is computationally efficient and allows the decomposition of the binding freeenergy into residual contributions. This is especially useful to identify residues thatcontribute most to the association free energy105,106, so-called hot-spot residues107. Incontrast to experimental mutagenesis experiments it is relatively straightforward tointroduce mutations computationally, and hence a computational alanine scanningapproach has been described.108,109 Lately, methods were developed to estimate ab-solute binding free energies110–112 that can directly be compared to experimentallymeasured binding constants, and the effect from displacing solvent molecules is be-ing studied113. However, stringent accuracy is required to be of use in drug discoverywhere correct ranking of a list of ligands can be vital.
3.5.8 Bioinformatics: sequence-structure relationship
Knowledge of the three-dimensional structure of the protein is invaluable to startcomputational studies and to understand protein function in a mechanistic sense.Genome sequencing projects provided vast data of protein sequences. However, themajority of sequences remain without known 3D structure despite great advances inexperimental structure determination such as X-ray crystallography, NMR and high-resolution electron microscopy. To bridge this gap a lot of effort has been put into thedevelopment of computational methods to predict 3D structures (see refs.114,115 andthe comprehensive book chapters116,117).
Homology modeling
Homology modeling, also known as comparative modeling or template-based mod-eling, attempts to construct atomic-resolution of a protein based on its amino acidsequence. The general procedure involves the selection of a known structure with
35

3 Methods Survey
high sequence identity which is used as the template structure. Alignment of thetemplate with the unknown so called target sequence is followed by the model con-struction. Coordinates are generated first for the structurally conserved core fromthose of the known structure. Structurally variable loops and side-chain conforma-tions are built thereafter, and finally the model structure is refined. The success ofhomology modeling is based on the fact that evolutionary related sequences gener-ally have similar 3D structures due to the constraints of proper protein folding andprotein function. The final accuracy of the homology model is greatly affected by thesequence identity and the correctness of sequence alignment. If the sequency identityis below 30%, a region often referred to as the "twilight zone", serious errors suchas misprediction of the protein fold can occur. If no suitable template structure isavailable for comparative modeling, de novo modeling methods also called ab initio
modeling may be used. The quality of homology models does not allow processessuch as drug-design, where the exact sidechain orientation is crucial. Nevertheless,the models are useful for qualitative conclusions and can guide mutagenesis exper-iments and structure-function hypotheses. In conjunction with molecular dynamicssimulations, homology models are useful to obtain kinetics and dynamics informa-tion of the protein system.
The structural genomics project attempts to generate a diverse set of representativeexperimental structures for each class of protein folds, so that every newly discov-ered protein sequence is within modeling distance of a solved structure.118,119 Thus,reliable structure prediction methods have become very important and are assessedin the bi-annual Critical Assessment of Techniques for Protein Structure Prediction(CASP) providing a community wide platform challenging prediction teams to pre-dict structures which have been solved but not yet published. Because the volume ofdata is too large to process manually, automated structure prediction servers120 arenecessary.
Folding of intrinsically disordered regions induced by target binding
Intrinsically disordered proteins can adopt folded structures upon binding to theirbiological target. For example the TipAL protein, a bacterial transcriptional regula-tor, forms two additional α-helices induced upon complex formation with the antibi-otic, whereas in the apo structure this part is unstructured as revealed by NMR spec-troscopy.121 Based on the ligand-induced helix formation a possible mechanism forTipAL transcriptional activation was proposed where the introduced rigidity trans-
36

3 Methods Survey
Table 4: Web-based programs to generate homology models
SwissModel120
http://swissmodel.expasy.org/SWISS-MODEL.htmlA fully automated protein structure homology-modeling server.Requires protein sequence or UniProt AC code.
WHAT IF
http://swift.cmbi.kun.nl/servers/html/index.htmlProtein structure analysis program for mutant prediction, structure verifica-tion and molecular graphics.Requires aligned sequences and PDB file of template structure for homologymodeling.
mits forces to the DNA-binding parts. Intact secondary structure is also particularlyimportant for immunological signal transduction. Molecular dynamics simulationsshowed that the small NC β-sheet is the key structural fragment to transmit confor-mational changes between domains V and C, the variable and constant domains ofthe Fab fragment of immunoglobulin G.82 Coupled folding and binding is realizedto be a general mechanism of molecular recognition122, where the inherent flexibil-ity allows structural modification in response to different targets controlling cellularsignaling. Attempts to predict regions of native disorder from sequence have beenmade.123–127
Evolutionary conserved networks from sequence analysis
Evolution can be viewed as large-scale random mutagenesis with selection con-straints imposed by protein function. Residues important for function, e.g. activesite residues for enzymatic reactions or implicated in allosteric signalling, are notonly highly conserved within domain families but also co-evolved. Ranganathan andco-workers33 proposed a method to quantitatively calculate the level of conservation,comparing amino acid frequencies to their mean values after multiple sequence align-ment, and to detect energetic coupling between two residues i and j. If sites i and j
co-evolved, for functional or structural reason, a perturbation at site i will lead to achange in the amino acid distribution at site j highlighting their mutual dependence.This sequence-based statistical method was successfully applied to several proteinfamilies of distinct folds and functions33,34 such as the protein domain PDZ, trans-
37

3 Methods Survey
Table 5: Web-based programs to find potentially functional disordered parts
DISOPRED2123
http://bioinf.cs.ucl.ac.uk/disopred/disopred.htmlIdentifies dynamically disordered regions with no stable secondary structureand high flexibility in solution.Requires protein sequence.
DisEMBL124
http://dis.embl.dePredicts intrinsic protein disorder.Requires protein sequence or SwissProt ID.
DisProt
http://www.disprot.orgDatabase of protein disorder providing information about proteins that lackfixed 3D structure in their putatively native states, either in their entirety orin part.Requires search entry by keyword or sequence.
RONN125 (Regional Order Neural Network)
http://www.strubi.ox.ac.uk/RONNDatabase of protein disorder providing information about proteins that lackfixed 3D structure in their putatively native states, either in their entirety orin part.Requires protein sequence.
GLOBPLOT2126 (Intrinsic Protein Disorder, Domain & GlobularityPrediction)
http://globplot.embl.deIdentifies the tendency of order/globularity and disorder.Requires sequence or SwissProt ID.
Domain prediction from sequence
DomCut128
http://www.bork.embl.de/~suyama/domcut/Identifies domain linkers.Requires protein sequence.
DomPred128
http://bioinf.cs.ucl.ac.uk/dompred/DomPredform.htmlIdentifies domain linkers.Requires sequence.
membrane signaling receptors GPCRs or the multi-subunit protein hemoglobin. Thismethod can be automated using cluster analysis of perturbation matrices for proteinfamilies to map the global network of amino acid interactions. This method allowsidentification of potentially important residues from sequence only. Nevertheless,
38

3 Methods Survey
knowledge of structure contributes strongly to the visualization, identified residuesthat often form pathways of connected residues, and helps to find a signal transduc-tion mechanism.
Profound understanding of the relationship between protein sequence and structureis of major interest. In particular bioinformatics tools attempt to close the gap betweenthe rapid protein sequencing and the slow structure determination. Additionally, theprotein sequence can tell us about intrinsically flexible regions that are potentiallyfunctional and long-range communication routes that have developed during evolu-tion.
Contributions from computational methods:
• bioinformatics assists in providing structural models and bridges the gap be-tween vast protein sequence data and very limited protein structures
• MD gives structure at atomistic level and dynamics simultaneously
• probe signaling mechanisms: energy flow or coupled motion
• provide energetics information: binding affinity and mapping the protein en-ergy landscape
• dissect complex motion into simple movements of individual NMs and assist inthe mechanistic description of domain motion
39

3 Methods Survey
40

4 Bacterial Second Messenger
c-di-GMP and PleD as Model
System
4.1 Ubiquitous bacterial second messenger c-di-GMP
Cyclic di-guanosine-monophosphate (c-di-GMP) was first discovered as an activatorof cellulose synthase in Acetobacter xylinum (currently Gluconacetobacter xylinus) in the1980’s by Benziman and co-workers.129 However, its impact as a major cell regulatorwas discovered only recently.130–133 C-di-GMP is a novel second messenger in bacte-ria, but not in eukaryotes or Archae and intense research is conducted to elucidate itsbiological function and the interplay with cellular components134,135. To date, c-di-GMP is known to orchestrate cellular pathways implicated in bacterial cell adhesionand motility, including the swarmer-to-stalk cell transformation136,137, biofilm for-mation138,139, pathogenicity and virulence140 described in recent reviews141,142 andreferences therein.
DGCs, PDEs and c-di-GMP control the concentration of the second messenger
High cellular levels of c-di-GMP inhibit motility and activate biofilm formation, asurface-attached bacterial community embedded in an extracellular matrix. Thus, tosecure adequate regulation of the transition between motile and sessile lifestyles atight control of the cellular c-di-GMP concentration is critical. The c-di-GMP concen-tration is regulated by the opposing activity of diguanylate cyclases (DGCs), whichsynthesize c-di-GMP from two GTP molecules, and c-di-GMP specific phosphodi-esterases (PDEs) cleaving the cyclic compound into the inactive linear pGpG (seeFigure 5 A).143 Genetic analysis and biochemical characterization demonstrated thatDGC activity resides exclusively in the GGDEF domain (earlier termed DUF1)131,144–149,named after the conserved sequence motif that constitutes part of the active site. PDE
41

4 Bacterial Second Messenger c-di-GMP and PleD as Model System
activity is assigned to the EAL domain (earlier termed DUF2).144,150–152 The highabundance of GGDEF domains in the bacterial kingdom, often associated with theEAL domain, found by subsequent genome screens underlines the importance of thesecond messenger c-di-GMP and its regulation by these domains. In addition, c-di-GMP itself can modulate DGC activity by allosteric control. The ability for productinhibition was first discovered in the multidomain protein PleD of Caulobacter crescen-
tus51 and later identified as a general feature, intrinsic to the GGDEF domain and re-quiring the motif RxxD of conserved residues in the inhibition site (see section 5.1).148
Based on the X-ray structure of PleD with bound c-di-GMP a "domain immobiliza-tion" model was proposed, where c-di-GMP links domains preventing the productiveencounter of two loaded active sites (illustrated in Figure 6 B).51,52
C-di-GMP network
Fusion of the catalytically active domain GGDEF to numerous sensory domains147
allows the conversion of environmental stimuli such as change in temperature, light,pH-shift, availability of oxygen and nutrients into internal signals via synthesis ofsmall diffusible molecules, here c-di-GMP. The variety of sensory domains combinedwith GGDEF domains creates a complex network of regulatory interactions and maylink different signaling pathways. The search for c-di-GMP downstream elements hasjust begun, and the PilZ protein family was recently identified as a class of specificdiguanylate receptors.153–156
The demonstration that binding of c-di-GMP to an I-site of the GGDEF domain pre-vents further production of c-di-GMP is of medicinal relevance and renders DGCsa protential target to combat biofilm-related infections. However, unlike the estab-lished c-di-GMP controlled switch from motile single-cell lifestyle to surface-attachedmulticellular communities, a complete picture of the regulatory pathways of c-di-GMP and a detailed understanding of the mechanism of allosteric control of c-di-GMP on the GGDEF domain are still lacking. In the following PleD of C. crescentus,serving as a model system for which extensive structural and biochemical data isavailable, is characterized in detail and computational results on the allosteric regu-lation are presented in section 5.
42

4 Bacterial Second Messenger c-di-GMP and PleD as Model System
Biological function of the second messenger:
• c-di-GMP regulates motility, biofilm formation and pathogenicity
• c-di-GMP concentration is controlled by DGC and PDE activity
• c-di-GMP inhibits DGC activity which is intrinsic to the GGDEF domain
• c-di-GMP binds to the PilZ domain, a downstream receptor family
Figure 5: Biological function of c-di-GMP
A) Schematic diagram of the signaling pathway of c-di-GMP. Upon input from various sensorydomains c-di-GMP is synthesized from 2 GTP molecules by diguanylate cyclases (DGCs) and de-graded into the linear dinucleotide pGpG by c-di-GMP specific phosphodiesterases (PDEs), shownin yellow, green and purple, respectively. The second messenger is sensed by diguanylate recep-tor proteins (DGR) that have diverse output functions such as inhibition of flagellar function andbiofilm formation. Illustration according to ref. 155. B) Chemical structure of intercalated c-di-GMPand a spatial representation of dimeric c-di-GMP. C) Dynamic localization of the histidine kinasesPleC and DivJ which regulate the response regulator PleD during the cell cycle of C. crescentus.Illustration according to ref. 147.
4.2 PleD activity under allosteric control
Diguanylate cyclase PleD is a response regulator
The multidomain protein PleD of Caulobacter crescentus is a well characterized diguany-late cyclase.51,52,136,147,148,157,158 The domain architecture and a structural representa-tion of the protein is given in Figure 6 A and D. The C-terminal catalytically activeGGDEF domain (DGC) synthesizes the second messenger c-di-GMP as output signaland in turn regulates the pole remodeling which is required for the swarmer-to-stalk
43

4 Bacterial Second Messenger c-di-GMP and PleD as Model System
cell transition in the bacterial lifestyle (see Figure 5 C).136,137,159,160 The DGC domainis fused to two N-terminal CheY-like receiver domains arranged in tandem (D1 andD2), which have the (βα)5 topology typical for response regulator receiver domains(REC).51,136 The domain architecture of N-terminal sensory domains linked to a C-terminal effector domain is characteristic for response regulator proteins. Responseregulators (RR) are part of a phosphotransfer pathway, commonly referred to as two-component signal transduction, which is widespread in bacteria to "process" externalstimuli.161,162 Changes in the environment are sensed by kinases, usually located inthe membrane, and trigger the transfer of a phosphate group to a conserved residueon the RR. Phosphorylation induces a conformational change in the regulatory do-main that results in the activation of an associated domain that effects the response,and is the most common covalent modification used to achieve allosteric control inproteins. PleD is phosphorylated and dephosphorylated at residue D53 of the firstREC domain D1 by the action of the DivJ and PleC histidine kinases, respectively.Fluorescence experiments showed co-localization of DivJ with PleD to the flagellatedpole restricting c-di-GMP production spatially and triggering flagella ejection andstalk synthesis.147,157,163
Inhibition via domain immobilization
Structure determination of non-phosphorylated PleD (code 1W2551), co-crystallizedwith c-di-GMP identified an allosteric site for the mutually intercalated c-di-GMPdimer, here referred to as c-di-GMP though in reality it is [c-di-GMP]2. Binding ofc-di-GMP to this allosteric site (inhibition site, I-site) leads to strong non-competitiveinhibition of PleD as demonstrated by kinetic studies.51,148 C-di-GMP binds to theDGC domain through residues R359, D362 and R390. Moreover, c-di-GMP presentin the I-site can crosslink to either the neighboring domain D2 or to another close-by DGC domain by additional interactions to residues R148 and R178 or R313, re-spectively.51,52 Based on these structural findings a mechanistic model was suggestedwhere bound c-di-GMP locks the DGC domain in a non-productive orientation whichblocks the encounter of two GTP-loaded active sites and subsequent conversion toc-di-GMP (see Figure 6 B). The two different immobilization modes found, namelyDGC-D2 and DGC-DGC crosslinking, are redundant and the integrity of only one isrequired for non-competitive product inhibition. The occurrence of DGC-DGC im-mobilization extends the applicability of the proposed mechanistic model of domainimmobilization even to single domain proteins.
44
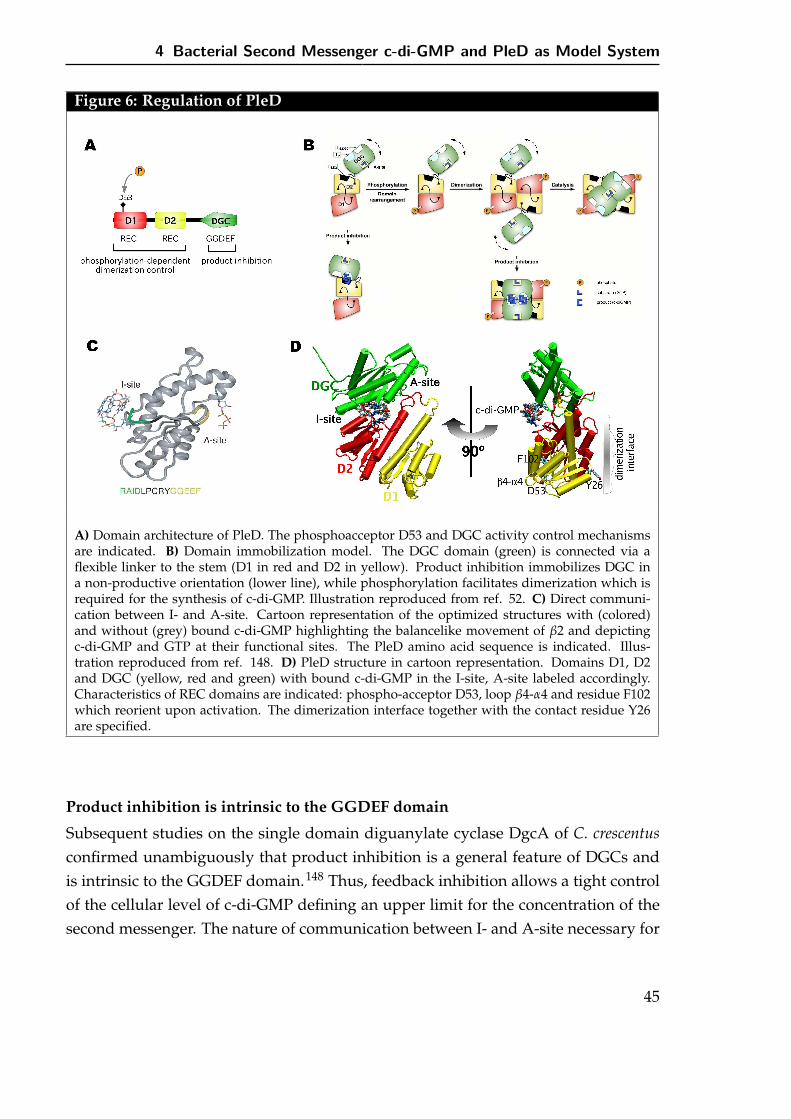
4 Bacterial Second Messenger c-di-GMP and PleD as Model System
Figure 6: Regulation of PleD
A) Domain architecture of PleD. The phosphoacceptor D53 and DGC activity control mechanismsare indicated. B) Domain immobilization model. The DGC domain (green) is connected via aflexible linker to the stem (D1 in red and D2 in yellow). Product inhibition immobilizes DGC ina non-productive orientation (lower line), while phosphorylation facilitates dimerization which isrequired for the synthesis of c-di-GMP. Illustration reproduced from ref. 52. C) Direct communi-cation between I- and A-site. Cartoon representation of the optimized structures with (colored)and without (grey) bound c-di-GMP highlighting the balancelike movement of β2 and depictingc-di-GMP and GTP at their functional sites. The PleD amino acid sequence is indicated. Illus-tration reproduced from ref. 148. D) PleD structure in cartoon representation. Domains D1, D2and DGC (yellow, red and green) with bound c-di-GMP in the I-site, A-site labeled accordingly.Characteristics of REC domains are indicated: phospho-acceptor D53, loop β4-α4 and residue F102which reorient upon activation. The dimerization interface together with the contact residue Y26are specified.
Product inhibition is intrinsic to the GGDEF domain
Subsequent studies on the single domain diguanylate cyclase DgcA of C. crescentus
confirmed unambiguously that product inhibition is a general feature of DGCs andis intrinsic to the GGDEF domain.148 Thus, feedback inhibition allows a tight controlof the cellular level of c-di-GMP defining an upper limit for the concentration of thesecond messenger. The nature of communication between I- and A-site necessary for
45

4 Bacterial Second Messenger c-di-GMP and PleD as Model System
self-regulation is still being investigated. The results presented in this work arguefor a combination of structural rearrangement and simultaneous changes in proteinflexibility. Comparison of optimized structures of PleD with and without the ligandc-di-GMP present in the I-site showed a balancelike movement of the β-strand β2which connects the two functional sites and may in turn affect the catalytic activityby displacing the enzymatic residues (see Figure 6 C).148 Moreover, a conserved RxxDsequence motif in the I-site (α2-β2 loop) together with a conserved spacer length be-tween the I- and A-site is found in more than 60% of GGDEF proteins. In addition tothe structural aspect, dynamical coupling between the two sites is revealed by nor-mal mode analysis, i.e. upon c-di-GMP binding to the allosteric site a marked drop inprotein motion is observed for both I- and A-site simultaneously.81 Binding of c-di-GMP also has long-range effects changing the domain-domain correlations, DGC-D2coupling is enhanced where D1-D2 become less correlated. Further research on theallosteric control in PleD and GGDEF domains in general is required. In particular,the exact role of the RxxD motif remains to be investigated.
Additional level of control via phosphorylation-mediated dimerization
Consistent with the symmetric condensation reaction to synthesize c-di-GMP, cross-linking experiments demonstrated that DGC activity of PleD is contained entirelywithin the dimer fraction.158 The dimerization rate and hence the c-di-GMP produc-tion depends on the phosphorylation-state of PleD and it appears that this regulationis the sole function of the first REC domain D1 and, while D53N mutation of thephosphoryl acceptor site abolishes activation ability completely. Unlike domain D1which contains all functional residues of a RR50 (D9, D10, phosphoacceptor D53, T83,F102 and K105), the role of the second REC domain is unclear and it was proposed tofunction as an adaptor.51,157
In enzymatic studies and structure determinations the unstable phosphate group isoften replaced with BeF−
3 , which is a stable functional and structural analog of thephosphoryl group.50,164–167 Indeed, BeF−
3 -activated PleD is approximately 35 timesmore active than unphosphorylated PleD158, and could be crystallized successfully52.In terms of structure, activation leads to a D1/D2 domain repositioning eventuallypromoting tight homodimerization as indicated by a 500 Å2 increase of the buriedsurface per monomer. Structural changes upon activation of receiver domains havebeen studied thoroughly on CheY50,168,169 and other receiver domains161,170 detectingthe characteristic β4-α4 loop repositioning accompanied by the sidechain rotation of
46

4 Bacterial Second Messenger c-di-GMP and PleD as Model System
a conserved Tyr/Phe residue (F102 in PleD) and a concomitant repositioning of Thr(T83) to interact with the phospho moiety. F102 being located in the D1/D2 interfacepotentially influences the domain rearrangement facilitating dimerization. However,little is known about how these well known conformational changes influence dimer-ization and are transmitted to the effector domain. In addition, the functional role ofresidue Y26 which is required for PleD dimerization is completely unknown.158
Combined genetic, biochemical and structural data showed two independent lay-ers of DGC control, product inhibition and phosphorylation-mediated dimerization.These allosteric regulations of DGC activity raise the question of how the informationis transferred between the distant functional sites. PleD X-ray structures51,52 beingavailable opens the possibility to complement experimental data with computer sim-ulations providing dynamics information together with the structure at atomic reso-lution. In the following sections, the effect of bound c-di-GMP is studied by normalmode analysis and cross-correlation maps derived from trajectories. Furthermore,the signal transmission in the dimerization process is investigated on a truncatedPleD system, considering simply the D1/D2 stem domains. Due to the substantialorientational freedom of the DGC domain vs. the stem domains that form the dimerinterface, the DGC domain is neglected. Here, we focus on events following the localβ4-α4 loop reorientation with regard to PleD dimerization.
Allosteric regulation in PleD
• "domain immobilization": c-di-GMP locks domains in non-productive orien-tation
• phosphorylation-mediated dimerization
• dynamic coupling between inhibition- and active-site (this work)
• change in interdomain correlated motion (this work)
• extended α5-helix has leverage effect (this work)
47

4 Bacterial Second Messenger c-di-GMP and PleD as Model System
48

5 Results
5.1 Allosteric control of cyclic di-GMP signaling
B. Christen, M. Christen, R. Paul, F. Schmid, M. Folcher, P. Jenoe,M. Meuwly and U. Jenal
J. Biol. Chem. (2006) 281:32015-32024
My contribution: Computational simulations and molecular modeling.
49

Allosteric Control of Cyclic di-GMP Signaling*□S
Received for publication, April 13, 2006, and in revised form, June 21, 2006 Published, JBC Papers in Press, August 21, 2006, DOI 10.1074/jbc.M603589200
Beat Christen‡1, Matthias Christen‡1, Ralf Paul‡, Franziska Schmid§, Marc Folcher‡, Paul Jenoe‡, Markus Meuwly§,and Urs Jenal‡2
From the ‡Biozentrum and the §Department of Chemistry, University of Basel, Klingelbergstrasse 70, 4056 Basel, Switzerland
Cyclic di-guanosine monophosphate is a bacterial second
messenger that has been implicated in biofilm formation, anti-
biotic resistance, and persistence of pathogenic bacteria in their
animal host. Although the enzymes responsible for the regula-
tion of cellular levels of c-di-GMP, diguanylate cyclases (DGC)
and phosphodiesterases, have been identified recently, little
information is available on the molecular mechanisms involved
in controlling the activity of these key enzymes or on the specific
interactions of c-di-GMPwith effector proteins. By using a com-
bination of genetic, biochemical, and modeling techniques we
demonstrate that an allosteric binding site for c-di-GMP (I-site)
is responsible for non-competitive product inhibition of DGCs.
The I-site was mapped in both multi- and single domain DGC
proteins and is fully contained within the GGDEF domain itself.
In vivo selection experiments and kinetic analysis of the evolved
I-sitemutants led to the definition of an RXXDmotif as the core
c-di-GMP binding site. Based on these results and based on the
observation that the I-site is conserved in a majority of known
and potential DGC proteins, we propose that product inhibi-
tion of DGCs is of fundamental importance for c-di-GMP
signaling and cellular homeostasis. The definition of the
I-site binding pocket provides an entry point into unraveling
the molecular mechanisms of ligand-protein interactions
involved in c-di-GMP signaling and makes DGCs a valuable
target for drug design to develop new strategies against bio-
film-related diseases.
A global signaling network that relies on the production ofthe second messenger cyclic diguanylic acid has recently beendiscovered in bacteria (1, 2). The c-di-GMP3 system emerges asa regulatory mastermind orchestrating multicellular behaviorand biofilm formation in a wide variety of bacteria (2). In addi-tion, c-di-GMP signaling also plays a role in bacterial virulence
and persistence (3–7). The broad importance of this novel sig-naling molecule in pathogenic and non-pathogenic bacteriacalls for careful analysis of themolecularmechanisms that con-trol cellular levels of c-di-GMP and regulate its downstreamtargets. c-di-GMP is formed by the condensation of two GTPmolecules (8–10) and is hydrolyzed toGMPvia the linear inter-mediate pGpG (11–14). Two widespread and highly conservedbacterial protein domains have been implicated in the synthesisand hydrolysis of c-di-GMP, respectively (15). The breakdownof c-di-GMP is catalyzed by the EAL domain (12–14), and thediguanylate cyclase (8) activity resides in the GGDEF domain(10, 16). The highly conserved amino acid sequence GG(D/E)EF forms part of the catalytically active site (A-site) of theDGC enzyme (8). In agreement with this, mutations thatchange the GG(D/E)EF motif generally abolish the activity ofthe respective proteins (14, 16–18).
GGDEF domains are often found associated with sensordomains, arguing that DGC activity is controlled by direct sig-nal input through these domains (1). The best understoodexample for controlled activation of a DGC is the response reg-ulator PleD, which constitutes a timing device for Caulobactercrescentus pole development (17, 19, 20). PleD is activated dur-ing C. crescentus development by phosphorylation of an N-ter-minal receiver domain and, as a result, sequesters to the differ-entiating cell pole (17, 19). An additional layer of control wassuggested by the crystal structure of PleD solved recently incomplex with c-di-GMP (8) (Fig. 1). A c-di-GMP binding sitewas identified in the crystal, spatially separated from the cata-lytically active site (A-site). Two mutually intercalating c-di-GMP molecules were found tightly bound to this site, at theinterface between the GGDEF and the central receiver-likedomain of PleD (Fig. 1). Based on the observation that PleDactivity shows a strong non-competitive product inhibition, itwas proposed that this site might constitute an allosteric bind-ing site (I-site) (8). Based on the observation that functionallyimportant residues of the PleD I-site are highly conserved in amajority of GGDEF proteins listed in the data base, we testedthe hypothesis that allosteric product inhibition is a generalregulatory principle of bacterial diguanylate cyclases.
MATERIALS AND METHODS
Strains, Plasmids, and Media—Escherichia coli and Salmo-
nella enterica serovar Typhimurium strains were grown inLuria broth (LB). C. crescentus strains were grown in complexpeptone yeast extract (21). For DGC activity assays in vivo,E. coliwas plated onto LB Congo Red plates (Sigma, 50 �g/ml).To determine the IPTG induction phenotype, 3 �l of a liquidlog phase culture was spotted onto LB Congo Red plates with-
* This work was supported by Swiss National Science Foundation Fellowship3100A0-108186 (to U. J.) and by a Swiss National Science FoundationForderprofessur (to M. M.). The costs of publication of this article weredefrayed in part by the payment of page charges. This article must there-fore be hereby marked “advertisement” in accordance with 18 U.S.C. Sec-tion 1734 solely to indicate this fact.
□S The on-line version of this article (available at http://www.jbc.org) containssupplemental text and Figs. S1–S4.
1 These authors contributed equally to this work.2 To whom correspondence should be addressed: Tel.: 41-61-267-2135; Fax:
41-61-267-2118; E-mail: [email protected] The abbreviations used are: c-di-GMP, cyclic diguanylic acid; pGpG, linear
diguanylic acid; LB, Luria broth; DGC, diguanylate cyclase; PDE, phospho-diesterase; H6, hexa-histidine tag; rdar, red, dry, and rough; IPTG, isopropyl1-thio-�-D-galactopyranoside; DgcA, diguanylate cyclase A; PdeA, phos-phodiesterase A; CR, Congo Red; AC, adenylate cyclase; GC, guanylatecyclase.
THE JOURNAL OF BIOLOGICAL CHEMISTRY VOL. 281, NO. 42, pp. 32015–32024, October 20, 2006© 2006 by The American Society for Biochemistry and Molecular Biology, Inc. Printed in the U.S.A.
OCTOBER 20, 2006 • VOLUME 281 • NUMBER 42 JOURNAL OF BIOLOGICAL CHEMISTRY 32015
at M
ED
IZIN
BIB
LIO
TH
EK
on
Octo
be
r 23
, 20
06
w
ww
.jbc.o
rgD
ow
nlo
ad
ed
from
http://www.jbc.org/cgi/content/full/M603589200/DC1Supplemental Material can be found at:
5 Results
50

out and with 1 mM IPTG. Biofilm formation was quantifiedafter overnight growth by staining with 1% Crystal Violet asdescribed (22). Motility phenotypes were determined using LBor peptone yeast extract motility plates containing 0.3% Difco-Agar. The exact procedure of strain and plasmid construction isavailable on request.Random I-site Tetrapeptide Library—The dgcA gene
(CC3285)was amplified by PCRusing primers #1006 and #1007(for primer list see supplemental text). The PCR product wasdigested with NdeI and XhoI and cloned into pET21a (Nova-gen). In a next step adgcA�RESDallelewith a silent PstI restric-tion site was generated by splicing with overlapping extensionPCR using primers #1129, #670, and #1132. The resulting PCRproduct was digested with NdeI and XhoI and cloned intopET42b (Novagen) to produce pET42::dgcA�RESD. The PstI/XhoI fragment of pET42b::dgcA�RESD was replaced by 20independent PCR products, which had been generated usingpET42b::dgcA�RESD as a template and primers #1131 and#670. The resulting 20 independent random libraries were indi-vidually transformed into E. coli BL21 and screened on CongoRed plates (LB plates supplementedwith 50�g/ml Congo Red).As a control reaction, the deleted I-site was reverted back to thewild-type RESD motif by cloning the PCR product generatedwith primers #1130 and #670 into the PstI and XhoI site ofpET42b::dgcA�RESD.Diguanylate Cyclase and Phosphodiesterase Activity Assays—
DGC reactions were performed at 30 °C with 0.5 �M purifiedhexahistidine-tagged DgcA or 5 �M PleD in DGC reactionbuffer containing 250 mM NaCl, 25 mM Tris-Cl, pH 8.0, 5 mM
�-mercaptoethanol, and 20 mM MgCl2. For inhibition assaysthe protein was preincubated with different concentrations ofc-di-GMP (1–100 �M) for 2 min at 30 °C before 100 �M
[33P]GTP (Amersham Biosciences) was added. The reactionwas stopped at regular time intervals by adding an equal volumeof 0.5 M EDTA, pH 8.0. DGC/PDE tandem assays were carriedout using 1�M hexahistidine-taggedDgcA, which was preincu-bated for 2 min in the presence or absence of 4.5 �M hexahisti-dine-tagged phosphodiesterase PdeA. The reaction was startedby adding 100 �M [33P]GTP. The reactions were stopped atregular time intervals of 15 s by adding equal volumes of 0.5 M
EDTA, pH 8.0, and their nucleotide composition was analyzedas described below.
Initial velocity (Vo) and inhibition constants were deter-mined by plotting the corresponding nucleotide concentrationversus time and by fitting the curve according to allosteric prod-uct inhibited Michaelis-Menten kinetics with the programProFit 5.6.7 (with fit function [c-di-GMP]t � a(1)*t/(a(2) � t),where the initial velocity Vo is defined as a(1)/a(2)) using theLevenberg-Marquardt algorithm.Ki values were determined byplotting Vo versus c-di-GMP concentration and using the fol-lowing fit function, Vo[c-di-GMP] � Vo[c-di-GMP] � 0 *(1 � ([c-di-GMP]/(Ki � [c-di-GMP])).Polyethyleneimine Cellulose Chromatography—Samples were
dissolved in 5 �l of running buffer containing 1:1.5 (v/v) satu-rated NH4SO4 and 1.5 M KH2PO4, pH 3.60, and blotted onPolygram� CEL 300 polyethyleneimine cellulose TLC plates(Macherey-Nagel). Plates were developed in 1:1.5 (v/v) satu-rated NH4SO4 and 1.5 M KH2PO4, pH 3.60 (Rf(c-di-GMP) 0.2,
Rf(pGpG) 0.4), dried, and exposed on a storage phosphor imag-ing screen (Amersham Biosciences). The intensity of the vari-ous radioactive species was calculated by quantifying the inten-sities of the relevant spots using ImageJ software version 1.33.Vo and Ki were determined with the Software ProFit 5.6.7.UVCross-linking with [33P]c-di-GMP—The 33P-labeled c-di-
GMP was produced enzymatically using [33P]GTP (3000Ci/mmol) and purified according to a previous study (14). Pro-tein samples were incubated for 10 min on ice in DGC reactionbuffer (25mMTris-HCl, pH 8.0, 250mMNaCl, 10mMMgCl2, 5mM �-mercaptoethanol) together with 1 �M c-di-GMP and33P-radiolabeled c-di-GMP (0.75�Ci, 6000 Ci/mmol). Sampleswere then irradiated at 254 nm for 20 min in an ice-cooled,parafilm-wrapped 96-well aluminumblock in an RPR-100 pho-tochemical reactor with a UV lamp RPR-3500 (Southern NewEnglandUltraviolet Co.). After irradiation, samples weremixedwith 2� SDS-PAGE sample buffer (250mMTris-HCl at pH 6.8,40% glycerol, 8% SDS, 2.4 M �-mercaptoethanol, 0.06% brom-phenol blue, 40 mM EDTA) and heated for 5 min at 95 °C.Labeled proteins were separated by SDS-PAGE and quantifiedby autoradiography.Nucleotide Extraction andAnalysis—2.0ml of E. coli cell cul-
tures (A600 0.4) were harvested by centrifugation, and superna-tant was discarded. The cell pellet was dissolved in 200 �l of 0.5M formic acid, and nucleotides were extracted for 10 min at4 °C. Insoluble cell components were then pelleted, and thesupernatant was directly analyzed by chromatography. Nucle-otides were extracted and separated according to a previousstudy (23) on a 125/4 Nucleosil 4000-1 polyethyleneimine col-umn (Macherey-Nagel) using the SMART-System (AmershamBiosciences). The nucleotide peak corresponding to c-di-GMPwas verified by co-elution with a chemically synthesized c-di-GMP standard.DgcA Protein Expression Levels—DgcA protein expression
levels in E. coli BL21 were determined byWestern blot analysisusingAnti-His(C-Term) antibody (Invitrogen) andhorseradishperoxidase conjugate of goat anti-mouse IgG (Invitrogen) assecondary antibody. The protein concentration was deter-mined by measuring the intensities of the relevant spots usingImageJ software version 1.33. Signals were calibrated to definedconcentrations of purified wild-type DgcA.Molecular Modeling of PleD—All-atom simulations were
carried out using the CHARMM (24) program and theCHARMM22/27 force field (25). For additional informationsee the supplemental material.
RESULTS
Feedback Inhibition of the PleDDiguanylate Cyclase RequiresBinding of c-di-GMP to the I-site—The PleD crystal structureindicated the existence of an allosteric binding pocket (I-site) atthe interface of theGGDEF and REC2 domains (8). Binding of ac-di-GMP dimer in the I-site is mediated by specific electro-static interactions with charged residues of the GGDEF andREC2 domain (Fig. 1). To provide evidence for c-di-GMP bind-ing to the I-site pocket in solution, trypsin digests were per-formed with purified PleD protein (5 �M) in the presence orabsence of c-di-GMP (25 �M). The resulting peptide fragmentswere separated on a C18 column and analyzed by matrix-as-
Diguanylate Cyclase Feedback Control
32016 JOURNAL OF BIOLOGICAL CHEMISTRY VOLUME 281 • NUMBER 42 • OCTOBER 20, 2006
at M
ED
IZIN
BIB
LIO
TH
EK
on
Octo
be
r 23
, 20
06
w
ww
.jbc.o
rgD
ow
nlo
ad
ed
from
5 Results
51

sisted laser desorption ionization time-of-flight. Both chro-matograms were identical, with the exception of two peaks thatwere only detected in the absence of ligand but were protectedwhen c-di-GMP present during tryptic digest (supplementalFig. S1). One of the two peptides (T47, retention time 25.6min)was identified by mass spectrometry and corresponds to theamino acids 354–359 (supplemental Fig. S1), arguing that c-di-GMP specifically protects from trypsin cleavage at Arg-359. To
provide additional evidence for ligand binding in solution, weperformedUVcross-linking assays using 33P-labeled c-di-GMP(14). Residues Arg-148 and Arg-178 of the REC2 domain andArg-359, Asp-362, and Arg-390 of the GGDEF domain werereplaced with alanine, and the resulting protein variants wereanalyzed. As shown in Fig. 2, mutating I-site residues of theGGDEF domain abolished (�R359�D362) or strongly reduced(R359A and R390A) c-di-GMP binding. In contrast, mutationsin theA-site (E370Q, E371Q, and EE370GG), which completelyabolished enzymatic activity (Table 1), had no effect on c-di-GMP binding (Fig. 2), indicating that labeling with radioactivec-di-GMP results from ligand binding at the I-site. Althoughmutations R359A, R359V, �R359�D362, and D362A allshowed a dramatically reduced or complete loss of enzymaticactivity, mutant R390A showed wild-type-like DGC activity(Table 1). In agreement with the reduced binding of c-di-GMP(Fig. 2), the Ki of mutant R390A was increased �20-fold (Table1). PleD proteins harboring mutations in the REC2 portion ofthe I-site (R148A and R178A) showed an increased bindingof c-di-GMP (Fig. 2) and slightly lower Ki values than wildtype (Table 1). Surprisingly, R148A/R178A single and doublemutants displayed a 5- to 20-fold higher DGC activity com-pared with wild-type PleD (Table 1). Finally, c-di-GMP bindingwas normal in mutant proteins that either lacked the REC1receiver domain or had a bulky tryptophan residue introducedat the REC2-GGDEF interface (G194W, Fig. 2). Together theseresults implied that the structural requirements for c-di-GMPbinding are contained within the GGDEF domain of PleD andthat residues Arg-359, Asp-362, and Arg-390 form the core ofan allosteric binding pocket for c-di-GMP.
FIGURE 1. Crystal structure of the response regulator PleD. A, domainarchitecture of PleD with receiver domain REC1 (blue), receiver domain REC2(green), and GGDEF domain harboring diguanylate cyclase activity (red). Theactive site (A-site) loop and the allosteric binding site (I-site) are indicated. B,zoom in view of the I-site pocket with a bound dimer of c-di-GMP with inter-calated purine bases. Residues Arg-148 and Arg-178 (green) from the REC2domain and residues Arg-359, Asp-362, and Arg-390 (red) from the GGDEFdomain make specific contacts to the ligand in the crystal structure. C, sche-matic of c-di-GMP synthesis and degradation reactions.
FIGURE 2. c-di-GMP labeling efficiency of different PleD mutants. Theupper lane shows autoradiographs of [33P]c-di-GMP UV cross-linked hexahis-tidine-tagged PleD mutant proteins separated by SDS-PAGE. Relative label-ing efficiency with c-di-GMP is shown below with wild-type PleD correspond-ing to 100%. Specific mutants in different domains are colored in gray (REC1),dark gray (REC2) and light gray (GGDEF).
Diguanylate Cyclase Feedback Control
OCTOBER 20, 2006 • VOLUME 281 • NUMBER 42 JOURNAL OF BIOLOGICAL CHEMISTRY 32017
at M
ED
IZIN
BIB
LIO
TH
EK
on
Octo
be
r 23
, 20
06
w
ww
.jbc.o
rgD
ow
nlo
ad
ed
from
5 Results
52

Evidence for an in Vivo Role of I-site-mediated FeedbackControl—To test a possible role for feedback inhibition ofdiguanylate cyclases in vivo, we developed a simple assay basedon the observation that in E. coli and other Enterobacteriaceaeincreased cellular levels of c-di-GMP correlate with Congo Red(CR) staining of colonies on plates (28). Low level expression (inthe absence of the inducer IPTG) of active pleD alleles caused ared colony phenotype in the E. coli B strain BL21, whereas cellsexpressing inactive pleD alleles under the same conditionsstained white (Fig. 3). Interestingly, PleDmutants with dramat-ically different diguanylate cyclase activities in vitro showedonly minor differences of CR staining in vivo. For instance,PleDR148A/R178A, which showed a 20-fold increased activity(Table 1), or PleD*, a constitutively active mutant of PleD sev-eral 100-fold more active than wild-type (9), caused virtuallyidentical CR values like PleD wild type (Fig. 3). In contrast,expression of the feedback inhibition mutant PleDR390Aresulted in a significantly higher CR staining even though its invitro DGC activity was lower than wild-type PleD (Table 1).This argued that in vivo steady-state concentrations of c-di-GMP were determined mainly by the PleD inhibition constant(as opposed to the overall activity of the enzyme) and that afunctional I-site is critical for DGC control in vivo.DgcA, a Single Domain Diguanylate Cyclase, Is Subject to
Allosteric Product Inhibition—Sequence alignments of �1000annotated GGDEF domain proteins revealed that that I-siteresidues Arg-359 and Asp-362 of PleD are highly conserved.57% of the proteins containing a GGDEF domain and 27% ofGGDEF/EAL composite proteins possess this motif. This sug-gested that c-di-GMP product inhibition could be a generalregulatorymechanism of bacterial diguanylate cyclases. To testthis, hexahistidine-tagged derivatives of two C. crescentusGGDEF domain proteins were analyzed biochemically withrespect to their DGC activities and c-di-GMP binding proper-
ties. Purified DgcA (diguanylate cyclase A, CC3285), a soluble,single domain GGDEF protein that lacks an obvious N-termi-nal input domain, showed strong diguanylate cyclase activity(Fig. 5A). DgcA has an RESDmotive five amino acids upstreamof the conservedGGDEF active site andwas readily labeledwith[33P]c-di-GMP in a cross-linking experiment (Fig. 4). Consist-ent with this, DgcA showed strong feedback inhibition (Fig. 5A)with its Ki (1 �M) being in the same range as the inhibitionconstant determined for PleD (8). In contrast, the GGDEFdomain of PdeA (phosphodiesterase A, CC3396), which lackscatalytic activity (14), had no conserved I-site residues and didnot bind radiolabeled c-di-GMP (Fig. 4). Thus, specific bindingof c-di-GMP correlated with the presence of a conserved I-sitemotif RXXD (Fig. 4).
Diguanylate cyclase activity assays revealed strong and rapidproduct inhibition of DgcA. DgcA alone was able to convertonly a small fraction of the availableGTP substrate pool into theproduct c-di-GMP (Vo � 2.8 �mol of c-di-GMP �mol pro-tein�1 min�1) (Fig. 5B). In contrast, GTP consumption andconversion into c-di-GMP and pGpG was rapid (Vo � 43.0�mol of c-di-GMP �mol protein�1 min�1) and almost com-plete when the PDE CC3396 was added in excess to the enzy-matic reaction (Fig. 5B). This argued that c-di-GMP feedbackinhibition is abolished in a sequential DGC-PDE reaction,because the steady-state concentration of the inhibitor c-di-GMP is kept low by continuous degradation of c-di-GMP intothe linear dinucleotide pGpG. As a consequence of rapid feed-back inhibition, the experimentally determinedVo values of theDGC reaction are generally underestimated. In conclusion,these results strengthen the view that allosteric product inhibi-
FIGURE 3. In vivo activity of different PleD and DgcA mutant proteins.E. coli BL21 strains expressing different pleD alleles and dgcA wild type werespotted onto Congo Red plates. Relative Congo Red binding was determinedusing imageJ software with BL21 corresponding to 100%. FIGURE 4. UV cross-linking of different GGDEF domains with 33P-labeled
c-di-GMP. A, Coomassie-stained SDS-PAGE and B, autoradiograph of BSA(control), PleD�REC1, DgcA, and the isolated GGDEF domain of the c-di-GMP-specific phosphodiesterase PdeA (CC3396) after UV cross-linking with [33P]c-di-GMP. C, alignment of I- and A-site sequence of PleD, DgcA, and PdeA. I-site(RXXD) and A-site residues (GGDEF) are marked in black and gray,respectively.
Diguanylate Cyclase Feedback Control
32018 JOURNAL OF BIOLOGICAL CHEMISTRY VOLUME 281 • NUMBER 42 • OCTOBER 20, 2006
at M
ED
IZIN
BIB
LIO
TH
EK
on
Octo
be
r 23
, 20
06
w
ww
.jbc.o
rgD
ow
nlo
ad
ed
from
5 Results
53

tion is a general principle of diguanylate cyclases and that highaffinity binding of c-di-GMP requires an RXXD I-site motifpositioned in close proximity to the active site.Development of an in Vivo Assay to Genetically Probe Allos-
teric Control of DgcA—DGCs from different bacterial specieshave been shown to be functionally interchangeable (17, 26, 27).To determine if DgcA is active in vivo we expressed a plasmid-based copy of the dgcA gene in C. crescentus, S. enterica, andEscherichia coli B and tested the respective strains for the phe-notypes known to result from increased cellular levels of c-di-GMP (17, 26, 27). Consistentwith these earlier findings, expres-sion of dgcA strongly inhibited flagellar-based motility in allthree organisms, dramatically increased the ability of S. entericaand E. coli for surface colonization, and produced the charac-teristic red, dry, and rough (rdar) colony morphotype whenplated on CR plates (Fig. 6, A–F) (29). The red phenotype pro-vided the basis for a visual genetic screen on CR plates. Underthese conditions, cells producing active DgcA variants would
produce dark red single colonies, whereas cells producing inac-tive DgcA mutants would remain white. This prompted us touse the CR screen to isolate dgcAmutants, which had a specificdefect in feedback regulation, and to define the minimalrequirements for product inhibition of this class of enzymes.Randomization of c-di-GMP Binding Pocket Reveals Three
Mutant Classes—To probe the minimal requirements of theI-site for c-di-GMP binding and product inhibition, a dgcAmutant library was constructed with the RESD signaturereplaced by a randomized tetrapeptide sequence (see “Materi-als and Methods”). In short, a dgcA gene, which carried a dele-tion of the four I-site codons, was used as template for a PCRreaction. For the amplification step a primer complementary tothe 3�-end of dgcA was used in combination with a mixture ofoligonucleotides that spanned the deletion site and contained12 randomized base pairs at the position coding for the deletedamino acids. The resulting PCR fragments were fused in-framewith the 5�-end of dgcA in the expression plasmid pET42b andwere transformed into E. coli BL21. The resulting gene librarycontains a theoretical number of 1.67� 107 (412) different dgcAalleles, coding for DgcA variants with different combinations ofI-site residues.
When plated onCR plates, colonies transformedwith a wild-type dgcA allele showed the typical rdar colony morphology(Fig. 6G). Transformation of E. coli BL21 with a plasmidexpressing a mutant DgcA, which lacked the four amino acidsof the I-site (DgcA�RESD), produced white colonies on CRplates (Fig. 6H), indicating that this mutant form had lost DGCactivity. About 10% of the clones with random tetrapeptideinsertions stained red on CR plates and thus had retained DGCactivity (Fig. 6I). This result is consistent with the observationthat alanine scanning of the PleD I-site almost exclusively pro-duced non-active enzyme variants (Table 1) and argues that themajority of amino acid substitutions introduced at the I-site aredetrimental for the catalytic activity of the DGC. To furthercharacterize active DgcA I-site variants, a total of 800 red col-onies was isolated and patched onto CR plates without (Fig. 6, JandK) or with the inducer IPTG (Fig. 6, L andM). This second-ary screen was based on the observation that IPTG-inducedexpression of the pleDR390A allele (Table 1), but not of thepleDwild-type allele, abolished growth of E. coli BL21 (data notshown). This suggested that at elevated protein levels, DGCsthat lack feedback control are toxic in vivo (see below). Themajority of the I-site library clones tested failed to grow onplates containing IPTG, indicating that their activity is no lon-ger controlled by product inhibition (Fig. 6, L and M). Only 7mutants (out of 9000 colonies screened) showed a wild type-like behavior in that they stained dark red on CR plates andtolerated the presence of the inducer IPTG (Fig. 6, L andM).
This genetic screen led to the isolation of three differentI-site mutant classes with the following characteristics: 1) cat-alytically inactive mutants (A�, frequency �90%); 2) feedbackcontrol negative mutants (I�A�, frequency �10%); and wild-type-like mutants (I�A�, frequency �0.1%). A subset of class 1and 2 mutants and all seven class 3 mutants were selected, andhexahistidine-tagged forms of the respective proteins werepurified for biochemical characterization. Kinetic parametersof activity (Vo) and feedback inhibition (Ki) were determined
FIGURE 5. c-di-GMP product inhibition of DgcA. A, initial velocities of thewild-type diguanylate cyclase DgcA (squares) and the non-feedback inhibitedI-site mutant DgcA0244 (circles) in the presence of increasing concentrationsof c-di-GMP. B, conversion of GTP into c-di-GMP by DgcA (dashed lines) andaccelerated GTP consumption, c-di-GMP synthesis, and cleavage into pGpGby a diguanylate cyclase-phosphodiesterase tandem reaction (plain lines).
Diguanylate Cyclase Feedback Control
OCTOBER 20, 2006 • VOLUME 281 • NUMBER 42 JOURNAL OF BIOLOGICAL CHEMISTRY 32019
at M
ED
IZIN
BIB
LIO
TH
EK
on
Octo
be
r 23
, 20
06
w
ww
.jbc.o
rgD
ow
nlo
ad
ed
from
5 Results
54

individually using an in vitro diguanylate cyclase activity assay(16). Consistent with their rdar-like in vivo phenotype, onlyclass 2 and class 3 mutants showed detectable diguanylatecyclase activity with an initial velocity between 1.93 and 14.21�mol of c-di-GMP �mol protein�1 min�1 (Table 2). Onlymutant proteins from the IPTG tolerant class 3 showedproductinhibition withKi values close to 1 �M (Table 2). In contrast, allproteins from class 2mutants showed no feedback inhibition invitro, arguing that their in vivo toxicity is the result of uncon-trolled run-off DGC activity (Fig. 5A and Table 2). Support forthis hypothesis comes from experiments determining the cel-lular concentration of c-di-GMP and DgcA protein expressionlevels in E. coli BL21 carrying selected dgcA alleles on plasmidpET42b (see “Materials and Methods”). Alleles dgcA0244,
dgcA1229, and dgcA1250were chosen, because the DGC activ-ity of these enzymes is similar towild typeDgcA (Table 2). Basallevel expression (no IPTG) of dgcA0244, the allele coding for aDGC that completely lacks feedback inhibition, resulted in amore than 100-fold increased cellular level of c-di-GMP ascompared with cells expressing wild-type dgcA (Table 3). Thiswas due to an almost 100-fold higher overall turnover of themutant enzyme as compared with wild type (Table 3). In con-trast, enzymatic turnover and cellular concentration of c-di-GMP was increased only marginally in E. coli cells expressingalleles dgcA1229, and dgcA1250 with restored feedback inhibi-tion control (Table 3).
Sequence analysis of the tetrapeptide insertions of class 2 andclass 3 mutants revealed several important characteristics of afunctional allosteric I-site binding pocket. All catalyticallyactive and feedback inhibition competent mutants restored thewild-type Arg and Asp residues at positions one and four of theRXXDmotive (Table 2).Whereas most of themutants that hadlost feedback inhibition had altered either one or both of thesecharged residues (Table 2) only two feedback inhibitionmutants had retained both charges with changes in the inter-vening residues (Table 2). Obviously, Arg and Asp, while beingstrictly required for feedback inhibition, need to be placed inthe appropriate sequence context of the I-site loop. Theseexperiments define the minimal requirements of the I-site coreregion and demonstrate that the Arg and Asp residues thatmake direct contacts to the c-di-GMP ligand in the crystalstructure are of critical functional importance for DGC feed-back inhibition in vivo and in vitro. This provides a plausible
FIGURE 6. Phenotypic characterization of ectopically expressed diguanylate cyclase dgcA in E. coli and S. enterica. Behavior of E. coli strain BL21 withempty pET42b plasmid (A) and pET42b::dgcA (B) on motility plates. Colony morphology of E. coli strain BL21 with empty pET42b plasmid (C ) and withpET42b::dgcA (D) on Congo Red plates. Biofilm formation of S. enterica serovar Typhimurium trp::T7RNAP with empty pET42b (E ) and pET42b::dgcA (F ) grownin liquid culture and stained with crystal violet. E. coli BL21 transformed with PCR-restored dgcA wild type on pET42b::dgcA (G), with the inactive alleledgcA�RESD (pET42b::dgcA�RESD) (H), and with a library of random tetrapeptide insertions in the I-site (pET42b::dgcAXXXX) (I) and plated on Congo Red plates.E. coli BL21 expressing different I-site mutant alleles were spotted onto Congo Red plates without (J and K ) and with 1 mM IPTG (L and M) to screen for feedbackinhibition dgcA alleles.
TABLE 1
Kinetic analysis of PleD mutants
Protein Vo �Vo Ki
�Ki
�mol c-di-GMP/
(�mol protein*min)
�M
PleD wild type 0.202 0.023 5.8 1.0PleDR359A 0.005 NDa
�100 NDPleDR359V 0.0 NDPleD�359�362 0.0 NDPleDD362A 0.0 NDPleDR390A 0.076 0.007 115.0 18.1PleDR148A 0.822 0.020 2.8 1.2PleDR178A 0.918 0.292 3.6 0.1PleDR148AR178A 3.75 0.43 2.9 0.6PleDG194W 0.161 0.005 6.3 1.9PleDEE370GG 0.0 NDPleDE370Q 0.0 NDPleDE371Q 0.0 ND
a ND, not determined.
Diguanylate Cyclase Feedback Control
32020 JOURNAL OF BIOLOGICAL CHEMISTRY VOLUME 281 • NUMBER 42 • OCTOBER 20, 2006
at M
ED
IZIN
BIB
LIO
TH
EK
on
Octo
be
r 23
, 20
06
w
ww
.jbc.o
rgD
ow
nlo
ad
ed
from
5 Results
55

explanation for the strong conservation of the RXXD motif inGGDEF domains.
The molecular mechanism of product inhibition throughI-site binding remains unclear. To assist the interpretation ofthe present data and provide information on binding inducedmobility, atomistically detailed simulations were carried out.Normal mode calculations on ligated and unligated PleD wereused to analyze the structural transitions that occur duringI-site binding of c-di-GMP. Normal mode calculations on theoptimized structures yielded no imaginary frequencies, andtranslational and rotational frequencies were close to zero (���� 0.02 cm�1). This indicated that the minimized structurescorrespond to real minima on the potential energy surface. Thedisplacements calculated for the ligated and the unligated pro-tein showed a significant decrease in mobility for both I- andA-site residues upon complexation (supplemental Figs. S2 andS3). Whereas motion in the I-site is suppressed due to stericinteractions upon ligand insertion, quenching of the A-site res-idues suggested that the two sitesmight be dynamically coupledvia the short connecting �-strand (�2). Backbone C�-atomsand side chains of the I-site and A-site loops were displaced byan average of 1–4 Å in opposite directions, arguing that a bal-ance-like movement centered around �2 could be responsiblefor direct information transfer between the two sites (Fig. 7).The cumulated displacements per residue over all 147 modes
(supplemental Fig. S3) showed differentmobilities in additionalregions of the protein. The C� atoms of residues exhibitinglarge changes in flexibility upon ligand binding are depicted asspheres in supplemental Fig. S3. Reduced flexibility (yellowspheres) is found at the I-site, A-site, phosphorylation site, andthe dimer interface, whereas the flexibility is enhanced (blackspheres) at the REC1/REC2 interface. In summary, these simu-lations show that I-site binding of c-di-GMP not only reducedthe mobility around the RXXDmotif but also of the residues ofthe A-site loop.
DISCUSSION
Feedback Inhibition Is a General Control Mechanism ofDiguanylate Cyclases—The data presented here propose a gen-eral mechanism to regulate the activity of diguanylate cyclases(DGCs), key enzymes of c-di-GMP-based signal transductionin bacteria. High affinity binding of c-di-GMP to a site distantfrom the catalytic pocket (I-site) efficiently blocks enzymaticactivity in a non-competitive manner. Mutational analysis ofmulti- and single-domain DGC proteins has provided convinc-ing evidence for the role of several charged amino acids in c-di-GMP binding and allosteric regulation. Furthermore, theseexperiments indicated that the allosteric binding site is func-tionally contained within the GGDEF domain. An in vivo selec-tion experiment using a random tetrapeptide library, and
TABLE 2
Diguanylate cyclase activity and inhibition constant of DgcA I-site mutant proteins
Protein Motif Vo �Vo Ki
�Ki
�mol c-di-GMP/
(�mol protein�min)
�M
DgcA wt RESD 2.79 0.01 0.96 0.09DgcA1406 RQGD 5.35 0.05 7.02 2.92DgcA1040 RLVD 4.92 0.19 4.52 1.81DgcA1229 RGAD 2.03 0.01 1.84 0.26DgcA1524 RSAD 3.70 0.13 7.36 2.69DgcA1529 RLAD 2.79 0.04 1.01 0.23DgcA0751 RCAD 3.65 0.10 3.51 0.52DgcA1250 RGGD 2.07 0.02 2.24 0.49DgcA�RESD 0.14 0.06 NDa
DgcA0207 GMGG 14.21 0.54 No inhibitionDgcA0244 VMGG 2.57 0.05 No inhibitionDgcA0613 GGVA 4.29 0.06 No inhibitionDgcA0646 GRDC 8.90 0.10 No inhibitionDgcA0913 GVGD 3.81 0.04 No inhibitionDgcA1300 MEGD 0.87 0.02 No inhibitionDgcA1733 GGNH 11.47 0.17 No inhibitionDgcA3018 RESE 11.1 0.11 No inhibitionDgcA0230 RNRD 3.02 0.06 No inhibitionDgcA0642 RVDS 4.17 0.08 No inhibitionDgcA1007 RAGG 6.06 0.05 No inhibitionDgcA2006 RGQD 1.93 0.01 No inhibition
a ND, not determined.
TABLE 3
DgcA protein levels and cellular c-di-GMP concentrations in the absence or presence of IPTG induction at 1 mM
Protein conc.a c-di-GMP conc. Turnoverb
No induction 1 mM IPTG No induction 1 mM IPTG No induction 1 mM IPTG
pmol protein/mg dry weight pmol c-di-GMP/mg dry weight pmol c-di-GMP per pmol protein
DgcA0244 4.1 22 1466.3 1570.7 357.6 71.4DgcA1229 3.5 31 87.6 139.5 25.0 4.5DgcA1250 2.7 43 24.2 305.4 9.0 7.1DgcA wt 2.9 33 13.75 189.4 4.7 5.7DgcA�RESD 3.5 23 NDc ND NAd NA
a See “Materials and Methods.”b As derived from the cellular c-di-GMP concentration divided by the cellular protein concentration.c ND, not detectable.d NA, not applicable.
Diguanylate Cyclase Feedback Control
OCTOBER 20, 2006 • VOLUME 281 • NUMBER 42 JOURNAL OF BIOLOGICAL CHEMISTRY 32021
at M
ED
IZIN
BIB
LIO
TH
EK
on
Octo
be
r 23
, 20
06
w
ww
.jbc.o
rgD
ow
nlo
ad
ed
from
5 Results
56

designed to re-engineer the I-site has led to the definition of ahighly conserved RXXD core motif of the c-di-GMP bindingpocket. The RXXD motif forms a turn at the end of a shortfive-amino acid �-sheet that directly connects the I-site withthe conserved catalytic A-site motif, GG(D/E)EF (Fig. 7). Thisraised the question of how I-site ligand bindingmodulatesDGCenzyme activity. In the multidomain protein PleD, c-di-GMPbound to the I-site physically connects the GGDEF domainwith the REC1-REC2 dimerization stem. It was speculated thatproduct inhibition occurs by domain immobilization, whichwould prevent the encounter of the twoDGC substrate bindingsites (8). Several observations argue in favor of a more directcommunication between I- and A-sites. First, with a large vari-ety of domains found to be associated with GGDEF domains, itseems unlikely that functional I-sites are generally formed bythe interface of a GGDEF with its neighboring domain (2). Inagreement with this, residues of the PleD REC2 domain arenot required for c-di-GMP binding and feedback inhibition.Second, the single domain DGC protein, DgcA, shows I-site-dependent allosteric control with aKi of 1 �M. Third, the intro-duction of a bulky tryptophan residue (G194W) at the GGDEF-REC2 interface did not affect activity, I-site binding, orfeedback inhibition of PleD (Fig. 2 and Table 1). Fourth, atom-istic simulations of ligated and unligated PleD predicted amarked drop in flexibility of C�-atoms both in the I- and A-siteupon ligand binding. Simultaneous with motion quenching, �2and its flanking I- and A-loops undergo a balance-like move-ment that repositions A-site residues in the catalytic active site(Fig. 7). This is consistent with the idea that structural changeswithin the GGDEF domain upon binding of c-di-GMP at the
I-site lead to repositioning of active site residues and possiblyaltered kinetic parameters. Thus, we propose that c-di-GMPbinding and allosteric control represents an intrinsic regulatoryproperty of DGCs that contain an RXXDmotif.
Like guanylate and adenylate cyclases (GCs and ACs) andDNApolymerases,DGCs catalyze the nucleophilic attack of the3�-hydroxyl group on the �-phosphate of a nucleoside triphos-phate. Despite the lack of obvious sequence similarities, thePleD x-ray structure revealed that DGCs possess a similardomain architecture like ACs and GCs (8, 30). Based on muta-tional analysis (8, 14, 16) and on structural comparisonsbetween DGC, AC, GC, and DNA polymerases (31–34), amodel for DGC catalysis can be proposed. In contrast to theheterodimeric ACs and GCs, DGCs form homodimers, with aGTP molecule bound within the catalytic core of each DGCmonomer (8). Two Mg2� ions are coordinated by the highlyconserved glutamic acid residue Glu-371, which is part of theGGDEF motif, and possibly by Asp-327 on the opposing�-sheet. The divalent Mg2� carboxyl complex coordinates thetriphosphate moiety of GTP and activates the 3�-hydroxylgroup for intermolecular nucleophilic attack. Substrate speci-ficity of AC and GC can be interchanged by converting a fewkey residues involved in purine recognition (31, 34, 35). Thisincludes an arginine residue, which in PleD corresponds to thehighly conservedArg-366 located in the�-sheet connecting theI- and A-sites. Based on the active site model, two alternativeinhibition mechanisms can be envisaged. In a first scenario,binding of c-di-GMP to the I-site would change the orientationof Arg-366 and would thereby disturb the guanine bindingpocket resulting in an increased Km for GTP. Alternatively,inhibitor binding could rearrange the Mg2� carboxyl complexand thus destabilize the active state.In Silico Analysis of the GGDEF Protein Family Indicates
That Product Inhibition Is a General Regulatory Mechanism—DGC activity of GGDEF domain proteins seems to strictlydepend on conserved GGDEF or GGEEF motifs in the activesite (10, 16, 18, 36–38). Consistent with this, �90% of theGGDEF and 62% of the GGDEF/EAL composite proteins showa conserved GG(D/E)EF A-site motif. Of the GGDEF proteinswith a highly conserved A-site motif, �60% have conservedRXXD I-site residues and a conserved spacer length between I-and A-site, arguing that the three-dimensional arrangement ofcatalytic and allosteric pocket is likely to be similar in all DGCs.From a total of 19 GGDEF proteins, for which convincing evi-dence for a DGC activity exists, 14 have a conserved I-site (sup-plemental Fig. S4). Ryjenkov and coworkers (10) reportedsevere toxicity problems when expressing diguanylate cyclaseslacking I-site residues inE. coliBL21. This is consistentwith thegrowth defect observed upon expression of dgcA feedback inhi-bitionmutants inE. coliBL21 and argues that these proteins arenot feedback-controlled. The molecular basis of growth inter-ference under these conditions is unclear. It is possible thatdepletion of the GTP pool or adverse effects of unphysiologi-cally high levels of c-di-GMP are responsible for this effect.Although the experiments presented here define a role for theI-site in DGC feedback inhibition, the c-di-GMP bindingpocket could also be exploited for other roles in c-di-GMP sig-naling. It has been proposed recently that non-catalyticGGDEF
FIGURE 7. Comparison of the energy-minimized structures of the PleDGGDEF domain with and without ligand bound to the I-site. For improvedclarity, the domain is sliced through the I-site loop/�2/A-site loop plane. Theunligated protein is shown in gray and the I-site loop (green), �2 (black), andA-site loop (gold ) of the bound structure are shown as an overlay. GTP boundto the active site is modeled according to the orientation of c-di-GMP boundto the A-site in the crystal structure. The PleD amino acid sequence of I-site,�2, and A-site is indicated below.
Diguanylate Cyclase Feedback Control
32022 JOURNAL OF BIOLOGICAL CHEMISTRY VOLUME 281 • NUMBER 42 • OCTOBER 20, 2006
at M
ED
IZIN
BIB
LIO
TH
EK
on
Octo
be
r 23
, 20
06
w
ww
.jbc.o
rgD
ow
nlo
ad
ed
from
5 Results
57

domains with variant A-site motifs can fulfill regulatory func-tions (14). It is attractive to speculate that a subgroupofGGDEFproteins that has degenerate catalytic A-sites but conservedc-di-GMP binding pockets, represents a novel class of c-di-GMP effector proteins that regulate cellular functions inresponse to c-di-GMP binding.Regulatory Significance of DGC Feedback Control—GGDEF
domains are often associated with sensory domains in one- ortwo-component signaling systems (39, 40). Thus it is reasona-ble to assume that in most cases DGC activity is controlled bydirect signal input through these domains. But why then woulda substantial portion of these enzymes also be subject to feed-back inhibition? There are several possibilities, which amongthemselves are not mutually exclusive. Given the anticipatedregulatory complexity of the c-di-GMP signaling network (2,39) and the potentially dramatic changes in cellular physiologyand behavior caused by fluctuating levels of c-di-GMP, it is inthe cell’s best interest to rigorously control the production ofthe second messenger. Product inhibition of DGCs allows theestablishment of precise threshold concentrations of the sec-ond messenger, or, in combination with counteracting PDEs,could produce short spikes or even generate oscillations of c-di-GMP. In addition, negative feedback loops have been impli-cated in neutralizing noise and providing robustness in geneticnetworks by limiting the range over which the concentrationsof the network components fluctuate (41, 42). Similarly, prod-uct inhibition of DGCs could contribute to the reduction ofstochastic perturbations and increase the stability of the c-di-GMP circuitry by keeping c-di-GMP levels in defined concen-tration windows. Alternatively, DGC autoregulationmay influ-ence the kinetics of c-di-GMP signaling. Mathematicalmodeling and experimental evidence suggested that negativeautoregulation in combination with strong promoters substan-tially shortens the rise-time of transcription responses (43–45).In analogy, a desired steady-state concentration of c-di-GMPcan in principle be achieved by two regulatory designs: (a) a lowactivity DGCwith no product inhibition, and (b) a high activityDGC with built-in negative autoregulation. In cases where cir-cuits have been optimized for fast up-kinetics, design B will besuperior. It is plausible that DGCs with or without I-site motifscan be divided into these two kinetically different classes.
This study contributes to the emerging understanding of thec-di-GMP regulatory network in bacteria. The current empha-sis lies on the identification of effector molecules, regulatorymechanisms, and processes controlled by c-di-GMP. With thelong term goal in mind of approaching a detailed systems-levelunderstanding of c-di-GMP signaling, kinetic parameters ofsignalingmechanismswill require our particular attention.Ourexperiments provide an entry point into the kinetic analysis ofindividual DGCs and the quantitative assessment of the c-di-GMP circuitry.
Acknowledgments—We thank Tilman Schirmer for helpful discus-
sions and students of the Microbiology and Immunology Course
(Biozentrum of the University of Basel, 2005) and of the Advanced
Bacterial Genetics Course (Cold SpringHarbor, 2005) for their help in
mutant screening.
REFERENCES
1. Jenal, U. (2004) Curr. Opin. Microbiol. 7, 185–191
2. Romling, U., Gomelsky,M., andGalperin,M. Y. (2005)Mol.Microbiol. 57,
629–639
3. Brouillette, E., Hyodo,M.,Hayakawa, Y., Karaolis, D. K. R., andMalouin, F.
(2005) Antimicrob. Agents Chemother. 49, 3109–3113
4. Hisert, K. B., MacCoss, M., Shiloh, M. U., Darwin, K. H., Singh, S., Jones,
R. A., Ehrt, S., Zhang, Z. Y., Gaffney, B. L., Gandotra, S., Holden, D. W.,
Murray, D., and Nathan, C. (2005)Mol. Microbiol. 56, 1234–1245
5. Kulesekara, H., Lee, V., Brencic, A., Liberati, N., Urbach, J., Miyata, S., Lee,
D. G., Neely, A. N., Hyodo, M., Hayakawa, Y., Ausubel, F. M., and Lory, S.
(2006) Proc. Natl. Acad. Sci. U. S. A. 103, 2839–2844
6. Lestrate, P., Dricot, A., Delrue, R.M., Lambert, C., Martinelli, V., De Bolle,
X., Letesson, J. J., and Tibor, A. (2003) Infect. Immun. 71, 7053–7060
7. Tischler, A. D., Lee, S. H., and Camilli, A. (2002) J. Bacteriol. 184,
4104–4113
8. Chan, C., Paul, R., Samoray, D., Amiot, N. C., Giese, B., Jenal, U., and
Schirmer, T. (2004) Proc. Natl. Acad. Sci. U. S. A. 101, 17084–17089
9. Ross, P., Weinhouse, H., Aloni, Y., Michaeli, D., Weinbergerohana, P.,
Mayer, R., Braun, S., Devroom, E., Vandermarel, G. A., Vanboom, J. H.,
and Benziman, M. (1987) Nature 325, 279–281
10. Ryjenkov, D. A., Tarutina, M., Moskvin, O. V., and Gomelsky, M. (2005) J.
Bacteriol. 187, 1792–1798
11. Ross, P., Mayer, R., and Benziman, M. (1991)Microbiol. Rev. 55, 35–58
12. Schmidt, A. J., Ryjenkov, D. A., and Gomelsky, M. (2005) J. Bacteriol. 187,
4774–4781
13. Tamayo, R., Tischler, A. D., and Camilli, A. (2005) J. Biol. Chem. 280,
33324–33330
14. Christen, M., Christen, B., Folcher, M., Schauerte, A., and Jenal, U. (2005)
J. Biol. Chem. 280, 30829–30837
15. Tal, R., Wong, H. C., Calhoon, R., Gelfand, D., Fear, A. L., Volman, G.,
Mayer, R., Ross, P., Amikam, D., Weinhouse, H., Cohen, A., Sapir, S.,
Ohana, P., and Benziman, M. (1998) J. Bacteriol. 180, 4416–4425
16. Paul, R., Weiser, S., Amiot, N. C., Chan, C., Schirmer, T., Giese, B., and
Jenal, U. (2004) Genes Dev. 18, 715–727
17. Aldridge, P., Paul, R., Goymer, P., Rainey, P., and Jenal, U. (2003) Mol.
Microbiol. 47, 1695–1708
18. Kirillina, O., Fetherston, J. D., Bobrov, A. G., Abney, J., and Perry, R. D.
(2004)Mol. Microbiol. 54, 75–88
19. Aldridge, P., and Jenal, U. (1999)Mol. Microbiol. 32, 379–391
20. Hecht, G. B., and Newton, A. (1995) J. Bacteriol. 177, 6223–6229
21. Ely, B. (1991)Methods Enzymol. 204, 372–384
22. O’Toole, G. A., Pratt, L. A., Watnick, P. I., Newman, D. K., Weaver, V. B.,
and Kolter, R. (1999)Methods Enzymol. 34, 586–595
23. Ochi, Y., Hosoda, S., Hachiya, T., Yoshimura, M., Miyazaki, T., and Kajita,
Y. (1981) Acta Endocrinol. 98, 62–67
24. Brooks, B. R., Bruccoleri, R. E., Olafson, B. D., States, D. J., Swaminathan,
S., and Karplus, M. (1983) J. Comput. Chem. 4, 187–217
25. MacKerell, A. D., Bashford, D., Bellott,M., Dunbrack, R. L., Evanseck, J. D.,
Field, M. J., Fischer, S., Gao, J., Guo, H., Ha, S., Joseph-McCarthy, D.,
Kuchnir, L., Kuczera, K., Lau, F. T. K., Mattos, C., Michnick, S., Ngo, T.,
Nguyen, D. T., Prodhom, B., Reiher, W. E., Roux, B., Schlenkrich, M.,
Smith, J. C., Stote, R., Straub, J., Watanabe, M., Wiorkiewicz-Kuczera, J.,
Yin, D., and Karplus, M. (1998) J. Phys. Chem. B 102, 3586–3616
26. Ausmees, N., Mayer, R., Weinhouse, H., Volman, G., Amikam, D., Benzi-
man, M., and Lindberg, M. (2001) FEMS Microbiol. Lett. 204, 163–167
27. Simm, R., Fetherston, J. D., Kader, A., Romling, U., and Perry, R. D. (2005)
J. Bacteriol. 187, 6816–6823
28. Garcia, B., Latasa, C., Solano, C., Portillo, F. G., Gamazo, C., and Lasa, I.
(2004)Mol. Microbiol. 54, 264–277
29. Zogaj, X., Nimtz, M., Rohde, M., Bokranz, W., and Romling, U. (2001)
Mol. Microbiol. 39, 1452–1463
30. Pei, J., and Grishin, N. V. (2001) Proteins 42, 210–216
31. Tucker, C. L., Hurley, J. H.,Miller, T. R., andHurley, J. B. (1998) Proc. Natl.
Acad. Sci. U. S. A. 95, 5993–5997
32. Zhang,G. Y., Liu, Y., Ruoho,A. E., andHurley, J. H. (1997)Nature 388, 204
(Errratum)
Diguanylate Cyclase Feedback Control
OCTOBER 20, 2006 • VOLUME 281 • NUMBER 42 JOURNAL OF BIOLOGICAL CHEMISTRY 32023
at M
ED
IZIN
BIB
LIO
TH
EK
on
Octo
be
r 23
, 20
06
w
ww
.jbc.o
rgD
ow
nlo
ad
ed
from
5 Results
58

33. Tesmer, J. J., Sunahara, R. K., Johnson, R. A., Gosselin, G., Gilman, A. G.,
and Sprang, S. R. (1999) Science 285, 756–760
34. Sunahara, R. K., Beuve, A., Tesmer, J. J. G., Sprang, S. R., Garbers, D. L., and
Gilman, A. G. (1998) J. Biol. Chem. 273, 16332–16338
35. Baker, D. A., and Kelly, J. M. (2004)Mol. Microbiol. 52, 1229–1242
36. Hickman, J. W., Tifrea, D. F., and Harwood, C. S. (2005) Proc. Natl. Acad.
Sci. U. S. A. 102, 14422–14427
37. Mendez-Ortiz,M.M., Hyodo,M., Hayakawa, Y., andMembrillo-Hernan-
dez, J. (2006) J. Biol. Chem. 281, 8090–8099
38. Simm, R., Morr, M., Kader, A., Nimtz, M., and Romling, U. (2004) Mol.
Microbiol. 53, 1123–1134
39. Galperin, M. Y., Nikolskaya, A. N., and Koonin, E. V. (2001) FEMSMicro-
biol. Lett. 204, 213–214
40. Ulrich, L. E., Koonin, E. V., and Zhulin, I. B. (2005) Trends Microbiol. 13,
52–56
41. Becskei, A., and Serrano, L. (2000) Nature 405, 590–593
42. Gardner, T. S., Cantor, C. R., and Collins, J. J. (2000) Nature 403,
339–342
43. McAdams, H. H., and Arkin, A. (1997) Proc. Natl. Acad. Sci. U. S. A. 94,
814–819
44. Rosenfeld, N., Elowitz, M. B., and Alon, U. (2002) J. Mol. Biol. 323,
785–793
Diguanylate Cyclase Feedback Control
32024 JOURNAL OF BIOLOGICAL CHEMISTRY VOLUME 281 • NUMBER 42 • OCTOBER 20, 2006
at M
ED
IZIN
BIB
LIO
TH
EK
on
Octo
be
r 23
, 20
06
w
ww
.jbc.o
rgD
ow
nlo
ad
ed
from
5 Results
59

1
SUPPLEMENTAL MATERIAL:
MATERIALS AND METHODS:
Purification of His-tagged proteins - E. coli BL21 cells carrying the respective expression
plasmid were grown in LB medium with ampicillin (100μg/ml) or kanamycin (30μg/ml) and
expression was induced by adding IPTG at OD600 0.4 to a final concentration of 0.4 mM. After
harvesting by centrifugation, cells were resuspended in buffer containing 50 mM Tris-HCl, pH
8.0, 250 mM NaCl, 5 mM !-mercaptoethanol, lysed by passage through a French pressure cell,
and the suspension was clarified by centrifugation for 10 min at 5,000 x g. Soluble and insoluble
protein fractions were separated by a high-spin centrifugation step (100,000 x g, 1 h). The
supernatant was loaded onto Ni-NTA affinity resin (Qiagen), washed with buffer, and eluted with
an imidazol-gradient as recommended by the manufacturer. Protein preparations were examined
for purity by SDS-PAGE and fractions containing pure protein were pooled and dialyzed for 12 h
at 4°C.
Molecular modeling of PleD
All-atom simulations were carried out using the CHARMM (25) program and the
CHARMM22/27 force field (26). The A chain of the X-ray dimer structure (PDB entry: 1W25
(17)) was used. All titratable side chains were generated in their standard protonation state at pH
7. Parameters and partial charges for the non-standard residue c-di-GMP were adopted from the
extended CHARMM parameter sets for nucleic acids. The structure of the ligated (intercalated c-
di-GMP bound to the I-site) and the unligated protein, to which hydrogen atoms were added,
were minimized using a distance-dependent dielectric with "=4 and a cutoff of 12 Å for non-
bonded interactions. 5000 steps of steepest descent minimization were followed by adopted
Newton Raphson minimization until a RMS gradient of 10-7 kcal/mol·Å was reached. Such a
threshold is found to be sufficient for normal mode calculations (49). Normal modes were
calculated with the diagonalization in a mixed basis (DIMB) method, as implemented in
CHARMM. The DIMB method is an approximate scheme retaining the full atomistic description
of the protein, where the Hessian is approximated iteratively. The total number of basis functions
was 153 and cumulated displacements were calculated for T = 300 K.
For ligated PleD motion is suppressed at L(!1, 1) (res.10-12), L(!3, 3) domain REC1, the C-
terminal end of 3 (res. 220-224) of domain REC2, the unstructured linker between REC2 and
GGDEF domain (res. 282-284), the residues forming the A-site (res. 352), L( 2,!2) (res. 357-
5 Results
60

2
360, I-site), L(!2,!3) (res. 367-373, A-site) and at the C-terminal end of 3 (res. 396-398) of the
GGDEF domain. By contrast upon ligand binding mobility increases for 1 (res. 24), 4 (res. 96-
99) of domain REC1, residues (res. 149, 175), L(!2, 2) (res. 205-207), L(!5, 5) (res. 254-257)
of domain REC2 and residues L(!3',!3'') (res. 404-407) and L(!4, 4) (res. 422-424) of the
GGDEF domain.
Primer list
The following primers were used: #1006, ACA CGC TAC ATA TGA AAA TCT CAG GCG
CCC GGA C; #1007, ACT CTC GAG AGC GCT CCT GCG CTT; #1129, CAA GCG GCT
GCA GGC CAA TGT GAT CGT CGG CCG CAT GGG TGG TGA; #670, TGC TAG TTA TTG
CTC AGC GG; #1006 ACA CGC TAC ATA TGA AAA TCT CAG GCG CCC GGA C; #1130,
CAA GCG GCT GCA GGC CAA TGT GCG CGA AAG CGA CAT CGT CGG CCG CAT
GGG TGG TGA; #1132, CAC ATT GGC CTG CAG CCG CTT GGC GAC; #1131, CAA GCG
GCT GCA GGC CAA TGT GNN NNN NNN NNN NAT CGT CGG CCG CAT GGG TGG
TGA.
5 Results
61

3
FIGURE LEGENDS:
Figure S1: Separation of peptides yielded from tryptic digest of PleD in the presence (red
chromatogram) or absence of c-di-GMP (black chromatogram) on a C18 column. Peaks
identified by ESI-MS: c-di-GMP m/z 691, tR 7.70 min, T47 (amino acids 354-359) m/z 659.3 tR
25.64 min. T49 (amino acids 367-386) m/z 2167.7 tR 47.73 min.
Figure S2: Normal modes of PleD I-site and A-site residues. The displacements for each mode
of the ligated and unligated structures are shown in Å for the residues of the REC2 domain
(green) and the GGDEF domain (red). Insertion of intercalated c-di-GMP in the I-site quenches
motion in both the I-site (R359-D362, R390) and the A-site (G368-E371), suggesting that the two
sites are dynamically coupled.
Figure S3: Representation of the PleD protein (blue: REC1, green: REC2, red: DGC) with c-
di-GMP bound to the I-site. C -atoms at positions of considerable changes in flexibility upon
ligand binding are shown as spheres; reduced flexibility (yellow) and enhanced flexibility (black).
Note that binding of c-di-GMP at the I-site (I) affects mobility not only in the I-site, but also in
other regions of the protein, e.g. A-site (A), phosphorylation site (P) and dimer interface.
Figure S4: Alignment of I- and A-site sequence of biochemically characterized diguanylate
cyclases. I-site residues (RXXD) are underlined in green and A-site residues (GGDEF) are
underlined in yellow.
5 Results
62

20
FIGURE LEGENDS:
Figure S1: Separation of peptides yielded from tryptic digest of PleD in the presence (red
chromatogram) or absence of c-di-GMP (black chromatogram) on a C18 column. Peaks
identified by ESI-MS: c-di-GMP m/z 691, tR 7.70 min, T47 (amino acids 354-359) m/z 659.3 tR
25.64 min. T49 (amino acids 367-386) m/z 2167.7 tR 47.73 min.
Figure S2: Normal modes of PleD I-site and A-site residues. The displacements for each mode
of the ligated and unligated structures are shown in Å for the residues of the REC2 domain
(green) and the GGDEF domain (red). Insertion of intercalated c-di-GMP in the I-site quenches
motion in both the I-site (R359-D362, R390) and the A-site (G368-E371), suggesting that the two
sites are dynamically coupled.
Figure S3: Representation of the PleD protein (blue: REC1, green: REC2, red: DGC) with c-
di-GMP bound to the I-site. C -atoms at positions of considerable changes in flexibility upon
ligand binding are shown as spheres; reduced flexibility (yellow) and enhanced flexibility (black).
Note that binding of c-di-GMP at the I-site (I) affects mobility not only in the I-site, but also in
other regions of the protein, e.g. A-site (A), phosphorylation site (P) and dimer interface.
Figure S4: Alignment of I- and A-site sequence of biochemically characterized diguanylate
cyclases. I-site residues (RXXD) are underlined in green and A-site residues (GGDEF) are
underlined in yellow.
5 Results
63

5 Results
64

5 Results
65
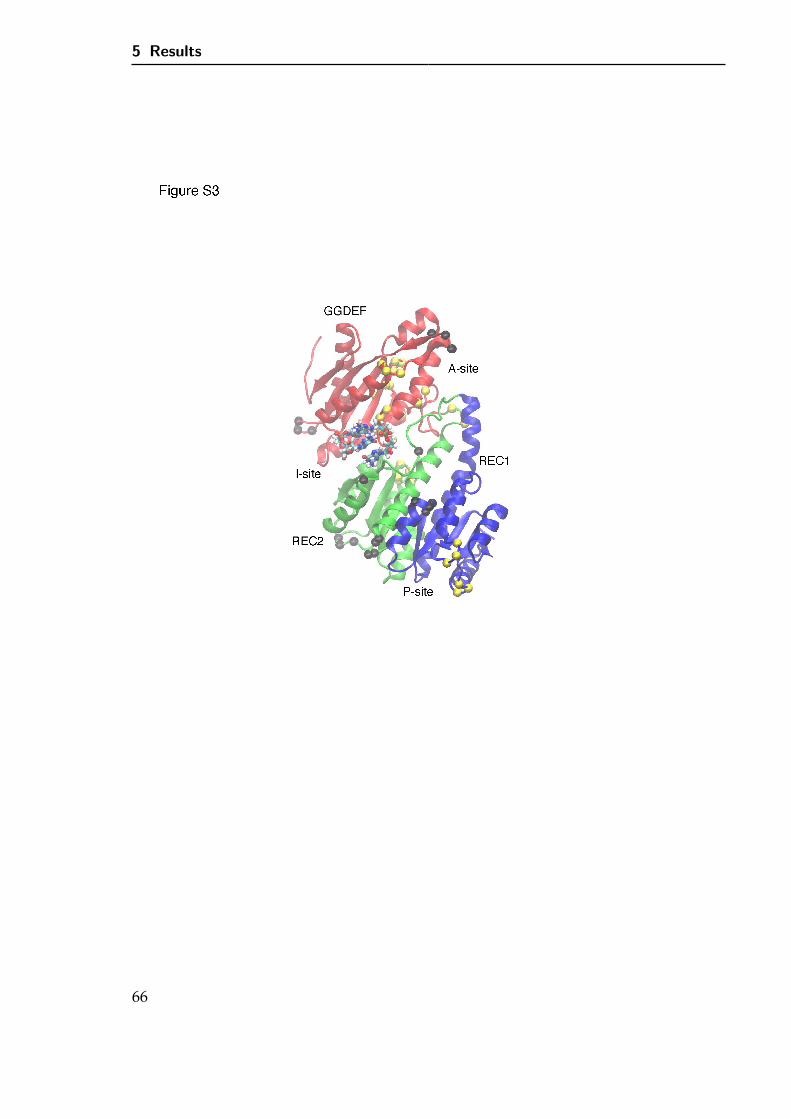
5 Results
66

5 Results
67

5 Results
5.2 All-atom simulations of structures and energetics of
c-di-GMP bound and free PleD
F. F.-F. Schmid and M. MeuwlyJ. Mol. Biol. (2007) 374:1270-1285
68

All-atom Simulations of Structures and Energeticsof c-di-GMP-bound and free PleD
Franziska F.-F. Schmid and Markus Meuwly⁎
Department of Chemistry,University of Basel,Klingelbergstrasse 80,CH-4056 Basel, Switzerland
Received 14 May 2007;received in revised form1 September 2007;accepted 22 September 2007Available online29 September 2007
Cyclic diguanosine monophosphate is a bacterial second messengerinvolved in a lifestyle switch from single cells to biofilm formation.Atomistic simulations are used to characterize inhibited diguanylate cyclase(DGC) PleD with emphasis on the feedback inhibition mechanism. Normal-mode calculations show a rigidification particularly in both the inhibitionsite and the active site of the protein upon ligand binding. Extensivemolecular dynamics simulations in explicit solvent and analysis of thedynamical cross-correlation maps suggest two distinct coupling pathwaysbetween the active and the inhibition site: direct information transfer eitherthrough the β-strands β2 and β3 of the DGC domain (pathway I) or via thedisordered regions connecting domains D2 and DGC (pathway II). Inaddition, dynamical cross-correlation maps show differences in thecorrelation between neighboring domains upon ligand binding and uponthe point mutation R390A. The correlated motions between domains D1and D2, which form the dimerization interface, are stronger for free PleD.Complementary to the experimentally observed short-range interactions inligated PleD, the present work also characterizes the long-range, delocalizedinteractions between domains that are important for understandingactivation and allosteric control of the protein. Based on the results,experimental characterization of the point mutant R353 and of the doublemutant N357/H394 is proposed to differentiate between pathways I and II.
© 2007 Elsevier Ltd. All rights reserved.
Edited by M. LevittKeywords: MD simulations; second messenger c-di-GMP; diguanylatecyclase; product inhibition; protein function
Introduction
Cyclic diguanosine monophosphate (c-di-GMP)has recently been identified as a second messengerin bacteria important for multicellular behavior andpersistence. Bacterial biofilm formation is involvedin life-threatening infectious diseases, such as cysticfibrosis, or the colonization of medical devices.Cellular levels of c-di-GMP are controlled throughdiguanylate cyclases (DGCs) and c-di-GMP-specific
phosphodiesterases.1 DGCs convert two moleculesof guanosine triphosphate (GTP) into c-di-GMP,while phosphodiesterases cleave the cyclic com-pound into the linear dinucleotide pGpG.2 Recently,an involvement of c-di-GMP in regulation of host–pathogen interactions including antioxidant defenseand cytotoxicity have been proposed.3 Thus, inhibi-tion of DGCs is a potential target to combat biofilm-related infections.Genetic studies support the notion that DGCs
control bacterial growth on surfaces by regulatingmotility and cellular adhesion.4 This rests to someextent on investigations of PleD from Caulobactercrescentus, a protein that efficiently catalyzes theconversion of GTP into c-di-GMP.5 PleD is a multi-domain regulator protein with a C-terminal DGCdomain that serves as an output module.5,6 TheDGC domain (also called GGDEF or DUF1) is highlyconserved in many bacterial species and corre-sponds to one of the largest protein families in thedatabase. The DGC domain of PleD is associated
*Corresponding author. E-mail address:[email protected] used: ABNR, adopted Newton–Raphson;
BNM, block normal mode; c-di-GMP, cyclic diguanosinemonophosphate; DCCM, dynamical cross-correlation map;DIMB, diagonalization in a mixed basis; DGC, diguanylatecyclase; GTP, guanosine triphosphate; MD, moleculardynamics; NMs, normal modes; NMA, normal-modeanalysis; RMSF, root-mean-square fluctuation.
doi:10.1016/j.jmb.2007.09.068 J. Mol. Biol. (2007) 374, 1270–1285
Available online at www.sciencedirect.com
0022-2836/$ - see front matter © 2007 Elsevier Ltd. All rights reserved.
5 Results
69

with two N-terminal CheY-like receiver domains(D1 and D2). The PleD DGC is activated by specificphosphorylation of the first receiver domain (D1).7
Very recently, the structure of PleD complexedwith c-di-GMP has been successfully determinedusing X-ray crystallography.8 This structure identi-fied a potential allosteric inhibition site (I-site) withtwo mutually intercalated c-di-GMP moleculestightly bound to the DGC/D2 domain interface.8
Structure/function analysis of PleD and DgcA, arelated DGC, has confirmed the role of the I-site infeedback inhibition control.2 Biochemical, geneticand structural analysis of CheY had indicated thatphosphorylation induces a structural change uponactivation.9–13 However, it is unclear how much thephosphorylation-induced conformational changescontribute to the observed stabilization of the activestate over the inactive state in CheY.9 It is interestingto note that the structural difference between theactive and the inactive form of CheY is quite small(on average below 1 Å) and restricted to a smallregion of the protein (around residues 90 and 113,which are loop regions).10
So far, little is known about how DGCs work at amolecular level. For example, the mechanism ofDGC feedback inhibition, mentioned above, is notknown. For this, structural information on the pro-tein and its ligand is required. Possible modes ofaction have been suggested on the basis of the X-raystructure and general features based on structure–function relationships.8 One possibility is that thebinding of c-di-GMP results in domain intercalationand immobilization of the DGC and D2 domains.Alternatively, upon I-site occupation, the dimeriza-tion interface may be altered, preventing dimerformation and thus inhibiting DGC activity.8 Thelatter proposal is consistentwith the observation thatPleD has to form a dimer for activation. Finally, it ispossible that binding of c-di-GMP to the I-site leadsto intradomain rearrangements that would alter thecatalytic properties of the active site.2
The present study investigates inhibited mono-meric PleD with intercalated c-di-GMP present inthe inhibition site in view of a possible biologicalmechanism for allosteric control. Traditionally,protein function has been inferred from its structure,and possibly additional information (such as kineticand spectroscopic data). However, contrary to thestatic view of protein function, the view emergedthat protein dynamics contributes considerably tofunction.14 One example are collective, usually lowfrequency vibrations (so-called functional modes)that can play important roles in conformational tran-sitions relevant to protein function.14
Results
In the following, results are presented for struc-tural properties (energy-minimized structures andB-factors), which are compared to data from experi-ments, for the exploration around the energy-minimized structures (normal modes), and for the
dynamics [through molecular dynamics (MD) simu-lations and analysis of the correlated motions].Results are first presented for the ligated nativeprotein, for which experimental data are available.Then, changes compared to ligated PleD are dis-cussed upon removing the ligand. To describestructural features the following nomenclature isused: αX for α-helices, βX for β-strands where X is anumber. Loop regions are written as L(x,y) where xand y are the flanking secondary-structure elements.
Structures and validation of the ligated andunligated protein
Ligated PleD
Figure 1 gives an overview of the structure of onemonomer of ligated PleD. The DGC domain (top)contains the active site (cyan), whereas the inhibitionsite (orange) is located between domains DGC andD2. The active site (A-site production site for c-di-GMP) is located in the region of the α1 and α2helices with the conserved GGDEF motif in the loopL(β2,β3) of the DGC domain (residues G368, G369,E370, E371).5
Optimized structures were calculated as describedin Materials and Methods for ligated PleD startingfrom the X-ray structure. The final RMS differencebetween the calculated and experimentally deter-mined structure is 0.97 Å (constrained) and 1.77 Å(free) for the backbone atoms (residues 2–454),respectively. Such an RMSD is quite typical forforce field optimizations of medium to large pro-teins using a similar minimization protocol.15,16Normal-mode calculations [block normal-mode(BNM) method] using the X-ray structure of inhi-bited PleD yielded 149 negative normal-modefrequencies and hence this is not a minimum-energystructure. Regions showing considerable rearrange-ments during structural optimization also exhibitlarge fluctuations in the imaginary modes, namely,the unstructured parts connecting the domainsD1–D2 and D2–DGC.
B-factors for ligated PleD
The MD simulations of ligated PleD (for details,see below) also allow one to calculate root-mean-square fluctuations (RMSFs), which are a measure ofthe flexibility and fluctuations around the averageprotein structure and which are related to measuredB-factors. They are calculated over the last 1.25 ns ofthe MD simulations. Figure 2 shows that, in general,the location of the flexible regions—characterizedby larger B-factors and RMSF—and the more rigidparts of the protein agree quitewell. In regionswhereno electron density was found in the experimentresidues 138–146 and residues 283–285), the calcu-lated RMSFs are large. These parts of the proteincorrespond to linking regions between the differentdomains.Experimental B-factors and RMSFs differ in the
region of residues 325 to 345, which are adjacent to
1271MD Simulations of Inhibited and Free PleD
5 Results
70

the A-site (see Fig. 1). The increased mobility inthe MD simulations compared to the more rigidbehavior found experimentally is consistent with thefact that in the crystal c-di-GMP is present8 in theA-site, while in the simulations this position is notoccupied. Further differences between mobilitiesfrom experiment and simulations are found indomain D1 for helix α2 and the adjacent loopL(α2,β3) (residues 36–50). Analyzing the X-raystructure (Swiss PDB Viewer17), we found thesetwo elements are involved in crystal contacts, whichexplains the observed difference in motility.
Characterization of the structure of unligated PleD
It is also of interest to characterize possiblestructural changes upon removing the ligand fromPleD. The experimental results suggest that thestructures of ligated PleD (as a dimer) and theunligated monomer differ.5 In general, it is notpossible to predict changes in the protein structureupon removal or insertion of the ligand based solelyon knowledge of the ligand size, for example.The structural optimizations for unligated PleD
were started from the ligated X-ray structure from
Fig. 1. Structure of c-di-GMP-ligated PleD. Overview of PleD ligated with c-di-GMP: the guanylate cyclase domain(DGC) in green, domains D1 and D2 in red and yellow, respectively. The ligand c-di-GMP (colored by atom type; C, cyan;N, blue; P, yellow; O, red; H, white) is shown in ball-and-stick representation. Protein residues forming the active (cyan)and the inhibition site (orange) are highlighted.
1272 MD Simulations of Inhibited and Free PleD
5 Results
71

which c-di-GMP was removed. The final RMSdifference is 0.98 Å (constrained) and 1.88 Å (free)for the backbone atoms (residues 2–454), similar tothe RMSD found for ligated PleD. Ligand removalleads to structural differences mainly in the DGCdomain and the unstructured regions connecting thedifferent domains. BNM calculations yield two(constrained) and three (free) slightly negativenormal modes (≤0.001 cm−1), respectively, whichshows that the structures correspond to real minimaon the potential energy surface. However, it isquite likely that the structures investigated do notcorrespond to a low-energy structure (see alsoDiscussion and Conclusions).
Fluctuations and change of flexibility uponcomplexation
To characterize the influence of ligand binding onthe flexibility of the protein, the Cα RMSFs of ligatedand unligated PleD are compared (see Fig. 2).Differences are found in the following regions:RMSF values for unligated PleD are higher forL(β1,α1) (residues 8–15), L(β3,α3) and neighboringα3 (residues 54–70) and the C-terminal half of α5(residues 120–138) of domain D1, α3 (residues 210–225) of domain D2, the linking region between D2and DGC (residues 283–289) and L(α0,β1) (residues315–319) of the domain DGC. In contrast, RMSFvalues for unligated PleD are lower for the linkingregion between D1 and D2 (residues 138–150),L(β4,α4) (residues 234–239) of domain D2 andL(β3′,β3″) (residues 402–408) of domain DGC.To summarize, it is found that the structure and
B-factors of ligated PleD agree well with experi-mental findings, while for unligated PleD the struc-ture can be further relaxed upon removing theligand. This is consistent with experiments, whichfind that the structures of ligated and unligated PleDdiffer. Comparing the RMSFs between ligated and
unligated PleD indicate subtle but potentially im-portant differences in the local flexibilities of second-ary-structure elements also away from the I site andin the linker regions between domains. This pointwill be further discussed in the MD simulations.
Normal-mode analysis
Normal modes (NMs), that is, excursions of amolecule around a minimum-energy structure, areusually calculated from diagonalizing the 3N×3NHessianmatrix (matrix of second derivatives), whereN is the number of atoms of the molecule.18–20 Forfree (N=7140) and complexed (N=7276) PleD thenumber is too large for direct diagonalization of theentire Hessian. Consequently, approximate methodssuch as diagonalization in a mixed basis (DIMB) orBNM are used for calculating vibrational frequen-cies. DIMB retains the full atomistic description ofthe protein, whereas BNM is a coarse-grained model(see Materials and Methods). First, the results ofDIMB are described and then compared to BNMcalculations.To validate DIMB for the present work, the full set
of NMs was calculated for isolated c-di-GMP andcompared with DIMB using m=103 basis functions.This leads to 97 nonzero NMs from DIMB. For these97 NMs, no difference was found between DIMBand frequencies based on the diagonalization of thefull Hessian matrix. These results give confidencethat DIMB applied to the free and ligated structureof PleD is meaningful, especially for the low-frequency modes. Convergence studies were alsocarried out for ligated and unligated PleD with mranging from 50 to 300 (53, 103, 153, 175, 200, 225,250, 275 and 300). Increasing m also increases thenumber of atoms in a particular block and thenormal-mode frequencies shift to lower values untilthey converge for mN275. To further assess theinfluence of the basis set size used with DIMB,
Fig. 2. B-factors versus calcu-lated RMSF. Experimental B-factorsand RMSF (in angstroms) from theMD simulations for ligated (blackand blue) and unligated PleD (red).The secondary-structure elementsare indicated on top: arrows forβ-strands and rectangular boxes forhelices. Domains D1, D2 and DGCare color coded in red, yellow andgreen, respectively. It should benoted that in regions where noelectron density was found experi-mentally (residues 138–146, 283–285) the B-factor in the PDB filewas arbitrarily set to 20. Prominentdifferences between the calculatedB-factors for ligated and unligatedPleD occur mostly in loop regions:L(β3, α3) and L(β5, α5) of D1
(residues 54–57, 104–108); disordered region and part of α3 of D2 (residues 144–147, 219–221); L(β4, α4) of DGC(residues 420–424). In general, the pattern from the experiment is well reproduced by the simulations (see, e.g., the regionaround residues 400 and 420).
1273MD Simulations of Inhibited and Free PleD
5 Results
72

RMSFs of the normal modes at T=300 K werecalculated for m=53, 103 and 153. The RMS fluc-tuations from normal mode analysis (NMA) agreequalitatively with those obtained from the MDsimulations and are shown in Fig. 3. Furthermore,identification of the flexible regions is independentof the basis set size. It should be mentioned, how-ever, that NMA explores the region around theminimum of the potential energy surface, while MDsimulations allow structural rearrangements. Inaddition, the MD simulations are carried out inexplicit solvent, while for the NMA a distance-dependent dielectric is used.As an alternative, a coarse-grained method (BNM)
was used to calculate the normal modes. Thisanalysis provides a comparison of NMs based onDIMBwith a method that allows one to calculate themajority of low-frequency NMs. Because BNMcontains one phenomenological coupling constantbetween neighboring residues and not explicitmasses,21 the frequencies are only determined upto an approximate multiplicative factor and absolutefrequencies cannot be directly compared to a DIMBcalculation. However, it is possible to characterizethe large-scale motions of the protein.
Overview of the normal modes
Figure 4a shows the frequencies as a function ofthe mode number calculated with DIMB (basis setsize 153) (solid line) and BNM (dashed line). It isfound that the BNM frequencies are lower than theones from DIMB, whereas the density of states iscomparable. For both methods, frequencies for mostnormal modes are slightly higher for ligated PleD(blue) than for the unligated protein (red). This is ahint that ligand binding influences the flexibilityof the protein such that the complex is more rigid.The mode density distribution for both DIMBand BNM is shown in Fig. 4b and c. When com-paring the percentage of modes with frequencies
below 10 cm− 1, one finds 7.5% and 7.9% forunligated PleD, which is higher than 5.4% and7.7% for the complex system, respectively. Thisdistribution difference is more pronounced in thecase of DIMB. The effect of ligand binding on theprotein flexibility is analyzed in more detail forresidues of the I- and A-site.
Amplitudes per mode for I- and A-site residues
From an NMA it is also possible to investigatewhether the magnitude of motion of a particularresidue is damped or enhanced upon ligand bindingand which residues and parts of the protein parti-cipate in a particular NM. A considerable displace-ment for a given mode suggests that this residue isstrongly involved in the mode. The displacementsfor the residues in the I- and A-site for each of the147 nonzero modes from DIMB are shown in Fig. 5.Residues 368 to 371 are involved in binding of GTPin the A site, whereas residues 148, 174, 177–178,359–362 and 390 were identified to be important forfeedback inhibition with c-di-GMP.8
For ligated and unligated PleD, Cα displacementsfor each NM were calculated at T=300 K. It is foundthat the displacements for the A-site residues areconsiderably larger for free PleD than for the ligatedprotein. In particular, motion for modes 75 to 100 isgreatly enhanced for unligated PleD. The effect isless pronounced for the I-site residues, albeit R359and A360 are still more mobile for the free system.NMA suggests that ligand insertion reduces theflexibility of the I- and A-sites.To ensure that the reduced flexibility in both the I-
and A-sites is indeed due to ligand binding and notan artifact of the NMA, displacements for distantresidues were calculated. These control residues (notshown) display random increase/decrease of dis-placements upon ligand binding. When the basis setsize is increased to 300 (with concomitant increaseof the number of atoms per block), the difference in
Fig. 3. Residue mobility fromMD simulations and normal modecalculations. Comparison betweenRMSFs from the MD simulationsand from normal mode calculations(DIMB) with different basis set sizesfor (a) unligated and (b) ligatedPleD. The following color code isused: MD, black; DIMB with basis-set size 153, blue; 103, green; and 53,red. The secondary-structure ele-ments are indicated on top: arrowsfor β-strands and rectangular boxesfor helices. Domains D1, D2 andDGC are color coded in red, yellowand green, respectively. The shapeof the RMSF obtained from the MDsimulation and the NMA are verysimilar. There is an improvement ifa higher number of NMs is included(see, e.g., around residue 175).
1274 MD Simulations of Inhibited and Free PleD
5 Results
73

mobility between ligated and unligated PleD is lesspronounced. However, ligand binding still reducesthe mobility of R359, A360, I361, E362, R148, H177,R178 and R390.
The NMs also allow one to study the influence ofligand binding on the mobility of residues that formthe I- and A-sites (see Fig. 5). Comparing theresidual displacements in ligated and unligated
Fig. 5. Influence of ligand binding on active and inhibition site residues. Cα displacements calculated from normal-mode calculations (DIMB) at T=300 K for I- (red) and A-site (green) residues, respectively. Ligand binding in theinhibition site decreases the mobility of the residues involved in binding. However, the mobility of residues in the distantA-site is also considerably damped.
Fig. 4. Normal mode frequen-cies. (a) The normal mode frequen-cies obtained from DIMB withm=153 basis functions (dashed line)and BNM calculation (continuousline). The absolute wave numbersfrom the BNM calculations arelower but the shape of the curvesis comparable. (b) and (c) Densitydistribution of the frequencies fromDIMB and BNM, respectively. In allplots, ligand binding shifts mostnormal modes to slightly higherfrequencies. The number of modeswith frequencies below 10 cm− 1 ishigher in the unligated PleD (7.5%versus 5.4% for DIMB and 7.9%versus 7.7% for BNM) than in thecomplex structure. The difference inmobility is more pronounced forDIMB. In all plots, ligated PleD isblue and unligated PleD is red.
1275MD Simulations of Inhibited and Free PleD
5 Results
74

PleD, we find that the most striking feature is thesuppression of motion upon ligand binding in boththe I- and A-sites. The influence of ligand binding onthe dynamics of residues in both sites can beattributed to dynamical coupling. One interestingpoint is to understand how the two sites are coupledin detail. Looking at the structure, we can envisagetwo possibilities for information transfer: localizedcoupling involving the short β-strand β2 thatconnects the I- and the A-sites. Alternatively, thecoupling may be distributed over the entire protein.To get information about the coupling mechanism,for example, through which structure elementscoupling occurs, the NMs that involve residuesfrom the I- and A-sites are characterized. In thefollowing, modes 27, 56 and 78 and the range from89 to 98 calculated with DIMB (basis set size 153)will be considered more closely. Modes 27, 78 andthose from 89 to 98 involve both I- and A-siteresidues, whereas in mode 56 only A-site residuesparticipate.
Modes 89 to 98
Cα atoms of A- (residues G368 to E371) and I-site(R359, A360) residues have displacements of up to0.1 Å for these modes and the modes are delocalizedover the entire protein. The largest amplitudes arefound in the DGC domain. Helices α3 and α1 areanticorrelated to L(β2,β3) (A-site) andβ3″. The loopsL(β2,β3) and L(α2,β2) (A- and I-site loops) areconnected via the short β-strand β2, which mediatesmotion. Structural elements forming the I-site pocketare correlated with the I-site loop. Overall, a screw-like motion of the helices α1, α2 and α3 in the DGCdomain translates β2 along the strand direction.
Modes 27 and 78
Considerable displacements in both sites arefound for modes 27 and 78. In mode 27 the I- andA-site loops, connected via the β-strand β2, movetogether in the same direction. The helix α0 seems todisplace the β-strand β2. However, this specificmode leads to major movement of domain D1without the extended helix α5 as a unit and in theDGC domain α0, L(β4,α4), β3′ to β3″ and L(α1,α2)with parts of the neighboring helices. The D2domain remains stationary. In mode 78, substantialmotion is found in the I-site region, especially thedisordered linking regions and the C-terminal partof α5 of D1. The loops L(α2,β2) and L(β2,β3) (I- andA-site loop) move in the opposite direction, as foundfor modes 89 to 98. Other parts of the protein thatdisplay motion in this mode are α4 to β5 and bothends of α0 of DGC, β2 to α2 of D2 and L(β3,α3) ofD1.
Mode 56
Contrary to the above, mode 56 involves onlymotion of A-site residues. Further movements arefound in the DGC domain, α1 of D2 and α2 and the
C-terminal half of α5 of D1. L(β2,β3) moves togetherwith α1 and α4 of DGC. The motion of the N-terminal part of α3 is in the opposite direction. TheC-terminal half of α5 of D1 and β0 of DGC alsomove in the direction opposite that of the A-siteloop.In summary, the NMA suggests that the I- and
A-sites in DGC are dynamically coupled via theshort β-strand β2 that itself is influenced frommotion of the nearby helices. In addition, dynamicalcoupling between the two sites is not restricted to asingle functional mode but is present in several low-frequency modes.
Molecular dynamics simulations of native,complexed PleD
Complementary to NMA, MD simulations pro-vide additional information about collective mo-tions within a protein, including a realistic solvationenvironment. One further important difference isthat NMA is sensitive to motion around theoptimized structure, whereas MD simulations alsocapture anharmonic contributions and allow, forexample, crossing of torsional barriers. Representa-tive of all trajectories, the MD simulations for ligatedPleD are described in more detail, because for thissystem a well-defined starting structure is availablefrom experiment.During the MD simulations all secondary-struc-
ture elements are preserved. The average RMSD ofall Cα atoms, compared to the X-ray structure, is2.0 Å (see Fig. 6a). Surprisingly, the RMSD for thecomplex is higher than for the unligated protein.This is mainly due to a reorientation of the DGCdomain with respect to domains D1 and D2 (seeFigs. 6b and 7c) At longer simulation times thisfeature becomes less pronounced and the RMSD forboth systems is ≈2.0 Å. In particular, DGC domainreorientation is reduced for trajectory III (see alsoFig. 3 in Supplementary Data). To distinguishbetween structural changes within the domainsand rearrangement between the three domains,snapshots taken every 10 ps were reoriented withrespect to each domain (D1, D2 and DGC). Then,average RMSDs were calculated for all Cα atoms ofPleD (see Fig. 6b) and for the Cα atoms of eachdomain, respectively (see Fig. 6c). Comparing theaverage RMSDs for Cα atoms within each domainafter superposition on the domain considered givesinformation about intradomain structural changes.RMSDs for the Cα atoms in domains D1, D2 and
DGC are 1.2, 1.5 and 1.4 Å, respectively. Interdo-main changes can be assessed from the difference inRMSD of all Cα atoms after reorientation on a singledomain (see Fig. 6b). The RMSD consideringdomains D1 and D2 give similar values (2.5 Å forD1 and 2.2 Å for D2) However, the catalyticallyactive domain DGC is oriented differently withrespect to the other domains, which is also reflectedin an RMSD of 3.5 Å (see Fig. 7c).To represent global motions of the protein, snap-
shots taken every 250 ps are superimposed (see
1276 MD Simulations of Inhibited and Free PleD
5 Results
75

Fig. 7) onto the backbone atoms. The most flexibleparts of the protein are the region β3′/β3ʺ and theC-terminus of the DGC domain. In addition, forthe complex system, one observes the reorientationof the DGC domain with respect to domains D1and D2 (see Fig. 7c). This is also reflected in theRMSD of all Cα atoms after reorientation ondomain DGC (3.5 Å versus 2.4 Å for ligated andunligated PleD, respectively). The D1/D2 interfaceis also rearranged.For unligated PleD, major shifts of secondary-
structure elements are observed in the DGC and D1domain (see Fig. 7a) compared to the X-raystructure. The helix α0 of the DGC domain movestowards the unoccupied I-site pocket, and domainD1, except for the extended helix α5, is moved alongthe axis of the α-helices α2 and α3. The majorrearrangement—the RMSD for Cα atoms reachesabout 2.4 Å—is the reorientation of domain DGCrelative to domains D1 andD2 for the complex. In allcases, the X-ray structure was used for comparison.Therefore, one cannot exclude artifacts from crystalpacking and it has to be kept in mind that simu-lations were carried out for the PleD monomer,whereas the asymmetric unit is a dimer.
Cross-correlation maps for native, ligated PleD
Dynamical cross-correlation maps (DCCMs) allowanalysis of persistent (anti)correlated motions ofresidue pairs from the MD simulations and serveas a quantitative measure for the collective motion ina protein. First, the results obtained for the ligatedsystem are discussed in detail (see Fig. 8a). Then,changes in the DCCMs upon removing the ligandare described. This allows the investigation ofligand-induced effects upon binding in PleD. Corre-lation coefficients above 0.3 are reported. A thresh-old of 0.3 is used to capture correlations between the
ligand and the protein. To further characterize thecomputed correlations, they were calculated for thefirst and second nanosecond of trajectory I and forshorter (25 ps) and longer (70 ps) windows. Theresults, shown in Figs. 1 and 2 of the SupplementaryData, demonstrate that the reported correlations arepersistent and largely independent of the details ofthe averaging procedures. A large number ofcorrelated motions within each domain and someinterdomain correlations are found, whereas anti-correlated motions are rare. Most correlated motionscorrespond to spatial proximity of the residuesinvolved.The correlation pattern of domains D1 and D2 is
very similar, as can be expected, because bothdomains are annotated CheY-like receiver domains.The central β-strand β3 is coupled to all secondary-structure elements of the domain, suggesting atightly packed domain. For the catalytically activedomain (DGC), no single secondary-structure ele-ment with correlation to all other elements withinDGC are found. Interdomain couplings can serve to“transfer information” (e.g., following a conforma-tional transition in one domain) between individualdomains. Such interdomain couplings are cross-correlation motions between different domains. ForPleD they are found between neighboring domains,D1/D2 and D2/DGC, respectively. The extendedα5-helix of D2 is interacting with α4, β5 and α5 ofD1. β2 and α2 of D2 are correlated to α0 of DGC.For the loop regions, mainly intradomain correla-
tions are found. The couplings in domains D1 andD2 are again similar. Interdomain correlations arefound between D2 and DGC, but none between D1and D2. The two unstructured regions connectingneighboring domains, D1–D2 and D2–DGC, respec-tively, are correlated. Additional connections arefrom L(α2,β2)—the I-site loop—to the unstructuredregion D1–D2 and to L(α1,β2).
Fig. 6. RMSD during the MDsimulation. RMSDs for Cα atomswith respect to the X-ray structureof ligated PleD from the MD si-mulations in explicit solvent. (a)The RMSD calculated for all Cα
atoms reaches a constant valueafter ≈250 ps for unligated PleD(red) and ≈500 ps for ligated PleD(blue). To ensure the full equilibra-tion of the system, the simulation ofligated PleD was extended to 3.0 ns.(b) RMSD for all Cα atoms aftersuperposition on domains D1 (red),D2 (orange), DGC (green) andD1/D2 (black), respectively, areshown in the middle panel (top,ligated; bottom, unligated). For thecomplex, superposition on thedomain DGC leads to a significantlylarger RMSD compared to the othercases. (c) RMSD calculated for eachdomain separately (same color code;top, ligated; bottom, unligated).
1277MD Simulations of Inhibited and Free PleD
5 Results
76

Removing the ligand from the I-site modifies thecross-correlation pattern. In the following, onlychanges upon ligand withdrawal are described,first for secondary-structure elements and then forthe loop regions. If the ligand is removed from theI-site, changes occur in all three domains. Somecorrelations present in the complex disappear andnew correlations emerge. α4 of D2 becomes morestrongly correlated to elements within D2 and alsocouples to α5 of D1, which is now correlated to α2 ofD1. Within DGC, coupling between α1 and β3′ is
found. It should be noted that these secondary-structure elements are close to the active site. WithinDGC, correlation between α0 and β3 is deleted. Thismight be of interest, as β3 is part of the β-sheetconnecting the I-site with the A-site loop and α0 is atthe interface to domain D2. In D2, interactionsbetween α1 and α3 and between β1 and α5disappear. In D1, α1 and β3 are no longer correlated.Residue D53, which is phosphorylated to activatethe DGC, is part of β3. Finally, the interactionbetween D2 and DGC, namely, β2 of D2 and α0 of
Fig. 7. Superposition of snapshots for ligated and unligated PleD. Superposition of eight snapshots taken every 250 psfrom the MD trajectories on the X-ray structure. The snapshots are reoriented on all backbone atoms for unligated (a) andligated (b) PleD. Reorientation on the backbone atoms of DGC only for ligated PleD (c). The structures are colored asfollows: X-ray structure, silver (cartoon representation); 0.25 ns, black; 0.50 ns, blue; 0.75 ns, cyan; 1.00 ns, green; 1.25 ns,yellow; 1.50 ns, orange; 1.75 ns, red; and 2.00 ns, purple. Comparison of (b) and (c) shows the displacement of D1 and D2versus DGC and the flexibility of the region β3′/β3″ of DGC.
1278 MD Simulations of Inhibited and Free PleD
5 Results
77

DGC, is weakened. Analysis of the loop regionsshows changes concerning all three domains asfound for the secondary-structure element analysis.In D2, L(β3,α3) and L(α4,β5) become correlated
when the ligand is removed. For DGC, a new cou-pling is found between L(α0,β1) and the C-terminus.In addition, L(β5,α5) of D1 interacts with L(β4,α4)across the D1/D2 interface, whereas interdomaincorrelation between D2 and DGC is decreased.The I-site loop L(α2,β2) no longer interacts withthe disordered region D1–D2 and with the loopL(α1,β2). The absence of these interdomaincorrelations can be rationalized by spatial contactsvia the ligand.
In summary, ligand removal leads to strongercorrelation between D1 and the proximal part of D2.However, ligand-induced couplings, whether due tospatial proximity or to structural rearrangement,disappear and are mainly located at the I-site pocket,the interface D2–DGC, in domain DGC close to theI-site loop, β3, and in the distant domain D1 at theactivation site, D53 of β3. These trends are observedto be persistent for different trajectories of ligatedPleD (see Supplementary Data Fig. 3 for validationand Fig. 4 for a comparison of the DCCMs).Finally, the direct correlations between PleD and
c-di-GMP are discussed. The ligand is coupled toresidues from both domains D2 and DGC. Thesecondary-structure elements α1 and β2 of D2 andα2 and α3 of DGC are correlated with the ligand.The two elements of D2 show different correlationsin the ligated and unligated protein, whereas theelements of DGC are unaffected by ligand binding.Furthermore, the ligand is interacting with thefollowing loop regions: L(α1,β2) and L(β2,α2) ofD2 and L(α2,β2) (I-site) and L(β3,α3) of DGC. Theloops L(α1,β2) of D2 and L(α2,β2) of DGC showdifferences in loop–loop correlations upon ligandremoval.The correlation patterns for ligated and unligated
PleD and the differences between them may help torationalize how ligand binding at the I-site modifiesand/or controls A-site functionality. One possibilityis that control occurs directly via the short β-strandβ2 that directly connects the I-site and the A-site.However, no direct correlation to the ligand is foundfrom the cross-correlation analysis. Another route iscoupling through the neighboring β-strand β3 or theα-helices α2, α3 situated above the β-sheet. Thecross-correlations display couplings from β2 to boththe antiparallel β-strand β3 and the helix α0 situatedat the interface to the neighboring domain D2, andthe correlation pattern of the neighboring β-strandβ3 is sensitive to the presence or absence of theligand. The motion of the I-site loop is correlatedwith L(β3,α3), and if the ligand is present the I-siteloop is coupled to L(α1,β2) of D2 and the disorderedregion D1–D2. The A-site loop, consisting of theresidues important for substrate binding and cata-lysis, is coupled to the disordered region D2–DGC.From the cross-correlations, a model involving α2 orα3 as connection element is less likely since ligandbinding does not affect the dynamical correlation ofthese helices.Two possible pathways remain: either via the
β-sheet or via the disordered regions. Pathway Iinvolving β2 and β3 is plausible because thesecondary-structure elements connect the two sitesdirectly and β3 correlations are altered by ligandbinding. This finding is also in accord with thepreviously reported β2 balance-like movement ofthe I- and A-site loops, based on the superposition ofthe minimized structures.2 Pathway II via thedisordered regions, D1–D2 and D2–DGC, originatesfrom an observed cascade of direct correlations fromthe I-site to the A-site in the DCCM analysis. Inaddition, this cascade is only present if the ligand is
Fig. 8. DCCM for ligated and unligated PleD. DCCMsfor ligated (a) and unligated (b) PleD. The following colorcode is used for the cross-correlation values: 0.3–0.4,green; 0.4–0.5, yellow; 0.5–0.6, orange; 0.6–0.7, red; 0.7–0.8, indigo; 0.8–0.9, blue; 0.9–1.0, black. The blue boxmarks direct correlations with the ligand. Blue and blackcircles, labeled with arabic and roman numerals, markcorrelations that are present exclusively in ligated andunligated PleD, respectively.
1279MD Simulations of Inhibited and Free PleD
5 Results
78

bound, otherwise the connection I-site loop todisordered region D1–D2 is absent.
Discussion and Conclusions
Currently, it is believed that both structure anddynamics contribute to protein function.22–26 Com-plementary to experimental work such as pointmutation studies or binding affinity measurements,computer simulations provide valuable and testableinformation at an atomic level. In this work, theligated and unligated multidomain DGC PleDmonomer is characterized by using MD simulations.Studying the monomer is appropriate because it hasbeen previously proposed that the monomer iscrucial for understanding allosteric inhibition inPleD.8 This is further supported by investigations ofthe single-domain DGC DgcA, which has preservedthe ability for feedback inhibition that indicates thatallostery is an intrinsic characteristic of the DGCdomain.2 Finally, binding of c-di-GMP to the PleDmonomer and dimer has been proposed to eliminatecatalytic activity by domain immobilization.8 This isin agreement with the observation from the presentsimulations that ligation of c-di-GMP leads to arigidification of the monomer.In the present work, the applicability of atomistic
simulations was first validated by calculatingoptimized structures and RMSFs around the mini-mum that can be directly compared to experimentaldata (X-ray structure and B-factors). Having estab-lished that this approach is meaningful, we inves-tigated the normal modes and the moleculardynamics in detail. The results suggest that theinhibition (I-site) and the active site (A-site) of PleDare dynamically coupled through an elaboratenetwork of atomic motions that involves the β2-strand (direct coupling within DGC) and thestructural elements β3, α2 and α3 of DGC (moredelocalized, network coupling).From the superposition of the energy-minimized
structures of ligated and unligated PleD a balance-like movement of the β-strand β2 was previouslyproposed.2 This motion displaces the I- and A-siteloops simultaneously. The present work extends thismodel explicitly to the atomic dynamics and doesnot assume that the ligated (experimentallyobserved) and the unligated protein structure areclosely related, which is not necessarily the case (seebelow). Thus, the results presented here are strongerevidence that direct communication between I- andA-site along β2 contributes to allosteric control inPleD.The experimentally determined structure for PleD
was obtained through co-crystallization with c-di-GMP.8 For further understanding of the mechanismsunderlying PleD function additional insight into theunligated structure is useful. The prediction of thestructural changes upon ligand binding is a difficulttask. Using the protocol described in Materials andMethods [steepest descent (SD)/adopted Newton–Raphson (ABNR) minimization until RMS gradient
of 10−7, distance-dependent dielectric with ε=4,decreasing constraints on the backbone atoms],snapshots along the MD trajectory were minimized.Assuming a large-scale motion of the DGC domainwith respect to domains D1 and D2, an “open”structure (see Fig. 9) that is considerably differentfrom the ligand-bound structure can be envisaged.Ten snapshots from a short, high-temperature MDsimulation (10 ps, T=500 K, distance-dependentdielectric with ε=4) were minimized using thestandard protocol. The final structures are consider-ably lower in energy (by 95 kcal/mol) compared tooptimized structures of unligated PleD in its X-rayconformation. Favorable electrostatic interactionsand orientations (dihedral angles) stabilize theputative open structure by ≈140 kcal/mol relativeto the optimized unligated structure of PleD,whereas unfavorable van der Waals and valenceangle energies destabilize it by ≈45 kcal/mol. It isinteresting to note that the low-energy character ofthis postulated open conformation is in qualitativeagreement with X-ray data of BeF−-activated PleDstructure, although the experimentally found struc-ture is even more open.27 The open, unligatedstructure has no I-site (originally formed by residuesfrom the DGC and D2 domains), and the A-site isclose to the unstructured region connecting domainsD1 and D2. The existence of two distinct conforma-tions (unligated open versus ligated closed) strength-ens the widely known equilibrium shift betweenactive and inactive structure through binding of theligand.9,28–31
From the normal mode analysis, no single func-tional mode with exceptionally high involvementcoefficient was found for the eigenvectors calculatedfrom the unligated or for the ligated structure (seeFig. 10). This is in agreement with recent proposi-tions that single functional modes are characteristicfor motor proteins, but not for signaling proteins.15
In fact, PleD is a signaling protein activated by astimulus (phosphorylation at D53 in domain D1).However, although normal modes can be helpful inanalyzing functionally important motions in aprotein, there are limitations in their interpretation,as has been discussed recently.32 The present findingsshow that binding of c-di-GMP to the I-site does notaffect only one dominant, functionally relevantmode, but rather influences a network of motionaldegrees of freedom that are relevant for PleD func-tion. From the DCCM, two distinct pathways areplausible: the first runs along the secondary-structureelements β2 and β3 with the possibility to include theα-helices α2 and α3 situated above the β-sheet,whereas the second pathway includes the disorderedregions connecting the different domains, D1–D2 andD2–DGC. The second pathway is only possible if theligand is bound, which implies that the ligand can actas a switch.A central question in understanding the function
of PleD is to relate its primary function (productionof c-di-GMP) with self-inhibition by c-di-GMP. Sincethe I- and A-sites are both located in the DGCdomain, one possibility is that ligation of c-di-GMP
1280 MD Simulations of Inhibited and Free PleD
5 Results
79

in the I-site leads to loss of functional modes (flexi-bility), which restricts motion around the A-site.Indeed, NMA and RMSF calculations on minimizedPleD structures show that c-di-GMP bound at theI-site influences the flexibility of the protein such thatspecifically both the I- and A-site regions becomemore rigid. The dynamics simulations support thetheory that information transfer between the twofunctional sites (I- and A-site) might be due todynamical coupling via β-strand β2 (pathway I) orthrough delocalized global motion of the protein(pathway II).To obtain additional information on the proposed
pathway and the correlations in inhibited PleD,similar calculations were carried out for the point
mutant R390A with c-di-GMP bound at the I-site.2
The mutation is located in the α-helix α3 of the DGCdomain and was obtained by deleting and rebuild-ing the appropriate residue side chain. Changes inthe correlation pattern are found in all threedomains, which indicates that the R390A mutationaffects the dynamics of the entire protein. Correla-tions within domains D1 and D2 are stronglydecreased in the mutant compared to the wild-type protein, whereas the correlation between thetwo domains is increased. In the catalytically activedomain DGC a similar number of correlations occur.However, different structural elements are corre-lated in the native compared to the mutant protein.For pathway I (β2 and β3 including the α-helices α2
Fig. 9. Open structure of free PleD. Putative open conformation structure of PleD superimposed on the original crystalstructure (gray): the guanylate cyclase domain (DGC) in green, domains D1 and D2 in red and yellow, respectively.Protein residues forming the active (cyan) and the former inhibition site (orange) present in the crystal structure arehighlighted.
1281MD Simulations of Inhibited and Free PleD
5 Results
80

and α3) the I- to A-site correlation is largelypreserved, whereas the direct correlation of theligand with α2 is missing. In contrast, pathway II(connecting regions between domains D1–D2 andD2–DGC) no longer exists. Overall, the DCCM ofthe mutant R390A shows that a single pointmutation considerably influences the overalldynamics in PleD. The mutation alters the correla-tions across the entire protein, and both suggestedpathways for I-/A-site communication are affected.This is in accord with combined mutagenesis andbiochemical experiments on the point mutantR390A, which show that the decreased feedbackinhibition is mostly due to a strong decrease in c-di-GMP binding affinity.2
However, to corroborate their existence and todiscriminate between the two pathways, furtherexperimental and computational investigations arerequired. To verify that the DGC domain is sufficientfor feedback inhibition and to exclude pathway II itwill be interesting to study the DGC domain of PleDindividually by biochemically removing the link todomains D1 and D2. Pathway I involves the motifsβ2 and β3, which are coupled to the α-helices α2 andα3. Studying the double mutant N357A/H394A(disruption of hydrogen bond between α2 and α3)or the single mutant R353 (side-chain backboneinteraction between α2 and α3 will be unavailable)should lead to decreased interaction between theα-helices that in turn affects coupling between theI- and the A-site.Based on MD simulations, the present work
characterizes the atomic dynamics of ligated andunligated PleD. The mechanistic model proposed byChan et al. is to some extent supported by thepresent data; for example, an “open” structure ofPleD is suggested from preliminary X-ray data andsimulation data where the mobility of DGC withrespect to domains D1/D2 leads to a structure that islower in energy.8 However, ligand binding to theinhibition site leads more likely to the loss of proteinflexibility than to a total immobilization of the three
domains. It was found that upon ligand binding theprotein is rendered less flexible specifically in boththe I- and A-sites, which was shown to be mediatedthrough dynamical coupling between the two sites.Simulations found stronger correlations betweenD1 and D2 for unligated PleD, which may affect thedimerization rate. Together with the availablebiological data, this is a first step towards a detailed,atomistic understanding of the important bacterialsecond messenger c-di-GMP. Further experimentaland computational work on this rich and interestingsystem should provide fundamental informationabout allosteric control and the role of dynamics inprotein–ligand systems.
Materials and Methods
Setup of the protein and the ligand
All MD simulations were carried out with eitherCHARMM33 or NAMD34 using the CHARMM 22/27force field.35 The starting structure was taken from theX-ray structure of the PleD dimer [Brookhaven ProteinData Bank (PDB), code 1W25] resolved at 2.7 Å. For allsubsequent studies the A chain of PleD with the c-di-GMPmolecule in the inhibition (I-) site was considered. Theadditional c-di-GMP molecule in the active (A-) site andthe metal ions are omitted because the present study isprimarily concerned with investigating effects uponinhibition of PleD (the Mg2+ ion close to residue D53 isimportant for the phosphorylation reaction). The proteinPleD consists of 460 amino acids and a total of 7140 atoms.Hydrogen atoms and the missing residues (M1, His-tagH456–H460) were generated and the structure wasrelaxed by 500 steps of SD minimization. All titratableside chains are generated in their standard protonationstate for pH 7. The system has an overall charge of −7 forPleD and −4 for the ligand. No counterions were intro-duced to neutralize the systems.To describe the nonstandard residue c-di-GMP, para-
meters and partial charges were adopted from theextended CHARMM parameter sets for nucleic acids.The structure of the intercalated c-di-GMP was optimized
Fig. 10. Involvement coefficientscalculated for the transition betweenminimized structures of ligated andunligated PleD. Involvement coeffi-cients, CIN, calculated for the transi-tion between the minimized (free)structure of ligated and unligatedPleD from the eigenvectors ob-tained with DIMB (basis set 153).No single mode contributing mostto the structural transition can befound for the eigenvectors calcu-lated from the unligated (top) struc-ture or for those obtained from theligated (bottom) structure. The cu-mulative sum of the square of theinvolvement coefficients is shownas a black line.
1282 MD Simulations of Inhibited and Free PleD
5 Results
81

using 5000 steps of SD minimization followed by ABNRminimization until a RMS gradient of 10−7 was reached ina distance-dependent dielectric with ε=4. Also, the ligandwas solvated in a small (37.3 Å×34.1 Å×34.1 Å) water boxand 24 ps of heating and equilibration and 100 psproductionMD simulations were run to assess its stability.The structure of the ligated (intercalated c-di-GMP
docked into the inhibition site of PleD) and the unligatedprotein was optimized using a distance-dependent dielec-tric with ε=4 and a cutoff of 12 Å for nonbondedinteractions. Starting from the X-ray structure, 1000 stepsof SD optimization were followed by 7500 steps of ABNRminimization with gradually decreasing constraints (morerestrictive on the backbone atoms) to prevent largestructural distortions. Initially, the structures were relaxeduntil a RMS gradient of 0.01 kcal/mol was reached. Such aminimization will be referred to as “constrained.” Startingfrom the constraint-optimized structure, further minimi-zation using no constraints and a RMS gradient of10−7 kcal/mol as a convergence criterion will be labeled“constrained E-7.” In addition, full minimizations until aRMS gradient of 10−7 kcal/mol without any constraintswere carried out, which are called “free.”
Normal-mode calculations
Normal mode calculations were carried out with theVIBRAN module of CHARMM. Since the unligated andthe ligated protein consist of 7140 and 7276 atoms,respectively, no full NMA is possible because of thelarge size of the resulting Hessian matrix. Thus, theapproximate schemes, DIMB and coarse-grained one-residue-per-block method (BNM) as implemented inCHARMM were used.21,36–38 The normal modes werecalculated for minimized structures of the system. Theminimization was performed using SD and ABNRminimization until the RMS of the energy gradientreached a value of 0.01 kcal/mol/Å using graduallydecreasing constraints or 10−7 kcal/mol/Å. A gradientvalue of 0.01 kcal/mol/Å has been shown to be satis-factory for calculating normal modes. RMSD from theX-ray structure calculated for the backbone atoms(residues 2–454) is 1.77 Å (free) and 0.97 Å (constrained)for the complex and 1.88 Å (free) and 0.98 Å (constrained)for the unligated protein. The basis set size was variedfrom 50 to 300 to analyze its convergence. The transla-tional–rotational coupling was removed by shifting thesemodes to high frequency. To test the DIMB approachfor the present case, normal modes for the intercalatedc-di-GMP ligand were calculated with diagonalization ofthe full Hessian (DIAG command) and compared toDIMB calculations retaining 103 basis functions.The BNMs are coarse-grained descriptions that allow
one to calculate normal modes at reduced computationalexpense. BNM uses a coarse-graining procedure thatcan range from a single residue to a secondary-structureelement. For BNM, the recent implementation into theCHARMM program was used.38 One residue per blockwas chosen and the frequencies were adjusted by scalingwith 0.5882 as suggested.
Molecular dynamics simulations
For the MD simulations the protein was solvated in arectangular box. With CHARMM, a 99.3 Å×74.5 Å×96.2 Åbox of pre-equilibrated TIP3P water39 was used andsolvent molecules overlapping with the protein wereremoved, which gives a system size of ≈70,640 atoms:
7140 atoms from native protein PleD, 136 atoms fromthe ligand (c-di-GMP dimer) and 63,500 solvent atomsapproximately. In the case of NAMD, the solvationfunction with a protein–box distance of 15 Å was used,resulting in a box with dimensions of 74 Å×112 Å×95 Å.This system size contains approximately 75,000 atoms.In all simulations, periodic boundary conditions wereused, images were updated every 10 time steps and a12 Å cutoff was applied to the shifted electrostatic andswitched van der Waals interactions. All MD simulationswere carried out using SHAKE40 to constrain hydrogenatoms and with a time step of 1 fs. For simulations withCHARMM the solvent was equilibrated at 300 K during29 ps (4 ps solvent heating and 25 ps solventequilibration) with the protein kept fixed. The entiresystem was then heated to 300 K and equilibrated for275 ps before starting the production runs. Totalsimulation times were 3.0 and 2.0 ns for ligated andunligated PleD, respectively. In the following, trajectory(I) is the CHARMM simulation for ligated PleD.Additional trajectories (II and III, discussed in theSupplementary Data) for ligated PleD, carried out withNAMD, were run for 2.5 ns (started from the X-raystructure and previously equilibrated for 0.5 ns) and3.5 ns (started from a snapshot at 0.6 ns of the equili-brated system), respectively.
Analysis of the results
The results of the NMA and the MD simulations wereanalyzed by calculating involvement coefficients andcross-correlated motions.Involvement coefficients are extracted from the NMA via
Ik ¼YX1 �
YX2
jYX1 �YX2jd
YLn ð1Þ
where YX1 �
YX2 is the displacement vector between two
conformations andYLn is the eigenvector of the n-th normalmode. Involvement coefficients Ik quantify the geometricalsimilarity between the n-th normal mode and theconformational transition between the structures consid-ered, YX1 and
YX2. In addition, the cumulative involvementcoefficient CIN can be calculated.
CIN ¼X
N
n¼1
I2n ð2Þ
For a complete orthonormal set of normal-mode eigen-vectors, CIN is expected to be 1. Thus, In2 gives the maximalpercentile contribution of motion along the n-th mode tothe conformational transition between two structures.Cross-correlated motions were calculated from the MD
simulations as averages over blocks of different lengths(25, 50 and 70 ps for the CHARMM run and 25, 50, 100,200 ps for the first NAMD run) after removing the overalltranslation and rotation of the system. The cross-correla-tion coefficient Cij of residues i and j is given by
Cij ¼DriDrj� �
ffiffiffiffiffiffiffiffiffiffiffiffiffiffiffiffiffiffiffiffiffiffiffi
Dr2i� �
hDr2j iq ð3Þ
where Δri and Δrj are the displacements of the backboneatoms from the reference position. Cij varies between 1 and−1, where 1 corresponds to movement in the samedirection (correlated) and −1 to movement in the opposite
1283MD Simulations of Inhibited and Free PleD
5 Results
82

direction (anti-correlated). In a DCCM, motion in the samedirection (correlated) can be found in the upper left tri-angle, whilemotion in opposite directions (anti-correlated)is in the lower right panel. Typically, correlated motionsare much more pronounced than anti-correlated motions.α-Helices are manifest as a broadening of the diagonal,while β-sheets appear off diagonal (ascending for parallel,and descending for antiparallel β-sheets). It should benoted that DCCMs do not give information about themagnitude or the direction of the motion.
Acknowledgements
The authors acknowledge financial support fromthe Swiss National Science Foundation through aFörderungsprofessur to M.M. The authors are grate-ful for stimulating discussions with Prof. U. Jenaland Prof. T. Schirmer. Generous allocation of com-puting time for the NAMD simulations at the CSCSin Manno, Switzerland, is acknowledged.
Supplementary Data
Supplementary data associated with this articlecan be found, in the online version, at doi:10.1016/j.jmb.2007.09.068
References
1. Jenal, U. & Malone, J. (2006). Mechanisms of cyclic-di-GMP signaling in bacteria. Annu. Rev. Genet. 40,385–407.
2. Christen, B., Christen, M., Paul, R., Schmid, F., Folcher,M., Jenoe, P. et al. (2006). Allosteric control of cyclic di-GMP signaling. J. Biol. Chem. 281, 32015–32024.
3. Hisert, K. B., MacCoss, M., Shiloh, M. U., Darwin,K. H., Singh, S., Jones, R. A. et al. (2005). A glutamate–alanine–leucine (EAL) domain protein of Salmonellacontrols bacterial survival in mice, antioxidant de-fence and killing of macrophages: role of cyclicdiGMP. Mol. Microbiol. 56, 1234–1245.
4. Jenal, U. (2004). Cyclic di-guanosine-monophosphatecomes of age: a novel secondary messenger involvedin modulating cell surface structures in bacteria? Curr.Opin. Microbiol. 7, 185–191.
5. Paul, R., Weiser, S., Amiot, N. C., Chan, C., Schirmer,T., Giese, B. & Jenal, U. (2004). Cell cycle-dependentdynamic localization of a bacterial response regulatorwith a novel di-guanylate cyclase output domain.Genes Dev. 18, 715–727.
6. Hecht, G. B. & Newton, A. (1995). Identification of anovel response regulator required for the swarmer-to-stalked cell transition in Caulobacter crescentus.J. Bacteriol. 177, 6223–6229.
7. Aldridge, P., Paul, R., Goymer, P., Rainey, P. & Jenal, U.(2003). Role of the GGDEF regulator PleD in polardevelopment of Caulobacter crescentus. Mol. Microbiol.47, 1695–1708.
8. Chan, C., Paul, R., Samoray, D., Amiot, N. C., Giese,B., Jenal, U. & Schirmer, T. (2004). Structural basis ofactivity and allosteric control of diguanylate cyclase.Proc. Natl. Acad. Sci. USA, 101, 17084–17089.
9. Formaneck, M. S., Ma, L. & Cui, Q. (2006). Reconcilingthe “old” and “new” views of protein allostery: Amolecular simulation study of Chemotaxis Y protein(CheY). Proteins: Struct. Funct. Bioinf. 63, 846–867.
10. Lee, S.-Y., Cho, H. S., Pelton, J. G., Yan, D., Berry, E. A.&Wemmer, D. E. (2001). Crystal structure of activatedCheY. Comparison with other activated receiverdomains. J. Biol. Chem. 276, 16425–16431.
11. Zhu, X., Amsler, C. D., Volz, K. & Matsumura, P.(1996). Tyrosine 106 of CheY plays an important rolein chemotaxis signal transduction in Escherichia coli.J. Bacteriol. 178, 4208–4215.
12. Appleby, J. L. & Bourret, R. B. (1998). Proposed signaltransduction role for conserved CheY residue Thr87, amember of the response regulator active-site quintet.J. Bacteriol. 180, 3563–3569.
13. Volz, K. & Matsumura, P. (1991). Crystal structure ofEscherichia coli CheY refined at 1.7-Å resolution. J. Biol.Chem. 266, 15511–15519.
14. Berendsen, H. J. C. & Hayward, S. (2000). Collectiveprotein dynamics in relation to function. Curr. Opin.Struct. Biol. 10, 165–169.
15. Li, G. & Cui, Q. (2004). Analysis of functional motionsin “Brownian molecular machines” with an efficientblock normal mode approach: Myosin-II and Ca2+-ATPase. Biophys. J. 86, 743–763.
16. Cui, Q., Li, G., Ma, J. & Karplus, M. (2004). Anormal mode analysis of structural plasticity in thebiomolecular motor F1-ATPase. J. Mol. Biol. 340,345–372.
17. Guex, N. & Peitsch, M. C. (1997). SWISS-MODEL andthe Swiss-Pdb Viewer: an environment for compara-tive protein modeling. Electrophoresis, 18, 2714–2723.
18. Levitt, M., Sander, C. & Stern, P. S. (1985). Pro-tein normal-mode dynamics: trypsin inhibitor, cram-bin, ribonuclease and lysozyme. J. Mol. Biol. 181,423–447.
19. Brooks, B. & Karplus, M. (1983). Harmonic dynamicsof proteins: normal modes and fluctuations in bovinepancreatic trypsin inhibitor. Proc. Natl. Acad. Sci. USA,80, 6571–6575.
20. Go, N., Noguti, T. & Nishikawa, T. (1983). Dynamicsof a small globular protein in terms of low-frequencyvibrational modes. Proc. Natl. Acad. Sci. USA, 80,3696–3700.
21. Tirion, M. M. (1996). Large amplitude elastic motionsin proteins from a single-parameter, atomic analysis.Phys. Rev. Lett. 77, 1905–1908.
22. Mayer, K. L., Earley, M. R., Gupta, S., Pichumani, K.,Regan, L. & Stone, M. J. (2003). Covariation ofbackbone motion throughout a small protein domain.Nat. Struct. Biol. 10, 962–965.
23. Popovych, N., Sun, S., Ebright, R. H. & Kalodimos,C. G. (2006). Dynamically driven protein allostery.Nat. Struct. Biol. 13, 831–838.
24. Vendruscolo, M. & Dobson, C. M. (2006). Structuralbiology: dynamic visions of enzymatic reactions.Science, 313, 1586–1587.
25. Hammes-Schiffer, S. & Benkovic, S. J. (2006). Relatingprotein motion to catalysis. Annu. Rev. Biochem. 75,519–541.
26. Eisenmesser, E. Z., Bosco, D. A., Akke, M. & Kern, D.(2002). Enzyme dynamics during catalysis. Science,295, 1520–1523.
27. Wassmann, P., Chan, C., Paul, R., Beck, A., Heerklotz,H., Jenal, U. & Schirmer, T. (2007). Structure of BeF3−
modified response regulator PleD: implications fordiguanylate cyclase activation, catalysis, and feedbackinhibition. Structure, 15, 1–13.
1284 MD Simulations of Inhibited and Free PleD
5 Results
83

28. Gunasekaran, K., Ma, B. & Nussinov, R. (2004). Isallostery an intrinsic property of all dynamic proteins?Proteins: Struct. Funct. Bioinf. 57, 433–443.
29. Stock, A. M. & Guhaniyogi, J. (2006). A new pers-pective on response regulator activation. J. Bacteriol.188, 7328–7330.
30. Volkman, B. F., Lipson, D., Wemmer, D. E. & Kern, D.(2001). Two-state allosteric behavior in a single-domain signaling protein. Science, 291, 2429–2433.
31. Kern, D. & Zuiderweg, E. R. P. (2003). The role ofdynamics in allosteric regulation. Curr. Opin. Struct.Biol. 13, 748–757.
32. Wynsberghe, A. W. V. & Cui, Q. (2006). Interpretingcorrelated motions using normal mode analysis.Structure, 14, 1647–1653.
33. Brooks, B. R., Bruccoleri, R. E., Olafson, B. D., States,D. J., Swaminathan, S. & Karplus, M. (1983).CHARMM: a program for macromolecular energy,minimization and dynamics calculations. J. Comput.Chem. 4, 187–217.
34. Phillips, J. C., Braun, R., Wang, W., Gumbardt, J.,Tajkhorshid, E., Villa, E. et al. (2005). ScalablemoleculardynamicswithNAMD. J. Comput. Chem. 26, 1781–1802.
35. MacKerell, A. D., Jr, Bashford, D., Bellott, M.,
Dunbrack, R. L., Jr, Evanseck, J. D., Field, M. J. et al.(1998). All-atom empirical potential for molecularmodeling and dynamics studies of proteins. J. Phys.Chem. B, 102, 3586–3616.
36. Mouawad, L. & Perahia, D. (1993). Diagonalization ina mixed basis—a method to compute low-frequencynormal-modes for large macromolecules. Biopolymers,33, 599–611.
37. Tama, F., Gadea, F. X., Marques, O. & Sanejouand,Y. H. (2000). Building-block approach for determininglow-frequency normal modes of macromolecules.Proteins: Struct. Funct. Genet. 41, 1–7.
38. Li, G. H. & Cui, Q. (2002). A coarse-grained normalmode approach for macromolecules: an efficient imple-mentation and application to Ca2+-ATPase. Biophys. J.83, 2457–2474.
39. Jorgensen, W. L., Chandrasekhar, J., Madura, J.,Impey, R. & Klein, M. (1983). Comparison of simplepotential functions for simulating liquid water.J. Comput. Phys. 79, 926–935.
40. Ryckaert, J.-P., Ciccotti, G. & Berendsen, H. J. C. (1977).Numerical integration of the Cartesian equations ofmotion of a system with constraints: moleculardynamics of n-alkanes. J. Comput. Phys. 23, 327–341.
1285MD Simulations of Inhibited and Free PleD
5 Results
84

���������������� �����������
����������������������������������������������������������������������� ��� ������ ������� ���� �� ���� �� ������ ��� �� ������� � �� ����� ��� ����� ����� ��� ��� ������ �� ����� �� �� �������� ���� ��� ��������� ����� ���� �� ���� ��� �� ��������������� ����! ∀�#�∀�∃ �������% ∀�∃�∀�& ��������% ∀�&�∀�∋ �������% ∀�∋�∀�( �����% ∀�(�∀�) ��������% ∀�)�∀�∗ �+����% ∀�∗�,�∀ �+��−��
����� ���������������!����!�������������������� ����������������������������� ��� ������ ��� ����� ���� �� ����� ��� �������� ������ ������� ��� ��������� ���� +����� �������� ������� ������� �� ���������� ��� ������� �� �������� �� ������ ����� ���� � �� .����� , /���������
5 Results
85

�����∀��#���������������������� ���������������������∃����
0�� ��� �1��� ����������� �0�/�� ��� �α���� ��� ������ � �� 2��� ������� �� ����� ���� ���� ������� �� ��������� �� �3����� ��� ��� �� �� 0�/� ������� ��� �� �α���� �� ≈4�4& 5 ��� �� ���������� 6���� ���� ������� � �+����% ������� �� ���− ������% ������� ��� ���1������ �� ������� ���� ������ �+� 0�/� ��� �� �α���� ��� ������������ �� ������ �, �����% �4 �������% �7� ������� �� �,8�4 �+��−� ������� ���� .��� �� � +���! ������� �% ��% ��� �� ������� ����� ��� 0�/� ������� ��� ��� ����� ������� ���� ����� ����9 ��� ����� �� � +�����
5 Results
86

�����%�������������������������&��������������������������� ��� ������ ��� ����� ���� �� ����� ��� �� ���� ��������� �������� ����������� �� ����������% ��������� �� ���� �������% �� �+��� ��� � �� ����� � ���������� ����� ������ �� ���� ������� � ���������� +����� ������ ����� �� ����� ������ �� +��� �� �� ���� ��������� ������� ��� ����������� �% ���% # �� ∃�� ��� ����� ���������� �� �� ����� ��� ������ ��� �� �� �4 �� �7� ����� �� ����� �� �� ���� ���������� ���������� ������ ��� ����� ���� �� �� ����� ��������� ��� �� ����� ����� ������� ���������� ���������� +����� �4 �� �7� ����������� # �� ∃�� ��������� �� ����� ���� �� �����+����� � ������ +� ���� � ��� �� :����; ��������� ������� �48�7� ���������� �� +���� <������ ���� �� ���� ���������� +����� ������ �, �� �4 ���������� �� �� ������� �������� �� α4 �� α# �� �7� ���������� �=�� 6+����� �� �� �������� ���������� � �� .����� ) �� ����� ���� � �� .����� , /���������� ������
5 Results
87

�����∋��(�� ��� ������)�������� ������������������∗�+���������������∗,+�∃������ ����� ������ ��� ����� ����� ( � ,&# ����� ����� ������ �������� ��� ���� ����� �� �� �� ���������� >��� ��% �� ���������� ���� �� ?�≅ ������ +� ��������� �� ������� � ����� ���� �� ��������� ��� ����#4 ����� ���� � �� .����� , /���������
5 Results
88

�����−����)�������� ���������� �����./�����//��������������������������∃������������� �� �� ����� ��� �������� �� �� �7� ����� ���� ������������ �� ����� ����� ∗∀ � ,∀∀ �� ����� �� �� ������� �+� ����� ��� ��� �������� ����������� +����� �� �� �+� �� �� ���� ���������� �������� �� �� ≅� �� ����� �������� ���−�� +� ������� �� �� �������� �� �� ������� ������� β, ��� α4 �� β, ��� α# ���� �� ����� �����7�� �� ������� /������� ������� ������� �� �� �7� ����� �� ������� +� +�3��� ����� ���� � �� .����� , /���������
5 Results
89

5 Results
5.3 PleD dimerization process
Introduction
Sensing environmental signals and rapid metabolic response are crucial for bacte-ria to survive. A typical cascade to integrate external stimuli is the so-called "two-component" signal transduction system162, i.e. the signal is sensed by a histidine pro-tein kinase that transfers a phosphoryl group to a conserved aspartate of a responseregulator (RR) protein thereby modulating its activity. The diguanylate cyclase PleDof Caulobacter crescentus is such a response regulator with its activity controlled bythe kinases DivJ and PleC and is required for polar differentiation in the cell cycleof the bacteria.137,147,157,163 Cells without functional PleD are hypermobile and fail toaccomplish the swarmer-to-stalked cell transition. PleD synthesizes the bacterial sec-ond messenger cyclic di-guanylic monophosphate (c-di-GMP)147, a molecule of greatinterest since it regulates surface-adhesion properties and motility in bacteria130,141.In addition, relevance to virulence of pathogenic bacteria and implication in biofilmformation has been demonstrated.142 The fact that c-di-GMP is found exclusively inbacteria makes it a potential target for medicinal applications.
The symmetric condensation reaction of two GTP molecules into c-di-GMP requiresthe encounter of two loaded active sites, i.e. exclusively dimeric PleD is catalyt-ically active which has been confirmed by cross-linking experiments.158 Thus, theoverall production rate depends on the dimerization rate. PleD dimerization is sig-nificantly enhanced upon phosphorylation (or pseudo-phosphorylation by BeF−
3 ).158
This phosphorylation-mediated dimerization control constitutes an additional levelof allosteric regulation. The unit cell in the X-ray structures of both inactive and BeF−
3 -activated PleD51,52 contain dimeric PleD indicating that the stem domains D1/D2form the dimerization interface. BeF−
3 -activated PleD shows an optimal tight-packeddimer interface that comes about by a shift/rotation of domain D1 with respect toD2.52 The domains D1 and D2 of PleD are CheY-like receiver domains (REC), whereofonly D1 contains all invariant residues of the active site136, including the phospho-acceptor residue D53. Structural changes following the phosphorylation have beenstudied extensively on the model system CheY and are also characteristic to receiverdomains.37,50,168,169,171 The rather subtle change involves the repositioning of the β4-α4 loop and sidechain reorientations of conserved Thr/Ser and Phe/Tyr residues alsoknown as "Y-T" coupling. Threonine forms a hydrogen bond to the phospho-moietyand makes space for the Phenylalanine to adopt the "buried" position. This raises the
90

5 Results
question of how the local phosphorylation-induced loop repositioning is propagatedto the α4-β5-α5 interface between domains D1 and D2, and in turn promotes domainreorientation and dimerization. In addition, the exact role of the pseudo-receiver do-main D2 is unknown. It could either have an adaptive function responding to theactivation state of D1 or solely enlarge the dimerization contact area. And last, mu-tation experiments showed that the isologuous contact residue Y26 is required fordimerization.158 This residue is located at the center of a hydrophobic patch whichexists in both the active and inactive state and it is also strictly conserved in PleDhomologs that share the REC-REC-DGC domain architecture. However, its exact rolein the dimerization process is unidentified. The present computational study focuseson the characterization of processes associated with the spontaneous relaxation fromthe active to the non-active state.
Materials & Methods
Setup of the "PleD" dimers
All MD simulations were carried out with NAMD172 using the CHARMM22 forcefield74. From the X-ray structures of inactive and BeF−
3 -activated PleD (PDB codes1W2551 and 2V0N52), residues 1 to 285 which correspond to domains D1 and D2were kept, deleting all other residues, ions and additional ligand molecules. Simula-tion of domains D1/D2 should be sufficient to investigate the dimerization processincluding the observed rearrangement of domains D1 and D2 of PleD. The catalyti-cally active domain DGC shows different orientations in the two X-ray structures ar-guing for substantial orientational freedom of the domain vs. the PleD D1/D2 stem.Absence of the stabilizing BeF−
3 moiety in the active conformation will possibly leadto spontaneous active-inactive transition events. All titratable sidechains were gen-erated in their standard protonation state for pH 7, the HSD model was applied toall Histidine residues and the overall charge of −3 in each monomer was not neutral-ized by adding counterions. Positions of added hydrogen atoms were relaxed using200 steps of steepest descent minimization. Mutations were introduced by deletingand rebuilding the sidechain of the specific amino acid. The systems studied hereare the dimers of domains D1/D2 of PleD in the inactive (dimer) and BeF−
3 -activatedstate (adimer) and the mutants Y26A in the active conformation, A_Y26A and B_Y26A
introducing the mutation in monomer A or B, respectively.
91

5 Results
Molecular dynamics simulations
MD simulations were carried out in explicit TIP3 water solvent. The NAMD solva-tion package was used with a protein-box distance of 15 Å resulting in system sizes of80,000 and 50,000 atoms approximately for dimeric and monomeric D1/D2, respec-tively. Periodic boundary conditions were used in all simulations and images wereupdated every 10 steps. A 9 Å cutoff was used for shifted electrostatic and switchedvan der Waals interactions, hydrogen atoms were constrained with SHAKE173 and atimestep of 1 fs was used. Starting from the solvated X-ray structure, the system wasminimized for 1,000 steps and simulations were carried out at T = 300 K and constantpressure of 1 atm. 3 ns trajectories were run and analyzed after 5 ps of equilibration.
Data analysis
The β4-α4 loop conformation which is related to the activation state of response regu-lators can be quantified by the pseudodihedral angle formed by the Cα-atoms of theloop residues (residue 83 to 86 in domain D1, residue 232 to 235 in domain D2).37,169
An angle of 113◦ corresponds to the fully active conformation, whereas 14◦ is foundin the inactive state.
Interface residues are defined as all residues that have at least one atom within 5 Ådistance of the other monomer or domain.
The dimerization contact area is calculated by the difference in solvent accessible surfacearea (SASA) between the individual monomers and the complex. To calculate theSASA a probe radius of 1.4 Å was used.
The secondary structure was assigned for snapshots taken every 10 ps using the se-quence analyzer174 implemented in VMD175.
Cross-correlated motions were calculated from MD simulations as averages over blocksof 50 ps after removing the overall translation and rotation of the system. The cross-correlation coefficient Cij of residues i and j is given by
Cij =〈∆ri∆rj〉
√
〈∆r2i 〉〈∆r2
j 〉(5.1)
where ∆ri and ∆rj are the displacements of the backbone atoms from the referenceposition. Cij varies between 1 for perfect correlation (motion in same direction) and-1 for anti-correlation (motion in opposite direction), but gives no information aboutthe magnitude or the direction of the motion.
92

5 Results
Results & Discussion
The PleD dimerization process is studied using domains D1/D2 which are knownto interact. Considering only the D1/D2 stem domains should be legitimate sincethe DGC domain is attached via a flexible linker and can move substantially as seenfrom the two X-ray structures.51,52 This truncated PleD, the stem D1/D2, is hence-forth called PleD. Simulations were initiated from both the BeF−
3 -activated structure(1V0N) and the inactive one (1W25), named hereafter adimer and dimer, respectively.Because force field parameters for BeF−
3 or aspartyl-phosphate are not available theBeF−
3 moiety was removed from the active conformation before starting the simu-lations. Instead of studying the active state, the relaxation from the active to theinactive form is investigated here and events accompanying this transition are re-ported. Moreover, the contact residue Y26 is being mutated to an Alanine in one ofthe monomer to study its effect on the dimerization. These simulations start fromthe active conformation and are denoted A_Y26A and B_Y26A depending in whichmonomer the mutation is introduced.
Structural changes characteristic to receiver domains
Spontaneous relaxation of the β4-α4 loop
Domains D1 and D2 of PleD are both assigned to the class of CheY-like receiver do-mains. These regulatory domains undergo a repositioning of the β4-α4 loop which isaccompanied by a sidechain rotation of the residues Threonine and Tyrosine, a pro-cess often termed "Y-T" coupling. The conformation of the β4-α4 loop can be quan-tified by the pseudodihedral angle of the loop’s Cα-atoms37,169, residues 83 to 86 indomain D1 and residues 232 to 235 in D2 according to the alignment by Hecht etal.136. X-ray structures showed that an angle of 113◦ corresponds to the fully activeconformation, while 14◦ is found in the inactive state.
The pseudodihedral angle values of the β4-α4 loop sampled during the 3 ns simula-tion are shown in Figure 7.
Active-to-inactive transition in domain D1. In the X-ray structure of BeF−3 -activated PleD
an angle of 100◦ approximately is found which is consistent with findings in CheYand confirms the active conformation. In all three simulations starting from the ac-tive form with the BeF−
3 moiety removed, a spontaneous active-to-inactive transitionof the β4-α4 loop is observed in at least one of the monomers (see red and blue lines
93

5 Results
Figure 7: β4-α4 loop conformation
The pseudodihedral angle of the β4-α4 loop in domains D1 and D2 is shown for simulations (A)dimer, (B) adimer, (C) A_Y26A and (D) B_Y26A. Loop relaxation from the active to the inactive state,indicated by a drop of the pseudodihedral angle value from 113◦ to 14◦, is observed in domain D1during the 3 ns trajectory, while in D2 no change is observed. Color coding is as follows: red andyellow for domains D1 and D2 in monomer A, blue and green for D1 and D2 in monomer B.
in Figure 7 B, C and D). In adimer the loop repositioning is observed at 1.8 ns formonomer B. In the Y26A mutants the first loop transition occurs earlier comparedto wildtype PleD, namely at 1.1 and 0.3 ns in simulations A_Y26A and B_Y26A, re-spectively. The relaxation process is fairly fast and is completed within 0.5 ns ap-proximately. In contrast, the deactivation of the second monomer in B_Y26A is muchslower and takes 1.3 ns to complete. Interestingly, this transition closely follows thefast deactivation in the other monomer. On the other hand, in the inactive crystalstructure an angle of -91◦ is found which is significantly different from the 14◦ ob-served in inactive CheY, the model system of RRs. It is possible that this deviationis due to crystal contacts. Moreover, during the dimer simulation the pseudodihedralangle changes from -91◦ to -20◦ approximately (see Figure 7 A), which is closer to thecommonly found 14◦. Although the value 14◦ is not reached during the 3 ns simula-
94

5 Results
tion time, it indicates that the β4-α4 loop position found in the X-ray structure is anartefact and an angle between 0◦ and -25◦ is more representative for the inactive stateof PleD.
The dimer stabilizes the active state conformation. In addition to dynamics simulations ofPleD dimer, monomeric PleD was studied to elucidate the influence of an associatedmonomer. In monomer A of the wildtype (wt) and the Y26A mutant the active-to-inactive transition occurs at 1.2 ns, which is the same time as in the A_Y26A simu-lation (results for monomer simulations not shown), but does not complete entirelyand remains at an angle of 50◦ approximately. In contrast, for monomer B differencesbetween the wt and mutant are observed. In the former the loop reorientation takesplace at 0.2 ns which is much earlier than the 1.6 ns in the dimer simulation. Onthe contrary, the loop conformation does not change for the Y26A mutant, at leastnot within the 3 ns calculated. In the case of the inactive monomer the β4-α4 loopstays significantly longer in the unusual conformation found in the X-ray structureand the pseudodihedral angle changes to a value close to 0◦ only for monomer B af-ter 2.4 ns. Altogether in PleD wt the loop relaxation occurs earlier in the monomerthan in the dimer arguing that an associated monomer slows down the deactivationprocess by stabilizing the active conformation. This suggestion is in accord with thefact that phosphorylation increases the dimeric fraction. Moreover, the fact that thepseudodihedral angle in the inactive form ranges from -90◦ to +100◦, -90◦ for inac-tive monomer, 0◦ for inactive dimer and +100◦ in the active state, potentially allows"stepwise" regulation.
Domain D2 shows no change in the loop conformation. Since domain D2 is also annotatedCheY-like domain, we monitored the β4-α4 loop conformation (see yellow and greenlines in Figure 7). D2 shares the common (βα)5 domain fold, though it lacks sev-eral conserved residues constituting the active site, including the phospho-acceptoraspartate. In all simulations, dimeric and monomeric PleD in the different activationstates, the pseudodihedral angle of the β4-α4 loop stays close to -130◦ the value foundin both X-ray structures. Thus, it seems that the β4-α4 loop positioning in domain D2is invariant and not correlated to the activation state of PleD. The functional role ofD2 is still unknown, yet it seems that domain D2 is not responding to the activationstate of D1 in a REC-like fashion, i.e. changing the loop conformation. It is morelikely that activation of D1 alters the domain interaction surface and enables domainrearrangement eventually enlargening the dimerization area.
95

5 Results
"Y-T" coupling
The concurrent movement of residues Tyr/Phe and Thr/Ser (F102 and T83 in PleD)is a key signaling cascade in CheY known as "Y-T" coupling. Phosphorylation trans-fer is followed by the sidechain reorientation of Tyr/Phe from a solvent exposed (g+)to a "buried" position (trans). Simultaneously Thr/Ser rearranges to form a hydro-gen bond to the phospho moiety. The sidechain orientation can be characterized bythe dihedral angle χ1. Thus, we monitored the residue’s χ1 angle in order to detectany reorientation. Specifically the rotameric state of residues F102 and T83 were ana-lyzed and in general no reorientation is observed during the 3 ns simulations. Only inmonomer A of the active trajectory a transition from trans indicating the active formto gauche− is observed at 2.5 ns. It is possible that the sidechain rotation of F102 maybe observed at longer time scales. However, in PleD residue F102 is located in theD1/D2 interface, while in CheY it is positioned at the surface. This may hinder ro-tation and in addition there’s no "protein-solvent" change between the two rotamers.The counterparts in domain D2, residues I251 and V232, are more flexible. As do-main D2 is likely to have a function different from REC domains, there is no relationbetween their rotameric state and protein activity. Hence, the rotamer sampling isless restricted than for residues involved in the signaling cascade. All characteristicsregarding the state of CheY-like RRs are summarized in Table 6 together with eventsobserved in the dynamics simulations.
D1/D2 domain reorientation
α4-β5-α5 modulated interface area
Comparison of the experimental structures revealed a substantial reorientation of thetwo receiver domains upon phospho-activation which results in a two-fold symmet-ric domain arrangement (see Figure 8). This rearrangement within the monomer isalso reflected by different sizes of the contact area between domains D1 and D2. Cal-culation of the buried solvent accessible surface area (SASA) shows an increase from2,700 Å2 to 3,500 Å2 indicating a more optimal domain interface in the active state.Interestingly, in the adimer simulation, a sharp decrease of 300 Å2 in the interactionarea is observed at 2.2 and 2.6 ns for monomer A and B, respectively, which is ap-proximately 0.5 ns after the β4-α4 loop relaxation in monomer B. This event needsto be investigated further to draw any conclusions on whether loop repositioning isrelated to the interface change.
96

5 Results
Table 6: Characteristics of phospho-activation in CheY-like RRs
active inactive during MD simulation
β4-α4 loop conformationCα 83-86 104◦ / 100◦ -91◦ / -91◦ transitions observedCα 232-235 -136◦ / -146◦ -142◦ / -146◦ unchanged
F102 sidechain orientationχ1 F102 -177◦ / -179◦ -58◦ / -57◦ unchanged,
except monomer A (active):t → g− at 2.5 ns
χ1 I251 -80◦ / -37◦ 47◦ / -28◦ inactive: unchangedactive: t, g− and g+ sampled
T83 sidechain orientationχ1 T83 173◦ / 172◦ 59◦ / 60◦ unchanged (active: t, inactive: g−)χ1 V232 -63◦ / -59◦ -59◦ / -62◦ unchanged,
except monomer B (A_Y26A):t → g− → t at 1.2 and 1.3 ns
All values are indicated for monomer A and B, respectively. Corresponding residues in domain D2from alignment in ref. 136.
Figure 8: Reorientation of domains D1 and D2
Cartoon representation of the D1/D2 interface in the (A) active and (B) inactive X-ray structure.The α4-β5-α5 face of domain D1 (red) is highlighted (yellow), while domain D2 is colored grey.Arrows and axis indicate the reorientation of domain D1 with respect to D2 upon activation. Notethe symmetry in the active state.
97

5 Results
Extended helix α5 has leverage effect
Figure 9: Motion of the extended helix α5
A) Representative structures for the active (red, blue) and inactive (orange, cyan) state. Rearrange-ments at the α4-β5-α5 face lead to large shifts at the C-terminal end of the helix α5. B) DomainsD1 and D2 in cartoon representation with helix α5 indicated in the activated (red) and inactive(grey) state. Secondary structure annotation obtained with the module STRIDE174 implemented inVMD175 for the two X-ray structures. α-helices colored in red, β-strands in yellow and unstructuredparts in grey.
To study structural differences within one monomer that were induced by the active-to-inactive transition of the β4-α4 loop, snapshots taken every 100 ps were super-
98

5 Results
imposed on the backbone atoms of domain D2. Two distinct conformations are ob-served, one for the time before and one after loop repositioning (see Figure 9 A). Re-arrangements in the α4-β5-α5 face were observed, e.g. displacement of the β5 strand.Yet, largest shifts are found for the C-terminal end of the extended helix α5. Theα4-β5-α5 surface is well known as adaptive region, for example binding of CheYto FliM168 or in homodimerization of the OmpR/PhoB response regulator subfam-ily176–179 which is very similar to PleD. In the latter the two-fold symmetric interac-tion is promoted by phosphorylation and specific H-bonds and salt-bridges formedbetween highly conserved residues. Several of these residues are also found in PleD.However, common RR domains have a globular structure whereas domains D1 andD2 of PleD are "P-shaped". The main globular part of the domain is located at theN-terminal end of the unique extended helix α5. Based on the result that the α5 C-terminal end is displaced most when the β4-α4 loop is relaxed the following modelcan be suggested. A slight domain adjustment at the adaptive interface α4-β5-α5 isamplified towards the C-terminal end by the remarkable length of the helix α5 in aleverage fashion.
Furthermore, in the active state the long helix α5 is extended at the C-terminal endby 4-5 residues which correspond to a little more than one turn (see Figure 9 B). Thesecondary structure was predicted for snapshots taken every 10 ps using the STRIDEmodule174 implemented in VMD175. Overall, the structure is preserved in all simu-lations. The least stable is the region around helix α3 which is sometimes assigned asturn, α- or α3_10-helix.
Dimerization interface
It is found from the X-ray structures that PleD in the BeF−3 activated form has a more
optimal dimerization interface reflected in an increase from 900 Å2 to 1,436 Å2 permonomer.52 The contact area is calculated as the buried solvent accessible surfacearea (SASA) using a probe of the radius 1.4 Å. A difference of 1,000 Å2 is also cal-culated from the simulations (see Figure 10 A black vs. blue, red and green line).The Y26A mutation is thought to decrease the dimerization area due to the smallervolume of the residue sidechain. However, a similar area is observed for the mutantY26A_B and an even larger value is found for Y26A_A. In the adimer simulation, a dipfrom 4,400 to 4,000 Å2 is detected around 2 ns. Interestingly, this event occurs shortlyafter the β4-α4 loop relaxation. Calculation of the interface residues, i.e. residues
99

5 Results
Figure 10: Dimer contact area and interface residues
A) The difference in solvent accessible surface area (SASA) between complex and individualmonomers corresponds to the dimerization contact area and is shown for dimer (black), adimer(blue), A_Y26A (red) and B_Y26A (green). In the active state, the dimerization interface is sig-nificantly larger by 1,000 Å2 approximately. A probe radius of 1.4 Å was used to calculate theSASA. Note the drop in buried SASA for adimer at 2 ns. B) The number of interface residues inadimer are shown in blue, and the contributions of monomer A and B are colored purple and cyan,respectively. Interface residues are defined as residues which have atoms within 5 Å of the othermonomer.
which have at least one atom within a distance of 5 Å of the other monomer, showedthe loss of 5 interface residues in each monomer simultaneously (see Figure 10 B).The fact that the buried SASA recovers partly after the structural change argues foradaptation of the interacting surfaces similar to the induced fit phenomenon. Further-more, in simulation B_Y26A monomer B responds 0.5 ns after changes in monomerA which is indicated by the number of contact residues (data not shown).
System dynamics
Cross-correlated motions
Structure elements of the protein system which move in a coupled fashion are oftendepicted in dynamical cross-correlation maps (DCCMs). Residual correlation coeffi-cients Cij between residues i and j are calculated from the 3 ns trajectories and canadopt a value between -1 and 1 corresponding to anti-correlation and correlation.Persistent correlations are interesting because they can potentially transmit signalsover long-range distances, in particular if correlations are found between differentdomains or subunits. In Figure 11 A and B the DCCM are shown for dimer and
100

5 Results
Figure 11: Cross-correlated motion and protein flexibility
Top: Residual correlation coefficients Cij are calculated from simulations (A) dimer and (B) adimerusing a window length of 50 ps. Correlations are shown in the upper left triangle while anti-correlations are at the lower right. Differences in the α4-β5-α5 region are indicated by violet circlesand coupling between domains are highlighted in blue. Bottom: Calculated root mean-squaredfluctuations are shown for (C) dimer and (D) adimer and are a measure of the protein flexibility.Monomers A and B are colored red and blue, respectively. Differences are indicated with arrows.
adimer. The DCCM for mutants A_Y26A and B_Y26A are similar to adimer and notshown here. Overall, the pattern within the individual domains shows little changesbetween the active and inactive conformation. In contrast, couplings between differ-ent domains and subunits are enhanced or newly formed in the active form. Mostprominent differences concern interactions with helix α5 (marked violet in Figure 11A and B). In the active state the core β-sheet is less coupled to α5 in domain D1 but
101

5 Results
not in D2. In addition changes in the D1/D2 interface α4-β5-α5 are observed, whereβ5 is no longer correlated to helix α5 of the other domain when activated. However,correlations between helices α4 and α5 remain. Correlations between the monomers(marked blue in Figure 11 A and B) are mainly through interactions of the globularpart of the protein and additional correlations between the α5 helices in the activestate reflecting the tight helix bundle structure. Thus, results from cross-correlatedmotion analysis also indicate the special role of the extended helix α5 in that it inter-acts with the different domains and subunit, and differs in the modulated α4-β5-α5area between the active and inactive state.
Root mean-square fluctuations
The protein flexibility can be characterized by root mean-square fluctuations (RMSFs)calculated from the trajectory, where large RMSF values indicate highly mobile re-gions. In general, the RMSFs are smaller in the active than in the inactive state (seeFigure 11 C and D), stating that the protein in the active conformation is overall lessflexible. In detail, prominent differences are observed for the region linking domainsD1 and D2 in monomer A (residues 130-150) being more rigid in adimer. This differ-ence in amplitude between monomer A and B introduces some sort of asymmetry tothe dimer system. Moreover, the β4-α4 loop residues are more flexible in the inac-tive form (residues 83-86 and correspondingly at position 368-371). This finding maybe of interest since the β4-α4 loop is part of the functional activation process. In themutant systems the previously described features resemble more the inactive state.In contrast, the flexibility of helix α1 (residues 13-25) in domain D1 is enhanced inadimer, while in all other simulations this part is slightly more rigid. Regarding themutant simulations this is somewhat surprising since the replacement of Tyrosine bythe small Alanine is thought to decrease interactions and thus provide more flexibil-ity.
Even though differences between simulations of the active and inactive system arefound in both the cross-correlated motions and protein flexibility, 3 ns trajectoriesmost probably are not sufficient to capture the entire dynamics intrinsic to the systemand longer simulation times are needed.
102
5 Results
Conclusions & Outlook
Molecular dynamics simulations have the advantage of atomistic resolution, inherenthigh time resolution and the possibility to study species not characterized thus far byexperiments. The present work shows that it is possible to observe and analyze theactive-to-inactive transition in PleD within 3 ns simulation time. The β4-α4 loop re-laxation is found to be faster in monomeric PleD arguing for a stabilization effectfrom the associated monomer. In addition, the loop repositioning leads to structuralrearrangements in the D1/D2 interface, particularly involving the α4-β5-α5 region.Based on structure comparison the following model was proposed: Small angle re-orientations at the N-terminal end of the extended helix α5 are amplified towards theC-terminal end, having a leverage effect. Helix α5 has strong correlations to otherdomains and subunits corroborating its importance to protein function. However,no conclusions on how the contact residue Y26 mediates dimerization can be drawnand further simulations are necessary. For example, calculation of residual interac-tion energies can clarify if residue Y26 is a "hot-spot" residue, a residue contributingsignificantly to the overall interaction energy. Furthermore, biased simulations can beenvisaged. Steered MD where the monomers are pulled apart can give informationabout which contacts are broken first and may also reveal interaction networks andthe functional role of residue Y26.Another interesting aspect to study is the effect from the associated monomer, for ex-ample whether it is able to activate its partner. MD simulations are especially suitedto analyze mixed dimers, i.e. an activated monomer interacting with an inactive oneor wildtype PleD with mutants. Genetics experiments discovered a constitutivelyactive PleD mutant147,157,158, PleD∗, which is locked in the active state and is pre-dominantly present as dimers in solution.
Acknowledgments
Generous allocation of computing time at the CSCS in Manno, Switzerland is ac-knowledged.
103

5 Results
104

6 Discussion
Extensive research on the small signaling molecule cyclic diguanosine monophos-phate (c-d-GMP) has highlighted its central role in bacterial metabolism (see re-views141,142). Mutation and/or overexpression experiments combined with pheno-typic evaluation linked c-di-GMP turnover with proteins containing GGDEF andEAL domains and demonstrated the implication of the signaling molecule in cellmotility, virulence and biofilm formation. Experimental results from co-workersshowed that the c-di-GMP concentration is tightly regulated via feedback inhibi-tion, a property intrinsic to the GGDEF domain148, and that the response regula-tor PleD is additionally controlled by phosphorylation-mediated dimerization52,158.Based on PleD X-ray structures a "domain immobilization" mechanism was proposed,where contact between the active sites and subsequent c-di-GMP production is pre-vented.51,52 Results from the present work contribute to the mechanistic understand-ing of DGC activity regulation, in particular the system’s dynamics and effects fromligand-binding and phospho-activation.
Communication between allosteric and active site
Comparison of energy optimized structures of monomeric PleD with and without c-di-GMP present in the allosteric site have indicated a balancelike movement of theβ-strand β2, that physically connects the active with the allosteric site.148 Thus, lig-and binding repositioning the I-site loop may potentially lead to misalignment of theenzymatic residues and prevent catalysis. This structure based mechanism worksnot only for PleD, but can be applied to the GGDEF domain in general. In addition, asubstantial drop in flexibility is observed for I- and A-site residues simultaneously, ar-guing for dynamical coupling.81 This finding emphasizes the dynamic contributionto allostery. In order to elucidate dynamic signaling pathways, correlated motionswere calculated from trajectories. Results suggest two possible communication cas-cades running either along nearby secondary structure elements, including the previ-ously mentioned strand β2, or across the disordered regions that link the neighboring
105

6 Discussion
domains. It was also found that the presence or absence of the ligand alters the corre-lation between domains such that the interaction between D1 and D2 is enhanced infree PleD. This long-range effect is of potential interest since it is known that domainsD1 and D2 rearrange upon activation.
Flexibility of the DGC domain vs. the stem domains
Conformation and energetics of unliganded PleD were probed using high-tempera-ture dynamics simulations and biased domain repositioning.81 An "open" form ofPleD, being considerably lower in energy than the starting X-ray structure wherebound c-di-GMP was removed, is in accord with the recent X-ray structure of acti-vated PleD52. The fact that both conformations, and possibly still more conforma-tions are energetically stable corroborates the model of the DGC domain being flex-ibly attached to the D1/D2 stem. This aspect is the basis for the suggested "domainimmobilization" model where ligand binding fixes one non-productive domain ori-entation. However, nothing is known about the actual energy barriers for the domainto adopt different conformations.
Activation mechanism in view of the dimerization process
Dynamics simulations were carried out using D1/D2 dimers in the inactive andBeF−
3 -activated conformation. Spontaneous relaxation of the β4-α4 loop was ob-served within the 3 ns simulation time. This active-to-inactive transition is foundto be correlated with rearrangements in the D1/D2 interface and leads to a slightdecrease of the dimerization contact area. Specifically, adjustments in the α4-β5-α5modulating region are amplified towards the C-terminal end of the extended helixα5. Moreover, this α5 helix is implicated in interactions between different domainsand subunits as indicated by cross-correlation maps.
Contribution of computational methods to understand protein function
Molecular visualization of structural motion is an important element to build mech-anistic models to explain protein function. Immense advances in computer technol-ogy now allow simulations approaching the µs regime and computational sciencesare increasingly recognized to provide detailed insight into protein motion, residueinterplay and energetics. In PleD, for example, dynamics information and potentialcommunication routes were found using molecular simulations. Each of the meth-ods reviewed has its own strengths and weaknesses with respect to sensitivity and
106

6 Discussion
specificity emphasizing their complementarity. Thus, general consensus from manytechniques, theoretical and experimental, increases the reliability of the proposedmechanism. Subdividing the complexity of supramolecular assemblies in biologyinto simple but quantitatively precise questions that can be solved by specific "exper-iments" should prove important. The focus of computational approaches lies in char-acterizing sequential events to understand how information is transferred.180 Proteinallostery surely is interdisciplinary, and brings together researchers with very dis-tinct but complementary expertise in molecular biology, computational science, andphysics. Easy-to-use web-based programs and standardized setups for molecular dy-namics simulations could encourage experimentalists to interpret and complementtheir data with calculations, enabling a closer collaboration with theoreticians. Inturn, simulation and programming experts might focus on force field improvementsand the development of efficient algorithms.
Protein allostery: a constantly evolving concept
The combined efforts of different disciplinary fields have provided new ideas andconcepts on allosteric regulation over time. The two most widely accepted are thepopulation-shift of co-existing states and the propagation of structural change alongpredefined pathways when triggered by effector binding. In addition, protein dy-namics undoubtedly contribute to function and even allow allostery to take placewithout visible structural change.26,27,29 All these views on protein allostery are notmutually exclusive and may be true to some extent. In PleD, suggested modelsinvolve structurally distinct states and dynamical structural pathways. It is possi-ble that there exists a common mechanism that holds for all biomolecular systems,but which has not yet been found because the different features are differently pro-nounced, and may be even too small to detect with current methods. In any case,allosteric regulation is vital for a cell to respond to environmental signals, and de-tailed insight may be used for practical application in drug and protein design.181
107

6 Discussion
108

7 Future Directions
Characterization of binding mode & drug design
The design of potent DGC inhibitors is of substantial medical interest to combat infec-tions caused by bacterial biofilms. For drug molecules to be successful, high affinitywhich allows medication in the nM to µM range and receptor specificity are most im-portant. Computational methods to estimate binding free energies110–112 can be usedin the drug discovery process to discriminate binding ligands from non-binding lig-ands, and even rank the ligands according to their binding affinity. Though, it shouldbe noted that the accuracy of prediction is important to be of pharmacological use.In contrast with experimental affinity measurements, computational studies have theadvantage that they combine binding free energies with structural features. The in-dividual contributions from chemical groups and the different interaction types areeasily calculated. Structural properties such as sidechain conformations, salt-bridges,H-bonds and the size of the binding pocket can be combined into fingerprints and thesubsequent use of clustering techniques may detect features that distinguish bindersfrom non-binders. Such insight is valuable to rational drug design.A suitable system to study c-di-GMP binding is the single domain protein DgcA of C.
crescentus (CC3285) for which inhibition constants, Ki, have been measured for severalI-site mutants.148 In contrast to common ligand screening, here the ligand c-di-GMPstays the same but the protein binding site differs. Once the determinants of bind-ing are known, computational and experimental ligand modification to increase theaffinity to the allosteric site can be envisaged. So far, c-di-GMP binding sites containa significant number of Arginine residues, in both PleD and the first identified c-di-GMP receptor domain, the PilZ domain153–155. Detection of important protein-ligandinteractions in the DgcA system is relevant due to the fact that the conserved motifRxxD (residues 359 to 362 in PleD) required for inhibition is found in more than 60%of DGCs.
109

7 Future Directions
Force field extension to study protein phosphorylation
Modulation of protein activity is often achieved by chemical modifications, whereofphosphotransfers between kinases and response regulators are most common form-ing "two-component" signaling pathways.162 However, common force fields includeparameters for phospho-groups for RNA and DNA molecules but mainly lack suit-able phospho-aminoacid parameters. In the present study the problem of missingparameters is circumvented by removing the phospho-group (or BeF−
3 moiety) fromthe active conformation structure and analyzing the relaxation process from the ac-tive to the inactive form. However, for future studies it is desirable to have forcefield parameters which will allow the study of energetics. A first attempt to findparameters that reproduce geometries and energies from ab initio calculations hasbeen made.182 In addition, treating phosphorylation as a perturbation to the energylandscape proved useful to predict local structural changes, and helps to understandenergetic components driving the structural rearrangement.183
110

Bibliography
1. A. V. Hill. The possible effects of the aggregation of the molecules ofhaemoglobin on its dissociation curves. J. Physiol. (Lond.), 40:iv–vii, 1910.
2. A. F. Cullis, H. Muirhead, M. F. Perutz, M. G. Rossmann, and A. C. T. North.The structure of haemoglobin. IX. a three-dimensional Fourier synthesis at 5.5 Åresolution: Description of the structure. Proc. R. Soc. Lond. A, 265:161–187, 1962.
3. M. F. Perutz. Stereochemistry of cooperative effects in haemoglobin. Nature,228:726–734, 1970.
4. D. E. Koshland, Jr., G. Némethy, and D. Filmer. Comparison of experimentalbinding data and theoretical models in proteins containing subunits. Biochem-
istry, 5:365–385, 1966.
5. J. Monod, J. Wyman, and J.-P. Changeux. On the nature of allosteric transitions:A plausible model. J. Mol. Biol., 12:88–118, 1965.
6. B. F. Volkman, D. Lipson, D. E. Wemmer, and D. Kern. Two-state allosteric be-havior in a single-domain signaling protein. Science, 291:2429–2433, 2001.
7. J. Gsponer, J. Christodoulou, A. Cavalli, J. M. Bui, B. Richter, C. M. Dobson,and M. Vendruscolo. A coupled equilibrium shift mechanism in calmodulin-mediated signal transduction. Structure, 16:736–746, 2008.
8. J. N. Onuchic, Z. Luthey-Schulten, and P. G. Wolynes. Theory of protein folding:The energy landscape perspective. Annu. Rev. Phys. Chem., 48:545–600, 1997.
9. J. N. Onuchic and P. G. Wolynes. Theory of protein folding. Curr. Op. Struct.
Biol., 14:70–75, 2004.
10. D. Kern and E. R. P. Zuiderweg. The role of dynamics in allosteric regulation.Curr. Op. Struct. Biol., 13:748–757, 2003.
111

Bibliography
11. K. Henzler-Wildman and D. Kern. Dynamic personalities of proteins. Nature,450:964–972, 2007.
12. A. Mittermaier and L. E. Kay. New tools provide new insights in NMR studiesof protein dynamics. Science, 312:224–228, 2006.
13. M. Akke. NMR methods for characterizing microsecond to millisecond dynam-ics in recognition and catalysis. Curr. Op. Struct. Biol., 12:642–647, 2002.
14. A. G. Palmer III, C. D. Kroenke, and J. P. Loria. Nuclear magnetic reso-nance methods for quantifying microsecond-to-millisecond motions in biolog-ical macromolecules. Methods Enzymol., 339:204–238, 2001.
15. M. Diez, B. Zimmermann, M. Börsch, M. König, E. Schweinberger, S. Steigmiller,R. Reuter, S. Felekyan, V. Kudryavtsev, C. A. M. Seidel, and P. Gräber. Proton-powered subunit rotation in single membrane-bound F0F1-ATP synthase. Nat.
Struct. Mol. Biol., 11:135–141, 2004.
16. F. Schotte, M. Lim, T. A. Jackson, A. V. Smirnov, J. Soman, J. S. Olson, G. N.Phillips Jr., M. Wulff, and P. A. Anfinrud. Watching a portein as it functions with150-ps time-resolved X-ray crystallography. Science, 300:1944–1947, 2004.
17. V. Šrajer, Z. Ren, T.-Y. Teng, M. Schmidt, T. Ursby, D. Bourgeois, C. Pradervand,W. Schildkamp, M. Wulff, and K. Moffat. Protein conformational relaxation andligand migration in myoglobin: A nanosecond to millisecond molecular moviefrom time-resolved Laue X-ray diffraction. Biochemistry, 40:13802–13815, 2001.
18. J. E. Knapp, R. Pahl, V. Šrajer, and W. E. Royer Jr. Allosteric action in real time:Time-resolved crystallographic studies of a cooperative dimeric hemoglobin.Proc. Natl. Acad. Sci. USA, 103:7649–7654, 2006.
19. A. Liwo, C. Czaplewski, S. Oldziej, and H. A. Scheraga. Computational tech-niques for efficient conformational sampling of proteins. Curr. Op. Struct. Biol.,18:134–139, 2008.
20. H. Valadié, J. J. Lacapcre, Y.-H. Sanejouand, and C. Etchebest. Dynamical proper-ties of the MscL of Escherichia coli: A normal mode analysis. J. Mol. Biol., 332:657–674, 2003.
112

Bibliography
21. Q. Cui, G. Li, J. Ma, and M. Karplus. A normal mode analysis of structuralplasticity in the biomolecular motor F1-ATPase. J. Mol. Biol., 340:345–372, 2004.
22. G. Li and Q. Cui. Analysis of functional motions in brownian molecular ma-chines with an efficient block normal mode approach: Myosin-II and Ca2+-ATPase. Biophys. J., 86:743–763, 2004.
23. M Lu and J. Ma. The role of shape in determining molecular motions. Biophys.
J., 89:2395–2401, 2005.
24. J. Ma. Usefulness and limitations of normal mode analysis in modeling dynam-ics of biomolecular complexes. Structure, 13:373–380, 2005.
25. K. Lindorff-Larsen, R. B. Best, M. A. DePristo, C. M. Dobson, and M. Vendrus-colo. Simultaneous determination of protein structure and dynamics. Nature,433:128–132, 2005.
26. C.-J. Tsai, A. del Sol, and R. Nussinov. Allostery: Absence of a change in shapedoes not imply that allostery is not at play. J. Mol. Biol., 378:1–11, 2008.
27. N. Popovych, S. Sun, R. H. Ebright, and C. G. Kalodimos. Dynamically drivenprotein allostery. Nat. Struct. Mol. Biol., 13:831–838, 2006.
28. A. Cooper and D. T. F. Dryden. Allostery without conformational change. Eur.
Biophys. J., 11:103–109, 1984.
29. K. Gunasekaran, B. Ma, and R. Nussinov. Is allostery an intrinsic property of all
dynamic proteins? Proteins: Struct. Funct. Bioinf., 57:433–443, 2004.
30. K. A. Henzler-Wildman, V. Thai, M. Lei, M. Ott, M Wolf-Watz, T. Fenn,E. Pozharski, M. A. Wilson, G. A. Petsko, M. Karplus, C. G. Hübner, and D. Kern.Intrinsic motions along an enzymatic reaction trajectory. Nature, 450:838–844,2007.
31. F. Tama and Y.-H. Sanejouand. Conformational change of proteins arising fromnormal mode calculations. Protein Engineering, 14:1–6, 2001.
32. D. Tobi and I. Bahar. Structural changes involved in protein binding correlatewith intrinsic motions of proteins in the unbound state. Proc. Natl. Acad. Sci.
USA, 102:18908–18913, 2005.
113

Bibliography
33. S. W. Lockless and R. Ranganathan. Evolutionarily conserved pathways of en-ergetic connectivity in protein families. Science, 286:295–299, 1999.
34. G. M. Süel, S. W. Lockless, M. A. Wall, and R. Ranganathan. Evolutionarilyconserved networks of residues mediate allosteric communication in proteins.Nat. Struct. Biol., 10:59–68, 2003.
35. N. Ota and D. A. Agard. Intramolecular signaling pathways revealed by mod-eling anisotropic thermal diffusion. J. Mol. Biol., 351:345–354, 2005.
36. K. Sharp and J. J. Skinner. Pump-probe molecular dynamics as a tool for study-ing protein motion and long range coupling. Proteins: Struct. Funct. Bioinf.,65:347–361, 2006.
37. M. S. Formaneck, L. Ma, and Q. Cui. Reconciling the "old" and "new" views ofprotein allostery: A molecular simulation study of chemotaxis Y protein (CheY).Proteins: Struct. Funct. Bioinf., 63:846–867, 2006.
38. B. Isralewitz, M. Gao, and K. Schulten. Steered molecular dynamics and me-chanical functions of proteins. Curr. Op. Struct. Biol., 11:224–230, 2001.
39. J. Ma, P. B. Sigler, Z. Xu, and M. Karplus. A dynamic model for the allostericmechanism of GroEL. J. Mol. Biol., 302:303–313, 2000.
40. B. Isralewitz, S. Izrailev, and K. Schulten. Binding pathway of retinal to bacterio-opsin: A prediction by molecular dynamics simulations. Biophys. J., 73:2972–2979, 1997.
41. N. M. Goodey and S. J. Benkovic. Allosteric regulation and catalysis emerge viaa common route. Nat. Chem. Biol., 4:474–482, 2008.
42. Q. Cui and M. Karplus. Allostery and cooperativity revisited. Prot. Sci., 17:1–13,2008.
43. J. Kuriyan and D. Eisenberg. The origin of protein interactions and allostery incolocalization. Nature, 450:983–990, 2007.
44. A. Fersht. The basic equations of enzyme kinetics. In Structure and Mechanism
in Protein Science: A Guide to Enzyme Catalysis and Protein Folding, A. Fersht, Ed.,W.H. Freeman, 1998
114

Bibliography
45. H. Lineweaver and D. Burk. The determination of enzyme dissociation con-stants. J. Am. Chem. Soc., 56:658–666, 1934.
46. B. H. J. Hofstee. Non-inverted versus inverted plots in enzyme kinetics. Nature,184:1296–1298, 1959.
47. E. M. Phizicky and S. Fields. Protein-protein interactions: Methods for detectionand analysis. Microbiol. Rev., 59:94–123, 1995.
48. S. Fields and O.-K. Song. A novel genetic system to detect protein-protein inter-actions. Nature, 340:245–246, 1989.
49. A. Sinz. Chemical cross-linking and mass spectrometry for mapping three-dimensional structures of proteins and protein complexes. J. Mass Spectrom.,38:1225–1237, 2003.
50. S.-Y. Lee, H. S. Cho, J. G. Pelton, D. Yan, E. A. Berry, and D. E. Wemmer. Crystalstructure of activated CheY. J. Biol. Chem., 276:16425–16431, 2001.
51. C. Chan, R. Paul, D. Samoray, N. C. Amiot, B. Giese, U. Jenal, and T. Schirmer.Structural basis of activity and allosteric control of diguanylate cyclase. Proc.
Natl. Acad. Sci. USA, 101:17084–17089, 2004.
52. P. Wassmann, C. Chan, R. Paul, A. Beck, H. Heerklotz, U. Jenal, and T. Schirmer.Structure of BeF−
3 -modified response regulator PleD: Implications for diguany-late cyclase activation, catalysis, and feedback inhibition. Structure, 15:915–927,2007.
53. K. Moffat. Time-resolved biochemical crystallography: A mechanistic perspec-tive. Chem. Rev., 101:1569–1581, 2001.
54. R. C. Wilmouth, I. J. Clifton, and R. Neutze. Recent successes in time-resolvedprotein crystallography. Nat. Prod. Rep., 17:527–533, 2000.
55. H. R. Saibil. Macromolecular structure determination by cryo-electron mi-croscopy. Acta Cryst., D56:1215–1222, 2000.
56. J. Elands and W. Hax. CryoEM as a complement to current techniques in proteinstructural analysis. Current Drug Discovery, October:15–20, 2004.
115

Bibliography
57. A. Sali, R. Glaeser, T. Earnest, and W. Baumeister. From words to literature instructural proteomics. Nature, 422:216–225, 2003.
58. A. G. Palmer III. NMR probes of molecular dynamics: Overview and compari-son with other techniques. Annu. Rev. Biophys. Biomol. Struct., 30:129–155, 2001.
59. R. Das, M. Abu-Abed, and G. Melacini. Mapping allostery through equilibriumperturbation NMR spectroscopy. J. Am. Chem. Soc., 128:8406–8407, 2006.
60. W. Jahnke. Spin labels as a tool to identify and characterize protein-ligand inter-actions by NMR spectroscopy. Chem. Bio. Chem., 3:167–173, 2002.
61. P. Dosset, J.-C. Hus, D. Marion, and M. Blackledge. A novel interactive tool forrigid-body modeling of multi-domain macromolecules using residual dipolarcouplings. J. Biomol. NMR, 20:223–231, 2001.
62. G. Bouvignies, P Bernadó, S. Meier, K. Cho, S. Grzesiek, R. Brüschweiler, andM. Blackledge. Identification of slow correlated motions in proteins using resid-ual dipolar and hydrogen-bond scalar couplings. Proc. Natl. Acad. Sci. USA,102:13885–13890, 2005.
63. F. Cordier and S. Grzesiek. Direct observation of hydrogen bonds in proteins byinterresidue 3h JNC′ scalar couplings. J. Am. Chem. Soc., 121:1601–1602, 1999.
64. M. Barfield. Structural dependencies of interresidue scalar coupling 3h JNC′ anddonor 1H chemical shifts in the hydrogen bonding regions of proteins. J. Am.
Chem. Soc., 124:4158–4168, 2002.
65. S. A. Showalter and R. Brüschweiler. Validation of molecular dynamics simula-tions of biomolecules using NMR spin relaxation as benchmarks: Application tothe AMBER99SB force field. J. Chem. Theory Comput., 3:961–975, 2007.
66. F. F.-F. Schmid and M. Meuwly. Direct comparison of experimental and calcu-lated NMR scalar coupling constants for force field validation and adaptation. J.
Chem. Theory Comput., 4:1949–1958, 2008.
67. A. A. Deniz, S. Mukhopadhyay, and E. A. Lemke. Single-molecule biophysics: atthe interface of biology, physics and chemistry. J. R. Soc. Interface, 5:15–45, 2008.
68. T. Förster. Zwischenmolekulare Energiewanderung und Fluoreszenz. Ann.
Physik, 6:55–75, 1948.
116
Bibliography
69. C. Joo, H. Balci, Y. Ishitsuka, C. Buranachai, and T. Ha. Advances in single-molecule fluorescence methods for molecular biology. Annu. Rev. Biochem.,77:51–76, 2008.
70. P. R. Selvin. The renaissance of fluorescence resonance energy transfer. Nat.
Struct. Biol., 7:730–734, 2000.
71. M. Karplus and J. Kuriyan. Molecular dynamics and protein function. Proc. Natl.
Acad. Sci. USA, 102:6679–6685, 2005.
72. A. W. van Wynsberghe, L. Ma, X. Chen, and Q. Cui. Functional motions inbiomolecules: Insights from computational studies at multiple scales. In Compu-
tational Structural Biology Methods and Applications, T. Schwede, M. Peitsch, Eds.,World Scientific Publishing Co. Pte. Ltd., 2008.
73. S. A. Adcock and J. A. McCammon. Molecular dynamics: Survey of methodsfor simulating the activity of proteins. Chem. Rev., 106:1589–1615, 2006.
74. A. D. MacKerell, Jr., D. Bashford, M. Bellott, R. L. Dunbrack, Jr., J. D. Evanseck,M. J. Field, S. Fischer, J. Gao, H. Guo, S. Ha, D. Joseph-McCarthy, L. Kuchnir,K. Kuczera, F. T. K. Lau, C. Mattos, S. Michnick, T. Ngo, D. T. Nguyen, B. Prod-hom, W. E. Reiher, III, B. Roux, M. Schlenkrich, J. C. Smith, R. Stote, J. E. Straub,M. Watanabe, J. Wiorkiewicz-Kuczera, D. Yin, and M. Karplus. All-atom empir-ical potential for molecular modeling and dynamics studies of proteins. J. Phys.
Chem. B, 102:3586, 1998.
75. T. C. Bruice and K. Kahn. Computational enzymology. Curr. Opin. Chem. Biol.,4:540–544, 2000.
76. G. Monard, X. Prat-Resina, A. González-Lafont, and J. M. Lluch. Determinationof enzymatic reaction pathways using QM/MM methods. Int. J. Quantum Chem.,93:229–244, 2003.
77. T. A. Halgren and W. Damm. Polarizable force fields. Curr. Op. Struct. Biol.,11:236–242, 2001.
78. S. Lammers, S. Lutz, and M. Meuwly. Reactive force fields for proton transferdynamics. J. Comput. Chem., 29:1048–1063, 2008.
117

Bibliography
79. J. Danielsson and M. Meuwly. Atomistic simulation of adiabatic reactive pro-cesses based on multi-state potential energy surfaces. J. Chem. Theory Comput.,4:1083–1093, 2008.
80. P. L. Freddolino, A. S. Arkhipov, S. B. Larson, A. McPherson, and K. Schulten.Molecular dynamics simulations of the complete satellite tobacco mosaic virus.Structure, 14:437–449, 2005.
81. F. F.-F. Schmid and M. Meuwly. All-atom simulations of structures and energet-ics of c-di-GMP-bound and free PleD. J. Mol. Biol., 374:1270–1285, 2007.
82. M. Król, I. Roterman, B. Piekarska, L. Konieczny, J. Rybarska, B. Stopa, andP. Spólnik. Analysis of correlated domain motions in IgG light chain reveals pos-sible mechanisms of immunological signal transduction. Proteins: Struct. Funct.
Bioinf., 59:545–554, 2005.
83. A. W. van Wynsberghe and Q. Cui. Interpreting correlated motions using nor-mal mode analysis. Structure, 14:1647–1653, 2006.
84. P. De Los Rios, F. Cecconi, A. Pretre, G. Dietler, O. Michielin, F. Piazza, andB. Juanico. Functional dynamics of PDZ binding domains: A normal-mode anal-ysis. Biophys. J., 89:14–21, 2005.
85. A. Taly, M. Delarue, T. Grutter, M. Nilges, N. Le Novère, P.-J. Corringer, and J.-P.Changeux. Normal mode analysis suggests a quaternary twist model for thenicotinic receptor gating mechanism. Biophys. J., 88:3954–3965, 2005.
86. S. Hayward. Normal mode analysis of biological molecules. In Computational
Biochemistry and Biophysics, O. M. Becker, A. D. MacKerell Jr., B. Roux, andM. Watanabe, Eds., Routledge, USA, 2001.
87. Authors. Title. Biopolymers, 33:599, 1993.
88. D. Perahia and L. Mouawad. Computation of low-frequency normal modes inmacromolecules: Improvements to the method of diagonalization in a mixedbasis and application to hemoglobin. Computers Chem., 19:241–246, 1995.
89. G. Li and Q. Cui. A coarse-grained normal mode approach for macromolecules:An efficient implementation and application to Ca2+-ATPase. Biophys. J.,83:2457–2474, 2002.
118

Bibliography
90. O. Kurkcuoglu, R. L. Jernigan, and P. Doruker. Mixed levels of coarse-grainingof large proteins using elastic network model succeeds in extracting the slowestmotions. Polymer, 45:649–657, 2004.
91. K. Suhre and Y.-H. Sanejouand. ElNémo: a normal mode web server for proteinmovement analysis and the generation of templates for molecular replacement.Nucleic Acids Res., 32:610–614, 2004.
92. W. Zheng and B. R. Brooks. Modeling protein conformational changes by iter-ative fitting of distance constraints using reoriented normal modes. Biophys. J.,90:4327–4336, 2006.
93. S. M. Hollup, G. Salensminde, and N. Reuter. WEBnm: a web application fornormal mode analyses of proteins. BMC Bioinformatics, 6:52–59, 2005.
94. W. Zheng, B. R. Brooks, and G. Hummer. Protein conformational transitionsexplored by mixed elastic network models. Proteins: Struct. Funct. Bioinf., 69:43–57, 2007.
95. S. Izrailev, S. Stepaniants, M. Balsera, Y. Oono, and K. Schulten. Molecular dy-namics study of unbinding of the avidin-biotin complex. Biophys. J., 72:1568–1581, 1997.
96. C. Jarzynski. Nonequilibrium equality for free energy differences. Phys. Rev.
Lett., 78:2690–2693, 1997.
97. S. Park, F. Khalili-Araghi, E. Tajkhorshid, and K. Schulten. Free energy calcula-tion from steered molecular dynamics simulations using Jarzynski’s equality. J.
Chem. Phys., 119:3559–3566, 2003.
98. N. Echols, D. Milburn, and M. Gerstein. MolMovDB: analysis and visualizationof conformational change and structural flexibility. Nucleic Acids Res., 31:478–482, 2003.
99. M. Gerstein and W. Krebs. A database of macromolecular motions. Nucleic Acids
Res., 26:4280–4290, 1998.
100. G. Qi, R. Lee, and S. Hayward. A comprehensive and non-redundant databaseof protein domain movements. Bioinformatics, 21:2832–2838, 2005.
119

Bibliography
101. Y. Xu, D. Xu, and H. N. Gabow. Protein domain decomposition using a graph-theoretic approach. Bioinformatics, 16:1091–1104, 2000.
102. S. Hayward and H. J. C. Berendsen. Systematic analysis of domain motions inproteins from conformational change: New results on citrate synthase and T4lysozyme. Proteins: Struct. Funct. Bioinf., 30:144–154, 1998.
103. S. Hayward and R. A. Lee. Improvements in the analysis of domain motionsin proteins from conformational change: DynDom version 1.50. J. Mol. Graphics
Modell., 21:181–183, 2002.
104. K. Hinsen. Domain motions in proteins. J. Molecular Liquids, 84:53–63, 2000.
105. H. Gohlke, C. Kiel, and D. A. Case. Insights into protein-protein binding bybinding free energy calculation and free energy decomposition for the Ras-Rafand Ras-RalGDS complexes. J. Mol. Biol., 330:891–913, 2003.
106. V. Zoete, M. Meuwly, and M. Karplus. Study of the insulin dimerization frombinding free energy calculations and per-residue free energy decomposition.Proteins: Struct. Funct. Bioinf., 61:79–93, 2005.
107. I. S. Moreira, P. A. Fernandes, and M. J. Ramos. Hot spots – a review ofthe protein-protein interface determinant amino-acid residues. Proteins: Struct.
Funct. Bioinf., 68:803–812, 2007.
108. I. S. Moreira, P. A. Fernandes, and M. J. Ramos. Computational alanine scanningmutagenesis – an improved methodological approach. J. Comput. Chem., 28:644–654, 2007.
109. I. S. Moreira, P. A. Fernandes, and M. J. Ramos. Unravelling hot spots: a compre-hensive computational mutagenesis study. Theor. Chem. Acc., 117:99–113, 2007.
110. H.-J. Woo and B. Roux. Calculation of absolute protein-ligand binding free en-ergy from computer simulations. Proc. Natl. Acad. Sci. USA, 102:6825–6830, 2005.
111. J. Wang, Y. Deng, and B. Roux. Absolute binding free energy calculations usingmolecular dynamics simulations with restraining potentials. Biophys. J., 91:2798–2814, 2006.
120

Bibliography
112. C. Bartels, A. Widmer, and C. Ehrhardt. Absolute free energies of binding ofpeptide analogs to the HIV-1 protease from molecular dynamics simulations. J.
Comput. Chem., 26:1294–1305, 2005.
113. R. Abel, T. Young, R. Farid, B. J. Berne, and R. A. Friesner. Role of the active-sitesolvent in the thermodynamics of factor Xa ligand binding. J. Am. Chem. Soc.,130:2817–2831, 2008.
114. M. A. Martí-Renom, A. C. Stuart, A. Fiser, R. Sánchez, M. Melo, and A. Šali.Comparative protein structure modeling of genes and genomes. Annu. Rev. Bio-
phys. Biomol. Struct, 29:291–325, 2000.
115. D. Baker and A. Sali. Protein structure prediction and structural genomics. Sci-
ence, 294:93–96, 2001.
116. T. Schwede, A. Sali, N. Eswar, and M. C. Peitsch. Protein structure modeling. InComputational Structural Biology Methods and Applications, T. Schwede, M. Peitsch,Eds., World Scientific Publishing Co. Pte. Ltd., 2008.
117. L. J. McGuffin. Protein fold recognition aand threading. In Computational Struc-
tural Biology Methods and Applications, T. Schwede, M. Peitsch, Eds., World Scien-tific Publishing Co. Pte. Ltd., 2008.
118. S. E. Brenner. A tour of structural genomics. Nat. Rev. Genet., 2:801–809, 2001.
119. M. R. Chance, A. R. Bresnick, S. K. Burley, J.-S. Jiang, C. D. Lima, A. Sali, S. C.Almo, J. B. Bonanno, J. A. Buglino, S. Boulton, H. Chen, N. Eswar, G. He,R. Huang, V. Ilyin, L. McMahan, U. Pieper, S. Ray, M. Vidal, and L. K. Wang.Structural genomics: A pipeline for providing structures for the biologist. Prot.
Sci., 11:723–738, 2002.
120. K. Arnold, L. Bordoli, J. Kopp, and T. Schwede. The SWISS-MODEL workspace:a web-based environment for protein structure homology modelling. Bioinfor-
matics, 22:195–201, 2006.
121. J. D. Kahmann, H.-J. Sass, M. G. Allan, H. Seto, C. J. Thompson, and S. Grze-siek. Structural basis for antibiotic recognition by the TipA class of multidrug-resistance transcriptional regulators. EMBO J., 22:1824–1834, 2003.
121

Bibliography
122. H. J. Dyson and P. E. Wright. Coupling of folding and binding for unstructuredproteins. Curr. Op. Struct. Biol., 12:54–60, 2002.
123. J. J. Ward, J. S. Sodhi, L. J. McGuffin, B. F. Buxton, and D. T. Jones. Predictionand functional analysis of native disorder in proteins from the three kingdomsof life. J. Mol. Biol., 337:635–645, 2004.
124. R. Linding, L. J. Jensen, F. Diella, P. Bork, T. J. Gibson, and R. B. Russell. Proteindisorder prediction: Implications for structural proteomics. Structure, 11:1453–1459, 2003.
125. Z. R. Yang, R. Thomson, P. McNeil, and R. M. Esnouf. RONN: the bio-basis func-tion neural network technique applied to the detection of natively disorderedregions in proteins. Bioinformatics, 21:3369–3376, 2005.
126. R. Linding, R. B. Russell, V. Neduva, and T. J. Gibson. GlobPlot: exploring pro-tein sequences for globularity and disorder. Nucleic Acids Res., 31:3701–3708,2003.
127. J. Gu, M. Gribskov, and P. E. Bourne. Wiggle - predicting functionally flexibleregions from primary sequence. PLoS Comp. Biol., 2:0769–0785, 2006.
128. M. Suyama and O. Ohara. DomCut: prediction of inter-domain linker regionsin amino acid sequences. Bioinformatics, 19:673–674, 2003.
129. P. Ross, H. Weinhouse, Y. Aloni, D. Michaeli, P. Weinberger-Ohana, R. Mayer,S. Braun, E. de Vroom, G. A. van der Marel, J. H. van Boom, and M. Benziman.Regulation of cellulose synthesis in Acetobacter xylinum by cyclic diguanylic acid.Nature, 325:279–281, 1987.
130. U. Jenal. Cyclic di-guanosine-monophosphate comes of age: A novel secondarymessenger involved in modulating cell surface structures in bacteria? Curr. Op.
Microbiol., 7:185–191, 2004.
131. D. A. Ryjenkov, M. Tarutina, O. V. Moskvin, and M. Gomelsky. Cyclic diguany-late is a ubiquitious signaling molecule in bacteria: Insights into biochemistry ofthe GGDEF protein domain. J. Bacteriol., 187:1792–1798, 2005.
132. U. Römling and D. Amikam. Cyclic di-GMP as a second messenger. Curr. Op.
Microbiol., 9:218–228, 2006.
122

Bibliography
133. D. A. D’Argenio and S. I. Miller. Cyclic di-GMP as a bacterial second messenger.Microbiology, 150:2497–2502, 2004.
134. B. M Prüss, C. Besemann, A. Denton, and A. J. Wolfe. A complex transcriptionnetwork controls the early stages of biofilm development by Escherichia coli. J.
Bacteriol., 188:3731–3739, 2006.
135. M. Y. Galperin. Bacterial signal transduction network in a genomic perspective.Environ. Microbiol., 6:552–567, 2004.
136. G. B. Hecht and A. Newton. Identification of a novel response regulator requiredfor the swarmer-to-stalked-cell transition in Caulobacter crescentus. J. Bacteriol.,177:6223–6229, 1995.
137. P. Aldridge and U. Jenal. Cell cycle-dependent degradation of a flagellar motorcomponent requires a novel-type response regulator. Mol. Microbiol., 32:379–391,1999.
138. B. García, C. Latasa, C. Solano, F. García-del Portillo C. Gamazo, and I. Lasa. Roleof the GGDEF protein family in Salmonella cellulose biosynthesis and biofilmformation. Mol. Microbiol., 54:264–277, 2004.
139. A. D. Tischler and A. Camilli. Cyclic diguanylate (c-di-GMP) regulates Vibrio
cholerae biofilm formation. Mol. Microbiol., 53:857–869, 2004.
140. P. A. Cotter and S. Stibitz. C-di-GMP-mediated regulation of virulence andbiofilm formation. Curr. Op. Microbiol., 10:17–23, 2007.
141. U. Jenal and J. Malone. Mechanisms of cyclic-di-GMP signaling in bacteria.Annu. Rev. Genet., 40:385–407, 2006.
142. R. Tamayo, J. T. Pratt, and A. Camilli. Roles of cyclic diguanylate in the regula-tion of bacterial pathogenesis. Annu. Rev. Microbiol., 61:131–148, 2007.
143. R. Simm, M. Morr, A. Kader, M. Nimtz, and U. Römling. GGDEF and EALdomains inversely regulate cyclic di-GMP levels and transition from sessility tomotility. Mol. Microbiol., 53:1123–1134, 2004.
144. R. Tal, H. C. Wong, R. Calhoon, D. Gelfand, A. L. Fear, G. Volman, R. Mayer,P. Ross, D. Amikam, H. Weinhouse, A. Cohen, S. Sapir, P. Ohana, and M. Benzi-man. Three cdg operons control cellular turnover of cyclic di-GMP in Acetobacter
123

Bibliography
xylinum: Genetic organization and occurence of conserved domains in isoen-zymes. J. Bacteriol., 180:4416–4425, 1998.
145. M. Y. Galperin, A. N. Nikolskaya, and E. V. Koonin. Novel domains of theprokaryotic two-component signal transduction systems. FEMS Microbiol. Lett.,203:11–21, 2001.
146. J. Pei and N. V. Grishin. GGDEF domain is homologous to adenylyl cylcase.Proteins: Struct. Funct. Bioinf., 42:210–216, 2001.
147. R. Paul, S. Weiser, N. C. Amiot, C. Chan, T. Schirmer, B. Giese, and U. Jenal. Cellcycle-dependent dynamic localization of a bacterial response regulator with anovel di-guanylate cyclase output domain. Genes Dev., 18:715–727, 2004.
148. B. Christen, M. Christen, R. Paul, F. Schmid, M. Folcher, P. Jenoe, M. Meuwly,and U. Jenal. Allosteric control of cyclic di-GMP signaling. J. Biol. Chem.,281:32015–32024, 2006.
149. N. Ausmees, R. Mayer, H. Weinhouse, G. Volman, D. Amikam, M. Benziman,and M. Lindberg. Genetic data indicate that proteins containing the GGDEFdomain possess diguanylate cylclase activity. FEMS Microbiol. Lett., 204:163–167,2001.
150. M. Christen, B. Christen, M. Folcher, A. Schauerte, and U. Jenal. Identificationand characterization of a cyclic di-GMP-specific phosphodiesterase and its al-losteric control by GTP*. J. Biol. Chem., 280:30829–30837, 2005.
151. A. J. Schmidt, D. A. Ryjenkov, and M. Gomelsky. The ubiquitous protein do-main EAL is a cyclic diguanylate-specific phosphodiesterase: Enzymatically ac-tive and inactive EAL domains. J. Bacteriol., 187:4774–4781, 2005.
152. A. G. Bobrov, O. Kirillina, and R. D. Perry. The phosphodiesterase activity of theHmsP EAL domain is required for negative regulation of biofilm formation inYersinia pestis. FEMS Microbiol. Lett., 247:123–130, 2005.
153. D. Amikam and M. Y. Galperin. PilZ domain is part of the bacterial c-di-GMPbinding protein. Bioinformatics, 22:3–6, 2006.
154. D. A. Ryjenkov, R. Simm, U. Römling, and M. Gomelsky. The PilZ domain isa receptor for the second messenger c-di-GMP. J. Biol. Chem., 281:30310–30314,2006.
124

Bibliography
155. M. Christen, B. Christen, M. G. Allan, M. Folcher, P. Jenö, S. Grzesiek, and U. Je-nal. DgrA is a member of a new family of cyclic diguanosine monophosphatereceptors and controls flagellar motor function in Caulobacter crescentus. Proc.
Natl. Acad. Sci. USA, 104:4112–4117, 2007.
156. T. A. Ramelot, A. Yee, J. R. Court, A. Semesi, C. H. Arrowsmith, and M. A.Kennedy. NMR structure and binding studies confirm that PA4608 from Pseu-
domonas aeruginosa is a PilZ domain and a c-di-GMP binding protein. Proteins:
Struct. Funct. Bioinf., 66:266–271, 2007.
157. P. Aldridge, R. Paul, P. Goymer, P. Rainey, and U. Jenal. Role of the GGDEFregulator PleD in polar development of Caulobacter crescentus. Mol. Microbiol.,47:1695–1708, 2003.
158. R. Paul, S. Abel, P. Wassmann, A. Beck, H. Heerklotz, and U. Jenal. Activationof the diguanylate cyclase PleD by phosphorylation-mediated dimerization. J.
Biol. Chem., 282:29170–29177, 2007.
159. A. Levi and U. Jenal. Holdfast formation in motile swarmer cells optimizessurface attachment during Caulobacter crescentus development. J. Bacteriol.,188:5315–5318, 2006.
160. P. H. Viollier and L. Shapiro. Spatial complexity of mechanisms controlling abacterial cell cycle. Curr. Op. Microbiol., 7:572–578, 2004.
161. V. L. Robinson, D. R. Buckler, and A. M. Stock. A tale of two components: anovel kinase and a regulatory switch. Nat. Struct. Biol., 7:626–633, 2000.
162. A. M. Stock, V. L. Robinson, and P. N. Goudreau. Two-component signal trans-duction. Annu. Rev. Biochem., 69:183–215, 2000.
163. G. J. Burton, G. B. Hecht, and A. Newton. Roles of the histidine protein kinasePleC in Caulobacter crescentus motility and chemotaxis. J. Bacteriol., 179:5849–5853, 1997.
164. R. J. Lewis, J. A. Brannigan, K. Muchová, I. Barák, and A. J. Wilkinson. Phos-phorylated aspartate in the structure of a response regulator protein. J. Mol. Biol.,294:9–15, 1999.
125

Bibliography
165. D. Yan, H. S. Cho, C. A. Hastings, M. M. Igo, S.-Y. Lee, J. G. Pelton, V. Stewart,D. E. Wemmer, and S. Kustu. Beryllofluoride mimics phosphorylation of NtrCand other bacterial response regulators. Proc. Natl. Acad. Sci. USA, 96:14789–14794, 1999.
166. D. E. Wemmer and D. Kern. Beryllofluoride binding mimics phosphorylation ofaspartate in response regulators. J. Bacteriol., 187:8229–8230, 2005.
167. C. A. Hastings, S.-Y. Lee, H. S. Cho, D. Yan, S. Kustu, and D. E. Wemmer. High-resolution solution structure of the beryllofluoride-activated NtrC receiver do-main. Biochemistry, 42:9081–9090, 2003.
168. S.-Y. Lee, H. S. Cho, J. G. Pelton, D. Yan, R. K. Henderson, D. S. King, L.-S.Huang, S. Kustu, E. A. Berry, and D. E. Wemmer. Crystal structure of an acti-vated response regulator bound to its target. Nat. Struct. Biol., 8:52–56, 2001.
169. C. M. Dyer and F. W. Dahlquist. Switched or not?: The structure of unphos-phorylated CheY bound to the N terminus of FliM. J. Bacteriol., 188:7354–7363,2006.
170. C. Birck, L. Mourey, P. Gouet, B. Fabry, J. Schumacher, P. Rousseau, D. Kahn, andJ.-P. Samama. Conformational changes induced by phosphorylation of the FixJreceiver domain. Structure, 7:1505–1515, 1999.
171. M. H. Knaggs, F. R. Salsbury Jr., M. H. Edgell, and J. S. Fetrow. Insights intocorrelated motions and long-range interactions in CheY derived from moleculardynamics simulations. Biophys. J., 92:2062–2079, 2007.
172. J. C. Phillips, R. Braun, W. Wang, J. Gumbart, E. Tajkhorshid, E. Villa, C. Chipot,R. D. Skeel, L. Kale, and K. Schulten. Scalable molecular dynamics with NAMD.J. Comput. Chem., 26:1781–1802, 2005.
173. J.-P. Ryckaert, G. Ciccotti, and H. J. C. Berendsen. Numerical integration of thecartesian equations of motion of a system with constraints: molecular dynamicsof n-alkanes. J. Chem. Phys., 23:327–341, 1977.
174. D. Frishman and P. Argos. Knowledge-based protein secondary structure as-signment. Proteins: structure, function and genetics, 23:566–579, 1995.
126
Bibliography
175. W. Humphrey, A. Dalke, and K. Schulten. VMD - visual molecular dynamics. J.
Molec. Graphics, 14:33–38, 1996.
176. A. Toro-Roman, T. Wu, and A. M. Stock. A common dimerization interface inbacterial response regulator KdpE and TorR. Prot. Sci., 14:3077–3088, 2005.
177. A. Toro-Roman, T. R. Mack, and A. M. Stock. Structural analysis and solutionstudies of the activated regulatory domain of the response regulator ArcA: Asymmetric dimer mediated by the α4-β5-α5face. J. Mol. Biol., 349:11–26, 2005.
178. P. Bachhawat, G. V. T. Swapna, G. T. Montelione, and A. M. Stock. Mechanism ofactivation for transcription factor PhoB suggested by different modes of dimer-ization in the inactive and active states. Structure, 13:1353–1363, 2005.
179. P. Bachhawat and A. M. Stock. Crystal structures of the receiver domain of theresponse regulator PhoP from Escherichia coli in the absence and presence of thephosphoryl analog beryllofluoride. J. Bacteriol., 189:5987–5995, 2007.
180. C. Chennubhotla and I. Bahar. Signal propagation in proteins and relation toequilibrium fluctuations. PLoS Comp. Biol., 3:e172, 2007.
181. J. A. Hardy and J. A. Wells. Searching for new allosteric sites in enzymes. Curr.
Op. Struct. Biol., 14:1–10, 2004.
182. N. Homeyer, A. H. C. Horn, H. Lanig, and H. Sticht. AMBER force-field pa-rameters for phosphorylated amino acids in different protonation states: phos-phoserine, phosphothreonine, phosphotyrosine, and phosphohistidine. J. Mol.
Model., 12:281–289, 2006.
183. E. S. Groban, A. Narayanan, and M. P. Jacobson. Conformational changes inprotein loops and helices induced by post-translational phosphorylation. PLoS
Comp. Biol., 2:0238–0250, 2006.
127

Bibliography
128

Appendix
Curriculum vitae
Personal Data
Address: Franziska F.-F. SchmidGotthardstrasse 1244054 Basel
Email: [email protected]
Nationality: Swiss
Education
11/2004 – 11/2008 PhD Studies, Department of Chemistry, University of Basel
- Thesis: Protein Allostery: Computational Characterization of Diguanylate Cyclase PleD
- Supervisor: Prof. M. Meuwly, University of Basel
- External Examiner: Prof. L. Nilsson, Karolinska Institutet, Sweden
10/2000 – 12/2008 Courses in Pharmacy and Biology, University of Basel
09/2000 – 10/2004 Studies in Chemistry, University of Basel
-Thesis: Combining MD Simulations and NMR Data for Analysis of Hydrogen Bonding in Small
Proteins and Refinement of Force Field Parameters
- Supervisor: Prof. M. Meuwly
08/1996 – 05/2000 Matura Typ. C (Math), Alte Kantonsschule Aarau
129

Appendix
Publications
• Direct Comparison of Experimental and Calculated NMR Scalar Coupling Constants for
Force Field Validation and Adaptation
F. F.-F. Schmid, M. Meuwly.J. Chem. Theory Comput. 2008, 4(11): 1949 – 1958
• All-atom Simulations of Structures and Energetics of c-di-GMP-bound and free PleD
F. F.-F. Schmid, M. Meuwly.J. Mol. Biol. 2007, 374(5):1270 – 1285
• Correlation of Protein Structure and Dynamics to Scalar Couplings across Hydrogen Bonds
H.-J. Sass, F. F.-F. Schmid, S. Grzesiek.J. Am. Chem. Soc. 2007, 129(18):5898 – 5903
• Allosteric Control of Cyclic di-GMP Signaling
B. Christen, M. Christen, R. Paul, F. Schmid, M. Folcher, P. Jenoe, M. Meuwly, U. Jenal.J. Biol. Chem. 2006, 281(42):32015 – 32024
• Insulin: a model system for nanomedicine?
M. Koch, F. F.-F. Schmid, V. Zoete, M. Meuwly.Future Medicine 2006, 1(3):373 – 377
Poster & Oral Presentations at Conferences
• Molecular Dynamics Simulations to Study the PleD Dimerization Process
Poster, 2008 Swiss Chemical Society Fall Meeting in Zurich, Switzerland
• Investigation of Parameters Influencing 3h JNC′ -couplings Across Hydrogen Bonds Using MD
Simulations
Poster, 2007 Swiss Chemical Society Fall Meeting in Lausanne, Switzerland
• Computational Characterization of the Feedback Mechanism in PleD
Presentation, 2006 Swiss Chemical Society Fall Meeting in Zurich, Switzerland
• Computational Approach to Allosteric Mechanism: Feedback Inhibition in Guanylate Cy-
clase PleD
Poster, 2006 Gordon Research Conference “Computational Chemistry“ in Les Diablerets, Switzer-land
• Computational Approach to Allosteric Mechanism: Feedback Inhibition in Guanylate Cy-
clase PleD
Poster, 2006 1st European Chemistry Congress in Budapest, Hungary
• Functional Analysis of Diguanylate Cyclase PleD by Molecular Dynamics Simulations
Poster, 2005 15th IUPAB / 5th EBSA International Biophysics Congress in Montpellier, France
130

Appendix
Work Experience & Practical Training
2004 – 2008 Computer Administration of the Department , University of Basel- Setup and maintenance of Linux computer cluster
- Technical support for students
2004 – 2008 Supervision of Undergraduate Research Projects , University of Basel
2007 – 2008 Participating in “Women Into Industry (WIN)“ a joint mentoring programby the University Basel and Novartis
2006 Participating in the 3ème Cycle Summer School “Computational Quantum
Dynamics“
2005 Participating in a “Parallel Programming“ Workshop at the CSCS inManno, Switzerland
2003 Practical Training with Prof. B. Ernst , Department of Pharmacy, Universityof Basel
- Bioenzymatic and regular chemical synthesis of Sialyl LexisX and analoga
- Compound analysis using 2D-NMR spectra (COSY, HSQC)
1998 – 2002 Private Tutoring in Math and French for Secondary School Students
(age 12 to 16)
2000 Participating in SJF Research Week “Forschen in der Chemie“
1999 Participating in SJF Research Week “Elektrotechnik und Maschinenbau“
Personal Skills
Operating System Proficient in use and administration of Linux and Windows
Software Molecular dynamics packages (CHARMM, NAMD)Visualization programs (VMD, MolMol, Molden)Least-squares fitting program I-NoLLSAb-initio package Gaussian
Programming Experienced in Fortran77, Tcl/Tk, HTML, BASHBasic knowledge in MPI and Perl
Languages German (native), English (fluent), French (conversational)
131