Development of Level 3 (gridded) products for the Atmospheric Infrared Sounder (AIRS

Comparison of upper tropospheric water vapor observations
from theMicrowave Limb Sounder and Atmospheric Infrared Sounder
Eric J. Fetzer,1 William G. Read,1 Duane Waliser,1 Brian H. Kahn,1 Baijun Tian,1,2
Holger Vomel,3 Fredrick W. Irion,1 Hui Su,1 Annmarie Eldering,1
Manuel de la Torre Juarez,1 Jonathan Jiang,1 and Van Dang1
Received 20 February 2008; revised 2 September 2008; accepted 23 September 2008; published 29 November 2008.
[1] We compare matched retrievals of upper tropospheric water vapor (UTWV) mixingratios from the Microwave Limb Sounder (MLS) instrument on the Aura satellite, and theAtmospheric Infrared Sounder (AIRS) instrument on the Aqua satellite. Because eachinstrument’s sampling is affected by tropical conditions, about half of mutually observedscenes in the tropics yield simultaneous successful retrievals from both systems. Thefraction of mutually retrieved scenes drops to 30% at higher latitudes where cloudssignificantly inhibit AIRS sounding. Essentially all scenes observed by MLS inextratropical and polar regions yield successful retrievals. At 250 hPa in the tropics,measurements from the two instruments are highly correlated, the differences of theirmeans ( �Dq) are smaller than 10%, and the standard deviations of their differences (sq) are30% or less. At 300 hPa, MLS means are drier by 10–15%, and sq is 40–60%, indicatingthat responses of MLS and AIRS to UTWV perturbations are not one-to-one. Rootmean square agreement is also poorer over the poles at 300 hPa and at 200 and 150 hPa atlower latitudes. In these regions, j �Dqj = 10% or more, and sq = 40–70%. Correlationsbetween the two data sets are 0.7–0.9 at 300 and 250 hPa globally and at 200 hPa in thetropics. This high correlation indicates that sq of 50% or greater comes mainly fromsystematic differences in sensitivity of the two instruments, especially for small and largeUTWV amounts; larger values of sq are generally not due to large random errors fromeither instrument. An AIRS low-end sensitivity threshold of 15–20 ppmv leads to pooreragreement under the driest conditions. Disagreement at 300 hPa likely comes fromoverestimation by MLS for the wettest conditions of >400 ppmv. While MLS is biasedslightly dry overall at 300 hPa, it is biased wet in the wettest regions, particularly thoseassociated with deep convection. These sensitivity differences explain nonunity slopesof linear fits to the two data sets. MLS everywhere has a greater dynamic range thanAIRS, with larger maxima and smaller minima. Good agreement at 250 hPa suggestsAIRS uncertainties of 25% up to the reported 250–200 hPa layer in the tropics andextratropics, consistent with previous comparisons with balloon- and aircraft-borneinstruments. The agreement at 250 hPa also indicates that MLS is reliable from its reported215-hPa level upward in altitude.
Citation: Fetzer, E. J., et al. (2008), Comparison of upper tropospheric water vapor observations from the Microwave Limb Sounder
and Atmospheric Infrared Sounder, J. Geophys. Res., 113, D22110, doi:10.1029/2008JD010000.
1. Introduction
[2] Improved global observations of upper troposphericwater vapor (UTWV) are critical in answering severalunresolved climate questions. UTWV is particularly impor-tant in climate feedback mechanisms, either directly through
radiative effects, or indirectly through cloud formationprocesses. The size of these feedbacks is still in question[Held and Soden, 2000; Stephens, 2005; Bony et al., 2006;Soden and Held, 2006]. UTWV is significant in determiningthe atmospheric radiative balance, especially in partiallycloudy and cloud-free scenes [L’Ecuyer and Stephens,2003; Lin et al., 2006]. The relationship between UTWVand cloud formation processes is an active area of research[Jensen et al., 2000; Eguchi and Shiotani, 2004; Liu, 2007;Peter et al., 2006]. Any possible indirect effects of aerosolon radiative and precipitative properties of cirrus clouds aremediated by UTWV [Karcher and Lohmann, 2003; Jensenand Ackerman, 2006; Massie et al., 2007]. Also, UTWV
JOURNAL OF GEOPHYSICAL RESEARCH, VOL. 113, D22110, doi:10.1029/2008JD010000, 2008ClickHere
for
FullArticle
1Jet Propulsion Laboratory, California Institute of Technology,Pasadena, California, USA.
2Joint Institute for Regional Earth System Science and Engineering,University of California, Los Angeles, California, USA.
3Deutscher Wetterdienst, Lindenberg, Germany.
Copyright 2008 by the American Geophysical Union.0148-0227/08/2008JD010000$09.00
D22110 1 of 17

and upper tropospheric temperature are important factors instratospheric hydration mechanisms [Holton et al., 1995;Sherwood and Dessler, 2001; Holton and Gettelman, 2001;Liu et al., 2007].[3] We compare height-resolved water vapor mixing
ratios from two independent satellite observing systems atpressures from 300 to 150 hPa. The Atmospheric InfraredSounder (AIRS) experiment, in operation since September2002 on the Aqua spacecraft, utilizes a combination ofinfrared and microwave radiances observed near nadir toretrieve mixing ratios from the surface to the upper tropo-sphere [Aumann et al., 2003]. The Earth Observing SystemMicrowave Limb Sounder (EOS MLS; hereafter referred toas MLS), operating since July 2004 on the Aura spacecraft,observes microwave emissions from the limb. MLS radi-ances are inverted to profiles of mixing ratio from 316 hPainto the mesosphere [Waters et al., 2006]. Both MLS andAIRS retrieve temperature, minor gases, and cloud proper-ties along with water vapor mixing ratios. Although MLSand AIRS are carried on separate satellites, they fly in closeformation in the NASA A-Train satellite constellation, sothe two systems’ observations are co-located and separatedin time by about 8 minutes [Stephens et al., 2002]. BecauseMLS and AIRS use fundamentally different observingmethods that are sensitive to different atmospheric condi-tions, a combination of observations from both instrumentsoffers the potential of a more complete UTWV climatologythan either instrument can provide individually. However,the two sets of observations must first be compared tocharacterize their relative uncertainties, and must be recon-ciled with correlative observations, typically from radio-sondes and aircraft.[4] AIRS and MLS comparisons shown here are limited
to those mutually observed upper tropospheric scenes whereboth instruments return a valid retrieval. This approach issimilar to comparisons between satellite and in situ data,which are typically also limited to those conditions wherethe satellite instrument can retrieve information. We do notcompare AIRS and MLS in the stratosphere because AIRSreported stratospheric water vapor is, at best, able toreproduce the mean climatology of a region and period[Gettelman et al., 2004; Read et al., 2007].[5] The potential effects of reduced sampling rates on
both instruments are examined in Fetzer et al. [The effect ofsampling on upper tropospheric water vapor climatologiesfrom the Microwave Limb Sounder and Atmospheric Infra-red Sounder, manuscript in preparation, 2008]. As will beshown below, the two instruments can simultaneouslyretrieve UTWV for roughly 40 to 70% of all observedscenes within a 15� latitude band; this study is concernedwith those scenes. The remaining scenes are not observedby either AIRS or MLS primarily because clouds may affectupwelling radiation from UTWV. Sampling characteristicsare relevant because AIRS sounding is prevented by thickerclouds, However, some observations are attained by AIRSfor up to 70% effective cloud cover because the AIRSretrieval method exploits microwave information to partiallyremove the effects of clouds [Susskind et al., 2006; Fetzer etal., 2006]. MLS constituent sampling is partially affected byice particles [Livesey et al., 2006a, 2006b; Wu et al., 2006],but MLS retrieval algorithms may also fail in regions where
the a priori solution is unrepresentative [Read et al., 2007].Scattering by ice particles appears to be the dominant sourceof failed MLS retrievals in tropical regions with extensivecloud cover. (However, as discussed below, other factorscan lead to failed MLS retrievals under clear tropicalconditions.) Both instruments are capable of making someUTWV observations under cloudy conditions. An under-standing of the effects of cloud on both instruments is anecessary step toward creating a complete and representa-tive UTWV climatology. The goal of this study is aconstraint on the relative uncertainties of the two instru-ments when they simultaneously observe.[6] UTWV observations are available from other instru-
ments besides AIRS and MLS. Balloon-based observationsof UTWVare limited because operational radiosonde instru-ments are insensitive to water vapor for the cold, dryconditions typical of pressures less than about 300 hPa[Ferrare et al., 2004; Whiteman et al., 2006; Miloshevich etal., 2006]. The sensitive balloon-borne instruments describedin Vomel et al. [2007] are used to validate MLS water vaporunder very dry stratospheric conditions. Aircraft observa-tions are of high quality but limited extent [e. g., Gettelmanet al., 2004]. A variety of operational satellite instruments inboth geostationary and low-earth orbits carry a 6.7 mmchannel sensitive to water vapor. While operational satelliteUTWV measurements are limited to relative humidity overa layer several kilometers thick [Soden and Bretherton,1993], their coverage extends nearly 30 years. In addition,operational sounders in geosynchronous orbit can be used toexamine the diurnal cycle [Soden, 2000; Tian et al., 2004].(In contrast, AIRS and MLS can each retrieve temperatureand absolute humidity over 1–3 km thick layers, but theircoverage is limited to a few years. Also, because they are insun-synchronous orbits they sample only two points in thediurnal cycle.) Other observations of upper troposphericrelative humidity from an earlier version of the MicrowaveLimb Sounder instrument on the Upper AtmosphericResearch Satellite (UARS/MLS) launched in 1991 [Readet al., 2001] have been used to study water vapor feedbackprocesses [Minschwaner and Dessler, 2004].[7] The structure of this paper is as follows. Section 2
describes the AIRS and MLS observing methodologies, theviewing geometries of the two systems, the instruments’coverage, and the validation state of both data sources. (AnAppendix describes the quality flagging and the procedurefor matching the two data sets.) Section 3 presents time-zonal mean statistics of the fraction of converged retrievals,mean UTWV, mean UTWV differences, standard deviationof differences, sampling extrema of matched data, correla-tions, and degree of linearity of the two data sets (asmeasured by slopes of fitted lines). Section 3 also interpretsthe performance of the separate instruments by season,pressure and latitude. Section 4 presents a summary ofthe conclusions about instrument performance reached insection 3. Section 4 also discusses the implications of thiswork for other studies, and suggests further research.
2. Data Sources
[8] This section describes basic characteristics of theAIRS and MLS instruments, their validation status, their
D22110 FETZER ET AL.: MLS AND AIRS WATER VAPOR
2 of 17
D22110

viewing geometries, and the importance of excluding AIRSstratospheric water vapor values. The Appendix providesaddition discussions of quality flags and the data matchingmethod used in this study.
2.1. Atmospheric Infrared Sounder
[9] The AIRS experiment was launched on the Aquaspacecraft on 4 May 2002, and became fully functionalon 1 September 2002. Aqua is in a sun-synchronous orbitwith an equator crossing time of 1:30 AM (PM) on thesouthward or descending (northward or ascending) orbit.Observations from Aqua are intended to improve ourunderstanding of the Earth’s hydrologic cycle [Parkinson,2003]. The AIRS experiment includes the AIRS instrument[Pagano et al., 2003] and two microwave sounding instru-ments: the Advanced Microwave Sounding Unit (AMSU)and the Humidity Sounder for Brazil (HSB) [Lambrigtsen,2003]. HSB improves the water vapor retrieval capability ofthe AIRS system [Fetzer et al., 2006], but ceased operatingin February 2003, some eighteen months before the launchof MLS. All results presented here use AIRS/AMSUretrievals. A retrieval algorithm inverts observed radiancesfrom AIRS and AMSU to vertical profiles of temperature,minor gases, and water vapor, along with cloud amount,cloud top properties, and surface properties [Susskind et al.,2003, 2006]. The AIRS and AMSU instruments viewdownward, scanning in a swath about 1600 km wide, witha maximum viewing angle of 49.5� from nadir. The hori-zontal spacing of AIRS profile quantities is about 45 km atnadir, with thirty retrieved profiles across the viewingswath. (This is the AMSU resolution, while the AIRSinstrument samples infrared spectra at three times higherhorizontal resolution; see discussion of Figure 1 below.)Each profile is retrieved from a set of nine observed AIRSspectra and one observed AMSU spectrum. The AMSUobservation rate is 324,000 spectra per day, so up to324,000 profiles may be retrieved daily. Because cloudscan block infrared radiances from below, roughly 30% ofpossible profiles are retrieved from the AMSU microwaveobservations alone [Susskind et al., 2006]; that fractionvaries considerably with location and the prevalence ofclouds [Fetzer et al., 2006]. Microwave-only retrievals areexcluded from this study because they contain no UTWV
information. Below we discuss instruments ‘‘yields.’’ ForAIRS this effectively means the percentage of retrievalswhere clouds do not significantly obscure the infraredradiances emitted from below those clouds. This study usesAIRS Version 4.0 Level data, available at http://airs.jpl.nasa.gov/.[10] The AIRS system was designed and built to resolve
water vapor with 15% root mean square (RMS) uncertaintyin 2 km layers in the troposphere. AIRS UTWV in thetropics has been compared in several studies with in situobservations using data from aircraft [Gettelman et al.,2004] and balloons [Hagan et al., 2004; Tobin et al.,2006], though at a limited set of locations. Other studies[Divakarla et al., 2006; Tobin et al., 2006; Nalli et al., 2006;Susskind et al., 2006; Fetzer et al., 2004, 2006; Ye et al.,2007] have compared AIRS total precipitable water, lowertropospheric water vapor, and temperature profiles withobservations from a variety of correlative data sourcesregionally and globally. In summary, these studies showindividual AIRS specific humidity profiles have RMSmeasurement uncertainties of ±10–30%, and measurementbiases of 10% or less in 2 km layers in nonpolar regions. Asnoted by Hearty et al. [2007], the AIRS Version 5.0 datahave smaller UTWV bias relative to radiosondes than earlierdata releases, including the V4.0 data discussed here. TheRMS characteristics of AIRS Version 4.0 and Version 5.0data are very similar [Hearty et al., 2007].[11] As discussed by Read et al. [2007], vertical resolu-
tion estimates are based on the retrieval averaging kernels.Because the AIRS Version 4.0 data used in this study do notprovide averaging kernels, we presume that the AIRSresolution is near 2 km, as determined through simulationby Susskind et al. [2003]. Averaging kernels are beingprovided as part of Version 5.0 data, first available in thesummer of 2007. Preliminary comparisons of the AIRSV5.0 data with in situ observations corroborate the V4.0results. Maddy and Barnet [2008] examine AIRS verticalresolution in Version 5.0 data, and report water vaporresolution of 2–3 km throughout the troposphere.
2.2. Aura Microwave Limb Sounder
[12] MLS is a limb-scanning microwave radiometer onthe Aura spacecraft, launched on 14 July 2006. Aura and
Figure 1. Plan view of MLS and AIRS/AMSU viewing geometries with MLS tangent points as boldcross, central MLS averaging kernel as a broad gray line, and approximate AMSU response functions asdashed ovals with pluses at their center. Nine AIRS spatial response functions are represented as shadedoblongs for each of four AMSU fields of view nearest the MLS tangent point.
D22110 FETZER ET AL.: MLS AND AIRS WATER VAPOR
3 of 17
D22110

Aqua (carrying AIRS) fly in the A-Train formation, withAqua leading by 15 minutes. Observations from instrumentson Aura are intended to answer a number of importantquestions about atmospheric processes, with a particularemphasis on chemical constituents [Schoeberl et al., 2006].Observed microwave radiances from MLS are inverted toprofiles of temperature, geopotential height, cloud ice, andseveral minor gases, including water vapor from the uppertroposphere into the stratosphere [Waters et al., 2006]. MLSpoints in a fixed azimuth and its data are sampled along asingle track slightly displaced from the orbit track. BecauseMLS views in the forward direction, AIRS and MLSobservations are spaced in time by roughly eight minutesdespite a spacecraft separation time of fifteen minutes. MLSretrievals are spaced horizontally by 165 km [Livesey et al.,2006b]. The maximum MLS global retrieval rate is 3494profiles per day. This study uses Version 1.5 water vaporretrievals publicly available at the Goddard SpaceflightCenter DAAC through http://mls.jpl.nasa.gov.[13] The rate of successful MLS retrievals is much higher
than for AIRS, though it can be as low as 50% in the moisttropics. The causes of unsuccessful MLS yields are two-fold. Roughly two-thirds of MLS tropical retrievals areunsuccessful due to non-representative a priori solutions[Read et al., 2007]. This occurs most commonly under clearbut moist conditions. The remaining third of unsuccessfulMLS retrievals is a consequence of upwelling microwaveradiances from water vapor being scattered from larger iceparticles, of diameters greater than 200 mm [Wu et al., 2005,2006]. This scattering distorts the line shapes so thatspectral fits cannot be obtained in the retrieval. Of course,these unsuccessful retrievals are most common in cloudiestconditions.[14] Froidevaux et al. [2006] report a preliminary RMS
uncertainty estimate for MLS Version 1.5 UTWVof 17% orless. This estimate is based on an error model internal to theMLS retrieval system. That study also includes a compar-ison of AIRS and MLS UTWV. Froidevaux et al. did notdiscriminate between stratospheric conditions, as is donehere, or eliminate UTWV values of less than 20 ppmv, aswas done by Read et al. [2007]. Froidevaux et al. [2006]report bias of AIRS relative to MLS of �12 to +25% andstandard deviations of their differences of ±53 to ±125%,
with percentages relative to the mean UTWV. (Thesenumbers are analogous to �Dq and sq, as defined in Table 1).In contrast, Read et al. [2007] and this study both showAIRS-MLS UTWV RMS agreement is as good as ±30%(analogous to the RMS of �Dq and sq). The improvement inagreement is primarily a consequence of the exclusion ofstratospheric observations. More recently, Vomel et al.[2007] compared MLS UTWV against very accurate Cryo-genic Frostpoint Hygrometer (CFH) instruments on bal-loons, and report MLS Version 1.5 dry biases of about 25%near 300 hPa, with smaller biases at lower pressures. Thestandard deviations of the differences are 25–40%. Vomel etal. [2007] show CFH-MLS agreement improves for drier,colder conditions, with best agreement for the very lowmixing ratios of a few ppmv typical of the stratosphere.Read et al. [2007] show that both MLS Version 1.5 and 2.2data at 316 hPa have an overall dry bias of �25% relative toAIRS, but a wet bias for wettest scenes at 300 hPa whenmixing ratios are 500 to 1000 ppmv. MLS again becomesdrier above about 1000 ppmv, but these wettest values arevery infrequent. Read et al. [2007] ascribe the MLS wet biasin wet scenes to an error of �1% in transmissivity in theMLS forward radiative transfer model. So, at 316 hPa MLSis biased dry in the mean, but is biased wet for scenesgreater than 500 ppmv. Read et al. also find in comparisonwith MLS that AIRS loses sensitivity around 20 ppmv,broadly consistent with Gettelman et al. [2004] who sug-gested a 15 ppmv threshold for AIRS. Read et al. note thatMLS has a lower sensitivity threshold of 3–4 ppmv, wellbelow typical UTWV values discussed here.
2.3. Viewing Geometries and Coverage
[15] Figure 1 shows the local viewing geometries of MLSand AIRS. Most of the MLS signal is received from aroughly 3 km vertical by 7 km cross-track by 180 km along-track volume along the tangent path [Livesey et al., 2006b].The MLS horizontal averaging kernel is shaded in Figure 1;this represents the weighted contribution to the signal by theUTWV field. In contrast, most of the AMSU- and AIRS-observed radiance is emitted from a single AMSU field ofview represented by dashed circles in Figure 1, and the ninecorresponding AIRS infrared radiance observing fields ofview shown as shaded oblongs. The infrared radiancesprovide most of the information for the AIRS UTWVretrievals, with the AMSU microwave observations primar-ily constraining the AIRS total water vapor. The verticalresolution of MLS is due mainly to the vertically confinedviewing geometry as discussed by Livesey et al. [2006b].The AIRS vertical resolution comes from the large numberof water vapor, carbon dioxide and other constituent spec-tral lines in the AIRS spectra [Strow et al., 2006]. The AIRSretrieval algorithm essentially deconvolves the manyweighting functions to resolve vertical scales smaller thanan individual weighting function’s thickness. Figure 1 alsosuggests the density of sampling by the two instruments.Figure 9 of Read et al. [2007] shows the regional coverageof AIRS and MLS, and clearly illustrates the roughly 100-fold greater coverage by AIRS.
2.4. Exclusion of AIRS Stratospheric Values
[16] In addition to the quality flag screening discussed inthe Appendix, care must be taken to include only those
Table 1. Definition of Symbols for Quantities Discussed in
Section 3
Quantity Definition
�q Mean MLS and AIRS UTWV in ppmv�Dq Bias between mean matched AIRS and MLS
(AIRS minus MLS) UTWV,as percentage of �q
sq Standard deviation of the difference of matched AIRSand MLS UTWV observations as percentage of �q
qMLS�3% The third percentile (driest 3%) of MLS observedUTWV in ppmv
%AIRS�3% The third percentile (driest 3%) of AIRSobservations as percentage of qMLS�3%
qMLS�97% The 97th percentile (wettest 97%) of MLSobservations in ppmv
%AIRS�97% The 97th percentile of AIRS observations(wettest 97%) as a percentage of qMLS-97%
r The linear correlation coefficient betweenAIRS and MLS UTWV
m The slope of the least squares fittedline of AIRS to MLS
D22110 FETZER ET AL.: MLS AND AIRS WATER VAPOR
4 of 17
D22110
portions of AIRS UTWV profiles within the troposphere.The AIRS system is sensitive only to tropospheric watervapor amounts [Susskind et al., 2003]. This rejection ofstratospheric values is especially important in polar regions,where tropopause pressures can be 300 hPa or greater. AIRSlower stratospheric water vapor values may be misleadingbecause their means and those from MLS may differ byonly a few percent, while the correlation between AIRS andMLS stratospheric water vapor is zero to high statisticalsignificance.[17] Because AIRS has only climate-mean skill (at best)
in the stratosphere, this study considers only those portionsof AIRS UTWV profiles where pressures are greater thanthe WMO-defined AIRS retrieved tropopause pressure[World Meteorological Organization, 1957]. Tropopausepressure is derived from the AIRS temperature-pressureprofile, and reported in the AIRS data files. It is reportedto a few hundred meters, finer than the 1–3 km resolutionof the AIRS temperature and humidity profiles. Preliminarycomparisons of AIRS and Global Positioning Systemretrieved temperature profiles show tropopause log-pressurealtitude agreement to within about ±0.5 km globally forJanuary 2003.
3. Comparison of Matched Observations
[18] In this section we present zonal mean summaries ofall matched AIRS-MLS retrieval pairs of highest qualityfrom both instruments. Summaries are shown for each ofthe twelve months in 2005, and in twelve zonal bandsbetween the poles, defined as [90–75S, 75–60S, . . .,75–90N]. While the poles are given as the limits of thecomparison, note that viewing geometry restricts theextreme MLS latitudes (and so the latitudes of highestmatched AIRS-MLS observations) to ±81.8�. For this study
we examined a number of quantities pertinent to theindividual instruments’ measurements, and their matcheddifferences. These include statistical moments (means andvariances), ranked statistics (medians and quantiles), andcorrelation coefficients (both Pearson and nonparametricestimators). The results of those comparisons are presentedhere primarily as means, biases, standard deviations,extrema, Pearson correlation coefficients, and the slopesof fitted lines. We show these quantities because instrumentperformance is generally specified in terms of the measure-ment bias (accuracy) and standard deviation (precision), orthe root mean square of the two [Aumann et al., 2003]. Aswill be seen, root mean square (RMS) differences may belarge even when the two data sets are highly correlated,suggesting both instruments are sensitive to a wide range ofUTWV conditions, but have different responses to thoseconditions.
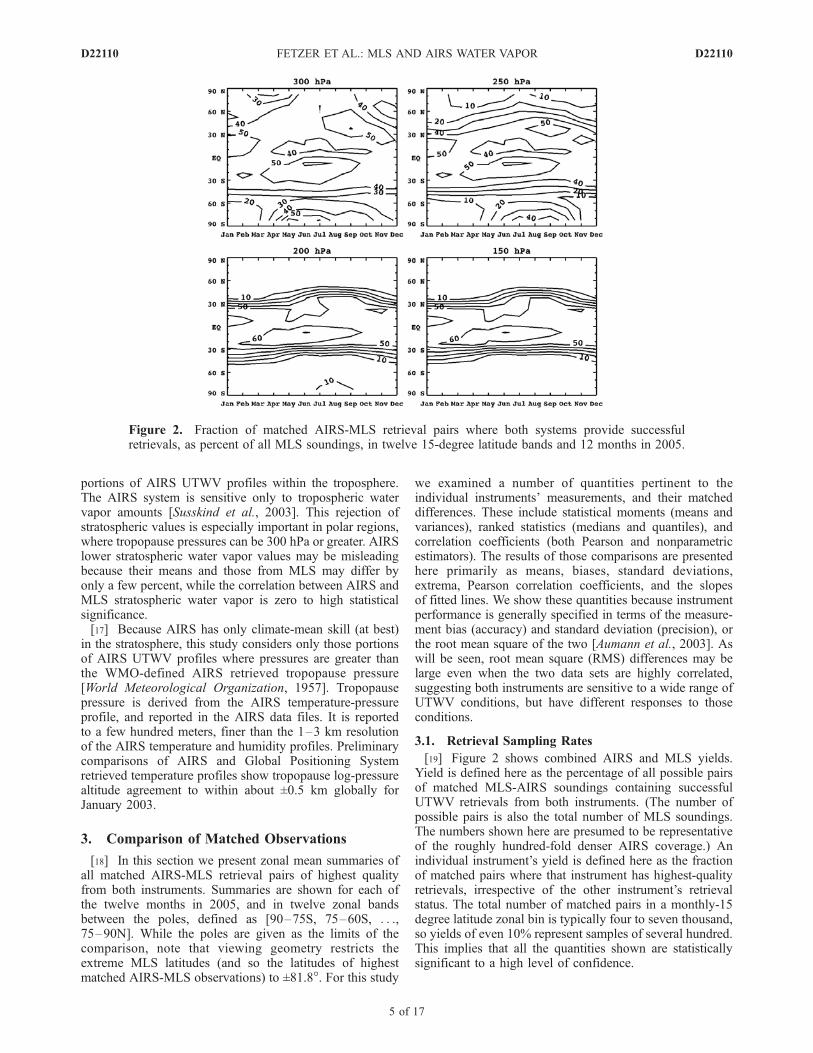
3.1. Retrieval Sampling Rates
[19] Figure 2 shows combined AIRS and MLS yields.Yield is defined here as the percentage of all possible pairsof matched MLS-AIRS soundings containing successfulUTWV retrievals from both instruments. (The number ofpossible pairs is also the total number of MLS soundings.The numbers shown here are presumed to be representativeof the roughly hundred-fold denser AIRS coverage.) Anindividual instrument’s yield is defined here as the fractionof matched pairs where that instrument has highest-qualityretrievals, irrespective of the other instrument’s retrievalstatus. The total number of matched pairs in a monthly-15degree latitude zonal bin is typically four to seven thousand,so yields of even 10% represent samples of several hundred.This implies that all the quantities shown are statisticallysignificant to a high level of confidence.
Figure 2. Fraction of matched AIRS-MLS retrieval pairs where both systems provide successfulretrievals, as percent of all MLS soundings, in twelve 15-degree latitude bands and 12 months in 2005.
D22110 FETZER ET AL.: MLS AND AIRS WATER VAPOR
5 of 17
D22110

[20] Several factors determine the distribution of yields inFigure 2, and the most dramatic is the effect of a lowertropopause at high latitudes. This explains why the 10%contour is often equatorward of ±50� latitude at 150 hPa.Other high-latitude reductions in yields at 300 and 250 hPain Figure 2 are almost entirely a consequence of decreasedAIRS yields because of extensive high-latitude cloudiness.See the study of Fetzer et al. [2006] for a discussion of theeffects of cloud type on AIRS water vapor sampling.Roughly 35 to 50% of all AIRS retrievals pass highestquality control at high latitudes, with an AIRS-only yieldlocal maximum at 300 hPa of about 65% over the AntarcticPlateau during austral winter, presumably due to very clearconditions there. (Lower pressures have larger numbers ofstratospheric cases even when the retrievals are successful.)Also, the lowest AIRS yields of 20–30% in Figure 2 arefound in the 45–60 S band, consistent with the very cloudyconditions prevalent over the Southern Ocean. The MLSyields at all pressures of interest here are nearly 100% forlatitudes poleward of 45�.[21] At latitudes between 45 S and 45 N the yields in
Figure 2 are explained by reductions in sampling by bothAIRS and MLS. This is most apparent in the tropics, whereminimum zonal mean yields of 40–50% are seen in thesummer hemisphere. This summertime minimum is likelydue to deep convective clouds reducing the soundingcapability of both instruments.[22] The largest low-latitude yields in Figure 2 are found
in the wintertime subtropical belts, presumably associatedwith diminished high level cloud cover [Rossow andSchiffer, 1999]. Fetzer et al. [2006] showed maxima inAIRS yields as large as 90% in the wintertime subtropicsnear the centers of the ocean basins. Here the MLS yieldsare comparable to AIRS. However, the zonal means shown
in Figure 2 include opaque cloudiness associated withbaroclinic wave activity in the winter equatorial hemispherein all months, reducing yields to the 60–70% values shown.Compared to high latitudes, the effect of lower tropopausealtitude is relatively minor in the tropics and subtropics, andcontributes 20–40% of the reduced yield at 200 and 150 hPafrom ±30–45� latitude during winter.
3.2. Mean Maps and Sampling Distributionsof Matched Observations
[23] Figure 3 shows maps of the mean MLS and AIRSUTWV during July–September 2005. Here mean watervapor is defined to be �q = (�qMLS + �qAIRS)/2. (See Table 1for definitions of all symbols used in this and the followingdiscussions.) Yields of less than 10% are represented asmissing data in Figure 3 (and subsequent figures), indicat-ing prevalent stratospheric conditions. This illustrates howthe 200 hPa surface is usually in the stratosphere at middleand high latitudes. Several other features are apparent fromFigure 3, including a global maximum over the AsianMonsoon region at all levels [Fu et al., 2006], local maximaover the continents (presumably associated with transport tothe upper troposphere by enhanced convective uplift), anddecreasing UTWV moving both poleward and to lowerpressures. In addition to a 10- to 30-fold decrease between300 and 150 hPa, the water vapor fields in Figure 3 becomemore zonally symmetric moving upward. This is presum-ably associated with more vigorous convection over thecontinents causing more frequent convective penetration to100–150 hPa [Betts, 1973; Yanai et al., 1973; Highwoodand Hoskins, 1998; Hartmann and Larson, 2003; Folkinsand Martin, 2005]. At 300 and 250 hPa in Figure 3 thesouthern winter polar regions are roughly half as moist asthe northern polar regions, consistent with significantly
Figure 3. Mean UTWV maps from combined matched AIRS and MLS observations for July–September 2005. Blank regions represent regions where fewer than 10% of samples are within the AIRS-defined troposphere.
D22110 FETZER ET AL.: MLS AND AIRS WATER VAPOR
6 of 17
D22110

lower temperatures in the upper troposphere in the winterhemisphere. The poleward and upward decreases in watervapor have implications for AIRS sensitivity. Note that themean 250 hPa water vapor is below 32 ppmv southward ofabout 40 S. This suggests that scenes drier than the nominal15–20 ppmv lower sensitivity limit of AIRS [Gettelman etal., 2004; Read et al., 2007] are common there. Similarly,the 150 hPa water vapor is primarily 20 ppmv or drier,suggesting AIRS is insensitive to prevalent conditions at150 hPa. However, AIRS may be quite capable of sensingthe very wettest conditions locally over Asia at 150 hPaduring northern summer, as well as near and within thincirrus clouds surrounding convection throughout the tropics[Kahn et al., 2008]. MLS may be less sensitive to the verywettest conditions at 300 hPa in Figure 3, especially overthe convective regions where mean water vapor is 400 ppmvor greater, and the MLS water vapor signal may reachsaturation.[24] Figure 4 shows histograms of UTWV from MLS and
AIRS in the 15 S to 15 N latitude band during July toSeptember 2005. These plots show the same data used tocreate the tropical portion of the maps shown in Figure 3.Because the histograms in Figure 4 are generated frommatched retrievals, differences between the curves inFigure 4 indicate different responses to UTWV from AIRSand MLS. At 300 hPa MLS observes more of the driestscenes. The cause of the MLS 300 hPa dry bias noted by
Read et al. [2007] is apparent from Figure 4: the MLS PDFis skewed toward drier values, with a peak shifted�60 ppmvlower than AIRS. Note that the 300 hPa bin size is 30 ppmv,so the difference at 300 hPa for all but the smallest bincannot be attributed to AIRS insensitivity to low UTWV. At250 hPa the agreement between the two curves is clearlybetter than at any other pressure level. As will be seen,AIRS and MLS UTWV have very similar characteristics at250 hPa. The histograms are again noticeably different at200 hPa, with quite good agreement for driest scenes, butwith the AIRS curve now more sharply peaked. By 150 hPa,the distributions from both instruments are of similar shape,but with AIRS showing a slight moist bias. (We presumeAIRS is biased because roughly half the samples at 150 hPaare obtained for scenes less with than 15–20 ppmv of watervapor, the nominal lower limit of sensitivity for AIRS.)
3.3. Zonal Means, Biases, and Standard Deviationsof Differences of Matched Observations
[25] Figure 5 shows mean time-zonal UTWV (�q), definedas averages of the MLS and AIRS means, for the twelvemonths, twelve zonal bands, and four pressures of interest.Note that these means are not the average of all observationsfrom AIRS and MLS, but are instead limited to the fractionof matched pairs whose yields are shown in Figure 2. Herewe define �q to be the arithmetic mean of the AIRS and MLSmeans (their sum divided by two). The limited number of
Figure 4. Distribution of UTWV from matched MLS (blue histograms) and AIRS (red histograms)retrievals for the latitude range ±15 degrees and the period July–September 2005. Bin size is 30 ppmv at300 hPa, 12.5 ppmv at 250 hPa, 5 ppmv at 200 hPa, and 1 ppmv at 150 hPa.
D22110 FETZER ET AL.: MLS AND AIRS WATER VAPOR
7 of 17
D22110

any tropospheric observations at 200 and 150 hPa polewardof about 50� latitude in Figure 5 follows from the very lowyields seen there in Figure 2. Note that the largest �q is foundin the 0–15 N band at 300 hPa between May and August.This maximum extends upward to all other levels. Drierregions are encountered when moving upward and pole-ward from the tropics at 300 hPa, including a roughly thirty-fold decrease in mean mixing ratios between 300 and150 hPa, and an eight-fold decrease between tropics andpoles. Seasonal changes in the tropics are clearly associatedwith movement of tropical deep convection and its moist-ening effect in the upper troposphere [Tian et al., 2006].Two manifestations of hemispheric asymmetry are also seenin Figure 5. Arctic summer is roughly twice as moist asAntarctic summer at 300 and 250 hPa in Figure 5. Similarlythe northern summer subtropics are significantly wetter thansouthern summer subtropics. This is consistent with strongermonsoon uplift of water vapor in the northern hemisphere.[26] Figure 6a shows the biases between mean matched
AIRS and MLS (AIRS minus MLS) UTWVobservations aspercentages of �q in Figure 5. Designated �Dq, this iseffectively the relative accuracy (the mean difference) ofthe AIRS and MLS observations. Figure 6b shows theassociated fractional standard deviations of the differences(sq) of individual AIRS and MLS matched observations, aspercents of �q in Figure 5. The sq in Figure 6b is due to acombination of separate AIRS and MLS measurementsystem errors, along with errors introduced by the nearest-neighbor matching process described in the Appendix.Assuming measurement errors from AIRS and MLS areuncorrelated, sq in Figure 6b is an upper bound on the root-
sum-squared precision from MLS and AIRS, for thoseconditions where both make observations. Of course, therelative errors �Dq and sq cannot be deduced for unmatchedobservations, so in regions of e.g., 40% yields in Figure 2,Figure 6 tells us nothing about the remaining 60% percentof unmatched retrieval pairs. Therefore Figure 6 is one ofseveral sources of information about MLS and AIRSuncertainties, and it must be interpreted in the context ofother validation studies of AIRS and MLS UTWV.[27] The biases ( �Dq) in Figure 6a are generally less than
about 5% absolute except at 250 hPa away from the poles.At 300 hPa, MLS is 10–15% drier in middle and lowlatitudes. Also, at 300 hPa AIRS is wetter over the Antarcticin summer, but 10–20% drier in winter. In the Arctic at300 hPa AIRS is wetter during the first six months of 2005,but drier during the second six months. (We have notexamined whether this holds for other years.) The causeof this is ambiguity in polar regions at 300 hPa is notobvious, but may be related to the climatologies of wetextrema affecting MLS, dry extrema affecting AIRS,behavior of the tropopause not captured by AIRS, or errorsin the AIRS-estimated tropopause. In Figure 6b, sq at300 hPa indicates large variability in the AIRS-MLS differ-ences, ranging from 50% at the poles to ±70–80% at lowand middle latitudes. Vomel et al. [2007] report an MLS drybias in the tropics of about 25% at 316 hPa, and a slightMLS dry bias in polar regions. Tobin et al. [2006] andHagan et al. [2004] show AIRS-radiosonde differences ofabout ±20% in the tropics at 300 hPa, with Tobin et al.[2006] reporting a dry bias of 10–20% in AIRS Version 4.0data (preliminary, unpublished results by Tobin show
Figure 5. Time-zonal means of the average AIRS and MLS water vapor mixing ratios from matchedMLS and AIRS retrieval pairs (�q) by latitude and month in 2005.
D22110 FETZER ET AL.: MLS AND AIRS WATER VAPOR
8 of 17
D22110

smaller biases in AIRS Version 5.0 data). Aircraft compar-isons by Gettelman et al. [2004] agree with AIRS to ±25%,with no discernable bias at 300 hPa. No validation studieshave addressed AIRS UTWV over the poles, thoughGettelman et al. [2006c] and Ye et al. [2007] showed goodagreement with sondes at lower levels.
[28] Considering all studies, we interpret Figure 6 at300 hPa as follows: in the ±45� latitude band MLS is biasedlow by 10–25% relative to AIRS (consistent with Vomel etal. [2007] and �Dq in Figure 6b), while AIRS itself may betoo dry by 10% (consistent with Tobin et al. [2006]).Consequently, �q at 300 hPa in Figure 5 is underestimated
Figure 6. (a) Biases between mean mixing ratios from AIRS and MLS ( �Dq) as percentage of means inFigure 5; the zero contour is represented by dotted lines, positive contours are represented by solid lines,and negative contours are represented by dashed lines; contour intervals are 5% for �15% absolute butotherwise 10%. (b) Standard deviation of the differences of matched MLS and AIRS retrievals pairs (sq),as percent of means in Figure 5, with contour intervals of 10%.
D22110 FETZER ET AL.: MLS AND AIRS WATER VAPOR
9 of 17
D22110

by about 10%. Given an AIRS UTWV precision of �25%[Gettelman et al., 2004; Hagan et al., 2004; Tobin et al.,2006], we conclude from sq in Figure 6b that the MLSprecision at 300 hPa is roughly 50% in the ±45� latitudebands. Below we will argue that most of this ‘‘uncertainty’’comes from differences in how AIRS and MLS respond toUTWV signals, not random error. In short, the two instru-ments’ responses are correlated but their separate responsesto UTWVare not one-to-one. At 300 hPa AIRS is drier thanMLS by about 10% in northern summer, but wetter by about10% in southern summer; Because the summer mixingratios of 60 ppmv or greater at 300 hPa are well withinthe sensitivity ranges of both instruments, we cannot con-clude which instrument is the source of the �10% ambigu-ity in absolute UTWV in high-latitude summer. AIRS isslightly wetter thanMLS in thewinter hemisphere at 300 hPa,reflecting the AIRS tendency toward wetter UTWVestimateunder the driest conditions. Vomel et al. [2007] find CFHsondes to be �10% wetter than MLS in Arctic winter. Thesq in Figure 6b at 300 hPa puts an upper bound on the twoinstruments’ precision at high latitudes: they are bothsomewhere in the 25 to 40% range at 300 hPa, assuminga reasonable lower limit of about 25%. Note that this high-latitude estimate of precision is an overestimate because itassumes the nearest-neighbor matching procedure introdu-ces no uncertainty.[29] The situation at 250 hPa is much clearer than at
300 hPa. Figure 6a shows essentially zero bias ( �Dq), exceptin high-latitude summer where AIRS is wetter by 10–20%,and high-latitude winter where AIRS is drier by 10–20%.As �q in Figure 5 shows, this AIRS moist bias occurswhere UTWV is near the AIRS sensitivity threshold of15–20 ppmv, implying that polar UTWV values at 250 hPaare usually below the AIRS sensitivity threshold. Values ofsq at 250 hPa in Figure 6b are everywhere 40% or less,implying individual instrument precisions of 20–30% at250 hPa. We conclude that UTWV at 250 hPa from eitherAIRS or MLS, at all but highest latitudes, are correct towithin ±25%, with a dry bias of 10% or less by bothinstruments (supported by Vomel et al. [2007] for MLSand Tobin et al. [2006] for AIRS). At highest latitudes,AIRS uncertainties at 250 hPa are greater than 30%,probably because of the prevalence of drier conditions there.In summary, Figure 6 indicates remarkable agreementbetween AIRS and MLS water vapor measurements at250 hPa except when mixing ratios are near the AIRSsensitivity limit of 15–20 ppmv. At those lowest mixingratios AIRS shows a consistent wet bias.[30] At 200 hPa both �Dq and sq are considerably larger
than at 250 hPa. Values of �Dq in Figure 6a show that MLSis wetter than AIRS by 5–15% at 200 hPa, opposite to thesituation at 300 hPa. Although Read et al. [2007] did notfind such large differences as shown here, they rejected allmatches where MLS UTWV is 20 ppmv or less. Read et al.[2007] were not able to devise an AIRS-only rejectionthreshold that gives good agreement with MLS. We reportthe complete comparison statistics because this screeningmethod is not viable for the roughly 99% of AIRS footprintsthat do not match to an MLS sounding. This will aid ininterpretation of the entire AIRS data volume. Values of sqat 200 hPa in Figure 6b range from 40 to 70%, andexamination of the 200 hPa �q in Figure 5 shows these large
uncertainties are associated with mean mixing ratios of 10–60 ppmv. This is close to, or below, the 15–20 ppmvsensitivity threshold for AIRS. Furthermore, Vomel et al.[2007] show improved agreement between MLS and CFHmeasurements for drier conditions (with the best agreementseen for mixing ratios of roughly 3 to 10 ppmv; Lambert etal. [2007]). We therefore conclude that the most likelyexplanation of large values for both �Dq and sq in Figure 6at 200 hPa is AIRS insensitivity to drier conditions. Thisimplies the AIRS uncertainties at 200 hPa are roughly �10to �20 ± 40 to 60%. Similar arguments hold for the �Dq
values of �10 to +20, and sq values of 50–90% at 150 hPa.The MLS uncertainties at these pressure were shown to be�25% by Vomel et al. [2007], so �Dq and sq in Figures 6aand 6b are the effective AIRS uncertainties at 150 hPa. Aswill be shown below, correlations between AIRS and MLSat 200 and 150 hPa are small though significantly largerthan zero, suggesting AIRS has some skill even at thesepressures. Also, the AIRS performance will be significantlybetter than the zonal mean value in Figure 6 wherever localUTWV is above approximately 15 ppmv, though poorerwhere UTWV is locally small.
3.4. Extrema
[31] The previous section described the zonal meanagreement between the AIRS and MLS differences. Anotherimportant requirement for creating climatologies from thetwo instruments is understanding how they sample dry andmoist extrema. Extrema are also significant in determiningcorrelations between data. Note, however, that even perfectagreement in probability distributions does not guaranteethat one or both instruments have skill, since they maysimply be defaulting to similar climatologies. For thisreason section 3.5 below shows correlations between thetwo data sets.[32] Figure 7a gives the third percentile of MLS obser-
vations (qMLS�3%). These represent the driest 3% of scenesobserved by MLS. A comparison of qMLS�3% in Figure 7awith �q in Figure 5 shows the maxima in both fields arecollocated, and both fields diminish poleward. Note,however, that the ratio of the quantities in Figures 7aand 5 (qMLS�3%: q) varies from �10% at 300 hPa in thetropics to �40% at 150 hPa. This indicates lower variabilitywith increasing height. That ratio is also smaller at higherlatitudes. Higher fractional variability at lower latitudesand altitudes suggest larger effects of deep convection at300 hPa. Interestingly, fields of qMLS�3% at 300 and 250 hPain Figure 7a are very similar despite a roughly threefolddecrease in �q between these two levels in Figure 5. It isunclear whether this is an artifact of the MLS retrieval or atrue characteristic of the atmosphere.[33] Figure 7b shows the third percentile, or driest 3%, of
AIRS observations, but as a percentage of qMLS�3% inFigure 7a (designated %AIRS�3% to signify percentage).Note that if MLS and AIRS have similar lower limitsampling, then %AIRS�3% in Figure 7b would be roughly100% everywhere. Instead, %AIRS�3% is generally largerthan 100%. At 300 hPa %AIRS�3% is never smaller than150%, so the driest scenes from AIRS are always wetterthan those from MLS. Note, however, that qMLS�3% at300 hPa in Figure 7a is everywhere near the putative 15–20 ppmv sensitivity threshold of AIRS, and that AIRS
D22110 FETZER ET AL.: MLS AND AIRS WATER VAPOR
10 of 17
D22110
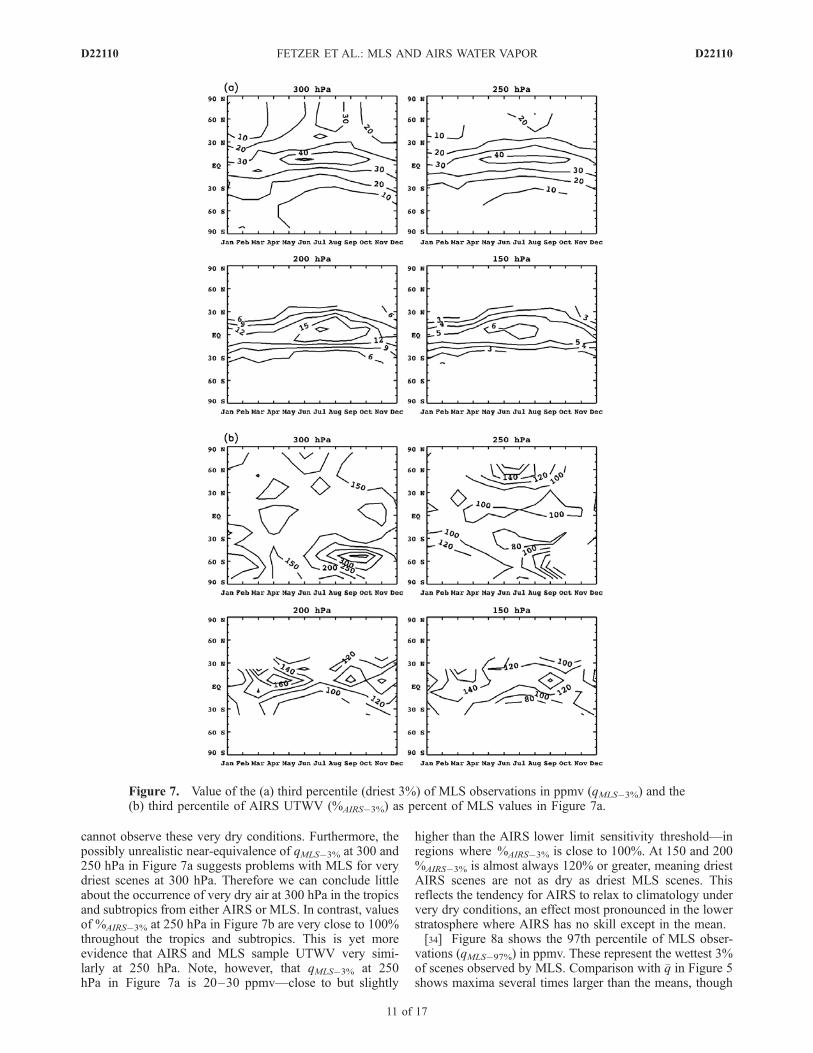
cannot observe these very dry conditions. Furthermore, thepossibly unrealistic near-equivalence of qMLS�3% at 300 and250 hPa in Figure 7a suggests problems with MLS for verydriest scenes at 300 hPa. Therefore we can conclude littleabout the occurrence of very dry air at 300 hPa in the tropicsand subtropics from either AIRS or MLS. In contrast, valuesof %AIRS�3% at 250 hPa in Figure 7b are very close to 100%throughout the tropics and subtropics. This is yet moreevidence that AIRS and MLS sample UTWV very simi-larly at 250 hPa. Note, however, that qMLS�3% at 250hPa in Figure 7a is 20–30 ppmv—close to but slightly
higher than the AIRS lower limit sensitivity threshold—inregions where %AIRS�3% is close to 100%. At 150 and 200%AIRS�3% is almost always 120% or greater, meaning driestAIRS scenes are not as dry as driest MLS scenes. Thisreflects the tendency for AIRS to relax to climatology undervery dry conditions, an effect most pronounced in the lowerstratosphere where AIRS has no skill except in the mean.[34] Figure 8a shows the 97th percentile of MLS obser-
vations (qMLS�97%) in ppmv. These represent the wettest 3%of scenes observed by MLS. Comparison with �q in Figure 5shows maxima several times larger than the means, though
Figure 7. Value of the (a) third percentile (driest 3%) of MLS observations in ppmv (qMLS�3%) and the(b) third percentile of AIRS UTWV (%AIRS�3%) as percent of MLS values in Figure 7a.
D22110 FETZER ET AL.: MLS AND AIRS WATER VAPOR
11 of 17
D22110

the ratio qMLS�97%: �q varies from about 4:1 to 6:1 at 300 hPato about 2:1 at 150 hPa. Recall that the dynamic range ofqMLS�3% similarly decreased with pressure. This indicatesthat the magnitude and fractional variability of UTWV areboth largest at 300 hPa. Figure 8b gives the 97th percentileof AIRS observations as a percentage of qMLS�97% (definedas %AIRS�97%). Figure 8b shows that AIRS maxima arealmost always smaller than those of MLS at 300 and 200hPa. Overall, AIRS has drier maxima than MLS at lowlatitudes, with maxima above the roughly 15–20 ppmv
AIRS sensitivity threshold everywhere at 300 hPa, and inthe moist tropics at 250 and 200 hPa. Smaller AIRS maximaare further supported by the 90th percentile plot (notshown), analogous to %AIRS�97% in Figure 8b but every-where smaller than Figure 6a. This shows that the larger thevalue of an observation, the higher the probability of MLSbeing wetter than AIRS, consistent with the findings ofRead et al. [2007]. A tendency toward the mean in AIRS isnoted byMcMillin et al. [2007] in their comparison of AIRStotal precipitable water vapor with ground-based sensors; a
Figure 8. Value of the (a) 97th percentile (wettest 3%) of MLS observations (qMLS�97%) in ppmv andthe (b) 97th percentile of AIRS observations (%AIRS�97%) as percent of MLS values in Figure 8a.
D22110 FETZER ET AL.: MLS AND AIRS WATER VAPOR
12 of 17
D22110

similar effect may be occurring for AIRS UTWV observa-tions. However, as argued by Read et al. [2007], MLS tendsto overestimate scenes wetter than 400 ppmv. So, the RMSdifferences seen at 300 hPa in Figure 4b are most likely dueto MLS overestimation of water vapor for the wettestconditions.
3.5. Correlation Coefficients and Linearity
[35] The linear (Pearson) correlation coefficients betweenAIRS and MLS UTWV (designated r) for the twelve
months, twelve zonal bands and four pressures are shownin Figure 9a. The slope of the least squares fitted line (m) isshown in Figure 9b. AIRS is treated as the dependentvariable in the line fitting here, so m values less than unityimply AIRS has smaller maxima and/or larger minima. Thehighest correlations in Figure 9a (greater than 0.9) are foundat 250 hPa, with a rapid decrease at upper levels. Note,however, that the fitted MLS-AIRS linear slope is always0.9 or less. The bias toward smaller m is consistent with theextrema just discussed, with AIRS having a smaller dynamic
Figure 9. (a) Pearson correlation coefficients between AIRS and MLS UTWV values (r). (b) Slope oflinear fit of AIRS to MLS data (m).
D22110 FETZER ET AL.: MLS AND AIRS WATER VAPOR
13 of 17
D22110

range than MLS. Purely random measurement noise wouldgive a mean m of unity, with some variations about that.[36] At 300 hPa, r in Figure 9a is relatively high (0.7 to
0.8), while m in Figure 9b is 0.5–0.6. The relative errorsshown in Figure 2 at 300 hPa, and the extrema discussedwith Figures 7 and 8 above explain this apparent discrep-ancy. At 300 hPa MLS tends to measure wetter than AIRSwhen wet, and drier than AIRS when dry. This is consistentwith the smaller values of m in Figure 9b. However the highcorrelation in Figure 9a at 300 hPa suggests that MLS hassensitivity at this level, though a different response toUTWV than AIRS. Vomel et al. [2007] similarly findMLS is responsive to geophysical signal but does notrespond in the same manner as the balloon-borne CFHsensors at 316 hPa. Figure 9 explains the relatively largeRMS differences at 300 hPa seen in Figure 6: while the twodata sets are monotonically related to one another, thatrelationship is not one-to-one, leading to larger RMSdifferences.[37] The highest correlation in Figure 9a is seen at 250 hPa,
where r is as large as 0.9. Note, however, that the fittedslope m at 250 hPa has a maximum of 0.9; no values of m at250 hPa (or anywhere else) exceeds unity. The explanationfor this is found in Figure 8a: AIRS maxima at 250 hPa arealways 100% or less of MLS maxima. Because bothcorrelation coefficients and slope calculations use leastsquares fitting, both are influenced heavily by the largestvalues [Wilks, 2006]. Moving upward, at 200 hPa thecorrelation r in Figure 9a continues to decrease to 0.5–0.8 at 200 hPa, while the fitted slope m in Figure 9b is only0.4 to 0.6. Again the explanation for this weaker linearity islower extrema for AIRS (as discussed above with Figures 7and 8). The poorer correlation at 200 hPa is due toincreasing AIRS uncertainty. Note that minimum r at200 hPa near the equator during September is inconsistentwith putatively better AIRS sensitivity for moderately wetconditions, suggesting a suboptimal retrieval method forAIRS at the lowest limits of its sensitivity at 200 hPa.Finally, at 150 hPa, r is only 0.2–0.5. While small, acorrelation coefficient of 0.5 suggests AIRS has some skillat 150 hPa. However, m is only 0.2–0.4 at 150 hPa,suggesting that AIRS skill is confined to only the verywettest scenes. Examination of scatter plots of AIRS andMLS 150 hPa water vapor supports this conclusion.
4. Summary and Conclusions
[38] This work takes several steps toward providing acomplete and representative UTWV climatology from AIRSand MLS. Several of the conclusions reached here areconsistent with earlier studies of UTWV derived from AIRSand MLS, especially those of Read et al. [2007] and Vomelet al. [2007]. Examples of corroborations of earlier resultsare: an AIRS sensitivity threshold around 15–20 ppmv[Gettelman et al., 2004], an MLS dry bias of 10–20% at300 hPa, a tendency for MLS to be responsive to the wettestscenes but overestimating the largest values, and bestagreement at 250 hPa in the tropics. Some aspects of thisstudy have not been examined in earlier studies, especiallythe two instrument’s sampling variations by month andlatitude as shown in Figure 2. Notably, both instrumentspreferentially sample clear scenes in the tropics, while MLS
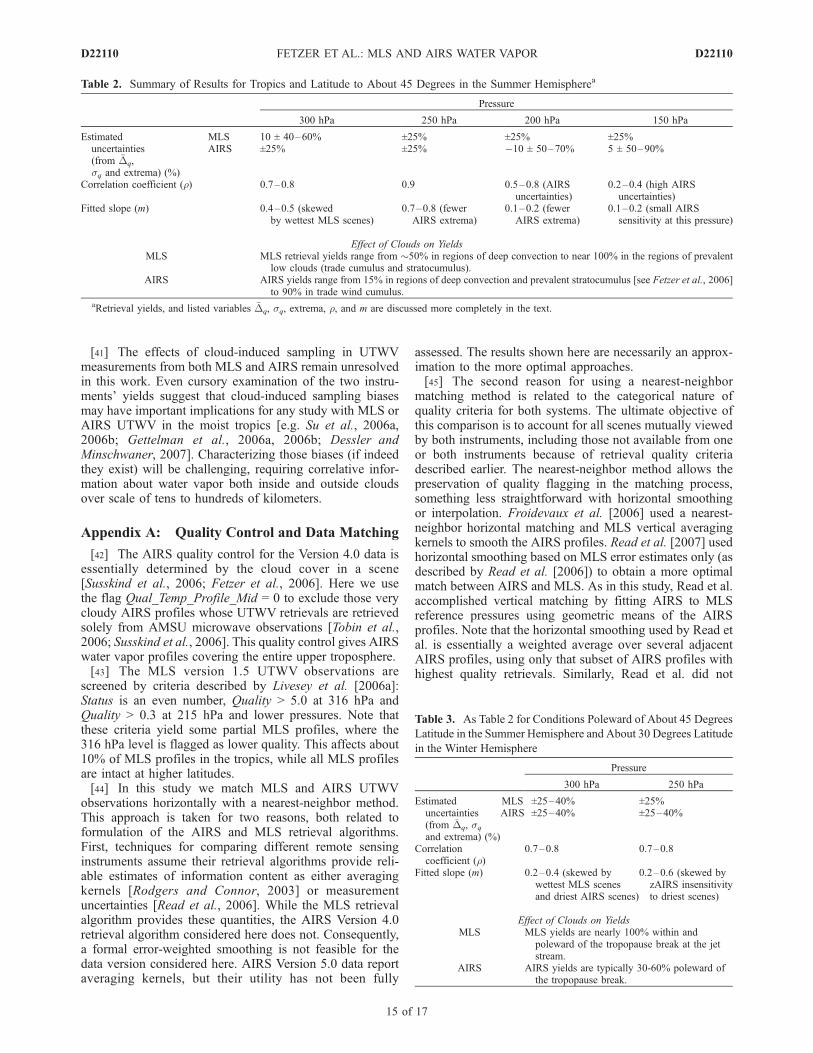
is completely unaffected by clouds poleward of ±45�latitude. Also, the AIRS performance decreases rapidlyabove about 200 hPa, likely because of the increasingprevalence of dry conditions with altitude. This is near thenominal lower extent of the tropical tropopause layer, whereconvection reaches its upper limits [Gettelman and Forster,2002].[39] The results of this study are summarized in Tables 2
and 3, broadly divided between lower latitude climateregimes where AIRS samples the entire troposphere(Table 2), and higher latitudes where a lowered tropopauseusually precludes AIRS observations at 200 and 150 hPa(Table 3). While our estimates of biases and standarddeviations are sometimes as large as 20% and 90%, respec-tively, correlation is a more fundamental measure of agree-ment. Tables 2 and 3 show correlations of 0.7 or greatereverywhere at 300 and 250 hPa, and throughout the tropicsat 200 hPa. This high correlation suggests that both AIRSand MLS are responsive to prevalent UTWV amountsthroughout most of the upper troposphere, and certainly inthose locations with roughly 20 to 400 ppmv of water vapor.However, the two instrument’s responses with UTWVamount may be different. (AIRS stratospheric water vapor‘‘observations’’ have only climatological information, andessentially zero correlation with MLS observations.) Smallerrors in the spectroscopy used in the forward models ineach instrument’s retrieval system are a plausible explana-tion for this apparent discrepancy between correlation inFigure 9 and RMS differences in Figure 6b. Read et al.[2007] ascribe shortcomings in UTWV fromMLS at 316 hPato spectral calibration and transmission uncertainties of�1%, and similar effects may be at work in the AIRSretrieval system. The AIRS spectroscopic validation isdescribed by Strow et al. [2003, 2006].[40] The results shown here are relevant to several pub-
lished studies. As noted here and by Vomel et al. [2007] andRead et al. [2007], MLS overestimates UTWV in thewettest scenes. Su et al. [2006a, 2006b] determine watervapor and cloud feedbacks by relating the logarithm of totalUTWV in the 316–100 hPa layer (dominated by the 316 hPavalue), the logarithm of mean MLS cloud ice amounts, andsea surface temperature (SST). MLS has sensitivity toUTWV at pressures considered here (although that sensitiv-ity is not linear with AIRS sensitivity at 300 hPa). Also, theinferred feedback relationships are logarithmic in changes inUTWV. Therefore the fundamental results of Su et al.[2006a, 2006b] are likely unchanged: water vapor and cloudfeedbacks increase with SST. However, the amplitude ofthat change will be modified with MLS water vapor at316 hPa as transmissivities are corrected in later dataversions. Importantly, changes in estimated feedbackstrength will be proportional to the changes in the logarithmof the MLS water vapor. Also, Gettelman et al. [2006a,2006b] examined relative humidity climatologies, includingthose in the 200 hPa layer in the tropics. These studies focusmainly on saturation and near-saturation conditions, associ-ated with highest water vapor loading. Figure 8 suggeststhat AIRS may be underestimating the 200 hPa water vaporfor wettest scenes, so that regions of supersaturation notedby Gettelman et al. [2006a, 2006b] may be more extensivethan described there.
D22110 FETZER ET AL.: MLS AND AIRS WATER VAPOR
14 of 17
D22110
[41] The effects of cloud-induced sampling in UTWVmeasurements from both MLS and AIRS remain unresolvedin this work. Even cursory examination of the two instru-ments’ yields suggest that cloud-induced sampling biasesmay have important implications for any study with MLS orAIRS UTWV in the moist tropics [e.g. Su et al., 2006a,2006b; Gettelman et al., 2006a, 2006b; Dessler andMinschwaner, 2007]. Characterizing those biases (if indeedthey exist) will be challenging, requiring correlative infor-mation about water vapor both inside and outside cloudsover scale of tens to hundreds of kilometers.
Appendix A: Quality Control and Data Matching
[42] The AIRS quality control for the Version 4.0 data isessentially determined by the cloud cover in a scene[Susskind et al., 2006; Fetzer et al., 2006]. Here we usethe flag Qual_Temp_Profile_Mid = 0 to exclude those verycloudy AIRS profiles whose UTWV retrievals are retrievedsolely from AMSU microwave observations [Tobin et al.,2006; Susskind et al., 2006]. This quality control gives AIRSwater vapor profiles covering the entire upper troposphere.[43] The MLS version 1.5 UTWV observations are
screened by criteria described by Livesey et al. [2006a]:Status is an even number, Quality > 5.0 at 316 hPa andQuality > 0.3 at 215 hPa and lower pressures. Note thatthese criteria yield some partial MLS profiles, where the316 hPa level is flagged as lower quality. This affects about10% of MLS profiles in the tropics, while all MLS profilesare intact at higher latitudes.[44] In this study we match MLS and AIRS UTWV
observations horizontally with a nearest-neighbor method.This approach is taken for two reasons, both related toformulation of the AIRS and MLS retrieval algorithms.First, techniques for comparing different remote sensinginstruments assume their retrieval algorithms provide reli-able estimates of information content as either averagingkernels [Rodgers and Connor, 2003] or measurementuncertainties [Read et al., 2006]. While the MLS retrievalalgorithm provides these quantities, the AIRS Version 4.0retrieval algorithm considered here does not. Consequently,a formal error-weighted smoothing is not feasible for thedata version considered here. AIRS Version 5.0 data reportaveraging kernels, but their utility has not been fully
assessed. The results shown here are necessarily an approx-imation to the more optimal approaches.[45] The second reason for using a nearest-neighbor
matching method is related to the categorical nature ofquality criteria for both systems. The ultimate objective ofthis comparison is to account for all scenes mutually viewedby both instruments, including those not available from oneor both instruments because of retrieval quality criteriadescribed earlier. The nearest-neighbor method allows thepreservation of quality flagging in the matching process,something less straightforward with horizontal smoothingor interpolation. Froidevaux et al. [2006] used a nearest-neighbor horizontal matching and MLS vertical averagingkernels to smooth the AIRS profiles. Read et al. [2007] usedhorizontal smoothing based on MLS error estimates only (asdescribed by Read et al. [2006]) to obtain a more optimalmatch between AIRS and MLS. As in this study, Read et al.accomplished vertical matching by fitting AIRS to MLSreference pressures using geometric means of the AIRSprofiles. Note that the horizontal smoothing used by Read etal. is essentially a weighted average over several adjacentAIRS profiles, using only that subset of AIRS profiles withhighest quality retrievals. Similarly, Read et al. did not
Table 2. Summary of Results for Tropics and Latitude to About 45 Degrees in the Summer Hemispherea
Pressure
300 hPa 250 hPa 200 hPa 150 hPa
Estimateduncertainties(from �Dq,sq and extrema) (%)
MLS 10 ± 40–60% ±25% ±25% ±25%AIRS ±25% ±25% �10 ± 50–70% 5 ± 50–90%
Correlation coefficient (r) 0.7–0.8 0.9 0.5–0.8 (AIRSuncertainties)
0.2–0.4 (high AIRSuncertainties)
Fitted slope (m) 0.4–0.5 (skewedby wettest MLS scenes)
0.7–0.8 (fewerAIRS extrema)
0.1–0.2 (fewerAIRS extrema)
0.1–0.2 (small AIRSsensitivity at this pressure)
Effect of Clouds on YieldsMLS MLS retrieval yields range from �50% in regions of deep convection to near 100% in the regions of prevalent
low clouds (trade cumulus and stratocumulus).AIRS AIRS yields range from 15% in regions of deep convection and prevalent stratocumulus [see Fetzer et al., 2006]
to 90% in trade wind cumulus.aRetrieval yields, and listed variables �Dq, sq, extrema, r, and m are discussed more completely in the text.
Table 3. As Table 2 for Conditions Poleward of About 45 Degrees
Latitude in the Summer Hemisphere and About 30 Degrees Latitude
in the Winter Hemisphere
Pressure
300 hPa 250 hPa
Estimateduncertainties(from �Dq, sqand extrema) (%)
MLS ±25–40% ±25%AIRS ±25–40% ±25–40%
Correlationcoefficient (r)
0.7–0.8 0.7–0.8
Fitted slope (m) 0.2–0.4 (skewed bywettest MLS scenesand driest AIRS scenes)
0.2–0.6 (skewed byzAIRS insensitivityto driest scenes)
Effect of Clouds on YieldsMLS MLS yields are nearly 100% within and
poleward of the tropopause break at the jetstream.
AIRS AIRS yields are typically 30-60% poleward ofthe tropopause break.
D22110 FETZER ET AL.: MLS AND AIRS WATER VAPOR
15 of 17
D22110
match non-convergent MLS retrievals to any AIRS retrieval.Here we consider scenes with both convergent and non-convergent solutions.[46] We compare UTWV mixing ratios on the 300, 250,
200 and 150 hPa levels (not the layer means, as reported forAIRS). MLS reports level values at 316, 215, 147 and100 hPa, and the MLS retrieval algorithm is formulated sothe logarithm of mixing ratio is linear in logarithm ofpressure [Livesey et al., 2006a]. The MLS observationsare placed on the reference pressures of 400, 300, 250,200 and 100 hPa using this functional relationship betweenMLS UTWV and pressure. This preserves the verticalresolution of MLS UTWV, as discussed by Waters et al.[2006] and Livesey et al. [2006b].[47] The AIRS Version 4.0 data are reported as log-
pressure-weighted mean values within layers. The AIRSlayer indexing is such that the reference pressure is thehigher of the bracketing pressures; e.g., �q(p = 300) repre-sents the 300–250 hPa layer average. The index decreaseswith pressure. We assume linear variations of the logarithmof mixing ratio with the logarithm of pressure, and usegeometric means to calculate the level values betweenlayers qAIRS(pi) =
ffiffiffiffiffiffiffiffiffiffiffiffiffiffiffiffiffiffiffiffiffiffiffiffiffiffiffiffiffiffiffiffiffiffiffiffiffiffiffi�qAIRS pið Þ�qAIRS pi�1ð Þ
p. Here �qAIRS(pi) is
the reported layer average value and qAIRS(pi), is thegeometric mean used in this study. This requires layersvalues reported at 400, 300, 250, 200 and 150 hPa (brack-eting our pressure levels of 300, 250, 200 and 150 hPa).[48] As with the nearest neighbor method used to match
in the horizontal, this vertical matching is not formallyoptimal [Rodgers and Connor, 2003]. However, the MLSvertical resolution is about 2.7 km (the grid spacing), whileAIRS vertical resolution in the upper troposphere is similar[Maddy and Barnet, 2008]. Both instruments’ resolutionsare close to the water vapor e-folding height of 2–3 km. Wepostulate that the vertical matching procedure used heredoes not introduce large errors; basically neither instru-ment’s fine-scale structure contributes significantly to theRMS differences. The RMS differences between AIRS andMLS at 250 hPa are 30% everywhere except the poles,comparable to the differences seen by Read et al. [2007]when more formal horizontal matching procedures are used.This suggests that AIRS and MLS are individuallyperforming to better than 25% RMS uncertainty at 250 hPa.Regions of poorer agreement can be best explained byreduced performance by either AIRS for driest conditions,or MLS for wettest conditions.
[49] Acknowledgments. The research described in this paper wascarried out at the Jet Propulsion Laboratory, California Institute ofTechnology, under a contract with the National Aeronautics and SpaceAdministration. It was supported by the AIRS and MLS projects at JPLand by the NASA and Energy and Water-cycle Study (NEWS) project. Webenefited from conversations with Darryn Waugh, Andrew Gettelman, JimYoe, M. K. Rama Varma Raja, Bill Randel, Mijeong Park, George Aumann,and Evan Fishbein.
ReferencesAumann, H. H., et al. (2003), AIRS/AMSU/HSB on the Aqua mission:Design, science objectives, data products and processing system, IEEETrans. Geosci. Remote Sens., 41, 253–264.
Betts, A. K. (1973), A composite mesoscale cumulonimbus budget,J. Atmos. Sci., 30, 597–610.
Bony, S., et al. (2006), How well do we understand and evaluate climatechange feedback processes?, J. Clim., 19, 3445–3448.
Dessler, A. E., and K. Minschwaner (2007), An analysis of the regulation oftropical tropospheric water vapor, J. Geophys. Res., 112, D10120,doi:10.1029/2006JD007683.
Divakarla, M., C. Barnet, M. D. Goldberg, L. McMillin, E. S. Maddy, W. W.Wolf, L. Zhou, and X. Liu (2006), Validation of Atmospheric InfraredSounder temperature and water vapor retrievals with matched radiosondemeasurements and forecasts, J. Geophys. Res., 111, D09S15, doi:10.1029/2005JD006116.
Eguchi, N., and M. Shiotani (2004), Intraseasonal variations of water vaporand cirrus clouds in the tropical upper troposphere, J. Geophys. Res., 109,D12106, doi:10.1029/2003JD004314.
Ferrare, R. A., et al. (2004), Source characterization of upper-tropospherewater vapor measurements during AFWEX using LASE, J. Atmos.Ocean. Technol., 21, 1790–1808.
Fetzer, E. J., J. Teixeira, E. Olsen, and E. Fishbein (2004), Satellite remotesounding of atmospheric boundary layer temperature inversions over thesubtropical eastern Pacific, Geophys. Res. Lett., 31, L17102, doi:10.1029/2004GL020174.
Fetzer, E. J., B. H. Lambrigtsen, A. Eldering, H. H. Aumann, and M. T.Chahine (2006), Biases in total precipitable water vapor climatologiesfrom Atmospheric Infrared Sounder and Advanced Microwave ScanningRadiometer, J. Geophys. Res., 111, D09S16, doi:10.1029/2005JD006598.
Folkins, I., and R. V. Martin (2005), The vertical structure of tropicalconvection, and its impact on the budgets of water vapor and ozone,J. Atmos. Sci., 62, 1560–1573.
Froidevaux, L., et al. (2006), Early validation analyses of atmosphericprofiles from EOS MLS on the Aura satellite, IEEE Trans. Geosci. Re-mote Sens., 44(5), 1106–1121.
Fu, R., Y. Hu, J. S.Wright, J. H. Jiang, R. E. Dickinson,M. Chen,M. Filipiak,W. G. Read, J.W.Waters, andD. L.Wu (2006), Short circuit of water vaporand polluted air to the global stratosphere by convective transport over theTibetan Plateau, Proc. Natl. Acad. Sci. U.S.A., 103, 5664–5669.
Gettelman, A., and P. M. de F. Forster (2002), A climatology of the tropicaltropopause layer, J. Meteorol. Soc. Jpn., 80(4B), 911–924.
Gettelman, A., et al. (2004), Validation of Aqua satellite data in the uppertroposphere and lower stratosphere with in-situ aircraft instruments, Geo-phys. Res. Lett., 31, L22107, doi:10.1029/2004GL020730.
Gettelman, A., W. D. Collins, E. J. Fetzer, A. Eldering, and F. W. Irion(2006a), A satellite climatology of upper tropospheric relative humidityand implications for climate, J. Clim., 23, 6104–6121.
Gettelman, A., E. J. Fetzer, A. Eldering, and F. W. Irion (2006b), The globaldistribution of supersaturation in the upper troposphere from the Atmo-spheric Infrared Sounder, J. Clim., 23, 6089–6103.
Gettelman, A., V. P. Walden, L. M. Miloshevich, W. L. Roth, and B. Halter(2006c), Relative humidity over Antarctica from radiosondes, satellites,and a general circulation model, J. Geophys. Res., 111, D09S13,doi:10.1029/2005JD006636.
Hagan, D. E., C. R. Webster, C. B. Farmer, R. D. May, R. L. Herman, E. M.Weinstock, L. E. Christensen, L. R. Lait, and P. A. Newman (2004),Validating AIRS upper atmosphere water vapor retrievals using aircraftand balloon in situ measurements, Geophys. Res. Lett., 31, L21103,doi:10.1029/2004GL020302.
Hartmann, D. L., and K. Larson (2003), An important constraint on tropicalcloud—Climate feedback,Geophys. Res. Lett., 29(20), 1951, doi:10.1029/2002GL015835.
Hearty, T. J., E. T. Olsen, E. Fetzer, S.-Y. Lee, E. Fishbein, W. F. Irion,B. Kahn, E. Manning, S. Granger, and B. Tian (2007), AIRS/AMSU/HSB Version 5 Level 2 Performance and Test Report. (Available at http://disc.sci.gsfc.nasa.gov/AIRS/documentation/v5_docs/v5_docs_list.shtml)
Held, I., and B. J. Soden (2000), Water vapor feedback and global warming,Annu. Rev. Energy Environ., 25, 441–475.
Highwood, E. J., and B. J. Hoskins (1998), The tropical tropopause, Q. J. R.Meteorol. Soc., 124, 1579–1604.
Holton, J. R., and A. Gettelman (2001), Horizontal transport and the dehy-dration of the stratosphere, Geophys. Res. Lett., 28, 2799–2802.
Holton, J. R., P. H. Haynes, M. E. McIntyre, A. R. Douglass, R. B. Rood,and L. P. Pfister (1995), Stratosphere-Troposphere exchange, Rev. Geo-phys., 33, 405–439.
Jensen, E. J., and A. S. Ackerman (2006), Homogeneous aerosol freezing inthe tops of high-altitude tropical cumulonimbus clouds, Geophys. Res.Lett., 33, L08802, doi:10.1029/2005GL024928.
Jensen, E. J., et al. (2000), Prevalence of ice supersaturated regions in theupper troposphere: Implications for optically thin ice cloud formation,J. Geophys. Res., 106, 17,253–17,266.
Kahn, B. H., C. K. Liang, A. Eldering, A. Gettelman, Q. Yue, and K.-N. Liou(2008), Tropical thin cirrus and relative humidity observed by the Atmo-spheric Infrared Sounder, Atmos. Chem. Phys. Discuss., 7, 16,185–16,225.
Karcher, B., and W. V. Lohmann (2003), A parameterization of cirrus cloudformation: Heterogeneous freezing, J. Geophys. Res., 108(D14), 4402,doi:10.1029/2002JD003220.
D22110 FETZER ET AL.: MLS AND AIRS WATER VAPOR
16 of 17
D22110
Lambert, A., et al. (2007), Validation of the Aura Microwave Limb Soundermiddle atmosphere water vapor and nitrous oxide measurements, J. Geo-phys. Res., 112, D24S36, doi:10.1029/2007JD008724.
Lambrigtsen, B. H. (2003), Calibration of the AIRS microwave instru-ments, IEEE Trans. Geosci. Remote Sens., 41, 369–378.
L’Ecuyer, T. S., and G. L. Stephens (2003), The tropical oceanic energybudget from the TRMM perspective. part I: Algorithm and uncertainties,J. Clim., 16, 1967–1985.
Lin, B., B. A. Wielicki, P. Minnis, L. Chambers, K. M. Xu, Y. X. Hu, andA. Fan (2006), The effect of environmental conditions on tropical deepconvective systems observed from the TRMM satellite, J. Clim., 19,5745–5761.
Liu, C. (2007), Geographical and seasonal distribution of tropical tropo-pause thin clouds and their relation to deep convection and water vaporviewed from satellite measurements, J. Geophys. Res., 112, D09205,doi:10.1029/2006JD007479.
Liu, C., E. Zipser, T. Garrett, J. H. Jiang, and H. Su (2007), How do thewater vapor and carbon monoxide ‘‘tape recorders’’ start near the tropicaltropopause?,Geophys. Res. Lett., 34, L09804, doi:10.1029/2006GL029234.
Livesey, N. J., et al. (2006a), Earth Observing System (EOS) MicrowaveLimb Sounder (MLS) Version 1.5 Level 2 Data Quality and DescriptionDocument. (Available at http://mls.jpl.nasa.gov/)
Livesey, N. J., W. V. Snyder, W. G. Read, and P. A. Wagner (2006b),Retrieval algorithms for the EOS Microwave Limb Sounder (MLS)instrument, IEEE Trans. Geosci. Remote Sens., 44(5), 1144–1155.
Maddy, E. S., and C. D. Barnet (2008), Vertical resolution estimates inVersion 5 of AIRS operational retrievals, IEEE Trans. Geosci. RemoteSens., in press.
Massie, S. T., A. Heymsfield, C. Schmitt, D. Muller, and P. Seifert (2007),Aerosol indirect effects as a function of cloud top pressure, J. Geophys.Res., 112, D06202, doi:10.1029/2006JD007383.
McMillin, L. M., J. Zhao, M. K. Rama Varma Raja, S. I. Gutman, and J. G.Yoe (2007), Radiosonde humidity corrections and potential AtmosphericInfrared Sounder moisture accuracy, J. Geophys. Res., 112, D13S90,doi:10.1029/2005JD006109.
Miloshevich, L. M., H. Vomel, D. Whiteman, B. Lesht, F. J. Schmidlin, andF. Russo (2006), Absolute accuracy of water vapor measurements fromsix operational radiosonde types launched during AWEX-G and implica-tions for AIRS validation, J. Geophys. Res., 111, D09S10, doi:10.1029/2005JD006083.
Minschwaner, K., and A. E. Dessler (2004), Water vapor feedback in thetropical upper troposphere: Model results and observations, J. Clim., 17,1272–1281.
Nalli, N. R., et al. (2006), Ship-based measurements for infrared sensorvalidation during Aerosol and Ocean Science Expedition 2004, J. Geo-phys. Res., 111, D09S04, doi:10.1029/2005JD006385.
Pagano, T. S., H. H. Aumann, D. E. Hagan, and K. Overoye (2003), Pre-launch and in-flight radiometric calibration of the Atmospheric InfraredSounder (AIRS), IEEE Trans. Geosci. Remote Sens., 41, 265–273.
Parkinson, C. L. (2003), Aqua: An earth-observing satellite mission toexamine water and other climate variables, IEEE Trans. Geosci. RemoteSens., 41, 173–183.
Peter, T., C. Marcolli, P. Spichtinger, T. Corti, M. B. Baker, and T. Koop(2006), When dry air is too humid, Science, 314, 1399–1402.
Read, W. G., et al. (2001), UARS MLS upper tropospheric humidity mea-surement: Method and validation, J. Geophys. Res., 106, 32,207–32,258.
Read, W. G., Z. Shippony, and W. V. Snyder (2006), The clear-sky unpo-larized forward model for the EOS Aura microwave limb sounder (MLS),IEEE Trans. Geosci. Remote Sens., 44, 1367–1379.
Read, W. G., et al. (2007), Aura Microwave Limb Sounder upper tropo-spheric and lower stratospheric H2O and relative humidity with respect toice validation, J. Geophys. Res., 112, D24S35, doi:10.1029/2007JD008752.
Rodgers, C. D., andB. J. Connor (2003), Intercomparison of remote soundinginstruments, J. Geophys. Res., 108(D3), 4116, doi:10.1029/2002JD002299.
Rossow, W. B., and R. A. Schiffer (1999), Advances in understandingclouds from ISCCP, Bull. Am. Meteorol. Soc., 80, 2261–2287.
Schoeberl, M. R., et al. (2006), Overview of the EOS Aura mission, IEEETrans. Geosci. Remote Sens., 44(5), 1066–1074.
Sherwood, S. C., and A. E. Dessler (2001), A model for transport across thetropical tropopause, J. Atmos. Sci., 58, 765–779.
Soden, B. J. (2000), The diurnal cycle of convection, clouds, and water vaporin the tropical upper troposphere, Geophys. Res. Lett., 27, 2173–2176.
Soden, B. J., and F. P. Bretherton (1993), Upper-tropospheric relative-humidity from the GOES 6.7 um channel: Method and climatologyfor July 1987, J. Geophys. Res., 98, 16,669–16,688.
Soden, B. J., and I. M. Held (2006), An assessment of climate feedbacks incoupled atmosphere-ocean models, J. Clim., 19, 3360–3554.
Stephens, G. L. (2005), Cloud feedbacks in the climate system: A criticalreview, J. Clim., 18, 237–273.
Stephens, G. L., et al. (2002), The CloudSat Mission and the A-Train: Anew dimension of space-based observations of clouds and precipitation,Bull. Am. Meteorol. Soc., 83, 1771–1790.
Strow, L. L., S. E. Hannon, S. De Souza-Machado, H. E. Motteler, andD. Tobin (2003), IEEE Trans. Geosci. Remote Sens., 41, 303–313.
Strow, L. L., S. E. Hannon, S. De-Souza Machado, H. E. Motteler, and D. C.Tobin (2006), Validation of the Atmospheric Infrared Sounder radiativetransfer algorithm, J. Geophys. Res., 111, D09S06, doi:10.1029/2005JD006146.
Su, H., W. G. Read, J. H. Jiang, J. W. Waters, D. L. Wu, and E. J. Fetzer(2006a), Enhanced positive water vapor feedback associated with tropicaldeep convection: New evidence from Aura MLS, Geophys. Res. Lett., 33,L05709, doi:10.1029/2005GL025505.
Su, H., D. E. Waliser, J. Jiang, J. Li, W. G. Read, J. W. Waters, andA. Tompkins (2006b), Relationships of upper tropospheric water vapor,clouds and SST: MLS observations, ECMWF analyses and GCM simu-lations, Geophys. Res. Lett., 33, L22802, doi:10.1029/2006GL027582.
Susskind, J., C. D. Barnet, and J. M. Blaisdell (2003), Retrieval of atmo-spheric and surface parameters from AIRS/AMSU/HSB data in the pre-sence of clouds, IEEE Trans. Geosci. Remote Sens., 41, 390–409.
Susskind, J., C. Barnet, J. Blaisdell, L. Iredell, F. Keita, L. Kouvaris,G. Molnar, and M. Chahine (2006), Accuracy of geophysical parametersderived from Atmospheric Infrared Sounder/Advanced MicrowaveSounding Unit as a function of fractional cloud cover, J. Geophys.Res., 111, D09S17, doi:10.1029/2005JD006272.
Tian, B. J., B. J. Soden, and X. Q. Wu (2004), Diurnal cycle of convection,clouds, and water vapor in the tropical upper troposphere: Satellites versusa general circulation model, J. Geophys. Res., 109, D10101, doi:10.1029/2003JD004117.
Tian, B., D. E. Waliser, E. J. Fetzer, B. H. Lambrigtsen, Y. L. Yung,and B. Wang (2006), Vertical moist thermodynamic structure andspatial-temporal evolution of the Madden-Julian oscillation in Atmo-spheric Infrared Sounder observations, J. Atmos. Sci., 63, 2462–2485.
Tobin, D. C., H. E. Revercomb, R. O. Knuteson, B. Lesht, L. L. Strow, S. E.Hannon, W. F. Feltz, L. Moy, E. J. Fetzer, and T. Cress (2006), Atmo-spheric radiation measurement site atmospheric state best estimates forAtmospheric Infrared Sounder temperature and water vapor retrievalvalidation, J. Geophys. Res., 111, D09S14, doi:10.1029/2005JD006103.
Vomel, H., et al. (2007), Validation of Aura/MLS water vapor by balloonborne Cryogenic Frostpoint Hygrometer measurements, J. Geophys. Res.,112, D24S37, doi:10.1029/2007JD008698.
Waters, J. W., et al. (2006), The Earth Observing System Microwave LimbSounder (EOS MLS) on the Aura satellite, IEEE Trans. Geosci. RemoteSens., 44(5), 1075–1092.
Whiteman, D., et al. (2006), Analysis of Raman lidar and radiosonde mea-surements from the AWEX-G field campaign and its relation to Aquavalidation, J. Geophys. Res., 111, D09S09, doi:10.1029/2005JD006429.
Wilks, D. S. (2006), Statistical Methods in the Atmospheric Science,Academic, London, U.K.
World Meteorological Organization (1957), Definition of the tropopause,WMO Bull., 6, 136.
Wu, D. L., W. G. Read, A. E. Dessler, S. C. Sherwood, and J. H. Jiang(2005), UARS/MLS cloud ice measurements: Implications for H2O trans-port near the tropopause, J. Atmos. Sci., 62, 518–530.
Wu, D. L., J. H. Jiang, and C. P. Davis (2006), EOS MLS cloud icemeasurements and cloudy-sky radiative transfer model, IEEE Trans.Geosci. Remote Sens., 44(5), 1156–1165.
Yanai, M., S. Esbensen, and J. Chu (1973), Determination of bulk proper-ties of tropical cloud clusters from large-scale heat and moisture budgets,J. Atmos. Sci., 30, 611–627.
Ye, H., E. J. Fetzer, D. H. Bromwich, E. F. Fishbein, E. T. Olsen, S. Granger,S.-Y. Lee, L. Chen, and H. Bjorn Lambrigtsen (2007), Atmospheric totalprecipitable water from AIRS and ECMWF during Antarctic summer,Geophys. Res. Lett., 34, L19701, doi:10.1029/2006GL028547.
�����������������������V. Dang, M. de la Torre Juarez, A. Eldering, E. J. Fetzer, F. W. Irion,
J. Jiang, B. H. Kahn, W. G. Read, H. Su, and D. Waliser, Jet PropulsionLaboratory, California Institute of Technology, MS 169-237, 4800 OakGrove Drive, Pasadena, CA 91109, USA. ([email protected])B. Tian, Jet Propulsion Laboratory, California Institute of Technology,
4800 Oak Grove Drive, Pasadena, CA 91109, USA.H. Vomel, Deutscher Wetterdienst, Am Observatorium 12, 15848 Tauche/
Lindenberg, Germany.
D22110 FETZER ET AL.: MLS AND AIRS WATER VAPOR
17 of 17
D22110
Copyright © 2022 FDOKUMEN