
Forecasting spot prices in bulk shipping using multivariate and univariate models
Upload
independentCategory
view
1download
0
Spectrochimica Acta Part B 65 (2010) 66–74
Contents lists available at ScienceDirect
Spectrochimica Acta Part B
j ourna l homepage: www.e lsev ie r.com/ locate /sab
Comparison of univariate and multivariate calibration for the determinationof micronutrients in pellets of plant materials by laser inducedbreakdown spectrometry☆
Jez Willian Batista Braga a, Lilian Cristina Trevizan b, Lidiane Cristina Nunes b,c, Iolanda Aparecida Rufini b,Dário Santos Jr. d, Francisco José Krug b,⁎a Instituto de Química, Universidade de Brasília, Campus Universitário Darcy Ribeiro, 70904-970, Brasília-DF, Brazilb Centro de Energia Nuclear na Agricultura, Universidade de São Paulo, Av. Centenário 303, 13416-000, Piracicaba-SP, Brazilc Departamento de Química, Universidade Federal de São Carlos, Rod. Washington Luís, km 235, 13565-905, São Carlos-SP, Brazild Universidade Federal de São Paulo, Diadema-SP, Brazil
☆ This paper was presented at the 5th InternationalBreakdown Spectroscopy (LIBS 2008), held in BerlinSeptember 2008.⁎ Corresponding author. Tel.: +55 19 34294648; fax:
E-mail address: [email protected] (F.J. Krug).
0584-8547/$ – see front matter © 2009 Elsevier B.V. Adoi:10.1016/j.sab.2009.11.007
a b s t r a c t
a r t i c l e i n f oArticle history:Received 17 December 2008Accepted 15 November 2009Available online 20 November 2009
Keywords:LIBSMultivariate calibrationPLSRPlant materialMicronutrient
The application of laser induced breakdown spectrometry (LIBS) aiming the direct analysis of plantmaterials isa great challenge that still needs efforts for its development and validation. In this way, a series of experimentalapproaches has been carried out in order to show that LIBS can be used as an alternative method to wet aciddigestions based methods for analysis of agricultural and environmental samples. The large amount ofinformation provided by LIBS spectra for these complex samples increases the difficulties for selecting themostappropriated wavelengths for each analyte. Some applications have suggested that improvements in bothaccuracy and precision can be achieved by the application of multivariate calibration in LIBS data whencompared to the univariate regression developed with line emission intensities. In the present work, theperformance of univariate and multivariate calibration, based on partial least squares regression (PLSR), wascompared for analysis of pellets of plant materials made from an appropriate mixture of cryogenically groundsamples with cellulose as the binding agent. The development of a specific PLSRmodel for each analyte and theselection of spectral regions containing only lines of the analyte of interest were the best conditions for theanalysis. In this particular application, these models showed a similar performance, but PLSR seemed to bemore robust due to a lower occurrence of outliers in comparison to the univariate method. Data suggests thatefforts dealing with sample presentation and fitness of standards for LIBS analysis must be done in order tofulfill the boundary conditions for matrix independent development and validation.
Conference on Laser-Induced, Adlershof, Germany, 22–26
+55 19 34294610.
ll rights reserved.
© 2009 Elsevier B.V. All rights reserved.
1. Introduction
In laser induced breakdown spectrometry (LIBS), the excitations ofatomic, ionic and molecular species are promoted in a plasma by ashort pulse of high energy radiation generated by a laser focused on asample [1,2]. Several applications of LIBS for the analysis of elementalcomposition are focused on metallurgical samples [3]. However,recent applications have demonstrated the ability of LIBS forqualitative and quantitative applications in several types of samples,such as jewelry [4–6], polymers [7–9], wood [10], toxic elements insolution [11], paintings and organic samples [12], and biological andchemical agents [13].
Unfortunately, in spite of the various advantages and versatility ofLIBS, serious difficulties have been observed for quantitative analysis,which can be related to laser sample interaction, such as the relativelysmall amount of mass that is vaporized in the ablation process,changes in the ablated mass between different craters or test samples,and the adequacy or lack of standards for the development ofcalibration models. Some of these limitations were pointed out notonly for LIBS but for laser-ablation inductively coupled plasma mass-spectrometry (LA-ICP-MS) as well [14,15]. In fact, according to Smith[16], LIBS can be considered as an important technique for qualitativeanalysis, but research still needs to be done in order to make it areliable quantitative technique.
Some applications of LIBS for analysis of plant materials arereported in the literature, such as the determination of trace elementsin sunflower seedling stem [17], the determination of Fe in leaves veinand parts of leaf positioned between the veins [18] andmapping of Cdand Pb in biological structures that accumulate metals in leaves androots [19]. Sunflower plants response to stress induced by Ag+ ionswas also monitored by LIBS [20]. Galiová et al. [21] showed that the

67J.W.B. Braga et al. / Spectrochimica Acta Part B 65 (2010) 66–74
spatial resolution mapping of Pb in plant leaves and the resultssuggested that high levels of this analyte influence the concentrationand distribution of K and Mn within the sample. In another paper,Galiová et al. [22] demonstrated the capability of LIBS and LA-ICP-MSfor high resolution mapping of Ag and Cu distribution in HelianthusAnnuus L. treated with contaminant under controlled conditions. LIBShas been used for the identification of elements which are responsiblefor the glycemic potential of fruit peel aqueous extracts of Psidiumguajava [23]. Qualitative analysis of fresh vegetables were performedby Juvé et al. [24] by using an ultraviolet nanosecond laser. Sun et al.[25] developed a method for direct solid analysis of powdered plantleaves by LIBS which was applied directly on a double-sided tape ona glass slide with calibration curves made from certified referencematerials (CRMs).
Most recently, the determination of macro and micronutrients inpellets of plant materials was evaluated in our laboratory [26,27],and the approach was based on univariate calibration with CRMs.However, some discrepant results were observed and indicated thatmatrix effects and differences in particle size distribution of CRMsand samples were relevant for the analysis. Even so, these resultsindicated that LIBS can be an alternative to the existing recommendedmethods that require an acid decomposition step.
The application of chemometric methods in LIBS is relatively recent,and the first contributions were published in the nineties [9,28].Quantitative methods employing multivariate calibration, such asthose based on partial least squares regression (PLSR) [4–7,10,28–42],principal component regression (PCR) [7,32,33,41,43,44], multi-linearregression (MLR) [32] or artificial neural networks (ANN) [30,45,46]have been found. PLSR applications were used to predict the mainelemental composition [36,37] and characterization [38] of samples ofthe jewelry industry and its application to study the matrix effects insteel samples [40,41]. Ferreira et al. [46] showed that the soil analysesusing a portable LIBS system with a relatively low spectral resolutionwas not able to provide selective lines for Cu determination by uni-variate calibration. Thus, the application of ANNwas necessary to makethe analyte determination possible. Besides, classification methodsusing principal component analysis (PCA) [9,10,13,47–51], soft inde-pendent modeling of class analogy (SIMCA) [13,52–54], PLSR fordiscriminant analysis (PLSDA) [52,53,55] or linear discriminant analysis(LDA) [52] were also applied to deal with LIBS data.
The aim of this investigation is to compare the efficiency of modelsperformed by multivariate calibration, based on the PLSR algorithm,with univariate linear regression model for the determination ofmicronutrients (B, Cu, Fe, Mn and Zn) in pellets of plant materials.The selection of wavelength regions containing characteristic emis-sion lines of the analytes to develop the PLSR models is discussed.Accuracy, precision and limits of detection were used to comparethe regression models. The occurrence and coincidence of outliers inboth models are also compared and discussed in order to verify therobustness against possible matrix effects.
2. Theoretical: multivariate calibration — partial least squaresregression (PLSR)
The PLSR model has been discussed in detail in relevant references[56–59]. Thus, only a description of the applied method for variablesselection and estimation of detection limits is presented.
The PLSR models can be divided in PLSR1, in which a multivariatecalibration model is developed for each dependent variable, and PLSR2,whose single model is developed for all dependent variables [57]. Inorder to obtain the best results with PLSR in this particular application,different regions were selected for each element. Therefore, one PLSRmodel was built for eachmicronutrient (dependent variable), known asPLSR1 models in the chemometric literature [56–59].
The data matrix X is formed by wavelength regions of the LIBSspectra and the vector y contains the reference values for concentra-
tion of each analyte. The selection of the most appropriate spectralregions for model development can be carried out by a previousknowledge of the system or by using the information presented inNIST atomic spectral database [60]. For elements with a high numberof emission lines, the selection of the best spectral region wasperformed by using interval partial least squares regression (IPLSR).The choice of the best IPLSR model was done by comparing theprediction performance of IPLSR models with the global model builtwith the full-spectrum [61,62]. The comparison was performed basedon the validation parameter RMSECV (root mean square error ofcross-validation), estimated as:
RMSECV =
ffiffiffiffiffiffiffiffiffiffiffiffiffiffiffiffiffiffiffiffiffiffiffiffiffiffiffiffiffiffiffiffiffiffiffiffiffiffiffiffi∑n
i=1∑m
j=1ðyi;j � yiÞ2
nm
vuuutð1Þ
where m is the number of replicates (5 in this case), n is the numberof samples, yi is the reference concentration value of the ith sampleand ŷi,j the estimative for the ith sample and jth replicate given bycontinuous blocks cross-validation. It is important to observe that ineach iteration of the continuous blocks cross-validation method thefive replicates of the same sample were removed from the calibrationdataset. This process was repeated until all replicates of all sampleshave been removed (note that n times m gives the total number oflines of the X calibration data matrix).
The occurrence of outliers is commonly checked in multivariatecalibrations, as theymay occur due tomany different reasons. Outlierscan be defined as observations that show some type of departure fromthe bulk of the data error, including objects from another population,instrument error and samples presenting matrix effects, for example[58]. Methods for identification of outliers in multivariate datahave already been described in several papers [58,62–64]. The threesimplest forms to identify abnormal samples are based on datawith extreme leverage, unmodeled residuals in spectral data andunmodeled residuals in the dependent variable [58]. These methodswere applied to identify and exclude these outliers when PLSR wasused, whereas only the test for extreme residuals in the dependentvariable was applied to the univariate data.
According to IUPAC recommendations, the limit of detection (LOD)can be defined as the minimum detectable value of net signal (orconcentration) for which the probabilities of false negative (α) andfalse positive (β) are 0.05 [65]. The determination of LOD in themultivariate domain has recently been discussed in several multivar-iate techniques [66–68], but an approximation can be estimatedanalogously to univariate calibration [62,68]:
LOD = 3:3 δx1
SEN= 3:3 δx‖b‖ ð2Þ
where δx is an estimate of the noise level in the data, which can beobtained from replicate measurements of a blank sample; SEN is thesensitivity of the PLSR model, that gives the fraction of analyticalsignal that is due to the increase of the concentration of a particularanalyte at unit concentration (estimated as the inverse of theEuclidian norm of the regression coefficients vector (1/||b||)). Asblank samples were not available in this application, the standarddeviations of the background (δx) for each analyte were estimated bymeasuring the variation of the noise in the surroundings of theselected emission line or selected regions. All calibration sampleswere used for δx estimation, so that the number of LIBS spectra usedwas larger than 50.
PLSR calculations were carried out from home made routinesbased on the work of Dayal and MacGregor [59] in Matlab 6.5®
environment [69]. The number of latent variables used in the PLSRmodels was chosen based on the RMSECV values obtained for a trialnumber of latent variables, where the lowest value indicate the

Table 1Concentration intervals covered by the calibration samples.
Element Concentration interval (mg kg−1)
Boron 8.6–77Copper 1.1–51Iron 11.4–1070Manganese 9.4–636Zinc 5.8–313
68 J.W.B. Braga et al. / Spectrochimica Acta Part B 65 (2010) 66–74
correct choice for the number of latent variables [70]. The IPLSRcalculations were accomplished with a program provided byNørgaard et al. [61,71] and limits of detection estimated by homemade routines.
3. Experimental
3.1. LIBS instrumentation
Experiments were carried out in a LIBS system (LTB, Berlin)equipped with a 10 Hz Q-switched Nd:YAG laser (Big Sky, Quantel,France) operating at 532 nm and generating 12 ns (FWHM) pulses of140 mJ and 6 mm beam diameter. An Aryelle Butterfly ICCD-echellespectrometer with f/10 numerical aperture and 400 mm focal lengthwas used. Two wavelength regions were used: VUV range (180 to440 nm) and UV–VIS–NIR range (278 to 820 nm). Spectral resolutioncapabilities were 35,000 and 15,000 respectively for the VUV and UV–VIS–NIR regions andwavelength accuracywas better than 2.5 pm. Theimage signals were digitalized in dynamic range of 16 bits and furtherprocessed by an industrial computer. The dark current of the ICCDwas automatically subtracted from the measured spectral data.Wavelength calibration was performed using a Hg spectral lamp.Time delay, integration time gate, number of pulses and detectoramplification gain, previously optimized by a neuro-genetic approach[72], were 9 µs, 1.1 µs, 30 pulses and 225 a.u, respectively. The spectralregion from 180 to 440 nm was exploited for wavelengths selection.
The 15 mm diameter pellet was placed into a plastic sampleholder which was adapted in the ablation chamber. Argon flowing at1.0 l min−1 was continuously fed into the ablation chamber by foursymmetrically positioned entrance inlets in the sample holder and theflow-rate was controlled by a rotameter. The optical arrangementprovided a fluence and irradiance of 25 J cm−2 and 2.0 GW cm−2,respectively, at the maximum pulse energy (71 mJ). Under theseconditions, craters of about 0.6 mm diameter were observed in thepellets. As pre-processing for the PLSR models, boron and ironemission signals in the selected regions were normalized with thecorrected emission intensity of C I 193.090 nm line and meancentering was applied in all models.
3.2. Samples and certified reference materials
For the development of both univariate and multivariate calibra-tion models, an initial number of 15 calibration samples were used.These calibration samples were composed by certified referencematerials (CRMs) and samples with known reference analytesconcentration determined by inductively coupled plasma opticalemission spectrometry (ICP OES) after microwave-assisted aciddecomposition. The following CRMs and samples were used as cali-bration samples: aquatic plant (Community Bureau of Reference —
BCR 60), aquatic moss (BCR 61), bush branches and leaves (NationalResearch Centre for CRMs — GBW 07603), cabbage (InternationalAtomic Energy Agency — IAEA 359), soya flour (IAEA 361), rice flour(National Institute for Environmental Studies — NIES 10-c), wheatflour (National Institute of Standards and Technology — NIST 1567a)and spinach leaves (NIST 1570a), brachiaria (Brachiaria decumbens),banana leaves (Musa Paradisíaca sapientum), coffee leaves (Coffeaarabica), maize leaves (Zea mays), mango leaves (Mangifera indica),pepper leaves (Piper nigrum) and soya leaves (Glycine max). It wasused an independent validation set of two CRMs and three samples:olive leaves (BCR 62), apple leaves (NIST 1515), guava leaves (Psidiumguaiava), grass (Axonopus obtusifolius) and jackfruit leaves (Artocarpusintegrifolia). The concentration intervals of each analyte covered bythe calibration samples are presented in Table 1.
Plant materials (or CRMs) were mixed with 30% m m−1 celluloseas binding agent and ground in a cryogenic mill (Spex model 6800)with a 5 min pre-cooling step, followed by 3 grinding cycles of 2 min
each one. Up to 4 laboratory samples can be independently groundand homogenized simultaneously. Cellulose was used in order tominimize differences in pellets porosity, within and between the testsamples and reference materials. Pellets were prepared in a Spexmodel 3624B X-Press by transferring 0.5 g of powdered material toa 15 mm die set and applying 8.0 tons cm−2 during 10 min. Pelletswere approximately 2 mm thick.
3.3. Data treatment for univariate calibration
In each sample, five replicates of the LIBS spectra were measured.Each replicate consisted of an average of ten spectra collected indifferent test portions of the sample pellet. Each sampling spot wasobtained after 30 consecutive laser pulses and the resulting spectraof each test portion corresponded to an average of 300 pulses(10 sampling spots equal to 1 test portion).
For background (BG) correction, averaged emission signals ofindependent spectral regions in the surroundings of the emission linewere estimated for each analyte. Corrected emission intensities wereobtained after subtraction of the calculated BG from the maximumintensity of each selected emission line. The normalization ofcorrected analyte emission signals with the corrected emission ofthe C I 193.090 nm line was evaluated for all analytes in order tocompensate for changes in the ablated mass between craters and tocorrect eventual matrix effects in the samples.
Univariate models were obtained from the regression of thecorrected maximum intensity of the analyte emission line against thereference concentrations of the calibration samples, by using theclassical least squares regressionmodel [73]. B I 249.773, Cu I 327.396,Fe II 238.200, Mn II 257.610 and Zn II 206.200 emission lines werechosen for calibration, taking into account spectral selectivity andsensitivity.
4. Results and discussion
For IPLSR, the usual procedure for selecting the intervals is toperform local PLSR models, based on equidistant subintervals,with further comparison of the RMSECV with its respective valuefound in a model built with all subintervals together. As the CRMs andsamples are constituted of different plant materials and each LIBSspectra presents a large number of emission lines, this usualprocedure for IPLSR can present some difficulties: (1) emission linesof concomitants may present correlation with the analyte concentra-tion and (2) emission lines of concomitants, close to an emission lineof the analyte, may stand for a matrix interference that would maskand avoid the selection of the analyte emission line. In order tominimize these drawbacks, the main emission lines of the analyteswere manually selected based on the information of the NIST atomicspectral database [60], and this first selection was used to performthe IPLSR models.
Fig. 1A illustrates the first manual selection for Fe determination.By considering that a large number of iron emission lines wasobserved and the selected regions were relatively narrow in thewhole LIBS spectra (180 to 435 nm), only the fragment between 233and 260 nm showing the selected regions (gray bars) is depicted.
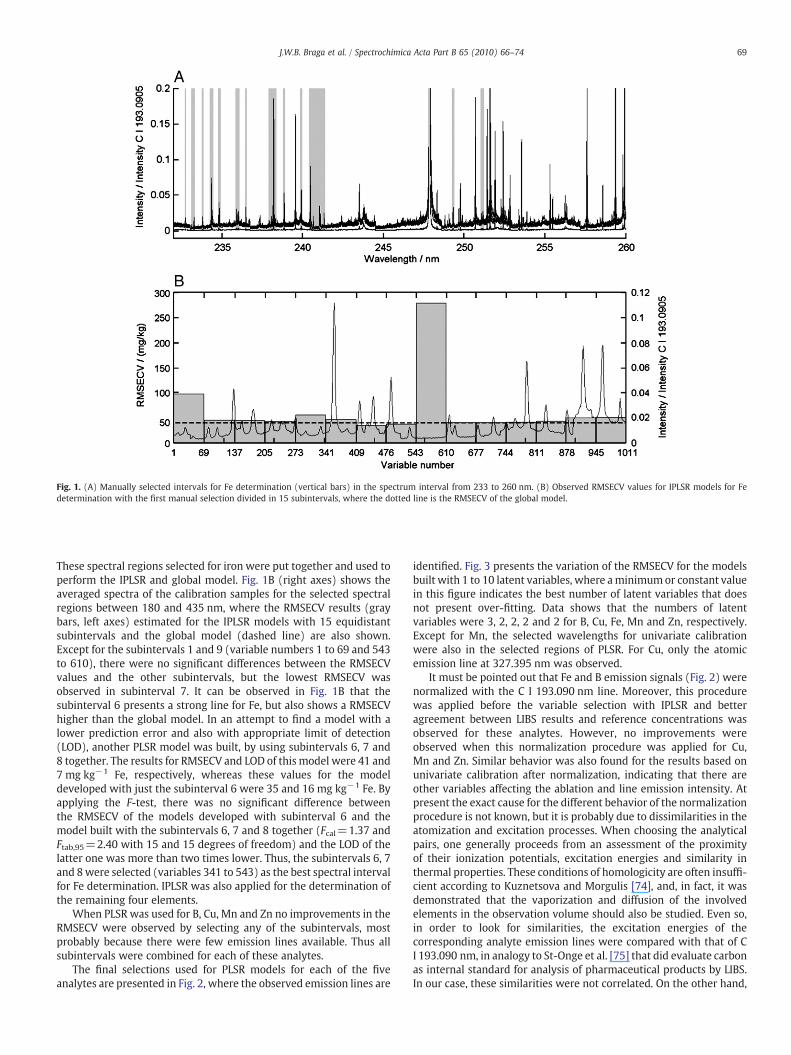
Fig. 1. (A) Manually selected intervals for Fe determination (vertical bars) in the spectrum interval from 233 to 260 nm. (B) Observed RMSECV values for IPLSR models for Fedetermination with the first manual selection divided in 15 subintervals, where the dotted line is the RMSECV of the global model.
69J.W.B. Braga et al. / Spectrochimica Acta Part B 65 (2010) 66–74
These spectral regions selected for iron were put together and used toperform the IPLSR and global model. Fig. 1B (right axes) shows theaveraged spectra of the calibration samples for the selected spectralregions between 180 and 435 nm, where the RMSECV results (graybars, left axes) estimated for the IPLSR models with 15 equidistantsubintervals and the global model (dashed line) are also shown.Except for the subintervals 1 and 9 (variable numbers 1 to 69 and 543to 610), there were no significant differences between the RMSECVvalues and the other subintervals, but the lowest RMSECV wasobserved in subinterval 7. It can be observed in Fig. 1B that thesubinterval 6 presents a strong line for Fe, but also shows a RMSECVhigher than the global model. In an attempt to find a model with alower prediction error and also with appropriate limit of detection(LOD), another PLSR model was built, by using subintervals 6, 7 and8 together. The results for RMSECV and LOD of this model were 41 and7 mg kg−1 Fe, respectively, whereas these values for the modeldeveloped with just the subinterval 6 were 35 and 16 mg kg−1 Fe. Byapplying the F-test, there was no significant difference betweenthe RMSECV of the models developed with subinterval 6 and themodel built with the subintervals 6, 7 and 8 together (Fcal=1.37 andFtab,95=2.40 with 15 and 15 degrees of freedom) and the LOD of thelatter one was more than two times lower. Thus, the subintervals 6, 7and 8were selected (variables 341 to 543) as the best spectral intervalfor Fe determination. IPLSR was also applied for the determination ofthe remaining four elements.
When PLSR was used for B, Cu, Mn and Zn no improvements in theRMSECV were observed by selecting any of the subintervals, mostprobably because there were few emission lines available. Thus allsubintervals were combined for each of these analytes.
The final selections used for PLSR models for each of the fiveanalytes are presented in Fig. 2, where the observed emission lines are
identified. Fig. 3 presents the variation of the RMSECV for the modelsbuilt with 1 to 10 latent variables, where aminimumor constant valuein this figure indicates the best number of latent variables that doesnot present over-fitting. Data shows that the numbers of latentvariables were 3, 2, 2, 2 and 2 for B, Cu, Fe, Mn and Zn, respectively.Except for Mn, the selected wavelengths for univariate calibrationwere also in the selected regions of PLSR. For Cu, only the atomicemission line at 327.395 nm was observed.
It must be pointed out that Fe and B emission signals (Fig. 2) werenormalized with the C I 193.090 nm line. Moreover, this procedurewas applied before the variable selection with IPLSR and betteragreement between LIBS results and reference concentrations wasobserved for these analytes. However, no improvements wereobserved when this normalization procedure was applied for Cu,Mn and Zn. Similar behavior was also found for the results based onunivariate calibration after normalization, indicating that there areother variables affecting the ablation and line emission intensity. Atpresent the exact cause for the different behavior of the normalizationprocedure is not known, but it is probably due to dissimilarities in theatomization and excitation processes. When choosing the analyticalpairs, one generally proceeds from an assessment of the proximityof their ionization potentials, excitation energies and similarity inthermal properties. These conditions of homologicity are often insuffi-cient according to Kuznetsova and Morgulis [74], and, in fact, it wasdemonstrated that the vaporization and diffusion of the involvedelements in the observation volume should also be studied. Even so,in order to look for similarities, the excitation energies of thecorresponding analyte emission lines were compared with that of CI 193.090 nm, in analogy to St-Onge et al. [75] that did evaluate carbonas internal standard for analysis of pharmaceutical products by LIBS.In our case, these similarities were not correlated. On the other hand,
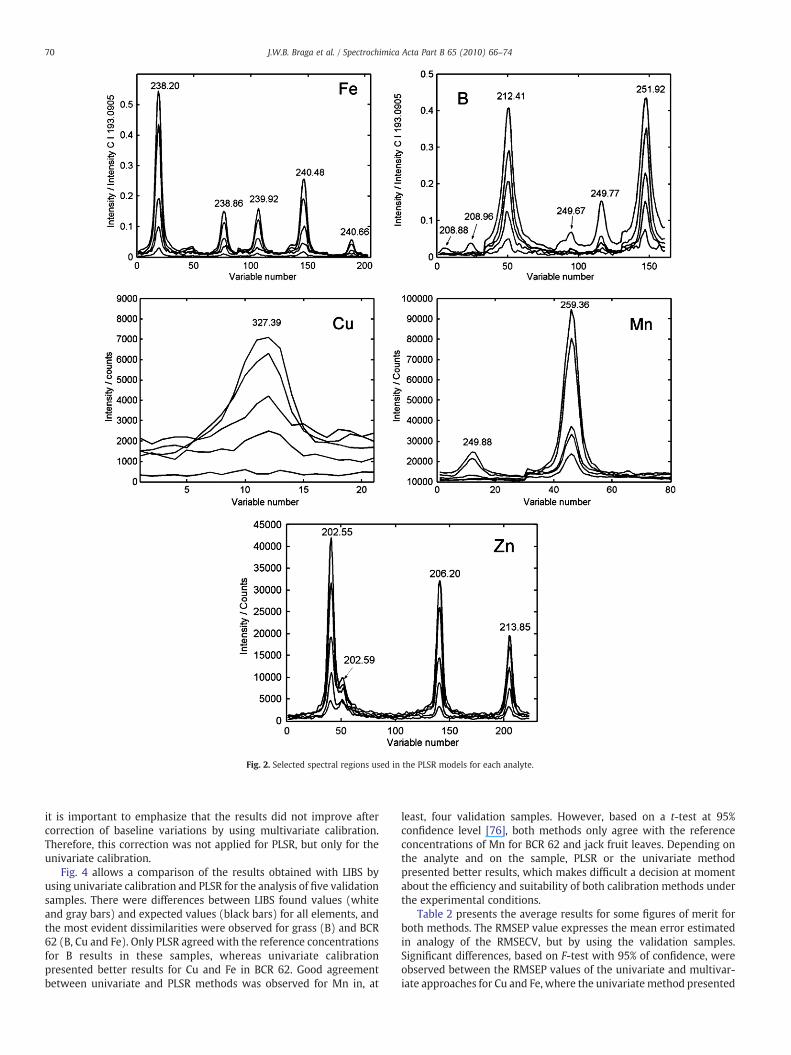
Fig. 2. Selected spectral regions used in the PLSR models for each analyte.
70 J.W.B. Braga et al. / Spectrochimica Acta Part B 65 (2010) 66–74
it is important to emphasize that the results did not improve aftercorrection of baseline variations by using multivariate calibration.Therefore, this correction was not applied for PLSR, but only for theunivariate calibration.
Fig. 4 allows a comparison of the results obtained with LIBS byusing univariate calibration and PLSR for the analysis of five validationsamples. There were differences between LIBS found values (whiteand gray bars) and expected values (black bars) for all elements, andthe most evident dissimilarities were observed for grass (B) and BCR62 (B, Cu and Fe). Only PLSR agreed with the reference concentrationsfor B results in these samples, whereas univariate calibrationpresented better results for Cu and Fe in BCR 62. Good agreementbetween univariate and PLSR methods was observed for Mn in, at
least, four validation samples. However, based on a t-test at 95%confidence level [76], both methods only agree with the referenceconcentrations of Mn for BCR 62 and jack fruit leaves. Depending onthe analyte and on the sample, PLSR or the univariate methodpresented better results, which makes difficult a decision at momentabout the efficiency and suitability of both calibration methods underthe experimental conditions.
Table 2 presents the average results for some figures of merit forboth methods. The RMSEP value expresses the mean error estimatedin analogy of the RMSECV, but by using the validation samples.Significant differences, based on F-test with 95% of confidence, wereobserved between the RMSEP values of the univariate and multivar-iate approaches for Cu and Fe, where the univariate method presented

Fig. 3. RMSECV variation as a function of the number of latent variables for PLSRmodels.
71J.W.B. Braga et al. / Spectrochimica Acta Part B 65 (2010) 66–74
the best results for both elements. However, it can be observed thatthe large error obtained for BCR 62 is themain cause for the differencein the RMSEP values of these elements (Fig. 4). If BCR 62 was notconsidered in both methods, the estimated RMSEP values would
Fig. 4. Determination of B, Cu, Fe, Mn and Zn in pellets of plant leaves by using LIBS univariatobtained from certified values (BCR62 and NIST 1515) or after analysis of acid digests by IC
improve for copper from 11.8 to 1.4 mg kg−1 and for iron from 113 to30 mg kg−1 Fe by using PLSR. On the other hand, negligible or nosignificant improvements were observed for both analytes by usingunivariate calibration.
The equivalence was expressed as the number of CRMs andsamples that presented concentrations statistically equivalent tothe reference values, based on a t-test for comparison of means at95% confidence [76]. More accurate results were obtained by PLSR forB and Zn, whereas univariate regression was better for Cu. Similaraccuracy was observed for Fe and Mn by using univariate or multi-variate calibration.
Both LIBS results present uncertainties (error bars, Fig. 4) whichare relatively higher than those associated to the certified values ofthe CRMs as well as those associated to the results obtained by ICPOES, mainly for Mn and Zn. At first, the main reasons for the relativelyhigh standard deviations can be attributed to the relatively smallablated test portion from the test sample (pellet), to the micro-heterogeneity of the analytes in the pellets, and to differences inparticle size distribution of the ground leaves and/or CRMs for pelletspreparation. According to data based on the pooled standarddeviation for all validation samples (Table 2), statistically differentprecisions were observed for Cu, Fe and Zn by applying the F-test at
e (white bars), LIBS multivariate PLSR (gray bars) and the corresponding mass fractionsP OES (black bars). Error bars represent ±1 estimated standard deviation (n=5).

Table 2Average results of some figures of merit comparing univariate and PLSR calibrations.
Univariate regression
B249.773 Cu327.395 Fe275.578 Mn257.610 Zn206.200
Equivalencea 0 4 1 2 3Precisionb 3.4 3.9 66 37 1.5Limit of detection (LOD)b 5 10 7 9 4Number of outliersc 3 7 2 6 6RMSEPd 11.6 3.2 39 55 2.5
PLSR
B Cu Fe Mn Zn
Equivalencea 3 3 1 2 4Precisionb 3.2 2.4 37 32 3.5Limit of detection (LOD)b 3 5 7 4 12Number of outliersc 4 3 3 4 0RMSEPd 5.6 11.8 113 49 3.7
a Number of samples with statistically equivalent concentrations following a t-testfor mean comparison (95% of confidence).
b Pooled standard deviation in mg/kg with 20 degrees of freedom.c Calibration dataset.d Determined in analogy with the RMSECV (Eq. (1)) but with the validation samples
and expressed as mg/kg.
72 J.W.B. Braga et al. / Spectrochimica Acta Part B 65 (2010) 66–74
95% confidence level (20 degrees of freedom in both numerator anddenominator) between both calibration methods. PLSR presentedbetter results for Cu and Fe, whereas more precise results wereobserved for Zn by using the univariate method. No significantdifferences were observed for B and Mn precisions.
The estimated LODs were also presented in Table 2. By comparingthe univariate andmultivariate calibrations, the largest difference wasfound for Zn, where the LOD for the univariate method was 3 timesbetter than for PLSR. In general, both calibration methods did notpresent any significant difference between LODs for most analytes.It is interesting to point out that when the estimated LODs arecompared to the lowest concentrations of the calibration samples,they were close to these concentrations. In fact, the LODs for Cu ofboth univariate and PLSR methods were above the lowest concentra-tion in the calibration samples, indicating that LIBS was notappropriate for copper determination in concentrations lower than10 mg kg−1 if univariate calibration is used under the definedoperational conditions with Nd:YAG at 532 nm. In general, the LODsreported in this work were slightly worse than those obtained inpellets of plant materials using Nd:YAG at 1064 nm and applying200 mJ per pulse [27]. However, it must be taken into account thatdifferent spectrometers and optical set ups were used. At 1064 nm,the calculated fluence and irradiance were 41.4 J cm− 2 and8.3 GW cm−2, whereas at 532 nm, it was approximately 25 J cm−2
and 2.0 GW cm−2, respectively.A high number of outliers were observed in the calibration
samples (Table 2), which were identified by the high errors in theestimated concentration values (errors in the dependent variables).For Cu and Zn, the number of outliers in PLSR was much lower than inthe univariate model, indicating that PLSR was more robust to theseeffects. Moreover, samples identified as outliers in PLSR were alsooutliers in the univariate approach, which suggests that, at leastin these samples, a significant matrix effect is present. Indeed,differences in craters diameter and depth were observed for somesamples even maintaining the same number of laser pulses in eachcrater. Trevizan et al. also reported these effects and suggested thatthey were probably caused by differences in the interaction of thelaser beamwith the various test samples analyzed [27]. Differences inparticle size distribution among samples may also affect results andmust be considered as an additional factor that have contributed tothe differences between LIBS and certified or ICP OES data. Datasuggests that efforts in dealing with sample presentation and fitnessof standards for LIBS analysis must be done in order to fulfill the
boundary conditions for matrix independent calibration and valida-tion. Indeed, although the presence of cellulose as binding agentimproved crater geometry and diminishes pellets porosity (data notshown), it did not help solving pellets matrix effects. A set ofexperiments in dealing with sample presentation for analysis ofpellets of plant materials is under evaluation at authors' laboratoryand will be presented in the near future.
5. Conclusions
Results indicate that the selection of variables for development ofPLSR models for direct analysis of pellets of plant tissues need to becarefully done when the calibration samples are composed ofdifferent plant species. The main reason is the occurrence or not ofemission lines in the selected regions, which depends on samplecomposition, impairing the model development. This problem isavoided by the selection of spectral regions containing only lines ofthe analyte of interest and the development of specific PLSR modelsfor each analyte (PLSR1 models).
In this application of LIBS, the comparison of PLSR and univariatecalibration showed a similar performance in accuracy and precision.However, a significant lower number of outliers were observed in thecalibration samples for Cu and Zn, suggesting that PLSR method wasmore robust in this application. The number of outliers observed alsoindicates that it is advisable the development of a specific calibrationmethod for each plant species with similar matrix for the directanalysis of plant tissues by LIBS, avoiding effects due the differentchemical composition and physical properties of the test samples.When this experimental condition is not fulfilled, an analogousprocedure for the variable selection is recommended to minimizepossible occurrence of matrix effects, so that the results anddiscussion presented in the development of multivariate calibrationmodels can be helpful for the analysis of samples presenting thislimitation.
Taking into account the application of the proposed method, itis possible to predict that the LIBS method will be an appropriatealternative for the analysis of plant materials aiming the determina-tion of micronutrients, but the calibration will be matrix dependent.
Acknowledgments
The authors are thankful to Fundação de Amparo à Pesquisa doEstado de São Paulo (FAPESP, process: 07/06547-0, 04/15965-2, 06/06466-8, and 05/50773-0), to Conselho Nacional de DesenvolvimentoCientífico e Tecnológico (CNPq, process: 477385/2006-0 and 301285/2006-3) and to Coordenação de Aperfeiçoamento de Pessoal de NívelSuperior (CAPES) for financial support.
References
[1] V. Bulatov, R. Krasniker, I. Shechter, Study of matrix effects in laser plasmaspectroscopy by combinedmultifiber spatial and temporal resolutions, Anal. Chem.70 (1998) 5302–5311.
[2] C. Pasquini, J. Cortez, L.M.C. Silva, F.B. Gonzaga, Laser induced breakdownspectroscopy, J. Braz. Chem. Soc. 18 (2007) 463–512.
[3] W.B. Lee, J.Y. Wu, Y.I. Lee, J. Sneddon, Recent applications of laser-inducedbreakdown spectrometry: a review of material approaches, Appl. Spectrosc. Rev.39 (2004) 27–97.
[4] L.E. García-Ayuso, J. Amador-Hernandéz, J.M. Fernández-Romero, M.D. Luque deCastro, Characterization of jewellery products by laser-induced breakdownspectroscopy, Anal. Chim. Acta 457 (2002) 247–256.
[5] A. Jurado-López, M.D. Luque de Castro, An atypical interlaboratory assay: lookingfor an updated hallmark (-jewelry) method, Anal. Bioanal. Chem. 372 (2002)109–114.
[6] M.C. Ortiz, L. Sarabia, A. Jurado-López, M.D. Luque de Castro, Minimum valueassured by a method to determine gold in alloys by using laser-induced break-down spectroscopy and partial least-squares calibration model, Anal. Chim. Acta515 (2004) 151–157.
[7] H. Fink, U. Panne, R. Niessner, Process analysis of recycled thermoplasts fromconsumer electronics by laser-induced plasma spectroscopy, Anal. Chem. 74 (2002)4334–4342.
73J.W.B. Braga et al. / Spectrochimica Acta Part B 65 (2010) 66–74
[8] M. Milán, J.M. Vadillo, J.J. Laserna, Removal of air interference in laser-inducedbreakdown spectrometry monitored by spatially and temporally resolved charge-coupled device measurements, J. Anal. At. Spectrom. 12 (1997) 441–444.
[9] R. Sattmann, I. Mönch, H. Krause, R. Noll, S. Couris, A. Hatziapostolou, A.Mavromanolakis, C. Fotakis, E. Larrauri, R. Miguel, Laser-induced breakdownspectroscopy for polymer identification, Appl. Spectrosc. 52 (1998) 456–461.
[10] M.Z. Martin, N. Labbé, T.G. Rials, S.D. Wullshleger, Analysis of preservative-treatedwood by multivariate analysis of laser-induced breakdown spectroscopy spectra,Spectrochim. Acta Part B 60 (2005) 1179–1185.
[11] D.M.D. Pace, C.A. D'Angelo, G. Bertuccelli, D. Bertuccelli, Analysis of heavy metalsin liquids using Laser Induced Breakdown Spectroscopy by liquid-to-solid matrixconversion, Spectrochim. Acta Part B 61 (2006) 929–933.
[12] B.C. Castle, A.K. Knight, K. Visser, B.W. Smith, J.D. Winefordner, Battery poweredlaser-induced plasma spectrometer for elemental determinations, J. Anal. At.Spectrom. 13 (1998) 589–595.
[13] C.A. Munson, K.C. De Lucia Jr., T. Piehler, K.L. McNesty, A.W. Miziolek, Investigationof statistics strategies for improving the discriminating power of laser-inducedbreakdown spectroscopy for chemical and biological warfare agent simulants,Spectrochim. Acta Part B 60 (2005) 1217–1224.
[14] B. Fernández, F. Claverie, C. Pécheyran, O.F.X. Donard, Direct analysis of solidsamples by fs-LA-ICP-MS, Trends Anal. Chem. 26 (2007) 951–966.
[15] E. Hoffmann, C. Lüdke, H. Scholze, Is laser-ablation-ICP-MS an alternative tosolution analysis of solid samples? Fresenius' J. Anal. Chem. 359 (1997) 394–398.
[16] B. Smith, 25 years of lasers and analytical chemistry: a reluctant pairing with apromising future, Trends Anal. Chem. 26 (2007) 60–64.
[17] A. Assion, M. Wollenhaupt, L. Haag, F. Mayorov, C. Sarpe-Tudoran, M. Winter,U. Kutschera, T. Baumert, Femtosecond laser-induced-breakdown spectrometryfor Ca2+ analysis of biological samples with high spatial resolution, Appl. Phys., B77 (2003) 391–397.
[18] O. Samek, J. Lambert, R. Hergenröder, M. Liska, J. Kaiser, K. Novotny, S. Kukhlevsky,Femtosecond laser spectrochemical analysis of plant samples, Laser Phys. Lett.3 (2006) 21–25.
[19] J. Kaiser, O. Samek, L. Reale, M. Liska, R. Malina, A. Ritucci, A. Poma, A. Tucci, F. Flora,A. Lai, L. Mancini, G. Tromba, F. Zanini, A. Faenov, T. Pikuz, G. Cinque, Monitoringof the heavy-metal hyperaccumulation in vegetal tissues by X-ray radiographyand by femto-second laser induced breakdown spectroscopy, Microsc. Res. Tech.70 (2007) 147–153.
[20] S. Krizkova, P. Ryant, O. Krystofova, V. Adam, M. Galiova, M. Beklova, P. Babula,J. Kaiser, K. Novotny, J. Novotny, M. Liska, R. Malina, J. Zehnalek, J. Hubalek, L. Havel,R. Kizek, Multi-instrumental analysis of tissues of sunflower plants treated withsilver(I) ions—plants as bioindicators of environmental pollution, Sensors 8 (2008)445–463.
[21] M. Galiová, J. Kaiser, K. Novotný, O. Samek, L. Reale, R. Malina, K. Páleníková, M.Liška, V. Čudek, V. Kanický, V. Otruba, A. Poma, A. Tucci, Utilization of laser inducedbreakdown spectroscopy for investigation of the metal accumulation in vegetaltissues, Spectrochim. Acta Part B 62 (2007) 1597–1605.
[22] M. Galiová, J. Kaiser, K. Novotný, J. Novotný, T. Vaculov, M. Liška, R. Malina, K.Stejskal, V. Adam, R. Kizek, Investigation of heavy-metal accumulation in selectedplant samples using laser induced breakdown spectroscopy and laser ablationinductively coupled plasma mass spectrometry, Appl. Phys., A 93 (2008) 917–922.
[23] P.K. Rai, N.K. Rai, A.K. Rai, G. Watal, Role of LIBS in elemental analysis of Psidiumguajava responsible for glycemic potential, Instrum. Sci. Technolog 35 (2007)507–522.
[24] V. Juvé, R. Portelli, M. Boueri, M. Baudelet, J. Yu, Space-resolved analysis of traceelements in fresh vegetables using ultraviolet nanosecond laser-induced break-down spectroscopy, Spectrochim. Acta Part B 63 (2008) 1047–1053.
[25] Q. Sun, M. Tran, B.W. Smith, J.D. Winefordner, Direct determination of P, Al, Ca, Cu,Mn, Zn, Mg and Fe in plant materials by laser-induced plasma spectroscopy, Can. J.Anal. Sci. Spectrosc. 44 (1999) 164–170.
[26] L.C. Trevizan, D. Santos Junior, R.E. Samad, N.D. Vieira Junior, C.S. Nomura, L.C.Nunes, I.A. Rufini, F.J. Krug, Evaluation of laser induced breakdown spectroscopyfor the determination of macronutrients in plant materials, Spectrochim. ActaPart B 63 (2008) 1151–1158.
[27] L.C. Trevizan, D. Santos Junior, R.E. Samad, N.D. Vieira Junior, L.C. Nunes, I.A. Rufini,F.J. Krug, Evaluation of laser induced breakdown spectroscopy for the determi-nation of micronutrients in plant materials, Spectrochim. Acta Part B 64 (2009)369–377.
[28] U. Panne, M. Clara, C. Haísch, R. Niessner, Analysis of glass and glass melts duringthe vitrification of fly and bottom ashes by laser-induced plasma spectroscopy.Part II. Process analysis, Spectrochim. Acta Part B 53 (1998) 1969–1981.
[29] F.B. Gonzaga, C. Pasquini, A complementary metal oxide semiconductor sensorarray based detection system for laser induced breakdown spectroscopy:evaluation of calibration strategies and application for manganese determinationin steel, Spectrochim. Acta Part B 63 (2008) 56–63.
[30] J.B. Sirven, B. Bousquet, L. Canioni, L. Sarger, Laser-induced breakdown spectros-copy of composite samples: comparison of advanced chemometricsmethods, Anal.Chem. 78 (2006) 1462–1469.
[31] L. Barrette, S. Turmel, On-line iron-ore slurry monitoring for real-time processcontrol of pellet making processes using laser-induced breakdown spectroscopy:graphitic vs. total carbon detection, Spectrochim. Acta Part B 56 (2001) 715–723.
[32] F.R. Doucet, T.F. Belliveau, J.L. Fortier, J. Hubert, Use of chemometrics and laser-induced breakdown spectroscopy for quantitative analysis of major and minorelements in aluminum alloys, Appl. Spectrosc. 61 (2007) 327–332.
[33] F.R. Doucet, P.J. Faustino, M. Sabsabi, R.C. Lyon, Quantitative molecular analysiswith molecular bands emission using laser-induced breakdown spectroscopy andchemometrics, J. Anal. At. Spectrom. 23 (2008) 694–701.
[34] A. Jurado-Lopez, M.D. Luque De Castro, Chemometric approach to laser-inducedbreakdown analysis of gold alloys, Appl. Spectrosc. 57 (2003) 349–352.
[35] M. Kraushaar, R. Noll, H.U. Schmitz, Slag analysis with laser-induced breakdownspectrometry, Appl. Spectrosc. 57 (2003) 1282–1287.
[36] A. Jurado-López, M.D. Luque de Castro, Rank correlation of laser-induced breakdownspectroscopic data for the identification of alloys used in jewelry manufacture,Spectrochim. Acta Part B 58 (2003) 1291–1299.
[37] A. Jurado-López, M.D. Luque de Castro, Laser-induced breakdown spectrometry injewellery industry—part II: quantitative characterisation of goldfilled interface,Talanta 59 (2003) 409–415.
[38] L.E. García-Ayuso, J. Amador-Hernández, J.M. Fernández-Romero, M.D. Luque deCastro, Characterization of jewellery products by laser-induced breakdownspectroscopy, Anal. Chim. Acta 457 (2002) 247–256.
[39] S. Laville, M. Sabsabi, F.R. Doucet, Multi-elemental analysis of solidified mineralmelt samples by Laser-Induced Breakdown Spectroscopy coupled with a linearmultivariate calibration, Spectrochim. Acta Part B 62 (2007) 1557–1566.
[40] S. Palanco, J.J. Laserna, Full automation of a laser-induced breakdown spectrom-eter for quality assessment in the steel industry with sample handling, surfacepreparation and quantitative analysis capabilities, J. Anal. At. Spectrom. 15 (2000)1321–1327.
[41] J. Amador-Hernández, L.E. García-Ayuso, J.M. Fernández-Romero, M.D. Luque deCastro, Partial least squares regression for problem solving in precious metalanalysis by laser induced breakdown spectrometry, J. Anal. At. Spectrom. 15 (2000)587–593.
[42] J.L. Luque-García, R. Soto-Ayala, M.D. Luque de Castro, Determination of the majorelements in homogeneous and heterogeneous samples by tandem laser-inducedbreakdown spectroscopy–partial least square regression, Microchem. J. 73 (2002)355–362.
[43] S.R. Goode, S.L. Morgan, R. Hoskins, A. Oxsher, Identifying alloys by laser-inducedbreakdown spectroscopywith a time-resolved high resolution Echelle spectrometer,J. Anal. At. Spectrom. 15 (2000) 1133–1138.
[44] D.L. Death, A.P. Cunningham, L.J. Pollard, Multi-element analysis of iron ore pelletsby Laser-induced Breakdown Spectroscopy and Principal Components Regression,Spectrochim. Acta Part B 63 (2008) 763–769.
[45] J.B. Sirven, B. Bousquet, L. Canioni, L. Sarger, S. Tellier, M. Potin-Gautier, I. Le Hecho,Qualitative and quantitative investigation of chromium-polluted soils by laser-induced breakdown spectroscopy combined with neural networks analysis, Anal.Bioanal. Chem. 385 (2006) 256–262.
[46] E.C. Ferreira, D.M.B.P. Milori, E.J. Ferreira, R.M. da Silva, L. Martin-Neto, Artificialneural network for Cu quantitative determination in soil using a portable LaserInduced Breakdown Spectroscopy system, Spectrochim. Acta Part B 63 (2008)1216–1220.
[47] A.C. Samuels, F.C. DeLucia Jr., K.L. McNesby, A.W. Miziolek, Laser-inducedbreakdown spectroscopy of bacterial spores, molds, pollens, and protein: initialstudies of discrimination potential, Appl. Opt. 42 (2003) 6205–6209.
[48] M.Z. Martin, N. Labbé, N. André, R. Harris, M. Ebinger, S.D. Wullschleger, A.A. Vass,High resolution applications of laser-induced breakdown spectroscopy forenvironmental and forensic applications, Spectrochim. Acta Part B 62 (2007)1426–1432.
[49] B. Bousquet, J.-B. Sirven, L. Canioni, Towards quantitative laser-induced break-down spectroscopy analysis of soil samples, Spectrochim. Acta Part B 62 (2007)1582–1589.
[50] D.W. Merdes, J.M. Suhan, J.M. Keay, D.M. Hadka, W.R. Bradley, The investigation oflaser-induced breakdown spectroscopy for detection of biological contaminantson surfaces, Spectroscopy 22 (2007) 28–35.
[51] Labbé Nicole, I.M. Swamidoss, N. André, M.Z. Martin, T.M. Young, T.G. Rials,Extraction of information from laser-induced breakdown spectroscopy spectraldata by multivariate analysis, Appl. Optics 47 (2008) G158–G165.
[52] M.J.C. Pontes, J. Cortez, R.K.H. Galvão, C. Pasquini, M.C.U. Araújo, R.M. Coelho, M.K.Chiba, M.F. Abreu, B.E. Madari, Classification of Brazilian soils by using LIBS andvariable selection in the wavelet domain, Anal. Chim. Acta 642 (2009) 12–18.
[53] J.L. Gottfried, F.C. De Lucia, C.A. Munson, A.W. Miziolek, Strategies for residueexplosives detection using laser-induced breakdown spectroscopy, J. Anal. At.Spectrom. 23 (2008) 205–216.
[54] J.B. Sirven, B. Sallé, P. Mauchien, J.L. Lacour, S. Maurice, G. Manhès, Feasibility studyof rock identification at the surface of Mars by remote laser-induced breakdownspectroscopy and three chemometric methods, J. Anal. At. Spectrom. 22 (2007)1471–1480.
[55] F.C. De Lucia, J.L. Gottfried, C.A. Munson, A.W. Miziolek, Multivariate analysis ofstandoff laser-induced breakdown spectroscopy spectra for classification ofexplosive-containing residues, Appl. Opt. 47 (2008) G112–G121.
[56] P. Geladi, B.R. Kowalski, Partial least-squares regression — a tutorial, Anal. Chim.Acta 185 (1986) 1–17.
[57] R.G. Brereton, Introduction tomultivariate calibration in analytical chemistry, Analyst125 (2000) 2125–2154.
[58] H.Martens, T. Naes,Multivariate Calibration,first ed., JohnWiley & Sons, NewYork,1989.
[59] B.S. Dayal, J.F. MacGregor, Improved PLS algorithms, J. Chemom. 11 (1997) 73–85.[60] Yu. Ralchenko, A.E. Kramida, J. Reader, NIST ASD Team, NIST Atomic Spectra
Database (version 3.1.5), [Online], National Institute of Standards and Technology,Gaithersburg, MD, 2008 Available: http://physics.nist.gov/asd3 [2008, May 23].
[61] L. Nørgaard, A. Saudland, J. Wagner, J.P. Nielsen, L. Munck, S.B. Engelsen, Intervalpartial least-squares regression (iPLS): a comparative chemometric study with anexample from near-infrared spectroscopy, Appl. Spectrosc. 54 (2000) 413–419.
[62] P. Valderrama, J.W.B. Braga, R.J. Poppi, Variable selection, outlier detection andfigures of merit estimation in a PLSR multivariate calibration model. A case study

74 J.W.B. Braga et al. / Spectrochimica Acta Part B 65 (2010) 66–74
for the determination of quality parameters in alcohol industry by near infraredspectroscopy, J. Agric. Food Chem. 55 (2007) 8331–8338.
[63] B. Walczak, D.L. Massart, Multiple outlier detection revisited, Chemom. Intell. Lab.Syst. 41 (1998) 1–15.
[64] J.A. Fernández Pierna, F. Wahl, O.E. Noord, D.L. Massart, Methods for outlierdetection in prediction, Chemom. Intell. Lab. Syst. 63 (2002) 27–39.
[65] L.A. Currie, Nomenclature in evaluation of analytical methods including detectionand quantification capabilities, Pure Appl. Chem. 67 (1995) 1699–1723.
[66] R. Boqué, F.X. Rius, Multivariate detection limits estimators, Chemom. Intell. Lab.Syst. 32 (1996) 11–23.
[67] R. Boqué, N.M. Faber, F.X. Rius, Detection limits in classical multivariate calibrationmodels, Anal. Chim. Acta 431 (2000) 41–49.
[68] A.C. Olivieri, N.M. Faber, Standard error of prediction in parallel factor analysis ofthree-way data, Chemom. Intell. Lab. Syst. 70 (2004) 75–82.
[69] MATLAB 6.5, The Mathworks Inc, Natick, MA, 2000.[70] E.V. Thomas, A primer on multivariate calibration, Anal. Chem. 66 (1994)
795A–804A.
[71] http://www.models.life.ku.dk/source/ accessed on 11/13/2008.[72] L.C. Nunes, G.A. da Silva, L.C. Trevizan, D. Santos Júnior, R.J. Poppi, F.J. Krug,
Simultaneous optimization byneuro-genetic approach for analysis of plantmaterialsby laser induced breakdown spectroscopy, Spectrochim. Acta Part B 64 (2009)565–572.
[73] K. Danzer, L.A. Currie, Guidelines for calibration in analytical chemistry — part 1.Fundamentals and single component calibration, Pure Appl. Chem. 70 (1998)993–1104.
[74] A.I. Kuznetsova, T.E. Morgulis, Investigation of internal standardisation for atomicemission spectrometric analysis with direct current arc excitation, J. Anal. At.Spectrom. 3 (1988) 973–977.
[75] L. St-Onge, E. Kwong, M. Sabsabi, E.B. Vadas, Quantitative analysis of pharmaceu-tical products by laser-induced breakdown spectroscopy, Spectrochim. Acta Part B57 (2002) 1131–1140.
[76] J.N. Miller, J.C. Miller, Statistics and Chemometrics for Analytical Chemistry, FourthEd.Prentice Hall, London, 2000.
Copyright © 2022 FDOKUMEN