Evaluation of laser induced breakdown spectrometry for the determination of macro and micronutrients...
9
Evaluation of laser induced breakdown spectroscopy for the determination of micronutrients in plant materials Lilian Cristina Trevizan a , Dário Santos Jr. b , Ricardo Elgul Samad c , Nilson Dias Vieira Jr. c , Lidiane Cristina Nunes a,d , Iolanda Aparecida Rufini a , Francisco José Krug a, ⁎ a Centro de Energia Nuclear na Agricultura-Universidade de São Paulo, Av. Centenário 303,13416-000, Piracicaba-SP, Brazil b Universidade Federal de São Paulo - UNIFESP, Rua Prof. Artur Riedel 275, 09972-270, Diadema-SP, Brazil c Centro de Lasers e Aplicações, IPEN/CNEN-SP, Av. Prof. Lineu Prestes 2242, 05508-000, São Paulo-SP, Brazil d Departamento de Química, Universidade Federal de São Carlos, Rodovia Washington Luís (SP-310), km 235,13565-905, São Carlos-SP, Brazil abstract article info Article history: Received 25 September 2008 Accepted 6 April 2009 Available online 17 April 2009 Keywords: LIBS Plant material Micronutrients Laser-induced breakdown spectrometry Laser induced breakdown spectroscopy (LIBS) has been evaluated for the determination of micronutrients (B, Cu, Fe, Mn and Zn) in pellets of plant materials, using NIST, BCR and GBW biological certified reference materials for analytical calibration. Pellets of approximately 2 mm thick and 15 mm diameter were prepared by transferring 0.5 g of powdered material to a 15 mm die set and applying 8.0 tons cm −2 . An experimental setup was designed by using a Nd:YAG laser operating at 1064 nm (200 mJ per pulse, 10 Hz) and an Echelle spectrometer with ICCD detector. Repeatability precision varied from 4 to 30% from measurements obtained in 10 different positions (8 laser shots per test portion) in the same sample pellet. Limits of detection were appropriate for routine analysis of plant materials and were 2.2 mg kg −1 B, 3.0 mg kg −1 Cu, 3.6 mg kg −1 Fe, 1.8 mg kg −1 Mn and 1.2 mg kg −1 Zn. Analysis of different plant samples were carried out by LIBS and results were compared with those obtained by ICP OES after wet acid decomposition. © 2009 Elsevier B.V. All rights reserved. 1. Introduction The determination of essential elements in plant materials is of key importance to evaluate the nutritional status of crops of economical interest. From the knowledge of the concentration of the most important nutrients in the plant leaves, one can define the best strategy to correct any deficiency, if present, that will limit the production and/or the quality of fruits, vegetables, and cereals, for example. Essential macronutrients (N, P, K, Ca, Mg, S) and essential micronutrients (Fe, Cu, Mn, Zn, B, Mo, Cl and Ni) play a decisive role in plant nutrition and can affect crop yields when they are not present in appropriate concentration levels [1]. In general, to evaluate the crop nutritional status, the laboratory samples are washed, dried and ground and further steps of the analytical sequence include a wet acid digestion of a given test portion (250–1000 mg) in open or closed systems, prior to the determination. The most recommended technique for large routine analysis of acid digests is ICP OES, due to its inherent multielement and simultaneous analytical capabilities for almost all macro and micronutrients that may limit plant growth and productivity. For instance, accurate determinations of P, K, Ca, Mg, S, Fe, Cu, Mn, Zn and B can be carried out in approximately 20–30 s in each digest in modern instrumentation with radial or axial viewing ICP. The determination of Mo can be carried out by graphite furnace atomic absorption spectrometry, but is not often determined, in spite of its importance, because it occurs in low concentrations. Chloride deficiencies are very rare and not observed in plants of economical interest, and the determination of this essential element is very rare and/or not relevant. The remaining micronutrient, which is not included in routine analysis, is nickel, mainly because its deficiency was not yet observed in higher plants. On the other hand, nickel toxicity may limit plant growth. Other important elements that are not essential but may present beneficial effects to plant development are Co, Na and Si [1]. Taking into consideration the scope of this paper, the general range of concentrations of micronutrients for most plants of agricultural interest in good nutritional status is assumed to be 10–200 mg kg −1 B, 3–50 mg kg −1 Cu, 50–900 mg kg −1 Fe, 20–2000 mg kg −1 Mn and 5–200 mg kg −1 Zn on dry matter basis [2]. Most recently, we started a project in Brazil for overcoming the main drawbacks towards clean chemistry, trying to avoid acid digestion procedures, which also requires appropriate exhaustion fume hoods as well as additional on line treatment of emitted toxic gases. Direct solid analysis of agricultural and environmental samples by laser induced breakdown spectroscopy (LIBS) was chosen as the alternative technique to be evaluated for the simultaneous multi- elemental determinations of the most important essential and bene- ficial elements in plant materials. In this sense, an evaluation of LIBS for the determination of P, K, Ca and Mg in pellets of plant materials was carried out in our laboratory [3]. A LIBS system equipped with a 360 mJ/pulse Nd:YAG laser at 1064 nm was used and calibration was done with certified reference Spectrochimica Acta Part B 64 (2009) 369–377 ⁎ Corresponding author. Fax: +55 19 34294610. E-mail address: [email protected] (F.J. Krug). 0584-8547/$ – see front matter © 2009 Elsevier B.V. All rights reserved. doi:10.1016/j.sab.2009.04.003 Contents lists available at ScienceDirect Spectrochimica Acta Part B journal homepage: www.elsevier.com/locate/sab
-
Upload
independent -
Category
Documents
-
view
5 -
download
0
Transcript of Evaluation of laser induced breakdown spectrometry for the determination of macro and micronutrients...

Spectrochimica Acta Part B 64 (2009) 369–377
Contents lists available at ScienceDirect
Spectrochimica Acta Part B
j ourna l homepage: www.e lsev ie r.com/ locate /sab
Evaluation of laser induced breakdown spectroscopy for the determination ofmicronutrients in plant materials
Lilian Cristina Trevizan a, Dário Santos Jr. b, Ricardo Elgul Samad c, Nilson Dias Vieira Jr. c,Lidiane Cristina Nunes a,d, Iolanda Aparecida Rufini a, Francisco José Krug a,⁎a Centro de Energia Nuclear na Agricultura-Universidade de São Paulo, Av. Centenário 303, 13416-000, Piracicaba-SP, Brazilb Universidade Federal de São Paulo - UNIFESP, Rua Prof. Artur Riedel 275, 09972-270, Diadema-SP, Brazilc Centro de Lasers e Aplicações, IPEN/CNEN-SP, Av. Prof. Lineu Prestes 2242, 05508-000, São Paulo-SP, Brazild Departamento de Química, Universidade Federal de São Carlos, Rodovia Washington Luís (SP-310), km 235, 13565-905, São Carlos-SP, Brazil
⁎ Corresponding author. Fax: +55 19 34294610.E-mail address: [email protected] (F.J. Krug).
0584-8547/$ – see front matter © 2009 Elsevier B.V. Adoi:10.1016/j.sab.2009.04.003
a b s t r a c t
a r t i c l e i n f oArticle history:Received 25 September 2008Accepted 6 April 2009Available online 17 April 2009
Keywords:LIBSPlant materialMicronutrientsLaser-induced breakdown spectrometry
Laser induced breakdown spectroscopy (LIBS) has been evaluated for the determination of micronutrients(B, Cu, Fe, Mn and Zn) in pellets of plant materials, using NIST, BCR and GBW biological certified referencematerials for analytical calibration. Pellets of approximately 2 mm thick and 15 mm diameter were preparedby transferring 0.5 g of powdered material to a 15 mm die set and applying 8.0 tons cm−2. An experimentalsetup was designed by using a Nd:YAG laser operating at 1064 nm (200 mJ per pulse, 10 Hz) and an Echellespectrometer with ICCD detector. Repeatability precision varied from 4 to 30% from measurements obtainedin 10 different positions (8 laser shots per test portion) in the same sample pellet. Limits of detection wereappropriate for routine analysis of plant materials and were 2.2 mg kg−1 B, 3.0 mg kg−1 Cu, 3.6 mg kg−1 Fe,1.8 mg kg−1 Mn and 1.2 mg kg−1 Zn. Analysis of different plant samples were carried out by LIBS and resultswere compared with those obtained by ICP OES after wet acid decomposition.
© 2009 Elsevier B.V. All rights reserved.
1. Introduction
The determination of essential elements in plant materials is of keyimportance to evaluate the nutritional status of crops of economicalinterest. From the knowledge of the concentration of themost importantnutrients in the plant leaves, one can define the best strategy to correctanydeficiency, if present, thatwill limit theproduction and/or thequalityof fruits, vegetables, and cereals, for example. Essential macronutrients(N, P, K, Ca, Mg, S) and essential micronutrients (Fe, Cu, Mn, Zn, B, Mo, Cland Ni) play a decisive role in plant nutrition and can affect crop yieldswhen they are not present in appropriate concentration levels [1]. Ingeneral, to evaluate the cropnutritional status, the laboratory samples arewashed, dried and ground and further steps of the analytical sequenceinclude a wet acid digestion of a given test portion (250–1000 mg) inopen or closed systems, prior to the determination. The mostrecommended technique for large routine analysis of acid digests is ICPOES, due to its inherent multielement and simultaneous analyticalcapabilities for almost all macro and micronutrients that may limit plantgrowth andproductivity. For instance, accurate determinations of P, K, Ca,Mg, S, Fe, Cu,Mn, Zn and B can be carried out in approximately 20–30 s ineach digest in modern instrumentation with radial or axial viewing ICP.The determination of Mo can be carried out by graphite furnace atomicabsorption spectrometry, but is not often determined, in spite of its
ll rights reserved.
importance, because itoccurs in lowconcentrations. Chloridedeficienciesare very rare and not observed in plants of economical interest, and thedetermination of this essential element is very rare and/or not relevant.The remainingmicronutrient, which is not included in routine analysis, isnickel, mainly because its deficiency was not yet observed in higherplants. On the other hand, nickel toxicity may limit plant growth. Otherimportant elements that are not essential but may present beneficialeffects to plant development are Co, Na and Si [1].
Taking into consideration the scope of this paper, the general rangeof concentrations of micronutrients for most plants of agriculturalinterest in good nutritional status is assumed to be 10–200 mg kg−1
B, 3–50 mg kg−1 Cu, 50–900 mg kg−1 Fe, 20–2000 mg kg−1 Mn and5–200 mg kg−1 Zn on dry matter basis [2].
Most recently, we started a project in Brazil for overcoming themain drawbacks towards clean chemistry, trying to avoid aciddigestion procedures, which also requires appropriate exhaustionfume hoods as well as additional on line treatment of emitted toxicgases. Direct solid analysis of agricultural and environmental samplesby laser induced breakdown spectroscopy (LIBS) was chosen as thealternative technique to be evaluated for the simultaneous multi-elemental determinations of the most important essential and bene-ficial elements in plant materials.
In this sense, an evaluation of LIBS for the determination of P, K, Caand Mg in pellets of plant materials was carried out in our laboratory[3]. A LIBS system equipped with a 360 mJ/pulse Nd:YAG laser at1064 nm was used and calibration was done with certified reference
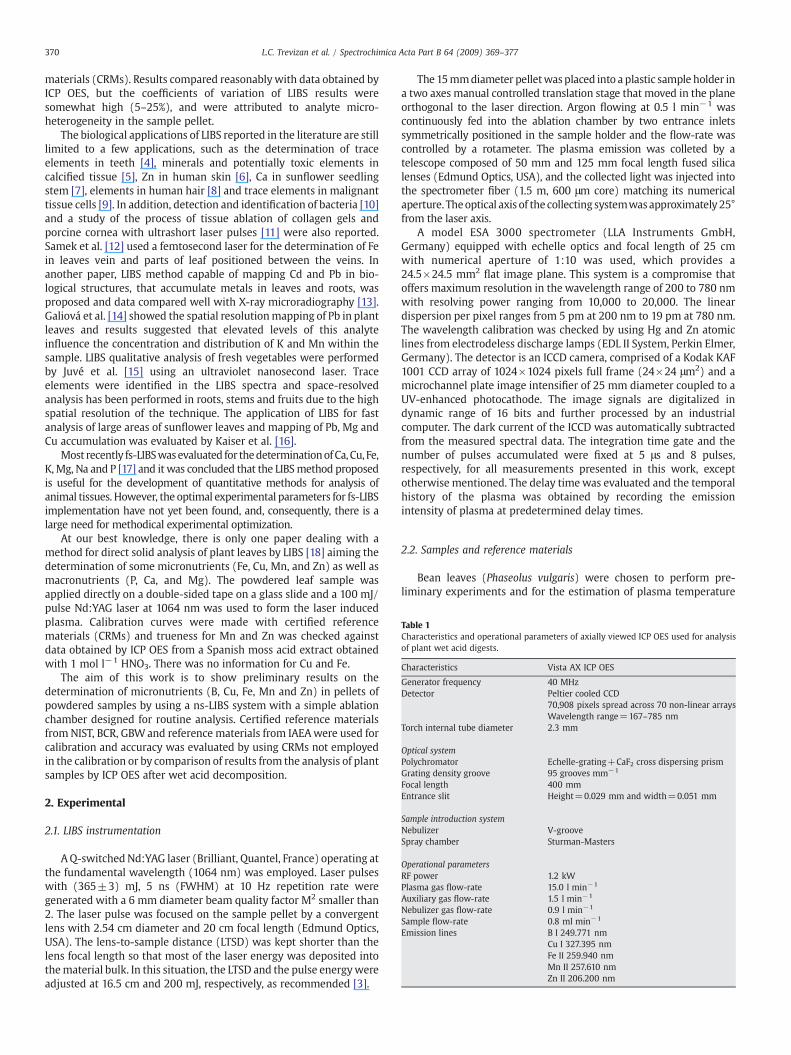
Table 1Characteristics and operational parameters of axially viewed ICP OES used for analysisof plant wet acid digests.
Characteristics Vista AX ICP OES
Generator frequency 40 MHzDetector Peltier cooled CCD
70,908 pixels spread across 70 non-linear arraysWavelength range=167–785 nm
Torch internal tube diameter 2.3 mm
Optical systemPolychromator Echelle-grating+CaF2 cross dispersing prismGrating density groove 95 grooves mm−1
Focal length 400 mmEntrance slit Height=0.029 mm and width=0.051 mm
Sample introduction systemNebulizer V-grooveSpray chamber Sturman-Masters
Operational parametersRF power 1.2 kWPlasma gas flow-rate 15.0 l min−1
Auxiliary gas flow-rate 1.5 l min−1
Nebulizer gas flow-rate 0.9 l min−1
Sample flow-rate 0.8 ml min−1
Emission lines B I 249.771 nmCu I 327.395 nmFe II 259.940 nmMn II 257.610 nmZn II 206.200 nm
370 L.C. Trevizan et al. / Spectrochimica Acta Part B 64 (2009) 369–377
materials (CRMs). Results compared reasonablywith data obtained byICP OES, but the coefficients of variation of LIBS results weresomewhat high (5–25%), and were attributed to analyte micro-heterogeneity in the sample pellet.
The biological applications of LIBS reported in the literature are stilllimited to a few applications, such as the determination of traceelements in teeth [4], minerals and potentially toxic elements incalcified tissue [5], Zn in human skin [6], Ca in sunflower seedlingstem [7], elements in human hair [8] and trace elements in malignanttissue cells [9]. In addition, detection and identification of bacteria [10]and a study of the process of tissue ablation of collagen gels andporcine cornea with ultrashort laser pulses [11] were also reported.Samek et al. [12] used a femtosecond laser for the determination of Fein leaves vein and parts of leaf positioned between the veins. Inanother paper, LIBS method capable of mapping Cd and Pb in bio-logical structures, that accumulate metals in leaves and roots, wasproposed and data compared well with X-ray microradiography [13].Galiová et al. [14] showed the spatial resolutionmapping of Pb in plantleaves and results suggested that elevated levels of this analyteinfluence the concentration and distribution of K and Mn within thesample. LIBS qualitative analysis of fresh vegetables were performedby Juvé et al. [15] using an ultraviolet nanosecond laser. Traceelements were identified in the LIBS spectra and space-resolvedanalysis has been performed in roots, stems and fruits due to the highspatial resolution of the technique. The application of LIBS for fastanalysis of large areas of sunflower leaves and mapping of Pb, Mg andCu accumulation was evaluated by Kaiser et al. [16].
Most recently fs-LIBSwasevaluated for thedeterminationofCa, Cu, Fe,K,Mg, Na and P [17] and it was concluded that the LIBSmethod proposedis useful for the development of quantitative methods for analysis ofanimal tissues. However, the optimal experimental parameters for fs-LIBSimplementation have not yet been found, and, consequently, there is alarge need for methodical experimental optimization.
At our best knowledge, there is only one paper dealing with amethod for direct solid analysis of plant leaves by LIBS [18] aiming thedetermination of some micronutrients (Fe, Cu, Mn, and Zn) as well asmacronutrients (P, Ca, and Mg). The powdered leaf sample wasapplied directly on a double-sided tape on a glass slide and a 100 mJ/pulse Nd:YAG laser at 1064 nm was used to form the laser inducedplasma. Calibration curves were made with certified referencematerials (CRMs) and trueness for Mn and Zn was checked againstdata obtained by ICP OES from a Spanish moss acid extract obtainedwith 1 mol l−1 HNO3. There was no information for Cu and Fe.
The aim of this work is to show preliminary results on thedetermination of micronutrients (B, Cu, Fe, Mn and Zn) in pellets ofpowdered samples by using a ns-LIBS system with a simple ablationchamber designed for routine analysis. Certified reference materialsfrom NIST, BCR, GBWand reference materials from IAEAwere used forcalibration and accuracy was evaluated by using CRMs not employedin the calibration or by comparison of results from the analysis of plantsamples by ICP OES after wet acid decomposition.
2. Experimental
2.1. LIBS instrumentation
AQ-switched Nd:YAG laser (Brilliant, Quantel, France) operating atthe fundamental wavelength (1064 nm) was employed. Laser pulseswith (365±3) mJ, 5 ns (FWHM) at 10 Hz repetition rate weregenerated with a 6 mm diameter beam quality factor M2 smaller than2. The laser pulse was focused on the sample pellet by a convergentlens with 2.54 cm diameter and 20 cm focal length (Edmund Optics,USA). The lens-to-sample distance (LTSD) was kept shorter than thelens focal length so that most of the laser energy was deposited intothematerial bulk. In this situation, the LTSD and the pulse energywereadjusted at 16.5 cm and 200 mJ, respectively, as recommended [3].
The 15mmdiameter pelletwasplaced into a plastic sample holder ina two axes manual controlled translation stage that moved in the planeorthogonal to the laser direction. Argon flowing at 0.5 l min−1 wascontinuously fed into the ablation chamber by two entrance inletssymmetrically positioned in the sample holder and the flow-rate wascontrolled by a rotameter. The plasma emission was colleted by atelescope composed of 50 mm and 125 mm focal length fused silicalenses (Edmund Optics, USA), and the collected light was injected intothe spectrometer fiber (1.5 m, 600 μm core) matching its numericalaperture. Theoptical axis of the collecting systemwasapproximately 25°from the laser axis.
A model ESA 3000 spectrometer (LLA Instruments GmbH,Germany) equipped with echelle optics and focal length of 25 cmwith numerical aperture of 1:10 was used, which provides a24.5×24.5 mm2
flat image plane. This system is a compromise thatoffers maximum resolution in the wavelength range of 200 to 780 nmwith resolving power ranging from 10,000 to 20,000. The lineardispersion per pixel ranges from 5 pm at 200 nm to 19 pm at 780 nm.The wavelength calibration was checked by using Hg and Zn atomiclines from electrodeless discharge lamps (EDL II System, Perkin Elmer,Germany). The detector is an ICCD camera, comprised of a Kodak KAF1001 CCD array of 1024×1024 pixels full frame (24×24 μm2) and amicrochannel plate image intensifier of 25 mm diameter coupled to aUV-enhanced photocathode. The image signals are digitalized indynamic range of 16 bits and further processed by an industrialcomputer. The dark current of the ICCD was automatically subtractedfrom the measured spectral data. The integration time gate and thenumber of pulses accumulated were fixed at 5 μs and 8 pulses,respectively, for all measurements presented in this work, exceptotherwise mentioned. The delay timewas evaluated and the temporalhistory of the plasma was obtained by recording the emissionintensity of plasma at predetermined delay times.
2.2. Samples and reference materials
Bean leaves (Phaseolus vulgaris) were chosen to perform pre-liminary experiments and for the estimation of plasma temperature
371L.C. Trevizan et al. / Spectrochimica Acta Part B 64 (2009) 369–377
and temporal characterization. The leaves were washed separatelywith running tap water and further rinsed twice with distilled waterand three times with ultra purity water. After washing, samples weredried, chopped and oven-dried to constant mass at 60 °C during 48–96 h. Leaves were ground and homogenized by using a cryogenic millmodel MA-775 (Marconi) with a self-container liquid nitrogen bath. Apre-cooling time of 5 min was used with further 2 min grinding.
The following certified reference materials and reference materialswere used for calibration: aquatic plant (Community Bureau ofReference — BCR 60), aquatic moss (BCR 61), olive leaves (BCR 62),bush branches and leaves (National Research Centre for CRM's— GBW07603), cabbage (International Atomic Energy Agency — IAEA 359),rice flour (National Institute for Environmental Studies — NIES 10-c),apple leaves (National Institute of Standards and Technology — NIST1515), peach leaves (NIST 1547), wheat flour (NIST 1567a) andspinach leaves (NIST 1570a). The following materials were homo-
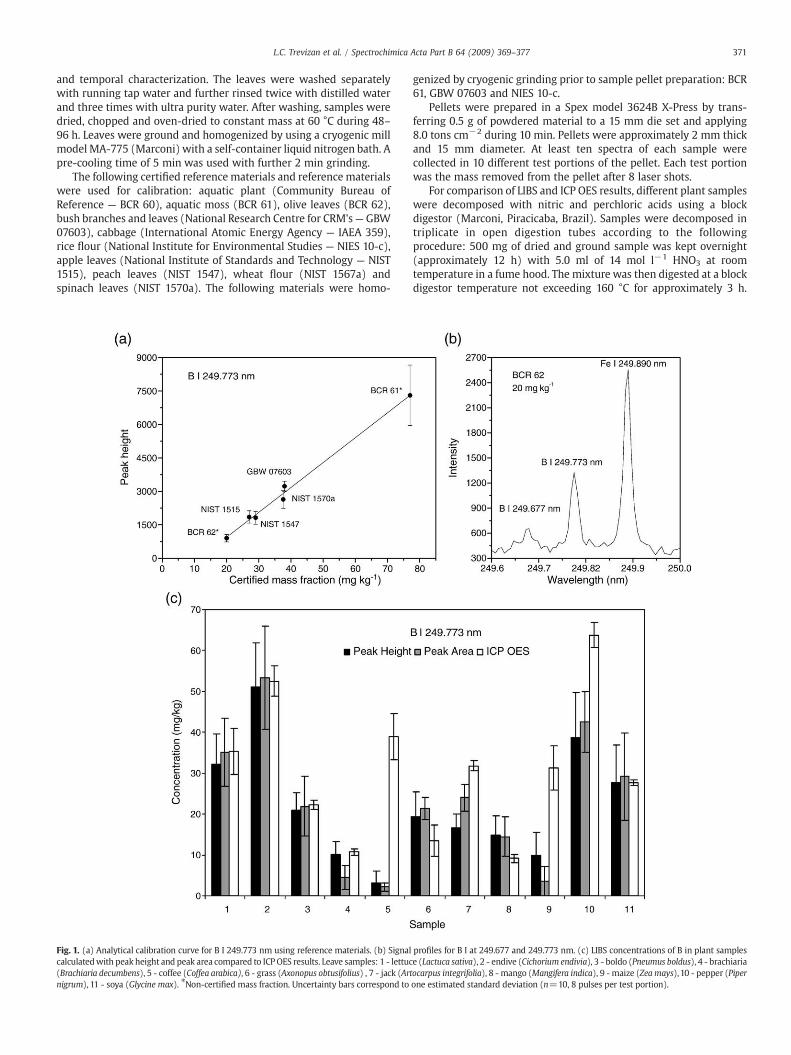
Fig. 1. (a) Analytical calibration curve for B I 249.773 nm using reference materials. (b) Signalcalculatedwith peak height and peak area compared to ICPOES results. Leave samples: 1 - lettuc(Brachiaria decumbens), 5 - coffee (Coffea arabica), 6 - grass (Axonopus obtusifolius) , 7 - jack (Artnigrum), 11 - soya (Glycine max). ⁎Non-certified mass fraction. Uncertainty bars correspond to
genized by cryogenic grinding prior to sample pellet preparation: BCR61, GBW 07603 and NIES 10-c.
Pellets were prepared in a Spex model 3624B X-Press by trans-ferring 0.5 g of powdered material to a 15 mm die set and applying8.0 tons cm−2 during 10 min. Pellets were approximately 2 mm thickand 15 mm diameter. At least ten spectra of each sample werecollected in 10 different test portions of the pellet. Each test portionwas the mass removed from the pellet after 8 laser shots.
For comparison of LIBS and ICP OES results, different plant sampleswere decomposed with nitric and perchloric acids using a blockdigestor (Marconi, Piracicaba, Brazil). Samples were decomposed intriplicate in open digestion tubes according to the followingprocedure: 500 mg of dried and ground sample was kept overnight(approximately 12 h) with 5.0 ml of 14 mol l−1 HNO3 at roomtemperature in a fume hood. The mixture was then digested at a blockdigestor temperature not exceeding 160 °C for approximately 3 h.
profiles for B I at 249.677 and 249.773 nm. (c) LIBS concentrations of B in plant samplese (Lactuca sativa), 2 - endive (Cichorium endivia), 3 - boldo (Pneumus boldus), 4 - brachiariaocarpus integrifolia), 8 - mango (Mangifera indica), 9 - maize (Zea mays),10 - pepper (Piperone estimated standard deviation (n=10, 8 pulses per test portion).

372 L.C. Trevizan et al. / Spectrochimica Acta Part B 64 (2009) 369–377
After cooling, the excess of nitric acid was driven off by adding 1.3 ml72% HClO4 and increasing the block digestor temperature to 210 °C.Heating was continued until a clear colorless solution was obtainedand dense fumes of perchloric acid dihydrate appears. After cooling,the digests were diluted with water up to 50 ml and analysed byaxially viewed ICP OES (Vista AX, Varian, Australia) with theoperational parameters showed in Table 1.
3. Results
The temperature of the induced micro-plasma in pellets of plantmaterials was estimated through Boltzmann plots by using Fe(I) linesand varied between 10,140 and 7720 K at the delay times from 1 to4 μs, respectively [3]. At 2 μs the plasma excitation temperature was9130±130 K. Gate delay time and integration time was fixed at 2 and5 μs, respectively, due to a better signal-to-noise ratio obtained atthese conditions. The LIBS spectrum obtained under argon atmo-sphere (0.5 l min−1 Ar flow-rate) was significantly more intense thanin the presence of air. Similar results were previously reported in theliterature [19].
Fig. 2. (a) Analytical calibration curve for Cu I 324.754 nm. (b) Signal profile for Cu I. (c) LIBlettuce (Lactuca sativa), 2 - endive (Cichorium endivia), 3 - boldo (Pneumus boldus), 4 - brachiajack (Artocarpus integrifolia), 8 - mango (Mangifera indica), 9 - maize (Zea mays), 10 - peppestandard deviation (n=10, 8 pulses per test portion).
Pellets of reference materials were analyzed by the proposed LIBSsystem by applying 8 consecutive laser shots in 10 different positions(test portions) at the sample surface and data was based on cumu-lative spectra. The lens-to-sample distance was kept at 16.5 cm. Forcalibration, most data refers to certified mass fractions, but areference material (IAEA 359) was also used for some analytes. Bykeeping the same strategy done for evaluation of macronutrients [3],it was decided to use the CRMs even knowing that there was arecommendation in the certificates stating that the certified valueswere based on a minimum sample mass of 150 mg. The calculatedmass of the 10 ablated test portions with 8 pulses each was approx-imately 360 μg.
Figs. 1–5 show the analytical calibration curves of B, Cu, Fe, Mn andZn, a selected peak profile of each analyte in the selected wavelengthand LIBS results from the analysis of 11 pellets of plant samplescompared to the analysis of the corresponding acid digests by ICP OES.All data was based on background corrected peak height and/or peakareas. The calculated coefficient of variations of peak height intensitiesfor each reference material used in the analytical calibration curvesvaried from 4 to 30% (n=10). In spite of previous assumptions [3,17]
S concentrations of Cu in plant samples compared to ICP OES results. Leave samples: 1 -ria (Brachiaria decumbens), 5 - coffee (Coffea arabica), 6 - grass (Axonopus obtusifolius), 7 -r (Piper nigrum), 11 - soya (Glycine max). Uncertainty bars correspond to one estimated
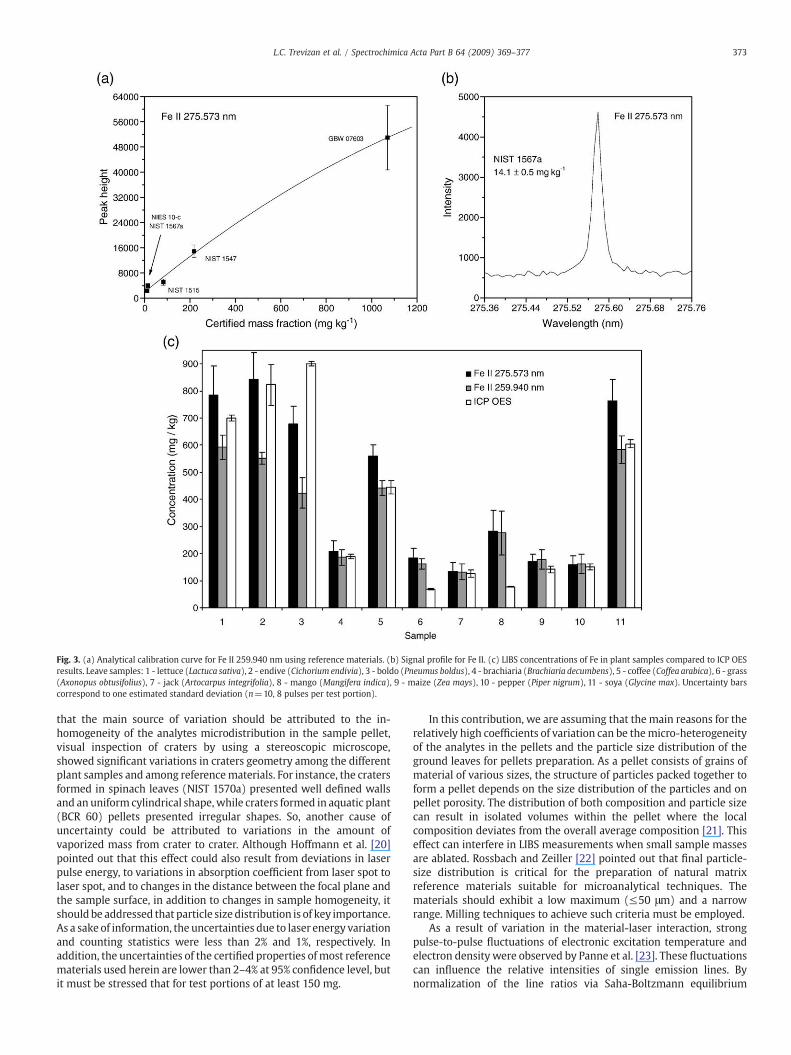
Fig. 3. (a) Analytical calibration curve for Fe II 259.940 nm using reference materials. (b) Signal profile for Fe II. (c) LIBS concentrations of Fe in plant samples compared to ICP OESresults. Leave samples: 1 - lettuce (Lactuca sativa), 2 - endive (Cichorium endivia), 3 - boldo (Pneumus boldus), 4 - brachiaria (Brachiaria decumbens), 5 - coffee (Coffea arabica), 6 - grass(Axonopus obtusifolius), 7 - jack (Artocarpus integrifolia), 8 - mango (Mangifera indica), 9 - maize (Zea mays), 10 - pepper (Piper nigrum), 11 - soya (Glycine max). Uncertainty barscorrespond to one estimated standard deviation (n=10, 8 pulses per test portion).
373L.C. Trevizan et al. / Spectrochimica Acta Part B 64 (2009) 369–377
that the main source of variation should be attributed to the in-homogeneity of the analytes microdistribution in the sample pellet,visual inspection of craters by using a stereoscopic microscope,showed significant variations in craters geometry among the differentplant samples and among referencematerials. For instance, the cratersformed in spinach leaves (NIST 1570a) presented well defined wallsand an uniform cylindrical shape, while craters formed in aquatic plant(BCR 60) pellets presented irregular shapes. So, another cause ofuncertainty could be attributed to variations in the amount ofvaporized mass from crater to crater. Although Hoffmann et al. [20]pointed out that this effect could also result from deviations in laserpulse energy, to variations in absorption coefficient from laser spot tolaser spot, and to changes in the distance between the focal plane andthe sample surface, in addition to changes in sample homogeneity, itshould be addressed that particle size distribution is of key importance.As a sake of information, the uncertainties due to laser energy variationand counting statistics were less than 2% and 1%, respectively. Inaddition, the uncertainties of the certified properties ofmost referencematerials used herein are lower than 2–4% at 95% confidence level, butit must be stressed that for test portions of at least 150 mg.
In this contribution, we are assuming that the main reasons for therelatively high coefficients of variation can be themicro-heterogeneityof the analytes in the pellets and the particle size distribution of theground leaves for pellets preparation. As a pellet consists of grains ofmaterial of various sizes, the structure of particles packed together toform a pellet depends on the size distribution of the particles and onpellet porosity. The distribution of both composition and particle sizecan result in isolated volumes within the pellet where the localcomposition deviates from the overall average composition [21]. Thiseffect can interfere in LIBS measurements when small sample massesare ablated. Rossbach and Zeiller [22] pointed out that final particle-size distribution is critical for the preparation of natural matrixreference materials suitable for microanalytical techniques. Thematerials should exhibit a low maximum (≤50 μm) and a narrowrange. Milling techniques to achieve such criteria must be employed.
As a result of variation in the material-laser interaction, strongpulse-to-pulse fluctuations of electronic excitation temperature andelectron density were observed by Panne et al. [23]. These fluctuationscan influence the relative intensities of single emission lines. Bynormalization of the line ratios via Saha-Boltzmann equilibrium
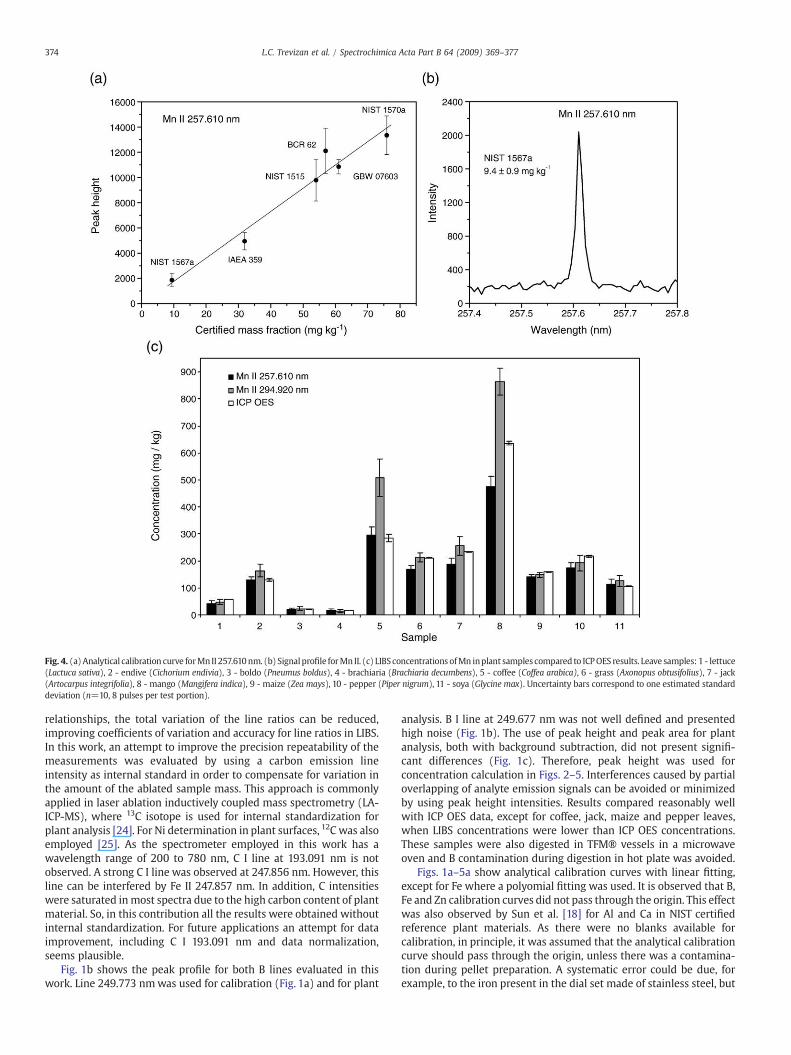
Fig. 4. (a) Analytical calibration curve forMn II 257.610nm. (b) Signalprofile forMn II. (c) LIBS concentrations ofMn inplant samples compared to ICPOES results. Leave samples: 1 - lettuce(Lactuca sativa), 2 - endive (Cichorium endivia), 3 - boldo (Pneumus boldus), 4 - brachiaria (Brachiaria decumbens), 5 - coffee (Coffea arabica), 6 - grass (Axonopus obtusifolius), 7 - jack(Artocarpus integrifolia), 8 - mango (Mangifera indica), 9 - maize (Zea mays), 10 - pepper (Piper nigrum), 11 - soya (Glycine max). Uncertainty bars correspond to one estimated standarddeviation (n=10, 8 pulses per test portion).
374 L.C. Trevizan et al. / Spectrochimica Acta Part B 64 (2009) 369–377
relationships, the total variation of the line ratios can be reduced,improving coefficients of variation and accuracy for line ratios in LIBS.In this work, an attempt to improve the precision repeatability of themeasurements was evaluated by using a carbon emission lineintensity as internal standard in order to compensate for variation inthe amount of the ablated sample mass. This approach is commonlyapplied in laser ablation inductively coupled mass spectrometry (LA-ICP-MS), where 13C isotope is used for internal standardization forplant analysis [24]. For Ni determination in plant surfaces, 12C was alsoemployed [25]. As the spectrometer employed in this work has awavelength range of 200 to 780 nm, C I line at 193.091 nm is notobserved. A strong C I line was observed at 247.856 nm. However, thisline can be interfered by Fe II 247.857 nm. In addition, C intensitieswere saturated in most spectra due to the high carbon content of plantmaterial. So, in this contribution all the results were obtained withoutinternal standardization. For future applications an attempt for dataimprovement, including C I 193.091 nm and data normalization,seems plausible.
Fig. 1b shows the peak profile for both B lines evaluated in thiswork. Line 249.773 nmwas used for calibration (Fig. 1a) and for plant
analysis. B I line at 249.677 nm was not well defined and presentedhigh noise (Fig. 1b). The use of peak height and peak area for plantanalysis, both with background subtraction, did not present signifi-cant differences (Fig. 1c). Therefore, peak height was used forconcentration calculation in Figs. 2–5. Interferences caused by partialoverlapping of analyte emission signals can be avoided or minimizedby using peak height intensities. Results compared reasonably wellwith ICP OES data, except for coffee, jack, maize and pepper leaves,when LIBS concentrations were lower than ICP OES concentrations.These samples were also digested in TFM® vessels in a microwaveoven and B contamination during digestion in hot plate was avoided.
Figs. 1a–5a show analytical calibration curves with linear fitting,except for Fe where a polyomial fitting was used. It is observed that B,Fe and Zn calibration curves did not pass through the origin. This effectwas also observed by Sun et al. [18] for Al and Ca in NIST certifiedreference plant materials. As there were no blanks available forcalibration, in principle, it was assumed that the analytical calibrationcurve should pass through the origin, unless there was a contamina-tion during pellet preparation. A systematic error could be due, forexample, to the iron present in the dial set made of stainless steel, but
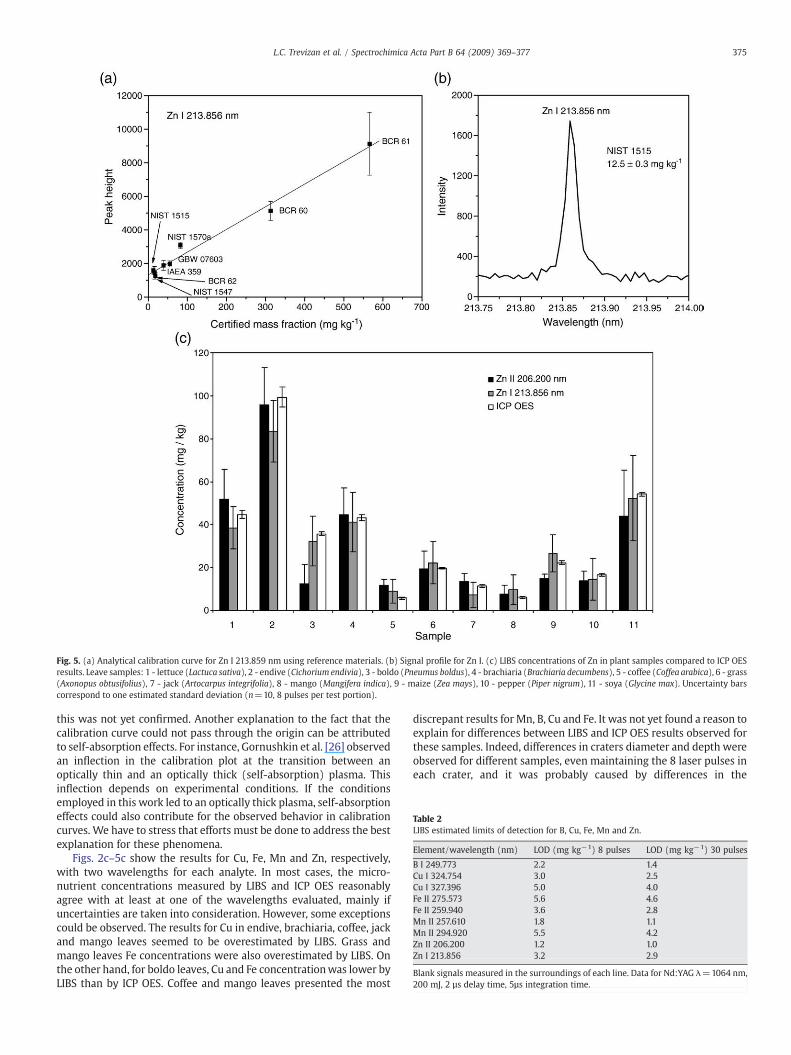
Fig. 5. (a) Analytical calibration curve for Zn I 213.859 nm using reference materials. (b) Signal profile for Zn I. (c) LIBS concentrations of Zn in plant samples compared to ICP OESresults. Leave samples: 1 - lettuce (Lactuca sativa), 2 - endive (Cichorium endivia), 3 - boldo (Pneumus boldus), 4 - brachiaria (Brachiaria decumbens), 5 - coffee (Coffea arabica), 6 - grass(Axonopus obtusifolius), 7 - jack (Artocarpus integrifolia), 8 - mango (Mangifera indica), 9 - maize (Zea mays), 10 - pepper (Piper nigrum), 11 - soya (Glycine max). Uncertainty barscorrespond to one estimated standard deviation (n=10, 8 pulses per test portion).
Table 2LIBS estimated limits of detection for B, Cu, Fe, Mn and Zn.
Element/wavelength (nm) LOD (mg kg−1) 8 pulses LOD (mg kg−1) 30 pulses
B I 249.773 2.2 1.4Cu I 324.754 3.0 2.5Cu I 327.396 5.0 4.0Fe II 275.573 5.6 4.6Fe II 259.940 3.6 2.8Mn II 257.610 1.8 1.1Mn II 294.920 5.5 4.2Zn II 206.200 1.2 1.0Zn I 213.856 3.2 2.9
Blank signals measured in the surroundings of each line. Data for Nd:YAG λ=1064 nm,200 mJ, 2 µs delay time, 5µs integration time.
375L.C. Trevizan et al. / Spectrochimica Acta Part B 64 (2009) 369–377
this was not yet confirmed. Another explanation to the fact that thecalibration curve could not pass through the origin can be attributedto self-absorption effects. For instance, Gornushkin et al. [26] observedan inflection in the calibration plot at the transition between anoptically thin and an optically thick (self-absorption) plasma. Thisinflection depends on experimental conditions. If the conditionsemployed in this work led to an optically thick plasma, self-absorptioneffects could also contribute for the observed behavior in calibrationcurves. We have to stress that efforts must be done to address the bestexplanation for these phenomena.
Figs. 2c–5c show the results for Cu, Fe, Mn and Zn, respectively,with two wavelengths for each analyte. In most cases, the micro-nutrient concentrations measured by LIBS and ICP OES reasonablyagree with at least at one of the wavelengths evaluated, mainly ifuncertainties are taken into consideration. However, some exceptionscould be observed. The results for Cu in endive, brachiaria, coffee, jackand mango leaves seemed to be overestimated by LIBS. Grass andmango leaves Fe concentrations were also overestimated by LIBS. Onthe other hand, for boldo leaves, Cu and Fe concentrationwas lower byLIBS than by ICP OES. Coffee and mango leaves presented the most
discrepant results for Mn, B, Cu and Fe. It was not yet found a reason toexplain for differences between LIBS and ICP OES results observed forthese samples. Indeed, differences in craters diameter and depth wereobserved for different samples, even maintaining the 8 laser pulses ineach crater, and it was probably caused by differences in the
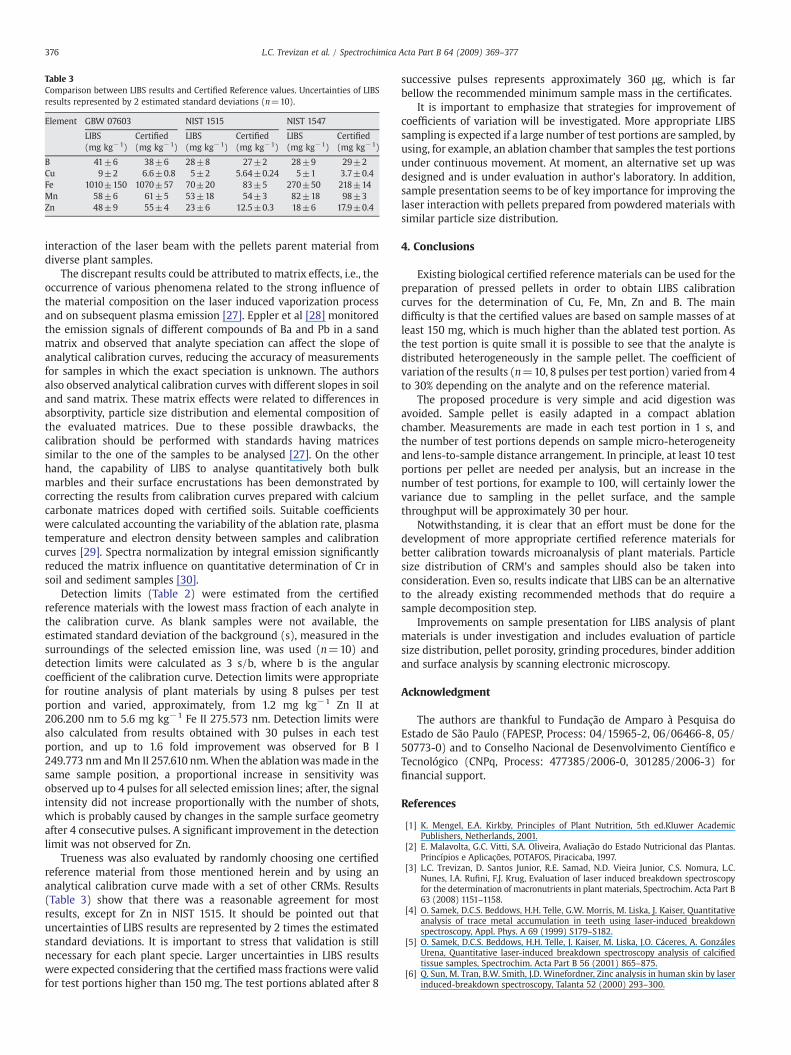
Table 3Comparison between LIBS results and Certified Reference values. Uncertainties of LIBSresults represented by 2 estimated standard deviations (n=10).
Element GBW 07603 NIST 1515 NIST 1547
LIBS Certified LIBS Certified LIBS Certified(mg kg−1) (mg kg−1) (mg kg−1) (mg kg−1) (mg kg−1) (mg kg−1)
B 41±6 38±6 28±8 27±2 28±9 29±2Cu 9±2 6.6±0.8 5±2 5.64±0.24 5±1 3.7±0.4Fe 1010±150 1070±57 70±20 83±5 270±50 218±14Mn 58±6 61±5 53±18 54±3 82±18 98±3Zn 48±9 55±4 23±6 12.5±0.3 18±6 17.9±0.4
376 L.C. Trevizan et al. / Spectrochimica Acta Part B 64 (2009) 369–377
interaction of the laser beam with the pellets parent material fromdiverse plant samples.
The discrepant results could be attributed to matrix effects, i.e., theoccurrence of various phenomena related to the strong influence ofthe material composition on the laser induced vaporization processand on subsequent plasma emission [27]. Eppler et al [28] monitoredthe emission signals of different compounds of Ba and Pb in a sandmatrix and observed that analyte speciation can affect the slope ofanalytical calibration curves, reducing the accuracy of measurementsfor samples in which the exact speciation is unknown. The authorsalso observed analytical calibration curves with different slopes in soiland sand matrix. These matrix effects were related to differences inabsorptivity, particle size distribution and elemental composition ofthe evaluated matrices. Due to these possible drawbacks, thecalibration should be performed with standards having matricessimilar to the one of the samples to be analysed [27]. On the otherhand, the capability of LIBS to analyse quantitatively both bulkmarbles and their surface encrustations has been demonstrated bycorrecting the results from calibration curves prepared with calciumcarbonate matrices doped with certified soils. Suitable coefficientswere calculated accounting the variability of the ablation rate, plasmatemperature and electron density between samples and calibrationcurves [29]. Spectra normalization by integral emission significantlyreduced the matrix influence on quantitative determination of Cr insoil and sediment samples [30].
Detection limits (Table 2) were estimated from the certifiedreference materials with the lowest mass fraction of each analyte inthe calibration curve. As blank samples were not available, theestimated standard deviation of the background (s), measured in thesurroundings of the selected emission line, was used (n=10) anddetection limits were calculated as 3 s/b, where b is the angularcoefficient of the calibration curve. Detection limits were appropriatefor routine analysis of plant materials by using 8 pulses per testportion and varied, approximately, from 1.2 mg kg−1 Zn II at206.200 nm to 5.6 mg kg−1 Fe II 275.573 nm. Detection limits werealso calculated from results obtained with 30 pulses in each testportion, and up to 1.6 fold improvement was observed for B I249.773 nm andMn II 257.610 nm.When the ablationwasmade in thesame sample position, a proportional increase in sensitivity wasobserved up to 4 pulses for all selected emission lines; after, the signalintensity did not increase proportionally with the number of shots,which is probably caused by changes in the sample surface geometryafter 4 consecutive pulses. A significant improvement in the detectionlimit was not observed for Zn.
Trueness was also evaluated by randomly choosing one certifiedreference material from those mentioned herein and by using ananalytical calibration curve made with a set of other CRMs. Results(Table 3) show that there was a reasonable agreement for mostresults, except for Zn in NIST 1515. It should be pointed out thatuncertainties of LIBS results are represented by 2 times the estimatedstandard deviations. It is important to stress that validation is stillnecessary for each plant specie. Larger uncertainties in LIBS resultswere expected considering that the certified mass fractions were validfor test portions higher than 150 mg. The test portions ablated after 8
successive pulses represents approximately 360 μg, which is farbellow the recommended minimum sample mass in the certificates.
It is important to emphasize that strategies for improvement ofcoefficients of variation will be investigated. More appropriate LIBSsampling is expected if a large number of test portions are sampled, byusing, for example, an ablation chamber that samples the test portionsunder continuous movement. At moment, an alternative set up wasdesigned and is under evaluation in author's laboratory. In addition,sample presentation seems to be of key importance for improving thelaser interaction with pellets prepared from powdered materials withsimilar particle size distribution.
4. Conclusions
Existing biological certified reference materials can be used for thepreparation of pressed pellets in order to obtain LIBS calibrationcurves for the determination of Cu, Fe, Mn, Zn and B. The maindifficulty is that the certified values are based on sample masses of atleast 150 mg, which is much higher than the ablated test portion. Asthe test portion is quite small it is possible to see that the analyte isdistributed heterogeneously in the sample pellet. The coefficient ofvariation of the results (n=10, 8 pulses per test portion) varied from4to 30% depending on the analyte and on the reference material.
The proposed procedure is very simple and acid digestion wasavoided. Sample pellet is easily adapted in a compact ablationchamber. Measurements are made in each test portion in 1 s, andthe number of test portions depends on sample micro-heterogeneityand lens-to-sample distance arrangement. In principle, at least 10 testportions per pellet are needed per analysis, but an increase in thenumber of test portions, for example to 100, will certainly lower thevariance due to sampling in the pellet surface, and the samplethroughput will be approximately 30 per hour.
Notwithstanding, it is clear that an effort must be done for thedevelopment of more appropriate certified reference materials forbetter calibration towards microanalysis of plant materials. Particlesize distribution of CRM's and samples should also be taken intoconsideration. Even so, results indicate that LIBS can be an alternativeto the already existing recommended methods that do require asample decomposition step.
Improvements on sample presentation for LIBS analysis of plantmaterials is under investigation and includes evaluation of particlesize distribution, pellet porosity, grinding procedures, binder additionand surface analysis by scanning electronic microscopy.
Acknowledgment
The authors are thankful to Fundação de Amparo à Pesquisa doEstado de São Paulo (FAPESP, Process: 04/15965-2, 06/06466-8, 05/50773-0) and to Conselho Nacional de Desenvolvimento Científico eTecnológico (CNPq, Process: 477385/2006-0, 301285/2006-3) forfinancial support.
References
[1] K. Mengel, E.A. Kirkby, Principles of Plant Nutrition, 5th ed.Kluwer AcademicPublishers, Netherlands, 2001.
[2] E. Malavolta, G.C. Vitti, S.A. Oliveira, Avaliação do Estado Nutricional das Plantas.Princípios e Aplicações, POTAFOS, Piracicaba, 1997.
[3] L.C. Trevizan, D. Santos Junior, R.E. Samad, N.D. Vieira Junior, C.S. Nomura, L.C.Nunes, I.A. Rufini, F.J. Krug, Evaluation of laser induced breakdown spectroscopyfor the determination of macronutrients in plant materials, Spectrochim. Acta Part B63 (2008) 1151–1158.
[4] O. Samek, D.C.S. Beddows, H.H. Telle, G.W. Morris, M. Liska, J. Kaiser, Quantitativeanalysis of trace metal accumulation in teeth using laser-induced breakdownspectroscopy, Appl. Phys. A 69 (1999) S179–S182.
[5] O. Samek, D.C.S. Beddows, H.H. Telle, J. Kaiser, M. Liska, J.O. Cáceres, A. GonzálesUrena, Quantitative laser-induced breakdown spectroscopy analysis of calcifiedtissue samples, Spectrochim. Acta Part B 56 (2001) 865–875.
[6] Q. Sun, M. Tran, B.W. Smith, J.D. Winefordner, Zinc analysis in human skin by laserinduced-breakdown spectroscopy, Talanta 52 (2000) 293–300.
377L.C. Trevizan et al. / Spectrochimica Acta Part B 64 (2009) 369–377
[7] A. Assion, M. Wollenhaupt, L. Haag, F. Mayorov, C. Sarpe-Tudoran, M. Winter, U.Kutschera, T. Baumert, Femtosecond laser-induced-breakdown spectrometry forCa2+ analysis of biological samples with high spatial resolution, Appl. Phys. B 77(2003) 391–397.
[8] M. Corsi, G. Cristoforetti, M. Hidalgo, S. Legnaioli, V. Palleschi, A. Salvetti, E.Tognoni, C. Vallebona, Application of laser-induced breakdown spectroscopytechnique to hair tissue mineral analysis, Appl. Opt. 42 (2003) 6133–6137.
[9] A. Kumar, F.Y. Yueh, J.P. Singh, S. Burgess, Characterization of malignant tissue cellsby laser-induced breakdown spectroscopy, Appl. Opt. 43 (2004) 5399–5403.
[10] M. Baudelet, L. Guyon, J. Yu, J.P. Wolf, T. Amodeo, E. Fréjafon, Femtosecond time-resolved laser-induced breakdown spectroscopy for detection and identification ofbacteria: a comparison to the nanosecond regime, J. Appl. Phys. 99 (2006) 084701.
[11] A.A. Oraevsky, L.B. Da Silva, A.M. Rubenchik, M.D. Feit,M.E. Glinsky,M.D. Perry, B.M.Mammini,W. Small, B.C. Stuart, Plasmamediated ablation of biological tissueswithnanosecond-to-femtosecond laser pulses: relative role of linear and nonlinearabsorption, IEEE J. Sel. Top. Quantum Electron. 2 (1996) 801–809.
[12] O. Samek, J. Lambert, R. Hergenröder, M. Liska, J. Kaiser, K. Novotny, S. Kukhlevsky,Femtosecond laser spectrochemical analysis of plant samples, Laser Phys. Lett. 3(2006) 21–25.
[13] J. Kaiser, O. Samek, L. Reale, M. Liska, R. Malina, A. Ritucci, A. Poma, A. Tucci, F. Flora,A. Lai, L. Mancini, G. Tromba, F. Zanini, A. Faenov, T. Pikuz, G. Cinque, Monitoring ofthe heavy-metal hyperaccumulation in vegetal tissues by X-ray radiography andby femto-second laser induced breakdown spectroscopy, Microsc. Res. Tech. 70(2007) 147–153.
[14] M. Galiová, J. Kaiser, K. Novotny, O. Samek, L. Reale, R. Malina, K. Páleníková, M.Liska, V. Cudek, V. Kanicky, V. Otruba, A. Poma, A. Tucci, Utilization of laser inducedbreakdown spectroscopy for investigation of the metal accumulation in vegetaltissues, Spectrochim. Acta Part B 62 (2007) 1597–1605.
[15] V. Juvé, R. Portelli, M. Boueri, M. Baudelet, J. Yu, Space-resolved analysis of traceelements in fresh vegetables using ultraviolet nanosecond laser-induced break-down spectroscopy, Spectrochim. Acta Part B 63 (2008) 1047–1053.
[16] J. Kaiser, M. Galiová, K. Novotny, R. Cervenka, L. Reale, J. Novotny, M. Liska, O.Samek, V. Kanicky, A. Hrdlicka, K. Stejskal, V. Adam, R. Kizek, Mapping of lead,magnesium and cupper accumulation in plant tissues by laser-induced breakdownspectroscopy and laser-ablation inductively coupled plasma mass spectrometry,Spectrochim. Acta Part B 64 (2008) 67–73.
[17] D. Santos Jr., R.E. Samad, L.C. Trevizan, A.Z. Freitas, N.D. Vieira Jr., F.J. Krug,Evaluation of femtosecond laser-induced breakdown spectroscopy for analysis ofanimal tissues, Appl. Spectrosc. 62 (2008) 1137–1143.
[18] Q. Sun, M. Tran, B.W. Smith, J.D. Winefordner, Direct determination of P, Al, Ca, Cu,Mn, Zn, Mg and Fe in plant materials by laser-induced plasma spectroscopy, Can. J.Anal. Sci. Spectrosc. 44 (1999) 164–170.
[19] V.I. Babushok, F.C. DeLucia Jr., P.J. Dagdigian, A.W. Miziolek, Experimental andkinetic modeling study of the laser-induced breakdown spectroscopy plume frommetallic lead in argon, Spectrochim. Acta Part B 60 (2005) 926–934.
[20] E. Hoffmann, C. Lüdke, H. Scholze, Is laser-ablation-ICP-MS and alternative tosolution analysis of solid samples? Fresenius J. Anal. Chem. 359 (1997) 394–398.
[21] G.A. Georgalli, M.A. Reuter, A particle packing algorithm for pellet design with apredetermined size distribution, Powder Technol. 173 (2007) 189–199.
[22] M. Rossbach, E. Zeiller, Assessment of element-specific homogeneity in referencematerials using microanalytical techniques, Anal. Bioanal. Chem. 377 (2003)334–339.
[23] U. Panne, C. Haisch, M. Clara, R. Niessner, Analysis of glass and glass melts duringthe vitrification process of fly and bottom ashes by laser-induced plasmaspectroscopy. Part I: normalization and plasma diagnostic, Spectrochim. ActaPart B 53 (1998) 1957–1968.
[24] E. Hoffmann, C. Lüdke, J. Skole, H. Stephanowitz, E. Ullrich, D. Colditz, Spatialdetermination of elements in green leaves of oak trees (Quercus robur) by laserablation-ICP-MS, Fresenius J. Anal. Chem. 367 (2000) 579–585.
[25] T. Punshon, B.P. Jackson, P.M. Bertsch, J. Burger, Mass loading of nickel and uraniumon plant surfaces: application of laser ablation-ICP-MS, J. Environ. Monit. 6 (2004)153–159.
[26] I.B. Gornushkin, J.M. Anzano, L.A. King, B.W. Smith, N. Omenetto, J.D. Winefordner,Curve of growth methodology applied to laser-induced plasma emission spectro-scopy, Spectrochim. Acta Part B 54 (1999) 491–503.
[27] R. Fantoni, L. Caneve, F. Colao, L. Fornarini, V. Lazic, V. Spizzichino, Methodologiesfor laboratory laser induced breakdown spectroscopy semi-quantitative andquantitative analysis — a review, Spectrochim. Acta Part B 63 (2008) 1097–1108.
[28] A.S. Eppler, D.A. Cremers, D.D. Hickmott, M.J. Ferris, A.C. Koskelo, Matrix effects inthe detection of Pb and Ba in soils using laser-induced breakdown spectroscopy,Appl. Spectrosc. 50 (1996) 1175–1181.
[29] V. Lazic, R. Fantoni, F. Colao, A. Santagata, A. Morone, V. Spizzichino, Quantitativelaser induced breakdown spectroscopy analysis of ancient marble and correctionsfor the variability of plasma parameters and of ablation rate, J. Anal. At. Spectrom.19 (2004) 429–436.
[30] V. Lazic, R. Barbini, F. Colao, R. Fantoni, A. Palucci, Self-absorption model inquantitative laser induced breakdown spectroscopy measurements on soils andsediments, Spectrochim. Acta Part B 56 (2000) 807–820.