Comparison of thermal behavior of natural and hot-washed sisal fibers based on their main...
17
Thermochimica Acta 581 (2014) 70–86 Contents lists available at ScienceDirect Thermochimica Acta j ourna l h omepage: www.elsevier.com/locate/tca Comparison of thermal behavior of natural and hot-washed sisal fibers based on their main components: Cellulose, xylan and lignin. TG-FTIR analysis of volatile products Mónica Benítez-Guerrero a,∗ , Jorge López-Beceiro b , Pedro E. Sánchez-Jiménez c , José Pascual-Cosp a a Departamento de Ingeniería Civil, Materiales y Fabricación, Universidad de Málaga, Escuela de Ingenierías, C/ Dr. Ortiz Ramos s/n, Campus Teatinos, 29071 Málaga, Spain b Departamento de Ingeniería Industrial II, Escola Politécnica Superior, Universidade da Coru˜ na, Avda. Mendizábal, 15403 Ferrol, Spain c Instituto de Ciencia de Materiales de Sevilla, CSIC-Universidad de Sevilla, C/ Américo Vespucio 49, 41092 Sevilla, Spain a r t i c l e i n f o Article history: Received 5 November 2013 Received in revised form 12 February 2014 Accepted 17 February 2014 Available online 25 February 2014 Keywords: Sisal fiber Hot-water treatment Biomass components Gas evolution Pyrolysis Combustion a b s t r a c t This paper presents in a comprehensive way the thermal behavior of natural and hot-washed sisal fibers, based on the fundamental components of lignocellulosic materials: cellulose, xylan and lignin. The research highlights the influence exerted on the thermal stability of sisal fibers by other constituents such as non-cellulosic polysaccharides (NCP) and mineral matter. Thermal changes were investigated by thermal X-ray diffraction (TXRD), analyzing the crystallinity index (%Ic) of cellulosic samples, and by simultaneous thermogravimetric and differential thermal anal- ysis coupled with Fourier-transformed infrared spectrometry (TG/DTA-FTIR), which allowed to examine the evolution of the main volatile compounds evolved during the degradation under inert and oxidizing atmospheres. The work demonstrates the potential of this technique to elucidate different steps during the thermal decomposition of sisal, providing extensible results to other lignocellulosic fibers, through the analysis of the evolution of CO 2 , CO, H 2 O, CH 4 , acetic acid, formic acid, methanol, formaldehyde and 2-butanone, and comparing it with the volatile products from pyrolysis of the biomass components. The hydroxyacetaldehyde detected during pyrolysis of sisal is indicative of an alternative route to that of levoglucosan, generated during cellulose pyrolysis. Hot-washing at 75 ◦ C mostly extracts non-cellulosic components of low decomposition temperature, and reduces the range of temperature in which sisal decomposition occurs, causing a retard in the pyrol- ysis stage and increasing Tb NCP and Tb CEL , temperatures at the maximum mass loss rate of non-cellulosic polysaccharides and cellulose decompositions, respectively. However, enriching sisal fibers in cellulose produces a decrease of Tb CEL under an oxidizing atmosphere, and furthermore, a delay of the combustion process, displacing Tb COM to higher temperatures. The results and findings of the paper would help further understanding of thermal processes where Agave fibers are involved, as the decomposition of their composites. © 2014 Elsevier B.V. All rights reserved. 1. Introduction The large number and diversity of lignocellulosic products as well as plurality of their applications in many industrial sectors, implies the need to comprehensively know their thermal behavior, stability and degradation processes at elevated temperatures. ∗ Corresponding author. Tel.: +34 951952594; fax: +34 951952601. E-mail address: monica benitez [email protected] (M. Benítez-Guerrero). Pyrolysis studies of synthetic biomass, obtained by mixing its fundamental constituents, revealed that, in general, the overall degradation of biomass follows the principle of additivity [1,2]. However, different authors [3,4] show that interaction among the constituents exits, whereby the proportion of the pyrolysis prod- ucts differs from that of natural biomass. It has been demonstrated that the addition of extractives and mineral compounds to the fundamental biomass components [5–7], and the degree of crystallinity of cellulose [8], affect the pyrolysis process. The influence of extractives and mineral mat- ter on thermal decomposition of different lignocellulosic materials http://dx.doi.org/10.1016/j.tca.2014.02.013 0040-6031/© 2014 Elsevier B.V. All rights reserved.
-
Upload
independent -
Category
Documents
-
view
1 -
download
0
Transcript of Comparison of thermal behavior of natural and hot-washed sisal fibers based on their main...
CfiT
MJa
2b
c
a
ARRAA
KSHBGPC
1
wis
h0
Thermochimica Acta 581 (2014) 70–86
Contents lists available at ScienceDirect
Thermochimica Acta
j ourna l h omepage: www.elsev ier .com/ locate / tca
omparison of thermal behavior of natural and hot-washed sisalbers based on their main components: Cellulose, xylan and lignin.G-FTIR analysis of volatile products
ónica Benítez-Guerreroa,∗, Jorge López-Beceirob, Pedro E. Sánchez-Jiménezc,osé Pascual-Cospa
Departamento de Ingeniería Civil, Materiales y Fabricación, Universidad de Málaga, Escuela de Ingenierías, C/ Dr. Ortiz Ramos s/n, Campus Teatinos,9071 Málaga, SpainDepartamento de Ingeniería Industrial II, Escola Politécnica Superior, Universidade da Coruna, Avda. Mendizábal, 15403 Ferrol, SpainInstituto de Ciencia de Materiales de Sevilla, CSIC-Universidad de Sevilla, C/ Américo Vespucio 49, 41092 Sevilla, Spain
r t i c l e i n f o
rticle history:eceived 5 November 2013eceived in revised form 12 February 2014ccepted 17 February 2014vailable online 25 February 2014
eywords:isal fiberot-water treatmentiomass componentsas evolutionyrolysisombustion
a b s t r a c t
This paper presents in a comprehensive way the thermal behavior of natural and hot-washed sisalfibers, based on the fundamental components of lignocellulosic materials: cellulose, xylan and lignin.The research highlights the influence exerted on the thermal stability of sisal fibers by other constituentssuch as non-cellulosic polysaccharides (NCP) and mineral matter.
Thermal changes were investigated by thermal X-ray diffraction (TXRD), analyzing the crystallinityindex (%Ic) of cellulosic samples, and by simultaneous thermogravimetric and differential thermal anal-ysis coupled with Fourier-transformed infrared spectrometry (TG/DTA-FTIR), which allowed to examinethe evolution of the main volatile compounds evolved during the degradation under inert and oxidizingatmospheres. The work demonstrates the potential of this technique to elucidate different steps duringthe thermal decomposition of sisal, providing extensible results to other lignocellulosic fibers, throughthe analysis of the evolution of CO2, CO, H2O, CH4, acetic acid, formic acid, methanol, formaldehyde and2-butanone, and comparing it with the volatile products from pyrolysis of the biomass components. Thehydroxyacetaldehyde detected during pyrolysis of sisal is indicative of an alternative route to that oflevoglucosan, generated during cellulose pyrolysis.
Hot-washing at 75 ◦C mostly extracts non-cellulosic components of low decomposition temperature,and reduces the range of temperature in which sisal decomposition occurs, causing a retard in the pyrol-ysis stage and increasing TbNCP and TbCEL, temperatures at the maximum mass loss rate of non-cellulosic
polysaccharides and cellulose decompositions, respectively. However, enriching sisal fibers in celluloseproduces a decrease of TbCEL under an oxidizing atmosphere, and furthermore, a delay of the combustionprocess, displacing TbCOM to higher temperatures.The results and findings of the paper would help further understanding of thermal processes whereAgave fibers are involved, as the decomposition of their composites.
© 2014 Elsevier B.V. All rights reserved.
. Introduction
The large number and diversity of lignocellulosic products asell as plurality of their applications in many industrial sectors,
mplies the need to comprehensively know their thermal behavior,tability and degradation processes at elevated temperatures.
∗ Corresponding author. Tel.: +34 951952594; fax: +34 951952601.E-mail address: monica benitez [email protected] (M. Benítez-Guerrero).
ttp://dx.doi.org/10.1016/j.tca.2014.02.013040-6031/© 2014 Elsevier B.V. All rights reserved.
Pyrolysis studies of synthetic biomass, obtained by mixing itsfundamental constituents, revealed that, in general, the overalldegradation of biomass follows the principle of additivity [1,2].However, different authors [3,4] show that interaction among theconstituents exits, whereby the proportion of the pyrolysis prod-ucts differs from that of natural biomass.
It has been demonstrated that the addition of extractives and
mineral compounds to the fundamental biomass components[5–7], and the degree of crystallinity of cellulose [8], affect thepyrolysis process. The influence of extractives and mineral mat-ter on thermal decomposition of different lignocellulosic materials
rmoch
haaapgwtfec
fiidbpdotigpa
cmasplccmtpaTa
tittgltpcdtdht
ivtc
sfiatea
M. Benítez-Guerrero et al. / The
as been studied extensively [9–11]. Water washing is a simplend economical pretreatment, which has been used to removelkali metals from biomass, to avoid the toxicity of mists gener-ted by the combustion of biomass, so preventing accumulationroblems (deposition, corrosion, erosion, etc.) in combustion andasification plants, and also to improve process yields [12–14]. Hotashing process reduces the proportion of substances adhered to
he cell walls, removing organic compounds, as a hemicelluloseraction and other low molecular weight carbohydrates, and min-rals such as salts of alkali, alkaline earth and transition metalations.
In addition to the traditional purposes, the use of Agave speciesbers has spread to a variety of processes of interest in many
ndustrial sectors, due to their ease of cultivation, with high pro-uctivity and low cost associated, as well as their renewable andiodegradable character. Furthermore, their biomass componentroportion makes them suitable for processability and biofuel pro-uction [15,16]. In particular, Agave sisalana fiber or sisal fiber isne of the most widely used due to its good mechanical proper-ies, utilized in a great variety of traditional applications due tots hardness, coarseness and resistance to wear, which has gainedreat interest during the last decades in the manufacturing of com-osite materials, particularly as reinforcement of mortars, concretend polymeric matrices [17–19], as polypropylene [20–22].
Sisal fibers are mainly composed of cellulose and non-ellulosic polysaccharides (NCP): hemicellulose O-acetyl-(4-O-ethylglucurono)xylan [23] and pectins composed of rhamnose,
rabinose and uronic acid at a 2.3:1:3.3 ratio [24], along with amaller amount of lignin, whose molar ratio of constitutional units,-hydroxyl phenol (H), guaiacyl (G) and syringyl (S), has been estab-
ished in 2% H, 22% G and 76% S [25]. Furthermore, the fiber isonstituted by a lower proportion of extractives, such as lipophilicomponents [26], simple phenolic derivatives and mineral matter,ainly represented by calcium oxalate deposits located between
he elementary fibers comprising the fiber bundle [27]. The com-osition of sisal, as any natural fiber, varies depending on the origin,ge and extraction process of the components, among other factors.he compositional variability in terms of constituents is very larges can be deduced from different reviews [15,28,29].
There is a lot of information scattered in the literature about thehermal behavior of sisal fibers, but few studies have analyzed itn depth [30–32]. The extensive work recently published by Mar-in et al. [33] focuses on the thermal decomposition of sisal andhe main biocomponents extracted from the fiber itself. However,iven the complexity of thermal processes occurring in lignocellu-osic materials, the comparison of thermogravimetric stages withheir associated energy effects requires a detailed analysis, inter-reted through the analysis of the decomposition of pure biomassomponents, adding a new perspective that would allow for a betterefinition of the phenomena occurring. Furthermore, the evolu-ion of the thermal degradation products of sisal fibers is poorlyescribed. Only the liquid fraction released during fast pyrolysisas been characterized [34], there being a lack of information abouthe gaseous products emitted.
The thermogravimetry coupled with Fourier-transformednfrared spectroscopy (TG-FTIR) technique has been proved to be aaluable and simple tool, not only to analyze the gas phase duringhe thermolysis of lignocellulosic compounds [35–37], but also tolarify different steps during fiber decomposition.
This paper aims to analyze and present in a comprehen-ive way the thermal behavior of natural and hot washed sisalbers, discussing their thermogravimetric and differential thermal
nalysis (TG-DTA) on the basis of the degradation of fundamen-al components, cellulose, lignin and xylan, and comparing thevolution of the gas phase decomposition products by TG-FTIRnalysis.imica Acta 581 (2014) 70–86 71
2. Materials and methods
The sisal fibers used in this work were provided by CayetanoGarcía del Moral S. L. (Cabra de Santo Cristo, Jaén, Spain). They werecut to 2–4 mm length and then subjected to a washing process withstirring in hot water at 75 ◦C for 2 h. Hereinafter the samples will bereferred to as natural sisal and washed sisal. Microcrystalline cel-lulose powder (Aldrich), alkali low sulfonate content lignin (SigmaAldrich) and birch xylan (xylose ≥ 90%, Aldrich) were used as rep-resentatives of the main biomass components.
X-ray diffraction (XRD) measurements were performed in aPhilips X ıPert PRO MPD, with a X ıCelerator real time multiple stripRTMS system. Thermodiffraction was performed in Helium atmo-sphere at temperatures up to 400 ◦C, using a TTK450N chamberfor Aldrich cellulose and a one HTK1200N for natural sisal. Spectrawere acquired every 20 ◦C, each one was recorded for 50 min in the2� range from 5 to 45◦. Temperature was linearly changed betweenisotherms at 5 ◦C/min, and the stabilization time at each isothermwas 5 min. Data were analyzed employing X’Pert HighScore soft-ware. The crystallinity index, %Ic(XRD), was calculated at severaltemperatures using the equation proposed by Segal [38]:
%Ic(XRD) = 1 − Iam
Imax× 100
where Imax is the maximum intensity of the (0 0 2) lattice reflectionof cellulose Iˇ type, located at 2� between 22 and 23◦, and Iam is theintensity attributed to amorphous part, given at 2� between 18◦
and 19◦ for Iˇ cellulose.Thermogravimetric study was performed in a TA Instruments
STD 2960 simultaneous thermal analyzer. The experimental setupconsisted of a 10 ◦C/min linear heating program from 20 to 750 ◦C,with flow rates of 50 and 120 mL/min, both in air and in nitrogen.The gases released were immediately analyzed in a Bruker VECTOR22 infrared spectrometer, coupled to the outlet port of the SDT. Thetransfer line and the cell were kept to a temperature of 200 ◦C. Thespectrum of the evolved gas was recorded every 61 seconds, andconsists of an average of 64 scans with a resolution of 4 cm−1 in therange from 4000 to 500 cm−1. Spectra were analyzed using BrukerOPUS 5.5 software, being baseline-corrected by a concave rubberband algorithm computed with 10 iterations on 64 points.
Ashes from the combustion of natural and washed sisal fiberswere semi quantitatively analyzed by X-ray fluorescence, using aPANalytical AXIOS spectrometer.
3. Results and discussion
3.1. Evolution of the crystallinity index of cellulose and sisal
The diffraction patterns at different temperatures of microcrys-talline cellulose and natural sisal are shown in Fig. 1. At roomtemperature, cellulose clearly presents reflections around 2� = 15,16.5, 20.5, 22.5 and 34.5◦, corresponding respectively to the planes(1 0 1), (1 0 1), (0 2 1), (0 0 2) and (0 4 0) of Iˇ type allomorph,while sisal fiber only exhibits the main (0 0 2) peak, and a con-volution of (1 0 1)–(1 0 1), reflections, which are superimposed tocalcium oxalate hydrate Ca(COO)2·H2O ones (pattern 20-0231 ofthe Joint Committee on Powder Diffraction Standards – Interna-tional Center for Diffraction Data, JCPDS – ICDD). For both, it isobserved that the intensity of reflections decreases with increas-ing temperature, shifting the diffraction peaks toward a greaterspacing. It can be explained due to the progressive deteriorationof cellulose crystal lattice, until the structure becomes completely
amorphous, observed before 310 ◦C. Furthermore, the constitutiveminerals of sisal fiber experiment transformations with increasingtemperature, generating stable crystalline compounds under inertatmosphere.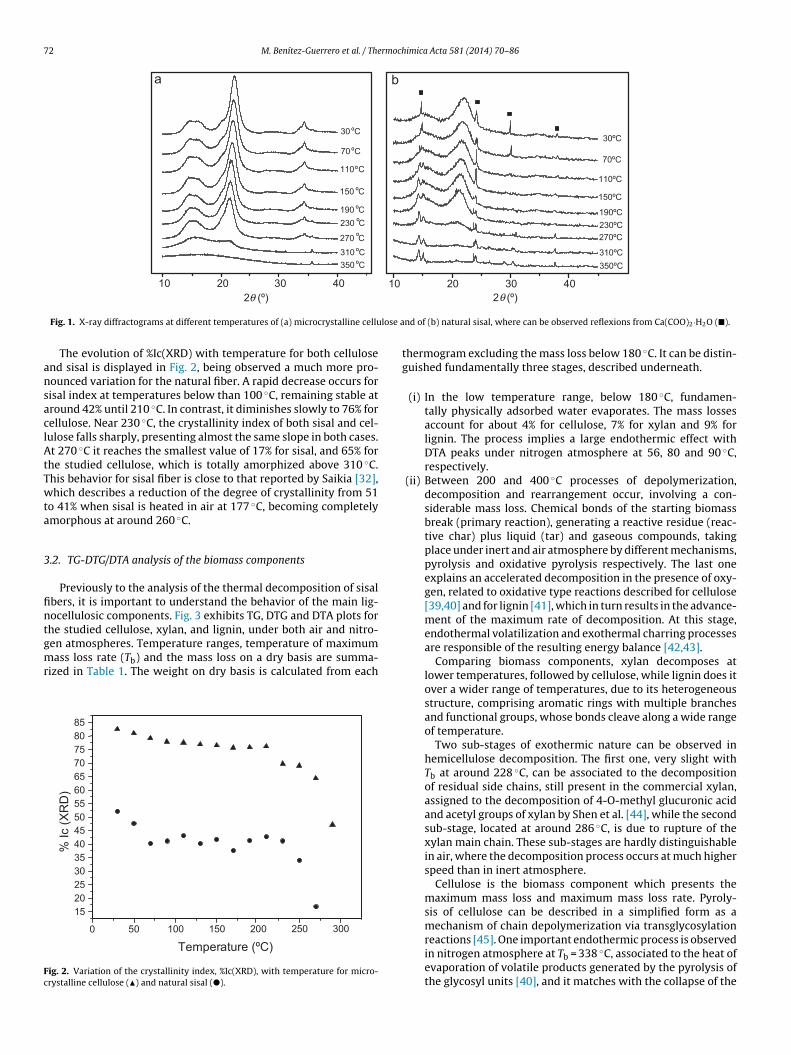
72 M. Benítez-Guerrero et al. / Thermochimica Acta 581 (2014) 70–86
a b
lose a
ansaclAtTwta
3
fintgmr
Fc
θ
Fig. 1. X-ray diffractograms at different temperatures of (a) microcrystalline cellu
The evolution of %Ic(XRD) with temperature for both cellulosend sisal is displayed in Fig. 2, being observed a much more pro-ounced variation for the natural fiber. A rapid decrease occurs forisal index at temperatures below than 100 ◦C, remaining stable atround 42% until 210 ◦C. In contrast, it diminishes slowly to 76% forellulose. Near 230 ◦C, the crystallinity index of both sisal and cel-ulose falls sharply, presenting almost the same slope in both cases.t 270 ◦C it reaches the smallest value of 17% for sisal, and 65% for
he studied cellulose, which is totally amorphized above 310 ◦C.his behavior for sisal fiber is close to that reported by Saikia [32],hich describes a reduction of the degree of crystallinity from 51
o 41% when sisal is heated in air at 177 ◦C, becoming completelymorphous at around 260 ◦C.
.2. TG-DTG/DTA analysis of the biomass components
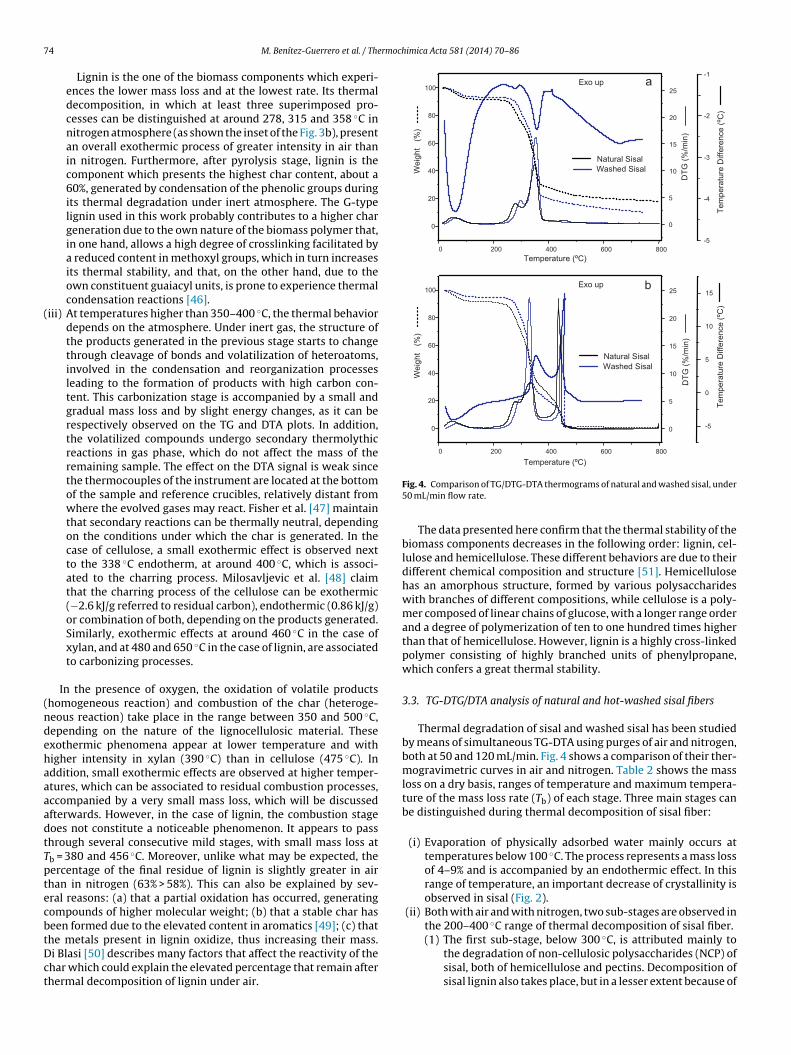
Previously to the analysis of the thermal decomposition of sisalbers, it is important to understand the behavior of the main lig-ocellulosic components. Fig. 3 exhibits TG, DTG and DTA plots forhe studied cellulose, xylan, and lignin, under both air and nitro-
en atmospheres. Temperature ranges, temperature of maximumass loss rate (Tb) and the mass loss on a dry basis are summa-ized in Table 1. The weight on dry basis is calculated from each
ig. 2. Variation of the crystallinity index, %Ic(XRD), with temperature for micro-rystalline cellulose (�) and natural sisal (�).
θ
nd of (b) natural sisal, where can be observed reflexions from Ca(COO)2·H2O (�).
thermogram excluding the mass loss below 180 ◦C. It can be distin-guished fundamentally three stages, described underneath.
(i) In the low temperature range, below 180 ◦C, fundamen-tally physically adsorbed water evaporates. The mass lossesaccount for about 4% for cellulose, 7% for xylan and 9% forlignin. The process implies a large endothermic effect withDTA peaks under nitrogen atmosphere at 56, 80 and 90 ◦C,respectively.
(ii) Between 200 and 400 ◦C processes of depolymerization,decomposition and rearrangement occur, involving a con-siderable mass loss. Chemical bonds of the starting biomassbreak (primary reaction), generating a reactive residue (reac-tive char) plus liquid (tar) and gaseous compounds, takingplace under inert and air atmosphere by different mechanisms,pyrolysis and oxidative pyrolysis respectively. The last oneexplains an accelerated decomposition in the presence of oxy-gen, related to oxidative type reactions described for cellulose[39,40] and for lignin [41], which in turn results in the advance-ment of the maximum rate of decomposition. At this stage,endothermal volatilization and exothermal charring processesare responsible of the resulting energy balance [42,43].
Comparing biomass components, xylan decomposes atlower temperatures, followed by cellulose, while lignin does itover a wider range of temperatures, due to its heterogeneousstructure, comprising aromatic rings with multiple branchesand functional groups, whose bonds cleave along a wide rangeof temperature.
Two sub-stages of exothermic nature can be observed inhemicellulose decomposition. The first one, very slight withTb at around 228 ◦C, can be associated to the decompositionof residual side chains, still present in the commercial xylan,assigned to the decomposition of 4-O-methyl glucuronic acidand acetyl groups of xylan by Shen et al. [44], while the secondsub-stage, located at around 286 ◦C, is due to rupture of thexylan main chain. These sub-stages are hardly distinguishablein air, where the decomposition process occurs at much higherspeed than in inert atmosphere.
Cellulose is the biomass component which presents themaximum mass loss and maximum mass loss rate. Pyroly-sis of cellulose can be described in a simplified form as amechanism of chain depolymerization via transglycosylation
reactions [45]. One important endothermic process is observedin nitrogen atmosphere at Tb = 338 ◦C, associated to the heat ofevaporation of volatile products generated by the pyrolysis ofthe glycosyl units [40], and it matches with the collapse of the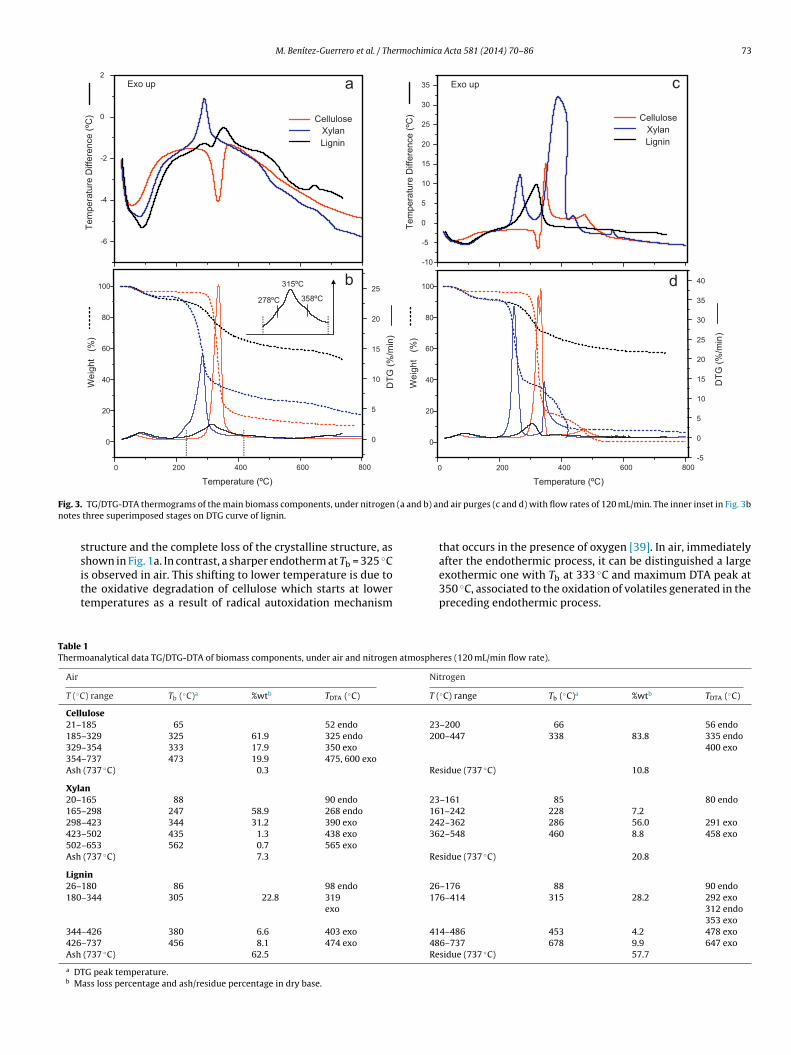
M. Benítez-Guerrero et al. / Thermochimica Acta 581 (2014) 70–86 73
F (a ann
TT
ig. 3. TG/DTG-DTA thermograms of the main biomass components, under nitrogenotes three superimposed stages on DTG curve of lignin.
structure and the complete loss of the crystalline structure, asshown in Fig. 1a. In contrast, a sharper endotherm at Tb = 325 ◦C
is observed in air. This shifting to lower temperature is due tothe oxidative degradation of cellulose which starts at lowertemperatures as a result of radical autoxidation mechanismable 1hermoanalytical data TG/DTG-DTA of biomass components, under air and nitrogen atmo
Air
T (◦C) range Tb (◦C)a %wtb TDTA (◦C)
Cellulose21–185 65 52 endo
185–329 325 61.9 325 endo329–354 333 17.9 350 exo
354–737 473 19.9 475, 600 exoAsh (737 ◦C) 0.3
Xylan20–165 88 90 endo
165–298 247 58.9 268 endo
298–423 344 31.2 390 exo
423–502 435 1.3 438 exo
502–653 562 0.7 565 exoAsh (737 ◦C) 7.3
Lignin26–180 86 98 endo
180–344 305 22.8 319exo
344–426 380 6.6 403 exo
426–737 456 8.1 474 exo
Ash (737 ◦C) 62.5
a DTG peak temperature.b Mass loss percentage and ash/residue percentage in dry base.
d b) and air purges (c and d) with flow rates of 120 mL/min. The inner inset in Fig. 3b
that occurs in the presence of oxygen [39]. In air, immediatelyafter the endothermic process, it can be distinguished a large
exothermic one with Tb at 333 ◦C and maximum DTA peak at350 ◦C, associated to the oxidation of volatiles generated in thepreceding endothermic process.spheres (120 mL/min flow rate).
Nitrogen
T (◦C) range Tb (◦C)a %wtb TDTA (◦C)
23–200 66 56 endo200–447 338 83.8 335 endo
400 exo
Residue (737 ◦C) 10.8
23–161 85 80 endo161–242 228 7.2242–362 286 56.0 291 exo362–548 460 8.8 458 exo
Residue (737 ◦C) 20.8
26–176 88 90 endo176–414 315 28.2 292 exo
312 endo353 exo
414–486 453 4.2 478 exo486–737 678 9.9 647 exoResidue (737 ◦C) 57.7
7 rmochimica Acta 581 (2014) 70–86
(
(ndehaaaadtTptecbtDct
4 M. Benítez-Guerrero et al. / The
Lignin is the one of the biomass components which experi-ences the lower mass loss and at the lowest rate. Its thermaldecomposition, in which at least three superimposed pro-cesses can be distinguished at around 278, 315 and 358 ◦C innitrogen atmosphere (as shown the inset of the Fig. 3b), presentan overall exothermic process of greater intensity in air thanin nitrogen. Furthermore, after pyrolysis stage, lignin is thecomponent which presents the highest char content, about a60%, generated by condensation of the phenolic groups duringits thermal degradation under inert atmosphere. The G-typelignin used in this work probably contributes to a higher chargeneration due to the own nature of the biomass polymer that,in one hand, allows a high degree of crosslinking facilitated bya reduced content in methoxyl groups, which in turn increasesits thermal stability, and that, on the other hand, due to theown constituent guaiacyl units, is prone to experience thermalcondensation reactions [46].
iii) At temperatures higher than 350–400 ◦C, the thermal behaviordepends on the atmosphere. Under inert gas, the structure ofthe products generated in the previous stage starts to changethrough cleavage of bonds and volatilization of heteroatoms,involved in the condensation and reorganization processesleading to the formation of products with high carbon con-tent. This carbonization stage is accompanied by a small andgradual mass loss and by slight energy changes, as it can berespectively observed on the TG and DTA plots. In addition,the volatilized compounds undergo secondary thermolythicreactions in gas phase, which do not affect the mass of theremaining sample. The effect on the DTA signal is weak sincethe thermocouples of the instrument are located at the bottomof the sample and reference crucibles, relatively distant fromwhere the evolved gases may react. Fisher et al. [47] maintainthat secondary reactions can be thermally neutral, dependingon the conditions under which the char is generated. In thecase of cellulose, a small exothermic effect is observed nextto the 338 ◦C endotherm, at around 400 ◦C, which is associ-ated to the charring process. Milosavljevic et al. [48] claimthat the charring process of the cellulose can be exothermic(−2.6 kJ/g referred to residual carbon), endothermic (0.86 kJ/g)or combination of both, depending on the products generated.Similarly, exothermic effects at around 460 ◦C in the case ofxylan, and at 480 and 650 ◦C in the case of lignin, are associatedto carbonizing processes.
In the presence of oxygen, the oxidation of volatile productshomogeneous reaction) and combustion of the char (heteroge-eous reaction) take place in the range between 350 and 500 ◦C,epending on the nature of the lignocellulosic material. Thesexothermic phenomena appear at lower temperature and withigher intensity in xylan (390 ◦C) than in cellulose (475 ◦C). Inddition, small exothermic effects are observed at higher temper-tures, which can be associated to residual combustion processes,ccompanied by a very small mass loss, which will be discussedfterwards. However, in the case of lignin, the combustion stageoes not constitute a noticeable phenomenon. It appears to passhrough several consecutive mild stages, with small mass loss atb = 380 and 456 ◦C. Moreover, unlike what may be expected, theercentage of the final residue of lignin is slightly greater in airhan in nitrogen (63% > 58%). This can also be explained by sev-ral reasons: (a) that a partial oxidation has occurred, generatingompounds of higher molecular weight; (b) that a stable char haseen formed due to the elevated content in aromatics [49]; (c) that
he metals present in lignin oxidize, thus increasing their mass.i Blasi [50] describes many factors that affect the reactivity of thehar which could explain the elevated percentage that remain afterhermal decomposition of lignin under air.Fig. 4. Comparison of TG/DTG-DTA thermograms of natural and washed sisal, under50 mL/min flow rate.
The data presented here confirm that the thermal stability of thebiomass components decreases in the following order: lignin, cel-lulose and hemicellulose. These different behaviors are due to theirdifferent chemical composition and structure [51]. Hemicellulosehas an amorphous structure, formed by various polysaccharideswith branches of different compositions, while cellulose is a poly-mer composed of linear chains of glucose, with a longer range orderand a degree of polymerization of ten to one hundred times higherthan that of hemicellulose. However, lignin is a highly cross-linkedpolymer consisting of highly branched units of phenylpropane,which confers a great thermal stability.
3.3. TG-DTG/DTA analysis of natural and hot-washed sisal fibers
Thermal degradation of sisal and washed sisal has been studiedby means of simultaneous TG-DTA using purges of air and nitrogen,both at 50 and 120 mL/min. Fig. 4 shows a comparison of their ther-mogravimetric curves in air and nitrogen. Table 2 shows the massloss on a dry basis, ranges of temperature and maximum tempera-ture of the mass loss rate (Tb) of each stage. Three main stages canbe distinguished during thermal decomposition of sisal fiber:
(i) Evaporation of physically adsorbed water mainly occurs attemperatures below 100 ◦C. The process represents a mass lossof 4–9% and is accompanied by an endothermic effect. In thisrange of temperature, an important decrease of crystallinity isobserved in sisal (Fig. 2).
(ii) Both with air and with nitrogen, two sub-stages are observed inthe 200–400 ◦C range of thermal decomposition of sisal fiber.
◦
(1) The first sub-stage, below 300 C, is attributed mainly tothe degradation of non-cellulosic polysaccharides (NCP) ofsisal, both of hemicellulose and pectins. Decomposition ofsisal lignin also takes place, but in a lesser extent because of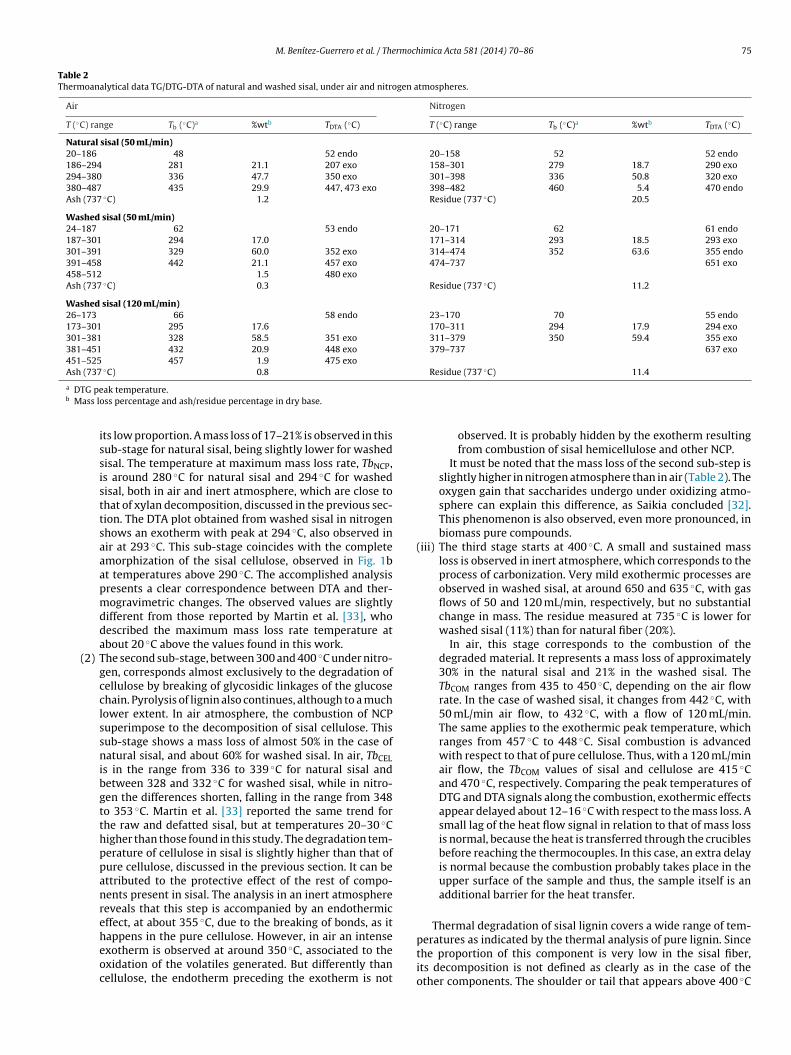
M. Benítez-Guerrero et al. / Thermochimica Acta 581 (2014) 70–86 75
Table 2Thermoanalytical data TG/DTG-DTA of natural and washed sisal, under air and nitrogen atmospheres.
Air Nitrogen
T (◦C) range Tb (◦C)a %wtb TDTA (◦C) T (◦C) range Tb (◦C)a %wtb TDTA (◦C)
Natural sisal (50 mL/min)20–186 48 52 endo 20–158 52 52 endo186–294 281 21.1 207 exo 158–301 279 18.7 290 exo294–380 336 47.7 350 exo 301–398 336 50.8 320 exo380–487 435 29.9 447, 473 exo 398–482 460 5.4 470 endoAsh (737 ◦C) 1.2 Residue (737 ◦C) 20.5
Washed sisal (50 mL/min)24–187 62 53 endo 20–171 62 61 endo187–301 294 17.0 171–314 293 18.5 293 exo301–391 329 60.0 352 exo 314–474 352 63.6 355 endo391–458 442 21.1 457 exo 474–737 651 exo458–512 1.5 480 exoAsh (737 ◦C) 0.3 Residue (737 ◦C) 11.2
Washed sisal (120 mL/min)26–173 66 58 endo 23–170 70 55 endo173–301 295 17.6 170–311 294 17.9 294 exo301–381 328 58.5 351 exo 311–379 350 59.4 355 exo381–451 432 20.9 448 exo 379–737 637 exo451–525 457 1.9 475 exoAsh (737 ◦C) 0.8 Residue (737 ◦C) 11.4
a DTG peak temperature.b Mass loss percentage and ash/residue percentage in dry base.
its low proportion. A mass loss of 17–21% is observed in thissub-stage for natural sisal, being slightly lower for washedsisal. The temperature at maximum mass loss rate, TbNCP,is around 280 ◦C for natural sisal and 294 ◦C for washedsisal, both in air and inert atmosphere, which are close tothat of xylan decomposition, discussed in the previous sec-tion. The DTA plot obtained from washed sisal in nitrogenshows an exotherm with peak at 294 ◦C, also observed inair at 293 ◦C. This sub-stage coincides with the completeamorphization of the sisal cellulose, observed in Fig. 1bat temperatures above 290 ◦C. The accomplished analysispresents a clear correspondence between DTA and ther-mogravimetric changes. The observed values are slightlydifferent from those reported by Martin et al. [33], whodescribed the maximum mass loss rate temperature atabout 20 ◦C above the values found in this work.
(2) The second sub-stage, between 300 and 400 ◦C under nitro-gen, corresponds almost exclusively to the degradation ofcellulose by breaking of glycosidic linkages of the glucosechain. Pyrolysis of lignin also continues, although to a muchlower extent. In air atmosphere, the combustion of NCPsuperimpose to the decomposition of sisal cellulose. Thissub-stage shows a mass loss of almost 50% in the case ofnatural sisal, and about 60% for washed sisal. In air, TbCELis in the range from 336 to 339 ◦C for natural sisal andbetween 328 and 332 ◦C for washed sisal, while in nitro-gen the differences shorten, falling in the range from 348to 353 ◦C. Martin et al. [33] reported the same trend forthe raw and defatted sisal, but at temperatures 20–30 ◦Chigher than those found in this study. The degradation tem-perature of cellulose in sisal is slightly higher than that ofpure cellulose, discussed in the previous section. It can beattributed to the protective effect of the rest of compo-nents present in sisal. The analysis in an inert atmospherereveals that this step is accompanied by an endothermiceffect, at about 355 ◦C, due to the breaking of bonds, as it
happens in the pure cellulose. However, in air an intenseexotherm is observed at around 350 ◦C, associated to theoxidation of the volatiles generated. But differently thancellulose, the endotherm preceding the exotherm is notobserved. It is probably hidden by the exotherm resultingfrom combustion of sisal hemicellulose and other NCP.
It must be noted that the mass loss of the second sub-step isslightly higher in nitrogen atmosphere than in air (Table 2). Theoxygen gain that saccharides undergo under oxidizing atmo-sphere can explain this difference, as Saikia concluded [32].This phenomenon is also observed, even more pronounced, inbiomass pure compounds.
(iii) The third stage starts at 400 ◦C. A small and sustained massloss is observed in inert atmosphere, which corresponds to theprocess of carbonization. Very mild exothermic processes areobserved in washed sisal, at around 650 and 635 ◦C, with gasflows of 50 and 120 mL/min, respectively, but no substantialchange in mass. The residue measured at 735 ◦C is lower forwashed sisal (11%) than for natural fiber (20%).
In air, this stage corresponds to the combustion of thedegraded material. It represents a mass loss of approximately30% in the natural sisal and 21% in the washed sisal. TheTbCOM ranges from 435 to 450 ◦C, depending on the air flowrate. In the case of washed sisal, it changes from 442 ◦C, with50 mL/min air flow, to 432 ◦C, with a flow of 120 mL/min.The same applies to the exothermic peak temperature, whichranges from 457 ◦C to 448 ◦C. Sisal combustion is advancedwith respect to that of pure cellulose. Thus, with a 120 mL/minair flow, the TbCOM values of sisal and cellulose are 415 ◦Cand 470 ◦C, respectively. Comparing the peak temperatures ofDTG and DTA signals along the combustion, exothermic effectsappear delayed about 12–16 ◦C with respect to the mass loss. Asmall lag of the heat flow signal in relation to that of mass lossis normal, because the heat is transferred through the cruciblesbefore reaching the thermocouples. In this case, an extra delayis normal because the combustion probably takes place in theupper surface of the sample and thus, the sample itself is anadditional barrier for the heat transfer.
Thermal degradation of sisal lignin covers a wide range of tem-
peratures as indicated by the thermal analysis of pure lignin. Sincethe proportion of this component is very low in the sisal fiber,its decomposition is not defined as clearly as in the case of theother components. The shoulder or tail that appears above 400 ◦C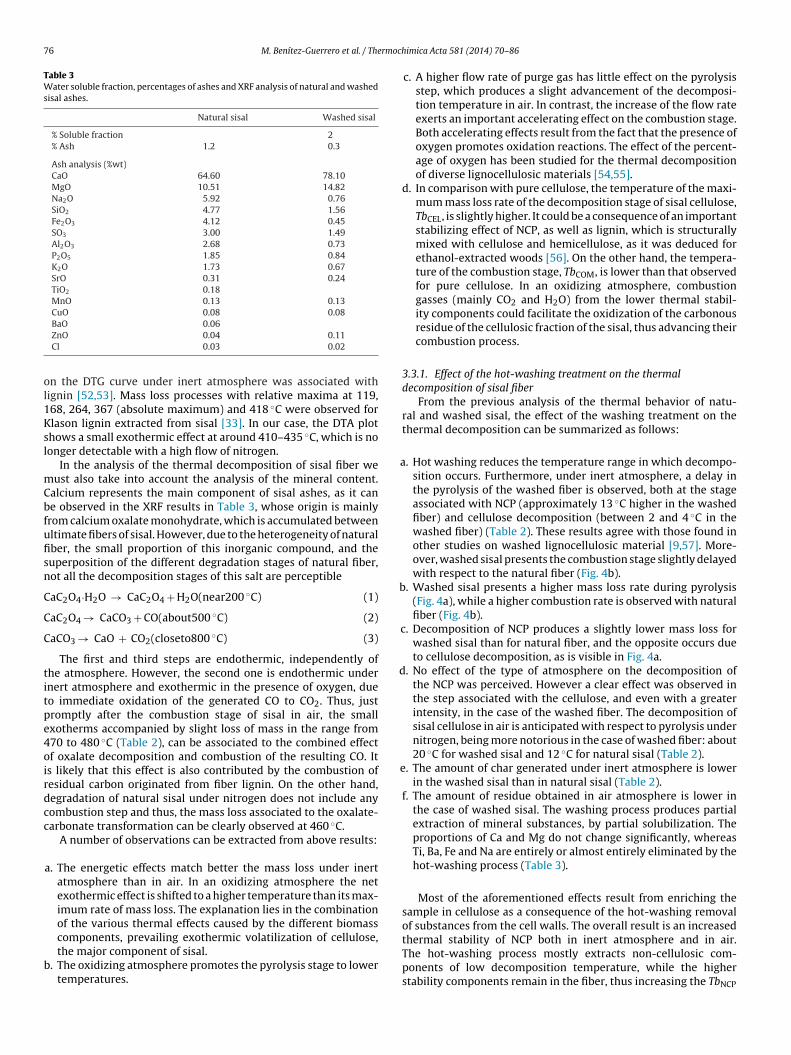
76 M. Benítez-Guerrero et al. / Thermoch
Table 3Water soluble fraction, percentages of ashes and XRF analysis of natural and washedsisal ashes.
Natural sisal Washed sisal
% Soluble fraction 2% Ash 1.2 0.3
Ash analysis (%wt)CaO 64.60 78.10MgO 10.51 14.82Na2O 5.92 0.76SiO2 4.77 1.56Fe2O3 4.12 0.45SO3 3.00 1.49Al2O3 2.68 0.73P2O5 1.85 0.84K2O 1.73 0.67SrO 0.31 0.24TiO2 0.18MnO 0.13 0.13CuO 0.08 0.08
ol1Ksl
mCbfufisn
C
C
C
titpe4oirdcc
b
a
b
c
d
e
BaO 0.06ZnO 0.04 0.11Cl 0.03 0.02
n the DTG curve under inert atmosphere was associated withignin [52,53]. Mass loss processes with relative maxima at 119,68, 264, 367 (absolute maximum) and 418 ◦C were observed forlason lignin extracted from sisal [33]. In our case, the DTA plothows a small exothermic effect at around 410–435 ◦C, which is noonger detectable with a high flow of nitrogen.
In the analysis of the thermal decomposition of sisal fiber weust also take into account the analysis of the mineral content.
alcium represents the main component of sisal ashes, as it cane observed in the XRF results in Table 3, whose origin is mainlyrom calcium oxalate monohydrate, which is accumulated betweenltimate fibers of sisal. However, due to the heterogeneity of naturalber, the small proportion of this inorganic compound, and theuperposition of the different degradation stages of natural fiber,ot all the decomposition stages of this salt are perceptible
aC2O4·H2O → CaC2O4 + H2O(near200 ◦C) (1)
aC2O4 → CaCO3 + CO(about500 ◦C) (2)
aCO3 → CaO + CO2(closeto800 ◦C) (3)
The first and third steps are endothermic, independently ofhe atmosphere. However, the second one is endothermic undernert atmosphere and exothermic in the presence of oxygen, dueo immediate oxidation of the generated CO to CO2. Thus, justromptly after the combustion stage of sisal in air, the smallxotherms accompanied by slight loss of mass in the range from70 to 480 ◦C (Table 2), can be associated to the combined effectf oxalate decomposition and combustion of the resulting CO. Its likely that this effect is also contributed by the combustion ofesidual carbon originated from fiber lignin. On the other hand,egradation of natural sisal under nitrogen does not include anyombustion step and thus, the mass loss associated to the oxalate-arbonate transformation can be clearly observed at 460 ◦C.
A number of observations can be extracted from above results:
a. The energetic effects match better the mass loss under inertatmosphere than in air. In an oxidizing atmosphere the netexothermic effect is shifted to a higher temperature than its max-imum rate of mass loss. The explanation lies in the combinationof the various thermal effects caused by the different biomass
components, prevailing exothermic volatilization of cellulose,the major component of sisal.. The oxidizing atmosphere promotes the pyrolysis stage to lowertemperatures.
imica Acta 581 (2014) 70–86
c. A higher flow rate of purge gas has little effect on the pyrolysisstep, which produces a slight advancement of the decomposi-tion temperature in air. In contrast, the increase of the flow rateexerts an important accelerating effect on the combustion stage.Both accelerating effects result from the fact that the presence ofoxygen promotes oxidation reactions. The effect of the percent-age of oxygen has been studied for the thermal decompositionof diverse lignocellulosic materials [54,55].
d. In comparison with pure cellulose, the temperature of the maxi-mum mass loss rate of the decomposition stage of sisal cellulose,TbCEL, is slightly higher. It could be a consequence of an importantstabilizing effect of NCP, as well as lignin, which is structurallymixed with cellulose and hemicellulose, as it was deduced forethanol-extracted woods [56]. On the other hand, the tempera-ture of the combustion stage, TbCOM, is lower than that observedfor pure cellulose. In an oxidizing atmosphere, combustiongasses (mainly CO2 and H2O) from the lower thermal stabil-ity components could facilitate the oxidization of the carbonousresidue of the cellulosic fraction of the sisal, thus advancing theircombustion process.
3.3.1. Effect of the hot-washing treatment on the thermaldecomposition of sisal fiber
From the previous analysis of the thermal behavior of natu-ral and washed sisal, the effect of the washing treatment on thethermal decomposition can be summarized as follows:
. Hot washing reduces the temperature range in which decompo-sition occurs. Furthermore, under inert atmosphere, a delay inthe pyrolysis of the washed fiber is observed, both at the stageassociated with NCP (approximately 13 ◦C higher in the washedfiber) and cellulose decomposition (between 2 and 4 ◦C in thewashed fiber) (Table 2). These results agree with those found inother studies on washed lignocellulosic material [9,57]. More-over, washed sisal presents the combustion stage slightly delayedwith respect to the natural fiber (Fig. 4b).
. Washed sisal presents a higher mass loss rate during pyrolysis(Fig. 4a), while a higher combustion rate is observed with naturalfiber (Fig. 4b).
. Decomposition of NCP produces a slightly lower mass loss forwashed sisal than for natural fiber, and the opposite occurs dueto cellulose decomposition, as is visible in Fig. 4a.
. No effect of the type of atmosphere on the decomposition ofthe NCP was perceived. However a clear effect was observed inthe step associated with the cellulose, and even with a greaterintensity, in the case of the washed fiber. The decomposition ofsisal cellulose in air is anticipated with respect to pyrolysis undernitrogen, being more notorious in the case of washed fiber: about20 ◦C for washed sisal and 12 ◦C for natural sisal (Table 2).
. The amount of char generated under inert atmosphere is lowerin the washed sisal than in natural sisal (Table 2).
f. The amount of residue obtained in air atmosphere is lower inthe case of washed sisal. The washing process produces partialextraction of mineral substances, by partial solubilization. Theproportions of Ca and Mg do not change significantly, whereasTi, Ba, Fe and Na are entirely or almost entirely eliminated by thehot-washing process (Table 3).
Most of the aforementioned effects result from enriching thesample in cellulose as a consequence of the hot-washing removalof substances from the cell walls. The overall result is an increased
thermal stability of NCP both in inert atmosphere and in air.The hot-washing process mostly extracts non-cellulosic com-ponents of low decomposition temperature, while the higherstability components remain in the fiber, thus increasing the TbNCP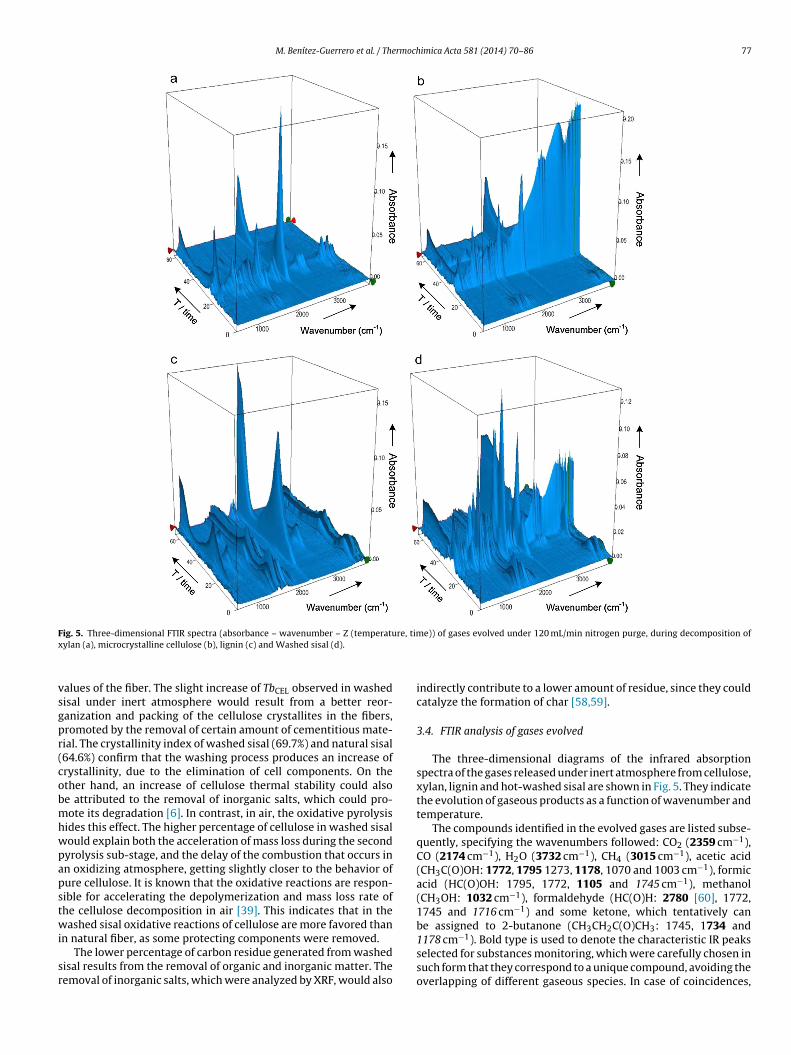
M. Benítez-Guerrero et al. / Thermochimica Acta 581 (2014) 70–86 77
F re, timx
vsgpr(cobmhwpapstwi
sr
ig. 5. Three-dimensional FTIR spectra (absorbance – wavenumber – Z (temperatuylan (a), microcrystalline cellulose (b), lignin (c) and Washed sisal (d).
alues of the fiber. The slight increase of TbCEL observed in washedisal under inert atmosphere would result from a better reor-anization and packing of the cellulose crystallites in the fibers,romoted by the removal of certain amount of cementitious mate-ial. The crystallinity index of washed sisal (69.7%) and natural sisal64.6%) confirm that the washing process produces an increase ofrystallinity, due to the elimination of cell components. On thether hand, an increase of cellulose thermal stability could alsoe attributed to the removal of inorganic salts, which could pro-ote its degradation [6]. In contrast, in air, the oxidative pyrolysis
ides this effect. The higher percentage of cellulose in washed sisalould explain both the acceleration of mass loss during the secondyrolysis sub-stage, and the delay of the combustion that occurs inn oxidizing atmosphere, getting slightly closer to the behavior ofure cellulose. It is known that the oxidative reactions are respon-ible for accelerating the depolymerization and mass loss rate ofhe cellulose decomposition in air [39]. This indicates that in theashed sisal oxidative reactions of cellulose are more favored than
n natural fiber, as some protecting components were removed.The lower percentage of carbon residue generated from washed
isal results from the removal of organic and inorganic matter. Theemoval of inorganic salts, which were analyzed by XRF, would also
e)) of gases evolved under 120 mL/min nitrogen purge, during decomposition of
indirectly contribute to a lower amount of residue, since they couldcatalyze the formation of char [58,59].
3.4. FTIR analysis of gases evolved
The three-dimensional diagrams of the infrared absorptionspectra of the gases released under inert atmosphere from cellulose,xylan, lignin and hot-washed sisal are shown in Fig. 5. They indicatethe evolution of gaseous products as a function of wavenumber andtemperature.
The compounds identified in the evolved gases are listed subse-quently, specifying the wavenumbers followed: CO2 (2359 cm−1),CO (2174 cm−1), H2O (3732 cm−1), CH4 (3015 cm−1), acetic acid(CH3C(O)OH: 1772, 1795 1273, 1178, 1070 and 1003 cm−1), formicacid (HC(O)OH: 1795, 1772, 1105 and 1745 cm−1), methanol(CH3OH: 1032 cm−1), formaldehyde (HC(O)H: 2780 [60], 1772,1745 and 1716 cm−1) and some ketone, which tentatively canbe assigned to 2-butanone (CH3CH2C(O)CH3: 1745, 1734 and
1178 cm−1). Bold type is used to denote the characteristic IR peaksselected for substances monitoring, which were carefully chosen insuch form that they correspond to a unique compound, avoiding theoverlapping of different gaseous species. In case of coincidences,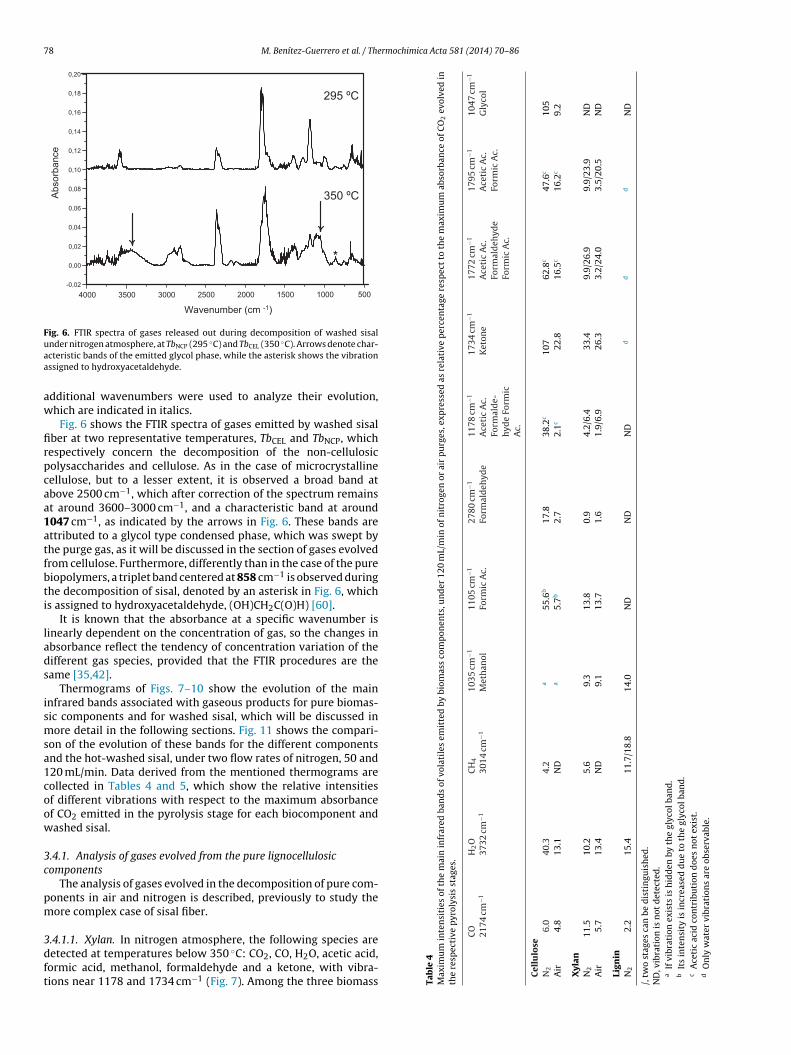
78 M. Benítez-Guerrero et al. / Thermochimica Acta 581 (2014) 70–86
Fig. 6. FTIR spectra of gases released out during decomposition of washed sisaluaa
aw
firpcaa1atfbti
lads
ismsa1coow
3c
pm
3dft
ten
siti
es
of
the
mai
n
infr
ared
ban
ds
of
vola
tile
s
emit
ted
by
biom
ass
com
pon
ents
, un
der
120
mL/
min
of
nit
roge
n
or
air
pu
rges
, exp
ress
ed
as
rela
tive
per
cen
tage
resp
ect
to
the
max
imu
m
abso
rban
ce
of
CO
2ev
olve
d
ine
pyr
olys
is
stag
es.
O 174
cm−1
H2O
3732
cm−1
CH
4
3014
cm−1
1035
cm−1
Met
han
ol11
05
cm−1
Form
ic
Ac.
2780
cm−1
Form
ald
ehyd
e11
78
cm−1
Ace
tic
Ac.
Form
ald
e-h
yde
Form
icA
c.
1734
cm−1
Ket
one
1772
cm−1
Ace
tic
Ac.
Form
ald
ehyd
eFo
rmic
Ac.
1795
cm−1
Ace
tic
Ac.
Form
ic
Ac.
1047
cm−1
Gly
col
6.0
40.3
4.2
a55
.6b
17.8
38.2
c10
7
62.8
c47
.6c
105
4.8
13.1
ND
a5.
7b2.
7
2.1c
22.8
16.5
c16
.2c
9.2
1.5
10.2
5.6
9.3
13.8
0.9
4.2/
6.4
33.4
9.9/
26.9
9.9/
23.9
ND
5.7
13.4
ND
9.1
13.7
1.6
1.9/
6.9
26.3
3.2/
24.0
3.5/
20.5
ND
2.2
15.4
11.7
/18.
8
14.0
ND
ND
ND
d
d
dN
D
can
be
dis
tin
guis
hed
.
is
not
det
ecte
d.
n
exis
ts
is
hid
den
by
the
glyc
ol
ban
d.
ity
is
incr
ease
d
du
e
to
the
glyc
ol
ban
d.
id
con
trib
uti
on
doe
s
not
exis
t.er
vibr
atio
ns
are
obse
rvab
le.
nder nitrogen atmosphere, at TbNCP (295 ◦C) and TbCEL (350 ◦C). Arrows denote char-cteristic bands of the emitted glycol phase, while the asterisk shows the vibrationssigned to hydroxyacetaldehyde.
dditional wavenumbers were used to analyze their evolution,hich are indicated in italics.
Fig. 6 shows the FTIR spectra of gases emitted by washed sisalber at two representative temperatures, TbCEL and TbNCP, whichespectively concern the decomposition of the non-cellulosicolysaccharides and cellulose. As in the case of microcrystallineellulose, but to a lesser extent, it is observed a broad band atbove 2500 cm−1, which after correction of the spectrum remainst around 3600–3000 cm−1, and a characteristic band at around047 cm−1, as indicated by the arrows in Fig. 6. These bands arettributed to a glycol type condensed phase, which was swept byhe purge gas, as it will be discussed in the section of gases evolvedrom cellulose. Furthermore, differently than in the case of the pureiopolymers, a triplet band centered at 858 cm−1 is observed duringhe decomposition of sisal, denoted by an asterisk in Fig. 6, whichs assigned to hydroxyacetaldehyde, (OH)CH2C(O)H) [60].
It is known that the absorbance at a specific wavenumber isinearly dependent on the concentration of gas, so the changes inbsorbance reflect the tendency of concentration variation of theifferent gas species, provided that the FTIR procedures are theame [35,42].
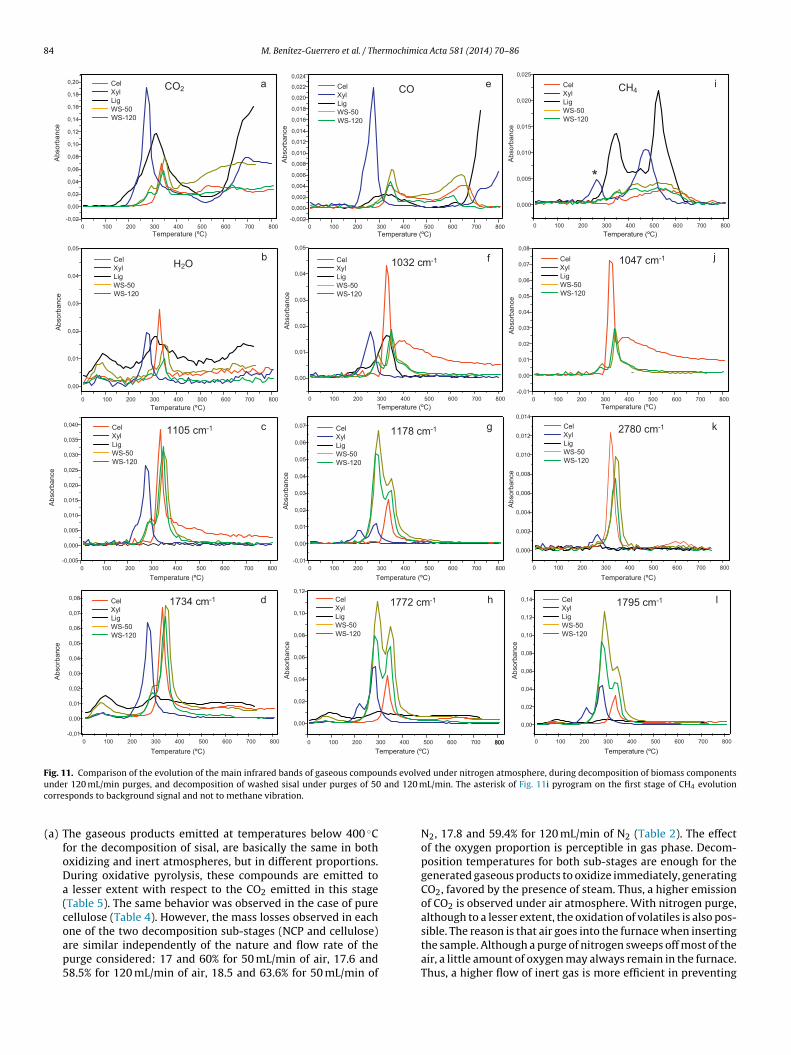
Thermograms of Figs. 7–10 show the evolution of the mainnfrared bands associated with gaseous products for pure biomas-ic components and for washed sisal, which will be discussed inore detail in the following sections. Fig. 11 shows the compari-
on of the evolution of these bands for the different componentsnd the hot-washed sisal, under two flow rates of nitrogen, 50 and20 mL/min. Data derived from the mentioned thermograms areollected in Tables 4 and 5, which show the relative intensitiesf different vibrations with respect to the maximum absorbancef CO2 emitted in the pyrolysis stage for each biocomponent andashed sisal.
.4.1. Analysis of gases evolved from the pure lignocellulosicomponents
The analysis of gases evolved in the decomposition of pure com-onents in air and nitrogen is described, previously to study theore complex case of sisal fiber.
.4.1.1. Xylan. In nitrogen atmosphere, the following species areetected at temperatures below 350 ◦C: CO2, CO, H2O, acetic acid,ormic acid, methanol, formaldehyde and a ketone, with vibra-ions near 1178 and 1734 cm−1 (Fig. 7). Among the three biomass Ta
ble
4M
axim
um
inth
e
resp
ecti
v C 2
Cel
lulo
seN
2
Air
Xyl
anN
21
Air
Lign
inN
2
/,
two
stag
es
ND
, vib
rati
ona
If
vibr
atio
bIt
s
inte
ns
cA
ceti
c
acd
On
ly
wat
M. Benítez-Guerrero et al. / Thermochimica Acta 581 (2014) 70–86 79
F omposD
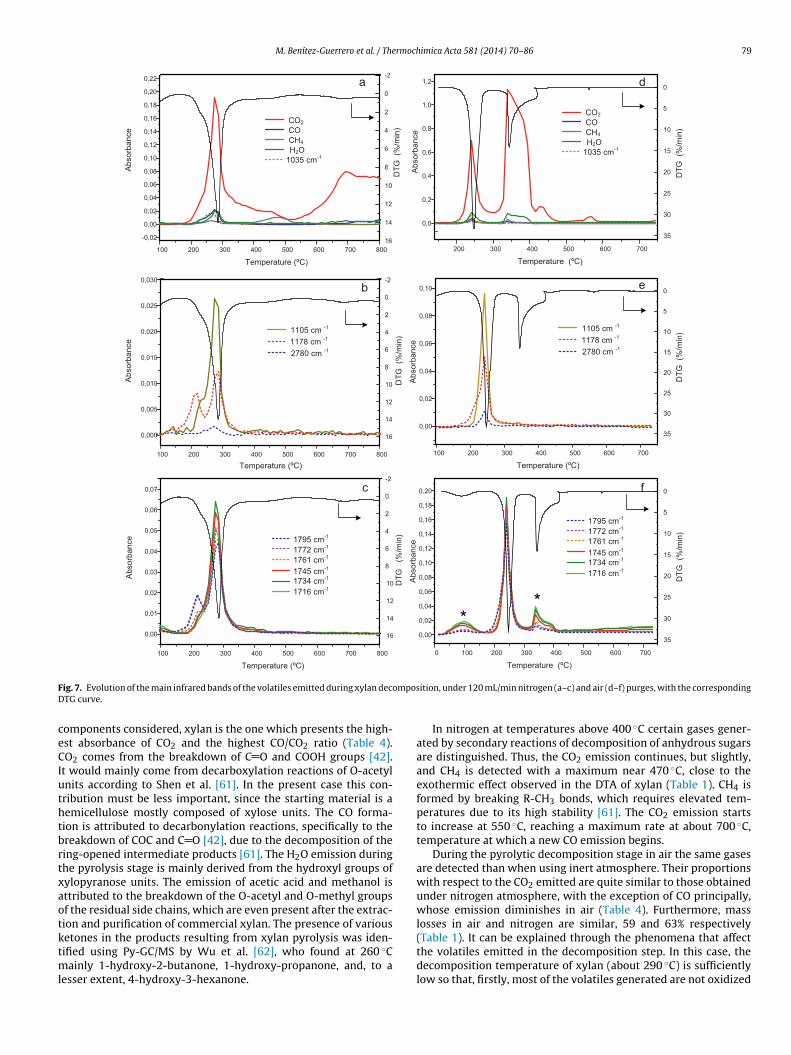
ceCIuthtbrtxaotktml
ig. 7. Evolution of the main infrared bands of the volatiles emitted during xylan decTG curve.
omponents considered, xylan is the one which presents the high-st absorbance of CO2 and the highest CO/CO2 ratio (Table 4).O2 comes from the breakdown of C O and COOH groups [42].
t would mainly come from decarboxylation reactions of O-acetylnits according to Shen et al. [61]. In the present case this con-ribution must be less important, since the starting material is aemicellulose mostly composed of xylose units. The CO forma-ion is attributed to decarbonylation reactions, specifically to thereakdown of COC and C O [42], due to the decomposition of theing-opened intermediate products [61]. The H2O emission duringhe pyrolysis stage is mainly derived from the hydroxyl groups ofylopyranose units. The emission of acetic acid and methanol isttributed to the breakdown of the O-acetyl and O-methyl groupsf the residual side chains, which are even present after the extrac-ion and purification of commercial xylan. The presence of various
etones in the products resulting from xylan pyrolysis was iden-ified using Py-GC/MS by Wu et al. [62], who found at 260 ◦Cainly 1-hydroxy-2-butanone, 1-hydroxy-propanone, and, to aesser extent, 4-hydroxy-3-hexanone.
ition, under 120 mL/min nitrogen (a–c) and air (d–f) purges, with the corresponding
In nitrogen at temperatures above 400 ◦C certain gases gener-ated by secondary reactions of decomposition of anhydrous sugarsare distinguished. Thus, the CO2 emission continues, but slightly,and CH4 is detected with a maximum near 470 ◦C, close to theexothermic effect observed in the DTA of xylan (Table 1). CH4 isformed by breaking R-CH3 bonds, which requires elevated tem-peratures due to its high stability [61]. The CO2 emission startsto increase at 550 ◦C, reaching a maximum rate at about 700 ◦C,temperature at which a new CO emission begins.
During the pyrolytic decomposition stage in air the same gasesare detected than when using inert atmosphere. Their proportionswith respect to the CO2 emitted are quite similar to those obtainedunder nitrogen atmosphere, with the exception of CO principally,whose emission diminishes in air (Table 4). Furthermore, masslosses in air and nitrogen are similar, 59 and 63% respectively
(Table 1). It can be explained through the phenomena that affectthe volatiles emitted in the decomposition step. In this case, thedecomposition temperature of xylan (about 290 ◦C) is sufficientlylow so that, firstly, most of the volatiles generated are not oxidized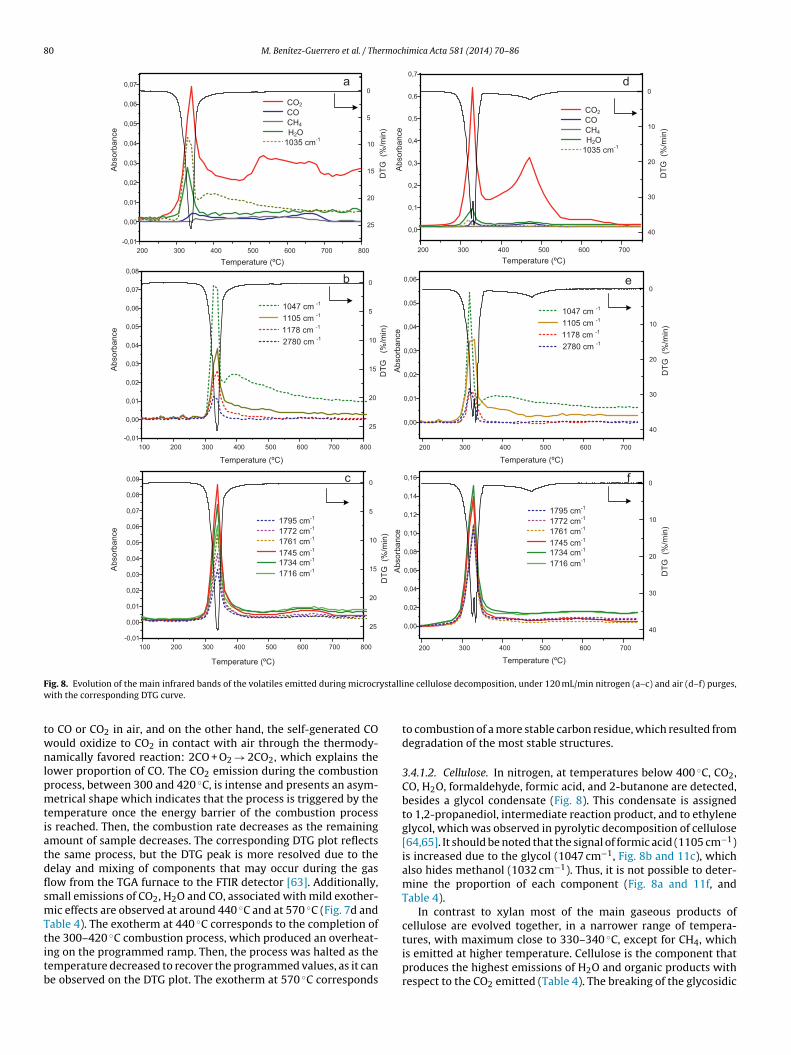
80 M. Benítez-Guerrero et al. / Thermochimica Acta 581 (2014) 70–86
F ystalliw
twnlpmtiatdflsmTtitb
ig. 8. Evolution of the main infrared bands of the volatiles emitted during microcrith the corresponding DTG curve.
o CO or CO2 in air, and on the other hand, the self-generated COould oxidize to CO2 in contact with air through the thermody-amically favored reaction: 2CO + O2 → 2CO2, which explains the
ower proportion of CO. The CO2 emission during the combustionrocess, between 300 and 420 ◦C, is intense and presents an asym-etrical shape which indicates that the process is triggered by the
emperature once the energy barrier of the combustion processs reached. Then, the combustion rate decreases as the remainingmount of sample decreases. The corresponding DTG plot reflectshe same process, but the DTG peak is more resolved due to theelay and mixing of components that may occur during the gasow from the TGA furnace to the FTIR detector [63]. Additionally,mall emissions of CO2, H2O and CO, associated with mild exother-ic effects are observed at around 440 ◦C and at 570 ◦C (Fig. 7d and
able 4). The exotherm at 440 ◦C corresponds to the completion of
he 300–420 ◦C combustion process, which produced an overheat-ng on the programmed ramp. Then, the process was halted as theemperature decreased to recover the programmed values, as it cane observed on the DTG plot. The exotherm at 570 ◦C correspondsne cellulose decomposition, under 120 mL/min nitrogen (a–c) and air (d–f) purges,
to combustion of a more stable carbon residue, which resulted fromdegradation of the most stable structures.
3.4.1.2. Cellulose. In nitrogen, at temperatures below 400 ◦C, CO2,CO, H2O, formaldehyde, formic acid, and 2-butanone are detected,besides a glycol condensate (Fig. 8). This condensate is assignedto 1,2-propanediol, intermediate reaction product, and to ethyleneglycol, which was observed in pyrolytic decomposition of cellulose[64,65]. It should be noted that the signal of formic acid (1105 cm−1)is increased due to the glycol (1047 cm−1, Fig. 8b and 11c), whichalso hides methanol (1032 cm−1). Thus, it is not possible to deter-mine the proportion of each component (Fig. 8a and 11f, andTable 4).
In contrast to xylan most of the main gaseous products ofcellulose are evolved together, in a narrower range of tempera-
tures, with maximum close to 330–340 ◦C, except for CH4, whichis emitted at higher temperature. Cellulose is the component thatproduces the highest emissions of H2O and organic products withrespect to the CO2 emitted (Table 4). The breaking of the glycosidic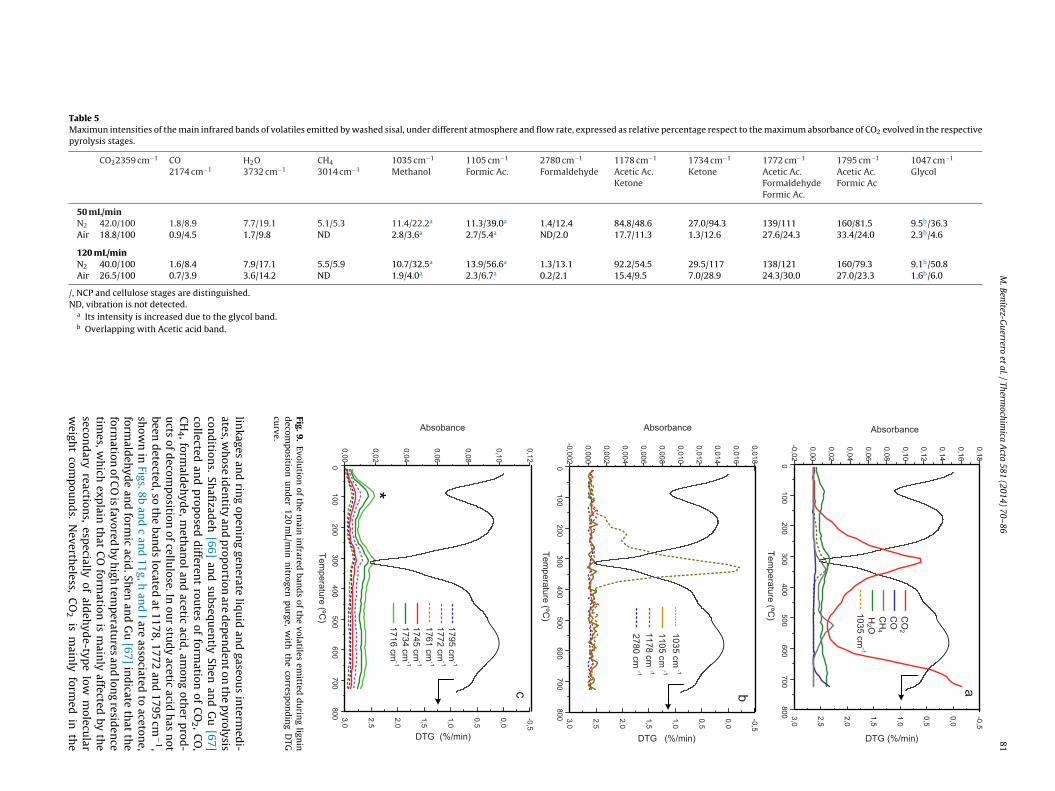
M.
Benítez-Guerrero
et al.
/ Therm
ochimica
Acta
581 (2014)
70–86
81
Table 5Maximun intensities of the main infrared bands of volatiles emitted by washed sisal, under different atmosphere and flow rate, expressed as relative percentage respect to the maximum absorbance of CO2 evolved in the respectivepyrolysis stages.
CO22359 cm−1 CO2174 cm−1
H2O3732 cm−1
CH4
3014 cm−11035 cm−1
Methanol1105 cm−1
Formic Ac.2780 cm−1
Formaldehyde1178 cm−1
Acetic Ac.Ketone
1734 cm−1
Ketone1772 cm−1
Acetic Ac.FormaldehydeFormic Ac.
1795 cm−1
Acetic Ac.Formic Ac
1047 cm−1
Glycol
50 mL/minN2 42.0/100 1.8/8.9 7.7/19.1 5.1/5.3 11.4/22.2a 11.3/39.0a 1.4/12.4 84.8/48.6 27.0/94.3 139/111 160/81.5 9.5b/36.3Air 18.8/100 0.9/4.5 1.7/9.8 ND 2.8/3.6a 2.7/5.4a ND/2.0 17.7/11.3 1.3/12.6 27.6/24.3 33.4/24.0 2.3b/4.6
120 mL/minN2 40.0/100 1.6/8.4 7.9/17.1 5.5/5.9 10.7/32.5a 13.9/56.6a 1.3/13.1 92.2/54.5 29.5/117 138/121 160/79.3 9.1b/50.8Air 26.5/100 0.7/3.9 3.6/14.2 ND 1.9/4.0a 2.3/6.7a 0.2/2.1 15.4/9.5 7.0/28.9 24.3/30.0 27.0/23.3 1.6b/6.0
/, NCP and cellulose stages are distinguished.ND, vibration is not detected.
a Its intensity is increased due to the glycol band.b Overlapping with Acetic acid band.
Fig. 9.
Evolution
of th
e m
ain in
frared ban
ds
of th
e volatiles
emitted
du
ring
lignin
decom
position
un
der
120 m
L/min
nitrogen
pu
rge, w
ith th
e corresp
ond
ing
DTG
curve.
linkages
and
ring
open
ing
generate
liquid
and
gaseous
interm
edi-
ates, w
hose
iden
tity an
d p
roportion
are d
epen
den
t on
the
pyrolysis
cond
itions.
Shafi
zadeh
[66] an
d su
bsequen
tly Sh
en an
d G
u [67]
collected an
d p
roposed
differen
t rou
tes of
formation
of C
O2 ,
CO
,C
H4 ,
formald
ehyd
e, m
ethan
ol an
d acetic
acid,
amon
g oth
er p
rod-
ucts
of d
ecomp
osition of
cellulose.
In ou
r stu
dy
acetic acid
has
not
been d
etected,
so th
e ban
ds
located at
1178, 1772
and
1795 cm
−1,
show
n in
Figs. 8b
and
c an
d 11g,
h an
d l
are associated
to aceton
e,form
aldeh
yde
and
formic
acid.
Shen
and
Gu
[67] in
dicate
that
the
formation
of C
O is
favored by
high
temp
eratures
and
long
residen
cetim
es, w
hich
explain
that
CO
formation
is m
ainly
affected by
the
second
ary reaction
s, esp
ecially of
aldeh
yde-typ
e low
molecu
larw
eight
comp
oun
ds.
Neverth
eless, C
O2
is m
ainly
formed
in th
e
8 rmoch
efls5cbpoc4iapt
dei
ltdtteg
ediotacacmeca
3ltaw
doathrs5pieptcitce
2 M. Benítez-Guerrero et al. / The
arly stages of the pyrolysis of cellulose. Li et al. [60] found thatormaldehyde formation is favored by a lower purge flow and byonger residence times, which would explain its formation throughecondary reactions. They explain that at high temperatures, near50 ◦C, formaldehyde decomposes to generate CO and H2, which isonsistent with the observation of Shen et al. Various ketones haveeen proposed and detected at the primary decomposition andyrolysis of cellulose. Thus, 2,3-butanedione is among the productsf pyrolysis of levoglucosan, a major decomposition product ofellulose [68]. 2-butanone, detected here at temperatures below00 ◦C, has also been detected by Py-GC/MS analysis [62]. Accord-
ng to other reports, it may come from decarboxylation of levuliniccid [66]. Radlein et al. [69] found formic acid in the pyrolysisroducts of different celluloses, which would be originated fromhe decomposition of levoglucosan according to Hosoya et al. [70].
In nitrogen, at temperatures above 450 ◦C, CO2, CO and CH4 areetected, resulting from side reactions. In this stage, maximummission of CO2 and CH4 is observed at about 530 ◦C, while the max-ma of CO2 and CO appear at 650 ◦C, as shown in Figs. 8a, 11a, e and i.
The products detected during the decomposition in air of cellu-ose are the same than under inert atmosphere. However, comparedo that of CO2, the emission of organic compounds and H2O hasecreased significantly in air, while the proportion of CO is main-ained in almost the same proportion as in nitrogen (Table 4). Sincehe mass loss after pyrolysis under air and nitrogen are similar, thexplanation lies primarily in the changes suffered by the emittedaseous compound.
In an oxidizing atmosphere, when the temperature is highnough, it could happen that at the same instant in which theecomposition/pyrolysis of the cellulose occurs, the volatile organ-
cs generated oxidize, which would be favored by the presencef steam. Thus, a gasification reaction explains the lower propor-ion of H2O detected. On the other hand, the consumption of COccording to the reaction 2CO + O2 → 2CO2 is less thermodynami-ally favored, which explains its higher relative proportion underir atmosphere. The evolution of CO2 in the combustion processomprises a wide interval of temperatures, from 370 to 700 ◦C andaximum at 470 ◦C, where CO and H2O are detected. Exothermic
ffects, around 540 and 600 ◦C, detected in the DTA of the cellulose,orrespond mainly to the emission of CO2, as observed in Fig. 8b,ssociated to additional combustion phenomena.
.4.1.3. Lignin. Unlike cellulose and hemicellulose, degradation ofignin under inert atmosphere covers a very wide range of tempera-ure, from 130 to 500 ◦C (Fig. 9). The gases detected in this intervalre CO2, CO, H2O, CH4 and CH3OH. No other organic compoundsere detected.
Of the three biomass components, lignin is the one which pro-uces the highest proportion of CH4 and CH3OH and the lowestf CO with respect to the maximum absorbance of CO2 emittedt the pyrolysis stage (Table 4). At temperatures below 500 ◦C,he emission of H2O can be associated to aliphatic and aromaticydroxyl groups, and the emission of CO2 and CO to cracking andeforming of the carboxyl, carbonyl and ester groups, present in theide chains of the phenylpropane units [41]. Their evolution above00 ◦C is associated with the secondary pyrolysis of volatiles. Inarticular, several authors claim that CO is originated at the break-
ng of two different types of ether bonds: at low temperature thether bonds between different lignin subunits, whilst at high tem-erature diaryl ether groups are involved [71,72]. Below 400 ◦C,he evolution of CH3OH and CH4 is mainly associated with theleavage and demethylation of methoxyl groups ( O CH3) present
n lignin [42,73]. Methanol formation may also be contributed byhe CH2OH groups located on the � carbon of the alkyl lateralhain of the phenylpropane units [41,71]. Above 400 ◦C methanemission continues, reaching a second maximum at 525 ◦C, moreimica Acta 581 (2014) 70–86
intense than the first one. It is produced by side reactions, andalso by primary reactions of condensation and reorganization ofthe char. At these high temperatures the rupture of the aromaticrings starts, generating methyl radicals and methylene groups, andfinally forming methane [41] [71]. From 600 ◦C methane signalbegins to disappear, because it breaks down into H2 and C [72].
The composition and evolution of gases emitted by lignin in thisstudy turn out to be virtually identical to those of alkaline ligninstudied by Yang et al. [42]. Other studies describe the emission ofother organic compounds, not detected in the present work, such asformaldehyde, formic acid and phenols originated by the rupture ofphenylpropane units. The types of lignin and the extraction methodwould explain the differences in the composition of the emittedgases. The basic reason why a smaller variety of volatile organiccompounds is detected is that char formation reactions are favoredagainst the generation of volatile compounds. G type lignins, asthe one used in this study are prone to undergo condensation andcoupling reactions between phenylpropane units, causing them togenerate more amount of char and emit less amount of phenolicderivatives [41], which would be characterized by intense vibra-tions around 1500, 1250 and 1100 cm−1 [73]. On the other hand,lignins containing little sulfur, as the one studied, are more affectedby this type of condensation reactions. Fenner and Lephardt [73]indicate that the incorporation of sulfur facilitates the fragmenta-tion of phenylpropane units and decreases its condensation.
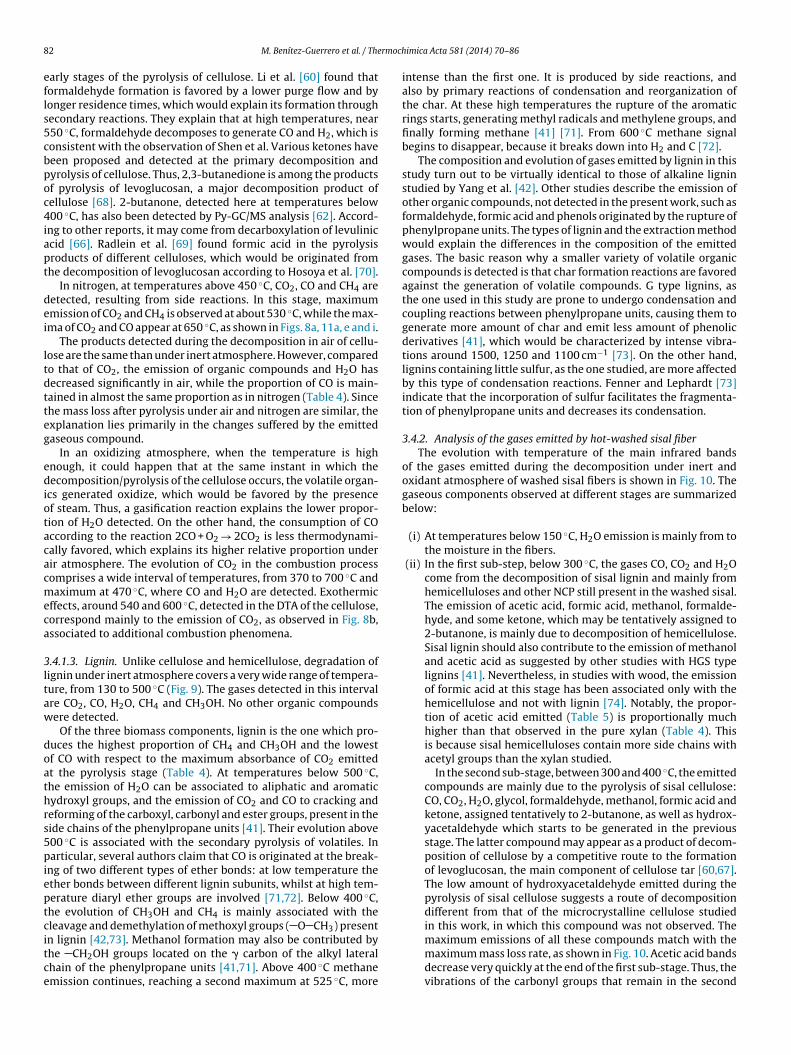
3.4.2. Analysis of the gases emitted by hot-washed sisal fiberThe evolution with temperature of the main infrared bands
of the gases emitted during the decomposition under inert andoxidant atmosphere of washed sisal fibers is shown in Fig. 10. Thegaseous components observed at different stages are summarizedbelow:
(i) At temperatures below 150 ◦C, H2O emission is mainly from tothe moisture in the fibers.
(ii) In the first sub-step, below 300 ◦C, the gases CO, CO2 and H2Ocome from the decomposition of sisal lignin and mainly fromhemicelluloses and other NCP still present in the washed sisal.The emission of acetic acid, formic acid, methanol, formalde-hyde, and some ketone, which may be tentatively assigned to2-butanone, is mainly due to decomposition of hemicellulose.Sisal lignin should also contribute to the emission of methanoland acetic acid as suggested by other studies with HGS typelignins [41]. Nevertheless, in studies with wood, the emissionof formic acid at this stage has been associated only with thehemicellulose and not with lignin [74]. Notably, the propor-tion of acetic acid emitted (Table 5) is proportionally muchhigher than that observed in the pure xylan (Table 4). Thisis because sisal hemicelluloses contain more side chains withacetyl groups than the xylan studied.
In the second sub-stage, between 300 and 400 ◦C, the emittedcompounds are mainly due to the pyrolysis of sisal cellulose:CO, CO2, H2O, glycol, formaldehyde, methanol, formic acid andketone, assigned tentatively to 2-butanone, as well as hydrox-yacetaldehyde which starts to be generated in the previousstage. The latter compound may appear as a product of decom-position of cellulose by a competitive route to the formationof levoglucosan, the main component of cellulose tar [60,67].The low amount of hydroxyacetaldehyde emitted during thepyrolysis of sisal cellulose suggests a route of decompositiondifferent from that of the microcrystalline cellulose studiedin this work, in which this compound was not observed. The
maximum emissions of all these compounds match with themaximum mass loss rate, as shown in Fig. 10. Acetic acid bandsdecrease very quickly at the end of the first sub-stage. Thus, thevibrations of the carbonyl groups that remain in the second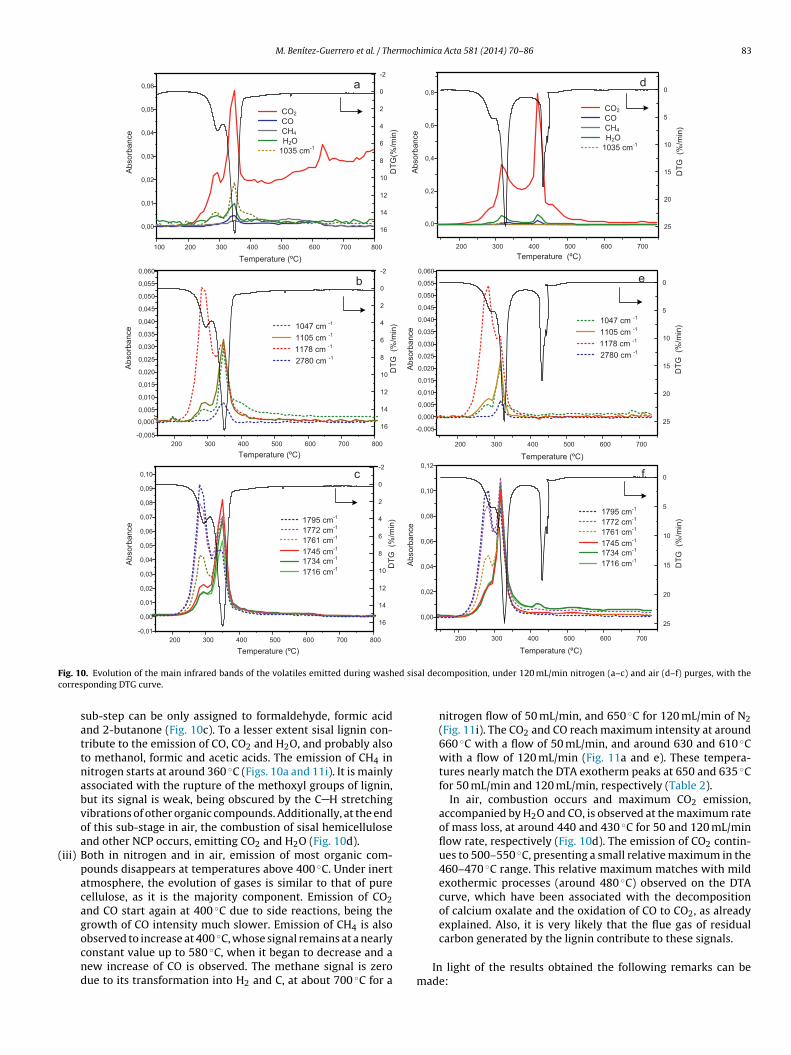
M. Benítez-Guerrero et al. / Thermochimica Acta 581 (2014) 70–86 83
F ed sisc
(
ig. 10. Evolution of the main infrared bands of the volatiles emitted during washorresponding DTG curve.
sub-step can be only assigned to formaldehyde, formic acidand 2-butanone (Fig. 10c). To a lesser extent sisal lignin con-tribute to the emission of CO, CO2 and H2O, and probably alsoto methanol, formic and acetic acids. The emission of CH4 innitrogen starts at around 360 ◦C (Figs. 10a and 11i). It is mainlyassociated with the rupture of the methoxyl groups of lignin,but its signal is weak, being obscured by the C H stretchingvibrations of other organic compounds. Additionally, at the endof this sub-stage in air, the combustion of sisal hemicelluloseand other NCP occurs, emitting CO2 and H2O (Fig. 10d).
iii) Both in nitrogen and in air, emission of most organic com-pounds disappears at temperatures above 400 ◦C. Under inertatmosphere, the evolution of gases is similar to that of purecellulose, as it is the majority component. Emission of CO2and CO start again at 400 ◦C due to side reactions, being thegrowth of CO intensity much slower. Emission of CH4 is also
observed to increase at 400 ◦C, whose signal remains at a nearlyconstant value up to 580 ◦C, when it began to decrease and anew increase of CO is observed. The methane signal is zerodue to its transformation into H2 and C, at about 700 ◦C for aal decomposition, under 120 mL/min nitrogen (a–c) and air (d–f) purges, with the
nitrogen flow of 50 mL/min, and 650 ◦C for 120 mL/min of N2(Fig. 11i). The CO2 and CO reach maximum intensity at around660 ◦C with a flow of 50 mL/min, and around 630 and 610 ◦Cwith a flow of 120 mL/min (Fig. 11a and e). These tempera-tures nearly match the DTA exotherm peaks at 650 and 635 ◦Cfor 50 mL/min and 120 mL/min, respectively (Table 2).
In air, combustion occurs and maximum CO2 emission,accompanied by H2O and CO, is observed at the maximum rateof mass loss, at around 440 and 430 ◦C for 50 and 120 mL/minflow rate, respectively (Fig. 10d). The emission of CO2 contin-ues to 500–550 ◦C, presenting a small relative maximum in the460–470 ◦C range. This relative maximum matches with mildexothermic processes (around 480 ◦C) observed on the DTAcurve, which have been associated with the decompositionof calcium oxalate and the oxidation of CO to CO2, as alreadyexplained. Also, it is very likely that the flue gas of residual
carbon generated by the lignin contribute to these signals.In light of the results obtained the following remarks can bemade:
84 M. Benítez-Guerrero et al. / Thermochimica Acta 581 (2014) 70–86
Fig. 11. Comparison of the evolution of the main infrared bands of gaseous compounds evolved under nitrogen atmosphere, during decomposition of biomass componentsu and
c
nder 120 mL/min purges, and decomposition of washed sisal under purges of 50orresponds to background signal and not to methane vibration.(a) The gaseous products emitted at temperatures below 400 ◦Cfor the decomposition of sisal, are basically the same in bothoxidizing and inert atmospheres, but in different proportions.During oxidative pyrolysis, these compounds are emitted toa lesser extent with respect to the CO2 emitted in this stage(Table 5). The same behavior was observed in the case of purecellulose (Table 4). However, the mass losses observed in each
one of the two decomposition sub-stages (NCP and cellulose)are similar independently of the nature and flow rate of thepurge considered: 17 and 60% for 50 mL/min of air, 17.6 and58.5% for 120 mL/min of air, 18.5 and 63.6% for 50 mL/min of120 mL/min. The asterisk of Fig. 11i pyrogram on the first stage of CH4 evolution
N2, 17.8 and 59.4% for 120 mL/min of N2 (Table 2). The effectof the oxygen proportion is perceptible in gas phase. Decom-position temperatures for both sub-stages are enough for thegenerated gaseous products to oxidize immediately, generatingCO2, favored by the presence of steam. Thus, a higher emissionof CO2 is observed under air atmosphere. With nitrogen purge,although to a lesser extent, the oxidation of volatiles is also pos-
sible. The reason is that air goes into the furnace when insertingthe sample. Although a purge of nitrogen sweeps off most of theair, a little amount of oxygen may always remain in the furnace.Thus, a higher flow of inert gas is more efficient in preventing
rmoch
(
4
cio
iccoattsfttcdg
sNwwidtimdio
[
[
[
[
[
[
[
[
[
[
[
[
[
M. Benítez-Guerrero et al. / The
the oxidation of volatiles and also of the solid residue.The pres-ence of constituents as cellulose, lignin and mineral salts, wouldexplain the different proportions of organic compounds emit-ted during the first sub-stage of sisal decomposition accordingto the kind of atmosphere used, fact not observed in pure xylan.Furthermore, the increase in the decomposition temperatureof the hemicellulose could be enough to elevate the activationthreshold to initiate the oxidization of volatile compounds.
b) An increased flow of purge gas does not produce any changein the nature of the flue gases. However, it exerts a number ofeffects in the evolution of gases, which are summarized below:(1) Dilution of the output gas. The FTIR spectra show, in general,
that the absolute absorbance values are slightly lower inthe spectra obtained at higher flow (Table 5 and Fig. 11). Agreater flow rate decreases the concentration of compoundsemitted.
(2) Decreasing the intensity of the secondary processes experi-enced by the volatile products, by shortening the residencetimes in the furnace. For example, it can be observed inFig. 11a how a higher flow rate reduces the oxidation of thevolatiles at temperatures above 450 ◦C, and thus reducingthe CO2 formation.
(3) Advancement of the apparent temperature range in whichthe gases generated by side reactions are emitted (e.g., theCO emission above 450 ◦C, Fig. 11e).
(4) As disadvantage, a higher flow carries a higher percent-age of glycol condensate, increasing the infrared vibrationintensity by overlapping, like methanol and formic acid sig-nals and, even, hiding them, as occur in the case of volatilesemitted by pure cellulose.
. Conclusions
TG-FTIR analysis of pure biomass components has helped tolarify the thermal decomposition phenomena of sisal fibers, bothn nitrogen and air atmospheres. This analysis may be extended tother lignocellulosic fibers.
Thermal behavior of sisal is explained as a combination ofts main biomass components, prevailing cellulose. The researchonfirms that other constituents, such as non-cellulosic polysac-harides (NCP) and mineral matter, modify the thermal behaviorf the main component. The presence of pectins, hemicellulosesnd inorganic elements exerts different effects on the tempera-ure of pyrolysis and combustion of sisal cellulose. On one hand,he protective effect of the NCP explains the delay in the pyroly-is stage of it. However, in an oxidizing atmosphere, the flue gasesrom the NCP facilitate the oxidation of the char, thus advancinghe combustion process. The hydroxyacetaldehyde detected duringhe pyrolysis stage of sisal cellulose, and not in pure cellulose, indi-ates that the interaction with other components enables celluloseecomposition through an alternative route to that of levoglucosaneneration.
The hot washing reduces the range of temperature in whichisal decomposition occurs. An increased thermal stability of sisalCP, both under inert and air atmosphere, is produced by the hotashing process due to the removing of substances from the cellalls. Furthermore, enriching the sample in cellulose produces an
ncrease of the mass loss rate at the second sub-step of pyrolysis, aelay of the combustion process and, depending on the decomposi-ion atmosphere, different temperature displacements. Thus, undernert atmosphere, a slight increase of the temperature at the maxi-
um mass loss rate of cellulose decomposition (TbCEL) is observed,ue to a better packing of the cellulose crystallites and removal of
norganic salts. Under an oxidizing atmosphere, this effect is notbserved and TbCEL is shifted to lower temperatures, as cellulose
[
imica Acta 581 (2014) 70–86 85
depolymerization is accelerated by oxidative reactions favored inwashed sisal once the protective components are removed.
Increasing the air flow produces a slight advancement of theoxidative pyrolysis and a significant advancement of combustion.Respect to the gas evolution, an increased flow results in dilution ofthe exhaust gases, decreasing the FTIR absorbance signals, besidesreducing the intensity of the reactions of volatile products in thefurnace, and advancing the apparent temperature range at whichthe resulting gases are emitted.
Acknowledgements
The author M. Benítez Guerrero wishes to thank the Span-ish Consejo Superior de Investigaciones Científicas (CSIC) for theawarding of a JAE pre-doctoral grant. Support from the “Laboratoriode materiales y superficies” (CSIC – Univ. Malaga) is acknowledged.The second author acknowledges the Spanish Ministerio de Edu-cación y Ciencia for the MTM2008-00166 and MTM2011-22392funds.
References
[1] K. Raveendran, A. Ganesh, K.C. Khilar, Pyrolysis characteristics of biomass andbiomass components, Fuel 75 (1996) 987–998.
[2] H. Yang, R. Yan, H. Chen, C. Zheng, D.H. Lee, D.T. Liang, In-depth investigation ofbiomass pyrolysis based on three major components: hemicellulose, celluloseand lignin, Energy Fuel 20 (2006) 388–393.
[3] T. Hosoya, H. Kawamoto, S. Saka, Cellulose–hemicellulose and cellulose–lignininteractions in wood pyrolysis at gasification temperature, J. Anal. Appl. Pyrol-ysis 80 (2007) 118–125.
[4] Q. Liu, Z. Zhong, S. Wang, Z. Luo, Interactions of biomass components duringpyrolysis: a TG-FTIR study, J. Anal. Appl. Pyrolysis 90 (2011) 213–218.
[5] K. Raveendran, A. Ganesh, K.C. Khilar, Influence of mineral matter on biomasspyrolysis characteristics, Fuel 74 (1995) 1812–1822.
[6] G. Várhegyi, M.J. Antal, E. Jakab, P. Szabó, Kinetic modelling of biomass pyrolysis,J. Anal. Appl. Pyrolysis 42 (1997) 73–87.
[7] X. Guo, S. Wang, K. Wang, Q. Liu, Z. Luo, Influence of extractives on mechanismof biomass pyrolysis, J. Fuel Chem. Technol. 38 (2010) 42–46.
[8] J. Zhang, J. Luo, D. Tong, L. Zhu, L. Dong, C. Hu, The dependence of pyrolysisbehavior on the crystal state of cellulose, Carbohydr. Polym. 79 (2010) 164–169.
[9] G. Várhegyi, M.G. Grønli, C.D. Blasi, Effects of sample origin, extraction, andhot-water washing on the devolatilization kinetics of Chestnut wood, Ind. Eng.Chem. Res. 43 (2004) 2356–2367.
10] H. Yang, R. Yan, H. Chen, C. Zheng, D.H. Lee, D.T. Liang, Influence of mineralmatter on pyrolysis of palm oil wastes, Combust. Flame 146 (2006) 605–611.
11] A.N. Shebani, A.J.V. Reenen, M. Meincken, The effect of wood extractives onthe thermal stability of different wood species, Thermochim. Acta 471 (2008)43–50.
12] B.M. Jenkins, R.R. Bakker, J.B. Wei, On the properties of washed straw, BiomassBioenergy 10 (1996) 177–200.
13] S.Q. Turn, M. Kinoshita, D.M. Ishimura, Removal of inorganic constituents ofbiomass feedstocks by mechanical dewatering and leaching, Biomass Bioen-ergy 12 (1997) 241–252.
14] S. Arvelakis, E.G. Koukios, Physicochemical upgrading of agroresidues as feed-stocks for energy production via thermochemical conversion methods, BiomassBioenergy 22 (2002) 331–348.
15] R.R. Frank, Bast and Other Plant Fibers, Woodhead Publishing Ltd/CRC Press,Abington/Cambridge, 2005.
16] L.L. Escamilla-Trevino, Potential of plants from the genus Agave as bioenergycrops, Bioenerg. Res. 5 (2012) 1–9.
17] Y. Li, Y.-W. Mai, L. Ye, Sisal fibre and its composites: a review of recent devel-opments, Compos. Sci. Technol. 60 (2000) 2037–2055.
18] R.D. Tolêdo-Filho, K. Ghavami, G.L. England, K. Scrivener, Development ofvegetable fibre–mortar composites of improved durability, Cement Concrete.Compos. 25 (2003) 185–196.
19] J. Wei, C. Meyer, Improving degradation resistance of sisal fiber in concretethrough fiber surface treatment, Appl. Surf. Sci. 289 (2014) 511–523.
20] K.L. Fung, X.S. Xing, R.K.Y. Li, S.C. Tjong, Y.-W. Mai, An investigation on theprocessing of sisal fibre reinforced polypropylene composites, Compos. Sci.Technol. 63 (2003) 1255–1258.
21] S. Kaewkuk, Effect of heat treated sisal fiber on physical properties ofpolypropylene composites, Adv. Mater. Res. 123–125 (2010) 1123–1126.
22] A. El-Sabbagh, Effect of coupling agent on natural fibre in natural
fibre/polypropylene composites on mechanical and thermal behaviour, Com-pos. B: Eng. 57 (2014) 126–135.23] G. Marques, A. Gutiérrez, J.C. del Río, D.V. Evtuguin, Acetylated heteroxylanfrom Agave sisalana and its behavior in alkaline pulping and TCF/ECF bleaching,Carbohydr. Polym. 81 (2010) 517–523.
8 rmoch
[
[
[
[
[
[
[
[
[
[
[
[
[
[
[
[
[
[
[
[
[
[
[
[
[
[
[
[
[
[
[
[
[
[
[
[
[
[
[
[
[
[
[
[
[
[
[
[
[
6 M. Benítez-Guerrero et al. / The
24] D. Stewart, A. Azzinib, A.T. Hall, I.M. Morrison, Sisal fibres and their constituentno-cellulosic polymer, Ind. Crop Prod. 6 (1997) 17–26.
25] J.C. del Río, A. Gutiérrez, I.M. Rodríguez, D. Ibarra, A.T. Martínez, Composition ofnon-woody plant lignins and cinnamic acids by Py-GC/MS, Py/TMAH and FT-IR,J. Anal. Appl. Pyrolysis 79 (2007) 39–46.
26] A. Gutiérrez, I.M. Rodríguez, J.C. del Río, Chemical Composition of lipophilicextractives from sisal (Agave sisalana) fibers, Ind. Crop Prod. 28 (2008) 81–87.
27] B.C. Barkakaty, Some structural aspects of sisal fibers, J. Appl. Polym. Sci. 20(1976) 2921–2940.
28] A. Bismarck, S. Mishra, T. Lampke, Plant fibers as reinforcement for greencomposites, in: A.K. Mohanty, M. Misra, L.T. Drzal (Eds.), Natural Fibers, Biopoly-mers, and Biocomposites, CRC Press, Florida, 2005, pp. 37–108.
29] J. Biagiotti, D. Puglia, J.M. Kenny, A review on natural fibre-based composites.Part I: Structure, processing and properties of vegetable fibres, J. Nat. Fibers 1(2004) 37–68.
30] N. Chand, S. Sood, D.K. Singh, P.K. Rohatgi, Structural and thermal studies onsisal fibre, J. Therm. Anal. 32 (1987) 595–599.
31] C. Yi, L. Tian, Y. Tong, W. Xu, Thermal stability and mechanical properties ofsisal in cycle process, J. Therm. Anal. Calorim. 94 (2008) 129–135.
32] D. Saikia, Investigations on structural characteristics, thermal stability andhygroscopicity of sisal fibers at elevated temperatures, Int. J. Thermophys. 29(2008) 2215–2225.
33] A.R. Martin, M.A. Martins, O.R.R.F d. Silva, L.H.C. Mattoso, Studies on the ther-mal properties of sisal fiber and its constituents, Thermochim. Acta 506 (2010)14–19.
34] J.C. del Río, A. Gutiérrez, A.T. Martínez, Identifying acetylated lignin units innon-wood fibers using pyrolysis-gas chromatografy/mass spectrometry, RapidCommun. Mass Spectrom. 18 (2004) 1181–1185.
35] R. Bassilakis, R.M. Carangelo, M.A. Wójtowicz, TG-FTIR analysis of biomasspyrolysis, Fuel 80 (2001) 1765–1786.
36] B.S. Souza, A.P.D. Moreira, A.M.R.F. Teixeira, TG-FTIR coupling to monitor thepyrolysis products from agricultural residues, J. Therm. Anal. Calorim. 97 (2009)637–642.
37] S.B. Lee, O. Fasina, TG-FTIR analysis of switchgrass pyrolysis, J. Anal. Appl. Pyrol-ysis 86 (2009) 39–43.
38] L. Segal, An empirical method for estimating the degree of crystallinity of nativecellulose using the X-ray diffractometer, Text. Res. J. 29 (1959) 786–794.
39] F. Shafizadeh, A.G.W. Bradbury, Thermal degradation of cellulose in air andnitrogen at low temperatures, J. Anal. Appl. Pyrolysis 23 (1979) 1431–1442.
40] F. Shafizadeh, Y. Sekiguchi, Oxidation of chars during smoldering combustionof cellulosic materials, Combust. Flame 55 (1984) 171–179.
41] O. Faix, E. Jakab, F. Till, T. Székely, Study on low mass thermal degradation prod-ucts of milled wood lignins by thermogravimetry-mass-spectrometry, WoodSci. Technol. 22 (1988) 323–334.
42] H. Yang, R. Yan, H. Chen, D.H. Lee, C. Zheng, Characteristics of hemicellulose,cellulose and lignin pyrolysis, Fuel 86 (2007) 1781–1788.
43] R. Ball, A.C. McIntosh, J. Brindley, Feedback processes in cellulose thermaldecomposition: implications for fire-retarding strategies and treatments, Com-bust. Theor. Model. 8 (2004) 281–291.
44] D.K. Shen, S. Gua, A.V. Bridgwater, The thermal performance of the polysac-charides extracted from hardwood: cellulose and hemicellulose, Carbohydr.Polym. 82 (2010) 39–45.
45] G. Várhegyi, E. Jakab, M.J. Antal, Is the Broido–Shafizadeh model for cellulosetrue? Energy Fuels 8 (1994) 1345–1352.
46] E. Jakab, O. Faix, F. Till, Thermal decomposition of milled wood lignins studiedby thermogravimetry/mass spectrometry, J. Anal. Appl. Pyrolysis 40–41 (1997)171–186.
47] T. Fisher, M. Hajaligol, B. Waymack, D. Kellogg, Pyrolysis behavior and kineticsof biomass derived materials, J. Anal. Appl. Pyrolysis 62 (2002) 331–349.
48] I. Milosavljevic, V. Oja, E.M. Suuberg, Thermal effects in cellulose pyrolysis: rela-tionship to char formation processes, Ind. Eng. Chem. Res. 35 (1996) 653–662.
49] X. Xie, B. Goodell, D. Zhang, D.C. Nagle, Y. Qian, M.L. Peterson, J. Jellison, Char-acterization of carbons derived from cellulose and lignin and their oxidativebehaviour, Bioresour. Technol. 100 (2009) 1797–1802.
[
[
imica Acta 581 (2014) 70–86
50] C.D. Blasi, Combustion and gasification rates of lignocellulosic chars, Prog.Energ. Combust. 35 (2009) 121–140.
51] R.M. Rowell, R. Pettersen, J.S. Han, J.S. Rowell, M.A. Tshabalal, Cell wall chem-istry, in: R.M. Rowell (Ed.), Handbook of wood chemistry and wood composites,CRC Press, Florida, 2005, pp. 35–74.
52] C.D. Blasi, Modelling chemical and physical processes of wood and biomasspyrolysis, Prog. Energ. Combust. 34 (2008) 47–90.
53] V. Tihay, P. Gillard, Pyrolysis gases released during the thermal decompositionof three Mediterranean species, J. Anal. Appl. Pyrolysis 88 (2010) 168–174.
54] R. Bilbao, J.F. Mastral, M.E. Aldea, J. Ceamanos, The influence of the percentageof oxygen in the atmosphere on the thermal decomposition of lignocellulosicmaterials, J. Anal. Appl. Pyrolysis 42 (1997) 189–202.
55] Y. Chen, J. Duan, Y.H. Luo, Investigation of agricultural residues pyrolysis behav-ior under inert and oxidative conditions, J. Anal. Appl. Pyrolysis 83 (2008)165–174.
56] T. Sebio-Punal, S. Naya, J. López-Beceiro, J. Tarrío-Saavedra, R. Artiaga, Thermo-gravimetric analysis of wood, holocellulose, and lignin from five wood species,J. Therm. Anal. Calorim. 109 (2012) 1163–1167.
57] C.D. Blasi, C. Branca, G. D’Errico, Degradation characteristics of straw andwashed straw, Thermochim. Acta 364 (2000) 133–142.
58] M. Stenseng, A. Jensen, K.D. Johansen, Investigation of biomass pyrolysis bythermogravimetric analysis and differential scanning calorimetry, J. Anal. Appl.Pyrolysis 58–59 (2001) 765–780.
59] P.T. Williams, P.A. Horne, The role of metal salts in the pyrolysis of biomass,Renew. Energ. 4 (1994) 1–13.
60] S. Li, J. Lyons-Hart, J. Banyasz, K. Shafer, Real-time evolved gas analysis byFTIR method: an experimental study of cellulose pyrolysis, Fuel 80 (2001)1809–1817.
61] D.K. Shen, S. Gu, A.V. Bridgwater, Study on the pyrolytic behaviour of xylan-based hemicellulose using TG-FTIR and Py-GC-MS, J. Anal. Appl. Pyrolysis 87(2010) 199–206.
62] Y. Wu, Z. Zhao, H. Li, F. He, Low temperature pyrolysis characteristics of majorcomponents of biomass, J. Fuel Chem. Technol. 37 (2009) 427–432.
63] R. Artiaga, R. Cao, S. Naya, B. González-Martín, J.L. Mier, A. García, Separationof overlapping processes from TGA data and verification by EGA, J. ASTM Int. 2(2005) 355–366.
64] A. Demirbas, Mechanisms of liquefaction and pyrolysis reactions of biomass,Energy Convers. Manage. 41 (2000) 633–646.
65] J. Piskorz, D.S.A.G. Radlein, D.S. Scott, S. Czernik, Pretreatment of wood andcellulose for production of sugars by fast pyrolysis, J. Anal. Appl. Pyrolysis 16(1989) 127–142.
66] F. Shafizadeh, Pyrolysis and combustion of cellulosic materials, in: M.L. Wol-from, R.S. Tipson (Eds.), Advances in Carbohydrate Chemistry, Academic Press,New York, 1968, pp. 419–474.
67] D.K. Shen, S. Gu, The mechanism for thermal decomposition of cellulose and itsmain products, Bioresour. Technol. 100 (2009) 6496–6504.
68] F. Shafizadeh, Introduction to pyrolysis of biomass, J. Anal. Appl. Pyrolysis 3(1982) 283–305.
69] D. Radlein, J. Piskorz, D.S. Scott, Fast pyrolysis of natural polysaccharides as apotential industrial process, J. Anal. Appl. Pyrolysis 19 (1991) 41–63.
70] T. Hosoya, H. Kawamoto, S. Saka, Different pyrolytic pathways of levoglu-cosan in vapor- and liquid/solid-phases, J. Anal. Appl. Pyrolysis 83 (2008)64–70.
71] S. Wang, K. Wang, Q. Liu, Y. Gu, Z. Luo, K. Cen, T. Fransson, Comparison of thepyrolysis behavior of lignins from different tree species, Biotechnol. Adv. 27(2009) 562–567.
72] D. Ferdous, A.K. Dalai, S.K. Bej, R.W. Thring, N.N. Bakhshi, Production of H2
and medium Btu gas via pyrolysis of lignins in a fixed-bed reactor, Fuel Pro-cess.Technol. 70 (2001) 9–26.
73] R.A. Fenner, J.O. Lephardt, Examination of thermal decomposition of kraftpine lignin by FTIR evolved gas analysis, J. Agric. Food Chem. 29 (1981)846–849.
74] W.F. DeGroot, W.P. Pan, M.D. Rahman, G.N. Richards, First chemical events inpyrolysis of wood, J. Anal. Appl. Pyrolysis 13 (1988) 221–231.


![=^f EPiTSa^_b³Tgc^acX^]´ Q^\Q^]Tg 7< BT]P](https://static.fdokumen.com/doc/165x107/631b1814c51d6b41aa0517ad/f-epitsabtgcacx-qqtg-7-btp.jpg)