
Comparison of biomass and size spectra derived from optical plankton counter data and net samples:...
10
Comparison of biomass and size spectra derived from optical plankton counter data and net samples: application to the assessment of mesoplankton distribution along the Northwest and North Iberian Shelf Enrique Nogueira, Gonzalo Gonza ´lez-Nuevo, Antonio Bode, Manuel Varela, Xose ´ Anxelu G. Mora ´n, and Luis Valde ´s Nogueira, E., Gonza ´lez-Nuevo, G., Bode, A., Varela, M., Mora ´n, X. A. G., and Valde ´s, L. 2004. Comparison of biomass and size spectra derived from optical plankton counter data and net samples: application to the assessment of mesoplankton distribution along the Northwest and North Iberian Shelf. e ICES Journal of Marine Science, 61: 508e517. Data from vertical net hauls and from a submersible optical plankton counter (OPC) were compared in terms of biomass and slope of the normalized biomassesize spectra (NBeSS), a proxy for the size structure of the community. The relationship between the estimates of biomass in the overlapping range sampled by both methods (0.2e2 mm equivalent spherical diameter (ESD)) was linear and not significantly different to 1 (B OPC : B NET ¼ 1:1 G 0:1, r 2 ¼ 0:84). However, the relationship varied depending on the size fraction con- sidered; the ratio B OPC :B NET was 0:10 G 0:04 (r 2 ¼ 0:30), 0:8 G 0:2 (r 2 ¼ 0:66), and 2:4 G 0:5 (r 2 ¼ 0:64) for the size fractions 0.2e0.5, 0.5e1, and 1e2 mm ESD, respect- ively. The discrepancies between methods were presumably due to the combined effect of the limitations of the instrument in the lower detection limit and the errors in the volume of water sampled by the net for the smallest size fraction, and to net avoidance enhanced by clogging for the largest size fraction. The agreement between methods improved when the NBeSS of the different data sets were compared. The slope (b ¼1:1) and the intercept (a ¼ 14:6) of the NBeSS integrated across stations were not significantly different (Student’s t-test) for the linear model fitted to net samples, OPC data, or pooled data from both methods. Station by station, the slopes of the NBeSS from the net (b NET ) and the OPC (b OPC ) were not significantly different in 61% of the stations. This percentage increased to 78% when the comparison was limited to the mesoplankton size range. As an example of the applicability of the OPC, we showed the distribution of mesoplankton biomass and size structure along the NW and N Iberian Shelf during the winterespring transition of 2002 and its relationship with the hydrographic scenario. Ó 2004 International Council for the Exploration of the Sea. Published by Elsevier Ltd. All rights reserved. Keywords: biomass, mesoplankton, N and NW Iberian Shelf, net samples, optical plankton counter (OPC), size structure. E. Nogueira, G. Gonza ´lez-Nuevo, X.A. G. Mora ´n, and L. Valde ´s: Centro Oceanogra ´fico de Gijo ´n, Instituto Espan ˜ol de Oceanografı ´a, Avda. Prı ´ncipe de Asturias, 70 bis, 33212 Gijo ´n, Asturias, Spain. A. Bode and M. Varela: Centro Oceanogra ´fico de A Corun ˜a, Instituto Espan ˜ol de Oceanografı ´a, Muelle de las A ´ nimas, s/n Apdo. 130, 15001 A Corun ˜a, Galicia, Spain; tel: C34 981 229 077; fax: C34 981 229 077. Correspondence to E. Nogueira: tel: C34 985 308 672; fax: C34 985 326 272; e-mail: [email protected]. Introduction Concurrent measurements of physico-chemical variables and standing stocks of planktonic organisms undertaken over the appropriate spatio-temporal scales are critical to our understanding of marine ecosystem dynamics. Meso- planktonic organisms (i.e. 0.2e2 mm) constitute an impor- tant component of the planktonic community, channelling matter and energy towards higher trophic levels and repre- senting the main food source for many important fish stocks. Conventional methods for sampling plankton are based on net tows, which are often poorly suited to capture the spatio-temporal variability and patchy distributions of these organisms and are difficult to integrate with physical data acquired at nearly real-time. A variety of automatic plankton samplers based on optical principles have been ICES Journal of Marine Science, 61: 508e517 (2004) doi:10.1016/j.icesjms.2004.03.018 1054-3139/$30.00 Ó 2004 International Council for the Exploration of the Sea. Published by Elsevier Ltd. All rights reserved. by guest on December 11, 2013 http://icesjms.oxfordjournals.org/ Downloaded from
Transcript of Comparison of biomass and size spectra derived from optical plankton counter data and net samples:...
ICES Journal of Marine Science, 61: 508e517 (2004)doi:10.1016/j.icesjms.2004.03.018
by guest on Decem
ber 11, 2013http://icesjm
s.oxfordjournals.org/D
ownloaded from
Comparison of biomass and size spectra derived from opticalplankton counter data and net samples: application to theassessment of mesoplankton distribution along theNorthwest and North Iberian Shelf
Enrique Nogueira, Gonzalo Gonzalez-Nuevo, Antonio Bode, Manuel Varela,Xose Anxelu G. Moran, and Luis Valdes
Nogueira, E., Gonzalez-Nuevo, G., Bode, A., Varela, M., Moran, X. A. G., and Valdes, L.2004. Comparison of biomass and size spectra derived from optical plankton counter dataand net samples: application to the assessment of mesoplankton distribution along theNorthwest and North Iberian Shelf. e ICES Journal of Marine Science, 61: 508e517.
Data from vertical net hauls and from a submersible optical plankton counter (OPC) werecompared in terms of biomass and slope of the normalized biomassesize spectra (NBeSS),a proxy for the size structure of the community. The relationship between the estimates ofbiomass in the overlapping range sampled by both methods (0.2e2 mm equivalentspherical diameter (ESD)) was linear and not significantly different to 1 (BOPC : BNET ¼1:1G 0:1, r2 ¼ 0:84). However, the relationship varied depending on the size fraction con-sidered; the ratio BOPC:BNET was 0:10G 0:04 (r2 ¼ 0:30), 0:8G 0:2 (r2 ¼ 0:66), and2:4G 0:5 (r2 ¼ 0:64) for the size fractions 0.2e0.5, 0.5e1, and 1e2 mm ESD, respect-ively. The discrepancies between methods were presumably due to the combined effect ofthe limitations of the instrument in the lower detection limit and the errors in the volume ofwater sampled by the net for the smallest size fraction, and to net avoidance enhanced byclogging for the largest size fraction. The agreement between methods improved when theNBeSS of the different data sets were compared. The slope (b ¼ �1:1) and the intercept(a ¼ 14:6) of the NBeSS integrated across stations were not significantly different(Student’s t-test) for the linear model fitted to net samples, OPC data, or pooled data fromboth methods. Station by station, the slopes of the NBeSS from the net (bNET) and the OPC(bOPC) were not significantly different in 61% of the stations. This percentage increased to78% when the comparison was limited to the mesoplankton size range. As an example ofthe applicability of the OPC, we showed the distribution of mesoplankton biomass and sizestructure along the NW and N Iberian Shelf during the winterespring transition of 2002 andits relationship with the hydrographic scenario.
� 2004 International Council for the Exploration of the Sea. Published by Elsevier Ltd. All rights reserved.
Keywords: biomass, mesoplankton, N and NW Iberian Shelf, net samples, optical planktoncounter (OPC), size structure.
E. Nogueira, G. Gonzalez-Nuevo, X.A. G. Moran, and L. Valdes: Centro Oceanografico deGijon, Instituto Espanol de Oceanografıa, Avda. Prıncipe de Asturias, 70 bis, 33212 Gijon,Asturias, Spain. A. Bode and M. Varela: Centro Oceanografico de A Coruna, InstitutoEspanol de Oceanografıa, Muelle de las Animas, s/n Apdo. 130, 15001 A Coruna, Galicia,Spain; tel: C34 981 229 077; fax: C34 981 229 077. Correspondence to E. Nogueira: tel:C34 985 308 672; fax: C34 985 326 272; e-mail: [email protected].
Introduction
Concurrent measurements of physico-chemical variables
and standing stocks of planktonic organisms undertaken
over the appropriate spatio-temporal scales are critical to
our understanding of marine ecosystem dynamics. Meso-
planktonic organisms (i.e. 0.2e2 mm) constitute an impor-
tant component of the planktonic community, channelling
1054-3139/$30.00 � 2004 International Cou
matter and energy towards higher trophic levels and repre-
senting the main food source for many important fish
stocks. Conventional methods for sampling plankton are
based on net tows, which are often poorly suited to capture
the spatio-temporal variability and patchy distributions of
these organisms and are difficult to integrate with physical
data acquired at nearly real-time. A variety of automatic
plankton samplers based on optical principles have been
ncil for the Exploration of the Sea. Published by Elsevier Ltd. All rights reserved.
509Comparison of OPC data and net samples
Dow
nloaded
Table 1. Recent studies comparing biomass estimations derived from the OPC and different types of sampling nets for a variety of marine
ecosystems. The explanations given by the authors for the discrepancies OPC vs. net system were: (a) coincident counts, (b) lower
detection limit of the OPC, (c) particle orientation through the OPC light beam, (d) interference due to phytoplankton, (e) clogging,
extrusion, and escape of copepods, (f) estimation of sampled volume, (g) disparity of scales.
Reference Net system Comparison units Results (OPC:Net) Explanation
Herman (1988) BIONESS Concentration (total and size
fractionated)
0.25e0.33 (a) (b)
Herman (1992) BIONESS (243 mm) Total concentration 0.33 (a) (c) (d)
Huntley et al. (1995) Bongo (155 mm) Concentration and size spectra Variable results (e)
Grant et al. (2000) LHPR (200 mm) Concentration Variable results (e) (f)
Ruberg and Eadie (2000) Simple (153 mm) Concentration and integrated biomass w1 or O1 (a) (c) (e)
Halliday et al. (2001) LHPR (200 mm) Concentration and size spectra 5 (e)
Hopcroft (2002) WP2 (64 mm) Size spectra General agreement (c) (e)
Labat et al. (2002) WP2 (200 mm) Size spectra (vertical hauls with WP2
and undulating transects with the OPC)
Large differences (c) (g)
Mustard et al. (2002) WP2 (200 mm) Concentration and size spectra 33 (a) (d)
Herman (2002) Bongo (80 mm) Logarithm of total biomass 1 (a) (d)
by guest on Decem
ber 11, 2013http://icesjm
s.oxfordjournals.org/ from
developed in recent decades and are nowadays widely ap-plied in resolving the spatio-temporal patterns of the
different components of the planktonic community (Foote,
2000). The optical plankton counter (OPC) developed by
Herman (1988, 1992) is a practical method for character-
izing the abundance and size distribution of plankton in the
size range of meso- and macroplankton (0.25e17 mm
ESD). The OPC has been extensively used in the past
decade to study zooplankton distributions in a variety of
marine (references in Table 1) and freshwater (e.g. Sprules
et al., 1998) ecosystems. More information about the OPC
and its applications can be downloaded at: http://www.
es.umb.edu/faculty/mzh/files/web-opc/web-opc.htm. How-
ever, the results from the OPC are sometimes difficult to
reconcile with those from net sampling systems, with both
OPC underestimates and overestimates relative to the
estimations from a variety of net samplers (Table 1). These
discrepancies stress the need for more comparison exercises
among different sampling methodologies.
In this article we present the results of the comparison
of the biomass estimates and size spectra obtained using
a simple 20-mm plankton net and a submersible OPC during
a cruise in the NW and N Iberian Shelf during the winterespring transition of 2002. As an example of the applic-
ability of the OPC, we also describe the spatial distribution
of the mesoplankton community in relation to the hydro-
graphic scenario.
Material and methods
Sampling strategy
Sampling was carried out on board RV ‘‘Thalassa’’ during
the PELACUS 0302 cruise. Simultaneous profiles of temp-
erature, salinity, and fluorescence obtained along the NW
and N Iberian Shelf by means of a Sea Bird 25 CTD
equipped with a SeaPoint fluorometer, and particle-size
distributions in the 0.25e17 mm ESD size range obtained
with a submersible OPC (Herman, 1988; Focal Technolo-
gies Ltd.), were acquired at night (between 21:00 and 05:00
GMT) during the winterespring transition (from 14 to 30
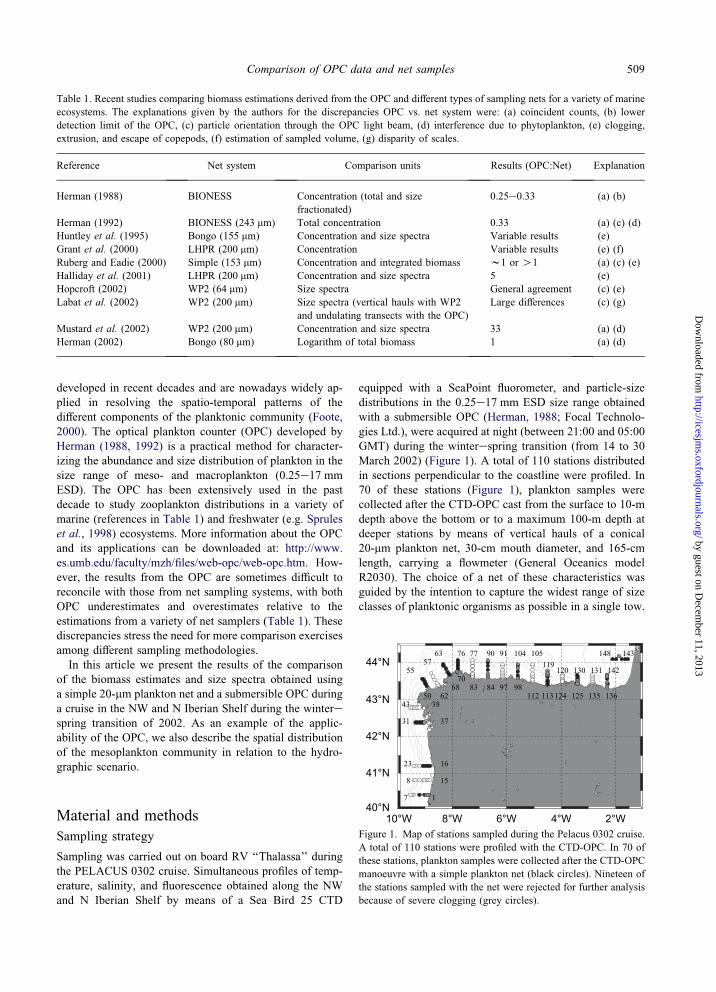
March 2002) (Figure 1). A total of 110 stations distributed
in sections perpendicular to the coastline were profiled. In
70 of these stations (Figure 1), plankton samples were
collected after the CTD-OPC cast from the surface to 10-m
depth above the bottom or to a maximum 100-m depth at
deeper stations by means of vertical hauls of a conical
20-mm plankton net, 30-cm mouth diameter, and 165-cm
length, carrying a flowmeter (General Oceanics model
R2030). The choice of a net of these characteristics was
guided by the intention to capture the widest range of size
classes of planktonic organisms as possible in a single tow.
10°W 8°W 6°W 4°W 2°W 40°N
41°N
42°N
43°N
44°N
1 7
158
16 23
37 31
38 43
50
55
62
57
68
63
70
76
83
77
84
90
97
91
98
104
112
105
113
119
124
120
125
130
135
131
136
142
143 148
Figure 1. Map of stations sampled during the Pelacus 0302 cruise.
A total of 110 stations were profiled with the CTD-OPC. In 70 of
these stations, plankton samples were collected after the CTD-OPC
manoeuvre with a simple plankton net (black circles). Nineteen of
the stations sampled with the net were rejected for further analysis
because of severe clogging (grey circles).
510 E. Nogueira et al.
by guest on Decem
ber 11, 2013http://icesjm
s.oxfordjournals.org/D
ownloaded from
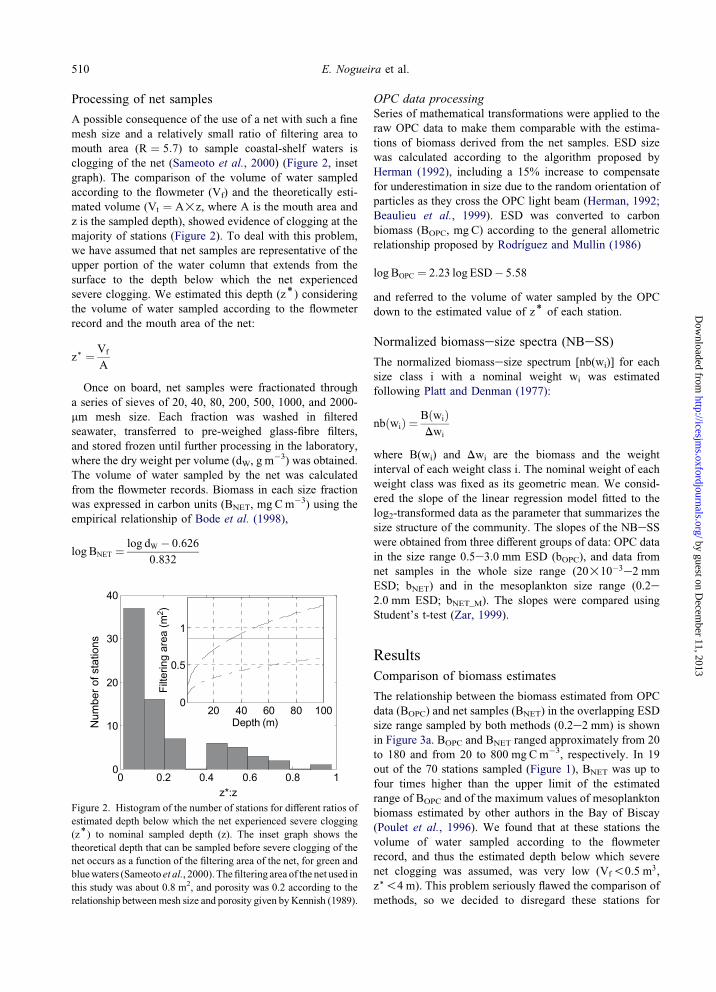
Processing of net samples
A possible consequence of the use of a net with such a fine
mesh size and a relatively small ratio of filtering area to
mouth area (R ¼ 5:7) to sample coastal-shelf waters is
clogging of the net (Sameoto et al., 2000) (Figure 2, inset
graph). The comparison of the volume of water sampled
according to the flowmeter (Vf) and the theoretically esti-
mated volume (Vt ¼ A!z, where A is the mouth area and
z is the sampled depth), showed evidence of clogging at the
majority of stations (Figure 2). To deal with this problem,
we have assumed that net samples are representative of the
upper portion of the water column that extends from the
surface to the depth below which the net experienced
severe clogging. We estimated this depth (z)) consideringthe volume of water sampled according to the flowmeter
record and the mouth area of the net:
z) ¼ Vf
A
Once on board, net samples were fractionated through
a series of sieves of 20, 40, 80, 200, 500, 1000, and 2000-
mm mesh size. Each fraction was washed in filtered
seawater, transferred to pre-weighed glass-fibre filters,
and stored frozen until further processing in the laboratory,
where the dry weight per volume (dW, g m�3) was obtained.
The volume of water sampled by the net was calculated
from the flowmeter records. Biomass in each size fraction
was expressed in carbon units (BNET, mg Cm�3) using the
empirical relationship of Bode et al. (1998),
log BNET ¼log dW � 0:626
0:832
0 0.2 0.4 0.6 0.8 10
10
20
30
40
z*:z
Num
ber
of s
tatio
ns
20 40 60 80 1000
0.5
1
Depth (m)
Filt
erin
g ar
ea (
m2 )
Figure 2. Histogram of the number of stations for different ratios of
estimated depth below which the net experienced severe clogging
(z)) to nominal sampled depth (z). The inset graph shows the
theoretical depth that can be sampled before severe clogging of the
net occurs as a function of the filtering area of the net, for green and
bluewaters (Sameoto et al., 2000).Thefiltering area of the net used in
this study was about 0.8 m2, and porosity was 0.2 according to the
relationship between mesh size and porosity given byKennish (1989).
OPC data processing
Series of mathematical transformations were applied to the
raw OPC data to make them comparable with the estima-
tions of biomass derived from the net samples. ESD size
was calculated according to the algorithm proposed by
Herman (1992), including a 15% increase to compensate
for underestimation in size due to the random orientation of
particles as they cross the OPC light beam (Herman, 1992;
Beaulieu et al., 1999). ESD was converted to carbon
biomass (BOPC, mg C) according to the general allometric
relationship proposed by Rodrıguez and Mullin (1986)
log BOPC ¼ 2:23 log ESD� 5:58
and referred to the volume of water sampled by the OPC
down to the estimated value of z) of each station.
Normalized biomassesize spectra (NBeSS)
The normalized biomassesize spectrum [nb(wi)] for each
size class i with a nominal weight wi was estimated
following Platt and Denman (1977):
nbðwiÞ ¼BðwiÞDwi
where B(wi) and Dwi are the biomass and the weight
interval of each weight class i. The nominal weight of each
weight class was fixed as its geometric mean. We consid-
ered the slope of the linear regression model fitted to the
log2-transformed data as the parameter that summarizes the
size structure of the community. The slopes of the NBeSSwere obtained from three different groups of data: OPC data
in the size range 0.5e3.0 mm ESD (bOPC), and data from
net samples in the whole size range (20!10�3e2 mm
ESD; bNET) and in the mesoplankton size range (0.2e2.0 mm ESD; bNET_M). The slopes were compared using
Student’s t-test (Zar, 1999).
Results
Comparison of biomass estimates
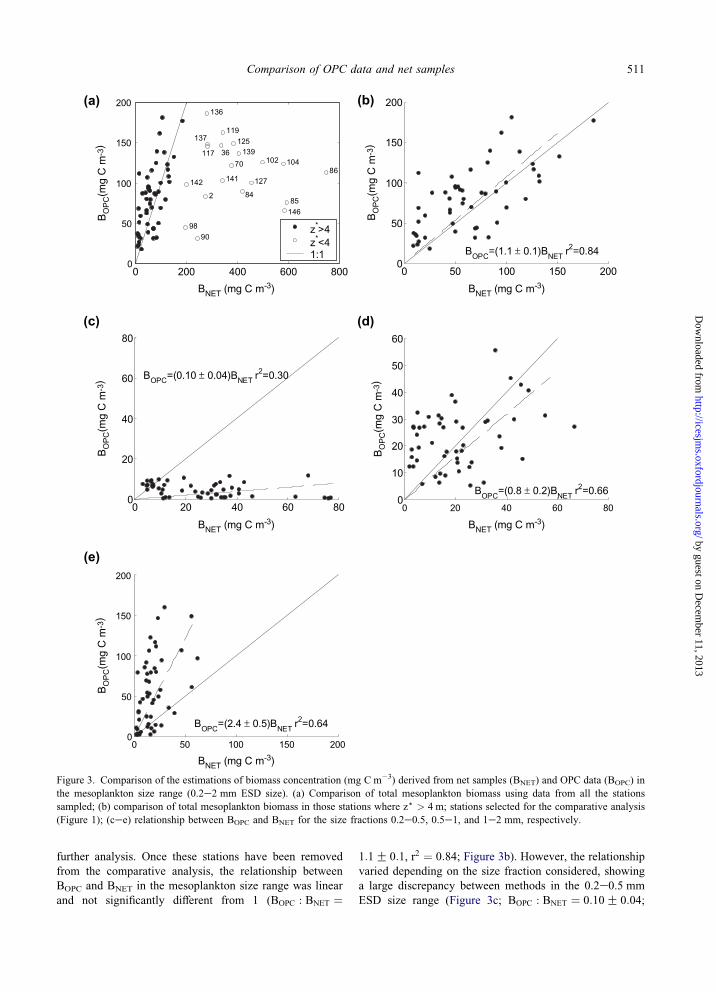
The relationship between the biomass estimated from OPC
data (BOPC) and net samples (BNET) in the overlapping ESD
size range sampled by both methods (0.2e2 mm) is shown
in Figure 3a. BOPC and BNET ranged approximately from 20
to 180 and from 20 to 800 mg Cm�3, respectively. In 19
out of the 70 stations sampled (Figure 1), BNET was up to
four times higher than the upper limit of the estimated
range of BOPC and of the maximum values of mesoplankton
biomass estimated by other authors in the Bay of Biscay
(Poulet et al., 1996). We found that at these stations the
volume of water sampled according to the flowmeter
record, and thus the estimated depth below which severe
net clogging was assumed, was very low (Vf!0:5 m3,
z)!4 m). This problem seriously flawed the comparison of
methods, so we decided to disregard these stations for
511Comparison of OPC data and net samples
by guest on Decem
ber 11, 2013http://icesjm
s.oxfordjournals.org/D
ownloaded from
0 200 400 600 8000
50
100
150
200B
OP
C(m
g C
m-3
)
BO
PC(m
g C
m-3
)
BO
PC(m
g C
m-3
)
BO
PC(m
g C
m-3
)
BO
PC(m
g C
m-3
)
2
36
70
90
86
8584
98
102 104117
119125
127
136
137
139
141142
146
z*>4z*<41:1
0 50 100 150 2000
50
100
150
200
BOPC=(1.1 ± 0.1)BNET r2=0.84
0 20 40 60 800
20
40
60
80
BOPC=(0.10 ± 0.04)BNET r2=0.30
0 20 40 60 800
10
20
30
40
50
60
BOPC=(0.8 ± 0.2)BNET r2=0.66
0 50 100 150 2000
50
100
150
200
BOPC=(2.4 ± 0.5)BNET r2=0.64
BNET (mg C m-3)
BNET (mg C m-3) BNET (mg C m-3)
BNET (mg C m-3)BNET (mg C m-3)
(a)
(c)
(e)
(b)
(d)
Figure 3. Comparison of the estimations of biomass concentration (mg C m�3) derived from net samples (BNET) and OPC data (BOPC) in
the mesoplankton size range (0.2e2 mm ESD size). (a) Comparison of total mesoplankton biomass using data from all the stations
sampled; (b) comparison of total mesoplankton biomass in those stations where z) > 4 m; stations selected for the comparative analysis
(Figure 1); (cee) relationship between BOPC and BNET for the size fractions 0.2e0.5, 0.5e1, and 1e2 mm, respectively.
further analysis. Once these stations have been removed
from the comparative analysis, the relationship between
BOPC and BNET in the mesoplankton size range was linear
and not significantly different from 1 (BOPC : BNET ¼
1:1G 0:1, r2 ¼ 0:84; Figure 3b). However, the relationshipvaried depending on the size fraction considered, showing
a large discrepancy between methods in the 0.2e0.5 mm
ESD size range (Figure 3c; BOPC : BNET ¼ 0:10G 0:04;
512 E. Nogueira et al.
by guest on De
http://icesjms.oxfordjournals.org/
Dow
nloaded from
r2 ¼ 0:30), a good match in the 0.5e1 mm ESD (Figure 3d;
BOPC : BNET ¼ 0:8G 0:2; r2 ¼ 0:66) and a slight overesti-
mation by the OPC relative to net samples in the 1e2 mm
ESD size range (Figure 3c; BOPC : BNET ¼ 2:4G 0:5;r2 ¼ 0:64).
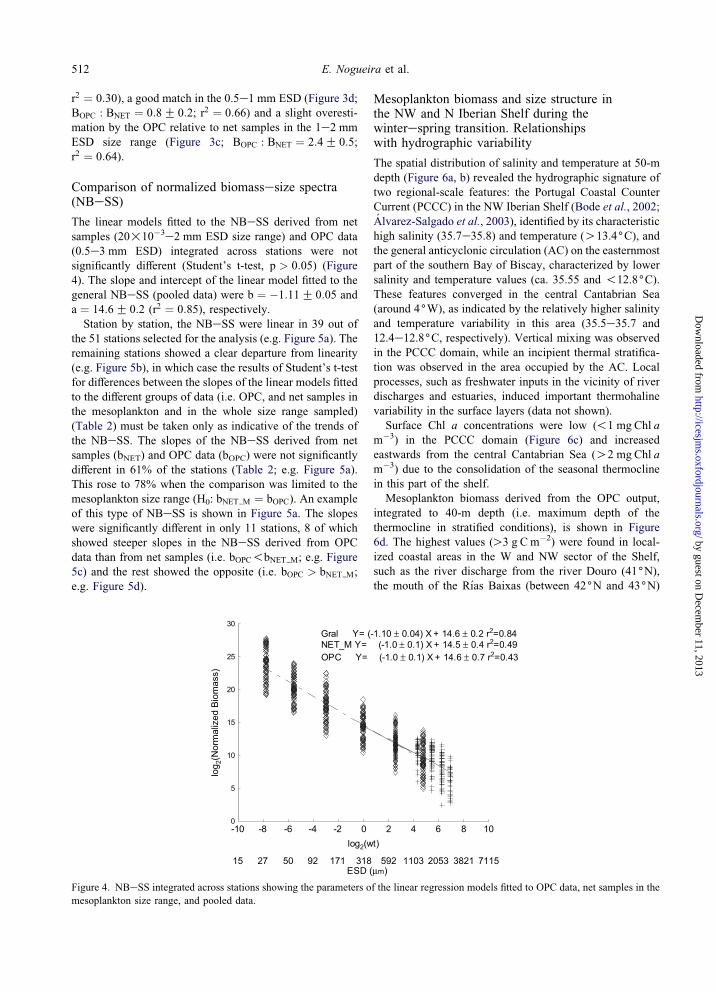
Comparison of normalized biomassesize spectra(NBeSS)
The linear models fitted to the NBeSS derived from net
samples (20!10�3e2 mm ESD size range) and OPC data
(0.5e3 mm ESD) integrated across stations were not
significantly different (Student’s t-test, p > 0:05) (Figure
4). The slope and intercept of the linear model fitted to the
general NBeSS (pooled data) were b ¼ �1:11G 0:05 and
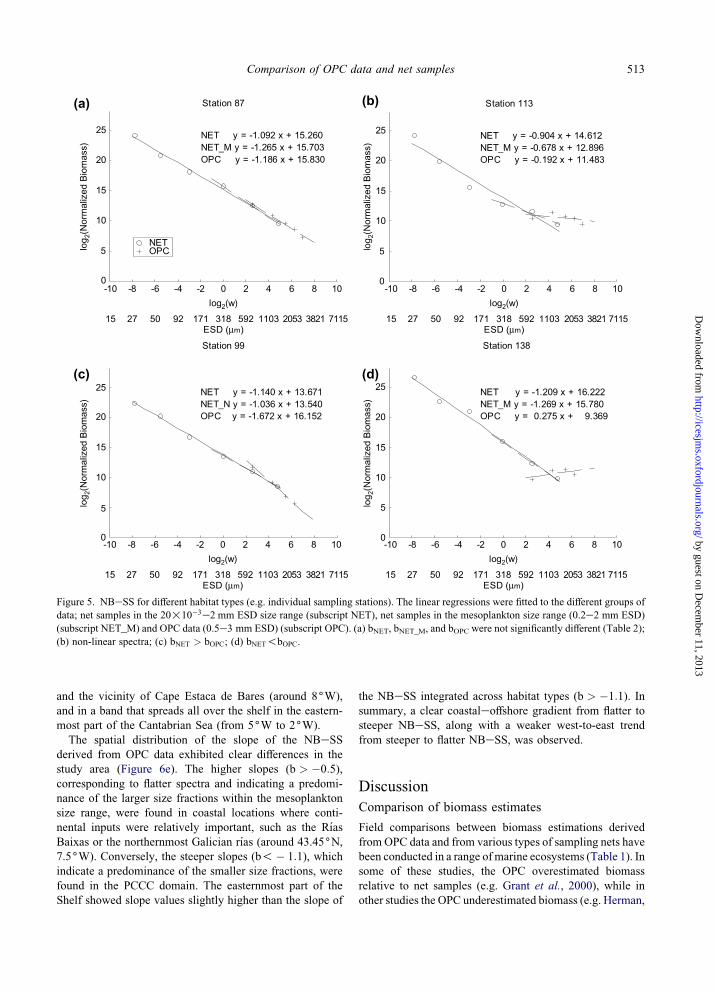
a ¼ 14:6G 0:2 (r2 ¼ 0:85), respectively.Station by station, the NBeSS were linear in 39 out of
the 51 stations selected for the analysis (e.g. Figure 5a). The
remaining stations showed a clear departure from linearity
(e.g. Figure 5b), in which case the results of Student’s t-test
for differences between the slopes of the linear models fitted
to the different groups of data (i.e. OPC, and net samples in
the mesoplankton and in the whole size range sampled)
(Table 2) must be taken only as indicative of the trends of
the NBeSS. The slopes of the NBeSS derived from net
samples (bNET) and OPC data (bOPC) were not significantly
different in 61% of the stations (Table 2; e.g. Figure 5a).
This rose to 78% when the comparison was limited to the
mesoplankton size range (H0: bNET M ¼ bOPC). An example
of this type of NBeSS is shown in Figure 5a. The slopes
were significantly different in only 11 stations, 8 of which
showed steeper slopes in the NBeSS derived from OPC
data than from net samples (i.e. bOPC!bNET M; e.g. Figure
5c) and the rest showed the opposite (i.e. bOPC > bNET M;
e.g. Figure 5d).
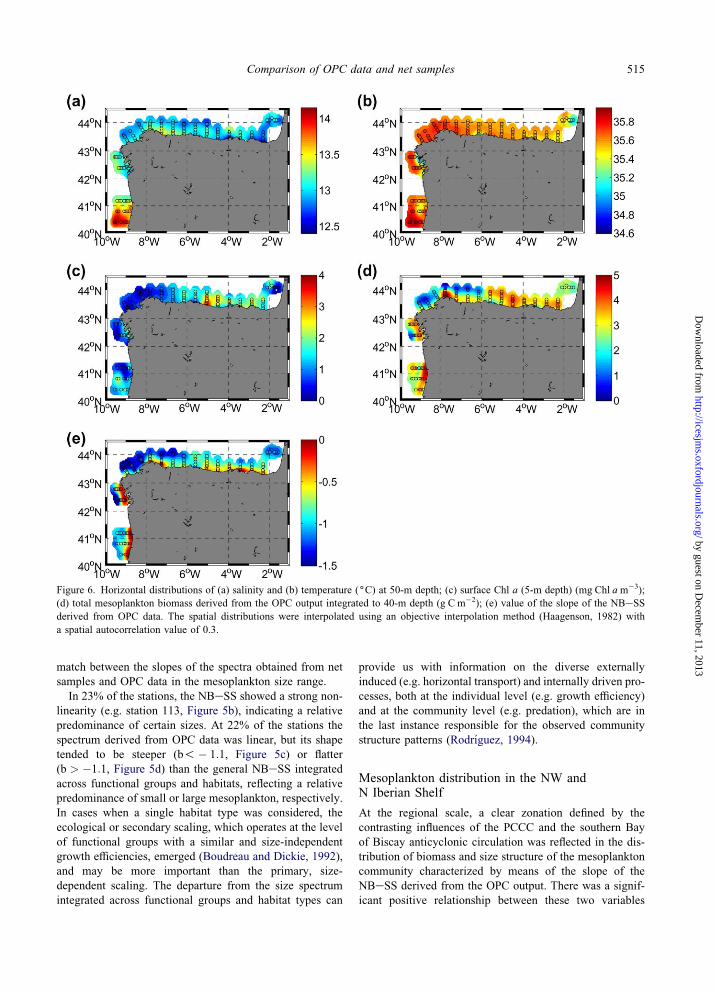
Mesoplankton biomass and size structure inthe NW and N Iberian Shelf during thewinterespring transition. Relationshipswith hydrographic variability
The spatial distribution of salinity and temperature at 50-m
depth (Figure 6a, b) revealed the hydrographic signature of
two regional-scale features: the Portugal Coastal Counter
Current (PCCC) in the NW Iberian Shelf (Bode et al., 2002;
Alvarez-Salgado et al., 2003), identified by its characteristic
high salinity (35.7e35.8) and temperature (O13.4(C), andthe general anticyclonic circulation (AC) on the easternmost
part of the southern Bay of Biscay, characterized by lower
salinity and temperature values (ca. 35.55 and !12.8(C).These features converged in the central Cantabrian Sea
(around 4(W), as indicated by the relatively higher salinity
and temperature variability in this area (35.5e35.7 and
12.4e12.8(C, respectively). Vertical mixing was observed
in the PCCC domain, while an incipient thermal stratifica-
tion was observed in the area occupied by the AC. Local
processes, such as freshwater inputs in the vicinity of river
discharges and estuaries, induced important thermohaline
variability in the surface layers (data not shown).
Surface Chl a concentrations were low (!1 mg Chl a
m�3) in the PCCC domain (Figure 6c) and increased
eastwards from the central Cantabrian Sea (O2 mg Chl a
m�3) due to the consolidation of the seasonal thermocline
in this part of the shelf.
Mesoplankton biomass derived from the OPC output,
integrated to 40-m depth (i.e. maximum depth of the
thermocline in stratified conditions), is shown in Figure
6d. The highest values (O3 g Cm�2) were found in local-
ized coastal areas in the W and NW sector of the Shelf,
such as the river discharge from the river Douro (41(N),the mouth of the Rıas Baixas (between 42(N and 43(N)
cember 11, 2013
-6 -4 -2 0 2 4 6 8 100
5
10
15
20
25
30
log2(wt)
log 2
(Nor
mal
ized
Bio
mas
s)
Gral Y= (-1.10 ± 0.04) X + 14.6 ± 0.2 r2=0.84 NET_M Y= (-1.0 ± 0.1) X + 14.5 ± 0.4 r2=0.49 OPC Y= (-1.0 ± 0.1) X + 14.6 ± 0.7 r2=0.43
-10
15
-8
27 50 92 171 318 592 1103 2053 3821 7115ESD (µm)
Figure 4. NBeSS integrated across stations showing the parameters of the linear regression models fitted to OPC data, net samples in the
mesoplankton size range, and pooled data.
513Comparison of OPC data and net samples
by guest on Decem
ber 11, 2http://icesjm
s.oxfordjournals.org/D
ownloaded from
-10 -8 -6 -4 -2 0 2 4 6 8 100
5
10
15
20
25 NET y = -1.092 x + 15.260NET_M y = -1.265 x + 15.703OPC y = -1.186 x + 15.830
log2(w)
log 2
(Nor
mal
ized
Bio
mas
s)lo
g 2(N
orm
aliz
ed B
iom
ass)
log 2
(Nor
mal
ized
Bio
mas
s)lo
g 2(N
orm
aliz
ed B
iom
ass)
Station 87
NETOPC
0
5
10
15
20
25 NET y = -0.904 x + 14.612NET_M y = -0.678 x + 12.896OPC y = -0.192 x + 11.483
Station 113
0
5
10
15
20
25 NET y = -1.140 x + 13.671NET_N y = -1.036 x + 13.540OPC y = -1.672 x + 16.152
Station 99
0
5
10
15
20
25 NET y = -1.209 x + 16.222NET_M y = -1.269 x + 15.780OPC y = 0.275 x + 9.369
(a)
(c)
(b)
(d)
15 27 50 92 171 318 592 1103 2053 3821 7115ESD (µm)
-10 -8 -6 -4 -2 0 2 4 6 8 10
log2(w)
Station 138
15 27 50 92 171 318 592 1103 2053 3821 7115ESD (µm)
-10 -8 -6 -4 -2 0 2 4 6 8 10
log2(w)
15 27 50 92 171 318 592 1103 2053 3821 7115ESD (µm)
-10 -8 -6 -4 -2 0 2 4 6 8 10
log2(w)
15 27 50 92 171 318 592 1103 2053 3821 7115ESD (µm)
Figure 5. NBeSS for different habitat types (e.g. individual sampling stations). The linear regressions were fitted to the different groups of
data; net samples in the 20!10�3e2 mm ESD size range (subscript NET), net samples in the mesoplankton size range (0.2e2 mm ESD)
(subscript NET_M) and OPC data (0.5e3 mm ESD) (subscript OPC). (a) bNET, bNET_M, and bOPC were not significantly different (Table 2);
(b) non-linear spectra; (c) bNET > bOPC; (d) bNET!bOPC.
013
and the vicinity of Cape Estaca de Bares (around 8(W),
and in a band that spreads all over the shelf in the eastern-
most part of the Cantabrian Sea (from 5(W to 2(W).
The spatial distribution of the slope of the NBeSSderived from OPC data exhibited clear differences in the
study area (Figure 6e). The higher slopes (b > �0:5),corresponding to flatter spectra and indicating a predomi-
nance of the larger size fractions within the mesoplankton
size range, were found in coastal locations where conti-
nental inputs were relatively important, such as the Rıas
Baixas or the northernmost Galician rıas (around 43.45(N,7.5(W). Conversely, the steeper slopes (b!� 1:1), whichindicate a predominance of the smaller size fractions, were
found in the PCCC domain. The easternmost part of the
Shelf showed slope values slightly higher than the slope of
the NBeSS integrated across habitat types (b > �1:1). Insummary, a clear coastaleoffshore gradient from flatter to
steeper NBeSS, along with a weaker west-to-east trend
from steeper to flatter NBeSS, was observed.
Discussion
Comparison of biomass estimates
Field comparisons between biomass estimations derived
fromOPC data and from various types of sampling nets have
been conducted in a range of marine ecosystems (Table 1). In
some of these studies, the OPC overestimated biomass
relative to net samples (e.g. Grant et al., 2000), while in
other studies the OPC underestimated biomass (e.g. Herman,
514 E. Nogueira et al.
by guest on Decem
ber 11, 2013http://icesjm
s.oxfordjournals.org/D
ownloaded from
1988). Only in few studies were the results not significantlydifferent (e.g. Herman, 2002). The reasons suggested by the
authors to explain the observed discrepancies were related
to the characteristics of the sampling methods (Table 1).
The estimations of mesoplankton biomass from OPC data
presented here were slightly higher than the estimations
made by other authors in the area, for instance, those given
by Valdes et al. (1990) for neritic waters of the Galician
coast (5e120 mg Cm�3) or Fernandez et al. (1993) for shelf
waters in the central Cantabrian Sea (5e75 mg Cm�3). The
overall agreement among independent estimates was rea-
sonably good, taking into account the different sampling
strategies, methodologies, processing of samples, and
spatio-temporal scales. However, it must be noted that in
19 out of the 70 stations sampled, the estimates from net
samples were up to fourfold higher than the maximum
concentration estimated by the OPC (ca. 180 mg Cm�3) or
than the maximum values estimated in the Bay of Biscay
(Poulet et al., 1996). We checked these stations and found
that the volume of water sampled according to the flowmeter
record (Vf) was too low in comparison with the theoretically
estimated volume (Vt). The error in the estimation of Vf
resulted in very high mesoplankton concentrations and very
low values of the estimated depth where clogging was
assumed to be severe (z)), so we decided to remove these
stations for the comparative analysis. These stations (Figure
1) were located in the vicinity of river discharges and
estuaries and in areas of relatively high (i.e. O3 mg
Chl am�3) Chl a concentrations (Figure 6c), where the pro-
blem of net cloggingmay be enhanced due to the presumably
high concentrations of suspended matter.
The comparison of biomass for different size fractions
revealed a huge discrepancy for the smallest size fraction,
resulting in very low estimations from the OPC relative to
the net samples, a good agreement between methods for the
intermediate size fraction and a slight overestimation by the
Table 2. Comparison between the slopes of the linear models fitted
to the NBeSS obtained with the different groups of data (i.e. OPC
data and net samples in the whole size range sampled and in the
mesoplankton size range e bOPC, bNET, and bNET_M, respectively)
using Student’s t-test for aR0:05 (null hypothesis, H0:
bNET ¼ bOPC or bNET M ¼ bOPC).
bNET:bOPC bNET_M:bOPC Stations %
= = 1, 3, 4, 16e19, 31,32, 34, 53, 55, 65,
67, 68, 71e76, 87,
100, 101, 103,
128e130, 143e145
61
s = 33, 35, 54, 63, 113,
115, 140, 147, 147
17
s s bNET_M! bOPC 114, 116, 138 6
s s bNET_M > bOPC 20, 50e52, 64, 66,89, 99
16
OPC relative to net samples for the largest size fraction.
The discrepancy observed for the smallest size fraction may
be due to problems related to the lower detection limit of
the OPC, nominally fixed at 0.25 mm ESD size (Herman,
2002). A more realistic lower detection limit for the OPC
could be set around 0.35 mm in order to avoid these meth-
odological constraints. On the other hand, the differences
between methods for the largest size fraction could be
attributed to the escape response by large copepods, likely
enhanced by net clogging (Sameoto et al., 2000). Un-
fortunately, we lack estimations of the number of particles
per volume sampled by the net which would have been
useful in support of our explanations concerning the dis-
crepancies between methods.
Apart from the problems associated with the definition of
the lower detection limit of the OPC and the errors in the
calculation of the water volume sampled due to net clog-
ging, other important issues that preclude a direct compar-
ison between methods were the uncertainties associated
with conversion factors and the non-simultaneous sam-
pling. These factors must be considered and controlled in
future, specifically designed, intercomparison studies.
Comparison of NBeSS
The slope of the general NBeSS, i.e. integrated across
stations (i.e. habitat types) and across sampled sizes (b ¼�1:11G 0:05) was close to the expected value of �1.2 that
characterizes oceanic pelagic systems when biomass is ex-
pressed in carbon units (Quinones, 1994). This value
indicates a roughly uniform biomass distribution over log-
arithmic size classes (Sheldon et al., 1972). Such a distribu-
tion usually appears when the spectrum is obtained from
a wide range of habitat types and sizes of organisms
(Rodrıguez, 1994). According to Boudreau and Dickie
(1992) the slope of the integrated NBeSS across trophic
levels, thus covering a wide range of sizes, reflects the
physiological or primary scaling in the size distribution of
ecological properties, where the size dependence of metab-
olism exhibits its ecological significance. The primary
scaling of the NBeSS integrated across habitat types esti-
mated from both OPC data and net samples provided similar
results. Therefore, the primary or physiological structure of
the plankton community could be estimated from the size
spectrum of the mesoplankton community sampled by the
OPC, provided that the spectrum is integrated across habitat
types (i.e. filtering out the spatio-temporal variability).
The slopes of the size spectra estimated for each station
(i.e. each particular habitat type) with different sampling
methodologies that covered distinct size ranges (i.e. from
20!10�3 to 2 mm ESD size for the net and from 0.5 to
3 mm ESD size for the OPC) were not significantly
different in most of the sampled stations (61%). In these
cases, the structure of the planktonic community, from
microplankton to mesoplankton, could have been reliably
inferred from the OPC data alone. There was also a good
515Comparison of OPC data and net samples
by guest on Decem
ber 11http://icesjm
s.oxfordjournals.org/D
ownloaded from
Figure 6. Horizontal distributions of (a) salinity and (b) temperature ((C) at 50-m depth; (c) surface Chl a (5-m depth) (mg Chl am�3);
(d) total mesoplankton biomass derived from the OPC output integrated to 40-m depth (g C m�2); (e) value of the slope of the NBeSS
derived from OPC data. The spatial distributions were interpolated using an objective interpolation method (Haagenson, 1982) with
a spatial autocorrelation value of 0.3.
, 2013
match between the slopes of the spectra obtained from netsamples and OPC data in the mesoplankton size range.
In 23% of the stations, the NBeSS showed a strong non-
linearity (e.g. station 113, Figure 5b), indicating a relative
predominance of certain sizes. At 22% of the stations the
spectrum derived from OPC data was linear, but its shape
tended to be steeper (b!� 1:1, Figure 5c) or flatter
(b > �1:1, Figure 5d) than the general NBeSS integrated
across functional groups and habitats, reflecting a relative
predominance of small or large mesoplankton, respectively.
In cases when a single habitat type was considered, the
ecological or secondary scaling, which operates at the level
of functional groups with a similar and size-independent
growth efficiencies, emerged (Boudreau and Dickie, 1992),
and may be more important than the primary, size-
dependent scaling. The departure from the size spectrum
integrated across functional groups and habitat types can
provide us with information on the diverse externally
induced (e.g. horizontal transport) and internally driven pro-
cesses, both at the individual level (e.g. growth efficiency)
and at the community level (e.g. predation), which are in
the last instance responsible for the observed community
structure patterns (Rodrıguez, 1994).
Mesoplankton distribution in the NW andN Iberian Shelf
At the regional scale, a clear zonation defined by the
contrasting influences of the PCCC and the southern Bay
of Biscay anticyclonic circulation was reflected in the dis-
tribution of biomass and size structure of the mesoplankton
community characterized by means of the slope of the
NBeSS derived from the OPC output. There was a signif-
icant positive relationship between these two variables
516 E. Nogueira et al.
by guest on Decem
ber 11, 2013http://icesjm
s.oxfordjournals.org/D
ownloaded from
(BOPC ¼ 55:7bOPC þ 104:3, r2 ¼ 0:54), indicating that high
mesoplankton biomass corresponded with low values of the
slope of the NBeSS and vice versa. A conspicuous coastal-
offshore gradient was observed: large mesoplankton, and
thus relatively high biomass values, were found in the
coastal zone and in the vicinity of river flows, while small
mesoplankton, and thus relatively low biomass values, were
found offshore. A less marked trend was also observed from
west to east. In the domain of the PCCC, small meso-
plankton prevailed, while in the easternmost part, where
thermal stratification was well underway, large mesoplank-
ton were more important. Such patterns are consistent with
earlier observations of microplankton in the NW Iberian
Shelf (Bode et al., 2002) showing the relevant influence of
hydrographic features on the distribution of plankton. Our
results expand the influence of the hydrographic scenario
on the distribution and size structure of the mesoplankton
community, mainly integrated by zooplankton.
Acknowledgements
We are indebted to the captain and crew of RV ‘‘Thalassa’’
for their assistance and to the Chief Scientist (P. Carrera)
for his continuous support during the cruise. A. Alvarez,
B. Castro, J. Lorenzo, and M. M. Varela collaborated in the
sampling and processing of plankton samples, and
R. Revilla assisted with OPC data collection and prepara-
tion. We thank Dr A. Lopez-Urrutia and three anonymous
referees for comments that greatly improved the manu-
script. This research was supported in part by projects
PELASSES (contract no. 90/10) and SARDYN (QLRT-
2001-00818) of the European Union, and by additional
funds from the Instituto Espanol de Oceanografıa (Spain).
References
Alvarez-Salgado, X. A., Figueiras, F. G., Perez, F. F., Groom, S.,Nogueira, E., Borges, A. V., Chou, L., Castro, C. G., Moncoiffe,G., Rıos, A. F., Miller, A. E. J., Frankignoulle, M., Savidge, G.,and Wollast, R. 2003. The Portugal coastal counter current offNW Spain: new insights on its biogeochemical variability.Progress in Oceanography, 56: 281e321.
Beaulieu, S. E., Mullin, M. M., Tang, V. T., Pyne, S. M., King,A. L., and Twining, B. T. 1999. Using an optical plankton counterto determine the size distribution of preserved zooplanktonsamples. Journal of Plankton Research, 21: 1939e1956.
Bode, A., Alvarez-Ossorio, M. T., and Gonzalez, N. 1998.Estimations of zooplankton biomass in a coastal upwellingarea off NW Spain. Journal of Plankton Research, 20:1005e1014.
Bode, A., Varela, M., Casas, B., and Gonzalez, N. 2002. Intrusionsof eastern North Atlantic central waters and phytoplankton in thenorth and northwestern Iberian Shelf during spring. Journal ofMarine Systems, 36: 197e218.
Boudreau, P. R., and Dickie, L. M. 1992. Biomass spectra of aquaticecosystems in relation to fisheries yield. Canadian Journal ofFisheries and Aquatic Sciences, 49: 1528e1538.
Fernandez, E., Cabal, J., Acuna, J. L., Bode, A., Botas, A., andGarcıa-Soto, C. 1993. Plankton distribution across a slopecurrent-induced front in the Southern Bay of Biscay. Journal ofPlankton Research, 15: 619e632.
Foote, K. G. 2000. Optical methods. In ICES ZooplanktonMethodology Manual, pp. 259e291. Ed. by R. P. Harris, P. H.Wiebe, J. Lenz, H. R. Skjoldal, and M. Huntley. AcademicPress, London. 684 pp.
Grant, S., Ward, P., Murphy, E., Bone, D., and Abott, S. 2000.Field comparison of an LHPR net sampling system and anoptical plankton counter (OPC) in the Southern Ocean. Journalof Plankton Research, 22: 619e638.
Haagenson, P. L. 1982. Review and evaluation of methods forobjective analysis of meteorological variables. Papers inMeteorological Research, 5: 113e133.
Halliday, N., Coombs, S. H., and Smith, C. 2001. A comparison ofLHPR and OPC from vertical distribution sampling ofzooplankton in a Norwegian fjord. Sarsia, 86: 87e99.
Herman, A. W. 1988. Simultaneous measurement of zooplankton:a light attenuance with a new optical plankton counter.Continental Shelf Research, 8: 205e221.
Herman, A. W. 1992. Design and calibration of a new opticalplankton counter capable of sizing small zooplankton. Deep-SeaResearch, 39: 395e415.
Herman, A. W. 2002. Sampling characteristic of vertical planktonnets and comparison with an optical plankton counter. Journal ofPlankton Research (submitted for publication).
Hopcroft, R. R. 2002. Comparison of plankton size spectra fromnet tow samples and OPC measurements in marine waters. InOptical Plankton Counter Workshop, pp. 7e11. Ed. by M. Zhouand K. Tande. GLOBEC Report No. 17, Tromso.
Huntley, M. E., Zhou, M., and Nordhausen, W. 1995. Mesoscaledistribution of zooplankton in the California Current in latespring, observed by optical plankton counter. Journal of MarineResearch, 53: 647e674.
Kennish, M. J. 1989. CRC Practical Handbook of Marine Science.CRC Press, Boca Raton, Fl.
Labat, J.Ph., Nayzauz, P., Dallot, S., Errhif, A., Razouls, S., andSabini, S. 2002. Mesoscale distribution of zooplankton distri-bution on the Sub-Antarctic frontal system in the Indian part ofthe Southern Ocean: a comparison between optical planktoncounter and net sampling. Deep-Sea Research I, 49: 735e749.
Mustard, A. T., Irigoien, X., Crisp, N., Fielding, S., and Allen, J. T.2002. Can an optical plankton counter produce reproducible andrealistic estimates of zooplankton abundance at different in situphytoplankton concentrations? Journal of Plankton Research(submitted for publication).
Platt, T., and Denman, K. 1977. Organization in the pelagicecosystems. Wiss Meeresunters Helgoland, 30: 575e581.
Poulet, S. E., Laabir, M., and Chaudron, Y. 1996. Characteristicfeatures of zooplankton in the Bay of Biscay. Scientia Marina,60(Suppl 2): 79e95.
Quinones,R.A. 1994.A comment on the use of allometry in the studyof pelagic ecosystem processes. Scientia Marina, 58: 11e16.
Rodrıguez, J. 1994. Some comments on the size-based structuralanalysis of the pelagic ecosystem. Scientia Marina, 58: 1e10.
Rodrıguez, J., and Mullin, M. M. 1986. Relationship betweenbiomass and body weight of plankton in a steady state oceanicecosystem. Limnology and Oceanography, 31(2): 361e370.
Ruberg, S. A., and Eadie, B. J. 2000. Remotely deployable watersampler. Proceedings of Sea Technology e Oceans 2000, pp.113e117. MTS/IEEE, 11e14 September, 2000. Providence,Rhode Island, Marine Technology Society, Washington, DC.
Sameoto, D., Wiebe, P., Runge, J., Postel, L., Dunn, J., Miller, C.,and Coombs, S. 2000. Collecting zooplankton. In ICESZooplankton Methodology Manual, pp. 55e78. Ed. by R. P.Harris, P. H. Wiebe, J. Lenz, H. R. Skjoldal, and M. Huntley.Academic Press, London. 684 pp.
517Comparison of OPC data and net samples
Sheldon, R. W., Prakah, A., and Sutcliffe, W. H. 1972. The sizedistribution of particles in the ocean. Limnology and Oceanog-raphy, 17: 327e340.
Sprules, W. G., Jin, E. H., Herman, A. W., and Stockwell, J. D.1998. Calibration of an optical plankton counter for use in freshwater. Limnology and Oceanography, 43: 726e733.
Valdes, L., Alvarez-Osorio, M. T., and Varela, M. 1990. Relacionentre la estructura de tallas y la biomasa del zooplancton nerıticoen la plataforma de La Coruna. Boletın del Instituto Espanol deOceanografıa, 6: 97e106.
Zar, J. H. 1999. Biostatistical Analysis, 4th edn. Prentice-Hall, NewYork. 663 pp.
by guest on Decem
ber 11, 2013http://icesjm
s.oxfordjournals.org/D
ownloaded from