Comparing ANN and GMM in a voice conversion framework
11
Applied Soft Computing 12 (2012) 3332–3342 Contents lists available at SciVerse ScienceDirect Applied Soft Computing j ourna l ho me p age: www.elsevier.com/l ocate/asoc Comparing ANN and GMM in a voice conversion framework R.H. Laskar a,∗ , D. Chakrabarty b , F.A. Talukdar a , K. Sreenivasa Rao c , K. Banerjee a a Department of Electronics & Communication Engineering, National Institute of Technology Silchar, Silchar 788010, Assam, India b Department of Electronics & Communication Engineering, Indian Institute of Technology Guwahati, Guwahati 781039, Assam, India c School of Information Technology, IIT Kharagpur, Kharagpur 721302, West Bengal, India a r t i c l e i n f o Article history: Received 9 October 2011 Received in revised form 19 March 2012 Accepted 22 May 2012 Available online 5 July 2012 Keywords: Artificial neural networks Gaussian mixture models Prosody Pitch contour Intonation patterns Duration patterns Energy profiles Residual modification a b s t r a c t In this paper, we present a comparative analysis of artificial neural networks (ANNs) and Gaussian mixture models (GMMs) for design of voice conversion system using line spectral frequencies (LSFs) as feature vectors. Both the ANN and GMM based models are explored to capture nonlinear mapping functions for modifying the vocal tract characteristics of a source speaker according to a desired target speaker. The LSFs are used to represent the vocal tract transfer function of a particular speaker. Mapping of the intonation patterns (pitch contour) is carried out using a codebook based model at segmental level. The energy profile of the signal is modified using a fixed scaling factor defined between the source and target speakers at the segmental level. Two different methods for residual modification such as residual copying and residual selection methods are used to generate the target residual signal. The performance of ANN and GMM based voice conversion (VC) system are conducted using subjective and objective measures. The results indicate that the proposed ANN-based model using LSFs feature set may be used as an alternative to state-of-the-art GMM-based models used to design a voice conversion system. © 2012 Elsevier B.V. All rights reserved. 1. Introduction Voice conversion (VC) is to modify the characteristics of the speech signal spoken by the source speaker according to a desired target speaker. The potential applications of this technology are customization of text-to-speech systems, entertainment and secu- rity applications [1,2]. It may also be applied for movie dubbing, translation to a different language and personification of syn- thesized speech for automated systems in computer interaction tools [3,4]. To design a voice conversion system, it needs to modify speaker- specific acoustic features contained in the speech signal. The vocal tract transfer function, shape of the glottal pulse, the prosodic fea- tures and linguistic cues can uniquely characterize a particular speaker [5,6]. Out of all the acoustic features, the vocal tract transfer function and the pitch contour are the two most important speaker specific acoustic cues [5]. Proper modification of residual signal is required to generate high quality synthesized target speech signal [7]. There are various speech features which are used to represent the vocal tract transfer function. They may be classified into three categories. The features that belong to acoustic phonetic models ∗ Corresponding author. Tel.: +91 9401437104; fax: +91 3842233797. E-mail address: [email protected] (R.H. Laskar). are: formant frequencies, formant bandwidths [5]. The linear pre- diction related features are linear prediction coefficients (LPCs) [8], reflection coefficients (RCs) [9], log-area ratios (LARs) [11] and line spectrum frequencies (LSFs) [1,12–14]. There are features without considering any speech model such as spectral lines [15], cepstral coefficients [10], and mel-cepstral frequencies [16]. In LP related features, it is observed that LSFs, that posses good interpolation property, ensure stable filter and are closely related to formant frequencies are the good choice to represent the vocal tract char- acteristics in a voice conversion system [1]. For mapping the speaker-specific features between source and target speakers, various models have been explored in the lit- erature. These models are specific to the kind of features used for mapping. For instance, Gaussian mixture models (GMMs) [10,2,17,14], vector quantization (VQ) [8], fuzzy vector quantization (FVQ) [18], linear multivariate regression (LMR) [19], dynamic fre- quency warping (DFW) [17], radial basis function networks (RBFNs) [11], artificial neural network (ANNs) [20,12,13,16] are widely used for mapping the vocal tract characteristics. In GMM-based approach, the joint distribution of features extracted from the speech signals of the source and target speak- ers is modeled as a mixture of Gaussians. Conventional GMM-based conversion tend to generate overly smoothed utterances [21]. It has also been observed that the GMM-based voice conversion systems needs around 30–50 parallel utterances to build a voice conver- sion model [16]. A modest amount of data, say 40 utterances can 1568-4946/$ – see front matter © 2012 Elsevier B.V. All rights reserved. http://dx.doi.org/10.1016/j.asoc.2012.05.027
Transcript of Comparing ANN and GMM in a voice conversion framework

C
Ra
b
c
a
ARRAA
KAGPPIDER
1
stcrttt
sttsfsis
tc
1h
Applied Soft Computing 12 (2012) 3332–3342
Contents lists available at SciVerse ScienceDirect
Applied Soft Computing
j ourna l ho me p age: www.elsev ier .com/ l ocate /asoc
omparing ANN and GMM in a voice conversion framework
.H. Laskara,∗, D. Chakrabartyb, F.A. Talukdara, K. Sreenivasa Raoc, K. Banerjeea
Department of Electronics & Communication Engineering, National Institute of Technology Silchar, Silchar 788010, Assam, IndiaDepartment of Electronics & Communication Engineering, Indian Institute of Technology Guwahati, Guwahati 781039, Assam, IndiaSchool of Information Technology, IIT Kharagpur, Kharagpur 721302, West Bengal, India
r t i c l e i n f o
rticle history:eceived 9 October 2011eceived in revised form 19 March 2012ccepted 22 May 2012vailable online 5 July 2012
eywords:rtificial neural networks
a b s t r a c t
In this paper, we present a comparative analysis of artificial neural networks (ANNs) and Gaussian mixturemodels (GMMs) for design of voice conversion system using line spectral frequencies (LSFs) as featurevectors. Both the ANN and GMM based models are explored to capture nonlinear mapping functionsfor modifying the vocal tract characteristics of a source speaker according to a desired target speaker.The LSFs are used to represent the vocal tract transfer function of a particular speaker. Mapping of theintonation patterns (pitch contour) is carried out using a codebook based model at segmental level. Theenergy profile of the signal is modified using a fixed scaling factor defined between the source and target
aussian mixture modelsrosodyitch contourntonation patternsuration patternsnergy profilesesidual modification
speakers at the segmental level. Two different methods for residual modification such as residual copyingand residual selection methods are used to generate the target residual signal. The performance of ANNand GMM based voice conversion (VC) system are conducted using subjective and objective measures. Theresults indicate that the proposed ANN-based model using LSFs feature set may be used as an alternativeto state-of-the-art GMM-based models used to design a voice conversion system.
© 2012 Elsevier B.V. All rights reserved.
. Introduction
Voice conversion (VC) is to modify the characteristics of thepeech signal spoken by the source speaker according to a desiredarget speaker. The potential applications of this technology areustomization of text-to-speech systems, entertainment and secu-ity applications [1,2]. It may also be applied for movie dubbing,ranslation to a different language and personification of syn-hesized speech for automated systems in computer interactionools [3,4].
To design a voice conversion system, it needs to modify speaker-pecific acoustic features contained in the speech signal. The vocalract transfer function, shape of the glottal pulse, the prosodic fea-ures and linguistic cues can uniquely characterize a particularpeaker [5,6]. Out of all the acoustic features, the vocal tract transferunction and the pitch contour are the two most important speakerpecific acoustic cues [5]. Proper modification of residual signals required to generate high quality synthesized target speechignal [7].
There are various speech features which are used to representhe vocal tract transfer function. They may be classified into threeategories. The features that belong to acoustic phonetic models
∗ Corresponding author. Tel.: +91 9401437104; fax: +91 3842233797.E-mail address: [email protected] (R.H. Laskar).
568-4946/$ – see front matter © 2012 Elsevier B.V. All rights reserved.ttp://dx.doi.org/10.1016/j.asoc.2012.05.027
are: formant frequencies, formant bandwidths [5]. The linear pre-diction related features are linear prediction coefficients (LPCs) [8],reflection coefficients (RCs) [9], log-area ratios (LARs) [11] and linespectrum frequencies (LSFs) [1,12–14]. There are features withoutconsidering any speech model such as spectral lines [15], cepstralcoefficients [10], and mel-cepstral frequencies [16]. In LP relatedfeatures, it is observed that LSFs, that posses good interpolationproperty, ensure stable filter and are closely related to formantfrequencies are the good choice to represent the vocal tract char-acteristics in a voice conversion system [1].
For mapping the speaker-specific features between source andtarget speakers, various models have been explored in the lit-erature. These models are specific to the kind of features usedfor mapping. For instance, Gaussian mixture models (GMMs)[10,2,17,14], vector quantization (VQ) [8], fuzzy vector quantization(FVQ) [18], linear multivariate regression (LMR) [19], dynamic fre-quency warping (DFW) [17], radial basis function networks (RBFNs)[11], artificial neural network (ANNs) [20,12,13,16] are widely usedfor mapping the vocal tract characteristics.
In GMM-based approach, the joint distribution of featuresextracted from the speech signals of the source and target speak-ers is modeled as a mixture of Gaussians. Conventional GMM-based
conversion tend to generate overly smoothed utterances [21]. It hasalso been observed that the GMM-based voice conversion systemsneeds around 30–50 parallel utterances to build a voice conver-sion model [16]. A modest amount of data, say 40 utterances can
t Com
paumWwGt
arIrpsetcatuameccfiawaufLtfawcTprots
atspfTriaatcpf[ppPtoc
R.H. Laskar et al. / Applied Sof
roduce an acceptable level of transformation in both the GMMnd ANN-based systems [16,17]. GMM-based system needs to tunep according to the amount of training data [14]. The number ofixtures must be decreased as the training data decreases [22].ith few training data GMM, HMM and CART performs in a similaray [14]. Overfitting and oversmoothing are the main drawback ofMM. The GMM with diagonal covariance do not work well when
he data exhibit strong correlation properties like LSFs [22,10].The changes in the vocal tract shape for different speakers
re highly nonlinear, therefore to model these nonlinearities, it isequired to capture the nonlinear relations present in the patterns.t is observed that the selection of suitable acoustic features (toepresent the vocal tract characteristics) and an appropriate map-ing function, dictate the overall performance of a voice conversionystem. Very few comparative studies have been made so far tovaluate the performance of GMM and ANN based models for spec-ral transformation in a voice conversion framework [19,16]. Theomparative study made by Baudoin et al. [19] used CNET databasend the cepstral coefficients were used to represent the vocal tractransfer function. The VQ, GMM, ANN and LMR based models weresed for mapping the spectral characteristics of one speaker tonother. The study suggest that the performance of GMM-basedodel is better than ANN-based model. The study made by Desai
t al. [16] made use of CMU ARCTIC database taking mel-cepstraloefficients (MCEPs) as acoustic features to represent the vocal tractharacteristics. They used mel log spectrum approximation (MLSA)lter to synthesize the target speech signal. The subjective evalu-tion results suggest that the ANN-based model perform equallyell as that of GMM-based model for spectral transformation in
voice conversion system. It has been observed that the modelssed for spectral mapping are specific to the kind of features usedor capturing the mapping function. In this paper, we have usedP analysis–synthesis model for feature extraction and synthesis ofhe speech signal. The LSFs derived from LPCs are used as acousticeatures to represent the vocal tract transfer function. We propose
neural network based model (5-layer feed forward neural net-ork architecture) for mapping the vocal tract characteristics and
odebook based model for mapping the intonation characteristics.he main reason for exploring neural network models for map-ing the vocal tract characteristics is that it captures the nonlinearelations present in the feature patterns. Hence, the main objectivef this paper is to explore the performance of ANN-based VC sys-em using LSF feature set, and to make a comparative study withtate-of-the-art GMM-based system.
It has been observed that modification of the spectral featureslone generates a third speaker’s voice, and the quality of the syn-hesized speech is not a natural one [2,23,14]. To produce a naturalounding high quality synthesized speech, it needs to modify therosodic features along with the spectral features. The prosodiceatures are very difficult to analyze and model in a VC framework.he pitch contour is one of the most important prosodic featureselated to speaker identity. The pitch contour carries significantnformation about the identity of a particular speaker [24]. Therere various methods proposed in the literature to capture the globals well the local dynamics of the pitch contour. Linear models, scat-er plots, GMMs, sentence contour codebook and segment contourodebook are used for mapping the pitch contour [25–27]. Map-ing functions derived by linear, cubic and GMM based modelsail to predict the local variations present in the pitch contours25,27]. To capture the local dynamics of the pitch contour, weroposed a codebook based model at voiced segment level for map-ing the source pitch contour according to the target pitch contour.
itch contour codebooks has been prepared for both the source andhe target speakers from the time aligned sentences. There exitsne-to-one relation between source and the target pitch contourodebooks. The unknown source pitch contour is coded with sourceputing 12 (2012) 3332–3342 3333
codebook and decoded as the weighted average of all the entries ofthe target codebook.
The residual signal carries significant information about theidentity of a speaker [2,23,14]. Therefore, appropriate modificationof the residual signal is required to synthesize high quality tar-get speaker’s voice. Various methods for modification of residualsignal has been proposed in the literature. They may be catego-rized as residual copying, residual prediction, residual selectionand unit selection methods [30,28,29,14]. The residual copying andresidual prediction methods fail to capture the strong correlationbetween the source and system characteristics. The method basedon residual selection and unit selection can capture the correlationpresent in speech production mechanism of a particular speaker.The reported evaluation results show that the residual copyingmethods perform better in MOS but fails in ABX test [30]. How-ever, the residual selection method performs well in terms of boththe MOS and ABX test [30]. Therefore, in this paper, we propose amodified residual copying and residual selection method to mod-ify the residual signal of the source speaker according to the targetspeaker maintaining a high correlation between the source andsystem characteristics. The following are the contributions of thispaper: (i) a database consisting of four Indian speakers are preparedto design a voice conversion system, (ii) the ANN-based modelis proposed to capture the relation between the vocal-tract char-acteristics between the speaker pairs, (iii) an epoch based modelhas been developed for modification of intonation patterns of thesource speaker according to the target speaker, (iv) an epoch basedmodel has been developed for copying the LP residual signal togenerate the target speaker’s LP residual signal, and (v) a compar-ative analysis has been performed between the residual copyingmethod and residual selection method for generating the residualsignal corresponding to the desired target speaker.
The paper is organized as follows. In Section 2, the database usedin this paper and the extraction of acoustic features are discussed. InSection 3, we have provided a brief theory of ANN and GMM-basedmodel to design a voice conversion system. Mapping of intonationpatterns between source and target speakers using the codebookbased model is discussed in Section 4. The different methods forresidual modification has been discussed in Section 5. Performanceevaluation of target speaker’s speech signal using both the subjec-tive and objective tests are given in Section 6. Conclusion and futuredirection of work are highlighted in Section 7.
2. Database preparation and feature extraction
For deriving the mapping function, it is required to train themodels with input–output acoustic features. The LPCs extractedfrom the utterances of source and target speakers are used to rep-resent the vocal tract transfer function. However, the LPCs possesspoor interpolation property and the stability of the filter is notguaranteed. Therefore, we have used LSFs, a derived parameterset from LPCs to represent the vocal tract characteristics of a par-ticular speaker. The LSFs are having good interpolation propertyand ensures a stable filter [1,13,14]. Dynamic time warping (DTW)algorithm has been used to derive the time-aligned LSFs from theparallel utterances of the source and target speakers.
We have prepared a database that consists of four Indian speak-ers. Since, the TIMIT database contain phonetically rich balancedsound units, therefore, we have used the text-prompts from theTIMIT database to prepare our own database. There are four (2 maleand 2 female adult Indian) speakers belonging to different dialect
zones of India. The prepared database consists of 100 English sen-tences uttered by each of the speaker. The sentences are recordedusing mono-channel, 8 kHz sampling frequency and with 16 bit res-olution. The recording is done in normal environment and speakers
3 t Com
aste3pfstoptpte(piabcd
3
fbflcpa
3
aedGp
p
wodsdmttmTo
te
F
˜
334 R.H. Laskar et al. / Applied Sof
re allowed to utter in the natural way they used to speak. As thepeakers belong to different dialect zones of the country, therefore,he speaking rate, the speaking style and accent are different forach of the speaker. The duration of the sentences are varying from–5 s. Each sentence has roughly about 5–8 words. Input and out-ut feature spaces consists of 10 dimensional LPCs, that are derivedrom the parallel sentences uttered by both the source and targetpeakers. Out of these 100 sentences, 70 sentences are used to trainhe system and 30 sentences are used to evaluate the performancef the system. There are around 30,000 time aligned frames of LSFsresent in the database for training the models and around 12,000ime aligned LSFs for testing the performance of the models. Theitch contour is derived at segmented level from the parallel sen-ences of the source and target speakers. The pitch contours arextracted from the knowledge of instants of significant excitationglottal closure instant) using group delay analysis [31–33]. Theitch contours are resampled to a length of 100 to make entries
n the codebook. For preparation of codebooks, the pitch contourre extracted from the time-aligned parallel sentences uttered byoth the source and target speakers. There are around 16,000 pitchontour segments corresponding to each of the speaker pairs in theatabases.
. GMM and ANN based models
GMM and ANN are the most popular mapping functions usedor spectral modification in a voice conversion system. The GMM-ased model captures a locally linear, globally nonlinear mappingunction. However, the ANN based model captures a globally non-inear mapping function in a voice conversion framework. Toapture both the mapping functions for spectral modification, weresent here a detailed theoretical analysis of state-of-the-art GMMnd ANN-based design of a VC system.
.1. GMM based voice conversion model
In the GMM-based mapping algorithm the learning procedureims to fit a GMM model to the augmented source and target speak-rs’ acoustics feature spaces [2]. The GMM allows the probabilityistribution of a random variable z to be modeled as the sum of Qaussian components, also referred to as classes or mixtures. Itsrobability density function (pdf) can be written as
(z) =Q∑
i=1
˛iN(z; �i, �i)Q∑
i=1
˛i = 1 ˛i ≥ 0 (1)
here z = [XTYT] is an augmented feature vector of input X andutput Y. Let X = [x1 ; x2 ; . . . ; xN] be a sequence of N feature vectorsescribing the source speaker and Y = [y1 ; y2 ; . . . ; yN] be the corre-ponding sequence as produced by the target speaker. N(z ; �i, �i)enotes the Gaussian distribution with mean vector �i, covarianceatrix �i and ˛i denotes the prior probability that vector z belongs
o the ith class. The model parameters (z ; � ; �) are estimated usinghe expectation maximization (EM) algorithm which is an iterative
ethod for computing maximum likelihood parameter estimation.he computation of the Gaussian distribution parameters is the partf the training procedure.
The testing process involves regression, i.e., given the input vec-ors, X, we need to predict Y using GMM, which is calculated by thequations given below.
(xi) = E[yi|xi] =Q∑
i=1
hi(x)[�yi
+ �yxi
(�xxi )−1(x − �x
i )] (2)
puting 12 (2012) 3332–3342
where,
hi(x) = ˛iN(z; �xi; �xx
i)∑Q
j=1˛jN(z; �xj; �xx
j )(3)
is the a posterior probability that a given input vector x belongs tothe ith class. �x
i, �y
idenote mean vectors of class i for the source and
target speakers respectively. �xxi is the covariance matrix of class i
for source speaker and �yxi
denotes the cross-covariance matrix ofclass i for the source and target speakers.
Using LSFs as the acoustic feature to represent the vocal tractcharacteristics of the speakers, GMM-based model has been devel-oped to a capture a nonlinear mapping function. The number ofmixtures used for designing the model varies from 2 to 64 depend-ing on the amount of training data. It is observed that with givendatabase, the 64 number of mixtures can well represent the acous-tic space of a particular speaker. Since, the GMM with diagonalcovariance does not work well with the highly correlated data likeLSFs, therefore, we have used the full diagonal covariance matrix[22]. In this paper, the GMM joint density based model has beenused as a baseline system for spectral mapping between the speakerpairs [2]. It is also observed that the linear transformation trainingaccording to Kain et al. [2] is only reasonable in conjunction withfull covariance matrices. The mapping function captured during thetraining phase is used to predict the vocal tract characteristics ofthe desired target speaker. The predicted LSFs are converted to LPCsthat represent the desired target speaker’s vocal tract characteris-tics.
3.2. ANN based voice conversion model
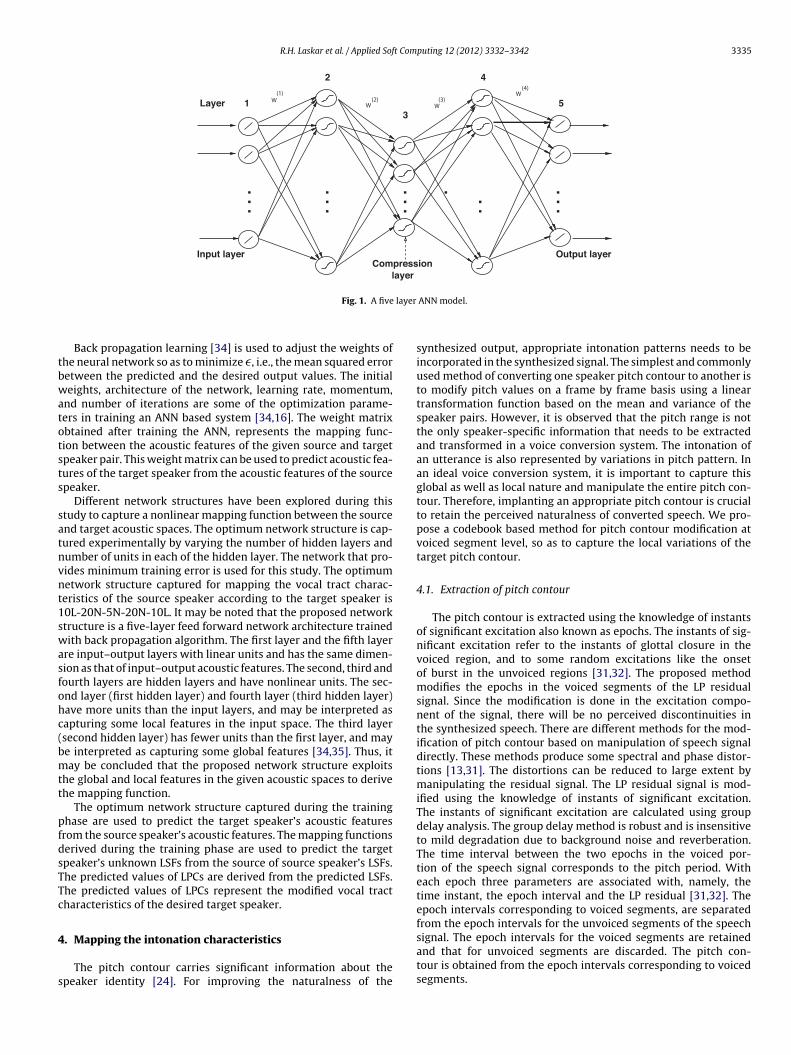
The shape of the vocal tract can be characterized by the grossenvelope of the linear prediction (LP) spectrum. The LPC parametersposses poor interpolation property and does not always ensure astable filter [1,4]. Therefore, LSFs, a derived parameter from LPCsare also used to parameterize the vocal tract characteristics. Foreach of the speaker combination, four pairs of time-aligned LSFs arederived from the parallel utterances of speakers. In this section, wepresent an ANN-based voice conversion system using LSF featureset. A five layer network structure has been used to capture thenonlinear mapping function between the vocal tract characteristicsof the source and target speakers. The neural network model usedin this work is shown in Fig. 1.
During the process of training, the source and target speakersacoustic features are fed as input–output to the network. The net-work learns from these two data set and tries to capture a nonlinearmapping function based on minimum mean square error.
If G(xt) denotes the ANN mapping of xt, then the error of map-ping is given by
� =N∑
t=1
‖yt − G(xt)‖2 (4)
where, xt, yt and G(xt) are the tth source, target and predictedLSF vectors respectively and N is the number of LSF vectors in thedatabase.
The mapping function G(xt) is given by
G(xt) = g̃(w(4)g3(w(3)g2(w(2)g1(w(1)xt)))) (5)
where,
g(ϑ) = ϑ, gi(ϑ) = a tanh(bϑ) (6)
Here, w(1), w(2), w(3) and w(4) represents the weight matrices offirst, second, third and fourth layers of the ANN model respectivelyand i = 1, 2 and 3. The values of the constants a and b used in tanhfunction are captured empirically.
R.H. Laskar et al. / Applied Soft Computing 12 (2012) 3332–3342 3335
Input layer
Layer
.
.......
....
...
Compressionlayer
Output layer
1
2
3
4
5WW W
W (1) (2) (3)
(4)
layer
tbwatotsts
satnvnt1swasfohc(bmtt
pfdsTTc
4
s
Fig. 1. A five
Back propagation learning [34] is used to adjust the weights ofhe neural network so as to minimize �, i.e., the mean squared erroretween the predicted and the desired output values. The initialeights, architecture of the network, learning rate, momentum,
nd number of iterations are some of the optimization parame-ers in training an ANN based system [34,16]. The weight matrixbtained after training the ANN, represents the mapping func-ion between the acoustic features of the given source and targetpeaker pair. This weight matrix can be used to predict acoustic fea-ures of the target speaker from the acoustic features of the sourcepeaker.
Different network structures have been explored during thistudy to capture a nonlinear mapping function between the sourcend target acoustic spaces. The optimum network structure is cap-ured experimentally by varying the number of hidden layers andumber of units in each of the hidden layer. The network that pro-ides minimum training error is used for this study. The optimumetwork structure captured for mapping the vocal tract charac-eristics of the source speaker according to the target speaker is0L-20N-5N-20N-10L. It may be noted that the proposed networktructure is a five-layer feed forward network architecture trainedith back propagation algorithm. The first layer and the fifth layer
re input–output layers with linear units and has the same dimen-ion as that of input–output acoustic features. The second, third andourth layers are hidden layers and have nonlinear units. The sec-nd layer (first hidden layer) and fourth layer (third hidden layer)ave more units than the input layers, and may be interpreted asapturing some local features in the input space. The third layersecond hidden layer) has fewer units than the first layer, and maye interpreted as capturing some global features [34,35]. Thus, itay be concluded that the proposed network structure exploits
he global and local features in the given acoustic spaces to derivehe mapping function.
The optimum network structure captured during the traininghase are used to predict the target speaker’s acoustic featuresrom the source speaker’s acoustic features. The mapping functionserived during the training phase are used to predict the targetpeaker’s unknown LSFs from the source of source speaker’s LSFs.he predicted values of LPCs are derived from the predicted LSFs.he predicted values of LPCs represent the modified vocal tractharacteristics of the desired target speaker.
. Mapping the intonation characteristics
The pitch contour carries significant information about thepeaker identity [24]. For improving the naturalness of the
ANN model.
synthesized output, appropriate intonation patterns needs to beincorporated in the synthesized signal. The simplest and commonlyused method of converting one speaker pitch contour to another isto modify pitch values on a frame by frame basis using a lineartransformation function based on the mean and variance of thespeaker pairs. However, it is observed that the pitch range is notthe only speaker-specific information that needs to be extractedand transformed in a voice conversion system. The intonation ofan utterance is also represented by variations in pitch pattern. Inan ideal voice conversion system, it is important to capture thisglobal as well as local nature and manipulate the entire pitch con-tour. Therefore, implanting an appropriate pitch contour is crucialto retain the perceived naturalness of converted speech. We pro-pose a codebook based method for pitch contour modification atvoiced segment level, so as to capture the local variations of thetarget pitch contour.
4.1. Extraction of pitch contour
The pitch contour is extracted using the knowledge of instantsof significant excitation also known as epochs. The instants of sig-nificant excitation refer to the instants of glottal closure in thevoiced region, and to some random excitations like the onsetof burst in the unvoiced regions [31,32]. The proposed methodmodifies the epochs in the voiced segments of the LP residualsignal. Since the modification is done in the excitation compo-nent of the signal, there will be no perceived discontinuities inthe synthesized speech. There are different methods for the mod-ification of pitch contour based on manipulation of speech signaldirectly. These methods produce some spectral and phase distor-tions [13,31]. The distortions can be reduced to large extent bymanipulating the residual signal. The LP residual signal is mod-ified using the knowledge of instants of significant excitation.The instants of significant excitation are calculated using groupdelay analysis. The group delay method is robust and is insensitiveto mild degradation due to background noise and reverberation.The time interval between the two epochs in the voiced por-tion of the speech signal corresponds to the pitch period. Witheach epoch three parameters are associated with, namely, thetime instant, the epoch interval and the LP residual [31,32]. Theepoch intervals corresponding to voiced segments, are separatedfrom the epoch intervals for the unvoiced segments of the speech
signal. The epoch intervals for the voiced segments are retainedand that for unvoiced segments are discarded. The pitch con-tour is obtained from the epoch intervals corresponding to voicedsegments.
3 t Com
4
sTwppFtlgwcpp
acTrsmttttivtvpttp
fpm
TS
336 R.H. Laskar et al. / Applied Sof
.2. Mapping the pitch contour
The intonation patterns of a particular speaker can be repre-ented by local as well as the global variations in a pitch contour.herefore, database containing sufficient number of pitch segmentsith rises and falls can be used to represent the variations of theitch contour. This assumption is made to capture the intonationatterns of the target pitch contour from the source pitch contour.or this purpose, a codebook based model has been proposed inhis paper. The pitch contours are extracted at the voiced segmentevel from the parallel sentences uttered by the source and the tar-et speakers. Since the voiced segments are of varying durationsithin a sentence and across the sentences in a database, the pitch
ontours obtained are of different length. The mean length of theitch contours of the voiced segments are chosen to be 100 pitcheriods for this study.
For preparing the codebook, the source and target sentencesre time aligned using DTW algorithm. The source and target pitchontours are extracted from the time aligned parallel sentences.he target pitch contour is linearly interpolated in the non-voicedegions [4]. The voiced segments of the pitch contours of the sourcepeaker is extracted. The corresponding target pitch contour seg-ent for a given source pitch contour segment is extracted from
he interpolated and aligned target pitch contour. The pitch con-ours extracted at voiced segment level are resampled to makeheir length equal. Two codebooks are prepared for the source andhe target speakers and the extracted pitch contours are enteredn the respective codebooks. This process is repeated for all theoiced segments in a particular sentence and then for all the sen-ences in the database. During the transformation, the resampledoiced segments of source pitch contour is coded with the sourceitch contour codebook and decoded as the weighted average ofhe target pitch contour codebook. The overall procedure for theransformation of source speaker’s pitch contour to target speaker’sitch contour is given in Table 1.
The proposed algorithm is used to map the pitch contours for
our different speaker pairs selected for this study. These speakerairs are male1 to female1 (M1–F1), female2 to male2 (F2–M2),ale1 to male2 (M1–M2) and female1 to female2 (F1–F2). Theable 1teps for transforming the pitch contour.
1. Derive the pitch contours from the sentence spoken by the sourcespeaker.
2. Segment the pitch contour with respect to the voiced segmentspresent in the utterance.Resample all the voiced segments to apitch period of length 100.
3. For each segment of the pitch contour, determine the distancebetween the given pitchcontour and the codebook entries ofthe source speaker.
4. The distances are mapped to weights. The weights are normalized.If D = [D1, D2, . . .. . . DM] is the Euclidean distance vectorwith Di , i = 1, 2, . . . Mas the elements, then the normalized weight vector w,whose elements are given
by wk = Dk/(∑M
i=1Di); k = 1, 2, . . . M
5. By using the weight vector corresponding to the codebook entry of thesource speaker,generate the pitch contour by the summation of the weightedcodebook entries of thetarget speaker.
6. The generated target pitch contour segment is resampled to theoriginal length of theof the source pitch contour segment.
7. Pitch contour for the target speaker at the sentence level is derived byconcatenating thevoiced segment level pitch contours derived from step 6.
puting 12 (2012) 3332–3342
mapped pitch contour for male1 to female1 (M1–F1) and female2to male2 (F2–M2) conversion, using the proposed codebook basedmethod are shown in Figs. 2 and 3 respectively.
It is observed from the above figures that the proposed codebookbased method for mapping the pitch contour, can capture the localvariations of the target pitch contour to certain extent. The globalnature of the pitch contour is also captured by this model. It isobserved that this method fails to capture the sudden jumps in thetarget pitch contour.
4.3. Mapping the energy patterns of the signal
To design an effective voice conversion system, the energy ofthe source speaker needs to be modified. In order to modify theenergy of the source speech signal to match the target speech sig-nal, the energy of the sentences in the database are calculated forboth the speakers. As voiced signal contains the maximum informa-tion in the signal, therefore, the energy corresponding to the voicedsegments are retained. The average of the energy of the voicedsegments are calculated for both the speakers. A constant trans-formation ratio derived from the average energy of both the sourceand target speakers. During transformation phase, the energy cor-responding to the voiced segments of the synthesized target speechsignal amplified or attenuated on a frame by frame basis using thetransformation ratio.
5. Modification of the residual signal
To generate the synthesized speech signal it is required to excitethe modified vocal tract characteristics with the modified residualsignal. The residual signal is modified using two different methods.The methods used in this paper are residual copying and residualselection.
5.1. Residual copying method
To obtain the modified LP residual signal for the target speaker,the source excitation signal needs to be modified. This can be doneby deriving the new epoch interval plot from the mapped pitch con-tour. The new epoch sequences are obtained from the new epochinterval plot. Each new epoch, is associated with the nearest orig-inal epoch of the source speaker. The original epoch sequences inthe voiced segments of the source speaker are replaced by the newepoch sequences. The epoch sequences corresponding to unvoicedsegments of the original source speaker are left unchanged. Thisgives a new sequence of epochs for both the voiced and unvoicedsegments of the source speaker’s original LP residual signal. Forgenerating the new residual signal, 20% of samples [31,12] of theLP residual signal around the original epoch are directly copiedto new epoch associated with it. The rest of the excitation signalbetween the two successive original epochs are resampled and,copied between the successive new epochs associated with them.The modified LP residual signal is used to excite the modified vocaltract filter to obtain the synthesized target output speech signal.
To integrate both the spectral and prosodic modifications, themodified LP residual is used to excite the time varying vocal tractfilter. The vocal tract filter is represented by the modified LPCsobtained from the converted LSFs. The convolved signal betweenthe modified LP residual and modified vocal tract filter is the syn-thesized output speech signal for the desired target speaker. Thetarget speech signal is synthesized for all the speaker combina-
tions, such as male-1 to female1 (M1–F1), female-2 to male-2(F2–M2), male-1 to male-2 (M1–M2) and female-1 to female-2(F1–F2) selected for this study. The energy profile of the signal ismodified by the constant scaling factor as discussed in Section 4.3.
R.H. Laskar et al. / Applied Soft Computing 12 (2012) 3332–3342 3337
2000 3000 4000 5000 6000 7000 8000
100
150
200
250
300
Time (Samples)
Pic
th (
Hz)
SourceTargetPredicted
Fig. 2. Modification of pitch contour from male to female (M1–F1) using proposed codebook based method.
1.8 1.9 2 2.1 2.2 2.3 2.4x 10 4
50
100
150
200
250
300
Time (Samples)
Pit
ch (
Hz)
SourceTargetPredicted
male
msruiitts
5
uosTaftfsmcf(
s
Fig. 3. Modification of pitch contour from female to
Other than the residual copying method, there are differentethods proposed in the literature for modification of the residual
ignal. They can be categorized as residual prediction [28,13,7] andesidual selection [30,14] methods. It has been observed that resid-al selection performs better than the residual copying method
n converting the identity of the speaker maintaining naturalnessn the synthesized target speech [30]. Therefore, a residual selec-ion method similar to unit selection technique is used to modifyhe residual signal of the source speaker according to the targetpeaker.
.2. Residual selection method
The residual selection method is similar to unit selection methodsed for concatenative speech synthesis. During the training phasef the VC system, both the LSFs and corresponding residuals aretored in the database for both the source and the target speakers.hus, the database for each of the speaker contains the informationbout the vocal tract characteristics and the residual signal for eachrame of the speech signal used in the training phase. The LSFs arerained using the ANN as discussed in Section 3. During the trans-ormation phase, the LSFs and residual signal are extracted from thepeech signal of the source speaker. The LSFs are mapped using theapping function captured during the training phase. The residual
orresponding to a particular frame of the mapped LSF is selected
rom the target residual database using the criteria given by Eqs.4) and (5).Let x̃t represents the mapped LSF vector corresponding to aource LSF vector xs. The yti
for i = 1, 2 . . . N, represents the entries
(F2–M2) using proposed codebook based method.
of LSFs in the target database. The rs represents the source residualcorresponding to source LSF vector xs. The rti
for i = 1, 2 . . . N rep-resents the entries in the residual database corresponding to eachyti
, for i = 1, 2 . . . N. The cost (C) function is given by
C =N∑
i=1
w1‖yti− x̃t‖2 + w2(E(rti
) − E(rs)) (7)
where, E(.) represents the energy of the residual frame. The residualis selected from the training target database based on minimumcost. Let k represent the index for which the cost is minimum, thenthe residual selected for the mapped LSF vector x̃t is given by
k = INDEX [min(C)] (8)
Thus, rtkrepresents the best match for the mapped LSF vector
x̃t having a good correlation between the mapped vocal tract andsource characteristics, so as to obtain naturalness in the synthesizedtarget speech signal. The parameters w1 and w2 are determinedexperimentally. The parameters should satisfy the following con-straints:
w1 + w2 ≤ 1; w1, w2 ≥ 0 (9)
6. Results and discussions
The performance of ANN and GMM based mapping functionsmay be evaluated by subjective and objective measures. Theobjective measure consists of calculating the spectral distortionsbetween desired and predicted spectrum. In this paper, the root

3338 R.H. Laskar et al. / Applied Soft Com
Table 2RMSE for performance evaluation of the VC systems designed using ANN and GMMbased models.
Speaker pair ANN GMM
mtthttf
6
pR
R
wd(
tta
atpdwdfabtou
fpclpa
oGtfctc
fbdct
M1–F1 0.3812 0.3615F2–M2 0.3768 0.3489
ean square error (RMSE) for LSFs and formant (first, second andhird) frequencies are used as the performance measures for objec-ive evaluation. The end user of the voice conversion system isuman listeners. Therefore, the performance of mapping func-ions are evaluated by perceptual tests (i.e., by conducting listeningests). Mean opinion score (MOS) and ABX test are used as metricsor subjective evaluation of the performance of VC system.
.1. Objective evaluation
Root mean square error (RMSE) is calculated for the desired andredicted LSFs using both the ANN and GMM-based models. TheMSE is given by
MSE =∑N
j=1
√∑di=1(̃xti
− yti)2
N(10)
here x̃tiand yti
are the predicted and desired LSF vectors, d is theimension of the LSF vectors and N is the number of speech framesTable 2).
The calculated RMSE in case of ANN-based model is almost closeo that obtained for GMM-based model. The RMSE indicates thathe spectral distortion in case of ANN and GMM-based models arelmost similar.
Fig. 4(a) shows the desired and predicted LSF patterns for firstnd third order LSFs, obtained by GMM-based model along withhe source LSF patterns. It may be observed that the predicted LSFatterns follow the of desired patterns. It is clearly visible that pre-icted first order LSF pattern is more closer to the desired pattern,hich is of course desired, as speaker relevant information is moreominant in the initial orders of LSFs. Similar results are obtainedor other combinations of speaker pair as well. In Fig. 4(b), the firstnd third order desired and predicted LSF patterns obtained usingoth the ANN and GMM based models are plotted as a function ofime (frame). The plots show that the ANN predicted first and thirdrder LSF patterns closely follow the predicated patterns obtainedsing GMM-based model.
The desired and the ANN as well as GMM predicted LSF patternor a particular speech frame is shown in Fig. 5. It shows that theredicted LSF patterns for both the GMM and ANN based modellosely follow the LSF pattern of the desired target speaker. Forower order LSFs, the GMM pattern is more closer to the desiredattern. However, in case of higher order LSFs, the patterns arelmost indistinguishable.
Figs. 6 and 7, show the scatter plots of the first formant (f1), sec-nd formant (f2) and third formant (f3) frequencies for ANN andMM based models for spectral modification. It is observed from
he figures that patterns of clusters formed around the respectiveormants in case of ANN closely follows the patterns obtained inase of GMM. However, the clusters formed around the respec-ive formants in case of GMM-based model are little bit dense asompared to ANN-based model.
The desired and predicted spectral envelopes for a particularrame of the speech signal, obtained using both the ANN and GMM
ased models are shown in Fig. 8. It is clear from that figure that pre-icted spectral envelopes obtained by using ANN and GMM modelslosely follows the desired spectral envelope pattern. Even though,he location of spectral peaks are same in both the models, theputing 12 (2012) 3332–3342
amplitude of the spectral peaks in case of GMM-based model ismore closer than the ANN-based model.
The spectrogram of the desired speech signal along with thesynthesized speech signals using ANN and GMM-based models areshown in Fig. 9. The figure shows that the formant structures ofdesired speech signal is almost captured by both the ANN and GMMmodels. However, the formant movements in case of GMM is morecloser to that of the desired pattern as compared to ANN-basedmodel.
The parameter Di is computed as percentage change in predictedformant frequencies with respect to desired formant frequencies.It indicates the percentage of test frames that lie within a givendeviation. The Di is given by
Di = |xi − yi|xi
× 100 (11)
The parameters xi and yi are the desired and predicted formatfrequency values respectively. The root mean square error (�RMSE)is computed in terms of percentage of the mean of the desiredvalues.
�RMSE =√
(∑
i|xi − yi|2)/N
x× 100 (12)
� =√∑
idi2
N, di = ei − �, ei = xi − yi,
� =∑
i|xi − yi|N
(13)
The parameter ei is the error between the desired and predictedformant values. The deviation in error is di, and N is the number ofobserved formant values of the speech frames.
The correlation coefficient is given by
�X,Y = VX,Y
�X.�Y, where VX,Y =
∑i|xi − x|.|yi − y|
N(14)
The quantities �x, �Y are the standard deviations for the desiredand predicted formant values respectively, and VX,Y is the covari-ance between the desired and predicted formant values. The Di (for5%, 10%, 20%, 25%, 30%, 40%, and 50%), �RMSE and �X,Y for M1–F1 andF2–M2 speaker combinations are shown in Tables 3 and 4.
6.2. Subjective evaluation
Separate mapping functions are developed for transformingthe speaker voices from male to female (M1–F1), female to male(F2–M2), male to male (M1–M2) and female to female (F1–F2).For each case ten utterances are synthesized using their associ-ated mapping functions. Listening tests are conducted to assess thedesired (target) speaker characteristics present in the synthesizedspeech. The recorded speech utterances of the target speaker cor-respond to the synthesized speech utterances are made available tothe listeners to judge the relative performance. The listeners wereasked to give their opinion score on a 5-point scale. The rating 5indicates the excellent match between the original target speakerspeech and the synthesized speech (i.e., synthesized speech is closeto the original speech of the target speaker). The rating 1 indicatesvery poor match between the original and synthesized utterances,and the other ratings indicate different levels of deviation between1 and 5. Each listener has to give the opinion scores for each of theten utterances in all the four cases (altogether 40 scores for resid-
ual copying and 40 scores for residual selection method) mentionedabove. The mean opinion scores (MOS) for male to female (M1–F1),female to male (F2–M2), male to male (M1–M2) and female tofemale (F1–F2) transformations are shown in Table 5. The obtained
R.H. Laskar et al. / Applied Soft Computing 12 (2012) 3332–3342 3339
555 560 565 570 575 580 585200
400
600
800
1000
1200
Time (Frame)
LS
F (
Hz)
SourceDesiredGMM
(a)
60 70 80 90 100 110 120 130
300
400
500
600
700
800
900
1000
1100
Time (Frame)
LS
F (
HZ
)
GMMANN
(b)
Fig. 4. Pattern of the first and third order LSFs for desired and predicted values (a) source, desired and GMM; (b) ANN and GMM.
1 2 3 4 5 6 7 8 9 100
0.5
1
1.5
2
2.5
3
Order of LSF
Mag
nit
ud
e (r
adia
ns)
Desired
GMM
ANN
Fig. 5. Pattern of the desired and predicted values of LSFs using ANN and GMM for a particular speech frame.
0 100 200 300 400 500 600 700 800 900 10000
100
200
300
400
500
600
700
800
900
1000
Desired formants (Hz)
Pre
dic
ted
fo
rman
ts (
Hz) f1
(a)
0 500 1000 1500 2000 25000
500
1000
1500
2000
2500
Desired formants (Hz)
Pre
dic
ted
fo
rman
ts (
Hz)
f2
(b)
0 500 1000 1500 2000 2500 30000
500
1000
1500
2000
2500
3000
Desired formants (Hz)
Pre
dic
ted
fo
rman
ts (
Hz)
f3(c)
Fig. 6. Desired and predicted values of the formant frequencies using A
NN (a) first formants, (b) second formants and (c) third formants.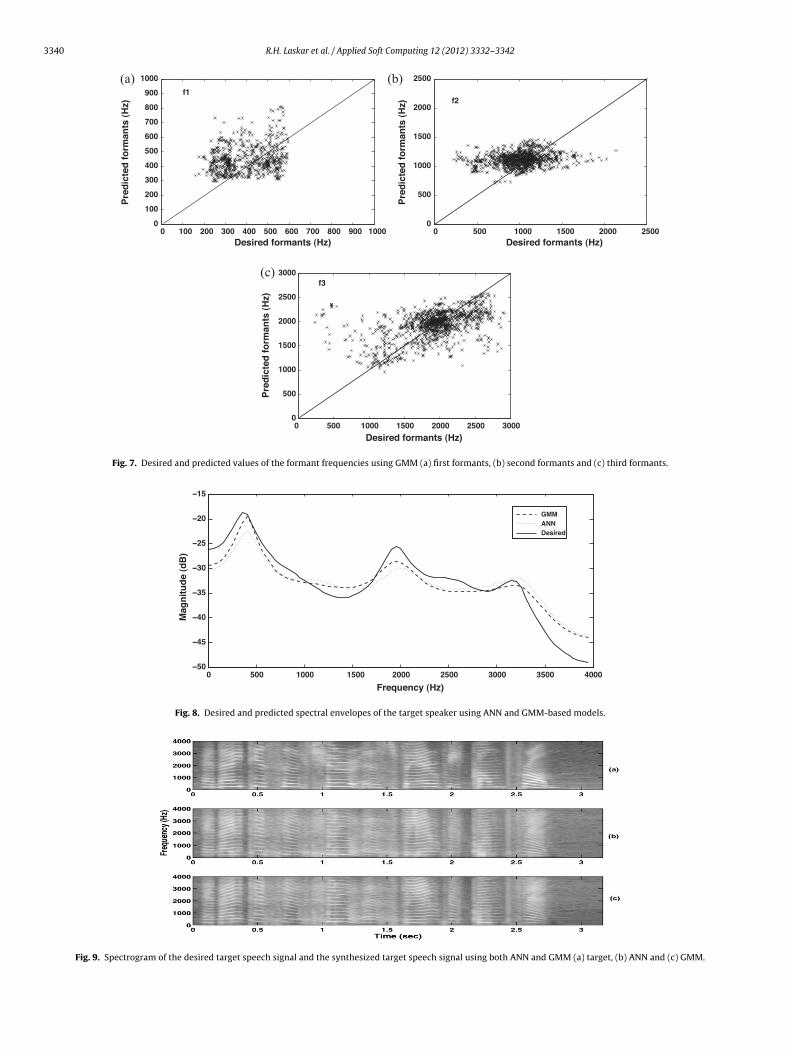
3340 R.H. Laskar et al. / Applied Soft Computing 12 (2012) 3332–3342
0 100 200 300 400 500 600 700 800 900 10000
100
200
300
400
500
600
700
800
900
1000
Desired formants (Hz)
Pre
dic
ted
fo
rman
ts (
Hz)
f1
(a)
0 500 1000 1500 2000 25000
500
1000
1500
2000
2500
Desired formants (Hz)
Pre
dic
ted
fo
rman
ts (
Hz) f2
(b)
0 500 1000 1500 2000 2500 30000
500
1000
1500
2000
2500
3000
Desired formants (Hz)
Pre
dic
ted
fo
rman
ts (
Hz)
f3(c)
Fig. 7. Desired and predicted values of the formant frequencies using GMM (a) first formants, (b) second formants and (c) third formants.
0 500 1000 1500 2000 2500 3000 3500 4000−50
−45
−40
−35
−30
−25
−20
−15
Frequency (Hz)
Mag
nit
ud
e (d
B)
GMMANNDesired
Fig. 8. Desired and predicted spectral envelopes of the target speaker using ANN and GMM-based models.
Fig. 9. Spectrogram of the desired target speech signal and the synthesized targe
t speech signal using both ANN and GMM (a) target, (b) ANN and (c) GMM.
R.H. Laskar et al. / Applied Soft Computing 12 (2012) 3332–3342 3341
Table 3Performance of GMM and ANN model for predicting the formant values within a particular percentage of deviation for M1–F1 (M1: male speaker-1 and F1: female speaker-1).
Model Formants % of predicted frame within deviation �RMSE �X,Y
5% 10% 20% 25% 30% 40% 50%
GMMf1 25 46 61 70 77 83 87 11.93 0.59f2 37 61 74 83 87 89 91 10.20 0.64f3 55 80 88 93 94 96 97 7.33 0.83
ANNf1 26 45 63 74 81 85 89 11.31 0.62f2 34 59 75 82 86 88 91 9.89 0.61f3 52 77 86 91 93 95 96 7.84 0.75
Table 4Performance of GMM and ANN model for predicting the formant values within a particular percentage of deviation for F2–M2 (F2: female speaker-2 and M2: male speaker-2).
Model Formants % of predicted frame within deviation �RMSE �X,Y
5% 10% 20% 25% 30% 40% 50%
GMMf1 29 51 61 71 75 85 89 10.65 0.57f2 37 62 75 82 89 86 88 10.79 0.58f3 62 86 94 97 97 97 98 5.78 0.81
ANNf1 28 53 60 69 73 86 91 10.43 0.63f2 39 64 74 81 87 88 95 9.79 0.56f3 59 88 93 96 98 98 99 6.23 0.79
Table 5MOS for performance evaluation of the VC systems designed using ANN and GMM.
Speaker combination ANN +residual copyingmethod
ANN +residualselection method
GMM +residualcopying method
GMM +residualselection method
M1–F1 3.76 3.52
F2–M2 3.64 3.48
Table 6ABX test for performance evaluation of the VC systems designed using ANN andGMM.
ANN +residual ANN +residual GMM +residual GMM +residual
MtvstdvsmtiSosssTbT
imMtttc
copying method selection method copying method selection method
58 72 61 74
OS indicate that the transformation is effective, if the source andarget speakers are from different genders. The basic reason for thisariation in MOS with respect to gender is that the variation in thehapes of the vocal tract and intonation patterns may be large inhe case of source and target speakers belongs to different gen-ers. Since the listener is exposed to source and target speakersoices (original) as well as transformed voice with respect to targetpeaker, he or she may observe wide transformation in the case ofale to female or female to male voice conversions compared to
he other cases (male to male or female to female). Hence their feel-ng is reflected in the judgment. The ABX (A: Source, B: Target, X:ynthesized speech signal) test is also performed by exposing theriginal source and target sentences along with the synthesizedentences to the listeners. The ABX test is performed for the tenentences synthesized using both the residual copying and residualelection methods. The ABX is a measure of identity transformation.he more the value of ABX in percentage, more is the closenessetween the synthesized and the target signal in terms of identity.he ABX test results are shown in Table 6.
It is observed from Tables 5 and 6 that residual copying methodntegrated with either of the ANN or GMM-based model used to
odify the vocal tract characteristics performs betters in terms ofOS. The residual copying method provide more naturalness, as
he residual signal is less modified. However, the residual selec-ion method outperforms the residual copying method in the ABXest. The reason may be due to the fact that residual signal containsertain amount of speaker identity. The vocal tract characteristics
3.78 3.553.65 3.52
and source characteristics of a particular speaker are highly corre-lated. This fact has been utilized in the residual selection methodto obtain the synthesized target speech signal. The listeners haveobserved certain artifacts in the synthesized signal obtained byresidual selection method. The naturalness (MOS score) for residualselection method may be improved further by adding a concate-nation cost along with the cost function calculated in Eq. (7). Theconcatenation cost is an estimate of a join between the consecutiveresidual units used for unit selection based concatenative speechsynthesis. It is also observed that the quality of the synthesizedsignal obtained using ANN-based model (along with either of theresidual copying or residual selection method) is almost close tothe synthesized signal obtained using GMM-based model.
7. Conclusion
A five layer ANN model was proposed for mapping the vocaltract characteristics of the source speaker according to the targetspeaker. LSFs derived from the LPCs are used to represent the shapeof the vocal tract characteristics. The pitch contour is modified usinga segmental codebook based method at voiced segment level. Thetarget speaker’s speech is synthesized using the parameters derivedfrom the mapping functions corresponding to vocal tract systemcharacteristics and intonation characteristics by residual copyingmethod. The target speaker’s speech signal is also synthesizedusing the modified vocal tract characteristics and residual selec-tion method. Subjective tests are conducted to evaluate the targetspeaker characteristics present in the synthesized speech signal.The speech signal is also synthesized using GMM-based model forvocal tract modification along with residual copying and residual
selection methods. From the perceptual tests, it is observed that thevoice conversion is more effective, if the source and target speakersbelongs to different genders. Subjective evaluation also indicatedthat the developed voice conversion system using residual copying
3 t Com
mMtGts
sasDpstabbiptaoic
R
[
[
[
[
[
[
[
[
[
[
[
[
[
[
[
[
[
[
[
[
[
[
[
[
342 R.H. Laskar et al. / Applied Sof
ethod performs better than residual selection method in terms ofOS. However, in case of ABX test, the later method outperforms
he former method. It may also be observed that both the ANN andMM-based models perform in a similar manner in MOS and ABX
ests. The listeners are bit biased towards the GMM modified speechignal.
We have not included the mapping functions corresponding toource characteristics (shape of the glottal pulse), duration patternsnd other speaker-specific features. The energy profiles betweenource and target speakers are modified by a fixed scaling factor.eveloping proper mapping functions to transform the durationatterns and energy profiles may improve the performance of theystem. In the residual selection method, more emphasis is giveno maintain the correlation between the source and system char-cteristics. The closeness between the vocal tract transfer functionetween the predicted and target templates and energy differenceetween the given source residual frame and the residual frames
n the target templates are used to pick up the best match. Theerformance may be improved by including concatenation costo select the appropriate residual signal from the target databasend providing additional weight to match the pitch pattern. Theverall performance of the voice conversion system may be furthermproved by suitably mapping the other speaker-specific acousticsues.
eferences
[1] L.M. Arslan, Speaker transformation algorithm using segmental code books(STASC), Speech Communication 28 (1999) 211–226.
[2] A. Kain, M. Macon, Spectral voice conversion for Text-to-Speech synthesis, in:Proc. of Int. Conf. on Acoustics, Speech, and Signal Processing, IEEE, vol. 1, 1998,pp. 285–288.
[3] Lee L Ki-Seung, Statistical approach for voice personality transformation, in:IEEE Trans. Audio, Speech, and Language Processing, vol. 15, February, 2007,pp. 641–651.
[4] O. Turk, L.M. Arslan, Robust processing techniques for voice conversion, Com-puter Speech & Language Processing 20 (2006) 441–467.
[5] H. Kuwabara, Y. Sagisaka, Acoustics characteristics of speaker individuality:control and conversion, Speech Communication 16 (1995) 165–173.
[6] B. Yegnanarayana, K.S. Reddy, S.P. Kishore, Source and system features forspeaker recognition using AANN models, in: Proc. of Int. Conf. on Acoustics,Speech, and Signal Processing, IEEE, May, 2001, pp. 409–412.
[7] A. Kain, M.W. Macon, Design and evaluation of a voice conversion algorithmbased on spectral envelop mapping and residual prediction, in: Proc. of Int. Conf.on Acoustics, Speech, and Signal Processing, IEEE, vol. 2, 2001, pp. 813–816.
[8] M. Abe, S. Nakanura, K. Shikano, H. Kuwabara, Voice conversion through vectorquantization, in: Proc. of Int. Conf. on Acoustics, Speech, and Signal Processing,IEEE, May, 1988, pp. 655–658.
[9] W. Verhelst, J. Mertens, Voice conversion using partitions of spectral featurespace, in: Proc. of Int. Conf. on Acoustics, Speech, and Signal Processing, IEEE,1996, pp. 365–368.
10] Y. Stylianou, Y. Cappe, E. Moulines, Continuous probabilistic transform for
voice conversion, in: IEEE Trans. Speech and Audio Processing, vol. 6, 1998,pp. 131–142.11] N. Iwahashi, Y. Sagisaka, Speech spectrum conversion based on speaker inter-polation and multi-functional representation with weighting by radial basisfunction networks, Speech Communication 16 (1995) 139–151.
[
[
puting 12 (2012) 3332–3342
12] K.S. Rao, R.H. Laskar, S.G. Koolagudi, Voice transformation by mapping the fea-tures at syllable level, in: Lecture Notes in Computer Science, Springer, 2007,pp. 479–486.
13] K.S. Rao, Voice conversion by mapping the speaker-specific features using pitchsynchronous approach, Computer Speech & Language Processing 24 (July (3))(2010) 474–494.
14] H. Duxans, A. Bonafonte, A. Kain, J. Van Santen, Including dynamic and pho-netic information in voice conversion systems, in: Proc. of Int. Conf. on SpokenLanguage Processing, October, 2004, pp. 1193–1196.
15] D. Suendermann, H. Ney, H. Hoege, VTLN-based cross-language voice conver-sion, in: Proc. of Automatic Speech Recognition and Understanding Workshop,IEEE, December, 2003, pp. 676–681.
16] S. Desai, A.W. Black, B. Yegnanarayana, K. Prahallad, Spectral mapping usingartificial neural networks for voice conversion, in: IEEE Trans. Audio, Speechand Language Processing, vol. 18, no. 5, July, 2010, pp. 954–964.
17] T. Toda, H. Saruwatari, K. Shikano, Voice conversion algorithm based on Gaus-sian mixture model with dynamic frequency warping of STRAIGHT spectrum,in: Proc. of Int. Conf. on Acoustics, Speech, and Signal Processing, IEEE, vol. 2,May, 2001, pp. 841–844.
18] K. Shikano, S. Nakamura, M. Abe, Speaker adaptation and voice conversion bycodebook Mapping, in: IEEE International Symposium on Circuits and Systems,1991, pp. 594–597.
19] G. Baudoin, Y. Stylianou, On the transformation of speech spectrum for voiceconversion, in: Proc. of Int. Conf. on Spoken Language Processing, 1996, pp.1045–1048.
20] M. Narendranath, H.A. Murthy, S. Rajendran, B. Yegnanarayana, Transforma-tion of formants for voice conversion using artificial neural networks, SpeechCommunication 16 (February) (1995) 206–216.
21] Y. Chen, M. Chu, E. Chang, J. Liu, R. Liu, Voice conversion with smoothed GMMand MAP adaptation, in: Proc. of Eurospeech, Geneva, 2003, pp. 2413–2416.
22] E. Helander, J. Nurminen, M. Gabbouj, LSF mapping for voice conversion withvery small training sets, in: Proc. of Int. Conf. on Acoustics, Speech, and SignalProcessing, IEEE, 2008, pp. 4669–4672.
23] D. Suendermann, H. Hoege, A. Bonafonte, H. Ney, A. Black, Residual predic-tion based on unit selection, in: Proc. of Automatic Speech Recognition andUnderstanding Workshop, IEEE, November, 2005, pp. 369–374.
24] M. Akagi, T. Ienaga, Speaker individualities in fundamental frequency contoursand its control, in: Proc. of Eurospeech, 1995, pp. 439–442.
25] Z. Inanoglu, Transforming pitch in a voice conversion framework, M.Phil thesis,St. Edmund’s College University of Cambridge, July 2003.
26] D.T. Chappel, J.H.L. Hansen, Speaker specific pitch contour modeling and modi-fication, in: Proc. of Int. Conf. on Acoustics, Speech, and Signal Processing, IEEE,Seattle, USA, 1998, pp. 885–888.
27] O. Turk, L.M. Arslan, Robust processing techniques for voice conversion, Com-puter Speech & Language Processing 20 (2006) 441–467.
28] K.S. Lee, D.H. Youn, I.W. Cha, A new voice personality transformation based onboth linear and non-linear prediction analysis, in: Proc. of Int. Conf. on SpokenLanguage Processing, 1996, pp. 1401–1404.
29] H. Ye, S. Young, High quality voice morphing, in: Proc. of Int. Conf. on Acoustics,Speech, and Signal Processing, IEEE, 2004, pp. 9–12.
30] D. Suendermann, A. Bonafonte, H. Ney, H. Hoege, A study on residual predictiontechniques for voice conversion, in: Proc. of Int. Conf. on Acoustics, Speech, andSignal Processing, IEEE, March, 2005, pp. 13–16.
31] K.S. Rao, B. Yegnanarayana, Prosody modification using instants of significantexcitation, in: IEEE Trans. Audio, Speech and Language Processing, vol. 14, May,2006, pp. 972–980.
32] S.R.M. Prasanna, C.S. Gupta, B. Yegnarayana, Extraction of speaker-specificinformation from linear prediction residual of speech, Speech Communication48 (2006) 1243–1261.
33] N. Dhananjaya, B. Yegnarayana, Voiced/nonvoiced detection based on robust-
ness of voiced epochs, in: IEEE Signal Processing Letters, vol. 17, no. 3, March,2010, pp. 273–276.34] S. Haykin, Neural Networks: A Comprehensive Foundation, Prentice-Hall Inc.,NJ, 1999.
35] B. Yegnarayana, Artificial Neural Networks, Prentice-Hall Inc., New Delhi, 1999.