
Permanent magnet Vernier machines for direct-drive offshore ...
Upload
khangminh22Category
view
0download
0
Citation: Gundogdu, T.; Zhu, Z.-Q.;
Chan, C.C. Comparative Study of
Permanent Magnet, Conventional,
and Advanced Induction Machines
for Traction Applications. World
Electr. Veh. J. 2022, 13, 137.
https://doi.org/10.3390/
wevj13080137
Academic Editor: Hui Yang
Received: 22 June 2022
Accepted: 26 July 2022
Published: 28 July 2022
Publisher’s Note: MDPI stays neutral
with regard to jurisdictional claims in
published maps and institutional affil-
iations.
Copyright: © 2022 by the authors.
Licensee MDPI, Basel, Switzerland.
This article is an open access article
distributed under the terms and
conditions of the Creative Commons
Attribution (CC BY) license (https://
creativecommons.org/licenses/by/
4.0/).
Article
Comparative Study of Permanent Magnet, Conventional, andAdvanced Induction Machines for Traction ApplicationsTayfun Gundogdu 1,2 , Zi-Qiang Zhu 2,* and Ching Chuen Chan 3
1 Department of Electrical and Electronic Engineering, Hakkari University, Zeynel Bey Campus, Keklikpinar,Pinarlar Cd., 30000 Hakkari, Turkey; [email protected]
2 Department of Electronic and Electrical Engineering, University of Sheffield, Mappin Street,Sheffield S1 3JD, UK
3 Department of Electronic and Electrical Engineering, The University of Hong Kong, Hong Kong, China;[email protected]
* Correspondence: [email protected]
Abstract: This paper investigates and compares the torque-generating capabilities and electromag-netic performance of advanced non-overlapping winding induction machines (AIM), conventionalinduction machines (CIM), and interior-permanent magnet (IPM) machines for electric vehicle (EV)applications. All investigated machines are designed based on the specifications of the Toyota Prius2010 IPM machine. The steady-state and flux-weakening performance characteristics are calculatedby employing the 2D finite element method and MatLab, and the obtained results are quantitativelycompared. Furthermore, the torque-generating capabilities of three machines are investigated fordifferent electric loadings, and the machine having the highest torque-generating capability is deter-mined as AIM. Moreover, the major parameters affecting the torque-generating capability, such asmagnetic saturation and magnet demagnetization, are examined in depth.
Keywords: electric vehicles; induction machine; interior permanent magnet machine; non-overlappingwinding; saliency; torque capability
1. Introduction
Internal combustion engine vehicles are responsible for 21% of worldwide anthro-pogenic CO2 emissions [1]. Making the transition of the global vehicle fleet to zero-emissionvehicle technology is critical for decarbonizing road transportation and fulfilling the envi-ronmental and climate targets. Therefore, worldwide electric vehicle (EV) sales, includingpassenger cars, light trucks, and light commercial vehicles, reached 6.75 million units in2021, corresponding to a 108% increase over 2020 [2]. It is very critical to choose the rightelectrical machine topology for EV applications in order to maximize efficiency, transientelectromagnetic performance characteristics, flux-weakening capability, and cost. Theworldwide five best-selling models in 2021 [3] and their electrical machine technologies arelisted in Table 1. In addition, permanent magnet synchronous machines (PMSMs), particu-larly interior-permanent magnet (IPM) machines, are used in the world’s top commercialEVs and hybrid electric vehicles (HEVs), including Toyota/Prius, Nissan/Leaf, BMW/i3,and numerous other vehicles. Other cars, on the other hand, including the BMW/X5,Renault/Kangoo, GM/EV1, Chrysler/Durango, and a few others, employ induction ma-chines (IMs) [4–11]. Moreover, Tesla Motors Inc., one of the world’s leading plug-in EVmanufacturers, utilizes both IM (front) and IPM (rear) machines in its best-selling mod-els, as seen in Table 1 [3]. In addition, Audi also utilizes the same traction topology ine-Tron models.
World Electr. Veh. J. 2022, 13, 137. https://doi.org/10.3390/wevj13080137 https://www.mdpi.com/journal/wevj

World Electr. Veh. J. 2022, 13, 137 2 of 18
Table 1. Top selling EV models in 2021 and their machine technology [3].
Top Selling Models Machine Technology
Tesla/Model 3 IM + IPMWuling/Hongguang Mini EV PMSMTesla/Model Y IM + IPMVolkswagen/ID.4 PMSMBYD/Qin Plus PHEV PMSM
The common characteristics of electric machines designed for traction applicationscan be listed as [12,13]: (a) high starting torque; (b) high torque and high-power densities;(c) high efficiency across a broad speed range; (d) low torque ripple; (e) light weight; and(f) low cost.
Although there are many favorable characteristics of squirrel-cage IMs, such as robust-ness, relatively low-cost, good control dynamics, and mature manufacturing technology,having conductor bars in the rotor is its major disadvantage because the solid conductorbars of the IM cause additional joule losses in the rotor and hence result in a relatively lowerefficiency compared to PMSMs. PMSMs, on the other hand, possesses superior advantages,such as high torque, high power, and relatively high efficiency. However, the high costof NdFeB magnets has a significant impact on their popularity [8]. Moreover, there are anumber of comparative studies on the performance comparisons of electrical machinesemployed in the traction applications in literature [4–28]. In these studies, the performancecharacteristics of IMs, PMSMs, switched and synchronous reluctance machines, PM as-sisted reluctance and brushless DC machines have been compared quantitatively. Thesquirrel-cage IMs have been noted as having established production technology and theability to offer the required driving characteristics. PMSMs, on the other hand, have beennoted as having better efficiency and torque density. Moreover, according to a compre-hensive quantitative comparison study on electrical machines for traction applications,IPM machines have a higher power factor and efficiency than IMs, whereas IMs providecompetitive performance characteristics at a lower cost and with better overloading ca-pability. Wound field, reluctance, and variable flux synchronous machines have all beendemonstrated to be less appealing for traction applications because of their poorer torquedensity and efficiency characteristics [20,22,27,28]. In addition, in order to improve thetorque characteristics of PMSMs some unconventional methods have been proposed andcompared with conventional electrical machines employed in traction applications [29,30].
Torque-generating capacities are investigated in this paper, in addition to previousresearch comparing the performance of IMs and PMSMs in the literature [5–9,12–14,19].Therefore, the major goal of this study is to determine which machine is capable of produc-ing higher torque under overload operating conditions and examine the underlying causes.In addition, this comparison incorporates an advanced induction machine (AIM) withnon-overlapping windings, which was recently developed for EV/HEV applications [31].
This paper focuses on the analysis and quantitative comparison of electromagneticperformance and design characteristics of the IPM machine, CIM, and AIM operated underthe same conditions and the same slot/pole number combinations. The major steady-state electromagnetic performance and flux-weakening characteristics are provided anddiscussed, with a particular focus on torque-generating capabilities. Moreover, since oneof the AIM’s most significant advantages is its comparatively small total axial length, theimpact of stack length on steady-state performance is systematically investigated.
2. Research Method2.1. Concept
This study presents FEA and electromagnetic performance comparisons of differenttypes of electrical machines, namely PMSM and IM, employed in traction applications.Among the considered machines, the IPM and CIM are adopted by conventional integer

World Electr. Veh. J. 2022, 13, 137 3 of 18
slot distributed windings (ISDWs), while AIM is adopted by advanced non-overlappingwindings (ANWs).
2.2. Description of the Tool
An IPM machine, CIM, and AIM, having the same operating and design specificationsas the Toyota Prius 2010 IPM machine, are modelled and analyzed by 2D, time steppingFEA. Accordingly, the flux-weakening performance characteristics are calculated by theMatlab tool by using the flux matrices obtained from FEA calculations.
2.3. Analysis Scheme
Various analyses, including transient, steady state, electric loading, and flux-weakening,have been conducted in this study. Transient and steady-state analyses have been con-ducted to reveal the rated performance characteristics such as electromagnetic torque,torque ripple, back-EMF and induced voltage waveforms, flux line and density distribu-tions, and saturation factors. Electric loading analyses have been conducted to comparethe torque-generating capabilities of the aforementioned machines. The flux-weakeningcharacteristics are calculated to compare the torque and power versus speed curves andefficiency maps.
2.4. Research Results
Since the vehicle acceleration is of great importance, the torque-generating capabilitiesof different traction machines need to be revealed. In this study, apart from the comparisonof the torque-generating capabilities, flux-weakening characteristics, torque ripple levels,and total active material costs have been compared quantitively. The results presentedin this study show that the overall flux-weakening characteristics of IMs are comparableto those of IPM machines and because of the demagnetization of the magnets of IPMmachine during overloading operating, the IMs deliver higher torque during accelerationor overloading modes.
3. Design Specifications
In order to evaluate the torque-generating capabilities, the performance characteristicsof the studied machines are examined utilizing time-stepping 2D finite element method(FEM) for rated and various electric loading operations. In order to investigate the torque-generating capabilities, the electric loading will be varied from one to five times the ratedcurrent value. For a fair comparison and to achieve comparable results, the same operatingconditions and geometrical parameters as shown in Table 2 are utilized.
For a fair comparison, the Toyota Prius 2010 IPM machine is directly adapted by ap-plying the optimal specifications [21,32], and the IMs are designed with the same geometricdimensions and pole number. It is worth mentioning that Toyota Prius 2010 IPM machinehas been used since all specifications and data for the Prius 2010 are fully available. How-ever, other models are still not available because of the confidential issues of the company.On the other hand, some essential geometric and operating design specifications of electricalmachines for traction applications can be found in [21–26]. Furthermore, the IPM machineand the CIM share the identical stator slot/pole number combination (48S/8P) and windinglayout with 5-slot pitch single-layer windings. In addition, a double-layer non-overlapping2-slot pitch winding topology is adopted for AIM having a 24S/8P combination.
IMs are optimized by using multi-objective global optimization via genetic algorithm,as presented in [33]. Two-dimensional cross-sectional views and the design specifications ofthe machines are shown in Figure 1 and given in Table 2, respectively. As shown in Table 2,all the machines have the same main operational and geometrical specifications. Moreover,the same iron core material whose core loss coefficients, namely hysteresis kh, eddy currentkc, and excessive ke are given in the table, has been assigned as core material for stator androtor parts of the machines. A strong grade of PM, whose remanence, relative permeabilityµr, and coercivity Hc are given in the table, is assigned for the IPM machine. Moreover,

World Electr. Veh. J. 2022, 13, 137 4 of 18
because of the better heat and resistance characteristics of the copper over aluminium,copper has been assigned as material of the squirrel-cage [34].
Table 2. Specifications of Prius IPM machine and IMs.
Parameters IPM CIM AIM
S/(R or M) */P 48S/16M/8P 48S/52R/8P 24S/26R/8PVoltage limit (Vrms) 650 V × 85% × 2/πRated current (Apeak) 250Number of coils per phase 8 8 8Number of turns per coil 11 8 11Number of series turn per phase 88 64 88Fundamental winding factor 0.966 0.966 0.866Number of parallel brunch 1Slot fill factor 0.6Phase resistance at 21 C 0.077 0.05612 0.0577Stack length (mm) 50.8Stator parameters
Outer diameter (mm) 264Inner diameter (mm) 161.9 185.85 184.8Tooth width (mm) 7.55 8.45 11.52Slot opening (mm) 1.88 1.88 5.8Slot height (mm) 30.9 15.4 22/11
Air-gap length (mm) 0.73 0.4 0.4Rotor parameters
Tooth width (mm) — 6.83 11.97Slot opening (mm) — 1.88 5.6Slot height (mm) — 14 20Magnet dimensions 49.3 × 17.88 × 7.16 — —Cage material — Copper Copper
Iron grade DW310-35kh 179.038kc 0.375ke 0.262
Magnet grade NdFeB (N35) — —µr 1.05 — —Br 1.1Hc(kA/m) −805.4 — —
* R: Number of rotor slots. M: Number of permanent magnets. S: Number of stator slots.
World Electr. Veh. J. 2022, 13, x FOR PEER REVIEW 5 of 20
for the IPM machine. Moreover, because of the better heat and resistance characteristics of the copper over aluminium, copper has been assigned as material of the squirrel-cage [34].
(a) (b) (c)
Figure 1. Two-dimensional views of the compared machines: (a) IPM (48S/16M/8P). (b) CIM
(48S/52R/8P). (c) AIM (24S/26R/8P).
4. Performance and Active Material Cost Comparison The performance characteristics of the IPM machine and IMs are determined using a
dq-axis reference frame with the d-axis oriented with the rotor field [35]. The obtained results are presented in the following subsections.
4.1. Winding Factor and MMF Harmonics The calculated winding factors and MMF amplitudes for 1-ampere-1-turn for 24S/8P
(double-layer) and 48S/8P (single-layer) winding topologies are illustrated in Figure 2. As seen in Figure 2a, the fundamental winding factor and MMF amplitude of the 24S/8P to-pology are 10.35% lower than those of the 48S/8P topology. Therefore, it can be predicted that in order to obtain the same torque, the higher number of turns per phase is required for the 24S/8P topology under the operating conditions with the same excitation current. As seen in Figure 2b, the THD of the MMF of the 24S/8P topology is 49.68% higher than that of the 48S/8P topology. Hence, it can be expected that the rotor bar copper loss of 24S/8P topology will be considerably higher than that of the 48S/8P counterpart.
(a) (b)
Figure 2. Comparison of winding factors and MMF harmonics of the considered machines. (a) Winding factors of harmonics. (b) MMF harmonics spectra for 1-turn and 1-ampere
4.2. Induced Voltage and Back-EMF The line back-EMF waveform for IPM machine and induced voltage waveforms for
IMs, their harmonic spectra, and THD percentages are illustrated in Figure 3. As seen, the back-EMF waveform of the IPM machine is highly distorted. The possible reasons behind
0
0.2
0.4
0.6
0.8
1
0 4 8 12 16 20 24 28 32 36 40 44 48 52 56 60 64 68 72 76 80 84 88 92 96 100
Win
ding
Fac
tor
Harmonic Order
24S/8P 48S/8P
0
0.4
0.8
1.2
1.6
2
0 4 8 12 16 20 24 28 32 36 40 44 48 52 56 60 64 68 72 76 80 84 88 92 96 100
MM
F A
mpl
itude
(At)
Harmonic Order
24S/8P (AIM)48S/8P (IPM, CIM)
THD (%)28.3414.26
Figure 1. Two-dimensional views of the compared machines: (a) IPM (48S/16M/8P). (b) CIM(48S/52R/8P). (c) AIM (24S/26R/8P).

World Electr. Veh. J. 2022, 13, 137 5 of 18
4. Performance and Active Material Cost Comparison
The performance characteristics of the IPM machine and IMs are determined usinga dq-axis reference frame with the d-axis oriented with the rotor field [35]. The obtainedresults are presented in the following subsections.
4.1. Winding Factor and MMF Harmonics
The calculated winding factors and MMF amplitudes for 1-ampere-1-turn for 24S/8P(double-layer) and 48S/8P (single-layer) winding topologies are illustrated in Figure 2.As seen in Figure 2a, the fundamental winding factor and MMF amplitude of the 24S/8Ptopology are 10.35% lower than those of the 48S/8P topology. Therefore, it can be predictedthat in order to obtain the same torque, the higher number of turns per phase is requiredfor the 24S/8P topology under the operating conditions with the same excitation current.As seen in Figure 2b, the THD of the MMF of the 24S/8P topology is 49.68% higher thanthat of the 48S/8P topology. Hence, it can be expected that the rotor bar copper loss of24S/8P topology will be considerably higher than that of the 48S/8P counterpart.
World Electr. Veh. J. 2022, 13, x FOR PEER REVIEW 5 of 20
for the IPM machine. Moreover, because of the better heat and resistance characteristics of the copper over aluminium, copper has been assigned as material of the squirrel-cage [34].
(a) (b) (c)
Figure 1. Two-dimensional views of the compared machines: (a) IPM (48S/16M/8P). (b) CIM
(48S/52R/8P). (c) AIM (24S/26R/8P).
4. Performance and Active Material Cost Comparison The performance characteristics of the IPM machine and IMs are determined using a
dq-axis reference frame with the d-axis oriented with the rotor field [35]. The obtained results are presented in the following subsections.
4.1. Winding Factor and MMF Harmonics The calculated winding factors and MMF amplitudes for 1-ampere-1-turn for 24S/8P
(double-layer) and 48S/8P (single-layer) winding topologies are illustrated in Figure 2. As seen in Figure 2a, the fundamental winding factor and MMF amplitude of the 24S/8P to-pology are 10.35% lower than those of the 48S/8P topology. Therefore, it can be predicted that in order to obtain the same torque, the higher number of turns per phase is required for the 24S/8P topology under the operating conditions with the same excitation current. As seen in Figure 2b, the THD of the MMF of the 24S/8P topology is 49.68% higher than that of the 48S/8P topology. Hence, it can be expected that the rotor bar copper loss of 24S/8P topology will be considerably higher than that of the 48S/8P counterpart.
(a) (b)
Figure 2. Comparison of winding factors and MMF harmonics of the considered machines. (a) Winding factors of harmonics. (b) MMF harmonics spectra for 1-turn and 1-ampere
4.2. Induced Voltage and Back-EMF The line back-EMF waveform for IPM machine and induced voltage waveforms for
IMs, their harmonic spectra, and THD percentages are illustrated in Figure 3. As seen, the back-EMF waveform of the IPM machine is highly distorted. The possible reasons behind
0
0.2
0.4
0.6
0.8
1
0 4 8 12 16 20 24 28 32 36 40 44 48 52 56 60 64 68 72 76 80 84 88 92 96 100
Win
ding
Fac
tor
Harmonic Order
24S/8P 48S/8P
0
0.4
0.8
1.2
1.6
2
0 4 8 12 16 20 24 28 32 36 40 44 48 52 56 60 64 68 72 76 80 84 88 92 96 100
MM
F A
mpl
itude
(At)
Harmonic Order
24S/8P (AIM)48S/8P (IPM, CIM)
THD (%)28.3414.26
Figure 2. Comparison of winding factors and MMF harmonics of the considered machines.(a) Winding factors of harmonics. (b) MMF harmonics spectra for 1-turn and 1-ampere.
4.2. Induced Voltage and Back-EMF
The line back-EMF waveform for IPM machine and induced voltage waveforms forIMs, their harmonic spectra, and THD percentages are illustrated in Figure 3. As seen, theback-EMF waveform of the IPM machine is highly distorted. The possible reasons behindthe distorted back-EMF waveforms can be the combined effect of stator slotting and theheavily saturated stator core. On the other hand, since the number of turns per phase andhence the ampere-turn magnitude at the same current is higher for the IPM machine, itsback-EMF amplitude is higher than the IMs induced voltage values.
World Electr. Veh. J. 2022, 13, x FOR PEER REVIEW 6 of 20
the distorted back-EMF waveforms can be the combined effect of stator slotting and the heavily saturated stator core. On the other hand, since the number of turns per phase and hence the ampere-turn magnitude at the same current is higher for the IPM machine, its back-EMF amplitude is higher than the IMs induced voltage values.
(a) (b)
Figure 3. Comparison of back-EMF waveforms and their harmonic spectra. (a) Line Back-EMF and induced voltage waveforms. (b) Harmonic spectra of the back-EMF and induced voltage.
4.3. Flux Density and Flux Line Distributions Figure 4 shows the flux density and flux line distributions of the considered ma-
chines. As expected, the flux density levels of the stator and rotor tooth parts are the high-est. Among the designed machines, the CIM’s averaged core saturation level is the lowest whilst the averaged core saturation of the IPM machine is the highest.
(a) (b)
(c) (d)
-450-300-150
0150300450
0 60 120 180 240 300 360
Volta
ge (V
)
Rotor Position (Elec. Deg.)
IPMCIMAIM
050
100150200250300350400
1 3 5 7 9 11 13 15 17 19 21 23 25
Am
plitu
de (V
)
Harmonic Order
IPMCIMAIM
THD (%)11.757.648.87
Figure 3. Comparison of back-EMF waveforms and their harmonic spectra. (a) Line Back-EMF andinduced voltage waveforms. (b) Harmonic spectra of the back-EMF and induced voltage.

World Electr. Veh. J. 2022, 13, 137 6 of 18
4.3. Flux Density and Flux Line Distributions
Figure 4 shows the flux density and flux line distributions of the considered machines.As expected, the flux density levels of the stator and rotor tooth parts are the highest.Among the designed machines, the CIM’s averaged core saturation level is the lowestwhilst the averaged core saturation of the IPM machine is the highest.
World Electr. Veh. J. 2022, 13, x FOR PEER REVIEW 6 of 20
the distorted back-EMF waveforms can be the combined effect of stator slotting and the heavily saturated stator core. On the other hand, since the number of turns per phase and hence the ampere-turn magnitude at the same current is higher for the IPM machine, its back-EMF amplitude is higher than the IMs induced voltage values.
(a) (b)
Figure 3. Comparison of back-EMF waveforms and their harmonic spectra. (a) Line Back-EMF and induced voltage waveforms. (b) Harmonic spectra of the back-EMF and induced voltage.
4.3. Flux Density and Flux Line Distributions Figure 4 shows the flux density and flux line distributions of the considered ma-
chines. As expected, the flux density levels of the stator and rotor tooth parts are the high-est. Among the designed machines, the CIM’s averaged core saturation level is the lowest whilst the averaged core saturation of the IPM machine is the highest.
(a) (b)
(c) (d)
-450-300-150
0150300450
0 60 120 180 240 300 360
Volta
ge (V
)
Rotor Position (Elec. Deg.)
IPMCIMAIM
050
100150200250300350400
1 3 5 7 9 11 13 15 17 19 21 23 25
Am
plitu
de (V
)
Harmonic Order
IPMCIMAIM
THD (%)11.757.648.87
World Electr. Veh. J. 2022, 13, x FOR PEER REVIEW 7 of 20
(e) (f)
Figure 4. Flux density and flux line distributions of the machines. (a) IPM machine flux density. (b) IPM machine flux line. (c) CIM flux density. (d) CIM flux line. (e) AIM flux density. (f) AIM flux line.
4.4. Torque and Torque Ripple The electromagnetic torque of the machines is calculated by using the expressions
given between (1) and (3). As expressed in (1), there are two variable components contrib-uting the torque of PM machines. The first variable term in (1) depends on the rotor exci-tation that is the PM flux 𝜓 which depends on the properties of the PM material includ-ing size, maximum energy product 𝐵𝐻 , etc. and the second term, known as reluctance torque, depends on the saliency of the rotor which is determined by inductance compo-nents 𝐿 and 𝐿 . 𝑚 is the phase number and 𝑝 is the pole pair number. 𝑇 = 𝑚2 𝑝 𝜓 𝐼 + 𝐿 − 𝐿 𝐼 𝐼 (1)
The IPM machine’s electromagnetic torque can be determined by modifying (1) with flux components as shown in (2). Furthermore, the electromagnetic torque of a squirrel-cage IM may be estimated using (3), which was developed for stator flux-oriented IM drives [36]. The superscript “𝑒𝑠” in (3) indicates that the quantity is in the synchronous reference frame oriented to the stator flux. 𝑇 _ = 32 𝑝 𝜓 𝐼 − 𝜓 𝐼 (2)
𝑇 _ = 32 𝑝 𝜓 𝐼 (3)
For IPM machines and IMs, the current angle providing the maximum torque in mo-tor operation mode has been determined to be 270° and 0° electrical degrees, respectively. Figure 5 illustrates the calculated electromagnetic torque waveforms and their harmonic spectra. As clearly seen in the figure, although all the machines have a similar average torque, the torque ripple percentage of the AIM is the highest. It is almost 2 times and 2.3 times higher than the CIM and IPM machines, respectively. Therefore, it is clear that spe-cial care should be taken during the design stage of the AIM. Consequently, an effective torque ripple reduction method involving utilizing u-shaped bridges on the rotor slots of the AIM is presented in [33]. As for IPM machines, numerous different ways exist to min-imize the torque ripple, such as rotor, flux barrier, and magnet shape optimization, rotor skewing, harmonic current injection, stator slot optimization, and proper slot/pole num-ber combination selection.
Figure 4. Flux density and flux line distributions of the machines. (a) IPM machine flux density.(b) IPM machine flux line. (c) CIM flux density. (d) CIM flux line. (e) AIM flux density. (f) AIMflux line.
4.4. Torque and Torque Ripple
The electromagnetic torque of the machines is calculated by using the expressionsgiven between (1) and (3). As expressed in (1), there are two variable components contribut-ing the torque of PM machines. The first variable term in (1) depends on the rotor excitationthat is the PM flux ψPM which depends on the properties of the PM material including size,maximum energy product BHmax, etc. and the second term, known as reluctance torque,depends on the saliency of the rotor which is determined by inductance components Lqand Ld. m is the phase number and p is the pole pair number.

World Electr. Veh. J. 2022, 13, 137 7 of 18
Tem =m2
p
ψPM Iq︸ ︷︷ ︸Excitation
+(
Lq − Ld)
Id Iq︸ ︷︷ ︸Reluctance
(1)
The IPM machine’s electromagnetic torque can be determined by modifying (1) withflux components as shown in (2). Furthermore, the electromagnetic torque of a squirrel-cageIM may be estimated using (3), which was developed for stator flux-oriented IM drives [36].The superscript “es” in (3) indicates that the quantity is in the synchronous reference frameoriented to the stator flux.
Tem_IPM =32
p(ψd Iq − ψq Id
)(2)
Tem_IM =32
p(
ψesd Ies
q
)(3)
For IPM machines and IMs, the current angle providing the maximum torque in motoroperation mode has been determined to be 270 and 0 electrical degrees, respectively.Figure 5 illustrates the calculated electromagnetic torque waveforms and their harmonicspectra. As clearly seen in the figure, although all the machines have a similar averagetorque, the torque ripple percentage of the AIM is the highest. It is almost 2 times and2.3 times higher than the CIM and IPM machines, respectively. Therefore, it is clear thatspecial care should be taken during the design stage of the AIM. Consequently, an effectivetorque ripple reduction method involving utilizing u-shaped bridges on the rotor slotsof the AIM is presented in [33]. As for IPM machines, numerous different ways exist tominimize the torque ripple, such as rotor, flux barrier, and magnet shape optimization,rotor skewing, harmonic current injection, stator slot optimization, and proper slot/polenumber combination selection.
World Electr. Veh. J. 2022, 13, x FOR PEER REVIEW 8 of 20
(a) (b)
Figure 5. Comparison of the torque waveforms and their spectra. (a) Electromagnetic torque wave-forms. (b) Harmonic spectra of torque.
4.5. Flux-Weakening Characteristics The machines’ flux-weakening performances were computed using a combined nu-
merical and analytical method described in [9,37]. The obtained torque-speed and power-speed curves of the machines are illustrated in Figure 6. Although IMs have remarkable flux-weakening performance in the constant torque region, their performance in the con-stant power region, particularly in the deep flux-weakening area, falls far short of that of IPM machines [9]. As seen in Figure 6a, all the machines have the same maximum output torque. Although IMs’ characteristics are poorer than IPM machine at high-speed region, the maximum torque/power-speed characteristics of the IMs are not poorer than IPM ma-chine. As clearly seen in Figure 6, in some speed regions, IMs show even better flux-weak-ening characteristics than the IPM machine. Therefore, in terms of flux-weakening char-acteristics, the IM can replace IPM with a slight sacrifice of torque in the very deep flux-weakening region. Moreover, it is also revealed that the AIM has poorer flux-weakening characteristics than the CIM. The main underlying cause is that due to its lower funda-mental winding factor, the AIM requires more turns to retain the average torque.
(a)
150
170
190
210
230
250
0.5 0.52 0.54 0.56 0.58 0.6 0.62 0.64
Torq
ue (N
m)
Time (s)
IPMCIMAIM
Ripple (%)8.510.1519.5
0
40
80
120
160
200
240
0 2 4 6 8 10 12 14 16 18 20 22 24
Am
plitu
de (N
m)
Harmonic Order
0
2
4
6
8
10
1 3 5 7 9 11 13 15 17 19 21 23 25
IPMCIMAIM
THD (%)3.763.155.85
0
50
100
150
200
250
0 2 4 6 8 10 12 14 16 18 20
Torq
ue (N
m)
Speed (krpm)
Torque (IPM)Torque (CIM)Torque (AIM)
Figure 5. Comparison of the torque waveforms and their spectra. (a) Electromagnetic torquewaveforms. (b) Harmonic spectra of torque.
4.5. Flux-Weakening Characteristics
The machines’ flux-weakening performances were computed using a combined numer-ical and analytical method described in [9,37]. The obtained torque-speed and power-speedcurves of the machines are illustrated in Figure 6. Although IMs have remarkable flux-weakening performance in the constant torque region, their performance in the constantpower region, particularly in the deep flux-weakening area, falls far short of that of IPMmachines [9]. As seen in Figure 6a, all the machines have the same maximum output torque.Although IMs’ characteristics are poorer than IPM machine at high-speed region, the max-imum torque/power-speed characteristics of the IMs are not poorer than IPM machine.As clearly seen in Figure 6, in some speed regions, IMs show even better flux-weakeningcharacteristics than the IPM machine. Therefore, in terms of flux-weakening characteristics,the IM can replace IPM with a slight sacrifice of torque in the very deep flux-weakeningregion. Moreover, it is also revealed that the AIM has poorer flux-weakening characteristics

World Electr. Veh. J. 2022, 13, 137 8 of 18
than the CIM. The main underlying cause is that due to its lower fundamental windingfactor, the AIM requires more turns to retain the average torque.
World Electr. Veh. J. 2022, 13, x FOR PEER REVIEW 8 of 20
(a) (b)
Figure 5. Comparison of the torque waveforms and their spectra. (a) Electromagnetic torque wave-forms. (b) Harmonic spectra of torque.
4.5. Flux-Weakening Characteristics The machines’ flux-weakening performances were computed using a combined nu-
merical and analytical method described in [9,37]. The obtained torque-speed and power-speed curves of the machines are illustrated in Figure 6. Although IMs have remarkable flux-weakening performance in the constant torque region, their performance in the con-stant power region, particularly in the deep flux-weakening area, falls far short of that of IPM machines [9]. As seen in Figure 6a, all the machines have the same maximum output torque. Although IMs’ characteristics are poorer than IPM machine at high-speed region, the maximum torque/power-speed characteristics of the IMs are not poorer than IPM ma-chine. As clearly seen in Figure 6, in some speed regions, IMs show even better flux-weak-ening characteristics than the IPM machine. Therefore, in terms of flux-weakening char-acteristics, the IM can replace IPM with a slight sacrifice of torque in the very deep flux-weakening region. Moreover, it is also revealed that the AIM has poorer flux-weakening characteristics than the CIM. The main underlying cause is that due to its lower funda-mental winding factor, the AIM requires more turns to retain the average torque.
(a)
150
170
190
210
230
250
0.5 0.52 0.54 0.56 0.58 0.6 0.62 0.64
Torq
ue (N
m)
Time (s)
IPMCIMAIM
Ripple (%)8.510.1519.5
0
40
80
120
160
200
240
0 2 4 6 8 10 12 14 16 18 20 22 24
Am
plitu
de (N
m)
Harmonic Order
0
2
4
6
8
10
1 3 5 7 9 11 13 15 17 19 21 23 25
IPMCIMAIM
THD (%)3.763.155.85
0
50
100
150
200
250
0 2 4 6 8 10 12 14 16 18 20
Torq
ue (N
m)
Speed (krpm)
Torque (IPM)Torque (CIM)Torque (AIM)
World Electr. Veh. J. 2022, 13, x FOR PEER REVIEW 9 of 20
(b)
Figure 6. Flux-weakening characteristics. (a) Torque-speed characteristics. (b) Power-speed charac-teristics.
4.6. Efficiency Maps Efficiency maps of the IPM machine and IMs are calculated for the 250Apeak current
excitation operation considering the phase resistances calculated at 80 . In addition, me-chanical loss 𝑃 and additional losses 𝑃 including the friction, wind, and stray load loss have been taken into account as expressed in (4) and (5) [38], respectively. 𝑃 = 𝑘 𝑓 + 𝑘 𝑓 (4)
𝑃 = 0.01𝑃 𝑓𝑓 . 𝐼𝐼 (5)
where 𝑘 and 𝑘 are the mechanical loss coefficients, 𝑓 , 𝑓 , and 𝑓 are the funda-mental, working, and rated frequencies, respectively. 𝑃 is the working output power and 𝐼 and 𝐼 are the no load and rated current amplitudes, respectively.
Calculated efficiency maps for the IPM machine, CIM, and AIM are illustrated in Figure 7. As clearly seen in Figure 7, the maximum efficiency is achieved at a different speed range for each machine. Moreover, the differences between the highest efficiencies are not significant. While the highest efficiency is achieved between 3–4 krpm for IPM, it is achieved between 4.5–7.5 krpm for CIM and 7–8 krpm for AIM. As seen from Figure 7c, the AIM has the highest efficiency at the deep flux-weakening region. The following are some of the most notable main findings: • The IPM machine and CIM shows similar characteristics in terms of efficiency: lower
efficiency at the lowest and highest speed regions; • The efficiency of AIM at a lower speed is lower than those of the IPM machine and
CIM. However, its efficiency at a higher speed is higher than those of the IPM ma-chine and CIM.
0
20
40
60
80
100
120
0 2 4 6 8 10 12 14 16 18 20
Pow
er (k
W)
Speed (krpm)
Power (IPM)Power (CIM)Power (AIM)
Figure 6. Flux-weakening characteristics. (a) Torque-speed characteristics. (b) Power-speed characteristics.
4.6. Efficiency Maps
Efficiency maps of the IPM machine and IMs are calculated for the 250Apeak currentexcitation operation considering the phase resistances calculated at 80 °C. In addition,mechanical loss Pmech and additional losses Padd including the friction, wind, and stray loadloss have been taken into account as expressed in (4) and (5) [38], respectively.
Pmech = km1 f0 + km2 f 20 (4)
Padd = 0.01Pout1
(f1
fn
)1.5( In
INL
)2(5)
where km1 and km2 are the mechanical loss coefficients, f0, f1, and fn are the fundamental,working, and rated frequencies, respectively. Pout1 is the working output power and INLand In are the no load and rated current amplitudes, respectively.
Calculated efficiency maps for the IPM machine, CIM, and AIM are illustrated inFigure 7. As clearly seen in Figure 7, the maximum efficiency is achieved at a differentspeed range for each machine. Moreover, the differences between the highest efficienciesare not significant. While the highest efficiency is achieved between 3–4 krpm for IPM, it isachieved between 4.5–7.5 krpm for CIM and 7–8 krpm for AIM. As seen from Figure 7c,the AIM has the highest efficiency at the deep flux-weakening region. The following aresome of the most notable main findings:
• The IPM machine and CIM shows similar characteristics in terms of efficiency: lowerefficiency at the lowest and highest speed regions;

World Electr. Veh. J. 2022, 13, 137 9 of 18
• The efficiency of AIM at a lower speed is lower than those of the IPM machine andCIM. However, its efficiency at a higher speed is higher than those of the IPM machineand CIM.
World Electr. Veh. J. 2022, 13, x FOR PEER REVIEW 10 of 20
(a)
(b)
(c)
Speed (krpm)
Torq
ue (N
m)
7582868890919293949596
7580
8486
8890
9293
9495
0 2 4 6 8 10 12 14 16 18 200
50
100
150
200
250
76
78
80
82
84
86
88
90
92
94
96
Figure 7. Comparison of the efficiency maps of the considered machines. (a) IPM machine. (b) CIM.(c) AIM.

World Electr. Veh. J. 2022, 13, 137 10 of 18
4.7. Torque Production Capability
To be able to compare the torque-generating capabilities, the influence of electricloading on the torque is investigated. Figure 8 depicts the variation current angle of IPMand slip percentage of IMs that deliver the maximum torque. The current angle deliveringthe maximum torque for various peak current changes between 80 to 98.
World Electr. Veh. J. 2022, 13, x FOR PEER REVIEW 11 of 20
Figure 7. Comparison of the efficiency maps of the considered machines. (a) IPM machine. (b) CIM. (c) AIM.
4.7. Torque Production Capability To be able to compare the torque-generating capabilities, the influence of electric
loading on the torque is investigated. Figure 8 depicts the variation current angle of IPM and slip percentage of IMs that deliver the maximum torque. The current angle delivering the maximum torque for various peak current changes between 80° to 98°.
The current angle trend increases until peak inverter current limit (250Apeak) and then starts to decrease with the increasing current. However, for the IM, the slip, i.e., the difference between the stator and rotor magnetic fields, always increases with increasing peak current. Moreover, the AIM’s overall slip, delivering the maximum torque, is lower than that of the CIM. The electromagnetic torque capability comparison of the machines is shown in Figure 9. Note that it is assumed that the conductors and isolation materials can operate safely under the excitation of twice the rated current operation, and the limi-tation of the current density is infinite. That means the thermal issues are ignored. As clearly seen in Figure 9, the increase in torque capability of IMs with peak current is much faster than that of an IPM machine. Furthermore, it is obvious from Figure 9 that the torque capability of the IPM machine is better for lower electric load operations than the rated current (250A). Once the electric loading starts to become higher than the rated cur-rent, the torque capability of the IMs becomes better.
Figure 8. Variation of current angle (for IPM machine) and slip percentage (for IMs) with respect to peak current.
Figure 9. Comparison of torque production capabilities.
The torque ripple percentages for various electric loadings are compared in Figure 10. As seen, for the IPM machine, the higher the electric loading, the higher the torque ripple. On the other hand, for CIM, the higher the electric loading, the lower the torque ripple. For AIM, the torque ripple increases with the increasing electric loading until the
0
2
4
6
8
10
0
20
40
60
80
100
50 100 150 200 250 300 350 400 450 500
Slip
(%)
Curre
nt A
ngle
(Deg
.)
Current (A)
IPM (C. Angle)CIM (Slip)AIM (Slip)
0
100
200
300
400
500
600
0 50 100 150 200 250 300 350 400 450 500
Torq
ue (N
m)
Current (A)
IPM CIM AIM
Figure 8. Variation of current angle (for IPM machine) and slip percentage (for IMs) with respect topeak current.
The current angle trend increases until peak inverter current limit (250Apeak) andthen starts to decrease with the increasing current. However, for the IM, the slip, i.e., thedifference between the stator and rotor magnetic fields, always increases with increasingpeak current. Moreover, the AIM’s overall slip, delivering the maximum torque, is lowerthan that of the CIM. The electromagnetic torque capability comparison of the machines isshown in Figure 9. Note that it is assumed that the conductors and isolation materials canoperate safely under the excitation of twice the rated current operation, and the limitationof the current density is infinite. That means the thermal issues are ignored. As clearlyseen in Figure 9, the increase in torque capability of IMs with peak current is much fasterthan that of an IPM machine. Furthermore, it is obvious from Figure 9 that the torquecapability of the IPM machine is better for lower electric load operations than the ratedcurrent (250A). Once the electric loading starts to become higher than the rated current, thetorque capability of the IMs becomes better.
World Electr. Veh. J. 2022, 13, x FOR PEER REVIEW 11 of 20
Figure 7. Comparison of the efficiency maps of the considered machines. (a) IPM machine. (b) CIM. (c) AIM.
4.7. Torque Production Capability To be able to compare the torque-generating capabilities, the influence of electric
loading on the torque is investigated. Figure 8 depicts the variation current angle of IPM and slip percentage of IMs that deliver the maximum torque. The current angle delivering the maximum torque for various peak current changes between 80° to 98°.
The current angle trend increases until peak inverter current limit (250Apeak) and then starts to decrease with the increasing current. However, for the IM, the slip, i.e., the difference between the stator and rotor magnetic fields, always increases with increasing peak current. Moreover, the AIM’s overall slip, delivering the maximum torque, is lower than that of the CIM. The electromagnetic torque capability comparison of the machines is shown in Figure 9. Note that it is assumed that the conductors and isolation materials can operate safely under the excitation of twice the rated current operation, and the limi-tation of the current density is infinite. That means the thermal issues are ignored. As clearly seen in Figure 9, the increase in torque capability of IMs with peak current is much faster than that of an IPM machine. Furthermore, it is obvious from Figure 9 that the torque capability of the IPM machine is better for lower electric load operations than the rated current (250A). Once the electric loading starts to become higher than the rated cur-rent, the torque capability of the IMs becomes better.
Figure 8. Variation of current angle (for IPM machine) and slip percentage (for IMs) with respect to peak current.
Figure 9. Comparison of torque production capabilities.
The torque ripple percentages for various electric loadings are compared in Figure 10. As seen, for the IPM machine, the higher the electric loading, the higher the torque ripple. On the other hand, for CIM, the higher the electric loading, the lower the torque ripple. For AIM, the torque ripple increases with the increasing electric loading until the
0
2
4
6
8
10
0
20
40
60
80
100
50 100 150 200 250 300 350 400 450 500
Slip
(%)
Curre
nt A
ngle
(Deg
.)
Current (A)
IPM (C. Angle)CIM (Slip)AIM (Slip)
0
100
200
300
400
500
600
0 50 100 150 200 250 300 350 400 450 500
Torq
ue (N
m)
Current (A)
IPM CIM AIM
Figure 9. Comparison of torque production capabilities.
The torque ripple percentages for various electric loadings are compared in Figure 10.As seen, for the IPM machine, the higher the electric loading, the higher the torque ripple.On the other hand, for CIM, the higher the electric loading, the lower the torque ripple. ForAIM, the torque ripple increases with the increasing electric loading until the rated currentis reached. As previously explained, the electromagnetic torque of PM machines consistsof PM and reluctance torque components. As seen in (1), the PM torque component is

World Electr. Veh. J. 2022, 13, 137 11 of 18
proportional to the stator current, but the reluctance torque component is proportional tothe square of the stator current. The reluctance torque component diminishes as the saliencyratio drops with increased electric loading. However, when the electric load increases,the impact of PMs becomes less prominent (PMs are getting demagnetized) as seen inFigure 11. Furthermore, the saturation caused by PMs may affect the increase in torqueof the IPM machine. In fact, the IPM machine has PMs with constant flux magnitude.Even if the induced voltage is increased in the stator and the flux produced by the statorwindings is increased with increasing excitation current, the flux produced by the PMscannot be increased.
World Electr. Veh. J. 2022, 13, x FOR PEER REVIEW 12 of 20
rated current is reached. As previously explained, the electromagnetic torque of PM ma-chines consists of PM and reluctance torque components. As seen in (1), the PM torque component is proportional to the stator current, but the reluctance torque component is proportional to the square of the stator current. The reluctance torque component dimin-ishes as the saliency ratio drops with increased electric loading. However, when the elec-tric load increases, the impact of PMs becomes less prominent (PMs are getting demag-netized) as seen in Figure 11. Furthermore, the saturation caused by PMs may affect the increase in torque of the IPM machine. In fact, the IPM machine has PMs with constant flux magnitude. Even if the induced voltage is increased in the stator and the flux pro-duced by the stator windings is increased with increasing excitation current, the flux pro-duced by the PMs cannot be increased.
Figure 10. Comparison of torque ripple percentage for different electric loadings.
0
5
10
15
20
25
0 50 100 150 200 250 300 350 400 450 500
Torq
ue R
ippl
e (%
)
Current (A)
IPM CIM AIM
Figure 10. Comparison of torque ripple percentage for different electric loadings.
Essentially, as clearly seen in Figure 11, the flux generated by PMs dramatically reducesas the excitation current increases. This figure explains the underlying reason behind thelower torque generation of the IPM machine under overloading operating conditions. Oncethe IPM machine is loaded from 50% to 200%, the flux production capability of PMs reducessubstantially. The flux produced by the stator windings dominates the flux produced bythe PMs. In other words, PMs are temporarily demagnetized by the stator field. Therefore,since the flux density of the rotor core is much higher than the PM’s flux density, quite a lowflux can be produced by the PMs. Since the excitation and reluctance torque components ofthe IPM machine are decreased dramatically with increasing excitation current, it could notgenerate torque as high as IM (see Figure 9). For the IPM machine, the total flux is limitedby PMs and saliency. However, for IM, with the increasing injected current, both the statorand rotor circuit’s fluxes are increased since the rotor bar current will be increased by theincreased excitation current. Therefore, since the total flux is increased, the obtained torquewill also be increased. In theory, in comparison with PM machines, if the current densityand heating issues are ignored, there is no torque limitation for the IMs. In order to estimatethe saturation levels of the machines, the saturation factors for both of the machines havebeen calculated by using (6) and the variation of the calculated saturation factors withrespect to electric loading is illustrated in Figure 12.
ksat = 1 +MMFS + MMFR
MMFg= 1 +
HS + HRHg
(6)
where MMFS, MMFR, and MMFg are the magneto-motive force of stator, rotor, and air-gap,respectively, and HS, HR, and Hg represent the surface integrations of flux intensity of thesame regions. As seen in Figure 12, the saturation levels are similar, and they increasedramatically with increasing electric loading.

World Electr. Veh. J. 2022, 13, 137 12 of 18World Electr. Veh. J. 2022, 13, x FOR PEER REVIEW 13 of 20
Figure 11. Flux density vectors of PMs for various electric loadings.
Essentially, as clearly seen in Figure 11, the flux generated by PMs dramatically re-duces as the excitation current increases. This figure explains the underlying reason be-hind the lower torque generation of the IPM machine under overloading operating con-ditions. Once the IPM machine is loaded from 50% to 200%, the flux production capability of PMs reduces substantially. The flux produced by the stator windings dominates the flux produced by the PMs. In other words, PMs are temporarily demagnetized by the stator field. Therefore, since the flux density of the rotor core is much higher than the PM’s flux density, quite a low flux can be produced by the PMs. Since the excitation and reluc-tance torque components of the IPM machine are decreased dramatically with increasing excitation current, it could not generate torque as high as IM (see Figure 9). For the IPM machine, the total flux is limited by PMs and saliency. However, for IM, with the increas-ing injected current, both the stator and rotor circuit’s fluxes are increased since the rotor bar current will be increased by the increased excitation current. Therefore, since the total flux is increased, the obtained torque will also be increased. In theory, in comparison with PM machines, if the current density and heating issues are ignored, there is no torque
Figure 11. Flux density vectors of PMs for various electric loadings.
World Electr. Veh. J. 2022, 13, x FOR PEER REVIEW 14 of 20
limitation for the IMs. In order to estimate the saturation levels of the machines, the satu-ration factors for both of the machines have been calculated by using (6) and the variation of the calculated saturation factors with respect to electric loading is illustrated in Figure 12. 𝑘 = 1 + 𝑀𝑀𝐹 + 𝑀𝑀𝐹𝑀𝑀𝐹 = 1 + 𝐻 + 𝐻𝐻 (6)
where 𝑀𝑀𝐹 , 𝑀𝑀𝐹 , and 𝑀𝑀𝐹 are the magneto-motive force of stator, rotor, and air-gap, respectively, and 𝐻 , 𝐻 , and 𝐻 represent the surface integrations of flux intensity of the same regions. As seen in Figure 12, the saturation levels are similar, and they in-crease dramatically with increasing electric loading.
Figure 12. Variation of saturation factor with respect to electric loading.
4.8. Influence of Stack Lenght In this section, in order to observe the performance of AIM designed with the same
total axial length of the IPM machine and CIM, AIM1 and AIM2 have been designed, re-spectively. As presented previously, the AIM was designed with the same stack length as the Toyota Prius IPM machine. However, as shown in Table 3, once the AIM is designed with the same stack length as the Toyota Prius IPM machine, its total axial length is ap-proximately 21.5% shorter than that of the IPM machine. In the same manner, it is 25% shorter than the CIM. Therefore, it is intended to investigate the performance of the pro-posed AIM, which is designed with increased stack lengths.
Table 3. Overall comparison of key results.
IPM CIM AIM AIM1 AIM2 𝑛 88 64 84 60 60 ℓ (mm) 50.8 50.8 50.8 72.4 76 ℓ (mm) 97.5 101.1 76.66 97.5 101.1 𝑅 (Ω) 0.077 0.0561 0.0577 0.0408 0.0371 𝑇 (Nm) 222.38 220.75 219.15 218.38 220.45 ∆𝑇 (%) 8.45 10.15 19.63 19.5 19.8 𝑠 (%) 0 3.33 4.4 3.2 3.33 𝑃 (kW) 34.93 33.52 32.909 33.2 33.48 𝜂 (%) 85.532 83.00 79.32 84.21 84.47 𝑀 (kg) 22.7 25.22 24.279 31.02 32.7 Cost (£) 76.7 69.71 68.55 70.77 76.97 𝐽 (A/mm2) 21.77 28.52 28.76 23.92 21.6 𝐽 (A/mm2) ― 18.17 16.69 13.35 12.65
0
1
2
3
4
5
0 50 100 150 200 250 300 350 400 450 500
k sat
Current (A)
IPM
CIM
AIM
Figure 12. Variation of saturation factor with respect to electric loading.
World Electr. Veh. J. 2022, 13, 137 13 of 18
4.8. Influence of Stack Lenght
In this section, in order to observe the performance of AIM designed with the sametotal axial length of the IPM machine and CIM, AIM1 and AIM2 have been designed,respectively. As presented previously, the AIM was designed with the same stack length asthe Toyota Prius IPM machine. However, as shown in Table 3, once the AIM is designedwith the same stack length as the Toyota Prius IPM machine, its total axial length isapproximately 21.5% shorter than that of the IPM machine. In the same manner, it is25% shorter than the CIM. Therefore, it is intended to investigate the performance of theproposed AIM, which is designed with increased stack lengths.
Table 3. Overall comparison of key results.
IPM CIM AIM AIM1 AIM2
ns 88 64 84 60 60` (mm) 50.8 50.8 50.8 72.4 76`a (mm) 97.5 101.1 76.66 97.5 101.1Rph (Ω) 0.077 0.0561 0.0577 0.0408 0.0371Tem (Nm) 222.38 220.75 219.15 218.38 220.45∆T (%) 8.45 10.15 19.63 19.5 19.8s (%) 0 3.33 4.4 3.2 3.33Pout (kW) 34.93 33.52 32.909 33.2 33.48η (%) 85.532 83.00 79.32 84.21 84.47MT (kg) 22.7 25.22 24.279 31.02 32.7Cost (£) 76.7 69.71 68.55 70.77 76.97Js (A/mm2) 21.77 28.52 28.76 23.92 21.6Jr (A/mm2) — 18.17 16.69 13.35 12.65
4.9. Comparison of Copper Losses
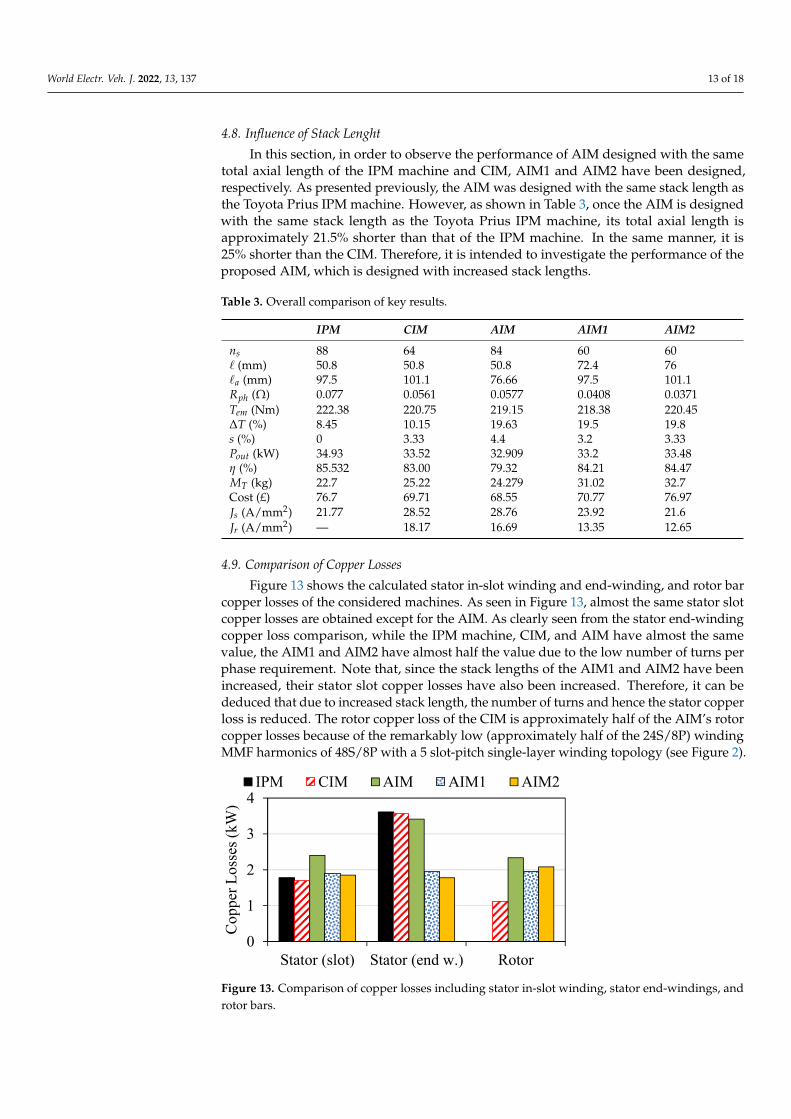
Figure 13 shows the calculated stator in-slot winding and end-winding, and rotor barcopper losses of the considered machines. As seen in Figure 13, almost the same stator slotcopper losses are obtained except for the AIM. As clearly seen from the stator end-windingcopper loss comparison, while the IPM machine, CIM, and AIM have almost the samevalue, the AIM1 and AIM2 have almost half the value due to the low number of turns perphase requirement. Note that, since the stack lengths of the AIM1 and AIM2 have beenincreased, their stator slot copper losses have also been increased. Therefore, it can bededuced that due to increased stack length, the number of turns and hence the stator copperloss is reduced. The rotor copper loss of the CIM is approximately half of the AIM’s rotorcopper losses because of the remarkably low (approximately half of the 24S/8P) windingMMF harmonics of 48S/8P with a 5 slot-pitch single-layer winding topology (see Figure 2).
World Electr. Veh. J. 2022, 13, x FOR PEER REVIEW 15 of 20
4.9. Comparison of Copper Losses Figure 13 shows the calculated stator in-slot winding and end-winding, and rotor bar
copper losses of the considered machines. As seen in Figure 13, almost the same stator slot copper losses are obtained except for the AIM. As clearly seen from the stator end-wind-ing copper loss comparison, while the IPM machine, CIM, and AIM have almost the same value, the AIM1 and AIM2 have almost half the value due to the low number of turns per phase requirement. Note that, since the stack lengths of the AIM1 and AIM2 have been increased, their stator slot copper losses have also been increased. Therefore, it can be de-duced that due to increased stack length, the number of turns and hence the stator copper loss is reduced. The rotor copper loss of the CIM is approximately half of the AIM’s rotor copper losses because of the remarkably low (approximately half of the 24S/8P) winding MMF harmonics of 48S/8P with a 5 slot-pitch single-layer winding topology (see Figure 2).
Figure 13. Comparison of copper losses including stator in-slot winding, stator end-windings, and rotor bars.
4.10. Overall Comparison The electromagnetic performance and design characteristics of the IPM machine,
CIM, AIM, and AIM1 and AIM2, which are designed with different stack lengths, are listed in Table 3. As can be observed, to be able to sustain the average torque, the number of turns of AIM1 and AIM2 are reduced while their stack lengths are increased. Therefore, it can be directly predicted that if the AIM topology is designed to have an equal total axial length with the IPM machine and CIM, the phase resistance would be reduced as shown in Table 3. As seen, if the AIM was designed with the same stack length as the IPM machine, its total axial length would be 21.5% and 25% shorter than the IPM machine and CIM, respectively, without sacrificing torque. On the other hand, if the AIM is designed to have the same total axial length as the IPM machine, the efficiency of the AIM can be increased by up to 6.5% without sacrificing the torque and output power. However, when the AIM is configured with same total axial length as that of the CIM, its efficiency is increased by 1.8% due to the increased output power.
The masses and the active material costs of each machine are calculated using the expression specified in (7) and (8) for IM and IPM machines, respectively, 𝑀 = 𝐷 𝐴 + 𝐴 ℓ + 2𝐷 𝑁 𝐴 ∙ ℓ + 𝜏 − 𝑏2 + 𝐷 𝑅𝐴 ℓ + 2𝐴 ℓ (7)
𝑀 = 𝐷 𝐴 + 𝐴 ℓ + 2𝐷 𝑁 𝐴 ∙ ℓ + 𝜏 − 𝑏2 + 𝐷 𝑁 𝐴 ℓ (8)
0
1
2
3
4
Stator (slot) Stator (end w.) Rotor
Copp
er L
osse
s (kW
)
IPM CIM AIM AIM1 AIM2
Figure 13. Comparison of copper losses including stator in-slot winding, stator end-windings, androtor bars.

World Electr. Veh. J. 2022, 13, 137 14 of 18
4.10. Overall Comparison
The electromagnetic performance and design characteristics of the IPM machine, CIM,AIM, and AIM1 and AIM2, which are designed with different stack lengths, are listed inTable 3. As can be observed, to be able to sustain the average torque, the number of turnsof AIM1 and AIM2 are reduced while their stack lengths are increased. Therefore, it can bedirectly predicted that if the AIM topology is designed to have an equal total axial lengthwith the IPM machine and CIM, the phase resistance would be reduced as shown in Table 3.As seen, if the AIM was designed with the same stack length as the IPM machine, its totalaxial length would be 21.5% and 25% shorter than the IPM machine and CIM, respectively,without sacrificing torque. On the other hand, if the AIM is designed to have the same totalaxial length as the IPM machine, the efficiency of the AIM can be increased by up to 6.5%without sacrificing the torque and output power. However, when the AIM is configuredwith same total axial length as that of the CIM, its efficiency is increased by 1.8% due to theincreased output power.
The masses and the active material costs of each machine are calculated using theexpression specified in (7) and (8) for IM and IPM machines, respectively,
MTotIM = DW330(AScore + ARcore)`+ 2Dcus Nc AScoil ·[`+ τs −
(bsw
2
)]+ DcuR
(RABar`+ 2ARing`Ring
)(7)
MTotPM = DW330(AScore + ARcore)`+ 2Dcus Nc ASco′l ·[`+ τs −
(bsw
2
)]+ DPM NPM APM` (8)
where AScore, ARcore, AScoil , ABar, ARing, and APM indicate surface areas of stator and rotorcores, stator coils, rotor bars, rotor end rings, and magnets respectively. Nc, NPM, R, and`Ring are the total coil number, total magnet number, the number of rotor slots, and theaxial length of ring, respectively. DW330, DCuS , DCuR , and DPM indicate the mass densitiesof core, the stator copper, rotor bar copper, and magnet materials, respectively. In addition,` is the stack length, bsw is the stator slot width, and τs is the average coil pitch. The cost ofthe raw materials is calculated using the most recent material price data from [39] and [40],as shown below:
• Copper: 7.354 £/kg—mass density: 7400 (kg/m3);• Steel: 0.44 £/kg—mass density: 8933 (kg/m3);• NdFeB35: 42.28 £/kg—mass density: 7520 (kg/m3).
As shown in Table 3, raw material costs of all machines are similar. Therefore, consid-ering the overall performance and flux-weakening characteristics, IMs can easily replacethe expensive IPM machines. It is also revealed that if the stack length is increased, it ispossible to reduce the stator and rotor current densities simultaneously.
5. Conclusions
In this study, the electromagnetic performance and design characteristics of the IPMmachine, CIM, and AIM are quantitatively compared with particular reference to the torque-generation capability. The key findings of such a comparison have been summarized forthe rated current operation condition and variable electric loading operations as follows:
• The overall flux-weakening characteristic of IMs are comparable to that of IPM machines;• The flux-weakening characteristic of AIM are poorer than that of CIM;• The overall efficiency of the IPM machine is higher than the CIM, and the difference
between the maximum efficiency regions is 1.041% only;• The efficiency of AIM is higher than CIM in deep flux-weakening regions;• The torque ripple of the AIM is nearly 57% and 50% higher than that of the IPM
machine and CIM, respectively, in the constant torque region;• By extending the stack length without surpassing the total axial length of an IPM
machine or CIM, it is feasible to significantly improve the output power and efficiencyof AIM;

World Electr. Veh. J. 2022, 13, 137 15 of 18
• It is also possible to reduce both the stator and rotor current densities simultaneouslyby extending the stack length;
Moreover, other important key findings related to the torque production capabilityand electric-loading operations can be summarized as follows.
The higher the electric loading level:
• The much faster the torque increases for IMs machines, the higher the torque levelsbecome for the electric loading levels higher than the rated current (250Apeak), whilstit is vice-versa for the electric loading levels lower than the 250Apeak;
• The lower the torque ripple for the CIM, whilst it is higher for the IPM machine andthe AIM;
• The higher the slip percentage for IMs;• The higher the risk of demagnetization for the IPM machine.
It has been shown that non-overlapping winding topology is a very effective method,yielding several advantages, such as shorter axial length without compromising efficiencyand torque, and simplicity in manufacturing. It has also been shown that the main disad-vantages of the AIM topology are higher torque ripple and higher rotor copper loss due tovery high amplitudes of MMF harmonics.
It has also been demonstrated that because of the AIM topology’s vast design choices,smaller and relatively efficient IMs may be designed. If improved electromagnetic perfor-mance and efficiency are more significant design goals, it is possible to fulfill these criteriaby extending the AIM’s stack length without exceeding the entire axial length of the relatedCIM design.
Author Contributions: Conceptualization and methodology, T.G. and Z.-Q.Z.; software, T.G.; formalanalysis, T.G., Z.-Q.Z. and C.C.C.; investigation, T.G. and Z.-Q.Z.; resources, Z.-Q.Z.; data curation,T.G.; writing—original draft preparation, T.G.; writing—review and editing, Z.-Q.Z. and C.C.C.; visu-alization, T.G.; supervision, Z.-Q.Z. and C.C.C.; project administration, Z.-Q.Z.; funding acquisition,Z.-Q.Z. All authors have read and agreed to the published version of the manuscript.
Funding: This research was partially funded by Valeo Powertrain Electric Systems, 94017 CréteilCEDEX, France.
Institutional Review Board Statement: Not applicable.
Informed Consent Statement: Not applicable.
Data Availability Statement: Not applicable.
Conflicts of Interest: The authors declare no conflict of interest.
Abbreviations
2D Two-DimensionalAIM Advanced Non-overlapping winding Induction MachineANW Advanced Non-overlapping WindingCIM Conventional Induction MachineCO2 Carbon DioxideDC Direct CurrentEMF Electromotive ForceEV Electric VehicleHEV Hybrid Electric VehicleIM Induction MachineIPM Interior-Permanent MagnetISDW Integer Slot Distributed WindingM Magnet NumberMMF Magnetomotive ForceNdFeB Neodymium Iron Boron

World Electr. Veh. J. 2022, 13, 137 16 of 18
P Pole NumberPM Permanent MagnetPMSM Permanent Magnet Synchronous MachineR Rotor Slot NumberS Stator Slot NumberTHD Total Harmonic Distortion
Nomenclature
AScoil Surface Area of Stator SlotDCuR Mass Density of Rotor Bar Copper MaterialDCuS Mass Density of Stator Copper Material`Ring Ring Axial Length`a Total Axial LengthABar Surface Area of Rotor SlotAPM Surface Area of MagnetARcore Surface Area of Rotor Core LaminationARing Surface Area of Rotor RingAScore Surface Area of Stator Core LaminationDPM Mass Density of MagnetDW330 Mass Density of Core Material (W330)HR Surface Integrations of Rotor Flux IntensityHS Surface Integrations of Stator Flux IntensityHg Surface Integrations of Airgap Flux IntensityINL No Load Current AmplitudeId D-axis CurrentIn Rated Current AmplitudeIq Q-axis CurrentIesq D-Axis Current in Synchronous Reference Frame Oriented to Stator Flux
Jr Rotor Bar Current DensityJs Stator Current DensityLd D-axis InductanceLq Q-axis InductanceMTotIM Total Weight of IMMTotPM Total Weight of IPM MachineMMFR Rotor Magnetomotive ForceMMFS Stator Magnetomotive ForceMMFg Airgap Magnetomotive ForceMT Total WeightNPM Number of MagnetsNc Number of CoilPout1 Working Output PowerPadd Additional Power LossPmech Mechanical Power LossPout Rated Output PowerRph Phase ResistanceTem Electromagnetic Torquebsw Stator Slot Widthf0 Fundamental Frequencyf1 Working Frequencyfn Rated Frequencykm1, 2 Mechanical Loss Coefficientsksat Saturation Factorns Serial Turn Numberτs Average Coil PitchψPM Magnet Fluxψd D-axis Flux

World Electr. Veh. J. 2022, 13, 137 17 of 18
ψesd D-Axis Flux in Synchronous Reference Frame Oriented to The Stator Flux
ψq Q-axis Flux∆T Torque Ripple` Stack LengthP Pole NumberR Rotor Slot Numberm Number of Phasess Slip
References1. Miller, J.; Khan, T.; Yang, Z.; Sen, A.; Kohli, S. Decarbonizing Road Transport by 2050: Accelerating the Global Transition to Zero-Emission
Vehicles; Briefing Paper; ZEV Transition Council, International Council on Clean Transportation: San Francisco, CA, USA, 2021.2. Irle, R. Global EV Sales for 2021. Available online: http://www.ev-volumes.com/ (accessed on 18 February 2022).3. Pontes, J. World Plugin Vehicle Sales-Top Brands. Available online: https://cleantechnica.com/2022/01/31/tesla-1-in-world-ev-
sales-in-2021/ (accessed on 18 February 2022).4. Zeraoulia, M.; Benbouzid, M.E.H.; Diallo, D. Electric motor drive selection issues for HEV propulsion systems: A comparative
study. IEEE Trans. Veh. Technol. 2006, 55, 1756–1764. [CrossRef]5. Dorrell, D.G.; Knight, A.M.; Evans, L.; Popescu, M. Analysis and design techniques applied to hybrid vehicle drive
machines—Assessment of alternative IPM and induction motor topologies. IEEE Trans. Ind. Electron. 2012, 59, 3690–3699.[CrossRef]
6. Goss, J.; Popescu, M.; Staton, D. A comparison of an interior permanent magnet and copper rotor induction motor in a hybridelectric vehicle application. In Proceedings of the 2013 International Electric Machines & Drives Conference, Chicago, IL, USA,12–15 May 2013; pp. 220–225. [CrossRef]
7. Boldea, I.; Tutelea, L.N.; Parsa, L.; Dorrell, D. Automotive electric propulsion systems with reduced or no permanent magnets:An overview. IEEE Trans. Ind. Electron. 2014, 61, 5696–5711. [CrossRef]
8. Yang, Z.; Shang, F.; Brown, I.P.; Krishnamurthy, M. Comparative Study of Interior Permanent Magnet, Induction, and SwitchedReluctance Motor Drives for EV and HEV Applications. IEEE Trans. Transp. Electrif. 2015, 1, 245–254. [CrossRef]
9. Guan, Y.; Zhu, Z.Q.; Afinowi, I.A.A.; Mipo, J.C.; Farah, P. Comparison between induction machine and interior permanentmagnet machine for electric vehicle application. COMPEL Int. J. Comput. Math. Electr. Electron. Eng. 2016, 35, 572–585. [CrossRef]
10. Yang, Y.; Castano, S.M.; Yang, R.; Kasprzak, M.; Bilgin, B.; Sathyan, A.; Dadkhah, H.; Emadi, A. Design and comparison of interiorpermanent magnet motor topologies for traction applications. IEEE Trans. Transp. Electrif. 2017, 3, 86–97. [CrossRef]
11. El-Refaie, A.M. Motors/generators for traction/propulsion applications: A review. IEEE Veh. Technol. Mag. 2013, 8, 90–99.[CrossRef]
12. Zhu, Z.Q.; Howe, D. Electrical machines and drives for electric, hybrid, and fuel cell vehicles. Proc. IEEE 2007, 95, 746–765.[CrossRef]
13. Zhu, Z.Q.; Chan, C.C. Electrical machine topologies and technologies for electric, hybrid, and fuel cell vehicles. In Proceedings ofthe 2008 IEEE Vehicle Power and Propulsion Conference, Harbin, China, 3–5 September 2008; pp. 1–6. [CrossRef]
14. Jiang, Y.; Krishnamurthy, M. Performance evaluation of ac machines for propulsion in a range extended electric auto rickshaw. InProceedings of the 2012 IEEE Transportation Electrification Conference and Expo (ITEC), Dearborn, MI, USA, 17–20 June 2012;pp. 1–6. [CrossRef]
15. Wu, S.; Tian, L.; Cui, S. A Comparative study of the interior permanent magnet electrical machine’s rotor configurations fora single shaft hybrid electric bus. In Proceedings of the 2008 IEEE Vehicle Power and Propulsion Conference, Harbin, China,3–5 September 2008; pp. 1–4. [CrossRef]
16. Wang, A.; Jia, Y.; Soong, W.L. Comparison of five topologies for an interior permanent-magnet machine for a hybrid electricvehicle. IEEE Trans. Magn. 2011, 47, 3606–3609. [CrossRef]
17. Liu, X.; Chen, H.; Zhao, J.; Belahcen, A. Research on the performances and parameters of interior PMSM used for electric vehicles.IEEE Trans. Ind. Electron. 2016, 63, 3533–3545. [CrossRef]
18. Yamazaki, K.; Kumagai, M. Torque analysis of interior permanent-magnet synchronous motors by considering cross-magnetization: Variation in torque components with permanent-magnet configurations. IEEE Trans. Ind. Electron. 2014, 61,3192–3201. [CrossRef]
19. Bucherl, D.; Nuscheler, R.; Meyer, W.; Herzog, H.-G. Comparison of electrical machine types in hybrid drive trains: Inductionmachine vs. permanent magnet synchronous machine. In Proceedings of the 2008 18th International Conference on ElectricalMachines, Vilamoura, Portugal, 6–9 September 2008; pp. 1–6. [CrossRef]
20. Zhu, Z.Q.; Chu, W.Q.; Guan, Y. quantitative comparison of electromagnetic performance of electrical machines for HEVs/EVs.CES Trans. Electr. Mach. Syst. 2017, 1, 37–47. [CrossRef]
21. Wang, S.; Zhu, Z.; Pride, A.; Shi, J.; Deodhar, R.; Umemura, C. Comparison of different winding configurations for dualthree-phase interior pm machines in electric vehicles. World Electr. Veh. J. 2022, 13, 51. [CrossRef]
22. Aiso, K.; Akatsu, K. Performance comparison of high-speed motors for electric vehicle. World Electr. Veh. J. 2022, 13, 57. [CrossRef]

World Electr. Veh. J. 2022, 13, 137 18 of 18
23. Dmitrievskii, V.; Prakht, V.; Kazakbaev, V.; Anuchin, A. Comparison of interior permanent magnet and synchronous homopolarmotors for a mining dump truck traction drive operated in wide constant power speed range. Mathematics 2022, 10, 1581.[CrossRef]
24. Orecchini, F.; Santiangeli, A.; Zuccari, F.; Alessandrini, A.; Cignini, F.; Ortenzi, F. Real drive truth test of the toyota yaris hybrid2020 and energy analysis comparison with the 2017 model. Energies 2021, 14, 8032. [CrossRef]
25. Gronwald, P.-O.; Kern, T.A. Experimental validation and parameter study of a 2d geometry-based, flexible designed thermalmotor model for different cooled traction motor drives. World Electr. Veh. J. 2021, 12, 76. [CrossRef]
26. Vosswinkel, M.; Lohner, A.; Platte, V.; Hirche, T. Design, Production, and verification of a switched-reluctance wheel hub drivetrain for battery electric vehicles. World Electr. Veh. J. 2019, 10, 82. [CrossRef]
27. Agamloh, E.; von Jouanne, A.; Yokochi, A. An overview of electric machine trends in modern electric vehicles. Machines 2020,8, 20. [CrossRef]
28. He, T.; Zhu, Z.; Eastham, F.; Wang, Y.; Bin, H.; Wu, D.; Gong, L.; Chen, J. Permanent magnet machines for high-speed applications.World Electr. Veh. J. 2022, 13, 18. [CrossRef]
29. Yun, D.; Kim, N.; Hyun, D.; Baek, J. Torque improvement of six-phase permanent-magnet synchronous machine drive withfifth-harmonic current injection for electric vehicles. Energies 2022, 15, 3122. [CrossRef]
30. Li, C.; Guo, X.; Fu, J.; Fu, W.; Liu, Y.; Chen, H.; Wang, R.; Li, Z. Design and analysis of a novel double-stator double-rotor motordrive system for in-wheel direct drive of electric vehicles. Machines 2022, 10, 27. [CrossRef]
31. Gundogdu, T.; Zhu, Z.-Q.; Mipo, J.-C. Design and analysis of advanced nonoverlapping winding induction machines for EV/HEVapplications. Energies 2021, 14, 6849. [CrossRef]
32. Olszewski, M. Evaluation of the 2010 Toyota Prius Hybrid Synergy Drive System; Oak Ridge National Laboratory: Oak Ridge, TN,USA; United States Department of Energy: Washington, DC, USA, 2011.
33. Gundogdu, T.; Zhu, Z.Q.; Mipo, J.C. Optimization and improvement of advanced nonoverlapping induction machines forEVs/HEVs. IEEE Access 2022, 10, 13329–13353. [CrossRef]
34. Kirtley, J.L.; Cowie, J.G.; Brush, E.F.; Peters, D.T.; Kimmich, R. Improving induction motor efficiency with die-cast copper rotorcages. In Proceedings of the 2007 IEEE Power Engineering Society General Meeting, Tampa, FL, USA, 24–28 June 2007; pp. 1–6.[CrossRef]
35. Vas, P. Vector Control of AC Machines; Clarendon Press: Oxford, UK; Springer: Berlin/Heidelberg, Germany, 1990; pp. 124–130.[CrossRef]
36. Xu, X.; De Doncker, R.; Novotny, D.W. A stator flux oriented induction machine drive. In Proceedings of the PESC’88 Record.,19th Annual IEEE Power Electronics Specialists Conference, Kyoto, Japan, 11–14 April 1988; Volume 2, pp. 870–876. [CrossRef]
37. Shin, M.-H.; Hyun, D.-S.; Cho, S.-B. Maximum torque control of stator-flux-oriented induction machine drive in the field-weakening region. IEEE Trans. Ind. Appl. 2002, 38, 117–122. [CrossRef]
38. Pyrhönen, J.; Jokinen, T.; Hrabovcová, V. Design of Rotating Electrical Machines, 2nd ed.; John Wiley & Sons, Ltd.: West Sussex, UK,2014; pp. 523–534; ISBN 978-1-118-58157-5.
39. Material Market Priced for 8 August 2017. Available online: https://www.lme.com/ (accessed on 22 February 2022).40. NdFeB Sintered Rough 35H EXW Magnet. Available online: https://ise-metal-quotes.com/ (accessed on 22 March 2022).
Copyright © 2022 FDOKUMEN