Comparative proteogenomics: combining mass spectrometry and comparative genomics to analyze multiple...
16
Comparative Proteogenomics: Combining Mass Spectrometry and Comparative Genomics to Analyze Multiple Genomes Nitin Gupta 1 , Jamal Benhamida 1 , Vipul Bhargava 1 , Daniel Goodman 1 , Elisabeth Kain 1 , Ian Kerman 1 , Ngan Nguyen 1 , Noah Ollikainen 1 , Jesse Rodriguez 1 , Jian Wang 1 , Mary S. Lipton 3 , Margaret Romine 3 , Andrei Osterman 4 , Vineet Bafna 1,2 , Richard D. Smith 3 , Pavel A. Pevzner 1,2 1 Bioinformatics Program, University of California San Diego, La Jolla 92093, USA. 2 Department of Computer Science and Engineering, University of California San Diego, La Jolla 92093, USA. 3 Biological Sciences Division, Pacific Northwest National Laboratory, Richland 99352, USA. 4 Burnham Instutute for Medical Research, La Jolla, 92037, USA. Correspondence to Nitin Gupta: [email protected] Abstract Mass spectrometry recently emerged as a valuable technique for proteogenomic annota- tions that improve on the state-of-the art in predicting genes and other features. However, previous proteogenomic approaches were limited to a single genome and did not take ad- vantage of analyzing mass spectrometry data from multiple genomes at once. We show that such comparative proteogenomics approach (similarly to comparative genomics approaches) allows one to address the problems that remained beyond the reach of the traditional “single proteome” approach in mass-spectrometry. In particular, we show how comparative pro- teogenomics addresses the notoriously difficult problem of “one-hit-wonders” in proteomics and improves on the existing gene prediction tools in genomics. 1 Introduction Since the sequencing of the first genome, H. influenzae [1] in 1995, the number of sequenced genomes has been rising sharply. Every sequencing project is followed by annotation of the genome to identify genes, pathways, etc. Comparative genomics analysis of multiple genomes has emerged as one of the key approaches for discovery of such genomic elements that greatly improves on existing annotation tools [2, 3, 4]. Another recent development is the application of tandem mass spectrometry (MS/MS) for genomic annotations [5, 6, 7, 8, 9, 10]. Such pro- teogenomic approaches further improve gene predictions and allow one to address problems that remained beyond the reach of both traditional gene prediction tools and comparative ge- nomics. We recently developed MS-Genome software for automated proteogenomic annotation of bacterial genomes [6] and applied it for improving annotation of Shewanella oneidensis MR- 1, a model bacterium for studies of bioremediation and metal reduction. However, the synergy between MS/MS data from different species was never explored in the past. We argue that such comparative proteogenomics analysis sheds new light on the annotations of both genomes and proteomes. 1
-
Upload
independent -
Category
Documents
-
view
3 -
download
0
Transcript of Comparative proteogenomics: combining mass spectrometry and comparative genomics to analyze multiple...
Comparative Proteogenomics: Combining Mass Spectrometry
and Comparative Genomics to Analyze Multiple Genomes
Nitin Gupta1, Jamal Benhamida1, Vipul Bhargava1, Daniel Goodman1,Elisabeth Kain1, Ian Kerman1, Ngan Nguyen1, Noah Ollikainen1,
Jesse Rodriguez1, Jian Wang1, Mary S. Lipton3, Margaret Romine3,Andrei Osterman4, Vineet Bafna1,2, Richard D. Smith3, Pavel A. Pevzner1,2
1Bioinformatics Program, University of California San Diego, La Jolla 92093, USA.2Department of Computer Science and Engineering, University of California San Diego, La Jolla 92093, USA.
3Biological Sciences Division, Pacific Northwest National Laboratory, Richland 99352, USA.4Burnham Instutute for Medical Research, La Jolla, 92037, USA.
Correspondence to Nitin Gupta: [email protected]
Abstract
Mass spectrometry recently emerged as a valuable technique for proteogenomic annota-tions that improve on the state-of-the art in predicting genes and other features. However,previous proteogenomic approaches were limited to a single genome and did not take ad-vantage of analyzing mass spectrometry data from multiple genomes at once. We show thatsuch comparative proteogenomics approach (similarly to comparative genomics approaches)allows one to address the problems that remained beyond the reach of the traditional “singleproteome” approach in mass-spectrometry. In particular, we show how comparative pro-teogenomics addresses the notoriously difficult problem of “one-hit-wonders” in proteomicsand improves on the existing gene prediction tools in genomics.
1 Introduction
Since the sequencing of the first genome, H. influenzae [1] in 1995, the number of sequencedgenomes has been rising sharply. Every sequencing project is followed by annotation of thegenome to identify genes, pathways, etc. Comparative genomics analysis of multiple genomeshas emerged as one of the key approaches for discovery of such genomic elements that greatlyimproves on existing annotation tools [2, 3, 4]. Another recent development is the applicationof tandem mass spectrometry (MS/MS) for genomic annotations [5, 6, 7, 8, 9, 10]. Such pro-teogenomic approaches further improve gene predictions and allow one to address problemsthat remained beyond the reach of both traditional gene prediction tools and comparative ge-nomics. We recently developed MS-Genome software for automated proteogenomic annotationof bacterial genomes [6] and applied it for improving annotation of Shewanella oneidensis MR-1, a model bacterium for studies of bioremediation and metal reduction. However, the synergybetween MS/MS data from different species was never explored in the past. We argue thatsuch comparative proteogenomics analysis sheds new light on the annotations of both genomesand proteomes.
1
Similar to Expressed Sequence Tags (EST) studies, mass spectrometry experiments generateExpressed Protein Tags (EPT) that provide valuable information about expressed proteins.However, while there 100s of studies on using ESTs for genome annotation, EPT studies arestill in infancy. This is unfortunate since EPTs may provide some advantages over ESTS andare easy to generate. In particular, in difference from ESTs, EPTs are relatively uniformlydistributed along the protein length and provide information about the translational startsand proteolytic events (e.g., signal peptides). Also, EPTs may be less affected by splicingartifacts (like transplicing) and sequencing errors. However, some EPTs may represent errorsin peptide identifications (and are thus completely wrong) making it non-trivial to transformthe existing EST approaches into the EPT domain.
While recent high-throughput MS/MS studies generated large spectral datasets for manyrelated species, it remains unclear how to utilize these datasets across various genomes. Inthis study, we analyze MS/MS datasets for three Shewanella bacteria representing multiplegrowth conditions: Shewanella oneidensis MR-1 (≈14.5 million spectra), Shewanella frigidi-marina (≈ 0.955 million spectra) and Shewanella putrefaciens CN-32 (≈ 0.768 million spectra).These datasets provide an opportunity to analyze expressed proteomes across these bacteria(henceforth referred to as So, Sf and Sp respectively). In addition to predicting new genes andfinding errors in existing annotations, we show that MS/MS data helps to identify programmedframeshifts (as well as sequencing errors), a difficult problem in genomics. Drawing parallelsfrom gene microarray platforms, we use mass spectrometry based protein expression data toanalyze the conserved and differentially expressed pathways across these species. We also showthat comparative analysis of peptides across species is helpful in resolving the notoriously dif-ficult problem of “one-hit-wonders” in proteomics. Our compartaive proteogenomics softwareis available at http://peptide.ucsd.edu/.
2 Methods
2.1 Peptide Identification
Peptide identification in So was described in the earlier study [6]. We use InsPecT [11] tosearch the spectra of each species against a database containing the six-frame translation ofthe genome along with common contaminants and a decoy database of the same size. InsPecTscore threshold is selected for each case to limit the number of identification on the decoydatabase to at most 5% of the number of identifications on the target database. Note thatwe use a decoy database of the size of the six-frame translation of the genome, almost 7-timeslarger than the total length of proteins; using a decoy database of the size of the proteome (acommon practice in the proteomics community) will result in false discovery rate below 1%.InsPecT software (July, 2007 version) produced 36,914 peptides in So, 27,605 peptides in Sfand 26,625 peptides in Sp. At the same time it produced 2,351, 3,159 and 1,676 peptides inSo, Sf, Sp correspondingly that do not match the annotated proteins in these genomes. Wedemonstrate that coordinated mapping of these peptides (that are usually discarded as falseidentifications) represents valuable information for improving genome annotations.
2.2 Expression analysis of GO categories
In order to provide a functional characterization of protein expression, we analyze the expressionat the level of Gene Ontology(GO) [12] classes. Note that, in difference from traditional array
2
studies, we consider a binary notion of expression (a protein is considered expressed if it isidentified by two or more peptides). We use the Protein Function Prediction (PFP) software[13] to functionally annotate all proteins with GO categories. This provides us a pathway levelannotation of proteins rather than the specific function of every protein. The annotated proteinsare clustered according to the Biological Process branch of the GO annotation using Bingo fromCytoscape [14]. The statistical significance of over-representation or under-representation ofexpressed proteins in each GO category is assessed using the Fisher’s exact test. The p-valuesfor each GO category in the three organisms are provided in Supplementary Table S1-A.
2.3 Analyzing late start codons
We describe an algorithm for predicting “late” start codons, i.e., the (correct) start codonsthat are located downstream of the wrongly annotated start codons. While a late start codonimplies a “missing” peptide in the beginning of the protein (between the wrongly annotated andcorrect start codons), such missing peptides can also be caused by low peptide detectability [15]or may simply represent signal peptides. However, non-covered peptides (non-tryptic peptideswith no upstream coverage, see [6] for more details) in the beginning of the protein, thatcannot be explained by the signal peptide consensus sequence, point to late start codons.There are 36 cases of N-terminal-most non-covered peptides in So, within 30 residues of thestart. Conspicuously, many of them either begin with ATG start codons or start immediatelyafter a start codon (as in the case of N-terminal Methionine cleavage, see [6]). If all thesepeptides were artifacts, the distribution of the codons for amino acids at positions 1 (where theobserved peptide begins) and -1 (corresponding to N-terminal Methionine cleavage) in thesepeptides would be somewhat uniform with average 36/61 ≈ 0.6 peptides per codon. Instead, wesee a non-uniform distribution at position -1 with a sharp peak at ATG (standard Methioninestart codon) and over-representation of other start codons (TTG and GTG). We thus arguethat all these cases cannot be artifacts (such as degradation products or incorrect peptideidentifications).
To exclude signal peptides from consideration, we consider only non-covered peptides lo-cated within a distance of 18aa or less from the start of the protein (signal peptides are typicallylonger than 18 aa). 41, 25 and 18 candidates are observed in So, Sf and Sp respectively. Com-parative analysis of the three Shewanella species is subsequently performed to validate thesecandidates for late start codons.
2.4 Correlated Peptides
Traditional MS/MS analysis is focused on identification of proteins and is less concerned withthe question which peptides in a protein are observed or not observed. In this study, we utilizethe availability of proteomic data from related species to analyze the expression of peptidesat orthologous positions. In a typical mass spectrometry experiment, some peptides with lowdetectability are always missed, resulting in a highly non-uniform protein coverage by identifiedpeptides [16, 15]. For example, while most ribosomal proteins in So have high coverage (above50%), a few have low coverage and one of them does not have any identified peptides.
All identified peptides in shared genes were mapped to the alignment of the orthologs toget their coordinates with respect to the alignment. This provides a uniform reference scaleto compare the positions of observed peptides between the orthologous proteins in the threespecies, as individual proteins may have different lengths. Peptides identified by MS/MS in two
3
(a) (b)
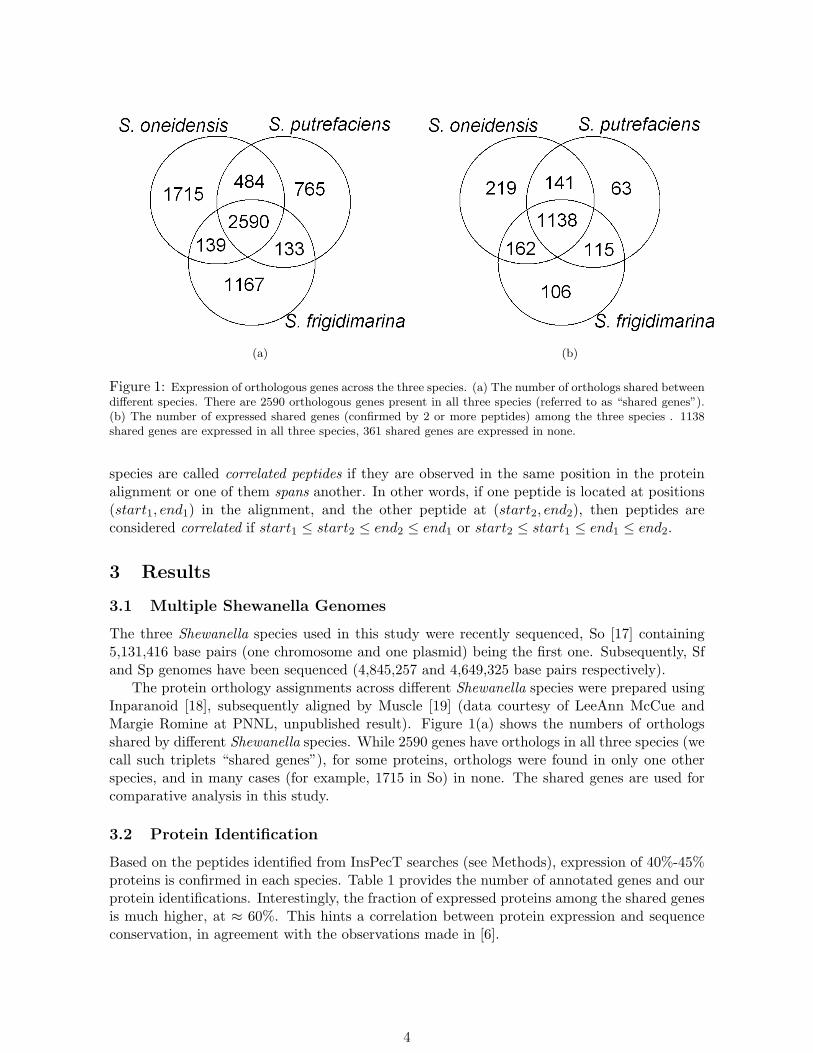
Figure 1: Expression of orthologous genes across the three species. (a) The number of orthologs shared betweendifferent species. There are 2590 orthologous genes present in all three species (referred to as “shared genes”).(b) The number of expressed shared genes (confirmed by 2 or more peptides) among the three species . 1138shared genes are expressed in all three species, 361 shared genes are expressed in none.
species are called correlated peptides if they are observed in the same position in the proteinalignment or one of them spans another. In other words, if one peptide is located at positions(start1, end1) in the alignment, and the other peptide at (start2, end2), then peptides areconsidered correlated if start1 ≤ start2 ≤ end2 ≤ end1 or start2 ≤ start1 ≤ end1 ≤ end2.
3 Results
3.1 Multiple Shewanella Genomes
The three Shewanella species used in this study were recently sequenced, So [17] containing5,131,416 base pairs (one chromosome and one plasmid) being the first one. Subsequently, Sfand Sp genomes have been sequenced (4,845,257 and 4,649,325 base pairs respectively).
The protein orthology assignments across different Shewanella species were prepared usingInparanoid [18], subsequently aligned by Muscle [19] (data courtesy of LeeAnn McCue andMargie Romine at PNNL, unpublished result). Figure 1(a) shows the numbers of orthologsshared by different Shewanella species. While 2590 genes have orthologs in all three species (wecall such triplets “shared genes”), for some proteins, orthologs were found in only one otherspecies, and in many cases (for example, 1715 in So) in none. The shared genes are used forcomparative analysis in this study.
3.2 Protein Identification
Based on the peptides identified from InsPecT searches (see Methods), expression of 40%-45%proteins is confirmed in each species. Table 1 provides the number of annotated genes and ourprotein identifications. Interestingly, the fraction of expressed proteins among the shared genesis much higher, at ≈ 60%. This hints a correlation between protein expression and sequenceconservation, in agreement with the observations made in [6].
4
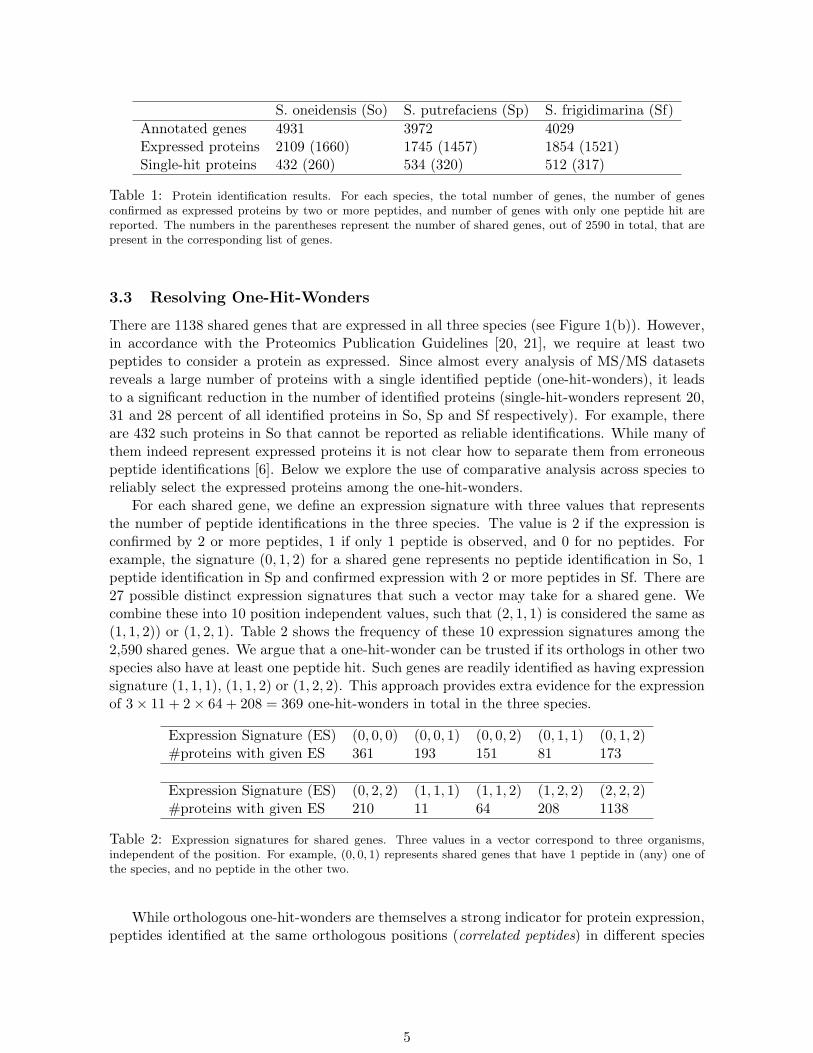
S. oneidensis (So) S. putrefaciens (Sp) S. frigidimarina (Sf)Annotated genes 4931 3972 4029Expressed proteins 2109 (1660) 1745 (1457) 1854 (1521)Single-hit proteins 432 (260) 534 (320) 512 (317)
Table 1: Protein identification results. For each species, the total number of genes, the number of genesconfirmed as expressed proteins by two or more peptides, and number of genes with only one peptide hit arereported. The numbers in the parentheses represent the number of shared genes, out of 2590 in total, that arepresent in the corresponding list of genes.
3.3 Resolving One-Hit-Wonders
There are 1138 shared genes that are expressed in all three species (see Figure 1(b)). However,in accordance with the Proteomics Publication Guidelines [20, 21], we require at least twopeptides to consider a protein as expressed. Since almost every analysis of MS/MS datasetsreveals a large number of proteins with a single identified peptide (one-hit-wonders), it leadsto a significant reduction in the number of identified proteins (single-hit-wonders represent 20,31 and 28 percent of all identified proteins in So, Sp and Sf respectively). For example, thereare 432 such proteins in So that cannot be reported as reliable identifications. While many ofthem indeed represent expressed proteins it is not clear how to separate them from erroneouspeptide identifications [6]. Below we explore the use of comparative analysis across species toreliably select the expressed proteins among the one-hit-wonders.
For each shared gene, we define an expression signature with three values that representsthe number of peptide identifications in the three species. The value is 2 if the expression isconfirmed by 2 or more peptides, 1 if only 1 peptide is observed, and 0 for no peptides. Forexample, the signature (0, 1, 2) for a shared gene represents no peptide identification in So, 1peptide identification in Sp and confirmed expression with 2 or more peptides in Sf. There are27 possible distinct expression signatures that such a vector may take for a shared gene. Wecombine these into 10 position independent values, such that (2, 1, 1) is considered the same as(1, 1, 2)) or (1, 2, 1). Table 2 shows the frequency of these 10 expression signatures among the2,590 shared genes. We argue that a one-hit-wonder can be trusted if its orthologs in other twospecies also have at least one peptide hit. Such genes are readily identified as having expressionsignature (1, 1, 1), (1, 1, 2) or (1, 2, 2). This approach provides extra evidence for the expressionof 3× 11 + 2× 64 + 208 = 369 one-hit-wonders in total in the three species.
Expression Signature (ES) (0, 0, 0) (0, 0, 1) (0, 0, 2) (0, 1, 1) (0, 1, 2)#proteins with given ES 361 193 151 81 173
Expression Signature (ES) (0, 2, 2) (1, 1, 1) (1, 1, 2) (1, 2, 2) (2, 2, 2)#proteins with given ES 210 11 64 208 1138
Table 2: Expression signatures for shared genes. Three values in a vector correspond to three organisms,independent of the position. For example, (0, 0, 1) represents shared genes that have 1 peptide in (any) one ofthe species, and no peptide in the other two.
While orthologous one-hit-wonders are themselves a strong indicator for protein expression,peptides identified at the same orthologous positions (correlated peptides) in different species
5
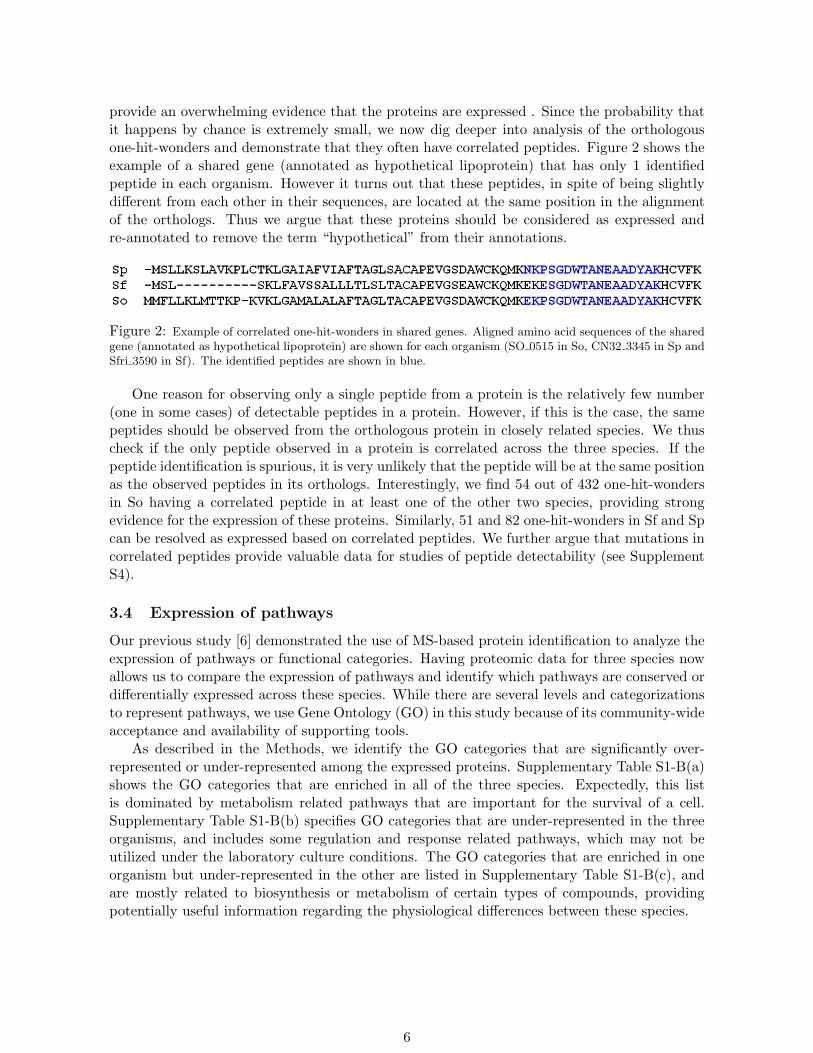
provide an overwhelming evidence that the proteins are expressed . Since the probability thatit happens by chance is extremely small, we now dig deeper into analysis of the orthologousone-hit-wonders and demonstrate that they often have correlated peptides. Figure 2 shows theexample of a shared gene (annotated as hypothetical lipoprotein) that has only 1 identifiedpeptide in each organism. However it turns out that these peptides, in spite of being slightlydifferent from each other in their sequences, are located at the same position in the alignmentof the orthologs. Thus we argue that these proteins should be considered as expressed andre-annotated to remove the term “hypothetical” from their annotations.
Figure 2: Example of correlated one-hit-wonders in shared genes. Aligned amino acid sequences of the sharedgene (annotated as hypothetical lipoprotein) are shown for each organism (SO 0515 in So, CN32 3345 in Sp andSfri 3590 in Sf). The identified peptides are shown in blue.
One reason for observing only a single peptide from a protein is the relatively few number(one in some cases) of detectable peptides in a protein. However, if this is the case, the samepeptides should be observed from the orthologous protein in closely related species. We thuscheck if the only peptide observed in a protein is correlated across the three species. If thepeptide identification is spurious, it is very unlikely that the peptide will be at the same positionas the observed peptides in its orthologs. Interestingly, we find 54 out of 432 one-hit-wondersin So having a correlated peptide in at least one of the other two species, providing strongevidence for the expression of these proteins. Similarly, 51 and 82 one-hit-wonders in Sf and Spcan be resolved as expressed based on correlated peptides. We further argue that mutations incorrelated peptides provide valuable data for studies of peptide detectability (see SupplementS4).
3.4 Expression of pathways
Our previous study [6] demonstrated the use of MS-based protein identification to analyze theexpression of pathways or functional categories. Having proteomic data for three species nowallows us to compare the expression of pathways and identify which pathways are conserved ordifferentially expressed across these species. While there are several levels and categorizationsto represent pathways, we use Gene Ontology (GO) in this study because of its community-wideacceptance and availability of supporting tools.
As described in the Methods, we identify the GO categories that are significantly over-represented or under-represented among the expressed proteins. Supplementary Table S1-B(a)shows the GO categories that are enriched in all of the three species. Expectedly, this listis dominated by metabolism related pathways that are important for the survival of a cell.Supplementary Table S1-B(b) specifies GO categories that are under-represented in the threeorganisms, and includes some regulation and response related pathways, which may not beutilized under the laboratory culture conditions. The GO categories that are enriched in oneorganism but under-represented in the other are listed in Supplementary Table S1-B(c), andare mostly related to biosynthesis or metabolism of certain types of compounds, providingpotentially useful information regarding the physiological differences between these species.
6
3.5 Correcting Start Sites
Peptides that match the genome in the non protein-coding region upstream to a gene, within 200bp distance, are considered candidates for early start sites. These are cases of mis-annotatedgenes that are shortened at their N-terminus. Cases with stop codons between the peptideand the gene start site are discarded. To avoid spurious candidates from incorrect peptideidentifications, we consider a peptide only if there is another identified peptide in the samereading frame within 200 bp [6]. The starting position of the peptide (call it position X) doesnot necessarily correspond to the actual start site of the gene, but only tells that the actualstart should be further upstream to X.
To verify early start sites and determine their exact positions, these genes were searchedagainst proteins in 10 other Shewanella strains, and position X for each candidate was comparedto the start site of the aligned homolog. These strains included Shewanella loihica PV-4, S.baltica OS155, S. amazonensis SB2B, S. sp. W3-18-1, S. denitrificans OS217, S. sp. ANA-3,S. sp MR-4 and S. sp. MR-7, besides the other two from So, Sf and Sp (leaving the one whichthe candidate gene belongs to). If the start site of homolog aligned to a particular positionequal to or upstream of position X, then this new position was considered to be putative earlystart site. The most frequent (supported by maximum number of homologs) of these putativestarts is chosen as the new start site for the gene.
The list of early start site candidates is provided in Supplementary Table S2-A. 24 among 39such candidates in So are assigned new start sites based on the comparative analysis mentionedabove. Notably, 19 of these early start sites have the expected ATG, GTG or TTG start codons,indicating that these automatically predicted start sites are indeed reliable. 3 and 5 early startsites are identified in Sp and Sf respectively. Interestingly, four of the candidate genes withearly start sites are observed in more than one organisms providing further support that thesegenes have been currently assigned incorrect start sites. These include ligA (So and Sp), ilvg(So and Sp), pcnB in (So and Sf) and infC (So, Sp and Sf).
As described in the Methods, candidates for late start sites were generated using evidencefrom non-covered peptides. Such instances indicated a potential late start site either at thebeginning of the non-covered peptide (call it position X) or, if N-terminal cleavage occurred,one position upstream (X − 1). The sequences of these candidate genes are aligned to theproteins in 9 other Shewanella strains. Each instance where the start of a protein in the otherstrains aligns to the potential late start site (beginning at position X or X − 1) is consideredas confirmed by comparative genomics.
Supplementary Table S2-B summarizes these cases in each of the three organisms. In So, 6out of 41 late start candidates are confirmed, four of which start with ATG codon and one withGTG. Similarly, 13 out of 25 candidates are confirmed in Sf, and 6 among the 18 are confirmedin Sp. The table also shows that the majority of these candidates have N-terminal methioninecleavage in the observed peptide. We find comparative proteomic evidence for one case wherethe late start site (10 amino acids downstream of the annotated start site) is conserved in theorthologs (ATP-dependent Clp protease, proteolytic subunit ClpP) between So (SO 1794) andSp (CN32 1490). However, we note that this site is also found in our analysis of conservedproteolytic sites (below). While it is unclear whether this peptide corresponds to the late startsite or a proteolytic event, it clearly represents a real non-tryptic peptide, as opposed to anincorrect identification.
7
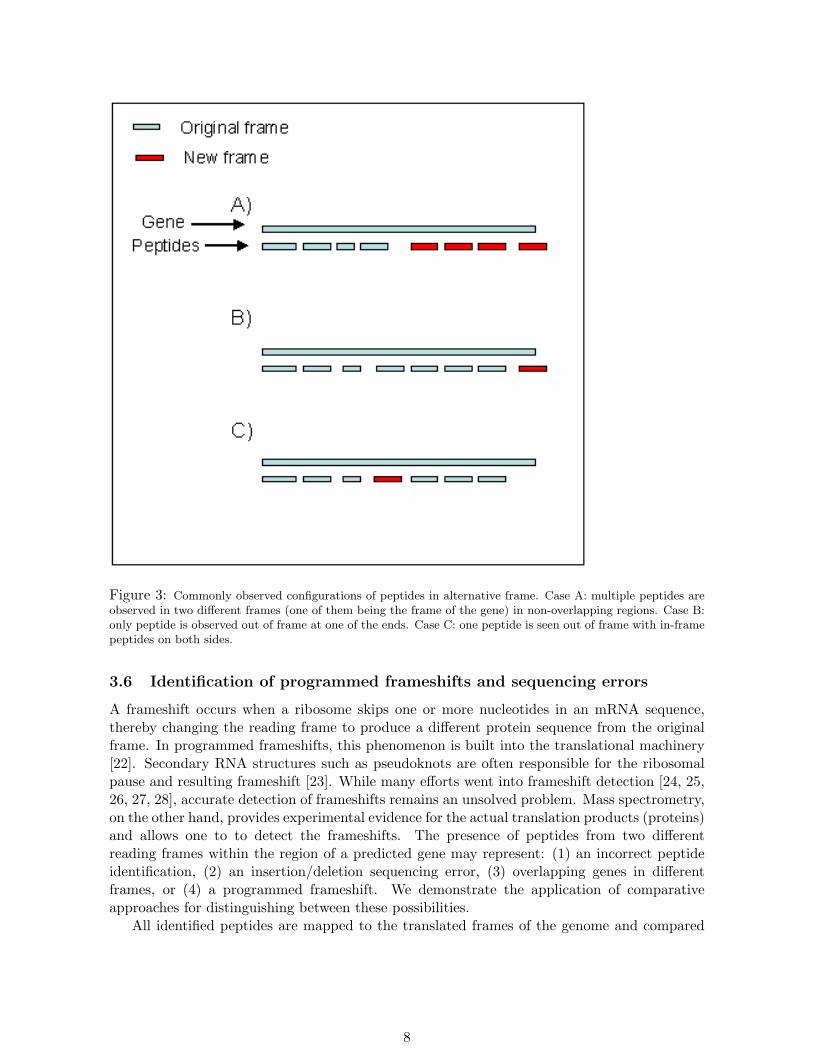
Figure 3: Commonly observed configurations of peptides in alternative frame. Case A: multiple peptides areobserved in two different frames (one of them being the frame of the gene) in non-overlapping regions. Case B:only peptide is observed out of frame at one of the ends. Case C: one peptide is seen out of frame with in-framepeptides on both sides.
3.6 Identification of programmed frameshifts and sequencing errors
A frameshift occurs when a ribosome skips one or more nucleotides in an mRNA sequence,thereby changing the reading frame to produce a different protein sequence from the originalframe. In programmed frameshifts, this phenomenon is built into the translational machinery[22]. Secondary RNA structures such as pseudoknots are often responsible for the ribosomalpause and resulting frameshift [23]. While many efforts went into frameshift detection [24, 25,26, 27, 28], accurate detection of frameshifts remains an unsolved problem. Mass spectrometry,on the other hand, provides experimental evidence for the actual translation products (proteins)and allows one to to detect the frameshifts. The presence of peptides from two differentreading frames within the region of a predicted gene may represent: (1) an incorrect peptideidentification, (2) an insertion/deletion sequencing error, (3) overlapping genes in differentframes, or (4) a programmed frameshift. We demonstrate the application of comparativeapproaches for distinguishing between these possibilities.
All identified peptides are mapped to the translated frames of the genome and compared
8
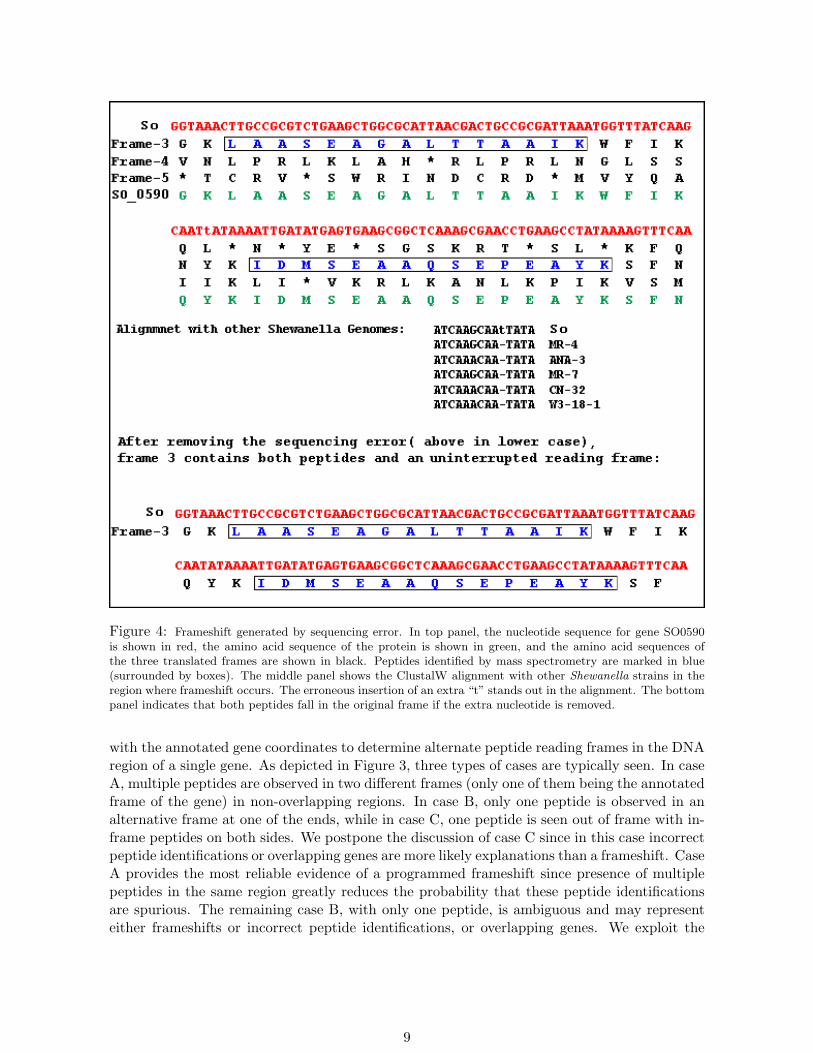
Figure 4: Frameshift generated by sequencing error. In top panel, the nucleotide sequence for gene SO0590is shown in red, the amino acid sequence of the protein is shown in green, and the amino acid sequences ofthe three translated frames are shown in black. Peptides identified by mass spectrometry are marked in blue(surrounded by boxes). The middle panel shows the ClustalW alignment with other Shewanella strains in theregion where frameshift occurs. The erroneous insertion of an extra “t” stands out in the alignment. The bottompanel indicates that both peptides fall in the original frame if the extra nucleotide is removed.
with the annotated gene coordinates to determine alternate peptide reading frames in the DNAregion of a single gene. As depicted in Figure 3, three types of cases are typically seen. In caseA, multiple peptides are observed in two different frames (only one of them being the annotatedframe of the gene) in non-overlapping regions. In case B, only one peptide is observed in analternative frame at one of the ends, while in case C, one peptide is seen out of frame with in-frame peptides on both sides. We postpone the discussion of case C since in this case incorrectpeptide identifications or overlapping genes are more likely explanations than a frameshift. CaseA provides the most reliable evidence of a programmed frameshift since presence of multiplepeptides in the same region greatly reduces the probability that these peptide identificationsare spurious. The remaining case B, with only one peptide, is ambiguous and may representeither frameshifts or incorrect peptide identifications, or overlapping genes. We exploit the
9
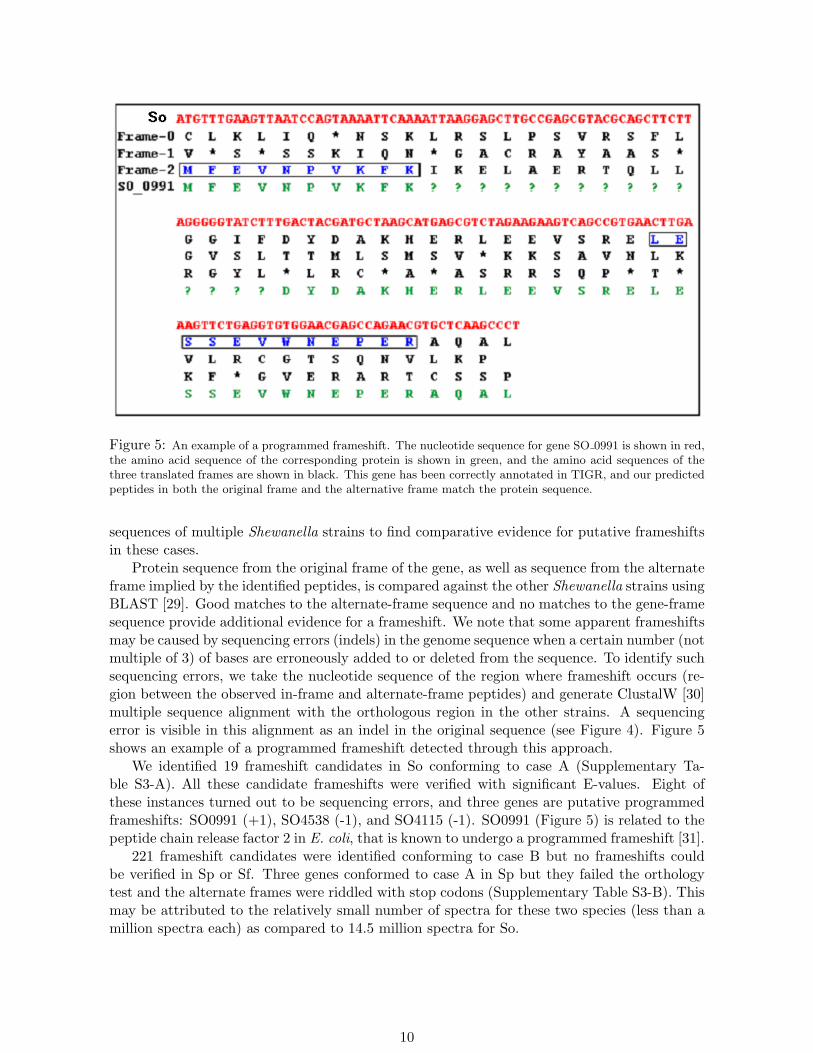
Figure 5: An example of a programmed frameshift. The nucleotide sequence for gene SO 0991 is shown in red,the amino acid sequence of the corresponding protein is shown in green, and the amino acid sequences of thethree translated frames are shown in black. This gene has been correctly annotated in TIGR, and our predictedpeptides in both the original frame and the alternative frame match the protein sequence.
sequences of multiple Shewanella strains to find comparative evidence for putative frameshiftsin these cases.
Protein sequence from the original frame of the gene, as well as sequence from the alternateframe implied by the identified peptides, is compared against the other Shewanella strains usingBLAST [29]. Good matches to the alternate-frame sequence and no matches to the gene-framesequence provide additional evidence for a frameshift. We note that some apparent frameshiftsmay be caused by sequencing errors (indels) in the genome sequence when a certain number (notmultiple of 3) of bases are erroneously added to or deleted from the sequence. To identify suchsequencing errors, we take the nucleotide sequence of the region where frameshift occurs (re-gion between the observed in-frame and alternate-frame peptides) and generate ClustalW [30]multiple sequence alignment with the orthologous region in the other strains. A sequencingerror is visible in this alignment as an indel in the original sequence (see Figure 4). Figure 5shows an example of a programmed frameshift detected through this approach.
We identified 19 frameshift candidates in So conforming to case A (Supplementary Ta-ble S3-A). All these candidate frameshifts were verified with significant E-values. Eight ofthese instances turned out to be sequencing errors, and three genes are putative programmedframeshifts: SO0991 (+1), SO4538 (-1), and SO4115 (-1). SO0991 (Figure 5) is related to thepeptide chain release factor 2 in E. coli, that is known to undergo a programmed frameshift [31].
221 frameshift candidates were identified conforming to case B but no frameshifts couldbe verified in Sp or Sf. Three genes conformed to case A in Sp but they failed the orthologytest and the alternate frames were riddled with stop codons (Supplementary Table S3-B). Thismay be attributed to the relatively small number of spectra for these two species (less than amillion spectra each) as compared to 14.5 million spectra for So.
10
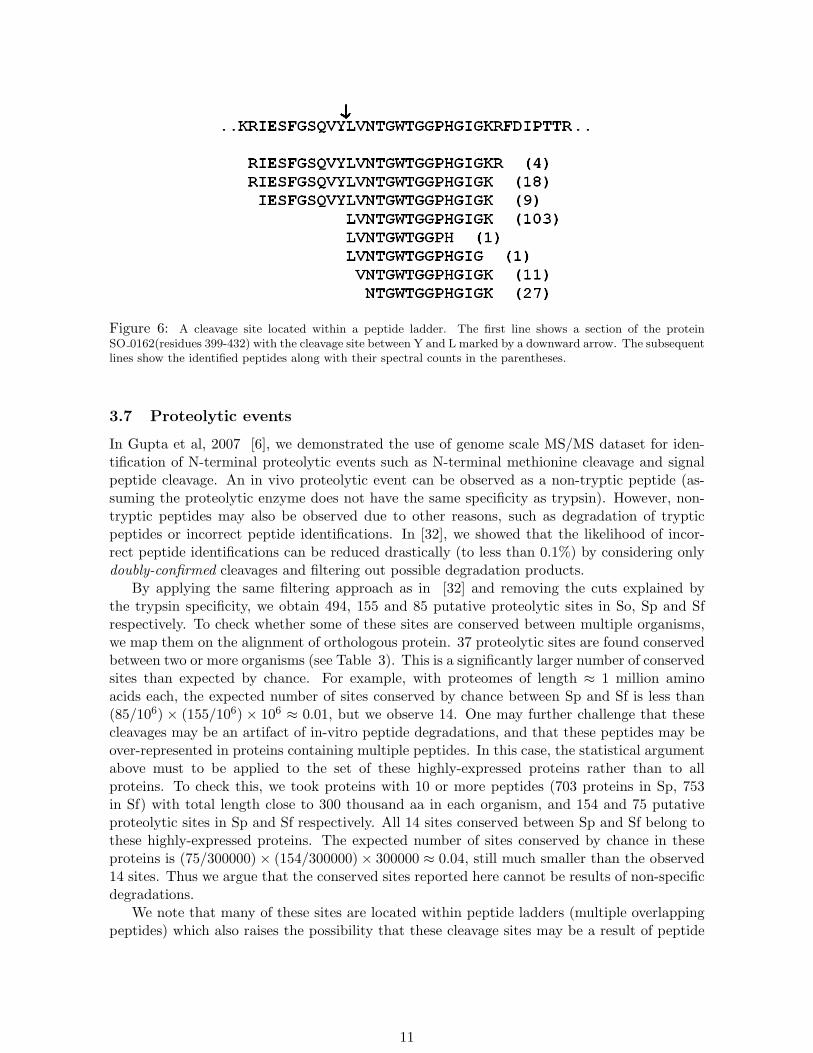
Figure 6: A cleavage site located within a peptide ladder. The first line shows a section of the proteinSO 0162(residues 399-432) with the cleavage site between Y and L marked by a downward arrow. The subsequentlines show the identified peptides along with their spectral counts in the parentheses.
3.7 Proteolytic events
In Gupta et al, 2007 [6], we demonstrated the use of genome scale MS/MS dataset for iden-tification of N-terminal proteolytic events such as N-terminal methionine cleavage and signalpeptide cleavage. An in vivo proteolytic event can be observed as a non-tryptic peptide (as-suming the proteolytic enzyme does not have the same specificity as trypsin). However, non-tryptic peptides may also be observed due to other reasons, such as degradation of trypticpeptides or incorrect peptide identifications. In [32], we showed that the likelihood of incor-rect peptide identifications can be reduced drastically (to less than 0.1%) by considering onlydoubly-confirmed cleavages and filtering out possible degradation products.
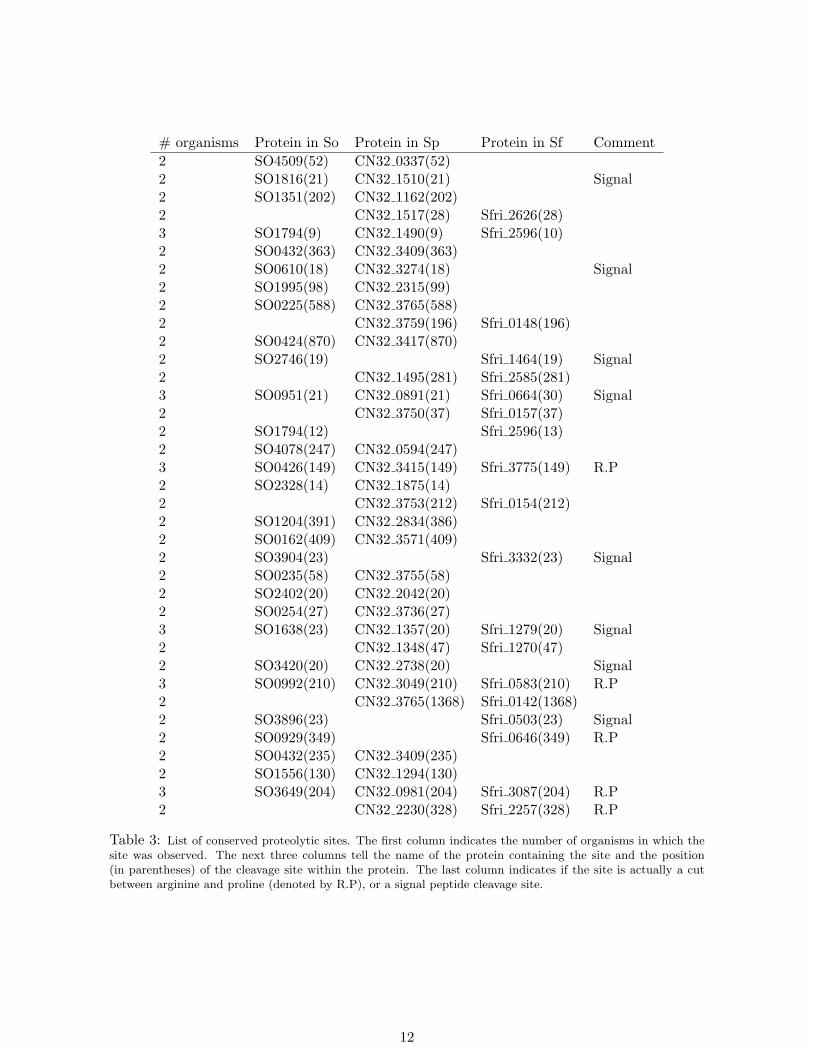
By applying the same filtering approach as in [32] and removing the cuts explained bythe trypsin specificity, we obtain 494, 155 and 85 putative proteolytic sites in So, Sp and Sfrespectively. To check whether some of these sites are conserved between multiple organisms,we map them on the alignment of orthologous protein. 37 proteolytic sites are found conservedbetween two or more organisms (see Table 3). This is a significantly larger number of conservedsites than expected by chance. For example, with proteomes of length ≈ 1 million aminoacids each, the expected number of sites conserved by chance between Sp and Sf is less than(85/106) × (155/106) × 106 ≈ 0.01, but we observe 14. One may further challenge that thesecleavages may be an artifact of in-vitro peptide degradations, and that these peptides may beover-represented in proteins containing multiple peptides. In this case, the statistical argumentabove must to be applied to the set of these highly-expressed proteins rather than to allproteins. To check this, we took proteins with 10 or more peptides (703 proteins in Sp, 753in Sf) with total length close to 300 thousand aa in each organism, and 154 and 75 putativeproteolytic sites in Sp and Sf respectively. All 14 sites conserved between Sp and Sf belong tothese highly-expressed proteins. The expected number of sites conserved by chance in theseproteins is (75/300000)× (154/300000)× 300000 ≈ 0.04, still much smaller than the observed14 sites. Thus we argue that the conserved sites reported here cannot be results of non-specificdegradations.
We note that many of these sites are located within peptide ladders (multiple overlappingpeptides) which also raises the possibility that these cleavage sites may be a result of peptide
11
# organisms Protein in So Protein in Sp Protein in Sf Comment2 SO4509(52) CN32 0337(52)2 SO1816(21) CN32 1510(21) Signal2 SO1351(202) CN32 1162(202)2 CN32 1517(28) Sfri 2626(28)3 SO1794(9) CN32 1490(9) Sfri 2596(10)2 SO0432(363) CN32 3409(363)2 SO0610(18) CN32 3274(18) Signal2 SO1995(98) CN32 2315(99)2 SO0225(588) CN32 3765(588)2 CN32 3759(196) Sfri 0148(196)2 SO0424(870) CN32 3417(870)2 SO2746(19) Sfri 1464(19) Signal2 CN32 1495(281) Sfri 2585(281)3 SO0951(21) CN32 0891(21) Sfri 0664(30) Signal2 CN32 3750(37) Sfri 0157(37)2 SO1794(12) Sfri 2596(13)2 SO4078(247) CN32 0594(247)3 SO0426(149) CN32 3415(149) Sfri 3775(149) R.P2 SO2328(14) CN32 1875(14)2 CN32 3753(212) Sfri 0154(212)2 SO1204(391) CN32 2834(386)2 SO0162(409) CN32 3571(409)2 SO3904(23) Sfri 3332(23) Signal2 SO0235(58) CN32 3755(58)2 SO2402(20) CN32 2042(20)2 SO0254(27) CN32 3736(27)3 SO1638(23) CN32 1357(20) Sfri 1279(20) Signal2 CN32 1348(47) Sfri 1270(47)2 SO3420(20) CN32 2738(20) Signal3 SO0992(210) CN32 3049(210) Sfri 0583(210) R.P2 CN32 3765(1368) Sfri 0142(1368)2 SO3896(23) Sfri 0503(23) Signal2 SO0929(349) Sfri 0646(349) R.P2 SO0432(235) CN32 3409(235)2 SO1556(130) CN32 1294(130)3 SO3649(204) CN32 0981(204) Sfri 3087(204) R.P2 CN32 2230(328) Sfri 2257(328) R.P
Table 3: List of conserved proteolytic sites. The first column indicates the number of organisms in which thesite was observed. The next three columns tell the name of the protein containing the site and the position(in parentheses) of the cleavage site within the protein. The last column indicates if the site is actually a cutbetween arginine and proline (denoted by R.P), or a signal peptide cleavage site.
12
degradation (see example in Figure 6). However, carefully looking into these ladders, we seethat they are more likely a union of two peptide ladders, one coming from the proteolysed andthe other from the unproteolysed protein product. This is supported by high spectral countsfor the peptides around the cleavage site in many cases, given that one expects much lowerspectral counts (usually 1) for degraded peptides as compared to the tryptic (un-degraded)peptide in a ladder. For example, the peptide LVNTGWTGGPHGIGK that supports thepredicted cleavage site in Figure 6 has a spectral count of 103, even higher than the spectralcounts of the covering tryptic peptides. Based on this and the statistical evidence shownabove, we expect that our conserved cleavage sites represent in-vivo proteolytic events. Sincethe knowledge of proteolytic events in bacteria is still very limited at genomic scale, we arenot able to provide additional supporting information about the origin or relevance of eachpredicted site individually; but we make the data available for comparison with future studies.Supplement S5 provides peptides ladders for all the 37 identified sites (see Instructions.txt inthe supplement archive for details).
Note that here we used the traditional rules for trypsin specificity, allowing a cut afterarginine or lysine but not before proline. Interestingly, 5 of the 37 conserved sites happen to becuts between arginine and proline, indicating that these may be a result of trypsin digestion,further supporting our claim in [32] that the cuts after arginine and lysine followed by aproline should be considered tryptic. Other 8 sites are signal peptide cleavages also predictedby SignalP [33] providing additional support that the found sites represent proteolytic eventsrather than statistical artifacts.
4 Discussion
Shewanella oneidensis MR-1 is among the most carefully annotated bacterial genomes: genepredictions in this genome were studied in two papers [34, 35] and are being continuouslyimproved by the Shewanella Federation http://www.shewanella.org/. Significant manual effort(that took into account comparative genomics evidence) also went into the annotation of She-wanella frigidimarina and Shewanella putrefaciens CN-32 at the Joint Genome Institute. Wedemonstrate that comparative proteogenomics approach leads to improved annotations evenfor these well-studied genomes, let alone for genomes with only automated annotations avail-able. Recent proliferation of low-cost DNA sequencing techniques and metagenomics studieswill soon lead to an explosive growth in the number of sequenced genomes and will turn manualannotations into a luxury that can be afforded for only a small fraction of newly sequencedgenomes. We therefore argue that complementing DNA sequencing projects by comparativeproteogenomics projects can be a viable alternative approach to improve both genomic andproteomic annotations.
5 Acknowledgments
This work was supported by National Institutes of Health Grant NIGMS 1-R01-RR16522 andby Howard Hughes Medical Institute Professor Award. Part of this research at Pacific North-west National Laboratory was supported by the Genomics:GtL Program, Office of Biologicaland Environmental Research, U.S. Department of Energy. Pacific Northwest National Labora-tory is operated for the DOE by Batelle Memorial Institute under Contract DE-AC06-76RLO1830.
13
References
[1] R.D. Fleischmann, M.D. Adams, O. White, R.A. Clayton, E.F. Kirkness, A.R. Kerlavage,C.J. Bult, J.F. Tomb, B.A. Dougherty, J.M. Merrick, et al. Whole-Genome RandomSequencing and Assembly of Haemophilus Influenzae Rd. Science, 269:496–498, 1995.
[2] S. Batzoglou, L. Pachter, J.P. Mesirov, B. Berger, and E.S. Lander. Human and MouseGene Structure: Comparative Analysis and Application to Exon Prediction. Genome Res,10:950, 2000.
[3] M. Kellis, N. Patterson, M. Endrizzi, B. Birren, and E.S. Lander. Sequencing and com-parison of yeast species to identify genes and regulatory elements. Nature, 423:241–254,2003.
[4] X. Xie, J. Lu, E.J. Kulbokas, T.R. Golub, V. Mootha, K. Lindblad-Toh, E.S. Lander, andM. Kellis. Systematic discovery of regulatory motifs in human promoters and 3’ UTRs bycomparison of several mammals. Nature, 434:338–345, 2005.
[5] S. Tanner, Z. Shen, J. Ng, L. Florea, R. Guigo, S.P. Briggs, and V. Bafna. Improving geneannotation using peptide mass spectrometry. Genome Res, 17:231, 2007.
[6] N. Gupta, S. Tanner, N. Jaitly, J. Adkins, M. Lipton, R. Edwards, M. Romine, A. Oster-man, V. Bafna, R. Smith, and P. Pevzner. Whole proteome analysis of post-translationalmodifications: applications of mass-spectrometry for proteogenomic annotation. GenomeRes, 17:1362–1377, 2007.
[7] J.D. Jaffe, H.C. Berg, and G.M. Church. Proteogenomic mapping as a complementarymethod to perform genome annotation. Proteomics, 4:59–77, 2004.
[8] D. Fermin, B.B. Allen, T.W. Blackwell, R. Menon, M. Adamski, Y. Xu, P. Ulintz, G.S.Omenn, and D.J. States. Novel gene and gene model detection using a whole genome openreading frame analysis in proteomics. Genome Biol, 7, 2006.
[9] D.E. Kalume, S. Peri, R. Reddy, J. Zhong, M. Okulate, N. Kumar, and A. Pandey. Genomeannotation of Anopheles gambiae using mass spectrometry-derived data. BMC Genomics,2005:128, 2005.
[10] R. Wang, J.T. Prince, and E.M. Marcotte. Mass spectrometry of the M. smegmatisproteome: Protein expression levels correlate with function, operons, and codon bias.Genome Res, 15:1118–1126, 2005.
[11] S. Tanner, H. Shu, A. Frank, L. Wang, E. Zandi, M. Mumby, P.A. Pevzner, and V. Bafna.Inspect: Fast and accurate identification of post-translationally modified peptides fromtandem mass spectra. Anal. Chem., 77:4626–4639, 2005.
[12] M. Ashburner, C.A. Ball, J.A. Blake, D. Botstein, H. Butler, J.M. Cherry, A.P. Davis,K. Dolinski, S.S. Dwight, J.T. Eppig, et al. Gene Ontology: tool for the unification ofbiology. Nature Genetics, 25:25–29, 2000.
[13] T. Hawkins, S. Luban, and D. Kihara. Enhanced automated function prediction usingdistantly related sequences and contextual association by PFP. Protein Science, 15:1550–1556, 2006.
14
[14] S. Maere, K. Heymans, and M. Kuiper. BiNGO: a Cytoscape plugin to assess overrepresen-tation of Gene Ontology categories in Biological Networks. Bioinformatics, 21:3448–3449,2005.
[15] B. Kuster, M. Schirle, P. Mallick, and R. Aebersold. Scoring Proteomes With ProteotypicPeptide Probes. Nature Reviews Molecular Cell Biology, 6:577–583, 2005.
[16] S. Purvine, A.F. Picone, and E. Kolker. Standard Mixtures for Proteome Studies. OmicsA Journal of Integrative Biology, 8:79–92, 2004.
[17] J.F. Heidelberg et al. Genome sequence of the dissimilatory metal ion-reducing bacteriumShewanella oneidensis. Nature Biotechnology, 20:1118–1123, 2002.
[18] M. Remm, C.E. Storm, and E.L. Sonnhammer. Automatic clustering of orthologs andin-paralogs from pairwise species comparisons. J. Mol. Biol, 314:1041–1052, 2001.
[19] R.C. Edgar and O. Journals. MUSCLE: multiple sequence alignment with high accuracyand high throughput. Nucleic Acids Research, 32:1792–1797, 2004.
[20] S. Carr, R. Aebersold, M. Baldwin, A. Burlingame, K. Clauser, and A. Nesvizhskii. TheNeed for Guidelines in Publication of Peptide and Protein Identification Data: WorkingGroup On Publication Guidelines For Peptide And Protein Identification Data. Mol CellProteomics, 3:531, 2004.
[21] R.A. Bradshaw, A.L. Burlingame, S. Carr, and R. Aebersold. Reporting Protein Identifi-cation Data: The next Generation of Guidelines. Mol Cell Proteomics, 5:787–8, 2006.
[22] P.J. Farabaugh. Programmed translational frameshifting. Microbiology and MolecularBiology Reviews, 60:103–134, 1996.
[23] C. Tu, T. Tzeng, and JA Bruenn. Ribosomal Movement Impeded at a Pseudoknot Re-quired for Frameshifting. Proceedings of the National Academy of Sciences, 89:8636–8640,1992.
[24] J. Posfai and R.J. Roberts. Finding Errors in DNA Sequences. Proceedings of the NationalAcademy of Sciences, 89:4698–4702, 1992.
[25] J.M. Claverie. Detecting frame shifts by amino acid sequence comparison. J Mol Biol,234:1140–57, 1993.
[26] N.P. Brown, C. Sander, and P. Bork. Frame: detection of genomic sequencing errors.Bioinformatics, 14:367–371, 1998.
[27] G.A. Fichant and Y. Quentin. A frameshift error detection algorithm for DNA sequencingprojects. Nucleic Acids Res, 23:2900–2908, 1995.
[28] C. Medigue, M. Rose, A. Viari, and A. Danchin. Detecting and Analyzing DNA SequencingErrors: Toward a Higher Quality of the Bacillus subtilis Genome Sequence. Genome Res,9:1116–1127, 1999.
[29] S. Altschul et al. Gapped BLAST and PSI-BLAST: a new generation of protein databasesearch programs. Nucleic Acids Research, 25:3389–3402, 1997.
15
[30] R. Chenna, H. Sugawara, T. Koike, R. Lopez, T.J. Gibson, D.G. Higgins, and J.D. Thomp-son. Multiple sequence alignment with the Clustal series of programs. Nucleic AcidsResearch, 31:3497–3500, 2003.
[31] W.J. Craigen, R.G. Cook, W.P. Tate, and C.T. Caskey. Bacterial Peptide Chain ReleaseFactors: Conserved Primary Structure and Possible Frameshift Regulation of ReleaseFactor 2. Proceedings of the National Academy of Sciences, 82:3616–3620, 1985.
[32] J. Rodriguez, N. Gupta, and P.A. Pevzner. Does trypsin cut before proline? Submitted.
[33] J.D. Bendtsen, H. Nielsen, G. von Heijne, and S. Brunak. Improved prediction of signalpeptides: SignalP 3.0. J Mol Biol, 340:783–795, Jul 2004.
[34] K.H. Nealson, A. Belz, and B. McKee. Breathing metals as a way of life: geobiology inaction. Antonie Van Leeuwenhoek, 81:215–222, 2002.
[35] N. Daraselia, D. Dernovoy, Y. Tian, M. Borodovsky, R. Tatusov, and T. Tatusova. Re-annotation of Shewanella oneidensis Genome. OMICS: A Journal of Integrative Biology,7:171–176, 2003.
16