Comparative human oral clinical pharmacology of cefadroxil, cephalexin, and cephradine
8
ANTiMICROBIAL AGENTS AND CHEMOTHERAPY, Feb. 1977, p. 331-338 Copyright © 1977 American Society for Microbiology Vol. 11, No. 2 Printed in U.S.A. Comparative Human Oral Clinical Pharmacology of Cefadroxil, Cephalexin, and Cephradine MORRIS PFEFFER'*, ANDRE JACKSON, JOSE XIMENES, AND JAIRO PERCHE DE MENEZES Bristol-Myers Co., Inc., New York, New York 10022 Received for publication 28 July 1976 At equivalent oral doses, cefadroxil has a longer serum half-life, slower urinary excretion rate, greater area under the serum level versus time curve than cephalexin or cephradine, and peak serum concentrations that are 75 to 80% those of cephalexin. The calculated, apparent in vivo volume of distribution of cefadroxil is greater than that of cephalexin. These properties infer greater persistence of cefadroxil in serum and urine and more prolonged in vivo bacte- rial exposure to cefadroxil than to cephalexin or cephradine. Neither cefadroxil nor cephalexin demonstrates drug accumulation on repeated administration. The serum levels achieved by cefadroxil are unaffected by food. The pharmacoki- netic properties of cefadroxil are supportive of the development of clinical efficacy data which could indicate that cefadroxil could be administered at 12-h intervals. The studies reported here were undertaken to compare the pharmacokinetic properties in humans of the orally administered cephalospo- rin antibiotics cefadroxil, cephalexin, and cephradine (structures presented in Fig. 1) and to determine the factors which control their disposition in vivo. A companion paper presents data on the antibacterial activity of cefadroxil (1). The inhibitory activity of cefadroxil on clin- ical isolates was similar to that of cephalexin and cephradine. Cefadroxil was more effective than cephalexin against Streptococcus py- ogenes and comparably as effective as cepha- lexin against Streptococcus pneumoniae, Staph- ylococcus aureus, and several gram-negative species in oral treatment of experimental infec- tions in mice. MATERIALS AND METHODS Bioassays for antibiotic activity in serum and ur- ine were carried out by standard cup plate assay methodology (4) using Sarcina lutea ATCC 9341 as the bioassay organism versus analytical standards of each of the cephalosporin antibiotics employed. All antibiotic doses administered are reported in terms of antibiotic content as established by bioas- say. In all three studies all subjects gave informed consent to their participation. All subjects were be- tween the ages of 23 and 59 years and weighed between 51 and 83 kg. Additional criteria for en- trance into the studies included lack of penicillin allergy or sensitivity, a normal routine physical examination, and determinations of hemoglobin, hematocrit, white blood cell and differential count, I Address reprint requests to: P.O. Box 657, Syracuse, NY 13201. blood area nitrogen, serum glutamic pyruvic trans- aminase, bilirubin, urinalysis (including protein test, sugar and microscopy for casts and cells), and stool parasitological examination. Subjects with ab- normal values or findings were not admitted into these studies. None of the subjects were to have taken any medication for 3 weeks prior to the study in which they participated. All subjects were fasted overnight before each study. Oral doses of drugs were always administered at 8:00 a.m. with 250 ml of water, and a further 250 ml of water was ingested every succeeding 2 h for the duration of the study. Except for portions of a study on the effect of food on drug bioavailability, the subjects maintained their fast for 2 h after drug administration. All studies were designed as balanced, random- ized complete crossovers. There was a 6-day washout period between crossover legs. Study HL-74-41. The first study was a three-pe- riod crossover pharmacokinetic and bioavailability comparison between cephalexin and the monohy- drate and trihydrate of cefadroxil. The drugs admin- istered were: cefadroxil monohydrate capsules, 300 mg; cefadroxil trihydrate capsules, 300 mg; and com- mercial cephalexin monohydrate capsules, 250 mg. There were 16 volunteers (13 males, 3 females). Blood samples for the preparation of serum were taken at zero time (before dosage) and at 0.5, 1, 1.5, 3, 6, and 8 h after dosing. Total urine collections were made during the 0- to 4- and 4- to 8-h intervals after dosing. Study HL-75-47. Study HL-75-47 was a three-pe- riod crossover comparison between cefadroxil mono- hydrate capsules, commercial cephalexin monohy- drate capsules, and commercial cephradine cap- sules. The doses of all three antibiotics were a con- stant 500 mg. There were 12 volunteers (11 males and 1 female). Blood samples were collected at zero time and at 0.5, 1, 1.5, 2, 4, 6, 8, and 12 h after 331 on October 8, 2016 by guest http://aac.asm.org/ Downloaded from
-
Upload
independent -
Category
Documents
-
view
1 -
download
0
Transcript of Comparative human oral clinical pharmacology of cefadroxil, cephalexin, and cephradine
ANTiMICROBIAL AGENTS AND CHEMOTHERAPY, Feb. 1977, p. 331-338Copyright © 1977 American Society for Microbiology
Vol. 11, No. 2Printed in U.S.A.
Comparative Human Oral Clinical Pharmacology ofCefadroxil, Cephalexin, and Cephradine
MORRIS PFEFFER'*, ANDRE JACKSON, JOSE XIMENES, AND JAIRO PERCHE DE MENEZES
Bristol-Myers Co., Inc., New York, New York 10022
Received for publication 28 July 1976
At equivalent oral doses, cefadroxil has a longer serum half-life, slowerurinary excretion rate, greater area under the serum level versus time curve
than cephalexin or cephradine, and peak serum concentrations that are 75 to80% those of cephalexin. The calculated, apparent in vivo volume of distributionof cefadroxil is greater than that of cephalexin. These properties infer greaterpersistence of cefadroxil in serum and urine and more prolonged in vivo bacte-rial exposure to cefadroxil than to cephalexin or cephradine. Neither cefadroxilnor cephalexin demonstrates drug accumulation on repeated administration.The serum levels achieved by cefadroxil are unaffected by food. The pharmacoki-netic properties of cefadroxil are supportive of the development of clinicalefficacy data which could indicate that cefadroxil could be administered at 12-hintervals.
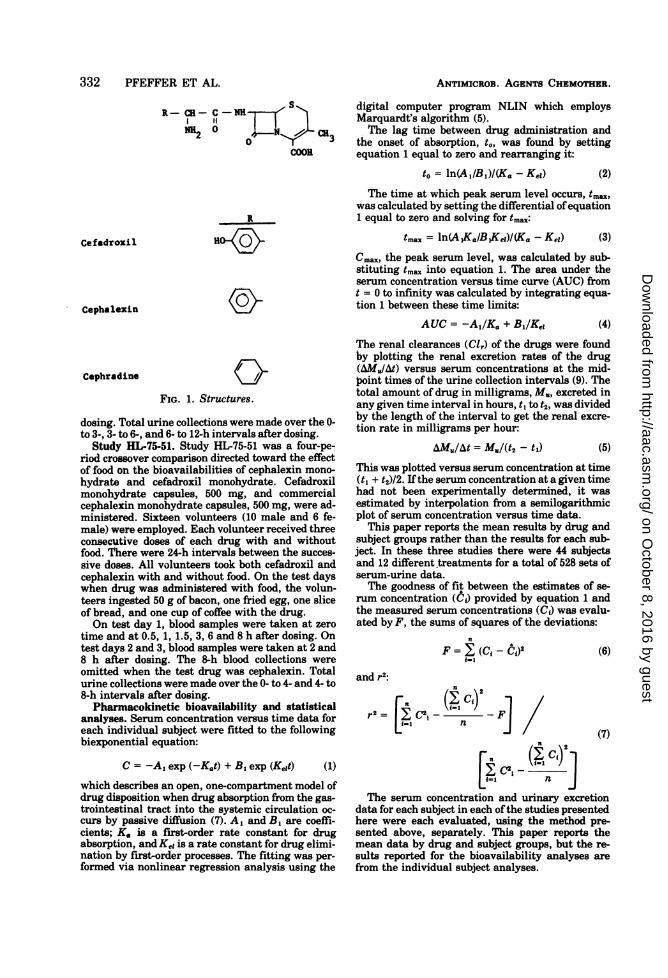
The studies reported here were undertakento compare the pharmacokinetic properties inhumans of the orally administered cephalospo-rin antibiotics cefadroxil, cephalexin, andcephradine (structures presented in Fig. 1) andto determine the factors which control theirdisposition in vivo. A companion paper presentsdata on the antibacterial activity of cefadroxil(1). The inhibitory activity of cefadroxil on clin-ical isolates was similar to that of cephalexinand cephradine. Cefadroxil was more effectivethan cephalexin against Streptococcus py-ogenes and comparably as effective as cepha-lexin against Streptococcus pneumoniae, Staph-ylococcus aureus, and several gram-negativespecies in oral treatment of experimental infec-tions in mice.
MATERIALS AND METHODSBioassays for antibiotic activity in serum and ur-
ine were carried out by standard cup plate assaymethodology (4) using Sarcina lutea ATCC 9341 asthe bioassay organism versus analytical standardsof each of the cephalosporin antibiotics employed.All antibiotic doses administered are reported interms of antibiotic content as established by bioas-say.
In all three studies all subjects gave informedconsent to their participation. All subjects were be-tween the ages of 23 and 59 years and weighedbetween 51 and 83 kg. Additional criteria for en-trance into the studies included lack of penicillinallergy or sensitivity, a normal routine physicalexamination, and determinations of hemoglobin,hematocrit, white blood cell and differential count,
I Address reprint requests to: P.O. Box 657, Syracuse,NY 13201.
blood area nitrogen, serum glutamic pyruvic trans-aminase, bilirubin, urinalysis (including proteintest, sugar and microscopy for casts and cells), andstool parasitological examination. Subjects with ab-normal values or findings were not admitted intothese studies. None of the subjects were to havetaken any medication for 3 weeks prior to the studyin which they participated.
All subjects were fasted overnight before eachstudy. Oral doses ofdrugs were always administeredat 8:00 a.m. with 250 ml of water, and a further 250ml of water was ingested every succeeding 2 h forthe duration of the study. Except for portions of astudy on the effect of food on drug bioavailability,the subjects maintained their fast for 2 h after drugadministration.
All studies were designed as balanced, random-ized complete crossovers. There was a 6-day washoutperiod between crossover legs.
Study HL-74-41. The first study was a three-pe-riod crossover pharmacokinetic and bioavailabilitycomparison between cephalexin and the monohy-drate and trihydrate of cefadroxil. The drugs admin-istered were: cefadroxil monohydrate capsules, 300mg; cefadroxil trihydrate capsules, 300 mg; and com-mercial cephalexin monohydrate capsules, 250 mg.There were 16 volunteers (13 males, 3 females).Blood samples for the preparation of serum weretaken at zero time (before dosage) and at 0.5, 1, 1.5,3, 6, and 8 h after dosing. Total urine collectionswere made during the 0- to 4- and 4- to 8-h intervalsafter dosing.
Study HL-75-47. Study HL-75-47 was a three-pe-riod crossover comparison between cefadroxil mono-hydrate capsules, commercial cephalexin monohy-drate capsules, and commercial cephradine cap-sules. The doses of all three antibiotics were a con-stant 500 mg. There were 12 volunteers (11 malesand 1 female). Blood samples were collected at zerotime and at 0.5, 1, 1.5, 2, 4, 6, 8, and 12 h after
331
on October 8, 2016 by guest
http://aac.asm.org/
Dow
nloaded from
332 PFEFFER ET AL.
SR-CR- C-NH Sf
NH2 0 r- vN CH3COOH
ANTIMICROB. AGENTs CHEMOTHER.
digital computer program NLIN which employsMarquardt's algorithm (5).The lag time between drug administration and
the onset of absorption, to, was found by settingequation 1 equal to zero and rearranging it:
to = ln(Al/Bi)I(Ka- Ke) (2)
R
HoK~Cefadroxil
Cephalexin
Cephradine \jF
FIG. 1. Structures.
dosing. Total urine collections were made over the 0-to 3-, 3- to 6-, and 6- to 12-h intervals after dosing.
Study HL-75-51. Study HL-75-51 was a four-pe-riod crossover comparison directed toward the effectof food on the bioavailabilities of cephalexin mono-hydrate and cefadroxil monohydrate. Cefadroxilmonohydrate capsules, 500 mg, and commercialcephalexin monohydrate capsules, 500 mg, were ad-ministered. Sixteen volunteers (10 male and 6 fe-male) were employed. Each volunteer received threeconsecut'ive doses of each drug with and withoutfood. There were 24-h intervals between the succes-
sive doses. All volunteers took both cefadroxil andcephalexin with and without food. On the test dayswhen drug was administered with food, the volun-teers ingested 50 g of bacon, one fried egg, one sliceof bread, and one cup of coffee with the drug.On test day 1, blood samples were taken at zero
time and at 0.5, 1, 1.5, 3, 6 and 8 h after dosing. Ontest days 2 and 3, blood samples were taken at 2 and8 h after dosing. The 8-h blood collections wereomitted when the test drug was cephalexin. Totalurine collections were made over the 0- to 4- and 4- to8-h intervals after dosing.
Pharmacokinetic bioavailability and statisticalanalyses. Serum concentration versus time data foreach individual subject were fitted to the followingbiexponential equation:
C = -Al exp (-K0t) + B, exp (Keit) (1)
which describes an open, one-compartment model ofdrug disposition when drug absorption from the gas-trointestinal tract into the systemic circulation oc-curs by passive diffusion (7). Al and B, are coeffi-cients; K. is a first-order rate constant for drugabsorption, and Kel is a rate constant for drug elimi-nation by first-order processes. The fitting was per-
formed via nonlinear regression analysis using the
The time at which peak serum level occurs, tmax,was calculated by setting the differential ofequation1 equal to zero and solving for tmax:
tmax = ln(A,Ka/BXKeW)I(Ka - Kel) (3)
Cma., the peak serum level, was calculated by sub-stituting tmax into equation 1. The area under theserum concentration versus time curve (AUC) fromt = 0 to infinity was calculated by integrating equa-tion 1 between these time limits:
AUC = -A,/K0 + Bi/Kel (4)
The renal clearances (Clr) of the drugs were foundby plotting the renal excretion rates of the drug(AM.JAt) versus serum concentrations at the mid-point times of the urine collection intervals (9). Thetotal amount of drug in milligrams, M., excreted inany given time interval in hours, ti to t2, was dividedby the length of the interval to get the renal excre-tion rate in milligrams per hour:
AM/At = M3/(t2 - tl) (5)
This was plotted versus serum concentration at time(tl + t2)/2. Ifthe serum concentration at a given timehad not been experimentally determined, it wasestimated by interpolation from a semilogarithmicplot of serum concentration versus time data.
This paper reports the mean results by drug andsubject groups rather than the results for each sub-ject. In these three studies there were 44 subjectsand 12 different treatments for a total of 528 sets ofserum-urine data.The goodness of fit between the estimates of se-
rum concentration (6w) provided by equation 1 andthe measured serum concentrations (CD was evalu-ated by F, the sums of squares of the deviations:
n
F=YE (C{-C)2 (6){=1
and r2:
r2=~~~~r2 C2,a - ( 1 - F (/
n_ _ / ~~~~~~~~~~(7)
[ C,, ( )]=l n
The serum concentration and urinary excretiondata for each subject in each ofthe studies presentedhere were each evaluated, using the method pre-sented above, separately. This paper reports themean data by drug and subject groups, but the re-sults reported for the bioavailability analyses arefrom the individual subject analyses.
on October 8, 2016 by guest
http://aac.asm.org/
Dow
nloaded from
CEFADROXIL, CEPHALEXIN, CEPHRADINE IN HUMANS 333
Cefadroxil, cephalexin, and cephradine are eachdistinctive chemical entities, and it could not be as-sumed that their in vivo dispositions were identical.For that reason it was inappropriate to consistentlytest statistical hypotheses regarding bioavailabilitywithin each study by a single multiway analysis ofvariance (ANOVA). Such an ANOVA was appropri-ate when testing "treatment" affects on bioavaila-bility for a given antibiotic within a single study.Thus, when comparing cefadroxil monohydrate andtrihydrate in study HL-74-41 and the effect of foodand fasting on cefadroxil monohydrate or cephalexinmonohydrate in study HLI75-51, such an ANOVAcould be used. A two-period crossover designANOVA (3) served in these cases. When comparingdifferent antibiotics in a single study or performinginterstudy comparisons, the more appropriate one-way ANOVA (6) was used. All hypotheses weretested at the P = 0.05 level of significance.
Bioavailability comparisons on a given antibioticwere performed usingK., tma and Cmax to character-ize rate of availability and AUC to characterize totalextent of availability once statistical equivalence ofKe, values in the crossover had been established (10).
The urine concentrations of the antibiotics havebeen calculated and compared at their modes (theconcentration values corresponding to the greatestconcentration frequencies) rather than their means,since the distributions of urine concentrations wereskewed and apparently not nQrmal distributions.
RESULTS AND DISCUSSIONSerum concentrations. Tables 1 and 2, 3 and
4, and 5 and 6 contain the mean serum concen-trations and pharmacokinetic parameters +standard error (SE) for studies HL-74-41, HL-75-47, and HL-75-51, respectively. Up to concen-trations of 25 gg/ml, the serum protein bind-ings of cefadroxil and cephalexin were verysimilar: cefadroxil was 20% bound, and cepha-lexin was 17% bound (1).The monohydrate and trihydrate of cefad-
roxil are fully equivalent to each other. Statis-tical analyses indicated no significant differ-
ences between their rate or total extent of bioa-vailability.The data from all three studies indicate that
cephalexin is more rapidly absorbed than cefad-roxil: Ka for cephalexin was always greaterthanKa for cefadroxil. This led to the later tmaxfor cefadroxil than for cephalexin. This latertmax for cefadroxil was not due to delayed ab-sorption of the drug; the overall absorption lagtimes for the two drugs were almost identical at24 min for cefadroxil and 20 min for cephalexin.At doses of500 mg, the mean Cmax for cefadroxil(16 ug/ml) was about 80% ofthat for cephalexin(21 ug/ml). The overall mean half-life of cefad-roxil (1.2 h) was twofold greater than the over-all mean half-life ofcephalexin (0.6 h); the AUCfor cefadroxil (47.4 ,tgh/ml) was 1.6-fold greaterthan the AUC for cephalexin (29.0 lugh/ml),indicating that although the peak serum levelof cefadroxil is lower than that of cephalexin,cefadroxil persists in the body an appreciablylonger time than does cephalexin. At equiva-lent doses the cefadroxil serum level washigher than the cephalexin serum level by 1.5 hafter dose and remained consistently higherthereafter. At the 500-mg dose, cephalexin con-centration dropped to 1 ,ug/ml at about 4 h, and
TABLE 1. Mean serum antibiotic concentrations forstudy HL-74-41
Mean serum antibiotic concn (jAg/mI ± SE)Time Cefadroxil Cefadroxil Cephalexin(h) monohydrate trihydrate monohydrate
(300 mg) (300 mg) (250 mg)0 0 0 00.5 2.52 + 0.8 3.38 + 0.65 4.28 + 0.791 9.19 + 0.38 9.59 + 0.55 8.58 + 0.651.5 9.43 ± 0.36 9.29 ± 0.41 5.19 + 0.393 4.13 + 0.23 3.90 ± 0.19 1.20 + 0.096 0.74 + 0.06 0.67 + 0.04 <0.048 0.34 + 0.04 0.28 ± 0.03 <0.04
TABLE 2. Pharmacokinetic parameters for study HL-74-41
Value + SE
Parameter Cefadroxil Cefadroxil Cephalexinmonohydrate trihydrate monohydrate
(300 mg) (300 mg) (250 mg)
AUC (,ugh per ml) 26.8 ± 0.8 26.3 ± 0.8 14.0 ± 0.6Ka (h-) 2.82 ± 0.36 2.97 ± 0.40 4.28 ± 0.42KeI (h-) 0.659 ± 0.028 0.666 ± 0.029 1.35 ± 0.10tmax (h) 1.19 ± 0.05 1.12 ± 0.05 0.86 ± 0.05Cmax (jg/ml) 9.82 ± 0.31 10.3 ± 0.5 9.93 ± 0.76t112 (h) 1.05 ± 0.05 1.04 + 0.05 0.51 ± 0.04to (min) 26 0.8 23 2 24 1
F 0.193 0.494 1.365r2 0.998 0.994 0.951
VOL. 11, 1977
on October 8, 2016 by guest
http://aac.asm.org/
Dow
nloaded from
334 PFEFFER ET AL.
cefadroxil concentration dropped to 1 ,ug/ml atabout 7 h.
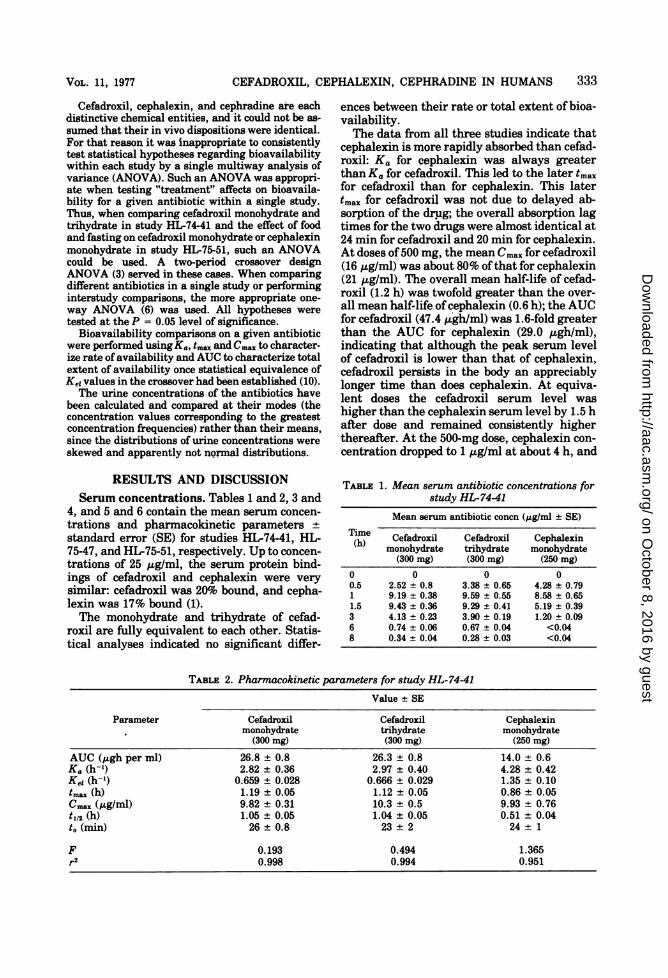
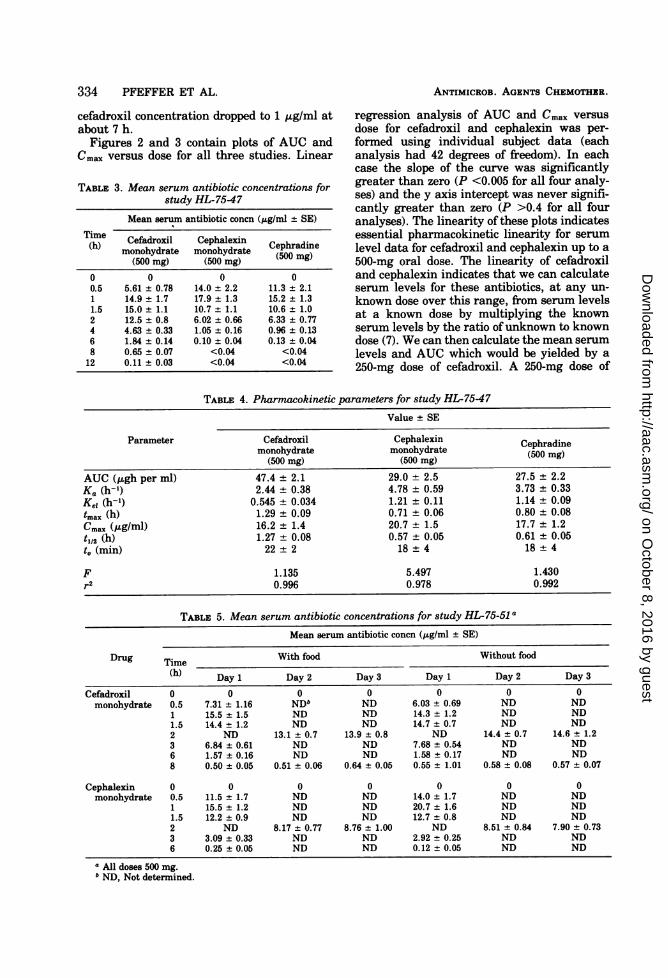
Figures 2 and 3 contain plots of AUC andCmax versus dose for all three studies. Linear
TABLE 3. Mean serum antibiotic concentrations forstudy HL-75-47
Mean serum antibiotic concn (jAg/ml + SE)
Time Cefadroxil Cephalexin Cephradine(h) monohydrate monohydrate (500 mg)
(500 mg) (500 mg) (0 g
0 0 0 00.5 5.61 + 0.78 14.0 ± 2.2 11.3 ± 2.11 14.9 ± 1.7 17.9 + 1.3 15.2 ± 1.31.5 15.0 ± 1.1 10.7 + 1.1 10.6 ± 1.02 12.5 ± 0.8 6.02 + 0.66 6.33 ± 0.774 4.63 ± 0.33 1.05 + 0.16 0.96 ± 0.136 1.84 ± 0.14 0.10 ± 0.04 0.13 ± 0.048 0.65 ± 0.07 <0.04 <0.04
12 0.11 ± 0.03 <0.04 <0.04
ANTIMICROB. AGENTS CHEMOTHER.
regression analysis of AUC and Cmax versus
dose for cefadroxil and cephalexin was per-
formed using individual subject data (eachanalysis had 42 degrees of freedom). In eachcase the slope of the curve was significantlygreater than zero (P <0.005 for all four analy-ses) and the y axis intercept was never signifi-cantly greater than zero (P >0.4 for all fouranalyses). The linearity of these plots indicatesessential pharmacokinetic linearity for serumlevel data for cefadroxil and cephalexin up to a
500-mg oral dose. The linearity of cefadroxiland cephalexin indicates that we can calculateserum levels for these antibiotics, at any un-
known dose over this range, from serum levelsat a known dose by multiplying the knownserum levels by the ratio ofunknown to knowndose (7). We can then calculate the mean serum
levels and AUC which would be yielded by a
250-mg dose of cefadroxil. A 250-mg dose of
TABLE 4. Pharmacokinetic parameters for study HL-75-47
Value ± SE
Parameter Cefadroxil Cephalexin Cephradinemonohydrate monohydrate (500 mg)
(500 mg) (500 mg)AUC (,ugh per ml) 47.4 ± 2.1 29.0 ± 2.5 27.5 + 2.2Ka (h-1) 2.44 ± 0.38 4.78 ± 0.59 3.73 ± 0.33Kei (h-9) 0.545 ± 0.034 1.21 ± 0.11 1.14 ± 0.09tmax (h) 1.29 ± 0.09 0.71 ± 0.06 0.80 + 0.08CmaX (,ug/ml) 16.2 + 1.4 20.7 ± 1.5 17.7 + 1.2t1/2 (h) 1.27 ± 0.08 0.57 ± 0.05 0.61 ± 0.05to (min) 22 2 18 4 18 4
F 1.135 5.497 1.430r2 0.996 0.978 0.992
TABLE 5. Mean serum antibiotic concentrations for study HL-75-51 a
Mean serum antibiotic concn (,g/ml ± SE)
Drug Time With food Without food
(h) Day 1 Day 2 Day 3 Day 1 Day 2 Day 3
Cefadroxil 0 0 0 0 0 0 0monohydrate 0.5 7.31 ± 1.16 NDb ND 6.03 ± 0.69 ND ND
1 15.5 ± 1.5 ND ND 14.3 + 1.2 ND ND1.5 14.4 + 1.2 ND ND 14.7 + 0.7 ND ND2 ND 13.1 ± 0.7 13.9 + 0.8 ND 14.4 + 0.7 14.6 + 1.23 6.84 + 0.61 ND ND 7.68 ± 0.54 ND ND6 1.57 ± 0.16 ND ND 1.58 ± 0.17 ND ND8 0.50 + 0.05 0.51 ± 0.06 0.64 + 0.05 0.55 + 1.01 0.58 ± 0.08 0.57 ± 0.07
Cephalexin 0 0 0 0 0 0 0monohydrate 0.5 11.5 + 1.7 ND ND 14.0 + 1.7 ND ND
1 15.5 + 1.2 ND ND 20.7 ± 1.6 ND ND1.5 12.2 ± 0.9 ND ND 12.7 + 0.8 ND ND2 ND 8.17 ± 0.77 8.76 ± 1.00 ND 8.51 + 0.84 7.90 + 0.733 3.09 + 0.33 ND ND 2.92 ± 0.25 ND ND6 0.25 ± 0.05 ND ND 0.12 + 0.05 ND ND
a All doses 500 mg.b ND, Not determined.
on October 8, 2016 by guest
http://aac.asm.org/
Dow
nloaded from
CEFADROXIL, CEPHALEXIN, CEPHRADINE IN HUMANS 335
TABLE 6. Pharmacokinetic parameters for study HL-75-51 a
Value + SE
Parameter Cefadroxil monohydrate Cephalexin monohydrate
With food Without food With food Without food
AUC (Agh per ml) 45.1 ± 2.4 43.3 ± 2.4 31.3 ± 1.8 32.8 ± 1.8Ka (h-1) 3.21 ± 0.48 2.47 ± 0.32 5.31 ± 1.67 6.92 ± 2.23Kei (h-') 0.550 ± 0.052 0.546 + 0.017 0.867 ± 0.085 0.960 + 0.049tmax (h) 1.17 ± 010 1.20 ± 0.06 0.82 ± 0.08 0.74 ± 0.22Cmax (Ag/ml) 16.3 ± 0.8 14.7 ± 0.8 18.5 ± 1.9 21.4 ± 1.5t1/2 (h) 1.26 ± 0.12 1.27 ± 0.04 0.80 ± 0.08 0.72 ± 0.04to (min) 24 ± 3 20 ± 2 17 ± 3 18 2
F 0.169 2.230 0.666 1.440r2 0.999 0.988 0.996 0.995
a All doses 500 mg.
A
0
> b
O KOo 200 300 400 aOOODOW, M
FIG. 2. Area under curve as a function ofdose.
cefadroxil would yield a C,,,. 80% as great andan AUC 1.6-fold greater than those produced bythe 250-mg dose of cephalexin.The pharmacokinetic parameters found for
cefadroxil and cephalexin show no more thannormal variation between studies. cmaxp tmax)Kap and AUC values under fasting conditionsare very consistent. Cefadroxil half-life variedbetween 1.05 h in study HL-74-41 and 1.27 h instudies HL-75-47 and HL-75-51. Cephalexinhalf-life varied between 0.51 and 0.57 h in stud-ies HL-74-41 and HL-75-47 and 0.8 h in studyHL-75-51. These half-lives remain in the rangeof expectable biological variability. Cephalexinhalf-lives ranging from 0.6 to 1.2 h have beenreported in the literature (8). In this series ofthree studies, cefadroxil consistently had a
-I
0-
-0 10200 JOO 400 50
DOOE ,MOFIG. 3. Peak serum levels as a function ofdose.
longer half-life than cephalexin in each of the44 subjects. We might expect to continue to seeconsistently longer half-lives for cefadroxilthan for cephalexin in humans.Cephalexin is normally administered every 6
h. At approximately 45 min after dosing, a 250-mg dose of cephalexin yields a mean Cma. of 10,ug/ml, and at a 500-mg dose it yields a meanC.a. of 20 /,ag/ml. By 6 h, at 250 mg, there is nodetectable cephalexin present in serum. At a500-mg dose, the mean 6-h serum level is 0.13jig/ml. Cefadroxil is more persistent. At a doseof 250 mg it will achieve a mean peak serumlevel of 8 ,ug/ml at approximately 70 min andthe mean serum concentration will be 0.33 ,uglml at 8 h and 0.06 ,ug/ml at 12 h. At a dose of500mg, cefadroxil has a mean peak serum level of16 ,ug/ml at approximately 70 min and themean serum concentrations will be 0.65 ,ug/ml
VOL. 11, 1977
on October 8, 2016 by guest
http://aac.asm.org/
Dow
nloaded from
336 PFEFFER ET AL.
at 8 h and 0.11 ,ug/ml at 12 h. Cefadroxil wouldhave analogous persistence in urine at thesedoses. It would seem reasonable to develop clin-ical efficacy data which, supported by thesepharnacokinetic properties, could indicate a12-h dosing interval for cefadroxil.The disposition of cephradine seems very
similar to that of cephalexin. Their serum levelcurves and the values for their pharmacoki-netic parameters are very similar (see Tables 3and 4).Concurrent ingestion of food with either ce-
fadroxil or cephalexin on study day 1 (studyHL-75-51, Tables 5 and 6) had no statisticallysignificant effect on their bioavailability rela-tive to fasting conditions. Neither rates ofavailability nor total availability were affected.Continued concurrent administration of fooddid not markedly affect cefadroxil or cephalexinbioavailability.The predose, zero-time serum samples on
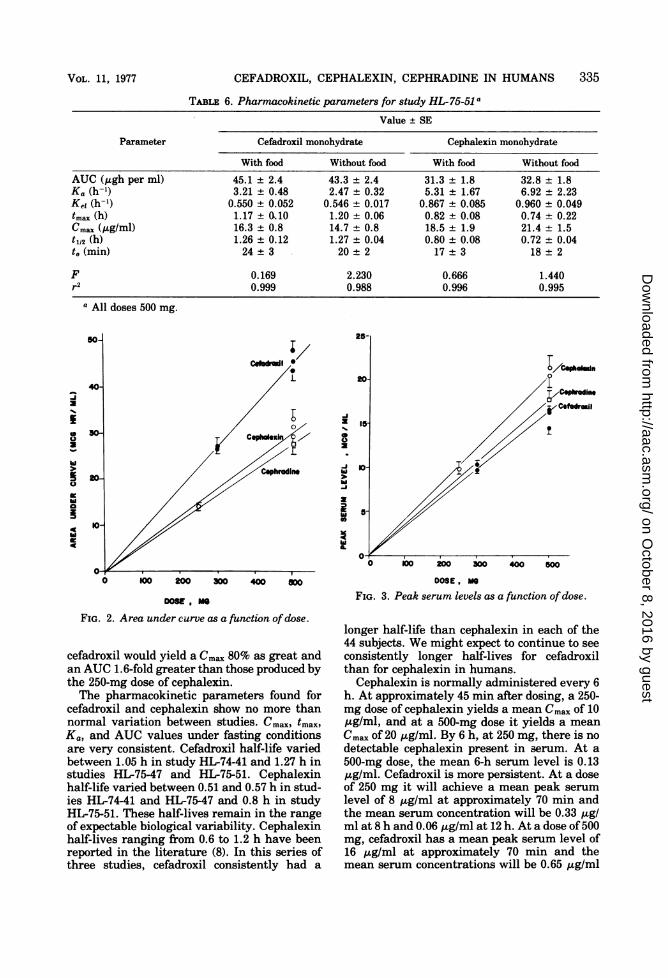
days 2 or 3 did not contain detectable levels ofantibiotics. Neither cefadroxil nor cephalexindemonstrated either accumulation of drug orinduction of elimination on repeated adminis-tration.Urinary excretion. Plotting AM./At versus
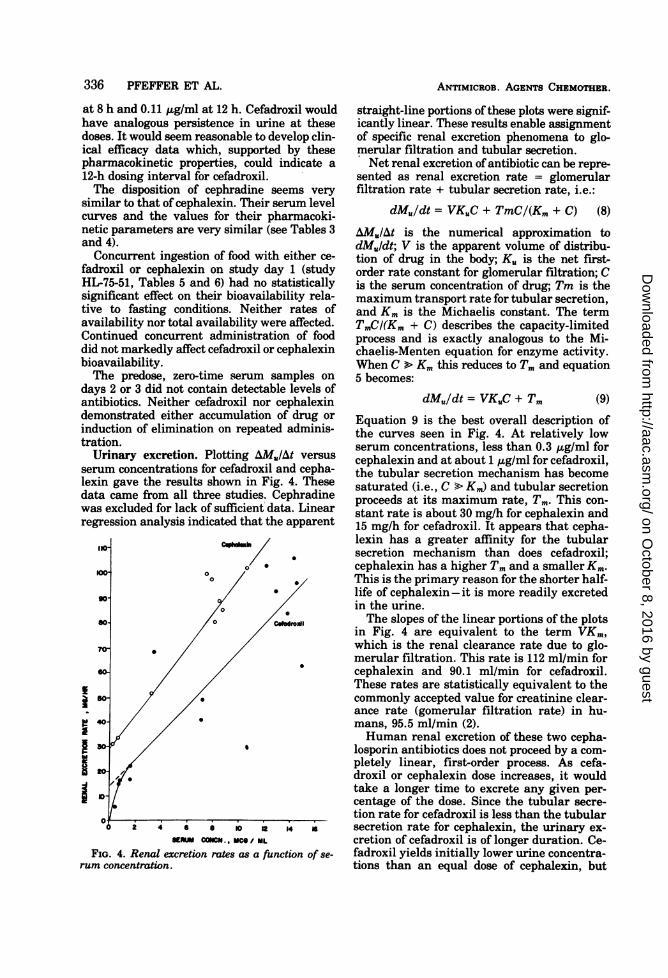
serum concentrations for cefadroxil and cepha-lexin gave the results shown in Fig. 4. Thesedata came from all three studies. Cephradinewas excluded for lack of sufficient data. Linearregression analysis indicated that the apparent
0KW ~~~~~0
0
90- A X
70-~~~~~~~
40 0e4o /0 ifs.~~~~~~~~~~~~~S ,D-
1DJ
ANTIMICROB. AGENTS CHEMOTHER.
straight-line portions of these plots were signif-icantly linear. These results enable assignmentof specific renal excretion phenomena to glo-merular filtration and tubular secretion.Net renal excretion of antibiotic can be repre-
sented as renal excretion rate = glomerularfiltration rate + tubular secretion rate, i.e.:
dMu/dt = VKUC + TmC/(Km + C) (8)
AMuIAt is the numerical approximation todMuldt; V is the apparent volume of distribu-tion of drug in the body; Ku is the net first-order rate constant for glomerular filtration; Cis the serum concentration of drug; Tm is themaximum transport rate for tubular secretion,and Km is the Michaelis constant. The termTmCI(Km + C) describes the capacity-limitedprocess and is exactly analogous to the Mi-chaelis-Menten equation for enzyme activity.When C > Km this reduces to Tm and equation5 becomes:
dMu/dt = VKuC + Tm (9)Equation 9 is the best overall description ofthe curves seen in Fig. 4. At relatively lowserum concentrations, less than 0.3 ,g/ml forcephalexin and at about 1 ,g/ml for cefadroxil,the tubular secretion mechanism has becomesaturated (i.e., C > Ki) and tubular secretionproceeds at its maximum rate, Tm. This con-stant rate is about 30 mg/h for cephalexin and15 mg/h for cefadroxil. It appears that cepha-lexin has a greater affinity for the tubularsecretion mechanism than does cefadroxil;cephalexin has a higher Tm and a smaller Km.This is the primary reason for the shorter half-life of cephalexin -it is more readily excretedin the urine.The slopes of the linear portions of the plots
in Fig. 4 are equivalent to the term VKm,which is the renal clearance rate due to glo-merular filtration. This rate is 112 m/min forcephalexin and 90.1 ml/min for cefadroxil.These rates are statistically equivalent to thecommonly accepted value for creatinine clear-ance rate (gomerular filtration rate) in hu-mans, 95.5 ml/min (2).Human renal excretion of these two cepha-
losporin antibiotics does not proceed by a com-pletely linear, first-order process. As cefa-droxil or cephalexin dose increases, it wouldtake a longer time to excrete any given per-centage of the dose. Since the tubular secre-tion rate for cefadroxil is less than the tubularsecretion rate for cephalexin, the urinary ex-cretion of cefadroxil is of longer duration. Ce-fadroxil yields initially lower urine concentra-tions than an equal dose of cephalexin, but
0 2 4 6 a 10 it 4 aSERUM COCH., MCO/ ML
FIG. 4. Renal excretion rates as a function of se-rum concentration.
on October 8, 2016 by guest
http://aac.asm.org/
Dow
nloaded from
CEFADROXIL, CEPHALEXIN, CEPHRADINE IN HUMANS 337
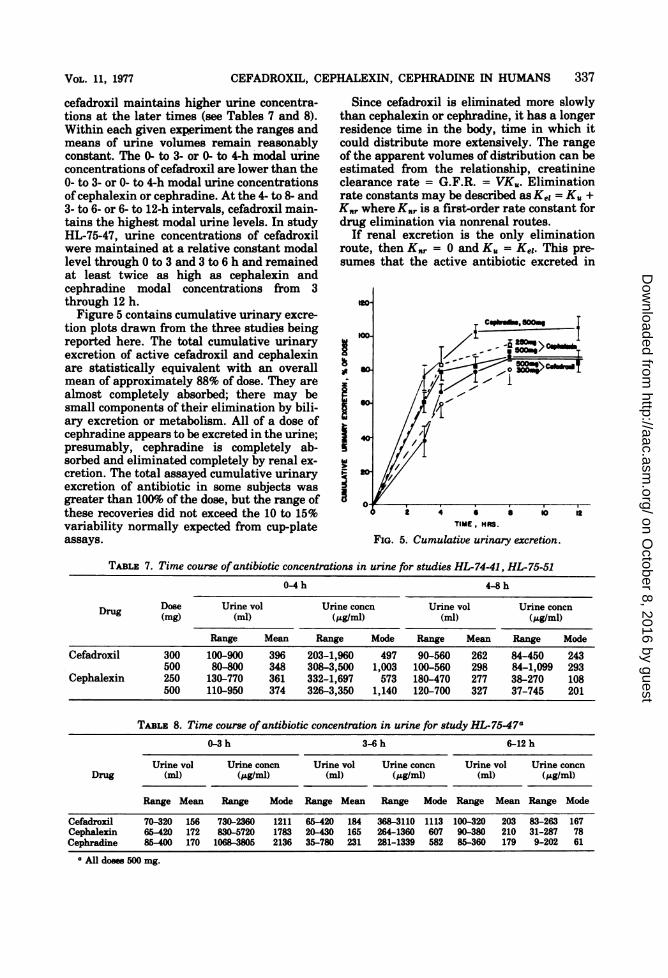
cefadroxil maintains higher urine concentra-tions at the later times (see Tables 7 and 8).Within each given experiment the ranges andmeans of urine volumes remain reasonablyconstant. The 0- to 3- or 0- to 4-h modal urineconcentrations of cefadroxil are lower than the0- to 3- or 0- to 4-h modal urine concentrationsofcephalexin or cephradine. At the 4- to 8- and3- to 6- or 6- to 12-h intervals, cefadroxil main-tains the highest modal urine levels. In studyHL-75-47, urine concentrations of cefadroxilwere maintained at a relative constant modallevel through 0 to 3 and 3 to 6 h and remainedat least twice as high as cephalexin andcephradine modal concentrations from 3through 12 h.Figure 5 contains cumulative urinary excre-
tion plots drawn from the three studies beingreported here. The total cumulative urinaryexcretion of active cefadroxil and cephalexinare statistically equivalent with an overallmean of approximately 88% of dose. They arealmost completely absorbed; there may besmall components of their elimination by bili-ary excretion or metabolism. All of a dose ofcephradine appears to be excreted in the urine;presumably, cephradine is completely ab-sorbed and eliminated completely by renal ex-cretion. The total assayed cumulative urinaryexcretion of antibiotic in some subjects wasgreater than 100% of the dose, but the range ofthese recoveries did not exceed the 10 to 15%variability normally expected from cup-plateassays.
Since cefadroxil is eliminated more slowlythan cephalexin or cephradine, it has a longerresidence time in the body, time in which itcould distribute more extensively. The rangeof the apparent volumes of distribution can beestimated from the relationship, creatinineclearance rate = G.F.R. = VKu. Eliminationrate constants may be described as Kei = K. +K.r where K., is a first-order rate constant fordrug elimination via nonrenal routes.
If renal excretion is the only eliminationroute, then Knr = 0 and K. = Ke,. This pre-sumes that the active antibiotic excreted in
to-
100- / C
Z 4 aTIME, HAS.
FIG. 5. Cumulative urinary excretion.
TABLE 7. Time course ofantibiotic concentrations in urine for studies HL-74-41, HL-75-51
0-4h 4-8h
Drug Dose Urine vol Urine concn Urine vol Urine concn
E)rug (mg) (ml) (j&g/ml) (ml) (.g/ml)Range Mean Range Mode Range Mean Range Mode
Cefadroxil 300 100-900 396 203-1,960 497 90-560 262 84-450 243500 80-800 348 308-3,500 1,003 100-560 298 84-1,099 293
Cephalexin 250 130-770 361 332-1,697 573 180-470 277 38-270 108500 110-950 374 326-3,350 1,140 120-700 327 37-745 201
TABLE 8. Time course ofantibiotic concentration in urine for study HL-75-47a0-3h 3-6h 6-12h
Urine vol Urine concn Urine vol Urine concn Urine vol Urine concnDrug (ml) (AtgIml) (ml) (,ug/ml) (ml) (;&gIml)
Range Mean Range Mode Range Mean Range Mode Range Mean Range Mode
Cefadroxil 70-320 156 730-2360 1211 65-420 184 368-3110 1113 100-320 203 83-263 167Cephalexin 65420 172 830-5720 1783 20-430 165 264-1360 607 90-380 210 31-287 78Cephradine 85-400 170 1063W805 2136 35-780 231 281-1339 582 85-360 179 9-202 61
a All doses 500 mg.
VOL. 11, 1977
on October 8, 2016 by guest
http://aac.asm.org/
Dow
nloaded from
338 PFEFFER ET AL.
urine represents all of the drug absorbed. Ifthe drug was completely bioavailable, thenthe difference between the total dose and thecumulative fraction excreted in the urine (Fe)
represents the amount eliminated by nonrenalroutes and:
K. = Ke, - K., = FeKei (10)
since Knr = (1 - Fe)Kei. Thus, the value ofK.must lie between Ke, and FeKei. Applying theselimits to the relationship V = G.F.R./KU we
can calculate that the possible range of appar-ent volumes of distribution for cefadroxil is 9.7to 11.6 liters (i.e., 14 to 17% of body weight)and for cephalexin it is 5.2 to 5.8 liters (i.e., 7.4to 8.3% of body weight). The longer durationand more extensive distribution of cefadroxil invito are interrelated factors.
LITERATURE CITED
1. Buck, R. E., and K. E. Price. 1976. Cefadroxil, a new
broad-spectrum cephalosporin. Antimicrob. Agents
ANTIMICROB. AGENTS CHEMOTHER.
Chemother. 11:324-330.2. Diem, K. 1962. Documenta giegy, 6th ed., p. 545. Giegy
Pharmaceuticals, Ardsley, N.Y.3. Grizzle, J. E. 1965. The two-period change-over design
and its use in clinical trials. Biometrics 21:467-480.4. Grove, D. C., and W. A. Randall. 1953. Assay methods
ofantibiotics. A laboratory manual. Medical Encyclo-pedia Inc., N.Y.
5. Marquardt, D. W. 1963. An algorithm for least-squaresestimation of non-linear parameters. J. Soc. Ind.Appl. Math. 11:431-441.
6. Snedecor, G. W., and W. G. Cochran. 1973. Statisticalmethods, 6th ed., p. 258-298. Iowa State UniversityPress, Ames, Iowa.
7. Teorell, T. 1937. Kinetics of distribution of substancesadministered to the body. I. The extravascular modesof administration. Arch. Int. Pharmacodyn. 57:205-225.
8. Thrupp, L. D. 1974. Newer cephalosporins and "ex-panded-spectrum" penicillins. Annu. Rev. Pharma-col. 14:435-467.
9. Wagner, J. G. 1971. Biopharmaceutics and relevantpharmacokinetics, p. 247-248. Drug Intelligence Pub-lishers, Hamilton, Ill.
10. Wagner, J. G. 1972. An overview of the analysis andinterpretation of bioavailability studies in man.Pharmacology 8:102-117.
on October 8, 2016 by guest
http://aac.asm.org/
Dow
nloaded from