"Pharmacology of salicin derivatives in sheep"
236
Copyright is owned by the Author of the thesis. Permission is given for a copy to be downloaded by an individual for the purpose of research and private study only. The thesis may not be reproduced elsewhere without the permission of the Author.
-
Upload
khangminh22 -
Category
Documents
-
view
0 -
download
0
Transcript of "Pharmacology of salicin derivatives in sheep"

Copyright is owned by the Author of the thesis. Permission is given for a copy to be downloaded by an individual for the purpose of research and private study only. The thesis may not be reproduced elsewhere without the permission of the Author.

“Pharmacology of Salicin Derivatives in Sheep”
A thesis presented in partial fulfilment
of the requirements for the degree of
Doctor of Philosophy
in Animal Science
Institute of Veterinary, Animal and Biomedical Sciences
Massey University, Palmerston North
New Zealand
Shashwati Chandrakant Mathurkar
2016

II
Dedicated to my husband
Chandrakant Mathurkar
III
Abstract
Sheep suffer from pain during various husbandry practices as well as during injury or
diseases such as footrot. This pain could be potentially minimised with the use of analgesics
such as non-steroidal anti-inflammatory drugs (NSAID). Unfortunately, there are very few
registered NSAIDs for sheep. Thus, registered analgesics for cattle, for instance ketoprofen
and meloxicam are used in sheep. Again, the high cost of analgesics and associated potential
side effects such as reduced fertility, gastric irritation, gastric ulcers etc. evident in other
species usually limits their use in sheep. Fear of residues in meat may stop some farmers
from using analgesics. Considering these problems, this study was designed as a groundwork
to explore a possible and potential use of natural, inexpensive analgesic for sheep.
Salicylic acid, a derivative of salicin, is a NSAID used effectively in humans as an analgesic
since ancient times in the form of willow bark and leaves. During this research study, the
pharmacokinetics of salicylic acid in sheep was analysed after administration of the sodium
salt of salicylic acid (sodium salicylate/NaS) intravenously and orally at different dose rates.
The analgesic efficacy of salicylic acid in sheep was also studied after administration of
sodium salicylate at different dose rates by measuring mechanical and thermal nociceptive
thresholds. The minimum therapeutic plasma concentration of salicylic acid for analgesia in
sheep ranged from 25 to 30 μg/mL, which was achieved for about 30 minutes by a 200 mg/kg
intravenous dose of NaS. During this study it was discovered that thermal nociceptive
threshold testing is unable to detect any analgesia from salicylic acid and ketoprofen in
sheep. However, mechanical nociceptive threshold testing efficiently detected the analgesic
effects of salicylic acid and the positive control, ketoprofen.
The seasonal variation of willow salicin content (principal precursor of salicylic acid in
willow) was studied over a year. The salicin in willows in New Zealand is higher during the
summer months as compared to the winter months of the year, and appears greater in areas
subject to drought. The analgesic efficacy of willow leaves can be assessed by feeding the
willow leaves to lame sheep as they readily eat willow leaves. However, to assess the
analgesia produced by willow in sheep, further research is warranted.
Keywords: Salicin, sheep, salicylic acid, analgesia, HPLC, nociceptive testing, willow.
IV
Acknowledgements
It takes immense privilege to express my sincere and whole hearted thanks to my supervisors A/P Paul Chambers, Dr. Kavitha Kongara and Dr. Preet Singh for their impeccable guidance, expert feedback, ever-willing help and encouragement throughout my doctoral study. I shall always remain indebted for your benevolence and valuable advice to cope up with difficulties and challenges I faced during my study. I am blessed to have wonderful supervisors like you.
My sincere thanks are due to Neuroscience group members Neil Ward, Sheryl Mitchinson, Tyran Mirko and Antony Jacob for their skilled assistance. Especially, Neil’s everlasting support in IT is much appreciated. Ty, your help in my last experimental trial is duly acknowledged.
I would like to extend my big thanks to LATU (Large Animal Teaching Unit, Massey University) staff Mike Reilly, Garry Sparrow and Kerry Miller for providing excellent facilities and assistance during my all animal studies. Thanks are also due to Mr. Brian Best for providing facilities at Ag-Hort laboratory.
Guidance obtained from Dr. Mike Geiseg and Dr. Ignacio Lizarraga in thermal nociceptive threshold testing is duly acknowledged. Also, discussion and guidance on willow from Prof. Tom Barry and Dr. Dipti Pitta is much appreciated.
I am thankful to IVABS for providing post-graduate research funds to conduct my research and offering IVABS travel funds to attend international conferences to present my research. Also, I am grateful to Scholarships Committee, Massey University for offering financial assistance in the form of small bursaries during my PhD.
All my research experiments were approved by Massey University Animal Ethics Committee (MUAEC). I would like to extend my thanks to the chairman of MUAEC Prof. Craig Johnson and all the committee members.
My heart-felt thanks to Debbie Hill for her constant administrative and friendly support during my PhD.
I wish to extend my gratitude towards all post-graduate colleagues for providing pleasant work environment.
I must thank my friends Sharini, Doris, Gauri, Nidhi-Girish Nair, Shaheda-Farid Patel, Ameya-Amruta Desai, Madhumita, Shruti, Hitesh, Mani & Isha for their constant moral boosting, help and support throughout my study period.
My vocabulary fails to express gratitude towards my family for their constant support and encouragement. I will be always indebted to my parents Shubhangi & (Late) Krishnarao Ambatkar, my in-laws Pushpa & Lekram Mathurkar for bestowing their blessings, love and financial support. My brother Aditya, sister-in-law & brother-in-law Shilpa & Sanjay Borde who have always been a great support throughout my study and it’s much valued.
To my loving and caring husband Chandrakant, your patience, ever-lasting support and encouragement is highly appreciated. I am unable to express my love and gratitude for you. All I can say is you are my strength.
Finally, not everyone may be cited but none is forgotten.
V
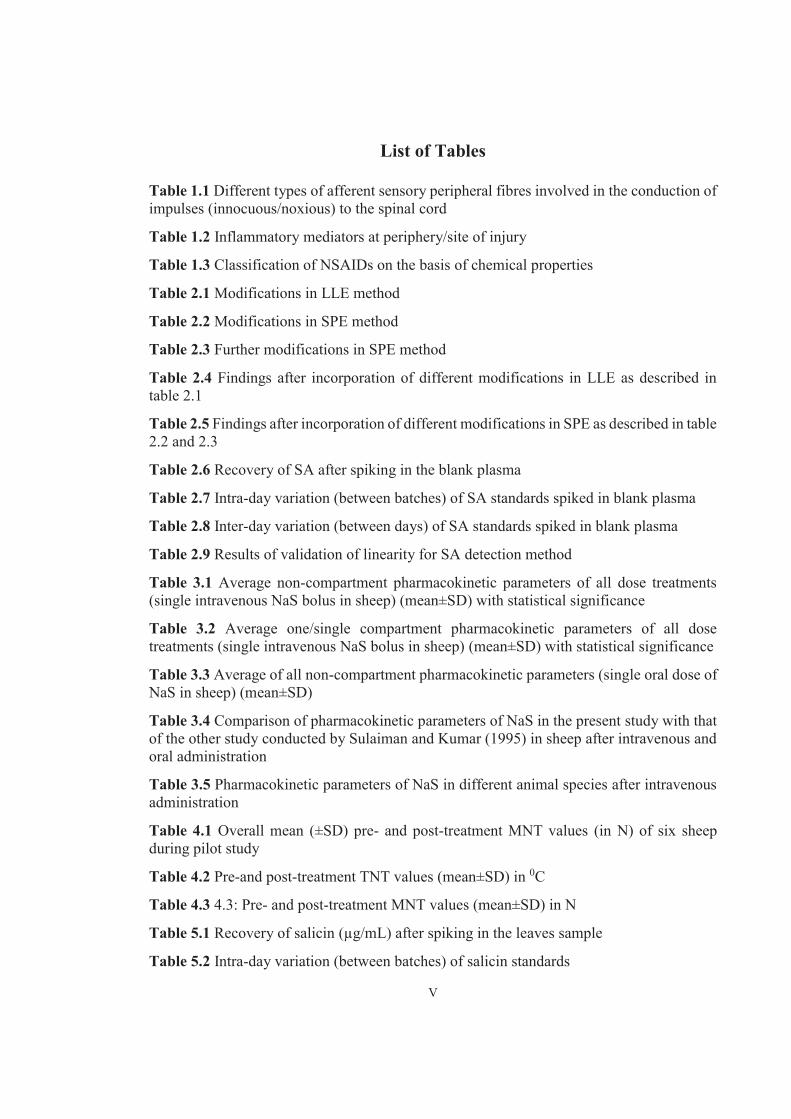
List of Tables
Table 1.1 Different types of afferent sensory peripheral fibres involved in the conduction of impulses (innocuous/noxious) to the spinal cord
Table 1.2 Inflammatory mediators at periphery/site of injury
Table 1.3 Classification of NSAIDs on the basis of chemical properties
Table 2.1 Modifications in LLE method
Table 2.2 Modifications in SPE method
Table 2.3 Further modifications in SPE method
Table 2.4 Findings after incorporation of different modifications in LLE as described in table 2.1
Table 2.5 Findings after incorporation of different modifications in SPE as described in table 2.2 and 2.3
Table 2.6 Recovery of SA after spiking in the blank plasma
Table 2.7 Intra-day variation (between batches) of SA standards spiked in blank plasma
Table 2.8 Inter-day variation (between days) of SA standards spiked in blank plasma
Table 2.9 Results of validation of linearity for SA detection method
Table 3.1 Average non-compartment pharmacokinetic parameters of all dose treatments (single intravenous NaS bolus in sheep) (mean±SD) with statistical significance
Table 3.2 Average one/single compartment pharmacokinetic parameters of all dose treatments (single intravenous NaS bolus in sheep) (mean±SD) with statistical significance
Table 3.3 Average of all non-compartment pharmacokinetic parameters (single oral dose of NaS in sheep) (mean±SD)
Table 3.4 Comparison of pharmacokinetic parameters of NaS in the present study with that of the other study conducted by Sulaiman and Kumar (1995) in sheep after intravenous and oral administration
Table 3.5 Pharmacokinetic parameters of NaS in different animal species after intravenous administration
Table 4.1 Overall mean (±SD) pre- and post-treatment MNT values (in N) of six sheep during pilot study
Table 4.2 Pre-and post-treatment TNT values (mean±SD) in 0C
Table 4.3 4.3: Pre- and post-treatment MNT values (mean±SD) in N
Table 5.1 Recovery of salicin (μg/mL) after spiking in the leaves sample
Table 5.2 Intra-day variation (between batches) of salicin standards

VI
Table 5.3 Inter day variation (between days) of salicin standards
Table 5.4 Results of validation of linearity for salicin detection method
Table 5.5 Salicin (g/kg) content in fresh willow leaves (mean±SD)
Table 5.6 Difference in Salicin (g/kg) content of fresh willow leaves from trees located on two different locations (mean±SD)
VII
List of Figures
Figure 1.1 Mechanism of pain (Courtesy: Associate Professor Paul Chambers)
Figure 1.2 Laminar distribution of spinal dorsal horn, edited from:(Todd, 2010)
Figure 1.3 Synthesis of prostaglandins, edited from (Rao and Knaus, 2008)
Figure 1.4 Mechanism of action of NSAIDs, edited from (Rao and Knaus, 2008)
Figure 1.5 Structure of salicin molecule
Figure 1.6 Structure of sodium salicylate molecule
Figure 1.7 Structure of salicylic acid molecule
Figure 1.8 Structure of aspirin molecule
Figure 1.9 Pharmacokinetics- Disposition of the drug in the body after administration, edited from: (Katzung et al., 2004)
Figure 1.10 Area under curve showing the measured concentration of the drug during given time
Figure 1.11 One-compartment open pharmacokinetic model (Riviere, 2011a)
Figure 1.12 Semilogarithmic concentration-time profile for a one-compartment drug with slope -Kel and intercept Cp0 (Riviere, 2011a)
Figure 1.13 One-compartment-open pharmacokinetic model with first order absorption (Riviere, 2011a)
Figure 1.14 Semilogarithmic plot of concentration versus time for one compartment open model with first order absorption with two slopes -Ka and –Kel (Riviere, 2011a)
Figure 1.15 Two-compartment-open pharmacokinetic model (Riviere, 2011a)
Figure 1.16 Semilogarithmic graph of concentration versus time for two compartment open mode, describing distribution phase (α) and elimination phase (β) with their respective intercepts A and B (Riviere, 2011a)
Figure 1.17 Generalised two compartment model for extravascular dose of drug with absorption constant (K01)(Riviere, 2011a)
Figure 1.18 Semilogarithmic plot of concentration versus time for two compartment model after extravascular administration of drug (Riviere, 2011a)
Figure 1.19 PK-PD modelling concept from: (Mehrotra et al., 2006)
Figure 1.20 (a) S. babylonica, (b) S. matsudana× alba, (c) S. alba, (d) S. purpurea, (e) S. viminalis
Figure 2.1 Chromatographs of 50μg SA standard in the mobile phase. Peak 1 represents SA extraction with Phenomenex Kinetex C18 column; although, the retention time is lesser (5.0±0.6 minutes), peak resolution is not ideal. Peak 2 represents SA extraction with Synergi Hydro C18 column; the peak resolution is superior to other two columns and retention time (9.4±0.5 minute) is increased as opposed to Kinetex column. Peak 3 represents SA extraction
VIII
with Luna C18 column with poor peak resolution and higher retention time (12.8±0.9) minutes
Figure 2.2 Chromatographs of 10μg SA standard in blank plasma at different flow rates of mobile phase. The peak efficiency with lowest flow rate 0.6mL/minute is lower (3596.74 N). Peak efficiency with flow rate 0.8ml/minute and 1mL/minute is 17874.67N and 17882.24N respectively which are not significantly variable
Figure 2.3 Chromatographs showing absence of SA (SA) peak in the blank plasma and presence of SA peaks in mobile phase and SA spiked blank plasma sample
Figure 2.4 Chromatographs showing lower concentrations of SA in mobile phase
Figure 2.5 Chromatographs showing lower concentrations of SA spiked in blank plasma and a blank plasma sample
Figure 2.6 Calibration/standard curve for SA
Figure 2.7 Concentration-time curve of the SA in sheep plasma determined by the validated HPLC method
Figure 3.1 Chromatographs showing SA peaks 30 minutes, 1hour (Tmax) and 6 hours after oral administration of 200mg/kg NaS in sheep; while a drug-free/blank plasma of a sheep has no peak at the retention time of SA
Figure 3.2a Concentration time curve for all treatments (10, 50, 100,200mg/kg body weight) of intravenous NaS in sheep
Figure 3.2b Semi-log concentration time curve for all treatments (10, 50, 100, 200mg) of intravenous NaS in six sheep (mean± SD)
Figure 3.3a Concentration time curve for 100 and 200mg/kg treatments of oral NaS in six sheep (mean± SD)
Figure 3.3b Semi-log concentration time curve for 100 and 200mg/kg treatments of oral NaS in six sheep (mean± SD)
Figure 4.1a MNT device used to stimulate nociceptive stimulus in sheep during the study
Figure 4.1b The leg unit of MNT device with its various components and blunt pin of the device which is pressed against the sheep’s leg to produce a nociceptive stimulus
Figure 4.1c MNT device as a whole assembly including (a) J-rack, (b) PowerLab, (c) Computer and (d) Compressor
Figure 4.2 Calibration curve for MNT device displaying the values in Newtons against the Volts measured in the Lab-Chart. X-axis represents volts (V) recorded in the Lab-Cart software and Y-axis represents the corresponding Force in Newtons (N)
Figure 4.3a Pre- and post- treatment threshold responses of sheep recorded at different time points during pilot study. The time for drug injection is represented as time zero on X-axis
Figure 4.3b AUC for 120 minutes after each treatment. X-axis represents experimental treatments. Y-axis represents AUC in Newton-minute for each experimental treatment
IX
Figure 4.4a Thermode of TNT testing device which is heated to produce thermal noxious stimulus and is constantly in contact with the sheep’s skin to stimulate the thermal nociceptors
Figure 4.4b The assembly of thermal device (a) A polycarbonate box comprising of circuitry and blue tooth (b) The set of 6V batteries connected from one side to the heating box supplies power to control the heating (c) Thermode (which has to be applied on the sheep’s leg) is attached through extended set of wires from another side
Figure 4.5 (a) Sheep with both MNT and TNT testing devices on right and left foreleg respectively (b) Right leg of sheep zoomed in to display the leg unit (box with blunt pin) of the MNT testing device (c) Left leg of sheep zoomed in to display leg unit (thermode) of TNT testing device
Figure 4.6a Pre- and post- treatment TNT responses of sheep recorded at different time points during main study. The black arrow indicates drug administration time
Figure 4.6b AUC calculated for TNTs of sheep, over the experimental period of 120 minutes post each treatment. X-axis represents each experimental treatment. Y-axis represents values of area under curve for each treatment
Figure 4.7a Pre- and post-treatment MNT responses of sheep recorded at different time points during main study. The black arrow indicates drug administration time
Figure 4.7b AUCs calculated for MNTs during main study over the experimental period of 120 minutes post each treatment. X-axis represents different treatments. Y-axis represents actual area under curve values for each treatment
Figure 4.8 Baseline thermal nociceptive thresholds and corresponding ambient temperatures. X-axis represents different ambient temperatures during experimental period. Y-axis represents corresponding baseline thermal threshold values of the experimental sheep
Figure 5.1 (a, b, c) Leaves from different willow trees showing differences in morphology (different species)
Figure 5.2 Chromatographs showing presence and absence of salicin peak in salicin containing and blank samples respectively
Figure 5.3 Chromatographs of lower concentrations of salicin and blank sample for determination of lower limit of quantification
Figure 5.4 Calibration curve for salicin detection with HPLC
Figure 5.5 Chromatographs of salicin standard 100μg and willow leaves sample showing respective peaks at given retention time (10±0.69 minutes)
Figure 5.6 Graphical representation of willow leaves salicin content (g/kg of fresh willow leaves) in individual tree
Figure 5.7 Graphical representation of average monthly temperature vs. respective monthly willow leaves salicin content (g/kg of fresh willow leaves) during leaves collection period
X
List of Abbreviations
μg Microgram/ micrograms
ADME Absorption, Distribution, Metabolism, Excretion
AIC Akaike information criterion
ANOVA Analysis of variance
A/P Associate professor
AUC Area under curve/ Area under concentration-time curve
AUMC Area under the moment curve
BC Before Christ
BIC Bayesian information criterion
C Concentration of the drug in the plasma
C0 Concentration of drug at time zero
Ca++ Calcium ions
CGRP Calcitonin gene related peptide
CINODs COX inhibition nitric oxide donors
Cl Clearance
Cmax Maximum concentration in the plasma
CMPS-SF Glasgow composite measure pain scale short form
CNS Central nervous system
COX Cycloxygenase
COX-1 Cycloxygenase 1
COX-2 Cycloxygenase 2
COX-3 Cycloxygenase 3
COXIBs COX-2 selective inhibitors
CYP450 Cytochrome P450
D Dose
Da Dalton
DF Descending facilitation
DI Descending inhibition
DLF Dorsolateral funiculus
DNA Deoxyribonucleic acid
DP1 PGD receptor

XI
DRG Dorsal root ganglia
EEG Electroencephalography
EP E prostanoid receptor
F Bioavailability
FDA The Food and Drug Administration
FP PGF receptor
Fig Figure
G/g gram/grams
GABA Gamma amino butyric acid
GCMPS Glasgow composite measure pain scale
GI Gastro-intestinal
G-proteins Guanosine nucleotide-binding proteins
HPLC High performance liquid chromatography
Hr/hr Hour
Hrs/hrs Hours
HVA High voltage activated
IASP International Association for the Study of Pain
IP PGI receptor
I/V Intravenous/intravenously
IVABS Institute of Veterinary, Animal and Biomedical Sciences
K12/ K21/ K10 Inter-compartmental constants
Ka Absorption constant
KA Kainate
Kel/K10 Elimination rate constant
Kg/kg Kilogram/kilograms
L Litre/Litres
LATU Large Animal Teaching Unit
LLE Liquid-liquid extraction
LOD (Lower) limit of detection
LOX Lipoxygenase
LTMR Low-threshold mechanoreceptor
LTP Low term potentiation
XII
LVA Low voltage activated
M++ Magnesium ions
mg Milligram/milligrams
Min Minute/minutes
mL Millilitre/millilitre
MNT Mechanical nociceptive threshold testing
MRP2 Multi-drug-resistance-associated-protein type 2
MRT Mean residence time
MS Mass spectrometry
N Newton/Newtons
Na+ Sodium ions
NaS Sodium salicylate
NCA Non-compartmental analysis
NFκB Nuclear transcription factor
NMDA N-methyl-D-Aspartate
NO Nitric oxide
NRS Numerical rating scale
NS Nociceptive specific
NSAID Non-steroidal anti-inflammatory drug
NTS Nucleus tractus solitaris
PAG Peri-aquaductal grey matter
PD Pharmacodynamics
PG Prostaglandin
PGD Prostaglandin D2
PGF Prostaglandin F2
PGG Prostaglandin G2
PGI Prostaglandin I2
PK Pharmacokinetics
PKC Protein kinase
PN Parabrachial nucleus
PPAR-γ Peroxisome proliferator-activated receptor-gamma
PTFE Polytetrafluoroethylene

XIII
R2/r2 Correlation coefficient
R-COH Enolic acids
R-COOH Carboxylic acids
RPM/rpm Revolutions per minute
RSD Relative standard deviation
RVM Rostral ventromedial medulla
SA Salicylic acid
SD Standard deviation
SDS Simple descriptive scale
SEP Somatosensory evoked potentials
SMT Spinomesecephalic
SP Substance P
SPE Solid phase extraction
SRT Spinoreticular
STT Spinothalamic
T1/2 Half-life
Tmax Time at which plasma drug concentration is maximum
TNF Tumour necrosis factor
TNT Thermal nociceptive threshold testing
TP Thromboxane receptor
TT Theotepa
TTX-r Tetrodotoxin-resistant
TXA2 Thromboxanes
VAS Visual analogue scale
Vd Volume of distribution
VOCC Voltage operated calcium channels
WDR Wide dynamic range
Α Alpha
Β Beta
Δ Delta

XIV
CONTENTS 1 GENERAL INTRODUCTION AND LITERATURE REVIEW .................................. 1
1.1 INTRODUCTION .................................................................................................. 1
1.2 LITERATURE REVIEW ....................................................................................... 1
1.2.1 Pain .................................................................................................................. 1
1.2.2 Pain in animals ............................................................................................... 13
1.2.3 Assessment of pain in animals ....................................................................... 16
1.2.4 Analgesics ...................................................................................................... 26
1.2.5 NSAIDs.......................................................................................................... 27
1.2.6 Salicylates ...................................................................................................... 39
1.2.7 Pharmacokinetics ........................................................................................... 45
1.2.8 PK-PD modelling........................................................................................... 63
1.2.9 Willow ........................................................................................................... 65
1.3 PURPOSE OF THIS WORK ................................................................................ 73
2 DEVELOPMENT AND VALIDATION OF HIGH PERFORMANCE LIQUID CHROMATOGRAPHY METHOD FOR DETECTION OF SALICYLIC ACID IN SHEEP PLASMA ............................................................................................................................. 74
ABSTRACT ..................................................................................................................... 74
2.1 INTRODUCTION ................................................................................................ 74
2.2 [A] PRELIMINARY WORK AND DEVELOPMENT OF HPLC TECHNIQUE FOR DETERMINATION OF SALICYLIC ACID IN SHEEP PLASMA ..................... 76
2.2.1 HPLC system ................................................................................................. 76
2.2.2 Reagents and solutions .................................................................................. 76
2.2.3 Column selection ........................................................................................... 76
2.2.4 Column temperature ...................................................................................... 76
2.2.5 Mobile phase composition ............................................................................. 77
2.2.6 Mobile phase flow rate .................................................................................. 77
2.2.7 Sample preparation methods .......................................................................... 77
2.2.8 Results............................................................................................................ 78
2.2.9 Discussion ...................................................................................................... 87
XV
2.3 [B] VALIDATION OF HPLC TECHNIQUE FOR DETECTION OF SALICYLIC ACID IN SHEEP PLASMA ............................................................................................ 90
2.3.1 Material and methods .................................................................................... 90
2.3.2 Chromatographic analysis of sheep plasma samples (pilot study) ................ 92
2.3.3 Results ........................................................................................................... 92
2.3.4 Discussion .................................................................................................... 100
2.4 CONCLUSION ................................................................................................... 101
3 PHARMACOKINETICS OF SODIUM SALICYLATE IN SHEEP ........................ 102
ABSTRACT ................................................................................................................... 102
3.1 INTRODUCTION .............................................................................................. 103
3.2 MATERIALS AND METHODS ........................................................................ 105
3.2.1 [A] Blood collection .................................................................................... 105
3.2.2 [B] HPLC analysis of plasma samples ........................................................ 107
3.2.3 Pharmacokinetic analyses ............................................................................ 107
3.2.4 Statistical analyses ....................................................................................... 107
3.3 RESULTS ........................................................................................................... 108
3.3.1 Pharmacokinetic parameters for SA in sheep after intravenous administration 108
3.3.2 Pharmacokinetic parameters for SA in sheep after oral administration ...... 109
3.4 DISCUSSION ..................................................................................................... 116
3.5 CONCLUSION ................................................................................................... 119
4 PHARMACODYNAMICS OF SODIUM SALICYLATE IN SHEEP ..................... 121
ABSTRACT ................................................................................................................... 121
4.1 INTRODUCTION .............................................................................................. 122
MATERIALS AND METHODS ................................................................................... 123
4.2 PILOT STUDY ................................................................................................... 123
4.2.1 Experimental design and preparation of animals ........................................ 123
4.2.2 Description of the mechanical nociceptive device ...................................... 123
4.2.3 Calibration of the device ............................................................................. 126
4.2.4 Drug administration ..................................................................................... 127
XVI
4.2.5 Mechanical nociceptive threshold testing .................................................... 127
4.2.6 Statistical analyses ....................................................................................... 128
4.2.7 Results.......................................................................................................... 128
4.2.8 Discussion .................................................................................................... 130
4.3 MAIN STUDY .................................................................................................... 131
4.3.1 Experimental design and preparation of animals ......................................... 132
4.3.2 Description of devices ................................................................................. 132
4.3.3 Experimental set-up ..................................................................................... 135
4.3.4 Response of sheep to noxious stimuli .......................................................... 135
4.3.5 Drug administration ..................................................................................... 135
4.3.6 Data recording ............................................................................................. 137
4.3.7 Statistical analyses ....................................................................................... 137
4.3.8 Results.......................................................................................................... 138
4.3.9 Discussion .................................................................................................... 144
4.4 CONCLUSION ................................................................................................... 151
5 ASSESSMENT OF SALICIN CONTENT IN WILLOW (SALIX SPP) LEAVES AND SEASONAL VARIATION ............................................................................................... 152
ABSTRACT ................................................................................................................... 152
5.1 INTRODUCTION .............................................................................................. 152
MATERIALS AND METHODS ................................................................................... 153
5.1.1 Leaf collection, drying and grinding ........................................................... 153
5.1.2 HPLC analysis of salicin content in willow leaves ..................................... 154
5.1.3 HPLC Analysis of samples .......................................................................... 158
5.1.4 Weather data collection ............................................................................... 160
5.1.5 Statistical analysis ........................................................................................ 161
5.1.6 Results.......................................................................................................... 161
5.1.7 Discussion .................................................................................................... 166
5.2 CONCLUSION ................................................................................................... 167
6 GENERAL DISCUSSION ......................................................................................... 168
6.1 PHARMACOKINETIC STUDIES..................................................................... 168
XVII
6.2 PHARMACODYNAMICS STUDIES ............................................................... 171
6.3 ASSOCIATION AND SIGNIFICANCE OF ALL THE STUDIES CONDUCTED DURING THIS RESEARCH PROJECT ...................................................................... 173
6.4 FUTURE WORK ................................................................................................ 173
6.5 CONCLUSION ................................................................................................... 174
REFERENCES .............................................................................................................. 175
Appendix: 1 .................................................................................................................... 211
Appendix: 2a .................................................................................................................. 212
Appendix: 2b .................................................................................................................. 216

1
1 GENERAL INTRODUCTION AND LITERATURE
REVIEW
1.1 INTRODUCTION
Sheep welfare in New Zealand is important from both ethical and economical perspectives.
As stated in the Animal Welfare Act 2006, one of the five freedoms of animal welfare is
“freedom from pain, injury or disease”. Sheep pain (resulting from routine husbandry
practices or pathological conditions such as footrot) is under treated due to variety of reasons,
including lack of ability to reliably recognise it, lack of knowledge on use of analgesics, their
high cost and fear of residues in the meat. Also, a limited number of products are available
in the market for management of pain in sheep (Lizarraga and Chambers, 2012, Martinsen
et al., 2011, Chambers et al., 2002).
Therefore, discovery of new analgesics for sheep is essential. In this research work, the
analgesic efficacy of salicin derivative sodium salicylate (sodium salt of salicylic acid) in
sheep was investigated by exploring its pharmacokinetics and pharmacodynamics. The
pharmacokinetics were analysed to assess the disposition of the drug in sheep. The
pharmacodynamics of sodium salicylate was evaluated using pain threshold testing. Finally,
of salicin concentration in willow leaves (natural source of salicylic acid) and its seasonal
variation was explored with the further aim and possibility to establish the use of willow
leaves as an analgesic in sheep.
1.2 LITERATURE REVIEW
1.2.1 Pain
Pain is the universal experience for all human beings (and probably all mammals) though
the intensity and kind of pain experienced by each individual may differ (Beecher, 1957).
The pain is not only physical/sensory but emotional experience as well (Anil et al., 2005).
The International Association for the Study of Pain (IASP) defines pain as “an unpleasant
sensory and emotional experience associated with actual or potential tissue damage, or

2
described in terms of such damage” (ISAP, 1979). This definition is adequate for normal
adult human beings as it is reliant upon self-reporting but the requirement of language or
verbal communication confines its use in non-speaking humans and animals (Anand and
Craig, 1996).
Pain is complex phenomenon comprising of sensory, emotional components (Hellebrekers,
2000). Understanding the mechanisms of pain is consequently important for the management
of painful disorders in humans and especially in animals due to their incapability to
communicate their experiences verbally. Hence, identification of pain mechanisms has been
recommended as the key to analgesia (Farquhar-Smith, 2008). The types, mechanism and
pathways of pain are discussed further below.
Pain can be considered clinically as acute or chronic depending upon its duration; it can also
be contemplated as musculoskeletal/somatic, visceral and neuropathic on the basis of its
location (Hsu and Riedesel, 2013, Lorenz, 2011). Livingston and Chambers (2000) in
accordance with Woolf and Chong (1993) considered simply two types of pain for more
convenient and easier understanding as physiological and pathological pain.
Physiological pain is the pain which is perceived as a noxious stimulus and is often defensive
pain to protect from the tissue damage and is usually acute pain. Perception of this type of
pain is proportional to the intensity of noxious stimulus (Livingston and Chambers, 2000).
Pathological pain refers to the perception that is greater than noxious stimulus with
involvement of inflammatory changes due to peripheral stimulus causing tissue damage and
this pain can be acute or chronic. The pain without inflammatory process or lesions is also a
pathological pain which involves the damage or improper functioning of nervous system
(Loeser and Treede, 2008, Livingston and Chambers, 2000). For instance, acute or
inflammatory pain is produced by the tissue damage (leading to process of inflammation);
visceral pain doesn’t require inflammation and only distensions of organs (such as distension
of colon) can cause pain. Similarly, phantom pain is represented in a limb or any other body
part which does not exist/ amputed/removed. Tooth pain can also be a result of damaged
nerve. Ischemic pain is different in its own way (Julius and Basbaum, 2001, Gebhart, 1996).
The explanation for such pain covers many theories such as neuromatrix theory, body
schema theory and others (Giummarra et al., 2007, Katz and Melzack, 1990). Therefore, to

3
present all aspects of pain is beyond the scope of this thesis. Hence, inflammatory pain will
be given prominence in this thesis.
The inflammatory pain pathway is usually initiated by noxious stimulus at the peripheral
level, then progresses to spinal and central mechanisms where pain signals reach the higher
centres of the brain and then pain perception as well as inhibitory/descending modulatory
pathway is produced (Figure 1.1)
Fig 1.1: Mechanism of pain (Courtesy: Associate Professor Paul Chambers)
1.2.1.1 Peripheral /afferent pathway
The pain signal arises when some intense noxious stimuli (mechanical, thermal or chemical)
is detected by the nociceptive receptors extensively found in the skin, mucosa, membranes,
deep fascias, connective tissues of visceral organs, ligaments and articular capsules,
periosteum, muscles, tendons, and arterial vessels (Almeida et al., 2004). Activation of these
nociceptive receptors by an external noxious stimulus and its conversion to electrical activity
is termed transduction (Bridgestock and Rae, 2013, Kidd and Urban, 2001). The process of
detection of noxious stimuli is called nociception (Latremoliere and Woolf, 2009,
Sherrington, 1906).

4
The nociceptive receptors correspond to peripheral free nerve endings/fibres otherwise
referred as nociceptors (Basbaum et al., 2009, Basbaum and Jessell, 2000). Nociceptors
conduct the noxious stimuli/impulse to the dorsal horn of the spinal cord (Kidd and Urban,
2001). These nociceptors/fibres originate from the nerve cell bodies and their diameter is
categorised as large, medium or small depending upon the size and type of nerve cells they
belong (Table 1.1). Aδ-fibres are thinly myelinated, medium diameter and fast conducting;
activation results in acute sharp pain with a withdrawal reflex. This type of pain is also called
first pain and is usually a protective or defensive mechanism for animal or human to prevent
tissue damage (Diesch, 2010, Livingston and Chambers, 2000). C-fibres are non-myelinated,
small diameter and slow conducting fibres resulting in dull, burning or longer lasting pain
(Julius and Basbaum, 2001, Livingston and Chambers, 2000). Another type of fibres are Aβ-
fibres with large diameters and rapidly conducting fibres which respond usually to normal
innocuous (e.g. light touch or proprioception) (Basbaum et al., 2009). In addition to noxious
stimuli, peripheral sensitisation occurs primarily by post-translational reorganisation of key
receptors and ion channels (Costigan and Woolf, 2000). To exemplify, phosphorylation of
TTX-r (tetrodotoxin-resistant) sodium channel by protein kinase A (PKC-A) and protein
kinase C (PKC- C) increases sodium currents to provoke a depolarising stimulus to produce
additional excitation, and the activation threshold of the neurons is lowered (Tate et al.,
1998). Also, alterations in voltage-gated sodium channels play significant role in the
pathogenicity of chronic inflammatory as well as neuropathic pain (Amir et al., 2006).
Table 1.1: Different types of afferent sensory peripheral fibres involved in the conduction of impulses (Innocuous/noxious) to the spinal corda
Fibres Diameter Velocity of conduction*
Myelinated Function/information carried
Aα 13-20μm 120-60 Yes Proprioception Aβ 6-12 μm 75-35 Yes Proprioception, superficial touch, deep touch,
vibration Aδ 1-5 μm 30-6 Yes Pain, temperature (cool) C 0.2-1.5 μm 2-0.5 No Pain, temperature (warm), itch
aEdited from: (Pappagallo, 2005, Burke-Doe). * Unit for measuring velocity of conduction is metre/second.
Tissue injury causing damage to cells also causes secretion of numerous compounds
resulting in inflammation in the vicinity of peripheral fibres. This inflammatory secretion
5
has a variety of components which act as inflammatory mediators (Besson, 1999, Dray,
1997a) such as prostaglandins, bradykinin, hydrogen ions, potassium ions, histamine,
purines, leukotrienes, growth factors, substance P and neuropeptides responsible for
excitation or sensitisation of the peripheral nerve fibres and collectively referred as
“inflammatory soup” (Dickenson, 2008, Julius and Basbaum, 2001, Livingston and
Chambers, 2000). Inflammatory mediators contribute to nociception either by exciting or
sensitising afferent nerve fibres (Table 1.2) which affects the conduction of nociceptive
impulses. A small number of afferent fibres called “silent” or “sleeping” nociceptors can be
traced in the skin, joints and visceral organs and these are usually unresponsive to intense
stimuli; however, when influenced by inflammatory mediators, these nociceptors become
sensitised and responsive to sensory stimuli (Dray, 1997b). The constant application of the
noxious stimulus for a longer duration results in increased nociceptive responses of that
tissue and such a state is called hyperalgesia (Short, 1998); while nociceptive responses
produced by the surrounding tissues is referred to as secondary hyperalgesia (Simone, 1992).
Inflammation of peripheral tissues causes spontaneous pain and hyperalgesia (Ikeda et al.,
2006). Sometimes normal non-noxious stimulus too produces nociceptive responses and
such state is called as allodynia (Short, 1998). The nociceptive impulses carried by afferent
nerve fibres are conducted to the spinal cord where they are further processed by numerous
chemicals such as different neurotransmitters, ion channels, amino acids etc. and dispatched
further to the higher brain centres.
1.2.1.2 Spinal cord
Dorsal horn grey matter neurons of the spinal cord acquire sensory information from primary
afferents of the sensory receptive neurons that innervate the skin and deeper tissues of the
body and that respond to definite types of noxious and non-noxious stimuli (Todd, 2010,
Caspary and Anderson, 2003, Costigan and Woolf, 2000). Noxious stimuli are transduced
to electrical activity by these highly receptive neurons (Farquhar-Smith, 2008, Costigan and
Woolf, 2000). Impulses from the nociceptive afferent fibres (sensory fibres) Aδ
mechanoreceptive and C polymodal at first instance synapse in the spinal cord in the grey
matter of the dorsal horn. However, these noxious signals are also carried to the ventral horn
to form spinally mediated reflex arc (withdrawal response through motor neuron) as the
6
ventral half of the spinal cord regulates motor output (Caspary and Anderson, 2003,
Livingston and Chambers, 2000).The nociceptive afferents terminate in a specifically
distributed pattern of the dorsal horn that is determined by their sensory modality and the
part of the body which they innervate and is also an important site of drug action (Todd,
2010, Pappagallo, 2005, Livingston and Chambers, 2000). The dorsal horn of the spinal cord
is divided into anatomically and electrophysiologically distinct laminae (I to X) (Figure 1.2)
(Basbaum et al., 2009, Basbaum and Jessell, 2000, Rexed, 1952). Aδ nociceptors project to
lamina I and to the deeper dorsal horn (lamina V). Similarly, low threshold, rapidly
conducting Aβ afferents, those which respond to light touch, project into deeper laminae (III
to VI) (Colvin and Power, 2005). On the contrary, C nociceptors project more superficially
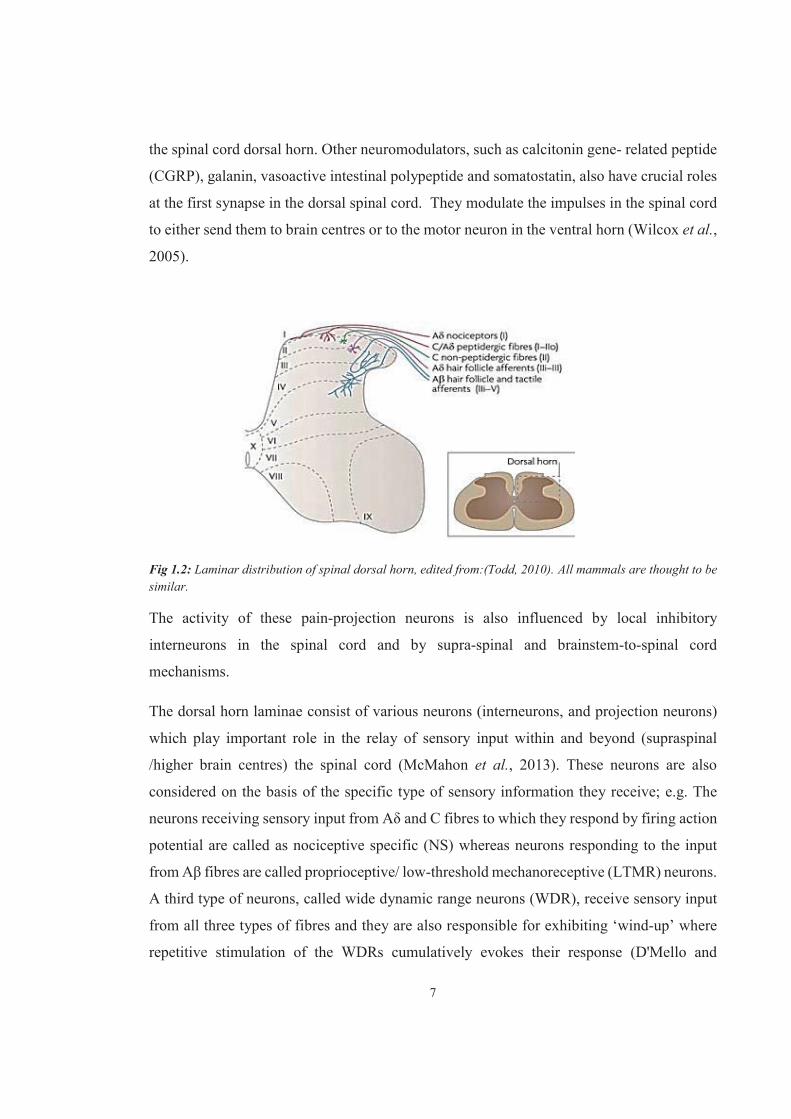
to laminae I and II (Dickenson, 2008, Pappagallo, 2005).
Table 1.2: Inflammatory mediators at periphery/site of injuryb
Inflammatory mediator Origin/source Effect on nociceptors
Protons (H+) Hypoxia of muscle Activation
Nitric oxide Sensory neurons Activation
Adenosine ATP Sensitisation
Kinins: Bradykinin Kallidin
Blood cells Kininogen
Activation Activation
Prostanoids: Prostaglandins, Leukotrienes, Hydroxy-acids
Mast cells release Arachidonic acid by cyclooxygenase and lipoxygenase enzymes
Sensitisation
5-Hydroxytryptamine Platelets and mast cells Activation
Histamine Mast cells Activation
Potassium ions Damaged cells Activation
Growth factor Macrophages Sensitisation
Substance P Sensory nerve endings Sensitisation
Neuro peptides Sensory nerve endings Sensitisation
bEdited from: (Kongara, 2008, Costigan and Woolf, 2000, Carr and Goudas, 1999, Dray, 1997b)
All these nociceptors use glutamate as their primary neurotransmitter which is present all
over the central nervous system, though the actions of glutamate are modulated by the
different neuropeptides in the dorsal root ganglia (DRG) through which the nociceptors enter
7
the spinal cord dorsal horn. Other neuromodulators, such as calcitonin gene- related peptide
(CGRP), galanin, vasoactive intestinal polypeptide and somatostatin, also have crucial roles
at the first synapse in the dorsal spinal cord. They modulate the impulses in the spinal cord
to either send them to brain centres or to the motor neuron in the ventral horn (Wilcox et al.,
2005).
Fig 1.2: Laminar distribution of spinal dorsal horn, edited from:(Todd, 2010). All mammals are thought to be similar.
The activity of these pain-projection neurons is also influenced by local inhibitory
interneurons in the spinal cord and by supra-spinal and brainstem-to-spinal cord
mechanisms.
The dorsal horn laminae consist of various neurons (interneurons, and projection neurons)
which play important role in the relay of sensory input within and beyond (supraspinal
/higher brain centres) the spinal cord (McMahon et al., 2013). These neurons are also
considered on the basis of the specific type of sensory information they receive; e.g. The
neurons receiving sensory input from Aδ and C fibres to which they respond by firing action
potential are called as nociceptive specific (NS) whereas neurons responding to the input
from Aβ fibres are called proprioceptive/ low-threshold mechanoreceptive (LTMR) neurons.
A third type of neurons, called wide dynamic range neurons (WDR), receive sensory input
from all three types of fibres and they are also responsible for exhibiting ‘wind-up’ where
repetitive stimulation of the WDRs cumulatively evokes their response (D'Mello and
8
Dickenson, 2008, Herrero and Max Headley, 1995). It has been observed that somatosensory
neurons in the spinal dorsal horn of fully conscious sheep had wide dynamic range properties
and over 60 % neurons exhibited these properties. These neurons were found in both
superficial as well as deeper laminae of the spinal dorsal horn (Herrero and Max Headley,
1995).
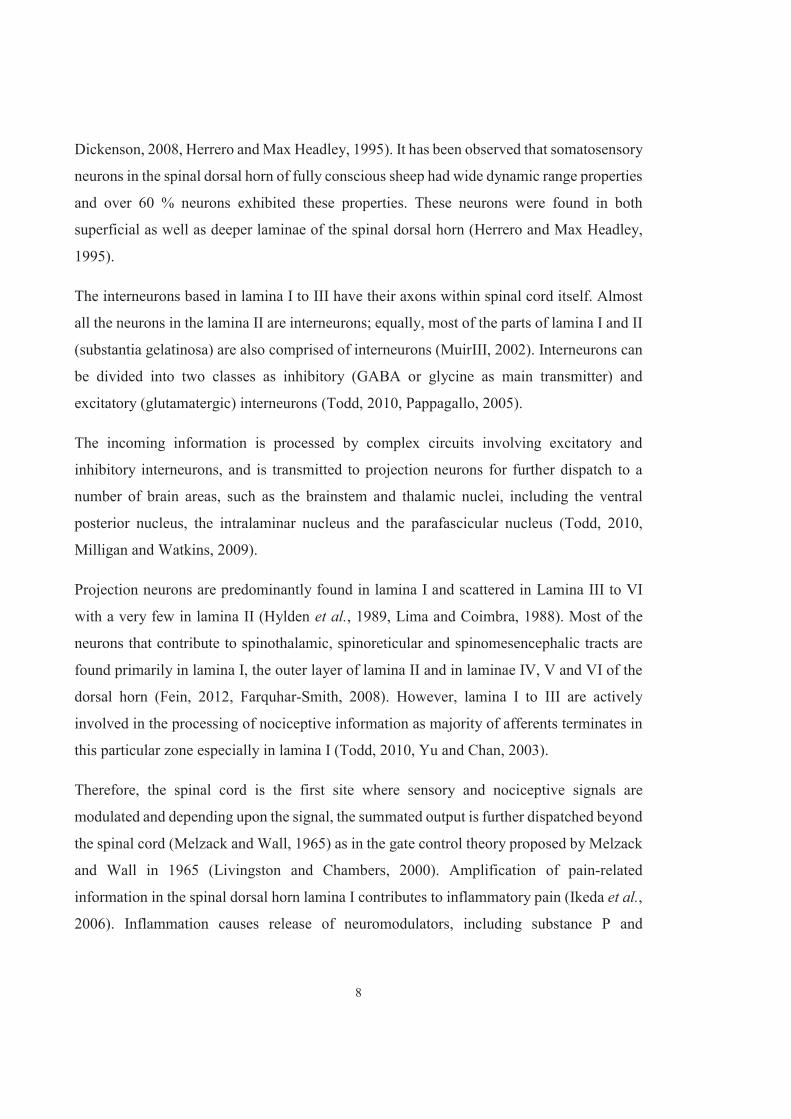
The interneurons based in lamina I to III have their axons within spinal cord itself. Almost
all the neurons in the lamina II are interneurons; equally, most of the parts of lamina I and II
(substantia gelatinosa) are also comprised of interneurons (MuirIII, 2002). Interneurons can
be divided into two classes as inhibitory (GABA or glycine as main transmitter) and
excitatory (glutamatergic) interneurons (Todd, 2010, Pappagallo, 2005).
The incoming information is processed by complex circuits involving excitatory and
inhibitory interneurons, and is transmitted to projection neurons for further dispatch to a
number of brain areas, such as the brainstem and thalamic nuclei, including the ventral
posterior nucleus, the intralaminar nucleus and the parafascicular nucleus (Todd, 2010,
Milligan and Watkins, 2009).
Projection neurons are predominantly found in lamina I and scattered in Lamina III to VI
with a very few in lamina II (Hylden et al., 1989, Lima and Coimbra, 1988). Most of the
neurons that contribute to spinothalamic, spinoreticular and spinomesencephalic tracts are
found primarily in lamina I, the outer layer of lamina II and in laminae IV, V and VI of the
dorsal horn (Fein, 2012, Farquhar-Smith, 2008). However, lamina I to III are actively
involved in the processing of nociceptive information as majority of afferents terminates in
this particular zone especially in lamina I (Todd, 2010, Yu and Chan, 2003).
Therefore, the spinal cord is the first site where sensory and nociceptive signals are
modulated and depending upon the signal, the summated output is further dispatched beyond
the spinal cord (Melzack and Wall, 1965) as in the gate control theory proposed by Melzack
and Wall in 1965 (Livingston and Chambers, 2000). Amplification of pain-related
information in the spinal dorsal horn lamina I contributes to inflammatory pain (Ikeda et al.,
2006). Inflammation causes release of neuromodulators, including substance P and

9
neurotransmitter such as glutamate in spinal dorsal horn and they play very important role
in modulation of pain impulses (Milligan and Watkins, 2009, Ikeda et al., 2006).
Calcium (Ca++) ions also play an important role in numerous biological processes including
the overall process of pain. Even a momentary upturn in cytoplasmic Ca++ concentration can
cause neurotransmitter release and the modulation of cell membrane excitability. The
passage of Ca++ ions through membrane channels, transport by ion pumps, or release of Ca++
ions from internal stores are the bases for cytoplasmic concentration changes (Prado, 2001).
The Ca++ ion influx is controlled by three ways: first, voltage operated calcium channels
(VOCC), secondly, receptor activated calcium channels and lastly, the ligand gated non-
specific calcium channels (Barritt, 1999). VOCC are further divided into two types as high
voltage activated (HVA) and low voltage activated (LVA); HVA has several subtypes as L,
N, P, Q, R and T and each having specific function (Bourinet et al., 2014).
Intracellular Ca++ ion influx is increased in response to acute activation of primary afferent
terminals leading to glutamate release. Further persistent stimulation of these afferents
increases intracellular Ca++ provoking substance P (SP) release and more secretion of
glutamate. Also, these afferents use glutamate and substance P as their transmitters to
transmit the nociceptive information (Bear et al., 2007, Kangrga and Randic, 1990, De Biasi
and Rustioni, 1988). N-type Ca++ channels are mainly responsible for neurotransmitters
release such as calcitonin gene related peptide (CGRP), glutamate and SP at both peripheral
as well as dorsal horn synaptic level (Bourinet et al., 2014).
The glutamate binds to several receptors subtypes with different affinity. These receptors
are NMDA (N-Methyl-D- Aspartate), AMPA (α-amino-3-hydroxy-5-methyl-4-isoxazole
proprionic acid), kainate (KA) receptors for fast excitatory transmission (Pin and Duvoisin,
1995) and metabotropic glutamate receptors that are coupled to G-proteins (guanosine
nucleotide-binding proteins) (Costigan and Woolf, 2000) for slower synaptic transmission
(Ferraguti and Shigemoto, 2006). NMDA receptors have overall seven sub-units; glycine
binding Glu1 and two glutamate binding Glu2 (Glu2A, Glu2B, Glu2C, Glu2D) and Glu3
(Glu3A, Glu3B) (Bourinet et al., 2014, Paoletti et al., 2013, Lizarraga and Chambers, 2006,
Dingledine et al., 1999). Amongst these receptors, NMDA has been shown to play a
significant role in central sensitivity and hyperalgesia (Besson, 1999). Excitatory synaptic
10
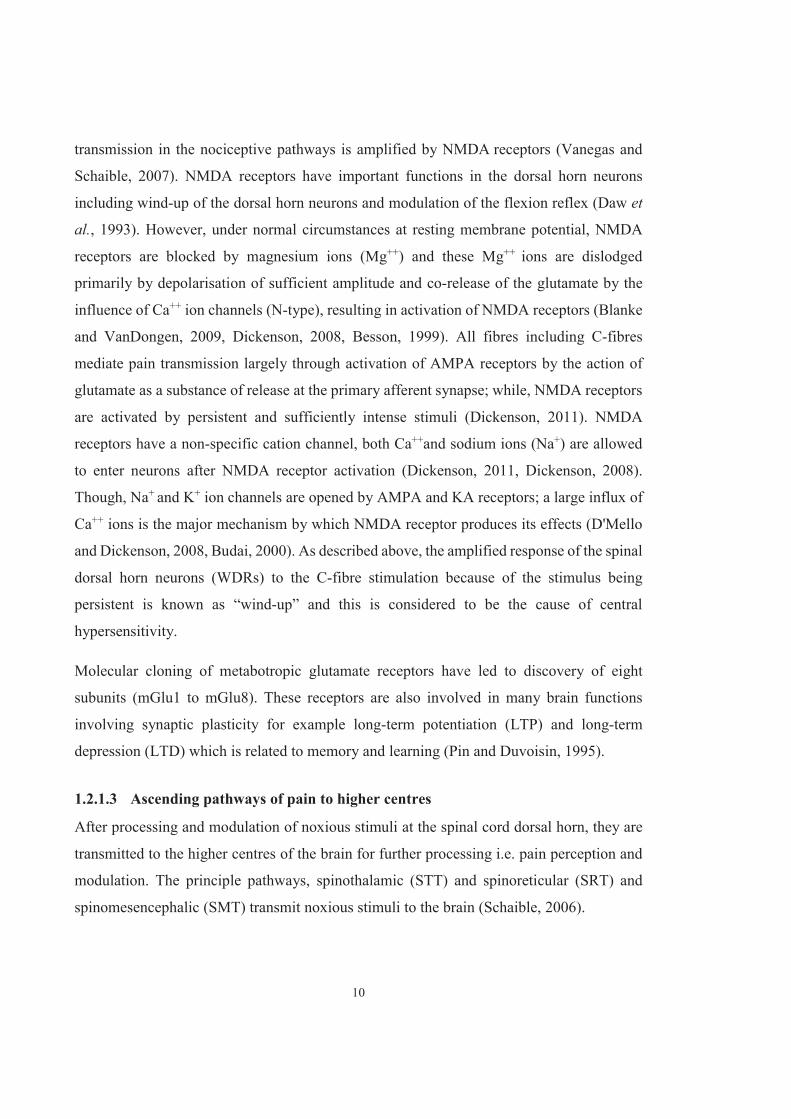
transmission in the nociceptive pathways is amplified by NMDA receptors (Vanegas and
Schaible, 2007). NMDA receptors have important functions in the dorsal horn neurons
including wind-up of the dorsal horn neurons and modulation of the flexion reflex (Daw et
al., 1993). However, under normal circumstances at resting membrane potential, NMDA
receptors are blocked by magnesium ions (Mg++) and these Mg++ ions are dislodged
primarily by depolarisation of sufficient amplitude and co-release of the glutamate by the
influence of Ca++ ion channels (N-type), resulting in activation of NMDA receptors (Blanke
and VanDongen, 2009, Dickenson, 2008, Besson, 1999). All fibres including C-fibres
mediate pain transmission largely through activation of AMPA receptors by the action of
glutamate as a substance of release at the primary afferent synapse; while, NMDA receptors
are activated by persistent and sufficiently intense stimuli (Dickenson, 2011). NMDA
receptors have a non-specific cation channel, both Ca++and sodium ions (Na+) are allowed
to enter neurons after NMDA receptor activation (Dickenson, 2011, Dickenson, 2008).
Though, Na+ and K+ ion channels are opened by AMPA and KA receptors; a large influx of
Ca++ ions is the major mechanism by which NMDA receptor produces its effects (D'Mello
and Dickenson, 2008, Budai, 2000). As described above, the amplified response of the spinal
dorsal horn neurons (WDRs) to the C-fibre stimulation because of the stimulus being
persistent is known as “wind-up” and this is considered to be the cause of central
hypersensitivity.
Molecular cloning of metabotropic glutamate receptors have led to discovery of eight
subunits (mGlu1 to mGlu8). These receptors are also involved in many brain functions
involving synaptic plasticity for example long-term potentiation (LTP) and long-term
depression (LTD) which is related to memory and learning (Pin and Duvoisin, 1995).
1.2.1.3 Ascending pathways of pain to higher centres
After processing and modulation of noxious stimuli at the spinal cord dorsal horn, they are
transmitted to the higher centres of the brain for further processing i.e. pain perception and
modulation. The principle pathways, spinothalamic (STT) and spinoreticular (SRT) and
spinomesencephalic (SMT) transmit noxious stimuli to the brain (Schaible, 2006).
11
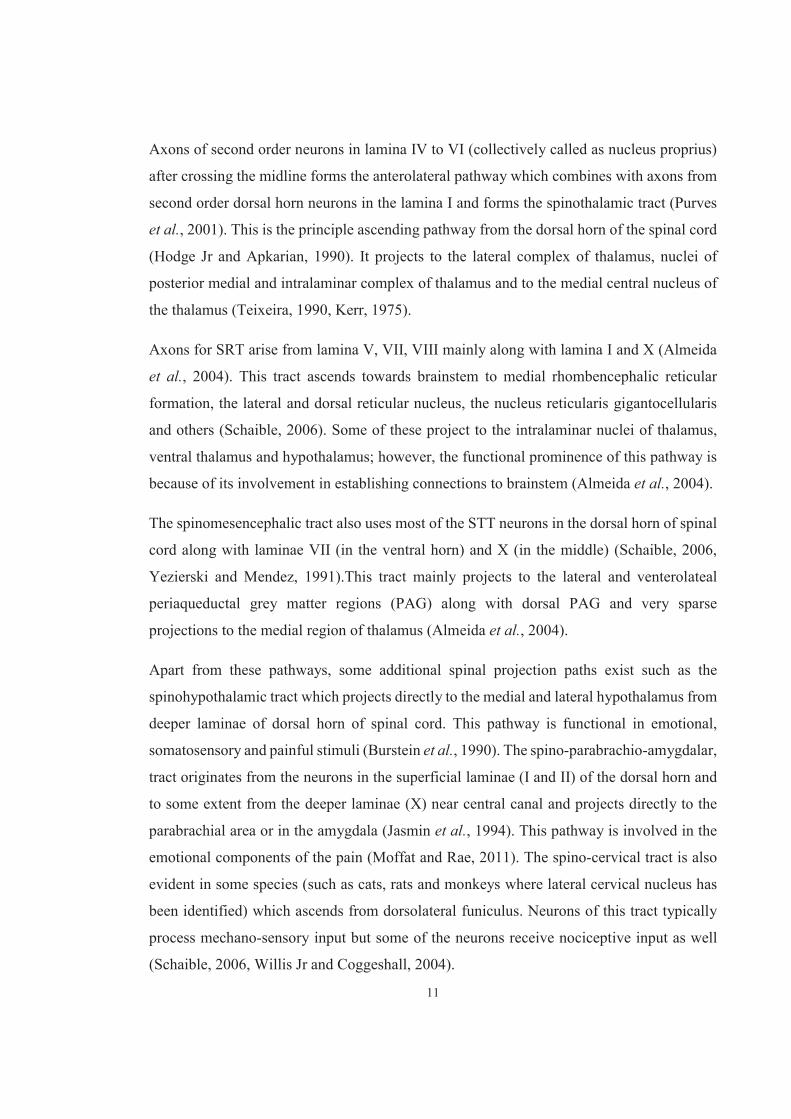
Axons of second order neurons in lamina IV to VI (collectively called as nucleus proprius)
after crossing the midline forms the anterolateral pathway which combines with axons from
second order dorsal horn neurons in the lamina I and forms the spinothalamic tract (Purves
et al., 2001). This is the principle ascending pathway from the dorsal horn of the spinal cord
(Hodge Jr and Apkarian, 1990). It projects to the lateral complex of thalamus, nuclei of
posterior medial and intralaminar complex of thalamus and to the medial central nucleus of
the thalamus (Teixeira, 1990, Kerr, 1975).
Axons for SRT arise from lamina V, VII, VIII mainly along with lamina I and X (Almeida
et al., 2004). This tract ascends towards brainstem to medial rhombencephalic reticular
formation, the lateral and dorsal reticular nucleus, the nucleus reticularis gigantocellularis
and others (Schaible, 2006). Some of these project to the intralaminar nuclei of thalamus,
ventral thalamus and hypothalamus; however, the functional prominence of this pathway is
because of its involvement in establishing connections to brainstem (Almeida et al., 2004).
The spinomesencephalic tract also uses most of the STT neurons in the dorsal horn of spinal
cord along with laminae VII (in the ventral horn) and X (in the middle) (Schaible, 2006,
Yezierski and Mendez, 1991).This tract mainly projects to the lateral and venterolateal
periaqueductal grey matter regions (PAG) along with dorsal PAG and very sparse
projections to the medial region of thalamus (Almeida et al., 2004).
Apart from these pathways, some additional spinal projection paths exist such as the
spinohypothalamic tract which projects directly to the medial and lateral hypothalamus from
deeper laminae of dorsal horn of spinal cord. This pathway is functional in emotional,
somatosensory and painful stimuli (Burstein et al., 1990). The spino-parabrachio-amygdalar,
tract originates from the neurons in the superficial laminae (I and II) of the dorsal horn and
to some extent from the deeper laminae (X) near central canal and projects directly to the
parabrachial area or in the amygdala (Jasmin et al., 1994). This pathway is involved in the
emotional components of the pain (Moffat and Rae, 2011). The spino-cervical tract is also
evident in some species (such as cats, rats and monkeys where lateral cervical nucleus has
been identified) which ascends from dorsolateral funiculus. Neurons of this tract typically
process mechano-sensory input but some of the neurons receive nociceptive input as well
(Schaible, 2006, Willis Jr and Coggeshall, 2004).
12
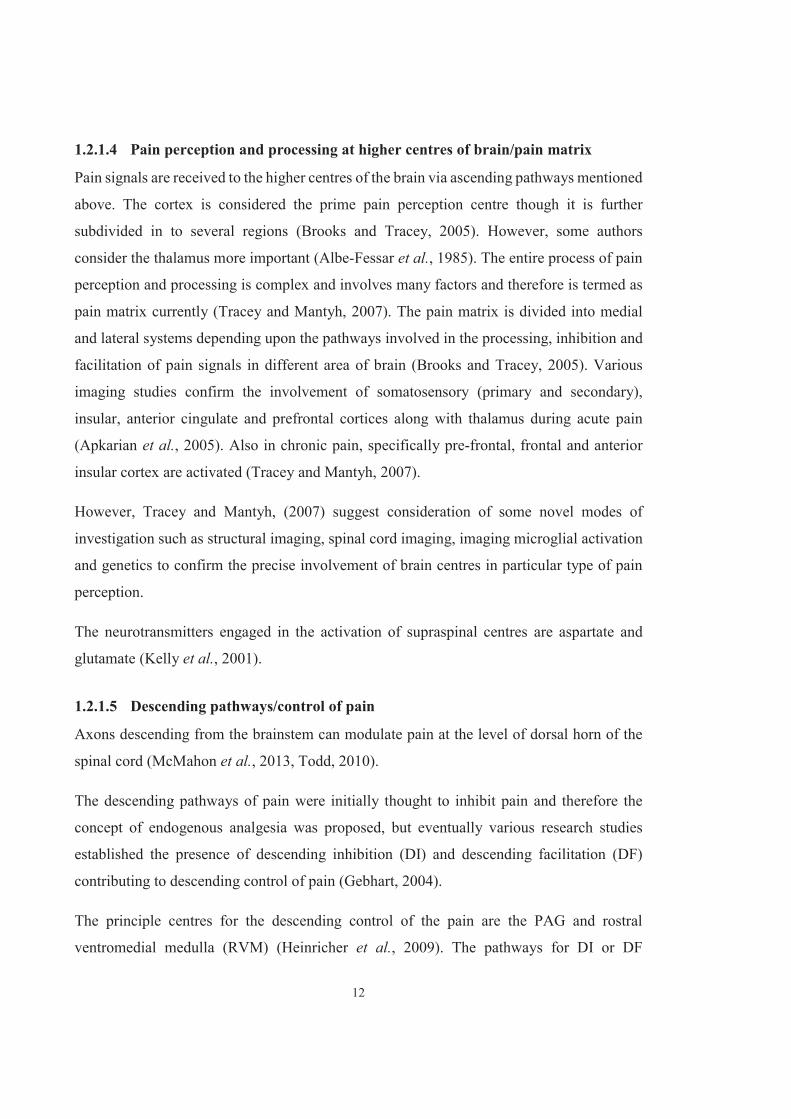
1.2.1.4 Pain perception and processing at higher centres of brain/pain matrix
Pain signals are received to the higher centres of the brain via ascending pathways mentioned
above. The cortex is considered the prime pain perception centre though it is further
subdivided in to several regions (Brooks and Tracey, 2005). However, some authors
consider the thalamus more important (Albe-Fessar et al., 1985). The entire process of pain
perception and processing is complex and involves many factors and therefore is termed as
pain matrix currently (Tracey and Mantyh, 2007). The pain matrix is divided into medial
and lateral systems depending upon the pathways involved in the processing, inhibition and
facilitation of pain signals in different area of brain (Brooks and Tracey, 2005). Various
imaging studies confirm the involvement of somatosensory (primary and secondary),
insular, anterior cingulate and prefrontal cortices along with thalamus during acute pain
(Apkarian et al., 2005). Also in chronic pain, specifically pre-frontal, frontal and anterior
insular cortex are activated (Tracey and Mantyh, 2007).
However, Tracey and Mantyh, (2007) suggest consideration of some novel modes of
investigation such as structural imaging, spinal cord imaging, imaging microglial activation
and genetics to confirm the precise involvement of brain centres in particular type of pain
perception.
The neurotransmitters engaged in the activation of supraspinal centres are aspartate and
glutamate (Kelly et al., 2001).
1.2.1.5 Descending pathways/control of pain
Axons descending from the brainstem can modulate pain at the level of dorsal horn of the
spinal cord (McMahon et al., 2013, Todd, 2010).
The descending pathways of pain were initially thought to inhibit pain and therefore the
concept of endogenous analgesia was proposed, but eventually various research studies
established the presence of descending inhibition (DI) and descending facilitation (DF)
contributing to descending control of pain (Gebhart, 2004).
The principle centres for the descending control of the pain are the PAG and rostral
ventromedial medulla (RVM) (Heinricher et al., 2009). The pathways for DI or DF

13
originating from higher brain centres (thalamus and cortex) pass through the RVM. They
also receive afferent input from PAG, nucleus tractus solitaris (NTS) and parabrachial
nucleus (PN) to form spinobulbospinal loops (Moffat and Rae, 2011) during chronic pain
states.
Modulation of pain at RVM and also at spinal cord level is governed by various transmitters,
receptors along with group of neurons (in RVM, on and off cells) to either facilitate or inhibit
pain (Palazzo et al., 2008, Vanderah et al., 2001, Fürst, 1999). Various descending pathways
of pain modulation have been studied to date and the involvement of each neurotransmitter,
receptor and the neuronal circuitry is known (Todd, 2010, Bee and Dickenson, 2009, Millan,
2002).
Further descending pathways from the supra-spinal centres originate from the higher brain
centres (thalamus, hypothalamus, anterior cingulate, cortex etc.) and the central relay and
modulatory centre for them is the RVM (Heinricher et al., 2009). The descending projections
from the RVM pass to the dorsolateral funiculus (DLF) and the dorsal horn where they
synapse with primary afferent neuron terminals, intrinsic interneurons, ascending tract
neurons and terminals of the further descending tract neurons (Bee and Dickenson, 2009).
Primary transmitters involved in the various descending modulations are histamine,
acetylcholine, GABA, neuropeptides, neurotensins, galanin, SP and glutamate, 5-HT,
noradrenaline depending upon serotonergic and counteracting noradrenergic pathways
(Benarroch, 2008, Millan, 2002). Pain modulation occurs through endogenous opioids
(endorphins) and opioid receptors at different brain regions (especially in RVM) also
contribute to the overall nociception processing (Basbaum and Fields, 1984).
Central action of NSAIDs in pain modulation/inhibition is evident in descending pain
pathway in RVM by altering responses of on and off cells (Vanegas et al., 2010).
1.2.2 Pain in animals
Although, the mechanisms of pain in animals and humans are similar, pain in animals is
difficult to understand and detect accurately. There have been many arguments about animal
pain over past years.
14
Animals lack speech and therefore for years, the dispute on “can animals feel pain” was on-
going (Musk, 2013, Paul-Murphy et al., 2004). However, now it is almost universally
accepted that animals do feel pain but the expression of pain varies in different species
(Rutherford, 2002). The IASP (1979) suggested that the inability to communicate does not
mean that the individual is not experiencing pain.
Pain detection and amelioration are therefore important components in animal care and
welfare (Anil et al., 2005, Barnett, 1997). It is reported that animal and human pain are
similar in terms of physiological, pathological and emotional components (Panksepp, 2005,
Yaksh et al., 1999, Bennett and Xie, 1988, Berkowitz, 1983). Many of the pain management
strategies for humans are based on animal models (Morton and Griffiths, 1985). This has
been possible due to the similar neuronal pathways and neurotransmitter receptors in animals
and humans (Livingston, 2010).
It has been suggested that new-born and young animals may experience pain more intensely
than do older animals (Moss et al., 2007, Johnson et al., 2005, Mellor and Gregory, 2003).
On the contrary it has been argued that the infants under the age of one year do not feel pain
(Derbyshire, 2003).
According to the Animal Welfare Act (1999), a painful procedure is defined as any
procedure that reasonably would be expected to cause more than slight and momentary pain
or distress in a human being (AWIC, 2000). It has been argued that animals should receive
the benefit of the doubt (Anil et al., 2005).
Many husbandry procedures in animals such as castration, tail docking, disbudding or
destruction of the horn bud, dehorning, branding, debeaking and even management practices
such as shackling, transport, milking, housing etc. may result in acute pain, (Sneddon and
Gentle, 2000) compromising animal welfare (Grant, 2004).
In addition to the routine surgical and other practices, farmed animals tend to acquire injuries
from fighting and various activities. The systemic conditions such as pneumonia, enteritis,
arthritis, mastitis, foot rot etc. are also painful leading to acute or chronic pain (Molony and
Kent, 1997). Acute pain is usually a short term pain associated with the development of
protective mechanisms to prevent further processing of pain (Greisen et al., 1999). However,

15
on-going acute pain which ultimately results in chronic pain is not beneficial. Chronic pain
in farmed animals leads to poor appetite, poor growth and production (Molony et al., 1995,
Dantzer and Mormède, 1983). Therefore, the welfare as well as production of the animals
is compromised and in such conditions, analgesic treatment and proper animal care is
warranted (Stafford and Mellor, 2005, Anil et al., 2005). The qualitative and/or quantitative
assessment of pain in animals is essential for the management of painful conditions and
welfare improvement (Fitzpatrick et al., 2006).
1.2.2.1 Pain in sheep
Sheep are susceptible to various diseases and either infectious or non-infectious diseases can
compromise welfare of sheep by generating pain (Fitzpatrick et al., 2006).
1.2.2.1.1 Lameness
Sheep lameness is caused due to pain and this pain is associated with many conditions such
as foot and mouth disease to footrot (Winter, 2008). However, 80 per cent of lameness in
sheep is caused by footrot and interdigital dermatitis in UK (Kaler and Green, 2009). Also
in many other countries of the world, lameness due to footrot is reported and lameness in
sheep is global problem (FAW, 2011). Therefore, assessment of lameness and its
treatment/management is a requirement for improving sheep welfare.
1.2.2.1.2 Footrot
Footrot is an acute, sub-acute or chronic disease of sheep which mainly affects sheep feet
(Murnane, 1933). The causative agent of this disease is Dichelobacter nodosus, (D. nodosus)
which is active after initial infection of the feet with Fusobacterium necroforum (F.
necroforum) bacteria which causes interdigital infection followed by footrot lesions (Winter,
2008).
Pre-disposing factors for footrot are wet conditions (mud during winter, faeces), humidity
(temperatures above 10°C) which deteriorate interdigital skin and provide favourable
conditions to F. necroforum to proceed with further damage which allows entry of D.
nodosus (Morck et al., 1994). The damp conditions are also responsible for the transmission
of the disease between sheep (Green and George, 2008). Potentially the bacteria produce
16
protease enzyme which acts on the hoof tissue and causes under-running hoof leading to
virulent footrot (Winter, 2008). Another mild or benign footrot type is also developed by the
similar causative agent but there is no damage to hoof as the strain of F. nodosus is not
virulent and only inflammation of interdigital skin is observed (Egerton et al., 1969).
Samples from footrot lesions confirm the presence of both D. nodosus and F. necroforum
with several strains where D. nodosus with type IV fimbriae are responsible for virulence
due to production of serine proteases (Kennan et al., 2011). General clinical signs observed
in sheep during footrot are severe lameness, poor feed intake, isolation from the herd, loss
of body condition and ultimately lowered growth and production (wool, meat) etc. causing
impact on the welfare and economics (Bennett and Hickford, 2011).
Typical footrot treatment consists of parenteral antibiotics, foot baths of either formalin (2-
3%) or zinc sulphate (10-20%) solution, hoof trimming in very severely affected feet,
isolation of the affected animals and provision of clean and dry environment to prevent the
transmission of the disease within the herd (Winter, 2008). Also, vaccination for prevention
of footrot is available. However, the presence of multiple strains of causative bacteria
restricts the utility of these vaccines (Schwartzkoff et al., 1993).
Pain due to footrot can be managed with other treatment strategies such as use of analgesic
(NSAIDs) drugs as they have demonstrated efficacy to minimise pain due to lameness
(Welsh and Nolan, 1995).
1.2.3 Assessment of pain in animals
The assessment of animal pain is a vital aspect of veterinary medicine and animal welfare.
However, pain is an individual experience and its measurement is exceedingly challenging
(O Callaghan et al., 2003), as there are intraspecies and interspecies variations in responses
to painful stimuli. Even the responses of the same animal may not be the same in all cases
(Anil et al., 2002). The individual variation may be associated with stage of development
(age), sex, genetic variation, environment, emotional status and prior pain experience etc.
(Nielsen et al., 2008, Johnson et al., 2005, Mellor and Stafford, 2000).

17
Therefore, to assess pain in animals in the absence of verbal communication, the researcher
has to rely on other approaches to confirm or quantify the nature and intensity of the painful
or nociceptive experience (Livingston, 2010). Bufalari (2007), has suggested the inclusion
of neurological, cardiovascular, respiratory, skeletal, endocrine, digestive and urinary
systems for the evaluation of pain (Bufalari et al., 2007). Apparently, direct and indirect
indicators such as behavioural, physiological and/or clinical responses can be considered for
assessing pain in animals (Landa, 2012).
1.2.3.1 Behavioral responses
Behavioural responses of animals due to pain involve changes in postures or gait,
vocalisation, temperament and others such as alteration in urination and defecation
frequency (Morton and Griffiths, 1985), changes in responses to nociceptive thresholds (Ley
et al., 1989) changes in locomotion such as licking, lying down, shaking head, flicking ears,
lameness etc. (Duncan, 2006, Molony and Kent, 1997), changes in facial expressions
(Guesgen, 2015, Love et al., 2011). Also, change in feeding pattern (loss of appetite) can be
observed during pain (González et al., 2008).
Many techniques have been suggested for pain assessment on the basis of behavioural
changes in animals during pain. Researchers have developed different pain scales for
different animals to score the pain. Criteria selected for the measurement of pain varies and
are conditional as on the study and animals (Bufalari et al., 2007). Pain scales are considered
subjective methods (Rutherford, 2002). The most commonly used pain scales are the simple
descriptive scale (SDS), numerical rating scale (NRS) and visual analogue scale (VAS) in
animals (Holton et al., 1998a). There are also various composite pain scales published, the
Glasgow composite measure pain scale (GCMPS) followed by Glasgow composite measure
pain short form (CMPS-SF) has been developed to measure acute pain in dogs and its use in
cats has also been validated (Brondani et al., 2011, Reid et al., 2007, Holton et al., 2001).
1.2.3.1.1 Simple descriptive scale (SDS)
The simple descriptive scale is the most basic of all the pain scales (Carpenter et al., 2004).
This scale is usually based on limited scores for respective intensities of pain starting from
‘no pain’ (0 score) and progressing towards ‘mild pain’ (1), ‘moderate pain’ (2) and ‘severe

18
pain’ (3) (Holton et al., 1998b) in dogs. Similarly in cats, depending upon the particular
behavioral parameter (such as lameness, feeding pattern, pain on palpation, weight bearing
capacity, general demeanour etc.), each parameter is scored from minimum 1 to maximum
4 (Clarke and Bennett, 2006, Lascelles et al., 2001).
Advantages of this scale as stated by (Clarke and Trim, 2013):
1. Basic scale and easy to use
2. Time saver/quick assessment.
Disadvantages of this scale as stated by (Clarke and Trim, 2013, Kongara, 2008):
1. Limited pain scores/intensities
2. Inter-observer variability (subjective).
1.2.3.1.2 Numerical rating scale (NRS)
Numerical rating scale is occasionally mentioned under simple descriptive scale by some
researchers (Quinn et al., 2007). However, when simple numerical scale is considered, it
usually has a score from 0 to 10 where 10 is the worst pain (Clarke and Trim, 2013). Another
NRS which is more advanced considers multiple behavioral parameters where each
parameter is scored and the summation of all the scores is considered as the final pain score
which can exceed the score of 10 up to the extent of parameters selected (Bussières et al.,
2008). NRS is often used to score lameness in animals (Quinn et al., 2007, Pritchett et al.,
2003, Ley et al., 1989).
The advantages of NRS are (Clarke and Trim, 2013, Fitzpatrick et al., 2006):
1. It has advantage of scoring multiple parameters with marginal scores
2. More accurate than SDS
3. Easy to integrate the scores with accuracy.
Disadvantages of NRS are (Clarke and Trim, 2013, Mathews, 2000):
1. Time consuming
2. Lack of specificity e.g. if vocalisation is one of the parameters to score pain, then
even if animal vocalises due to other reason than pain, may lead to over-scoring and
vice versa.
19
1.2.3.1.3 Visual analogue scale (VAS)
Visual analogue scale uses a line usually 100mm long where one end is marked with 0
meaning ‘no pain’ and another extreme end as ‘worst pain’ having score of 100 (Lascelles
et al., 1997). In this scale observer marks the pain of the patient or animal on the line
according to the severity perceived. This scale is widely used to measure post-operative pain
in animals after surgical procedures (Dodman and Clark, 1992, Mbugua et al., 1988).
Advantage of VAS are (Kongara, 2008, Chapman et al., 1985):
1. Sensitive, popular and reproducible
2. Provides scope for multiple parameters as it does not include descriptive parameters.
Disadvantages of VAS include (Mathews, 2000):
1. Trained and experienced observer is required
2. Inter-observer variability.
Apart from these scales, many other modifications of these scales have been proposed by
researchers and those scales as well are gaining popularity in assessment of animal pain.
Examples of such scales are CPS (composite multifactorial pain scale) for horses UMPS
(University of Melbourne pain scores) for dogs, GCMPS for dogs, CMPS-SF dogs, etc.
(Bussières et al., 2008, Reid et al., 2007, Firth and Haldane, 1999, Holton et al., 1998b).
Other behavioural tests have also been discovered which are demonstrated as reliable
indicators of pain assessment in animals such as place preference where animals such as
livestock avoid the places where painful husbandry practices were performed on them
(Millman, 2013) and self-selection of analgesics where animals prefer pain relieving
drug/solution over normal/placebo drug; for instance, Colpaert et al. (1980) in their
experiment with rats suffering from adjuvant-induced arthritis observed the preference of
rats for consumption of analgesic solution over normal sugar solution which was preferred
by control (healthy animals). Such self-selection of analgesic was also observed by Danbury
et al. (2000) in lame broiler chickens when they preferred analgesic carprofen containing
feed over normal feed.

20
1.2.3.2 Changes in responses to nociceptive thresholds
Animals can feel pain and can react to it, if a stimulus capable of activating nociceptive
receptors located subcutaneously in animals is perceived.
The significance of term “nociceptive” is the stimulus which the animal perceives as noxious
and can produce a pain with or without tissue damage (Criado, 2010). The nociception can
be restricted to produce acute pain resulting in action by an animal or human to prevent
further pain or it can damage the tissue to produce chronic pain (inflammatory soup) (Loeser
and Melzack, 1999). To measure the changes in response to nociceptive thresholds, four
types of nociceptive stimuli are used. They are mechanical, thermal, chemical (not used often
due to technical difficulties) and electrical (Le Bars et al., 2001). Among the four types of
nociceptive stimuli, mechanical and thermal nociceptive stimuli are commonly used in the
farm animals such as sheep, cattle, horses etc. (Poller et al., 2013, Love et al., 2011, Whay
et al., 1998, Welsh and Nolan, 1995, Chambers et al., 1994, Chambers et al., 1990).
Electrical stimuli are less often used as they activate all neurons, rather than those specific
for pain. Therefore, in this review, mechanical and thermal nociceptive threshold testing will
be discussed in detail.
1.2.3.2.1 Mechanical nociceptive threshold testing (MNT)
Mechanical nociceptive testing (MNT) usually involves external application of pressure to
produce a noxious stimulus in an animal. This stimulus is usually quantifiable and the animal
responds by lifting its leg (if the stimulus is applied to leg) or flicking of skin, vocalising,
flicking of ear or tail, changing gait or posture and sometimes standing still, without any
movement etc. depending upon the species of animal or location of the stimulus (Vivancos
et al., 2004, Le Bars et al., 2001, Chambers et al., 1990, Ley et al., 1989). The most
commonly used device for MNT, especially in farm animals is a pneumatically driven blunt
pin in a specific region on the animal’s body to create a noxious stimulus which is terminated
as soon as the animal responds (Chambers et al., 1990, Ley et al., 1989).
During MNT, after application of stimulus, selective nociceptors are activated in response,
which includes two types of Aδ and polymodal C fibre nociceptors (Julius and Basbaum,
21
2001). They transmit the noxious stimuli to dorsal and ventral spinal cord as well as to the
higher brain centres, so that pain perception and the response to pain is generated.
In animals, MNT is mostly used to test the efficacy of analgesic drugs as it is reliable,
reproducible and does not damage the tissue (Dixon et al., 2010). Dixon et al. has used the
MNT in cats to test the analgesic efficacy of different NSAIDs as well as opioids (Dixon et
al., 2010, Dixon et al., 2007, Steagall et al., 2007, Dixon et al., 2002). In horses, the efficacy
of different classes of drugs such as NSAIDs, opioids, α2-adrenergic agonists and other
analgesics have been tested with MNT (Love et al., 2012, Love et al., 2011, Moens et al.,
2003, Chambers et al., 1990). In cattle, apart from analgesic efficacy, the severity of
lameness and its impact on the nociceptive thresholds has also been evaluated by using MNT
(Tadich et al., 2013, Whay et al., 1998). Also, pain assessment and analgesic efficacy of
various classes of drugs in other mammals such as pigs (Nalon et al., 2013, Janczak et al.,
2012, Sandercock et al., 2009), donkeys (Grint et al., 2014) , rabbits (Tanelian and
Beuerman, 1984) and birds (Hothersall et al., 2011) using MNT has been reported.
Advantages of MNT are (Le Bars et al., 2001):
1. The responses produced by this method are directly proportional to the intensity of
stimulus
2. This method produces precise results to evaluate analgesic efficacy of drugs and is
reproducible.
Disadvantages of MNT include (Le Bars et al., 2001, Hargreaves et al., 1988):
1. Associated with technical difficulties in freely moving animals
2. Both high and low mechanoreceptors in cutaneous and non-cutaneous tissue are
activated, so the contribution of each in behavioural response is not distinguishable.
1.2.3.2.2 Thermal nociceptive threshold testing (TNT)
Thermal nociceptive threshold testing applies thermal stimulation (usually heat) using
different sources such as a thermode, infrared radiation (usually a laser) and hot water (Dixon
et al., 2002, Veissier et al., 2000, Hardy et al., 1965).

22
Thermal nociception activates the cutaneous thermoceptors including Aδ and polymodal C
fibre nociceptors.
A thermode based device is usually mounted on either on animal’s leg or ear and then the
temperature gradually increased until a response is evoked through either lifting of leg,
flicking of ear, tail, etc. (Dixon et al., 2002).
A laser based device has a beam of known intensity which is projected on the skin surface
of the animal at a constant distance and the response from the animal is similar to that of the
thermode device (Veissier et al., 2000).
Thermal nociceptive threshold testing is useful tool in pain assessment and it is widely used
in different animals to evaluate analgesic efficacy, particularly for opioids, in animals such
as cattle (Herskin et al., 2003, Veissier et al., 2000, Machado Filho et al., 1998), pigs (Di
Giminiani et al., 2013, Herskin et al., 2009), rabbit (Tanelian and Beuerman, 1984) birds
(Hothersall et al., 2011) and also in fishes (Nordgreen et al., 2009).
There are particular advantages and disadvantages of thermode, laser and hot water as every
device generates heat by a different mechanism and therefore the time and distribution of
heat in the animal’s skin is dissimilar (Le Bars et al., 2001).
Advantage of TNT (Le Bars et al., 2001)
1. Specific/selective receptors (physiological) can be activated and therefore properties of targeted receptors can be studied.
Disadvantage of TNT includes (Le Bars et al., 2001):
1. Skin surface and thermode contact limits the conduction of heat while this can be
overpowered by the use of laser technique. However, the cost is usually prohibitive.
1.2.3.3 Physiological responses
Measurement of physiological parameters includes plasma cortisol (gluco-corticoid
hormone) levels during stress or painful procedures in animals. They are often used as
markers for assessment of pain (Stafford et al., 2002, Mathews, 2000, Mellor et al., 2000).
Some researchers have also measured β-endorphin, lactate, tumour necrosis factor alpha,
interleukin-1beta, C-reactive protein, serum amyloid A and haptoglobin levels in blood
(Moya et al., 2008, Mears and Brown, 1997, Shutt et al., 1988). However, plasma cortisol
23
remains the preferred and reliable physiological parameter (Landa, 2012). Physiological
responses which can alter due to pain include pulse, temperature, respiration, blood pressure,
etc. It may be useful during normal and painful conditions to relate and compare the
parameters before and during pain (Bussières et al., 2008, Mellor et al., 2000). All of these
physiological parameters are responses to stress, rather than pain, and stress can also be
induced by non-painful stimuli such as handling.
Neurophysiological responses can also be monitored during painful conditions with
electroencephalography (EEG) which provides an overall indication of cortical activity. This
can give an indication of pain as the cerebral cortex is involved in pain perception and
processing (Murrell and Johnson, 2006, Jongman et al., 2000). Some other
neurophysiological techniques such as bispectral index (BIS, a number derived from the
EEG) and somatosensory evoked potentials (SEPs) have their own advantages and
disadvantages (Murrell and Johnson, 2006). However, many studies have been conducted in
different animals using spectral analysis of the EEG to evaluate the efficacy of many
analgesic and anaesthetic drugs, e.g. in horses (Murrell et al., 2005), cattle (Gibson et al.,
2009), sheep (Jongman et al., 2000), dogs (Kongara et al., 2012) and pigs (Haga and
Ranheim, 2005). The advantages of EEG recording are that it is a non-invasive technique
and data recording is not limited to certain data points but is continuous (Murrell and
Johnson, 2006, Supèr and Roelfsema, 2005, Teplan, 2002) although the data is analysed in
packets. However, it is technically difficult, particularly in awake animals, and prone to
artefacts which can be exaggerated by the mathematical processing required (Kongara, 2008,
Murrell and Johnson, 2006).
Finally, assessment of pain in animals by giving analgesic drugs, then measuring the
behavioral and physiological responses is widely used (Livingston, 2010, Livingston and
Chambers, 2000).
1.2.3.4 Assessment of pain in sheep
Pain assessment in sheep is often difficult. Sheep have evolved prone to attack by predators,
such as wolves (J. Fitzpatrick et al., 2006). Different predators like coyotes (Canada, and
US), black-backed jackals (Africa), and dingo (Australia) attack sheep as prey (Ensminger
24
and Parker, 1986). In New Zealand they are rarely attacked by keas and (more commonly)
feral dogs but are still considered free from predators (Shelton, 2004, Linhart et al., 1982).
Sheep usually tend to mask the effect of pain by expressing normal behaviour in spite of
being in painful conditions (Fitzpatrick et al., 2006), presumably because animals showing
signs of injury are more likely to be picked out by predators. Presence of people is also a
contributing factor for a sheep’s pain hiding (Beausoleil et al., 2005) and they tend to behave
normally when people are around. This does not mean that sheep do not experience pain.
Hyperalgesia, which is an increased sensitivity to pain (Lorenz, 2011), has been observed
both in sheep with chronic mastitis (Dolan et al., 2000) and in lame sheep (Ley et al., 1995).
Various pain related studies in sheep have been conducted in the past (Molony and Kent,
1997, Waterman et al., 1988, Nolan et al., 1987a, Nolan et al., 1987b). However, sheep pain
has not gained as much attention as companion animal pain (Short, 2003). Therefore pain
assessment and management in sheep is necessary to prevent welfare compromise and
lowered production.
Measurement of physiological variables such as plasma cortisol levels have been used as a
method to assess sheep pain (Mellor et al., 2000, Mellor and Stafford, 2000). Mellor and
Stafford, observed that the different methods of castration and tailing in lambs elevate
cortisol levels to different concentrations which may indicate the distress and pain induced
by that method. Similarly, Graham et al. (1997) studied different behavioural responses as
well as cortisol responses in lambs after docking with different methods and obtained results
where the maximal increase in cortisol level was observed after rubber ring application for
docking compared to other methods such as docking iron and rubber ring with Burdizzo. A
corresponding increase in active behaviour was also observed. These results were supported
by (Grant, 2004), when he studied behavioural responses to all routine husbandry practices
such as ear tagging, docking, castration, mulesing etc. with different methods amongst which
all the methods involving rubber ring for castration and docking exhibited elevated
behavioural responses. These behavioural responses included vocalisation, restlessness, the
number of times a lamb stood up and lay down, tail wagging, kicking or foot stamping,
rolling, jumping, licking or biting the wound site, hyperventilating, trembling, stretching and
easing quarters etc. (Grant, 2004). Therefore, these behavioral responses can be considered
helpful for assessment of pain in sheep.

25
Neurophysiological techniques such as EEG recording has been investigated as a method to
study pain in sheep. EEG recordings of changes in the brain activity of sheep that were
subjected to a painful stimulus demonstrated that the response in the brain to pain was similar
to that of humans (Ong et al., 1997). Johnson et al. (2009) recorded EEG readings during
rubber ring castration of lambs over first 7-10 days of their post-natal life. They found
significant changes in EEG indices of nociception and opined that mechanisms that suppress
responses of the foetus to noxious stimulation may still be active in the first few days after
birth. This method though has a disadvantage. The recording of responses to the noxious
stimulation is only practical under general anaesthesia. As anaesthesia blunts the responses
to noxious stimulation the need for general anaesthesia is an obvious limitation of this
technique (Johnson et al., 2009).
Similarly, behavioural responses by using pain scales as described earlier such as NRS and,
VAS etc. have also been used to assess the sheep pain due to lameness (Welsh et al., 1993,
Ley et al., 1989) and also after castration to study the efficacy of carprofen (Steiner et al.,
2003).
Other behavioural responses such as changes in nociceptive threshold responses (thermal,
mechanical and electrical) have also been investigated in sheep to evaluate the analgesic
efficacy various drugs or to investigate sensitisation of peripheral nociceptors following
chronic pain by many researchers (Chambers et al., 1995, Main et al., 1995, Ley et al., 1989,
Nolan et al., 1988, Nolan et al., 1987a, Nolan et al., 1987b). The analgesic action of alpha
2-adrenoceptor agonists and opioids, measured using a thermal and a mechanical test were
shown in a study by Nolan et al., (1987), Waterman et al., (1988) showed that intrathecal
injections of the alpha 2-adrenoceptor agonists, xylazine and clonidine, into the cervical
region of the spinal cord of conscious unrestrained sheep produced a dose-dependent
analgesia of the forelimbs as measured using a mechanical pressure device.
Along with change in physiological parameters and behavioural response/changes;
nociceptive testing is a significant and sensitive tool to assess analgesia in sheep.
26
1.2.3.4.1 Mechanical nociceptive testing
Several devices for delivering noxious mechanical stimuli have been developed for the use
in sheep (Haerdi-Landerer et al., 2003, Chambers et al., 1995, Main et al., 1995, Welsh and
Nolan, 1995, Ley et al., 1989, Nolan et al., 1988, Nolan et al., 1987a, Nolan et al., 1987b).
Waterman et al. (1988) conducted an analgesic study where the sheep were placed in a small
pen in a quiet room and the mechanical pressure testing device was attached to one forelimb
in the region of the lower end of the radius. The device produced a gradually increasing
pressure through a small pin pressing against a bony area of the leg. This pressure was
recorded on a dial in units which were converted to Newtons (N). The response of the animal
to the stimulus was indicated by lifting of the leg, and the pressure at this point was recorded.
1.2.3.4.2 Thermal nociceptive threshold testing
Main et al. (1995), Ley et al. (1989) measured thermal thresholds in sheep using a clip
incorporating a heater, a thermocouple and an inertia cut-off device which was attached to
the pinna of the ear as described by (Nolan et al., 1987a). A gradual increase in the
temperature of the device elicited a well-defined response, either an ear flick or head shake
which operated the cut-out and also recorded the threshold temperature.
The assessment of pain is necessary to guide treatment with analgesic drugs.
1.2.4 Analgesics
Analgesics are drugs that eliminate pain. However, most of these drugs act on the sensory
and emotional components of pain to control it without affecting consciousness. Some of
these drugs alter the threshold of pain by acting as anti-hyperalgesic and they mostly reduce
the pain rather than completely eliminating it, though this can be dose dependent (Nolan,
2000).
Analgesics are classified as (Riviere and Papich, 2013, Singh, 2011, Hewitt, 2000)
1. Opioids
2. Nonsteroidal anti-inflammatory drugs (NSAIDs)
3. Alpha-2 adrenoceptor agonists
27
4. N-methyl-D-aspartate (NMDA) receptor antagonists
5. others
Analgesics are used by veterinarians to provide analgesia in many painful conditions such
as post-operative or post trauma pain, musculoskeletal pain, soft tissue inflammation etc. in
companion animals such as dogs and cats; however among large animals only horses and
cattle are routinely given analgesics (Flecknell, 2008). According to (Riviere and Papich,
2013), since 1998 use of analgesics in veterinary market has been increased. The main
limitations for widespread use of these analgesics in farm animals is their high cost and lack
of accurate pain assessment to guide the dosing regimen (Hewson et al., 2007).
In animals such as dogs and cats opioids class of analgesics is used to manage pain
(Robertson and Taylor, 2004). However, CNS associated side effects such as sedation,
euphoria, dysphoria, and excitement have been reported in small animals (Papich, 2000).
In case of farm animals like cattle and sheep, opioids induced side effects such as light
sedation, vocalization and restlessness have been observed (Bassert and Thomas, 2014) and
cheap drugs like morphine are not effective in ruminants and at the same time they can
cause residues in food animals (Chambers et al., 2002). Also, with alpha-2 adrenoceptor
agonists sedation and ataxia are common side effects in large animals (Bassert and Thomas,
2014, Chambers et al., 2002). Local anaesthetics are short acting though, they are cheap and
some of the metabolites are being considered as carcinogenic in Europe (Chambers et al.,
2002). NSAIDs on the other hand primarily act on the peripheral sites of pain instead on
CNS to reduce associated CNS related side effects and also have zero or minimal
withholding time for milk (Chambers et al., 2002, Papich, 2000). Thus, high costs, CNS
related side effects and short acting nature of the non-NSAIDs makes them disadvantageous
while, making NSAIDs the most effective class of analgesics for ruminants (Chambers et
al., 2002).
1.2.5 NSAIDs
NSAIDs have been used to treat various inflammatory conditions along with fever,
musculoskeletal pain and arthritis since ancient times. The first recorded use was in the
Assyrian era (4000 B.C.) and then Sumerian era (3000 to 1900 B.C.) in the form of willow
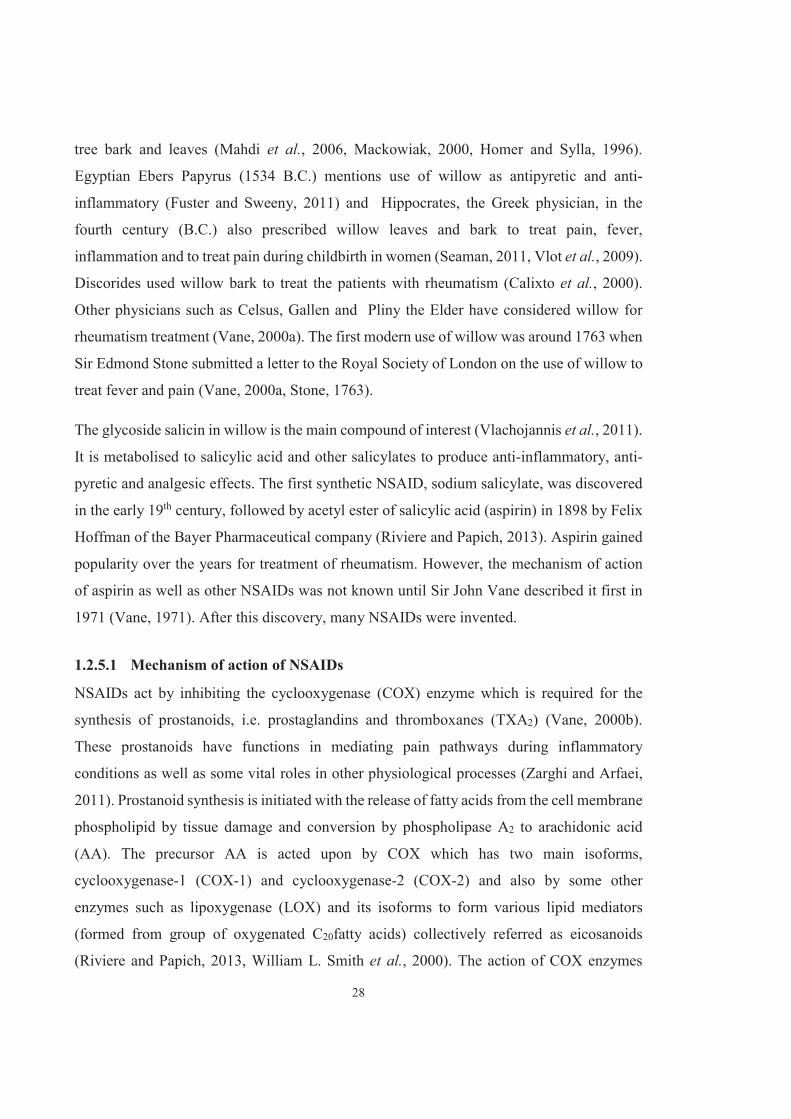
28
tree bark and leaves (Mahdi et al., 2006, Mackowiak, 2000, Homer and Sylla, 1996).
Egyptian Ebers Papyrus (1534 B.C.) mentions use of willow as antipyretic and anti-
inflammatory (Fuster and Sweeny, 2011) and Hippocrates, the Greek physician, in the
fourth century (B.C.) also prescribed willow leaves and bark to treat pain, fever,
inflammation and to treat pain during childbirth in women (Seaman, 2011, Vlot et al., 2009).
Discorides used willow bark to treat the patients with rheumatism (Calixto et al., 2000).
Other physicians such as Celsus, Gallen and Pliny the Elder have considered willow for
rheumatism treatment (Vane, 2000a). The first modern use of willow was around 1763 when
Sir Edmond Stone submitted a letter to the Royal Society of London on the use of willow to
treat fever and pain (Vane, 2000a, Stone, 1763).
The glycoside salicin in willow is the main compound of interest (Vlachojannis et al., 2011).
It is metabolised to salicylic acid and other salicylates to produce anti-inflammatory, anti-
pyretic and analgesic effects. The first synthetic NSAID, sodium salicylate, was discovered
in the early 19th century, followed by acetyl ester of salicylic acid (aspirin) in 1898 by Felix
Hoffman of the Bayer Pharmaceutical company (Riviere and Papich, 2013). Aspirin gained
popularity over the years for treatment of rheumatism. However, the mechanism of action
of aspirin as well as other NSAIDs was not known until Sir John Vane described it first in
1971 (Vane, 1971). After this discovery, many NSAIDs were invented.
1.2.5.1 Mechanism of action of NSAIDs
NSAIDs act by inhibiting the cyclooxygenase (COX) enzyme which is required for the
synthesis of prostanoids, i.e. prostaglandins and thromboxanes (TXA2) (Vane, 2000b).
These prostanoids have functions in mediating pain pathways during inflammatory
conditions as well as some vital roles in other physiological processes (Zarghi and Arfaei,
2011). Prostanoid synthesis is initiated with the release of fatty acids from the cell membrane
phospholipid by tissue damage and conversion by phospholipase A2 to arachidonic acid
(AA). The precursor AA is acted upon by COX which has two main isoforms,
cyclooxygenase-1 (COX-1) and cyclooxygenase-2 (COX-2) and also by some other
enzymes such as lipoxygenase (LOX) and its isoforms to form various lipid mediators
(formed from group of oxygenated C20fatty acids) collectively referred as eicosanoids
(Riviere and Papich, 2013, William L. Smith et al., 2000). The action of COX enzymes
29
produces prostaglandin G2 (PGG2) which is unstable and converted to prostaglandin H2
(PGH2) by peroxidase; further synthesis of other prostaglandins (PGD2, PGE2, PGI2, PGF2
and TXA2) is also accomplished by catalytic synthase enzymes (Figure:1.3) (Rao and Knaus,
2008). Prostaglandins are found in inflammatory exudates as their synthesis is increased in
response to tissue damage (Davies et al., 1984). Therefore, NSAIDs act on the COX
enzymes to prevent the synthesis of prostanoids (figure 1.4) and ultimately produce
analgesic effects. However, the knowledge about functions of prostaglandins, COX enzymes
and selective actions of NSAIDs on COX is required to understand the mechanism of action
of NSAIDs in detail.
1.2.5.2 Prostaglandins and their functions
The term prostaglandin was first introduced by Euler in 1935, when he discovered this acidic
lipid substance in the human seminal plasma due to the assumption that it is secreted by
prostate gland (Horton, 1969). Later, many scientists revealed the biosynthesis of
prostaglandins from AA. Prostaglandins are found in physiological systems such as
gastrointestinal, central nervous system (CNS), endocrine, respiratory, immune system etc.
and also in pathological conditions such as inflammation, cancer, cardiovascular disease and
hypertension where they exert mainly harmful effects (Hata and Breyer, 2004, Narumiya,
2003). Therefore, they have both constitutive and induced functions.
1.2.5.2.1 PGs in inflammation
PGH2 is the precursor for the main bioactive prostaglandins, PGD2, PGE2, PGI2 and PGF2
which are present in most cells; however, their biosynthesis is remarkably increased in
response to inflammation, especially in acutely inflamed tissues (Ricciotti and FitzGerald,
2011). Each prostanoid has specific tissues where preferential synthesis takes place e.g.
PGF2α in uterus, PGI2 in endothelium etc. (Ricciotti and FitzGerald, 2011, Breyer et al.,
2001).
The synthesis of prostaglandins depends upon COX enzymes which have two main
isoforms, COX-1 and COX-2. COX-1 is considered to produce the PGs which have
constitutive function, while COX-2 is induced by inflammatory processes (Brzozowski et
al., 2001). COX-1 preferentially links with thromboxane synthase, PGF synthase, and PGE

30
(cytosol) synthase, while COX-2 prefers PGI and the PGE (microsomal) synthase (Smyth et
al., 2009).
Fig 1.3: Synthesis of prostaglandins, edited from (Rao and Knaus, 2008)
Fig 1.4: Mechanism of action of NSAIDs, edited from (Rao and Knaus, 2008)
*5-HPETE (5-hydroperoxyeicosatetraenoic acid)
Cell membrane
AA
Phospholipids
Phospholipase A2
COX-1 COX-2
PGG2
PGH2
Peroxidase function
Various Leucotrines (LT) through 5-HPETE 5-HPETE
TXA2 PGD2
PGF2
PGE2
PGI2
PGD synthase TXA synthase
PGE
synt
hase
Cell membrane
AA
Phospholipids
Phospholipase A2
COX-1 COX-2
PGG2
PGH2
Peroxidase function
Various Leucotrines (LT) through 5-HPETE 5-HPETE
TXA2 PGD2
PGF2
PGE2
PGI2
PGD synthase TXA synthase
PGE
synt
hase
Aspirin Indomethacin Ibuprofen
Aspirin Indomethacin Ibuprofen Rofecoxib Celecoxib
Inhibition Inhibition
No synthesis of PGs due to COX inhibition by NSAIDs
31
PGs bind to specific rhodopsin-like-7-transmembrane-spanning G protein-coupled receptors
(Ricciotti and FitzGerald, 2011). There are eight prostanoid receptors, E prostanoid receptor
(EP) 1, EP2, EP3 and EP4 which bind PGE; D prostanoid receptor (DP1); F prostanoid
receptor (FP); I prostanoid receptor (IP); and thromboxane receptor (TP) (Breyer et al.,
2001).
1.2.5.2.2 PGE2
PGE2 is a COX-1 and 2 derived PG exhibited in many animal species and is widely involved
in biological processes such as immunity, gastrointestinal integrity, fertility and blood
pressure; however, impairment in its synthesis is followed by series of pathological
conditions such as chronic inflammation, Alzheimer's disease, or tumorigenesis (Legler et
al., 2010). PGE2 is involved in all classical processes of inflammation such as redness,
swelling and pain which makes the role of PGE2 prominent in inflammation (Ricciotti and
FitzGerald, 2011). EP1 receptors are involved in the typical sign of inflammation,
hyperalgesia, which occurs through peripheral as well as central activation (Moriyama et al.,
2005). EP2 and EP4 are involved in collagen induced arthritis where development of
swelling is due to these receptors (Honda et al., 2006). Similarly, EP2 and EP3 are observed
in carrageenan induced oedema and pleurisy (Yuhki et al., 2004).
1.2.5.2.3 PGD2
PGD2 is widely involved in the various systems of the body such as central nervous system
where it plays role in induction of sleep, regulation of body temperature and hormonal
release (Nagata and Hirai, 2003, Kobayashi and Narumiya, 2002) and other systems such
as the vascular and immune systems where it has specific roles. In the vascular system it
inhibits the aggregation of platelets and in the immune system it is secreted by mast cells
after activation with antigen in allergic conditions such as asthma (Nagata and Hirai, 2003,
Kobayashi and Narumiya, 2002).
1.2.5.2.4 PGI2
PGI2 or prostacyclin, is a prostaglandin that affects many body systems. It has two main
functions as inhibition of platelet aggregation and it acts as vasodialator (Kelton and
Blajchman, 1980). This eicosanoid has an important role in the cardiovascular system
32
through its receptor IP and along with vasodilation it is an inhibitor of platelet aggregation,
leukocyte adhesion, and vascular smooth muscle cells proliferation (Kawabe et al., 2010).
Apart from its protective role, this PG is present in inflammatory exudates in arthritis
(Ricciotti and FitzGerald, 2011).
1.2.5.2.5 PGF2α
This PG has a role in various activities of the reproductive system such as in luteolysis (in
ruminants including sheep is most important), uterine smooth muscle contraction, and
instigation of parturition; apart from this, it is also involved in the renal function, myocardial
function and pain (allodynia) (Ricciotti and FitzGerald, 2011, Kunori et al., 2009, Eguchi et
al., 1992, Silvia et al., 1991). PGF2α is present in acute and chronic inflammatory exudates
in conditions such as arthritis, obesity, diabetes etc. (Higdon and Frei, 2003). In humans
PGF2α has been reported to cause bronchoconstriction, especially asthamatic people are
more prone to this action; however response differs on individual basis (Pasargiklian et al.,
1976).
1.2.5.2.6 TXA2
TXA2 is largely a COX-1 derivative (Ricciotti and FitzGerald, 2011). It has mixed role as
pro- and anti-inflammatory mediator as it is evident in the asthma (Tilley et al., 2001). It is
involved in platelet aggregation (Gryglewski et al., 1978). It is also a potent vasoconstrictor
and therefore has potential risk in induction of cardiovascular disorders (Cheng et al., 2002).
1.2.5.3 Cyclooxygenase (COX) enzymes
Cyclooxygenase (COX) is the enzyme required to catalyse the process of prostaglandins
synthesis. It has two main isoforms COX-1 and COX-2 and these enzymes are also known
as prostaglandin endoperoxide H synthases (PGHS) (Smith et al., 1996). The enzyme was
first discovered from sheep seminal vesicles when Sir John Vane described the mechanism
of aspirin inhibiting the enzyme COX and ultimately preventing the synthesis of prostanoids
(Vane, 1971). After about 20 years, COX-2 was discovered in early 90’s with about 60%
similar amino acid sequencing as that of COX-1 with a different expression pattern and
biology (Smith et al., 1996). Recently, third isoform called COX-3 has also been discovered
33
which is considered as the variant of COX-1 (Chandrasekharan et al., 2002) and may only
be present in dogs.
1.2.5.3.1 COX-1
COX-1 is a constitutive enzyme which is present in almost every tissue and responsible for
the synthesis of prostaglandins that are important in many vital physiological functions
(Talley et al., 2000). PGE2, PGF2α and TXA2 are predominantly COX-1 derived and they
play important physiological functions (Ricciotti and FitzGerald, 2011). Classic NSAIDs
such as aspirin and indomethacin inhibit COX-1 and prevent synthesis of prostaglandins
required for protective functions such as maintenance of integrity of gastrointestinal mucosa,
reproductive functions related to PGF2α (Willoughby et al., 2000, Mitchell et al., 1993).
1.2.5.3.2 COX-2
The discovery of COX-2 enzyme led to the development of COX selective NSAIDs. COX-
2 is an isomer of COX-1 with a slight difference in its amino acid sequencing (COX-1 has
576 amino acids as opposed to COX-2 with 581 amino acids) (Rouzer and Marnett, 2009).
COX-2 is not present in all tissues normally but has dramatically increased levels after
exposure to cytokines (IL-1, TNFα), growth factors, bacterial toxins etc.(Riviere and Papich,
2013, Dubois et al., 1998). COX-2 has wide range of functions which includes both
constitutive physiological and pathological processes. In the reproductive system of mice
COX-2 is involved in the ovulation, fertilization, and implantation as well as during the
completion of pregnancy (Lim et al., 1997). It is also constitutively present in monocytes,
macrophages, endothelial cells, spinal cord, brain and ciliary body of the eye etc. (Riviere
and Papich, 2013). However, in the brain, it is involved in the neurodegenerative disorders
(Alzheimer’s disease) and also synthesises PGs which induce fever (Teismann et al., 2003).
It has also a significant role in certain cancers (Riviere, 2009). The presence of COX-2 in
the cartilage and synovial fluid in osteoarthritis and rheumatoid arthritis shows its role in
inflammatory and painful conditions which can be considered due to its action at peripheral
as well as central sites (Dubois et al., 1998). Due to the participation of COX-2 in these non-
constitutive functions, COX-2 selective NSAIDs have been developed so that they can
specifically inhibit COX-2 without disrupting the COX-1 functions (DeWitt, 1999). Coxibs
34
are a new class of COX-2 selective NSAIDs which includes deracoxib, mavacoxib,
robenacoxib, firocoxib for veterinary use (Riviere and Papich, 2013). There are several in
vitro test systems available for testing the selectivity of COX-2 inhibitors. These tests are
classed into three main groups as purified/recombinant enzymes, cultures of intact cells and
human whole blood assay (Giuliano and Warner, 1999).
1.2.5.3.3 COX-3
Simmons et al. (1999) and Willoughby et al. (2000) proposed a third isoform of this enzyme
family, COX-3, which might represent a new therapeutic target. However, Chandrasekharan
et al. (2002) discovered COX-3 was derived from the COX-1 gene but retained intron 1 in
mRNA. COX-3 is expressed in canine cerebral cortex and in lesser amounts in other tissues
analysed. In human, COX-3 mRNA is expressed as an approximately 5.2-kb transcript and
is most abundant in cerebral cortex and heart. Intron 1 is conserved in length and in sequence
in mammalian COX-1 genes (Botting and Ayoub, 2005, Chandrasekharan et al., 2002).
COX-3 is expressed efficiently in insect cells as membrane-bound proteins
(Chandrasekharan et al., 2002). COX-3 possesses glycosylation-dependent cyclooxygenase
activity (Warner and Mitchell, 2002). Comparison of canine COX-3 activity with murine
COX-1 and -2 demonstrates that this enzyme is selectively inhibited by drugs such as
paracetamol, phenacetin, antipyrine and dipyrone. Thus, inhibition of COX-3 could
represent a primary central mechanism by which these drugs decrease pain and possibly
fever (Warner and Mitchell, 2002, Chandrasekharan et al., 2002).
1.2.5.4 Additional possible mechanisms of action of NSAIDs
It has been established that some NSAIDs act not only on COX-1 and COX-2, but also
inhibit the nuclear transcription factor ĸB that is essential for cytokine gene expression
during inflammation (Vaish and Sanyal, 2011, Lawrence, 2009). Inhibition of NFĸB, related
transcription factors, or cytokines themselves, could be considered a potential treatment for
acute and chronic inflammatory pain (Carr and Goudas, 1999). Another possible mechanism
of action could be the inhibition of 5-LO (5-lipoxygenase) which ultimately inhibits
leukotrienes synthesis; tepoxalin is an example of a dual inhibitor i.e. COX and 5-LO
(Kirchner et al., 1997). Inhibition of NFҡB which controls the expression of COX-2 and
35
cyclin-1; also inhibition of TNF (tumour necrosis factor) by most of the NSAIDs such as
aspirin, ibuprofen, sulindac, phenylbutazone, naproxen, indomethacin, diclofenac, celecoxib
has been demonstrated and should be considered as an additional mechanism of action of
NSAIDs (Takada et al., 2004). Similarly, various other mechanisms of action of NSAIDs
described are inhibition of action of eicosanoids on their receptors (Funk, 2001), stimulation
of nuclear receptor peroxisome proliferator-activated receptor-gamma (PPAR-γ) (Fahmi et
al., 2002, Jiang et al., 1998)inhibition of bradykinin (Engelhardt et al., 1995), modulation of
release of pro-inflammatory cytokines (e.g. IL (interleukin) -1, IL-6, TNF-α), increased
intracellular breakdown of ATP to adenosine, inhibition of neutrophil activation and
ultimately preventing release of oxygen radicals (superoxide, hydroxyl) as well as lysosomal
and non-lysosomal enzymes (Riviere and Papich, 2013), modulation of synthesis of nitric
oxide (Bergh and Budsberg, 2005, Wallace et al., 1994) etc. Further, a spinal mechanism of
action of NSAIDs has been reported in different studies where intra-thecal administration of
NSAIDs inhibits behavioural hyperalgesia produced by the action SP and NMDA (by
formation of PGs) in the spinal cord (McCormack, 1994a, Malmberg and Yaksh, 1994).
1.2.5.5 Therapeutic uses of NSAIDs
NSAIDs are generally used as anti-inflammatory, anti-pyretic and analgesic drugs. Their use
during perioperative conditions, in acute injury e.g. lameness, accidental or sports injuries
(usually in equines and sometimes in dogs), musculoskeletal conditions is common
(Lascelles et al., 1997, Welsh and Nolan, 1995).
NSAIDs are also used in animals to treat chronic pain, specifically arthritis in horses and
dogs (Goodrich and Nixon, 2006, Fung and Kirschenbaum, 1999). This means they are likely
to be useful in other animals such as sheep suffering lameness.
NSAIDs act as antithrombotic agents as they inhibit blood clotting by blocking the formation
of TXA2 by COX-1 (Riviere and Papich, 2013) especially aspirin which irreversibly inhibits
COX-1 in platelets and therefore is used in cats to treat aortic embolism (Smith et al., 2003).
Similarly, the use of NSAIDs in oncology has also been revealed as some promising results
were observed in controlling the growth of neoplastic cells in rats and dogs (Bergh and

36
Budsberg, 2005) and also been used routinely in some cancers such as colon and rectal
cancers in people (Rayburn et al., 2009).
1.2.5.6 Side effects of NSAIDs
The most common side effects of NSAIDs are gastrointestinal irritation and ulcer in
monogastric animals and humans (Beck et al., 2000, Bjarnason et al., 1993). Rarely renal
failure (especially with COX-inhibitors) has also been observed in animals such as dogs and
in humans (Lomas and Grauer, 2015, Whelton and Hamilton, 1991). Apart from these, some
other very rare adverse effects are also reported in humans which are similar for all NSAIDs.
Central nervous system associated symptoms such as headaches, tinnitus and dizziness.
Cardiovascular symptoms include fluid retention, hypertension, oedema and rarely,
congestive heart failure. Gastrointestinal symptoms involve abdominal pain, dysplasia,
nausea, vomiting, ulcers and bleeding. Other side effects such as thrombocytopenia,
neutropenia, abnormal liver enzymes, asthma, skin rashes (pruritis) and renal insufficiency.
(Katzung et al., 2004).
In ruminants such as cattle only reduction in fertility i.e. irregular oestrous cycles, reduction
in pregnancy rates and reduced formation of corpus leutium have been reported (Stahringer
et al., 1999). Only one report of gastrointestinal impairment (abomasal ulceration) due to
NSAID (ibuprofen) in ruminants (calves) is evident as far as our knowledge till date (Walsh
et al., 2016) .
1.2.5.7 Classification of NSAIDs
All NSAIDs have potentially similar properties. Chemically, all are weak acids and have
similar pharmacological actions i.e. anti-inflammatory, anti-pyretic and analgesic properties,
and also clinical uses (Riviere and Papich, 2013). However, they can be classified
considering different criteria such as chemical properties, clinical uses, COX enzyme
selectivity etc. (Conaghan, 2012). Therefore, researchers are attempting to improve NSAIDs
classification. Frölich (1997), have classified NSAIDs on their COX selectivity and other
criterion nonetheless, Griswold et al. (1997) disagreed with this classification to some
extent, though he agrees the necessity of re-classification of NSAIDs.
37
According to chemical properties, classically NSAIDs are described as two weak acid groups
namely, carboxylic acids (R-COOH) and enolic acids (R-COH) (Nolan, 2000). Further
classification of these acid groups’ compounds is shown below (table 1.3) as described by
Riviere and Papich (2013) for veterinary use. In addition to these, another group of NSAIDs
is COXIBs on the basis of their COX selectivity i.e. the ability/preference of the NSAID to
inhibit COX-1 or COX-2 or both and is expressed as the ratio of the COX-2 IC50 to the COX-
1 IC50, so that the more COX-2-selective an agent the smaller is the ratio expressed (Hawkey,
1999); (IC50 is the half maximal inhibitory concentration. It is a measure of the effectiveness
of a substance/drug in inhibiting a specific biological or biochemical function; here,
inhibition of enzymes COX-1 and/or COX-2). Some NSAIDs inhibit COX-1 enzyme, some
inhibit specifically COX-2 enzyme while some are non-selective. The existing drugs which
selectively inhibit COX-2 enzyme are meloxicam, nimesulide, etodolac and nabumatone;
however, other specifically designed drugs have been emerged as a drug development
programme and these drugs preferentially select COX-2 (Hawkey, 1999). These drugs are
efficient in reducing gastric ulceration and irritation due to their selectivity to COX-2 in
animals such as rats and in humans (Silverstein et al., 2000, Hawkey, 1999). Examples of
these drugs are coxibs (specially, rofecoxib and celecoxib).
Again, classification by Conaghan (2012) on the basis of COX selectivity as well as chemical
properties and pharmacological uses has been considered as below.
1.2.5.7.1 Selective COX-2 inhibitors (COXIBs)
These drugs have activity against COX-2 enzymes and have been helpful in providing major
improvement in pain therapy (Sinatra, 2002). These drugs exhibit no inhibition or partial
inhibition of COX-1 enzyme. The major advantage due to these drugs is improved GI tract
safety. The examples of COXIBs used in the veterinary medicines are fircoxib, deracoxib,
mavacoxib and robenacoxib (Riviere and Papich, 2013).
1.2.5.7.2 COX inhibiting nitric oxide donors (CINODs)
These are nitroesters of older non-selective COX inhibitors such as aspirin, indomethacin
and phynylbutazone. These drugs with ester linkage are hydrolysed when administered in
vivo so that parent NSAID is generated along with the vasodilator nitric oxide (NO). NO is
38
supposed to enhance potency of the drug and gastric tolerance (Wallace et al., 1994).
However, no CINOD has been introduced in veterinary medicine (Riviere and Papich, 2013).
Table 1.3: Classification of NSAIDs on the basis chemical propertiesab
Carboxylic acids Enolic acids COXIBs
Salicylates • Sodium salicylate • Acetylsalicylic acid (aspirin)
Oxicams • Meloxicam • Piroxicam • Tenoxicam
COX-2 inhibitors • Celecoxib • Rofecoxib • Firocoxib • Mavacoxib • Deracoxib • Robenacoxib • Cimicoxib
Indoleacetic acid • Etodolac
Pyrazolones • Phenylbutazone • Oxyphenbutazone • Isopyrin • Dipyrone
Indolines • Indomethacin
Thiophenacetic acid • Diclofenac • Eltenac
2-Arylpropionic acids • Carprofen • Ketoprofen • Vedaprofen • Flurbiprofen • Ibuprofen • Naproxen
Anthranilic acids • Flunixin • Meclofenamic acid • Tolfenamic acid • Mefenamic acid
Quinolines • Cincophen
aAs described by (Riviere and Papich, 2013), bedited from (Wright, 2002)
1.2.5.7.3 Dual COX/ 5-LOX inhibitors
This class of compounds is dual inhibitor of COX as well as 5-LOX. Earlier drugs
demonstrated low potency. Recently, second-generation dual inhibitors have been
developed. Tepoxalin and licofelone are two compounds which are used in veterinary
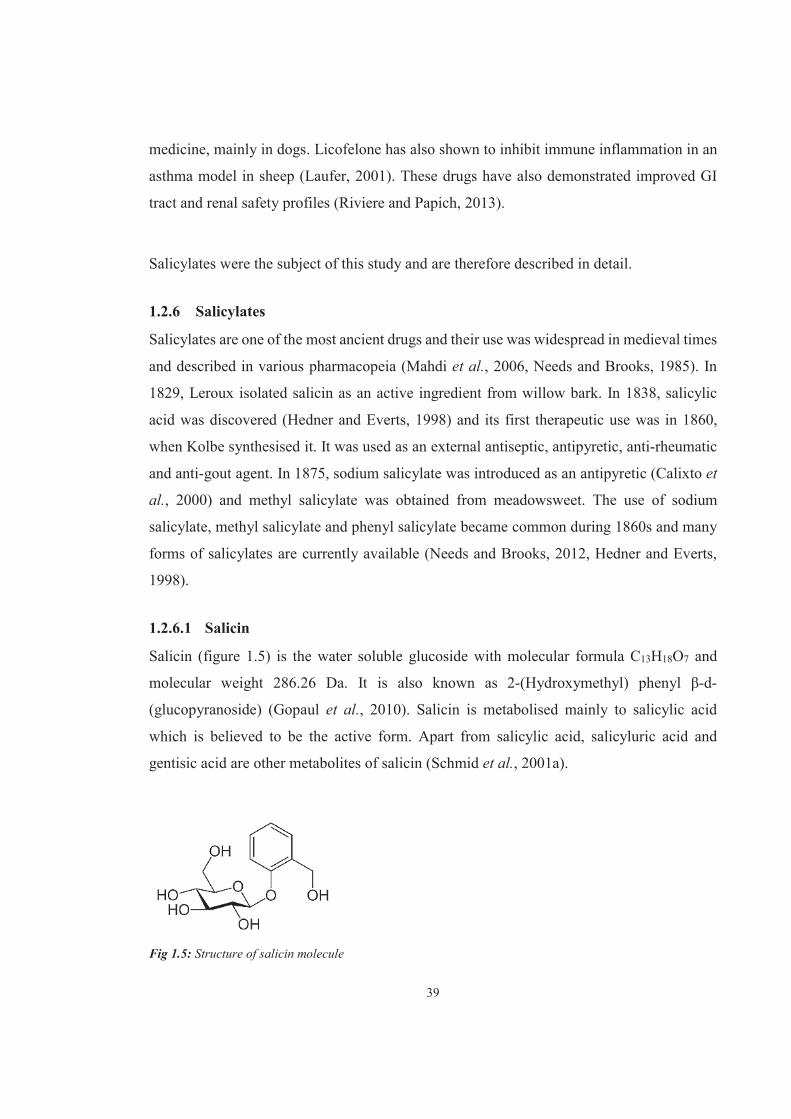
39
medicine, mainly in dogs. Licofelone has also shown to inhibit immune inflammation in an
asthma model in sheep (Laufer, 2001). These drugs have also demonstrated improved GI
tract and renal safety profiles (Riviere and Papich, 2013).
Salicylates were the subject of this study and are therefore described in detail.
1.2.6 Salicylates
Salicylates are one of the most ancient drugs and their use was widespread in medieval times
and described in various pharmacopeia (Mahdi et al., 2006, Needs and Brooks, 1985). In
1829, Leroux isolated salicin as an active ingredient from willow bark. In 1838, salicylic
acid was discovered (Hedner and Everts, 1998) and its first therapeutic use was in 1860,
when Kolbe synthesised it. It was used as an external antiseptic, antipyretic, anti-rheumatic
and anti-gout agent. In 1875, sodium salicylate was introduced as an antipyretic (Calixto et
al., 2000) and methyl salicylate was obtained from meadowsweet. The use of sodium
salicylate, methyl salicylate and phenyl salicylate became common during 1860s and many
forms of salicylates are currently available (Needs and Brooks, 2012, Hedner and Everts,
1998).
1.2.6.1 Salicin
Salicin (figure 1.5) is the water soluble glucoside with molecular formula C13H18O7 and
molecular weight 286.26 Da. It is also known as 2-(Hydroxymethyl) phenyl β-d-
(glucopyranoside) (Gopaul et al., 2010). Salicin is metabolised mainly to salicylic acid
which is believed to be the active form. Apart from salicylic acid, salicyluric acid and
gentisic acid are other metabolites of salicin (Schmid et al., 2001a).
Fig 1.5: Structure of salicin molecule
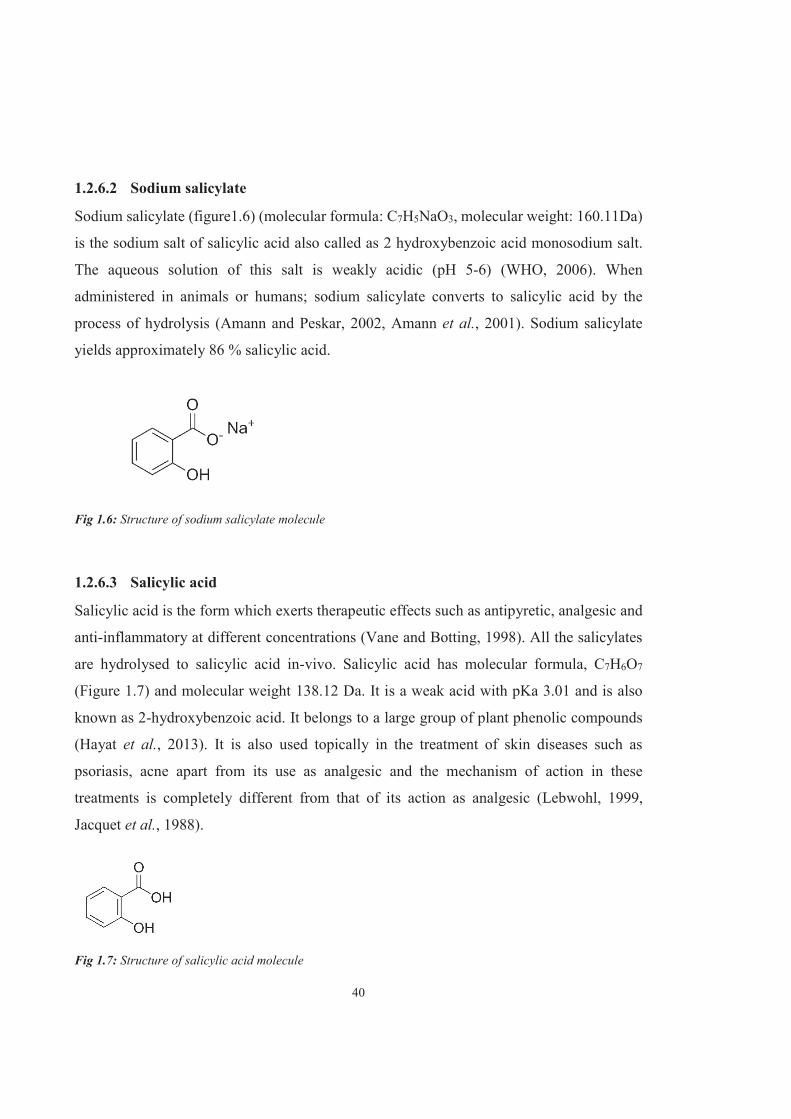
40
1.2.6.2 Sodium salicylate
Sodium salicylate (figure1.6) (molecular formula: C7H5NaO3, molecular weight: 160.11Da)
is the sodium salt of salicylic acid also called as 2 hydroxybenzoic acid monosodium salt.
The aqueous solution of this salt is weakly acidic (pH 5-6) (WHO, 2006). When
administered in animals or humans; sodium salicylate converts to salicylic acid by the
process of hydrolysis (Amann and Peskar, 2002, Amann et al., 2001). Sodium salicylate
yields approximately 86 % salicylic acid.
Fig 1.6: Structure of sodium salicylate molecule
1.2.6.3 Salicylic acid
Salicylic acid is the form which exerts therapeutic effects such as antipyretic, analgesic and
anti-inflammatory at different concentrations (Vane and Botting, 1998). All the salicylates
are hydrolysed to salicylic acid in-vivo. Salicylic acid has molecular formula, C7H6O7
(Figure 1.7) and molecular weight 138.12 Da. It is a weak acid with pKa 3.01 and is also
known as 2-hydroxybenzoic acid. It belongs to a large group of plant phenolic compounds
(Hayat et al., 2013). It is also used topically in the treatment of skin diseases such as
psoriasis, acne apart from its use as analgesic and the mechanism of action in these
treatments is completely different from that of its action as analgesic (Lebwohl, 1999,
Jacquet et al., 1988).
Fig 1.7: Structure of salicylic acid molecule

41
1.2.6.4 Aspirin/acetylsalicylic acid
Aspirin (molecular formula: C9H8O4, molecular weight: 180.157 Da, pKa 3.49) (figure 1.8)
is a weak acid. It was first synthesised by Felix Hoffman at Bayer pharmaceuticals to treat
his father’s rheumatism. Later, as research director of Bayer, he introduced this drug to the
world in 1899 (Vane and Botting, 1998). It became a popular drug over the decades and is
still used commonly to treat pain, fever etc. However, the adverse effects caused by long
term use have reduced its use in painful conditions and its use as anti-platelet agent has
become more popular. Similarly, aspirin has shown promising results in prevention of
several types of cancers such as colorectal cancer, angina, transient ischemic attacks and
thrombosis when taken at smaller doses in long term (Katzung et al., 2004, Sandler et al.,
2003).
Aspirin itself produces an anti-platelet effect; however, it is rapidly metabolised to acetic
acid and salicylate by tissue and blood esterases and therefore, as such has a half-life of about
15 minutes in vivo (Hsu, 2013, Katzung et al., 2004).
Fig 1.8: Structure of aspirin molecule
1.2.6.5 Pharmacological actions of salicylates
1.2.6.5.1 Anti-inflammatory activity
Salicylates are believed to exert their pharmacological/therapeutic effects by inhibiting the
activity of COX enzymes. However, their potency is a matter of discussion (Amann and
Peskar, 2002). According to some views, salicylates exhibit a similar mechanism of action
as aspirin. Aspirin mainly acetylates the essential serine at the active site of COX in platelets
irreversibly and therefore, inhibits the synthesis of prostanoids. Aspirin is rapidly

42
deacetylated to yield salicylates which are therefore probably mediate the anti-inflammatory
activities. This is evident from several in-vivo studies (Amann and Peskar, 2002, Higgs et
al., 1987). Nonetheless, an in-vivo study (Chiabrando et al., 1989) on the inhibitory effects
of salicylates on the prostaglandin inhibition demonstrates that all the inhibitory effects of
aspirin are not mediated by salicylates. Most studies show weak inhibitory activity of
salicylate against prostaglandin biosynthesis when introduced in intact cells. However,
interestingly, some show moderately preferential COX-1 inhibition by salicylates (Mitchell
et al., 1993) while others show selectivity for COX-2. The explanation for variable potencies
of salicylate in prostaglandin synthesis inhibition could be the concentration of arachidonic
acid present. Also, proteins available in the cell may bind to the salicylates and arachidonic
acid which also alters their potency (Amann and Peskar, 2002, Amann et al., 2001, Mitchell
et al., 1997).
Salicylates tend to accumulate in inflammatory exudates in higher concentrations than that
of the plasma, which makes plasma concentration a poor measure of pharmacological effect
(Lees, 2003, Amann and Peskar, 2002, McCormack, 1994a, McCormack, 1994b).
However, the role of salicylates in extracellular signaling pathways as mentioned in the other
possible mechanisms of action of NSAIDs is evident. Almost all the possible mechanisms
including inhibition of nuclear transcription factor ĸB, TNF, cytokines, modulation of
release of pro-inflammatory cytokines, entrapping of free hydroxyl radicals are shown by
salicylates, especially sodium salicylate (Funk, 2001, Cronstein et al., 1999, Colantoni et al.,
1998, Epstein et al., 1997, Van Jaarsveld et al., 1994), except the activation of PPAR-γ
(Lehmann et al., 1997).
Salicylates do not acetylate COX-1 in the gastric mucosa irreversibly and therefore they do
not cause gastric ulceration to the same extent as aspirin (Amann and Peskar, 2002). On the
other hand, salicylates do not encourage the formation of lipoxins (15-epi-lipoxins), while
aspirin promotes the formation of lipoxins when COX-2 is acetylated with aspirin (Paul-
Clark et al., 2004, Serhan, 1997). Lipoxins exhibit anti-inflammatory activities (Machado et
al., 2006).
43
1.2.6.5.2 Analgesic activity
The analgesia produced by salicylates is mild. The analgesic effect is probably mediated
both peripherally and centrally (Bannwarth et al., 1995, Houser and Paré, 1973).
1.2.6.5.3 Antipyretic activity
The antipyretic activity of salicylates is mediated by blockade of PGE production by
pyrogens in the hypothalamus. However, when administered at toxic doses, they can act as
pyretic agents due to dehydration produced by salicylate intoxication (Brunton et al., 2011,
Cranston et al., 1970).
1.2.6.6 Absorption, distribution, biotransformation and excretion of salicylates
Salicylate absorption after oral administration is rapid, partially from the stomach and
generally from the upper small intestine in humans and in monogastric animals. Salicylates
are weak acids and are less ionised at lower pH and readily absorbed by passive diffusion in
the non-dissociated salicylic acid form (Needs and Brooks, 1985, Hollister and Levy, 1965).
In ruminants’ the drug administered in solid form usually absorbed well from the rumen if
it’s a weak acid; however, when administered in liquid form it is initially received by
reticulum and may pass through reticulo-omasal orifice to reduce ruminal degradation and
providing more drug for intestinal absorption; this applies to all NSAIDs including
salicylates (Riviere and Papich, 2013).
The absorption of salicylates in general depends upon the site of absorption (for instance,
rectal absorption is lower than intestinal, absorption of salicylic acid from intact skin is very
rapid), presence of food in the stomach as it may bind to the digesta, pH of the site etc.
(Brunton et al., 2011).
Distribution of salicylates occurs throughout the body tissues and transcellular fluids
depending on the pH. Salicylates are readily distributed across choroid plexus and can also
cross the placental barrier. Salicylates bind to plasma proteins (80-90 %), especially albumin
(Brunton et al., 2011). Therefore, volume of distribution of salicylates is low (0.5 to 0.7
L/kg). This leads to affinity for inflammatory exudates that are rich in proteins. However, at
higher doses of salicylate, the binding sites of plasma proteins are saturated and
consequently, a high volume of distribution is seen due to free salicylates in the plasma.
44
Thus the volume of distribution of the salicylates depends upon the albumin available for
binding and also on the presence of other compounds competing for the protein binding sites
(Brunton et al., 2011, Needs and Brooks, 1985).
The metabolism of salicylates in humans occurs primarily in hepatic endoplasmic reticulum
and mitochondria, although it occurs in many other tissues too. The metabolites of salicylate
are produced after its conjugation with different compounds. Salicyluric acid is the chief
metabolite as a result of conjugation with glycine; phenolic glucoronide and acyl
glucoronide are also important conjugates. A minor fraction is also oxidised to gentisic acid
and to gentisuric acid. 2, 3 dihydroxybenzoic acid and 2, 3, 5-trihydroxybenzoic acids are
also generated (Brunton et al., 2011, Needs and Brooks, 1985, Levy, 1981).
The excretion of salicylates occurs through urine as salicylic acid (10 %), salicyluric acid
(75 %), salicylic phenolic glucuronide (10%), acid glucoronides (5%) and gentisic acid (less
than 1 %). However, the elimination of salicylate depends on the dose and species as well
as the pH of the urine. Alkaline urine enhances excretion of salicylates while acidic urine
diminishes it to lower than normal (Riviere and Papich, 2013, Brunton et al., 2011).
1.2.6.7 Therapeutic effects and pharmacokinetic parameters of salicylates in different species
Salicylates are mostly used in humans for the treatment of inflammatory painful conditions
such as rheumatoid arthritis, apart from fever, headache and other painful conditions
(Preston et al., 1989, Boardman and Hart, 1967). Moderate analgesic and antipyretic effects
of salicylates are produced when plasma salicylate concentration is less than 60μg/mL and
the dose of salicylate for analgesia and antipyresis ranges from 325 to 650 mg orally every
four hours in adult humans. However, their action is diverse in different animal species due
to differences in the pharmacokinetics, which are affected by various factors ( for instance,
extent of plasma protein binding, bioavailability and pH of the urine affecting the elimination
from the body) (Needs and Brooks, 2012, Katzung et al., 2004).
Clinically, pharmacokinetics of the salicylates differs widely between animal species and
extrapolating from one species to other is not recommended. Davis and Westfall (1972),
have reported salicylate half-life values in several animals which display a wide range of
variation: goat 0.8 hrs, horse 1 hr, pig 5.9 hrs, dog 8.6 hrs and cat 37.6 hrs. (All other
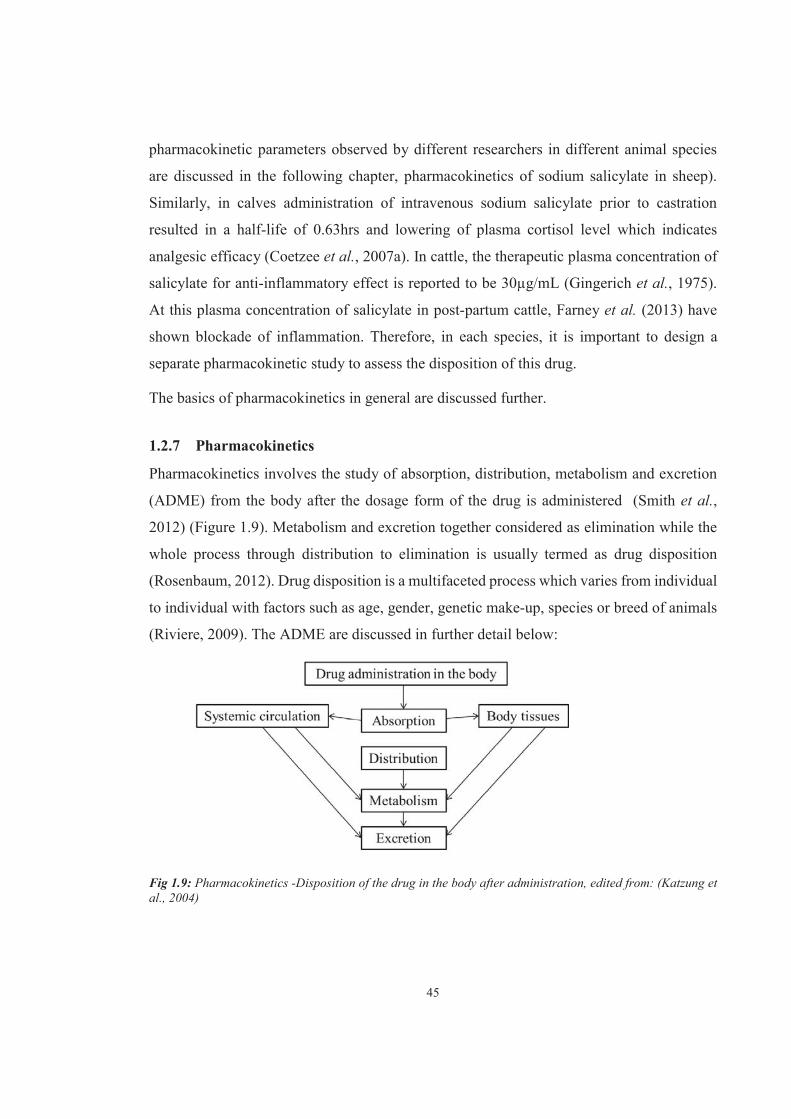
45
pharmacokinetic parameters observed by different researchers in different animal species
are discussed in the following chapter, pharmacokinetics of sodium salicylate in sheep).
Similarly, in calves administration of intravenous sodium salicylate prior to castration
resulted in a half-life of 0.63hrs and lowering of plasma cortisol level which indicates
analgesic efficacy (Coetzee et al., 2007a). In cattle, the therapeutic plasma concentration of
salicylate for anti-inflammatory effect is reported to be 30μg/mL (Gingerich et al., 1975).
At this plasma concentration of salicylate in post-partum cattle, Farney et al. (2013) have
shown blockade of inflammation. Therefore, in each species, it is important to design a
separate pharmacokinetic study to assess the disposition of this drug.
The basics of pharmacokinetics in general are discussed further.
1.2.7 Pharmacokinetics
Pharmacokinetics involves the study of absorption, distribution, metabolism and excretion
(ADME) from the body after the dosage form of the drug is administered (Smith et al.,
2012) (Figure 1.9). Metabolism and excretion together considered as elimination while the
whole process through distribution to elimination is usually termed as drug disposition
(Rosenbaum, 2012). Drug disposition is a multifaceted process which varies from individual
to individual with factors such as age, gender, genetic make-up, species or breed of animals
(Riviere, 2009). The ADME are discussed in further detail below:
Fig 1.9: Pharmacokinetics -Disposition of the drug in the body after administration, edited from: (Katzung et al., 2004)
46
1.2.7.1 Absorption
Absorption of the drug is its movement from the site of administration to blood or systemic
circulation (Riviere, 2009). Absorption of the drug depends upon the route of drug
administration and the form of the drug administered. Drugs administered intravenously are
absorbed directly in to the circulatory system while drugs administered through
extravascular routes take a longer time to get into circulation. Similarly, the absorption of a
liquid formulation of the drug is quick as it does not require any dissolution; however, tablets
or capsules are solid and require disintegration and dissolution before absorption.
Dissolution is partly dependent on the dissociation constant of the drug. Orally administered
drug is mostly absorbed by GI tract epithelium to reach into the portal circulation; however,
the drug which is extensively metabolised in the liver may not reach the systemic circulation
in high enough concentration to produce therapeutic effects.
In general, absorption of the drug depends upon various elements such as formulation,
particle size, physicochemical properties (e.g. pH, lipophilicity) of the drug, route of
administration, solubility of the drug, species of the animal, systemic environment of the
animal, pathological and physiological condition etc. (Riviere and Papich, 2013, Brunton et
al., 2011)
Absorption is directly related to the bioavailability of the drug which is the fraction of the
drug which reaches the systemic circulation and the clinician is usually concerned about this.
Therefore, bioavailability is also affected by the same factors as absorption (Brunton et al.,
2011).
1.2.7.2 Distribution
After absorption or administration into the circulation, the drug is distributed in the different
body fluids such as plasma, interstitial fluid, intracellular fluid etc. to reach the tissues of the
different organs. The distribution of the drug depends upon several physiological factors of
the body as well physiochemical properties of the drug. The physiological factors include
cardiac output, regional blood flow, capillary permeability, tissue volume etc. while,
physiochemical properties of the drug involves its molecular weight, pKa and lipid solubility
(Brunton et al., 2011, Riviere, 2009).

47
Most drugs are distributed in the first instance to the highly perfused organs such as heart,
liver, kidney, brain etc.; then they are delivered to skin, fat and most of the viscera slowly
(Riviere, 2009). The lipophilic drugs such as cyclosporin, paclitaxel etc. are highly
distributed (Fahr et al., 2005).
1.2.7.3 Metabolism
Drug metabolism or biotransformation is a series of enzymatic or chemical reactions through
which the drug is changed to produce its therapeutic effects or terminate biological activity
respectively. Metabolites are usually more polar (hydrolphilic) (Brunton et al., 2011). These
reactions are classified as phase I and phase II reactions occurring primarily in hepatocytes.
Phase I reactions involve simple biotransformation processes such as hydrolysis, oxidation,
reduction where the parent drug is mostly converted to a more polar metabolite by
introduction or exposure of a functional group (-OH, -NH etc.). The resultant metabolite is
either more active than the parent compound or if sufficiently polar, then it is readily
excreted by the kidney. Phase I reactions are catalysed by isoforms of the enzyme family
cytochrome P450 (CYP450). Phase II reactions are usually conjugation reactions and most
phase I metabolites undergo these reactions to become more polar (Gibson and Skett, 2001).
Examples of phase I reactions where pro-drug is acted upon by CYP450 enzyme isoforms
are nabumetone, an NSAID which is converted to its active form 6-methoxy-2-
naphthylacetic acid to produce its analgesic effects (by inhibition of COX-2) with reduced
gastrointestinal irritation. Another example is losartan, an extremely selective, competitive
angiotensin II receptor type 1 antagonist and pharmacologically active itself. However, it is
oxidized by cytochrome P450 to its 5-carboxylic acid derivative. This metabolite is known
as EXP3174, which is 10–40 times more potent than that of losartan (Montellano, 2013).
Phase II conjugation reactions forms covalent linkage of functional group of the parent
compound or phase I metabolite with glucuronic acid, amino acids, acetate, glutathione or
sulphate to form highly polar inactive compounds which are rapidly excreted through urine
and faeces. Morphine is the exceptional example where its active conjugate 6-glucoronide
metabolite is a more potent analgesic than its parent drug (Brunton et al., 2011).
48
Though enzymes involved in the metabolism of drugs are primarily located in the liver, other
organs such as GI tract, kidneys and lungs can be involved in metabolic activity as they have
significant metabolic capacity. For instance, a significant amount of the orally administered
dose of the drug may be inactivated metabolically in the GI tract or in liver before reaching
systemic circulation. This metabolism is known as first-pass metabolism and it minimises
the oral availability of highly metabolised drugs such as morphine (Brunton et al., 2011).
Hence, metabolism or biotransformation plays an important role in altering the activity of
the drug to either terminate or potentiate its effect.
1.2.7.4 Excretion
Excretion of the drug is the process of its elimination from the body either in the unchanged
form or after its conversion to metabolites. The kidney is the most important organ for
excretion of drugs and their metabolites. Three distinct processes are involved during
excretion of the drugs: glomerular filtration, active tubular secretion and passive tubular
reabsorption. Alteration in renal function affects all the three processes. Excretion depends
upon the glomerular filtration rate and the extent of plasma binding. Only unbound drug is
filtered through the kidney. Many other factors affects the renal excretion such as ionisation
of the metabolite, active carrier mediated tubular secretion in the proximal renal tubule,
transporters (multi-drug-resistance-associated protein type 2 i.e. MRP2) localised in the
apical brush-border membrane responsible for secretion of conjugated metabolites, blood
pressure etc.
In the proximal and distal tubules, the process of passive reabsorption of the unionised weak
acids and bases is carried out. Tubular cells are less permeable to ionised forms of weak
electrolytes; therefore, passive absorption of such electrolytes depends upon the pH of the
urine. When tubular urine is made alkaline, weak acids are ionised and rapidly excreted. For
instance, salicylic acid excretion is augmented after alkalisation of urine (Brunton et al.,
2011).
Apart from kidney, other organs such as lungs are important for elimination of some drugs
such as anaesthetic gases. Some compounds are also excreted through the faeces as they are
primarily unabsorbed post oral administration or they are metabolites (especially
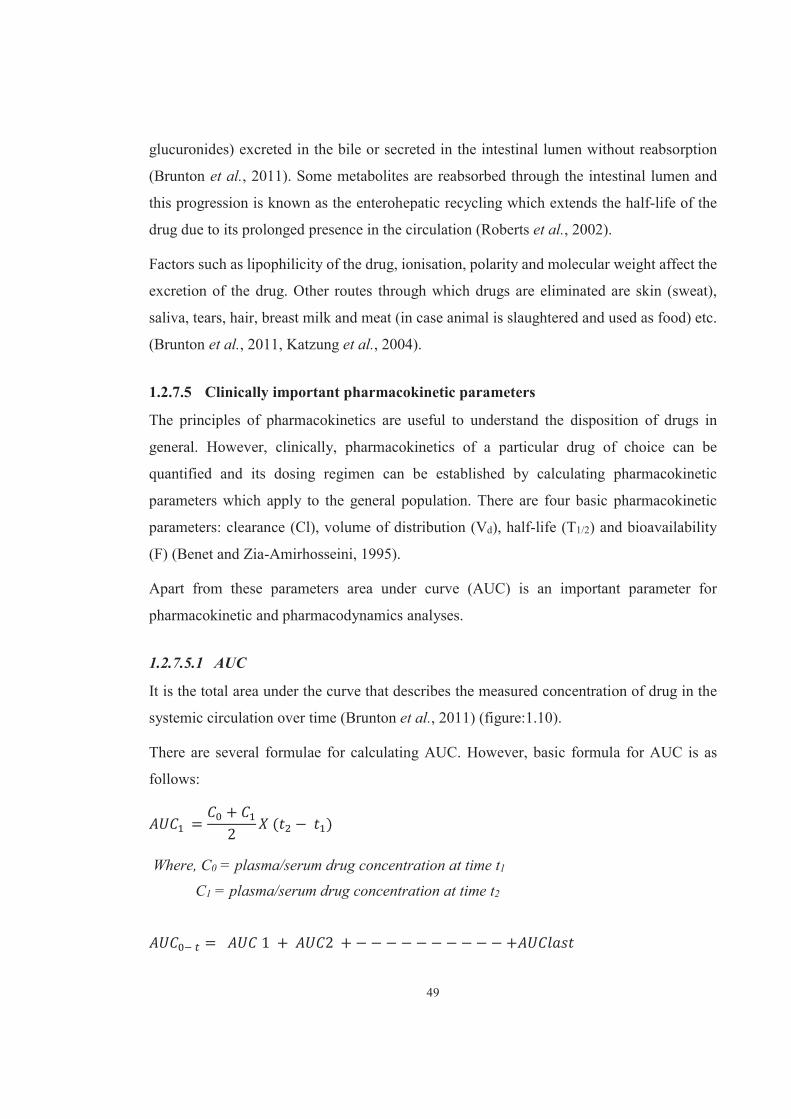
49
glucuronides) excreted in the bile or secreted in the intestinal lumen without reabsorption
(Brunton et al., 2011). Some metabolites are reabsorbed through the intestinal lumen and
this progression is known as the enterohepatic recycling which extends the half-life of the
drug due to its prolonged presence in the circulation (Roberts et al., 2002).
Factors such as lipophilicity of the drug, ionisation, polarity and molecular weight affect the
excretion of the drug. Other routes through which drugs are eliminated are skin (sweat),
saliva, tears, hair, breast milk and meat (in case animal is slaughtered and used as food) etc.
(Brunton et al., 2011, Katzung et al., 2004).
1.2.7.5 Clinically important pharmacokinetic parameters
The principles of pharmacokinetics are useful to understand the disposition of drugs in
general. However, clinically, pharmacokinetics of a particular drug of choice can be
quantified and its dosing regimen can be established by calculating pharmacokinetic
parameters which apply to the general population. There are four basic pharmacokinetic
parameters: clearance (Cl), volume of distribution (Vd), half-life (T1/2) and bioavailability
(F) (Benet and Zia-Amirhosseini, 1995).
Apart from these parameters area under curve (AUC) is an important parameter for
pharmacokinetic and pharmacodynamics analyses.
1.2.7.5.1 AUC
It is the total area under the curve that describes the measured concentration of drug in the
systemic circulation over time (Brunton et al., 2011) (figure:1.10).
There are several formulae for calculating AUC. However, basic formula for AUC is as
follows:
= +2 ( − )
Where, C0 = plasma/serum drug concentration at time t1
C1 = plasma/serum drug concentration at time t2
= 1 + 2 + − − − − − − − − − − +
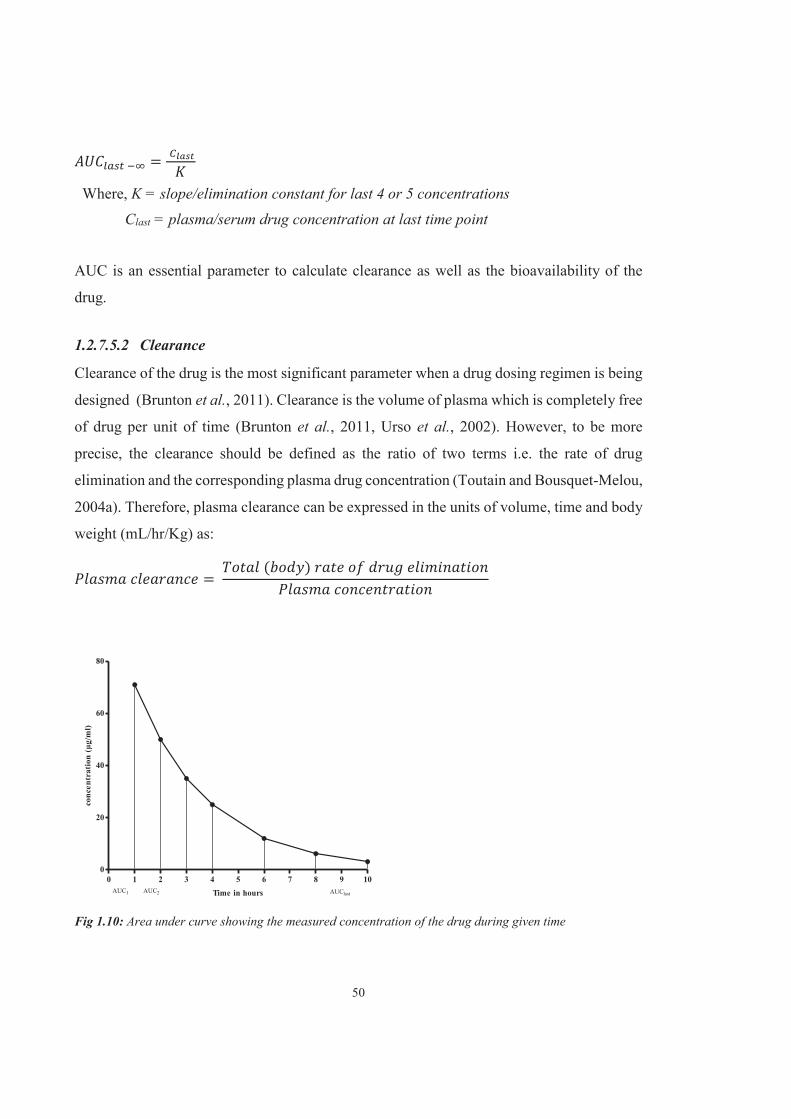
50
=
Where, K = slope/elimination constant for last 4 or 5 concentrations
Clast = plasma/serum drug concentration at last time point
AUC is an essential parameter to calculate clearance as well as the bioavailability of the
drug.
1.2.7.5.2 Clearance
Clearance of the drug is the most significant parameter when a drug dosing regimen is being
designed (Brunton et al., 2011). Clearance is the volume of plasma which is completely free
of drug per unit of time (Brunton et al., 2011, Urso et al., 2002). However, to be more
precise, the clearance should be defined as the ratio of two terms i.e. the rate of drug
elimination and the corresponding plasma drug concentration (Toutain and Bousquet-Melou,
2004a). Therefore, plasma clearance can be expressed in the units of volume, time and body
weight (mL/hr/Kg) as:
= ( )
0 1 2 3 4 5 6 7 8 9 100
20
40
60
80
AUC1 AUC2 AUClastTime in hours
conc
entr
atio
n (μ
g/m
l)
Fig 1.10: Area under curve showing the measured concentration of the drug during given time

51
This equation is accurate for the drugs following first order kinetics, where constant fraction
of drug in the body is eliminated per unit time; therefore, this is dose independent reaction
and most of the drugs follow first order kinetics. However, for the drugs that follows zero
order kinetics, where the constant amount of drug in the body is eliminated per unit time
indicating dose dependence. Therefore, for the drugs following zero order kinetics, the
clearance can be derived in the units of volume/time as:
= ( + )
Where, Vm= the maximal rate of elimination,
Km = the concentration at which half the maximal rate of elimination is
reached (mass/volume)
C = concentration of the drug in the plasma
Clearance can be constitutively represented as additive function due to elimination of the
drug from different organs, such as kidney, liver and others. Therefore systemic clearance is
given as: = + +
Where, Cl = clearance of the drug from body/total systemic clearance
Clhepatic = clearance of a drug from liver
Clrenal = clearance of a drug from kidney
Clother = clearance from GI, skin, lung etc.
In general, systemic clearance of the drug following first order kinetics is calculated using
bioavailability and the concentration of the drug in the plasma at steady state which is given
by AUC as described above and therefore systemic clearance is derived as:
= .
Where, F is the bioavailability.
The drugs administered intravenously have 100% bioavailability hence, in such cases
clearance of the drug is calculated as:
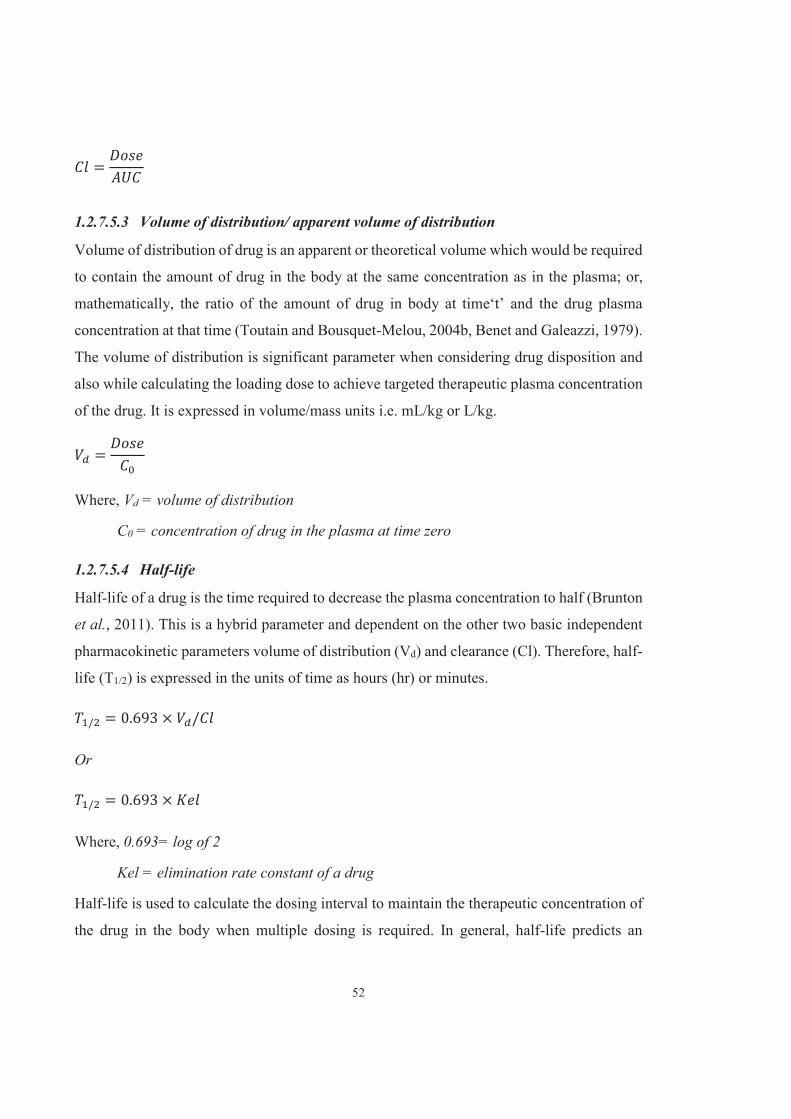
52
=
1.2.7.5.3 Volume of distribution/ apparent volume of distribution
Volume of distribution of drug is an apparent or theoretical volume which would be required
to contain the amount of drug in the body at the same concentration as in the plasma; or,
mathematically, the ratio of the amount of drug in body at time‘t’ and the drug plasma
concentration at that time (Toutain and Bousquet-Melou, 2004b, Benet and Galeazzi, 1979).
The volume of distribution is significant parameter when considering drug disposition and
also while calculating the loading dose to achieve targeted therapeutic plasma concentration
of the drug. It is expressed in volume/mass units i.e. mL/kg or L/kg.
=
Where, Vd = volume of distribution
C0 = concentration of drug in the plasma at time zero
1.2.7.5.4 Half-life
Half-life of a drug is the time required to decrease the plasma concentration to half (Brunton
et al., 2011). This is a hybrid parameter and dependent on the other two basic independent
pharmacokinetic parameters volume of distribution (Vd) and clearance (Cl). Therefore, half-
life (T1/2) is expressed in the units of time as hours (hr) or minutes.
/ = 0.693 × /
Or
/ = 0.693 ×
Where, 0.693= log of 2
Kel = elimination rate constant of a drug
Half-life is used to calculate the dosing interval to maintain the therapeutic concentration of
the drug in the body when multiple dosing is required. In general, half-life predicts an

53
accumulation of the drug in the body and ultimately the time required to achieve steady state
equilibrium (Toutain and Bousquet-Melou, 2004b).
1.2.7.5.5 Bioavailability
Bioavailability (F) essentially reaches the systemic circulation to produce therapeutic effects
(Toutain and Bousquet-Melou, 2004a). It is usually expressed in percentage (%). The
bioavailability of a drug is 100% or F= 1 when administered intravenously as the entire drug
is “absorbed” directly in the systemic circulation. In the case of extra-vascular routes, such
as oral, sub-cutaneous, intramuscular etc., bioavailability depends upon the rate of drug
absorption compared to elimination. The extravascular route of drug administration is
usually associated with the escape of some fraction of drug during gastrointestinal tract (GI)
metabolism or absorption in case of oral administration. Therefore, to calculate the
bioavailability through these routes, comparative or relative bioavailability to the
intravenous dose is more useful.
The absolute bioavailability for extravascular routes can be calculated as:
(%) = ×
Bioavailability varies widely from 0 to 1. Therefore, for drugs with lower bioavailability,
drug dose required is larger to produce therapeutic effects (Brunton et al., 2011).
1.2.7.5.6 Mean residence time
Mean residence time (MRT) of a drug is the mean time or period for which drug was present
in the body. It can be defined as the mean time for the intact drug molecules to transit through
the body and involves all kinetic processes, including in vivo release from the dosage form,
absorption into the body, and all disposition processes (Riegelman and Collier, 1980).
It is calculated from the AUC and AUMC (area under the moment curve) as:
=
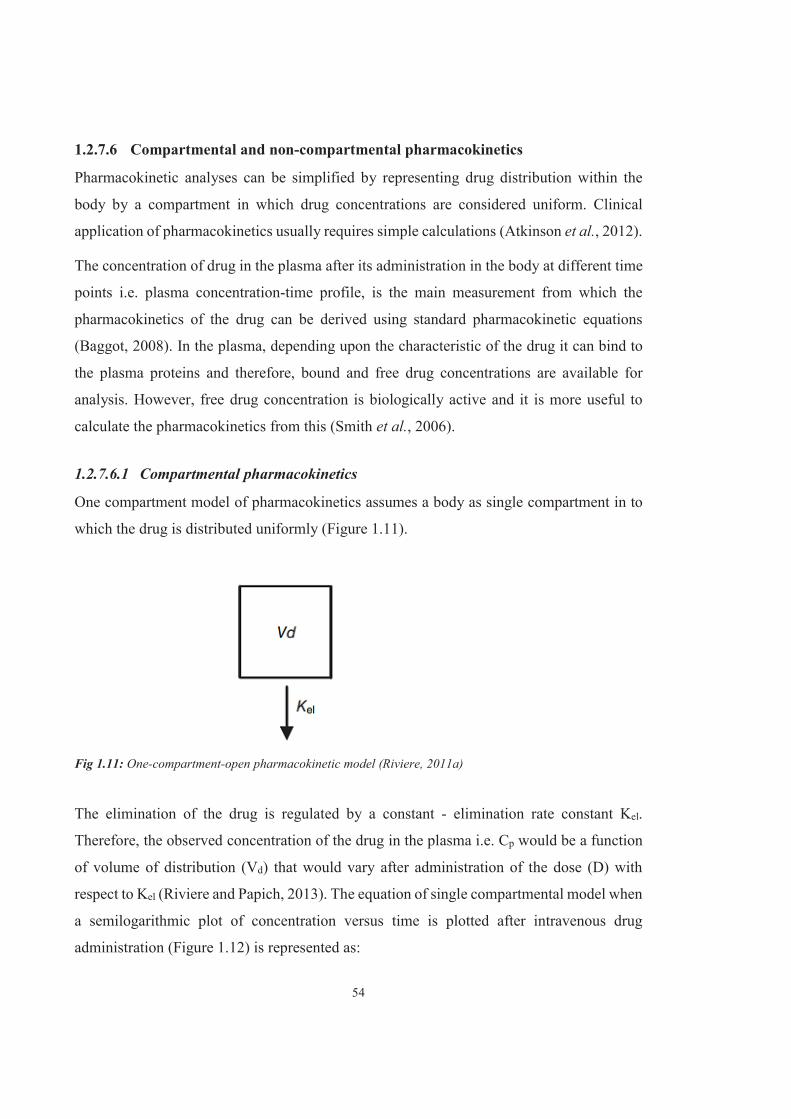
54
1.2.7.6 Compartmental and non-compartmental pharmacokinetics
Pharmacokinetic analyses can be simplified by representing drug distribution within the
body by a compartment in which drug concentrations are considered uniform. Clinical
application of pharmacokinetics usually requires simple calculations (Atkinson et al., 2012).
The concentration of drug in the plasma after its administration in the body at different time
points i.e. plasma concentration-time profile, is the main measurement from which the
pharmacokinetics of the drug can be derived using standard pharmacokinetic equations
(Baggot, 2008). In the plasma, depending upon the characteristic of the drug it can bind to
the plasma proteins and therefore, bound and free drug concentrations are available for
analysis. However, free drug concentration is biologically active and it is more useful to
calculate the pharmacokinetics from this (Smith et al., 2006).
1.2.7.6.1 Compartmental pharmacokinetics
One compartment model of pharmacokinetics assumes a body as single compartment in to
which the drug is distributed uniformly (Figure 1.11).
Fig 1.11: One-compartment-open pharmacokinetic model (Riviere, 2011a)
The elimination of the drug is regulated by a constant - elimination rate constant Kel.
Therefore, the observed concentration of the drug in the plasma i.e. Cp would be a function
of volume of distribution (Vd) that would vary after administration of the dose (D) with
respect to Kel (Riviere and Papich, 2013). The equation of single compartmental model when
a semilogarithmic plot of concentration versus time is plotted after intravenous drug
administration (Figure 1.12) is represented as:

55
= 0
Where, Cp0 = the plasma concentration extrapolated to time 0 after intravenous drug
administration
t = time at which Cp is observed
Fig 1.12: Semilogarithmic concentration-time profile for a one-compartment drug with slope -Kel and intercept Cp0 (Riviere, 2011a)
The Vd in this model is calculated as:
= 0
The clearance is interpreted as: = ×
Half-life calculation for one compartmental model is given as:
/ = 0.693
AUC for this model can be calculated as:
= 0
When absorption is involved in one compartment model calculations, i.e. when the drug is
administered by extravascular route, then absorption constant (Ka) must be taken into
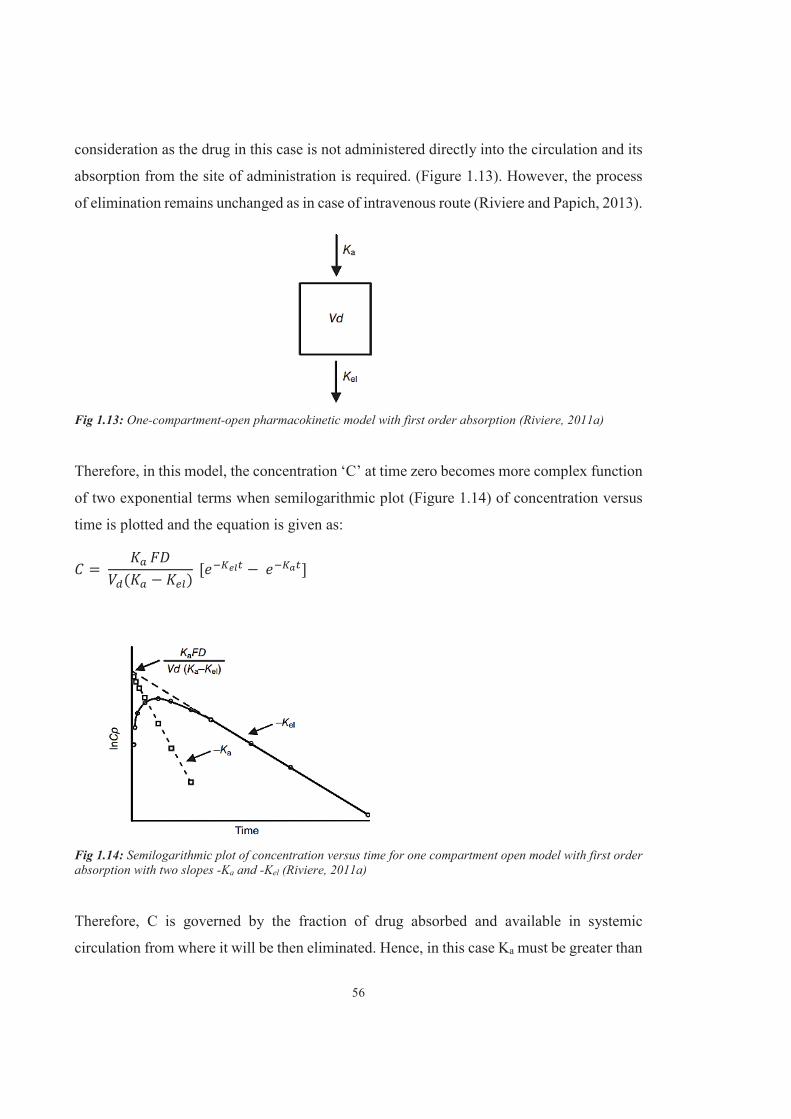
56
consideration as the drug in this case is not administered directly into the circulation and its
absorption from the site of administration is required. (Figure 1.13). However, the process
of elimination remains unchanged as in case of intravenous route (Riviere and Papich, 2013).
Fig 1.13: One-compartment-open pharmacokinetic model with first order absorption (Riviere, 2011a)
Therefore, in this model, the concentration ‘C’ at time zero becomes more complex function
of two exponential terms when semilogarithmic plot (Figure 1.14) of concentration versus
time is plotted and the equation is given as:
= ( − ) [ − ]
Fig 1.14: Semilogarithmic plot of concentration versus time for one compartment open model with first order absorption with two slopes -Ka and -Kel (Riviere, 2011a)
Therefore, C is governed by the fraction of drug absorbed and available in systemic
circulation from where it will be then eliminated. Hence, in this case Ka must be greater than

57
Kel. As the Ka approaches zero, the elimination phase is continued and the exponential term
of absorption phase would be eliminated. In case, if Kel is greater than Ka, then the equation
is would be reversed and Kel would be replaced as Ka. This phenomenon is also called ‘flip-
flop’ kinetics (Riviere and Papich, 2013). However, for any extravascular route, the drug
disposition study would not be as reliable as intravenous route, due the limitation factors
such as absorption and systemic availability on which the other routes are dependent and
complete bioavailability (F=1) cannot be assumed except by the intravenous route (Riviere,
2011a).
Two compartment models assume there are central and peripheral compartments (Figure
1.15). Many drugs do not follow a simple one compartment model due to non-linearity of
the concentration-time profile. In this case, biologically, the drug is distributed in different
regions of the body at different rates and these regions are considered as central and
peripheral compartments on the basis where drug is instantaneously distributed. It is
assumed that the drug is first distributed in the central compartment (central compartment is
composed of the blood plasma and extracellular fluids of the vital organs such as liver,
kidney, heart, lungs etc.) and from here it is distributed slowly to the peripheral compartment
(remaining body parts) with a distribution rate constant usually called K12 and then re-
distributed back to the central compartment with another constant called K21. Elimination
occurs from the central compartment at a constant rate (K10) which is equivalent to Kel in a
one compartment model (Riviere, 2011a, Gabrielsson and Weiner, 2001). The constants K12
and K21 are considered slower than K10. Therefore, in a two compartment model, the
concentration versus time profile is an outcome of two pharmacokinetic processes (Figure1.
16): distribution phase (α) and elimination phase (β). The equation of two compartment
model is given as: = . + . Where, A = intercept for distribution phase α
B = intercept for elimination phase β
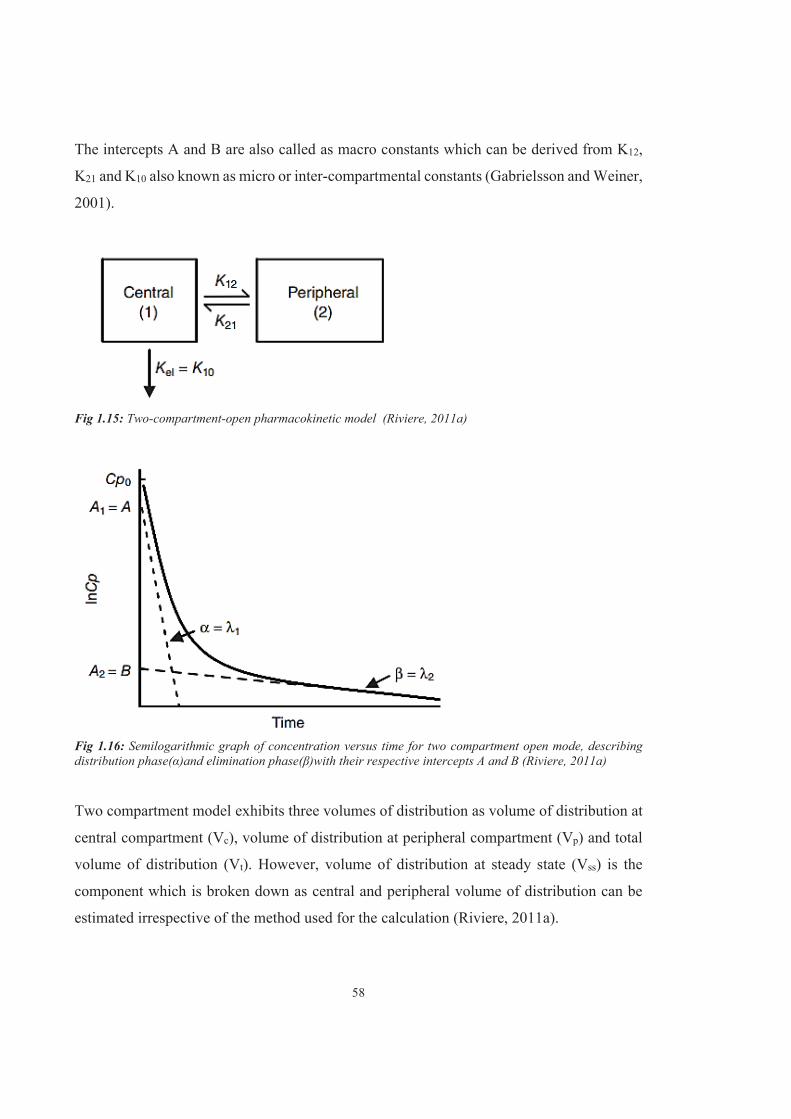
58
The intercepts A and B are also called as macro constants which can be derived from K12,
K21 and K10 also known as micro or inter-compartmental constants (Gabrielsson and Weiner,
2001).
Fig 1.15: Two-compartment-open pharmacokinetic model (Riviere, 2011a)
Fig 1.16: Semilogarithmic graph of concentration versus time for two compartment open mode, describing distribution phase(α)and elimination phase(β)with their respective intercepts A and B (Riviere, 2011a)
Two compartment model exhibits three volumes of distribution as volume of distribution at
central compartment (Vc), volume of distribution at peripheral compartment (Vp) and total
volume of distribution (Vt). However, volume of distribution at steady state (Vss) is the
component which is broken down as central and peripheral volume of distribution can be
estimated irrespective of the method used for the calculation (Riviere, 2011a).
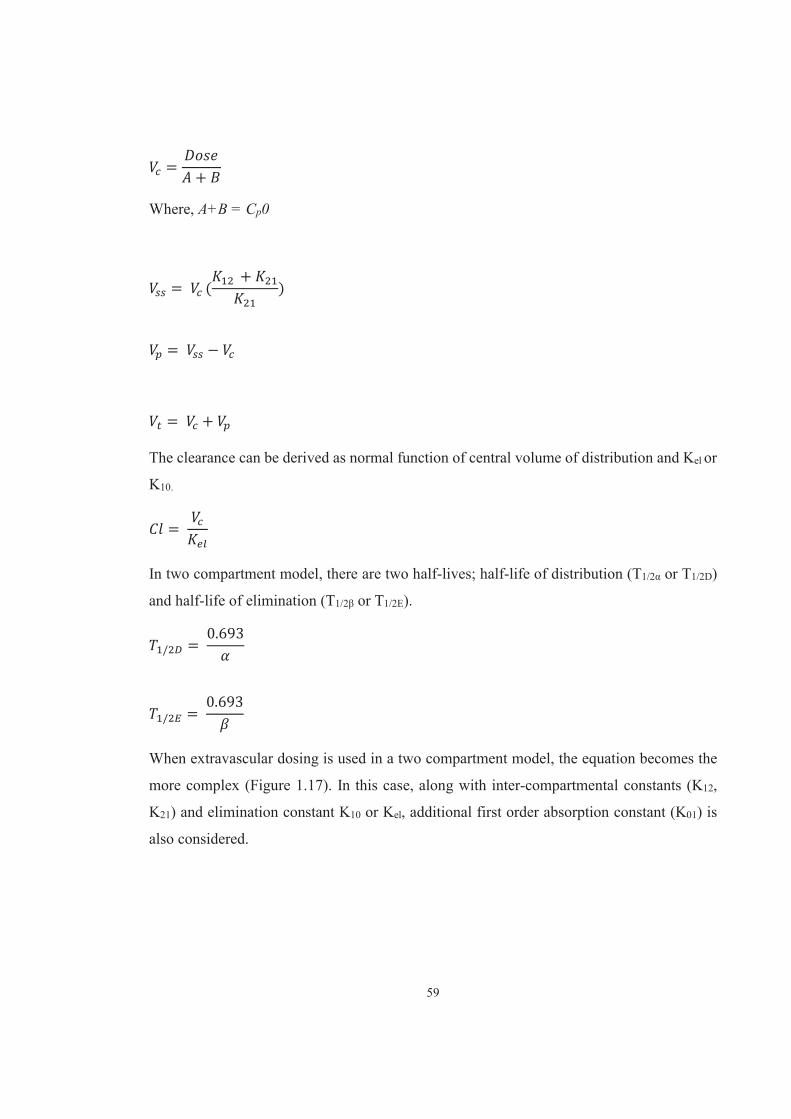
59
= +
Where, A+B = Cp0
= ( + )
= −
= +
The clearance can be derived as normal function of central volume of distribution and Kel or
K10.
=
In two compartment model, there are two half-lives; half-life of distribution (T1/2α or T1/2D)
and half-life of elimination (T1/2β or T1/2E).
/ = 0.693
/ = 0.693
When extravascular dosing is used in a two compartment model, the equation becomes the
more complex (Figure 1.17). In this case, along with inter-compartmental constants (K12,
K21) and elimination constant K10 or Kel, additional first order absorption constant (K01) is
also considered.
60
Fig 1.17: Generalised two compartment model for extravascular dose of drug with absorption constant (K01)(Riviere, 2011a)
= ( . ⁄ ). [ + − ]
In this equation, λ1, λ2 and K01 are slopes of the three phases as shown in the figure 1.18, An
are different than those derived in intravenous two compartment model (Riviere, 2011a,
Gabrielsson and Weiner, 2001). They are derived as: ′ = ( − ) [( − ). ( − )] ′ = ( − ) [( − ). ( − )] ′ = ( − ) [( − ). ( − )]

61
Fig 1.18: Semilogarithmic plot of concentration versus time for two compartment model after extravascular administration of drug (Riviere, 2011a)
1.2.7.6.2 Non-compartmental pharmacokinetics
Non-compartmental pharmacokinetic analysis (NCA) has been adopted as the preferred
method since 1979 when it was developed and applied in radiation decay analysis
(Gabrielsson and Weiner, 2012, Riviere, 2011b). The main advantage of this method is that
no assumption is required as in compartmental analysis. The calculations are based on the
statistical moment theory by using plasma drug concentration versus time (CT) profile. This
is more stochastic methodology. In NCA, basic pharmacokinetic parameters can be
estimated using primary CT data and considerably simpler calculations are involved to
derive them. For instance, MRTiv (after intravenous administration of drug) can be
calculated by using AUMC (area under first moment curve) and AUC (MRTiv =
AUMC/AUC) where, AUMC is a CT-T profile (Riviere, 2011b).
The half-life of a drug becomes a function of MRT and is derived as:
/ = 0.693( ) = 0.693( )
The clearance is calculated by general approach as:
=
Volume of distribution can be estimated from basic AUC and AUMC parameters or also as
a function of clearance.
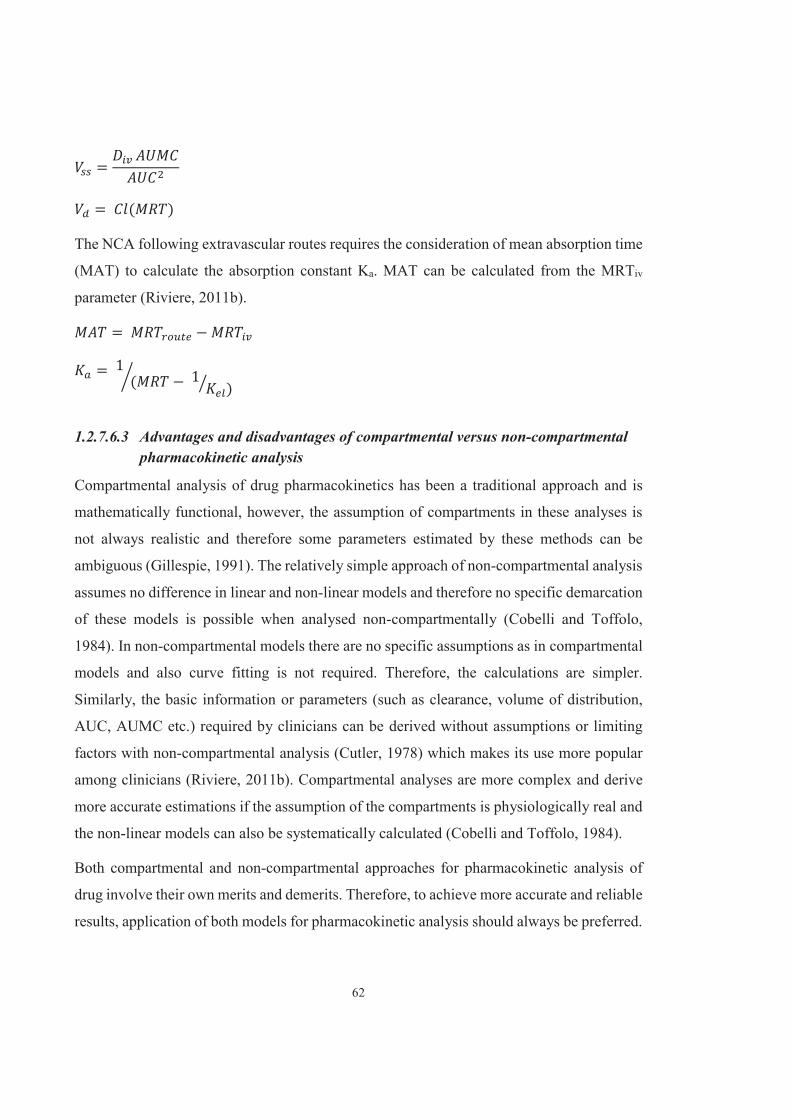
62
= = ( )
The NCA following extravascular routes requires the consideration of mean absorption time
(MAT) to calculate the absorption constant Ka. MAT can be calculated from the MRTiv
parameter (Riviere, 2011b). = − = 1 ( − 1 )
1.2.7.6.3 Advantages and disadvantages of compartmental versus non-compartmental pharmacokinetic analysis
Compartmental analysis of drug pharmacokinetics has been a traditional approach and is
mathematically functional, however, the assumption of compartments in these analyses is
not always realistic and therefore some parameters estimated by these methods can be
ambiguous (Gillespie, 1991). The relatively simple approach of non-compartmental analysis
assumes no difference in linear and non-linear models and therefore no specific demarcation
of these models is possible when analysed non-compartmentally (Cobelli and Toffolo,
1984). In non-compartmental models there are no specific assumptions as in compartmental
models and also curve fitting is not required. Therefore, the calculations are simpler.
Similarly, the basic information or parameters (such as clearance, volume of distribution,
AUC, AUMC etc.) required by clinicians can be derived without assumptions or limiting
factors with non-compartmental analysis (Cutler, 1978) which makes its use more popular
among clinicians (Riviere, 2011b). Compartmental analyses are more complex and derive
more accurate estimations if the assumption of the compartments is physiologically real and
the non-linear models can also be systematically calculated (Cobelli and Toffolo, 1984).
Both compartmental and non-compartmental approaches for pharmacokinetic analysis of
drug involve their own merits and demerits. Therefore, to achieve more accurate and reliable
results, application of both models for pharmacokinetic analysis should always be preferred.
63
1.2.7.6.4 Applications of pharmacokinetics
Pharmacokinetics plays an important role in the discovery of new drug and evaluation of
drug therapy. If a drug cannot get to its site of action, it cannot work. Clinical application of
pharmacokinetics besides its application in research has enormously advanced the field of
pharmacology.
Apart from pharmacokinetics, pharmacodynamics is the other important element of
pharmacology to evaluate the effect of the drug on the body.
1.2.8 PK-PD modelling
PK-PD (pharmacokinetic-pharmacodynamic) modelling is based on the dose response
relationship over time and its application involves the identification of the effect of the drug
in vivo under physiologic and pathologic conditions, determining dosing regimen and
dosage form of the drug to achieve the concentration to produce the desired effect (Pérez-
Urizar et al., 2000). Figure 1.19 depicts the concept of PK PD modelling.
Fig 1.19: PK-PD modelling concept from: (Mehrotra et al., 2006)
PK-PD models are developed on the basis of drug concentration and effect relationship
according to the pattern and extent of the effect produced in proportion to the drug
concentration.
1.2.8.1 Linear model
This model considers direct proportionality of the drug concentration to drug effect and
quantification of drug effect is possible which can be expressed as:
64
= . +
Where, E = intensity of effect,
C = drug concentration,
S = slope of the line,
E0 = value of the effect when no drug is present
E0 can be dropped from the equation if there is no effect in the absence of drug (Pérez-Urizar
et al., 2000).
This model is not appropriate when the drug concentration is to low or too high as the
linearity follows the direct proportionality between drug concentration and drug effect only
in the medium range of drug concentration (Schwinghammer and Kroboth, 1988).
1.2.8.2 Log linear model
Log linear model has been adapted from the linear model and is similar to it except the
logarithmic use and also use of the constant term. The use of logarithm allows to create a
linear concentration-effect curve. It can be represented as:
= . +
Where, I = imperic constant which has no physiologic value.
This model is useful for higher concentration range of drug effect up to about 80% possible
effect. However, at the zero concentration of the drug, the model fails to evaluate the effect
(Schwinghammer and Kroboth, 1988).
1.2.8.3 The Emax model
This is the most widely used model for many drugs over wide range of concentrations and
is also the simplest model. This model is applicable for the drugs where the effect of the
drug produced is directly proportional to the drug concentration in the body and maximum
possible effect can be calculated with this model as:
= .+
Where, C = concentration of the drug,
E = effect produced by the concentration C,

65
Emax = maximum possible response that can be attributed to the drug,
EC50 = drug concentration that can produce 50 % of the maximum possible effect.
This model can be converted to calculate the inhibition percentage when, the effect of the
drug is inhibitory (Schwinghammer and Kroboth, 1988).
Another models such as Sigmoid Emax model and inhibitory are also used with some
modified patterns of drug effect with respect to the concentration (Pérez-Urizar et al., 2000).
PK-PD modelling in the analysis of drug efficacy or in the development of new drug can be
useful. NSAIDs usually bind to plasma proteins and hence, free or unbound plasma
concentrations of NSAIDs are lower than the total concentration (Riviere and Papich, 2013).
However, during inflammatory conditions, NSAIDs are accumulated gradually in the
inflammatory exudate and sometimes even exceed their concentrations in the plasma
(Scherkl et al., 1996). Though plasma concentrations are often indicators of drug effects, for
NSAIDs this is not true. Where plasma concentrations do not represent the drug
concentrations at the site of action (inflammatory exudates), the pharmacodynamic effect
may be measured by calculating their IC50 from the concentration of prostaglandins or
concentration of drug in the inflammatory exudates (Lees et al., 2004). However, this is
technically difficult.
As discussed in the introduction, it is essential to explore new analgesic drugs for sheep.
Therefore, in this study, an effective, abundantly available, cheap and natural analgesic in
the form of willow leaves has been investigated.
1.2.9 Willow
Willow (Salix spp) is a genus of tree of over 300 species, and belongs to the family Salicacae
(Newsholme, 1992). Along with poplar (Populus spp) (which also contains salicin) willow
has been distributed in many countries (over 90) of the world like United States, Canada,
United Kingdom, Russia, France etc. (Ball et al., 2005). It is a plant of sub-tropical and
tropical zones and originally from the northern hemisphere (Kuzovkina and Quigley, 2005,
Argus, 1997).

66
Willow is a versatile plant having many valuable properties and contributes to the treatment
of many problems such as prevention of soil erosion, phytoremediation and carbon
sequestration. It is a suitable wood for shelterbelts, timber and generation of electricity
(Kuzovkina and Quigley, 2005, Heller et al., 2004, Greger and Landberg, 1999). Non-wood
products of willow include fodder and shelter for livestock, birds, wild habitat (Smith et al.,
1978). It is also appropriate for fencing, to make wood items such as baskets, fish traps, bats
and many other ornamental things (Scott and Huskisson, 1976, Warren-Wren, 1965).
Besides all these attributes, willow has medicinal properties.
Willows are easily propagated vegetatively. They are popular because of high growth and
early adaptation to new habitats (Verwijst, 2001). Therefore willow has a significant role to
play in today’s world.
1.2.9.1 Willow in New Zealand
Willow is not native to New Zealand and was introduced in 1840s by early European settlers
(Phillips and Daly, 2008, Charlton et al., 2007). Willow was utilized in New Zealand
primarily for the control of soil erosion by planting on the banks of rivers and streams by
farmers, councils etc. However, over the years its usefulness was expanded and now it has
been used as a fodder for livestock such as cattle, goats and sheep during drought periods
(Olsen and Charlton, 2003, Wilkinson, 1999, McCabe and Barry, 1988).
Over 60 willow species were imported in 1934 to Christchurch botanical gardens from the
Kew and since then over 100 clones have been developed in New Zealand (Charlton et al.,
2007, Hussain, 2007). To identify the species of the willow is difficult for many reasons
(Karp et al., 2011) and many hybrids are seen. Most commonly in the New Zealand, willows
are classified as tree willows, osier willows and shrub willows (McIvor, 2013, Stace, 1998,
Douglas et al., 1996).
Various species/crosses of different species/clones which are popular and commonly used
for different purposes in New Zealand are as follows (Charlton et al., 2007) (figure 1.20:a,
b, c, d, e).
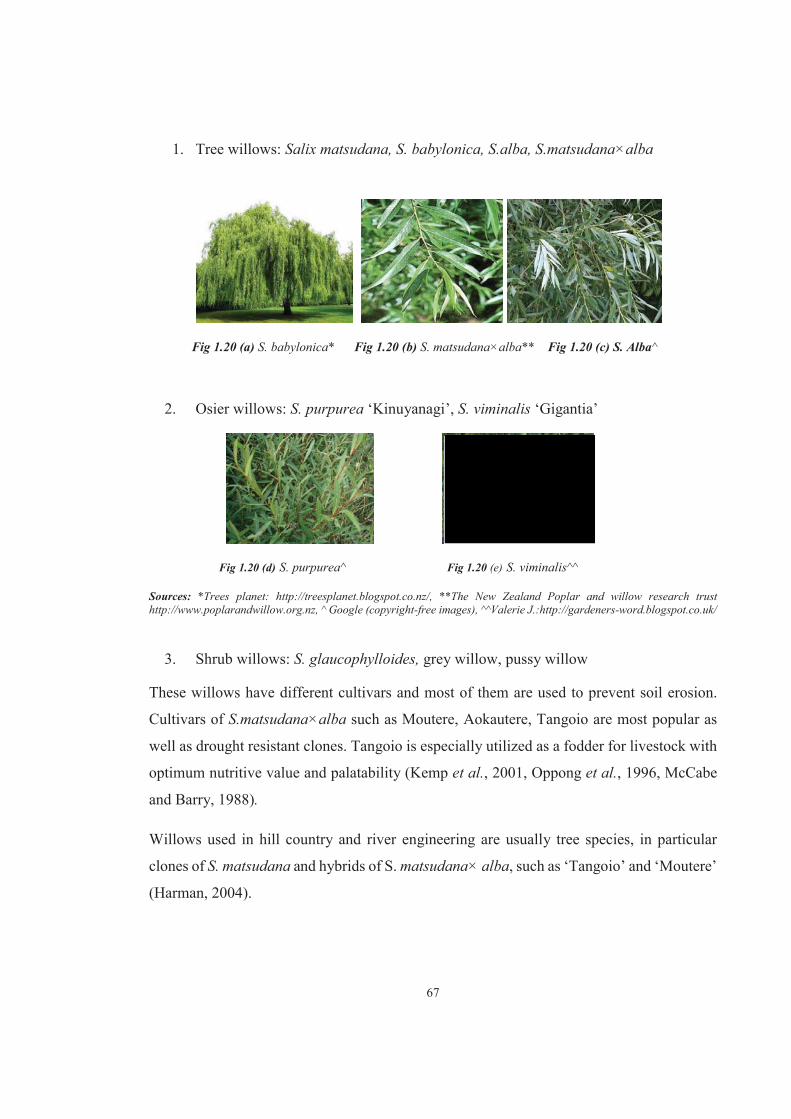
67
1. Tree willows: Salix matsudana, S. babylonica, S.alba, S.matsudana×alba
Fig 1.20 (a) S. babylonica* Fig 1.20 (b) S. matsudana×alba** Fig 1.20 (c) S. Alba^
2. Osier willows: S. purpurea ‘Kinuyanagi’, S. viminalis ‘Gigantia’
Fig 1.20 (d) S. purpurea^ Fig 1.20 (e) S. viminalis^^
Sources: *Trees planet: http://treesplanet.blogspot.co.nz/, **The New Zealand Poplar and willow research trust http://www.poplarandwillow.org.nz, ^ Google (copyright-free images), ^^Valerie J.:http://gardeners-word.blogspot.co.uk/
3. Shrub willows: S. glaucophylloides, grey willow, pussy willow
These willows have different cultivars and most of them are used to prevent soil erosion.
Cultivars of S.matsudana×alba such as Moutere, Aokautere, Tangoio are most popular as
well as drought resistant clones. Tangoio is especially utilized as a fodder for livestock with
optimum nutritive value and palatability (Kemp et al., 2001, Oppong et al., 1996, McCabe
and Barry, 1988).
Willows used in hill country and river engineering are usually tree species, in particular
clones of S. matsudana and hybrids of S. matsudana× alba, such as ‘Tangoio’ and ‘Moutere’
(Harman, 2004).
68
Willows in New Zealand shed a large quantity of leaves in autumn and early winter i.e. April
to June. Precise time and duration of leaf-fall depends on cultivar of willow and weather
(personal observation).
1.2.9.2 Willow in livestock as fodder
Willow has high feeding value for livestock (Kemp et al., 2001, Oppong et al., 1996). It has
been well accepted by livestock including sheep, cattle, goats and deer (Kovalchik and
Elmore, 1992, McCabe and Barry, 1988, Seip and Bunnell, 1985). Cattle will eat trimmings
up to 10 to 25mm and sheep up to 5mm in diameter. Both cattle and sheep will strip off and
eat the bark (Oppong et al., 1996, McCabe and Barry, 1988). Willow leaves are also high in
zinc and magnesium, which are important animal health minerals.
1.2.9.3 Willow as fodder in sheep
There is an extensive literature on willow leaves as fodder in sheep, which supports the fact
that willow leaves’ feeding is adequate for maintenance. In 1983, Dann and Axelsen
conducted an experiment during a drought where they fed a sole diet of willow leaves and
twigs to four merino hoggets and four crossbred lambs and they found 1.9 and 1.8 kg weight
gain over 6 weeks without any ill effects of the diet (Dann and Axelsen, 1986).
The preliminary study conducted by Oppong et al. (1996) concludes that willow cultivar
Tangoio is a potential maintenance feed for sheep during summer drought and early autumn.
Similarly Kinuyanagi willow can be used as a supplementary drought fodder due to its high
edible forage yield (Oppong et al., 1996). It has also been proposed that willow and poplar
trees provide forage for livestock of moderate nutritive value (Kemp et al., 2001). Feeding
of willow leaves or trimmings to ewes during mating resulted in reduction of live weight
loss and increase in reproductive rates (McWilliam et al., 2005). Also for mating ewes in
dry summer/autumn, full access to willow fodder blocks is a beneficial supplement in NZ
(Pitta et al., 2007). Willow fodder block grazing can also be helpful in supportable farming
systems for hoggets as it maintains growth rates, increases reproductive rates as well as
reduces dag formation in parasitized hoggets (Musonda et al., 2009).
69
Ramírez-Restrepo et al. (2010) conducted a study to analyse the effect of willow feeding on
methane production and blood composition in ewe hoggets. They observed that the willow
leaves as fodder were accepted and preferred by the ewe hoggets (Ramírez-Restrepo et al.,
2010).
Therefore, willow leaves/bark can be used as fodder, is readily eaten, has no obvious adverse
effects and is a potential maintenance ration for sheep and other livestock.
1.2.9.4 Medicinal history of willow
The medicinal history of willow has already been described in the section NSAIDs.
The species S. alba L., S. fragilis L. and S. purpurea L. are most commonly used for
medicinal purposes (Setty and Sigal, 2005). The active component of Salix spp. is considered
to be salicin. However, studies have revealed that willow has other salicin derivatives
(phenolic glycosides), such as salicortin, fragilin and tremulacin 23-26% as total salicin
derivatives and additionally flavonoids, condensed tannins and polyphenols (Calixto et al.,
2000, Trease and Evans, 1978). Distinctive flavonoids are glycosides of naringenin,
isosalipurpuroside or eriodictyol which had been given less attention initially (Bonaterra et
al., 2009, Nahrstedt et al., 2007).
1.2.9.5 Variation in salicin content and other phenolic glycosides in willow
Salicin content in the willow varies a with age, season, location, species (Rank, 1991),
(Chapter 5), (Kenstaviciene et al., 2008). Kenstaviciene et al., in 2008 observed variation in
salicin content in different species (from 0.04% in S. viminalis “Americana” to 12.06% in S.
acutifolia). Rank, in 1991 in addition to species variation, observed that the salicin content
not in all but in some species declines over summer in the USA, (Nevada and central and
eastern California). On the contrary, in New Zealand when we conducted a study over the
year for detection of salicin content in willow, we observed that most of the willows we
studied had high salicin content over the summer (November to March) in NZ i.e. when
plants were stressed.
Variation in phenolic glycosides has also been observed with differences in the sex of the
plant. Some studies showed that male plants have lower salicin content and phenolic
70
glycosides than female plants (Elmqvist et al., 1991, Palo, 1984); whereas Nichols-Orians
et al. (1993) observed no variation in salicin content as well as phenolic glycosides content
due to sex difference but they found that genetic clonal differences in willow causes variation
in the phenolic glycosides.
1.2.9.6 Pharmacological properties and products of willow
Willow bark and leaves extracts are used to formulate many pharmaceutical products and
dietary supplements such as an analgesic, antipyretic, antiphlogistic and weight loss
enhancement remedies (Pobłocka-Olech et al., 2010, Schmid et al., 2001b) in different
forms such as tablets, capsules, liquid formulations and powder for pain relief (Biegert et
al., 2004, Boullata et al., 2003). The use of willow products is very common in European
countries for treatment of headache, back ache, fever and to treat arthritis (Biegert et al.,
2004).
Apart from antipyretic, anti-inflammatory properties, willow bark and leaf extracts has
shown anti-cancer, anti-oxidant and platelet aggregation effects.
Tremulacin is one of the derivatives of salicin which has anti-inflammatory effect (Yang et
al., 1994). Chronic inflammation can progress to cancer in many situations and in such cases
anti-inflammatory/cancer activity in willow bark and leaf extract has been shown from its
polyphenol and flavonoid components rather that salicin (Nahrstedt et al., 2007).
Clinical studies were conducted where effect of young willow (Salix safsaf salicacae) leaf
extract on leukemic cells of 18 patients in Egypt was observed and majority of blasts of acute
myeloid leukemia were killed by leaf extracts (El-Shemy et al., 2003). In 2007, same extract
was used against human carcinoma cells in vivo and in vitro. In vivo Ehrlich Ascites
Carcinoma Cells were injected into the intra-peritoneal cavity of mice and willow extract
was fed through stomach tube. In vivo tumour growth was reduced and death was delayed.
While, in vitro the willow extract killed about 70-80 % of abnormal cells. The targeted cell
death in this case was occurred by apoptosis due to DNA fragmentation within treated cells.
In conclusion, metabolites within the willow extract may act as tumour inhibitors that
promote apoptosis, cause DNA damage, and affect cell membranes and/or denature proteins
(El-Shemy et al., 2007).
71
Clinical trial was conducted by Mills et al., in 1996 to observe the effect of willow bark
extract in patients suffering from osteoarthritis resulted in lesser pain in patients (Mills et
al., 1996).
Chrubasik et al., in 2000 conducted a study in 210 patients with chronic low back pain where
they were given high dose of willow bark (240 mg salicin) or low dose of willow bark
extract (120 mg salicin) or placebo. This was a four week blinded study. At the end of four
weeks higher number of patients from high dose willow bark treatment group were pain free
as compared to other two groups (Chrubasik et al., 2000). This study provides evidence that
willow bark extract may be a useful treatment for low back pain.
A study reported by Krivoy et al., shows lesser inhibition of platelets by Salicis cortex extract
when compared to acetylsalicylic acid (aspirin) (Krivoy et al., 2001).
1.2.9.6.1 Side effects and toxicity
There are very few reports of side effects of willow bark. Vlachojannis et al., have collected
and cited many studies of treatment with willow bark extract in human and they have even
argued over the restriction imposed by the EMA (European Medicines Authority) limiting
use of willow bark to 4 weeks (Vlachojannis et al., 2014) because, in their opinion, the use
of willow bark for longer duration than four weeks does not have potential risk. They have
also found few reports of adverse effects due to willow bark. In 2003, a patient had severe
anaphylactic reaction with history of allergy to salicylates (Boullata et al., 2003). Another
patient with deficiency of glucose-6-phosphate dehydrogenase developed haemolysis after
taking willow herbal preparation (Baker and Thomas, 1987). One more study where 436
patients with different musculoskeletal pains were treated with willow bark extract has
suggested that use of willow bark extract in long term pain might be effective as the overall
adverse events during this study were low (up to 3 % in osteoarthritis and/or fibromyalgia)
(Uehleke et al., 2013, Vlachojannis et al., 2014). However, willow does contain some gastro
protective substances (Vlachojannis et al., 2014, Pobłocka-Olech et al., 2010, Pobłocka-
Olech and Krauze-Baranowska, 2008) while of some species e.g. S. daphnoides, S. pupurea
contain carcinogenic compounds such as pyrocatechol (Pobłocka-Olech et al., 2010). Apart
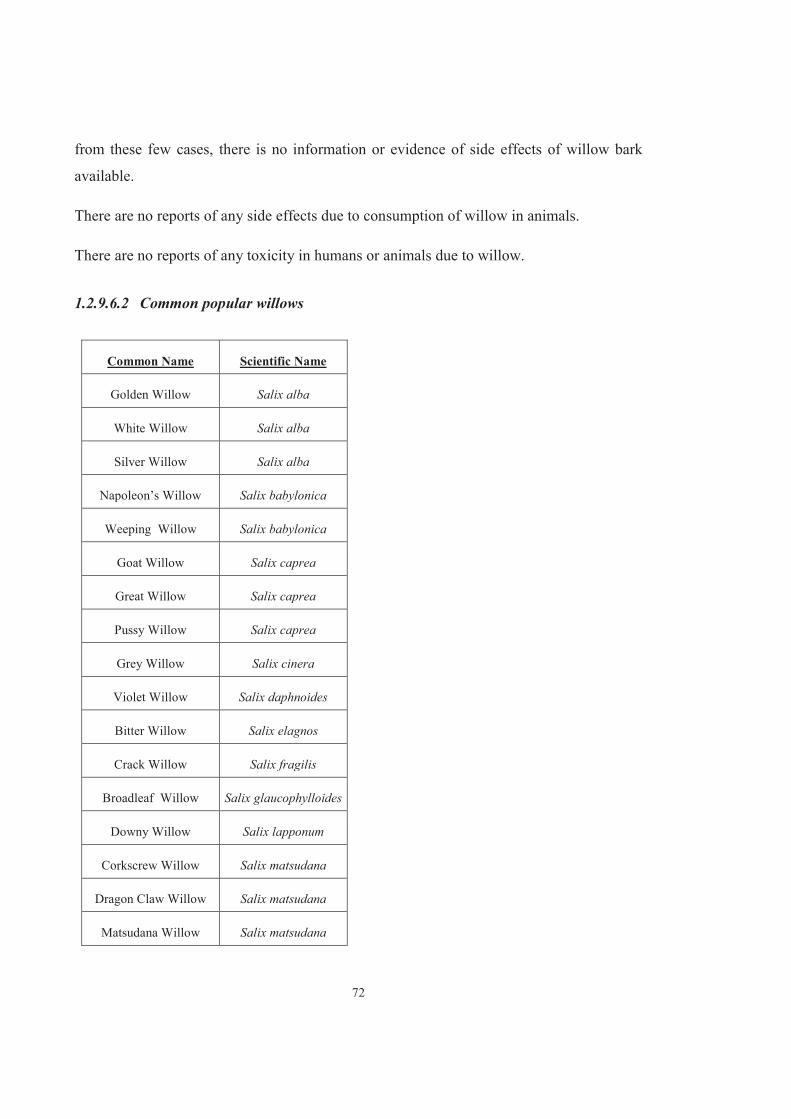
72
from these few cases, there is no information or evidence of side effects of willow bark
available.
There are no reports of any side effects due to consumption of willow in animals.
There are no reports of any toxicity in humans or animals due to willow.
1.2.9.6.2 Common popular willows
Common Name Scientific Name
Golden Willow Salix alba
White Willow Salix alba
Silver Willow Salix alba
Napoleon’s Willow Salix babylonica
Weeping Willow Salix babylonica
Goat Willow Salix caprea
Great Willow Salix caprea
Pussy Willow Salix caprea
Grey Willow Salix cinera
Violet Willow Salix daphnoides
Bitter Willow Salix elagnos
Crack Willow Salix fragilis
Broadleaf Willow Salix glaucophylloides
Downy Willow Salix lapponum
Corkscrew Willow Salix matsudana
Dragon Claw Willow Salix matsudana
Matsudana Willow Salix matsudana

73
Tortured Willow Salix matsudana
Black Willow Salix nigra
Purple osier Salix purpurea
Silesian Willow Salix silesiaca
Osier Salix viminalis
Golden weeping Willow Salix xchrysochroma
Pussy Willow Salix xereichardtii
Kemp Willow Salix xsepulcoalis
1.3 PURPOSE OF THIS WORK
This thesis set out to answer the questions:
1. Is the salicin derivative salicylic acid analgesic in sheep?
2. Is natural source of salicin i.e. willow leaves have any seasonal variation in salicin concentration in New Zealand?
The work involved a number of laboratory and farm studies described in the following chapters.
74
2 DEVELOPMENT AND VALIDATION OF HIGH
PERFORMANCE LIQUID CHROMATOGRAPHY
METHOD FOR DETECTION OF SALICYLIC ACID IN
SHEEP PLASMA
ABSTRACT
A simple, efficient and robust HPLC method for analysis of salicylic acid in sheep plasma
was developed and validated in this study. The aim of this thesis is to investigate the
analgesic efficacy of salicylic acid in sheep. Therefore, there was a need to validate a HPLC
method before conducting the pharmacokinetics of salicylic acid in sheep study. The various
methods published for detection of salicylic acid were not validated for sheep plasma. Also
lack of reproducibility was one of major drivers of developing a method specifically for this
study. A proper validation protocol recommended by FDA (USA Food and Drug
Administration) was followed. The limit of detection (LOD) (0.0625μg) of salicylic acid
when compared to other methods showed the high sensitivity of the method. The relative
standard deviation (RSD) for intra-day and inter-day variability (Mean±SD) were 1.45±1.03
and 1.58±1.26% respectively. Linearity of the method for salicylic acid was 0.9996. Overall
RSD (Mean±SD) for recovery was 1.32±0.39%. Sheep plasma samples were successfully
analysed with this method for salicylic acid as aimed. The HPLC method developed here is
simple, reproducible and may be adapted to any species.
2.1 INTRODUCTION
There are numerous HPLC techniques developed and reported in the literature for analysis
of salicylic acid (SA). These techniques have been developed for the detection of salicylic
acid in biological fluids such as plasma, serum, urine, tissue exudate and other matrices.
Rumble et al. (1981) developed an HPLC method to analyse aspirin and its metabolites
including SA in human plasma and urine. Although they introduced very simple method of
preparation for plasma samples, they did not mention the lower limit of detection (LOD) for
either analyte. The lowest SA standard concentration mentioned in Rumble and co-workers’
75
study was 0.5μg/mL. (Reidl, 1983) developed a HPLC technique for detection of aspirin,
SA and other metabolites in the plasma, urine and tissue homogenates of rabbit and human.
The LOD for this method was 0.2μg/mL. Also, the column used in this method was
LiChrosorb RP-18 (15 cm X 4 mm I.D., packed with 5 μm) and was thermostatic at 45ºC in
a water bath. The working backpressure of the pumps of HPLC system was 27.5Mpa and
the flow rate of the mobile phase (methanol: water; 40:60) was 1.5mL/minute during the
analysis. This method had lower retention time of 5.5 minutes for the SA at the detector
wavelength of 280nm. Similarly, Fogel et al. (1984), O’Kruk et al. (1984), Mays et al. (1984)
developed other HPLC techniques using UV detectors with different columns and HPLC
systems. The LOD of SA reported by these authors was in the range of 0.2 to 1μg/mL
suggesting possibility of further improvement in sensitivity of the method. Moreover, the
extensive course of sample preparation described by these authors is time consuming. The
pre-processing of blood samples for storage immediately post-collection from
animals/humans was required for the unstable compounds such as aspirin in the study
reported by (Rumble et al., 1981) as it is hydrolysed quickly (Shaw and Tsai, 2012); on the
contrary, for our study pre-processing of sample was not required due to the compound to
be analysed (SA) being stable. In the present analysis, only SA assayed. Other HPLC
techniques described by Mallikaarjun et al. (1989), Jian-Hua and Smith (1996), Pirola et
al.(1998), Sawyer and Kumar (2003), Pirker et al. (2004), Croubels et al. (2005), Chaudhary
et al.(2010), Shaw and Tsai (2012) include simultaneous determination of aspirin and SA.
These methods are not sensitive enough for a pharmacokinetic study in sheep. The reported
LOD in these methods was 0.2μg/mL, only. In our study, we will be using a lower dose of
SA which may need a very sensitive method for analysis. These methods also were not
reproducible in our laboratory, which limits their use. Likewise, none of these methods was
developed specifically for sheep plasma which contributed to the problems. Therefore, in
the present study attempts were made to develop and validate a HPLC technique to analyse
SA. This method of analysis will further be used in the pharmacokinetic study of SA in sheep
after administration of sodium salt of SA (sodium salicylate) in the chapter 3,
pharmacokinetics of sodium salicylate (NaS) in sheep.
This chapter is structured in two parts. First part includes the preliminary work carried out
and the selection of final method. Second part describes the validation study.
76
2.2 [A] PRELIMINARY WORK AND DEVELOPMENT OF HPLC TECHNIQUE FOR DETERMINATION OF SALICYLIC ACID IN SHEEP PLASMA
2.2.1 HPLC system
The HPLC system consisted of two LC-20 AD pumps, SIL- 20 AC HT auto-injector, SPD-
M20A diode array detector (DAD), CTO-20A column oven, DGU-20 A3 degasser
(Shimadzu Japan). All the chromatographs were analysed in the software LC Solutions
(Shimadzu, Japan). The DAD was set at 230nm wave length for SA detection throughout
the experimental procedure.
2.2.2 Reagents and solutions
All reagents used in the experiment were HPLC grade. Acetonitrile methanol and acetic acid
(glacial, 100% anhydrous) were purchased from Merck, KGaA; 64271 Darmastadt,
Germany. Orthophosphoric acid (OPA) was purchased from BDH Limited, Poole, England.
Milli-Q water (Milli-q PFplus system, Millipore Cooperation, USA) was used during the
experiment.
The stock solution was prepared by dissolving 0.5 g of NaS (Laboratory grade reagent,
Fisher Scientific UK) in Milli-q water (1000μg/mL concentration). Salicylic acid (SA)
standards at different concentrations ranging from 100μg/mL to 0.03125μg/mL were
prepared by serial dilutions of the stock solution with the mobile phase.
2.2.3 Column selection
Three different columns were used during preliminary experiments. Initially a Phenomenex,
C18A (Luna® 5 μm C18 100 Å, LC Column 150 x 4.6 mm) reversed phase (RP) column
was used. It was then replaced by Phenomenex, Kinetex (C18, 100 μm, 150 x 4.6 mm) RP
column. The third column used during this developmental process was Synergi Hydro®
(C18, RP 4μ, 80 Å, LC Column 150 x 4.6 mm) column. The column selection was based on
peak height, resolution and column back pressure and stability.
2.2.4 Column temperature
The column temperature was initially set at 32ºC. It was then increased to 35ºC and finally to 40ºC during the analysis.
77
2.2.5 Mobile phase composition
Initially mobile phase was composed of water: acetonitrile: acetic acid (71:28:1). It was
further altered with respect to analytical column. In the new mobile phase, acetic acid was
replaced by OPA. Therefore, this mobile phase was composed of water: acetonitrile: OPA
(71:28:1).
2.2.6 Mobile phase flow rate
Mobile phase was initially run at flow rate of 1mL/minute. It was gradually reduced during
experimental conditions to 0.8mL/minute and further to 0.6mL/minute. However,
0.8mL/minute flow rate of mobile phase was retained as a working flow rate.
2.2.7 Sample preparation methods
Two types of sample preparation methods were tried during the developmental procedure.
Initially a liquid-liquid extraction (LLE) method was used. It was followed by solid phase
extraction (SPE).
2.2.7.1 Liquid-liquid extraction
During this process, 300μL of the drug-free sheep plasma was spiked with a known amount
of SA standard (500μL). This (300μL plasma + 500 μL of known SA standard) was
considered as a sample. This sample was diluted with 5 mL of 10% acetic acid in acetonitrile
followed by vortex mixing for 20 seconds and the centrifugation at 3000g for 20 minutes.
Supernatant was separated and dried under compressed air at 30ºC. Dried sample was
reconstituted with 200μL of mobile phase and again centrifuged (3000g) for 10 minutes. The
volume of 50μL of this sample was injected in the HPLC machine for analysis. Further
variations to this method are listed in table 2.1. These variations include, a change in volume
of plasma, volume of spiked standard, concentration and pH of acetonitrile used for
precipitation of plasma proteins.
78
2.2.7.2 Solid phase extraction
2.2.7.2.1 Method 1
Phenomenex strata-X 3ml, 60mg SPE cartridge was used for solid phase extraction. The
plasma sample was prepared by using 500μL drug-free sheep plasma and 500μL of SA
standard of known concentration. This sample was vortex mixed for 30 seconds. The SPE
cartridge was activated with 1 mL of 100% methanol followed by equilibration with 1 mL
of Milli-Q water. The vortex mixed sample was then loaded on to the SPE cartridge followed
by washing with 50% methanol. Ten minutes drying period was allowed under full vacuum
and the elution was collected in a test tube as a sample in 1 mL of 100% methanol. This
eluate was dried under a gentle stream of compressed air at 50ºC and reconstituted with
500μL of mobile phase followed by 30 seconds of vortex mixing. The reconstituted sample
was then transferred to an Eppendorf vial for centrifugation at 14000g for 10 minutes. 50μL
of this final sample was injected in the HPLC machine for analysis.
2.2.7.2.2 Method 2
The plasma sample used in this method was pre-processed with LLE. Initially 1 mL drug-
free sheep plasma was spiked with 500μL of known concentration of SA and vortex mixed
together. This mixture was diluted by adding 5mL of 10% acetic acid in acetonitrile and was
centrifuged at 3000 g for 20 minutes. The supernatant was separated and 1 mL of this
supernatant was used as a sample for SPE. Remaining procedure for SPE was followed as
described in method 1 with only exception of volume of mobile phase used to reconstitute
the dried plasma sample which was reduced to 400μL in this method.
We also tried many variations in the SPE method by changing the volume of plasma, time
spent on vortex mixing and change in the drying temperature. All these modifications are
listed in tables 2.2 and 2.3.
2.2.8 Results
2.2.8.1 Chromatographic conditions
The initial C18A (Luna® 5 μm C18 100 Å, LC Column 150 x 4.6 mm) reversed phase (RP)
column was used in all LLE methods. Although, in the method 10 (table 2.1) drug recovery
79
was optimum; the backpressure of the column was high - above 15MPa. High backpressure
caused the HPLC system to stop frequently. The retention time for SA with this column was
12.8±0.9 minutes.
The Luna column was replaced by Phenomenex Kinetex (C18, 100 μm, 150 x 4.6 mm) RP
column. Although retention time for SA with this column was significantly less at 5.0±0.6
minutes, the higher column backpressure than the Luna column made us change to another
HPLC column.
Synergi Hydro® (C18, RP 4μ, 80 Å, LC Column 150 x 4.6 mm) column resulted in stable
column backpressure and optimum drug recovery with the SPE sample preparation method.
The retention time of the SA with this column was 9.4±0.5 minutes. Overall performance of
Synergi Hydro column was superior to the other two columns. The chromatographs of same
SA concentrations in three columns are shown in figure 2.1.
A column temperature of 32ºC exhibited higher column backpressure and increased
retention time as compare to 35ºC. Further increase in the column temperature to 40ºC
lowered the backpressure of column and retention time of SA without affecting drug
recovery, and peak resolution.
The mobile phase flow rate of 1mL/minute generated more than 10MPa column back
pressure. A reduction of flow rate to 0.8mL/minute lowered the column backpressure to 6-
7MPa without any effect on peak resolution. However, a further reduction of mobile phase
flow rate to 0.6mL/minute resulted in reduction in peak efficiency. Chromatographs in figure
2.2 shows the prolonged retention time and altered peak efficiency with reduced flow rate
of mobile phase. Hence, the final flow rate of the mobile phase was set at 0.8ml/minute.
2.2.8.2 Sample preparation methods
2.2.8.2.1 Liquid-liquid extraction
The original LLE method (method 1, table 2.1) resulted in enormously high recoveries of
the drug. These recoveries were inappropriate as they were more than 1000% and were
unacceptable. Therefore, further LLE methods were developed. An inconsistency in drug
recoveries ranging from 65 to 300% was obtained with Methods 2 and 3.

80
Table 2.1: Modifications in LLE phase method
Method No.
Sample (μL)
Acetic Acid Vortex mixing
Centrifugation Supernatant Drying Reconstitution (mobile phase) + centrifugation
Injection volume
1. 300+500μL standard
5mL (10 %) 20 sec 3000 rpm, 20 mins
Yes 32 ºC 200 μL 50μL
2. 300+500μL standard
5mL (10 %) 20 sec 3000 rpm, 20 mins
Yes 32 ºC 300 μL 50μL
3. 300+500μL standard
5mL (10 %) 20 sec 3000 rpm, 20 mins
Yes 32 ºC 400 μL 50μL
4. 300+500μL standard
5mL (10 %) 20 sec 3000 rpm, 20 mins
Yes 32 ºC 500 μL 50μL
5. 500+500μL standard
5mL (10 %) 20 sec 3000 rpm, 20 mins
Yes 32 ºC 500 μL 50μL
6. 500+500μL standard
2 mL (100%)
20 sec 3000 rpm, 20 mins
Yes 32 ºC 500 μL 50μL
7. 1000+ 500μL, standard
5mL (10% acetic acid in acetonitrile)
30 sec 3000 rpm, 20 mins
Yes 32 ºC 400μL 50μL
8. 1000+ 500μL, standard
5mL (10% acetic acid in acetonitrile)
30 sec 3000 rpm, 20 mins
Yes 32 ºC 200μL 50μL
9. 1000+ 500μL, standard
5mL (15% acetic acid in acetonitrile)
30 sec 3000 rpm, 20 mins
Yes 32 ºC 200μL 50μL
10. 500+500μL standard
5mL (15 % acetic acid in acetonitrile)
30 sec 3000 rpm, 20 mins
Yes 32 ºC 500 μL 50μL
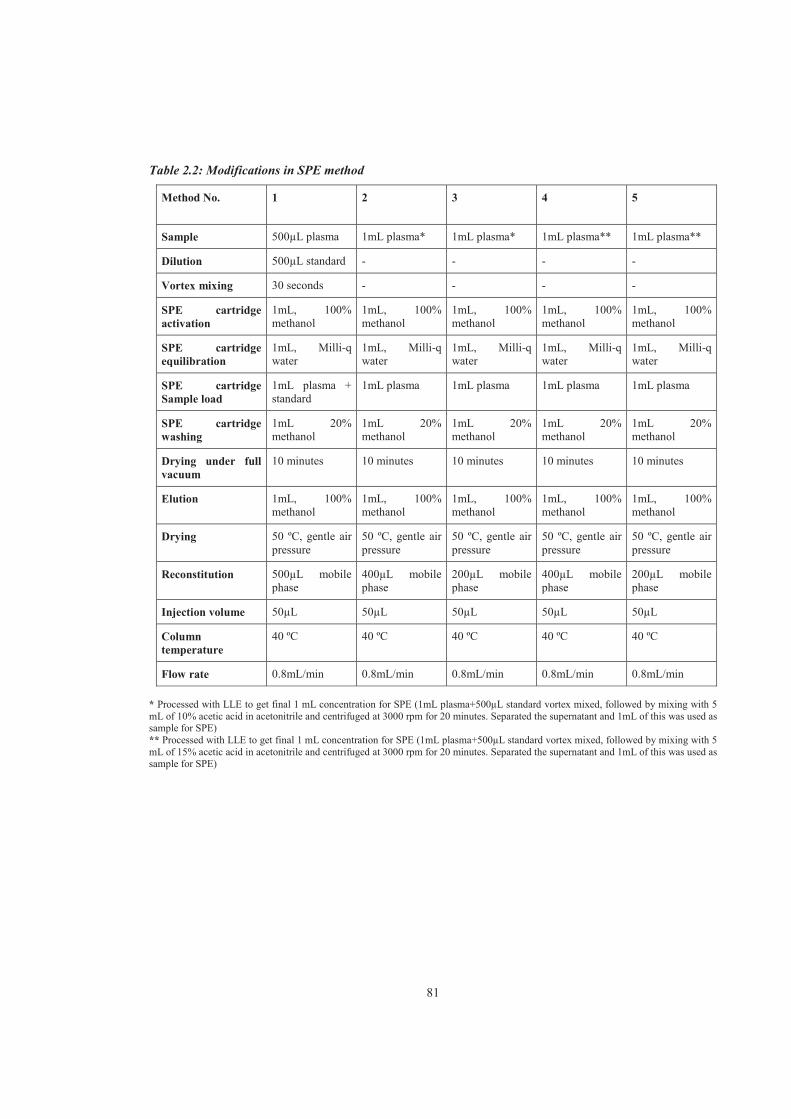
81
Table 2.2: Modifications in SPE method
Method No. 1 2 3 4 5
Sample 500μL plasma 1mL plasma* 1mL plasma* 1mL plasma** 1mL plasma**
Dilution 500μL standard - - - -
Vortex mixing 30 seconds - - - -
SPE cartridge activation
1mL, 100% methanol
1mL, 100% methanol
1mL, 100% methanol
1mL, 100% methanol
1mL, 100% methanol
SPE cartridge equilibration
1mL, Milli-q water
1mL, Milli-q water
1mL, Milli-q water
1mL, Milli-q water
1mL, Milli-q water
SPE cartridge Sample load
1mL plasma + standard
1mL plasma 1mL plasma 1mL plasma 1mL plasma
SPE cartridge washing
1mL 20% methanol
1mL 20% methanol
1mL 20% methanol
1mL 20% methanol
1mL 20% methanol
Drying under full vacuum
10 minutes 10 minutes 10 minutes 10 minutes 10 minutes
Elution 1mL, 100% methanol
1mL, 100% methanol
1mL, 100% methanol
1mL, 100% methanol
1mL, 100% methanol
Drying 50 ºC, gentle air pressure
50 ºC, gentle air pressure
50 ºC, gentle air pressure
50 ºC, gentle air pressure
50 ºC, gentle air pressure
Reconstitution 500μL mobile phase
400μL mobile phase
200μL mobile phase
400μL mobile phase
200μL mobile phase
Injection volume 50μL 50μL 50μL 50μL 50μL
Column temperature
40 ºC 40 ºC 40 ºC 40 ºC 40 ºC
Flow rate 0.8mL/min 0.8mL/min 0.8mL/min 0.8mL/min 0.8mL/min * Processed with LLE to get final 1 mL concentration for SPE (1mL plasma+500μL standard vortex mixed, followed by mixing with 5 mL of 10% acetic acid in acetonitrile and centrifuged at 3000 rpm for 20 minutes. Separated the supernatant and 1mL of this was used as sample for SPE) ** Processed with LLE to get final 1 mL concentration for SPE (1mL plasma+500μL standard vortex mixed, followed by mixing with 5 mL of 15% acetic acid in acetonitrile and centrifuged at 3000 rpm for 20 minutes. Separated the supernatant and 1mL of this was used as sample for SPE)
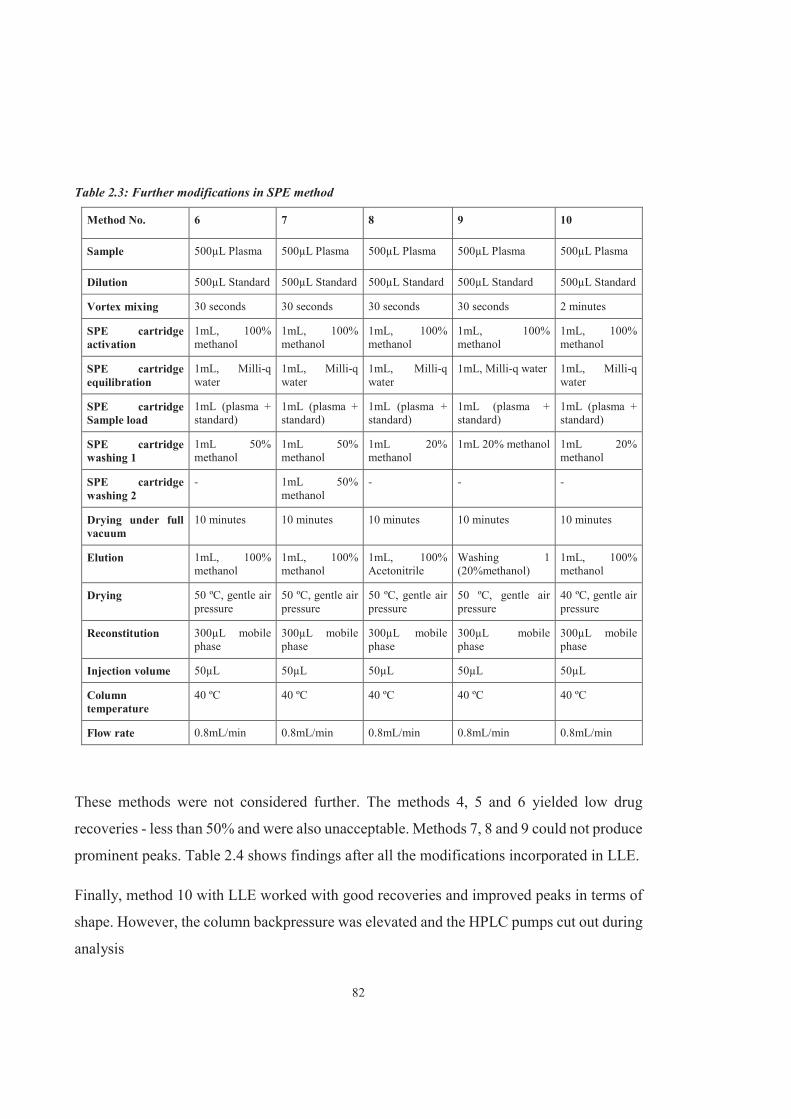
82
Table 2.3: Further modifications in SPE method
Method No. 6 7 8 9 10
Sample 500μL Plasma 500μL Plasma 500μL Plasma 500μL Plasma 500μL Plasma
Dilution 500μL Standard 500μL Standard 500μL Standard 500μL Standard 500μL Standard
Vortex mixing 30 seconds 30 seconds 30 seconds 30 seconds 2 minutes
SPE cartridge activation
1mL, 100% methanol
1mL, 100% methanol
1mL, 100% methanol
1mL, 100% methanol
1mL, 100% methanol
SPE cartridge equilibration
1mL, Milli-q water
1mL, Milli-q water
1mL, Milli-q water
1mL, Milli-q water 1mL, Milli-q water
SPE cartridge Sample load
1mL (plasma + standard)
1mL (plasma + standard)
1mL (plasma + standard)
1mL (plasma + standard)
1mL (plasma + standard)
SPE cartridge washing 1
1mL 50% methanol
1mL 50% methanol
1mL 20% methanol
1mL 20% methanol 1mL 20% methanol
SPE cartridge washing 2
- 1mL 50% methanol
- - -
Drying under full vacuum
10 minutes 10 minutes 10 minutes 10 minutes 10 minutes
Elution 1mL, 100% methanol
1mL, 100% methanol
1mL, 100% Acetonitrile
Washing 1 (20%methanol)
1mL, 100% methanol
Drying 50 ºC, gentle air pressure
50 ºC, gentle air pressure
50 ºC, gentle air pressure
50 ºC, gentle air pressure
40 ºC, gentle air pressure
Reconstitution 300μL mobile phase
300μL mobile phase
300μL mobile phase
300μL mobile phase
300μL mobile phase
Injection volume 50μL 50μL 50μL 50μL 50μL
Column temperature
40 ºC 40 ºC 40 ºC 40 ºC 40 ºC
Flow rate 0.8mL/min 0.8mL/min 0.8mL/min 0.8mL/min 0.8mL/min
These methods were not considered further. The methods 4, 5 and 6 yielded low drug
recoveries - less than 50% and were also unacceptable. Methods 7, 8 and 9 could not produce
prominent peaks. Table 2.4 shows findings after all the modifications incorporated in LLE.
Finally, method 10 with LLE worked with good recoveries and improved peaks in terms of
shape. However, the column backpressure was elevated and the HPLC pumps cut out during
analysis
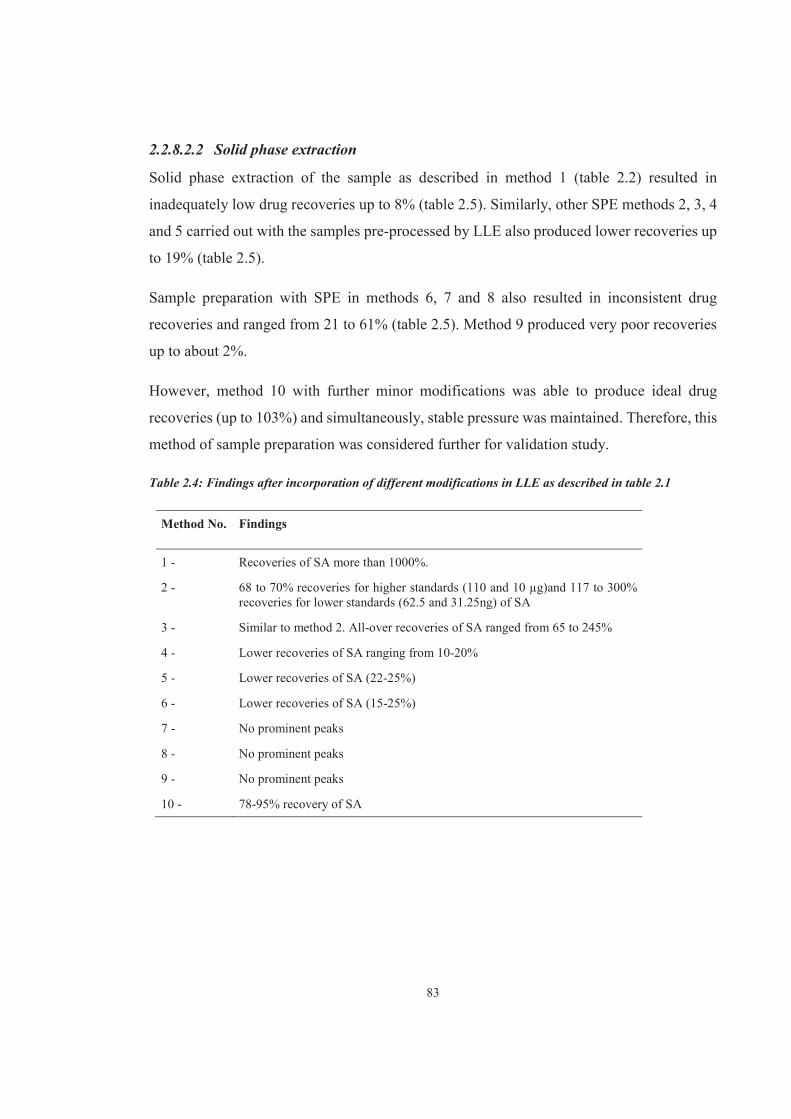
83
2.2.8.2.2 Solid phase extraction
Solid phase extraction of the sample as described in method 1 (table 2.2) resulted in
inadequately low drug recoveries up to 8% (table 2.5). Similarly, other SPE methods 2, 3, 4
and 5 carried out with the samples pre-processed by LLE also produced lower recoveries up
to 19% (table 2.5).
Sample preparation with SPE in methods 6, 7 and 8 also resulted in inconsistent drug
recoveries and ranged from 21 to 61% (table 2.5). Method 9 produced very poor recoveries
up to about 2%.
However, method 10 with further minor modifications was able to produce ideal drug
recoveries (up to 103%) and simultaneously, stable pressure was maintained. Therefore, this
method of sample preparation was considered further for validation study.
Table 2.4: Findings after incorporation of different modifications in LLE as described in table 2.1
Method No. Findings
1 - Recoveries of SA more than 1000%.
2 - 68 to 70% recoveries for higher standards (110 and 10 μg)and 117 to 300% recoveries for lower standards (62.5 and 31.25ng) of SA
3 - Similar to method 2. All-over recoveries of SA ranged from 65 to 245%
4 - Lower recoveries of SA ranging from 10-20%
5 - Lower recoveries of SA (22-25%)
6 - Lower recoveries of SA (15-25%)
7 - No prominent peaks
8 - No prominent peaks
9 - No prominent peaks
10 - 78-95% recovery of SA
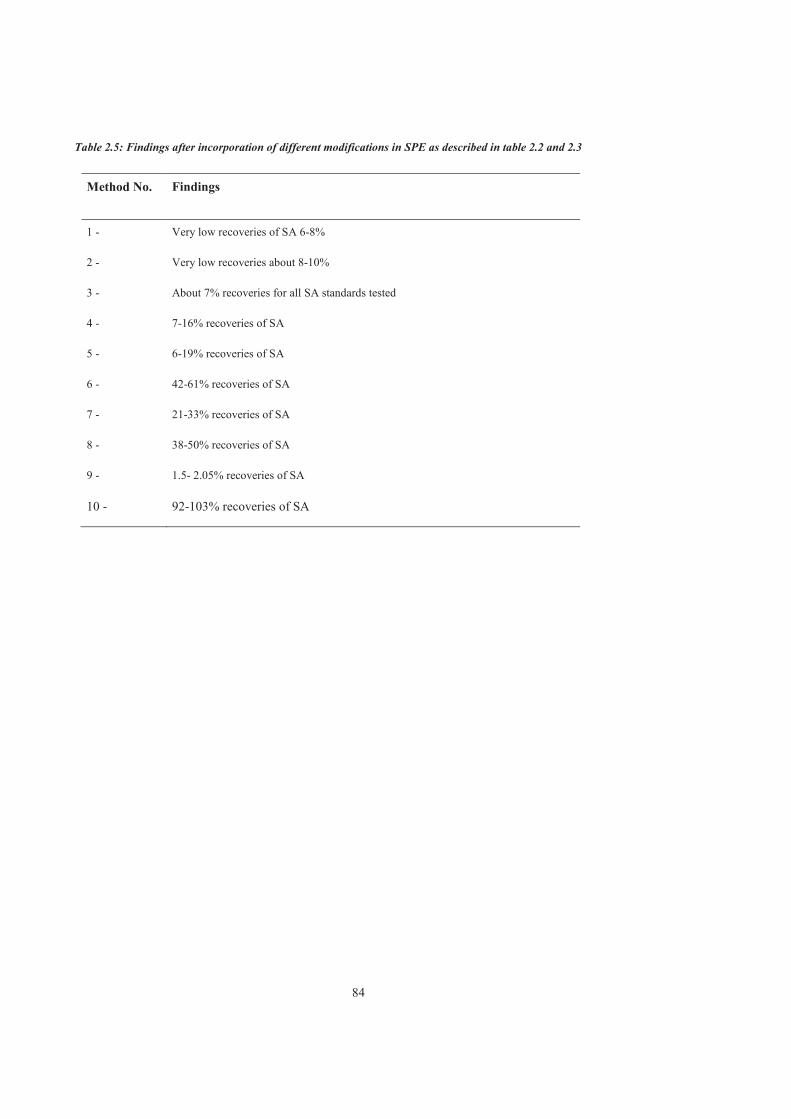
84
Table 2.5: Findings after incorporation of different modifications in SPE as described in table 2.2 and 2.3
Method No. Findings
1 - Very low recoveries of SA 6-8%
2 - Very low recoveries about 8-10%
3 - About 7% recoveries for all SA standards tested
4 - 7-16% recoveries of SA
5 - 6-19% recoveries of SA
6 - 42-61% recoveries of SA
7 - 21-33% recoveries of SA
8 - 38-50% recoveries of SA
9 - 1.5- 2.05% recoveries of SA
10 - 92-103% recoveries of SA

85
5 10 15 20
-500000.0
0.0
500000.0
1000000.0
1500000.0
50μg SA standard (Luna)
50μg SA standard (Synergi)
50μg SA standard (Kinetex)
1
2
3
Retention time (minutes)
Inte
nsity
Fig 2.1: Chromatographs of 50μg SA standard in the mobile phase. Peak 1 represents SA extraction with Phenomenex Kinetex C18 column; although, the retention time is lesser (5.0±0.6 minutes), peak resolution is not ideal. Peak 2 represents SA extraction with Synergi Hydro C18 column; the peak resolution is superior to other two columns and retention time (9.4±0.5 minute) is increased as opposed to Kinetex column. Peak 3 represents SA extraction with Luna C18 column with poor peak resolution and higher retention time (12.8±0.9) minutes

86
5 10 15 20
-100000
0
100000
200000
300000
400000
500000
0.6mL/minute flow rate
1mL/minute flow rate
0.8mL/minute flow rate
Salicylic acid peaks
Retention time (minutes)
Inte
nsity
Fig 2.2: Chromatographs of 10μg SA standard in blank plasma at different flow rates of mobile phase. The peak efficiency with lowest flow rate 0.6mL/minute is lower (3596.74 N). Peak efficiency with flow rate 0.8ml/minute and 1mL/minute is 17874.67N and 17882.24N respectively which are not significantly variable
*Peak efficiency was calculated with the formula N (peak efficiency) = tr (retention time)/W0.5 (width of the peak’s half height)

87
2.2.9 Discussion
A simple and robust method for analysis of SA in sheep plasma was developed. The HPLC
methods published so far for SA were irreproducible. Thus for this study, it was necessary
to develop and validate a sensitive and reproducible method for SA analysis in sheep plasma
samples.
During the development of this HPLC method a variety of chromatographic conditions were
considered and performance checks were conducted to assure optimum peak efficiency,
comparable retention time and recovery of our analyte of interest.
The column selection was prioritised as it is important to select the ideal column for isolation
of analyte (Gilroy et al., 2003, Cruz et al., 1997). As described in the results, three different
analytical columns (LunaC10 RP, Kinetex C18 RP and Synergi Hydro C18 RP) were used
and the Synergi Hydro, C18, RP had optimum performance and was selected for the final
method. We first tested Luna C18 column, based on the published literature and also because
it is the most commonly used column in drug analysis. We experienced exceptionally high
back pressure with the Luna C18 column. Thus, we decided to test Kinetex C18 due to its
new core-shell technology. In other columns the particles of packaging material are
completely porous silica particles providing a porous surface. In contrast, core-shell
technology in Kinetex provides non-porous surface to provide better and faster separation
of the analyte (Fekete et al., 2012). The Kinetex C18 also gave high back pressure. The
possible reasons for high backpressure could be the bonding of stationary phase in the
column and the impurities in the final sample which might deposit on the non-porous surface
of column packing material to cause higher backpressure. On the other hand, the Synergi
Hydro column had bonded phase endcapped with a proprietary polar group which provides
optimum retention of both hydrophobic and polar compounds through polar interactions,
hydrogen bonding or electrostatic interactions. This improved peak efficiency and produced
stable column backpressure. Thus, this column gave higher peak resolution and efficiency
along with lower back pressure compared to other HPLC columns tested in this experiment.
The column temperature also plays an important role in elution of an analyte (Vanhoenacker
and Sandra, 2007). It is inversely proportional to the column pressure and retention time.
88
Increase in column temperature decreases column pressure and retention time of the analyte
and vice-versa (Poppe et al., 1981). Initially column temperature was maintained at 32ºC,
it was then increased to 35ºC and finally to 40ºC which resulted in lower retention time as
well as lower column pressure. Also, peak efficiency and drug recoveries were unaffected
due to change in temperature. Hence, the final column temperature was set at 40ºC.
Mobile phase used in this experiment did not require additional buffer solution to maintain
the pH. Moreover, gradient flow rate of the mobile phase as reported by other researchers
was not necessary for this method. Acetic acid in the mobile phase was replaced with OPA.
The peak resolution and reproducibility were improved with OPA as the SA is well
dissociated with this stronger acid (Heyrman and Henry, 1999). In addition, OPA yielded
stable pressure in association with Synergi Hydro-RP column compared to acetic acid.
Similar improvements in peak resolution and pressure stability were observed by (Long and
Henderson Jr, 2009) after replacement of acid component of mobile phase with alternate
acid for pH maintenance.
The mobile phase components described by (Fogel et al., 1984) are similar to our final
mobile phase components. However, their ratio (76:24:0.5) differs from the one which we
used in our method (71:28:1). A similar isocratic flow rate of different mobile phase
composition without phosphate buffer was described by (Sawyer and Kumar, 2003) for
separation of SA and aspirin in the effervescent tablets.
Mobile phase flow rate was set to 0.8mL/minute as lower back pressure was maintained
without compromising the peak efficiency as opposed to high back pressure with
1mL/minute (figure 2.1). Generally, high flow rate of mobile phase results in high column
pressure and vice-versa (Graham and Rogers, 1980).
Recovery of the drug in the first method was abnormally high (more than 1000%), which
could be due to the dilution of the blank plasma with SA. A 300μL of drug free plasma
sample was spiked with 500μL of SA. After drying under gentle stream of air, it was
reconstituted 200μL of mobile phase. Thus, the higher recoveries were due to dilution error.
In other LLE methods, modifications in the method of sample preparation were carried out
to achieve high recoveries and a cleaner sample. The various volumes at different
89
percentages of acetic acid were used to enhance plasma protein precipitation to improve
isolation of analyte. Also, vortex mixing time was increased from 20 seconds to 30 seconds
for better mixing of plasma with acetic acid to ensure protein precipitation. Similarly, to
obtain higher recoveries, either plasma sample volumes or mobile phase volumes (for re-
constitution) or both were altered. However, due to loss of drug (either protein binding or
loss during separation in LLE) the recoveries in these methods were inadequate. Though
method 10 with LLE worked well to achieve ideal recoveries of SA; the increase in column
back pressure limited the use of this method. In this case, back pressure might have increased
due to the deposition of proteins or impurities in the plasma sample on to the column surface.
The SPE method was introduced to improve recoveries and clean-up of the plasma samples.
While using this method, initially few plasma samples were pre-processed with LLE
followed by SPE to assess the recovery. However, the drug loss was obvious and would have
occurred due to pre-LLE processing which resulted in poor recoveries. Another probable
cause for the loss of the drug could be extensive (twice) washing during the SPE clean-up
procedure. Therefore, to prevent excessive loss of drug during washing, further change was
incorporated where the sample was washed with 20% methanol rather than 50% methanol.
Also, for elution of sample, methanol (100%) was replaced by acetonitrile (100%) to see if
recovery improved. However, the findings were not satisfactory. Methanol has been reported
to have highest strength to elute (Norberg-King, 2005). Due to inconstant and low
recoveries, the possibility of loss of drug during the washing procedure was presumed. This
loss was confirmed by using the post-washing (with 20% methanol) waste solution as elute
and processed further to prepare final sample. The recoveries obtained due to this
modification were even lower. This showed that there was no significant loss of drug during
the washing process. Finally, to ensure proper mixing of plasma and the drug, the samples
were vortex mixed for 2 minutes instead of 30 seconds. Another concern about the loss of
drug at high temperature (50ºC) during drying was considered and the temperature for drying
was reduced to 40ºC as this is the commonly used temperature in routine sample preparation
methods (Vaudry and Biggio, 2011). These two variations confirmed the importance of
mixing of samples and critical temperature to consider for drying the sample to prevent the
loss of drug from it. Finally, ideal recoveries of the drug were obtained with this last method
(10) of SPE.
90
2.3 [B] VALIDATION OF HPLC TECHNIQUE FOR DETECTION OF SALICYLIC ACID IN SHEEP PLASMA
2.3.1 Material and methods
2.3.1.1 Reagents and solutions
Acetonitrile HPLC grade was purchased from Merck, KGaA; 64271 Darmastadt, Germany
and Orthophosphoric acid from BDH Limited, Poole, England. Sodium salicylate
(Laboratory grade reagent) was purchased from Fisher Scientific UK. The stock solution of
NaS was prepared in Milli Q water (Milli-q PFplus system, Millipore Cooperation, USA) by
dissolving 0.1g NaS in 100mL. The working standard solutions were prepared in mobile
phase fresh daily from the stock solution.
2.3.1.2 Sample preparation and analysis
2.3.1.2.1 Solid phase extraction
All samples and standards (spiked in blank the plasma) were prepared for analysis by using
solid phase extraction (SPE) method with Phenomenex strata-X 3ml, 60mg SPE cartridge
(Phenomenex, Auckland, New Zealand). A 500μL of plasma was spiked with either 500 μL
of a known concentration of NaS standard or Milli-Q water (in case of plasma sample
obtained from the test sheep administered with NaS). The sample was vortex mixed for 2
minutes. The cartridge was activated by 1 mL (100 %) methanol followed by equilibration
with 1 mL of Milli-Q water. 1 mL sample was loaded followed by a single washing with
20% methanol. The cartridge was then dried for 10 minutes under full vacuum. The elution
was carried out with 1 mL of 100% methanol, collected in a glass test tube. This eluent was
dried under the gentle stream of compressed air at 40ºC and reconstituted with 300μL of
mobile phase. The sample was vortex mixed for 30 seconds and then centrifuged at 14000
rpm for 10 minutes. The injection volume was 50 μL. Each sample was injected twice in the
HPLC machine
2.3.1.3 Chromatographic conditions
The mobile phase was prepared by mixing water, acetonitrile and orthophosphoric acid at
71:28:1 proportion. The pH of mobile phase was 2.54. Mobile phase was filtered through
91
0.2μm membrane filter. Analysis of the samples was carried out under isocratic conditions.
The flow rate was 0.8mL/minute. A Synergi Hydro® (C18, RP 4μ, 80 Å, LC Column 150 x
4.6 mm) column was used for sample separation. The oven temperature was set at 40ºC. All
the chromatograms were analysed at 230nm wavelength.
2.3.1.4 Selectivity/Specificity
The selectivity of the method was detected by analysing the drug-free plasma sample from
10 different sheep, processed with the same method.
2.3.1.5 Accuracy/Recovery
Accuracy of the method was determined by spiking three different concentrations of the
standards of SA (from the stock solution) in the blank plasma samples. Recovery of the SA
was obtained by comparing the peak areas of spiked plasma samples to that of the pure
standards of the SA using linear regression model for estimation of the true recovery.
2.3.1.6 Precision
Precision of the HPLC method was checked by intra- and inter-day variation. Three
concentrations of SA (50, 0.5 and 0.25 μg/mL) spiked with the blank sheep plasma were
analysed for three consecutive days. The samples for each concentration were prepared every
day and were run in three different batches each day in triplicate for intra-day variation. This
was repeated for three different days to check inter-day variation.
2.3.1.7 Linearity
Five different concentrations of SA ranging from 50 to 0.125μg/ml were spiked with blank
plasma (three sets; set 1, set 2, set 3) and their linearity was assessed by plotting the graph
of peak areas against the concentrations. Linear regression model in the statistical software
GraphPad Prism 5 was used to assess the linearity.
2.3.1.8 Limit of quantification
A range of low concentrations of SA (0.0625, 0.125, 0.250, 0.50 μg/mL) were analysed to
detect the quantifiable limits.
92
2.3.1.9 Standards
Six different concentrations of NaS standards, 50μg/mL, 5μg/mL, 0.5μg/mL, 0.25μg/mL,
0.125μg/mL and 0.0625μg/mL were prepared from stock solution in mobile phase (diluting
the stock solution with mobile phase to get desired standard concentration) to make a
calibration curve.
2.3.2 Chromatographic analysis of sheep plasma samples (pilot study)
This pilot study was approved by Massey University Animal Ethics Committee. Two sheep
were administered an intravenous dose of NaS at 50mg/kg body weight in right jugular vein.
Blood samples were collected at 0, 0.25, 0.5, 1, 2, 4 and 6 hours in heparinised vacutainers
from the left jugular vein. The samples were immediately placed on ice and were centrifuged
at 7000g for 15 minutes. The plasma was separated and stored at -700C until the day of
analysis.
2.3.3 Results
The method detected the presence of SA in sheep plasma sample at the specified retention
time (9.4±0.5 minutes). Figure 2.3 shows three chromatographs, the first chromatograph of
a blank plasma sample demonstrates the absence of a peak at the retention time for SA. The
second chromatograph of plasma sample spiked with known (50μg) SA exhibits the SA
peak; whereas, SA standard (50μg) in mobile phase also shows the peak at the same retention
time. Recovery for the tested (50μg, 0.5μg, 0.25μg) concentrations ranged between
97.67±0.004% (for 0.25μg/mL) to 102.67±0.01% (for 0.5g/mL). Relative standard deviation
(RSD %) for recoveries was ranging between 0.87 to 1.51% (table 2.6). The formula used
to calculate RSD is as below:
(%) = ( ) × 100
Table 2.7 and 2.8 shows the intra- and inter-day variation respectively. The maximum RSD
% for intra- and inter-day variation was 3.38 and 2.73% respectively for the concentration
0.5μg/mL of NaS. Mean r2 (correlation coefficient) of linearity was 0.9996± 0.00056. Table
2.9 shows the slope, Y intercept and r2 values for three different sets of SA concentrations.
Figures 2.4 and 2.5 show the peaks for different lower concentrations of SA in mobile phase

93
and spiked in blank plasma. The limit of quantification based on the signal to noise ratio of
10 in this method for SA was 0.0625μg (figures 2.4 and 2.5). The calibration/standard curve
(Figure 2.6) was prepared using liner regression model (r2= 0.9999) in software GraphPad
Prism (Prism 5 for windows, version 5.01, August, 2007, GraphPad Software, Inc. CA,
USA). Figure 2.7 shows the concentration time curve for SA after HPLC analysis of sheep
plasma sample collected for pilot study. The maximum concentration (Cmax) observed during
this study was 18.02μg at 15 minutes (Tmax) after drug administration while the minimum
concentration was observed (1.17μg) at 2 hours.
Table 2.6: Recovery of SA after spiking in the blank plasma
SA(μg/mL) spiked Mean (n=9) SA (μg/mL) recovered Recovery (%)
SD (n=9)
RSD (% )
50 49.68 99.35 0.43 0.87
0.50 0.52 102.67 0.01 1.58
0.25 0.25 97.67 0.004 1.51
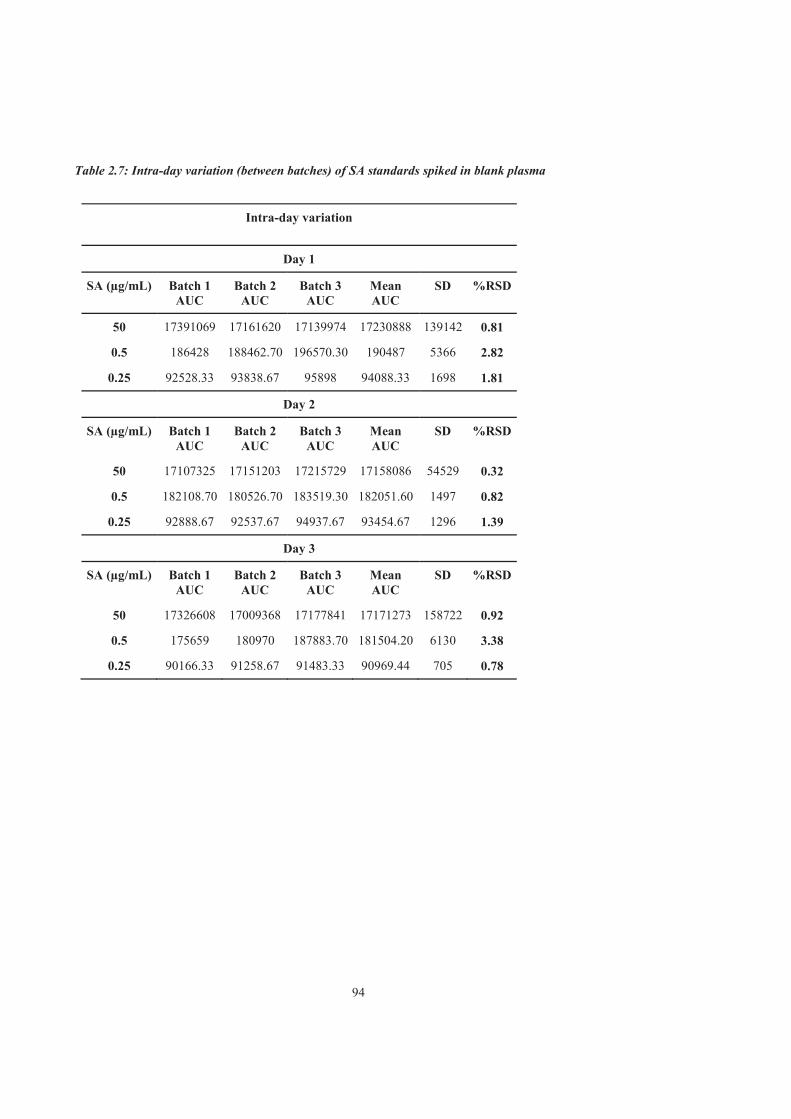
94
Table 2.7: Intra-day variation (between batches) of SA standards spiked in blank plasma
Intra-day variation
Day 1
SA (μg/mL) Batch 1 AUC
Batch 2 AUC
Batch 3 AUC
Mean AUC
SD %RSD
50 17391069 17161620 17139974 17230888 139142 0.81 0.5 186428 188462.70 196570.30 190487 5366 2.82
0.25 92528.33 93838.67 95898 94088.33 1698 1.81
Day 2
SA (μg/mL) Batch 1 AUC
Batch 2 AUC
Batch 3 AUC
Mean AUC
SD %RSD
50 17107325 17151203 17215729 17158086 54529 0.32 0.5 182108.70 180526.70 183519.30 182051.60 1497 0.82
0.25 92888.67 92537.67 94937.67 93454.67 1296 1.39
Day 3
SA (μg/mL) Batch 1 AUC
Batch 2 AUC
Batch 3 AUC
Mean AUC
SD %RSD
50 17326608 17009368 17177841 17171273 158722 0.92 0.5 175659 180970 187883.70 181504.20 6130 3.38
0.25 90166.33 91258.67 91483.33 90969.44 705 0.78
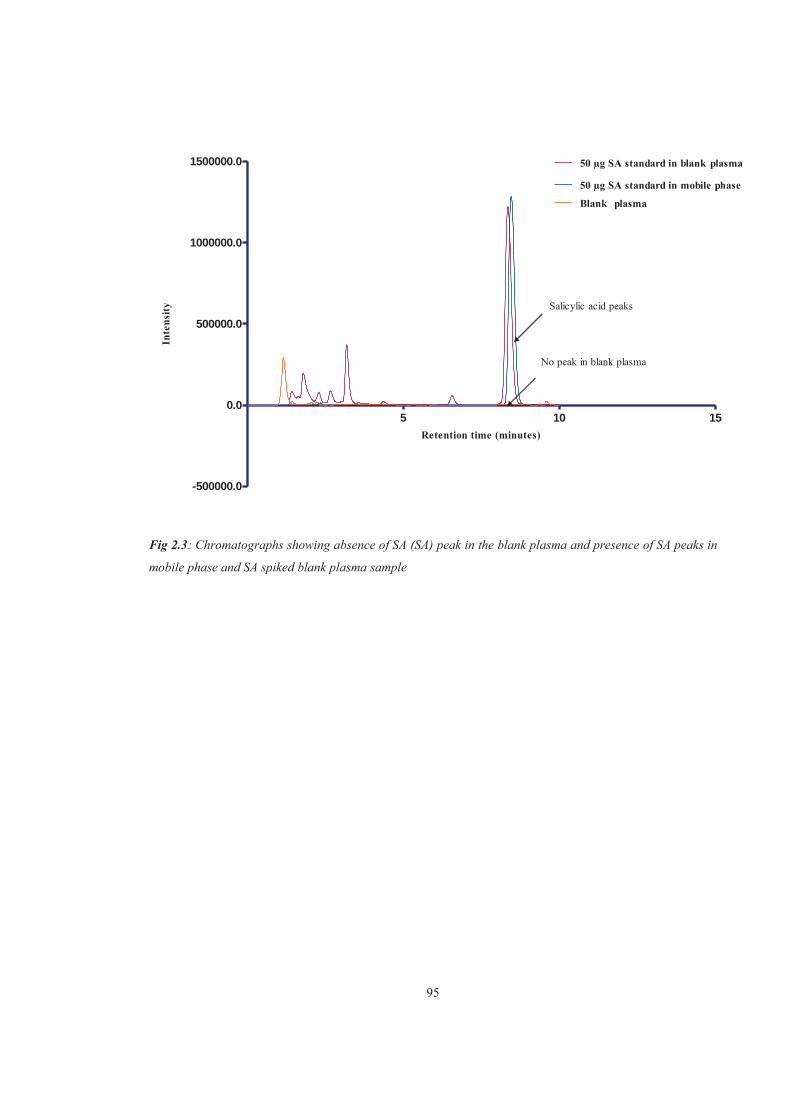
95
5 10 15
-500000.0
0.0
500000.0
1000000.0
1500000.0 50 μg SA standard in blank plasma
50 μg SA standard in mobile phase
Blank plasma
Salicylic acid peaks
No peak in blank plasma
Retention time (minutes)
Inte
nsity
Fig 2.3: Chromatographs showing absence of SA (SA) peak in the blank plasma and presence of SA peaks in
mobile phase and SA spiked blank plasma sample

96
Table 2.8: Inter-day variation (between days) of SA standards spiked in blank plasma
Inter day variation
Mean AUC’s (n=3) AUC
SA (μg/mL) Day 1 Day 2 Day 3 Mean SD % RSD
50 17230888 17158086 17171273 17186749 38790 0.23 0.5 190487 182051.6 181504.2 184680.9 5036 2.73
0.25 94088.33 93454.67 90969.44 92837.48 1648 1.78
Table 2.9: Results of validation of linearity for SA detection method
Slope y- intercept r2
Set 1 167090 100830 0.9996 Set 2 167071 107302 0.9996 Set 3 177099 104822 0.9997 Mean 170420 104318 0.9996333
SD 5784.19 3265.30 0.000056 % RSD 3.39 3.13 0.0058
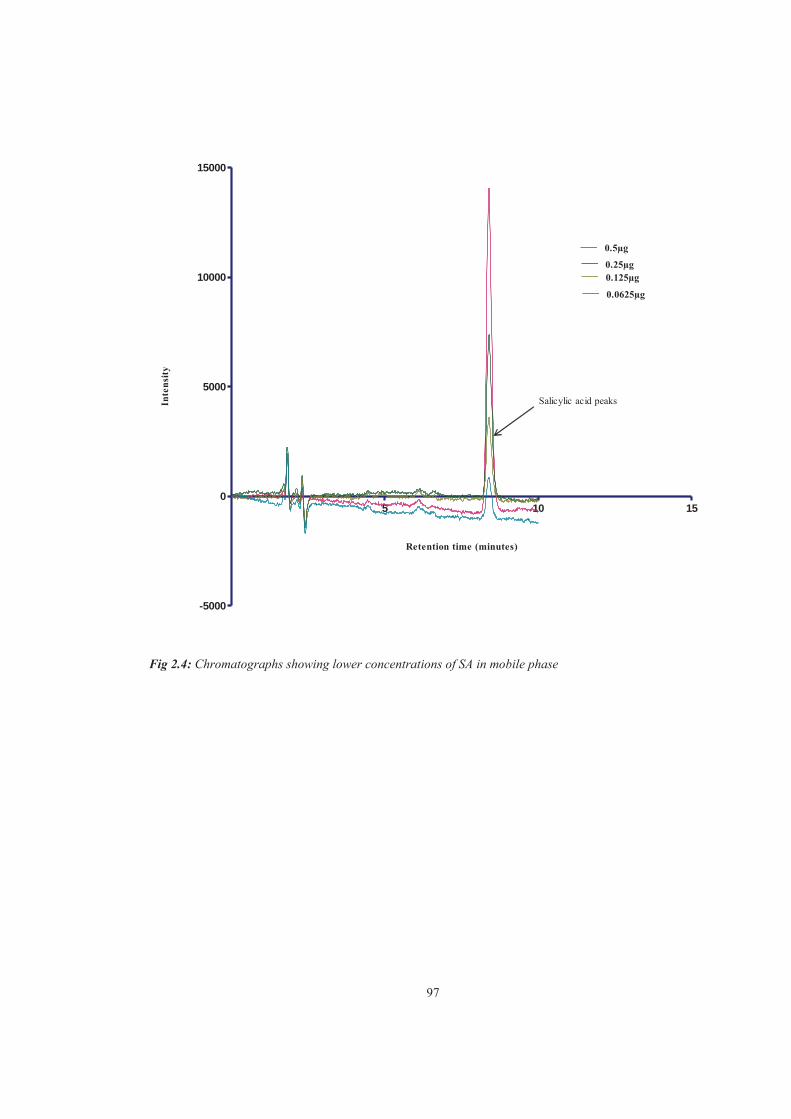
97
5 10 15
-5000
0
5000
10000
15000
0.5μg
0.25μg0.125μg
0.0625μg
Salicylic acid peaks
Retention time (minutes)
Inte
nsity
Fig 2.4: Chromatographs showing lower concentrations of SA in mobile phase
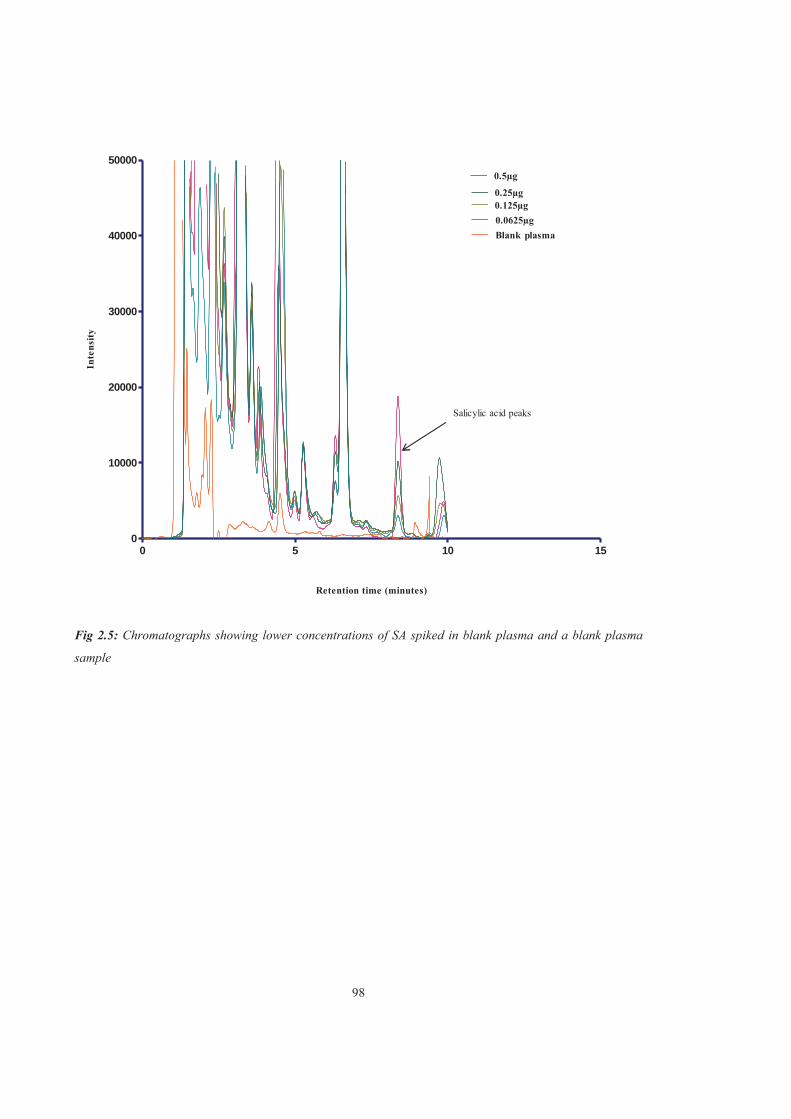
98
0 5 10 150
10000
20000
30000
40000
500000.5μg
0.25μg0.125μg0.0625μg
Salicylic acid peaks
Blank plasma
Retention time (minutes)
Inte
nsity
Fig 2.5: Chromatographs showing lower concentrations of SA spiked in blank plasma and a blank plasma
sample

99
0 20 40 600
2.0 106
4.0 106
6.0 106
8.0 106
Concentration (μg/mL)
Are
a un
der c
urve
Fig 2.6: Calibration/standard curve for SA
0 2 4 6 80
5
10
15
20
Sheep 1
Sheep 2
Time in hours
conc
entr
atio
n of
SA
in s
heep
pla
sma
(μg/
ml)
Fig 2.7: Concentration-time curve of the SA in sheep plasma determined by the validated HPLC method
100
2.3.4 Discussion
The validation study of the parameters such as selectivity, accuracy, precision and linearity
showed that the % RSD for each parameter well within the limits defined by (FDA, 2007).
The sensitivity of our method is better than that reported in published literature. The limit of
detection of SA described by other workers ranges from 5μg to 0.1μg (Sawyer and Kumar,
2003, Pirola et al., 1998, Jian-Hua and Smith, 1996, O'Kruk et al., 1984, Mays et al., 1984).
Our method can quantify as low as 0.0625μg of SA in sheep plasma. This sensitivity could
be attributed to the SPE method used to prepare plasma sample which isolates SA by
improving clean-up of sample and yielding more drug so that smaller quantities can be
detected.
Maximum % RSD for intra-day variation in our HPLC method for SA analysis was lower
(3.38%) than Chaudhary et al. (2010) (7.71%) and comparable to Mallikaarjun et al. (1989)
(2.78%). Similarly, inter-day variation for our method was less (2.78%) than other studies
Mallikaarjun et al. (1989) (8.90%), O'Kruk et al. (1984) (4.20%), and Chaudhary et al.
(2010) (5.51%).
Various published HPLC methods for SA analysis mentioned above were not reproducible
in our lab due to differences in instrumentation and our requirement for analysis of SA in
sheep plasma. No method has been published to analyse SA in sheep plasma, thus validation
of this method is significant. However the expensive SPE process for sample preparation
could be a limiting factor of our method. Though SPE cartridges are expensive, they provide
maximum recovery of the drug resulting in high sensitivity without any interfering peaks.
Also, a Diode Array Detector is less sensitive than Mass Spectrometry (MS) for most of the
analytes (Kopec et al., 2013), but is a commonly used detector in pharmacology laboratories
due to its cheaper cost. Hence, by using MS, a more sensitive and precise method for SA
analysis in sheep plasma may be developed.
The merits of our method include fewer reagents and solutions which makes it simpler. No
pre-processing prior to storage of plasma samples is required.
101
Moreover, SA separation in the plasma samples of sheep administered NaS was achieved
with the validated HPLC method. The concentration-time curve of the two sheep (figure 2.5)
for plasma SA shows the utility of this HPLC technique.
2.4 CONCLUSION
In conclusion, a simple, accurate, reproducible, sensitive and robust (pH independent) HPLC
method for determination of SA in sheep plasma has been developed. The method has been
shown to be applicable in pharmacokinetic studies in sheep.
102
3 PHARMACOKINETICS OF SODIUM SALICYLATE IN
SHEEP
ABSTRACT
This study was conducted to determine the pharmacokinetic parameters of sodium salicylate
in sheep after oral and intravenous administration. Six healthy sheep were administered
intravenous sodium salicylate at four different dose rates 10, 50, 100 and 200mg/kg body
weight and another six were drenched with 100 and 200mg/kg orally. A washout period of
one week between each treatment was allowed after both intravenous and oral
administration. Blood samples were collected at pre-determined time intervals. Analysis of
these samples was carried out with High Performance Liquid Chromatography to measure
plasma salicylic acid concentrations. The pharmacokinetic data after intravenous
administration of sodium salicylate in sheep fitted best a one compartmental model. The
concentration of drug extrapolated to time zero (Cp0) for 10 mg/kg was significantly lower
than for 200 and 100mg/kg of sodium salicylate. The elimination rate constant (Kel) for the
lowest dose rate (10mg/kg) was significantly higher than for 200 and 100mg/kg. The volume
of distribution for 200mg/kg was significantly higher than other dose rates. Half-lives for 10
and 50 mg/kg body weight were significantly lower than the half-life of 200mg/kg.
Non-compartmental pharmacokinetic analysis was performed after oral administration.
Average Cmax for both oral dose rates, 100 and 200mg/kg were 4.22±2.33 and
8.27±2.38μg/mL, achieved at 1±0 and 0.67±0.26 hours, respectively. Average
bioavailability, clearance, volume of distribution and half-life of sodium salicylate/salicylic
acid in sheep were 0.53 (53%) and 0.64 (64%), 4.62±1.38 and 5.79±2.16L/hr/kg, 12.48±
4.02 and 16.45±8.33L/kg and 1.86±0.11 and 1.90±0.35 hours for 100 and 200mg/kg,
respectively.
The minimum plasma salicylic acid concentration (16.8μg/mL) required to produce the
analgesia in humans was achieved in our study after intravenous administration of 100 and
200mg/kg sodium salicylate in sheep. However, reported minimum plasma salicylic acid
103
concentration in cattle (25 to 30μg/mL) to produce analgesia was only achieved after
intravenous administration of 200mg/kg sodium salicylate to sheep in our study.
3.1 INTRODUCTION
Sodium salicylate (NaS) is a NSAID with anti-pyretic, analgesic and anti-inflammatory
properties. It has been used as a source/pro-drug for salicylic acid which is the active
ingredient as discussed in chapter one.
The use of NaS as a NSAID in humans is well established. In animals such as cattle, it has
been used as an analgesic and anti-inflammatory agent (Coetzee et al., 2007a). In sheep,
very few pharmacokinetic studies have been conducted. However, pharmacokinetic
parameters are not consistent in animals and they can vary with respect to age, gender,
weight, breed, environment and climate (Riviere and Papich, 2013, Nawaz and Nawaz,
1983).
Therefore, the current study was conducted to determine the pharmacokinetic parameters of
NaS in typical sheep in New Zealand. Other studies have been conducted in the different
parts of the world with different breeds of sheep. For instance, Sulaiman and Kumar (1995)
in India administered intravenous as well as an oral single dose of NaS at 100mg/kg body
weight in Bannur (local Indian breed) sheep. Blood samples were collected at every 15
minutes after intravenous drug administration until one hour and then at two and four hours;
after oral administration of drug, blood samples were collected at every 15 minutes until one
hour and then at every one hour up to 8 hours. However, they analysed blood samples for
total salicylates. In our pharmacokinetic study, only plasma salicylic acid (SA) (active
ingredient) concentration was analysed.
Another pharmacokinetic study of salicylate in the sheep was conducted by Ali (2003) in
Saudi Arabia. In this study they assessed total salicylate concentrations in the sheep plasma
to analyse pharmacokinetic parameters after intravenous and intramuscular administration
of DL-lysine-acetyl salicylate (20mg/kg body weight). This study compared the
pharmacokinetics in camel, sheep and goats.

104
The pharmacokinetics of salicylate or aspirin have also been conducted in cattle, horse,
rabbit, goat, camel, cat and avian species such as turkey, ostrich, pigeon, chicken etc. as well
as people.
In cattle, aspirin was commonly used to treat respiratory ailments caused by bacteria and
viruses (Gingerich et al., 1975). The pharmacokinetics of salicylate was studied by Whittem
et al. (1996) after administration of DL-lysine-acetyl salicylate intravenously in cattle at
dose rate of 26 mg/kg body weight. The half-life of salicylate reported in this study was short
of about 30 minutes and volume of distribution was lower (1.2L/kg). Coetzee et al. (2007b)
studied the pharmacokinetics of NaS in calves at 50 mg/kg body weight and observed similar
results as Whittem and co-workers. In another pharmacokinetic study in cattle conducted by
Short et al. (1990), NaS was administered intravenously as well as orally and its excretion
was observed by collecting urine samples. The findings of this study suggested that 54%
NaS is excreted in its original form after intravenous administration while, after oral
administration, less than 12% NaS was eliminated through urine. Another metabolite,
salicyluric acid, (the glycine conjugate) was reported to be a major metabolite excreted by
cattle after intravenous and oral administration. In goats, when NaS was administered
intravenously and orally, its recovery as NaS in urine was 67.9 and 30.2% respectively and
salicyluric acid was also excreted as major metabolite (Short et al., 1990). In humans, the
major metabolite of SA eliminated in urine was also salicyluric acid (Needs and Brooks,
1985). The pharmacokinetic studies in cattle and goats could be of relevance to compare
with sheep, as all these species are ruminants. However, inter-species pharmacokinetic
differences should always be considered.
Inter-species variation in pharmacokinetics of salicylate is evident from the studies reported
by various authors (table 3.5). The wide disparity of half-lives (about 26 minutes in goats to
22 hours in cats), and clearances (ranging from 0.04L/hr/kg in rabbits to 5.31L/hr/kg in cats)
in different animals can be observed. The significant factors which affect pharmacokinetics
of salicylate are the extent of plasma protein binding (salicylates highly bind to plasma
proteins, especially, albumin), pH of the urine, bioavailability, and extent of absorption from
the site of administration (Needs and Brooks, 2012, Katzung et al., 2004). Also, intra-species
(within the species in different breeds) and inter-individual (between individuals of the same
breed) variation has been observed by some researchers in cattle (Whittem et al., 1996,
105
Gingerich et al., 1975). Thus, due to inter- and intra-species variability in the
pharmacokinetics of salicylate, a distinct pharmacokinetic study in each species is
warranted.
A pharmacokinetic study to assess its absorption, variation in its concentrations in the body
over time and its metabolism and excretion is essential before clinical use of any drug (Pea
and Furlanut, 2008). Pharmacokinetic parameters such as half-life, clearance, volume of
distribution must be estimated to calculate dosing regimen of the drug in individual
animal/species.
The ultimate aim of this thesis is to assess the analgesic efficacy of salicin derivative,
salicylic acid in sheep. SA shows analgesic effects when it is metabolised from salicin which
is naturally present in willow leaves. Therefore, study of the pharmacokinetic parameters of
salicylate is essential.
The current experiment was conducted to analyse pharmacokinetic parameters of SA at the
different dose rates of NaS given intravenously and orally to sheep.
3.2 MATERIALS AND METHODS
3.2.1 [A] Blood collection
3.2.1.1 Animal preparation and study design
Two different studies were conducted for analysing intravenous and oral pharmacokinetic
parameters of NaS in sheep. These studies were approved by Animal Ethics Committee,
Massey University, Palmerston North, New Zealand. Both studies were carried out at Large
Animal Teaching Unit (LATU), Massey, University, Palmerston North, New Zealand.
Six healthy Romney cross sheep (2 males and 4 females) age 5-6 months with similar
weights (mean±SD) 42.25±5.7kg were used for intravenous administration of NaS in a
randomised crossover study. Sheep were weighed, clipped in the neck area for easy access
to the jugular veins from both the sides. An 18 G catheter was placed in one jugular vein
used for blood collection, while the contralateral vein was used for injection of the drug.
For the oral pharmacokinetic study a randomised crossover design was followed. Six healthy
Romney cross sheep (3 males and 3 females) aged between 8-10 months and weighing
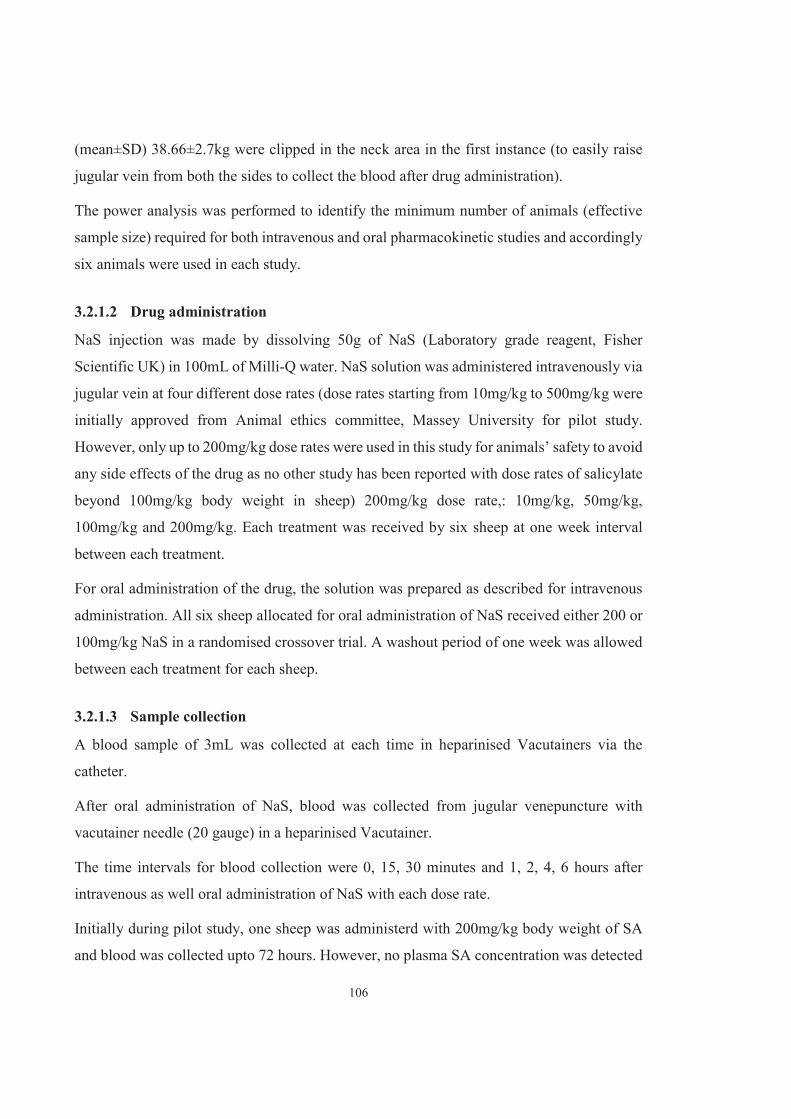
106
(mean±SD) 38.66±2.7kg were clipped in the neck area in the first instance (to easily raise
jugular vein from both the sides to collect the blood after drug administration).
The power analysis was performed to identify the minimum number of animals (effective
sample size) required for both intravenous and oral pharmacokinetic studies and accordingly
six animals were used in each study.
3.2.1.2 Drug administration
NaS injection was made by dissolving 50g of NaS (Laboratory grade reagent, Fisher
Scientific UK) in 100mL of Milli-Q water. NaS solution was administered intravenously via
jugular vein at four different dose rates (dose rates starting from 10mg/kg to 500mg/kg were
initially approved from Animal ethics committee, Massey University for pilot study.
However, only up to 200mg/kg dose rates were used in this study for animals’ safety to avoid
any side effects of the drug as no other study has been reported with dose rates of salicylate
beyond 100mg/kg body weight in sheep) 200mg/kg dose rate,: 10mg/kg, 50mg/kg,
100mg/kg and 200mg/kg. Each treatment was received by six sheep at one week interval
between each treatment.
For oral administration of the drug, the solution was prepared as described for intravenous
administration. All six sheep allocated for oral administration of NaS received either 200 or
100mg/kg NaS in a randomised crossover trial. A washout period of one week was allowed
between each treatment for each sheep.
3.2.1.3 Sample collection
A blood sample of 3mL was collected at each time in heparinised Vacutainers via the
catheter.
After oral administration of NaS, blood was collected from jugular venepuncture with
vacutainer needle (20 gauge) in a heparinised Vacutainer.
The time intervals for blood collection were 0, 15, 30 minutes and 1, 2, 4, 6 hours after
intravenous as well oral administration of NaS with each dose rate.
Initially during pilot study, one sheep was administerd with 200mg/kg body weight of SA
and blood was collected upto 72 hours. However, no plasma SA concentration was detected

107
in the samples collected at 6 to 72 hours post drug administration. Hence, blood sampling
was stopped at 6 hours post drug admnistration in both studies.
After collection of blood samples during both studies, they were centrifuged at 7000g for 15
minutes and plasma was harvested and stored at -700C till the day of analysis (analysis of
samples was performed within three weeks after blood collection).
3.2.2 [B] HPLC analysis of plasma samples
All the plasma samples were analysed for SA concentration by the HPLC method as
described in chapter two. The chromatographs of sheep plasma sample with SA peaks are
shown in figure 3.1.
3.2.3 Pharmacokinetic analyses
The data obtained from HPLC analysis (plasma SA concentrations for each treatment after
intravenous and oral administration of NaS) were used to evaluate pharmacokinetics. Non-
compartment (NCA) and compartmental pharmacokinetic analyses were carried out in the
software SimBiology (MATLAB R, 2014b, Version8.4). The same software was used to
analyse AIC (Akaike Information Criterion) and BIC (Bayesian information criterion)
values to select the suitability of the model for pharmacokinetic study after intravenous
administration of NaS.
3.2.4 Statistical analyses
The Kolmogorov-Smirnov test was performed to check the normality of the data obtained
from both intravenous and oral pharmacokinetic analyses.
Normally distributed data for intravenous pharmacokinetics of NaS were then analysed by
One-way ANOVA (analysis of variance) with post hoc Tukey’s multiple comparison test.
Non-normally distributed data were analysed using Kruskal Wallis test with Dunn’s multiple
comparison test as a post hoc test.
Normally distributed data for oral pharmacokinetics of NaS were analysed for significant
differences between the pharmacokinetic parameters of the two dose rates (oral 100 and
200mg/kg NaS) using a paired t test. Non-normally distributed data were analysed using
Mann Whitney-U test.

108
All statistical analyses were carried out in statistical software GraphPad Prism 5(Prism 5 for
windows, version 5.01, August, 2007) and were considered significant at P<0.05.
3.3 RESULTS
No side effects were observed in any animal throughout both pharmacokinetic studies as
animals were monitored continuously for any side effects during experimental period. The
age and body weights of the animals in these studies were not significantly different. No
significant differences were observed in pharmacokinetic parameters were observed due to
differences in the sex of animals.
3.3.1 Pharmacokinetic parameters for SA in sheep after intravenous administration
The maximum plasma SA concentration (Cmax) in sheep plasma was observed at 15 minute
after each treatment as 2.39±1.14μg/mL after 10mg/kg, 17.05±6.65μg/mL after 50mg/kg,
20.82±3.64μg/mL after 100mg/kg and 27.72±6.43μg/mL after 200mg/kg. Plasma
concentrations then declined post 15 minutes. The lowest concentrations of SA ranged from
0 to 3.74μg/mL after 200 and 100mg/kg intravenous dose and were detected at six hours. At
50 and 10 mg/kg intravenous dose, SA was detected only till four hours up to 0.03 to
0.4μg/mL. Sheep administered 100 and 200mg/kg body weight of NaS had overall
significantly higher (P<0.05) AUC (area under concentration-time curve) than 50 and
10mg/kg body weight.
The concentration-time curve and semi-log concentration-time curve for all treatments (10,
50, 100, 200mg) of intravenous NaS in sheep are shown in figure 3.2 (a, b).
Pharmacokinetic parameters of NaS after intravenous administration in sheep at different
dose rates are represented below as non-compartment (table 3.1), one compartment (table
3.2) models of pharmacokinetics after statistical analysis.
Analysis of calculated pharmacokinetic parameters in the software SimBiology (MATLAB)
for AIC and BIC values, showed the suitability of the pharmacokinetic model. Linear one
compartmental model provided the best fit for the data obtained after intravenous
administration.

109
3.3.2 Pharmacokinetic parameters for SA in sheep after oral administration
The Cmax after a single oral dose for 100 and 200mg/kg was 4.22±2.33μg/ml and
8.27±2.38μg/ml respectively. Bioavailability (absolute) of the drug (SA) was calculated by
using the standard formula (Agoram et al., 2001, Amidon et al., 1995) after comparing with
the AUC’s of intravenous bolus of the NaS. However, the animals used in the intravenous
and oral pharmacokinetics studies were different. Therefore, overall average bioavailability
for respective doses was used for each animal for further pharmacokinetics analysis.
Bioavailability for 200mg/kg oral NaS was 0.64 (64%) and for 100mg/kg it was 0.53 (53%).
The concentration-time curve and semi-log concentration-time curve for 100 and 200mg/kg
oral NaS in sheep are shown in figure 3.3 (a, b). The non-compartmental pharmacokinetics
of sheep with statistical analysis after oral administration of NaS at 100 and 200mg/kg is
shown in table 3.3.
None of the pharmacokinetic parameters were significantly different for oral dose rates 100
and 200mg/kg except AUMC. Also, high volumes of distribution were observed as
compared to the intravenous study.
Table 3.1: Average non-compartment pharmacokinetic parameters of all dose treatments (single intravenous NaS bolus in sheep) (mean±SD) with statistical significance
(Differences are considered significant when P<0.05)
Parameters Units 200 mg 100 mg 50 mg 10 mg
Cmax μg/mL 27.72±6.43a 20.82±3.64a 17.05±6.65b 2.39±1.14c
Tmax Hours 0.25 0.25 0.25 0.25
AUC 0-∞ μg.hr/mL 47.11±13.02a 25.95±5.05ac 14.94±5.39bc 1.42±1.00b
AUMC0-∞ μg.hr2/mL 82.50±39.94a 28.62±10.14ac 12.32±6.48bc 1.29±1.98b
MRT Hours 1.67±0.47a 1.07±0.20b 0.79±0.20b 0.66±0.47b
F 1.00±0.00 1.00±0.00 1.00±0.00 1.00±0.00
Cl L/hr/kg 4.52±1.22a 3.99±0.83a 3.89±1.93a 9.29±4.64b
Vd L/kg 7.19±1.12a 4.16±0.32b 2.86±0.98b 5.07±2.23b
T1/2 Hours 1.16±0.32a 0.74±0.14b 0.54±0.14b 0.46±0.32b
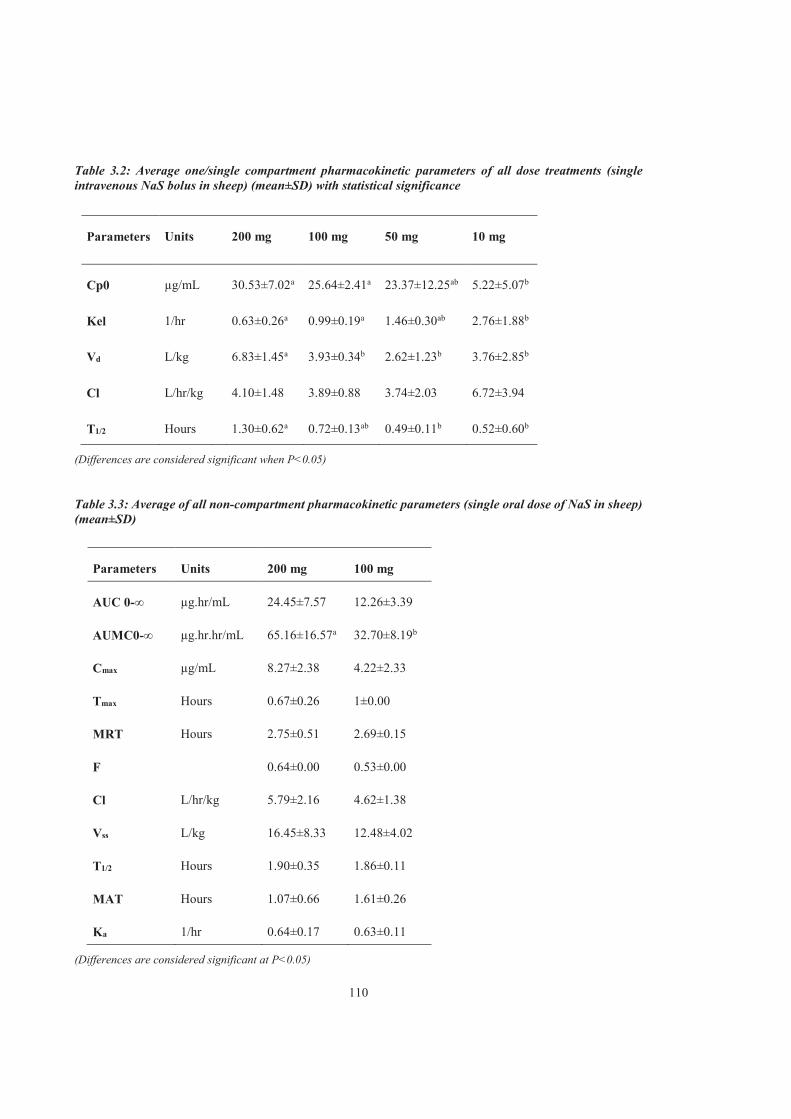
110
Table 3.2: Average one/single compartment pharmacokinetic parameters of all dose treatments (single intravenous NaS bolus in sheep) (mean±SD) with statistical significance
Parameters Units 200 mg 100 mg 50 mg 10 mg
Cp0 μg/mL 30.53±7.02a 25.64±2.41a 23.37±12.25ab 5.22±5.07b
Kel 1/hr 0.63±0.26a 0.99±0.19a 1.46±0.30ab 2.76±1.88b
Vd L/kg 6.83±1.45a 3.93±0.34b 2.62±1.23b 3.76±2.85b
Cl L/hr/kg 4.10±1.48 3.89±0.88 3.74±2.03 6.72±3.94
T1/2 Hours 1.30±0.62a 0.72±0.13ab 0.49±0.11b 0.52±0.60b
(Differences are considered significant when P<0.05)
Table 3.3: Average of all non-compartment pharmacokinetic parameters (single oral dose of NaS in sheep) (mean±SD)
Parameters Units 200 mg 100 mg
AUC 0-∞ μg.hr/mL 24.45±7.57 12.26±3.39
AUMC0-∞ μg.hr.hr/mL 65.16±16.57a 32.70±8.19b
Cmax μg/mL 8.27±2.38 4.22±2.33
Tmax Hours 0.67±0.26 1±0.00
MRT Hours 2.75±0.51 2.69±0.15
F 0.64±0.00 0.53±0.00
Cl L/hr/kg 5.79±2.16 4.62±1.38
Vss L/kg 16.45±8.33 12.48±4.02
T1/2 Hours 1.90±0.35 1.86±0.11
MAT Hours 1.07±0.66 1.61±0.26
Ka 1/hr 0.64±0.17 0.63±0.11
(Differences are considered significant at P<0.05)

111
5 10 150
100000
200000
300000
Blank plasma
200 mg at 30 minutes
Salicylic acid peaks
200 mg at 1 hour200 mg at 6 hours
RetentionTime (minutes)
Inte
nsi
ty
Fig 3.1: Chromatographs showing SA peaks 30 minutes, 1hour (Tmax) and 6 hours after oral administration of 200mg/kg NaS in sheep; while a drug-free/blank plasma of a sheep has no peak at the retention time of SA
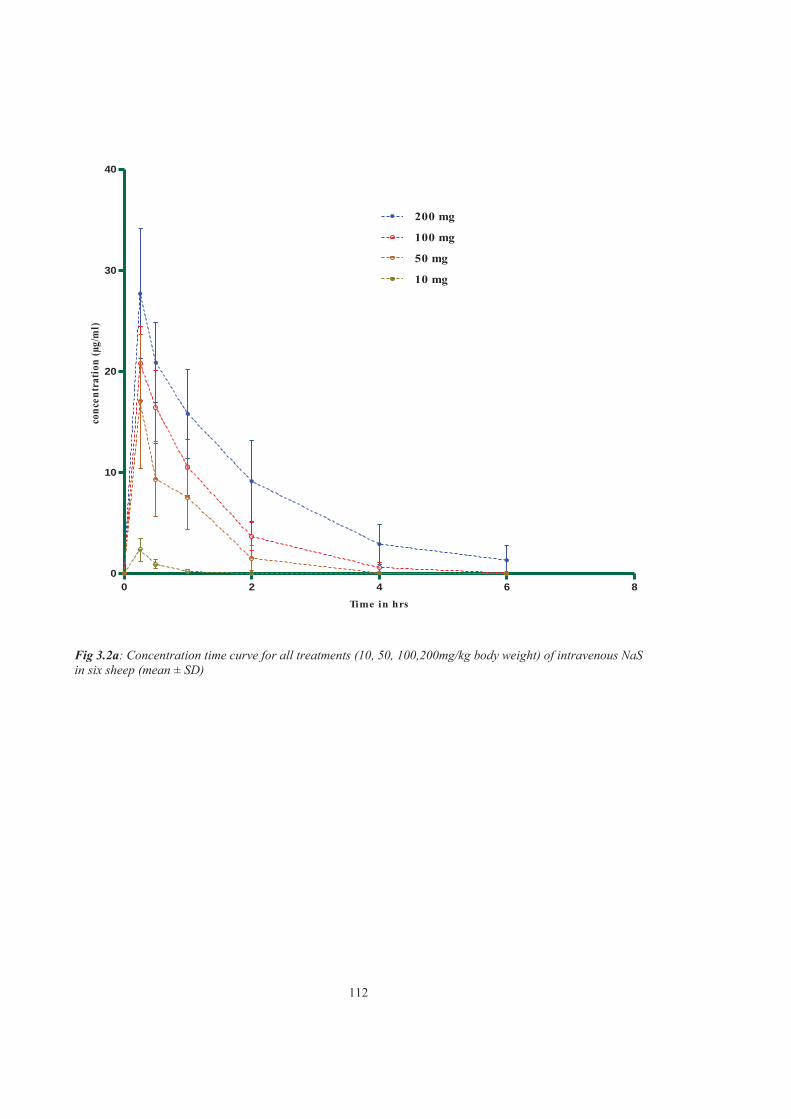
112
0 2 4 6 80
10
20
30
40
200 mg
100 mg
50 mg
10 mg
Time in hrs
conc
entr
atio
n (μ
g/m
l)
Fig 3.2a: Concentration time curve for all treatments (10, 50, 100,200mg/kg body weight) of intravenous NaS in six sheep (mean ± SD)
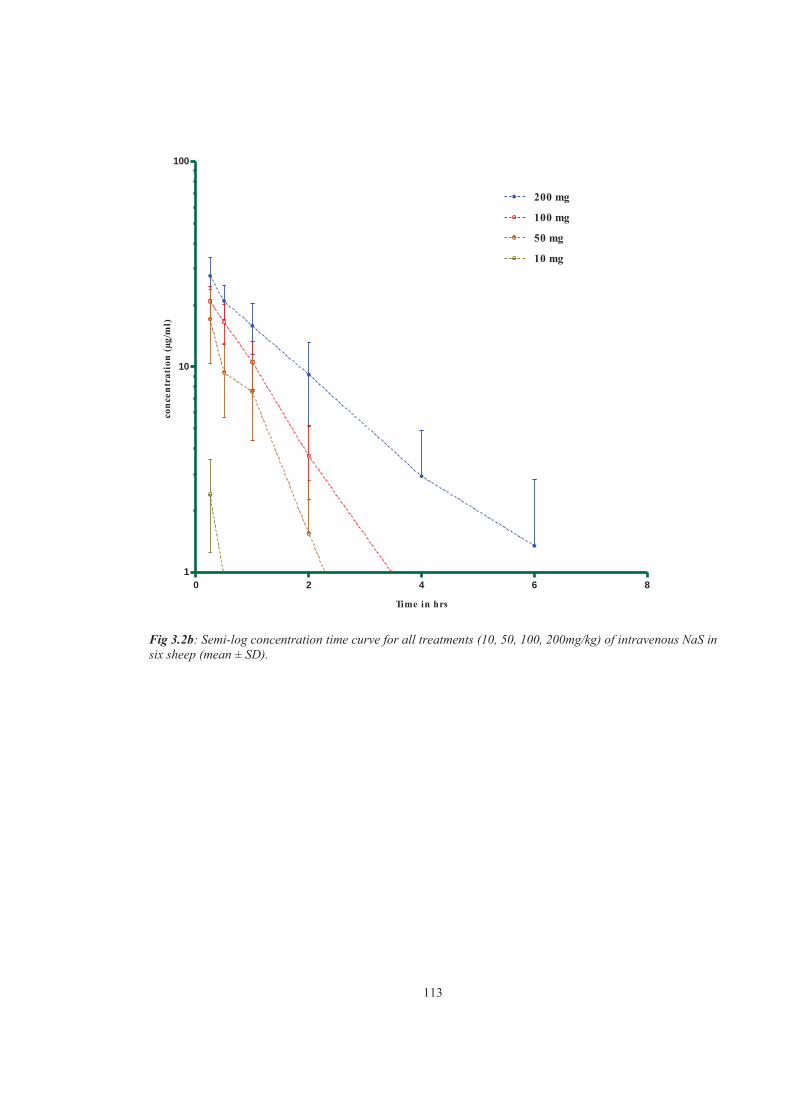
113
0 2 4 6 81
10
100
200 mg
100 mg
50 mg
10 mg
Time in hrs
conc
entr
atio
n (μ
g/m
l)
Fig 3.2b: Semi-log concentration time curve for all treatments (10, 50, 100, 200mg/kg) of intravenous NaS in six sheep (mean ± SD).
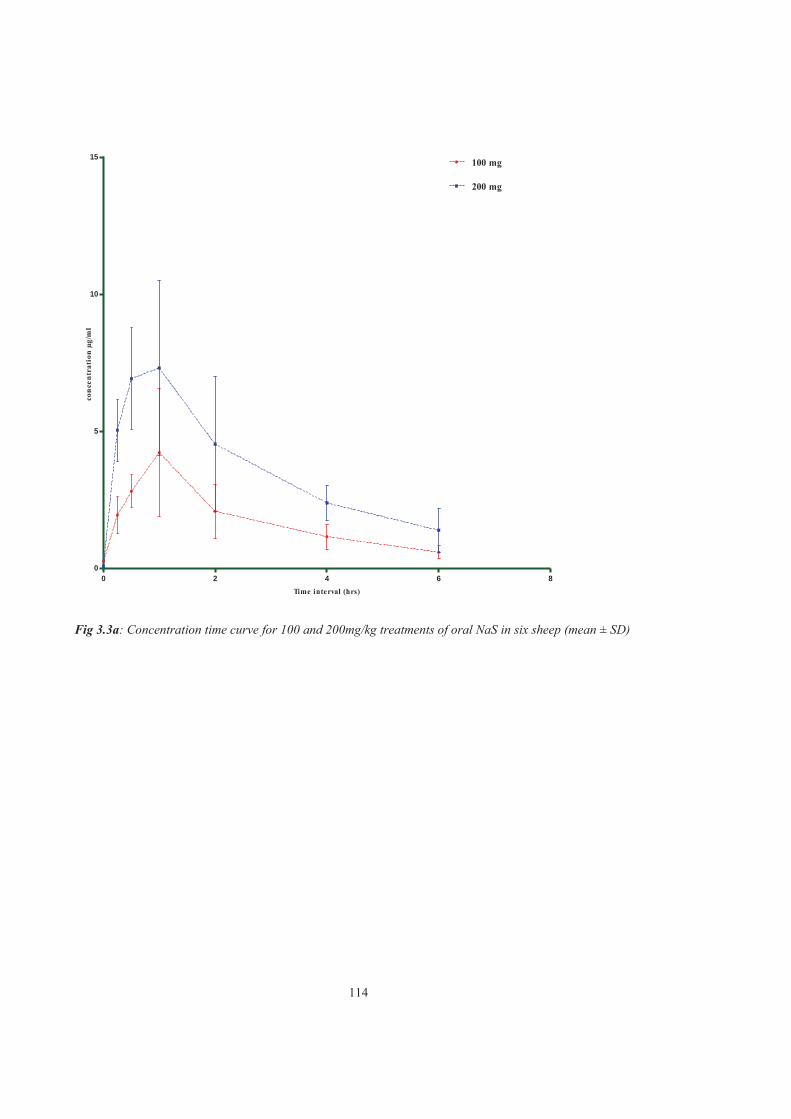
114
0 2 4 6 80
5
10
15 100 mg
200 mg
Time interval (hrs)
con
cen
trat
ion
μg/
ml
Fig 3.3a: Concentration time curve for 100 and 200mg/kg treatments of oral NaS in six sheep (mean ± SD)
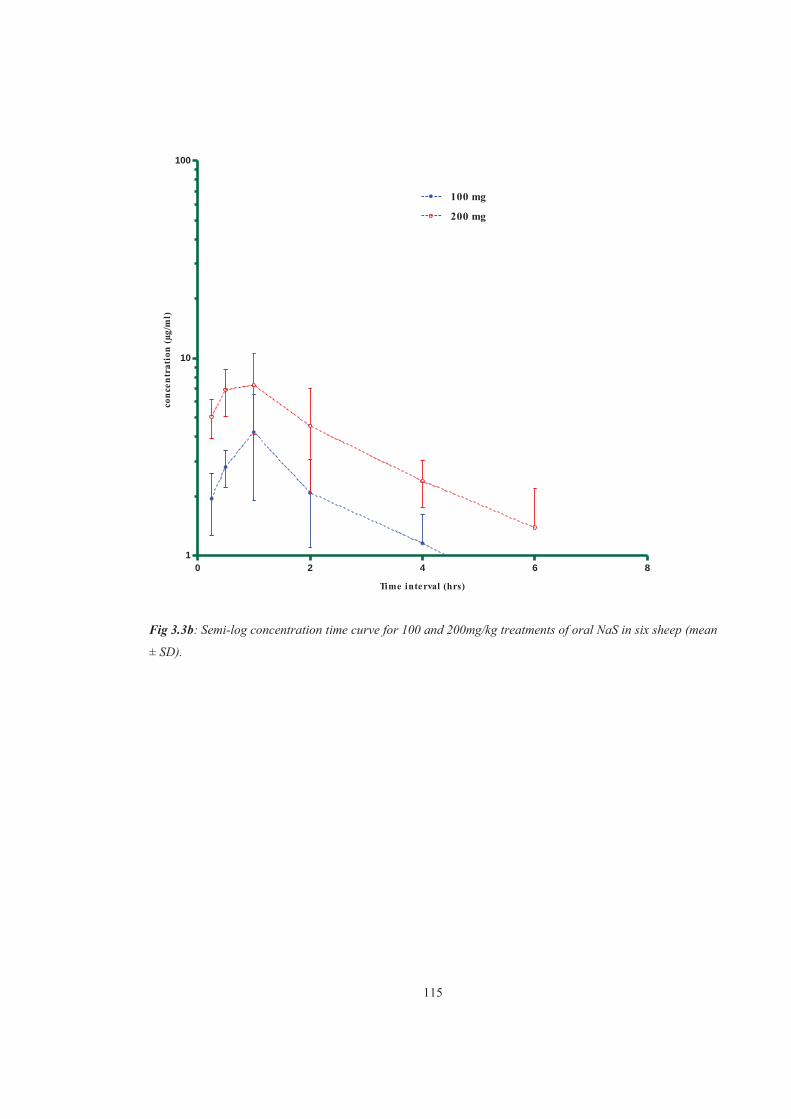
115
0 2 4 6 81
10
100
100 mg
200 mg
Time interval (hrs)
conc
entr
atio
n (μ
g/m
l)
Fig 3.3b: Semi-log concentration time curve for 100 and 200mg/kg treatments of oral NaS in six sheep (mean
± SD).
116
3.4 DISCUSSION
The pharmacokinetics of SA after intravenous and oral administration of NaS in sheep in
our study showed a number of variations. Significant differences between the
pharmacokinetic parameters were observed at different dose rates of the single intravenous
bolus. The faster clearance at lower dose (10mg/kg) indicates the dose dependent elimination
of NaS. NaS usually follows first order kinetics in humans at lower doses (65mg/kg) while
at higher doses (100mg/kg) it follows dose dependent kinetics with respect to elimination.
Thus, clearances are different at higher doses (Gibson et al., 1975, Levy and Tsuchiya,
1972). It conjugates with glycine to form salicyluric acid while conjugation with
glucuronides results in salicyl phenolic glucuronide and acyl salicyl glucuronide (Brunton
et al., 2011). It is also hydrolysed to form gentisic acid. When lower doses are administered,
SA forms these metabolites at faster rate, while at higher doses, it reaches saturation,
especially during conjugation with glucuronide (Needs and Brooks, 1985, Levy, 1981).
Therefore, reduced metabolism results in the accumulation of drug in the plasma thus
increasing the elimination half-life with reduced clearance. Similar variation in clearance
was observed with the single intravenous bolus of anti-neoplastic agent thiotepa (TT) in
children and a difference in clearance was observed at different doses of TT (Heideman et
al., 1989).
The elimination rate constant (K10) for 10mg/kg was significantly higher than any other
treatment groups. In the current study, half-life and mean residence time (MRT) of NaS at
200mg/kg body weight was significantly higher than other three lower doses after
intravenous administration. Therefore, the possibility of NaS following Michaelis Menten
kinetics (In this kinetics, drug follows first order kinetics i.e. dose independent kinetics at
lower dose rates; however, at higher dose rates some metabolites of the drug that are formed
gets saturated and follows dose dependent kinetics) at higher doses than 200mg/kg in sheep
may be expected as it occurs in people (Levy and Tsuchiya, 1972). This type of kinetics was
not observed in the present study. In contrast, a one compartment model fitted best the
pharmacokinetic data of all doses of NaS.
The MRT after oral administration of NaS was extended as compared to intravenous dose
due to absorption. Half-lives after both oral and intravenous administration of NaS were not
117
significantly different when respective dose rates of both routes are compared. Hence, rapid
elimination of SA is evident after oral administration. This shows the necessity of frequent
dosing after oral administration.
The minimum effective plasma concentration (MEC) of SA in humans to produce analgesia
is reported to be 16.8μg/mL (Bromm et al., 1991). In the present study, plasma SA
concentration was maintained above the human MEC for 30 and 15 minutes after an
intravenous dose of NaS at 200 and 100 mg/kg respectively. However, after intravenous
doses of 50 and 10mg/kg or a single oral dose of 200 and 100mg/kg NaS could not achieve
plasma SA concentrations above the MEC. Thus, these dose rates may not be effective. The
plasma SA concentration to produce analgesia in cattle is reported to be 25 to 30μg/mL
(Kotschwar et al., 2009, Coetzee et al., 2007a, Gingerich et al., 1975), which was achieved
only for 15 minutes after 200mg/kg intravenous dose rate in sheep in our study.
The plasma concentrations of SA achieved during the oral pharmacokinetic study were
similar to the study conducted by (Maalouf et al., 2009) in humans, where they administered
162mg aspirin orally and found plasma SA concentrations which were not higher than
10μg/mL. However, the species extrapolation of SA pharmacokinetic parameters is not
appropriate (Riviere and Papich, 2013, Levy, 1979). To assess the analgesic efficacy of this
drug in sheep, pharmacodynamics associated with the corresponding plasma SA level is
essential.
The Tmax after oral administration at 100 mg/kg observed in our study was similar to one
conducted by Sulaiman and Kumar (1995). However, after 200mg/kg NaS oral dose in our
study, Tmax ranged from 0.5 to 1 hour within the six sheep. This shows that individual
variation impacts the pharmacokinetic data. The comparison of pharmacokinetic parameters
in both studies (Sulaiman and Kumar’s study and present study) is represented in table 3.4.
The plasma clearance was higher in our studies as compared to Sulaiman and Kumar’s study
after both intravenous and oral administration of NaS, resulting in shorter half-life in our
study compared to theirs. Probably in our study the quantity of available SA was adequate
to conjugate with glycine and glucuronide to form their respective salicylate metabolites
which can be eliminated readily, resulting in high clearance. The availability of SA for
118
conjugation in sheep in our study could be due to the different body weights, age of sheep
and climatic conditions than that of Sulaiman and Kumar’s study.
Bioavailability of NaS after oral administration in our study was higher than previously
reported (Sulaiman and Kumar 1995) which could be due the different animals used in both
(intravenous and oral) pharmacokinetic experiments. Thus, during computation of
pharmacokinetic parameters, the average bioavailability was used instead of bioavailability
of each individual sheep. The volume of distribution was also higher in oral pharmacokinetic
study which could be due to better absorption though at slower rate of weak acids such as
NSAIDs in ruminants in reticulo-rumen (pH 5.5-6.5) (Hardee and Baggo, 1998, Neill and
Hickman, 1997, Verbeeck et al., 1983). Thus, higher distribution after oral administration is
explicable. Salicylates have low volumes of distribution ranging from 0.1 to 0.2L/kg and
they are subject to high individual variation (Rainsford, 2013). The low volume of
distribution of salicylates is due to the high plasma protein binding; resulting in lower
concentrations of free drug in the plasma. Salicylates are also reported to be highly lipophilic
(Rainsford, 2013) due to their weakly acidic nature. This may result in their higher
distribution into the body tissues, extracellular fluids and other body fluids that could
contribute to the high volumes of distribution as observed in the present study (Remington
et al., 2006, Wible, 2005). A higher Vd in our study could also be due to a higher body fat
of animals in this study as compared to the study conducted by Sulaiman and Kumar with
leaner sheep. Similarly, protein deficiency may also affect the pharmacokinetic parameters
(Yue and Varma, 1982). However, the protein parameters were not considered in either
study. Overall, apart from Cmax, other pharmacokinetic parameters of intravenous and oral
NaS in sheep differ from another reported study by (Sulaiman and Kumar, 1995) in sheep.
These differences could be attributed to the method of pharmacokinetic analysis and
calculations, age, breed and weights of the animals, analytical methods used to determine
SA or salicylate concentration (In the present study, free/unbound plasma SA concentrations
were determined; while, in the other study total serum salicylate concentrations were
determined). Also, climatic/environmental differences might well contribute to the varying
pharmacokinetic parameters (Modric et al., 1998). It would be valuable to measure the total
proteins and lipid profile as well as liver enzymes in plasma.
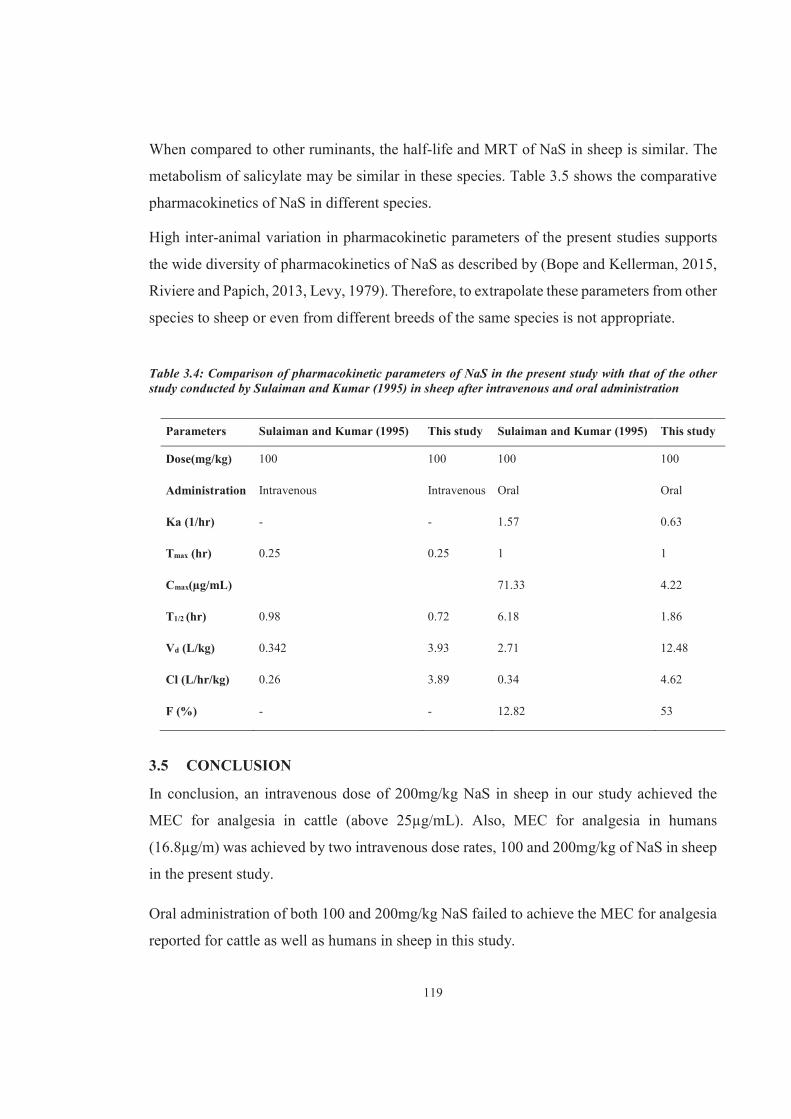
119
When compared to other ruminants, the half-life and MRT of NaS in sheep is similar. The
metabolism of salicylate may be similar in these species. Table 3.5 shows the comparative
pharmacokinetics of NaS in different species.
High inter-animal variation in pharmacokinetic parameters of the present studies supports
the wide diversity of pharmacokinetics of NaS as described by (Bope and Kellerman, 2015,
Riviere and Papich, 2013, Levy, 1979). Therefore, to extrapolate these parameters from other
species to sheep or even from different breeds of the same species is not appropriate.
Table 3.4: Comparison of pharmacokinetic parameters of NaS in the present study with that of the other study conducted by Sulaiman and Kumar (1995) in sheep after intravenous and oral administration
Parameters Sulaiman and Kumar (1995) This study Sulaiman and Kumar (1995) This study
Dose(mg/kg) 100 100 100 100
Administration Intravenous Intravenous Oral Oral
Ka (1/hr) - - 1.57 0.63
Tmax (hr) 0.25 0.25 1 1
Cmax(μg/mL) 71.33 4.22
T1/2 (hr) 0.98 0.72 6.18 1.86
Vd (L/kg) 0.342 3.93 2.71 12.48
Cl (L/hr/kg) 0.26 3.89 0.34 4.62
F (%) - - 12.82 53
3.5 CONCLUSION
In conclusion, an intravenous dose of 200mg/kg NaS in sheep in our study achieved the
MEC for analgesia in cattle (above 25μg/mL). Also, MEC for analgesia in humans
(16.8μg/m) was achieved by two intravenous dose rates, 100 and 200mg/kg of NaS in sheep
in the present study.
Oral administration of both 100 and 200mg/kg NaS failed to achieve the MEC for analgesia
reported for cattle as well as humans in sheep in this study.
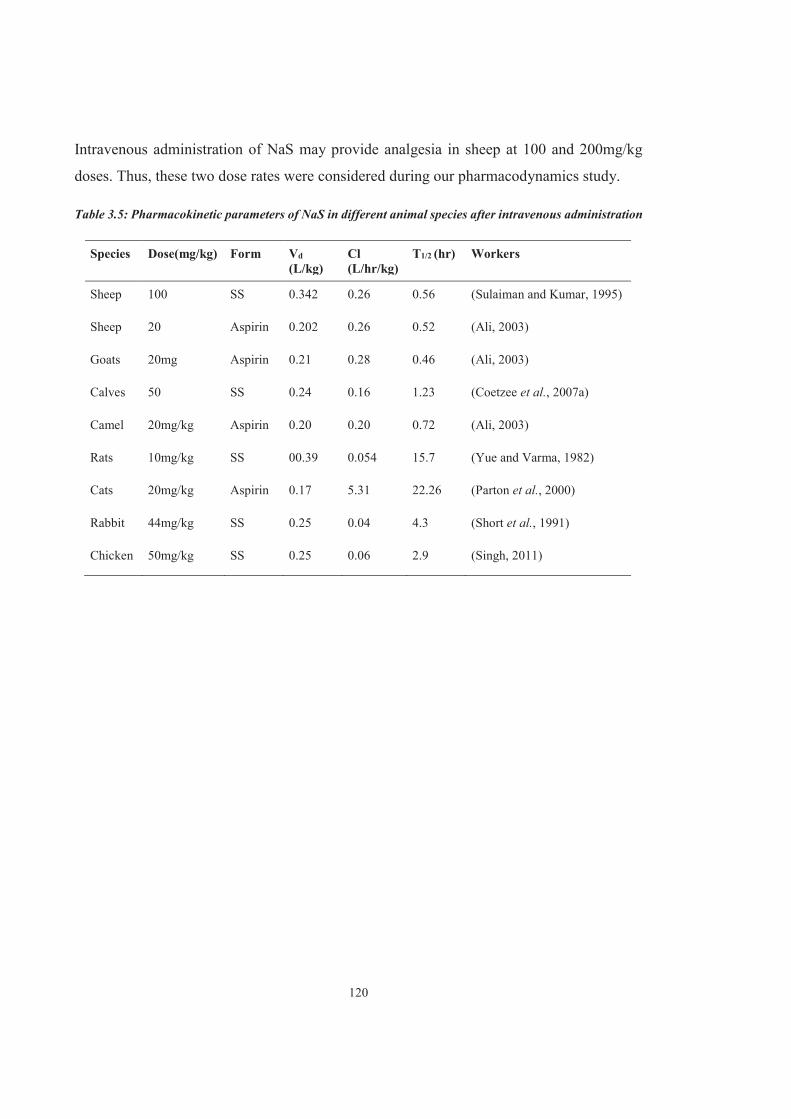
120
Intravenous administration of NaS may provide analgesia in sheep at 100 and 200mg/kg
doses. Thus, these two dose rates were considered during our pharmacodynamics study.
Table 3.5: Pharmacokinetic parameters of NaS in different animal species after intravenous administration
Species Dose(mg/kg) Form Vd
(L/kg) Cl (L/hr/kg)
T1/2 (hr) Workers
Sheep 100 SS 0.342 0.26 0.56 (Sulaiman and Kumar, 1995)
Sheep 20 Aspirin 0.202 0.26 0.52 (Ali, 2003)
Goats 20mg Aspirin 0.21 0.28 0.46 (Ali, 2003)
Calves 50 SS 0.24 0.16 1.23 (Coetzee et al., 2007a)
Camel 20mg/kg Aspirin 0.20 0.20 0.72 (Ali, 2003)
Rats 10mg/kg SS 00.39 0.054 15.7 (Yue and Varma, 1982)
Cats 20mg/kg Aspirin 0.17 5.31 22.26 (Parton et al., 2000)
Rabbit 44mg/kg SS 0.25 0.04 4.3 (Short et al., 1991)
Chicken 50mg/kg SS 0.25 0.06 2.9 (Singh, 2011)
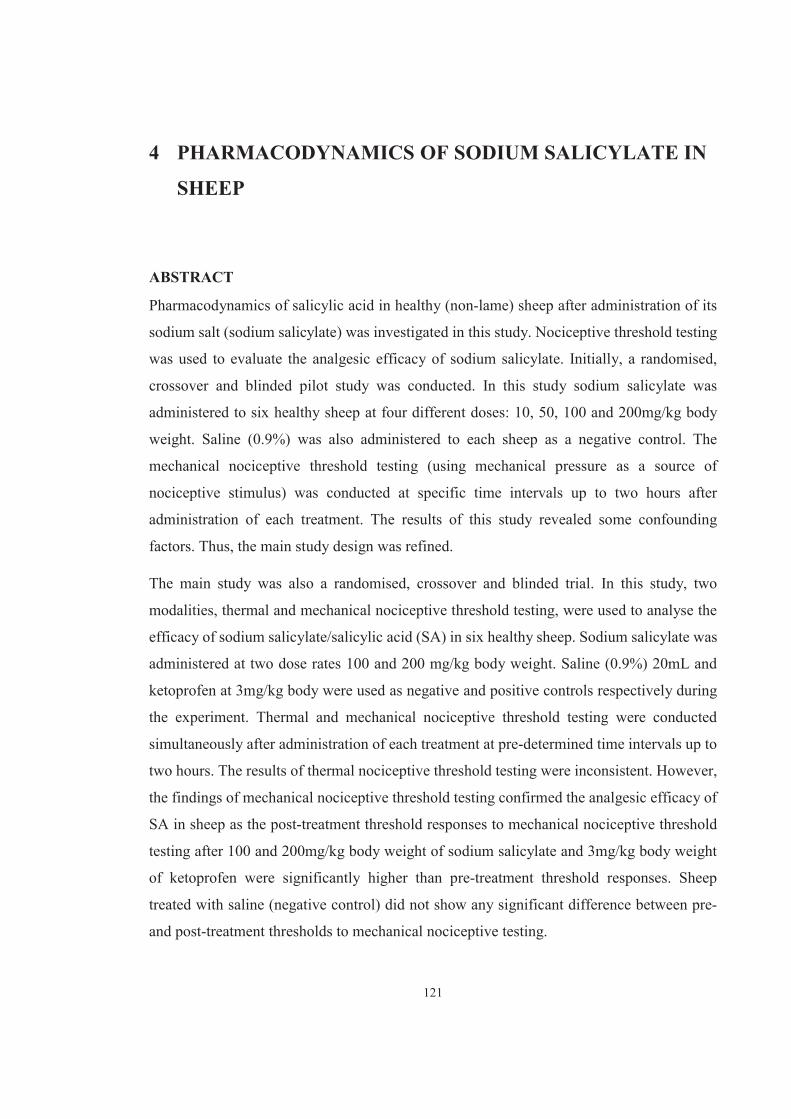
121
4 PHARMACODYNAMICS OF SODIUM SALICYLATE IN
SHEEP
ABSTRACT
Pharmacodynamics of salicylic acid in healthy (non-lame) sheep after administration of its
sodium salt (sodium salicylate) was investigated in this study. Nociceptive threshold testing
was used to evaluate the analgesic efficacy of sodium salicylate. Initially, a randomised,
crossover and blinded pilot study was conducted. In this study sodium salicylate was
administered to six healthy sheep at four different doses: 10, 50, 100 and 200mg/kg body
weight. Saline (0.9%) was also administered to each sheep as a negative control. The
mechanical nociceptive threshold testing (using mechanical pressure as a source of
nociceptive stimulus) was conducted at specific time intervals up to two hours after
administration of each treatment. The results of this study revealed some confounding
factors. Thus, the main study design was refined.
The main study was also a randomised, crossover and blinded trial. In this study, two
modalities, thermal and mechanical nociceptive threshold testing, were used to analyse the
efficacy of sodium salicylate/salicylic acid (SA) in six healthy sheep. Sodium salicylate was
administered at two dose rates 100 and 200 mg/kg body weight. Saline (0.9%) 20mL and
ketoprofen at 3mg/kg body were used as negative and positive controls respectively during
the experiment. Thermal and mechanical nociceptive threshold testing were conducted
simultaneously after administration of each treatment at pre-determined time intervals up to
two hours. The results of thermal nociceptive threshold testing were inconsistent. However,
the findings of mechanical nociceptive threshold testing confirmed the analgesic efficacy of
SA in sheep as the post-treatment threshold responses to mechanical nociceptive threshold
testing after 100 and 200mg/kg body weight of sodium salicylate and 3mg/kg body weight
of ketoprofen were significantly higher than pre-treatment threshold responses. Sheep
treated with saline (negative control) did not show any significant difference between pre-
and post-treatment thresholds to mechanical nociceptive testing.

122
4.1 INTRODUCTION
The pharmacokinetic study conducted after single intravenous and oral doses of sodium
salicylate (NaS) in sheep has been discussed in chapter 3. Knowledge of the drug’s effects
in conjunction with optimum pain evaluation methods is essential for investigation of
effective analgesic strategies in animals (Viñuela-Fernández et al., 2007). Although sodium
salicylate has been in use as an analgesic in farm animals, it is not licensed for use in the
sheep. In the literature, studies demonstrating the analgesic efficacy of NaS in sheep have
not been reported. Therefore, to explore its utility as an analgesic in sheep with pain, the
pharmacodynamics of this drug in healthy animals must be assessed.
Unlike humans, animals lack verbal reporting ability, and are unable to communicate the
intensity of pain they experience. Nociceptive threshold testing is one of the effective pain
evaluation methods in non-verbal animals. This method of pain assessment has been
demonstrated to be valid in animals, as animals show pain related responses to the
nociceptive stimulus (Le Bars et al., 2001). These pain responses/behaviours are taken as
the end point for the stimulus and thus the threshold. Analgesic effects of a drug are apparent
when there is a raised threshold (no response or increased latency of response to the
nociceptive stimulus) (Tjølsen and Hole, 1997). However, there are subjective variations in
the type of responses (different response to the same type of nociceptive stimulus by
individual animal) to the nociceptive stimulus in animals (Bianchi and Panerai, 2002). It is
therefore, necessary to identify the response of individual animals prior to the start of
experimental procedure.
Many studies have been conducted to assess the efficacy of analgesic drugs by using
mechanical (Chambers et al., 1995, Chambers et al., 1994, Waterman et al., 1988) and
thermal nociceptive (Ley et al., 1991, Waterman et al., 1991, Ley et al., 1989) threshold
testing in sheep. Merits of these testing methods include ease of use and ability to elicit
quantifiable responses by animals. In the current study, mechanical and thermal nociceptive
thresholds of sheep were tested before and after administration of NaS in order to investigate
its analgesic efficacy.
NaS is metabolised to SA to produce its effects after administration in humans and animals.
The aim of this thesis was to investigate the analgesic efficacy of SA in sheep. Salicin, the

123
active ingredient in the willow, is ultimately converted to SA to produce analgesia (Schmid
et al., 2001a). Since, reports on NaS (SA) analgesia in sheep are not available; it was decided
to assess the effects of NaS on nociceptive thresholds of sheep. The hypothesis was that
NaS would raise the nociceptive thresholds of the sheep compared to saline.
This research was conducted as a pilot study followed by the main study with the inclusion
of positive and negative control groups.
MATERIALS AND METHODS
4.2 PILOT STUDY
This study was approved by the Animal Ethics Committee, Massey University, Palmerston
North, New Zealand and was carried out at the Large Animal Teaching Unit (LATU),
Massey University, Palmerston North.
4.2.1 Experimental design and preparation of animals
In this randomised and crossover study, six healthy Romney cross sheep (females) of age 4-
6 months, weighing 46.63±6.49kg (mean±SD) were used. The power analysis was
performed to identify the minimum effective number of animals/sheep to be used in this
experiment. All study animals were kept in a specially arranged pen to reduce the isolation
stress. To perform the test procedures each sheep was placed in a restraining metal crate in
the pen. One hour was allowed for each sheep to become accustomed to the crate before
performing any procedures. Before the start of each experiment, an 18 gauge catheter was
placed aseptically into the left jugular vein for test drug administration. Catheters were
removed at the end of each experiment.
4.2.2 Description of the mechanical nociceptive device
The device used for testing the mechanical nociceptive thresholds (MNT) of sheep (Figure
4.1: a, b, c) was built in the neuroscience laboratory, Institute of Veterinary, Animal and
Biomedical Sciences (IVABS), Massey University by Associate Professor Paul Chambers,
Professor Craig Johnson and Mr. Neil Ward (Senior technician). The design of the device
was based on the original device built by (Chambers et al., 1994). Several structural
modifications were considered and implemented while rebuilding this device to enhance the
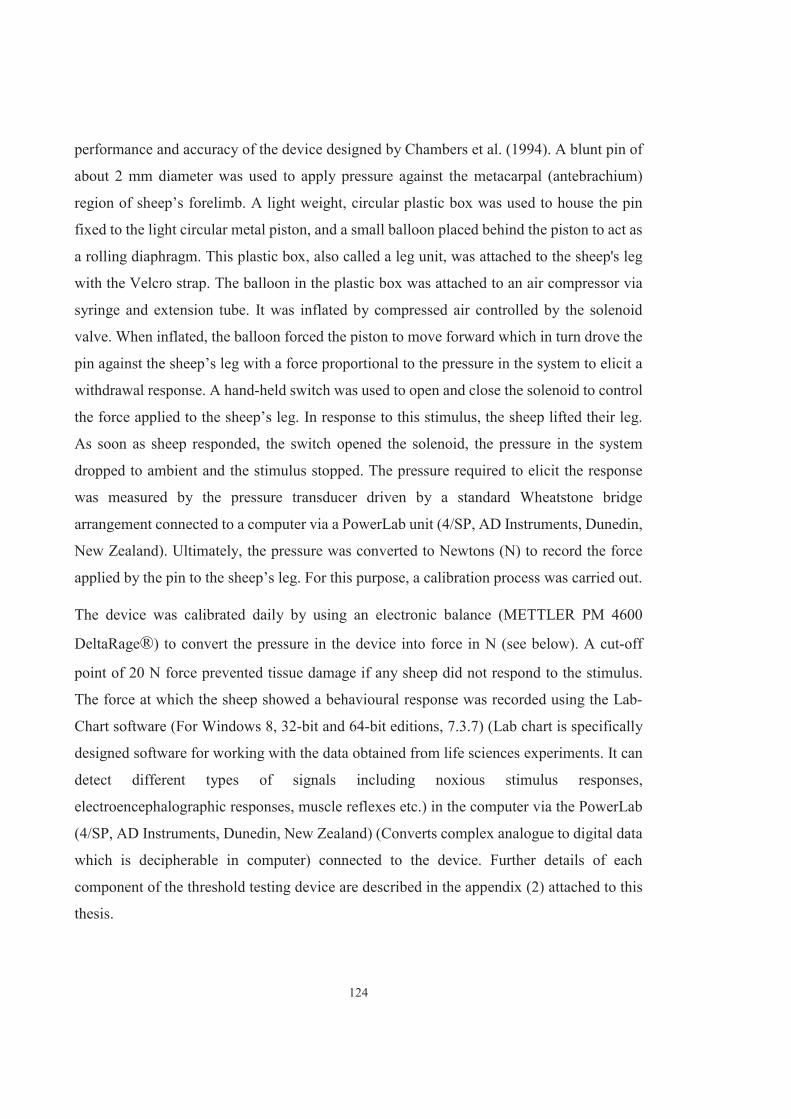
124
performance and accuracy of the device designed by Chambers et al. (1994). A blunt pin of
about 2 mm diameter was used to apply pressure against the metacarpal (antebrachium)
region of sheep’s forelimb. A light weight, circular plastic box was used to house the pin
fixed to the light circular metal piston, and a small balloon placed behind the piston to act as
a rolling diaphragm. This plastic box, also called a leg unit, was attached to the sheep's leg
with the Velcro strap. The balloon in the plastic box was attached to an air compressor via
syringe and extension tube. It was inflated by compressed air controlled by the solenoid
valve. When inflated, the balloon forced the piston to move forward which in turn drove the
pin against the sheep’s leg with a force proportional to the pressure in the system to elicit a
withdrawal response. A hand-held switch was used to open and close the solenoid to control
the force applied to the sheep’s leg. In response to this stimulus, the sheep lifted their leg.
As soon as sheep responded, the switch opened the solenoid, the pressure in the system
dropped to ambient and the stimulus stopped. The pressure required to elicit the response
was measured by the pressure transducer driven by a standard Wheatstone bridge
arrangement connected to a computer via a PowerLab unit (4/SP, AD Instruments, Dunedin,
New Zealand). Ultimately, the pressure was converted to Newtons (N) to record the force
applied by the pin to the sheep’s leg. For this purpose, a calibration process was carried out.
The device was calibrated daily by using an electronic balance (METTLER PM 4600
DeltaRage®) to convert the pressure in the device into force in N (see below). A cut-off
point of 20 N force prevented tissue damage if any sheep did not respond to the stimulus.
The force at which the sheep showed a behavioural response was recorded using the Lab-
Chart software (For Windows 8, 32-bit and 64-bit editions, 7.3.7) (Lab chart is specifically
designed software for working with the data obtained from life sciences experiments. It can
detect different types of signals including noxious stimulus responses,
electroencephalographic responses, muscle reflexes etc.) in the computer via the PowerLab
(4/SP, AD Instruments, Dunedin, New Zealand) (Converts complex analogue to digital data
which is decipherable in computer) connected to the device. Further details of each
component of the threshold testing device are described in the appendix (2) attached to this
thesis.
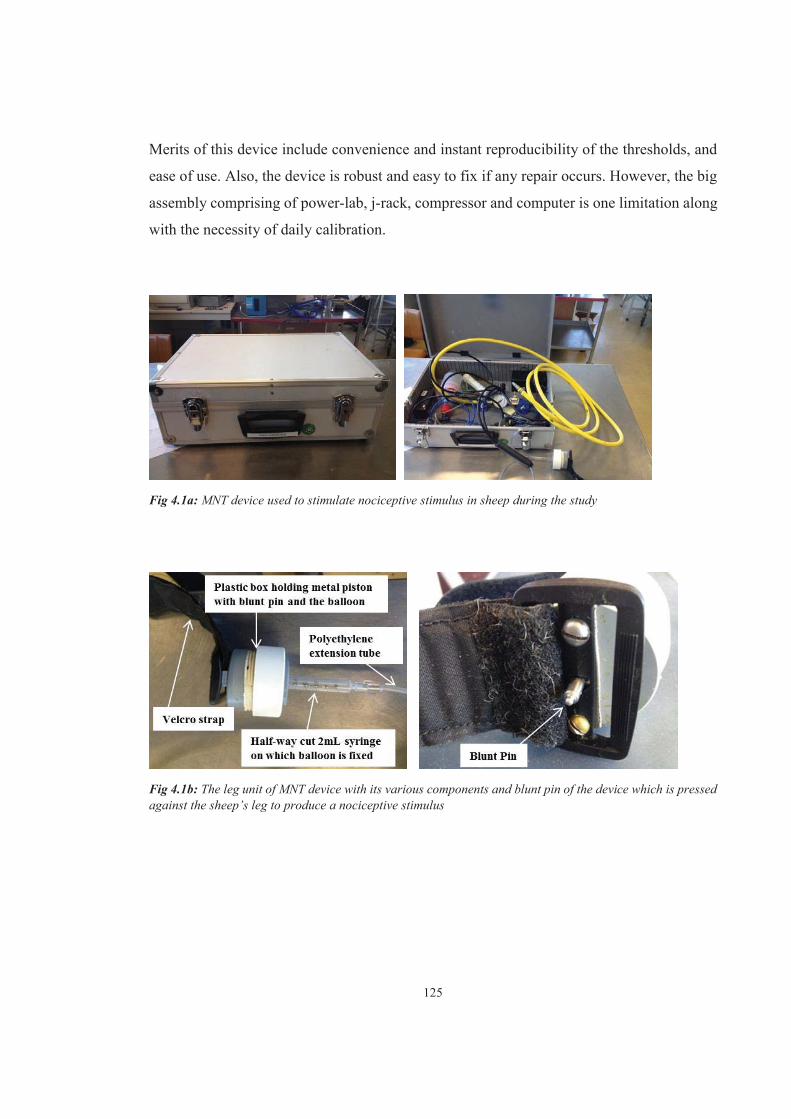
125
Merits of this device include convenience and instant reproducibility of the thresholds, and
ease of use. Also, the device is robust and easy to fix if any repair occurs. However, the big
assembly comprising of power-lab, j-rack, compressor and computer is one limitation along
with the necessity of daily calibration.
Fig 4.1a: MNT device used to stimulate nociceptive stimulus in sheep during the study
Fig 4.1b: The leg unit of MNT device with its various components and blunt pin of the device which is pressed against the sheep’s leg to produce a nociceptive stimulus
126
Fig 4.1c: MNT device as a whole assembly including (a) J-rack (b) PowerLab (c) Computer and (d) Compressor
4.2.3 Calibration of the device
The device was calibrated by measuring the pressure created by pneumatically driven pin.
The pressure was recorded against weight (in grams) on the electronic weighing scale
(METTLER PM 4600 DeltaRage®). The pressure applied several times with different
intensities was recorded as a series of weights (grams force) and incorporated into the lab-
chart software for conversion to Newtons. In the Lab-Chart, the Volts (V) corresponding to
the pressure readings were converted to Newtons. Therefore, to check the validity of
calibration, the calibration curve (Figure 4.2) was prepared and linearity was assessed by
linear regression. The r 2 value was 0.9888.

127
0 2 4 6 8 100
2
4
6
8
Volts (in labchart)
New
tons
Fig 4.2: Calibration curve for MNT device displaying the values in Newtons against the Volts measured in the Lab-Chart. X-axis represents volts (V) recorded in the Lab-Cart software and Y-axis represents the corresponding Force in Newtons (N)
4.2.4 Drug administration
Each sheep received four different doses of NaS (10mg/kg, 50mg/kg, 100mg/kg and
200mg/kg) each dose diluted down to 20 mL, and 0.9% saline (20 mL/sheep) intravenously
(I/V) in a cross-over design. The sequence of the dose of NaS administered was randomised
for each animal; a one week wash out period was allowed between the treatments for each
animal.
4.2.5 Mechanical nociceptive threshold testing
The MNT device described above was used to apply a nociceptive stimulus on the dorsal
metacarpal region of the sheep’s foreleg. The stimulus was applied at the same site in all
sheep. Behavioural response indicating the threshold was leg lifting, and the force at which
the sheep lifted its leg was recorded as the end point. A single, blinded operator measured
the threshold responses throughout the study to avoid inter-observer variability. The sheep
were not able to see the operator to avoid any distress.
MNT values were recorded for about 20 minutes to obtain constant baseline values before
drug administration. These values were recorded at 8, 6, 4 and 2 minute time intervals. Post-
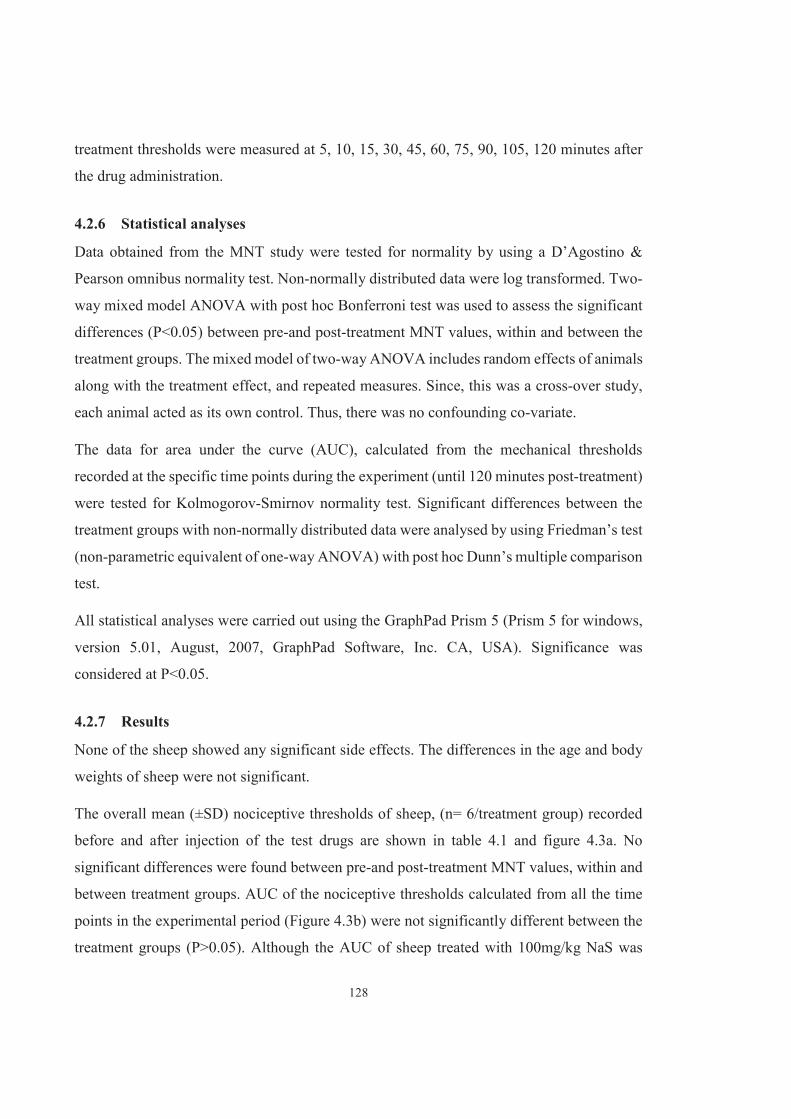
128
treatment thresholds were measured at 5, 10, 15, 30, 45, 60, 75, 90, 105, 120 minutes after
the drug administration.
4.2.6 Statistical analyses
Data obtained from the MNT study were tested for normality by using a D’Agostino &
Pearson omnibus normality test. Non-normally distributed data were log transformed. Two-
way mixed model ANOVA with post hoc Bonferroni test was used to assess the significant
differences (P<0.05) between pre-and post-treatment MNT values, within and between the
treatment groups. The mixed model of two-way ANOVA includes random effects of animals
along with the treatment effect, and repeated measures. Since, this was a cross-over study,
each animal acted as its own control. Thus, there was no confounding co-variate.
The data for area under the curve (AUC), calculated from the mechanical thresholds
recorded at the specific time points during the experiment (until 120 minutes post-treatment)
were tested for Kolmogorov-Smirnov normality test. Significant differences between the
treatment groups with non-normally distributed data were analysed by using Friedman’s test
(non-parametric equivalent of one-way ANOVA) with post hoc Dunn’s multiple comparison
test.
All statistical analyses were carried out using the GraphPad Prism 5 (Prism 5 for windows,
version 5.01, August, 2007, GraphPad Software, Inc. CA, USA). Significance was
considered at P<0.05.
4.2.7 Results
None of the sheep showed any significant side effects. The differences in the age and body
weights of sheep were not significant.
The overall mean (±SD) nociceptive thresholds of sheep, (n= 6/treatment group) recorded
before and after injection of the test drugs are shown in table 4.1 and figure 4.3a. No
significant differences were found between pre-and post-treatment MNT values, within and
between treatment groups. AUC of the nociceptive thresholds calculated from all the time
points in the experimental period (Figure 4.3b) were not significantly different between the
treatment groups (P>0.05). Although the AUC of sheep treated with 100mg/kg NaS was
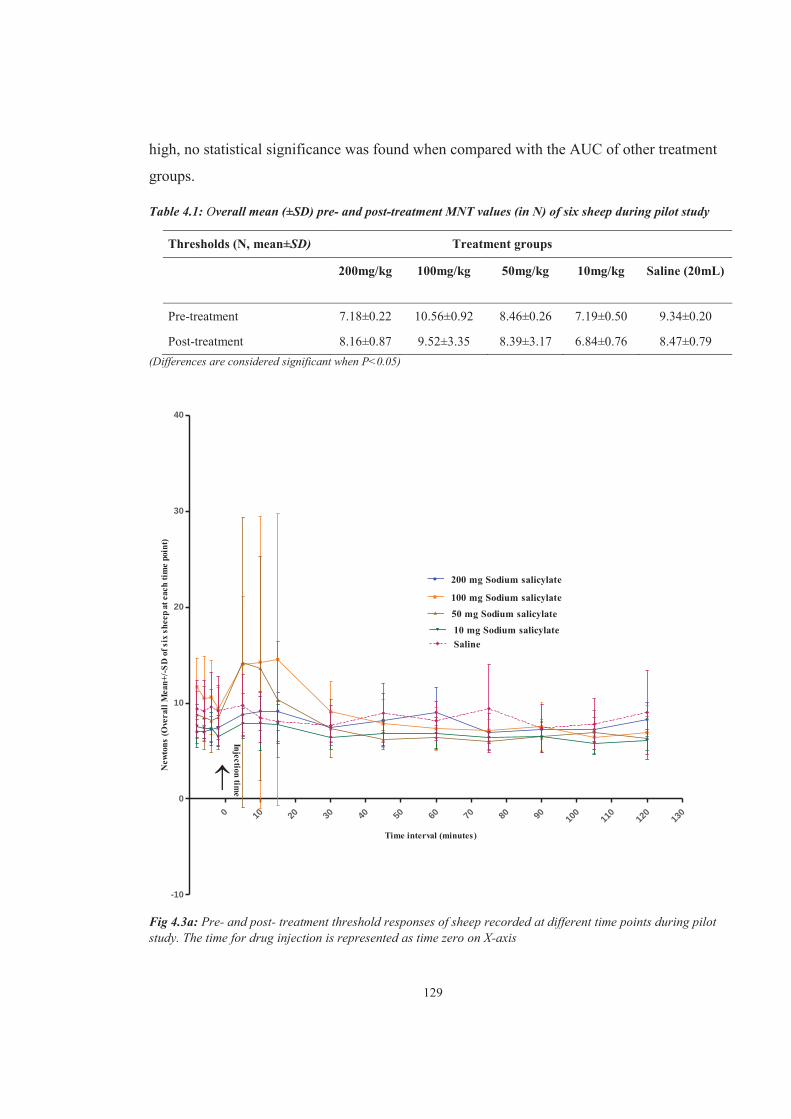
129
high, no statistical significance was found when compared with the AUC of other treatment
groups.
Table 4.1: Overall mean (±SD) pre- and post-treatment MNT values (in N) of six sheep during pilot study
Thresholds (N, mean±SD) Treatment groups
200mg/kg 100mg/kg 50mg/kg 10mg/kg Saline (20mL)
Pre-treatment 7.18±0.22 10.56±0.92 8.46±0.26 7.19±0.50 9.34±0.20 Post-treatment 8.16±0.87 9.52±3.35 8.39±3.17 6.84±0.76 8.47±0.79
(Differences are considered significant when P<0.05)
0 10 20 30 40 50 60 70 80 90 100
110
120
130
-10
0
10
20
30
40
200 mg Sodium salicylate
100 mg Sodium salicylate
50 mg Sodium salicylate
10 mg Sodium salicylateSaline
Injection time
Time interval (minutes)
New
tons
(Ove
rall
Mea
n+/-S
D o
f six
she
ep a
t eac
h tim
e po
int)
Fig 4.3a: Pre- and post- treatment threshold responses of sheep recorded at different time points during pilot study. The time for drug injection is represented as time zero on X-axis
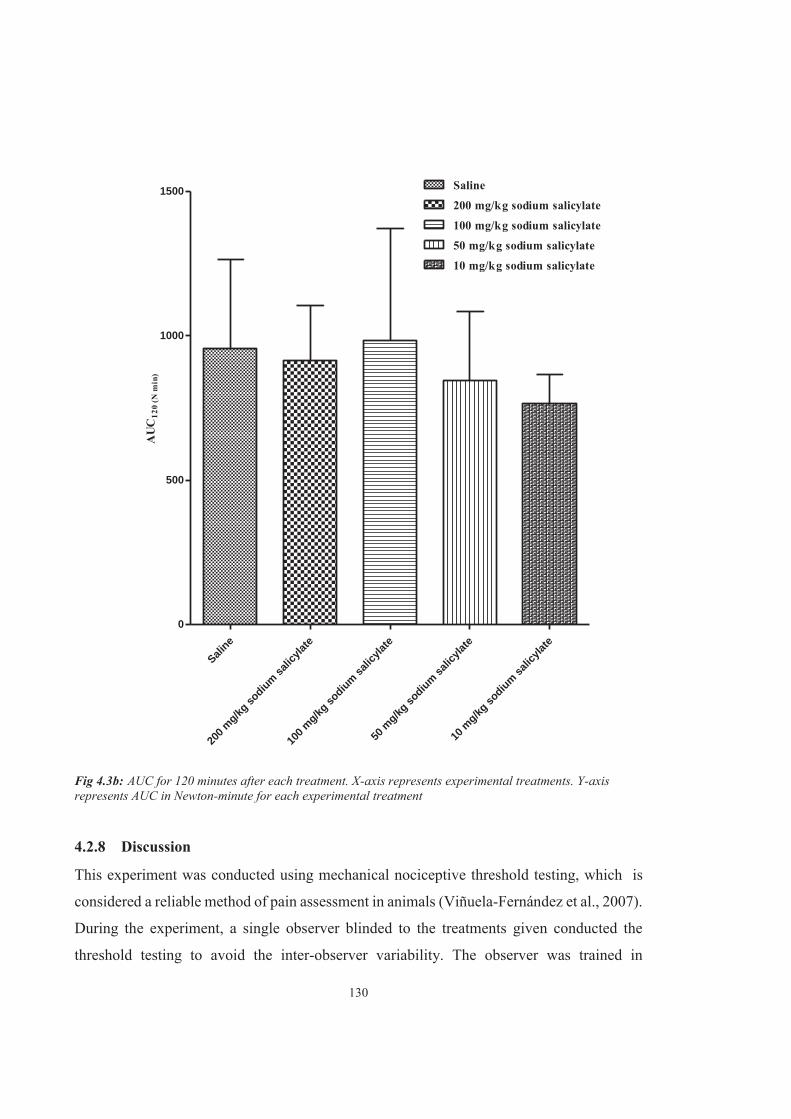
130
Saline
200 m
g/kg so
dium salic
ylate
100 m
g/kg so
dium salic
ylate
50 m
g/kg so
dium salic
ylate
10 m
g/kg so
dium salic
ylate
0
500
1000
1500 Saline
200 mg/kg sodium salicylate
100 mg/kg sodium salicylate
50 mg/kg sodium salicylate
10 mg/kg sodium salicylate
AU
C12
0 (N
min
)
Fig 4.3b: AUC for 120 minutes after each treatment. X-axis represents experimental treatments. Y-axis represents AUC in Newton-minute for each experimental treatment
4.2.8 Discussion
This experiment was conducted using mechanical nociceptive threshold testing, which is
considered a reliable method of pain assessment in animals (Viñuela-Fernández et al., 2007).
During the experiment, a single observer blinded to the treatments given conducted the
threshold testing to avoid the inter-observer variability. The observer was trained in
131
threshold testing method, and identifying sheep’s responses to threshold test prior to the start
of experiment.
No significant difference was found between pre- and post-treatment thresholds of sheep
that received four different doses of NaS (P>0.05). Though the nociceptive thresholds of the
sheep that received 100 mg/kg NaS were increased at 5, 10 and 15 minutes post-treatment,
they did not approach significance when compared to pre-treatment thresholds, and that of
other four treatment groups. The carry-over effect of the treatment was insignificant in our
study as one week washing period was allowed in between the treatments.
Also, the AUC calculated for 100mg/kg NaS was higher but not significantly different to
any other NaS treatment or negative control treatment (saline). These findings did not
provide conclusive evidence of the efficacy of NaS in sheep in response to a painful stimulus.
These inconclusive findings could be attributed to the noisy distractions at some time points
during the experiment that stressed sheep, and stress induced hypoalgesia might have
affected threshold responses of sheep. In the course of our study at LATU, teaching classes
for veterinary students were conducted in the vicinity.
Another important factor which could be considered is the lack of training of the sheep prior
to the start of experiment. It has been observed that animals accustomed to the experimental
conditions usually respond consistently to the noxious stimuli (Lodola and Stadler, 2011).
In the present study sheep were not trained prior to the experiment; this could have resulted
in inconsistency of the nociceptive thresholds. Also, inclusion of a positive control group
treated with a traditional analgesic of well-known efficacy would have improved the
accuracy of study outcome. Hence, further study was essential.
4.3 MAIN STUDY
This study was conducted to investigate the efficacy of NaS in a controlled environment
using a positive and a negative control group. Prior to the start of this study, the animals
were trained for MNT testing for three weeks to obtain consistent threshold responses.

132
4.3.1 Experimental design and preparation of animals
This study was approved by Animal Ethics Committee, Massey University, Palmerston
North, New Zealand and was carried out at Large Animal Teaching Unit (LATU), Massey
University, Palmerston North. Six healthy Romney cross ewes of age 4 years and weight
(weight±SD) 67.83±10.10kg were assigned to receive test drugs in a randomised, crossover
design. This study was conducted during the semester break to avoid any distractions due to
any teaching classes near the study area. Experimental animals were housed and maintained
under similar conditions described in the pilot study.
In this study along with the MNT testing, thermal nociceptive threshold (TNT) testing was
also carried out simultaneously. Inclusion of TNT testing in the study could provide another
pain modality to investigate the analgesic efficacy of test drug. Besides, it is highly
recommended to consider the responses to different pain modalities for confirming the
analgesic efficacy of drugs (Olesen et al., 2012). In sheep, thermal and mechanical
nociceptive threshold testing are established methods of pain assessment, and a combination
of more than one pain assessment methods rather than a single technique is useful to confirm
efficacy (Lizarraga and Chambers, 2012). To conduct MNT and TNT tests, two nociceptive
threshold testing devices were used.
4.3.2 Description of devices
4.3.2.1 Mechanical nociceptive threshold device
MNT testing device used in the pilot study was used during this study.
4.3.2.2 Thermal nociceptive threshold device
A custom built TNT device (designed by Dr. Mike Gieseg and A/P. Paul Chambers, IVABS,
Massey University, Palmerston North, New Zealand) consisting of a thermode, controller
and power supply attached was used in our study. The thermode (Figure 4.4a) consisted of
a 40mm square Peltier chip with a 50mm square aluminium plate containing a digital
temperature sensor (Dallas DS18B20; RS Components, Auckland, New Zealand) on the skin
side. On the other side was a large heat sink with a fan (DC Brushless EFB0512HA; Delta

133
Electronics Inc., Tainan City, Taiwan) to draw air through the heat sink to enable rapid
cooling.
The controller unit consisted of a microcontroller board (Arduino Uno; RS Electronics)
running a microprocessor (ATmega328P; Atmel Corporation, San Jose, CA, USA) and a N-
channel MOSFET (FQP30N06L; RS Components) to control heating of the thermode using
pulse width modulation, and a Bluetooth modem (BlueSMiRF Silver; SparkFun Electronics,
Niwot, CO, USA). Connections and wiring to the microcontroller board were custom built
on a prototyping shield (ProtoShield Basic; Freetronics, Croydon South, Victoria, Australia).
The microcontroller board was programmed to increase or decrease the power to the Peltier
chip in response to the temperature sensor output to achieve linear heating. The Bluetooth
modem allowed the controller to communicate with a laptop computer to display the
thermode temperature at 0.5 second intervals and also to receive commands from the
observer via a laptop computer. The controller unit was housed in a polycarbonate box (160
x 80 x 55 mm) with a single on-off switch. Connections from the controller to the thermode
were made with break apart plugs to allow the thermode to be removed from the controller.
The thermode and controller were powered by two 12 V 6.5 A sealed lead acid rechargeable
batteries (DiaMec DM12-65; DiaMec Industrial Battery Ltd., Huiyang City, Guangdong
Province, China) running in series. Temperature of the thermode increased at the rate of
0.8ºC/second.
The batteries and the controller (Figure 4.4b) were fitted in fabric cases with Velcro fasteners
and this whole assembly was hung on the side of the cage containing the sheep with nylon
webbing and buckles for extra stability of the equipment and to reduce the stress of the sheep.
The thermode was fixed on the clean shaved sheep leg on either lateral shank region (for
thin legged sheep) or on the lateral metacarpal bone (for heavy sheep) to provide the
maximum surface area for the contact with thermode. After application of thermode on the
sheep’s leg, the temperature of sheep skin was displayed as the thermode temperature and it
was considered as the base temperature which remained constant. The temperature of
thermode declined to the base temperature in about two minute’s time after it has reached to
the maximum/cut-off (60ºC) temperature. The cut-off temperature was safe and did not
cause any tissue damage in sheep.
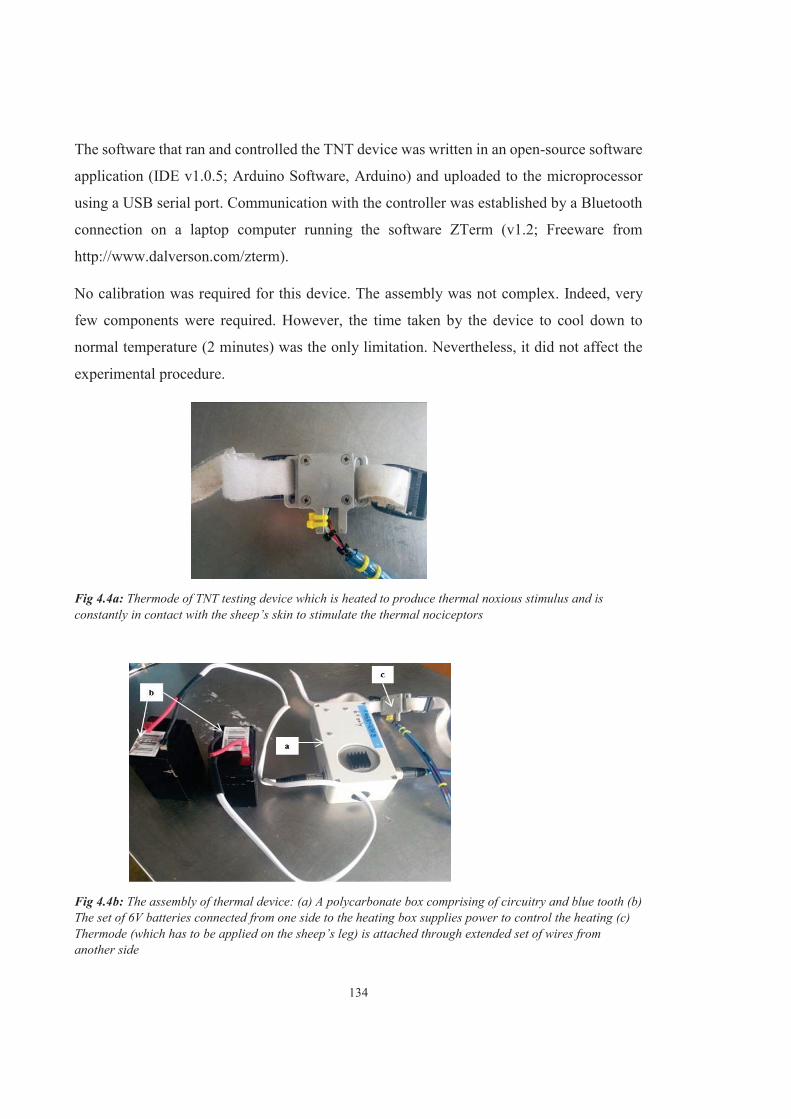
134
The software that ran and controlled the TNT device was written in an open-source software
application (IDE v1.0.5; Arduino Software, Arduino) and uploaded to the microprocessor
using a USB serial port. Communication with the controller was established by a Bluetooth
connection on a laptop computer running the software ZTerm (v1.2; Freeware from
http://www.dalverson.com/zterm).
No calibration was required for this device. The assembly was not complex. Indeed, very
few components were required. However, the time taken by the device to cool down to
normal temperature (2 minutes) was the only limitation. Nevertheless, it did not affect the
experimental procedure.
Fig 4.4a: Thermode of TNT testing device which is heated to produce thermal noxious stimulus and is constantly in contact with the sheep’s skin to stimulate the thermal nociceptors
Fig 4.4b: The assembly of thermal device: (a) A polycarbonate box comprising of circuitry and blue tooth (b) The set of 6V batteries connected from one side to the heating box supplies power to control the heating (c) Thermode (which has to be applied on the sheep’s leg) is attached through extended set of wires from another side
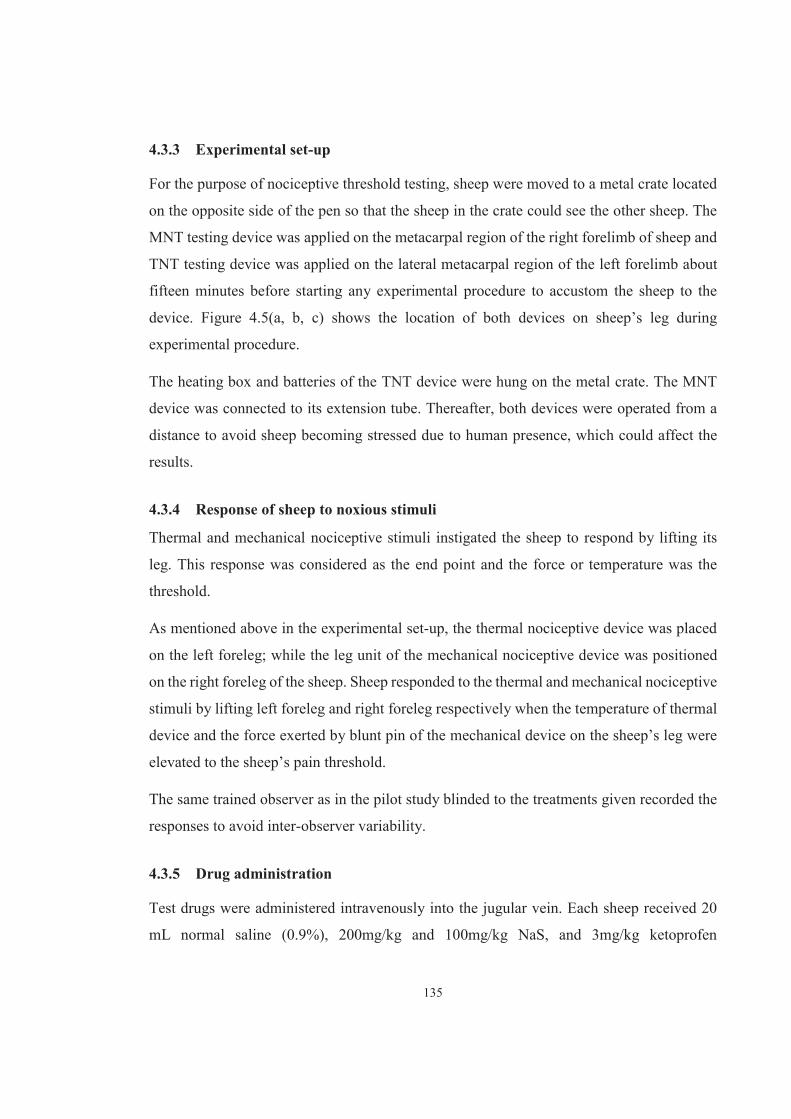
135
4.3.3 Experimental set-up
For the purpose of nociceptive threshold testing, sheep were moved to a metal crate located
on the opposite side of the pen so that the sheep in the crate could see the other sheep. The
MNT testing device was applied on the metacarpal region of the right forelimb of sheep and
TNT testing device was applied on the lateral metacarpal region of the left forelimb about
fifteen minutes before starting any experimental procedure to accustom the sheep to the
device. Figure 4.5(a, b, c) shows the location of both devices on sheep’s leg during
experimental procedure.
The heating box and batteries of the TNT device were hung on the metal crate. The MNT
device was connected to its extension tube. Thereafter, both devices were operated from a
distance to avoid sheep becoming stressed due to human presence, which could affect the
results.
4.3.4 Response of sheep to noxious stimuli
Thermal and mechanical nociceptive stimuli instigated the sheep to respond by lifting its
leg. This response was considered as the end point and the force or temperature was the
threshold.
As mentioned above in the experimental set-up, the thermal nociceptive device was placed
on the left foreleg; while the leg unit of the mechanical nociceptive device was positioned
on the right foreleg of the sheep. Sheep responded to the thermal and mechanical nociceptive
stimuli by lifting left foreleg and right foreleg respectively when the temperature of thermal
device and the force exerted by blunt pin of the mechanical device on the sheep’s leg were
elevated to the sheep’s pain threshold.
The same trained observer as in the pilot study blinded to the treatments given recorded the
responses to avoid inter-observer variability.
4.3.5 Drug administration
Test drugs were administered intravenously into the jugular vein. Each sheep received 20
mL normal saline (0.9%), 200mg/kg and 100mg/kg NaS, and 3mg/kg ketoprofen

136
(Ketoprofen™ 10%, Merial Ltd. Manukau city, New Zealand) randomly with one week
interval (washout period) between each treatment.
Lower doses of NaS (50 and 10 mg/kg) tested in the pilot study, were not tested in this main
study. From the pharmacokinetic study described in chapter 2, it was apparent that NaS given
in lower doses did not achieve high enough plasma SA concentrations (16.8μg/mL; this
concentration of SA is reported to be analgesic in humans) for longer duration (the effective
plasma concentration was maintained for about 15 minutes when 200 and 100mg/kg of NaS
were given). This decision was made after obtaining the results of the pharmacokinetics (PK)
study of NaS (Chapter 2), which was conducted after the pilot study.
Fig 4.5: (a) Sheep with both MNT and TNT testing devices on right and left foreleg respectively (b) Right leg of sheep zoomed in to display the leg unit (box with blunt pin) of the MNT testing device (c) Left leg of sheep zoomed in to display leg unit (thermode) of TNT testing device
137
4.3.6 Data recording
4.3.6.1 Pre-treatment thresholds
Once sheep were accustomed to the testing devices, baseline thresholds to thermal (0C)
followed by mechanical nociceptive stimuli (N) were recorded. Baseline threshold
measurements were taken until three consistent readings were obtained with each type of
stimulus. Two-minute time intervals were allowed between each pair of recordings.
4.3.6.2 Post-treatment thresholds
The thermal and mechanical nociceptive thresholds of sheep were recorded at 4, 9, 14, 19,
24, 29, 44, 59, 74, 89, 104, 119, and 5, 10, 15, 20, 25, 30, 45, 60, 75, 90, 105 and 120
minutes respectively, after the test drug administration.
4.3.7 Statistical analyses
Data obtained from both mechanical and thermal nociceptive threshold testing were initially
analysed for normality with D’Agostino & Pearson omnibus normality test. Normally
distributed data were analysed using Two-way ANOVA (mixed model) with post hoc
Bonferroni test to find any significant differences (P<0.05) between pre-and post-treatment
values, within and between the treatment groups. During this statistical analysis, data
obtained from one sheep showing abnormal signs was excluded to avoid the erroneous
outcomes. In our experiments, carry-over effect was insignificant as a one week wash out
interval was allowed between the treatments. Two-way mixed model ANOVA considers
effect of treatment and random effects.
Data for area under the curve (AUC), calculated from the mechanical as well as thermal
thresholds recorded at the specific time points during the experiment (until 120 minutes post-
treatment) were initially assessed for Kolmogorov-Smirnov normality test. Non-normally
distributed data were analysed for significant differences between the treatments with
Friedman’s test (non-parametric equivalent for one way ANOVA) with post hoc Dunn’s
multiple comparison test. Normally distributed data were tested for significant differences
between the treatment groups using a one-way ANOVA with post hoc Bonferroni test.
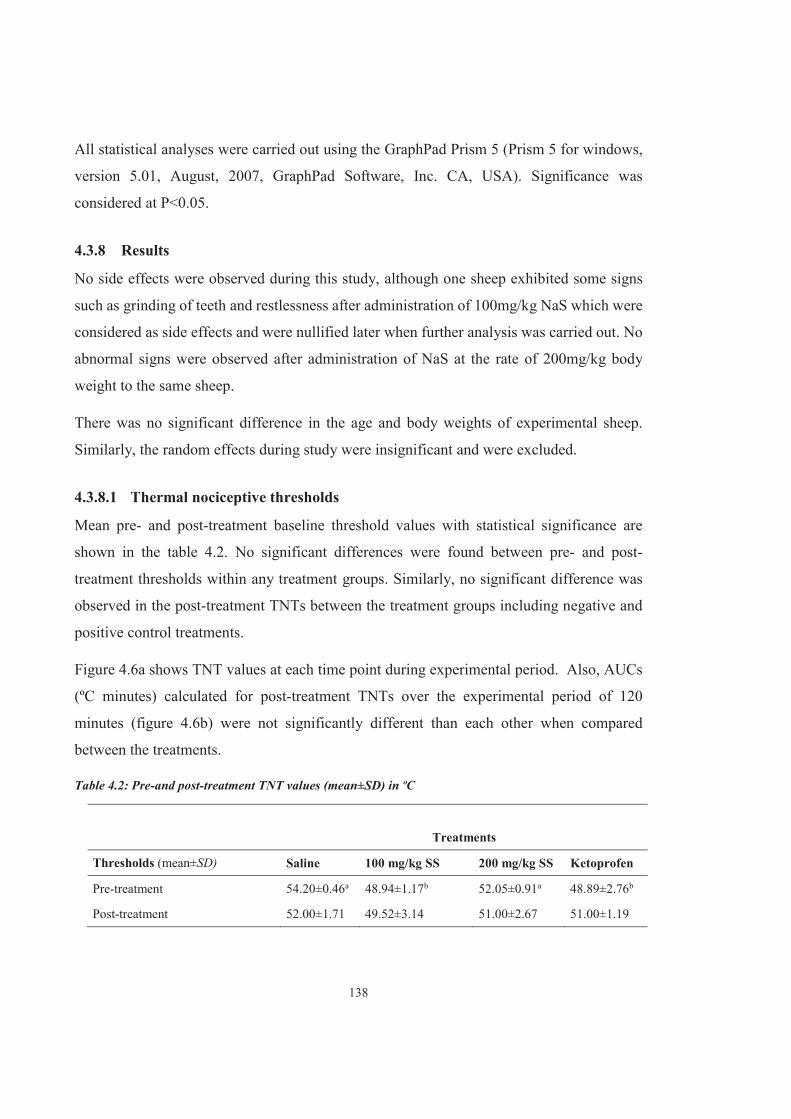
138
All statistical analyses were carried out using the GraphPad Prism 5 (Prism 5 for windows,
version 5.01, August, 2007, GraphPad Software, Inc. CA, USA). Significance was
considered at P<0.05.
4.3.8 Results
No side effects were observed during this study, although one sheep exhibited some signs
such as grinding of teeth and restlessness after administration of 100mg/kg NaS which were
considered as side effects and were nullified later when further analysis was carried out. No
abnormal signs were observed after administration of NaS at the rate of 200mg/kg body
weight to the same sheep.
There was no significant difference in the age and body weights of experimental sheep.
Similarly, the random effects during study were insignificant and were excluded.
4.3.8.1 Thermal nociceptive thresholds
Mean pre- and post-treatment baseline threshold values with statistical significance are
shown in the table 4.2. No significant differences were found between pre- and post-
treatment thresholds within any treatment groups. Similarly, no significant difference was
observed in the post-treatment TNTs between the treatment groups including negative and
positive control treatments.
Figure 4.6a shows TNT values at each time point during experimental period. Also, AUCs
(ºC minutes) calculated for post-treatment TNTs over the experimental period of 120
minutes (figure 4.6b) were not significantly different than each other when compared
between the treatments.
Table 4.2: Pre-and post-treatment TNT values (mean±SD) in ºC
Treatments
Thresholds (mean±SD) Saline 100 mg/kg SS 200 mg/kg SS Ketoprofen
Pre-treatment 54.20±0.46a 48.94±1.17b 52.05±0.91a 48.89±2.76b Post-treatment 52.00±1.71 49.52±3.14 51.00±2.67 51.00±1.19
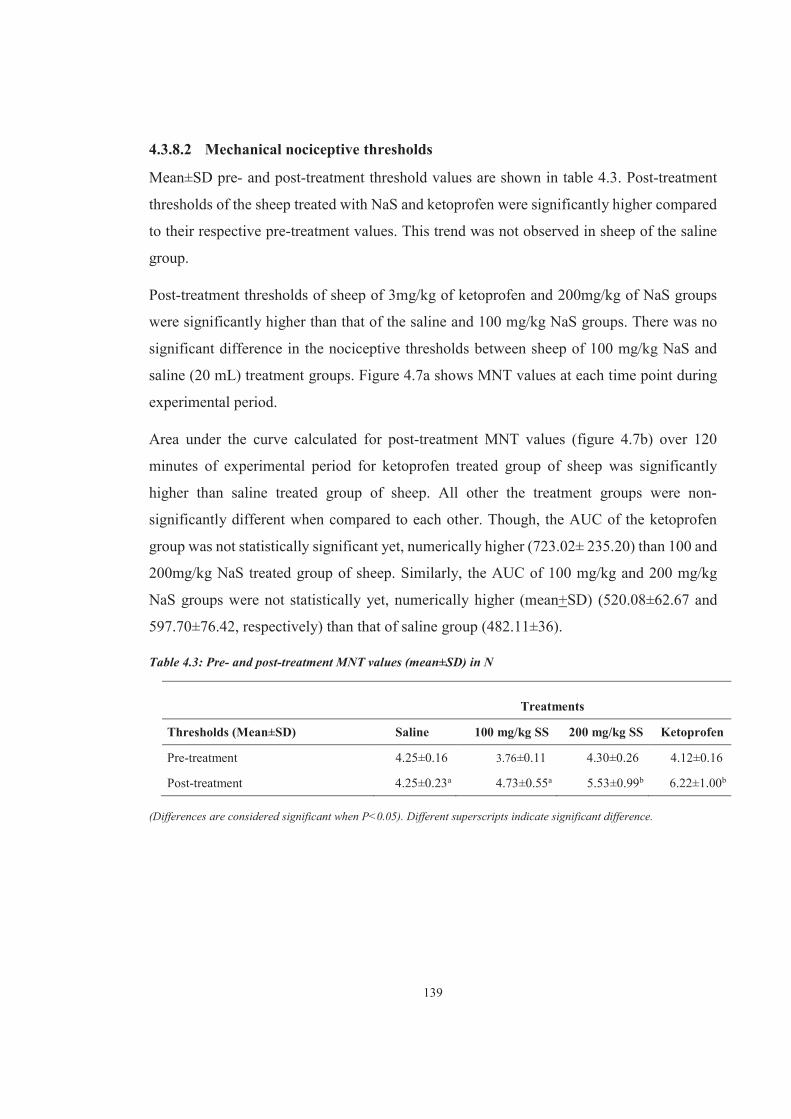
139
4.3.8.2 Mechanical nociceptive thresholds
Mean±SD pre- and post-treatment threshold values are shown in table 4.3. Post-treatment
thresholds of the sheep treated with NaS and ketoprofen were significantly higher compared
to their respective pre-treatment values. This trend was not observed in sheep of the saline
group.
Post-treatment thresholds of sheep of 3mg/kg of ketoprofen and 200mg/kg of NaS groups
were significantly higher than that of the saline and 100 mg/kg NaS groups. There was no
significant difference in the nociceptive thresholds between sheep of 100 mg/kg NaS and
saline (20 mL) treatment groups. Figure 4.7a shows MNT values at each time point during
experimental period.
Area under the curve calculated for post-treatment MNT values (figure 4.7b) over 120
minutes of experimental period for ketoprofen treated group of sheep was significantly
higher than saline treated group of sheep. All other the treatment groups were non-
significantly different when compared to each other. Though, the AUC of the ketoprofen
group was not statistically significant yet, numerically higher (723.02± 235.20) than 100 and
200mg/kg NaS treated group of sheep. Similarly, the AUC of 100 mg/kg and 200 mg/kg
NaS groups were not statistically yet, numerically higher (mean+SD) (520.08±62.67 and
597.70±76.42, respectively) than that of saline group (482.11±36).
Table 4.3: Pre- and post-treatment MNT values (mean±SD) in N
Treatments
Thresholds (Mean±SD) Saline 100 mg/kg SS 200 mg/kg SS Ketoprofen
Pre-treatment 4.25±0.16 3.76±0.11 4.30±0.26 4.12±0.16 Post-treatment 4.25±0.23a 4.73±0.55a 5.53±0.99b 6.22±1.00b
(Differences are considered significant when P<0.05). Different superscripts indicate significant difference.
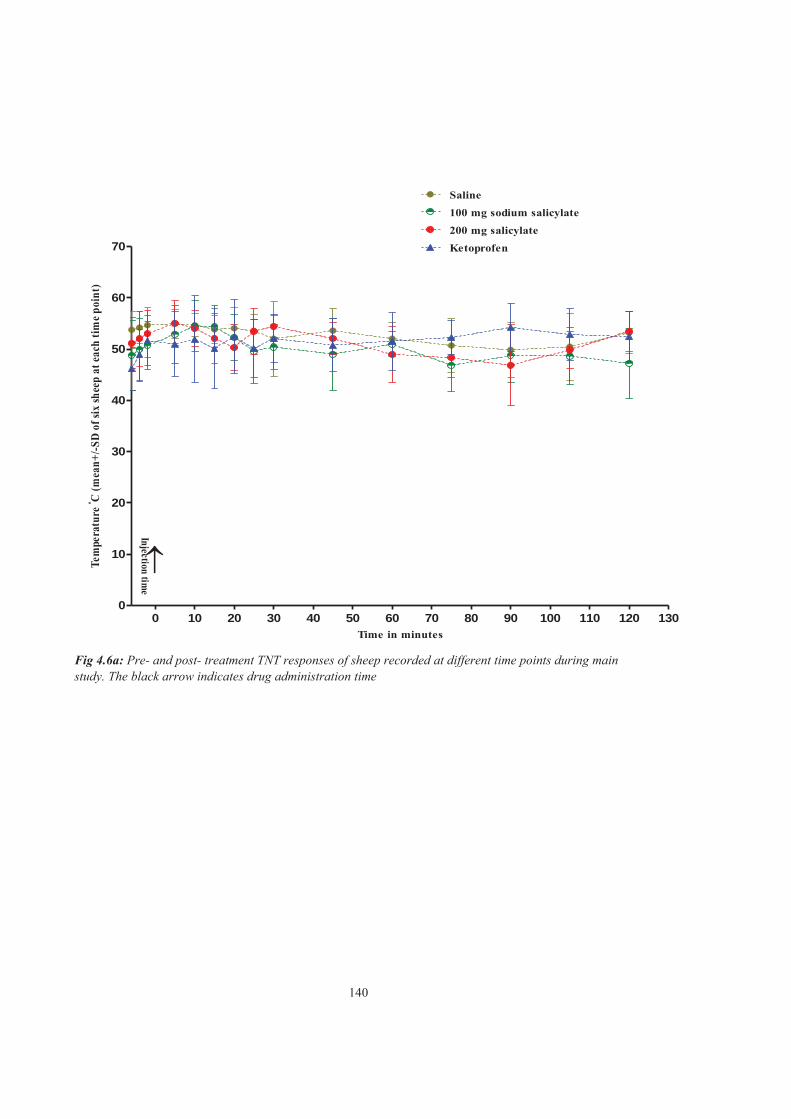
140
0 10 20 30 40 50 60 70 80 90 100 110 120 1300
10
20
30
40
50
60
70
Saline
100 mg sodium salicylate
200 mg salicylate
Ketoprofen
Injection time
Time in minutes
Tem
pera
ture
º C(m
ean+
/-SD
of s
ix sh
eep
at ea
ch ti
me p
oint
)
Fig 4.6a: Pre- and post- treatment TNT responses of sheep recorded at different time points during main study. The black arrow indicates drug administration time
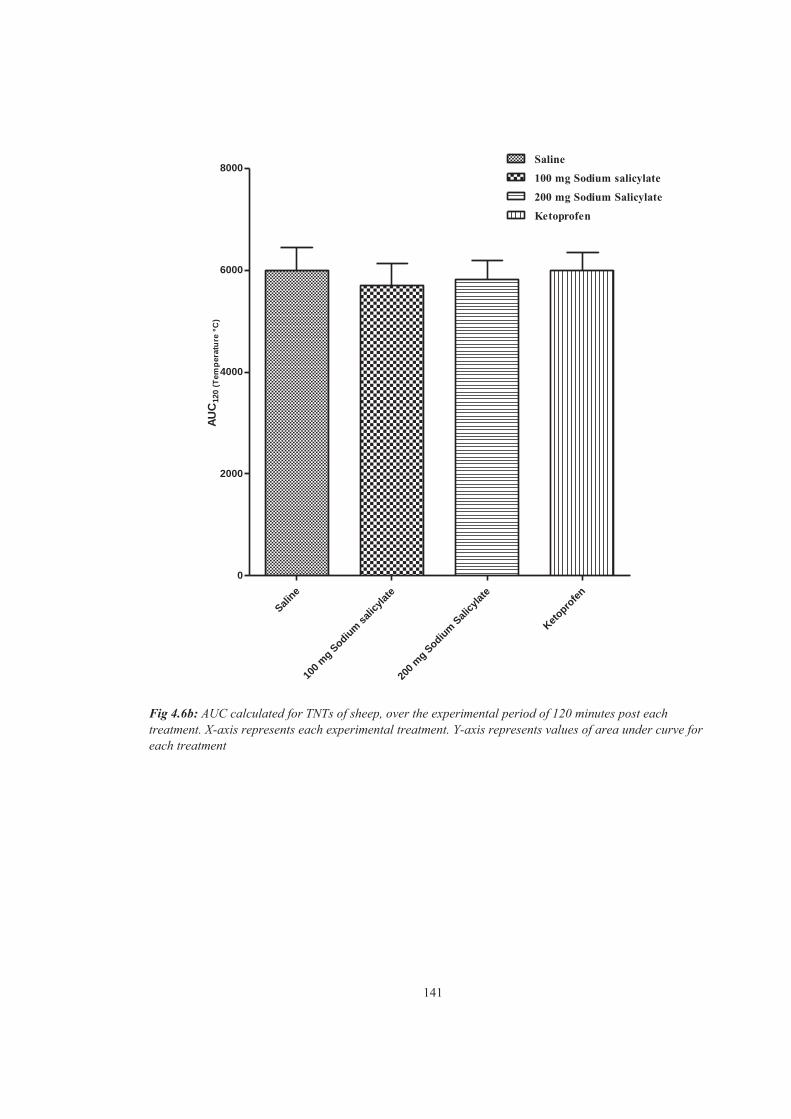
141
Saline
100 m
g Sodium salic
ylate
200 m
g Sodium Salicy
late
Ketopro
fen0
2000
4000
6000
8000Saline
100 mg Sodium salicylate
200 mg Sodium Salicylate
KetoprofenAU
C12
0 (T
empe
ratu
re º
C)
Fig 4.6b: AUC calculated for TNTs of sheep, over the experimental period of 120 minutes post each treatment. X-axis represents each experimental treatment. Y-axis represents values of area under curve for each treatment
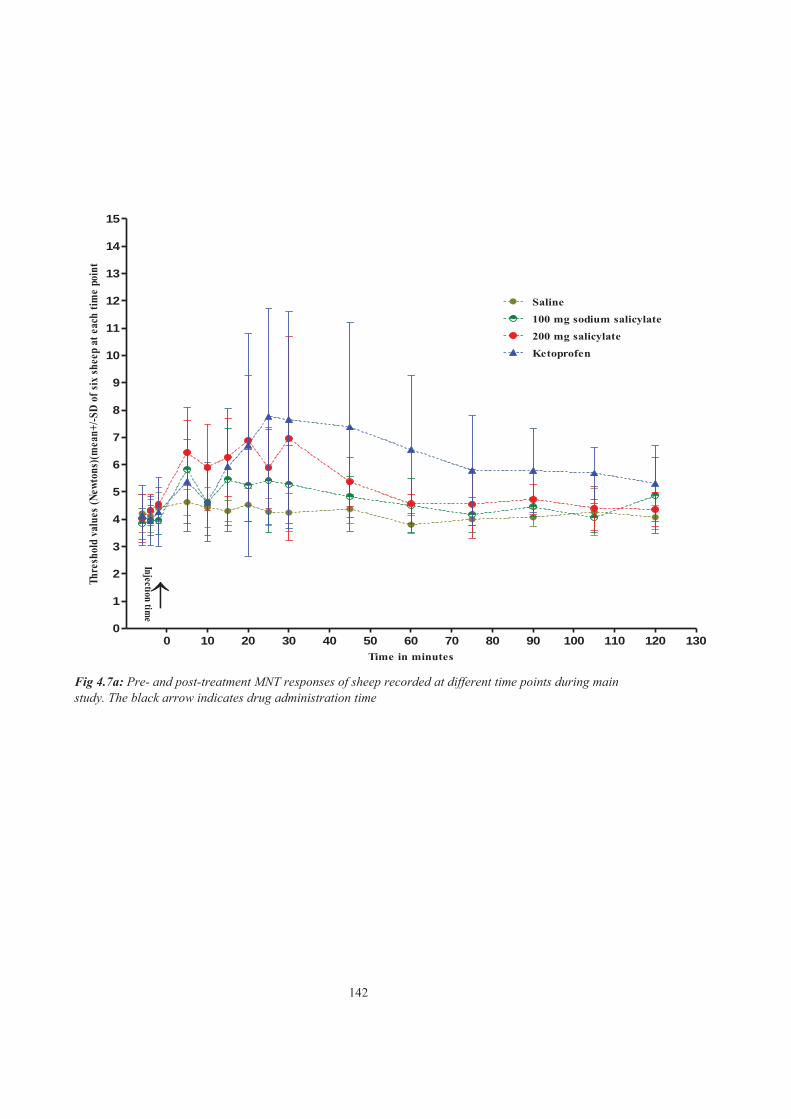
142
0 10 20 30 40 50 60 70 80 90 100 110 120 1300
1
2
3
4
5
6
7
8
9
10
11
12
13
14
15
Saline
100 mg sodium salicylate
200 mg salicylate
Ketoprofen
Injection time
Time in minutes
Thre
shol
d va
lues
(New
tons
)(mea
n+/-S
D of
six
shee
p at
eac
h tim
e po
int
Fig 4.7a: Pre- and post-treatment MNT responses of sheep recorded at different time points during main study. The black arrow indicates drug administration time

143
Saline
100 m
g Sodium salic
ylate
200 m
g Sodium salic
ylate
Ketopro
fen0
500
1000
1500
Saline
100 mg Sodium salicylate
200 mg Sodium salicylate
Ketoprofen
†
AUC
120
(N m
in)
Fig 4.7b: AUCs calculated for MNTs during main study over the experimental period of 120 minutes post each treatment. X-axis represents different treatments. Y-axis represents actual area under curve values for each treatment

144
10 15 20 25 3030
40
50
60
70
Ambient temperatures (ºC)
Ther
mal
thre
shol
ds (
º C)
Fig 4.8: Baseline thermal nociceptive thresholds and corresponding ambient temperatures. X-axis represents different ambient temperatures during experimental period. Y-axis represents corresponding baseline thermal threshold values of the experimental sheep
4.3.9 Discussion
In this study, nociceptive thresholds of sheep in response to thermal and mechanical stimuli
were tested to detect the analgesic efficacy of NaS. NaS administered in two different doses
(100 mg/kg and 200 mg/kg) could increase the mechanical but not the thermal thresholds of
sheep recorded at specific time-points in the experimental period.
All the necessary pre-requisites such as controlled environment, trained observer and device
handler, allowance of optimum time for animals to adapt to the experimental environment
were taken into consideration and implemented during the study.
4.3.9.1 Thermal nociceptive thresholds
Inconsistent responses were observed during the TNT testing study. Also, pre-treatment
TNT temperatures for individual sheep varied between the experimental days. This was
unanticipated. Under similar experimental conditions, the baseline MNTs of the individual
sheep were constant between the experimental days. Prior to the start of each experiment,
more time was allocated for sheep to adapt to the experimental setup in order to obtain
consistent pre-treatment thresholds.

145
The inconclusive results of TNT testing in the present study are similar to findings of other
studies in animals. In sheep with chronic foot-rot lesions, Ley et al (1989) could not find any
change in thermal thresholds. On the other hand their mechanical nociceptive thresholds
were decreased significantly.
Other researchers also observed the inefficiency of TNT testing to determine the analgesic
activity of NSAIDs in animals (Koch, 2006). The ineffectiveness of these tests is believed
to be either due to increased tolerance or over-sensitisation of animals to the TNT testing
resulting in lowered thresholds (Tapper, 2011, Koch, 2006). Over-sensitisation results in
lowered thermal thresholds. Hence, effect of analgesic administration on thresholds becomes
insignificant and in spite of drug being effective, its analgesic effect may not be exhibited
Also, the location of the TNT device on animal’s body can contribute to the variation in the
responses due to high/lower sensitivity of that particular area of animal’s body to thermal
nociceptive stimulus (Caplen et al., 2013, Love et al., 2011, Ley et al., 1989, Kamerling et
al., 1986). In this study, the device (thermode) was placed on the sheep’s leg. In sheep, the
ear pinna has been suggested to be a reliable site to elicit optimum response to TNT
(Lizarraga and Chambers, 2012, Nolan et al., 1987a). However, the device was too heavy to
be placed on the ear pinna and it was located on the leg of the sheep during this study.
The pre-treatment TNT values were not consistent during the experimental days. This inter-
day inconsistency in TNT values between the treatments could be due to lack of training to
sheep prior to the experimental procedure. During training session, sheep were trained for
MNT testing. Unfortunately, due to the unavailability of TNT device in this period,
simultaneous training for TNT testing was not performed. The TNT values of sheep given 3
mg/kg ketoprofen (positive control) did not differ significantly from baseline values, and
that of the other treatment groups. Thus, in the present study unacquaintance of animals to
this technique might have resulted in these inconsistencies in responses even after
administration of an analgesic (ketoprofen). Pre-experimental training is important to
accustom the animals to the experimental device and technique, which is helpful to obtain
consistent results (Lodola and Stadler, 2011). This was evident in the experiments conducted
by various researchers in horses subjected to thermal nociceptive threshold testing
(Chambers et al., 1994, Kamerling et al., 1986). In contrast, it was observed that sheep
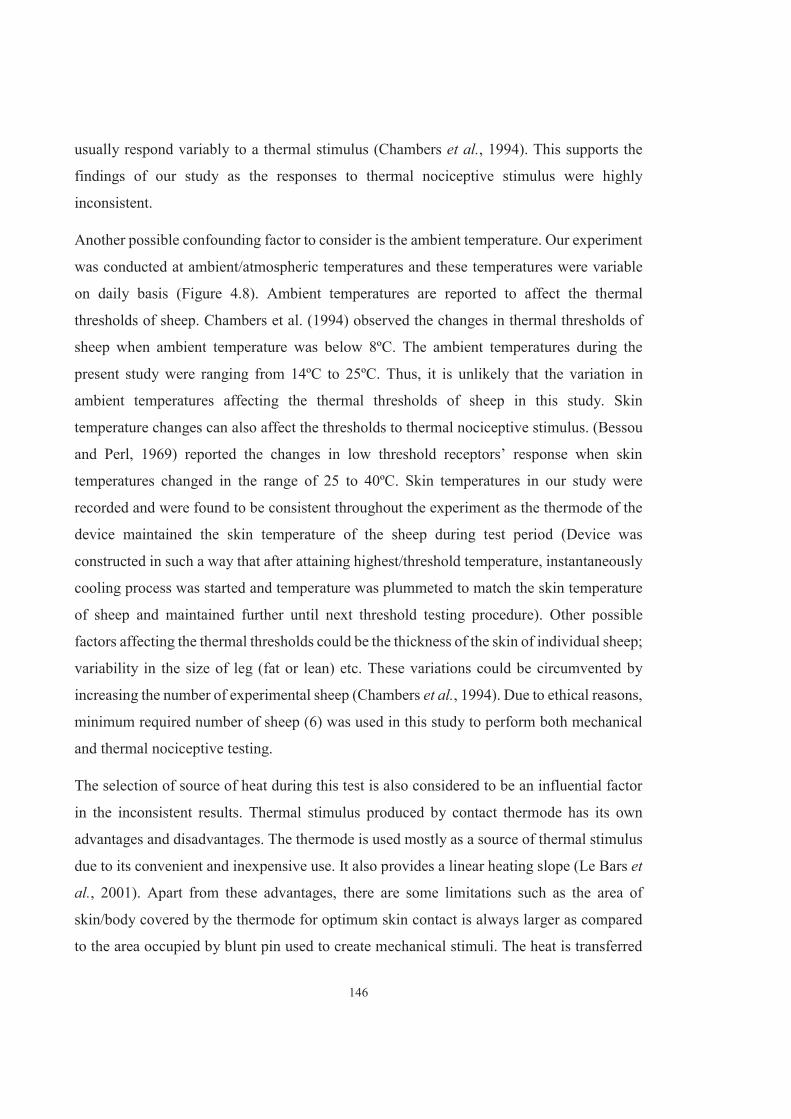
146
usually respond variably to a thermal stimulus (Chambers et al., 1994). This supports the
findings of our study as the responses to thermal nociceptive stimulus were highly
inconsistent.
Another possible confounding factor to consider is the ambient temperature. Our experiment
was conducted at ambient/atmospheric temperatures and these temperatures were variable
on daily basis (Figure 4.8). Ambient temperatures are reported to affect the thermal
thresholds of sheep. Chambers et al. (1994) observed the changes in thermal thresholds of
sheep when ambient temperature was below 8ºC. The ambient temperatures during the
present study were ranging from 14ºC to 25ºC. Thus, it is unlikely that the variation in
ambient temperatures affecting the thermal thresholds of sheep in this study. Skin
temperature changes can also affect the thresholds to thermal nociceptive stimulus. (Bessou
and Perl, 1969) reported the changes in low threshold receptors’ response when skin
temperatures changed in the range of 25 to 40ºC. Skin temperatures in our study were
recorded and were found to be consistent throughout the experiment as the thermode of the
device maintained the skin temperature of the sheep during test period (Device was
constructed in such a way that after attaining highest/threshold temperature, instantaneously
cooling process was started and temperature was plummeted to match the skin temperature
of sheep and maintained further until next threshold testing procedure). Other possible
factors affecting the thermal thresholds could be the thickness of the skin of individual sheep;
variability in the size of leg (fat or lean) etc. These variations could be circumvented by
increasing the number of experimental sheep (Chambers et al., 1994). Due to ethical reasons,
minimum required number of sheep (6) was used in this study to perform both mechanical
and thermal nociceptive testing.
The selection of source of heat during this test is also considered to be an influential factor
in the inconsistent results. Thermal stimulus produced by contact thermode has its own
advantages and disadvantages. The thermode is used mostly as a source of thermal stimulus
due to its convenient and inexpensive use. It also provides a linear heating slope (Le Bars et
al., 2001). Apart from these advantages, there are some limitations such as the area of
skin/body covered by the thermode for optimum skin contact is always larger as compared
to the area occupied by blunt pin used to create mechanical stimuli. The heat is transferred

147
from the thermode by means of conduction. During the process of conduction, along with
the cutaneous nociceptors, heat specific thermoreceptors of low thresholds are also activated
that can initiate inhibitory pain pathways (Kuhtz-Buschbeck et al., 2010). Therefore, the
response to the thermal noxious stimulus is delayed (Le Bars et al., 2001) and might result
in higher basal nociceptive thresholds as observed in our study. Also, when the heating
process of thermode is slow i.e. less than 1ºC/second, the chances of Aδ fiber nociceptors
getting activated could be reduced. These (Aδ-fiber) nociceptors are activated only in
response to the intense and swift nociceptive stimuli such as mechanical nociceptive stimuli
(Bessou and Perl, 1969). During this study, the thermode was heating up slowly at
0.8ºC/second. Thus, activation of Aδ fiber nociceptors is unlikely to occur. The measured
responses to thermal stimulus could be due to the activation of two types of nociceptors,
firstly, slow conducting C-fibre nociceptors and secondly, low threshold thermoreceptors.
On the contrary, responses to mechanical noxious stimulus were more likely due to
activation of the Aδ type nociceptors. Thus, the disparity in responses obtained during
thermal and mechanical nociceptive threshold testing could be attributed to the activation of
different types of nociceptors. The nociceptors activated by thermal stimulus are effectively
blocked by opioids as compared to NSAIDs due to their mechanism of action (Steagall et
al., 2007). Also, absence of inflammatory pain in experimental sheep is major factor in this
study. The NSAIDs are reported to exhibit their effects during inflammatory conditions
rather than acute thermal nociception (Sukhtankar et al., 2014). Many other studies have
reported the effectiveness of thermal nociceptive threshold testing to detect the analgesic
efficacy of different drugs during inflammatory pain in animals (Musk et al., 2013, Slingsby
and Taylor, 2008).
4.3.9.2 Mechanical nociceptive thresholds
Responses exhibited by sheep to the mechanical nociceptive stimulus were consistent and
distinct as described in the results. Post-treatment MNT values were significantly higher
than pre-treatment values within each treatment group except saline. This indicates the
analgesic activity of NaS and ketoprofen. Ketoprofen is a NSAID in sheep and is used as
analgesic during painful conditions. In the current study, after intravenous administration of
ketoprofen, a delayed response to mechanical nociceptive stimuli was observed confirming

148
its analgesic activity. Similarly, post-treatment nociceptive thresholds of sheep administered
with 100mg/kg and 200mg/kg NaS were elevated as compared to their pre-treatment
thresholds, indicating the analgesic efficacy of NaS in this study. Statistical analyses resulted
in non-significant difference between post-treatment MNTs of sheep treated with ketoprofen
(3mg/kg body weight) and 200mg/kg body weight of NaS. Also, these two treatment groups
(ketoprofen and 200mg/kg body weight NaS) had significantly higher post-treatment MNTs
than that of the saline (negative control) group. These results confirm the analgesic efficacy
of NaS at 200mg/kg body weight.
Further statistical comparisons provide non-significance between the post-treatment MNT
values of sheep treated with saline (20mL) and 100 mg/kg body weight of NaS; nonetheless,
post-treatment MNTs of the sheep treated with 100mg/kg body weight NaS were
numerically higher than the post-treatment MNTs of the sheep treated with saline (20mL).
Post-treatment MNT values of sheep treated with 100 and 200mg/kg body weight of NaS
treatment were significantly different; where, 200mg/kg body weight of NaS exhibited
higher MNTs in sheep as compared to 100mg/kg body weight of NaS. However, post-
treatment MNT values of sheep treated with 100mg/kg NaS as compared to their pre-
treatment MNT values were higher and exhibited statistical significance. Though, the
analgesia in this case is evident, it is not equivalent to the analgesia produced by either
200mg/kg body weight of NaS or 3mg/kg body weight of ketoprofen in sheep. Thus,
analgesic efficiency of NaS may be established (even at the lower dose 100mg/kg body
weight of NaS) if larger number of sheep are subjected to the experimental treatment.
However, in our study due to ethical considerations, minimum required number of sheep
were used.
Studies showing the analgesic efficacy of NaS in sheep have not been published to date. Its
anti-nociceptive activity has been reported in other animals such as rats and sows. (Tapper,
2011, Baluchnejadmojarad et al., 2005). In these studies, experimental animals were
suffering from inflammatory pain; conversely, in our study, nociceptive pain was induced in
healthy sheep (absence of inflammation). Generally, analgesic effects of NSAIDs are
presumed to be due to their anti-inflammatory effects that inhibit the formation of
cyclooxygenase (COX) enzymes involved in production of prostaglandins (PGs). Inhibition

149
of PGs decreases inflammation and eventually minimises pain due to blocking of pain
signals transmitted by PGs (Voilley, 2004). This is attributed to the peripheral mechanisms
of NSAID action during inflammatory conditions. Researchers have also reported a central
mechanism of NSAID analgesia such as their action dependent on G-protein function and
blocking acid sensing channels (Voilley, 2004, Walker, 1995, McCormack, 1994b). These
actions of NSAIDs dissociate their anti-inflammatory and analgesic activities (Voilley,
2004, Walker, 1995). The present study was conducted in healthy sheep and there was no
apparent tissue damage by the MNT testing device probe. Therefore, the analgesic activity
of NaS observed during this study could be due to its central mechanism of action.
It is also apparent, that NSAIDs such as ketoprofen and NaS inhibit the nociceptive pain
initiated by the activation of thinly myelinated Aδ fiber nociceptors by their central
mechanism of analgesia (Malfait and Schnitzer, 2013, Ferreira et al., 1978). In contrast, the
nociceptive pain by thermal stimulus through a weak source of heating (thermode) activates
mixed nociceptors (low threshold thermoreceptors, and might activate C fibers). C fiber
nociceptors are more sensitive to inflammatory conditions and tend to activate in the
presence of inflammation (Kuhtz-Buschbeck et al., 2010, Le Bars et al., 2001). Thus,
analgesic efficacy of ketoprofen or NaS after thermal nociceptive threshold testing was not
evident in our study which may be due to absence of inflammatory pain.
A study in normal rats demonstrated the efficacy of aspirin in reducing the pain related
behaviours in response to mechanical nociceptive stimuli (LaBuda and Fuchs, 2001).
Researchers of the study opined that mechanisms other than inhibition of peripheral
inflammation might contribute to analgesia produced by aspirin. Moreover, many
researchers consider that the central mechanisms involved in the analgesic activity of
NSAIDs are more effective than their peripheral anti-inflammatory activities (Burian and
Geisslinger, 2005).
The MNT testing method in the current study demonstrates two important prerequisites;
firstly, training and acclimatisation of animals to the nociceptive threshold testing prior to
the start of experiment, secondly, a quiet environment during the testing. When the present
study was conducted in a quiet environment after training the sheep for three weeks, more
consistent and conclusive results compared to those of the pilot study were obtained. In the
150
pilot study, due to a noisy environment, stress induced analgesia or distraction might have
masked the analgesic effects of NaS. Stress induced analgesia is also evident in the main
study for shorter duration (about 5minutes). Drug administration during the main study was
carried out by jugular venepuncture without catheterisation. On the other hand, sheep were
catheterised for drug administration in the pilot study. Unfortunately, some sheep pulled out
the catheters resulting in further stress during this study. Hence, in the main study
catheterisation was avoided. Jugular venepuncture for drug-injection in this (main) study
consequently demonstrated stress in sheep immediately after injection (due to manual
restraining of sheep for few minutes for the purpose of injection). It is usual and likely for
animals such as sheep to become psychologically stressed due to handling, transport and
other husbandry procedures (Grandin, 1997). The stress in sheep was evident from
behavioural changes such change in posture, increased movements during restraining etc.
which are known and general behavioural changes in sheep (Cockram, 2004). In order to
manage any kind of stress, an internal mechanism of analgesia (stress-induced analgesia) is
activated by secretion of endorphins (Shutt et al., 1987, Owens et al., 1984) In figure 4.6a
(main study results) MNTs of all the treatment groups at 5 minutes time interval (very first
threshold testing point after injection) are high as compared to baseline thresholds. This short
increase of thresholds may be a result of stress-induced analgesia. Further nociceptive testing
at 10 minutes (post-injection) time resulted in decreased thresholds as sheep were stable and
stress-free. Thereafter, no stress induced analgesia was apparent for the rest of the study
period since there were no other additional stress causing factors such as a noisy
environment.
NSAIDs including salicylates are reported to produce various side effects such as gastric
irritation and haemorrhages, diarrhoea, respiratory distress, nausea, skin rashes, renal
dysfunction etc. (Katzung et al., 2004). During the present study sheep were constantly
monitored for the side effects of NaS if any. One sheep showed abnormal signs such as teeth
grinding and restlessness at 90 minutes after administration of 100mg/kg NaS. Thus, 40 mL
of 5% dextrose saline was given IV to this sheep, and was monitored carefully for the next
two days. However, sheep was normal and healthy within 15 minutes of saline
administration. Nonetheless, these symptoms were considered as side effects of NaS.
151
Further administration of 200mg/kg NaS, a week later in the same sheep, did not cause any
abnormal signs. The plausible explanation for the absence of any abnormal symptoms after
higher dose of NaS could be the temperament of the sheep. It is usually assumed that
grinding of teeth in sheep is evidence of irritability and pain. During the 100mg/kg treatment,
the sheep was given the test drug after several hours of waiting in the pen and later moved
to the crate for experimental procedure which could have resulted in anxiety. Also, when the
drug is not properly injected into the vein, it could be painful sheep due to extravasation. In
this case, tit is likely that extravasation of 100mg/kg NaS resulted in the described signs.
Thus, the signs exhibited by sheep post-100mg/kg NaS treatment were not considered as
side effects of NaS.
4.4 CONCLUSION
Analgesic efficacy of NaS in sheep was evident after mechanical nociceptive threshold
testing. NaS treatment at 200mg/kg body weight exhibited equivalent analgesic potency to
3mg/kg body weight of ketoprofen (positive control) in sheep. Conflicting results obtained
from the thermal nociceptive threshold testing in this study could be due to activation of
different types of nociceptors as compared to mechanical threshold testing.
From these findings it appears that mechanical nociceptive threshold testing is more
appropriate method than thermal nociceptive threshold testing in healthy (without
inflammatory pain) sheep to investigate the analgesic efficacy of NSAIDs like NaS.
The apparent analgesic efficacy of NaS in the absence of inflammatory condition in sheep
specifies central mechanism involved in analgesia
To conclude, NaS (metabolised to SA) is analgesic in sheep. This provides strong
groundwork for testing the analgesic efficacy of willow leaves in sheep.
152
5 ASSESSMENT OF SALICIN CONTENT IN WILLOW
(SALIX SPP) LEAVES AND SEASONAL VARIATION
ABSTRACT
Willow (Family: Salicaceae, Genus: Salix) is a medicinal plant and has been used for
analgesia in humans since ancient times because of the salicin it contains. The utility of
willow as a fodder for livestock during droughts due to its abundant presence in New Zealand
has been studied (Pitta et al., 2007, Kemp et al., 2001, McCabe and Barry, 1988). Its efficacy
as an analgesic in animals has never been reported. Therefore, with the possibility of using
willow leaves as analgesic in sheep, this study was conducted to assess the variation in
salicin content. Willow leaves from 12 trees were collected monthly over the year. Leaves
were dried and processed to determine the salicin content by using high performance liquid
chromatography. Salicin content of willow leaves on a monthly basis was compared.
Corresponding average monthly temperature and rainfall during the leaves collection period
were obtained and correlated with the salicin content. The effect of location, species and age
was noted but not studied in detail. Salicin content and temperature has positive correlation.
Salicin content in willow leaves in New Zealand (North Island) varies significantly with
season and is high (1.62±0.17 grams/kilogram of fresh willow leaves) from November to
March (from late spring throughout the summer to early autumn).
5.1 INTRODUCTION
Willow (Salix spp) belongs to the family Salicaceae and has hundreds of species
(Newsholme, 1992) (which hybridise) distributed worldwide (Ball et al., 2005). Although it
is not native to New Zealand, it was introduced in 1840s by early European settlers (Phillips
and Daly, 2008, Charlton et al., 2007). The primary purpose of willow trees in New Zealand
was to control soil erosion. Now willows are often used as a fodder for livestock such as
cattle, deer and sheep during draught period (Olsen and Charlton, 2003, Wilkinson, 1999,
McCabe and Barry, 1988). Willow is a medicinal plant and has been used as analgesic in
humans since ancient times because of the active metabolite salicin. Willow bark and leaves
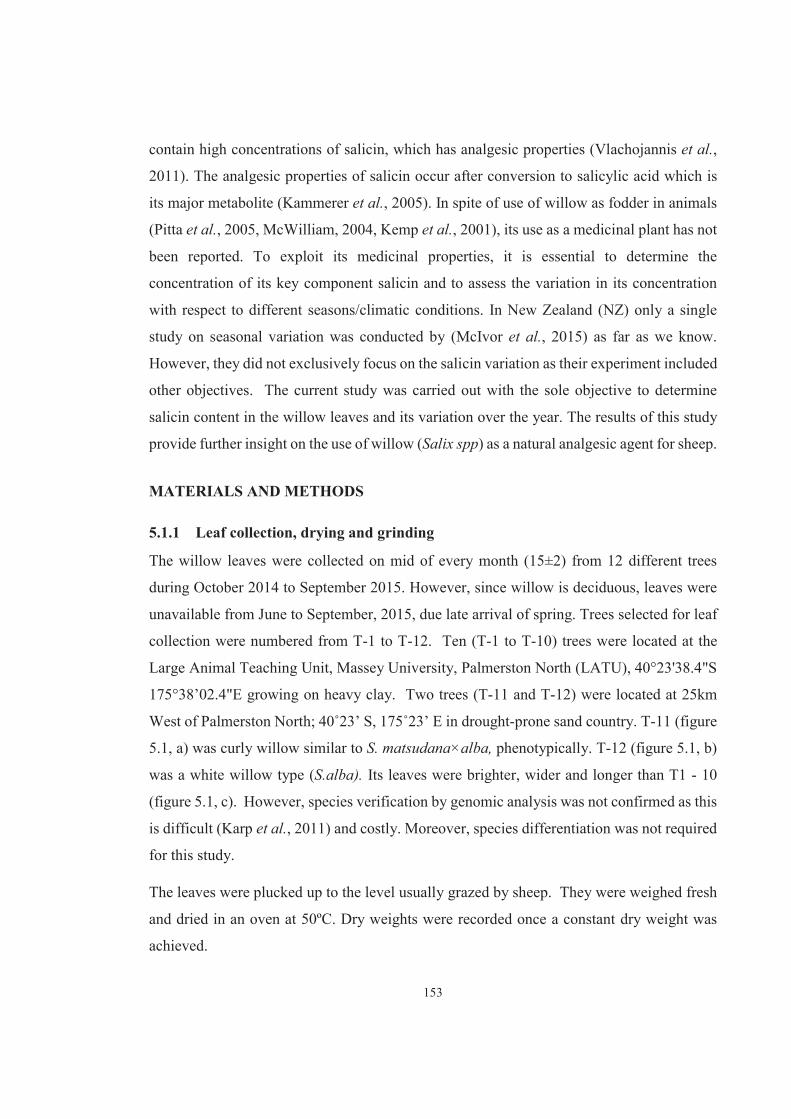
153
contain high concentrations of salicin, which has analgesic properties (Vlachojannis et al.,
2011). The analgesic properties of salicin occur after conversion to salicylic acid which is
its major metabolite (Kammerer et al., 2005). In spite of use of willow as fodder in animals
(Pitta et al., 2005, McWilliam, 2004, Kemp et al., 2001), its use as a medicinal plant has not
been reported. To exploit its medicinal properties, it is essential to determine the
concentration of its key component salicin and to assess the variation in its concentration
with respect to different seasons/climatic conditions. In New Zealand (NZ) only a single
study on seasonal variation was conducted by (McIvor et al., 2015) as far as we know.
However, they did not exclusively focus on the salicin variation as their experiment included
other objectives. The current study was carried out with the sole objective to determine
salicin content in the willow leaves and its variation over the year. The results of this study
provide further insight on the use of willow (Salix spp) as a natural analgesic agent for sheep.
MATERIALS AND METHODS
5.1.1 Leaf collection, drying and grinding
The willow leaves were collected on mid of every month (15±2) from 12 different trees
during October 2014 to September 2015. However, since willow is deciduous, leaves were
unavailable from June to September, 2015, due late arrival of spring. Trees selected for leaf
collection were numbered from T-1 to T-12. Ten (T-1 to T-10) trees were located at the
Large Animal Teaching Unit, Massey University, Palmerston North (LATU), 40°23'38.4"S
175°38’02.4"E growing on heavy clay. Two trees (T-11 and T-12) were located at 25km
West of Palmerston North; 40˚23’ S, 175˚23’ E in drought-prone sand country. T-11 (figure
5.1, a) was curly willow similar to S. matsudana×alba, phenotypically. T-12 (figure 5.1, b)
was a white willow type (S.alba). Its leaves were brighter, wider and longer than T1 - 10
(figure 5.1, c). However, species verification by genomic analysis was not confirmed as this
is difficult (Karp et al., 2011) and costly. Moreover, species differentiation was not required
for this study.
The leaves were plucked up to the level usually grazed by sheep. They were weighed fresh
and dried in an oven at 50ºC. Dry weights were recorded once a constant dry weight was
achieved.
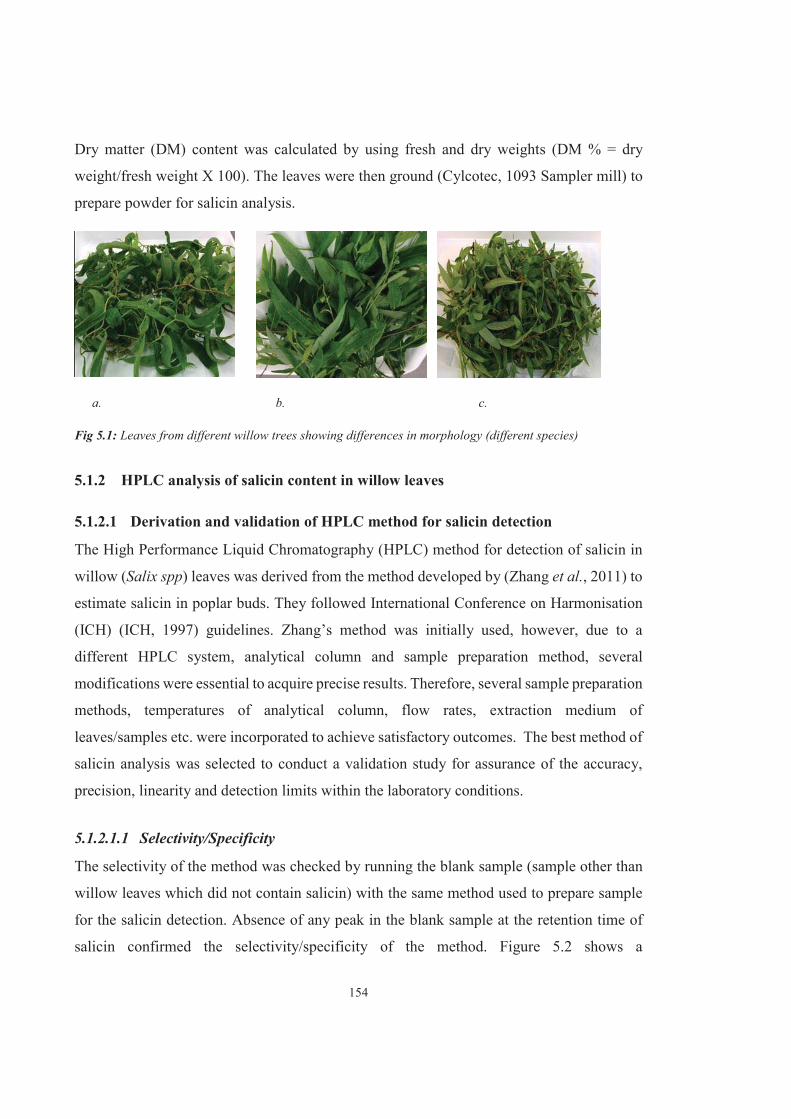
154
Dry matter (DM) content was calculated by using fresh and dry weights (DM % = dry
weight/fresh weight X 100). The leaves were then ground (Cylcotec, 1093 Sampler mill) to
prepare powder for salicin analysis.
a. b. c.
Fig 5.1: Leaves from different willow trees showing differences in morphology (different species)
5.1.2 HPLC analysis of salicin content in willow leaves
5.1.2.1 Derivation and validation of HPLC method for salicin detection
The High Performance Liquid Chromatography (HPLC) method for detection of salicin in
willow (Salix spp) leaves was derived from the method developed by (Zhang et al., 2011) to
estimate salicin in poplar buds. They followed International Conference on Harmonisation
(ICH) (ICH, 1997) guidelines. Zhang’s method was initially used, however, due to a
different HPLC system, analytical column and sample preparation method, several
modifications were essential to acquire precise results. Therefore, several sample preparation
methods, temperatures of analytical column, flow rates, extraction medium of
leaves/samples etc. were incorporated to achieve satisfactory outcomes. The best method of
salicin analysis was selected to conduct a validation study for assurance of the accuracy,
precision, linearity and detection limits within the laboratory conditions.
5.1.2.1.1 Selectivity/Specificity
The selectivity of the method was checked by running the blank sample (sample other than
willow leaves which did not contain salicin) with the same method used to prepare sample
for the salicin detection. Absence of any peak in the blank sample at the retention time of
salicin confirmed the selectivity/specificity of the method. Figure 5.2 shows a
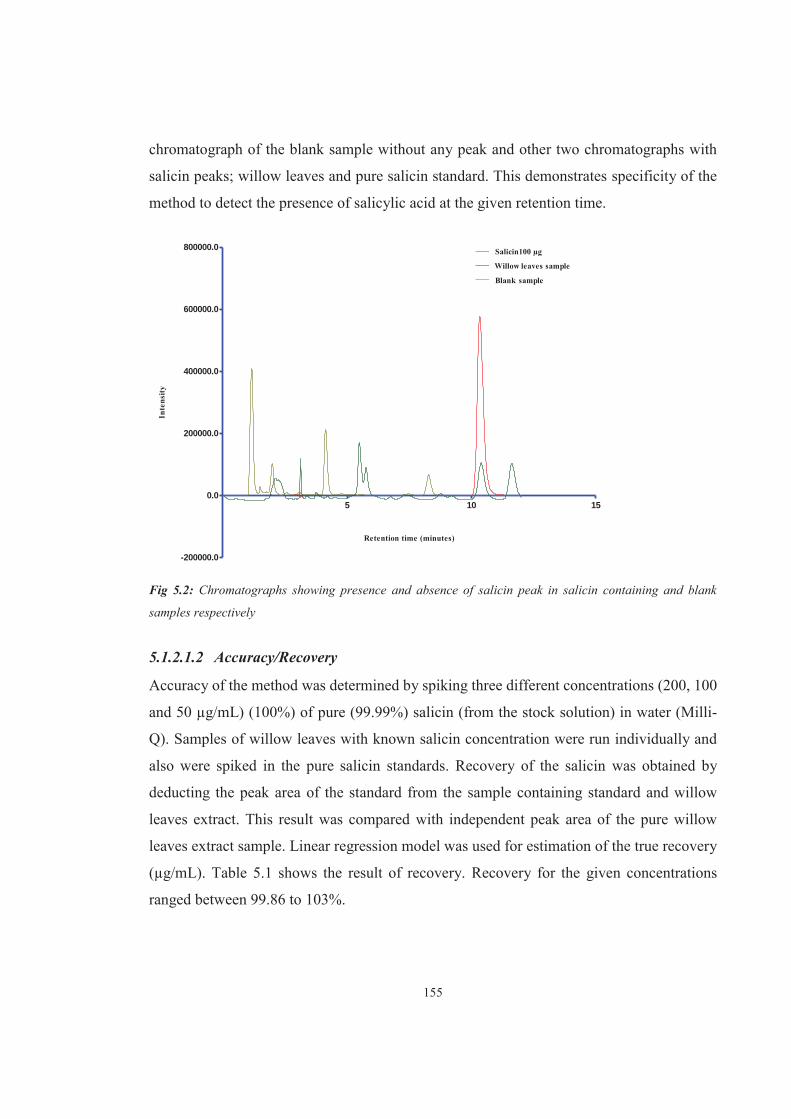
155
chromatograph of the blank sample without any peak and other two chromatographs with
salicin peaks; willow leaves and pure salicin standard. This demonstrates specificity of the
method to detect the presence of salicylic acid at the given retention time.
5 10 15
-200000.0
0.0
200000.0
400000.0
600000.0
800000.0
Willow leaves sample
Blank sample
Salicin100 μg
Retention time (minutes)
Inte
nsity
Fig 5.2: Chromatographs showing presence and absence of salicin peak in salicin containing and blank
samples respectively
5.1.2.1.2 Accuracy/Recovery
Accuracy of the method was determined by spiking three different concentrations (200, 100
and 50 μg/mL) (100%) of pure (99.99%) salicin (from the stock solution) in water (Milli-
Q). Samples of willow leaves with known salicin concentration were run individually and
also were spiked in the pure salicin standards. Recovery of the salicin was obtained by
deducting the peak area of the standard from the sample containing standard and willow
leaves extract. This result was compared with independent peak area of the pure willow
leaves extract sample. Linear regression model was used for estimation of the true recovery
(μg/mL). Table 5.1 shows the result of recovery. Recovery for the given concentrations
ranged between 99.86 to 103%.
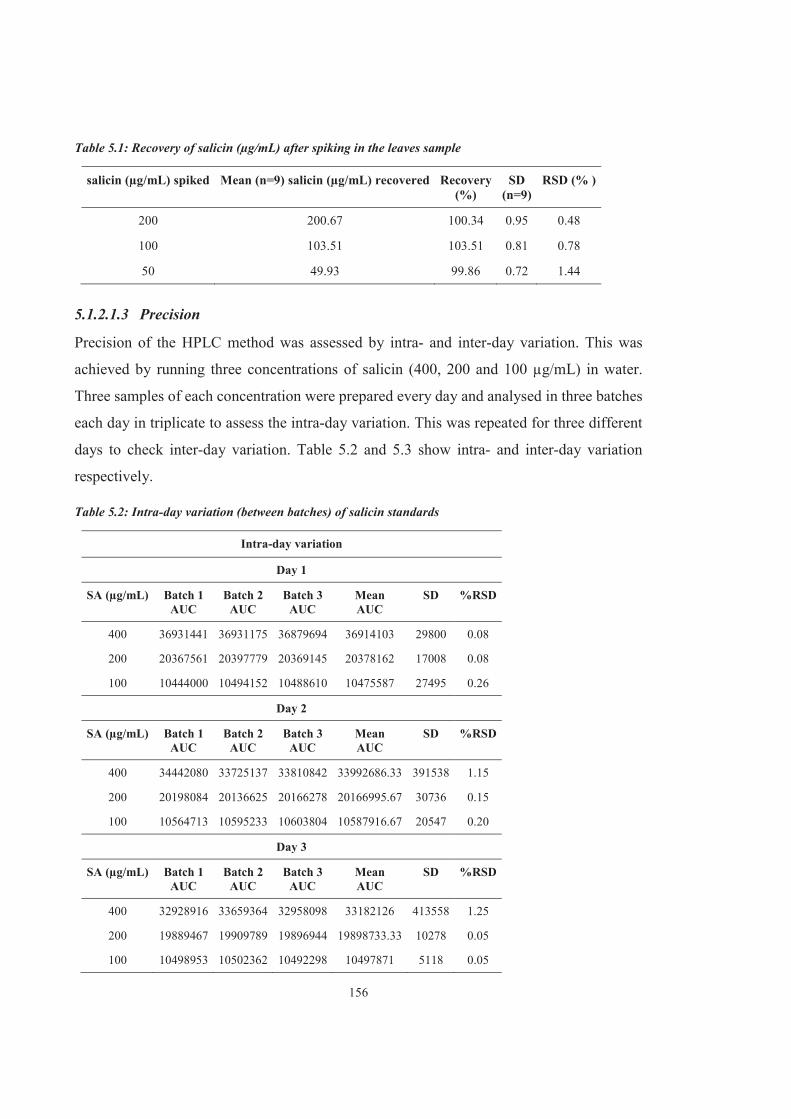
156
Table 5.1: Recovery of salicin (μg/mL) after spiking in the leaves sample
salicin (μg/mL) spiked Mean (n=9) salicin (μg/mL) recovered Recovery (%)
SD (n=9)
RSD (% )
200 200.67 100.34 0.95 0.48 100 103.51 103.51 0.81 0.78 50 49.93 99.86 0.72 1.44
5.1.2.1.3 Precision
Precision of the HPLC method was assessed by intra- and inter-day variation. This was
achieved by running three concentrations of salicin (400, 200 and 100 μg/mL) in water.
Three samples of each concentration were prepared every day and analysed in three batches
each day in triplicate to assess the intra-day variation. This was repeated for three different
days to check inter-day variation. Table 5.2 and 5.3 show intra- and inter-day variation
respectively.
Table 5.2: Intra-day variation (between batches) of salicin standards
Intra-day variation
Day 1
SA (μg/mL) Batch 1 AUC
Batch 2 AUC
Batch 3 AUC
Mean AUC
SD %RSD
400 36931441 36931175 36879694 36914103 29800 0.08
200 20367561 20397779 20369145 20378162 17008 0.08
100 10444000 10494152 10488610 10475587 27495 0.26
Day 2
SA (μg/mL) Batch 1 AUC
Batch 2 AUC
Batch 3 AUC
Mean AUC
SD %RSD
400 34442080 33725137 33810842 33992686.33 391538 1.15
200 20198084 20136625 20166278 20166995.67 30736 0.15
100 10564713 10595233 10603804 10587916.67 20547 0.20
Day 3
SA (μg/mL) Batch 1 AUC
Batch 2 AUC
Batch 3 AUC
Mean AUC
SD %RSD
400 32928916 33659364 32958098 33182126 413558 1.25
200 19889467 19909789 19896944 19898733.33 10278 0.05
100 10498953 10502362 10492298 10497871 5118 0.05

157
Table 5.3: Inter day variation (between days) of salicin standards
Mean AUC’s (n=3) AUC
SA (μg/mL) Day 1 Day 2 Day 3 Mean SD % RSD
400 36914103.33 33992686.33 33182126 34696305.22 1962963 5.66
200 20378161.67 20166995.67 19898733.33 20147963.56 240280 1.19
100 10475587.33 10587916.67 10497871 10520458.33 59474 0.57
5.1.2.1.4 Linearity
Five samples with different concentrations of salicin from 25 to 400μg/ml were run and their
linearity was assessed by plotting the graph of peak areas against the concentrations by
applying a linear regression model in the statistical software GraphPad Prism 5. The r2
(determination coefficient) was 0.9945. Table 5.4 shows the slope, Y intercept and r2 values
for three different sets of salicin concentrations.
Table 5. 4: Results of validation of linearity for salicin detection method
Slope y- intercept r2
Set 1 91140 1000000 0.9972
Set 2 88566 1000000 0.9961
Set 3 88209 1000000 0.9958
Mean 89305 1000000 0.9964
SD 1599 - 0.00074
% RSD 1.79 - 0.074
5.1.2.1.5 Limit of quantification
Range of lower concentrations of salicin (3.125, 6.25, 12.5μg/mL) were tested along with
the blank sample to detect the quantifiable limits (figure 5.3). Concentration 6.25μg/mL and
above were quantifiable at signal to noise ratio of 1:10.
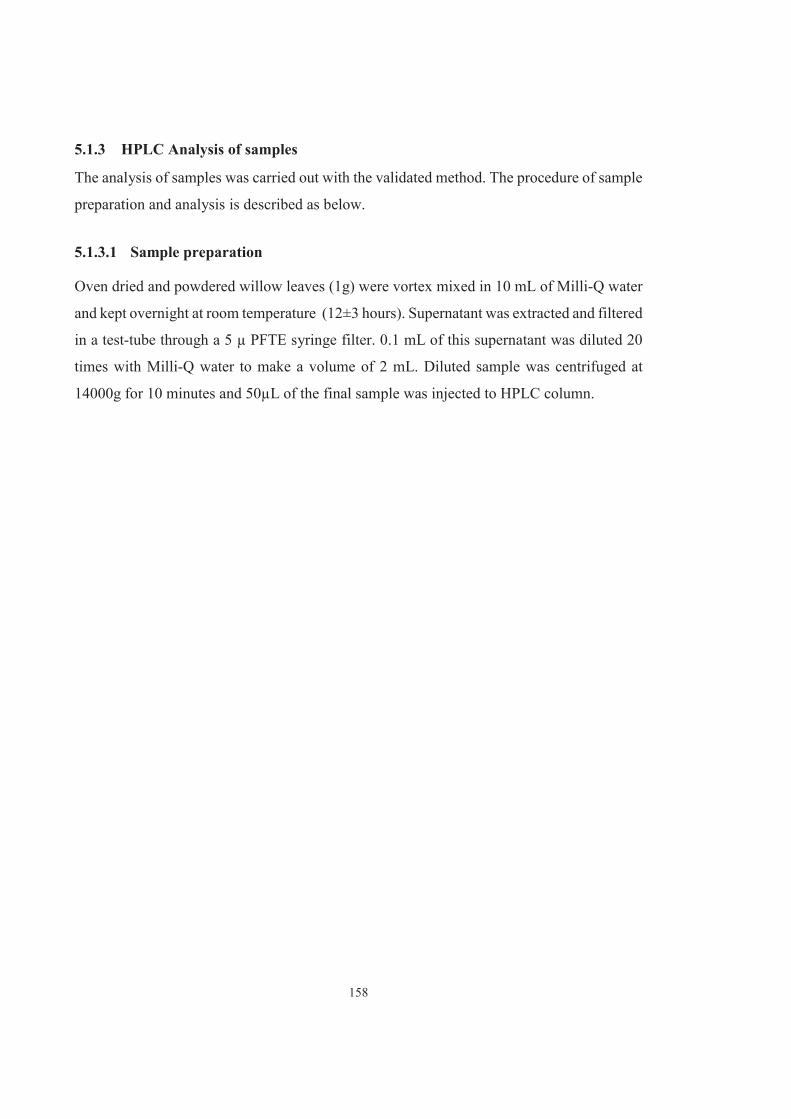
158
5.1.3 HPLC Analysis of samples
The analysis of samples was carried out with the validated method. The procedure of sample
preparation and analysis is described as below.
5.1.3.1 Sample preparation
Oven dried and powdered willow leaves (1g) were vortex mixed in 10 mL of Milli-Q water
and kept overnight at room temperature (12±3 hours). Supernatant was extracted and filtered
in a test-tube through a 5 μ PFTE syringe filter. 0.1 mL of this supernatant was diluted 20
times with Milli-Q water to make a volume of 2 mL. Diluted sample was centrifuged at
14000g for 10 minutes and 50μL of the final sample was injected to HPLC column.
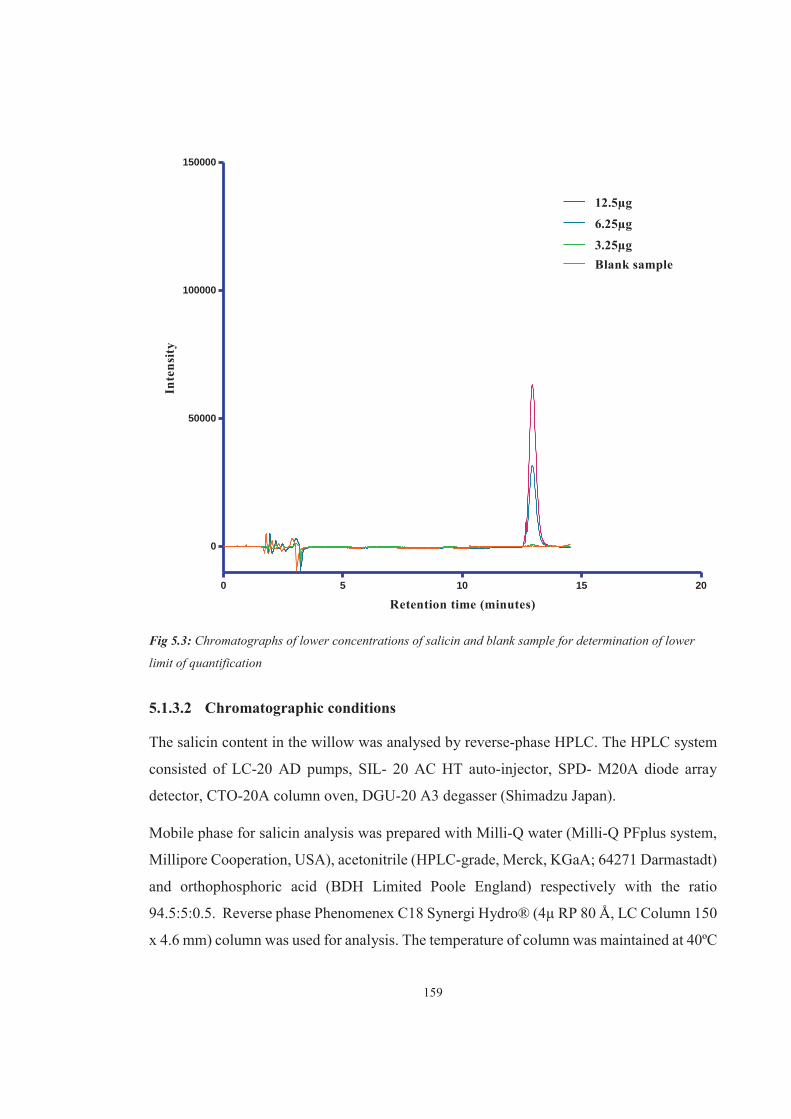
159
0 5 10 15 20
0
50000
100000
150000
12.5μg
6.25μg
3.25μgBlank sample
Retention time (minutes)
Inte
nsit
y
Fig 5.3: Chromatographs of lower concentrations of salicin and blank sample for determination of lower
limit of quantification
5.1.3.2 Chromatographic conditions
The salicin content in the willow was analysed by reverse-phase HPLC. The HPLC system
consisted of LC-20 AD pumps, SIL- 20 AC HT auto-injector, SPD- M20A diode array
detector, CTO-20A column oven, DGU-20 A3 degasser (Shimadzu Japan).
Mobile phase for salicin analysis was prepared with Milli-Q water (Milli-Q PFplus system,
Millipore Cooperation, USA), acetonitrile (HPLC-grade, Merck, KGaA; 64271 Darmastadt)
and orthophosphoric acid (BDH Limited Poole England) respectively with the ratio
94.5:5:0.5. Reverse phase Phenomenex C18 Synergi Hydro® (4μ RP 80 Å, LC Column 150
x 4.6 mm) column was used for analysis. The temperature of column was maintained at 40ºC
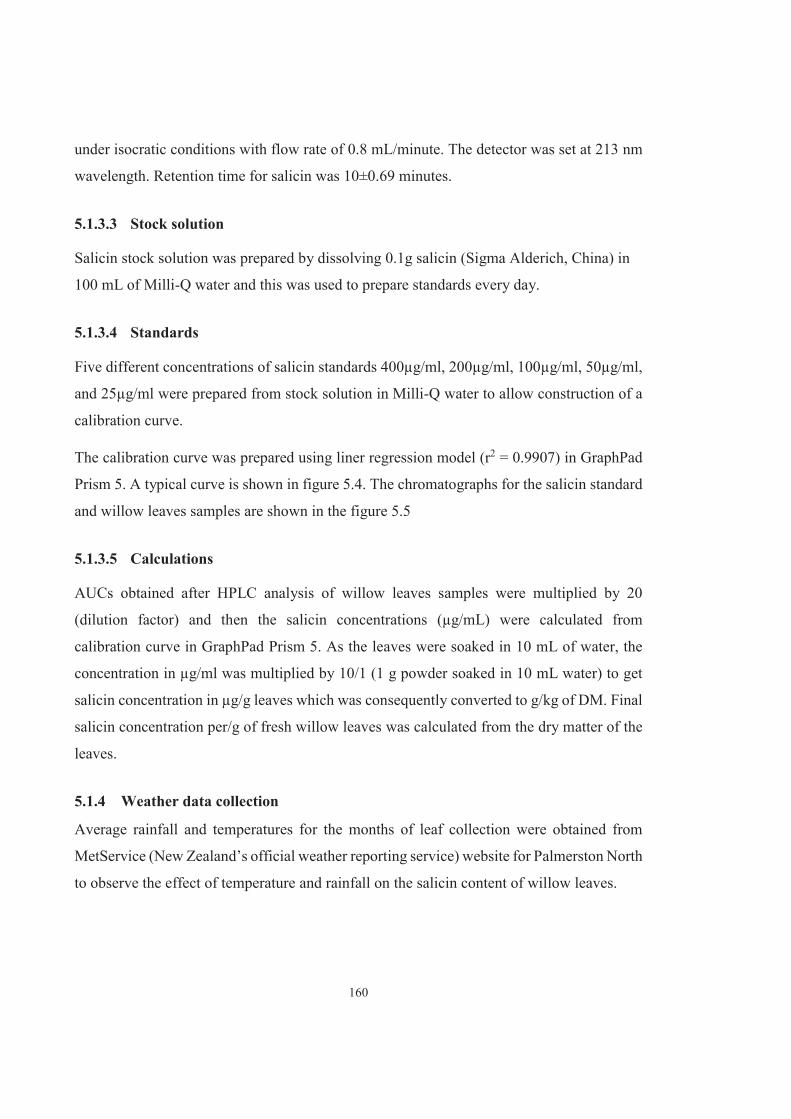
160
under isocratic conditions with flow rate of 0.8 mL/minute. The detector was set at 213 nm
wavelength. Retention time for salicin was 10±0.69 minutes.
5.1.3.3 Stock solution
Salicin stock solution was prepared by dissolving 0.1g salicin (Sigma Alderich, China) in
100 mL of Milli-Q water and this was used to prepare standards every day.
5.1.3.4 Standards
Five different concentrations of salicin standards 400μg/ml, 200μg/ml, 100μg/ml, 50μg/ml,
and 25μg/ml were prepared from stock solution in Milli-Q water to allow construction of a
calibration curve.
The calibration curve was prepared using liner regression model (r2 = 0.9907) in GraphPad
Prism 5. A typical curve is shown in figure 5.4. The chromatographs for the salicin standard
and willow leaves samples are shown in the figure 5.5
5.1.3.5 Calculations
AUCs obtained after HPLC analysis of willow leaves samples were multiplied by 20
(dilution factor) and then the salicin concentrations (μg/mL) were calculated from
calibration curve in GraphPad Prism 5. As the leaves were soaked in 10 mL of water, the
concentration in μg/ml was multiplied by 10/1 (1 g powder soaked in 10 mL water) to get
salicin concentration in μg/g leaves which was consequently converted to g/kg of DM. Final
salicin concentration per/g of fresh willow leaves was calculated from the dry matter of the
leaves.
5.1.4 Weather data collection
Average rainfall and temperatures for the months of leaf collection were obtained from
MetService (New Zealand’s official weather reporting service) website for Palmerston North
to observe the effect of temperature and rainfall on the salicin content of willow leaves.
161
0 100 200 300 400 5000
10000000
20000000
30000000
40000000
Concentration in μg/ml
AU
C
Fig 5.4: Calibration curve for salicin detection with HPLC
5.1.5 Statistical analysis
The experimental data was analysed by one way ANOVA with post Tukey’s multiple
comparison test to compare the salicin content on the monthly basis. An unpaired t test with
Welch’s correction demonstrated the statistical difference between the two different
locations. The Spearman correlation coefficient between temperature and salicin content was
calculated to assess the effect of temperature on salicin variation. All statistical analyses
were done in GraphPad Prism 5 (Prism 5 for windows, version 5.01, August, 2007) and were
considered significant at P<0.05.
5.1.6 Results
5.1.6.1 Salicin content
Willow leaves had significantly (P<0.05) lower salicin content in the months of October-
2014 and May-2015 as compared to other months. The monthly average content of salicin
is shown in table 5.5.
It was observed that the salicin content in the two trees (T-11 and T-12) which were located
distant from other 10 trees was consistently significantly higher (P<0.05) than other trees

162
throughout the year. Table 5.6 and figure 5.6 shows the variation in salicin content of
individual trees throughout the study period as well higher salicin content in T-11 and T-12.
Table 5.5: Salicin (g/kg) content in fresh willow leaves (mean±SD)
Month-year N (number of trees) Salicin content (mean±SD) (g/kg)
October-2014 10 0.59±0.28 November-2014 12 1.87±0.86 December-2014 12 1.51±1.01 January-2015 12 1.71±0.74 February-2015 12 1.43±0.97 March-2015 12 1.56±1.21 April-2015 NS NS May-2015 11 0.85±0.59 June-2015 NS NS July-2015 NS NS August-2015 NS NS September-2015 NS NS
NS - No leaves/sample available during this time
Table 5.6: Difference in Salicin (g/kg) content of fresh willow leaves from trees located on two different locations (mean±SD)
Month-year Salicin content (g/kg)
T-(1to10) T-(11+12)
October-2014 0.59±0.28 NS November-2014 1.52±0.20 3.64±0.50 December-2014 1.15±0.27 3.64±0.65 January-2015 1.41±0.23 3.21±0.29 February-2015 1.01±0.12 3.49±0.12 March-2015 1.06±0.24 4.05±0.76 April-2015 NS NS May-2015 0.60±0.22 1.96±0.18
NS - No leaves/sample available during this time
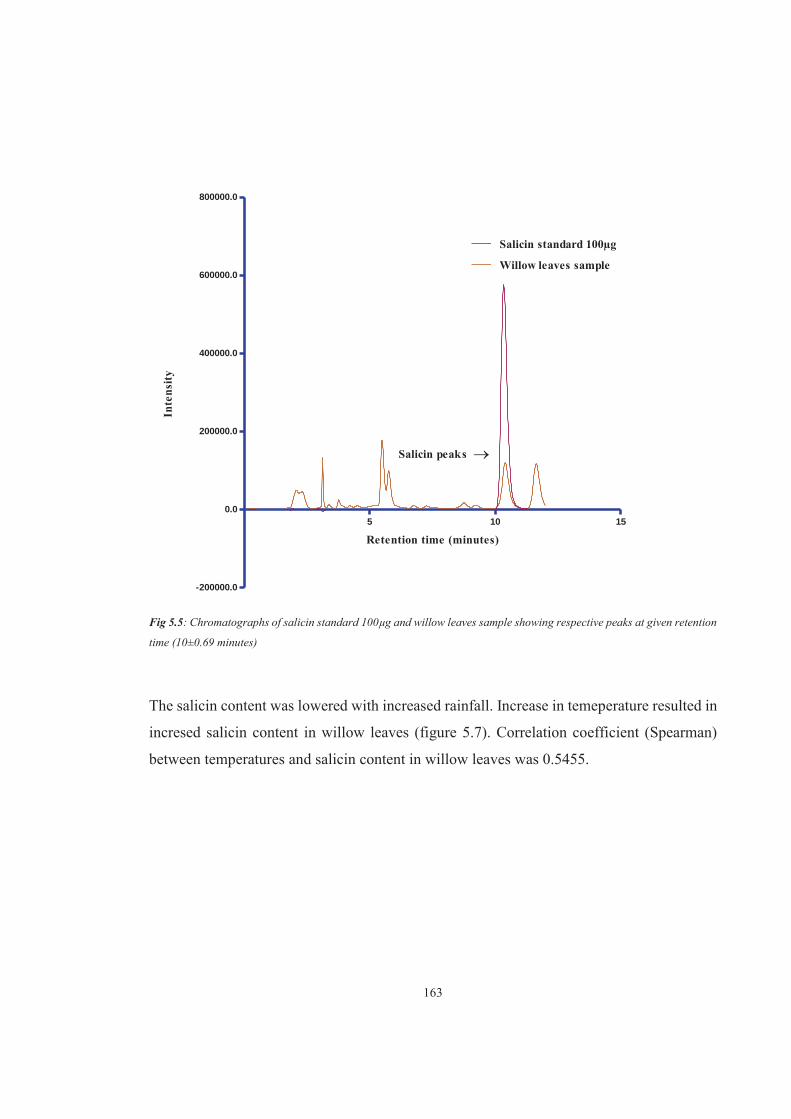
163
5 10 15
-200000.0
0.0
200000.0
400000.0
600000.0
800000.0
Willow leaves sample
Salicin standard 100μg
Salicin peaks
Retention time (minutes)
Inte
nsity
Fig 5.5: Chromatographs of salicin standard 100μg and willow leaves sample showing respective peaks at given retention
time (10±0.69 minutes)
The salicin content was lowered with increased rainfall. Increase in temeperature resulted in
incresed salicin content in willow leaves (figure 5.7). Correlation coefficient (Spearman)
between temperatures and salicin content in willow leaves was 0.5455.
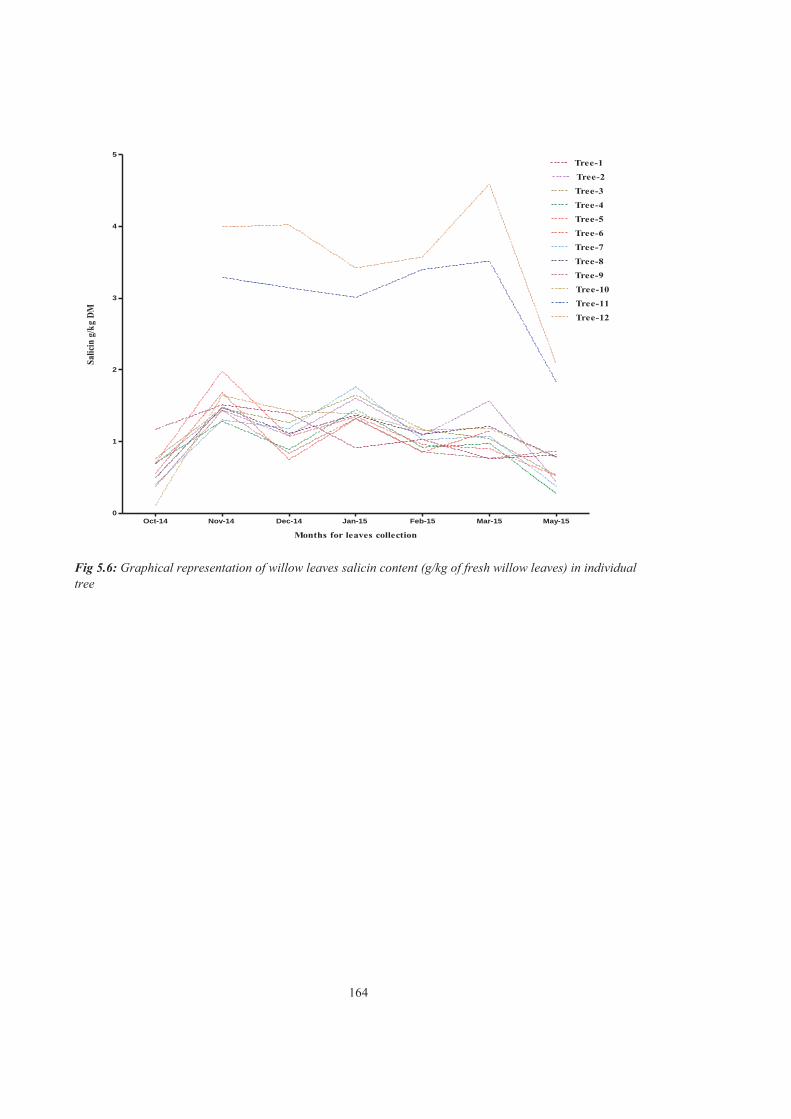
164
Oct-14 Nov-14 Dec-14 Jan-15 Feb-15 Mar-15 May-150
1
2
3
4
5Tree-1
Tree-2
Tree-3
Tree-4
Tree-5
Tree-6
Tree-7
Tree-8
Tree-9
Tree-10
Tree-11
Tree-12
Months for leaves collection
Salic
in g
/kg
DM
Fig 5.6: Graphical representation of willow leaves salicin content (g/kg of fresh willow leaves) in individual tree

165
Jan
Feb MarMay Oct
NovDec
15
20
25
30
35
0.0
0.5
1.0
1.5
2.0
2.5
Salicin content
Temperature
Months of leaves collection
Tem
pera
ture
0C
Salicin g/kg of fresh leaves
Fig 5.7: Graphical representation of average monthly temperature vs. respective monthly willow leaves salicin content (g/kg of fresh willow leaves) during leaves collection period
166
5.1.7 Discussion
Salicin content in the willow leaves over the year was variable with the season. During the
winter months, salicin content was declined while; during summer months it was elevated.
Similar observations were reported by (McIvor et al., 2015) when they studied willows in
New Zealand.
Location and species also influenced the salicin concentrations; as two of the distantly
located trees in the current study had higher salicin concentration than other ten trees.
However, McIvor et al. (2015) did not observe salicin variation due to change in
geographical location.
Overall salicin concentration in willow leaves collected in this study was consistent through
the month November to March. Therefore, as per New Zealand’s climatic conditions, salicin
in willow trees considered in this study was high during late spring, throughout the summer
to early autumn. Rank (1991) observed a decline in salicin content in some species of
willows over summer (May to July) in the USA, Nevada (central and eastern California). On
the contrary, in the present study, salicin content in willows we studied had high salicin
content over the summer (November to March) in New Zealand i.e. when plants were
stressed. Therefore, climatic alterations in different regions/parts of the world influence
salicin content of willow.
The increase in temperature results in the increased salicin content in the leaves. Willow
leaves were present on the trees and accessible during 2014 from late May while in 2015
leaves on the trees selected for this study were inaccessible from mid-April as rainfall was
high during that period, but in May some leaves were available. Though, unlike in 2014,
leaves were not available from June till the end of September due to higher rainfall in 2015.
Literature suggests that salicin content in the willow varies a with age, season, location,
species of the tree (Kenstaviciene et al., 2008, Rank, 1991). Some studies have mentioned
that the male plants have lower salicin content and phenolic glycosides than female plants
(Elmqvist et al., 1991, Palo, 1984); whereas, Nichols-Orians et al. (1993) observed no
variation in salicin content as well as phenolic glycosides content due to sex difference but
they found that genetic clonal differences in willow causes variation in the phenolic

167
glycosides. Therefore, to evaluate factors for salicin variation in willow is challenging due
to the inconsistencies reported in different studies. Hence, in this study, variation with
respect to regional weather and season was considered as the objective of the study.
This study is an important pre-requisite for the analysis of analgesic efficacy of willow
leaves in sheep.
5.2 CONCLUSION
This study showed overall salicin variation in willow leaves in Palmerston North (Manawatu
region), New Zealand, on a seasonal basis. Also, a simple method of processing willow
leaves for salicin estimation with reversed-phase HPLC has been derived which will make
future salicin estimation studies easier.
168
6 GENERAL DISCUSSION
In New Zealand, sheep farming is the second largest farming sector after cattle. According
to Statistics New Zealand (government record) (Statistics, 2015) the country has six sheep
per person (In year 2016, this has been declined to less than six sheep per person), a total
sheep population of 29.5 million. Also, animal welfare is given high importance in this
country and the New Zealand Animal Welfare Code (2005) recommends alleviation of pain
in animals under all circumstances. Pain in sheep has deleterious consequences with respect
to welfare and production (Montossi et al., 2013, J. Fitzpatrick et al., 2006). Therefore, pain
management in sheep is very important to improve welfare as well as production.
In general, animal pain management with analgesics is an effective approach and in many
cases the only alternative to euthanasia. In our study, exploring a “new” analgesic for sheep
was prioritised because of the existing scarcity of analgesics for sheep. The NSAID, salicylic
acid which is derivative of salicin obtained in natural analgesic willow was selected. Salicin
is the important metabolite present in the willow leaves which in turn produces SA which is
analgesic in humans. However, to investigate the absorption, metabolism and excretion of
the drug (SA) in sheep, a pharmacokinetic study is essential. Likewise, to assess the effect
of the drug in sheep, a pharmacodynamics study is important. Hence, initially,
pharmacokinetics and pharmacodynamics of SA were investigated in healthy sheep. These
studies provided strong groundwork for testing the analgesic efficacy of willow in sheep in
future.
6.1 PHARMACOKINETIC STUDIES
As described in the chapter 3, the pharmacokinetic study of SA after intravenous and oral
administration in the form of its sodium salt in sheep provided the basis for further work and
also showed significant differences when compared to the single similar published
pharmacokinetic study conducted in sheep in India. During our experiment, a simple, robust
and sensitive HPLC method was developed and validated in our laboratory for the analysis
of SA in sheep plasma. Currently, no other HPLC method has been published to analyse SA
specifically in sheep plasma. Thus, this method will be useful for further research to be
169
conducted in sheep with SA. The sensitivity of our HPLC method was higher than other
published methods described for the analysis of SA in plasma samples of different animals.
The pharmacokinetic study of SA was conducted after intravenous and oral single doses of
sodium salicylate. During this study, SA was administered in the form of its sodium salt
rather than its free form. The administration of salt of a drug does not affect the release of
its original moiety after administration; instead, it improves the absorption and availability
of the drug in the body (Hedaya, 2012). However, while administering the salt of any drug,
it is important to consider the free form of the drug available for absorption. Sodium salt of
SA yields about 86% of SA (Saltzman, 1948). In our study, we selected four dose rates for
intravenous administration as 200, 100, 50 and 10mg/kg body weight of sodium salicylate
which produces 172, 86, 43 and 8.6mg/kg bodyweight of SA respectively. During
pharmacokinetic analysis, plasma SA concentrations were analysed to investigate its
pharmacokinetics. However, calculation of pharmacokinetic parameters was carried out for
the respective doses of both sodium salicylate and SA. No significant difference was
observed in the pharmacokinetic parameters of both compounds. Thus, pharmacokinetics of
SA, with the mentioned dose rates of sodium salicylate was preferred and presented in this
thesis.
In our pharmacokinetic study, maximum plasma concentration of SA was 37.91μg/mL
which was maintained for shorter duration (less than 15 minutes) after administration of
200mg/kg body weight of sodium salicylate. Yet, no other study with this dose rate
(200mg/kg) in sheep has been reported as far as our knowledge. Sulaiman and Kumar (1995)
administered a single bolus/dose of sodium salicylate at the rate of 100mg/kg body weight
both intravenously and orally. Doses in our study for intravenous administration (200, 100,
50 and 10mg/kg body weight of sodium salicylate) and two doses for oral administration
(200 and 100mg/kg body weight of sodium salicylate), 100mg/kg dose of sodium salicylate
included the single dose used by Sulaiman and Kumar in their study in sheep. Comparison
of pharmacokinetic parameters after administration of 100mg/kg body weight in both studies
intravenously and orally, reveals divergent results. Sulaiman and Kumar analysed total
plasma salicylate concentration for calculating pharmacokinetic parameters. On the
contrary, in our study plasma SA (free form) concentrations were analysed to calculate

170
pharmacokinetic parameters. This may account for the diversity in results. However, some
of their findings were in agreement with the present study. For instance, they evaluated and
recommended a one compartment model as a best fit for sodium salicylate plasma
concentrations over time. Similarly, calculation of AIC and BIC values in our study explored
the suitability of a linear one compartment model as the best fit for SA in sheep. Comparison
of other pharmacokinetic parameters demonstrated high diversity due to analysis of total
salicylate as opposed to plasma SA. Sulaiman and Kumar calculated the extrapolated
concentration of total salicylates at time zero (Cp0) as 300.37μg/mL after intravenous
administration of 100 mg/kg body weight of sodium salicylate in sheep. Correspondingly,
in our study, after evaluation of one compartment model, Cp0 was found to be
25.64±2.41μg/mL for the same dose rate (100mg/kg body weight of sodium salicylate). This
concentration was almost 12 folds lower than the total plasma salicylates concentration
reported by Sulaiman and Kumar.
In our pharmacokinetic study, volume of distribution of SA was enormously high after
intravenous as well as oral administration. In general, the volume of distribution is very low
for NSAIDs (Riviere and Papich, 2013). Also, in other studies, of different animals including
sheep, cattle, goat, camel, rat, cat, rabbit and chicken the volume of distribution for
salicylates/SA after intravenous administration was in the range of 0.17 to 0.39L/kg; while
in our study it was observed between 2.25 and 8.73L/kg after intravenous administration.
The range of volume of distribution after oral administration of sodium salicylate in our
study was even higher than intravenous study and was in the range of 7.97 to 28.73L/kg.
While discovering the causes for these enormously high volumes of distribution in our study,
the most probable factor appears to be lipophilic nature of the SA. Rainsford (2013),
mentioned the lipophilic nature of salicylates at favourable pH conditions, usually above pH
5 (Bronaugh and Maibach, 1989). Sheep plasma pH is usually 7.42 which seem favourable
for SA to be lipophilic. At the same time, availability of high tissue fats will entice SA for
distribution in the tissues. SA is comparatively more soluble in fats than water. One gram of
SA is soluble in 460mL of water; while, the same quantity can dissolve in only 80mL of fats
(Beers et al., 2003). In our study, the sheep had comparatively high body weights and
consequently had higher body fats. This may explain the high volume of distribution in our
study.
171
Further differences in pharmacokinetic parameters when compared to other studies could be
attributed to the various factors in each study such as difference in analysis techniques,
calculation methods and other influences such as climatic/temperature conditions, age, breed
and species of the animals used in the study. For instance, Sulaiman and Kumar used local
Bannur breed of sheep of average age 17 months; while in the present study Romney cross
sheep of about 6 months age were used. These inter-breed differences must be considered
(Riviere and Papich, 2013). Furthermore, Nawaz and Nawaz (1983) compared the
pharmacokinetics of sulphadimidine in sheep after a single intravenous injection during two
different seasons, summer and winter. They observed that zero time extrapolated plasma
concentration of the drug was higher during summer as compared to winter. Therefore,
climatic/temperature conditions are also decisive and should be taken in to consideration.
In New Zealand, or other temperate regions, no other study in sheep with sodium salicylate
has been reported. Thus, comparison of pharmacokinetic parameters in our study under the
similar climatic conditions was not possible.
6.2 PHARMACODYNAMICS STUDIES
As described in chapter 4, in the pharmacodynamic study, analgesic effects of sodium
salicylate were apparent with 200mg/kg sodium salicylate and were similar to the positive
control ketoprofen (3mg/kg) in sheep. Pharmacodynamics of sodium salicylate/SA in sheep
after administration of high dose rates (200 and 100mg/kg) have not been reported in
literature as far as we know. Lizarraga and Chambers (2006) administered a smaller dose of
10mg/kg SA in sheep intravenously and observed no effect on mechanical thresholds. This
dose was not used in the main study; we considered that a higher dose was more likely to
achieve an analgesic effect. These findings certainly looked promising for the study which
may be conducted in lame sheep by feeding willow leaves.
In chapter 4, pharmacodynamics was evaluated with thermal and mechanical nociceptive
threshold testing. These studies showed the ineffectiveness of thermal nociceptive threshold
testing at detecting the analgesic effects of sodium salicylate in sheep. Simultaneously,
mechanical nociceptive threshold testing was able to show analgesic effects of this drug.
172
These contradictory results may appear dubious. However, previous studies conducted in
animals confirmed the validity of the results obtained from mechanical nociceptive threshold
testing. For instance, Ley et al. (1989), Chambers et al. (1994), Hothersall et al. (2014) report
similar findings to those of our study. Similarly, unreliability of thermal nociceptive
threshold testing in detection of analgesia of NSAIDs in healthy animals (without an
inflammatory condition) has also been reported. Chambers et al. (1994), in their experiment
observed inconsistent responses of sheep to the thermal threshold testing. For those reasons,
other methods of detecting pharmacodynamics/analgesic efficacy of drugs may be
considered in future studies in healthy animals. These methods include neurophysiological
techniques such as EEG (Murrell and Johnson, 2006) and COX inhibition in serum samples
(Schäfer et al., 2006), although neither of these measure analgesia directly. EEG analysis to
detect analgesic effects of drugs can only easily be carried out in anaesthetised sheep
(Johnson et al., 2005): in awake, non-anaesthetised sheep movement artefacts render this
technique useless. Similarly, COX inhibition is appropriate during inflammatory conditions
to evaluate the peripheral mechanism/anti-inflammatory properties of the drug (Burian and
Geisslinger, 2005) but these may not account for all the analgesic effects. The sheep in our
study were healthy with no inflammation.
The fact that SA can provide analgesia in healthy sheep in the absence of inflammation
implies the involvement of central mechanisms to produce analgesia. Central mechanisms
of analgesia by NSAIDs have been evident (Burian and Geisslinger, 2005); therefore, these
studies in healthy sheep may be considered as a foundation for the use of SA in pre-emptive
analgesia in sheep prior to the surgical interventions or other painful practices.
SA is metabolised from both sodium salicylate and salicin. When willow leaves are
considered as a source of SA, salicin is the element which is converted to SA through initial
hydrolysis of salicin to saligenin (salicyl alcohol) and then oxidation of this compound to
SA (Mahdi, 2014). When these chemical reactions are taken into consideration, theoretically
salicin can produce about 49% of SA (calculated based on the molecular weight of both
compounds). Hence, it is promising to feed willow leaves to sheep in pain to test the anaglsic
efficacy of willow leaves.
173
6.3 ASSOCIATION AND SIGNIFICANCE OF ALL THE STUDIES CONDUCTED DURING THIS RESEARCH PROJECT
All the experimental studies conducted during this research work complement each other
and add to our knowledge of analgesia in sheep.
NSAIDs are reported to produce various side effects in monogastric animals (Katzung et al.,
2004). Therefore, pilot studies were conducted prior to both pharmacokinetic and
pharmacodynamics studies to ensure that there were no obvious risks to safety of the
animals. Pilot studies can play an important role in avoiding bias in the definitive studies
and also reduce overall cost (Hillman et al., 1991). The pilot study on pharmacodynamics
of sodium salicylate revealed some inadequacies which were amended during the main
study. The main pharmacodynamic study confirmed that SA was analgesic in healthy sheep.
The pharmacokinetic study provided plasma SA concentrations in healthy sheep along with
other important pharmacokinetic parameters. Together these should allow prediction of the
effect in the general sheep population. The aim of this thesis was achieved as we wanted to
test if salicin derivative SA is analgesic in sheep.
6.4 FUTURE WORK
In this current research work, pharmacology of salicylic acid in sheep has been studied using
nociceptive testing. Clinical pain may well respond to lower doses; this needs to be assessed.
However, the use of natural source of salicylic acid i.e. willow leaves as analgesic in sheep
should be further studied in future by feeding willow leaves to lame sheep. Some more work
would be beneficial prior to willow feeding in sheep.
The concentration of salicin and ultimately of SA differs in individual willow plant
depending upon location and season, and probably also age, climatic conditions, cultivar etc.
Hence, collection of willow leaves from different willow cultivars from different parts of the
country and perhaps different parts of the world to further investigate the seasonal variation
in salicin content can add to the specific knowledge about the use of willow leaves with
respect to their salicin content in sheep. This future work may validate the use of willow
leaves in sheep for pain relief. In this particular research project we aimed to test only if
salicylic acid is analgesic in sheep; thus, these factors were not investigated.
174
6.5 CONCLUSION
Overall, in this research, we used well established method of pain assessment such as
nociceptive threshold testing by a blinded, trained observer (Molony and Kent, 1997, Ley et
al., 1989, Carlsson, 1983) to assure the accuracy and reliability of the results. During all the
studies, behavioural changes were also monitored carefully and all variable factors including
altered responses of an individual animal were considered. Hence, we consider the results
reliable. Similarly, the HPLC method to determine SA and salicin in sheep plasma and
willow leaves was thoroughly validated to ensure accurate analysis. Standard
pharmacokinetic models were used to determine pharmacokinetic parameters to aid the
development of accurate dosing regimens and intervals. No side effects apart from possible
pain on inadvertent subcutaneous injection were seen.
175
REFERENCES
Act, A. W. 1999. Ministry of Primary Industries. New Zealand. Agoram, B., Woltosz, W. S. & Bolger, M. B. 2001. Predicting the impact of physiological
and biochemical processes on oral drug bioavailability. Advanced Drug Delivery Reviews, 50, Supplement 1, S41-S67. Available: DOI http://dx.doi.org/10.1016/S0169-409X(01)00179-X.
Albe-Fessar, D., Berkley, K. J., Kruger, L., Ralston, H. J. & Willis, W. D. 1985. Diencephalic mechanisms of pain sensation. Brain Research Reviews, 9, 217-296. Available: DOI http://dx.doi.org/10.1016/0165-0173(85)90013-X.
Ali, B. 2003. Comparative pharmacokinetics of salicylate in camels, sheep and goats. European journal of drug metabolism and pharmacokinetics, 28, 125-128.
Almeida, T. F., Roizenblatt, S. & Tufik, S. 2004. Afferent pain pathways: a neuroanatomical review. Brain Research, 1000, 40-56. Available: DOI http://dx.doi.org/10.1016/j.brainres.2003.10.073.
Amann, R., Egger, T., Schuligoi, R., Heinemann, A. & Peskar, B. A. 2001. Sodium salicylate enhances the expression of cyclooxygenase-2 in endotoxin-stimulated human mononuclear cells. European Journal of Pharmacology, 433, 129-134. Available: DOI http://dx.doi.org/10.1016/S0014-2999(01)01488-1.
Amann, R. & Peskar, B. A. 2002. Anti-inflammatory effects of aspirin and sodium salicylate. European Journal of Pharmacology, 447, 1-9. Available: DOI http://dx.doi.org/10.1016/S0014-2999(02)01828-9.
Amidon, G., Lennernäs, H., Shah, V. & Crison, J. 1995. A Theoretical Basis for a Biopharmaceutic Drug Classification: The Correlation of in Vitro Drug Product Dissolution and in Vivo Bioavailability. Pharmaceutical Research, 12, 413-420. Available: DOI 10.1023/A:1016212804288.
Amir, R., Argoff, C. E., Bennett, G. J., Cummins, T. R., Durieux, M. E., Gerner, P., Gold, M. S., Porreca, F. & Strichartz, G. R. 2006. The Role of Sodium Channels in Chronic Inflammatory and Neuropathic Pain. The Journal of Pain, 7, S1-S29. Available: DOI http://dx.doi.org/10.1016/j.jpain.2006.01.444.
Anand, K. & Craig, K. D. 1996. New perspectives on the definition of pain. Pain-Journal of the International Association for the Study of Pain, 67, 3-6.
Anil, L., Anil, S. S. & Deen, J. 2005. Pain detection and amelioration in animals on the farm: issues and options. J Appl Anim Welf Sci, 8, 261-78.
Anil, S. S., Anil, L. & Deen, J. 2002. Challenges of pain assessment in domestic animals. Journal of the American Veterinary Medical Association, 220, 313-319.
Apkarian, A. V., Bushnell, M. C., Treede, R. D. & Zubieta, J. K. 2005. Human brain mechanisms of pain perception and regulation in health and disease. European Journal of Pain, 9, 463-463.
Argus, G. W. 1997. Infrageneric classification of Salix (Salicaceae) in the new world. Systematic botany monographs, 1-121.
Atkinson, A. J., Huang, S.-M., Lertora, J. J. & Markey, S. P. 2012. Principles of clinical pharmacology, Academic Press.
Awic 2000. Animal welfare: Definitions for and reporting of pain and distress. . Animal Welfare Information Centre
176
Baggot, J. D. 2008. The physiological basis of veterinary clinical pharmacology, John Wiley & Sons.
Baker, S. & Thomas, P. 1987. Herbal medicine precipitating massive haemolysis. The Lancet, 329, 1039-1040.
Ball, J., Carle, J. & Del Lungo, A. 2005. Contribution of poplars and willows to sustainable forestry and rural development. Unasylva-FAO, 56, 3.
Baluchnejadmojarad, T., Roghani, M. & Roghani-Dehkordi, F. 2005. Antinociceptive effect of Teucrium polium leaf extract in the diabetic rat formalin test. Journal of Ethnopharmacology, 97, 207-210. Available: DOI http://dx.doi.org/10.1016/j.jep.2004.10.030.
Bannwarth, B., Demotes-Mainard, F., Schaeverbeke, T., Labat, L. & Dehais, J. 1995. Central analgesic effects of aspirin-like drugs. Fundamental & Clinical Pharmacology, 9, 1-7. Available: DOI 10.1111/j.1472-8206.1995.tb00258.x.
Barnett, J. L. 1997. Measuring pain in animals. Aust Vet J, 75, 878-879. Available: DOI 10.1111/j.1751-0813.1997.tb11256.x.
Barritt, G. J. 1999. Receptor-activated Ca2+ inflow in animal cells: a variety of pathways tailored to meet different intracellular Ca2+ signalling requirements. Biochem. J. , 337, 153-169.
Basbaum, A. I., Bautista, D. M., Scherrer, G. & Julius, D. 2009. Cellular and Molecular Mechanisms of Pain. Cell, 139, 267-284. Available: DOI http://dx.doi.org/10.1016/j.cell.2009.09.028.
Basbaum, A. I. & Fields, H. L. 1984. Endogenous pain control systems: brainstem spinal pathways and endorphin circuitry. Annual review of neuroscience, 7, 309-338.
Basbaum, A. I. & Jessell, T. M. 2000. The perception of pain. Principles of neural science, 4, 472-491.
Bassert, J. M. & Thomas, J. 2014. McCurnin's clinical textbook for veterinary technicians, Elsevier Health Sciences.
Bear, M. F., Connors, B. W. & Paradiso, M. A. 2007. Neuroscience exploring the brain, second edition. USA: Lippincott Williams & Wilkins.
Beausoleil, N. J., Stafford, K. J. & Mellor, D. J. 2005. Sheep show more aversion to a dog than to a human in an arena test. Applied Animal Behaviour Science, 91, 219-232. Available: DOI http://dx.doi.org/10.1016/j.applanim.2004.10.008.
Beck, P. L., Xavier, R., Lu, N., Nanda, N. N., Dinauer, M., Podolsky, D. K. & Seed, B. 2000. Mechanisms of NSAID-induced gastrointestinal injury defined using mutant mice. Gastroenterology, 119, 699-705. Available: DOI http://dx.doi.org/10.1053/gast.2000.16497.
Bee, L. & Dickenson, A. 2009. Descending Modulation of Pain. In: Malcangio, M. (ed.) Synaptic Plasticity in Pain. Springer New York. Available: DOI 10.1007/978-1-4419-0226-9_14.
Beecher, H. K. 1957. THE MEASUREMENT OF PAIN: Prototype for the Quantitative Study of Subjective Responses. Pharmacological Reviews, 9, 59-209.
Beers, M. H., Fletcher, A. J., Jones, T., Porter, R., Berkwitz, M. & Kaplan, J. 2003. The Merck manual of medical information, Pocket Books.
Benarroch, E. E. 2008. Descending monoaminergic pain modulation Bidirectional control and clinical relevance. Neurology, 71, 217-221.

177
Benet, L. Z. & Galeazzi, R. L. 1979. Noncompartmental determination of the steady-state volume of distribution. Journal of Pharmaceutical Sciences, 68, 1071-1074. Available: DOI 10.1002/jps.2600680845.
Benet, L. Z. & Zia-Amirhosseini, P. 1995. Basic Principles of Pharmacokinetics. Toxicologic Pathology, 23, 115-123. Available: DOI 10.1177/019262339502300203.
Bennett, G. J. & Xie, Y.-K. 1988. A peripheral mononeuropathy in rat that produces disorders of pain sensation like those seen in man. Pain, 33, 87-107.
Bennett, G. N. & Hickford, J. G. H. 2011. Ovine footrot: New approaches to an old disease. Veterinary Microbiology, 148, 1-7. Available: DOI http://dx.doi.org/10.1016/j.vetmic.2010.09.003.
Bergh, M. S. & Budsberg, S. C. 2005. The Coxib NSAIDs: Potential Clinical and Pharmacologic Importance in Veterinary Medicine. Journal of Veterinary Internal Medicine, 19, 633-643. Available: DOI 10.1111/j.1939-1676.2005.tb02741.x.
Berkowitz, L. 1983. Aversively stimulated aggression: Some parallels and differences in research with animals and humans. US: American Psychological Association.
Besson, J. M. 1999. The neurobiology of pain. The Lancet, 353, 1610-1615. Available: DOI http://dx.doi.org/10.1016/S0140-6736(99)01313-6.
Bessou, P. & Perl, E. R. 1969. Response of cutaneous sensory units with unmyelinated fibers to noxious stimuli. Journal of Neurophysiology, 32, 1025-1043.
Bianchi, M. & Panerai, A. E. 2002. Effects of lornoxicam, piroxicam, and meloxicam in a model of thermal hindpaw hyperalgesia induced by formalin injection in rat tail. Pharmacological Research, 45, 101-105. Available: DOI http://dx.doi.org/10.1006/phrs.2001.0921.
Biegert, C., Wagner, I., Lüdtke, R., Kötter, I., Lohmüller, C., Günaydin, I., Taxis, K. & Heide, L. 2004. Efficacy and safety of willow bark extract in the treatment of osteoarthritis and rheumatoid arthritis: results of 2 randomized double-blind controlled trials. The Journal of rheumatology, 31, 2121-2130.
Bjarnason, I., Hayllar, J., Macpherson, A. J. & Russell, A. S. 1993. Side effects of nonsteroidal anti-inflammatory drugs on the small and large intestine in humans. Gastroenterology, 104, 1832-47.
Blanke, M. L. & Vandongen, A. M. 2009. Activation mechanisms of the NMDA receptor. Boardman, P. & Hart, F. D. 1967. Clinical measurement of the anti-inflammatory effects
of salicylates in rheumatoid arthritis. BMJ, 4, 264-268. Bonaterra, G. A., Kelber, O., Weiser, D., Metz, J. & Kinscherf, R. 2009. In vitro anti-
proliferative effects of the willow bark extract STW 33-I. Arzneimittel-Forschung, 60, 330-335.
Bope, E. T. & Kellerman, R. D. 2015. Conn's Current Therapy 2016, Elsevier Health Sciences.
Botting, R. & Ayoub, S. S. 2005. COX-3 and the mechanism of action of paracetamol/acetaminophen. Prostaglandins, Leukotrienes and Essential Fatty Acids, 72, 85-87. Available: DOI http://dx.doi.org/10.1016/j.plefa.2004.10.005.
Boullata, J. I., Mcdonnell, P. J. & Oliva, C. D. 2003. Anaphylactic Reaction to a Dietary Supplement Containing Willow Bark. Annals of Pharmacotherapy, 37, 832-835. Available: DOI 10.1345/aph.1D027.
178
Bourinet, E., Altier, C., Hildebrand, M. E., Trang, T., Salter, M. W. & Zamponi, G. W. 2014. Calcium-Permeable Ion Channels in Pain Signaling. Available: DOI 10.1152/physrev.00023.2013.
Breyer, R. M., Carey K Bagdassarian, Scott a Myers & Breyer, M. D. 2001. PROSTANOID RECEPTORS: Subtypes and Signaling. Annual Review of Pharmacology and Toxicology, 41, 661-690. Available: DOI doi:10.1146/annurev.pharmtox.41.1.661.
Bridgestock, C. & Rae, C. P. 2013. Anatomy, physiology and pharmacology of pain. Anaesthesia & Intensive Care Medicine, 14, 480-483. Available: DOI http://dx.doi.org/10.1016/j.mpaic.2013.08.004.
Bromm, B., Rundshagen, I. & Scharein, E. 1991. Central analgesic effects of acetylsalicylic acid in healthy men. Arzneimittel-Forschung, 41, 1123-1129.
Bronaugh, R. L. & Maibach, H. I. 1989. Percutaneous absorption: mechanisms--methodology--drug delivery, Marcel Dekker Inc.
Brondani, J. T., Luna, S. P. L. & Padovani, C. R. 2011. Refinement and initial validation of a multidimensional composite scale for use in assessing acute postoperative pain in cats. American Journal of Veterinary Research, 72, 174-183. Available: DOI 10.2460/ajvr.72.2.174.
Brooks, J. & Tracey, I. 2005. REVIEW: from nociception to pain perception: imaging the spinal and supraspinal pathways. Journal of Anatomy, 207, 19-33.
Brunton, L., Lazo, J. & Parker, K. 2011. Goodman & Gilman's The Pharmacological Basis of Therapeutics, New York, NY, McGraw-Hill.
Brzozowski, T., Konturek, P. C., Konturek, S. J., Sliwowski, Z., Pajdo, R., Drozdowicz, D., Ptak, A. & Hahn, E. G. 2001. Classic NSAID and selective cyclooxygenase (COX)‐1 and COX‐2 inhibitors in healing of chronic gastric ulcers. Microscopy research and technique, 53, 343-353.
Budai, D. 2000. Neurotransmitters and receptors in the dorsal horn of the spinal cord. Acta Biol Szeged, 44, 21-38.
Bufalari, A., Adami, C., Angeli, G. & Short, C. 2007. Pain assessment in animals. Veterinary research communications, 31, 55-58.
Burian, M. & Geisslinger, G. 2005. COX-dependent mechanisms involved in the antinociceptive action of NSAIDs at central and peripheral sites. Pharmacology & Therapeutics, 107, 139-154. Available: DOI http://dx.doi.org/10.1016/j.pharmthera.2005.02.004.
Burke-Doe, A. Somatosnesory Pathways [Online]. Available: http://accessphysiotherapy.mhmedical.com/data/Multimedia/grandRounds/somatosensorypathways/media/somatosensorypathways_print.html [Accessed 15-09-2014 2014].
Burstein, R., Cliffer, K. D. & Giesler, G. J. 1990. Cells of origin of the spinohypothalamic tract in the rat. The Journal of Comparative Neurology, 291, 329-344. Available: DOI 10.1002/cne.902910302.
Bussières, G., Jacques, C., Lainay, O., Beauchamp, G., Leblond, A., Cadoré, J. L., Desmaizières, L. M., Cuvelliez, S. G. & Troncy, E. 2008. Development of a composite orthopaedic pain scale in horses. Research in Veterinary Science, 85, 294-306. Available: DOI http://dx.doi.org/10.1016/j.rvsc.2007.10.011.

179
Calixto, J. B., Beirith, A., Ferreira, J., Santos, A. R., Filho, V. C. & Yunes, R. A. 2000. Naturally occurring antinociceptive substances from plants. Phytotherapy Research, 14, 401-418.
Caplen, G., Baker, L., Hothersall, B., Mckeegan, D. E. F., Sandilands, V., Sparks, N. H. C., Waterman-Pearson, A. E. & Murrell, J. C. 2013. Thermal nociception as a measure of non-steroidal anti-inflammatory drug effectiveness in broiler chickens with articular pain. The Veterinary Journal, 198, 616-619. Available: DOI http://dx.doi.org/10.1016/j.tvjl.2013.09.013.
Carlsson, A. M. 1983. Assessment of chronic pain. I. Aspects of the reliability and validity of the visual analogue scale. Pain, 16, 87-101. Available: DOI http://dx.doi.org/10.1016/0304-3959(83)90088-X.
Carpenter, R. E., Wilson, D. V. & Evans, A. T. 2004. Evaluation of intraperitoneal and incisional lidocaine or bupivacaine for analgesia following ovariohysterectomy in the dog. Veterinary Anaesthesia and Analgesia, 31, 46-52. Available: DOI 10.1111/j.1467-2995.2004.00137.x.
Carr, D. B. & Goudas, L. C. 1999. Acute pain. The Lancet, 353, 2051-2058. Available: DOI http://dx.doi.org/10.1016/S0140-6736(99)03313-9.
Caspary, T. & Anderson, K. V. 2003. Patterning cell types in the dorsal spinal cord: what the mouse mutants say. Nat Rev Neurosci, 4, 289-297.
Chambers, J., Stafford, K. & Mellor, D. 2002. Analgesics: what use are they in farm animals? Proceedings-New Zealand Society of Animal Production, 62, 359-362.
Chambers, J. P., Livingston, A. & Waterman, A. E. 1990. A device for testing nociceptive thresholds in horses. Veterinary Anaesthesia and Analgesia, 17, 42-44. Available: DOI 10.1111/j.1467-2995.1990.tb00389.x.
Chambers, J. P., Waterman, A. E. & Livingston, A. 1994. Further development of equipment to measure nociceptive thresholds in large animals. Veterinary Anaesthesia and Analgesia, 21, 66-72. Available: DOI 10.1111/j.1467-2995.1994.tb00489.x.
Chambers, J. P., Waterman, A. E. & Livingston, A. 1995. The effects of opioid and α2 adrenergic blockade on non-steroidal anti-inflammatory drug analgesia in sheep. Journal of Veterinary Pharmacology and Therapeutics, 18, 161-166. Available: DOI 10.1111/j.1365-2885.1995.tb00573.x.
Chandrasekharan, N. V., Dai, H., Roos, K. L. T., Evanson, N. K., Tomsik, J., Elton, T. S. & Simmons, D. L. 2002. COX-3, a cyclooxygenase-1 variant inhibited by acetaminophen and other analgesic/antipyretic drugs: Cloning, structure, and expression. Proceedings of the National Academy of Sciences, 99, 13926-13931. Available: DOI 10.1073/pnas.162468699.
Chapman, C. R., Casey, K. L., Dubner, R., Foley, K. M., Gracely, R. H. & Reading, A. E. 1985. Pain measurement: an overview. Pain, 22, 1-31. Available: DOI http://dx.doi.org/10.1016/0304-3959(85)90145-9.
Charlton, D., Mcivor, I., Gawith, P. & Douglas, G. 2007. Growing Poplar and Willow Trees on Farms New Zealand. Available: http://www.fao.org/forestry/21644-03ae5c141473930a1cf4b566f59b3255f.pdf.
Chaudhary, A., Wang, J. & Prabhu, S. 2010. Development and validation of a high-performance liquid chromatography method for the simultaneous determination of
180
aspirin and folic acid from nano-particulate systems. Biomedical Chromatography, 24, 919-925. Available: DOI 10.1002/bmc.1386.
Cheng, Y., Austin, S. C., Rocca, B., Koller, B. H., Coffman, T. M., Grosser, T., Lawson, J. A. & Fitzgerald, G. A. 2002. Role of Prostacyclin in the Cardiovascular Response to Thromboxane A2. Science, 296, 539-541. Available: DOI 10.1126/science.1068711.
Chiabrando, C., Castelli, M. G., Cozzi, E., Fanelli, R., Campoleoni, A., Balotta, C., Latini, R. & Garattini, S. 1989. Antiinflammatory action of salicylates: aspirin is not a prodrug for salicylate against rat carrageenin pleurisy. European Journal of Pharmacology, 159, 257-264. Available: DOI http://dx.doi.org/10.1016/0014-2999(89)90156-8.
Chrubasik, S., Eisenberg, E., Balan, E., Weinberger, T., Luzzati, R. & Conradt, C. 2000. Treatment of low back pain exacerbations with willow bark extract: a randomized double-blind study. The American Journal of Medicine, 109, 9-14. Available: DOI http://dx.doi.org/10.1016/S0002-9343(00)00442-3.
Clarke, K. W. & Trim, C. M. 2013. Veterinary anaesthesia, Elsevier Health Sciences. Clarke, S. P. & Bennett, D. 2006. Feline osteoarthritis: a prospective study of 28 cases.
Journal of Small Animal Practice, 47, 439-445. Available: DOI 10.1111/j.1748-5827.2006.00143.x.
Cobelli, C. & Toffolo, G. 1984. Compartmental vs. noncompartmental modeling for two accessible pools. American Journal of Physiology-Regulatory, Integrative and Comparative Physiology, 247, R488-R496.
Cockram, M. 2004. A review of behavioural and physiological responses of sheep to stressors to identify potential behavioural signs of distress. Animal welfare, 13, 283-291.
Coetzee, J., Gehring, R., Bettenhausen, A., Lubbers, B., Toerber, S., Thomson, D., Kukanich, B. & Apley, M. 2007a. Attenuation of acute plasma cortisol response in calves following intravenous sodium salicylate administration prior to castration. Journal of veterinary pharmacology and therapeutics, 30, 305-313.
Coetzee, J. F., Gehring, R., Bettenhausen, A. C., Lubbers, B. V., Toerber, S. E., Thomson, D. U., Kukanich, B. & Apley, M. D. 2007b. Attenuation of acute plasma cortisol response in calves following intravenous sodium salicylate administration prior to castration. Journal of Veterinary Pharmacology and Therapeutics, 30, 305-313. Available: DOI 10.1111/j.1365-2885.2007.00869.x.
Colantoni, A., De Maria, N., Caraceni, P., Bernardi, M., Floyd, R. A. & Van Thiel, D. H. 1998. Prevention of reoxygenation injury by sodium salicylate in isolated-perfused rat liver. Free Radical Biology and Medicine, 25, 87-94.
Colpaert, F. C., De Witte, P., Maroli, A. N., Awouters, F., Niemegeers, C. J. E. & Janssen, P. a. J. 1980. Self-administration of the analgesic suprofen in arthritic rats: Evidence of Mycobaterium butyricum-induced arthritis as an experimental model of chronic pain. Life Sciences, 27, 921-928. Available: DOI http://dx.doi.org/10.1016/0024-3205(80)90101-0.
Colvin, L. A. & Power, I. 2005. Neurobiology of chronic pain states. Anaesthesia & Intensive Care Medicine, 6, 10-13. Available: DOI http://dx.doi.org/10.1383/anes.6.1.10.57134.
181
Conaghan, P. 2012. A turbulent decade for NSAIDs: update on current concepts of classification, epidemiology, comparative efficacy, and toxicity. Rheumatology International, 32, 1491-1502. Available: DOI 10.1007/s00296-011-2263-6.
Costigan, M. & Woolf, C. J. 2000. Pain: Molecular mechanisms. The Journal of Pain, 1, 35-44. Available: DOI http://dx.doi.org/10.1054/jpai.2000.9818.
Cranston, W., Luff, R., Rawlins, M. & Rosendorff, C. 1970. The effects of salicylate on temperature regulation in the rabbit. The Journal of Physiology, 208, 251.
Criado, A. 2010. Recognition and alleviation of pain in laboratory animals. Laboratory Animals, 44, 380-380.
Cronstein, B. N., Montesinos, M. C. & Weissmann, G. 1999. Salicylates and sulfasalazine, but not glucocorticoids, inhibit leukocyte accumulation by an adenosine-dependent mechanism that is independent of inhibition of prostaglandin synthesis and p105 of NFκB. Proceedings of the National Academy of Sciences, 96, 6377-6381.
Cruz, E., Euerby, M. R., Johnson, C. M. & Hackett, C. A. 1997. Chromatographic classification of commercially available reverse-phase HPLC columns. Chromatographia, 44, 151-161. Available: DOI 10.1007/bf02466449.
Cutler, D. J. 1978. Linear systems analysis in pharmacokinetics. Journal of pharmacokinetics and biopharmaceutics, 6, 265-282.
D'mello, R. & Dickenson, A. H. 2008. Spinal cord mechanisms of pain. British Journal of Anaesthesia, 101, 8-16. Available: DOI 10.1093/bja/aen088.
Danbury, T., Weeks, C., Chambers, J., Waterman-Pearson, A. & Kestin, S. 2000. Self-selection of the analgesic drug carprofen by lame broiler chickens. The Veterinary Record, 146, 307-311.
Dann, P. & Axelsen, A. Willow (Salix spp.) as drought feed for sheep. Proc Aust Soc Anim Prod, 1986. 408.
Dantzer, R. & Mormède, P. 1983. Stress in farm animals: a need for reevaluation. Journal of Animal Science, 57, 6-18.
Davies, P., Bailey, P. J., Goldenberg, M. M. & Ford-Hutchinson, A. W. 1984. The role of arachidonic acid oxygenation products in pain and inflammation. Annual review of immunology, 2, 335-357.
Davis, L. E. & Westfall, B. A. 1972. Species differences in biotransformation and excretion of salicylate. American journal of veterinary research, 33, 1253-1262.
Daw, N., Stein, P. & Fox, K. 1993. The role of NMDA receptors in information processing. Annual review of neuroscience, 16, 207-222.
De Biasi, S. & Rustioni, A. 1988. Glutamate and substance P coexist in primary afferent terminals in the superficial laminae of spinal cord. Proceedings of the National Academy of Sciences, 85, 7820-7824.
Derbyshire, S. W. 2003. Fetal ‘‘pain’’–a look at the evidence. American Pain Society Bulletin, 13.
Dewitt, D. L. 1999. Cox-2-Selective Inhibitors: The New Super Aspirins. Molecular Pharmacology, 55, 625-631.
Di Giminiani, P., Petersen, L. J. & Herskin, M. S. 2013. Nociceptive responses to thermal and mechanical stimulations in awake pigs. European Journal of Pain, 17, 638-648. Available: DOI 10.1002/j.1532-2149.2012.00228.x.
182
Dickenson, A. 2008. The neurobiology of chronic pain states. Anaesthesia & Intensive Care Medicine, 9, 8-12. Available: DOI http://dx.doi.org/10.1016/j.mpaic.2007.10.006.
Dickenson, A. 2011. The neurobiology of chronic pain states. Anaesthesia & Intensive Care Medicine, 12, 5-8. Available: DOI http://dx.doi.org/10.1016/j.mpaic.2010.10.005.
Diesch, T. J. 2010. Neurological development and the potential for conscious perception after birth : comparison between species and implications for animal welfare. PhD Thesis, Massey University, Palmerston North, New Zealand.
Dingledine, R., Borges, K., Bowie, D. & Traynelis, S. F. 1999. The Glutamate Receptor Ion Channels. Pharmacological Reviews, 51, 7-62.
Dixon, M., Robertson, S. & Taylor, P. 2002. A thermal threshold testing device for evaluation of analgesics in cats. Research in veterinary science, 72, 205-210.
Dixon, M., Taylor, P., Slingsby, L., Hoffmann, M., Kästner, S. & Murrell, J. 2010. A small, silent, low friction, linear actuator for mechanical nociceptive testing in veterinary research. Lab Anim, 44, 247-253.
Dixon, M., Taylor, P., Steagall, P., Brondani, J. & Luna, S. 2007. Development of a pressure nociceptive threshold testing device for evaluation of analgesics in cats. Research in veterinary science, 82, 85-92.
Dodman, N. & Clark, G. 1992. Court, MH, Fikes, LL, & Boudrieau, RJ. Epidural opioid administration for postoperative pain relief in the dog. Animal Pain, 274-7.
Dolan, S., Field, L. C. & Nolan, A. M. 2000. The role of nitric oxide and prostaglandin signaling pathways in spinal nociceptive processing in chronic inflammation. PAIN, 86, 311-320.
Douglas, G., Bulloch, B. & Foote, A. 1996. Cutting management of willows (Salix spp.) and leguminous shrubs for forage during summer. New Zealand journal of agricultural research, 39, 175-184.
Dray, A. 1997a. Kinins and their receptors in hyperalgesia. Can J Pharmacol, 75, 704-12. Dray, A. 1997b. Peripheral Mediators of Pain. In: Dickenson, A. & Besson, J.-M. (eds.)
The Pharmacology of Pain. New York: Springer. Dubois, R. N., Abramson, S. B., Crofford, L., Gupta, R. A., Simon, L. S., A. Van De Putte,
L. B. & Lipsky, P. E. 1998. Cyclooxygenase in biology and disease. The FASEB Journal, 12, 1063-1073.
Duncan, I. J. H. 2006. The changing concept of animal sentience. Applied Animal Behaviour Science, 100, 11-19. Available: DOI http://dx.doi.org/10.1016/j.applanim.2006.04.011.
Egerton, J. R., Roberts, D. S. & Parsonson, I. M. 1969. The aetiology and pathogenesis of ovine foot-rot. Journal of Comparative Pathology, 79, 207-IN7. Available: DOI http://dx.doi.org/10.1016/0021-9975(69)90007-3.
Eguchi, N., Kaneko, T., Urade, Y., Hayashi, H. & Hayaishi, O. 1992. Permeability of brain structures and other peripheral tissues to prostaglandins D2, E2 and F2 alpha in rats. Journal of Pharmacology and Experimental Therapeutics, 262, 1110-1120.
El-Shemy, H. A., Aboul-Enein, A. M., Aboul-Enein, K. M. & Fujita, K. 2007. Willow leaves’ extracts contain anti-tumor agents effective against three cell types. Plos one, 2, e178.

183
El-Shemy, H. A., Aboul-Enein, A. M., Aboul-Enein, M. I., Issa, S. I. & Fujita, K. 2003. The effect of willow leaf extracts on human leukemic cells in vitro. BMB Reports, 36, 387-389.
Elmqvist, T., Cates, R. G., Harper, J. K. & Gardfjell, H. 1991. Flowering in males and females of a Utah willow, Salix rigida and effects on growth, tannins, phenolic glycosides and sugars. Oikos, 65-72.
Engelhardt, G., Homma, D., Schlegel, K., Utzmann, R. & Schnitzler, C. 1995. Anti-inflammatory, analgesic, antipyretic and related properties of meloxicam, a new non-steroidal anti-inflammatory agent with favourable gastrointestinal tolerance. Inflammation Research, 44, 423-433. Available: DOI 10.1007/BF01757699.
Ensminger, M. E. & Parker, R. 1986. Sheep & goat science, The Interstate Printers & Publishers, Inc.
Epstein, F. H., Barnes, P. J. & Karin, M. 1997. Nuclear factor-κB—a pivotal transcription factor in chronic inflammatory diseases. New England Journal of Medicine, 336, 1066-1071.
Fahmi, H., Pelletier, J.-P. & Martel-Pelletier, J. 2002. PPARgamma ligands as modulators of inflammatory and catabolic responses in arthritis. An overview. The Journal of Rheumatology, 29, 3-14.
Fahr, A., Hoogevest, P. V., May, S., Bergstrand, N. & S. Leigh, M. L. 2005. Transfer of lipophilic drugs between liposomal membranes and biological interfaces: Consequences for drug delivery. European Journal of Pharmaceutical Sciences, 26, 251-265. Available: DOI http://dx.doi.org/10.1016/j.ejps.2005.05.012.
Farney, J. K., Mamedova, L. K., Coetzee, J. F., Kukanich, B., Sordillo, L. M., Stoakes, S. K., Minton, J. E., Hollis, L. C. & Bradford, B. J. 2013. Anti-inflammatory salicylate treatment alters the metabolic adaptations to lactation in dairy cattle. American Journal of Physiology-Regulatory, Integrative and Comparative Physiology, 305, R110-R117.
Farquhar-Smith, W. P. 2008. Anatomy, physiology and pharmacology of pain. Anaesthesia & Intensive Care Medicine, 9, 3-7. Available: DOI http://dx.doi.org/10.1016/j.mpaic.2007.10.011.
Faw 2011. Opinion on lameness in sheep. Farm Animal Welfare Council http://www. fawc. org. uk/pdf/sheep-lameness-opinion-110328. pdf.
Fda 2007. Food & Drug Administration; Guidance for industry: bioanalytical method validation (2001). Available from: www. fda. gov/ downloads/ drugs/ guidancecomplian ceregulatoryinfo rmation/ guidances/ ucm368107. pdf.
Fein, A. 2012. Nociceptors And The Perception Of Pain. University of Connecticut Health Center, 153.
Fekete, S., Oláh, E. & Fekete, J. 2012. Fast liquid chromatography: the domination of core–shell and very fine particles. Journal of chromatography A, 1228, 57-71.
Ferraguti, F. & Shigemoto, R. 2006. Metabotropic glutamate receptors. Cell and Tissue Research, 326, 483-504. Available: DOI 10.1007/s00441-006-0266-5.
Ferreira, S. H., Lorenzetti, B. B. & Corrêa, F. M. 1978. Central and peripheral antialgesic action of aspirin-like drugs. European journal of pharmacology, 53, 39-48.
Firth, A. M. & Haldane, S. L. 1999. Development of a scale to evaluate postoperative pain in dogs. Journal of the American Veterinary Medical Association, 214, 651-659.
184
Fitzpatrick, J., Scott, M. & Nolan, A. 2006. Assessment of pain and welfare in sheep. Small Ruminant Research, 62, 55-61.
Flecknell, P. 2008. Analgesia from a veterinary perspective. British Journal of Anaesthesia, 101, 121-124. Available: DOI 10.1093/bja/aen087.
Fogel, J., Epstein, P. & Chen, P. 1984. Simultaneous high-performance liquid chromatography assay of acetylsalicylic acid and salicylic acid in film-coated aspirin tablets. Journal of Chromatography A, 317, 507-511. Available: DOI http://dx.doi.org/10.1016/S0021-9673(01)91690-5.
Frölich, J. C. 1997. A classification of NSAIDs according to the relative inhibition of cyclooxygenase isoenzymes. Trends in Pharmacological Sciences, 18, 30-34. Available: DOI http://dx.doi.org/10.1016/S0165-6147(96)01017-6.
Fung, H. B. & Kirschenbaum, H. L. 1999. Selective cyclooxygenase-2 inhibitors for the treatment of arthritis. Clinical Therapeutics, 21, 1131-1157. Available: DOI http://dx.doi.org/10.1016/S0149-2918(00)80018-1.
Funk, C. D. 2001. Prostaglandins and Leukotrienes: Advances in Eicosanoid Biology. Science, 294, 1871-1875. Available: DOI 10.1126/science.294.5548.1871.
Fürst, S. 1999. Transmitters involved in antinociception in the spinal cord. Brain Research Bulletin, 48, 129-141. Available: DOI http://dx.doi.org/10.1016/S0361-9230(98)00159-2.
Fuster, V. & Sweeny, J. M. 2011. Aspirin: A Historical and Contemporary Therapeutic Overview. Circulation, 123, 768-778. Available: DOI 10.1161/circulationaha.110.963843.
Gabrielsson, J. & Weiner, D. 2001. Pharmacokinetic and pharmacodynamic data analysis: concepts and applications, CRC Press.
Gabrielsson, J. & Weiner, D. 2012. Non-compartmental Analysis. In: Reisfeld, B. & Mayeno, A. N. (eds.) Computational Toxicology. Humana Press. Available: DOI 10.1007/978-1-62703-050-2_16.
Gebhart, G. F. 1996. Visceral polymodal receptors. Prog Brain research, 113, 101-112. Gebhart, G. F. 2004. Descending modulation of pain. Neuroscience & Biobehavioral
Reviews, 27, 729-737. Available: DOI http://dx.doi.org/10.1016/j.neubiorev.2003.11.008.
Gibson, G. G. & Skett, P. 2001. Introduction to drug metabolism, Cheltenham, United Kingdom, Nelson Thornes.
Gibson, T., Zaphiropoulos, G., Grove, J., Widdop, B. & Berry, D. 1975. Kinetics of salicylate metabolism. British journal of clinical pharmacology, 2, 233-238.
Gibson, T. J., Johnson, C. B., Murrell, J. C., Hulls, C. M., Mitchinson, S. L., Stafford, K. J., Johnstone, A. C. & Mellor, D. J. 2009. Electroencephalographic responses of halothane-anaesthetised calves to slaughter by ventral-neck incision without prior stunning. New Zealand Veterinary Journal, 57, 77-83. Available: DOI 10.1080/00480169.2009.36882.
Gillespie, W. R. 1991. Noncompartmental Versus Compartmental Modelling in Clinical Pharmacokinetics Clin. Pharmacokinetics, 20, 253-262.
Gilroy, J. J., Dolan, J. W. & Snyder, L. R. 2003. Column selectivity in reversed-phase liquid chromatography: IV. Type-B alkyl-silica columns. Journal of Chromatography A, 1000, 757-778. Available: DOI http://dx.doi.org/10.1016/S0021-9673(03)00512-0.
185
Gingerich, D., Baggot, J. & Yeary, R. 1975. Pharmacokinetics and dosage of aspirin in cattle. Journal of the American Veterinary Medical Association, 167, 945-948.
Giuliano, F. & Warner, T. D. 1999. Ex vivo assay to determine the cyclooxygenase selectivity of non-steroidal anti-inflammatory drugs. British Journal of Pharmacology, 126, 1824-1830. Available: DOI 10.1038/sj.bjp.0702518.
Giummarra, M. J., Gibson, S. J., Georgiou-Karistianis, N. & Bradshaw, J. L. 2007. Central mechanisms in phantom limb perception: The past, present and future. Brain Research Reviews, 54, 219-232. Available: DOI http://dx.doi.org/10.1016/j.brainresrev.2007.01.009.
González, L. A., Tolkamp, B. J., Coffey, M. P., Ferret, A. & Kyriazakis, I. 2008. Changes in Feeding Behavior as Possible Indicators for the Automatic Monitoring of Health Disorders in Dairy Cows. Journal of Dairy Science, 91, 1017-1028. Available: DOI http://dx.doi.org/10.3168/jds.2007-0530.
Goodrich, L. R. & Nixon, A. J. 2006. Medical treatment of osteoarthritis in the horse – A review. The Veterinary Journal, 171, 51-69. Available: DOI http://dx.doi.org/10.1016/j.tvjl.2004.07.008.
Gopaul, R., Knaggs, H. E., Lephart, J. F., Holley, K. C. & Gibson, E. M. 2010. Original Contribution: An evaluation of the effect of a topical product containing salicin on the visible signs of human skin aging. Journal of Cosmetic Dermatology, 9, 196-201. Available: DOI 10.1111/j.1473-2165.2010.00512.x.
Graham, J. A. & Rogers, L. B. 1980. Effects of Column Length, Particle Size, Flow Rate, and Pressure Programming Rate on Resolution in Pressure-Programmed Supercritical Fluid Chromatography. Journal of Chromatographic Science, 18, 75-84. Available: DOI 10.1093/chromsci/18.2.75.
Graham, M. J., Kent, J. E. & Molony, V. 1997. Effects of four analgesic treatments on the behaviouraland cortisol responses of 3-week-old lambs to tail docking. The Veterinary Journal, 153, 87-97. Available: DOI http://dx.doi.org/10.1016/S1090-0233(97)80013-5.
Grandin, T. 1997. Assessment of stress during handling and transport. Journal of animal science, 75, 249-257.
Grant, C. 2004. Behavioural responses of lambs to common painful husbandry procedures. Applied Animal Behaviour Science, 87, 255-273. Available: DOI http://dx.doi.org/10.1016/j.applanim.2004.01.011.
Green, L. E. & George, T. R. N. 2008. Assessment of current knowledge of footrot in sheep with particular reference to Dichelobacter nodosus and implications for elimination or control strategies for sheep in Great Britain. The Veterinary Journal, 175, 173-180. Available: DOI http://dx.doi.org/10.1016/j.tvjl.2007.01.014.
Greger, M. & Landberg, T. 1999. Use of Willow in Phytoextraction. International Journal of Phytoremediation, 1, 115-123. Available: DOI 10.1080/15226519908500010.
Greisen, J., Hokland, M., Grøfte, T., Hansen, P. O., Jensen, T. S., Vilstrup, H. & Tønnesen, E. 1999. Acute pain induces an instant increase in natural killer cell cytotoxicity in humans and this response is abolished by local anaesthesia. British journal of anaesthesia, 83, 235-240.
Grint, N. J., Beths, T., Yvorchuk, K., Taylor, P. M., Dixon, M., Whay, H. R. & Murrell, J. C. 2014. The influence of various confounding factors on mechanical nociceptive

186
thresholds in the donkey. Veterinary Anaesthesia and Analgesia, 41, 421-429. Available: DOI 10.1111/vaa.12132.
Griswold, D. E., Ruffolo, R. R., Poste, G. & Torphy, T. J. 1997. Re-classification of NSAIDs. Trends in pharmacological sciences, 18, 312-312.
Gryglewski, R. J., Dembinska-Kiec, A. & Korbut, R. 1978. A possible role of thromboxane A2 (TXA2) and prostacyclin (PGI2) in circulation. Acta Biol Med Ger, 37, 715-23.
Guesgen, M. J. 2015. The social function of pain-related behaviour and novel techniques for the assessment of pain in lambs: a thesis presented in partial fulfilment of the requirements for the degree of Doctor of Philosophy in Zoology at Massey University, Turitea campus, Manawatu, New Zealand. The author.
Haerdi-Landerer, M. C., Schlegel, U. & Neiger-Aeschbacher, G. 2003. Antinociceptive effect of intrathecally applied alpha2 agonists (xylazine and detomidine) in sheep and the response to atipamezole. Veterinary Anaesthesia and Analgesia, 30, 87-87. Available: DOI 10.1046/j.1467-2995.2003.01321.x.
Haga, H. A. & Ranheim, B. 2005. Castration of piglets: the analgesic effects of intratesticular and intrafunicular lidocaine injection. Veterinary Anaesthesia and Analgesia, 32, 1-9. Available: DOI 10.1111/j.1467-2995.2004.00225.x.
Hardee, G. E. & Baggo, J. D. 1998. Development and formulation of veterinary dosage forms, CRC Press.
Hardy, J. D., Stolwijk, J., Hammel, H. & Murgatroyd, D. 1965. Skin temperature and cutaneous pain during warm water immersion. Journal of applied physiology, 20, 1014-1021.
Hargreaves, K., Dubner, R., Brown, F., Flores, C. & Joris, J. 1988. A new and sensitive method for measuring thermal nociception in cutaneous hyperalgesia. PAIN, 32, 77-88.
Harman, H. M. 2004. Feasibility of biological control of grey willow Salix cinerea. DOC Science Internal series. Wellington, New Zealand: New Zealand Department of Conservation. Available: http://www.doc.govt.nz/documents/science-and-technical/dsis183.pdf.
Hata, A. N. & Breyer, R. M. 2004. Pharmacology and signaling of prostaglandin receptors: Multiple roles in inflammation and immune modulation. Pharmacology & Therapeutics, 103, 147-166. Available: DOI http://dx.doi.org/10.1016/j.pharmthera.2004.06.003.
Hawkey, C. J. 1999. COX-2 inhibitors. The Lancet, 353, 307-314. Available: DOI http://dx.doi.org/10.1016/S0140-6736(98)12154-2.
Hayat, S., Ahmad, A. & Alyemeni, M. N. 2013. Salicylic Acid: Plant Growth and Development, Springer Science & Business Media.
Hedaya, M. A. 2012. Basic pharmacokinetics, CRC Press. Hedner, T. & Everts, B. 1998. The early clinical history of salicylates in rheumatology and
pain. Clinical rheumatology, 17, 17-25. Heideman, R. L., Cole, D. E., Balis, F., Sato, J., Reaman, G. H., Packer, R. J., Singher, L.
J., Ettinger, L. J., Gillespie, A. & Sam, J. 1989. Phase I and pharmacokinetic evaluation of thiotepa in the cerebrospinal fluid and plasma of pediatric patients: evidence for dose-dependent plasma clearance of thiotepa. Cancer research, 49, 736-741.
187
Heinricher, M. M., Tavares, I., Leith, J. L. & Lumb, B. M. 2009. Descending control of nociception: Specificity, recruitment and plasticity. Brain Research Reviews, 60, 214-225. Available: DOI http://dx.doi.org/10.1016/j.brainresrev.2008.12.009.
Hellebrekers, L. J. 2000. Pathophysiology of pain in animals and its consequence for analgesic therapy. In: Hellebrekers, L. J. E. (ed.) Animal Pain:A Practice-Oriented Approach to an Effective Pain Control in Animals. The Netherlands: Van Der Wees, Utrecht,.
Heller, M. C., Keoleian, G. A., Mann, M. K. & Volk, T. A. 2004. Life cycle energy and environmental benefits of generating electricity from willow biomass. Renewable Energy, 29, 1023-1042. Available: DOI http://dx.doi.org/10.1016/j.renene.2003.11.018.
Herrero, J. F. & Max Headley, P. 1995. The dominant class of somatosensory neurone recorded in the spinal dorsal horn of awake sheep has wide dynamic range properties. Pain, 61, 133-138. Available: DOI http://dx.doi.org/10.1016/0304-3959(94)00152-5.
Herskin, M. S., Ladewig, J. & Arendt-Nielsen, L. 2009. Measuring cutaneous thermal nociception in group-housed pigs using laser technique—Effects of laser power output. Applied Animal Behaviour Science, 118, 144-151. Available: DOI http://dx.doi.org/10.1016/j.applanim.2009.02.016.
Herskin, M. S., Müller, R., Schrader, L. & Ladewig, J. 2003. A laser-based method to measure thermal nociception in dairy cows: Short-term repeatability and effects of power output and skin condition. Journal of Animal Science, 81, 945-954. Available: DOI /2003.814945x.
Hewitt, D. J. 2000. The Use of NMDA‐Receptor Antagonists in the Treatment of Chronic Pain. The Clinical journal of pain, 16, S73-S79.
Hewson, C. J., Dohoo, I. R., Lemke, K. A. & Barkema, H. W. 2007. Canadian veterinarians’ use of analgesics in cattle, pigs, and horses in 2004 and 2005. The Canadian Veterinary Journal, 48, 155-164.
Heyrman, A. N. & Henry, R. A. 1999. Importance of controlling mobile phase pH in reversed phase HPLC.
Higdon, J. V. & Frei, B. 2003. Obesity and Oxidative Stress: A Direct Link to CVD? Arteriosclerosis, Thrombosis, and Vascular Biology, 23, 365-367. Available: DOI 10.1161/01.atv.0000063608.43095.e2.
Higgs, G. A., Salmon, J. A., Henderson, B. & Vane, J. R. 1987. Pharmacokinetics of aspirin and salicylate in relation to inhibition of arachidonate cyclooxygenase and antiinflammatory activity. Proceedings of the National Academy of Sciences, 84, 1417-1420.
Hillman , A. L., Eisenberg , J. M., Pauly , M. V., Bloom , B. S., Click , H., Kinosian , B. & Schwartz , J. S. 1991. Avoiding Bias in the Conduct and Reporting of Cost-Effectiveness Research Sponsored by Pharmaceutical Companies. New England Journal of Medicine, 324, 1362-1365. Available: DOI doi:10.1056/NEJM199105093241911.
Hodge Jr, C. J. & Apkarian, A. 1990. The spinothalamic tract. Crit Rev Neurobiol, 5, 363-397.
188
Hollister, L. & Levy, G. 1965. Some aspects of salicylate distribution and metabolism in man. Journal of Pharmaceutical Sciences, 54, 1126-1129. Available: DOI 10.1002/jps.2600540806.
Holton, L., Reid, J., Scott, E. M., Pawson, P. & Nolan, A. 2001. Development of a behaviour-based scale to measure acute pain in dogs. The Veterinary record, 148, 525-531. Available: DOI 10.1136/vr.148.17.525.
Holton, L., Scott, E., Nolan, A., Reid, J. & Welsh, E. 1998a. Relationship between physiological factors and clinical pain in dogs scored using a numerical rating scale. Journal of small animal practice, 39, 469-474.
Holton, L. L., Scott, E. M., Nolan, A. M., Reid, J., Welsh, E. & Flaherty, D. 1998b. Comparison of three methods used for assessment of pain in dogs. Journal of the American Veterinary Medical Association, 212, 61-66.
Homer, S. & Sylla, R. E. 1996. A history of interest rates, Rutgers University Press. Honda, T., Segi-Nishida, E., Miyachi, Y. & Narumiya, S. 2006. Prostacyclin-IP signaling
and prostaglandin E2-EP2/EP4 signaling both mediate joint inflammation in mouse collagen-induced arthritis. The Journal of Experimental Medicine, 203, 325-335. Available: DOI 10.1084/jem.20051310.
Horton, E. 1969. Hypotheses on physiological roles of prostaglandins. Physiol. Rev, 49. Hothersall, B., Caplen, G., Nicol, C., Taylor, P., Waterman-Pearson, A., Weeks, C. &
Murrell, J. 2011. Development of mechanical and thermal nociceptive threshold testing devices in unrestrained birds (broiler chickens). Journal of Neuroscience Methods, 201, 220-227.
Hothersall, B., Caplen, G., Parker, R. M. A., Nicol, C. J., Waterman-Pearson, A. E., Weeks, C. A. & Murrell, J. C. 2014. Thermal Nociceptive Threshold Testing Detects Altered Sensory Processing in Broiler Chickens with Spontaneous Lameness. PLoS ONE, 9, e97883. Available: DOI 10.1371/journal.pone.0097883.
Houser, V. P. & Paré, W. P. 1973. Analgesic potency of sodium salicylate, indomethacin, and chlordiazepoxide as measured by the spatial preference technique in the rat. Psychopharmacologia, 32, 121-131. Available: DOI 10.1007/bf00428683.
Hsu, W. H. 2013. Handbook of veterinary pharmacology, John Wiley & Sons. Hsu, W. H. & Riedesel, D. H. 2013. Drugs Acting on the central Nervous system. In: Hsu,
W. H. (ed.) Handbook of Veterinary Pharmacology, second edition,. Hussain, Z. 2007. Environmental effects of densely planted willow and poplar in a
silvopastoral system : a thesis presented in partial fulfilment of the requirements for the degree of Doctor of Philosophy (Ph. D.) in Agroforestry, Institute of Natural Resources, Massey University, Palmerston North, New Zealand.
Hylden, J., Anton, F. & Nahin, R. 1989. Spinal lamina I projection neurons in the rat: collateral innervation of parabrachial area and thalamus. Neuroscience, 28, 27-37.
Ich, I. C. O. H. E. W. G. 1997. Code of federal regulations & international conference on harmonization guidelines. Philadelphia: Parexel Barnett.
Ikeda, H., Stark, J., Fischer, H., Wagner, M., Drdla, R., Jäger, T. & Sandkühler, J. 2006. Synaptic Amplifier of Inflammatory Pain in the Spinal Dorsal Horn. Science, 312, 1659-1662. Available: DOI 10.1126/science.1127233.
Isap 1979. Pain terms: a list with definitions and notes on usage. Pain, 6, 249-252. J. Fitzpatrick Et Al., M. S., A. Nolan 2006. Assessment of pain and welfare in sheep. Small
Ruminant Research, 62, 55-61.
189
Jacquet, B., Leveque, J. L., Hocquaux, M. & Leger, D. S. 1988. Topical compositions intended for skin treatment containing salicylic acid derivatives. Google Patents.
Janczak, A. M., Ranheim, B., Fosse, T. K., Hild, S., Nordgreen, J., Moe, R. O. & Zanella, A. J. 2012. Factors affecting mechanical (nociceptive) thresholds in piglets. Veterinary Anaesthesia and Analgesia, 39, 628-635. Available: DOI 10.1111/j.1467-2995.2012.00737.x.
Jasmin, L., Wang, H., Tarczy-Hornoch, K., Levine, J. & Basbaum, A. 1994. Differential effects of morphine on noxious stimulus-evoked fos-like immunoreactivity in subpopulations of spinoparabrachial neurons. The Journal of Neuroscience, 14, 7252-7260.
Jian-Hua, L. & Smith, P. C. 1996. Direct analysis of salicylic acid, salicyl acyl glucuronide, salicyluric acid and gentisic acid in human plasma and urine by high-performance liquid chromatography. Journal of Chromatography B: Biomedical Sciences and Applications, 675, 61-70. Available: DOI http://dx.doi.org/10.1016/0378-4347(95)00337-1.
Jiang, C., Ting, A. T. & Seed, B. 1998. PPAR-[gamma] agonists inhibit production of monocyte inflammatory cytokines. Nature, 391, 82-86.
Johnson, C., Stafford, K., Sylvester, S., Ward, R., Mitchinson, S. & Mellor, D. 2005. Effects of age on the electroencephalographic response to castration in lambs anaesthetised using halothane in oxygen. New Zealand Veterinary Journal, 53, 433-437.
Johnson, C. B., Sylvester, S. P., Stafford, K. J., Mitchinson, S. L., Ward, R. N. & Mellor, D. J. 2009. Effects of age on the electroencephalographic response to castration in lambs anaesthetized with halothane in oxygen from birth to 6 weeks old. Veterinary Anaesthesia and Analgesia, 36, 273-279. Available: DOI 10.1111/j.1467-2995.2009.00448.x.
Jongman, E. C., Morris, J. P., Barnett, J. L. & Hemsworth, P. H. 2000. EEG changes in 4-week-old lambs in response to castration, tail docking and mulesing. Australian Veterinary Journal, 78, 339-343. Available: DOI 10.1111/j.1751-0813.2000.tb11789.x.
Julius, D. & Basbaum, A. I. 2001. Molecular mechanisms of nociception. Nature, 413, 203-210.
Kaler, J. & Green, L. E. 2009. Farmers’ practices and factors associated with the prevalence of all lameness and lameness attributed to interdigital dermatitis and footrot in sheep flocks in England in 2004. Preventive Veterinary Medicine, 92, 52-59. Available: DOI http://dx.doi.org/10.1016/j.prevetmed.2009.08.001.
Kamerling, S. G., Dequick, D. J., Weckman, T. J. & Tobin, T. 1986. Dose-related effects of ethylketazocine on nociception, behaviour and autonomic responses in the horse. Journal of Pharmacy and Pharmacology, 38, 40-45. Available: DOI 10.1111/j.2042-7158.1986.tb04464.x.
Kammerer, B., Kahlich, R., Biegert, C., Gleiter, C. H. & Heide, L. 2005. HPLC-MS/MS analysis of willow bark extracts contained in pharmaceutical preparations. Phytochemical Analysis, 16, 470-478. Available: DOI 10.1002/pca.873.
Kangrga, I. & Randic, M. 1990. Tachykinins and calcitonin gene-related peptide enhance release of endogenous glutamate and aspartate from the rat spinal dorsal horn slice. The Journal of Neuroscience, 10, 2026-2038.
190
Karp, A., Hanley, S. J., Trybush, S. O., Macalpine, W., Pei, M. & Shield, I. 2011. Genetic Improvement of Willow for Bioenergy and BiofuelsFree Access. Journal of Integrative Plant Biology, 53, 151-165. Available: DOI 10.1111/j.1744-7909.2010.01015.x.
Katz, J. & Melzack, R. 1990. Pain ‘memories’ in phantom limbs: review and clinical observations. Pain, 43, 319-336. Available: DOI http://dx.doi.org/10.1016/0304-3959(90)90029-D.
Katzung, B. G., Masters, S. B. & Trevor, A. J. 2004. Basic & clinical pharmacology. Kawabe, J.-I., Ushikubi, F. & Hasebe, N. 2010. Prostacyclin in Vascular Diseases
– Recent Insights and Future Perspectives &ndash. Circulation Journal, 74, 836-843. Available: DOI 10.1253/circj.CJ-10-0195.
Kelly, D. J., Ahmad, M. & Brull, S. J. 2001. Preemptive analgesia I: physiological pathways and pharmacological modalities. Canadian journal of anaesthesia, 48, 1000-1010.
Kelton, J. G. & Blajchman, M. A. 1980. Prostaglandin I2 (prostacyclin). Canadian Medical Association Journal, 122, 175.
Kemp, P., Mackay, A., Matheson, A. & Timmins, M. 2001. The forage value of poplars and willows. Proceedings of the New Zealand Grassland Association, 63, 115 - 119.
Kennan, R. M., Han, X., Porter, C. J. & Rood, J. I. 2011. The pathogenesis of ovine footrot. Veterinary Microbiology, 153, 59-66. Available: DOI http://dx.doi.org/10.1016/j.vetmic.2011.04.005.
Kenstaviciene, P., Nenortiene, P., Kiliuviene, G., Zevzikovas, A., Lukosius, A. & Kazlauskiene, D. 2008. Application of high-performance liquid chromatography for research of salicin in bark of different varieties of Salix. Medicina (Kaunas, Lithuania), 45, 644-651.
Kerr, F. W. L. 1975. The ventral spinothalamic tract and other ascending systems of the ventral funiculus of the spinal cord. The Journal of Comparative Neurology, 159, 335-355. Available: DOI 10.1002/cne.901590304.
Kidd, B. & Urban, L. 2001. Mechanisms of inflammatory pain. British Journal of Anaesthesia, 87, 3-11.
Kirchner, T., Aparicio, B., Argentieri, D. C., Lau, C. Y. & Ritchie, D. M. 1997. Effects of tepoxalin, a dual inhibitor of cyclooxygenase/5-lipoxygenase, on events associated with NSAID-induced gastrointestinal inflammation. Prostaglandins, Leukotrienes and Essential Fatty Acids, 56, 417-423. Available: DOI http://dx.doi.org/10.1016/S0952-3278(97)90593-7.
Kobayashi, T. & Narumiya, S. 2002. Function of prostanoid receptors: studies on knockout mice. Prostaglandins & Other Lipid Mediators, 68–69, 557-573. Available: DOI http://dx.doi.org/10.1016/S0090-6980(02)00055-2.
Koch, K. 2006. Assessing the impact of non-steroidal antiinflammatory drugs in the hot plate test: An alternative model. Honours, Macalester College.
Kongara, K. 2008. Studies on Renal Safety and Preventive Analgesic Efficacy of Tramadol and Paracoxib in Dogs. PhD, Massey University.
Kongara, K., Chambers, J. P. & Johnson, C. B. 2012. Effects of tramadol, morphine or their combination in dogs undergoing ovariohysterectomy on peri-operative

191
electroencephalographic responses and post-operative pain. New Zealand Veterinary Journal, 60, 129-135. Available: DOI 10.1080/00480169.2011.641156.
Kopec, R. E., Schweiggert, R. M., Riedl, K. M., Carle, R. & Schwartz, S. J. 2013. Comparison of high‐performance liquid chromatography/tandem mass spectrometry and high‐performance liquid chromatography/photo‐diode array detection for the quantitation of carotenoids, retinyl esters, α‐tocopherol and phylloquinone in chylomicron‐rich fractions of human plasma. Rapid Communications in Mass Spectrometry, 27, 1393-1402.
Kotschwar, J. L., Coetzee, J. F., Anderson, D. E., Gehring, R., Kukanich, B. & Apley, M. D. 2009. Analgesic efficacy of sodium salicylate in an amphotericin B-induced bovine synovitis-arthritis model. Journal of Dairy Science, 92, 3731-3743. Available: DOI http://dx.doi.org/10.3168/jds.2009-2058.
Kovalchik, B. L. & Elmore, W. Effects of cattle grazing systems on willow-dominated plant associations in central Oregon. McArthur, D. Bedunah, and CL Wambolt,(eds.) Proc. Symposium on Ecology and Management of Riparian Shrub Communities, USDA For. Serv., Gen. Tech. Rept. INT-GTR-289, 1992. 111-119.
Krivoy, N., Pavlotzky, E., Chrubasik, S., Eisenberg, E. & Brook, G. 2001. Effect of salicis cortex extract on human platelet aggregation. Planta medica, 67, 209-212.
Kuhtz-Buschbeck, J. P., Andresen, W., Göbel, S., Gilster, R. & Stick, C. 2010. Thermoreception and nociception of the skin: a classic paper of Bessou and Perl and analyses of thermal sensitivity during a student laboratory exercise. Advances in Physiology Education, 34, 25-34. Available: DOI 10.1152/advan.00002.2010.
Kunori, S., Matsumura, S., Mabuchi, T., Tatsumi, S., Sugimoto, Y., Minami, T. & Ito, S. 2009. Involvement of prostaglandin F2α receptor in ATP-induced mechanical allodynia. Neuroscience, 163, 362-371. Available: DOI http://dx.doi.org/10.1016/j.neuroscience.2009.05.069.
Kuzovkina, Y. A. & Quigley, M. F. 2005. Willows beyond wetlands: uses of Salix L. species for environmental projects. Water, Air, and Soil Pollution, 162, 183-204.
Labuda, C. J. & Fuchs, P. N. 2001. Low dose aspirin attenuates escape/avoidance behavior, but does not reduce mechanical hyperalgesia in a rodent model of inflammatory pain. Neuroscience Letters, 304, 137-140. Available: DOI http://dx.doi.org/10.1016/S0304-3940(01)01787-6.
Landa, L. 2012. Pain in domestic animals and how to assess it: a review. Veterinární medicína, 57, 185-192.
Lascelles, B., Cripps, P., Jones, A. & Waterman, A. 1997. Post-operative central hypersensitivity and pain: the pre-emptive value of pethidine for ovariohysterectomy. Pain, 73, 461-471.
Lascelles, B. D. X., Henderson, A. J. & Hackett, I. J. 2001. Evaluation of the clinical efficacy of meloxicam in cats with painful locomotor disorders. Journal of Small Animal Practice, 42, 587-593. Available: DOI 10.1111/j.1748-5827.2001.tb06034.x.
Latremoliere, A. & Woolf, C. J. 2009. Central Sensitization: A Generator of Pain Hypersensitivity by Central Neural Plasticity. The Journal of Pain, 10, 895-926. Available: DOI http://dx.doi.org/10.1016/j.jpain.2009.06.012.
Laufer, S. 2001. Discovery and development of ML3000. InflammoPharmacology, 9, 101-112. Available: DOI 10.1163/156856001300248371.

192
Lawrence, T. 2009. The Nuclear Factor NF-κB Pathway in Inflammation. Cold Spring Harbor Perspectives in Biology, 1, a001651. Available: DOI 10.1101/cshperspect.a001651.
Le Bars, D., Gozariu, M. & Cadden, S. W. 2001. Animal models of nociception. Pharmacological Reviews, 53, 597-652.
Lebwohl, M. 1999. The role of salicylic acid in the treatment of psoriasis. International Journal of Dermatology, 38, 16-24. Available: DOI 10.1046/j.1365-4362.1999.00500.x.
Lees, P. 2003. Pharmacology of drugs used to treat osteoarthritis in veterinary practice. Inflammopharmacology, 11, 385-399. Available: DOI doi:10.1163/156856003322699564.
Lees, P., Landoni, M. F., Giraudel, J. & Toutain, P. L. 2004. Pharmacodynamics and pharmacokinetics of nonsteroidal anti-inflammatory drugs in species of veterinary interest. Journal of Veterinary Pharmacology and Therapeutics, 27, 479-490. Available: DOI 10.1111/j.1365-2885.2004.00617.x.
Legler, D. F., Bruckner, M., Uetz-Von Allmen, E. & Krause, P. 2010. Prostaglandin E2 at new glance: Novel insights in functional diversity offer therapeutic chances. The International Journal of Biochemistry & Cell Biology, 42, 198-201. Available: DOI http://dx.doi.org/10.1016/j.biocel.2009.09.015.
Lehmann, J. M., Lenhard, J. M., Oliver, B. B., Ringold, G. M. & Kliewer, S. A. 1997. Peroxisome proliferator-activated receptors α and γ are activated by indomethacin and other non-steroidal anti-inflammatory drugs. Journal of Biological Chemistry, 272, 3406-3410.
Levy, G. 1979. Pharmacokinetics of salicylate in man. Drug metabolism reviews, 9, 3-19. Levy, G. Clinical Pharmacokinetics of Aspirin and Other Salicylates: Implications for
Research and Therapy. Allergy and Asthma Proceedings, 1981. OceanSide Publications, Inc, 68-71.
Levy, G. & Tsuchiya, T. 1972. Salicylate Accumulation Kinetics in Man. New England Journal of Medicine, 287, 430-432. Available: DOI doi:10.1056/NEJM197208312870903.
Ley, S., Waterman, A. & Livingston, A. 1991. The influence of chronic pain on the analgesic effects of the alpha 2-adrenoceptor agonist, xylazine, in sheep. J Vet Pharmacol Ther, 14, 141-4.
Ley, S., Waterman, A. & Livingston, A. 1995. A field study of the effect of lameness on mechanical nociceptive thresholds in sheep. Veterinary Record, 137, 85-87. Available: DOI 10.1136/vr.137.4.85.
Ley, S. J., Livingston, A. & Waterman, A. E. 1989. The effect of chronic clinical pain on thermal and mechanical thresholds in sheep. PAIN, 39, 353-357.
Lim, H., Paria, B. C., Das, S. K., Dinchuk, J. E., Langenbach, R., Trzaskos, J. M. & Dey, S. K. 1997. Multiple Female Reproductive Failures in Cyclooxygenase 2–Deficient Mice. Cell, 91, 197-208. Available: DOI http://dx.doi.org/10.1016/S0092-8674(00)80402-X.
Lima, D. & Coimbra, A. 1988. The spinothalamic system of the rat: Structural types of retrogradely labelled neurons in the marginal zone (lamina I). Neuroscience, 27, 215-230. Available: DOI http://dx.doi.org/10.1016/0306-4522(88)90232-1.
193
Linhart, S. B., Roberts, J. D. & Dasch, G. J. 1982. Electric Fencing Reduces Coyote Predation on Pastured Sheep. Journal of Range Management, 35, 276-281. Available: DOI 10.2307/3898301.
Livingston, A. 2010. Pain and Analgesia in Domestic Animals. In: Fiona Cunningham, J. E., Peter Lees, Editors (ed.) Comparative and veterinary pharmacology. Heidelberg: Springer.
Livingston, A. & Chambers, P. 2000. The physiology of pain. In: Flecknell, P. A. & Waterman-Pearson, A. E. (eds.) Pain Management in Animals. London, UK: W.B.Saunders.
Lizarraga, I. & Chambers, J. 2012. Use of analgesic drugs for pain management in sheep. N Z Vet J, 60, 87-94.
Lizarraga, I. & Chambers, J. P. 2006. Involvement of opioidergic and alpha2-adrenergic mechanisms in the central analgesic effects of non-steroidal anti-inflammatory drugs in sheep. Res Vet Sci, 80, 194-200.
Lodola, A. & Stadler, J. 2011. Pharmaceutical Toxicology in Practice: A Guide to Non-clinical Development, John Wiley & Sons.
Loeser, J. D. & Melzack, R. 1999. Pain: an overview. The Lancet, 353, 1607-1609. Available: DOI http://dx.doi.org/10.1016/S0140-6736(99)01311-2.
Loeser, J. D. & Treede, R.-D. 2008. The Kyoto protocol of IASP Basic Pain Terminology☆. Pain, 137, 473-477.
Lomas, A. L. & Grauer, G. F. 2015. The renal effects of NSAIDs in dogs. J Am Anim Hosp Assoc, 51, 197-203. Available: DOI 10.5326/jaaha-ms-6239.
Long, W. J. & Henderson Jr, J. W. 2009. Separation of Salicylic Acid Impurities with Different Acid Mobile-Phase Modfiers.
Lorenz, M. D., Coates, Joan. R., Kent, Marc. 2011. Pain. Handbook of veterinary neurology.
Love, E. J., Murrell, J. & Whay, H. 2011. Thermal and mechanical nociceptive threshold testing in horses: a review. Veterinary Anaesthesia and Analgesia, 38, 3-14.
Love, E. J., Taylor, P. M., Murrell, J. & Whay, H. R. 2012. Effects of acepromazine, butorphanol and buprenorphine on thermal and mechanical nociceptive thresholds in horses. Equine Veterinary Journal, 44, 221-225. Available: DOI 10.1111/j.2042-3306.2011.00412.x.
Maalouf, R., Mosley, M., James Kallail, K., Kramer, K. M. & Kumar, G. 2009. A Comparison of Salicylic Acid Levels in Normal Subjects after Rectal versus Oral Dosing. Academic Emergency Medicine, 16, 157-161. Available: DOI 10.1111/j.1553-2712.2008.00318.x.
Machado Filho, L., Hurnik, J. & Ewing, K. 1998. A thermal threshold assay to measure the nociceptive response to morphine sulphate in cattle. Canadian journal of veterinary research, 62, 218.
Machado, F. S., Johndrow, J. E., Esper, L., Dias, A., Bafica, A., Serhan, C. N. & Aliberti, J. 2006. Anti-inflammatory actions of lipoxin A4 and aspirin-triggered lipoxin are SOCS-2 dependent. Nature medicine, 12, 330-334.
Mackowiak, P. A. 2000. Brief history of antipyretic therapy. Clinical infectious diseases, 31, S154-S156.
194
Mahdi, J., Mahdi, A. & Bowen, I. 2006. The historical analysis of aspirin discovery, its relation to the willow tree and antiproliferative and anticancer potential. Cell proliferation, 39, 147-155.
Mahdi, J. G. 2014. Biosynthesis and metabolism of β-d-salicin: A novel molecule that exerts biological function in humans and plants. Biotechnology Reports, 4, 73-79.
Main, D. C., Waterman, A. E. & Kilpatrick, I. C. 1995. Behavioural analysis of changes in nociceptive thresholds produced by remoxipride in sheep and rats. European journal of pharmacology, 287, 221-231.
Malfait, A.-M. & Schnitzer, T. J. 2013. Towards a mechanism-based approach to pain management in osteoarthritis. Nature reviews. Rheumatology, 9, 654-664. Available: DOI 10.1038/nrrheum.2013.138.
Mallikaarjun, S., Wood, J. H. & Karnes, H. T. 1989. High-performance liquid chromatographic method for the determination of salicylic acid and its metabolites in urine by direct injection. Journal of Chromatography B: Biomedical Sciences and Applications, 493, 93-104. Available: DOI http://dx.doi.org/10.1016/S0378-4347(00)82712-7.
Malmberg, A. & Yaksh, T. 1994. Voltage-sensitive calcium channels in spinal nociceptive processing: blockade of N- and P-type channels inhibits formalin-induced nociception. The Journal of Neuroscience, 14, 4882-4890.
Martinsen, V., Mulder, J., Austrheim, G. & Mysterud, A. 2011. Carbon storage in low-alpine grassland soils: effects of different grazing intensities of sheep. European Journal of Soil Science, 62, 822-833. Available: DOI 10.1111/j.1365-2389.2011.01393.x.
Mathews, K. A. 2000. Pain Assessment and General Approach to Management. Veterinary Clinics of North America: Small Animal Practice, 30, 729-755. Available: DOI http://dx.doi.org/10.1016/S0195-5616(08)70004-4.
Mays, D. C., Sharp, D. E., Beach, C. A., Kershaw, R. A., Bianchine, J. R. & Gerber, N. 1984. Improved method for the determination of aspirin and its metabolites in biological fluids by high-performance liquid chromatography: applications to human and animal studies. Journal of Chromatography B: Biomedical Sciences and Applications, 311, 301-309. Available: DOI http://dx.doi.org/10.1016/S0378-4347(00)84723-4.
Mbugua, S., Skoglund, L. & Løkken, P. 1988. Effects of phenylbutazone and indomethacin on the post-operative course following experimental orthopaedic surgery in dogs. Acta veterinaria Scandinavica, 30, 27-35.
Mccabe, S. M. & Barry, T. N. 1988. Nutritive value of willow (Salix sp.) for sheep, goats and deer. The Journal of Agricultural Science, 111, 1-9. Available: DOI doi:10.1017/S0021859600082745.
Mccormack, K. 1994a. Non-steroidal anti-inflammatory drugs and spinal nociceptive processing. Pain, 59, 9-43. Available: DOI http://dx.doi.org/10.1016/0304-3959(94)90045-0.
Mccormack, K. 1994b. The Spinal Actions of Nonsteroidal Anti-Inflammatory Drugs and the Dissociation between their Anti-Inflammatory and Analgesic Effects. Drugs, 47, 28-45. Available: DOI 10.2165/00003495-199400475-00006.
Mcivor, I. 2013. Willows for the farms specially selected for the New Zealand conditions. Willows. Palmerston North, New Zealand: Plant and Food Research.
195
Mcivor, I., Rowan, D. & Charles, J. 2015. Searching for resistance to willow sawfly: the importance of chemicals. New Zealand: Poplar and willow organisation. Available: http://www.poplarandwillow.org.nz/documents/willow-sawfly-and-plant-chemistry.pdf.
Mcmahon, S., Koltzenburg, M., Tracey, I. & Turk, D. C. 2013. Wall & Melzack's Textbook of Pain: Expert Consult-Online, Elsevier Health Sciences.
Mcwilliam, E., Barry, T., Lopez-Villalobos, N., Cameron, P. & Kemp, P. 2005. Effects of willow (< i> Salix</i>) versus poplar (< i> Populus</i>) supplementation on the reproductive performance of ewes grazing low quality drought pasture during mating. Animal feed science and technology, 119, 69-86.
Mcwilliam, E. L. H. 2004. The effect of poplar (Populus spp.) and willow (Salix spp.) supplementation on the reproductive performance of ewes grazing low quality drought pasture during mating : a thesis presented in partial fulfilment of the requirements for the degree of Doctor of Philosophy in Animal Science in the Institute of Veterinary Animal and Biomedical Science, Massey University.
Mears, G. J. & Brown, F. A. 1997. Cortisol and β-endorphin responses to physical and psychological stressors in lambs. Canadian Journal of Animal Science, 77, 689-694. Available: DOI 10.4141/A97-051.
Mehrotra, N., Gupta, M., Kovar, A. & Meibohm, B. 2006. The role of pharmacokinetics and pharmacodynamics in phosphodiesterase-5 inhibitor therapy. Int J Impot Res, 19, 253-264.
Mellor, D., Cook, C. & Stafford, K. 2000. Quantifying some responses to pain as a stressor. The Biology of Animal Stress: Basic Principles and Implications for Welfare, 171-98.
Mellor, D. & Gregory, N. 2003. Responsiveness, behavioural arousal and awareness in fetal and newborn lambs: experimental, practical and therapeutic implications. New Zealand Veterinary Journal, 51, 2-13.
Mellor, D. & Stafford, K. 2000. Acute castration and/or tailing distress and its alleviation in lambs. New Zealand Veterinary Journal, 48, 33-43.
Melzack, R. & Wall, P. D. 1965. Pain Mechanisms: A New Theory. Science, 150, 971-979. Available: DOI 10.1126/science.150.3699.971.
Millan, M. J. 2002. Descending control of pain. Progress in Neurobiology, 66, 355-474. Available: DOI http://dx.doi.org/10.1016/S0301-0082(02)00009-6.
Milligan, E. D. & Watkins, L. R. 2009. Pathological and protective roles of glia in chronic pain. Nat Rev Neurosci, 10, 23-36.
Millman, S. T. 2013. Behavioral responses of cattle to pain and implications for diagnosis, management, and animal welfare. Veterinary Clinics of North America: Food Animal Practice, 29, 47-58.
Mills, S., Jacoby, R., Chacksfield, M. & Willoughby, M. 1996. Effect of a proprietary herbal medicine on the relief of chronic arthritic pain: a double-blind study. Rheumatology, 35, 874-878.
Mitchell, J. A., Akarasereenont, P., Thiemermann, C., Flower, R. J. & Vane, J. R. 1993. Selectivity of nonsteroidal antiinflammatory drugs as inhibitors of constitutive and inducible cyclooxygenase. Proceedings of the National Academy of Sciences, 90, 11693-11697.
196
Mitchell, J. A., Saunders, M., Barnes, P. J., Newton, R. & Belvisi, M. G. 1997. Sodium Salicylate Inhibits Cyclo-Oxygenase-2 Activity Independently of Transcription Factor (Nuclear Factor κB) Activation: Role of Arachidonic Acid. Molecular Pharmacology, 51, 907-912. Available: DOI 10.1124/mol.51.6.907.
Modric, Webb & Derendorf 1998. Pharmacokinetics and pharmacodynamics of tilmicosin in sheep and cattle. Journal of Veterinary Pharmacology and Therapeutics, 21, 444-452. Available: DOI 10.1046/j.1365-2885.1998.00177.x.
Moens, Y., Lanz, F., G. Doherr, M. & Schatzmann, U. 2003. A comparison of the antinociceptive effects of xylazine, detomidine and romifidine on experimental pain in horses. Veterinary Anaesthesia and Analgesia, 30, 183-190. Available: DOI 10.1046/j.1467-2995.2003.00105.x.
Moffat, R. & Rae, C. P. 2011. Anatomy, physiology and pharmacology of pain. Anaesthesia & Intensive Care Medicine, 12, 12-15. Available: DOI http://dx.doi.org/10.1016/j.mpaic.2010.10.011.
Molony, V. & Kent, J. 1997. Assessment of acute pain in farm animals using behavioral and physiological measurements. Journal of animal science, 75, 266-272.
Molony, V., Kent, J. E. & Robertson, I. S. 1995. Assessment of acute and chronic pain after different methods of castration of calves. Applied Animal Behaviour Science, 46, 33-48. Available: DOI http://dx.doi.org/10.1016/0168-1591(95)00635-4.
Montellano, P. R. O. D. 2013. Cytochrome P450-activated prodrugs. Future medicinal chemistry, 5, 213-228. Available: DOI 10.4155/fmc.12.197.
Montossi, F., Font-I-Furnols, M., Del Campo, M., San Julián, R., Brito, G. & Sañudo, C. 2013. Sustainable sheep production and consumer preference trends: Compatibilities, contradictions, and unresolved dilemmas. Meat Science, 95, 772-789. Available: DOI http://dx.doi.org/10.1016/j.meatsci.2013.04.048.
Morck, D. W., Gard, M. S. & Olson, M. E. 1994. Experimental evaluation of a commercial footrot vaccine against native Canadian strains of Dichelobacter nodosus. Canadian Journal of Veterinary Research, 58, 122-126.
Moriyama, T., Higashi, T., Togashi, K., Iida, T., Segi, E., Sugimoto, Y., Tominaga, T., Narumiya, S. & Tominaga, M. 2005. Sensitization of TRPV1 by EP1 and IP reveals peripheral nociceptive mechanism of prostaglandins. Molecular pain, 1, 3.
Morton, D. & Griffiths, P. 1985. Guidelines on the recognition of pain, distress and discomfort in experimental animals and an hypothesis for assessment. The Veterinary Record, 116, 431-436.
Moss, A., Beggs, S., Vega-Avelaira, D., Costigan, M., Hathway, G. J., Salter, M. W. & Fitzgerald, M. 2007. Spinal microglia and neuropathic pain in young rats. Pain, 128, 215-224.
Moya, L. S., Boyle, L. A., Lynch, P. B. & Arkins, S. 2008. Effect of surgical castration on the behavioural and acute phase responses of 5-day-old piglets. Applied Animal Behaviour Science, 111, 133-145. Available: DOI http://dx.doi.org/10.1016/j.applanim.2007.05.019.
Muiriii, W. W. 2002. Physiology and Pathophysiology of Pain. In: Gaynor, J. S. & Iii, W. W. M. (eds.) Handbook of Veterinary Pain Management, second edition. St. Louis Missouri: Mosby Elsevier.
Murnane, D. 1933. Foot-rot in sheep. J. Coun. scient. ind. Res. Aust., 6, 252-259.
197
Murrell, J. C. & Johnson, C. B. 2006. Neurophysiological techniques to assess pain in animals. Journal of Veterinary Pharmacology and Therapeutics, 29, 325-335. Available: DOI 10.1111/j.1365-2885.2006.00758.x.
Murrell, J. C., White, K. L., Johnson, C. B., Taylor, P. M., Doherty, T. J. & Waterman-Pearson, A. E. 2005. Investigation of the EEG effects of intravenous lidocaine during halothane anaesthesia in ponies. Veterinary Anaesthesia and Analgesia, 32, 212-221. Available: DOI 10.1111/j.1467-2995.2005.00201.x.
Musk, G. C. 2013. Pain assessment in animals. Australasian Anaesthesia, 209. Musk, G. C., Murdoch, F. R., Tuke, J., Kemp, M. W., Dixon, M. J. & Taylor, P. M. 2013.
Thermal and mechanical nociceptive threshold testing in pregnant sheep. Veterinary Anaesthesia and Analgesia, n/a-n/a. Available: DOI 10.1111/vaa.12103.
Musonda, K., Barry, T. N., Mcwilliam, E. L., Lopez-Villalobos, N. & Pomroy, W. E. 2009. Grazing willow (Salix spp.) fodder blocks for increased reproductive rates and internal parasite control in mated hoggets. Animal Feed Science and Technology, 150, 46-61. Available: DOI http://dx.doi.org/10.1016/j.anifeedsci.2008.08.003.
Nagata, K. & Hirai, H. 2003. The second PGD2 receptor CRTH2: structure, properties, and functions in leukocytes. Prostaglandins, Leukotrienes and Essential Fatty Acids, 69, 169-177. Available: DOI http://dx.doi.org/10.1016/S0952-3278(03)00078-4.
Nahrstedt, A., Schmidt, M., Jäggi, R., Metz, J. & Khayyal, M. T. 2007. Willow bark extract: the contribution of polyphenols to the overall effect. Wiener Medizinische Wochenschrift, 157, 348-351.
Nalon, E., Maes, D., Piepers, S., Van Riet, M. M. J., Janssens, G. P. J., Millet, S. & Tuyttens, F. a. M. 2013. Mechanical nociception thresholds in lame sows: Evidence of hyperalgesia as measured by two different methods. The Veterinary Journal, 198, 386-390. Available: DOI http://dx.doi.org/10.1016/j.tvjl.2013.08.016.
Narumiya, S. 2003. Prostanoids in immunity: Roles revealed by mice deficient in their receptors. Life Sciences, 74, 391-395. Available: DOI http://dx.doi.org/10.1016/j.lfs.2003.09.025.
Nawaz, M. & Nawaz, R. 1983. Pharmacokinetics and urinary excretion of sulphadimidine in sheep during summer and winter. The Veterinary record, 112, 379-381.
Needs, C. & Brooks, P. M. 1985. Clinical Pharmacokinetics of the Salicylates. Clinical Pharmacokinetics, 10, 164-177. Available: DOI 10.2165/00003088-198510020-00004.
Needs, C. J. & Brooks, P. M. 2012. Clinical Pharmacokinetics of the Salicylates. Clinical Pharmacokinetics, 10, 164-177. Available: DOI 10.2165/00003088-198510020-00004.
Neill, J. & Hickman, R. J. 1997. Influence of pH on drug absorption from the gastrointestinal tract. Journal of chemical education, 74, 855-856.
Newsholme, C. 1992. Willows: the genus Salix, Timber Press, Inc. Nichols-Orians, C. M., Fritz, R. S. & Clausen, T. P. 1993. The genetic basis for variation
in the concentration of phenolic glycosides in Salix sericea: Clonal variation and sex-based differences. Biochemical Systematics and Ecology, 21, 535-542. Available: DOI http://dx.doi.org/10.1016/0305-1978(93)90052-S.
198
Nielsen, C. S., Stubhaug, A., Price, D. D., Vassend, O., Czajkowski, N. & Harris, J. R. 2008. Individual differences in pain sensitivity: Genetic and environmental contributions. PAIN, 136, 21-29. Available: DOI http://dx.doi.org/10.1016/j.pain.2007.06.008.
Nolan, A., Livingston, A., Morris, R. & Waterman, A. 1987a. Techniques for comparison of thermal and mechanical nociceptive stimuli in the sheep. J Pharmacol Methods, 17, 39-49.
Nolan, A., Livingston, A. & Waterman, A. 1987b. Investigation of the antinociceptive activity of buprenorphine in sheep. British Journal of Pharmacology, 92, 527-533.
Nolan, A., Waterman, A. & Livingston, A. 1988. The correlation of the thermal and mechanical antinociceptive activity of pethidine hydrochloride with plasma concentrations of the drug in sheep. Journal of veterinary pharmacology and therapeutics, 11, 94-102.
Nolan, A. M. 2000. Chapter 3 - Pharmacology of Analgesic Drugs. In: Waterman-Pearson, P. a. F. (ed.) Pain Management in Animals. Oxford: W.B. Saunders. Available: DOI http://dx.doi.org/10.1016/B978-0-7020-1767-4.50006-0.
Norberg-King, T. 2005. Toxicity reduction and toxicity identification evaluations for effluents, ambient waters, and other aqueous media, SETAC.
Nordgreen, J., Garner, J. P., Janczak, A. M., Ranheim, B., Muir, W. M. & Horsberg, T. E. 2009. Thermonociception in fish: Effects of two different doses of morphine on thermal threshold and post-test behaviour in goldfish (Carassius auratus). Applied Animal Behaviour Science, 119, 101-107. Available: DOI http://dx.doi.org/10.1016/j.applanim.2009.03.015.
O'kruk, R. J., Adams, M. A. & Philp, R. B. 1984. Rapid and sensitive determination of acetylsalicylic acid and its metabolites using reversed-phase high-performance liquid chromatography. Journal of Chromatography B: Biomedical Sciences and Applications, 310, 343-352. Available: DOI http://dx.doi.org/10.1016/0378-4347(84)80099-7.
O Callaghan, K., Cripps, P., Downham, D. & Murray, R. 2003. Subjective and objective assessment of pain and discomfort due to lameness in dairy cattle. Animal Welfare-Potters Bar then Wheathampstead-, 12, 605-610.
Olesen, A. E., Andresen, T., Staahl, C. & Drewes, A. M. 2012. Human Experimental Pain Models for Assessing the Therapeutic Efficacy of Analgesic Drugs. Pharmacological Reviews, 64, 722-779. Available: DOI 10.1124/pr.111.005447.
Olsen, A. & Charlton, J. Practical tree fodder experience during drought. Proceedings of the sustainable farming fund tree fodder workshop. Grassland research and practice series, 2003. 17-22.
Ong, R., Morris, J., O'dwyer, J., Barnett, J., Hemsworth, P. & Clarke, I. 1997. Behavioural and EEG changes in sheep in response to painful acute electrical stimuli. Aust Vet J, 75, 189-193.
Oppong, S., Kemp, P., Douglas, G. & Bulloch, B. Management of browse plants as drought fodder for sheep: a preliminary study. Proceedings of The Conference-New Zealand Grassland Association, 1996. 93-98.
Owens, P., Smith, R., Green, D. & Falconer, L. 1984. Effect of hypoglycemic stress on plasma and cerebrospinal fluid immunoreactive β-endorphin in conscious sheep. Neuroscience letters, 49, 1-6.
199
Palazzo, E., Rossi, F. & Maione, S. 2008. Role of TRPV1 receptors in descending modulation of pain. Molecular and Cellular Endocrinology, 286, S79-S83. Available: DOI http://dx.doi.org/10.1016/j.mce.2008.01.013.
Palo, R. T. 1984. Distribution of birch (Betula spp.), willow (Salix spp.), and poplar (Populus spp.) secondary metabolites and their potential role as chemical defense against herbivores. Journal of Chemical Ecology, 10, 499-520.
Panksepp, J. 2005. Affective consciousness: Core emotional feelings in animals and humans. Consciousness and Cognition, 14, 30-80. Available: DOI http://dx.doi.org/10.1016/j.concog.2004.10.004.
Paoletti, P., Bellone, C. & Zhou, Q. 2013. NMDA receptor subunit diversity: impact on receptor properties, synaptic plasticity and disease. Nat Rev Neurosci, 14, 383-400. Available: DOI 10.1038/nrn3504.
Papich, M. G. 2000. Pharmacologic considerations for opiate analgesic and nonsteroidal anti-inflammatory drugs. Veterinary Clinics of North America: Small Animal Practice, 30, 815-837.
Pappagallo, M. 2005. Sensory modalities and their afferent modalities. The Neurological Basis of Pain, p. 122: edited from Martin JH: Neuroanatomy: Text and Atlas, 3d ed., 2003, p. 108. New York: McGraw-Hill.
Parton, Balmer, Boyle, Whittem & Machon 2000. The pharmacokinetics and effects of intravenously administered carprofen and salicylate on gastrointestinal mucosa and selected biochemical measurements in healthy cats. Journal of Veterinary Pharmacology and Therapeutics, 23, 73-79. Available: DOI 10.1046/j.1365-2885.2000.00253.x.
Pasargiklian, M., Bianco, S. & Allegra, L. 1976. Clinical, functional and pathogenetic aspects of bronchial reactivity to prostaglandins F2alpha, E1, and E2. Advances in prostaglandin and thromboxane research, 1, 461-475.
Paul-Clark, M. J., Van Cao, T., Moradi-Bidhendi, N., Cooper, D. & Gilroy, D. W. 2004. 15-epi-lipoxin A4–mediated induction of nitric oxide explains how aspirin inhibits acute inflammation. The Journal of experimental medicine, 200, 69-78.
Paul-Murphy, J., Ludders, J. W., Robertson, S. A., Gaynor, J. S., Hellyer, P. W. & Wong, P. L. 2004. The need for a cross-species approach to the study of pain in animals. Journal of the American Veterinary Medical Association, 224, 692-697. Available: DOI 10.2460/javma.2004.224.692.
Pea, F. & Furlanut, M. 2008. Importance of pharmacokinetics. Core Topics in Cardiothoracic Critical Care, 123.
Pérez-Urizar, J., Granados-Soto, V., Flores-Murrieta, F. J. & Castañeda-Hernández, G. 2000. Pharmacokinetic-Pharmacodynamic Modeling: Why? Archives of Medical Research, 31, 539-545. Available: DOI http://dx.doi.org/10.1016/S0188-4409(00)00242-3.
Phillips, C. & Daly, C. 2008. Willows or natives for stream bank control: a survey of usage in New Zealand regional councils. Landcare Research, Lincoln, New Zealand. Available: http://icm.landcareresearch.co.nz/knowledgebase/publications/public/Willows_survey_report_2008.pdf.
200
Pin, J. P. & Duvoisin, R. 1995. The metabotropic glutamate receptors: Structure and functions. Neuropharmacology, 34, 1-26. Available: DOI http://dx.doi.org/10.1016/0028-3908(94)00129-G.
Pirola, R., Bareggi, S. R. & De Benedittis, G. 1998. Determination of acetylsalicylic acid and salicylic acid in skin and plasma by high-performance liquid chromatography. Journal of Chromatography B: Biomedical Sciences and Applications, 705, 309-315. Available: DOI http://dx.doi.org/10.1016/S0378-4347(97)00539-2.
Pitta, D. W., Barry, T. N., Lopez-Villalobos, N. & Kemp, P. D. 2005. Effects on ewe reproduction of grazing willow fodder blocks during drought. Animal Feed Science and Technology, 120, 217-234. Available: DOI http://dx.doi.org/10.1016/j.anifeedsci.2005.02.030.
Pitta, D. W., Barry, T. N., Lopez-Villalobos, N. & Kemp, P. D. 2007. Willow fodder blocks—An alternate forage to low quality pasture for mating ewes during drought? Animal Feed Science and Technology, 133, 240-258. Available: DOI http://dx.doi.org/10.1016/j.anifeedsci.2006.04.006.
Pobłocka-Olech, L. & Krauze-Baranowska, M. 2008. SPE-HPTLC of procyanidins from the barks of different species and clones of Salix. Journal of pharmaceutical and biomedical analysis, 48, 965-968.
Pobłocka-Olech, L., Krauze-Baranowska, M., Głód, D., Kawiak, A. & Łojkowska, E. 2010. Chromatographic analysis of simple phenols in some species from the genus Salix. Phytochemical Analysis, 21, 463-469. Available: DOI 10.1002/pca.1220.
Poller, C., Hopster, K., Rohn, K. & Kastner, S. B. 2013. Evaluation of contact heat thermal threshold testing for standardized assessment of cutaneous nociception in horses - comparison of different locations and environmental conditions. BMC Veterinary Research, 9, 4.
Poppe, H., Kraak, J. C., Huber, J. F. K. & Berg, J. H. M. 1981. Temperature gradients in HPLC columns due to viscous heat dissipation. Chromatographia, 14, 515-523. Available: DOI 10.1007/bf02265631.
Prado, W. A. 2001. Involvement of calcium in pain and antinociception. Brazilian Journal of Medical and Biological Research, 34, 449-461.
Preston, S. J., Arnold, M. H., Beller, E. M., Brooks, P. M. & Buchanan, W. W. 1989. Comparative analgesic and anti-inflammatory properties of sodium salicylate and acetylsalicylic acid (aspirin) in rheumatoid arthritis. British Journal of Clinical Pharmacology, 27, 607-611. Available: DOI 10.1111/j.1365-2125.1989.tb03423.x.
Pritchett, L. C., Ulibarri, C., Roberts, M. C., Schneider, R. K. & Sellon, D. C. 2003. Identification of potential physiological and behavioral indicators of postoperative pain in horses after exploratory celiotomy for colic. Applied Animal Behaviour Science, 80, 31-43. Available: DOI http://dx.doi.org/10.1016/S0168-1591(02)00205-8.
Purves, D., Augustine, G. J., Fitzpatrick, D., Katz, L. C., Lamantia, A.-S., Mcnamara, J. O. & Williams, S. M. 2001. Central Pain Pathways: The Spinothalamic Tract.
Quinn, M. M., Keuler, N. S., Lu, Y. a. N., Faria, M. L. E., Muir, P. & Markel, M. D. 2007. Evaluation of Agreement Between Numerical Rating Scales, Visual Analogue Scoring Scales, and Force Plate Gait Analysis in Dogs. Veterinary Surgery, 36, 360-367. Available: DOI 10.1111/j.1532-950X.2007.00276.x.
Rainsford, K. D. 2013. Aspirin and the Salicylates, Elsevier.
201
Ramírez-Restrepo, C. A., Barry, T. N., Marriner, A., López-Villalobos, N., Mcwilliam, E. L., Lassey, K. R. & Clark, H. 2010. Effects of grazing willow fodder blocks upon methane production and blood composition in young sheep. Animal Feed Science and Technology, 155, 33-43. Available: DOI http://dx.doi.org/10.1016/j.anifeedsci.2009.10.003.
Rank, N. E. 1991. Effects of plant chemical variation on a specialist herbivore: willow leaf beetles in the Eastern Sierra Nevada. Natural History of Eastern California and High-altitude Research. University of California Press, Berkeley, 161-181.
Rao, P. & Knaus, E. E. 2008. Evolution of nonsteroidal anti-inflammatory drugs (NSAIDs): cyclooxygenase (COX) inhibition and beyond. Journal of Pharmacy & Pharmaceutical Sciences, 11, 81s-110s.
Rayburn, E. R., Ezell, S. J. & Zhang, R. 2009. Anti-Inflammatory Agents for Cancer Therapy. Molecular and cellular pharmacology, 1, 29-43. Available: DOI 10.4255/mcpharmacol.09.05.
Reid, J., Nolan, A. M., Hughes, J. M. L., Lascelles, D., Pawson, P. & Scott, E. M. 2007. Development of the short-form Glasgow Composite Measure Pain Scale (CMPS-SF) and derivation of an analgesic intervention score. Animal Welfare, 16, 97-104.
Reidl, U. 1983. Determination of acetylsalicyclic acid and metabolites in biological fluids by high-performance liquid chromatography. Journal of Chromatography B: Biomedical Sciences and Applications, 272, 325-331. Available: DOI http://dx.doi.org/10.1016/S0378-4347(00)86135-6.
Remington, J. P., Troy, D. B. & Beringer, P. 2006. Remington: The science and practice of pharmacy, Lippincott Williams & Wilkins.
Rexed, B. 1952. The cytoarchitectonic organization of the spinal cord in the cat. Journal of Comparative Neurology, 96, 415-495.
Ricciotti, E. & Fitzgerald, G. A. 2011. Prostaglandins and Inflammation. Arteriosclerosis, Thrombosis, and Vascular Biology, 31, 986-1000. Available: DOI 10.1161/atvbaha.110.207449.
Riegelman, S. & Collier, P. 1980. The application of statistical moment theory to the evaluation ofin vivo dissolution time and absorption time. Journal of pharmacokinetics and biopharmaceutics, 8, 509-534.
Riviere, J. E. 2009. Absorption, Distribution, Metabolism, and Elimination. In: Riviere, J. E. & Papich, M. G. (eds.) Veterinary Pharmacology and Therapeutics. Iowa, USA: Wiley-Blackwell.
Riviere, J. E. 2011a. Compartmental Models. Comparative Pharmacokinetics. Wiley-Blackwell. Available: DOI 10.1002/9780470959916.ch8.
Riviere, J. E. 2011b. Noncompartmental Models. Comparative Pharmacokinetics. Wiley-Blackwell. Available: DOI 10.1002/9780470959916.ch9.
Riviere, J. E. & Papich, M. G. 2013. Veterinary pharmacology and therapeutics, John Wiley & Sons.
Roberts, M., Magnusson, B., Burczynski, F. & Weiss, M. 2002. Enterohepatic Circulation. Clinical Pharmacokinetics, 41, 751-790. Available: DOI 10.2165/00003088-200241100-00005.
Robertson, S. A. & Taylor, P. M. 2004. Pain management in cats—past, present and future. Part 2. Treatment of pain—clinical pharmacology. Journal of Feline Medicine and Surgery, 6, 321-333. Available: DOI 10.1016/j.jfms.2003.10.002.

202
Rosenbaum, S. E. 2012. Basic pharmacokinetics and pharmacodynamics: An integrated textbook and computer simulations, John Wiley & Sons.
Rouzer, C. A. & Marnett, L. J. 2009. Cyclooxygenases: structural and functional insights. Journal of Lipid Research, 50, S29-S34. Available: DOI 10.1194/jlr.R800042-JLR200.
Rumble, R. H., Roberts, M. S. & Wanwimolruk, S. 1981. Determination of aspirin and its major metabolites in plasma by high-performance liquid chromatography without solvent extraction. Journal of Chromatography B: Biomedical Sciences and Applications, 225, 252-260. Available: DOI http://dx.doi.org/10.1016/S0378-4347(00)80270-4.
Rutherford, K. M. D. 2002. Assessing Pain in Animals. Animal Welfare, 11, 31-53. Saltzman, A. 1948. Fluorophotometric method for the estimation of salicylate in blood.
Journal of Biological Chemistry, 174, 399-404. Sandercock, D. A., Gibson, I. F., Brash, H. M., Rutherford, K., Scott, E. M. & Nolan, A.
M. 2009. Development of a mechanical stimulator and force measurement system for the assessment of nociceptive thresholds in pigs. Journal of Neuroscience Methods, 182, 64-70.
Sandler, R. S., Halabi, S., Baron, J. A., Budinger, S., Paskett, E., Keresztes, R., Petrelli, N., Pipas, J. M., Karp, D. D., Loprinzi, C. L., Steinbach, G. & Schilsky, R. 2003. A Randomized Trial of Aspirin to Prevent Colorectal Adenomas in Patients with Previous Colorectal Cancer. New England Journal of Medicine, 348, 883-890. Available: DOI doi:10.1056/NEJMoa021633.
Sawyer, M. & Kumar, V. 2003. A Rapid High-Performance Liquid Chromatographic Method for the Simultaneous Quantitation of Aspirin, Salicylic Acid, and Caffeine in Effervescent Tablets. Journal of Chromatographic Science, 41, 393-397. Available: DOI 10.1093/chromsci/41.8.393.
Schäfer, A., Chovanová, Z., Muchová, J., Sumegová, K., Liptáková, A., Ďuračková, Z. & Högger, P. 2006. Inhibition of COX-1 and COX-2 activity by plasma of human volunteers after ingestion of French maritime pine bark extract (Pycnogenol). Biomedicine & Pharmacotherapy, 60, 5-9. Available: DOI http://dx.doi.org/10.1016/j.biopha.2005.08.006.
Schaible, H.-G. 2006. Peripheral and central mechanisms of pain generation. Analgesia. Springer.
Scherkl, R., Hashem, A. & Frey, H. H. 1996. [The tissue cage in dogs--a pharmacologic model for the representation of plasma and tissue kinetics]. Dtsch Tierarztl Wochenschr, 103, 174-7.
Schmid, B., Kötter, I. & Heide, L. 2001a. Pharmacokinetics of salicin after oral administration of a standardised willow bark extract. European journal of clinical pharmacology, 57, 387-391.
Schmid, B., Lüdtke, R., Selbmann, H. K., Kötter, I., Tschirdewahn, B., Schaffner, W. & Heide, L. 2001b. Efficacy and tolerability of a standardized willow bark extract in patients with osteoarthritis: randomized placebo‐controlled, double blind clinical trial. Phytotherapy Research, 15, 344-350.
Schwartzkoff, C. L., Egerton, J. R., Stewart, D. J., Lehrbach, P. R., Elleman, T. C. & Hoyne, P. A. 1993. The effects of antigenic competition on the efficacy of
203
multivalent footrot vaccines. Australian Veterinary Journal, 70, 123-126. Available: DOI 10.1111/j.1751-0813.1993.tb06101.x.
Schwinghammer, T. L. & Kroboth, P. D. 1988. Basic Concepts in Pharmacodynamic Modeling. The Journal of Clinical Pharmacology, 28, 388-394. Available: DOI 10.1002/j.1552-4604.1988.tb05745.x.
Scott, J. & Huskisson, E. C. 1976. Graphic representation of pain. Pain, 2, 175-184. Available: DOI http://dx.doi.org/10.1016/0304-3959(76)90113-5.
Seaman, D. R. 2011. White Willow Bark: The Oldest New Natural Anti-inflammatory/Analgesic agent. American Chiropractor, 33, 52.
Seip, D. R. & Bunnell, F. L. 1985. Foraging behaviour and food habits of Stone's sheep. Canadian Journal of Zoology, 63, 1638-1646. Available: DOI 10.1139/z85-243.
Serhan, C. N. 1997. Lipoxins and novel aspirin-triggered 15-epi-lipoxins (ATL): a jungle of cell-cell interactions or a therapeutic opportunity? Prostaglandins, 53, 107-137.
Setty, A. R. & Sigal, L. H. 2005. Herbal Medications Commonly Used in the Practice of Rheumatology: Mechanisms of Action, Efficacy, and Side Effects. Seminars in Arthritis and Rheumatism, 34, 773-784. Available: DOI http://dx.doi.org/10.1016/j.semarthrit.2005.01.011.
Shaw, L.-H. & Tsai, T.-H. 2012. Simultaneous determination and pharmacokinetics of protein unbound aspirin and salicylic acid in rat blood and brain by microdialysis: An application to herbal–drug interaction. Journal of Chromatography B, 895–896, 31-38. Available: DOI http://dx.doi.org/10.1016/j.jchromb.2012.03.010.
Shelton, M. 2004. Predation and Livestock Production: Perspective and Overview. Sherrington, C. S. 1906. Observations on the scratch-reflex in the spinal dog. J Physiol, 34,
1-50. Short, C. E. 1998. Fundamentals of pain perception in animals. Applied Animal Behaviour
Science, 59, 125-133. Available: DOI http://dx.doi.org/10.1016/S0168-1591(98)00127-0.
Short, C. E. 2003. The management of animal pain where have we been, where are now, and where are we going? The Veterinary Journal, 165, 101-103.
Short, C. R., Hsieh, L. C., Malbrough, M. S., Barker, S. A., Neff-Davis, C. A., Davis, L. E., Koritz, G. & Bevill, R. F. 1990. Elimination of salicylic acid in goats and cattle. Am J Vet Res, 51, 1267-70.
Short, C. R., Neff-Davis, C. A., Hsieh, L. C., Koritz, G. D., Malbrough, M. S., Barker, S. A. & Davis, L. E. 1991. Pharmacokinetics and elimination of salicylic acid in rabbits. J Vet Pharmacol Ther, 14, 70-7.
Shutt, D., Fell, L., Connell, R. & Bell, A. 1988. Stress responses in lambs docked and castrated surgically or by the application of rubber rings. Australian Veterinary Journal, 65, 5-7.
Shutt, D., Fell, L., Connell, R., Bell, A., Wallace, C. & Smith, A. 1987. Stress-induced Changes in Plasma Concentrations of Immunoreactive ß-Endorphin and Cortisol in Response to Routine Surgical Procedures in Lambs. Australian Journal of Biological Sciences, 40, 97-104. Available: DOI http://dx.doi.org/10.1071/BI9870097.
Silverstein, F. E., Faich, G., Goldstein, J. L., Simon, L. S., Pincus, T., Whelton, A., Makuch, R., Eisen, G., Agrawal, N. M. & Stenson, W. F. 2000. Gastrointestinal toxicity with celecoxib vs nonsteroidal anti-inflammatory drugs for osteoarthritis

204
and rheumatoid arthritis: the CLASS study: a randomized controlled trial. Jama, 284, 1247-1255.
Silvia, W. J., Lewis, G. S., Mccracken, J. A., Thatcher, W. W. & Wilson, L. 1991. Hormonal regulation of uterine secretion of prostaglandin F2 alpha during luteolysis in ruminants. Biology of Reproduction, 45, 655-663. Available: DOI 10.1095/biolreprod45.5.655.
Simmons, D. L., Botting, R. M., Robertson, P. M., Madsen, M. L. & Vane, J. R. 1999. Induction of an acetaminophen-sensitive cyclooxygenase with reduced sensitivity to nonsteroid antiinflammatory drugs. Proceedings of the National Academy of Sciences, 96, 3275-3280. Available: DOI 10.1073/pnas.96.6.3275.
Simone, D. A. 1992. Neural mechanisms of hyperalgesia. Current Opinion in Neurobiology, 2, 479-483. Available: DOI http://dx.doi.org/10.1016/0959-4388(92)90183-L.
Sinatra, R. 2002. Role of COX-2 Inhibitors in the Evolution of Acute Pain Management. Journal of Pain and Symptom Management, 24, S18-S27. Available: DOI http://dx.doi.org/10.1016/S0885-3924(02)00410-4.
Singh, P. M. 2011. Pharmacology of Analgesic Drugs in Birds. PhD, Massey University. Available: http://mro.massey.ac.nz/handle/10179/3407.
Slingsby, L. S. & Taylor, P. M. 2008. Thermal antinociception after dexmedetomidine administration in cats: a dose-finding study. Journal of Veterinary Pharmacology and Therapeutics, 31, 135-142. Available: DOI 10.1111/j.1365-2885.2007.00931.x.
Smith, D. A., Allerton, C., Kalgutkar, A. S., Han Van De, W. & Walker, D. K. 2012. Pharmacokinetics. Pharmacokinetics and Metabolism in Drug Design. Wiley-VCH Verlag GmbH & Co. KGaA. Available: DOI 10.1002/9783527645763.ch2.
Smith, D. A., Van De Waterbeemd, H. & Walker, D. K. 2006. Pharmacokinetics. Pharmacokinetics and Metabolism in Drug Design. Wiley-VCH Verlag GmbH & Co. KGaA. Available: DOI 10.1002/3527608222.ch2.
Smith, F., Smith, D. & Argus, G. 1978. Willows for pleasure and benefit [Salix, varieities, ornamentals]. American Horticulturist.
Smith, S. A., Tobias, A. H., Jacob, K. A., Fine, D. M. & Grumbles, P. L. 2003. Arterial Thromboembolism in Cats: Acute Crisis in 127 Cases (1992–2001) and Long-Term Management with Low-Dose Aspirin in 24 Cases. Journal of Veterinary Internal Medicine, 17, 73-83. Available: DOI 10.1111/j.1939-1676.2003.tb01326.x.
Smith, W. L., Garavito, R. M. & Dewitt, D. L. 1996. Prostaglandin Endoperoxide H Synthases (Cyclooxygenases)-1 and −2. Journal of Biological Chemistry, 271, 33157-33160. Available: DOI 10.1074/jbc.271.52.33157.
Smyth, E. M., Grosser, T., Wang, M., Yu, Y. & Fitzgerald, G. A. 2009. Prostanoids in health and disease. Journal of Lipid Research, 50, S423-S428. Available: DOI 10.1194/jlr.R800094-JLR200.
Sneddon, L. U. & Gentle, M. J. 2000. Pain in farm animals. Mariensee: Federal Agricultural Research Centre (FAL).
Stace, C. 1998. Uses and management of willow species. Whakatane, New Zealand: Bay of Plenty Regional Council. Available: http://www.boprc.govt.nz/media/29173/LandManagement-090526-Factsheet21.pdf.
205
Stafford, K. & Mellor, D. 2005. The welfare significance of the castration of cattle: a review. New Zealand Veterinary Journal, 53, 271-278.
Stafford, K. J., Mellor, D. J., Todd, S. E., Bruce, R. A. & Ward, R. N. 2002. Effects of local anaesthesia or local anaesthesia plus a non-steroidal anti-inflammatory drug on the acute cortisol response of calves to five different methods of castration. Research in Veterinary Science, 73, 61-70. Available: DOI http://dx.doi.org/10.1016/S0034-5288(02)00045-0.
Stahringer, R., Neuendorff, D. & Randel, R. 1999. The effect of aspirin administration and parity on plasma salicylate concentrations and postpartum reproductive parameters in Brahman cows. Prostaglandins & other lipid mediators, 58, 125-138.
Statistics, N. Z. 2015. Global New Zealand–International trade, investment, and travel profile: Year ended June 2015. Wellington: Ministry of Foreign Affairs and Trade, and Statistics New Zealand. in November 2015 year by Statistics New Zealand Tatauranga Aotearoa Wellington, New Zealand. Available: http://www.stats.govt.nz/browse_for_stats/population/mythbusters/3million-people-60million-sheep.aspx.
Steagall, P. V. M., Taylor, P. M., Brondani, J. T., Luna, S. P. L., Dixon, M. J. & Ferreira, T. H. 2007. Effects of buprenorphine, carprofen and saline on thermal and mechanical nociceptive thresholds in cats. Veterinary Anaesthesia and Analgesia, 34, 344-350. Available: DOI 10.1111/j.1467-2995.2006.00331.x.
Steiner, B., Kamm, A. & Bettschart-Wolfensberger, R. 2003. Influences of carprofen and the experience of the surgeon on post-castration pain in lambs and young sheep. Veterinary Anaesthesia and Analgesia, 30, 91-92. Available: DOI 10.1046/j.1467-2995.2003.00132_7.x.
Stone, E. 1763. An account of the success of the bark of the willow in the cure of agues. In a letter to the Right Honourable George Earl of Macclesfield, President of RS from the Rev. Mr. Edmund Stone, of Chipping-Norton in Oxfordshire. Philosophical Transactions, 53, 195-200.
Sukhtankar, D. D., Lee, H., Rice, K. C. & Ko, M.-C. 2014. Differential Effects of Opioid-Related Ligands and NSAIDs in Nonhuman Primate Models of Acute and Inflammatory Pain. Psychopharmacology, 231, 1377-1387. Available: DOI 10.1007/s00213-013-3341-0.
Sulaiman, S. & Kumar, B. 1995. Pharmacokinetic disposition of sodium-salicylate in sheep. Indian Veterinary Journal, 72, 135-138.
Supèr, H. & Roelfsema, P. R. 2005. Chronic multiunit recordings in behaving animals: advantages and limitations. Progress in Brain Research. Elsevier. Available: DOI http://dx.doi.org/10.1016/S0079-6123(04)47020-4.
Tadich, N., Tejeda, C., Bastias, S., Rosenfeld, C. & Green, L. E. 2013. Nociceptive threshold, blood constituents and physiological values in 213 cows with locomotion scores ranging from normal to severely lame. The Veterinary Journal, 197, 401-405. Available: DOI http://dx.doi.org/10.1016/j.tvjl.2013.01.029.
Takada, Y., Bhardwaj, A., Potdar, P. & Aggarwal, B. B. 2004. Nonsteroidal anti-inflammatory agents differ in their ability to suppress NF-[kappa]B activation, inhibition of expression of cyclooxygenase-2 and cyclin D1, and abrogation of tumor cell proliferation. Oncogene, 23, 9247-9258.
206
Talley, J. J., Brown, D. L., Carter, J. S., Graneto, M. J., Koboldt, C. M., Masferrer, J. L., Perkins, W. E., Rogers, R. S., Shaffer, A. F., Zhang, Y. Y., Zweifel, B. S. & Seibert, K. 2000. 4-[5-Methyl-3-phenylisoxazol-4-yl]- benzenesulfonamide, Valdecoxib: A Potent and Selective Inhibitor of COX-2. Journal of Medicinal Chemistry, 43, 775-777. Available: DOI 10.1021/jm990577v.
Tanelian, D. L. & Beuerman, R. W. 1984. Responses of rabbit corneal nociceptors to mechanical and thermal stimulation. Experimental Neurology, 84, 165-178. Available: DOI http://dx.doi.org/10.1016/0014-4886(84)90013-X.
Tapper, K. R. 2011. An investigation of pressure algometry and thermal sensitivity tests for assessing pain associated with a sow lameness model and calf disbudding.
Tate, S., Benn, S., Hick, C., Trezise, D., John, V., Mannion, R. J., Costigan, M., Plumpton, C., Grose, D. & Gladwell, Z. 1998. Two sodium channels contribute to the TTX-R sodium current in primary sensory neurons. Nature neuroscience, 1, 653-655.
Teismann, P., Vila, M., Choi, D. K., Tieu, K., Wu, D. C., Jackson-Lewis, V. & Przedborski, S. 2003. COX-2 and Neurodegeneration in Parkinson's Disease. Annals of the New York Academy of Sciences, 991, 272-277. Available: DOI 10.1111/j.1749-6632.2003.tb07482.x.
Teixeira, M. 1990. A lesão do trato de Lissauer e do corno posterior da medula espinal e a estimulação elétrica do sistema nervoso central para o tratamento da dor por desaferentação. São Paulo: Faculdade de Medicina da Universidade de São Paulo.
Teplan, M. 2002. Fundamentals of EEG measurement. Measurement science review, 2, 1-11.
Tilley, S. L., Coffman, T. M. & Koller, B. H. 2001. Mixed messages: modulation of inflammation and immune responses by prostaglandins and thromboxanes. Journal of Clinical Investigation, 108, 15-23.
Tjølsen, A. & Hole, K. 1997. Animal models of analgesia. The pharmacology of pain. Springer.
Todd, A. J. 2010. Neuronal circuitry for pain processing in the dorsal horn. Nat Rev Neurosci, 11, 823-836.
Toutain, P.-L. & Bousquet‐Melou, A. 2004a. Bioavailability and its assessment. Journal of veterinary pharmacology and therapeutics, 27, 455-466.
Toutain, P.-L. & Bousquet‐Melou, A. 2004b. Plasma terminal half‐life. Journal of veterinary pharmacology and therapeutics, 27, 427-439.
Toutain, P. L. & Bousquet-Melou, A. 2004a. Plasma clearance. Journal of Veterinary Pharmacology and Therapeutics, 27, 415-425. Available: DOI 10.1111/j.1365-2885.2004.00605.x.
Toutain, P. L. & Bousquet-Melou, A. 2004b. Volumes of distribution. Journal of Veterinary Pharmacology and Therapeutics, 27, 441-453. Available: DOI 10.1111/j.1365-2885.2004.00602.x.
Tracey, I. & Mantyh, P. W. 2007. The Cerebral Signature for Pain Perception and Its Modulation. Neuron, 55, 377-391. Available: DOI http://dx.doi.org/10.1016/j.neuron.2007.07.012.
Trease, G. & Evans, W. 1978. Text book of Pharmacognsy. Bailliere Tindall and Cox, London, 536.
Uehleke, B., Preis, S., Mueller, J., Stange, R., Kelber, O. & Melzer, J. 2013. Willow bark extract STW 33-I is safe and effective in the long-term treatment of out-patients
207
with rheumatic pain, esp osteoarthritis or back pain. A subgroup analysis. Zeitschrift für Phytotherapie, 34, P09.
Urso, R., Blardi, P. & Giorgi, G. 2002. A short introduction to pharmacokinetics. European review for medical and pharmacological sciences, 6, 33-44.
Vaish, V. & Sanyal, S. N. 2011. Chemopreventive effects of NSAIDs on cytokines and transcription factors during the early stages of colorectal cancer. Pharmacol Rep, 63, 1210-21.
Van Jaarsveld, H., Kuyl, J., Van Zyl, G. & Barnard, H. 1994. Salicylate in the perfusate during ischemia/reperfusion prevented mitochondrial injury. Research communications in molecular pathology and pharmacology, 86, 287-295.
Vanderah, T. W., Ossipov, M. H., Lai, J., Malan Jr, T. P. & Porreca, F. 2001. Mechanisms of opioid-induced pain and antinociceptive tolerance: descending facilitation and spinal dynorphin. Pain, 92, 5-9. Available: DOI http://dx.doi.org/10.1016/S0304-3959(01)00311-6.
Vane, J. 2000a. The fight against rheumatism: from willow bark to COX-1 sparing drugs. Journal of physiology and pharmacology, 51.
Vane, J. 2000b. The mechanism of action of anti-inflammatory drugs. Advances in eicosanoid research. Springer.
Vane, J. & Botting, R. 1998. Anti-inflammatory drugs and their mechanism of action. Inflammation Research, 47, 78-87.
Vane, J. R. 1971. Inhibition of prostaglandin synthesis as a mechanism of action for aspirin-like drugs. Nature: New biology, 232-5.
Vanegas, H. & Schaible, H.-G. 2007. NMDA Receptors in Spinal Nociceptive Processing. In: Schmidt, R. F. & Willis, W. D. (eds.) Encyclopedia of Pain. Springer Berlin Heidelberg. Available: DOI 10.1007/978-3-540-29805-2_2732.
Vanegas, H., Vazquez, E. & Tortorici, V. 2010. NSAIDs, Opioids, Cannabinoids and the Control of Pain by the Central Nervous System. Pharmaceuticals, 3, 1335-1347. Available: DOI 10.3390/ph3051335.
Vanhoenacker, G. & Sandra, P. 2007. High temperature and temperature programmed HPLC: possibilities and limitations. Analytical and Bioanalytical Chemistry, 390, 245-248. Available: DOI 10.1007/s00216-007-1671-7.
Vaudry, H. & Biggio, G. 2011. Neurosteroids and GABA-A receptor function. Neurosteroids, 106.
Veissier, I., Rushen, J., Colwell, D. & De Passillé, A. M. 2000. A laser-based method for measuring thermal nociception of cattle. Applied Animal Behaviour Science, 66, 289-304. Available: DOI http://dx.doi.org/10.1016/S0168-1591(99)00099-4.
Verbeeck, R., Blackburn, J. & Loewen, G. 1983. Clinical Pharmacokinetics of Non-steroidal Anti-inflammatory Drugs. Clinical Pharmacokinetics, 8, 297-331. Available: DOI 10.2165/00003088-198308040-00003.
Verwijst, T. 2001. Willows: An underestimated resource for environment and society. The Forestry Chronicle, 77, 281-285. Available: DOI 10.5558/tfc77281-2.
Viñuela-Fernández, I., Jones, E., Welsh, E. M. & Fleetwood-Walker, S. M. 2007. Pain mechanisms and their implication for the management of pain in farm and companion animals. The Veterinary Journal, 174, 227-239. Available: DOI http://dx.doi.org/10.1016/j.tvjl.2007.02.002.
208
Vivancos, G. G., Verri Jr., W. A., Cunha, T. M., Schivo, I. R. S., Parada, C. A., Cunha, F. Q. & Ferreira, S. H. 2004. An electronic pressure-meter nociception paw test for rats. Brazilian Journal of Medical and Biological Research, 37, 391-399.
Vlachojannis, C., Magora, F. & Chrubasik-Hausmann, S. 2014. Pro and Contra Duration Restriction of Treatment with Willow Bark Extract. Phytotherapy Research, 28, 148-149. Available: DOI 10.1002/ptr.5008.
Vlachojannis, J., Magora, F. & Chrubasik, S. 2011. Willow Species and Aspirin: Different Mechanism of Actions. Phytotherapy Research, 25, 1102-1104. Available: DOI 10.1002/ptr.3386.
Vlot, A. C., Dempsey, D. M. A. & Klessig, D. F. 2009. Salicylic acid, a multifaceted hormone to combat disease. Annual review of phytopathology, 47, 177-206.
Voilley, N. 2004. Acid-sensing ion channels (ASICs): new targets for the analgesic effects of non-steroid anti-inflammatory drugs (NSAIDs). Current Drug Targets-Inflammation & Allergy, 3, 71-79.
Walker, J. S. 1995. Australasian Society of Clinical and Experimental Pharmacologists and Toxicologists, 1994: NSAID: An Update on Their Analgesic Effects. Clinical and Experimental Pharmacology and Physiology, 22, 855-860. Available: DOI 10.1111/j.1440-1681.1995.tb01950.x.
Wallace, J. L., Reuter, B. K. & Cirino, G. 1994. Nitric oxide-releasing non-steroidal anti-inflammatory drugs: A novel approach for reducing gastrointestinal toxicity. Journal of Gastroenterology and Hepatology, 9, S40-S44. Available: DOI 10.1111/j.1440-1746.1994.tb01300.x.
Walsh, P., Carvallo Chaigneau, F., Anderson, M., Behrens, N., Mceligot, H., Gunnarson, B. & Gershwin, L. 2016. Adverse effects of a 10‐day course of ibuprofen in Holstein calves. Journal of veterinary pharmacology and therapeutics, 39, 518-521.
Warner, T. D. & Mitchell, J. A. 2002. Cyclooxygenase-3 (COX-3): filling in the gaps toward a COX continuum? Proceedings of the National Academy of Sciences, 99, 13371-13373.
Warren-Wren, S. 1965. The Production of Cricket Bat Timber. Arboricultural Association Journal, 1, 10-15.
Waterman, A., Livingston, A. & Bouchenafa, O. 1988. Analgesic effects of intrathecally-applied< i> α</i>< sub> 2</sub>-adrenoceptor agonists in conscious, unrestrained sheep. Neuropharmacology, 27, 213-216.
Waterman, A. E., Livingston, A. & Amin, A. 1991. Further studies on the antinociceptive activity and respiratory effects of buprenorphine in sheep. J Vet Pharmacol Ther, 14, 230-4.
Welsh, E., Gettinby, G. & Nolan, A. 1993. Comparison of a visual analogue scale and a numerical rating scale for assessment of lameness, using sheep as a model. American journal of veterinary research, 54, 976-983.
Welsh, E. & Nolan, A. 1995. Effect of flunixin meglumine on the thresholds to mechanical stimulation in healthy and lame sheep. Research in veterinary science, 58, 61-66.
Whay, H., Waterman, A., Webster, A. & O'brien, J. 1998. The influence of lesion type on the duration ofhyperalgesia associated with hindlimb lameness in dairy cattle. The veterinary journal, 156, 23-29.
209
Whelton, A. & Hamilton, C. W. 1991. Nonsteroidal anti-inflammatory drugs: effects on kidney function. J Clin Pharmacol, 31, 588-98.
Whittem, T., Freeman, D., Parton, K. & Hanlon, D. 1996. The pharmacokinetics of salicylate in dairy cattle are not altered by simultaneous intravenous ceftiofur sodium and DL‐lysine‐acetyl salicylate (Aspirin). Journal of veterinary pharmacology and therapeutics, 19, 104-108.
Who, W. H. O. 2006. The International Pharmacopoeia, World Health Organization. Wible, J. M. 2005. Pharmacology for massage therapy, Lippincott Williams & Wilkins. Wilcox, G. L., Stone, L. S., Ossipov, M. H., Lai, J. & Porreca, F. 2005. Pharmacology of
Pain Transmission and Modulation I. Central Mechanisms. In: Pappagallo, M. (ed.) The Neurological Basis of Pain. United States of America: McGraw-Hill.
Wilkinson, A. 1999. Poplars and willows for soil erosion control in New Zealand. Biomass Energy, 16, 263 - 274.
William L. Smith, David L. Dewitt, A. & Garavito, R. M. 2000. Cyclooxygenases: Structural, Cellular, and Molecular Biology. Annual Review of Biochemistry, 69, 145-182. Available: DOI doi:10.1146/annurev.biochem.69.1.145.
Willis Jr, W. D. & Coggeshall, R. E. 2004. Sensory pathways in the dorsal funiculus. Sensory mechanisms of the spinal cord. Springer.
Willoughby, D. A., Moore, A. R. & Colville-Nash, P. R. 2000. COX-1, COX-2, and COX-3 and the future treatment of chronic inflammatory disease. The Lancet, 355, 646-648. Available: DOI http://dx.doi.org/10.1016/S0140-6736(99)12031-2.
Winter, A. C. 2008. Lameness in sheep. Small Ruminant Research, 76, 149-153. Available: DOI http://dx.doi.org/10.1016/j.smallrumres.2007.12.008.
Woolf, C. J. & Chong, M.-S. 1993. Preemptive analgesia-treating postoperative pain by preventing the establishment of central sensitization. Anesthesia & Analgesia, 77, 362-379.
Wright, J. M. 2002. The double-edged sword of COX-2 selective NSAIDs. Canadian Medical Association Journal, 167, 1131-1137.
Yaksh, T. L., Hua, X.-Y., Kalcheva, I., Nozaki-Taguchi, N. & Marsala, M. 1999. The spinal biology in humans and animals of pain states generated by persistent small afferent input. Proceedings of the National Academy of Sciences, 96, 7680-7686. Available: DOI 10.1073/pnas.96.14.7680.
Yang, D., He, K. & Cheng, G. 1994. [Effect of tremulacin on actions of SRS-A and histamine]. Yao xue xue bao= Acta pharmaceutica Sinica, 30, 254-257.
Yezierski, R. P. & Mendez, C. M. 1991. Spinal distribution and collateral projections of rat spinomesencephalic tract cells. Neuroscience, 44, 113-130. Available: DOI http://dx.doi.org/10.1016/0306-4522(91)90254-L.
Yu, K. & Chan, P. 2003. Current Understanding of the Neurobiology of Pain. Hong Kong Journal of Orthopaedic Surgery, 7, 62-67.
Yue, T. L. & Varma, D. R. 1982. Pharmacokinetics, metabolism and disposition of salicylate in protein-deficient rats. Drug Metabolism and Disposition, 10, 147-152.
Yuhki, K.-I., Ueno, A., Naraba, H., Kojima, F., Ushikubi, F., Narumiya, S. & Oh-Ishi, S. 2004. Prostaglandin Receptors EP2, EP3, and IP Mediate Exudate Formation in Carrageenin-Induced Mouse Pleurisy. Journal of Pharmacology and Experimental Therapeutics, 311, 1218-1224. Available: DOI 10.1124/jpet.104.071548.

210
Zarghi, A. & Arfaei, S. 2011. Selective COX-2 Inhibitors: A Review of Their Structure-Activity Relationships. Iranian Journal of Pharmaceutical Research : IJPR, 10, 655-683.
Zhang, C.-P., Zheng, H.-Q., Liu, G. & Hu, F.-L. 2011. Development and validation of HPLC method for determination of salicin in poplar buds: Application for screening of counterfeit propolis. Food Chemistry, 127, 345-350. Available: DOI http://dx.doi.org/10.1016/j.foodchem.2011.01.014.

211
Appendix: 1
Chromatographs showing better peak of salicylic acid after replacement of acetic acid in
the mobile phase with OPA for HPLC analysis of salicylic acid
1 2 3 4 5 6 7 8 9 10 11
-50000
0
50000
100000
150000
200000
Acetic acid in mobile phase
OPA in mobile phase
Retention time (minutes)
Inte
nsity
Chromatographs of 50μg SA standard in the mobile phase. SA extraction with Synergi Hydro C18 column and
altered mobile phase mobile phase composition as (a) water (71): acetonitrile (28): OPA (1) and (b) water
(71): acetonitrile (28): acetic acid (1). The chromatograph with mobile phase composition ‘a’ has better peak
resolution than mobile phase composition ‘b’
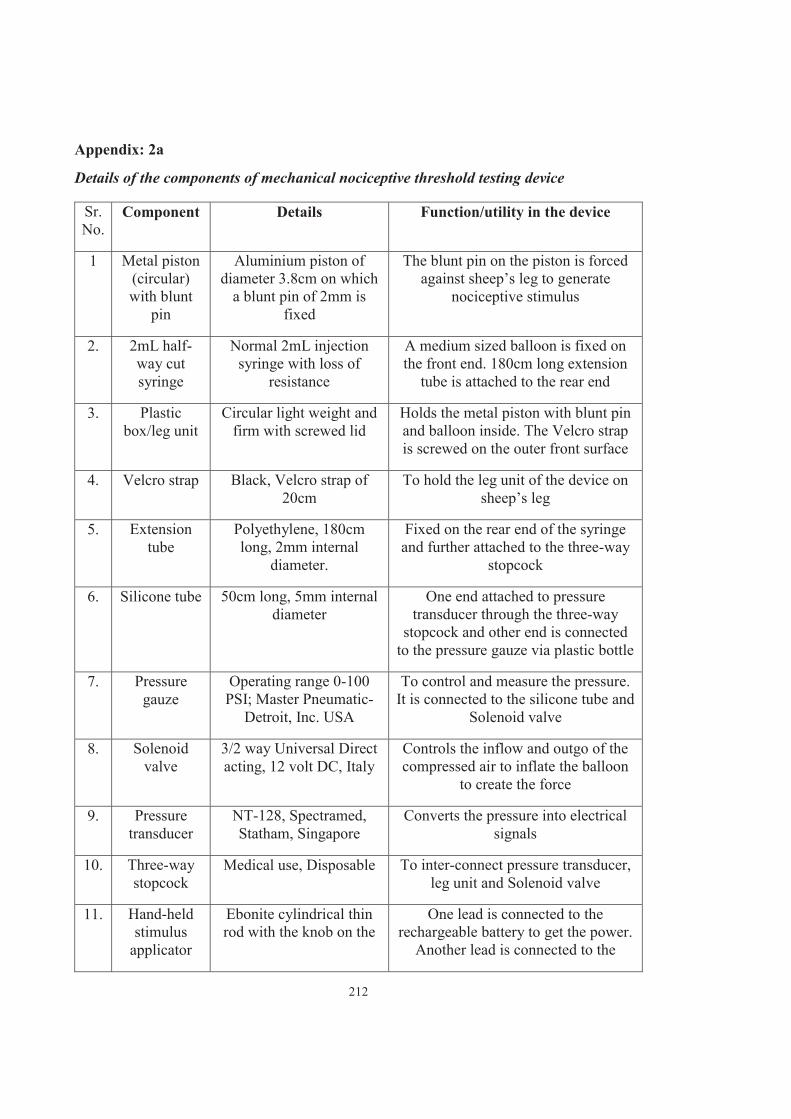
212
Appendix: 2a
Details of the components of mechanical nociceptive threshold testing device
Sr. No.
Component Details Function/utility in the device
1 Metal piston (circular) with blunt
pin
Aluminium piston of diameter 3.8cm on which
a blunt pin of 2mm is fixed
The blunt pin on the piston is forced against sheep’s leg to generate
nociceptive stimulus
2. 2mL half-way cut syringe
Normal 2mL injection syringe with loss of
resistance
A medium sized balloon is fixed on the front end. 180cm long extension
tube is attached to the rear end
3. Plastic box/leg unit
Circular light weight and firm with screwed lid
Holds the metal piston with blunt pin and balloon inside. The Velcro strap is screwed on the outer front surface
4. Velcro strap Black, Velcro strap of 20cm
To hold the leg unit of the device on sheep’s leg
5. Extension tube
Polyethylene, 180cm long, 2mm internal
diameter.
Fixed on the rear end of the syringe and further attached to the three-way
stopcock
6. Silicone tube 50cm long, 5mm internal diameter
One end attached to pressure transducer through the three-way
stopcock and other end is connected to the pressure gauze via plastic bottle
7. Pressure gauze
Operating range 0-100 PSI; Master Pneumatic-
Detroit, Inc. USA
To control and measure the pressure. It is connected to the silicone tube and
Solenoid valve
8. Solenoid valve
3/2 way Universal Direct acting, 12 volt DC, Italy
Controls the inflow and outgo of the compressed air to inflate the balloon
to create the force
9. Pressure transducer
NT-128, Spectramed, Statham, Singapore
Converts the pressure into electrical signals
10. Three-way stopcock
Medical use, Disposable To inter-connect pressure transducer, leg unit and Solenoid valve
11. Hand-held stimulus
applicator
Ebonite cylindrical thin rod with the knob on the
One lead is connected to the rechargeable battery to get the power.
Another lead is connected to the
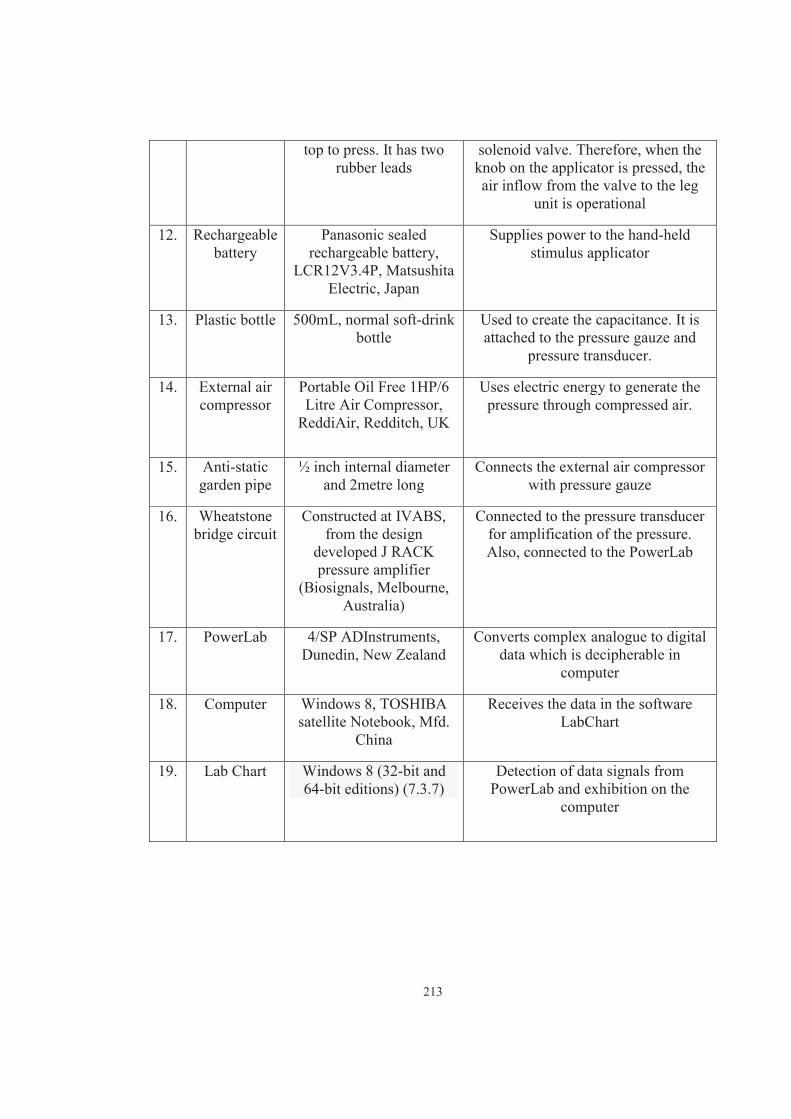
213
top to press. It has two rubber leads
solenoid valve. Therefore, when the knob on the applicator is pressed, the air inflow from the valve to the leg
unit is operational
12. Rechargeable battery
Panasonic sealed rechargeable battery,
LCR12V3.4P, Matsushita Electric, Japan
Supplies power to the hand-held stimulus applicator
13. Plastic bottle 500mL, normal soft-drink bottle
Used to create the capacitance. It is attached to the pressure gauze and
pressure transducer.
14. External air compressor
Portable Oil Free 1HP/6 Litre Air Compressor,
ReddiAir, Redditch, UK
Uses electric energy to generate the pressure through compressed air.
15. Anti-static garden pipe
½ inch internal diameter and 2metre long
Connects the external air compressor with pressure gauze
16. Wheatstone bridge circuit
Constructed at IVABS, from the design
developed J RACK pressure amplifier
(Biosignals, Melbourne, Australia)
Connected to the pressure transducer for amplification of the pressure. Also, connected to the PowerLab
17. PowerLab 4/SP ADInstruments, Dunedin, New Zealand
Converts complex analogue to digital data which is decipherable in
computer
18. Computer Windows 8, TOSHIBA satellite Notebook, Mfd.
China
Receives the data in the software LabChart
19. Lab Chart Windows 8 (32-bit and 64-bit editions) (7.3.7)
Detection of data signals from PowerLab and exhibition on the
computer
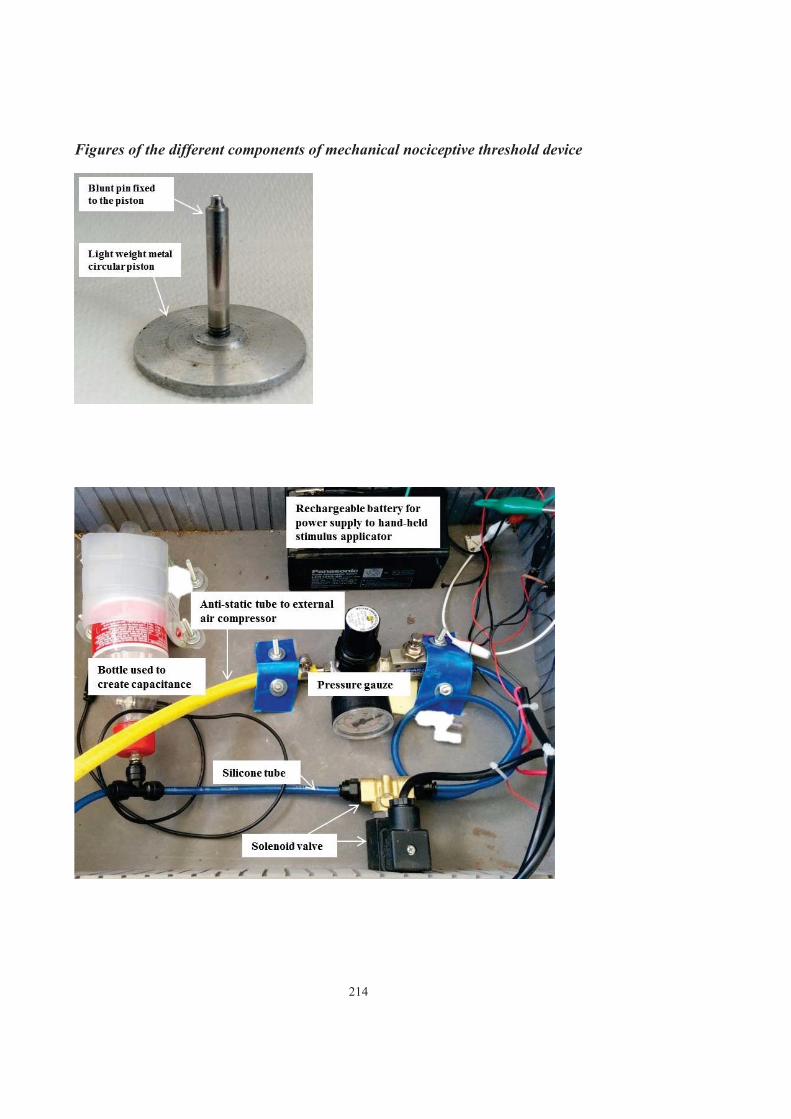
214
Figures of the different components of mechanical nociceptive threshold device
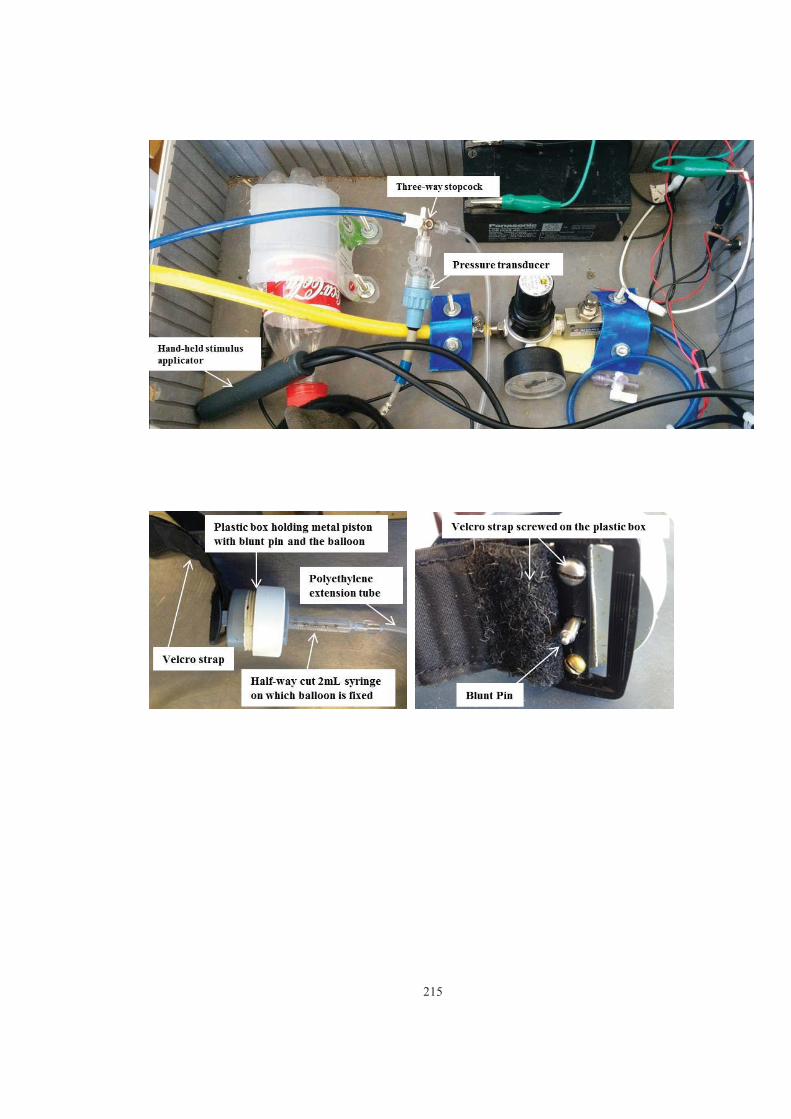
215
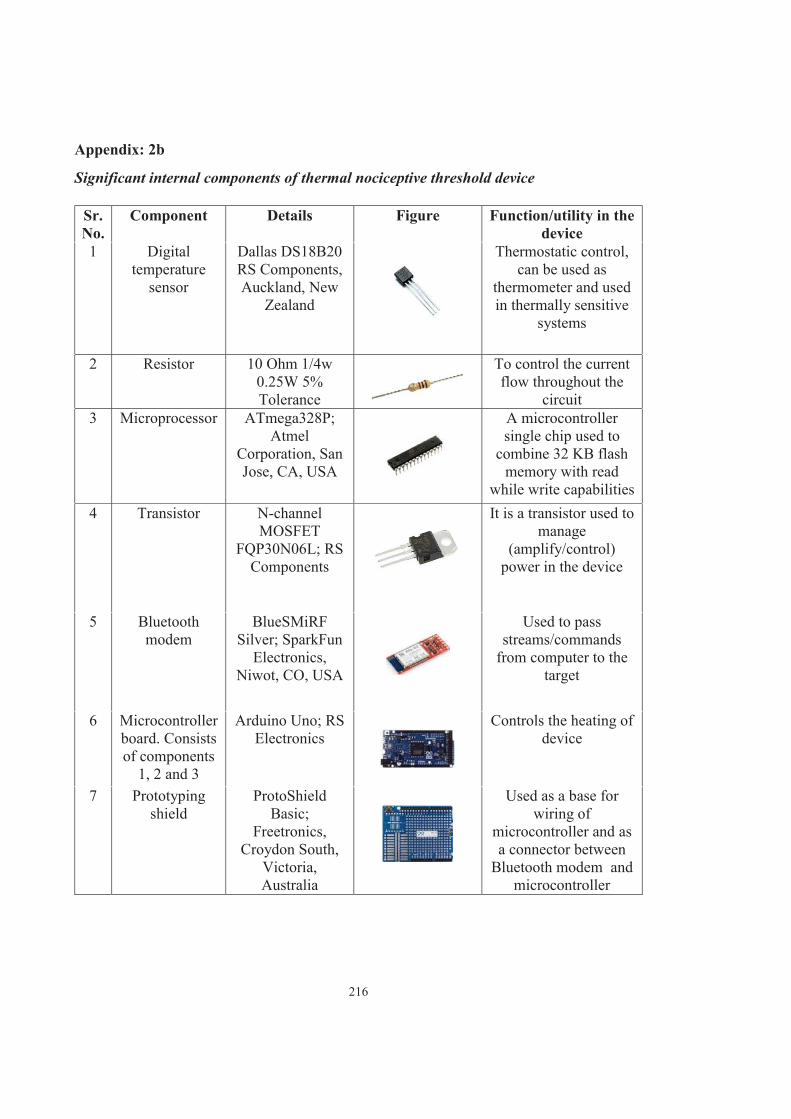
216
Appendix: 2b
Significant internal components of thermal nociceptive threshold device
Sr. No.
Component Details Figure Function/utility in the device
1 Digital temperature
sensor
Dallas DS18B20 RS Components, Auckland, New
Zealand
Thermostatic control, can be used as
thermometer and used in thermally sensitive
systems
2 Resistor 10 Ohm 1/4w 0.25W 5% Tolerance
To control the current flow throughout the
circuit 3 Microprocessor ATmega328P;
Atmel Corporation, San Jose, CA, USA
A microcontroller single chip used to
combine 32 KB flash memory with read
while write capabilities 4 Transistor N-channel
MOSFET FQP30N06L; RS
Components
It is a transistor used to manage
(amplify/control) power in the device
5 Bluetooth modem
BlueSMiRF Silver; SparkFun
Electronics, Niwot, CO, USA
Used to pass streams/commands
from computer to the target
6 Microcontroller board. Consists of components
1, 2 and 3
Arduino Uno; RS Electronics
Controls the heating of device
7 Prototyping shield
ProtoShield Basic;
Freetronics, Croydon South,
Victoria, Australia
Used as a base for wiring of
microcontroller and as a connector between
Bluetooth modem and microcontroller

217