Clinical Pharmacology and Therapeutic Drug Monitoring of ...
148
University of Groningen Clinical pharmacology and therapeutic drug monitoring of first-line anti-tuberculosis drugs Sturkenboom, Marieke Gemma Geertruida IMPORTANT NOTE: You are advised to consult the publisher's version (publisher's PDF) if you wish to cite from it. Please check the document version below. Document Version Publisher's PDF, also known as Version of record Publication date: 2016 Link to publication in University of Groningen/UMCG research database Citation for published version (APA): Sturkenboom, M. G. G. (2016). Clinical pharmacology and therapeutic drug monitoring of first-line anti- tuberculosis drugs. Copyright Other than for strictly personal use, it is not permitted to download or to forward/distribute the text or part of it without the consent of the author(s) and/or copyright holder(s), unless the work is under an open content license (like Creative Commons). The publication may also be distributed here under the terms of Article 25fa of the Dutch Copyright Act, indicated by the “Taverne” license. More information can be found on the University of Groningen website: https://www.rug.nl/library/open-access/self-archiving-pure/taverne- amendment. Take-down policy If you believe that this document breaches copyright please contact us providing details, and we will remove access to the work immediately and investigate your claim. Downloaded from the University of Groningen/UMCG research database (Pure): http://www.rug.nl/research/portal. For technical reasons the number of authors shown on this cover page is limited to 10 maximum. Download date: 29-05-2022
-
Upload
khangminh22 -
Category
Documents
-
view
2 -
download
0
Transcript of Clinical Pharmacology and Therapeutic Drug Monitoring of ...

University of Groningen
Clinical pharmacology and therapeutic drug monitoring of first-line anti-tuberculosis drugsSturkenboom, Marieke Gemma Geertruida
IMPORTANT NOTE: You are advised to consult the publisher's version (publisher's PDF) if you wish to cite fromit. Please check the document version below.
Document VersionPublisher's PDF, also known as Version of record
Publication date:2016
Link to publication in University of Groningen/UMCG research database
Citation for published version (APA):Sturkenboom, M. G. G. (2016). Clinical pharmacology and therapeutic drug monitoring of first-line anti-tuberculosis drugs.
CopyrightOther than for strictly personal use, it is not permitted to download or to forward/distribute the text or part of it without the consent of theauthor(s) and/or copyright holder(s), unless the work is under an open content license (like Creative Commons).
The publication may also be distributed here under the terms of Article 25fa of the Dutch Copyright Act, indicated by the “Taverne” license.More information can be found on the University of Groningen website: https://www.rug.nl/library/open-access/self-archiving-pure/taverne-amendment.
Take-down policyIf you believe that this document breaches copyright please contact us providing details, and we will remove access to the work immediatelyand investigate your claim.
Downloaded from the University of Groningen/UMCG research database (Pure): http://www.rug.nl/research/portal. For technical reasons thenumber of authors shown on this cover page is limited to 10 maximum.
Download date: 29-05-2022

Clinical Pharmacology andTherapeutic Drug Monitoring of
First-Line Anti-Tuberculosis DrugsMarieke G.G. Sturkenboom

Publication of this thesis was financially supported by the Groningen UniversityInstitute for Drug Exploration (GUIDE), KNCV Tuberculosis Foundation, Rijksuni-versiteit Groningen (RUG), Stichting Beatrixoord Noord-Nederland and Stichtingter bevordering van Onderzoek in de Ziekenhuisfarmacie te Groningen (StichtingO.Z.G.).
Cover Red cross on black circle by Kazimir Malevich (1920-1922)Layout Marcel Harkema & Marieke SturkenboomPrinted by Ridderprint BV, The NetherlandsISBN 978-90-367-8646-1ISBN 978-90-367-8645-4 (electronic version)
© Marieke G.G. Sturkenboom 2016
Copyright of the published articles is with the corresponding journal or otherwisewith the author. No part of this publication may be reproduced, stored in a retrievalsystem, or transmitted, in any form or by any means, without the prior permissionin writing from the author or the copyright-owning journal.

Clinical Pharmacology andTherapeutic Drug Monitoring ofFirst-Line Anti-Tuberculosis Drugs
Proefschrift
ter verkrijging van de graad van doctor aan deRijksuniversiteit Groningen
op gezag van derector magnificus prof. dr. E. Sterken
en volgens besluit van het College voor Promoties.
De openbare verdediging zal plaatsvinden op
woensdag 23 maart 2016 om 11.00 uur
door
Marieke Gemma Geertruida Sturkenboom
geboren op 6 juli 1974te Noordoostpolder
PromotoresProf. dr. J.G.W. KosterinkProf. dr. T.S. van der WerfProf. dr. D.R.A. Uges
CopromotorDr. J.W.C. Alffenaar
BeoordelingscommissieProf. dr. E.N. van RoonProf. dr. D. van SoolingenProf. dr. G.H. Bothamley

CONTENTS
1 Introduction 11.1 First-line anti-TB treatment . . . . . . . . . . . . . . . . . . . . . . . . 21.2 Pharmacology and therapeutic drug monitoring . . . . . . . . . . . . 31.3 Outline of the thesis . . . . . . . . . . . . . . . . . . . . . . . . . . . . . 5
2 LC-MS/MS for therapeutic drug monitoring of anti-infective drugs 92.1 Introduction . . . . . . . . . . . . . . . . . . . . . . . . . . . . . . . . . 112.2 TDM . . . . . . . . . . . . . . . . . . . . . . . . . . . . . . . . . . . . . . 112.3 LC-MS/MS in TDM . . . . . . . . . . . . . . . . . . . . . . . . . . . . . 152.4 Free drug concentration . . . . . . . . . . . . . . . . . . . . . . . . . . 182.5 Site of infection (alternative matrices) . . . . . . . . . . . . . . . . . . 202.6 Proficiency testing programme . . . . . . . . . . . . . . . . . . . . . . 222.7 Outpatient monitoring . . . . . . . . . . . . . . . . . . . . . . . . . . . 232.8 Conclusion . . . . . . . . . . . . . . . . . . . . . . . . . . . . . . . . . . 24
3 Quantification of isoniazid, pyrazinamide and ethambutol in serumusing liquid chromatography-tandem mass spectrometry 313.1 Introduction . . . . . . . . . . . . . . . . . . . . . . . . . . . . . . . . . 333.2 Material and methods . . . . . . . . . . . . . . . . . . . . . . . . . . . . 343.3 Results . . . . . . . . . . . . . . . . . . . . . . . . . . . . . . . . . . . . . 403.4 Discussion . . . . . . . . . . . . . . . . . . . . . . . . . . . . . . . . . . 453.5 Conclusion . . . . . . . . . . . . . . . . . . . . . . . . . . . . . . . . . . 47
4 An interlaboratory quality control programme for the measurement oftuberculosis drugs 51
5a Pharmacokinetic modeling and optimal sampling strategies for thera-peutic drug monitoring of rifampin in patients with tuberculosis 595a.1 Introduction . . . . . . . . . . . . . . . . . . . . . . . . . . . . . . . . . 615a.2 Materials and Methods . . . . . . . . . . . . . . . . . . . . . . . . . . . 62
iv Contents
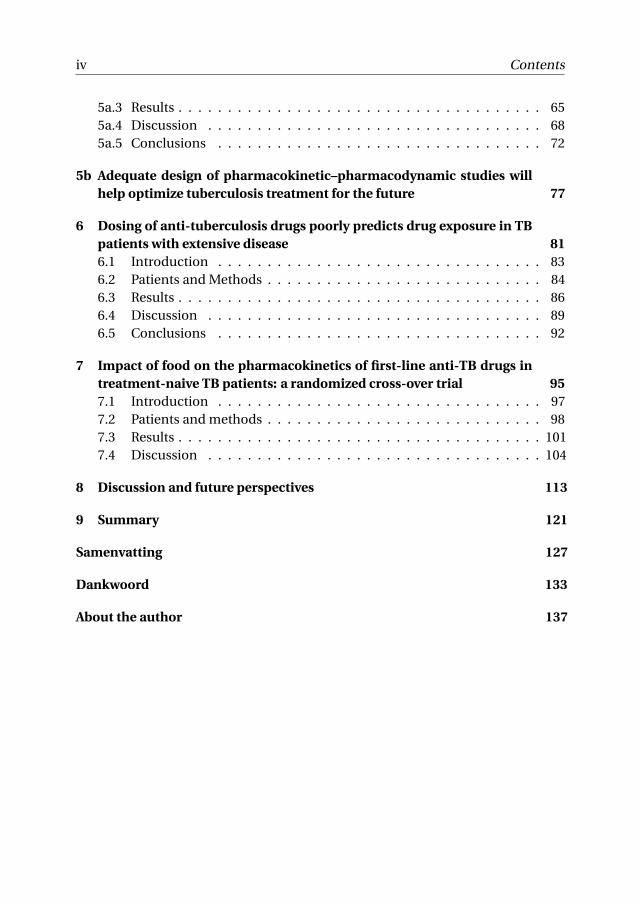
5a.3 Results . . . . . . . . . . . . . . . . . . . . . . . . . . . . . . . . . . . . . 655a.4 Discussion . . . . . . . . . . . . . . . . . . . . . . . . . . . . . . . . . . 685a.5 Conclusions . . . . . . . . . . . . . . . . . . . . . . . . . . . . . . . . . 72
5b Adequate design of pharmacokinetic–pharmacodynamic studies willhelp optimize tuberculosis treatment for the future 77
6 Dosing of anti-tuberculosis drugs poorly predicts drug exposure in TBpatients with extensive disease 816.1 Introduction . . . . . . . . . . . . . . . . . . . . . . . . . . . . . . . . . 836.2 Patients and Methods . . . . . . . . . . . . . . . . . . . . . . . . . . . . 846.3 Results . . . . . . . . . . . . . . . . . . . . . . . . . . . . . . . . . . . . . 866.4 Discussion . . . . . . . . . . . . . . . . . . . . . . . . . . . . . . . . . . 896.5 Conclusions . . . . . . . . . . . . . . . . . . . . . . . . . . . . . . . . . 92
7 Impact of food on the pharmacokinetics of first-line anti-TB drugs intreatment-naive TB patients: a randomized cross-over trial 957.1 Introduction . . . . . . . . . . . . . . . . . . . . . . . . . . . . . . . . . 977.2 Patients and methods . . . . . . . . . . . . . . . . . . . . . . . . . . . . 987.3 Results . . . . . . . . . . . . . . . . . . . . . . . . . . . . . . . . . . . . . 1017.4 Discussion . . . . . . . . . . . . . . . . . . . . . . . . . . . . . . . . . . 104
8 Discussion and future perspectives 113
9 Summary 121
Samenvatting 127
Dankwoord 133
About the author 137

CH
AP
TE
R
1INTRODUCTION

2 Chapter 1. Introduction
Tuberculosis (TB) is caused by infection with Mycobacterium tuberculosis. It is oneof the infectious diseases with the highest morbidity and mortality in the world. In2014, an estimated 9.6 million people were infected with TB and 1.5 million peopledied due to TB [1].
Patients with active pulmonary TB are the main source of transmission of M. tuber-culosis. The disease is spread in the air when people, who are sick with pulmonaryTB, expel bacteria, for example by coughing. A relatively small proportion of peopleinfected with M. tuberculosis will develop active TB disease. In more than 90% ofpersons infected with M. tuberculosis, the pathogen is contained as asymptomaticlatent infection [2]. Worldwide, one third of the population, approximately twobillion people, have latent infection and are at risk for reactivation [2].
TB typically affects the lungs (pulmonary TB), but can affect other sites as well (ex-trapulmonary TB). Symptoms of active disease are a productive cough often withother respiratory symptoms like shortness of breath, chest pain or haemoptysisand fever with night sweats, fatigue and loss of appetite and body weight [3]. Ex-trapulmonary TB can affect virtually any organ in the body, with a variety of clinicalmanifestations and therefore it requires a high index of clinical suspicion [2].
The most common method for diagnosing TB worldwide is sputum smear micro-scopy. The use of rapid molecular tests to diagnose TB and drug-resistant TB isincreasing. In countries with more developed laboratory facilities, cases of TB arealso diagnosed via culture methods, which is currently the reference standard [1].
Without adequate treatment, TB mortality rates are high [1]. Drug-susceptible TBis treated with the first-line anti-TB drugs, isoniazid, rifampicin (rifampin), pyrazi-namide and ethambutol, during the first two months, continued with isoniazidand rifampicin for another four months [3, 4]. In general, treatment success ratecontinues to be high among new TB cases [1]. However, healthcare providers arestill confronted with treatment failure on a regular basis. In multidrug-resistantTB (MDR-TB), M. tuberculosis is resistant to isoniazid and rifampicin. In 2014, anestimated 480.000 people developed MDR-TB [1]. MDR-TB is difficult and costly totreat, as first-line treatment is not effective. Besides, treatment takes much longerthan six months in drug-susceptible TB, generally it takes 20 months.
1.1 First-line anti-TB treatment
Isoniazid and rifampicin are still the cornerstones of treatment in drug-susceptibleTB. Both drugs are cheap and readily available worldwide. Rifampicin is bacter-icidal, by inhibition of the β-subunit of RNA polymerase of M. tuberculosis. It ishighly effective and extremely valuable in TB treatment, as rifampicin is capable of

1.2. Pharmacology and therapeutic drug monitoring 3
killing both actively dividing and ‘dormant’ bacilli [5].
Isoniazid is a prodrug that is activated by the mycobacterial enzyme KatG [5, 6].It exerts its activity by inhibiting mycolic acid synthesis, which is essential formycobacterial cell wall integrity. If M. tuberculosis lacks the katG enzyme, it showsresistance to isoniazid. Isoniazid is mostly active in the first few days of therapy asit exhibits the most potent early bactericidal activity (EBA), the decrease in numberof bacilli in sputum in the first two treatment days, among the anti-TB drugs.
Pyrazinamide is a prodrug that is bio-activated by the pyrazinamidase enzymeinside M. tuberculosis. The mechanism of action for pyrazinamide is not clearlyunderstood. It has been suggested to act by inhibiting fatty acid synthase I [5]. Butalso inhibition of protein translation or depletion of cellular adenosine triphosphatehave been proposed [5]. Pyrazinamide is an essential component in the treatmentof M. tuberculosis and is supposed to play an important role in new multidrugregimens which focus on shortening treatment duration [7].
Ethambutol acts by inhibiting the synthesis of arabinogalactan, which is part ofthe mycobacterial cell wall. It is used to protect rifampicin from acquired drugresistance and is the least potent of the four first-line anti-TB drugs [5].
1.2 Pharmacology and therapeutic drug monitoring
Pharmacokinetics describes the behaviour of a drug in the patient’s body, includingabsorption, distribution, metabolism and excretion, whereas pharmacodynamicsdescribe the biochemical or pharmacological effect of a drug at the site of actionin the patient’s body. Together, both parameters determine the pharmacologicalprofile of the drug.
In infectious diseases, the pharmacological effect of the drug is directed against thepathogen. The minimum inhibitory concentration (MIC), a measure of potencyof the drug for the microorganism, is the lowest concentration at which the druginhibits growth of M. tuberculosis. In case of first-line anti-TB drugs, actual MICsare often unknown. Critical concentrations or breakpoints have been defined as theMIC above which maximum tolerated doses fail to effectively kill M. tuberculosis[8]. Conventionally, these critical concentrations were 1.0 mg/L for rifampicinand 0.2 mg/L and 1.0 mg/L for low-level and high-level resistance for isoniazid.However, Gumbo et al. advocated the use of much lower critical concentrations,0.0625 mg/L for rifampicin and 0.0312 and 0.125 mg/L for isoniazid, suggestingthat M. tuberculosis is resistant at a much lower level [8].
The efficacy of anti-infective drugs is not only dependent on the pathogens re-lated MIC, but also on the exposure of the drug in the patient. The area under

4 Chapter 1. Introduction
the concentration-time curve (AUC) over 24 h in steady state (AUC0–24) representsthis exposure. Studies in both hollow fiber infection models and murine modelsshowed that the AUC divided by the MIC (AUC/MIC ratio) is the best predictivepharmacokinetic/pharmacodynamic parameter for determination of the efficacyof first-line anti-TB drugs [9–15]. More importantly, these data were recently con-firmed in TB patients, as poor long-term outcome was predicted by low AUC valuesof pyrazinamide, rifampicin and isoniazid [7].
For a long time, it was suggested that poor compliance was the cause of acquireddrug resistance of M. tuberculosis. Now it has become clear that pharmacokineticvariability is much more likely to be the driving force of drug resistance [16]. In thestudy by Pasipanodya et al., low maximum concentrations (Cmax) or peak levelsof rifampicin or isoniazid preceded all (three) cases of acquired drug resistance in142 TB patients [7]. Therefore, both AUC and Cmax are important parameters toinvestigate. This can be done using therapeutic drug monitoring (TDM).
The International Association of Therapeutic Drug Monitoring and Clinical Toxic-ology defined TDM ”as a multi-disciplinary clinical specialty aimed at improvingpatient care by individually adjusting the dose of drugs for which clinical experi-ence or clinical trials have shown it improved outcome in the general or specialpopulations. It can be based on an a priori pharmacogenetic, demographic and clin-ical information and/or on the a posteriori measurement of blood concentrationsof drugs (pharmacokinetic monitoring) and/or biomarkers (pharmacodynamicmonitoring).”
TDM has been used when it is impossible to measure the pharmacodynamic effectof the drug faster or in a more direct way. For antibiotics this is often true, as itis both difficult and time-consuming to observe whether the infection is beingtreated adequately. If the infection is not treated adequately, it may be too late toturn the tide. However, in the case of anti-TB drugs, a therapeutic range or targethas not been established. Until recently, the available data was based mostly onmeasurements in TB patients, rather than target values based on outcome. It haslong been thought that exposure was sufficient and TDM was not indicated. Hence,TDM of first-line anti-TB drugs has not been performed on a regular basis.
Moreover, obtaining a full concentration-time curve to calculate the AUC valuesis a laborious and expensive procedure and it is therefore not feasible in clinicalpractice. Alternative strategies to easily evaluate drug exposure are urgently needed.An optimal sampling procedure based on a population pharmacokinetic modelmay help to overcome these problems. This method implies that a limited numberof appropriately timed blood samples are needed to adequately predict the AUC asa measure for drug exposure [17–19].

1.3. Outline of the thesis 5
However, there are more hurdles to take. Not many laboratories are capable of per-forming bioanalysis, as no commercially available assays exist and thus all methodshave to be developed in-house. As a consequence, TDM has long been thought tobe too costly and too difficult. Finally, once one has decided on performing TDM offirst-line anti-TB drugs, the logistics of the blood samples is complicated by boththe instability of the drugs in blood and the contagiousness of the material.
Treatment with the first-line anti-TB drugs, though usually successful, is increas-ingly challenged by the emergence of drug resistance, toxicity, relapse and non-response. It is believed that for both rifampicin and isoniazid higher doses mightwell be indicated and tolerated [5, 20–22].
We hypothesize that it is necessary to move away from the ‘one size fits all’ approach[23]. The aim of this thesis is to develop methods to facilitate TDM of first-lineanti-TB drugs and to optimize treatment in drug-susceptible TB patients.
1.3 Outline of the thesis
In Chapter 2, a review is presented on the use of liquid chromatography-tandemmass spectrometry (LC-MS/MS) in TDM of anti-infective drugs. Pharmacokineticand pharmacodynamic parameters are discussed. We explore aspects of newmatrices such as saliva and new sampling techniques like dried blood spot (DBS)and their analysis.
The objective of Chapter 3 was to develop a fast, simple and reliable LC-MS/MSmethod for the simultaneous determination of isoniazid, pyrazinamide and etham-butol in human serum for TDM and pharmacokinetic studies.
In Chapter 4, we describe a recently initiated international interlaboratory qualitycontrol (QC) or proficiency testing programme for the measurement of anti-TBdrugs. In the first round of this programme, the four first-line anti-TB drugs and thesecond-line TB drugs moxifloxacin and linezolid were included. The programmeaddresses the utility of an ongoing QC programme in this area of bioanalysis.
The objective of Chapter 5a was to develop an optimal sampling procedure basedon population pharmacokinetics to predict AUC0–24 of rifampicin. In Chapter 5b,we discuss the need of well-designed pharmacokinetic studies to produce reliabledata and relevant outcome.
In Chapter 6, we performed a retrospective study in TB patients in which we determ-ined the correlation of clinical variables with exposure of isoniazid and rifampicin.The aim was to discuss the maximum dose of isoniazid and rifampicin, which isguided by the World Health Organization [3].

6 Chapter 1. Introduction
Concomitant food is known to influence pharmacokinetics of first-line anti-TBdrugs in healthy volunteers. However in treatment-naive TB patients who arestarting with drug treatment, data on the influence of food intake on the phar-macokinetics are absent. In Chapter 7, we performed a prospective randomizedcrossover pharmacokinetic study that aimed to quantify the influence of food onthe pharmacokinetics of isoniazid, rifampicin, ethambutol and pyrazinamide in TBpatients, starting anti-TB treatment.
In Chapter 8, the outcome of the research in this thesis is discussed and future per-spectives are presented. This chapter is based on a letter to the editor in which westress the importance of well-designed randomized controlled trials to investigatethe effectiveness of TDM on outcome.
References
1. World Health Organization. Global Tuberculosis Report 2015 tech. rep. (2015).
2. Zumla A., Raviglione M., Hafner R. & von Reyn C. F. Tuberculosis. N Engl J Med368, 745–755 (2013).
3. World Health Organization. Treatment of tuberculosis guidelines 4th editiontech. rep. (2010).
4. Blumberg H. M. et al. American Thoracic Society/Centers for Disease Controland Prevention/Infectious Diseases Society of America: treatment of tubercu-losis. Am J Respir Crit Care Med 167, 603–662 (2003).
5. Egelund E. F., Alsultan A. & Peloquin C. A. Optimizing the clinical pharmaco-logy of tuberculosis medications. Clin Pharmacol Ther 98, 387–93 (2015).
6. Timmins G. S. & Deretic V. Mechanisms of action of isoniazid. Mol Microbiol62, 1220–1227 (2006).
7. Pasipanodya J. G., McIlleron H., Burger A., Wash P. A., Smith P. & Gumbo T.Serum drug concentrations predictive of pulmonary tuberculosis outcomes. JInfect Dis 208, 1464–1473 (2013).
8. Gumbo T., Pasipanodya J. G., Wash P., Burger A. & McIlleron H. Redefiningmultidrug-resistant tuberculosis based on clinical response to combinationtherapy. Antimicrob Agents Chemother 58, 6111–5 (2014).
9. Gumbo T., Louie A., Deziel M. R., Liu W., Parsons L. M., Salfinger M. & DrusanoG. L. Concentration-dependent Mycobacterium tuberculosis killing and pre-vention of resistance by rifampin. Antimicrob Agents Chemother 51, 3781–3788 (2007).

References 7
10. Jayaram R. et al. Pharmacokinetics-pharmacodynamics of rifampin in anaerosol infection model of tuberculosis. Antimicrob Agents Chemother 47,2118–2124 (2003).
11. Gumbo T., Louie A., Liu W., Brown D., Ambrose P. G., Bhavnani S. M. & DrusanoG. L. Isoniazid bactericidal activity and resistance emergence: integratingpharmacodynamics and pharmacogenomics to predict efficacy in differentethnic populations. Antimicrob Agents Chemother 51, 2329–2336 (2007).
12. Jayaram R. et al. Isoniazid pharmacokinetics-pharmacodynamics in an aero-sol infection model of tuberculosis. Antimicrob Agents Chemother 48, 2951–2957 (2004).
13. Gumbo T., Dona C. S., Meek C. & Leff R. Pharmacokinetics-pharmacodynamicsof pyrazinamide in a novel in vitro model of tuberculosis for sterilizing effect:a paradigm for faster assessment of new antituberculosis drugs. AntimicrobAgents Chemother 53, 3197–3204 (2009).
14. Srivastava S., Musuka S., Sherman C., Meek C., Leff R. & Gumbo T. Efflux-pump-derived multiple drug resistance to ethambutol monotherapy in Myco-bacterium tuberculosis and the pharmacokinetics and pharmacodynamics ofethambutol. J Infect Dis 201, 1225–1231 (2010).
15. Gumbo T. New susceptibility breakpoints for first-line antituberculosis drugsbased on antimicrobial pharmacokinetic/pharmacodynamic science andpopulation pharmacokinetic variability. Antimicrob Agents Chemother 54,1484–1491 (2010).
16. Srivastava S., Pasipanodya J. G., Meek C., Leff R. & Gumbo T. Multidrug-resistant tuberculosis not due to noncompliance but to between-patientpharmacokinetic variability. J Infect Dis 204, 1951–1959 (2011).
17. Alffenaar J. W., Kosterink J. G., van Altena R., van der Werf T. S., Uges D. R. &Proost J. H. Limited sampling strategies for therapeutic drug monitoring oflinezolid in patients with multidrug-resistant tuberculosis. Ther Drug Monit32, 97–101 (2010).
18. Pranger A. D., Kosterink J. G., van Altena R., Aarnoutse R. E., van der Werf T. S.,Uges D. R. & Alffenaar J. W. Limited-sampling strategies for therapeutic drugmonitoring of moxifloxacin in patients with tuberculosis. Ther Drug Monit 33,350–354 (2011).
19. Magis-Escurra C. et al. Population pharmacokinetics and limited samplingstrategy for first-line tuberculosis drugs and moxifloxacin. Int J AntimicrobAgents 44, 229–34 (2014).

8 Chapter 1. Introduction
20. Ruslami R., Nijland H. M., Alisjahbana B., Parwati I., van Crevel R. & AarnoutseR. E. Pharmacokinetics and tolerability of a higher rifampin dose versusthe standard dose in pulmonary tuberculosis patients. Antimicrob AgentsChemother 51, 2546–2551 (2007).
21. Van Ingen J., Aarnoutse R. E., Donald P. R., Diacon A. H., Dawson R., Plem-per van Balen G., Gillespie S. H. & Boeree M. J. Why Do We Use 600 mg ofRifampicin in Tuberculosis Treatment? Clin Infect Dis 52, e194–9 (2011).
22. Boeree M. J. et al. A Dose Ranging Trial to Optimize the Dose of Rifampin inthe Treatment of Tuberculosis. Am J Respir Crit Care Med 191, 1058–65 (2015).
23. Van der Burgt E. P., Sturkenboom M. G., Bolhuis M. S., Akkerman O. W., Kos-terink J. G., de Lange W. C., Cobelens F. G., van der Werf T. S. & Alffenaar J.-W.End TB with precision treatment! Eur Respir J 47, 680–2 (2016).

CH
AP
TE
R
2LC-MS/MS FOR THERAPEUTIC DRUG
MONITORING OF ANTI-INFECTIVE DRUGS
∗ Anette Veringa∗ Marieke G.G. Sturkenboom
Bart G.J. DekkersRemco A. KosterJason A. Roberts
Charles A. PeloquinDaan J. Touw
Jan-Willem C. Alffenaar∗ Both authors contributed equally to the manuscript
Accepted in Trends in Analytical Chemistry 2016

10 Chapter 2. Review
Abstract
Therapeutic drug monitoring (TDM) is a tool used to integrate pharmacokineticand pharmacodynamic knowledge to optimise and personalize drug therapy. TDMis of specific interest for anti-infectives: to assure adequate drug exposure andreduce adverse events, to increase patient compliance and to prevent antimicrobialresistance. For TDM, drug blood concentrations are determined to bring and keepthe concentration within the targeted therapeutic range. Currently, LC-MS/MSis the primary analytical technique for fast and accurate quantification of anti-infective drug concentrations. In addition to blood, several alternative matrices(cerebrospinal fluid, inflammatory fluids, specific cells and tissue) and alternativesampling strategies (dried blood spot and saliva) are currently being exploredand introduced to support TDM. Here, we review the current challenges in thebioanalysis of anti-infective drugs and give insight in the pre- and postanalyticalissues surrounding TDM.

2.1. Introduction 11
2.1 Introduction
Traditionally, therapeutic drug monitoring (TDM) was restricted to anti-epilepticdrugs and aminoglycosides, but also now covers - amongst others - immunosup-pressant drugs, drugs acting on the cardiovascular system, anti-HIV drugs andantifungal drugs. For some classes of drugs, TDM has not only proven to be benefi-cial for patient outcome, but also to be cost-effective [1, 2].
With increasing pathogen resistance to anti-infective drugs, there is a clear need fornew agents. However, the development of new anti-infectives is time consumingand expensive. Therefore, treatment optimization of the current anti-infectivesshould be a focus of contemporary treatment. Due to its urgency, developmentof antimicrobial resistance has a high priority for many organizations and evenentered the political agendas. Treatment optimization can be realized by selectingthe appropriate antimicrobial drug, assuring adequate drug exposure in relation tothe susceptibility of the micro-organism and reducing adverse events in order toincrease patient’s compliance with treatment.
For many years, immunoassays and traditional high performance liquid chro-matography (HPLC) methods were the major techniques used to determine con-centrations of anti-infective drugs in human specimens. However, immunoassaytechniques are only available for a limited number of drugs and cross-reactivity, forinstance with drugs and their metabolites, is a problem. HPLC coupled with UVdetection (HPLC-UV) often requires extensive sample preparation and is thereforelabour intensive. In addition, long runtimes are often required in order to obtain aselective analysis method. In addition, both immunoassays and HPLC-UV meth-ods often lack sensitivity. Nowadays, analytical challenges like these have beenovercome with the introduction of HPLC coupled with tandem mass spectrometry(LC-MS/MS). With the use of LC-MS/MS, sensitivity and selectivity has signific-antly improved, allowing simple and fast sample preparations and short runtimes.This review will focus on the bioanalytical hurdles related to the measurement ofanti-infective drugs, but also will give insight in pre- and post-analytical issues inorder to help clinical chemists, clinical pharmacologists and analytical techniciansto raise their standards.
2.2 TDM
For over 30 years, TDM has been used as a tool to integrate pharmacokinetic andpharmacodynamic knowledge to optimise drug therapy at the individual patientlevel [3]. Pharmacokinetics describe the behaviour of a drug in the patient’s body,including absorption, distribution, metabolism and excretion, whereas pharmaco-

12 Chapter 2. Review
dynamics describe the biochemical or pharmacological effect of a drug on thepatient’s body or micro-organism within the body. Together, both parametersdetermine the pharmacological profile of the drug.
TDM uses drug blood concentrations to personalise drug therapy in order to bringand keep the concentration within the targeted therapeutic range [4, 5]. Belowthis range the drug concentration is subtherapeutic or ineffective, whereas highconcentrations may result in adverse events or toxicity.
TDM is used when it is impossible to measure the pharmacodynamic effect of thedrug faster or in a more direct way, or it is used to optimise dosing in patients withseverely altered pharmacokinetic parameters (e.g. critically ill patients in ICU [1,4]). For anti-infectives, it is both difficult and time-consuming to observe whetherthe infection is being treated adequately. If the infection is not treated adequately,it may be too late to turn the tide of illness, resulting in treatment failure includingpatient morbidity or mortality or the emergence of antimicrobial resistance.
Before TDM can be performed, several prerequisites have to be fulfilled. First, aconcentration effect relationship or therapeutic range should be established [4].Secondly, large interindividual (e.g. sex, age or genetic variations) or intraindividualvariability (e.g. drug-drug interactions, decreased renal function or liver failure)in pharmacokinetics should be observed, resulting in a large variation in bloodconcentrations [4]. The final obvious prerequisite is that a sensitive and specificassay must be available to determine the drug in blood or other biological matrices[4, 5].
2.2.1 Pharmacokinetic/pharmacodynamic relationships
For anti-infectives, the minimum inhibitory concentration (MIC), a measure ofpotency of the drug for the micro-organism, is central to pharmacodynamics [6].The MIC is de lowest concentration at which an antibiotic inhibits visible growthof the micro-organism after 18 to 24 hours incubation [7]. Unlike antibiotics,there is no simple standard pharmacodynamic parameter, such as the MIC, thattests antiviral susceptibility [7]. Although not applied in clinical practice, the halfmaximum inhibitory concentration (IC50) could be used to establish efficacy in anappropriate in vitro or animal model [7].
The efficacy of anti-infective drugs not only is dependent on the pathogen’s MIC,but also on the exposure of the drug in the patient. This exposure is commonlydescribed by the area under the concentration-time curve (AUC) [6]. For manydrugs, the AUC/MIC ratio is the most relevant pharmacokinetic/pharmacodynamic(PK/PD) index (Figure 2.1) [6].

2.2. TDM 13
Time
Concentration
Peak level, Cmax
AUC
T>MIC
Trough level, Cmin
MIC
Figure 2.1: The effective pharmacokinetic/pharmacodynamic (PK/PD) parameters in anti-infective drugs. AUC,area under the concentration-time curve; Cmin, minimum concentration; Cmax, maximum concentration; MIC,minimum inhibitory concentration; T>MIC, time of the drug blood concentration above the MIC.
In addition to the AUC/MIC ratio, other PK/PD indices also may be relevant. Anoverview of the effective PK/PD indices of many antibiotics was previously providedby Roberts et al. [1]. For instance, beta-lactam antibiotics, such as penicillins andcarbapenems, display time-dependent pharmacodynamics, meaning that the timeof the unbound (or free) drug concentration exceeds the MIC (f T>MIC) is the mostrelevant PK/PD index [8]. For these drugs, both frequency of dosing and durationof infusion are important [6]. Constant drug concentrations rather than high peakconcentrations result in more effective treatment [9]. Moreover, for these drugshigher concentrations do not result in greater effectiveness. For these reasons,continuous administration, preceded by a loading dose to quickly attain steadystate, has been suggested as an potentially improved strategy to conventionalintermittent dosing [9].
The peak level or maximum concentration of a drug (Cmax) also may be important.For instance aminoglycosides, exert their effectiveness and prevent from drugresistance by the Cmax/MIC [1].

14 Chapter 2. Review
Depending on the effective PK/PD index and the pharmacokinetics of the drug oneor more sampling times are usually chosen for TDM.
2.2.2 Multidisciplinary team
Although TDM is routinely performed for several anti-infective agents, optimaltreatment of the patient also depends on effective communication and cooperationbetween many healthcare professionals (Figure 2.2). In general, drug treatment ofinfectious diseases is selected based on clinically suspected pathogens. Adjustmentof the treatment is required after antimicrobial susceptibility testing results be-come available. Since resistance to anti-infective drugs is a problem of increasingmagnitude, narrowing the anti-infective treatment is recommended based on thesusceptibility of the pathogen. Where antimicrobial resistance is observed, ther-apy should be changed to a more effective regimen. Subsequently TDM can beperformed, if a sensitive and accurate analytical method is available.
Patient with infection
Anti-infective treatment
Therapeutic drug
monitoring
Optimization anti-infective
treatment
Antimicrobial susceptibility
testing
Clinical microbiologist
Clinical pharmacist/
pharmacologist
Analytical method
development
Infectious disease
physician
Software to support dosing
optimization
Clinical pharmacist/
chemist
Sample collection
Nurse
Clinical pharmacist/
pharmacologist
Hospital epidemiologist
Adjustment of anti-infective
treatment
Figure 2.2: The multidisciplinary team involved in the infectious disease treatment.
Antimicrobial stewardship (AMS) programmes have been developed to optimiseclinical outcomes and minimize unintended negative consequences of antimicro-bial use. An infectious disease physician and a clinical pharmacist with infectious

2.3. LC-MS/MS in TDM 15
disease training are the core members of the AMS team [10, 11]. Among otherfactors, AMS is involved in appropriate treatment initiation and modification whereappropriate. Furthermore, dose optimization is a part of AMS, in which TDM playsan important role for an increasing number of anti-infectives [10, 11]. Therefore,good collaboration between the infectious disease physician and clinical phar-macist is necessary for the correct diagnosis and treatment of the infection, andthe correct interpretation and implementation of the TDM results. Additionally, aclinical microbiologist can provide surveillance data on the susceptibility of thepathogen and potential emergence of antimicrobial resistance. For implement-ation of recommendations, computer support is necessary and an informationsystem specialist also may play an important role in AMS. Thus, to optimise clinicaloutcome for the patient, good cooperation between these professionals plays acrucial role in AMS and is cost-effective in many cases [10, 12].
2.3 LC-MS/MS in TDM
LC-MS/MS has nowadays established itself as the primary analytical technique tosupport TDM [13]. The commonly used matrices for TDM are blood, plasma, andserum. More recently, dried blood spots (DBS) and saliva have been introducedfor TDM. Matrices like cerebrospinal fluid (CSF), inflammatory fluids, specific cellsand tissue are not routinely used for TDM, but may be relevant in specific cases[8]. However, each matrix has its analytical advantages and disadvantages and theclinical interpretation of the results strongly depends on this matrix. A number ofguidelines on bioanalytical and clinical method validation have been published inorder to improve and ensure the quality of analytical method validation and thegenerated analytical results. Among these are the Food and Drug Administration(FDA) with the ‘bioanalytical method validation’, European Medicines AgencyCommittee (EMEA) with the ‘guideline on bioanalytical validation’, and the Clinicaland Laboratory Standards Institute (CLSI) with the ‘C62-A, Liquid Chromatography-Mass Spectrometry Methods; Approved Guideline’ [14–17].
LC-MS/MS has replaced HPLC-UV in many clinical laboratories in high incomecountries. Unfortunately, the required broad repertoire of antimicrobial drugassays necessary for an anti-infective TDM program will reduce the number oftests per LC-MS/MS instrument annually, resulting in a relatively high price pertest. Although less attractive from a laboratory perspective, costs resulting frominadequate antimicrobial treatment are much higher. If cheap, first-line anti-infectives fail and have to be switched to salvage therapy with second-line anti-infective drugs, costs will rise substantially. Before a hospital makes investments inan LC-MS/MS to service a TDM program for antimicrobial drugs, one should make

16 Chapter 2. Review
an business case. In general 20,000-50,000 tests annually are considered to be anacceptable justification of the investment [18]. For small hospitals, combining anLC-MS/MS for other TDM programs as well (e.g. antidepressants, antipsychotics orimmunosuppressants), could result in cost-effective operation of an LC-MS/MS.Another alternative could be sending a sample to a nearby reference center, ifturnaround time is acceptable. For low income countries, HPLC-UV still is analternative as long as sensitivity is not an issue. Hopefully, increased use of LC-MS/MS in clinical laboratories will result in lower investments costs enablingbroader implementation of LC-MS/MS.
2.3.1 Sample preparation
Because of the sensitivity and selectivity of the LC-MS/MS, extensive sample ex-traction techniques like solid-phase extraction (SPE) and liquid-liquid extraction(LLE) are often unnecessary. Therefore, fast and simple extraction techniques, likeprotein precipitation or sample dilution, are feasible. However, due to the limitedsample preparation, endogenous compounds including lipids, phospholipids, andfatty acids are not sufficiently removed from the sample with protein precipitation.These compounds can interfere with the ionisation process resulting in ionisationsuppression. These so-called matrix effects are observed frequently and shouldbe solved for a reliable assay. Other types of matrix effects can originate fromsubstance interaction with the matrix. For example, the drug can form chelatecomplexes with ferric ions, bind with heme groups, or can bind with the samplingmatrix [19–23]. Isotopically labelled internal standards may correct for matrixeffects better than structural analogues, but are unfortunately more expensive.
Ionisation suppression during the LC gradient can be visualized by continousinfusion of a high concentration of stock solution via a T-piece connection tothe mobile phase flow. Injection of a blank processed sample followed by the LCgradient shows lowered substance response at periods of ionisation suppression ina normally stable, but elevated baseline. By comparing the substance response of aspiked neat sample with a spiked processed blank sample, the relative ionisationsuppression can be calculated.
A structural analogue as internal standard is preferred to elute at the same retentiontime and to have comparable ionisation characteristics. Since this is often notpossible, ionisation suppression should also be evaluated for the internal standard.When ionisation suppression is present at the retention time of the substance, thegradient should first be optimized in order to chromatographically separate theionisation suppression from the substance retention time. Dilution of the processedsample or the use of another ionisation method, like atmospheric pressure chemical

2.3. LC-MS/MS in TDM 17
ionisation (APCI), may also be used to avoid ionisation suppression. Ultimately,an extensive sample preparation like SPE or LLE could be performed, which willeliminate most of the ionisation suppression effects.
In some patient groups, especially newborns, it is difficult to collect a sufficientlylarge blood volume for HPLC-UV analysis. Due to its high selectivity and sensitivity,sample volumes of 10 μL of plasma or serum are sufficient for LC-MS/MS analysis[24]. Multiple analyses can be performed with LC-MS/MS using a single bloodsample or even a sample which was taken for other routine laboratory measure-ments.
For analytical procedures used to analyse multiple compounds in a single sample,it may be more efficient to apply protein precipitation instead of LLE or SPE. Thevariation in physical and chemical properties of the different compounds to beanalysed complicates the development of a suitable LLE or SPE extraction method.An LLE or SPE extraction method with acceptable recoveries for multiple com-pounds will per definition be far less selective than an extraction method for asingle compound. If the use of protein precipitation allows the quantification ofthe compound at the desired concentrations without ionisation suppression, it isthe first choice of sample preparation for LC-MS/MS.
Although protein precipitation easily allows the simultaneous analysis of multiplecompounds in one LC-MS/MS method, differences in chemical and physical prop-erties might still complicate chromatographic separation. Alternatively, anotheranalytical column (with the use of a column switch) and/or mobile phase (with theuse of a quaternary pump) can be selected and reinjection of the samples can beperformed automatically [25].
2.3.2 LC-MS/MS turnaround time
Use of the LC-MS/MS analysis technique has significantly improved the turnaroundtimes for TDM samples. HPLC-UV and HPLC coupled with diode array detection(HPLC-DAD) or often require extensive sample preparation to clean up and/orto concentrate the sample. In addition, the chromatographic runtimes of thesetechniques often exceed ten minutes. Runtimes of approximately five minutesare often feasible and use of an ultra performance liquid chromatography (UPLC)method can even reduce runtimes to less than two minutes.
In order to ensure short turnaround times, it also is useful to minimize overhead in-jections. Bioanalytical method validation guidelines state that a sufficient numberof standards should be used to adequately define the relationship between concen-trations and response [14, 15]. According to the guidelines for bioanalytical studiesa calibration curve of six to eight standards and quality control (QC) samples should

18 Chapter 2. Review
be incorporated in each analytical run. However for linear regression, multipleconcentration levels are unnecessary for reliable and accurate calibration. Instead,two calibration concentrations (at the lower limit of quantification and at the higherlimit of quantification) are sufficient and proved to provide equal quality in analysisresults with QC samples at concentrations throughout the linear range [26]. Atwo-point calibration curve could be impaired when the curve becomes non-linear,possibly due to changing ionization characteristics or overdue maintenance. Anisotopically labelled internal standard can compensate for changing ionizationcharacteristics. In addition, with the use of QC samples throughout the linearrange, linearity issues would result in unacceptable biases for the QC samples andrun rejection. Overhead samples put great pressure on the sample turnaroundtime, especially when a run could consist of approximately 16 overhead samplesand only one patient sample. Minimizing overhead samples can be realized byvalidating a two-point calibration curve in addition to an eight-point calibrationcurve, resulting in a large reduction of injections. Subsequently, for the analysis ofjust one patient sample, a QC sample before and after the patient sample may besufficient. Reduction in the turnaround time can make TDM more efficient.
2.4 Free drug concentration
Regularly, blood concentrations for TDM are determined as total drug concentra-tions, i.e. the sum of the unbound and plasma protein bound fraction of the drug.However, only the unbound, free drug can diffuse through biological membranes tothe site of action and exert its pharmacological and/or toxicological effects [27, 28].Therefore for highly protein bound drugs, a small change in the extent of proteinbinding may result in a major change in free fraction of highly protein bound drugs[28, 29].
In clinical practice, unbound drug concentrations of highly protein bound drugsmay be relevant for specific conditions, for instance in critically ill patients sufferingfrom hypoalbuminemia. This results in a higher free fraction of that particulardrug with subsequently several effects (Figure 2.3). Initially the unbound drugconcentration increases. Since only the unbound drug can be removed from theblood, the amount of drug cleared from the blood increases. Furthermore, thedistribution of the unbound drug from the blood to peripheral tissues is increased.As a result, the unbound drug concentration decreases to the original value, whilethe total drug concentration is decreased. Therefore, total drug concentrationsmay not be representative for the effective PK/PD index and the unbound drugconcentration should be measured instead of total drug concentration, in particularfor highly bound drugs [8, 28, 30].

2.4. Free drug concentration 19
Cu
Decreased protein binding
Ctot
Time
Amount cleared ↑
Vu ↑ CtotCu
Fu =
**CtotCu
Fu =
Figure 2.3: If the protein binding of a drug is decreased, the total drug concentration (Ctot) is decreased due toincreased distribution and an increased amount cleared, while the unbound concentration of drug (Cu) remainsthe same. Ctot, total drug concentration; Cu, unbound concentration of drug; Fu, fraction unbound; Vu, Volumeof distribution of unbound drug.
2.4.1 Methods of separation
There are several methods to separate the sample into unbound and bound por-tions. The most commonly used methods are equilibrium dialysis, ultracentrifuga-tion, and ultrafiltration.
Due to its robustness, equilibrium dialysis is the reference method for determiningunbound drug concentrations. However, this method is less suitable in clinicalpractice because of the long time to reach equilibrium. Another method to separ-ate bound and unbound drug concentration is ultracentrifugation. An importantadvantage of ultracentrifugation, compared with equilibrium dialysis and ultra-filtration, is the elimination of the possible interaction of the compound to thefilter membrane, since no filter membrane is used in ultracentrifugation. However,the equipment used for ultracentrifugation is more expensive than the equipmentused for equilibrium dialysis and ultrafiltration [31]. Consequently, one of the

20 Chapter 2. Review
most commonly used methods in clinical practice is ultrafiltration, because of itssimple and rapid performance. Furthermore, with ultrafiltration all the proteinsare filtered out and further sample pre-treatment may not be necessary for LC-MS/MS analysis. With ultrafiltration, blood samples are centrifuged in systemsthat contain a membrane with a certain molecular weight cut-off. The durationof centrifugation differs for ultrafiltration, but is significantly shorter than equi-librium dialysis, which can be more than 24 hours. Subsequently, the free drugconcentration is measured in the ultrafiltrate. For several anti-infective drugs, freedrug concentrations are determined using ultrafiltration. However, during methoddevelopment, the possible interaction of the compound to the filter membraneshould be evaluated as well as the influence of temperature, centrifugation timeand centrifugal forces on protein binding of the drug [27, 29, 31–33].
2.5 Site of infection (alternative matrices)
For TDM blood samples are predominantly used, while the site of infection islocated elsewhere. If there are no significant barriers, influx or efflux mechanismsat the site of infection, it is expected that equilibrium is rapidly reached betweenthe drug concentration in tissue fluid and blood [34]. However, it is more accuratelyto measure the drug concentration at the site of infection.
2.5.1 CSF
For central nervous system infections, the penetration of drugs from blood to thesite of infection may be variable. Due to inflammation associated with infection,the blood brain barrier may initially be permeable for drugs, with the barrier thenbeing restored when the infection subsides. This results in reduced drug concen-trations in the central nervous system before the infection has been completelyresolved [34]. Therefore, it may be necessary to determine the concentration ofthe drug in the CSF. The LC-MS/MS analysis of CSF is comparable to the analysisof ultrafiltrate. CSF contains very little proteins and is therefore relatively clean.For the proteins that are present, a protein precipitation procedure is sufficient assample preparation. Obtaining blank CSF for method validation is manageable,provided that institutional guidelines allow the use of left-over materials. The useof an isotopically labelled internal standard is highly recommended when differentmatrices are used between patient samples and standards and QC samples. Al-though CSF normally contains very low amounts of protein, central nervous systeminfections and intracranial bleeding may significantly increase the protein contentin the patient sample. This may result in haemolytic CSF and matrix effects, whichaffects the analysis results. This variation in protein concentration between patient

2.5. Site of infection (alternative matrices) 21
samples and standards and QC samples should be incorporated in the analyticalmethod validation.
2.5.2 Pulmonary epithelial lining fluids and alveolar macrophages
Anti-infectives are frequently used in pulmonary infections. For extracellular andintracellular respiratory pathogens, drug concentrations have been measured inrespectively pulmonary epithelial lining fluid (ELF) and alveolar macrophages orbronchoalveolar lavage (BAL) fluid [8, 35, 36]. These studies are helpful as theyshow whether a drug may be suitable for the treatment of pulmonary infections.In clinical practice, ELF and alveolar macrophages concentrations, however, arerarely measured due to the poor availability of assays and/or the invasive nature ofsample collection. Sometimes it is important to know whether the drug is presentat sufficient concentrations at the site of infection. In the absence of a validatedassay, one may use a standard addition method to obtain a semi-quantitative result.
2.5.3 Intracellular
It may be of interest to measure intracellular concentrations for some drugs. Forexample, for antiretroviral drugs since HIV replicates within the cells of the im-mune system. Moreover, some of these drugs are administrated as prodrugs andare converted intracellularly into an active form. Subsequently, several studies haveshown that the efficacy and toxicity of some antiretroviral drugs depend on intracel-lular concentrations [37]. In clinical practice, intracellular concentrations are notroutinely measured for antiretroviral drugs, because for most antiretroviral drugslike non-nucleoside reverse transcriptase inhibitors and protease inhibitors a clearrelation exists between the plasma and intracellular concentration [37]. However,this does not apply for nucleoside reverse transcriptase inhibitors and thereforeintracellular drug concentrations should be monitored for these. Together withthe isolation and counting of peripheral blood mononuclear cells, the analysis ofintracellular concentrations is still a major technical challenge. Intracellular drugmolecules are bound to membranes or proteins and therefore it will be difficultto approximate the actual intracellular free drug concentration. Again, obtainingblank matrix consisting of peripheral blood mononuclear cells is difficult and labor-ious. Moreover, it could require additional sample preparation and concentrationto accurately quantify the very low intracellular concentrations with LC-MS/MS[37].

22 Chapter 2. Review
2.5.4 Tissue
In some situations, it may be helpful to quantify the drug concentration in infectedtissue material which has been obtained during operation. In addition to the bloodconcentration, drug concentrations in tissue-homogenate may provide informationon the exposure of the tissue to the drug. The sample processing of the tissuematerial includes weighing and homogenization of the sample. After weighing, theextraction solvent containing the internal standard can be added to the sample andthis will be centrifuged. The obtained supernatant can be analysed by LC-MS/MS.This method is still in its infancy and exposure-response relations are not describedfor the drug concentration in tissue-homogenate [38]. In addition, one shouldrealise, that drugs may be distributed unequally throughout the tissue, for exampleduring ischemia or when the drug is actively taken up by specific cells. In summary,tissue homogenates are unlikely to be useful for drugs without equal interstitialfluid and intracellular distribution and is likely to under represent concentrationsof drugs that do not penetrate intracellularly (e.g. beta-lactams).
A less invasive and more accurate sampling technique for measuring drug tissueconcentrations is microdialysis, which is increasingly being used in clinical pharma-cokinetic studies but is not commonly used in clinical practice. In contrast to tissuebiopsy, with microdialysis unbound drug tissue concentrations can be measureddirectly and continuously in the interstitial space fluid in various tissues. Therefore,microdialysis may provide extra information for patients with complicated infec-tions and where blood concentrations appear to be sufficient, but anti-infectivetherapy is failing [39].
2.6 Proficiency testing programme
A variety of analytical methods has been published for the quantification of anti-infective drugs in human serum or plasma. The reliability of these analyticalmethods is essential to provide information on the drug concentration to the anti-microbial stewardship that hopefully translates in the best outcome for our patients.Intralaboratory (internal) method validation and intralaboratory QC procedures,such as validation of equipment and qualification of technicians, should ensurethat these methods have sufficient accuracy, precision and specificity [14, 15]. Parti-cipation in an interlaboratory (external) QC or proficiency testing (PT) programmeis an essential component of quality assurance and also provides evidence of labor-atory competence for clinicians, researchers, accrediting bodies and regulatoryagencies [40].
A PT programme is essential to verify whether the analytical method used for TDM

2.7. Outpatient monitoring 23
complies with the quality required for patient care. Many PT programmes existin the field of HIV, antifungal and antituberculosis drugs and have indeed led toanalytical improvement [40–42]. For instance, in a PT programme for the meas-urement of antifungal drug concentrations, the results showed that one out of fivemeasurements was inaccurate. The performing laboratory was the main determ-ining factor for these inaccuracies, which probably means that intralaboratorymethod validation was inaccurate [41]. In addition, the results of a PT programmefor antiretroviral drugs showed that the measurement of low antiretroviral concen-trations also was problematic and led to inappropriate dosing recommendations[42]. These examples illustrate and emphasize the importance of PT programmesfor analytical methods used for TDM in clinical practice.
2.7 Outpatient monitoring
Routinely, blood samples are used for TDM which are often collected by venepunc-ture [43, 44]. However, this sampling strategy has several disadvantages. First,venous sampling is difficult in some populations, such as neonates and patientssuffering from venous damage [43]. Second, there may be logistical setbacks. Forvenous sampling the patient needs to travel to the hospital or a designated laborat-ory. This may not always be possible, for instance in resource-limited and remoteareas [43]. Another problem, especially in (sub)tropical areas, is sample stability.Many drugs are not stable in serum or plasma at room temperature and have to bestored and transported at -20 °C or lower [44]. To resolve these stability problems,alternative sampling strategies have been developed, such as DBS, dried plasmaspots and microsampling [45–47].
DBS sampling is increasingly applied for optimizing drug dosages for many drugs[43, 44, 48]. DBS is popular for its advantages like minimal invasive sampling,sample stability and small blood volume required for analysis. In general, a DBSsample consists of a peripheral blood sample obtained by a finger prick. Withclear instructions and after training, patients will be able to perform the procedurethemselves at home [44]. DBS methods have been published for several antibac-terial, antifungal and antiretroviral drugs [44, 49]. Reference values for TDM aretraditionally based on serum or plasma drug concentrations and not on wholeblood concentrations. Therefore, clinical validation is required to translate ca-pillary blood-to-serum or -plasma concentration [44, 48, 50]. Another possibleimportant factor may be the interaction of the drug with the blood matrix or theDBS card matrix. Rifampicin has demonstrated to interact with endogenous bloodcomponents, like ferric ions from the red blood cells causing complex formation[22]. This causes low recoveries from DBS extracts which can be improved by the

24 Chapter 2. Review
addition of chelating agents, such as EDTA and deferoxamine, to the extractionprocedure. Also direct binding of the drug by hydrogen bonding with the DBScard matrix may have an effect on recovery [19, 20]. Recovery also is influenced byhaematocrit value, substance concentration and drying time of the DBS card [20].This interaction is inherent to the current cellulose based card matrices [21]. Anadvantage of the dried plasma spot technique over DBS is that it is not influencedby haematocrit value. Quantification of anti-infective drugs using the dried plasmaspot technique has been described for fosfomycin, daptomycin, linezolid, triazoleantifungal drugs and antiretroviral drugs [45, 47]. Although the use of DBS anddried plasma spot techniques is not yet widely spread, both are a promising altern-ative for venous blood sampling and in some cases (i.e. low resource and remoteareas) the only viable options.
Another patient friendly method of sampling is the use of saliva [43, 51]. Comparedto blood sampling, saliva is easy to collect and non-invasively with a negligiblechance of infections [52]. Furthermore, it is cheap and causes less stress and dis-comfort to the patients [52]. As saliva is a very low protein matrix (∼0.3%), themeasured concentration represents the unbound concentration of the drug. Thismay require a very sensitive LC-MS/MS analysis method or an extensive samplepreparation procedure like SPE or LLE to concentrate the sample for drugs withhigh protein binding. As there are many other determinants of the salivary drugconcentration, such as salivary flow rate, stability of the drug and its metabolites,time of sample collection and ingestion of food or beverages [52], target concentra-tions in saliva should be established on a drug-to-drug basis [43]. Saliva methodsusing LC-MS/MS have been published for a few anti-infective drugs (doxycycline,fluconazole, linezolid, lopinavir and oseltamivir) [52–54].
2.8 Conclusion
In conclusion, TDM plays an important role in the optimisation of treatment withanti-infective drugs. To perform TDM adequately, it is essential to design assayswith a rapid turnaround time, enabling the antimicrobial stewardship to quicklyadjust and optimise treatment if necessary. LC-MS/MS is a fast and accurate tech-nique for quantification of anti-infective drugs. If an analytical method is developedand validated, interlaboratory quality control is an important component of qualityassurance.
In clinical practice blood is the most commonly used matrix for TDM since it servesas a good surrogate for the site of infection. In general, it is easily obtained, incontrast to other matrices. However, in complex infectious cases other matricescould be used to optimise anti-infective treatment.

References 25
References
1. Roberts J. A. et al. Individualised antibiotic dosing for patients who are crit-ically ill: challenges and potential solutions. Lancet Infect Dis 14, 498–509(2014).
2. Touw D. J., Neef C., Thomson A. H., Vinks A. A., of Therapeutic Drug Monitor-ing Committee of the International Association for Therapeutic Drug Monit-oring C.-E. & Toxicology C. Cost-effectiveness of therapeutic drug monitoring:a systematic review. Ther Drug Monit 27, 10–17 (2005).
3. Brüggemann R. J. & Aarnoutse R. E. Fundament and Prerequisites for theApplication of an Antifungal TDM Service. Curr Fungal Infect Rep 9, 122–129(2015).
4. Aarnoutse R. E., Schapiro J. M., Boucher C. A., Hekster Y. A. & Burger D. M.Therapeutic drug monitoring: an aid to optimising response to antiretroviraldrugs? Drugs 63, 741–53 (2003).
5. Van der Meer A. F., Marcus M. A., Touw D. J., Proost J. H. & Neef C. Optimalsampling strategy development methodology using maximum a posterioriBayesian estimation. Ther Drug Monit 33, 133–46 (2011).
6. Mouton J. W., Ambrose P. G., Canton R., Drusano G. L., Harbarth S., MacGowanA., Theuretzbacher U. & Turnidge J. Conserving antibiotics for the future: newways to use old and new drugs from a pharmacokinetic and pharmacody-namic perspective. Drug Resist Updat 14, 107–17 (2011).
7. Schmidt S., Barbour A., Sahre M., Rand K. H. & Derendorf H. PK/PD: newinsights for antibacterial and antiviral applications. Curr Opin Pharmacol 8,549–56 (2008).
8. Wong G. et al. An international, multicentre survey of β-lactam antibiotictherapeutic drug monitoring practice in intensive care units. J AntimicrobChemother 69, 1416–23 (2014).
9. Mohd Hafiz A.-A., Staatz C. E., Kirkpatrick C. M., Lipman J. & Roberts J. A.Continuous infusion vs. bolus dosing: implications for beta-lactam antibiotics.Minerva Anestesiol 78, 94–104 (2012).
10. Dellit T. H. et al. Infectious Diseases Society of America and the Society forHealthcare Epidemiology of America guidelines for developing an institu-tional program to enhance antimicrobial stewardship. Clin Infect Dis 44, 159–77 (2007).
11. Ananda-Rajah M. R., Slavin M. A. & Thursky K. T. The case for antifungalstewardship. Curr Opin Infect Dis 25, 107–15 (2012).

26 Chapter 2. Review
12. Coulter S., Merollini K., Roberts J. A., Graves N. & Halton K. The need for cost-effectiveness analyses of antimicrobial stewardship programmes: A structuredreview. Int J Antimicrob Agents 46, 140–9 (2015).
13. Adaway J. E. & Keevil B. G. Therapeutic drug monitoring and LC-MS/MS. JChromatogr B 883-884, 33–49 (2012).
14. Food and Drug Administration US Department of Health. Guidance for in-dustry, bioanalytical method validation tech. rep. (Center for Drug Evalutationand Research, 2001).
15. European Medicines Agency Committee for Medicinal Products for HumanUse. Guideline on bioanalytical validation (EMEA/CHMP/EWP/192217/2009)tech. rep. (2011).
16. Clinical Laboratory and Standards Institute. Liquid chromatography-massspectrometry methods; approved guideline tech. rep. October (2014), CLSIDocument C62–A.
17. Lynch K. L. CLSI C62-A: A New Standard for Clinical Mass Spectrometry. ClinChem (2016).
18. Van den Ouweland J. M. & Kema I. P. The role of liquid chromatography-tandem mass spectrometry in the clinical laboratory. J Chromatogr B 883-884,18–32 (2012).
19. Koster R. A., Alffenaar J. W., Greijdanus B. & Uges D. R. Fast LC-MS/MS analysisof tacrolimus, sirolimus, everolimus and cyclosporin A in dried blood spotsand the in fluence of the hematocrit and immunosuppressant concentrationon recovery. Talanta 115, 47–54 (2013).
20. Koster R. A., Alffenaar J.-W., Botma R., Greijdanus B., Uges D. R., Kosterink J. G.& Touw D. J. The relation of the number of hydrogen-bond acceptors withrecoveries of immunosuppressants in DBS analysis. Bioanalysis 7, 1717–22(2015).
21. Koster R. A., Botma R., Greijdanus B., Uges D. R., Kosterink J. G., Touw D. J. &Alffenaar J.-W. The performance of five different dried blood spot cards forthe analysis of six immunosuppressants. Bioanalysis 7, 1225–35 (2015).
22. Vu D. H., Koster R. A., Bolhuis M. S., Greijdanus B., Altena R. V., Nguyen D. H.,Brouwers J. R., Uges D. R. & Alffenaar J. W. Simultaneous determination ofrifampicin, clarithromycin and their metabolites in dried blood spots usingLC-MS/MS. Talanta 121, 9–17 (2014).
23. Van Eeckhaut A., Lanckmans K., Sarre S., Smolders I. & Michotte Y. Validationof bioanalytical LC–MS/MS assays: Evaluation of matrix effects. J ChromatogrB 877, 2198–2207 (2009).

References 27
24. Autmizguine J., Benjamin D. K., Smith P. B., Sampson M., Ovetchkine P., Cohen-Wolkowiez M. & Watt K. M. Pharmacokinetic studies in infants using minimal-risk study designs. Curr Clin Pharmacol 9, 350–8 (2014).
25. Koster R. A., Greijdanus B., Alffenaar J.-W. & Touw D. J. Dried blood spotanalysis of creatinine with LC-MS/MS in addition to immunosuppressantsanalysis. Anal Bioanal Chem 407, 1585–94 (2015).
26. Tan A., Awaiye K. & Trabelsi F. Some unnecessary or inadequate commonpractices in regulated LC–MS bioanalysis. Bioanalysis 6, 2751–2765 (2014).
27. Musteata F. M. Monitoring free drug concentrations: challenges. Bioanalysis3, 1753–68 (2011).
28. Barre J., Didey F., Delion F. & Tillement J. P. Problems in therapeutic drugmonitoring: free drug level monitoring. Ther Drug Monit 10, 133–43 (1988).
29. Illamola S. M., Hirt D., Tréluyer J. M., Urien S. & Benaboud S. Challengesregarding analysis of unbound fraction of highly bound protein antiretroviraldrugs in several biological matrices: lack of harmonisation and guidelines.Drug Discov Today 20, 466–74 (2015).
30. Ulldemolins M., Roberts J. A., Rello J., Paterson D. L. & Lipman J. The effects ofhypoalbuminaemia on optimizing antibacterial dosing in critically ill patients.Clin Pharmacokinet 50, 99–110 (2011).
31. Vuignier K., Schappler J., Veuthey J.-L., Carrupt P.-A. & Martel S. Drug-proteinbinding: a critical review of analytical tools. Anal Bioanal Chem 398, 53–66(2010).
32. Kratzer A., Liebchen U., Schleibinger M., Kees M. G. & Kees F. Determinationof free vancomycin, ceftriaxone, cefazolin and ertapenem in plasma by ul-trafiltration: impact of experimental conditions. J Chromatogr B 961, 97–102(2014).
33. Li X., Wang F., Xu B., Yu X., Yang Y., Zhang L. & Li H. Determination of the freeand total concentrations of vancomycin by two-dimensional liquid chroma-tography and its application in elderly patients. J Chromatogr B 969, 181–9(2014).
34. Theuretzbacher U. Tissue penetration of antibacterial agents: how should thisbe incorporated into pharmacodynamic analyses? Curr Opin Pharmacol 7,498–504 (2007).
35. Rodvold K. A., Yoo L. & George J. M. Penetration of Anti-Infective Agents intoPulmonaryEpithelial Lining Fluid. Clin Pharmacokinet 50, 689–704 (2011).

28 Chapter 2. Review
36. Rodvold K. A., George J. M. & Yoo L. Penetration of anti-infective agents intopulmonary epithelial lining fluid: focus on antibacterial agents. Clin Pharma-cokinet 50, 637–64 (2011).
37. Bazzoli C., Jullien V., Le Tiec C., Rey E., Mentré F. & Taburet A.-M. IntracellularPharmacokinetics of Antiretroviral Drugs in HIV-Infected Patients, and theirCorrelation with Drug Action. Clin Pharmacokinet 49, 17–45 (2010).
38. Mouton J. W., Theuretzbacher U., Craig W. A., Tulkens P. M., Derendorf H. &Cars O. Tissue concentrations: do we ever learn? J Antimicrob Chemother 61,235–237 (2008).
39. Joukhadar C. & Müller M. Microdialysis: current applications in clinical phar-macokinetic studies and its potential role in the future. Clin Pharmacokinet44, 895–913 (2005).
40. Aarnoutse R. E., Sturkenboom M. G., Robijns K., Harteveld A. R., GreijdanusB., Uges D. R., Touw D. J. & Alffenaar J.-W. An interlaboratory quality controlprogramme for the measurement of tuberculosis drugs. Eur Respir J 46, 268–71 (2015).
41. Burger D., Krens S., Robijns K., Aarnoutse R., Brüggemann R. & Touw D. Poorperformance of laboratories assaying newly developed antiretroviral agents:results for darunavir, etravirine, and raltegravir from the international qualitycontrol program for therapeutic drug monitoring of antiretroviral drugs inhuman plasma/serum. Ther Drug Monit 36, 824–7 (2014).
42. Lempers V. J., Alffenaar J. W., Touw D. J., Burger D. M., Uges D. R., AarnoutseR. E. & Brüggemann R. J. Five year results of an international proficiencytesting programme for measurement of antifungal drug concentrations. JAntimicrob Chemother 69, 2988–94 (2014).
43. Ter Heine R., Beijnen J. H. & Huitema A. D. Bioanalytical issues in patient-friendly sampling methods for therapeutic drug monitoring: focus on antiret-roviral drugs. Bioanalysis 1, 1329–38 (2009).
44. Wilhelm A. J., den Burger J. C. & Swart E. L. Therapeutic drug monitoring bydried blood spot: progress to date and future directions. Clin Pharmacokinet53, 961–73 (2014).
45. Parker S. L., Lipman J., Dimopoulos G., Roberts J. A. & Wallis S. C. A validatedmethod for the quantification of fosfomycin on dried plasma spots by HPLC-MS/MS: application to a pilot pharmacokinetic study in humans. J PharmBiomed Anal 115, 509–14 (2015).
46. Musteata F. M. Pharmacokinetic applications of microdevices and microsam-pling techniques. Bioanalysis 1, 171–85 (2009).

References 29
47. Zimmer J. S., Christianson C. D., Johnson C. J. & Needham S. R. Recent ad-vances in the bioanalytical applications of dried matrix spotting for the ana-lysis of drugs and their metabolites. Bioanalysis 5, 2581–2588 (2013).
48. Hofman S., Bolhuis M. S., Koster R. A., Akkerman O. W., van Assen S., Stove C.& Alffenaar J.-W. Role of therapeutic drug monitoring in pulmonary infections:use and potential for expanded use of dried blood spot samples. Bioanalysis7, 481–95 (2015).
49. Vu D. H., Alffenaar J. W., Edelbroek P. M., Brouwers J. R. & Uges D. R. Driedblood spots: a new tool for tuberculosis treatment optimization. Curr PharmDes 17, 2931–2939 (2011).
50. Koster R. A., Alffenaar J.-W., Botma R., Greijdanus B., Touw D. J., Uges D. R. &Kosterink J. G. What is the right blood hematocrit preparation procedure forstandards and quality control samples for dried blood spot analysis? Bioana-lysis 7, 345–51 (2015).
51. Nunes L. A., Mussavira S. & Bindhu O. S. Clinical and diagnostic utility of salivaas a non-invasive diagnostic fluid: a systematic review. Biochem Med (Zagreb)25, 177–92 (2015).
52. Raju K. S., Taneja I., Singh S. P. & Wahajuddin. Utility of noninvasive bio-matrices in pharmacokinetic studies. Biomed Chromatogr 27, 1354–66 (2013).
53. Van der Elst K. C., van Alst M., Lub-de Hooge M. N., van Hateren K., KosterinkJ. G., Alffenaar J.-W. & Schölvinck E. H. Clinical validation of the analysis of fluc-onazole in oral fluid in hospitalized children. Antimicrob Agents Chemother58, 6742–6 (2014).
54. Bolhuis M. S., van Altena R., van Hateren K., de Lange W. C., Greijdanus B.,Uges D. R., Kosterink J. G., van der Werf T. S. & Alffenaar J. W. Clinical validationof the analysis of linezolid and clarithromycin in oral fluid of patients withmultidrug-resistant tuberculosis. Antimicrob Agents Chemother 57, 3676–80(2013).


CH
AP
TE
R
3QUANTIFICATION OF ISONIAZID,
PYRAZINAMIDE AND ETHAMBUTOL IN
SERUM USING LIQUID
CHROMATOGRAPHY-TANDEM MASS
SPECTROMETRY
∗ Marieke G.G. Sturkenboom∗ Henk van der Lijke
Erwin M. JongedijkWim Th Kok
Ben GreijdanusDonald R.A. Uges
Jan-Willem C. Alffenaar∗ Both authors contributed equally to the manuscript
Journal of Applied Bioanalysis 2015; 1(3): 89-98

32 Chapter 3. LC-MS/MS
Abstract
Clinical studies on tuberculosis have shown a correlation between low drug expos-ure and treatment failure and acquired drug resistance. Objective was to developan LC-MS/MS method for the quantification of isoniazid, pyrazinamide and eth-ambutol. Stable isotope-labelled isoniazid-D4 and ethambutol-D4 were used asinternal standards. Protein binding of isoniazid, pyrazinamide and ethambutol wasinvestigated and proved low. Therefore, sample preparation using ultrafiltrationcould be applied, resulting in linear calibration curves in the range of 0.2 - 8 mg/Lfor isoniazid and ethambutol and 2 - 80 mg/L for pyrazinamide. The method wasvalidated according to the guidelines of the FDA.
A fast, simple and reliable LC-MS/MS method has been developed for the simultan-eous determination of isoniazid, pyrazinamide and ethambutol in human serumfor therapeutic drug monitoring and pharmacokinetic studies.

3.1. Introduction 33
3.1 Introduction
Tuberculosis (TB) is one of the infectious diseases with the highest morbidityand mortality in the world [1]. First-line treatment of TB consists of isoniazid,rifampicin, pyrazinamide and ethambutol during the first two months, continuingwith isoniazid and rifampicin for another four months [1]. Although treatmentis often successful, healthcare providers around the world are confronted withtreatment failure daily. Recently, Pasipanodya et al. showed that risk on treatmentfailure was almost nine-fold higher in patients with low drug exposure comparedto patients with higher drug exposure [2]. Therefore, monitoring of drug exposurein patients at risk for low drug exposure is worthwhile to explore in a prospectivemanner [3].
To be able to evaluate drug exposure a fast, accurate and simple method for de-termination of isoniazid, rifampicin, pyrazinamide and ethambutol in serum isvaluable. As for other antimicrobial drugs, it would be ideal to determine all fourcompounds in the same sample using a single method of analysis [4, 5]. Song etal. published a method for the simultaneous determination of all first-line anti-TB drugs using liquid chromatography-tandem mass spectrometry (LC-MS/MS)[6]. Unfortunately, the polar compounds isoniazid, pyrazinamide and ethambutolelute near the void volume of the system, co-eluting with endogenous compoundsresulting in substantial ion suppression [6, 7]. As matrix effects may vary withinand between subjects, ion suppression at the time of elution of the compoundsof interest should be avoided or overcome using a stable isotope-labelled internalstandard [8–10].
Zhou et al. used hydrophilic interaction chromatography (HILIC) to quantify iso-niazid, rifampicin, pyrazinamide, ethambutol and streptomycin [11]. They testedfive different HILIC columns and several mobile phase compositions. An initialattempt by the authors to determine isoniazid and ethambutol using HILIC wasabandoned, as our method suffered from split peaks and bad repeatability. Recently,Kim et al. developed an LC-MS/MS method for the simultaneous quantificationof 20 anti-TB drugs. The method consisted of two different precipitation methods,different solid and mobile phases [12].
We successfully applied ultrafiltration as a means of sample preparation for thepolar compound ribavirin [13] and we were interested whether this might also beapplied for the first-line anti-TB drugs. However, rifampicin shows high proteinbinding of around 80% to 90% [14], which makes it a less suitable candidate forultrafiltration compared to isoniazid, pyrazinamide and ethambutol. Therefore, itwas decided to split the patient sample, followed by a subsequent separate analysisof rifampicin and a separate one for isoniazid, pyrazinamide and ethambutol

34 Chapter 3. LC-MS/MS
together resulting in more reliable results within the same runtime. A previouslydeveloped method will be used for the analysis of rifampicin [7, 15]. The objectiveof this study was to develop and validate a simple and rapid LC-MS/MS method forthe determination of isoniazid, pyrazinamide and ethambutol in human serum.
3.2 Material and methods
3.2.1 Chemicals, reagents and disposables
Isoniazid (purity > 99%) was purchased from Bufa (Uitgeest, The Netherlands).Ethambutol dihydrochloride (purity > 99%) and pyrazinamide (purity ≥ 98%) werepurchased from Sigma-Aldrich (Zwijndrecht, The Netherlands).
The internal standard isoniazid-D4 was produced by CDN Isotopes (Pointe-Claire,Canada). The internal standard ethambutol-D4 was synthesized by Syncom (Gronin-gen, the Netherlands).
Acetonitrile (Ultra LC-MS-grade) was obtained from BioSolve (Valkenswaard, TheNetherlands). Ammonium acetate and acetic acid (p.a. quality) from Merck werepurchased from VWR (Amsterdam, The Netherlands). Water was purified with aMilli-Q system (Millipore Corporation, Billerica, MA, USA).
Blank human serum and plasma was obtained from healthy volunteers accordingto the appropriate guidelines of the University Medical Center Groningen.
Pall Nanosep 30K Omega centrifugal devices, Varian non-deactivated 2 mL boro-silicate glass screw top vials and 600µL polypropylene screw top vials were pur-chased from VWR (Amsterdam, The Netherlands). The inserts were made fromSchott Fiolax®-clear glass and were purchased from Aluglas (Uithoorn, The Neth-erlands).
3.2.2 Equipment and conditions
Experiments were performed on an Agilent 6460A (Santa Clara, CA, USA) triplequadrupole LC-MS/MS system, with an Agilent 1200 series combined LC-system.The mass selective detector operated in heated electrospray positive ionisationmode and performed dynamic multiple reaction monitoring (DMRM) with unitmass resolution. High purity nitrogen was used for both the source and collisiongas flows. Precursor ions, product ions, optimum fragmentor voltages and collisionenergy values are listed in Table 3.1. For all substances the capillary voltage wasset at 4,000 V, gas temperature at 320 °C, gas flow at 13 L/min, nebulizer gas at 60psi, sheath gas temperature at 400 °C, sheath gas flow at 12 L/min and the nozzle

3.2. Material and methods 35
voltage at 0 V. The Agilent 1290 autosampler and the 1260 TCC column oven wereset at a temperature of 20 °C.
Component Parent ion(m/z)
Product ion(m/z)
FragmentorVoltage(Volts)
Collision en-ergy (Volts)
Retentiontime (min)
Ethambutol 205.1 116.1 76 13 1.15Ethambutol-D4 209.1 120.1 76 13 1.15Isoniazid 138.1 121.0 72 11 1.41Isoniazid-D4 142.1 125.0 72 11 1.40Pyrazinamide 124.0 81.0 72 20 1.72
Table 3.1: Mass spectrometer settings for all substances.
Separation was performed on an Atlantis T3 reversed-phase C18 analytical column(2.0 x 100 mm, 3 µm particle size) from Waters (Etten-Leur, The Netherlands). Themobile phase consisted of acetonitrile, water and a 200 mM ammonium acetatebuffer pH 5.0. Chromatographic separation was performed using the mobile phasegradient listed in Table 3.2 at a flow of 500 µL/min, which resulted in a run time of2.5 minutes.
Step Time (min) Mobile phaseEluent A (% v/v) Eluent B (% v/v)
0 0.00 100 01 0.01 90 102 1.20 90 103 1.21 0 1004 1.35 0 1005 1.36 100 06 1.50 100 07 1.51 0 1008 2.00 0 1009 2.01 100 010 2.50 100 0
Table 3.2: Mobile phase gradient. Eluent A: 200 mM ammonium acetate buffer pH 5.0 : water (5 : 95), EluentB: 200 mM ammonium acetate buffer pH 5.0 : water : acetonitrile (5 : 45 : 50).
Peak area ratios of the analytes and their associated internal standards were usedto calculate concentrations. Agilent Masshunter software for quantitative analysis(version B.04.00) was used for quantification of the analysis results. Vortexingwas performed with a Labtek multi-tube vortexer (Christchurch, New Zealand).Centrifugation was performed using a unthermostated Hettich EBA 21 centrifuge(Tuttlingen, Germany) with a 45º fixed angle rotor. Temperature was not con-trolled because no effect of increasing temperature was observed during earlierexperiments (data not shown).

36 Chapter 3. LC-MS/MS
3.2.3 Method development
The analytical range was based on clinical pharmacokinetic data and set at 0.2 – 8.0mg/L for isoniazid and ethambutol and 2 – 80 mg/L for pyrazinamide [3, 16].
As stable isotope-labelled internal standards are known to compensate for matrixeffects [9, 10], isoniazid-D4 and ethambutol-D4 were used as such. Since a stableisotope-labelled internal standard for pyrazinamide was unavailable, no internalstandard was used for the quantification of this compound.
I. Protein binding and ultrafiltration
Reported protein binding levels vary considerably for the three compounds: ran-ging from 0% to 74% for isoniazid [17, 18], from 5% to 50% for pyrazinamide [17,19] and from 10% to 30% for ethambutol [17, 20]. However, one expects proteinbinding to be limited as isoniazid, pyrazinamide and ethambutol are very polarcompounds. If protein binding proves to be low, ultrafiltration as a means of de-proteinization of the serum samples can be applied. Although ultrafiltration iscommonly used for determining free unbound drug levels in serum [21], it haspreviously been applied as a means of sample preparation for other polar com-pounds such as acyclovir, ganciclovir, ribavirin and zidovudine [13, 22–25]. Theobtained ultra filtrate is purely aqueous which is particularly suitable for injectingonto LC-systems that are equilibrated under the same conditions. To investigatethe applicability of ultrafiltration for the assay, it was decided to determine proteinbinding of the three compounds using the 30 kDa centrifuge filters applied for thesample preparation. The Pall Nanosep 30 K Omega centrifugal device was chosenbecause it removes over 99.5% of all serum proteins, shows low protein binding,allows for fast processing times and fits standard micro-centrifuges [13].
Protein binding was determined by measuring a calibration curve with calibrationstandards at seven levels prepared in human serum and compare it to an equivalentcalibration curve prepared in water with added blank ultra filtrate to compensatefor matrix effects. The ratio of the slopes of these curves shows the extent of proteinbinding. In this experiment, calibration curve samples were freshly prepared andprocessed within 30 minutes to minimise alterations to isoniazid other than thereversible protein binding under investigation. This period is comparable to otherstudies on protein binding [26, 27]. Inert type 1 borosilicate glass inserts were usedto minimise any adsorption of ethambutol to glass inserts.

3.2. Material and methods 37
II. Adsorption
During early method development, a significant decline in signal for ethambutolwas observed when the aqueous test mixtures were injected from the standard non-deactivated glass vials compared to plastic vials. To investigate this observation, anadsorption test was performed. A test solution with isoniazid, pyrazinamide andethambutol was prepared and was divided over a polypropylene vial, a glass vialand a glass insert made out of type I borosilicate glass. The samples were shakenvigorously for one minute and five repetitive injections were made from each typeof vial.
III. Carry-over
Carry-over from high isoniazid and ethambutol standards was observed duringmethod development. Therefore, an experiment in five-fold was performed toevaluate the magnitude of the carry-over by injecting five LLOQ (lower limit ofquantification) samples after an HLQ (higher limit of quantification with 8.0 mg/Lisoniazid and ethambutol and 80 mg/L pyrazinamide) sample.
3.2.4 Sample Preparation
For the calibration (reference) standards and quality control (QC) samples, separatestock solutions of 200 mg/L isoniazid and ethambutol and 2000 mg/L pyrazinamidein water were prepared. Calibration standards and QC samples were freshly pre-pared immediately before use by diluting appropriate amounts of stock solutionswith blank human serum or plasma. QC samples were freshly prepared as stabilityof isoniazid is known to be limited [28, 29]. The total amount of stock solutionsadded to the serum was less than 5% of the final volume. Calibration standardsat eight levels ranged from 0.2-8.0 mg/L for isoniazid and ethambutol and from2.0-80 mg/L for pyrazinamide. QC samples consisted of LLOQ, Low, Medium, Highand over-the-curve (OTC) levels for each compound (Table 3.3).
Component Stock Calibration standards (mg/L) QC samples (mg/L)(mg/L) LLOQ Low Med High OTC
Isoniazid 200 0.2, 0.3, 0.5, 0.8, 1.5, 3.0, 5.0, 8,0 0.2 0.5 2.5 6.5 40Pyrazinamide 2000 2.0, 3.0, 5.0, 8.0, 15, 30, 50, 80 2.0 5.0 25 65 400Ethambutol 200 0.2, 0.3, 0.5, 0.8, 1.5, 3.0, 5.0, 8,0 0.2 0.5 2.5 6.5 40
Table 3.3: Concentration of stock solutions, calibration standards and QC samples. QC quality control, LLOQlower limit of quantification, OTC over-the-curve.
The internal standard solution was prepared with 0.25 mg/L isoniazid-D4 and 0.25mg/L ethambutol-D4 in water.

38 Chapter 3. LC-MS/MS
QC samples for the freeze/thaw stability were prepared beforehand. Separate Lowand High level QC samples in human serum were thawed, frozen and analysed onthree consecutive days. The samples for determining the bench top stability werefreshly prepared and analysed immediately and after being kept for 24 hours atambient temperature.
Calibration standards, QC or human serum samples were homogenised and ali-quots of 10 µL were directly transferred onto the upper reservoir of the centrifugefilters and 250 µL of internal standard solution was added. The centrifuge filterswere closed and the samples were briefly homogenised using a vortex mixer. Fil-tration was performed by centrifugation for 10 minutes at 14,000 g at an angle of45º. A 5 µL volume of the ultra filtrate was injected onto the LC-MS/MS system.Samples for the stability test were processed in the same way as the samples for thevalidation and routine analysis.
3.2.5 Analytical validation
In accordance with the ‘Guidance for Industry – Bioanalytical Method Validation’ ofthe FDA [30], method validation included selectivity, linearity, accuracy, precisionand stability.
The linearity was assessed by using eight point calibration curves on three days forthe three compounds. To determine accuracy and precision, LLOQ, Low, Mediumand High QC samples were analysed. All QC samples were analysed in five-fold inthree separate runs on separate days.
The calibration model was chosen by evaluating the accuracy results at LLOQ,Low, Medium and High concentration level of the first precision and accuracy run.The simplest linear model at three weighting factors (x, 1/x and 1/x2) at which allaccuracies were within the specifications of the FDA was chosen and set for theentire validation and ensuing bioanalysis.
Automatic immuno-assays do not exist for the quantification of anti-TB drugs.Therefore, all assays for anti-TB drugs are ‘in-house’ developed and validatedchromatographic methods [31]. To be able to compare obtained results betweenlaboratories, it is important to participate in an external quality control programme.Recently, such a proficiency testing programme has been set up [31] and we parti-cipated in the programme with the developed method.
3.2.6 Matrix effect
The matrix effect was assessed using six different human sera and six differenthuman edetate plasmas adding up to 12 different matrices. The first set (A) was

3.2. Material and methods 39
prepared of QC stock in water to evaluate the neat MS response of the compoundsand the internal standards. The second set (B), 12 different calibration sets wereprepared with internal standard solution and after ultrafiltration QC stock wasadded.
The matrix factor was calculated as the ratio of the peak area of the spiked standardsafter sample preparation (B) to the corresponding peak area of the neat solutionstandards (A) [9]. The internal standard-normalised matrix factor was calculatedby dividing matrix factor of isoniazid and ethambutol by the matrix factor of theirinternal standard [9]. As pyrazinamide was determined without internal standard,the matrix factor was calculated without normalisation.
3.2.7 Stability
The stability of the compounds was extensively evaluated as a part of a largerinvestigation on the stability of many anti-TB drugs. Human serum standardswere prepared by adding appropriate amounts of stock solution to blank matrices.Analyses were performed in duplicate and time point 0 served as the reference.The final serum concentrations for the Low concentration samples were 0.51 mg/Lisoniazid, 20.2 mg/L pyrazinamide and 1.00 mg/L ethambutol. For the High concen-tration samples, the values were 6.89 mg/L, 62.4 mg/L and 5.09 mg/L for isoniazid,pyrazinamide and ethambutol respectively.
The prepared human serum standards were divided into 0.5 mL aliquots and storedin sealed plastic tubes at four different conditions: ambient temperature (18-24 °C),refrigerator (4-8 °C) and at two freezing temperatures (-20 °C and -80 °C). Frozensamples were thawed immediately before analysis. To determine bench top stability,samples were thawed and analysed immediately and after being left for 24 hours atambient temperature. To determine the autosampler stability, Low and High QCsamples were processed at day one, were left in the autosampler for 24 hours andre-injected on day two.
To determine freeze/thaw stability, separate Low and High QC samples were thawed,frozen at -80 °C and analysed on three consecutive days.
One portion of human serum was divided into 1 mL aliquots in 10 mL glass con-tainers and freeze-dried using a Leybold Lyovac GT4 lyophilizer according to localstandard operating procedure by authorized personnel. Then they were sealed andrefrigerated at 4-8 °C. Freeze-dried samples were reconstituted by adding 1 mL ofwater, immediately before use.

40 Chapter 3. LC-MS/MS
3.2.8 Clinical application
After validation the analytical procedure was used in routine patient care and aclinical study evaluating the influence of food and fasting on the pharmacokineticsof first-line anti-TB drugs. Twenty patients included in this study were diagnosedwith drug-susceptible TB and provided written informed consent. The study pro-tocol was approved by the Medical and Health Research Ethics Committee of theGadjah Mada University in Yogyakarta, Indonesia.
3.3 Results
3.3.1 Method development
Using the Waters Atlantis T3 column, best peak shapes and repeatable retentiontimes were obtained by starting and ending the mobile phase gradient in 100%aqueous conditions. Mean retention times were 1.15 min for ethambutol, 1.41 minfor isoniazid and 1.72 min for pyrazinamide, respectively (Table 3.1). The hold-uptime of the system is approximately 0.9 min. To optimize the chromatography ofthe compounds a mobile phase buffer pH 5 was used. This resulted in acceptablepeak shapes (Figure 3.1). Although isoniazid and ethambutol elute within a shortperiod, no interference was observed. However, some tailing of ethambutol wasobserved. We were unable to further diminish this tailing.
The results of the protein binding tests are presented in Table 3.4. As proteinbinding indeed proved to be low, ultrafiltration as a means of sample preparationcould be applied.
Isoniazid Pyrazinamide EthambutolSlope water 226145 17732 2793786Slope serum 211345 15178 2729384Protein binding (mean %) 6.54 14.41 2.31Confidence limit (%) 4.31 7.13 7.90
Table 3.4: Protein binding.
In the adsorption test, ethambutol showed a significant loss of approximately35% in peak area when injected from the standard glass vial (Figure 3.2). Theisoniazid response showed a small but significant decrease when injected from thepolypropylene and the glass vial. Pyrazinamide was unaffected by the differentmaterials. The type I borosilicate glass insert showed the least absorption for mostcompounds and was chosen as the standard vial.
The test for carry-over showed that it was caused by a memory effect of the column.This memory effect was proven by repeating the gradient three times during an

Figure 3.1: Chromatograms of blank (dotted line) and LLOQ concentrations (solid line) of ethambutol (0.2mg/L), isoniazid (0.2 mg/L) and pyrazinamide (2.0 mg/L).
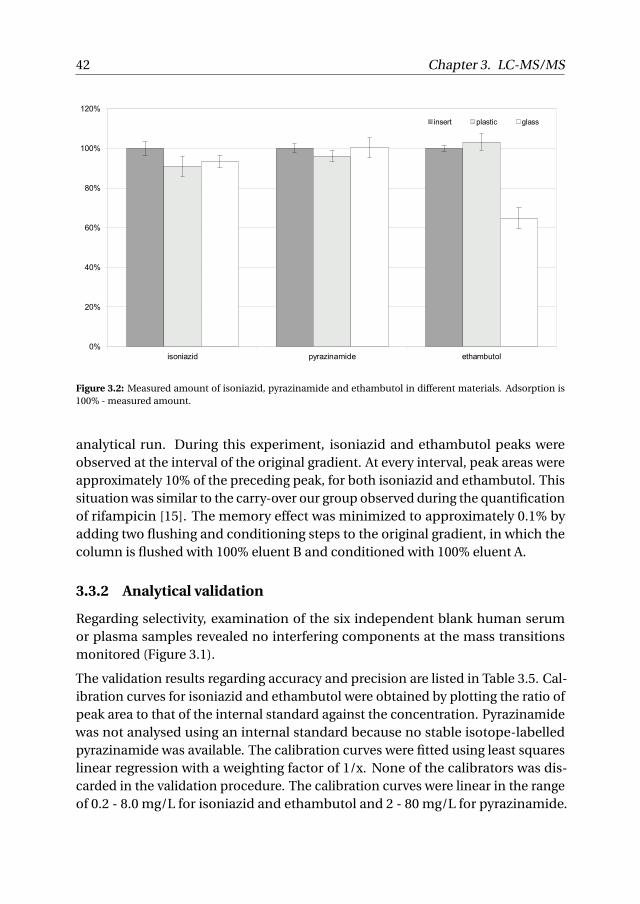
42 Chapter 3. LC-MS/MS
0%
20%
40%
60%
80%
100%
120%
isoniazid pyrazinamide ethambutol
insert plastic glass
Figure 3.2: Measured amount of isoniazid, pyrazinamide and ethambutol in different materials. Adsorption is100% - measured amount.
analytical run. During this experiment, isoniazid and ethambutol peaks wereobserved at the interval of the original gradient. At every interval, peak areas wereapproximately 10% of the preceding peak, for both isoniazid and ethambutol. Thissituation was similar to the carry-over our group observed during the quantificationof rifampicin [15]. The memory effect was minimized to approximately 0.1% byadding two flushing and conditioning steps to the original gradient, in which thecolumn is flushed with 100% eluent B and conditioned with 100% eluent A.
3.3.2 Analytical validation
Regarding selectivity, examination of the six independent blank human serumor plasma samples revealed no interfering components at the mass transitionsmonitored (Figure 3.1).
The validation results regarding accuracy and precision are listed in Table 3.5. Cal-ibration curves for isoniazid and ethambutol were obtained by plotting the ratio ofpeak area to that of the internal standard against the concentration. Pyrazinamidewas not analysed using an internal standard because no stable isotope-labelledpyrazinamide was available. The calibration curves were fitted using least squareslinear regression with a weighting factor of 1/x. None of the calibrators was dis-carded in the validation procedure. The calibration curves were linear in the rangeof 0.2 - 8.0 mg/L for isoniazid and ethambutol and 2 - 80 mg/L for pyrazinamide.

3.3. Results 43
The average correlation coefficients were 0.9987 for isoniazid, 0.9992 for pyrazin-amide and 0.9984 for ethambutol. All the calibration curves showed a significantgoodness of fit. All obtained results met the acceptance criteria set by the FDA [27].These criteria were < 20% bias and < 20% coefficient of variation (CV) for LLOQ QCsamples and < 15% bias and < 15% CV for the other QC samples. The maximumoverall bias was 10.7% and the maximum overall CV was 8.1%, which is well withinthe limits set by the FDA.
Component Concentration(mg/L)
Bias (%) CV (%)
Isoniazid LLOQ (0.2) 10.7 6.7Low (0.5) 2.2 2.5Med (2.5) 4.3 8.1High (6.5) 2.7 1.8OTC (40) 7.1 3.3
Pyrazinamide LLOQ (2) -0.3 3.6Low (5) -0.6 2.4Med (25) 2.1 2.0High (65) -4.5 1.7OTC (400) -3.7 2.4
Ethambutol LLOQ (0.2) 7.3 5.9Low (0.5) 2.3 3.3Med (2.5) 2.6 2.2High (6.5) 0.6 3.9OTC (40) -10.5 3.9
Table 3.5: Accuracy and precision results. LLOQ lower limit of quantification, OTC over-the-curve, CV coeffi-cient of variation.
We participated with this method in the second round of an interlaboratory qualitycontrol program for the measurement of anti-TB drugs [31]. All values were withinthe limits of 20% set by the organisation of the programme.
3.3.3 Matrix effect
The results for the matrix effect tests are listed in Table 3.6. Data for both serum andplasma samples were pooled, as no significant difference was observed betweenthem. For all compounds, a small positive (internal standard-normalised) matrixfactor was determined for low and high concentrations. Maximum CV was 6.0% forthe Low level of ethambutol, this is within the limit of 15% set by the EMA [9].
3.3.4 Stability
The results of the stability tests showed that isoniazid is not stable at ambienttemperature in human serum (Table 3.7). However, if it is present in ultra filtrate asin the autosampler test, isoniazid proves to be stable for at least 24 hours. Isoniazidserum standards are only stable at -80 °C or in freeze-dried conditions for longer

44 Chapter 3. LC-MS/MS
Component Concentration(mg/L)
Matrix factor CV (%)
Isoniazid Low (0.5) 1.128 4.7High (6.5) 1.157 5.0
Pyrazinamide1 Low (5) 1.184 2.8High (65) 1.142 3.3
Ethambutol Low (0.5) 1.079 6.0High (6.5) 1.065 5.5
Table 3.6: Internal standard-normalised matrix factor [9].1 matrix factor of pyrazinamide is not internal standard-normalised, due to absence of stable isotope-labelledinternal standard for pyrazinamide. CV coefficient of variation.
periods. From the data in Table 3.7, it is calculated that average in vitro half-lifevalues for isoniazid were 6 days at ambient temperature, 15 days at refrigeratingtemperatures and 115 days at -20 °C.
Component Isoniazid Pyrazinamide EthambutolSample Low (%) High (%) Low (%) High (%) Low (%) High (%)Autosampler (ultra filtrate), 24 h 96.7 97.4 97.1 98.5 92.9 93.7Ambient temperature, 24 h 75.7 78.5 106.1 103.4 97.3 96.7Ambient temperature, 51 d n.d. 28.2 n.d. 85.3 94.0 86.2Refrigerator, 51 d 31.3 34.0 106.8 102.7 89.0 86.8Freezer (-20 °C), 51 d 74.2 67.8 99.7 109.6 84.6 90.4Freezer (-80 °C), 51 d 101.6 102.5 108.1 104.9 90.0 96.3Freeze-dried, 51 d 101.6 95.6 104.9 103.8 82.0 87.8Freeze-thaw (3 cycles) 87.0 94.4 86.6 98.2 111.7 103.3
Table 3.7: Stability testing results for isoniazid, pyrazinamide and ethambutol. n.d.: not detectable. Low concen-tration sample: 0.51 mg/L isoniazid, 20.2 mg/L pyrazinamide and 1.00 mg/L ethambutol, High concentrationsample 6.89 mg/L isoniazid, 62.4 mg/L pyrazinamide and 5.09 mg/L ethambutol.
None of the three compounds in human serum showed degradation beyond criteriaafter three freezing and thawing cycles, although the concentrations of the isoniazidand pyrazinamide samples at low concentration level dropped considerably afterthe third cycle.
Pyrazinamide in human serum is stable at all temperatures except at ambient tem-perature. Measured pyrazinamide concentrations at ambient temperature startedto decline significantly after five days. Since the human matrices stored at ambi-ent temperature showed signs of decomposition over time, degradation productsmay have affected these measurements. None of the measured ethambutol con-centrations fell beyond acceptance limits at any of the time points for all storageconditions. A limited concentration drop for all long term stability samples wasobserved however.

3.4. Discussion 45
3.3.5 Clinical application
To illustrate the clinical application a concentration-time curve over a 24 hours timeperiod of a TB patient recently started on TB treatment is shown in Figure 3.3. Shereceived her medication orally on an empty stomach. Including the preparation ofcalibration standards and QC samples, it takes approximately 1.5 hours to analysethe three drugs in these 12 samples. The maximum capacity is almost 200 samplesper 24 hours. In the same time, the samples can be analysed for rifampicin on aseparate LC-MS/MS [7, 15], resulting in a processing time similar to the method ofSong [6].
Figure 3.3: A concentration-time curve of a female TB patient (39 kg) receiving 225 mg isoniazid (white circle),825 mg ethambutol (black circle) and 1200 mg pyrazinamide (black diamond).
3.4 Discussion
The most important aspect from these results presented here is that ethambutoldid not show any significant in vitro protein binding in serum using this method,which clearly contradicts earlier results [17, 20]. This may partly be caused by thedifference in temperature, as this factor is known to influence protein binding [26].

46 Chapter 3. LC-MS/MS
In our experiments we used an unthermostated centrifuge. However it can beobserved from the accuracy and precision results in Table 3.5, that temperature hadlimited influence on the validation. In the adsorption test, ethambutol showed asignificant loss of approximately 35% in peak area when injected from the standardglass vial. Earlier reported protein binding results [17, 20] vary and may be obscuredby adsorption of ethambutol to non deactivated glass vials. Furthermore, anypossible protein binding would be reduced by the extensive dilution of the sampleswith internal standard solution during sample preparation before the ultrafiltration[32]. By then, variation of any possible protein binding of ethambutol in the dilutedsamples is compensated by the stable isotope-labelled internal standard.
Protein binding of isoniazid and pyrazinamide is also lower than reported values.Reported (reversible) protein binding values of isoniazid might have been obscuredby the instability of isoniazid in serum. The instability of isoniazid is attributed toirreversible protein binding [33]. As protein binding of isoniazid, pyrazinamide andethambutol proved low, ultrafiltration as a means of sample preparation could beapplied resulting in a fast and simple method of analysis.
Significant carry-over and memory effects were observed for isoniazid and ethamb-utol, during method development. This can be explained by absorption to silicaand metal surfaces, due to their polar characteristics. Carry-over was overcomeby rinsing the sample needle and needle seat with eluent B, in-between sampleinjections. Memory effects were overcome by adding two flushing and conditioningsteps to the original gradient (Table 3.2).
Bench-top stability testing and the more extensive stability assessment showedthat isoniazid is unstable in human serum unless it is freeze-dried or stored at-80 °C. Instability of isoniazid in plasma at ambient temperature and -20 °C hasbeen reported earlier [28, 29]. This instability calls for adequate standard operatingprocedures and rapid handling of samples. The autosampler stability testing showthat isoniazid is stable in ultra filtrate for at least 24 hours proving that serumproteins are involved in the instability of isoniazid. Pyrazinamide serum samplesare more stable and can be kept for at least 51 days in a refrigerator. Ethambutolproved to be stable at ambient temperature.
Using this method, almost 200 patient samples can be analysed for isoniazid,pyrazinamide and ethambutol in 24 hours. If one makes use of an optimal samplingstrategy consisting of three samples to calculate the area under the concentration-time curve, information on drug exposure of 65 patients can be obtained in oneday. The presented analytical method has shown to be robust for therapeuticdrug monitoring and pharmacokinetic studies of isoniazid, pyrazinamide andethambutol. It may be of clinical help and importance as the current opinion is

3.5. Conclusion 47
moving from standard dosing towards a more drug exposure based evaluation ofTB treatment [34].
3.5 Conclusion
A fast, simple and reliable LC-MS/MS method has been developed for the determ-ination of isoniazid, pyrazinamide and ethambutol in human serum. Isoniazid,pyrazinamide and especially ethambutol have proven to be low protein bound.Therefore, ultrafiltration as a means of sample preparation could be applied. Themethod adheres to all the validation criteria and is suitable for the simultaneousdetermination of isoniazid, pyrazinamide and ethambutol in human serum fortherapeutic drug monitoring and pharmacokinetic studies.
References
1. World Health Organization Stop TB Partnership. The global plan to stop TB2011-2015: transforming the fight towards elimination of tuberculosis. tech.rep. (WHO Press, 2010).
2. Pasipanodya J. G., McIlleron H., Burger A., Wash P. A., Smith P. & Gumbo T.Serum drug concentrations predictive of pulmonary tuberculosis outcomes. JInfect Dis 208, 1464–1473 (2013).
3. Peloquin C. A. Therapeutic drug monitoring in the treatment of tuberculosis.Drugs 62, 2169–2183 (2002).
4. Alffenaar J. W., Wessels A. M., van Hateren K., Greijdanus B., Kosterink J. G. &Uges D. R. Method for therapeutic drug monitoring of azole antifungal drugsin human serum using LC/MS/MS. J Chromatogr B 878, 39–44 (2010).
5. Mistri H. N., Jangid A. G., Pudage A., Gomes N., Sanyal M. & Shrivastav P. Highthroughput LC-MS/MS method for simultaneous quantification of lamivud-ine, stavudine and nevirapine in human plasma. J Chromatogr B 853, 320–332(2007).
6. Song S. H., Jun S. H., Park K. U., Yoon Y., Lee J. H., Kim J. Q. & Song J. Simul-taneous determination of first-line anti-tuberculosis drugs and their majormetabolic ratios by liquid chromatography/tandem mass spectrometry. RapidCommun Mass Spectrom 21, 1331–1338 (2007).

48 Chapter 3. LC-MS/MS
7. De Velde F., Alffenaar J. W., Wessels A. M., Greijdanus B. & Uges D. R. Simultan-eous determination of clarithromycin, rifampicin and their main metabolitesin human plasma by liquid chromatography-tandem mass spectrometry. JChromatogr B 877, 1771–1777 (2009).
8. Matuszewski B. K., Constanzer M. L. & Chavez-Eng C. M. Strategies for theassessment of matrix effect in quantitative bioanalytical methods based onHPLC-MS/MS. Anal Chem 75, 3019–3030 (2003).
9. European Medicines Agency Committee for Medicinal Products for HumanUse. Guideline on bioanalytical validation (EMEA/CHMP/EWP/192217/2009)tech. rep. (2011).
10. Matuszewski B. K. Standard line slopes as a measure of a relative matrix effectin quantitative HPLC-MS bioanalysis. J Chromatogr B 830, 293–300 (2006).
11. Zhou Z., Wu X., Wei Q., Liu Y., Liu P., Ma A. & Zou F. Development and val-idation of a hydrophilic interaction liquid chromatography-tandem massspectrometry method for the simultaneous determination of five first-lineantituberculosis drugs in plasma. Anal Bioanal Chem 405, 6323–6335 (2013).
12. Kim H. J., Seo K. A., Kim H. M., Jeong E. S., Ghim J. L., Lee S. H., Lee Y. M.,Kim D. H. & Shin J. G. Simple and accurate quantitative analysis of 20 anti-tuberculosis drugs in human plasma using liquid chromatography-electrosprayionization-tandem mass spectrometry. J Pharm Biomed Anal 102C, 9–16(2014).
13. Van der Lijke H., Alffenaar J.-W., Kok W. T., Greijdanus B. & Uges D. R. Determ-ination of ribavirin in human serum using liquid chromatography tandemmass spectrometry. Talanta 88, 385–90 (2012).
14. Becker C., Dressman J. B., Junginger H. E., Kopp S., Midha K. K., Shah V. P.,Stavchansky S. & Barends D. M. Biowaiver monographs for immediate releasesolid oral dosage forms: rifampicin. J Pharm Sci 98, 2252–2267 (2009).
15. Vu D. H., Koster R. A., Wessels A. M., Greijdanus B., Alffenaar J. W. & UgesD. R. Troubleshooting carry-over of LC-MS/MS method for rifampicin, clari-thromycin and metabolites in human plasma. J Chromatogr B 917-918, 1–4(2013).
16. Chideya S., Winston C. A., Peloquin C. A., Bradford W. Z., Hopewell P. C.,Wells C. D., Reingold A. L., Kenyon T. A., Moeti T. L. & Tappero J. W. Isoniazid,rifampin, ethambutol, and pyrazinamide pharmacokinetics and treatmentoutcomes among a predominantly HIV-infected cohort of adults with tuber-culosis from Botswana. Clin Infect Dis 48, 1685–1694 (2009).

References 49
17. Thomson Reuters (Healthcare). Micromedex® 2.0 (electronic version) <http://www.thomsonhc.com> (2015).
18. Becker C., Dressman J. B., Amidon G. L., Junginger H. E., Kopp S., MidhaK. K., Shah V. P., Stavchansky S., Barends D. M. & International PharmaceuticalFederation G. B. C. S. Biowaiver monographs for immediate release solid oraldosage forms: isoniazid. J Pharm Sci 96, 522–531 (2007).
19. Becker C., Dressman J. B., Amidon G. L., Junginger H. E., Kopp S., MidhaK. K., Shah V. P., Stavchansky S. & Barends D. M. Biowaiver monographs forimmediate release solid oral dosage forms: pyrazinamide. J Pharm Sci 97,3709–3720 (2008).
20. Becker C., Dressman J. B., Amidon G. L., Junginger H. E., Kopp S., MidhaK. K., Shah V. P., Stavchansky S. & Barends D. M. Biowaiver monographs forimmediate release solid oral dosage forms: ethambutol dihydrochloride. JPharm Sci 97, 1350–1360 (2008).
21. Singh S. S. & Mehta J. Measurement of drug-protein binding by immobilizedhuman serum albumin-HPLC and comparison with ultrafiltration. J Chroma-togr B 834, 108–116 (2006).
22. Nebinger P. & Koel M. Determination of acyclovir by ultrafiltration and high-performance liquid chromatography. J Chromatogr 619, 342–344 (1993).
23. Koel M. & Nebinger P. HPLC determination of serum ganciclovir using ultra-filtration, ultraviolet and fluorescence detection. J Pharm Biomed Anal 12,429–432 (1994).
24. Nebinger P. & Koel M. Determination of serum zidovudine by ultrafiltrationand high-performance liquid chromatography. J Pharm Biomed Anal 12, 141–143 (1994).
25. Kenney K. B., Wring S. A., Carr R. M., Wells G. N. & Dunn J. A. Simultaneousdetermination of zidovudine and lamivudine in human serum using HPLCwith tandem mass spectrometry. J Pharm Biomed Anal 22, 967–983 (2000).
26. Stove V., Coene L., Carlier M., De Waele J. J., Fiers T. & Verstraete A. G. Measur-ing unbound versus total vancomycin concentrations in serum and plasma:methodological issues and relevance. Ther Drug Monit 37, 180–7 (2015).
27. Butterfield J. M., Patel N., Pai M. P., Rosano T. G., Drusano G. L. & LodiseT. P. Refining vancomycin protein binding estimates: identification of clinicalfactors that influence protein binding. Antimicrob Agents Chemother 55, 4277–82 (2011).

50 Chapter 3. LC-MS/MS
28. Huang L., Marzan F., Jayewardene A. L., Lizak P. S., Li X. & Aweeka F. T. Devel-opment and validation of a hydrophilic interaction liquid chromatography-tandem mass spectrometry method for determination of isoniazid in humanplasma. J Chromatogr B 877, 285–290 (2009).
29. Hutchings A., Monie R. D., Spragg B. & Routledge P. A. A method to prevent theloss of isoniazid and acetylisoniazid in human plasma. Br J Clin Pharmacol15, 263–266 (1983).
30. Food and Drug Administration US Department of Health. Guidance for in-dustry, bioanalytical method validation tech. rep. (Center for Drug Evalutationand Research, 2001).
31. Aarnoutse R. E., Sturkenboom M. G., Robijns K., Harteveld A. R., GreijdanusB., Uges D. R., Touw D. J. & Alffenaar J.-W. An interlaboratory quality controlprogramme for the measurement of tuberculosis drugs. Eur Respir J 46, 268–71 (2015).
32. Yuan J., Yang D. C., Birkmeier J. & Stolzenbach J. Determination of proteinbinding by in vitro charcoal adsorption. J Pharmacokinet Biopharm 23, 41–55(1995).
33. Holdiness M. R. Chromatographic analysis of antituberculosis drugs in biolo-gical samples. J Chromatogr 340, 321–359 (1985).
34. Sotgiu G., Alffenaar J.-W., Centis R., D’Ambrosio L., Spanevello A., Piana A. &Migliori G. B. Therapeutic drug monitoring: how to improve drug dosage andpatient safety in tuberculosis treatment. Int J Infect Dis 32, 101–4 (2015).

CH
AP
TE
R
4AN INTERLABORATORY QUALITY CONTROL
PROGRAMME FOR THE MEASUREMENT OF
TUBERCULOSIS DRUGS
Rob E. AarnoutseMarieke G.G. Sturkenboom
Karen RobijnsAnneke R. Harteveld
Ben GreijdanusDonald R.A. Uges
Daniel J. TouwJan-Willem C. Alffenaar
European Respiratory Journal 2015; 46(1): 268-271

52 Chapter 4. Interlaboratory QC Programme
To the Editor
Tuberculosis (TB) remains a major global health problem. Inadequate exposureto TB drugs constitutes one of the main factors underlying suboptimal treatmentresponse and development of resistance, as evidenced by results from the in vitrohollow fibre model [1], clinical studies on relationships between drug concentra-tions and response [2–5], a pharmacogenetic trial [6], and findings of a recentmeta-analysis [7].
More specifically, these concentration-effect evaluations suggest that cliniciansshould prescribe higher doses of rifampicin [2, 5], use acetylator status to determinethe dose of isoniazid [6, 7], and that higher doses and exposures to pyrazinamidemay increase efficacy [4, 5].
Clearly such studies also underline the relevance of careful concentration-effectevaluations during the development of new TB drugs that eventually will be appliedby clinicians all over the world.
Finally, these studies support the concept of therapeutic drug monitoring (TDM)of TB drugs as applied by clinicians and pharmacists in selected centres aroundthe world [8–10]. In contrast to administering the same fixed dose to all patients,TDM is seeking to individualize drug doses, guided by measurement of serum (orplasma) drug concentrations.
Both pharmacokinetic evaluations in academia and in drug development pro-grammes and the use of TDM require the application of analytical methods forTB drugs. Intralaboratory (internal) method validation and intralaboratory qualitycontrol (QC) procedures, such as validation of equipment and qualification oftechnicians, should ensure that these methods have sufficient accuracy, precisionand specificity. In addition, participation in an interlaboratory (external) QC (orproficiency testing) programme is an essential component of quality assuranceand also provides evidence of laboratory competence for clinicians, researchers,accrediting bodies and regulatory agencies [11].
It is worth noting that (semi)automated immuno-assays are not available for meas-urement of TB drugs. TB drugs are being measured by so called chromatographicassays that have to be developed and validated within each laboratory, sometimesbased on published analytical methods, which also explains the current limitedavailability of TDM for TB drugs. Clearly more complex, labour-intensive assays de-veloped ‘in house’ hinder the inter-laboratory comparability of drug measurementsand definitely require participation in an external QC programme.
Unfortunately an international interlaboratory QC programme is as yet unavailablefor TB drugs. We therefore started such an external QC programme, focusing on

53
first-line as well as several second-line TB drugs.
TB drugs involved in the first round of the QC programme were isoniazid, rifampi-cin, pyrazinamide, ethambutol (first-line TB drugs), moxifloxacin and linezolid(second-line TB drugs). All raw drug substances were of analytical quality and hada high and specified purity (> 99%). TB drugs were weighed out on independentlycalibrated balances and dissolved in methanol/water using calibrated pipettesand volumetric flasks. Drug-free human serum was obtained from the regionalblood bank. Blank serum was spiked with solutions of TB drugs to obtain two QCsamples. Each of the two samples contained all six TB drugs in either a low orintermediate/high concentration (Table 4.1). The QC samples were freeze-driedimmediately in view of the instability of some of the drugs and to decrease shippingcosts. We had previously assessed stability under various conditions after freeze-drying (unpublished data). All weighed-in concentrations were considered as truevalues.
Drug Measure-ments, n
Conc.Level1
Measured conc.relative to truevalue (%)
Absoluteinaccuracy(%)2
Measurements withacceptable accuracy,
n and %3
Isoniazid 77
LowInt./High
95 (84-105)104 (80-108)
5 (3-16)7 (3-20)
77
100%
Rifampicin 66
LowInt./High
78 (38-116)87 (49-135)
26 (6-62)27 (1-51)
32
42%
Pyrazinamide 55
LowInt./High
108 (104-117)110 (101-118)
8 (4-17)10 (1-18)
55
100%
Ethambutol 66
LowInt./High
107 (75-137)104 (98-142)
14 (4-37)4 (1-42)
45
75%
Moxifloxacin 33
LowInt./High
98 (95-108)105 (87-106)
5 (2-8)6 (5-13)
33
100%
Linezolid 22
LowInt./High
95 (90-99)4
94 (89-98)45 (1-10)6 (2-11)
22
100%
Table 4.1: Measurements of quality control samples, subdivided by drug and concentration level. Data arepresented as median (range) unless otherwise stated. Conc.: concentration; int.: intermediate.1 Low and Int./High conc. levels were 0.48 and 6.47 mg/L (isoniazid), 1.41 and 5.60 mg/L (rifampicin), 18.79 and58.61 mg/L (pyrazinamide), 0.93 and 4.78 mg/L (ethambutol) , 0.31 and 2.65 mg/L (moxifloxacin), and 0.91 and11.09 mg/L (linezolid). 2 Inaccuracy is the percentage bias from the true conc., i.e. inaccuracy = (100 * meas-ured conc. / true conc.) - 100%. 3 Acceptable measurements are within 20% limits from the true conc.4 Mean (range).
Seven laboratories from two continents participated in the first round of the pro-gramme. The freeze-dried QC samples were transported at room temperature tothese laboratories. The laboratories were informed that the samples had to bestored at 4 – 8 °C after receipt. They were requested to reconstitute the sampleswith 1 ml water and to analyze them as soon as possible. Reconstituted samplescould also be stored at –80 °C for analysis at a later time point. The participatinglaboratories were asked to return their results within 6 weeks after dispatch of the

54 Chapter 4. Interlaboratory QC Programme
samples.
Descriptive statistics were calculated after standardization of all laboratory resultsto percentages with reference to the true value. By subtracting 100% from thesepercentages, the percentage bias from the true concentration (inaccuracy) wascalculated. 20% limits around the true values were considered to be appropriatethreshold values for satisfactory measurements, as used and justified in our otherinternational QC programmes [12] [13]. All participants were informed about theirperformance within 2 months after reporting of their results.
Two of the seven participating laboratories were able to measure all six TB drugs,one laboratory measured five drugs (all four first-line TB drugs and moxifloxa-cin), two laboratories measured four drugs (all four first-line TB drugs, but notthe second-line drugs moxifloxacin and linezolid) and the two remaining laborat-ories were able to measure less than four of the first-line drugs. Analytical meth-odology used was conventional high-performance liquid chromatography, ultra-performance liquid chromatography, liquid chromatography with mass spectro-metric detection or gas chromatography with mass spectrometric detection.
A total of 58 analyses were performed, with satisfactory (accurate) results reportedfor 48 (83%) measurements. Table 4.1 summarizes the results by TB drug. Ri-fampicin concentrations were too low in three laboratories both at the low andmedium/high concentration. Furthermore, the programme showed ethambutolconcentrations that were too high for one laboratory, a trend for higher concentra-tions of pyrazinamide in one participating laboratory, and similarly high concen-trations of rifampicin in another laboratory.
The concentration level did not appear to affect accuracy, as 24 (83%) out of 29 of themeasurements was performed satisfactorily both at the low and intermediate/highconcentration levels .
When arranged by performing laboratory, it appeared that three out of seven labor-atories performed all measurements within 20% inaccuracy limits (i.e. a 100%score, 12 out of 12, 10 out of 10 and two out of two accurate results, respectively).The other laboratories measured 10 out of 12 (83%), four out of six (67%), five out ofeight (63%) and five out of eight (63%) of the concentrations within the acceptancelimits.
83% of the measurements were within 20% limits of the true weighed-in concentra-tions, meaning the initial results of this QC programme show a reasonably goodperformance of the participating laboratories in measuring TB drugs. For com-parison, first rounds of similar programmes for antiretroviral drugs and antifungaldrugs yielded satisfactory measurements in 65% and 77% of the measurements,respectively [12, 13]. One out of six (17%) measurements of TB drugs was still inac-

55
curate and such figures are relevant in the context of pharmacokinetic studies andTDM. In this respect, it should be recognised that the first round of this programmemay have selected the best-performing laboratories or those with emphasis onquality assurance.
The results for rifampicin in this first round were clearly worse than for other drugs.We have wondered whether these results might be due to incomplete dissolution ofthe freeze-dried samples, as rifampicin is slightly soluble in aquous solutions. Forthe next rounds we will validate the dissolution of the samples once more.
Beyond the possible QC programme problems, many other sources of error mayexplain the rifampicin results, including method (validation) problems, equipment,technical and clerical errors, as well as unexplained errors [11]. In the past we haveevaluated such possible sources of error in other QC programmes by sending anerror evaluation form to the laboratories; this will be considered for future roundsof the TB programme.
It is worth noting that low rifampicin serum or plasma concentrations have beenreported by many authors in populations all over the world. Based on the resultsof this first round of the QC programme, it can not be excluded that some of thesefindings may be explained by inaccuracy in the measurement of rifampicin, yetthe results of the first round of this programme should not be overinterpreted andresults from subsequent rounds should be awaited.
Many research consortia are currently studying the effects of higher doses of ri-fampicin, and resulting in higher exposures achieved with these doses, both inpulmonary and extrapulmonary TB. This emphasises the relevance of accurateassays for rifampicin and the usefulness of this QC programme.
In addition to the low rifampicin concentrations measured in some laboratories,the programme revealed possible inaccuracies or previously undetected problemsrelated to analysis of ethambutol and pyrazinamide in some laboratories. By parti-cipating in the programme, these laboratories were alerted to these problems, andthis may enable and encourage them to optimise their methods and intralaboratoryQC procedures. Clearly, this is how external QC control testing aims to achieveimprovement in laboratory performance and attain interconvertibility of resultsbetween laboratories [9, 11].
For the first round of the programme, we selected all first-line TB drugs (group I ofTB drugs), moxifloxacin as a pivotal representative from group III of TB drugs(fluoroquinolones) [14] and linezolid because this drug is frequently used formultidrug-resistant/extensively drug-resistant TB treatment despite its allocationto group V of TB drugs [10, 15]. In future rounds of the programme, we will considerincorporating other TB drugs (with consideration of the requests of the participants)

56 Chapter 4. Interlaboratory QC Programme
and offer two patient casus in relation to the measurements, for those involvedin TDM for TB drugs. An increase in the number of participants may allow for anevaluation of the effects of the drug measured, the concentration level or analyticalmethodology on the accuracy of the results and will provide a better impression ofoverall laboratory performance.
In summary, external QC for measurement of TB drugs in serum or plasma is pivotalconsidering the high level of interest in the pharmacokinetics of TB drugs, bothfor the development of new TB regimens and for direct applications in patientcare (TDM). We have developed an interlaboratory (external) QC programme orproficiency testing programme for TB drugs and invite laboratories to participatein this programme.
References
1. Srivastava S., Pasipanodya J. G., Meek C., Leff R. & Gumbo T. Multidrug-resistant tuberculosis not due to noncompliance but to between-patientpharmacokinetic variability. J Infect Dis 204, 1951–1959 (2011).
2. Mehta J. B., Shantaveerapa H., Byrd R. P., Morton S. E., Fountain F. & RoyT. M. Utility of rifampin blood levels in the treatment and follow-up of activepulmonary tuberculosis in patients who were slow to respond to routinedirectly observed therapy. Chest 120, 1520–1524 (2001).
3. Weiner M. et al. Association between acquired rifamycin resistance and thepharmacokinetics of rifabutin and isoniazid among patients with HIV andtuberculosis. Clin Infect Dis 40, 1481–1491 (2005).
4. Chideya S., Winston C. A., Peloquin C. A., Bradford W. Z., Hopewell P. C.,Wells C. D., Reingold A. L., Kenyon T. A., Moeti T. L. & Tappero J. W. Isoniazid,rifampin, ethambutol, and pyrazinamide pharmacokinetics and treatmentoutcomes among a predominantly HIV-infected cohort of adults with tuber-culosis from Botswana. Clin Infect Dis 48, 1685–1694 (2009).
5. Pasipanodya J. G., McIlleron H., Burger A., Wash P. A., Smith P. & Gumbo T.Serum drug concentrations predictive of pulmonary tuberculosis outcomes. JInfect Dis 208, 1464–1473 (2013).
6. Azuma J. et al. NAT2 genotype guided regimen reduces isoniazid-induced liverinjury and early treatment failure in the 6-month four-drug standard treat-ment of tuberculosis: A randomized controlled trial for pharmacogenetics-based therapy. Eur J Clin Pharmacol 69, 1091–1101 (2013).

References 57
7. Pasipanodya J. G., Srivastava S. & Gumbo T. Meta-analysis of clinical stud-ies supports the pharmacokinetic variability hypothesis for acquired drugresistance and failure of antituberculosis therapy. Clin Infect Dis 55, 169–177(2012).
8. Alsultan A. & Peloquin C. A. Therapeutic drug monitoring in the treatment oftuberculosis: an update. Drugs 74, 839–854 (2014).
9. Srivastava S., Peloquin C. A., Sotgiu G. & Migliori G. B. Therapeutic drugmanagement: is it the future of multidrug-resistant tuberculosis treatment?Eur Respir J 42, 1449–1453 (2013).
10. Lange C. et al. Management of patients with multidrug-resistant/extensivelydrug-resistant tuberculosis in Europe: a TBNET consensus statement. EurRespir J 44, 23–63 (2014).
11. Clinical Laboratory and Standards Institute. Using Proficiency Testing to Im-prove the Clinical Laboratory; Approved Guideline tech. rep. (2007), CLSI doc-ument GP27–A2.
12. Aarnoutse R. E., Verweij-van Wissen C. P., van Ewijk-Beneken Kolmer E. W.,Wuis E. W., Koopmans P. P., Hekster Y. A. & Burger D. M. International interlab-oratory quality control program for measurement of antiretroviral drugs inplasma. Antimicrob Agents Chemother 46, 884–6 (2002).
13. Brüggemann R. J., Touw D. J., Aarnoutse R. E., Verweij P. E. & Burger D. M.International interlaboratory proficiency testing program for measurementof azole antifungal plasma concentrations. Antimicrob Agents Chemother 53,303–5 (2009).
14. Pranger A. D., van Altena R., Aarnoutse R. E., van Soolingen D., Uges D. R.,Kosterink J. G., van der Werf T. S. & Alffenaar J. W. Evaluation of moxifloxacinfor the treatment of tuberculosis: 3 years of experience. Eur Respir J 38, 888–894 (2011).
15. Sotgiu G. et al. Efficacy, safety and tolerability of linezolid containing regimensin treating MDR-TB and XDR-TB: systematic review and meta-analysis. EurRespir J 40, 1430–42 (2012).


CH
AP
TE
R
5aPHARMACOKINETIC MODELING AND
OPTIMAL SAMPLING STRATEGIES FOR
THERAPEUTIC DRUG MONITORING OF
RIFAMPIN IN PATIENTS WITH
TUBERCULOSIS
Marieke G.G. SturkenboomLeonie W. Mulder
Arthur de JagerRichard van Altena
Rob E. AarnoutseWiel C.M. de LangeJohannes H. Proost
Jos G.W. KosterinkTjip S. van der Werf
Jan-Willem C. Alffenaar
Antimicrobial Agents and Chemotherapy 2015; 59(8): 4907-4913

60 Chapter 5a. Optimal Sampling
Abstract
Rifampin, together with isoniazid, has been the backbone of the current first-linetreatment of tuberculosis (TB). The ratio of the area under the concentration-timecurve from 0 to 24h (AUC0–24) to the MIC is the best predictive pharmacokinetic-pharmacodynamic parameter for determinations of efficacy. The objective of thisstudy was to develop an optimal sampling procedure based on population pharma-cokinetics to predict AUC0–24 values. Patients received rifampin orally once daily aspart of their anti-TB treatment. A one-compartmental pharmacokinetic populationmodel with first-order absorption and lag time was developed using observed ri-fampin plasma concentrations from 55 patients. The population pharmacokineticmodel was developed using an iterative two-stage Bayesian procedure and wascross-validated. Optimal sampling strategies were calculated using Monte Carlosimulation (n=1,000). The geometric mean AUC0–24 was 41.5 (range, 13.5-117)mg ·h/L. The median time to maximum concentration of drug in serum (Tmax) was2.2h, ranging from 0.4 up to 5.7h. This wide range indicates that only obtaininga concentration level at 2h (C2) would not capture the peak concentration in alarge proportion of the population. Optimal sampling using concentrations at 1, 3and 8h postdosing was considered clinically suitable with r2 value of 0.96, a rootmean squared error of 13.2% and a prediction bias of –0.4%. This study showed thatrifampin AUC0–24 in TB patients can be predicted with acceptable accuracy andprecision using the developed population pharmacokinetic model with optimalsampling at time points 1, 3 and 8h.

5a.1. Introduction 61
5a.1 Introduction
Tuberculosis (TB) is still one of the infectious diseases with the highest morbidityand mortality in the world. In 2013, an estimated 9.0 million people acquired TBand 1.5 million people died due to TB [1]. First-line treatment of TB consists ofadministration of isoniazid, rifampin, pyrazinamide and ethambutol during thefirst 2 months, continuing with isoniazid and rifampin for another 4 months [2, 3].
In general, treatment success rate continues to be high among new TB cases glob-ally [1]. However, healthcare providers around the world are still confronted withtreatment failure on a regular basis. Recently, it was shown that the risk of treatmentfailure was almost nine-fold higher in patients with low drug exposure than in pa-tients with higher drug exposure [4]. Earlier data already showed that pharmacokin-etic variability is likely to be the driving force in the occurrence of development ofdrug resistance [5].
Studies in both hollow fiber infection models and murine models showed that thearea under the concentration-time curve over 24h in the steady state divided by theMIC (AUC/MIC ratio) is the best predictive pharmacokinetic/pharmacodynamicparameter for determination of the efficacy of rifampin [6, 7]. More importantly,these data were confirmed in TB patients, as poor long-term outcome was predictedby low AUC values [4]. In addition, low peak plasma concentrations (Cmax)/MICratios preceded the acquisition of drug-resistance [4].
Drug exposure may be influenced by a number of variables, such as concomitantfood intake, comorbidities and intraindividual differences in pharmacokinetics[8–12]. Therefore, it seems rational to monitor drug exposure in patients withsuspected malabsorption, gastrointestinal disorders, drug-drug interactions, dia-betes mellitus, or HIV coinfection [13]. To optimize treatment outcome in patientssuspected with low drug exposure, therapeutic drug monitoring (TDM) may beuseful [13, 14]. In the past, the drug concentration level at 2h after administration(C2) has been used to approximate Cmax and the level at 6h (C6) has been usedto distinguish between delayed absorption and overall poor intestinal absorption[13]. Indeed, it has been recognized that the C2 level does not always capture theCmax [15–17]. Furthermore, it is unknown whether C2 and C6 levels do reflect AUCvalues or can be used to accurately predict the AUC values [18]. Obtaining a fullconcentration-time curve to calculate the AUC values is a laborious and expensiveprocedure and thus not feasible in clinical practice. Alternative strategies to easilyevaluate drug exposure are urgently needed. An optimal sampling procedure basedon a population pharmacokinetic model may help to overcome these problems.This method implies that a limited number of appropriately timed blood samplesare needed to adequately predict the AUC as a measure for drug exposure [19–

62 Chapter 5a. Optimal Sampling
21]. Therefore, the objective of this study was to develop and validate an optimalsampling procedure for determination of rifampin concentrations based on pop-ulation pharmacokinetics, in order to predict area under the concentration-timecurve from 0 to 24h (AUC0–24) for this pivotal anti-TB drug.
5a.2 Materials and Methods
5a.2.1 Study Population
The study population was constituted of two groups. Group 1 were patients agedat least 18 years that were eligible for inclusion if they were treated with rifampinfor drug-susceptible TB at the University Medical Center Groningen, TuberculosisCentre Beatrixoord, Haren, The Netherlands, between 2009 and 2013. Patientswhose bodyweight was below 50 kg were administered 450 mg of rifampin andpatients over 50 kg received 600 mg of rifampin. In general, to prevent or alleviateadverse gastrointestinal effects of rifampin administration, patients received alight breakfast before taking the medication. After at least 2 weeks of treatment,a pharmacokinetic curve consisting of a predose and three to nine time pointsrandomly between 0.5 and 8h post-dose was obtained for TDM as part of routinepatient care. The predose level was obtained just before dosing and this level wasdefined as C24, the concentration level at 24h. Samples were transported the sameday to the laboratory and plasma was separated and stored at -20 °C until analysiswhich was performed within 10 days. Under these circumstances, rifampin con-centrations are stable, as evidenced by our previous assay [12, 22]. Plasma sampleswere analyzed for rifampin by liquid chromatography-tandem mass spectrometry(LC-MS/MS), as previously described [23, 24]. Plasma concentrations values belowthe lower quantification limit were treated as zeros. Demographic and medical data,including age, sex, weight, height, serum creatinine level, diagnosis, localization ofTB, ethnicity, presence of comorbidity and concomitant medication and rifampindose, were collected from the medical chart. This study was evaluated by the localethics committee and found to be in accordance with the Dutch law due to itsretrospective nature (ERB decision 2013-492).
To also include patients that had received rifampin in a fasted state, data frompatients from an earlier study at our centers were included [21]. These patientsconstituted group 2. Study subjects were TB patients admitted to the two DutchTB referral centers, the above-mentioned Tuberculosis Centre Beatrixoord, Harenand the Centre for Chronic Diseases Dekkerswald, Radboud University MedicalCenter, Nijmegen, The Netherlands [21]. The patients who were included were atleast 18 years of age and they had to provide written informed consent. The studyprotocol was approved by the Ethical Review Board of Radboud University Medical

5a.2. Materials and Methods 63
Center Nijmegen, The Netherlands [21]. Patients whose bodyweight was below 50kg were administered 450 mg of rifampin and patients over 50 kg received 600 mgof rifampin. A full pharmacokinetic curve was recorded during the intensive phaseof TB treatment after steady state was reached (≥ 2 weeks). Patients refrained fromfood intake from 11.00 p.m. on the day preceding the pharmacokinetic assessmentto 4h after intake of study medication. Serial venous blood samples were collectedjust prior to and at 1.0, 1.5, 2.0, 2.5, 3.0, 4.0, 6.0, 8.0, 12.0 and 24.0h after witnessedintake of study medication. Plasma was separated immediately, frozen to -80 °Cand transported on dry ice for bioanalysis [21]. Plasma samples were analyzed forrifampin levels by high performance liquid chromatography (HPLC), as previouslydescribed [12, 25].
5a.2.2 Population Pharmacokinetic Model
The concentration-time curves were used to develop a one-compartmental pop-ulation pharmacokinetic model using an iterative two-stage Bayesian (ITSB) pro-cedure (KinPop module of MW\Pharm version 3.60; Mediware, Zuidhorn, TheNetherlands) [5, 10, 11]. This design was chosen despite rifampin’s relatively com-plex and nonlinear pharmacokinetics, with distribution to a wide variety of tissues,conversion into its slightly active metabolite desacetyl-rifampin and both hepaticand renal clearance [12, 26, 27]. However, the one-compartmental model can bejustified as rifampin diffuses easily to tissue [28–30] and it has been used earlier [10,11, 31, 32]. The final model was selected based on the Akaike information criterion(AIC), a measure for goodness of fit [33].
The bioavailability of rifampin could not be determined because it was admin-istered orally only. Furthermore, its bioavailability is known to be almost completeand therefore, was assumed to be equivalent to a value of 1 [8] [Micromedex 2.0(electronic version); Thomson Reuters (Healthcare), Greenwood Village, CO, USA].On the basis of the pertinent literature, the rifampin clearance/creatinine clear-ance ratio (fr) was 0.14 [28, 29]. Pharmacokinetic parameters were assumed to belog-normally distributed. Residual errors were assumed normally distributed, withstandard deviation (SD) calculated as follows: SD = 0.1 + 0.10 ·C, where C is theobserved plasma concentration of rifampin.
To evaluate the ability of this population pharmacokinetic model to predict in-dividual AUC values, cross-validation was performed. For this cross-validation,a number of submodels were developed, with each model leaving out five pa-tients. The number of submodels was equal to the number of sets of five pa-tients among the total number of patients. All subjects were excluded once andthe AUC of each ‘left-out’ subject was estimated (AUC0–24, estimated) by fitting the

64 Chapter 5a. Optimal Sampling
concentration-time curve using the complementary submodel excluding this sub-ject. This left-out model estimates how well the final model might perform to pre-dict individual AUC0–24 values for future TB patients [20, 34]. For all subjects, thisAUC0–24, estimated was compared to the calculated AUC0–24 (AUC0–24, calculated).AUC0–24, calculated values and the values of other individual pharmacokinetic para-meters were calculated using MW\Pharm’s KinFit module. AUC0–24, calculated val-ues were determined by the log-linear trapezoidal rule. Cmax was defined as thehighest observed plasma concentration with the time to maximum concentrationof drug in serum (Tmax) as the corresponding time.
5a.2.3 Optimal Sampling Strategies
A Monte Carlo simulation of 1,000 subjects randomly drawn from the populationmodel was used to evaluate optimal sampling strategies (OSS) for prediction ofAUC0–24. OSS with different combinations of one to three sampling time pointsranging from 0 to 24h with a time resolution of 1h were evaluated using Bayesianfitting. All possible combinations within the groups of one to three time pointswere evaluated. OSS was considered acceptable if the root mean squared error(RMSE), a measure for precision, was < 15%. The mean prediction error, a measurefor bias, was accepted if it was < 5%. The best-performing OSS was subsequentlyevaluated by comparing the AUC0–24 predicted with OSS (AUC0–24, OSS) to theAUC0–24, calculated for all patients. Group 1 patients were sampled predose andrandomly between 0.5 and 8h. If the exact time point was unavailable, the nearest(preferably, earlier) time point (for instance, 7 instead of 8h) was chosen for predic-tion of AUC0–24, OSS.
5a.2.4 Statistics
The influence of patient characteristics on population pharmacokinetic paramet-ers was investigated with a Mann-Whitney U test, chi-square test, or a Kruskal-Wallis test or by determination of the Spearman correlation coefficient. Correlationbetween different AUC values was studied using the Spearman correlation coef-ficient. Agreement between AUC0–24, calculated and AUC0–24, OSS was evaluatedusing a Bland-Altman analysis. Two-sided P values ≤ 0.05 were considered statist-ically significant. All statistical measurements were either derived directly fromMW\Pharm or were computed using IBM SPSS Statistics 20 (IBM Corp., Armonk,NY, USA).

5a.3. Results 65
5a.3 Results
5a.3.1 Study Population
This study included 55 patients: 22 from group 1, the patient care cohort of 2009to 2013 and 33 patients from group 2, the earlier study. Patient characteristicsare displayed in Table 5a.1. Several characteristics, especially weight and thoserelated to weight, were significantly different between the group of patients andthe population of study participants. The median administered dose was 10.2(range, 4.7 to 21.4) mg of rifampin/kg of body weight. Most patients (85%) re-ceived 600 mg rifampin. Dosage regimens of 450 mg and 900 mg were receivedby five (9%) and three (5%) patients, respectively. Gender, dose, age, body surfacearea (BSA), ethnicity and presence of comorbidity or concomitant medication hadno significant influence on the individual pharmacokinetic parameters (all P val-ues > 0.05). Table 5a.2 shows the calculated pharmacokinetic parameters of theconcentration-time curves that were used for modeling (n=55).
Patient parameter Group 1, n=22 Group 2, n=33 All patients, n=55 P1
Male/female, n (%) 14/8 (64/36) 29/4 (88/12) 43/12 (78/22) 0.035Age, yr, median (IQR) 36 (24-43) 44 (30-57) 39 (29-51) 0.052Weight, kg 56.5 (16.6) 65.9 (15.6) 62.2 (16.5) 0.011Lean body mass, kg 52.2 (10.6) 61.8 (8.8) 58.0 (10.6) 0.001Height, m 1.70 (0.09) 1.73 (0.08) 1.72 (0.08) 0.115Body mass index, kg/m2 19.7 (5.8) 22.0 (5.0) 21.1 (5.4) 0.037Body surface area, m2 1.63 (0.22) 1.80 (0.21) 1.74 (0.23) 0.012Dose, mg 614 (130) 595 (26.1) 602 (84.1) 0.844Dose/ weight, mg/kg 11.4 (3.2) 9.40 (1.8) 10.2 (2.6) 0.008Ethnicity, n (%): 0.0812
Black 11 (50) 10 (30) 21 (38)Caucasian 4 (18) 14 (42) 18 (33)Asian 1 (5) 5 (15) 6 (11)Other 6 (27) 4 (12) 10 (18)
Type of tuberculosis, n (%): 0.0892
Pulmonary 12 (55) 27 (82) 39 (71)Extra-pulmonary 6 (27) 4 (12) 10 (18)Both 4 (18) 2 (6) 6 (11)
Comorbidity, present n (%): 4 (18) 13 (39) 17 (31) 0.0952
Co-medication, present n (%): 7 (32) 26 (79) 33 (60) 0.0002
Samples/patient, 6.5 (1.3) 10.3 (0.9) 8.8 (2.2) < 0.001Sampling schedule predose and ran-
domly between0.5 and 8h post-dose
predose and1.0, 1.5, 2.0, 2.5,3.0, 4.0, 6.0, 8.0,12.0 and 24.0hpost-dose
Table 5a.1: Patient demographics. Data are presented as mean (SD), unless stated otherwise. IQR, interquartilerange.1 Continuous data from comparisons of groups 1 and 2 were tested using the Mann-Whitney U test.2 Chi-square test.

66 Chapter 5a. Optimal Sampling
Pharmacokinetic parameter Group 1, n=22 Group 2, n=33 All patients, n=55 P1
AUC0–24 (mg ·h/L) 35.2 (23.9-109) 46.3 (13.5-117) 41.5 (13.5-117) 0.007Cmax (mg/L) 6.8 (3.5-15.6) 9.3 (2.4-24.1) 8.2 (2.4-24.1) 0.002Tmax (h) 2.6 (0.5-4.5) 2.0 (0.4-5.7) 2.2 (0.4-5.7) 0.069CL/F (L/h) 17.5 (10.0-31.5) 13.0 (4.9-51.3) 14.7 (4.9-51.3) 0.013Vd/F (liter) 51.9(25.5-103) 41.5 (12.8-182) 45.4 (12.8-182) 0.054T1/2 (h) 1.9 (0.7-2.4) 2.2 (1.6-6.6) 2.1 (0.7-6.6) 0.559
Table 5a.2: Noncompartmental pharmacokinetic parameters of rifampin. Data are presented as geometricmean (range), except for the Tmax data, which is displayed as median (range). AUC0–24, area under theconcentration-time curve from 0 to 24h in milligrams · hour per liter; Cmax, maximum concentration in mgper liter, Tmax, time of maximum concentration in hours; CL/F, apparent clearance in liters per hour, Vd/F,apparent volume of distribution in liters; T1/2, elimination half-life in hours.1 Data from comparisons of groups 1 and 2 were tested using the Mann-Whitney U test.
5a.3.2 Population Pharmacokinetic Model
The final one-compartmental model was selected based on the Akaike informationcriterion [33]. Geometric mean pharmacokinetic parameters of the final populationmodel (n=55) are shown in Table 5a.3. Pharmacokinetic parameters of the twopatients groups are shown in Table 5a.4. The mean values of the 11 sub-modelsdeveloped for cross-validation were close to those from the final model.
Pharmacokinetic parameter All patients, n=55CLm/F (L/h/1.85m2) 15.5 (8.0)fr 0.14 (fixed)Vd/F (L/kg LBM) 0.713 (0.282)ka (1/h) 1.14 (1.03)Tlag (h) 0.887 (0.571)F 1 (fixed)
Table 5a.3: Final population pharmacokinetic model parameters. Data are presented as population mean (SD).Bioavailability (F) was fixed at a value of 1 and the rifampin clearance/creatinine clearance ratio (fr ) was fixedat a value of 0.14. CLm/F, apparent metabolic clearance in liters per hour normalized to a body surface area of1.85 m2; Vd/F, apparent volume of distribution in liters per kilogram of lean body mass (LBM); ka, absorptionconstant in 1/h; Tlag, lag time in the absorption phase in hours.
Pharmacokinetic parameter Group 1, n=22 Group 2, n=33 P1
CLm/F (L/h/1.85m2) 17.9 (9.1-32.9) 13.8 (5.4-54.3) 0.035Vd/F (L/kg LBM) 0.844 (0.545-1.514) 0.637 (0.325-1.162) 0.002ka (1/h) 0.90 (0.22-3.24) 1.33 (0.26-5.37) 0.078Tlag (h) 1.11 (0.46-2.92) 0.77 (0.30-2.12) 0.017
Table 5a.4: Pharmacokinetic parameters of group 1 and group 2. Data are presented as geometric mean(range). CLm/F, apparent metabolic clearance in liters per hour normalized to a body surface area of 1.85m2; Vd/F, apparent volume of distribution in liter per kg of lean body mass; ka, absorption constant in 1/h;Tlag, lag time in the absorption phase in hours.1 Data from comparisons of groups 1 and 2 were tested using the Mann-Whitney U test.
Compared to the AUC0–24, calculated values, the AUC0–24, estimated values were un-

5a.3. Results 67
derestimated by a median difference of 5.9% (range, -39.8% to 13.5%). A highlypositive correlation between the two AUC calculations was shown by the Spear-man correlation coefficient, r2 = 0.96 (p < 0.01). In Figure 5a.1, the correlationbetween AUC0–24, calculated and AUC0–24, estimated values is shown. For one sub-ject, fitting the concentration-time curve using its complementary submodel asa Bayesian prior resulted in a large difference between AUC0–24, estimated andAUC0–24, calculated (65.7 and 109 mg ·h/L, respectively; underestimation, 39.8%).With this estimation considered an outlier (> 3 ·SD difference), the median under-estimation decreases to 4.9% (range, -21.8% to 13.5%), indicating limited influenceof the outlier.
Figure 5a.1: Correlation of AUC0–24, calculated and AUC0–24, estimated in the cross-validation. AUC0–24, estimatedwas determined by fitting the individual concentration-time curve using the complementary submodel exclud-ing this subject.

68 Chapter 5a. Optimal Sampling
5a.3.3 Optimal Sampling Strategy
Of all OSS possibilities, the five best-performing OSS values for one, two and threetime points are shown in Table 5a.5. RMSE values of all OSS with either one or twotime points were > 15%. The values for RMSE and bias of the five best-performingOSS with three samples were < 15% and < 5%, respectively. Based on clinicalsuitability, an OSS with time points of sampling at 1, 3 and 8h (OSS 1-3-8) wasconsidered the best option.
Firstsamplingtimepoint (h)
Secondsamplingtimepoint (h)
Thirdsamplingtimepoint (h)
Correlation coeffi-cient (r)
Mean predictive er-ror (% bias)
% RMSE1
7 0.83 3.8 27.46 0.83 0.5 27.68 0.83 5.7 27.95 0.81 -4.2 29.09 0.81 6.9 29.13 10 0.93 -3.2 18.32 8 0.92 0.3 18.73 9 0.93 -4.4 18.82 7 0.92 -2.8 18.83 8 0.93 -5.2 19.01 3 8 0.96 -0.4 13.22 4 10 0.96 -2.7 14.02 4 9 0.96 -3.6 14.01 3 9 0.96 -0.6 14.22 5 14 0.96 -2.3 14.3
Table 5a.5: Best-performing optimal sampling strategies for one, two and three time points.1 RMSE, root mean squared error.
AUC0–24, OSS 1–3–8 correlated to AUC0–24, calculated with Spearman correlation coef-ficient of 0.95 (P < 0.01) and was underestimated by a median difference of 1.0%(range, -24.9% to 10.0%). Agreement between AUC0–24, calculated and the estimatedAUC0–24, OSS 1–3–8 is shown in the Bland-Altman plot (Figure 5a.2). In the Bland-Altman plot, data from four patients can be observed that are below the lowerline of agreement. High AUC0–24, calculated values (90 to 110 mg ·h/L) were seenwith all four patients and the values were underestimated by 17.9% to 24.9%. Theestimated AUC0–24, OSS 1–3–8 values ranged from 72 to 90 mg ·h/L and were thus allstill reasonably high.
5a.4 Discussion
Here we developed a population pharmacokinetic model and an OSS using timepoints 1, 3 and 8h. Using these combined approaches, we were able to predictAUC0–24 of rifampin with sufficient accuracy and precision.

5a.4. Discussion 69
Figure 5a.2: Bland-Altman plot of mean AUC0–24 versus the difference between AUC0–24, calculated andAUC0–24, OSS 1–3–8. The solid line represents the mean difference. The corresponding limits of agreement (meandifference ± 2 SD difference) are depicted as dashed lines.
Comparing the two groups of patients, it can be observed that AUC0–24 and Cmax
were higher in group 2. The difference in these parameters may have been causedby the difference in food intake or fasting around the time the medication wasingested in the two groups. However, the magnitude of this factor is unclear. Ameta-analysis on the impact of concomitant food intake has shown that there is nodifference in rifampin AUC values after food or fasting [35]. A recent study showeda 26% decrease in AUC0–10 values under fed conditions compared with fastedconditions [36]. As a consequence of the lower AUC values in group 1 patients,clearance was higher in this group than in group 2.
A limitation of this study is that only patients admitted to a TB referral center,not regular outpatients, were included, which may have introduced selection bias.However, in our experience, particularly these patients are typically selected forTDM, as TDM in patients with drug-susceptible TB is mainly performed if problems

70 Chapter 5a. Optimal Sampling
emerge with therapy.
TDM of rifampin is mostly driven by the need to prevent sub-therapeutic levels,rather than by concerns regarding toxicity, as the drug is well tolerated at higherconcentrations [12, 37]. Due to the correlation between the bactericidal effect ofrifampin and the AUC [4, 6, 7], the validation of the population model focused onits ability to predict AUC0–24 values. The model was able to predict the AUC0–24
values with acceptable accuracy and precision. Moreover, discarding of the outlieridentified during cross-validation did not result in a large difference, suggestingsufficient robustness of the model.
The precision of the AUC prediction with the best OSS, defined as an RMSE of13.2%, might still be regarded to be relatively high. However, dose adjustmentsare generally performed using matching tablets or capsules (i.e., 150 mg or 300mg), resulting in adjustments of 33% or more. These dose adjustments result in aneven higher increase of AUC values [12]. We therefore do not consider the possibledeviation from the AUC0–24, estimated from the calculated AUC due to imprecisionto be clinically relevant. A reason for the high RMSE could be the diverse populationused for the development of the population model. Regarded from a contrastingpoint of view, this implies that implementation of the model and the OSS in TDMmight be applicable for various patients around the world.
Given that data related to outcome have become available only recently, we aimedat an AUC/MIC ratio of 270 [7]. As we studied patients with drug-susceptible TB,actual MICs of the isolates for rifampin were not determined. If the mean MICfor rifampin is defined as 0.2 mg/L [37], this would imply an adequate or targetAUC0–24 value of 54 mg ·h/L or higher. This AUC was only obtained in 13 (24%)of the 55 patients studied. In the event that observed MIC was lower, this mightstill result in a favourable AUC/MIC ratio [38]. Furthermore, on the basis of thelower AUC0–24 value of 13 mg ·h/L for rifampin in the presence of pyrazinamideAUC value over 363 mg ·h/L recently proposed by Pasipanodya et al. [4], all ourpatients obtained sufficient exposure. At this time, a lack of data on drug exposureand MIC values makes it difficult to interpret the drug exposure of a single drug in afour-drug regimen with a possible range of MIC values. Well-designed prospectivestudies are needed to elucidate the pharmacokinetic/pharmacodynamic targets ofthe first-line regimen.
The median Tmax value was 2.2h, ranging from 0.4 to 5.7h (Figure 5a.3). Thewide range indicates that obtaining only a C2 level would fail to capture the peakconcentration in a large proportion of the population. One might argue that thiswas a consequence of the fact that our group 1 patients receiving standard carewere not fasting, due to the institution’s regulations. However, this variation in the

5a.4. Discussion 71
Tmax values was due only partly to delayed absorption, as the range of Tmax valuesfor the fasted group 2 patients (i.e., 0.4 to 5.7h) was larger than the range of Tmax
values for the patients in group 1 who were allowed to eat (0.5 to 4.5h).
Figure 5a.3: Histogram of time of maximum concentration in hours.
Comparing our OSS with the data recently published by Magis-Escurra et al. thereare three differences [21]. First, their OSS was deliberately limited to time pointsup to 6h postdose and ours was not. Obviously, their proposed OSS of 1, 4 and6h for rifampin is more feasible in daily practice than ours. In our OSS, thesetime points were not selected as the best-performing OSS; thus they result in a lessaccurate and precise prediction of the AUC values [21]. The second difference is thatthe model presented here was developed using a larger and more heterogeneouspopulation. The population consisted of both fasted and fed patients making ourmodel more widely applicable for daily practice. Thirdly, Magis-Escurra et al. usedmultiple linear regression to derive OSS, whereas we used a Bayesian approachin the current analysis. Both strategies have advantages and disadvantages. Thedistinct advantage of our Bayesian approach is that it is more flexible, allowing for

72 Chapter 5a. Optimal Sampling
deviations from the exact sampling times at 1, 3 and 8h [39]. But this requires use ofour model and software, whereas multiple linear regression yields a straightforwardequation to fill in.
Recently, Medellin-Garibay et al. published an OSS for analysis of rifampin levels at2, 4 and 12h postdose [16]. This is less practical than the one presented here. Thechoice of those time points may be a consequence of their low elimination rateconstant and long half-life of 5.1h, which is quite different from literature [6, 13].
5a.5 Conclusions
A one-compartmental population pharmacokinetic rifampin model was developedin order to estimate the effective pharmacokinetic/pharmacodynamic parametersof rifampin AUC values in tuberculosis patients. With an optimal sampling strategywith sampling points at 1, 3 and 8h, the model is able to predict AUC0–24 valueswith acceptable accuracy and precision.
Acknowledgement
The authors would like to thank A. Yahoo for his initial work on the rifampin model.
References
1. World Health Organization. Global Tuberculosis Report 2014 tech. rep. (2014).
2. World Health Organization. Treatment of tuberculosis guidelines 4th editiontech. rep. (2010).
3. Blumberg H. M. et al. American Thoracic Society/Centers for Disease Controland Prevention/Infectious Diseases Society of America: treatment of tubercu-losis. Am J Respir Crit Care Med 167, 603–662 (2003).
4. Pasipanodya J. G., McIlleron H., Burger A., Wash P. A., Smith P. & Gumbo T.Serum drug concentrations predictive of pulmonary tuberculosis outcomes. JInfect Dis 208, 1464–1473 (2013).
5. Srivastava S., Pasipanodya J. G., Meek C., Leff R. & Gumbo T. Multidrug-resistant tuberculosis not due to noncompliance but to between-patientpharmacokinetic variability. J Infect Dis 204, 1951–1959 (2011).

References 73
6. Gumbo T., Louie A., Deziel M. R., Liu W., Parsons L. M., Salfinger M. & DrusanoG. L. Concentration-dependent Mycobacterium tuberculosis killing and pre-vention of resistance by rifampin. Antimicrob Agents Chemother 51, 3781–3788 (2007).
7. Jayaram R. et al. Pharmacokinetics-pharmacodynamics of rifampin in anaerosol infection model of tuberculosis. Antimicrob Agents Chemother 47,2118–2124 (2003).
8. Becker C., Dressman J. B., Junginger H. E., Kopp S., Midha K. K., Shah V. P.,Stavchansky S. & Barends D. M. Biowaiver monographs for immediate releasesolid oral dosage forms: rifampicin. J Pharm Sci 98, 2252–2267 (2009).
9. Smythe W. et al. A semimechanistic pharmacokinetic-enzyme turnover modelfor rifampin autoinduction in adult tuberculosis patients. Antimicrob AgentsChemother 56, 2091–2098 (2012).
10. Wilkins J. J., Savic R. M., Karlsson M. O., Langdon G., McIlleron H., PillaiG., Smith P. J. & Simonsson U. S. Population pharmacokinetics of rifampinin pulmonary tuberculosis patients, including a semimechanistic model todescribe variable absorption. Antimicrob Agents Chemother 52, 2138–2148(2008).
11. Peloquin C. A., Jaresko G. S., Yong C. L., Keung A. C., Bulpitt A. E. & Jelliffe R. W.Population pharmacokinetic modeling of isoniazid, rifampin, and pyrazinam-ide. Antimicrob Agents Chemother 41, 2670–2679 (1997).
12. Ruslami R., Nijland H. M., Alisjahbana B., Parwati I., van Crevel R. & AarnoutseR. E. Pharmacokinetics and tolerability of a higher rifampin dose versusthe standard dose in pulmonary tuberculosis patients. Antimicrob AgentsChemother 51, 2546–2551 (2007).
13. Peloquin C. A. Therapeutic drug monitoring in the treatment of tuberculosis.Drugs 62, 2169–2183 (2002).
14. Ray J., Gardiner I. & Marriott D. Managing antituberculosis drug therapy bytherapeutic drug monitoring of rifampicin and isoniazid. Intern Med J 33,229–234 (2003).
15. Magis-Escurra C., van den Boogaard J., IJdema D., Boeree M. & Aarnoutse R.Therapeutic drug monitoring in the treatment of tuberculosis patients. PulmPharmacol Ther 25, 83–86 (2012).
16. Medellin-Garibay S. E., Correa-Lopez T., Romero-Mendez C., Milan-SegoviaR. C. & Romano-Moreno S. Limited sampling strategies to predict the areaunder the concentration-time curve for rifampicin. Ther Drug Monit 36, 746–751 (2014).

74 Chapter 5a. Optimal Sampling
17. Prahl J. B., Johansen I. S., Cohen A. S., Frimodt-Moller N. & Andersen A. B. Clin-ical significance of 2 h plasma concentrations of first-line anti-tuberculosisdrugs: a prospective observational study. J Antimicrob Chemother 69, 2841–2847 (2014).
18. Sturkenboom M. G., Akkerman O. W., Bolhuis M. S., de Lange W. C., van derWerf T. S. & Alffenaar J.-W. Adequate design of pharmacokinetic-pharma-codynamic studies will help optimize tuberculosis treatment for the future.Antimicrob Agents Chemother 59, 2474 (2015).
19. Alffenaar J. W., Kosterink J. G., van Altena R., van der Werf T. S., Uges D. R. &Proost J. H. Limited sampling strategies for therapeutic drug monitoring oflinezolid in patients with multidrug-resistant tuberculosis. Ther Drug Monit32, 97–101 (2010).
20. Pranger A. D., Kosterink J. G., van Altena R., Aarnoutse R. E., van der Werf T. S.,Uges D. R. & Alffenaar J. W. Limited-sampling strategies for therapeutic drugmonitoring of moxifloxacin in patients with tuberculosis. Ther Drug Monit 33,350–354 (2011).
21. Magis-Escurra C. et al. Population pharmacokinetics and limited samplingstrategy for first-line tuberculosis drugs and moxifloxacin. Int J AntimicrobAgents 44, 229–34 (2014).
22. Aarnoutse R. E., Sturkenboom M. G., Robijns K., Harteveld A. R., GreijdanusB., Uges D. R., Touw D. J. & Alffenaar J.-W. An interlaboratory quality controlprogramme for the measurement of tuberculosis drugs. Eur Respir J 46, 268–71 (2015).
23. De Velde F., Alffenaar J. W., Wessels A. M., Greijdanus B. & Uges D. R. Simultan-eous determination of clarithromycin, rifampicin and their main metabolitesin human plasma by liquid chromatography-tandem mass spectrometry. JChromatogr B 877, 1771–1777 (2009).
24. Vu D. H., Koster R. A., Wessels A. M., Greijdanus B., Alffenaar J. W. & UgesD. R. Troubleshooting carry-over of LC-MS/MS method for rifampicin, clari-thromycin and metabolites in human plasma. J Chromatogr B 917-918, 1–4(2013).
25. Nijland H. M., Ruslami R., Suroto A. J., Burger D. M., Alisjahbana B., van CrevelR. & Aarnoutse R. E. Rifampicin reduces plasma concentrations of moxifloxa-cin in patients with tuberculosis. Clin Infect Dis 45, 1001–1007 (2007).
26. Acocella G. Pharmacokinetics and metabolism of rifampin in humans. RevInfect Dis 5 Suppl 3, S428–32 (1983).

References 75
27. Acocella G., Mattiussi R. & Segre G. Multicompartmental analysis of serum, ur-ine and bile concentrations of rifampicin and desacetyl-rifampicin in subjectstreated for one week. Pharmacol Res Commun 10, 271–288 (1978).
28. Launay-Vacher V., Izzedine H. & Deray G. Pharmacokinetic considerationsin the treatment of tuberculosis in patients with renal failure. Clin Pharma-cokinet 44, 221–235 (2005).
29. Ellard G. A. & Fourie P. B. Rifampicin bioavailability: a review of its pharmaco-logy and the chemotherapeutic necessity for ensuring optimal absorption. IntJ Tuberc Lung Dis 3, S301–8, discussion S317–21 (1999).
30. Summary of product characteristics Rifadin 2013.
31. Pahkla R., Lambert J., Ansko P., Winstanley P., Davies P. D. & Kiivet R. A. Com-parative bioavailability of three different preparations of rifampicin. J ClinPharm Ther 24, 219–225 (1999).
32. Milan-Segovia R. C., Dominguez-Ramirez A. M., Jung-Cook H., Magana-AquinoM., Vigna-Perez M., Brundage R. C. & Romano-Moreno S. Population pharma-cokinetics of rifampicin in Mexican patients with tuberculosis. J Clin PharmTher 38, 56–61 (2013).
33. Proost J. H. & Eleveld D. J. Performance of an iterative two-stage bayesiantechnique for population pharmacokinetic analysis of rich data sets. PharmRes 23, 2748–2759 (2006).
34. Altman D. G. & Royston P. What do we mean by validating a prognostic model?Stat Med 19, 453–73 (2000).
35. Lin M. Y., Lin S. J., Chan L. C. & Lu Y. C. Impact of food and antacids on thepharmacokinetics of anti-tuberculosis drugs: systematic review and meta-analysis. Int J Tuberc Lung Dis 14, 806–818 (2010).
36. Lin H. C., Yu M. C., Liu H. J. & Bai K. J. Impact of food intake on the phar-macokinetics of first-line antituberculosis drugs in Taiwanese tuberculosispatients. J Formos Med Assoc 113, 291–297 (2014).
37. Van Ingen J., Aarnoutse R. E., Donald P. R., Diacon A. H., Dawson R., Plem-per van Balen G., Gillespie S. H. & Boeree M. J. Why Do We Use 600 mg ofRifampicin in Tuberculosis Treatment? Clin Infect Dis 52, e194–9 (2011).
38. Daskapan A., de Lange W. C., Akkerman O. W., Kosterink J. G., van der WerfT. S., Stienstra Y. & Alffenaar J.-W. The role of therapeutic drug monitoring inindividualised drug dosage and exposure measurement in tuberculosis andHIV co-infection. Eur Respir J 45, 569–71 (2015).

76 Chapter 5a. Optimal Sampling
39. Ting L. S. L., Villeneuve E. & Ensom M. H. Beyond cyclosporine: a systematicreview of limited sampling strategies for other immunosuppressants. TherDrug Monit 28, 419–30 (2006).

CH
AP
TE
R
5bADEQUATE DESIGN OF
PHARMACOKINETIC–PHARMACODYNAMIC
STUDIES WILL HELP OPTIMIZE
TUBERCULOSIS TREATMENT FOR THE
FUTURE
Marieke G.G. SturkenboomOnno W. AkkermanMathieu S. BolhuisWiel C.M de Lange
Tjip S. van der WerfJan-Willem C. Alffenaar
Antimicrobial Agents and Chemotherapy 2015; 59(4): 2474
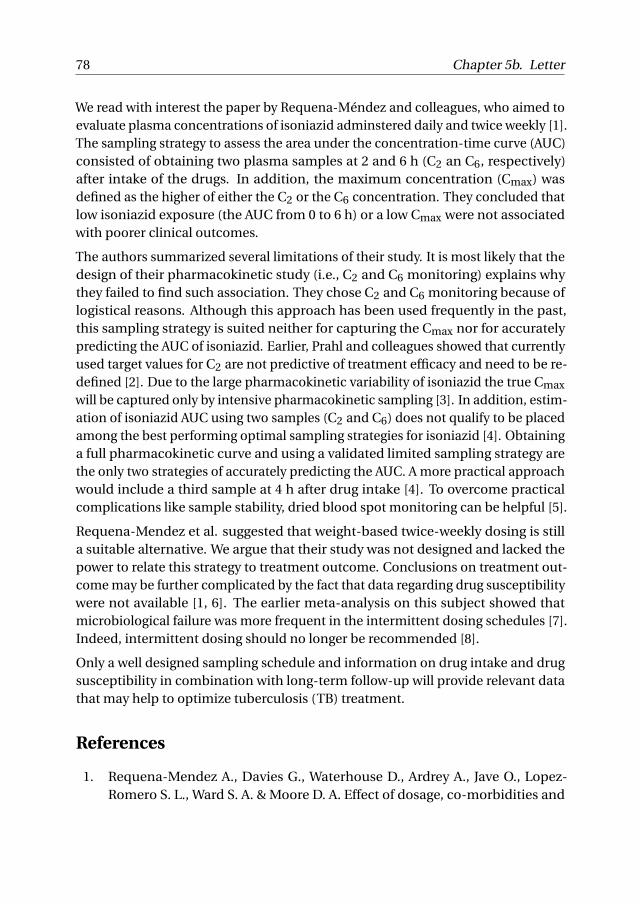
78 Chapter 5b. Letter
We read with interest the paper by Requena-Méndez and colleagues, who aimed toevaluate plasma concentrations of isoniazid adminstered daily and twice weekly [1].The sampling strategy to assess the area under the concentration-time curve (AUC)consisted of obtaining two plasma samples at 2 and 6 h (C2 an C6, respectively)after intake of the drugs. In addition, the maximum concentration (Cmax) wasdefined as the higher of either the C2 or the C6 concentration. They concluded thatlow isoniazid exposure (the AUC from 0 to 6 h) or a low Cmax were not associatedwith poorer clinical outcomes.
The authors summarized several limitations of their study. It is most likely that thedesign of their pharmacokinetic study (i.e., C2 and C6 monitoring) explains whythey failed to find such association. They chose C2 and C6 monitoring because oflogistical reasons. Although this approach has been used frequently in the past,this sampling strategy is suited neither for capturing the Cmax nor for accuratelypredicting the AUC of isoniazid. Earlier, Prahl and colleagues showed that currentlyused target values for C2 are not predictive of treatment efficacy and need to be re-defined [2]. Due to the large pharmacokinetic variability of isoniazid the true Cmax
will be captured only by intensive pharmacokinetic sampling [3]. In addition, estim-ation of isoniazid AUC using two samples (C2 and C6) does not qualify to be placedamong the best performing optimal sampling strategies for isoniazid [4]. Obtaininga full pharmacokinetic curve and using a validated limited sampling strategy arethe only two strategies of accurately predicting the AUC. A more practical approachwould include a third sample at 4 h after drug intake [4]. To overcome practicalcomplications like sample stability, dried blood spot monitoring can be helpful [5].
Requena-Mendez et al. suggested that weight-based twice-weekly dosing is stilla suitable alternative. We argue that their study was not designed and lacked thepower to relate this strategy to treatment outcome. Conclusions on treatment out-come may be further complicated by the fact that data regarding drug susceptibilitywere not available [1, 6]. The earlier meta-analysis on this subject showed thatmicrobiological failure was more frequent in the intermittent dosing schedules [7].Indeed, intermittent dosing should no longer be recommended [8].
Only a well designed sampling schedule and information on drug intake and drugsusceptibility in combination with long-term follow-up will provide relevant datathat may help to optimize tuberculosis (TB) treatment.
References
1. Requena-Mendez A., Davies G., Waterhouse D., Ardrey A., Jave O., Lopez-Romero S. L., Ward S. A. & Moore D. A. Effect of dosage, co-morbidities and

References 79
food on pharmacokinetics of isoniazid in Peruvian TB patients. AntimicrobAgents Chemother 58, 7164–7170 (2014).
2. Prahl J. B., Johansen I. S., Cohen A. S., Frimodt-Moller N. & Andersen A. B. Clin-ical significance of 2 h plasma concentrations of first-line anti-tuberculosisdrugs: a prospective observational study. J Antimicrob Chemother 69, 2841–2847 (2014).
3. Pasipanodya J. G., Srivastava S. & Gumbo T. Comment on: Clinical signific-ance of 2 h plasma concentrations of first-line anti-tuberculosis drugs: aprospective observational study. J Antimicrob Chemother 70, 320–1 (2015).
4. Magis-Escurra C. et al. Population pharmacokinetics and limited samplingstrategy for first-line tuberculosis drugs and moxifloxacin. Int J AntimicrobAgents 44, 229–34 (2014).
5. Vu D. H., Alffenaar J. W., Edelbroek P. M., Brouwers J. R. & Uges D. R. Driedblood spots: a new tool for tuberculosis treatment optimization. Curr PharmDes 17, 2931–2939 (2011).
6. Gumbo T., Louie A., Liu W., Brown D., Ambrose P. G., Bhavnani S. M. & DrusanoG. L. Isoniazid bactericidal activity and resistance emergence: integratingpharmacodynamics and pharmacogenomics to predict efficacy in differentethnic populations. Antimicrob Agents Chemother 51, 2329–2336 (2007).
7. Pasipanodya J. G., Srivastava S. & Gumbo T. Meta-analysis of clinical stud-ies supports the pharmacokinetic variability hypothesis for acquired drugresistance and failure of antituberculosis therapy. Clin Infect Dis 55, 169–177(2012).
8. World Health Organization. Treatment of tuberculosis guidelines 4th editiontech. rep. (2010).


CH
AP
TE
R
6DOSING OF ANTI-TUBERCULOSIS DRUGS
POORLY PREDICTS DRUG EXPOSURE IN TBPATIENTS WITH EXTENSIVE DISEASE
Marieke G.G. SturkenboomOnno W. AkkermanRichard van AltenaWiel C.M. de Lange
Jos G.W. KosterinkTjip S. van der Werf
Jan-Willem C. Alffenaar
Submitted

82 Chapter 6. Predictors of Drug Exposure
Abstract
Background: Isoniazid and rifampicin are first-line anti-tuberculosis drugs thatare dosed on total body weight (TBW). Due to the variability in clinical conditionrelated to low TBW, we hypothesized that TBW may not be the best parameter fordosing. The aim of this study is to investigate the association of different patientrelated parameters with drug exposure.
Methods: We conducted a retrospective study of TB patients treated with isoniazidor rifampicin and for whom an area under the concentration-time curve over 24h(AUC0–24) of isoniazid or rifampicin was available. We collected demographic,clinical and biochemical data from the medical records. The correlation of clinicalvariables with drug exposure was determined.
Results: 66 patients were included. Univariate analysis showed no correlationbetween isoniazid dose/TBW and exposure (adjusted R2=0.008, P=.232). A weakpositive association was shown between rifampicin dose/TBW and exposure (ad-justed R2=0.102, P=.006) and between gender and exposure (adjusted R2=0.194,P<.001). Multiple linear regression analysis showed a significant, small, independ-ent and positive association of isoniazid AUC0–24 with the dose/TBW, body massindex (BMI) and elevated C-reactive protein (CRP) level (adjusted R2=0.162, P=.010).A significant, independent and positive association of rifampicin AUC0–24 wasshown with the dose/TBW, gender, BMI and CRP level (adjusted R2=0.354, P<.001).
Conclusions: Dose/TBW showed no correlation with isoniazid exposure and only aweak correlation with rifampicin exposure. Patients with a BMI < 16 kg/m2 receiveda higher dose/TBW but showed similar exposure as patients with a higher BMI. Toaccurately estimate isoniazid and rifampicin exposure, TDM should be performed.

6.1. Introduction 83
6.1 Introduction
Tuberculosis (TB) is globally the leading cause of death related to infectious dis-eases. In 2014 an estimated 9.6 million people became TB-infected and 1.5 millionpeople died due to TB [1]. First-line treatment of TB consists of isoniazid, rifampi-cin, pyrazinamide and ethambutol during the first two months, continuing withisoniazid and rifampicin for another four months [2, 3].
In general, treatment success rate continues to be high among new TB cases [1].However, treatment has been increasingly challenged by the emergence of drugresistance, toxicity, relapse and non-response [4]. Recently, it was shown that riskon treatment failure was almost nine-fold higher in patients with low drug exposurecompared to patients with higher drug exposure [5]. Earlier data already showedthat pharmacokinetic variability is likely to be the driving force in the occurrenceof development of drug resistance [6]. In addition, low peak plasma concentrations(Cmax) preceded acquired drug-resistance [5].
The World Health Organanization (WHO) advises to dose adult patients based onbody weight (TBW) with a maximum of 300 mg once daily for isoniazid and 600mg for rifampicin [2]. In the guidelines, it is not indicated whether TBW at timeof start of treatment should be used or TBW before the patient developed TB withsubsequent weight loss.
A low body mass index (BMI) was associated with delay in sputum conversionand increased early mortality [7, 8]. TB and malnutrition are closely associated;malnutrition is a risk factor for TB, while TB in turn causes malnutrition [9, 10].TB is probably associated with more severe malnutrition and weight loss thanother illnesses, presumably as a result of increased levels of the appetite-relatedhormones leptin and ghrelin [10, 11]. Resting energy expenditure is increased andendogenous protein synthesis is impaired by the so called ‘anabolic block’ [9, 10].
Due to the variability in clinical condition related to low TBW, we hypothesized thatTBW may not be the best parameter for dose selection of isoniazid and rifampicin,indeed other size descriptors might be better suited for dosing. Furthermore, theremay be other factors, such as liver function or infection related parameters, thatmay influence drug exposure. The aim of this study is to investigate the associationof different patient related parameters with drug exposure in TB patients.

84 Chapter 6. Predictors of Drug Exposure
6.2 Patients and Methods
6.2.1 Study Population
Patients aged at least 18 years were included in the study if they were treated withrifampicin or isoniazid for TB between 2010 and 2014 at the University MedicalCenter Groningen, Tuberculosis Centre Beatrixoord, Haren, The Netherlands. Thisstudy was evaluated by the local ethics committee and found to be in accordancewith the Dutch law due to its retrospective nature (ERB decision 2013-492).
Patients were dosed according to the WHO guidelines [2]. In general, patientsreceived a light breakfast before taking the medication. After at least two weeksof treatment, a pharmacokinetic curve, consisting of a pre-dose and three to ninetime points randomly between 0.5-8 hours post-dose, was obtained for therapeuticdrug monitoring (TDM) as part of routine patient care. The pre-dose level wasobtained just before dosing and this level was also used as C24, the concentra-tion level at 24 hours. Samples were transported the same day to the laborat-ory and plasma was separated and stored at –20 °C until analysis within 10 days.Under these circumstances, isoniazid and rifampicin concentrations remainedstable [12–14]. Plasma samples were analyzed for isoniazid or rifampicin by liquidchromatography-tandem mass spectrometry (LC-MS/MS), as previously described[12, 15, 16]. Plasma concentrations below the lower quantification limit weretreated as zeros. Based on drug exposure, doses were adjusted if necessary.
Exposure of isoniazid and rifampicin was calculated as area under the concentration-time curve (AUC) over 24 hours in steady state (AUC0–24). AUC0–24 values and thevalues of other individual pharmacokinetic parameters were calculated using theKinFit module of MW\Pharm version 3.60 (Mediware, Zuidhorn, The Netherlands).AUC0–24 values were determined by the log-linear trapezoidal rule. Cmax wasdefined as the highest observed plasma concentration with the time to Cmax ofdrug in serum (Tmax) as the corresponding time. Patients with calculated half-life of isoniazid ≤ 130 min were considered fast acetylators, otherwise they wereconsidered slow acetylators [17].
Demographic medical and biochemistry data were collected from the medicalchart including age, gender, TBW, height, diagnosis, localization of TB, drug dose,ethnicity, comorbidities and interfering comedication (see Table 6.1). Biochemistrydata included liver function tests, renal function, albumin level, C-reactive protein(CRP) and erythrocyte sedimentation rate. The different size and weight descriptorswere calculated using the demographic data recorded in the medical chart [18].

6.2. Patients and Methods 85
Characteristic All patients, n=66Male/female, n (%) 38/28 (58/42)Age (yr) 35.1 (26.2-49.1)Total body weight (kg) 50.3 (43.0-63.3)Height (cm) 170 (162-175)Size descriptor
Body mass index (kg/m2) 17.9 (15.4-21.9)Body surface area (m2) 1.56 (1.45-1.76)Ideal body weight (kg) 63.8 (56.2-70.0)Fat-free mass (kg) 48.1 (40.4-54.5)Lean body weight (kg) 41.8 (37.3-51.5)Adjusted body weight (kg) 58.1 (52.0-66.1)
BiochemistryAspartate aminotransferase (U/L) 27 (18-37)Alanine aminotransferase (U/L) 20 (11-36)Total bilirubin (µmol/L) 5 (4-7)Gamma-glutamyl transferase (U/L) 83 (41-146)Albumin (g/L) 36 (31-40)Erythrocyte sedimentation rate (mm/h) 66 (31-91)C-reactive protein CRP (mg/L) 36 (11-69)Glomerular filtration rate (mL/min/1.73m2) 139 (119-176)Unknown / missing 5 (8)
Localization of TB, n (%)Pulmonary 38 (58)Extra-pulmonary 10 (15)Both 15 (23)Unknown / missing 3 (5)
Type of TB, n (%)Drug-susceptible 52 (79)Isoniazid resistance 11 (17)Rifampicin resistance 3 (5)
Relapse, n (%) 8 (12)WHO region, n (%)
Africa 7 (11)America 5 (8)Eastern Mediterranean 26 (39)Europe 15 (23)South-East Asia 6 (9)Western Pacific 2 (3)
Comorbidity, n (%)Diabetes Mellitus 8 (12)HIV 6 (9)Other 17 (26)Unknown/ missing 4 (6)
Comedication, n (%)None 43 (65)Antacid 2 (3)Anti-diabetic 6 (9)Anti-HIV 6 (9)Corticosteroid 10 (15)Unknown 2 (3)
Table 6.1: Patient characteristics. Antacid; aluminiumoxide/magnesium hydroxide (2), Anti-diabetic; insulin(2), insulin and oral anti-diabetic (2), metformin (1), Anti-HIV; tenofovir/emcitrabine and raltegravir (3), teno-fovir/emcitrabine and efavirenz (1), raltegravir (1), darunavir/ritonavir (1), Corticosteroid; prednisone (7), dexa-methasone (2), hydrocortisone (1). Continuous data are presented as median (range).

86 Chapter 6. Predictors of Drug Exposure
We assessed the correlation of AUC0–24 of isoniazid and rifampicin with factors thatcan influence the pharmacokinetics of the drugs, such as age, size descriptors orbiochemistry data. The correlation of the dose per kg TBW (dose/TBW) of isoniazidor rifampicin with the AUC0–24 was assessed as well. Furthermore, we performeda multiple linear regression analysis to assess the relation between the AUC0–24
of isoniazid and rifampicin and several explanatory variables. Variables with a Pvalue < 0.10 in the univariate analyses and variables that could conceivably indicatealtered pharmacokinetics were included in the analysis. Finally, we compared bothdrug doses/TBW and exposure of isoniazid and rifampicin between patient groupswith different BMI, gender, relapse, CRP, acetylator status (isoniazid only) and thepresence of co-medication.
6.2.2 Statistics
Values are expressed as medians with interquartile range (IQR) for continuousvariables and as percentages of the group from which they were derived for cat-egorical variables. Pharmacokinetic data were log transformed and are presentedas geometric mean with range. Continuous data of groups were tested using theMann-Whitney U test.
In the univariate linear regression, all variables were correlated with exposure.Multiple linear regression was performed with backward analysis, thereby removingnonsignificant variables, starting with the one with the highest P value. Two-sidedP values ≤ 0.05 were considered statistically significant. All statistical analyses wereperformed using SPSS for Windows, version 22 (IBM Corp., Armonk, NY, USA).
6.3 Results
Sixty-six patients were included, of whom 55 had a pharmacokinetic curve forTDM of isoniazid and 63 patients underwent TDM of rifampicin. The patientcharacteristics are displayed in Table 6.1. Median BMI was 17.9 (IQR 15.4-21.9)kg/m2, indicating that the majority of the population suffered from moderate tosevere underweight. Most patients received both isoniazid and rifampicin for drug-susceptible TB. In 11 (17%) and three (5%) patients, TB was resistant to isoniazidor rifampicin respectively. Several reasons for TDM were identified, i.e. low TBW,gastro-intestinal symptoms, relapse and lack of clinical improvement. Table 6.2shows the non-compartmental pharmacokinetic parameters for both drugs.
Univariate analysis showed no association between isoniazid dose/TBW and expos-ure (adjusted R2=0.008, P=.232). A weak positive association was shown between ri-fampicin dose/TBW and exposure (adjusted R2=0.102, P=.006) and between gender

6.3. Results 87
Pharmacokinetic parameter All patientsIsoniazid, n=55
AUC0–24 (mg ·h/L) 11.8 (2.3-42.1)Maximum concentration, Cmax (mg/L) 2.3 (0.5-6.4)Time of maximum concentration, Tmax (h) 1.3 (0.5-4.0)Apparent clearance, CL/F (L/h) 22.9 (7.1-87.6)Apparent volume of distribution, V/F (L) 101 (15.1-570)Elimination half-life, T1/2 (h) 3.0 (1.4-15.8)
Rifampicin, n=63AUC0–24 (mg ·h/L) 34.6 (2.3-130)Maximum concentration, Cmax (mg/L) 6.4 (0.7-15.8)Time of maximum concentration, Tmax (h) 2.6 (0.5-7.8)Apparent clearance, CL/F (L/h) 14.9 (4.6-43.9)Apparent volume of distribution, V/F (L) 45.8 (10.3-137)Elimination half-life, T1/2 (h) 2.1 (1.2-11.0)
Table 6.2: Noncompartmental pharmacokinetic parameters of isoniazid and rifampicin. Data are presented asgeometric mean (range).
and exposure (adjusted R2=0.194, P<.001, Table 6.3). When dose/TBW was cor-related with Cmax, similar results were observed. Neither isoniazid dose/TBWcorrelated with Cmax (adjusted R2=-0.007, P=.437), nor did rifampicin dose/TBWcorrelate with Cmax (adjusted R2=0.045, P=.053).
Regression Adjusted R2 Effect 95% CI PUnivariate linear regression
Dose/TBW 0.102 3.945 1.168-6.722 .006gender 0.194 22.864 11.400-34.328 <.001
Multiple linear regression 0.354 <.001Dose/TBW 3.529 0.536-6.522 .022gender 20.979 10.566-31.392 <.001BMI 1.952 0.395-3.509 .015CRP 0.172 0.040-0.304 .012
Table 6.3: Linear regression model of factors significantly correlated with rifampicin AUC0–24.
In the multiple linear regression isoniazid dose/TBW, BMI and elevated CRP level (≥5 mg/L) correlated significantly with AUC0–24 (adjusted R2=0.162, P=.010, Table 6.4).In the multiple linear regression, rifampicin dose/TBW, gender, BMI and CRPlevel correlated significantly with rifampicin exposure (adjusted R2=0.354, P<.001,Table 6.3). We also performed the univariate and multiple linear regression with logtransformed AUC0–24. As the outcome was essentially the same for both isoniazidand rifampicin, we only present the nontransformed data.
Diabetes mellitus, HIV, the presence of co-medication and liver function tests didnot correlate with the exposure of either drug.
The comparisons of dose/TBW and corresponding exposures in different patientgroups are presented in Tables 6.5 and 6.6. From Table 6.5, it can be observed that

88 Chapter 6. Predictors of Drug Exposure
Regression Adjusted R2 Effect 95% CI PMultiple linear regression .162 .010
Dose/TBW 3.038 0.307-5.769 .030BMI 0.738 0.132-1.343 .018Elevated CRP (≥ 5 mg/L) 6.379 0.630-12.128 .031
Table 6.4: Linear regression model of factors significantly correlated with isoniazid AUC0–24.
if patients were divided in two dosing groups, up to and over 10 mg/kg rifampicin,the exposure significantly differs between the groups.
We divided the patients receiving isoniazid in fast and slow acetylators, based onthe half-life of isoniazid [17]. Table 6.6 showed no significant difference betweenthese groups. It is notable that the fast acetylators showed a trend towards a highergeometric mean AUC0–24 than the slow acetylators.
Figures 6.1 and 6.2 and Tables 6.5 and 6.6 illustrate that the effect of BMI resultedin comparable exposure, although the low BMI group (BMI < 16 kg/m2) received asignificantly higher dose/TBW of both rifampicin and isoniazid.
Dose/TBW (mg/kg) AUC0–24 (mg ·h/L)Yes No P1 Yes No P1
Low dose/TBW(≤ 10 mg/kg)
8.9 (6.9-10.0) 11.7 (10.1-20.5) <.001 29.4 (2.3-114) 39.8 (12.8-130) .026
gender, male 10.0 (6.9-20.5) 10.7 (7.1-14.4) .044 28.0 (2.3-67.9) 46.9 (18.7-130) .002BMI < 16kg/m2
11.9 (9.6-20.5) 9.6 (6.9-14.4) <.001 36.7 (12.8-81.7) 33.6 (2.3-130) .521
Elevated CRP(≥ 5 mg/L)
10.3 (7.1-20.5) 9.8 (6.9-12.8) .579 33.5 (2.3-130) 34.0 (12.8-64.3) .655
Relapse 9.7 (7.4-12.3) 10.4 (6.9-20.5) .661 39.2 (13.7-81.7) 34.1 (2.3-130) .513Comedication 9.9 (7.1-14.0) 10.6 (6.9-20.5) .225 33.4 (2.3-114) 35.3 (13.7-130) .753
Table 6.5: Rifampicin dosing and exposure in different patient groups (geometric mean and range).1 Data from comparisons of groups were tested using the Mann-Whitney U test.
Dose/TBW (mg/kg) AUC0–24 (mg ·h/L)Yes No P1 Yes No P1
Low dose/TBW(≤ 5 mg/kg)
4.3 (3.4-5.0) 5.9 (5.0-7.2) <.001 9.9 (2.3-41.1) 13.7 (4.9-42.1) .189
Acetylator, fast 5.0 (3.5-7.2) 5.2 (3.4-7.1) .484 13.2 (4.9-41.1) 11.3 (2.3-42.1) .335gender, male 5.0 (3.4-7.2) 5.4 (3.5-7.1) .263 11.0 (3.4-42.1) 12.9 (2.3-41.1) .317BMI < 16kg/m2
5.7 (4.6-7.1) 4.9 (3.4-7.2) .003 12.1 (3.4-42.1) 11.6 (2.3-41.1) .868
Elevated CRP(≥ 5 mg/L)
5.1 (3.5-7.2) 5.2 (3.4-7.1) .767 12.7 (4.2-42.1) 7.3 (2.3-13.1) .015
Relapse 5.3 (3.7-7.1) 5.2 (3.4-7.2) .582 13.8 (8.9-31.0) 11.5 (2.3-42.1) .519Comedication 5.0 (3.5-7.1) 5.2 (3.4-7.2) .299 13.0 (2.3-41.1) 11.3 (4.2-42.1) .267
Table 6.6: Isoniazid dosing and exposure in different patient groups (geometric mean and range).1 Data from comparisons of groups were tested using the Mann-Whitney U test.

6.4. Discussion 89
Figure 6.1: Median rifampicin AUC0–24 for two patient groups, BMI < 16 kg/m2 and BMI≥ 16 kg/m2. Median boxplot with interval from the 10th to the 90th percentile of the rifampicin AUC0–24 (P=.521) and median rifampicindose/TBW (P<.001) are presented.
6.4 Discussion
Our data show that variability in exposure of both isoniazid and rifampicin waslarge. For isoniazid, an 18-fold difference was observed between the highest andlowest AUC0–24. For rifampicin, a strikingly 56-fold difference was noted (Table 6.2).These very wide ranges were not completely anticipated. Although many factors,such as concomitant food intake, comorbidities, gastrointestinal disorders anddrug-drug interactions may influence drug exposure [19–21], this is not addressedin current dosing guidelines. Therefore, additional measures like monitoring drugexposure in patients at risk for altered drug exposure should be undertaken [19].
The most striking outcome of this retrospective study is that dose/TBW showed nocorrelation with isoniazid exposure and only a weak albeit significant correlationwith rifampicin exposure. When dose/TBW was correlated with Cmax, the same

90 Chapter 6. Predictors of Drug Exposure
Figure 6.2: Median isoniazid AUC0–24 for two patient groups, BMI < 16 kg/m2 and BMI ≥ 16 kg/m2. Median boxplot with interval from the 10th to the 90th percentile of the isoniazid AUC0–24 (P=.868) and median isoniaziddose/TBW (P=.003) are presented.
was found and this confirms the data by Ray et al. [22].
BMI had a weak positive correlation with exposure of both drugs in the multiplelinear analysis, meaning that patients with a low BMI (BMI < 16 kg/m2) showeda lower exposure. Indirectly, this may confirm the data on outcome of Putri et al.[8]. This effect of BMI resulted in comparable exposure, although the low BMIgroup received a significantly higher dose/TBW of both rifampicin and isoniazid(Figures 6.1 and 6.2). These data confirm the data of the Indonesian TB patients inwhom the effect of malnutrition on exposure of bound and unbound rifampicinwas investigated [23].
Table 6.6 showed no significant difference in isoniazid exposure between fast andslow acetylators, this is in contrast with what is generally experienced [21]. Com-bined with the low Cmax we have observed in our population (Table 6.2), it mightindicate that the main problem of low exposure in the patients we studied might

6.4. Discussion 91
have been caused by poor intestinal absorption rather than an increased rate ofelimination. Our group recently performed a pharmacokinetic trial in treatment-naive TB patients in which we investigated the influence of food of the first-lineanti-TB drugs [20]. In this prospective trial we also observed low Cmax, indeedsuggesting that reduced absorption might be an important cause of low exposure[20].
Our study suffers from several limitations and the first is the sample size. Onlypatients admitted to a TB referral center were included, which may have introducedselection bias. However, referral of patients, based on clinical condition, to a TBcenter may differ per setting, country and WHO region. Therefore these resultsmay also guide implementation of TDM in an outpatient setting; patients notresponding to standard treatment may be selected for TDM avoiding the need tooffer TDM to all patients.
Another limitation is that only total and not free unbound, concentrations of iso-niazid and rifampicin were measured. For isoniazid this is not really problematic,but for rifampicin which is highly protein bound, this may be relevant [23, 24].As we studied patients with mainly drug-susceptible TB, drug susceptibility wasdetermined by breakpoint testing and actual MICs of the isolates for isoniazid orrifampicin were unknown. Patients with a low AUC in combination with a very lowMIC could have had an AUC/MIC ratio in the target range, while a comparablecase with a MIC near the breakpoint could have had an AUC/MIC ratio below thetarget range. Furthermore, data on outcome are lacking because patients weretransferred to municipal health providers throughout the country for continuationof their treatment after they improved clinically enough to be released from the TBclinic.
Recently, poor treatment outcome has been linked with low TB drug exposure.Pasipanodya et al. showed that to achieve a favourable outcome, in order of im-portance, AUC0–24 of pyrazinamide, rifampicin and isoniazid should be over 363,13 and 52 mg ·h/L respectively [5]. In the presence of pyrazinamide, rifampicinAUC0–24 was sufficiently high in the majority of our patients (61/63, 97%) with re-spect to long-term outcome. It is however striking to see that in none of our patientsthe AUC0–24 of isoniazid met this target to predict a favourable long-term outcome.Of course, one should keep in mind that the pharmacokinetic/pharmacodynamicindex is AUC over MIC and in both studies actual MIC values were not obtained.MIC distribution may vary in different regions around the world and this should betaken into account when AUC is linked to treatment outcome [25].
At this point in time, we were unable to identify all factors predisposing for lowexposure of isoniazid or rifampicin in TB patients. However, most patients have

92 Chapter 6. Predictors of Drug Exposure
in common that their worsening clinical condition resulted in the need for admis-sion to a TB clinic. Therefore, TDM may help optimize drug exposure and therebytreatment in TB patients with a worsening condition [4]. Finally, a randomizedclinical trial should explore the potential benefit of TDM in TB treatment. Standardtreatment should be compared with TDM guided dosing in combination with MICtesting. The study should be powered to detect both clinically and epidemiolo-gically meaningful differences in relapse rate, acquired drug resistance or toxicity[4].
6.5 Conclusions
Dose/TBW showed no correlation with isoniazid exposure and only a weak butsignificant correlation with rifampicin exposure. Patients with a BMI < 16 kg/m2
received a higher dose/TBW but showed similar exposure as patients with a higherBMI. To accurately estimate isoniazid and rifampicin exposure, TDM should beperformed.
References
1. World Health Organization. Global Tuberculosis Report 2015 tech. rep. (2015).
2. World Health Organization. Treatment of tuberculosis guidelines 4th editiontech. rep. (2010).
3. Blumberg H. M. et al. American Thoracic Society/Centers for Disease Controland Prevention/Infectious Diseases Society of America: treatment of tubercu-losis. Am J Respir Crit Care Med 167, 603–662 (2003).
4. Van der Burgt E. P., Sturkenboom M. G., Bolhuis M. S., Akkerman O. W., Kos-terink J. G., de Lange W. C., Cobelens F. G., van der Werf T. S. & Alffenaar J.-W.End TB with precision treatment! Eur Respir J 47, 680–2 (2016).
5. Pasipanodya J. G., McIlleron H., Burger A., Wash P. A., Smith P. & Gumbo T.Serum drug concentrations predictive of pulmonary tuberculosis outcomes. JInfect Dis 208, 1464–1473 (2013).
6. Srivastava S., Pasipanodya J. G., Meek C., Leff R. & Gumbo T. Multidrug-resistant tuberculosis not due to noncompliance but to between-patientpharmacokinetic variability. J Infect Dis 204, 1951–1959 (2011).
7. Zachariah R., Spielmann M. P., Harries A. D. & Salaniponi F. M. Moderate tosevere malnutrition in patients with tuberculosis is a risk factor associatedwith early death. Trans R Soc Trop Med Hyg 96, 291–4.

References 93
8. Putri F. A., Burhan E., Nawas A., Soepandi P. Z., Sutoyo D. K., Agustin H.,Isbaniah F. & Dowdy D. W. Body mass index predictive of sputum cultureconversion among MDR-TB patients in Indonesia. Int J Tuberc Lung Dis 18,564–70 (2014).
9. Macallan D. C. Malnutrition in tuberculosis. Diagn Microbiol Infect Dis 34,153–157 (1999).
10. Gupta K. B., Gupta R., Atreja A., Verma M. & Vishvkarma S. Tuberculosis andnutrition. Lung India 26, 9–16 (2009).
11. Zheng Y., Ma A., Wang Q., Han X., Cai J., Schouten E. G., Kok F. J. & Li Y.Relation of leptin, ghrelin and inflammatory cytokines with body mass indexin pulmonary tuberculosis patients with and without type 2 diabetes mellitus.PLoS One 8, e80122 (2013).
12. Sturkenboom M. G., van der Lijke H., Jongedijk E. M., Kok W. T., Greijdanus B.,Uges D. R. & Alffenaar J.-W. Quantification of isoniazid, pyrazinamide and eth-ambutol in serum using liquid chromatography-tandem mass spectrometry. JAppl Bioanalysis 1, 89–98 (2015).
13. Aarnoutse R. E., Sturkenboom M. G., Robijns K., Harteveld A. R., GreijdanusB., Uges D. R., Touw D. J. & Alffenaar J.-W. An interlaboratory quality controlprogramme for the measurement of tuberculosis drugs. Eur Respir J 46, 268–71 (2015).
14. Magis-Escurra C. et al. Population pharmacokinetics and limited samplingstrategy for first-line tuberculosis drugs and moxifloxacin. Int J AntimicrobAgents 44, 229–34 (2014).
15. De Velde F., Alffenaar J. W., Wessels A. M., Greijdanus B. & Uges D. R. Simultan-eous determination of clarithromycin, rifampicin and their main metabolitesin human plasma by liquid chromatography-tandem mass spectrometry. JChromatogr B 877, 1771–1777 (2009).
16. Vu D. H., Koster R. A., Wessels A. M., Greijdanus B., Alffenaar J. W. & UgesD. R. Troubleshooting carry-over of LC-MS/MS method for rifampicin, clari-thromycin and metabolites in human plasma. J Chromatogr B 917-918, 1–4(2013).
17. Tostmann A., Mtabho C. M., Semvua H. H., van den Boogaard J., Kibiki G. S.,Boeree M. J. & Aarnoutse R. E. Pharmacokinetics of first-line tuberculosisdrugs in Tanzanian patients. Antimicrob Agents Chemother 57, 3208–3213(2013).
18. Green B. & Duffull S. B. What is the best size descriptor to use for pharma-cokinetic studies in the obese? Br J Clin Pharmacol 58, 119–33 (2004).

94 Chapter 6. Predictors of Drug Exposure
19. Alsultan A. & Peloquin C. A. Therapeutic drug monitoring in the treatment oftuberculosis: an update. Drugs 74, 839–854 (2014).
20. Saktiawati A. M., Sturkenboom M. G., Stienstra Y., Subronto Y. W., Sumardi,Kosterink J. G., van der Werf T. S. & Alffenaar J.-W. Impact of food on thepharmacokinetics of first-line anti-TB drugs in treatment-naive TB patients: arandomized cross-over trial. J Antimicrob Chemother 71, 703–710 (2016).
21. Pasipanodya J. G., Srivastava S. & Gumbo T. Meta-analysis of clinical stud-ies supports the pharmacokinetic variability hypothesis for acquired drugresistance and failure of antituberculosis therapy. Clin Infect Dis 55, 169–177(2012).
22. Ray J., Gardiner I. & Marriott D. Managing antituberculosis drug therapy bytherapeutic drug monitoring of rifampicin and isoniazid. Intern Med J 33,229–234 (2003).
23. Te Brake L. H. et al. Exposure to total and protein-unbound rifampicin isnot affected by malnutrition in Indonesian tuberculosis patients. AntimicrobAgents Chemother 59, 3233–3239 (2015).
24. Polasa K., Murthy K. J. & Krishnaswamy K. Rifampicin kinetics in undernutri-tion. Br J Clin Pharmacol 17, 481–484 (1984).
25. Daskapan A., de Lange W. C., Akkerman O. W., Kosterink J. G., van der WerfT. S., Stienstra Y. & Alffenaar J.-W. The role of therapeutic drug monitoring inindividualised drug dosage and exposure measurement in tuberculosis andHIV co-infection. Eur Respir J 45, 569–71 (2015).

CH
AP
TE
R
7IMPACT OF FOOD ON THE
PHARMACOKINETICS OF FIRST-LINE
ANTI-TB DRUGS IN TREATMENT-NAIVE TBPATIENTS: A RANDOMIZED CROSS-OVER
TRIAL
∗ Antonia M.I. Saktiawati∗ Marieke G.G. Sturkenboom
Ymkje StienstraYanri W. Subronto
SumardiJos G.W. Kosterink
Tjip S. van der WerfJan-Willem C. Alffenaar
∗ Both authors contributed equally to the manuscript
Journal of Antimicrobial Chemotherapy 2016; 71(3): 703-710

96 Chapter 7. Fast-Food
Abstract
Objectives: Concomitant food intake influences pharmacokinetics of first-line anti-tuberculosis drugs in healthy volunteers. However, in treatment-naive TB patientswho are starting with drug treatment, data on the influence of food intake on thepharmacokinetics are absent. This study aimed to quantify the influence of foodon the pharmacokinetics of isoniazid, rifampicin, ethambutol and pyrazinamide inTB patients starting anti-TB treatment.
Methods: A prospective randomized cross-over pharmacokinetic study was con-ducted in treatment-naive adults with drug-susceptible TB. They received isoniazid,rifampicin and ethambutol intravenously and oral pyrazinamide on day 1, followedby oral administration of these drugs in fasted and fed condition on two consecutivedays. Primary outcome was the bioavailability while fasting and with concomitantfood intake. This study was registered with clinicaltrial.gov identifier NCT02121314.
Results: Twenty subjects completed the study protocol. Absolute bioavailability inthe fasted state and the fed state was 93% and 78% for isoniazid, 87% and 71% forrifampicin and 87% and 82% for ethambutol. Food decreased absolute bioavail-ability of isoniazid and rifampicin by 15% and 16%, respectively. PyrazinamideAUC0–24 was comparable for fasted (481 mg ·h/L) and fed state (468 mg ·h/L). Foodlowered the maximum concentration of isoniazid, rifampicin and pyrazinamideby 42%, 22% and 10% respectively. Time to maximum concentration was delayedfor isoniazid, rifampicin and pyrazinamide. The pharmacokinetics of ethambutolwere unaffected by food.
Conclusions: Food decreased absolute bioavailability and maximum concentrationof isoniazid and rifampicin but not of ethambutol or pyrazinamide, in treatment-naive TB patients. In patients prone to low drug exposure, this may further com-promise treatment efficacy and increase risk of acquired drug resistance.

7.1. Introduction 97
7.1 Introduction
Tuberculosis is the infectious disease with the second-highest morbidity and mor-tality by one single pathogen around the world. In 2013 an estimated 9.0 millionpeople became TB infected and 1.5 million people died because of TB [1]. First-linetreatment of TB consists of isoniazid, rifampicin, pyrazinamide and ethambutolduring the first two months, continuing with isoniazid and rifampicin for anotherfour months [2, 3]. Reported treatment success rates range from 60% to 87% de-pending on co-morbidity [4, 5]. Conceivably, filling the gaps of our knowledgeof pharmacokinetics and pharmacodynamics may help to improve TB treatmentthereby preventing the emergence of drug-resistant organisms.
Effective pharmacokinetic parameters for TB drugs are AUC and maximum con-centration of drugs in the blood (Cmax). Higher AUC values are associated withincreased efficacy, while low Cmax has been associated with emergence of drug res-istance [6]. During the first two weeks of treatment, when TB patients are seriouslyill, they often suffer from gastrointestinal reactions such as abdominal pain, nauseaand vomiting. Concomitant intake of food has been recommended [2, 3] but ithas an ambivalent impact on drug therapy. Food makes patients less vulnerableto nausea and vomiting, possibly resulting in a decrease of refusal of medication.However, exposure to isoniazid and rifampicin in healthy volunteers has beenshown to be reduced by dosing with meals [7–10].
A meta-analysis by Lin et al. showed that both AUC and Cmax of isoniazid weredecreased by food [11]. Cmax, but not AUC, of rifampicin and ethambutol weredecreased by food. Pyrazinamide absorption was not influenced by food. However,the majority of these data were obtained in healthy volunteers [11] and not inTB patients [12, 13]. One study in TB patients after 2 weeks of treatment showedthat a high-carbohydrate diet decreased AUC0–8 and Cmax of isoniazid [12]. Re-cently, it was shown that food reduced the Cmax and AUC0–10 of all first-line anti-TBdrugs in TB patients at least after four days of treatment [14]. The pharmacokin-etics of first-line drugs in treatment-naive patients may be different from those ofTB patients who are on anti-TB therapy for some time because of differences inseverity of disease, malnutrition and hypoalbuminemia [15, 16]. Furthermore, intreatment-naive patients, the number of bacilli is high and when the drug exposureis inadequate, the risk of acquired drug resistance is higher [6]. To prevent nausea,vomiting and possible treatment failure in patients, it is important to quantifythe impact of food on drug exposure of the first-line anti-TB drugs in TB patientsstarting their treatment. Therefore, the goal of this study was to investigate theabsolute bioavailability of isoniazid, rifampicin, ethambutol and pyrazinamide intreatment-naive TB patients under fasting conditions and with food on the first

98 Chapter 7. Fast-Food
three days of treatment.
7.2 Patients and methods
7.2.1 Study Design and Population
This was a prospective randomized cross-over pharmacokinetic study. The studyprotocol followed the guidelines of the Helsinki Declaration of 2008 and was ap-proved by the institutional review board at Faculty of Medicine, Universitas GadjahMada, Yogyakarta, Indonesia (KE/FK/626/EC) and the National Agency of Foodand Drug Control, Indonesia (PN.01.06.1.31.11.12.7158). Written informed consentwas obtained from each subject before the study. This study was registered withclinicaltrial.gov identifier NCT02121314.
We considered the comparison between fasted and fed to be a type of bioequival-ence study. The European Medicines Agency (EMA) guideline on bioequivalencestates that ≥ 12 subjects should be used for a bioequivalence study [17]. Therefore,it was thought that 20 patients should be sufficient to detect the influence of foodon the bioavailability of anti-TB drugs.
Newly diagnosed, treatment-naive TB patients aged ≥ 18 years old were eligiblefor inclusion. Subjects were recruited from the governmental chest clinics inYogyakarta and Sardjito General Hospital, Yogyakarta, Indonesia. Exclusion criteriawere active unstable liver disease, history of kidney disease or use of antacids thatcould not be discontinued during the study. The subjects agreed to refrain from theuse of non-prescription drugs and alcohol during the entire study period.
The study was performed on the first three days of anti-TB treatment, so there wasno washout period and patients did not reach steady state of any of the four drugs(Figure 7.1). To determine absolute bioavailability, all subjects started on day 1with intravenous treatment of isoniazid, rifampicin and ethambutol. Pyrazinamideis not available as an injection and was therefore administered orally on day 1(Table 7.1). All subjects fasted overnight for the 3 study days of the study. For thefasted treatment, they continued to fast until 2h after drug dosing. For the fedtreatment, they consumed a high-carbohydrate breakfast containing 600 Kcal 0.5hbefore dosing. Primary endpoints were absolute bioavailability (F) and AUC fromtime of administration to 24h after (AUC0–24). Secondary endpoints were Cmax andits corresponding time (Tmax).

7.2. Patients and methods 99
Allocated to fed day 2, fasted day 3 (10+1)• received allocated intervention (11)• did not receive allocated intervention (0)
Allocated to fasted day 2, fed day 3 (10)• received allocated intervention (10)• did not receive allocated intervention (0)
Follow up (11)• lost to follow up (0)• discontinued intervention (1)
Folow up (10)• lost to follow up (0)• discontinued intervention (0)
Analysed (10)• excluded from analysis (0)
Analysed (10)• excluded from analysis (0)
Not eligible (9)• did not meet inclusion criteria (2)• declined to participate (7)
Assessed for eligibility (30)
Randomized (20) Eligible (1)• replaced excluded patient (1)
Figure 7.1: Study design. Number of patients in parentheses.
Subjects were dosed on their pre-study weights according to the WHO guidelines,i.e. 5mg/kg isoniazid, 10 mg/kg rifampicin, 15 mg/kg ethambutol and 25 mg/kgpyrazinamide [2]. On day 1, intravenous drugs were administered using isoniazid100 mg/mL injection (Department of Clinical Pharmacy and Pharmacology, UMCG,Groningen, The Netherlands, license number 108964F), Rifadin 600 mg injection(Sanofi Aventis, Gouda, The Netherlands) and EMB-Fatol 1000 mg injection (Riem-ser Arzneimittel AG, Greifswald-Insel Riems, Germany). Isoniazid was given as ashort infusion of 30 minutes. Rifampicin and ethambutol were infused in 2 hours.Pyrazinamide was administered as 500 mg tablet orally (PT. Indofarma, Bekasi,Indonesia).
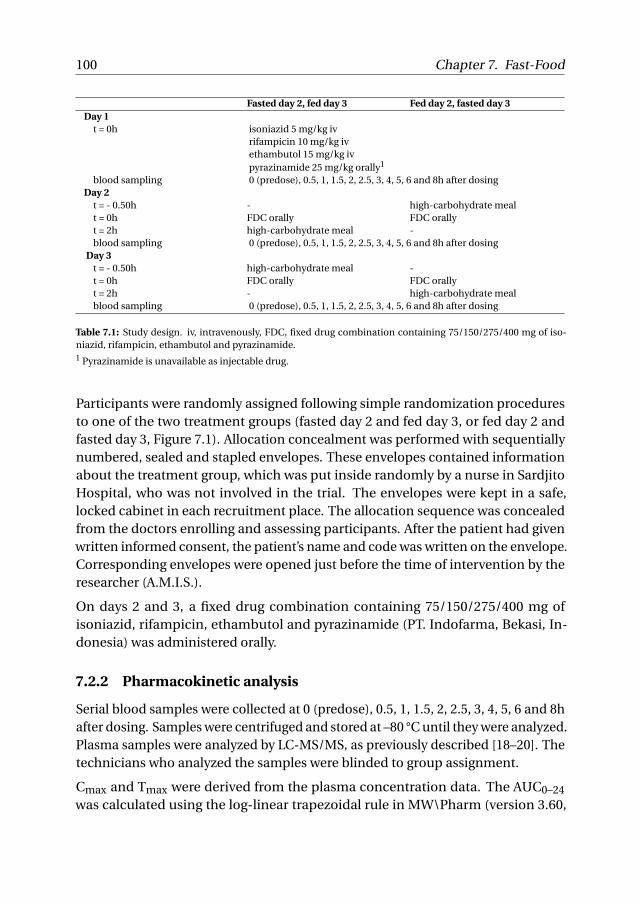
100 Chapter 7. Fast-Food
Fasted day 2, fed day 3 Fed day 2, fasted day 3Day 1
t = 0h isoniazid 5 mg/kg ivrifampicin 10 mg/kg ivethambutol 15 mg/kg ivpyrazinamide 25 mg/kg orally1
blood sampling 0 (predose), 0.5, 1, 1.5, 2, 2.5, 3, 4, 5, 6 and 8h after dosingDay 2
t = - 0.50h - high-carbohydrate mealt = 0h FDC orally FDC orallyt = 2h high-carbohydrate meal -blood sampling 0 (predose), 0.5, 1, 1.5, 2, 2.5, 3, 4, 5, 6 and 8h after dosing
Day 3t = - 0.50h high-carbohydrate meal -t = 0h FDC orally FDC orallyt = 2h - high-carbohydrate mealblood sampling 0 (predose), 0.5, 1, 1.5, 2, 2.5, 3, 4, 5, 6 and 8h after dosing
Table 7.1: Study design. iv, intravenously, FDC, fixed drug combination containing 75/150/275/400 mg of iso-niazid, rifampicin, ethambutol and pyrazinamide.1 Pyrazinamide is unavailable as injectable drug.
Participants were randomly assigned following simple randomization proceduresto one of the two treatment groups (fasted day 2 and fed day 3, or fed day 2 andfasted day 3, Figure 7.1). Allocation concealment was performed with sequentiallynumbered, sealed and stapled envelopes. These envelopes contained informationabout the treatment group, which was put inside randomly by a nurse in SardjitoHospital, who was not involved in the trial. The envelopes were kept in a safe,locked cabinet in each recruitment place. The allocation sequence was concealedfrom the doctors enrolling and assessing participants. After the patient had givenwritten informed consent, the patient’s name and code was written on the envelope.Corresponding envelopes were opened just before the time of intervention by theresearcher (A.M.I.S.).
On days 2 and 3, a fixed drug combination containing 75/150/275/400 mg ofisoniazid, rifampicin, ethambutol and pyrazinamide (PT. Indofarma, Bekasi, In-donesia) was administered orally.
7.2.2 Pharmacokinetic analysis
Serial blood samples were collected at 0 (predose), 0.5, 1, 1.5, 2, 2.5, 3, 4, 5, 6 and 8hafter dosing. Samples were centrifuged and stored at –80 °C until they were analyzed.Plasma samples were analyzed by LC-MS/MS, as previously described [18–20]. Thetechnicians who analyzed the samples were blinded to group assignment.
Cmax and Tmax were derived from the plasma concentration data. The AUC0–24
was calculated using the log-linear trapezoidal rule in MW\Pharm (version 3.60,

7.3. Results 101
Mediware, Groningen, The Netherlands). Concentrations at time points 0 of day2 and 3 also served as C24 of days 1 and 2. C24 of day 3 was calculated usingthe formula C24 = Cmax ·e–β·(24–Tmax) in which β is the first order elimination rateconstant. Plasma concentrations below the quantification lower limit were treatedas zeros. Absolute bioavailability (F) was normalized for dosage and calculated as(AUC0–24, fasted or fed/AUC0–24, intravenously)∗ (Doseintravenously/Doseorally).
Patients with calculated half-life of isoniazid ≤ 2h were considered fast acetylators,otherwise they were considered slow acetylators [7].
7.2.3 Statistical analysis
For the patient characteristics, means are reported ± standard deviation (SD). Cmax,AUC0–24 and F were log transformed to calculate geometric mean (and range).Differences between fasted and fed treatments were tested using the Wilcoxonsigned rank test. Statistical analysis was performed using IBM SPSS Statistics22 (IBM Corp., Armonk, NY, USA). Two-sided P values ≤ 0.05 were consideredsignificant.
7.3 Results
From November 2012 to March 2013, 20 subjects were included in the study. Onepatient vomited shortly after ingestion of the medication on both the fed and fastedday. This patient was excluded from the study and replaced by inclusion of anothersubject (Figure 7.1). Patient characteristics are presented in Table 7.2. The meanbody mass index (BMI) was 17.4 (± 2.6) kg/m2, showing that a large proportionof the study population (70%) was underweight (i.e. BMI < 18.5 kg/m2) [21, 22].Fifteen subjects were fast acetylators for isoniazid. Two patients also suffered fromtype II diabetes mellitus and two others were co-infected with HIV.
Dosing information of the subjects is presented in Table 7.3. Due to the fact that itwas possible to dose more exactly with the injection, there is a statistically signific-ant difference in intravenous (median 15.0 mg/kg) and oral (19.6 mg/kg, P<0.001)dosing of ethambutol. Assuming that this difference in dosing had no influence onthe bioavailability itself, a linear correction was performed [23, 24].
In Table 7.4 and Figure 7.2, the pharmacokinetic data of the first-line anti-TB drugsafter intravenous administration and after oral administration in both fasted stateand fed state are presented. From one patient, data of time points 0.5, 1, 1.5 and2h of the intravenous administration of rifampicin and ethambutol were omittedfrom the analysis, as these samples were drawn from the same arm as infusion wasgiven.

102 Chapter 7. Fast-Food
Characteristic Subjects, n=20Male/female, n/n (%/%) 12/8 (60/40)Age (years), mean (SD) 40.5 (19.6)Bodyweight (kg), mean (SD) 42.9 (6.4)BMI (kg/m2), mean (SD) 17.4 (2.6)Underweight, n (%)1 14 (70)Acetylator fast/slow, n/n (%/%)2 15/5 (75/25)Ethnicity, n (%)
Javanese 17 (85)Sudanese 2 (10)Madura 1 (5)
Co-morbidity, n (%) 4 (20)HIV 2 (10)diabetes, type II 2 (10)
Co-medication, n (%)3 8 (40)
Table 7.2: Patient characteristics.1 Underweight is defined as BMI < 18.5 kg/m2. 2 Patients with a calculated half-life of isoniazid ≤ 2h were con-sidered fast acetylators; otherwise they were considered slow acetylators. 3 Co-medication: acetaminophen(1), acetaminophen/acetylcysteine (2), acetaminophen/acetylcysteine and salbutamol (1), metformin (1), met-formin, insulin and simvastatin (1), methylprednisolone (1), nystatin (1).
Drug Intravenously day 1 Orally day 2-3 P1
Isoniaziddose, mg/kg 5.0 (5.0-5.0) 5.4 (4.2-6.0) 0.234dose, mg 208 (150-275) 225 (150-300) 0.136
Rifampicindose, mg/kg 10.0 (9.9-10.0) 10.7 (8.3-12.0) 0.141dose, mg 415 (300-550) 450 (300-600) 0.234
Ethambutoldose, mg/kg 15.0 (15.0-15.3) 19.6 (15.3-22.0) <0.001dose, mg 623 (450-825) 825 (550-1100) <0.001
Pyrazinamide Orally2
dose, mg/kg 25.5 (22.7-29.8) 28.6 (22.2-32.0) 0.040dose, mg 1000 (750-1500) 1200 (800-1600) 0.046
Table 7.3: Dosing information. Data are presented as median (range).1 Related Samples Wilcoxon Signed Rank Test was used to compare intravenous and oral dosing.2 Pyrazinamide is unavailable as injectable drug.
The high-carbohydrate meal had significant effects on Cmax and Tmax of all drugsbut ethambutol. The decrease of Cmax in fed state compared with fasting state was1.9 mg/L (42%) for isoniazid, 2.4 mg/L (22%) for rifampicin and 4.4 mg/L (10%) forpyrazinamide. Tmax was significantly delayed for these three drugs. The time toTmax for isoniazid almost doubled; Tmax in fasting state was 1.3h and Tmax in fedstate was 2.5h. For rifampicin, Tmax was 2.3h in fasted and 3.6h in fed state. Tmax ofpyrazinamide was 1.5h in fasted and 2.8h in fed state. The time delays for all threedrugs were similar, 1.2h, 1.3h and 1.3h, respectively.
Absolute bioavailability in fasted and fed state for isoniazid was 93% and 78%,for rifampicin 87% and 71% and for ethambutol 87% and 82% (Table 7.4 and

Figure 7.2: Concentration-time curves (mean and SD) of first-line anti-TB drugs.

104 Chapter 7. Fast-Food
Drug Intravenously Orally, fasted Orally, fed P1
IsoniazidTmax (h), median (IQR) 0.67 (0.58-0.93) 1.28 (0.48-1.52) 2.48 (1.62-3.13) 0.001Cmax (mg/L) 6.2 (3.4-14.1) 4.5 (2.0-7.5) 2.6 (1.2-5.9) 0.001AUC0–24 (mg ·h/L) 16.3 (7.8-35.5) 15.6 (7.5-33.0) 13.1 (5.5-36.8) 0.014F (%) 100 92.7 (43.3–172) 77.8 (28.3-192) 0.014
RifampicinTmax (h), median (IQR) 1.83 (1.00-2.25)2 2.28 (1.50-2.50) 3.60 (2.48-5.02) < 0.001Cmax (mg/L) 12.3 (7.5-17.3)2 10.7 (7.1-15.1) 8.3 (4.1-13.3) 0.002AUC0–24 (mg ·h/L) 79.6 (36.9-162) 71.8 (36.0-129) 58.2 (29.0-115) < 0.001F (%) 100 87.1 (58.8-131) 70.9 (36.3-110) < 0.001
EthambutolTmax (h), median (IQR) 1.25 (1.00-1.55)2 3.00 (2.18-3.13) 3.00 (2.52-4.12) 0.136Cmax (mg/L) 5.3 (2.6-10.4)2 2.8 (0.6-6.3) 2.5 (0.8-3.7) 0.126AUC0–24 (mg ·h/L) 14.4 (8.1-26.8) 15.7 (7.0-24.9) 14.8 (7.3-33.5) 0.681F (%) 100 86.6 (27.4-155) 81.5 (29.5-146) 0.681
Pyrazinamidec3
Tmax (h), median (IQR) 1.50 (1.02-1.98) 2.78 (2.00-4.00) < 0.001Cmax (mg/L) 44.0 (32.4-66.3) 39.6 (27.6-56.4) 0.001AUC0–24 (mg ·h/L) 481 (290-668) 468 (278-688) 0.263
Table 7.4: Pharmacokinetic data of first-line anti-TB drugs after intravenous administration and orally infasted and fed condition. Data are presented as geometric mean (range), except for Tmax, which is presentedas median (IQR).1 Related-samples Wilcoxon signed rank test was used to compare ‘orally, fasted’ and ‘orally, fed’ treatments.2 Cmax and Tmax of rifampicin and ethambutol were unavailable for one patient (N=19).3 Pyrazinamide is not available as injectable drug.
Figure 7.3). The decrease of 15% and 16% in absolute bioavailability of isoniazidand rifampicin, respectively, was statistically significant. Due to the absence of anintravenous injection, we were unable to determine the absolute bioavailability ofpyrazinamide. No significant decrease in AUC0–24 for pyrazinamide was observed.Finally, none of the pharmacokinetic parameters of ethambutol were affected byconcomitant food.
7.4 Discussion
To the best of our knowledge, this is the first randomized cross-over trial, in whichthe influence of food on the absolute bioavailability and pharmacokinetics of allfirst-line anti-TB drugs has been investigated quantitatively in treatment-naive TBpatients. The high-carbohydrate meal influenced all pharmacokinetic parametersof isoniazid and rifampicin but not of ethambutol or pyrazinamide.
The absolute bioavailability of isoniazid, rifampicin and ethambutol has beenreported to be 91%±10%, 93% and 75%-80% respectively [23, 25–28]. In fasted state,our data are in line with these earlier findings. Data on absolute bioavailabilityin fed state have not been published before as far as we know. Food decreased

7.4. Discussion 105
Figure 7.3: Median bioavailability of isoniazid, rifampicin and ethambutol under fasted and fed condition.
absolute bioavailability of isoniazid and rifampicin by < 20% and may thereforebe considered not to be clinically relevant according to regulatory guidelines [17].However, this conclusion may be too conservative. A further reduction of drugexposure in patients prone to low drug exposure may actually increase the risk ofpoor treatment outcome [6, 29].
For isoniazid and rifampicin, the differences in Cmax between fasted and fed statedo not meet the criteria for bioequivalence [17]. These lowered maximum concen-trations may further increase the risk of acquired drug resistance.
Our study is different from other pharmacokinetics studies in TB patients as weincluded treatment-naive patients at the start of their treatment. Other trials onthe influence of food on pharmacokinetics of anti-TB drugs were in steady state:after ≥ 4 days of treatment [14], or ≥ 2 weeks [12]. The latter did not investigateethambutol, and neither trial provided data on the absolute bioavailability of iso-niazid, rifampicin or ethambutol as they did not compare their treatments with thegold standard, intravenous treatment. This difference in time of treatment madeit difficult to compare our data with the earlier studies [12, 14]. The differences inAUC0–24 of rifampicin can be explained by the fact that auto-induction of rifampi-cin is not maximized until 20-40 days of treatment and our study was performed in

106 Chapter 7. Fast-Food
the first three days of treatment [27, 30].
As for many TB patients who start with drug treatment, the subjects in this studywere actually really ill. The mean BMI of the subjects was 17.4 (± 2.6) kg/m2
and the majority of subjects were underweight. Most (79%) of these low BMIsubjects showed low albumin levels indicating that subjects were malnourished.Malnourished people may be under dosed as a low BMI approximates to fat massbut also to low weight and fat-free mass [31]. The poor nutritional status in additionto inflammation might affect the intestinal mucosa, reducing drug absorption. Itmight delay gastric emptying, alter the gastric pH and change bio-distributionof the drugs [15]. On the other hand, low serum albumin might be beneficial forrifampicin as the drug is highly protein bound, resulting in a higher free fraction ofthe drug [15].
There are several limitations to this study. Free drug concentrations were notmeasured. This would have been more informative as perhaps high free fractionsof relative low total concentrations could still have resulted in a favourable drugexposure [15]. Actual pharmacokinetic/pharmacodynamic ratios could not becalculated because only breakpoints were available and not actual MICs. Due tothe absence of an intravenous formulation of pyrazinamide, we were unable todetermine the absolute bioavailability of pyrazinamide.
Recently, poor treatment outcome has been linked with low TB drug exposure andit was shown that risk on treatment failure was almost nine-fold higher in patientswith low drug exposure based on AUC compared to patients with higher drugexposure [6]. Sufficient drug exposure in the first days of treatment is important toreduce bacterial load rapidly [32, 33]. Pasipanodya et al. showed that to achieve afavourable outcome, in order of importance, AUC0–24 of pyrazinamide, rifampicinand isoniazid should be over 363, 13 and 52 mg ·h/L respectively [6]. PyrazinamideAUC0–24 was sufficiently high in the majority of patients with respect to long-term outcome. Eighteen (90%) and 16 (80%) patients in the fasted and fed group,respectively, showed sufficiently high AUC0–24 (Table 7.5). Observed AUC0–24 ofrifampicin were sufficient in all patients, regardless of fasted or fed state. It ishowever striking to see that none of the AUC0–24 of isoniazid met this target topredict a favourable long-term outcome.
Low Cmax have been shown to precede acquired drug-resistance [6]. Therefore,there is a need to safeguard that Cmax/MIC ratios are adequate. Only in one patientin fasted state, Cmax of pyrazinamide was sufficiently high to prevent acquired drugresistance (Table 7.5) [6]. The majority of patients had sufficient Cmax of rifampicin.For isoniazid, again none of the patients, whether fasted or fed, achieved a Cmax
that was high enough.

7.4. Discussion 107
Drug Intravenously Orally, fasted Orally, fedIsoniazid, n/N
patients with Cmax ≤ 8.8 mg/L 16/20 20/20 20/20patients with AUC0–24 ≤ 52 mg ·h/L 20/20 20/20 20/20
Rifampicin, n/Npatients with Cmax ≤ 6.6 mg/L 0/191 0/20 4/20patients with AUC0–24 ≤ 13 mg ·h/L 0/20 0/20 0/20
Pyrazinamide, n/N2
patients with Cmax ≤ 58.3 mg/L 19/20 20/20patients with AUC0–24 ≤ 363 mg ·h/L 2/20 4/20
Table 7.5: Number of patients with exposure lower than reference values.1 Cmax of rifampicin was unavailable for one patient (N=19). 2 Pyrazinamide is not available as injectabledrug.
The magnitude of these pharmacokinetic findings underlines the importance of theevaluation of drug exposure in relation to the drug susceptibility of the pathogen[34]. Because actual MIC values were unknown, it remains difficult to understandthe impact of the observed differences in AUC0–24 and Cmax between fasted andfed state for each individual patient.
This study has shown that food decreases absolute bioavailability and Cmax ofisoniazid and rifampicin. More than the difference between the fed and fasted state,we were worried about the very large ranges that were shown for AUC0–24 and ab-solute bioavailability. Between the highest and lowest value within a group, a factor2.2, for fasted rifampicin, to 6.8, for fed isoniazid, was observed. Therefore, theeffect of food intake contributed only partly to the large inter- and intra-individualpharmacokinetic variability [35].
Inter-individual variability caused by comorbidities like HIV and diabetes mellitusor pharmacogenetics of N-acetyltransferase 2 (NAT2), intra-individual variabilitysuch as the auto-inducing activity of rifampicin and variability of MICs, all havetheir impact on the pharmacokinetic/pharmacodynamic ratio. In spite of that,we emphasize that further reduction of drug exposure due to concomitant foodin patients prone to low drug exposure may increase the risk of poor treatmentoutcome [6, 29].
Optimizing drug exposure of first-line drugs by means of therapeutic drug monit-oring (TDM) including helpful tools like optimal sampling strategies [36, 37] anddried blood spot analysis [38] or higher dosing of rifampicin [39, 40] have recentlybeen subject of investigation. Compared to the introduction of new compounds forfirst-line treatment of TB in an effort to shorten drug therapy [41–44], optimizationof the current treatment may not be inferior. With higher doses of rifampicin andTDM to safeguard drug exposure, shortened treatment may be pursued.
Taken into account all these initiatives, we propose a randomized controlled trial

108 Chapter 7. Fast-Food
including drug exposure and actual MIC values of TB strains in comparison withstandard care. Long-term follow up should be performed to fully understand thetrue impact of the optimization of current first-line treatment.
In conclusion, this study showed that food decreased absolute bioavailability,AUC0–24 and Cmax of isoniazid and rifampicin in treatment-naive TB patientsstarting with anti-TB treatment. Cmax of pyrazinamide was decreased by a high-carbohydrate meal, but AUC0–24 was not. Pharmacokinetics of ethambutol wereunaffected by food. Absolute bioavailability in fed state met the criteria for bioequi-valence. Nevertheless, the decreased drug exposure in fed patients may pose themmore at risk for poor treatment outcome or acquired drug resistance.
Acknowledgements
Our high appreciation is addressed to the patients for their participation in thisstudy and to the staffs at the governmental chest clinic/ Balai Pengobatan PenyakitParu-paru (BP4) Yogyakarta and Sardjito General Hospital for their cooperation.The technicians of the lab of the department of Clinical Pharmacy and Pharmaco-logy of UMCG are greatly acknowledged for the analysis of plasma samples.
References
1. World Health Organization. Global Tuberculosis Report 2014 tech. rep. (2014).
2. World Health Organization. Treatment of tuberculosis guidelines 4th editiontech. rep. (2010).
3. Blumberg H. M. et al. American Thoracic Society/Centers for Disease Controland Prevention/Infectious Diseases Society of America: treatment of tubercu-losis. Am J Respir Crit Care Med 167, 603–662 (2003).
4. Agbor A. A., Bigna J. J., Billong S. C., Tejiokem M. C., Ekali G. L., Plottel C. S.,Noubiap J. J., Abessolo H., Toby R. & Koulla-Shiro S. Factors Associated withDeath during Tuberculosis Treatment of Patients Co-Infected with HIV at theYaounde Central Hospital, Cameroon: An 8-Year Hospital-Based RetrospectiveCohort Study (2006-2013). PLoS One 9, e115211 (2014).
5. Van den Broek J., Mfinanga S., Moshiro C., O’Brien R., Mugomela A. & LefiM. Impact of human immunodeficiency virus infection on the outcome oftreatment and survival of tuberculosis patients in Mwanza, Tanzania. Int JTuberc Lung Dis 2, 547–552 (1998).

References 109
6. Pasipanodya J. G., McIlleron H., Burger A., Wash P. A., Smith P. & Gumbo T.Serum drug concentrations predictive of pulmonary tuberculosis outcomes. JInfect Dis 208, 1464–1473 (2013).
7. Peloquin C. A., Namdar R., Dodge A. A. & Nix D. E. Pharmacokinetics ofisoniazid under fasting conditions, with food, and with antacids. Int J TubercLung Dis 3, 703–710 (1999).
8. Peloquin C. A., Namdar R., Singleton M. D. & Nix D. E. Pharmacokinetics ofrifampin under fasting conditions, with food, and with antacids. Chest 115,12–18 (1999).
9. Peloquin C. A., Bulpitt A. E., Jaresko G. S., Jelliffe R. W., James G. T. & Nix D. E.Pharmacokinetics of pyrazinamide under fasting conditions, with food, andwith antacids. Pharmacotherapy 18, 1205–1211 (1998).
10. Peloquin C. A., Bulpitt A. M., Jaresko G. S., Jelliffe R. W., Childs J. M. & Nix D. E.Pharmacokinetics of Ethambutol under Fasting Conditions , with Food , andwith Antacids. Antimicrob Agents Chemother 43, 568–572 (1999).
11. Lin M. Y., Lin S. J., Chan L. C. & Lu Y. C. Impact of food and antacids on thepharmacokinetics of anti-tuberculosis drugs: systematic review and meta-analysis. Int J Tuberc Lung Dis 14, 806–818 (2010).
12. Zent C. & Smith P. Study of the effect of concomitant food on the bioavailabilityof rifampicin, isoniazid and pyrazinamide. Tuber Lung Dis 76, 109–113 (1995).
13. Siegler D. I., Bryant M., Burley D. M., Citron K. M. & Standen S. M. Effect ofmeals on rifampicin absorption. Lancet 2, 197–198 (1974).
14. Lin H. C., Yu M. C., Liu H. J. & Bai K. J. Impact of food intake on the phar-macokinetics of first-line antituberculosis drugs in Taiwanese tuberculosispatients. J Formos Med Assoc 113, 291–297 (2014).
15. Polasa K., Murthy K. J. & Krishnaswamy K. Rifampicin kinetics in undernutri-tion. Br J Clin Pharmacol 17, 481–484 (1984).
16. Krishnaswamy K. Drug metabolism and pharmacokinetics in malnutrition.Trends Pharmacol Sci 4, 295–299 (1983).
17. European Medicines Agency. Guideline on the investigation of bioequivalence;CPMP/EWP/QWP/1401/98 Rev. 1/ Corr. tech. rep. January (European MedicinesAgency, 2010).
18. Sturkenboom M. G., van der Lijke H., Jongedijk E. M., Kok W. T., Greijdanus B.,Uges D. R. & Alffenaar J.-W. Quantification of isoniazid, pyrazinamide and eth-ambutol in serum using liquid chromatography-tandem mass spectrometry. JAppl Bioanalysis 1, 89–98 (2015).

110 Chapter 7. Fast-Food
19. De Velde F., Alffenaar J. W., Wessels A. M., Greijdanus B. & Uges D. R. Simultan-eous determination of clarithromycin, rifampicin and their main metabolitesin human plasma by liquid chromatography-tandem mass spectrometry. JChromatogr B 877, 1771–1777 (2009).
20. Vu D. H., Koster R. A., Wessels A. M., Greijdanus B., Alffenaar J. W. & UgesD. R. Troubleshooting carry-over of LC-MS/MS method for rifampicin, clari-thromycin and metabolites in human plasma. J Chromatogr B 917-918, 1–4(2013).
21. World Health Organization, Expert Consultation. Appropriate body-massindex for Asian populations and its implications for policy and interventionstrategies. Lancet 363, 157–163 (2004).
22. World Health Organization. WHO Technical Report Series 854 Physical Status:The use and interpretation of anthropometry (1995).
23. Becker C., Dressman J. B., Amidon G. L., Junginger H. E., Kopp S., MidhaK. K., Shah V. P., Stavchansky S. & Barends D. M. Biowaiver monographs forimmediate release solid oral dosage forms: ethambutol dihydrochloride. JPharm Sci 97, 1350–1360 (2008).
24. Zhu M. et al. Pharmacokinetics of ethambutol in children and adults withtuberculosis. Int J Tuberc Lung Dis 8, 1360–1367 (2004).
25. Holdiness M. R. Clinical pharmacokinetics of the antituberculosis drugs. ClinPharmacokinet 9, 511–44 (1984).
26. Becker C., Dressman J. B., Amidon G. L., Junginger H. E., Kopp S., MidhaK. K., Shah V. P., Stavchansky S., Barends D. M. & International PharmaceuticalFederation G. B. C. S. Biowaiver monographs for immediate release solid oraldosage forms: isoniazid. J Pharm Sci 96, 522–531 (2007).
27. Becker C., Dressman J. B., Junginger H. E., Kopp S., Midha K. K., Shah V. P.,Stavchansky S. & Barends D. M. Biowaiver monographs for immediate releasesolid oral dosage forms: rifampicin. J Pharm Sci 98, 2252–2267 (2009).
28. Jonsson S., Davidse A., Wilkins J., der Walt J. S. V., Simonsson U. S., KarlssonM. O., Smith P. & McIlleron H. Population pharmacokinetics of ethambutol inSouth African tuberculosis patients. Antimicrob Agents Chemother 55, 4230–4237 (2011).
29. Azuma J. et al. NAT2 genotype guided regimen reduces isoniazid-induced liverinjury and early treatment failure in the 6-month four-drug standard treat-ment of tuberculosis: A randomized controlled trial for pharmacogenetics-based therapy. Eur J Clin Pharmacol 69, 1091–1101 (2013).

References 111
30. Smythe W. et al. A semimechanistic pharmacokinetic-enzyme turnover modelfor rifampin autoinduction in adult tuberculosis patients. Antimicrob AgentsChemother 56, 2091–2098 (2012).
31. Norgan N. G. Population differences in body composition in relation to thebody mass index. Eur J Clin Nutr 48 Suppl 3, S10–25, discussion S26–7 (1994).
32. Chigutsa E., Pasipanodya J. G., Visser M. E., van Helden P. D., Smith P. J., SirgelF. A., Gumbo T. & McIlleron H. Impact of nonlinear interactions of pharma-cokinetics and MICs on sputum bacillary kill rates as a marker of sterilizingeffect in tuberculosis. Antimicrob Agents Chemother 59, 38–45 (2015).
33. Jindani A., Doré C. J. & Mitchison D. A. Bactericidal and sterilizing activities ofantituberculosis drugs during the first 14 days. Am J Respir Crit Care Med 167,1348–54 (2003).
34. Gumbo T. New susceptibility breakpoints for first-line antituberculosis drugsbased on antimicrobial pharmacokinetic/pharmacodynamic science andpopulation pharmacokinetic variability. Antimicrob Agents Chemother 54,1484–1491 (2010).
35. Srivastava S., Pasipanodya J. G., Meek C., Leff R. & Gumbo T. Multidrug-resistant tuberculosis not due to noncompliance but to between-patientpharmacokinetic variability. J Infect Dis 204, 1951–1959 (2011).
36. Magis-Escurra C. et al. Population pharmacokinetics and limited samplingstrategy for first-line tuberculosis drugs and moxifloxacin. Int J AntimicrobAgents 44, 229–34 (2014).
37. Sturkenboom M. G., Mulder L. W., de Jager A., van Altena R., Aarnoutse R. E.,de Lange W. C., Proost J. H., Kosterink J. G., van der Werf T. & Alffenaar J.-W.Pharmacokinetic Modeling and Optimal Sampling Strategies for TherapeuticDrug Monitoring of Rifampin in Patients with Tuberculosis. Antimicrob AgentsChemother 59, 4907–13 (2015).
38. Vu D. H., Alffenaar J. W., Edelbroek P. M., Brouwers J. R. & Uges D. R. Driedblood spots: a new tool for tuberculosis treatment optimization. Curr PharmDes 17, 2931–2939 (2011).
39. Ruslami R., Nijland H. M., Alisjahbana B., Parwati I., van Crevel R. & AarnoutseR. E. Pharmacokinetics and tolerability of a higher rifampin dose versusthe standard dose in pulmonary tuberculosis patients. Antimicrob AgentsChemother 51, 2546–2551 (2007).

112 Chapter 7. Fast-Food
40. Ruslami R., Ganiem A. R., Dian S., Apriani L., Achmad T. H., van der VenA. J., Borm G., Aarnoutse R. E. & van Crevel R. Intensified regimen contain-ing rifampicin and moxifloxacin for tuberculous meningitis: an open-label,randomised controlled phase 2 trial. Lancet Infect Dis 13, 27–35 (2013).
41. Jindani A. et al. High-Dose Rifapentine with Moxifloxacin for PulmonaryTuberculosis. N Engl J Med 371, 1599–1608 (2014).
42. Merle C. S. et al. A four-month gatifloxacin-containing regimen for treatingtuberculosis. N Engl J Med 371, 1588–1598 (2014).
43. Gillespie S. H., Crook A. M., McHugh T. D., Mendel C. M., Meredith S. K.,Murray S. R., Pappas F., Phillips P. P. & Nunn A. J. Four-Month Moxifloxacin-Based Regimens for Drug-Sensitive Tuberculosis. N Engl J Med 371, 1577–1587(2014).
44. Dorman S. E. et al. Daily rifapentine for treatment of pulmonary tuberculosis.A randomized, dose-ranging trial. Am J Respir Crit Care Med 191, 333–43(2015).

CH
AP
TE
R
8DISCUSSION AND FUTURE PERSPECTIVES
Adapted from: Van der Burgt EP, Sturkenboom MG, Bolhuis MS, Akkerman OW,Kosterink JG, de Lange WC, Cobelens FG, van der Werf TS, Alffenaar JW. END TB by
precision treatment! European Respiratory Journal 2016; 47(2): 680-682.

114 Chapter 8. Discussion
Treatment of tuberculosis (TB) with the four first-line drugs, though usually suc-cessful, has been challenged by the emergence of drug resistance, toxicity, relapseand non-response [1]. In this thesis, we have identified factors that can be optim-ized in the first-line treatment of drug-susceptible TB. In Chapters 3 and 4, two ofthe prerequisites for therapeutic drug monitoring (TDM) are described: a sensitive,simple and rapid liquid chromatography-tandem mass spectrometry (LC-MS/MS)method to quantify isoniazid, ethambutol and pyrazinamide and an interlaborat-ory proficiency testing programme that enables laboratories to externally validatetheir bioanalysis methods for first-line and two second-line anti-TB drugs. Theprogramme alerted some laboratories to previously undetected problems, demon-strating the need for and utility of an ongoing quality control programme in thisarea of bioanalysis.
For a drug to be effective, both its action at the site of the disease process (phar-macodynamics) and the drug concentration over time in body fluids and tissues(pharmacokinetics) are of major importance. For the first-line anti-TB drugs, thearea under the concentration-time curve (AUC) is the most important pharma-cokinetic parameter [2]. Drug exposure may be influenced by different factors, suchas concomitant food-intake, comorbidities, co-medication and intra-individualdifferences in pharmacokinetics [1]. Patients prone to low drug exposure are thosewith mal-absorption and gastro-intestinal disorders, patients suffering from drug-drug interactions and those with diabetes mellitus or HIV co-infection. Moreimportantly, pharmacokinetic variability is the driver of drug resistance [2, 3]. In allthese individuals, there is a rationale for TDM [1].
Apart from the above-mentioned external factors, the first-line anti-TB drugs them-selves are also problematic [1]. The variability of rifampicin plasma drug concen-trations over time is influenced by its auto-inducing capacity, lowering rifampicinexposure with 40% after 40 days when the induction is maximized [4]. Variabilityof isoniazid exposure is further influenced by N-acetyltransferase 2 (NAT2), whichmetabolizes isoniazid to non-hepatotoxic metabolites. Generally, slow acetylatorsexhibit higher isoniazid plasma concentrations than rapid acetylators [5]. In arandomized clinical trial, isoniazid dosing adjusted for NAT2 genotype resulted inreduced toxicity and less treatment failure [6]. Clearance of isoniazid, rifampicinand pyrazinamide is a metabolic process handled by liver enzymes. Altered orimpaired hepatic function further complicates dosing of these drugs. It is ratherdifficult to quantify the metabolizing capacity of the liver, making TDM the onlyway to ascertain adequate dosing [1]. Three of the first-line anti-TB drugs, isoniazid,rifampicin and pyrazinamide, are potentially hepatotoxic [7] and more so if plasmaconcentrations increase [8]. TDM may therefore also prevent toxicity if performedtimely [1].

115
Low anti-TB drug exposure has been associated with poor treatment outcome, withan almost nine-fold increase in treatment failure in patients with low drug exposure[3]. Low maximum concentration (Cmax) preceded acquired drug-resistance [3].Although the data were not related to minimum inhibitory concentrations (MICs),they clearly support the need for TDM [1].
In Chapter 5a, we described the development of an optimal sampling procedurebased on population pharmacokinetics to predict AUC0–24 of rifampicin. The studysubjects we included were TB patients, either participating in a pharmacokineticstudy [9] or patients that were admitted to the University Medical Center Groningen,Tuberculosis Centre Beatrixoord, Haren, The Netherlands. These two groups ofpatients represent a rather diverse population; as for instance rifampicin wasingested on an empty stomach in the pharmacokinetic study and with a lightbreakfast in the Beatrixoord group. Possibly, patients in Beatrixoord reflect a morecomplicated group of TB patients as TDM of rifampicin is only performed basedon a clinical indication and therefore, selection bias might be involved. A one-compartmental pharmacokinetic population model with first-order absorptionand lag time was developed using observed rifampicin plasma concentrations from55 patients. This study showed that rifampicin AUC0–24 in TB patients can bepredicted with acceptable accuracy and precision using the developed populationpharmacokinetic model with optimal sampling at time points 1, 3 and 8 h.
In a similar study, we developed a one-compartmental model with lag time forisoniazid using 36 concentration-time curves [10]. Optimal sampling using concen-trations at 1, 3 and 8 h post dosing with r2 0.96, root mean squared error 15.3% andprediction bias 3.3% was considered clinically suitable. Both estimated AUC0–24 us-ing the one-compartmental model and estimated AUC0–24 using optimal samplingat time points 1, 3 and 8 h were highly correlated to the calculated AUC0–24 (Spear-man correlation coefficient, 0.96; p<0.01 and 0.95; p<0.01 respectively) [10]. Theseoptimal sampling studies facilitate obtaining an AUC and show that calculatingAUC0–24 is possible with sufficient precision and accuracy. In future, in patient carethere is no longer a need to obtain a full pharmacokinetic curve and this approachfacilitates effective TDM.
For TB treatment, the time has come to move away from a ‘one size fits all’ ap-proach [1]. We need individualized approaches with considerably more precision.In Chapter 6, we described a retrospective study in TB patients in which we in-vestigated the correlation of clinical variables with the exposure of isoniazid andrifampicin. If size descriptors, such as body mass index (BMI), show a predictiverelationship with drug exposure (AUC), than dose might be adjusted prior to startof treatment and TDM may not be necessary. Univariate analysis showed no associ-ation between isoniazid dose per total body weight (TBW) and exposure (adjusted

116 Chapter 8. Discussion
R2=0.008, P=0.232). A small, but significant positive association was shown betweenrifampicin dose/TBW and exposure (adjusted R2=0.102, P=0.006). Multiple linearregression analysis showed a significant, weak positive association of isoniazidAUC0–24 with the dose/TBW, BMI and elevated C-reactive protein (CRP) level (ad-justed R2=0.162, P=0.010). A significant, independent and positive association ofrifampicin AUC0–24 was shown with the dose/TBW, gender, BMI and CRP level(adjusted R2=0.354, P<0.001). Therefore, we conclude that ‘dose doesn’t matter’. Topredict exposure of either drug, we will still have to perform TDM.
In drug-susceptible TB, breakpoints are used instead of actual MICs. Therefore, todate, we could only speculate on the pharmacokinetic/pharmacodynamic (PK/PD)parameter for determination of the efficacy of the treatment. We suggest to performa trial in which exposure combined with susceptibility is tested for long-termoutcome. This randomized clinical trial should explore the potential benefit ofTDM in TB treatment. Standard treatment should be compared with TDM guideddosing in combination with MIC testing [1]. The study should be powered todetect both clinically and epidemiologically meaningful differences in relapse rate,acquired drug resistance or toxicity. TDM implementation in TB treatment need notnecessarily increase cost [1]. Even in high TB-burdened, resource-poor countriesTDM might at the end of the day prove cost-effective [1]. Local healthcare workersmay be taught to take patient samples. Dried blood spot sampling (DBS) shouldbe used because of considerable logistic and financial advantages involving easiersampling, storage and transportation, making TDM an attainable goal in remote,poorly resources areas [11].
Actual MICs of M. tuberculosis strains of patients on which we performed TDM(Chapter 6) are currently determined by the National Mycobacteria ReferenceLaboratory, National Institute for Public Health and the Environment, Bilthoven,the Netherlands. Combining these data with outcome, we will be able to determinethe actual PK/PD parameter for efficacy.
In treatment-naive TB patients who are starting on drug treatment, data on theinfluence of food intake on the pharmacokinetics were absent until recently. InChapter 7, we performed the ‘Fast-food trial’, in which we quantified the influenceof food on the pharmacokinetics of isoniazid, rifampicin, ethambutol and pyrazin-amide in TB patients. A prospective randomized crossover pharmacokinetic studywas conducted in 20 treatment-naive adults with drug-susceptible TB, during thefirst three days of drug treatment. We investigated the influence of food on the(absolute) bioavailability and pharmacokinetics of the first-line anti-TB drugs. Thehigh-carbohydrate meal influenced all pharmacokinetic parameters of isoniazidand rifampicin but not of ethambutol or pyrazinamide. Food decreased absolutebioavailability of isoniazid and rifampicin by approximately 15%. According to

References 117
regulatory guidelines [12], this is considered to be bioequivalent. However, thisconclusion may be too conservative. A further reduction of drug exposure in pa-tients prone to low drug exposure may actually increase the risk of poor treatmentoutcome [3, 6].
Besides the difference between the fed and fasted state, we were concerned aboutthe very large ranges which were shown for AUC0–24 and absolute bioavailability.Between the highest and lowest value within a group, a factor 2.2, for fasted ri-fampicin, to 6.8, for fed isoniazid, was observed. In the optimal sampling studiesand Chapter 6, we observed similar or even wider ranges [10]. Therefore, the ef-fect of food intake contributed only partly to the large inter- and intra-individualpharmacokinetic variability [2] and it is again an argument to perform TDM.
Considering the importance of isoniazid in the first days of treatment and the factthat neither TDM nor pharmacokinetics will be performed on a daily basis, it seemsworthwhile to investigate higher dosing of isoniazid for the first days, just as it isexplored for rifampicin [13, 14]. Donald et al. did not find a higher EBA for dosesover 300 mg but this may have been caused by a difference between slow and fastacetylators [15].
Physicians and pharmacists have used TDM in TB treatment if toxicity was suspec-ted, or patients responded unfavourably. In this thesis, we have shown that TDMis ready for prime time. Next to possible upfront higher dosing of rifampicin andisoniazid, TDM is the way to go in our opinion. There are many situations in whichTDM may make the difference between success and failure. Instead of working inthe dark, with a gunshot approach, clinicians should switch on the light providedby TDM and support their clinical decisions with current technologies to hit theirtarget with much more precision [1].
References
1. Van der Burgt E. P., Sturkenboom M. G., Bolhuis M. S., Akkerman O. W., Kos-terink J. G., de Lange W. C., Cobelens F. G., van der Werf T. S. & Alffenaar J.-W.End TB with precision treatment! Eur Respir J 47, 680–2 (2016).
2. Srivastava S., Pasipanodya J. G., Meek C., Leff R. & Gumbo T. Multidrug-resistant tuberculosis not due to noncompliance but to between-patientpharmacokinetic variability. J Infect Dis 204, 1951–1959 (2011).
3. Pasipanodya J. G., McIlleron H., Burger A., Wash P. A., Smith P. & Gumbo T.Serum drug concentrations predictive of pulmonary tuberculosis outcomes. JInfect Dis 208, 1464–1473 (2013).

118 Chapter 8. Discussion
4. Smythe W. et al. A semimechanistic pharmacokinetic-enzyme turnover modelfor rifampin autoinduction in adult tuberculosis patients. Antimicrob AgentsChemother 56, 2091–2098 (2012).
5. Conte Jr. J. E., Golden J. A., Mcquitty M., Kipps J., Duncan S., Mckenna E. &Zurlinden E. Effects of Gender, AIDS , and Acetylator Status on IntrapulmonaryConcentrations of Isoniazid. Antimicrob Agents Chemother 46, 2358–2364(2002).
6. Azuma J. et al. NAT2 genotype guided regimen reduces isoniazid-induced liverinjury and early treatment failure in the 6-month four-drug standard treat-ment of tuberculosis: A randomized controlled trial for pharmacogenetics-based therapy. Eur J Clin Pharmacol 69, 1091–1101 (2013).
7. Tostmann A., Boeree M. J., Aarnoutse R. E., de Lange W. C., van der Ven A. J. &Dekhuijzen R. Antituberculosis Drug-induced Hepatotoxicity: Concise Up-to-date Review. J Gastroenterol Hepatol 23, 192–202 (2008).
8. Satyaraddi A., Velpandian T., Sharma S. K., Vishnubhatla S., Sharma A., Sirohi-wal A., Makharia G. K., Sinha S., Biswas A. & Singh S. Correlation of plasmaanti-tuberculosis drug levels with subsequent development of hepatotoxicity.Int J Tuberc Lung Dis 18, 188–95, i–iii (2014).
9. Magis-Escurra C. et al. Population pharmacokinetics and limited samplingstrategy for first-line tuberculosis drugs and moxifloxacin. Int J AntimicrobAgents 44, 229–34 (2014).
10. Sturkenboom M. G., Engelage C. A., de Lange W. C., Akkerman O. W., KosterinkJ. G., van der Werf T. S. & Alffenaar J.-W. Pharmacokinetic Modeling andLimited Sampling Strategies for Therapeutic Drug Monitoring of Isoniazid inPatients with Tuberculosis. 7th Int Worksh Clin Pharmacol TB Drugs (2014),abstract 23.
11. Vu D. H., Alffenaar J. W., Edelbroek P. M., Brouwers J. R. & Uges D. R. Driedblood spots: a new tool for tuberculosis treatment optimization. Curr PharmDes 17, 2931–2939 (2011).
12. European Medicines Agency. Guideline on the investigation of bioequivalence;CPMP/EWP/QWP/1401/98 Rev. 1/ Corr. tech. rep. January (European MedicinesAgency, 2010).
13. Boeree M. J. et al. A Dose Ranging Trial to Optimize the Dose of Rifampin inthe Treatment of Tuberculosis. Am J Respir Crit Care Med 191, 1058–65 (2015).

References 119
14. Ruslami R., Ganiem A. R., Dian S., Apriani L., Achmad T. H., van der VenA. J., Borm G., Aarnoutse R. E. & van Crevel R. Intensified regimen contain-ing rifampicin and moxifloxacin for tuberculous meningitis: an open-label,randomised controlled phase 2 trial. Lancet Infect Dis 13, 27–35 (2013).
15. Donald P. R., Sirgel F. A., Botha F. J., Seifart H. I., Parkin D. P., Vandenplas M. L.,Van de Wal B. W., Maritz J. S. & Mitchison D. A. The early bactericidal activityof isoniazid related to its dose size in pulmonary tuberculosis. Am J Respir CritCare Med 156, 895–900 (1997).


CH
AP
TE
R
9SUMMARY

122 Chapter 9. Summary
Tuberculosis (TB), caused by infection with Mycobacterium tuberculosis, is one ofthe infectious diseases with the highest morbidity and mortality in the world. In2013, an estimated 9.0 million people acquired TB and 1.5 million people died dueto TB. Drug-susceptible TB is treated with the first-line anti-TB drugs, isoniazid,rifampicin (rifampin), pyrazinamide and ethambutol, during the first two months,continued with isoniazid and rifampicin for another four months. Treatmentwith the first-line anti-TB drugs, though usually successful, is challenged by theemergence of drug resistance, toxicity, relapse and non-response.
In this thesis, we hypothesized that it is necessary to move away from the ’one sizefits all’ pharmacotherapeutic approach. We explored individualized approacheswith conceivably considerably more precision. We described factors to considerwhen a patient is dosed with first-line anti-TB drugs and proposed methods tooptimize treatment in drug-susceptible TB.
In Chapter 2, a review was presented on the use of liquid chromatography-tandemmass spectrometry (LC-MS/MS) in therapeutic drug monitoring (TDM) of anti-infective drugs. Pharmacokinetic and pharmacodynamic parameters of anti-infec-tive drugs were discussed. Furthermore, we explored aspects of new matricessuch as saliva and new sampling techniques like dried blood spot (DBS) and theiranalysis to optimize patient friendly TDM.
Two of the prerequisites for TDM were described. In Chapter 3 we developed asensitive, simple and rapid LC-MS/MS method for the quantification of isoniazid,ethambutol and pyrazinamide. Protein binding was investigated and proved low.Therefore, sample preparation using ultrafiltration could be applied, resulting inlinear calibration curves in the range of 0.2 - 8 mg/L for isoniazid and ethambutoland 2 - 80 mg/L for pyrazinamide. The method was validated according to theguidelines of the FDA. The method was extensively tested for matrix effects andhas shown to be robust for pharmacokinetic studies of isoniazid, pyrazinamide andethambutol.
In Chapter 4, we described a recently initiated interlaboratory proficiency test-ing programme for the first-line and moxifloxacin and linezolid, two second-line,anti-TB drugs. Seven laboratories from Europe and the United States participatedin the first round of the programme. The majority of measurements (83%) waswithin 20% limits of the true weighed-in concentrations, meaning the initial resultsof this proficiency testing programme showed a reasonably good performanceof the participating laboratories in measuring anti-TB drugs. However, the res-ults for rifampicin were clearly worse compared to the other drugs. This mighthave been caused by possible incomplete dissolution of the sample, validation ortechnical problems. The programme also revealed possible inaccuracies or previ-

123
ously undetected problems related to analysis of ethambutol and pyrazinamide insome laboratories. The programme enabled laboratories to externally validate theirbioanalysis methods. External quality control for measurement of anti-TB drugs inserum is pivotal, considering the high level of interest in the pharmacokinetics ofanti-TB drugs necessary for TDM in patient care.
The objective of Chapter 5a was to develop an optimal sampling procedure based onpopulation pharmacokinetics to predict area under the concentration-time curve(AUC0–24) of rifampicin. A one-compartmental pharmacokinetic population modelwith first-order absorption and lag time was developed using rifampicin plasmaconcentrations obtained from 55 patients. The population pharmacokinetic modelwas developed using an iterative two-stage Bayesian procedure and was cross-validated. The median time to maximum concentration of the drug in serum (Tmax)was 2.2 h, ranging from 0.4 up to 5.7 h. This wide range indicates that only obtaininga concentration level at 2 h (C2) would not capture the peak concentration in a largeproportion of the population. Optimal sampling using concentrations at 1, 3 and 8 hafter administration of the drugs was considered clinically suitable with R2 value of0.96, a root mean squared error of 13.2% and a prediction bias of –0.4%. This studyshowed that rifampicin AUC0–24 in TB patients can be predicted with acceptableaccuracy and precision using the developed population pharmacokinetic modelwith optimal sampling at time points 1, 3 and 8 h.
In Chapter 5b, a letter to the editor, we discussed the need of well-designed phar-macokinetic studies to produce reliable data enabling to evaluate the effect of drugexposure on outcome. Obtaining a full pharmacokinetic curve and using a valid-ated optimal sampling strategy are the only two strategies of accurately predictingthe AUC of isoniazid. Only a well designed sampling schedule and information ondrug intake and drug susceptibility in combination with long-term follow-up willprovide relevant data that may help to optimize TB treatment.
In Chapter 6, we performed a retrospective study in TB patients to evaluate theinfluence of dose and co-variables (size descriptors and biochemistry) on theexposure (AUC0–24) of isoniazid and rifampicin. Univariate analysis showed noassociation between isoniazid dose per total body weight (TBW) and exposure(adjusted R2=0.008, P=0.232). A small, but significantly positive association wasshown between rifampicin dose/TBW and exposure (adjusted R2=0.102, P=0.006)and between gender and exposure (adjusted R2=0.194, P<0.001). Multiple linear re-gression analysis showed a significant, small, independent and positive associationof isoniazid AUC0–24 with the dose/TBW, body mass index (BMI), and an elevatedC-reactive protein (CRP) level (adjusted R2=0.162, P=0.010). A significant, independ-ent and positive association of rifampicin AUC0–24 was shown with the dose/TBW,gender, BMI and CRP level (adjusted R2=0.354, P<0.001). We concluded that iso-

124 Chapter 9. Summary
niazid dose per TBW was not associated with its exposure in drug-susceptible TBpatients. Rifampicin dose per TBW and gender were associated with rifampicinexposure but have limited influence.
TB patients are seriously ill during the first two weeks of treatment and they oftensuffer from gastrointestinal reactions such as abdominal pain, nausea and vomiting.Concomitant intake of food has been recommended but it has an ambivalent im-pact on drug therapy. Food makes patients less vulnerable to nausea and vomiting,possibly resulting in a decrease of refusal of medication. However, exposure toisoniazid and rifampicin in healthy volunteers has shown to be reduced by dosingwith meals. In treatment-naïve TB patients who are starting drug treatment, dataon the influence of food intake on the pharmacokinetics were absent until recently.In Chapter 7, we performed the ‘Fast-food trial’, in which we quantified the influ-ence of food on the pharmacokinetics of isoniazid, rifampicin, ethambutol andpyrazinamide in TB patients. A prospective randomized crossover pharmacokineticstudy was conducted in 20 treatment-naïve adults with drug-susceptible TB, duringthe first three days of drug treatment. We investigated the influence of food on the(absolute) bioavailability and pharmacokinetics of the first-line anti-TB drugs. Thehigh-carbohydrate meal, when taken 30 minutes before the drugs, influenced allpharmacokinetic parameters of isoniazid and rifampicin but not of ethambutol orpyrazinamide. Food decreased absolute bioavailability of isoniazid and rifampicinby approximately 15%. According to regulatory guidelines, this is considered to bebioequivalent. However, a further reduction of drug exposure in patients prone tolow drug exposure may actually increase the risk of poor treatment outcome.
In Chapter 8 the outcome of the research in this thesis was discussed and futureperspectives were presented. This chapter is based on a letter to the editor inwhich we stress the importance of well-designed randomized controlled trialsto investigate the impact of TDM on outcome. We suggested to perform a trialin which exposure combined with susceptibility is tested for long-term outcome.This randomized clinical trial should explore the potential benefit of TDM in TBtreatment. Standard treatment should be compared with TDM guided dosingin combination with MIC testing. This study should be powered to detect bothclinically and epidemiologically meaningful differences in relapse rate, toxicity andin the best case acquired drug resistance. Implementation of TDM in TB treatmentdoes not necessarily increase costs. Even in high TB-burdened, resource-poor,countries TDM might at the end of the day prove cost-effective.
In the past physicians and pharmacists have used TDM in TB treatment if toxicitywas suspected, or patients responded unfavourably. Instead of working in the dark,with a gunshot approach, clinicians should switch on the light provided by TDMand support their clinical decisions with current technologies to hit their target

125
with much more precision.


SAMENVATTING

128 Samenvatting
Tuberculose (TB of TBC) is een ernstige infectieziekte veroorzaakt door de bacterieMycobacterium tuberculosis. Wereldwijd ontwikkelen jaarlijks 9 miljoen mensenTB en overlijden er 1,5 miljoen mensen aan deze ziekte. Een derde van de wereldbe-volking heeft een latente TB infectie: de mensen zijn geïnfecteerd met de bacteriezonder dat ze symptomen van de ziekte hebben.
De belangrijkste klachten en verschijnselen van TB zijn hoesten, gewichtsverlies,nachtzweten en vermoeidheid. Omdat ze niet erg specifiek zijn, is het vooral vanbelang dat artsen denken aan de mogelijkheid van TB. Als TB niet wordt behan-deld, is de mortaliteit hoog. De behandeling is medicamenteus en bestaat uit eencombinatie van antibiotica: isoniazide, rifampicine, pyrazinamide en ethambutolgedurende twee maanden waarna nog vier maanden moet worden doorbehandeldmet isoniazide en rifampicine. Behandeling met deze zogenoemde eerstelijns ge-neesmiddelen is in het algemeen succesvol, maar resistentie tegen deze middelenen bijwerkingen worden regelmatig gezien. Door de lange behandelduur is ooktherapietrouw een belangrijk probleem.
De medicamenteuze behandeling wordt gedoseerd op basis van lichaamsgewichtvan de patiënt, maar is gemaximeerd voor isoniazide en rifampicine. Er komensteeds meer signalen dat, met name voor deze twee middelen, de doseringenwellicht aan de lage kant zijn. De hypothese in dit proefschrift is de ‘one sizefits all’ of ‘confectiekleding’ strategie van doseren los te laten en te gaan voormaatwerk (geïndividualiseerde therapie). We onderzochten diverse methodeswaarin geneesmiddeltherapie geïndividualiseerd is.
In hoofdstuk 1 is het doel van en de werkwijze in dit proefschrift toegelicht. Farma-cokinetiek beschrijft het gedrag van het geneesmiddel in het lichaam, daaronderzijn begrepen de processen van opname (absorptie), verdeling (distributie), om-zetting (metabolisme) en uitscheiding (excretie). Farmacodynamie beschrijft hetbiochemische of farmacologische effect van het geneesmiddel op de plaats vanwerking in het lichaam. Bij infectieziekten is dit farmacologisch effect gericht te-gen een micro-organisme, bijvoorbeeld het doden van een bacterie of schimmeldoor de celwand aan te tasten. De effectiviteit van het geneesmiddel is niet alleenafhankelijk van de gevoeligheid van het micro-organisme voor het geneesmiddel,de minimale remmende (inhibitoire) concentratie of MIC, maar ook de mate vande blootstelling aan het geneesmiddel in de patiënt. De blootstelling wordt vaakgemeten in de vorm van de oppervlakte onder de concentratie-tijd curve, AUC.In vitro en in vivo modellen hebben aangetoond dat AUC/MIC ratio de effectievefarmacokinetische-farmacodynamische parameter is voor de eerstelijns anti-TBmiddelen. Dit is onlangs bevestigd in TB patiënten omdat gebleken is dat eenslechte uitkomst van de behandeling werd voorafgegaan door lage blootstelling vanpyrazinamide, rifampicine en isoniazide. In hetzelfde onderzoek werd ook gezien

129
dat lage maximum concentraties (piekspiegels) van pyrazinamide, rifampicine enisoniazide leidden tot resistentie-ontwikkeling van de bacterie. Therapeutic drugmonitoring (TDM) is een techniek waarbij, op basis van gemeten geneesmiddel-concentraties in het bloed van de patiënt, de dosering van het geneesmiddel wordtaangepast. TDM wordt toegepast als het beoogde effect van een geneesmiddel nietmakkelijker of snel genoeg op een andere manier is te meten.
Hoofdstuk 2 is een overzichtsartikel waarin beschreven wordt welke rol de analyse-techniek LC-MS/MS (vloeistofchromatografie met massaspectrometrie) speelt bijTDM van geneesmiddelen die gegeven worden bij infectieziekten. Farmacokineti-sche en farmacodynamische parameters van deze middelen worden besproken ende mogelijkheden en beperkingen van de LC-MS/MS komen aan bod.
Hoofdstuk 3 beschrijft een gevoelige en snelle LC-MS/MS-methode voor de ana-lyse van isoniazide, pyrazinamide en ethambutol in serum. In hoofdstuk 4 wordtingegaan op een recent ontwikkeld internationaal kwaliteitscontrole-programmavoor de bepaling van de vier eerstelijns anti-TB middelen en moxifloxacine enlinezolide. Het merendeel van de ingezonden resultaten voldeed aan de gesteldeeisen, maar het programma heeft wel een aantal laboratoria kunnen wijzen opmogelijke structurele fouten in hun analysemethodes.
In hoofdstuk 5a wordt een populatie farmacokinetisch model van rifampicinebeschreven. Concentratie-tijd curves van 55 patiënten zijn gebruikt om het één-compartimentsmodel te ontwikkelen. Op basis van dit model is een optimalebemonsteringsmethode, optimal sampling strategy, ontwikkeld. Dit is een methodewaarbij, met een beperkt aantal monsters genomen op specifieke tijdstippen, eengoede inschatting kan worden gemaakt van de totale blootstelling (AUC) aan eengeneesmiddel. De optimale tijdstippen voor TDM zijn 1, 3 en 8 uur na innamevan rifampicine. In dit hoofdstuk hebben we aangetoond dat een gebruikelijkemethode van TDM, het nemen van een monster 2 uur na inname van rifampicine(piekspiegel), onvoldoende is om een betrouwbare inschatting te maken van deblootstelling.
In hoofdstuk 5b, een letter to the editor, bediscussiëren we de noodzaak van hetuitvoeren van goed opgezet onderzoek. Alleen op deze manier wordt betrouwbareresultaten geproduceerd waaruit valide conclusies kunnen worden getrokken. Deenige twee mogelijkheden voor het accuraat voorspellen van de blootstelling vanisoniazide zijn het afnemen van een volledige AUC door middel van afname vanvele monsters gedurende het doseerinterval of het gebruik van een gevalideerdeoptimal sampling strategy.
In hoofdstuk 6 is een retrospectief onderzoek beschreven waarin gekeken is naar debeïnvloeding van een aantal parameters op de blootstelling (AUC) van isoniazide

130 Samenvatting
en rifampicine. Univariate regressieanalyse gaf geen relatie te zien tussen dosisisoniazide per lichaamsgewicht en blootstelling van isoniazide. Een kleine maarsignificante relatie werd gevonden tussen dosis rifampicine per lichaamsgewicht enblootstelling. Multiple lineaire regressie geeft een kleine positieve correlatie tussenisoniazide blootstelling en dosis per lichaamsgewicht, de body mass index (BMI),en verhoogde ontstekingswaarden in het bloed (C-reactief proteïne of CRP) te zien.Een significante, positieve associatie is gevonden tussen rifampicine blootstellingen dosis per lichaamsgewicht, geslacht, BMI en CRP. Vergeleken met patiënten meteen BMI ≥ 16 kg/m2, ontvingen patiënten met een BMI < 16 kg/m2 een hogeredosis per lichaamsgewicht, maar dit leidde niet tot een hogere blootstelling.
Tijdens de eerste weken van de TB behandeling zijn patiënten vaak erg ziek. Zehebben maag-darmklachten zoals buikpijn, misselijkheid en braken. Om dezeproblemen te verminderen is voorgesteld om de medicatie tegelijkertijd met etenin te nemen. Bij gezonde vrijwilligers vermindert voedsel echter de absorptie van demedicatie. In onbehandelde patiënten waren tot nu toe geen gegevens beschikbaarover de invloed van voedsel op de opname van de eerstelijns anti-TB geneesmid-delen in het bloed. In hoofdstuk 7 beschrijven we daarom de ‘Fast-food trial’ diein Indonesië is uitgevoerd. Dit was een prospectief gerandomiseerd cross-overfarmacokinetisch onderzoek waarin we de invloed van voedsel op de blootstellingvan alle vier eerstelijns anti-TB geneesmiddelen hebben gekwantificeerd. Gedu-rende de eerste drie dagen van de behandeling kregen 20 patiënten de medicatieintraveneus toegediend en daarna één dag medicatie oraal, nuchter en één dagmedicatie oraal, maar nadat ze een koolhydraatrijk ontbijt hadden genuttigd. Deinvloed van dit ontbijt op de blootstelling is op deze manier gekwantificeerd. Hetkoolhydraatrijke voedsel verlaagde de blootstelling van isoniazide en rifampicinemet 15%. De maximale concentratie werd verlaagd met 42%, 22% en 10% voor res-pectievelijk isoniazide, rifampicine en pyrazinamide. Deze resultaten laten zien datvooral in patiënten, die al een risico hebben op een lage blootstelling, het risico opeen slechte uitkomst verder wordt verhoogd. De farmacokinetiek van ethambutolwerd niet beïnvloed door gelijktijdige inname van voedsel.
In hoofdstuk 8 worden de onderzoeksresultaten van dit proefschrift bediscussieerden er wordt een blik in de toekomst geworpen. Het hoofdstuk is gebaseerd opeen letter to the editor waarin we opnieuw het belang van goed opgezet onder-zoek benadrukken. Alleen op deze manier kunnen we de invloed van TDM opuitkomst van ziektebehandeling inschatten. We stellen voor om een onderzoekuit te voeren waarin blootstelling gecombineerd met gevoeligheidsbepalingen vanMycobacterium tuberculosis wordt getest op lange termijn uitkomsten. Voorheenwerd TDM vooral gebruikt wanneer bijwerkingen werden gezien of als de patiëntonvoldoende of onvoldoende snel reageerde op de behandeling. Wij stellen voor

131
om TDM laagdrempelig in te zetten om zo in een vroeg stadium de behandeling,indien nodig, bij te kunnen stellen en op deze manier resistentieontwikkeling enongewenste uitkomsten te minimaliseren.


DANKWOORD

134 Dankwoord
Het is af! Wat heb ik uitgekeken naar het mogen schrijven van dit minst wetenschap-pelijke maar misschien wel best gelezen deel van het proefschrift. Promoveren doeje niet alleen en ik ben dan ook veel mensen dank verschuldigd. Ten eerste hartelijkdank aan alle patiënten, zonder wie dit proefschrift niet had bestaan.
Prof. dr. J.G.W. Kosterink, beste Jos, hartelijk dank voor je begeleiding en ondersteu-ning. Dank dat je me de mogelijkheid geboden hebt om als ziekenhuisapothekerdeeltijd te mogen promoveren. Het meest dankbaar ben ik je voor het vertrouwendat je mij hebt gegeven om helemaal opnieuw te mogen beginnen met een nieuwpromotietraject. Gelukkig is het dit keer gelukt.
Prof. dr. T.S. van der Werf, beste Tjip, dank je wel voor je betrokkenheid. Watfijn om een clinicus in de begeleidingscommissie te hebben en wat voor één!Ik ben onder de indruk van de snelheid en de scherpte waarmee je iedere keerweer manuscripten, hoe groen ook nog, van opbouwend commentaar voorziet.Daarnaast is het ontzettend fijn om met de snelheid van een automatisch antwoordeen reactie te krijgen op welke vraag of email dan ook.
Prof. dr. D.R.A. Uges, beste Donald, dank voor je betrokkenheid en humor voor,maar vooral ook tijdens, je emeritaat, dank voor de inzet van het laboratorium.Maar vooral hartelijk dank dat je me intussen alweer een tijd geleden naar Gronin-gen en naar het mooiste lab van het land hebt gehaald.
Dr. J.W.C. Alffenaar, beste Jan-Willem, wat heb ik geboft met jou als copromotor! Jijbent de bedenker en initiator geweest van dit proefschrift. Toen ik bij je langskwamhad je binnen een paar minuten twee scenario’s geschetst en ik mocht kiezen! Watben je ongelofelijk goed in stimuleren, nieuwe ideeën verzinnen en kansen grijpen.En wat ben je snel in het beoordelen van stukken. Ik hoop, ook na mijn promotie,nog veel met je samen mogen werken in het onderzoek.
Jos, Tjip, Donald en Jan-Willem, heel hartelijk dank dat ik jullie promovendusmocht zijn. Jullie hebben me in staat gesteld de deuk in mijn zelfvertrouwen weg tepoetsen.
Prof. Dr. D.J. Touw, beste Daan, fijn dat je het laatste jaar bij mijn proefschriftbetrokken bent geraakt. Heel hartelijk dank voor de ruimte die je me gegeven hebtom mijn proefschrift af te ronden, het is essentieel geweest. Veel kan in eigen tijd,maar de verschillende periodes die ik er in 2014 en 2015 aan heb kunnen werken,hebben wel het verschil gemaakt. Wat fijn dat jij ook de overstap naar Groningenhebt gemaakt, ik geniet dagelijks van onze samenwerking!
Prof. Dr. E.N. van Roon, Prof. dr. D. Van Soolingen and Prof. dr. G.H. Bothamley,thank you for judging this thesis. I am very honoured that this thesis crosses theborder.

135
Dr. O.W. Akkerman, drs. R. van Altena en drs. W.C.M. de Lange, beste Onno, Ri-chard en Wiel, hartelijk dank voor het includeren van patiënten in het TuberculoseCentrum Beatrixoord. Zonder jullie inspanningen hadden we nooit zoveel curvesgekregen. Fijn dat jullie zo TDM-minded zijn!
Beste Ben, Erwin, Gerben, Henk, Remco, Kai, Akbar, Annika, Arthur, Erik, Lotte, Roe-land, Romano, Wimkees, hartelijk dank voor jullie inzet, ontwikkel- en denkwerk,validatie en analyses voor dit onderzoek.
Alle coauteurs Anet, Anneke, Bart, Evelien, Frank, Hans, Karen, Leonie, Mathieu,Rob, Wim en Ymkje, dank voor jullie medewerking, -schrijven en -denken. A specialthank you to the authors from abroad, I was so glad to work with, Morita Saktiawati,Yanri Subronto, Sumardi, Jason Roberts and Charles Peloquin, I hope to be able towork with all of you someday again, for now Thank You!
Beste analisten van het lab Albert-Jan, Annalie, Ellen, Hiltjo, Ingrid, Jan, Jan, Justine,Marry, Mireille, Pauline, Renella, Stephan en Tanja, allen hartelijk dank voor desteun en bijdrage in het onderzoek. Met zijn allen, geven we vorm aan het mooistelab van het land!
Het secretariaat Annemiek, Jessica en Wianda, dank voor jullie inzet, niet alleenvoor dit proefschrift maar altijd. Het maakt niet uit wat ik vraag, maar het is altijdsecuur en snel geregeld, dank! Bouwien, dank je wel voor de snelle service als ikweer eens een artikel niet kon vinden. Dick, bedankt voor alle hulp bij vragen overMW/Pharm, SESOP of iets anders ICT-gerelateerd.
Alle collega’s van de sectie patiëntenzorg van de afgelopen jaren Arianna, Annelies,Anton, Bahez, Barbara, Bob, Derk, Eli, Esther, Gea, Hèlen, Hendrikus, Hilma, Iemke,Jan, Joke, Kim, Lisanne, Marian, Marina, Marijn, Marjolijn, Matthijs, Minke, Nour,Prashant, Reinout, Simke, Susan, Sylvia, Trea en Wouter, dank voor de ruimte diejullie me gegeven hebben om dit project succesvol af te ronden.
Lieve paranimfen Katja en Laura, dank dat jullie me bij willen staan op dit zoessentiële moment in mijn leven. Ik kijk er zo naar uit om daar met zijn drieën testaan. En lieve collegaaa, ook om in juni jou bij te mogen staan in Nijmegen.
Lieve papa en mama, wat had ik zonder jullie moeten beginnen? Alle donderdagendat jullie naar Groningen kwamen, zodat ik boven op zolder aan het werk kon, zezijn talrijk en belangrijk geweest. Fijn ook altijd als de tuin, zowel voor- als achter-,er weer totaal verzorgd bijlag. Dat werkt echt een stuk opgeruimder ;-). Dankook voor de support en de gezelligheid mama, nu komt eindelijk weer de tijd omgezellig samen naar de stad te gaan. En wat mij betreft hoeft het niet beperkt te zijntot Groningen (of Nederland)!
Liefste Gerben en Lidwien, eindelijk hoeft mama niet meer standaard nee te zeggen.

136 Dankwoord
Jullie geduld wordt eindelijk beloond, we gaan naar het strand en leuke dingendoen, mama hoeft niet meer alleen maar te computeren.
Liefste Marcel, ik kan oprecht zeggen dat zonder jou dit proefschrift niet zo mooiwas geweest. Je LATEX skills zijn niet te evenaren en jij weet ook het simpele Googlezoekwerk tot kunst van internationaal niveau te verheffen. Ik ben trots op ons derdekind ;-). Eindelijk tijd voor vakantie en andere leuke dingen. We kunnen ons beiderdoctoraten gaan vieren in Legoland met de kinderen, ik heb er zin in!

ABOUT THE AUTHOR

138 About the author
Curriculum vitae
Marieke Sturkenboom was born on July 6, 1974 in Emmeloord, Noordoostpolder.She grew up there and attended high school at Zuyderzeecollege.
In 1992 she started studying pharmacy at the University of Utrecht. She graduatedin 1999 and started working in the hospital pharmacy at the Claraziekenhuis inRotterdam. She had a great time there and immediately realised that she wanted tobecome a hospital pharmacist.
From 2001 to 2005 she was trained as hospital pharmacist in the Zaans MedicalCenter, Zaandam and the VU Medical Center, Amsterdam. In the VU MedicalCenter, she was introduced in the field of radiopharmacy, especially the productionand quality control of PET-radiopharmaceuticals.
In 2005 she started working as a hospital pharmacist in the University MedicalCenter Groningen, Groningen. First, she combined working in the field of radio-pharmacy at the department of nuclear medicine and molecular imaging withworking at the laboratory of the department of hospital pharmacy. Later, sheworked at the quality assurance section of the department of hospital pharmacy.From 2012, she completely focussed on working as a hospital pharmacist at thelaboratory, performing therapeutic drug monitoring and quality control of pharma-ceutical preparations. In 2014-2015, she succesfully led the project to transfer thequality system of the lab from CCKL to ISO 15189.
In 2006, she started a PhD project on radiolabeling of alemtuzumab, but this wasstopped in 2010. In 2012 she started with this PhD project. From 2012 to 2014, shedid a traineeship as clinical pharmacologist.
Marieke lives together with Marcel Harkema and their two children Gerben andLidwien in Groningen. She enjoys cooking and learning the Spanish language.

List of publications 139
List of publications
1. Hofman S., Segers M. M., Ghimire S., Bolhuis M. S., Sturkenboom M. G., vanSoolingen D. & Alffenaar J.-W. Emerging drugs and alternative possibilities inthe treatment of tuberculosis. Expert Opin Emerg Drugs, Epub (2016).
2. Ghimire S., Bolhuis M. S., Sturkenboom M. G., Akkerman O. W., de Lange W. C.,van der Werf T. S. & Alffenaar J.-W. Incorporating therapeutic drug monitoringin WHO’s hierarchy of Tuberculosis diagnostics! Eur Respir J, Accepted (2016).
3. Veringa A., Sturkenboom M. G., Dekkers B. G., Koster R. A., Roberts J. A.,Peloquin C. A., Touw D. J. & Alffenaar J.-W. LC-MS/MS for Therapeutic DrugMonitoring of anti-infective drugs. Trends Analyt Chem, Accepted (2016).
4. Van der Burgt E. P., Sturkenboom M. G., Bolhuis M. S., Akkerman O. W., Kos-terink J. G., de Lange W. C., Cobelens F. G., van der Werf T. S. & Alffenaar J.-W.End TB with precision treatment! Eur Respir J 47, 680–2 (2016).
5. Saktiawati A. M., Sturkenboom M. G., Stienstra Y., Subronto Y. W., Sumardi,Kosterink J. G., van der Werf T. S. & Alffenaar J.-W. Impact of food on thepharmacokinetics of first-line anti-TB drugs in treatment-naive TB patients: arandomized cross-over trial. J Antimicrob Chemother 71, 703–710 (2016).
6. Alffenaar J.-W., Bolhuis M., van Hateren K., Sturkenboom M., Akkerman O.,de Lange W., Greijdanus B., van der Werf T. & Touw D. Determination ofBedaquiline in Human Serum Using Liquid Chromatography-Tandem MassSpectrometry. Antimicrob Agents Chemother 59, 5675–80 (2015).
7. Sturkenboom M. G., van der Lijke H., Jongedijk E. M., Kok W. T., Greijdanus B.,Uges D. R. & Alffenaar J.-W. Quantification of isoniazid, pyrazinamide and eth-ambutol in serum using liquid chromatography-tandem mass spectrometry. JAppl Bioanalysis 1, 89–98 (2015).
8. Sturkenboom M. G., Mulder L. W., de Jager A., van Altena R., Aarnoutse R. E.,de Lange W. C., Proost J. H., Kosterink J. G., van der Werf T. & Alffenaar J.-W.Pharmacokinetic Modeling and Optimal Sampling Strategies for TherapeuticDrug Monitoring of Rifampin in Patients with Tuberculosis. Antimicrob AgentsChemother 59, 4907–13 (2015).
9. Aarnoutse R. E., Sturkenboom M. G., Robijns K., Harteveld A. R., GreijdanusB., Uges D. R., Touw D. J. & Alffenaar J.-W. An interlaboratory quality controlprogramme for the measurement of tuberculosis drugs. Eur Respir J 46, 268–71 (2015).
140 About the author
10. Sturkenboom M. G., Akkerman O. W., Bolhuis M. S., de Lange W. C., van derWerf T. S. & Alffenaar J.-W. Adequate design of pharmacokinetic-pharma-codynamic studies will help optimize tuberculosis treatment for the future.Antimicrob Agents Chemother 59, 2474 (2015).
11. Dijkstra J. A., Sturkenboom M. G., van Hateren K., Koster R. A., Greijdanus B.& Alffenaar J.-W. C. Quantification of amikacin and kanamycin in serum usinga simple and validated LC-MS/MS method. Bioanalysis 6, 2125–33 (2014).
12. Buurman D. J., Vande Casteele N., Sturkenboom M. G., Kleibeuker J. H., Ver-meire S., van der Kleij D., Rispens T., Gils A. & Dijkstra G. Letter: detection ofinfliximab levels and anti-infliximab antibodies–comparison of three differentassays; authors’ reply. Aliment Pharmacol There 37, 282 (2013).
13. Boersma H. H., Sturkenboom M. G., Lub-de Hooge M. N., Elsinga P. H.,Luurtsema G., Dierckx R. A. & Kosterink J. G. Trends of PET in drug devel-opment. 1st ed., 727–750 (2012).
14. Vande Casteele N., Buurman D. J., Sturkenboom M. G., Kleibeuker J. H., Ver-meire S., Rispens T., van der Kleij D., Gils A. & Dijkstra G. Detection of inflix-imab levels and anti-infliximab antibodies: a comparison of three differentassays. Aliment Pharmacol There 36, 765–71 (2012).
15. Panday P. N. & Sturkenboom M. Continuous infusion of vancomycin lesseffective and safe than intermittent infusion, based on pharmacodynamicand pharmacokinetic principles. Clin Infect Dis 49, 1964–5, author reply 1965(2009).
16. Sturkenboom M. G., Hoekstra O. S., Postema E. J., Zijlstra J. M., Berkhof J.& Franssen E. J. A randomised controlled trial assessing the effect of oraldiazepam on 18F-FDG uptake in the neck and upper chest region. Mol Ima-ging Biol 11, 364–8 (2009).
17. Panday P. V., Vischjager P., Rodgers M. G., Maurer J. M., Sturkenboom M. G. &Nijsten M. W. Rifampicin treatment of persistently elevated benzodiazepinemetabolites in a comatose patient. Intensive Care Med 35, 1647–8 (2009).
18. Phan H. T., Jager P. L., Paans A. M., Plukker J. T., Sturkenboom M. G., SluiterW. J., Wolffenbuttel B. H., Dierckx R. A. & Links T. P. The diagnostic value of124I-PET in patients with differentiated thyroid cancer. Eur J Nucl Med MolImaging 35, 958–65 (2008).
19. Van Heerde M., Sturkenboom M. G., Zweegman S., Labadie J. & Plötz F. B.Fatal intracranial haemorrhage associated with the administration of low-molecular-weight-heparin in a child. Eur J Pediatr 164, 589–90 (2005).

List of publications 141
20. Sturkenboom M. G., Franssen E. J., Berkhof J. & Hoekstra O. S. Physiologicaluptake of [18F]fluorodeoxyglucose in the neck and upper chest region: arethere predictive characteristics? Nucl Med Commun 25, 1109–11 (2004).
21. Philcox J. C., Sturkenboom M., Coyle P. & Rofe A. M. Metallothionein in micereduces intestinal zinc loss during acute endotoxin inflammation, but notduring starvation or dietary zinc restriction. J Nutr 130, 1901–9 (2000).
22. Rofe A. M., Philcox J. C., Sturkenboom M. & Coyle P. Metallothionein IV 1st ed.,309–313 (1999).