gastric acidity before and after operative procedure ... - NCBI
Integrated acidity and rabeprazole pharmacology
J . D. GARDNER*, C. PERDOMO , S. SLOANà , W. F. HAHNE , J . A. BARTH ,
S. RODRIGUEZ-STANLEY§ & M. ROBINSON§
*Science for Organizations Inc., Chatham, NJ; Eisai Inc., Teaneck, NJ; àJanssen Pharmaceutica Inc., Titusville, NJ;
§Oklahoma Foundation for Digestive Research, University of Oklahoma Health Sciences Center, Oklahoma City, OK, USA
Accepted for publication 8 August 2001
INTRODUCTION
Use of continuous pH recordings has become the
cornerstone for assessment of gastro-oesophageal re¯ux
disease (GERD) and its treatment with antisecretory
agents.1±9 Despite the fact that pH recordings involve
about 900 measurements per hour, these data are
frequently collapsed to a single value, such as the
percentage of the recording period that pH < 4 or
median pH for a particular recording period. It seems
likely that fuller use of all available data from pH
recordings should provide better de®nition of acidity and
the differential effects of speci®c pharmacologic agents.
Previously,10 we calculated values for integrated
gastric and oesophageal acidity from 24-h pH record-
ings performed in the conventional manner. Values that
resulted from these calculations fully quanti®ed oeso-
phageal and gastric acidity, in contrast to conventional
measurements of the percentage of time that the pH is
below a particular value, which only partially quanti®ed
oesophageal or gastric acidity. As a result, values for
integrated acidity were used to examine quantitative
relationships between oesophageal acidity and gastric
acidity. In addition, calculating integrated acidity made
it possible to assess changes in acidity over time in a
SUMMARY
Background: Integrated gastric and oesophageal acidity
can be calculated from measurements of gastric and
oesophageal pH and used to quantify gastric and
oesophageal acidity over time. Rabeprazole is a new
proton pump inhibitor that is effective in treating
gastro-oesophageal re¯ux disease (GERD).
Aim: To use measurement of integrated gastric and
oesophageal acidity to determine the onset, duration
and overall effect of rabeprazole in subjects with GERD.
Methods: Subjects with GERD were required to have
oesophageal pH £ 4 for at least 10% of a 24-h
recording. Effects of 20 mg rabeprazole on 24-h gastric
and oesophageal pH were measured on days 1 and 7 of
dosing. Integrated gastric and oesophageal acidity were
calculated from time-weighted average hydrogen ion
concentrations at each second of the 24-h record.
Results: At steady-state, 20 mg rabeprazole inhibited
gastric acidity by 89% and oesophageal acidity by 95%.
The ®rst dose of rabeprazole inhibited gastric and
oesophageal acidity by at least 70% of the steady-state
effect. Oesophageal acidity could be divided into mono-
phasic and biphasic patterns, and rabeprazole had
different effects on oesophageal and gastric acidity in
these two GERD subpopulations. The onset of action of
the ®rst dose of rabeprazole on gastric acidity was 4 h
and on oesophageal acidity was 4 h in monophasic
subjects and 7 h in biphasic subjects. Integrated acidity
was more sensitive than time pH £ 4 in measuring the
inhibitory actions of rabeprazole.
Conclusions: Integrated gastric and oesophageal acidity
are quantitative measurements that provide useful and
novel information regarding the pathophysiology of
GERD as well as the impact of antisecretory agents such
as rabeprazole.
Correspondence to: Dr J. D. Gardner, Science for Organizations Inc., 156
Terrace Drive, Chatham, NJ 07928, USA.E-mail: [email protected]
Aliment Pharmacol Ther 2002; 16: 455±464.
Ó 2002 Blackwell Science Ltd 455

simple, straight-forward manner. These changes were
then used to distinguish different pathophysiologic types
of GERD based on patterns for integrated oesophageal
acidity. We have also found that integrated acidity can
be useful in determining the onset and duration of
action of antacids and histamine H2-receptor antag-
onists on gastric and oesophageal acidity in subjects
with recurrent heartburn.11
In the present study, we used measures of integrated
acidity to characterize effects of rabeprazole, a new
proton pump inhibitor, on oesophageal and gastric
acidity in subjects with GERD and to compare assess-
ments based on integrated acidity with those that utilize
the conventional measure of percentage time pH £ 4 or
some other cutoff value.
METHODS
This study was approved by and conducted in compli-
ance with good clinical practices as supervised by the
Western Institutional Review Board, Olympia, WA. All
subjects enrolled in this study gave written informed
consent.
Subjects
Subjects were 15 males and ®ve females, aged 24±
61 years, with clinical GERD, and oesophageal pH £ 4
for at least 10% of a 24-h recording period during
baseline screening. Subjects were not tested for Helicob-
acter pylori infection. Subjects could not have been
treated with a histamine H2-receptor antagonist,
sucralfate or a prostaglandin analogue within 3 days,
with omeprazole or bismuth subsalicylate within
7 days, or with an investigational drug within 30 days
prior to study entry. Subjects were also excluded if they
had deep oesophageal ulcers, oesophageal stricture,
gastric ulcers or duodenal ulcers within 6 months prior
to study entry, previous gastric or oesophageal surgery,
pyloric stenosis or been treated for cancer other than
basal cell skin cancer. Analyses of baseline recordings
from these subjects have been reported previously.10
Study design
The study was conducted at the Oklahoma Foundation
for Digestive Research on the campus of the University
of Oklahoma Health Sciences Center and was a
randomized, double-blind, two-way crossover evalu-
ation of the effects of 20 mg and 40 mg rabeprazole on
24-h gastric and oesophageal pH. Data for 24-h gastric
and oesophageal pH were acquired at baseline and then
on days 1, 7 and 8 of dosing with either 20 mg or
40 mg rabeprazole for 7 days and again, at baseline and
then on days 1, 7 and 8 of dosing with the alternate
dose of rabeprazole. Three to 5 days elapsed between
the baseline evaluation and the ®rst dose of rabeprazole.
The recordings on day 8 represented measurements
from hours 24 through 48 following the last dose
of rabeprazole on day 7. Subjects then underwent a
7±10 day washout period, a second baseline 24-h pH
recording, and 3±5 days later, 7 days of dosing with the
alternate dose of rabeprazole with 24-h pH recordings
on days 1, 7 and 8.
Subjects fasted from approximately 22:00 hours the
evening before until the beginning of pH recording the
following morning, usually at 8:00 hours. Study
medication was taken in the morning before break-
fast at approximately 8:00 hours. Subjects remained
in the study centre for the 24-h recording sessions
and were given three de®ned meals during the
pH recording periods. Breakfast was provided at
9:00±9:30 hours, lunch at 13:00±14:00 hours and
dinner at 18:00±19:00 hours during the baseline
period and on days 1, 7 and 8. Subjects spent the
night supine in bed. Smoking and eating or drinking
between meals were prohibited during pH recording
periods. Gastric antisecretory medications other than
study medication were prohibited for the duration of
the study. Antacids were permitted as needed for relief
of symptoms throughout the study, except during the
pH recording periods.
Gastric and oesophageal pH data were collected using
an ambulatory, disposable, dual channel pH recording
system (Medtronic Synectics, Shoreview, MN, USA)
with antimony electrodes. One electrode was placed in
the stomach 10 cm below and the second was placed in
the oesophagus 5 cm above the manometrically de®ned
upper border of the lower oesophageal sphincter.
Electrodes were calibrated to pH 1 and 7 using solutions
composed of pH 1.07, 59 mM KNO3, 27 mM KCl and
pH 7.01, 16.5 mM Tris buffer, 40 mM KNO3, 96 mM
KCl. Data were collected using a portable data storage
unit (Digitrapper, Medtronic Synectics). Recordings
usually began at 8:00 hours and continued for 24 h.
Values for intragastric and intraesophageal pH were
recorded every 4 s. Data were transferred from the
portable data storage unit and processed in DOS mode
456 J. D. GARDNER et al.
Ó 2002 Blackwell Science Ltd, Aliment Pharmacol Ther 16, 455±464

using software designed for pH recordings (Polygram for
Windows, Version 2.04, Medtronic Synectics). The
software adjusts all pH values for the difference between
the temperature at which the electrodes were calibrated
(25 °C) and the recording temperature (37 °C).
Although we refer to the current measurements as
acid `concentration', the pH electrode actually measures
hydrogen ion `activity'. Others have documented the
extent to which hydrogen ion concentration can differ
from hydrogen ion activity, particularly in the presence
of other ions, and have developed methods to adjust
hydrogen ion activity to hydrogen ion concentra-
tion.12, 13 We calibrated the electrodes to pH 1 and 7
using polyelectrolyte solutions provided by the manu-
facturer, which results in measured hydrogen ion
activity more closely approximating the hydrogen ion
concentration. We have not adjusted the measured
hydrogen ion activity.
Analytical procedures
Polygram software calculates values for conventional
indices of oesophageal and gastric pH recordings, e.g.
number of oesophageal re¯ux episodes, number of re¯ux
episodes > 5 min, percentage of the recording period
that the oesophageal pH was < 4, and percentage of the
recording period that the gastric pH was < 4. Polygram
software also takes the individual pH values that are
recorded every 4 s and ®lls in the same value for the
other 3 s resulting in one value for every second of the
recording period for each electrode. These pH data for
one-second intervals were used to calculate integrated
acidity.
Data from subjects treated with 40 mg rabeprazole were
not analysed for the present report, because results with
20 mg rabeprazole illustrate the major ®ndings from this
study. Dual-channel recordings from both baseline
periods, and day 1 and day 7 of dosing with 20 mg
rabeprazole were analysed from each of 20 subjects
(80 records). Recordings from day 8 were not analysed,
because we wanted to focus on the onset of action and
steady-state effects of rabeprazole instead of its actions
that occur on the day after dosing is stopped. One subject
had technically unsatisfactory baseline recordings
resulting from a malfunctioning gastric electrode, and
data from this subject were omitted from the analyses.
Integrated gastric and oesophageal acidity were cal-
culated for each second of the recording period as
follows:
1 Acid concentration (mM) � 1000 ´ 10±pH.
2 Acidity (mmol.h/L) � (acid in mM at time `t' + acid
in mM at time `t ± 1')/2 ´ (t ± t ± 1).
3 Values for acidity were summed cumulatively for
every second.
4 Integrated acidity is expressed as mM ´ time, i.e.
mmol.h/L.
5 In the present study, values for integrated acidity
were analysed for each hour of the 24-h recording
period.
This calculation of integrated acidity has been referred
to as `mean weighted acidity' by others.14
The values for integrated acidity at any given time
indicate the cumulative integrated acidity up to that
point in time, and the mean acid concentration up to
that point in time can be calculated by dividing the
value for integrated acidity by the corresponding
recording time. For example, the mean gastric acid
concentration for hours 8:00±24:00 can be calculated
by dividing the value for integrated gastric acidity at
24:00 hours by 16.
Mean acid concentration for each hour was calculated
as integrated acidity at time `t' minus integrated acidity
at time `t ± 1'. The resulting value represents the mean
acid concentration for the hour indicated.
Values are displayed in relation to a 24-h clock with
8:00 hours as the beginning of the recording period.
Baseline values for integrated acidity for each subject
were represented by the mean of values from the two
baseline recordings. Similarly, baseline values for
conventional indices for each subject were also repre-
sented by the mean of values from the two baseline
recordings. Of the 38 technically satisfactory baseline
records, 34 were for 24 h, three were for 23 h and one
was for 22 h. Of the 38 technically satisfactory records
with 20 mg rabeprazole, 36 were for 24 h, one was for
23 h and one was for 22 h. When a record was less
than 24 h, the last calculated value was carried
forward.
Statistical analyses were performed using Microsoft
Excel 97 or GraphPad for InStat version 3.01 for
Windows software. As will be shown later in Figure 1,
values from different subjects for integrated gastric and
oesophageal acidity as well as for time gastric and
oesophageal pH £ 4 were not normally distributed,
therefore median values are presented. Results were
analysed using the Mann±Whitney test or the Wilcoxon
matched pairs test.
INTEGRATED ACIDITY AND RABEPRAZOLE PHARMACOLOGY 457
Ó 2002 Blackwell Science Ltd, Aliment Pharmacol Ther 16, 455±464

RESULTS
Determining the time that gastric or oesophageal pH is
£ 4 is used frequently to assess gastric and oesophageal
acidity.1±9 Figure 1 left panel illustrates the distribu-
tions of values for times that oesophageal and gastric pH
were £ 4. Compared to the normal Gaussian distribu-
tion, both distributions were skewed.15 With oesopha-
geal pH time, the distribution was skewed toward high
values, whereas with gastric pH time, the distribution
was skewed toward both low and high values. Figure 1
right panel illustrates that that the distributions for
integrated gastric and oesophageal acidity were both
skewed toward high values and the oesophageal values
were more skewed than the gastric values. Because of
the distributions illustrated in Figure 1, we analysed
results in the present study using nonparametric
statistical tests. The results illustrated in Figure 1 can
be calculated using the procedures described in Chapter
2 of reference 15 and the normal distribution function
in Microsoft Excel.
Previously, we reported that subjects with GERD could
be divided into two groups based on their pattern of
integrated oesophageal acidity.10 This classi®cation was
consistent with the different patterns of oesophageal
acidity that had been described previously.16±18 Sub-
jects with a monophasic pattern reached 50% of maxi-
mal integrated oesophageal acidity at 17:00 hours,
whereas those with a biphasic pattern reached 50% of
maximal integrated oesophageal acidity at 1:00 hours.
Figure 2 illustrates values for integrated gastric acidity
after the ®rst and seventh doses of 20 mg rabeprazole in
monophasic and biphasic subjects. In both groups, the
®rst dose of rabeprazole caused a signi®cant decrease in
integrated gastric acidity from 14:00 hours until the
end of the recording period, and integrated gastric
Figure 2. Effect of 20 mg rabeprazole on
integrated gastric acidity in monophasic
(left panel) and biphasic (right panel) GERD
after 1 and 7 days of dosing. Values given
are medians from 12 subjects with a
monophasic pattern for oesophageal acidity
and seven subjects with a biphasic pattern
for oesophageal acidity. The closed circles
at the top of the panel indicate the times at
which values on the ®rst day of dosing are
signi®cantly different from corresponding
baseline values (P < 0.05).
Figure 1. Distribution of values for time
oesophageal and gastric pH £ 4 (left panel)
and for integrated oesophageal and gastric
acidity (right panel). Observed values for
the 24-h recording period are given on the
vertical axis, and values calculated for the
normal distribution are given on the hori-
zontal axis. The diagonal line is the identity
line for the normal distribution. If the dis-
tribution of observed values is normal, all
points will lie on the diagonal line. Values
given are from 19 subjects.
458 J. D. GARDNER et al.
Ó 2002 Blackwell Science Ltd, Aliment Pharmacol Ther 16, 455±464

acidity was decreased further after the seventh dose of
rabeprazole.
As illustrated in Figure 3, in both monophasic and
biphasic subjects, the baseline mean gastric acid
concentration had a triphasic pattern that correlated
with ingestion of three meals during the 24-h baseline
period. For example, after breakfast at 9:00 hours,
mean acid concentration increased progressively until
13:00 hours when subjects ate lunch. After the
beginning of lunch, mean acid concentration decreased
over the next 2 h as a result of meal-related buffering
effects on gastric acidity, and then increased to
another peak when subjects ate dinner at
18:00 hours. After dinner, mean acid concentration
again decreased to a nadir and then increased to a
prominent third peak at 2:00±4:00 hours. Mean acid
concentration then decreased progressively, in this
case without ingestion of a meal. Figure 3 left panel
illustrates that in subjects with monophasic GERD, the
®rst dose of 20 mg rabeprazole decreased mean gastric
acid concentrations over much of the recording period,
and nearly abolished the triphasic pattern. Figure 3
right panel illustrates that in subjects with biphasic
GERD, the ®rst dose of 20 mg rabeprazole also
decreased mean gastric acid concentrations over much
of the recording period, but did not abolish the
nocturnal increase. The results in Figure 3 also
illustrate that calculating integrated gastric acidity
makes it possible to distinguish a clear difference in the
action of rabeprazole on gastric acidity in different
types of GERD. The onset of action of the ®rst dose of
rabeprazole, de®ned as the earliest time that the mean
gastric acid concentration was signi®cantly less than
the corresponding baseline concentration, was 4 h
after dosing when results from all subjects combined
were analysed. The duration of action of a single
20 mg dose of rabeprazole on gastric acidity was 24 h.
Figure 4 illustrates values for integrated oesophageal
acidity after the ®rst and seventh doses of 20 mg
rabeprazole in monophasic and biphasic subjects. In
monophasic subjects, the ®rst dose of rabeprazole
caused a signi®cant decrease in integrated oesophageal
acidity from 13:00 hours until the end of the recording
period. In contrast, in biphasic subjects, the ®rst dose of
rabeprazole did not cause a signi®cant decrease in
integrated oesophageal acidity until 24:00 hours and
this decrease persisted until the end of the recording
period. In monophasic subjects, the seventh dose of
rabeprazole produced a further decrease in integrated
oesophageal acidity during the period 8:00±
14:00 hours. In biphasic subjects, the seventh dose of
rabeprazole produced a further decrease in integrated
oesophageal acidity over the entire 24-h period.
It is important to note that the vertical scale in the
right panel in Figure 4 is ®ve times greater than that in
the left panel. Thus, the ®rst dose of rabeprazole failed
to produce a signi®cant decrease in integrated oeso-
phageal acidity in biphasic subjects during the times
that their values were comparable to those in mono-
phasic subjects that were signi®cantly decreased by
rabeprazole. This lack of effect of rabeprazole in biphasic
subjects during hours 13:00±23:00 was not attribut-
able to a lack of effect of rabeprazole on gastric acidity,
because as illustrated in Figure 2, gastric acidity
following the ®rst dose of rabeprazole in biphasic
subjects was lower than that in monophasic subjects.
Figure 3. Effect of 20 mg rabeprazole on
mean gastric acid concentration in mono-
phasic (left panel) and biphasic (right
panel) GERD after 1 day of dosing. Values
given are medians from 12 subjects with a
monophasic pattern for oesophageal acidity
and seven subjects with a biphasic pattern
for oesophageal acidity. The closed circles
at the top of the panel indicate the times at
which values on the ®rst day of dosing are
signi®cantly different from corresponding
baseline values (P < 0.05).
INTEGRATED ACIDITY AND RABEPRAZOLE PHARMACOLOGY 459
Ó 2002 Blackwell Science Ltd, Aliment Pharmacol Ther 16, 455±464
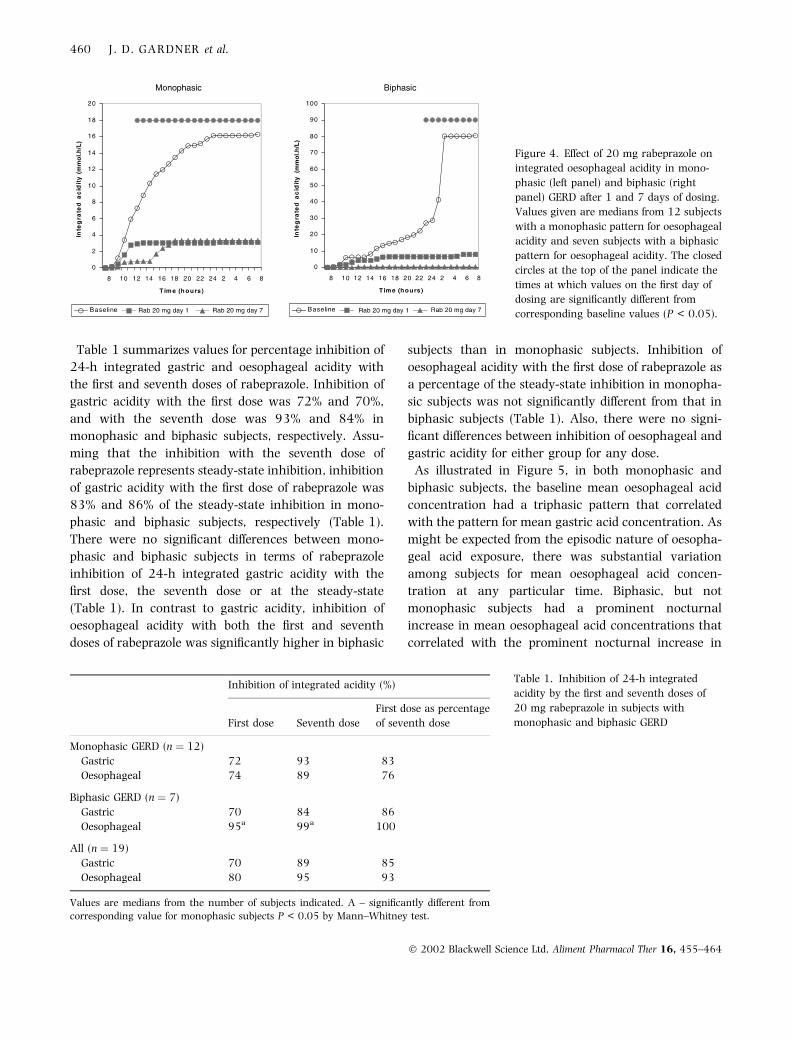
Table 1 summarizes values for percentage inhibition of
24-h integrated gastric and oesophageal acidity with
the ®rst and seventh doses of rabeprazole. Inhibition of
gastric acidity with the ®rst dose was 72% and 70%,
and with the seventh dose was 93% and 84% in
monophasic and biphasic subjects, respectively. Assu-
ming that the inhibition with the seventh dose of
rabeprazole represents steady-state inhibition, inhibition
of gastric acidity with the ®rst dose of rabeprazole was
83% and 86% of the steady-state inhibition in mono-
phasic and biphasic subjects, respectively (Table 1).
There were no signi®cant differences between mono-
phasic and biphasic subjects in terms of rabeprazole
inhibition of 24-h integrated gastric acidity with the
®rst dose, the seventh dose or at the steady-state
(Table 1). In contrast to gastric acidity, inhibition of
oesophageal acidity with both the ®rst and seventh
doses of rabeprazole was signi®cantly higher in biphasic
subjects than in monophasic subjects. Inhibition of
oesophageal acidity with the ®rst dose of rabeprazole as
a percentage of the steady-state inhibition in monopha-
sic subjects was not signi®cantly different from that in
biphasic subjects (Table 1). Also, there were no signi-
®cant differences between inhibition of oesophageal and
gastric acidity for either group for any dose.
As illustrated in Figure 5, in both monophasic and
biphasic subjects, the baseline mean oesophageal acid
concentration had a triphasic pattern that correlated
with the pattern for mean gastric acid concentration. As
might be expected from the episodic nature of oesopha-
geal acid exposure, there was substantial variation
among subjects for mean oesophageal acid concen-
tration at any particular time. Biphasic, but not
monophasic subjects had a prominent nocturnal
increase in mean oesophageal acid concentrations that
correlated with the prominent nocturnal increase in
Inhibition of integrated acidity (%)
First dose Seventh dose
First dose as percentage
of seventh dose
Monophasic GERD (n � 12)
Gastric 72 93 83
Oesophageal 74 89 76
Biphasic GERD (n � 7)
Gastric 70 84 86
Oesophageal 95a 99a 100
All (n � 19)
Gastric 70 89 85
Oesophageal 80 95 93
Values are medians from the number of subjects indicated. A ± signi®cantly different from
corresponding value for monophasic subjects P < 0.05 by Mann±Whitney test.
Table 1. Inhibition of 24-h integrated
acidity by the ®rst and seventh doses of
20 mg rabeprazole in subjects with
monophasic and biphasic GERD
Figure 4. Effect of 20 mg rabeprazole on
integrated oesophageal acidity in mono-
phasic (left panel) and biphasic (right
panel) GERD after 1 and 7 days of dosing.
Values given are medians from 12 subjects
with a monophasic pattern for oesophageal
acidity and seven subjects with a biphasic
pattern for oesophageal acidity. The closed
circles at the top of the panel indicate the
times at which values on the ®rst day of
dosing are signi®cantly different from
corresponding baseline values (P < 0.05).
460 J. D. GARDNER et al.
Ó 2002 Blackwell Science Ltd, Aliment Pharmacol Ther 16, 455±464

mean gastric acid concentrations. Figure 5 left panel
illustrates that in subjects with monophasic GERD, the
®rst dose of 20 mg rabeprazole decreased mean oeso-
phageal acid concentrations from 12:00 to 1:00 hours.
Figure 5 right panel illustrates that in subjects with
biphasic GERD, the ®rst dose of 20 mg rabeprazole
decreased mean oesophageal acid concentrations from
15:00 to 3:00 hours. Interestingly, the ®rst dose of
rabeprazole abolished the nocturnal increase in the
mean oesophageal acid concentration in biphasic
subjects even though there was a persistent increase
in mean gastric acid concentration. The results in
Figures 3 and 5 illustrate that calculating integrated
acidity makes it possible to distinguish a clear difference
between the action of rabeprazole on gastric acidity and
oesophageal acidity in biphasic subjects. The onset of
action of the ®rst dose of rabeprazole, de®ned as the
earliest time that the mean oesophageal acid concen-
tration was signi®cantly less than the corresponding
baseline concentration, was 4 h after dosing for mono-
phasic subjects and 7 h after dosing for biphasic
subjects (Figure 5).
Determining the time that gastric or oesophageal
pH £ 4 is used frequently to assess gastric and oeso-
phageal acidity,1±9 therefore we compared these param-
eters to values for 24-h integrated acidity in terms of
measuring the inhibitory action of the ®rst dose of
rabeprazole. Figure 6 left panel plots inhibition of gastric
acidity determined from values for 24-h integrated
gastric acidity vs. corresponding values determined
from time gastric pH £ 4. In 16 of 18 subjects, the
magnitude of inhibition assessed by integrated acidity
was higher than that assessed by time pH £ 4. Thus,
24-h integrated gastric acidity is signi®cantly more
sensitive than time gastric pH £ 4 in assessing the effect
of rabeprazole on gastric acidity. Figure 6 right panel
displays modi®ed box plots15 of values for inhibition of
integrated gastric acidity and corresponding values
obtained using different pH cutoff values for time gastric
pH was less than a particular value. Median values
using pH cutoffs of 2, 3 and 4, but not 1, were lower
than the median value for integrated gastric acidity.
Figure 7 left panel plots inhibition of oesophageal
acidity determined from values for 24-h integrated
oesophageal acidity vs. corresponding values deter-
mined from time oesophageal pH £ 4, and illustrates
that 24-h integrated oesophageal acidity is signi®cantly
more sensitive than time oesophageal pH £ 4 in asses-
sing the effect of rabeprazole on oesophageal acidity.
Figure 6 right panel displays modi®ed box plots of
values for inhibition of integrated oesophageal acidity
and corresponding values obtained using different pH
cutoff values for time oesophageal pH was less than a
particular value. Median values using pH cutoffs of 3, 4,
5 and 6 were lower than the median value for
integrated oesophageal acidity.
DISCUSSION
The present results illustrate that measurements
of integrated acidity can provide particularly useful
information regarding the actions of gastric antisecre-
tory agents. These measurements can be used to assess
the onset, duration, and overall effects of a drug on
gastric and oesophageal acidity. In the present study,
we found that the onset of action of rabeprazole on
Figure 5. Effect of 20 mg rabeprazole on
mean oesophageal acid concentration in
monophasic (left panel) and biphasic (right
panel) GERD after 1 day of dosing. Values
given are medians from 12 subjects with a
monophasic pattern for oesophageal acidity
and seven subjects with a biphasic pattern
for oesophageal acidity. The closed circles
at the top of the panel indicate the times at
which values on the ®rst day of dosing are
signi®cantly different from corresponding
baseline values (P < 0.05).
INTEGRATED ACIDITY AND RABEPRAZOLE PHARMACOLOGY 461
Ó 2002 Blackwell Science Ltd, Aliment Pharmacol Ther 16, 455±464

gastric acidity was 4 h, and on oesophageal acidity was
4 h in monophasic subjects and 7 h in biphasic
subjects. The duration of action on gastric acidity was
24 h. In addition, the effect of the ®rst dose of 20 mg
rabeprazole on integrated gastric acidity was 83%
(biphasic subjects) and 86% (monophasic subjects) of
the corresponding effect on day 7 of dosing. There was
also a substantial effect of the ®rst dose of 20 mg
rabeprazole on oesophageal acidity in that the effect of
rabeprazole on integrated oesophageal acidity was 76%
Figure 6. Comparison of the inhibitory effect of 20 mg rabeprazole on gastric acidity assessed by different parameters. The left panel
compares values for inhibition of integrated gastric acidity with corresponding values for inhibition of time gastric pH £ 4. Each
point represents two values from a single subject. The diagonal line is the identity line for values on the horizontal axis. The difference
between the two values is given by the vertical or horizontal distance from the diagonal line. Values above the diagonal line indicate
that inhibition is greater with integrated acidity than with time pH £ 4, and values below the line indicate the opposite. Values with
integrated acidity were signi®cantly greater than those with time pH £ 4 (P � 0.0116). The right panel is a modi®ed box plot of inhibition
with different pH cutoffs and integrated acidity. Solid symbols give medians; asterisks give minimum and maximum values; and
horizontal bars give the 1st and 3rd quartiles. Values given are from 18 subjects for the 24-h recording period. Results from one subject
were omitted because of very large negative values with pH time.
Figure 7. Comparison of the inhibitory effect of 20 mg rabeprazole on oesophageal acidity assessed by different parameters. The left panel
compares values for inhibition of integrated oesophageal acidity with corresponding values for inhibition of time oesophageal pH £ 4.
Each point represents two values from a single subject. The diagonal line is the identity line for values on the horizontal axis. The
difference between the two values is given by the vertical or horizontal distance from the diagonal line. Values above the diagonal line
indicate that inhibition is greater with integrated acidity than with time pH £ 4, and values below the line indicate the opposite. Values
with integrated acidity were signi®cantly greater than those with time pH £ 4 (P � 0.018). The right panel is a modi®ed box plot of
inhibition with different pH cutoffs and integrated acidity. Solid symbols give medians; asterisks give minimum and maximum values; and
horizontal bars give the 1st and 3rd quartiles. Values given are from 17 subjects for the 24-h recording period. Results from two subjects
were omitted because of very large negative values with pH time.
462 J. D. GARDNER et al.
Ó 2002 Blackwell Science Ltd, Aliment Pharmacol Ther 16, 455±464

of the corresponding effect on day 7 of dosing in
monophasic subjects and 100% in biphasic subjects.
The ®nding that the ®rst dose of rabeprazole produced
full steady-state inhibition of integrated oesophageal
acidity in subjects with biphasic GERD was not antici-
pated, because biphasic subjects had signi®cantly higher
baseline oesophageal acid exposure than monophasic
subjects. These ®ndings probably re¯ect differences
between subjects with monophasic GERD and those
with biphasic GERD with respect to their responses to
proton pump inhibitors.
Other studies have used measurements of gastric pH
determined with a pH electrode1, 5, 8 or by aspirating a
sample of gastric contents19 to assess effects of gastric
antisecretory agents on gastric acidity. The results have
usually been expressed in terms of percentage of the
recording time that gastric pH was above a particular
value or median (or mean) gastric pH over different
periods during the 24-h study. Onset of action has
frequently been reported as the earliest period during
which values with active treatment were signi®cantly
different from placebo (e.g. 8). The studies that have
measured pH on samples of aspirated gastric ¯uid have
also reported values for the area under the time±gastric
acid concentration curve (e.g. 19), and our calculations
of integrated acidity are conceptually the same as these
measurements. The main difference between integrated
acidity as determined in the present study and the AUC
gastric acid concentration is the duration of the
integration interval.
Assessing the onset of action of an antisecretory agent
by measuring gastric acid secretion is limited by the
need to allow absorption of the drug before beginning
aspiration or intragastric titration and the relative
insensitivity of measurements of acid secretion. For
example, one study that measured the antisecretory
actions of 15 mg and 30 mg of lansoprazole and 20 mg
and 40 mg omeprazole in 10 healthy subjects using
intragastric titration failed to detect a signi®cant
antisecretory effect of either agent assessed at 4, 10,
16 and 24 h after the ®rst dose.20 In contrast,
assessments of the gastric antisecretory actions of
lansoprazole and omeprazole measuring gastric pH
have demonstrated signi®cant effects within several
hours after the ®rst dose.8, 19, 21, 22
Previously,10 we systematically compared values for
integrated oesophageal and gastric acidity to values
from conventional assessments of the same data using
different pH cutoff values. These comparisons showed
that integrated acidity has several advantages over the
conventional indices in that integrated acidity fully
quanti®es acidity with a single value. In contrast,
conventional indices only partially quantify acidity,
require two numbers to estimate acidity, employ
arbitrary pH cutoff values, and a result using one pH
cutoff value cannot be transformed to a result obtained
using another pH cutoff value. There was a signi®cant
correlation between the values for baseline integrated
acidity and corresponding values for conventional indi-
ces, however the strength of the correlation increased
with decreasing pH cutoff values.
In the present study, we found that values for
rabeprazole inhibition of both oesophageal and gastric
acidity obtained using time pH £ 4 were signi®cantly
lower than those determined using integrated oesopha-
geal and gastric acidity, respectively. These ®ndings
indicate that results using these pH cutoff values
underestimate the effects of antisecretory agents and
that these conventional assessments are less sensitive in
quantifying the decrease in oesophageal or gastric
acidity produced by a gastric antisecretory agent. We
compared results obtained with integrated acidity to
those obtained using pH cutoff values other than 4 and
found that these other cutoff values also underestimated
the magnitude of the inhibition of oesophageal and
gastric acidity.
The present results also illustrate that simultaneous
measurements of integrated oesophageal and gastric
acidity make it possible to relate effects of a gastric
antisecretory agent on gastric acidity to effects on
oesophageal acidity in the same subject at the same
time. Others23±25 have described nocturnal gastric acid
breakthrough (nocturnal gastric pH < 4 for at least
1 h) in patients with GERD treated b.d. with 20 mg
omperazole or 30 mg lansoprazole and have speculated
regarding the potential signi®cance of this phenomenon
for treatment. We have found, however, that subjects
with monophasic GERD have little, if any, baseline
nocturnal oesophageal acid exposure even though they
have a substantial nocturnal increase in gastric acidity.
We have also found that subjects with biphasic GERD
have a baseline increase in nocturnal gastric acidity that
is accompanied by a pronounced nocturnal increase in
oesophageal acidity. In these biphasic subjects, how-
ever, the ®rst dose of 20 mg rabeprazole abolished the
nocturnal increase in oesophageal acidity even though
it did not abolish the nocturnal increase in gastric
acidity. These results illustrate that simultaneous
INTEGRATED ACIDITY AND RABEPRAZOLE PHARMACOLOGY 463
Ó 2002 Blackwell Science Ltd, Aliment Pharmacol Ther 16, 455±464

measurements of oesophageal and gastric pH are
necessary to assess the effects that changes in gastric
acidity may have on oesophageal acidity.
In summary, integrated gastric and oesophageal
acidity are quantitative measurements that are more
sensitive than time pH £ 4 in assessing the inhibitory
actions of gastric antisecretory agents. In the present
study, integrated acidity provided an excellent index of
the overall effect of rabeprazole as well as its onset and
duration of action on both gastric and oesophageal
acidity in patients with GERD. These measurements
also made it possible to demonstrate that the ®rst dose
of rabeprazole provided near steady-state inhibition of
gastric and oesophageal acidity, and that the pattern of
inhibitory action of rabeprazole on oesophageal acidity
cannot necessarily be predicted from its inhibitory effect
on gastric acidity.
ACKNOWLEDGEMENTS
This work was supported by grants from Eli Lilly and
Company, Eisai Inc., and Janssen Pharmaceutica Inc. to
the Oklahoma Foundation for Digestive Research and
consulting agreements between Science for Organiza-
tions Inc. and Eisai Inc., and Science for Organizations
Inc. and Janssen Pharmaceutica Research Foundation.
REFERENCES
1 Merki HS, Witzel L, Walt RP, et al. Day-to-day variation of
24-hour intragastric acidity. Gastroenterology 1988; 94:
887±91.
2 Jamieson JR, Stein HJ, DeMeester TR, Bonavina L, Schwizer
W, Hinder RA, Albertucci M. Ambulatory 24-h esophageal pH
monitoring: normal values, optimal thresholds, speci®city,
sensitivity, and reproducibility. Am J Gastroenterol 1992; 87:
1102±11.
3 Quigley EMM. 24-h pH monitoring for gastroesophageal
re¯ux disease: already standard but not yet gold? Am J
Gastroenterol 1992; 87: 1071±5.
4 Bell NJV, Burget D, Howden CW, Wilkinson J, Hunt RH.
Appropriate acid suppression for the management of gas-
troesophageal re¯ux disease. Digestion 1992; 51(Suppl. 1):
59±67.
5 Bruley des Varannes S, Levy P, Lartigue S, Dellatolas F,
Lemaire M, Galmiche JP. Comparison of lansoprazole with
omeprazole on 24-hour intragastric pH, acid secretion and
serum gastrin in healthy volunteers. Aliment Pharmacol Ther
1994; 8: 309±14.
6 Hunt RH. The relationship between the control of pH and
healing and symptom relief in gastro-oesophageal re¯ux dis-
ease. Aliment Pharmacol Ther 1995; 9(Suppl. 1): 3±7.
7 Hatlebakk JG, Berstad A. Pharmacokinetic optimisation in the
treatment of gastro-oesophageal re¯ux disease. Clin Pharma-
cokinet 1996; 31: 386±406.
8 Bell NJV, Hunt RH. Time to maximum effect of lansoprazole
on gastric pH in normal male volunteers. Aliment Pharmacol
Ther 1996; 10: 897±904.
9 Dent J. Gastro-oesophageal re¯ux disease. Digestion 1998; 59:
433±45.
10 Gardner JD, Rodriguez-Stanley S, Robinson M. Integrated
acidity and the pathophysiology of GERD. Am J Gastroenterol
2001; 96: 1363±70.
11 Robinson M, Rodriguez-Stanley S, Ciociola AA, et al. Synergy
between low dose ranitidine and antacid in reducing gastric
and esophageal acidity and relieving meal-induced heartburn.
Aliment Pharmacol Ther 2001; 15: 1365±74.
12 Moore EW, Scarlata RW. The determination of gastric acidity
by the glass electrode. Gastroenterology 1965; 49: 178±88.
13 Makhlouf GM, Blum AL, Moore EW. Undissociated acidity
of human gastric juice. Gastroenterology 1970; 58: 345±51.
14 Grimley CE, Constantinides S, Snell CC, Mills JG, Nwokolo CU.
Inhibition of intragastric acidity in healthy subjects dosed
with ranitidine 75 mg: a comparative study with cimetidine
and placebo. Aliment Pharmacol Ther 1997; 11: 875±9.
15 Cleveland WS. Visualizing Data. Summit, NJ: Hobart Press,
1993.
16 DeMeester TR, Johnson LF, Joseph GJ, Toscano MS, Hall AW,
Skinner DB. Patterns of gastroesophageal re¯ux in health and
disease. Ann Surg 1976; 84: 459±70.
17 DeCastecker JS, Blackwell JN, Pryde A, Heading RC. Daytime
gastro-oesophageal re¯ux is important in oesophagitis. Gut
1987; 28: 519±26.
18 Robertson D, Aldersley M, Shepherd H, Smith CL. Patterns of
acid re¯ux in complicated oesophagitis. Gut 1987; 28: 1484±8.
19 Williams MP, Sercombe J, Hamilton MI, Pounder RE. A placebo-
controlled trial to assess the effects of 8 days of dosing
with rabeprazole versus omperazole on 24-h intragastric
acidity and plasma gastrin concentrations in young healthy
subjects. Aliment Pharmacol Ther 1998; 12: 1079±89.
20 Dammann HG, Fuchs W, Richter G, Burkhardt F, Wolf N,
Walter TA. Lansoprazole versus omeprazole: in¯uence on
meal-stimulated gastric acid secretion. Aliment Pharmacol
Ther 1997; 11: 359±64.
21 Howden CW. Clinical pharmacology of omeprazole. Clin
Pharmacokinet 1991; 20: 38±49.
22 Andersson T. Pharmacokinetics metabolism and interactions
of acid pump inhibitors. Clin Pharmacokinet 1996; 31: 9±28.
23 Peghini PL, Katz PO, Bracy NA, Castell DO. Nocturnal
recovery of gastric acid secretion with twice-daily dosing of
proton pump inhibitors. Am J Gastroenterol 1998; 93: 763±7.
24 Katz PO, Anderson C, Khoury R, Castell DO. Gastro-
oesophageal re¯ux associated with nocturnal gastric acid
breakthrough on proton pump inhibitors. Aliment Pharmacol
Ther 1998; 12: 1231±4.
25 Hatlebakk JG, Katz PO, Kuo B, Castell DO. Nocturnal gastric
acidity and acid breakthrough on different regimens of
omeprazole 40 mg daily. Aliment Pharmacol Ther 1998; 11:
1235±40.
464 J. D. GARDNER et al.
Ó 2002 Blackwell Science Ltd, Aliment Pharmacol Ther 16, 455±464
Copyright © 2022 FDOKUMEN