Comparative genomics and transcriptomics of lineages I, II, and III strains of Listeria...
367
Transcript of Comparative genomics and transcriptomics of lineages I, II, and III strains of Listeria...


Evolutionary Biology – Concepts, Molecularand Morphological Evolution

.

Pierre PontarottiEditor
Evolutionary Biology –Concepts, Molecular andMorphological Evolution

EditorDr. Pierre PontarottiUMR 6632Universite d’Aix-Marseille/CNRSLaboratoire Evolution Biologique etModelisation, case 19Place Victor Hugo 313331 Marseille Cedex [email protected]
ISBN 978-3-642-12339-9 e-ISBN 978-3-642-12340-5DOI 10.1007/978-3-642-12340-5Springer Heidelberg Dordrecht London New York
Library of Congress Control Number: 2010933958
# Springer-Verlag Berlin Heidelberg 2010This work is subject to copyright. All rights are reserved, whether the whole or part of the material isconcerned, specifically the rights of translation, reprinting, reuse of illustrations, recitation, broadcasting,reproduction on microfilm or in any other way, and storage in data banks. Duplication of this publicationor parts thereof is permitted only under the provisions of the German Copyright Law of September 9,1965, in its current version, and permission for use must always be obtained from Springer. Violationsare liable to prosecution under the German Copyright Law.The use of general descriptive names, registered names, trademarks, etc. in this publication does not imply,even in the absence of a specific statement, that such names are exempt from the relevant protective laws andregulations and therefore free for general use.
Cover design: WMXDesign GmbH, Heidelberg, Germany
Cover illustration:An antennal tip of a female parasitic wasp (Ichneumonidae: Cryptinae: Latibulus sp.).See Fig. 16.3b
Printed on acid-free paper
Springer is part of Springer Science+Business Media (www.springer.com)

Preface
The 13th Evolutionary Biology Meeting was held in Marseille on the 22–25
September 2009. These events aim to gather leading scientists involved in research
on evolutionary biology, promoting an exchange of state-of-the-art knowledge and
the initiation of inter-group collaborations. Over the past years, this has been
rewarded by the publication of several important review articles dealing with this
subject matter. For me personally, the Evolutionary Biology Meeting is a valuable
scientific exchange platform serving as booster for the use of evolutionary-based
approaches not only in biology but also in other scientific fields.
In 2009, some 100 presentations (oral, as well as “fast presentation” and
traditional posters) admirably reflected the epistemological nature of the meeting.
I selected one fifth of the most representative contributions for this book, these 21
articles being organized in different categories: Evolutionary Biology Concepts,
Genome/Molecular Evolution, and Morphological Evolution/Speciation.
I would like to thank the contributors to this book, as well as all other partici-
pants who helped making this meeting such as success, and our sponsors – the
Universite de Provence, CNRS, GDR BIM, Conseil General 13, and Ville de
Marseille. I gratefully acknowledge the support of members of the Association
pour l’Etude de l’Evolution Biologique (AEEB). In addition, I am indebted to the
staff of our publisher, Springer, for their competence and help.
Last but not least, I sincerely wish to thank the AEEB coordinator, Axelle
Pontarotti, for the excellent organization of the meeting and the production of the
book. In terms of collaborative scientific exchange and the publication of this
proceedings, the scientific output of the 13th Marseille meeting reflects the high
quality not only of individual contributions but also of the Marseille way of hosting,
for which Axelle Pontarotti is an outstanding ambassador.
Marseille, France Pierre Pontarotti
May 2010
v

.

Contents
Part I Evolutionary Biology Concepts
1 Extinct and Extant Reptiles: A Model System for the Study
of Sex Chromosome Evolution . . . . . . . . . . . . . . . . . . . . . . . . . . . . . . . . . . . . . . . . . . . 3
Daniel E. Janes
2 Constraints, Plasticity, and Universal Patterns in Genome
and Phenome Evolution . . . . . . . . . . . . . . . . . . . . . . . . . . . . . . . . . . . . . . . . . . . . . . . . . 19
Eugene V. Koonin and Yuri I. Wolf
3 Starvation-Induced Reproductive Isolation in Yeast . . . . . . . . . . . . . . . . . 49
Eugene Kroll, R. Frank Rosenzweig, and Barbara Dunn
4 Populations of RNA Molecules as Computational Model
for Evolution . . . . . . . . . . . . . . . . . . . . . . . . . . . . . . . . . . . . . . . . . . . . . . . . . . . . . . . . . . . . . 67
Michael Stich, Carlos Briones, Ester Lzaro, and Susanna C. Manrubia
5 Pseudaptations and the Emergence of Beneficial Traits . . . . . . . . . . . . . . 81
Steven E. Massey
Part II Genome/Molecular Evolution
6 Transferomics: Seeing the Evolutionary Forest Using
Phylogenetic Trees . . . . . . . . . . . . . . . . . . . . . . . . . . . . . . . . . . . . . . . . . . . . . . . . . . . . . . 101
John W. Whitaker and David R. Westhead
7 Comparative Genomics and Transcriptomics of Lactation . . . . . . . . . 115
Christophe M. Lefevre, Karensa Menzies, Julie A. Sharp,
and Kevin R. Nicholas
vii

8 Evolutionary Dynamics in the Aphid Genome: Search
for Genes Under Positive Selection and Detection
of Gene Family Expansions . . . . . . . . . . . . . . . . . . . . . . . . . . . . . . . . . . . . . . . . . . . . 133
Morgane Ollivier and Claude Rispe
9 Mammalian Chromosomal Evolution: From Ancestral States
to Evolutionary Regions . . . . . . . . . . . . . . . . . . . . . . . . . . . . . . . . . . . . . . . . . . . . . . . . 143
Terence J. Robinson and Aurora Ruiz-Herrera
10 Mechanisms and Evolution of Dorsal–Ventral Patterning . . . . . . . . . . 159
Claudia Mieko Mizutani and Rui Sousa-Neves
11 Evolutionary Genomics for Eye Diversification . . . . . . . . . . . . . . . . . . . . . . 179
Atsushi Ogura
12 Do Long and Highly Conserved Noncoding Sequences
in Vertebrates Have Biological Functions? . . . . . . . . . . . . . . . . . . . . . . . . . . . 187
Yoichi Gondo
Part III Morphological Evolution/Speciation
13 Male-Killing Wolbachia in the Butterfly Hypolimnas bolina . . . . . . . . 209
Anne Duplouy and Scott L. O’Neill
14 Evolution of Immunosuppressive Organelles from DNA
Viruses in Insects . . . . . . . . . . . . . . . . . . . . . . . . . . . . . . . . . . . . . . . . . . . . . . . . . . . . . . . 229
Brian A. Federici and Yves Bigot
15 The Neogastropoda: Evolutionary Innovations of Predatory
Marine Snails with Remarkable Pharmacological Potential . . . . . . . . 249
Maria Vittoria Modica and Mande Holford
16 Antennal Hammers: Echos of Sensillae Past . . . . . . . . . . . . . . . . . . . . . . . . . 271
Nina Laurenne and Donald L.J. Quicke
17 Adaptive Radiation of Neotropical Emballonurid Bats:
Molecular Phylogenetics and Evolutionary Patterns
in Behavior and Morphology . . . . . . . . . . . . . . . . . . . . . . . . . . . . . . . . . . . . . . . . . . 283
Burton K. Lim
18 Trends in Rhizobial Evolution and Some Taxonomic Remarks . . . . 301
Julio C. Martınez-Romero, Ernesto Ormeno-Orrillo, Marco A. Rogel,
Aline Lopez-Lopez, and Esperanza Martınez-Romero
viii Contents

19 Convergent Evolution of Morphogenetic Processes in Fungi . . . . . . . 317
Sylvain Brun and Philippe Silar
20 Evolution and Historical Biogeography of a Song Sparrow
Ring in Western North America . . . . . . . . . . . . . . . . . . . . . . . . . . . . . . . . . . . . . . . 329
Michael A. Patten
21 Cave Bear Genomics in the Paleolithic Painted Cave
of Chauvet-Pont d’Arc . . . . . . . . . . . . . . . . . . . . . . . . . . . . . . . . . . . . . . . . . . . . . . . . . 343
Celine Bon and Jean-Marc Elalouf
Index . . . . . . . . . . . . . . . . . . . . . . . . . . . . . . . . . . . . . . . . . . . . . . . . . . . . . . . . . . . . . . . . . . . . . . . . . . 357
Contents ix

.

Contributors
Yves Bigot Laboratoire d’Etude des Parasites GenetiquesParc Grandmont,
Universite de Tours, U.F.R. des Sciences et Techniques, 37200 Tours, France
Celine Bon CEA, IBiTec-S, F-91191, Gif-sur-Yvette cedex, France, celine.bon@
cea.fr
Sylvain Brun UFR des Sciences du Vivant, Universite de Paris 7 – Denis Diderot,
75205 Paris Cedex 13, France; Institut de Genetique et Microbiologie, UMR
CNRS – Universite de Paris 11, UPS Bat. 400, 91405, Orsay cedex, France
Barbara Dunn Department of Genetics, Stanford University, Stanford,
CA 94305, USA
Anne Duplouy School of Biological Sciences, The University of Queensland,
Brisbane, QLD 4072, Australia, [email protected]
Jean-Marc Elalouf CEA, IBiTec-S, F-91191 Gif-sur-Yvette cedex, France
Brian A. Federici Department of Entomology and Interdepartmental Graduate
Programs in Genetics and Microbiology, University of California, Riverside,
CA 92521, USA; Laboratoire d’Etude des Parasites GenetiquesParc Grandmont,
Universite de Tours, U.F.R. des Sciences et Techniques, 37200 Tours, France,
Yoichi Gondo Mutagenesis and Genomics TeamRIKEN BioResource Center,
3-1-1 Koyadai, Tsukuba 305-0074, Japan, [email protected]
Mande Holford York College and Graduate Center, and The American Museum
of Natural History, The City University of New York, NY, USA, mholford@york.
cuny.edu
xi

Daniel E. Janes Department of Organismic and Evolutionary Biology, Harvard
University, Cambridge, MA 02138-3899, USA, [email protected]
Eugene V. Koonin National Center for Biotechnology Information, National
Library of Medicine, National Institutes of Health, Bethesda, MD 20892, USA,
Eugene Kroll Division of Biological Sciences, University of Montana, Missoula,
MT 59812, USA, [email protected]
Nina Laurenne Museum of Natural History, Entomology Division, University
of Helsinki, P.O. Box 17(P. Arkadiankatu 13), 00014, Helsinki, Finland, nina.
ChristopheM. Lefevre Institute for Technology Research and Innovation, Deakin
University, Waurn Ponds, Geelong, VIC 3217, Australia; CRC for Innovative
Dairy Products, Department of Zoology, University of Melbourne, Melbourne,
VIC 3010, Australia; Victorian Bioinformatics Consortium, Monash University,
Clayton, Melbourne, VIC 3080, Australia, [email protected]
Burton K. Lim Department of Natural History, Royal Ontario Museum, 100
Queen’s Park, Toronto, Ontario M5S 2C6, Canada, [email protected]
Aline Lopez-Lopez Centro de Ciencias Genomicas, UNAM, Av. Universidad,
Cuernavaca, Morelos 62210, Mexico
Julio C. Martınez-Romero Centro de Ciencias Genomicas, UNAM,
Av. Universidad, Cuernavaca, Morelos 62210, Mexico
Esperanza Martınez-Romero Centro de Ciencias Genomicas, UNAM,
Av. Universidad, Cuernavaca, Morelos 62210, Mexico, esperanzaeriksson@
yahoo.com.mx
Steven E. Massey Biology Department, University of Puerto Rico – Rio Piedras,
P.O. Box 23360, San Juan, Puerto Rico 00931, USA, [email protected]
Karensa Menzies Institute for Technology Research and Innovation, Deakin
University, Waurn Ponds, Geelong, VIC 3217, Australia; CRC for Innovative
Dairy Products, Department of Zoology, University of Melbourne, Melbourne,
VIC 3010, Australia
Claudia Mieko Mizutani Department of Biology, Case Western Reserve
University, 10900 Euclid Ave, Cleveland, OH 447080, USA Department of
Genetics, Case Western Reserve University, 10900 Euclid Ave, Cleveland,
OH 447080, USA, [email protected]
xii Contributors

Maria Vittoria Modica Sapienza University of Rome, Piazzale Aldo Moro 5,
00185 Rome, Italy, [email protected]
Kevin R. Nicholas Institute for Technology Research and Innovation, Deakin
University, Waurn Ponds, Geelong, VIC 3217, Australia; CRC for Innovative
Dairy Products, Department of Zoology, University of Melbourne, Melbourne,
VIC 3010, Australia
Scott L. O’Neill School of Biological Sciences, The University of Queensland,
Brisbane, QLD 4072, Australia
Atsushi Ogura Division of Advanced Sciences, Ochadai Academic Production,
Ochanomizu University, Ohtsuka 2-1-1, Bunkyo, Tokyo 112-8610, Japan, ogura.
Morgane Ollivier INRA, UMR1099 BiO3P, Domaine de la Motte, F-35653,
Le Rheu, France
Ernesto Ormeno-Orrillo Centro de Ciencias Genomicas, UNAM,
Av. Universidad, Cuernavaca, Morelos 62210, Mexico
Michael A. Patten Oklahoma Biological Survey and Department of Zoology,
University of Oklahoma, 111 E. Chesapeake Street, Norman, OK 73019, USA,
Donald L.J. Quicke Department of Life Sciences, Imperial College London, Sil-
wood Park Campus, Ascot, Berkshire SL5 7PY, UK; Department of Entomology,
Natural History Museum, London, SW7 5BD, UK
Claude Rispe INRA, UMR1099 BiO3P, Domaine de la Motte, F-35653, Le Rheu,
France, [email protected]
Terence J. Robinson Evolutionary Genomics Group, Department of Botany and
Zoology, University of Stellenbosch, Private Bag X1, Matieland 7602, South
Africa, [email protected]
Marco A. Rogel Centro de Ciencias Genomicas, UNAM, Av. Universidad,
Cuernavaca, Morelos 62210, Mexico
R. Frank Rosenzweig Division of Biological Sciences, University of Montana,
Missoula, MT 59812, USA
Aurora Ruiz-Herrera Unitat de Citologia i Histologia, Departament de Biologia
Cel.lular, Fisiologia i Inmunologia, Universitat Autonoma de Barcelona, Campus
Contributors xiii

Bellaterra, 08193, Barcelona, Spain; Institut de Biotecnologia i Biomedicina,
Universitat Autonoma de Barcelona, Campus Bellaterra, 08193 Barcelona, Spain,
Julie A. Sharp Institute for Technology Research and Innovation, Deakin
University, Waurn Ponds, Geelong, VIC 3217, Australia; CRC for Innovative
Dairy Products, Department of Zoology, University of Melbourne, Melbourne,
VIC 3010, Australia
Philippe Silar UFR des Sciences du Vivant, Universite de Paris 7 – Denis Diderot,
75205 Paris Cedex 13, France; Institut de Genetique et Microbiologie, UMR
CNRS – Universite de Paris 11, UPS Bat. 400, 91405 Orsay cedex, France,
Rui Sousa-Neves Department of Biology, Case Western Reserve University,
10900 Euclid Ave, Cleveland, OH 447080, USA
Michael Stich Dpto de Evolucion Molecular, Centro de Astrobiologıa
(CSIC-INTA), Ctra de Ajalvir, km 4, Torrejon de Ardoz, Madrid 28850, Spain,
David R. Westhead Institute of Molecular and Cellular Biology, University of
Leeds, Garstang Building, Leeds LS2 9J, UK, [email protected]
John W. Whitaker Institute of Molecular and Cellular Biology, University of
Leeds, Garstang Building, Leeds, LS2 9J, UK, [email protected]
Yuri I. Wolf National Center for Biotechnology Information, National Library of
Medicine, National Institutes of Health, Bethesda, MD 20892, USA
xiv Contributors

Part IEvolutionary Biology Concepts

Chapter 1
Extinct and Extant Reptiles: A Model System
for the Study of Sex Chromosome Evolution
Daniel E. Janes
Abstract The evolution and functional dynamics of sex chromosomes are focuses
of current biological research. Although common organismal morphologies and
functions of males and females are found among amniotes, underlying sex chromo-
some organizations and sex-determining mechanisms are widely variable. This
chapter investigates the role that reptiles play in the study of sex chromosome
evolution. Reptile studies have described the coevolution of genotypic sex determi-
nation and viviparity, the adaptive significance of sex-determining mechanisms,
and shared ancestry of chromosomes. Novel resources, including whole-genome
sequences and mapped sex-linked markers, have allowed researchers to examine
sex chromosome evolution in reptiles, an important group for this type of study for
their position as the sister group to mammals. Compared with mammals, reptiles
exhibit much more variability in sex chromosome organization, providing raw
material for study of sex chromosome evolution across amniotes.
1.1 Introduction
Embryos develop as either male or female depending on factors that vary widely
among amniotes. Broadly speaking, amniotes can be classified as either genotypi-
cally sex-determined (GSD) or temperature-dependently sex-determined (TSD).
Embryos of GSD species, including all mammals, birds, snakes, and many lizards
and turtles, develop as either male or female depending on chromosomal contribu-
tions from parents at conception. Many, but not all, of these species exhibit detectable
D.E. Janes
Department of Organismic and Evolutionary Biology, Harvard University, Cambridge, MA
02138-3899, USA
e-mail: [email protected]
P. Pontarotti (ed.), Evolutionary Biology – Concepts, Molecularand Morphological Evolution, DOI 10.1007/978-3-642-12340-5_1,# Springer-Verlag Berlin Heidelberg 2010
3

cytogenetic sex differences (i.e., heteromorphic sex chromosomes). The difference
between heteromorphic and homomorphic sex chromosomes could be explained by
the length of the interval since the origin of genotypic sex determination in a species
(Ohno 1967; Janes et al. 2010b). Apparently, sex chromosomes begin to diverge
from each other only after a new GSD system arises (see Sect. 1.3.1). This sex
difference in karyotype is not apparent in individuals of TSD amniotes that develop
as male or female primarily in response to incubation temperature, including all
crocodilians, tuataras, and some turtles and lizards.
In this review, I will describe the variability of sex-determining mechanisms
among amniotes. This variability includes, for example, the temperatures that trigger
male or female development and the timing of temperature’s effect among TSD
species, as well as the presence or absence and type of sex chromosomes in GSD
species. Almost all mammals exhibit male heterogamety in which females carry two
X sex chromosomes of the same size and content, whereas males carry one X sex
chromosome and one smaller, degenerated Y sex chromosome. In birds, females are
heterogametic which means they carry the smaller, degenerated W sex chromosome
and one larger, more gene-rich Z sex chromosome, whereas male birds carry two Z
sex chromosomes. This difference in heterogamety affects the genomics of amniotes
in ways that are discernible from genome sequencing and experimental evidence.
Further, the evolutionary history of sex-determining mechanisms informs the diffe-
rent arrangements of amniotic sex chromosomes that have been studied using
techniques that include phylogenetic inference, cytogenetic mapping, and measure-
ments of population genetics parameters. Recent studies of sex-determining mechan-
isms and, specifically, the evolution of sex chromosomes have focused on extinct and
extant reptiles for two reasons. First, nonavian reptiles exhibit greater variety of sex-
determining mechanisms and sex chromosomes than birds or mammals. Second,
genomic resources for reptiles (including birds) have recently improved to an extent
that previously untestable hypotheses are now open to experimentation and compar-
ative analyses (Janes et al. 2008).
1.2 Sex-Determining Mechanisms
1.2.1 Patterns and Variability
Amniote sex-determining mechanisms are typically described as either GSD or
TSD but within those categories, functional patterns vary. As described above,
GSD species vary in their organization of sex chromosomes [i.e., female hetero-
gamety (ZW system) or male heterogamety (XY system)] (Fig. 1.1a). Phylogenetic
inference and comparative chromosome hybridizations suggest that male and
female heterogamety have evolved more than once among amniotes although the
exact number of independent origins is debated (Ezaz et al. 2009; Organ and Janes
2008). Likewise, the number of independent origins of temperature-dependent sex
4 D.E. Janes

determination is not clear. Although the sex-determining mechanisms of two or
more species may respond to incubation temperature in a similar manner, the
similarity may represent convergence. Three basic patterns of sex-determining
response to incubation temperature (Types Ia, Ib, and II) have been described
(Fig. 1.1b) (Bull 1983). Species that exhibit Type Ia temperature-dependent sex
determination, such as loggerhead (Caretta caretta), green (Chelonia mydas), andleatherback (Dermochelys coriacea) sea turtles, produce more male offspring from
eggs incubated at cooler temperatures (Standora and Spotila 1985). Species with
Type Ib temperature-dependent sex determination, such as all crocodilians, produce
more male offspring from eggs incubated at warmer temperatures (Valenzuela
2004). Species with Type II temperature-dependent sex determination, such as
leopard geckos (Eublepharis macularius), produce a maximal proportion of males
from eggs incubated at an intermediate temperature, whereas cooler or warmer
temperatures yield higher proportions of females (Janes and Wayne 2006; Viets
et al. 1994).
Male Heterogamety
Female Heterogamety
ZZ
AAAA
Z
W
XX
Y
X
No Heterogamety
Incubation Temperature
% M
ale
Offs
prin
g / C
lutc
h
Type Ia TSD
Male HeterogametyFemale HeterogametyNo Heterogamety
Type Ib TSDType II TSDGSD
a b
Fig. 1.1 (a) Pairs of sex chromosomes that consist of either a male-specific Y chromosome and an
X chromosome or a female-specific W chromosome and a Z chromosome. Species that exhibit
these sex chromosomes are described as either male heterogametic (XY system) or female
heterogametic (ZW system). Other GSD species exhibit no detectable heterogameties or sex
differences in karyotype. (b) Influence of incubation temperature on offspring sex ratios among
temperature-dependently (TSD) and genotypically sex-determined (GSD) species. The y-axismodels the proportion of males yielded per clutch of eggs incubated at different points on the
thermal gradient indicated on the x-axis. Sex-determining response to incubation temperature
follows one of three patterns (Type Ia, Ib, or II) in TSD species. GSD species produce similarly
balanced offspring sex ratios regardless of incubation temperature or type of heterogamety
1 Extinct and Extant Reptiles 5

The timing of the effect of temperature on sex-determining response also varies
among TSD reptiles. Shine et al. (2007) tested two TSD lizards for the effects of
fadrozole, a chemical that blocks the bioconversion of testosterone to estrogen,
thereby causing male development in eggs incubated at female-producing tempera-
tures. In this type of experiment, the stage during which fadrozole affects offspring
sex ratios represents the thermally sensitive period when temperature can influence
sex determination. In two TSD reptiles, jacky dragons (Amphibolurus muricatus)and Duperrey’s window-eyed skinks (Bassiana duperreyi), the thermally sensitive
period in which sex could be reversed by fadrozole treatment occurred in the first
half of the postoviposition incubation period. The thermally sensitive period has
been shown to occur slightly later in turtles and tuataras, during only the middle
third of the postoviposition incubation period (Ewert et al. 2004; Mitchell et al.
2006) and occurs even later in crocodilians, during the third quarter of the entire
incubatory period (Lang and Andrews 1994).
GSD amniotes exhibit a similar degree of variability (Organ and Janes 2008). In
birds, snakes, and some turtles and lizards, females are the heterogametic sex. Male
heterogamety is found in some turtles and lizards and throughout mammals (with
exceptions). The mammalian exceptions include, among others, the mole vole
(Ellobius lutescens) in which a Y sex chromosome is absent. Both males and
females of this species carry one X sex chromosome (Just et al. 1995; Vogel
et al. 1998). Within heterogameties, there is variation in the extent of degeneration
of either the male-specific Y sex chromosome or the female-specific W sex chromo-
some. For example, the Z and W sex chromosomes of emus (Dromaius novaehol-landiae) are virtually homomorphic, whereas in chickens (Gallus gallus), the W sex
chromosome is considerably smaller than the Z sex chromosome (Janes et al. 2009;
Solari 1994). Clearly, a single line of demarcation between genotypic and tempera-
ture-dependent sex determination is overly simplistic and does not accurately repre-
sent the evolutionary history of sex-determining mechanisms in amniotes (Sarre et al.
2004).
1.2.2 Adaptive Significance of Sex-Determining Mechanisms
The variability of reptilian sex-determining mechanisms and, among GSD species,
type of heterogamety are difficult to explain. Among agamid lizards, for example,
species within the same genus with no discernible differences in natural history
exhibit different sex-determining mechanisms (Ezaz et al. 2009; Uller et al. 2006).
However, the adaptive significance of both genotypic and temperature-dependent
sex determination has been explored in theory and experimentation. Fisher (1930)
argued that parents should invest equally in sons and daughters. If sons and
daughters represent equivalent parental investment, genotypic sex determination
is expected to balance offspring sex ratios by matching them to the balanced
6 D.E. Janes

probability of inheriting an X or a Y chromosome from a male parent in a male
heterogametic species or the probability of inheriting a Z or a W chromosome from
a female parent in a female heterogametic species. Charnov and Bull (1977)
hypothesized that temperature-dependent sex determination would allow parents
greater control over offspring sex ratios in environments where the costs of sons and
daughters are unequal and fluctuating. However, the Charnov–Bull hypothesis has
not acquired much empirical support. Parents of TSD species do not appear to
control offspring sex ratios by nesting behavior. However, Freedberg and Wade
(2001) suggested that offspring sex ratios are inherited as nest sites, and their
unique exposures to sun and soil temperature are passed matrilineally. Also,
Warner and Shine (2008) demonstrated that incubation temperature can affect
reproductive success in jacky dragons. Male jacky dragons hatched from eggs
incubated at the optimal male-producing temperature had greater lifetime repro-
ductive success than males hatched from eggs incubated at a different temperature
and experimentally masculinized by chemical aromatase inhibition. The same
pattern of greater reproductive success was reported among females incubated at
either the optimal female-producing temperature or a different temperature. This
study provides evidence that, in a TSD species, incubation temperature directly
influences reproductive success in a sex-differential manner. Although this study
supports the Charnov–Bull hypothesis, it does not explain why some species would
benefit from temperature-dependent sex determination but not other closely related
species with similar life history traits.
Reproductive mode, whether a species is oviparous (egg-laying) or viviparous
(live-bearing), is associated with type of sex-determining mechanism. Viviparity
appears to be enabled by genotypic but not temperature-dependent sex determi-
nation. From a sample of 94 extant amniote species for which sex-determining
mechanism, reproductive mode, and phylogenetic position are known, only two,
perhaps three, exhibit both temperature-dependent sex determination and vivi-
parity. The southern water skink (Eulamprus tympanum) and its sister species
(Eulamprus heatwolei) give live birth and exhibit temperature-dependent sex
determination and some evidence suggests that the spotted skink (Niveoscincusocellatus) is also TSD and viviparous (Organ et al. 2009). For TSD species
including these skinks, producing both male and female offspring requires expos-
ing different embryos to one of at least two (optimal male-producing and optimal
female-producing) thermal environments. For viviparous species, this require-
ment entails manipulating maternal body temperature and evidence for maternal
manipulation of body temperature in TSD, viviparous skinks is debated (Allsop
et al. 2006; While and Wapstra 2009). Further, as explained in Sect. 1.4, fluctua-
tions in maternal body temperatures are even less likely in thermally consistent
environments such as deep oceans. Apparently, thermal consistency is not an
issue for oviparous, TSD species such as crocodilians and sea turtles because their
nests experience sufficient thermal variation from top to bottom to explain mixed
sex ratios emerging from clutches of eggs (Georges 1992 but see Warner and
Shine 2009).
1 Extinct and Extant Reptiles 7

1.2.3 Genotype and Environment Interaction
The proximate differences among sex-determining mechanisms remain unclear.
Controlled incubation studies in the laboratory have been used to identify species in
which incubation temperatures may or may not skew offspring sex ratios. These
incubation experiments that measure offspring sex ratios are challenged by the
possibility that a specific temperature that elicits a sex-determining response goes
inadvertently untested. Further, in a tested species, the difference between a tem-
perature that yields a consistent offspring sex ratio and a temperature that yields
lethality may be too small to tease them apart in incubation studies. In the face of
such uncertainty, many experimental characterizations of sex-determining mechan-
isms are considered tentative (Viets et al. 1994).
In addition to results from incubation studies, GSD and TSD species can be
distinguished by the presence or absence of sex chromosomes. If a species has
detectable sex chromosomes, then offspring sex ratios are expected to be defined by
genotype. However, an exception to this rule has been presented by a study of
central bearded dragons (Pogona vitticeps) (Quinn et al. 2007). Central bearded
dragons exhibit clear female heterogamety, yet extreme incubation temperatures
can feminize genotypically male embryos. This result suggests environmental
effects on sex determination in a GSD species. Likewise, genotypic effects have
been reported for leopard geckos (Eublepharis macularius), a reptile that has beenclassified as exhibiting TSD because incubation studies of leopard geckos demon-
strate a clear and repeatable influence of incubation temperature on offspring sex
ratios (Janes et al. 2007; Viets et al. 1993; Wagner 1980). Nonetheless, a quantita-
tive genetic effect on temperature-dependent sex determination is clear from study
of sex-determining response to incubation temperature in different matrilineal lines
of leopard geckos. Janes and Wayne (2006) identified genetically dissimilar
females within a captive-bred colony of leopard geckos. These females were each
mated to fertile males and the resultant offspring were placed randomly within one
of three environmental chambers set to temperatures known to produce either 0%,
�50%, or�70%male offspring. In this species, a 100%male-producing incubation
temperature has not been identified. Although incubation temperature overwhelm-
ingly influenced offspring sex ratios across family lines, a genotype � environment
interaction was detected in the varying offspring sex ratios from different matrilin-
eal lines exposed to the same incubation temperatures. This result suggests that
families vary in their sex-determining response to incubation temperature. Geno-
type � environment interactions also indicate that a studied trait is polygenic
(Falconer and MacKay 1996). Polygenic inheritance is relevant to conservation
of TSD reptiles that may be exceptionally vulnerable to climate change because of
the possibility that they are not exposed to temperatures needed to produce both
sons and daughters (Huey and Janzen 2008). If there is an underlying polygenic
control of sex-determining responses to temperature in TSD reptiles, then there is
opportunity for microevolution and adaptation to changing climates. Recent
modeling has suggested that tuataras (Sphenodon guntheri) occupy a habitat in
8 D.E. Janes

which ambient temperature is expected to change to a degree that could negatively
affect offspring sex ratios within the next century (Huey and Janzen 2008). If sex-
determining responses to temperature do not change adaptively, the remaining
possibilities include extinction or migration to cooler habitats but migration is
unlikely without human intervention considering tuataras’ habitat of small islands
off New Zealand.
1.3 Sex Chromosomes
1.3.1 Origins and Degeneration of Sex Chromosomes
Heteromorphic sex chromosomes arise when one of a pair of sex chromosomes
degenerates to a sufficient degree that cytogenetic differences between the pair are
observable. A number of different causes for this degeneration have been proposed,
including the Hill–Robertson effect, background selection, Muller’s Ratchet,
and hitchhiking of deleterious alleles onto favored mutations (Charlesworth and
Charlesworth 2000; Charlesworth et al. 1987). The Hill–Robertson effect prevents
the repair or elimination of deleterious alleles because of their close linkage to
beneficial alleles and background selection explains rates of elimination or fixation
by the degree to which an allele is either deleterious or beneficial. Mildly deleteri-
ous alleles are more likely to be tolerated than more seriously deleterious alleles
(Charlesworth and Charlesworth 2000). If mildly deleterious alleles are permitted
to accumulate on the Y chromosome as a result of reduced repair via recombination
with the X, then, over time, the mean fitness of the Y chromosome declines. The
accumulation of mildly deleterious alleles, known as Muller’s Ratchet, eventually
causes an allele to become damaged and then eliminated. Following that, the
homologous copy becomes fixed at a rate that is much faster than the fixation rate
for genes that are retained as two copies (Rice 1987). Hitchhiking works in
conjunction with Muller’s Ratchet to hasten the degeneration of the Y chromosome.
Deleterious mutations that hitchhike with favorable alleles on the Y are less likely
to be purged, further reducing the overall fitness of the chromosome. These forces
drive the degeneration of sex chromosomes after an initial event that converts an
ancestral pair of autosomes into sex chromosomes.
Ohno (1967) described the origination of sex chromosomes from ancestral
autosomes. Once a novel sex-determining gene is either exapted from a different
function or transposed to a chromosome from elsewhere in the genome, recombi-
nation ceases in the general vicinity of the gene. This block to recombination
allows parents to pass the sex-determining gene to either sons or daughters,
depending on the nature of the expression of the sex-determining gene. In
mammals, a single-copy gene called the sex-determining region on the Y (Sry)initiates male sexual development (Sinclair et al. 1990). Cessation of recombina-
tion around the Sry or some other ancestral sex-determining gene speeds up
1 Extinct and Extant Reptiles 9

Muller’s Ratchet, causing the degeneration of the mammalian Y chromosome.
The evolution of avian sex chromosomes may have followed a different path. In
chickens, dosage-dependent effects of a Z-linked gene, Dmrt1, appear to drive
male sexual development rather than the absence of a single copy of a W-linked
gene (Smith et al. 2009).
Reptiles provide an excellent model for the process of sex chromosome degen-
eration because of the intermediate stages of chromosomal degeneration found in
the group. For example, the smooth softshell turtle (Apalone mutica) is GSD but sex
chromosomes have not yet been identified, most likely due to a lack of sufficient
heteromorphy (Valenzuela et al. 2006). Further, micro-sex chromosomes have been
found in central bearded dragons (Pogona vitticeps), common snake-necked turtles
(Chelodina longicollis), and Chinese soft-shelled turtles (Pelodiscus sinensis)(Ezaz et al. 2005, 2006; Kawai et al. 2007). The variety of sex chromosome
organizations has been mapped onto phylogenetic trees to investigate the number
of origins of sex chromosomes and types of heterogameties in the group (Janzen
and Krenz 2004; Pokorna and Kratochvil 2009). Parsimony, likelihood, Bayesian,
and stochastic approaches reconstruct temperature-dependent sex determination as
ancestral to archosaurs (turtles, crocodilians, and birds) (Organ and Janes 2008).
Turtles are extraordinarily variable in their organizations of sex chromosomes with
species exhibiting male heterogamety, female heterogamety, no detectable hetero-
gamety, or temperature-dependent sex determination (Organ and Janes 2008).
These results indicate multiple independent origins of sex chromosomes among
archosaurs (Fig. 1.2). Also, Matsubara et al. (2006) demonstrated a lack of sequence
similarity between the female heterogametic sex chromosomes of birds and those of
snakes, indicating at least two independent origins of sex chromosomes. Reptiles,
with such variability and rapidly improving genomic resources, provide tremen-
dous raw material for studies of the causes and consequences of sex chromosome
origination and degeneration.
1.3.2 Detection of Sex Chromosomes
Species for which genotypic sex determination has been ascribed but sex chromo-
somes have not yet been identified are an important focus of research on reptile
genomics (Janes et al. 2010a). For species like the smooth softshell turtle, sex
chromosomes have not been reported but it is unclear if this is because they are
lacking in this species or if current cytogenetic techniques are not yet sufficiently
sensitive to detect them. The cytogenetic technique of C-banding, which stains
the heterochromatic regions of chromosomes, has identified female-specific W sex
chromosomes in central bearded dragons (P. vitticeps) (Ezaz et al. 2005) as well aseastern bearded dragons (Pogona barbata), Nobbi dragons (Amphibolurus nobbi),and Mallee dragons (Ctenophorus fordi) (Ezaz et al. 2009). Comparative genomic
hybridization, Ag–NOR staining, and fluorescent in situ hybridization (FISH)
are also standard techniques for identifying karyotypic sex differences (Kawai
10 D.E. Janes

et al. 2007). As more sex chromosomes are identified, more sex-linked sequences
will be cataloged for reptile species. For example, 18 S–28 S ribosomal RNA genes
are located on both micro-sex chromosomes in the Chinese soft-shelled turtle but in
more copies on the W chromosome than on the Z chromosome (Kawai et al. 2007).
Comparative FISH mapping of sex-linked markers will be useful for supporting or
rejecting hypotheses regarding the evolutionary history of sex-determining
mechanisms. Clearly, snake and bird sex chromosomes have little or no sequence
in common but the similarities and differences of sex chromosomes among birds,
turtles, and possibly TSD reptiles have not yet been characterized (Fig. 1.2) (Janes
et al. 2010b). However, Kawagoshi et al. (2009) identified five Z-linked markers in
the Chinese soft-shelled turtle by FISH mapping cDNA fragments of the genes
GIT2, NF2, SBNO1, SF3A1, and TOP3B. These markers map to chicken chromo-
some 15, suggesting a common origin.
Am
phib
ians
Tur
tles
Cro
codi
lians
Bird
s
Igua
nids
Sna
kes
Lace
rtid
liza
rds
Ski
nks
Gec
kos
Tua
tara
Mam
mal
s
F M
F M
F M
F M
F MF M
F M
F M
0 Mya
100 Mya
200 Mya
300 Mya
F M
F MF M
Fig. 1.2 Presence or absence of male or female heterogamety across amphibians, nonavian and
avian reptiles, and mammals (Organ and Janes 2008). Sex chromosomes have not been reported
for crocodilians or tuataras, both exhibiting temperature-dependent sex determination. Female
heterogamety is exhibited by snakes but is shaded differently in this figure to indicate that snake
sex chromosomes do not share sequence with avian sex chromosomes as the two pairs of sex
chromosomes most likely resulted from independent origins of female heterogamety (Matsubara
et al. 2006). The characterization of similarities or differences between avian sex chromosomes
and female heterogameties found in other reptiles and the estimation of the number of independent
origins of sex chromosomes are focuses of reptilian genomics research (Janes et al. 2010a)
1 Extinct and Extant Reptiles 11

1.3.3 Heterogamety and Dosage Compensation
Hypotheses are emerging about the differences between male and female hetero-
gamety. For example, dosage compensation appears to function differently between
male heterogametic and female heterogametic species. Genes found on the
X chromosome in male heterogametic species and on the Z chromosome in female
heterogametic species occur in different doses between males and females.
Mammals balance gene dosage by inactivating an X chromosome. X-chromosome
inactivation transcriptionally silences genes on one of two X chromosomes in a
female, thereby balancing gene dosage between males and females (Payer and Lee
2008). Birds, however, do not globally inactivate a Z chromosome in males. Rather,
dosage compensation appears to act rarely and on small regions of avian sex
chromosomes (Melamed and Arnold 2007). In fact, global dosage compensation
has only been found in male heterogametic groups, including therian mammals,
fruitflies (Drosophila), and nematodes (Caenorhabditis elegans), whereas local
dosage compensation has been found in female heterogametic groups, including
birds and lepidopterans (Mank 2009). At present, the pattern has only been
described among three male heterogametic groups and two female heterogametic
groups and has yet to be explored among reptiles (but see King and Lawson 1996).
Inactivation or hyper-transcription of sex-linked genes and entire chromosomes
should be compared between closely related male heterogametic and female
heterogametic reptiles, particularly among emydid turtles, chameleons, and geckos
that exhibit differences in heterogamety within families (Organ and Janes 2008).
1.4 Fossil Evidence
Extinct reptiles are relevant to the study of sex chromosome evolution because of
the order in which genotypic sex determination and sex chromosomes evolve. Sex
chromosomes become detectable only after they have been sufficiently affected by
evolutionary forces that arise subsequent to the block to recombination caused by
either the novel function or novel location of a sex-determining gene. Fossils of
extinct reptiles allow us to examine the history of sex-determining mechanisms and
subsequently predict which extinct reptiles exhibited genotypic sex determination.
Organ et al. (2009) used a reversible-jump Markov-chain Monte Carlo algorithm to
establish a Bayesian posterior probability distribution for models of correlated
change between different types of sex-determining mechanisms and reproductive
modes in extant amniotes (see Sect. 1.2.2). Reproductive mode describes the means
by which parents produce young. Among amniotes, species are either viviparous or
oviparous. The Bayesian analysis yielded a significant result for correlated evolu-
tion of genotypic sex determination and viviparity. Oviparity does not effectively
predict a certain sex-determining mechanism but viviparity predicts genotypic sex
determination. As described above, only two, perhaps three, of 94 studied extant
12 D.E. Janes

amniotes are both viviparous and TSD. This correlation permitted a prediction of
genotypic sex determination in extinct species known to be viviparous. In fact,
fossil evidence demonstrates viviparity in several extinct marine reptiles, including
sauropterygians, mosasaurs, and ichthyosaurs. The study predicted sex-determining
mechanisms for seven species for which sex-determining mechanisms were known
but not introduced to the algorithm. This test group included six extant reptiles and
an extinct horse (Propalaeotherium) for which pregnant specimens have been
found in the fossil record. The study showed that genotypic sex determination
could be accurately predicted for viviparous species. All ten marine reptiles exam-
ined in the study were assigned a significant posterior probability of having
genotypic sex determination.
Organ et al. (2009) argued that this result is meaningful for the natural history of
extinct marine reptiles. Oviparity in the open ocean would not have been possible
for amniote species like ichthyosaurs because amniotic eggs require gas-exchange
with the atmosphere (Andrews and Mathies 2000). Extant marine reptiles including
saltwater crocodiles (Crocodylus porosus) and sea turtles nest on land but extinct
marine reptiles like ichthyosaurs did not have a body plan that was likely to allow
terrestrial nesting. Freed by viviparity from the requirement to nest on land, extinct
marine reptiles evolved morphologies that were adaptive to pelagic existence.
These morphologies included fluked tails, dorsal fins, and wing-shaped limbs.
Further, if prerequisite for the evolution of viviparity, genotypic sex determination
may have permitted the adaptive radiation of extinct marine reptiles since viviparity
seems to be a prerequisite for the pelagic existence of those species (Caldwell and
Lee 2001).
1.5 Impact of Genome Projects and Future Directions
The study of sex chromosome evolution has much to gain from current genome
sequencing efforts. At present, only the green anole (Anolis carolinensis) and the
painted turtle (Chrysemys picta) are focuses of genome sequencing projects (Janes
et al. 2008) but the recently announced Genome 10K collection of species that has
been targeted for whole-genome sequencing includes 3,297 nonavian reptiles
(Haussler et al. 2009). In particular, the genome sequences of 140 turtles, 569
iguanids, and 621 geckos that have been targeted for genome sequencing will
provide a window into the variability of sex-determining mechanisms and sex
chromosome organizations found in these three groups. The identities and map
locations of sex-linked markers will support or reject current hypotheses of com-
mon origins of sex chromosomes. For example, Kawai et al. (2009) suggested a
common origin between the sex chromosome pairs of the gecko lizard (Gekkohokouensis) and chicken because they share a linkage group that consists of six
markers. Following the publication of multiple reptile genomes, studies of this kind
will involve more markers in more species, allowing more robust conclusions to be
made regarding the number of independent origins of reptilian sex chromosomes.
1 Extinct and Extant Reptiles 13

Until the sequencing and mapping of sex-linked and sex-differentiating markers
have reached a more advanced stage, studies of reptilian sex chromosomes will be
smaller in scope. Nonetheless, sex-linked markers have been identified in birds
(Backstrom et al. 2006; Hillier et al. 2004), snakes (Matsubara et al. 2006), turtles
(Kawagoshi et al. 2009), and lizards (Kawai et al. 2009). These sequences provide
sufficient raw material for mapping comparisons among pairs of reptilian sex
chromosomes. Comparative mapping studies, in concert with ancestral reconstruc-
tions, will directly inform questions regarding the number of independent origins
of sex chromosomes in reptiles and why sex chromosome systems have higher
turnover in nonavian reptiles than they have in either birds or mammals.
Acknowledgments I would like to thank Miguel Alcaide, Maude Baldwin, Elena Gonzalez, June
Yong Lee, Christopher Organ, and Irene Salicini for their critical reviews of this chapter. This
work has benefited from conversations with Nicole Valenzuela (NV), Scott V. Edwards (SVE),
Tariq Ezaz, Jennifer A.M. Graves, Arthur Georges, and Andrew Sinclair. Support in the laboratory
and valuable discussions were shared by Christopher Balakrishnan, Charles Chapus, and Andrew
Shedlock. Funding for this work was provided by a grant from the United States National Science
Foundation (MCB0817687) to NV and SVE. Last, I would like to thank Pierre Pontarotti for the
invitation to contribute to the 13th Evolutionary Biology Meeting at Marseille where this work was
presented.
References
Allsop DJ, Warner DA, Langkilde T, Du W, Shine R (2006) Do operational sex ratios influence
sex allocation in viviparous lizards with temperature-dependent sex determination? J Evol Biol
19(4):1175–1182
Andrews RM, Mathies T (2000) Natural history of reptilian development: constraints on the
evolution of viviparity. Bioscience 50(3):227–238
Backstrom N, BrandstromM, Gustafsson L, Qvarnstrom A, Cheng H, Ellegren H (2006) Genetic
mapping in a natural population of collared flycatchers (Ficedula albicollis): conservedsynteny but gene order rearrangements on the avian Z chromosome. Genetics 174(1):
377–386
Bull JJ (1983) Evolution of sex determining mechanisms. Benjamin/Cummings, Menlo Park, CA
Caldwell MW, Lee MSY (2001) Live birth in Cretaceous marine lizards (mosasauroids). Proc R
Soc Lond B Biol Sci 268(1484):2397–2401
Charlesworth B, Charlesworth D (2000) The degeneration of Y chromosomes. Phil Trans Roy Soc
Lond B 355(1403):1563–1572
Charlesworth B, Coyne JA, Barton NH (1987) The relative rates of evolution of sex chromosomes
and autosomes. Am Nat 130(1):113–146
Charnov EL, Bull J (1977) When is sex environmentally determined. Nature 266(5605):829–830
Ewert BJ, Etchberger CR, Nelson CE (2004) Turtle sex-determining modes and TSD patterns, and
some TSD pattern correlates. In: Valenzuela N, Lance VA (eds) Temperature-dependent sex
determination in vertebrates. Smithsonian Books, Washington, DC, pp 21–32
Ezaz T, Quinn AE, Miura I, Sarre SD, Georges A, Graves JAM (2005) The dragon lizard Pogonavitticeps has ZZ/ZW micro-sex chromosomes. Chromosome Res 13(8):763–776
Ezaz T, Valenzuela N, Grutzner F, Miura I, Georges A, Burke RL, Graves JAM (2006) An XX/XY
sex microchromosome system in a freshwater turtle, Chelodina longicollis (Testudines:
Chelidae) with genetic sex determination. Chromosome Res 14(2):139–150
14 D.E. Janes

Ezaz T, Quinn AE, Sarre SD, O’Meally D, Georges A, Graves JAM (2009) Molecular marker
suggests rapid changes of sex-determining mechanisms in Australian dragon lizards. Chromo-
some Res 17(1):91–98
Falconer DS, MacKay TFC (1996) Introduction to quantitative genetics. Longmann Press,
London, UK
Fisher RA (1930) The genetical theory of natural selection. Oxford University Press, New York,
USA
Freedberg S, Wade MJ (2001) Cultural inheritance as a mechanism for population sex-ratio bias
in reptiles. Evolution 55(5):1049–1055
Georges A (1992) Thermal characteristics and sex determination in field nests of the pig-nosed
turtle, Carettochelys insculpta (Chelonia, Carettochelydidae), from northern Australia. Aust
J Zool 40(5):511–521
Haussler D, O’Brien SJ, Ryder OA, Barker FK, Clamp M, Crawford AJ, Hanner R, Hanotte O,
Johnson WE, McGuire JA, Miller W, Murphy RW, Murphy WJ, Sheldon FH, Sinervo B,
Venkatesh B, Wiley EO, Allendorf FW, Amato G, Baker CS, Bauer A, Beja-Pereira A,
Bermingham E, Bernardi G, Bonvicino CR, Brenner S, Burke T, Cracraft J, Diekhans M,
Edwards S, Ericson PGP, Estes J, Fjelsda J, Flesness N, Gamble T, Gaubert P, Graphodatsky
AS, Graves JAM, Green ED, Green RE, Hackett S, Hebert P, Helgen KM, Joseph L, Kessing B,
Kingsley DM, Lewin HA, Luikart G, Martelli P, Moreira MAM, Nguyen N, Orti G, Pike BL,
Rawson DM, Schuster SC, Seuanez HN, Shaffer HB, Springer MS, Stuart JM, Sumner J,
Teeling E, Vrijenhoek RC, Ward RD, Warren WC, Wayne R, Williams TM, Wolfe ND,
Zhang YP (2009) Genome 10K: a proposal to obtain whole-genome sequence for 10 000
vertebrate species. J Hered 100(6):659–674
Hillier LW, Miller W, Birney E, Warren W, Hardison RC, Ponting CP, Bork P, Burt DW, Groenen
MAM, Delany ME, Dodgson JB, Chinwalla AT, Cliften PF, Clifton SW, Delehaunty KD,
Fronick C, Fulton RS, Graves TA, Kremitzki C, Layman D, Magrini V, McPherson JD, Miner
TL, Minx P, NashWE, Nhan MN, Nelson JO, Oddy LG, Pohl CS, Randall-Maher J, Smith SM,
Wallis JW, Yang SP, Romanov MN, Rondelli CM, Paton B, Smith J, Morrice D, Daniels L,
Tempest HG, Robertson L, Masabanda JS, Griffin DK, Vignal A, Fillon V, Jacobbson L,
Kerje S, Andersson L, Crooijmans RPM, Aerts J, van der Poel JJ, Ellegren H, Caldwell RB,
Hubbard SJ, Grafham DV, Kierzek AM, McLaren SR, Overton IM, Arakawa H, Beattie KJ,
Bezzubov Y, Boardman PE, Bonfield JK, CroningMDR, Davies RM, Francis MD, Humphray SJ,
Scott CE, Taylor RG, Tickle C, Brown WRA, Rogers J, Buerstedde JM, Wilson SA, Stubbs L,
Ovcharenko I, Gordon L, Lucas S, Miller MM, Inoko H, Shiina T, Kaufman J, Salomonsen J,
Skjoedt K, Wong GKS, Wang J, Liu B, Yu J, Yang HM, Nefedov M, Koriabine M, deJong PJ,
Goodstadt L, Webber C, Dickens NJ, Letunic I, Suyama M, Torrents D, von Mering C,
Zdobnov EM, Makova K, Nekrutenko A, Elnitski L, Eswara P, King DC, Yang S, Tyekucheva
S, Radakrishnan A, Harris RS, Chiaromonte F, Taylor J, He JB, Rijnkels M, Griffiths-Jones S,
Ureta-Vidal A, HoffmanMM, Severin J, Searle SMJ, Law AS, Speed D,Waddington D, Cheng Z,
Tuzun E, Eichler E, Bao ZR, Flicek P, Shteynberg DD, Brent MR, Bye JM, Huckle EJ,
Chatterji S, Dewey C, Pachter L, Kouranov A, Mourelatos Z, Hatzigeorgiou AG, Paterson
AH, Ivarie R, Brandstrom M, Axelsson E, Backstrom N, Berlin S, Webster MT, Pourquie O,
Reymond A, Ucla C, Antonarakis SE, Long MY, Emerson JJ, Betran E, Dupanloup I,
Kaessmann H, Hinrichs AS, Bejerano G, Furey TS, Harte RA, Raney B, Siepel A, Kent WJ,
Haussler D, Eyras E, Castelo R, Abril JF, Castellano S, Camara F, Parra G, Guigo R, Bourque
G, Tesler G, Pevzner PA, Smit A, Fulton LA, Mardis ER, Wilson RK (2004) Sequence and
comparative analysis of the chicken genome provide unique perspectives on vertebrate evolu-
tion. Nature 432(7018):695–716
Huey RB, Janzen FJ (2008) Climate warming and environmental sex determination in tuatara: the
last of the Sphenodontians? Proc R Soc Lond B Biol Sci 275(1648):2181–2183
Janes DE, Wayne ML (2006) Evidence for a genotype � environment interaction in sex-deter-
mining response to incubation temperature in the leopard gecko, Eublepharis macularius.Herpetologica 62(1):56–62
1 Extinct and Extant Reptiles 15

Janes DE, Bermudez D, Guillette LJ, Wayne ML (2007) Estrogens induced male production at a
female-producing temperature in a reptile (Leopard Gecko, Eublepharis macularius) with
temperature-dependent sex determination. J Herpetol 41(1):9–15
Janes DE, Organ C, Valenzuela N (2008) New resources inform study of genome size, content, and
organization in nonavian reptiles. Integr Comp Biol 48(4):447–453
Janes DE, Ezaz T, Graves JAM, Edwards SV (2009) Recombination and nucleotide diversity in
the sex chromosomal pseudoautosomal region of the emu, Dromaius novaehollandiae. J Hered100(2):125–136
Janes DE, Fujita MK, Organ CL, Shedlock AM, Edwards SV (2010a) Genome evolution in
Reptilia, the sister group of mammals. Annu Rev Genom Hum Genet (in press)
Janes DE, Organ CL, Edwards SV (2010b) Variability in sex-determining mechanisms influences
genome complexity in Reptilia. Cytogenet Genome Res 127(2–4):242–248
Janzen FJ, Krenz JG (2004) Phylogenetics: which was first, TSD or GSD? In: Valenzuela N,
Lance VA (eds) Temperature-dependent sex determination in vertebrates. Smithsonian Books,
Washington, DC, pp 121–130
Just W, Rau W, Vogel W, Akhverdian M, Fredga K, Graves JAM, Lyapunova E (1995) Absence
of Sry in species of the vole Ellobius. Nat Genet 11(2):117–118Kawagoshi T, Uno Y, Matsubara K, Matsuda Y, Nishida C (2009) The ZW micro-sex chromo-
somes of the chinese soft-shelled turtle (Pelodiscus sinensis, Trionychidae, Testudines) havethe same origin as chicken chromosome 15. Cytogenet Genome Res 125:125–131
Kawai A, Nishida-Umehara C, Ishijima J, Tsuda Y, Ota H, Matsuda Y (2007) Different origins of
bird and reptile sex chromosomes inferred from comparative mapping of chicken Z-linked
genes. Cytogenet Genome Res 117(1–4):92–102
Kawai A, Ishijima J, Nishida C, Kosaka A, Ota H, Kohno S, Matsuda Y (2009) The ZW sex
chromosomes of Gekko hokouensis (Gekkonidae, Squamata) represent highly conserved
homology with those of avian species. Chromosoma 118(1):43–51
King RB, Lawson R (1996) Sex-linked inheritance of fumarate hydratase alleles in natricine
snakes. J Hered 87:81–83
Lang JW, Andrews HV (1994) Temperature-dependent sex determination in crocodilians. J Exp
Zool 270(1):28–44
Mank JE (2009) The W, X, Y and Z of sex-chromosome dosage compensation. Trends Genet
25(5):226–233
Matsubara K, Tarui H, Toriba M, Yamada K, Nishida-Umehara C, Agata K, Matsuda Y (2006)
Evidence for different origin of sex chromosomes in snakes, birds, and mammals and step-wise
differentiation of snake sex chromosomes. Proc Natl Acad Sci USA 103(48):18190–18195
Melamed E, Arnold AP (2007) Regional differences in dosage compensation on the chicken Z
chromosome. Genome Biol 8(9):R202
Mitchell NJ, Nelson NJ, Cree A, Pledger S, Keall SN, Daugherty CH (2006) Support for a rare
pattern of temperature-dependent sex determination in archaic reptiles: evidence from two
species of tuatara (Sphenodon). Front Zool 3:9Ohno S (1967) Sex chromosomes and sex linked genes. Springer, Berlin
Organ CL, Janes DE (2008) Evolution of sex chromosomes in Sauropsida. Integr Comp Biol 48
(4):512–519
Organ CL, Janes DE, Meade A, Pagel M (2009) Genotypic sex determination enabled adaptive
radiations of extinct marine reptiles. Nature 461(7262):389–392
Payer B, Lee JT (2008) X chromosome dosage compensation: how mammals keep the balance.
Annu Rev Genet 42:733–772
Pokorna M, Kratochvil L (2009) Phylogeny of sex-determining mechanisms in squamate reptiles:
are sex chromosomes an evolutionary trap? Zool J Linn Soc 156(1):168–183
Quinn AE, Georges A, Sarre SD, Guarino F, Ezaz T, Graves JAM (2007) Temperature sex reversal
implies sex gene dosage in a reptile. Science 316(5823):411
Rice WR (1987) Genetic hitchhiking and the evolution of reduced genetic activity of the Y sex
chromosome. Genetics 116(1):161–167
16 D.E. Janes

Sarre SD, Georges A, Quinn A (2004) The ends of a continuum: genetic and temperature-
dependent sex determination in reptiles. Bioessays 26(6):639–645
Shine R, Warner DA, Radder R (2007) Windows of embryonic sexual lability in two lizard species
with environmental sex determination. Ecology 88(7):1781–1788
Sinclair AH, Berta P, Palmer MS, Hawkins JR, Griffiths BL, Smith MJ, Foster JW, Frischauf AM,
Lovell-badge R, Goodfellow PN (1990) A gene from the human sex-determining region
encodes a protein with homology to a conserved DNA-binding motif. Nature 346(6281):
240–244
Smith CA, Roeszler KN, Ohnesorg T, Cummins DM, Fairlie PG, Doran TJ, Sinclair AH (2009)
The avian Z-linked gene DMRT1 is required for male sex determination in the chicken. Nature
461:267–271
Solari AJ (1994) Sex chromosomes and sex determination in vertebrates. CRC Press, Boca
Raton, FL
Standora EA, Spotila JR (1985) Temperature-dependent sex determination in sea turtles. Copeia
3:711–722
Uller T, Mott B, Odierna G, Olsson M (2006) Consistent sex ratio bias of individual female dragon
lizards. Biol Lett 2(4):569–572
Valenzuela N (2004) Introduction. In: Valenzuela N, Lance VA (eds) Temperature-dependent sex
determination in vertebrates. Smithsonian Books, Washington, DC, pp 1–4
Valenzuela N, LeClere A, Shikano T (2006) Comparative gene expression of steroidogenic factor
1 in Chrysemys picta and Apalone mutica turtles with temperature-dependent and genotypic
sex determination. Evol Dev 8(5):424–432
Viets BE, Tousignant A, Ewert MA, Nelson CE, Crews D (1993) Temperature-dependent sex
determination in the leopard gecko, Eublepharis macularius. J Exp Zool 265(6):679–683
Viets BE, Ewert MA, Talent LG, Nelson CE (1994) Sex-determining mechanisms in squamate
reptiles. J Exp Zool 270(1):45–56
Vogel W, Jainta S, Rau W, Geerkens C, Baumstark A, Correa-Cerro LS, Ebenhoch C, Just W
(1998) Sex determination in Ellobius lutescens: the story of an enigma. Cytogenet Cell Genet
80(1–4):214–221
Wagner E (1980) Temperature-dependent sex determination in a gekko lizard. Q Rev Biol 55:21,
appendix
Warner DA, Shine R (2008) The adaptive significance of temperature-dependent sex determina-
tion in a reptile. Nature 451(7178):566–568
Warner DA, Shine R (2009) Maternal and environmental effects on offspring phenotypes in an
oviparous lizard: do field data corroborate laboratory data? Oecologia 161(1):209–220
While GM, Wapstra E (2009) Snow skinks (Niveoscincus ocellatus) do not shift their sex
allocation patterns in response to mating history. Behaviour 146:1405–1422
1 Extinct and Extant Reptiles 17

Chapter 2
Constraints, Plasticity, and Universal Patterns
in Genome and Phenome Evolution
Eugene V. Koonin and Yuri I. Wolf
Abstract Evolutionary genomics identifies multiple constraints that differentially
affect different parts of the genomes of diverse life forms. The selective pressures
that shape the evolution of viral, prokaryotic, and eukaryotic genomes differ
dramatically, and substantial differences exist even between animal and bacterial
lineages. Constraints on protein evolution appear to be more universal and could be
determined by the fundamental physics of protein folding. Some key features of the
molecular phenome such as protein abundance turn out to be unexpectedly con-
served and hence strongly constrained. The constraints that shape the evolution
of genomes and phenomes are complemented by the plasticity and robustness
of genome architecture, expression, and regulation. Several universal “laws” of
genome and phenome evolution were detected, some of which seem to be dictated
by selective constraints and others by neutral process.
2.1 Introduction
In principle, the entire genome of any life form can be perceived as evolving under
constraints (purifying selection) the strength of which varies from 0 (unconstrained
evolution) to 1 (absolute conservation). Moreover, constraints affect evolution at all
levels of biological organization, from genome sequence to genome architecture to
gene expression to molecular interactions to actual organismal phenotypes (Kimura
1983; Lynch 2007c). Generally, constraints on the rates and paths of evolution can
be divided into genomic, those that are manifest at the level of the genome sequence
and architecture, and phenomic, those that pertain to phenotypic characteristics
(although ultimately realized through genomic changes as well). Comparative
E.V. Koonin and Y.I. Wolf
National Center for Biotechnology Information, National Library of Medicine, National Institutes
of Health, Bethesda, MD 20892, USA
e-mail: [email protected]
P. Pontarotti (ed.), Evolutionary Biology – Concepts, Molecularand Morphological Evolution, DOI 10.1007/978-3-642-12340-5_2,# Springer-Verlag Berlin Heidelberg 2010
19

genomics and systems biology produce massive amounts of diverse data that
provide for previously inconceivable insights into the patterns and processes of
genome and phenome evolution (Kitano 2002; Medina 2005; Koonin and Wolf
2006; Lynch 2007c; Loewe 2009; Yamada and Bork 2009).
Comparative genomics allows us, at least in principle, to measure the strength of
constraints that affect different classes of sites in genomes and to elucidate the
biological nature of these constraints. However, genome comparison does more
than that as it gives us material to address evolutionary constraints beyond the
traditional aspect of sequence conservation to higher level questions such as: how
constrained in evolution are gene repertoires of organisms, genome architecture,
evolution rate itself, and more? The massive influx of data from systems biology
takes the study of evolutionary constraints into new dimensions by allowing
researchers to ask qualitatively new questions: what are the nature and strength of
constraints that affect gene expression, regulatory, and interaction networks, meta-
bolic fluxes and other characteristics of organisms that can be denoted “molecular
phenome”?
In this article, we present a broad overview of the constraints that affect gene
sequences, genome architectures, and molecular phenotypic characteristics such as
gene expression level and the structures of protein–protein interaction and regu-
latory networks. We attempt a genome-wide and organism-wide assessment of
different types of constraints operative at different levels and additionally discuss
the concepts of robustness and plasticity that are intimately linked to constraints.
Of course, the subject we address is vast and cannot be reasonably covered in full
in one, relatively brief review. We leave out some important areas such as deve-
lopmental constraints and only fleetingly touch upon others such as evolution of
regulatory networks. Nevertheless, it is our hope that even such sketchy discussion
reveals some important general aspects of constraints that define evolution at
diverse levels of biological organization.
2.2 Evolutionary Constraints on Sequence Evolution
Across Genomes and Taxa
The origins and characteristic strengths of constraints that affect different classes of
sequences in genomes of different life forms are extremely diverse and certainly are
not yet known in full. Typically, the constraints on sequences encoding proteins and
structural RNAs (such as rRNAs and tRNAs) are stronger than the constraints on
noncoding sequences although, for each type of sequences, there is a broad distri-
bution of constraint strengths, and the ranges of the distributions overlap (Shabalina
and Kondrashov 1999; Margulies et al. 2007). Obviously, constraints that affect a
particular class of sites can be measured only by comparison to another class of sites
that can be construed to evolve neutrally. The choice of an appropriate neutral
model is a major problem in molecular evolution. In the pregenomic era, Motoo
20 E.V. Koonin and Y.I. Wolf

Kimura, the founder of the neutral theory, was the first to come up with the simple
but important idea that pseudogenes that are numerous in vertebrates could be used
as a neutral baseline for assessing selection pressure (Kimura 1983). Despite some
exceptional cases of pseudogene recruitment for specific functions (Khachane and
Harrison 2009), in general, this contention still appears to hold true (Harrison and
Gerstein 2002). Genomics revealed additional sources of (apparently) neutrally
evolving sequences such as introns and intergenic regions in animals (Parsch
et al. 2010; Resch et al. 2007). However, a general difficulty with any attempt to
define a universal baseline of neutral evolution is that different parts of a genome
differ in their mutation rates, and consequently, in the rate of neutral evolution for
which the fixation rate equals the mutation rate (Ellegren et al. 2003). Therefore, for
a reliable estimate of the strength of selection/constraints, the neutral model has to
be derived from the same gene/region for which selection is being measured.
Several such measures have been developed (Nielsen 2005; Charlesworth and
Eyre-Walker 2008; Eyre-Walker and Keightley 2009). The most popular gage of
selection pressure for protein-coding sequences naturally follows from the redun-
dancy and nonrandom structure of the genetic code in which the same amino acid
typically is encoded by codons that differ only in their third (or less commonly first)
positions. This measure, Ka/Ks (dN/dS), is the ratio of the number or rate of
nonsynonymous substitutions (those that change an amino acid in the encoded
protein) to the number or rate of synonymous substitutions (those that occur in
synonymous positions of codons and so do not affect the protein sequence) (Hurst
2002; Ellegren 2008). The assumption that underpins the use of Ka/Ks as a measure
of selection is that synonymous sites evolve neutrally or at least under weak
selection compared with nonsynonymous sites, allowing the use of synonymous
sites as the baseline to measure the constraints on protein evolution. As a crude
approximation, this assumption holds as for the great majority of protein-coding
genes from any organism, Ka/Ks << 1 indicating that, taken as a whole, most
proteins are subject to purifying selection of widely differing strength (Fig. 2.1).
Moreover, the distribution of Ka spans a substantially wider range of values than
the distribution of Ks, indicating that the constraints affecting proteins are qualita-
tively different from and much more diverse than those affecting synonymous sites
(Fig. 2.1). For unconstrained, neutral evolution, Ka ¼ Ks as is the case for most
pseudogenes. For a small subset of protein-coding genes, Ka/Ks > 1, which is
construed as evidence of evolution under positive selection. Genes evolving under
positive selection encode specialized proteins for which rapid change is paramount
for function that typically involves “arms race” between competing agencies
such as hosts and parasites; examples include proteins bacterial surface proteins
(Petersen et al. 2007; Muzzi et al. 2008) and proteins involved in mammalian
spermatogenesis, sperm competition, and sperm–egg interaction (Nielsen et al.
2005; Turner et al. 2008). Of course, evolution under positive selection is not
unconstrained as constraints on the overall protein structure still apply (Worth
et al. 2009) but evolution along the available trajectories proceeds rapidly.
The fact that most protein-coding genes evolve under constraints imposed by
purifying selection by no means implies that all amino acid sites are subject to the
2 Constraints, Plasticity, and Universal Patterns in Genome and Phenome Evolution 21

same constraints. On the contrary, the evolutionary rates of sites and by implication
the strength of constraints affecting different sites are well described by a charac-
teristic skewed Gamma distribution (or more precisely a mixture of Gamma
distribution), with a small fraction of sites that are virtually unconstrained or, in
some cases, subject to positive selection and the majority of the sites subject to
broadly distributed constraints (Kelly and Churchill 1996; Grishin et al. 2000;
Mayrose et al. 2005; Nielsen 2005).
The characteristic strengths of constraints that affect evolution of protein-coding
genes widely differ between organisms. Typically, prokaryotic proteins are sub-
ject to stronger constraints than eukaryotic proteins, especially, those of multi-
cellular forms (plants and animals), with the characteristic median Ka/Ks valuesin the range of 0.01–0.1 and 0.1–0.5, respectively (Fig. 2.1) (Jordan et al. 2002;
0.001 0.01 0.1 1 10
dN/dS ratio for orthologs
Human-Macaque
B.cenocepacia-B.vietnamiensis
Aspergillus-Neosartorya
0.0001 0.001 0.01 0.1 1 10
distance between Human and Macaque orthologs
dN
dS
Fig. 2.1 The distributions of evolutionary rates for nonsynonymous and synonymous sites of
protein-coding genes in primates and the Ka/Ks ratios for three diverse pairs of species (Wolf et al.
2009)
22 E.V. Koonin and Y.I. Wolf

Novichkov et al. 2009b). The values of Ka/Ks and by inference the strength of
constraints widely differ between evolutionary lineages such as diverse lineages of
bacteria and archaea, and seem to be related to the specific lifestyles of the
respective organisms (Novichkov et al. 2009b).
The assumption that synonymous sites in protein-coding genes evolve neutrally
is useful for measuring selection acting at the protein level but in itself is a rough
approximation at best. The universally observed, significant positive correlation
between Ka and Ks (Makalowski and Boguski 1998; Drummond and Wilke 2008,
2009; Ellegren 2008) indicates that evolution of synonymous sites is constrained as
well and suggests that the evolutionary forces that shape the evolution of non-
synonymous and synonymous sites are related (see the section on protein evolution
below).
More accurate and powerful tests for purifying and positive selection affecting
different classes of sites are variations of the classic McDonald–Kreitman test
which compares the patterns of substitutions for within species variation (poly-
morphisms) with those for between species divergences, under the assumption that
the fraction of nonneutral polymorphisms is negligible (Nielsen 2001, 2005).
The overall distributions of constraints across genomes are dramatically different
in life forms with distinct genome architectures, in particular, between viruses and
prokaryotes, on the one hand, with their “wall-to-wall” genomes that consist mostly
of protein-coding and RNA-coding genes, and multicellular eukaryotes in whose
genomes the coding nucleotides are in the minority, on the other hand (Lynch and
Conery 2003; Koonin 2009a) (Fig. 2.2). On a per nucleotide basis, the constraints
affecting compact genomes, particularly, those of prokaryotes are orders of magni-
tude greater than the constraints on the larger genomes of multicellular eukaryotes.
Considering the characteristic low Ka/Ks values indicative of strongly constrained
evolution of protein sequences (Fig. 2.1), there are almost no sequences whose
evolution is (effectively) unconstrained in the compact viral and prokaryotic gen-
omes. The notable exception are pseudogenes that are common in some parasitic
bacteria such as Rickettsia or Mycobacterium leprae (Harrison and Gerstein 2002;
Darby et al. 2007; Monot et al. 2009). In typical genomes of free-living prokaryotes
and especially viruses, noncoding regions constitute only 10–15% of the genome,
and a considerable fraction of these sequences consists of regulatory elements
(promoters, operators, terminators, and translation initiation regions) whose evolu-
tion is variably constrained (Molina and van Nimwegen 2008). The genomes of
most viruses are even more compact than prokaryotic genomes, with nearly all of
the genome sequence taken up by protein-coding genes (Koonin 2009a).
Unicellular eukaryotes resemble prokaryotes in their overall genome architec-
ture (notwithstanding important differences such as the absence of operons and the
presence of varying numbers of introns) and show a roughly similar distribution of
evolutionary constraints although the fraction of apparently unconstrained noncod-
ing sequences in these genomes is somewhat greater. However, the genomes of
multicellular eukaryotes (plants and especially animals) present a stark contrast.
These organisms have intron-rich genomes with long intergenic regions, and a
substantial, albeit variable fraction of these noncoding sequences indeed appear to
2 Constraints, Plasticity, and Universal Patterns in Genome and Phenome Evolution 23

undergo unconstrained evolution (Fig. 2.2). Using McDonald–Kreitman-based
approaches, it is possible to estimate the fraction of the nucleotides in a genome
that are subject to evolutionary constraints (Sella et al. 2009). These estimated
fractions substantially differ even between animals: in Drosophila, �70% of the
sites including �65% of the noncoding sites appear to be subject to selection
(including positive selection) (Sella et al. 2009), whereas in mammals, this fraction
is estimated at 5–6% only as determined using repeats ancestral to human and
mouse as a neutral baseline (Waterston et al. 2002). An independent approach based
on the deviations from the expected neutral distribution of insertions and deletions
in mammalian genomes led to an even lower value of�3% of sites under constraint
(Lunter et al. 2006). It is notable, however, that the absolute numbers of sites
subject to selection in these animal genomes of widely different size are quite
close. By contrast, in Arabidopsis, a plant that is comparable toDrosophila in terms
of genome size and overall architecture, the fraction of constrained noncoding sites
appears to be substantially lower.
The estimate of 3–6% for the fraction of constrained sites in mammalian
genomes is remarkable from two opposite standpoints. On the one hand, it appears
that the great majority of the mammalian genomic DNA after all fits the early (and
much maligned) definition of junk (Doolittle and Sapienza 1980). Of course,
0%
20%
40%
60%
80%
100%
ORFs
control elementsintrons
"junk" genome
strong constraints
weak constraints
viru
ses
prok
aryo
tes
unic
ellu
lar
euka
ryot
es
mul
tiice
llula
reu
kary
otes
Fig. 2.2 Approximate distribution of evolutionary constraints across genomes with different
architectures. The fractions of different classes of sequences subject to constraints of varying
strength are shown as rough approximation of the values that are typical of the respective class of
genomes
24 E.V. Koonin and Y.I. Wolf

recruitment of “junk” sequences, such as those of diverse transposable elements,
for various functions is common (Jordan et al. 2003; Bowen and Jordan 2007), so
yesterday’s junk can be today’s essential gene (and vice versa) but at any given
time, most of the primate genome evolves without appreciable constraints. But the
converse aspect of these estimates is that, as protein-coding sequences comprise
only �1.2% of the genome (Waterston et al. 2002), the substantial majority of the
selected sites do not encode amino acids. We still do not know the actual distribu-
tion of the constrained sites among different classes of sequences or the distribution
of selection pressures but some important contributions and their approximate
magnitudes have become clear. In particular, the selective pressure on 50-terminal
and especially long 30-terminal untranslated regions of mammalian genomes is
comparable to that affecting synonymous sites in coding regions if not stronger
(Duret et al. 1993; Shabalina et al. 2004; Drake et al. 2006). An even greater
contribution to the noncoding part of the mammalian “selectome” using the term
in the most general sense as the totality of sites subject to all form of selection as
opposed to the original usage limited to positive selection (Proux et al. 2009) is the
ever-growing compendium of noncoding RNA genes present in vertebrate gen-
omes, the RNome (Costa 2005). A major and currently best characterized part of
the RNome consists of thousands of regulatory microRNAs that are subject to a
broad range of evolutionary constraints (Shabalina and Koonin 2008; Carthew
and Sontheimer 2009). In addition, there are numerous long noncoding (macro)
RNAs the functions of which remain largely unclear although there is striking
anecdotal evidence of roles of these RNAs in gene regulation and development
(Ponting et al. 2009). Approximately 3,000 macroRNAs were found to be con-
served in mammals and are subject to a selective pressure that appears to be
comparable to the constraints affecting protein-coding genes (Ponjavic et al. 2007).
Beyond doubt, the known part of the RNome is the proverbial tip of the iceberg,
especially considering the detection of transcripts from nearly all sequences in
mammalian genomes (Bertone et al. 2004; Johnson et al. 2005). Comparative-
genomic analysis reveals numerous conserved sequences (including the so-called
ultraconserved elements that retained their identity throughout long evolutionary
spans such as the entire course of vertebrate evolution) within introns and intergenic
regions of animals and plant genomes (Dermitzakis et al. 2005; Elgar 2009), but so
far transcription into a specific functional RNA has been demonstrated only for a
few of these (Bejerano et al. 2004; Baira et al. 2008). Nevertheless, it has been
shown that the ultraconserved sequences are subject to “ultraselection” suggesting
key functions that remain to be deciphered (Katzman et al. 2007). On the whole, the
problem of evolutionarily constrained “dark matter” in animal genomes remains
pertinent as the status of the majority of constrained nucleotides is still unclear, at
least, in vertebrates, the organisms with the lowest known gene density. In parti-
cular, the extent of sequence conservation unrelated to transcription but rather
caused by requirements of expression regulation, chromatin structure, and other
factors is still a wide open question.
To succinctly summarize the current understanding of the constraints affecting
different types of sites across the known diversity of the genomes (Fig. 2.2), some
2 Constraints, Plasticity, and Universal Patterns in Genome and Phenome Evolution 25

fundamental, straightforward conclusions appear indisputable, in particular, that
nonsynonymous sites in protein-coding sequences and sequences encoding struc-
tural RNAs are among the most strongly constrained and that the characteristic
distributions of constraints critically depend on genome architecture. However,
beyond these basic principles, and perhaps unexpectedly, the evolutionary regimes
seem to widely differ even for rather closely related lineages, and much additional
work in diverse organisms is required to develop a comprehensive picture of the
constraints and pressures that shape genome evolution.
2.3 Evolutionary Constraints on Gene and Genome
Architectures
Beyond sequence evolution, comparative genomics yields massive amounts of
data on the evolution of gene and genome organization, or architecture. An aspect
of gene architecture that is common to all life forms but is particularly prominent
in eukaryotes is the multidomain organization of proteins (Koonin et al. 2000).
Numerous proteins consist of multiple “evolutionary domains” that may or may not
correspond to structural domains but in either case show varying degrees of
evolutionary mobility. The multidomain organization of some key proteins is
conserved through the entire course of evolution of domains of cellular life
(archaea, bacteria, and eukaryotes), as is the case of the association of polymerase
domains with nuclease domains in different families of DNA polymerases (Aravind
and Koonin 1998), to mention just one striking example. More generally, however,
domain rearrangements at all ranges of evolutionary distances form an important
resource of evolutionary plasticity which is particularly remarkable in the case of
so-called promiscuous domains which combine with diverse other domains in
numerous proteins and often provide connections in interaction and regulatory
networks and complexes (Wuchty and Almaas 2005; Basu et al. 2008, 2009).
A feature of gene architecture that is almost fully eukaryote-specific is the
exon–intron organization of protein-coding genes which in eukaryotes consist of
multiple exons separated by introns. A notable discovery of comparative genomics
is the high level of conservation of intron positions over long evolutionary spans:
indeed, up to 25–30% of the intron positions are shared between animals and plants,
with the implication that most of these introns remained in the same positions
throughout eukaryotic evolution (Fedorov et al. 2002; Rogozin et al. 2003; Roy and
Gilbert 2006). Within some of the animals lineages, in particular, vertebrates, there
seems to be almost complete intron stasis, with minimal intron loss and virtually no
gain. In a sharp contrast, evolution of other lineages, such as nematodes, as well as
many groups of unicellular eukaryotes, involves extensive turnover of introns
(Carmel et al. 2007; Roy and Penny 2007). Thus, evolution of eukaryotic gene
architecture shows a complex landscape, with a dynamic evolutionary process in
some lineages but much less change in others.
26 E.V. Koonin and Y.I. Wolf

Genome architecture refers to all aspects of the mapping of genetic elements
onto the genome including gene order, clustering, and co-regulation of genes with
related functions, allocation of genes to individual chromosomes, etc. (Carmel et al.
2007; Lynch 2007c; Roy and Penny 2007; Koonin 2009a). The very first compar-
isons of the order of genes in sequenced bacterial genomes revealed a remarkable
lack of conservation of the long-range gene order which contrasts with the recurrent
presence of partially conserved arrays of co-regulated genes, operons, in diverse
prokaryotes (Mushegian and Koonin 1996a; Dandekar et al. 1998). Subsequent
analysis has shown that the divergence of long-range gene orders in prokaryotes is
roughly proportional to sequence divergence of protein-coding genes but evolution
of gene order is extremely fast such that, for many lineages, no long-range conser-
vation is seen even at very low levels of sequence divergence. Beyond this general
pattern, the rate of gene order decay substantially differs between prokaryotic
lineages (Novichkov et al. 2009b) (Fig. 2.3). The gene order in prokaryotes appears
to be disrupted primarily by inversions centered at the origin of replication the
frequency of which dramatically differs among prokaryotes (Eisen et al. 2000).
Apparently, the origin-centered inversion is a neutral process that is not constrained
(or minimally constrained) by purifying selection and depends primarily on the
activity of the relevant recombination machinery.
In contrast to the lack of conservation of the long-range gene order, prokaryotic
operons are characterized by a combination of evolutionary resilience and plasti-
city, forming overlapping gene arrays that are partially shared by evolutionarily
0
0.05
0.1
0.15
0.2
0.25
0.3
0 0.5 1 1.5 2 2.5
Gen
om
e re
arra
ng
emen
t d
ista
nce
(d
Y)
Sequence distance (dS)
Shewanella baltica
Bacillus anthracis
Burkholderia ambifaria
Yersinia pestis
Fig. 2.3 Divergence of large-scale genome organization vs. protein sequence conservation. The
data are shown for four sets of closely related bacterial strains from the ATGC database (Novichkov
et al. 2009a). The rearrangement distance (dY) is calculated as the fraction of (putative) orthologs
that do not belong to regions of synteny. The dS value of 1 approximately corresponds to 93–97%
identity between the compared sequences (Novichkov et al. 2009b)
2 Constraints, Plasticity, and Universal Patterns in Genome and Phenome Evolution 27

distant organisms (Rogozin et al. 2002; Ling et al. 2009). To a large extent, the wide
spread of some operons among prokaryotes (the ribosomal superoperon and mem-
brane transport cassette operons being the prime cases in point) owes to horizontal
gene transfer (HGT) as captured in the selfish operon concept (Lawrence and Roth
1996; Lawrence 1999). When a transferred piece of DNA includes an entire operon
consisting of genes encoding a complete pathway or functional system, the chances
of fixation dramatically increase. The lack of long-range gene order conservation
notwithstanding, the gross architecture of prokaryotic genomes is not entirely
unconstrained: there are substantial biases in gene localization, for instance, the
preferential codirectionality of gene transcription with replication, conceivably, as
a result of selection for minimization of the chance of collision between RNA
polymerase and replication forks (Rocha 2008).
With a few notable exceptions, such as nematodes and trypanosomes, eukaryotes
have no operons; those operons that do exist have nothing to do with prokaryotic
operons and seem to have evolved de novo (Blumenthal 2004; Osbourn and Field
2009). Attempts to identify nonrandomness in the eukaryotic gene order, in the
form of clustering of genes with connected functions, similar expression levels, and
patterns, and other similar characteristics have led to mixed results (Hurst et al.
2004; Koonin 2009a; Osbourn and Field 2009). With some striking exceptions such
as the strict order of the animal Hox genes (Lemons and McGinnis 2006), the trends
in gene clustering tend to be weak, so the gene order can be considered quasi-
random (Koonin 2009a). Evolution of gene order in eukaryotes seems to be
determined, primarily, by random chromosomal breaks, and there are no highly
conserved gene arrays between distantly related forms, such as different animal
phyla, let alone animals and fungi or plants.
On the whole, evolution of genome architecture appears to be shaped by the
interplay of strong constraints that determine the conservation of operons, weak
constraints on other forms of functional clustering and large-scale gene organiza-
tion, and extensive dynamics of genome rearrangements and HGT. This dynamics
both counteracts weak constraints by disrupting gene associations and reinforces
the effect of stronger constraints as in the case of horizontal spread of “selfish”
operons.
2.4 Evolutionary Constraints on Genome Size, Gene
Number, Evolution of Orthologous Gene Lineages,
and Gene Repertoires
The number of protein-coding genes in cellular life forms varies within a surpris-
ingly narrow range compared with the genome size and especially considering the
difference in organizational complexity between prokaryotes and multicellular
eukaryotes. Excluding, on one end of the spectrum, extremely reduced genomes
of some intracellular parasitic bacteria that seem to be on their way to becoming
28 E.V. Koonin and Y.I. Wolf

organelles (Nakabachi et al. 2006) and, on the other end, polyploid plant genomes,
the number of encoded proteins varies only from �500 to �25,000, less than two
orders of magnitude (Koonin 2009a). The largest known bacterial genome contains
only about twofold fewer protein-coding genes than the most complex eukaryotic
genomes. As already mentioned above, the genome architectures are drastically
different between unicellular and multicellular life forms, so that in unicellular
organisms, especially in prokaryotes, the number of encoded proteins closely
correlates with the genome size (roughly constant gene density, around one gene
per kilobase of DNA), whereas in multicellular organisms, especially animals, the
two are decoupled.
What constrains the number of encoded proteins from below and from above?
The low threshold of genomic complexity intuitively relates to a “minimal gene set
for cellular life”, that is, the minimal set of genes sufficient to maintain a functional
cell (in practice, of course, a prokaryotic cell) (Koonin 2003; Moya et al. 2009). The
concept of a minimal gene set is intrinsically linked to the definition of gene
orthology and orthologous gene sets and nonorthologous gene displacement. Ortho-
logs are genes that evolved from a single ancestral gene in the last common ancestor
of the compared genomes in contrast to paralogs, genes that evolved by duplication
(Koonin 2005). For the majority of genes, evolution of orthologous gene lineages is
constrained within a distinct trajectory so that such lineages remain unique and
distinguishable from each other over long evolutionary spans. This evolutionary
distinctness of orthologous lineages provides for the considerable effectiveness of
straightforward methods for identifications of orthologous genes sets based on
“bidirectional best hits” and is key to comparative genomics allowing comprehen-
sive comparison of gene repertoires and delineation of core sets of conserved genes
and putative minimal gene sets (Tatusov et al. 1997; Altenhoff and Dessimoz 2009).
Minimal gene sets for cellular life derived by comparative-genomic and experimen-
tal approaches converge at 250–350 genes and seem to encode most of the essential
cellular functions (Koonin 2003; Moya et al. 2009). However, an apparent paradox
is that a set of 250–350 conserved orthologous genes can be derived only in
comparisons of small sets of genomes of not too diverse organisms as exemplified
by the first analysis of this kind that compared the parasitic bacteria Haemophilusinfluenzae and Mycoplasma genitalium and yielded a hypothetical minimal gene
set of approximately 250 genes (Mushegian and Koonin 1996b). The core set of
ubiquitously conserved genes is continuously shrinking with the addition of new
sequenced genomes and seems to be limited to approximately 30 genes, all encoding
proteins involved in translation and transcription (Charlebois and Doolittle 2004;
Koonin and Wolf 2008). The explanation is nonorthologous gene displacement:
most of the essential cellular functions can be performed by members of more than
one orthologous gene set, and in many cases, genes or systems responsible for the
same function are completely unrelated (Koonin et al. 1996; Koonin 2003). The
relevant concept for defining a minimal genetic complement of a cell – the low
bound of genomic complexity – is not a unique minimal gene set but rather a unique
set of indispensable functional niches that can be filled with diverse collections of
genes. Minimal requirements for specific life styles can be defined similarly, for
2 Constraints, Plasticity, and Universal Patterns in Genome and Phenome Evolution 29

instance, the minimal gene complement of an autotrophic organism, which includes
about 1,000 essential functions (Koonin 2003). Thus, the low bound is defined by
the minimal number of functions that are necessary to support a particular life style,
but even at this fundamental level of cellular organization, there is notable plasticity
in terms of specific gene complements supporting these functions.
The nature of the upper bound of genetic complexity is much less clear. However,
the question why, despite the accelerating genome sequencing, the maximum number
of genes practically does not grow, seems pressing, especially, considering the
decoupling of gene number and genome size seen in multicellular prokaryotes. One
attractive hypothesis is the “bureaucratic ceiling of complexity”. It has been noticed
that different functional classes of genes scale differently with the total number of
genes in a genome. Some variation notwithstanding, in prokaryotes, there seem to be
three fundamental exponents that characterizes these dependences: 0, 1, and 2 (van
Nimwegen 2003; Koonin andWolf 2008). Genes for proteins involved in information
processing (translation, transcription, and replication) scale with a 0 exponent, i.e.,
the number of these genes reaches a plateau already in the smallest genomes and
effectively does not depend on the overall genomic complexity; metabolic enzymes
and transport proteins scale roughly proportionally to the total number of genes,
whereas regulators and signal transduction system components scale quadratically
(Fig. 2.4). The characteristic exponents of the three broad functional classes of genes
show remarkably little variation across prokaryotic lineages suggesting that the
differential evolutionary dynamics of genes with different functions reflect funda-
mental “laws” of evolution of cellular organization (Molina and van Nimwegen
2009) or, in other words, distinct, strong constraints on the functional composition
1
10
100
1000
10000
100 1000 10000
Nu
mb
er o
f p
rote
ins
in t
he
clas
s
Total number of proteins in COGs
Transcriptional regulators
Signal transduction
Metabolism
Translation
g= 1.9
g= 1.0
g= 1.9
γ = 0.2
Fig. 2.4 Differential scaling of four broad classes of genes with the total number of genes in
prokaryotic genomes. The data are from (Koonin and Wolf 2008); genes that did not belong to
COGs (typically, 15–20% in each genome) were not taken into account
30 E.V. Koonin and Y.I. Wolf

of genomes. Eukaryotic genes show similar even if less pronounced patterns of power
law gene scaling, with the exponent for the regulatory genes being substantially
greater than one (van Nimwegen 2003).
The deep underlying causes of the superlinear scaling of the regulators remain to
be understood. A simple “toolbox” model of evolution of prokaryotic metabolic
networks seems to be compatible with the quadratic scaling of regulators (Maslov
et al. 2009). Under this model, enzymes for utilizing new metabolites together with
their dedicated regulators are added (primarily, via HGT) to a progressively versa-
tile reaction network, and because of the growing complexity of the preexisting
network that provides enzymes for intermediate reactions, the ratio of regulators to
regulated genes steadily grows. Regardless of the exact underlying mechanisms, the
superlinear scaling of the regulators clearly could determine the upper limit of the
growth of the gene number. At some point (that is not easy to identify precisely),
the cost of adding extra regulation (“inflating bureaucracy”) will inevitably become
unsustainable, curbing the growth of genetic complexity.
The bureaucracy ceiling hypothesis seems particularly plausible in view of the
surprising lack of major gene number expansion in vertebrates where the coupling
between the gene number and genome size is obviously broken (see also below). In
these organisms, the cost of replication can be ruled out as the major factor deter-
mining the upper limit, and the cost of regulation, possibly, along with the cost of
expression, is the most likely candidate for the role of the principal constraint. It is
not by chance, then, that vertebrates evolved other, elaborate means of increasing
the proteomic complexity, such as the pervasive alternative splicing and alternative
transcription (Nilsen and Graveley 2010), and regulatory complexity (the expan-
sive, still under-appreciated regulatory RNome) that do not involve inflation of the
number of protein-coding genes.
A major process of genome evolution that in eukaryotes could be the principal
path to innovation is gene duplication leading to the formation of paralogous gene
families (Ohno 1970; Lespinet et al. 2002). The size distribution of paralogous
families in each studied genome follows a power-law-like function that is repro-
duced, with a high precision, by a simple gene birth and death model conditioned on
the equilibrium (constant size) in genome evolution (Karev et al. 2002; Koonin
et al. 2002). This process seems to underlie a fundamental constraint on gene
demography that is coupled to the constraint on the total number of genes.
Beyond the sheer numbers of genes, comparative genomics yields insights into
the constraints on and plasticity of gene repertoires. In agreement with the findings
on the small and shrinking cores of conserved genes, nonorthologous gene dis-
placement, and extensive redundancy, gene loss has emerged as a major factor
of evolution in all life forms. Gene loss is dominant over other processes in the
evolution of parasites but is extensive in all lineages, in particular, in the evolution
of many animal taxa as illustrated by the high level of orthology between verte-
brates and primitive animals such as sea anemone and trichoplax, in contrast to
much more limited orthologous relationships between vertebrates and arthropods
or nematodes (Putnam et al. 2007; Srivastava et al. 2008). Individual genes show
a broad distribution of propensities for gene loss (PGL) (Krylov et al. 2003), and
2 Constraints, Plasticity, and Universal Patterns in Genome and Phenome Evolution 31

moreover, it appears that the observed evolutionary and phenomic features of genes
are compatible with a steady-state model of genome evolution under which the
distribution of PGL as well as the distribution of gene loss rate remain effectively
constant over extended evolutionary spans (Wolf et al. 2009). This distribution
might be another important constraint governing genome evolution.
2.5 The Causes of Evolution of Protein-Coding Genes
Protein-coding genes, at least, the nonsynonymous positions that determine the
amino acid identity, are among the most strongly constrained sequences in all
genomes. However, the distribution of the rates of evolution among orthologous
genes in any pair of compared genomes spans 3–4 orders of magnitude and is much
broader than the distribution of the rates for synonymous sites (Fig. 2.1). Remarkably,
the shapes of the rate distributions for orthologous proteins are highly similar for all
studied cellular life forms, from bacteria to archaea to mammals (Wolf et al. 2009)
(Fig. 2.5). Another universal of genomic and phenomic evolution is the anticorrela-
tion between the rate of evolution of a protein-coding gene and its expression level:
highly expressed genes evolve slowly, a dependence that was invariably observed in
all model organisms for which expression data are available (Pal et al. 2001, 2006;
Krylov et al. 2003; Drummond and Wilke 2008). Given the aforementioned positive
0.01 0.1 1 10
Relative evolution rate
Burkholderia
Salinispora
Methanococcus
Homo
Aspergillus
model
Fig. 2.5 The universal distribution of evolutionary rates across orthologous gene sets. The
evolutionary rates for five pairs of closely related organisms from different branches of life were
calculated as nucleotide distances for the complete sets of orthologous genes (Wolf et al. 2009).
The relative evolution rate for each gene was obtained by dividing its evolution rate by the median
rate for the respective pair of organisms. “Model” refers to estimated transition rates in 134
mutationally connected networks for simulated robustly folding 18-mer protein-like molecules
(Lobkovsky et al. 2010). Original model rates were normalized by their median value and scaled to
standard deviation of 0.25 to match the width of the distributions derived from biological data
32 E.V. Koonin and Y.I. Wolf

correlation between Ka and Ks, it is not surprising that both rates show the same
dependence; more unexpectedly, this anticorrelation with the evolutionary rate was
detected also for 30UTRs but not for 50UTRs (Jordan et al. 2004).
The existence of these universals of genomic evolution and their fundamental
link with phenomic characteristics suggest that the primary causes of protein
evolution could have more to do with fundamental principles of protein folding
than with unique biological functions. It has been proposed that the principal
selective factor underlying the evolution of proteins is robustness to misfolding,
owing to the deleterious effect of misfolded proteins that, in addition to the expen-
diture of energy, can be toxic to the cell (Drummond et al. 2005; Drummond and
Wilke 2008, 2009). Moreover, under this model, evolution of synonymous sites is
constrained, at least, in part, by the same factors as the evolution of proteins owing to
the pressure for the preferential use of optimal codons in highly expressed proteins
and in specific sites that are important for protein folding (Drummond and Wilke
2008; Zhou et al. 2009), and evolution of the 30UTRs could follow the same trend
(Jordan et al. 2004) as these regions are involved in the regulation of translation.
A recent modeling study of misfolding-dominated protein evolution that
employed a simple off-lattice model of protein folding and produced estimates of
evolutionary rates under the assumption that protein misfolding was the only source
of fitness cost (Lobkovsky et al. 2010) reproduced the universal distribution of
protein evolutionary rates as well as the dependence between evolutionary rate and
expression with considerable accuracy (Fig. 2.5). These findings suggest that the
universal rate distribution indeed might be a consequence of fundamental physics of
proteins and provide for a general model of protein evolution under which evolution
of a given protein is determined, primarily, by its intrinsic robustness to misfolding
which also determines the attainable level of translation (Fig. 2.6) (Wolf et al. 2010).
In general, the robustness of a protein to misfolding and accordingly the rate of
evolution are determined by the size of the (nearly) neutral network, that is, the
network of sequences that have approximately the same robustness and accordingly
the same fitness as the original sequence (Wagner 2008). Under the model (Wolf
et al. 2010), the nearly neutral network size is (roughly) inversely proportional to
the robustness of the original sequence, i.e., in the fitness landscape, robust, highly
expressed proteins occupy tall, steep peaks, with small areas of high fitness, hence
slow evolution; in contrast, proteins with lower robustness occupy lower and wider
peaks, with larger areas of high fitness, allowing faster evolution (Fig. 2.6).
The original hypothesis on misfolding-dominated evolution of protein-coding
genes held that misfolding was largely induced by mistranslation of the coding
sequence (Drummond and Wilke 2008, 2009). The latest analysis of the relative
contributions of structural–functional constraints and translation rate to protein
evolution imply that stochastic misfolding of the native sequence could be even
more common and consequential than mistranslation-induced misfolding (Wolf
et al. 2010). Nevertheless, mistranslation (somatic mutation), which is relatively
frequent [10�4–10�5 per codon (Kramer and Farabaugh 2007)], is likely to be an
important factor affecting the instantaneous shape of the robustness landscape by
temporarily expanding the nearly neutral network (Fig. 2.6).
2 Constraints, Plasticity, and Universal Patterns in Genome and Phenome Evolution 33

The view of protein evolution under which the primary constraints have to do
more with the maintenance of the native folding as well as intermolecular inter-
actions than with unique protein functions seems to be compatible with the recent
large-scale analysis of protein family evolution (Worth et al. 2009).
2.6 Constraints on Molecular Phenotypes
The advances of systems biology provide for direct evolutionary study of molecular
phenomic variables, such as gene expression, protein abundance, and architecture
of interaction networks. In other words, it is now possible to assess evolutionary
variance and constraints by directly comparing gene expression profiles and net-
works, protein abundances and other features of the molecular phenotype between
different organism and evolutionary lineages.
fold
ing
robu
stne
ss
at low expression(higher evolution rate)
at high expression(lower evolution rate)
fitness
low high
proteinfamily X
sequence space
proteinfamily Y
Fig. 2.6 A conceptual model of misfolding-driven protein evolution. The cartoon schematically
shows the robustness/fitness landscapes for two protein families at high and low expression levels.
The high fitness/robustness area (green) reflects the size of the nearly neutral network in the
sequence space
34 E.V. Koonin and Y.I. Wolf

Molecular phenomic variables, such as gene expression level and number of
interaction partners of a protein, show a distinct structure of dependences among
themselves and with evolutionary variables such as sequence evolution rate and the
rate of gene loss (Wolf et al. 2006). The correlations between phenomic variables
are typically positive, i.e., highly expressed proteins also tend to interact with many
other proteins, to have many paralogs etc., whereas the correlations between the
phenomic and evolutionary variables are negative, for instance, highly expressed
genes on average evolve slower than those expressed at a low level. Thus, as
exemplified by the model of protein evolution discussed above, constraints on the
ranges of phenomic variables, in part, appear to constrain evolution of gene
sequences, gene repertoires, and genome architectures.
Several studies suggested that gene expression in animals is not strongly con-
strained during evolution (Jordan et al. 2004; Khaitovich et al. 2004) or at least has a
major neutral component (Jordan et al. 2004; Khaitovich et al. 2004). However,
subsequent analyzes revealed clear signatures of selective constraints that affect
gene expression (Denver et al. 2005; Jordan et al. 2005; Gilad et al. 2006). Recently,
it has been shown that the abundances of orthologous proteins are strongly corre-
lated even among distantly related animals. A correlation coefficient greater than
0.8 was observed for approximately 3,000 orthologous genes from the nematode
C. elegans and the fly D. melanogaster, a value that is in sharp contrast with the
correlation coefficients in the range of 0.2–0.4 that are typically seen in comparisons
of genomic and molecular phenomic variables (Wolf et al. 2006). Strikingly, the
correlation between protein abundances was found to be substantially greater than
the correlation between mRNA expression rates and between the rates of coding
sequence evolution (measured by comparison of orthologous genes from pairs of
closely related species) within the same set of genes (Schrimpf et al. 2009; Wolf
et al. 2010). Thus, assuming there are no unrecognized biases in the measurements,
protein abundance appears to be constrained during evolution to a substantially
greater extent than gene expression and even stronger than the sequence evolution
itself.
The global architectures of protein interaction and gene coexpression networks
appear to be universal across all life forms, with the characteristic power law
distribution of the network node degree (number of connections) (Barabasi and
Oltvai 2004). Local network structures seem to be much less strongly constrained
and differ even among closely related organisms (Bergmann et al. 2004; Tsaparas
et al. 2006). However, a comparison of gene coexpression networks from the
so-called mutation accumulation lineages of C. elegans, in which the selective
constraints are effectively removed (Denver et al. 2005), with those of the natural
isolate suggests that it is the local wiring of the coexpression network that is
constrained by selection, whereas the global properties are not affected by the
removal of constraints (Jordan et al. 2008). Thus, the similar global network
properties seen in widely different organisms might reflect “neutral” rather than
selective constraints, that is, could have evolved via simple, stochastic, nonselective
processes as exemplified by birth-and-death models of genome and network evolu-
tion (Koonin et al. 2002; Lynch 2007a).
2 Constraints, Plasticity, and Universal Patterns in Genome and Phenome Evolution 35

2.7 Constraints on Evolutionary Trajectories: What Happens
When the Tape of Evolution Is Rewound?
An intriguing, deep question in evolutionary biology is how constrained is the
course of evolution itself, or in other words, to what extent the evolutionary process
is free to explore different trajectories between the given initial and end states
(Kassen 2009). In theory, mutational trajectories in sequence space are considered
to be fundamentally stochastic (Mani and Clarke 1990). However, experimental
evolution studies indicate that paths of adaptive evolution are substantially con-
strained by interactions between mutation (epistasis and pleiotropy) although not
to the point of becoming deterministic. A series of experiments on evolution of
bacterial antibiotic resistance resulting from 5 point mutations in the b-lactamase
gene showed that, of the 120 trajectories across the sequence space, 102 were
inaccessible to evolution, and of the remaining 18 trajectories, several had negligi-
ble probability of realization (Weinreich et al. 2006). Even stronger constraints
were identified in a subsequent study that explored a more complex fitness land-
scape by simultaneously evolving resistance to two antibiotics (Novais et al. 2010).
The remarkable long-term study of bacterial evolution under controlled condi-
tions by Lenski and coworkers provides examples of both parallel emergence of the
same mutations under a particular selective pressure and the realization of multiple
trajectories (Barrick et al. 2009; Barrick and Lenski 2009; Kassen 2009; Stanek
et al. 2009). For instance, it has been explicitly shown that evolution of the same,
extremely rare phenotype, the ability to grow on citrate, proceeded along distinct
trajectories in different Escherichia coli populations (Blount et al. 2008).Direct studies of evolutionary trajectories in the sequence space are still very
limited but they have already made it clear that, although historical contingency is
crucial in the evolutionary process (Jacob 1977), the exploration of the sequence
space is strongly constrained so that only a minority of theoretically possible
trajectories are accessible. The extent of these constraints depends on the shape
of the fitness landscape: the more rugged the landscape, the stronger the constraints.
The shape of the landscape itself depends on the nature, strength, and interactions
of the relevant selective factors and evolves with time, which makes it more of a
seascape (Mustonen and Lassig 2009, 2010).
2.8 Robustness, Plasticity, and Evolutionary Constraints
The aspects of evolution that are orthogonal to constraints are the plasticity of
genomic and phenomic characteristics and the robustness of molecular phenotypes
(Wagner 2005). In many groups of organisms, large-scale genome organization
seems to be only weakly constrained so that gene order substantially differs even
between closely related organisms, especially, among prokaryotes (Koonin 2009a;
Novichkov et al. 2009b) (Fig. 2.6). The gene repertoire of many organisms,
36 E.V. Koonin and Y.I. Wolf

especially, prokaryotes shows plasticity that may even exceed the plasticity of
genome architecture as dramatically illustrated by rapid genome reduction in
parasitic bacteria (Darby et al. 2007) and by acquisition of pathogenicity islands
that may comprise over 30% of the recipient genome in bacterial pathogens
(Dobrindt et al. 2003). The plasticity of genome organization and composition is
paralleled by the evolutionary flexibility of regulatory networks and complements
the more strongly constrained evolution of individual genes (Lozada-Chavez et al.
2006; Kazakov et al. 2009).
Evolutionary plasticity and the strength of evolutionary constraints are tightly
linked to robustness of biological systems, that is, resistance of phenotypes to
genetic perturbation (mutations, recombination, etc.). Robustness seems to be an
evolved property as demonstrated by the study of specialized buffering mecha-
nism (for instance, those mediated by molecular chaperones of the HSP90 fam-
ily), the impairment of which (often by environmental stress) reveals hidden
genetic variation and accordingly enhances the evolutionary potential of the
organism (Queitsch et al. 2002; Wagner 2008; Masel and Siegal 2009). Recently,
the concept of variation stabilization has been extended to include numerous
genes that are not molecular chaperones but possess extremely diverse functions;
it seems that stabilization is a general property of interaction networks, so that
disruption of almost any highly connected node reduces robustness of the system
and leads to increased variation (Bergman and Siegal 2003). A comprehensive
study of such “capacitor” properties of yeast mutants revealed approximately 300
genes (about 6% of the total) whose disruption significantly decreased the robust-
ness of yeast to environmental perturbations (Levy and Siegal 2008). Thus,
robustness might be a major, selectable mechanism that counteracts evolutionary
constraints, in particular, those caused by the interaction between mutations, and
enhances plasticity.
2.9 Effective Population Size as the General Determinant
of Evolutionary Constrains and Distinction Between
Constraints and Neutral Conservation
The classic population genetics theory asserts that the effectiveness of purifying
selection is proportional to the effective population size of the given organism
(assuming a uniform mutation rate for simplicity). In other words, only those mut-
ational changes can be fixed or efficiently eliminated during evolution for which
s > 1/Ne, where s is the selection coefficient and Ne is the effective population size(Lynch 2007c). Conversely, mutations with s < 1/Ne are effectively “invisible” to
selection. This simple dependence seems to be an important, possibly, the primary
determinant of the constraints that affect different aspects of genome and phenome
evolution. In particular, differences in Ne seem to underlie the qualitative differ-
ence in the genome architectures of unicellular and multicellular organisms
2 Constraints, Plasticity, and Universal Patterns in Genome and Phenome Evolution 37

described above (Lynch and Conery 2003; Lynch 2007b). Substantial genome
expansion seems to be attainable only in organisms with small populations and
the attendant weak selection, such as plants and animals. In these organisms, the
deleterious effect of propagation of nonfunctional sequences is often too small to
allow their “detection” and elimination by purifying selection. Accordingly, evolu-
tionary conservation does not automatically imply that the conserved feature is
constrained by purifying selection but rather, somewhat paradoxically, can reflect
weak purifying selection that is insufficient to eliminate nonadaptive ancestral
features.
Evolution of the exon–intron gene structure in eukaryotes provides an excel-
lent case in point for this population-genetic paradigm. Most of the introns do not
appear to possess a distinct function but do require distinct splicing signals for
transcript maturation to occur accurately. Thus, approximately 25 nucleotides
per intron are subject to purifying selection of varying strength (Lynch 2006a).
Because of the associated cost of selection and also owing to the expenditure of
time and energy on replication and transcription of intronic sequences, function-
less introns are weakly deleterious for the respective organisms. However, a
simple estimate taking into account the characteristic mutation rates in eukaryotes
shows that the deleterious effect of introns is “visible” to purifying selection only
in relatively large populations with Ne on the order of 107 or greater. This is the
characteristic range of effective population sizes of unicellular eukaryotes,
whereas multicellular eukaryotes typically have smaller populations (Lynch and
Conery 2003; Lynch 2006a, 2007c). The effect of these differences on the evo-
lution of genome architecture in eukaryotes is dramatic. Unlike genomes of
unicellular forms that typically contain less than one intron per gene, and in
many case, only a few introns in the entire genome, plants, and animals possess
numerous introns, up to 8 per gene in vertebrates (Roy and Gilbert 2006). The
positions of many introns are conserved in orthologous genes of animals and
plants (see above), that is, most likely, since the time of existence of the last
common ancestor of the extant eukaryotes. However, there seems to be no reason
to claim that, in general, the positions of introns are constrained during evolution.
The conservation of intron positions appears to be due to the weak purifying
selection that precludes efficient elimination of introns in organisms with small
characteristic values of Ne.
Beyond the sheer number of introns, the features of introns themselves drasti-
cally differ: all the introns in intron-poor genomes of unicellular eukaryotes are
short, with tightly controlled lengths and highly conserved, optimized splice signals
at exon–intron junctions (Irimia et al. 2007; Irimia and Roy 2008). By contrast,
introns in intron-rich genomes, such as plants, and animals, are often long (espe-
cially, in vertebrates) and are bounded by relatively weak, suboptimal splice signals
owing to the relatively low selection favoring strong splicing signals (Irimia et al.
2009). The existence of these long introns with weak splice signals, which yield
relatively inaccurate splicing, provides for the evolution of alternative splicing and
nested gene structures, the crucial factors of structural and regulatory diversifica-
tion of proteins and RNAs in multicellular eukaryotes.
38 E.V. Koonin and Y.I. Wolf

The case of intron evolution illustrates the crucial interplay of constraints and
plasticity that is central to the evolution of genomes and molecular phenomes
(Fig. 2.7). Effective population size determines the background strength of purify-
ing selection (constraints). When Ne is small, as in multicellular eukaryotes,
constraints are relatively weak, so plasticity is enhanced such that nonfunctional
genomic elements like introns can be retained, the result being a system that is
relatively inefficient and vulnerable to random factors that can cause extinction, but
also possesses a high potential for evolutionary innovation. Conversely, when Ne is
large, as in most prokaryotes, many aspects of evolution are strongly constrained
although there is still much plasticity in the evolution of these organisms thanks to
dynamic, effectively neutral processes, in particular, HGT.
Its fundamental importance notwithstanding, it is important to keep in mind that
Ne determines the course of evolution only on a coarse grain scale. Thus, a
comparative analysis of the Kn/Ks values among prokaryotic lineages failed to
detect a negative correlation between selective constraints and genome size, as
implied by the straightforward population genetic perspective (Lynch 2006b). On
the contrary, larger genomes tend to evolve under stronger constraints (even when
only free-living microbes are analyzed) suggesting that lifestyle could be a critical
determinant of genome evolution (favoring, in particular, gene acquisition via HGT
in variable environments) independent of Ne (Jordan et al. 2002; Novichkov et al.
2009b).
strong
weak
level of organization
molecular structure anddynamics
local genome context genome architecture molecular phenomics
functional andfolding-critical sites
disordered segments
intron donor andacceptor sites
"junk" genome
typical regulatorysites
genome-scale geneorder
operons and geneclusters
synonymous sites inCDS
introns
gene neighborhoods
typical protein sites
functional andregulatory networks
protein abundance
mRNA abundance
gene islands andsuperoperons
protein function
cons
trai
mts
plas
ticity
low
high
Fig. 2.7 Genomic and phenomic constraints operative at different levels of biological organi-
zation. The scales are rough approximations
2 Constraints, Plasticity, and Universal Patterns in Genome and Phenome Evolution 39

2.10 Conclusions: Selective and Neutral Constraints
and Evolutionary Universals
The prevailing theme that emerges from the recent advances of evolutionary
genomics and evolutionary systems biology is the plurality of constraints that affect
the evolution of different types of sequences in any genome, genome architectures,
and molecular phenomes (Fig. 2.7) along with major differences of evolutionary
regimens between taxa. Nevertheless, beyond this diversity, comparative-genomic
and molecular phenomic analysis reveals universal patterns that at least in some
cases are compatible with relatively simple and general models of evolution. As
discussed here, such models start to suggest simple, fundamental causes underlying
important aspects of evolution such as the constraints on evolution of proteins and
evolution of gene repertoire (Table 2.1). In this context, it seems appropriate to
expand the notion of constraints to include not only selective but also “neutral”
constraints that are determined by nonselective, stochastic properties of biological
systems and are often amenable to modeling using techniques borrowed from
statistical physics (Table 2.1) (Frank 2009; Koonin 2009b).
Evolutionary trajectories in the sequence space seem to be strongly constrained,
thus substantially limiting the “tinkering potential” of evolution, using the famous
metaphor of Jacob (Jacob 1977). The evolutionary process thus appears to be a
compromise “between design and bricolage” (Wilkins 2007), the design aspect
Table 2.1 Universals of genome and molecular phenome evolution
Universal pattern Putative underlying
process/model
Nature of
relevant
constraints
References
Approximately log-normal
distribution of
evolutionary rates of
protein-coding genes
Protein folding Selective: protein
robustness to
misfolding
(Wolf et al. 2009;
Lobkovsky et al.
2010)
Anticorrelation between
evolution rate and
expression level
(translation rate) of
protein-coding genes
Protein folding Selective: protein
robustness to
misfolding
dependent on
translation
rate
(Drummond and
Wilke 2008,
2009; Wolf et al.
2010)
Distinct scaling laws for
different functional
classes of genes
“Toolbox”-like growth
of metabolic
networks
Neutral (van Nimwegen
2003; Maslov
et al. 2009;
Molina and van
Nimwegen 2009)
Power law like distribution
of paralogous gene family
size
Birth and death
process of gene
evolution
Neutral (Karev et al. 2002;
Koonin et al.
2002)
Power law like distribution
of node degree in
interaction and
coexpression networks
Network evolution by
preferential
attachments
Neutral (Barabasi and Oltvai
2004; Tsaparas
et al. 2006)
40 E.V. Koonin and Y.I. Wolf

brought about by constraints (certainly having nothing to do with any intelligence)
and the bricolage stemming from the evolved robustness and the ensuing plasticity
of evolving organisms.
Comparative genomics and systems approaches transform evolutionary biology
into a much more complex but also more precise, quantitative field than it was in the
twentieth century. Next generation sequencing, quantitative proteomics, and other
systemic approaches, combined with more specific approaches of experimental
evolution, can be expected to reveal the specific, precise constraints affecting
diverse aspects of genome and phenome evolution.
References
Altenhoff AM, Dessimoz C (2009) Phylogenetic and functional assessment of orthologs inference
projects and methods. PLoS Comput Biol 5:e1000262
Aravind L, Koonin EV (1998) Phosphoesterase domains associated with DNA polymerases of
diverse origins. Nucleic Acids Res 26:3746–3752
Baira E, Greshock J, Coukos G, Zhang L (2008) Ultraconserved elements: genomics, function and
disease. RNA Biol 5:132–134
Barabasi AL, Oltvai ZN (2004) Network biology: understanding the cell’s functional organization.
Nat Rev Genet 5:101–113
Barrick JE, Lenski RE (2009) Genome-wide mutational diversity in an evolving population of
Escherichia coli. Cold Spring Harb Symp Quant Biol 16:345–355
Barrick JE, Yu DS, Yoon SH, Jeong H, Oh TK, Schneider D, Lenski RE, Kim JF (2009) Genome
evolution and adaptation in a long-term experiment with Escherichia coli. Nature
461:1243–1247
Basu MK, Carmel L, Rogozin IB, Koonin EV (2008) Evolution of protein domain promiscuity in
eukaryotes. Genome Res 18:449–461
Basu MK, Poliakov E, Rogozin IB (2009) Domain mobility in proteins: functional and evolution-
ary implications. Brief Bioinform 10:205–216
Bejerano G, Pheasant M, Makunin I, Stephen S, Kent WJ, Mattick JS, Haussler D (2004)
Ultraconserved elements in the human genome. Science 304:1321–1325
Bergman A, Siegal ML (2003) Evolutionary capacitance as a general feature of complex gene
networks. Nature 424:549–552
Bergmann S, Ihmels J, Barkai N (2004) Similarities and differences in genome-wide expression
data of six organisms. PLoS Biol 2:E9
Bertone P, Stolc V, Royce TE, Rozowsky JS, Urban AE, Zhu X, Rinn JL, Tongprasit W, Samanta
M, Weissman S, Gerstein M, Snyder M (2004) Global identification of human transcribed
sequences with genome tiling arrays. Science 306:2242–2246
Blount ZD, Borland CZ, Lenski RE (2008) Historical contingency and the evolution of a key
innovation in an experimental population of Escherichia coli. Proc Natl Acad Sci USA
105:7899–7906
Blumenthal T (2004) Operons in eukaryotes. Brief Funct Genomic Proteomic 3:199–211
Bowen NJ, Jordan IK (2007) Exaptation of protein coding sequences from transposable elements.
Genome Dyn 3:147–162
Carmel L, Rogozin IB, Wolf YI, Koonin EV (2007) Patterns of intron gain and conservation in
eukaryotic genes. BMC Evol Biol 7:192
Carthew RW, Sontheimer EJ (2009) Origins and mechanisms of miRNAs and siRNAs. Cell
136:642–655
Charlebois RL, Doolittle WF (2004) Computing prokaryotic gene ubiquity: rescuing the core from
extinction. Genome Res 14:2469–2477
2 Constraints, Plasticity, and Universal Patterns in Genome and Phenome Evolution 41

Charlesworth J, Eyre-Walker A (2008) The McDonald–Kreitman test and slightly deleterious
mutations. Mol Biol Evol 25:1007–1015
Costa FF (2005) Non-coding RNAs: new players in eukaryotic biology. Gene 357:83–94
Dandekar T, Snel B, Huynen M, Bork P (1998) Conservation of gene order: a fingerprint of
proteins that physically interact. Trends Biochem Sci 23:324–328
Darby AC, Cho NH, Fuxelius HH, Westberg J, Andersson SG (2007) Intracellular pathogens go
extreme: genome evolution in the Rickettsiales. Trends Genet 23:511–520
Denver DR, Morris K, Streelman JT, Kim SK, Lynch M, Thomas WK (2005) The transcriptional
consequences of mutation and natural selection in Caenorhabditis elegans. Nat Genet
37:544–548
Dermitzakis ET, Reymond A, Antonarakis SE (2005) Conserved non-genic sequences – an
unexpected feature of mammalian genomes. Nat Rev Genet 6:151–157
Dobrindt U, Agerer F, Michaelis K, Janka A, Buchrieser C, Samuelson M, Svanborg C, Gottschalk
G, Karch H, Hacker J (2003) Analysis of genome plasticity in pathogenic and commensal
Escherichia coli isolates by use of DNA arrays. J Bacteriol 185:1831–1840
Doolittle WF, Sapienza C (1980) Selfish genes, the phenotype paradigm and genome evolution.
Nature 284:601–603
Drake JA, Bird C, Nemesh J, Thomas DJ, Newton-Cheh C, Reymond A, Excoffier L, Attar H,
Antonarakis SE, Dermitzakis ET, Hirschhorn JN (2006) Conserved noncoding sequences are
selectively constrained and not mutation cold spots. Nat Genet 38:223–227
Drummond DA, Wilke CO (2008) Mistranslation-induced protein misfolding as a dominant
constraint on coding-sequence evolution. Cell 134:341–352
Drummond DA, Wilke CO (2009) The evolutionary consequences of erroneous protein synthesis.
Nat Rev Genet 10:715–724
Drummond DA, Bloom JD, Adami C, Wilke CO, Arnold FH (2005) Why highly expressed
proteins evolve slowly. Proc Natl Acad Sci USA 102:14338–14343
Duret L, Dorkeld F, Gautier C (1993) Strong conservation of non-coding sequences during
vertebrates evolution: potential involvement in post-transcriptional regulation of gene expres-
sion. Nucleic Acids Res 21:2315–2322
Eisen JA, Heidelberg JF, White O, Salzberg SL (2000) Evidence for symmetric chromosomal
inversions around the replication origin in bacteria. Genome Biol 1(6):RESEARCH0011
Elgar G (2009) Pan-vertebrate conserved non-coding sequences associated with developmental
regulation. Brief Funct Genomic Proteomic 8:256–265
Ellegren H (2008) Comparative genomics and the study of evolution by natural selection. Mol
Ecol 17:4586–4596
Ellegren H, Smith NG, Webster MT (2003) Mutation rate variation in the mammalian genome.
Curr Opin Genet Dev 13:562–568
Eyre-Walker A, Keightley PD (2009) Estimating the rate of adaptive molecular evolution in the
presence of slightly deleterious mutations and population size change. Mol Biol Evol
26:2097–2108
Fedorov A, Merican AF, Gilbert W (2002) Large-scale comparison of intron positions among
animal, plant, and fungal genes. Proc Natl Acad Sci USA 99:16128–16133
Frank SA (2009) The common patterns of nature. J Evol Biol 22:1563–1585
Gilad Y, Oshlack A, Rifkin SA (2006) Natural selection on gene expression. Trends Genet
22:456–461
Grishin NV, Wolf YI, Koonin EV (2000) From complete genomes to measures of substitution rate
variability within and between proteins. Genome Res 10:991–1000
Harrison PM, Gerstein M (2002) Studying genomes through the aeons: protein families, pseudo-
genes and proteome evolution. J Mol Biol 318:1155–1174
Hurst LD (2002) The Ka/Ks ratio: diagnosing the form of sequence evolution. Trends Genet
18:486
Hurst LD, Pal C, Lercher MJ (2004) The evolutionary dynamics of eukaryotic gene order. Nat Rev
Genet 5:299–310
42 E.V. Koonin and Y.I. Wolf

Irimia M, Roy SW (2008) Evolutionary convergence on highly-conserved 3’ intron structures in
intron-poor eukaryotes and insights into the ancestral eukaryotic genome. PLoS Genet 4:
e1000148
Irimia M, Penny D, Roy SW (2007) Coevolution of genomic intron number and splice sites.
Trends Genet 23:321–325
Irimia M, Roy SW, Neafsey DE, Abril JF, Garcia-Fernandez J, Koonin EV (2009) Complex
selection on 5’ splice sites in intron-rich organisms. Genome Res 19:2021–2027
Jacob F (1977) Evolution and tinkering. Science 196:1161–1166
Johnson JM, Edwards S, Shoemaker D, Schadt EE (2005) Dark matter in the genome: evidence of
widespread transcription detected by microarray tiling experiments. Trends Genet 21:93–102
Jordan IK, Rogozin IB, Wolf YI, Koonin EV (2002) Microevolutionary genomics of bacteria.
Theor Popul Biol 61:435–447
Jordan IK, Rogozin IB, Glazko GV, Koonin EV (2003) Origin of a substantial fraction of human
regulatory sequences from transposable elements. Trends Genet 19:68–72
Jordan IK, Marino-Ramirez L, Wolf YI, Koonin EV (2004) Conservation and coevolution in the
scale-free human gene coexpression network. Mol Biol Evol 21:2058–2070
Jordan IK, Marino-Ramirez L, Koonin EV (2005) Evolutionary significance of gene expression
divergence. Gene 345:119–126
Jordan IK, Katz LS, Denver DR, Streelman JT (2008) Natural selection governs local, but
not global, evolutionary gene coexpression networks in Caenorhabditis elegans. BMC Syst
Biol 2:96
Karev GP, Wolf YI, Rzhetsky AY, Berezovskaya FS, Koonin EV (2002) Birth and death of protein
domains: a simple model of evolution explains power law behavior. BMC Evol Biol 2:18
Kassen R (2009) Toward a general theory of adaptive radiation: insights from microbial experi-
mental evolution. Ann N Y Acad Sci 1168:3–22
Katzman S, Kern AD, Bejerano G, Fewell G, Fulton L, Wilson RK, Salama SR, Haussler D (2007)
Human genome ultraconserved elements are ultraselected. Science 317:915
Kazakov AE, Rodionov DA, Alm E, Arkin AP, Dubchak I, Gelfand MS (2009) Comparative
genomics of regulation of fatty acid and branched-chain amino acid utilization in proteobac-
teria. J Bacteriol 191:52–64
Kelly C, Churchill GA (1996) Biases in amino acid replacement matrices and alignment scores
due to rate heterogeneity. J Comput Biol 3:307–318
Khachane AN, Harrison PM (2009) Assessing the genomic evidence for conserved transcribed
pseudogenes under selection. BMC Genomics 10:435
Khaitovich P, Weiss G, Lachmann M, Hellmann I, Enard W, Muetzel B, Wirkner U, Ansorge W,
Paabo S (2004) A neutral model of transcriptome evolution. PLoS Biol 2:E132
Kimura M (1983) The neutral theory of molecular evolution. Cambridge University Press,
Cambridge
Kitano H (2002) Computational systems biology. Nature 420:206–210
Koonin EV (2003) Comparative genomics, minimal gene-sets and the last universal common
ancestor. Nat Rev Microbiol 1:127–136
Koonin EV (2005) Orthologs, paralogs, and evolutionary genomics. Annu Rev Genet 39:309–338
Koonin EV (2009a) Evolution of genome architecture. Int J Biochem Cell Biol 41:298–306
Koonin EV (2009b) Darwinian evolution in the light of genomics. Nucleic Acids Res
37:1011–1034
Koonin EV, Wolf YI (2006) Evolutionary systems biology: links between gene evolution and
function. Curr Opin Biotechnol 17:481–487
Koonin EV, Wolf YI (2008) Genomics of bacteria and archaea: the emerging dynamic view of the
prokaryotic world. Nucleic Acids Res 36(21):6688–6719
Koonin EV, Mushegian AR, Bork P (1996) Non-orthologous gene displacement. Trends Genet
12:334–336
Koonin EV, Aravind L, Kondrashov AS (2000) The impact of comparative genomics on our
understanding of evolution. Cell 101:573–576
2 Constraints, Plasticity, and Universal Patterns in Genome and Phenome Evolution 43

Koonin EV, Wolf YI, Karev GP (2002) The structure of the protein universe and genome
evolution. Nature 420:218–223
Kramer EB, Farabaugh PJ (2007) The frequency of translational misreading errors in E. coli is
largely determined by tRNA competition. RNA 13:87–96
Krylov DM, Wolf YI, Rogozin IB, Koonin EV (2003) Gene loss, protein sequence divergence,
gene dispensability, expression level, and interactivity are correlated in eukaryotic evolution.
Genome Res 13:2229–2235
Lawrence J (1999) Selfish operons: the evolutionary impact of gene clustering in prokaryotes and
eukaryotes. Curr Opin Genet Dev 9:642–648
Lawrence JG, Roth JR (1996) Selfish operons: horizontal transfer may drive the evolution of gene
clusters. Genetics 143:1843–1860
Lemons D, McGinnis W (2006) Genomic evolution of Hox gene clusters. Science 313:1918–1922
Lespinet O, Wolf YI, Koonin EV, Aravind L (2002) The role of lineage-specific gene family
expansion in the evolution of eukaryotes. Genome Res 12:1048–1059
Levy SF, Siegal ML (2008) Network hubs buffer environmental variation in Saccharomyces
cerevisiae. PLoS Biol 6:e264
Ling X, He X, Xin D (2009) Detecting gene clusters under evolutionary constraint in a large
number of genomes. Bioinformatics 25:571–577
Lobkovsky AE, Wolf YI, Koonin EV (2010) Universal distribution of protein evolution rates as a
consequence of protein folding physics. Proc Natl Acad Sci USA 107(7):2983–2988, doi:
10.1073/pnas.0910445107
Loewe L (2009) A framework for evolutionary systems biology. BMC Syst Biol 3:27
Lozada-Chavez I, Janga SC, Collado-Vides J (2006) Bacterial regulatory networks are extremely
flexible in evolution. Nucleic Acids Res 34:3434–3445
Lunter G, Ponting CP, Hein J (2006) Genome-wide identification of human functional DNA using
a neutral indel model. PLoS Comput Biol 2:e5
Lynch M (2006a) The origins of eukaryotic gene structure. Mol Biol Evol 23:450–468
Lynch M (2006b) Streamlining and simplification of microbial genome architecture. Annu Rev
Microbiol 60:327–349
Lynch M (2007a) The evolution of genetic networks by non-adaptive processes. Nat Rev Genet
8:803–813
Lynch M (2007b) The frailty of adaptive hypotheses for the origins of organismal complexity.
Proc Natl Acad Sci USA 104(Suppl 1):8597–8604
Lynch M (2007c) The origins of genome architecture. Sinauer Associates, Sunderland, MA
Lynch M, Conery JS (2003) The origins of genome complexity. Science 302:1401–1404
Makalowski W, Boguski MS (1998) Synonymous and nonsynonymous substitution distances are
correlated in mouse and rat genes. J Mol Evol 47:119–121
Mani GS, Clarke BC (1990) Mutational order: a major stochastic process in evolution. Proc R Soc
Lond B Biol Sci 240:29–37
Margulies EH, Cooper GM, Asimenos G, Thomas DJ, Dewey CN, Siepel A, Birney E, Keefe D,
Schwartz AS, Hou M, Taylor J, Nikolaev S, Montoya-Burgos JI, Loytynoja A, Whelan S,
Pardi F, Massingham T, Brown JB, Bickel P, Holmes I, Mullikin JC, Ureta-Vidal A, Paten B,
Stone EA, Rosenbloom KR, Kent WJ, Bouffard GG, Guan X, Hansen NF, Idol JR, Maduro
VV, Maskeri B, McDowell JC, Park M, Thomas PJ, Young AC, Blakesley RW, Muzny DM,
Sodergren E, Wheeler DA, Worley KC, Jiang H, Weinstock GM, Gibbs RA, Graves T, Fulton
R, Mardis ER, Wilson RK, Clamp M, Cuff J, Gnerre S, Jaffe DB, Chang JL, Lindblad-Toh K,
Lander ES, Hinrichs A, Trumbower H, Clawson H, Zweig A, Kuhn RM, Barber G, Harte R,
Karolchik D, Field MA, Moore RA, Matthewson CA, Schein JE, Marra MA, Antonarakis SE,
Batzoglou S, Goldman N, Hardison R, Haussler D, Miller W, Pachter L, Green ED, Sidow A
(2007) Analyses of deep mammalian sequence alignments and constraint predictions for 1%
of the human genome. Genome Res 17:760–774
Masel J, Siegal ML (2009) Robustness: mechanisms and consequences. Trends Genet 25:395–403
Maslov S, Krishna S, Pang TY, Sneppen K (2009) Toolbox model of evolution of prokaryotic
metabolic networks and their regulation. Proc Natl Acad Sci USA 106:9743–9748
44 E.V. Koonin and Y.I. Wolf

Mayrose I, Friedman N, Pupko T (2005) A gamma mixture model better accounts for among site
rate heterogeneity. Bioinformatics 21(Suppl 2):ii151–ii158
Medina M (2005) Genomes, phylogeny, and evolutionary systems biology. Proc Natl Acad Sci
USA 102(Suppl 1):6630–6635
Molina N, van Nimwegen E (2008) Universal patterns of purifying selection at noncoding
positions in bacteria. Genome Res 18:148–160
Molina N, van Nimwegen E (2009) Scaling laws in functional genome content across prokaryotic
clades and lifestyles. Trends Genet 25:243–247
Monot M, Honore N, Garnier T, Zidane N, Sherafi D, Paniz-Mondolfi A, Matsuoka M, Taylor GM,
Donoghue HD, Bouwman A, Mays S, Watson C, Lockwood D, Khamispour A, Dowlati Y,
Jianping S, Rea TH, Vera-Cabrera L, Stefani MM, Banu S, Macdonald M, Sapkota BR,
Spencer JS, Thomas J, Harshman K, Singh P, Busso P, Gattiker A, Rougemont J, Brennan PJ,
Cole ST (2009) Comparative genomic and phylogeographic analysis of Mycobacterium leprae.
Nat Genet 41:1282–1289
Moya A, Gil R, Latorre A, Pereto J, Pilar Garcillan-Barcia M, de la Cruz F (2009) Toward minimal
bacterial cells: evolution vs. design. FEMS Microbiol Rev 33:225–235
Mushegian AR, Koonin EV (1996a) Gene order is not conserved in bacterial evolution. Trends
Genet 12:289–290
Mushegian AR, Koonin EV (1996b) A minimal gene set for cellular life derived by comparison of
complete bacterial genomes [see comments]. Proc Natl Acad Sci USA 93:10268–10273
Mustonen V, Lassig M (2009) From fitness landscapes to seascapes: non-equilibrium dynamics
of selection and adaptation. Trends Genet 25:111–119
Mustonen V, Lassig M (2010) Fitness flux and ubiquity of adaptive evolution. Proc Natl Acad Sci
USA 107(9):4248–4253
Muzzi A, Moschioni M, Covacci A, Rappuoli R, Donati C (2008) Pilus operon evolution in
Streptococcus pneumoniae is driven by positive selection and recombination. PLoSONE 3:e3660
Nakabachi A, Yamashita A, Toh H, Ishikawa H, Dunbar HE, Moran NA, Hattori M (2006) The
160-kilobase genome of the bacterial endosymbiont Carsonella. Science 314:267
Nielsen R (2001) Statistical tests of selective neutrality in the age of genomics. Heredity
86:641–647
Nielsen R (2005) Molecular signatures of natural selection. Annu Rev Genet 39:197–218
Nielsen R, Bustamante C, Clark AG, Glanowski S, Sackton TB, Hubisz MJ, Fledel-Alon A,
Tanenbaum DM, Civello D, White TJ, Sninsky JJ, Adams MD, Cargill M (2005) A scan for
positively selected genes in the genomes of humans and chimpanzees. PLoS Biol 3(6):e170
Nilsen TW, Graveley BR (2010) Expansion of the eukaryotic proteome by alternative splicing.
Nature 463:457–463
Novais A, Comas I, Baquero F, Canton R, Coque TM, Moya A, Gonzalez-Candelas F, Galan JC
(2010) Evolutionary trajectories of beta-lactamase CTX-M-1 cluster enzymes: predicting
antibiotic resistance. PLoS Pathog 6(1):e1000735
Novichkov PS, Ratnere I, Wolf YI, Koonin EV, Dubchak I (2009a) ATGC: a database of
orthologous genes from closely related prokaryotic genomes and a research platform for
microevolution of prokaryotes. Nucleic Acids Res 37:D448–D454
Novichkov PS, Wolf YI, Dubchak I, Koonin EV (2009b) Trends in prokaryotic evolution revealed
by comparison of closely related bacterial and archaeal genomes. J Bacteriol 191:65–73
Ohno S (1970) Evolution by gene duplication. Springer-Verlag, Berlin-Heidelberg-New York
Osbourn AE, Field B (2009) Operons. Cell Mol Life Sci 66:3755–3775
Pal C, Papp B, Hurst LD (2001) Highly expressed genes in yeast evolve slowly. Genetics
158:927–931
Pal C, Papp B, Lercher MJ (2006) An integrated view of protein evolution. Nat Rev Genet
7:337–348
Parsch J, Novozhilov S, Saminadin-Peter SS, Wong KM and Andolfatto P (2010) On the utility of
short intron sequences as a reference for the detection of positive and negative selection in
Drosophila. Mol Biol Evol [Epub ahead of print]
2 Constraints, Plasticity, and Universal Patterns in Genome and Phenome Evolution 45

Petersen L, Bollback JP, Dimmic M, Hubisz M, Nielsen R (2007) Genes under positive selection
in Escherichia coli. Genome Res 17:1336–1343
Ponjavic J, Ponting CP, Lunter G (2007) Functionality or transcriptional noise? Evidence for
selection within long noncoding RNAs. Genome Res 17:556–565
Ponting CP, Oliver PL, Reik W (2009) Evolution and functions of long noncoding RNAs. Cell
136:629–641
Proux E, Studer RA, Moretti S, Robinson-Rechavi M (2009) Selectome: a database of positive
selection. Nucleic Acids Res 37:D404–D407
Putnam NH, Srivastava M, Hellsten U, Dirks B, Chapman J, Salamov A, Terry A, Shapiro H,
Lindquist E, Kapitonov VV, Jurka J, Genikhovich G, Grigoriev IV, Lucas SM, Steele RE,
Finnerty JR, Technau U, Martindale MQ, Rokhsar DS (2007) Sea anemone genome reveals
ancestral eumetazoan gene repertoire and genomic organization. Science 317:86–94
Queitsch C, Sangster TA, Lindquist S (2002) Hsp90 as a capacitor of phenotypic variation. Nature
417:618–624
Resch AM, Carmel L, Marino-Ramirez L, Ogurtsov AY, Shabalina SA, Rogozin IB, Koonin EV
(2007) Widespread positive selection in synonymous sites of mammalian genes. Mol Biol Evol
24:1821–1831
Rocha EP (2008) The organization of the bacterial genome. Annu Rev Genet 42:211–233
Rogozin IB, Makarova KS, Murvai J, Czabarka E, Wolf YI, Tatusov RL, Szekely LA, Koonin EV
(2002) Connected gene neighborhoods in prokaryotic genomes. Nucleic Acids Res
30:2212–2223
Rogozin IB, Wolf YI, Sorokin AV, Mirkin BG, Koonin EV (2003) Remarkable interkingdom
conservation of intron positions and massive, lineage-specific intron loss and gain in eukaryotic
evolution. Curr Biol 13:1512–1517
Roy SW, Gilbert W (2006) The evolution of spliceosomal introns: patterns, puzzles and progress.
Nat Rev Genet 7:211–221
Roy SW, Penny D (2007) Patterns of intron loss and gain in plants: intron loss-dominated evolution
and genome-wide comparison of O. sativa and A. thaliana. Mol Biol Evol 24:171–181
Schrimpf SP, Weiss M, Reiter L, Ahrens CH, Jovanovic M, Malmstrom J, Brunner E, Mohanty S,
Lercher MJ, Hunziker PE, Aebersold R, von Mering C, Hengartner MO (2009) Comparative
functional analysis of the Caenorhabditis elegans and Drosophila melanogaster proteomes.
PLoS Biol 7:e48
Sella G, Petrov DA, Przeworski M, Andolfatto P (2009) Pervasive natural selection in the
Drosophila genome? PLoS Genet 5:e1000495
Shabalina SA, Kondrashov AS (1999) Pattern of selective constraint in C. elegans and C. briggsae
genomes. Genet Res 74:23–30
Shabalina SA, Koonin EV (2008) Origins and evolution of eukaryotic RNA interference. Trends
Ecol Evol 23:578–587
Shabalina SA, Ogurtsov AY, Rogozin IB, Koonin EV, Lipman DJ (2004) Comparative analysis of
orthologous eukaryotic mRNAs: potential hidden functional signals. Nucleic Acids Res
32:1774–1782
Srivastava M, Begovic E, Chapman J, Putnam NH, Hellsten U, Kawashima T, Kuo A, Mitros T,
Salamov A, Carpenter ML, Signorovitch AY, Moreno MA, Kamm K, Grimwood J, Schmutz J,
Shapiro H, Grigoriev IV, Buss LW, Schierwater B, Dellaporta SL, Rokhsar DS (2008) The
Trichoplax genome and the nature of placozoans. Nature 454:955–960
Stanek MT, Cooper TF, Lenski RE (2009) Identification and dynamics of a beneficial mutation in a
long-term evolution experiment with Escherichia coli. BMC Evol Biol 9:302
Tatusov RL, Koonin EV, Lipman DJ (1997) A genomic perspective on protein families. Science
278:631–637
Tsaparas P, Marino-Ramirez L, Bodenreider O, Koonin EV, Jordan IK (2006) Global similarity
and local divergence in human and mouse gene co-expression networks. BMC Biol 6:70
Turner LM, Chuong EB, Hoekstra HE (2008) Comparative analysis of testis protein evolution in
rodents. Genetics 179:2075–2089
46 E.V. Koonin and Y.I. Wolf

van Nimwegen E (2003) Scaling laws in the functional content of genomes. Trends Genet
19:479–484
Wagner A (2005) Robustness, evolvability, and neutrality. FEBS Lett 579:1772–1778
Wagner A (2008) Neutralism and selectionism: a network-based reconciliation. Nat Rev Genet
9:965–974
Waterston RH, Lindblad-TohK, Birney E, Rogers J, Abril JF, Agarwal P, Agarwala R, Ainscough R,
Alexandersson M, An P, Antonarakis SE, Attwood J, Baertsch R, Bailey J, Barlow K, Beck S,
Berry E, Birren B, Bloom T, Bork P, Botcherby M, Bray N, Brent MR, Brown DG, Brown SD,
Bult C, Burton J, Butler J, Campbell RD, Carninci P, Cawley S, Chiaromonte F, Chinwalla AT,
Church DM, Clamp M, Clee C, Collins FS, Cook LL, Copley RR, Coulson A, Couronne O,
Cuff J, Curwen V, Cutts T, Daly M, David R, Davies J, Delehaunty KD, Deri J, Dermitzakis ET,
Dewey C, Dickens NJ, Diekhans M, Dodge S, Dubchak I, Dunn DM, Eddy SR, Elnitski L,
Emes RD, Eswara P, Eyras E, Felsenfeld A, Fewell GA, Flicek P, Foley K, Frankel WN, Fulton
LA, Fulton RS, Furey TS, Gage D, Gibbs RA, Glusman G, Gnerre S, Goldman N, Goodstadt L,
Grafham D, Graves TA, Green ED, Gregory S, Guigo R, Guyer M, Hardison RC, Haussler D,
Hayashizaki Y, Hillier LW, Hinrichs A, HlavinaW,Holzer T, Hsu F, Hua A, Hubbard T, Hunt A,
Jackson I, Jaffe DB, Johnson LS, Jones M, Jones TA, Joy A, Kamal M, Karlsson EK, Karolchik
D, Kasprzyk A, Kawai J, Keibler E, Kells C, Kent WJ, Kirby A, Kolbe DL, Korf I, Kucherlapati
RS, Kulbokas EJ, Kulp D, Landers T, Leger JP, Leonard S, Letunic I, Levine R, Li J, LiM, Lloyd
C, Lucas S, Ma B, Maglott DR, Mardis ER, Matthews L, Mauceli E, Mayer JH, McCarthy M,
McCombie WR, McLaren S, McLay K, McPherson JD, Meldrim J, Meredith B, Mesirov JP,
Miller W,Miner TL, Mongin E, Montgomery KT, MorganM, Mott R, Mullikin JC, Muzny DM,
NashWE, Nelson JO, NhanMN, Nicol R, Ning Z, NusbaumC,O’ConnorMJ, Okazaki Y, Oliver
K, Overton-Larty E, Pachter L, Parra G, Pepin KH, Peterson J, Pevzner P, Plumb R, Pohl CS,
Poliakov A, Ponce TC, Ponting CP, Potter S, Quail M, Reymond A, Roe BA, Roskin KM, Rubin
EM, Rust AG, Santos R, Sapojnikov V, Schultz B, Schultz J, Schwartz MS, Schwartz S, Scott C,
Seaman S, Searle S, Sharpe T, Sheridan A, Shownkeen R, Sims S, Singer JB, Slater G, Smit A,
Smith DR, Spencer B, Stabenau A, Stange-Thomann N, Sugnet C, Suyama M, Tesler G,
Thompson J, Torrents D, Trevaskis E, Tromp J, Ucla C, Ureta-Vidal A, Vinson JP, Von
Niederhausern AC, Wade CM, Wall M, Weber RJ, Weiss RB, Wendl MC, West AP, Wetter-
strand K, Wheeler R, Whelan S, Wierzbowski J, Willey D, Williams S, Wilson RK, Winter E,
Worley KC, Wyman D, Yang S, Yang SP, Zdobnov EM, Zody MC, Lander ES (2002) Initial
sequencing and comparative analysis of the mouse genome. Nature 420:520–562
Weinreich DM, Delaney NF, Depristo MA, Hartl DL (2006) Darwinian evolution can follow only
very few mutational paths to fitter proteins. Science 312:111–114
Wilkins AS (2007) Between “design” and “bricolage”: genetic networks, levels of selection, and
adaptive evolution. Proc Natl Acad Sci USA 104(Suppl 1):8590–8596
Wolf YI, Carmel L, Koonin EV (2006) Unifying measures of gene function and evolution. Proc
Biol Sci 273:1507–1515
Wolf YI, Novichkov PS, Karev GP, Koonin EV, Lipman DJ (2009) The universal distribution of
evolutionary rates of genes and distinct characteristics of eukaryotic genes of different apparent
ages. Proc Natl Acad Sci USA 106:7273–7280
Wolf YI, Gopich IV, Lipman DJ, Koonin EV (2010) Relative contributions of intrinsic structural-
functional constraints and translation rate to the evolution of protein-coding genes. Genome
Biol Evol 2010:190–199
Worth CL, Gong S, Blundell TL (2009) Structural and functional constraints in the evolution of
protein families. Nat Rev Mol Cell Biol 10:709–720
Wuchty S, Almaas E (2005) Evolutionary cores of domain co-occurrence networks. BMC Evol
Biol 5:24
Yamada T, Bork P (2009) Evolution of biomolecular networks: lessons from metabolic and
protein interactions. Nat Rev Mol Cell Biol 10:791–803
Zhou T, Weems M, Wilke CO (2009) Translationally optimal codons associate with structurally
sensitive sites in proteins. Mol Biol Evol 26:1571–1580
2 Constraints, Plasticity, and Universal Patterns in Genome and Phenome Evolution 47

Chapter 3
Starvation-Induced Reproductive Isolation
in Yeast
Eugene Kroll, R. Frank Rosenzweig, and Barbara Dunn
Abstract Speciation in eukaryotes is one of the central issues in evolutionary
biology. Retrospective studies of existing species may not reveal the molecular
events underlying speciation, as it is frequently impossible to distinguish changes
which preceded speciation from those which happened after speciation has
occurred. We propose a model for experimental speciation using a well-studied
Eukaryotic organism, the yeast Saccharomyces cerevisiae, and starvation as an
agent of speciation. Starvation can be viewed as a general and widespread conse-
quence of catastrophic environmental change that leads to a decrease in survival or
reproductive success. We find that yeast populations subjected to a month-long
starvation exhibit a drastic increase in genomic rearrangements compared with a
modest increase in point mutation. We subsequently find that starved yeast popula-
tions become reproductively isolated from their ancestor, which we attribute to
chromosomal abnormalities in the starved clones’ genomes. Our model provides
direct molecular evidence – that speciation can rapidly occur without the precondi-
tion of geographic separation or divergent selection.
3.1 Continuing Uncertainty over Species Definitions
Among the Eukarya
Two central questions in eukaryotic evolutionary biology are: how do new species
emerge and how are they perpetuated? We can provisionally define a species as
group of organisms that shares a complex genetic network of interacting alleles and
E. Kroll, and R.F. Rosenzweig
Division of Biological Sciences, University of Montana, 32 campus dr., Missoula, MT 59812,
USA
e-mail: [email protected]
B. Dunn
Department of Genetics, Stanford University, Stanford, CA 94305, USA
P. Pontarotti (ed.), Evolutionary Biology – Concepts, Molecularand Morphological Evolution, DOI 10.1007/978-3-642-12340-5_3,# Springer-Verlag Berlin Heidelberg 2010
49

preserves its integrity by restricting the exchange of genetic material with other
such networks (Mayr 1966). The processes by which new networks emerge, i.e.,
speciation, appear to be diverse and their relative contributions remain the subject
of considerable controversy. While Darwin explicitly linked the process of spe-
ciation to the adaptation of organisms to novel environments (Darwin 1859, Ch. 4),
neo-Darwinists have emphasized the role of interpopulation isolation (Fisher 1930;
Dobzhansky 1937; Muller 1940; Mayr 1942). Uncertainty persists as to which of
these emphases is correct (Lande 1989; Vulic et al. 1999; Orr and Presgraves 2000;
Schilthuizen 2000; Turelli et al. 2001; Sinervo and Svensson 2002; Herrmann et al.
2003), largely due to the dearth of knowledge about the specific molecular mechan-
isms that underlie eukaryotic speciation and the fact that species can be defined in
various ways.
The most widely used definition for speciation is based on the biological
species concept, i.e., the cessation of gene flow between groups of organisms,
or “reproductive isolation” (Dobzhansky 1937; Mayr 1942, 1996; Lande 1989;
Coyne and Orr 1998). Though this definition is not universally accepted
(Darwin 1859, Ch. 8; Schilthuizen 2000 and refs. therein), it is, due to its
inherently measurable nature, the most amenable framework for experimental
investigation. Relative reproductive isolation between two species is a quanti-
tative trait that can be measured as a ratio between fertilities of interspecific
hybrids and their conspecific parentals. Importantly, “relative reproductive
isolation” can be used as a proxy to assess divergence between closely related
organisms.
Reproductive isolation in sexual species can be both pre and postzygotic. To
date, efforts to explain incipient speciation in eukaryotes have focused on pre-
zygotic isolation mechanisms such as spatial/temporal or behavioral separation
(Orr and Presgraves 2000). In many cases, the former arises in allopatry, whereas
the latter is viewed as a reinforcing mechanism. That said, much theoretical
and experimental work now indicates that postzygotic mechanisms, e.g., the
inviability or infertility of interspecific hybrids, can play crucial roles in initiating
reproductive isolation, and that prezygotic mechanisms might therefore evolve at
a later stage (Lande 1989; Schliewen et al. 1994; Dieckmann and Doebeli 1999;
Schilthuizen 2000; Turelli et al. 2001; Via 2001). Hence, it may be difficult to
uncover, using existing species as evidence, the important transformative events
that initiate speciation, as genetic divergence following reproductive isolation is
likely to obscure initial steps in the process. In other words, most of the geneticdifferences that separate contemporary species by enforcing isolation may not bethe differences that originally caused speciation. Overall, our research goal is to
elucidate the exact molecular mechanisms that bring about speciation in a model
eukaryote and to do so in real time under controlled laboratory conditions. We
contend that an experimental rather than a comparative approach is more likely
to enable us to clarify the role of postzygotic mechanisms in the initial stages of
speciation.
50 E. Kroll et al.

3.2 The Nature of Postzygotic Reproductive Isolation
in Eukaryotes
Postzygotic reproductive isolation manifests in the inviability or infertility of
hybrid progeny (Orr and Presgraves 2000). While hybrid inviability can be caused
by developmental incompatibilities or dysgenesis (Hartl et al. 1997), hybrid infer-
tility is likely a consequence of defective hybrid meiosis. Establishment of post-
zygotic reproductive isolation in eukaryotes has been explained by one of two
competing theories. One, “the chromosomal theory of speciation,” holds that
chromosomal changes (genomic rearrangements) disrupt recombination and segre-
gation of homologues in meiosis I, and/or fine-scale mutations disrupt meiotic
recombination via the action of mismatch repair (White 1978; King 1993; Radman
and Wagner 1993; Chambers et al. 1996; Searle 1998; Britton-Davidian et al. 2000;
Rieseberg 2001). The other, “the genic theory of speciation” (“speciation genes”)
holds that genic changes, e.g., functional incompatibilities between diverged
alleles, result in lower hybrid fitness (Bateson 1909; Dobzhansky 1937; Muller
1940; Coyne and Orr 1998). A third possibility, the idea that postzygotic isolation
occurs due to a combination of these two theories described above, has also been
proposed (Henikoff et al. 2001; Noor et al. 2001; Rieseberg 2001).
The chromosomal theory of speciation did not gain acceptance during the early
studies on postzygotic reproductive isolation due to two reasons: first, pioneering
experiments in Drosophila by Dobzhansky appeared to demonstrate the genic
nature of postzygotic isolation (Dobzhansky 1933); second, chromosomal specia-
tion appears to be incompatible due to the “underdominance” effect, wherein an
individual is rendered less fertile if it sustains a chromosomal rearrangement, and it
thus would not be able to form a new species (Livingstone and Rieseberg 2004).
The archetypal experiments by T. Dobzhansky first demonstrated that the
sterility of male hybrids formed as a result of interbreeding between two races
of Drosophila pseudoobscura distinguished by several chromosomal rearrange-
ments was due to mis-segregation of homologous chromosomes in meiosis I
(Dobzhansky 1933). Dobzhansky further noted that in rare instances when tetra-
ploid spermatogonia were found in these interracial hybrids, chromosomes also
had mis-segregated in meiosis I. From this observation, Dobzhansky deduced
that because every chromosome in tetraploid hybrid meioses is furnished with its
exact homologue, tetraploidization should have restored faithful segregation of
homologues if mis-segregation had been caused by chromosomal rearrangements
and not by genic incompatibilities. Thus, he concluded that genic incompatibi-
lities, not chromosomal changes, caused hybrid sterility to occur in the male
hybrids of two races of D. pseudoobscura. The ensuing rush for “speciation
genes” or, rather, incompatible alleles, did render some tangible results, notably
from the cloning of Odysseus, a gene encoding a homeobox protein responsible
for interspecific incompatibilies in Drosophila (Ting et al. 1998; Greenberg et al.
2003) and several more genes that control hybrid infertility (Lee et al. 2008;
Phadnis and Orr 2009).
3 Starvation-Induced Reproductive Isolation in Yeast 51

However, there is absolutely no way to make certain that such incompatible
alleles were the actual reason for speciation and not merely the product of species
divergence; in other words, finding speciation genes is not in fact a proof that
speciation ultimately has a genic nature. Intriguingly, in a footnote to his pioneering
paper on the genic nature of reproductive isolation mentioned above, Dobzhansky
acknowledges that he did not report the results of the reciprocal cross, which is “dif-
ferent in many important details” and would be “published elsewhere” (Dobzhansky
1933).
In stark contrast to the aforementioned studies of Dobzhansky, Noor and collea-
gues used the very same species of Drosophila to directly implicate large chromo-
somal inversions in the reproductive isolation between sympatric D. pseudoobscuraand D. persimilis populations (Noor et al. 2001). Indeed, inversions and other small
rearrangements that may have a deleterious effect on meiosis have been shown to
be abundant between related species in many species of yeast (Seoighe et al. 2000;
Kellis et al. 2003; Fischer et al. 2006), as well as in roundworms (Hutter et al.
2000), mice (Hauffe and Searle 1998), plants (Blanc et al. 2000), and a variety of
other organisms (for a review: Eichler and Sankoff 2003).
Experiments on tetraploidization in several species of plants showed that certain
types of chromosomal rearrangements were responsible for postzygotic reproductive
isolation (Anderson 1949; White 1978; Searle 1998; Pialek et al. 2001; Rieseberg
2001). Chromosomal rearrangements have also been implicated in human evolution,
acting to decrease gene flow in the chromosomal regions that harbor inversions
(Navarro and Barton 2003). In Saccharomyces cerevisiae, chromosomal inversions
have been shown to directly and efficiently impair the progression of meiosis
(Dresser et al. 1994; Jinks-Robertson et al. 1997; Chen and Jinks-Robertson 1999).
As for the concept of underdominance – a decrease in, or lack of, the ability to go
through meiosis due to one or more heterozygous rearrangement – overshadowing
the chromosomal speciation theory, it is fair to say that different genomic rearran-
gements may have very different effects on meiosis, ranging from irrelevant to
prohibitive, with all shades in between. Clearly, an organism that contains a chro-
mosomal rearrangement that abrogates meiosis is not going to form a new species;
however, a partial restriction of gene flow resulting from a rearrangement could
allow for faster rates of sequence and functional divergence (Lande 1989; Noor
et al. 2001; Rieseberg 2001; Navarro and Barton 2003), increasing the probability
of speciation. Finally, using the same logic that is used for epistasis in speciation
genes (Bateson 1909), genomic rearrangements can also form incompatible pairs,
further destabilizing meiosis in hybrid organisms.
Assuming that the experimental observations supporting both theories of post-
zygotic isolation are correct, should one conclude that these opposing results reflect
variation in experimental techniques, or are they more readily explained as varia-
tions between diverse taxa? And is it then reasonable to assume that both the genic
and chromosomal models of speciation (acting in concert or separately in different
taxa) can act in the process of speciation? To address these questions experimen-
tally, we have developed a laboratory assay using the yeast S. cerevisiae to isolate
reproductively separated clones during the course of prolonged starvation.
52 E. Kroll et al.

3.3 A Starvation-Based Experimental Model May Help
Resolve Uncertainties Concerning the Molecular
Basis for Speciation
Comparative analyzes of existing species may poorly discriminate between
changes that cause speciation and those that arise secondarily (Schilthuizen
2000). However, experimental evidence obtained under conditions physiologi-
cally close to optimal may be difficult to acquire as these conditions typically
result in low and constant mutation rates (Drake et al. 1998) that make speciation
less likely to occur (Rice and Hostert 1993). We have therefore developed an
experimental laboratory model to study speciation that uses prolonged starvation
as a proxy for sudden and severe environmental change. This treatment effectively
disrupts normal living conditions, disintegrating a population’s niche, over time
diminishing its mean fitness, measured as both survivorship and reproductive
capacity.
Furthermore, starvation is a condition that virtually all species experience and
that many contend with regularly in the wild (Koch 1971; Death and Ferenci
1994). All manner of environmental change, such as wildfire, flood, sudden trans-
fer to a new habitat, or even the invasion of a competitive species can bring about
starvation. We hypothesize that because starvation is universally experienced in
the wild owing to a plethora of circumstances, natural selection has brought
about mechanisms that respond to this generic signal in ways that may increase
population diversity via increased mutations, including large-scale genome
rearrangements.
3.4 Starvation-Responses That Could Increase Population
Genetic Diversity
Escherichia coli’s SOS system activates multiple responses to DNA damage,
nutrient starvation, and low temperature that are both mutagenic and recombino-
genic (Witkin and Wermundsen 1979; Dri and Moreau 1993; Friedberg et al. 1995;
McKenzie et al. 2000). Following activation of the SOS system, bacteria sustain a
high frequency of random mutation, rearrangements, and transposition (Radman
1975; Witkin 1976; Petit et al. 1991; Guerin et al. 2009), revealing a genetic link
between stress caused by highly challenging environmental conditions and varia-
bility (Taddei et al. 1997). In fact, it has been shown that starvation-induced muta-
genesis in bacteria is directly controlled by the SOS system (Taddei et al. 1995;
Hastings et al. 2000; McKenzie et al. 2000; Finkel 2006; He et al. 2006) as well as
by global stress response (Zinser and Kolter 1999; Bjedov et al. 2003; Lombardo
et al. 2004).
Eukaryotes possess a combination of genetic pathways that may be functionally
analogous to those of bacteria, such as checkpoint adaptation, translesion synthesis,
3 Starvation-Induced Reproductive Isolation in Yeast 53

stress signaling, and others (Toczyski et al. 1997; Kai and Wang 2003; Smets et al.
2010). However, although the causal connection between environmental stress and
an increase in adaptively significant variation has been well studied, the molecular
basis for such connection in eukaryotes remains obscure. By employing starvation
to mimic severe stress, we hope to model conditions in nature with which all
populations must contend (Death and Ferenci 1994) and to discover molecular
mechanisms that link catastrophic environmental change with the types of genetic
variation that could lead to speciation.
3.5 Advantages of Using Yeast as Model to Study
Speciation in Real Time
Several factors contributed to our choice of S. cerevisiae as a model organism.
S. cerevisiae is a well-studied organism that possesses most of the major signal
transduction (Smets et al. 2010) and DNAmaintenance pathways (San Filippo et al.
2008) found in other eukaryotes. Also, the genomes of multiple strains of
S. cerevisiae and more than ten-related species have been sequenced. Lastly,
yeast genetics, especially as it relates to DNA maintenance, cell cycle, checkpoints
and stress resistance, is well understood. In S. cerevisiae, as in higher eukaryotes,
the controlled occurrence of DNA double-strand breaks early in meiotic prophase is
essential for the maturation of the synaptonemal complex as well as for chiasmata
formation in diplotene and for faithful homologue segregation at anaphase I
(Peoples et al. 2002; Page and Hawley 2003). This dependence is reinforced by
the pachytene checkpoint (Roeder and Bailis 2000), which ensures that meiotic
recombination and homologue synapsis are completed before cells proceed to
metaphase I. In contrast, the chromosomes in another well-studied yeast species,
Schizosaccharomyces pombe, do not form synaptonemal complexes in meiosis
(Davis and Smith 2003); while in the popular multicellular model organisms
C. elegans and D. melanogaster, double-strand breaks are not required for chromo-
some synapsis to occur (Dernburg et al. 1998; Jang et al. 2003). Moreover,
heterogametic (male) meioses in Drosophila and other Diptera and Lepidoptera
occur in the complete absence of recombination (Hawley 2002). Thus, among
favored models systems, the processes of meiosis in S. cerevisiae most resemble
those found within meioses of mouse and human spermatocytes (Lichten 2001;
Page and Hawley 2003).
Finally, in S. cerevisiae, reproductive isolation manifests as a quantitative trait
that can be scored as the efficiency of producing viable spores or spore yield
(a combination of sporulation efficiency and spore viability). We chose an S288c
strain [BY4743 (Brachmann et al. 1998)] for our speciation studies because this
diploid, unlike other laboratory strains, does not spontaneously sporulate when
starved, and thus starved diploids that have not gone through meiosis can be reliably
obtained.
54 E. Kroll et al.

3.6 Three Modes of PostZygotic Isolation in Yeast – Sequence,
Chromosome, Breakpoint-Recombination
The six nonhybrid species that comprise the sensu stricto group of Saccharomyces(S. cerevisiae, S. paradoxus, S. mikatae, S. cariocanus, S. kudriavzevii, andS. bayanus) show large genomic rearrangements relative to each other, as detected
by pulsed-field gel analysis, with the exception of S. cerevisiae and S. paradoxuswhich are almost identical. Fischer et al. showed that these rearrangements did not
in fact correspond to a phylogenetic tree based on sequence divergence of rRNA
(Fischer et al. 2000, 2006), and thus concluded that genomic rearrangements were
unimportant in the speciation of yeast. Interestingly, the restoration of the colinear-
ity of gene order between two sensu stricto species, S. cerevisiae and S. mikatae, didlead to a partial restoration of the interspecific hybrid fertility (Delneri et al. 2003),
indicating that genomic rearrangements are important for the maintenance of the
postzygotic reproductive isolation in yeast.
Mutational load and the action of the mismatch repair system also affect, albeit
partially, reproductive isolation between S. cerevisiae and S. paradoxus (Chambers
et al. 1996; Chen and Jinks-Robertson 1999), as crossing-over in yeast is dependent on
sequence homology between homeologous chromosomes (Hunter et al. 1996). How-
ever, experiments suggesting these possibilities were conducted with extant species,
where genetic changes such as sequence divergence – proposed as a possible cause for a
reproductive barrier – may actually have occurred after the speciation event and thus
might not be a reason for the initial reproductive barrier. Additionally, dominant
epistatic incompatibilities between two sensu stricto species of Saccharomyces havebeen shown not to be important for speciation by either tetraploidization experiments
(Greig et al. 2002) or directly checking for speciation genes (Greig and Leu 2009).
Although one pair of incompatible alleles has been recently identified between
S. cerevisiae and S. bayanus (Lee et al. 2008), it is again unclear whether this incompat-
ibility was a driving force, or a secondary consequence, of the initial speciation event.
Chromosome rearrangements are plentiful in yeast genomes. Genomic rearran-
gements, such as reciprocal translocations, transpositions, insertions, deletions, and
inversions, are ubiquitous features of even closely related species. Studies using
pulsed-field gel analysis and hybridization, such as Fischer et al. (Fischer et al.
2000), identified only a small subset of all rearrangements and inversions among
the sensu stricto species – as shown by subsequent whole genome sequencing –
because smaller rearrangements and inversions simply cannot be resolved by
pulsed-field gels. Remarkably, of all the syntenic breakpoints between S. cerevisiaeand S. bayanus, less than 10% are large-scale rearrangements (Fischer et al. 2001).
Sequence data from the S. bayanus, S. mikatae, and S. paradoxus genomes have
revealed many more genomic rearrangements than were previously known, espe-
cially at chromosome ends (Kellis et al. 2003). The nine inversions that exist
between the genomes of these three species and S. cerevisiae are flanked by
tRNA genes, usually of the same isoacceptor type (Kellis et al. 2003). This finding
suggests that inversions and perhaps other rearrangements that have accumulated in
3 Starvation-Induced Reproductive Isolation in Yeast 55

the genomes of the Saccharomyces spp. arose via homologous recombination. An
alternative hypothesis is that rearrangements may have been caused by yeast retro-
transposons (Ty), as the tRNA genes are hotspots for Ty1, 3, and 5 transposition
(Natsoulis et al. 1989). In addition, nonhomologous end-joining may have played a
role in creating some of the rearrangements, as has been observed among flor yeast
used in fortified winemaking (Infante et al. 2003).
Thus, in our opinion, certain genomic rearrangements that include small and large
inversions, small translocations, and small insertion–deletions that escape detection
by pulsed-field gel analysis (but discovered later by sequencing) may be a ubiquitous
feature of evolving genomes. We further suggest that such rearrangements may play
a key role in incipient speciation among yeasts and other Eukaryotes.
3.7 Starved Yeast Cultures Sustain High Frequencies
of Genomic Rearrangements
In extant species of Saccharomyces yeast, the rates of genomic rearrangements
are highly variable (Fischer et al. 2006). We contend that starvation as a result of
environmental change can affect the rates of genomic variation. Moreover, we have
already shown that a champagne strain, DB146, sustains a massive amount of
change in genomic architecture after prolonged starvation (Coyle and Kroll 2008).
To appraise the effect of prolonged starvation on genomic change, we starved
multiple random clones of the laboratory yeast diploid BY4743 (Brachmann et al.
1998), essentially as described (Coyle and Kroll 2008). During a 1-month-long
starvation treatment, and accounting for diminished viability, the starving cultures
underwent an average of ten generations. At no point did we observe sporulating
cells in starving cultures. For comparison, we established a control by growing
BY4743 cells in rich medium for approximately twice the number of generations
that starved cultures underwent. Because, strictly speaking, the cells obtained at the
end of these �20 generations are neither ancestral nor “wild-type” to the starved
cultures, we chose to call them “nonstarved” cultures.
3.7.1 Starved Cultures Sporulate at Lower LevelThan the Nonstarved Cultures
Genomic rearrangements may create a reproductive barrier between two popula-
tions, as discussed previously. If a reproductive barrier existed between our starved
and ancestral populations, it would manifest as decreased fertility of starved cultures
in backcrosses between haploid progeny of the starved and ancestral populations
when compared with the values for nonstarved to ancestral backcrosses. Both
efficiency of sporulation (the frequency at which yeast cells form gametes or spores)
and spore viability (colony-forming units per number of spores plated) could be
56 E. Kroll et al.

expected to affect hybrid fertility. Generally, only a partial measure of fertility –
spore viability – is measured in crosses between separate yeast species (Naumov
et al. 2000). Since different species usually require different conditions for optimal
sporulation, sporulation efficiency of the interspecific hybrid lacks an obvious
control. However, in our case, we used only one ancestral strain, and thus we
were able to assess both sporulation efficiency and spore viability of the backcross
hybrids. To score these traits, we incubated the cells overnight in fresh rich medium
to minimize the fraction of dead cells in starved cultures, then sporulated them using
conditions optimized for the ancestral strain, We scored sporulation efficiency and
the viability of the resultant spores. For all comparisons we used nonparametric
statistical tests, as we could not assume normal distribution for our data.
Nonstarved diploid cultures sporulated at the efficiency characteristic of the
BY4743 ancestor and spore viability was nearly 100%. In contrast, starved
BY4743 cultures sporulated about at half the frequency of the nonstarved cultures,
even after prolonged sporulation (Coyle et al. in preparation). Nevertheless, spore
viability among sporulated starved cultures was almost as high as that of spores
derived from the nonstarved cultures (Fig. 3.1).
The fact that starved cultures exhibited significantly lower sporulation efficiency
than nonstarved control suggests the possibility that accumulated changes in the
genomes of starved cultures alter their fertility. Viable spores derived from such
starved cells might be wholly or partially reproductively isolated from each other
and from the ancestral population.
3.7.2 A Subset of Starved Backcrosses Show Lower FertilityThan the Nonstarved Backcrosses
To test how reproductive isolation was distributed within starved cultures we
assessed the fertility of the backcrossed hybrids. We isolated rare spores from
Fig. 3.1 Starved and nonstarved cultures of BY4743 sporulated for 2 days. Arrows denote sporesacks (asci) that contain three or four spores. (a) Starved diploid culture. Only one misshapen spore
sack (ascus) is shown (arrow). (b) Nonstarved culture. The majority of cells have formed asci
3 Starvation-Induced Reproductive Isolation in Yeast 57

1 month starved cultures, germinated those spores into haploid strains, or “starved
isolates” and performed backcrosses. We then sporulated the resultant backcross
hybrids and measured their sporulation efficiency and spore viability; finally, we
compared their hybrid fertility with that of the nonstarved isolates.
The results recapitulate the previous findings for starved diploids: multiple back-
crossed hybrids exhibited significantly lower average sporulation efficiency than the
nonstarved backcrosses (Mann–Whitney U test). Specifically, about one-third of
starved isolates used for the backcross analysis showed a sporulation efficiency that
was significantly lower than those of their respective nonstarved intercrosses (Coyle
et al. in preparation). In contrast to sporulation efficiency, spore viability in all cases
was indistinguishable from the ancestral (Coyle et al. in preparation).
3.7.3 Starved Isolates Reproductively Isolated from theAncestral Population Are Self-Fertile
Complete inability to undergo meiosis would prevent the establishment of a new
species. This might be caused either by mutations in genes important for meiosis or
by a chromosome aberration that prohibits meiosis. To ensure that the starved isolates
could have found a new lineage, capable of sexual reproduction, we selfed starved
isolates that exhibited lower fertility in backcrosses. To do this, we made haploid
progeny of those starved isolates homothallic and isolated their selfed diploid prog-
eny. After sporulating these selfed diploids we found that their sporulation efficiency
was significantly higher than the fertility of the backcross hybrid (Coyle et al. in
preparation). We concluded that starved isolates reproductively isolated from the
ancestral population were self-fertile and able to form new sexually reproducing
lineages, that is, new biological species. These results confirm bona fide incipient
speciation arising in a yeast population within a 1-month period of starvation.
3.7.4 Molecular Basis of Reproductive Barrier in a Starved Isolate
To discover the molecular mechanism of reproductive isolation, we further studied
several of the reproductively isolated starved isolates. Our experiments showed that
forward mutation frequency increased only two times in starved populations com-
pared with the nonstarved control, which could not account for the widespread
reproductive isolation. In contrast, pulsed-field gel analysis revealed a 6.6% total
frequency of new chromosomal variants in the starved BY4743 cultures, with no
rearrangements detected in nonstarved cultures (Coyle et al. in preparation). This
frequency is orders of magnitude higher than can be estimated for a typical labo-
ratory yeast strain (Schmidt et al. 2006). Finally, using microarray-based compara-
tive genomic hybridization (Dunn et al. 2005) we showed that all starved isolates
contained deletions and additions of genomic DNA (Coyle et al. in preparation).
58 E. Kroll et al.

In particular, one isolate contained duplication of the whole Chromosome I (Coyle
et al. in preparation).We decided to examine this disomic haploid isolate further todetermine whether chromosomal abnormalities which arose during starvation could
explain this strain’s reproductive isolation.
As has been reasoned before, in tetraploid hybrid meioses every chromosome is
furnished with its exact homologue (Dobzhansky 1933), therefore tetraploidization
should restore faithful segregation of homologues if mis-segregation in the diploid
hybrid were caused by chromosomal rearrangements and not by genic incompa-
tibilities. In our case, when we crossed the disomic starved isolate to its haploid
ancestor, we obtained a diploid hybrid with trisomy for Chromosome I (two copies
of the chromosome from the starved isolate and one from the ancestor). If the
Chromosome I trisomy were responsible for the lowered fertility of the backcross
hybrid, because there was no homologue furnished for the extra Chromosome I,
we would expect tetraploidization of this hybrid to restore its fertility. If the fertility
of the backcross hybrid were not restored then we would have to assume that an
epistatic interaction between incompatible alleles underlies reproductive barrier
between this isolate and its ancestor.
To test for this possibility, we obtained tetraploid versions of the trisomic
backcross hybrid by deleting one of the two MAT loci in the hybrid. We identified
hybrids expressing either MATa or MATalpha and crossed such strains using a
micromanipulator to produce several independent tetraploid versions of the back-
cross hybrid. We repeated this procedure with the nonstarved isolates to obtain
control tetraploids. After tetraploidy was confirmed by tetrad dissection, we sporu-
lated the resulting diploid hybrids and their tetraploid derivatives and measured the
sporulation efficiency as before. The results are shown in Fig. 3.2.
100
90
80
70
60
50
40
30
20
10
0
a b c d
Fig. 3.2 Relative sporulation efficiency of (a) Diploid starved backcross hybrid with extra
Chromosome I, (b) tetraploid starved backcross hybrid with extra Chromosome I, (c) diploid
nonstarved backcross hybrid, (d) tetraploid backcross hybrid. Ancestral sporulation efficiency is
assumed to be 100%. Spore viability in all strains was indistinguishable from the ancestral
3 Starvation-Induced Reproductive Isolation in Yeast 59

Independently obtained tetraploid derivatives of the trisomic hybrid showed a
dramatic increase in sporulation efficiency compared with the diploid hybrid using
Mann–Whitney U test (Coyle et al. in preparation). In contrast, the increase in
sporulation efficiency of the nonstarved tetraploidized backcross hybrids was indis-
tinguishable from that of the nonstarved diploid backcross, indicating that tetra-
ploidization does not generally result in increased sporulation efficiency in the
nonstarved clones. Our results indicate that reproductive isolation in the starved
disomic isolate cannot be a consequence of the allelic incompatibilities between
the disomic isolate and the nonstarved ancestor. Rather, these results support the
hypothesis that chromosomal rather than genic differences underlie reduced ferti-
lity of the starved isolate.
3.8 Conclusions
The experiments described here provide insight into the phenomenon of starvation-
associated genomic rearrangements and its possible role in establishing reproduc-
tive isolation. Starvation is a condition that most natural organisms frequently
contend within the wild. Because a variety of changes in the external milieu can
result in starvation, we contend that starvation is a generic “interpreter” of catastro-
phic environmental change. Organisms that evolved mechanisms to harness star-
vation as signal to increase population diversity could be expected to leave more
descendants in the wake of such catastrophes. These mechanisms represent an
alternative population-level evolutionary response to the many individual-level
responses that enable organisms to persist under severe stress (e.g., spores, hiber-
nation, aestivation, extreme desiccation resistance, etc.).
Eukaryotes possess genetic mechanisms able to respond to stressful conditions;
however, no connection between starvation, starvation-induced genetic variation,
and speciation has been experimentally established in eukaryotes. Our experiments
provide evidence for this connection by showing that starved yeast populations
sustain genomic rearrangements at a dramatically higher frequency than nonstarved
populations, and that certain clones that survive starvation are reproductively
isolated from their ancestors. These newly evolved clones may represent incipient
species.
Genomic rearrangements have been shown to occur in yeast during chemical
treatment (Hughes et al. 2000) and growth in nutrient-limiting conditions (Adams
et al. 1992; Dunham et al. 2002). In fact, Dunham et al. note that several of their
parallel cultures grown in continuous culture under glucose limitation failed tosporulate, a phenomenon similar to the one observed here (Dunham et al. 2002).
This phenotype arose after 250–500 generations of continuous growth, unlike our
cultures which only underwent �10 generations during the course of starvation.
Recently, another study has shown that adaptation to diverse environments leads to
incipient speciation in yeast (Dettman et al. 2007), echoing the classic experiments
in Drosophila (Rice and Hostert 1993). The authors attempted to examine the
60 E. Kroll et al.

molecular nature of de novo speciation, using correlation between hybrid fitness
and fertility. Interestingly, in contrast to findings in extant yeast species (Greig
2009), their yeast hybrids, like ours, retained almost 100% of spore viability but
exhibited lower sporulation efficiency (Dettman et al. 2007).
We contend that genomic rearrangements arising during starvation may contrib-
ute to reproductive isolation, supporting the chromosomal theory of speciation
(White 1978). When the rate of genomic rearrangements is very low and the
effective population size is high, the chromosomal theory of speciation cannot
plausibly explain the process of speciation (Rieseberg 2001). However, the stress
of complete starvation circumvents these problems by dramatically increasing the
rate of chromosomal rearrangements in starving populations and simultaneously
decreasing the effective population size (because of the lower chances of having
enough resources to mate and also because of lower viability). Thus, environmental
conditions leading to starvation may favor the establishment of small, reproduc-
tively isolated, inbred subpopulations that harbor restructured genomes poised to
undergo rapid speciation without a requirement for any other type of prezygotic
isolation.
Acknowledgments We would like to acknowledge technical help from S. Coyle. This work was
supported by NSF grant 0134648 to E.K., NASA grant NNX07AJ28G grant to R.F.R. and NSF
ADVANCE grant DBI-0340856 to BD
References
Adams J, Puskas-Rozsa S, Simlar J, Wilke CM (1992) Adaptation and major chromosomal
changes in populations of Saccharomyces cerevisiae. Curr Genet 22:13–19
Anderson E (1949) Introgressive hybridization. Chapman & Hall, London
Bateson W (1909) Heredity and variation in modern lights. Darwin and modern science.
Cambridge University Press, Cambridge, UK
Bjedov I, Tenaillon O, Gerard B, Souza V, Denamur E, Radman M, Taddei F, Matic I (2003)
Stress-induced mutagenesis in bacteria. Science 300:1404–1409
Blanc G, Barakat A, Guyot R, Cooke R, Delseny M (2000) Extensive duplication and reshuffling
in the Arabidopsis genome. Plant Cell 12:1093–1101
Brachmann CB, Davies A, Cost GJ, Caputo E, Li J, Hieter P, Boeke JD (1998) Designer deletion
strains derived from Saccharomyces cerevisiae S288C: a useful set of strains and plasmids for
PCR-mediated gene disruption and other applications. Yeast 14:115–132
Britton-Davidian J, Catalan J, da Graca Ramalhinho M, Ganem G, Auffray JC, Capela R, Biscoito
M, Searle JB, da Luz Mathias M (2000) Rapid chromosomal evolution in island mice. Nature
403:158
Chambers SR, Hunter N, Louis EJ, Borts RH (1996) The mismatch repair system reduces meiotic
homeologous recombination and stimulates recombination-dependent chromosome loss. Mol
Cell Biol 16:6110–6120
Chen W, Jinks-Robertson S (1999) The role of the mismatch repair machinery in regulating
mitotic and meiotic recombination between diverged sequences in yeast. Genetics
151:1299–1313
Coyle S, Kroll E (2008) Starvation induces genomic rearrangements and starvation-resilient
phenotypes in yeast. Mol Biol Evol 25:310–318
Coyle S, Dunn B, Rosenzweig RF, Kroll E (in preparation) The molecular basis of starvation-
associated reproductive isolation in yeast
3 Starvation-Induced Reproductive Isolation in Yeast 61

Coyne JA, Orr HA (1998) The evolutionary genetics of speciation. Philos Trans R Soc Lond B
Biol Sci 353:287–305
Darwin C (1859) On the origin of species by means of natural selection, or the preservation of
favoured races in the struggle for life. J. Murray, London
Davis L, Smith GR (2003) Nonrandom homolog segregation at meiosis I in Schizosaccharomyces
pombe mutants lacking recombination. Genetics 163:857–874
Death A, Ferenci T (1994) Between feast and famine: endogenous inducer synthesis in the
adaptation of Escherichia coli to growth with limiting carbohydrates. J Bacteriol
176:5101–5107
Delneri D, Colson I, Grammenoudi S, Roberts IN, Louis EJ, Oliver SG (2003) Engineering
evolution to study speciation in yeasts. Nature 422:68–72
Dernburg AF, McDonald K, Moulder G, Barstead R, Dresser M, Villeneuve AM (1998) Meiotic
recombination in C. elegans initiates by a conserved mechanism and is dispensable for
homologous chromosome synapsis. Cell 94:387–398
Dettman JR, Sirjusingh C, Kohn LM, Anderson JB (2007) Incipient speciation by divergent
adaptation and antagonistic epistasis in yeast. Nature 447:585–588
Dieckmann U, Doebeli M (1999) On the origin of species by sympatric speciation. Nature
400:354–357
Dobzhansky T (1933) On the sterility of the interracial hybrids in Drosophila pseudoobscura. ProcNatl Acad Sci USA 19:397–403
Dobzhansky T (1937) Genetics and the origin of species. Columbia Press, New York
Drake JW, Charlesworth B, Charlesworth D, Crow JF (1998) Rates of spontaneous mutation.
Genetics 148:1667–1686
Dresser ME, Ewing DJ, Harwell SN, Coody D, Conrad MN (1994) Nonhomologous synapsis and
reduced crossing over in a heterozygous paracentric inversion in Saccharomyces cerevisiae.
Genetics 138:633–647
Dri AM, Moreau PL (1993) Phosphate starvation and low temperature as well as ultraviolet
irradiation transcriptionally induce the Escherichia coli LexA- controlled gene sfiA. Mol
Microbiol 8:697–706
Dunham MJ, Badrane H, Ferea T, Adams J, Brown PO, Rosenzweig F, Botstein D (2002)
Characteristic genome rearrangements in experimental evolution of Saccharomyces cerevisiae.
Proc Natl Acad Sci USA 99:16144–16149
Dunn B, Levine RP, Sherlock G (2005) Microarray karyotyping of commercial wine yeast strains
reveals shared, as well as unique, genomic signatures. BMC Genomics 6(1):53–57
Eichler EE, Sankoff D (2003) Structural dynamics of eukaryotic chromosome evolution. Science
301:793–797
Finkel SE (2006) Long-term survival during stationary phase: evolution and the GASP phenotype.
Nat Rev Microbiol 4:113–120
Fischer G, James SA, Roberts IN, Oliver SG, Louis EJ (2000) Chromosomal evolution in
Saccharomyces. Nature 405:451–454
Fischer G, Neuveglise C, Durrens P, Gaillardin C, Dujon B (2001) Evolution of gene order in the
genomes of two related yeast species. Genome Res 11:2009–2019
Fischer G, Rocha EP, Brunet F, Vergassola M, Dujon B (2006) Highly variable rates of genome
rearrangements between hemiascomycetous yeast lineages. PLoS Genet 2:e32
Fisher RA (1930) The Genetical theory of natural selection. Oxford, UK
Friedberg E, Walker G, Siede W (1995) DNA repair and mutagenesis. Am Soc Microbiol,
Washington, DC
Greenberg AJ, Moran JR, Coyne JA, Wu CI (2003) Ecological adaptation during incipient
speciation revealed by precise gene replacement. Science 302:1754–1757
Greig D (2009) Reproductive isolation in Saccharomyces. Heredity 102:39–44
Greig D, Leu JY (2009) Natural history of budding yeast. Curr Biol 19:R886–R890
Greig D, Borts RH, Louis EJ, Travisano M (2002) Epistasis and hybrid sterility in Saccharomyces.
Proc R Soc Lond B Biol Sci 269:1167–1171
62 E. Kroll et al.

Guerin E, Cambray G, Sanchez-Alberola N, Campoy S, Erill I, Da Re S, Gonzalez-Zorn B, Barbe J,
PloyMC,Mazel D (2009) The SOS response controls integron recombination. Science 324:1034
Hartl DL, Lohe AR, Lozovskaya ER (1997) Regulation of the transposable element mariner.
Genetica 100:177–184
Hastings PJ, Bull HJ, Klump JR, Rosenberg SM (2000) Adaptive amplification. An inducible
chromosomal instability mechanism. Cell 103:723–731
Hauffe HC, Searle JB (1998) Chromosomal heterozygosity and fertility in house mice (Mus
musculus domesticus) from Northern Italy. Genetics 150:1143–1154
Hawley RS (2002) Meiosis: how male flies do meiosis. Curr Biol 12:R660–R662
He AS, Rohatgi PR, Hersh MN, Rosenberg SM (2006) Roles of E. coli double-strand-break-repair
proteins in stress-induced mutation. DNA Repair 5:258–273
Henikoff S, Ahmad K, Malik HS (2001) The centromere paradox: stable inheritance with rapidly
evolving DNA. Science 293:1098–1102
Herrmann RG, Maier RM, Schmitz-Linneweber C (2003) Eukaryotic genome evolution: rear-
rangement and coevolution of compartmentalized genetic information. Philos Trans R Soc
Lond B Biol Sci 358:87–97, discussion 97
Hughes TR, Roberts CJ, Dai H, Jones AR, Meyer MR, Slade D, Burchard J, Dow S, Ward TR,
Kidd MJ, Friend SH, Marton MJ (2000) Widespread aneuploidy revealed by DNA microarray
expression profiling. Nat Genet 25:333–337
Hunter N, Chambers SR, Louis EJ, Borts RH (1996) The mismatch repair system contributes to
meiotic sterility in an interspecific yeast hybrid. EMBO J 15:1726–1733
Hutter H, Vogel BE, Plenefisch JD, Norris CR, Proenca RB, Spieth J, Guo C, Mastwal S, Zhu X,
Scheel J, Hedgecock EM (2000) Conservation and novelty in the evolution of cell adhesion and
extracellular matrix genes. Science 287:989–994
Infante JJ, Dombek KM, Rebordinos L, Cantoral JM, Young ET (2003) Genome-wide amplifica-
tions caused by chromosomal rearrangements play a major role in the adaptive evolution of
natural yeast. Genetics 165:1745–1759
Jang JK, Sherizen DE, Bhagat R, Manheim EA, McKim KS (2003) Relationship of DNA double-
strand breaks to synapsis in Drosophila. J Cell Sci 116:3069–3077
Jinks-Robertson S, Sayeed S, Murphy T (1997) Meiotic crossing over between nonhomologous
chromosomes affects chromosome segregation in yeast. Genetics 146:69–78
Kai M, Wang TS (2003) Checkpoint activation regulates mutagenic translesion synthesis. Genes
Dev 17:64–76
Kellis M, Patterson N, Endrizzi M, Birren B, Lander ES (2003) Sequencing and comparison of
yeast species to identify genes and regulatory elements. Nature 423:241–254
King M (1993) Species evolution: the role of chromosome change. Cambridge University Press,
Cambridge
Koch AL (1971) The adaptive responses of Escherichia coli to a feast and famine existence. Adv
Microb Physiol 6:147–217
Lande R (1989) Fisherian and Wrightian theories of speciation. Genome 31:221–227
Lee HY, Chou JY, Cheong L, Chang NH, Yang SY, Leu JY (2008) Incompatibility of nuclear and
mitochondrial genomes causes hybrid sterility between two yeast species. Cell 135:1065–1073
Lichten M (2001) Meiotic recombination: breaking the genome to save it. Curr Biol 11:
R253–R256
Livingstone K, Rieseberg L (2004) Chromosomal evolution and speciation: a recombination-
based approach. New Phytol 161:107–112
Lombardo MJ, Aponyi I, Rosenberg SM (2004) General stress response regulator RpoS in
adaptive mutation and amplification in Escherichia coli. Genetics 166:669–680
Mayr E (1942) Systematics and the origins of species. Columbia University Press, New York
Mayr E (1966) Animal species and evolution. Harvard University Press, Cambridge
Mayr E (1996) What is a species and what is not? Philos Sci 63:262–277
McKenzie GJ, Harris RS, Lee PL, Rosenberg SM (2000) The SOS response regulates adaptive
mutation. Proc Natl Acad Sci USA 97:6646–6651
3 Starvation-Induced Reproductive Isolation in Yeast 63

Muller HJ (1940) Bearing of the Drosophila work on systematics. In: Huxley J (ed) The new
systematics. Clarendon, Oxford, pp 185–268
Natsoulis G, Thomas W, Roghmann MC, Winston F, Boeke JD (1989) Ty1 transposition in
Saccharomyces cerevisiae is nonrandom. Genetics 123:269–279
Naumov GI, James SA, Naumova ES, Louis EJ, Roberts IN (2000) Three new species in the
Saccharomyces sensu stricto complex: Saccharomyces cariocanus,Saccharomyces kudriavze-
vii and Saccharomyces mikatae. Int J Syst Evol Microbiol 50(Pt 5):1931–1942
Navarro A, Barton NH (2003) Chromosomal speciation and molecular divergence–accelerated
evolution in rearranged chromosomes. Science 300:321–324
Noor MA, Grams KL, Bertucci LA, Reiland J (2001) Chromosomal inversions and the reproduc-
tive isolation of species. Proc Natl Acad Sci USA 98:12084–12088
Orr HA, Presgraves DC (2000) Speciation by postzygotic isolation: forces, genes and molecules.
Bioessays 22:1085–1094
Page SL, Hawley RS (2003) Chromosome choreography: the meiotic ballet. Science 301:785–789
Peoples TL, Dean E, Gonzalez O, Lambourne L, Burgess SM (2002) Close, stable homolog
juxtaposition during meiosis in budding yeast is dependent on meiotic recombination, occurs
independently of synapsis, and is distinct from DSB-independent pairing contacts. Genes Dev
16:1682–1695
Petit MA, Dimpfl J, Radman M, Echols H (1991) Control of large chromosomal duplications in
Escherichia coli by the mismatch repair system. Genetics 129:327–332
Phadnis N, Orr HA (2009) A single gene causes both male sterility and segregation distortion in
Drosophila hybrids. Science 323:376–379
Pialek J, Hauffe HC, Rodriguez-Clark KM, Searle JB (2001) Raciation and speciation in house
mice from the Alps: the role of chromosomes. Mol Ecol 10:613–625
Radman M (1975) SOS repair hypothesis: phenomenology of an inducible DNA repair which is
accompanied by mutagenesis. Basic Life Sci 5A:355–367
Radman M, Wagner R (1993) Mismatch recognition in chromosomal interactions and speciation.
Chromosoma 102:369–373
Rice W, Hostert E (1993) Laboratory experiments on speciation: what have we learned in 40
years? Evolution 47:1637–1653
Rieseberg LH (2001) Chromosomal rearrangements and speciation. Trends Ecol Evol 16:351–358
Roeder GS, Bailis JM (2000) The pachytene checkpoint. Trends Genet 16:395–403
San Filippo J, Sung P, Klein H (2008) Mechanism of eukaryotic homologous recombination. Annu
Rev Biochem 77:229–257
Schilthuizen M (2000) Dualism and conflicts in understanding speciation. Bioessays 22:1134–1141
Schliewen UK, Tautz D, Paabo S (1994) Sympatric speciation suggested by monophyly of crater
lake cichlids. Nature 368:629–632
Schmidt KH, Pennaneach V, Putnam CD, Kolodner RD (2006) Analysis of gross-chromosomal
rearrangements in Saccharomyces cerevisiae. Methods Enzymol 409:462–476
Searle JB (1998) Speciation, chromosomes, and genomes. Genome Res 8:1–3
Seoighe C, Federspiel N, Jones T, Hansen N, Bivolarovic V, Surzycki R, Tamse R, Komp C,
Huizar L, Davis RW, Scherer S, Tait E, Shaw DJ, Harris D, Murphy L, Oliver K, Taylor K,
Rajandream MA, Barrell BG, Wolfe KH (2000) Prevalence of small inversions in yeast gene
order evolution. Proc Natl Acad Sci USA 97:14433–14437
Sinervo B, Svensson E (2002) Correlational selection and the evolution of genomic architecture.
Heredity 89:329–338
Smets B, Ghillebert R, De Snijder P, Binda M, Swinnen E, De Virgilio C, Winderickx J (2010)
Life in the midst of scarcity: adaptations to nutrient availability in Saccharomyces cerevisiae.
Curr Genet 56:1–32
Taddei F, Matic I, Radman M (1995) cAMP-dependent SOS induction and mutagenesis in resting
bacterial populations. Proc Natl Acad Sci USA 92:11736–11740
Taddei F, Vulic M, Radman M, Matic I (1997) Genetic variability and adaptation to stress. EXS
83:271–290
64 E. Kroll et al.

Ting CT, Tsaur SC, Wu ML, Wu CI (1998) A rapidly evolving homeobox at the site of a hybrid
sterility gene. Science 282:1501–1504
Toczyski DP, Galgoczy DJ, Hartwell LH (1997) CDC5 and CKII control adaptation to the yeast
DNA damage checkpoint. Cell 90:1097–1106
Turelli M, Barton NH, Coyne JA (2001) Theory and speciation. Trends Ecol Evol 16:330–343
Via S (2001) Sympatric speciation in animals: the ugly duckling grows up. Trends Ecol Evol
16:381–390
Vulic M, Lenski RE, Radman M (1999) Mutation, recombination, and incipient speciation of
bacteria in the laboratory. Proc Natl Acad Sci USA 96:7348–7351
White MJD (1978) Modes of speciation. W.H. Freeman& Co, SanFrancisco
Witkin EM (1976) Ultraviolet mutagenesis and inducible DNA repair in Escherichia coli. Bacte-
riol Rev 40:869–907
Witkin EM, Wermundsen IE (1979) Targeted and untargeted mutagenesis by various inducers of
SOS functions in Escherichia coli. Cold Spring Harb Symp Quant Biol 43(Pt 2):881–886
Zinser ER, Kolter R (1999) Mutations enhancing amino acid catabolism confer a growth advan-
tage in stationary phase. J Bacteriol 181:5800–5807
3 Starvation-Induced Reproductive Isolation in Yeast 65

Chapter 4
Populations of RNAMolecules as Computational
Model for Evolution
Michael Stich, Carlos Briones, Ester Lazaro, and Susanna C. Manrubia
Abstract We consider populations of RNA molecules as computational model for
molecular evolution. Based on a large body of previous work, we review some
recent results. In the first place, we study the sequence–structure map, its implica-
tions on the structural repertoire of a pool of random RNA sequences and its
relevance for the RNA world hypothesis of the origin of life. In a scenario where
template replication is possible, we discuss the internal organization of evolving
populations and its relationship with robustness and adaptability. Finally, we
explore how the effect of the mutation rate on fitness changes depends on the
degree of adaptation of an RNA population.
4.1 Introduction
Molecular evolution covers a huge area of research, ranging from prebiotic chem-
istry and questions on the origin of life, through many aspects related to the origin
of and the relationships among species, the study of viral and bacterial evolution
and their medical implications up to the artificial design and in vitro selection of
molecules, with all their applications in nano- and biotechnology. In this chapter,
we do not aim to give a complete overview of that wide research field, but focus on
the use of populations of RNA molecules as a model to understand evolution of
prebiotic replicators in the RNA world. As RNA viruses share many characteristics
with primitive RNA molecules with replicative ability, these studies can also be
used to tackle many aspects of viral evolution. Although a large body of our work is
inspired by experiments, in this chapter we focus on theoretical approaches for
understanding evolutionary processes.
M. Stich, C. Briones, E. Lazaro, and S.C. Manrubia
Dpto de Evolucion Molecular, Centro de Astrobiologıa (CSIC-INTA), Ctra de Ajalvir, km 4,
28850 Torrejon de Ardoz (Madrid), Spain
e-mail: [email protected]
P. Pontarotti (ed.), Evolutionary Biology – Concepts, Molecularand Morphological Evolution, DOI 10.1007/978-3-642-12340-5_4,# Springer-Verlag Berlin Heidelberg 2010
67

RNAmolecules are a very well suited model for studying evolution because they
incorporate, in a single molecular entity, both genotype and phenotype. While
errors in the replication process introduce mutations in the RNA sequence (geno-
type), selection acts upon the function (phenotype) of the molecule. Since in many
cases the spatial structure of the molecule is crucial for its biochemical function, the
structure of an RNA molecule can be considered as a minimal representation of the
phenotype.
In current biology, RNA viruses are the paradigmatic example for evolving
populations: replication is fast, it takes place with a relatively high error rate, and
population sizes are large. This has made RNA viruses an often used example for
quasispecies, a concept originally proposed by Eigen (1971) and developed over
the last decades in the context of virology (Domingo 2006). It states that a popula-
tion of replicators, e.g., an RNA virus evolving within an infected host, cannot be
represented by only one, fittest, genome, but by the spectrum of related mutants that
are present in the population. The quasispecies evolves under a certain error
(mutation) rate and the cloud of mutants enables the population to adapt quickly
to new environmental situations, such as population bottlenecks and changed
selective pressures. Under constant external conditions, a quasispecies approaches
a dynamic equilibrium between selection of favorable sequences (what we mean by
favorable, will be specified below) and the diversity constantly introduced by muta-
tion. Therefore, the mutation rate is of crucial importance in the study of such
heterogeneous populations in molecular evolution (Huynen et al. 1996; Biebricher
and Eigen 2005): if the mutation rate becomes too large, selection becomes ineffi-
cient, the correlations between the genomes within the population decay, and the
whole population may even become extinct. There are many reported examples of
the extinction of RNA virus populations when replication takes place at increased
error rates due to the presence of mutagenic agents (Sierra et al. 2000; Domingo
2005; Cases-Gonzalez et al. 2008). These results have inspired a new promising
antiviral strategy named lethal mutagenesis (Loeb et al. 1999).
Another field of research within molecular evolution is the quest for understand-
ing the origin and early evolution of life. One of the most appealing theories in this
context is the so-called RNA world hypothesis. It is based on the facts that RNA
cannot only represent a genetic code, like DNA in present-day cells, but also can act
as catalyst of biochemical reactions, like present-day enzymes. Therefore, a single
RNA molecule could have been endowed with the two main features of living
matter, providing the genome (i.e., the blueprint for replication) and the primordial
machinery for replication and metabolism. One of the open questions in this context
is how the first template-dependent RNA polymerase ribozyme could have
emerged. Experimentally, a minimum size of approximately 165 nucleotides has
been established for such a molecule (Johnston et al. 1999; Joyce 2004), a length
three to four times that of the longest RNA oligomers obtained by random poly-
merization (Huang and Ferris 2003, 2006). Hence, one of the main challenges
within the RNA world scenario is to convincingly bridge this gap.
In this chapter, we will review some recent results obtained in our lab (Manrubia
and Briones 2007; Stich et al. 2007, 2008, 2010; Briones et al. 2009) and put them
68 M. Stich et al.

into the context of the aforementioned issues. The first part of this chapter tries to
deepen our understanding of the sequence–structure map, relevant for the RNAworld
model. Then, we discuss the internal organization of evolving populations and its
relevance for robustness and adaptability. Subsequently, we explore the relationship
between microscopic mutation rate and the fractions of beneficial and deleterious
mutations, as observed in experiments or used in phenomenological models.
4.2 Structural Repertoire of RNA Pools
RNA structure is crucial for biochemical function of an RNA molecule. A lot of
research efforts are dedicated to the folding process that relates RNA sequences
with RNA structures. For our purpose, it is sufficient to consider two-dimensional
secondary structures as good approximation of real three-dimensional structures.
Two fundamental properties of the sequence–structure map are that (1) the number
of different sequences is much higher than the number of structures and (2) not all
possible structures are equally probable (Fontana et al. 1993; Schuster et al. 1994).
In this context, common structures are those which have many different sequences
folding into them and rare structures are those which have only few sequences
folding into them. In this section, we explore the structural repertoire of a pool of
random sequences.
We first describe the results of the folding of 108 RNA molecules of length 35 nt
consisting of random sequences composed of the four types of nucleotides A, C, G,and U (Stich et al. 2008). As secondary structure of each molecule, we take the
minimum free energy structure as given by the fold () routine from the Vienna
RNA Package (Hofacker et al. 1994).
RNA secondary structures consist of stems, where base pairing (A–U, G–C,G–U) between nucleotides occurs, and unpaired regions. In standard bracket nota-
tion, nucleotides paired with each other are denoted by “(” and “)”, while unpaired
nucleotides are represented by “.”. Among unpaired regions, we can distinguish
dangling ends and different kinds of loops: hairpin loops, bulges, interior loops, and
multiloops. The simplest structure is called a stem–loop, it consists of one hairpin
loop and one stem, and possibly one or two dangling ends. While there are 4n
sequences of length n (the so-called sequence space), the number Sn of different
structures (the structure space) is much smaller. Based on theoretical studies
(Waterman 1978), the expression Sn � 0.7131 � n�3/2 (2.2888)n has been given
(Gr€uner et al. 1996). Therefore, different sequences will actually fold into the same
secondary structure, grouping into neutral networks of genomes (Gr€uner et al. 1996;Huynen et al. 1996). Neutral networks are formed by genomes sharing the same
phenotype, here secondary structure, and which are connected by (single) muta-
tional events. The sequence–structure map turns out to be very complex. Two
sequences that are just one mutation apart may fold into structures very different
from each other. At the same time, in a relatively small neighborhood of any
sequence, almost all common structures can be found (Fontana et al. 1993).
4 Populations of RNA Molecules as Computational Model for Evolution 69

In our case, 108 sequences folded into 5,163,324 structures (Stich et al. 2008). A
way to visualize the uneven distribution of sequences into structures is the frequen-
cy–rank diagram. In Fig. 4.1a, we have ranked the structures according to the number
of sequences folding into them. One can see that there are around thousand common
structures, each of them obtained from about 104 different sequences. On the other
hand, we also find a few million rare structures yielded by only one or two sequences.
Although for a much smaller pool, this has already been reported before (Schuster
et al. 1994; Gr€uner et al. 1996; Schuster and Stadler 1994; Tacker et al. 1996).
In order to study the distribution of common vs. rare structures in more detail, we
have proposed a classification where we characterize a structure in terms of three
numbers (Stich et al. 2008): (a) the number of hairpin loops, H, (b) the sum of
bulges and interior loops, I, and (c) the number of multiloops, M. For example, a
simple stem–loop structure, denoted as SL, is characterized by (H,I,M) ¼ (1,0,0),
and all stem–loop structures found in the pool are grouped into that structure family.Other important families are the hairpin structure family, HP, with one interior loop
or bulge (1,1,0), the double stem–loop, DSL, represented by (2,0,0), and the simple
hammerhead structure, HH, by (2,0,1). Of course, there exist more complicated
structure families, as detailed in Stich et al. (2008). For the pool that we have
folded, we find that only 21 structure families are enough to cover all the 5.2 million
structures identified.
Our analysis, displayed in Fig. 4.1b, shows that the vast majority of sequences
fold into simple structure families. For example, 79.0% of all sequences belong to
only three structure families (HP, HP2, SL, in decreasing abundance), and 92.1% of
all sequences fold into simple structures with at most 3 stems (HP, HP2, SL, DSL,
DSL2, HH). Note that 2.1% of all sequences remain open and do not fold. Our data
is in agreement with other findings on the structural repertoire of RNA sequence
open
SL
HP
HP2
HP3HH
DSL
DSL2
rest
100 101 102 103 104 105 106 107
Rank
100 101 102 103 104 105 106 107
Rank
100
101
102
103
104
105
Freq
uenc
y
10–4
10–3
10–2
10–1
100
101
102
103
104
105
Bin
ned
abso
lute
fre
quen
cy
HPHP2SLDSLHP3DSL2
a b c
Fig. 4.1 (a) Frequency–rank diagram of the 5,163,324 different secondary structures, obtained by
folding 108 RNA sequences of length 35 nt. (b) Distribution of the sequences in structure families
according to their frequency. Higher-order hairpins, HPx, are defined as (H,I,M) ¼ (1,x,0), beingx � 2, higher-order double stem–loops, DSLx, as (H,I,M) ¼ (2, x�1,0), and higher-order ham-
merheads, HHx, as (2, x�1,1). (c) Frequency–rank diagram according to the structural family. The
upper thick solid curve denotes the same curve as in (a). Parts (a) and (c) after Stich et al. (2008)
70 M. Stich et al.

pools where the influence of the sequence length (Sabeti et al. 1997; Gevertz et al.
2005), the nucleotide composition (Knight et al. 2005; Kim et al. 2007), and pool
size (Gevertz et al. 2005) has been studied.
Now, we can reconsider the frequency–rank diagram. We sum up all structures
of a given structure family within a rank interval. Through this binning procedure,
we obtain for each structure family a curve which describes its relative frequency
compared with that of the other families. The curves for the most frequent families
are shown in Fig. 4.1c. We immediately see that the most frequent structures belong
to the stem–loop family, followed by the hairpin family, double stem loops, higher-
order hairpin families, and hammerheads. For low ranks, the SL curve is identical
with the curve describing all structures. For ranks between 4 � 103 and 104, it is the
HP curve which practically coincides with the total curve. Interestingly, the posi-
tion of the bump around rank 103 falls together with the locations where the SL
and HP families are equally present. Hence, we conclude that the bumps in the
frequency–rank diagram correspond to the succession of different structural
families and are not smoothed by better sampling of the sequence space.
What implications have these findings for the RNA world scenario? The stan-
dard view of the RNA world hypothesis states that the first chains of polymerized
polynucleotides consisted of random sequences. Therefore, it is important to study
the structural and subsequently the functional repertoire of such short sequences.
We have seen that a random pool is very rich in simple structures. However, as
already mentioned above, short molecules cannot perform template-dependent
replication. Therefore, we devised a four-step model of modular evolution as a
possible pathway for the emergence of functional and progressively longer mole-
cules starting with a random pool of RNA oligomers (Briones et al. 2009). The first
step is the random polymerization of RNA molecules up to 40-mers. The second
step is the folding of these sequences, leading to high fractions of simple structures
like hairpins, as just shown. The third step is based on the observation that simple
hairpin structures, similar to those formed by short random sequences in huge
amounts, are actually known to show catalytic activity, leading to RNA–RNA
ligation (Puerta-Fernandez et al. 2003). If a certain fraction of the hairpin molecules
originated is capable of displaying ligase activity, longer molecules may be formed.
Even though the majority of the long molecules may not perform ligase activity,
some of them will keep the modular structure of their building blocks and remain
active to catalyze further RNA–RNA ligations (Manrubia and Briones 2007). This
suggests that hairpin ribozymes, both in individual modules and in combined
structures, could have catalyzed the synthesis of progressively longer RNA mole-
cules from short and structurally simpler modules (Briones et al. 2009). Finally, the
fourth step of the model consists of a maturation of these ligating RNAmolecules of
intermediate length into self-replicating RNA ligase networks, which could coexist
and even compete with each other, leading eventually to a molecule long and
complex enough to perform template-dependent RNA replication [further details
in Briones et al. (2009)]. It is important to emphasize that the whole model relies
strongly on the observation that simple structures like hairpins – with potential
ligase activity – are ubiquitous in pools of random RNA sequences.
4 Populations of RNA Molecules as Computational Model for Evolution 71

4.3 Internal Organization of Evolving Populations
Above, we have discussed the static picture of the sequence–structure map. Once
replication within a population is possible, evolution through Darwinian selection is
triggered. Here, RNA serves as a model to study the interplay between mutation,
selection, and the diversity sustained in populations of fast mutating replicators
(Stich et al. 2007).
First, we briefly describe the evolutionary algorithm. Our system consists of a
population of N replicating RNA sequences, each of length n nucleotides. At the
beginning of the simulation, every molecule is initialized with a random sequence.
Every time that a sequence replicates, each of its nucleotides has a probability m(mutation rate) to be replaced by another nucleotide, randomly chosen among the
four possibilities A, C, G, U.At each generation, the sequences are folded into secondary structures as
described above. We define a target structure that represents in a simple way
optimal performance in a given environment. It can be a hairpin, hammerhead, or
any other structure: the qualitative behavior of the system does not depend on this
choice. We compare every folded structure with the target structure by means of the
base pair distance di, defined as the number of base pairs that have to be opened and
closed to transform a given structure into the target structure (Hofacker et al. 1994).
The closer a secondary structure is to the target structure, the higher the probability
p(di) that the corresponding sequence i replicates:
p dið Þ ¼ exp �bdið ÞPNi¼1 exp �bdið Þ : (4.1)
The parameter b denotes the selective pressure and is here chosen as b ¼ 2/n.Generations in our simulations are nonoverlapping and the offspring generation is
calculated according to Wright–Fisher sampling.
Two relevant quantities to characterize the state of the population are the
average distance d ¼PNi¼1 di=N to the target structure and the fraction r of struc-
tures in the population folding exactly into the target structure. Because of the
persisting action of mutation, both quantities fluctuate in time even after reaching
the asymptotic regime. Therefore, we perform averages over long time intervals
(and different realizations, starting from distinct initial RNA populations), obtain-
ing mean values denoted by �d and �r, respectively.In order to quantify collective properties of the molecular ensemble, we first
determine the consensus sequence of the population, given by, for each position
along the sequence, the most frequent type of nucleotide found within the popu-
lation. In real RNA molecular and viral quasispecies, the consensus sequence is
obtained by means of population sequencing (Thurner et al. 2004; Simmonds et al.
2004; Domingo 2006), and it does not necessarily correspond to any of the indi-
vidual sequences present in the population. It is straightforward to fold the con-
sensus sequence and obtain the structure of the consensus sequence, for which its
72 M. Stich et al.

coincidence with the target structure can be determined. At each time step we count
either one, corresponding to coincidence, or zero, otherwise. Averages over time
(and realizations) of this binary variable yield �rC, which corresponds to the
probability that, at a randomly chosen time step, the structure of the consensus
sequence coincides with the target structure.
We further define a consensus structure. It is calculated by determining, for each
position along the molecule, the most frequent structural state found within the
population, i.e., unpaired “.”, paired upstream “(”, or paired down-stream “)”. Due
to this definition, the consensus structure does not necessarily represent a valid
secondary structure of an RNA molecule. This procedure is hence fundamentally
different from assigning a consensus structure to an alignment of sequences
(Hofacker et al. 2002). Averages over time (and realizations) of the coincidence
between the consensus structure and the target structure yield the probability �r S.
Within this model, evolution takes place in the following way: sequences which
fold into structures similar to the target structure will replicate more likely and their
fraction in the population increases. Mutation introduces diversity and enables the
system to find structures that are closer to the target, and finally find and fix the
target structure. Starting from a random set of sequences, we can distinguish several
phases of evolution: the search phase, where d decreases while r ¼ 0. This phase
finishes at generation gA when a molecule folds into the target structure for the first
time. Then, the phase of fixation begins, where – on average – d still decreases and
r increases. However, due to the stochastic nature of mutation – and hence in
particular for large mutation rates as will be explored further below – the population
may lose again the target structure (and r drops down to zero). If r does not drop to
zero for 500 consecutive generations, we say that the target structure has been fixed
at generation gF. Then, the asymptotic regime is reached, where d and r fluctuate
around constant values and which corresponds to a mutation–selection equilibrium.
If the mutation rate m is too large, the population is unable to maintain the target
structure within the population. In absence of an analytic theory for the system we
are studying, we determine the fixation threshold as the value mF at which the curvegF(m) diverges.
Since we now have defined the main quantities to describe the population, we
show the results in Fig. 4.2. They were obtained from simulations for a system of
N ¼ 1,000 RNAmolecules of length n ¼ 30 nt evolving toward a hairpin structure.
In (a) we show the curves for �r; �rC, and �rS. The quantity �r describes the funda-
mental property of a quasispecies at mutation–selection equilibrium. For small m, �rtakes maximal values. This means that a population contains the largest fraction of
correctly folded molecules if it evolves at small mutation rates. As m increases, �rdecreases monotonously until it approaches zero. To determine the fixation thresh-
old, we look at Fig. 4.2b where we show the curves of the search time and search
plus fixation time. The solid curve represents the search time. We observe that for
small m finding the target structure is difficult because only little diversity is
introduced and the search process is slow. Therefore, fixation takes a long time.
As m increases, the introduced diversity in the population becomes larger and both
search and search plus fixation times decrease. However, fixation turns out to be a
4 Populations of RNA Molecules as Computational Model for Evolution 73

difficult task if m is too large, and the curves for search and search plus fixation start
to deviate. The search plus fixation time gF (dotted curve) diverges around
m � 0.045, where we approximately locate the fixation threshold for this n and
target structure. This means that while the population shows largest �r for small mand highest degree of diversity close to the fixation threshold, the search and
fixation times are optimized for intermediate mutation rates around m � 0.025
well below the fixation threshold.
Coming back to Fig. 4.2a, we now have a look at the curves for �rC and �rS. Thecurve of �rC lies for all considered mutation rates above the curve of �r. This means
that based upon the information of the consensus sequence only, one may overesti-
mate the evolutionary success. This effect is observed both below and above the
fixation threshold. For example, for m ¼ 0.05, where only 0.5% sequences fold into
the target structure, and only into an intermittent way, the probability that the
consensus sequence folds into the target structure is still 18%. Consequently, the
population remains close to sequences that actually fold into the target structure
although it is unable to fix it. Obviously, this is related to the fact that at least part of
the population are descendents from the same sequence and hence are closely
related to each other. Note that the probability that a sequence of the population
folds into the target structure is different from the probability that the consensus
sequence does. Since consensus sequences are readily obtained from molecular or
viral quasispecies, one should take into account this difference.
Considering now the curve for �rS, we observe a qualitatively different behavior:
for m < 0.025, the probability that the consensus structure coincides with the target
structure is practically one, while for m > 0.025, it approaches zero. For small m,this effect can be easily explained: the weight of all the correctly folded molecules
is strong enough to keep �rS high. But in Stich et al. (2007), we showed that even
0 0.01 0.02 0.03 0.04 0.05 0.06
μ
0
0.2
0.4
0.6
0.8
1a b
ρρC
ρS
0.07 0.08 0 0.01 0.02 0.03 0.04 0.05 0.06
μ0.07 0.08
0
50
100
150
200
250
300
gAgF
Fig. 4.2 (a) Asymptotic properties of a population of size N ¼ 1,000 and molecules of length
n ¼ 30 nt as function of the mutation rate m. Displayed are the average fraction of correctly foldedstructures �r, and the quantities �rC and �rS. Averaging has been performed over 4,000 generations
and 20 realizations, disregarding the first 2,000 generations. (b) Search time gA and search plus
fixation time gF. We locate the fixation threshold where gF diverges. Averaging has been
performed over 200 realizations. The population evolves toward a hairpin target structure given
by ..((((((. . .(((. . .))). . ..)))))) in bracket notation
74 M. Stich et al.

neglecting the correctly folded molecules and for large mutation rates, among the
remaining sequences there is a sufficiently large fraction of those molecules which
have a similar structure to the target structure. An analogous effect is known for
random sequences: in a small neighborhood of a given sequence, the most probable
structures are identical or very similar to the structure of the reference sequence
(Fontana et al. 1993). Even where rS ¼ 0, the distribution of the structure states
along the chain may still resemble the target structure and the positions where the
concordance is broken correspond to positions that are actually less stable.
While �rC senses the similarity among the sequences and �rS the similarity among
the structures, both quantities take superior values than �r for most of the mutation
rates in spite of the fact that selection is actually acting upon structure (not
sequence) and that the corresponding fitness landscape is rough. This means that
the population retains relevant structural information in a distributed fashion even
above the fixation threshold. This represents a strong structural robustness and
suggests that certain functional RNA secondary structures may effectively with-
stand high mutation rates (Stich et al. 2007).
4.4 Phenotypic Effect of Mutations
In the last section, we have already discussed the optimal mutation rate to promote
adaptation in an evolving system. Here, we calculate the distribution of the effects
of mutations on fitness and the relative fractions of beneficial and deleterious
mutations (Stich et al. 2010). It is important to recall that the effect of mutations
on the phenotype depends on the genomic and populational context. We explore
two different situations: the mutation–selection equilibrium (equilibrated popula-
tion) and the first stages of the adaptation process (adapting population).
Here, we consider a population of N ¼ 1,000 molecules of length n ¼ 50 nt
evolving toward a hairpin target structure. The change in fitness of an RNA
sequence under replication is quantified by the change of distance to the target
structure, i.e., by Dij ¼ di – dj, where i denotes the mother and j the daughter
sequence. Hence, for Dij > 0 (Dij < 0), the mutations lead to an increase (decrease)
of fitness and hence are beneficial (deleterious). If Dij ¼ 0, either no mutation
occurred or the mutations had no effect on fitness (were neutral). As we sum up
over N values of Dij at each generation (and over generations and realizations as
specified below), we obtain a probability distributionP(D) of the changes in fitness.In Fig. 4.3a, we show for three different mutation rates the distributions P(D),
obtained for populations at mutation–selection equilibrium. The part of the distri-
bution with the largest weight represents replication events with no or neutral
mutations (D ¼ 0). For a very low mutation rate, negative fitness events strongly
dominate over the positive ones and hence beneficial mutations are rare. As the
mutation rate increases, the curves move up for positive and negative D since there
are more mutation events. Although in particular beneficial mutations occur more
often, negative fitness effects still dominate in absolute numbers.
4 Populations of RNA Molecules as Computational Model for Evolution 75

From the distribution P we can calculate the fraction of deleterious changes
p and beneficial changes q in the following way:
q ¼Z 1
0þP Dð ÞdD; (4.2)
p ¼Z 0�
�1P Dð ÞdD: (4.3)
These quantities represent the beneficial and deleterious phenotypic mutation
rates which shall not be confounded with the microscopic mutation rate m. Bydefinition, p þ q þ P(0) ¼ 1.
Π(Δ
)
–10 0 10–30 –20 20 30
Δ
10–6
10–4
10–2
100a
c
b
d
10–6
10–4
10–2
100
Π(Δ
)
μ = 5x10⁻⁴
μ = 1x10⁻²
μ = 4x10⁻²
μ = 5x10⁻⁴
μ = 1x10⁻²
μ = 4x10⁻²
10–4 10–3 10–2 10–1 100
μ
10–5
–10 0 10–30 –20 20 30
Δ10–4 10–3 10–2 10–1 100
μ
10–5
10–4
10–3
10–2
10–1
100
10–4
10–3
10–2
10–1
100
pqΠ(0)
pqΠ(0)
μF
μF
Fig. 4.3 Phenotypic changes of mutations for optimized (a, b) and adapting (c, d) populations. (a)
Probability distribution P(D) obtained from 300 generations in the asymptotic regime and for
three different values of m. (b) Beneficial (q) and deleterious (p) phenotypic mutation rates as
function of the microscopic mutation rate m for optimized populations. Replication events without
fitness change are given byP(0). (c) As (a), but for adapting populations (probability distributions
obtained from the first 50 generations and 6 different realizations). (d) As (b), but for adapting
populations. The thin curves denote the curves from (b). The target structure is ((((. . .. . ..(((((.(((((. . .. . .))))).))))). . .. . ..)))) in bracket notation. After Stich et al. (2010)
76 M. Stich et al.

How q and p depend on m is depicted in Fig. 4.3b. For low mutation rates, we see
that p is more than two orders of magnitude larger than q. As m increases, both p andq increase, although p > q for all m, in particular for mutation rates below the
fixation threshold, for this n and target structure approximately located at
mF ¼ 0.02. As m increases, the fraction of replication events with no change in
fitness, given by P(0), decreases. The ratio p/q decreases from more than two
orders of magnitude to less than one close to mF. This reflects the fact that the higherthe mutation rate at which a population has reached mutation–selection equilibrium
the lower the fraction of correctly folded molecules, and hence beneficial mutations
are more probable. However, these beneficial mutations do not increase the degree
of adaptation of the population due to the difficulties to get fixed at high error rate.
In Fig. 4.3c,d, we show the distribution P(D) and the functional behavior of
(p, q) ¼ f(m) for adapting populations. In this case, fitness changes are measured
before the target structure has been found. The distributionsP(D) behave in a qualita-tively similar way, although quantitative differences to Fig 4.3a can be seen, e.g., for
m ¼ 0.0005: The range of negativeD is smaller than for an equilibrated population, so
very deleterious mutations are not present, and also the overall level of deleterious
mutations is lower. At the same time, beneficial mutations are more common. This
observation can be explained by the fact that since the population is still relatively far
from target, mutations that drive a sequence even further are less likely. For the same
reason, mutations that have a positive effect on fitness are more probable.
Figure 4.3d summarizes the results: In an adapting population, p is smaller than
at equilibrium, and q is larger, although these differences get much lower as the
error rate increases. However, in all cases there are still more deleterious mutations
than beneficial ones. Again, both phenotypic mutation rates increase as m increases,
while replication events without phenotypic change decrease.
4.5 Summary
Here, we have presented recent results with RNA populations as computational
model to explore and understand evolutionary processes, using the complex under-
lying sequence–structure–function relationship of RNA molecules.
In the first section, we showed some observations on the structural repertoire of
random RNA sequences (Stich et al. 2008). One important result is that simple
structures like stem–loops and hairpins are dominant in pools of short sequences.
This finding, together with other results and arguments, allowed us to devise a
stepwise model of modular evolution for the origin of the RNA world (Briones et al.
2009).
In the second section, we introduced an algorithm of RNA evolution in silico
(Stich et al. 2007). After characterizing the asymptotic state of the population (at
mutation–selection equilibrium), we showed that search and fixation times are
optimized for intermediate mutation rates, far from the fixation threshold where
the creation of diversity is maximal and far from the regime of low mutation rates
4 Populations of RNA Molecules as Computational Model for Evolution 77

where evolutionary success is optimized (in terms of correctly folded molecules).
These results have important implications for the adaptability of virus and repli-
cator populations that, due to the changes in the selective pressures that they
continuously experience, need to have the capability to adapt rapidly, which can
be obtained by the selection of high mutation rates. However, the difficulties for the
fixation of beneficial mutations, together with the low fitness values attained when
replication takes place at mutation rates close to the error threshold, suggest that
viral quasispecies operate at mutation rates considerably smaller.
Furthermore, close to and even beyond the fixation threshold, RNA populations
show clear signatures of the target structure they try to approach (Stich et al. 2007).
For example, even a population that contains practically no molecule that folds into
the correct structure, as a whole may actually harbor the target structure as the
structure of its consensus sequence. This demonstrates that the evolutionary success
of the population is more robust than suggested by the spectrum of its mutants alone.
Finally, we have established a connection between the microscopic mutation rate
m and the phenotypic mutation rates p and q (Stich et al. 2010). These mutation rates
are used in phenomenological models of population dynamics and also in fitting
models of data obtained from experiments (Eyre-Walker and Keightley 2007). We
find that adapting populations have a much larger fraction of beneficial mutations
than equilibrated ones, especially for small mutation rates. Furthermore, we have
shown that increases in m do not cause linearly proportional increases in p and q, asoften assumed in simple models of population evolution.
In summary, our results encourage the combined approach of experimental
research and computational modeling for studying molecular evolution.
Acknowledgments The authors acknowledge support from Spanish MICIIN through projects
FIS2008-05273 and BIO2007-67523, from INTA, and from Comunidad Autonoma de Madrid,
project MODELICO (S2009/ESP-1691).
References
Biebricher CK, Eigen M (2005) The error threshold. Virus Res 107:117–127
Briones C, Stich M, Manrubia SC (2009) The dawn of the RNA world: Toward functional
complexity through ligation of random RNA oligomers. RNA 15:743–749
Cases-Gonzalez C, Arribas M, Domingo E, Lazaro E (2008) Beneficial effects of population
bottlenecks in an RNA virus evolving at increases error rate. J Mol Biol 384:1120–1129
Domingo E (ed) (2005) Virus entry into error catastrophe as a new antiviral strategy. Virus Res
107:115–228
Domingo E (ed) (2006) Quasispecies: concept and implications for virology. Springer, Berlin
Eigen M (1971) Self-organization of matter and the evolution of biological macromolecules.
Naturwissenschaften 58:465–523
Eyre-Walker A, Keightley PD (2007) The distribution of fitness effects of new mutations. Nat Rev
Genet 8:610–618
Fontana W, Konings DAM, Stadler PF, Schuster P (1993) Statistics of RNA secondary structures.
Biopolymers 33:1389–1404
78 M. Stich et al.

Gevertz J, Gan HH, Schlick T (2005) In vitro RNA random pools are not structurally diverse: a
computational analysis. RNA 11:853–863
Gr€uner W, Giegerich R, Strothmann D, Reidys C, Weber J, Hofacker IL, Stadler PF, Schuster P
(1996) Analysis of RNA sequence structure maps by exhaustive enumeration. I. Neutral
networks. Monatsh Chem 127:355–374
Hofacker IL, FontanaW, Stadler PF, Bonhoeffer LS, Tacker M, Schuster P (1994) Fast folding and
comparison of RNA secondary structures. Monatsh Chem 125:167–188
Hofacker IL, Fekete M, Stadler PF (2002) Secondary structure prediction for aligned RNA
sequences. J Mol Biol 319:1059–1066
Huang W, Ferris JP (2003) Synthesis of 35–40 mers of RNA oligomers from unblocked mono-
mers. A simple approach to the RNA world. Chem Commun 12:1458–1459
Huang W, Ferris JP (2006) One-step, regioselective synthesis of up to 50-mers of RNA oligomers
by montmorillonite catalysis. J Am Chem Soc 128:8914–8919
Huynen MA, Stadler PF, Fontana W (1996) Smoothness within ruggedness: the role of neutrality
in adaptation. Proc Natl Acad Sci USA 93:397–401
Johnston WK, Unrau PJ, Lawrence MS, Glasner ME, Bartel DP (1999) RNA-catalyzed RNA
polymerization: accurate and general RNA-templated primer extension. Science 292:1319–1325
Joyce GF (2004) Directed evolution of nucleic acid enzymes. Annu Rev Biochem 73:791–836
Kim N, Gan HH, Schlick T (2007) A computational proposal for designing structured RNA pools
for in vitro selection of RNAs. RNA 13:478–492
Knight R, De Sterck H, Markel R, Smit S, Oshmyansky A, Yarus M (2005) Abundance of
correctly folded RNA motifs in sequence space, calculated on computational grids. Nucleic
Acids Res 33:5924–5935
Loeb LA, Essigmann JM, Kazazi F, Zhang J, Rose KD, Mullins JI (1999) Lethal mutagenesis of
HIV with mutagenic nucleoside analogs. Proc Natl Acad Sci USA 96:1492–1497
Manrubia SC, Briones C (2007) Modular evolution and increase of functional complexity in
replicating RNA molecules. RNA 13:97–107
Puerta-Fernandez E, Romero-Lopez C, Barroso-delJesus A, Berzal-Herranz A (2003) Ribozymes:
recent advances in the development of RNA tools. FEMS Microbiol Rev 27:75–97
Sabeti PC, Unrau PJ, Bartel DP (1997) Accessing rare activities from random RNA sequences: the
importance of the length of molecules in the starting pool. Chem Biol 4:767–774
Schuster P, Stadler PF (1994) Landscapes: complex optimization problems and biopolymer
structures. Comput Chem 18:295–324
Schuster P, Fontana W, Stadler PF, Hofacker IL (1994) From sequences to shapes and back: a case
study in RNA secondary structures. Proc R Soc Lond B Biol Sci 255:279–284
Sierra S, Davila M, Lowenstein PR, Domingo E (2000) Response of foot-and-mouth disease virus
to increased mutagenesis. J Virol 74:8316–8323
Simmonds P, Tuplin A, Evans DJ (2004) Detection of genome-scale ordered RNA structure
(GORS) in genomes of positive-stranded RNA viruses: implication for virus evolution and
host persistence. RNA 10:1337–1351
Stich M, Briones C, Manrubia SC (2007) Collective properties of evolving molecular quasispe-
cies. BMC Evol Biol 7:110
Stich M, Briones C, Manrubia SC (2008) On the structural repertoire of pools of short, random
RNA sequences. J Theor Biol 252:750–763
Stich M, Lazaro E, Manrubia SC (2010) Phenotypic effect of mutations in evolving populations of
RNA molecules. BMC Evol Biol 10:46
Tacker M, Stadler PF, Bornberg-Bauer EG, Hofacker IL, Schuster P (1996) Algorithm indepen-
dent properties of RNA secondary structure predictions. Eur Biophys J 25:115–130
Thurner C, Witwer C, Hofacker IL, Stadler PF (2004) Conserved RNA secondary structures in
flaviviridae genomes. J Gen Virol 85:1113–1124
Waterman MS (1978) Secondary Structure of Single-stranded Nucleic Acids. In: Rota G-C (ed)
Studies in Foundation and Combinatorics, vol 1 of: Advances in Mathematics Supplementary
Studies. Academic Press, New York, pp 167–212
4 Populations of RNA Molecules as Computational Model for Evolution 79

Chapter 5
Pseudaptations and the Emergence
of Beneficial Traits
Steven E. Massey
Abstract There is increasing evidence for the emergence of some beneficial
traits in biological systems in the absence of direct selection. Many of these
encompass mutational robustness, which increasingly appears to arise as a by-
product of natural selection, as a consequence of the biased incremental change of
complex biological systems. Understanding the emergence of robustness in dis-
parate biological systems is facilitated by the use of graph theory and the concept
of connectivity. A particular case that is explored here is that of the standard
genetic code (SGC). The SGC is arranged so that mutations tend to result in
conservative as opposed to radical amino acid changes, a property termed “error
minimization”. A commonly cited explanation for this property is the “Adaptive
Code” hypothesis, which proposes that error minimization has been directly
selected for. However, it is shown that direct selection of the error minimization
property is mechanistically difficult. In addition, it is apparent that error minimi-
zation may arise simply as a result of code expansion, this is termed the
“emergence” hypothesis. The emergence of error minimization in the genetic
code is likened to other biological examples, where mutational robustness arises
from the innate dynamics of complex systems; these include neutral networks and
a variety of subcellular networks. The concept of “biased incrementalism” is
introduced to account for the emergence of robustness in these diverse systems,
while the term “pseudaptation” is used for such traits that are beneficial to fitness,
but are not directly selected for.
S.E. Massey
Biology Department, University of Puerto Rico – Rio Piedras, P.O. Box 23360, San Juan, Puerto
Rico 00931, USA
e-mail: [email protected]
P. Pontarotti (ed.), Evolutionary Biology – Concepts, Molecularand Morphological Evolution, DOI 10.1007/978-3-642-12340-5_5,# Springer-Verlag Berlin Heidelberg 2010
81

5.1 Adaptive Evolution and Natural Selection
The modern definition of an adaptation is tautological in relation to natural selection;
fromMayr’s book “What Evolution Is” (Mayr 2001), adaptations are beneficial traits
that arise by natural selection, of if they occur by chance are maintained by natural
selection. From a panselectionist perspective, all beneficial phenotypes are to be
regarded as adaptations, arising from natural selection. However, it may be argued
that the definition of “adaptation” is not inviolate; indeed, it is worth remembering
that until the modern synthesis natural selection was not widely accepted as the
predominant force behind adaptive evolution; the so-called “eclipse of Darwinism”
(Huxley 1942). The theme of this work is to clarify the definition of adaptation, in the
context of natural selection, and to examine examples of beneficial traits that have
arisen in the absence of direct selection, and how they should be defined.
5.2 Emergence as a By-Product of Natural Selection
Emergence is a term used in studies of complexity, to describe properties that arise
from the summation of numerous individual interactions. Diverse examples include
the emergence of nonrandom network topologies (ranging from biological net-
works such as metabolic networks, social interaction networks such as sexual
contact and scientific collaboration networks, infrastructure networks such as the
Internet and power networks and chemical networks; Gleiss et al. 2001; Albert and
Barabasi 2002), weather features such as hurricanes, and Adam Smith’s “invisible
hand” that self-regulates the market. In biological systems emergent properties may
be directly selected for; examples of this include termite mounds, the shoaling
behavior of fish or the ability of ant colonies to solve geometric problems, such as
the shortest route to a food source. In contrast, this chapter is devoted to addressing
cases where beneficial traits emerge in the absence of direct selection.
5.3 “Pseudaptation” as a Descriptor of Beneficial Traits
That Arise in the Absence of Direct Selection
The term “spandrel” was coined to describe phenotypes that arise without the
direct agency of natural selection (Gould and Lewontin 1979; Gould 1997). How-
ever, it is unclear in the definition whether these traits are beneficial to fitness.
Therefore, it is proposed that the term “spandrel” should be used to refer to
phenotypes that arise nonadaptively, as a side-product of natural selection, but
are not clearly beneficial to fitness. This work is devoted to discussing beneficial
traits that are not directly selected for, hence a term is required for such phenomena;
it is suggested that the term “pseudaptation” is used for such traits (Massey 2010).
82 S.E. Massey

The prefix “pseud” is used to indicate the potential tendency to misinterpret such
traits as true adaptations resulting from natural selection. In contrast, therefore,
“adaptations” are beneficial traits that result from the agency of natural selection.
The vast majority of beneficial traits are expected to be true adaptations.
5.4 The Genetic Code as a Case Study
The standard genetic code (SGC) will be used as a case study for illustrating how a
pseudaptation may emerge in a complex system. The arrangement of amino acids to
codons in the SGC is such that proteins are remarkably robust to the deleterious
effects of mutations and transcriptional/translational errors, in comparison to ran-
domly generated genetic codes (Alff-Steinberger 1969; Di Giulio 1989; Haig and
Hurst 1992; Ardell 1998; Freeland et al. 2000; Gilis et al. 2001; Goodarzi et al.
2004, etc.). This property of the SGC is termed “error minimization” (EM) and
results in a tendency for conservative as opposed to radical amino acid substitutions
(Fig. 5.1). EM can be expressed mathematically by the “EM value”. This is a
Fig. 5.1 The influence of the structure of the standard genetic code on the proportions of
conservative or radical amino acid substitutions. There are 75 different amino acid substitutions
that can result from a single point mutation, due to the structure of the SGC. The similarity of the
amino acids separated by a single point mutation was defined according to the Grantham matrix.
The proportion of substitutions that corresponded to different Grantham values was binned
accordingly. The chart shows a strong skew toward conservative substitutions
5 Pseudaptations and the Emergence of Beneficial Traits 83

parameter that calculates the average difference between two amino acids arising
from a nonsynonymous mutation and is defined as follows:
EM ¼X61i¼1
XNtN¼1
dNi=Nt
!,61 Massey 2008ð Þ;
where there are i sense codons, Nt is the total number of sense codons separated by a
single point mutation from the ith codon under consideration, dNi is the physico-
chemical distance between the amino acids coded for by the ith sense codon and theNth sense point mutation, according to the 20 � 20 Grantham physicochemical
similarity matrix (Grantham 1974).
The smaller the value between two amino acids in the Grantham matrix, the
more similar they are, thus the smaller the EM value the larger the extent of EM in a
genetic code. The EM value of the SGC is 60.7, while the EM value of a computa-
tionally randomly generated code is 74.5. Only 0.03% of computationally randomly
generated genetic codes possess EM values equal or better than that of the SGC,
which is indication of the remarkable optimization of the SGC (Massey 2008a).
Thus, the code is near optimal for the property of EM.
The EM value of the SGC can be understood as representing the average con-
nectivity of all the codons. Figure 5.2 shows how a typical codon may be repre-
sented as the node of a graph, with edges representing point mutations to different
codons. Each codon may be represented this way, thus the SGC may be envisaged
as a graph, composed of 64 nodes. The EM value represents the average connectivity
of the SGC, thus robustness arises from a maximization of the average connectivity
of the code in terms of neutrality. Another way of putting this is that the amino acids
are assigned to codon blocks so that the likelihood of an amino acid substitution
being selectively neutral is high. The property of EM is beneficial in that it limits
the deleterious effects of mutations and transcriptional/translational errors. Thus,
the “Adaptive Code” hypothesis proposes that the EM property is a beneficial trait
that has been selected via natural selection (Freeland et al. 2000). The Adaptive
Code hypothesis implies that “code space”, the space of alternative genetic codes,
was “searched” by natural selection until a near-optimal code was reached (the
SGC). However, there are problems with this scenario, discussed next.
5.4.1 Challenges for the Adaptive Code Hypothesis to Explainthe Origin of the EM Property of the SGC
There are several challenges for explaining how the EM property was directly
selected for by natural selection. First, in order to “find” an optimal or near-optimal
genetic code for the property of EM, the code space of alternative codes needs to be
searched. This necessitates the occurrence of “codon reassignments”, which are
where the amino acid identity of a codon(s) is reassigned from one of the 20 amino
acids to another. While these have occurred in nature, mainly in mitochondrial
84 S.E. Massey

Table 5.1 The emergence of EM in simulations of genetic code evolution
V A D G1 2 3 4
V A D G1 2 3 4
5 6 7 89 10 11 12
5 6 7 8
9 10 10
865
1314
A2V1 G4
11 1211 12
13 14 15 10
7
17
15
1918
9
16
D3
20
10
88
5 6 7 8
V1 A2 D3 G4
1 2 3 4V A D G
i) ii)
iv) v)
iii)
Selective criteria
(amino acid
difference according
to the Grantham
matrix)
Average EM value
of alternate codes
Average percentage
optimization of alternate
codes compared with the
standard genetic code
Percentage of alternate
codes that have equal or
superior error
minimization than the
standard genetic code
<150 70.2 31.2 0.3
<140 69.6 35.5 0.3
<130 68.8 41.3 0.7
<120 67.8 48.6 1.2
<110 67.4 51.4 1.1
<100 66.9 55.1 2
<90 65.3 66.7 6.8
<80 64.2 74.6 13.6
<70 64.5 72.5 12.2
<60 62.7 85.5 21.9
<50 64 76.1 17.7
<40 65.2 67.4 10.1
Genetic code evolution was simulated according to the 213 model (Massey 2006), utilizing a
model of code expansion facilitated by gene duplication of charging enzymes and adaptor
molecules (Massey 2008a). The 213 model proposes that the middle (2nd) position of the codon
became informational (coding) first, followed by the 1st position of the codon and finally the 3rd
position of the codon; hence “213”. The simulation was conducted as follows. Starting codons
were assigned to valine, alanine, aspartate, and glycine. These were chosen for their likely ancient
ancestry (Massey 2008a). Amino acids were randomly added to the expanding code according to
their similarity with a parent amino acid and its requisite codon. The similarity criteria were based
on the Grantham matrix and were set for each simulation. The figure shows the scheme of code
expansion according to the 213 model. There are four initial amino acids and codons; new amino
acids are added to the expanding code via duplication events, randomly but according to the
similarity criterion, until the structure of the SGC is achieved. The similarity criteria under which
code evolution was simulated are shown in the left hand column of the table. 10000 codes were
simulated for each selective criterion. The average EM values of the alternative codes are
displayed, along with the optimality of the alternative codes compared with the SGC. Table and
figure reproduced from Massey (2008a)
5 Pseudaptations and the Emergence of Beneficial Traits 85

genomes, they are extremely rare in free-living genomes. There are two main
mechanisms for codon reassignment; the Codon Capture mechanism (Osawa and
Jukes 1989) and the Ambiguous Intermediate mechanism (Schultz and Yarus
1994). The Codon Capture mechanism proposes that an AT or GC rich codon(s)
was initially lost under extreme GC/AT pressure, and on its reappearance in the
genome, after reversal of the GC/AT pressure, was reassigned to code for a different
amino acid. The Ambiguous Intermediate mechanism proposes that a codon(s)
undergoes a period of coding ambiguity, while it is reassigned to code from one
amino acid to another.
The searching of code space was simulated computationally to test the plausibi-
lity of selecting for an error minimized genetic code (Massey 2010). An initial
alternative genetic code was generated by randomly assigning the 20 amino acids to
the 20 codon groupings of the SGC. The EM value of this code was determined.
Then a random codon reassignment was conducted, according either to the Codon
Capture or Ambiguous Intermediate mechanism. If the EM value of the new code
was better than the old, then the new code was accepted and the process repeated. If
not, then the new code was rejected, and a new random codon reassignment was
conducted on the previous code. The process was continued until the code attained
an EM value better or equal to that of the SGC. In this way, the average number of
codon reassignments required to achieve EM on a par with the SGCwas determined.
It was found that it is very difficult to select an optimal code via the Codon
Capture mechanism, with only 1.2–3.2% searches resulting in success (Table 5.2).
This effectively rules out searching of code space via the Codon Capture
Fig. 5.2 Connectivity of a
codon in the genetic code.
The connectivity of the
tyrosine TAT codon is shown,
the arrows represent point
mutations that lead to a
different sense codon. The
average value of a point
mutation of the TAT codon
is 93.25 (resulting from
(22 þ 144 þ 0 þ 0 þ 0 þ83 þ 143 þ 160 þ 194)/8,
where mutations to stop
codons and synonymous
mutations are equivalent to
zero. These values are
obtained from the Grantham
matrix). All codons in the
SGC are likewise connected,
thus the SGC may be viewed
as a regular network or graph
of 64 nodes
86 S.E. Massey

mechanism. In addition, when searching of code space is simulated using the
Ambiguous Intermediate mechanism, it is shown that 20–31 codon reassignments
on average are required to achieve an alternative code with equivalent or better EM
than the SGC (Table 5.2). This implies that there was a “burst” of codon reassign-
ments up to the last universal ancestor, which possessed the SGC, and stasis since
then. As it stands, the Adaptive Code does not provide an explanation for why this
should be. In addition, if the code were optimized via a search through code space
then it seems that the search ceased before full optimality had been achieved
Table 5.2 The number of codon reasignments required to produce a robust genetic code
Model for searching
of code space
(a) Average number of
codon reassignments
required to produce an
optimal genetic code (a
single codon reassigned
at a time)
(b) Average number of
codon reassignments
required to produce an
optimal genetic code
(two codons reassigned
at a time)
(c) Average number of
codon reassignments
required to produce an
optimal genetic code
(one or two codons
reassigned)
1. Selection for
superior EM
31 (SD ¼ 10)
0 failures
23 (SD ¼ 7)
292 failures
23 (SD ¼ 7)
0 failures
2. Selection for
superior EM,
with codon
adjacency
constraint
31 (SD ¼ 10)
3 failures
20 (SD ¼ 7)
668 failures
23 (SD ¼ 7)
0 failures
3. Selection for
superior EM,
with GC/AT
content
constraint
16 (SD ¼ 9)
968 failures
Two purine (A and G)
ending codons or
two pyrimidine
(T and C) ending
codons cannot be
reassigned under
the GC/AT
constraint
Two purine (A and G)
ending codons or
two pyrimidine
(T and C) ending
codons cannot be
reassigned under
the GC/AT
constraint
4. Selection for
superior EM,
with adjacency
constraint and
GC/AT content
contraint
16 (SD ¼ 6)
988 failures
Two purine (A and G)
ending codons or
two pyrimidine
(T and C) ending
codons cannot be
reassigned under
the GC/AT
constraint
Two purine (A and G)
ending codons or
two pyrimidine
(T and C) ending
codons cannot be
reassigned under
the GC/AT
constraint
1000 random codes were generated, and then the average number of codon reassignments required
to produce a code that was equal or more optimized than the SGC for EMwas determined for each.
Averages were calculated from 1,000 initial codes, except for model (3) where the average value
was calculated from the simulations out of 1,000 that produced optimal codes. Simulations that
failed to achieve an optimized genetic code are described as resulting in “failures”. Two con-
straints were applied to the simulations. The GC/AT constraint is that the codon reassigned should
be either composed of GC only or AT only. A GC rich codon is likely to be lost in an extremely
AT-biased genome, while AT rich codon is likely to be lost in an extremely GC-biased genome.
This is part of the Codon Capture mechanism. The adjacency constraint is that the amino acid
should be reassigned to a codon block adjacent to the original codon block, this follows a pattern
observed in extant codon reassignments. Reproduced from Massey (2010)
5 Pseudaptations and the Emergence of Beneficial Traits 87

(Fig. 5.3). Again, the Adaptive Code hypothesis does not provide an explanation for
why this should be.
Additional difficulties with the Adaptive Code hypothesis are as follows. First,
when searching of code space is simulated via the Ambiguous Intermediate mecha-
nism, the structures of the codes generated differ from that of the SGC; the code
resulting from codon reassignments of single codons is more fragmented than the
SGC, the code resulting from the codon reassignment of double codons has three
amino acids (M, Q, T) that have large numbers of codons distributed throughout the
code, and the code resulting from the codon reassignment of single and double
codons displays both these features (Fig. 5.4). Second, no present day codon reas-
signment displays improved EM (Freeland et al. 2000). It is hard to envisage how a
Fig. 5.3 Increase in error minimization of random alternative genetic codes, with increasing
numbers of codon reassignments. The increase in error minimization of a randomly generated
genetic code with increasing numbers of codon reassignments was followed according to the
selective models described in Table 5.2. Each codon reassignment resulted in an increase in the
EM of the code. (a) One codon reassigned; (b) two codons reassigned; (c) one or two codons
reassigned. Data taken from Table 1. Reproduced from Massey (2010)
88 S.E. Massey

Fig.5.4
Typicalalternativegeneticcodes
thathaveundergoneoptimization.A
lternativegeneticcodes
wereproducedbycomputationalsimulation,following
theAmbiguousInterm
ediate
mechanism.Typical
codestructuresaredisplayed
asfollows:(a)resultingfrom
reassignmentsofsingle
codonsonly,having
undergone31codonreassignments;(b)resultingfrom
reassignments
oftwocodonsonly,havingundergone23codonreassignments;(c)resultingfrom
reassignmentsofacombinationof1or2codons,havingundergone23codonreassignments.Datataken
from
Table
1.Reproducedfrom
Massey(2010)
5 Pseudaptations and the Emergence of Beneficial Traits 89

codon reassignment that improves EM can be selected for, given that every codon in
every protein would be affected by the codon reassignment andmost fitness-affecting
changes would be expected to be deleterious, whereas improved EM would only
affect a fraction of the total number of codons, for improvedmutational robustness or
robustness to phenotypic mutations. This can be expressed as follows:
Maximum number of codons j in the genome affected by improved EM
(for genotypic mutations) ¼ 3Nj� mg
where Nj is the total number of codon j in the genome and mg is the genomic
mutation rate per bp. The factor of 3 is used to convert the triplet codon. As mg isvery small, then the maximum number of codons j affected by improved EM is also
very small. In contrast, the maximum number of codons that may be adversely
affected by the reassignment, if occurring via the Ambiguous Intermediate mecha-
nism, is Nj. Indeed, there is evidence that mitochondrial codon reassignments are
deleterious (Massey and Garey 2007; Massey 2008b). This means that the potential
benefit is far outweighed by the likely deleterious effect of a codon reassignment.
This reasoning is also applicable to any improvements that a codon reassignment
may confer against transcriptional/translational errors.
Third, multiple extinctions are implied by the selective mechanism, with all
species with previous suboptimal codes being subject to mass extinction, given that
there are no extant organisms with codes that represent ancestors of the SGC. This
problem is also applicable to the alternative “Emergence” hypothesis, though to a
lesser degree.
5.4.2 The Emergence Hypothesis as an Explanationfor the Origin of EM in the SGC
If selecting for an error-minimized genetic code is problematic, what is an alterna-
tive explanation for the EM property? A mechanism for the origin of the EM
property has been proposed based on code expansion (growth) via gene duplication
of charging enzymes (aminoacyl-tRNA synthetases) and adaptor molecules
(tRNAs; Massey 2008a). An allusion to this mechanism was made by Crick
(1968), who proposed that the process of genetic code expansion occurred via
gene duplication of charging enzymes and adaptor molecules, resulting in “similar
codons coding for similar amino acids”.
In the 2008 study, it was demonstrated that a substantial amount of EM might
arise neutrally (i.e., emerge), simply as a result of the addition of similar amino
acids to similar codons, by mimicking the process of charging enzyme duplication.
Simulations were conducted on three different mechanisms of code evolution.
A substantial amount of EM was shown to arise in all three of these different
models of genetic code evolution. This result implies that no matter what the actual
90 S.E. Massey

details of code expansion (which remain to be determined), given the requirement
for charging enzymes and adaptor molecules, and the observation that gene dupli-
cates are likely to possess physicochemically related substrates, then EM is likely
an emergent property of code evolution. Thus, the conclusion is that at least a
proportion of the EM property has arisen neutrally, and was not directly selected
for, hence constituting a pseudaptation. The “emergence” of the EM property in the
simulations results from the incremental growth of the code, from the bias with
which similar amino acids are added to similar codons, and from a parent codon.
Thus, a process of “biased incrementalism” is responsible for the emergence of
mutational robustness. This process of biased incrementalism also appears to be
responsible for the emergence of mutational robustness in scale-free networks and
neutral networks as discussed below. Hence this may be a universal process in
complex systems, leading to the emergence of robustness. It is also potentially
significant that all three systems, such as SGC, scale-free networks, and neutral
networks, may be represented as graphs or networks.
5.5 The Emergence of Robustness in Other Biological Systems
5.5.1 Scale-Free Networks
There are many different types of networks in nature, from protein–protein interac-
tion networks, neuronal networks, up to ecosystem food webs and social interaction
networks. A common property in these networks is that they are usually scale-free.
The term scale-free refers to the distribution of connections of the nodes in the
network, whereby the distribution follows a power law; P(k) � k–y, where P(k) isthe fraction of nodes in the network having k connections to other nodes, and y is theexponent; y is usually between 2 and 3 in empirically observed networks. This type
of distribution means that a few nodes have many connections, while many of the
nodes only have a few connections. As most nodes only have a few connections,
scale-free networks are robust to the removal of nodes (Albert et al. 2000). In
subcellular biological networks such as metabolic and gene networks, this results in
mutational robustness, discussed below.
The scale-free property is also widespread in nonbiological systems such as the
Internet, electricity distribution networks, and transportation networks. This implies
that when observed in biological networks the property is not a product of natural
selection, but is an emergent property and hence represents a pseudaptation.
A widely accepted mechanism for the origin of the scale-free property is that of
preferential attachment during the growth of a network (Barabasi and Albert 1999).
According to the model, a well-connected node is more likely to gain more
connections, as nodes and connections are added to a growing network. This
“rich gets richer” model results in the scale-free property of the network, and it is
a passive process in that the structure of the network is not designed or selected for.
5 Pseudaptations and the Emergence of Beneficial Traits 91

The concept falls into the larger concept of “biased incrementalism”, introduced
above to account for the emergent property of robustness in the SGC, as new
connections are added incrementally in a biased fashion (preferentially to highly
connected nodes). Three biological networks that possess the scale-free property
are discussed next.
Metabolic networks describe the metabolism of an organism. The nodes of the
network represent metabolites, while connections between the nodes represent
chemical reactions that convert one metabolite into another. These reactions are
catalyzed by enzymes. The overall flux of metabolic networks is robust to gene
deletion (Edwards and Palsson 1999, 2000). Metabolic networks are typically
scale free (Jeong et al. 2000; Ravasz et al. 2002), which means that most metabo-
lites are connected to only a few other metabolites, while a few serve as “hubs” and
are involved in many reactions. The robustness of metabolic networks to gene
deletion may be accounted for by the scale-free property (Jeong et al. 2000). The
origin of the scale-free property is unclear. There is some evidence that preferential
attachment has given rise to the scale-free property (Light et al. 2005). This
suggests that new enzymes are added to metabolism by gene duplication retain
some of the metabolites in the original reaction. This would mean that the most
connected metabolites are the most ancient, for which there is some evidence (Light
et al. 2005; Wagner 2006). Thus, the scale-free property of metabolic networks
appears to be an emergent property, and one that is beneficial to the organism in
terms of increased robustness to genetic perturbation.
Protein interaction networks attempt to characterize all of the protein�protein
interactions present within a cell. High-throughput technologies based on the yeast
two-hybrid technique or mass spectroscopy allow such networks to be constructed
on a large scale. Protein interaction networks are also typically scale-free (e.g.,
S. cerevisiae, Wagner 2001; human, Stelzl et al. 2005). Thus, these networks appear
to be tolerant of gene deletions, i.e., they are mutationally robust (Li et al. 2006),
although there is some debate as to whether the disruption of highly connected
nodes is truly more deleterious than of less connected nodes (Hahn et al. 2004). The
scale-free property appears to have arisen by preferential attachment of new edges
to highly connected nodes, without the direct action of natural selection (Wagner
2003; Berg et al. 2004).
Transcription factor networks represent the known regulatory interactions at the
transcriptional level within a cell and may be derived from various sources such as
molecular genetics and high-throughput technologies. A transcription factor net-
work consists of two types of nodes representing transcription factor genes and
genes that are the target of regulation; the transcription factor nodes are direction-
ally connected to regulated gene nodes. These networks are scale-free in humans
(Rodriguez-Caso et al. 2005), E.coli, and yeast (Maslov and Sneppen 2006), and as
a result they are robust to disruption (Balaji et al. 2006; Krishnan et al. 2007;
Guzman-Vargas and Santillan 2008). The precise mechanics leading to the scale-
free property remain to be determined, but appear to be related to the observation
that transcription factors with transcripts that have a short half life are more highly
connected (Wang and Purisima 2005).
92 S.E. Massey

5.5.2 Neutral Networks
Neutral networks are hyperdimensional regions of sequence space theoretically
applicable to both RNA and protein sequences and are represented using graph
theory. Nodes in the networks represent individual sequences, while connections
between the nodes represent neutral mutations leading from one sequence to
another. Migration of sequences to highly connected regions of the neutral network
is likely, simply by chance (van Nimwegen, Wilke 2001; Fig. 5.5). By definition,
sequences residing in such regions would have a greater number of connections,
and thus a greater proportion of potential neutral mutations, increasing their muta-
tional robustness. Hence, the stochastic migration of sequences to highly connected
regions of a neutral network is expected to result in the passive emergence of
mutational robustness in the absence of direct selection, this constitutes a pseudap-
tation. Natural selection still has an important role, in the formation of the neutral
network in the first place. The migration of sequences through sequence space to
highly connected regions is consistent with the concept of biased incrementalism, in
that a sequence will change incrementally a point mutation at a time (usually), and
the type of mutation that gets fixed is biased toward neutral mutations.
5.5.2.1 Neutral Networks in RNA
Efficient algorithms exist to predict RNA secondary structures (Tacker et al. 1996).
Simulation studies using simple RNA structures have demonstrated the existence of
neutral networks in RNA molecules (Schuster et al. 1994). The acquisition of
robustness by stochastic migration to highly connected regions of the neutral
network has also been demonstrated using computer simulations of simple RNA
structures, consistent with one of the predictions of neutral network theory (van
Nimwegen et al. 1999; Szollosi and Derenyi 2008). There is some evidence that
viral RNAs (Huynen et al. 1993; Wagner and Stadler 1999; Sanjuan et al. 2006) and
Fig. 5.5 Migration to a highly connected region of a neutral network. On the left is a simplified
representation of a neutral network structure. Nodes represent sequences, while edges represent
neutral point mutations between the sequences. The structure on the right represents the most
likely distribution of sequences that will be achieved by simple stochastic change, with larger
nodes representing more likely sequences
5 Pseudaptations and the Emergence of Beneficial Traits 93

micro RNAs (Borenstein and Ruppin 2006; Shu et al. 2008) are mutationally
robust. The extent to which the robustness of wild type RNA molecules has arisen
by migration through neutral networks remains to be determined.
5.5.2.2 Neutral Networks in Proteins
The concept of a neutral network was initially proposed to account for the obser-
vation that there was likely extensive sequence redundancy amongst proteins
(Maynard Smith 1970. The term “neutral network” was coined by Schuster et al.
1994). There is indirect evidence for the presence of neutral networks in proteins.
This includes the observation that proteins may retain the same structure and
function, but vary extensively in sequence. The existence of neutral networks has
been shown by simulation studies in 2D lattice models (Govindarajan and Goldstein
1997; Bornberg-Bauer and Chan 1999; Xia and Levitt 2002). Babjide et al. (1997)
also present evidence for the existence of neutral networks in wild type proteins
using knowledge-based interaction potentials to calculate the stability of a sequence
in a given 3D structure. Simulation studies on 2D lattice proteins suggest that the
acquisition of mutational robustness may occur in these simplified models (Taverna
and Goldstein 2002). There is a substantial literature demonstrating the robustness
of proteins to point mutations (reviewed in Wagner 2005, Chap. 5). Whether extant
proteins have acquired robustness from migration through neutral networks is
unclear, but should be a fruitful area of future research.
5.6 The Difficulty of Selecting for Mutational Robustness
Mutational robustness may take two forms; intrinsic and extrinsic (Elena et al.
2006). Intrinisic robustness is an innate property of a sequence or network, while
extrinsic robustness is robustness that arises by the application of an external factor,
such as a heat shock protein, DNA repair or any homeostatic mechanism. In this
chapter, we have been concerned only with intrinsic robustness. The ability of
natural selection to select for intrinsic mutational robustness is unclear. Theoreti-
cally, intrinsic mutational robustness could be directly selected for via group
selection, whereby mutationally robust populations would be more successful in
competing with less robust populations. However, evidence for such a group
selection effect is elusive (Okasha 2001). The occurrence of high mutation rates
has been proposed to lead to selection for intrinsic mutational robustness (Schuster
and Swetina 1988); this has been demonstrated in digital organisms (Wilke et al.
2001), but examples from nature are scarce. The mechanistic difficulties of directly
selecting for intrinsic mutational robustness are consistent with the observations of
the emergence of mutational robustness in various biological systems in the
absence of direct selection.
94 S.E. Massey

A mechanism that may indirectly produce intrinsic mutational robustness is to
select for robustness to phenotypic mutations (defined as errors in transcription and/
or translation). Sequences that have been selected to be robust to phenotypic
mutations will by default be robust to genotypic mutations. This process has been
demonstrated experimentally (Goldsmith and Tawfik 2009). In this case, although
beneficial, the property of mutational robustness is not directly selected for, and so
constitutes a pseudaptation.
5.7 Is Mutational Robustness the Only Pseudaptation?
Here, several instances of mutational robustness have been described as pseudapta-
tions, that is, beneficial traits that have not been directly selected for. However,
while these may be beneficial in the short term for ameliorating the effects of
deleterious mutations, mutational robustness may not be beneficial in the long term
because it reduces phenotypic variability (Lenski et al. 2006). However, increased
robustness is not only detrimental in the long term; robustness also results in an
increase in the amount of neutrality, which can act to improve adaptability by
increasing the accessibility of sequence space. For instance, an interesting example
of how the robustness of the SGC may improve adaptability is explored by Zhu and
Freeland (2006). This apparent contradiction may be resolved by distinguishing
between genotypic and phenotypic robustness; genotypic (sequence) robustness
tends to decrease adaptability by reducing variation, while phenotypic robustness
tends to increase adaptability by allowing sequences to vary, thus accessing novel
areas of sequence space (Wagner 2008), for which there is empirical evidence
(Bloom et al. 2006; Amitai et al. 2007). As described here, emergent robustness
appears to arise by a process of biased incrementalism in a series of biological
systems; the genetic code, neutral networks, and cellular networks. It may be worth
noting that natural selection itself is a form of biased incrementalism; biased in that
over time generations see an incremental increase in fitness due to the biased
fixation of adaptive mutations. Fitness is analogous to survivability, which could
be viewed as a form of robustness.
Evolvability, or adaptability, is another beneficial trait that is sometimes
described as an adaptation. Evolvability refers to the ability to adapt to new
environmental challenges, thus the long-term survival of a lineage with enhanced
evolvability will be more likely. Whether evolvability can be selected for is unclear,
the anticipatory nature of selecting for evolvability being problematic. An example
is the evolution of sex as a mechanism to increase adaptability (Otto and
Lenormand 2002, a review). Acknowledging that enhanced evolvability will lead
to improved success of a population over the long term, the process of selecting for
evolvability remains to be demonstrated; thus, some cases may turn out to be
pseudaptations that are not selected for at the individual level. For example, lateral
gene transfer may lead to increased adaptability, notably in bacteria, but whether it
is a trait that is selected for that purpose is unclear. Likewise, human social
5 Pseudaptations and the Emergence of Beneficial Traits 95

behaviors such as worship, music, and morality are presently at the center of a
debate as to whether they may be regarded as adaptations, the product of natural
selection, or are nonadaptive in origin. The field of evolutionary psychology
promises to reveal which of these behaviors were directly selected for. Those
behaviors that are beneficial to an individual, but turn out not to have been selected
for may be better described as pseudaptations.
While adaptations often typify an individual species, the instances of mutational
robustness characterized here as pseudaptations do not appear to. For instance, the
mutational robustness of the genetic code is universal to all organisms. In addition,
emergent properties, as they are often invisible to selection, are not necessarily
restricted to beneficial traits, but are also likely to encompass deleterious traits also.
Examples of such deleterious emergent traits await characterization.
Acknowledgments This work was supported by the Biology Department, University of Puerto
Rico – Rio Piedras, Puerto Rico.
References
Albert R, Barabasi AL (2002) Statistical mechanics of complex networks. Rev Modern Phy
74:47–94
Albert R, Jeong H, Barabasi AL (2000) Error and attack tolerance of complex networks. Nature
406:378–382
Alff-Steinberger C (1969) The genetic code and error transmission. Proc Natl Acad Sci USA
64:584–591
Amitai G, Devi Gupta R, Tawfik DS (2007) Latent evolutionary potentials under the neutral
mutational drift of an enzyme. HFSP J 1:67–78
Ardell DH (1998) On error minimization in a sequential origin of the standard genetic code. J Mol
Evol 47:1–13
Babjide A, Hofacker IL, Sippl MJ, Stadler PF (1997) Neutral networks in protein space:
a computational study based on knowledge-based potentials of mean force. Fold Des
2:261–269
Balaji S, Iyer LM, Aravind L, Babu MM (2006) Uncovering a hidden distributed architecture
behind scale-free transcriptional regulatory networks. J Mol Biol 360:204–212
Barabasi AL, Albert R (1999) Emergence of scaling in random networks. Science 286:509–512
Berg J, Lassig M, Wagner A (2004) Structure and evolution of protein in interaction networks:
a statistical model for link dynamics. BMC Evol Biol 4:51
Bloom JD, Labthavikul ST, Otey CR, Arnold FH (2006) Protein stability promotes evolvability.
Proc Natl Acad Sci USA 103:5869–5874
Bornberg-Bauer E, Chan HS (1999) Modeling evolutionary landscapes: mutational stability,
topology and superfunnels in sequence space. Proc Natl Acad Sci USA 96:10689–10694
Borenstein E, Ruppin E (2006) Direct evolution of genetic robustness in microRNA. Proc Natl
Acad Sci USA 103:6593–6598
Crick FHC (1968) The origin of the genetic code. J Mol Biol 38:367–379
Di Giulio M (1989) The extension reached by the minimization of polarity distances during the
evolution of the genetic code. J Mol Evol 29:288–293
Edwards JS, Palsson BO (1999) Systems properties of the Haemophilus influenzae Rd metabolic
genotype. J Biol Chem 274:17410–17416
Edwards JS, Palsson BO (2000) Robustness analysis of the Escherichia coli metabolic network.
Biotech Prog 16:927–939
96 S.E. Massey

Elena SF, Carrasco P, Daros J-A, Sanjuan R (2006) Mechanisms of genetic robustness in RNA
viruses. EMBO Rep 7:168–173
Freeland SJ, Knight RD, Landweber LF, Hurst LD (2000) Early fixation of an optimal genetic
code. Mol Biol Evol 17:511–518
Gilis D, Massar S, Cerf NJ, Rooman M (2001) Optimality of the genetic code with respect to
protein stability and amino-acid frequencies. Genome Biol 2:11
Gleiss PM, Stadler PF, Wagner A (2001) Relevant cycles in chemical reaction networks. Adv
Complex Sys 1:1–18
Goldsmith M, Tawfik DS (2009) Potential role of phenotypic mutations in the evolution of protein
expression and stability. Proc Natl Acad Sci USA 106:6197–6202
Goodarzi H, Nejad HA, Torabi N (2004) On the optimality of the genetic code, with consideration
of termination codons. BioSystems 77:163–173
Gould SG (1997) The exaptive excellence of spandrels as a term and prototype. Proc Natl Acad Sci
USA 94:10750–10755
Gould SG, Lewontin RC (1979) The spandrels of San Marco and the panglossian paradigm: a
critique of the adaptionist program. Proc R Soc Lond B 205:581–598
Govindarajan S, Goldstein RA (1997) Evolution of model proteins on a foldability landscape.
Proteins 29:461–464
Grantham R (1974) Amino acid difference formula to help explain protein evolution. Science
185:862–864
Guzman-Vargas L, Santillan M (2008) Comparative analysis of the transcription-factor gene
regulatory networks of E.coli and S.cerevisiae. BMC Syst Biol 2:13
Hahn MW, Conant GC, Wagner A (2004) Molecular evolution in large genetic networks: does
connectivity equal constraint. J Mol Evol 58:203–211
Haig D, Hurst LD (1992) A quantitative measure of error minimization in the genetic code. J Mol
Evol 33:412–417
Huxley J (1942) Evolution: the modern synthesis. MIT Press, Cambridge Massachusetts
Huynen MA, Konings DAM, Hogeweg P (1993) Multiple coding and the evolutionary properties
of RNA secondary structure. J Theor Biol 185:251–267
Jeong H, Tombor B, Albert R, Oltvai ZN, Barabasi AL (2000) The large-scale organization of
metabolic networks. Nature 407:651–654
Krishnan A, Tomita M, Giuliani A (2007) Evolution of gene regulatory networks: robustness as an
emergent property of evolution. Phys Stat Mech Appl 387:2170–2186
Lenski RE, Barrick JE, Ofria C (2006) Balancing robustness and evolvability. PLOS Biol 4:e428
Li D, Li J, Ouyang S, Wang J, Wu S, Wan P, Zhu Y, Xu X, He F (2006) Protein interaction
networks of Saccharomyces cerevisiae, Caenorhabditis elegans andDrosophila melanogaster:Large-scale organization and robustness. Proteomics 6:456–461
Light S, Kraulis P, Elofsson A (2005) Preferential attachment in the evolution of metabolic
networks. BMC Genom 6:159
Maslov S, Sneppen K (2006) Large-scale topological properties of molecular networks. In:
Koonin E, Wolf Y, Karev G (eds) Power laws, scale-free networks and genome biology.
Springer, New York
Massey SE (2006) A sequential “2-1-3” model of genetic code evolution that explains codon
constraints. J Mol Evol 62:809–810
Massey SE, Garey JR (2007) A comparative genomics analysis of codon reassignments reveals a
link with mitochondrial proteome size and a mechanism of genetic code change via suppressor
tRNAs. J Mol Evol 64:399–410
Massey SE (2008a) A neutral origin of error minimization in the genetic code. J Mol Evol
67:510–516
Massey SE (2008b) The proteomic constraint and its role in molecular evolution. Mol Biol Evol
25:2557–2565
Massey SE (2010) Searching of code space for an error minimized genetic code via Codon Capture
leads to failure, or requires at least 20 improving codon reassignments via the Ambiguous
Intermediate mechanism. J Mol Evol 70:106–115
5 Pseudaptations and the Emergence of Beneficial Traits 97

Maynard Smith J (1970) Natural selection and the concept of a protein space. Nature 225:563–564
Mayr E (2001) What evolution is. Basic Books, New York
Okasha S (2001) Why won’t the group selection controversy go away? Brit J Phil Sci 52:25–50
Osawa S, Jukes TH (1989) Codon reassignment (codon capture) in evolution. J Mol Evol
28:271–278
Otto SP, Lenormand T (2002) Resolving the paradox of sex and recombination. Nat Rev Gen
3:252–261
Ravasz E, Somera AL, Mongru DA, Oltvai ZN, Barabasi AL (2002) Hierarchical organization of
modularity in metabolic networks. Science 297:1551–1555
Rodriguez-Caso C, Medina MA, Sole RV (2005) Topology, tinkering and evolution of the human
transcription factor network. FEBS J 272:6423–6434
Sanjuan R, Forment J, Elena SF (2006) In silico predicted robustness of viroids RNA secondary
structures. I. The effect of single mutations. Mol Biol Evol 23:1427–1436
Schultz DW, Yarus M (1994) Transfer RNA mutation and the malleability of the genetic code.
J Mol Biol 235:1377–1380
Schuster P, Swetina J (1988) Stationary mutant distributions and evolutionary optimization. Bull
Math Biol 50:635–660
Schuster P, Fontana W, Stadler PF, Hofacker IL (1994) From sequences to shapes and back: a case
study in RNA secondary structures. Proc Roy Soc Lond B 255:279–284
Shu W, Ni M, Bo X, Zheng Z, Wang S (2008) In silico genetic robustness analysis of secondary
structural elements in the miRNA gene. J Mol Evol 67:560–569
Stelzl U et al (2005) A human protein–protein interaction network: a resource for annotating the
proteome. Cell 122:957–968
Szollosi GJ, Derenyi I (2008) The effect of recombination on the neutral evolution of genetic
robustness. Math Biosci 214:58–62
Tacker M, Stadler P, Bornberg-Bauer E, Hofacker I, Schuster P (1996) Algorithm independent
properties of RNA secondary structure predictions. Eur Biophys J Biophys Lett 25:115–130
Taverna DM, Goldstein RA (2002) Why are proteins so robust to site mutations? J Mol Biol
315:479–484
Van Nimwegen E, Crutchfield JP, Huynen M (1999) Neutral evolution of mutational robustness.
Proc Natl Acad Sci USA 96:9716–9720
Wagner A (2001) The yeast protein interaction network evolves rapidly and contains few redun-
dant duplicate genes. Mol Biol Evol 18:1283–1292
Wagner A (2003) How the global structure of protein interaction networks evolves. Proc R Soc
Lond B 270:457–466
Wagner A (2005) Robustness and evolvability in living systems. Princeton University Press,
Princeton
Wagner A (2006) The connectivity of large genetic networks. Design, history or mere chemistry?
In: Koonin E, Wolf Y, Karev G (eds) Power laws, scale-free networks and genome biology.
Springer, New York
Wagner A (2008) Robustness and evolvability: a paradox resolved. Proc R Soc B 275:91–100
Wagner A, Stadler PF (1999) Viral RNA and evolved mutational robustness. J Exp Zool
285:119–127
Wang E, Purisima E (2005) Network motifs are enriched with transcription factors whose
transcripts have short half-lifes. Trends Gen 21:492–495
Wilke CO (2001) Adaptive evolution on neutral network. Bull Math Sci 63:715–730
Wilke CO, Wang JL, Ofria C, Lenski RE, Adami C (2001) Evolution of digital organisms at high
mutation rates leads to survival of the flattest. Nature 412:331–333
Xia Y, Levitt M (2002) Roles of mutation and recombination in the evolution of protein thermo-
dynamics. Proc Natl Acad Sci USA 99:10382–10387
Zhu W, Freeland S (2006) The standard genetic code enhances adaptive evolution of proteins.
J Theor Biol 239:63–70
98 S.E. Massey

Part IIGenome / Molecular Evolution

Chapter 6
Transferomics: Seeing the Evolutionary Forest
Using Phylogenetic Trees
John W. Whitaker and David R. Westhead
Abstract Horizontal gene transfer (HGT) is the movement of genetic material
between species that would otherwise have isolated heritages. The immediate gain
of a gene, or sets of genes, allows traits to be acquired far more rapidly than through
Darwinian evolution. The entire set of genes within a species that were acquired
through HGT is known as its transferome. Studies of prokaryotes transferomes have
revealed that the propensity of a gene to be transferred is related to biological
network structure. Recent increases in the number of sequenced eukaryotic gen-
omes have made it possible to carry out analysis of their transferomes, and this has
revealed novel insight into eukaryotic evolution. In this chapter, we present a
review of some studies that have increased our understanding of transferomes.
6.1 Introduction
Inheritance is the movement of genetic information from one generation to the next.
Traditionally information only flows vertically, from parent to offspring, within the
same species. This rule of inheritance is so important that it forms the commonly
used law upon which a species is defined. That is, for two groups of organisms to be
considered the same species, they must be able to reproduce and the resulting
offspring must be fertile. During traditional inheritance, new traits can be acquired
within a species through the processes of mutation and selection. This has led to the
idea of evolution forming a tree, with the last universal common ancestor at the base
and modern day species at the leaves. Horizontal gene transfer (HGT) breaks the
vertical law of inheritance and allows genes to move between species. The gain of a
J.W. Whitaker and D.R. Westhead
Institute of Molecular and Cellular Biology, Garstang Building, University of Leeds, Leeds
LS2 9J, UK
e-mail: [email protected]; [email protected]
P. Pontarotti (ed.), Evolutionary Biology – Concepts, Molecularand Morphological Evolution, DOI 10.1007/978-3-642-12340-5_6,# Springer-Verlag Berlin Heidelberg 2010
101

gene through horizontal transfer can be of great advantage as it allows traits to be
acquired far more rapidly than through mutation.
The most powerful method of predicting the genes that have been acquired through
horizontal transfer is through the construction of phylogenetic trees (Whitaker
et al. 2009c). A phylogenetic tree allows the horizontally transferred genes to be
identified, because the grouping of species within the tree will differ from that of the
accepted taxonomy. The publication of whole genome sequences brings with it
the opportunity to carry HGT predictions on a genomic scale. The study of HGT on
a genomic level is known as transferomics (Whitaker et al. 2009a) and allows for
the comparison of the levels of gene transfer between species. Moreover, it allows
gene transfer to be considered in the context of biological systems, such as
metabolic networks, thus revealing the underlying evolutionary pressures that
influence the process of gene transfer. In this chapter, we review several studies
which have carried out analysis of transferomes in the context of biological
systems. Initially, we start with some seminal work which analysed the transfer-
omes of prokaryotes and eukaryotes. Then we discuss our recent work which has
looked at the transferomes of unicellular eukaryotes.
6.2 Horizontal Gene Transfer in Prokaryotes
The process of HGT has been most extensively studied in prokaryotes (Beiko et al.
2005; Lerat et al. 2005; Zhaxybayeva et al. 2006). Prokaryotes have a number of
mobile genetic elements, including plasmids, transposons and intergrons, which
can carry genes from one species to another. To encourage the movement of genetic
elements, bacteria are able to swap DNA between cells, through conjugation, or
take it up from the environment, through transformation. Furthermore, prokaryotic
viruses, phages, can carry genes between prokaryotes through a process known as
transduction. As prokaryotes are so well adapted to HGT it is not surprising that it
occurs extensively. It has been estimated that since E. coli diverged from the
Salmonella lineage, 100 million years ago, 18% of its 4,288 genes have been
acquired through HGT (Lawrence and Ochman 1998). The observation of such
extensive HGT has led to the suggestion that the ancestry of prokaryotes would be
better represented by a network than a tree (William 1999).
The genomes of prokaryotes can be split into two parts, a core genome and a
dispensable genome, which together are termed the pan-genome (Tettelin et al.
2005). The core genome represents the genes that are common to all members of a
species and carry out the core functions. The dispensable genome represents genes
that are only partially shared between strains of a species. In Streptococcus aga-lactiae, the dispensable genome was estimated to make up 20% of the genes within
the pan-genome (Tettelin et al. 2005). Analysis of the types of genes that are
commonly transferred has brought the “complexity hypothesis”. According to the
complexity hypothesis, genes which are involved in complex interactions are
unlikely to be transferred, while genes that are in few interactions are more likely
102 J.W. Whitaker and D.R. Westhead

to be transferred. More particularly, “informational genes” (e.g. genes involved in
transcription, translation, and related process) are less likely to be transferred than
“operational genes” (e.g. genes encoding metabolic enzymes). Furthermore, analy-
sis of HGT within prokaryote metabolic networks found that genes on the periphery
of the network were more likely to be transferred than those at the core (Pal et al.
2005). Taken together, these findings have led to the suggestion that prokaryotic
genomes are in a constant state of flux, with new environment specific genes being
constantly acquired, allowing rapid adaptation (Thomason and Read 2006). In this
process, environmentally specific genes join at the networks edge allowing adapta-
tion of the existing network to the new environment. For example, the gain of an
enzyme might enable the breakdown of a rare suger, allowing it to enter glycolysis.
6.3 Horizontal Gene Transfer in Eukaryotes
HGT has not been studied as extensively in eukaryotes. In multicellular eukaryotes,
where DNA would have to be transferred into the germ line, it seems unlikely that
HGT will occur (Salzberg et al. 2001); although, it cannot be ruled out altogether. In
unicellular eukaryotes, this barrier does not exist; however, they do not possess the
same HGT machinery as prokaryotes, and therefore, it is unlikely to be as prevalent.
Sources of HGT in eukaryotes include viruses, absorption from the environment,
phagocytosis and endosymbiosis. Additionally, there are well characterised exam-
ples of gene transfer from prokaryotes to eukaryotes, e.g. the tumour inducing
plasmid of Agrobacterium tumefaciens being transferred into a plant (Chilton et al.
1977). With the sequencing of many unicellular eukaryotic genomes, it has recently
become feasible to study the extent to which HGT has occurred.
HGT that accompanies endosymbiosis is termed endosymbiotic gene transfer
(EGT) and was important in establishing the eukaryotic organelles: the mitochon-
dria and plastids. In addition to the primary endosymbiosis events that established
plastids as eukaryotic organelles, multiple endosymbioses have occurred in unicel-
lular eukaryotes (Reyes-Prieto et al. 2007; Yoon et al. 2005). An important example
is the event, or events, which gave rise to the chromalveolates, in which a hetero-
trophic eukaryote gained a plastid through endocytosis of a plastid-containing red
alga (Cavalier-Smith 1999). This brought together five genomes in one cell; two
nuclear, two mitochondrial and one plastid; and with them came the opportunity for
large scale EGT (Huang et al. 2004a; Tyler et al. 2006) (see Fig. 6.1). A further
potential source of EGT in eukaryotes is from chlamydia and may have occurred
during the establishment of the primary plastid (Becker et al. 2008; Huang and
Gogarten 2007).
Over the past few years there have been many studies that have looked at the
levels of HGT which occurred in unicellular eukaryotes (Alsmark et al. 2009;
Andersson et al. 2007; Carlton et al. 2007; Huang et al. 2004a, b; Nosenko and
Bhattacharya 2007; Richards et al. 2006; Striepen et al. 2004). Within these studies,
the genes that are most commonly found to have been gained through transfer are
6 Transferomics: Seeing the Evolutionary Forest Using Phylogenetic Trees 103

those which encode metabolic enzymes. This finding is in keeping with the com-
plexity hypothesis (Alsmark et al. 2009). Eukaryotes that have phagotrophic life-
styles have been shown to have many HGTs. The predominant levels of HGT
associated with phagocytosis and endosymbiosis have led to the suggestion that
“you are what you eat” (Doolittle 1998). Here, the host nuclei are being repeatedly
exposed to genes from endosymbionts or food bacteria. The repeated exposure
means that a gene already present in the host nucleus could be replaced by a foreign
gene. When a gene is replaced by a gene transfer of the same function, it is termed
orthologous replacement.
A recent study has identified a case of large scale HGT from bacteria, fungi and
plants into the Bdelloid rotifers (Gladyshev et al. 2008). Bdelloid rotifers are
asexual multicellular animals that are highly desiccation tolerant. It is believed
that the gain of so many genes may have been facilitated by repeated desiccation
and recovery. Furthermore, it is possible that genetic exchange between Bdelloid
rotifers could be occurring by the same mechanism. This could explain how they
have survived asexually for millions of years.
6.4 metaTIGER and Its Application to Transferomics
In this section, we shall discuss our recent studies of the transferomes of unicellular
eukaryotes. We shall begin by describing the construction and functionality of the
metabolic evolution resource, metaTIGER (Whitaker et al. 2009b). Then we shall
describe how metaTIGER was used to investigate the transferomes of ten groups of
unicellular eukaryotes (Whitaker et al. 2009a). Detailed descriptions of these works
can be found in the corresponding publications; herein, we provide a brief summary
of the studies.
Fig. 6.1 Secondary endosymbiosis and gene transfer. The large cell represents a primordial
eukaryote that initially does not possess a plastid. The smaller cell represents an alga that does
possess a plastid. The two nuclei are shown by black dotted lines, the two mitochondria are shown
by grey ovals with black boarders and the plastid is shown by a black oval with a white and greyboarder. In the image on the left, the two cells are living autonomously but in a symbiotic
relationship. In the middle image, the alga cell has been engulfed by the other cell to maximise
the surface area between the two cells allowing more efficient exchange of nutrients. Owing to the
close proximity of the cells DNA from the alga genome may be transferred into the nuclear
genome of the other cell. Over time this leads to a reduction in the size of the algal genomes. In the
image on the right, the alga nucleuses and mitochondria have been lost altogether leaving only the
plastid
104 J.W. Whitaker and D.R. Westhead

6.4.1 metaTIGER
The reconstruction of metabolic networks is an essential aspect of genome analysis.
metaTIGER is the first resource to bring together the reconstructed metabolic
networks of 121 eukaryotes with detailed evolutionary information. The construc-
tion and functionality of metaTIGER are summarised in Fig. 6.2.
6.4.1.1 Enzyme Prediction
To construct metaTIGER, the websites of online sequence repositories and
sequencing centres were searched for genomic sequence data. The quality of
sequence data that was used varied from assembled genomes to expressed sequence
tags (ESTs). The enzymes that are present within the genomes were predicted
through homology to PRIAM enzymes sequence profiles (Claudel-Renard et al.
2003) using the program SHARKhunt (Pinney et al. 2005). The PRIAM enzyme
sequences profiles correspond to the conserved domains of proteins that all share
the same enzymatic function. For each of the profiles, enzymatic function is
denoted by an E.C. number. When used by SHARKhunt the conserved domains
are used to make position specific scoring matrices (PSSMs) and hidden Markov
models (HMMs), which are respectively used by PSI-BLAST (Altschul et al. 1997)
Fig. 6.2 An overview of metaTIGER website. On the left are the sources of the information that
were used in the construction of metaTIGER. In the centre grey box are the three main elements of
the metaTIGER site. On the right are the ways that a user can interact with the metaTIGER site.
Arrows show the flow of information
6 Transferomics: Seeing the Evolutionary Forest Using Phylogenetic Trees 105

and GeneWise2 (Birney and Durbin 2000) to search the genomic sequence data.
SHARKhunt works by running an initial PSI-BLAST search that quickly identifies
regions of the genome which are similar to the PRIAM PSI-BLAST profile. Then
these regions are extracted matched against the corresponding HMM using Gene-
Wise2. The region of the genome that matches the HMM is extracted and used to
create a polypeptide sequence. The polypeptide is then tested using PSI-BLAST
and the original PRIAM PSI-BLAST profile. The E-values and sequences are then
given as output.
6.4.1.2 Website Construction
The enzyme predictions were uploaded into the metaTIGER relational database. To
allow the enzyme predictions to be searched and interpreted in relation to the
metabolic network, parts of the KEGG Ligand database (Kanehisa et al. 2006;
Ogata et al. 1999) were also loaded into the metaTIGER database. Furthermore,
custom KEGG pathway images, for each organism, were produced to allow the
predicted enzymes to be viewed in the context of metabolic pathways. To allow
comparative analysis of pathways two tools are provided on the metaTIGER
website. These tools allow the enzymes that are present within a particular pathway
to be compared between multiple organisms.
6.4.1.3 Phylogenetic Trees
Integrated into the metaTIGER site is evolutionary information in the form of a
phylogenetic tree for each of the predicted enzymes. When producing the phylogenetic
trees care was taken to make them in a way that reduced the chance of artefacts
and makes them suitable for the prediction of HGTs. The trees can be viewed in the
site using the interactive tree viewer iTOL (Letunic and Bork 2007) (see Fig. 6.5 for
an example of phylogenetic tree viewed via the metaTIGER site) or they can be
searched for clades of interest using PhyloGenie (Frickey and Lupas 2004). The tree
searching functionality is of particular importance, when metaTIGER is applied
to transferomic analysis, as it allows phylogenetic trees that depict HGT events to
be rapidly identified.
6.4.2 Transferome Analysis
The tools and data that are intergraded into the metaTIGER website were used to
investigate the process of HGT in unicellular eukaryotes (Whitaker et al. 2009a).
The transferome analysis was made up of four sections: identification of a high-
confidence HGT dataset; comparison of the gene transfer levels and identification
of drug targets; connectivity analysis; and enrichment analysis.
106 J.W. Whitaker and D.R. Westhead

6.4.2.1 The Identification of a High-Confidence HGT Dataset
To establish a dataset of putative EGTs and HGTs (E/HGTs), the metaTIGER tree
search facility was used. Four different types of gene transfer events were identi-
fied: EGT from Cyanobacteria, EGT from Chlamydia, EGT from archaeplastida
(land plants, green alga, red alga and glaucophytes) and HGT from bacteria.
The gene transfer events were identified in ten groups of unicellular eukaryotes:
Plasmodium, Theileria, Toxoplasma, Cryptosporidium, Leishmania, Trypanosoma,Phytophthora, diatoms, Ostreococcus and Saccharomyces. These ten groups were
used as each of them had more one completed genome sequence. By using only
groups with more than one completed genome sequences, it meant that contamina-
tion in a single genome sequence would not influence the results of the analysis.
PhyloGenie tree queries were designed to identify all phylogenetic trees that
depicted the corresponding E/HGT event. The tree queries constitute a way of
screening a large database of trees for trees of potential interest; subsequent manual
checking of the identified trees is necessary and was carried out, and unconvincing
examples were rejected. When searching for trees depicting high-confidence HGT
events, only clades with bootstrap support of 70% or above were considered. A cut-
off of 70% was used because it corresponds to at least a 95% chance that the clade is
correct (Hillis and Bull 1993). The E/HGT predictions that were made can be
viewed as high-confidence predictions as three steps have been taken to ensure
their quality: (1) the use of organism groups with more than one genome sequence;
(2) the manual inspection of E/HGT depicting trees; and (3) a bootstrap cut-off of
greater than 70%.
6.4.2.2 Comparison of the Gene Transfer Levels and Identification
of Drug Targets
The level of predict E/HGTs was compared between the ten groups of unicellular
eukaryotes and is shown in Fig. 6.3. The largest number of EGTs was found in the
two photosynthetic groups (Ostreococcus and the diatoms), which confirmed that
the high-confidence dataset of E/HGT predictions were suitable for revealing gene
transfer trends. Organisms that posses a plastid like organelle but are not photosyn-
thetic (Toxoplasma, Theileria and Plasmodium) were found to retain EGTs, indi-
cating non-photosynthetic metabolic activities have been gained through EGT.
Furthermore, organism groups that have believed to have once possessed a plastid,
which is now lost (Cryptosporidium and Phytophthora), have also retained EGTs,
indicating that enzymes which function outside of the plastid have been gained. No
EGTs were found in Saccharomyces, which are not thought to have ancestrally
possessed a plastid.
There are two reasons why HGT may be good drug targets. First, the acquired
genes could have previously been specific to prokaryotes and therefore be absent
from the parasites host. Second, if the acquired gene is present within the pathogens
host but acquired version is highly divergent from the hosts copy (e.g. the acquired
6 Transferomics: Seeing the Evolutionary Forest Using Phylogenetic Trees 107

gene is of prokaryotic origin) then parasite specific inhibitors can be produced. The
trypanosomatids (Trypanosoma and Leishmania) were found to possess a large
number of genes that have been gained through HGT from bacteria. As there is a
great need for new therapeutic strategies to combat these parasites, the predicted
HGTs were investigated further. This revealed that one of the HGTs, Pyruvate
decarboxylase, was already a target for the drug omeprazole, which is currently
used in the treatment of Leishmania tropica. Moreover, three HGTs were suggested
a possible new drug targets: isopentenyl pyrophosphate isomerase (see Fig. 6.4),
isocitrate dehydrogenase and pyrroline-5-carboxylate reductase.
To investigate the idea that Chlamydia assisted in the establishment of the primary
plastid (Becker et al. 2008; Huang and Gogarten 2007) the predicted EGTs were
considered. The EGT predictions were compared to identify gene transfers, where
a gene had been transferred from Chlamydia into the archaeplastida, then into a thirdlineage during secondary endosymbiosis. The following examples were identified:
four genes in the diatoms; three genes within Plasmodium and Toxoplasma; and one
gene in Theileria. These results support the idea that Chlamydia assisted in
the establishment primary plastid and show that Chlamydial genes have been trans-
ferred during secondary endosymbiosis. The metaTIGER phylogenetic tree of enoyl-
[acyl-carrier-protein] reductase is shown as an example in Fig. 6.5.
6.4.2.3 Connectivity Analysis
The enzymes whose genes have been identified as being gained through E/HGT
have successfully integrated into their new hosts metabolic networks. For the genes
to have become fixed within the lineages they must have provided an evolutionary
advantage through enhancement of the metabolic network. If two or more enzyme
encoding genes, which are connected within a metabolic pathway, are co-trans-
ferred they could provide a greater enhancement to the metabolic network than two
Fig. 6.3 The metabolic transferomes. The total number of enzymes found in metaTIGER with an
E-value beneath 1.0 � 10�30 are shown for each of the groups of unicellular eukaryotes. The
counts of E/HGTs are indicated by the differently coloured bars
108 J.W. Whitaker and D.R. Westhead

enzymes that are not connected. This greater potential for enhancement could
provide greater evolutionary pressure for the fixation of co-transferred genes,
which encode enzymes that are connected within metabolic pathways. To investi-
gate this, the number of connexions between enzymes, whose genes were acquired
via horizontal transfer, was considered.
The connectivity analysis worked by comparing the number of connexions
between E/HGTs to the number of connexions between enzymes picked at random
from the species metabolic network. Enzymes were taken as being connected if
they carried out consecutive reactions within the organisms metabolic network.
This analysis was carried out separately for EGTs and HGTs. For EGTs, it was
found that the number of connections was significantly greater than random. In
particular, the number of connections between EGTs from the organisms that have
now lost their plastids (Cryptosporidium and Phytophthora) was found to be
significantly greater than random. This demonstrates the co-transfer of enzyme
encoding genes that are connected within the metabolic network but do not function
within the plastid.
When the connectivity analysis was applied to the HGTs from bacteria, no
organism groups were found to be significantly more connected than random.
Fig. 6.4 The mevalonate
isoprenoid biosynthesis
pathways in T. cruzi.Enzymes are shown by
E.C. number. The enzyme
isopentenyl pyrophosphate
isomerase (5.3.3.2) is a
predicted HGT in the
trypanosomatids. The enzyme
farnesyl diphosphate synthase
(2.5.1.10) has been validated
as a drug target in T. cruzi,suggesting that isopentenyl
pyrophosphate isomerase
would also be an effective
drug target
6 Transferomics: Seeing the Evolutionary Forest Using Phylogenetic Trees 109

Fig.6.5
ThemetaT
IGERphylogenetic
tree
ofenoyl-[acyl-carrier-protein]reductase.Thephylogenetic
tree
ontheleftshowstheentire
phylogenetic
tree
of
enoyl-[acyl-carrier-protein]reductase(1.3.1.9)as
viewed
onthemetaT
IGERwebsite.Thephylogenetictree
ontherigh
tshowsasinglecladewhichhas
been
enlarged
andhad
certaintaxahighlighted.Bacterialtaxaarehighlightedwithagrey
backgroundandeukaryotictaxaarehighlightedwithablackbackground.
Certain
taxahavebeenenlarged
tomakethetree
easier
tointerpret(N
B:ThediatomsarePha
eoda
ctylum
tricornu
tum
andTha
lassiosira
pseudo
nana
)
110 J.W. Whitaker and D.R. Westhead

However, the two groups with the largest numbers of HGTs (Leishmania and
Ostreococcus) approached statistical significance. Thus, suggesting that if a less
stringent criterion had been used during HGT prediction, significances might have
also been found for HGTs from bacteria.
6.4.2.4 Enrichment Analysis
Genes are commonly characterised according to three ontology categories: molec-
ular function, biological process and cellular location. In the case of metabolic
enzymes, these categories relate to the chemical reactions they catalyse, the path-
ways and sub-networks within which they function and the location within the cell
where they function. Enrichment analysis was carried out to investigate if the genes
encoding enzymes in particular pathways or of particular molecular function are
more likely to have been acquired through HGT. Enrichment analysis of cellular
location was not carried out as it is likely to be less conserved between organism
groups than other aspects of ontology.
Of the different enrichment analyses that were used it was only enrichment of
KEGG metabolic pathways that found significant results. The pathways enrichment
was carried out on three levels: KEGG map group (large groups of related path-
ways); KEGG maps (a set of closely related pathways); and KEGG modules
(specific metabolic pathways). Aspects of plastid metabolism that are known to
occur within specific organism groups were found to be enriched with EGTs. Thus,
demonstrating that the high-confidence E/HGTs predictions can uncover the under-
lying trends of enrichment. The most significant and unexpected trend at the level
of KEGG map groups level was an enrichment of EGTs within carbohydrate
metabolism. Several examples of metabolic pathways that could be important to
the pathogenicity of some of the parasites being studied were identified: xylose
metabolism in Leishmania; 1-3-beta-glucan metabolic in Phytophthora; trehalosemetabolism in Phytophthora; and lipopolysaccharide biosynthesis in Phytophthora.
Of the pathway enrichments that may be important to pathogenicity, lipopoly-
saccharide biosynthesis pathway is the most exciting because it has not been seen
before in eukaryotes, outside than members to the archaeplastida. Moreover,
lipopolysaccharides are important pathogenicity factor in Gram-negative bacteria.
Thus, it is possible that lipopolysaccharides may be important to the pathogenicity
of Phytophthora and its discovery may aid the development of new control agents.
6.5 Conclusions
Transferomics is the study of HGT on a genomic scale and can be used to reveal the
underlying trends that influence gene transfer. Large scale transferomic studies are
no longer exclusive to prokaryotes. Transferomic analysis of eukaryotes can be
6 Transferomics: Seeing the Evolutionary Forest Using Phylogenetic Trees 111

used to reveal insight into their evolution which may be useful in the development
of new therapeutic strategies.
References
Alsmark UC, Sicheritz-Ponten T, Foster PG, Hirt RP, Embley TM (2009) Horizontal gene transfer
in eukaryotic parasites: a case study of Entamoeba histolytica and Trichomonas vaginalis. In:Gogarten MB, Gogarten JP, Olendzenski L (eds) Horizontal gene transfer genomes in flux, vol
532, Methods in molecular biology. Springer, Heidelberg, pp 489–500
Altschul SF, Madden TL, Schaffer AA, Zhang J, Zhang Z, Miller W, Lipman DJ (1997) Gapped
BLAST and PSI-BLAST: a new generation of protein database search programs. Nucleic
Acids Res 25:3389–3402
Andersson JO, Sjogren AM, Horner DS, Murphy CA, Dyal PL, Svard SG, Logsdon JM Jr,
Ragan MA, Hirt RP, Roger AJ (2007) A genomic survey of the fish parasite Spironucleussalmonicida indicates genomic plasticity among diplomonads and significant lateral gene
transfer in eukaryote genome evolution. BMC Genomics 8:51
Becker B, Hoef-Emden K, Melkonian M (2008) Chlamydial genes shed light on the evolution of
photoautotrophic eukaryotes. BMC Evol Biol 8:203
Beiko RG, Harlow TJ, Ragan MA (2005) Highways of gene sharing in prokaryotes. Proc Natl
Acad Sci USA 102:14332–14337
Birney E, Durbin R (2000) Using genewise in the Drosophila annotation experiment. Genome Res
10:547–548
Carlton JM, Hirt RP, Silva JC, Delcher AL, Schatz M, Zhao Q, Wortman JR, Bidwell SL,
Alsmark UCM, Besteiro S, Sicheritz-Ponten T, Noel CJ, Dacks JB, Foster PG, Simillion C,
Van de Peer Y, Miranda-Saavedra D, Barton GJ, Westrop GD, Muller S, Dessi D, Fiori PL,
Ren Q, Paulsen I, Zhang H, Bastida-Corcuera FD, Simoes-Barbosa A, Brown MT, Hayes RD,
Mukherjee M, Okumura CY, Schneider R, Smith AJ, Vanacova S, Villalvazo M, Haas BJ,
Pertea M, Feldblyum TV, Utterback TR, Shu C-L, Osoegawa K, de Jong PJ, Hrdy I,
Horvathova L, Zubacova Z, Dolezal P, Malik S-B, Logsdon JM Jr, Henze K, Gupta A,
Wang CC, Dunne RL, Upcroft JA, Upcroft P, White O, Salzberg SL, Tang P, Chiu C-H,
Lee Y-S, Embley TM, Coombs GH, Mottram JC, Tachezy J, Fraser-Liggett CM, Johnson PJ
(2007) Draft genome sequence of the sexually transmitted pathogen Trichomonas vaginalis.Science 315:207–212
Cavalier-Smith T (1999) Principles of protein and lipid targeting in secondary symbiogenesis:
euglenoid, dinoflagellate, and sporozoan plastid origins and the eukaryote family tree.
J Eukaryot Microbiol 46:347–366
Chilton M-D, Drummond MH, Merlo DJ, Sciaky D, Montoya AL, Gordon MP, Nester EW (1977)
Stable incorporation of plasmid DNA into higher plant cells: the molecular basis of crown gall
tumorigenesis. Cell 11:263
Claudel-Renard C, Chevalet C, Faraut T, Kahn D (2003) Enzyme-specific profiles for genome
annotation: PRIAM. Nucleic Acids Res 31:6633–6639
Doolittle WF (1998) You are what you eat: a gene transfer ratchet could account for bacterial
genes in eukaryotic nuclear genomes. Trends Genet 14:307–311
Frickey T, Lupas AN (2004) PhyloGenie: automated phylome generation and analysis. Nucleic
Acids Res 32:5231–5238
Gladyshev EA, Meselson M, Arkhipova IR (2008) Massive horizontal gene transfer in bdelloid
rotifers. Science 320:1210–1213
Hillis DM, Bull JJ (1993) An empirical test of bootstrapping as a method for assessing confidence
in phylogenetic analysis. Syst Biol 42:182
112 J.W. Whitaker and D.R. Westhead

Huang J, Gogarten JP (2007) Did an ancient chlamydial endosymbiosis facilitate the establishment
of primary plastids? Genome Biol 8:R99
Huang J, Mullapudi N, Lancto CA, Scott M, AbrahamsenMS, Kissinger JC (2004a) Phylogenomic
evidence supports past endosymbiosis, intracellular and horizontal gene transfer in Cryptospo-ridium parvum. Genome Biol 5:R88
Huang J, Mullapudi N, Sicheritz-Ponten T, Kissinger JC (2004b) A first glimpse into the pattern
and scale of gene transfer in Apicomplexa. Int J Parasitol 34:265–274
Kanehisa M, Goto S, Hattori M, Aoki-Kinoshita KF, Itoh M, Kawashima S, Katayama T, Araki M,
Hirakawa M (2006) From genomics to chemical genomics: new developments in KEGG.
Nucleic Acids Res 34:D354–D357
Lawrence JG, Ochman H (1998) Molecular archaeology of the Escherichia coli genome. Proc Natl
Acad Sci USA 95:9413–9417
Lerat E, Daubin V, Ochman H, Moran NA (2005) Evolutionary origins of genomic repertoires in
bacteria. PLoS Biol 3:e130
Letunic I, Bork P (2007) Interactive Tree Of Life (iTOL): an online tool for phylogenetic tree
display and annotation. Bioinformatics 23:127–128
Nosenko T, Bhattacharya D (2007) Horizontal gene transfer in chromalveolates. BMC Evol Biol
7:173
Ogata H, Goto S, Sato K, Fujibuchi W, Bono H, Kanehisa M (1999) KEGG: Kyoto Encyclopedia
of Genes and Genomes. Nucleic Acids Res 27:29–34
Pal C, Papp B, Lercher MJ (2005) Adaptive evolution of bacterial metabolic networks by
horizontal gene transfer. Nat Genet 37:1372–1375
Pinney JW, Shirley MW, McConkey GA, Westhead DR (2005) metaSHARK: software for
automated metabolic network prediction from DNA sequence and its application to the
genomes of Plasmodium falciparum and Eimeria tenella. Nucleic Acids Res 33:1399–1409Reyes-Prieto A, Weber APM, Bhattacharya D (2007) The origin and establishment of the plastid
in algae and plants. Annu Rev Genet 41:147–168
Richards TA, Dacks JB, Jenkinson JM, Thornton CR, Talbot NJ (2006) Evolution of filamentous
plant pathogens: gene exchange across eukaryotic kingdoms. Curr Biol 16:1857–1864
Salzberg SL, White O, Peterson J, Eisen JA (2001) Microbial genes in the human genome: lateral
transfer or gene loss? Science 292:1903–1906
Striepen B, Pruijssers AJ, Huang J, Li C, Gubbels MJ, Umejiego NN, Hedstrom L, Kissinger JC
(2004) Gene transfer in the evolution of parasite nucleotide biosynthesis. Proc Natl Acad Sci
USA 101:3154–3159
Tettelin H, Masignani V, Cieslewicz MJ, Donati C, Medini D, Ward NL, Angiuoli SV, Crabtree J,
Jones AL, Durkin AS, DeBoy RT, Davidsen TM, Mora M, Scarselli M, Margarit y Ros I,
Peterson JD, Hauser CR, Sundaram JP, Nelson WC, Madupu R, Brinkac LM, Dodson RJ,
Rosovitz MJ, Sullivan SA, Daugherty SC, Haft DH, Selengut J, Gwinn ML, Zhou L, Zafar N,
Khouri H, Radune D, Dimitrov G, Watkins K, O’Connor KJB, Smith S, Utterback TR, White O,
Rubens CE, Grandi G, Madoff LC, Kasper DL, Telford JL, Wessels MR, Rappuoli R, Fraser CM
(2005) Genome analysis of multiple pathogenic isolates of Streptococcus agalactiae: implications
for the microbial “pan-genome”. Proc Natl Acad Sci USA 102:13950–13955
Thomason B, Read TD (2006) Shuffling bacterial metabolomes. Genome Biol 7:204
Tyler BM, Tripathy S, Zhang X, Dehal P, Jiang RH, Aerts A, Arredondo FD, Baxter L, Bensasson D,
Beynon JL, Chapman J, Damasceno CM, Dorrance AE, Dou D, Dickerman AW, Dubchak IL,
Garbelotto M, Gijzen M, Gordon SG, Govers F, Grunwald NJ, Huang W, Ivors KL, Jones RW,
Kamoun S, Krampis K, Lamour KH, Lee MK, McDonald WH, Medina M, Meijer HJ,
Nordberg EK, Maclean DJ, Ospina-Giraldo MD, Morris PF, Phuntumart V, Putnam NH,
Rash S, Rose JK, Sakihama Y, Salamov AA, Savidor A, Scheuring CF, Smith BM, Sobral BW,
Terry A, Torto-Alalibo TA, Win J, Xu Z, Zhang H, Grigoriev IV, Rokhsar DS, Boore JL (2006)
Phytophthora genome sequences uncover evolutionary origins and mechanisms of pathogenesis.
Science 313:1261–1266
6 Transferomics: Seeing the Evolutionary Forest Using Phylogenetic Trees 113

Whitaker J, McConkey G, Westhead D (2009a) The transferome of metabolic genes explored:
analysis of the horizontal transfer of enzyme encoding genes in unicellular eukaryotes.
Genome Biol 10:R36
Whitaker JW, Letunic I, McConkey GA, Westhead DR (2009b) metaTIGER: a metabolic evolu-
tion resource. Nucleic Acids Res 37:D531–D538
Whitaker JW, McConkey GA, Westhead DR (2009c) Prediction of horizontal gene transfers in
eukaryotes: approaches and challenges. Biochem Soc Trans 37:792–795
William M (1999) Mosaic bacterial chromosomes: a challenge en route to a tree of genomes.
Bioessays 21:99–104
Yoon HS, Hackett JD, Van Dolah FM, Nosenko T, Lidie KL, Bhattacharya D (2005) Tertiary
endosymbiosis driven genome evolution in dinoflagellate algae. Mol Biol Evol 22:1299–1308
Zhaxybayeva O, Gogarten JP, Charlebois RL, Doolittle WF, Papke RT (2006) Phylogenetic
analyses of cyanobacterial genomes: quantification of horizontal gene transfer events. Genome
Res 16:1099–1108
114 J.W. Whitaker and D.R. Westhead

Chapter 7
Comparative Genomics and Transcriptomics
of Lactation
Christophe M. Lefevre, Karensa Menzies, Julie A. Sharp,
and Kevin R. Nicholas
Abstract Lactation is an important characteristic of mammalian reproduction
sometimes referred to as the quintessence of mammals. Comparative genomics
and transcriptomics experiments are allowing a more in-depth molecular analysis of
the evolution of lactation throughout the mammalian kingdom and these recent
results are reviewed here. Milk cell and mammary gland gene expression analysis
with sequencing methodology have started to reveal conserved or specific milk
protein and components of the lactation system of monotreme, marsupial and
eutherian lineages. These experiments have confirmed the ancient origin of the
complex lactation system and provided useful insight into the function of specific
milk proteins in the control of the lactation programme or the role of milk in the
regulation of growth and development of the young beyond simple nutritive
aspects.
C.M. Lefevre
Institute for Technology Research and Innovation, Deakin University, Waurn Ponds, Geelong,
VIC 3217, Australia
CRC for Innovative Dairy Products, Department of Zoology, University of Melbourne,
Melbourne, VIC 3010, Australia
Victorian Bioinformatics Consortium, Monash University, Clayton, Melbourne, VIC 3080,
Australia
e-mail: [email protected]
K. Menzies, J.A. Sharp, and K.R. Nicholas
Institute for Technology Research and Innovation, Deakin University, Waurn Ponds, Geelong,
VIC 3217, Australia
CRC for Innovative Dairy Products, Department of Zoology, University of Melbourne,
Melbourne, VIC 3010, Australia
P. Pontarotti (ed.), Evolutionary Biology – Concepts, Molecularand Morphological Evolution, DOI 10.1007/978-3-642-12340-5_7,# Springer-Verlag Berlin Heidelberg 2010
115

7.1 Introduction: Lactation Evolution and Diversity
Lactation consists in the nourishment of the young with copious milk secretion by
the mammary gland. This aspect of mammalian reproduction is a defining charac-
teristic of mammals and it is often referred to as the quintessence of mammals
despite the existence of other differentiating characters (jaw bone structure, fur. . .).It has also been suggested that a key role of lactation during mammalian evolution
has been to allow the development of affectivity with an opportunity for learning,
therefore providing a substrate for the development of intelligence in man (Peaker
2002). Thus, due to its essential role in reproduction, lactation is in part responsible
for the evolutionary success of mammals.
Milk provision is a complex process, with changes in milk composition and
interactions between parent and young beyond the straightforward nutritional
function. The precise mechanism of how lactation evolved and its ancestral role
are still unclear, but a diversity of lactation strategies has been adopted by mam-
mals. Fossil and molecular evidence point to the appearance of early mammals
toward the end of the Triassic on the synaptid branch of the tree of life separating
mammalian ancestors from other living creatures during the Permian (about 320
million years ago, Fig. 7.1). Comparative genome analysis has recently emphasised
at the molecular level the ancient origin of the essential components of the lactation
system. This complex lactation system has gradually evolved during therapsid
evolution in the Triassic period and was already well established in the crown
mammals and probably in the preceding mammaliaforms of the late triassic.
Today, after more than 200 million years of evolution, the diversity of mamma-
lian species and the extreme variations in their reproductive strategies affecting in
particular the lactation cycle provide numerous examples of lineage or species-
specific adaptations of the lactation system during evolution. The earliest split in the
mammalian phylogeny established the Prototheria (monotreme or Monotrema)
which separated from the Theria about 166 (Bininda-Emonds et al. 2007) to 220
(Madsen 2009) million years ago. Theria latter split into Metatheria (marsupials or
Marsupialia) and Eutheria (eutherian or placentalia) lineages as illustrated in
Fig. 7.1. Only two genera of Monotremes have survived in Australiasia; the
platypus (Ornithorhynchus anatinus) and echidnas (Tachyglossus and Zaglosusgenera). These egg-laying Monotremes are often regarded as representative of
early mammals with a more primitive prototherian lactation system. Genomics
and transcriptomics approaches have recently enable the molecular analysis of
monotreme (Lefevre et al. 2009), marsupial (Lefevre et al. 2007) and eutherian
(Lemay et al. 2009) lactation. Comparative approaches have started to allow a
detailed analysis of the functional evolution of specific molecular components of
lactation (Menzies et al. 2009c; Topcic et al. 2009).
The recent advances in genome sequencing of a number of mammalian species
have provided invaluable resources for the comparative evolutionary analysis of
milk proteins and other genes involved in lactation. The recent release of the bovine
(Bos Taurus) genome draft has stimulated intense activity in lactation genomics
116 C.M. Lefevre et al.

(Elsik et al. 2009). Lactation gene sets have been compiled from mammary gland
cDNA libraries at multiple stages of mammary development or lactation status to
identify unique milk proteins or important mammary genes in the cow (Lemay et al.
2009) and other species including monotremes (Lefevre et al. 2009) and Marsupials
(Lefevre et al. 2007). Some of these results are reviewed here.
7.2 Milk Cell Sequencing and Monotreme Lactation
Egg-laying monotremes are regarded as close representatives of ancient mam-
mals. Tiny hatchlings are highly altricial and depend completely on milk as a
source of nutrition during the period of suckling, which is prolonged relative to
gestation and incubation (Griffiths 1978). Monotremes have no teat and milk is
excreted from a series of ducts opening directly on the surface of the ventral skin
patch of the areola. However, monotreme young exhibit a real suckling behaviour
Car
boni
fero
us
0
65
146
208
250
290
325
360
Pal
eozo
icM
esoz
oic
Cen
ozoi
c
Per
mia
nT
riass
icJu
rass
icT
ertia
ryC
reta
ceou
s
Mon
otre
mes
Mar
supi
als
Eut
heria
ns
Prototherian Therian
Metatherian
Amniotes
Synapsids Sauropsids
Therapsids
Cynodonts
Mammaliaformes
Mammals turtles,crocodiles,
dinosaurs & birds,
Placentation, viviparity
GradualAccrual of
Milk secretionby cutaneous
glands
Complex lactation system established
oviparity
Constantsecretion
ofcomplex
milk
changesin
MilkThroughout
lactation
secretionof
complexmilk
Fig. 7.1 Evolution of mammals and lactation
7 Comparative Genomics and Transcriptomics of Lactation 117

and do not simply leak the milk secretion. The role of milk in monotreme young
development remains to be established and, apart from the initial lactation period,
changes in milk composition similar to those reported in marsupials with lactation
phase-specific changes in milk protein gene expression are still controversial.
Changes in milk fat composition have been described in echidna but an effect of
diet on milk fat content has been demonstrated and milk taken from the same
platypus over a 3-month period in the wild showed no significant change in milk
fat content (Griffiths 1978). However, in Echidna, changes in milk protein
expression profiles have been reported ( Joseph and Griffiths 1992). The protein
composition of monotreme milk has been investigated. Whey proteins including
alpha-lactalbumin, lyzosyme (Guss et al. 1997; Messer et al. 1997, Shaw et al.
1993) and, more recently, whey acidic proteins WAP and WFDC2 (Sharp et al.
2007) as well as a complete set of caseins and other proteins (Lefevre et al. 2009)
have been characterised.
7.2.1 Milk Cell cDNA Sequencing
In order to collect molecular probes and develop a non-invasive sequencing
approach for the analysis of lactation in protected species such as the platypus
(Ornithorhynchus anatinus) and the short-beak echidna (Tachyglossus aculeatus), amilk cell cDNA sequencing approach has been developed (Lefevre et al. 2009).
Similar approaches may be more generally useful for the comparative analysis of
lactation in mammalian species, which may be protected or not easily bred in the
laboratory. Non-destructive approach may also be used in future experiments for
the controlled study of variation of gene expression in the same mammal during the
full course of lactation. Better knowledge of milk composition in endangered
species may be useful to conservation programmes to determine best substitution
practice for artificial feeding or cross species fostering. Milk cells preparation may
contain cells not only from mammary epithelia origin but also immune cells or cells
from skin or sebaceous glands. For example, at the end of lactation when milk
production stops, massive infiltration of immune cells into the mammary gland of
monotremes has been described (Griffiths 1978). The areola also contains seba-
ceous glands. Thus, milk cells may include skin cells, immune cells, exfoliated
epithelial cells from ducts and mammary or sebaceous glands. The purification of
milk fat globules mRNA from milk has been proposed as one possible approach for
the enrichment of mammary epithelial transcripts from human milk (Maningat et al.
2007). However, shallow milk cell cDNA sequencing during peak lactation in
monotremes has provided information about a number of caseins and whey protein
genes. Milk proteins transcripts were detected at high level indicating that mono-
treme milk is enriched in exfoliated mammary epithelial cells (Lefevre et al. 2009).
Potentially, all-milk cell fraction analysis may reveal changes in mammary gene
expression signatures from non-epithelial compartments as well. In the future, deep
118 C.M. Lefevre et al.

sequencing will be useful to analyse the variation of gene expression and the cell
composition of milk during the course of lactation in monotremes and other species.
In exploratory experiments, milk protein sequences from platypus and echidna
were characterised including a full set of caseins. Some of these genes could not be
accurately predicted from the current platypus genome sequence annotation alone.
Sequence divergence between monotremes and other mammals represents an
average of one change per nucleotide so that neutral or rapidly evolving sequences
of monotremes and eutherians cannot be easily aligned for efficient annotation
(Warren et al. 2008). The problem is also compounded with the rapid evolution of
milk proteins such as casein (Mercier et al. 1976) typically genetically encoded by
diverse combinations of short exons and the presence of unresolved gaps in the draft
genome sequence of the platypus.
7.2.2 Monotreme Casein and the Ancient Originof the Casein Gene Cluster
Caseins are major milk proteins and their dual functionality is to serve as a source
of amino acids as well as to transport phosphate and calcium to support bone
growth of the young. Alpha and beta caseins (CSN1 and CSN2) and their variants
are also called “calcium sensitive caseins” because they precipitate easily in low
to moderate calcium concentrations. They are secreted as large calcium-depen-
dent aggregates or casein micelles sequestering calcium under the stabilising
action of kappa casein (CSN3). It was previously believed that CSN3 was evolu-
tionary unrelated to other caseins (Jones et al. 1985). However, this view has been
challenged and gene structure analysis has revealed the similar and peculiar
organisation of all casein genes, with short all in-frame exons, placing them
together with other calcium-binding phosphoproteins in a new protein family
(Kawasaki and Weiss 2003). Monotreme milk cells express all types of caseins
and casein variants (Lefevre et al. 2009) similar to those reported in other
mammals (Rijnkels 2002). In Fig. 7.2, the organisation of the monotreme casein
cluster locus is compared with other mammals, including a marsupial (the opos-
sum Monodelphis domestica) and eutherians. A physical linkage of casein genes
is seen in the casein locus of all mammalian genomes examined and the locus has
expended during mammalian radiation. A recent duplication of beta casein
occurred in the monotreme lineage. Similar duplications have also occurred
recursively along eutherian lineages (Rijnkels 2002). Casein sequences exhibit a
rapid evolution. This is in part due to extensive exon usage variation. As in other
mammals, a number of casein splice variants have been identified in monotremes
and the platypus or the echidna may use different exons. Despite this variability,
the close genomic proximity of the main alpha and beta casein genes in an
inverted tail–tail orientation and the relative orientation of additional casein-
like genes and the more distant kappa casein gene are similar in all mammalian
7 Comparative Genomics and Transcriptomics of Lactation 119

genome sequences so far available. This configuration is likely to be important for
the concerted expression of casein genes. During mammalian evolution, the
casein cluster has expended by gene duplication within the cluster. Eutherian
have expended the most, acquiring new genes including caseins or additional
calcium-binding phosphoproteins from salivary secretion or enamel matrix
(Kawasaki and Weiss 2003). Marsupials seem to possess only one copy of each
CSN1 and CSN2 (Lefevre et al. 2007). Interestingly, marsupial beta caseins are
longer than in other mammals (Lefevre et al. 2007) suggesting that the absence of
a third casein homolog may be compensated by an apparent elongation of the
CSN2 sequence. Two models are presented for the ancient organisation of the
casein cluster in the crown mammals with either two or three calcium-binding
casein in addition to kappa-casein (Fig. 7.2). Importantly, the most complex
model is supported by similar gene organisation of eutherian CSN1S2 and full-
length monotreme CSN2b and the presence of a canonical phosphorylation site in
the most ancient monotreme CSN2b coding region. This model also implies the
deletion of the ancestral CSN1S2 in the marsupial lineage, supported by the
presence of several retrotransposon type repeats in the corresponding region of
the opossum casein locus. The simpler model is more difficult to explain as it
implies the opportunistic construction of a strong casein-like phosphorylation site
from the more ancient, non-duplicated, genome sequence and independent dupli-
cations in the eutherian lineage. Thus, it is certain that the ancestral casein locus
was already highly organised before the common ancestor of extant mammals,
and it is likely that three calcium sensing casein had already arisen from duplica-
tion in a more ancient ancestor (Lefevre et al. 2009).
0 0.05 0.1 0.15 0.2 0.25 0.3 Mb
CSN2
CSN2
CSN1S1 CSN3
CSN2
CSN1S2STAT HIS3 HIS1
NP_999876.1
ODAM
FDSCPCSN1S2b
CSN1 CSN2b CSN3
CSN1 CSN3Odam
CSN1S1
CSN2
CSN3CSN1S2 OdamHIS STAT
csnkcsna Csn1s2a Csn1s2b OdamSTAT HIS
csnb
AK05291
Platypus ultra362
Opossum chr.5
Cattle chr.6
Mouse chr.5
Human chr.4
Fig. 7.2 Comparative analysis of the casein locus in mammals
120 C.M. Lefevre et al.

7.2.3 Monotreme Milk Transcriptome
Other genes have been identified from monotreme milk cells. The milk cell
transcriptome of platypus and echidna estimated by cDNA sequencing is presented
in Fig. 7.3. A global discrepancy was seen between the transcript frequencies in the
two species, with the platypus transcriptome largely dominated by beta-lactoglo-
bin and casein transcripts while echidna milk cell RNA includes a higher propor-
tion of whey proteins. This discrepancy is consistent with the observation that
platypus milk contains fewer whey proteins than echidna milk (Hopper and
McKenzie 1974). A number of whey protein such as alpha-lactalbumin, lacto-
transferin and WAP and WDC2 have been identified. WAP has shown extensive
rearrangements in mammalian lineages leading to a reorganisation of the number
of exons from monotremes to marsupials and eutherian while a functional gene
has been lost in human, cow and goats (Sharp et al. 2007). Interestingly, WAPdomains have been shown to carry specific functional activities in different
lineages (Topcic et al. 2009). However, the function of WAP is not fully under-
stood. The monotreme ortholog of human C6orf58, a protein of unknown function
expressed in epithelial cells of the digestive track of other mammals but not
previously identified in milk, was found to be expressed at high level in mono-
treme milk cells. Putative proteins or proteins of unknown function have been
identified including a gene with high similarity to chondromodulin II which is a
positive regulator of chondrocyte proliferation (Mori et al. 1997; Yamagoe et al.
1998), a gene with similarity to prolactin inducible protein PIP (Murphy et al.
1987), and ovostatin.
Fig. 7.3 Quantitative estimates of gene expression in milk cells from monotremes. (a) Platypus
milk cell transcriptome. (b) Echidna milk cell transcriptome
7 Comparative Genomics and Transcriptomics of Lactation 121

7.2.4 Ancient Origins and Variability of the Lactation System
Overall the conservation of the key milk caseins, in particular their consistent
genomic organisation, indicates the early, pre-monotreme development of the
fundamental lactation mechanism across all mammals. In contrast, either the
lineage-specific gene duplications that have occurred specifically within the casein
locus of monotremes and eutherians but not marsupials or the more complex
rearrangements and losses that have occurred in WAP genes (Sharp et al. 2007),
as well as the presence of putative lineage-specific milk proteins, emphases the
independent selection on milk provision strategies to the young, likely to be linked
to different developmental strategies. The monotremes therefore provide insight
into the ancestral drivers for lactation and how these have adapted in different
lineages, including our own.
7.3 Marsupial Lactation: The Marsupial Lactation Cycle
and Mammary Gland Sequencing
Amongst mammals, marsupials exhibit one of the most interesting lactation system
with complex changes during the lactation cycle.
7.3.1 Marsupial Lactation
After a short gestation period, marsupials give birth to a relatively immature
newborn that is totally dependant on milk for growth and development during a
relatively long lactation period. Important changes occur during the lactation cycle
of marsupials in terms of mammary gland development, milk production, milk
composition as well as development or behaviour of the young (Green et al. 1983).
This is in sharp contrast with eutherians with a larger investment during gestation
(Tyndale-Biscoe et al. 1988) and milk of a relatively constant composition, apart
from the initial colostrum during the immediate postpartum period (Jenness 1986).
Marsupial milk provides essential nutrients and putative growth factors for the
development of the young and cross-fostering experiments have shown that milk
controls post-natal development (Ballard et al. 1995; Trott et al. 2003; Waite et al.
2005). Endocrine and others factors, potentially intrinsic to the mammary gland,
are likely to control milk secretion (Hendry et al. 1998) and marsupial milk con-
tains autocrine/paracrine regulators of the mammary gland (Brennan et al. 2007;
Nicholas et al. 1997). In special circumstances, macropod marsupials such as the
tammar wallaby (Macropus eugenii) and red kangaroo (Macropus Rufus) may
present asynchronous concurrent lactation, feeding concurrently two young of
different ages with milk of different compositions from adjacent mammary glands;
122 C.M. Lefevre et al.

a new born pouch young and a few month older animal (Lemon and Bailey 1966;
Nicholas 1988). Although teat-sealing experiments have also shown gland-specific
involution in mice, the case of marsupials goes farther to demonstrate the impor-
tance of local control in the complex lactation programme of marsupial. However,
the molecular control mechanisms of marsupial milk composition are not fully
known.
7.3.2 The Tammar Wallaby: An Animal Model of MarsupialLactation
The tammar wallaby (Macropus Eugenii) is one of the most studied marsupial
models. It is an annual breeder characterised by a short pregnancy lasting 26 days
followed by an extended lactation period of about a 300 days. The lactation cycle is
divided into three phases of approximately 100 days each based on the sucking
pattern of the young (permanently attached to the teat, permanently in the pouch
and intermittently sucking, in and out of the pouch) and milk composition. Shortly
after birth, the single young weighing only 400 mg crawls into the pouch and
attaches to one of four teats, each associated with a separate mammary gland. The
chosen teat will provide all the milk during the entire period of lactation with
massive growth of the associated glandular tissue while the other three glands do
not generally participate in any milk production.
Changes in expression levels of milk protein genes have been described for a
number of milk proteins in several marsupial species. In particular, lactation stage-
specific genes, such as early lactation protein (ELP), mid-late whey acidic protein
(WAP) and late lactation proteins (LLP-A and LLP-B), have been characterised in
the tammar and other marsupial species (Bird et al. 1994; Demmer et al. 2001;
Green et al. 1980, 1991; Nicholas et al. 1987, 2001; Simpson et al. 1998; Trott et al.
2002). With the exception of WAP which is also found in milk of many eutherians
(Hennighausen and Sippel 1982) but not in humans, goat and ewe (Hajjoubi et al.
2006), all of these phase-specific milk proteins are marsupial-specific and have not
been found in eutherian or monotreme milk. Other marsupial-specific milk proteins
include trichosurin (Piotte et al. 1998) and the newly identified putative proteins
include PTMP-1 and PTMP-2 (Lefevre et al. 2007). PTMP-1 does not occur in
the genome sequence of the American marsupial opossum and may be Macropod
lineage-specific.
7.3.3 Tammar Mammary Transcriptome Sequencing
We have also reported expression of marsupial genes quantified by sampling the
mammary transcriptome at specific stages of the tammar lactation cycle (Lefevre
7 Comparative Genomics and Transcriptomics of Lactation 123

et al. 2007) by shallow and deep cDNA sequencing methods (Fig. 7.4). Ten percent
of the mammary transcriptome was estimated to represent marsupial-specific genes
and 15% mammal-specific genes. These results have also identified non-coding
RNA expressed during lactation. PTNC-1 is a novel non-coding RNA derived from
a region of the genome that is ultra-conserved in mammals suggesting an important
functional role. Other non-coding RNAs candidates have also been identified.
Further work will be required to characterise the function of these molecules.
During the course of lactation, the tammar mammary gland expresses a limited
number of common or phase-specific milk protein genes at high and increasing
levels. This accounts for over 60% of all transcripts during copious late lactation.
The remaining transcripts predominantly represent translational machinery compo-
nents, immune-related product or genes involved in energy production. These
results depict the lactating mammary gland as an organ highly specialised in the
synthesis of milk. Observations from the mammary tissue of late pregnant animals
have shown how the late pregnant mammary gland is primed for the rapid com-
mencement of milk production after parturition. Similarly, the large increase in
protein content of tammar milk during mid to late lactation is accompanied by an
increase of secreted milk protein gene expression in the mammary gland. Secreted
protein gene expression correlates with growth of the mammary gland, growth of
the young, milk production and milk protein synthesis, which all steadily increase
during the lactation cycle (Findlay 1982; Green et al. 1980). This global change of
gene expression in the mammary gland may reflect a combination of changes in
cellular gene expression and cell type populations within the tissue. As the mam-
mary gland size steadily increases during the lactation cycle, progressive replace-
ment of the stroma by alveolar tissue during the course of pregnancy and lactation,
and a marked increase of alveolar size during late lactation have been described
(Findlay 1982). The increase in relative abundance of milk protein transcripts may
correspond to an increase of milk protein gene expression in mammary epithelial
cells (lactogenesis) only or an increase in the number and proportion of secretory
epithelial cells in the mammary gland during lactation (mammogenesis).
Fig. 7.4 Mammary gland transcriptome from the Marsupial tammar wallaby at different stages of
the lactation cycle
124 C.M. Lefevre et al.

The mammary transcriptome most likely represent a combination of these pro-
cesses. Transcriptomics of milk cells in this species as described above for mono-
tremes would provide interesting complementary data.
The combination of cDNA and signature digital sequencing methodologies has
highlighted some of the caveat and limitations of sequencing approaches for the
study of gene expression in the highly specialised mammary gland. In lactating
tissue with a large dominance of milk protein transcripts, sequencing is less
effective method for gene discovery. Next generation sequencing might over-
come these limitations in the future. One advantage of digital sequencing for the
estimation of gene expression over differential gene expression estimation by
microarray is that it provides an estimation of relative mRNA levels. However,
the ongoing development of marsupial microarrays will allow the detail analysis of
differential expression of a larger gene catalogue to investigate the molecular,
hormonal and cellular mechanisms involved in the regulation of lactation in
marsupials.
7.4 Eutherian Lactation: Fur Seal Adaptation and
Mammary Gland Involution
Within eutherian animal diversity the Pinniped family includes a variety of extreme
adaptations of the lactation system, containing species with some of the shortest
lactation periods or, most interestingly, species with the most elongated periods
between successive nursing periods.
7.4.1 Adaptations of Lactation in Pinnipeds
The three families of Pinnipeds, comprising Phocids (true seals), Odobenids
(walrus), and Otariids (sea lions, fur seals), evolved from a carnivorous ancestor
around 25 million years ago and diverged during the middle Miocene (10 million
years ago) (Fordyce 2002). Each family adopted different approaches to lactation.
The walrus has the lowest reproductive rate of any pinniped species. Calves
accompany their mother from birth, nursing on demand during these trips and are
not weaned for 2 years or more. Phocid seals evolved large sizes to reduce heat loss,
risk of predation and increased body reserves. This enabled them to adopt a “fasting
strategy” of lactation (Oftedal et al. 1987) whereby amassed body reserves of stored
nutrients facilitate fasting on land during continuous milk production over rela-
tively short periods (4–42 days, depending on the species).
In contrast, otariid seals retained smaller body sizes and insulating fur adopting a
“foraging lactation” strategy, breeding at rockeries to gain proximity to local prey
resources (Bonner 1984). Reduced prey availability and the need to exploit
7 Comparative Genomics and Transcriptomics of Lactation 125

resources farther off shore led to extended lactation (4–12 month) with a reduction
of foraging trip frequency and an extension of the foraging period. Otariid seals
produce milk with no detectable lactose and have adopted a lactation strategy which
is characterised by alternation between periods of several days of copious milk
production on shore and extended periods of maternal foraging at sea (Bonner
1984). Inter-suckling intervals of up to 23 days are among the longest ever recorded
for a mammal (Bonner 1984). For other mammals in general, accumulation of milk
in the mammary gland when suckling is interrupted causes rapid down regulation of
milk protein gene expression, followed by involution via apoptotic cell loss after
a few days (Li et al. 1997). However, in otariid the mammary gland remains
functional despite sustained interruptions in suckling activity.
7.4.2 The Mammary Transcriptome of an Otariid:The Lactating Fur Seal During the Foraging Period
The mammary transcriptome from the mammary gland of a foraging Cape fur seal
(Arctocephalus pusillus) is represented in Fig. 7.5. In contrast to the tammar
transcriptome in Fig. 7.4, milk proteins are less predominant. During foraging
periods at sea in the absence of sucking, fur seal mammary glands have been
recorded to produce 80% less milk than when lactating on land (Arnould and
Lysozyme
CSN1S2
CSN1S1
CSN2
CSN3
Serum amyloid A-3
IGJ
?
Fig. 7.5 Mammary gland transcriptome of lactating fur seal during the foraging period
126 C.M. Lefevre et al.

Boyd 1995), and milk protein gene expression decreases (Sharp et al. 2006), aspects
which are common with cessation of sucking in other mammalian species and
characteristic of the reversible initiation phase of involution. However, in other
mammals these events are rapidly followed by involution with marked apoptotic
mammary gland cell death. The fur seal mammary gland does not pursue involution
at this time (Sharp et al. 2006) and remains active in readiness for return to land to
continue nursing the young.
7.4.3 Adaptation of Otariid Lactation Suggest a Key Rolefor Alpha-Lactalbumin in Mammary Gland Involution
Transcriptomics and genome analysis of three otariids: Cape fur seal (Arctocepha-lus pusillus), California sea lion (Zalophus californianus) and Antarctic fur seal
(Arctocephalus gazella) and three phocids: grey seal (Halichoerus grypus), ringedseal (Pusa hispida) and harbour seal (Phoca vitulina) have shown that the expres-
sion of LALBA has been knocked down during otariid evolution due to a cis-actingmutations in the promoter region (Sharp et al. 2008). LALBA encodes alpha-
lactalbumin, a milk protein involved in lactose synthesis. There are other examples
in nature where lactose is not required for milk production. In tammar wallaby
(Macropus eugenii) milk, carbohydrate is low and lactose is absent throughout peak
lactation (Messer and Elliott 1987) during which time other unknown factors act as
the major osmole, demonstrating that lactose is not necessary for milk production.
LALBA was reported to cause apoptosis of mouse and human mammary epithelial
cell lines and fur seal primary mammary cells (Sharp et al. 2008). Modified LALBA
(combined with oleic acid) also causes apoptosis of tumour cell lines (Tolin et al.
2009). Whether absence of LALBA alone or in combination with other changes is
responsible for the delay of involution in otariid remains to be established, but the
extinction of LALBA expression apparently represents a key event in the evolution
of lactation in this family.
7.5 Discussion
Genome analysis has shown that, in general, milk protein genes are not co-clustered
together in the genome except for the caseins. The conserved genomic organisation
of the caseins genes (Lefevre et al. 2009; Warren et al. 2008) or the co-clustering of
other milk proteins with mammary genes in the bovine genome (Lemay et al. 2009)
suggests that the need for coordinate expression during lactation may be an
influential factor in shaping the genome of mammals. Compared with other genes
of the bovine genomes, mammary and milk genes are more conserved in mammals
and evolve slowly in the bovine lineage. The most conserved proteins are
7 Comparative Genomics and Transcriptomics of Lactation 127

associated with secretory processes, especially component of the milk fat globule,
while the most divergent are associated with nutritional and immunological com-
ponents of milk (Lemay et al. 2009). In all, the high conservation of mammary
genes suggests that lactation evolved by co-opting existing structures and pathways
for the synthesis and secretion of copious milk (Lemay et al. 2009; Menzies et al.
2009c), and that a complex lactation system was already fully implemented in early
mammals. The apparently strong negative selection and the absence of positive
selection in milk and mammary genes support the hypothesis that milk evolution
has been constrained to optimise survival of both mother and offspring. Further
analysis of the mammalian diversity will be needed to confirm this or identify
differential constraints on the molecular components and biological pathways of
lactation.
Significantly more mammary gene duplications have occurred since the diver-
gence of the monotremes and therians than for other bovine genes. This variability
in copy number may be in part responsible for the variability in milk composition.
The regulation of transcription and other physiological energy partitioning pro-
cesses may also play a role and studies on the transcriptional regulation of genes in
epithelial cell culture, mammary explants or mammary gland tissue from a number
of animal models are starting to address this aspect (Brennan et al. 2008; Lemay
et al. 2007; Menzies et al. 2009a, b, c; Rudolph et al. 2003). A number of genera-
specific milk proteins have also been identified, especially in marsupials. For
ubiquitous milk proteins such as caseins and WAP, lineage-specific recombination
of protein domains has been described. A detailed analysis of the structure of WAP
has shown extensive rearrangements of the genes in mammalian lineages leading
to a reorganisation of the number of exons from monotremes to marsupials and
eutherians while a functional gene has been lost in human, cow and goats (Sharp
et al. 2007). Preliminary experiments suggest specific WAP domains carry unique
functional activities in different lineages (Topcic et al. 2009).
These studies provide a broad picture of the evolutionary landscape of lactation
revealing the importance of conserved metabolic and secretory pathways concur-
rently with the modular reorganisation of existing milk components or the appear-
ance of specific milk proteins. This mix of robustness and flexibility allows the
adoption of a diversity of lactation strategies under physiologic, behavioural or
environmental conditions. Thus, both the ancient and highly conserved or the more
variable and specific molecular components of lactation are, in part, responsible for
the success of the mammals to survive, adapt and evolve.
7.6 Conclusion
During mammalian radiation, species have diversified lactation strategies to accom-
modate reproductive success and adapt to the environment. There is much to learn
from the natural resource of animal diversity about the genetics of lactation. This
has been illustrated by the comparative analysis of gene expression in a variety of
128 C.M. Lefevre et al.

lactating mammalian lineages. Sequencing approaches will enable a broader explo-
ration of lactation diversity. We have shown that milk cells provide easy access to
functional data. Comparative genome analysis of the lactation system is also a new
and complementary methodology. It will then become possible to study in detail
how the evolutionary constraints on lactation vary between lineages depending on
lactation strategies or environmental adaptations.
In all mammals, milk provision is a complex process with changes in milk
composition and interactions between parent and young beyond the straightforward
nutritional function. The role of milk on the mammary gland or the development of
the young is starting to emerge through studies of lactation in mammals with
extreme adaptations of the lactation systems such as fur seals or marsupials. Such
adaptations provide valuable models to enhance our understanding of the biology of
lactation. The central role of milk is best studied in animal models with extreme
adaptation to lactation that allow researchers to more easily identify regula-
tory mechanisms that are present, but not as readily apparent in eutherian species
(Nicholas et al. reviews). Early development of the eutherian young is programmed
and regulated in utero. Inappropriate signalling results in abnormal development
and mature onset disease. The marsupial gives birth to an altricial young and much
of the early development is regulated by milk. It is now apparent that new roles for
milk are emerging and future studies using the marsupial and other models will
allow researchers to more fully understand the central role of milk to deliver time-
dependent signals for both growth and development of the young, protect the young
and mammary gland from infection and regulate the development and function of
the mammary gland. A better understanding of the temporal delivery of these
signals will provide new opportunities for treatment and prevention of disease.
The results presented here have illustrated how comparative analysis of lactation
by genomics and transcriptomics enables a better understanding of the role of milk
in the programming of mammalian development.
References
Arnould JPY, Boyd IL (1995) Temporal patterns of milk production in Antarctic fur seals
(Arctocephalus gazella). J Zool 237:1–12Ballard FJ, Grbovac S, Nicholas KR, Owens PC, Read LC (1995) Differential changes in the milk
concentrations of epidermal growth factor and insulin-like growth factor-I during lactation in
the tammar wallaby, Macropus eugenii. Gen Comp Endocrinol 98:262–268
Bininda-Emonds OR, Cardillo M, Jones KE, MacPhee RD, Beck RM et al (2007) The delayed rise
of present-day mammals. Nature 446:507–512
Bird PH, Hendry KA, Shaw DC, Wilde CJ, Nicholas KR (1994) Progressive changes in milk
protein gene expression and prolactin binding during lactation in the tammar wallaby (Macro-
pus eugenii). J Mol Endocrinol 13:117–125
Bonner WN (1984) Lactation strategies in pinnipeds: problems for a marine mammalian group.
Symp Zool Soc Lond 51:253–272
7 Comparative Genomics and Transcriptomics of Lactation 129

Brennan AJ, Sharp JA, Digby MR, Nicholas KR (2007) The tammar wallaby: a model to examine
endocrine and local control of lactation. IUBMB Life 59:146–150
Brennan AJ, Sharp JA, Lefevre CM, Nicholas KR (2008) Uncoupling the mechanisms that
facilitate cell survival in hormone-deprived bovine mammary explants. J Mol Endocrinol
41:103–116
Demmer J, Stasiuk SJ, Grigor MR, Simpson KJ, Nicholas KR (2001) Differential expression of the
whey acidic protein gene during lactation in the brushtail possum (Trichosurus vulpecula).
Biochim Biophys Acta 1522:187–194
Elsik CG, Tellam RL, Worley KC, Gibbs RA, Muzny DM et al (2009) The genome sequence of
taurine cattle: a window to ruminant biology and evolution. Science 324:522–528
Findlay L (1982) The mammary glands of the tammar wallaby (Macropus eugenii) during
pregnancy and lactation. J Reprod Fertil 65:59–66
Fordyce RE (ed) (2002) Fossil record. Academic Press, San Diego, California, USA, pp 453–471
Green B, Newgrain K, Merchant J (1980) Changes in milk composition during lactation in the
tammar wallaby (Macropus eugenii). Aust J Biol Sci 33:35–42
Green B, Griffiths M, Leckie RM (1983) Qualitative and quantitative changes in milk fat during
lactation in the tammar wallaby (Macropus eugenii). Aust J Biol Sci 36:455–461
Green B, VandeBerg JL, Newgrain K (1991) Milk composition in an American marsupial
(Monodelphis domestica). Comp Biochem Physiol B 99:663–665
Griffiths M (1978) The biology of monotremes. Academic Press, New York, NY
Guss JM, Messer M, Costello M, Hardy K, Kumar V (1997) Structure of the calcium-binding
echidna milk lysozyme at 1.9 A resolution. Acta Crystallogr D Biol Crystallogr 53:355–363
Hajjoubi S, Rival-Gervier S, Hayes H, Floriot S, Eggen A et al (2006) Ruminants genome no
longer contains whey acidic protein gene but only a pseudogene. Gene 370:104–112
Hendry KA, Simpson KJ, Nicholas KR, Wilde CJ (1998) Autocrine inhibition of milk secretion in
the lactating tammar wallaby (Macropus eugenii). J Mol Endocrinol 21:169–177
Hennighausen LG, Sippel AE (1982) Characterization and cloning of the mRNAs specific for the
lactating mouse mammary gland. Eur J Biochem 125:131–141
Hopper KE, McKenzie HA (1974) Comparative studies of alpha-lactalbumin and lysozyme:
echidna lysozyme. Mol Cell Biochem 3:93–108
Jenness R (1986) Lactational performance of various mammalian species. J Dairy Sci 69:869–885
Jones WK, Yu-Lee LY, Clift SM, Brown TL, Rosen JM (1985) The rat casein multigene family.
Fine structure and evolution of the beta-casein gene. J Biol Chem 260:7042–7050
Joseph M, Griffiths M (1992) Whey proteins in milks of monotremes and wallabies. Australian
Mammology 14:125–127
Kawasaki K, Weiss KM (2003) Mineralized tissue and vertebrate evolution: the secretory calcium-
binding phosphoprotein gene cluster. Proc Natl Acad Sci USA 100:4060–4065
Lefevre CM, Digby MR, Whitley JC, Strahm Y, Nicholas KR (2007) Lactation transcriptomics
in the australian marsupial, Macropus eugenii: transcript sequencing and quantification. BMC
Genomics 8:417
Lefevre CM, Sharp JA, Nicholas KR (2009) Characterisation of monotreme caseins reveals lineage-
specific expansion of an ancestral casein locus in mammals. Reprod Fertil Dev 21:1015–1027
Lemay DG, Neville MC, Rudolph MC, Pollard KS, German JB (2007) Gene regulatory networks
in lactation: identification of global principles using bioinformatics. BMC Syst Biol 1:56
Lemay DG, Lynn DJ, Martin WF, Neville MC, Casey TM et al (2009) The bovine lactation
genome: insights into the evolution of mammalian milk. Genome Biol 10:R43
Lemon M, Bailey LF (1966) A specific protein difference in the milk from two mammary glands
of a red kangaroo. Aust J Exp Biol Med Sci 44:705–707
Li M, Liu X, Robinson G, Bar-Peled U, Wagner KU et al (1997) Mammary-derived signals
activate programmed cell death during the first stage of mammary gland involution. Proc Natl
Acad Sci USA 94:3425–3430
Madsen O (2009) Mammals (mammalia). In: Hedges SB, Kumar SB (eds) The timetree of life.
Oxford Univeristy Press, Oxford, pp 459–461
130 C.M. Lefevre et al.

Maningat PD, Sen P, Sunehag AL, Hadsell DL, Haymond MW (2007) Regulation of gene expres-
sion in human mammary epithelium: effect of breast pumping. J Endocrinol 195:503–511
Menzies KK, Lee HJ, Lefevre C, Ormandy CJ, Macmillan KL, Nicholas KR (2009a) Insulin, a key
regulator of hormone responsive milk protein synthesis during lactogenesis in murine mam-
mary explants. Funct Integr Genomics 10(1):87–95
Menzies KK, Lefevre C, Macmillan KL, Nicholas KR (2009b) Insulin regulates milk protein
synthesis at multiple levels in the bovine mammary gland. Funct Integr Genomics 9:197–217
Menzies KK, Lefevre C, Sharp JA, Macmillan KL, Sheehy PA, Nicholas KR (2009c) A novel
approach identified the FOLR1 gene, a putative regulator of milk protein synthesis. Mamm
Genome 20:498–503
Mercier JC, Chobert JM, Addeo F (1976) Comparative study of the amino acid sequences of the
caseinomacropeptides from seven species. FEBS Lett 72:208–214
Messer M, Elliott C (1987) Changes in alpha-lactalbumin, total lactose, UDP-galactose hydrolase
and other factors in tammar wallaby (Macropus eugenii) milk during lactation. Aust J Biol Sci
40:37–46
Messer M, Griffiths M, Rismiller PD, Shaw DC (1997) Lactose synthesis in a monotreme, the
echidna (Tachyglossus aculeatus): isolation and amino acid sequence of echidna alpha-lactal-
bumin. Comp Biochem Physiol B Biochem Mol Biol 118:403–410
Mori Y, Hiraki Y, Shukunami C, Kakudo S, Shiokawa M et al (1997) Stimulation of osteoblast
proliferation by the cartilage-derived growth promoting factors chondromodulin-I and -II.
FEBS Lett 406:310–314
Murphy LC, Tsuyuki D, Myal Y, Shiu RP (1987) Isolation and sequencing of a cDNA clone for a
prolactin-inducible protein (PIP). Regulation of PIP gene expression in the human breast
cancer cell line, T-47D. J Biol Chem 262:15236–15241
Nicholas KR (1988) Asynchronous dual lactation in a marsupial, the tammar wallaby (Macropus
eugenii). Biochem Biophys Res Commun 154:529–536
Nicholas KR, Messer M, Elliott C, Maher F, Shaw DC (1987) A novel whey protein synthesized
only in late lactation by the mammary gland from the tammar (Macropus eugenii). Biochem
J 241:899–904
Nicholas K, Simpson K, Wilson M, Trott J, Shaw D (1997) The tammar wallaby: a model to study
putative autocrine-induced changes in milk composition. J Mammary Gland Biol Neoplasia
2:299–310
Nicholas KR, Fisher JA, Muths E, Trott J, Janssens PA et al (2001) Secretion of whey acidic
protein and cystatin is down regulated at mid-lactation in the red kangaroo (Macropus rufus).
Comp Biochem Physiol A Mol Integr Physiol 129:851–858
Oftedal OT, Boness DJ, Tedmam RA (1987) The behaviour, physiology, and anatomy of lactation
in the Pinnipedia. Curr Mammal 1:175–245
Peaker M (2002) The mammary gland in mammalian evolution: a brief commentary on some of
the concepts. J Mammary Gland Biol Neoplasia 7:347–353
Piotte CP, Hunter AK, Marshall CJ, Grigor MR (1998) Phylogenetic analysis of three lipocalin-
like proteins present in the milk of Trichosurus vulpecula (Phalangeridae, Marsupialia). J Mol
Evol 46:361–369
Rijnkels M (2002) Multispecies comparison of the casein gene loci and evolution of casein gene
family. J Mammary Gland Biol Neoplasia 7:327–345
Rudolph MC, McManaman JL, Hunter L, Phang T, Neville MC (2003) Functional development of
the mammary gland: use of expression profiling and trajectory clustering to reveal changes in
gene expression during pregnancy, lactation, and involution. J Mammary Gland Biol Neoplasia
8:287–307
Sharp JA, Cane KN, Lefevre C, Arnould JP, Nicholas KR (2006) Fur seal adaptations to lactation:
insights into mammary gland function. Curr Top Dev Biol 72:275–308
Sharp JA, Lefevre C, Nicholas KR (2007) Molecular evolution of monotreme and marsupial whey
acidic protein genes. Evol Dev 9:378–392
7 Comparative Genomics and Transcriptomics of Lactation 131

Sharp JA, Lefevre C, Nicholas KR (2008) Lack of functional alpha-lactalbumin prevents involu-
tion in cape fur seals and identifies the protein as an apoptotic milk factor in mammary gland
involution. BMC Biol 6:48
Shaw DC, Messer M, Scrivener AM, Nicholas KR, Griffiths M (1993) Isolation, partial character-
isation, and amino acid sequence of alpha-lactalbumin from platypus (Ornithorhynchus anati-
nus) milk. Biochim Biophys Acta 1161:177–186
Simpson K, Shaw D, Nicholas K (1998) Developmentally-regulated expression of a putative
protease inhibitor gene in the lactating mammary gland of the tammar wallaby, Macropus
eugenii. Comp Biochem Physiol B Biochem Mol Biol 120:535–541
Tolin S, De Franceschi G, Spolaore B, Frare E, Canton M et al (2009) The oleic acid com-
plexes of proteolytic fragments of alpha-lactalbumin display apoptotic activity. FEBS J
277(1):163–173
Topcic D, Auguste A, De Leo AA, Lefevre C, Digby MR, Nicholas KR (2009) Characterization of
the tammar wallaby (Macropus eugenii) whey acidic protein gene: new insights into the
function of the protein. Evol Dev 11:363–375
Trott JF, Wilson MJ, Hovey RC, Shaw DC, Nicholas KR (2002) Expression of novel lipocalin-like
milk protein gene is developmentally-regulated during lactation in the tammar wallaby,
Macropus eugenii. Gene 283:287–297
Trott JF, Simpson KJ, Moyle RL, Hearn CM, Shaw G et al (2003) Maternal regulation of milk
composition, milk production, and pouch young development during lactation in the tammar
wallaby (Macropus eugenii). Biol Reprod 68:929–936
Tyndale-Biscoe H, Janssens PA, Australian Academy of Science, Australian Society for Repro-
ductive Biology, Australian Mammal Society (1988) The developing marsupial: models for
biomedical research, vol viii. Springer-Verlag, Berlin, p 245
Waite R, Giraud A, Old J, Howlett M, Shaw G et al (2005) Cross-fostering in Macropus eugenii
leads to increased weight but not accelerated gastrointestinal maturation. J Exp Zool
303:331–344
Warren WC, Hillier LW, Marshall Graves JA, Birney E, Ponting CP et al (2008) Genome analysis
of the platypus reveals unique signatures of evolution. Nature 453:175–183
Yamagoe S, Mizuno S, Suzuki K (1998) Molecular cloning of human and bovine LECT2 having a
neutrophil chemotactic activity and its specific expression in the liver. Biochim Biophys Acta
1396:105–113
132 C.M. Lefevre et al.

Chapter 8
Evolutionary Dynamics in the Aphid Genome:
Search for Genes Under Positive Selection
and Detection of Gene Family Expansions
Morgane Ollivier and Claude Rispe
Abstract Aphids have a high adaptative potential and their capacity to adapt to
various environments could be linked with specific expansions in gene repertoires.
A large scale acquisition of genomic data has been recently undertaken with the
genome of Acyrthosiphon pisum (reference gene set) and EST data from three other
species: Myzus persicae, Aphis gossypii and Toxoptera citricida. We identified
paralogs through an intra-genomic Reciprocical Best Hit search in A. pisum and
highlighted a high and steady level of duplications in A. pisum. We assembled,
ESTs, predicted coding sequences and identified pairs of orthologs with A. pisum.We identified a fraction of fast-evolving sequences (high ratio of non-synonymous
to synonymous rates) including genes shared by aphids but not identified in non-
aphid species. Phylogenetic study of fast-evolving genes (Apo, C002, Spaetzel)
shows that rate accelerations and duplication events are linked and could favour the
emergence of specific biological functions.
8.1 Introduction
Studies of the adaptation of species to their environment have historically been
focused on analyses of phenotypic variation. The enormous increase in sequence
data now allows to directly detect at the gene level processes which contribute
to adaptation. In a given population, genes are under drift and selection effects.
Selection can act against deleterious mutation or in favour of advantageous
mutations. It is possible to detect traces of selection on genomes by comparing
M. Ollivier and C. Rispe
INRA, UMR 1099 BiO3P, Domaine de la Motte, F-35653, Le Rheu, France
e-mail: [email protected]
P. Pontarotti (ed.), Evolutionary Biology – Concepts, Molecularand Morphological Evolution, DOI 10.1007/978-3-642-12340-5_8,# Springer-Verlag Berlin Heidelberg 2010
133

homologous sequences from different organisms and by computing maximum
likelihood (ML) synonymous (dS) and non-synonymous (dN) evolutionary rates.
The ratio omega (dN/dS) is indeed used as an indicator of variable evolutio-
nary pressures among protein-coding genes: low ratios are typical of highly
constrained sequences (under purifying selection), while values close to unity
would reflect relaxed selection and values above unity would result from positive
selection.
Another interesting point to consider are gene duplications. Whereas the major-
ity of duplicated sequences are removed from a genome, duplications can provide
new evolutionary opportunities as duplicated genes are often under particular
selective pressures (either relaxation or positive selection).
Aphids (Insecta: Hemiptera) are small insects that feed on plant sap. Some
species are crop-feeding and considered as pests in agriculture. Their effects
on crops are enhanced by host–plant specialisation (Hawthorne and Via 2001;
Hufbauer and Via 1999) and their rapid demographic increases due to viviparous
clonal reproduction (parthenogenesis). Phenotypic plasticity (of reproductive
mode, of dispersal) enhances their high adaptive potential. Their life cycle is
remarkable as it shows alternation of asexual and sexual reproduction (Fig. 8.1).
The capacity of aphids to adapt to various environments could be linked with
shifts in gene repertories (more genes/specific gene regulation) and expansions of
specific gene families. Recently, the genome of the pea aphid Acyrthosiphon pisum(Aphidinae, Macrosiphini) has been completely sequenced as a joint effort of the
International Aphid Genomics Consortium (2010); it comprises close to 34,000
predicted genes. Collections of ESTs are available for three other aphid species,
Myzus persicae, Toxoptera citricida and Aphis gossypii. This body of data providesa significant material to analyse fine-scale evolutions (selective pressures on the
different genes, amplification of some gene families) and to relate specific evolu-
tions in the aphid genome and biological adaptations in the pea aphid genome and
between aphid species.
To better evaluate the adaptive aspects of gene repertoires and gene sequence
evolution in aphids as a group, we developed a two step approach. The first
consisted in an evaluation of the importance of duplication in the pea aphid
genome, by comparison with two others insect genomes. The second study was
a comparison of the coding genomes of different aphid species comprising
two different tribes (Macrosiphini and Aphidini) and characterised by different
life-cycle and host–plant preferences: A. pisum, M. persicae, A. gossypii andT. citricida. For these comparisons, we used the pea aphid genome and all ESTs
available for the three other species. We quantified the fraction of genes shared by
different aphid species but unknown from other insects, which thus could play a
special role in the biology of aphids. We also analysed the patterns of divergence
among putative orthologs, and especially focus on fast-evolving sequences, which
could be so as a result of positive selection and rapid adaptation to environmental
changes, or strong co-evolutionary interactions as those between insects and their
host–plant.
134 M. Ollivier and C. Rispe

8.2 Dynamic of Duplication During the Evolutionary
Time (IAGC, Plos Biology, 2010)
Genome comparisons are very efficient to detect specificity of gene repertoires
among species, like relative duplication phenomenon (e.g. as it has been done in the
Drosophila genus Zdobnov et al. 2002; Heger and Ponting 2007). In a group, it is
possible to measure the relative importance and the dynamic of duplications
between genomes. A “self-blast” of the coding sequences (CDS) from a genome
can indeed allow identifying paralogous genes. We then can measure the diver-
gence time between copies with the dS rate which is a rough measure of evolution-
ary time since duplication. This method has been efficient to detect global
duplication events in Arabidopsis thaliana (Blanc and Wolfe 2004) or Paramecium
Viviparous female
Parthenogenetic femalesn clonal generations
Eggs
“Sexual” lineage1 Sexual generation
Sexuals
Winter
Fall
Spring
Summer
Fig. 8.1 Life cycle of the pea aphid Acyrthosiphon pisum. A parthenogenetic female generates
several clonal generations. In fall, the photoperiod decreases and parthenogenetic female produces
males and oviparous females that can mate. Oviparous females produce eggs that can stay in
diapause during the winter. In spring, Viviparous females emerge from the eggs
8 Evolutionary Dynamics in the Aphid Genome 135

tetraurelium (Aury et al. 2006), which appeared as very clear peaks in the distribu-
tion of dS distances among all paralogs.
With this method, we studied the A. pisum genome and for comparison two other
insect genomes, D. melanogaster (Adams et al. 2000), which comprises more than
14,000 predicted genes, and Apis mellifera (Weinstock et al. 2006), which com-
prises about 9,000 predicted genes. Each coding genome was blasted on itself
(blastP, Evalue ¼ 1.0 e�10). Reciprocical Best Hit (RBH) (Hirsh and Fraser
2001; Jordan et al. 2002) in each genome were considered as potential gene copies
dating back to the nearest duplication event. We then aligned and computed the
synonymous mutation rate between all RBH pairs of sequences in the three
genomes using a codon-based model (Codeml from PAML; Yang 1997).
Comparison of dS gene value distributions across the pea aphid, fruitfly and
honeybee genomes (Fig. 8.2) shows a particularly high and steady level of duplica-
tions in the pea aphid genome, well above that observed in the bee and fruitly
genomes.
4000
3500
3000
2500
Pai
rs o
f par
alog
s
Classes of dS (synonymous changes per sites)
2000
1500
1000
500
00.25 – 0.500 – 0.25 0.50 – 0.75 0.75 – 1.00 1.00 – 1.25 1.25 – 1.50
Fig. 8.2 Widespread gene duplication in an ancestor of the pea aphid as suggested by the
distributions of synonymous divergences among pairs of recent paralogs (Reciprocal Best Hits)
within pea aphid, honey bee and drosophila. Black: Acyrthosiphon pisum, grey: Drosophilamelanogaster, white: Apis mellifera
136 M. Ollivier and C. Rispe

8.3 Comparative Analysis of the A. pisum Genome and
EST-Based Genes Sets from Other Aphid Species
(Ollivier et al. IMB, Accepted)
Comparisons of the gene repertoires of related organisms and of the evolutionary
rates of genes may bring insights about the genes and functions that are particularly
significant at the biological level for that group of organisms.
8.3.1 Search for Orthologous Genes
We assembled ESTs for three aphid species: Myzus persicae, Aphis gossypii andToxoptera citricida. From these collections of unigenes, we predicted CDS in each
species. They are available in Aphidbase (http://www.aphidbase.com; Legeai et al.
2010). We identified putative orthologs thanks to RBH method and found 259 RBH
between the four species (restricted set biased towards genes with a high level of
expression), 4649 RBH between A. pisum and M. persicae, 1789 RBH between
A. pisum and A. gossypii and 982 RBH between A. pisum and T. citricida. Evolu-tionary rates (non-synonymous mutation rates, dN; Synonymous mutation rate, dSand dN/dS ratio) were computed between all orthologous pairs of sequences, using
codeml from PAML.
8.3.2 Pairwise Comparisons and Estimation ofEvolutionary Rates
Distributions of dN/dS ratios (Fig. 8.3) were similar for the three pairwise compa-
risons, A. pisum/M. persicae, A. pisum/A. gossypii and A. pisum/T. citricida. We
observed three L-shaped distributions with a low mode and a long right tail
corresponding to RBH with the highest ratios in all comparisons. We focused on
those sequences, as they might be fast-evolving genes of particular interest, and
found 248, 60 and 32 genes for which dN/dS > 0.4, for the three comparisons
respectively.
We also recorded all sequences that were RBH in the three pairwise comparisons
and which had no hit in Uniprot (tentative aphid-specific genes). This category
comprised 10% of all pairwise RBH, so 445, 159 and 66 genes respectively in the
three comparisons. In this sets, dN and dN/dS ratios were three times higher than
in the reference set (P value >10 � 10�3, Z-test), and 50% of those genes had a
dN/dS > 0.40.
This suggests that those genes are evolving particularly fast at the proteic level
and are under positive or relaxed selection. It can also explain why those genes are
8 Evolutionary Dynamics in the Aphid Genome 137

only recognised within aphids: they may have diverged too much from other related
sequences in other animals group.
8.3.3 Phylogenetic Analyses of Two Fast-Evolving Sequences
8.3.3.1 Gene “Apo”: Example of Specific Lineage Duplications
This gene, with no similarity in Uniprot database, presented high dN/dS ratios in
pairwise comparisons. We found this gene in all aphid species and in four copies in
A. pisum. AnML phylogenetic tree (Fig. 8.4) strongly supported the grouping of the
four A. pisum copies, suggesting a lineage-specific duplication. A free–ratio model
(PAML) was significant and showed an increase of the dN/dS ratio for Apo2 (1.69),the Apo3/Apo4 (1.66) group and the ancestral branch to A. pisum (2.02); whereas
the dN/dS ratio for M. persicae, T. citricida and A. gossypii branches are under
0.40. The ratio increases were related with duplication events. Similar pattern was
found for other sequences like Juvenil Hormone Acid Methyl transferase and
Glycosyl-hydrolase (see Ollivier et al. 2010, IMB). In each case, we found strong
increases of the dN/dS ratios consistent with specific lineage duplications. This
shows that duplication strongly influenced evolutionary rates, possibly as the result
of an adaptative process.
2500
2000
1500
1000
500
00 – 0.1 0.1 – 0.2 0.2 – 0.3
dN/dS ratio
Num
ber
of R
BH
0.3 – 0.4 > 0.4
Fig. 8.3 Distribution of the estimated pairwise ratio of non-synonymous to synonymous diver-
gence, for RBH genes among the pea aphid (complete genome) and EST-based gene sets from
each of three other aphid species. White: A. pisum/M. persicae, black: A. pisum/T. citricida, grey:A. pisum/A. gossypii
138 M. Ollivier and C. Rispe

8.3.3.2 Protein C002: A Specific Protein of Aphid Lineage
This protein, as an example, presents a high dN/dS ratio between A. pisum and
M. persicae (0.57). This gene has no hit in uniprot. We found these genes in a single
copy in the four species considered. The global dN/dS ratio (one–ratio model from
PAML) computed on the species tree was exceptionally high at 0.73. This gene has
recently been identified as specific to salivary glands and essential in feeding (Mutti
et al. 2008): this protein is transferred from aphid to plant during feeding; C002
knock-down insects die prematurely. We may thus interpret this very high rate as
the result of an adaptative response of strong plant interaction. The fact that these
gene has no homologs in other insects group suggests too a specific adaptation.
8.3.4 Functional Annotation of Fast-Evolving Genes
We compiled the 5139 A. pisum sequences found in RBH pairs: 3141 could be
annotated through Blast2GO (Conesa et al. 2005; http://www.blast2go.org/) with
26.138 GO terms. We found an annotation for 60% of A. pisum sequences, but,
A. pisum - Apo1
A. pisum - Apo2
A. pisum - Apo3
A. pisum - Apo4
M. persicae
A. gossypii
T. citricida
95
100
100
0.05
Fig. 8.4 Maximum likelihood tree of “Apo” gene in four aphid species (�Lnl ¼ 1683.99,
Gamma ¼ 2.21; Likelihood settings from best-fit model (TrNþG) selected by AIC in Modeltest).
Bootstraps values indicated under nodes
8 Evolutionary Dynamics in the Aphid Genome 139

analysing separately the “Fast-Evolving” (dN/dS > 0.40) genes, only 30% were
annotated. The sets of annotated A. pisum sequences were too small to make
statistical comparisons in A. pisum/A. gossypii and A. pisum/T. citricida compar-
isons. However, in the A. pisum/M. persicae comparison, we found significant
differences among frequencies of GO categories between the “fast-evolving” subset
of sequences and the rest of genes. 22 GO were over represented in the subset
(P value < 0.01, exact Fisher’s test). One category that appears significantly
enriched under Fisher’s test is of particular interest: genes annotated as “defence
response to fungus”, genes “cactus” and “Spaetzel”. They are involved in develop-
ment and innate immunity in the Toll signalling pathway. Genes involved in defence
and immunity are relatively few in A. pisum overall (Gerardo et al. 2010). dN/dSratios are respectively 0.50 and 0.44 for the Cactus and Spaetzel gene, and while
Cactus is single copy, we found five copies in Spaetzel gene resulting from a serial
lineage duplication. These duplications may have enhanced increases of non-synon-
ymous substitution rates in Spaetzel lineage. Aphids present a particular immune
system pattern and genes involved in this function seem evolving in a particular
pathway. These genes are thus probably under strong selective pressure.
8.4 Conclusion and Prospects
We highlighted an unusually high rate of duplication in A. pisum genome. This
finding can give us new insights to test theoretical predictions on the relation between
duplications and evolutionary rates (Ohno 1970). Because cases of positive selection
(Hugues 1994) often occur among gene families, we expected that a large fraction of
the pea aphid genome is thus concerned by patterns of accelerated evolution, which
could favour the emergence of new biological functions and of adaptations.
The comparisons of A. pisum genome and EST-based gene sets from three
other species, even though they constitute partial genomes helped highlighting
two particular gene sets: fast-evolving genes and/or genes that are aphid specific.
The fact that some genes have no hit in non-Aphid databases can reflect a deep
divergence of those genes with their ortholog in other non-aphid species. These
genes could have evolved for specific functions in link to aphid biology.
We have shown that duplications can strongly influence evolution rates of at
least some of the gene copies. We have developed some examples of fast-evolving
genes, some of them being “aphid-specific”. These genes may be under positive or
relaxed selection and could be the result of an adaptative process.
However, our study has been limited by relatively small number of homologous
genes and the exact role of duplication in aphid adaptation remains to be demonstrated
in a larger scale. We will consider, in our future prospects, two main objectives:
1. A fine-scale study of the high level of duplication and of influence of duplica-
tions on evolutionary rates.
2. We will focus on a particular biological feature in aphids: reproduction
polyphenism. Some aphid species are considered as sexual and present, in
140 M. Ollivier and C. Rispe

their biological cycle, an asexual and a sexual phase, as previously described
(Fig. 8.1). But some species have lost the sexual phase and have become entirely
clonal. Loss of sexuality and of recombination is expected to result in an
accumulation of deleterious mutations and then in the doom of asexual lineages
(Kondrashov 1988). We aim to evaluate the extent by which clonal aphid species
are affected by mutation accumulation and to determine their evolutionary time
of persistence. For this particular project, we have obtained the sequencing of
20,000 ESTs sequences for six new Aphid species, including both taxa that
maintain a sexual reproduction and taxa that are entirely clonal.
Genomic data will then soon be available for more aphid species, including one
complete genome (A. pisum) and partial genomes (ESTs-based data or genomic
data from low-coverage sequencing projects). In such situation, as we start to refine
our knowledge of genomes in the whole aphid group, a relevant strategy is to
determine all possible phylomes. The group of Tonı Gabaldon (“Comparative
Genomics”, CRG Barcelone) has for example developed a pipeline to generate
phylomes from partial or entire genomes of several species (Huerta-Cepas et al.
2008; http://phylomedb.org/). Thanks to collaboration with this group, in Autumn
2009, we have started to generate such phylomes with the extant genomic data for
aphids. This will allow us to retrieve all orthologs available between all species.
Between pair of asexual and sexual species, we will thus be able to compare the
accumulation of non-synonymous mutations in sexual and asexual taxa. We will
also be able to quantify duplication patterns along the different branches of the
aphid species tree. Finally, we will test the correlation between duplication, accel-
eration of evolution and specific aphid biological features.
References
Adams MD, Celniker SE et al (2000) The genome sequence of Drosophila melanogaster. Science287(5461):2185–2195
Aury JM, Jaillon O et al (2006) Global trends of whole-genome duplications revealed by the ciliate
Paramecium tetraurelia. Nature 444(7116):171–178Blanc G, Wolfe KH (2004) Widespread paleopolyploidy in model plant species inferred from age
distributions of duplicate genes. Plant Cell 16(7):1667–1678
Conesa A, Gotz S et al (2005) Blast2GO: a universal tool for annotation, visualization and analysis
in functional genomics research. Bioinformatics 21(18):3674–3676
Gerardo NM, Altincicek B et al (2010) Immunity and defense in pea aphids Acyrthosiphon pisumGenome Biol 11:R21
Hawthorne DJ, Via S (2001) Genetic linkage of ecological specialization and reproductive
isolation in pea aphids. Nature 412(6850):904–907
Heger A, Ponting CP (2007) Evolutionary rate analyses of orthologs and paralogs from 12
Drosophila genomes. Genome Res 17(12):1837–1849
Hirsh AE, Fraser HB (2001) Protein dispensability and rate of evolution. Nature 411(6841):
1046–1049
8 Evolutionary Dynamics in the Aphid Genome 141

Huerta-Cepas J, Bueno A et al (2008) PhylomeDB: a database for genome-wide collections of
gene phylogenies. Nucleic Acids Res 36:D491–D496
Hufbauer RA, Via S (1999) Evolution of an aphid–parasitoid interaction: variation in resistance
to parasitism among aphid populations specialized on different plants. Evolution 53(5):
1435–1445
Hugues A (1994) The evolution of functionally novel proteins after gene duplication. Proc Biol Sci
256:119–124
IAGC (2010) Genome sequence of the Pea Aphid Acyrthosiphon pisum. Plos Biol doi 10.1311/journal.phio.1000313
Jordan IK, Rogozin IB et al (2002) Essential genes are more evolutionarily conserved than are
nonessential genes in bacteria. Genome Res 12(6):962–968
Kondrashov AS (1988) Deleterious mutations and the evolution of sexual reproduction. Nature
336:435–441
Legeai F, Shigenobu S et al (2010) AphidBase: a centralized bioinformatic resource for annotation
of the pea aphid genome. Insect Mol Biol 19(2):5–12
Mutti NS, Louis J et al (2008) A protein from the salivary glands of the pea aphid, Acyrthosiphonpisum, is essential in feeding on a host plant. Proc Natl Acad Sci USA 105(29):9965–9969
Ohno S (ed) (1970) Evolution by gene duplication. New York, Springer
Ollivier M, Legeai F, Rispe C (2010) Comparative analysis of the Acyrthosiphon pisum genome
and EST-based gene sets from other aphid species. Insect Mol Biol 19(2):33–45
Weinstock GM, Robinson GE et al (2006) Insights into social insects from the genome of the
honeybee Apis mellifera. Nature 443(7114):931–949Yang ZH (1997) PAML: a program package for phylogenetic analysis by maximum likelihood.
Comput Appl Biosci 13(5):555–556
Zdobnov EM, von Mering C et al (2002) Comparative genome and proteome analysis of Anophe-les gambiae and Drosophila melanogaster. Science 298(5591):149–159
142 M. Ollivier and C. Rispe

Chapter 9
Mammalian Chromosomal Evolution: From
Ancestral States to Evolutionary Regions
Terence J. Robinson and Aurora Ruiz-Herrera
Abstract Chromosome painting by fluorescence in situ hybridization (FISH) has
allowed the detection of regions of orthology in most orders of mammals permitting
the formulation of ancestral mammalian karyotypes at higher taxonomic levels. We
show (1) how the availability of genome sequence data from outgroup species has
facilitated the identification of chromosomes and chromosomal segments that
define eutherian monophyly, and (2) that FISH together with in silico analysis of
genomic sequences point to a nonrandom distribution of evolutionary breakpoints
that are rich in repeat elements and segmental duplications. These regions may
mediate rearrangement by nonallelic homologous recombination between mis-
aligned copies of duplicated regions and lead to breakpoint reuse. Characters that
have arisen convergently (i.e., homoplasy), pose a significant challenge in system-
atics, as does lineage sorting of genetic polymorphisms across successive speciation
nodes (hemiplasy). We show how hemiplasy, a theoretically plausible evolutionary
phenomenon, can materially affect data sets and explore the distinction between
homoplasy and hemiplasy based on persistence times of phylogenetic markers.
T.J. Robinson
Evolutionary Genomics Group, Department of Botany & Zoology, University of Stellenbosch,
Private Bag X1, Matieland 7602, South Africa
e-mail: [email protected]
A. Ruiz-Herrera
Unitat de Citologia i Histologia, Departament de Biologia Cellular, Fisiologia i Inmunologia,
Universitat Autonoma de Barcelona, Campus Bellaterra, 08193 Barcelona, Spain
Institut de Biotecnologia i Biomedicina, Universitat Autonoma de Barcelona, Campus Bellaterra,
08193 Barcelona, Spain
e-mail: [email protected]
This manuscript is a synthesis of spoken presentations by: Robinson TJ: Molecular discoveries at
the root of the eutherian tree: Homoplasy, hemiplasy and ancestral states in the phylogenetic
reconstructions of mammalian karyotypes. Ruiz-Herrera A: The genomic puzzle of mammalian
evolutionary breakpoints: can we track any trend?
P. Pontarotti (ed.), Evolutionary Biology – Concepts, Molecularand Morphological Evolution, DOI 10.1007/978-3-642-12340-5_9,# Springer-Verlag Berlin Heidelberg 2010
143

9.1 Introduction
Chromosome reorganization resulting from inversions, translocations, fusions, and
fissions, among other structural changes, contributes to the shuffling of the mamma-
lian genome and thus to the generation of new chromosomal forms on which natural
selection may work. These rearrangements can be caused by the improper repair
of double strand breaks (DSBs) and if the DNA damage occurs in the germ line
and the structural rearrangements are transmissible, the modified chromosome(s)
have the potential to establish in a population through selection and/or stochastic
processes. It is this context that mammalian phylogenomics (the combination of
genomics and phylogenetics that elucidates the phylogenetic relationships among
species by analysis of their entire genomes) has become one of the most integrative
fields in evolutionary biology. A component of this, specifically how chromosomal
rearrangements are involved in speciation and macroevolution, is fundamental for
understanding the dynamics of mammalian chromosomal evolution.
In this overview, we focus on recent developments related to three topical issues
in chromosomal phylogenomics. We report on recent attempts to cladistically
define chromosomal characters that are consistent with eutherian monophyly by
examining the composition of the putative eutherian ancestral karyotype (defined
by cross-species chromosome painting, Ferguson-Smith and Trifonov 2007) and
the genome assemblies of two outgroup species, the opossum (Monodelphis domes-tica) and chicken (Gallus gallus). Second, we summarize evidence supporting a
causal relationship between segmental duplication, repetitive elements, and evolu-
tionary breakpoints at the junction of conserved syntenies, and the propensity for
breakpoint reuse among eutherian species. Finally, we examine the complications
attendant in inferring evolutionary relationships from the cladistic analysis of
chromosomal characters (so called rare genomic changes, Rokas and Holland
2000). We suggest that the critical distinction between homoplasy (convergence
or reversal) and hemiplasy (persistence of the rearrangement across speciation
nodes, Avise and Robinson 2008) may be resolved in instances where divergence
times for nodes are well defined, and the persistence time is less than the divergence
time from a common ancestor.
9.2 Chromosomal Evolution
Nadeau and Taylor (1984) proposed the random-breakage model of chromosomal
evolution. Their thesis, which extended earlier work by Ohno (1973), emphasized
three important points: (1) chromosomal segments are expected to be conserved
among species, (2) that a diploid number of 48 was likely for the common ances-
tor of all mammals, and (3) chromosomal rearrangements are randomly distri-
buted within genomes. Almost 40 years later, and given advances resulting from
144 T.J. Robinson and A. Ruiz-Herrera

molecular cytogenetics, large-scale genome sequencing projects, and new mathe-
matical algorithms, it is interesting to assess how prescient these early observations
were.
9.2.1 Ancestral Karyotypes
Ancestral reconstructions are of interest for different reasons: (1) conserved synte-
nies among species allow the prediction of gene locations based on chromosomal
orthologs (with clear application to species for which genomic data are not avail-
able), (2) ancestral reconstructions provide a framework for estimating rates and
directions of chromosomal change, and (3) mapping karyotypic characters on
evolutionary trees can highlight the importance of chromosomal change in phylo-
genetic reconstructions.
Data derived from cross-species fluorescence in situ hybridization (Zoo–FISH)
are useful for inferring the composition of ancestral karyotypes at various taxo-
nomic and hierarchical levels, i.e., Eutheria (Chowdhary et al. 1998; Richard et al.2003; Yang et al. 2003; Svartman et al. 2004; Ferguson-Smith and Trifonov 2007;
Robinson and Ruiz-Herrera 2008), Boreoeutheria (Froenicke et al. 2006; Robinson
et al. 2006), Rodentia (Graphodatsky et al. 2008), Primates (Stanyon et al. 2008),
Carnivora (Graphodatsky et al. 2002), Cetartiodactyla (Balmus et al. 2007), and
Perissodactyla (Trifonov et al. 2008).
Of the 46 chromosomes in the putative ancestral eutherian karyotype (Fig. 9.1a)
Robinson and Ruiz-Herrera (2008) show that two intact chromosome pairs
(corresponding to human chromosomes 13 and 18) and three conserved chromo-
some segments (10q, 8q, and 19p in the human karyotype) are probably symple-
siomorphic for Eutheria because they are also present as unaltered orthologs in one
or both of the outgroup species (opossum and chicken). Seven additional syntenies
(4q/8p/4pq, 3p/21, 14/15, 10p/12pq/22qt, 19q/16q, 16p/7a, and 12qt/22q), each
involving human chromosomal segments that in combination correspond to intact
chromosomes in the ancestral eutherian karyotype, are also present in one or both
outgroup taxa and thus are probable symplesiomorphies for Eutheria. However,
eight chromosome pairs (corresponding in toto to human chromosomes 1, 5, 6, 9,
11, 17, 20, and the X) and three chromosome segments (2p-q13, 7b, and 2q13-qter)
are derived characters that support the monophyly of eutherian mammals.
There is also considerable recent support for a 2n ¼ 46 chromosome number
in the boreoeutherian ancestor that is not dissimilar to Ohno’s 2n ¼ 48. The
boreoeutherian ancestor originally proposed by Froenicke (2005) is virtually
identical to the eutherian karyotype presented by Ferguson-Smith and Trifonov
(2007) with both benefiting from refinements by Robinson and Ruiz-Herrera
(2008), i.e., the HSA 4q/8p/4pq, HSA2p-q13, HSA10p/12pq/22qt, HSA 19q/
16q, HSA 16p/7a, and HSA 12qt/22q syntenies (see Table 1 in Robinson and
Ruiz-Herrera 2008).
9 Chromosomal Evolution 145

Fig. 9.1 (a) The ancestral eutherian autosomal karyotype based on Ferguson-Smith and Trifonov
(2007) with refinements by Robinson and Ruiz-Herrera (2008). The X chromosome is conserved
across all eutherianmammals and is not included here. (Asterisk) Analysis of reciprocal chromosome
painting data together with genome sequence information indicates that the breakpoint is located in
HSA 3p (see Ruiz-Herrera and Robinson 2007). (b) Schematic representation of orthologous blocks
detected in different mammals that correspond to human chromosome 3. Species included in the
comparison have been studied by reciprocal chromosome painting providing for a rigorous delimi-
tion of the boundaries of synteny. Adapted from Ruiz-Herrera and Robinson (2008)
146 T.J. Robinson and A. Ruiz-Herrera

9.2.2 Evolutionary Breakpoints
In silico analysis led to the formulation of the fragile-breakage model (Bourque
and Pevzner 2002; Pevzner and Tesler 2003; Bourque et al. 2004). Contrary to the
random-breakage model (Sect. 9.2 above), Pevzner and Tesler (2003) showed that
transformation of the mouse gene order to that in human would require consider-
able breakpoint reuse due to the large number of syntenic blocks less than 1 Mb in
size. This suggests that chromosomal rearrangements are not randomly distributed
in the genome, but are concentrated rather in certain regions that can be consid-
ered “hot spots” for recombination – an observation substantiated by chromosome
painting studies (Fig. 9.1b; see also Froenicke 2005; Ruiz-Herrera et al. 2005) that
indicated some genomic regions areas are more prone to breakage and reorgani-
zation than others (Bourque et al. 2004; Murphy et al. 2005; Ruiz-Herrera et al.
2005, 2006; Ma et al. 2006, Kemkemer et al. 2009; Larkin et al. 2009). In a
phylogenetic context, the term “breakpoint reuse” accounts for the recurrence of
the same breakpoint in two different species but, based on comparison with an
outgroup lineage, not in the common ancestor (Murphy et al. 2005; Larkin et al.
2009; Sankoff 2009).
The assumption that some chromosome regions have been reused during the
mammalian chromosomal evolution raises several intriguing questions. (a) Is any
particular DNA configuration or sequence composition driving chromosome evo-
lution?, (b) how are these regions organized in the three-dimensional cell nucleus?,
and (c) by which mechanisms are they regulated in the germ line?
The chromosomal rearrangements that shape mammalian genomes originate as
DSBs. This type of lesion can result from exogenous factors (ionizing radiation
and chemical agents), endogenous agents (free radicals or a stalled replication
fork), or through highly specialized cellular processes that include meiosis and the
recombination of immunoglobulins in the immune system. In all instances,
however, mammalian cells repair DSBs by homologous recombination (HR) or
nonhomologous end joining (NHEJ) (Karran 2000). NHEJ dominates during G1
to the early S phase of the cell cycle, and HR occurs mainly in late S and the G2
phases. Should either mechanisms (HR or NHEJ) fail, DSBs are ineffectively
repaired leading to cell death, or enhanced genomic instability as reflected by
large-scale chromosomal alterations (i.e., deletions, duplications, translocations).
In somatic cells these rearrangements often distinguish neoplasms (see Ruiz-
Herrera and Robinson 2008 and references therein). If these new chromosomal
forms are produced in the germ line, however, they may be coincidental with the
formation of new species.
An interesting aspect to emerge from comparative genomic studies is the finding
that breakpoint regions are rich in repetitive elements. These include tandem
repeats (Puttagunta et al. 2000; Kehrer-Sawatzki et al. 2005), segmental duplica-
tions (SD) (Goidts et al. 2004; Carbone et al. 2006; Bailey and Eichler 2006;
Kehrer-Sawatzki and Cooper 2008), and transposable elements (TEs) (Caceres
et al. 1999; Carbone et al. 2009; Longo et al. 2009), each of which is dealt with
9 Chromosomal Evolution 147

serially below. Additionally, new data suggest that the permissiveness of some
regions of the genome to undergo chromosomal breakage could be determined by
changes in chromatin conformation (Carbone et al. 2009; Lemaitre et al. 2009).
9.2.3 Tandem Repeats
Tandem repeats have been regarded as an important source of DNA variation and
mutation (Armour 2006) having the capacity to form a variety of secondary
structures such as hairpins and bipartite triplexes (Catasti et al. 1999). The instabil-
ity that characterizes tandem repeats is thought to result from slippage during DNA
replication and recombination during meiosis (Usdin and Grabczyk 2000). Expan-
sions of the repeat array occur when an unusual secondary structure is formed in the
lagging daughter strand during DNA replication. Deletions, on the other hand,
occur when an unusual configuration develops in the template for lagging-strand
DNA synthesis (Usdin and Grabczyk 2000). It seems probable that just as tandem
repeats are affected by deletions and expansions in some well-known human
diseases, so too are they implicated in the formation of evolutionary breakpoints.
Some simple tandem repeats have been detected in breakpoint regions, for
instance, the dinucleotide [TA]n (Kehrer-Sawatzki et al. 2005) and [TCTG]n,
[CT]n and [GTCTCT]n (Puttagunta et al. 2000). These early observations led to
further investigations of the possible role of tandem repeat in shaping mammalian
genome architecture (Ruiz-Herrera et al. 2006). The analysis of the distribution
of tandem repeats in human chromosomes by Ruiz-Herrera and colleagues (Ruiz-
Herrera et al. 2006), and their spatial relationship to evolutionary breakpoints
highlights two important points. First, it emphasizes the high concentration of
tandem repeats found at the telomeres and the pericentromeric areas (in agreement
with recent reports on the distribution of duplicated regions by Schueler and
Sullivan 2006 and Riethman 2008). The second is the concentration of tandem
repeats at evolutionary chromosomal bands. Although this is by no means ubiqui-
tous, the correspondence is typified by human chromosomes 3 and 7 (Robinson
et al. 2006; Ruiz-Herrera and Robinson 2008). For example, bands with the greatest
number of tandem repeats in human chromosome 3 (3p25, 3p21.3, 3p12, 3q13.1,
3q21, and 3q29) are also the chromosomal regions that have been implicated in
evolutionary rearrangements (Ruiz-Herrera and Robinson 2008).
9.2.4 Segmental Duplications
SD, or large blocks of genomic sequence (from 1 kb to hundreds of kb) that share
>90% of sequence identity, constitute at least 5% of the human genome (Eichler
2001). They are unevenly distributed along different human chromosomes but
148 T.J. Robinson and A. Ruiz-Herrera

concentrate mainly in the pericentromeric and subtelomeric regions of chromo-
somes (Vallente-Samonte and Eichler 2002).
From an evolutionary perspective, sequence data have identified SD as an
important element in large-scale genome reorganization that underpins evolution-
ary lineages (reviewed in Bailey and Eichler 2006). Nonallelic homologous recom-
bination (NAHR, homologous recombination among paralogous sequences)
mediated by duplicated sequences can, depending on their orientation, result in
deletions, duplications, inversions, and translocations (Bailey and Eichler 2006;
Turner et al. 2008; Marques-Bonet et al. 2009). For example, Armengol et al.
(2003) found an accumulation of SD in rearrangement breakpoints when comparing
the human and mouse whole-genome assemblies; these findings were subsequently
extended to the rat genome (Armengol et al. 2005).
The presence of SDs in evolutionary breakpoint regions has similarly been
shown in primates (Antonell et al. 2005; Nickerson and Nelson 1998; Carbone
et al. 2006; Kehrer-Sawatzki and Cooper 2008). Nine pericentric inversions distin-
guish the human and the chimpanzee karyotypes in addition to the ancestral fusion
of human chromosome 2 (Yunis and Prakash 1982). SDs are located at the break-
points of six of these pericentric inversions, affecting human chromosomes 1, 9, 12,
15, 16, and 18 (Kehrer-Sawatzki and Cooper 2008). The gorilla specific transloca-
tion t(4;19) also appears to be rich in SDs (Stankiewicz et al. 2004).
An analysis of human chromosome 3 typifies how SDs have shaped the evolu-
tionary architecture of mammalian genomes (Ruiz-Herrera and Robinson 2008).
This chromosome contains 2,062 duplicated regions (90% homology and 1 kb
length) accounting for 1.7% (3.3 Mbp) of its length (see http://genome.icsc.edu).
Of these duplicated regions 480 (23.28%) represent 10 kb of continuous sequence,
36 of which occur in 3p25 (7.5%), 160 in 3p12 (33.33%), 173 in 3q21 (36.04%),
and 89 in 3q29 (18.5%) (Ruiz-Herrera and Robinson 2008). The accumulation of
SD in 3q29 is not surprising given that transchromosomal duplications tend to
concentrate in the subtelomeric and pericentromeric areas (Eichler 2001). Of
interest is the fact that three of the four chromosomal bands implicated as evolu-
tionary breakpoints during the eutherian evolution (3p25, 3p12 and 3q21; Fig. 9.1b)
also have the highest concentration of SDs in HSA3. These values contrast sharply
with bands not implicated in evolutionary breakpoints such as 3p14, 3q13.3, and
3q26 (Ruiz-Herrera and Robinson 2008).
9.2.5 Transposable Elements
Other repetitive elements, such as TEs, have been implicated in genomic reorgani-
zation and structural variation by mechanisms that include HR and transposition
(Gray 2000; Ostertag and Kazazian 2001; Feschotte and Prithman 2007; Cordaux
and Batzer 2009). TEs are DNA sequences that are able to move from one locus
to another, often duplicating themselves in the process. They are classified into
two classes according to their sequence structure and mechanism of transposition
9 Chromosomal Evolution 149

(Wicker et al. 2007): Class 1 includes those that transpose through reverse tran-
scription of an RNA intermediate (retrotransposons), and Class 2 refers to DNA
transposons that move through transposition of a DNA intermediate. Retrotranspo-
sons have been the most successful TEs to colonize mammalian genomes – they
make up approximately 40 and 50% of the human and opossum genomes, respec-
tively (Lander et al. 2001; Gentles et al. 2007).
TEs, as with SDs, have the capacity to influence genome plasticity. This can be
done, for example, by (1) the alteration of gene function and regulation, (2) con-
tributing to the creation of new genes, and (3) inducing chromosomal rearrange-
ments (see Feschotte and Prithman 2007 and Cordaux and Batzer 2009 for reviews).
TE-triggered chromosomal rearrangements have been extensively recorded in
plants and animals such as maize and Drosophila (Walker et al. 1995; Caceres
et al. 1999). In the case of primates not all the inversion breakpoints between human
and chimpanzee map to regions of SDs. The breakpoints of the inversions affecting
human chromosome 4, 5, and 17 are rich in Alu elements (Kehrer-Sawatzki and
Cooper 2008). Moreover, a high proportion of Alu elements at the ends of SDs
suggest that they were generated by Alu mispairing, followed by HR in the human
genome (Bailey et al. 2003). There is also evidence in the recent literature for an
accumulation of L1 elements in evolutionary breakpoint regions (Zhao
and Bourque 2009). Longo and collaborators (Longo et al. 2009), for example,
described an accumulation of L1 elements and ERVs (endogenous retroviruses) in
an evolutionary breakpoint in the tammar wallaby genome, a marsupial species.
Gibbons (Family Hylobatidae) represent an interesting case among Hominoidea
(which also include humans and the other great apes, i.e., chimpanzee, gorilla, and
orang-utan), as they are characterized by a strikingly unstable karyotype – this in
sharp contrast to the stability observed for the great apes and most of the more
distantly related primate species (Muller et al. 2003). In a series of elegant studies,
Carbone and co-workers have established a physical map containing most of the
synteny disruptions existing in the white-cheeked gibbon (Nomascus leucogenys)(Carbone et al. 2006, 2009). They isolated most of the synteny-breakpoints in gibbon
BAC clones and subsequently identified them at highest resolution. Their results
revealed an enrichment of active Alu in the gibbon breakpoints, these being less
methylated (CpG-rich) than their orthologous counterparts in the human genome.
The authors hypothesized that this epigenetic state could promote changes into an
open chromatin configuration that, in turn, may be responsible for the higher rate
of chromosomal breakage characterizing the Hylobatidae (Carbone et al. 2009).
9.3 Hemiplasy
During the course of comparing the syntenic blocks in eutherian mammals (see
Sect. 9.2.1 above), we noticed several candidate examples of hemiplasy (two ofwhich
involved chiropterans and afrotherians; Robinson et al. 2008). It was apparent from
these comparisons that a complication with using chromosomal characters to infer
150 T.J. Robinson and A. Ruiz-Herrera

phylogenetic relationships concerns the distinction between characters that have
arisen convergently (i.e., are homoplasic), and those that are due to common ancestry
but which result in homoplasy-like outcomes even though the character states
themselves are genuinely homologous – i.e., are hemiplasic (Avise and Robinson
2008). A likely outcome of the failure to identify hemiplasy (as with homoplasy) is a
misleading phylogenetic interpretation of chromosomal characters, and hence
attempts to disentangle the effects of homoplasy and hemiplasy in a specific phylog-
eny are both useful and conceptually interesting.
9.3.1 Defining Hemiplasy
In brief, hemiplasy can arise where character states a, b, and c represent any type ofgenetic polymorphism (including alternative states of karyotypic features – see
Fig. 9.2a). The more persistent the polymorphic state, the greater the probability of
an eventual discordance between a species tree and a gene tree.
Figure 9.2a illustrates how idiosyncratic lineage sorting can eventuate in gene–
tree/species–tree discordance, and how alternative explanations are possible where
conflicting hypotheses are suggested by different data sets. For example, sequence-
based phylogenies have suggested an association of elephant shrew, tenrec, and
golden mole to the exclusion of aardvark (Amrine-Madsen et al. 2003; Murphy
et al. 2007a) or, alternatively, aardvark, tenrec, and golden mole to the exclusion of
elephant shrews (Waddell and Shelley 2003). In contrast, molecular cytogenetic data
point to a sister relationship between elephant shrew and aardvark to the exclusion of
golden mole (Robinson et al. 2004). This latter association would contradict much
other phylogenetic evidence and we have argued (Robinson et al. 2008) that this
conflict may be explained by the polymorphic state of the 10q/17 and 3/20 syntenies
in an afroinsectiphillian common ancestor that subsequently sorted idiosyncratically
to produce a gene tree/species tree discordance (Fig. 9.2b). Both the 10q/17 and 3/20
syntenies in the aardvark and elephant shrew are caused by centric fusions that must
have arisen in the common ancestor to Afroinsectiphillia prior to the basal divergence
of aardvark �75 mya. They then became independently fixed in the lineage leading
to the elephant shrew (thought to have diverged at 73 mya), but were lost in the
lineage to Afroinsectivora (represented in our analysis only by the golden mole)
subsequent to the divergence of this clade �65 mya meaning also that the character
states themselves would be genuinely homologous and have persisted minimally as
polymorphic states for �2 million years.
9.3.2 Distinguishing Hemiplasy
In an attempt to emphasize the distinction between hemiplasy and homoplasy of
chromosomal characters, consider the tree presented in Fig. 9.2c. This scheme
shows two Robertsonian fusions (A/B and C/E) associated with divergence dates
9 Chromosomal Evolution 151

Fig. 9.2 (a) A schematic representation of how a chromosomal polymorphism that traversed
successive speciation nodes can become fixed in the descendant species in a pattern that appears
discordant with the species phylogeny. Idiosyncratic sorting of a Robertsonian (Rb) fusion
polymorphism (a, b, c) into the descendant taxa would result in lineages that are fixed for the
karyotypic state prior to fusion (i.e., the 2n is unaltered), and those that are homozygous for the
rearrangement (i.e., 2n-2). Note that allele “c” in is a derived character state that it is shared by two
descendant taxa (II and III) that do not constitute a clade at the organismal level. (b) A diagramme
showing how the Robertsonian fusions 10q/17 and 3/20 arose �75 mya in a common ancestor to
Afroinsectiphillia and sorted idiosyncratically (oval) suggesting that these derived chromosomal
syntenies must have persisted for at least �2 million years in order to temporally encompass the
relevant speciation nodes. (c) A hypothetical phylogeny showing the presence of chromosomal
characters A/B, C/D, and C/E in five species (I–V). Two alternative hypotheses can be proposed to
accommodate the distribution of the characters among species (see text)
152 T.J. Robinson and A. Ruiz-Herrera

that vary from 15 to 2 mya for pertinent nodes. It is instructive first to examine the
A/B adjacent synteny. Hemiplasy would require an unlikely persistence time of
13 mya to account for the presence of A/B in distant parts of the species tree (i.e.,
species I and II). The alternative – and more likely explanation – is convergence,
with A/B arising independently in both lineages (homoplasy).
In contrast to this pattern, we argue that chromosomal character C/E most
likely reflects an instance of hemiplasy. As with A/B, two mutually exclusive
hypotheses can be advanced to explain the pattern shown in Fig. 9.2c. First, it
could be argued that the rearrangement (C/E) was present in the common ancestor
of II–V (dated at 4 mya), and its absence in II is due to reversal. Alternatively, it
was fixed in the common ancestor to IV þ V (2 mya), and convergently so in III.
Two “rare genomic changes” would be required in either scenario. Second, and in
contrast to the first hypothesis, hemiplasy would suggest the origin of a single
rearrangement (¼ a single “rare genomic change”) at the common node (4 mya),
followed by incomplete lineage sorting when the ancestral polymorphism is
retained through speciation events, i.e., C/E becomes fixed in the lineages leading
to species III–V and is lost in the lineage to II. The maximum persistence time
required for retention of the chromosomal polymorphism under this scenario is
2 million years. Moreover, this latter explanation most parsimoniously accounts
for the presence of the C/D synteny in species II. This is that the C/E rearrange-
ment was present in a polymorphic state in the common ancestor of II–V (i.e., a
fused C/E and the unfused homologues C and E), a combination that would permit
the independent fusion of C with D. The alternative explanation (the de novo
fission of C/E on the branch leading to species II followed by a fusion of C with D)
being considered less likely.
This scheme emphasizes a critical distinction between hemiplasy and homo-
plasy. This is that hemiplasy is generally more likely for near neutral polymorph-
isms or those that are overdominant. It is also more likely when the internodal
distances in a phylogenetic tree are short (relative to effective population sizes, see
Robinson et al. 2008). On the other hand, homoplasy is less likely to be constrained
by narrow divergence times – the greater the temporal distance, the more likely the
possibility of convergence and reversals of chromosomal rearrangements.
9.4 Conclusions
Contemporary studies of mammalian chromosome evolution are informed by
factors that include data from various sources. First, ancestral karyotypes (and the
critical distinction between symplesiomorphic and synapomorphic characters that
can only be inferred using appropriate outgroups) usually form the comparative
basis for determining the mode and often, the tempo of karyotypic change. This in
turn is reliant on the correct identification of orthologous blocks (either by FISH or
chromosome banding), and is further shaped by knowledge of segmental duplica-
tion, repetitive elements, and breakpoint reuse. In turn these data can have bearing
9 Chromosomal Evolution 153

on the phylogenetic distinction between characters that are convergent/reversals
(i.e., homoplasious), and those that potentially reflect persistence of characters
across species nodes (hemiplasy).
Considerable progress has been made in determining the major features of
mammalian chromosomal evolution. However, recent developments in sequencing
efficiency and expectations of an improvement in annotation technology make it
likely that initiatives such as the recent proposal to target 10,000 vertebrate species
for whole-genome sequencing (Genome 10K Community of Scientists 2009) will
provide a level of resolution and taxonomic scope that is unprecedented for
studying vertebrate and, in particular, mammalian evolutionary relationships. It
can be anticipated that data generated by the G10KCOS initiative will provide
detailed answers on the mechanisms of genomic change, including rearrangements,
duplications, and losses, and definitive insights into the origin of mammalian
karyotypic diversity.
Acknowledgments Financial support to TJR (National Research Foundation, South Africa) and
ARH (Parque Zoologico de Barcelona, Spain) is gratefully acknowledged. Anne Ropiquet is
thanked for discussion on chromosomal phylogenies and Clement Gilbert for comments on an
earlier version of this manuscript.
References
Amrine-Madsen H, Koepfli K-P, Wayne RK, Springer MS (2003) A new phylogenetic marker,
apolipoprotein B, provides compelling evidence for eutherian relationships. Mol Phylogenet
Evol 28:225–240
Antonell A, de Luis O, Domingo-Roura X, Perez-Jurado LA (2005) Evolutionary mechanisms
shaping the genomic structure of the Williams-Beuren syndrome chromosomal region at
human 7q11.23. Genome Res 15:1179–1188
Armengol L, Pujana MA, Cheung J, Scherer SW, Estivill X (2003) Enrichment of segmental
duplications in regions of breaks of synteny between the human and mouse genomes suggest
their involvement in evolutionary rearrangements. Hum Mol Genet 12:2201–2208
Armengol L, Marques-Bonet T, Cheung J, Khaja R, Gonzalez JR, Scherer SW, Navarro A,
Estivill X (2005) Murine segmental duplications are hot spots for chromosome and gene
evolution. Genomics 86:692–700
Armour JA (2006) Tandemly repeated DNA: why should anyone care? Mutat Res 598:6–14
Avise JC, Robinson TJ (2008) Hemiplasy: a new term in the lexicon of phylogenetics. Syst Biol
57:503–507
Bailey JA, Liu G, Eichler EE (2003) An Alu transposition model for the origin and expansion of
human segmental duplications. Am J Hum Genet 73(4):823–834
Bailey JA, Eichler EE (2006) Primate segmental duplications: crucibles of evolution, diversity and
disease. Nat Rev Genet 7:552–564
Balmus G, Trifonov VA, Biltueva LS, O’Brien PC, Alkalaeva ES, Fu B, Skidmore JA, Allen T,
Graphodatsky AS, Yang F, Ferguson-Smith MA (2007) Cross-species chromosome painting
among camel, cattle, pig and human: further insights into the putative Cetartiodactyla ancestral
karyotype. Chromosome Res 15(4):499–515
Bourque G, Pevzner PA (2002) Reconstructing gene orders in the ancestral genomes. Genome Res
12:26–36
154 T.J. Robinson and A. Ruiz-Herrera

Bourque G, Pevzner PA, Tesler G (2004) Reconstructing the genomic architecture of ancestral
mammals: lessons from human, mouse, and rat genomes. Genome Res 14:507–516
Caceres M, Ranz JM, Barbadilla A, Long M, Ruiz A (1999) Generation of a widespread
Drosophila inversion by a transposable element. Science 285:415–418
Carbone L, Vessere GM, ten Hallers BF, Zhu B, Osoegawa K, Mootnick AR, Kofler A,
Wienberg J, Rogers J, Humphray S, Scott C, Harris RA, Milosavljevic A, de Jong P (2006)
A high-resolution map of synteny disruptions in gibbon and human genomes. PLoS Genet
2:223
Carbone L, Harris RA, Vessere GM, Mootnick AR, Humphray S, Rogers J, Kim SK, Wall JD,
Martin D, Jurka J, Milosavljevic A, de Jong PJ (2009) Evolutionary breakpoints in the gibbon
suggest association between cytosine methylation and karyotype evolution. PLoS Genet
5:e1000538
Catasti P, Chen X, Mariappan SVS, Bradbury EM, Gupta G (1999) DNA repeats in the human
genome. Genetica 106:15–36
Chowdhary BP, Raudsepp T, Froenicke L, Scherthan H (1998) Emerging patterns of comparative
genome organization in some mammalian species as revealed by Zoo-FISH. Genome Res
8:577–589
Cordaux R, Batzer MA (2009) The impact of retrotransposons on human genome evolution. Nat
Rev Genet 10:691–703
Eichler EE (2001) Recent duplication, domain accretion and the dynamic mutation of the human
genome. Trends Genet 17:661–669
Ferguson-Smith MA, Trifonov V (2007) Mammalian karyotype evolution. Nat Rev Genet
8:950–962
Feschotte C, Prithman EJ (2007) DNA transposons and the evolution of the eukaryotic genomes.
Annu Rev Genet 41:331–368
Froenicke L (2005) Origins of primate chromosomes – as delineated by Zoo-FISH and alignments
of human and mouse draft genome sequences. Cytogenet Genome Res 108:122–138
Froenicke F, Wienberg J, Stone G, Adams L, Stanyon R (2003) Towards the delineation of the
ancestral eutherian genome organization: comparative genome maps of human and the African
elephant (Loxodonta africana) generated by chromosome painting. Proc R Soc Lond B Biol
Sci 270:1331–1340
Froenicke L, Caldes MG, Graphodatsky A, M€uller S, Lyons LA, Robinson TJ, Volleth M, Yang F,
Wienberg J (2006) Are molecular cytogenetics and bioinformatics suggesting contradictory
models of ancestral mammalian genomes? Genome Res 16:306–310
Genome 10K Community of Scientists (2009) Genome 10K: a proposal to obtain whole-genome
sequence for 10,000 vertebrate species. J Hered 100:659–674
Gentles AJ, Wakefield MJ, Kohany O, Gu W, Batzer MA, Pollock DD, Jurka J (2007) Evolution-
ary dynamics of transposable elements in the short-tailed opossum Monodelphis domestica.
Genome Res 17:992–1004
Goidts V, Szamalek JM, Hameister H, Kehrer-Sawatzki H (2004) Segmental duplication asso-
ciated with the human-specific inversion of chromosome 18: a further example of the impact of
segmental duplications on karyotype and genome evolution in primates. Hum Genet
117:168–176
Graphodatsky AS, Yang F, Perelman PL, O’Brien PC, Serdukova NA, Milne BS, Biltueva LS,
Fu B, Vorobieva NV, Kawada SI, Robinson TJ, Ferguson-Smith MA (2002) Comparative
molecular cytogenetic studies in the order Carnivora: mapping chromosomal rearrangements
onto the phylogenetic tree. Cytogenet Genome Res 96:137–145
Graphodatsky AS, Yang F, Dobigny G, Romanenko SA, Biltueva LS, Perelman PL, Beklemisheva
VR, Alkalaeva EZ, Serdukova NA, Ferguson-Smith MA, Murphy WJ, Robinson TJ (2008)
Tracking the evolution of genome organization in rodents by ZOO-FISH. Chromosome Res
16:261–274
Gray YH (2000) It takes two transposons to tango: transposable-element-mediated chromosomal
rearrangements. Trends Genet 16:461–468
9 Chromosomal Evolution 155

Karran P (2000) DNA double strand break repair in mammalian cells. Curr Opin Genet Dev
10:144–150
Kehrer-Sawatzki H, Cooper DN (2008) Molecular mechanisms of chromosomal rearrangement
during primate evolution. Chromosome Res 16:41–56
Kehrer-Sawatzki H, Szamalek JM, Tanzer S, Platzer M, Hameister H (2005) Molecular character-
ization of the pericentric inversion of chimpanzee chromosome 11 homologous to human
chromosome 9. Genomics 85:542–550
Kemkemer C, Kohn M, Cooper DN, Froenicke L, Hogel J, Hameister H, Kehrer-Sawatzki H
(2009) Gene synteny comparisons between different vertebrates provide new insights
into breakage and fusion events during mammalian karyotype evolution. BMC Evol Biol
9:84
Korstanje R, O’Brien PCM, Yang F, Rens W, Bosma AA, van Lith HA, van Zutphen LF,
Ferguson-Smith MA (1999) Complete homology maps of the rabbit (Oryctolagus cuniculus)and human by reciprocal chromosome painting. Cytogenet Cell Genet 86:317–322
Lander ES and the Int Human Genome Sequencing Consortium (2001) Initial sequencing and
analysis of the human genome. Nature 409:860–921
Larkin DM, Pape G, Donthu R, Auvil L, Welge M, Lewin HA (2009) Breakpoint regions and
homologous synteny blocks in chromosomes have different evolutionary histories. Genome
Res 19:770–777
Lemaitre C, Zaghloul L, Sagot MF, Gautier C, Arneodo A, Tannier E, Audit B (2009) Analysis of
fine-scale mammalian evolutionary breakpoints provides new insight into their relation to
genome organisation. BMC Genomics 10:335
Li T, O’Brien PCM, Biltueva L, Fu B, Wang J, Nie W, Ferguson-Smith MA, Graphodatsky AS,
Yang F (2004) Evolution of genome organizations of squirrels (Sciuridae) revealed by cross-
species chromosome painting. Chromosome Res 12:317–335
Longo MS, Carone DM, NISC Comparative Sequencing Program, Green ED, O’Neill MJ, O’Neill
RJ (2009) Distinct retroelement classes define evolutionary breakpoints demarcating sites of
evolutionary novelty. BMC Genomics 10:334
Ma J, Zhang L, Suh BB, Raney BJ, Burhans RC, Kent WJ, Blanchette M, Haussler D, Miller W
(2006) Reconstructing contiguous regions of an ancestral genome. Genome Res 16:1557–1565
Marques-Bonet T, Girirajan S, Eichler EE (2009) The origins and impact of primate segmental
duplications. Trends Genet 25:443–545
Muller S, Stanyon R, O’Brien PCM, Ferguson-Smith MA, Plesker R, Wienberg J (1999) Defining
the ancestral karyotype of all primates by multidirectional chromosome painting between tree
shrews, lemurs and humans. Chromosoma 108:393–400
Muller S, Hollatz M, Wienberg J (2003) Chromosomal phylogeny and evolution of gibbons
(Hylobatidae). Hum Genet 113:493–501
Murphy WJ, Larkin DM, Everts-van-der Wind A, Bourque G, Tesler G, Auvil L, Beever JE,
Chowdhary BP, Galibert F, Gatzke L, Hitte C, Meyers SN, Milan D, Ostrander EA, Pape G,
Parker HG, Raudsepp T, Rogatcheva MB, Schook LB, Skow LC, Welge M, Womack JE,
O’brien SJ, Pevzner PA, Lewin HA (2005) Dynamics of mammalian chromosome evolution
inferred from multispecies comparative maps. Science 309:613–617
Murphy WJ, Pringle TH, Crider TA, Springer MS, Miller W (2007a) Using genomic data to
unravel the root of the placental mammal phylogeny. Genome Res 17:413–421
Murphy WJ, Davis B, David VA, Agarwala R, Schaffer AA, Pearks Wilkerson AJ, Neelam B,
O’Brien SJ, Menotti-Raymond M (2007b) A 1.5-Mb-resolution radiation hybrid map of the
cat genome and comparative analysis with the canine and human genomes. Genomics
89:189–196
Nadeau JH, Taylor BA (1984) Lengths of chromosomal segments conserved since divergence of
man and mouse. Proc Natl Acad Sci USA 81:814–818
Nickerson E, Nelson DL (1998) Molecular definition of pericentric inversion breakpoints occur-
ring during the evolution of humans and chimpanzees. Genomics 50:368–372
Ohno S (1973) Ancient linkage groups and frozen accidents. Nature 244:259–262
156 T.J. Robinson and A. Ruiz-Herrera

Ostertag EM, Kazazian HH (2001) Twin priming: a proposed mechanism for the creation of
inversions in L1 retrotransposition. Genome Res 11:2059–2065
Perelman PL, Graphodatsky AS, Serdukova NA, Nie W, Alkalaeva EZ, Fu B, Robinson TJ,
Yang F (2005) Karyotypic conservatism in the suborder Feliformia (Order Carnivora). Cyto-
genet Genome Res 108:348–354
Pevzner P, Tesler G (2003) Human and mouse genomic sequences reveal extensive breakpoint
reuse in mammalian evolution. Proc Natl Acad Sci USA 100:7672–7677
Puttagunta R, Gordon LA, Meyer GE, Kapfhamer D, Lamerdin JE, Kantheti P, Portman KM,
Chung WK, Jenne DE, Olsen AS, Burmeister M (2000) Comparative maps of human 19p13.3
and mouse chromosome 10 allow identification of sequences at evolutionary breakpoints.
Genome Res 10:1369–1380
Richard F, LombardM, Dutrillaux B (2003) Reconstruction of the ancestral karyotype of eutherian
mammals. Chromosome Res 11:605–618
Riethman H (2008) Human telomere structure and biology. Annu Rev Genomics Hum Genet
9:1–19
Robinson TJ, Ruiz-Herrera A (2008) Defining the ancestral eutherian karyotype: a cladistic
interpretation of chromosome painting and genome sequence assembly data. Chromosome
Res 16:1133–1141
Robinson TJ, Fu B, Ferguson-Smith MA, Yang F (2004) Cross-species chromosome painting in
the golden mole and elephant shrew: support for the mammalian clades Afrotheria and
Afroinsectiphillia but not Afroinsectivora. Proc Biol Sci 271:1477–1484
Robinson TJ, Ruiz-Herrera A, Froenicke L (2006) Dissecting the mammalian genome – new
insights into chromosomal evolution. Trends Genet 22:297–301
Robinson TJ, Ruiz-Herrera A, Avise JC (2008) Hemiplasy and homoplasy in the karyotypic
phylogenies of mammals. Proc Natl Acad Sci USA 105:14477–14481
Rokas A, Holland PW (2000) Rare genomic changes as a tool for phylogenetics. Trends Ecol Evol
15:454–459
Ruiz-Herrera A, Robinson TJ (2008) Evolutionary plasticity breakpoints in human chromosome 3.
BioEssays 30:1126–1137
Ruiz-Herrera A, Garcia F, Mora L, Egozcue J, Ponsa M, Garcia M (2005) Evolutionary conserved
chromosomal segments in the human karyotype are bounded by unstable chromosome bands.
Cytogenet Genome Res 108:161–174
Ruiz-Herrera A, Castresana J, Robinson TJ (2006) Is mammalian chromosomal evolution driven
by regions of genome fragility? Genome Biol 7:R115
Ruiz-Herrera A, Robinson TJ (2007) Chromosomal instability in Afrotheria: fragile sites, evolu-
tionary breakpoints and phylogenetic inference from genome sequence assemblies. BMC Evol
Biol 7:199
Sankoff D (2009) The where and wherefore of evolutionary breakpoints. J Biol 8:66
Schueler MG, Sullivan BA (2006) Structural and functional dynamics of human centromeric
chromatin. Annu Rev Genomics Hum Genet 7:301–313
Stankiewicz P, Shaw CJ, Withers M, Inoue K, Lupski JR (2004) Serial segmental duplications
during primate evolution result in complex human genome architecture. Genome Res
14:2209–2220
Stanyon R, Rocchi M, Capozzi R, Roberto R, Misceo D, Ventura M, Cardone MF, Bigoni F,
Archidiacono N (2008) Primate chromosome evolution: ancestral karyotypes, marker order
and neocentromeres. Chromosome Res 16:17–39
Svartman M, Stone G, Page JE, Stanyon R (2004) A chromosome painting test of the basal
eutherian karyotype. Chromosome Res 12:45–53
Trifonov VA, Stanyon R, Nesterenko AI, Fu B, Perelman PL, O’Brien PC, Stone G, Rubtsova NV,
Houck ML, Robinson TJ, Ferguson-Smith MA, Dobigny G, Graphodatsky AS, Yang F (2008)
Multidirectional cross-species painting illuminates the history of karyotypic evolution in
Perissodactyla. Chromosome Res 16:89–107
9 Chromosomal Evolution 157

Turner DJ, Miretti M, Rajan D, Fiegier H, Carter NP, Blayney ML, Beck S, Hurles ME (2008)
Germline rates of the novo meiotic deletions and duplications causing several genomic
disorders. Nat Genet 40:90–95
Usdin K, Grabczyk E (2000) DNA repeat expansions and human disease. Cell Mol Life Sci
57:914–931
Vallente-Samonte R, Eichler EE (2002) Segmental duplications and the evolution of the primate
genome. Nat Rev Genet 3:65–72
Waddell PJ, Shelley S (2003) Evaluating placental inter-ordinal phylogenies with novel sequences
including RAG1, gamma-fibrinogen, ND6, and mt-tRNA, plus MCMC-driven nucleotide,
amino acid, and codon models. Mol Phylogenet Evol 28:197–224
Walker EL, Robbins TP, Bureau TE, Kermicle J, Dellaporta SL (1995) Transposon-mediated
chromosomal rearrangements and gene duplications in the formation of the maize R-r
complex. EMBO J 14:2350–2363
Wicker T, Sabot F, Hua-Van A, Bennetzen JL, Capy P, Chalhoub B, Flavell A, Leroy P, Morgante
M, Panaud O, Paux E, SanMiguel P, Schulman AH (2007) A unified classification system for
eukaryotic transposable elements. Nature Rev Genet 8:973–982
Yang F, Alkalaeva EZ, Perelman PL, Pardini AT, Harrison WR, O’Brien PC, Fu B, Graphodatsky
AS, Ferguson-Smith MA, Robinson TJ (2003) Reciprocal chromosome painting among
human, aardvark, and elephant (superorder Afrotheria) reveals the likely eutherian ancestral
karyotype. Proc Natl Acad Sci USA 100:1062–1066
Yang F, Fu B, O’Brien PCM, Nie W, Ryder OA, Ferguson-Smith MA (2004) Refined genome-
wide comparative map of the domestic horse, donkey and human based on cross-species
chromosome painting: insight into the occasional fertility of mules. Chromosome Res
12:65–76
Yunis JJ, Prakash O (1982) The origin of man: a chromosomal pictorial legacy. Science
215:1525–1530
Zhao H, Bourque G (2009) Recovering genome rearrangements in the mammalian phylogeny.
Genome Res 19:934–942
158 T.J. Robinson and A. Ruiz-Herrera

Chapter 10
Mechanisms and Evolution of Dorsal–Ventral
Patterning
Claudia Mieko Mizutani and Rui Sousa-Neves
Abstract In the last two decades, a great progress has been made with the dis-
covery and understanding of conserved signaling pathways, in particular those
involved in embryonic dorsal–ventral patterning and the organization of the ner-
vous system. Remarkably, the spatial distribution of these signal molecules appears
conserved across a large group of animals that have centralized nervous systems.
Despite these achievements, there are still many unanswered questions on how the
nervous system organization evolves and responds to variations in organism size.
In this review, we discuss the progression of the field from early observations made
more than a century ago and introduce future challenges regarding the problem of
scaling of the nervous system during evolution.
10.1 Introduction
Animal development can lead to diverse life forms from a relatively limited number
of genes. A great progress to our understanding of the mechanisms of development
has been made using model organisms suitable to genetic and molecular analyses.
These model organisms are likely to continue uncovering mechanisms relevant to a
wide variety of species and of significance for human health. One example is the
conservation of the molecular components employed to differentiate neural tissues
C.M. Mizutani
Department of Biology, Case Western Reserve University, 10900 Euclid Ave, Cleveland, OH
447080, USA
Department of Genetics, Case Western Reserve University, 10900 Euclid Ave, Cleveland, OH
447080, USA
e-mail: [email protected]
R. Sousa-Neves
Department of Biology, Case Western Reserve University, 10900 Euclid Ave, Cleveland, OH
447080, USA
e-mail: [email protected]
P. Pontarotti (ed.), Evolutionary Biology – Concepts, Molecularand Morphological Evolution, DOI 10.1007/978-3-642-12340-5_10,# Springer-Verlag Berlin Heidelberg 2010
159

from epidermis and the subsequent subdivision of the nervous system into discrete
regions of gene expression. Most recently, the sequencing of several genomes and
technological advances made in the past decade brought previously intractable
organisms to scrutiny. These advances also opened the possibility to tackle ques-
tions that could not have been answered before and deserve attention. One of them
is how do organisms change over time? Another is how the body plan and organs
can be rescaled across species? Answers to these questions are essential to our
understanding of the evolution of novel body plans.
Broadly, two general mechanisms have been proposed to explain the generation
of different body plans and tissues, which in principle should apply to the dorsal–
ventral (D/V) axis formation. The first proposes that the evolution of cis-regulatory
sequences that control gene expression plays a significant role in body plan
diversity, while the second implicates the evolution of coding sequences in key
patterning genes. The first possibility has been tested by transferring previously
isolated cis-regulatory sequences from one organism to another, and assaying the
expression patterns generated by means of a reporter gene. In many cases, the
patterns of expression observed largely resemble that of the host (Kassis 1990;
Ludwig et al. 1998; Crocker et al. 2008; Liberman and Stathopoulos 2009). That is,
despite extensive modifications in regulatory sequences, the final expression pattern
resembles that of the species that implements the information rather than the donor
of these regulatory sequences. In other cases documented so far, we observe the
inverse: the patterns generated resemble those of the donor (Wittkopp et al. 2002;
Gompel et al. 2005; Crocker et al. 2008).
In addition to mutations in cis-regulatory sequences, there is also evidence that
changes in coding sequences lead to different developmental programs. One exam-
ple is the case of hybrid lethal systems, which provides an effective way of making
the development of two similar species incompatible. Such complementary lethal
genes are innocuous when present in individuals of a single species, but cause
lethality and/or sterility when combined in a hybrid between different species
(Sturtevant 1929; Yamamoto et al. 1997; Brideau et al. 2006). The molecular
identification of hybrid lethal genes isolated so far reveals that differences in the
coding sequences are responsible for the developmental incompatibilities observed.
Thus, both changes in regulatory sequences, as well as changes in coding sequences,
can lead to the generation of developmentally distinct processes and consequently
novel life forms. In addition, these results also highlight that gene networks, rather
than individual genes, are coevolving to adapt to mutations in both coding and
noncoding sequences.
In this review, we discuss the early molecular events that contribute to germ
layer specification, with an emphasis on the establishment of D/V morphogenetic
gradients that regulate patterns of neural gene expression in Drosophila. Thisproblem traces back to the nineteenth century, and recent investigation led to the
identification of key molecular players and a unifying view of neural development.
We also discuss the problem of morphogenetic scaling across species and possible
mechanisms that could explain how patterns of gene expression are reshaped in
response to size changes.
160 C.M. Mizutani and R. Sousa-Neves

10.1.1 The Unity of Plan Hypothesis and Body Axis Inversion
From humans to small bees and worms, animals exhibit complex behaviors and
social organizations generated by nervous systems of great complexity. Three
questions stand out when we observe these complex structures: (1) to what extent
different nervous systems share a similar and conserved molecular architecture; (2)
how and when did this organization arise; and (3) how do these structures evolve
and become more complex? Over the past 20 years, key findings from the field
of developmental biology have provided answers to some of these questions,
unlocking clues on the origins and evolution of the nervous system.
The advent of developmental biology as a field combining anatomy, embryology
genetics and molecular biology brought together two important discoveries sepa-
rated by a large number of years. The first one was an observation made by the
French anatomist Ethienne Goeffroy Saint-Hilaire in 1822, a proponent of the
“unity of plan” hypothesis (Geoffroy St. Hilaire 1822). Based on the anatomy of
a lobster to that of vertebrates, he suggested that invertebrates and vertebrates
shared the same elements of body construction, which could be explained by an
inversion of the embryonic D/V axis that caused the ventral position of the
invertebrate nervous system vs. a dorsal position in vertebrates. The second discov-
ery was the classical neural induction transplantation experiment carried out by
Spemann and Mangold, a century later in 1924 (Spemann and Mangold 1924).
Their experiment led to the identification of the Spemann organizer, a region of the
embryo capable of inducing surrounding cells to differentiate as neural tissue. What
are the signals released by the Organizer that result in neural induction and could
the D/V inversion be confirmed at the molecular level? Several decades had to
elapse before the answers to these questions were obtained and the final outcome of
those efforts was quite remarkable.
At the center of the mechanism of neural induction was the discovery of a gene
cassette that function antagonistically: the invertebrate genes short gastrulation(sog) and decapentaplegic (dpp) and their vertebrate counterparts BMP-4 and
Chordin (Chd). Genetic manipulations of these genes revealed that dpp/BMP-4
encodes a secreted protein belonging to the TGF-b family of transforming growth
factors (Padgett et al. 1987), which has a dual function; it signals to cells to promote
epidermal specification (Irish and Gelbart 1987; Wharton et al. 1993) and at the
same time, it blocks neural development. In vertebrates, Chd is secreted by the
Spemann organizer and it promotes neural development by blocking the BMP-4
anti-neural signal (Sasai et al. 1994). Similarly in flies, Sog is an antagonist of Dpp
and also protects the future site of neuroectoderm by binding to Dpp and preventing
it to activate its receptors (Francois et al. 1994; Biehs et al. 1996). Thus, neural
induction is achieved by a double-negative mechanism whereby neural develop-
ment is a result of repression of a repressive signal. The exciting side of this
research was that not only these long sought morphogens were finally isolated
and provided a mechanistic basis for neural induction, but also they were shown to
be completely interchangeable between vertebrates and invertebrates, and finally,
10 Mechanisms and Evolution of Dorsal–Ventral Patterning 161

their opposite expression patterns along the D/V axis were also shown to be upside-
down in these organisms (Padgett et al. 1993; Francois et al. 1994; Schmidt et al.
1995; Holley et al. 1995). That is, sog is expressed ventrally in invertebrates, whileChd is expressed dorsally, and in both cases, their expression domains demarcate
the future site of nervous system development. Together, these facts highlighted the
preceding ideas of axis inversion set forth by Saint-Hilaire and were suggestive of a
common ancestry among vertebrates and invertebrates (Arendt and Nubler-Jung
1994; De Robertis and Sasai 1996; Ferguson 1996; Bier 1997).
10.1.2 Dorsal, a Gene at Odds with the EvolutionaryConservation of D/V Patterning
Before the discovery of neural inducers, a series of studies in Drosophila demon-
strated that the early embryo is initially patterned by a ventral-to-dorsal gradient of
another protein called Dorsal, an NFk-B-related transcription factor. The Dorsal
nuclear gradient is established via a complex proteolytic cascade of exclusively
maternal information that culminates with a regulated transport of Dorsal into the
nucleus, resulting in a nuclear concentration gradient with high levels of Dorsal in
ventral most nuclei, moderate levels in lateral nuclei, and very low or absent levels
in dorsal nuclei (Roth et al. 1989; Rushlow et al. 1989; Steward 1989). Once inside
the nucleus, Dorsal can activate or repress the expression of several zygotic target
genes that implement the differentiation of the three primary germ layers of the
embryo (Ray et al. 1991; Stathopoulos et al. 2002). High levels of Dorsal activate
mesodermal genes (e.g., snail and twist) in the ventral side of the embryo, while
moderate levels activate neureoctodermal genes (e.g., sog). In contrast, Dorsal
represses ectodermal genes (e.g., dpp), and as a consequence these genes have
their expression restricted to the dorsal region of the embryo, where there are low or
undetectable levels of Dorsal (Fig. 10.1).
Even though the Dorsal gradient is crucial for defining the three primary germ
layers in Drosophila, this does not seem to represent the ancestral role of the
Dorsal/NFkB signaling pathway. Rather, Dorsal/NFkB pathway is involved in
immune response in both vertebrates and invertebrates (reviewed by Ferrandon
et al. 2007), whereas the recruitment of this signaling pathway in D/V patterning is
likely to be an innovation found in some invertebrates. One can also speculate that
the innovative role of the Dorsal gradient in D/V patterning is under a rapid process
of evolution. Recent work in divergent insect groups indicates that the mechanisms
controlling the formation of the Dorsal gradient is highly variable within insects,
possibly reflecting adaptations of this gradient to short germ band (e.g., tribolium)
vs. long germ band (e.g., flies) modes of development (Chen et al. 2000; Nunes da
Fonseca et al. 2008).
A number of studies indicate that the Dorsal gradient influences the further
subdivision of the Drosophila neuroectoderm into restricted domains of
162 C.M. Mizutani and R. Sousa-Neves

neuroectodermal gene expression, as discussed in the next section. This observation
stands in contrast to the subdivision of the neural tube in vertebrates, which
employs the morphogens BMP and Sonic Hedgehog (Shh) (Liem et al. 1995,
2000; Briscoe et al. 1999; Litingtung and Chiang 2000). Those differences led to
view that the D/V patterning of the nervous system of Drosophila and vertebrates
have arisen from completely different molecular mechanisms and may have
evolved by convergent evolution.
10.1.3 From Saint Hilaire and Spemann Toward a UnifyingMechanism for Neural Organization
Recently, research on nervous system origins has sparked another round of interest.
First, further analyses of the patterning of nervous system into organized D/V
domains of gene expression became available, along with studies of upstream
Fig. 10.1 Formation of dorsal–ventral gradients in the Drosophila embryo. (a) Scheme of an early
Drosophila embryo, in lateral view (anterior to the right). The embryo develops as a syncitium
blastoderm. Nuclei divide and migrate to the periphery of the embryo, where cellularization takes
place. (b) Dorsal–ventral gradients emanating from ventral and dorsal regions subdivide the
embryo into three primary domains that give rise to the mesoderm (MES), neuroectoderm (NE),
and ectoderm (ECT). (c and d) Cross-section view of embryo. (c) Representation of the Dpp and
Dorsal gradients. Small blue dots represent Dpp molecules that form a dorsal-to-ventral gradient in
the extracellular domain. The nuclear Dorsal gradient is represented by red colored nuclei. (d)
Expression domains of dorsal–ventral genes that elicit the differentiation of mesoderm, neuroec-
toderm, and ectoderm
10 Mechanisms and Evolution of Dorsal–Ventral Patterning 163

signaling events that generate this patterning (Mizutani et al. 2006; Mizutani and
Bier 2008). Second, experiments carried out in organisms that belong to other
phylogenetic branches, such as hemichordates, annelids, cnidarians, and sea
anemone, have served as outgroups for valuable comparative studies of nervous
system and axis formation evolution (Samuel et al. 2001; Rentzsch et al. 2006;
Lowe et al. 2006; Denes et al. 2007; Lapraz et al. 2009; Nomaksteinsky et al. 2009;
Saina et al. 2009).
The idea that the nervous system patterning predated the split between verte-
brates and invertebrates implies that a centralization and organization of the
nervous system must have originated a long time ago, an estimated time of
500–600 million years. Supporting this view, the BMP/dpp signaling pathway has
clearly emerged as a conserved pathway in all bilaterian organisms studied so far,
and in most cases it has been shown to be involved in not only nervous system
centralization, but also in its patterning (De Robertis 2008; Mizutani and Bier
2008). In the next section, we focus on the D/V subdivision of the nervous system
of Drosophila, and subsequently we discuss how morphogenetic gradients involved
in the overall D/V patterning of the primary germ layers may evolve in closely
Drosophila species. More detailed discussions on the evolution of the nervous
system have been reviewed elsewhere (Lowe et al. 2006; Mizutani and Bier
2008; Arendt et al. 2008; Holland 2009).
10.2 Neural Patterning and Specification of Neuroblasts
in Drosophila
Due to its simplicity, the ventral nervous cord of insects has served as a paradigm to
the study of differentiation of neuroblasts or neural stem cells. At early embryonic
stages, once the neural and nonneural ectodermal domains are established by the
activity of BMP/dpp and Chd/sog, the neural domain is further subdivided into
expression domains of key transcription factors that confer a unique identity to each
of the 30 neuroblasts per hemisegment that delaminate from the neuroectoderm
(reviewed in Bhat 1999; Technau et al. 2006). Each Neuroblast is committed to
generate a stereotyped neural cell lineage (Doe and Skeath 1996; Doe 1992, 2008)
after receiving “positional information” from both D/V and anterior–posterior
(A/P) expressing genes (Fig. 10.2). Information provided from the D/V axis dictates
the formation of main neural cell types, such as motorneurons, serotonergic, and
sensory neurons (Schmid et al. 1999). In the Drosophila embryo, the neural identity
genes responsible for D/V patterning are ventral nervous system defective (vnd),intermediate neuroblasts defective (ind), and muscle segment homeobox/Drop(msh/Dr), which are expressed in nonoverlapping domains. vnd is expressed in
the ventral most layer of the neuroectoderm, while ind is expressed in the interme-
diate region, and finally msh is expressed in the dorsal most region (Jimenez et al.
1995; Isshiki et al. 1997; McDonald et al. 1998; Weiss et al. 1998; Mellerick and
Modica 2002) (Fig. 10.1d).
164 C.M. Mizutani and R. Sousa-Neves

The study of nervous system patterning along the D/V axis provided additional
evidence for the common ancestry of the nervous system, since the vertebrate
homologues for vnd, ind, and msh (Nkx2.2., Gsh, and Msx) are also expressed in
the same arrangement along the D/V axis of the neural tube after it is inverted
(Valerius et al. 1995; Wang et al. 1996; Suzuki et al. 1997; Weiss et al. 1998;
Briscoe et al. 1999; Liu et al. 2004; Kriks et al. 2005). It has been shown that the
BMP signaling pathway is responsible for repressing the expression of neural
identity genes in a dosage-dependent fashion by reaching the adjacent neural
domain, such that ventrally expressing genes are more sensitive to its repression
than dorsally expressing genes are. As a result, the domains of vnd/NKx2.2. andind/Gsh are pushed away from the dorsal source of BMP secretion, while msh/Msx
domain is placed more dorsally since this gene can tolerate high levels of BMPs
before being repressed. In addition to this differential sensitivity to BMP levels,
there is also a cross-regulatory interaction among those neural identity genes that
cooperate in this patterning. Namely, they can repress each other in the ventral-
to-dorsal direction, an interaction referred to as “ventral dominance” (Cowden and
Levine 2003). Thus, vnd represses ind, while both vnd and ind repress msh expres-
sion. This same relationship also appears to be at least partially conserved in
vertebrates (Mizutani et al. 2006; Illes et al. 2009). It is noteworthy that even
though the specification of D/V neural cell types in the nervous system is also
dependent on other morphogens in vertebrates and invertebrates (i.e., Shh and
Dorsal, respectively), the BMP signaling can provide most of the information for
neural patterning in the absence of these additional cues (Jacob and Briscoe 2003;
Mizutani et al. 2006).
The findings above reconcile discrepancies found in some vertebrate and inver-
tebrate lineages of noncentralized nervous systems, which more likely represent
highly derived forms, and establish a common unifying mechanism that patterns the
Fig. 10.2 Neuroblast formation and neural determination in Drosophila. (a) Blastoderm stage
embryo. Germ layers are indicated, as well as the D/V neuroectodermal domains. (b) Mesodermal
cells invaginate, bringing the two halves of the neuroectoderm together at the ventral midline.
(c) Delamination of neuroblasts from respective neuroectodermal domains. (d) Ventral view of
neuroblast map, roughly representing the 30 neuroblasts per hemisegment. (e) Neuron types
formed along the D/V axis. Serotonergic neurons are formed in ventral region, sensory neurons
in lateral regions, and motoneurons in all three domains. Colors of neuroblasts in (d) and neurons
in (e) indicate their ventral (blue), lateral (green), and dorsal (red) identities
10 Mechanisms and Evolution of Dorsal–Ventral Patterning 165

nervous system. Further evidence of the ancestral role of BMP signaling in neural
patterning was substantiated by studies carried out in an outgroup organism, the
marine annelid Platynereis dumerilii, which belongs to the second major inverte-
brate branch of lophotrochozoa (Denes et al. 2007).
Thus, the nervous system evolution seems highly conservative and is likely to
have relied on the ancestral BMP signaling pathway to generate a similar architec-
ture of neural cell types arranged along the D/V axis for millions of years. The
picture that emerges from these studies also suggest that this ancestral signaling
cassette can be superimposed to other graded morphogenetic signals, such as Dorsal
in the case of Drosophila, and Shh in vertebrates. Remarkably, in the case of
insects, the whole system must still be able to maintain the layers of gene expres-
sion of vnd, ind, andmshwith similar number of cells. This view is supported by the
highly stereotyped neuroblast maps between divergent insects such as grasshopper,
Drosophila, and silverfish, and even more distant arthropods such as crustaceans
(Thomas et al. 1984; Doe 1992; Whitington 1996; Ungerer and Scholtz 2008).
Genetic experimentation in Drosophila has shown that alterations in the width of
expression domains of vnd, ind, and msh can lead to profound alterations of loss or
duplication of specific neuron cell types (Fig. 10.3). Even though some partial
modifications in the patterns of expression of those neural identity gene may exist,
Loss of ventral neuronsDuplication of RP2
Loss of RP2
Early NE domains
b c d
awt vnd- ind-
Late stage neurons (ventral and intermediate)
v iRP2
Fig. 10.3 Alterations in width of neuroectodermal domains lead to loss or duplications of specific
neurons. (a) Early neuroectodermal expression domains in wt and in vnd and indmutants. The vnddomain is represented in green, ind in blue, and msh in red. Position of ventral midline is indicated
by arrowhead. In vnd mutant, ind expression domain is expanded, while in ind mutant, both vndand ind are expanded. (b–d) Late stage embryos stained for even-skipped, which recognizes
neurons of ventral and intermediate fate (v and i). (b) Wild type. (c) vnd mutant displaying loss
of ventral neurons and duplication of RP2 motorneuron, an intermediate neuron. (d) ind mutant
with loss of RP2 neurons (red arrows). [(b and c) pictures were reproduced from McDonald et al.
1998. Picture in (d) was reproduced from Weiss et al 1998]
166 C.M. Mizutani and R. Sousa-Neves

as it has been reported in the bettle tribolium (Wheeler et al. 2005), in general there
seems to be a strong pressure to maintain a conserved organization of neuroblast
number and types. Therefore, it would not be surprising if there were a robust
mechanism that assures that the same number of cells is maintained in the nervous
system of insects despite their differences in embryo size.
10.3 Scaling of Germ Layers During Evolution
It seems intuitive that to understand the evolution of the nervous system, the
mechanism of scaling of animals and tissues will have to be considered. One way
to address this problem could be through the investigation of related organisms that
differ in size. If the patterning of the nervous system requires polarized morphoge-
netic signals that emanate from opposing sides of the embryo, then we might expect
that species of different embryonic sizes in which the source of morphogenetic
signals are located further apart should have variations in the organization of the
nervous system or other cell fates along the D/V axis.
Recent progress on the mechanisms of morphogenetic gradient scaling and
evolution has been made for A/P patterning in different fly species (McGregor
et al. 2001; Gregor et al. 2005, 2008; Lott et al. 2007). However, there are still a
number of gaps regarding scaling in the case of D/V patterning. For instance,
comparisons across species that differ in size using molecular markers for germ
layer domains are necessary to assess changes occurred during evolution of D/V
patterning. Also, quantitative expression profiles might resolve the question of
whether the levels of morphogens across related organisms that differ in size are
similar or significantly different. On a first estimate, divergent Drosophilids appear
to display variations in the width of peak levels of the Dorsal gradient (Crocker
et al. 2008), although a more precise quantitative measurement for those differences
is still lacking. Such comparisons are important to test the generality of predictions
made by current mathematical models based on D/V morphogenetic activity in one
species (Eldar et al. 2002; Mizutani et al. 2005; Zinzen et al. 2006; Kanodia et al.
2009) and begin elucidating the general principles that control the number of cells
allocated to particular tissue types. A better understanding of mechanisms that
govern tissue size and pattern is essential to manipulate tissue regeneration,
which is of relevance to the field of stem cell biology.
10.3.1 Investigation of Drosophila Sibling Specieswith Embryos That Vary in Size
In addition to those comparative studies, the investigation of closely related species
that can hybridize has the potential to clarify mechanisms of scaling by direct
10 Mechanisms and Evolution of Dorsal–Ventral Patterning 167

experimentation. For instance, the Drosophila D/V patterning relies on both mater-
nal (e.g., Dorsal) and zygotic (e.g., Dpp/Sog) cues that can be completely separated
by generating hybrid embryos from the cross of species that produce embryos of
different sizes (i.e., which receive maternal information exclusively from one
species and zygotic information from both parents). In this regard, the D. melano-gaster subgroup of sibling species offers unique advantages to such studies.
D. simulans and D. sechellia became separated from the ancestor of D. melanoga-ster approximately 5 million years ago. D. sechellia is believed to have differen-
tiated from D. simulans more recently in Seychelles Islands some 0.5 million years
ago (Lachaise et al. 1986). The external anatomy of those three sibling species is
very similar and the only way to reliably distinguish them is by differences in the
male genitalia and to a lesser extent by the pigmentation of the sixth abdominal
tergite in females. Both at the genomic and chromosomal levels, these species are
almost identical (Horton 1939; Lemeunier and Ashburner 1984; Clark et al. 2007).
However, D. melanogaster and D. sechellia produce eggs of considerably differentsizes (Fig. 10.4) (Lott et al. 2007), which has been shown to be genetically
determined and under little influence by environmental factors (Warren 1924).
The similarity and discrete differences among these sibling species, coupled to
the ability of hybridizing them, offer the opportunity to begin addressing the
questions raised above. When the D/V partition of these species was analyzed
using D/V markers such as snail, the larger sized embryo of D. sechellia has a
significantly wider mesoderm than D. melanogaster (Mizutani, C.M., unpublished
data). This difference in mesoderm size is remarkable, given the recent divergence
of these two species. However, it is not yet clear how the maternal gradient of
Dorsal and the zygotic Dpp gradient behave when the scale is modified to sustain
similar neuroectodermal domains. It remains to be determined if larger animals need
to produce higher levels of these morphogens or whether compensatory mechanisms
Fig. 10.4 Scaling of
neuroectodermal domains and
germ layers in Drosophilaspecies with embryos of
different sizes. (a) D. busckii.(b) D. melanogaster.(c) D. sechellia. Theneuroectodermal domains
(NE) are maintained in all
three species, but the
mesodermal domains (MES)
vary in size
168 C.M. Mizutani and R. Sousa-Neves

to circumvent variations in distance are at play. Other questions that these observa-
tions raise are whether a maternal gradient of one species can allocate the correct
number of cells per germ layer of another species, or if this process relies on zygotic
activity. As mentioned above, hybridization experiments should resolve these and
other issues regarding scaling. For instance, if only maternal cues define species-
specific D/V patterning, then hybrid embryos between those two species should
have a D/V subdivision similar to that provided by the mother of one of the species,
since information for the embryo size plus the entire machinery dedicated to
establish the Dorsal gradient are provided solely by the mother. Conversely, if
hybrid embryos displayed an intermediate D/V subdivision between two species,
then this would be indicative that zygotic determinants participate in the species-
specific partition of the germ layers. Ultimately, such experimental tests might help
define more precisely how D/V patterning evolves.
If the large embryo of D. sechellia has an increased mesoderm than D. melano-gaster, then we should expect a smaller embryo to have a narrower mesodermal
domain to compensate for the conserved size of the neuroectoderm observed in
several other insects (Whitington 1996). D. buskii lays embryos of about one third
of the size of D. melanogaster (Fig. 10.4) (Gregor et al. 2005), and indeed the
miniature embryos of this species have proportionally less mesodermal cells than
D. melanogaster and D. sechellia (Mizutani, C.M., unpublished data). Thus, this
is again in agreement that the D/V partition of the embryo should be sensitive to
the sources of morphogenetic information, distances, and consequently embryo
size. However, in contrast to the mesodermal variation, the number of cells con-
fined to the neuroectoderm is the same in all three species. Although this is
consistent with the fact that the nervous system patterning is under a strong pressure
to maintain an organization that preserves its function, the mechanisms that limit
the number of cells in the neuroectoderm cannot be explained by a D/V partition
based merely on either zygotic or maternal morphogenetic gradients. What are the
alternatives to explain this paradox? At this juncture, these observations are difficult
to reconcile and suggest we might be entering in new avenues of investigation of
evolutionary mechanisms of body plan formation. The ideas we would like to
discuss below are still highly speculative and based on a recent discovery of nuclei
movements in the Drosophila embryo.
10.3.2 Do Embryos Employ a Cell Counting Mechanism ThatCouples Nuclear Density and Morphogenetic Activity?
In general, the action of morphogenetic gradients is depicted as involving two static
cell populations: one committed to the role of sending a signal and another naıve
that receives and implements these signals. This view is convenient to establish the
differences in these two cell populations, but in living organisms, cell populations
are spatially displaced during cell divisions and morphogenetic movements. In the
10 Mechanisms and Evolution of Dorsal–Ventral Patterning 169
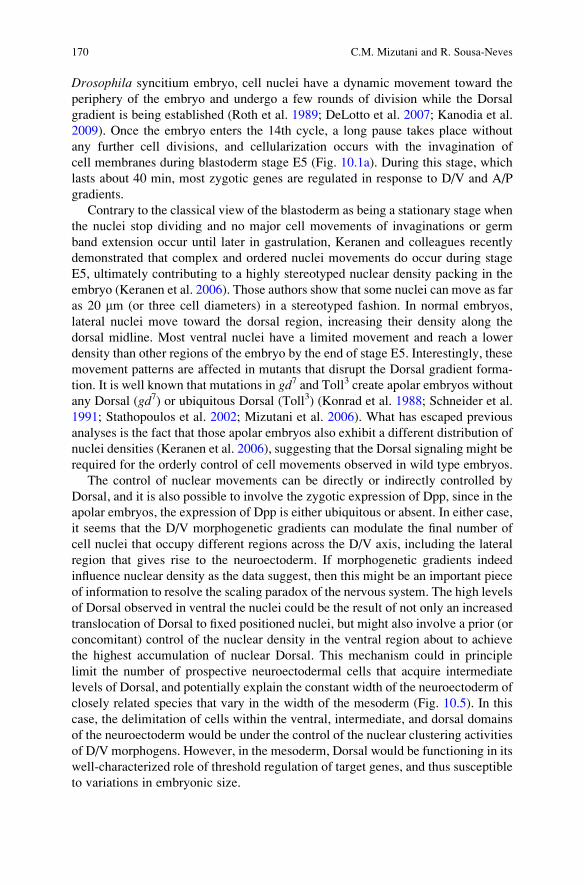
Drosophila syncitium embryo, cell nuclei have a dynamic movement toward the
periphery of the embryo and undergo a few rounds of division while the Dorsal
gradient is being established (Roth et al. 1989; DeLotto et al. 2007; Kanodia et al.
2009). Once the embryo enters the 14th cycle, a long pause takes place without
any further cell divisions, and cellularization occurs with the invagination of
cell membranes during blastoderm stage E5 (Fig. 10.1a). During this stage, which
lasts about 40 min, most zygotic genes are regulated in response to D/V and A/P
gradients.
Contrary to the classical view of the blastoderm as being a stationary stage when
the nuclei stop dividing and no major cell movements of invaginations or germ
band extension occur until later in gastrulation, Keranen and colleagues recently
demonstrated that complex and ordered nuclei movements do occur during stage
E5, ultimately contributing to a highly stereotyped nuclear density packing in the
embryo (Keranen et al. 2006). Those authors show that some nuclei can move as far
as 20 mm (or three cell diameters) in a stereotyped fashion. In normal embryos,
lateral nuclei move toward the dorsal region, increasing their density along the
dorsal midline. Most ventral nuclei have a limited movement and reach a lower
density than other regions of the embryo by the end of stage E5. Interestingly, these
movement patterns are affected in mutants that disrupt the Dorsal gradient forma-
tion. It is well known that mutations in gd7 and Toll3 create apolar embryos without
any Dorsal (gd7) or ubiquitous Dorsal (Toll3) (Konrad et al. 1988; Schneider et al.
1991; Stathopoulos et al. 2002; Mizutani et al. 2006). What has escaped previous
analyses is the fact that those apolar embryos also exhibit a different distribution of
nuclei densities (Keranen et al. 2006), suggesting that the Dorsal signaling might be
required for the orderly control of cell movements observed in wild type embryos.
The control of nuclear movements can be directly or indirectly controlled by
Dorsal, and it is also possible to involve the zygotic expression of Dpp, since in the
apolar embryos, the expression of Dpp is either ubiquitous or absent. In either case,
it seems that the D/V morphogenetic gradients can modulate the final number of
cell nuclei that occupy different regions across the D/V axis, including the lateral
region that gives rise to the neuroectoderm. If morphogenetic gradients indeed
influence nuclear density as the data suggest, then this might be an important piece
of information to resolve the scaling paradox of the nervous system. The high levels
of Dorsal observed in ventral the nuclei could be the result of not only an increased
translocation of Dorsal to fixed positioned nuclei, but might also involve a prior (or
concomitant) control of the nuclear density in the ventral region about to achieve
the highest accumulation of nuclear Dorsal. This mechanism could in principle
limit the number of prospective neuroectodermal cells that acquire intermediate
levels of Dorsal, and potentially explain the constant width of the neuroectoderm of
closely related species that vary in the width of the mesoderm (Fig. 10.5). In this
case, the delimitation of cells within the ventral, intermediate, and dorsal domains
of the neuroectoderm would be under the control of the nuclear clustering activities
of D/V morphogens. However, in the mesoderm, Dorsal would be functioning in its
well-characterized role of threshold regulation of target genes, and thus susceptible
to variations in embryonic size.
170 C.M. Mizutani and R. Sousa-Neves

10.4 Emergence of Novel Nervous System Properties
Despite Conservation in Cellular Architecture
In this review, we discussed that the organization of the nervous system is robust
and highly conservative. However, it is clear that this system finds breaches in this
robustness to create novelty. This observation is particularly pertinent in the light of
the sharp behavioral mating preferences and ecological differences that exist among
Fig. 10.5 Distribution of dorsal–ventral gradients, cell fate positions and nuclei density packing in
different Drosophila species. Graph representing Dorsal (red line) and Dpp (blue line) gradientlevels. Abscise indicates position of cell fates and gene expression domains along the D/V axis:
sna (red), vnd (blue), ind (green), msh (magenta), and dpp (yellow). Colored bar indicates nucleardensity packing (orange, low density; black, intermediate density; blue, high density). All three
species, D. melanogaster (a), D. sechellia (b), and D. busckii (c) have equally sized neuroecto-
dermal domains (vnd, ind and msh), but variable mesodermal domains (sna). Peak levels of Dorsalgradient inD. melanogaster (a) are higher than inD. sechellia (b), while the gradient is wider inD.sechellia than in D. melanogaster (Mizutani, unpublished data). One can speculate that D. busckiihas a Dorsal gradient with higher peak and narrower width than D. melanogaster (c). Nuclei
distribution for D. sechellia and D. busckii is hypothetical and takes into consideration a higher
concentration of nuclei in the ventral region in the case of D. sechellia and lower concentration in
D. busckii, in comparison to D. melanogaster. Such distribution could in principle change the finalDorsal gradient shape. Finally, another hypothetical representation is the Dpp gradient, which
would scale with size in all three species, based on models made in Xenopus (Ben-Zvi et al. 2008)
10 Mechanisms and Evolution of Dorsal–Ventral Patterning 171

theD. melanogaster sibling species (Watanabe and Kawanishi 1979; Lachaise et al.
1986). There are many alternative ways to create flexibility in nervous system
function without necessarily changing neuronal cell identities in closely related
species (reviewed in Katz and Harris-Warrick 1999). For instance, one can specu-
late that the increase in mesoderm verified in D. sechellia could lead to changes in
peripheral muscle tissue, with the consequence of modifying neural muscular
junction connections. Such modifications could in turn alter output responses
distinct from D. melanogaster in a variety of behaviors, including locomotion, or
mating courtship rituals produced by males. Indeed, the muscle of Lawrence,
responsible for wing vibration in males during courtship, has an increased number
of fibers inD. sechellia thanD. melanogaster, which could explain the difference inlove song frequencies in the two species (Orgogozo et al. 2007). Another way to
create novel behavioral functions would be through mutations in single genes that
regulate some aspect of neural physiology or response. One example is the loss of
olfactory and gustatory receptors in D. sechellia, which allowed this species to
specialize in feeding on Morinda fruit (Matsuo et al. 2007; McBride 2007). This
fruit contains toxic levels of octanol and is avoided by all other sibling species,
D. melanogaster, D. simulans, and D. mauritiana that retained these receptors.
With the sequencing of the genome of twelve Drosophila species (Clark et al.
2007), pair wise genome comparison among the D. melanogaster subgroup has
allowed the discovery of ancestral and fast-evolving alleles with predicted neural
functions, including potassium channels and additional gustatory and odorant
receptors (Sousa-Neves and Rosas, 2010).
10.5 Conclusion
The nervous system organization along the D/V axis into distinct domains of gene
expression is conserved in most bilaterian organisms and appears to rely on the
ancient BMP/dpp and Chd/sog signaling cassette. Previous work in insect embryos
has shown that this conservation can be resolved at the cellular level, since
neuroblast maps among divergent insects are very similar in terms of number and
types of cells. Evolutionary changes in embryo size must pose a tremendous
challenge to the scaling properties of morphogenetic gradients to constrain the
number of cells within these neural domains, and at the same time, novel body plans
can be created by altering the determination of other germ layers under a low
evolutionary pressure. We speculate that in addition to its traditional role in
defining cell fate and proliferation, morphogenetic gradients may also coordinate
nuclear clustering and distribution, which may function as a cell counting mecha-
nism that allocates the correct number of cells within specific dorsal–ventral
domains of embryos in Drosophilids. Future experimental and computational
modeling studies in closely related Drosophila species might reveal emerging
properties of evolutionary mechanisms of germ layer formation.
172 C.M. Mizutani and R. Sousa-Neves

References
Arendt D, Nubler-Jung K (1994) Inversion of dorsoventral axis? Nature 371:26
Arendt D, Denes AS, Jekely G, Tessmar-Raible K (2008) The evolution of nervous system
centralization. Philos Trans R Soc Lond B Biol Sci 363:1523–1528
Ben-Zvi D, Shilo BZ, Fainsod A, Barkai N (2008) Scaling of the BMP activation gradient in
Xenopus embryos. Nature 26:1205–1211
Bhat KM (1999) Segment polarity genes in neuroblast formation and identity specification during
Drosophila neurogenesis. Bioessays 21:472–485
Biehs B, Francois V, Bier E (1996) The Drosophila short gastrulation gene prevents Dpp
from autoactivating and suppressing neurogenesis in the neuroectoderm. Genes Dev 10:
2922–2934
Bier E (1997) Anti-neural-inhibition: a conserved mechanism for neural induction. Cell
89:681–684
Brideau NJ, Flores HA, Wang J, Maheshwari S, Wang X, Barbash DA (2006) Two Dobzhansky–
Muller genes interact to cause hybrid lethality in Drosophila. Science 314:1292–1295
Briscoe J, Sussel L, Serup P, Hartigan-O’Connor D, Jessell TM, Rubenstein JL, Ericson J (1999)
Homeobox gene Nkx2.2 and specification of neuronal identity by graded Sonic hedgehog
signalling. Nature 398:622–627
Chen G, Handel K, Roth S (2000) The maternal NF-kappaB/dorsal gradient of Tribolium casta-
neum: dynamics of early dorsoventral patterning in a short-germ beetle. Development
127:5145–5156
Clark AG, Eisen MB, Smith DR, Bergman CM, Oliver B, Markow TA, Kaufman TC, Kellis M,
Gelbart W, Iyer VN et al (2007) Evolution of genes and genomes on the Drosophila phylogeny.
Nature 450:203–218
Cowden J, Levine M (2003) Ventral dominance governs sequential patterns of gene expression
across the dorsal-ventral axis of the neuroectoderm in the Drosophila embryo. Dev Biol
262:335–349
Crocker J, Tamori Y, Erives A (2008) Evolution acts on enhancer organization to fine-tune
gradient threshold readouts. PLoS Biol 6:e263
De Robertis EM (2008) Evo-devo: variations on ancestral themes. Cell 132:185–195
De Robertis EM, Sasai Y (1996) A common plan for dorsoventral patterning in Bilateria. Nature
380:37–40
DeLotto R, DeLotto Y, Steward R, Lippincott-Schwartz J (2007) Nucleocytoplasmic shuttling
mediates the dynamic maintenance of nuclear dorsal levels during Drosophila embryogenesis.
Development 134:4233–4241
Denes AS, Jekely G, Steinmetz PR, Raible F, Snyman H, Prud’homme B, Ferrier DE, Balavoine G,
Arendt D (2007) Molecular architecture of annelid nerve cord supports common origin of
nervous system centralization in bilateria. Cell 129:277–288
Doe CQ (1992) Molecular markers for identified neuroblasts and ganglion mother cells in the
Drosophila central nervous system. Development 116:855–863
Doe CQ (2008) Neural stem cells: balancing self-renewal with differentiation. Development
135:1575–1587
Doe CQ, Skeath JB (1996) Neurogenesis in the insect central nervous system. Curr Opin
Neurobiol 6:18–24
Eldar A, Dorfman R, Weiss D, Ashe H, Shilo BZ, Barkai N (2002) Robustness of the BMP
morphogen gradient in Drosophila embryonic patterning. Nature 419:304–308
Ferguson EL (1996) Conservation of dorsal–ventral patterning in arthropods and chordates. Curr
Opin Genet Dev 6:424–431
Ferrandon D, Imler JL, Hetru C, Hoffmann JA (2007) The Drosophila systemic immune
response: sensing and signalling during bacterial and fungal infections. Nat Rev Immunol
7:862–874
10 Mechanisms and Evolution of Dorsal–Ventral Patterning 173

Francois V, Solloway M, O’Neill JW, Emery J, Bier E (1994) Dorsal–ventral patterning of the
Drosophila embryo depends on a putative negative growth factor encoded by the shortgastrulation gene. Genes Dev 8:2602–2616
Geoffroy St.-Hilaire E (1822) Considerations generales sur la vertebre. Mem Mus Hist Nat
9:89–119
Gompel N, Prud’homme B, Wittkopp PJ, Kassner VA, Carroll SB (2005) Chance caught on the
wing: cis-regulatory evolution and the origin of pigment patterns in Drosophila. Nature
433:481–487
Gregor T, Bialek W, de Ruyter van Steveninck RR, Tank DW, Wieschaus EF (2005) Diffusion
and scaling during early embryonic pattern formation. Proc Natl Acad Sci USA 102:
18403–18407
Gregor T, McGregor AP, Wieschaus EF (2008) Shape and function of the bicoid morphogen
gradient in dipteran species with different sized embryos. Dev Biol 316:350–358
Holland LZ (2009) Chordate roots of the vertebrate nervous system: expanding the molecular
toolkit. Nat Rev Neurosci 10:736–746
Holley SA, Jackson PD, Sasai Y, Lu B, De Robertis EM, Hoffmann FM, Ferguson EL (1995) A
conserved system for dorsal-ventral patterning in insects and vertebrates involving sog and
chordin. Nature 376:249–253Horton IH (1939) A comparison of the salivary gland chromosomes of Drosophila melanogaster
and D. simulans. Genetics 24:234–243
Illes JC, Winterbottom E, Isaacs HV (2009) Cloning and expression analysis of the anterior
parahox genes, Gsh1 and Gsh2 from Xenopus tropicalis. Dev Dyn 238:194–203
Irish VF, Gelbart WM (1987) The decapentaplegic gene is required for dorsal–ventral patterning
of the Drosophila embryo. Genes Dev 1:868–879
Isshiki T, Takeichi M, Nose A (1997) The role of the msh homeobox gene during Drosophilaneurogenesis: implication for the dorsoventral specification of the neuroectoderm. Develop-
ment 124:3099–3109
Jacob J, Briscoe J (2003) Gli proteins and the control of spinal-cord patterning. EMBO Rep
4:761–765
Jimenez F, Martin-Morris LE, Velasco L, Chu H, Sierra J, Rosen DR, White K (1995) vnd, a generequired for early neurogenesis of Drosophila, encodes a homeodomain protein. EMBO
J 14:3487–3495
Kanodia JS, Rikhy R, Kim Y, Lund VK, DelottoR Lippincott-Schwartz J, Shvartsman SY (2009)
Dynamics of the dorsal morphogen gradient. Proc Natl Acad Sci USA 106:21707–21712
Kassis JA (1990) Spatial and temporal control elements of the Drosophila engrailed gene. Genes
Dev 4:433–443
Katz PS, Harris-Warrick RM (1999) The evolution of neuronal circuits underlying species-specific
behavior. Curr Opin Neurobiol 9:628–633
Keranen SV, Fowlkes CC, Luengo Hendriks CL, Sudar D, Knowles DW, Malik J, Biggin MD
(2006) Three-dimensional morphology and gene expression in the Drosophila blastoderm at
cellular resolution II: dynamics. Genome Biol 7:R124
Konrad KD, Goralski TJ, Mahowald AP (1988) Developmental genetics of the gastrulation
defective locus in Drosophila melanogaster. Dev Biol 127:133–142
Kriks S, Lanuza GM, Mizuguchi R, Nakafuku M, Goulding M (2005) Gsh2 is required for the
repression of Ngn1 and specification of dorsal interneuron fate in the spinal cord. Development
132:2991–3002
Lachaise D, David JR, Lemeunier F, Tsacas L, Ashburner M (1986) The reproductive relationship
of Drosophila sechellia with Drosophila mauritiana, Drosophila simulans and Drosophila
melanogaster from the afro-tropical region. Evolution 40:262–271
Lapraz F, Besnardeau L, Lepage T (2009) Patterning of the dorsal–ventral axis in echinoderms:
insights into the evolution of the BMP-chordin signaling network. PLoS Biol 7:e1000248
Lemeunier F, Ashburner M (1984) Relationships within the melanogaster species subgroup of the
genus Drosophila (Sophophora). Chromosoma 89:343–351
174 C.M. Mizutani and R. Sousa-Neves

Liberman LM, Stathopoulos A (2009) Design flexibility in cis-regulatory control of gene expres-
sion: synthetic and comparative evidence. Dev Biol 327:578–589
Liem KF Jr, Tremml G, Roelink H, Jessell TM (1995) Dorsal differentiation of neural plate cells
induced by BMP-mediated signals from epidermal ectoderm. Cell 82:969–979
Liem KF Jr, Jessell TM, Briscoe J (2000) Regulation of the neural patterning activity of sonic
hedgehog by secreted BMP inhibitors expressed by notochord and somites. Development
127:4855–4866
Litingtung Y, Chiang C (2000) Specification of ventral neuron types is mediated by an antagonistic
interaction between Shh and Gli3. Nat Neurosci 3:979–985
Liu Y, Helms AW, Johnson JE (2004) Distinct activities of Msx1 and Msx3 in dorsal neural tube
development. Development 131:1017–1028
Lott SE, Kreitman M, Palsson A, Alekseeva E, Ludwig MZ (2007) Canalization of segmentation
and its evolution in Drosophila. Proc Natl Acad Sci USA 104:10926–10931
Lowe CJ, Terasaki M, WuM, Freeman RM Jr, Runft L, Kwan K, Haigo S, Aronowicz J, Lander E,
Gruber C et al (2006) Dorsoventral patterning in hemichordates: insights into early chordate
evolution. PLoS Biol 4:e291
Ludwig MZ, Patel NH, Kreitman M (1998) Functional analysis of eve stripe 2 enhancer evolution
in Drosophila: rules governing conservation and change. Development 125:949–958
Matsuo T, Sugaya S, Yasukawa J, Aigaki T, Fuyama Y (2007) Odorant-binding proteins OBP57d
and OBP57e affect taste perception and host-plant preference in Drosophila sechellia. PLoS
Biol 5:e118
McBride CS (2007) Rapid evolution of smell and taste receptor genes during host specialization in
Drosophila sechellia. Proc Natl Acad Sci USA 104:4996–5001
McDonald JA, Holbrook S, Isshiki T, Weiss J, Doe CQ, Mellerick DM (1998) Dorsoventral
patterning in the Drosophila central nervous system: the vnd homeobox gene specifies ventral
column identity. Genes Dev 12:3603–3612
McGregor AP, Shaw PJ, Hancock JM, Bopp D, Hediger M, Wratten NS, Dover GA (2001) Rapid
restructuring of bicoid-dependent hunchback promoters within and between Dipteran species:
implications for molecular coevolution. Evol Dev 3:397–407
Mellerick DM, Modica V (2002) Regulated vnd expression is required for both neural and glial
specification in Drosophila. J Neurobiol 50:118–136
Mizutani C, Bier E (2008) EvoD/Vo: the origins of BMP signalling in the neuroectoderm. Nat Rev
Genet 9:663–677
Mizutani CM, Nie Q, Wan FY, Zhang YT, Vilmos P, Sousa-Neves R, Bier E, Marsh JL,
Lander AD (2005) Formation of the BMP activity gradient in the Drosophila embryo. Dev
Cell 8:915–924
Mizutani CM, Meyer N, Roelink H, Bier E (2006) Threshold-dependent BMP-mediated repres-
sion: a model for a conserved mechanism that patterns the neuroectoderm. PLoS Biol 4:e313
Nomaksteinsky M, Rottinger E, Dufour HD, Chettouh Z, Lowe CJ, Martindale MQ, Brunet JF
(2009) Centralization of the deuterostome nervous system predates chordates. Curr Biol
19:1264–1269
Nunes da Fonseca R, von Levetzow C, Kalscheuer P, Basal A, van der Zee M, Roth S (2008) Self-
regulatory circuits in dorsoventral axis formation of the short-germ beetle Tribolium casta-
neum. Dev Cell 14:605–615
Orgogozo V, Muro NM, Stern DL (2007) Variation in fiber number of a male-specific muscle
between Drosophila species: a genetic and developmental analysis. Evol Dev 9:368–377
Padgett RW, St Johnston RD, Gelbart WM (1987) A transcript from a Drosophila pattern gene
predicts a protein homologous to the transforming growth factor-beta family. Nature
325:81–84
Padgett RW, Wozney JM, Gelbart WM (1993) Human BMP sequences can confer normal
dorsal–ventral patterning in the Drosophila embryo. Proc Natl Acad Sci USA 90:2905–2909
Ray RP, Arora K, Nusslein-Volhard C, Gelbart WM (1991) The control of cell fate along the
dorsal–ventral axis of the Drosophila embryo. Development 113:35–54
10 Mechanisms and Evolution of Dorsal–Ventral Patterning 175

Rentzsch F, Anton R, Saina M, Hammerschmidt M, Holstein TW, Technau U (2006) Asymmetric
expression of the BMP antagonists chordin and gremlin in the sea anemone Nematostella
vectensis: implications for the evolution of axial patterning. Dev Biol 296:375–387
Roth S, Stein D, Nusslein-Volhard C (1989) A gradient of nuclear localization of the dorsal protein
determines dorsoventral pattern in the Drosophila embryo. Cell 59:1189–1202
Rushlow CA, Han K, Manley JL, Levine M (1989) The graded distribution of the dorsal
morphogen is initiated by selective nuclear transport in Drosophila. Cell 59:1165–1177
Saina M, Genikhovich G, Renfer E, Technau U (2009) BMPs and chordin regulate patterning of
the directive axis in a sea anemone. Proc Natl Acad Sci USA 106:18592–18597
Samuel G, Miller D, Saint R (2001) Conservation of a DPP/BMP signaling pathway in the
nonbilateral cnidarian Acropora millepora. Evol Dev 3:241–250
Sasai Y, Lu B, Steinbeisser H, Geissert D, Gont LK, De Robertis EM (1994) Xenopus
chordin: a novel dorsalizing factor activated by organizer-specific homeobox genes. Cell
79:779–790
Schmid A, Chiba A, Doe CQ (1999) Clonal analysis of Drosophila embryonic neuroblasts: neural
cell types, axon projections and muscle targets. Development 126:4653–4689
Schmidt J, Francois V, Bier E, Kimelman D (1995) Drosophila short gastrulation induces an
ectopic axis in Xenopus: evidence for conserved mechanisms of dorsal–ventral patterning.
Development 121:4319–4328
Schneider DS, Hudson KL, Lin TY, Anderson KV (1991) Dominant and recessive mutations
define functional domains of Toll, a transmembrane protein required for dorsal–ventral polarity
in the Drosophila embryo. Genes Dev 5:797–807
Sousa-Neves R, Rosas A (2010) An Analysis of Genetic Changes during the Divergence of
Drosophila species. PloS One 5(5): e10485. doi:10.1371/journal.pone.0010485
Spemann H, Mangold H (1924) Uber induction von embryonanlagen durch implantation artfrem-
der organis atoren. W Roux’ Arch Ent Org 100:599–638
Stathopoulos A, Van Drenth M, Erives A, Markstein M, Levine M (2002) Whole-genome analysis
of dorsal–ventral patterning in the Drosophila embryo. Cell 111:687–701
Steward R (1989) Relocalization of the dorsal protein from the cytoplasm to the nucleus correlates
with its function. Cell 59:1179–1188
Sturtevant AH (1929) Contributions to the genetics of Drosophila simulans and Drosophila
melanogaster. I. The genetics of Drosophila simulans. Publs Carnegie Instn 399:1–62
Suzuki A, Ueno N, Hemmati-Brivanlou A (1997) Xenopus msx1 mediates epidermal induction
and neural inhibition by BMP4. Development 124:3037–3044
Technau GM, Berger C, Urbach R (2006) Generation of cell diversity and segmental pattern in the
embryonic central nervous system of Drosophila. Dev Dyn 235:861–869
Thomas JB, Bastiani MJ, Bate M, Goodman CS (1984) From grasshopper to Drosophila: a
common plan for neuronal development. Nature 310:203–207
Ungerer P, Scholtz G (2008) Filling the gap between identified neuroblasts and neurons in
crustaceans adds new support for Tetraconata. Proc Biol Sci 275:369–376
Valerius MT, Li H, Stock JL, Weinstein M, Kaur S, Singh G, Potter SS (1995) Gsh-1: a novel
murine homeobox gene expressed in the central nervous system. Dev Dyn 203:337–351
WangW, Chen X, Xu H, Lufkin T (1996) Msx3: a novel murine homologue of the Drosophila msh
homeobox gene restricted to the dorsal embryonic central nervous system. Mech Dev
58:203–215
Warren DC (1924) Inheritance of Egg Size in Drosophila melanogaster. Genetics 9:41–69
Watanabe TK, Kawanishi M (1979) Mating preference and the direction of evolution in drosoph-
ila. Science 205:906–907
Weiss JB, Von Ohlen T, Mellerick DM, Dressler G, Doe CQ, Scott MP (1998) Dorsoventral
patterning in the Drosophila central nervous system: the intermediate neuroblasts defectivehomeobox gene specifies intermediate column identity. Genes Dev 12:3591–3602
176 C.M. Mizutani and R. Sousa-Neves

Wharton KA, Ray RP, Gelbart WM (1993) An activity gradient of Decapentaplegic is necessary
for the specification of dorsal pattern elements in the Drosophila embryo. Development
117:807–822
Wheeler SR, Carrico ML, Wilson BA, Skeath JB (2005) The Tribolium columnar genes reveal
conservation and plasticity in neural precursor patterning along the embryonic dorsal–ventral
axis. Dev Biol 279:491–500
Whitington PM (1996) Evolution of neural development in the arthropods. Semin Cell Dev Biol
7:605–614
Wittkopp PJ, Vaccaro K, Carroll SB (2002) Evolution of yellow gene regulation and pigmentation
in Drosophila. Curr Biol 12:1547–1556
Yamamoto MT, Kamo M, Yamamoto S, Watanable TK (1997) Cytogenetic mapping of lethal
hybrid rescue gene of Drosophila simulans. Genes Genet Syst 72:297–301Zinzen RP, Senger K, Levine M, Papatsenko D (2006) Computational models for neurogenic gene
expression in the Drosophila embryo. Curr Biol 16:1358–1365
10 Mechanisms and Evolution of Dorsal–Ventral Patterning 177

Chapter 11
Evolutionary Genomics for Eye Diversification
Atsushi Ogura
Abstract There are several types of eyes in morphology such as camera eye,
compound eye, mirror eye, and single lens eye, and all the eye types have been
evolved from the same origin, the prototype eye. Even though there are conserved
genes and networks in the eye evolution, little is known about what kinds of genetic
basis have been contributed to the eye diversification. It is essential for discovering
genes for the morphological diversification to develop a platform of genomic and
transcriptomic comparison among species. We, therefore, developed microarray
that cover the genes related to development, function, and structure of molluscan
eye, as an example, for the evolutionary genomic studies.
11.1 Evolutionary Genomics for Eye Diversification
11.1.1 Evolution of the Eye
The eye is one of the most elaborate organs in animals and the study of its evolution
is of particular interest. The evolution of animal eyes has been one of the most
fundamental and classical subjects in the field of biology dating back to the time of
Darwin. However, it has been difficult to understand how this complex organ arose
simply from mutations and selections. Darwin discussed this matter in his “On the
Origin of Species by Means of Natural Selection” in a chapter titled, “Difficulties of
the Theory”, in which he wrote that “organs of extreme perfection and complica-
tion” such as the eye remained inexplicable by his theory (Darwin 1859).
A. Ogura
Division of Advanced Sciences, Ochadai Academic Production, Ochanomizu University, Ohtsuka
2-1-1, Bunkyo, Tokyo 112-8610, Japan
e-mail: [email protected]
P. Pontarotti (ed.), Evolutionary Biology – Concepts, Molecularand Morphological Evolution, DOI 10.1007/978-3-642-12340-5_11,# Springer-Verlag Berlin Heidelberg 2010
179

The evolutionary study of animal eyes was also difficult for a long time from the
viewpoint of molecular evolution and biology. There were only a few molecular
theories to link primitive eyes to the elaborate and varied eye organs commonly
seen today. It seemed that natural selection could not adequately explain the
evolutionary mechanism underlying the development of complex animal eyes.
However, studies based on basic control genes in the developmental processes in
animal eyes have revealed that there is a conserved key regulatory network repre-
sented by the Pax6 genes among almost all animals (Gehring 1996; Fernald 2000).
Even though there are no clear evolutionary tracks between the various types of
animal eyes, the evolutionary history of the eye can be explained from the con-
served molecular mechanisms. Recent studies have also reported that not only the
core gene regulatory network for eye development but also genes downstream of
the network and other peripheral genes related to the function and structure of eyes
have been conserved among animals at least since the split of bilateral animals
(Box 11.1). The origin and ancestral prototype of the eye as well as the molecular
mechanism underlying the diversification of the various eye types, however, remain
unclear.
Box 11.1
akhirin, apkc, apterous, arf4, arm, arr3, Arrestin, Ascll, ash1, ath5, Atoh4,
Atoh7, atonal, bad, BarH1, BarH2, barhl2, baz, bbs1, bbs2, bHLH, Big
brother, blimp1, blue-opsin, Bmp4, Bmp7, BRD-U, brn1, Brn3a, Brn3b,
Brother, bunched, c-kit, c-myc, calb2a, calb2b, Calphotin, CG13030, chaop-
tic, Chx10, cko, Cpsf1, crb, crb1, cre, crx, Cryba4, Cryz, cut, dachshund,
daughterless, dbx1/2, delta1, dkk1, Dlx1, Dlx2, drosocrystallin, dynein,
ectopic, eli, elk3, En-1, equarin, err2beta, ERRbeta, esrrb, Etv6, extramacro-
chaete, ey, Eya, flox, flr, Foxa2, FoxC1, FoxC2, FoxD1, FoxE3, FoxF1,
FoxG1, FoxK1, FoxL1, FoxM1, FoxN2, FoxN3, FoxN4, Foxn5, FoxO,
FoxO3, FoxP1, FoxP2, FoxP4, FoxS1, fzd4/5, gam1, gapeh, glass, gli2,
gli3, glu, hairy, Hes1, hes1, hes1, hes2, hes5, hmgb3, homothorax, Hoxb1,
Ihx, inaF, Islet-1, Jagged1, jmjd2c, jmjN/C, kif3, klingon, Krt1-12, L1cam,
lazaro, lfe1, Lhx2, Lhx9, Lmo4, lok, lozenge, lrp5, lrx3, m-opsin, mab21l1,
mab21l2, Maf, Math3, Math5, mdka, mdkb, meis2, melanopsin, mirror, Mitf,
Mmp9, Mocs3, mts, Munster, musashi, myc, nanog, ncad, ncam1, Necab2,
nestin, NeuroD, NeuroD1, ngn3, nkx2, nkx6, Nlz1, Nlz2, noggin, nohp1,
notch, nphp, nr2e1, Nr2e3, nr2f1, nr2f2, nr3b2, nrl, nrx, ocelliless, oct4, of,
onecut, opsin1, Optix, OTX1, OTX2, otx2, ovl, p27Xic1, p57kip2, par3, par6,
patj, Pax2, Pax6, pax6cre, pax7, PaxB, pebbled, peripherin, PhospholipaseD,
phyllopod, pi3p, Pias3, pikachurin, Pitx3, PNR, pp2a, pralemmin, Prep1,
prospero, Prox1, ptc, pten, Rab, RARa, RARb, RARg, rax, Rb1, recoverin,retp1, Rex1, rhodopsin, ror, rough, rpgrip1, rs1, runt, rx1, rx2, rx3, rxr, sara,
scabrous, shaven, Shh, sit, six1, six3, six6, smo, snare, so, sox1, sox11, sox2,
sox3, sox4a, sox8, sox9, SoxN, spineless, ssea-1, stardust, sufu, sufuko,
(continued)
180 A. Ogura

sumo1, syn3, tangerinA, target, tbx3, tbx5, teashirt, TFIID, TGIF, TGIF2,
timeless, tiptop, to, tramtrack, TRbeta1, TRbeta2, trp-like, trpgamma, trpm1,
tsk, tws, ubc9, vax2, vsx1, vsx2, warts, wnt, wnt2b, xhmgb3, xwnt8, zic1,
zic2, zic3
These genes were collected from NCBI and Pubmed and considered to be related to
development, structure, and function of animal eyes.
11.1.2 Origin and Prototype of the Eye
The evolution of different eye types might have occurred many times as indepen-
dent events in the lineages of different animals. However, few eyes have ever been
found as fossils because they are soft organs, thereby making it difficult to examine
the origin of animal eyes. Only in some animals, such as trilobites, the eyes consist
of calcite lenses can be fossilized. Trilobite fossils with compound eyes have been
found that date back to the early Cambrian period some 540 million years ago. This
suggests that the origin of eyes occurred before the preCambrian period. Cnidarian
is one of the most primitive animals to possess eyes, and intensive studies of the
cnidarian eye have revealed the fundamental mechanisms for eye formation and
development (Kozmik et al. 2003). Once fundamental genes for animal eyes and a
common type of photoreceptor cell were discovered to be conserved among
animals from the common origin, the evolution and diversification of different
eye types could be considered, not as independent events, but as divergent events
that originated from a prototype eye present in the ancestral species. This raises the
question as to the exact form and structure of the prototype eye. Gehring and Ikeo
have inferred a two celled prototype eye consisting of one photoreceptor cell and
one pigment cell (Gehring and Ikeo 1999). Recently, Gehring has suggested that the
eye organelle in the Protist, dinoflagellate, might be the prototype eye, and the
origin of all animals eyes (Gehring 2005). The characteristics of the prototype eye
can be estimated by a comparison of the structure and molecular basis of extant
animal eyes. The next question for researches is how various types of eyes came to
be diverged from the prototype eye.
11.1.3 Diversification of the Eye
Photoreceptors, as suggested by Salvini-Plawen and Mayr on the basis of morpho-
logical and embryological studies, have evolved independently in 40–65 different
lineages (Salvivi-Plawen and Mayr 1977). However, studies based on molecular
biology and evolution have revealed that, even though the evolutionary processes of
11 Evolutionary Genomics for Eye Diversification 181

different types of eyes seem different, the molecular basis is shared among the
various eye types and they arose by divergent evolution (Nilsson 2004; Serb and
Eernisse 2008). These phenomena have often been explained by the concepts of
convergent and divergent evolution. Convergent evolution is defined as the mecha-
nism by which similar tissue or organ structures can be evolved from different
origins or via different processes. Divergent evolution, on the other hand, is defined
as the evolutionary process in which different types of tissues and organs can be
evolved from the same origin. The camera eye of vertebrates and cephalopods, in
spite of the outward similarities, can be considered to be the result of divergent
evolution using the same gene source and genetic mechanisms (Ogura et al. 2004).
Jumping spiders also possess highly evolved camera eye like vertebrates but they
have acquired their eyes independently, which was validated by the phylogenetic
analysis (Su et al. 2007). Camera eye can be also found in more primitive species of
Cnidaria, cubozoan jellyfish (Nilsson 2004). These divergent mechanisms are the
key to explaining the diversification of not only the evolution of camera eye but also
that of various eye types.Molluscs provide one of the best targets for the study of this
topic because, even within one lineage of molluscs, all eye types can be found
(Kozmik et al. 2008). Squid and octopuses have a camera eye, the nautilus has a
pinhole eye, the scallop has a mirror eye, and the ark shell has a compound eye
(Fig. 11.1).
Fig. 11.1 Eyes of molluscs. Pictures show various types of eyes in molluscs; (a) Loligo vulgaris,a squid belonging to the family Loliginidae. (b) An eyeball extracted from Loligo. (c) Embryo of
idiosepius, pygmy squid. (d) Nautilus pompilius that has a pinhole eye. (e) Pecten yessoensis,a Japanese sea scallop that has a hundred of tiny mirror eyes
182 A. Ogura

The vertebrate camera eye was developed from the neural plate and formed an
optic vesicle, which was subsequently invaginated to form an optic cup. On the
contrary, the cephalopod camera eye developed as an evagination of the brain
leading to an invagination of the ectoderm. These differences in origin have
resulted in distinct differences in the orientation of the photoreceptor cells between
vertebrates and cephalopods, in which they face the light source in cephalopods but
face in the opposite direction in vertebrates.
The compound eye has a complex structure and is found inmany species including
Arthropoda and Mollusca. They are very different from the camera eye and consist
of hundreds of individual eyes with lenses and photoreceptors. In Drosophila, for
example, the eye primordia formed as an invagination of the embryonic ectoderm
that forms the eye imaginal disk in the larvae. During metamorphosis, the eye disk
organizes itself to form the compound eye, the photoreceptor cells of which extend
their axons backwards from the periphery to establish contact with the brain.
11.1.4 Genomic and Transcriptomic Approachesto Eye Evolution
Recent work on evolutionary genomics in various types of eyes, together with
comparative analyses of gene expression comparison among closely related spe-
cies, has led to the hypothesis of a dynamic mechanism for the diversification of
eyes (Wistow 2006; Choy et al. 2006; Bao and Friedrich 2009; Baker et al. 2009).
The advantages of these large-scale genomic and transcriptomic studies of animal
eyes are that they can trace the evolutionary process of not only the key regulatory
genes, such as Pax6, but also genes related to eye function and maintenance through
the analyses of orthologous gene sets involved in eye evolution. These advance-
ments were achieved by large-scale analyses using microarray technologies and
next generation sequencers.
Molluscs provide a good example of the application of evolutionary genomics
studies, as all eye types have evolved in one lineage. It is essential to identify the
genes responsible for the morphological diversification so as to allow the develop-
ment of a platform for the comparison of gene expression among species. In this
example, a microarray that covers the genes related to the development, function,
and structure of the molluscan eye was developed by constructing full-length cDNA
libraries for the octopus, nautilus, scallop, and two squid species (Fig. 11.2). This
strategy provides comparative genomic and transcriptomic approaches to the
molecular mechanism for diversification in the molluscan eye. The Molluscan
Eye Array, based on the above microarray, is designed for the comparative gene
expression analysis of the molluscan eye with genes expressed in eye of loligo,
octopus, nautilus, and pecten, as well as genes known to be expressed in vertebrate
eyes, and genes expressed in the idiosepius, the pygmy squid, and brain. We have
designed conserved regions of the genes for the microarray probes to detect the
gene expression of orthologous genes.
11 Evolutionary Genomics for Eye Diversification 183

As a result of the Molluscan Eye Array experiments using RNA samples from
the adult eye of the idiosepius, nautilus, and pecten, we could estimate the genes
expressed differentially among species that played an important role in the diversi-
fication of eye structure. More than 88% of the probe designed from the same
species tested in the experiment could be identified as expressed genes, and
10–30% of the probes could be detected by the RNA samples of different species
that were unknown transcripts ever (Fig. 11.3a). To validate the reliability of
interspecies array, we have tested gene expression of Pax6 in idiosepius with the
probe designed from zebrafish Pax6 gene and confirmed its expression by in situ
hybridization.
Next, to distinguish the stage-specific and camera eye-specific expression of eye
genes in cephalopods, we used RNAs from three different embryonic stages of the
pygmy squid eye for the array. We found that 2,893 genes are expressed in the squid
embryonic eye but not in the eyes of nautilus or pecten. Only 269/2,893 (9.3%)
genes were adult-specific expression in the idiosepius. In addition, 634/2,893 genes
are commonly observed in the gene expression databases of vertebrate eye and
retina (Fig. 11.3b). These results show that this approach provides an efficient
platform and database for searching candidate genes involved in camera eye
acquisition.
Furthermore, expression diversities of eye-related genes in molluscs were exam-
ined by calculating how much genes were shared to be expressed among species.
Pecten shows lower gene expression diversity comparing with squid and nautilus
statistically (Fig. 11.3c). This result indicates that pecten tended to conserve
commonly used genes since the last common ancestor of mollusca and not to
acquire novel gene much more than other molluscs. Cephalopods, on the other
Fig. 11.2 Scheme of Molluscan Eye Array design was illustrated. Eyeballs of five different
species, loligo, idiosepius, octopus, nautilus, and pecten, were extracted and used for the construc-
tion of cDNA libraries
184 A. Ogura

hand, tended to acquire lineage-specific genes in relation to the evolution of camera
eye structure, which makes their expression diversities higher than pecten.
Thus, evolutionary genomic and transcriptomic approaches might contribute to
the elucidation of the diversification mechanisms of animal eyes by searching
common and unique genes in the developmental processes and eye structures.
References
Baker RH et al (2009) Genomic analysis of a sexually-selected character: EST sequencing and
microarray analysis of eye-antennal imaginal discs in the stalk-eyed fly Teleopsis dalmanni
(Diopsidae). BMC Genomics 10(1):361
Bao R, Friedrich M (2009) Molecular evolution of the Drosophila retinome: exceptional gene gain
in the higher Diptera. Mol Biol Evol 26(6):1273–1287
Fig. 11.3 Characteristics of eye gene expressions in molluscs were shown in the figure. (a)
Proportions of probes designed from idiosepius, nautilus, and pecten hybridized that were detected
as expressed genes in the three Molluscan Eye Array experiments, idiosepius mRNA, nautilus
mRNA, and pecten mRNA were indicated. (b) Squid camera eye-specific genes were estimated by
comparing mRNA expression in the Molluscan Eye Array. (c) Species-specific expressions
represent exclusive gene expression in a particular species, and conserved expressions represent
gene expression that were observed in more than one species
11 Evolutionary Genomics for Eye Diversification 185

Choy KW et al (2006) Genomic annotation of 15, 809 ESTs identified from pooled early gestation
human eyes. Physiol Genomics 25(1):9–15
Darwin (1859) On the Origin of Species by Means of Species
Fernald RD (2000) Evolution of eyes. Curr Opin Neurobiol 10(4):444 – 450
Gehring WJ (1996) The master control gene for morphogenesis and evolution of the eye. Genes
Cells 1:11–15
Gehring WJ (2005) New perspectives on eye development and the evolution of eyes and photo-
receptors. J Hered 96(3):171–184
Gehring WJ, Ikeo K (1999) Pax 6: mastering eye morphogenesis and eye evolution. Trends Genet
15(9):371–377
Kozmik Z et al (2003) Role of Pax genes in eye evolution: a cnidarian PaxB gene uniting Pax2 and
Pax6 functions. Dev Cell 5(5):773–785
Kozmik Z et al (2008) Assembly of the cnidarian camera-type eye from vertebrate-like compo-
nents. Proc Natl Acad Sci USA 105(26):8989–8993
Nilsson DE (2004) Eye evolution: a question of genetic promiscuity. Curr Opin Neurobiol 14(4):
407–414
Ogura A et al (2004) Comparative analysis of gene expression for convergent evolution of camera
eye between octopus and human. Genome Res 14(8):1555–1561
Salvivi-Plawen LV, Mayr E (1977) On the evolution of photoreceptors and eyes. Evol Biol
10:207–263
Serb JM, Eernisse DJ (2008) Charting evolution’s trajectory: using molluscan eye diversity to
understand parallel and convergent evolution. Evol Educ Outreach 1(4):439–447
Su KF et al (2007) Convergent evolution of eye ultrastructure and divergent evolution of vision-
mediated predatory behaviour in jumping spiders. J Evol Biol 20(4):1478–1489
Wistow G (2006) The NEIBank project for ocular genomics: data-mining gene expression in
human and rodent eye tissues. Prog Retin Eye Res 25(1):43–77
186 A. Ogura

Chapter 12
Do Long and Highly Conserved Noncoding
Sequences in Vertebrates Have Biological
Functions?
Yoichi Gondo
Abstract Vertebrate genomes consist of only a small fraction of protein-coding
sequences with vast majority of repetitive and nonrepetitive noncoding sequences.
Based on the completion of whole genome sequencing including human, it has
become possible to characterize the genomic structure directly at the DNA sequence
level.With the first approximation of the functional portion of the genome to be highly
evolutionary conserved, comparative genomics with bioinformatics and experimental
tools are now revealing the details of each element in the genome. In this chapter,
recent efforts to extract highly conserved sequences are reviewed with particularly
focusing on noncoding and nonrepetitive human and rodent genomes. Strikingly,
extracted highly conserved sequences in noncoding sequences exhibit much higher
conservation in many vertebrate genomes but not in other invertebrate species than
actually functional protein-coding sequences do. Some testable working hypotheses
to maintain such highly conserved sequences are also reviewed and discussed.
Abbreviations
LINE Long interspersed elements
SINE Short interspersed elements
UTR Untranslated region
SNP Single nucleotide polymorphism
CNG Conserved non-genic sequence
UCE Ultraconserved element
POLA DNA polymerase alpha catalytic subunit gene
LCNS Long conserved noncoding sequence
Y. Gondo
Mutagenesis and Genomics Team, RIKEN BioResource Center, 3-1-1 Koyadai, Tsukuba
305-0074, Japan
e-mail: [email protected]
P. Pontarotti (ed.), Evolutionary Biology – Concepts, Molecularand Morphological Evolution, DOI 10.1007/978-3-642-12340-5_12,# Springer-Verlag Berlin Heidelberg 2010
187

HNRNPD Heterogeneous nuclear ribonucleoprotein D
HNRPDL Heterogeneous nuclear ribonucleoprotein D-like
KO Knockout
12.1 Introduction
Most of higher eukaryotes contain noncoding sequences in the genome. Classically,
the DNA reassociation kinetics analyses by using the self-hybridization of frag-
mented genomic DNA, called Cot curve analysis, experimentally revealed that
significant portions of higher eukaryotes encompassed various types of repetitive
sequences (e.g., Britten and Kohne 1968; Wetmur and Davidson 1968).
The gene-coding sequences were also estimated by various methods including
RNA–DNA reassociation kinetics or Rot curve analysis. For instance, the complex-
ity of RNA expression was studied by RNA–DNA association kinetics (Chikaraishi
et al. 1978). They found that a unique fraction (31.2%) of rat genomic DNA was
found in nuclear RNA of the rat brain and exhibited the highest RNA complexity
among various tested rat tissues. Based on the average length of the rat nuclear
RNA (4,500 nucleotides) (Bantle and Hahn 1976) and finding that two-thirds (4,500
nucleotides) (1.9 Gb) of the rat genome are unique sequences, Chikaraishi et al.
(1978) estimated that the total number of rat gene was 130,000.
Based on the spontaneous mutagenesis studies of viability polygenes inDrosoph-ila melanogaster, Mukai (1978) suggested that most of the functional mutations
affecting viability polygenes occurred in noncoding sequences. He and others esti-
mated the spontaneous mutation rate of viability polygenes on the second chromo-
some ofD. melanogaster to be at least 0.14 per generation (Mukai 1964; Mukai et al.
1972; Ohnishi 1977). Estimating the number of the protein-coding genes on the
second chromosome to be 2,200 based on the “one-band one-gene hypothesis” (Judd
et al. 1972) and the average spontaneous mutation rate per protein-coding gene per
generation to be�10�5 or less, Mukai (1978) calculated the total mutation rate of the
protein-coding genes on the second chromosome to be 0.022 per generation, which
could explain at most 16% (¼022/0.14) of the mutations of viability polygenes.
Based on these considerations,Mukai (1978) concluded that most (>84%)mutations
affecting viability polygenes occurred in noncoding sequences.
Since the completion of the human genome project (International Human
Genome Sequencing Consortium 2001), it has become possible to identify the
genomic structure directly at the level of the DNA sequence. Bioinformatics and
various software programs have been developed not only to detect repetitive
sequences but also to identify and predict known and unknown protein-coding
sequences in whole genomic DNA sequences. Functional genomicists are now
working to reveal the biological functions of protein-coding as well as noncoding
sequences.
188 Y. Gondo

12.2 Genomic Structure of Human and Mammalian Genome
The initial analysis by the International Human Genome Sequencing Consortium
(2001) revealed that the interspersed repetitive sequences of long interspersed
elements (LINEs), short interspersed elements (SINEs), retrovirus-like elements,
and DNA transposon fossils occupied 21, 13, 8, and 3% of the human genomic DNA
sequences, respectively. In short, interspersed repetitive sequences comprise
45% of the human genome. In consideration of the amount of chromosomal dupli-
cations (3.6%) and other repetitive elements, repetitive sequences were expected to
occupy at least 50% of the human genome. Additionally, the total number of
protein-coding gene in the draft human genome sequence was estimated to be
30,000–35,000, with an average coding length of �1,400 bp (International Human
Genome Sequencing Consortium 2001).
After completing the euchromatic sequencing of the human genome, the Interna-
tional Human Genome Sequencing Consortium (2004) reported the size of the human
genome to be 3.08 Gb, with the total finished sequences of 2.85 Gb and estimated
total gaps of 0.23 Gb. They estimated�28Mb of the gaps as euchromatic, concluding
that the total euchromatic human genome was thus 2.88 Gb. Coding sequences were
estimated to be �1.2% of the euchromatic genome or �34 Mb in total. Based on the
number of protein-coding genes in the human genome (�25,000), the average length
of the protein-coding sequence was expected to be �1,400 bp.
Based on the subsequent DNA sequencing of whole genomes of mouse and other
mammals, mammalian genomes were found to have a similar structure to the
human genome (Fig. 12.1) (e.g., International Mouse Sequencing Consortium
2002). As a rough approximation, 1.2–1.5% coding sequences in which
C
R1
R2
R3
R4R5
N
Fig. 12.1 Composition of human genome deduced from the analysis of whole genomic DNA
sequence. International Human Genome Sequencing Consortium (2001) depicted that the portion
of protein-coding sequences (C) is only 1.2–1.5% of the genome. Roughly a half of the genomic
sequences are various classes of repetitive sequences: R1, LINEs; R2, SINEs; R3, retrovirus-like
elements; R4, DNA transposon fossils and R5, other repetitive elements. Another �half of the
genome consists of noncoding and nonrepetitive sequences (N)
12 Do Long and Highly Conserved Noncoding Sequences in Vertebrates 189

approximately 25,000–30,000 genes are coded in the 3 Gb of the mammalian
genome, although the size of the euchromatic mouse genome was estimated
to be �2.5 Gb and significantly smaller (International Mouse Sequencing Consor-
tium 2002).
12.3 Noncoding Sequences in Mammalian Genome
Most (98–99%) of the mammalian genomic sequence is, therefore, noncoding.
Repetitive and nonrepetitive sequences each occupy roughly half of the mammalian
genome. The biological functions of repetitive as well as non-repetitive noncoding
sequences in the genome remain to be elucidated. As an alternative, the “junk DNA”
hypothesis has been raised that most of the noncoding DNAs may not have any
biological functions (e.g., Nowak 1994). Nonfunctional genomic DNA sequences are
expected to have a fast base-substitution rate in the course of evolution due to a lack
of evolutionary constraints that would eliminate detrimental base substitutions. For
instance, genomic noncoding sequences such as pseudogenes, introns, untranslated
regions (UTR) of mRNA, and intergenic sequences, assumed to be less functional
sequences than protein-coding sequences, usually have more single nucleotide poly-
morphisms (SNPs) within species and exhibit higher divergence between the homo-
logs among various species than the protein-coding sequences do. In turn, the degree
of homology detected by aligning the syntenic sequences between different species
has been used to find protein-coding sequences and functional regulatory elements
(reviewed by O’Brien et al. 1999). For instance, sequences that are more than 80%
similar between human and rodents are empirically recognized as good candidates for
protein-coding sequences and/or functionally constrained parts of the genome. The
overall similarity between human and mouse genome was estimated to be 66.7%
(International Mouse Sequencing Consortium 2002).
12.4 Conserved Noncoding Sequences
The human genome project and following whole genome sequencing of various
species have also allowed us to conduct more precise alignment and comparison of
genomic DNA sequences. Also, various conserved sequences have been identified
not only in protein-coding sequences but also in noncoding fractions of the
genome. For the first time, the capacity to search such highly conserved noncoding
sequences in a large scale between vertebrate species became available when the
whole mouse genomic sequence was released. The initial publication of the whole
mouse genome sequence (Mouse Genome Sequencing Consortium 2002)
described the comparison of whole genomic sequences between human and
mouse. Approximately, 5% of the 50–100 bp windows in the human genome
was conserved in the mouse genome. Since protein-coding sequences comprise
1.5% of the genome at most, the noncoding portion of the identified conserved
190 Y. Gondo

sequences is 3.5% or more in the human genome. Dermitzakis et al. (2002) in the
same issue of Nature reported more extensive searches focusing on the human
chromosome 21. They searched �100 bp with �70% identical sequences between
human chromosome 21 and syntenic mouse sequences after masking the repetitive
sequences. By further eliminating known coding sequences, Dermitzakis et al.
(2002) finally obtained 2,262 of conserved nongenic sequences (CNGs). They
further analyzed 220 CNG in 20 mammalian species and found that CNGs are
more conserved than protein-coding sequences and noncoding RNAs (Dermitzakis
et al. 2003). Indeed, approximately 80% similarity in the protein-coding genomic
sequences is high enough to keep the 100% identity of the amino acid sequence in
the protein. Because of the degeneracy of the genetic code, base-substitutions
between purines (A<>G) and pyrimidines (T<>C) do not change the coded
amino acid residue except three cases out of the 64 codons. Thus, to have more
than 90% homologies in any two sequences in a significant stretch, there must be
some mechanism(s) to maintain or create such long conserved sequences other
than to maintain the protein function.
12.4.1 Ultraconserved Elements
Bejerano et al. (2004) expanded the extraction of such highly conserved sequences
to the whole genomes of human, mouse and rat with more stringent condition of
�200 bp in length with 100% identity. They found 481 ultraconserved elements
(UCEs). Most of the UCEs are also conserved in many vertebrate species. For
instance, 477, 467, and 324 UCEs exhibited averages of 99.2, 95.7, and 76.8%
identities in dog, chicken, and fugu fish genomes, respectively (Bejerano et al.
2004). The distribution frequencies of SNPs were also analyzed within human and
chimp populations. Comparing to the distribution frequencies of SNPs in entire
genomes, Bejerano et al. (2004) found 20-fold fewer SNPs in the UCEs from both
genomes.
Bejerano et al. (2004) also analyzed the 481 UCEs with respect to their genomic
neighborhood. UCEs were found in both exons (111) and non-exons (256). The
remaining 114 UCEs were unknown in terms of this definition. Nonexonic UCEs
are further classified to 100 intronic UCEs and 156 intergenic UCEs. Thus, at least,
211 UCEs, which were exonic and intronic, were clearly transcribed. Nonexonic
UCEs tended to cluster in gene deserts. Further analysis of UCE locations suggested
that exonic UCEs were likely to exist close to known RNA regulating genes
whereas intergenic nonexonic UCEs had a tendency to flank genes for regulation
of transcription, DNA binding, and development. Intronic UCEs were also often
found in development-related genes. The longest UCEs (779, 770, and 731 bp) were
clustered in introns of the DNA polymerase alpha catalytic subunit gene (POLA)on the X chromosome. Particularly, the 779 bp UCE was adjacent to another
275 bp UCE, comprising a total of 1,046 bp highly conserved sequence (Bejerano
et al. 2004).
12 Do Long and Highly Conserved Noncoding Sequences in Vertebrates 191

12.4.2 Long Conserved Noncoding Sequences
12.4.2.1 Discovery of LCNS
Just after the completion of whole mouse genome sequencing (Mouse Genome
Sequencing Consortium 2002), we have independently started genomewide extrac-
tions of highly conserved noncoding sequences between human and mouse (Sakuraba
et al. 2008). We firstly masked not only repetitive sequences but also all the protein-
coding sequences from human and mouse genomes, thereby extracting only, non-
coding and nonrepetitive portion of each genome. Then highly homologous
sequences of�500 bp in length and�95% identity were extracted by BLAST search
between the human and mouse nonrepetitive noncoding sequences. The human and
mouse genomic sequence databases have been updated many times. In response, we
conducted the extraction of highly conserved noncoding/nonrepetitive sequences
three times during 2002–2007 (Sakuraba et al. 2008). A total of 611 long conserved
noncoding sequences (LNCS) were found. We did not consider synteny when we
conducted the extraction of LNCS. Nevertheless, the LCNS pairs were syntenic
(Sakuraba et al. 2008).
12.4.2.2 Similarity among 611 LCNS
In spite of the repeat masking, minor duplications may exist in the extracted LCNS.
We conducted BLAST search for each LCNS to the other and found that six LCNS
pairs exhibited some similarity (Sakuraba et al. 2008). The result is summarized in
Table 12.1. Four pairs (LCNS 504 and 719, LCNS744 and 767, LCNS 596 and 835
and LCNS 541 and 788) had 85–92.2% similarity but were rather short stretch of
84–294 bp. Each LCNS of the 4 pairs was located on separate chromosomes.
The LCNS501 and 503 pair were very similar (90.5%) in short length (63 bp) but
they were located very close to each other on the same chromosome in human
(chromosome 4) as well as in mouse (chromosome 5). LCNS501 and 503 were
found in an intron of the heterogeneous nuclear ribonucleoprotein D (HNRNPD)and heterogeneous nuclear ribonucleoprotein D-like (HNRPDL) genes, respec-
tively. Thus, LCNS501 and 503 seemed to be a part of the intrachromosomal
duplication around the HNRNPD and HNRPDL genes. Since this structure is the
same in the mouse (Hnrnpd gene and Hnrpdl genes on mouse chromosome 5), the
duplication for these paralogs seems to have occurred before the divergence
between human and mouse lineages. Then, mutations may have accumulated to
reduce the similarity to 90.5% in 65 bp. However, the orthologs are extremely
similar (95.7% and 97.1%) in very long stretch of 580 and 686 bp in LCNS501 and
503, respectively (Table 12.1) so they were extracted as one LCNS. It may be
possible to explain the huge difference in similarity between orthologs and paralogs
as follows. The intrachromosomal duplication around the ancestral HNRNPD gene
occurred long time before the common ancestor of human and mouse appeared and
the paralogous sequences accumulated many mutations. On the other hand,
192 Y. Gondo

Table
12.1
Six
pairs
ofLCNSwithsequence
similarity
Conservation
Length
aSim
ilarity
Human
(hg18)
Mouse
(mm9)
LCNSI.D.
Length
a%
Identity
Chr.
Start
End
Chr.
Start
End
242
504
98.6
133
85.0%
chr8
37,357,379
37,357,882
chr8
27,787,978
27,788,481
352
719
95.3
chr10
77,076,129
77,076,843
chr14
23,017,453
23,018,171
259
744
97.8
294
92.2%
chr16
53,780,778
53,781,520
chr8
95,069,373
95,070,116
580
767
98.0
chr5
3,565,400
3,566,166
chr13
72,166,145
72,166,910
269
596
99.7
84
90.5%
chr3
138,466,129
138,466,724
chr9
100,171,994
100,172,686
610
835
95.4
chr13
94,416,647
94,417,478
chr14
118,834,842
118,835,707
289
541
95.4
104
90.5%
chr2
58,711,520
58,712,060
chr11
25,908,519
25,909,051
340
788
95.3
chr14
96,500,728
96,501,514
chr12
107,367,078
107,367,862
501
580
95.7
63
90.5%
chr4
83,494,858
83,495,432
chr5
100,390,903
100,391,482
503
686
97.1
chr4
83,565,412
83,566,096
chr5
100,464,327
100,465,010
522
1,023
95.9
1,019
90.5%
chrX
41,093,072
41,094,094
chr6
102,886,532
102,887,550
654
1,061
97.2
chrX
41,093,034
41,094,094
chrX
12,869,761
12,870,815
Six
pairs
outof611LCNShad
somesequence
similarityandareshownin
pairw
ise
aLength
isin
bp
12 Do Long and Highly Conserved Noncoding Sequences in Vertebrates 193

mutations were hardly accumulated in these syntenic regions after the human and
mouse speciated so that the LCNS501 and 503 were highly conserved. It, however,
does not explain why only the LCNS501 and 503 were conserved but the flanking
syntenic regions had diverged between human and mouse. It may be because of the
evolutionary constraint against very functional sequences of LCNS501 and 503 and
will be discussed furthermore in Sect. 12.5.
The LCNS522 and 654 were another peculiar pair. They showed much longer
homology of 1,019 bp with 90.5% similarity compared with the other five LCNS
pairs (Table 12.1). LCNS 522 and 654 located on the different chromosomes in the
mouse but they were almost the same stretch on human X chromosome. In other
words, LCNS522 and 654 were one identical sequence in human but duplicated
interchromosomally in the mouse genome. Thus, strictly speaking, human and
mouse have 610 and 611 LCNS, respectively.
12.4.2.3 Comparison of LCNS with UCE
We compared the contents of 611 LCNS with the 481 UCE (Bejerano et al. 2004),
since the total extracted numbers of the conserved elements in the two independent
studies were quite similar in spite of different extraction criteria. The result is
summarized in Fig. 12.2. As depicted, 138 (23%) LCNS and 150 (31%) of UCE
overlap. LCNS are longer than UCEs by definition and 12 LCNS indeed encom-
passed two different UCEs. Another new set of 473 LCNS, independent from the
UCEs was, therefore, found (Sakuraba et al. 2008); Bejerano et al. (2004) extracted
the 481 UCEs with whole genome comparison including protein-coding as well as
repetitive sequences. Thus, 69 and 9 UCE overlap protein-coding and repetitive
sequences, respectively (Fig. 12.2), which were naturally different from the 611
LCNS. In addition, the 138 LCNS that contained one or two UCEs had extra
sequences that did not overlapped any UCEs. Such nonoverlapping portions of
the 138 LCNS to UCE were also newly identified highly conserved noncoding/
nonrepetitive sequences. It may be noteworthy that no UCEs were identified on
human chromosome 21 (Bejerano et al. 2004); on the other hand, we found three
473138
253
611 LCNS481 UCE
150
699
Fig. 12.2 Sequence
comparison between 611
LCNS and 481 UCE. In
addition to the 481 UCE, 473
additional LCNS were
discovered as highly
conserved elements in
vertebrates. NonUCE-
overlapping sequences in 138
LCNS that contained a part of
a UCE are also newly added
highly conserved sequences
194 Y. Gondo

LCNS on human chromosome 21 in the syntenic region to mouse chromosome 16
(see Supplementary Table 1 of Sakuraba et al. 2008).
12.4.2.4 Length, Identity, and Location of LCNS
Some characteristics of LCNS length and identity are summarized in Tables 12.2
and 12.3. Naturally, the length of LCNS was much longer than UCE. Table 12.2
depicted top 20 largest and 19 shortest LCNS whose mean identities were 96.1% in
both. The longest LCNS146 was 1,865 bp with 95.1% identity, barely satisfying the
similarity criterion. The second longest LCNS572, however, exhibited 98.0%
identity in the stretch of 1,768 bp. Forty-five LCNS were longer than 1,000 bp.
The mean and median lengths of 611 LCNS were 685 and 636 bp, respectively. The
20 most and least similar LCNS are also described in Table 12.3, the mean lengths
of which were 617 and 627 bp, respectively. The mean and median identities of 611
LCNS are 95.6 and 96.2%, respectively.
The locations of LCNS were classified as UTR, intronic, or intergenic
(Table 12.4 and Sakuraba et al. 2008) as done by Bejerano et al. (2004). We
eliminated protein-coding exons but kept UTR and still 22 (3.6%) of LCNS were
found in 50 or 30 UTRs. A large fraction of LCNS located in intron and more than
half (55.3%) were found in intergenic region often distant from nearby genes. Two
hundred and seventy nine LCNS were more than 10 kb distant from the closest
gene. In spite of the intrinsic differences of length and homology, overall location
was quite similar between LCNS and UCE. The LCNS were also clustered as the
case for UCE (see Fig. 1 of Sakuraba et al. 2008). As shown above, LCNS located
all chromosomes including human chromosome 21 except Y chromosome. The
distribution of LCNS varies. For instance, human chromosome 2 carries more than
2-folds of LCNS than average. Mouse chromosome 2 that is mostly syntenic to
human chromosome 2 also had 2 - 3 folds enriched with LCNS than average.
Contrarily, the number of LCNS on human chromosome 12, 21, 22, and Y and
mouse chromosome 10, 15, 16, and Y were extremely underrepresented (Sakuraba
et al. 2008).
Another key similarity of LCNS to UCE was the degree of conservation in the
other species. The 611 LCNS were surveyed in genomic DNA database of dog,
chicken, frog, fugu, tetraodon, and zebrafish in which 606, 493, 397, 82, 58, and 83
LCNS were identified, respectively. Three invertebrate species (Ciona intestinalis,Ciona savignyi, and Drosophila melanogaster) were also surveyed but no LCNS
homologs were found. Interestingly, the degree of conservation of LCNS in verte-
brate species was more or less inversely proportional to the evolutionary distance.
Not only the number of LCNS identified in the six vertebrate species but also the
average identities were negatively correlated to the evolutionary distance. The
average identities of LCNS located in dog, chicken, frog, fugu, tetraodon, and
zebrafish genomes were 95.6%, 94.1%, 91.6%, 90.8%, 90.9%, and 90.8%, respec-
tively (Sakuraba et al. 2008).
12 Do Long and Highly Conserved Noncoding Sequences in Vertebrates 195

Table
12.2
Twenty
longestandnineteenshortestLCNS
I.D.
Conservation
Human
(hg18)
Mouse
(mm9)
Length
a%
Identity
Chr.
Start
End
Chr.
Start
End
Location
Distance
b
LCNS146
1,865
95.1
chr6
99,531,674
99,533,530
chr4
22,228,018
22,229,881
Intergene
>10kb
LCNS572
1,768
98.0
chr14
25,985,222
25,986,988
chr12
47,799,178
47,800,939
30 U
TR
LCNS230
1,722
96.9
chr19
35,532,814
35,534,534
chr7
38,435,408
38,437,128
Intron
LCNS076
1,548
95.5
chr2
156,292,959
156,294,493
chr2
56,308,034
56,309,578
Intergene
>100kb
LCNS033
1,473
95.1
chr10
23,526,498
23,527,964
chr2
19,372,376
19,373,845
Intergene
�10kb
LCNS200
1,436
95.1
chr1
91,071,304
91,072,739
chr5
106,987,921
106,989,346
Intergene
>10kb
LCNS557
1,359
96.2
chr6
86,377,974
86,379,319
chr9
88,347,742
88,349,092
30 U
TR
LCNS440
1,291
97.4
chrX
24,825,753
24,827,039
chrX
90,654,218
90,655,508
Intron
>10kb
LCNS577
1,282
95.2
chr14
25,983,926
25,985,203
chr12
47,797,882
47,799,156
30 U
TR
LCNS334
1,257
95.1
chr14
35,884,301
35,885,557
chr12
57,488,091
57,489,341
Intergene
>10kb
LCNS478
1,253
97.2
chr3
159,508,610
159,509,860
chr3
66,995,021
66,996,272
Intron
>10kb
LCNS050
1,250
96.2
chr2
143,820,605
143,821,853
chr2
43,833,513
43,834,757
Intron
>10kb
LCNS583
1,232
96.4
chr5
91,478,639
91,479,869
chr13
80,139,355
80,140,585
Intergene
>100kb
LCNS639
1,219
95.1
chr10
103,201,169
103,202,380
chr19
45,520,854
45,522,070
Intron
>10kb
LCNS111
1,213
95.4
chr2
176,462,362
176,463,573
chr2
74,328,073
74,329,285
Intergene
>10kb
LCNS482
1,202
97.6
chr3
159,258,850
159,260,050
chr3
66,739,049
66,740,249
Intergene
>10kb
LCNS632
1,195
96.4
chr18
70,637,515
70,638,707
chr18
84,583,528
84,584,719
Intron
>10kb
LCNS316
1,185
96.6
chr14
28,928,655
28,929,832
chr12
51,220,916
51,222,097
Intergene
>100kb
LCNS474
1,180
96.4
chr1
97,051,832
97,053,011
chr3
119,421,838
119,423,010
Intergene
�10kb
LCNS364
1,162
95.7
chr14
56,126,548
56,127,704
chr14
49,075,805
49,076,962
Intron
LCNS181
503
95.2
chr1
32,282,701
32,283,345
chr4
129,390,856
129,391,399
Intron
LCNS228
503
95.6
chr19
35,724,274
35,724,775
chr7
38,271,355
38,271,857
Intron
LCNS062
503
96.8
chr2
144,978,686
144,979,187
chr2
44,952,525
44,953,237
Intron
>10kb
LCNS038
503
95.8
chr9
127,775,210
127,775,707
chr2
34,022,608
34,023,110
Intergene
�10kb
196 Y. Gondo

LCNS426
503
95.6
chrX
39,829,216
39,829,717
chrX
11,645,035
11,645,535
Intron
LCNS358
502
96.2
chr10
77,543,699
77,544,199
chr14
23,468,812
23,469,312
Intron
>10kb
LCNS411
502
96.0
chr18
43,323,216
43,323,716
chr18
76,812,642
76,813,143
Intergene
>100kb
LCNS113
502
95.4
chr2
177,211,340
177,211,838
chr2
74,976,214
74,976,715
Intergene
>10kb
LCNS114
502
95.8
chr2
177,393,500
177,394,001
chr2
75,155,446
75,155,947
Intergene
>100kb
LCNS153
502
98.8
chr6
97,651,729
97,652,230
chr4
24,596,593
24,597,094
Intron
>10kb
LCNS424
502
95.2
chr9
75,991,328
75,991,829
chr19
19,511,315
19,511,816
Intergene
>100kb
LCNS433
502
95.2
chrX
147,900,026
147,900,525
chrX
67,145,332
67,145,833
Intergene
>10kb
LCNS295
501
96.2
chr17
32,268,766
32,269,265
chr11
84,424,428
84,424,928
Intergene
>10kb
LCNS403
501
99.2
chr18
22,169,478
22,169,978
chr18
15,003,269
15,003,769
Intron
LCNS291
501
95.0
chr2
57,958,773
57,959,273
chr11
26,714,982
26,715,482
Intergene
>10kb
LCNS277
501
96.2
chr2
60,709,281
60,709,781
chr11
23,915,928
23,916,426
Intergene
>10kb
LCNS197
501
95.8
chr4
85,619,277
85,619,777
chr5
102,074,332
102,074,830
Intergene
>10kb
LCNS264
500
96.2
chr11
115,737,826
115,738,325
chr9
46,468,340
46,468,838
Intergene
>10kb
LCNS035
500
96.0
chr9
127,959,649
127,960,155
chr2
33,888,639
33,889,144
Intergene
>100kb
aLength
isin
bp
bDistance
from
thenearbyprotein-codingsequence
inthemouse
genome
12 Do Long and Highly Conserved Noncoding Sequences in Vertebrates 197

Table
12.3
Twenty
mostandleastsimilar
LCNS
I.D.
Conservation
Human
(hg18)
Mouse
(mm9)
Length
a%
Identity
Chr.
Start
End
Chr.
Start
End
Location
Distance
b
LCNS438
962
99.8
chrX
24,918,245
24,919,206
chrX
90,555,381
90,556,342
Intron
LCNS269
596
99.7
chr3
138,466,129
138,466,724
chr9
100,171,994
100,172,686
Intergene
>100kb
LCNS441
819
99.5
chrX
24,804,732
24,805,549
chrX
90,674,418
90,675,236
Intron
LCNS637
667
99.3
chr10
102,437,335
102,438,001
chr19
44,773,397
44,774,063
Intergene
>10kb
LCNS344
785
99.2
chr7
20,970,118
20,970,902
chr12
119,958,510
119,959,293
Intergene
>100kb
LCNS403
501
99.2
chr18
22,169,478
22,169,978
chr18
15,003,269
15,003,769
Intron
LCNS414
581
99.1
chr18
43,024,590
43,025,170
chr18
77,101,560
77,102,140
Intron
LCNS103
557
99.1
chr2
174,904,641
174,905,197
chr2
73,106,824
73,107,380
Intergene
�10kb
LCNS592
551
99.1
chr5
77,183,641
77,184,191
chr13
95,472,039
95,472,588
Intergene
>10kb
LCNS400
559
98.9
chr18
20,946,991
20,947,549
chr18
13,897,326
13,897,883
Intron
>10kb
LCNS152
538
98.9
chr6
97,769,812
97,770,349
chr4
24,471,724
24,472,261
Intron
LCNS477
616
98.9
chr3
181,919,488
181,920,103
chr3
33,781,632
33,782,247
Intergene
>10kb
LCNS472
525
98.9
chr9
134,485,104
134,485,628
chr2
28,740,382
28,740,906
Intron
LCNS039
516
98.8
chr9
127,696,600
127,697,115
chr2
34,100,300
34,100,813
Intron
>10kb
LCNS153
502
98.8
chr6
97,651,729
97,652,230
chr4
24,596,593
24,597,094
Intron
>10kb
LCNS506
739
98.8
chr7
114,117,479
114,118,217
chr6
15,388,331
15,389,069
30 U
TR
LCNS640
550
98.7
chr10
102,405,068
102,405,616
chr19
44,745,421
44,745,970
Intergene
>10kb
LCNS634
603
98.7
chr5
139,475,193
139,475,792
chr18
36,448,133
36,448,659
Intergene
�10kb
LCNS585
664
98.6
chr5
81,183,117
81,183,780
chr13
91,510,428
91,511,091
Intergene
>10kb
LCNS242
504
98.6
chr8
37,357,379
37,357,882
chr8
27,787,978
27,788,481
Intergene
>100kb
LCNS620
627
95.1
chr2
44,024,538
44,025,163
chr17
85,148,509
85,149,135
Intron
LCNS249
546
95.1
chr16
49,663,946
49,664,490
chr8
91,497,355
91,497,899
Intergene
>10kb
LCNS328
586
95.1
chr14
33,182,370
33,182,955
chr12
55,017,916
55,018,500
Intron
>10kb
LCNS342
586
95.1
chr14
98,953,026
98,953,611
chr12
109,360,726
109,361,309
Intron
198 Y. Gondo

LCNS361
889
95.1
chr10
78,060,662
78,061,550
chr14
23,913,918
23,914,806
Intergene
�10kb
LCNS140
786
95.0
chr8
59,976,155
59,976,939
chr4
6,717,506
6,718,290
Intron
>10kb
LCNS350
583
95.0
chr6
1,723,057
1,723,639
chr13
32,062,621
32,063,203
Intron
>10kb
LCNS280
603
95.0
chr2
60,370,645
60,371,246
chr11
24,212,663
24,213,264
Intergene
>100kb
LCNS381
723
95.0
chr13
99,409,271
99,409,993
chr14
122,852,051
122,852,772
Intergene
�10kb
LCNS406
522
95.0
chr18
35,155,674
35,156,195
chr18
27,787,891
27,788,411
Intergene
>10kb
LCNS072
522
95.0
chr2
147,006,391
147,006,912
chr2
47,158,094
47,158,615
Intergene
>100kb
LCNS442
522
95.0
chrX
71,478,279
71,478,798
chrX
99,489,220
99,489,740
Intergene
>10kb
LCNS067
803
95.0
chr2
146,405,657
146,406,459
chr2
46,521,971
46,522,769
Intergene
>100kb
LCNS057
542
95.0
chr2
144,471,545
144,472,086
chr2
44,480,335
44,480,871
Intron
>10kb
LCNS432
642
95.0
chrX
147,827,152
147,827,793
chrX
67,071,319
67,071,960
Intron
>10kb
LCNS291
501
95.0
chr2
57,958,773
57,959,273
chr11
26,714,982
26,715,482
Intergene
>10kb
LCNS088
601
95.0
chr2
163,813,314
163,813,913
chr2
63,413,486
63,414,085
Intergene
>100kb
LCNS549
621
95.0
chr15
65,691,994
65,692,614
chr9
63,159,161
63,159,778
Intron
LCNS621
661
95.0
chr2
44,661,079
44,661,739
chr17
85,694,024
85,694,683
Intron
>10kb
LCNS255
680
95.0
chr16
50,492,105
50,492,780
chr8
92,233,969
92,234,648
Intergene
>100kb
aLength
isin
bp
bDistance
from
thenearbyprotein-codingsequence
inthemouse
genome
12 Do Long and Highly Conserved Noncoding Sequences in Vertebrates 199

12.5 Working Hypotheses for Genomic Sequence Conservation
To understand the biological function(s) of the highly conserved noncoding
sequences, it is necessary to consider plausible mechanisms of making conserved
sequences in many different species. Four working hypotheses that would create
and/or maintain highly conserved sequences in coding sequences as well as in
noncoding sequences will be discussed below. These working hypotheses are not
exclusive to each other. Two or more combinations of plausible mechanisms may
contribute to maintain the conservation of genomic sequences among various
species. Among the four working hypotheses, only the first one (Sect. 12.5.1)
requires significant biological function for the maintenance of conserved sequences
whereas the other three hypotheses do not necessary need such functions to explain
the highly identical sequences among various species.
12.5.1 Functional Constraint
As described above, the primary working hypothesis for maintenance of LCNS is
that evolutionary constraints keep the functionally important genomic DNA
sequence from changing. Such functional genomic sequences may be protected
from accumulation of spontaneous and/or induced mutations by natural selection.
Mutations usually disrupt and disturb the normal function of the gene (or genomic
sequence), since the nature of the mutation is random in terms of base-pair array in
the genome. It is why radiations, chemical mutagens, and other genotoxic agents
are usually harmful to biology and cause various genetic disorders including
tumorigenesis, genetic diseases, and predispositions of various genetic risk factors
to individuals. Such detrimental mutations are eliminated from natural populations
by Darwinian selection. Thus, having more significant function, a genomic
sequence tends to exhibit higher degree of conservation among various species
due to the evolutionary constraints.
To directly test this hypothesis, in vivo assay has been conducted (Poulin et al.
2005; Pennacchio et al. 2006; Visel et al. 2008). By using a transgenic mouse
Table 12.4 Summary of
LCNS locationsUTR 50 6 1.0% 3.6%
30 16 2.6%
Intron >100 kb 3 0.5% 41.1%
>10 kb 119 19.5%
�10 kb 129 21.1%
Intergenic >100 kb 147 24.1% 55.3%
>10 kb 132 21.6%
�10 kb 59 9.7%
Total 611
The location of 611 LCNS are classified to one of eight cate-
gories based on the distance from the nearby protein-coding
sequence in the mouse genome
200 Y. Gondo

enhancer assay with reporter genes, highly conserved elements have been experi-
mentally examined of their enhancer cis-regulatory activity. For instance, Pennacchioet al. (2006) tested 167 highly conserved sequences and found that 45% of the
sequences had tissue-specific cis-regulatory function at mouse embryonic day 11.5.
Furthermore, Visel et al. (2008) compared such enhancer activities between UCE
and highly conserved but not in 100% identity sequences by using the transgenic
approach. They confirmed the enhancer activity not only in UCE but also in the
other highly conserved sequences, suggesting UCE may be a part of a larger
enhancer family in the genome.
Derti et al. (2006) proposed another possible function of UCE. They proposed
that the UCE and/or flanking sequences might maintain the diploid karyotype by the
dosage sensitivity. Mammalian UCEs are highly depleted among segmental dupli-
cations and copy number variants. This hypothesis seems to be concordant with the
fact that UCEs were not found on Y chromosome, human chromosome 21, or in the
syntenic regions of the mouse genome. The Y chromosome is only the only non-
diploid region in mammals. Human chromosome 21, in which trisomy causes
Down syndrome, might be less tolerant of diploid constraint. We, however, found
three LCNS on human chromosome 21 and the syntenic region in the mouse
(Sakuraba et al. 2008 and Sect. 12.4.2.3).
Knockout (KO) mouse studies of UCEs have raised controversial findings
related to the functional constraint hypothesis. For instance, Ahituv et al. (2007)
disrupted four UCE independently and analyzed the KO mice. None of four KO
mouse strains exhibited any anomalies, indicating such UCE should be dispensable.
Then, McLean and Bejerano (2008) found that ultraconserved-like elements were
over 300-fold less likely than neutral DNA to have been lost during rodent evolu-
tion. If UCEs are dispensable, then they should have been lost from the population,
similar to neutral sequences. The mutagenesis analysis of highly conserved
sequences is also discussed in Sect. 12.5.2.
12.5.2 Mutational Cold Spots
If a genomic sequence is a mutational cold spot, meaning little or no mutation
occurs in a sequence, such a genomic sequence might keep the same array of base
pairs in many generations and consequently conserved in many different species.
Since many mutagens directly target genomic DNA sequences to modify or break
down DNA molecules, tightly packed chromatin structure, e.g., in heterochromatic
regions, prevent the mutagen from attacking DNA molecules, resulting in a void of
the accumulation of mutations. Alternatively (or together), an enhanced DNA
repair system in particular genomic sequences would be another mechanism to
give rise to mutational cold spots. Whatever the mechanisms of making mutational
cold spots would be, if they exist in the genome, they would be highly conserved
portions of the genome.
12 Do Long and Highly Conserved Noncoding Sequences in Vertebrates 201

Bejerano et al. (2004) found much less but some SNPs in human UCE than
average. Thus, some mutations have occurred in UCEs. Several analyses of geno-
type data in human SNP projects (Drake et al. 2006; Katzman et al. 2007) indirectly
suggested that UCE and highly conserved sequences were not mutational cold
spots. We, therefore, experimentally tested if LCNS are mutational cold spots by
using ENU mutagenesis (Sakuraba et al. 2008). We have produced �10,000 ENU-
mutagenized G1 mice and extracted each DNA (Sakuraba et al. 2005). By using a
high-throughput mutation discovery system combining PCR amplification and
heteroduplex detection (Sakuraba et al. 2005), several LCNS as well as non-
LCNS were subjected to detect ENU-induced mutations (Sakuraba et al. 2008).
We found 12 and 136 ENU-induced mutations by screening a total of 16.5 and
181.0 Mb of LCNS and nonLCNS, respectively. Thus, ENU-mutations were found
one in 1.371 Mb and in 1.331 Mb of LCNS and nonLCNS, respectively. This very
equivalent ENU-induced mutation frequency was also reproduced in a new
enhanced mutation discovery system, in which we found 23 and 207 ENU-induced
mutations by screening 24.2 and 223.9 Mb of LCNS and nonLCNS, respectively
(Sakuraba et al. 2008). Thus, the mutational cold spot hypothesis is unlikely to
explain the maintenance of highly conserved sequences in vertebrates during
evolution.
All the G1 mice that were examined for the ENU mutagenesis study above were
maintained as frozen sperm (Sakuraba et al. 2005); therefore, it is possible to
analyze live mice carrying an ENU-induced mutation in the LCNS. The total of
35 mouse strains carrying an ENU-induced mutation in an LCNS are listed in our
WEB site (http://www.brc.riken.go.jp/lab/mutants/genedriven.htm) and freely
available based upon request to RIKEN BioResource Center (BRC) (http://www.
brc.riken.jp/lab/animal/en/depo.shtml).
12.5.3 Horizontal Transfer
Another mechanism to make a highly conserved genomic sequence among various
species is a recent event of DNA transfer from one species to the other. Interspecies-
active transposition and retroposition would be a plausible mechanism. If a DNA
segment horizontally transferred to many species at one time very recently, the
transmitted portion of the genomic DNA would have the very similar sequences in
the affected species. One discrepancy is that the horizontal transfer by transposon,
for instance, usually gives rise to multiple copies in the genome, comprising a part of
repetitive sequences. Also, if horizontal transfer happened very recently, the degree
of conservation should not be inversely proportional to the evolutionary distance. As
described in Sect. 12.4.2.4, however, the degree of the LCNS conservation was
inversely proportional to the evolutionary distance. A simple transposon hypothesis
does not explain syntenic localization of UCE and LCNS pairs in human and mouse.
A combination of functional constraint and horizontal transfer may have
occurred. At the beginning of adaptive radiation of vertebrate species, horizontal
202 Y. Gondo

transfer might have been very active via various transposons and spread out to
many radiated ancestors of vertebrates. If the transposons had been originated not
from the direct ancestor species but from e.g., fungi, viruses, and/or bacteria, it is
reasonable that neither UCE nor LCNS would be found in any invertebrate species.
In this model, various sequences could have been horizontally transmitted to
various loci in the genome of many vertebrate ancestors. Then bottleneck and
founder effects reduced the number of ancestors and a few lineages furthermore
may have undergone adaptive radiations. Each lineage, then, would maintain the
syntenic localization of highly conserved sequences like UCEs and LCNS in
human, mouse, and rat. Functional constraints might have been maintaining only
the highly conserved sequences like UCE and LCNS but flanking sequences
diversified. Bejerano et al. (2006) showed some evidence of retroposon-like origins
of UCEs.
12.5.4 Concerted Evolution and Gene Conversion
Some portions of genomic sequences have been homogenized to the identical or
similar sequences, resulting in the concerted evolution (Nenoi et al. 1998; Gondo
et al. 1998; Nei et al. 2000; Okada Y, Gondo Y, Ikeda JE, unpublished). An example
has been found in the genomic sequences of the ubiquitin gene among very diversi-
fied species of fungi, plants, and animals including human. Gene families code
ubiquitin and head-to-tail tandem structure and unequal crossing over seems to
maintain the identical genomic DNA sequence of the poly-ubiquitin gene (Nenoi
et al. 1998; Nei et al. 2000). A deubiquitinase gene coding for USP17 in human
(Gondo et al. 1998; Saitoh et al. 2000) was also found to be very conserved among
tested mammalian species (Gondo et al. 1998; Okada Y, Gondo Y, Ikeda JE
unpublished). The USP17 gene was found on human chromosomes 4 and 8 with
50–100 head-to-tail tandem copies and a few copies, respectively (Gondo et al. 1998;
Okada et al. 2002). The USP17 gene was also identified in many mammalian species
in head-to-tandem repeat structure except in the mouse (Gondo et al. 1998; Okada Y,
Gondo Y. Ikeda JE unpublished). The copy numbers on human chromosome 4 were
highly polymorphic (Gondo et al. 1998) but the 4.7 kb unit sequence of the USP17gene with the flanking sequences was very identical between copies (�99%). The
degree of homology (> 99%) between the 4.7 kb repeating units was at the level of
the UCE and LCNS. The extremely high similarity was found not only within the
tandem repeat on the chromosome 4 but also in a few copies on the chromosome 8.
Thus, simple unequal crossing over to homogenize the unit sequence may not be
enough to explain the highly conserved 4.7-kb sequences in human and other
mammalian species. Some unknown gene-conversion mechanism might have homo-
genized the 4.7-kb unit sequences between the tandemly repeated sequences on
chromosome 4 as well as between unit sequences on chromosome 4 and 8. If the
homogenization mechanism of the ubiquitin and the 4.7-kb unit including the USP17
12 Do Long and Highly Conserved Noncoding Sequences in Vertebrates 203

gene is revealed, it might provide another working hypothesis to give rise to highly
conserved sequences.
12.6 Conclusions
Highly conserved sequences have been found in vertebrates. The rich accumulation
of the knowledge of highly conserved sequences in vertebrates raises various
questions and working hypotheses. The answers, however, are yet to be determined.
One of the most critical issues in this field of study is the lack of highly conserved
sequences like UCE and LCNS in invertebrate species. Invertebrates may have their
own highly conserved sequences. It is necessary to survey in the other clade if some
other classes of highly conserved sequences exist. The horizontal transfer hypothe-
sis emphasizes the importance of genomic sequence data not only from species that
are closely related to vertebrates but also from more distantly related organisms
including fungi, bacteria, and viruses. Even metagenomics of lower eukaryotes and
prokaryotes may provide key genomic sequencing data set to explain the presence
of highly conserved sequences in vertebrates. New generation sequencing technol-
ogies should enhance such surveys. Extensive surveys of highly conserved
sequences in all kingdoms may provide clues to understand the nature of highly
conserved sequences in the genome such as the origin, mechanism of conservation,
and function if any at all.
Acknowledgments Author appreciates Dr. Daniel E. Janes for constructive discussions and
critical reading of this manuscript. The author thanks Dr. Yoshiyuki Sakaki and his colleagues
at RIKEN Genomic Sciences Center and Dr. Masayuki Yamamura and his colleagues at Tokyo
Institute of Technology for the extraction of LCNS and useful discussions. The author also
acknowledges Dr. Yoshiyuki Sakuraba and the members of the Population and Quantitative
Genomics Team at RIKEN Genomic Sciences Center, where the most of the LCNS works
described in this chapter was conducted. This work is partly supported by Grants-in-Aid for
Scientific Research (A) (KAKENHI 15200032 and KAKENHI 21240043).
References
Ahituv N, Zhu Y, Visel A, Holt A, Afzal V, Pennacchio LA, Rubin EM (2007) Deletion of
ultraconserved elements yields viable mice. PLoS Biol 5(9):e234
Bantle JA, Hahn WE (1976) Complexity and characterization of polyadenylated RNA in the
mouse brain. Cell 8:139–150
Bejerano G, Pheasant M, Makunin I, Stephen S, Kent WJ, Mattick JS, Haussler D (2004)
Ultraconserved elements in the human genome. Science 304(5675):1321–1325
Bejerano G, Lowe CB, Ahituv N, King B, Siepel A, Salama SR, Rubin EM, Kent WJ, Haussler D
(2006) A distal enhancer and an ultraconserved exon are derived from a novel retroposon.
Nature 441(7089):87–90
Britten RJ, Kohne D (1968) Repeated sequences in DNA. Science 161(841):529–540
204 Y. Gondo

Chikaraishi DM, Deeb SS, Sueoka N (1978) Sequence complexity of nuclear RNAs in adult rat
tissue. Cell 13:111–120
Dermitzakis ET, Reymond A, Lyle R, Scamuffa N, Ucla C, Deutsch S, Stevenson BJ, Flegel V,
Bucher P, Jongeneel CV, Antonarakis SE (2002) Numerous potentially functional but non-
genic conserved sequences on human chromosome 21. Nature 420(6915):578–582
Dermitzakis ET, Reymond A, Scamuffa N, Ucla C, Kirkness E, Rossier C, Antonarakis SE (2003)
Evolutionary discrimination of mammalian conserved non-genic sequences (CNGs). Science
302(5647):1033–1035
Derti A, Roth FP, Church GM, Wu CT (2006) Mammalian ultraconserved elements are strongly
depleted among segmental duplications and copy number variants. Nat Genet 38(10):
1216–1220
Drake JA, Bird C, Nemesh J, Thomas DJ, Newton-Cheh C, Reymond A, Excoffier L, Attar H,
Antonarakis SE, Dermitzakis ET, Hirschhorn JN (2006) Conserved noncoding sequences are
selectively constrained and not mutation cold spots. Nat Genet 38(2):223–227
Gondo Y, Okada T, Matsuyama N, Saitoh Y, Yanagisawa Y, Ikeda JE (1998) Human mega-
satellite DNA RS447: copy-number polymorphisms and interspecies conservation. Genomics
54(1):39–49
International Human Genome Sequencing Consortium (2001) Initial sequencing and analysis of
the human genome. Nature 409:860–921
International Human Genome Sequencing Consortium (2004) Finishing the euchromatic sequence
of the human genome. Nature 431:932–945
Judd BH, Shen MW, Kaufman TC (1972) The anatomy and function of a segment of the X
chromosome of Drosophila melanogaster. Genetics 71(1):139–156
Katzman S, Kern AD, Bejerano G, Fewell G, Fulton L, Wilson RK, Salama SR, Haussler D (2007)
Human genome ultraconserved elements are ultraselected. Science 317(5840):915
McLean C, Bejerano G (2008) Dispensability of mammalian DNA. Genome Res 18(11):
1743–1751
Mouse Genome Sequencing Consortium (2002) Initial sequencing and comparative analysis of the
mouse genome. Nature 420:520–562
Mukai T (1964) The genetic structure of natural populations of Drosophila melanogaster I.
Spontaneous mutation rate of polygenes controlling vaiability. Genetics 50:1–19
Mukai T (1978) Population genetics. Kodansha Scientific, Tokyo, in Japanese
Mukai T, Chigusa SI, Mettler LE, Crow JF (1972) Mutation rate and dominance of genes affecting
viability in Drosophila melanogaster. Genetics 72(2):335–355Nei M, Rogozin IB, Piontkivska H (2000) Purifying selection and birth-and-death evolution in the
ubiquitin gene family. Proc Natl Acad Sci USA 97(20):10866–10871
Nenoi M, Mita K, Ichimura S, Kawano A (1998) Higher frequency of concerted evolutionary
events in rodents than in man at the polyubiquitin gene VNTR locus. Genetics 148(2):867–876
Nowak R (1994) Mining treasures from “junk DNA”. Science 263:608–610
O’Brien SJ, Menotti-Raymond M, Murphy WJ, Nash WG, Wienberg J, Stanyon R, Copeland NG,
Jenkins NA, Womack JE, Marshall Graves JA (1999) The promise of comparative genomics in
mammals. Science 286(5439):458–481
Ohnishi O (1977) Spontaneous and ethyl methanesulfonate-induced mutations controlling viabil-
ity in Drosophila melanogaster. II. Homozygous effect of polygenic mutations. Genetics
87(3):529–545
Okada T, Gondo Y, Goto J, Kanazawa I, Hadano S, Ikeda JE (2002) Unstable transmission of the
RS447 human megasatellite tandem repetitive sequence that contains the USP17 deubiquiti-
nating enzyme gene. Hum Genet 110(4):302–313
Pennacchio LA, Ahituv N, Moses AM, Prabhakar S, Nobrega MA, Shoukry M, Minovitsky S,
Dubchak I, Holt A, Lewis KD, Plajzer-Frick I, Akiyama J, De Val S, Afzal V, Black BL,
Couronne O, Eisen MB, Visel A, Rubin EM (2006) In vivo enhancer analysis of human
conserved non-coding sequences. Nature 444(7118):499–502
12 Do Long and Highly Conserved Noncoding Sequences in Vertebrates 205

Poulin F, Nobrega MA, Plajzer-Frick I, Holt A, Afzal V, Rubin EM, Pennacchio LA (2005) In vivo
characterization of a vertebrate ultraconserved enhancer. Genomics 85(6):774–781
Saitoh Y, Miyamoto N, Okada T, Gondo Y, Showguchi-Miyata J, Hadano S, Ikeda JE (2000) The
RS447 human megasatellite tandem repetitive sequence encodes a novel deubiquitinating
enzyme with a functional promoter. Genomics 67(3):291–300
Sakuraba Y, Sezutsu H, Takahasi KR, Tsuchihashi K, Ichikawa R, Fujimoto N, Kaneko S, Nakai
Y, Uchiyama M, Goda N, Motoi R, Ikeda A, Karashima Y, Inoue M, Kaneda H, Masuya H,
Minowa O, Noguchi H, Toyoda A, Sakaki Y, Wakana S, Noda T, Shiroishi T, Gondo Y (2005)
Molecular characterization of ENU mouse mutagenesis and archives. Biochem Biophys Res
Commun 336(2):609–616
Sakuraba Y, Kimura T, Masuya H, Noguchi H, Sezutsu H, Takahasi KR, Toyoda A, Fukumura R,
Murata T, Sakaki Y, Yamamura M, Wakana S, Noda T, Shiroishi T, Gondo Y (2008)
Identification and characterization of new long conserved noncoding sequences in vertebrates.
Mamm Genome 19(10–12):703–712
Visel A, Prabhakar S, Akiyama JA, Shoukry M, Lewis KD, Holt A, Plajzer-Frick I, Afzal V, Rubin
EM, Pennacchio LA (2008) Ultraconservation identifies a small subset of extremely con-
strained developmental enhancers. Nat Genet 40(2):158–160
Wetmur J, Davidson N (1968) Kinetics of renaturation of DNA. J Mol Biol 31(3):349–370
206 Y. Gondo

Part IIIMorphological Evolution / Speciation

Chapter 13
Male-Killing Wolbachia in the Butterfly
Hypolimnas bolina
Anne Duplouy and Scott L. O’Neill
Abstract Maternally inherited insect symbionts often manipulate host reproduc-
tion for their own benefit. Symbionts are transmitted to the next host generation
through the female hosts, and as such males represent dead ends for transmission.
Natural selection therefore favors symbiont-induced phenotypes that provide a
reproductive advantage to infected females, regardless of possible negative selec-
tive effects on males.
Male-killing (MK) is one such phenotype, in which symbionts kill the male
progeny of infected females. Compared with other symbiont-associated reproduc-
tive phenotypes, MK is relatively unexplored mechanistically as well as ecologi-
cally. A male-killingWolbachia bacterium strain named wBol1 has been describedin the tropical butterfly Hypolimnas bolina. By reviewing the different features of
this association it is possible to summarize what is already known about the biology
and evolution of MK symbionts, as well as highlight the current gaps in our
understanding of this striking reproductive phenotype.
13.1 Introduction
There are numerous symbiotic associations known to occur within nature; however,
few associations are more complex than those involving endosymbiosis. The study of
endosymbionts challenges the scientific community with questions about how each
member of the symbiosis coexists and how they maximize their reproductive fitness.
Endosymbionts are extremely common and over the course of evolution
have arisen in very different taxonomic groups. In insects, although endosym-
biotic eukaryotic microorganisms are common (e.g., the yeast-like endosymbiont
A. Duplouy and S.L. O’Neill
School of Biological Sciences, The University of Queensland, Brisbane, QLD 4072, Australia
e-mail: [email protected]
P. Pontarotti (ed.), Evolutionary Biology – Concepts, Molecularand Morphological Evolution, DOI 10.1007/978-3-642-12340-5_13,# Springer-Verlag Berlin Heidelberg 2010
209

Symbiotaphrina buchneri infecting anobiid beetles, Noda and Kodama 1996; or the
fungal symbiont of the brown-banded cockroach species Supella longipalpa,Gibson and Hunter 2009), most described endosymbionts are bacteria including
members of the Proteobacteria (e.g., Buchnera and Wolbachia), Flavobacteria(e.g., Blattabacterium), and Mollicutes (e.g., Spiroplasma) (Werren and O’Neill
1997; Bourtzis and Miller 2003, 2006), amongst others. Insect endosymbionts also
show diversity in their modes of transmission, either vertically (maternally) trans-
mitted from mother to offspring or horizontally transmitted. In the latter case,
symbiont may be infectious within a single species or between different species.
Examples of occasional horizontal transfer of maternally transmitted symbionts
have been reported (Werren and O’Neill 1997).
“Primary endosymbionts” are usually obligate endosymbionts, needed for host
reproduction and/or survival. For example, Moran et al. (2005) showed that Buch-nera aphidicola provides essential nutrients deficient within the aphid host’s diet.
Some primary endosymbionts have been shown to display phylogenetic concor-
dance with their hosts over millions of years demonstrating long-term coevolution
(Moran et al. 1993, 1994; Bandi et al. 1994).
Facultative endosymbionts, often referred to as “secondary endosymbionts,”
infect individuals already carrying a primary symbiont. A classic example is the
pea aphid Acyrthosiphon pisum that harbors multiple secondary symbionts such as
Hamiltonella defensa, in addition to the primary symbiont Buchnera sp. (Moran
et al. 2005; Oliver et al. 2007). The functional roles of secondary symbionts within
the host are not always well defined, as any effect can be hidden by the action of the
primary symbionts (Chen et al. 2000; Moran et al. 2005; Ruan et al. 2006).
Finally, “reproductive symbionts,” also termed “guest microbes” (Bourtzis and
Miller 2003), were first described as symbionts able to enhance their own fitness by
manipulating host reproduction (Taylor and Hoerauf 1999). Some of these distortions
involve sex ratio manipulation of the host. Spiroplasma for example kills males in
Drosophila species (Hurst et al. 1999a), while Cardinium sterilizes certain males of
the wasp Encarsia pergandiella (Hunter et al. 2003). However, recent studies have
revealed additional capabilities of reproductive symbionts that enhance their fitness
without affecting the host’s reproductive system (Brownlie et al. 2009).
13.2 Wolbachia Pipientis
Wolbachia pipientis is a species of obligate intracellular alpha-Proteobacteria
closely related to Rickettsia. Wolbachia were first discovered in the early 1920s
in the ovaries of the mosquito Culex pipiens (Hertig and Wolbach 1924). Based on
genetic variationWolbachia strains were divided into eight highly divergent super-groups named A through H (Bandi et al. 1998; Zhou et al. 1998; Bourtzis and Miller
2003; Lo et al. 2007). The two most studied and describedWolbachia supergroups,A and B, diverged approximately 50–70 million years ago (Werren et al. 1995;
Werren and O’Neill 1997).Wolbachia belonging to these two groups, known as the
210 A. Duplouy and S.L. O’Neill

“arthropodWolbachia,” are mostly harbored by insects but are also described from
other host phyla such as Crustacea or Arachnida. Supergroups A and B Wolbachiaare mostly parasitic and induce a broad range of reproductive distortions in their
hosts. In comparison, Wolbachia belonging to both the C and D supergroups are
mutualistic strains required for fertility and development of their filarial nematode
hosts (Bandi et al. 1998). Within the C and D clusters, Wolbachia phylogeny is
concordant with host phylogeny, suggesting long-term coevolution. The remaining
four clusters (E–H) infect various arthropods or nematodes; however, these asso-
ciations are often poorly described and symbiont-induced effects are not always
known (Vandekerckhove et al. 1999; Lo and Evans 2007; Covacin and Barker
2007). W. pipientis, the most extensively studied reproductive endosymbiont to
date, has the greatest diversity of host interactions including mutualism and all
types of known reproductive manipulations – cytoplasmic incompatibility, femini-
zation, parthenogenesis, or male-killing (O’Neill et al. 1997).
13.2.1 Reproductive Distortions
Maternally transmitted endosymbionts, such as Wolbachia, can enhance their
transmission rate by manipulating their host’s reproduction (O’Neill et al. 1997;
Bourtzis and Miller 2003). To understand the benefits they gain from these manip-
ulations, it is worthwhile summarizing what is known about the most common
symbiont-induced reproductive phenotypes.
The first reproductive manipulation to be attributed to Wolbachia was cytoplas-
mic incompatibility (CI). In the 1950s, Ghelelovitch (1952) and Laven (1959)
described crosses between strains of the mosquito Culex pipiens that sometimes
failed to produce progeny. Later, Yen and Barr (1971) showed that Wolbachia was
the causative agent of these reproductive failures. Wolbachia-infected males when
crossed with uninfected females failed, whereas all other possible crosses (crosses
between uninfected individuals, and between infected females and either uninfected
males or males carrying the same infection) resulted in normal reproductive output.
The mechanistic basis of this reproductive incompatibility between uninfected
females and infected males has been linked to abnormalities during fertilization
by cytological studies (Tram and Sullivan 2002). Abnormal behavior of chromo-
somal material from infected males causes incompatibility with female pronuclei
and later the death of the progeny. The CI of these gametes provides an advantage
to infected females, as they can successfully mate with both infected and nonin-
fected males. As a result, the maternally transmitted symbiont spread rapidly into
the host population. CI is not unique to Wolbachia: Cardinium also induces CI in
the parasitoid wasp Encarsia pergandiella (Hunter et al. 2003; Perlman et al. 2008),
and CI has been described as the most common endosymbiont-induced reproduc-
tive manipulation in arthropods.
AsWolbachia are maternally transmitted, some strains distort the sex ratio of their
host population to favor the female sex only, creating populations where males are
sometimes extremely rare. Three mechanisms, feminization, parthenogenesis, and
13 Male-Killing Wolbachia in the Butterfly Hypolimnas bolina 211

male-killing (MK), cause imbalanced sex ratio in the host population. Feminizing
symbionts such asCardinium andWolbachia have been found in numerous arthropod
hosts including the isopod Armadillidium vulgare (Cordaux et al. 2004), the butterflyspecies Ostrinia furnacalis and Eurema hecabe (Narita et al. 2007; Kageyama et al.
2008), and the spider mite Brevipalpus phoenicis (Weeks et al. 2001). During
feminization, genetic males reproduce as functional females, which therefore trans-
mit Wolbachia to their progeny (Rigaud 1997; Stouthamer et al. 1999).
Feminization is often mistaken for parthenogenesis, as both mechanisms pro-
duce female-biased populations. Although feminization requires sexual reproduc-
tion, parthenogenesis allows the production of viable progeny without the need for
a male partner. Two types of parthenogenesis have been described: arrhenotokous
parthenogenesis (or arrhenotoky) occurs when diploid females arise from fertilized
eggs and thelytokous parthenogenesis (or thelytoky) where females are produced
from unfertilized eggs. In the wasp species Trichogramma spp., thelytoky is
induced by Wolbachia (Stouthamer and Kazmer 1994), which restores diploidy
by enhancing the fusion of the two nuclei of the first mitotic division (Stouthamer
and Kazmer 1994; Huigens et al. 2000).
Finally, a wide range of endosymbiont-infected arthropods produce only daugh-
ters as male offspring die at an early development stage. Males are usually killed
embryonically, but deaths also occur much later, typically in fourth instar larvae
(Hurst 1991). This common reproductive manipulation is known as male-killing
(MK). MK is caused by at least nine different bacteria from four taxonomic groups:
Mollicutes, Flavobacteria, Rickettsiaceae, and Enterobacteriaceae (Hurst et al.
1997, 2003). However, there are still very few studies investigating the underlying
cytogenetic and genetic mechanisms of this phenotype.
13.3 Male-KillingWolbachia in the Butterfly Hypolimnas bolina
Although MK systems are diverse, a review of the association between the MK
Wolbachia strain wBol1 and H. bolina provides a general overview of this repro-
ductive phenotype.
H. bolina, also known as the common or great egg-fly (Australia), or blue-moon
butterfly (New Zealand), was first described by Linnaeus in 1758. This species has a
vast subtropical distribution from Sri Lanka to French Polynesia and a latitudinal
range from Hong-Kong to Canberra, Australia. Occasional reports describe
H. bolina in Japan and New Zealand since the 1970s (Ramsay 1971; Clarke and
Sheppard 1975; Morishita and Kazuhiko 2002; Patrick 2004), but it is suspected
that these regions do not support endemic populations (Common and Waterhouse
1972). Individuals observed in Japan and New Zealand were probably migratory
individuals using favorable meteorological conditions (Ryan and Harris 1990;
Christensen 2004) to invade from close neighboring regions such as South East
Asia (SEA) or Australia, where stable populations exist (Gibbs 1961; Ramsay and
Ordish 1966; Ramsay 1971; Christensen 2004).
212 A. Duplouy and S.L. O’Neill

13.3.1 All-Female Broods in the Butterfly H. bolina
A strong female sex distortion has been described in numerous H. bolina popula-
tions throughout their wide geographical distribution (Simmonds, 1926, Clarke
et al. 1975; Dyson et al. 2002; Charlat et al. 2005). All-female broods were first
described in the 1920s (Poulton 1923; Simmonds 1926). This reproductive trait was
showed to be exclusive to females and therefore due to a cytoplasmic factor (Clarke
et al. 1975). It was reported not to be parthenogenesis as males were dying at early
stages of development (Clarke et al. 1975, 1983).
Dyson et al. (2002) identifiedW. pipientis as the causative agent of male rareness
in H. bolina, using PCR amplification and sequence analysis of a bacterial surface
protein gene (Zhou et al. 1998). ThisWolbachia strain termed wBol1 was shown tokill the male progeny of infected female butterflies at an early embryonic stage
before caterpillars hatch from the eggs (Dyson et al. 2002, Fig. 13.1).
First identified in Fiji, wBol1 was found to be present in most H. bolinapopulations across the South Pacific (Charlat et al. 2005). One intriguing feature
of the wBol1/H. bolina association has been a variation in wBol1 infection preva-
lence among different host populations. wBol1 infections were absent from
(1)
(2)
(5)4 days
4 days
25 days
7 days pupae
5 caterpillar instars
Death of thewBol1-infectedmale embryos
eggs
wBol1
wBol1
(4)(3)
Fig. 13.1 Life cycle of wBol1-infected Hypolimnas bolina: (1) a wBol1-infected female mates
with an uninfected male, (2) all males die during embryogenesis, only female eggs hatch 4 days
after being laid, (3) caterpillars develop in 20 days through 5 larval instars, (4) wBol1-infectedfemales emerge from 7-day old pupae, (5) and 4 days after emerging from the pupae, females are
reproductively mature
13 Male-Killing Wolbachia in the Butterfly Hypolimnas bolina 213

Australian and the Tubuai (French Polynesia, Austral Islands Archipelago)
H. bolina populations, while wBol1 infection frequencies of up to 50% in Fijian
populations and more than 85% in both the Independent Samoan and Tahitian
populations were recorded (Fig. 13.2; Charlat et al. 2005, 2006).
13.3.2 Competition Between Wolbachia Infections
A number of possible reasons have been suggested to explain the heterogeneity in
wBol1 infection rates (Fig. 13.2, Table 13.1). In the extreme case of Tubuai (Austral
Islands Archipelago, French Polynesia), no butterflies were found to be infected by
the male killer strain wBol1, while on the closest neighboring island of Rurutu, only210 km away, female wBol1 infection rate was more than 75% (Charlat et al. 2005,
2006). It was found that butterflies from Tubuai were infected with another Wol-bachia strain, named wBol2. The wBol2 strain is an A-group Wolbachia that is
phylogenetically distant from wBol1, a B-group Wolbachia. Crosses between
wBol1-infected females and wBol2-infected males were fully incompatible and
Island not infected by wBol 1
Low and medium infection rate
High infection rate(2)
(1)
(3)
(4)(5)
(6)
(7)(8)
(9) (10)
(12)(11)
Australia
New Zealand 1000 km
Equator
N
Fig. 13.2 Wolbachia infection frequencies in 12 H. bolina populations. (1) Philippines, (2)
Thailand, (3) Vanuatu, (4) Fiji, (5) New Caledonia: Ile des Pins, (6) Australia: Brisbane, (7)
Independent Samoa, (8) American Samoa, French Polynesia: (9) Moorea, (10) Tahiti, (11) Rurutu,
and (12) Tubuai. Less than 65% of the females are wBol1-infected in islands with low and medium
infection frequencies, and 65–100% of the females are wBol1-infected in islands with high
infection frequency
214 A. Duplouy and S.L. O’Neill

lead to unviable progeny. This phenotype was the result of wBol2-induced CI in
H. bolina (Charlat et al. 2006). The competition between wBol2 and wBol1 and thestrong CI observed between the twoWolbachia strains make the invasion of Tubuai
by the MK strain, wBol1, extremely unlikely. The presence of wBol2 was reported
in several other islands of the South Pacific where wBol1 was not shown to occur
(Charlat et al. 2006).
13.3.3 When the MK Phenotype Is Repressed, wBol1 Induces CI
At the other extreme, allH. bolina from South East Asian populations were infected
by wBol1, including males (Charlat et al. 2005; Hornett et al. 2006). Under the
strong selection pressure exerted by the wBol1 infection, butterflies have evolved
resistance to the MK phenotype. This mutation led to survival of male offspring and
restored a balanced sex ratio (Hornett et al. 2006, Table 13.1).
If wBol1 from host populations with the MK repressor gene were shown to retain
their ability to induce MK in nonresistant host, then it would suggest either (1) that
the repressor gene was the result of an extremely recent mutation in the host or (2)
that the MK character was linked to a desirable trait providing an advantage to the
repressed wBol1. Otherwise, long-term evolution in a host population that repressed
MK may result in the loss of wBol1’s MK virulence – a character no longer able to
spread in the population. Hornett and co-workers (2008) conducted crosses between
MK resistant H. bolina from SEA and nonresistant populations of French Polynesia
(Moorea and Tahiti, Society Islands Archipelago) and tested whether wBol1 from
SEA could induce MK. The SEA wBol1 infection was able to distort host
Table 13.1 Percentage of males and females in different populations naturally uninfected (column 2)
or infected by the different Wolbachia strains (columns 3–5)
Populations % Uninfected
male/female
% wBol1-a-infected male/
female
% wBol1-b-infected male/
female
% wBol2-infected male/
female
MK
repressor
gene
Philippines 0/0 100/100 0/0 0/0 Present
Thailand 0/0 100/100 0/0 0/0 Present
Ile des Pins 100/17 0/83 0/0 0/0
Fiji 100/50 0/50 0/0 0/0
Vanuatu 100/70 0/30 0/0 0/0
Australia 100/100 0/0 0/0 0/0
Ind. Samoa 0/0 100/100 0/0 0/0 Present
Am. Samoa 0/0 0/0 0/0 100/100
Moorea 98/17 0/80 0/3 2/0
Tahiti 100/4 0/90 0/6 0/0
Rurutu 98/29 0/69 0/0 2/2
Tubuai 2/2 0/0 0/0 98/98
MK repressor gene presence is shown in column 6 (Charlat et al. 2005, 2006, 2007b; Hornett et al.
2006)
13 Male-Killing Wolbachia in the Butterfly Hypolimnas bolina 215

reproduction when transferred into a French Polynesian background, indicating that
wBol1 from SEA can still induce theMK phenotype in nonresistant hosts. The study
also revealed a complete failure in egg hatch when SEAmales carrying both the MK
infection and MK repressor gene(s) were crossed with uninfected females. Control
crosses showed that the females were not sterile, suggesting that in addition to MK
wBol1 also induces CI in this population of H. bolina (Hornett et al. 2008).
13.3.4 MK Wolbachia Diversity in H. bolina
More recently, Charlat et al. (2009) shown that the MK phenotype in H. bolina wasinduced by two substrains, wBol1-a and wBol1-b. Although they are extremely
closely related phylogenetically, genetic variations between them have only been
found at two loci, wBol1-a and wBol1-b show phenotypic differences that make
them interesting candidates for comparative analysis (Charlat et al. 2009). wBol1-aand wBol1-b seem to differ in their sensitivity to the MK repressor from SEA.
Preliminary results suggest that wBol1-a MK was repressed when transferred into a
SEA background, while wBol1-b showed persistent MK phenotype in this novel
host background (Charlat pers. comm. 2007). These results suggest small variations
in the MK genetic bases between these two substrains.
These two substrains also differ in their transmission level. The wBol1-b infec-
tion, which has been found in only French Polynesia and Vanuatu (Charlat et al.
2009, Table 13.1), was associated with mitochondrial haplotypes (mitotypes) 3 and
6. These mitotypes were also found in Wolbachia-free butterflies, suggesting
imperfect vertical transmission of wBol1-b. In contrast, the most common strain
wBol1-a was present on all the islands where wBol1 was previously described
(Charlat et al. 2005, 2006 Table 13.1) and was strictly associated with mitotype 1.
The almost complete absence of uninfected butterflies carrying mitotype 1 suggests
a very high transmission efficiency of wBol1-a.More recent investigations into wBol1-a genetic variation have found no evi-
dence that wBol1-a prevalence was related to genetic differences between wBol1-apopulations (Duplouy et al. 2009). The age of the infection in the South Pacific
islands may vary; for example, the wBol1-a invasion of Fiji could be more recent
than that of Tahiti, where a larger proportion of females carried the infection.
13.3.5 A Rapidly Evolving System
The association between wBol1 and H. bolina has proved to be highly dynamic. In
2001, Samoan H. bolina populations were shown to have at most a single male per
hundred females. Charlat and colleagues (2007a) reported in a 2006 survey equal
sex ratios and a second case of MK repression in the South Pacific. It was not known
whether the genetic basis of MK resistance was similar in both SEA and Samoan
216 A. Duplouy and S.L. O’Neill

populations. Nonetheless, the shift in population sex ratio from 100:1 to 1:1 in less
than ten generations seemed to be one of the fastest ever recorded (Charlat et al.
2007a). A more ancient but similar evolution of a MK repressor gene has also been
described in butterflies from Malaysian Borneo (Hornett et al. 2009).
The spread of wBol1 through SEA and the South Pacific was estimated to have
taken less than 3,000 years (Duplouy et al. 2009). However, in some populations,
local invasions were suggested to have occurred more rapidly, on the scale of a
century. Museum samples from different South Pacific islands were tested for both
the infection type and prevalence in previous butterfly generations. In the 120 years
from 1883 until 2002, the infection frequencies in the French Polynesian Islands of
Ua Huka and Tahiti varied from very low prevalence (0% and less than 20%,
respectively) to very high prevalence (more than 80%) (Hornett et al. 2009).
13.4 Open Questions in wBol1 Research
13.4.1 wBol1 Biogeography
The biogeography of the wBol1-a infection in the South Pacific was one of the most
intriguing aspects of this system. The presence of butterfly populations on numer-
ous South Pacific islands provided clear evidence of natural migrations occurring
between islands; however, the range of these exchanges remained an unknown
factor. Butterfly populations infected with the CI-inducing strain wBol2 were
almost as common as wBol1-infected populations in the South Pacific. In contrast,
populations where the two infections coexist have rarely been recorded, and doubly
infected butterflies have never been found (Charlat et al. 2005). Models predicted
that, in this system, a CI-infected population would resist MK invasion. Under the
same conditions, a MK-infected population would only resist invasion by
CI-inducing Wolbachia if the latter did not reach a certain frequency threshold
(Freeland and McCabe 1997; Engelst€adter et al. 2004). If the limit was exceeded,
then the CI-inducing strain became more competitive and therefore, spread into the
population driving the former MK infection to extinction (Engelst€adter et al. 2004).Butterfly populations where wBol1 and wBol2 were in competion were rare in the
South Pacific islands (Charlat et al. 2005; Engelst€adter et al. 2008). This rarity
suggested a low migration rate between islands, allowing MK-infected populations
to resist wBol2 invasion.
13.4.2 Effects of MK Infection on Host Fitness
Endosymbiotic infections are generally costly to maintain as the symbionts exploit
resources that are destined for their host (Haine 2008). In order to be maintained
13 Male-Killing Wolbachia in the Butterfly Hypolimnas bolina 217

and spread within host populations, symbionts may develop strategies that enhance
the fitness of infected hosts relative to uninfected individuals. Wolbachia strains
have developed very intimate relationships with their hosts and stress treatments
have shown that some strains are beneficial to their hosts (Hedges et al. 2008;
Brownlie et al. 2009). Modeling predicts that MK fixation would lead to population
extinction because of a severe shortage of males (Hamilton 1967; Hurst 1991;
Randerson et al. 2000); however, wBol1 infection sometimes exceeds 75% of host
individuals in a population. The success of infected individuals over uninfected
ones suggests that wBol1 infection may confer a fitness advantage to its hosts, but
the nature of this benefit has not yet been characterized in H. bolina.
13.4.2.1 Benefits from the Infection in Other Host/MK WolbachiaAssociations
Direct benefits from the infection, such as an increased size, fecundity, or longevity,
have been recorded in different associations with MK Wolbachia (Ikeda 1970;
Majerus and Hurst 1997; Fry et al. 2004). These observations contrast with the
wBol1/H. bolina system where no benefit of this type has been shown (Dyson and
Hurst 2004; Charlat et al. 2007b).
Similarly, although indirect benefits from MK infection have been described in
several other MK systems, none has yet been associated with a fitness increase in
wBol1-infected butterflies. (Werren 1987) suggested that MK endosymbionts
could reduce sibling inbreeding, thereby favoring infected females. This explana-
tion makes sense for species that lay many eggs on the same plant and are not very
mobile after hatching. In the case of H. bolina, however, butterflies lay few eggs
per plant and are good migrants as individuals have frequently invaded New
Zealand from Australia, a journey of 2,000 km (Ramsay 1971; Ryan and Harris
1990; Patrick 2004). Majerus and Hurst (1997) suggested that the success of MK
strains in ladybirds (e.g., Adalia bipunctata) was correlated with different host
characteristics, including cannibalism at various developmental stages; so
infected females gain nutrition from feeding on their dead brothers, and from
large clutch sizes, as MK reduces sibling competition for food by diminishing
their numbers by half. H. bolina does not exhibit the characteristics of a host in
which a MKWolbachia would be successful. This butterfly is strictly herbivorousduring its larval stages and as adult feeds exclusively on nectar. As such, male
death would provide no direct nutritional benefit to infected sisters and as females
lay only 1–2 eggs per plant, food competition would be limited (Nafus 1993;
Kemp 1998).
13.4.2.2 Alternative Hypotheses
wBol1-a may confer a “hidden” selective advantage to infected hosts (Duplouy
et al. 2009). Insects are often infected with entomopathogenic agents (fungi, viruses
218 A. Duplouy and S.L. O’Neill

or bacteria). Phytophageous insects, such as butterflies, also have to avoid plant
defenses, such as toxic compounds, developed by their host plants to fight against
natural enemies (Lindroth 1989; Li et al. 2003; Wen et al. 2006). Caterpillars are
common prey for parasitoid or predatory wasps such as Cotesia spp. or Polistes spp.(Stamp and Bowers 1988; Nafus 1993; Beckage et al. 1994; van Nouhuys and
Hanski 2005). These selective pressures allow the survival of only resistant or
adapted individuals (Hochberg 1991; Russell and Moran 2005; Moran 2006; Haine
2008). Wolbachia may confer their host a benefit when exposed to toxins and/or
parasites and thereby increase its prevalence within host populations.
Recent studies have shown Wolbachia-infected flies delay mortality after virus
infection (Hedges et al. 2008; Teixeira et al. 2008). Investigating the effect of
wBol1 infection in a metacommunity involving the host, the symbiont, and at least a
third party such as a virus or a parasitoid wasp could provide insights into fitness
benefit(s) this infection provides the butterfly host with. Fitness benefit(s) that could
therefore help explaining the striking success of wBol1-a in H. bolina.
13.4.3 Mechanisms of MK
13.4.3.1 Cytology of MK
Two types of MK have been characterized based on the timing of male death (Hurst
1991). “Early MK” occurs during embryogenesis while “late MK” takes effect
during larval or pupal stages. Both early and late MK were observed inWolbachia-infected insects (Hurst et al. 1999b; Fialho and Stevens 2000; Jiggins et al. 2000;
Dyson et al. 2002; Jaenike 2007); however, the underlying mechanisms of either
phenomena have not yet been elucidated.
Studies on MK Spiroplasma-infected Drosophila have shown that male embryo
death was associated with abnormal mitoses, while later death was caused by
degeneration of cell nuclei (pycnosis) (Counce and Poulson 1962). In a similar
system, modification of the dosage compensation complex (DCC), which is
involved in sex differentiation, can also rescue males from MK symbionts. This
indicates that the DCC may be involved in expression of the MK phenotype (Veneti
et al. 2005). Although MK in Wolbachia-infected insects must also involve host
sex determination, similar mechanisms to those in Spiroplasma associations havenot yet been identified. One study showed that treatment of wBol1-a-infectedbutterflies with bacteriostatic antibiotics delayed the MK effect. This demon-
strates that wBol1 was able to identify male individuals and induce MK at
different time points during host development (Charlat et al. 2007c). However,
it is unknown if the basic mechanisms of the MK phenotype are identical at each
time point. As suggested, MK could be expressed through different pathways
(Hurst and Jiggins 2000), which would complicate the identification of the
mechanistic basis of these MK phenotypes.
13 Male-Killing Wolbachia in the Butterfly Hypolimnas bolina 219

13.4.3.2 Genomics of MK
To date the genomes of one mutualistic and three CI-inducing Wolbachia strains
have been sequenced (Wu et al. 2004; Foster et al. 2005; Klasson et al. 2008, 2009)
and several others are underway. Wolbachia’s intracellular biology has hampered
the completion of whole genome-sequencing projects. The genome sequence of the
MK strain wBol1 is nearing completion (Duplouy pers.comm.), and analysis of the
first chromosomal DNA sequence of a MK Wolbachia strain will certainly be of
great value. Comparative genomic analysis of wBol1 with the closely related and
fully sequenced wPip strain, which induces CI in Culex mosquitoes, should provide
an unique opportunity to investigate the evolution of Wolbachia genomes across
relatively short evolutionary timescales. This first genomic comparison between a
MK strain and a CI-inducing strain offers opportunities to test hypotheses
concerning the evolution and induction of the MK phenotype, such as identifying
candidate genes involved in both MK and CI.
Previous whole genome analyses have attempted to link genetic elements, such as
ankyrin coding genes, to the induction of different reproductive manipulations
(Iturbe-Ormaetxe et al. 2005; Duron et al. 2007; Walker et al. 2007; Klasson et al.
2008). Ankyrin repeat domains are believed to be involved in cellular and molecular
functions via protein–protein interactions (Caturegli et al. 2000;Mosavi et al. 2004).
Twenty-three, 29, and 60 ankyrin genes have been annotated in the Wolbachiastrains wMel, wRi, and wPip, respectively (Wu et al. 2004; Klasson et al. 2009;
Walker et al. 2007), while wBm seems to contain only 5 ankyrin coding genes
(Foster et al. 2005). wBol1 is phylogenetically close to the wPip strain, and it is
therefore expected that theMK strain also contains a large number of ankyrin coding
genes. The number and density of ankyrin coding genes in pathogenic strains make
them good candidates in the search for genes likely to play a role in the interactions
between Wolbachia and its host (Iturbe-Ormaetxe et al 2005; Duron et al. 2007;
Walker et al. 2007).
Despite intensive efforts,Wolbachia transformation is currently not an available
technique. While waiting for an efficient transformation protocol for Wolbachia,genomic comparison ofWolbachia strains may provide extremely valuable data. If
the mechanisms of MK are similar across strains, the genetic basis of this phenotype
should be conserved between these strains and putative MK genes could potentially
be identified. Genome comparisons of phylogenetically related strains such as
wBol1 and wPip or wBol1-a and wBol1-b, which induce different phenotypes in
their hosts, may identify highly variable genes or genetic features potentially
involved in the induction of the observed phenotypic differences.
To date, only protein coding genes have been investigated as potential genetic
mechanisms underlying Wolbachia-induced phenotypes (Sinkins et al 2005;
Walker et al. 2007; Duron et al. 2007). Small RNA molecules (sRNAs) are
known in other systems to act through RNA interference (RNAi) to regulate
translation of targeted genes (Tjaden et al. 2006 and including references). Simi-
larly, MK Wolbachia could use sRNAs, rather than proteins to distort their hosts’
reproductive system. Comparative projects should therefore not only focus on
220 A. Duplouy and S.L. O’Neill

protein coding genes present in Wolbachia genomes, but also on the diversity of
sRNA sequences, as they could also play a key role in the distortion of host
reproductive systems.
13.4.3.3 Role of the Host in the Expression of MK
We have already described the symbiont-induced effects on different aspects of
host biology; however, biological interactions are rarely unidirectional. Hosts can
also act to mitigate any negative fitness effects associated with the symbiont. These
interactions have been highlighted in different Wolbachia associations; however,
the molecular mechanisms that underlie these interactions are not understood.
In SEA and Samoa,H. bolina evolved resistance to theMK phenotype ofwBol1-a,saving males from embryonic death (Hornett et al. 2006; Charlat et al. 2007a).
Although the investigation of the butterfly genetics is in progress and should soon
provide answers (Hornett pers. comm. 2009), it is not yet known if the resistance
mechanism involves one or several genes, and whether this resistance is identical in
both the SEA and Samoan populations (Charlat et al. 2007a). This repression,
however, confirms the active involvement of the host in the phenotype induced
by its symbiont.
More interestingly, butterfly resistance to MK resulted in wBol1-a shifting to
inducing CI (Hornett et al. 2008). In general, the reproductive phenotype observed
in the natural host has been maintained in transfected hosts (Braig et al. 1994;
Riegler et al. 2004; Sakamoto et al. 2005; McMeniman et al. 2008); however,
immediate phenotypic shifts after transfection have been reported (Sasaki et al.
2002, 2005; Jaenike 2007). Phylogenetic studies of Wolbachia have demonstrated
that very closely related strains express different phenotypes in their native hosts
(Baldo et al. 2006), suggesting that shifts in phenotype expression are probably
more common than originally thought. It also suggests that MK and CI might share
a similar molecular basis that is differently expressed depending on host genotype
(Jaenike 2007). Both phenotypes could be mechanistically similar; however, MK
has evolved to be more extreme in its outcome than the CI.
13.5 Conclusion
Wolbachia have attracted the attention of a large scientific community, hoping to
understand the biology of this bacterium that induces such a wide range of host
phenotypes and has great potential as a biological control agent of insect pests and
human diseases (Brelsfoard et al. 2009; McMeniman et al. 2009; Moreira et al.
2009). Many discoveries have been made in the last decade, but a multitude of
questions still remain to be answered. MK is one of the least known Wolbachiaphenotypes. Although we have a relatively good understanding of how MK Wol-bachia affect host populations, genetics and dynamics, the cytology and genomics
13 Male-Killing Wolbachia in the Butterfly Hypolimnas bolina 221

aspects underlying the MK phenotype both remain poorly understood. We may
come closer to finding answers with projects such as whole genome comparison of
MK strains, but we are still far from having resolved all of Wolbachia’s mysteries.
Acknowledgments We would like to thank Dr. I. Iturbe-Ormaetxe, Dr. M. Woolfit and
Dr. P. Cook for very constructive comments on the manuscript. We are grateful to the Australian
Research Council (DP0772992) and to The University of Queensland (UQCS and UQIRTA) for
provision of the funds.
References
Baldo L, Hotopp JCD, Jolley KA, Bordenstein SR, Biber SA, Choudhury RR, Hayashi C, Maiden
MCJ, Tettelin H, Werren JH (2006) Multilocus sequence typing for Wolbachia. Appl EnvironMicrobiol 72(11):7098–7110
Bandi C, Damiani G, Magrassi L, Grigolo A, Fani R, Sacchi L (1994) Flavobacteria as intracellu-
lar symbionts in cockroaches. Proc Biol Sci 257:43–48
Bandi C, Anderson TJC, Genchi C, Blaxter ML (1998) Phylogeny of Wolbachia in filarial
nematodes. Proc Biol Sci 265:2407–2413
Beckage NE, Tan FF, Schleifer KW, Lane RD, Cherubin LL (1994) Characterization and
biological effects of Cotesia congregata polydnavirus on host larvae of the tobacco hornworm,
Manduca sexta. Arch Insect Biochem Physiol 26:165–195
Bourtzis K, Miller TA (eds) (2003) Insect symbiosis. CRC Press, New York, NY
Bourtzis K, Miller TA (eds) (2006) Insect symbiosis, vol 2. CRC Press, New York, NY
Braig HR, Guzman H, Tesh RB, O’Neill SL (1994) Replacement of the natural Wolbachiasymbiont of Drosophila simulans with a mosquito counterpart. Nature 367:453–455
Brelsfoard CL, StClair W, Dobson SL (2009) Integration of irradiation with cytoplasmic incom-
patibility to facilitate a lymphatic filariasis vector elimination approach. Parasit Vectors 2:38
Brownlie JC, Cass BN, Riegler M, Witsenburg JJ, Iturbe-Ormaetxe I, McGraw EA, O’Neill CL
(2009) Evidence for metabolic provisioning by a common invertebrate endosymbiont,
Wolbachia pipientis, during periods of nutritional stress. PLoS Pathog 5:6
Caturegli P, Asanovich KM, Walls JJ, Bakken JS, Madigan JE, Popov VL, Dumler JS (2000)
ankA: an Ehrlichia phagocytophila group gene encoding a cytoplasmic protein antigen with
ankyrin repeats. Infect Immun 68(9):5277–5283
Charlat S, Hornett EA, Dyson EA, Ho PPY, Thi-Loc N, Schilthuizen M, Davies N, Roderick GK,
Hurst GDD (2005) Prevalence and penetrance variation of male-killing Wolbachia across
Indo-Pacific populations of the butterfly Hypolimnas bolina. Mol Ecol 14:3525–3530
Charlat S, Engelstadter J, Dyson E, Hornett E, Duplouy A, Tortosa P, Davies N, Roderick G,
Wedell N, Hurst G (2006) Competing selfish genetic elements in the butterfly Hypolimnasbolina. Curr Biol 16:2453–2458
Charlat S, Hornett EA, Fullard JH, Davies N, Roderick GK, Wedell N, Hurst GDD (2007a)
Extraordinary flux in sex ratio. Science 317:214
Charlat S, Reuter M, Dyson EA, Hornett EA, Duplouy A, Davies N, Roderick GK, Wedell N,
Hurst GDD (2007b) Male-killing bacteria trigger a cycle of increasing male fatigue and female
promiscuity. Curr Biol 17:273–277
Charlat S, Davies N, Roderick GK, Hurst GDD (2007c) Disrupting the timing of Wolbachia-induced male-killing. Biol Lett 3:154–156
Charlat S, Duplouy A, Hornett EA, Dyson EA, Davies N, Roderick GK, Wedell N, Hurst GDD
(2009) The joint evolutionary histories of Wolbachia and mitochondria in Hypolimnas bolina.BMC Evol Biol 9:64
222 A. Duplouy and S.L. O’Neill

Chen D-Q, Montllor CB, Purcell AH (2000) Fitness effects of two facultative endosymbiotic
bacteria on the pea aphid, Acyrthosiphon pisum, and the blue alfalfa aphid, A. kondoi. Entomol
Exp Appl 95:315–323
Christensen B (2004) Tracking of migrant blue moon butterfly, Hypolimnas bolina nerina, usingweb-based software. Weta 28:47–48
Clarke C, Sheppard PM (1975) The genetics of the mimetic butterfly Hypolimnas bolina (L.).
Philos Trans R Soc Lond B Biol Sci 272(917):229–265
Clarke C, Sheppard P, Scali V (1975) All-female broods in the butterfly Hypolimnas bolina (L.).
Proc Biol Sci 189:29–37
Clarke SC, Jonhson G, Jonson B (1983) All-female broods in Hypolimnas bolina (L.). A re-survey
of West Fiji after 60 years. Biol J Linn Soc 19:221–235
Common IFB, Waterhouse DF (1972) Butterflies of Australia. Angus and Robertson, Sydney
Cordaux R, Michel-Salzat A, Frelon-Raimond M, Rigaud T, Bouchon D (2004) Evidence for a
new feminizing Wolbachia strain in the isopod Armadillidium vulgare: evolutionary implica-
tions. Heredity 93:78–84
Counce SJ, Poulson DF (1962) Developmental effects of the sex-ratio agent in embryos of
Drosophila willistoni. J Exp Zool 151:17–31
Covacin C, Barker SC (2007) Supergroup F Wolbachia bacteria parasite lice (Insecta: Phthirap-
tera). Parasitol Res 100:479–485
Duplouy A, Hurst GDD, O’Neill SL, Charlat S (2009) Rapid spread of male-killing Wolbachia in
the butterfly Hypolimnas bolina. J Evol Biol. Doi:10.1111/j.1420-9101.2009.01891.x
Duron O, Boureux A, Echaubard P, Berthomieu A, Berticat C, Fort P, Weill M (2007) Variability
and expression of ankyrin domain genes in Wolbachia infecting the mosquito Culex pipiens.J Bacteriol 189(12):4442–4448
Dyson EA, Hurst GDD (2004) Persistence of an extreme sex-ratio bias in a natural population.
PNAS 101(17):6520–6523
Dyson E, Kamath M, Hurst G (2002) Wolbachia infection associated with all-female broods in
Hypolimnas bolina (Lepidoptera: Nymphalidae): evidence for horizontal transmission of a
butterfly male killer. Heredity 88:166–171
Engelst€adter J, Telschow A, Hammerstein P (2004) Infection dynamics of different Wolbachia-
types within one host population. J Theor Biol 231:345–355
Engelst€adter J, Telschow A, Yamamura N (2008) Coexistence of cytoplasmic incompatibility and
male-killing-inducing endosymbionts, and their impact on host flow. Theor Popul Biol
73:125–133
Fialho RF, Stevens L (2000) Male-killing Wolbachia in a flour beetle. Proc Biol Sci
267:1469–1474
Foster J, Ganatra M, Kamal I, Ware J, Makarova K, Ivanova N, Bhattacharyya A, Kapatral V,
Kumar S, Posfai J, Vincze T, Ingram J, Moran L, Lapidus A, Omelchenko M, Kyrpides N,
Ghedin E, Wang S, Goltsman E, Joukov V, Ostrovskaya O, Tsukerman K, Mazur M, Comb D,
Koonin E, Slatko B (2005) TheWolbachia genome of Brugia malayi: endosymbiont evolution
within a human pathogenic nematode. PLoS Biol 3:599–614
Freeland SJ, McCabe BK (1997) Fitness compensation and the evolution of selfish cytoplasmic
elements. Heredity 78:391–402
Fry AJ, Palmer MR, Rand DM (2004) Variable fitness effects ofWolbachia infection in Drosoph-ila melanogaster. Heredity 93:379–389
Ghelelovitch S (1952) Sur le determinisme genetique de la sterilite dans les croisements entre
differentes souches de Culex autogenicus Roubaud. C R Acad Sci III 234:2386–2388
Gibbs GW (1961) New Zealand butterflies. Tuatara J Biol Soc 9:65–76
Gibson CM, Hunter MS (2009) Inherited fungal and bacterial endosymbiont of a parasitic wasp
and its cockroach host. Microb Ecol 57(3):542–549
Haine ER (2008) Symbiont-mediated protection. Proc Biol Sci 275:353–361
Hamilton WD (1967) Extraordinary sex ratios. Science 156(774):477–488
13 Male-Killing Wolbachia in the Butterfly Hypolimnas bolina 223

Hedges LM, Brownlies JC, O’Neill SL, Johnson KN (2008) Wolbachia and virus protection in
insects. Science 322:702
Hertig M, Wolbach SB (1924) Studies on Rickettsia-like microorganisms in insects. J Med Res
44:329–374
Hochberg ME (1991) Viruses as costs to gregarious feeding behaviors in the Lepidoptera. Oikos
61(3):291–296
Hornett EA, Charlat S, Duplouy AMR, Davies N, Roderick GK, Wedell N, Hurst GDD (2006)
Evolution of male killer suppression in natural population. PLoS Biol 4(9):e283
Hornett EA, Duplouy AMR, Davies N, Roderick GK, Wedell N, Hurst GDD, Charlat S (2008)
You can’t keep a good parasite down: evolution of a male-killer suppressor uncovers cytoplas-
mic incompatibility. Evolution 62(5):1258–1263
Hornett EA, Charlat S, Wedell N, Jiggins CD, Hurst GDD (2009) Rapidly shifting sex ratio across
a species range. Curr Biol 19:1628–1631
Huigens ME, Luck RF, Klaassen RHG, Maas MFPM, Timmermans MJTN, Stouthamer R (2000)
Infectious parthenogenesis. Nature 405:178–179
Hunter MS, Perlman SJ, Kelly SE (2003) A bacterial symbiont in the Bacteroidetes induces
cytoplasmic incompatibility in the parasitoid wasp Encarsis pergandiella. Proc Biol Sci
270:2185–2190
Hurst L (1991) The incidences and evolution of cytoplasmic male killers. Proc Biol Sci 244:91–99
Hurst GDD, Jiggins FM (2000) Male-killing bacteria in insects: mechanisms, incidence, and
implications. Emerg Infect Dis 6(4):329–336
Hurst GDD, Hurst LD, Majerus MEN (1997) Cytoplasmic sex ratio distorters. In: O’Neill SL,
Hoffmann AA, Werren JH (eds) Influential passengers, inherited microorganisms and arthro-
pod reproduction. Oxford University Press Inc, New York, pp 125–154
Hurst GDD, van der Schulenburg JHG, Majerus TMO, Bertrand D, Zakharov IA, Baungaard J,
Volkl W, Stouthamer R, Majerus MEN (1999a) Invasion of one insect species, Adaliabipunctata, by two different male-killing bacteria. Insect Mol Biol 8(1):133–139
Hurst GDD, Jiggins FM, van der Schulenburg JHG, Bertrand D, West SA, Goriacheva II,
Zakharov IA, Werren JH, Stouthamer R, Majerus MEN (1999b) Male-killing Wolbachia in
two species of insect. Proc Biol Sci 266(1420):735–740
Hurst GDD, Jiggins FM, Majerus MEN (2003) Inherited microorganisms that selectively kill male
hosts: the hidden players of insect evolution? In: Bourtzis K, Miller TA (eds) Insect symbiosis.
CRC Press, New York, NY, pp 177–197
Ikeda H (1970) The cytoplasmic-inherited ‘sex-ratio-condition’ in natural and experimental
populations of Drosophila bifasciata. Genetics 65:311–333Iturbe-Ormaetxe I, Riegler M, O’Neill SL (2005) New names for old strains?Wolbachia wSim is
actually wRi. Genome Biol 6:401
Jaenike J (2007) Spontaneous emergence of a new Wolbachia phenotype. Evolution 61
(9):2244–2252
Jiggins FM, Hurst GDD, Jiggins CD, von der Schulenburg JHG, Majerus MEN (2000) The
butterfly Danaus chrysippus is infected by a male-killing Spiroplasma bacterium. Parasitology
120:439–446
Kageyama D, Narita S, Noda H (2008) Transfection of feminizing Wolbachia endosymbionts of
the butterfly, Eurema hecabe, into the cell culture and various immature stages of the silkmoth,
Bombyx mori. Microb Ecol 56(4):733–741
Kemp DJ (1998) Oviposition behaviour of post-diapause Hypolimnas bolina (L.) (Lepidoptera:
Nymphalidae) in tropical Australia. Aust J Zool 46:451–459
Klasson L, Walker T, Sebaihia M, Sanders MJ, Quail MA, Lord A, Sanders S, Earl J, O’Neill SL,
Thomson N, Sinkins SP, Parkhill J (2008) Genome evolution of Wolbachia strain wPip from
the Culex pipiens group. Mol Biol Evol 25(9):1877–1887
Klasson L, Westberga J, Sapountzis P, Naslund K, Lutnaes Y, Darby AC, Veneti Z, Chend L,
Braig HR, Garrett R, Bourtzis K, Andersson SGE (2009) The mosaic genome structure of the
Wolbachia wRi strain infecting Drosophila simulans. PNAS 106(14):5725–5730
224 A. Duplouy and S.L. O’Neill

Laven H (1959) Speciation by cytoplasmic isolation in the Culex pipiens complex. Cold Spring
Harb Symp Quant Biol 24:166–175
Li W, Schuler MA, Berenbaum MR (2003) Diversification of furanocoumarin-metabolizing
cytochrome P450 monooxygenases in two papilionids: specificity and substrate encounter
rate. PNAS 100(Suppl 2):14593–14598
Lindroth RL (1989) Host plant alteration of detoxication activity in Papilio glaucus glaucus.Entomol Exp Appl 50:29–35
Lo N, Evans TA (2007) Phylogenetic diversity of the intracellular symbiontWolbachia in termites.
Mol Phylogenet Evol 44:461–466
Lo N, Paraskevopoulos C, Bourtzis K, O’Neill SL, Werren JH, Bordenstein SR, Bandi C (2007)
Taxonomic status of the intracellular bacteriumWolbachia pipientis. Int J Syst Evol Microbiol
57:654–657
Majerus MEN, Hurst GDD (1997) Ladybirds as a model for the study of male-killing symbionts.
Entomophaga 42(1/2):13–20
McMeniman CJ, Lane AM, Fong AW, Voronin DA, Iturbe-Ormaetxe I, Yamada R, McGraw EA,
O’Neill SL (2008) Host adaptation of a Wolbachia strain after long-term serial passage in
mosquito cell lines. Appl Environ Microbiol 74(22):6963–6969
McMeniman CJ, Lane RV, Cass BN, Fong AWC, Sidhu M, Wang Y-F, O’Neill SL (2009) Stable
introduction of a life-shorteningWolbachia infection into the mosquito Aedes aegypti. Science323:141–144
Moran NA (2006) Symbiosis. Curr Biol 16(20):866–871
Moran NA, Munson MA, Baumann P, Ishikawa H (1993) A molecular clock in endosymbiotic
bacteria is calibrated using the insect hosts. Proc Biol Sci 253:167–171
Moran NA, Baumann P, von Dohlen C (1994) Use of DNA sequences to reconstruct the history of
the association between members of the Sternorrhyncha (Homoptera) and their bacterial
endosymbionts. Eur J Entomol 91:79–83
Moran NA, Dunbar HE, Wilcox JL (2005) Regulation of transcription in a reduced bacterial
genome: nutrient-provisioning genes of the obligate symbiont Buchnera aphidicola. J Bacteriol187(12):4229–4237
Moreira LA, Iturbe-ormaetxe I, Jeffery JAL, Lu G, Pyke AT, Hedges LM, Rocha BC, Hall-
Mendelin S, Day A, Riegler M, Hugo LE, Johnson KN, Kay BH, McGraw EA, van der Hurk
AF, Ryan PA, O’Neill SL (2009) AWolbachia symbiont in Aedes aegypti limits infection with
dengue, chikungunya and Plasmodium. Cell 139(7):1268–1278Morishita and Kazuhiko (2002) A migrant from an oceanic island – Hypolimnas bolina, 6 days
stay near Zushi Beach, Kanagawa, Japan. Butterflies 32:24–26
Mosavi LK, Cammett TJ, Desrosiers DC, Peng Z-Y (2004) The ankyrin repeat as molecular
architecture for protein recognition. Protein Sci 13:1435–1448
Nafus DM (1993) Movement of introduced biological control agents onto nontarget butterflies,
Hypolimnas spp. (Lepidoptera: Nymphalidae). Environ Entomol 22(2):265–272
Narita S, Kageyama D, Nomura M, Fukatsu T (2007) Unexpected mechanism of symbiont-
induced reversal of insect sex: feminizing Wolbachia continuously acts on the butterfly
Eurema hecabe during larval development. Appl Environ Microbiol 73(13):4332–4341
Noda H, Kodama K (1996) Phylogenetic position of yeast-like endosymbionts of Anobiid beetles.
Appl Environ Microbiol 62(1):162–167
O’Neill SL, Hoffmann AA, Werren JH (1997) Influencial passengers,inherited microorganisms
and arthropod reproduction. Oxford University Press Inc., New York
Oliver KM, Campos J, Moran NA, Hunter MS (2007) Population dynamics of defensive symbionts
in aphids. Proc Biol Sci 275:293–299
Patrick BH (2004) Invasion of the blue moon butterfly in Taranaki. Weta 28:45–46
Perlman SJ, Kelly SE, Hunter MS (2008) Population biology of cytoplasmic incompatibility:
maintenance and spread of Cardinium symbionts in a parasitic wasp. Genetics 178:1003–1011
Poulton EB (1923) All female families of Hypolimnas bolina, bred in Fiji by HW Simmonds. Proc
R Ent Soc Lond 1923:9–12
13 Male-Killing Wolbachia in the Butterfly Hypolimnas bolina 225

Ramsay GW (1971) The blue moon butterfly Hypolimnas bolina nerina in New Zealand during
autumn, 1971. N Z Entomol 5:73–75
Ramsay GW, Ordish RG (1966) The Australian blue moon butterflyHypolimnas bolina nerina (F.)in New Zealand. NZ J Sci 9:719–729
Randerson JP, Smith NGC, Hurst LD (2000) The evolutionary dynamics of male-killers and their
hosts. Heredity 84:152–160
Riegler M, Charlat S, Stauffer C, Mercot H (2004) Wolbachia transfer from Rhagoletis cerasi toDrosophila simulans: investigating the outcomes of host-symbiont coevolution. Appl Environ
Microbiol 70(1):273–279
Rigaud T (1997) Inherited microorganisms and sex determination of arthropod hosts. In: O’Neill
SL, Hoffmann AA, Werren JH (eds) Influential passengers, inherited microorganisms and
arthropod reproduction. Oxford University Press Inc, New York, pp 81–101
Ruan Y-M, Xu J, Liu S-S (2006) Effects of antibiotics on fitness of the B biotype and a non-B
biotype of the whitefly Bemisia tabaci. Entomol Exp Appl 121:159–166
Russel JA, Moran NA (2005) Horizontal transfer of bacterial symbiont: heritability and fitness in a
novel aphid host. Appl Environ Microbiol 71(12):7987–7994
Ryan PA, Harris AC (1990) A note of recent records of Australian butterflies in New Zealand. N Z
Entomol 13:40–41
Sakamoto H, Ishikawa Y, Sasaki T, Kikuyama S, Tatsuki S, Hoshizaki S (2005) Transinfection
reveals the crucial importance ofWolbachia genotypes in determining the type of reproductive
alteration in the host. Genet Res 85:205–210
Sasaki T, Kubo T, Ishikawa H (2002) Interspecific transfer of Wolbachia between two lepidop-
teran insects expressing cytoplasmic incompatibility: a Wolbachia variant naturally infecting
Cadra cautella causes male-killing in Ephesia kuehniella. Genetics 162:1313–1319Sasaki T, Massaki N, Kubo T (2005) Wolbachia variant that induces two distinct reproductive
phenotypes in different hosts. Heredity 95:389–393
Simmonds HW (1926) Sex ratio of Hypolimnas bolina in Viti Levu, Fiji. Proc R Ent Soc Lond
1:29–32
Sinkins SP, Walker T, Lynd AR, Steven AR, Makepeace BL, Godfray HC, Parkhill J (2005)
Wolbachia variability and host effects on crossing type in Culex mosquitoes. Nature
14:257–260
Stamp NE, Bowers MD (1988) Direct and indirect effects of predatory wasps (Polistes sp.:
Vespidae) on gregarious caterpillars (Hemileuca lucina: Saturniidae). Oecologia 75:619–624
Stouthamer R, Kazmer D (1994) Cytogenetics of microbe-associated parthenogenesis and its
consequences for gene flow in Trichogramma wasps. Heredity 73:317–327
Stouthamer R, Breeuwer JAJ, Hurst GDD (1999) Wolbachia pipientis: microbial manipulator of
arthropod reproduction. Annu Rev Microbiol 53:71–102
Taylor MJ, Hoerauf A (1999) Wolbachia bacteria of filarial nematodes. Parasitol Today 15
(11):437–442
Teixeira L, Ferreira A, Ashburner M (2008) The bacterial symbiontWolbachia induces resistanceto RNA viral infections in Drosophila melanogaster. PLoS Biol 6(12):2753–2763
Tjaden B, Goodwin SS, Opdyke JA, Guillier M, Fu DX, Gottesman S, Storz G (2006) Target
prediction for small, noncoding RNAs in bacteria. Nucleic Acids Res 34(9):2791–2802
Tram U, Sullivan W (2002) Role of delayed nuclear envelope breakdown and mitosis in Wolba-chia-induced cytoplasmic incompatibility. Science 296:1124–1126
van Nouhuys S, Hanski I (2005) Metacommunities of butterflies, their host plant, and their
parasitoids. In: Holyoak M, Leibold MA, Holt RD (eds) Metacommunities spatial dynamics
and ecological communities. University of Chicago Press, USA
Vandekerckhove TTM, Watteyne S, Willems A, Swings JG, Mertens J, Gillis M (1999) Phyloge-
netic analysis of the 16 S rDNA of the cytoplasmic bacterium Wolbachia from the novel host
Folsomia candida (Hexpoda, Collembola) and its implications for Wolbachia taxonomy.
FEMS Microbiol Lett 180:179–286
226 A. Duplouy and S.L. O’Neill

Veneti Z, Bentley JK, Koana T, Braig HR, Hurst GDD (2005) A functional dosage compensation
complex required for male-killing in Drosophila. Science 307:1461–1463Walker T, Klasson L, Sebaihia M, Sanders MJ, Thomson NR, Parkhill J, Sinkins SP (2007)
Ankyrin repeat domain-encoding genes in the wPip strain ofWolbachia from the Culex pipiensgroup. BMC Biol 5(39):1–9
Weeks AR, Marec F, Breeuwer JAJ (2001) Amite species that consists entirely of haploid females.
Science 292:2479–2482
Wen Z, Rupasinghe S, Niu G, Berenbaum MR, Schuler MA (2006) CYP6B1 and CYP6B3 of the
Black Swallowtail (Papilio polyxenes): adaptative evolution through subfunctionalization.
Mol Biol Evol 23(12):2434–2443
Werren JH (1987) The coevolution of autosomal and cytoplasmic sex ratio factors. J Theor Biol
124:317–334
Werren JH, O’Neill SL (1997) The evolution of heritable symbionts. In: O’Neill SL, Hoffmann
AA, Werren JH (eds) Influential passengers, inherited microorganisms and arthropods repro-
duction. New York, Oxford University Press Inc., pp 1–41
Werren JH, Windsor D, Guo L (1995) Distribution of Wolbachia among neotropical arthropods.
Proc Biol Sci 262:197–204
Wu M, Sun LV, Vamathevan J, Riegler M, Deboy R, Brownlie JC, McGraw EA, Martin W,
Esser C, Ahmadinejad N, Wiegand C, Madupu R, Beanan MJ, Brinkac LM, Daugherty SC,
Durkin AS, Kolonay JF, Nelson WC, Mohamoud Y, Lee P, Berry K, Young MB, Utterback T,
Weidman J, Nierman WC, Paulsen IT, Nelson KE, Herve Tettelin, O’Neill SL, Eisen JA
(2004) Phylogenomics of the reproductive parasite Wolbachia pipientis wMel: a streamlined
genome overrun by mobile genetic elements. PLoS Biol 2:327–341
Yen JH, Barr AR (1971) New hypothesis of the cause of cytoplasmic incompatibility in Culexpipiens L. Nature 232:657–658
Zhou W, Rousset F, O’Neill SL (1998) Phylogeny and PCR-based classification of Wolbachiastrains using wsp gene sequences. Proc Biol Sci 265(1395):509–515
13 Male-Killing Wolbachia in the Butterfly Hypolimnas bolina 227

Chapter 14
Evolution of Immunosuppressive Organelles
from DNA Viruses in Insects
Brian A. Federici and Yves Bigot
Abstract Endoparasitic wasps inject particles into their lepidopteran hosts that
enable these parasitoids to evade or directly suppress the hosts’ innate immune
response, especially encapsulation by hemocytes. For decades, these particles
have been considered virions produced by DNA viruses known as polydnaviruses
(family Polydnaviridae). Structurally, there are two main types of particles, those
resembling, respectively, virions of baculoviruses or ascoviruses. These particles
contain double-stranded DNA in the form of multiple small circular molecules that
are transcribed but not replicated in cells of the lepidopteran hosts. Instead particle
DNA is replicated from the wasp genome and selectively amplified for packaging
into the particles in the reproductive tract of female wasps. Once assembled and
secreted into calyx lumen, the particles become mixed with eggs and injected
into caterpillars during wasp oviposition. Particle DNA, referred to as the “viral
genome,” has now been sequenced for several polydnaviruses. Annotation shows
that most of this DNA consists of noncoding DNA or wasp genes, not viral genes.
More significantly, recent studies have shown that particle structural proteins are
coded by the wasp genome, not by particle DNA, but are of viral origin. Together,
these findings provide strong evidence that these particles originated from viruses,
but through symbiogenesis followed by gene deletion and acquisition evolved into
transducing organelles that shuttle wasp immunosuppressive genes into their hosts,
thereby enhancing wasp progeny survival and species radiation.
B.A. Federici
Department of Entomology, University of California, Riverside 900 University Avenue, Riverside,
California 92521, USA
Laboratoire d’Etude des Parasites GenetiquesParc Grandmont, Universite de Tours, U.F.R. des
Sciences et Techniques, 37200, Tours, France
e-mail: [email protected]
Y. Bigot
Laboratoire d’Etude des Parasites GenetiquesParc Grandmont, Universite de Tours, U.F.R. des
Sciences et Techniques, 37200 Tours, France
P. Pontarotti (ed.), Evolutionary Biology – Concepts, Molecularand Morphological Evolution, DOI 10.1007/978-3-642-12340-5_14,# Springer-Verlag Berlin Heidelberg 2010
229

14.1 Introduction
14.1.1 Background
George Salt at the University of Cambridge published a series of pioneering studies
during the 1960s aimed at understanding how endoparasitic wasps circumvented
the innate immune response of their caterpillar hosts. Based on studies of the
ichneumonid parasitoid, Venturia (then Nemeritis) canescens and its lepidopteran
host, larvae of the Mediterranean flower moth, Ephestia kuehniella, he determined
that parasitoid eggs gained protection as they passed through the calyx (egg
storage region) of the female wasp’s reproductive tract (Salt 1965, 1966, 1968).
This protection was due to a coating added to the eggs in the calyx. Subsequently,
Susan Rotheram, one of Salt’s graduate students, determined that this coating
contained masses of enveloped virus-like particles about 130 nm in diameter. After
assembly in calyx cell nuclei, these were secreted into the calyx lumen where they
adhered to fibrillar matrix on the egg surface (Rotheram 1967). In later studies,
Rotheram 1973a, b showed that the particles contained protein and complex sugars,
but no DNA. Then another of Salt’s graduate students found that a major particle
glycoprotein was responsible for the immunoprotection (Bedwin 1979a, b). Follow-
ing on these studies, Otto Schmidt and his collaborators in Germany showed that this
protein was encoded in the wasp genome, but likely originated from basal lamina
proteins found in the caterpillar host (Schmidt and Schuchmann-Feddersen 1989;
Schmidt and Theopold 1991; Schmidt et al. 2001).
After Salt and Rotheram’s studies, Vinson and colleagues as well as others found
that particles in the calyx fluid of the endoparasitic ichneumonids Campoletissonorensis and Cardiochiles nigriceps also suppressed the immune response of
their caterpillar hosts (Vinson 1972; Vinson and Scott 1975; Vinson 1990). These
particles were also produced in the nuclei of calyx cells, but though morphologi-
cally similar to V. canescens particles, they contained DNA. These findings stimu-
lated numerous investigations of the calyx gland and secretions of many
endoparasitic wasps of the families Ichneumonidae and Braconidae, revealing
two major particle types, one in ichneumonids and another in braconids (see Stoltz
and Vinson 1979, and Vinson 1990; Webb et al. 2005). When first discovered, the
ichneumonid particles were not typical of virions of any known type of insect virus
(Fig. 14.1). They were bound by two unit membranes, were oblong to globular in
shape, and ranged from 130 to 150 nm in diameter by 300–400 nm in length, with a
fusiform nucleocapsid (Webb et al. 2005). Later, viruses of a new family, the
ascoviruses (family Ascoviridae) were discovered that attacked caterpillars, repli-
cating and produces progeny virions in various host tissues. The virions produced
by ascoviruses are structurally similar to the ichneumonid particles and are trans-
mitted by parasitic wasps (Federici 1983; Federici et al. 2005). In contrast to
the ichneumonid particles, those produced by braconid wasps resembled nudi-
virus virions and similar virions of the occluded form of baculoviruses (Burand
1998; Wang and Jehle 2009). They consisted primarily of one or more cylindrical
230 B.A. Federici and Y. Bigot

particles surrounded by a single envelope (Fig. 14.1b). The cylindrical inner
particle varied in length from 30 to 100 nm, even within the same wasp species.
Similar particles have been identified in more than 50 wasp species. In these, unlike
the genomes of most viruses of insects, the DNA does not occur as a single circular
molecule, but as numerous circular molecules. These vary in size from few to many
kbp and are referred to as segmented, polydispersed, or multipartite DNA (Stoltz
1993; Webb et al. 2005). Most evidence indicates these particles do not have a
genome per se, but rather their DNA is part of the wasp genome (Espagne et al.
2004; Webb et al. 2006; Desjardins et al. 2008). Moreover, as far as is known,
though genes contained in the particles are expressed in nuclei of the parasitoid’s
caterpillar host cells, no particle DNA replication occurs in these, nor do the
particles produce any progeny. From the standpoint of a viral life cycle, they are
a dead end.
14.1.2 Establishment of the Family Polydnaviridae
Based on the unusual physical and biological properties of these particles and their
obligate symbiotic relationship with wasps (Edson et al. 1981), a new virus family,
Polydnaviridae (“Poly” referring to the polydispersed DNA), was established to
accommodate these newly discovered viruses (Stoltz et al. 1984). Establishment of
this family formalized the recognition of two genera, the genus Ichnovirus (ichno-viruses) for particles produced by ichneumonid wasps, and genus Bracovirus(bracoviruses) for particles produced by braconids (Webb et al. 2005). At the
time these genera where erected, the particles were considered to be infective
viruses capable of replication (at least for these viruses in calyx cells), much like
that which occurs in other types of viruses. Although molecular data were not
Fig. 14.1 Transmission electron micrographs of immunosuppressive particles produced by endo-
parasitic braconid and ichneumonid wasps. (a) Bracovirus particles. (b) Ichneumonid particles.
The bracovirus particles resemble nudivirus and baculovirus virions, and molecular evidence now
indicates that these particles have their origin in an ancestral nudivirus. The ichneumonid particles
resemble ascovirus virions, but their origin remains uncertain at present. Bars ¼ 200 nm. Original
micrographs by D.B. Stoltz
14 Evolution of Immunosuppressive Organelles from DNA Viruses in Insects 231

sufficient at that time to undertake meaningful comparisons of these viruses,
available information as well as the significant structural differences between the
particles of these two virus types suggested that the association of each with its
corresponding wasp family arose independently. Thus, their similar functional roles
in parasite biology and success were and are considered a result of convergent
evolution.
14.1.3 Particle Function: General Mechanismsof Viral Immunosuppression
Detailed studies of several polydnavirus/parasitoid systems have shown that the
virus-like particles produced by these wasps in major braconid and ichneumonid
lineages (Whitfield 2002a, b) are required for suppression of the wasps’ hosts’
immune system in all species studied to date (Stoltz 1993, Vinson 1990; Webb et al.
2005, 2006). Suppression, depending on the specific system, occurs either by
molecular mimicry, where the surface of the egg and early instars are coated with
particles not recognized as foreign, by hemocyte inactivation through expression of
particle genes after oviposition, or by both mechanisms. Many of the genes encoded
by these wasp particles also inhibit components of innate immune pathways,
including the Toll and Imd pathways. Detailed knowledge of how the particle
genes of individual wasp species elude or incapacitate innate immune responses
varies considerably from one wasp species to another, and thus our understanding
of these processes is still in the early stages of development. Our purpose in this
chapter, therefore, is not to discuss specific particle functions, but rather to summa-
rize the key data that support the concept that these particles, though they originated
as virions, are a novel type of organelle that originated by lateral gene transfer/
symbiogenesis. Those interested in detailed discussions of particle functions as well
as their similarities and differences are referred to the excellent articles by Webb
et al. (2006) and Tanaka et al. (2007).
14.2 Polydnavirus Particles as Organelles Rather
Than Virions – the Concept
The structural similarity of braconid particles to baculovirus virions, and ichneu-
monid particles to ascovirus virions, made these viruses obvious choices as the
evolutionary sources of these two types of immunosuppressive particles (Federici
1991; Federici and Bigot 2003). At the time braconid particles were discovered,
the baculoviruses consisted of two main types, referred to as “occluded,” meaning
that the virions were occluded in a protein matrix, and “nonoccluded,” meaning that
they were not. Subsequently, the nonoccluded baculoviruses were reclassified into
232 B.A. Federici and Y. Bigot

a new type known as the nudiviruses. The nudivirus group consists of a small and
very diverse group of nonoccluded viruses from insects and crustaceans that share
33 core genes with baculoviruses (out of more than 100), but differ in host range
and pathology (Wang and Jehle 2009). Of significant evolutionary importance is
that one of these nudiviruses, HzNV-2, replicates in the reproductive tract of the
lepidopteran Heliothis zea, a host used commonly by many braconid and ichnomo-
nid wasps. Of particular significance is the recent finding that an ancestral nudivirus
is the likely source of the structural proteins encoded by braconid wasps that
compose their immunosuppressive particles (Bezier et al. 2009). While current
evidence for the origin of the ichneumonid immunosuppressive particles is not
nearly as strong as that for the braconids, recent molecular analyses suggest these
originated from ascovirus virions or a related ancestor virus (Bigot et al. 2008).
Data supporting these origins are discussed in more detail later below.
Although the braconid and ichneumonid particles clearly resemble nudivirus and
ascovirus virions, even early studies of these indicated they lacked important
properties characteristic of all viruses. For example, once within a lepidopteran
host cell, there was no replication of DNA. Moreover, in no case was there any
production of progeny virions to disseminate the virus and infect the next host or
cell. Other evidence indicating that the particles were not virions of a virus were
that the so-called infection of host cells and particle production in the wasp tissues
was strictly under control of the wasp. In all viruses, while they interact in various
ways with host cells, it is the virus that controls the synthesis of virus proteins and
replication of DNA, not the host cell, strictly speaking. Yet in the case of the
braconid and ichneumonid particles, they were only produced in female wasps, and
only in a narrow region of the reproductive tract, and only in pupal and adult tissues
as eggs were being produced (Webb et al. 2006). Adding to these problems in
classifying the particles as those of a virus was the occurrence of similar immuno-
suppressive particles that contained no DNA, such as those produced by the
ichneumonid, V. cansecens, discussed above (Rotheram 1967) and more recently
in other parasitic wasps (Barratt et al. 1999).
Given that even before the DNA in particles was sequenced there was substantial
evidence that they were not virions, the question became what are they? The most
obvious correlates were something like mitochondria and plastids, organelles that
originated from bacteria through the fusion of genomes, i.e., symbiogenesis fol-
lowed by gene loss and acquisition (Margulis and Fester 1991; Margulis 1992;
Khakhina 1992). The evidence is now indisputable that mitochondria and chlor-
oplasts, for example, originated from bacteria that became endosymbionts and
subsequently evolved into organelles. By analogy, the same evolutionary processes
occurred, although much more recently, with endoparasitic braconid and ichneu-
monid wasps and at least two different types of viruses, an ancestral nudivirus in the
case of the braconids, and for the ichneumonids, probably an ancestral ascovirus or
iridovirus (the latter being the ancestor of the ascoviruses). Whereas the molecular
evidence is still weak for the origin of the ichneumonid particles from ascoviruses,
the evidence that bracoviruses originated from an ancestral nudivirus is now very
strong (Bezier et al. 2009).
14 Evolution of Immunosuppressive Organelles from DNA Viruses in Insects 233

At present, polydnavirus researchers continue to refer to the braconid and
ichneumonid particles as, respectively, bracovirus or ichnovirus virions, despite
overwhelming evidence from their own studies to the contrary (Webb et al. 2006;
Tanaka et al. 2007; Bezier et al. 2009). Alternatively, based on the molecular data
regarding their evolution, current genetic complements, and functions, we argue
that these interesting immunosuppressive particles should be recognized for what
they are – organelles that evolved from viruses. Continuing to view these organelles
as viruses masks a much more interesting biological and evolutionary phenomenon
than viewing them as “symbiotic viruses.” It also contravenes the definition of such
fundamental concepts as a virus, a genome, and symbiosis. If these particles are
viruses, we have a tripartite – a virus, a wasp, and its lepidopteran host (Webb et al.
2006). Viewing the particles as organelles makes it a bipartite system, a wasp with a
novel organelle encoded in the genome and a lepidopteran host (Federici and Bigot
2003). We think that this new paradigm better explains their biological properties
and diversity and leads to better hypotheses for testing how they evolved and
facilitated the evolution of wasps and their insect hosts.
Below we elaborate on some of the key evidence for the likely evolutionary
pathways that led to these novel organelles. We move from the braconid system, for
which the most molecular data are available, to the ichneumonid system. We finish
with a description of several other types of endoparasitic wasp/insect host systems
which putatively represent various phases of the symbiotic evolutionary process
that range from (1) tripartite systems consisting of a wasp, true virus, and insect
host, to (2) bipartite systems consisting of a wasp with an organelle that has a DNA
complement, and an insect host, to (3) bipartite systems with wasp with organelle
lacking a DNA complement, and an insect host.
14.3 The Evolution of Braconid Particles from Nudiviruses
14.3.1 Early Studies of Nudiviruses in BraconidWasps and Their Hosts
Several viruses that have the structural features of nudiviruses have been known for
many years. For example, the nudivirus of the braconid, Microplitis croceipes, istransmitted vertically, replicates in hemocytes and other tissues, and causes signifi-
cant pathology and mortality in adult wasps (Hamm et al. 1988). A more interesting
nudivirus is the so-called filamentous virus (FV) of the braconid, Cotesia margin-iventris. CmFV is apparently a benign virus that is transmitted vertically by
C. marginiventris and replicates in cells of both the wasp’s lateral and common
oviduct, the latter near the calyx, and in cells of its lepidopteran hosts including
Helicoverpa zea and Spodoptera frugiperda (Hamm et al. 1990). Structurally, the
virions of these wasp-transmitted viruses resemble the nudiviruses, Hz-I, and the
Gonad-Specific Virus, that occur, respectively, in cells lines derived from H. zea
234 B.A. Federici and Y. Bigot

and in the gonadal tissues of this species (Burand 1998). TheMicroplitis and CmFV
nudiviruses viruses are apparently maintained in host populations by vertical
transmission. An even more interesting nudivirus is Hz-NV1, a large virus with a
genome of 228 kbp (Wang and Jehle 2009). This virus has been shown to integrate
into the chromosomes of Trichoplusia ni (TN 368) and S. frugiperda (SF21AE and
SF9) cells, in which it can establish a latent infection (Lin et al. 1999). This is
particularly relevant to symbiogenesis because it demonstrates that a large ds DNA
circular genome can integrate into the chromosomes of their insect hosts. This
provides a possible mechanism for the evolutionary entry of full or partial nudivirus
genomes into wasp genomic DNA.
The above examples are very limited but they do at least provide examples of
the types of viral/host systems that could lead over evolutionary time to the
integration of nudivirus or baculovirus genomes into those of their wasp hosts.
Fortunately, owing to the studies by Espagne et al. (2004), and more recently
Bezier et al. (2009), we now have very strong evidence that such an integration
actually occurred, and given the estimates of Whitfield (2002a), a little less than
100 mya.
14.3.2 Molecular Evidence for the Evolution of BraconidParticles from a Nudivirus
One of the predictions of a viral paradigm is that the DNA in the virions would
encode virion structural proteins and enzymes needed for the various replication
and assembly processes. An organelle paradigm, on the other hand, would predict a
significant reduction in genome size and that many, if not most of the original
genes, would be transferred to the nuclear genome or lost during evolution. Thus,
before any braconid or ichneumonid particles genomes, the so-called “viral
genomes” were sequenced, we predicted that most of the DNA in the particle
would consist of wasp genes, that is, DNA originating from wasp chromosomes
(Federici 1991; Federici and Bigot 2003). The first significant confirmation of the
organelle paradigm came from the sequencing DNA in the particles produced by
the braconid wasp, Cotesia congregata (Espagne et al. 2004). In this important
study, it was shown that fewer than 2% of the genes were related to those of any
known virus. Most of the genes encoded proteins with physiological functions,
such as protein tyrosine phosphatases, ankyrins, cysteine-rich proteins, and cysta-
tins. Some of the genes were related to the genes found in the particles produced
by other braconid species, but nevertheless, none of these was related to any
known virion structural protein. Similar findings have now been reported for the
“genomes” of particles produced by other braconids, including those of Glypta-panteles indiensis and G. flavicoxis (Desjardins et al. 2008). The DNA in all the
particles sequenced to date consists mostly of noncoding DNA of wasp origin, and
DNA that codes for wasp proteins. Some of these genes may well have originated
14 Evolution of Immunosuppressive Organelles from DNA Viruses in Insects 235

from viruses or bacteria, but they likely have been part of wasp genomes for
millions of years, and therefore are now in essence wasp genes. Even though the
structural characteristics of the particles made it probable they originated from a
baculovirus or nudivirus, these results made it clear that the “genomic” DNA,
unlike in the case of any other known virus, could not be used to find the viral
origin from which the particles evolved. Nor would these “genomes” be very
useful for polydnavirus systematics, because if the particle DNA is wasp DNA,
the sequences would likely reflect the relationships of the wasps. In fact, evidence
for this was already apparent years ago for braconid particle DNAs for several
Cotesia species (Whitfield 2002b).
As it had been known for many years that the braconid particles were produced
in calyx cells, a way to get at more meaningful data regarding the origin of the
braconid particles was to clone and sequence the transcripts from reproductive
tissues at the time of particle production. Thus, in another important and insightful
paper, Bezier et al. (2009) sequenced 5,000 expressed sequence tags from the
ovaries of two braconid wasps, Chelonus inanitus and C. congregata, and one
ichneumonid,Hyposoter didymator. The sequences from the ichneumonid wasp did
not show any relationship to known viral proteins, but analysis of the braconid
sequences proved very profitable. They identified 22 sequences related to nudi-
viruses, and 13 of these were core genes shared with baculoviruses. The genes
identified correlated with nudivirus and baculovirus virion structural proteins,
proteins involved in virion assembly, and subunits of viral RNA polymerases. No
polymerases involved in DNA replication were detected, indicating wasp poly-
merases were likely responsible for synthesis of braconid particle “genomes.”
Aside from providing excellent data regarding the original of crucial particle
components and proteins needed for particle assembly, these data show clearly
that these proteins are all encoded in the wasp genome and are under strict regulation
by the wasp genome, again a property not characteristic of any known virus.
14.4 Origin and Evolution of Ichneumonid Particles
As noted above for braconid particles, the DNA in ichnemonid particles consists
primarily of noncoding ichneumonid wasp DNA and genes coding for ichneumonid
proteins involved in immunosupression. Therefore, this DNA, while of some value
for suggesting the possible viral origins of these particles, as discussed below, we
do not currently have the type of information from these wasps corresponding to the
data described above for the braconid particles. The structure of the ichneumonid
particles suggests they originated from ascoviruses, and fortunately we do have
reasonably good molecular data for the evolution of ascoviruses from iridoviruses
(Stasiak et al. 2003). So we first review here pertinent key features of iridioviruses
and ascoviruses, and then review the limited molecular evidence suggesting the
ichnoviruses evolved from an ascovirus or iridovirus ancestor of these.
236 B.A. Federici and Y. Bigot

14.4.1 Family Iridoviridae
The family Iridoviridae is comprised of a diverse group of enveloped, double-
stranded (ds) DNA viruses which produce large icosahedral virions that typically
range 125–160 nm in diameter (Fig. 14.2). These viruses are commonly found in
invertebrates, particularly insects, but also occur among vertebrates (Chinchar et al.
2005). Iridoviruses have a broad tissue tropism in insects, and infect and replicate in
most tissues, with the unusual exception of the midgut epithelium, a tissue that most
insect viruses attack readily. Corresponding with their tissue tropism, iridoviruses
are poorly infectious per os (Federici 1993). Once within a cell, iridovirus DNA
replication, formation of the virogenic stroma, and virion assembly all take place in
the cytoplasm.
Iridoviruses have been reported from diverse lepidopteran hosts, including the
rice stem borer, Chilo suppressalis (Pyralidae), the American armyworm,
Heliothis armigera (Noctuidae), and the fall armyworm, S. frugiperda (Noctui-
dae). Relevant to the possibility that an ancestral iridovirus or ascovirus is the
source of the ichneumonid particles, the ichneumonid, Eiphosoma vitticolle,which parasitizes larvae of the fall armyworm, S. frugiperda, is also infected by
an iridovirus, and transmits this virus to fall armyworm populations in the field
(Lopez et al. 2002).
Fig. 14.2 Electron micrographs of iridovirus and ascovirus virions. Iridovirus virions observed in
negatively stained preparations (a) and by transmission electron microscopy (b), respectively.
Ascovirus virions as observed in negatively stained preparations (c) and by transmission electron
microscopy (d), respectively. Despite the marked difference in virion structure, molecular evi-
dence indicates these two types of viruses are closely related, and that the ascoviruses evolved
from iridoviruses. Bar ¼ 100 nm
14 Evolution of Immunosuppressive Organelles from DNA Viruses in Insects 237

14.4.2 Family Ascoviridae
The ascoviruses (family Ascoviridae) are ds DNA viruses that attack lepidopterans
and are characterized by large, enveloped virions, 130 � 400 nm, which vary,
depending on the species, from allantoid to bacilliform in shape (Federici et al.
2005). Structural studies of ascovirus virions suggest that these contain two unit
membranes, one that is part of the inner particle that surrounds the DNA core, and a
second that makes up part of the outer virion envelope (Fig. 14.2). There are
significant differences between ascovirus and ichneumonid particles, but neverthe-
less they correspond in size and general morphology (Figs. 14.1 and 14.2). Each
ascovirus virion contains a single ds DNA genome, which, depending on the species,
ranges from 138 to 180 kb. Four species of ascoviruses are recognized, S. frugiperdaascovirus (SfAV-1a), Trichoplusia ni ascovirus (TnAV-2a), Heliothis virescensascovirus (HvAV-3a), and Diadromus pulchellus ascovirus (DpAV-4a). The first
three occur in noctuid species such as the cabbage looper, T. ni, cotton budworms and
bollworms of Heliothis and Heliocoverpa species, and armyworms, Spodopteraspecies, in the United States. These viruses are pathogens that kill the wasp’s host
and as a result, wasp larvae as well. The fourth, noted earlier, occurs in France, where
it attacks the pupa of the leakmoth, Acrolepiosis assectella (family Yponomeutidae).
This ascovirus is a true symbiotic virus that enhances the parasitic success of its wasp
vector. All ascoviruses replicate genomic DNA, producing large numbers of progeny
virions in their caterpillar or pupal hosts. Ascoviruses differ from all other viruses in
that after they invade a cell, they destroy the nucleus and direct the cell to cleave into
numerous vesicles in which virion assembly proceeds. These vesicles are liberated
from tissues into the hemolymph, where female wasps acquire them mechanically
during oviposition and transmit them to new caterpillar hosts.
Aside from structural similarities, ascovirus virions and ichneumonid particles
depend on parasitic wasps for transmission. Much like insect iridoviruses, ascov-
iruses are very difficult to transmit per os, but are highly infectious when transmit-
ted by parasitoids or by injection (Hamm et al. 1985). Even more importantly with
respect to the organelle paradigm and symbiogenesis, the genome of the
D. pulchellus ascovirus (DpAV-4a) is carried in a nonintegrated form in the nuclei
of males and females of its ichneumonid wasp vector, D. pulchellus (Bigot et al.1997a, b). If one were looking for evolutionary intermediates between ascoviruses
and ichnoviruses, this would be a type that would be expected.
14.4.3 Molecular Evidence for the Evolution of Ascovirusesfrom Iridoviruses
As noted above, the molecular evidence that ichnovirus particles evolved from
ascoviruses is very limited. We therefore first discuss the data that exist for the
evolution of the ascoviruses from iridoviruses. These data provide an important
238 B.A. Federici and Y. Bigot

foundation for the ascovirus > ichneumonid particle hypothesis because ascoviruses
differ so much from iridoviruses in their cytopathology and morphology of their
virions. Thus, if ascoviruses, which recall are transmitted by parasitoids, evolved
from iridoviruses, the possibility that ichnoviruses evolved from ascoviruses, where
at least the changes in virion structure are less substantial, becomes more plausible.
The molecular evidence that ascoviruses evolved from iridoviruses is based on
analyses of four proteins that occur among a diversity vertebrate and invertebrate ds
DNA viruses. These proteins are the major capsid protein, DNA polymerase,
thymidine kinase, and ATPase III. Our analyses, performed using Parsimony and
Neighbor-Joining programs, indicate all these evolved from the same virus ancestor
(Stasiak et al. 2000, 2003). Although there are variations in the topologies of the
trees that emerged from our analyses of these proteins, two significant patterns are
apparent. First, ascoviruses and iridoviruses are more closely related to each other
than to the algal or vertebrate viruses in this viral lineage. Second and more
significantly, the TK and ATPase trees show the lepidopteran Chilo iridovirus
(CIV) clustering more closely with ascoviruses than with any of the vertebrate
iridioviruses (Stasiak et al. 2000, 2003). That the CIV and ascovirus MCP do not
cluster on the same branch is not surprising given the marked differences in virion
shape (Fig. 14.2). Another important feature that emerged from these analyses is
that the ascoviruses that are mechanically vectored by wasps, i.e., SfAV-1a,
TnAV-2a, and HvAV-3a, cluster together on one branch of the ascovirus tree,
whereas DpAV-4a, which is vertically transmitted by its wasp host, is found on a
separate branch. This difference correlates with the important difference in biology,
specifically, the more intimate association that DpAV-4a has with its wasp vector.
In summary, while the data indicating ascoviruses evolved from iridoviruses must
be considered preliminary, as the genes analyzed represent a small portion of those
encoded by these viruses, the results are nevertheless important because they reflect
patterns consistent with the biology of virus transmission by parasitic wasps.
More recent molecular studies, specifically the sequencing of the DpAV-4a
genome, suggest that in fact the ichneumonid particles may well have originated
from an ancestral iridovirus. We noted above that the ichneumonid, E. vitticolle, aparasite of noctuid caterpillars, is both capable of transmitting and being infected by
an iridovirus (Lopez et al. 2002). Annotation of the DpAV-4a genome shared more
core genes with lepidopteran iridoviruses than the more common, highly patho-
genic ascoviruses, e.g., SfAV-1, TnAV-2, and HzAV-3 (Bigot et al. 2009). These
findings again illustrate the need for more genomic sequence data on iridoviruses
and ascoviruses that infect lepidopteran insects.
14.4.4 Molecular Data Supporting an Iridovirus/AscovirusOrigin for Ichneumonid Particles
Though the molecular evidence at this stage is minimal, and despite the findings
regarding the DpAV-4 genome noted above, BLAST results obtained with several
14 Evolution of Immunosuppressive Organelles from DNA Viruses in Insects 239

ORFs in this genome provide evidence that certain ichnovirus ORFs have their
closest relatives in ascovirus genomes. Specifically, we identified a 13 kbp region
that contains a cluster of three genes (Fig. 14.3; ORF90, 91, and 93; Bigot et al.
2008) that have close homologs in a GfIV gene family composed of seven members
(Lapointe et al. 2007). All contain a domain similar to a conserved domain found in
the pox-D5 family of NTPases. To date, this pox-D5 domain has been identified as a
NTP binding domain of about 250 amino acid residues found only in viral proteins
encoded by poxvirus, iridovirus, ascovirus, and mimivirus genomes. These genes
seem to be specific to GfIV, as they are absent in the three sequenced genomes of
other ichnoviruses, namely CsIV, Tranosema rostrales ichnovirus (TrIV), and
Hyposoter fugitivus ichnovirus (HfIV).More specifically, in DpAV-4, ORF90 encodes a protein of 925 amino acid
residues that is 40 similar from position 140 to 925 to a protein of 972 amino acid
residues encoded by the ORF1 contained in the segment C20 in the GfIV genome.
These two proteins can therefore be considered putative orthologs. The 480
C-terminal residues of this DpAV-4 protein are also 42 similar to the C-terminal
domain of the protein homologs encoded by the ORF1 of the D1 and D4 GfIV
segments, 36 similar to the N-terminal and the C-terminal domains of the protein
encoded by the ORFs 184R and 128L of the iridovirus CIV and LCDV, and 30
similar with those encoded by ORFs 119, 99, and 78 in the ascovirus genomes of
HvAV-3e, SfAV-1a, and TnAV-2c, respectively. Overall, this indicates that this
DpAV-4 protein is more closely related to that of GfIV than to those found in other
ascovirus and iridovirus genomes currently available in databases. ORF091
encodes a protein of 161 amino acid residues similar only with the C-terminal
domain of three proteins encoded by the ORFs 1, 1, and 3, contained, respectively,
in GfIV segments D1, D4, and D3. In contrast, ORF93 is closer to iridovirus and
ascovirus genes than to GfIV genes. This protein of 849 amino acid residues is 43
similar over all its length to CIV ORF184R orthologs in all iridoviral and ascoviral
genomes and is only 36 similar over 350 amino acid residues to the C-terminal
domain of the GfIV protein homologs encoded by the ORF1, 2, 1, 1, 1, and 1 in,
respectively, the C20, C21, D1, D2, D3, and D4 segments of this virus.
Since the three DpAV-4 genes have relatives in all ascovirus and iridovirus
genomes sequenced so far, their presence in the DpAV-4 genome cannot result
Fig. 14.3 Map of the 13-kbp region of the DpAV4 genome (EMBL Acc. No. CU469068 and
CU467486) that contains the gene cluster with direct homologs in the genome of the Glyptafumiferanae ichnovirus. DpAV-4 ORF with well-characterized direct homologs among other
ascovirus and iridovirus genomes are represented by white arrows. Homologous ORF of the
GfIV genes are represented by black arrows (from Bigot et al. 2008). Below, the graph is scaled
in kbp
240 B.A. Federici and Y. Bigot

from a lateral transfer that occurred from an ichnovirus genome related GfIV to
DpAV-4. Thus, as these DpAV-4 genes are the closest relatives of the pox-D5 gene
family present in GfIV identified so far, they could be considered a landmark of the
symbiogenic ascovirus origin of the ichnovirus lineage to which this polydnavirus
belongs. An alternative explanation is that the presence of DpAV-4-like genes in the
genome of GfIV resulted from a lateral transfer from viral genomes closely related
to those of GfIV and DpAV-4. Indeed, this might have happened when a Glyptawasp was infected by an ancestral virus related to DpAV-4. Nevertheless, the
symbiogenic origin of GfIV from ascoviruses is also supported by morphological
features of its virions (Lapointe et al. 2007), which, aside from similarities in shape,
also show reticulations on their surface in negatively stained preparations, a charac-
teristic of the virions of all ascovirus species examined to date (Federici et al. 2005).
14.4.5 Relationships Between Ascovirus Virion and IchneumnidParticle Proteins
Because ascovirus virions and ichnovirus particles display structural similarities,
we developed an approach to search for homologs of virion structural proteins in
ichnoviruses. To date, only two virion proteins from the Campoletis sonorensisichnovirus (CsIV) have been characterized (Webb et al 2006). The first is the P44, a
structural protein that appears to be located as a layer between the out envelope and
nucleocapsid, and the second, P12, a capsid protein. Presently, there are more than
one hundred ascoviral or iridoviral MCP sequences in databases. BLAST searches
using these sequences failed to detect any similarities between CsIV virion proteins
and ascoviral or iridoviral MCPs, or any other proteins. To evaluate the possibility
that homology between ichnovirus and ascovirus virion proteins may simply not be
detectable by conventional Blastp searches, we used a different method, WAPAM
(weighted automata pattern matching). The models were designed on the basis of a
previous study (Stasiak et al. 2003) demonstrating that MCP encoded by ascovirus,
iridovirus, phycodnavirus, and asfarvirus genomes are related, and all contain seven
conserved domains separated by hinges of very variable size. We investigated these
conserved domains further using hydrophobic cluster analysis. This analysis
revealed that most conservation occurred at the level of hydrophobic residues, as
expected for structural proteins. The size variability of the hinges between con-
served domains and the conservation of hydrophobic residues might explain why
BLAST searches using iridoviral and ascoviral MCP sequences have limited ability
to detect MCP orthologs in phycodnavirus and asfarvirus genomes. We designed
two syntactic models which together were able to specifically align all MCP
sequences of the four virus families. Importantly, WAPAM aligned the CsIV
ichnovirus P44 structural protein with both models. Complementary structural
and HCA confirmed the presence of the seven conserved domains in this CsIV
structural protein (Fig. 14.4a).
14 Evolution of Immunosuppressive Organelles from DNA Viruses in Insects 241

In addition to the above analysis, ten syntactic models were developed using
proteins conserved in the three sequenced ascovirus species (SfAV-1a, TnAV-2c,
and HvAV-3a) and twelve iridoviruses. None of these models detected homologs
among ichnovirus proteins available in databases, except for one, developed from
small proteins encoded by the DpAV-4 ORF041, SfAV1a ORF061, HvAV-3a
ORF74, and TnAV-2c ORF118 in the ascovirus genomes, and iridovirus CIV
ORF347L and mimivirus MIV ORF096R genomes, respectively. Importantly,
these proteins have orthologs in vertebrate iridoviruses, phycodnaviruses, and
asfarvirus. In SfAV1a, the peptide encoded by ORF061 is one of the virion
components. In ascoviruses, iridoviruses, phycodnaviruses, and the asfarvirus,
Fig. 14.4 Sequence (lanes 1–3) and secondary structure (lanes 4–6) comparisons among (a) MCP
and (b) SfAV1a ORF061 orthologs fromCsIV (lanes 1 and 4, typed in black), DpAV4 (lanes 2 and 5,typed in blue), and SfAV1a (lanes 3 and 6, typed in purple). Conserved positions among the amino
acid sequence of CsIV and those of DpAV4 and SfAV1a are highlighted in gray. Secondarystructures in the three SfAV1a ORF061 orthologs were calculated with the Network Protein
Sequence Analysis at http://npsa-pbil.ibcp.fr/ website and the statistical relevance of the secondarystructures were evaluated with Psipred at http://bioinf.cs.ucl.ac.uk/psipred/ website. C, E, and H in
lanes 4–6 respectively indicated for each amino acid that it is involved in a coiled, b sheet, or a
helix structure. Using default parameters of Psipred, upper case letters indicate that the predicted
secondary structure is statically significant in Psipred results. Significant secondary structures are
highlighted in yellow. In (a), the comparisons were limited to three of the seven conserved
domains, 2, 5, and 7. Indeed, classical in silico methods appeared to be inappropriate to predict
statistically significant secondary structures in conserved structural protein rich in b strand such as
iridovirus and ascovirus major capsid proteins. In contrast, a complete and coherent domain
comparison was obtained by HCA profiles (see Bigot et al. 2008)
242 B.A. Federici and Y. Bigot

they have been annotated as thioredoxines, proteins that play a role in initiating
viral infection. Database mining with our model revealed four hits with CsIV
sequences (Acc N�. M80623, S47226, AF236017, AF362508) each a homolog
2a. Conservation, translocations and losts of the Ascovirus genes
2b. Translocation, duplication and diversification of host genes in the proviral genome of Ascoviral origine.
3a. Resulting proviral Ichnovirus genomes (monolocus solution)
3b. Resulting proviral Ichnovirus genomes (multilocus solution obtainedafter fragmention of the proviral genome by recombination)
1. Chromosomal integration of an Ascovirus genome in ancestors wasp genome of the Banchinae and Campopleginae lineages.
Fig. 14.5 Hypothetical mechanism for the integration and evolution of ascovirus genomes in
endoparasitic wasps. Schematic representation of the three-step process of symbiogenesis, and
DNA rearrangements that putatively occurred in the germ line of the wasp ancestors in the
Banchinae and Campopleginae lineages, from the integration of an ascoviral genome to
the proviral ichnoviral genome. Sequences that originate from the ascovirus are in blue, those ofthe wasp host and its chromosomes are in pink. Genes of ascoviral origin are surrounded by a thinblack or white line, depending on their final chromosomal location. Two solutions can account for
the final chromosomal organization of the proviral ichnovirus genome, monolocus or multilocus,
since this question is not fully understood in either wasp lineage. More complex alternatives to this
three-step process might also be proposed and would involve, for example, the complete de novo
creation of a mono or multi locus proviral genome from the recruitment by recombination or
transposition of ascoviral and host genes located elsewhere in the wasp chromosomes. This model
for the chromosomal organization of proviral DNA in polydnaviruses is consistent with published
data (Desjardins et al. 2007)
14 Evolution of Immunosuppressive Organelles from DNA Viruses in Insects 243

ORF of SfAV-1a ORF061. In fact, these sequences correspond to several variants
of a single region contained in the B segment of the CsIV genome. To date, these
have not been annotated in the final CsIV genome, probably because they overlap a
recombination site. HCA analyses confirmed that the hydrophobic cores were
conserved (Fig. 14.4b).
Confirmation of the apparent relationship of iridoviruses, ascoviruses, and the
ichneumonid particles awaits the sequencing of more of the viral genomes and
sequencing of the wasp genes that code for at least the structural proteins that make
up the ichneumonid particles. Nevertheless, the significant biological relationships
of endoparasitc ichneumond wasps with iridoviruses, ascoviruses, and their cater-
pillar hosts, and especially the unique relationship of DpAV-4 with its vector,
provide all the reagents for the development of symbiotic relationships that lead
to symbiogenesis. The evolutionary progression of these relationships, and the
benefits certain lineages of symbiotic viruses provided the wasps, and the likely
account for the origin of ichneumonid (and braconid) particles. In Fig. 14.5, we
illustrate a possible evolutionary scenario and mechanism that may have yielded the
interesting immunosuppressive organelles.
Table 14.1 Examples of viruses vertically transmitted by parasitoids and their possible viral
origins
Virus Evolutionary
origin
Parasitoid
family
Parasitoid
host
Reference
Produce virions in parasitoid’s host
Diadromus pulchellusascovirusa
Iridovirusc Ichneumonidae Lepidoptera Bigot et al. 1997a
Diachasmimorphalongicaudata poxvirusa
Poxvirus Braconidae Diptera Lawrence 2002
Microctonus aethiopoidesvirusa
Ascovirusc Braconidae Coleoptera Barratt et al.
1999
Cotesia melonoscela virus Ascovirusc Braconidae Lepidoptera Stoltz et al. 1988
Cotesia marginiventrisnudivirus
Nudivirus Braconidae Lepidoptera Hamm et al. 1990
Microplitis croceipes nudivirus Nudivirus Braconidae Lepidoptera Hamm et al. 1988
Diadromus pulchelluscypovirusb
Reovirus Ichneumonidae Lepidoptera Rabouille et al.
1994
Diachasmimorphalongicaudata rhabdovirusb
Rhabdovirus Braconidae Diptera Lawrence and
Akin 1990
No virions produced in parasitoid’s host
Campoletis sonorensisichnovirus
Ascovirusc Ichneumonidae Lepidoptera Webb et al. 2000
Cotesia marginiventrisbracovirus
Nudivirusc Braconidae Lepidoptera Webb et al. 2000
Bathyplectes anurus virus Poxvirusc Ichneumonidae Coleoptera Hess et al. 1980aInvolved in immunosuppressionbRNA viruscAncestral viruses from which the respective parasitic particles originated
244 B.A. Federici and Y. Bigot

14.5 Examples of the Diversity of Immunosuppressive
Wasp Viruses and Organelles
While the focus here has been on the origin and evolution of braconid and
ichneumonid particles, there are several other known endoparasitic wasp/virus
associations that range from symbiotic (i.e., involving true viruses) to organelles
that likely originated from viruses. These associations, along with several others
that have been discussed above, are listed in Table 14.1 to show the diversity of
these relationships, most of which have received very little study. Of particular
interest are the ascoviruses and poxviruses that replicate in both the parasitoid and
its insect host, produce progeny virions, and play a role in immunosuppression.
These include the D. pulchellus ascovirus, D. longicaudata entomopoxvirus, the
pox-like particles of Bathyplectes anurus, an ichneumonid parasite of a coleop-
teran, and the asco-like “virus” of M. aethiopoides, a braconid parasite of a
coleopteran.
14.6 Summary
During the last 100 million years, the genomes of at least two different types of
DNA viruses were integrated into the genomes of, respectively, endoparasitic
braconid and ichneumonid wasps. These viral genes thus became part of the wasp
genome. Over time, many of the original viral genes were deleted from the DNA
packaged into the virions and replaced by wasp genes involved in suppressing the
immune response of their caterpillar hosts, thereby transforming the original virions
into a novel type of transducing immunosuppressive organelle that enhanced the
survival of wasp progeny. The principal original viral genes that were selectively
maintained in a functional state in the wasp genomes were those involved in
producing critical structural proteins and enzymes essential for organelle assembly
and trafficking wasp immunosuppressive genes into caterpillar host cells and nuclei
for transcription. There are marked structural differences between the braconid and
ichneumonid organelles and their transducing wasp DNAs, yet their common role
in immunosuppression demonstrates a high degree of convergent evolution. This
relatively recent example of symbiogenesis through which two DNA viruses
evolved into immunosuppressive organelles likely accounts for much of the species
radiation characteristic of endoparasitic braconids and ichneumonids, two of the
largest groups of higher eukaryotic organisms.
Acknowledgments This research was supported by grants from the CNRS and the N.A.T.O. to
Y. Bigot, and U.S. National Science Foundation Grant INT-9726818 to B. A. Federici. The
photographs used in Fig. 14.1 are by D.B. Stoltz, of Dalhouise University, Halifax, Canada.
14 Evolution of Immunosuppressive Organelles from DNA Viruses in Insects 245

References
Barratt BIP, Evans AA, Stoltz DB, Vinson SB, Easingwood R (1999) Virus-like particles in the
ovaries of Microctonus aethiopoides Loan (Hymenoptera: Braconidae), a parasitoid of adult
weevils (Coleoptera: Curculionidae). J Invertebr Pathol 73:182–188
Bedwin O (1979a) The particulate basis of the resistance of a parasitoid to the defense reaction of
its insect host. Proc Biol Sci 205:267–270
Bedwin O (1979b) An insect glycoprotein; a study of the particles responsible for the resistance of
a parasitoids egg to the defense reactions of its insect hosts. Proc Biol Sci 205:271–286
Bezier A, Annaheim M, Herbiniere J, Wetterwald C, Gyapay G, Bernard-Samain S, Wincker P,
Roditi I, HellerM, BelghaziM, Pfister-WilhemR, Periquet G, DupuyC, Juguet E, Volkoff A-N,
Lanzrein B, Drezen J-M (2009) Polydnaviruses of braconid wasps derive from an ancestral
nudivirus. Science 323:926–930
Bigot Y, Rabouille A, Sizaret P-Y, Hamelim M-H, Periquet G (1997a) Particle and genomic
characterisation of a new member of the Ascoviridae, Diadromus pulchellus ascovirus. J GenVirol 78:1139–1147
Bigot Y, Rabouille A, Doury G, Sizaret P-Y, Delbost F, Hamelim M-H, Periquet G (1997b)
Biological and molecular features of the relationships between Diadromus pulchellus ascov-
irus, a parasitoid hymenopteran wasp (Diadromus pulchullus) and its lepidopteran host,
Acrolepiosis assectella. J Gen Virol 78:1149–1163
Bigot Y, Samain S, Auge-Gouillou C, Federici BA (2008) Molecular evidence for the evolution of
ichnoviruses from ascovirsues by symbiogenesis. BMCEvol Biol. doi:10.1186/1471-2148-8-253
Bigot Y, Renault S, Nicolas J, Moundras, C, Demattei MV, Semain S, Bideshi DK, Federici BA
(2009) Symbiotic virus at the evolutionary intersection of three types of large DNA viruses:
Iridoviruses, Ascoviruses, and Ichnoviruses. PloS One doi:10.1371/journal.pone.000639
Burand JP (1998) Nudiviruses. In: Miller LK, Bell LA (eds) The insect viruses. Plenum Press,
New York, pp 69–90
Chinchar VG, Essbauer S, He JG, Hyatt A, Miyazaki T, Seligy V, Williams T (2005) Family
Iridoviridae. In: Fauquet CM, Mayo MA, Maniloff J, Desselberger U, Ball LA (eds) Virus
taxonomy: eight report of the international committee on virus taxonomy. Elsevier/Academic
Press, London, pp 145–162
Deng L, Stoltz DB, Webb BA (2000) A gene encoding a polydnavirus structural polypeptide is not
encapsidated. Virology 269:440–450
Desjardins CA,Gundersen-RindalDE,Hostetler JB, TallonLJ, Fuester RW, SchatzMC, PedroniMJ,
Fadrosh DW, Haas BJ, Toms BS, Chen D, Nene V (2007) Structure and evolution of a proviral
locus of Glyptapanteles indiensis bracovirus. BMC Microbiol. doi:10.1186/1471-2180-7-61
Desjardins CA, Gundersen-Rindal DE, Hostetler JB, Tallon LJ, Fadrosh DW, Fuester RW,
Pedroni MJ, Haas BJ, Schatz MC, Jones LM, Crabtree J, Forberger H, Nene V (2008)
Comparative genomics of mutualistic viruses of Glyptapanteles parasitic wasps. Genome
Biol. doi:10.1186/gb-2008-9-12-r183
Edson KM, Vinson SB, Stoltz DB, Summers MD (1981) Virus in a parasitoid wasp: supression of
the cellular immune response in the parasitoid’s host. Science 211:582–583
Espagne E, Dupuy C, Huguet E, Cattolico L, Provost B, Martins N, Poire M, Periquet G, Drezen
JM (2004) Genome sequence of a polydnavirus: insights into symbiotic virus evolution.
Science 306:286–289
Federici BA (1983) Enveloped double stranded DNA insect virus with novel structure and
cytopathology. Proc Natl Acad Sci USA 80:7664–7668
Federici BA (1991) Viewing polydnaviruses as gene vectors of endoparasitic hymenoptera. Redia
74:387–392
Federici BA (1993) Viral pathology in relation to insect control. In: Beckage NE, Thompson SN,
Federici BA, (eds) Parasites and Pathogens of Insects, Vol 2, Academic Press, New York,
pp 81–101
246 B.A. Federici and Y. Bigot

Federici BA, Bigot Y (2003) Origin and evolution of polydnaviruses by symbiogenesis of insect
DNA viruses in endoparasitic wasps. J Insect Physiol 49:419–432
Federici BA, Bigot Y, Granados RR, Hamm JJ, Miller LK, Newton I, Stasiak K, Vlak JM (2005)
Family Ascoviridae. In: Fauquet CM, Mayo MA, Maniloff J, Desselberger U, Ball LA (eds)
Taxonomy of virus taxonomy: eight report of the international committee on virus taxonomy.
Elsevier/Academic Press, London, pp 269–274
Hamm JJ, Nordlung DA, Marti OG (1985) Effects of a nonoccluded virus of Spodoptera frugi-perda (Lepidoptera: Noctuidae) on the development of a parasitoid, Costesia marginiventris(Hymenoptera: Braconidae). Environ Entomol 14:258–261
Hamm JJ, Styer EL, Lewis WJ (1988) A baculovirus pathogenic to the parasitoid Microplituscroceipes (Hymenoptera: Braconidae). J Invertebr Pathol 52:189–191
Hamm JJ, Styer EL, Lewis WJ (1990) Comparative virogenesis of filamentous virus and poly-
dnavirus in the female reproductive track of Cotesia marginiventris (Hymenoptera: Braconi-
dae). J Invertebr Pathol 55:357–360
Hess RT, Poinar GO Jr, Etzel L, Merritt CC (1980) Calyx particle morphology of Bathyplectesanurus and B. curculionis (Hymenoptera: Ichneumonidae). Acta Zoo (Stockholm)
61:111–114
Khakhina LN (1992) Concepts of symbiogenesis. In: Margulis L, McMenamin M (eds) Historical
and critical study of the research of Russian botanists. Yale University Press, New Haven
Lapointe R, Tanaka K, Barney WE, Whitfield JB, Banks JC, Beliveau C, Stoltz D, Webb BA,
Cusson M (2007) Genomic and morphological features of a banchine oplydnavirus: compari-
son with bracoviruses and ichnoviruses. J Virol 81:6491–6501
Lawrence P (2002) Purification and partial characterization of an entomoposvirus (DLEPV) from
a parasitic wasp of tephritid fruit flies. J Insect Sci 2:10
Lin C-L, Lee JC, Chen SS, Wood HA, Li M-L, Li C-F, Chao Y-C (1999) Persistent Hz-1 virus
infection in insect cells: evidence for insertion of viral DNA into host chromosomes and viral
infection in a latent status. J Virol 73:128–139
Lopez M, Rojas JC, Vandame R, Williams T (2002) Parasitoid mediated transmission of an
iridescent virus. J Invertebr Pathol 80:160–170
Margulis L (1992) Biodiversity: molecular biological domains, symbiosis and kingdom origins.
Biosystems 27:39–51
Margulis L, Fester R (1991) Symbiosis as a source of evolutionary innovation. MIT Press,
Cambridge Massachusetts
Rabouille A, Bigot Y, Drezen JM, Sizaret P-Y, Hamelin M-H, Periquet G (1994) A member of the
reoviridae (DpRV) has a ploidy-specific genomic segment in the wasp Diadromus pulchellus(Hymenoptera). Virology 205:228–237
Rotheram S (1967) Immune surface of eggs of a parasitic insect. Nature 214:700
Rotheram S (1973a) The surface of the egg of a parasitic insect. I. The surface of the egg and first
instar larvae of Nemeritis. Proc Biol Sci 183:179–194Rotheram S (1973b) The surface of the egg of a parasitic insect. IL. The ultrastructure of the
particulate coat on the egg of Nemeritis. Proc Biol Sci 183:195–204Salt G (1965) Experimental studies in insect parasitism XIII. The haemocytic reaction of a
caterpillar to the eggs of its habitual parasite. Proc Biol Sci 162:303–318
Salt G (1966) Experimental studies in insect parasitism XIII. The haemocytic reaction of a
caterpillar to the eggs of its habitual parasite. Proc Biol Sci 165:155–178
Salt G (1968) The resistance of insect parasitoids to the defense reactions of their hosts. Biol Rev
43:200–232
Schmidt O, Schuchmann-Feddersen I (1989) Role of virus-like particles in parasitoid-host inter-
action of insects. Subcell Biochem 15:91–119
Schmidt O, Theopold U (1991) Immune defense and suppression in insects. BioEssays 13:343–346
Schmidt O, Theopold U, Strand M (2001) Innate immunity and its evasion and suppression by
hymenopteran endoparasitoids. BioEssays 23:344–351
14 Evolution of Immunosuppressive Organelles from DNA Viruses in Insects 247

Stasiak K, Demattei M-V, Federici BA, Bigot Y (2000) Phylogenetic position of the DpAV-4a
ascovirus DNA polymerase among viruses with a large double-stranded DNA genome. J Gen
Virol 81:3059–3072
Stasiak K, Renault S, Demattei MV, Bigot Y, Federici B (2003) Evidence for the evolution of
ascoviruses from iridoviruses. J Gen Virol 84:2999–3009
Stoltz DB (1993) The polydnavirus life cycle. In: Beckage NE, Thompson SN, Federici BA (eds)
Parasites and pathogens of insects, vol 1. Academic Press, New York, pp 167–187
Stoltz DB, Faulkner G (1978) Apparent replication of an unusual virus-like particle in both a
parasitoid wasp and its host. Can J Microbiol 24:1509–1514
Stoltz DB, Vinson SB (1979) Viruses and parasitism in insects. Adv Virus Res 24:125–171
Stoltz DB, Krell P, Summers MD, Vinson SB (1984) Polydnaviridae – a proposed family of insect
viruses with segmented, double-stranded, circular DNA genomes. Intervirology 21:1–4
Stoltz DB, Krell PJ, Cook D, MacKinnon EA, Lucarotti CJ (1988) An unusual virus from the
parasitic wasp Cotesia melanoscela. Virology 162:311–320
Tanaka K, Lapointe R, Narney WE, Makkay AM, Stoltz D, Cusson M, Webb BA (2007) Shared
and species-specific features among ichnovirus genomes. Virology 263:26–35
Vinson SB (1972) Factors involved in successful attack on Heliothis virescens by the parasitoid
Cardiochiles nigriceps. J Invertebr Pathol 20:118–123Vinson SB (1990) How parasitoids deal with the immune system of their host: an overview. Arch
Insect Biochem Physiol 13:2–27
Vinson SB, Scott JR (1975) Particles containing DNA associated with the oocyte of an insect
parasitoid. J Invertebr Pathol 25:375–378
Wang Y, Jehle JA (2009) Nudiviruses and other large, double-stranded circular DNA viruses of
invertebrates: new insights into an old topic. J Invertebr Pathol 101:187–193
Webb BA, Beckage NE, Hayakawa Y, Lanzrein B, Stoltz DB, Strand MR, Summers MD (2005)
Family Polydnaviridae. In: Fauquet CM, Mayo MA, Maniloff J, Desselberger U, Ball LA (eds)
Virus taxonomy: eight report of the international committee on virus taxonomy. Elsevier/
Academic Press, London, pp 255–265
Webb BA, Strand MR, Dickey SE, Beck MH, Hilgarth RS, Barney WE, Kadash K, Kromer JA,
Lindstrom KG, Rattanadechakul E, Shelby KS, Thoetkiattikul H, Turnbull MS, Witherell RA
(2006) Polydnavirus genomes reflect their dual roles as mutualists and pathogens. Virology
347:160–174
Whitfield JB (2002a) Estimating the age of the polydnavirus/braconid wasp symbiosis. Proc Natl
Acad Sci USA 99:7508–7513
Whitfield JB (2002b) Phylogeny of microgastroid braconid wasps, and what it tells us about
polydnavirus evolution. In: Austin AD, Dowton M (eds) Hymenoptera, evolution, biodiversity,
and biological control. CSIRO Publishing, Collingswood, Australia, pp 97–105
248 B.A. Federici and Y. Bigot

Chapter 15
The Neogastropoda: Evolutionary Innovations
of Predatory Marine Snails with Remarkable
Pharmacological Potential
Maria Vittoria Modica and Mande Holford
Abstract The Neogastropoda include many familiar molluscs, such as cone snails
(Conidae), purple dye snails (Muricidae), mud snails (Nassariidae), olive snails
(Olividae), oyster drills (Muricidae), tulip shells (Fasciolariidae), and whelks (Bucci-
nidae). Due to their amazing predatory specializations, neogastropods are often
dominantmembers of the benthic community at the top of the food chain. In a dazzling
display that ranges from boring holes to darting harpoons, neogastropods have
developed several prey hunting innovations with specialized compounds pharmaceu-
tical companies could only dream about. It has been hypothesized that evolutionary
innovations related to feeding were the main drivers of the rapid neogastropod
radiation in the late Cretaceous. The anatomical, behavioral, and biochemical specia-
lizations of neogastropod families that are promising targets in drug discovery
and development are addressed within an evolutionary framework in this chapter.
15.1 Introduction
15.1.1 The Neogastropoda
Neogastropoda is an order of gastropod molluscs that are well characterized mor-
phologically and are traditionally viewed as monophyletic (Ponder 1973; Taylor
and Morris 1988; Ponder and Lindberg 1996, 1997; Kantor 1996; Strong 2003).
M.V. Modica
Dipartimento di Biologia Animale e dell’Uomo, “La Sapienza”, University of Rome, Viale
dell’Universita 32, 00185 Rome, Italy
e-mail: [email protected]
M. Holford
The City University of New York – York College & Graduate Center, and The American Museum
of Natural History, 94–20 Guy R. Brewer Blvd, Jamaica, NY 11451, USA
e-mail: [email protected]
P. Pontarotti (ed.), Evolutionary Biology – Concepts, Molecularand Morphological Evolution, DOI 10.1007/978-3-642-12340-5_15,# Springer-Verlag Berlin Heidelberg 2010
249

This characterization of the Neogastropoda persists even after contrasting inter-
pretations have been proposed (see e.g., Colgan et al. 2007; Kantor and Fedosov
2009). Strong (2003) has recently provided the most updated report of potential
neogastropod synapomorphies. Anatomical characteristics of neogastropods
include a very peculiar anterior foregut with a proboscis (pleurembolic or intraem-
bolic), a valve of Leiblein, a gland of Leiblein (or a venom gland in Toxoglossa),
paired primary and accessory salivary glands, an anal gland, and several radular
peculiarities (Ponder 1973; Kantor 2002; Strong 2003). Figure 15.1 illustrates a
generalized scheme of neogastropod anatomy.
The order Neogastropoda includes up to 25 families (Bouchet and Rocroi 2005)
traditionally split into three superfamilies, Cancellarioidea, Conoidea, and Muri-
coidea, on the basis of anatomical features of the anterior foregut, including the
radula. Cancellarioidea, also called Nematoglossa, comprised of the single family
Cancellariidae, is perceived to be the basal offshoot of neogastropods (Kantor 1996;
Strong 2003; Oliverio and Modica 2009; Modica et al. 2009). They are character-
ized by a nematoglossan radula with a complex mechanism of interlocking of the
distal cusps (viewed as an adaptation to suctorial feeding: Petit and Harasewych
1986) and a mid-oesophageal gland that is generally not separated from the
oesophagous (Fig. 15.2a). Conoidea, also referred to as Toxoglossa, include Con-
idae, Terebridae, and the “turrid” which are estimated to have more than 10,000
extant species, and whose taxonomy is under revision (Puillandre et al. 2008). In
Conoidea, the radula is modified in various degrees until forming a harpoon
(toxoglossan radula), and the dorsal mid-oesophageal gland is separated from the
oesophagous and develops into a venom apparatus, with a muscular bulb and a
secretory tubule producing neurotoxins (Fig. 15.2b). Muricoidea (also termed
Rachiglossa) include the vast majority of neogastropod families, whose monophyly
is currently debated (Kantor 1996, 2002; Oliverio and Modica 2009). The muri-
coidean radula is rachiglossate (Fig. 15.2c) and their anatomy is similar to the
generalized model proposed in Fig. 15.1, but there are many modifications at
different taxonomic levels. Variations include the presence/absence of radula,
accessory salivary glands, valve and gland of Leiblein, anal gland and a number
of other foregut, renal, and reproductive features.
According to the fossil record, the adaptive radiation of neogastropods has been
particularly rapid (Taylor et al. 1980) and may be attributed to the evolution of a
predatory lifestyle and diversification in a number of different trophic strategies.
Such attributes allowed neogastropods to fully diversify their niches and to effici-
ently exploit their alimentary resources. In this scenario, the evolutionary role
played by chemical innovations in feeding is unquestionable.
The Cancellarioidea, Conoidea, and Muricoidea possess a bountiful reservoir of
bioactive compounds routinely used to sedate or capture prey. These compounds
are the building blocks for future drug discovery targets. Outlined in this chapter are
the anatomical features, specialty feeding strategies, and potential bioactive com-
pounds found in the families of the Neogastropoda. Specific attention is given to the
discovery and characterization of bioactive compounds from the Conoidea. Based
on the successful characterization and implementation of cone snail toxins in
250 M.V. Modica and M. Holford
250

pharmacological approaches (Favreau and Stocklin 2009; Twede 2009; Olivera and
Teichert 2007; Fox and Serrano 2007), several groups within the Neogastropoda are
highlighted as potential biodiversity targets for drug discovery.
15.1.2 Discovery and Characterization of Cone Snail Toxins
The gold standard for investigating toxins from marine snails is the discovery
and characterization of neurotoxins from cone snails (Conus) (Fig. 15.2b). Thisextremely diversified group of marine snails comprises active predators that use
biochemical substances to subdue their prey. Characterization of cone snail toxins
begun almost a half century ago (Kohn 1956; Kohn et al. 1960; Endean et al. 1974),
starting from empirical observations of envenomation episodes, and has blossomed
into a successful research field (review; Norton and Olivera 2006). The characteri-
zation of conotoxins provides scientists with new, powerful tools to manipulate the
function of ion channels and receptors governing the physiology of the nervous
Fig. 15.1 Generalized
scheme of neogastropod
anatomy (male). Mantle
longitudinally dissected, body
wall not shown.
Abbreviations are as follows:
a anus; ag anal gland; asgaccessory salivary gland; ctctenidium; dg digestive
gland; ft foot; hghypobranchial gland; lg glandof Leiblein; lv valve ofLeiblein; mo mouth; opoperculum; os osphradium;
pe penis; pg prostate gland;
pr proboscis; sd salivary duct;sg salivary gland; st stomach;
t testis. Modified after Ponder
(1998a)
15 The Neogastropoda: Evolutionary Innovations of Predatory Marine Snails 251
251

system. The pharmacological usage of ion channels and receptors as drug develop-
ment targets for the treatment of neurological and cardiovascular diseases is rapidly
gaining momentum. The discovery of Prialt (Ziconotide) (Miljanich 2004), the
synthetic form of the Conus magus peptide o-conotoxin MVIIA, an N-type calcium
channel blocker, significantly highlight the potential of toxins from marine snails.
Prialt was approved by the Food and Drug Administration of the United States in
December 2004 for analgesic use in HIV and cancer patients.
Although Prialt is a significant breakthrough, Conus represents only a very small
fraction of the diversity of Neogastropoda. Conus is one of the 20–30 recognized
neogastropod families and includes ca 4–500 species out of 10–15,000 estimated in
the Conoidea (Bouchet and Rocroi 2005). The pharmacological potential of neo-
gastropods as a source for bioactive compounds is largely unrealized. Similar to
cone snails, several other neogastropods have evolved specialized compounds as
a result of their feeding ecology that may have potential in pharmacological
applications.
Fig. 15.2 The Neogastropoda radiation. Three major families of the Neogastropoda are shown:
(a) Cancellarioidea, (b) Conoidea, and (c) Muricoidea. The grey triangles shown are proportional
to the number of species included in each lineage. Shown for each superfamily are radula, scheme
of the foregut, and some shell representatives. Shells shown, from left to right, by genus: (a)
Scalptia. (b) Conus, Terebra, Thatcheria, Gemmula. (c) Murex, Oliva, Vexillum, Melongena,Cymbiola, Fusinus, Volutopsius. (d) Schematic arrangement of the foregut (modified after Kantor
1996). Shell images courtesy of Guido and Philippe Poppe. Radula pictures courtesy of Yuri
Kantor (b) and Alisa Kosyan (c).
252 M.V. Modica and M. Holford
252

15.2 Feeding Strategies in the Neogastropoda
From what is known about the diets of neogastropod families, the vast majority of
neogastropods are carnivorous, with a degree of predatory activity that varies
from actively seeking prey to grazing on sessile invertebrates, to scavenging.
Some neogastropod families, such as Buccinidae and Muricidae, include many
generalist species, which can feed on a variety of living and dead organisms. Most
Muricidae feed on living bivalves, gastropods, polychaetes, bryozoans, sipuncu-
lids, barnacles, and other small crustaceans, but there are a few that also feed on
carrions. A species of Drupa has been observed feeding also on holothurians (Wu
1965), while Drupella (Ergalataxinae) and all Coralliophilinae feed on corals
(Taylor 1976; Ward 1965; Haynes 1990) (Fig. 15.4a). Some neogastropod
families appear to be highly specialized, such as the Mitridae, which feed exclu-
sively on sipunculids (Taylor et al 1980) and possess peculiar anatomical adapta-
tions to this kind of prey (Harasewych 2009). An interesting feeding strategy is
also displayed by the Volutidae, which has been reported for feeding on bivalves,
gastropods, and in some deep-water species, on echinoderms (Darragh and Ponder
1998). Members of the Volutidae use their large foot to engulf the prey in a
semiclosed environment, in which anesthetic substances are apparently released
(Bigatti et al. 2009). Described in the following paragraphs are neogastropod
feeding strategies that involve bioactive substances that may have pharmacologi-
cal utility.
15.2.1 Harpooning
Cone snails, terebrids, and turrids make up the superfamily Conoidea (or Tox-
oglossa, “poisoned tongued”). Toxoglossans are a megadiverse group of hunting
snails where the rapid evolution of venom peptide genes has led to an amazing
molecular diversity. They feed on molluscs, polychaetes, acorn worms, and fish
(Kohn 1959, 1968; Kohn and Nybakken 1975; Leviten 1980). The key evolution-
ary innovations enabling conoideans to hunt preys are a conspicuous venom
apparatus made up of highly modified radular teeth (harpoon), a venom duct
(a glandular duct connected to the oesophagous), and a muscular venom bulb
(Fig. 15.2b). The radular tooth, held at the proboscis tip, is inserted into the
prey and dispensed similar to a hypodermic needle (Olivera 2002). The mecha-
nism of envenomation involves the contraction of the muscular venom bulb,
which forces the secretion of the venom duct through the proboscis, until reaching
the tooth. A single cone snail specimen may produce between 50 and 200 dif-
ferent peptides, which are known to target different ion channels (Terlau and
Olivera 2004).
15 The Neogastropoda: Evolutionary Innovations of Predatory Marine Snails 253
253

15.2.2 Shell Drilling
Shell drilling is the most common feeding technique in muricids, and it is achieved
by the concerted action of the radula and a specialized glandular pad (the accessory
boring organ) placed on the foot sole (Carriker 1961) (Fig. 15.3a). The drilling
process may last up to 1 week (Palmer 1990; Dietl and Herbert 2005). Drilling is not
restricted to muricids and has been observed in other rachiglossans, such as the
marginellid genus Austroginella (Ponder and Taylor 1992), the buccinid Cominella(Peterson and Black 1995), and the nassariid Nassarius festivus (Morton and Chan
1997). Other feeding strategies developed by the muricids include the opening of
the prey shell with the foot (Wells 1958), the cracking of the shells close to the
apertural margin followed by proboscis insertion (Radwin and D’Attilio 1976) and
the use of shell projections on outer lip (labial spines) to force the opening of the
valves (Marko and Vermeij 1999).
15.2.3 Shell Wedging and Proboscis Insertion
As noted above, drilling has been reported for a few species of Buccinidae, but the
majority of buccinids use the strengthened margin of their shells to wedge open
bivalve shells (Nielsen 1975), in order to insert their proboscis (Fig. 15.3b).
Buccinidae eat polychaetes, small crustaceans, and some species have been
observed feeding on peculiar preys, e.g., Neptunea antiqua on priapulids, Taylor
1978). Buccinds can also insert their proboscis into the aperture of gastropod
shells. Similar strategies of proboscis insertion with mild radular rasping or use
of shell margins have been reported in families related to buccinids, such as: the
Nassariidae, which feed on polychaetes, barnacles and carrion; the Fasciolariidae,
which feed on bivalves, gastropods, sedentary polychaetes, and carrions; the
Melongenidae, which feed on gastropods and bivalves; and the Columbellidae,
which feed on ascidians, hydroids, small crustaceans, polychaetes, and algae
(Taylor et al. 1980).
15.2.4 Suctorial Feeding
Suctorial feeding, or sucking the innards of prey organisms, is an evolutionary
advanced feeding technique demonstrated by several neogastropod families. This
form of feeding does not always result in the death of the prey, and several
neogastropod species coexist with the prey. Two kinds of suctorial feedings are
described: haematophagy and corallivory.
254 M.V. Modica and M. Holford
254

15.2.4.1 Haematophagy
Three different neogastropod families, Cancellariidae, Marginellidae, and Colu-
brariidae, have independently evolved haematophagous feeding on fish
(Fig. 15.3c). The buccinoidean family Colubrariidae includes at least six species
involved in a parasitic association with different species of fish, mainly belonging
to the family Scaridae (Johnson et al. 1995; Bouchet and Perrine 1996). Colubrariaspecimens can extend their proboscis to a length exceeding three times the shell
length. When the extended Colubraria proboscis is in contact with the skin of the
prey, a scraping action with its minute radula allows access to the blood vessels of
the fish. The snail then apparently takes advantage of the blood pressure of the fish
to ingest its meal (Oliverio and Modica 2009). Experimental observations on
different Colubraria species (Modica and Oliverio, unpublished) suggest that
adaptation to haematophagy involves the use of anesthetic and anticoagulant
compounds. In fact, the fish appears to be anesthetized when the snail is feeding.
Anesthetization is reversible, and the fish usually recovers its full mobility in a few
minutes after the interruption of the contact with the snail. The anesthetic com-
pounds used are not lethal as the prey recovers, in agreement with field observations
Fig. 15.3 Examples of neogastropod feeding strategies. (a) An ocinebrine Muricidae drilling the
shell of a venerid bivalve (photo G. Herbert). (b) A Muricanthus sp. (Muricidae) using the shell
margin to wedge open a bivalve shell (photo G. Herbert). (c) Colubraria muricata (Colubrariidae)feeding on a clownfish in aquarium; the proboscis is inserted under the pectoral fins (photo
M. Oliverio). (d) Coralliophila meyendorffi (Coralliophilinae) feeding on Actinia equina (photo
P. Mariottini)
15 The Neogastropoda: Evolutionary Innovations of Predatory Marine Snails 255
255

that Colubraria usually feed on fish sleeping in crevices of the reef (M. Oliverio
pers. comm.; Bouchet and Perrine 1996; Johnson et al. 1995).
A similar strategy has been reported for the cancellariid Cancellaria cooperi(Cancellarioidea), which has been observed using its proboscis to ingest blood from
open injuries on the body of the electric ray Torpedo californica (O’Sullivan et al.
1987). Cancellariidae are likely to include exclusively suctorial feeders, as inferred
from foregut and radular characteristics. Dissection of Cancellaria cooperi evi-denced a peculiar oesophageal structure (M.V. Modica, J. Biggs, and M. Holford,
unpublished observations). In fact, the mid oesophagous is extremely long (up to 5
times the shell length) and glandular, similar to what is found in Colubraria,suggesting a convergent adaptation to haematophagy. Other examples of haemato-
phagous feeding are the very minute species of Marginellidae, Kogomea ovata,Hydroginella caledonica, and Tateshia yadai, that live attached to the pectoral fins
of their host (Kosuge 1986; Bouchet 1989).
15.2.4.2 Corallivory
Feeding on the living tissues of corals and other Anthozoans is reported in
Muricidae for Drupella (Ergalataxinae) and for the subfamily Coralliophilinae
(Taylor 1976; Ward 1965; Haynes 1990). Coralliophilinae includes over 200
marine tropical to temperate species, from shallow to deep waters. The few species
for which alimentary preferences are known (about 10% of the shallow water
species, Oliverio et al. 2008) feed exclusively on anthozoans (Fig. 15.3d). A variety
of feeding strategies and preferences are displayed for this group. Some species are
stenophagous, with very strict host specificity; they are mostly sessile on corals,
and many groups have developed interesting eco–morphological adaptations. In
fact, while Quoyula has a limpet-like shell suitable for external life on stony corals,
Rhizochilus lives and feeds on anthipatharians with the shell deformed to adhere to
the black coral branch. A second group lives embedded in the host skeleton: Rapalives inside alcyonarian octocorals, Magilopsis and Leptoconchus have ovoid
shells and bore holes into corals, while Magilus is sessile inside corals and
possesses an uncoiled adult shell (Robertson 1970). Some others are mobile as
Latiaxis, which is probably associated with deep-water gorgonians, or Babelo-murex that mostly feeds on shallow water hexacorals. In a few cases mobile
euryphagous species can feed on anthozoans belonging to different orders, such
as some species of Coralliophila associated with sea anemones, scleractinians,
and zoanthids (M. Oliverio, unpublished observations). Among coralliophilines
some anatomical modifications related to parasitism on corals are widespread, such
as the loss of the radula and jaws, viewed as an adaptation to suctorial feeding, and
brooding of embryos in capsules kept in the pallial cavity (Richter and Luque
2002).
The amazing display of feeding strategies developed by neogastropods is possi-
ble due to the diversity of innovative anatomical features and chemical compounds
that can be readily employed to overcome their prey.
256 M.V. Modica and M. Holford
256

15.3 Neogastropod Specialized Anatomy and Predatory
Chemical Substances
Most neogastropod snails have developed specialized glands or other anatomical
features that enable them to produce and use chemical substances to subdue their
prey. It can be argued that the development of specialized foregut glands, such as
the venom gland in Conoidea, or salivary and accessory salivary glands in other
neogastropod groups, has lead to the successful radiation of neogastropods. The
biochemical weaponry developed in the foregut and other glands is an evolutionary
advantage that has enabled neogastropods to thrive.
15.3.1 Foregut Glands
The foregut glands described here include the venom gland, primary, and accessory
salivary glands (Figs. 15.1 and 15.2). Toxins may be produced in a specific venom
gland, as is the case with most Conoideans, or in primary and/or accessory salivary
glands (Andrews 1991) for species that do not have a venom gland. In some cases,
the production of toxins might involve other foregut organs/tissues, such as the
glandular mid-oesophagous of the haematophagous Colubraria and Cancellaria.
15.3.1.1 Venom Gland
The presence of a venom apparatus is characteristic of the Conoidea (Fig. 15.2b).
Generally it is a conspicuous organ, constituted by a proximal muscular bulb and a
very long, convolute duct (the gland itself). The tubular gland always passes
through the nerve ring and opens into the buccal cavity, posterior to the radular
sac opening. The active exocrine secretion of the venom is due to a single cell type:
cuboidal ciliated cells, accumulating venom granules at their apex, until they are
discharged into the lumen (Smith 1967). The venom gland may be lined with such
secretory cells for its whole length or, as happens in some species, the secretory
tissue may be confined to the region posterior to the nerve ring, while the anterior-
most region is a simple ciliated duct (Taylor et al. 1993). The terminal muscular
bulb is usually constituted by two muscular layers, internal and external, separated
by connective tissue; the relative thickness and development of these layers is
variable between species. According to Ponder (1973) the tubular venom gland
originated from the dorsal glandular folds of the oesophagous while the gland of
Leiblein gave rise to the muscular bulb. Some conoideans, mostly radula-less
species, do not possess a venom apparatus.
All cone snails (Conus) have a venom apparatus and the toxins found in their
venom glands have led the field in characterizing peptide toxins from marine snails.
When venom is injected into a prey, the conotoxins work in a concerted manner to
15 The Neogastropoda: Evolutionary Innovations of Predatory Marine Snails 257
257

shut down the prey’s nervous system. Conotoxins are potent neurotoxins that target
ion channels and receptors. The complement of peptides found in any one Conusvenom is strikingly different from that found in the venom of any other Conusspecimens (Romeo et al. 2008). Thus, in the whole genus, many tens of thousands
of distinct active peptides have evolved. A question that immediately arises is why
individual cone snails should need somany different peptides. It has been speculated
that the complement of peptides in a venom may be used for at least three general
purposes: An individual peptide may play a role in (1) prey capture, directly or
indirectly; (2) defense and escape from predators; or (3) other biological processes,
such as interaction with potential competitors. Not all terebrids and turrids have a
venom apparatus, but those that do also produce toxins to subdue their prey. Unlike
conotoxins, less is known about terebrid and turrid toxins, teretoxins and turritoxins,
respectively. Preliminary characterization of terebrid and turrid toxins (Imperial
et al. 2003, 2007; Watkins et al. 2006; Heralde et al. 2008) indicate a similar three-
domain conotoxin structure consisting of a highly conserved signal sequence, amore
variable pro-region, and a hypervariable mature toxin sequence. While conotoxins
have been identified as potent neuropeptides, no known molecular target has been
identified for teretoxins or turritoxins. However, given their similarities to conotox-
ins it is expected they will also be effective modifiers for ion channels and receptors
in the nervous system.
15.3.1.2 Primary Salivary Glands
Primary salivary glands are usually acinous, with a very small lumen and a system
of narrow branched ducts (Fig. 15.1). In some species, the paired glands may be
fused together in a single glandular mass, but two salivary ducts are always present
and run along the oesophagous (or, in some groups, embedded in the oesophageal
walls) until opening into the roof of the buccal cavity. Two cell types have been
identified in the secretory epithelium, mixed with one another: (1) basal cells with
apocrine secretion and (2) superficial ciliated cells secreting mucus (Andrews
1991). Ciliary movement is responsible for delivering the secretion, as the outer
layer of muscle fibers is poorly developed (Andrews 1991). Acinous salivary glands
are present in all neogastropod, although their role in toxin production may be
variable, depending on whether other secreting structures, such as venom gland or
accessory salivary glands, are present.
Only acinous salivary glands are present in Buccinidae and related families, such
as Nassariidae, Melongenidae, Fasciolariidae, and Columbellidae (accessory sali-
vary glands are missing). Species of the buccinid genus Neptunea (as e.g.,
N. antiqua) have very large salivary glands containing high quantity of tetramine
(F€ange 1960; Asano and Itoh 1959, 1960; Saitoh et al. 1983; Fujii et al. 1992;
Shiomi et al. 1994; Watson-Wright et al. 1992; Power et al. 2002), which blocks
nicotinic acetylcholine receptors (Emmelin and F€ange 1958). A number of human
intoxication has been reported so far, caused by consumption of snails of these
species (Fleming 1971; Millar and Dey 1987; Reid et al. 1988). Further studies have
258 M.V. Modica and M. Holford
258

shown the presence of three additional unidentified toxins in the salivary glands of
N. antiqua that appear to inhibit neuronal Ca2+ channels (Power et al. 2002). Other
whelks are known to produce histamine, choline, and choline esters (Endean 1972).
Nassariidae possess three types of secreting cells in their salivary glands, one of
which secretes a glycoprotein rich in disulphide groups like the accessory salivary
glands of the muricid Nucella lapillus (Fretter and Graham 1994; Minniti 1986;
Martoja 1964).
The finding that conopeptides are expressed in the salivary gland of Conuspulicarius (Biggs et al. 2008) suggests that salivary glands may play a role in the
envenomation process. Crude extracts of salivary glands of the haematophagous
Colubraria reticulata have been observed to increase coagulation time of human
blood (S. Rufini, M.V. Modica, and M. Oliverio, unpublished). Current research by
Modica and colleagues is underway to identify the anticoagulant transcript using
cDNA analysis.
15.3.1.3 Accessory Salivary Glands
Accessory salivary glands are considered to be an informative synapomorphy of
Neogastropoda, although they are missing in several families. Accessory salivary
glands are present in the basal family Cancellariidae (Fig. 15.2a) and in several
Toxoglossa, where in some vermivorous cones they coexist with the venom gland
(Marsh 1971). Two pairs of accessory salivary glands are also found in Muricidae,
Mitridae, Costellariidae, Volutidae, and Olividae, while in Volutomitridae only
one gland is found. In Marginellidae, Harpidae, and in the buccinoideans, acces-
sory salivary glands are generally missing, but are present in Busycon (Andrews
1991). A common anatomical organization of the glands is shared by all neogas-
tropods. The paired glands are tubular in shape, with a lumen lined by a columnar
secretory epithelium surrounded by a subepithelial muscular coat richly inner-
vated. External to the muscle layer there is an outer layer of gland cells, with long
necks opening in the central lumen of the gland (Ponder 1973; Andrews 1991)
producing a peculiar granular secretion (Andrews 1991). Exceptions to this model
include olives, volutids, and some mitriform species (Marcus and Marcus 1959;
Ponder 1970, 1972). The structure is very similar to the venom gland of Conoidea
(West et al. 1996). The glandular accessory salivary glands open at the tip of the
buccal cavity with nonciliated ducts.
In Muricidae, accessory salivary glands are usually large and well developed. In
Nucella lapillus and Stramonita haemastoma, the only muricids studied so far at the
biochemical level, accessory salivary glands produce a glycoprotein rich in
cysteines (Martoja 1971; McGraw and Gunter 1972), similar to conotoxins. Extracts
of the glands are able to elicit flaccid paralysis inMytilus eduliswhich can be drilledor not, and, in the case of S. haemastoma, in barnacles, which are never drilled
(Carriker 1981; Huang and Mir 1972; Andrews 1991; West et al. 1996; Andrews
et al. 1991). S. haemastoma also produces a toxic secretion in the primary salivary
glands that decreases cardiac activity in mammals and induces vasodilatation,
15 The Neogastropoda: Evolutionary Innovations of Predatory Marine Snails 259
259

hypotension, and smooth muscle contraction (Huang and Mir 1972). A similar
response was demonstrated in a combined primary/accessory salivary glands extract
of another muricid, Acanthina spirata (Hemingway 1978). N. lapillus extracts alsodisrupt neuromuscular transmission in rat phrenic nerve–hemidiaphragm prepara-
tions (West et al. 1996). In some Volutidae, the accessory salivary glands have
been reported to produce a narcotizing compound, with a very low pH, inducing
muscular relaxation in the preys (Bigatti et al 2009).
15.3.2 Hypobranchial Gland
The hypobranchial gland is constituted by a thickening of the epithelium in the roof
of the pallial cavity and produces large amounts of mucus. Its primary function is
currently viewed to be the cleaning of the mantle cavity; the mucous secretion binds
together the particulate matter, which is then eliminated from the mantle cavity.
However, the hypobranchial gland comprises at least three different cell types that
may correspond to distinct chemical activities, which have only been partially
identified (Naegel and Aguilar-Cruz 2006). In many muricid species, the hypo-
branchial gland produces chromogens, which, exposed to light and oxygen, develop
into a purple pigment that has been used for centuries as a dye (Tyrian purple).
Similarly, in the Mitridae, the hypobranchial secretion once exposed to air becomes
yellowish, then purple, and finally dark brown (Harasewych 2009), while in Cost-
ellariidae it remains predominantly yellow-green (Ponder 1998b). The production
of small compounds, mainly choline esters, but also biogenic amines, has been
detected in the hypobranchial gland of several species of muricids and buccinids.
These substances elicit neuromuscular blocking, with paralyzing effects both in
invertebrates and vertebrates (Roseghini et al. 1996). Due to the low concentra-
tions in which these toxic compounds are found in the snails, it is not sure how
effective they are in prey hunting (West et al. 1996). The functions of the hypo-
branchial gland and the role it played in the evolution and diversification of the
Neogastropoda are still to be clarified; nevertheless, hypobranchial secretions may
have useful pharmacological properties.
15.4 Neurotoxins, Anesthetics, and Anticoagulants: Prominent
Bioactive Compounds from Neogastropod Snails
As stated in the introduction of this chapter, conotoxins, with the approval of the
analgesic drug Prialt, have demonstrated the utility of translating basic research of
marine snail compounds into drug development targets. The identification of novel
neurotoxins, anesthetics, and anticoagulants are three areas in which harvesting the
bioactive compounds of the Neogastropoda could prove very fruitful. The following
260 M.V. Modica and M. Holford
260

section highlights the success of conotoxins as neurotoxins and outlines the potential
of identifying anesthetic and anticoagulant compounds from neogastropod snails.
15.4.1 Neurotoxins
In the Conoidea, the best-characterized venom components are small, highly
structured disulfide peptides, individually encoded by a separate gene. Every
Conus species has its own distinct repertoire of 50–200 venom peptides, with
each peptide presumably having a physiologically relevant target in prey or poten-
tial predators/competitors (Olivera 2002). Most conotoxins are small peptides
(6–40 amino acids in length), with the majority being in the size range of 12–30
amino acids (Olivera et al. 1990; Terlau and Olivera 2004). Conotoxins are
comprised of a highly conserved precursor structure including a signal sequence,
followed by a propeptide region and then a mature toxin that is cleaved from the
prepro-structure. The mature toxins are highly disulfide rich and are classified
according to their cysteine framework. Cone snails practice combinatorial drug
therapy in that it is not one conotoxin that attacks the prey, but instead a cocktail of
the 50–200 venom peptides working together to shut down the prey’s nervous
system. The conotoxin cocktail contains ion channel and receptor modifiers that
can affect neuronal signaling. For example, conotoxins that inhibit Na+ channel
function prevent the formation of action potential, while conotoxins that target Ca2+
prevent vesicle fusion, which impedes the release of neurotransmitters. There are
presently more than 3,000 different Conus venom proteins reported in the literature
(Conoserver: http://research1t.imb.uq.edu.au/conoserver/). Less than 10% of the
described conotoxins have been functionally characterized. Of those characterized,
at least 25 different functions have been described (Olivera 2006; Conoserver).
Several conotoxins are at various stages of drug development with the more
promising examples being: MrIA (active on norepinephrine transporters), Vc1.1
(active on nicotinic receptors), and Conantokin-G (active on NMDA receptors)
(Olivera 2006). While the majority of conotoxins in therapeutic development are
analgesic compounds, conotoxins are also being considered as viable targets for
epilepsy or myocardial infarction, as well as disorders concerning neuroprotective/
cardioprotective properties (Twede et al. 2009).
Another promising group to investigate in order to discover new neurotoxins
and/or substances capable of inactivating toxins is the corallivorous subfamily
Coralliophilinae (Muricidae). The Anthozoa, such as sea anemones, and stony
and soft corals, which are included in the Cnidaria along with the jellyfishes
(Scyphozoa), sea-wasps (Cubozoa), hydrocorals, and hydromedusae (Hydrozoa),
are known to produce a neurotoxin-rich venom as well as other toxic defensive
compounds, from which the Coralliophilinae appear to be immune. Envenomation
by cnidarians represents a remarkable sanitary problem for humans. An estimated
40,000–50,000 marine envenomations occur annually due to several species of
Cnidaria. Cubozoan alone have been responsible for over 5,000 human deaths in
15 The Neogastropoda: Evolutionary Innovations of Predatory Marine Snails 261
261

the last 130 years (Brinkman and Burnell 2009). Antivenom is available only for a
very limited number of species. If, as is suggested by reported observations,
coralliophilines have antivenom-type compounds, they may potentially be useful
in cases of cnidarian envenomations. The immunity of Coralliophilinae raises a
number of interesting evolutionary questions, such as: What are the physiological
adaptations related to corallivory? Do corallivorous species secrete bioactive com-
pounds interacting with and inactivating anthozoans’ toxin? Are there specialized
organs involved in the production of the antivenom (e.g., salivary glands)? Is host
switching in euryphagous and host specificity in stenophagous correlated with
biochemical variations in the secretion? The answers to these questions may
translate into a modern physiological and biochemical understanding of gastropod
innovations related to feeding.
15.4.2 Anesthetic and Anticoagulant Compounds
As pointed out in Sect. 15.3, three different neogastropod families have haemato-
phagous species, which produce anesthetic and anticoagulant compounds that may
be useful in elucidating cellular communication in the nervous system and as
antithrombotic agents.
In Colubrariidae, anticoagulants are produced in the salivary glands, but the
anatomical structures responsible for anesthetic secretion are not yet known. In
addition to the salivary glands, it might be worthy to investigate the glandular
mid-posterior oesophagous, a peculiar derived structure that may be related to the
haematophagous lifestyle (Oliverio and Modica 2009). Furthermore, the peculiar
mid-oesophagous of Cancellaria cooperi is a very advantageous tissue to test for
bioactive compounds production, as cancellariid mid-oesophagous may be
homologous to toxoglossan venom glands (Ponder 1973; Kantor 1996, 2002).
Another issue of interest is the presence in Cancellariidae of both primary and
accessory salivary glands. The roles these anatomical structures play in prey
subduction and in the production of bioactive substances, as well as their inter-
actions, are still to be investigated. Are the bioactive substances the same in the
different haematophagous lineages? Intriguing evolutionary questions may be
addressed studying and comparing anticoagulant and anesthetic molecules in
Colubrariidae and Cancellariidae.
15.5 Investigating Genetic Evolution and Expression
of Neogastropod Toxins
The early evolution, and the first diversification of venom toxins, has been inter-
preted as the result of a process of neofunctionalization in which strong positive
selection acts on redundant genes produced in duplication events, originating new
262 M.V. Modica and M. Holford
262

functions (Ohno 1970). This evolutionary mechanism was reported also for con-
otoxins (Duda and Palumbi 1999). The evolutionary pressure promoting the varia-
bility of these “specialty genes” (also called exogenes, as their products act outside
the organism; Olivera 2006) is related with a predator–prey arms race process in
which the availability of a particular kind of prey may produce an evolutionary
force acting on ecologically important genetic loci. Conotoxins are particularly
prone to rapid genetic variations, due to their extremely reduced size. It is still
unclear at which level the results reported for Conus might be generalized in the
neogastropods, but it is plausible at least to hypothesize that the same organs
produce the same type of bioactive substances across the entire order Neogastro-
poda. According to the amount of variation that will be detected at the different
taxonomic levels in neogastropods, it will be possible to clarify the evolutionary
patterns acting at each level. In snakes, where the same neofunctionalization
mechanism is responsible for the evolution of the toxin gene families, the genes
that have been recruited to constitute the venom proteome have been partly
identified (Fry 2005). In neogastropods, including cone snails, the origin of the
toxin sequences has yet to be investigated.
The role of differential gene expression and posttranscriptional modifications
in modulating toxin diversity is also an intriguing area requiring further investi-
gation. This line of research could be addressed at different taxonomic levels: (1)
Between different species – a particular focus should be dedicated to host speci-
ficity, to verify if the inverse correlation between the degree of specialization and
the diversity of the venom in Conus leopardus (Remigio and Duda 2008) can be
generalized to other neogastropod groups. (2) In individuals of the same species –
the high levels of intraspecific variability observed in Conus ventricosus (Romeo
et al. 2008) raise the possibility that fine-scale modulatory mechanisms may act
in response to environmental and ecological variations. And (3) at different
ontogenetic stages – juvenile neogastropods have often a largely different diet
from the adults, implying a different suite of toxins. How and under which
mechanisms does venom composition change during ontogenesis? To address
these and other toxin evolution and expression topics, a robust phylogenetic
hypothesis and an integrated strategy for the characterization of bioactive com-
pounds are required.
15.6 Conclusion: Integrated Strategies for Building a More
Robust Evolutionary Framework and Effective Drug
Development Methods
The major challenges in characterizing bioactive compounds in snails are the
complexity of sampling, the scarcity of the biological material, and the absence
of databases for determination of peptide and protein sequences. Venom profiling
may thus prove an elusive target, unless molecular biology techniques are coupled
15 The Neogastropoda: Evolutionary Innovations of Predatory Marine Snails 263
263

with biochemical analysis of polypeptide composition. A multidisciplinary plat-
form, combining modern genomic and proteomic techniques, as well as phylogeny
and descriptive approaches to ecology and anatomy, is necessary to increase the
rate of pharmacological characterization of new bioactive compounds. Genomic
libraries can be obtained from tissues of interest and their analysis can be integrated
with proteomic techniques, such as venom fractionation, peptide purification, mass
spectrometry, and sequence analysis using automated Edman degradation. Spider
venoms have recently been analyzed by a three-dimensional approach, combining
calculated, predicted, and measured data obtained with different techniques such as
cDNA sequences and LC-MALDI analysis (Escoubas et al. 2006). The use of such
“venom landscapes” may constitute a significant improvement in venom profiling
and can also be effective as molecular markers in taxonomic and phylogenetic
studies. A similar strategy has been applied to snake venoms (Nascimento et al.
2006). Molecular phylogeny, combined with anatomical and ecological data, can
guide us through the maze of snail biodiversity, toward the species or group of
species which are likely to possess bioactive compounds worthy to investigation to
find new therapeutics (Fig. 15.4). This strategy was successfully applied to the
Terebridae, outlining particular genera/species important for teretoxin discovery
(Holford et al. 2009a, b).
Research fields
Integrative approach
Output
Ecology
Integratedevolutionaryframework
Enhanceddrug
development
Anatomy &Physiology
Chemicalecology
Comparative phylogeny
Genomics & Proteomics
Phylogeny Pharmacology
Fig. 15.4 Integrated research strategies for investigating biodiversity. The integration of different
approaches to diversity may lead to a more complete evolutionary framework and enhance the rate
of drug discovery and development
264 M.V. Modica and M. Holford
264

Interestingly, the relationship between drug discovery and phylogeny is a two-
way street. In fact, exogenes mostly belong to gene superfamilies with highly
conserved sequence elements, enabling the use of standard molecular techniques.
In what has been called a “concerted discovery strategy” venom toxins are revealed
to be useful characters for the taxonomy and phylogenetic relationships of their
producers (Olivera 2006; Olivera and Teichert 2007; Bulaj 2008). This integrated
approach has been used in non-molluscan toxin-producing groups such as snakes to
garner insight into the molecular evolution of snake venoms and to correlate the
appearance of other morphological evolutionary novelties (Fry and W€uster 2004).For the Neogastropoda, whose phylogeny cannot be readily elucidated using
standard taxonomic approaches, an integrated approach has several possibilities.
Proteomics of the venom as well as the characterization of its biochemical and
functional properties successfully separated two closely related, morphological
indistinguishable pit-viper species (Angulo et al. 2007).
The use of genomic analysis and venom profiling techniques, along with more
traditional approaches such as anatomical and physiological studies, will allow a
better understanding of the correlation between venom composition, trophic pre-
ferences, and adaptive radiation of the Neogastropoda, creating the basis for a
modern integrated evolutionary framework and an effective drug discovery strategy
(Fig. 15.4).
Acknowledgments The authors thank Marco Oliverio for invaluable advice and helpful com-
ments on the manuscript. Yuri Kantor, Alisa Kosyan, Gregory Herbert, Paolo Mariottini, Marco
Oliverio, and Guido and Philippe Poppe are acknowledged for images used in the figures. MH
acknowledges support from NIH grant GM088096-01.
References
Andrews EB (1991) The fine structure and function of the salivary glands of Nucella lapillus(Gastropoda: Muricidae). J Moll Stud 57:111–126
Andrews EB, Elphick MR, Thorndyke MC (1991) Pharmacologically active constituents of the
accessory salivary and hypobranchial glands of Nucella lapillus. J Moll Stud 57:136–138
Angulo Y, Escolano J, Lomonte B, Gutierrez JM, Sanz L, Calvete JJ (2007) Snake venomics of
Central American pitvipers: clues for rationalizing the distinct envenomation profiles of
Atropoides nummifer and Atropoides picadoi. J Proteome Res 7(2):706–719
Asano M, Itoh M (1959) Occurrence of tetramine and choline compounds in the salivary gland of a
marine gastropod Neptunea arthritica (Bernardi). J Agric Res 10:209
Asano M, Itoh M (1960) Salivary poison of a marine gastropod, Neptunea arthritica Bernardi, andthe seasonal variation of its toxicity. Ann N Y Acad Sci 90:675–688
Bigatti G, Sanchez Antelo CJM, Miloslavich P, Penchaszadeh PE (2009) Feeding behavior of
Adelomelon ancilla (Lighfoot, 1786): a predatory neogastropod (Gastropoda: Volutidae) in
Patagonian benthic communities. The Nautilus 123(3):159–165
Biggs JS, Olivera BM, Kantor YI (2008) a-Conopeptides specifically expressed in the salivary
gland of Conus pulicarius. Toxicon 52:101–105
Bouchet P (1989) A marginellid gastropod parasitize sleeping fishes. Bull Mar Sci 45:76–84
Bouchet P, Perrine D (1996) More gastropods feeding at night on parrotfishes. Bull Mar Sci 59
(1):224–228
15 The Neogastropoda: Evolutionary Innovations of Predatory Marine Snails 265
265

Bouchet P, Rocroi JP (2005) Classification and nomenclator of gastropod families. Malacologia 47
(1–2):1–397
Brinkman DL, Burnell JN (2009) Biochemical and molecular characterisation of cubozoan protein
toxins. Toxicon 54:1162–1173
Bulaj G (2008) Integrating the discovery pipeline for novel compounds targeting ion channels.
Curr Opin Chem Biol 12:441–447
Carriker MR (1961) Comparative functional morphology of boring mechanisms in gastropods.
Am Zool 1(2):263–266
Carriker MR (1981) Shell penetration and feeding by naticacean and muricacean predatory
neogastropods: a synthesis. Malacologia 20:403–422
Colgan DJ, Ponder WF, Beacham E, Macaranas JM (2007) Molecular phylogenetics of Caeno-
gastropoda (Gastropoda: Mollusca). Mol Phylogenet Evol 42(3):717–737
Conoserver: http://research1t.imb.uq.edu.au/conoserver/
Darragh TA, Ponder WF (1998) Family Volutidae. In: Beesley PL, Ross JGB, Wells A (eds)
Mollusca: the Southern synthesis. Fauna of Australia, vol 5. CSIRO Publishing, Melbourne,
pp 833–835, part B
Dietl GP, Herbert GS (2005) Influence of alternative shell-drilling behaviours on attack duration of
the predatory snail Chicoreus dilectus. J Zool 265:201–206Duda TFJ, Palumbi SR (1999) Molecular genetics of ecological diversification: duplication and
rapid evolution of toxin genes of the venomous gastropod Conus. Proc Natl Acad Sci USA
96:6820–6823
Emmelin N, F€ange R (1958) Comparison between biological effects of neurine and a salivary
glands extract of Neptunea antiqua. Acta Zool 39:47–52Endean R (1972) Aspects of molluscan pharmacology. In: Florkin M, Scheer BT (eds) Chemical
zoology, vol 7, Mollusca. Academic Press, New York, pp 421–466
Endean R, Parrish G, Gyr P (1974) Pharmacology of the venom of Conus geographus. Toxicon12:131
Escoubas P, Sollod B, King GF (2006) Venom landscapes: mining the complexity of spider
venoms via a combined cDNA and mass spectrometric approach. Toxicon 47:650–663
F€ange R (1960) The salivary gland of Neptunea antiqua. Ann N Y Acad Sci 90:689–694
Favreau P, Stocklin R (2009) Marine snail venoms: use and trends in receptor and channel
neuropharmacology. Curr Opin Pharmacol 9:594–601
Fleming C (1971) Case of poisoning from red whelks. Br Med J 3:250–251
Fox JW, Serrano SM (2007) Approaching the golden age of natural product pharmaceuticals from
venom libraries: an overview of toxins and toxin-derivatives currently involved in therapeutic
or diagnostic applications. Curr Pharm Res 13:2927–2934
Fretter V, Graham A (1994) British prosobranch molluscs. Revised and updated edition, Ray
Society, London
Fry BG (2005) From genome to “venome”: molecular origin and evolution of the snake venom
proteome inferred from phylogenetic analysis of toxin sequences and related body proteins.
Genome Res 15:403–420
Fry BG, W€uster W (2004) Assembling an arsenal: origin and evolution of the snake venom
proteome inferred from phylogenetic analysis of toxin sequences. Mol Biol Evol 21
(5):870–883
Fujii R, Moriwaki N, Tanaka K, Ogawa T, Mori E, Saitou M (1992) Spectrophotometric determi-
nation of tetramine in carnivorous gastropods with tetrabromophenolphthalein ethyl ester. J
Food Hyg Soc Japan 33(3):237–240
Harasewych MG (2009) Anatomy and biology of Mitra cornea Lamarck, 1811 (Mollusca,
Caenogastropoda, Mitridae) from the Azores. Acoreana 6:121–135
Haynes JA (1990) Distribution movement and impact of the corallivorous gastropod Coralliophilaabbreviata (Lamarck) in a Panamanian patch. J Exp Mar Biol Ecol 142:25–42
Hemingway GT (1978) Evidence for a paralytic venom in the intertidal snail Acanthina spirata(Neogastropoda: Thaisidae). Comp Biochem Physiol 60C:79–81
266 M.V. Modica and M. Holford
266

Heralde FM, Imperial J, Bandyopadhyay P, Olivera BM, Concepcion GP, Santos AD (2008) A
rapidly diverging superfamily of peptide toxins in venomous Gemmula species. Toxicon
51:890–897
Holford M, Puillandre N, Modica MV, Watkins M, Collin R, Bermingham E, Olivera BM (2009a)
Correlating molecular phylogeny with venom apparatus occurrence in panamic auger snails
(Terebridae). PLoS ONE 4(11):e7667. doi:10.1371/journal.pone.0007667
Holford M, Puillandre N, Terryn Y, Cruaud C, Olivera BM, Bouchet P (2009b) Evolution of the
Toxoglossa venom apparatus as inferred by molecular phylogeny of the Terebridae. Mol Biol
Evol 26(1):15–25
Huang CL, Mir GN (1972) Pharmacological investigation of salivary gland of Thais haemastoma(Clench). Toxicon 10:111–117
Imperial JS, Watkins M, Chen P, Hillyard DR, Cruz LJ, Olivera BM (2003) The augertoxins:
biochemical characterization of venom components from the toxoglossate gastropod Terebrasubulata. Toxicon 42:391–398
Imperial JS, Kantor YI, Watkins M, Heralde FM, Stevenson B, Chen P, Hansson K, Stenflo J,
Ownby J-P, Bouchet P, Olivera BM (2007) Venomous auger snail Hastula (Impages) hectica(Linnaeus, 1758): molecular phylogeny, foregut anatomy and comparative toxinology. J Exp
Zool 308B:744–756
Johnson S, Johnson J, Jazwinski S (1995) Parasitism of sleeping fish by gastropod mollusks in the
Colubrariidae and Marginellidae at Kwajalein, Marshall Islands. The Festivus 27(11):121–126
Kantor YI (1996) Phylogeny and relationships of Neogastropoda. In: Taylor J (ed) Origin and
evolutionary radiation of the Mollusca. Oxford University Press, Oxford, pp 221–230
Kantor YI (2002) Morphological prerequisite for understanding neogastropod phylogeny. Boll
Malacol Suppl 4:161–174
Kantor YI, Fedosov A (2009) Morphology and development of the valve of Leiblein: possible
evidence for paraphyly of the Neogastropoda. The Nautilus 123(3):73–82
Kohn AJ (1956) Piscivorous gastropods of the genus Conus. Proc Natl Acad Sci USA 42:168–171
Kohn AJ (1959) The ecology of Conus Hawaii. Ecol Monogr 29:47–90
Kohn AJ (1968) Microhabitats, abundance and food of Conus (Gastropoda) on atoll reefs in the
Maldive and Chagos islands. Ecology 49:1046–1062
Kohn AJ (1978) Ecological shift and release in an isolated reefs: the significance of prey size.
Ecology 59:614–631
Kohn AJ, Nybakken JW (1975) Ecology of Conus on eastern Indian ocean fringing reefs: diversityof species and resource utilization. Mar Biol 29:211–234
Kohn AJ, Saunders PR, Wiener S (1960) Preliminary studies on the venom of the marine snail
Conus. Ann N Y Acad Sci 90:706–725
Kosuge S (1986) Description of a new species of ecto-parasitic snail on fish. Bull Inst Malacol 2
(5):77
Leviten PJ (1980) The foraging strategy of vermivorous conid gastropods. Ecol Monogr
46:157–178
Marcus E, Marcus E (1959) Studies on Olividae. Bol Fac Fil Cienc Let Univ S Paulo Zool
22:99–188
Marko PB, Vermeij GJ (1999) Molecular phylogenetics and the evolution of labral spines among
eastern pacific ocenebrine gastropods. Mol Phylogenet Evol 13(2):275–288
Marsh M (1971) The foregut glands of some vermivorous cone shells. Aust J Zool 19:313–326
Martoja M (1964) Contribution a l’etude de l’appareil digestif et la digestion chez les gasteropodes
carnivores de la famille Nassarides. Cell 64:237–334
Martoja M (1971) Donnees histologiques sur les glandes salivaires et oesophagiennes de Thaislapillus (L.) (¼ Nucella lapillus. Prosobranche Neogastropode) Arch Zool Exp Gen
112:249–291
McGraw KA, Gunter G (1972) Observations on killing of the Virginia oyster by the Gulf oyster
borer, Thais haemastoma, with evidence for a paralytic secretion. Proc Natl Shellfish Assoc
62:95–97
15 The Neogastropoda: Evolutionary Innovations of Predatory Marine Snails 267
267

Miljanich GP (2004) Ziconotide: neuronal calcium channel blocker for treating severe chronic
pain. Curr Med Chem 11:3029–3040
Millar JG, Dey A (1987) Food poisoning due to the consumption of red whelks Neptunea antiqua.Comm Dis Scotl Wkly Rep 21(38):5–6
Minniti F (1986) Morphological and histochemical study of pharynx of Leiblein, salivary glands
and gland of Leiblein in the carnivorous Gastropoda Amyclina tinei Maravigna and Cyclopeneritea Lamarck (Nassariidae: Prosobranchia Stenoglossa). Zool Anz 217:14–22
Modica MV, Kosyan A, Oliverio M (2009) The relationships of the enigmatic gastropod Trito-noharpa: new data on early neogastropod evolution? The Nautilus 123(3):177–188
Morton B, Chan K (1997) The first report of shell-boring predation by a representative of the
Nassariidae (Gastropoda). J Moll Stud 63:480–482
Naegel LCA, Aguilar-Cruz CA (2006) The hypobranchial gland from the purple snail Plicopur-pura pansa (Gould, 1853) (Prosobranchia, Muricidae). J Shellfish Res 25(2):391–394
Nascimento DG, Rates B, Santos DM, Verano-Braga T, Barbosa-Silva A, Dutra AAA, Biondi I,
Martin-Euclaire MF, De Lima ME, Pimenta AMC (2006) Moving pieces in a taxonomic
puzzle: venom 2D-LC/MS and data clustering analyses to infer phylogenetic relationships in
some scorpions from the Buthidae family (Scorpiones). Toxicon 47:628–639
Nielsen C (1975) Observations on Buccinum undatum L. attacking bivalves and on prey responses,
with a short review on attacking methods of other prosobranchs. Ophelia 13:87–108
Norton RS, Olivera BM (2006) Conotoxins down under. Toxicon 48:780–798
O’Sullivan JB, McConnaughey RR, Huber ME (1987) A blood-sucking snail: the Cooper’s
nutmeg Cancellaria cooperi Gabb, parasitizes the California electric ray, Torpedo californicaAyres. Biol Bull 172:362–366
Ohno S (1970) Evolution by gene duplication. Springer, Berlin
Olivera BM (2002) Conus venom peptides: Reflections from the biology of clades and species.
Annu Rev Ecol Syst 33:25–47
Olivera BM (2006) Conus peptides: biodiversity-based discovery and exogenomics. J Biol Chem
281:31173–31177
Olivera BM, Teichert RW (2007) Diversity of the neurotoxic Conus peptides: a model for
concerted pharmacological discovery. Mol Interv 7(5):253–262
Olivera BM, Rivier J, Clark C, Ramilo CA, Corpuz GP, Abogadie FC, Mena EE, Woodward SR,
Hillyard DR, Cruz LJ (1990) Diversity of Conus neuropeptides. Science 249:257–263Oliverio M, Modica MV (2009) Relationships of the haematophagous marine snail Colubraria
(Rachiglossa, Colubrariidae), within the neogastropod phylogenetic framework. Zool J Linn
Soc. 158:779–800
Oliverio M, Barco A, Modica MV, Richter A, Mariottini P (2008) Ecological barcoding of
corallivory by ITS2 sequences: hosts of coralliophiline gastropods detected by the cnidarian
DNA in their stomach. Mol Ecol Resour 9(1):94–103
Palmer AR (1990) Effect of crab effluent and scent of damaged conspecifics on feeding, growth,
and shell morphology of the Atlantic dogwhelk, Nucella lapillus (L.). Hydrobiologia
193:155–182
Peterson CH, Black R (1995) Drilling by buccinid gastropods of the genus Cominella in Australia.The Veliger 38:37–42
Petit RE, HarasewychMG (1986) New Philippine Cancellariidae (Gastropoda: Cancellariacea), with
notes on the fine structure and function of the nematoglossan radula. The Veliger 28(4):436–443
Ponder WF (1970) The morphology of Alcithoe arabica (Mollusca: Volutidae). Malacol Rev
3:127–165
Ponder WF (1972) The morphology of some mitriform gastropods with special reference to their
alimentary and reproductive system (Neogastropoda). Malacologia 11(2):295–342
Ponder WF (1973) The origin and evolution of the Neogastropoda. Malacologia 12:295–338
Ponder WF (1998a) Infraorder Neogastropoda. In: Beesley PL, Ross JGB, Wells A (eds) Mol-
lusca: the Southern synthesis. Fauna of Australia, vol 5. CSIRO Publishing, Melbourne, p 819
part B
268 M.V. Modica and M. Holford

Ponder WF (1998b) Family Costellariidae. In: Beesley PL, Ross JGB, Wells A (eds) Mollusca: the
Southern synthesis. Fauna of Australia, vol 5. CSIRO Publishing, Melbourne, pp 843–845,
part B
Ponder WF, Lindberg DR (1996) Gastropod phylogeny – challenges for the 90s. In: Taylor J (ed)
Origin and evolutionary radiation of the Mollusca. Oxford University Press, London,
pp 135–154
Ponder WF, Lindberg DR (1997) Towards a phylogeny of gastropod molluscs: an analysis using
morphological characters. Zool J Linn Soc 119:83–265
Ponder WF, Taylor JD (1992) Predatory shell drilling by two species of Austroginella (Gastro-
poda: Marginellidae). J Zool 228:317–328
Power AJ, Keegan BF, Nolan K (2002) The seasonality and role of the neurotoxin tetramine in the
salivary glands of the red whelk Neptunea antiqua L. Toxicon 40:419–425
Puillandre N, Samadi S, Boisselier M-C, Sysoev AV, Kantor YI, Cruaud C, Couloux A, Bouchet P
(2008) Starting to unravel the toxoglossan knot: molecular phylogeny of the “turrids” (Neo-
gastropoda: Conoidea). Mol Phylogenet Evol 47:1122–1134
Radwin GE, D’Attilio A (1976) Murex shells of the world. Stanford University Press, Stanford
Reid TMS, Gould IM, Mackie IM, Ritchie AH, Hobbs G (1988) Food poisoning due to the
consumption of red whelks Neptunea antiqua. Epidemiol Infect 101:419
Remigio EA, Duda TFJ (2008) Evolution of ecological specialization and venom of a predatory
marine gastropod. Mol Ecol 17:1156–1162
Richter A, Luque AA (2002) Current knowledge on Coralliophilidae (Gastropoda) and phyloge-
netic implication of anatomical and reproductive characters. Boll Malacol 38:5–19
Robertson R (1970) Review of the predators and parasites of stony corals, with special reference to
symbiotic prosobranch gastropods. Pac Sci 24:43–54
Romeo C, Di Francesco L, Oliverio M, Palazzo P, Raybaudi Massilia G, Ascenzi P, Polticelli F,
Schinina ME (2008) Conus ventricosus venom peptides profiling by HPLC-MS: a new insight
in the intraspecific variation. J Sep Sci 31:488–498
Roseghini M, Severini C, Falconieri Erspamer G, Erspamer V (1996) Choline esters and biogenic
amines in the hypobranchial gland of 55 molluscan species of the neogastropod Muricoidea
superfamily. Toxicon 34(1):33–55
Saitoh H, Oikawa K, Takano T, Kamimura K (1983) Determination of tetramethylammonium ion
in shellfish by ion chromatography. J Chromatogr 281:397
Shiomi K, Mizukami M, Shimakura K, Nagashima Y (1994) Toxins in the salivary gland of some
marine carnivorous gastropods. Comp Biochem Physiol 107B:427–432
Smith EH (1967) The neogastropod midgut, with notes on the digestive diverticula and intestine.
Trans R Soc Edinburgh 67:23–42
Strong EE (2003) Refining molluscan characters: morphology, character coding and a phylogeny
of the Caenogastropoda. Zool J Linn Soc 137:447–554
Taylor JD (1976) Habitats, abundance and diets of muricacean gastropods at Aldabra Atoll. Zool J
Linn Soc 59:155–193
Taylor JD (1978) Habitats and diet of predatory gastropods at Addu Atoll, Maldives. J Exp Mar
Biol Ecol 31:83–103
Taylor JD, Morris NJ (1988) Relationships of neogastropoda. Malacol Rev 4:167–179
Taylor JD, Morris NJ, Taylor CN (1980) Food specialization and the evolution of predatory
prosobranch gastropods. Palaentology 23(2):375–409
Taylor JD, Kantor YI, Sysoev AV (1993) Foregut anatomy, feeding mechanisms, relationships
and classification of the Conoidea (¼Toxoglossa) (Gastropoda). Bull Br Mus Nat Hist
59:125–170
Terlau H, Olivera BM (2004) Conus venoms: a rich source of novel ion channel-targeted peptides.
Pysiol Rev 84:41–68
Twede VD, Miljanich GP, Olivera BM, Bulaj G (2009) Neuroprotective and cardioprotective
conopeptides: an emerging class of drug leads. Curr Opin Drug Discov Dev 12:231–239
15 The Neogastropoda: Evolutionary Innovations of Predatory Marine Snails 269

Ward J (1965) The digestive tract and its relation to feeding habits in the stenoglossan prosobranch
Coralliophila abbreviata (Lamarck). Can J Zool 43:447–464
Watkins M, Hillyard DR, Olivera BM (2006) Genes expressed in a turrid venom duct: divergence
and similarity to conotoxins. J Mol Evol 62:247–256
Watson-Wright WM, Sims GG, Smyth C, Gillis M, Maher M, Trottier T, Van Sinclair DE,
Gilgan M (1992) Identification of tetramine as toxin causing food poisoning in Atlantic
Canada following consumption of whelks Neptunea decemcostata. In: GopalakrishnakoneP, Tan CK (eds) Recent advances in toxinology research, vol 2. University of Singapore,
Singapore, pp 551–561
Wells HW (1958) Feeding habits of Murex fulvescens. Ecology 39:556–558
West DJ, Andrews EB, Bowman D, McVean AR, Thorndyke MC (1996) Toxins from some
poisonous and venomous marine snails. Comp Biochem Physiol 113C:l–10
Wu SK (1965) Comparative functional studies of the digestive system of the muricid gastropods
Drupa ricina and Morula granulata. Malacologia 3:211–233
270 M.V. Modica and M. Holford

Chapter 16
Antennal Hammers: Echos of Sensillae Past
Nina Laurenne and Donald L.J. Quicke
Abstract Many hosts of parasitoids live in concealed environments such as within
plants tissue and wood, and therefore they are difficult to find. This is likely to be
especially true when concealed hosts are in the pupal stage and thereby silent and
immobile. Cryptine ichneumonids collectively have a wide host range including
members of several insect orders with different degrees of concealment. Many
cryptine genera show a morphological adaptation to finding concealed hosts; their
antennal tips are modified into a hammer-like structures that are used to tap the
substrate. This vibrational sounding (¼echolocation though solid media) is typical
to the tribe Cryptini and it has multiple origins within the subfamily. We show that
vibrational sounding is associated with antennal modification and the usage of
wood-boring buprestid and cerambycid beetles, and suggest, based on an apparent
transition series, that the hammers are derived from mechano-sensilla within the
Cryptinae.
16.1 Introduction
The Ichneumonidae is one of the largest insect families with more than 20,000
described species (Yu et al. 2005), though, according to Gaston and Gauld (1993),
the real number of species may reach more than half of a million. Ichneumonid
wasps are cosmopolitan and whereas most species are parasitoids of other insects
N. Laurenne
Museum of Natural History, Entomology Division, University of Helsinki, P.O. Box 17,
(P. Arkadiankatu 13), 00014 Helsinki, Finland
e-mail: [email protected]
D.L.J. Quicke
Department of Life Sciences, Imperial College London, Silwood Park Campus, Ascot, Berkshire
SL5 7PY, UK
Department of Entomology, Natural History Museum, London SW7 5BD, UK
P. Pontarotti (ed.), Evolutionary Biology – Concepts, Molecularand Morphological Evolution, DOI 10.1007/978-3-642-12340-5_16,# Springer-Verlag Berlin Heidelberg 2010
271

and in some cases spiders, their way of life varies remarkably. Unlike simple
parasites, parasitoids always kill their hosts that are typically larvae or pupae of
various Lepidoptera, Coleoptera and Diptera.
Parasitoid life history strategies are commonly divided into two classes, the
koinobionts and idiobionts (Askew and Shaw 1986; Godfray 1994; Quicke 1997).
These two life strategies differ from each other considerably, but the defining
difference between them is that idiobionts do not permit their host to carry on
developing after parasitisation. In those cases in which the host is a larval stage, it is
typically paralysed by the female wasp’s venom. In contrast to idiobionts, the hosts
of koinobionts are allowed to continue their development after parasitisation until
they reach a suitable stage to be consumed by parasitoid larvae. Several other
features are associated with these life strategies, for example, koinobionts are
most usually endoparasitoids with relatively narrow host ranges as they have to
be able to adapt to the host’s immunological defenses. Idiobionts are typically
ectoparasitoids and generalists with a wide host range, though those that attack
pupal hosts are usually endoparasitoids. For idiobionts, host range is often largely
determined by the potential hosts that are encountered. The hosts of koinobionts are
often exposed or very little concealed. Paralysed hosts would be very prone to
predation if they were exposed, and therefore hosts of idiobionts tend to live in
concealed conditions (i.e. leaf-rolls or leaf mines, plant stems, under bark or inside
wood). The trait of exploiting concealed hosts is regarded as the ancestral state in
the Ichneumonidae and transitions from idiobiosis to koinobionsis appear to have
happened multiple times within the family (Belshaw et al. 1998; Whitfield 1998).
16.1.1 Host Location
According to Vinson (1988), host location consists of several stages beginning with
finding a suitable habitat. Then, a parasitoid must locate a potential host therein,
followed by examining it for suitability (species and the developmental stage) and
finally, oviposition.
Parasitoids use many modalities in host location; scent, vision, sound and
vibration are involved (Wertheim et al. 2003; Fischer et al. 2004; Fatouros et al.
2005). Wasps lead to a host by several cues, for example, parasitoids can recognise
shape, colour and a movement of a host (Fischer et al. 2001, 2004). Volatile
chemicals from host frass and damaged plant material are shown to be attractive
to parasitoids (Gohole et al. 2003; Bukovinszky et al. 2005). Some species have
even evolved to detect host sex pheromones and other kairomones and use them in
host searching (Wertheim et al. 2003; Jumean et al. 2005). In general, multiple cues
are involved in host-searching process and their efficiency is affected by environ-
mental factors, such as temperature (Fischer et al. 2001; Kroder et al. 2007a, b).
The female ovipositor and antennae are both important for host examination and
acceptance as they have various sensillae for detecting the suitability of a potential
272 N. Laurenne and D.L.J. Quicke

host (Mackauer et al. 1996; Ignacimuthu and Dorn 2000; Isidoro et al. 2001;
Romani et al. 2002).
Many mobile hosts of ichneumonid wasps live in concealed places such as
within wood. Such host larvae cause vibration when they chew wood and move,
and some parasitoid groups have evolved an ability to detecting these host-
generated vibrations. However, not all potential concealed hosts create their own
vibrations, e.g. pupal and prepupal stages or larva shortly about to moult. To locate
these, some parasitic wasps have evolved an active, vibration-based, method called
vibrational sounding. This form of echolocation occurs in one non-apocritan group,
the Orussidae which have highly modified antennae and massively enlarged sub-
genual (hearing) organs in the forelegs (Vilhelmsen et al. 2001). Females tap with
their antenna the substrate and detect the echoes with their subgenual organs. This
idea was originally suggested by Cooper (1953) and later Powell and Turner
(1975) made similar observations of female behaviour supporting Cooper’s
conjecture.
Use of vibrational sounding as a means of host location has also evolved on a
number of separate occasions within the Ichneumonidae. Amongst the parasitic
apocritan wasps vibrational sounding has been most thoroughly investigated in the
pimpline ichneumonid genus Pimpla and relatives (Henaut and Guerdoux 1982;
Henaut 1990; Meyhofer and Casas 1999; Fischer et al. 2001, 2003). The success of
echolocation is dependent of several factors, and Kroder et al. (2006, 2007b) have
shown it to be more efficient in warmer conditions and the role of vision to be more
important in cooler conditions. Parasitoids can adjust the intensity of echolocation
according to the temperature which shows adaptation to environmental conditions
in temperate regions. The ability to adjust to the microhabitat and its varying
environmental factors involves a complicated interaction. According to Otten
et al. (2001), females with larger size are better in finding concealed hosts in
comparison with smaller ones: a larger body mass is capable of transmitting
vibration better than smaller one.
Apart from in the pimplines, females of a number of other ichneumonid genera
are hypothesised to use vibrational sounding based on their morphology: with
antennal tips modified into a hammer-like structures suitable for “hammering”
the substrate and enlarged subgenual organs in their fore tibiae for detecting
substrate-borne vibrations (Broad and Quicke 2000). Additionally, the antennal
pegs of female Xorides (Xoridinae) are solid (Quicke unpublished observations)
and therefore likely to act as antennal hammers.
The largest subfamily of Ichneumonidae is the Cryptinae with 4,659 species
belonging to 394 genera (Yu et al. 2005). The cryptines are appropriate model
group as the vibrational sounding has multiple origins and losses and there is a
detailed molecular phylogenetic analysis (Laurenne et al. 2006). We tested the
association between the occurrence of hammer-like terminal antennal segments
within the Cryptinae and the explotation of wood-boring buprestids and ceramby-
cids within a comparative phylogenetic framework.
Traditionally, the Cryptini has been divided into three tribes: Cryptini, Phyga-
deuontini and Hemigasterini, and molecular studies largely support this classification
16 Antennal Hammers: Echos of Sensillae Past 273

(Laurenne et al. 2006; Quicke et al. 2009). Most cryptines are idiobiont ectoparasitoids
and their hosts usually belong the largest insect orders (Coleoptera, Lepidoptera,
Hymenoptera and Diptera), but spider egg predation occurs in some cryptine genera,
and a few other insect orders are occasionally attacked. Despite their host groups
covering several orders as a whole, individual cryptine species can be quite host
specific or have a narrow host range (Askew and Shaw 1986; Gauld 1988; Schwarz
and Shaw 1998, 2000).
16.2 Material and Methods
We examined the terminal antennal flagellomeres of species representing 122
genera of the subfamily Cryptinae, six of Ichneumoninae and one species each of
the Alomyinae, Eucerotinae and Pedunculinae. Scanning electron microscopy
(SEM) was used for the vast majority, though light microscope was occasionally
relied upon for larger sized specimens of some groups. For males we included 32
genera (26 cryptines, 2 hemigasterines and 4 phygadeuontines). Female antennal
tips were classified into five categories according to the degree of modification from
unmodified antennae with a tapered tip to ones forming a large flat surface. The
intermediate stages show structures of individual setae becoming thicker and
forming a cluster (Laurenne et al. 2009).
16.2.1 Comparative Analysis
Comparative analysis (CAIC) was carried out to test the statistical significance of
association between antennal modification and the use of wood-boring beetles
(buprestids and cerambycids) (Purvis and Rambaut 1995). The degree of antennal
modification was treated as a continuous variable and the coleopteran hosts were
treated as a categorical variable. Evolutionary rate was assumed to be the same for
each taxon.
The trees used in the comparative analysis were based on Laurenne et al.’s
(2006) molecular study of cryptine phylogeny based on the length-variable D2
(þD3) variable region of the nuclear 28S rDNA gene, but taxa without the host
record information were pruned from the tree as missing values are not allowed in
CAIC. Two cryptine genera (Mallochia and Schreineria) with host records were
added into the tree and, in the absence of molecular data, their placements were
based on Townes’s (1969) classification. To avoid biased results, the comparative
analyses were carried out using five different gap cost ratios and with two different
alignment methods (POY and Clustal W þ PAUP*). Details of the methods are
described in Laurenne et al. (2009).
274 N. Laurenne and D.L.J. Quicke

16.3 Results
The percentages of the degree of antennal modification are shown in Fig. 16.1.
Figure 16.2 presents the occurrence of antennal development on a phylogenetic tree.
Figures 16.3 and 16.4 show the transformation series from a simple antennal tip
with no especially modified sensilla to a large united structure with a virtually
uniform surface. Surculus (Fig. 16.3a) displays a simple antennal tip without
obvious modification. Figure 16.3b,c shows thickening of some apical setae in
the genera Latibulus (Fig. 16.3b) and Hidryta (Fig.16.3c). Setae are modified into
truncate structures forming a cluster in genera Camera (Fig.16.3d) and in Crypta-nura (Fig.16.3f) modified structures have started to fuse in the middle. In Fig. 16.4,
fused structures form a more or less flat surface in females of Acrorichnus(Fig. 16.4a), and Buathra (Fig. 16.4b) shows a smooth face of modified and fused
structures. The antennal tip of Osprynchotus (Fig. 16.4c) forms a large uniform flat
surface, a truly hammer-like antenna. Some genera have different types of specia-
lisation of the antennal tip, for example, Meringopus (Fig. 16.4d) has thickened
“setae” originating from sockets inside the antennal surface.
Terminal antennal structures of cryptines are often sexually dimorphic charac-
ters as males typically do not display any particular antennal modification. How-
ever, some specialisations do occur in males of a few genera. For example, males of
Gabunia (Fig. 16.4e) have two peg-like structures on their antennal tip and those ofEurycryptus have one smaller structure (Fig. 16.4f).
Fig. 16.1 The precentage of occurrence of each degree of antennal hammer development in each
tribe of Cryptinae
16 Antennal Hammers: Echos of Sensillae Past 275

Fig. 16.2 The phylogeny of cryptine waps (Laurenne et al. 2009). The black circles indicate
attacking buprestid/cerambycid beetles and having strongly modified antennae (category 4–5).
Grey circles indicate the occurrence of slightly modified antenna (categories 1–3)
276 N. Laurenne and D.L.J. Quicke

The CAIC analysis showed a significant association between the degree of
antennal development and the usage of wood-boring buprestid and cerambycid
beetles in the Cryptini. Thirteen genera of the tribe Cryptini exploit wood-boring
beetle larvae and have modified antennae. Within the Phygadeuontini, only
five genera have this association. p-Values showed a significant association
(0.0080–0.0397) in all analysis except with the alignment obtained with the highest
gap:substitution cost (4:1, p-value ¼ 0.0707). Detailed results are presented in
the Laurenne et al. (2009).
16.4 Discussion
Possession of an antennal hammer is a clearly homoplastic character at an higher
level as it is found also in other ichneumonid subfamilies (Labeninae, Xoridinae,
Claseinae and Pimplinae) (Broad and Quicke 2000) as well as in the Orussidae
(Cooper 1953; Broad and Quicke 2000; Vilhelmsen et al. 2001). This structure is
a b
c d
e f
Fig. 16.3 Female antennal tips showing antennal modification. (a) Surculus, not modified. (b
and c) Some thickened setae on a tip – (b) Latibulus and – (c) Hidryta. (d) Diapetimorpha,thickened structures form a cluster. (e) Camera, dense cluster of truncate structures form a patch.
(f) Cryptanura, a cluster of short apically flattened structures with a fusion in the middle
16 Antennal Hammers: Echos of Sensillae Past 277

associated with deeply concealed cerambycid and buprestid beetle hosts and we
have shown by comparative analysis that it is also highly homoplastic within the
single but large subfamily Cryptinae.
Behavioural observations of Echthrus and of a Gabunia sp. (Quicke et al. 2003)
support the hypothesis that antennal hammers in the Cryptini are associated with
host searching. In 2004, we video recorded the host-searching behaviour of a
female Echthrus reluctator on a pile of pine logs in Hungary (Quicke 2001). The
wasp walked along the log tapping the substrate with the antennae repeatedly
sweeping symmetrically in inwardly directed arcs. Similar behaviour was also
observed in an unidentified Afrotropical species of Gabunia (tribe Cryptini) in
Kibale Forest National Park in Uganda.
16.4.1 Hosts of Cryptine Wasps
Most cryptine wasps are ectoparasitoids and they do not need to adapt to host’s
immunological defense. This may explain why some genera attack hosts from
a b
c d
e f
Fig. 16.4 Antennal tips of female and males. (a) Acrorichnus female, apical structures form
a clear patch. (b) Buathra female, structures form a smooth patch. (c) Osprychotus female,
a hammer-like antennal tip. (d) Meringopus female, thickened antennal setae originating from
deep sockets. (e) Gabunia male, two pegs on antennal tips, (f) Eurycryptus, one antennal peg
278 N. Laurenne and D.L.J. Quicke

several insect orders. The essential ability in host usage might be to find concealed
hosts of suitable sized.
16.4.1.1 Hosts of the Phygadeuontini
Species of the tribe Phygadeuontini typically parasitise exposed or weakly con-
cealed hosts and this is considered to be a ground-plan biology for the Cryptinae
(Gokhman 1996). The comparative analysis using the phylogeny (Laurenne et al.
2006) shows that modified antennal tips have multiple origins within the Phyga-
deuontini and host range covers several insect orders. Antennal modification was
found in three genera, all of which attack wood-boring beetles (Fig. 16.4).
16.4.1.2 Hosts of the Cryptini
In the tribe Cryptini, all the taxa that exploit wood-boring beetles have antennal
hammers. This is probably the ground-plan for the tribe. Strongly modified antennal
structures are also found in genera that attack other insect groups such as aculeate
Hymenoptera larvae in their nests. Parasitoids probably locate cells with suitable
host using vibrational sounding. Aculeate larvae are probably largely silent and do
not chew wood, though they move inside a cell when they need a feed by adults.
Members of the genera Acroricnus, Eurycryptus, Messatoporus, Osprynchotus andPhotocryptus exploit aculeate larvae (Genaro 1996) and they all have modified
antennal tips. According to Gauld (1988) there may be a host shift from Coleoptera
hosts to the young of nest-building aculeate Hymenoptera, but this is only a
hypothesis and cannot be tested at present due to the lack of sufficient detailed
host information for the vast majority of Cryptinae genera.
Unlike most other subtribes, the Gabuniini form a well-supported monophyletic
group (Laurenne et al. 2006) comprising 12 genera. Ten of these have strong
antennal modifications and the four available host records indicate that these
species exploit cerambycid or buprestid beetle hosts. The cylindrical body shape
of gabuniines and their long ovipositors probably enable them to reach their hosts
and are perhaps constrained by host boring shape (Townes and Townes 1962); the
enlarged subgenual organs found in the forelegs of females are assumed to be for
detecting echos during host location (Broad and Quicke 2000).
Most of available host records concerning the cryptine wasps concern phyga-
deuontines, many of which attack rather weakly concealed hosts, especially ones in
cocoons, or spider egg masses. The spider egg “parasitoids” attack exposed egg
masses, and therefore, vibrational sounding probably has no role in locating them,
and the antennal tips of the spider egg “parasitoids” examined are typically simple.
Hyperparasitism of cocooned parasitoid hosts occurs more commonly in the Cryp-
tini than in the Phygadeuontini, though there are numerous examples within the
latter. Some genera have modified antennal tips, but that could possibly be
explained by the adaptation to exploit other insect groups as well.
Within the Cryptini, males of six out of the ten genera examined had either one
or two terminal flagellomere pegs. The females of the same genera also had
16 Antennal Hammers: Echos of Sensillae Past 279

antennal modifications except for the case of Chrysocryptus. Structures of male
terminal flagellomeres are probably not related to the echolocation role of female
antennal hammers. Their co-occurrence suggests that there might be homologous
genetic control in the tribe Cryptini. Whether, and in what way, they may be
functional has yet to be determined. Field observations of mate-location and mating
are sadly largely lacking.
Considering the size of the subfamily, very few host records are available for
cryptine genera, and when records exist, they are often vague. Records typically
especially lack information about the host’s precise developmental stage. Field
records are largely lacking, and the host-location behaviour is usually referred to as
“antennation” without describing what part of the antennae is used. We hope that
this paper will encourage more detailed observation and reporting in the future.
16.4.2 Postulated Derivation of Hammers from Sensilla
If the states shown in Fig. 16.3a–f represent various stages in the evolution of
antennal hammers as seems likely, then the individual components of the hammer
surface would appear to be derived from sensilla. The unmodified terminal flagel-
lomere of Surculus has many thin curved sensilla chaetica, with a lower number of
more erect obliquely ended chaetica (on right), and one visible blunt sensillum. In
Latibulus (Fig. 16.3b), there are numerous blunt trichoid sensilla in relatively small
sockets plus several longer more pointed chaetica in rather large sockets. In
Fig. 16.3c, there is a similar grouping of socketed and less conspicuously socketed
blunt sensilla but with their apices curving towards the antennal tip and interspersed
with small trichoid sensilla. In Fig. 16.3d, the apical cluster comprises a dense
central area of T-shaped pegs that lack sockets at least on the basal side though on
the side of the antennal apex there appears to be a well-developed basal socket;
these are surrounded by curved, socketed robust trichoid sensilla. Socketed trichoid
sensilla are typically involved in mechanoreception.
If, as the above suggests, the antennal hammers of cryptines, and possibly other
ichneumonid wasps, are evolved from mechanoreceptory sensilla, it begs the
question as to what the intermediate evolutionary stages did, and what substrates,
the hosts during those intermediate phases occupied. Certainly more detailed
behaviour, microscopic and ultrastructural observations of living representatives
of apparent intermediate stages are needed.
References
Askew RR, Shaw MR (1986) Parasitoid communities: their size, structure and development. In:
Waage J, Greathead D (eds) Insect parasitoids. Academic, London, pp 225–264
Belshaw R, Fitton M, Herniou E, Gimeno C, Quicke DLJ (1998) A phylogenetic reconstruction of
the Ichneumonoidea (Hymenoptera) based on the D2 variable region of 28S ribosomal RNA.
Syst Entomol 23:109–123
280 N. Laurenne and D.L.J. Quicke

Broad GR, Quicke DLJ (2000) The adaptive significance of host location by vibrational sounding
in parasitoid wasps. Proc R Soc Lond B Biol 267:2403–2409
Bukovinszky T, Gols R, Posthumus MA, Vet LEM, van Lenteren JC (2005) Variation in plant
volatiles and attraction of the parasitoid Diadegma semiclausum (Hellen). J Chem Ecol
31:461–480
Cooper KW (1953) Egg gigantism, oviposition, and genital anatomy: their bearing on the biology
and phylogenetic position of Orussus (Hymenoptera: Siricoidea). Proc R Acad Sci 10:38–68
Fatouros NE, Huigens ME, van Loon JJA, Dicke M, Hilker M (2005) Butterfly antiaphrodisiac
lures parasitic wasps. Nature 433:704
Fischer S, Samietz J, W€ackers FL, Dorn S (2001) Interaction of vibrational and visual cues in
parasitoid host location. J Comp Physiol A 187:785–791
Fischer S, Samietz J, Dorn S (2003) Efficiency of vibrational sounding in parasitoid host location
depends on substrate density. J Comp Physiol A 189:723–730
Fischer S, Samietz J, W€ackers FL, Dorn S (2004) Perception of chromatic cues during host
location by the pupal parasitoid Pimpla turionellae (L.) (Hymenoptera: Ichneumonidae).
Environ Entomol 33:81–87
Gaston KJ, Gauld ID (1993) How many species of pimplines (Hymenoptera: Ichneumonidae) are
there in Costa Rica? J Trop Ecol 9:491–499
Gauld ID (1988) Evolutionary patterns of host utilization by ichneumonoid parasitoids hymenop-
tera Ichneumonidae and Braconidae. Biol J Linn Soc 35:351–378
Genaro JA (1996) Nest parasites (Coleoptera, Diptera, Hymenoptera) of some wasps and bees
(Vespidae, Sphecidae, Colletidae, Megachilidae, Anthophoridae) in Cuba. Caribb J Sci
32:239–240
Gohole LS, Overholt WA, Khan ZR, Vet LEM (2003) Role of volatiles emitted by host and non-
host plants in the foraging behaviour of Dentichasmias busseolae, a pupal parasitoid of the
spotted stemborer Chilo partellus. Entomol Exp Appl 107:1–9
Godfray HCJ (1994) Parasitoids: behavioral and evolutionary ecology. Princeton University Press,
Princeton, NJ
Gokhman VE (1996) Trends of biological evolution in the subfamily Ichneumoninae and related
groups (Hymenoptera Ichneumonidae): an attempt of phylogenetic reconstruction. Russ
Entomol J 4:91–103
Henaut A, Guerdoux J (1982) Location of a lure by the drumming insect Pimpla instigator(Hymenoptera, Ichneumonidae). Experientia 38:346–347
Henaut A (1990) Study of the sound produced by Pimpla instigator (Hymenoptera, Ichneumoni-
dae) during host selection. Entomophaga 35:127–139
Ignacimuthu S, Dorn S (2000) Mechano- and chemoreceptors and their possible role in host
location behaviour of parasitoid Anisopteromalus calandrae Howard (Hymenoptera: Pteroma-
lidae). Entomon 25:179–184
Isidoro N, Romani R, Bin F (2001) Antennal multiporous sensilla: their gustatory features for host
recognition in female parasitic wasps (Insecta, Hymenoptera: Platygastroidea). Microsc Res
Tech 55:350–358
Jumean Z, Unruh T, Gries R, Gries G (2005)Mastrus ridibundus parasitoids eavesdrop on cocoon-spinning codling moth, Cydia pomonella, larvae. Naturwissenschaften 92:20–25
Kroder S, Samietz J, Dorn S (2006) Effect of ambient temperature on mechanosensory host
location in two parasitic wasps of different climatic origin. Physiol Entomol 31:299–305
Kroder S, Samietz J, Dorn S (2007a) Temperature affects interaction of visual and vibrational cues
in parasitoid host location. J Comp Physiol 193:223–231
Kroder S, Samietz J, Schneider D, Dorn S (2007b) Adjustment of vibratory signals to ambient
temperature in a host-searching parasitoid. Physiol Entomol 32:105–112
Laurenne NM, Broad GR, Quicke DLJ (2006) Direct optimization and multiple alignment of 28S
D2–D3 rDNA sequences: problems with indels on the way to a molecular phylogeny of the
cryptine ichneumon wasps (Insecta: Hymenoptera). Cladistics 22:442–473
16 Antennal Hammers: Echos of Sensillae Past 281

Laurenne NM, Karatolos N, Quicke DLJ (2009) Hammering homoplasy: multiple gains and losses
of vibrational sounding in cryptine wasps (Insecta: Hymenoptera: Ichneumonidae). Biol J Linn
Soc 96:82–102
Meyhofer R, Casas J (1999) Vibratory stimuli in host location by parasitic wasps. J Insect Physiol
45:967–971
Mackauer M, Michaud JP, Volkl W (1996) Host choice by aphidiid parasitoids (Hymenoptera:
Aphidiidae): host recognition, host quality, and host value. Can Entomol 128:959–980
Otten H, W€ackers F, Battini M, Dorn S (2001) Efficiency of vibrational sounding in the parasitoid
Pimpla turionellae is affected by female size. Anim Behav 61:671–677
Powell JA, Turner WJ (1975) Observations on oviposition behaviour and host selection in Orussusoccidentalis (Hymenoptera: Siricoidea). J Kans Entomol Soc 48:299–307
Purvis A, Rambaut A (1995) Comparative analysis by independent contrasts (CAIC): an Apple
Macintosh application for analysing comparative data. Comput Appl Biosci 11:247–251
Quicke DLJ (1997) Parasitic wasps. Chapman & Hall, London, New York
Quicke DLJ (2001) Movie of host searching Echthrus. http://www.imperial.ac.uk/imedia/vid/fons/
biology/quicke//Echthrus.mp4. Accessed 7 Dec 2009
Quicke DLJ, Laurenne NM, Broad GR, Barclay MVL (2003) Host location behaviour and a new
host record for Gabunia aff. togoensis Krieger (Hymenoptera: Ichneumonidae: Cryptinae) in
Kibale Forest National Park, West Uganda. Afr Entomol 11:308–310
Quicke DLJ, Laurenne NM, Fitton MG, Broad GR (2009) A thousand and one wasps: a 28S rDNA
and morphological phylogeny of the Ichneumonidae (Insecta: Hymenoptera) with an investi-
gation into alignment parameter space and elision. J Nat Hist 43:1305–1421
Romani R, Isidoro N, Bin F, Vinson SB (2002) Host recognition in the pupal parasitoid Trichopriadrosophilae: a morpho-functional approach. Entomol Exp Appl 105:119–128
Schwarz M, Shaw MR (1998) Western Palaearctic Cryptinae (Hymenoptera: Ichneumonidae) in
the National Museums of Scotland, with nomenclatural changes, taxonomic notes, rearing
records and special reference to the British check list. Part 1. Tribe Cryptini. Entomologist’s
Gaz 49:101–127
Schwarz M, Shaw MR (2000) Western Palaearctic Cryptinae (Hymenoptera: Ichneumonidae) in
the National Museums of Scotland, with nomenclatural changes, taxonomic notes, rearing
records and special reference to the British check list. Part 3. Tribe Phygadeuontini, subtribes
Chiroticina, Acrolytina, Hemitelina and Gelina (excluding Gelis), with descriptions of new
species. Entomologist’s Gaz 51:147–186
Townes H (1969) The genera of Ichneumonidae, part 1. Mem Am Entomol Inst 11:1–300
Townes H, Townes M (1962) Ichneumon-flies of America north of Mexico: 3. Subfamily Gelinae,
tribe Mesostenini. United States National Museum Bulletin 216:1–602
Vinson SB (1988) Comparison of host characteristics that elicit host recognition behavior of
parasitoid Hymenoptera. In: Gupta VK (ed) Advances in parasitic Hymenoptera research:
proceedings of the II conference on the taxonomy and biology of parasitic Hymenoptera. E. J.
Brill, Leiden, pp 285–291
Vilhelmsen L, Isidoro N, Romani R, Basibuyuk HH, Quicke DLJ (2001) Host location and
oviposition in a basal group of parasitic wasps: the subgenual organ, ovipositor apparatus
and associated structures in the Orussidae (Hymenoptera, Insecta). Zoomorphology 121:63–84
Wertheim B, Vet LEM, Dicke M (2003) Increased risk of parasitism as ecological costs of using
aggregation pheromones: laboratory and field study of Drosophila–Leptopilina interaction.
Oikos 100:269–282
Whitfield JB (1998) Phylogeny and evolution of host–parasitoid interactions in Hymenoptera. Ann
Rev Entomol 43:129–151
Yu D, van Achtenberg K, Horstmann K (2005) World Ichneumonoidea 2004. Taxonomy, biology,
morphology and distribution. CD/DVD, Taxapad, Vancouver, Canada
282 N. Laurenne and D.L.J. Quicke

Chapter 17
Adaptive Radiation of Neotropical Emballonurid
Bats: Molecular Phylogenetics and Evolutionary
Patterns in Behavior and Morphology
Burton K. Lim
Abstract A phylogenetic analysis of loci from the four genetic transmission path-
ways in mammals (mitochondrial, autosomal, X, and Y sex chromosomes) was
used to investigate the evolution of bats in the pantropically distributed family
Emballonuridae. The nuclear data sets support a monophyletic clade of species
found in the New World. Character optimization of distributional areas suggests
that the most recent common ancestor colonized South America from Africa.
Molecular dating with fossil calibrations estimated that a basal split occurred
approximately 27 million years ago followed by primary intergeneric diversifica-
tion 19.4–18.0 million years ago. An analysis of historical biogeography identified
the northern Amazon as the ancestral area where there was speciation by taxon
pulses from a stable core area in the Guiana Shield. Range contractions followed by
expansions during the Early Miocene suggest an adaptive radiation in cluttered
forest and open savannah habitats. A correlation of ear morphology, echolocation,
and foraging behavior indicates a phylogenetic basis for these complex character
systems.
17.1 Introduction
South America was an insular continent from the Late Cretaceous to the Early
Pliocene but nevertheless, it has high levels of biodiversity for many groups of
organisms compared with other parts of the world. For example, bats account for
20% of the mammalian faunal diversity (Wilson and Reeder 2005) and are unique
in being the only order of mammals that can fly. This gives bats an advantage for
over-water dispersal but there have been no studies investigating the evolutionary
B.K. Lim
Department of Natural History, Royal Ontario Museum, 100 Queen’s Park, Toronto, Ontario M5S
2C6, Canada
e-mail: [email protected]
P. Pontarotti (ed.), Evolutionary Biology – Concepts, Molecularand Morphological Evolution, DOI 10.1007/978-3-642-12340-5_17,# Springer-Verlag Berlin Heidelberg 2010
283

mechanisms for the successful radiation of bats, especially in the rainforests of the
Amazon. As with most taxa, this has been hindered by a lack of comprehensive
species-level phylogenies, a dearth of fossils in the paleontological record, and a
paucity of ecological data. Herein, I synthesize data on New World emballonurid
bats in the tribe Diclidurini as one of the first detailed studies of an adaptive
radiation of mammals in the Neotropics.
I begin by giving general background information on the biology of the family
Emballonuridae. The primary objective of this study is to hypothesize the processes
involved in the biotic diversification in NewWorld emballonurid bats by inferring a
robust phylogeny of New World emballonurid bats using a molecular phylogenetic
approach, estimating times of divergence based on molecular dating with fossil
calibration points, examining the historical biogeography with the incorporation of
both temporal and spatial information, and investigating patterns of evolution in
morphology and behavior as inferred from the phylogeny.
17.1.1 Emballonurid Bats
The family Emballonuridae is characterized by a tail that emerges mid-dorsally
from the interfemoral membrane, which is the origin of its common name of sheath-
tailed bats. They are found pantropical in distribution, and the New World embal-
lonurids occur from Mexico through Central America into South America to
southeastern Brazil, including the off-shore islands of Trinidad, Tobago, and
Grenada (Koopman 1994). Most species are uncommonly encountered in Neotrop-
ical rainforests using traditional methods of capture such as mesh mist nets set in the
understory because they typically fly in or over the canopy. Consequently, New
World emballonurid bats are typically poorly studied and incompletely sampled in
terms of taxonomic and geographic coverage. However, this apparent rarity is
associated with a sampling bias that may be partially corrected by supplemental
surveying by novel methods such as flap trapping (Borissenko 1999; Lim 2009),
acoustic monitoring (Jung et al. 2007), and systematically searching for roosts
(Simmons and Voss 1998).
17.1.2 Taxonomy
There are 16 genera of emballonurid bats with 13 extant (eight in the New World
and five in the Old World) and three extinct (all Old World) that are represented by
63 species with 52 extant (22 NewWorld and 30 Old World) and 11 extinct (all Old
World; McKenna and Bell 1997; Simmons 2005; Lim et al. 2010). Four previous
phylogenies have been proposed for Emballonuridae including studies on cranial
morphology (Barghoorn 1977), protein electrophoresis and immunology (Robbins
and Sarich 1988), hyoid morphology (Griffiths and Smith 1991), and morphology
284 B.K. Lim

and behavior (Dunlop 1998). All of these studies were at the taxonomic rank of
genus except for the species-level analysis of Dunlop (1998). However, the only
taxonomic congruence among the topologies is the higher-level recognition of
subfamilies (Emballonurinae and Taphozoinae). The lack of consensus in other
parts of these trees was confounded by a combination of incomplete taxonomic
sampling and poor resolution. A recent molecular phylogenetic analysis of DNA
sequence variation supported this taxonomic classification (Lim et al. 2008).
Although the New World emballonurid species were comprehensively surveyed,
there were only exemplar samples of the two Old World tribes, which are still
poorly represented by tissue collections.
17.2 Molecular Phylogenetic Analyses
The data set for New World emballonurid bats included 99 specimens representing
all of the eight recognized genera and 21 of the 22 species (Simmons 2005; Lim
et al. 2010). The only missing species is Saccopteryx antioquensis, which is
endemic to the northern Andes of Colombia and known by only two specimens
without tissue samples (Munoz and Cuartas 2001). Outgroup taxa included nine
specimens representing two genera of Old World emballonurids and four genera of
other bat species (Lim et al. 2008).
Loci from the four genomic components of mammalian transmission genetics
were used to hypothesize the evolutionary history of NewWorld emballonurid bats.
Each of these genetic transmission pathways has different properties associated
with effective population size, mutation rate, and recombination that should be
conducive for recovering a robust estimate of phylogeny. The mitochondrial
marker was the complete protein-coding gene cytochrome b (Cytb); the autosomal
marker was intron 26 of the protein-coding gene Chd1 (found on chromosome 5 in
humans); the Y sex chromosome marker was intron 7 of the protein-coding gene
Dby; and the X sex chromosome marker was intron 18 of the protein-coding gene
Usp9x (Lim et al. 2008). There were a total of 3,176 aligned basepairs (bp)
including 1,140 bp of Cytb, 624 bp of Chd1, 750 bp of Dby, and 662 bp of Usp9x.The phylogenetic analyses of individual and combined nucleotide data sets
incorporated both an explicit model of DNA evolution using a statistical Bayesian
approach and a model-free methodology using a maximum parsimony approach as
corroboration of topological robustness. Bayesian inference was implemented in
the programMrBayes (Ronquist and Huelsenbeck 2003) and parsimony reconstruc-
tion was implemented in the program PAUP* (Swofford 2001) as outlined by Lim
et al. (2008). Branch supports of the resultant trees were calculated by the posterior
probability distribution in the Bayesian analysis and by 1,000 bootstrap replications
in the parsimony analysis. The trees were compared for topological congruence
using the Approximately Unbiased (AU) test (Shimodaira and Hasegawa 2001).
Each data set was reciprocally constrained to the individual gene trees to determine
if one was better than another.
17 Adaptive Radiation of Neotropical Emballonurid Bats: Molecular Phylogenetics 285

17.2.1 Tree Topology
Parsimony and Bayesian analyses of each of the individual data sets gave congruent
topologies with high bootstrap proportions and posterior probabilities for mono-
phyletic clades representing the currently recognized genera and species of New
World emballonurid bats (Fig. 17.1; Lim et al. 2008). However, the mitochondrial
Fig. 17.1 Phylogenetic tree from a Bayesian analysis of combined DNA sequences of three
nuclear genes for New World emballonurid bats, tribe Diclidurini (Lim et al. 2008). The first
number along the branch is the Bayesian posterior probability percentage, and the second number
is the bootstrap percentage from a parsimony analysis. Numbers in parentheses are the
corresponding branch-support values from a phylogenetic analysis after the removal of the out-
group taxon Nycteris javanicus, which was missing data for two of the genes. Intrageneric support
values are the same for both analyses and branches with an asterisk (*) have 100% support.
Peropteryx macrotis has two divergent populations from Central America (CA) and South
America (SA)
286 B.K. Lim
gene had significantly faster rates of nucleotide substitution, higher levels of
homoplasy, and a greater degree of saturation of transitions than any of the three
nuclear genes. These factors contributed to the loss of phylogenetic signal at deeper
branches of the cytochrome b tree including the monophyly of the New World
emballonurids. In contrast, there was better resolution and branch support for the
more slowly evolving nuclear introns. However, the intergeneric relationships
within the two subtribes were poorly resolved and supported by only a few nucleo-
tide changes. This suggests a hard polytomy resulting from a lack of phylogenetic
signal in each of the different genetic transmission pathways because of rapid
speciation as opposed to a soft polytomy due to conflicting phylogenetic signal.
Based on topological congruence, linear accumulation of substitutions, and high
consistency index, the three nuclear genes were combined to lessen the effects of
random sequence errors among nucleotide sites and ensure the recovery of phylo-
genetic signal from a robust species tree. A monophyletic New World clade was
recovered in the individual and combined nuclear data sets indicating a single
origin of emballonurid bats in the Neotropics (Fig. 17.1). Similarly, there was a
basal split in the New World tribe Diclidurini that was congruent and well sup-
ported in the nuclear trees.
17.3 Divergence Times
The combined nuclear data set for the tribe Diclidurini was used in a Bayesian
relaxed clock approach to approximate the times of divergence (Thorne and
Kishino 2002). Two fossil constraints were used as calibration points including
a minimum age of 13 million years ago (mya) for the split of Cyttarops and
Diclidurus based on the only pre-Pleistocene record of an extant New World
emballonurid genus (Czaplewski 1997). The second constraint was a maximum
age of 30 million years ago for the split of the Old and New World emballonurids
based on a molecular dating analysis with fossil calibrations for all families of bats
(Teeling et al. 2005). The basal split in the New World emballonurids occurred in
the Late Oligocene approximately 27 million years ago and six of the eight
currently recognized genera diversified relatively rapidly in the Early Miocene
19.4–18.0 million years ago, and most intrageneric differentiation (16 of 21 species)
occurred before the Pliocene 5 million years ago (Fig. 17.2; Lim 2007).
17.4 Historical Biogeography
Character optimization (Farris 1970) of distributional areas onto the phylogeny for
the superfamily Emballonuroidea indicates that the ancestor of New World emballo-
nurid bats has its origins in Africa (Fig. 17.3; Lim 2007). This biogeographic scenario
was previously suggested from phylogenetic studies of interfamilial relationships of
17 Adaptive Radiation of Neotropical Emballonurid Bats: Molecular Phylogenetics 287

bats (Eick et al. 2005; Teeling et al. 2005). The paleoenvironment during the Early
Oligocene was drier than today with more open habitats such as woodlands and
savannahs as suggested by the prevalence of large hypsodont mammals in the fossil
record (Flynn and Wyss 1998). Colonization of South America by trans-Atlantic
dispersal and subsequent speciation in allopatry has been reported for three other
groups of placental mammals based on fossil records from the Oligocene including
molossid bats (Legendre 1984), caviomorph rodents (Wyss et al. 1993), and platyr-
rhine primates (Takai et al. 2000). These range expansions probably occurred earlier
in the Eocene (Poux et al. 2006).
The phylogenies of each of the eight genera of New World emballonurid bats
were incorporated in an historical biogeographic analysis using the algorithm
Phylogenetic Analysis for Comparing Trees (PACT; Wojcicki and Brooks 2005).
In constructing the area cladogram, temporal information from the molecular dating
Fig. 17.2 Molecular dating based on a relaxed clock Bayesian analysis with fossil calibrations of
New World emballonurid bats (Lim 2007). Nodes are labeled with divergence time estimates
(millions of years ago) and standard deviations. Intergeneric and most intrageneric diversification
occurred in the Miocene (shaded). Peropteryx macrotis has two divergent populations from
Central America (CA) and South America (SA)
288 B.K. Lim

analysis (Lim 2007) was also used in conjunction with spatial information based
on the current distribution of each species (Table 17.1). There were nine biogeo-
graphic areas identified in Central and South America for New World emballonur-
ids (Fig. 17.4). The final area cladogram identified the Northern Amazon as the
Fig. 17.3 Phylogenetic tree for the superfamily Emballonuroidea with the ancestral areas mapped
onto each node (AF Africa, EU Europe, NA North America, SA South America) following Lim
(2007). Lineage splits, other than the extant New World emballonurids (tribe Diclidurini), are
based on the minimum age of the fossil record (black bars). The basal divergence at 52 million
years ago (mya) of the families Nycteridae and Emballonuridae is the molecular approximation by
Teeling et al. (2005). Extinct taxa are indicated by an asterisk (*)
17 Adaptive Radiation of Neotropical Emballonurid Bats: Molecular Phylogenetics 289

ancestral area for the basal node and for most internal nodes based on character
optimization (Fig. 17.5). This indicates that most lineage splits were within-area
speciation events. However, there were three range expansions from the Northern
Amazon followed by vicariant contractions including (1) a peripheral isolation in
the Pacific slope of northwestern South America and subsequent colonization of
Proto-Central America during the Middle Miocene; (2) colonization of northern
Colombia and vicariant isolation after the uplift of the Andes during the Late
Miocene; and (3) overland dispersal into Central America during the Pleistocene
after the establishment of the Panamanian land bridge connection, which was
followed by extinction in the intervening area of the northern Andes in Colombia,
which resulted in allopatric speciation (Lim 2008).
As is the case for most species of New World emballonurid bats, widely
distributed species typically are not conducive for recovering biogeographic pat-
terns. However, the optimization of the Northern Amazon at most nodes of the area
cladogram indicates repeated within-area speciation events. Tectonic uplifting of
Table 17.1 Biogeographic areas identified for species of New World emballonurid bats based on
current species distributions (Lim 2008)
Species Biogeographic area
A B C D E F G H I
Balantiopteryx infusca C
Balantiopteryx io B
Balantiopteryx plicata A
Centronycteris centralis B C D H
Centronycteris maximiliani F G I
Cormura brevirostris B D E F G H
Cyttarops alecto B F G
Diclidurus albus A B D E F G I
Diclidurus ingens E F G
Diclidurus isabellus F
Diclidurus scutatus F G I
Peropteryx kappleri B C D E F G H I
Peropteryx leucoptera F G H I
Peropteryx macrotis (Central America) A B
Peropteryx macrotis (South America) D E F G H I
Peropteryx pallidoptera F G
Peropteryx trinitatis E F
Rhynchonycteris naso A B C D E F G H I
Saccopteryx antioquensis D
Saccopteryx bilineata A B C D E F G H I
Saccopteryx canescens D E F G H
Saccopteryx gymnura F G
Saccopteryx leptura A B C D E F G H I
A ¼ Pacific versant of Central America; B ¼ Atlantic versant of Central America; C ¼ Choco
region of northwestern South America; D ¼ northern Andes and valleys of Colombia; E ¼ north
coast of Venezuela and offshore islands; F ¼ north of the Amazon River; G ¼ south of the
Amazon River; H ¼ eastern slope of the Andes in the western Amazon basin; and I ¼ southeast-
ern South America (Fig. 17.4)
290 B.K. Lim

the northern Andes (Hoorn et al. 1995) combined with fluctuations in temperature
and sea levels (Haq et al. 1987; Miller et al. 2005), and changes in vegetation (Janis
1993) contributed to a heterogeneous paleoenvironment in South America during
the Miocene (Lundberg et al. 1998). This scenario is similar to the taxon-pulse
hypothesis of biotic diversification with recurring adaptive shifts over time to
different habitats centered on a stable core area (Erwin 1979, 1981). For New
World emballonurid bats, there were repeated episodes of range expansions and
contractions from a stable core area such as the ancient Guiana Shield of the
Northern Amazon.
Mapping the area cladogram (Fig. 17.5) onto the chronogram (Fig. 17.3) sug-
gests that other than an earlier colonization in the Miocene that was associated with
the genus Balantiopteryx (Lim 2008; Lim et al. 2004), range expansion from South
America into Central America probably did not occur until later in the Pliocene.
Although Centronycteris split vicariantly in the Late Miocene with Centronycterismaximiliani speciating in the Northern Amazon and Centronycteris centralis in theNorthern Andes, C. centralis did not colonize Central America until a later date.
Similarly, Saccopteryx bilineata and Saccopteryx leptura split during the Late
Miocene in the North Amazon before both species became widely distributed
throughout the continental mainland. Even more recently, Diclidurus albus and
Diclidurus ingens split during the Early Pleistocene in the North Amazon before
D. albus dispersed into Central America. Although the topology forms a trichotomy
with Peropteryx kappleri, the allopatrically distributed Central and South American
populations of Peropteryx macrotis split in the Late Pleistocene. Three other
Fig. 17.4 Map of the nine
biogeographical areas in
Central America and South
America that were identified
based on current species
distributions in Table 17.1
(Lim 2008): (A) Pacific
versant; (B) Atlantic versant;
(C) Choco; (D) Northern
Andes; (E) North Coast; (F)
Northern Amazon; (G)
Southern Amazon; (H)
Western Amazon; (I)
Southeastern South America
17 Adaptive Radiation of Neotropical Emballonurid Bats: Molecular Phylogenetics 291

species (Cormura brevirostris, Cyttarops alecto, and Rhynchonycteris naso) arealso widely distributed but their range expansions cannot be discerned from the area
cladogram. Likewise, patterns of range expansion from the Northern Amazon
southwards are not explicitly discernible because no speciation events involve the
Southern Amazon. However, C. maximiliani, S. bilineata, S. leptura, Saccopteryxcanescens, Saccopteryx gymnura, Diclidurus scutatus, and Peropteryx pallidopteradispersed from the Northern to the Southern Amazon sometime after they speciated
in the late Miocene. This timing coincides with the uplifting of the eastern
Fig. 17.5 Final area cladogram from an historical biogeographic analysis of New World embal-
lonurid bats (Lim 2008). Ancestral areas at nodes are derived from character optimization. Three
nodes marked with roman numerals in parentheses identify biotic expansions followed by vicari-
ant isolation. All other nodes are within-area taxon pulses of biotic diversification in the Northern
Amazon (F)
292 B.K. Lim

cordillera of the Andes, which created the Amazon River and primary drainage of
South America east toward the Atlantic Ocean as we know it today (Hoorn et al.
1995).
17.5 Evolutionary Patterns
17.5.1 Morphological Data
The most comprehensive morphological study of the family Emballonuridae
incorporated 141 external, cranial, and skeletal characters from 43 of 52 extant
species including 18 of 22 New World species (Dunlop 1998; Lim and Dunlop
2008). However, the phylogeny was poorly supported with the exception of the
genera within the tribe Diclidurini. Topological congruence using the KH (Kishino
and Hasegawa 1989), Wilcoxon signed ranks (Templeton 1983), and winning sites
(Prager and Wilson 1988) tests indicated that the morphological data set con-
strained to each of the molecular trees was significantly worse than its own tree
(p < 0.02), except for Usp9x (p < 0.07). Similarly, all three of the molecular data
sets were significantly worse (p < 0.01) when constrained to the morphological
tree as opposed to their own tree. In terms of character congruence, the incongru-
ence length difference test (Farris et al. 1995) identified the morphological data set
as significantly different from the molecular data sets. Taxonomic congruence
summarizes these topological and character differences because the three nuclear
gene trees corroborate the split of the NewWorld taxa into the subtribes Diclidurina
and Saccopterina, which are clades not recovered by the morphological tree. Except
for a collapse to a polytomy at the basal node of the subtribe Saccopterina in the
parsimony tree, combining the morphological and molecular data sets resulted in
the same topology as the nuclear tree for both Bayesian and parsimony analyses.
This indicates that the morphological dataset has a lot of homoplasy with very little
phylogenetic signal.
17.5.2 Ecological Data
The most comprehensive ecological study incorporated 28 characters primarily
associated with roosting and foraging behavior; however, data for most of the
species were unknown (Dunlop 1998; Lim and Dunlop 2008). A phylogenetic
analysis of this incomplete dataset resulted in a largely unresolved topology.
A combined analysis of morphological and behavioral characters resulted in a
slightly better but still poorly resolved consensus tree of 509 equally parsimonious
trees. The only higher level relationships recovered were the subfamilies Tapho-
zoinae and Emballonurinae.
17 Adaptive Radiation of Neotropical Emballonurid Bats: Molecular Phylogenetics 293

Although there is a lack of resolving power because of high levels of homoplasy
and large amounts of missing data, characters can be optimized onto the robust
molecular phylogeny to hypothesize evolutionary patterns in morphology and
behavior. Three examples are detailed herein that are associated with the diversifi-
cation of genera of New World emballonurid bats.
17.5.3 Wing Sacs
Species of Balantiopteryx, Cormura, Peropteryx, and Saccopteryx have a sac-like
structure in the propatagium between the shoulder and forearm that is uniquely
structured in each of the genera in terms of location in the wing membrane,
direction of the opening, and size. However, only the wing sac in S. bilineata has
been thoroughly studied. It is well developed in males and acts as a storage
container without glandular cells (Scully et al. 2000) for bodily secretions used in
a salting behavior to mark females in the harem (Voigt and von Helversen 1999).
Based on both a parsimony and likelihood method of ancestral state reconstruction
as implemented in Mesquite (Maddison and Maddison 2006), wing sac character
states mapped independently onto the molecular phylogeny (Fig. 17.6; Lim and
Dunlop 2008). An alternative hypothesis of a single origin of wing sacs for New
World emballonurid bats is less parsimonious with two additional losses and it is
also not supported by the likelihood method of ancestral state reconstruction, which
predicts no wing sac at the base of this clade. However, because of multiple
occurrences of sac-like structures in different genera, there is a possibility of a
phylogenetic predisposition (Soltis et al. 1995) whereby the genetic components
underlying the structure originated once on the tree (Lim and Dunlop 2008).
17.5.4 Roosts and Pelage
Most species of emballonurids and many bats in general have brown fur but some
genera have atypical appearances including paler pelage that is white, as in the
ghost bat Diclidurus, gray as in the smoky bat Cyttarops, or a pelage pattern with
two dorsal pale lines as in Rhynchonycteris and Saccopteryx. In terms of primary
roosting sites, most emballonurid bats occupy relatively sheltered areas such as
caves and crevices in rocky outcrops, or in man-made structures such as tombs and
buildings. Some species are primarily found in other forms of concealed roosts
including tree hollows and rotted-out logs. A few genera, however, predominately
roost in more exposed situations including in leaves at the tops of palm trees
(Cyttarops and Diclidurus), or on sloping tree trunks overhanging rivers
(R. naso), vertical tree trunks within forest (S. leptura), and within exposed cavitieson the outside of buttressed roots of trees (S. bilineata). Although Saccopteryx is
also known to roost in other places such as tree hollows, caves, and man-made
294 B.K. Lim

structures, they regularly use the exposed surfaces of trees, unlike other genera that
occupy sheltered areas (Bradbury and Emmons 1974; Bradbury and Vehrencamp
1976). Pelage and roosting behavior map consistently and are correlated on the
phylogeny suggesting a phylogenetic basis to these character systems and an
association of camouflage for genera that roost on exposed substrate such as tree
trunks and leaves at the tops of palm trees (Fig. 17.6; Lim and Dunlop 2008).
Fig. 17.6 Chronogram of New World emballonurid bats with the primary characters defining
the basal diversification during the Late Oligocene and Early Miocene. Echolocation call design:
C1 – frequency high (41.3–98.2 kHz), call duration low (4.8–7.6 ms), and pulse interval low
(58–119 ms); C2 – frequency low (23.5–42.6 kHz), call duration high (8.1–9.7 ms), and pulse
interval high (100–317 ms). Ear morphology: E1 – medial edge of ears arise from between the
eyes; E2 – medial edge of ears are connected between the eyes; E3 – medial edge of ears arise
above the inner portion of the eyes; E4 – medial edge of ears arise above the middle portion of the
eyes; E5 – medial edge of ears arise above the outer portion of the eyes. Pelage pattern: P1 – fur
typically a uniformly medium or dark brown color; P2 – fur has 2 wavy pale lines on the dorsum;
P3 – fur is pale gray; and P4 – fur is brownish white or white. Roost site: R1 – lives in shelter area;
R2 – lives in exposed areas on tree trunks; and R3 – lives in exposed areas under palm leaves.
Wing sacs: W1 – no wing sacs; W2 – large-sized wing sacs located along the forearm of the
propatagia; W3 – medium-sized wing sacs located in the middle of the propatagia; W4 – small-
sized and conspicuous wing sacs located near the leading edge of the propatagia; and W5 – small-
sized and inconspicuous wing sacs located near the leading edge of the propatagia
17 Adaptive Radiation of Neotropical Emballonurid Bats: Molecular Phylogenetics 295

17.5.5 Ear Morphology and Echolocation
Although bats are not the only mammals that echolocate, they have the most
sophisticated system of high frequency emission, sound reception, and neural
processing for navigating and foraging in the dark. Ear shape and position are
important factors for receiving returning echoes. The position of the medial edge of
the ear in relation to the eye dictates the degree of forward or lateral orientation of
the ear on the head of the bat. The direction of the ear may in turn influence the
ecological adaptation of flying behavior. The more basal nodes for extant bats are
equivocal for ear position because of polymorphic states in most families and the
lack of comprehensive intrafamilial phylogenies (Lim and Dunlop 2008). Nonethe-
less, a possible accelerated character transformation is an ancestral state reconstruc-
tion of the ear directed more forward with the medial edge located between the eyes
at the base of the New World emballonurid tree (Fig. 17.6). More laterally directed
ears as seen in the subtribe Saccopterygina would be considered derived states.
New World emballonurid bats are all aerial insectivores with an echolocation
search call consisting of a central quasi-constant frequency band with short fre-
quency modulated components and multiharmonics with most of the energy in the
second harmonic. There is a negative correlation of a decrease in flying distance to
forest clutter with an increase in peak echolocation frequency and a positive
correlation of a decrease in pulse interval and call duration with a decrease in
distance to clutter (Jung et al. 2007). These acoustic parameters map consistently on
the phylogeny suggesting that foraging habitat and echolocation call design reflect
phylogenetic relationships. Species within the subtribe Saccopterygina (Centronyc-teris, Rhynchonycteris, and Saccopteryx) fly in more cluttered environments within
the forest or near the edge of forest and have higher frequencies, shorter pulse
intervals, and shorter call durations (Fig. 17.6). In contrast, the subtribe Diclidurina
(Balantiopteryx, Cormura, Cyttarops, Diclidurus, and Peropteryx) fly in less clut-
tered environment in open spaces near the forest or above the canopy and have
lower frequencies, longer pulse intervals, and longer call durations. If ear position-
ing is linked to echolocation parameters and flying behavior, foraging near to forest
clutter would be considered a derived ecological adaptation for Saccopterygina
because forward directed ears are considered ancestral for New World emballonur-
ids and are also found in Diclidurina.
17.6 Conclusions
The most recent common ancestor of New World emballonurid bats colonized an
insular South America from Africa during the Early Oligocene 30 million years ago
when savannah was more prevalent than today. A basal split occurred approxi-
mately 27 million years ago in the Northern Amazon with the speciation of the
subtribes Saccopterygina in forested habitats and Diclidurina in savannah. There
296 B.K. Lim

was relative stasis until a rapid differentiation of genera 19.4–18.0 million years ago
during the Early Miocene when marine incursions from the Caribbean into the
northwestern Amazon region resulted in heterogeneous environments in a forest-
savannah mosaic. The uplands of the Guiana Shield acted as a stable core area
during range contractions. Subsequent range expansions back into favorable low-
land habitats completed episodes of taxon pulses of biotic diversification. These
changing paleoenvironments in the Early Miocene resulted in an adaptive radiation
occurring in forested habitats that gave rise to the differentiation of the genera in
Saccopterygina. The association of ear morphology and echolocation call design
suitable for foraging within cluttered environments supports a phylogenetic basis to
the evolution of these complex character systems. A similar radiation occurred in
savannah habitats giving rise to the diversification of genera in Diclidurina that
were adapted to foraging in more open environments. More detailed study of
morphology, ecology, and echolocation of emballonurids at the species-level in a
phylogenetic context will give further insights into the remarkable evolutionary
history and adaptive radiation of bats.
Acknowledgments I thank Mark Engstrom for critical comments throughout the formulation of
the ideas presented herein. Primary funding for fieldwork and research was secured through the
generous support of the Royal Ontario Museum Governors and Department of Natural History.
References
Barghoorn SF (1977) New material of Vespertiliavus Schlosser (Mammalia, Chiroptera) and
suggested relationships of emballonurid bats based on cranial morphology. Am Mus Novit
2618:1–29
Borissenko AV (1999) A mobile trap for capturing bats in flight. Plecotus et al 2:10–19
Bradbury JW, Emmons LH (1974) Social organization of some Trinidad bats: 1. Emballonuridae.
Z Tierpsychol 36:137–183
Bradbury JW, Vehrencamp SL (1976) Social organization and foraging in emballonurid bats.
Behav Ecol Sociobiol 1:337–381
Czaplewski NJ (1997) Chiroptera. In: Kay RF, Madden RH, Cifelli RL, Flynn JJ (eds) Vertebrate
paleontology in the neotropics: the Miocene fauna of La Venta, Colombia. Smithsonian
Institution Press, Washington, DC, pp 410–431
Dunlop JM (1998) The evolution of behavior and ecology in Emballonuridae (Chiroptera). PhD
dissertation, York University, North York, Ontario
Eick GN, Jacobs DS, Matthee CA (2005) A nuclear DNA phylogenetic perspective on the
evolution of echolocation and historical biogeography of extant bats (Chiroptera). Mol Biol
Evol 22:1869–1886
Erwin TL (1979) Thoughts on the evolutionary history of ground beetles: hypotheses generated
from comparative faunal analyses of lowland forest sites in temperate and tropical regions. In:
Erwin TL, Ball GE, Whitehead DR (eds) Carabid beetles: their evolution, natural history, and
classification. Dr W. Junk, The Hague, pp 539–592
Erwin TL (1981) Taxon pulses, vicariance, and dispersal: an evolutionary synthesis illustrated by
carabid beetles. In: Nelson G, Rosen DE (eds) Vicariance biogeography: a critique. Columbia
University Press, New York, pp 159–196
Farris JS (1970) Methods for computing Wagner trees. Syst Zool 19:83–92
17 Adaptive Radiation of Neotropical Emballonurid Bats: Molecular Phylogenetics 297

Farris JS, Kallersjo M, Kluge AG, Bult C (1995) Testing significance of incongruence. Cladistics
10:315–319
Flynn JJ, Wyss AR (1998) Recent advances in South American mammalian paleontology. Trends
Ecol Evol 13:449–454
Griffiths TA, Smith AL (1991) Systematics of emballonuroid bats (Chiroptera: Emballonuridae
and Rhinopomatidae) based on hyoid morphology. Bull Am Mus Nat Hist 206:62–83
Haq BU, Hardenbol J, Vail PR (1987) Chronology of fluctuating sea levels since the Triassic.
Science 235:1156–1167
Hoorn C, Guerrero J, Sarmiento GA, Lorente MA (1995) Andean tectonics as a cause for changing
drainage patterns in Miocene northern South America. Geology 23:237–240
Janis CM (1993) Tertiary mammal evolution in the context of changing climates, vegetation, and
tectonic events. Ann Rev Ecol Syst 24:467–500
Jung K, Kalko EKV, von Helversen O (2007) Echolocation calls in Central American emballo-
nurid bats: signal design and call frequency alternation. J Zool 212:125–137
Kishino H, Hasegawa M (1989) Evaluation of the maximum likelihood estimate of the evolution-
ary tree topologies from DNA sequence data, and the branching order in Hominoidea. J Mol
Evol 29:170–179
Koopman KF (1994) Chiroptera: systematics Part 60 of Mammalia, vol 8, Handbook of Zoology.
Walter de Gruyter, New York
Legendre S (1984) Etude odontologique des representants actuels du groupe Tadarida (Chiroptera,
Molossidae): implications phylogeniques, systematiques et zoogeographiques. Rev Suisse
Zool 91:399–442
Lim BK (2007) Divergence times and origin of neotropical sheath-tailed bats (tribe Diclidurini) in
South America. Mol Phylogenet Evol 45:777–791
Lim BK (2008) Historical biogeography of New World emballonurid bats (tribe Diclidurini):
taxon pulse diversification. J Biogeogr 35:1385–1401
Lim BK (2009) Environmental assessment at the Bakhuis Bauxite Concession: small-sized
mammal diversity and abundance in the lowland humid forests of Suriname. Open Biol J
2:42–57
Lim BK, Dunlop JM (2008) Evolutionary patterns of morphology and behavior as inferred from a
molecular phylogeny of New World emballonurid bats (tribe Diclidurini). J Mammal Evol
15:79–121
Lim BK, Engstrom MD, Simmons NB, Dunlop JM (2004) Phylogenetics and biogeography of
least sac-winged bats (Balantiopteryx) based on morphological and molecular data. Mamm
Biol 69:225–237
Lim BK, Engstrom MD, Bickham JW, Patton JC (2008) Molecular phylogeny of New World
emballonurid bats (Tribe Diclidurini) based on loci from the four genetic transmission systems
in mammals. Biol J Linn Soc 93:189–209
Lim BK, Engstrom MD, Reid FA, Simmons NB, Voss RS, Fleck DW (2010) A new species of
Peropteryx (Chiroptera: Emballonuridae) from western Amazonia with comments on phylo-
genetic relationships within the genus. Am Mus Novit 3686:1–20
Lundberg JG, Marshall LG, Guerrero J, Horton B, Malabarba MCSL, Wesselingh F (1998) The
stage for Neotropical fish diversification: a history of tropical South American rivers. In:
Malabarba LR, Reis RE, Vari RP, Lucena ZMS, Lucena CAS (eds) Phylogeny and classifica-
tion of Neotropical fishes. Edipucrs, Porto Alegre, Brazil, pp 13–48
Maddison WP, Maddison DR (2006) Mesquite: a modular system for evolutionary analysis,
version 1.12. http://mesquiteproject.org. Accessed 23 Sept 2006
McKenna MC, Bell SK (1997) Classification of mammals above the species level. Columbia
University Press, New York
Miller KG, Kominz MA, Browning JV, Wright JD, Mountain GS, Katz ME, Sugarman PJ,
Cramer BS, Christie-Blick N, Pekar SF (2005) The Phanerozoic record of global sea-level
change. Science 310:1293–1298
298 B.K. Lim

Munoz J, Cuartas CA (2001) Saccopteryx antioquensis n. sp. (Chiroptera: Emballonuridae) del
noroeste de Colombia. Actual Biol 23:53–61
Poux C, Chevret P, Huchon D, de Jong WW, Douzery EJP (2006) Arrival and diversification of
caviomorph rodents and platyrrhine primates in South America. Syst Biol 55:228–244
Prager EM, Wilson AC (1988) Ancient origin of lactalbumin from lysozyme: analysis of DNA and
amino acid sequences. J Mol Evol 27:326–335
Robbins LW, Sarich VM (1988) Evolutionary relationships in the family Emballonuridae (Chir-
optera). J Mammal 69:1–13
Ronquist F, Huelsenbeck JP (2003) MrBayes 3: Bayesian phylogenetic inference under mixed
models. Bioinformatics 19:1572–1574
Scully WMR, Fenton MB, Saleuddin ASM (2000) A histological examination of the holding sacs
and glandular scent organs of some bat species (Emballonuridae, Hipposideridae, Phyllosto-
midae, Vespertilionidae, and Molossidae). Can J Zool 78:613–623
Shimodaira H, Hasegawa M (2001) CONSEL: for assessing the confidence of phylogenetic tree
selection. Bioinformatics 17:1246–1247
Simmons NB (2005) Order Chiroptera. In: Wilson DE, Reeder DM (eds) Mammal species of the
world: a taxonomic and geographic reference, 3rd edn. Johns Hopkins University Press,
Baltimore, pp 312–529
Simmons NB, Voss RS (1998) The mammals of Paracou, French Guiana: a neotropical lowland
rainforest fauna. Part 1, bats. Bull Am Mus Nat Hist 237:1–219
Soltis DE, Soltis PS, Morgan DR, Swensen SM, Mullin BC, Dowd JM, Martin PG (1995)
Chloroplast gene sequence data suggest a single origin of the predisposition for symbiotic
nitrogen fixation in angiosperms. Proc Natl Acad Sci USA 92:2647–2651
Swofford DL (2001) PAUP*: phylogenetic analysis using parsimony (*and other methods),
version 4.0b10. Sinauer Associates, Sunderland, MA
Takai M, Anaya F, Shigehara N, Setoguchi T (2000) New fossil materials of the earliest New
World onkey, Branisella boliviana, and the problem of platyrrhine origins. Am J Phys
Anthropol 111:263–281
Teeling EC, Springer MS, Madsen O, Bates P, O’Brien SJ, Murphy WJ (2005) A molecular
phylogeny for bats illuminates biogeography and the fossil record. Science 307:580–584
Templeton AR (1983) Phylogenetic inference from restriction endonuclease cleavage site maps
with particular reference to the evolution of humans and the apes. Evolution 37:221–244
Thorne JL, Kishino H (2002) Divergence time and evolutionary rate estimation with multilocus
data. Syst Biol 51:689–702
Voigt CC, von Helversen O (1999) Storage and display of odour by male Saccopteryx bilineata(Chiroptera, Emballonuridae). Behav Ecol Sociobiol 50:29–40
Wilson DE, Reeder DM (eds) (2005) Mammal species of the world: a taxonomic and geographic
reference, 3rd edn. Baltimore, Johns Hopkins University Press
Wojcicki M, Brooks DR (2005) PACT: an efficient and powerful algorithm for generating area
cladograms. J Biogeogr 32:755–774
Wyss AR, Flynn JJ, Norell MA, Swisher CC, Charrier R, Novacek MJ, McKenna MC (1993)
South America’s earliest rodent and recognition of a new interval of mammalian evolution.
Nature 365:434–437
17 Adaptive Radiation of Neotropical Emballonurid Bats: Molecular Phylogenetics 299

Chapter 18
Trends in Rhizobial Evolution and Some
Taxonomic Remarks
Julio C. Martınez-Romero, Ernesto Ormeno-Orrillo, Marco A. Rogel,
Aline Lopez-Lopez, and Esperanza Martınez-Romero
Abstract Bacteria that establish nitrogen-fixing symbiosis in specialized plant
structures belong to only three of over 100 bacterial phyla. Among these, rhizobial
symbioses are the best known and nodulation genes (nod) have been described in
many species. nodA phylogenies revealed a larger diversity in Bradyrhizobium than
in other genera and suggest that bradyrhizobial nod genes are the oldest in agree-
ment to the proposal that nod genes evolved in Bradyrhizobium (Plant Soil
161:11–20, 1994). In many cases, rhizobial symbiotic and housekeeping genes
have different evolutionary histories in relation to the lateral transfer of symbiotic
genes among bacteria. Misclassified Rhizobium strains were identified, to properly
identify rhizobial species we propose the use of fragments of the rpoB and dnaKgenes, which according to probability analyses reflect the behavior of whole genes.
With these analyses several rhizobial species related to Agrobacterium tumefaciensmay be reclassified to a genus other than Rhizobium.
18.1 Introduction
Legume plants are widespread and diverse with a large number of species; they
profit from symbiosis with nitrogen-fixing bacteria (collectively designated as
rhizobia and comprising different, not closely related genera, such as Bradyrhizo-bium, Mesorhizobium, Azorhizobium, Sinorhizobium, Rhizobium, and others) that
induce the formation of nodules on roots and rarely on stems and provide nitrogen
that allows the plants to grow in nitrogen poor soils. Rhizobia are used as inoculants
in agriculture, a practice that has been in use for over a hundred years, substituting
fertilizers and saving millions of dollars in some cases (Hungria et al. 2000, 2005).
J.C. Martınez-Romero, E. Ormeno-Orrillo, M.A. Rogel, A. Lopez-Lopez, and E. Martınez-
Romero
Centro de Ciencias Genomicas, UNAM, Av. Universidad, Cuernavaca, Morelos 62210, Mexico
e-mail: [email protected]
P. Pontarotti (ed.), Evolutionary Biology – Concepts, Molecularand Morphological Evolution, DOI 10.1007/978-3-642-12340-5_18,# Springer-Verlag Berlin Heidelberg 2010
301

Rhizobial evolution and diversity (reviewed in Terefework et al. 2000; Wang
and Martınez-Romero 2000; Sprent 2001; Sessitsch et al. 2002; Provorov and
Vorobyov 2008; Martinez-Romero 2009) and molecular mechanisms mediating
their interaction with legume hosts (Barnett and Fisher 2006; Jones et al. 2007) have
been studied for a small proportion of legume-rhizobial symbioses (Lopez-Lopez
et al. 2010). The coevolution of Rhizobium and legumes in symbiosis has been
critically analyzed (Sprent 1997; Martinez-Romero 2009).
18.2 Nitrogen-Fixing Symbioses with Plants
In plants with nitrogen-fixing symbiosis, special structures are involved (Fig. 18.1)
indicating a sort of “convergent evolution” and suggesting a need to contain (in
specialized structures) large numbers of selected bacteria to provide enough nitro-
gen for plants and/or to confine, control, or protect bacteria. Few bacterial genera
belonging to only three phyla (out of over 100 current bacterial phyla) are capable
of forming these nitrogen-fixing symbioses with plants (Fig. 18.1). There are more
phyla with nitrogen-fixing bacteria than with nodulating bacteria, suggesting that
nodulating bacteria evolved from nitrogen-fixing bacteria. Other bacteria out of the
complex community found associated with plants, such as Azoarcus (Hurek and
Reinhold-Hurek 2003) and Herbaspirillum (Roncato-Maccari et al. 2003), fix low
levels of nitrogen not in nodules but as endophytes (inside plants); maybe rhizobial
nitrogen fixation started similarly, as low-level nitrogen fixation. It is the aim of
applied research with some of the plant-associated bacteria to achieve similar levels
of nitrogen fixation with rice, corn, sugar-cane, and potatoes, as those obtained with
the well recognized nitrogen-fixing symbioses of plants.
Bacteria induce the formation of nodules on actinorrhizal plants and in legumes
(including the nonlegume Parasponia) while cyanobacteria do not induce coralloidroots in cycads (an older symbiosis than those of legumes and actinorrhizal plants),
Firm
icute
sSp
iroch
aete
sCya
noba
cter
ia*
Actin
obac
teria
*Chl
orob
i
Prot
eoba
cter
ia*
Fig. 18.1 Bacterial phyla, names correspond to phyla containing nitrogen-fixing species. Asterisks(*) indicate phyla containing bacteria that establish symbiosis in specialized structures
302 J.C. Martınez-Romero et al.

and seemingly neither the specialized cavities in Azolla and Gunnera, such struc-
tures formed normally by plants are subsequently colonized by cyanobacteria.
Rhizobia and actinobacteria become intracellular in nodules as do cyanobacteria
in Gunnera. Interestingly, in Casuarina glauca, an actinorhizal plant, a legume
symbiotic gene (symRK) has been found that is required for nodulation suggesting
a common genetic basis for nodule formation in legumes and actinorrhizal plants
(Gherbi et al. 2008).
A landmark in symbiotic research in Rhizobium was the discovery of the
inducing molecules (Lerouge et al. 1990), Nod factors (produced by enzymes
encoded by nod genes), which have a unique structure in biology, are active at
nanomolar concentrations and are capable of inducing nodules in the absence of
bacteria (Denarie et al. 1996; Relic et al. 1994). Great interest and much effort have
been devoted toward identifying nodulation factors in actinobacteria but results
have not been reported yet. Genetic approaches in the 1980s led to the discovery of
nodulation mutants in Rhizobium and nod genes were described then (Long et al.
1983; Kondorosi et al. 1984). With the exception of photosynthetic Bradyrhizobiumnodulating some Aeschynomene species on stems (Giraud et al. 2007), all other
rhizobial species use Nod factors to induce nodules on legume roots. Furthermore,
the acquisition of nod genes in some nonsymbiotic bacteria makes them form
nodules (see later). The nodABC genes constitute an operon in most rhizobia.
Exceptions are Rhizobium etli biovar phaseoli with nodA separated from nodBC(Vazquez et al. 1991) andMesorhizobium loti where nodB does not form an operon
with nodA and C (Sullivan et al. 2002). nodABC genes encode the enzymes that
synthesize the core of the Nod factor: nodC encodes an N-acetylglucosaminyltrans-
ferase, nodB a chitooligosaccharide deacetylase, and nodA specifies the N-acylationof the aminosugar backbone by different fatty acids (Atkinson et al. 1994; Debelle
et al. 1996a; Roche et al. 1996). Other nod gene products act to add chemical
modifications to the Nod factor (Relic et al. 1994; Ferro et al. 2000), mediate its
secretion (Evans and Downie 1986), provide precursors (Baev et al. 1991), or
regulate nod gene expression (Mulligan and Long 1985; Kondorosi et al. 1991).
18.3 nod Gene Evolution
Where do nod genes originally come from? A hyaluronate synthase (hyaluronic
acid is an polymer of alternative N-acetylglucosamine and glucuronic acid) from
Streptococcus has sequence similarities to NodC, DG42 from Xenopus, and chitin
synthases from yeast. Some bacterial xylanases (that catalyze the hydrolysis of
linked xylose oligomeric and polymeric substrates) contain domains homologous to
NodB proteins (Laurie et al. 1997). A Bacillus strain produces a molecule
seemingly structurally related to Nod factors that stimulates plant proliferation
(Lian et al. 2001).
Interestingly, some plant mutants affecting rhizobial nodulation are defective in
the mycorrhization process (Oldroyd et al. 2005) and it is suggested that a common
18 Trends in Rhizobial Evolution and Some Taxonomic Remarks 303

signaling pathway exists for Nod factor perception and mycorrhizal symbiosis
(Catoira et al. 2000; Gianinazzi-Pearson and Denarie 1997). Mycorrhizal symbiosis
occurs in around 80% of all plants and is considered as old as the first plants that
evolved on Earth. The Nod factor may be considered as a very small chitin
molecule that subsequently acquired other chemical modifications, some of them
involved in protecting the molecule from plant chitinases (Staehelin et al. 1994).
Mycorrhiza, being fungi, have chitin. Maybe rhizobia mimicked micorrhizal sym-
biosis (Debelle et al. 1996b).
nod gene phylogenies have been reported in Bradyrhizobium, Rhizobium,Mesorhizobium, and Sinorhizobium (Moulin et al. 2004; Steenkamp et al. 2008;
Stepkowski et al. 2007; Han et al. 2008; Rincon-Rosales et al. 2009). A host
correlation to nod genes has been recognized (Suominen et al. 2001) and Nod
factor fucosylation and acetylation have been correlated to bacterial phylogenies
and specificities (Moulin et al. 2004); bacteria with sulfate modifications are
scattered in rhizobial phylogenies (Martınez et al. 1995). We constructed a phylo-
genetic tree with available reported nodA sequences (Fig. 18.2). There seems to be a
larger diversity of nodA sequences in Bradyrhizobium compared with the diversity
in b-Proteobacteria or Sinorhizobium. In 1994, we proposed the hypothesis that nodgenes evolved in Bradyrhizobium and that they were later transferred to other
genera such as Rhizobium (Martinez-Romero 1994). In Bradyrhizobium, an ances-
tral nod group has been identified from bacteria nodulating several diverse legumes
(indicated in Fig. 18.2), supposedly this group of legumes extended over many parts
of the world during the Eocene after the origin of legumes north of the Tethys Sea
(Steenkamp et al. 2008). Bradyrhizobium are the main nodule bacteria of tropical
tree legumes (Qian et al. 2003; Moreira et al. 1998; Parker 2004; Ormeno-Orrillo
et al. 2006) with a low degree of specificity and tropical legumes are considered
older than temperate legumes. We found 23 novel lineages of Bradyrhizobium in
the rain forest of Los Tuxtlas in Veracruz, Mexico, and they exhibited low speci-
ficity (Ormeno-Orrillo submitted). Specificity is a characteristic of many temperate
legumes and few tropical legumes and may have been acquired later in bacteria
(Perret et al. 2000; Young et al. 2003).
Most nodule forming bacteria belong to the a-Proteobacteria and few to
b-Proteobacteria (Moulin et al. 2001; Chen et al. 2003). Lateral transfer of nod genesto b-Proteobacteria was considered to account for the existence of nodulation in
Burkholderia and Cupriavidus nodulating species (Moulin et al. 2001; Amadou et al.
2008), inDevosia (Rivas et al. 2002), and in Phyllobacterium (Valverde et al. 2005).
18.4 Different Evolutionary Histories of Chromosomal
and Symbiotic Genes
In Rhizobium, Sinorhizobium, and in b-Proteobacteria, symbiotic genes including
nod and nif (nitrogen fixation) genes are located on plasmids (Amadou et al. 2008)
that may be transferred among species both in the laboratory and in nature.
304 J.C. Martınez-Romero et al.

Sin
orhi
zobi
um
Mes
orhi
zobi
um
B. t
uber
um
Rhi
zobi
um/
Sin
orhi
zobi
um
M. n
odul
ans
Bradyrhizobium
Mes
orhi
zobi
um
Rhi
zobi
um/
Sin
orhi
zobi
umA
zorh
izob
ium
Mes
orhi
zobi
um
Bur
khol
deria
/ C
upria
vidu
s
Rhi
zobi
um/
Sin
orhi
zobi
um
Fig.18.2
NodA
genephylogenyin
differentrhizobialgenera
18 Trends in Rhizobial Evolution and Some Taxonomic Remarks 305

In Mesorhizobium except Mesorhizobium amorphae (Wang et al. 1999b), in
Azorhizobium, in Methylobacterium, and in Bradyrhizobium, symbiotic genes are
on the chromosome. Symbiotic islands have been found to be transferable among
mesorhizobia in the environment (Sullivan et al. 1995; Sullivan and Ronson 1998;
Nandasena et al. 2007). Evidence that transfer and recombination occurs in nature is
obtained by comparing housekeeping and nod gene phylogenies revealing differentevolutionary histories in symbiotic and housekeeping genes (Haukka et al. 1998;
Steenkamp et al. 2008). In the laboratory plant pathogens such as Agrobacteriumtumefaciens and opportunistic human pathogens as Ochrobactrum may become
fully symbiotic by acquiring symbiotic plasmids from Rhizobium tropici,albeit with reduced levels of nitrogen fixation (Martinez et al. 1987; Rogel et al.
2006). Two highly diverging lineages of R. tropici (type A and B) harbor very
similar symbiotic plasmids that we suppose are exchanged among these lineages
(Martınez-Romero 1996).
Biovars were defined in Rhizobium as the different symbiotic specificities
(mainly plasmid encoded) that could be exhibited in a single chromosomal back-
ground (species). As such three biovars were recognized in Rhizobium legumino-sarum (viciae, trifolii, and phaseoli) (Jordan 1984); however, recently a more
complicated situation has been revealed and some R. leguminosarum strains have
been assigned to different species: Rhizobium pisi (Ramırez-Bahena et al. 2008)
and Rhizobium fabae (Tian et al. 2008). The symbiotic plasmid from biovar
phaseoli in R. etli is highly conserved (Gonzalez et al. 2010) may be in relation
to a recent evolutionary origin (Martinez-Romero 2009) maybe as recent as Pha-seolus vulgaris, dating of around 2–3 million years ago (Delgado-Salinas et al.
2006). We identified a new biovar in R. etli, biovar mimosae, and supposed that it
was a more ancient plasmid than the phaseoli plasmid (Wang et al. 1999a); nodgene phylogenies seem to support this hypothesis.
Nonrandom association between plasmid and chromosome markers (Young
et al. 2003) and limited plasmid transfer have been observed in nodule bacteria
(Wernegreen and Riley 1999); however, different evolutionary histories of symbi-
otic and metabolic genes or chromosomal markers have been recognized in some
cases in rhizobia (Silva et al. 2005; Tian et al. 2007; Han et al. 2008; Rincon-
Rosales et al. 2009). Two sympatric species of Sinorhizobium nodulating wild
Acaciellas in Mexico seem to contain the same symbiotic plasmid, and incon-
gruencies in symbiotic and housekeeping phylogenies have been repeatedly
observed in sinorhizobia (Haukka et al. 1998; Toledo et al. 2003; Lloret et al.
2007). African Sinorhizobium terangae is a close relative to these American
sinorhizobia but not on the basis of symbiotic genes (Rincon-Rosales et al. 2009)
(Fig 18.3). In symbionts of Galega orientalis and Galega officinalis (two native
legumes from the Caucasus), there is evidence of transfer of symbiotic information
(Andronov et al. 2003). In Bradyrhizobium japonicum, a biovar with symbiotic
genes specific for genistoid wild legumes is also found in another species
B. canariense (Vinuesa et al. 2005). Lateral transfer of symbiotic genes is recog-
nized to have occurred in Bradyrhizobium nodulating a diversity of wild legumes
(Steenkamp et al. 2008).
306 J.C. Martınez-Romero et al.

Symbiotic plasmids in rhizobia are repABC plasmids. repABC plasmids are
characteristic of a-Proteobacteria and differences in repA, repB, and repC gene
evolution have been reported (Castillo-Ramirez et al. 2009), supporting the occur-
rence of large recombination rates in plasmids. Genomic analyses have revealed
mosaicism in symbiotic plasmids (Gonzalez et al. 2006). Genetic information in
plasmids has been described as accessory or the mobile genome (Young et al.
2006). Plasmid (and maybe also genomic island) plasticity may have been instru-
mental for the adaptation of rhizobia to legume evolution and specificity (Martinez-
Romero 2009).
18.5 Chromosomal Evolution and Molecular Markers
Rhizobial lineages have been estimated to be nearly as old as plants, for example,
Rhizobium and Bradyrhizobium last common ancestor was dated as being over 400
million years old but legumes evolved around 100–65 million years ago (Sprent
2001). Nodulation seemingly evolved (Young and Johnston 1989), in only one
group of bacteria that were associated with plants (maybe as endophytes, Martinez-
Romero 2009). Further spread of nod genes by lateral gene transfer may have
conferred to diverse genera their nodulating capacity.
S. americanum
S. fredii
S. saheli
S. mexicanum
S. terangae
S. chiapanecum
S. kostiense
S. arboris
S. meliloti
S. medicae
S. adhaerens
S. morelense
rpoBS. americanum
S. fredii bv. mediterranense
S. mexicanum
S. chiapanecum
Mesorhizobium de acacias
S. kostiense
S. saheli
S. arboris
S. terangae
nodA
Fig. 18.3 Schematic comparison of chromosomal and symbiotic gene phylogenies in Sinorhizobium
18 Trends in Rhizobial Evolution and Some Taxonomic Remarks 307

In 1989, it was suggested that “We will eventually need many genera to
accommodate all the root-nodule bacteria” (Young and Johnston 1989), up to
now 13 genera and over 50 species have been described establishing symbioses
with a small sample of legumes analyzed. Small subunit ribosomal (16S rRNA)
gene sequences have been commonly used to identify and propose species in
rhizobia (Wang and Martınez-Romero 2000). It is remarkable that in spite of the
large divergence of nod gene sequences found in Bradyrhizobium, this genus
exhibits only a very limited diversity of 16S rRNA genes (Barrera et al. 1997;
Vinuesa et al. 2005) and species delineation is not clear with this marker. Several
molecular markers have been used to establish phylogenies and identify new
species not only in Bradyrhizobium but in rhizobia in general. Genomic information
provides large numbers of genes for these analyses (Young et al. 2006; Gonzalez
et al. 2006; Crossman et al. 2008) and congruent bacterial relationships have been
reported using indel analyses (Gupta 2005). Alternative phylogenetic relationships
are encountered in multiple gene analyses from reported complete genomes of
Agrobacterium, Rhizobium, and Sinorhizobium (Young et al. 2006); this suggests
that the divergence of these lineages occurred within a very short time as has been
concluded for other a-Proteobacteria (Castillo-Ramırez and Gonzalez 2008).
18.6 Probability Estimates to Distinguish Rhizobial Species
Representative molecular markers are being searched to better reflect species
phylogenies and not single gene phylogenies, in this regard dnaJ was found to
reproduce accepted phylogenetic relationships (Alexandre et al. 2008). rpoB gene
sequences have been considered for diversity studies in very different habitats or
communities (Planet et al. 1995; Dahlloef et al. 2000; Case et al. 2007; Sachman-
Ruiz et al. 2009). We have used partial sequences of rpoB as part of the phylo-
genetic studies to characterize new Sinorhizobium species (Lloret et al. 2007;
Rincon-Rosales et al. 2009) and a new species of Klebseilla (Rosenblueth et al.
2004). rpoB is a large gene (more than 4,140 bp in Rhizobium) and usually, only
fragments of the gene sequence are available. Different studies report sequences of
different fragments, hampering direct comparisons. Sequencing a common frag-
ment will facilitate comparisons and diminish misclassifications. Up to now several
genomes of species within the Rhizobium genus have been completely sequenced.
A practical utility for defining gene divergence ranges is to facilitate proper
identification of novel species and of species belonging to a single species. When
describing Sinorhizobium (Ensifer) mexicanum (Lloret et al. 2007) and Sinorhizo-bium chiapanecum (Rincon-Rosales et al. 2009), we proposed a probability range
of inter- and intraspecies gene differences that allowed the distinction of different
species and bacteria belonging to the same species. Comparing full rpoB gene
sequences from seven Rhizobium genomes, we calculated that the 95% confidence
interval for identities ranges from 0.898 to 1.000 for the sequences within this
genus. The 0.898 threshold provides a useful criterion to determine if a new isolate
308 J.C. Martınez-Romero et al.

belongs to this genus: an identity of less than 0.898 excludes it from being a
Rhizobium. Nevertheless, this is not a practical approach to classify new isolates
due to the large size of rpoB gene, which can hardly be expected to be totally
sequenced in diversity studies considering a large number of strains. Thus, we
examined 700 bp fragments that covered the entire 4,140 bp sequence and found
that the identities of a 700 bp fragment, ranging from positions 2,800 to 3,500,
closely match the distribution of the entire gene sequence (Kolmogorov Smirnoff,
p ¼ 0.05), in contrast to all other fragments analyzed. This fragment would provide
not only a dependable molecular marker to study the phylogenies of rhizobia, but
also a performable one. In both the full gene and the 700 bp (position 2,800–3,500)
fragment, with a 95% confidence it can be stated that while Agrobacterium radio-bacter is within the ranges of Rhizobium, A. tumefaciens, and Agrobacterium vitisidentities to the members of the group do not fall within the limits of the genus in
the distribution that described the dispersion of their differences.
The same analysis was performed for dnaK. For this gene, the 95% confidence
interval for identities ranges from 0.896 to 1.000 for the sequences within Rhizo-bium. Considering this interval, A. radiobacter and Agrobacterium rhizogenes arewithin the ranges of Rhizobium (therefore should be considered Rhizobium radio-bacter and Rhizobium rhizogenes as has been proposed by Young et al. 2001),
whereas A. tumefaciens and A. vitis identities to the members of the group do not
fall within the limits of the genus (Fig. 18.4). Thus, by rpoB and by dnaK analyses,
Agrobacterium could stand as an independent genus from Rhizobium as has been
claimed before (Farrand et al. 2003), in consequence Rhizobium galegae, Rhizo-bium huautlense, Rhizobium cellulosilyticum, Rhizobium selenireducens, and Rhi-zobium daejeonense, all related to A. tumefaciens should be reclassified. It is clear
from many published phylogenetic trees that Rhizobium is not monophyletic.
We encountered several examples of misclassified Rhizobium strains in a 16S
rRNA gene phylogenetic tree (Fig. 18.5), probably because many new isolates are
only recognized by 16S rRNA genes and designation is done based on the closest
relative frequently identified only as the best Blast hit, without further characteri-
zation. Rhizobium mongolense and Rhizobium lusitanum are polyphyletic
(Fig. 18.5). Emendments to such misclassifications should be done.
Agrobacteriumtumefaciens
Agrobacteriumrhizogenes
Agrobacteriumtumefaciens
rpoB
dnaK
Rhizobium
Rhizobium
Fig. 18.4 95% Confidence
intervals for identities of
species within Rhizobiumgenus for rpoB and dnaKgenes. The arrows indicatethe average identity of
Agrobacterium tumefaciensor A. rhizogenes to the
members of Rhizobium genus
18 Trends in Rhizobial Evolution and Some Taxonomic Remarks 309

Acknowledgments To PAPIIT IN200709 and Michael Dunn for reading the manuscript. Partial
financial support for this project was from GEF PNUMA, TSBF-CIAT. E.M. is grateful to
DGAPA UNAM for a postdoctoral fellowship during her sabattical year at UC Davis in California.
References
Alexandre A, Laranjo M, Young JPW, Oliveira S (2008) dnaJ is a useful phylogenetic marker for
alphaproteobacteria. Int J Syst Evol Microbiol 58:2839–2849
Amadou C, Pascal G, Mangenot S, Glew M, Bontemps C, Capela D, Carrere S, Cruveiller S,
Dossat C, Lajus A, Marchetti M, Poinsot V, Rouy Z, Servin B, Saad M, Schenowitz C, Barbe V,
Batut J, Medigue C, Masson-Boivin C (2008) Genome sequence of the beta-RhizobiumCupriavidus taiwanensis and comparative genomics of rhizobia. Genome Res 18:1472–1483
Andronov EE, Terefework Z, Roumiantseva ML, Dzyubenko NI, Onichtchouk OP, Kurchak ON,
Dresler-Nurmi A, Young JPW, Simarov BV, Lindstroem K (2003) Symbiotic and genetic
diversity of Rhizobium galegae isolates collected from the Galega orientalis gene center in theCaucasus. Appl Environ Microbiol 69:1067–1074
Atkinson EM, Palcic MM, Hindsgaul O, Long SR (1994) Biosynthesis of Rhizobium melilotilipooligosaccharide Nod factors: NodA is required for an N-acyltransferase activity. Proc NatlAcad Sci USA 91:8418–8422
Baev N, Endre G, Petrovics G, Banfalvi Z, Kondorosi A (1991) Six nodulation genes of nod box
locus 4 in Rhizobium meliloti are involved in nodulation signal production: nodM codes for
D-glucosamine synthetase. Mol Gen Genet 228:113–124
EU399697 Rhizobium mongolense CCBAU 05122
AF008130 Rhizobium gallicum R602sp
U89819 Rhizobium mongolense USDA 1844T
U89817 Rhizobium mongolense USDA 1877
U89822 Rhizobium mongolense USDA 2377
AY509212 Rhizobium mongolense S110*
EU256432 Rhizobium sullae CCBAU 85011
DQ196418 Rhizobium leguminosarum bv. viciae PEPSM13
EF141340 Rhizobium leguminosarum bv. phaseoli ATCC 14482
AY998046 Rhizobium etli bv. phaseoli IE4804
DQ648575 Rhizobium etli bv. mimosae Mim 7-4
U28916 Rhizobium etli CFN 42
AY509209 Rhizobium mongolense S152*
EU074200 Rhizobium lusitanum CCBAU 03301*
X67234 Rhizobium tropici IIA LMG9517
EF035070 Rhizobium multihospitium CCBAU 83435
U89832 Rhizobium tropici CIAT899
AY738130 Rhizobium lusitanum P1-7
CP000628 Agrobacterium radiobacter K84
AY945955 Agrobacterium rhizogenes ATCC 11325
EF522124 Agrobacterium rhizogenes CU10
9697
100
6377
96
62
99
90
6181
100
70
100
98
0.002
Fig. 18.5 Rhizobium 16S rRNA gene phylogenies.Misclassified strains are indicated by asterisks (*)
310 J.C. Martınez-Romero et al.

Barnett MJ, Fisher RF (2006) Global gene expression in the rhizobial-legume symbiosis.
Symbiosis 42:1–24
Barrera LL, Trujillo ME, Goodfellow M, Garcia FJ, Hernandez-Lucas I, Davila G, van Berkum P,
Martinez-Romero E (1997) Biodiversity of bradyrhizobia nodulating Lupinus spp. Int J SystBacteriol 47:1086–1091
Case RJ, Boucher Y, Dahlloef I, Holmstroem C, Doolittle WF, Kjelleberg S (2007) Use of 16S
rRNA and rpoB genes as molecular markers for microbial ecology studies. Appl Environ
Microbiol 73:278–288
Castillo-Ramırez S, Gonzalez V (2008) Factors affecting the concordance between orthologous
gene trees and species tree in bacteria. BMC Evol Biol 8:300
Castillo-Ramirez S, Vazquez-Castellanos JF, Gonzalez V, Cevallos MA (2009) Horizontal gene
transfer and diverse functional constrains within a common replication-partitioning system in
Alphaproteobacteria: the repABC operon. BMC Genomics 10:536
Catoira R, Galera C, De Billy F, Penmetsa RV, Journet E-P, Maillet F, Rosenberg C, Cook D,
Gough C, Denarie J (2000) Four genes of Medicago truncatula controlling components of a
Nod factor transduction pathway. Plant Cell 12:1647–1666
Chen W-M, Moulin L, Bontemps C, Vandamme P, Bena G, Boivin-Masson C (2003) Legume
symbiotic nitrogen fixation by b-Proteobacteria is widespread in nature. J Bacteriol
185:7266–7272
Crossman LC, Castillo-Ramırez S, McAnnula C, Lozano L, Vernikos GS, Acosta JL, Ghazoui ZF,
Hernandez-Gonzalez I, Meakin G,Walker AW, HynesMF, Young JPW, Downie JA, Romero D,
Johnston AWB, Davila G, Parkhill J, Gonzalez V (2008) A common genomic framework for a
diverse assembly of plasmids in the symbiotic nitrogen fixing bacteria. PLoS ONE 3(7):e2567
Dahlloef I, Baillie H, Kjelleberg S (2000) rpoB-based microbial community analysis avoids limita-
tions inherent in 16s rRNA gene intraspecies heterogeneity. Appl Environ Microbiol
66:3376–3380
Debelle F, Plazanet C, Roche P, Pujol C, Savagnac A, Rosenberg C, Prome J-C, Denarie J (1996a)
The NodA proteins of Rhizobium meliloti and Rhizobium tropici specify the N-acylation of
Nod factors by different fatty acids. Mol Microbiol 22:303–314
Debelle F, Yang GP, Ferro M, Truchet G, Prome JC, Denarie J (1996b) Rhizobium nodulation
factors in perspective. In: Legocki A, Bothe H, P€uhler A (eds) Biological fixation of nitrogen
for ecology and sustainable agriculture. Springer, Heidelberg, Germany, pp 15–24
Delgado-Salinas A, Bibler R, Lavin M (2006) Phylogeny of the genus Phaseolus (Leguminosae): a
recent diversification in an ancient landscape. Syst Bot 31:779–791
Denarie J, Debelle F, Prome JC (1996) Rhizobium lipo-chitooligosaccharide nodulation factors:
signaling molecules mediating recognition and morphogenesis. Annu Rev Biochem 65:503–535
Evans IJ, Downie JA (1986) The nodI gene product of Rhizobium leguminosarum is closely related
to ATP-binding bacterial transport proteins; nucleotide sequence analysis of the nodI and nodJgenes. Gene 43:95–101
Farrand SK, van Berkum PB, Oger P (2003) Agrobacterium is a definable genus of the family
Rhizobiaceae. Int J Syst Evol Microbiol 53:1681–1687
Ferro M, Lorquin J, Ba S, Sanon K, Prome JC, Boivin C (2000) Bradyrhizobium sp. strains that
nodulate the leguminous tree Acacia albida produce fucosylated and partially sulfated Nod
factors. Appl Environ Microbiol 66:5078–5082
Gherbi H, Markmann K, Svistoonoff S, Estevan J, Autran D, Giczey G, Auguy F, Peret B,
Laplaze L, Franche C, Parniske M, Bogusz D (2008) SymRK defines a common genetic
basis for plant root endosymbioses with arbuscular mycorrhiza fungi, rhizobia, and Frankia-
bacteria. Proc Natl Acad Sci USA 105:4928–4932
Gianinazzi-Pearson V, Denarie J (1997) Red carpet genetic programmes for root endosymbioses.
Trends Plant Sci 2:371–372
Giraud E, Moulin L, Vallenet D, Barbe V, Cytryn E, Avarre J-C, Jaubert M, Simon D, Cartieaux F,
Prin Y, Bena G, Hannibal L, Fardoux J, Kojadinovic M, Vuillet L, Lajus A, Cruveiller S, Rouy
Z, Mangenot S, Segurens B, Dossat C, Franck WL, Chang W-S, Saunders E, Bruce D,
18 Trends in Rhizobial Evolution and Some Taxonomic Remarks 311

Richardson P, Normand P, Dreyfus B, Pignol D, Stacey G, Emerich D, Vermeglio A,
Medigue C, Sadowsky M (2007) Legumes symbioses: absence of nod genes in photosynthetic
bradyrhizobia. Science 316:1307–1312
Gonzalez V, Santamaria RI, Bustos P, Hernandez-Gonzalez I, Medrano-Soto A, Moreno-
Hagelsieb G, Janga SC, Ramirez MA, Jimenez-Jacinto V, Collado-Vides J, Davila G (2006)
The partitioned Rhizobium etli genome: genetic and metabolic redundancy in seven interacting
replicons. Proc Natl Acad Sci USA 103:3834–3839
GonzalezV,Acosta JL, Santamarıa RI, Bustos P, Fernandez JL,HernandezGonzalez IL,DıazR, Flores
M, Palacios R, Mora J, Davila G (2010) Conserved symbiotic plasmid DNA sequences in the
multireplicon pangenomic structure of Rhizobium etli. Appl Environ Microbiol 76:1604–1614
Gupta RS (2005) Protein signatures distinctive of a-Proteobacteria and its subgroups and a model
for a-proteobacterial evolution. Crit Rev Microbiol 31:101–135
Han TX, Wang ET, Han LL, Chen WF, Sui XH, Chen WX (2008) Molecular diversity and
phylogeny of rhizobia associated with wild legumes native to Xinjiang, China. Syst Appl
Microbiol 31:287–301
Haukka K, Lindstrom K, Young JPW (1998) Three phylogenetic groups of nodA and nifH genes in
Sinorhizobium andMesorhizobium isolates from leguminous trees growing in Africa and Latin
America. Appl Environ Microbiol 64:419–426
Hungria M, Vargas MAT, Campo RJ, Chueire LMO, Andrade DS (2000) The Brazilian experience
with the soybean (Glycine max) and common bean (Phaseolus vulgaris) symbioses. In:
Pedrosa FO, Hungria M, Yates G, Newton WE (eds) Nitrogen fixation: from molecules to
crop production. Kluwer Academic Publishers, Netherlands, p 515
Hungria M, Franchini JC, Campo RJ, Graham PH (2005) The importance of nitrogen fixation to
soybean cropping in South America. In: Werner D, Newton WE (eds) Nitrogen fixation in
agriculture, forestry, ecology, and the environment. Springer, Dordrecht, pp 25–42
Hurek T, Reinhold-Hurek B (2003) Azoarcus sp. strain BH72 as a model for nitrogen-fixing grass
endophytes. J Biotechnol 106:169–178
Jones KM, Kobayashi H, Davies BW, Taga ME, Walker GC (2007) How rhizobial symbionts
invade plants: the Sinorhizobium-Medicago model. Nat Rev Microbiol 5:619–633
Jordan DC (1984) Family III. RhizobiaceaeConn 1938, 321AL. In: Krieg NR, Holt JG (eds) Bergeys’s
manual of systematic bacteriology, vol 1. The Williams and Wilkins Co., Baltimore, pp 234–254
Kondorosi E, Banfalvi Z, Kondorosi A (1984) Physical and genetic analysis of a symbiotic region
of Rhizobium meliloti: identification of nodulation genes. Mol Gen Genet 193:445–452
Kondorosi E, Pierre M, Cren M, Haumann U, Buire M, Hoffmann B, Schell J, Kondorosi A (1991)
Identification of NolR, a negative transacting factor controlling the nod regulon in Rhizobiummeliloti. J Mol Biol 222:885–896
Laurie JI, Clarke JH, Ciruela A, Faulds CB, Williamson G, Gilbert HJ, Rixon JE, Millward-Sadler
J, Hazlewood GP (1997) The NodB domain of a multidomain xylanase from Cellulomonas fimideacetylates acetylxylan. FEMS Microbiol Lett 148:261–264
Lerouge P, Roche P, Faucher C, Maillet F, Truchet G, Prome JC, Denarie J (1990) Symbiotic
host-specificity of Rhizobium meliloti is determined by a sulphated and acylated glucosamine
oligosaccharide signal. Nature 344:781–784
Lian B, Prithiviraj B, Souleimanov A, Smith DL (2001) Evidence for the production of chemical
compounds analogous to nod factor by the silicate bacterium Bacillus circulans GY92.
Microbiol Res 156:289–292
Lloret L, Ormeno-Orrillo E, Rincon R, Martınez-Romero J, Rogel-Hernandez MA, Martınez-
Romero E (2007) Ensifer mexicanus sp. nov. a new species nodulating Acacia angustissima(Mill.) Kuntze in Mexico. Syst Appl Microbiol 30:280–290
Long SR, Buikema WJ, Ausubel FM (1983) Cloning of Rhizobium meliloti nodulation genes by
direct complementation of Nod-mutants. Nature 298:485–487
Lopez-Lopez A, Rosenblueth M, Martınez J, Martınez-Romero E (2010) Rhizobial symbioses in
tropical legumes and non-legumes. In: Dion P (ed) Soil biology and agriculture in the tropics.
Springer Heidelberg, pp. 163–184
312 J.C. Martınez-Romero et al.

Martinez E, Palacios R, Sanchez F (1987) Nitrogen-fixing nodules induced by Agrobacteriumtumefaciens harboring Rhizobium phaseoli plasmids. J Bacteriol 169:2828–2834
Martınez E, Laeremans T, Poupot R, Rogel MA, Lopez L, Garcıa F, Vanderleyden J, Prome JC,
Lara F (1995) Nod metabolites and other compounds excreted by Rhizobium spp. In: Tikho-
novich IA, Provorov NA, Romanov VI, Newton WE (eds) Nitrogen fixation: fundamentals and
applications. Kluwer Academic Publishers, Dordrecht, pp 281–286
Martinez-Romero E (1994) Recent developments in Rhizobium taxonomy. Plant Soil 161:11–20
Martinez-Romero E (2009) Coevolution in Rhizobium-legume symbiosis? DNA Cell Biol
28:361–370
Martınez-Romero E (1996) Comments on Rhizobium systematics. Lessons from R. tropici andR. etli. In: Stacey G, Mullin B, Gresshoff PM (eds) Biology of plant–microbe interactions.
International Society for Molecular Plant–Microbe Interactions, St. Paul, Minnesota,
pp 503–508
Moreira FMS, Haukka K, Young JPW (1998) Biodiversity of rhizobia isolated from a wide range
of forest legumes in Brazil. Mol Ecol 7:889–895
Moulin L, Munive A, Dreyfus B, Boivin-Masson C (2001) Nodulation of legumes by members of
the b�subclass of Proteobacteria. Nature 411:948–950
Moulin L, Bena G, Boivin-Masson C, Stepkowski T (2004) Phylogenetic analyses of symbiotic
nodulation genes support vertical and lateral gene co-transfer within the Bradyrhizobiumgenus. Mol Phylogenet Evol 30:720–732
Mulligan JT, Long SR (1985) Induction of Rhizobium meliloti nodC expression by plant exudate
requires nodD. Proc Natl Acad Sci USA 82:6609–6613
Nandasena KG, O’Hara GW, Tiwari RP, Sezmis E, Howieson JG (2007) In situ lateral transfer ofsymbiosis islands results in rapid evolution of diverse competitive strains of mesorhizobia
suboptimal in symbiotic nitrogen fixation on the pasture legume Biserrula pelecinus L.
Environ Microbiol 9:2496–2511
Oldroyd GED, Harrison MJ, Udvardi M (2005) Peace talks and trade deals. Keys to long-term
harmony in legume-microbe symbioses. Plant Physiol 137:1205–1210
Ormeno-Orrillo E, Vinuesa P, Zuniga-Davila D, Martinez-Romero E (2006) Molecular diversity
of native bradyrhizobia isolated from Lima bean (Phaseolus lunatus L.) in Peru. Syst Appl
Microbiol 29:253–262
Parker MA (2004) rRNA and dnaK relationships of Bradyrhizobium sp. nodule bacteria from four
Papilionoid legume trees in Costa Rica. Syst Appl Microbiol 27:334–342
Perret X, Staehelin Ch, Broughton WJ (2000) Molecular basis of symbiotic promiscuity.
Microbiol Mol Biol Rev 64:180–201
Planet P, Jagoueix S, Bove JM, Garnier M (1995) Detection and characterization of the African
citrus greening Liberobacter by amplification, cloning, and sequencing of the rplKAJL-rpoBCoperon. Curr Microbiol 30:137–141
Provorov NA, Vorobyov NI (2008) Equilibrium between the “genuine mutualists” and “symbiotic
cheaters” in the bacterial population co-evolving with plants in a facultative symbiosis.
Theor Popul Biol 74:345–355
Qian J, Kwon S, Parker MA (2003) rRNA and nifD phylogeny of Bradyrhizobium from sites
across the Pacific Basin. FEMS Microbiol Lett 219:159–165
Ramırez-Bahena MH, Garcıa-Fraile P, Peix A, Valverde A, Rivas R, Igual JM, Mateos PF,
Martınez-Molina E, Velazquez E (2008) Revision of the taxonomic status of the species
Rhizobium leguminosarum (Frank 1879) Frank 1889AL, Rhizobium phaseoli Dangeard
1926AL and Rhizobium trifolii Dangeard 1926AL. R. trifolii is a later synonym of R. legumi-nosarum. Reclassification of the strain R. leguminosarum DSM 30132 (¼NCIMB 11478) as
Rhizobium pisi sp. nov. Int J Syst Evol Microbiol 58:2484–2490
Relic B, Perret X, Estrada-Garcia MT, Kopcinska J, Golinowski W, Krishnan HB, Pueppke SG,
Broughton WJ (1994) Nod factors of Rhizobium are a key to the legume door. Mol Microbiol
13:171–178
18 Trends in Rhizobial Evolution and Some Taxonomic Remarks 313

Rincon-Rosales R, Lloret L, Ponce E, Martinez-Romero E (2009) Rhizobia with different symbi-
otic efficiencies nodulate Acaciella angustissima in Mexico, including Sinorhizobiumchiapanecum sp. nov. which has common symbiotic genes with Sinorhizobium mexicanum.FEMS Microbiol Ecol 68:255–255
Rivas R, Velazquez E, Willems A, Vizcaino N, Subba-Rao NS, Mateos PF, Gillis M, Dazzo FB,
Martinez-Molina E (2002) A new species of Devosia that forms a unique nitrogen-fixing root-
nodule symbiosis with the aquatic legume Neptunia natans (L.f.) Druce. Appl Environ
Microbiol 68:5217–5222
Roche P, Maillet F, Plazanet C, Debelle F, Ferro M, Truchet G, Prome J-C, Denarie J (1996) The
common nodABC genes of Rhizobium meliloti are host-range determinants. Proc Natl Acad Sci
USA 93:15305–15310
Rogel MA, Torres C, Lloret L, Rosenblueth M, Hernandez-Lucas I, Martınez L, Martınez J,
Martınez-Romero E (2006) Lateral transfer of Rhizobium symbiotic plasmids leading to
genomic innovation. In: Sanchez F, Quinto C, Lopez-Lara IM, Geiger O (eds) Biology of
plant–microbe interactions, vol 5. International Society for Molecular Plant–Microbe Interac-
tions, St. Paul, USA, pp 310–318
Roncato-Maccari LDB, Ramos HJO, Pedrosa FO, Alquini Y, Chubatsu LS, Yates MG, Rigo LU,
Steffens MBR, Souza EM (2003) Endophytic Herbaspirillum seropedicae expresses nif genesin gramineous plants. FEMS Microbiol Ecol 45:39–47
Rosenblueth M, Martinez L, Silva J, Martinez-Romero E (2004) Klebsiella variicola, a novel
species with clinical and plant-associated isolates. Syst Appl Microbiol 27:27–35
Sachman-Ruiz B, Castillo-Rodal AI, Lopez-Vidal Y, Martınez-Romero E, Vinuesa P (2009)
Diversity of environmental mycobacteria in Mexican rivers assessed by cultivation and
metagenomics approaches. In: 109th General Meeting, American Society for Microbiology,
May 17–21, 2009, Philadelphia, Pennsylvania
Sessitsch A, Howieson JG, Perret X, Antoun H, Martinez-Romero E (2002) Advances in
Rhizobium research. Crit Rev Plant Sci 21:323–378
Silva C, Vinuesa P, Eguiarte LE, Souza V, Martinez-Romero E (2005) Evolutionary genetics and
biogeographic structure of Rhizobium gallicum sensu lato, a widely distributed bacterial
symbiont of diverse legumes. Mol Ecol 14:4033–4050
Sprent JI (1997) Co-evolution of legume-rhizobial symbioses:is it essential for either partner? In:
Legocki A, Bothe H, P€uhler A (eds) Biological fixation of nitrogen for ecology and sustainable
agriculture. Springer, Heidelberg, Germany, pp 313–316
Sprent JI (2001) Nodulation in legumes. Royal Botanic Gardens, Kew, UK
Staehelin C, Schultze M, Kondorosi E, Mellor RB, Boller T, Kondorosi A (1994) Structural
modifications in Rhizobium meliloti Nod factors influence their stability against hydrolysis by
root chitinases. Plant J 5:319–330
Steenkamp ET, Stepkowski T, Przymusiak A, Botha WJ, Law IJ (2008) Cowpea and peanut in
southern Africa are nodulated by diverse Bradyrhizobium strains harboring nodulation genes
that belong to the large pantropical clade common in Africa. Mol Phylogenet Evol
48:1131–1144
Stepkowski T, Hughes CE, Law IJ, Markiewicz L, Gurda D, Chlebicka A, Moulin L (2007)
Diversification of lupine Bradyrhizobium strains: evidence from nodulation gene trees. Appl
Environ Microbiol 73:3254–3264
Sullivan JT, Ronson CW (1998) Evolution of rhizobia by acquisition of a 500-kb symbiosis island
that integrates into a phe-tRNA gene. Proc Natl Acad Sci USA 95:5145–5149
Sullivan JT, Patrick HN, Lowther WL, Scott DB, Ronson CW (1995) Nodulating strains of
Rhizobium loti arise through chromosomal symbiotic gene transfer in the environment. Proc
Natl Acad Sci USA 92:8985–8989
Sullivan JT, Trzebiatowski JR, Cruickshank RW, Gouzy J, Brown SD, Elliot RM, Fleetwood DJ,
McCallum NG, Rossbach U, Stuart GS, Weaver JE, Webby RJ, de Bruijn FJ, Ronson CW
(2002) Comparative sequence analysis of the symbiosis island of Mesorhizobium loti strainR7A. J Bacteriol 184:3086–3095
314 J.C. Martınez-Romero et al.

Suominen L, Roos C, Lortet G, Paulin L, Lindstroem K (2001) Identification and structure of the
Rhizobium galegae common nodulation genes: evidence for horizontal gene transfer. Mol Biol
Evol 18:907–916
Terefework Z, Lortet G, Suominenl LK (2000) Molecular evolution of interactions between
rhizobia and their legume hosts. In: Triplett E (ed) Prokaryotic nitrogen fixation: a model for
analysis of a biological process. Horizon Scientific Press, Norfolk, England, pp 187–206
Tian CF, Wang ET, Han TX, Sui XH, Chen WX (2007) Genetic diversity of rhizobia associated
with Vicia faba in three ecological regions of China. Arch Microbiol 188:273–282
Tian CF, Wang ET, Wu LJ, Han TX, Chen WF, Gu CT, Gu JG, Chen WX (2008) Rhizobium fabaesp. nov., a bacterium that nodulates Vicia faba. Int J Syst Evol Microbiol 58:2871–2875
Toledo I, Lloret L, Martınez-Romero E (2003) Sinorhizobium americanum sp. nov., a new
Sinorhizobium species modulating nativeAcacia spp. inMexico. Syst ApplMicrobiol 26:54–64
Valverde A, Velazquez E, Fernandez-Santos F, Vizcaino N, Rivas R, Mateos PF, Martinez-Molina
E, Igual JM, Willems A (2005) Phyllobacterium trifolii sp. nov., nodulating Trifolium and
Lupinus in Spanish soils. Int J Syst Evol Microbiol 55:1985–1989
Vazquez M, Davalos A, de las Penas A, Sanchez F, Quinto C (1991) Novel organization of the
common nodulaiton genes in Rhizobium leguminosarum bv. phaseoli strains. J Bacteriol
173:1250–1258
Vinuesa P, Leon-Barrios M, Silva C, Willems A, Jarabo-Lorenzo A, Perez-Galdona R, Werner D,
Martınez-Romero E (2005) Bradyrhizobium canariense sp. nov., an acid-tolerant endosymbi-
ont that nodulates endemic genistoid legumes (Papilionoideae: Genisteae) from the Canary
Islands, along with Bradyrhizobium japonicum bv. genistearum, Bradyrhizobium genospecies
alpha and Bradyrhizobium genospecies beta. Int J Syst Evol Microbiol 55:569–575
Wang ET, Martınez-Romero E (2000) Phylogeny of root- and stem-nodule bacteria associated
with legumes. In: Triplett E (ed) Prokaryotic nitrogen fixation: a model for analysis of a
biological process. Horizon Scientific Press, Norfolk, England, pp 177–186
Wang ET, Rogel MA, Garcıa-De los Santos A, Martınez-Romero J, Cevallos MA, Martınez-
Romero E (1999a) Rhizobium etli bv. mimosae, a novel biovar isolated from Mimosa affinis.Int J Syst Bacteriol 49:1479–1491
Wang ET, van Berkum P, Sui XH, Beyene D, Chen WX, Martinez-Romero E (1999b) Diversity of
rhizobia associated with Amorpha fruticosa isolated from Chinese soils and description of
Mesorhizobium amorphae sp. nov. Int J Syst Bacteriol 49:51–65Wernegreen JJ, Riley MA (1999) Comparison of the evolutionary dynamics of symbiotic and
housekeeping loci: a case for the genetic coherence of rhizobial lineages. Mol Biol Evol
16:98–113
Young JPW, Johnston AWB (1989) The evolution of specificity in the legume-Rhizobium symbi-
osis. Trends Ecol Evol 4:341–349
Young JM, Kuykendall LD, Martinez-Romero E, Kerr A, Sawada H (2001) A revision of
Rhizobium Frank 1889, with an emended description of the genus, and the inclusion of all
species of Agrobacterium Conn 1942 and Allorhizobium undicolade Lajudie et al. 1998 as newcombinations: Rhizobium radiobacter, R. rhizogenes, R. rubi, R. undicola and R. vitis. Int JSyst Evol Microbiol 51:89–103
Young JPW, Mutch LA, Ashford DA, Zeze A, Mutch KE (2003) The molecular evolution of host
specificity in the Rhizobium-legume symbiosis. In: Hails R, Godfray HJC, Beringer JE (eds)
Genes in the environment. Blackwell Science, Oxford, pp 245–257
Young JPW, Crossman LC, Johnston AWB, Thomson NR, Ghazoui ZF, Hull KH, Wexler M,
Curson ARJ, Todd JD, Poole PS, Mauchline TH, East AK, Quail MA, Churcher C, Arrowsmith
C, Cherevach I, Chillingworth T, Clarke K, Cronin A, Davis P, Fraser A, Za H, Hauser H,
Jagels K, Moule S, Mungall K, Norbertczak H, Rabbinowitsch E, Sanders M, Simmonds M,
Whitehead S, Parkhill J (2006) The genome of Rhizobium leguminosarum has recognizable
core and accessory components. Genome Biol 7:R34
18 Trends in Rhizobial Evolution and Some Taxonomic Remarks 315

Chapter 19
Convergent Evolution of Morphogenetic
Processes in Fungi
Sylvain Brun and Philippe Silar
Abstract Eumycetes fungi are a diverse group of organisms whose evolution is
characterized by frequent changes in nutritional strategy and the corresponding
developmental programs. The reasons for this versatility are unknown. We previ-
ously discovered that the NADPH oxidase Nox2 and the tetraspanin Pls1 are used in
two radically different cell types to achieve the same purpose: exiting from a
reinforced cell, suggesting that convergent evolution of morphogenetic processes
could account for the repetitive switches in trophic modes during fungal evolution.
However, we recently observed that saprobic fungi are also able to differentiate
appressorium-like structure closely resembling those of phytopathogenic species,
arguing that the ability to differentiate such cells is an ancient property of filamen-
tous fungi. Adaptation of parasitic and mutualistic fungi to plant may thus not solely
reside in their ability to penetrate their host.
19.1 Introduction
Fungi belonging to the Eumycetes (Opisthokonta) are a great success of evolution.
Their ancestors switched from phagotrophy, the original eukaryotic trophic mode,
to osmotrophy likely a billion years ago (McLaughlin et al. 2009). Since then they
have diversified into hundreds of thousands species and possibly much more
(Hawksworth 1991). They have invaded nearly all biotopes, from the deepest
depths of the oceans to the top of the highest mountains all around the globe.
They are even found in the arctic soils that remain frozen most of the years (Schadt
et al. 2003). Their total biomass is huge and they greatly impact on their environ-
ment. They live either in parasitic or in mutualistic symbiosis with other organisms,
S. Brun and P. Silar
UFR des Sciences du Vivant, Universite de Paris 7 – Denis Diderot, 75205 Paris Cedex 13, France
Institut de Genetique et Microbiologie, UMRCNRS – Universite de Paris 11, UPS Bat. 400, 91405
Orsay cedex, France
e-mail: [email protected]
P. Pontarotti (ed.), Evolutionary Biology – Concepts, Molecularand Morphological Evolution, DOI 10.1007/978-3-642-12340-5_19,# Springer-Verlag Berlin Heidelberg 2010
317

or as free living saprobes. The saprobes participate in the global carbon cycle,
especially they degrade highly recalcitrant materials that no other organism may
and regulate soil health by producing humic acids. As mutualistic symbionts, the
mycorhizal and endophytic fungi increase plant fitness and those present inside the
digestive tract enable many insects and mammalian herbivores to use the hard-to-
digest plant materials as food. Similarly, the mutualistic lichens are an important
component of many extreme biotopes. Parasitic fungi are known for nearly all
organisms (even fungi!), but they are especially important for plants and insects.
These have a tremendous impact on the dynamics of natural populations but also on
domesticated plants and animals. The feeding, dispersal, and “behavioral” diversity
of fungi is such that complete books are required to describe it (Webster 2007).
Because of their importance, scientific programs aimed at better understanding
the evolution and biology of fungi have been launched. The aftol (Assembling the
Fungal Tree of Life) used multigene trees to resolve their phylogeny (James et al.
2006) and proposed a new classification (Hibbett et al. 2007). Numerous genomic
programs have established sequences from a great diversity of fungi (see, for example,
http://genome.jgi-psf.org/, http://www.broadinstitute.org/science/projects/fungal-
genome-initiative/current-fgi-sequence-projects, http://www.genoscope.cns.fr/
spip/Fungi-sequenced-at-Genoscope.html). The data show that fungi are highly
diverse (McLaughlin et al. 2009). For example, the genetic diversity of fungi
belonging to related families or even to the same family may exceed that of
animals from different classes (Dujon 2005; Espagne et al. 2008).
19.2 The Versatility of Fungal Development
An important point that emerges from phylogenetic studies is the versatility with
which fungi may switch their trophic modes and “invent” repeatedly the same
structures (James et al. 2006). For instance, saprobic and symbiotic fungi may exist
within the same genus, and within the same class, saprotrophy, plant pathogeny,
lichen symbiosis, and other trophic modes may evolve. Similarly, plant pathogens
and mutualists invade their host plant by many means, one of which involves the
in-force breaking of the plant cuticule and/or cell wall. To do this, fungi differenti-
ate special cells called appressoria (Deising et al. 2000). These come in different
sizes and shapes and their origin may be quite different. For example, in Magna-porthe grisea, a hemi-biotrophic parasite of rice and barley, the appressorium
develops at the extremity of a dedicated hypha that is produced by a three-celled
spore issued from asexual reproduction. In this species, appressoria are heavily
melanized round cells with a very well-defined structure, from which the penetra-
tion peg emerges (Fig. 19.1). In Botrytis cinerea, appressorium-like structures are
also produced at the extremity of an hypha that originates from a spore issued from
asexual reproduction, but this spore has only one cell and the appressorium is no
more than a specialized hypha slightly reinforced at its tip, which is able to orient its
growth toward plant wall and to penetrate it, thanks to a penetration peg (Fig. 19.1).
318 S. Brun and P. Silar

Fig. 19.1 Ontogeny of ascospores, appressorium, and appressorium-like structures. Sexual repro-
duction results in one-celled hyaline ascospores in B. cinerea, four-celled hyaline ascospores in
M. grisea, and two-celled melanised ascospores with a germ pore in P. anserina. In this latter
species, a cell death has occurred during ascospore differentiation. Appressorium is a roundish
heavily melanized structure in M. grisea, while it is no more than a reinforced hyphae in
B. cinerea. The similarity between P. anserina ascospore and M. grisea appressorium ontogenies
are highlighted by arrows
19 Convergent Evolution of Morphogenetic Processes in Fungi 319

These structures are thus qualified as “appressoria-like” rather than as true appres-
soria. M. grisea and B. cinerea belong to two different classes of ascomycetes,
the Sordariomycetes and Leotiomycetes, respectively. In these classes, numerous
species are known to live as saprobes, which seemingly do not differentiate
appressoria as they do not need to penetrate host plants. Thus, the question raised
is whether the utilization of appressoria to penetrate plants is the result of conver-
gent evolution by plant pathogens or whether it reflects an ancient ability of fungi to
differentiate penetration structures that would have been lost in saprobes.
Spore is another fungal structure (along with the fruiting body) that exhibits
many convergent evolutions. Spores are issued either from sexual (basidiospores,
ascospores. . .) or from asexual (conidia. . .) reproduction and constitute an impor-
tant part of the life cycle, since they enable fungi to disperse efficiently and to resist
to adverse conditions. They come in many shapes, sizes, and colors and have been
used in the past to classify fungi. For example, Podospora anserina, a model
ascomycete produces heavily melanized ascospores that germinate in a regulated
manner through a germ pore (Fig. 19.1). These are in fact constituted of two cells,
one of which has undergone a cell death. Neurospora crassa produces one-celled
striated ascospores with two germ pores located at the opposite poles, while
M. grisea ascospores are composed of four hyaline cells and lack a germ pore
(Fig. 19.1). Those of B. cinerea are composed of a single hyaline cell (Fig. 19.1).
Yet, spore evolution appears filled with convergence. For example, in some Sor-
dariomycetes, the fruiting body wall is a better descriptor of evolution than asco-
spore shape (Miller and Huhndorf 2005). Similarly, a germ pore is present in some
species for both basidiomycetes and ascomycetes and is absent in others.
The molecular basis for the versatility of fungi in switching trophic modes and
developments is unknown. The only documented instance is for a change from
mycoparasitism to saprotrophy in the genus Trichoderma. Indeed, there is evidencefor a horizontal transfer of a cluster of genes involved in nitrate assimilation from a
basidiomycete related to Ustilago maydis to the ascomycete Trichoderma reesei,whereas the other members of the Trichoderma genus appear to lack the cluster. Thishas been correlated with the fact that T. reesei is the only Trichoderma living as a
saprobe in woody materials, while the other members of the genus are mycoparasites
(Slot and Hibbett 2007). The nitrate assimilation cluster would enable T. reesei toefficiently scavenge nitrogen in wood, while the other Trichodermas must obtain it
from their host, accounting for the trophic change. Trichoderma may parasitize
basidiomycetes, favoring perhaps the gene transfer in the ancestors of T. reesei.
19.3 Are Appressoria and Appressorium-Like Structures
the Result of Convergent Evolution?
We discovered serendipitously a possible convergent evolution of morphogenetic
processes impacting on trophic strategy in filamentous fungi by studying the role
of the Pls1 tetraspanin and the Nox2 NADPH oxidase (Nox) in the saprobic fungus
320 S. Brun and P. Silar

P. anserina. Tetraspanin are membrane-bound proteins, whose roles are not yet
completely clear (Veneault-Fourrey et al. 2006b). In fungi, tetraspanin of the
Pls1 family have been at first unraveled as virulence factors in three different
plant pathogenic species. In M. grisea, B. cinerea, and Colleototrichum linde-muthianum, the Pls1 mutants are blocked at the penetration step; the appressorium
appears normal but penetration pegs are not produced (Clergeot et al. 2001;
Gourgues et al. 2004; Veneault-Fourrey et al. 2005). This was taken as the indica-
tion for a specific role of Pls1 tetraspanin in phytopathogenic fungi. Yet, ortholo-
gues of Pls1 are present in saprobic fungi, including P. anserina (Lambou et al.
2008). Tetraspanins share the same membrane localization as Nox. Nox are mem-
brane-bound enzymes that generate superoxide ions in exchange of consumption of
NADPH. Several years ago, we proposed that the ancient role of Nox (and of the
ROS they produce) was the sensing of the environment and cell-to-cell communi-
cation (Lalucque and Silar 2003). And indeed, these enzymes have now been
shown to play key roles in development, pathogeny, symbiosis, and defense in a
broad range of Eukaryotes (Lara-Ortiz et al. 2003; Malagnac et al. 2004; Aguirre
et al. 2005; Silar 2005; Takemoto et al. 2007). There is presently three Nox
isoforms known in fungi (see Table 19.1 for an update on Nox genes in fungal
genomes) and all data argue that they do not fulfill redundant roles (Takemoto et al.
2007). In particular, in two saprobic fungi, P. anserina and N. crassa, the Nox2
isoform seems to be more specifically dedicated to regulate melanized ascospore
germination (Malagnac et al. 2004; Cano-Dominguez et al. 2008). Indeed,
both fungi produce melanized ascospores and, in both species, Nox2 mutant
ascospores do not germinate. Furthermore, when P. anserina ascospore melanin
is removed, the Nox mutant ascospores germinate efficiently but in a nonregulated
manner (Malagnac et al. 2004). Accordingly, Nox2 appears dispensable for
the germination of B. cinerea ascospores, which are not melanized (Segmuller
et al. 2008).
When we deleted the PaPls1 gene of P. anserina, we discovered that the
DPaPls1 mutants had the same ascospore germination defects as the PaNox2mutants (Lambou et al. 2008). Again, removal of melanin in PaPls1 mutant
ascospores suppressed the germination default, leading to unregulated germination.
Interestingly, the Nox2 isoforms are necessary for plant penetration in M. griseaand B. cinerea (Egan et al. 2007; Segmuller et al. 2008). Additionally, Pls1 is
dispensable for the germination of theM. grisea nonmelanized ascospores (Lambou
et al. 2008). These data suggest that Pls1 and Nox2 may act together. This finding is
supported by the fact that both proteins are either present or absent in fungal
genomes (Table 19.1, Fig. 19.2). In lower fungi, the coevolution is not clear.
However, Pls1 tetraspanins are small proteins that evolve rapidly, impairing their
detection in very divergent genomes by using ordinary tools. In the “higher fungi”,
i.e., Ascomycetes and Basidiomycetes, the repartition of Pls1 and Nox2 is best
accounted for by at least nine independent losses of both genes during evolution
(Fig. 19.2). As the Pls1 and Nox2 genes are not linked in the genomes, these data
provide a strong argument for their acting in the same processes (Loganantharaj and
Atwi 2007). Both proteins may act together in a complex located at the plasma
19 Convergent Evolution of Morphogenetic Processes in Fungi 321

Table 19.1 Occurrence of Nox1, Nox2, Nox3, and Pls1 in Eumycota
Fungal species Nox1/
NoxA
Nox2/
NoxB
Nox3/
NoxC
Pls1
AscomycotaPezizomycotina
Sordariomycetes Podospora anserina 1 1 1 1
Sporotrichum thermophile 1 1 0 1
Thielavia terrestris 1 1 0 1
Chaetomium globosum 1 1 0 1
Neurospora tetrasperma 1 1 0 1
Neurospora discreta 1 1 0 1
Neurospora crassa 1 1 0 1
Magnaporthe grisea 1 1 1 1
Cryphonectria parasitica 1 1 0 1
Grosmannia clavigera 1 1 0 1
Fusarium graminearum 1 1 1 1
Fusarium verticillioides 1 1 1 1
Fusarium oxysporum 1 1b 1 1
Haematonectria (Nectria)haematococca
2 1 1 1
Epichloe festucae 1 1 0 1
Trichoderma atroviride 1 1 0 1
Trichoderma reesei 1 1 0 1
Trichoderma virens 1 1 0 1
Verticillium dahliae 1 1 1 1
Verticillium albo-atrum 2 1 1 1
Colletotrichum graminicola 1 1 1 1
Leotiomycetes Sclerotinia sclerotiorum 1 1 0 1
Botrytis cinerea 1 1 0 1
Blumeria graminis 1b 1 0 1
Eurotiomycetes Aspergillus oryzae 1 0 0 0
Aspergillus flavus 1 + 1b 0 0 0
Aspergillus terreus 1 0 1 0
Aspergillus carbonarius 1 0 0 0
Aspergillus niger 1 0 0 0
Aspergillus fumigatus 1 0 0 0
Neosartorya fischeri 1 0 0 0
Aspergillus clavatus 1 0 0 0
Aspergillus nidulans 1 0 0 0
Penicillium chrysogenum 1 0 0 0
Talaromyces stipitatus 1 1 0 1
Penicillium marneffei 1 1 0 1
Histoplasma capsulatum 1 1 0 1
Paracoccidioides brasiliensis 1 1 0 1
Blastomyces dermatitidis 1 1 0 1
Uncinocarpus reesii 1 1 0 1
Coccidioides posadasii 1 1 0 1
Coccidioides immitis 1 1 0 1
Arthroderma gypseum 1 1 0 1
Microsporum canis 1 1 0 1
Trichophyton tonsurans 1 1 0 1
Trichophyton rubrum 1 1 0 1
Trichophyton equinum 1 1 0 1
Ascosphaera apis 0 0 0 0
Dothideomycetes Mycosphaerella graminicolla 1 0 1 0
Mycosphaerella fijiensis 1 0 1 0
Cochliobolus heterostrophus 1 1 1 1
Alternaria brassicola 1 1 0 1
(continued)
322 S. Brun and P. Silar

membrane and despite varying fungal habitat and/or physiological diversity, the
function of this complex might have been conserved in the different lineages.
The second striking conclusion is that melanized ascospore germination requires
the same proteins as the formation of the penetration peg from appressoria. When
compared (Fig. 19.1), these two processes appear noticeably similar in P. anserina
Table 19.1 (continued)
Fungal species Nox1/
NoxA
Nox2/
NoxB
Nox3/
NoxC
Pls1
Pyrenophora tritici 1 1 1 1
Stagonospora nodorum 1b 1 1 1
Saccharomycotina Saccharomyces cerevisiae 0 0 0 0
Candida glabrata 0 0 0 0
Zygosaccharomyces rouxii 0 0 0 0
Saccharomyces kluyveri 0 0 0 0
Kluyveromyces thermotolerans 0 0 0 0
Kluyveromyces lactis 0 0 0 0
Ashbya gossypii 0 0 0 0
Candida albicans 0 0 0 0
Debaryomyces hansenii 0 0 0 0
Yarrowia lipolytica 0 0 0 0
Taphrinomycotina Schizosaccharomyces japonicus 0 0 0 0
Schizosaccharomyces pombe 0 0 0 0
Schizosaccharomyces octosporus 0 0 0 0
Pneumocystis carinii 0 0 0 0
BasidiomycotaUstilaginomycotina Ustilago maydis 0 0 0 0
Malassezia globosa 0 0 0 0
Agaricomycotina
Agaricomycetes Heterobasidion annosum 1 1 0 1
Schizophyllum commune 1 1 0 1
Coprinopsis cinerea 1 1 0 1
Laccaria bicolor 1 1 0 1
Postia placentaa 1 1 0 1
Pleurotus ostreatus 1 1 0 1
Phanerochaete chrysosporium 1 1 0 1
Tremellomycetes Cryptococcus neoformans 0 0 0 0
Tremella mesenterica 1 0 0 0
Pucciniomycotina Sporobolomyces roseus 1 0 0 0
Melampsora larici-populina 3 2 0 1
Puccinia graminis 1 1 0 1
“Lower fungi”
Mucoromycotina Rhizopus oryzae 0 0 0 1?
Mucor circinelloides 0 0 0 1?
Phycomyces blakesleeanus 0 0 0 1?
Microsporidia Encephalitozoon cuniculi 0 0 0 0
Antonospora locustae 0 0 0 0
Nosema ceranea 0 0 0 0
Blastocladiomycetes Allomyces macrogynus 1(1) 1 (4) 0 ?
Chytridiomycetes Spizellomyces punctatus 1 1 0 ?
Batrachochytrium dendrobatidis 1 1 0 ?aBLAST analysis detects two very similar copies for this species. However, the P. placenta projectsequenced the genome of a dikaryon (http://genome.jgi-psf.org/Pospl1/Pospl1.home.html). The
two copies are likely the different alleles present in each haploid genomebGenome sequence with an incomplete or erroneous gene sequence. Pseudogenes are in parenthesis
19 Convergent Evolution of Morphogenetic Processes in Fungi 323

andM. grisea. Indeed, during the ontogeny of appressoria and ascospores, there is aprogrammed cell death event (Beckett et al. 1968; Veneault-Fourrey et al. 2006a).
When the structures are formed they are both heavily melanized and both contain a
pore from which a peg is produced (Beckett et al. 1968; Deising et al. 2000).
We thus speculated that the same program was used by the two species to achieve
the same mean (exiting from a melanized structure). This provides a nice example
of the reutilisation of the same proteins to achieve a similar morphogenetic goal in
two different cell types. We also speculated that this process could be recruited
repeatedly during evolution to achieve the same mean, i.e., penetrate plants. If so,
appressoria from different fungi would be due to convergent evolution. However,
we recently obtained data that call off this statement. Indeed, we recently discov-
ered that Nox2 and Pls1 are involved in a novel developmental stage in P. anserina:the development of appressorium-like cells involved in plant material penetration
(Brun et al. 2009).
P.c
R.o
Blastocladiomycota
Mucoromycotina
Basidiomycota
Agaricomycotina
Ustilaginomycotina
Agaricomycetes
Tremellomycetes
PucciniomycotinaPucciniomycetes
Microbotryomycetes
Saccharomycotina
Ascomycota
Taphrinomycotina
Sordariomycetes
Leotiomycetes
Eurotiomycetes
Eurotiales
Dothideomycetes
Capnodiales
Pleosporales
Pezizomycotina
Sordariales
Magnaporthales
Diaporthales
Ophiostomatales
Hypocreales
Microsporidia
Chrytridiomycota
Ascosphaera
Onygenales
**
app
ress
ori
um
-lik
e st
ruct
ure
s
?
Lower Fungi
Fig. 19.2 Phylogenetic tree of Eumycetes. The tree shows the fungal groups for which complete
genome sequences are available. The nine vertical arrows locate the loss of Pls1 and Nox2.
Asterisks (*) indicate the two groups for which the Pls1 and Nox2 proteins have been recruited
for the same goal (exiting a reinforced structure) in two cell types: the ascospores in Sordariales
(P. anserina and N. crassa) and the appressorium in Magnaporthales (M. grisea). Possible
appearance of appressorium-like structures occurred very early during fungal evolution, however,
at a yet undefined moment. Fungi unable to differentiate appressorium-like structure are indicated
by P.c (Penicillium chrysogenum) and R.o (Rhizopus oryzae)
324 S. Brun and P. Silar

19.4 Differentiating Appressorium-Like Structures Could
Be an Ancient Property of Fungi
During our studies on Nox2 and Pls1, we noticed that in addition to their ascospore
germination default, the null mutants of both genes presented a defect in the
production of fruiting bodies, specifically when grown on cellulose as sole carbon
source (Malagnac et al. 2008). This prompted us to investigate in more details the
cellulose degradation process in P. anserina (Brun et al. 2009). When cellophane is
provided as food source, P. anserina is able to orient its growth toward the cello-
phane layer. Upon contacting cellophane, it differentiates a structure that greatly
resembles B. cinerea pseudo-appressorium. Even more striking is the similarity
between the appressorium-like phenotypes of B. cinerea and P. anserina Pls1 and
Nox2mutants (Segmuller et al. 2008; Brun et al. 2009). In both species, thesemutants
are impaired at the reorientation step toward the substrate (onion skin and cellophane,
respectively), which is a prerequisite for penetration. In both species, mutant hyphae
tend to “hesitate” in the direction to grow. Then, they establish loose contacts with
the substrate and finally are completely defective in penetrating it. Nonetheless, the
setting up of fully functional penetration structures is not only under the control of
Nox2 and Pls1 but also require the Nox1 isoform (Egan et al. 2007; Giesbert et al.
2008; Brun et al. 2009). In the view of this new finding, we speculate that the ability
to differentiate cellular structure dedicated to penetrate plant materials might be an
ancient property of filamentous fungi (at least ascomycetes and basidiomycetes),
which is used in saprobes to efficiently degrade dead plants, andmore aggressively in
phytopathogens to penetrate their hosts. To test this possibility, we have evaluated
the ability of several additional fungi to differentiate penetration structures on
cellophane (see Fig. 19.3 for an example). A variety of structures permitting to
breach the cellophane were indeed produced by a wide spectrum of fungi (several
Sordariomycetes and Agaricomycetes; S. Brun and P. Silar, unpublished data).
Presently, we did not detect such structures in two species, Penicillium chrysogenumand Rhizopus oryzae (Fig. 19.3). Significantly, both fungi lack Nox2 and Pls1
(Table 19.1, Fig. 19.2), confirming the crucial role of the two proteins in the
differentiation of appressorium-like cells. Therefore, a wide range of fungi seem to
possess the toolkit necessary to breach the plant cell wall. The patchy phylogenetic
repartition of species known to produce appressoria and related structure could thus
be due to biased sampling toward parasitic and mutualist plant symbionts in studies
dealing with appressorium formation. However, some species may truly be unable to
differentiate these structures: those that have lost Pls1 and Nox2.
In other words, there is no need to invoke complex convergent evolution of
fungal structures to explain the recurrent change in trophic lifestyle. Evidence
is arising which confirms a role of ROS and Nox in polarized hyphal growth
(Semighini and Harris 2008) and we believe that the ability of fungi to attack and
penetrate plant materials may simply rely on sensing the glucose gradient created by
the enzymatic degradation of the polysaccharides composing the plant cell wall, i.e.,
cellulose and hemicellulose (Brun et al. 2009). More generally, we believe that if
19 Convergent Evolution of Morphogenetic Processes in Fungi 325

this simple model is true, penetration structures under the control of Nox2/Pls1
should be found not only for phytopathogens and saprobes, but also for entomo-
pathogens (for cuticle breaching) as well as for fungal parasites such as Trichodermasp. (for chitin-based cell walls penetration) and possibly for human pathogens. We
thus now need to confirm on a larger sample if the correlation between the ability to
build these structures and the conservation of Nox2/Pls1 holds true.
Acknowledgments This work was supported by ANR grant n�ANR-05-Blan-0385-02.
Fig. 19.3 Cellophane breach. Four days old mycelia of P. anserina (P. a), Trichoderma species(T. sp), Penicillium chrysogenum (P. c), and Rhizopus oryzae (R. o) were observed as described
(Brun et al. 2009). Numbers indicate the distance from the first picture in mm as depicted by the
arrows on the schemes on the right. In the first column, mycelia of all the strains are growing
horizontally on the cellophane layer. In the second column, mycelia of P. anserina and T. speciesreorient their growth toward the cellophane and establish bulging contacts (some examples are
indicated by arrows). In P. chrysogenum and R. oryzae, there is no reorientation toward cellophane,though rare contact may occur. In the third column, needle-like hyphae (some examples are indicated
by asterisk) are emitted in P. anserina and T. species, which allow both fungi to penetrate into the
cellophane layer. In contrast, P. chrysogenum and R. oryzae cannot penetrate cellophane. In the
fourth column, schematic representation of the structures; the arrows points toward the approximate
focal plan of the first three columns and the eye indicates the direction of the observation
326 S. Brun and P. Silar

References
Aguirre J, Rios-Momberg M, Hewitt D, Hansberg W (2005) Reactive oxygen species and
development in microbial eukaryotes. Trends Microbiol 13:111–118
Beckett A, Barton R, Wilson IM (1968) Fine structure of the wall and appendage formation in
ascospores of Podospora anserina. J Gen Microbiol 53:89–94
Brun S, Malagnac F, Bidard F, Lalucque H, Silar P (2009) Functions and regulation of the Nox
family in the filamentous fungus Podospora anserina: a new role in cellulose degradation. Mol
Microbiol 74:480–496
Cano-Dominguez N, Alvarez-Delfin K, Hansberg W, Aguirre J (2008) NADPH oxidases NOX-1
and NOX-2 require the regulatory subunit NOR-1 to control cell differentiation and growth in
Neurospora crassa. Eukaryot Cell 7:1352–1361Clergeot PH, Gourgues M, Cots J, Laurans F, Latorse MP, Pepin R, Tharreau D, Notteghem JL,
LebrunMH (2001) PLS1, a gene encoding a tetraspanin-like protein, is required for penetration
of rice leaf by the fungal pathogen Magnaporthe grisea. Proc Natl Acad Sci USA
98:6963–6968
Deising HB, Werner S, Wernitz M (2000) The role of fungal appressoria in plant infection.
Microbes Infect 2:1631–1641
Dujon B (2005) Hemiascomycetous yeasts at the forefront of comparative genomics. Curr Opin
Genet Dev 15:614–620
Egan MJ, Wang ZY, Jones MA, Smirnoff N, Talbot NJ (2007) Generation of reactive oxygen
species by fungal NADPH oxidases is required for rice blast disease. Proc Natl Acad Sci USA
104:11772–11777
Espagne E, Lespinet O, Malagnac F, Da Silva C, Jaillon O, Porcel BM, Couloux A, Aury JM,
Segurens B, Poulain J, Anthouard V, Grossetete S, Khalili H, Coppin E, Dequard-Chablat M,
PicardM, Contamine V, Arnaise S, Bourdais A, Berteaux-Lecellier V, Gautheret D, de Vries RP,
Battaglia E, Coutinho PM, Danchin EG, Henrissat B, Khoury RE, Sainsard-Chanet A, Boivin A,
Pinan-Lucarre B, Sellem CH, Debuchy R, Wincker P, Weissenbach J, Silar P (2008) The
genome sequence of the model ascomycete fungus Podospora anserina. Genome Biol 9:R77
Giesbert S, Schurg T, Scheele S, Tudzynski P (2008) The NADPH oxidase Cpnox1 is required for
full pathogenicity of the ergot fungus Claviceps purpurea. Mol Plant Pathol 9:317–327
Gourgues M, Brunet-Simon A, Lebrun MH, Levis C (2004) The tetraspanin BcPls1 is required for
appressorium-mediated penetration of Botrytis cinerea into host plant leaves. Mol Microbiol
51:619–629
Hawksworth DL (1991) The fungal dimension of biodiversity: magnitude, significance, and
conservation. Mycol Res 95:641–655
Hibbett DS, Binder M, Bischoff JF, Blackwell M, Cannon PF, Eriksson OE, Huhndorf S, James T,
Kirk PM, Lucking R, Thorsten Lumbsch H, Lutzoni F, Matheny PB, McLaughlin DJ,
Powell MJ, Redhead S, Schoch CL, Spatafora JW, Stalpers JA, Vilgalys R, Aime MC,
Aptroot A, Bauer R, Begerow D, Benny GL, Castlebury LA, Crous PW, Dai YC, Gams W,
Geiser DM, Griffith GW, Gueidan C, Hawksworth DL, Hestmark G, Hosaka K, Humber RA,
Hyde KD, Ironside JE, Koljalg U, Kurtzman CP, Larsson KH, Lichtwardt R, Longcore J,
Miadlikowska J, Miller A, Moncalvo JM, Mozley-Standridge S, Oberwinkler F, Parmasto E,
Reeb V, Rogers JD, Roux C, Ryvarden L, Sampaio JP, Schussler A, Sugiyama J, Thorn RG,
Tibell L, Untereiner WA,Walker C, Wang Z, Weir A, Weiss M,White MM,Winka K, Yao YJ,
Zhang N (2007) A higher-level phylogenetic classification of the fungi. Mycol Res
111:509–547
James TY, Kauff F, Schoch CL, Matheny PB, Hofstetter V, Cox CJ, Celio G, Gueidan C, Fraker E,
Miadlikowska J, Lumbsch HT, Rauhut A, Reeb V, Arnold AE, Amtoft A, Stajich JE,
Hosaka K, Sung GH, Johnson D, O’Rourke B, Crockett M, Binder M, Curtis JM, Slot JC,
Wang Z, Wilson AW, Schussler A, Longcore JE, O’Donnell K, Mozley-Standridge S,
Porter D, Letcher PM, Powell MJ, Taylor JW, White MM, Griffith GW, Davies DR,
19 Convergent Evolution of Morphogenetic Processes in Fungi 327

Humber RA, Morton JB, Sugiyama J, Rossman AY, Rogers JD, Pfister DH, Hewitt D,
Hansen K, Hambleton S, Shoemaker RA, Kohlmeyer J, Volkmann-Kohlmeyer B, Spotts RA,
Serdani M, Crous PW, Hughes KW, Matsuura K, Langer E, Langer G, Untereiner WA,
Lucking R, Budel B, Geiser DM, Aptroot A, Diederich P, Schmitt I, Schultz M, Yahr R,
Hibbett DS, Lutzoni F, McLaughlin DJ, Spatafora JW, Vilgalys R (2006) Reconstructing the
early evolution of fungi using a six-gene phylogeny. Nature 443:818–822
Lalucque H, Silar P (2003) NADPH oxidase: an enzyme for multicellularity? Trends Microbiol
11:9–12
Lambou K, Malagnac F, Barbisan C, Tharreau D, Lebrun MH, Silar P (2008) A crucial role for the
Pls1 tetraspanin during ascospore germination of the saprophytic fungus Podospora anserina.Eukaryot Cell 7:1809–1818
Lara-Ortiz T, Riveros-Rosas H, Aguirre J (2003) Reactive oxygen species generated by microbial
NADPH oxidase NoxA regulate sexual development in Aspergillus nidulans. Mol Microbiol
50:1241–1255
Loganantharaj R, Atwi M (2007) Towards validating the hypothesis of phylogenetic profiling.
BMC Bioinformatics 8(Suppl 7):S25
Malagnac F, Bidard F, Lalucque H, Brun S, Lambou K, Lebrun MH, Silar P (2008) Convergent
evolution of morphogenetic processes in fungi: role of tetraspanins and NADPH oxidases 2 in
plant pathogens and saprobes. Commun Integr Biol 1:180–181
Malagnac F, Lalucque H, Lepere G, Silar P (2004) Two NADPH oxidase isoforms are required for
sexual reproduction and ascospore germination in the filamentous fungus Podospora anserina.Fungal Genet Biol 41:982–997
McLaughlin DJ, Hibbett DS, Lutzoni F, Spatafora JW, Vilgalys R (2009) The search for the fungal
tree of life. Trends Microbiol 17:488–497
Miller AN, Huhndorf SM (2005) Multi-gene phylogenies indicate ascomal wall morphology is a
better predictor of phylogenetic relationships than ascospore morphology in the Sordariales
(Ascomycota, Fungi). Mol Phylogenet Evol 35:60–75
Schadt CW, Martin AP, Lipson DA, Schmidt SK (2003) Seasonal dynamics of previously
unknown fungal lineages in tundra soils. Science 301:1359–1361
Segmuller N, Kokkelink L, Giesbert S, Odinius D, van Kan J, Tudzynski P (2008) NADPH
oxidases are involved in differentiation and pathogenicity in Botrytis cinerea. Mol Plant
Microbe Interact 21:808–819
Semighini CP, Harris SD (2008) Regulation of apical dominance in Aspergillus nidulans hyphaeby reactive oxygen species. Genetics 179:1919–1932
Silar P (2005) Peroxide accumulation and cell death in filamentous fungi induced by contact with a
contestant. Mycol Res 109:137–149
Slot JC, Hibbett DS (2007) Horizontal transfer of a nitrate assimilation gene cluster and ecological
transitions in fungi: a phylogenetic study. PLoS ONE 2:e1097
Takemoto D, Tanaka A, Scott B (2007) NADPH oxidases in fungi: diverse roles of reactive
oxygen species in fungal cellular differentiation. Fungal Genet Biol 44:1065–1076
Veneault-Fourrey C, Barooah M, Egan M, Wakley G, Talbot NJ (2006a) Autophagic fungal cell
death is necessary for infection by the rice blast fungus. Science 312:580–583
Veneault-Fourrey C, Lambou K, Lebrun MH (2006b) Fungal Pls1 tetraspanins as key factors of
penetration into host plants: a role in re-establishing polarized growth in the appressorium?
FEMS Microbiol Lett 256:179–184
Veneault-Fourrey C, Parisot D, Gourgues M, Lauge R, Lebrun MH, Langin T (2005) The
tetraspanin gene ClPLS1 is essential for appressorium-mediated penetration of the fungal
pathogen Colletotrichum lindemuthianum. Fungal Genet Biol 42:306–318Webster J (2007) Introduction to fungi, 3rd edn. Cambridge University Press, U.K
328 S. Brun and P. Silar

Chapter 20
Evolution and Historical Biogeography
of a Song Sparrow Ring in Western
North America
Michael A. Patten
Abstract The Song Sparrow, Melospiza melodia (Aves: Emberizidae), exhibits a
greater degree of geographic variation than does any other North American bird
species. Detailed morphological work has demonstrated that a subset of the 25
diagnosable subspecies forms a classic ring species in the western United States.
The ring’s center is the Sierra Nevada and Mojave Desert in California and adjacent
Nevada, and its connecting point is in southeastern California, where an olive and
black subspecies of the coastal slope interbreeds sporadically with a gray and rufous
subspecies of the arid interior. However, song differences associated with habitat
segregation lead to assortative mating between the two subspecies that meet in the
Coachella Valley at the southern base of San Gorgonio Pass. Moving clockwise
around the ring from the connecting point one finds a gradation of subspecies that
become paler, rustier, and grayer. Standard models of ring species evolution imply
the connecting point is the region occupied most recently, in this case after sparrows
would have spread southward down either side of the mountains and desert. This
scenario is plausible given molecular evidence of a glacial refugium on the Queen
Charlotte Islands, British Columbia, suggesting that ancestral birds could have
moved south in this pattern. By contrast, another postulated refugium is what is
now the arid desert of southeastern California or northeastern Baja California,
Mexico. This refugium’s location – coupled with a recent meta-analysis of North
American hybrid zones that identifies the San Gorgonio Pass region as an ancestral
contact zone of coastal and desert fauna – implies that the connecting point is the
region occupied earliest, an alternative that would mean the Song Sparrow ring differs
fundamentally from one that would have evolved via the standard model. Bio-
geographical and morphological data support the latter, more radical interpretation,
M.A. Patten
Oklahoma Biological Survey and Department of Zoology, University of Oklahoma,
111 E. Chesapeake Street, Norman, OK 73019, USA
e‐mail: [email protected]
P. Pontarotti (ed.), Evolutionary Biology – Concepts, Molecularand Morphological Evolution, DOI 10.1007/978-3-642-12340-5_20,# Springer-Verlag Berlin Heidelberg 2010
329

but genetic, vocal, ecological, and behavioral data are needed around the ring to
determine conclusively which model is best supported.
20.1 Ring Species as a Biogeographic Pattern
A concrete bridge between microevolution and macroevolution, including specia-
tion, continues to elude evolutionary biologists (Mayr 1982; Jablonski 2000;
Reznick and Ricklefs 2009). Some researchers have concluded that macroevolution
is no more than the accumulated effects of microevolution (Hansen and Martins
1996; Simons 2002), whereas others have concluded that macroevolution requires a
fundamentally different mechanism (Stanley 1998; Erwin 2000). Ring species may
prove to be that crucial bridge (Irwin et al. 2001b).
A ring species consists of multiple subspecies whose contiguous geographic
ranges encircle a geographic barrier and whose terminal subspecies behave as good
biological species where their ranges meet (Cain 1954; Irwin and Irwin 2002; Coyne
and Orr 2004). Subspecies around the ring that connect the terminal subspecies grade
into each other to form a continuous set of intermediate forms. Because reproductive
isolation evolves in the face of gene flow, Mayr (1942:180) referred to ring species as
“the perfect demonstration of speciation”, and Cain (1954:141) referred to them as
“the clearest evidence of geographical speciation”. But as Coyne and Orr (2004:102)
noted, ring species do not demonstrate geographical (¼allopatric) speciation but
rather speciation that occurs “through the attenuation of gene flow with distance”.
Thus, ring species remain a key to understanding the evolution of reproductive
isolation and, therefore, of speciation, and they demonstrate how “small changes
can lead to species-level differences” (Irwin et al. 2001b).
Lost or conflated in this argument about whether ring species are examples of
geographic speciation is a clear distinction between pattern and process. To fit the
pattern of a ring species, three conditions must be met (Irwin and Irwin 2002;
Joseph et al. 2008; Patten and Pruett 2009): (1) geographic ranges of neighboring
subspecies must meet, (2) phenotype and genotype of neighbors must exhibit the
effects of intergradation, except for (3) the two subspecies that form the terminal
points, which must exhibit a sharp break in phenotype, genotype, ecology, and
behavior, enough so that these subspecies behave as good biological species where
their ranges meet. Few proposed ring species meet these criteria (Irwin et al. 2001b;
Coyne and Orr 2004), and even a weaker criterion, replacing (1) and (2) above, of
“a series of progressively intermediate forms must be arranged in a ring” (Patten
and Pruett 2009) still excludes many of the proposed ring species. Regardless, if a
geographically variable species was found to fit the above criteria, it would be fair
to dub it a ring species, immaterial of how the pattern came to be. It also seems fair
to conclude that the pattern of phenotypic variation exhibited by a ring species
demonstrates that the microevolutionary processes that lead to population differen-
tiation are akin to the processes that lead to speciation, whatever differences there
are being only a matter of degree (Irwin et al. 2001b).
330 M.A. Patten

20.2 The Evidence for Ring Species
Whether any claimed ring species fits all three criteria outlined above is debatable
or unlikely (Coyne and Orr 2004; Martens and P€ackert 2007; Joseph et al. 2008). Forexample, Irwin et al. (2001b) and Irwin and Irwin (2002) reviewed 23 ring species
reported in the scientific literature. Almost all were found wanting in some way,
often because reproductive isolation of the terminal points had not been studied but
sometimes because gene flow around the ring was unlikely or was known not to
occur. In the case of the tsetse fly, Glossina morsitans, the terminal points did not
meet in sympatry. Even the two most widely studied examples of putative ring
species, the salamander Ensatina eschscholtzii (Stebbins 1957; Wake and Yanev
1986; Wake 2006; Kuchta et al. 2009) and the warbler Phylloscopus trochiloides(Mayr 1942; Irwin et al. 2001a, 2005), do not meet criteria fully (Coyne and Orr
2004; Martens and P€ackert 2007), although they nonetheless display enough char-
acteristics to be considered ring species by most evolutionary biologists.
Just over half of the examples of ring species Irwin et al. (2001b) considered
pertained to bird species, although they did not consider Mayr’s (1942) examples of
the Zosterops white-eyes in the Lesser Sunda Islands nor the Pernis honeyeaters inthe Philippines, to say nothing of Stejneger’s (in Jordan 1905) speculation regard-
ing Lanius shrikes around the Baltic Sea. Perhaps, there are no additional pertinent
data on these systems. To these examples can be added two avian ring species
described recently: the Willow Warbler (Phylloscopus trochilus) complex encir-
cling the Baltic Sea (Bensch et al. 2009) and subspecies of the Song Sparrow
(Melospiza melodia) encircling the Sierra Nevada and Mojave Desert of the south-
western United States (Patten and Pruett 2009). The Willow Warbler varies in
plumage color, body size, AFLPs (amplified fragment length polymorphism),
microsatellite markers, and migratory behavior to the extent that it “shares many
features with the classic examples of ring species”, albeit one that evolved recently
relative to nearly all other examples (Bensch et al. 2009).
The Song Sparrow varies considerably in plumage color and pattern around the
ring (Table 20.1), with phenotypically intermediate populations present in all
contact zones, implying gene flow and intergradation where ranges meet
(Fig. 20.1; Patten and Pruett 2009). The terminal points are two subspecies – the
pale, rufescent M. m. fallax of the desert Southwest and the dark, olivaceous
M. m. heermanni of southern and central California – that meet in the Coachella
Valley, which lies between San Gorgonio Pass and the Salton Sea. The terminal
taxa hybridize only rarely; instead, there is evidence that females choose mates
assortatively, males respond more strongly to their own subspecies’ songs, and song
structure is shaped by habitat structure, which differs between the subspecies
(Patten et al. 2004b). Although genetic variation has not yet been studied around
the ring, the terminal taxa differ in frequency of microsatellite markers and these
differences are associated with plumage differences (Patten et al. 2004b). More-
over, a recent study of Song Sparrows along the whole of the Pacific Coast, from the
western Aleutian Islands of Alaska to southernmost California, found, in many
20 Evolution and Historical Biogeography of a Song Sparrow Ring 331

Table 20.1 Patterns of phenotypic variation around the Song Sparrow Melospiza melodia ring in
western North America
heermanni gouldii cleonensis montana fallax
Mantle color Grayish Reddish Dark reddish Grayish Brownish
olive-brown olive-brown brown brown gray
Mantle fringe Gray, thin Absent Gray, thin Gray, broad Reddish gray, broad
Underparts White White Grayish White White
Streak color Fuscous Black Dark brown Brown Warm brown
Streak fringe Ruddy Olive Brown Chestnut Chestnut
Malar Reddish fuscous Blackish Fuscous Chestnut brown Chestnut
Supercilia Ashy Ashy Grayish Whitish Whitish
Fig. 20.1 The Song Sparrow (Melospiza melodia) ring in western North America (from Patten and
Pruett 2009). The northwestern portion of center of the ring is the Sierra Nevada, the tallest
mountain range in the conterminous United States. The remainder of the gap is the Mojave Desert
(southern California) and southern Great Basin desert (southern Nevada). The large lake in
southeastern California is the Salton Sea, which sits at the southern edge of where the terminal
taxa meet, and San Gorgonio Pass lies at the northwestern edge of Coachella Valley
332 M.A. Patten

cases, that microsatellite variation and plumage variation (subspecies) were corre-
lated significantly (Pruett et al. 2008; cf. Zink 2010). This finding suggests that a
detailed genetic survey around the ring holds the promise of yielding a pattern that
corroborates the pattern evident in the analysis of plumage variation.
20.3 Models for the Evolution of Ring Species
The two recently proposed ring species need more study, but at the least the criteria
for establishing the pattern appear to have been met as convincingly as in the two
more well-studied examples of Ensatina eschscholtzii and Phylloscopus trochi-loides. But determining that a species or subspecies complex fits a ring species is
only half of the battle. How a ring pattern came to be is about the process of a ring
species, and the stringent criteria Coyne and Orr (2004:103) set forth for determin-
ing if a ring species is valid focused equally on process and pattern. Although these
authors agreed that criterion (1) above must hold, they modified (2) to state that
geographic continuity must have been present always; i.e., no geographic barriers to
gene flow could have existed in the past, during ring formation. They further
imposed two criteria related to the process by which the ring formed: (A) there
must be historical information that the ring was formed by a single population (i.e.,
not from two or more genetically distinct lines), with all subspecies around the ring
descended from that single line, and (B) one of the terminal points must be
represented by a population that expanded its range most recently. Criterion (A)
may be justified if we wish to hold up a ring species as a solid example of speciation
either in the face of gene flow or with geographic distance. Criterion (B), by
contrast, implies that the ring must have formed in a certain way, which ignores
other plausible ways in which a ring could evolve.
The model inherent in criterion (B) is consistent with the first model put forth for
the evolution of a ring species (Stejneger, in Jordan 1905), a half-century before the
term “ring species” was coined. In one of several published response to Jordan’s
review of geographic speciation, Stejneger postulated that two subspecies might
breed in sympatry, but only under specific circumstances. Using Lanius shrikes innorthern Europe as an example, he asked readers to imagine that two trajectories of
range expansion split from a common stock in Asia, with one heading west through
central Europe to reach the Scandinavian Peninsula by way of Denmark and the
other heading northwest through Finland to colonize the Scandinavian Peninsula
from the north. The ranges of these subspecies would meet in southern part of the
peninsula. Stejneger (p. 552) proposed that “it is then not unnatural to conclude that
in the specimens meeting there the characters might have become so fixed that the
two forms would react on each other as two distinct species, though at their original
dividing line they might still remain in the imperfectly differentiated stage”. This
scenario corresponds with the classic conceptual model of how a ring forms
(Fig. 20.2, “classical I”; Martens and P€ackert 2007). An alternative model
(Fig. 20.2, “classical II”) yields the same pattern and still invokes forming a ring
that would meet Criterion (B).
20 Evolution and Historical Biogeography of a Song Sparrow Ring 333

Using current snapshots to distinguish between various iterations of these
“classical” models can be challenging (Kuchta et al. 2009), but alternative models
that would yield the pattern of a ring species and conform to conceptual specifica-
tions of the “ring species hypothesis” (sensu Joseph et al. 2008) have not been
explored. Yet there are alternative models in which a ring pattern evolves by means
of a process that retains the concept’s emphasis on divergence with gene flow, a
possibility increasingly recognized as plausible (Nosil 2008; Thorpe et al. 2008;
Mila et al. 2009). One such model is a simple scenario invoking in situ divergence
across various ecotones around a ring (Fig. 20.2), with divergence being especially
pronounced across one moderately steep, but not too steep, environmental gradient
(Doebeli and Dieckmann 2003; Leimar et al. 2008). Taxa on either side of this
gradient diverge by the process of ecological speciation, “the evolution of repro-
ductive isolation between populations by divergent natural selection arising from
differences between ecological environments” (Schluter 2009). These taxa become
the terminal points of the ring. Because geographic ranges were always and are still
continuous, and intergradation persists at other contact points where gradients are
shallower, a ring species pattern forms in the face of gene flow.
Another model for the evolution of a ring species also invokes ecological
speciation across an environmental gradient (Fig. 20.2, “ecological divergence”).
In this case, ranges expand around a geographic barrier, just as in the classical
models; however, ranges split initially from the parent population across an ecotone
Fig. 20.2 Competing models
for the evolution of a species
ring. The “classical I” model
corresponds to Leonard
Stejneger’s (in Jordan 1905)
conception of how a ring
formed (see also Martens and
P€ackert 2007). A ring may
also form in the classical
sense by encircling the
geographic barrier back to the
starting point (see Kuchta
et al. 2009 for similar
examples). The “in situ”
model relies on repeated,
simultaneous ecological
speciation, whereas the
“ecological divergence”
model combines aspects of a
classical ring model (e.g.,
differentiation during range
expansion) with ecological
speciation
334 M.A. Patten

with a moderately steep gradient, an area conducive to divergence (Endler 1977).
As ranges expand around either side of the barrier, time elapsed at the initial branch
point is sufficient for divergence to occur there, but the expanding front does not
diverge at this same rate. Indeed, the two fronts remain undifferentiated enough that
when the fronts meet, the populations interbreed readily, forming a broad hybrid
zone of secondary contact. The end result would again be a ring species pattern in
the face of gene flow. The chief differences from the classical models are that
terminal points occur at an ecotone and are at the opposite end of the ring from
where the expanding fronts met.
It is important to note that a variety of other scenarios may lead to a ring species
pattern. For example, a species may have spread from multiple glacial refugia and in
doing so form multiple zones of secondary contact (Bensch et al. 2009). Or a set of
subspecies may have arisen by a process of vicariant (allopatric) divergence, but all
barriers between resultant forms have since eroded, leaving a ring of connected forms
with intergradation where ranges meet (Joseph et al. 2008). We therefore ought to
predict the existence of a ring species pattern in situations that cannot teach us about
speciation in the face of gene flow, an oft-cited hallmark of the ring species hypothe-
sis. Such examples only add to the abundant evidence for allopatric speciation, albeit
they will prove suitable for studies of the maintenance of geographic variation in the
face of gene flow (e.g., hybrid zone dynamics; Barton and Hewitt 1989).
20.4 Evolution of the Song Sparrow Ring
The Song Sparrow currently ranges across North America, with populations occur-
ring north to southwestern Alaska and to southern Canada east to Newfoundland
and contiguous populations south to northwestern Mexico. There are also geo-
graphically isolated populations on the Channel Islands and Islas Coronados off of
California and Baja California, respectively, and at various locales in mainland
Mexico, south to the Trans-Mexican volcanic belt (Patten and Pruett 2009). So wide
a geographic range may hinder interpretation of the evolution of geographic varia-
tion. We thus need to consider whether the species was always so widespread or,
more likely, if the species expanded its range considerably in the wake of the most
recent glaciation �12,000 ybp.
In the case of the Song Sparrow, two genetic analyses (Zink and Dittmann 1993;
Fry and Zink 1998) identified two or three Pleistocene refugia, respectively. That is,
extant populations of the Song Sparrow carry a genetic signature that implies range
expansion away from either two or three regions that harbored the species’ ances-
tors during the last glacial maximum (Fig. 20.3; see Sommer and Zachos 2009).
Two refugia identified by mtDNA restriction sites (Zink and Dittmann 1993) were
Newfoundland and the Queen Charlotte Islands, British Columbia (Fig. 20.3).
Because Newfoundland was covered by a sheet of ice, it seems an implausible
site for a refugium. This concern was alleviated by a follow-up study of mtDNA
sequence (Fry and Zink 1998), who found evidence for a “model of Song Sparrow
20 Evolution and Historical Biogeography of a Song Sparrow Ring 335

population history involving multiple Pleistocene refugia and colonization of some
formerly glaciated regions from multiple sources”. Their study identified three
refugia: the Queen Charlotte Islands, the Atlantic Coast of the northeastern United
States, and, likely, southern California (Fig. 20.3).
Southern California was considered a likely location for a refugium, but it could
not be identified conclusively because sample size was small. Nevertheless, a
genetic survey across a suite of terrestrial vertebrate taxa – but not including the
Song Sparrow – identified southeastern California as a Pleistocene refugium
(Waltari et al. 2007), lending support to Fry and Zink’s (1998) finding. Waltari
et al. (2007) also presented evidence for a refugium in the central or southern Baja
Fig. 20.3 Approximate extent of the North American ice sheets during the last glacial maximum
(Ehlers and Gibbard 2004). On the basis of mitochondrial DNA restriction sites and sequences
(Zink and Dittmann 1993; Fry and Zink 1998), three glacial refugia (dashed circles) for the SongSparrow (Melopsiza melodia) have been proposed. A fourth (solid circle) was proposed initially
but later discarded
336 M.A. Patten

California peninsula, a location Fry and Zink (1998) could not have detected
because they lacked samples of the Song Sparrow from the peninsula. The Baja
California peninsula nonetheless corresponds to a common Pleistocene refugium
incorporated into a meta-analysis of North American hybrid zones (Fig. 20.4;
Swenson and Howard 2005). That the sparrow occurs currently in all three (or
four, if we include Baja California as separate from southern California) putative
refugia (Fig. 20.3) raises the possibility of future screening for ancestral haplotypes,
preferably in the nuclear genome.
The issue of hybrid or contact zones is an additional crucial consideration when
piecing together the evolutionary and biogeographic history of the Song Sparrow.
The contact zone of the terminal points of the sparrow ring occurs in the Coachella
Valley, at the southeastern base of San Gorgonio Pass (Fig. 20.1). The San
Fig. 20.4 Proposed routes of range expansion away from glacial refugia (squares) in North
America (after Swenson and Howard 2005)
20 Evolution and Historical Biogeography of a Song Sparrow Ring 337

Gorgonio Pass divides the north end of the north–south Peninsular Ranges from the
east–west Transverse Ranges and is an area of faunal transition (Patten et al. 2004a;
Leavitt et al. 2007). It has been identified as a “hot spot” for phylogeographic breaks
(Swenson and Howard 2005), locations where there are deep splits in phylogenetic
history. The Transverse Ranges themselves figure prominently in phylogenetic
breaks: animal taxa (invertebrate and vertebrate) either north or south of that line
of mountains tend to be in separate phylogenetic clusters (Calsbeek et al. 2003;
Burns et al. 2007), further emphasizing the prominence of the San Gorgonio Pass
region as a contact zone hot spot.
That the terminal points of the Song Sparrow ring occur in this region of faunal
transition is likely not a coincidence. If we accept that the Song Sparrow’s ancestors
persisted in a glacial refugium in southern California or in Baja California and
spread north from there (Figs. 20.3 and 20.4), a cleave in the expanding fronts of the
geographic range would be at the San Gorgonio Pass. The moderately steep
environmental gradient in the pass – from a Mediterranean climate at the northwest
end to an extreme desert climate at the southeast end – is conceivably ideal for
ecological speciation. If speciation occurred while the expanding fronts differen-
tiated, via isolation by distance, enough to be recognized as subspecies but not
enough to yield reproductive isolation, then the result would be a true ring species
that evolved by a process that best fit the “ecological divergence” model (Fig. 20.2).
Conversely, Lapointe and Rissler (2005) examined congruent phylogeographies
across California of seven verebrates, an invertebrate, and a plant and found general
patterns that corresponded broadly to the ranges of the subspecies of the Song
Sparrow that constitute the ring (Fig. 20.1). If these regions, each of which has a
distinct environment (i.e., general climate and vegetation), tend to promote diver-
gence via an ecological speciation model, then the San Gorgonio Pass still might be
the site of speciation when other contact zones represent areas where locally
adapted populations meet. Such a scenario would yield a true ring species, but
one that evolved by means of the “in situ” model (Fig. 20.2).
Morphologically, the California subspecies of the Song Sparrow form a distinct
group, as do the subspecies in the desert Southwest and the mesic Pacific Northwest
(Patten and Pruett 2009). It therefore seems unlikely that postglacial range expan-
sion was solely from the Queen Charlotte refugium, a requisite for the ring to
conform to a “classical I” model (Fig. 20.2). Evolution by means of a “classical II”
model may be more likely, if the ancestral taxon expanded north to encircle the
Sierra Nevada and Mojave Desert counterclockwise, yet such a pattern would not
jibe with general tracks of postglacial expansion in other species (Fig. 20.4;
Swenson and Howard 2005). Moreover, the subspecies M. m. rivularis of Baja
California Sur is morphologically most likeM. m. fallax of the Sonoran Desert, oneof the terminal points of the ring; indeed, they are nearly identical in plumage – the
principal difference is the diagnostically longer bill of M. m. rivularis (Patten and
Pruett 2009). If phenotype corresponds to evolutionary relatedness and the Pleisto-
cene refugium was in the Baja California peninsula, then the ancestral form
expanded northward only on the east side of the peninsula, an unlikely scenario
338 M.A. Patten

given presumably spotty suitable habitat in the far more xeric portion of Baja
California east of the Peninsular Ranges.
20.5 Conclusions
Morphological variation in the Song Sparrow in the southwestern United States
creates a ring species pattern around the Sierra Nevada and Mojave Desert (Patten
and Pruett 2009). A detailed study of two subspecies that differ most strikingly in
plumage implies that they are terminal points of the ring (Patten et al. 2004b). These
subspecies meet at the base of the San Gorgonio Pass, a well-known area of faunal
transition (Leavitt et al. 2007).
Yet prima facie evidence suggests that neither of the classical models for the
evolution of a ring species (Fig. 20.2) holds in this case. A glacial refugium for
the Song Sparrow likely existed in the desert Southwest (Fry and Zink 1998),
and postglacial range expansion from this region tended to be of a northward trajec-
tory (Swenson and Howard 2005). It thus would appear that an “ecological diver-
gence” model is the most plausible. This model requires ecological speciation of
M. m. heermanni and M. m. fallax, the terminal points, across the San Gorgonio
Pass while the species expanded its range northward on either side of the Sierra
Nevada and Mojave Desert (Fig. 20.5). At this stage an “in situ” model cannot be
eliminated, and distinguishing between these models requires detailed genetic, eco-
logical, and behavioral research around the ring. Even so, Occam’s razor would
argue in favor of the “ecological divergence” model, if only because it invokes
ecological speciation (or subspeciation) at only one location instead of a minimum
of four (the number of contact zones between Song Sparrow subspecies that form
the ring).
There are additional wrinkles in the formation of the Song Sparrow ring. For
example, M. m. cleonensis is morphologically intermediate between subspecies
in the “California group” and those in the “Alaska and Pacific Northwest group”
(sensu Patten and Pruett 2009). I suggest that this intermediacy reflects a historical
merging of a northward expanding front from the refugium in southern California
and the southward expanding front from the Queen Charlotte Islands. That
M. m. montana, the northern “cap” to the species ring, shares characters of both
California and “Eastern” subspecies also implies extensive gene flow, but it remains
to be determined whether eastward and southward fronts merged to leave a ring
species pattern without divergence in the face of gene flow or by distance.
Only in-depth studies that combine morphology, genetics (especially nuclear
DNA), ecology, and geological history will be able to distinguish among various
models for the evolution of a ring species or confirmation of the “ring species
hypothesis” (Joseph et al. 2008; Bensch et al. 2009). Regardless, an important
starting point for any investigation of a putative ring species is full consideration of
all plausible models that could have led to a ring species’ evolution, not just an
20 Evolution and Historical Biogeography of a Song Sparrow Ring 339

expectation of conformity to classical models. Consideration of alternative models
not only promises to provide deeper insight in how ring species evolve but also
promises to build a stronger bridge between micro- and macroevolution.
San Gorgonio Pass
Fig. 20.5 Hypothesized postglacial expansion of the Song Sparrow (Melospiza melodia) from an
identified (but nonetheless postulated) glacial refugium in the Sonoran Desert (dashed circle).Such range expansion would yield a ring species pattern, but in this species’ case the terminal
points are in the vicinity of the San Gorgonio Pass, meaning the ring evolved by a combination of
“divergence by distance” and ecological speciation (the “ecological divergence” model of
Fig. 20.2), a process heretofore not considered in studies of ring species
340 M.A. Patten

Acknowledgments I thank Pierre Pontarotti for the opportunity to speak at the 13th Evolutionary
Biology Meeting and Axelle Pontarotti for her excellent guidance both pre and post meeting. John
T. Rotenberry, Leonard Nunney, and Marlene Zuk advised during early stages of this study, and
Christin L. Pruett has been a sounding board during later stages. I am grateful to Lukas F. Keller
and his research group and colleagues at Universit€at Z€urich for their feedback following my
September 2008 seminar there. Brenda D. Smith-Patten has been a limitless source of support
throughout this research; she also helped prepare Fig. 20.2 and commented on a draft of this
chapter.
References
Barton NH, Hewitt GM (1989) Adaptation, speciation, and hybrid zones. Nature 341:497–503
Bensch S, Grahn M, M€uller N, Gay L, Akesson S (2009) Genetic, morphological, and feather
isotope variation of migratory Willow Warblers show gradual divergence in a ring. Mol Ecol
18:3087–3096
Burns KJ, Alexander MP, Barhoum DN, Sgariglia EA (2007) Statistical assessment of congruence
among phylogeographic histories of three avian species in the California Floristic Province.
Ornithol Monogr 63:96–109
Cain AJ (1954) Animal species and their evolution. Princeton University Press, Princeton, NJ
Calsbeek R, Thompson JN, Richardson JE (2003) Patterns of molecular evolution and diversifica-
tion in a biodiversity hotspot: the California Floristic Province. Mol Ecol 12:1021–1029
Coyne JA, Orr HA (2004) Speciation. Sinauer Assoc, Sunderland, MA
Doebeli M, Dieckmann U (2003) Speciation along environmental gradients. Nature 421:259–264
Ehlers J, Gibbard PL (2004) Quaternary glaciations – extent and chronology, part 2: North
America. Elsevier, Amsterdam
Endler JA (1977) Geographic variation, speciation, and clines. Princeton Monogr Pop Biol
10:1–246
Erwin DH (2000) Macroevolution is more than repeated rounds of microevolution. Evol Dev
2:78–84
Fry AJ, Zink RM (1998) Geographic analysis of nucleotide diversity and Song Sparrow
(Aves: Emberizidae) population history. Mol Ecol 7:1303–1313
Hansen TF, Martins EP (1996) Translating between microevolutionary process and macroevolu-
tionary patterns: the correlation structure of interspecific data. Evolution 50:1404–1417
Irwin DE, Irwin JH (2002) Circular overlaps: rare demonstrations of speciation. Auk 119:596–602
Irwin DE, Bensch S, Price TD (2001a) Speciation in a ring. Nature 409:333–337
Irwin DE, Irwin JH, Price TD (2001b) Ring species as bridges between microevolution and
speciation. Genetica 112–113:223–243
Irwin DE, Bensch S, Irwin JH, Price TD (2005) Speciation by distance in a ring species. Science
307:414–416
Jablonski D (2000) Micro- and macroevolution: scale and hierarchy in evolutionary biology and
paleobiology. Paleobiology 26(suppl):15–52
Jordan DS (1905) The origin of species through isolation. Science 22:545–562
Joseph L, Dolman G, Donnellan S, Saint KM, Berg ML, Bennett ATD (2008) Where and when
does a ring start and end? Testing the ring-species hypothesis in a species complex of
Australian parrots. Proc Biol Sci 275:2431–2440
Kuchta SR, Parks DS, Mueller RL, Wake DB (2009) Closing the ring: historical biogeography of
the salamander ring species Ensatina eschscholtzii. J Biogeogr 36:982–995Lapointe F-J, Rissler LJ (2005) Congruence, consensus, and the comparative phylogeography of
codistributed species in California. Am Nat 166:290–299
20 Evolution and Historical Biogeography of a Song Sparrow Ring 341

Leavitt DH, Bezy RL, Crandall KA, Sites JW Jr (2007) Multi-locus DNA sequence data reveal a
history of deep cryptic vicariance and habitat-driven convergence in the desert night lizard
Xantusia vigilis species complex (Squamata: Xantusiidae). Mol Ecol 16:4455–4481
Leimar O, Doebeli M, Dieckmann U (2008) Evolution of phenotypic clusters through competition
and local adaptation along an environmental gradient. Evolution 62:807–822
Martens J, P€ackert M (2007) Ring species – do they exist in birds? Zool Anz 246:315–324
Mayr E (1942) Systematics and the origin of species. Columbia University Press, New York
Mayr E (1982) Speciation and macroevolution. Evolution 36:1119–1132
Mila B, Wayne RK, Fitze P, Smith TB (2009) Divergence with gene flow and fine-scale
phylogeographical structure in the wedge-billed Woodcreeper, Glyphorynchus spirurus, aneotropical rainforest bird. Mol Ecol 18:2979–2995
Nosil P (2008) Speciation with gene flow could be common. Mol Ecol 17:2103–2106
Patten MA, Pruett CL (2009) The Song Sparrow as a ring species: patterns of geographic variation,
a revision of subspecies, and implications for speciation. System Biodivers 7:33–62
Patten MA, Erickson RA, Unitt P (2004a) Population changes and biogeographic affinities of the
birds of the Salton Sink, California/Baja California. Studies Avian Biol 27:24–32
Patten MA, Rotenberry JT, Zuk M (2004b) Habitat selection, acoustic adaptation, and the
evolution of reproductive isolation. Evolution 58:2144–2155
Pruett CL, Arcese P, Chan YL, Wilson AG, Patten MA, Keller LF, Winker K (2008) Concordant
and discordant signals between genetic data and described subspecies of Pacific coast Song
Sparrows. Condor 110:359–364
Reznick DN, Ricklefs RE (2009) Darwin’s bridge between microevolution and macroevolution.
Nature 457:837–842
Schluter D (2009) Evidence for ecological speciation and its alternative. Science 323:737–741
Simons AM (2002) The continuity of microevolution and macroevolution. J Evol Biol 15:688–701
Sommer RS, Zachos FE (2009) Fossil evidence and phylogeography of temperate species: ‘glacial
refugia’ and post-glacial recolonization. J Biogeogr 36:2013–2020
Stanley SM (1998) Macroevolution: pattern and process. Johns Hopkins University Press,
Baltimore
Stebbins RC (1957) Intraspecific sympatry in the lungless salamander Ensatina eschscholtzii.Evolution 11:265–270
Swenson NG, Howard DJ (2005) Clustering of contact zones, hybrid zones, and phylogeographic
breaks in North America. Am Nat 166:581–591
Thorpe RS, Surget-Groba Y, Johansson H (2008) The relative importance of ecology and
geographic isolation for speciation in anoles. Phil Trans R Soc Lond B Biol Sci 363:3071–3081
Wake DB (2006) Problems with species: patterns and processes of species formation in salaman-
ders. Ann Mo Bot Gard 93:8–23
Wake DB, Yanev KP (1986) Geographic variation in allozymes in a “ring species”, the pletho-
dontid salamander Ensatina eschscholtzii of western North America. Evolution 40:702–715
Waltari E, Hijmans RJ, Peterson AT, Nyari AS, Perkins SL, Guralnick RP (2007) Locating
Pleistocene refugia: comparing phylogeographic and ecological niche model predictions.
PLoS ONE 2(7):e563
Zink RM (2010) Drawbacks with the use of microsatellites in phylogeography: the Song Sparrow
Melospiza melodia as a case study. J Avian Biol 41:1–7
Zink RM, Dittmann DL (1993) Gene flow, refugia, and evolution of geographic variation in the
Song Sparrow (Melospiza melodia). Evolution 47:717–729
342 M.A. Patten

Chapter 21
Cave Bear Genomics in the Paleolithic Painted
Cave of Chauvet-Pont d’Arc
Celine Bon and Jean-Marc Elalouf
Abstract Caves are reservoirs of fossils, some of which belong to species now
extinct. Paleogenetics explores ancient DNA that may have survived in these fossils
to better understand the phylogeny of Pleistocene species and the paleoenviron-
ment. The Chauvet-Pont d’Arc Cave, which displays the earliest known human
drawings, contains thousands of animal remains, setting this cave as a mine for
genetic analysis. We focused on the extinct cave bear, Ursus spelaeus, and proved
that Chauvet-Pont d’Arc samples still contain enough DNA for genetic studies. One
of them yielded well-preserved DNA and allowed sequencing the complete cave
bear mitochondrial genome. We used this molecular information to establish bear
phylogeny and the tempo of Ursidae speciation. Widening our analysis to cave
bears samples from Chauvet-Pont d’Arc and a closely located cave, we showed that
the Pleistocene ursine population was highly homogeneous at the regional level.
21.1 The Chauvet-Pont d’Arc Cave, a Well-Preserved
Paleolithic Site
21.1.1 The Earliest Rock Art Recorded to Date
In 1994, the three cavers Jean-Marie Chauvet, Eliette Brunel, and Christian Hillaire
made a major discovery in the field of archeology: they found a cave containing
hundreds of Paleolithic rock art pictures. This cave, located near Vallon-Pont d’Arc
(Ardeche, Southeastern France) at the entrance of the Ardeche Gorge, is now
known as Chauvet-Pont d’Arc from one of its discoverers, Jean-Marie Chauvet.
C. Bon and J-M. Elalouf
CEA, IBiTec-S, F-91191 Gif-sur-Yvette cedex, France
e-mail: [email protected]
P. Pontarotti (ed.), Evolutionary Biology – Concepts, Molecularand Morphological Evolution, DOI 10.1007/978-3-642-12340-5_21,# Springer-Verlag Berlin Heidelberg 2010
343

Since some of the pictures were drawn with charcoal, dating analysis was
possible using the radiocarbon method. Several paintings returned a radiocarbon
age between 30,000 and 32,000 years Before Present (BP), which sets them about
twice older than the age currently proposed for Lascaux Cave paintings. Chauvet-
Pont d’Arc rock art is the oldest Paleolithic drawing known to date (Valladas et al.
2001). The cave displays three kinds of rock art pictures: charcoal- and ochre-made
drawings and engravings. As dating is only feasible for charcoal-made pictures,
some of the other pictures might be older than 32,000 years BP.
The cave also contains other remains of human occupation. The track of a male
infant was found in a deep part of the cave, in the Gallery of the Crosshatches.
During his trip, the child regularly rubbed his torch against the wall, leaving
numerous sooty marks. These marks were radiocarbon dated back to 26,000 years
BP (Garcia 2005).
Huge hearths were found in other cave sectors and were most probably used by
Paleolithic artists for the production of charcoal pencils. The cave also contains
about 20 flint tools as well as an ivory assegai point (Geneste 2005). Other
anthropogenic processes, such as stone blocks grouped together by humans or a
cave bear skull deposited on a large rock, remain enigmatic.
Due to the rich overall archeological content and, especially, the great age of the
rock art pictures, the Chauvet-Pont d’Arc Cave is protected from the very day of its
discovery (Baffier 2005). As soon as they saw the first rock art pictures, the three
discoverers took care to protect the ancient soil. Afterwards, footbridgeswere installed
throughout the cave. The access to the cave is restricted to a handful of people that are
granted authorization from the prefect. A permanent watch was set to detect microbial
pollution as well as local climate change. Even the scientific researches are strictly
monitored to ensure preservation of the site. Thus, there are only two short campaigns
of studies each year, no more than 12 people are tolerated inside the cave, no direct
contact with the archeological remains or the walls are allowed, and retrieving of
samples rests on special curator’s authorization (Baffier 2005).
Despite these constraints, the cave provides a unique basis for scientific research
because its preserved state gives us access to a Paleolithic site untouched since the
entrance of the cave collapsed some 20,000 years ago.
21.1.2 The Chauvet-Pont d’Arc Cave, a Bear Cave
Even without such anthropogenic remains, Chauvet-Pont d’Arc would still have
been a major paleontological discovery since it displays thousands of animal
remains, most of which consist of Ursus spelaeus bones (Fig. 21.1) (Fosse and
Philippe 2005). Among the 3,844 bones dispatched all over the ground, 3,703 are
ascribed to the cave bear. The brown bear (Ursus arctos) has been identified
through a single skull, which contrasts with the 200 cave bear skulls that are present
in Chauvet-Pont d’Arc. Other species, such as the wolf, extinct cave hyena, fox,
ibex, deer, are evidenced by a few samples. Canidae coprolites and footprints are
also present in the cave.
344 C. Bon and J.-M. Elalouf

Fig. 21.1 Topography of the Chauvet-Pont d’Arc Cave. Blue areas correspond to places with cavebear wallows; purple circles indicate cave bears footprints; green thick lines on walls indicate thatcave bear claw marks are present. Radiocarbon ages are given as years BP. Topography:
Y. Le Guillou and F. Maksud. Paleontological data: P. Fosse and M. Philippe
21 Cave Bear Genomics in the Paleolithic Painted Cave of Chauvet-Pont D’Arc 345

But the cave is not only a bear grave, for it also displays many evidences of live
animal’s occupation. The ground is warped by the numerous wallows in which
bears used to hibernate; the walls are scratched by claw marks and polished by their
roaming; bear footprints can be seen in every chamber.
Whereas the brown bear is still an extant species, the cave bear became extinct
about 25,000 years ago (Pacher and Stuart 2009). Ursus spelaeus was a robustly
built bear that weighed 200 kg more than the sturdiest extant bears, i.e., the Kodiac
and polar bears. The sexual dimorphism is strong, as well as the intraspecific
variability (Kurten 1976). It is currently estimated that the cave bear was confined
to Europe, even though cave-bear-looking bears that may belong to some cave bear
subspecies were found in Crimea, Caucasus, or Siberia (Knapp et al. 2009). It has
been considered that the cave bear was mostly herbivorous, but two recent studies
(Richards et al. 2008; Peigne et al. 2009) showed that it was omnivorous at least
during the prehibernation period.
Since the cave bear is an extinct species, its phylogenetic relationship with other
bears has long been only known through paleontological data. The direct ancestor of
the cave bear is Ursus deningeri, because Ursus spelaeus succeeds continuously to
Ursus deningeri (Mazza and Rustioni 1994). It is estimated that the transition
between the two species occurred around the beginning of the last interglacial, but
to draw a limit between these two chrono-species may be awkward (Argant 2001).
Views diverge about the origins of theUrsus arctos and theUrsus spelaeus lineages.Whereas most paleontologists assume that these two lineages emerged from Ursusetruscus, Mazza and Rustioni proposed that Ursus etruscus is a dead end, and that
Ursus deningeri appeared among extremely polymorphic Ursus arctos lineages.This issuewas first questioned in 1994 by analyzingmitochondrial DNA fragments
from Pleistocene remains (Hanni et al. 1994). This initial studies and subsequent work
(Loreille et al. 2001) yielded sequence data for the mitochondrial control region and
cytochrome b (CYTB) gene. However, when we initiated our studies the information
available consisted of less than 10 % of the mitochondrial genome. As increasing
evidences suggest that long sequences are necessary to obtain robust phylogenies and
to accurately date the divergence events between lineages (Rohland et al. 2007), a
complete cave bear mitochondrial genome sequence was highly desirable (Bon et al.
2008).
21.2 Sequencing the Mitochondrial Genome of the
Extinct Cave Bear
21.2.1 The Challenge of Retrieving and Sequencing Ancient DNA
The study of ancient DNA is tricky. Although in the living cell enzymatic processes
continuously repair DNA, endogenous nucleases and exogenous fungi or bacteria
begin degrading DNA from the death of an organism. Under rare circumstances
(such as rapid desiccation or adsorption on a mineral matrix), the DNA may escape
346 C. Bon and J.-M. Elalouf

the onslaught, its only source of deterioration being through chemical processes
(Hofreiter et al. 2001b; Paabo et al. 2004). Thus ancient DNA is scarce and displays
a number of chemical alterations. This has several consequences. The length of the
DNA molecules is reduced by strand breaks. In addition, depurination and cross-
linking between strands or between a DNA strand and another molecule result in
impeding PCR amplifications. As the initial amount of ancient DNA is extremely
low, the amplification stage is sensitive to contaminations, not only from modern
DNA but also from previously amplified products. Another problem is the deami-
nation of cytosine and adenine, leading to mutations such as T instead of C, and G
instead of A in the retrieved sequence. At last, the samples often contain a variety of
organic molecules that may act as PCR inhibitors. This prevents the use of a large
amount of extract in the PCR mix.
Considering the care taken to protect the Chauvet-Pont d’Arc Cave from con-
taminations, we turned to it to select an eligible cave bear sample for the sequencing
of the mitochondrial genome. After screening several samples, we chose US18
because of its biomolecular preservation. It still contained enough collagen for
radiocarbon dating, and the amino-acid racemization extent was quite low. After
DNA extraction, a 117 bp mitochondrial sequence was amplified over a wide range
of sample extract (from 0.1 to 2%), which shows that we retrieved large amounts of
DNA and few PCR inhibitors. Since independent replication is required in ancient
DNA studies, another group of investigators from another Institute performed
extraction and analysis. The same and another overlapping pair of primers were
used and confirmed the sequence initially obtained. Both extracts were employed in
the subsequent experiments.
21.2.2 Obtaining the Complete Cave Bear MitochondrialSequence
When this analysis began, only few fragments of the cave bear mitochondrial
genome were known: a portion of the control region had been sequenced from
several samples (Hanni et al. 1994; Hofreiter et al. 2002, 2007; Orlando et al. 2002;
Rohland et al. 2004). A single gene, namely CYTB, had been characterized
throughout its coding region from one sample found in the Balme-a-Collomb
Cave (Loreille et al. 2001).
We designed an iterative experimental strategy to determine the cave bear
mitochondrial genome. First, we aligned the mitochondrial genomes of the extant
brown bear (Ursus arctos), polar bear (Ursus maritimus), and American black bear
(Ursus americanus) (Delisle and Strobeck 2002). From this alignment, conserved
regions were identified and used to design a first series of primers for amplifying
DNA fragments ranging from 100 to 200 bp. These 147 primer pairs spanned the
entire genome.
Only 64 primer pairs out of 147 succeeded; the 83 failures may result from mis-
pairing between the template cave bear DNA and the primers. As a consequence, in
21 Cave Bear Genomics in the Paleolithic Painted Cave of Chauvet-Pont D’Arc 347

the following rounds, we used the sequence obtained from previous runs to design
cave bear specific primers. In the end, nine rounds were required and we successfully
used 245 primer pairs.
In order to avoid contaminations, prePCR steps were done in a dedicated
laboratory facility, in a building free from molecular biology research. Each primer
pair was designed to amplify DNA fragments shorter than 200 bp. For each
fragment, at least two PCR amplifications were performed. As differences caused
by ancient DNA damages were usually detected, a third amplification was often
carried out, and the consensus sequence was retained. In the worst case scenario,
this strategy is expected leading to a 0.06% error rate (Hofreiter et al. 2001a). PCR
products were cloned and a minimum of 12 colonies was sequenced on both
strands. In the end, 570 successful PCR amplifications and more than 14,000
sequencing reactions were required to cover the entire mitochondrial genome.
In order to check the accuracy of the sequence, we analyzed each fragment
individually by BLAST to validate that the best GenBank match was an Ursidaesequence. Specifically, we verified that previously analyzed cave bear mitochon-
drial sequences (control region and CYTB gene) displayed the best BLAST score
with our analogous sequences.
The control region sequence of US18 cave bear belongs to the B haplotype as
defined in Orlando et al. (2002) and is identical to Scladina cave’s samples SC3500
and SC3800. Our and the published CYTB sequences differ only on four transitions
(0.35% of all CYTB nucleotides), two of them being located at the third base
position of codons. Furthermore, as the two specimens belong to different mito-
chondrial haplotypes, these differences may highlight intraspecific polymorphism.
We obtained a 16,810 bp long mitochondrial genome, which is in the range of
the extant Ursidae mitochondrial genomes. These genomes vary in length between
16,723 bp (Ursus maritimus) (Arnason et al. 2002) and 17,044 bp (Ursus thibetanusformosanus). The variation of the mitochondrial genome length is mainly due to a
domain of the control region, which displays a highly variable number of repeat of a
10 bp motif (Yu et al. 2007). This domain is longer than 200 bp and therefore cannot
be retrieved through a single PCR from ancient cave bear extracts. Thus, we
designed two primer pairs to target the 50 and the 30 ends of the domain. Afterwards,
all fragments were assembled into a 350 bp repeat sequence.
Another group has sequenced a second cave bear mitochondrial genome from a
sample found in Gamssulzen cave, Austria (Krause et al. 2008). This sample is a
44,000-year-old bone and its sequence belongs to the D haplogroup as defined in
Orlando et al. (2002). The experimental strategy was slightly different from ours as
they used a two-step multiplex approach PCR. As we did, they confirmed their data
by at least two independent amplifications, cloning of the PCR product and
sequencing of multiple clones.
Both cave bears sequences are very similar. Without taking into account the
350 bp repeat region, 16,227 bp among 16,448 are identical. As expected, the 221
mutations are rather transitional mutations (216) than transversional (5), with a
transition/transversion ratio equal to 43.2. As these two sequences belong to
different haplogroups, it is not surprising that they display 1.3% differences.
348 C. Bon and J.-M. Elalouf

Our aim was to determine the phylogenetic position of the cave bear, especially
with respect to the two main brown bear lineages (Taberlet and Bouvet 1994). As
only one brown bear mitochondrial genome was published, we decided to sequence
the mitochondrial genome of a brown bear belonging to the western lineage. We
analyzed a submodern bone sample from a French Pyrenean site (Guzet, Ariege,
France). This was conducted in a third building and after the cave bear mitochon-
drial genome had been obtained to avoid cross-species contaminations. The same
experimental strategy was followed, except that the first series of primers (designed
on a brown bear sample) was already highly specific, and that, as submodern DNA
is still well conserved, less primer pairs were needed (only 52 primer pairs). As for
the cave bear sequence, each PCR was performed at least twice, several clones were
sequenced, and the consensus sequence was checked using BLAST.
21.2.3 Resolving the Phylogeny of the Extinct Cave Bear
In order to obtain the Ursidae phylogeny, we aligned the cave bear and the
Pyrenean brown bear mitochondrial sequences (EU327344 and EU497665, respec-
tively) with sequences retrieved from GenBank for other bears species, using
MEGA 4.0.2 alignment tool with the default parameters. The giant panda was set
as an outgroup. The domain of the control region containing the 10 bp repeat motif
was removed prior to the phylogenetic analyses.
First, we tested the mutational saturation of our dataset, in order to check that
homoplasy keeps low and does not alter the results. We calculated the patristic
distance using Patristic software (Fourment and Gibbs 2006) and plotted the genetic
distance against the patristic distance. These distances are almost equal, indicating
that mutational saturation is weak and that few reversions affect the dataset. We
also calculated the transition/transversion ratio, which is equal to 19:1. As this ratio
is rather high, it confirms that saturation is rare.
Phylogenetic trees were reconstructed from this dataset using Neighbor Joining
(NJ), Maximum Parsimony (MP), and Maximum Likelihood (ML) using PhyML
(Guindon and Gascuel 2003) and Mega 4.0.2 (Tamura et al. 2007) softwares, as
appropriate. PhyML was implemented with a GTR þ G4 substitution model with
some invariable sites, and for the NJ reconstruction method, we used the Tamura
3-parameters and the gamma-distribution shape parameter estimated with PhyML.
The robustness of the phylogenetic trees was estimated with the bootstrap method
(1,000 replicates for NJ and MP, 100 replicates for ML).
Almost the same topology was recovered whatever the algorithm used
(Fig. 21.2). The only difference concerns Ursus thibetanus subspecies’ relation-
ships. Our results confirm the spectacled bear’s (i.e. Tremarctos ornatus) basal
position (Waits et al. 1999; Yu et al. 2004, 2007; Pages et al. 2008). Ursinae is a
monophyletic group in which Melursus ursinus is the most basal bear. Then
Ursinae split into two clades, one leading to Ursus spelaeus, Ursus arctos, andUrsus maritimus and the other leading to Ursus thibetanus, Ursus americanus, and
21 Cave Bear Genomics in the Paleolithic Painted Cave of Chauvet-Pont D’Arc 349

Helarctos malayanus. Whereas the first group is highly robust (all bootstrap values
equal 100%), the second one is less statistically supported. Besides, this clade is
not always found when analyzing shorter dataset (Talbot and Shields 1996a;
Waits et al. 1999; Yu et al. 2004, 2007; Bon et al. 2008; Pages et al. 2008).
As most of the internal branches are very short, we conclude that ursine speciation
Fig. 21.2 Molecular phylogeny inferred from complete mitochondrial genomes. Tree reconstruc-
tion was performed by NJ analysis using the giant panda (Ailuropoda melanoleuca) as an out-
group. The same tree topology was obtained using two other methods, except for the relationships
between Ursus thibetanus subspecies. Bootstrap values are indicated for NJ (regular), MP (bold),and ML (italic) analysis. The two sequences from this study are displayed in bold. GenBank
accession numbers for the other sequences are: Ailuropoda melanoleuca, FM177761, EF212882,
EF196663, and AM711896; Tremarctos ornatus, FM177764 and EF196665; Melursus ursinus,EF196662; Ursus thibetanus, EF1966362, EF667005, FM177759, EF587265, EF076773, and
EF196661; Ursus americanus, AF303109; Helarctos malayanus, FM177765 and EF196664;
Ursus maritimus, AF303111 and AJ428577; Ursus arctoseast, AF303110; Ursus spelaeus,FM177760
350 C. Bon and J.-M. Elalouf

was very rapid. Because of this radiation, it is difficult to retrieve the branching
order, except for the brown-polar-cave bear clade.
Relationships within this group are always consistent and are supported by
maximal bootstrap values. The cave bear stands as a sister species to the brown
and polar bear clade. The brown bear species is a paraphyletic group with respect to
Ursus maritimus, as the polar bear species emerges from the western brown bear
lineage (Talbot and Shields 1996b).
Therefore, mitochondrial genome data disagree with Mazza and Rustoni’s late
speciation hypothesis and confirm that the cave bear and brown bear lineages split
before the radiation of the brown bear species.
The robust phylogeny obtained with a complete mitochondrial genome offers
the opportunity of evaluating the divergence times between species. We used the
BEAST software (Drummond et al. 2005; Drummond and Rambaut 2007) with the
complete mitochondrial genomes dataset. Calibration was performed with the
divergence between the giant panda and Ursidae, and between Ursinae and Tre-marctinidae, set at 12 � 1 MY and 6 � 0.5 MY (million years), respectively,
considering a normal distribution. We chose a relaxed uncorrelated lognormal
molecular clock, a GTR þ G4 substitution model with some invariable sites and
a Yule process of speciation. Two independent chains that each consist of
10,000,000 points were calculated and the burn-in was set to 10,000.
To highlight the benefits brought by the analysis of long DNA sequences in
molecular dating analysis, we randomly created alignments of various lengths from
whole mitochondrial genome sequences. We calculated node ages using the para-
meters described above. Obviously, short sequences yield different node ages and
wider credibility intervals than longer sequences. The alignment has to reach at
least 10 kb to stabilize the node ages. A long sequence alignment is therefore
required to obtain an accurate molecular dating (Bon et al. 2008).
According to the results obtained with complete mitochondrial genomes
(Fig. 21.3), Tremarctinae diverged from Ursinae 6.3 MY ago, shortly before the
appearance of Ursus boeckhi, the first ursine representative. The bears radiation
occurred about 4 millions years later, between 2 and 3 MY ago. The short time
while five bears groups appeared explains the difficulties in determining the
branching order of bears. These speciations happened during the Pliocene, when
Ursus minimus was the most common bear in Europe. As this fossil species is
assumed to be the last common ancestor ofUrsus spelaeus,Ursus arctos, andUrsusthibetanus, our results agree with paleontological data.
We date the divergence event between arctoid and speleoid lineages to 1.6 MY,
during the Villafranchian stage, when Ursus etruscus was the main bear in Europe.
Most paleontologists consider that Ursus etruscus was the last common ancestor of
the brown and cave bears.
In conclusion, our approach proved successful for sequencing the complete mito-
chondrial genome of a species extinct for more than 20,000 years. The cave bear
mitochondrial genome shares high similarities with other bear mitochondrial gen-
omes. In addition, the phylogenetic analysis robustly confirms that the cave bear is a
sister species to the brown and polar bear clade. The amount of data obtained made
21 Cave Bear Genomics in the Paleolithic Painted Cave of Chauvet-Pont D’Arc 351

possible to evaluate the tempo of bears’ history during Pliocene and Pleistocene and
compare our conclusions with paleontological ones.
The cave bear mitochondrial genome sequence opens up possibilities to push
forward extinct bears DNA analysis. First, this sequence will help rescuing poorly
preserved samples by targeting different regions of the mitochondrial genome. We
studied Chauvet-Pont d’Arc bear samples that failed to yield any DNA when
Fig. 21.3 Phylogeny and divergence times determined using the mitochondrial genome sequence
of the cave bear and of eight extant bears. Divergence times were calculated using BEAST
software with the splits between the giant panda and Ursidae and between Ursinae and Tremarc-tinidae set to 12 and 6 MY, respectively. Age for each node and 95% credibility intervals are, as
follows: 1, 6.3 MY (5.4–7.2); 2, 3.0 MY (2.2–3.8); 3, 2.8 MY (2.1–3.5); 4, 2.4 MY (1.7–3); 5, 2.1
MY (1.4–2.7); 6, 1.6 MY (1–2.1); 7, 0.6 MY (0.3–0.8); and 8, 0.4 MY (0.2–0.5). The extinct cave
bear is displayed by a picture from Chauvet-Pont d’Arc
352 C. Bon and J.-M. Elalouf

analyzed for the mitochondrial control region. We targeted 112 bp in the 16 S gene
and obtained a successful amplification for 48% of the 23 samples, instead of 17%
when the control region was queried. Second, sequence data provided by extant
bears may not be sufficient to analyze DNA sequences of species that existed before
Ursus spelaeus, such as Ursus deningeri. The availability of the cave bear mito-
chondrial genome is expected to provide a better template for exploring very
ancient bear species.
21.3 Genetic Diversity Among Chauvet-Pont d’Arc Cave Bears
We explored the genetic diversity of cave bears from Chauvet-Pont d’Arc Cave by
analyzing several samples from the cave. For comparison purposes, we turned to
another cave from the same area, the Deux-Ouvertures Cave. This cave is located
by the end of the Ardeche Gorge, approximately 15 km away from Chauvet-Pont
d’Arc, and displays rock art pictures. It also contains numerous cave bear remains,
and except for Chauvet-Pont d’Arc, is the most striking bears cave in the area.
We collected 39 and 17 samples from Chauvet-Pont d’Arc and Deux-Ouvertures
caves, respectively. DNA was extracted, and we attempted to amplify a 117 bp
fragment of the mitochondrial genome control region.
Most of the Chauvet-Pont d’Arc cave samples (32/39) and some of the Deux-
Ouvertures cave ones (3/17) failed to yield the queried fragment. We conclude that
this fragment was no longer present or that the samples contain too much PCR
inhibitory compounds for being successfully amplified.
The samples that gave positive results belong to the same haplogroup (haplo-
group B) and to two different haplotypes, which we named HT1 and HT2. HT1 is
also found in Scladina (AY149268, AY149267) and Gigny (AY149264) Caves
(Orlando et al. 2002). HT2 differs from HT1 only in the position 16,550 and is
found in the Cova-Linares Cave (AY149271, AY149272) (Loreille et al. 2001). It is
not surprising to find the B haplogroup in these two caves since it is widely spread
throughout Western Europe.
HT1 and HT2 were both found in Chauvet-Pont d’Arc: two samples in Chauvet-
Pont d’Arc Cave displayed the HT2 haplotype (US08 and US21); the five samples
that yielded the HT1 haplotype are US17, US18, US19, US34, and US39. On the
other hand, all Deux-Ouvertures Cave samples gave the same haplotype, HT1. In
order to verify that this homogeneity is not due to a biased sampling with different
bones belonging to the same individual, we sampled five humerus from five
different individuals. We obtained the HT1 sequence for each of them, validating
that HT1 is widely spread in this cave.
Thus, we observed a high genetic homogeneity inside the bear population of
each cave, as well as from one cave to another. This evidences the frequent female
genetic exchange along Ardeche Gorge and contrasts with the highly subdivided
cave bear population hypothesis (Hofreiter et al. 2002, 2007).
21 Cave Bear Genomics in the Paleolithic Painted Cave of Chauvet-Pont D’Arc 353

In the same time, several Chauvet-Pont d’Arc samples were dated and returned
radiocarbon age between 37,300 � 340 years BP and 29,560 � 160 years BP.
Most of them range from 30,000 to 32,000 years BP, indicating that cave bears
were present at Chauvet-Pont d’Arc for a relatively brief period of time. It is worth
noting that Scladina and Cova-Linares samples which belong to the HT1 and HT2
haplotypes display approximately the same age as the Chauvet-Pont d’Arc samples.
Scladina’s bones belong to an archeological layer estimated to 40,000–45,000
years, and Cova-Linares’ ones are from a 35,000-year-old layer.
In conclusion, the genetic studies carried out in Chauvet-Pont d’Arc provided a
complete mitochondrial genome for the extinct cave bear, which enabled us to
obtain robust phylogenetic trees for Ursidae. The amount of data also offers the
opportunity of evaluating the divergence dates between species and to compare
genetic and paleontological results. Widening our studies to several samples from
this cave and another cave allowed us to explore the genetic diversity of the area.
We established that the mitochondrial genetic landscape in two caves 15 km away
from each other in the Ardeche Gorge is almost homogeneous. With other bear
caves along the river, extending such analysis to additional sites may allow to
describe more precisely the genetic pattern of the area.
This study also demonstrates that well-preserved DNA still remains in the
Chauvet-Pont d’Arc Cave and establishes this painted cave as a reservoir for
ancient DNA researches. Other species from the Chauvet-Pont d’Arc Cave can
now be analyzed to better characterize the Pleistocene environment.
Reference
Argant A (2001) Los antepasados del oso de las cavernas. Cad Lab Xeol Laxe 26:9
Arnason U, Adegoke JA, Bodin K, Born EW, Esa YB, Gullberg A, Nilsson M, Short RV, Xu X,
Janke A (2002) Mammalian mitogenomic relationships and the root of the eutherian tree. Proc
Natl Acad Sci USA 99:8151–8156
Baffier D (2005) La Grotte Chauvet: conservation d’un patrimoine. Bulletin de la societe pre-
historique francaise 102:11–16
Bon C, Caudy N, de Dieuleveult M, Fosse P, Philippe M, Maksud F, Beraud-Colomb E, Bouzaid E,
Kefi R, Laugier C, Rousseau B, Casane D, van der Plicht J, Elalouf JM (2008) Deciphering the
complete mitochondrial genome and phylogeny of the extinct cave bear in the paleolithic
painted cave of Chauvet. Proc Natl Acad Sci USA 105:17447–17452
Delisle I, Strobeck C (2002) Conserved primers for rapid sequencing of the complete mitochon-
drial genome from carnivores, applied to three species of bears. Mol Biol Evol 19:357–361
Drummond AJ, Rambaut A (2007) BEAST: Bayesian evolutionary analysis by sampling trees.
BMC Evol Biol 7:214
Drummond AJ, Rambaut A, Shapiro B, Pybus OG (2005) Bayesian coalescent inference of past
population dynamics from molecular sequences. Mol Biol Evol 22:1185–1192
Fosse P, Philippe M (2005) La faune de la grotte Chauvet: paleobiologie et anthropozoologie.
Bulletin de la societe prehistorique francaise 102:89–102
Fourment M, Gibbs MJ (2006) PATRISTIC: a program for calculating patristic distances and
graphically comparing the components of genetic change. BMC Evol Biol 6:1
354 C. Bon and J.-M. Elalouf

Garcia MA (2005) Ichnologie generale de la grotte Chauvet. Bulletin de la societe prehistorique
francaise 102:103–108
Geneste JM (2005) L’archeologie des vestiges materiels dans la grotte Chauvet-Pont-d’Arc.
Bulletin de la societe prehistorique francaise 102:135–144
Guindon S, Gascuel O (2003) A simple, fast, and accurate algorithm to estimate large phylogenies
by maximum likelihood. Syst Biol 52:696–704
Hanni C, Laudet V, Stehelin D, Taberlet P (1994) Tracking the origins of the cave bear (Ursus
spelaeus) by mitochondrial DNA sequencing. Proc Natl Acad Sci USA 91:12336–12340
Hofreiter M, Jaenicke V, Serre D, von Haeseler A, Paabo S (2001a) DNA sequences from multiple
amplifications reveal artifacts induced by cytosine deamination in ancient DNA. Nucleic Acids
Res 29:4793–4799
Hofreiter M, Serre D, Poinar HN, Kuch M, Paabo S (2001b) Ancient DNA. Nat Rev Genet
2:353–359
Hofreiter M, Capelli C, Krings M, Waits L, Conard N, Munzel S, Rabeder G, Nagel D, Paunovic M,
Jambresic G, Meyer S, Weiss G, Paabo S (2002) Ancient DNA analyses reveal high mitochon-
drial DNA sequence diversity and parallel morphological evolution of late pleistocene cave
bears. Mol Biol Evol 19:1244–1250
Hofreiter M, Munzel S, Conard NJ, Pollack J, Slatkin M, Weiss G, Paabo S (2007) Sudden
replacement of cave bear mitochondrial DNA in the late Pleistocene. Curr Biol 17:R122–R123
Knapp M, Rohland N, Weinstock J, Baryshnikov G, Sher A, Nagel D, Rabeder G, Pinhasi R,
Schmidt HA, Hofreiter M (2009) First DNA sequences from Asian cave bear fossils reveal
deep divergences and complex phylogeographic patterns. Mol Ecol 18:1225–1238
Krause J, Unger T, Nocon A, Malaspinas AS, Kolokotronis SO, Stiller M, Soibelzon L, Spriggs H,
Dear PH, Briggs AW, Bray SC, O’Brien SJ, Rabeder G, Matheus P, Cooper A, Slatkin M,
Paabo S, Hofreiter M (2008) Mitochondrial genomes reveal an explosive radiation of extinct
and extant bears near the Miocene–Pliocene boundary. BMC Evol Biol 8:220
Kurten B (1976) The cave bear story: life and death of a vanished animal. Columbia University
Press, New York
Loreille O, Orlando L, Patou-Mathis M, Philippe M, Taberlet P, Hanni C (2001) Ancient DNA
analysis reveals divergence of the cave bear, Ursus spelaeus, and brown bear, Ursus arctos,
lineages. Curr Biol 11:200–203
Mazza P, Rustioni M (1994) On the phylogeny of Eurasian bears. Palaeontographica 230:38
Orlando L, Bonjean D, Bocherens H, Thenot A, Argant A, Otte M, Hanni C (2002) Ancient DNA
and the population genetics of cave bears (Ursus spelaeus) through space and time. Mol Biol
Evol 19:1920–1933
Paabo S, Poinar H, Serre D, Jaenicke-Despres V, Hebler J, Rohland N, KuchM,Krause J, Vigilant L,
Hofreiter M (2004) Genetic analyses from ancient DNA. Annu Rev Genet 38:645–679
Pacher M, Stuart AJ (2009) Extinction chronology and palaeobiology of the cave bear (Ursus
spelaeus). Boreas 38:189–206
Pages M, Calvignac S, Klein C, Paris M, Hughes S, Hanni C (2008) Combined analysis of fourteen
nuclear genes refines the Ursidae phylogeny. Mol Phylogenet Evol 47:73–83
Peigne S, Goillot C, Germonpre M, Blondel C, Bignon O, Merceron G (2009) Predormancy
omnivory in European cave bears evidenced by a dental microwear analysis of Ursus spelaeus
from Goyet, Belgium. Proc Natl Acad Sci USA 106:15390–15393
Richards MP, Pacher M, Stiller M, Quiles J, Hofreiter M, Constantin S, Zilhao J, Trinkaus E
(2008) Isotopic evidence for omnivory among European cave bears: late pleistocene Ursus
spelaeus from the Pestera cu Oase, Romania. Proc Natl Acad Sci USA 105:600–604
Rohland N, Siedel H, Hofreiter M (2004) Nondestructive DNA extraction method for mitochon-
drial DNA analyses of museum specimens. Biotechniques 36(814–816):818–821
Rohland N, Malaspinas AS, Pollack JL, Slatkin M, Matheus P, Hofreiter M (2007) Proboscidean
mitogenomics: chronology and mode of elephant evolution using mastodon as outgroup. PLoS
Biol 5:e207
21 Cave Bear Genomics in the Paleolithic Painted Cave of Chauvet-Pont D’Arc 355

Taberlet P, Bouvet J (1994) Mitochondrial DNA polymorphism, phylogeography, and conserva-
tion genetics of the brown bear Ursus arctos in Europe. Proc Biol Sci 255:195–200
Talbot SL, Shields GF (1996a) A phylogeny of the bears (Ursidae) inferred from complete
sequences of three mitochondrial genes. Mol Phylogenet Evol 5:567–575
Talbot SL, Shields GF (1996b) Phylogeography of brown bears (Ursus arctos) of Alaska and
paraphyly within the Ursidae. Mol Phylogenet Evol 5:477–494
Tamura K, Dudley J, Nei M, Kumar S (2007) MEGA4: Molecular Evolutionary Genetics Analysis
(MEGA) software version 4.0. Mol Biol Evol 24:1596–1599
Valladas H, Clottes J, Geneste JM, Garcia MA, Arnold M, Cachier H, Tisnerat-Laborde N (2001)
Palaeolithic paintings. Evolution of prehistoric cave art. Nature 413:479
Waits LP, Sullivan J, O’Brien SJ, Ward RH (1999) Rapid radiation events in the family Ursidae
indicated by likelihood phylogenetic estimation from multiple fragments of mtDNA. Mol
Phylogenet Evol 13:82–92
Yu L, Li QW, Ryder OA, Zhang YP (2004) Phylogeny of the bears (Ursidae) based on nuclear and
mitochondrial genes. Mol Phylogenet Evol 32:480–494
Yu L, Li YW, Ryder OA, Zhang YP (2007) Analysis of complete mitochondrial genome
sequences increases phylogenetic resolution of bears (Ursidae), a mammalian family that
experienced rapid speciation. BMC Evol Biol 7:198
356 C. Bon and J.-M. Elalouf

Index
A
Accessory, 250, 251, 254, 257–260, 262
Actinobacteria, 303
Actinorhizal plants, 303
Adaptations, 8, 50, 53, 60, 82, 83, 95, 96
Adaption, 82, 84–90, 95
Adaptive radiation, 13, 283–297
Aeschynomene, 303Ag–NOR staining, 10
Agrobacteriumradiobacter, 309rhizogenes, 309tumefaciens, 306, 309vitis, 309
Allopatry, 50
Alpha, 119
Alpha-lactalbumin, 118, 121, 127
Alternative splicing, 31, 38
Amazon, 284, 289–293, 296, 297
Amines, 260
Amniotes, 3, 4, 6, 7, 12, 13
Ancestral area, 289, 290, 292
Ancestral karyotype, 144–146, 153
Ancient DNA, 346–348, 354
Andes, 285, 290, 291, 293
Anesthetic, 253, 255, 260–262
Antarctic fur seal (Arctocephalus gazella), 127Antennal modification
antennal hammer, 271–280
Anticoagulant, 255, 259–262
Aphid
Acyrthosiphon pisum, 133–136Aphis gossypii, 133, 134, 137Myzus persicae, 133, 134, 137
Apparatus, 250, 253, 257, 258
Appressorium ascospores, 319, 324
Area cladogram, 288, 289, 291, 292
Aromatase, 7
Ascoviruses
Diadromus pulchellus, 238, 244, 245Heliothis virescens, 238Spodoptera frugiperda, 237, 238Trichoplusia ni, 238
Azoarcus, 302Azolla, 303Azorhizobium, 301, 306
B
Background selection, 9
Baculoviruses, 230, 232, 233, 236
Bats, 283–297
Bayesian, 10, 12
Bayesian inference, 285
Bdelloid rotifers, 104
Behavior, 283–297
Beta, 119, 120
Beta-lactoglobin, 121
Biased incrementalism, 91–93, 95
Birth and death model, 31, 35, 40
BLAST, 192
Bootstrap, 107
Bovine (bos Taurus), 116, 127, 128Bracoviruses
Chelonus inanitus, 236Cotesia congregata, 235, 236Glyptapanteles flavicoxis, 235Glyptapanteles indiensis, 235
Bradyrhizobiumcanariense, 306japonicum, 306
357

Brown bear, 344, 346, 347, 349, 351
Buccinidae, 253, 254, 258
Buccinids, 254, 258, 260
C
California sea lion (Zalophuscalifornianus), 127
Cancellariid, 256, 262
Cancellariidae, 250, 255, 256, 259, 262
Cancellarioidea, 250, 252, 256
Cape fur seal (Arctocephalus pusillus),126, 127
Caseins, 118–122, 127, 128
Cave bear, 343–354
C-banding, 10
Charnov–Bull hypothesis, 7
Chauvet-Pont d’Arc, 343–354
Chdl, 285Chemical alterations, 347
Choline, 259, 260
Chromogens, 260
Chromosomal inversions, 52, 55
Chromosomal rearrangements, 51, 52, 55,
58, 59, 61
Chromosomal theory of speciation, 51, 61
Chromosome rearrangements, 55
CNGs. See Conserved nongenic sequences
Codon reassignments
ambiguous intermediate mechanism,
86–90
codon capture mechanism, 86, 87
Coevolution, 302
Colinearity, 55
Colubrariidae, 255, 262
Columbellidae, 254, 258
Comparative analysis
CAIC, 277
Comparative genomics, 10, 19–20, 25, 26,
29, 31, 40, 41
Complexity hypothesis, 102
Concerted evolution, 203–204
Conidae, 250
Connectivity analysis, 106, 108, 109, 111
Conoidea, 250, 252, 253, 257, 259, 261
Conopeptides, 259
Conotoxins, 251, 252, 257–261, 263
Conserved nongenic sequences (CNGs), 191
Constraints, 19–41
Convergence, 5
Convergent evolution, 302, 317–326
Coralliophilinae, 253, 255, 256, 261, 262
Corallivory, 254, 256, 262
Costellariidae, 259
Cot curve analysis, 188
Cow, 117, 121, 128
Cryptinae, 273–275, 278, 279
Cryptosporidium, 107, 109Cyanobacteria, 302, 303
Cycads, 302
Cytb, 285
D
Dby, 285Deletions, 55, 56, 58
Deux-Ouvertures Cave, 353
Developmental biology, 161
Diatoms, 107, 108, 110
Diclidurini, 284, 286, 287, 289, 293
Divergence times, 351, 352
Diversity, 252, 253, 256, 263, 264
Dmrt1, 10Dobzhansky, T., 50–52, 59
Dosage compensation, 12
Dosage sensitivity, 201
Drug targets, 106–110
Duplication
Genome duplication, 134
Lineage specific duplications, 138
Paralogs, 133, 136
E
Early lactation protein (ELP), 123
Ear morphology, 295–297
Echidnas (Tachyglossus and zaglosus), 116Echolocation, 295–297
E.C. number, 105, 109
Ecotones, 334, 335
Efficiency of sporulation, 54, 56
ELP. See Early lactation protein
EM. See Error minimization
Emballonuridae, 284, 289, 293
Embryos, 3, 7, 8
Emergence, 81–96
Endoparasitic wasps
Braconidae
Chelonus inanitus, 236Cotesia congregata, 235, 236Cotesia marginiventris, 234, 244Glyptapanteles flavicoxis, 235Glyptapanteles indiensis, 235Microplitis croceipes, 234
Ichneumonidae
Campoletis sonorensis, 230, 241, 244Cardiochiles nigriceps, 230Eiphosoma vitticolle, 237, 239Hyposoter didymator, 236
358 Index

Hyposoter fugitivus, 240Venturia canescens, 230
Endosymbiont
bacteria, 212
eukaryote, 209
facultative, 210
obligate, 210
primary, 210
reproductive, 211
secondary, 210
Endosymbiosis, 103, 104, 108
Enrichment analysis, 106, 111
ENU mutagenesis, 202
Environmental stress, 54
Enzymes, 103–109, 111
Epistasis, 36, 52
Ergalataxinae, 253, 256
Error minimization (EM), 83–91
Esters, 259, 260
Estrogen, 6
Eukaryotes, 102–108, 111
Eumycetes and Fungi
Botrytis cinerea, 318, 322Magnaporthe grisea, 322Neurospora crassa, 320, 322Penicillium chrysogenum, 322, 324–326Podospora anserina, 320, 322Rhizopus oryzae, 323–326Trichoderma reesei, 320, 322Trichoderma species, 326
Eutheria (eutherian or placentalia), 116
Evolution, 249–265
convergent, 182
divergent, 182
Evolutionary breakpoints, 144, 147–150
Evolutionary constraints, 190, 194, 200
Evolutionary rates
Divergence time, 144
Mutations, 133
Omega ratio (dN/dS), 134, 137–140
Synonymous non-substitution rate (dN),
134, 135, 137
Synonymous substitution rate (dS), 134,
135, 137
Evolvability, 95
Exogenes, 263, 265
Exons, 26, 38
Extinction, 9
Eye
camera, 182–185
compound, 181–183
mirror, 182
pinhole, 182
F
Fadrozole, 6
Fasciolariidae, 254, 258
Feeding, 250, 252–256, 262
Fitness change, 75–77
Fitness landscape, 33, 34, 36
Fluorescent in situ hybridization (FISH),
10, 11
Forest, 294, 296, 297
Functional constraints, 200–203
G
Gene architecture, 26
Gene-conversion, 203–204
Gene duplication, 29, 31
Gene expression, 160, 163, 171
Gene identity intervals
interspecies, 308
intraspecies, 308
Gene markers
dnaJ, 308dnaK, 309rpoB, 308, 309
Genes, 253, 261–263, 265
Genetic code
adaptive code hypothesis, 84–90
emergence hypothesis, 90–91
Genetic code evolution, 85, 90, 91
Genetic diversity, 353–354
Gene transfer
lateral, horizontal, 232
Genic theory of speciation, 51
Genome architecture, 19, 20, 23, 26–29, 35,
37, 38, 40
Genome 10K, 13
Genome sequence, 19, 23
Genomic, 56, 58
Genomic rearrangements, 51, 52, 55–61
Genomic structure, 188–190
Genotype � environment, 8–9
Gland, 250, 251, 257–260, 262
Goats, 121, 123, 128
Grey seal (Halichoerus grypus), 127Guiana Shield, 291, 297
Gunnera, 303
H
Haematophagous, 255, 257, 259, 262
Haematophagy, 254–256
Haplogroup, 348, 353
Haplotypes, 348, 353, 354
Harbour seal (Phoca vitulina), 127Harpidae, 259
Index 359

Harpooning, 253
Hemiplasy, 144, 150–154
Herbaspirillum, 302Heterogamety, 4–8, 10–12
Heteromorphic sex chromosomes, 4, 9
Hill–Robertson effect, 9
Histamine, 259
Historical biogeography, 284, 287–293
Hitchhiking, 9
Homoplasy, 144, 151, 153
Horizontal gene transfer (HGT), 101–104,
106–109, 111
Horizontal transfer, 202–204
Host location, 272–274, 279, 280
Hosts, 272–274, 278–280
Human chromosome 2, 195
Human chromosome 21, 191, 194, 195, 201
Hybrid fertility, 55, 57, 58
Hybridization, 4, 10
Hypobranchial gland, 251, 260
Hypolimnas bolina
Hypolimnas bolinaresistance, 221
I
Ichneumonidae, 271–273
Ichnoviruses
Campoletis sonorensis, 240–244Cardiochiles nigriceps, 230Hyposoter fugitivus, 240Tranosema rostrales, 240
Immunosuppressive genes
Imd, 232
Toll, 232
Inactivation, 12
Incipient, 50, 56, 58, 60
Incubation, 4–8
Insertions, 55, 56
Interaction, 8–9
Introns, 21, 23, 25, 26, 38, 39
Inversions, 52, 55, 56
Iridoviruses
Chilo suppressalis, 237Isolation, 49–61
J
Junk DNA, 190
K
Kappa, 119, 120
Karyotype, 4, 5
KEGG, 106, 111
L
Lactotransferin, 121
LALBA, 127
Lateral transfer, 304, 306
Legume plants
Phaseolus vulgaris, 306Leishmania, 107, 108, 111Lepidopterans
Chilo suppressalis, 237Ephestia kuehniella, 230Heliothis armigera, 237Heliothis zea, 233Spodoptera frugiperda, 234Trichoplusia ni, 235
Likelihood, 10
LINEs. See Long interspersed elements
Lipopolysaccharides, 111
LLP-A, 123
LLP-B, 123
Long conserved noncoding sequences
(LNCS), 192
Long interspersed elements (LINEs), 189
M
Mammaliaforms, 116
Mammals, 116–122, 124, 126–129
Marginellid, 254
Marginellidae, 255, 256, 259
Markov-chain Monte Carlo, 12
McDonald–Kreitman test, 23, 24
Melongenidae, 254, 258
Melospiza melodia, 331, 332, 340Mesorhizobium
amorphae, 306loti, 303
Metabolic enzymes, 103, 104, 111
Metatheria (marsupials or Marsupialia), 116
metaTIGER, 104–111
Methylobacterium, 306
Microarray
interspecies array, 183, 184
Microevolution, 8
Migration, 9
Milk proteins, 116–119, 122–128
Minimal gene set, 29, 30
Miocene, 287, 288, 290–292, 295, 297
Misfolding, 33, 34, 40
Mismatch repair, 51, 55
Mitochondria, 103, 104
Mitochondrial genome, 346–354
Mitridae, 253, 259, 260
Molecular dating, 284, 287, 288
360 Index

Molecular evolution, 67, 68, 78
Molluscs
cephalopod, 182–184
nautilus, 182–185
octopus, 182–184
pectin, 182–185
squid, 182–185
Morphogenetic gradient
dorsal gradient, 162, 163, 167, 169–171
dpp gradient, 168, 171
gradient, 160, 164, 166, 167, 169–172
Morphology, 283–297
Mouse chromosome 2, 195
Muller’s Ratchet, 9, 10
Muricidae, 253, 255, 256, 259, 261
Muricids, 254, 259, 260
Muricoidea, 250, 252
Mutation, 188, 192, 194, 200–202
beneficial, 69, 75–78
deleterious, 69, 75–77
neutral, 75
Mutational cold spot, 201–202
Mutational load, 55
Mutation robustness
error minimization (EM), 83, 90, 91
extrinsic, 94
intrinsic, 94, 95
Mutation-selection equilibrium, 73, 75, 77
Mycorrhizal symbiosis, 304
N
NADPH oxidase, 320, 321, 325
Nassariid, 254
Nassariidae, 254, 258, 259
Natural science,
Natural selection, 82–84, 91–96
Neotropics, 283–297
Nervous system
neural, 159–167, 172
neuroblast, 164–167, 172
Networks, 20, 26, 31–35, 37, 40
Neurotoxins, 250, 251, 258, 260–262
Neutral networks, 91, 93–95
New World emballonurid bats, 284–288,
290, 292, 294–296
Nitrogen fixation, 302, 304, 306
Nodulation factors
nodB, 303nodC, 303
Noncoding sequences, 20, 23
Nonorthologous gene displacement, 29, 31
Nonsynonymous substitutions, 21
Northern Amazon, 289–292, 296
Nudiviruses, 231, 233–236, 244
O
Odobenids, 125
Oligocene, 287, 288, 295, 296
Olividae, 259
One-band-one-gene hypothesis, 188
Operons, 23, 27, 28
Organelles
immunosuppressive, 229–245
Origin of life, 67, 68
Ortholog, 134, 137
Orthologous, 28–32, 35, 38
Ostreococcus, 107, 111Otariids (sea lions, fur seals), 125, 127
Oviparity, 12, 13
P
Paleolithic, 343–354
Pan-genome, 102
Paralogs, 29, 31, 35, 40
Parsimony, 10, 285, 286, 293, 294
Particles
immunosuppressive, 231–234
Patterning, 159–172
Pelage, 294–295
Peptides, 252, 253, 257, 258, 261, 263, 264
Phenomic, 19, 32–36, 39, 40
Phocids (true seals), 125, 127
Photoreceptors, 181, 183
Phylogenetic trees, 101–112
Phylogenies, 304, 306–310
Phylogeny, 284, 285, 287, 293–296, 349–353
Phytophthora, 107, 109, 111Pinniped, 125–126
Plasmodium, 107, 108Plasticity, 19–41
Plastids, 103, 104, 107–109, 111
Platypus (Ornithorhynchus anatinus), 116,118, 119, 121
Pleiotropy, 36
Pleistocene, 287, 290, 291, 346, 352, 354
Pleistocene refugia, 335, 336
Pleistocene refugium, 336, 337
Pliocene, 283, 287, 291
Polydnaviruses, 232–234, 236, 241, 243
Polygenic inheritance, 8
Polymorphisms, 151–153
Positive selection, 21–25
Poxviruses
Diachasmimorpha longicaudatapoxvirus, 244
Preferential attachment, 91, 92
Prezygotic, 50, 61
Prialt, 252, 260
PRIAM, 105, 106
Index 361

Primary, 250, 257–260, 262
Production, 257, 258, 260, 262
Profiling, 263–265
Prokaryotes, 23, 27–30, 36, 37, 39,
102–103, 107, 108, 111
Promiscuous domains, 26
Proteomics, 264, 265
Prototheria (monotreme or Monotrema), 116
Pseudaptation, 81–96
Pseudogenes, 21, 23
PSI-BLAST, 105, 106
PTMP-1, 123
PTMP-2, 123
Q
Quasispecies, 68, 72–74, 78
R
RAC 2 (myoblast fusion),
Radiation, 351
Radiocarbon age, 345, 354
Radula, 250, 253–257
Rearrangements, 51–53, 55–61
Reciprocical Best Hit, 133, 136
Recombination, 9, 12
Red kangaroo (macropus rufus), 122Regulators, 30, 31
Reinforcing mechanism, 50
Relative reproductive isolation, 50
Repeat masking, 192
Replication, 68, 71, 72, 75–78
Reproductive, 49–61
Reproductive barrier, 55, 56, 58–60
Reproductive isolation, 49–61, 331, 338
Rhizobia, 301–310
RhizobiumR. cellulosilyticum, 309R. daejeonense, 309R. etli, 303, 306R. fabae, 306R. galegae, 309R. huautlense, 309R. leguminosarum, 306R. lusitanum, 309R. mongolense, 309R. pisi, 306R. selenireducens, 309R. tropici, 306
Ringed seal (Pusa hispida), 127Ring species
Ensatina eschscholtzii, 331, 333Glossina morsitans, 331Lanius, 331, 333Melospiza melodia, 331, 332, 340
Phylloscopus trochiloides, 331Phylloscopus trochilus, 331Zosterops, 331
RNA
folding, 69–72
sequence-structure map, 68, 69, 72
world, 67–69, 71, 77
RNA complexity, 188
RNome, 25, 31
Robustness, 20, 32–34, 36–37, 40, 41
Roosts, 284, 293–295
Rot curve analysis, 188
S
Saccharomyces, 107Saccharomyces cerevisiae, 52, 54, 55Salivary glands, 250, 251, 257–260, 262
Savannahs, 288, 296, 297
Scale free networks, 91–92
Scaling, 30, 31, 40
Scaling, size, 160, 167–172
SDs. See Segmental duplications
Secretion, 253, 257–260, 262
Segmental duplications (SDs), 144,
147–150, 153
Selection
Adaptation, 133, 140
Fast-evolving genes, 137, 139–140
Positive selection, 134, 140
Relaxed selection, 134, 137, 140
Selective pressure, 68, 72, 78
Selfish operon, 28
Sequence data
Coding sequence (CDS), 135
Expressed sequence tag (ESTs), 133, 137
Pea aphid genome, 134, 136, 140
Sequences, 10, 11, 13, 14
Sequencing, 116–125, 129
Sex determination, 4–8, 10–13
SHARKhunt, 105, 106
Shell drilling, 254
Shell wedging, 254
Short interspersed elements (SINEs), 189
Signaling pathways
BMP signaling pathway/BMP signaling,
165, 166
SINEs. See Short interspersed elements
Single nucleotide polymorphisms (SNPs), 190,
191, 202
SinorhizobiumS. chiapanecum, 308S. mexicanum, 308S. terangae, 306
SNPs. See Single nucleotide polymorphisms
362 Index

Song Sparrow, 329–340
SOS, 53
South America, 283, 284, 286, 288–291,
293, 296
Spandrel, 82
Speciation, 50–56, 58, 60, 61
allopatric, 330, 335
ecological, 334, 338–340
Species, 49–58, 60, 61
Sporulation efficiency, 54, 56–61
16S rRNA, 308–310
Sry, 9
Starvation, 49–61
Stochastic approaches, 10
Subspecies, 330, 331, 333, 335, 338, 339
Symbiogenesis
genome fusion, 233
Symbiosis, 234, 301, 302, 304
Symbiotic genes
nif, 304nodA, 303–305nodABC, 303nodB, 303nodBC, 303nodC, 303
Symbiotic islands, 306
Symbiotic plasmids, 306, 307
repA, 307repABC, 307repB, 307repC, 307
Synaptid, 116
Synonymous sites, 21, 22, 23, 25, 26, 32, 33
Synonymous substitutions, 21
Syntenies, 144, 145, 151, 152
T
Tandem repeats, 147, 148
Taxon-pulse, 291, 292, 297
Terebridae, 250, 264
Terebrids, 253, 258
Teretoxins, 258, 264
TEs. See Transposable elements
Testosterone, 6
Tetramine, 258
Tetraploid, 51, 59, 60
Tetraploidization, 51, 52, 55, 59
Tetraspanin, 320, 321
Theileria, 107, 108Therapsid, 116
Theria, 116
Toxins, 250–252, 257–259, 261,
262–263, 265
Toxoplasma, 107, 108
Transferomics, 101–112
Translocations, 55, 56
Transposable elements (TEs), 25, 147,
149–150
Transpositions, 53, 55, 56
Trichosurin, 123
Trypanosoma, 107, 108Turrids, 250, 253, 258
Turritoxins, 258
U
UCEs. See Ultraconserved elements
Ultraconserved elements (UCEs), 191,
194–195, 201–204
Underdominance, 51, 52
Ursidae, 348, 349, 351, 352, 354Ursinae, 349, 351, 352Ursus spelaeus, 344, 346, 349–351, 353Usp9x, 285, 293
V
Venom, 250, 253, 257–259, 261–265
Vibrational sounding, 273, 279
Viviparity, 4, 12, 13
Volutidae, 253, 259, 260
Volutomitridae, 259
W
Wallaby (macropus eugenii), 122–124, 127Walrus, 125
WAP. See Whey acidic protein
WDC2, 121
Whey acidic protein (WAP), 118, 121, 122,
123, 128
Whole-genome, 13
Wing sac, 294, 295
Within-area specification events, 290
Wolbachiacytoplasmic incompatibility (CI), 211, 215,
217, 220
male-killing (MK), 209–222
supergroup, 210, 211
transmission, 211, 216
wBol1, 212–216, 218–221wBol2, 214, 215, 217wPip, 220
Wood boring beetles
Wood-boring, 273, 277
X
X chromosome, 5, 12
Y
Y chromosome, 195, 201
Index 363