Comparative genomic hybridization, BRAF, RAS, RET, and oligo-array analysis in aneuploid papillary...
10
Abstract. Aneuploidy in papillary thyroid carcinomas (PTCs) is considered a marker of worse prognosis. Multiple genetic surveys have been performed in PTCs, however, we are not aware of any such studies in aneuploid PTCs. In order to contribute to a better comprehension of the genetic basis of this neoplasm's more aggressive behaviour in 17 aneuploid PTCs we performed a comparative genomic hybridization (CGH) analysis, studied the BRAF and RAS mutational status, searched for RET/PTC1 and RET/PTC3 rearrangements and determined their expression profile. Array results were valid- ated by TaqMan and immunohistochemistry. CGH revealed multiple non-random chromosomal abnormalities. BRAF V600E and RAS mutations were found in 41.2% and 33% of the carcinomas respectively. None of the studied cases presented RET/PTC1 or RET/PTC3 rearrangement. When comparing array data with the chromosomal, mutational and clinical data we found that: a) loss of control of cellular transcription was of major relevance in this group of neoplasms, HMGA2 being one of the most overexpressed genes; b) gene expression correlated with the mutational status of PTCs, as in BRAF + cases cMET and FN1 were concomitantly overexpressed; and c) death from disease and distant metastasis was associated to the overexpression of DDR2 and to the down-regulation of genes involved in immune, inflammatory response, signal transduction and cell adhesion processes. In conclusion we have identified in aneuploid PTCs a group of significantly altered molecules that may represent preferential targets for the development of new more efficient therapies in this type of cancer. Introduction Papillary thyroid carcinomas (PTC) are the most common malignant thyroid tumours. DNA measurements by flow cytometry in PTC revealed that only a small percentage of these neoplasms (7%) were aneuploid, i.e., with a DNA index (DI) >1 (1). It was demonstrated by Sturgis et al (2) that aneuploidy in PTC was significantly associated with death from disease (p<0.027) and it has been evidenced that aneuploid nuclear DNA content was a marker of worse prognosis and should be included in the existing AMES (Age of patient, presence of distant Metastasis, Extent and Size of tumour) risk group classification (3). In accordance with the most accepted model of thyroid tumourigenesis, papillary cancer is thought to derive through the accumulation of specific genetic alterations that cause the malignant transformation of normal follicular cells (4). Multiple chromosomal studies have been performed in papillary carcinomas. Conventional cytogenetic analysis revealed that the most common structural chromosomal abnormalities were rearrangements with breakpoints at l0q11.2, followed by abnormalities with breakpoints at 1p32-36, 1q22, 1lp11-13, 3p25-26 and 7q32-36 (5). Comparative genomic hybridization (CGH) analysis showed that 104 of the 255 (40.8%) analysed papillary carcinomas had chromosomal imbalances. The most common gains involved regions 17q (16.3%), 1q (15.6%), 9q (12.5%), 4q and 13q (9.6%); common chromosomal losses were found in 22q (22.1%), 9q (12.5%), 13q (10.7%) and 17p (9.6%) (6-11). Molecular studies on the genetic alterations associated to PTC pointed out that mutations in RET, RAS and BRAF genes were early, mutually exclusive, initiating events important to thyroid follicular cell transformation into papillary cancer (12). BRAF V600E mutations were demonstrated to be the most common of them (13). RET structural alterations were reported in 0-80% of the PTCs according to different studies, the most frequent being RET/PTC1 and RET/PTC3 rearrangements (14). RAS point mutations were described as rare in PTC but frequent and associated to aneuploidy in other follicular thyroid carcinomas (15). Genomic analysis by expression array technologies has been used in PTC by several groups and the de-regulation of multiple growth factors and receptors, signal transduction ONCOLOGY REPORTS 18: 917-926, 2007 917 Comparative genomic hybridization, BRAF, RAS, RET, and oligo-array analysis in aneuploid papillary thyroid carcinomas RAQUEL RODRIGUES 1 , LÚCIA ROQUE 1 , CARLA ESPADINHA 2 , ANTÓNIO PINTO 3 , RITA DOMINGUES 2 , JOANA DINIS 2 , ANA CATARINO 4 , TERESA PEREIRA 4 and VALERIANO LEITE 2,5 1 Cytogenetic Laboratory, CIPM, 2 Molecular Biology Laboratory, CIPM, 3 Cytometry Laboratory, Pathology Department, and 4 Pathology Department, Portuguese Cancer Institute; 5 Medical Science Faculty, Lisbon University, Lisbon, Portugal Received March 29, 2007; Accepted May 24, 2007 _________________________________________ Correspondence to: Dr Lúcia Roque, Cytogenetic Laboratory, CIPM, Portuguese Cancer Institute, R. Professor Lima Basto, 1099- 023 Lisbon, Portugal E-mail: [email protected] Key words: thyroid, papillary, cancer, aneuploidy, comparative genomic hybridization, BRAF, RAS, RET, expression
-
Upload
independent -
Category
Documents
-
view
1 -
download
0
Transcript of Comparative genomic hybridization, BRAF, RAS, RET, and oligo-array analysis in aneuploid papillary...
Abstract. Aneuploidy in papillary thyroid carcinomas (PTCs)is considered a marker of worse prognosis. Multiple geneticsurveys have been performed in PTCs, however, we are notaware of any such studies in aneuploid PTCs. In order tocontribute to a better comprehension of the genetic basis ofthis neoplasm's more aggressive behaviour in 17 aneuploidPTCs we performed a comparative genomic hybridization(CGH) analysis, studied the BRAF and RAS mutational status,searched for RET/PTC1 and RET/PTC3 rearrangements anddetermined their expression profile. Array results were valid-ated by TaqMan and immunohistochemistry. CGH revealedmultiple non-random chromosomal abnormalities. BRAFV600E
and RAS mutations were found in 41.2% and 33% of thecarcinomas respectively. None of the studied cases presentedRET/PTC1 or RET/PTC3 rearrangement. When comparingarray data with the chromosomal, mutational and clinicaldata we found that: a) loss of control of cellular transcriptionwas of major relevance in this group of neoplasms, HMGA2being one of the most overexpressed genes; b) gene expressioncorrelated with the mutational status of PTCs, as in BRAF+
cases cMET and FN1 were concomitantly overexpressed; andc) death from disease and distant metastasis was associatedto the overexpression of DDR2 and to the down-regulationof genes involved in immune, inflammatory response, signaltransduction and cell adhesion processes. In conclusion wehave identified in aneuploid PTCs a group of significantlyaltered molecules that may represent preferential targets forthe development of new more efficient therapies in this typeof cancer.
Introduction
Papillary thyroid carcinomas (PTC) are the most commonmalignant thyroid tumours. DNA measurements by flowcytometry in PTC revealed that only a small percentage ofthese neoplasms (7%) were aneuploid, i.e., with a DNA index(DI) >1 (1). It was demonstrated by Sturgis et al (2) thataneuploidy in PTC was significantly associated with death fromdisease (p<0.027) and it has been evidenced that aneuploidnuclear DNA content was a marker of worse prognosis andshould be included in the existing AMES (Age of patient,presence of distant Metastasis, Extent and Size of tumour)risk group classification (3).
In accordance with the most accepted model of thyroidtumourigenesis, papillary cancer is thought to derive throughthe accumulation of specific genetic alterations that cause themalignant transformation of normal follicular cells (4).
Multiple chromosomal studies have been performed inpapillary carcinomas. Conventional cytogenetic analysisrevealed that the most common structural chromosomalabnormalities were rearrangements with breakpoints at l0q11.2,followed by abnormalities with breakpoints at 1p32-36, 1q22,1lp11-13, 3p25-26 and 7q32-36 (5). Comparative genomichybridization (CGH) analysis showed that 104 of the 255(40.8%) analysed papillary carcinomas had chromosomalimbalances. The most common gains involved regions 17q(16.3%), 1q (15.6%), 9q (12.5%), 4q and 13q (9.6%); commonchromosomal losses were found in 22q (22.1%), 9q (12.5%),13q (10.7%) and 17p (9.6%) (6-11).
Molecular studies on the genetic alterations associated toPTC pointed out that mutations in RET, RAS and BRAF geneswere early, mutually exclusive, initiating events important tothyroid follicular cell transformation into papillary cancer(12). BRAFV600E mutations were demonstrated to be the mostcommon of them (13). RET structural alterations were reportedin 0-80% of the PTCs according to different studies, the mostfrequent being RET/PTC1 and RET/PTC3 rearrangements(14). RAS point mutations were described as rare in PTC butfrequent and associated to aneuploidy in other follicular thyroidcarcinomas (15).
Genomic analysis by expression array technologies hasbeen used in PTC by several groups and the de-regulation ofmultiple growth factors and receptors, signal transduction
ONCOLOGY REPORTS 18: 917-926, 2007 917
Comparative genomic hybridization, BRAF, RAS, RET, and oligo-array analysis in aneuploid papillary thyroid carcinomas
RAQUEL RODRIGUES1, LÚCIA ROQUE1, CARLA ESPADINHA2, ANTÓNIO PINTO3, RITA DOMINGUES2,
JOANA DINIS2, ANA CATARINO4, TERESA PEREIRA4 and VALERIANO LEITE2,5
1Cytogenetic Laboratory, CIPM, 2Molecular Biology Laboratory, CIPM, 3Cytometry Laboratory, Pathology Department, and4Pathology Department, Portuguese Cancer Institute; 5Medical Science Faculty, Lisbon University, Lisbon, Portugal
Received March 29, 2007; Accepted May 24, 2007
_________________________________________
Correspondence to: Dr Lúcia Roque, Cytogenetic Laboratory,CIPM, Portuguese Cancer Institute, R. Professor Lima Basto, 1099-023 Lisbon, PortugalE-mail: [email protected]
Key words: thyroid, papillary, cancer, aneuploidy, comparativegenomic hybridization, BRAF, RAS, RET, expression
917-926 7/9/07 18:20 Page 917

proteins, cell cycle regulators, tumor suppressor genes andcellular adhesion and extracellular molecules were reportedto be involved in determining PTC's morphological and bio-logical characteristics (reviewed in ref. 16).
Although PTC has been the object of several geneticstudies, we are not aware of any chromosomal or expressionarray analysis specifically addressing the aneuploid fractionof PTC. As such, and in order to determine their geneticfeatures and try to assess the causes of their more aggressivebehaviour we performed a CGH analysis in a group of 17aneuploid PTCs, determined the incidence BRAF, RAS andRET alterations and evaluated the expression profile of 13 ofthese tumours.
Materials and methods
Tumour specimens. Between 1991 and 2001, 255 tissuesamples from patients with thyroid papillary carcinoma werecollected for genetic studies at the Portuguese Cancer Institutein Lisbon. Of these, 17 (6.7%) had an aneuploid DNA index.It was in this fraction of tumours that we performed CGH,BRAF, RET, RAS and oligo-array analysis.
Histologically, all neoplasms were classified according tothe most recent World Health Organization criteria for endo-crine tumours (14). A summary of the clinical and histologicaldata of this series of aneuploid PTC is depicted in Table I.
Flow cytometry analysis. DNA flow cytometric analysis wasperformed on fresh tissue samples using the method of Deitchet al (17). The ploidy status was expressed by the DNA index(DI). All tumours had a DI>1.0, as such they were defined asaneuploid (18).
CGH analysis. CGH was performed on stored liquid nitrogenfragments, after determining that each fragment comprisedmore than 75% of tumour cells and according to the previouslydescribed protocol (19).
Detection of BRAF, RAS and RET alterations. Evaluation ofBRAF mutational status was performed in all aneuploid PTCs.For BRAF exon 15 amplification, two previously describedprimers were used (12). Samples presenting a restriction patterncompatible with the presence of a BRAFV600E mutation werefurther analysed by sequencing. Sequencing was performedwith the ABI PRISM® BigDye™ Terminator Cycle SequencingReady Reaction Kit (Applied Biosystems, Foster City, CA,USA). Data was analysed using the ABI PRISM 310 geneticanalyser.
We used RT-PCR followed by cDNA sequencing toanalyse N-RAS, H-RAS, and K-RAS mutations in 12 of the 17PTC samples (Table II). Primers were designated in order toamplify PCR segments containing the mutational hot-spots ofRAS genes (Table III). After purification PCR products weresubjected to automatic sequencing and data analyses usingthe technology previously described for BRAF mutationaldetection.
Rearrangements of RET/PTC1 and RET/PTC3 wereevaluated by RT-PCR, in 13 of the 17 PTCs (Table II) usingthe conditions and primers described elsewhere (20).
Oligonucleotide microarrays. Human thyroid total RNA fromClontech® (consisting in a pool of thyroid RNA obtained from65 individuals which died from sudden death) was used as anormal baseline reference for the microarray experiments.Total RNA from the tumours depicted above, was extracted
RODRIGUES et al: GENETICS OF ANEUPLOID PTC918
Table I. Clinical and histological data of the 17 analysed cases.–––––––––––––––––––––––––––––––––––––––––––––––––––––––––––––––––––––––––––––––––––––––––––––––––––––Case Sex/age Surgery date Histological diagnosis TNM Disease course–––––––––––––––––––––––––––––––––––––––––––––––––––––––––––––––––––––––––––––––––––––––––––––––––––––1 F/88 1991 PTC, common pattern T4N1Mx Dead2 F/63 1993 PTC, common pattern with PDA T4N0M1 Persistent D.3 F/71 1995 PTC common pattern with PDA T4N0M0 Dead4 F/77 1997 PTC, follicular variant T4N1M1 Dead5 M/64 1997 PTC, common pattern T1bN1bM0 Remission6 M/70 1998 PTC, common pattern T4N1bM1 Dead7 F/40 1998 PTC, capsulate follicular variant T2N0M0 Remission8 F/28 1999 PTC, common pattern T2N0M0 Remission9 M/75 1994 PTC, common pattern T4N1bM1 Dead
10 F/46 2000 PTC, common pattern with PDA T2N0M0 Persistent D.11 F/20 2000 PTC, capsulate follicular variant T3N0M0 Remission12 M/56 2000 Poorly differentiated PTC T3N0M1 Dead13 M/59 2001 PTC, follicular variant T3bN0M0 Persistent D.14 F/21 2001 PTC, common pattern T2N1M0 Remission15 F/46 2001 PTC, common pattern T3bN0M0 Remission16 F/71 2001 PTC, common pattern T1bN1M0 Remission17 M/73 2001 PTC, tall cell variant with PDA T4bN1M1 Dead–––––––––––––––––––––––––––––––––––––––––––––––––––––––––––––––––––––––––––––––––––––––––––––––––––––PTC, papillary thyroid carcinoma; PDA, poorly differentiated areas; Persistent D., persistent disease.–––––––––––––––––––––––––––––––––––––––––––––––––––––––––––––––––––––––––––––––––––––––––––––––––––––
917-926 7/9/07 18:20 Page 918
using the RNeasy mini kit (Qiagen, GmbH, Hilden, Germany)according to the manufacturer. Integrity of the total RNAwas assessed in the Bioanalyser Agilent 2100 (Agilent tech-nologies, Mill Road, PA, USA) and the concentration wasdetermined using Nanodrop ND-1000 (Peqlab Biotechnologie,GmbH, Germany). RNA for oligo-array assays was onlyavailable from 13 of the 17 carcinomas (cases #3, 4, 5, 7,8, 9, 10, 11, 12, 13, 14, 15, and 17). For hybridization, the
commercial GeneChip® Human Genome U133 Plus 2.0 Arrayfrom Affymetrix® (Santa Clara, CA, USA) was used. Thesamples were processed according to the experimentalprocedures specified by Affymetrix®. The obtained microarrayswere scanned in GeneChip® Scanner 3000 from Affymetrix(Santa Clara, CA, USA), controlled by a workstation with theGeneChip operating software (GCOS) version 1.1.
Statistical analysis of oligo-array results. The software chosenfor the analysis was the DNA-Chip analyser (dChip)® (2000-2004 Wong Lab, Harvard School of Public Health and Dana-Farber Cancer Institute, USA). In the first step of the statisticalanalysis the arrays were normalized with the invariant setnormalization method, so that all non-biological variableswere reduced, followed by a Model-based expression analysis,using the model PM-only. The genes were filtered, so thatthose absent in all the samples were eliminated from theanalysis. We considered genes to be differentially expressedbetween samples, when the lower bound of fold change(LBFC) was at least 2, with a confidence of 90%. The obtaineddata was subject to hierarchical clustering and principalcomponents analysis (PCA). The genes were also classifiedaccording to ‘gene ontology’ using the gene classifying tool of
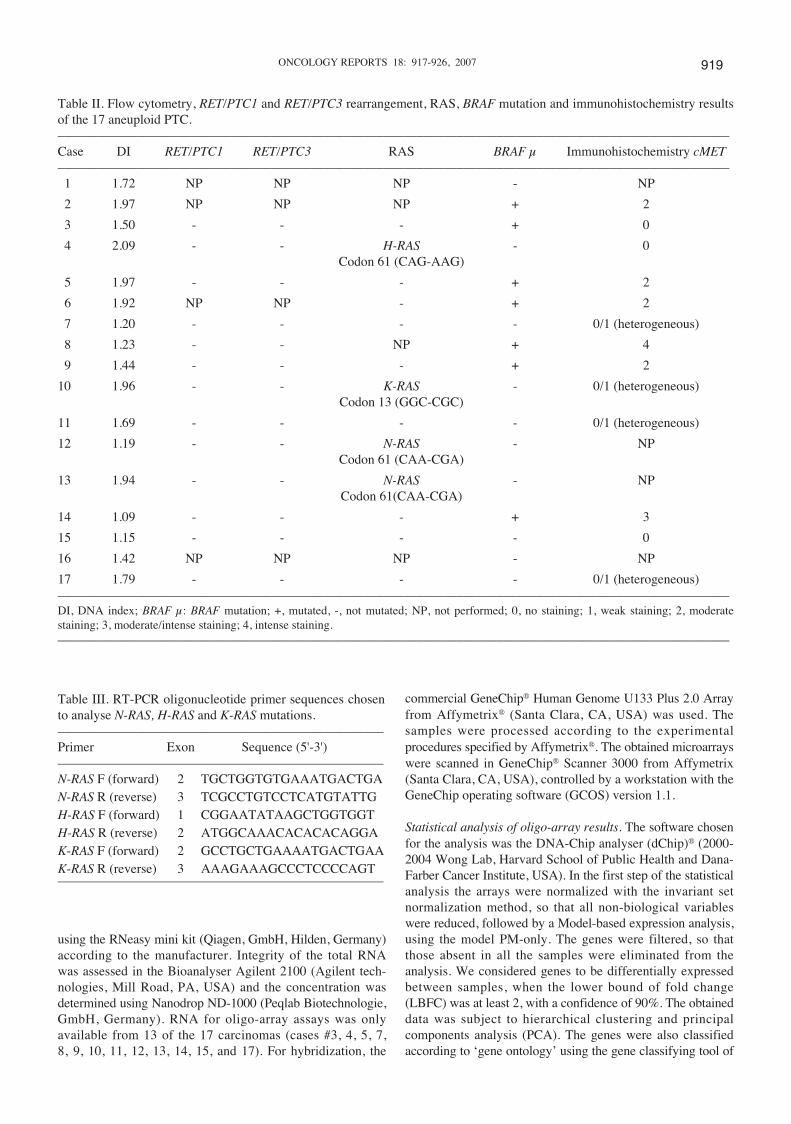
ONCOLOGY REPORTS 18: 917-926, 2007 919
Table II. Flow cytometry, RET/PTC1 and RET/PTC3 rearrangement, RAS, BRAF mutation and immunohistochemistry resultsof the 17 aneuploid PTC.–––––––––––––––––––––––––––––––––––––––––––––––––––––––––––––––––––––––––––––––––––––––––––––––––––––Case DI RET/PTC1 RET/PTC3 RAS BRAF μ Immunohistochemistry cMET–––––––––––––––––––––––––––––––––––––––––––––––––––––––––––––––––––––––––––––––––––––––––––––––––––––1 1.72 NP NP NP - NP
2 1.97 NP NP NP + 2
3 1.50 - - - + 0
4 2.09 - - H-RAS - 0Codon 61 (CAG-AAG)
5 1.97 - - - + 2
6 1.92 NP NP - + 2
7 1.20 - - - - 0/1 (heterogeneous)
8 1.23 - - NP + 4
9 1.44 - - - + 2
10 1.96 - - K-RAS - 0/1 (heterogeneous)Codon 13 (GGC-CGC)
11 1.69 - - - - 0/1 (heterogeneous)
12 1.19 - - N-RAS - NPCodon 61 (CAA-CGA)
13 1.94 - - N-RAS - NPCodon 61(CAA-CGA)
14 1.09 - - - + 3
15 1.15 - - - - 0
16 1.42 NP NP NP - NP
17 1.79 - - - - 0/1 (heterogeneous)–––––––––––––––––––––––––––––––––––––––––––––––––––––––––––––––––––––––––––––––––––––––––––––––––––––DI, DNA index; BRAF μ: BRAF mutation; +, mutated, -, not mutated; NP, not performed; 0, no staining; 1, weak staining; 2, moderatestaining; 3, moderate/intense staining; 4, intense staining.–––––––––––––––––––––––––––––––––––––––––––––––––––––––––––––––––––––––––––––––––––––––––––––––––––––
Table III. RT-PCR oligonucleotide primer sequences chosento analyse N-RAS, H-RAS and K-RAS mutations.–––––––––––––––––––––––––––––––––––––––––––––––––Primer Exon Sequence (5'-3')–––––––––––––––––––––––––––––––––––––––––––––––––N-RAS F (forward) 2 TGCTGGTGTGAAATGACTGAN-RAS R (reverse) 3 TCGCCTGTCCTCATGTATTGH-RAS F (forward) 1 CGGAATATAAGCTGGTGGTH-RAS R (reverse) 2 ATGGCAAACACACACAGGAK-RAS F (forward) 2 GCCTGCTGAAAATGACTGAAK-RAS R (reverse) 3 AAAGAAAGCCCTCCCCAGT–––––––––––––––––––––––––––––––––––––––––––––––––
917-926 7/9/07 18:20 Page 919

D-Chip. We regarded only the p significant genes (p<0.001)for this classification.
Quantitative real-time RT-PCR. To validate the array results,quantitative real-time RT-PCR was performed on 4 genes:fibronectin 1 (FN1), met proto-oncogene (hepatocyte growthfactor receptor) (cMET), chemokine (C-X-C motif) ligand 14(CXCL14), and discoidin domain receptor 2 (DDR2) using anABI PRISM 7900HT sequence detection system (AppliedBiosystems, Foster City, CA, USA). Sequence specific primersand probes were selected from the Assay-on-Demand products(Applied Biosystems). As endogenous control we selected thehousekeeping gene eukaryotic 18s rRNA (Applied Biosystems).The conditions of the TaqMan® PCR were as follows: 95˚Cfor 10 min, followed by 45-50 cycles of 95˚C for 15 sec and60˚C for 1 min. The relative expression of each sample wascalculated with respect to a standard calibration curve thatrepresents a serial dilution of cDNA positive for the expressionof the gene in analysis. Each sample was analysed three timesand each PCR experiment included at least one non-templatecontrol well.
Immunohistochemistry. We performed immunohistochemistryassays on paraffin-embedded tissues for cMET proto-oncogenein 13 of the 17 PTCs (Table II). Sections with 2-3 μm thicknesswere cut from formalin-fixed paraffin-embedded thyroid tissueblocks and stained with hematoxylin and eosin to confirm the
histological diagnosis. To enhance antigen exposure, specimenswere heated using a microwave oven in a 600 ml sodiumcitrate buffer (0.01 M, pH 6.0), Slides were incubated overnightat 4˚C with a rabbit polyclonal antibody directed against cMET(Zymed, San Francisco, CA). An anti-rabbit Envision polymer(Dako, Glostrup) was applied for 30 min followed by achromogenic substrate (3,3'-diaminobenzidine, Dako) for10 min. Sections were counterstained with Mayer hematoxylinfor 5 min. Negative controls were carried out by omitting theprimary antibody and a papillary carcinoma known to expresscMET was used as positive control. Staining intensity wasevaluated semi-quantitatively by an expert thyroid pathologist.The intensity of cMET staining was graded on a scale from 0 to4: 0, absent; l, weak; 2, moderate; 3, moderate/ intense; and 4,intense. In some cases, there were areas with different stainingintensities. These cases were classified as heterogeneous.
Results
Flow cytometry analysis. The DNA indexes (DI) for the 17cases are depicted in Table II. The assessed DI of thetumours varied between 1.09 and 2.09, as such all tumourswere considered to be aneuploid.
CGH analysis. CGH results are summarized in Fig. 1. CGHimbalances were observed in all 17 PTCs. The most frequentDNA gains involved the 5q region in 70.6% of the cases,
RODRIGUES et al: GENETICS OF ANEUPLOID PTC920
Figure 1. (A) Summary of the DNA copy number changes detected by CGH. Each bar on the left side of the chromosome ideograms (red) represents a loss inone tumour and each bar on the right side (green) represents a gain in one tumour.
917-926 7/9/07 18:20 Page 920
followed by gains of 7p, 7q and 12q in 64.7%, at 5p, 6q, and17q in 58.8% and at 4q, 14q and 16p in 52.9% of the tumours.None of the PTC presented high level amplifications. Chromo-somal losses were also frequently observed. By order offrequency, losses were at 9q in 52.9% of the cases, at 1p in47%, at 9p and 22q in 41.2% and at 11q and 13q in 35.3% ofthe neoplasms.
Detection of BRAF, RAS and RET alterations. BRAFV600E
mutation was observed in 7 of the 17 (41.2%) aneuploid PTCs(Table II).
RAS mutations were detected in only 4 of the 12 (33%)PTC samples (Table II). Two of four mutations were in codon61 of N-RAS, one in codon 61 of H-RAS, and one in codon13 of K-RAS. Mutations found in N-RAS were transitionsAT�GC at the second nucleotide of CAA codon resulting ina Gln�Arg substitution, the mutation found in H-RAS was atransversion CG�AT at the first nucleotide of CAG codon(Gln�Lys substitution) and the mutation found in K-RAS wasa transversion GC�CG at the first nucleotide of GGC codon(Gly�Arg substitution).
None of the 13 analysed cases presented RET/PTC1 orRET/PTC3 rearrangements (Table II).
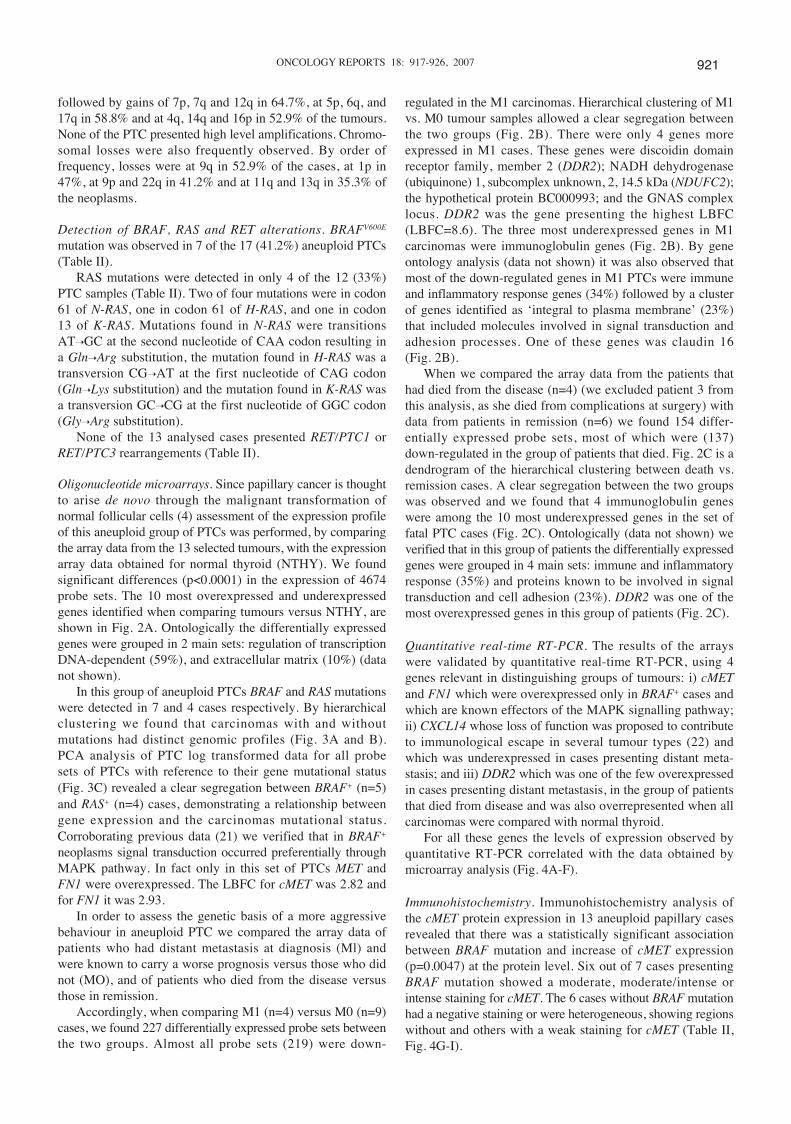
Oligonucleotide microarrays. Since papillary cancer is thoughtto arise de novo through the malignant transformation ofnormal follicular cells (4) assessment of the expression profileof this aneuploid group of PTCs was performed, by comparingthe array data from the 13 selected tumours, with the expressionarray data obtained for normal thyroid (NTHY). We foundsignificant differences (p<0.0001) in the expression of 4674probe sets. The 10 most overexpressed and underexpressedgenes identified when comparing tumours versus NTHY, areshown in Fig. 2A. Ontologically the differentially expressedgenes were grouped in 2 main sets: regulation of transcriptionDNA-dependent (59%), and extracellular matrix (10%) (datanot shown).
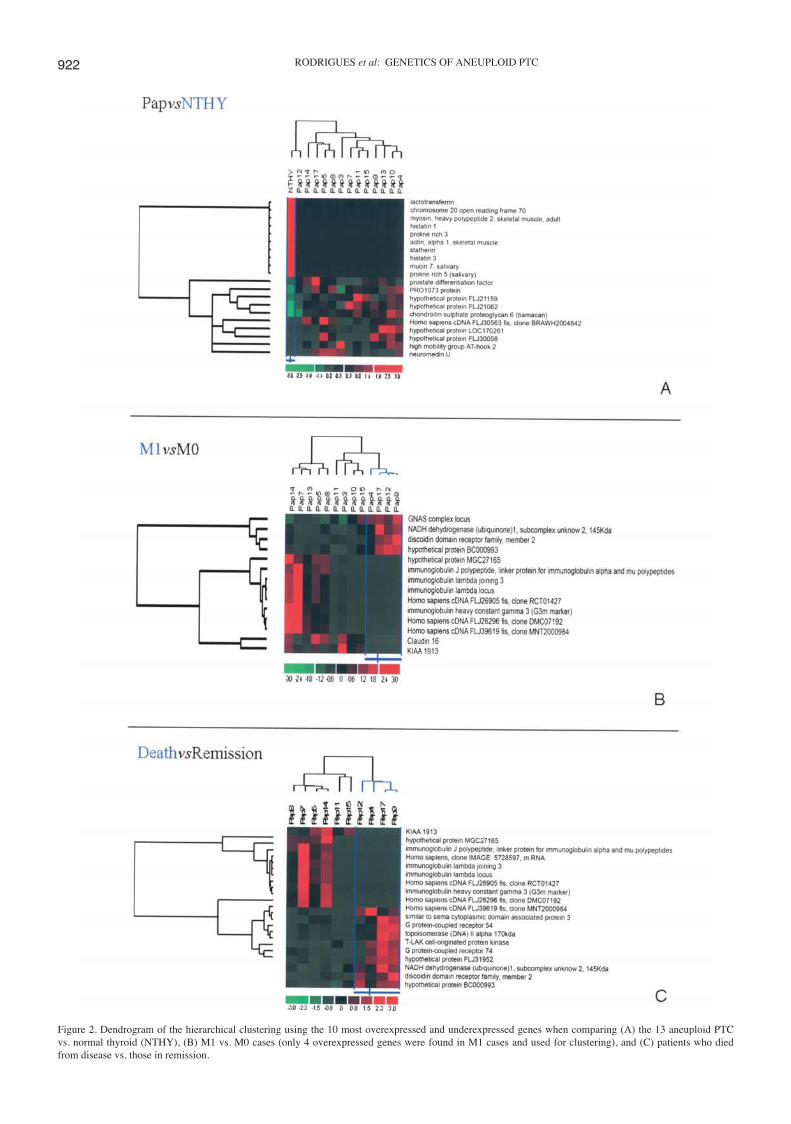
In this group of aneuploid PTCs BRAF and RAS mutationswere detected in 7 and 4 cases respectively. By hierarchicalclustering we found that carcinomas with and withoutmutations had distinct genomic profiles (Fig. 3A and B).PCA analysis of PTC log transformed data for all probesets of PTCs with reference to their gene mutational status(Fig. 3C) revealed a clear segregation between BRAF+ (n=5)and RAS+ (n=4) cases, demonstrating a relationship betweengene expression and the carcinomas mutational status.Corroborating previous data (21) we verified that in BRAF+
neoplasms signal transduction occurred preferentially throughMAPK pathway. In fact only in this set of PTCs MET andFN1 were overexpressed. The LBFC for cMET was 2.82 andfor FN1 it was 2.93.
In order to assess the genetic basis of a more aggressivebehaviour in aneuploid PTC we compared the array data ofpatients who had distant metastasis at diagnosis (Ml) andwere known to carry a worse prognosis versus those who didnot (MO), and of patients who died from the disease versusthose in remission.
Accordingly, when comparing M1 (n=4) versus M0 (n=9)cases, we found 227 differentially expressed probe sets betweenthe two groups. Almost all probe sets (219) were down-
regulated in the M1 carcinomas. Hierarchical clustering of M1vs. M0 tumour samples allowed a clear segregation betweenthe two groups (Fig. 2B). There were only 4 genes moreexpressed in M1 cases. These genes were discoidin domainreceptor family, member 2 (DDR2); NADH dehydrogenase(ubiquinone) 1, subcomplex unknown, 2, 14.5 kDa (NDUFC2);the hypothetical protein BC000993; and the GNAS complexlocus. DDR2 was the gene presenting the highest LBFC(LBFC=8.6). The three most underexpressed genes in M1carcinomas were immunoglobulin genes (Fig. 2B). By geneontology analysis (data not shown) it was also observed thatmost of the down-regulated genes in M1 PTCs were immuneand inflammatory response genes (34%) followed by a clusterof genes identified as ‘integral to plasma membrane’ (23%)that included molecules involved in signal transduction andadhesion processes. One of these genes was claudin 16(Fig. 2B).
When we compared the array data from the patients thathad died from the disease (n=4) (we excluded patient 3 fromthis analysis, as she died from complications at surgery) withdata from patients in remission (n=6) we found 154 differ-entially expressed probe sets, most of which were (137)down-regulated in the group of patients that died. Fig. 2C is adendrogram of the hierarchical clustering between death vs.remission cases. A clear segregation between the two groupswas observed and we found that 4 immunoglobulin geneswere among the 10 most underexpressed genes in the set offatal PTC cases (Fig. 2C). Ontologically (data not shown) weverified that in this group of patients the differentially expressedgenes were grouped in 4 main sets: immune and inflammatoryresponse (35%) and proteins known to be involved in signaltransduction and cell adhesion (23%). DDR2 was one of themost overexpressed genes in this group of patients (Fig. 2C).
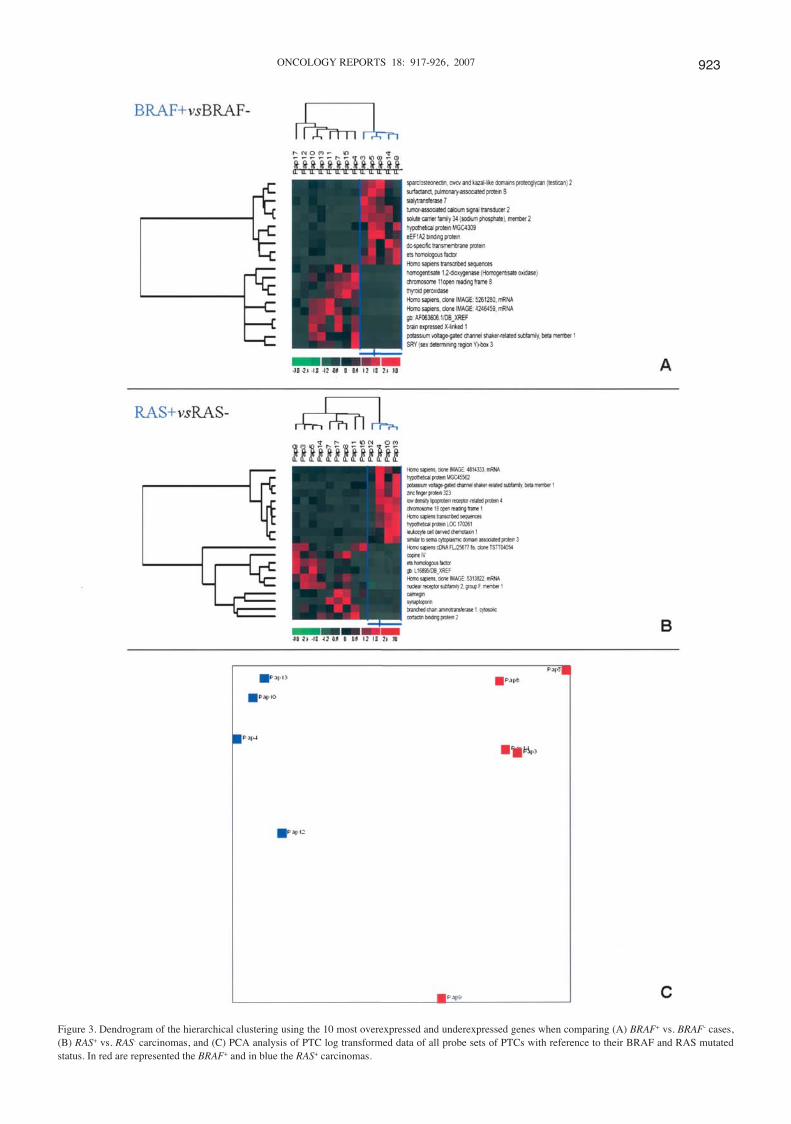
Quantitative real-time RT-PCR. The results of the arrayswere validated by quantitative real-time RT-PCR, using 4genes relevant in distinguishing groups of tumours: i) cMETand FN1 which were overexpressed only in BRAF+ cases andwhich are known effectors of the MAPK signalling pathway;ii) CXCL14 whose loss of function was proposed to contributeto immunological escape in several tumour types (22) andwhich was underexpressed in cases presenting distant meta-stasis; and iii) DDR2 which was one of the few overexpressedin cases presenting distant metastasis, in the group of patientsthat died from disease and was also overrepresented when allcarcinomas were compared with normal thyroid.
For all these genes the levels of expression observed byquantitative RT-PCR correlated with the data obtained bymicroarray analysis (Fig. 4A-F).
Immunohistochemistry. Immunohistochemistry analysis ofthe cMET protein expression in 13 aneuploid papillary casesrevealed that there was a statistically significant associationbetween BRAF mutation and increase of cMET expression(p=0.0047) at the protein level. Six out of 7 cases presentingBRAF mutation showed a moderate, moderate/intense orintense staining for cMET. The 6 cases without BRAF mutationhad a negative staining or were heterogeneous, showing regionswithout and others with a weak staining for cMET (Table II,Fig. 4G-I).
ONCOLOGY REPORTS 18: 917-926, 2007 921
917-926 7/9/07 18:20 Page 921
RODRIGUES et al: GENETICS OF ANEUPLOID PTC922
Figure 2. Dendrogram of the hierarchical clustering using the 10 most overexpressed and underexpressed genes when comparing (A) the 13 aneuploid PTCvs. normal thyroid (NTHY), (B) M1 vs. M0 cases (only 4 overexpressed genes were found in M1 cases and used for clustering), and (C) patients who diedfrom disease vs. those in remission.
917-926 7/9/07 18:20 Page 922
ONCOLOGY REPORTS 18: 917-926, 2007 923
Figure 3. Dendrogram of the hierarchical clustering using the 10 most overexpressed and underexpressed genes when comparing (A) BRAF+ vs. BRAF- cases,(B) RAS+ vs. RAS- carcinomas, and (C) PCA analysis of PTC log transformed data of all probe sets of PTCs with reference to their BRAF and RAS mutatedstatus. In red are represented the BRAF+ and in blue the RAS+ carcinomas.
917-926 7/9/07 18:20 Page 923
RODRIGUES et al: GENETICS OF ANEUPLOID PTC924
Fig
ure
4. C
ompa
riso
n of
RN
A a
ssay
s by
mic
roar
ray
hybr
idiz
atio
n (m
easu
red
by s
igna
l in
tens
ity)
, gra
phs
on t
he l
eft
side
; an
d by
rea
l-ti
me
quan
tita
tive
RT
-PC
R/T
aqM
an, (
mea
sure
d by
gen
e/18
s), g
raph
s on
the
rig
ht s
ide.
(A)
Com
pari
son
of c
ME
T e
xpre
ssio
n be
twee
n ca
ses
with
and
with
out B
RA
F m
utat
ion,
(B
) co
mpa
riso
n of
FN
1ex
pres
sion
bet
wee
n ca
ses
with
and
with
out B
RA
F m
utat
ion,
(C
) co
mpa
riso
n of
CX
CL
14ex
pres
sion
bet
wee
n ca
ses
with
and
with
out d
ista
nt m
etas
tasi
s, (
D)
com
pari
son
of D
DR
2 ex
pres
sion
bet
wee
n de
ad a
nd a
live
patie
nts,
(E
) be
twee
n M
1 an
d M
0 ca
ses,
(F)
and
bet
wee
n tu
mou
r sa
mpl
es a
nd n
orm
al th
yroi
d. I
mm
unos
tain
ing
for
cME
T in
(G
)ca
se 8
(B
RA
F+):
inte
nse
stai
ning
(x2
00),
(H
) ca
se 9
(B
RA
F+):
mod
erat
e st
aini
ng (
x200
), (
I) c
ase
11 (
BR
AF- ):
het
erog
enou
s w
eak/
no s
tain
ing
(x10
0).
917-926 7/9/07 18:20 Page 924
Discussion
Several genetic studies have been performed in PTC, however,to our knowledge, our study represents the first that specificallyaddressed the aneuploid fraction of papillary tumours.
CGH analysis of the 17 PTC revealed multiple chromo-somal imbalances in all cases. In this series of tumours wefound that, similarly to what is observed in follicular thyroidadenomas and carcinomas (19), aneuploid PTC presentedfrequent gains involving 5p/5q, 7p/7q, 12q and 17q. However,at variance with follicular type neoplasms, they were charac-terized by a high frequency of gains at 6q and losses at 1p,9p/9q, and 22q. Kjellman et al (8) reported that loss of9q21.3-q32 and gain of 1q were exclusively seen in PTCfrom patients with aggressive disease, and the presence ofdistant metastasis was associated with gains of 1q. In ourset of 17 aneuploid PTC, we did not find this association.Indeed, we found 1q gain in 8 of our cases (47%); of those,in the 7 where TNM classification was attainable, only 3presented distant metastasis.
Analysis of the expression profiles of the 13 aneuploid PTCrevealed, in keeping with the great chromosomal instabilitythat characterized this set of tumours, an extensive alterationof the gene expression levels. When compared to NTHY wefound significant differences (p<0.0001) in the expression of4674 probe sets. Ontologically we identified that most of thesedifferentially expressed probe sets (59%) were regulators oftranscription DNA-dependent genes. This data suggests thatloss of control of cellular transcription is of major relevancein the tumourigenesis of aneuploid PTC. Accordingly, wefound that one of the 10 most overexpressed genes in thisseries (Fig. 3A) was HMGA2, a gene mapped to chromosome12q15 and that codes for an architectural transcription factorwhich is an essential component of the enhancement. Theinvolvement of HMGA2 in thyroid tumourigenesis has beenpreviously demonstrated. Accordingly, Berlingieri et al (23)reported a high expression of HMGA2 in malignant celltransformation in rat thyroid cells, and in human thyroidcancer. Scala et al (24) demonstrated that gene transfer of anantisense adenoviral vector for the high mobility group ofproteins induced programmed cell death in two human thyroidanaplastic cell lines: ARO and FB-1, but not in normal humanthyroid cells.
The incidence of BRAF, RET and RAS alterations has neverbeen evaluated in aneuploid PTC. BRAFV600E mutation wasobserved in 7 of the 17 cases (41.2%). The detected frequencyof BRAF mutations is similar to that reported by others (13)and as previously observed none of our follicular variant PTCswere BRAF+. In our series no RET/PTC1 and RET/PTC3rearrangements were found. Fagin (15) advanced the existenceof a relationship between the presence of RAS mutations andaneuploidy in follicular type carcinomas, and Saavedra et al(25) verified that the introduction of oncogenic H-RAS intothe PCCL3 thyroid cell line induced chromosomal instability.Although, we could not study all 17 carcinomas due to sampleinsufficiency the observation that only 4 of the 12 PTCs hadRAS activating mutations indicates that in this fraction ofpapillary carcinomas oncogenic RAS transformation is not adeterminant modification for aneuploidy to occur. However,two of the RAS+ cases were follicular variant PTCs (Table II).
In a previous microarray analysis of a pool of 40 PTCsGiordano et al (21) demonstrated the existence of a mutationalspecific expression signature associated to RET/PTC, RASand BRAF mutation groups. No reference was made to theploidy status of the tumours in their report, but it is noteworthythat also in our aneuploid PTC we verified that the BRAF+
and RAS+ carcinomas had different and specific expressionprofiles (Fig. 3A-C). Our findings evidence that although ina complex genetic background the occurrence of dominantactivating mutations in BRAF and RAS has a fundamentalrole in the set up of gene expression alterations.
Giordano et al (21) have also remarked that BRAF+ mutantssignalled preferentially through MAPK pathway, MET andFN1 being included in the group of the 10 most overexpressedgenes in their study. In our set of BRAF+ carcinomas thesetwo genes were not in the list of the 10 genes with the highestLBFC. However, we noticed their up-regulation only in thisgroup of carcinomas. Quantitative real-time RT-PCR data andimmunohistochemistry experiments confirmed our array results(Fig. 4A, B, and G-I) with a statistically significant associationbetween BRAF mutation and increase of cMET expression(p=0.0047) at the protein level. Our data allows us thereforeto conclude that also in aneuploid PTCs BRAF+ tumours signalthrough the MAPK pathway. Considering that in a near futuremolecularly driven therapies will preferentially be applied inthe treatment of cancer our findings are highly suggestivethat cMET may be one of the target genes to consider in alltypes of BRAF+ carcinomas independently of their ploidystatus.
When we evaluated for the expression profile alterationsaccording to clinical data, we were able to verify that 98%of the differentially expressed genes between M1 and M0PTCs were down-regulated in the M1 group and that mostof the underexpressed genes were involved in immune andinflammatory response, signal transduction and cell adhesionprocesses. Remarkably, when we compared the expressionprofiles of patients who died vs. those in remission we alsoobserved that 89% of the differentially expressed genes weredown-regulated in patients who died from the disease andthat they were clustered through the same main ontologicalmolecular pathways as in the M1 patients. These findingsstrongly suggest that in this aneuploid group of carcinomasdown-regulation of genes involved in these four cellularmechanisms is one of the genetic causes of a more aggressivetumour behaviour.
Among the very few overexpressed genes in the M1 andthe death groups of patients we verified that DDR2 was up-regulated in both. DDR2 is a tyrosine kinase receptor whoseactivating ligands are collagens. DDR proteins are involvedin the proliferation of several cell types, and their inductionis implicated in breast and ovarian cancer, correlating tometastasis (26,27). The role of DDR2 was never investigatedin thyroid neoplasias, however, our data points out that thismolecule should be further evaluated in order to test itsputative role in aneuploid PTC cancer mechanisms, namelythose conducing to a higher aggressive behaviour.
In summary, we were able to identify in a group of PTCswith a more aggressive tumour behaviour a number ofsignificantly altered molecules that are involved in processessuch as regulation of cell transcription, cell adhesion, signal
ONCOLOGY REPORTS 18: 917-926, 2007 925
917-926 7/9/07 18:20 Page 925
transduction, and immune and inflammatory responses andthat represent preferential targets for the development ofmore efficient therapies.
Acknowledgments
This study was supported by Fundação para a Ciência eTecnologia (grant SFRH/BD/5015/2001), Portuguese CancerInstitute and Fundação Calouste Gulbenkian.
References
1. Jonasson JG and Hrafnkelsson J: Nuclear DNA analysis andprognosis in carcinoma of the thyroid gland. A nation widestudy in Iceland on carcinomas diagnosed 1955-1990. VirchowsArch 425: 349-355, 1994.
2. Sturgis CD, Caraway NP, Johnston DA, Sherman SI, Kidd Land Katz RL: Image analysis of papillary thyroid carcinomafine-needle aspirates: significant association between aneuploidyand death from disease. Cancer 87: 155-160, 1999.
3. Pasieka JL, Zedenius J, Auer G, Grimelius L, Hoog A, Lundell G,Wallin G and Backdahl M: Addition of nuclear DNA content tothe AMES risk-group classification for papillary thyroid cancer.Surgery 112: 1154-1159, 1992.
4. Wynford-Thomas D: Molecular basis of epithelial tumourigenesis:the thyroid model. Crit Rev Oncog 4: l-23, 1993.
5. Roque L, Nunes VM, Ribeiro C, Martins C and Soares J:Karyotypic characterization of papillary thyroid carcinomas.Cancer 92: 2529-2538, 2001.
6. Hemmer S, Wasenius VM, Knuutila S, Franssila K and Joensuu H:DNA copy number changes in thyroid carcinoma. Am J Pathol154: 1539-1547, 1999.
7. Singh B, Lim D, Cigudosa JC, Ghossein R, Shaha AR, Poluri A,Wreesmann VB, Tuttle M, Shah JP and Rao PH: Screeningfor genetic aberrations in papillary thyroid cancer by usingcomparative genomic hybridization. Surgery 128: 888-893,2000.
8. Kjellman P, Lagercrantz S, Hoog A, Wallin G, Larsson C andZedenius J: Gain of 1q and loss of 9q21.3-q32 are associatedwith a less favorable prognosis in papillary thyroid carcinoma.Genes Chromosomes Cancer 32: 43-49, 2001.
9. Wreesmann VB, Ghossein RA, Patel SG, Harris CP, Schnaser EA,Shaha AR, Turtle RM, Shah JP, Rao PH and Singh B: Genome-wide appraisal of thyroid cancer progression. Am J Pathol 161:1549-1556, 2002.
10. Wreesmann VB, Ghossein RA, Hezel M, Banerjee D, Shaha AR,Tuttle RM, Shah JP, Rao PH and Singh B: Follicular variantof papillary thyroid carcinoma: genome-wide appraisal of acontroversial entity. Genes Chromosomes Cancer 40: 355-364,2004.
11. Wreesmann VB, Sieczka EM, Socci ND, Hezel M, Belbin TJ,Childs G, Patel SG, Patel KN, Tallini G, Prystowsky M,Shaha AR, Kraus D, Shah JP, Rao PH, Ghossein R and Singh B:Genome-wide profiling of papillary thyroid cancer identifiesMUC1 as an independent prognostic marker. Cancer Res 64:3780-3789, 2004.
12. Kimura E, Nikiforova M, Zhu Z, Knauf J, Nikiforov Y andFagin J: High prevalence of BRAF mutations in thyroid cancer:genetic evidence for constitutive activation of the RET/PTC-RAS-BRAF signaling pathway in papillary thyroid carcinoma.Cancer Res 63: 1454-1457, 2003.
13. Xing M: BRAF mutation in thyroid cancer. Endocr RelatCancer 12: 245-262, 2005.
14. DeLellis RA and Williams ED: Tumours of the thyroid andparathyroid. In: World Health Organization Classification ofTumours. Pathology and Genetics of Tumours of EndocrineOrgans. DeLellis RA, Lloyd RV, Heitz PU and Eng C (eds).IARC Press, Lyon, pp49-93, 2004.
15. Fagin JA: Minireview: branded from the start - distinct oncogenicinitiating events may determine tumour fate in thyroid. MolEndocrinol 16: 903-911, 2002.
16. Kondo T, Ezzat S and Asa SL: Pathogenetic mechanismas inthyroid follicular-cell neoplasia. Nat Rev Cancer 4: 292-306,2006.
17. Deitch AD, Law H and deVere White R: A stable propidiumiodide staining procedure for flow cytometry. HistochemCytochem 30: 967-972, 1982.
18. Hiddemann W, Schumann J, Andreef M, Barlogie B, Herman CJ,Leif RC, Mayall BH, Murphy RF and Sandberg AA: Conventionon nomenclature for DNA cytometry. Committee on Nomen-clature, Society for Analytical Cytology. Cancer Genet Cytogenet13: 181-183, 1984.
19. Roque L, Rodrigues R, Pinto A, Moura-Nunes V and Soares J:Chromosome imbalances in thyroid follicular neoplasms: acomparison between follicular adenomas and carcinomas.Genes Chromosomes Cancer 36: 292-302, 2003.
20. Rebelo S, Domingues R, Catarino AL, Mendonca E, Santos JR,Sobrinho L and Bugalho MJ: Immunostaining and RT-PCR:different approaches to search for RET rearrangements in patientswith papillary thyroid carcinoma. Int J Oncol 23: 1025-1032,2003.
21. Giordano TJ, Kuick R, Thomas DG, Misek DE, Vinco M,Sanders D, Zhu Z, Ciampi R, Roh M, Shedden K, Gauger P,Doherty G, Thompson NW, Hanash S, Koenig RJ andNikiforov YE: Molecular classification of papillary thyroidcarcinoma: distinct BRAF, RAS, and RET/PTC mutation-specific gene expression profiles discovered by DNA microarrayanalysis. Oncogene 24: 6646-6656, 2005.
22. Shellenberger TD, Wang M, Gujrati M, Jayakumar A, Stricter RM,Burdick MD, Ioannides CG, Efferson CL, El-Naggar AK,Roberts D, Dayman GL and Frederick MJ: BRAK/CXCL14 is apotent inhibitor of angiogenesis and a chemotactic factor forimmature dendritic cells. Cancer Res 64: 8262-8270, 2004.
23. Berlingeri MT, Manfioletti G, Santoro M, Bandiera A, Visconti R,Giacotti V and Fusco A: Inhibition of HMGI-C protein synthesissuppresses retrovirally induced neoplastic transformation of ratthyroid cells. Mol Cell Biol 15: 1545-1553, 1995.
24. Scala S, Portella G, Fedele M, Chiappetta G and Fusco A:Adenovirus-mediated suppression of HMGI(Y) protein synthesisas potential therapy of human malignant neoplasias. Proc NatlAcad Sci USA 97: 4256-4261, 2000.
25. Saavedra HI, Knauf JA, Shirokawa JM, Wang J, Ouyang B,Elisei R, Stambrook PJ and Fagin JA: The RAS oncogeneinduces genomic instability in thyroid PCCL3 cells via MAPKpathway. Oncogene 19: 3948-3954, 2000.
26. Evtimova V, Zeillinger R and Weidle UH: Identification ofgenes associated with the invasive status of human mammarycarcinoma cell lines by transcriptional profiling. Tumour Biol24: 189-198, 2003.
27. Heinzelmann-Schwarz VA, Gardiner-Garden M, Henshall SM,Scurry J, Scolyer RA, Davies MJ, Heinzelmann M, Kalish LH,Bali A, Kench JG, Edwards LS, Van den Bergh PM, Hacker NF,Sutherland RL and O'Brien PM: Overexpression of the celladhesion molecules DDR1, Claudin 3, and Ep-CAM in meta-plastic ovarian epithelium and ovarian cancer. Clin Cancer Res10: 4427-4436, 2004.
RODRIGUES et al: GENETICS OF ANEUPLOID PTC926
917-926 7/9/07 18:20 Page 926