A multi-gene approach to differentiate papillary thyroid ...
18
A multi-gene approach to differentiate papillary thyroid carcinoma from benign lesions: gene selection using support vector machines with bootstrapping Krzysztof Fujarewicz 1 , Michal Jarza ˛b 3,4 , Markus Eszlinger 5 , Knut Krohn 5,6 , Ralf Paschke 5 , Malgorzata Oczko-Wojciechowska 2 , Malgorzata Wiench 2 , Aleksandra Kukulska 2 , Barbara Jarza ˛b 2 and Andrzej S ´ wierniak 1,2 1 Systems Engineering Group, Institute of Automatic Control, Silesian University of Technology, 44-100 Gliwice, Poland 2 Department of Nuclear Medicine and Endocrine Oncology, Institute of Oncology, Maria Sklodowska-Curie Memorial Cancer Center, Gliwice Branch, Wybrzez ˙e Armii Krajowej 15, 44-100 Gliwice, Poland Departments of 3 Tumor Biology and 4 Clinical Oncology, Institute of Oncology, Maria Sklodowska-Curie Memorial Cancer Center, Gliwice Branch, 44-100 Gliwice, Poland 5 III. Medical Department and 6 Interdisciplinary Center of Clinical Research Leipzig, University of Leipzig, 04103 Leipzig, Germany (Requests for offprints should be addressed to B Jarza ˛ b; Email: [email protected]) Abstract Selection of novel molecular markers is an important goal of cancer genomics studies. The aim of our analysis was to apply the multivariate bioinformatical tools to rank the genes – potential markers of papillary thyroid cancer (PTC) according to their diagnostic usefulness. We also assessed the accuracy of benign/malignant classification, based on gene expression profiling, for PTC. We analyzed a 180-array dataset (90 HG-U95A and 90 HG-U133A oligonucleotide arrays), which included a collection of 57 PTCs, 61 benign thyroid tumors, and 62 apparently normal tissues. Gene selection was carried out by the support vector machines method with bootstrapping, which allowed us 1) ranking the genes that were most important for classification quality and appeared most frequently in the classifiers (bootstrap-based feature ranking, BBFR); 2) ranking the samples, and thus detecting cases that were most difficult to classify (bootstrap-based outlier detection). The accuracy of PTC diagnosis was 98.5% for a 20-gene classifier, its 95% confidence interval (CI) was 95.9–100%, with the lower limit of CI exceeding 95% already for five genes. Only 5 of 180 samples (2.8%) were misclassified in more than 10% of bootstrap iterations. We specified 43 genes which are most suitable as molecular markers of PTC, among them some well-known PTC markers (MET, fibronectin 1, dipeptidylpeptidase 4, or adenosine A1 receptor) and potential new ones (UDP-galactose-4-epimerase, cadherin 16, gap junction protein 3, sushi, nidogen, and EGF-like domains 1, inhibitor of DNA binding 3, RUNX1, leiomodin 1, F-box protein 9, and tripartite motif-containing 58). The highest ranking gene, metallophosphoesterase domain-containing protein 2, achieved 96.7% of the maximum BBFR score. Endocrine-Related Cancer (2007) 14 809–826 Introduction Discrimination between benign thyroid nodules and cancer is an important aspect of determining the optimal extent of thyroid surgery. Currently, this is achieved by routine morphologic assessment of cytopathology samples. However, this method does not allow proper classification of all thyroid tumors (Baloch & Livolsi 2002, Franc et al. 2003). At several institutions, genomic studies have been undertaken which besides focusing on basic biological issues (Huang et al. 2001, Giordano et al. 2005), also explore potential diagnostic applications (Aldred et al. 2004, Chevillard et al. 2004, Finley et al. 2004a,b). Our recent microarray-based analysis brought a 20-gene classifier to differentiate between papillary thyroid cancer (PTC) and normal thyroid tissue (Jarzab et al. 2005), further verified using three independent datasets (Eszlinger et al. 2006). Very large and easily Endocrine-Related Cancer (2007) 14 809–826 Endocrine-Related Cancer (2007) 14 809–826 1351–0088/07/014–809 q 2007 Society for Endocrinology Printed in Great Britain DOI:10.1677/ERC-06-0048 Online version via http://www.endocrinology-journals.org Downloaded from Bioscientifica.com at 01/21/2022 07:30:33AM via free access
-
Upload
khangminh22 -
Category
Documents
-
view
2 -
download
0
Transcript of A multi-gene approach to differentiate papillary thyroid ...

Endocrine-Related Cancer (2007) 14 809–826
A multi-gene approach to differentiatepapillary thyroid carcinoma from benignlesions: gene selection using supportvector machines with bootstrapping
Krzysztof Fujarewicz1, Michał Jarzab3,4, Markus Eszlinger5, Knut Krohn5,6,Ralf Paschke5, Małgorzata Oczko-Wojciechowska2, Małgorzata Wiench2,Aleksandra Kukulska2, Barbara Jarzab2 and Andrzej Swierniak1,2
1Systems Engineering Group, Institute of Automatic Control, Silesian University of Technology, 44-100 Gliwice, Poland2Department of Nuclear Medicine and Endocrine Oncology, Institute of Oncology, Maria Skłodowska-Curie Memorial Cancer Center,
Gliwice Branch, Wybrzeze Armii Krajowej 15, 44-100 Gliwice, Poland
Departments of 3Tumor Biology and 4Clinical Oncology, Institute of Oncology, Maria Skłodowska-Curie Memorial Cancer Center,
Gliwice Branch, 44-100 Gliwice, Poland5III. Medical Department and 6Interdisciplinary Center of Clinical Research Leipzig, University of Leipzig, 04103 Leipzig, Germany
(Requests for offprints should be addressed to B Jarzab; Email: [email protected])
Abstract
Selection of novel molecular markers is an important goal of cancer genomics studies. The aim of ouranalysis was to apply the multivariate bioinformatical tools to rank the genes – potential markers ofpapillary thyroid cancer (PTC) according to their diagnostic usefulness. We also assessed theaccuracy ofbenign/malignant classification,basedongeneexpressionprofiling, forPTC. Weanalyzeda 180-array dataset (90 HG-U95A and 90 HG-U133A oligonucleotide arrays), which included acollection of 57 PTCs, 61 benign thyroid tumors, and 62 apparently normal tissues. Gene selection wascarried out by the support vector machines method with bootstrapping, which allowed us 1) ranking thegenes that were most important for classification quality and appeared most frequently in the classifiers(bootstrap-based feature ranking, BBFR); 2) ranking the samples, and thus detecting cases that weremost difficult toclassify (bootstrap-based outlier detection). The accuracy of PTC diagnosis was 98.5%for a 20-gene classifier, its 95% confidence interval (CI) was 95.9–100%, with the lower limit of CIexceeding 95% already for five genes. Only 5 of 180 samples (2.8%) were misclassified in more than10% of bootstrap iterations. We specified 43 genes which are most suitable as molecular markers ofPTC, among them some well-known PTC markers (MET, fibronectin 1, dipeptidylpeptidase 4, oradenosine A1 receptor) and potential new ones (UDP-galactose-4-epimerase, cadherin 16, gapjunction protein 3, sushi, nidogen, and EGF-like domains 1, inhibitor of DNA binding 3, RUNX1,leiomodin 1, F-box protein 9, and tripartite motif-containing 58). The highest ranking gene,metallophosphoesterase domain-containing protein 2, achieved 96.7% of the maximum BBFR score.
Endocrine-Related Cancer (2007) 14 809–826
Introduction
Discrimination between benign thyroid nodules and
cancer is an important aspect of determining the optimal
extent of thyroid surgery. Currently, this is achieved by
routine morphologic assessment of cytopathology
samples. However, this method does not allow proper
classification of all thyroid tumors (Baloch & Livolsi
2002, Franc et al. 2003). At several institutions, genomic
Endocrine-Related Cancer (2007) 14 809–826
1351–0088/07/014–809 q 2007 Society for Endocrinology Printed in Great
studies have been undertaken which besides focusing on
basic biological issues (Huang et al.2001,Giordano et al.
2005), also explore potential diagnostic applications
(Aldred et al. 2004, Chevillard et al. 2004, Finley et al.
2004a,b). Our recent microarray-based analysis brought
a 20-gene classifier to differentiate between papillary
thyroid cancer (PTC) and normal thyroid tissue (Jarzab
et al. 2005), further verified using three independent
datasets (Eszlinger et al. 2006). Very large and easily
Britain
DOI:10.1677/ERC-06-0048
Online version via http://www.endocrinology-journals.org
Downloaded from Bioscientifica.com at 01/21/2022 07:30:33AMvia free access

K Fujarewicz et al.: Multi-gene differentiation of PTC
distinguishable differences between the molecular
profiles of PTC and normal thyroid have clearly
demonstrated the applicability of gene expression
findings to diagnostic purposes. However, even more
desirable for the clinician would be genomic profiling-
based capability to discriminate between malignant
tumors and various benign lesions. Therefore, we
decided to use a balanced mixture of samples from
malignant and benign tumors and normal thyroid tissue
to mimic the clinical situation, where the material from
any of these may be obtained and shall be properly
classified. This large 180-array dataset is derived
respectively from de novo studies (nZ40), previously
published own microarray data (nZ124; Eszlinger et al.
2001, 2004, Jarzab et al. 2005), and accessible datasets
published by other authors (nZ16; Huang et al. 2001).
We set the following goals for the study:
1. To assess accuracy of benign/malignant classi-
fication of thyroid specimens in relation to gene
set size, in the context of PTC and
2. To optimize the list of diagnostically relevant
genes in PTC.
To answer both questions, we used the support vector
machines (SVMs) method with bootstrapping. This
approach relies on iterative construction of SVM
classifiers based on randomly selected sets of specimens
(bootstrap samples) and testing the classifiers on
remaining samples. We applied bootstrap to obtain both
gene (feature) ranking and outlier detection. The ranking
of the genes that are most important for classification
quality was based on the frequency of their occurrence in
the classifiers of different size (bootstrap-based feature
ranking, BBFR). The ranking of themisclassified samples
allowed to detect outliers (bootstrap-based outlier detec-
tion, BBOD) and to obtain a reliable estimate of
classification accuracy with appropriate confidence
intervals (CI) for gene sets of different size.
Material and methods
Microarray data used in the study
Microarray datasets from three sources were included
in the analysis:
1. Dataset obtained in Gliwice, Poland; in total, 90
specimens analyzed with GeneChip HG-U133A
microarrays. The specimens were collected from
71 patients with PTC (9 males and 40 females;
mean age 36 years, range 6–71 years) and 22 with
other thyroid diseases, 6 with follicular adenoma,
810
13 with nodular or colloid goiter and 3 with
chronic thyroiditis (9 males and 13 females; mean
age 45 years, range 11–71 years). The thyroid
tissue specimens included 49 PTC tumors and 41
normal/benign thyroid tissue samples. The latter
samples were from patients with PTC (nZ17) or
other benign thyroid lesions (nZ24), among
them six follicular adenomas, four nodular
goiters, nine colloid goiters, and five cases of
thyroiditis, two of them taken from the contral-
ateral lobe from patients with PTC. Fifty
microarrays were included in our previously
published study and publicly available at
www.genomika.pl/thyroidcancer (Jarzab et al.
2005); 40 microarrays were from de novo studies.
All new samples were processed according to
description given in Jarzab et al. (2005).
2. Dataset obtained in Leipzig, Germany; 74 speci-
mens analyzed with GeneChip HG-U95Av2
microarrays. The specimens included 15 autono-
mously functioning thyroid nodules, 22 cold
thyroid nodules, and 37 samples of their respective
surrounding thyroid tissues. The analysis of these
datasets was published previously (Eszlinger et al.
2001, 2004) and the datasets are available at http://
www.uni-leipzig.de/innere/_forschung/schwer-
punkte/etiology.html.
3. Dataset obtained in Columbus, OH, USA; 16
specimens analyzed with GeneChip HG-U95A
microarrays. The specimens were derived from
eight patients and included both PTC tumors and
their surrounding thyroid tissues. The dataset
(Huang et al. 2001) is publicly available at http://
thinker.med.ohio-state.edu.
In total, the three analyzed datasets comprised 57
PTCs, 61 benign thyroid lesions, and 62 apparently
normal thyroid tissues analyzed on 180 GeneChips of
two different generations. Half of them were U133A
and the rest U95A platforms.
Data pre-processing and generation of datasets
Each dataset was pre-processed by the MAS5
algorithm. To compare the expression data generated
using the U95A GeneChips (12 625 probe sets) with
those from the U133A GeneChips (22 283 probe sets),
we used the ‘Human Genome U95 to Human
Genome U133 Best Match Comparison Spreadsheet’
(www.affymetrix.com/support/technical/comparison_
spreadsheets.affx) which yielded an intersection of
9530 probe sets. The obtained data were log2
transformed.
www.endocrinology-journals.org
Downloaded from Bioscientifica.com at 01/21/2022 07:30:33AMvia free access
Endocrine-Related Cancer (2007) 14 809–826
Neighborhood analysis and recursive elimination
in gene selection
For selection of gene sets with diagnostic potential, we
applied here the recursive feature elimination (RFE)
algorithm (Guyon et al. 2002) which is computationally
less demanding than recursive feature replacement used
in our previous studies (Jarzab et al. 2005, Eszlinger et al.
2006). The introductory gene selection was performed
using neighborhood analysis (200 genes; Golub et al.
1999, Slonim et al. 2000), further selection of the 100
best genes set was carried out by RFE.
SVMs and classification
The linear SVM (Boser et al. 1992, Vapnik 1995) was
used for developing the classification rule. Asmentioned
earlier, the classifier was independently trained for
different numbers of selected genes (from 1 to 100).
Bootstrap for estimation of classifier accuracy
and its CI
In order to determine the accuracy of the developed
classifier, we performed classical bootstrap procedure
in 500 resampling iterations (selection with equal
probability and return of samples; Efron 1979).
Iterations of all stages of the classifier construction
(i.e. gene preselection, gene selection, and classifier
learning) were performed in each bootstrap, as
suggested previously (Simon et al. 2003). The
accuracy of the classifier was calculated using the
0.632 bootstrap estimator (Efron 1983). The distri-
bution of the misclassification rate obtained during all
bootstrap runs was used to estimate the 95% CI. The
accuracy of the classifier and the CI were calculated for
different numbers of selected genes (up to 100).
Bootstrap based feature ranking (BBFR) and
outlier detection (BBOD)
The primary purpose of the bootstrap used in this study
was to estimate the accuracy of the molecular classifier
for different sizes of gene subsets with appropriate CIs.
However, the computational effort for the bootstrap
technique may also be exploited to derive some
additional information. We apply two methods that
use the information collected during bootstrapping:
BBFR and BBOD. They are similar to the methods of
statistical learning based on resampling, such as
bagging and boosting. In both techniques, an ensemble
of many base classifiers is created. Each base classifier
is trained on different bootstrap subsamples. The final
decision is based on decisions of all base classifiers.
The simplest approach is bagging (bootstrap aggregat-
ing) originally proposed by Breiman (1996).
www.endocrinology-journals.org
In bagging, the subsamples are randomly drawn as in
classical bootstrapping where each observation is
picked with the same probability 1/m, where m is the
number of all observations. The final decision is the
decision of most base classifiers. In boosting, different
observations may be picked with different probability
and the final decision is weighted sum of decisions of
base classifiers. The well-known boosting algorithm is
AdaBoost (Freund & Schapire 1996).
In our approach, we do not create an ensemble
(committee) of many base classifiers but we use the
information collected during bootstrap-based vali-
dation step of the SVM classifier.
Let the data contain m instances (observations). One
instance is a vector of Nmax features (gene expression
values) with a corresponding class label specified by an
expert. Let LB be the number of bootstrap iterations.
In each run, we select (with equal probability and
return of samples) m instances from the dataset
(bootstrap sample). Then, the bootstrap sample is
used for feature selection and classifier learning.
Finally, the classifier is tested on the test set containing
all instances not belonging to the bootstrap sample.
To find the optimal size for the feature set, we select
N feature sets U1,U2,.,UN of sizes 1,2,.,N respect-
ively. In general, selected sets may not overlap, but in
most commonly used feature selection methods, based
on feature ranking or backward/forward searching,
feature subsets satisfy the relation
U13U23.3UN (1)
BBFR
Let rj(i) be a number of subsets Ui, iZ1,2,.,N where
the gene j belongs to. For gene selection methods
satisfying equation (1), we have
rjðiÞZNKðposition in the feature rankingÞC1: (2)
The BBFR score Rj of the feature j is defined as a
sum of rj(i) over all bootstrap runs as follows:
Rj ZXLB
iZ1
rjðiÞ (3)
The maximum possible value of the BBFR score is
LBN.
BBOD
Let qk be the number of bootstrap iterations where the
observation k is chosen as a test instance (not a member
811
Downloaded from Bioscientifica.com at 01/21/2022 07:30:33AMvia free access

K Fujarewicz et al.: Multi-gene differentiation of PTC
of the bootstrap sample). Let qk true be the number of
bootstrap iterations where the instance j is correctly
classified at the test stage.
The BBOD score for k-th observation is
Qk Zqk true
qk(4)
The value of Qk belongs to the interval h0,1i and the
low value indicates outliers.
Comparison of different class prediction
methods
We used BRB ArrayTools (developed by Dr Richard
Simon and Amy Peng Lam) to compare different class
prediction algorithms (Compound Covariate Predictor,
Linear Diagonal Discriminant Analysis, Nearest Centroid,
1-Nearest Neighbor, 3-Nearest Neighbors and SVMs).
To compute misclassification rate, 0.632 bootstrap cross-
validation method was used. All genes with univariate
misclassification rate below0.2were used for this analysis.
Figure 1 Accuracy of bootstrapping-estimated benign–malig-nant classification for different gene set sizes. The 95%confidence interval is marked by dashed lines.
Results
Accuracy of malignant/benign classification and
redundancy of PTC gene classifiers
The huge difference in gene expression between PTC and
benign/normal thyroid tissues implies that many multi-
gene classifiers with similar classification ability may be
created. For preliminary assessment of accuracy of the
differentiation between PTC and benign lesions or normal
thyroid, we randomly divided the 180-array dataset into
two subgroups, according to sample number: A (odd
numbers) andB (evennumbers).Each subgroupcontained
data from similar number of benign and malignant tumor
specimens analyzed with U133A or U95A GeneChips.
We used set A to obtain a 20-gene classifier; this classifier
was tested on set B and the procedure was repeated, using
set B as a training set and testing the classifier on set A.
Using the classifier obtained from set A, we were able to
correctly predict 86 out of 90 samples (95.6%) within set
B, while using the classifier obtained from set B, we
accurately diagnosed 88 out of 90 samples in set A
(97.8%). Both classifiers differed partly from our previous
20-gene classifier (37) obtained on a smaller dataset.
To avoid a bias in gene selection and accuracy
estimation, related to the arbitrary selection of the training
set,we carried out the procedure of accuracy estimation by
bootstrapping, i.e. randomly selecting large numbers of
slightly different training sets and validating them on the
remaining samples. This procedure allows using suf-
ficiently large training setswhile simultaneously obtaining
812
a reliable estimation of classification accuracy. By
applying this method, we estimated the accuracy of
discrimination between benign and malignant samples to
be 98.6%, with a rather narrow CI (see Fig. 1). For small
gene sets, the accuracy was a bit lower (93.7% for one-
gene set, 96.9% for two-gene set, 97.9 for three-gene set,
and from98.3 to 98.6 for larger sets, up tonZ100). For the
20-gene classifier, the accuracy was 98.5% and the
estimated 95% CI was 95.9–100% for the classifiers
built from more than five genes.
We compared the results of classification by the best
500 genes (Fig. 2) with the classification by consecutive
500-gene sets (i.e. first 500, 500–1000, 1000–1500, etc).
We noted that only the first 500 genes allow accurately
classifying samples by single genes or small gene sets.
Genes ranked 500–1000 achieved 90% accuracy only for
classifiers larger than 50 genes, while genes beyond the
first 1000 hardly achieve this limit of accuracy.Whenwe
excluded all genes analyzed in Fig. 2 (8!500Z4000),
the accuracy obtained for small sets was only w60%,
close to random. However, the accuracy rose with gene
set size, and for classifier sets larger than 700 genes it
achieved90% (data not shown). These results support the
conclusion that the PTC transcriptome differs from the
normal one in thousands of genes; they also provide
evidence that optimizing a diagnostic gene set is a
necessary step of analysis in order to make this set useful
for molecular PTC classification.
Ranking of PTC genes for their classification
ability
To obtain the ranking of genes based on their usefulness in
the diagnostic context, we performed subsequent repeti-
tive gene selection process by bootstrapping of the whole
dataset.We ranked all genes according to the frequency of
www.endocrinology-journals.org
Downloaded from Bioscientifica.com at 01/21/2022 07:30:33AMvia free access

Figure 2 Accuracy of classification obtained by successivegene set reduction. The accuracy of the best 500 genes wasevaluated in one iteration using the bootstrap technique, thenthe selected 500-gene set was removed from the wholedataset, and the next 500 genes were selected in the followingiteration. This procedure was repeated seven times, thus 3500genes were excluded (line no. 8). To speed up the procedure,only neighbourhood analysis (NA) was used for gene selection.
Endocrine-Related Cancer (2007) 14 809–826
appearance within the selected gene sets (BBFR). Genes
important for the majority of diagnostic datasets were
highly ranked, while less importance was given to
complementing transcripts, which exhibited higher
Figure 3 Result of bootstrap-based feature ranking (BBFR). Eachdot representsonegene,dashed linesdefinethesubsetof43geneswith BBFR score larger than half of the maximum one (black dots).
www.endocrinology-journals.org
variability (Fig. 3). During the selection process, 365
transcripts occurred at least once within the obtained
classifiers and some of them were present in nearly all
classifiers. The maximum theoretical score to be obtained
by a gene was 5!104 and the gene with the best rank,
encoding metallophosphoesterase domain-containing
protein 2 (MPPED2), had a score of 4.84!104, i.e.
96.7%of themaximumone. The first 20 geneswere given
scoresO3.74!104 (O77% of themaximum score), only
slightly lower than the top gene, and the first 100
transcripts were characterized by scores O0.64!104,
which is O13.2% of the maximum score obtained. In
total, 43 transcripts representing 41 genes scored higher
than half of the value for the top gene (O2.42!104,
Fig. 3). Among them, there were both genes known for
their changed expression in PTC or described in previous
microarray studies, some used already as single markers,
as well as new genes, not considered previously for their
diagnostic potential (Table 1).
We analyzed fold-change differences between PTC
and benign thyroid samples for the 43 selected
transcripts to evaluate the potential influence of inter-
platform differences on the obtained gene selection.
Twenty of them showed more than fourfold increase
(log ratio O2) and four transcripts were increased
more than twice, whereas the remaining 19 transcripts
were decreased. Generally, the consistency between
fold-changes observed in subsets from U95 and U133
arrays was good, although for some genes (e.g. the
well-known thyroid cancer markers fibronectin 1
(FN1) and MET or novel genes cadherin 16 (CDH16)
or gap junction protein b-3 (GJB3)) there were inter-
platform differences between the log ratios. However,
40 out of 43 selected genes exhibited more than
twofold change in both the U133 and the U95 subsets.
For all 43 genes, the PTC–benign difference was larger
than the difference between fold-changes obtained with
different GeneChip generation subsets. This confirms
that the selection performed was robust to inter-array
differences.
Misclassified thyroid samples
The algorithm with bootstrapping allows ranking the
samples according to the frequency of their misclassifi-
cation (Table 2). BBOF showed very frequent
misclassifications for two samples. One of them was
not properly classified by any gene set selected, and
this was sample no. 154 from the U133 dataset no. 1, a
small (10 mm in diameter) familial PTC found within a
larger follicular adenoma. It was observed in an
18-year-old woman. A year later her mother, 43
years old, was diagnosed with 0.7 cm PTC (follicular
813
Downloaded from Bioscientifica.com at 01/21/2022 07:30:33AMvia free access
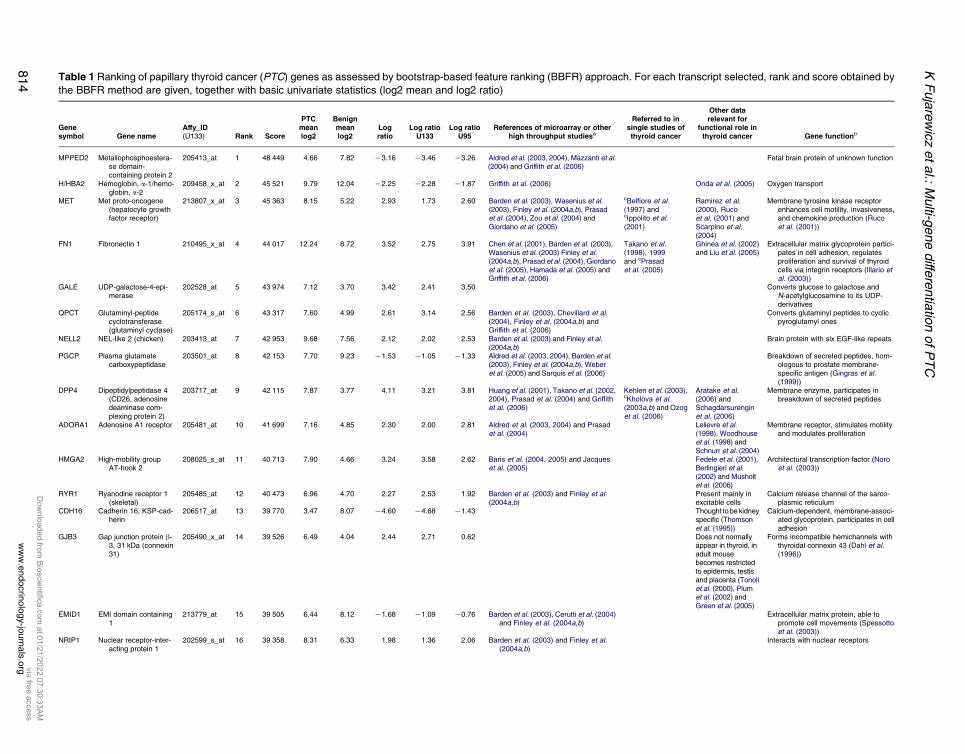
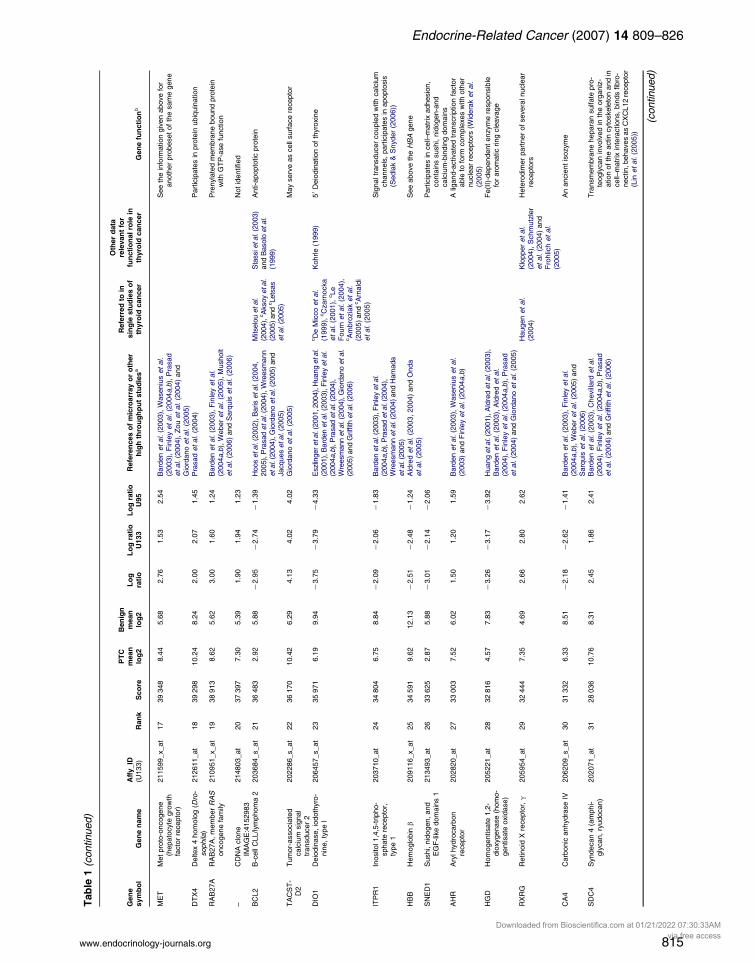
Table 1 Ranking of papillary thyroid cancer (PTC) genes as assessed by bootstrap-based feature ranking (BBFR) approach. For each transcript selected, rank and score obtained by
the BBFR method are given, together with basic univariate statistics (log2 mean and log2 ratio)
Genesymbol Gene name
Affy_ID(U133) Rank Score
PTCmeanlog2
Benignmeanlog2
Logratio
Log ratioU133
Log ratioU95
References of microarray or otherhigh throughput studiesa
Referred to insingle studies ofthyroid cancer
Other datarelevant for
functional role inthyroid cancer Gene functionb
MPPED2 Metallophosphoestera-se domain-containing protein 2
205413_at 1 48 449 4.66 7.82 K3.16 K3.46 K3.26 Aldred et al. (2003, 2004), Mazzanti et al.(2004) and Griffith et al. (2006)
Fetal brain protein of unknown function
H/HBA2 Hemoglobin, a-1/hemo-globin, a-2
209458_x_at 2 45 521 9.79 12.04 K2.25 K2.28 K1.87 Griffith et al. (2006) Onda et al. (2005) Oxygen transport
MET Met proto-oncogene(hepatocyte growthfactor receptor)
213807_x_at 3 45 363 8.15 5.22 2.93 1.73 2.60 Barden et al. (2003), Wasenius et al.(2003), Finley et al. (2004a,b), Prasadet al. (2004), Zou et al. (2004) andGiordano et al. (2005)
cBelfiore et al.(1997) andcIppolito et al.(2001)
Ramirez et al.(2000), Rucoet al. (2001) andScarpino et al.(2004)
Membrane tyrosine kinase receptorenhances cell motility, invasiveness,and chemokine production (Rucoet al. (2001))
FN1 Fibronectin 1 210495_x_at 4 44 017 12.24 8.72 3.52 2.75 3.91 Chen et al. (2001), Barden et al. (2003),Wasenius et al. (2003) Finley et al.(2004a,b), Prasad et al. (2004), Giordanoet al. (2005), Hamada et al. (2005) andGriffith et al. (2006)
Takano et al.(1998), 1999and cPrasadet al. (2005)
Ghinea et al. (2002)and Liu et al. (2005)
Extracellular matrix glycoprotein partici-pates in cell adhesion, regulatesproliferation and survival of thyroidcells via integrin receptors (Illario etal. (2003))
GALE UDP-galactose-4-epi-merase
202528_at 5 43 974 7.12 3.70 3.42 2.41 3.50 Converts glucose to galactose andN-acetylglucosamine to its UDP-derivatives
QPCT Glutaminyl-peptidecyclotransferase(glutaminyl cyclase)
205174_s_at 6 43 317 7.60 4.99 2.61 3.14 2.56 Barden et al. (2003), Chevillard et al.(2004), Finley et al. (2004a,b) andGriffith et al. (2006)
Converts glutaminyl peptides to cyclicpyroglutamyl ones
NELL2 NEL-like 2 (chicken) 203413_at 7 42 953 9.68 7.56 2.12 2.02 2.53 Barden et al. (2003) and Finley et al.(2004a,b)
Brain protein with six EGF-like repeats
PGCP Plasma glutamatecarboxypeptidase
203501_at 8 42 153 7.70 9.23 K1.53 K1.05 K1.33 Aldred et al. (2003, 2004), Barden et al.(2003), Finley et al. (2004a,b), Weberet al. (2005) and Sarquis et al. (2006)
Breakdown of secreted peptides, hom-ologous to prostate membrane-specific antigen (Gingras et al.(1999))
DPP4 Dipeptidylpeptidase 4(CD26, adenosinedeaminase com-plexing protein 2)
203717_at 9 42 115 7.87 3.77 4.11 3.21 3.81 Huang et al. (2001), Takano et al. (2002,2004), Prasad et al. (2004) and Griffithet al. (2006)
Kehlen et al. (2003),cKholova et al.(2003a,b) and Ozoget al. (2006)
Aratake et al.(2006) andSchagdarsurenginet al. (2006)
Membrane enzyme, participates inbreakdown of secreted peptides
ADORA1 Adenosine A1 receptor 205481_at 10 41 699 7.16 4.85 2.30 2.00 2.81 Aldred et al. (2003, 2004) and Prasadet al. (2004)
Lelievre et al.(1998), Woodhouseet al. (1998) andSchnurr et al. (2004)
Membrane receptor, stimulates motilityand modulates proliferation
HMGA2 High-mobility groupAT-hook 2
208025_s_at 11 40 713 7.90 4.66 3.24 3.58 2.62 Baris et al. (2004, 2005) and Jacqueset al. (2005)
Fedele et al. (2001),Berlingieri et al.(2002) and Musholtet al. (2006)
Architectural transcription factor (Noroet al. (2003))
RYR1 Ryanodine receptor 1(skeletal)
205485_at 12 40 473 6.96 4.70 2.27 2.53 1.92 Barden et al. (2003) and Finley et al.(2004a,b)
Present mainly inexcitable cells
Calcium release channel of the sarco-plasmic reticulum
CDH16 Cadherin 16, KSP-cad-herin
206517_at 13 39 770 3.47 8.07 K4.60 K4.68 K1.43 Thought to be kidneyspecific (Thomsonet al. (1995))
Calcium-dependent, membrane-associ-ated glycoprotein, participates in celladhesion
GJB3 Gap junction protein b-3, 31 kDa (connexin31)
205490_x_at 14 39 526 6.49 4.04 2.44 2.71 0.62 Does not normallyappear in thyroid, inadult mousebecomes restrictedto epidermis, testisand placenta (Tonoliet al. (2000), Plumet al. (2002) andGreen et al. (2005)
Forms incompatible hemichannels withthyroidal connexin 43 (Dahl et al.(1996))
EMID1 EMI domain containing1
213779_at 15 39 505 6.44 8.12 K1.68 K1.09 K0.76 Barden et al. (2003), Cerutti et al. (2004)and Finley et al. (2004a,b)
Extracellular matrix protein, able topromote cell movements (Spessottoet al. (2003))
NRIP1 Nuclear receptor-inter-acting protein 1
202599_s_at 16 39 358 8.31 6.33 1.98 1.36 2.06 Barden et al. (2003) and Finley et al.(2004a,b)
Interacts with nuclear receptors
KF
uja
rew
icz
et
al.:
Multi-g
ene
diffe
rentia
tion
of
PT
C
ww
w.e
ndocrin
olo
gy-jo
urn
als
.org
814
Dow
nloaded from Bioscientifica.com
at 01/21/2022 07:30:33AMvia free access
Table
1(c
ontinued)
Gene
symbol
Genename
Affy_ID
(U133)
Rank
Score
PTC
mean
log2
Benign
mean
log2
Log
ratio
Logratio
U133
Logratio
U95
Referencesofmicroarrayorother
highthroughputstudies
a
Referredto
insingle
studiesof
thyroid
cancer
Otherdata
relevantfor
functionalrole
inthyroid
cancer
Genefunction
b
ME
TM
et
pro
to-o
ncogene
(hepato
cyte
gro
wth
facto
rre
cepto
r)
211599_x_at
17
39
348
8.4
45.6
82.7
61.5
32.5
4B
ard
en
et
al.
(2003),
Waseniu
set
al.
(2003),
Fin
ley
et
al.
(2004a,b
),P
rasad
et
al.
(2004),
Zou
et
al.
(2004)
and
Gio
rdano
et
al.
(2005)
See
the
info
rmation
giv
en
above
for
anoth
er
pro
beset
of
the
sam
egene
DT
X4
Deltex
4hom
olo
g(D
ro-
sophila
)212611_at
18
39
298
10.2
48.2
42.0
02.0
71.4
5P
rasad
et
al.
(2004)
Part
icip
ate
sin
pro
tein
ubiq
uin
ation
RA
B27A
RA
B27A
,m
em
ber
RA
Soncogene
fam
ily210951_x_at
19
38
913
8.6
25.6
23.0
01.6
01.2
4B
ard
en
et
al.
(2003),
Fin
ley
et
al.
(2004a,b
),W
eber
et
al.
(2005),
Musholt
et
al.
(2006)
and
Sarq
uis
et
al.
(2006)
Pre
nyla
ted
mem
bra
ne
bound
pro
tein
with
GT
P-a
sefu
nction
–C
DN
Aclo
ne
IMA
GE
:4152983
214803_at
20
37
397
7.3
05.3
91.9
01.9
41.2
3N
ot
identified
BC
L2
B-c
ell
CLL/lym
phom
a2
203684_s_at
21
36
483
2.9
25.8
8K
2.9
5K
2.7
4K
1.3
9H
oos
etal.
(2002),
Baris
etal.
(2004,
2005),
Pra
sad
etal.
(2004),
Wre
esm
ann
etal.
(2004),
Gio
rdano
etal.
(2005)
and
Jacq
ues
etal.
(2005)
Mits
elo
uetal.
(2004),
cA
ksoy
eta
l.(2
005)
and
cLets
as
etal.
(2005)
Sta
ssie
tal.
(2003)
and
Baso
loetal.
(1999)
Anti-a
popto
tic
pro
tein
TA
CS
T-
D2
Tum
or-
associa
ted
calc
ium
sig
nal
transducer
2
202286_s_at
22
36
170
10.4
26.2
94.1
34.0
24.0
2G
iord
ano
et
al.
(2005)
May
serv
eas
cell
surf
ace
recepto
r
DIO
1D
eio
din
ase,
iodoth
yro
-nin
e,
type
I206457_s_at
23
35
971
6.1
99.9
4K
3.7
5K
3.7
9K
4.3
3E
szlin
gereta
l.(2
001,2
004),
Huang
eta
l.(2
001),
Bard
en
etal.
(2003),
Fin
ley
etal.
(2004a,b
),P
rasa
detal.
(2004),
Wre
esm
ann
etal.
(2004),
Gio
rdano
etal.
(2005)
and
Griffi
thetal.
(2006)
cD
eM
icco
et
al.
(1999),
cC
zarn
ocka
et
al.
(2001),
cLe
Fourn
et
al.
(2004),
cA
mbro
zia
ket
al.
(2005)
and
cA
rnald
iet
al.
(2005)
Kohrle
(1999)
50D
eio
din
ation
of
thyro
xin
e
ITP
R1
Inositol1,4
,5-t
ripho-
sphate
recepto
r,ty
pe
1
203710_at
24
34
804
6.7
58.8
4K
2.0
9K
2.0
6K
1.8
3B
ard
en
etal.
(2003),
Fin
ley
etal.
(2004a,b
),P
rasa
detal.
(2004),
Wre
esm
ann
etal.
(2004)
and
Ham
ada
etal.
(2005)
Sig
naltr
ansducer
couple
dw
ith
calc
ium
channels
,part
icip
ate
sin
apopto
sis
(Sedla
k&
Snyder
(2006))
HB
BH
em
oglo
bin
b209116_x_at
25
34
591
9.6
212.1
3K
2.5
1K
2.4
8K
1.2
4A
ldre
det
al.
(2003,
2004)
and
Onda
et
al.
(2005)
See
above
the
HB
Agene
SN
ED
1S
ushi,
nid
ogen,
and
EG
F-lik
edom
ain
s1
213493_at
26
33
625
2.8
75.8
8K
3.0
1K
2.1
4K
2.0
6P
art
icip
ate
sin
cell–
matr
ixadhesio
n,
conta
ins
sush
i,nid
ogen-a
nd
calc
ium
-bin
din
gdom
ain
sA
HR
Ary
lhydro
carb
on
recepto
r202820_at
27
33
003
7.5
26.0
21.5
01.2
01.5
9B
ard
en
et
al.
(2003),
Waseniu
set
al.
(2003)
and
Fin
ley
et
al.
(2004a,b
)A
ligand-a
ctivate
dtr
anscription
facto
rable
tofo
rmcom
ple
xes
with
oth
er
nucle
ar
recepto
rs(W
idera
ket
al.
(2005)
HG
DH
om
ogentisate
1,2
-dio
xygenase
(hom
o-
gentisate
oxid
ase)
205221_at
28
32
816
4.5
77.8
3K
3.2
6K
3.1
7K
3.9
2H
uang
etal.
(2001),
Ald
red
etal.
(2003),
Bard
en
et
al.
(2003),
Ald
red
et
al.
(2004),
Fin
ley
et
al.
(2004a,b
),P
rasad
et
al.
(2004)
and
Gio
rdano
et
al.
(2005)
Fe(I
I)-d
ependent
enzym
ere
sponsib
lefo
raro
matic
ring
cle
avage
RX
RG
Retinoid
Xre
cepto
r,g
205954_at
29
32
444
7.3
54.6
92.6
62.8
02.6
2H
augen
et
al.
(2004)
Klo
pper
et
al.
(2004),
Schm
utz
ler
et
al.
(2004)
and
Fro
hlic
het
al.
(2005)
Hete
rodim
er
part
ner
of
severa
lnucle
ar
recepto
rs
CA
4C
arb
onic
anhydra
se
IV206209_s_at
30
31
332
6.3
38.5
1K
2.1
8K
2.6
2K
1.4
1B
ard
en
et
al.
(2003),
Fin
ley
et
al.
(2004a,b
),W
eber
et
al.
(2005)
and
Sarq
uis
et
al.
(2006)
An
ancie
nt
isozym
e
SD
C4
Syndecan
4(a
mphi-
gly
can,
ryudocan)
202071_at
31
28
036
10.7
68.3
12.4
51.8
62.4
1B
ard
en
et
al.
(2003),
Chevill
ard
et
al.
(2004),
Fin
ley
et
al.
(2004a,b
),P
rasad
et
al.
(2004)
and
Griffi
thet
al.
(2006)
Tra
nsm
em
bra
ne
hepara
nsulfate
pro
-te
ogly
can
involv
ed
inth
eorg
aniz
-ation
ofth
eactin
cyto
skele
ton
and
incell–
matr
ixin
tera
ctions,
bin
ds
fibro
-nectin,b
ehaves
as
CX
CL12
recepto
r(L
inet
al.
(2005))
(continued)
Endocrine-Related Cancer (2007) 14 809–826
www.endocrinology-journals.org 815
Downloaded from Bioscientifica.com at 01/21/2022 07:30:33AMvia free access

Table 1 (continued)
Genesymbol Gene name
Affy_ID(U133) Rank Score
PTCmeanlog2
Benignmeanlog2
Logratio
Log ratioU133
Log ratioU95
References of microarray or otherhigh throughput studiesa
Referred to insingle studies ofthyroid cancer
Other datarelevant for
functional role inthyroid cancer Gene functionb
ENTPD1 Ectonucleoside tripho-sphate diphospho-hydrolase 1
209473_at 32 27 859 8.71 6.75 1.97 1.49 1.48 Weber et al. (2005) and Sarquis et al.(2006)
Membrane bound enzyme convertsadenine nucleotides to adenosine,interacts with caveolin 1 and 2 (Kittelet al. (2004))
TPO Thyroid peroxidase 210342_s_at 33 27 658 7.29 12.24 K4.95 K4.93 K3.75 Barden et al. (2003), Cerutti et al.(2004), Finley et al. (2004a,b) andGriffith et al. (2006)
Arturi et al. (1997),Lazar et al. (1999)and
Furuya et al. (2004) Thyroid-specific enzyme crucial fororganification of iodine and synthesisof thyroid hormones
KRT19 Keratin 19 201650_at 34 27 398 8.92 5.71 3.22 3.55 3.07 Barden et al. (2003), Chevillard et al.(2004), Finley et al. (2004a,b), Prasadet al. (2004) and Griffith et al. (2006)
Schelfhout et al.(1989)
The smallest known keratin expressedin some types of cancer
ID3 Inhibitor of DNA binding3, dominantnegative helix-loop-helix protein
207826_s_at 35 26 271 9.17 11.25 K2.08 K1.26 K1.29 Downstream target of pituitary tumortransforming gene (PTTG)
RUNX1 Runt-related transcrip-tion factor 1 (acutemyeloid leukemia 1;aml1 oncogene)
209360_s_at 36 26 202 7.37 4.80 2.58 3.50 2.01 Kim et al. (2007) Transcription factor may promote E-cadherin expression (Liu et al.(2005))
LMOD1 Leiomodin 1 (smoothmuscle)
203766_s_at 37 26 044 5.60 7.80 K2.20 K2.77 K0.95 Present both inthyroid cells andeye muscle(Krommingaet al. (1998))
64 kDa antigen, considered for its role inthyroid autoimmunity
RAB27A RAB27A, member RASoncogene family
209514_s_at 38 25 684 8.57 6.29 2.28 1.43 1.53 Barden et al. (2003), Finley et al.(2004a,b), Weber et al. (2005) andSarquis et al. (2006)
See above information on the alterna-tive probeset identifying the samegene
FBXO9 F-box protein 9 212987_at 39 25 331 8.47 9.29 K0.83 K0.50 K0.57 Members of this gene family incomplexes may act as protein–ubiquitin ligases
TRIM58 Tripartite motif-containing 58
215047_at 40 25 304 3.91 6.99 K3.08 K2.27 K1.74 Not identified
– – 210524_x_at 41 25 302 9.73 12.70 K2.97 K2.95 K2.12 Not identifiedMT1G Metallothionein 1G 204745_x_at 42 24 688 9.94 12.39 K2.45 K1.97 K4.00 Baris et al. (2004, 2005), Prasad et al.
(2004), Jacques et al. (2005) and Griffithet al. (2006)
Cherian et al.(2003)
Low molecular weight, cysteine-rich,zinc-donating protein. Associatedwith protection against DNAdamage, stress, and apoptosis(Theocharis et al. (2004))
ICAM1 Intercellular adhesionmolecule 1 (CD54),human rhinovirusreceptor
202638_s_at 43 24 534 8.18 5.61 2.57 1.70 2.40 Kawai et al. (1998) Epithelial adhesion molecule plays a keyrole in lymphocyte infiltration into thethyroid
aThe original papers (Eszlinger et al. 2001, 2004, Huang et al. 2001, Jarzab et al. 2005) containing datasets included in the present study were not cited here. RXRG was listed in our previousmicroarray-based analysis (Jarzab et al. 2005), together with FN1, MET, KRT19, DPP4, HBB, QPCT, GJB3, and DTX4, also occurring in this table.bOMIM-based information if not otherwise specified.cDenotes immunohistochemistry studies.
KF
uja
rew
icz
et
al.:
Multi-g
ene
diffe
rentia
tion
of
PT
C
ww
w.e
ndocrin
olo
gy-jo
urn
als
.org
816
Dow
nloaded from Bioscientifica.com
at 01/21/2022 07:30:33AMvia free access
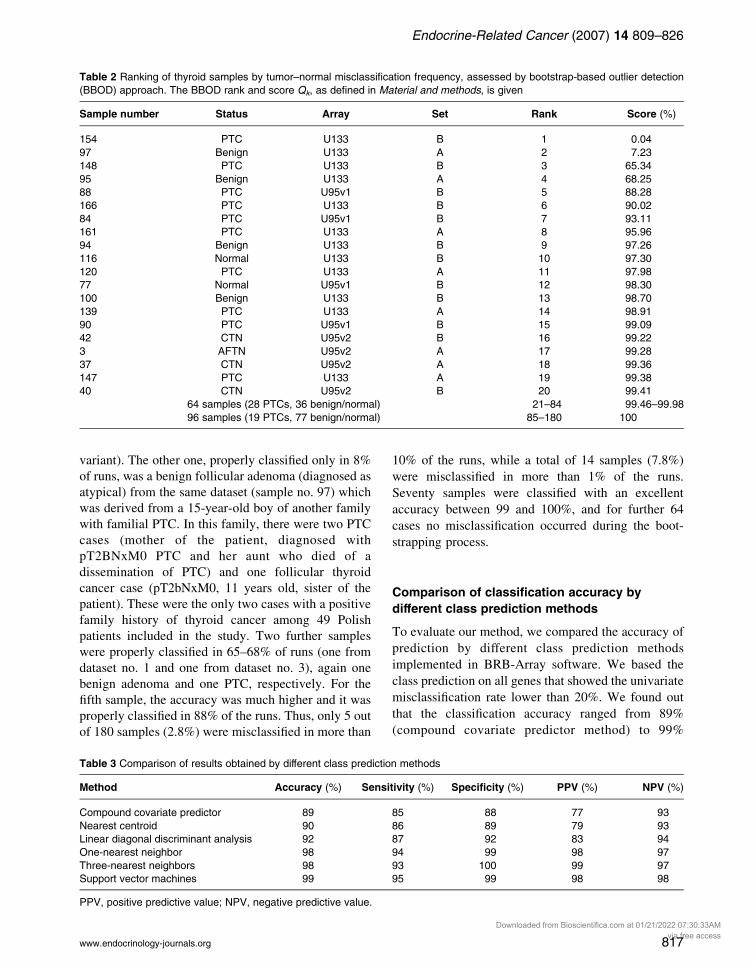
Table 2 Ranking of thyroid samples by tumor–normal misclassification frequency, assessed by bootstrap-based outlier detection
(BBOD) approach. The BBOD rank and score Qk, as defined in Material and methods, is given
Sample number Status Array Set Rank Score (%)
154 PTC U133 B 1 0.04
97 Benign U133 A 2 7.23
148 PTC U133 B 3 65.34
95 Benign U133 A 4 68.25
88 PTC U95v1 B 5 88.28
166 PTC U133 B 6 90.02
84 PTC U95v1 B 7 93.11
161 PTC U133 A 8 95.96
94 Benign U133 B 9 97.26
116 Normal U133 B 10 97.30
120 PTC U133 A 11 97.98
77 Normal U95v1 B 12 98.30
100 Benign U133 B 13 98.70
139 PTC U133 A 14 98.91
90 PTC U95v1 B 15 99.09
42 CTN U95v2 B 16 99.22
3 AFTN U95v2 A 17 99.28
37 CTN U95v2 A 18 99.36
147 PTC U133 A 19 99.38
40 CTN U95v2 B 20 99.41
64 samples (28 PTCs, 36 benign/normal) 21–84 99.46–99.98
96 samples (19 PTCs, 77 benign/normal) 85–180 100
Endocrine-Related Cancer (2007) 14 809–826
variant). The other one, properly classified only in 8%
of runs, was a benign follicular adenoma (diagnosed as
atypical) from the same dataset (sample no. 97) which
was derived from a 15-year-old boy of another family
with familial PTC. In this family, there were two PTC
cases (mother of the patient, diagnosed with
pT2BNxM0 PTC and her aunt who died of a
dissemination of PTC) and one follicular thyroid
cancer case (pT2bNxM0, 11 years old, sister of the
patient). These were the only two cases with a positive
family history of thyroid cancer among 49 Polish
patients included in the study. Two further samples
were properly classified in 65–68% of runs (one from
dataset no. 1 and one from dataset no. 3), again one
benign adenoma and one PTC, respectively. For the
fifth sample, the accuracy was much higher and it was
properly classified in 88% of the runs. Thus, only 5 out
of 180 samples (2.8%) were misclassified in more than
Table 3 Comparison of results obtained by different class predictio
Method Accuracy (%) Sensi
Compound covariate predictor 89
Nearest centroid 90
Linear diagonal discriminant analysis 92
One-nearest neighbor 98
Three-nearest neighbors 98
Support vector machines 99
PPV, positive predictive value; NPV, negative predictive value.
www.endocrinology-journals.org
10% of the runs, while a total of 14 samples (7.8%)
were misclassified in more than 1% of the runs.
Seventy samples were classified with an excellent
accuracy between 99 and 100%, and for further 64
cases no misclassification occurred during the boot-
strapping process.
Comparison of classification accuracy by
different class prediction methods
To evaluate our method, we compared the accuracy of
prediction by different class prediction methods
implemented in BRB-Array software. We based the
class prediction on all genes that showed the univariate
misclassification rate lower than 20%. We found out
that the classification accuracy ranged from 89%
(compound covariate predictor method) to 99%
n methods
tivity (%) Specificity (%) PPV (%) NPV (%)
85 88 77 93
86 89 79 93
87 92 83 94
94 99 98 97
93 100 99 97
95 99 98 98
817
Downloaded from Bioscientifica.com at 01/21/2022 07:30:33AMvia free access
K Fujarewicz et al.: Multi-gene differentiation of PTC
(SVM), and confirmed the best performance of SVM-
based methods to analyze these data (Table 3).
Discussion
Transcripts important for discriminating PTC
from benign and normal thyroid samples
In the study, we performed an advanced optimization
of putative PTC markers using a large group of benign
thyroid lesions and normal thyroid tissues and
proposed a list of 43 transcripts, selected by their
most frequent appearance in the classifiers.
An additional proof of their efficacy was obtained by
hierarchical clustering (all samples clustered correctly,
data shown in the web appendix to this article,
www.genomika.pl/thyroidcancer). Forty-one of them
(95.3%) could be attributed to 39 known genes, 32
well-defined ones, and 7 of unknown or not well-
defined function. There were 12 genes which had never
before been related to the thyroid gland nor mentioned
in genomic studies of thyroid cancer, while 29 genes
(74%) were identified in previous thyroid microarray
studies. However, only ten of them were discussed in
the original papers for their putative role in thyroid
carcinoma. Within the list of the well-known genes
which received high scores by BBFR, one should
mention gene encoding FN1, met proto-oncogene
(MET; both scored 4.4!104), dipeptidylpeptidase 4
(DPP4), adenosine A1 receptor (ADORA1), keratin
19, and B-cell CLL (BCL2) genes (Huang et al. 2001,
Wasenius et al. 2003, Baris et al. 2004, Chevillard
et al. 2004, Finley et al. 2004a, Wreesmann et al. 2004,
Giordano et al. 2005), all up-regulated with the
exception of BCL2. Their inclusion in our classifier
positively validates the applied criteria. All these genes
except ADORA1 were previously found by single gene
studies (see Table 1) and later confirmed by microarray
approaches. Moreover, in the recent meta-analysis of
thyroid cancer gene expression profile, MET and FN1
were included into top 12 candidates for consistent
gene expression markers (Griffith et al. 2006).
Similarly, thyroid-specific (down-regulated) genes,
deiodinase, iodothyronine, type I and thyroid per-
oxidase, were widely recognized previously for their
diagnostic significance both in microarray-based
(Eszlinger et al. 2001, Huang et al. 2001, Baris et al.
2004, Cerutti et al. 2004, Finley et al. 2004a,
Wreesmann et al. 2004) and single gene studies (Arturi
et al. 1997, Lazar et al. 1999, De Micco et al. 1999,
Czarnocka et al. 2001, Le Fourn et al. 2004,
Ambroziak et al. 2005, Arnaldi et al. 2005). Never-
theless, neither our approach nor the meta-analysis
818
mentioned earlier indicated other thyroid-specific
genes, confirming the lesser diagnostic potency of
sodium iodide symporter, thyroglobulin, thyrotrophin
receptor, or thyroid-specific transcription factors,
shown to be down-regulated in previous single gene
studies (Arturi et al. 1997, Lazar et al. 1999, Shimura
et al. 2001, Scouten et al. 2004, Ambroziak et al. 2005,
Wagner et al. 2005).
The top gene identified by our effort,MPPED2, which
is lost in PTC, was not previously considered for its role
in PTC, although it was previously listed byAldred et al.
(2004, in the context of FTC) and by Mazzanti et al.
(2004). It is an ancient gene highly conserved from
Caenorhabditis elegans to mammals and expressed in
fetal brain. Its function is unknown.
Already the first microarray-based analysis of a PTC
gene expression profile (Huang et al. 2001) indicated
the dominant position of genes controlling cell–matrix
adhesion and cell–cell communication. Besides, FN1
mentioned earlier, and intercellular adhesion molecule
1 (ICAM-1; Kawai et al. 1998), it seems important to
mention syndecan 4 (SDC4), a transmembrane heparan
sulfate proteoglycan known to bind FN1 and function-
ing also as CXCL12 receptor in signal transduction
(Huang et al. 2001, Chevillard et al. 2004, Finley et al.
2004a). Loss of CDH16 (kidney-specific cadherin;
Thomson et al. 1998) was indicated for the first time in
our study, a gene closely related to cadherin E (CDH1),
which is well known to be lost in a subgroup of PTCs
with negative prognostic significance (Rocha et al.
2003), while cadherin P (CDH3) is up-regulated in
PTC (Jarzab et al. 2005). Other genes involved in cell
adhesion and present in our list comprise ectonucleo-
side triphosphate diphosphohydrolase 1 (ENTPD1)
(up-regulated) and less known genes such as NEL-like
2 (up-regulated) and sushi, nidogen, and
EGF-like domains 1 (down-regulated), both exhibiting
EGF-like repeats (Watanabe et al. 1996). The GJB3
gene (connexin 31) encodes the protein subunit of gap
junctions, essential for cell–cell communication.
DPP4 (CD26), ICAM1, and ENTPD1 (CD39) may be
considered as immune-related genes, although their
expression is not confined to immune or endothelial
cells. ICAM1 was shown to be present in thyroid cancer
cells (Kawai et al. 1998). ENTPD1 (ecto-ATPase), in
turn, has not been described before for the thyroid gland;
its expression was shown in some other organs like
salivary glands or exocrine pancreas (Kittel et al. 2004).
It converts adenine nucleotides to adenosine, thus
participating in the control of signal transduction.
DPP4, another membrane-bound enzyme which hydro-
lyzes peptides engaged in paracrine and autocrine
www.endocrinology-journals.org
Downloaded from Bioscientifica.com at 01/21/2022 07:30:33AMvia free access

Endocrine-Related Cancer (2007) 14 809–826
regulation, is up-regulated in PTCs both on RNA and
protein level (Huang et al. 2001, Kholova et al. 2003).
The contribution of various enzymes to our list is
striking: others, not described previously in the context of
thyroid gland, comprise UDP-galactose epimerase
(GALE) and glutaminyl-peptide cyclotransferase
(QPCT), both with virtually unknown expression
patterns. The latter was also indicated by the meta-
analysis of Griffith et al.Among gene encoding enzymes
lost in PTC are plasma glutamate carboxypeptidase,
plasma glutamate carboxypeptidase (Gingras et al.
1999), notmentioned in any thyroid-related study before;
carbonic anhydrase 4 (CA4), and even the well-known
homogentisate oxidase (encoding HGD), not previously
related to the thyroid in any context, although listed in
many microarray-based reports (Table 1).
Underexpression of hemoglobin transcripts
(HBA1/A2 and HBB scored at positions 2 and 25
respectively) was already discussed in our papers as a
very characteristic feature of PTC gene expression
profile (Jarzab et al. 2005). We believe that the down-
regulation of hemoglobin gene could be associated
with tumor hypoxia; HBA has also been considered a
tumor suppressor since transduction of this gene in an
anaplastic thyroid cancer cell line induces an anti-
proliferative effect (Onda et al. 2005).
Many of the genes listed in Table 1 participate in
signal transduction; among them are MET, ADOR-
A1,RAB27A as well as tumor-associated calcium signal
transducer 2, inositol 1,4,5-triphosphate receptor, type
1 (ITPR1), ryanodine receptor 1, all up-regulated in
PTC except for ITPR1. Some enzymes mentioned
above (DPP4, ENTPD1, and QPCT) contribute to
synthesis or breakdown of signaling molecules. On the
other hand, the list also includes many genes
participating in transcription regulation, among them
high-mobility group AT-hook 2, aryl hydrocarbon
receptor, retinoid X receptor, g, ID3, nuclear receptor-interacting protein 1, and RUNX1. Both of these
functional classes are typical for cancer genes. We
noted only one gene clearly related to apoptosis (and
lost in PTC), the well-known BCL2. Interestingly
enough, some immunohistochemical studies report its
up-regulation in PTC (Aksoy et al. 2005).
Although the selected genes were obtained
by analysis of PTC, many of them may be found
also in other types of thyroid tumors (M Oczko-
Wojciechowska, J Starzynski, M Jarzab, Z Wygoda,
A Czarniecka, G Gala, M Kalemba, E Gubala &
B Jarzab, unpublished data). This is convincingly
illustrated by the overlapping results of our analysis
www.endocrinology-journals.org
and one of the studies which dealt with follicular
thyroid tumors only (Barden et al. 2003).
Accuracy of discriminating PTC from
benign/normal thyroid tissue
Our study is the first to define the classification
accuracy for thyroid cancer by 95% CIs and one of
the few dealing with the problem of diagnostic
accuracy of microarray-derived classifiers (Kerr &
Churchill 2001). Although the estimation of CIs by
Monte Carlo analysis has not gained a general
acceptance still, it is necessary to stress the very
good accuracy of PTC diagnosis in our study with the
lower range of the CI at 95%, obtained using a
sufficiently large study group, mimicking the real
clinical setting. From a clinical point of view, for a
PTC classifier, an even higher accuracy is required, as
the risk of diagnosing PTC in a thyroid nodule is only
about 5% (Hegedus 2004).
Our results stress the importance of multi-gene
approaches for the molecular diagnosis of cancer.
We observed that lower limits of accuracy CIs were
decreased in case of classification by gene sets with
less than ten genes. The initial conclusion from these
data is that any combination of more than five to ten
genes increases the reliability of distinguishing
between malignant and benign tissue samples. This
result is similar to that obtained by Hua et al. (2005),
who demonstrated on simulated and real breast cancer
data that for different classifiers the number of features
lower than five was usually much less effective than
larger classifiers. Recent paper reports a six-gene
molecular classifier, efficient for molecular diagnosis
of thyroid cancer (Kebebew et al. 2006).
Bootstrap-based multi-gene classification of PTC
microarray data
Selection of genes is an important goal of microarray
studies contributing to broader understanding of the
cancer transcriptome as well as yielding novel molecular
cancer markers. Such studies have been successfully
performed in PTC and large numbers of discriminating
physiologically relevant genes were proposed (Huang
et al. 2001, Wasenius et al. 2003, Aldred et al. 2004,
Chevillard et al. 2004, Finley et al. 2004a,b, Wreesmann
et al. 2004, Baris et al. 2005, Detours et al. 2005,
Giordano et al. 2005). However, in the majority of these
studies, the selection of important genes was based on
either fold-change or significance criteria obtained using
classical statistical tests. These approaches either favor
genes with large amplitudes, sometimes coming from a
819
Downloaded from Bioscientifica.com at 01/21/2022 07:30:33AMvia free access

K Fujarewicz et al.: Multi-gene differentiation of PTC
minor proportion of samples, or genes with low within-
group variance, thus rather stably expressed in all
analyzed tumor samples. Bearing in mind, complexity
of molecular changes in tumors, the widespread
skepticism about a single ‘cancer marker’ as well as
possible differences in histological subtypes or other
features of PTC, we decided to use SVM, a routine
machine-learning approach to construct classifiers based
onmultiple features of the analyzed objects. Thismethod
allows integrating the information carried bymany genes
in the gene sets. Thus, effective molecular multi-gene
classifiers may be built that rely on inter-gene
interactions rather than on combining single ‘best
markers’. SVMs have been confirmed as an effective
method of multi-gene set selection and this is supported
by our comparison to other class predictionmethods. Our
procedure helps us to optimize the list of markers which
are to be implemented to real-time quantitative PCR-
supported fine needle biopsy (Lubitz & Fahey 2006).
From the diagnostic point of view, the major
drawback of the SVM-based methods are the
fluctuations of gene content between classifiers of
different size or based on slightly different training
sets. To overcome this problem, we extended the
original algorithm with bootstrap iterations, as
recommended (Braga-Neto & Dougherty 2004).
A bootstrap iteration depends on creating a temporary
learning set (bootstrap sample) by performing selec-
tion from the original set with return of samples.
Then, the classification rule is derived based on a
bootstrap sample and applied to the rest of the original
set. Multiple selections of slightly different training
sets represent the variability, which may be observed
between different thyroid cancer collections, labora-
tories, etc. Indeed, our current data generated using
the bootstrap technique show much better agreement
with the results of other thyroid cancer studies
(Oczko-Wojciechowska et al. submitted) than data
created by leave-one-out cross-validation of the whole
dataset (Jarzab et al. 2005).
Originally, in a bootstrap iteration one counts only the
number of misclassifications. Since in all bootstrap
iterations every step of data processing (gene selection
and classifier training) has to be repeated (Simon et al.
2003), some additional knowledge can be gained. The
procedure used by us enables ranking of genes which are
most often present in the classifiers obtained from the
different subsets of the training set (BBFR). Furthermore,
it also estimates the accuracy with appropriate CIs.
Moreover, it allows ranking the samples according to the
frequency of misclassifications (BBOD). The use of
BBFR resulted in delineation of genes,whichwere either
820
novel or not recognized before for their contribution to
the PTC gene expression profile, even if they were
included in the large gene lists given in previous genomic
studies. BBOD allowed us to reveal ‘difficult’ samples
in the analyzed group. The two thyroid samples with the
poorest accuracy of diagnosis were derived frompatients
with familial thyroid tumors, which suggest that
their gene expression profiles may differ from sporadic
ones. For the remaining samples, in 175 out of
180 cases (O97%) the percentage of correct diagnoses
wasO90%.
Recently, Zhang et al. (2006) have published a SVM-
based recursive method of gene selection. This method,
called R-SVM, differs from the standard RFE algorithm,
used here, in modified criteria applied in elimination
steps. Moreover, the final gene subset is created on the
basis of any resamplemethodused at the validation stage,
which is similar to our approach presented here.
Nevertheless, our bootstrap-basedmethod allows detect-
ing outlier samples and provides the estimation of CIs for
the classification accuracy, which is much more
informative than the accuracy estimator alone.
PTC and normal/benign difference versus
inter-platform difference
To assure a sufficient number of tissue samples, it was
necessary to combine data obtained using different
generations of GeneChips, which cannot be compared
by a direct approach (Eszlinger et al. 2006). The use of
multi-gene classifiers allows, however, overcoming
this difficulty. We showed earlier that the classifier
selected using the U133 platform (Jarzab et al. 2005)
performs well on U95-obtained data and has high
classification accuracy (Eszlinger et al. 2006). In the
present paper, we demonstrate that it is possible, after
correctly matching genes from two different generation
microarrays, to derive an efficient multi-gene classifier.
When we included both benign and malignant samples
from both platforms, the vast majority of these samples
were properly classified. Using Affymetrix GeneChips,
Barden et al. (2003) and Finley et al. (2004a,b) had
previously reported 20 of 43 genes now confirmed by
us as diagnostically relevant for PTC. This is a level of
agreement rarely noted for inter-group comparisons of
microarray results.
Our analysis has been performed on microarray data
pre-processed by the standard MAS5 algorithm.
Although many authors demonstrate the superiority
of other pre-processing methods (e.g. RMA or
GC-RMA; Irizarry et al. 2003), for inter-platform
comparisons, the MAS5 method still seems to be a
reasonable approach. In the MAS5 algorithm, each
www.endocrinology-journals.org
Downloaded from Bioscientifica.com at 01/21/2022 07:30:33AMvia free access
Endocrine-Related Cancer (2007) 14 809–826
array is processed independently and the bootstrap
procedure does not have to involve this step. Use of
RMA pre-processing, which has to operate on the
whole dataset, would pose the question of whether this
step should also be bootstrapped. Presently, this is not
feasible due to huge computational demand of pre-
processing for large sample sets.
Redundancy of multi-gene cancer classifiers
This is inherently linked to the huge differences in
gene expression profiles of several tumors, originating
from the same tissue. This was indicated for the first
time by Ein-Dor et al. (2005) in breast cancer. These
authors re-analyzed the data of van’t Veer et al.
(2002) and showed that multiple similar classifiers
may be obtained; they have comparable classification
potency as van’t Veer’s original 70-gene classifier but
a different gene content. Ein-Dor et al. stressed also
that even slight differences in the training set
composition influenced the selected genes. Our
analysis demonstrates that similar redundancy is
present in PTC. This fact is frequently overlooked
by authors interpreting the results of gene expression
profile studies that involved only a few genes or
which were obtained in small groups of patients. In
this paper, we propose a method of ranking genes
according to their importance in multi-gene classifiers
and with appropriate CIs indicating the robustness of
the result.
To conclude, the primary goal of this study was to
validate a novel SVM-based approach to differen-
tiation of PTC from benign thyroid lesions. This goal
was achieved with a very satisfactory degree of
accuracy, over 95%. Simultaneously, we were able to
rank the genes most essential for the molecular
diagnosis of PTC. Although the presented list of
genes can be enlarged, we believe the first 40 genes
are especially suitable for further prospective studies
in fine needle biopsy material and may serve to
construct multi-gene classifiers with potential appli-
cation in clinical setting. The comparison with other
published microarray studies yields sufficient vali-
dation for the vast majority of them.
Acknowledgements
We gratefully acknowledge Aleksander Sochanik,
PhD, for the thorough language revision of the
manuscript. This work was partially supported by
Polish Ministry of Education and Science under grant
3T11A 019 29 (K F) and 2P05A 022 30 (B J). This
work was partially supported by the Deutsche
www.endocrinology-journals.org
Krebshilfe grant 106542 (R P and K K) and the
Interdisciplinary Center for Clinical Research at the
Faculty of Medicine of the University of Leipzig
(projects B20, Z03). This work was partially
supported within GENRISK-T project, contract
number 036495 (A S, B J). Authors declare no
potential conflict of interest.
References
AksoyM, Giles Y, Kapran Y, Terzioglu T & Tezelman S 2005
Expression of bcl-2 in papillary thyroid cancers and its
prognostic value. Acta Chirurgica Belgica 105 644–648.
Aldred MA, Ginn-Pease ME, Morrison CD, Popkie AP,
Gimm O, Hoang-Vu C, Krause U, Dralle H, Jhiang SM,
Plass C et al. 2003 Caveolin-1 and caveolin-2, together
with three bone morphogenetic protein-related genes,
may encode novel tumor suppressors down-regulated in
sporadic follicular thyroid carcinogenesis. Cancer
Research 63 2864–2871.
AldredMA,HuangY,Liyanarachchi S,PellegataNS,GimmO,
Jhiang S, Davuluri RV, de la Chapelle A & Eng C 2004
Papillary and follicular thyroid carcinomas show distinctly
different microarray expression profiles and can be
distinguished by a minimum of five genes. Journal of
Clinical Oncology 22 3531–3539.
AmbroziakM, Pachucki J, Stachlewska-Nasfeter E,Nauman J
&NaumanA 2005Disturbed expression of type 1 and type
2 iodothyronine deiodinase aswell as titf1/nkx2-1 and pax-
8 transcription factor genes in papillary thyroid cancer.
Thyroid 15 1137–1146.
Aratake Y, Nomura H, Kotani T, Marutsuka K, Kobayashi K,
Kuma K, Miyauchi A, Okayama A & Tamura K 2006
Coexistent anaplastic and differentiated thyroid carci-
noma: an Immunohistochemical Study. American
Journal of Clinical Pathology 125 399–406.
Arnaldi LA, Borra RC, Maciel RM & Cerutti JM 2005 Gene
expression profiles reveal that DCN, DIO1, and DIO2 are
underexpressed in benign and malignant thyroid tumors.
Thyroid 15 210–221.
Arturi F, Russo D, Giuffrida D, Ippolito A, Perrotti N,
Vigneri R & Filetti S 1997 Early diagnosis by genetic
analysis of differentiated thyroid cancer metastases in
small lymph nodes. Journal of Clinical Endocrinology
and Metabolism 82 1638–1641.
Baloch ZW & Livolsi VA 2002 Follicular-patterned lesions
of the thyroid: the bane of the pathologist. American
Journal of Clinical Pathology 117 143–150.
Barden CB, Shister KW, Zhu B, Guiter G, Greenblatt DY,
Zeiger MA & Fahey TJ III 2003 Classification of
follicular thyroid tumors by molecular signature: results
of gene profiling. Clinical Cancer Research 9 1792–1800.
Baris O, Savagner F, Nasser V, Loriod B, Granjeaud S,
Guyetant S, Franc B, Rodien P, Rohmer V, Bertucci F
et al. 2004 Transcriptional profiling reveals coordinated
821
Downloaded from Bioscientifica.com at 01/21/2022 07:30:33AMvia free access

K Fujarewicz et al.: Multi-gene differentiation of PTC
up-regulation of oxidative metabolism genes in thyroid
oncocytic tumors. Journal of Clinical Endocrinology and
Metabolism 89 994–1005.
Baris O, Mirebeau-Prunier D, Savagner F, Rodien P,
Ballester B, Loriod B, Granjeaud S, Guyetant S, Franc B,
Houlgatte R et al. 2005 Gene profiling reveals specific
oncogenic mechanisms and signaling pathways in
oncocytic and papillary thyroid carcinoma. Oncogene 24
4155–4161.
Basolo F, Fiore L, Fusco A, Giannini R, Albini A, Merlo GR,
Fontanini G, Conaldi PG & Toniolo A 1999 Potentiation
of the malignant phenotype of the undifferentiated ARO
thyroid cell line by insertion of the bcl-2 gene.
International Journal of Cancer 81 956–962.
Belfiore A, Gangemi P, Costantino A, Russo G, Santonocito
GM, Ippolito O, Di Renzo MF, Comoglio P, Fiumara A &
Vigneri R 1997 Negative/low expression of the Met/hepa-
tocyte growth factor receptor identifies papillary thyroid
carcinomas with high risk of distant metastases. Journal of
Clinical Endocrinology and Metabolism 82 2322–2328.
Berlingieri MT, Pierantoni GM, Giancotti V, Santoro M &
Fusco A 2002 Thyroid cell transformation requires
the expression of the HMGA1 proteins. Oncogene 21
2971–2980.
Boser B, Guyon I & Vapnik V 1992 A training algorithm for
optimal margin classifiers. Fifth Annual Workshop on
Computational Learning Theory, Pittsburgh.
Braga-Neto U & Dougherty E 2004 Is cross-validation valid
for small sample microarray classification? Bioinfor-
matics 20 374–380.
Breiman L 1996 Bagging predictors. Machine Learning 24
123–140.
Cerutti JM, Delcelo R, Amadei MJ, Nakabashi C, Maciel RM,
PetersonB, Shoemaker J&RigginsGJ 2004A preoperative
diagnostic test that distinguishes benign from malignant
thyroid carcinoma based on gene expression. Journal of
Clinical Investigation 113 1234–1242.
Chen KT, Lin JD, Chao TC, Hsueh C, Chang CA, Weng HF
& Chan EC 2001 Identifying differentially expressed
genes associated with metastasis of follicular thyroid
cancer by cDNA expression array. Thyroid 11 41–46.
Cherian MG, Jayasurya A & Bay BH 2003 Metallothioneins
in human tumors and potential roles in carcinogenesis.
Mutation Research 533 201–209.
Chevillard S, Ugolin N, Vielh P, Ory K, Levalois C, Elliott D,
Clayman GL & El-Naggar AK 2004 Gene expression
profiling of differentiated thyroid neoplasms: diagnostic
and clinical implications. Clinical Cancer Research 10
6586–6597.
Czarnocka B, Pastuszko D, Janota-Bzowski M, Weetman AP,
Watson PF, KempEH,McIntosh RS, AsgharMS, Jarzab B,
Gubala E et al. 2001 Is there loss or qualitative changes in
the expression of thyroid peroxidase protein in thyroid
epithelial cancer? British Journal of Cancer 85 875–880.
822
Dahl E, Winterhager E, Reuss B, Traub O, Butterweck A &
Willecke K 1996 Expression of the gap junction proteins
connexin31 and connexin43 correlates with communi-
cation compartments in extraembryonic tissues and in the
gastrulating mouse embryo, respectively. Journal of Cell
Science 109 191–197.
Detours V, Wattel S, Venet D, Hutsebaut N, Bogdanova T,
Tronko MD, Dumont JE, Franc B, Thomas G&Maenhaut
C 2005 Absence of a specific radiation signature in post-
Chernobyl thyroid cancers. British Journal of Cancer 92
1545–1552.
Efron B 1979 Bootstrap methods:another look at the
jackknife. Annals of Statistics 7 1–26.
Efron B 1983 Estimating the error rate of prediction rule:
improvement on cross-validation. Journal of the Amer-
ican Statistical Association 78 316–331.
Ein-Dor L, Kela I, Getz G, Givol D & Domany E 2005
Outcome signature genes in breast cancer: is there a
unique set? Bioinformatics 21 171–178.
Eszlinger M, Krohn K & Paschke R 2001 Complementary
DNA expression array analysis suggests a lower
expression of signal transduction proteins and receptors in
cold and hot thyroid nodules. Journal of Clinical
Endocrinology and Metabolism 86 4834–4842.
Eszlinger M, Krohn K, Frenzel R, Kropf S, Tonjes A &
Paschke R 2004 Gene expression analysis reveals
evidence for inactivation of the TGF-beta signaling
cascade in autonomously functioning thyroid nodules.
Oncogene 23 795–804.
EszlingerM,WienchM, JarzabB,KrohnK,BeckM,Lauter J,
Gubala E, Fujarewicz K, Swierniak A & Paschke R 2006
Meta- and reanalysis of gene expression profiles of hot and
cold thyroid nodules and papillary thyroid carcinoma for
gene groups. Journal of Clinical Endocrinology and
Metabolism 91 1934–1942.
Fedele M, Pierantoni GM, Berlingieri MT, Battista S,
Baldassarre G, Munshi N, Dentice M, Thanos D, Santoro
M, Viglietto G et al. 2001 Overexpression of proteins
HMGA1 induces cell cycle deregulation and apoptosis in
normal rat thyroid cells. Cancer Research 61 4583–4590.
Finley DJ, Arora N, Zhu B, Gallagher L & Fahey TJ III
2004a Molecular profiling distinguishes papillary carci-
noma from benign thyroid nodules. Journal of Clinical
Endocrinology and Metabolism 89 3214–3223.
Finley DJ, Zhu B, Barden CB & Fahey TJ III 2004b
Discrimination of benign and malignant thyroid
nodules by molecular profiling. Annals of Surgery 240
425–436.
Le Fourn V, Ferrand M & Franc JL 2004 Differential
expression of thyroperoxidase mRNA splice variants in
human thyroid tumors. Biochimica et Biophysic Acta
1689 134–141.
Franc B, De La Salmoniere P, Lange F, Hong C, Louvel A,
De Roquancourt A, Wild F, Hejblum G, Chevret S &
www.endocrinology-journals.org
Downloaded from Bioscientifica.com at 01/21/2022 07:30:33AMvia free access
Endocrine-Related Cancer (2007) 14 809–826
Chastang C 2003 Interobserver and intraobserver repro-
ducibility in the histopathology of follicular thyroid
carcinoma. Human Pathology 34 1092–1100.
Freund Y & Schapire R 1996 Experiments with a new
boosting algorithm. Proceedings of the 13th International
Conference on Machine Learning Bari 325–332.
Frohlich E, Machicao F & Wahl R 2005 Action of
thiazolidinediones on differentiation, proliferation and
apoptosis of normal and transformed thyrocytes in
culture. Endocrine-Related Cancer 12 291–303.
Furuya F, Shimura H, Miyazaki A, Taki K, Ohta K,
Haraguchi K, Onaya T, Endo T & Kobayashi T 2004
Adenovirus-mediated transfer of thyroid transcription
factor-1 induces radioiodide organification and
retention in thyroid cancer cells. Endocrinology 145
5397–5405.
Ghinea N, Baratti-Elbaz C, De Jesus-Lucas A & Milgrom E
2002TSH receptor interactionwith the extracellularmatrix:
role on constitutive activity and sensitivity to hormonal
stimulation.Molecular Endocrinology 16 912–923.
Gingras R, Richard C, El-Alfy M, Morales CR, Potier M &
Pshezhetsky AV 1999 Purification, cDNA cloning, and
expression of a new human blood plasma glutamate
carboxypeptidase homologous toN-acetyl-aspartyl-alpha-
glutamate carboxypeptidase/prostate-specific
membrane antigen. Journal of Biological Chemistry 274
11742–11750.
Giordano TJ, Kuick R, Thomas DG, Misek DE, Vinco M,
Sanders D, Zhu Z, Ciampi R, Roh M, Shedden K et al.
2005 Molecular classification of papillary thyroid
carcinoma: distinct BRAF, RAS, and RET/PTC mutation-
specific gene expression profiles discovered by DNA
microarray analysis. Oncogene 24 6646–6656.
Golub TR, Slonim DK, Tamayo P, Huard C, Gaasenbeek M,
Mesirov JP, Coller H, Loh ML, Downing JR, Caligiuri
MA et al. 1999 Molecular classification of cancer: class
discovery and class prediction by gene expression
monitoring. Science 286 531–537.
GreenLM,BianskiBM,MurrayDK,RightnarSS&NelsonGA
2005 Characterization of accelerated iron-induced damage
in gap junction-competent and -incompetent thyroid
follicular cells. Radiation Research 163 172–182.
Griffith OL, Melck A, Jones SJ & Wiseman SM 2006 Meta-
analysis and meta-review of thyroid cancer gene expression
profiling studies identifies important diagnostic biomarkers.
Journal of Clinical Oncology 24 5043–5051.
Guyon I, Weston J, Barnhill S & Vapnik V 2002 Gene
selection for cancer classification using support vector
machines. Machine Learning 64 389–422.
Hamada A, Mankovskaya S, Saenko V, Rogounovitch T,
Mine M, Namba H, Nakashima M, Demidchik Y,
Demidchik E & Yamashita S 2005 Diagnostic usefulness
of PCR profiling of the differentially expressed marker
genes in thyroid papillary carcinomas. Cancer Letters 224
289–301.
www.endocrinology-journals.org
Haugen BR, Larson LL, Pugazhenthi U,HaysWR,Klopper JP,
Kramer CA& Sharma V 2004 Retinoic acid and retinoid X
receptors are differentially expressed in thyroid cancer and
thyroid carcinoma cell lines and predict response to
treatment with retinoids. Journal of Clinical Endocrinology
and Metabolism 89 272–280.
Hegedus L 2004 Clinical practice. The thyroid nodule. New
England Journal of Medicine 351 1764–1771.
Hoos A, Stojadinovic A, Singh B, Dudas ME, Leung DH,
Shaha AR, Shah JP, Brennan MF, Cordon-Cardo C &
Ghossein R 2002 Clinical significance of molecular
expression profiles of Hurthle cell tumors of the thyroid
gland analyzed via tissue microarrays. American
Journal of Pathology 160 175–183.
Hua J, Xiong Z, Lowey J, Suh E & Dougherty ER 2005
Optimal number of features as a function of sample size
for various classification rules. Bioinformatics 21
1509–1515.
Huang Y, Prasad M, Lemon WJ, Hampel H, Wright FA,
Kornacker K, LiVolsi V, FrankelW,Kloos RT, Eng C et al.
2001 Gene expression in papillary thyroid
carcinoma reveals highly consistent profiles. PNAS 98
15044–15049.
Illario M, Amideo V, Casamassima A, Andreucci M, di MT,
Miele C, Rossi G, Fenzi G & Vitale M 2003 Integrin-
dependent cell growth and survival are mediated by
different signals in thyroid cells. Journal of Clinical
Endocrinology and Metabolism 88 260–269.
Ippolito A, Vella V, La Rosa GL, Pellegriti G, Vigneri R &
Belfiore A 2001 Immunostaining for Met/HGF receptor
may be useful to identify malignancies in thyroid lesions
classified suspicious at fine-needle aspiration biopsy.
Thyroid 11 783–787.
Irizarry R, Hobbs B, Colli F, Beazer-Barclay Y, Antonellis K,
Scherf U & Speed T 2003 Exploration, normalization, and
summaries of high density oligonucleotide array probe
level data. Biostatistics 4 249–264.
JacquesC,BarisO, Prunier-MirebeauD, Savagner F,Rodien P,
Rohmer V, Franc B, Guyetant S, Malthiery Y & Reynier P
2005 Two-step differential expression analysis reveals a
new set of genes involved in thyroid oncocytic tumors.
Journal of Clinical Endocrinology and Metabolism 90
2314–2320.
Jarzab B, Wiench M, Fujarewicz K, Simek K, Jarzab M,
Oczko-Wojciechowska M, Wloch J, Czarniecka A,
Chmielik E, Lange D et al. 2005 Gene expression profile
of papillary thyroid cancer: sources of variability and
diagnostic implications. Cancer Research 65 1587–1597.
Kawai K, Resetkova E, Enomoto T, Fornasier V & Volpe R
1998 Is human leukocyte antigen-DR and intercellular
adhesion molecule-1 expression on human thyrocytes
constitutive in papillary thyroid cancer? Comparative
studies in human thyroid xenografts in severe combined
immunodeficient and nude mice Journal of Clinical
Endocrinology and Metabolism 83 157–164.
823
Downloaded from Bioscientifica.com at 01/21/2022 07:30:33AMvia free access
K Fujarewicz et al.: Multi-gene differentiation of PTC
Kebebew E, Peng M, Reiff E &McMillan A 2006 Diagnostic
and extent of disease multigene assay for malignant
thyroid neoplasms. Cancer 106 2592–2597.
Kehlen A, Lendeckel U, Dralle H, Langner J & Hoang-Vu C
2003 Biological significance of aminopeptidase N/CD13
in thyroid carcinomas. Cancer Research 63 8500–8506.
Kerr MK & Churchill GA 2001 Bootstrapping cluster
analysis: assessing the reliability of conclusions from
microarray experiments. PNAS 98 8961–8965.
Kholova I, Ludvikova M, Ryska A, Topolcan O, Pikner R,
Pecen L, Cap J & Holubec L Jr 2003a Diagnostic role of
markers dipeptidyl peptidase IV and thyroid peroxidase in
thyroid tumors. Anticancer Research 23 871–875.
Kholova I, Ryska A, Ludvikova M, Cap J & Pecen L 2003b
Dipeptidyl peptidase IV expression in thyroid cytology:
retrospective histologically confirmed study.Cytopathology
14 27–31.
Kiess M, Scharm B, Aguzzi A, Hajnal A, Klemenz R,
Schwarte-Waldhoff I & Schafer R 1995 Expression of ril,
a novel LIM domain gene, is down-regulated in Hras-
transformed cells and restored in phenotypic revertants.
Oncogene 10 61–68.
KimHS,RohCR,ChenB, TyckoB,NelsonDM&SadovskyY
2007 Hypoxia regulates the expression of PHLDA2 in
primary term human trophoblasts. Placenta 28 77–84.
Kittel A, Csapo ZS, Csizmadia E, Jackson SW & Robson SC
2004 Co-localization of P2Y1 receptor and NTPDa-
se1/CD39 within caveolae in human placenta. European
Journal of Histochemistry 48 253–259.
Klopper JP, Hays WR, Sharma V, Baumbusch MA, Hersh-
man JM & Haugen BR 2004 Retinoid X receptor-gamma
and peroxisome proliferator-activated receptor-gamma
expression predicts thyroid carcinoma cell response to
retinoid and thiazolidinedione treatment. Molecular
Cancer Therapeutics 3 1011–1020.
Kohrle J 1999 Local activation and inactivation of thyroid
hormones: the deiodinase family.Molecular and Cellular
Endocrinology 151 103–119.
Kromminga A, Hagel C, Arndt R & Schuppert F 1998
Serological reactivity of recombinant 1D autoantigen and
its expression in human thyroid and eye muscle tissue: a
possible autoantigenic link in Graves’ patients.
Journal of Clinical Endocrinology and Metabolism 83
2817–2823.
Lazar V, Bidart JM, Caillou B, Mahe C, Lacroix L, Filetti S
& Schlumberger M 1999 Expression of the NaC/IK
symporter gene in human thyroid tumors: a comparison
study with other thyroid-specific genes. Journal of
Clinical Endocrinology and Metabolism 84 3228–3234.
Lelievre V, Muller JM& Falcon J 1998 Adenosine modulates
cell proliferation in human colonic adenocarcinoma. I.
Possible involvement of adenosine A1 receptor subtypes
in HT29 cells. European Journal of Pharmacology 341
289–297.
824
Letsas KP, Frangou-Lazaridis M, Skyrlas A, Tsatsoulis A &
Malamou-Mitsi V 2005 Transcription factor-mediated
proliferation and apoptosis in benign and malignant
thyroid lesions. Pathology International 55 694–702.
Lin F, Ren XD, Doris G & Clark RA 2005 Three-dimensional
migration of human adult dermal fibroblasts from collagen
lattices into fibrin/fibronectin gels requires syndecan-4
proteoglycan. Journal of Investigative Dermatology 124
906–913.
Liu W, Asa SL & Ezzat S 2005 1alpha,25-Dihydroxyvitamin
D3 targets PTEN-dependent fibronectin expression to
restore thyroid cancer cell adhesiveness. Molecular
Endocrinology 19 2349–2357.
Lubitz CC & Fahey TJI 2006 Gene expression profiling of
thyroid tumors – clinical applicability. Nature Clinical
Practice. Endocrinology & Metabolism 2 472–473.
Mazzanti C, Zeiger MA, Costouros NG, Umbricht C, Westra
WH, Smith D, Somervell H, Bevilacqua G, Alexander HR
& Libutti SK 2004 Using gene expression profiling to
differentiate benign versus malignant thyroid tumors.
Cancer Research 64 2898–2903.
De Micco C, Vassko V & Henry JF 1999 The value of
thyroid peroxidase immunohistochemistry for preopera-
tive fine-needle aspiration diagnosis of the follicular
variant of papillary thyroid cancer. Surgery 126
1200–1204.
Mitselou A, Peschos D, Dallas P, Charalabopoulos K,
Agnantis NJ & Vougiouklakis T 2004 Immunohisto-
chemical analysis of expression of bcl-2 protein in
papillary carcinomas and papillary microcarcinomas of
the thyroid gland. Experimental Oncology 26 282–286.
Musholt TJ, Brehm C, Hanack J, von WR & Musholt PB
2006 Identification of differentially expressed genes in
papillary thyroid carcinomas with and without
rearrangements of the tyrosine kinase receptors RET
and/or NTRK1. Journal of Surgical Research 131 15–25.
Noro B, Licheri B, Sgarra R, Rustighi A, Tessari MA, Chau
KY, Ono SJ, Giancotti V &Manfioletti G 2003 Molecular
dissection of the architectural transcription factor
HMGA2. Biochemistry 42 4569–4577.
Onda M, Akaishi J, Asaka S, Okamoto J, Miyamoto S,
Mizutani K, Yoshida A, Ito K & Emi M 2005
Decreased expression of haemoglobin beta (HBB) gene
in anaplastic thyroid cancer and recovery of its
expression inhibits cell growth. British Journal of
Cancer 92 2216–2224.
Ozog J, Jarzab M, Pawlaczek A, Oczko-Wojciechowska M,
Wloch J, Roskosz J & Gubala E 2006 Expression ofDPP4
gene in papillary thyroid carcinoma (In Polish). Endok-
rynologia Polska/Polish Journal of Endocrinology 57
12–17.
Plum A, Hallas G & Willecke K 2002 Expression of the
mouse gap junction gene Gjb3 is regulated by distinct
mechanisms in embryonic stem cells and keratinocytes.
Genomics 79 24–30.
www.endocrinology-journals.org
Downloaded from Bioscientifica.com at 01/21/2022 07:30:33AMvia free access
Endocrine-Related Cancer (2007) 14 809–826
Prasad ML, Pellegata NS, Kloos RT, Barbacioru C, Huang Y
& de la Chapelle A 2004 CITED1 protein expression
suggests papillary thyroid carcinoma in high throughput
tissue microarray-based study. Thyroid 14 169–175.
Prasad ML, Pellegata NS, Huang Y, Nagaraja HN, de la CA
& Kloos RT 2005 Galectin-3, fibronectin-1, CITED-1,
HBME1 and cytokeratin-19 immunohistochemistry is
useful for the differential diagnosis of thyroid tumors.
Modern Pathology 18 48–57.
Ramirez R, Hsu D, Patel A, Fenton C, Dinauer C, Tuttle RM
& Francis GL 2000 Over-expression of hepatocyte growth
factor/scatter factor (HGF/SF) and the HGF/SF receptor
(cMET) are associated with a high risk of metastasis and
recurrence for children and young adults with papillary
thyroid carcinoma. Clinical Endocrinology 53 635–644.
Rocha AS, Soares P, Fonseca E, Cameselle-Teijeiro J,
Oliveira MC & Sobrinho-Simoes M 2003 E-cadherin loss
rather than beta-catenin alterations is a common feature of
poorly differentiated thyroid carcinomas. Histopathology
42 580–587.
RucoLP, StoppacciaroA,Ballarini F, PratM&ScarpinoS 2001
Met protein and hepatocyte growth factor (HGF) in papillary
carcinoma of the thyroid: evidence for a pathogenetic role in
tumourigenesis. Journal of Pathology 194 4–8.
Sarquis MS, Weber F, Shen L, Broelsch CE, Jhiang SM,
Zedenius J, Frilling A & Eng C 2006 High frequency of
loss of heterozygosity in imprinted, compared with
nonimprinted, genomic regions in follicular thyroid
carcinomas and atypical adenomas. Journal of Clinical
Endocrinology and Metabolism 91 262–269.
Scarpino S, Di NA, Rapazzotti-Onelli M, Pilozzi E & Ruco L
2004 Papillary carcinoma of the thyroid: methylation is
not involved in the regulation of MET expression. British
Journal of Cancer 91 703–706.
Schagdarsurengin U, Gimm O, Dralle H, Hoang-Vu C &
Dammann R 2006 CpG island methylation of tumor-
related promotors occurs preferentially in undifferentiated
carcinoma. Thyroid 16 633–642.
Schelfhout LJ, Van Muijen GN & Fleuren GJ 1989
Expression of keratin 19 distinguishes papillary thyroid
carcinoma from follicular carcinomas and follicular
thyroid adenoma. American Journal of Clinical Path-
ology 92 654–658.
Schmutzler C, Hoang-Vu C, Ruger B & Kohrle J 2004
Human thyroid carcinoma cell lines show different
retinoic acid receptor repertoires and retinoid responses.
European Journal of Endocrinology 150 547–556.
Schnurr M, Toy T, Shin A, Hartmann G, Rothenfusser S,
Soellner J, Davis ID, Cebon J & Maraskovsky E 2004
Role of adenosine receptors in regulating chemotaxis and
cytokine production of plasmacytoid dendritic cells.
Blood 103 1391–1397.
ScoutenWT,PatelA,TerrellR,BurchHB,BernetVJ,TuttleRM
& Francis GL 2004 Cytoplasmic localization of the paired
www.endocrinology-journals.org
box gene,Pax-8, is found in pediatric thyroid cancer andmay
be associated with a greater risk of recurrence. Thyroid 14
1037–1046.
Sedlak TW& Snyder SH 2006 Messenger molecules and cell
death: therapeutic implications. JAMA 295 81–89.
Shimura H, Suzuki H, Miyazaki A, Furuya F, Ohta K,
Haraguchi K, Endo T & Onaya T 2001 Transcriptional
activation of the thyroglobulin promoter directing suicide
gene expression by thyroid transcription factor-1 in
thyroid cancer cells. Cancer Research 61 3640–3646.
Simon R, Radmacher MD, Dobbin K & McShane LM 2003
Pitfalls in the use of DNA microarray data for diagnostic
and prognostic classification. Journal of National Cancer
Institute 95 14–18.
Slonim D, Tamayo P, Mesirov J & Golub T 2000 Class
prediction and discovery using gene expression data.
Proceedings of the Fourth Annual International Con-
ference on Computational Molecular Biology 263–272.
Spessotto P, Cervi M, Mucignat MT, Mungiguerra G,
Sartoretto I, Doliana R & Colombatti A 2003 Beta 1
integrin-dependent cell adhesion to EMILIN-1 is
mediated by the gC1q domain. Journal of Biological
Chemistry 278 6160–6167.
Stassi G, TodaroM, ZerilliM,Ricci-Vitiani L,Di LD, PattiM,
Florena A, di GF, Di GG & De MR 2003 Thyroid cancer
resistance to chemotherapeutic drugs via autocrine
production of interleukin-4 and interleukin-10. Cancer
Research 63 6784–6790.
Takano T, Matsuzuka F, Miyauchi A, Yokozawa T, Liu G,
Morita S, Kuma K & Amino N 1998 Restricted
expression of oncofetal fibronectin mRNA in thyroid
papillary and anaplastic carcinoma: an in situ hybrid-
ization study. British Journal of Cancer 78 221–224.
Takano T, Miyauchi A, Yokozawa T, Matsuzuka F, Maeda I,
Kuma K & Amino N 1999 Preoperative diagnosis of
thyroid papillary and anaplastic carcinomas by real-time
quantitative reverse transcription-polymerase chain
reaction of oncofetal fibronectin messenger RNA. Cancer
Research 59 4542–4545.
Takano T, Hasegawa Y, Miyauchi A, Matsuzuka F, Yoshida
H, Kuma K, Hayashi N, Nakamori S & Amino N 2002
Quantitative analysis of osteonectin mRNA in thyroid
carcinomas. Endocrine Journal 49 511–516.
Takano T, Miyauchi A, Yoshida H, Kuma K & Amino N
2004 High-throughput differential screening of mRNAs
by serial analysis of gene expression: decreased
expression of trefoil factor 3 mRNA in thyroid
follicular carcinomas. British Journal of Cancer 90
1600–1605.
Theocharis SE, Margeli AP, Klijanienko JT & Kouraklis GP
2004 Metallothionein expression in human neoplasia.
Histopathology 45 103–118.
Thomson RB, Igarashi P, Biemesderfer D, Kim R, bu-Alfa A,
Soleimani M & Aronson PS 1995 Isolation and cDNA
825
Downloaded from Bioscientifica.com at 01/21/2022 07:30:33AMvia free access
K Fujarewicz et al.: Multi-gene differentiation of PTC
cloning of Ksp-cadherin, a novel kidney-specific member
of the cadherin multigene family. Journal of Biological
Chemistry 270 17594–17601.
Thomson RB,Ward DC, Quaggin SE, Igarashi P, Muckler ZE
& Aronson PS 1998 cDNA cloning and chromosomal
localization of the human and mouse isoforms of Ksp-
cadherin. Genomics 51 445–451.
Tonoli H, Flachon V, Audebet C, Calle A, Jarry-Guichard T,
Statuto M, Rousset B & Munari-Silem Y 2000 Formation
of three-dimensional thyroid follicle-like structures by
polarized FRT cells made communication competent by
transfection and stable expression of the connexin-32
gene. Endocrinology 141 1403–1413.
Vapnik V 1995 The Nature of Statistical Learning Theory.
New York: Springer-Verlag.
van’tVeerL,DaiH, van deVijverM,HeYD,HartAA,MaoM,
Peterse HL, van der Kooy K, Marton MJ, Witteveen AT
et al. 2002 Gene expression profiling predicts clinical
outcome of breast cancer. Nature 415 530–536.
Wagner K, Arciaga R, Siperstein A, Milas M, Warshawsky I,
Sethu S, Reddy K & Gupta MK 2005 Thyrotropin
receptor/thyroglobulin messenger ribonucleic acid in
peripheral blood and fine-needle aspiration cytology:
diagnostic synergy for detecting thyroid cancer. Journal of
Clinical Endocrinology and Metabolism 90 1921–1924.
Wasenius VM, Hemmer S, Kettunen E, Knuutila S, Franssila
K & Joensuu H 2003 Hepatocyte growth factor receptor,
matrix metalloproteinase-11, tissue inhibitor of metallo-
proteinase-1, and fibronectin are up-regulated in papillary
thyroid carcinoma: a cDNA and tissue microarray study.
Clinical Cancer Research 9 68–75.
Watanabe TK, Katagiri T, Suzuki M, Shimizu F, Fujiwara T,
Kanemoto N, Nakamura Y, Hirai Y, Maekawa H &
Takahashi E 1996 Cloning and characterization of two
826
novel human cDNAs (NELL1 and NELL2) encoding
proteins with six EGF-like repeats. Genomics 38
273–276.
Weber F, ShenL,AldredMA,MorrisonCD, FrillingA, SajiM,
Schuppert F, Broelsch CE, Ringel MD & Eng C 2005
Genetic classification of benign and malignant thyroid
follicular neoplasia based on a three-gene combination.
Journal of Clinical Endocrinology and Metabolism 90
2512–2521.
WiderakM,GhoneimC,DumontierMF,QuesneM,CorvolMT
&Savouret JF 2006 The aryl hydrocarbon receptor activates
the retinoic acid receptoralpha through SMRT antagonism.
Biochimie 88 387–397.
Woodhouse EC, Amanatullah DF, Schetz JA, Liotta LA,
Stracke ML & Clair T 1998 Adenosine receptor mediates
motility in human melanoma cells. Biochemical and
Biophysical Research Communications 246 888–894.
Wreesmann VB, Sieczka EM, Socci ND, Hezel M, Belbin TJ,
Childs G, Patel SG, Patel KN, Tallini G, Prystowsky M
et al. 2004 Genome-wide profiling of papillary thyroid
cancer identifies MUC1 as an independent prognostic
marker. Cancer Research 64 3780–3789.
Zhang X, Lu X, Shi Q, Xu XQ, Leung HC, Harris LN,
Iglehart JD, Miron A, Liu JS & Wong WH 2006
Recursive SVM feature selection and sample classi-
fication for mass-spectrometry and microarray data.
BMC Bioinformatics 7 197.
Zou M, Famulski KS, Parhar RS, Baitei E, Al-Mohanna FA,
Farid NR & Shi Y 2004 Microarray analysis of metastasis-
associated gene expression profiling in a murine model
of thyroid carcinoma pulmonary metastasis:
identification of S100A4 (Mts1) gene overexpression as
a poor prognostic marker for thyroid carcinoma.
Journal of Clinical Endocrinology and Metabolism 89
6146–6154.
www.endocrinology-journals.org
Downloaded from Bioscientifica.com at 01/21/2022 07:30:33AMvia free access