Comparative evaluation of community detection algorithms: a topological approach
16
Comparative Evaluation of Community Detection Algorithms: A Topological Approach Günce Keziban Orman 1,2 , Vincent Labatut 1 , Hocine Cherifi 2 1 Galatasaray University, 2 University of Burgundy [email protected], [email protected], [email protected] Abstract: Community detection is one of the most active fields in complex networks analysis, due to its potential value in practical applications. Many works inspired by different paradigms are devoted to the development of algorithmic solutions allowing to reveal the network structure in such cohesive subgroups. Comparative studies reported in the literature usually rely on a performance measure considering the community structure as a partition (Rand Index, Normalized Mutual information, etc.). However, this type of comparison neglects the topological properties of the communities. In this article, we present a comprehensive comparative study of a representative set of community detection methods, in which we adopt both types of evaluation. Community-oriented topological measures are used to qualify the communities and evaluate their deviation from the reference structure. In order to mimic real- world systems, we use artificially generated realistic networks. It turns out there is no equivalence between both approaches: a high performance does not necessarily correspond to correct topological properties, and vice-versa. They can therefore be considered as complementary, and we recommend applying both of them in order to perform a complete and accurate assessment. 1. Introduction As a modelling tool, the complex network paradigm has spread through many application fields during the last decades: biology, sociology, physics, computer science, communication, etc. (see [1] for a very complete review of applied studies). Once the model is established, the resulting network can be analysed or visualized using some of the many tools designed for graph mining. Such large real-world networks are characterized by a heterogeneous structure, leading to specific properties. In particular, a heterogeneous distribution of links often results in the presence of a so-called community structure [2]. A community roughly corresponds to a group of nodes more densely interconnected, relatively to the rest of the network [3]. The way such a structure can be interpreted is obviously dependent on the modelled system. However, independently from the nature of this system, it is clear the community structure conveys some very important information, necessary to a proper understanding [4]. Detecting communities is therefore an essential part of modern network analysis. There are many different community detection algorithms, as reported in [2]. They can differ in two ways: not only the process leading to an estimation of the community structure, but also the nature of the estimated communities themselves. This raises a question regarding the comparison of these algorithms, from both a theoretical and a practical point of view. Authors traditionally test their community detection algorithms on real-world [5, 6] and/or artificial networks [5-7]. Their performance is classically assessed in terms of node membership, by considering the community structures as partitions and comparing the communities simply as node sets. The estimated
-
Upload
galatasaray -
Category
Documents
-
view
1 -
download
0
Transcript of Comparative evaluation of community detection algorithms: a topological approach

Comparative Evaluation of Community Detection
Algorithms: A Topological Approach
Günce Keziban Orman1,2
, Vincent Labatut1, Hocine Cherifi
2
1Galatasaray University,
2University of Burgundy
[email protected], [email protected], [email protected]
Abstract: Community detection is one of the most active fields in complex networks analysis,
due to its potential value in practical applications. Many works inspired by different paradigms
are devoted to the development of algorithmic solutions allowing to reveal the network
structure in such cohesive subgroups. Comparative studies reported in the literature usually
rely on a performance measure considering the community structure as a partition (Rand Index,
Normalized Mutual information, etc.). However, this type of comparison neglects the
topological properties of the communities. In this article, we present a comprehensive
comparative study of a representative set of community detection methods, in which we adopt
both types of evaluation. Community-oriented topological measures are used to qualify the
communities and evaluate their deviation from the reference structure. In order to mimic real-
world systems, we use artificially generated realistic networks. It turns out there is no
equivalence between both approaches: a high performance does not necessarily correspond to
correct topological properties, and vice-versa. They can therefore be considered as
complementary, and we recommend applying both of them in order to perform a complete and
accurate assessment.
1. Introduction
As a modelling tool, the complex network paradigm has spread through many application fields during
the last decades: biology, sociology, physics, computer science, communication, etc. (see [1] for a
very complete review of applied studies). Once the model is established, the resulting network can be
analysed or visualized using some of the many tools designed for graph mining. Such large real-world
networks are characterized by a heterogeneous structure, leading to specific properties. In particular, a
heterogeneous distribution of links often results in the presence of a so-called community structure [2].
A community roughly corresponds to a group of nodes more densely interconnected, relatively to the
rest of the network [3]. The way such a structure can be interpreted is obviously dependent on the
modelled system. However, independently from the nature of this system, it is clear the community
structure conveys some very important information, necessary to a proper understanding [4]. Detecting
communities is therefore an essential part of modern network analysis.
There are many different community detection algorithms, as reported in [2]. They can differ in
two ways: not only the process leading to an estimation of the community structure, but also the nature
of the estimated communities themselves. This raises a question regarding the comparison of these
algorithms, from both a theoretical and a practical point of view. Authors traditionally test their
community detection algorithms on real-world [5, 6] and/or artificial networks [5-7]. Their
performance is classically assessed in terms of node membership, by considering the community
structures as partitions and comparing the communities simply as node sets. The estimated

communities are compared to some communities of reference using an association measure such as the
Normalized Mutual Information [8]. The resulting single score is then compared with those obtained
when applying pre-existing algorithms on the same data.
The main problem with this approach is it completely ignores the topological nature of the
communities: two algorithms can reach the exact same level of performance, but still estimate
community structures with very different link distributions. Thus, it seems important to take this
information into account when comparing the community structures. For this purpose, we propose to
use some of the community-oriented topological measures recently defined in the literature [4, 9].
Measures such as community-wise density, average distance, internal transitivity, hub dominance, and
embeddedness give a detailed description of the topology of the communities and their interactions.
Up to now, they have been used to characterize and compare the community structures of real-world
networks, but never to evaluate community detection algorithms. We consider them as an alternative
or an addition to the traditional performance measures mentioned earlier. The question is then to know
whether this new topological assessment leads to the same results than the partition-based approach.
Besides the method used to evaluate the algorithms, another important point concerns the data used
during this evaluation. It is well known that, when solving a search problem, no algorithm can be
superior on all possible instances of the problem [10]. It is therefore necessary to focus on a specific
subset when comparing algorithms. Community detection algorithms are usually designed to study
real-world systems, so it is natural to consider only the networks representing them. However, using
only real-world networks is an issue because the identification of their community structure implies an
expert human intervention, making them rare and/or relatively small. Artificial networks constitute an
appealing alternative, because they can easily be generated in large amounts. All that is needed is a
generative model able to produce networks with realistic topological properties. Some properties
common to most real-world networks are well-identified: power-law distributed degree, small-
worldness, non-zero degree correlation and relatively high transitivity [11]. Additionally, networks
with a community structure are characterized by a power-law distributed community size [12]. Several
generative models with increasing realism were successively designed [7] before finally meeting these
constraints [7, 13, 14].
In this article, we use the LFR model [7] with appropriate parameters to generate realistic
undirected and unweighted networks. We study their topological properties to assess their realism. We
then apply a representative selection of community detection algorithms to these networks. We
evaluate the quality of the estimated community structures using both the classic performance
measures and the topological approach, and we compare the obtained results. In section 2, we review
the performance measures traditionally used when comparing community detection algorithms and we
then describe the properties we selected to characterize the topology of community structures in
section 3. In section 4, we review the various approaches used in the literature to define the concept of
community, and select a representative set of community detection algorithms from this perspective.
In section 5, we describe the LFR model we used to generate the artificial networks constituting our
benchmark. Additionally, we introduce an adjustment allowing to improve their realism. In section 6,
we first analyse the topological properties of the generated community structures. We then focus on
the evaluation of the algorithms, both from a traditional and topological point of view. Finally, we
discuss our results and explain how our work could be extended.
2. Performance of Community Detection Algorithms
The traditional methods used to assess the performance of community detection algorithms consider a
community structure as a partition of the node set. Comparing the community structure estimated by
the algorithm with the reference community structure therefore consists in comparing two partitions
(estimated and reference). Many measures exist for this purpose, and this problem is very classic, so
we briefly describe the most widespread ones here.
The Fraction of Correctly Classified nodes (FCC) has been used by several authors, the first
seeming to be Girvan and Newman [6]. According to this measure, a node is correctly classified if its

estimated community is the same than for the majority of nodes present in its reference community.
Moreover, if an estimated community corresponds to a fusion of several reference communities, all the
concerned nodes are considered as misclassified [15, 16]. The total number of correctly classified
nodes is divided by n to normalize the measure, which results in a value between 0 and 1 .
The Rand Index (RI) [17] corresponds to the proportion of node pairs for which both the estimated
and reference community structures agree. For a given pair, there is agreement when both nodes
belong to the same community, or to different communities, for both community structures.
Consequently, there is disagreement if the nodes are in the same community for one community
structure, whereas they belong to two different ones for the other. The Rand Index ranges from 0 (the
algorithm completely failed to estimate the community structure), to 1 (the algorithm perfectly
estimated the community structure). The Adjusted Rand Index (ARI) is a corrected for chance version
of the RI [18] ranging from 1 (less than chance agreement) to 1 (complete agreement). Zero
corresponds to a pure chance agreement.
The Normalized Mutual Information measure (NMI) was defined in the context of classical
clustering [19] to compare two different partitions of one data set, by measuring how much
information they have in common. Danon et al. [16] used it to assess the performance of community
detection algorithms, and the measure was subsequently used by various other authors [7]. If the
estimated communities correspond perfectly to the reference ones, the measure takes the value 1 ,
whereas it is 0 when they are independent.
3. Community-Oriented Topological Properties
The performance measures presented in the previous section allow evaluating the similarity between
two community structures, by considering them as partitions. They are compared only in terms of
individual node membership, without taking links into account. In this section, we present some
topological properties defined to characterize community structures. Unlike the previous measures,
they can be used to compare two partitions from a purely topological perspective. In this sense, they
allow to evaluate the quality of an algorithm in a complementary way. Using these measures, a recent
study showed the real-world networks possessing a community structure display certain differences
[4], which contrasts with what we mentioned in the introduction regarding the existence of topological
properties common to most real-world networks. These differences appear to be characteristic of the
considered real-world system, which allows the authors to identify five different classes:
Communication, Internet, Information, Biological and Social networks. In this section, we describe the
main properties and give their typical real-world values for those classes.
3.1. Embeddedness
The embeddedness measure assesses how much the direct neighbours of a node belong to its own
community. It is defined as the ratio of the internal degree intk to the total degree k of the considered
node [4]:
inte k k (1)
This internal degree is the number of links the node has with other nodes from the same
community, by opposition to its external degree extk , which corresponds to connections with nodes
located in other communities. The maximal embeddedness of 1 is reached when all the neighbours are
in its community ( intk k ) whereas the minimal value of 0 corresponds to the case where all
neighbours belong to different communities ( 0intk ). In real-world networks, a majority of nodes,
usually with low degree, have a very high embeddedness (so almost no links outside their
community). For the remaining nodes, the embeddedness distribution depends on the considered class.
Communication, Internet and biological networks exhibit a peak around 0.5e , whereas social and
information networks have a more uniform distribution. In all cases, the whole range of e is
significantly represented, even small values [4].

3.2. Community Size
The community size distribution is considered as an important characteristic of the community
structure. It has been largely studied in real-world networks, and seems to follow a power-law [12]
with exponent ranging from 1 to 2 [5]. This means the community sizes are heterogeneous, with
many small communities and only a few very large ones. In real-world networks, the minimal
community size is 2 , but, the maximal community size varies widely depending on the class and the
granularity of the modelled system [4].
3.3. Internal Transitivity
The internal transitivity is based on the classic local transitivity, averaged over the nodes located
inside a community. The local transitivity of a given node depends on how its direct neighbours are
interconnected. It is defined as the number of links present between these neighbours, divided by the
number of links one would get if they were all interconnected. In other words, it represents the
proportion of existing to possible links in the node neighbourhood. The internal transitivity for some
community C is formally defined as:
21
1 C i C int int
l iT C
n k ki i
(2)
Here, Cn is the number of nodes in community C , l i is the number of links among the
neighbours of some node i which all belong to the same community, and intk i is the internal
degree of some node i (as defined previously for the embeddedness). In real-world networks, the
distribution of internal transitivity varies with the community size in different ways, as shown in [4]. It
increases for Internet and communication networks. For biological and social networks, it increases
until it reaches a peak value, and then starts decreasing.
3.4. Scaled Density
The density of a community C is defined as the ratio of links it actually contains, noted Cm , to the
number of links it could contain if all its nodes were connected. In the case of an undirected network,
the latter is 1 2C Cn n , where Cn is the number of nodes in the community, and we therefore get
2 1C C Cm n n . When compared to the overall network density, the community density allows
assessing the cohesion of the community: by definition, a community is supposed to be denser than the
network it belongs to. The scaled density is a variant obtained by multiplying the density by the
community size [4]:
2 1CC
C C n m n (3)
If the considered community is a tree, it has only 1C Cm n links, and 2C . If it is a clique
(completely connected subnetwork), then 1 2C C Cm n n and we have CC n . The scaled
density therefore allows characterizing the structure of the community. Some real-world networks
such as the Internet or communication networks have essentially tree-like communities. On the
contrary, for other classes like social and information networks, the scaled density increases with the
community size. Finally, biological networks exhibit a hybrid behaviour, their small communities
being tree-like whereas the large ones are denser and close to cliques [4].
3.5. Average Distance
The distance between two nodes corresponds to the length of their shortest path. When averaged over
all pairs of nodes in a community, it allows assessing the cohesion of this community. In real-world
networks, small communities ( 10Cn ) are supposedly small-world, which means that, over the whole
network, the community average distance should increase logarithmically with the community size

Cn [4]. For larger communities, the average distance still increases, but more slowly or even stabilizes
for certain classes of real-world networks like communication networks. A small average distance can
be explained by a high density (social), the presence of hubs (communication, Internet), or both
(biological, information).
3.6. Hub Dominance
From a community structure perspective, a hub is a node connected to many of the other nodes
belonging to the same community. The presence of a central hub in a community C can be assessed
using the hub dominance measure, which corresponds to the following ratio:
max 1int CC
h C k n (4)
The numerator is the maximal internal degree found in C , and the denominator is the maximal
degree theoretically possible given the community size. The hub dominance therefore reaches 1 when
at least one node is connected to all other nodes in the community. It can be 0 only if no nodes are
connected, which is unlikely for a community. In real-world networks, the behaviour of this property
depends on the considered class. For communication networks, it is close to the maximum for all
community sizes, meaning hubs are present in all communities. Considering their communities are
sparse and tree-like, one can conclude they are star-shaped. Other classes do not have as many hubs in
their large communities, which is why their hub dominance generally decreases with community size
increase [4].
4. Community Detection Algorithms
A very widespread informal definition of the community concept considers it as a group of nodes
densely interconnected compared to the other nodes [2, 20]. In other words, a community is a cohesive
subset clearly separated from the rest of the network. However, formal definitions differ in the way
they translate and combine both these aspects of cohesion and separation. In the literature, there are
numerous community detection algorithms, many implementing differently the notion of community
structure. Here, we selected a representative set of algorithms and categorized them according to the
method they apply to identify communities. We chose to ignore some algorithms because they were
too slow to be included in this study (e.g. node-removal approaches such as Edge-Betweenness [6]).
4.1. Modularity-Based Approaches
A direct translation of the informal definition given above consists in first specifying two distinct
measures to assess separately cohesion and separation, and then processing an overall measure by
considering their difference or ratio. This approach led to many variants, differing on how the
measures are defined and combined. The most widespread one is certainly the modularity, a chance-
corrected measure which assesses cohesion and separation through the number of intra- and inter-
community links, respectively [21]. We selected two modularity optimization algorithms, which differ
in the way they perform this optimization.
Fast Greedy applies a basic greedy approach [15] . It starts with a state in which each node is in its
own community and the algorithm repeatedly joins pairs of communities together to obtain larger
ones. At each step, the joined communities are selected by considering the largest increase (or smallest
decrease) in modularity. By definition of the modularity, communities connected by many links will
be favoured. Thanks to this agglomerative approach, FastGreedy produces a set of community
structures organized hierarchically, with increasing granularity. The one obtaining the maximal
modularity is considered as the best. This algorithm is relatively fast, however, the result of the greedy
optimization can be very coarse.
Louvain also adopts an agglomerative hierarchical method, but it relies on a slightly different
greedy optimization process, and includes an additional aggregation step to improve processing on
large networks [22]. Like for FastGreedy, each node is initially placed in its own community. For each
node, the modularity gains obtained by moving it into each one of its neighbours’ community is

calculated. The node is then moved in the community associated to the largest gain, or stays in its
original community if no gain is possible. Louvain applies this procedure repeatedly and sequentially
for all nodes until no further improvement can be achieved, which leads to the end of this first step.
The second step consists in building a new network whose nodes are the communities estimated
during the first step. The inter- and intra-community links are represented in the new network by
weighted regular links and self-loops, respectively. The first step is then applied to this network, and
both steps are repeated until stable communities are reached.
4.2. Node Similarity-Based Approaches
Another category of approaches is based on node similarity measures. Such a measure allows
translating the topological notions of cohesion and separation in terms of intra-community similarity
and inter-community dissimilarity. In other words: a community is viewed as a group of nodes which
are similar to each other, but dissimilar from the rest of the network. Once all node-to-node similarities
are known, detecting a community structure can be performed by applying a similarity-based classic
cluster analysis algorithm [23]. In this work, we have used one algorithm from this class.
WalkTrap uses a distance measure based on random walks and applies a hierarchical
agglomerative clustering approach [24]. A random walker is an agent moving from one node to
another following the network links. At each time step, the next node is selected by randomly picking
a neighbour of the current node. The idea behind this algorithm is that random walks tend to get
trapped into a community, hence its name. If two nodes i and j are in the same community, the
probability to get to a third node k located in the same community through a random walk should not
be very different for i and j . The distance is constructed by summing these differences over all
nodes, with a correction for degree.
4.3. Compression-Based Approaches
Some approaches based on data compression do not use the cohesion and separation concepts like the
previous definitions. They consider the community structure as a set of regularities in the network
topology, which can be used to represent the whole network in a more compact way than the whole
adjacency matrix. The best community structure is supposed to be the one maximizing compactness
while minimizing information loss. The quality of the representation is assessed through measures
derived from information theory. Algorithms essentially differ in the way they represent the
community structure and how they assess the quality of this representation. We have used two
algorithms from this class.
InfoMod uses a simplified representation of the network focusing on the community structure: a
community matrix and a membership vector [25]. The former is an adjacency matrix defined at the
level of the communities (instead of the nodes), which means its size is k k . The latter is a vector of
size n , associating each node to a community. The amount of information from the original network
contained in the simplified representation is quantified using the mutual information measure. Among
all possible assignment of nodes to communities, the best is the one associated with the maximal
mutual information. This optimisation is performed by simulated annealing. The selection of the
optimal number of communities is realized using the minimum description length principle.
InfoMap represents the community structure through a two-level nomenclature based on Huffman
coding [26]: one level to distinguish communities in the network and the other to distinguish nodes in
a community. The problem of finding the best community structure is expressed as minimizing the
quantity of information needed to represent some random walk in the network using this
nomenclature. With a partition containing few inter-community links, the walker will probably stay
longer inside communities, therefore only the second level will be needed to describe its path, leading
to a compact representation. The authors optimize their criterion using simulated annealing.
4.4. Significance-Based Approaches

A completely different approach consists in considering the statistical significance of the whole
community structure, or of the individual communities. A community structure can be expected under
certain circumstances, but groups of densely connected nodes can also appear only by chance. For
instance, even a generative model not supposed to create any community structure can produce
clusters of nodes due to random fluctuations. Statistical significance allows distinguish them from
actual communities. We use one algorithm from this category.
Order Statistics Local Optimization Method (OSLOM) is a local optimization method applied to a
score measuring the statistical significance of individual communities [27]. The authors define this statistical significance as the probability of finding a similar community (same size, degree sequence
and internal connections) in a null model possessing no community structure. In its first phase,
OSLOM agglomerates neighbour nodes to obtain a collection of significant, possibly overlapping
communities. Adjustments are performed by removing/adding nodes to communities, in order to
increase their significance. Due to its stochastic nature, this process is repeated several times to ensure
stability. Various hierarchical levels are obtained by applying recursively the same principle to the
resulting supernetwork (network whose nodes represent communities in the lower hierarchical level).
OSLOM allows detecting mutually-exclusive, overlapped or hierarchical communities in simple,
directed or weighted networks. However, as previously mentioned, here we use it only on undirected
unweighted networks.
4.5. Diffusion-Based Approaches
Diffusion-based approaches tackle the problem of community detection using a communication
paradigm. They rely on the assumption that information is more efficiently exchanged between nodes
of the same community. Therefore, communities can be detected by considering how information is
propagated in the network.
Community Overlap Propagation Algorithm (COPRA) is an extended version of Raghavan et al.’s
Label Propagation algorithm [28], proposed by Gregory [29]. The information takes the form of a
label, and the propagation mechanism relies on a vote between neighbours. Initially, each node is
labelled with a unique value. Then an iterative process takes place, where each node takes the label
which is the most spread in its neighbourhood (ties are broken randomly). This process goes on until
convergence, i.e. each node has the majority label of its neighbours. Communities are then obtained by
considering groups of nodes with the same label. By construction, one node has more neighbours in its
community than in the others. This algorithm is faster than most other algorithms. We apply Gregory’s
version to detect mutually exclusive communities in undirected unweighted unipartite networks.
However, note it is able to handle overlapping communities, for both weighted and bipartite networks.
MarkovCluster simulates a diffusion process in the network to detect communities [30]. This
approach relies on the transfer matrix, which describes the transition probabilities for a random walker
evolving in this network. Two transformations, expansion and inflation, are iteratively applied to this
matrix until convergence. The expansion operation raises the transfer matrix to a power p . The result
is a matrix showing the probability that a random walker starts from node i and reaches node j in p
steps. The inflation operation consists in raising each element in the matrix to some specified power,
in order to favour the higher probability values. These correspond to pairs of nodes presumably
belonging to the same community. The value of this power has a direct effect on the granularity of
final communities. The resulting matrix is then normalized to get a new transfer matrix, and the
process is repeated until convergence. The final matrix can be interpreted as the adjacency matrix of a
network with disconnected components, which correspond to communities in the original network.
5. Generative Model
We selected the LFR model to generate artificial networks with a community structure. By
construction, this model guaranties to obtain values considered as realistic [1, 11] for several
properties: size of the network, power-law distributed degrees and community sizes. The model allows
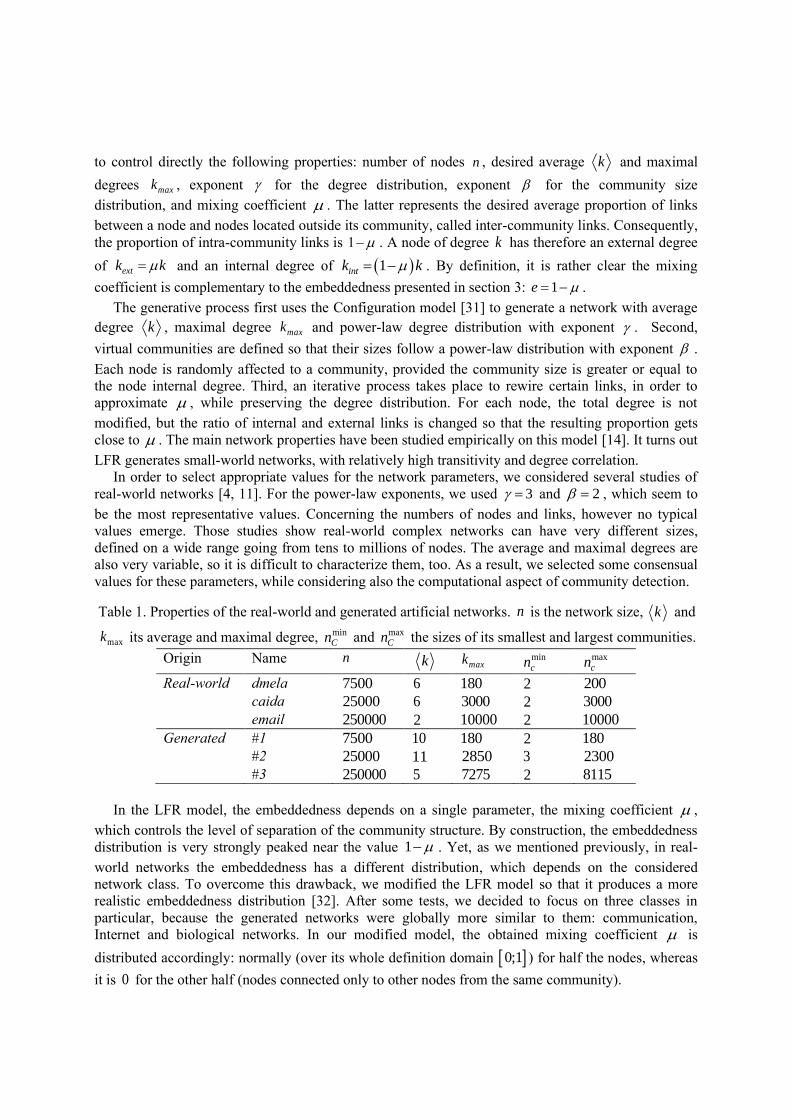
to control directly the following properties: number of nodes n , desired average k and maximal
degrees maxk , exponent for the degree distribution, exponent for the community size
distribution, and mixing coefficient . The latter represents the desired average proportion of links
between a node and nodes located outside its community, called inter-community links. Consequently,
the proportion of intra-community links is 1– . A node of degree k has therefore an external degree
of extk k and an internal degree of 1intk k . By definition, it is rather clear the mixing
coefficient is complementary to the embeddedness presented in section 3: 1e .
The generative process first uses the Configuration model [31] to generate a network with average
degree k , maximal degree maxk and power-law degree distribution with exponent . Second,
virtual communities are defined so that their sizes follow a power-law distribution with exponent .
Each node is randomly affected to a community, provided the community size is greater or equal to
the node internal degree. Third, an iterative process takes place to rewire certain links, in order to
approximate , while preserving the degree distribution. For each node, the total degree is not
modified, but the ratio of internal and external links is changed so that the resulting proportion gets
close to . The main network properties have been studied empirically on this model [14]. It turns out
LFR generates small-world networks, with relatively high transitivity and degree correlation.
In order to select appropriate values for the network parameters, we considered several studies of
real-world networks [4, 11]. For the power-law exponents, we used 3 and 2 , which seem to
be the most representative values. Concerning the numbers of nodes and links, however no typical
values emerge. Those studies show real-world complex networks can have very different sizes,
defined on a wide range going from tens to millions of nodes. The average and maximal degrees are
also very variable, so it is difficult to characterize them, too. As a result, we selected some consensual
values for these parameters, while considering also the computational aspect of community detection.
Table 1. Properties of the real-world and generated artificial networks. n is the network size, k and
maxk its average and maximal degree, minCn and max
Cn the sizes of its smallest and largest communities.
Origin Name n k maxk mincn
maxcn
Real-world dmela 7500 6 180 2 200
caida 25000 6 3000 2 3000
email 250000 2 10000 2 10000
Generated #1 7500 10 180 2 180
#2 25000 11 2850 3 2300
#3 250000 5 7275 2 8115
In the LFR model, the embeddedness depends on a single parameter, the mixing coefficient ,
which controls the level of separation of the community structure. By construction, the embeddedness
distribution is very strongly peaked near the value 1 . Yet, as we mentioned previously, in real-
world networks the embeddedness has a different distribution, which depends on the considered
network class. To overcome this drawback, we modified the LFR model so that it produces a more
realistic embeddedness distribution [32]. After some tests, we decided to focus on three classes in
particular, because the generated networks were globally more similar to them: communication,
Internet and biological networks. In our modified model, the obtained mixing coefficient is
distributed accordingly: normally (over its whole definition domain 0;1 ) for half the nodes, whereas
it is 0 for the other half (nodes connected only to other nodes from the same community).

The upper part of Table 1 summarizes the main properties measured for some networks
representing the three classes we wanted to match: biological (dmela), Internet (caida) and
communication (email) networks. The lower part focuses on the networks we generated, which display
very close properties. These are the most realistic networks we can get with respect to the current
knowledge. We generated samples of 5 networks for each network size, in order to insure
consistency.
6. Results
We analysed the properties of the generated networks and communities to check their realism level.
After this, we applied the eight selected community detection algorithms from section 4 and assessed
their results, not only from a community membership point of view as explained in section 2, but also
by considering the topological properties described in section 3.
6.1. Topological Properties of the Generated Networks and Communities
Among the community-related properties we described in section 3, two are directly controlled by the
LFR model: the community size and embeddedness distributions. Our measurements confirm on all
networks that the community sizes follow a power-law distribution as expected (cf. Figure 1). Note the
range of these sizes varies much from one real-world network to the other, and it is therefore difficult
to describe a typical set of values. However, as we have indicated in Table 1, the minimal and
maximal community sizes are very similar to those observed in real-world networks of comparable
size. For the embeddedness, we obtained 1 for half the nodes, as expected. But for the remaining half,
although we used a normal distribution during the generation process, we obtain more nodes with a 0
embeddedness than expected. We assume that this result is due to some incompatibilities between the
mixing coefficient and degree affected to certain nodes. For instance, a node whose degree is only 1
cannot have a 0.2 embeddedness: the LFR rewiring process will certainly give it a 0 embeddedness.
We plan to correct this point in our future work. Those results are nonetheless close enough to what
can be observed in biological, information and communication networks.
We now focus our attention on the uncontrolled properties. The scaled density increases from 2 to
14 for 7500n and 25000 and to 8 for 250000n , along with the community size. This means the
smallest communities are tree-like ( 2C ) which is consistent with what is observed in real-world
networks. However, for larger communities ( 5Cn ), there is no tree-like or clique-like ( CC n ),
structures, which is not realistic. It seems the links are distributed more homogeneously over the
generated networks, making small communities too dense and large ones too sparse.
As shown in Figure 1 the average distance increases regularly from 1 to 2 for 7500n , 1.5 to
2.5 for 25000n and 1.5 to 3 for 250000n until a community size limit (approximately 20 , 35
and 100 respectively), and then stays stable. For 25000n and 250000 in particular, we observe a
fast increase: this is characteristic of real-world networks. For the rest of the communities, the
observed distribution is also comparable to communication networks, with a stable average distance
for medium and large communities, though. Moreover, the values measured for these communities are
also realistic in terms of magnitude. This average distance distribution is especially similar to the
biological, information and communication networks that we used as references.
We observe that hub dominance decreases for small communities along with community size
increase, but for medium and large communities it starts to increase again. Its trend is similar for all
network sizes, but the peak values and community sizes triggering the increase and decrease are
different. For 7500n , hub dominance is very high for the smallest communities, with values close
to 1 . Then it decreases until 0.8 with community size increase and it stays relatively stable after this
value. For 25000n and 250000 , the decrease and the following increase are more evident. The hub
dominance value for small communities is around 0.8 for both sizes. It decreases very much until 0.4
for 250000n when community size is around 20 and 0.6 or 25000n for community size 10 .

For larger communities, we also observe a higher dispersion between the different iterations. The same
dispersion was also observed on real-world networks [4]. Hub dominance completely relies on the
way high degree nodes are distributed over communities, since it directly depends on the maximal
internal degree found in communities. The fact there are much less large communities, due to their
power law-distributed sizes, can explain this dispersion. A possible solution would be to consider a
measure based on the k highest internal degrees of the community instead of a single one.
The internal transitivity decreases when the community size increases. This decrease is more
evident for 7500n , ranging from 0.8 to 0.2 . But for larger networks, we observe neither a high
transitivity for small communities, nor a clear decrease. Especially, for 250000n we obtain very
low values. In real-world networks, the internal transitivity undergoes different trends: either an
increase along community size or an initial increase followed by a decrease. None are consistent with
what we observe on the generated networks. The LFR model relies on the Configuration model to
generate its initial scale-free network, and this model is known to produce networks with a very low
transitivity. As we showed in a previous study [13], the relatively high overall transitivity observed in
the final network is due to the rewiring process of LFR. From the results presented here, we can
conclude this effect seems to be stronger for the small communities than the large ones. This can be
explained by the fact the rewiring does not aim at forming triangles: it randomly selects nodes in the
same community. Therefore, it is more probable to inadvertently create triangles if the community is
small.
embeddedness
frequency
0 0.2 0.4 0.6 0.8 1
10-4
10-3
10-2
10-1
1
community size
frequency
1 101
102
103
104
10-4
10-3
10-2
10-1
1
community size
transitiv
ity
1 101
102
103
104
0
0.1
0.2
0.3
0.4
community size
scale
d d
ensity
1 101
102
103
104
1
101
102
community size
avera
ge d
ista
nce
1 101
102
103
104
0
0.5
1
1.5
2
2.5
3
community size
hub d
om
inance
1 101
102
103
104
0
0.2
0.4
0.6
0.8
1
Figure 1. Properties of the generated communities for 25000n , 3 and 2 . Each one of the
5 networks in the sample is represented with a different shape/colour. Points represent averages over
logarithmic bins of the community size.
To summarize our observations: the generated communities exhibit most of the properties observed
in real-world networks. The measured values vary according to the network size, but the trends are

very similar. The most realistic results have been obtained for 25000n . The distributions of
community sizes, average distance, hub dominance and scaled density, especially for small
communities, are globally realistic. However, this is not as true for the internal transitivity. Another
issue is the fact the generated networks do not comply with a specific class of real-world networks, but
rather have similarities with different classes depending on the considered property: the average
distance distribution is reminiscent of communication networks, but embeddedness and hub
dominance distributions are more related to social and biological networks. However, despites those
limitations, the modified LFR model allows us to generate the most realistic artificial networks to date.
6.2. Traditional Evaluation of the Algorithms
We applied the selected community detection algorithms on the generated networks. It is worth
recalling our goal is not to actually assess the performance of these algorithms, but rather to discuss
the evaluation methods themselves. For this reason, each algorithm is simply used with its default
parameters. Moreover, COPRA and OSLOM are forced to detect mutually exclusive communities (i.e.
no overlap allowed). We focused on the networks of size 25000n , which are the most realistic,
according to our analysis. We then processed the algorithms performances using all the measures
presented in section 2. The results are listed in Table 2.
Table 2. Traditional performance measure values and their ranking for all eight algorithms
FCC RI ARI NMI
Algorithm Value Rank Value Rank Value Rank Value Rank
COPRA 0.090 7 0.068 8 0.002 8 0.070 8 FastGreedy 0.080 8 0.919 7 0.272 6 0.588 7 InfoMap 0.862 2 0.997 1 0.930 1 0.930 1 InfoMod 0.255 6 0.971 5 0.256 7 0.620 6 Louvain 0.425 4 0.982 3 0.692 3 0.735 4 MarkovCluster 0.881 1 0.993 2 0.822 2 0.881 2
OSLOM 0.415 5 0.932 6 0.337 5 0.685 5
WalkTrap 0.818 3 0.979 4 0.614 4 0.865 3
All measures, except FCC, agree on the fact InfoMap finds the community structure the most
similar to the reference. For FCC, MarkovCluster is ranked first, whereas for the other measures, it is
the second best algorithm. WalkTrap and Louvain are the third or fourth best algorithms according to
all results. However, if the obtained values are very close for the measures ranking Louvain third (RI
and ARI), the difference is much more important when WalkTrap is third (FCC and NMI).
OSLOM is following Louvain as it is ranked fifth by all measures except RI, which puts it in sixth
position. InfoMod and FastGreedy follow, and for them the difference between the measures in terms
of amplitude of the measured performance is much more important than for the other algorithms.
Especially, for FCC, we observe a large difference between FastGreedy ( 0.08 ) and the other
algorithms ( 0.25 ). COPRA is the last algorithm according to RI, ARI and NMI while it is seventh
for FCC. Its performances are close to zero and clearly lower than all other algorithms especially for
RI, ARI and NMI. This might be due to the fact it was initially designed to detect overlapping
communities, which is not the case here.
For several algorithms, the values obtained with FCC are much lower than for the other measures:
FastGreedy, Louvain, InfoMod, COPRA and OSLOM. As explained in section 2, when an estimated
community corresponds to several reference ones, FCC considers all nodes as misclassified. So we can
suppose these algorithms tend to detect large communities corresponding to the merge of several
actual ones. We do not observe high differences between the algorithms performances for RI. On the
contrary, for ARI, which is the chance-corrected version of RI, we see clear differences, especially for
FastGreedy, OSLOM, COPRA and InfoMod. Among all measures, FCC and ARI give the most

contrasted results. However, in terms of algorithms ranking, all measures agree with very small
divergences. Let us consider the algorithms performance in function of the algorithms categories we
defined in section 4. The performance of InfoMap and InfoMod, which belong to the compression-
based approach category, are very different. Similarly, the performance of FastGreedy and Louvain,
both belonging to the modularity optimization category, are quite different. This seems to show that,
although some algorithms use the same idea to define what a community is, the process they
implement to perform the partitioning affects significantly their performance.
6.3. Topological Evaluation of the Algorithms
The topological properties of the algorithm-estimated and reference structures are shown on Figure 2.
The black line shows the properties of the reference structure and each shape/colour corresponds to
one algorithm. In order to verify if the sizes of the estimated communities follow a power-law like the
reference, we applied a test of goodness of fit. As shown on Figure 2, it is the case for WalkTrap,
MarkovCluster and InfoMap, with p-values of 0.33 , 0.31 and 0.12 , respectively. However, the other
algorithms (FastGreedy, Louvain, OSLOM, COPRA and InfoMod) find community structures whose
size distributions are significantly different from a power-law (p-value smaller than 0.001 ). This can
be explained by a thorough examination of the identified communities. The smallest community that
InfoMod identified has around 20 nodes, while it is 3 for the reference. The largest community found
by FastGreedy is close to 10000 , which is much larger than the largest reference community size,
around 2000 . COPRA puts almost all nodes into one community and the rest of the nodes are put in
their own community, or very small ones. Thus its largest community contains more than 20000
nodes. These remarks are consistent with the assumption we made to explain the very low FCC values
obtained in the previous subsection, regarding the possibility that many communities identified by
these algorithms may correspond to merged reference ones. To a lesser extent, MarkovCluster and
WalkTrap also find numerous single-node communities, but this does not seem to affect traditional
performance measures much. Note the inflation parameter of MarkovCluster determines the desired
granularity of the communities. We use the default value; it is likely larger communities would be
found if using higher values.
For the embeddedness, WalkTrap, FastGreedy, Louvain, OSLOM and InfoMap are very close to
the reference values. The frequency of the nodes having a zero embeddedness for InfoMap and
OSLOM is lower than in the reference, though. On the contrary, the embeddedness obtained for
InfoMod, COPRA and MarkovCluster is clearly different. InfoMod and MarkovCluster display more
uniform distributions. For InfoMod, in particular, almost half the nodes have very low embeddedness.
According to the observed embeddedness and community size distributions, we can suppose it puts in
the same community many nodes which do not have links between them, and are actually in different
communities in the reference structure. Thus, it finds communities larger than 20 nodes while in
reality the smallest communities contain only 3 nodes. Because COPRA puts most of the nodes into
one community, there is a large proportion of nodes with a maximal embeddedness, and the lower
embeddedness values are therefore less represented.
When considering the scaled density (Figure 2), InfoMap, MarkovCluster and WalkTrap are very
close to the reference, with InfoMap and WalkTrap diverging for large communities, though. For
FastGreedy, OSLOM and Louvain, the scaled density is relatively stable, and does not present the
slow increase which is characteristic of the reference. This can be interpreted as the fact the
communities detected by these algorithms all present the same structure, independently from their
size. For COPRA, the distribution corresponds to the reference for small communities ( 30 ).
However, its giant community does not match the reference trend; and as mentioned before, middle-
sized communities are not represented at all. We observe the most different trend for InfoMod, whose
scaled density decreases with the community size. This is completely opposed to what is observed for
the reference. The low scaled density obtained for large communities may be the result of InfoMod
putting small separated (i.e. without any connection) reference communities together in the same
estimated community.

The average distances measured on the FastGreedy, Louvain, OSLOM and InfoMod communities
are much dispersed and do not follow the evolution observed for the reference. FastGreedy, in
particular, has a much higher average distance than the reference and the other algorithms. InfoMod
has also larger average distances for larger communities. COPRA, for smaller communities, shows a
trend similar to the reference, but its giant community is clearly apart, again. This property is a good
indicator of cohesion, so it seems this quality is absent from the communities identified by
FastGreedy, Louvain, OSLOM and InfoMod. The remaining algorithms (InfoMap, MarkovCluster,
WalkTrap) are very close to the reference. The average distance of InfoMap is higher than the
reference for community sizes between 10 and 20 , though.
seq(1, 10)
reference infomap louvain infomod walktrap markovcluster fastgreedy oslom copra
embeddedness
frequency
0 0.2 0.4 0.6 0.8 1
10-5
10-4
10-3
10-2
10-1
1
community size
frequency
1 101
102
103
104
10-5
10-4
10-3
10-2
10-1
1
community size
transitiv
ity
1 101
102
103
104
0
0.2
0.4
0.6
0.8
1
community size
scale
d d
ensity
1 101
102
103
104
1
101
102
community size
avera
ge d
ista
nce
1 101
102
103
104
0
2
4
6
8
10
community size
hub d
om
inance
1 101
102
103
104
0
0.2
0.4
0.6
0.8
1
Figure 2. Properties of the detected communities for 25000n , 3 and 2 . Each shape/colour
corresponds to a different algorithm, whereas the reference is represented by a solid line. Points
represent averages over logarithmic bins of the community size.
Unlike for the other properties, we do not observe a very high similarity between the reference and
the algorithms for the hub dominance. WalkTrap and InfoMap have the most similar results. But
WalkTrap hub dominance is larger than in the reference for the communities whose sizes range from
1 0 to 1 00 , while with InfoMap it is smaller for the same communities. Moreover, the former presents
an outlier for the largest community: its hub dominance is very low and does not respect the general
trend. In other words, the largest communities detected by WalkTrap are much less centralized than in
the reference. The hub dominance trend for MarkovCluster is also similar to the reference, but the
values are higher for most of the community sizes. FastGreedy, Louvain, OSLOM, COPRA and
InfoMod once again display very different behaviours compared to the reference, with hub dominance
values bellow the reference ones. It is interesting to notice that for these algorithms, the hub
dominance evolves in opposition with the average distance. For instance, with FastGreedy, the

smallest and largest communities are centralized and have a small average distance, whereas it is the
contrary for the middle-sized communities. This seems to indicate the average distance depends on the
centralisation of the communities.
The general behaviour of the internal transitivity is similar to the reference for all algorithms: a
decrease when the community size increases. It is especially the case for WalkTrap, OSLOM,
MarkovCluster and InfoMap, with rare outliers. The values for FastGreedy and Louvain are higher
than the reference for all community sizes. The small communities ( 1 0 ) identified by COPRA
display a very high transitivity. For InfoMod, the decrease is much more sudden than in the reference,
reflecting the fact small communities have a very high transitivity, whereas it is very low for large
ones.
We occasionally observe a similar behaviour for algorithms belonging to the same category. For
instance, Louvain and FastGreedy, both based on modularity optimization, comparably differ from the
reference. However, most of the time there seems to be no relationships between the category and the
results. The very same Louvain and FastGreedy have very different results in terms of classic
performance. According to both topological properties and performance measures, InfoMap and
InfoMod, which belong to the same category, are completely opposed: they are the best and worst
algorithms, respectively. Another interesting observation regarding the algorithms category concerns
the similarity of the results obtained by OSLOM when compared to FastGreedy and Louvain. These
algorithms directly optimize two very different criteria: statistical significance for the former,
modularity for both others. They nevertheless lead to relatively similar results, not only in terms of
partition comparison, but also when considering the topological properties. It therefore seems both
approaches implicitly define the notion of community in a very similar way.
7. Conclusion
In this study, we took advantage of recent advances relative to the characterization of community
structures in complex networks to propose a new, topology-based way of evaluating community
detection algorithms. We first applied a variant of the LFR model [7] to generate artificial networks
with known community structures. We studied their topological properties and concluded most of
them are relatively realistic, which is a necessary condition for our purpose. We applied a
representative set of eight fast community detection algorithms to these networks: Fast Greedy,
Louvain, WalkTrap, InfoMap, InfoMod, Order Statistics Local Optimization Method (OSLOM),
Community Overlap Propagation Algorithm (COPRA) and MarkovCluster. We assessed their results
using first the traditional approach, which consists in evaluating the community structure quality in
terms of partition comparison. It turns out the considered measures (Fraction of Correctly Classified
Nodes, Rand Index, Adjusted Rand Index and Normalized Mutual Information) agree with each other
with small differences when considering the way they rank algorithms: InfoMap and MarkovCluster
are generally the first, followed by WalkTrap and Louvain, then OSLOM, InfoMod and FastGreedy,
and finally COPRA.
We then considered the topological properties of the estimated community structures. For the
extreme (first and last) algorithms, this analysis confirms the conclusions obtained with the traditional
measures: InfoMap results are the most similar to the reference, whereas those of COPRA, InfoMod
and FastGreedy are the most different. However, contrary to what these observations suggest,
performances and topological properties do not always agree for the other algorithms. According to
their performances, MarkovCluster and WalkTrap are almost as good as InfoMap, and ranked 2nd
and
3rd
, respectively. But their topological features are much less similar to the reference structure,
especially when considering their community size and embeddedness distributions. This is an essential
point, because it means even if the performance measured for these algorithms was relatively high, the
communities they identified substantially differ from the reference, topologically speaking. On the
contrary, some of the properties displayed by OSLOM are relatively close to the reference, but its
performance on this benchmark is far from being conclusive. So, it seems there is no equivalence
between obtaining a high performance and identifying a community structure with correct topological

properties. We see two reasons for that. First, each partition-based measure penalizes departures from
the real community structures in a different way. For instance, some are more affected by the number
of communities, whereas for others it is the distribution of the community sizes. Second, and more
importantly, it is possible to partition the network in order to get an estimated partition extremely
similar to the real one, but whose misclassified nodes have a strong topological weight. For instance,
misclassifying a hub will not change a partition-based measure much, but it can significantly affect the
topological properties of the concerned communities. We conclude both approaches are
complementary and needed to perform a relevant and complete analysis of community detection
results. From a practical perspective, the traditional approach is much faster and easier to apply, so as
a general guideline we propose to use it first. Then, the results corresponding to the best community
structures can be more thoroughly inspected thanks to the topological measures.
Our contributions are as follow. First, we introduced a modification in the LFR model, in order to
make the embeddedness distribution more realistic in the generated networks. Second, we studied
these generated networks in terms of community-centred topological properties. This complements
some previous analyses focusing on network-centred properties such as transitivity or degree
correlation [7, 13, 14]. Third, we used these properties to compare community structures, by
opposition to the traditionally applied performance-based approach [7, 8, 13, 14, 33]. Thanks to these
tools, we were able to rank the tested community detection algorithms. Note, however, that these
results might be specific to our benchmark, and we do not intent to generalize them to all kinds of
networks. Our goal was rather to study the agreement between the various ranking methods.
This work can be extended mainly in two ways. First, the internal transitivity measured in the
generated networks is very different from what is observed in real-world networks. The LFR model
uses a random approach which does not favour the creation of triangles. According to our literature
survey, there is no model generating networks with both a community structure and a controlled
transitivity. So a solution would require either to define such a model, or to modify the LFR model
again. Second, in this work we focused on a limited number of topological properties, classes of real-
world networks, and community detection algorithms. A more thorough analysis would consist in
expanding these factors. In particular, it would be interesting to include slower algorithms, which
would allow comparing other types of community definitions. It would also be relevant to apply more
classic network-wise measures to communities (degree correlation, centrality, etc.), and to consider
additional community specific measures. Those designed in [34] seem particularly complementary to
the embeddedness, and the concept of community profile [9] is promising, although it looks
particularly costly from a computational point of view.
References
[1] da Fontura Costa L, Oliveira Jr. O N, Travieso G, Rodrigues r A, Villas Boas P R, Antiqueira L,
Viana M P and da Rocha L E C 2008 Analyzing and Modeling Real-World Phenomena with
Complex Networks: A Survey of Applications arXiv physics.soc-ph 0711.3199
[2] Fortunato S 2010 Community detection in graphs Phys Rep 486 75-174
[3] Newman M E J and Girvan M 2004 Finding and evaluating community structure in networks
Phys Rev E 69 026113
[4] Lancichinetti A, Kivelä M, Saramäki J and Fortunato S 2010 Characterizing the Community
Structure of Complex Networks PLoS ONE 5 e11976
[5] Palla G, Derenyi I, Farkas I and Vicsek T 2005 Uncovering the overlapping community structure
of complex networks in nature and society Nature 435 814-8
[6] Girvan M and Newman M E J 2002 Community structure in social and biological networks
PNAS 99 7821-6
[7] Lancichinetti A, Fortunato S and Radicchi F 2008 Benchmark graphs for testing community
detection algorithms Phys Rev E 78 046110
[8] Danon L, Diaz-Guilera A and Arenas A 2006 The effect of size heterogeneity on community
identification in complex networks J Stat Mech 11010

[9] Leskovec J, Lang K J, Dasgupta A and Mahoney M W 2008 Statistical Properties of Community
Structure in Large Social and Information Networks. In: 17th International Conference on World
Wide Web, pp 695-704
[10] Wolpert D H and Macready W G 1995 No Free Lunch Theorems for search. Santa Fe Institute)
[11] Newman M E J 2003 The structure and function of complex networks SIAM Rev 45 167-256
[12] Guimerà R, Danon L, Díaz-Guilera A, Giralt F and Arenas A 2003 Self-similar community
structure in a network of human interactions Phys Rev E 68 065103
[13] Orman G K and Labatut V 2010 The Effect of Network Realism on Community Detection
Algorithms. In: ASONAM, (Odense, DK pp 301-5
[14] Orman G K and Labatut V 2009 A Comparison of Community Detection Algorithms on Artificial
Networks Lecture Notes in Artificial Intelligence 5808 242–56
[15] Newman M E J 2004 Fast algorithm for detecting community structure in networks Phys Rev E
69 066133
[16] Danon L, Díaz-Guilera A, Duch J and Arenas A 2005 Comparing community structure
identification J Stat Mech P09008
[17] Rand W M 1971 Objective Criteria for the Evaluation of Clustering Methods Journal of the
American Statistical Association 66 846-50
[18] Hubert L and Arabie P 1985 Comparing partitions Journal of Classification 2 193-218
[19] Fred A L N and Jain A K 2003 Robust Data Clustering. In: IEEE Computer Society Conference
on Computer Vision and Pattern Recognition: IEEE Computer Society) pp 128-36
[20] Danon L, Duch J, Arenas A and Díaz-Guilera A 2007 Large Scale Structure and Dynamics of
Complex Networks: From Information Technology to Finance and Natural Science: World
Scientific) pp 93-113
[21] Newman M E J 2006 Modularity and community structure in networks PNAS USA 103 8577-82
[22] Blondel V D, Guillaume J-L, Lambiotte R and Lefebvre E 2008 Fast unfolding of communities in
large networks J Stat Mech P10008
[23] Gan G a M, C. and Wu, J. 2007 Data Clustering: Theory, Algorithms, and Applications
(Philadelphia, US-PA: Society for Industrial and Applied Mathematics)
[24] Pons P and Latapy M 2005 Computing communities in large networks using random walks
LNCS 3733 284-93
[25] Rosvall M and Bergstrom C T 2007 An information-theoretic framework for resolving
community structure in complex networks Proceedings of the National Academy of Sciences of
the United States of America 104 7327-31
[26] Rosvall M and Bergstrom C T 2008 Maps of random walks on complex networks reveal
community structure PNAS 105 1118
[27] Lancichinetti A, Radicchi F, Ramasco J and Fortunato S Finding Statistically Significant
Communities in Networks PLoS ONE 6 e18961
[28] Raghavan U N, Albert R and Kumara S 2007 Near linear time algorithm to detect community
structures in large-scale networks Phys. Rev. E 76 036106
[29] Gregory S Finding overlapping communities in networks by label propagation New Journal of
Physics 12 103018
[30] van Dongen S 2008 Graph clustering via a discrete uncoupling process SIAM J Matrix Anal Appl
30 121-41
[31] Molloy M and Reed B 1995 A critical point for random graphs with a given degree sequence
Random Structures and Algorithms 6 161-79
[32] Orman G K, Labatut V and Cherifi H 2011 Qualitative Comparison of Community Detection
Algorithms. In: DICTAP (2), ed H Cherifi, et al. (167: Springer C1 -) pp 265-79
[33] Bagrow J P 2008 Evaluating local community methods in networks J Stat Mech -
[34] Guimerà R and Amaral L A N 2005 Functional cartography of complex metabolic networks
Nature 433 895-900