Comparative assessment of cloud compute services using run ...
236
Comparative Assessment of Cloud Compute Services using Run-Time Meta-Data Michael Menzel
-
Upload
khangminh22 -
Category
Documents
-
view
2 -
download
0
Transcript of Comparative assessment of cloud compute services using run ...

C: 40M: 2Y: 10 K: 0
C: 76M: 47Y: 30K: 5
ISBN 978-3-7375-5175-5
C: 40M: 2Y: 10 K: 0
C: 76M: 47Y: 30K: 5
ComparativeAssessment of Cloud
Compute Services usingRun-Time Meta-Data
Michael Menzel
Mic
hael
Men
zel:
Com
para
tive
Asse
ssm
ent o
f Clo
ud C
ompu
te S
ervi
ces u
sing
Run
-Tim
e M
eta-
Dat
a

Comparative Assessmentof Cloud Compute Servicesusing Run-Time Meta-Data
A Framework for Performance Measurementsand Virtual Machine Image Introspections
vorgelegt vonDipl. Wirt.-Inf. Michael Menzel
geb. in Mainz
von der Fakultät IV - Elektrotechnik und Informatikder Technischen Universität Berlin
zur Erlangung des akademischen Grades
Doktor der Ingenieurwissenschaften- Dr.-Ing. -
genehmigte Dissertation
Promotionsausschuss:Vorsitzender: Prof. Dr. Uwe NestmannGutachter: Prof. Dr. Stefan TaiGutachter: Prof. Dr. Alexander MädcheGutachter: Prof. Dr. Odej Kao
Tag der wissenschaftlichen Aussprache: 21.04.2015
Berlin 2015

ii

Credits
As most projects in life, a dissertation stands on the shoulders of giants. Foremost,it is the result of collaborations, ongoing discussions, and inspirations from many ac-quaintances, companions, and friends. A particularly inspiring giant that supervised thepresent work is Prof. Stefan Tai whom I like to thank for his patient advises, engage-ment, and steady support of this project. Furthermore, I am deeply thankful I had theluck to spend time with the most intriguing colleagues1. The way all of them engage indiscussions and strive for the best is remarkable.
Companionships between like-minded researchers develop unaffected by distance ortime zones. I am thankful to have met Rajiv Ranjan and Shrikumar Venugopal atthe University of New South Wales. Rajiv accompanied and contributed to some ofmy publications in the research community. He has been a valuable counterpart indiscussions. The arrangements never allowed me to discuss my research topics withShrikumar as intensively as I would’ve liked to, but his few hints unfolded as crucialadvises.
The support I have received from my friends, especially from Sebastian Roth andJeanette Homenu-Roth & Tobias Roth, will never be forgotten. Last but even more no-tably, I am grateful for my parents Sylvia and Wolfgang, and siblings Julia Konstanzeand Laura-Sophia, who never doubted I was able to complete this dissertation.
Above all, it is nearly impossible to express how outermost thankful I am for the un-ending support from one special person. Knowing her for so many years, there existsno word to describe how gratified and lucky I must be to share life with such a patient,understanding, and loving person as is my true love, Anna-Karolina Braun. She contin-ually encouraged me to pursue a PhD and to engage in a project which is as demandingand fulfilling as is this dissertation. Thank you!
Mannheim, April 2015 Michael Menzel
1In alphabetic order: Alexander Lenk, Bugra Derre, Christian Janiesch, Christian Zirpins, David Bermbach,Erik Wittern, Frank Pallas, Gregory Katsaros, Jens Nimis, Jörn Kuhlenkamp, Markus Klems, NellySchuster, Raffael Stein, Robin Fischer, Steffen Müller, Tilmann Kopp, Ulrich Scholten
iii


Abstract
The available amount of meta-data about compute service offerings which proofs reli-able, timely, and comparable is unsatisfactory. For example, the meta-data published bycompute service providers regarding performance attributes of their offers is typicallyrestricted to hardware figures and, thus, not necessarily sufficient for comparisons orplanning tasks, such as a thorough software system capacity planning. A similar prob-lem of meta-data scarcity affects the reuse of Virtual Machine (VM) images availablein repositories from compute service providers. The contents of the VM images are notdescribed by any available meta-data, yet.
The present work contributes a framework of compute service assessment and com-parison methods to the research community. The methods enables compute cloudconsumers to assess and compare compute services regarding diverse characteristics.As the purpose of the methods is to serve consumers, the general scheme is an ex-ploitation of the client-side remote access to VMs in order to gain meta-data at run-time. Therefore, an archetypical run-time assessment automation model is provided.The information extracted at run-time can furthermore be attached to compute ser-vices as meta-data through a generic and extensible meta-data model. Furthermore,a Multi-Attribute Decision-Making (MADM)-based scoring method is introduced bythe framework which enables consumers to compare compute services regarding mul-tiple characteristics with a single score. Besides, a stopping rule approach is able toenforce cost budgets during sequential compute service assessments. Additionally, ina search for a highest scoring compute service the rule uses priorly available meta-datato skip presumably low scoring services.
The framework is employed in two specific instantiations to assess compute servicesin regards of performance and VM image contents. In particular, this work featuresan instantiation of the framework which assesses compute services using performancemeasurements. Therefore, a method is presented that incorporates a procedure builtupon the framework’s automation model. The method uses the procedure to measurecompute services by injecting benchmarking scripts into VMs via remote interfacesfrom client-side. Aside from the procedure, the method features a definition languagefor configuring batches of performance measurements with repetitions and scheduledruns. Resulting performance meta-data can be captured with an extension of the frame-work’s meta-data model. For the comparison of performance meta-data gained with thebenchmarking method, the framework’s MADM-based method is adapted. The adapted
v
method enables compute cloud consumers to compare compute services according to ascore derived from a custom set of performance attributes. In the quest of containingcosts from benchmarking various compute services, the framework’s stopping rule isconfigured to consider information about compute service hardware figures availablebeforehand. In regards of VM image repositories of compute services, the proposedframework is instantiated to generate a procedure to introspect the contents of VM im-ages from the client-side. An extension of the framework’s meta-data model is able tocapture results from VM image introspections.
The feasibility of the methods is confirmed by software prototypes presented in thiswork. The prototypes, furthermore, serve as a basis to conduct an evaluation of the pro-posed methods and models. Several experiments proof the validity of the approaches.Further examinations in the course of an evaluation address aspects such as the promp-titude of the assessment approaches and the computational complexity to combine mul-tiple meta-data attributes into a score. Besides, the methods are compared to the stateof the art to expose advantages and shortcomings.
vi
Zusammenfassung
Die Menge verfügbarer Meta-Daten über Compute Service-Angebote erweist sich hin-sichtlich Zuverlässigkeit, Aktualität und Vergleichbarkeit ungenügend. Zum Beispielbeschränken sich die von Compute Service-Anbietern veröffentlichten Meta-Daten überLeistungsattribute ihrer Angebote typischerweise auf Hardwarekennzahlen und sind da-her nicht verwendbar für Vergleiche oder auch Planungsaufgaben wie bspw. eine Ka-pazitätsplanung für ein Softwaresystem. Ähnlich sind auch Meta-Daten über Abbildervon virtuellen Maschinen (VM) in den Sammlungen der Compute Service-Anbieterspärlich.
Die dargelegte Arbeit stellt der Forschergemeinschaft ein Rahmenwerk mit Bewertungs-und Vergleichsmethoden für Compute Services bereit. Die Methoden erlauben Compu-te Cloud-Konsumenten Compute Service hinsichtlich verschiedener Charakteristikenzu bewerten und zu vergleichen. Da die Methoden Cloud-Konsumenten dienen, basiertdas generelle Vorgehen auf der Nutzung von Client-seitigen Remote-Verbindungen zuvirtuellen Maschinen, um Meta-Daten zur Laufzeit zu gewinnen. Hierfür wird ein ar-chetypisches Automatisierungsmodell bereitgestellt. Die zur Laufzeit extrahierten In-formationen können Compute Services anhand eines generischen und erweiterbarenMeta-Datenmodells zugeordnet werden. Auserdem wird durch das Rahmenwerk basie-rend auf Ansätzen der multi-attributiven Entscheidungsfindung (MADM) eine Metho-de eingeführt, die es Konsumenten ermöglicht Compute Services hinsichtlich mehrererCharakteristiken anhand eines Scores zu vergleichen. Weiter kann ein StoppregelansatzKostenbudgets während sukzessiver Compute Service-Bewertungen durchsetzen. DieRegel schliest bei der Suche nach einem Compute Service mit höchstem Score anhandvon vorab verfügbaren Meta-Daten voraussichtlich schlecht abschneidende Servicesaus.
Das Rahmenwerk wird in zwei spezifischen Instanzen eingesetzt, um Compute Servicesbezüglich ihrer Leistung und Inhalten von VM-Abbildern zu bewerten. Eine Instanzdes Rahmenwerks erlaubt Bewertungen von Compute Services anhand derer Leistung.In diesem Zuge wird eine Methode präsentiert, die eine auf dem Automatisierungs-modell des Rahmenwerks basierenden Prozedur einsetzt, um Compute Services mitBenchmarking-Skripten zu messen, die über Remote-Schnittstellen von der Client-seite ausgeführt werden. Neben der Prozedur bietet die Methode eine Definitionss-prache für Stapelverarbeitung sowie die Wiederholung und Terminierung von Leis-tungsmessungen. Ergebnisse aus Messungen können durch eine Erweiterung des Meta-Datenmodells aus dem Framework festgehalten werden. Zum Vergleich der Ergebnisse,
vii

wird die MADM-basierte Scoring-Methode des Frameworks adaptiert. Die angepassteScoring-Methode erlaubt Compute Cloud-Konsumenten Vergleiche anhand eines Sco-res aus definierten Leistungsattributen. Zur Limitierung der durch das Benchmarkingvon verschiedenen Compute Services entstehenden Kosten wird die Stoppregel desRahmenwerks in solcherart konfiguriert, dass vorab bekannte Hardwarekennzahlen ein-bezogen werden. In Hinblick auf von Compute Services angebotene VM-Abbilder zeigteine Instanz des Rahmenwerks eine Prozedur zum Erfassen von VM-Inhalten von derClient-seite. Eine Erweiterung des Meta-Datenmodells des Rahmenwerks erlaubt dasFesthalten der Ergebnisse.
Die Umsetzbarkeit der Methoden wird durch Softwareprototypen belegt, die in der dar-gelegten Arbeit vorgestellt werden. Die Prototypen dienen zudem als Grundlage, um dieMethoden und Modell zu evaluieren. Eine Reihe von Experimenten zeigt die Validitätder Ansätze. Weitere Untersuchungen adressieren die Promptheit der Bewertungsan-sätze, sowie die Komplexität der Berechnungen bei der Kombination mehrerer Meta-Datenattribute in einen Score. Darüber hinaus werden die Methoden mit dem Stand derKunst verglichen, um Vor- und Nachteile herauszustellen.
viii

Contents
1. Introduction 11.1. Motivation . . . . . . . . . . . . . . . . . . . . . . . . . . . . . . . . . 11.2. Comparative Assessments . . . . . . . . . . . . . . . . . . . . . . . . 4
1.2.1. Performance of Compute Services . . . . . . . . . . . . . . . . 41.2.2. Virtual Machine Images . . . . . . . . . . . . . . . . . . . . . 8
1.3. Research Questions . . . . . . . . . . . . . . . . . . . . . . . . . . . . 101.4. Research Methodology . . . . . . . . . . . . . . . . . . . . . . . . . . 121.5. Contributions . . . . . . . . . . . . . . . . . . . . . . . . . . . . . . . 151.6. Published Material . . . . . . . . . . . . . . . . . . . . . . . . . . . . 171.7. Thesis Organization . . . . . . . . . . . . . . . . . . . . . . . . . . . . 20
I. Foundations 21
2. Background 232.1. Cloud Compute Services . . . . . . . . . . . . . . . . . . . . . . . . . 23
2.1.1. Definition of Cloud Computing . . . . . . . . . . . . . . . . . 232.1.2. Virtualization . . . . . . . . . . . . . . . . . . . . . . . . . . . 272.1.3. Consumption of Cloud Compute Services . . . . . . . . . . . . 28
2.2. Compute Service Meta-Data . . . . . . . . . . . . . . . . . . . . . . . 322.2.1. Performance of Compute Services . . . . . . . . . . . . . . . . 322.2.2. VM Images . . . . . . . . . . . . . . . . . . . . . . . . . . . . 39
2.3. Formal Decision-Making . . . . . . . . . . . . . . . . . . . . . . . . . 432.3.1. Multi-Criteria Decision-Making (MCDM) . . . . . . . . . . . . 432.3.2. The Analytic Hierarchy Process (AHP) . . . . . . . . . . . . . 44
2.4. Theory of Optimal Stopping . . . . . . . . . . . . . . . . . . . . . . . 482.4.1. Stopping Problems . . . . . . . . . . . . . . . . . . . . . . . . 482.4.2. Stopping Rules . . . . . . . . . . . . . . . . . . . . . . . . . . 48
3. State of the Art and Related Work 533.1. Compute Service Meta-Data Management . . . . . . . . . . . . . . . . 533.2. Comparative Assessments of Compute Services . . . . . . . . . . . . . 55
3.2.1. Assessments of Compute Services . . . . . . . . . . . . . . . . 563.2.2. Comparisons of Compute Services . . . . . . . . . . . . . . . . 57
ix

Contents
3.3. Compute Service Performance Measurements and Comparisons . . . . 593.3.1. Compute Service Performance Benchmarking . . . . . . . . . . 593.3.2. Automation and Repetition of Performance Benchmarks . . . . 61
3.4. Virtual Machine Image Introspections and Comparisons . . . . . . . . . 663.4.1. VM Image Meta-Data Attachment . . . . . . . . . . . . . . . . 663.4.2. Introspection of VM Image Meta-Data . . . . . . . . . . . . . . 67
II. Conceptual Framework 69
4. Framework for Comparative Assessments of Cloud Compute Ser-vices 714.1. Introduction & Overview . . . . . . . . . . . . . . . . . . . . . . . . . 71
4.1.1. Relations Between Models & Methods . . . . . . . . . . . . . 734.1.2. Extensibility of the Framework . . . . . . . . . . . . . . . . . . 74
4.2. Meta-Data Model . . . . . . . . . . . . . . . . . . . . . . . . . . . . . 754.3. Run-time Assessment Automation Model . . . . . . . . . . . . . . . . 764.4. Scoring Method . . . . . . . . . . . . . . . . . . . . . . . . . . . . . . 78
4.4.1. MADM for Value Aggregation . . . . . . . . . . . . . . . . . . 784.4.2. Evaluations with the (MC2)2 . . . . . . . . . . . . . . . . . . 794.4.3. Local Scoring . . . . . . . . . . . . . . . . . . . . . . . . . . . 864.4.4. Global Scoring . . . . . . . . . . . . . . . . . . . . . . . . . . 87
4.5. Cost Budgeting Stopping Rule . . . . . . . . . . . . . . . . . . . . . . 894.5.1. Cost Calculation . . . . . . . . . . . . . . . . . . . . . . . . . 894.5.2. Compute Service Scores & Ordering . . . . . . . . . . . . . . . 904.5.3. Stopping Rules . . . . . . . . . . . . . . . . . . . . . . . . . . 93
4.6. Software Prototype implementing the Scoring Method . . . . . . . . . 984.7. Evaluation of the MADM-based Scoring Method . . . . . . . . . . . . 102
4.7.1. Case Study with the Industry . . . . . . . . . . . . . . . . . . . 1034.7.2. Computational Complexity . . . . . . . . . . . . . . . . . . . . 105
III. Instantiation 113
5. Assessments of Compute Service Performance at Run-time 1155.1. Automated Performance Benchmarking of Compute Services . . . . . . 117
5.1.1. Automated Performance Benchmarking Procedure . . . . . . . 1185.1.2. Repetitions and Benchmarking Result Aggregation . . . . . . . 1205.1.3. Data Model for Roadmap Scheduling and Measurement Results 1245.1.4. Process Model for Using the Automated Benchmarking Proce-
dure . . . . . . . . . . . . . . . . . . . . . . . . . . . . . . . . 1265.1.5. Costs, Timeliness & Target Audience . . . . . . . . . . . . . . 129
x

Contents
5.2. Compute Service Performance Scoring . . . . . . . . . . . . . . . . . . 1315.2.1. Scoring for Performance Meta-Data . . . . . . . . . . . . . . . 1315.2.2. Aggregation Scheme Requirements . . . . . . . . . . . . . . . 1315.2.3. Weighted Compute Service Performance Scores . . . . . . . . . 132
5.3. Performance Benchmarking with the Cost Budgeting Stopping Rule . . 1355.3.1. Cost Calculation . . . . . . . . . . . . . . . . . . . . . . . . . 1355.3.2. Performance Scores as Observation of Compute Services . . . . 1365.3.3. Compute Service Order and Prior Information . . . . . . . . . . 1365.3.4. Configuration of the Stopping Rule . . . . . . . . . . . . . . . 137
5.4. Software Prototype for Automated Compute Service Performance Bench-marking with Stopping Rule . . . . . . . . . . . . . . . . . . . . . . . 1385.4.1. LibIntelliCloudBench Library . . . . . . . . . . . . . . . . . . 1385.4.2. Web Application . . . . . . . . . . . . . . . . . . . . . . . . . 140
5.5. Evaluation of the Automated Performance Benchmarking Method . . . 1425.5.1. Validation of the Automated Performance Benchmarking Ap-
proach . . . . . . . . . . . . . . . . . . . . . . . . . . . . . . . 1425.5.2. Comparison to the State of the Art . . . . . . . . . . . . . . . . 1455.5.3. Results of the Promptitude Measurements . . . . . . . . . . . . 1465.5.4. Statistics for AWS EC2 Compute Services . . . . . . . . . . . . 148
5.6. Evaluation of the Performance Benchmarking Stopping Rule . . . . . . 1515.6.1. Validation of the Performance Benchmarking Stopping Rule . . 1515.6.2. Comparison to Standard Stopping Rules . . . . . . . . . . . . . 153
6. Assessments of Virtual Machine Image Contents at Run-time 1596.1. Virtual Machine Image Meta-Data Model . . . . . . . . . . . . . . . . 1606.2. Introspection of Virtual Machine Images . . . . . . . . . . . . . . . . . 162
6.2.1. Automated VM Image Introspection Procedure . . . . . . . . . 1626.2.2. Discoverer Component . . . . . . . . . . . . . . . . . . . . . . 1636.2.3. Crawler Component . . . . . . . . . . . . . . . . . . . . . . . 164
6.3. Search and Comparison of Virtual Machine Images . . . . . . . . . . . 1676.4. Software Prototype for Virtual Machine Image Introspection . . . . . . 168
6.4.1. Crawler Script . . . . . . . . . . . . . . . . . . . . . . . . . . 1686.4.2. Web Application . . . . . . . . . . . . . . . . . . . . . . . . . 169
6.5. Evaluation of the VM Image Introspection Method . . . . . . . . . . . 1706.5.1. Validation of the VM Image Introspection Approach . . . . . . 1706.5.2. Results of the Promptitude Measurements . . . . . . . . . . . . 1716.5.3. Statistics for AWS EC2 Compute Services . . . . . . . . . . . . 172
IV. Finale 175
7. Conclusions, Discussion & Outlook 1777.1. Conclusions . . . . . . . . . . . . . . . . . . . . . . . . . . . . . . . . 177
xi

Contents
7.2. Discussion & Outlook . . . . . . . . . . . . . . . . . . . . . . . . . . . 181
Appendix 185
A. Performance Meta-Data on Compute Service Websites 187
B. Implementation Details & Code Examples 189B.1. Example of AotearoaLib Programming Interface . . . . . . . . . . . . 189B.2. Excluded Micro-benchmarks in LibIntelliCloudBench . . . . . . . . . . 191
C. Original Interview Form for a MADM Software Prototype 193
xii

1. Introduction
This chapter defines the context of the research presented in this work. After a moti-vation, the problems of assessing compute services in regards of performance and VMimages are explained. The chapter continues with the definition of research questionsand the followed research methodology. Then, the contributions provided by this workare presented. Finally, the chapter discusses published material and ends with an expla-nation of how this thesis is organized.
1.1. Motivation
Organizations have widely adopted Information Technology (IT) to support and auto-mate business operations [1]. Some organizations even base whole business models onIT systems, profiting from saving cost over manual work [2–4]. Nevertheless, runningan own infrastructure to operate IT systems generates costs for organizations. From thecapital expenditures (CAPEX) for real estates, hardware and software to operational ex-penditures (OPEX) for electricity and human resources, various expenditures aggregateinto the total costs of a company’s own IT infrastructure [5].
Unlike own IT infrastructures, cloud computing abandons large upfront investmentsand allows IT infrastructures to be outsourced and consumed as cloud infrastructureservices in virtually infinite amounts [6, 7]. There are various cloud infrastructureservices to build an IT infrastructure, of which compute services are very prominent toserve for computational tasks [8].
When leasing a compute service, a consumer is granted remote access to computerhardware resembled by a Virtual Machine (VM) for the duration of the leasing. Withmulti-cloud libraries like jClouds [9] multiple compute services can be accessed in asimilar manner.
While multi-cloud libraries facilitate consumers with access to various compute ser-vices, the differences between services are manifold. Compute services are distinguish-able in numerous aspects, such as pricing, contract duration, or service quality [10].Such characteristics can be expressed as data attributes which are attached or linked toa compute service. Data attached to and describing a compute service is referred to asmeta-data.
1
1. Introduction
The notion of meta-data is to describe characteristics and properties of an entity. Thepreceding term meta originates from ancient greek and means "add" or "with" whichrefers to the concepts of "in addition" or "linked to". Meta can, however, also refer toan abstract or higher level view of a concept - also called a meta-level. In regards ofmeta-data, the prefix defines particular data linked to an entity to describe its - higherlevel - attributes.
In case of compute services, such high level attributes describe characteristics of theservice to make it comparable with competing services. To assess meta-data for gaininginsights and for comparing compute services, consumers may access provider websites,read contracts, inquire other consumers, or observe a service in action.
There are numerous aspects to consider in an examination and comparison of computeservices. In this regard, providers and other sources typically lack in providing con-sumers with detailed and reliable meta-data concerning the various aspects (c.f. section2.2 and chapter 3) [10–12]. Therefore, a consumer is obliged to assess additional meta-data about compute services by own means. As this work gives consumers a novelapproach for single-handed assessments of compute services, the framework presentedin this work is employed to assess compute services in regards of two particular aspects:(1) performance, and (2) VM images.
To allow a comparison of compute services regarding performance meta-data, a con-sumer is confronted with a non-trivial measurement and evaluation task. Heterogeneoushardware and virtualization software used in compute services introduce variations inperformance outcomes [13–16]. In order to acquire reliable data, measurement meth-ods and metrics that can quantify the performance to be expected from a compute ser-vice are needed. The act of measuring a compute service’s performance, referred to asbenchmarking, implies the execution of computational tasks on a compute service VMat run-time. The sheer number of necessary measurement repetitions, due to perfor-mance variations in conjunction with observing multiple compute services, calls for anautomation of the measurement process.
Even with suitable performance metrics and measurement methods, a comparison ofcompute services remains multi-dimensional. To enable a simple, one-dimensionalcomparison of compute services, an aggregated score must be obtained. Hence, amethod to combine multiple performance attributes into a one-dimensional, represen-tative total value of a compute service is required. Generally, multi-attribute decision-making is capable of mapping compute services with multiple performance attributesto a single comparable score (on a ratio scale) [17–19]. Yet, an adoption to supportcompute service consumers with applying these methods for performance attributes ofcompute services is needed.
2

1.1. Motivation
Aside from performance meta-data of compute services, the use of compute servicesinvolves the assembly of a software stack from a VM image which is managed andpublished by the provider [20–22]. Using VM images available from repositories, con-sumers can build a custom software stack. While simple VM images ask consumers tostart with an operating system only, comprehensive repositories offer a wide range ofVM images with whole pre-configured software stacks. Thereby, every consumer canprofit from the expertise captured in prepared VM images, or rely on his own experienceand build a custom software stack on a simple VM image.
Nonetheless, to capture the diversity in VM image repositories, and to distinguish andunderstand the contents of VM images, compute services fail to provide sufficient meta-data (see chapter 3) [11, 12]. A plausible approach to assess meta-data about VM imagecontents is to introspect contents at run-time [23, 24].
Available meta-data about compute services is scarce and not necessarily reliable. There-fore, approaches that empower consumers in their undertaking to assess compute ser-vices single-handedly is imminent. This work introduces a framework which givesconsumers means to assess and compare compute services based on meta-data gainedat run-time.
In particular, an automation model is presented that describes how compute servicescan be assessed in an automated manner through remote interfaces. Furthermore, thepresent work includes a method to compare compute services regarding meta-data at-tributes using a MADM method. In addition, means to approach a mitigation of leasingcosts in an assessment of multiple compute service are developed by using a stoppingrule.
The generic concepts are employed in two particular instantiations of the frameworkin order to assess specific characteristics of compute services. Specifically, instantia-tions to assess compute services in regards of performance and VM image contents areestablished in this work.
3

1. Introduction
1.2. Comparative Assessments
The first section has argued about the amount of and the absence of reliable meta-data about compute service. Consequently, the necessity of methods to assess andcompare compute services in terms of meta-data has been identified. In this section, theintricacies of assessing and comparing compute services are discussed exemplarily fortwo aspects: (1) performance, and (2) VM images. These two aspects are reflected inthe research questions and later in this work treated with instantiations of the proposedassessment framework.
The following subsection will elaborate on the problems occurring in comparative as-sessments of performance and VM image contents in more detail. First, the intricaciesof comparative assessments of compute services in terms of performance are explored.Finally, the tasks to be solved to capture contents of VM images in meta-data are dis-cussed.
1.2.1. Performance of Compute Services
Compute service consumers can choose from a range of offerings available on the mar-ket. As a result, compute services compete for consumers with price differentiation andby offering various feature sets [25]. Due to compute services’ purpose to serve forcomputational tasks, compute service consumers typically consider the factors price,available performance attributes, and hardware figures, i.e., processor cores, and mem-ory and hard disk space [10]. Commonly, consumers consider given hardware figuresand resulting performance attributes in IT infrastructure capacity planning processes[26, 27].
In the following, a sample of cases that benefit from detailed compute service perfor-mance meta-data can be found:
• Capacity planning which incorporates testing and predicting a compute service’sperformance in terms of system requirements.
• Comparison of compute services according to multiple performance attributes.
• Monitoring of a compute service’s performance attributes over time to detectservice quality variations.
Nonetheless, providers regularly only describe hardware figures included in computeservices, but do not provide comparable performance attributes [10]. Since hardwareis heterogeneous between cloud providers and even within data centers, the actual per-formance of a compute service is not coherent with its hardware figures [13–16]. Forexample, compute services with 1 CPU core of competing providers may not show anidentical processing time for a certain computational task. Hence, methods to assess
4
1.2. Comparative Assessments
performance metrics at run-time are necessary to determine a comparable performancevalue.
Moreover, performance measurements of compute services may show variations overtime. A computational task, hence, requires varying processing times when executedat different points in time [28]. Particularly, compute services have been found to showvariations as hardware is frequently shared between rented systems [29, 30]. Thus,performance attributes must signify variations or include attributes with variation met-rics.
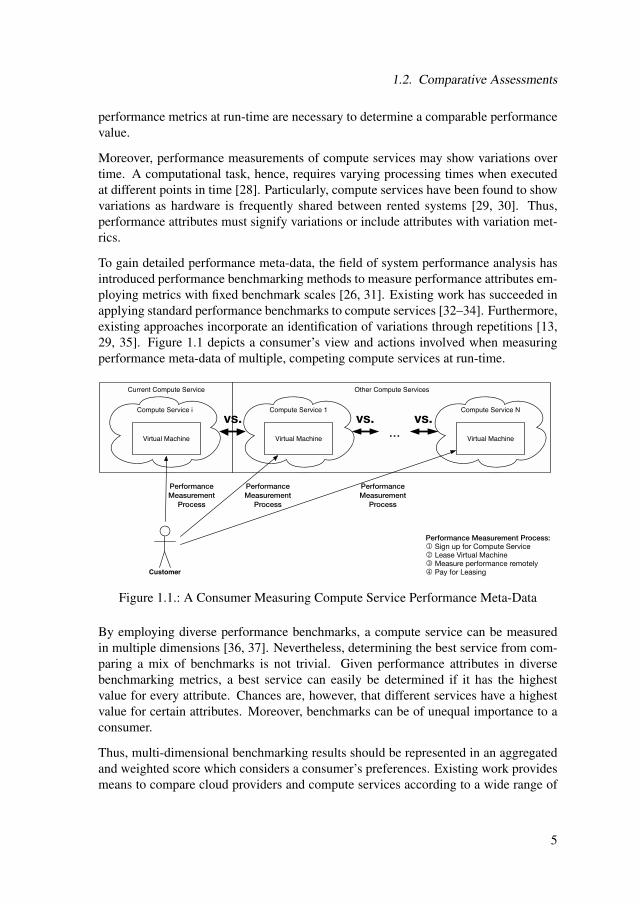
To gain detailed performance meta-data, the field of system performance analysis hasintroduced performance benchmarking methods to measure performance attributes em-ploying metrics with fixed benchmark scales [26, 31]. Existing work has succeeded inapplying standard performance benchmarks to compute services [32–34]. Furthermore,existing approaches incorporate an identification of variations through repetitions [13,29, 35]. Figure 1.1 depicts a consumer’s view and actions involved when measuringperformance meta-data of multiple, competing compute services at run-time.
Other Compute ServicesCurrent Compute Service
Compute Service 1 Compute Service NCompute Service i
vs.vs. vs.
...
Customer
Performance
Measurement
Process
Virtual Machine Virtual Machine Virtual Machine
Performance Measurement Process:
1 Sign up for Compute Service2 Lease Virtual Machine3 Measure performance remotely4 Pay for Leasing
Performance
Measurement
Process
Performance
Measurement
Process
Figure 1.1.: A Consumer Measuring Compute Service Performance Meta-Data
By employing diverse performance benchmarks, a compute service can be measuredin multiple dimensions [36, 37]. Nevertheless, determining the best service from com-paring a mix of benchmarks is not trivial. Given performance attributes in diversebenchmarking metrics, a best service can easily be determined if it has the highestvalue for every attribute. Chances are, however, that different services have a highestvalue for certain attributes. Moreover, benchmarks can be of unequal importance to aconsumer.
Thus, multi-dimensional benchmarking results should be represented in an aggregatedand weighted score which considers a consumer’s preferences. Existing work providesmeans to compare cloud providers and compute services according to a wide range of
5

1. Introduction
weighted attributes – e.g., security, availability or cost – using diverse methods fromMulti-Attribute Decision-Making [38–40].
Specifically, methods like the Analytic Hierarchy Process are able to weight multi-ple attribute values and calculate an aggregated, one-dimensional utility value on aratio scale [17, 41]. Although methods from Multi-Attribute Decision-Making [19] canweight and map multiple attributes of an alternative to a score, the attributes to considerhave to be defined beforehand. Yet, a method to evaluate services according to diverse,weighted performance attributes is absent.
Moreover, employing performance benchmarks requires to lease compute services forthe period of a measurement at run-time (see figure 1.1), thereby generating costs [42–44]. When observing multiple compute services, the total costs are the sum of theleasing costs for all services for the duration to conduct measurements.
For services and products in electronic markets, costs to assess information are com-monly reduced by platforms of intermediary third-parties, i.e., information providersor brokers [45]. Such third-party information platforms allow to split costs betweenconsumers and persist collected information [46]. However, there could be a set ofcompute service consumers that requires very specific performance meta-data that maynot be available from third-party platforms. For example, a consumer might desire toget hold of specific floating point benchmarking results for a certain set of computeservices to evaluate the suitability for a software that involves intensive floating pointcomputations. Hence, a development of tools to assess performance of compute ser-vices according to custom benchmarks is imminent.
Alternatively, costs can be reduced by only assessing information for a small, relevantsubset of compute services [47–49]. While smaller sets of compute services mean lesscosts, an intricate trade-off must be made to avoid sacrificing too many measurementresults and, thereby, fidelity by the virtue of ignored services and saved costs.
Stopping rules developed in the field of stopping problems are capable of making trade-offs between the continuation and ending of a process according to a stopping rule. Toapply a stopping rule approach, a specific rule must be found that expresses the trade-off to be made after each step of a process. For performance measurements, a stoppingrule is needed which evaluates the trade-off between result fidelity and costs of contin-uing the measurements. Existing meta-data about compute services, such as hardwarefigures, can be an indicator of which performance can be expected in pending measure-ments.
In conclusion, due to a lack of meta-data, making compute services comparable accord-ing to performance attributes requires run-time measurements. For measuring multipleperformance attributes of compute services, available standard benchmarks can be ap-plied. Besides, approaches exist which help to observe variations through repeatedmeasurements. However, means to aggregate measurement results into a single score
6

1.2. Comparative Assessments
while considering a consumer’s preferences respecting benchmarks must be developed.Thereby, consumers are facilitated with means to compare services according to multi-ple attributes. In addition, in a performance benchmarking process, consumers are ableto trade expenditures for the lease of compute services with the fidelity of the results byadjusting the number of compute services considered. Since the trade-off is not trivial,consumers need support in determining when to stop driving further measurements.
7

1. Introduction
1.2.2. Virtual Machine Images
Aside from the performance attributes of a compute service, also the array of VM im-ages available for a compute service are of interest to a consumer. Compute serviceconsumers are served with Virtual Machines resembling computers with hardware re-sources, i.e., processors, memory, hard disks, and network interfaces. By using virtu-alization technology, multiple VMs can be run on computer hardware using a VirtualMachine Monitor (VMM), also referred to as a hypervisor [6, 50]. A VM is persistedas a VM image that contains a copy of the (virtual) hard disk and, optionally, a hard-ware configuration, e.g., including the number of CPU cores and amount of memorydemanded by the VM. Using a VM image, multiple VMs can be instantiated with spe-cific hardware configurations and access to copies of the virtual hard disk, hence, withthe same data and software available.
The amount of data and pre-configured software on a VM image’s hard disk variesdepending on what a VM is needed for. For example, a VM image may contain only anoperating system if VMs from the image shall be very customizable or only need theoperating system as a basis. In contrast, a VM image that contains an operating systemand a pre-configured software stack gives a basis to deploy software with few efforts forinstallation and configuration procedures. The latter, more comprehensive VM imagecategory is referred to as virtual appliance.
In compute services, VM images are offered and maintained in repositories. VM im-ages in a repository comply with a certain format and are not necessarily compatiblewith more than a single compute service. Depending on the repository policy pursuedby a compute service provider, a repository is either open to the public or is accessi-ble to consumers only. Furthermore, actors adding and maintaining VM images in therepository can be any consumer or the provider only.
The contents of VM images and, in particular, of cloud appliances created from otherconsumers is typically not included in existing meta-data, nor can it be assessed fromthe VM image as a file alone. Instead, a consumer needs to instantiate and inspect a VMimage at run-time to discover its contents, such as contained data and software like theoperating system or installed system libraries. Potentially, the use of VM introspectionallows for automated access to a VM image’s content at run-time [23, 24]. In addi-tion, the field of Operating System Configuration Management (OSCM) is promisingin terms of its capabilities to detect installed software packages and libraries automati-cally when access is granted to a running VM [51, 52].
In the following, a list of example use cases is provided that illustrates how a computeservice consumer benefits from VM image meta-data:
• Search for a VM image with certain software and libraries from the repositorywhile benefiting from a provider’s or a community’s experience.
8

1.2. Comparative Assessments
• Highlighting differences between similar VM images and versions of one VMimage.
• Documentation of a VM image to rebuild an image with a similar software con-figuration at a different compute service.
Nevertheless, repositories of VM images can comprise large numbers entries1 render-ing a manual introspection of all images unfeasible due to time and cost constraints.Besides, virtual appliances may contain a plethora of system libraries and softwarepackages and, thus, demand a long time for an introspection. Therefore, an automationof the introspection process is necessary to free consumers from manual introspectionefforts.
In conclusion, to gain insights about available VM images and, in particular, virtualappliances, contents could be introspected at run-time. To document the available con-tents, the field of configuration management offers promising approaches to detect anddocument installed software packages. However, depending on the amount of softwarepackages in a VM image a consumer faces tremendous manual efforts in an introspec-tion. Also, the sheer number of available VM images indicates that consumers maywant to repeat the introspection process for various images. Altogether, the expectedeffort of VM image introspection for various compute services and repositories de-mands an automation of the process.
1Amazon EC2 comprises over 24.000 images in the US-EAST-1 region on 7th January 2014
9

1. Introduction
1.3. Research Questions
This thesis researches the problem of assessing compute services to gain meta-data, par-ticularly with relation to performance attributes and VM image contents. The problemleads to the principal question that asks for methods or procedures to gain and interpretmeta-data on performance attributes and VM image contents as a consumer.
The principal research question to be addressed by this work is:
How can cloud compute services be assessedat run-time regarding meta-data?
Since answering the principal research question is not trivial, the question is sub-divided into multiple more specific research questions RQ1-RQ3. Implicitly, this alsoallows for a detailed evaluation of the principal research question through its sub-questions.
The research questions posed in this work shall be divided according to the two meta-data aspects of compute services: performance and VM image contents. In a first step,the following question addressing performance meta-data shall be researched:
RQ1. How can multiple compute services be made comparable regardingmeta-data?
For comparing compute services regarding performance meta-data as requested byRQ1, approaches to measure performance are required. To gain a single-dimensionalmetric that reflects the performance value of a compute service in regards of a con-sumer’s preferences, MADM seems a suitable basis to calculate a weighted perfor-mance value. The following sub-questions shall be answered in this research work:
RQ1a. How can compute services be assessed at run-time in an automatedmanner?
RQ1b. Can MADM support the aggregation of multiple meta-data at-tributes into a subjective value for a compute service?
RQ1c. How is the computational complexity of using MADM to comparecompute services regarding meta-data?
Given that compute services can be measured and compared regarding meta-data, ap-proaches to reduce costs during assessments shall be researched. Run-time assessmentsneed access to a VM, the system under test [31], and entail leasing costs from computeservices. This research focuses on a budgeting of the costs occurring from run-timeassessments, leading to the following research question:
10

1.3. Research Questions
RQ2. How can costs for run-time assessments of multiple compute servicesbe budgeted?
Apart from research questions of general nature regarding run-time assessments ofmeta-data, this work explores two particular characteristics of compute services, i.e.performance and VM image contents. Both characteristics provide a task to instantiateand evaluate the framework introduced by this work. The instantiations of the frame-work furthermore represent units to examine the research questions in experiments andpractical scenarios.
As one particular compute service characteristic, the present work researches the run-time assessment of compute service performance. Within the scope of compute serviceperformance, results of measurements should be captured as meta-data. Besides, anautomation of the performance measurement process needs to be explored. Therefore,the following research question shall guide the exploration of assessments of computeservices in regards of performance:
RQ3. How can performance be assessed at run-time from multiple computeservices in an automated manner?
The present work also explores the assessment of VM image meta-data. The possibilityto document contents of a VM image as meta-data is of distinguished concern. Thefeasibility of automation regarding an assessment of VM images at run-time are tobe researched in this work. Consequently, the following research question shall beexplored:
RQ4. How can Virtual Machine image contents be assessed at run-timefrom multiple compute services in an automated manner?
11

1. Introduction
1.4. Research Methodology
The research conducted in this work follows a high-level process of three major steps:observation, development, and evaluation. Initially, in an observation phase, experi-ments with cloud compute services and a study of literature have led to the motivationof this work. After a clear understanding of the problem has been developed, researchquestions and a research methodology could be defined. With this in mind, modelsand methods were developed to address the questions. The development of models andmethods was carried out in iterations of conceptual development, implementation, andtest phases. Ultimately, final versions of the models and methods were validated andevaluated to test the results against the research questions. Figure 1.2 depicts the pro-cess followed in the research methodology that evolved over the course of this work.
Observation Experience
Development
Evaluation
Methods
Experiments
Literature
Models Implementation
Analysis
Figure 1.2.: Overview of Research Process
To test the validity and quality of the approaches proposed in this work, an analyti-cal evaluation and experiments with the help of instantiations as software prototypesare conducted. For the validation and evaluation of the proposed methods and theirinstantiations, research strategies from the field of software engineering research areapplied [53]. In addition, the quality of proposed methods is evaluated in analyticalexaminations.
In software engineering research, a specific set of research strategies exists [53]. Eachstrategy is defined by three components: (1) research question type, (2) research resulttype, and (3) validation type. A research question asks either for a method (for devel-opment or analysis), an analysis, a generalization, or a feasibility test. The researchresult corresponding to a question represents a procedure, a model, notation or tool,specific solution, judgement, or a report. And the validation may be manifested with ananalysis, through experiences, in examples, or in evaluations.
12

1.4. Research Methodology
Instantiation EvaluationImplementationMethod/ModelResearch Questions
RQ1a.
MADM-Based Comparison
Method
Run-time Assessment
Automation Model+
Meta-Data Model
AHP-based Scoring
Prototype
Cost Budgeting Stopping
Rule
Validation w/multiple Compute
Services
Analysis of Fidelity and Cost
Budgeting
Analysis of Computational
Complexity
Case Study w/ Industry
Stopping Rule Benchmarking
Prototype
extends
RQ1b.
RQ1c.
RQ2.
RQ4.Automated VM Image
Introspection
Validation w/ various VM
Images
Promptitude Measure
VM Image Introspection
Prototype
RQ3.Automated
Performance Benchmarking
Stopping Rule forPerformance
Benchmarking
Figure 1.3.: Overview of Research Paths
This work follows diverse paths to validate the presented methods in the light of theresearch questions. Figure 1.3 illustrates an overview of the research paths taken toanswer all research questions. On each path, a research question leads to a validationor evaluation of a proposed method.
In terms of software engineering research strategies, the research questions RQ1 andRQ2 point at a method for the analysis of compute service performance meta-data.Besides, RQ3 and RQ4 can be interpreted to demand a method of analysis concerningwith the documentation of performance and VM image meta-data. All of the presentedconceptual methods are implemented directly or indirectly as software prototypes andvalidated in examples and partly in case studies, some of which were conducted with theindustry (c.f. figure 1.3). While the MADM-based comparison method is implementeddirectly as a software prototype, the run-time assessment automation model, the meta-data model, and cost budgeting stopping rule are indirectly implemented as softwareprototypes for concrete instantiations of the methods. The instantiations for the run-time assessment model are using the model as a blueprint to assess compute servicesin terms of performance and VM image contents. The software prototypes stoppingrule benchmarking prototype and VM introspection prototype are an implementationsof the instantiations automated performance benchmarking and automated VM imageintrospection respectively.
Figure 1.3 also highlights relations between the prototypes. While the implementationof the subjective evaluation method in an AHP-based scoring prototype is evaluatedin a case study, both other implementations are validated by example. Moreover, im-plementations are used to explore practical qualities in the application of the methods.In particular, the actual computational complexity and promptitude of the methods is
13
1. Introduction
tested with the implementations in empirical experiments. Experiments are conductedwith all prototypes, namely the stopping rule benchmarking prototype, the AHP-basedscoring prototype, and the VM introspection prototype (cf. figure 1.3).
14

1.5. Contributions
1.5. Contributions
This work pursues the goal of giving means to assess cloud compute services at run-time to gain meta-data. In this regard, several contributions are made that support suchassessments, also under a cost aspect, and enable a comparison of compute services.The contributions are two-fold in their kind: conceptual work and implemented proto-types. The following subsections first present the conceptual contributions and then thecontributed software prototypes.
Contributed Conceptual Methods
In the following, a list of conceptual contributions to conduct assessments at run-timeand compare compute services:
Meta-data model As part of the framework a meta-data model is introduced whichis capable of attaching meta-data to compute services in a central, queriabledatabase. The meta-data model is furthermore extended in two distinct instantia-tions to capture performance attributes of compute services and contents of VMimages available in the repositories of a compute service. The extended meta-data model for performance attributes captures measured benchmarking resultsand variations from multiple iterations. Also, compute services in diverse hard-ware configurations can be reflected in the model. The extended meta-data modelto capture VM image contents provides a generalization of information availablefrom diverse software package managers that manage software configurations onvarious operating systems.
Automation of compute service assessments The conceptual method presentedin this work comprises an archetypical automation model to assess compute ser-vices in an automated manner. In particular, performance benchmarking drivenwith a procedure built upon the automation model is able to attain results repeat-edly over time and in diverse frequencies. Besides, a second instantiation of themodel allows consumers to introspect VM images of a compute service providerin an automated manner. During an introspection, meta-data about an image’scontents, specifically about installed software and libraries, is extracted.
Calculation of a comparable compute service score This work introduces amethod to aggregate meta-data attributes into a one-dimensional, weighted scorethat represents a compute service. An AHP-based evaluation normalizes and ag-gregates multiple meta-data attributes into a single value on an absolute scale.In an aggregation, the diverse considered attributes are weighted according to aconsumer’s preferences.
15
1. Introduction
Stopping rule with cost budget Using the stopping rule, a consumer is enabled toset a cost budget on the leasing costs for assessments of compute services. Thestopping rule calculates after each assessment the probability to still find a higherscoring compute service according to a AHP-based score.
Contributed Software Prototypes
The second kind of contributions contained in this work are software prototypes. Allprototypes are instantiations of conceptional methods presented in this work. The fol-lowing list summarizes the software prototypes contributed by this work:
Compute service comparison web application Implementation of a web appli-cation that facilitates compute service consumers with weighted, aggregated scoresfor compute services. The prototype supports diverse criteria catalogs as tem-plates, particularly with performance attributes, but also catalogs with a widerange of criteria to compare compute services according to aspects like security,prices, support quality, etc.
Compute service benchmarking web application Implementation of a systemto drive performance benchmarks on compute services. The system allows usersto measure multiple compute services with various benchmarks and, optionally,employ a stopping rule to trade measurement costs with fidelity of benchmark-ing results. Benchmarking runs can be scheduled and, thereby, a repetition ofmeasurements is possible.
Virtual Machine image crawler Implementation of a software prototype to describeand capture meta-data of Amazon machine images with Ubuntu Linux operatingsystems. In particular, the system focuses on documenting the software con-figurations of images and allows consumers to access a database of VM imagemeta-data via a web application.
16

1.6. Published Material
1.6. Published Material
There is preliminary work that has been published in the research community throughpeer-reviewed papers at conferences and in journals. Following, a list of publicationswhich incorporate related concepts referenced in this document:
[1] M. Menzel, M. Schönherr, J. Nimis, and S. Tai. “(MC2)2: A Generic Decision-Making Framework and its Application to Cloud Computing”. In: Proceedingsof the International Conference on Cloud Computing and Virtualization (CCV2010). GSTF. Singapore: GSTF, 2010.
[2] M. Menzel, M. Schönherr, and S. Tai. “(MC2)2: Criteria, Requirements and aSoftware Prototype for Cloud Infrastructure Decisions”. In: Software: Practiceand Experience (2011).
[3] A. Lenk, M. Menzel, J. Lipsky, S. Tai, and P. Offermann. “What Are You Payingfor? Performance Benchmarking for Infrastructure-as-a-Service Offerings”. In:Proceedings of the 2011 IEEE International Conference on Cloud Computing(CLOUD). IEEE. Washington, D.C., USA: IEEE, 2011, pp. 484–491.
[4] S. Haak and M. Menzel. “Autonomic Benchmarking for Cloud Infrastructures:An Economic Optimization Model”. In: Proceedings of the 1st ACM/IEEEworkshop on Autonomic computing in economics. ACM. Karlsruhe, Germany:ACM, 2011, pp. 27–32.
[5] M. Menzel, M. Klems, H. A. Le, and S. Tai. “A Configuration Crawler for Vir-tual Appliances in Compute Clouds”. In: Proceedings of the 1st InternationalConference on Cloud Engineering (IC2E). IEEE. San Francisco, USA: IEEE,2013, pp. 201–209.
[6] M. Menzel and R. Ranjan. “CloudGenius: Decision Support for Web ServerCloud Migration”. In: Proceedings of the 21st International Conference onWorld Wide Web. ACM. Lyon, France: ACM, 2012, pp. 979–988.
[7] M. Menzel, R. Ranjan, L. Wang, S. U. Khan, and J. Chen. “CloudGenius: AHybrid Decision Support Method for Automating the Migration of Web Appli-cation Clusters to Public Clouds”. In: Computers, IEEE Transactions on (2014).
Figure 1.4 sets all published material into context with the aspects of performance andVM image meta-data of the framework presented in part II. Parts of the publicationsbuild the foundation for compute service evaluations and decision-making. The publi-cations [1] and [2] present a framework to build multi-criteria decision making meth-ods. The (MC2)2 framework helps to define a scoring function applicable to computeservices. With the scoring function, an aggregated, weighted value can be calculatedgiven measured performance attributes of a compute service. The framework and scor-ing functions have already shown their applicability in strategic cloud infrastructuredecisions [2].
17

1. Introduction
Performance Meta-DataVirtual Machine Image
Meta-Data
Find VMsIntrospect
VMs
[4] “CloudGenius: Decision Support for Web Server
Cloud Migration”.
[6] “(MC2)2: A Generic Decision-Making
Framework and its Application to Cloud
Computing”.
[7] “(MC2)2: Criteria, Requirements and
a Software Prototype for Cloud
Infrastructure Decisions”.
[1] “Autonomic Benchmarking for Cloud
Infrastructures: An Economic Optimization
Model”.
[3] “A Configuration Crawler for Virtual
Appliances in Compute Clouds”.
[2] “What Are You Paying for? Performance
Benchmarking for Infrastructure-as-a-Service
Offerings”.
Implementation
Automated Performance Benchmarking
Multi-Attribute Comparison
[5] “CloudGenius: A Hybrid Decision Support
Method for Automating the Migration of Web
Application Clusters to Public Clouds”.
Extension of
Figure 1.4.: Published Material Overview
Moreover, there is preliminary work regarding performance benchmarking of computeservices. [3] analyses which standard benchmarks apply for compute services and es-tablishes a novel measurement method. Unlike existing methods, benchmarking is con-ducted over a time span in diverse frequencies. Using the method, experiments haveshown that the performance of a compute service can vary. A second finding of theexperiments is that performance benchmarks of compute services are costly.
To counter costs, [4] proposes a stopping rule that aims at budgeting the costs andminimize the number of observed services when benchmarking their performance. Thegoal is to find a service with a best performance score within a given cost budget forbenchmarking.
Apart from performance measurements, [5] describes a method to crawl software con-figurations of VM images. The method instantiates VM images of compute services,determines the operating system and collects the list of software and system librariesavailable.
[6] introduces CloudGenius, a cloud migration support framework which makes use ofthe previously mentioned assessment and scoring methods in the case of web server mi-grations. CloudGenius supports a selection of a compute service and VM image as tar-get platform in a migration. The framework comprises the notion of scoring functions, aprocess model, a data model, and links to meta-data assessment methods. For scorings
18

1.6. Published Material
of compute services, CloudGenius benefits from the (MC2)2 framework published in[1]. Besides, the work refers to [3, 5] for suitable methods to measure performance andintrospect VM images.
The CloudGenius framework has been extended to give decision support in the realm ofweb application migrations to the public cloud [7]. The extended version incorporatesa genetic algorithm implemented with the MapReduce programming model to evalu-ate large numbers of web server cluster setups on compute services using the (MC2)2
framework. The work also discusses the use of (MC2)2 evaluation functions for scor-ing purposes and fitness functions.
19

1. Introduction
1.7. Thesis Organization
The rest of the thesis is organized as follows: foundations in part I facilitate the readerwith definitions and background, and shed light on related work and the state of theart.
In part II the conceptual framework and methods contributed by this work are presented.Chapter 4 gives an overview of the framework and how methods relate to another. Fur-thermore, methods to assess compute services in an automated manner, capture meta-data attributes and link the to compute services, compare compute services using ascoring, and a stopping rule are presented and explained in detail. An implementationof the scoring method is presented and provides the basis for an evaluation with theindustry and in experiments in respect of computational complexity.
Part III presents instantiations of the framework’s models and methods to assess partic-ular characteristics of compute services. First, chapter 5 instantiates parts of the frame-work to benchmark compute services regarding performance in an automated manner.The instantiation also adapts the scoring method for compute service comparisons ac-cording to performance attributes. Furthermore, with the use of the framework’s stop-ping rule a cost budget can be enforced in compute service benchmarking tasks. Asoftware prototype asserts the feasibility of automated compute service performancebenchmarking and the application of the stopping rule. Besides, several experimentsare conducted to evaluate the compute service performance benchmarking method.
In chapter 6 the framework’s models and methods are instantiated to assess computeservices in regards of VM image contents. A method to introspect VM images re-garding contents, such as software libraries, in an automated manner is presented. Animplementation of the method shows the feasibility and is employed in experiments toevaluate the method.
Finally, part IV complete this document with a conclusion, discussion and outlook.
20

Part I.
Foundations
21


2. Background
Chapter 2 introduces the reader to basic concepts relevant throughout the present work.First, cloud computing and, in particular, cloud infrastructure services including com-pute services are introduced. Following, meta-data of compute services is explored.Then, methods of formal decision-making and comparisons are presented. Finally, thetheory of optimal stopping is explained in detail.
2.1. Cloud Compute Services
Cloud computing provides new models to offer and consume hardware infrastructureand software. The following sections define the notion of cloud computing with afocus on compute services, a particular cloud infrastructure service. In this respect,virtualization technology is explained as it provides a basis to cloud compute servicesand affects the behavior of compute services. The final sections specifically shed lighton the consumption and constituent parts of compute services.
2.1.1. Definition of Cloud Computing
A definition of cloud computing has been approached in many publications and by di-verse authors, in research, industry, and standardization organizations [6, 7, 54, 55].Amongst the multitude of definitions, two particular instances cover the essential fac-tors this work is based on. The National Institute of Technology (NIST) has publisheda definition of cloud computing that spans multiple dimensions:
Cloud computing is a model for enabling ubiquitous, convenient, on-demandnetwork access to a shared pool of configurable computing resources (e.g.,networks, servers, storage, applications, and services) that can be rapidlyprovisioned and released with minimal management effort or service providerinteraction. This cloud model is composed of five essential characteristics,three service models, and four deployment models. [7]
23

2. Background
The definition of the NIST is coherent with the definition of Baun et al. [6] whichchannels important aspects and influences this work as well. In contrast to NIST, Baunet al. expects resources utilized in cloud computing to be based on virtualization (seesection 2.1.2). Although using virtualization as a basis is not strictly common for allservices [56], most infrastructure services are employing virtualization technology [57,58].
By using virtualized computing and storage resources and modern Webtechnologies, cloud computing provides scalable, network-centric, abstractedIT infrastructures, platforms, and applications as on-demand services. Theseservices are billed on a usage basis. [6]
The NIST definition explicitly refers to a list of characteristics and models that describethe aspects of cloud computing in more detail. The definition of Baun et al. observessimilar cloud characteristics and explains details in addition to the definition. In thelight of both definitions, the subsequent subsections describe characteristics and modelsrelated to cloud computing.
Characteristics of Cloud Computing
The NIST definition of cloud computing incorporates five characteristics that describethe concept of cloud computing in more detail. The definition of the characteristicsfocuses on a description for the role of a consumer who actively interacts with cloudservices and is interested in meta-data of cloud services. Consequently, the explana-tions of the characteristics in this work will adapt the role of consumers. In contrast, acustomer who purchases cloud services is only involved in the business transactions toattain access to the services of a provider.
A consumer can provision resources from a cloud provider unilaterally, when neededand without further interaction (on-demand self-service). Furthermore, through broadnetwork access capabilities become available over the network (with standard mech-anisms) by using thin and thick client platforms. Cloud computing channels a multi-tenant model for pooled computing resources which leads to a concealing of the re-sources location (resource pooling). Besides, in cloud computing capabilities scalewith demand, often automatically (rapid elasticity). For consumers, the elastic behav-ior memes an availability of unlimited resources. The usage of resources is monitored,controlled and can be reported. Hence, a metering of consumer’s utilization of capabil-ities is available (measured service).
The list of advantages and disadvantages induced by cloud computing’s characteristicsis respectable. An implication caused by the fact that notion of cloud computing em-braces measured services is a pay-per-use billing model realized by cloud providers [6].
24

2.1. Cloud Compute Services
In turn, a pay-per-use billing model allows companies to avoid high capital expenditures(CAPEX) that were occurring in a purchase of on-premise IT infrastructure. Thereby,CAPEX are transmuted into operational expenditures (OPEX) which increase prallel tothe company’s growth. In addition, with economies of scale, the cloud promises to savecosts and to be more reliable than typical on-premise infrastructures [55].
Service Models of Cloud Computing
The capabilities served by cloud providers following the cloud computing model canbe divided into three service models. Commonly, offered cloud services can be dividedinto the three models: Software-as-a-Service (SaaS), Platform-as-a-Service (PaaS), andInfrastructure-as-a-Service (IaaS) [8]. While SaaS offers software and PaaS executionplatforms as services, IaaS offers hardware infrastructures as service. Lenk et al. [8]developed a more precise representation of service models depicted as a cloud stack infigure 2.1 which includes a classification of a range of cloud services. The cloud stackrepresentation also sorts the three models into layers since services can be based onlayers beneath.
The cloud stack comprises the IaaS layer that utilizes physical hardware to provideinfrastructure services, e.g., compute services, storage services and network services.Furthermore, the PaaS layer is built ontop the IaaS layer, and the SaaS layer is con-stituted from any of the aforementioned layers. Although, the stack implicates thatservices are built ontop of each other, this is not necessarily the case in every PaaS andSaaS implementation [56, 59, 60].
Deployment Models of Cloud Computing
There are multiple deployment models of cloud computing distinguishable by whomoperates and consumes services. A private cloud is consumed by a single organizationwhich may also be the owner and operator. Often, a third-party operates the privatecloud which may also be located off-premise. A billing can be absent in private cloudswhile services are still measured and other characteristics remain valid. A federation ofmultiple private clouds is referred to as a community cloud.
The public cloud deployment model offers cloud services to the public. Commonly,consumers are billed by a company that operates and owns the cloud infrastructure. Amix of the private and hybrid cloud deployment model is referred to as hybrid cloud.A hybrid model results in a composition of public and private (or community) cloudservices, allowing consumers to use public and private cloud services with the sametechnologies.
25

2. Background
Figure 2.1.: Service Models and Layers in the Cloud Stack [8]
26

2.1. Cloud Compute Services
2.1.2. Virtualization
Virtualization technology is the basis of cloud infrastructure services and its notions ofdividing hardware into virtual machines is a fundamental background for the presentwork. Particularly, the environment and effects created by virtualization software areconsiderable factors in the assessment of compute services, which is a cloud infrastruc-ture service.
The notion of virtualization is to build an abstraction layer ontop of physical hardware.Through virtualization a creation of a virtual resemblance of a system, hardware or soft-ware, becomes possible. For cloud computing, and most of all for cloud infrastructureservices, hardware virtualization is a fundamental prerequisite. A virtualized hardwareresembles a set of hardware, most commonly a whole physical machine with its pro-cessors, memory, hard disks and network devices. Virtualized physical machines arerefered to as Virtual Machines (VMs). A Virtual Machine Monitor (VMM) or hypervi-sor manages multiple VMs on a host system. VMs share resources of the host systemand can be started or stopped by the hypervisor. The basis for a VM is a Virtual Ma-chine (VM) image. By instantiating a VM image a new VM can be created or started.Images include a resource configuration that describes which hardware is required toinstantiate a VM. Besides, a VM image contains initial data on the virtual hard disksand virtual memory.
How a hypervisor is installed on a host system depends on the hypervisor implementa-tion. A hypervisor might be installed with it’s own operating system on the bare hard-ware or on a pre-installed operating system. Multiple vendors offer hypervisor prod-ucts, e.g., VMware vSphere [61], Citrix Xen Hypervisor [50], Red Hat Entperise Vir-tualization [62]. Figure 2.2 depicts the structure of a Xen hypervisor example setup.
As shown in figure 2.2, with virtualization software hardware is shared between manytenants. The use of the same hardware resources by multiple tenants leads to a poten-tially more economical utilization of the physical system. Traditionally, a single tenantuses a hardware resources constantly to a small extent or only occasionally to a full ex-tent depending on the workload patterns. Then, the hardware is under-utilized, at leastat times. By sharing the hardware resources, the costs to operate a physical system canbe split between the tenants.
Nevertheless, virtualization comes with several side-effects which potentially affect theperformance of VM provisioned by a compute service [30]. A more detailed discussionof such effects is conducted in section 2.2.1 by exploring the consumer-view of computeservice performance.
Cloud computing and in particular cloud infrastructure services became possible whenall requirements were fulfilled in order to attain a full automation of software deploy-ments in large scales. Virtualization technology closed the gap that hindered hardwareresources to be managed via remote interfaces, instantly and fully automated. Remote
27

2. Background
Figure 2.2.: Example Structure of a Xen Hypervisor [50]
interfaces of hypervisors allow to orchestrate large amounts of virtual machines in largedata centers. The wrapping of these management calls in web service interfaces, offeredto consumers and billed per use, completes the concept of cloud compute services andof most cloud infrastructure service.
2.1.3. Consumption of Cloud Compute Services
On the IaaS level, compute services provide virtual computer hardware with processors,memory and hard disks operated in a data center and make them available remotely tocircle of consumers, depending on the deployment model. For realization of a computeservice, typically, virtualization technologies are employed to divide physical machinesinto Virtual Machine segments and to homogenize varying physical hardware [55, 63].Prominent compute services are Amazon Web Services Elastic Compute Cloud [57],Rackspace Public Cloud [58], and GoGrid Cloud Servers [64].
Consumers of a compute service can instantiate VM images that package at least a basicoperating system or can even encapsulate a whole software stack. Virtual Machine(VM) images available for a compute service differ in the included operating systemand software packages (see section 2.1.3). The typical process of deployment, assumedan account with a compute service provider is available, follows a three-step process:
1. Choose a VM image
2. Choose a compute service hardware configuration
3. Create one or multiple VM instances from the VM image
28

2.1. Cloud Compute Services
Steps (1) and (2) do not have a particular order and step 3 can appear in arbitraryfrequency, e.g., triggered by an automatic scaling logic, depending in which context thecompute service is used. As a result of the process a consumer receives access to theVM instances via remote interfaces like Secure Shell (SSH) remote terminals.
Virtual Machine Images in Public Compute Services
VM images are an essential part of compute services as every instantiation of a VMalways involves an assignment of an image. To know about VM image contents isfundamental for consumers to successfully use compute services. VM images differin contained operating system and software installed. Depending on the software con-tained a VM image, a consumer must install missing software or remove unnecessaryitems.
To understand which contents of VM images can and should be assessed, it is nec-essary to observe the structure and availability of VM images in compute services.Generally, the provisioning of VM images, that contain software and libraries, variesbetween compute clouds. Repositories differ regarding the dimensions of openness andVM image complexity. VM image complexity ranges from simple images compris-ing only an operating system to complex full software stack images, called virtual orcloud appliances. A cloud appliance is a VM image that has been optimally config-ured for a particular purpose, e.g., a database server appliance or an application serverappliance.
Specific images with different configurations and software versions can lead to im-mensely large repositories. However, images from one repository of a certain providercannot necessarily be instantiated at a different provider. Although many providersbase their compute service on the same virtualization technologies, interoperability isnot yet granted.
The management of a repository lies typically with the cloud provider, but contributionsof new images can either be made by the cloud provider only or an open community.Figure 2.4 depicts an enhanced gantt chart of VM image repository contents and a clas-sification of three compute cloud providers, namely GoGrid, Rackspace, and Amazon.In general, three types of repositories are distinguishable: (1) centralized packagingand management of bare operating system images (e.g., Rackspace [58]), (2) central-ized packaging of a wide range of VM images, from bare operating system to complexsoftware stacks (e.g., GoGrid [64]), and (3) decentralized packaging that involves usersand communities (e.g., Amazon EC2 [57]).
VM image repositories of providers not only contain freely available images. Commer-cial software vendors, including IBM, SAP, and Oracle, package VM images and eitherrelease them for free or with commercial licenses. For example, Amazon’s Applica-tion Programming Interface (API) comprises fee and license payment services for VMs
29

2. Background
Figure 2.3.: Software on VM Images and Appliances
Figure 2.4.: Overview of VM Image Repository Contents
which are charged by hour or paid on a subscription basis. In parallel, commercial VMimages of Amazon’s repository are published on Amazon’s AWS Marketplace [65].
Apart from cloud provider’s API access to VM images, community websites publishlists of images. The images are often created by the community and available for mul-tiple public cloud services. For example, the Cloud Market [66] is a VM image ag-gregator that holds and maintains a database of 85,3651 VM images compatible withAmazon’s EC2 compute service. Similarly, bitnami [67] provides a wide range ofprepackaged software on VM images as an intermediary seller.
Compute Service Configurations
Compute service offerings differ in various attributes. Besides, service providers com-monly offer multiple compute services differing in attributes of the Virtual Machine andservice levels. A compute service is offered in a configuration with a certain amountof hardware resources, e.g., CPU cores, amount of memory, and hard disk space, for aprice per time unit – typically full hours [68–71].
1checked 8th Sept. 2013
30
2.1. Cloud Compute Services
The pricing for compute service configurations differ. Configurations made availableto consumers are predetermined in offered service variants by providers. In contrast,there are also providers which allow consumers to configure the hardware resources ofa compute service. Depending on the pricing model, one time fees and other additionalcosts may appear.
Compute services of one provider are distinguishable by hardware configuration, coinedas compute service type, since only the amount of hardware resources changes. Providers,including Amazon [72] and Rackspace [58], offer compute services in predefined con-figurations distinguishable by multiple dimensions such as processor cores, amount ofmemory, and hard drive size. In contrast, some compute services, e.g., 1&1 DynamicCloud Servers [73], facilitate consumers with a custom hardware configuration alongthose multiple dimensions. Accuracy and variations choosable within the dimensionsvary.
Detailed information about available predefined hardware configurations is commonlyavailable together with price tables on the websites of providers. For configurable com-pute services, the amount of hardware resources can be defined upon instantiation of aVM. Depending on the compute service, a VM image may restrict the configuration ofthe hardware resources. For example, Amazon EC2 offers VM images that only workwith 64-bit and 32-bit processors.
Compute Service Access
How compute services are offered is similar for most compute service providers. Com-pute services can typically be accessed via web frontends and web service interfaces,using a web browser or client software handed out by the provider respectively. Us-ing the interfaces, a consumer can start, configure and stop VM instances or save aninstance as a VM image, depending on the capabilities of the service.
Furthermore, since VMs are potentially accessible from anybody via the internet, con-sumers typically need credentials to access a running VM. For example, when aprovider uses the SSH protocol for remote connections to VMs a username and pass-word or a SSH certificate is required. Alternatively, some providers employ a VirtualPrivate Network (VPN) for security and establish remote connections to VMs via re-mote console software. Figure 2.5 gives an overview of the diverse access channels forusing the service or accessing VMs.
The jClouds java library [9] aggregates cloud service APIs of multiple providers into auniform interface for consumers. Additionally, interface specifications like OCCI [74,75] and CIMI [76] aim at fostering a unified access to compute services.
31

2. Background
Compute Service
VPN
Virtual Machine
Virtual Machine
Customer
SSH with certificate
Web Service APIClient
Software
HTTP
Web FrontendWeb
Browser
HTTP
VPN+SSH
Figure 2.5.: Exemplary Access Channels to a Compute Service
2.2. Compute Service Meta-Data
Meta-data is essential to distinguish and compare compute services of one or multipleproviders. This section explores the extent of meta-data available for compute servicesfrom providers and third-parties, particularly in respect of performance and VM imagecontents. Besides, generally available methods to assess compute services in regards ofperformance and software contents are presented.
2.2.1. Performance of Compute Services
Performance is a property of compute services that is of particular interest to con-sumers. The time to complete computational tasks depends on the performance utiliz-able from a service. Available meta-data indicates what performance can be expectedof a compute service. To gain more details about a computer system’s performance,benchmarking is an approach for further analyses. Since the performance may varyover time, repetitions give means to capture variations with metrics, such as statisticalvariance or standard deviation.
In the following, first the extent of available meta-data about compute services’ perfor-mance characteristics is examined. Then, methods to assess a computer systems perfor-mance are presented and the general applicability to compute services is discussed.
32

2.2. Compute Service Meta-Data
Available Compute Service Performance Meta-Data
For compute services, available meta-data is scarce in a sense of making profoundperformance predictions. The information provided in public sources, such as from theAPIs of compute service providers and on their websites, only gives an overview of thehardware dimensions. A summary of hardware and performance meta-data attributespublished by AWS EC2, Rackspace Cloud Servers, and GoGrid Cloud Servers is givenin table 2.1. The screenshots in figures A.1, A.2, A.3, and A.4 in chapter A of theappendix give an impression of how performance meta-data is published on providerwebsites.
Attribute EC2 Rackspace GoGrid
Amount CPU Cores ✓ ✓ ✓CPU Performance Indicator ✓ × ×CPU Architecture ✓ × ×CPU Hardware ✓ × ×Amount Memory ✓ ✓ ✓Memory Performance Indicator × × ×Disk Volumes ✓ ✓ ✓Disk Performance Indicator × × ×Network Bandwidth × ✓ ✓
Table 2.1.: Meta-data Attributes available on Provider Websites
Publicly available meta-data of compute services, whether hardware configuration orperformance, is generally rather scarce [10]. Commonly, compute services indicatethree hardware specifics: (1) number of processors (or cores) and their architecture, (2)amount of memory, (3) amount of hard disk space. While (2) and (3) are commonlydescribed in bits or bytes metric, (1) is defined by a number and frequently with anarchitecture identifier, such as 32bit or 64bit. Figure 2.6 illustrates the structure ofhardware configuration meta-data typically available for compute services.
Figure 2.6.: Structure of Compute Service Hardware Configuration Meta-Data [10]
A further specification of the performance characteristics of the physical hardware (re-
33

2. Background
garding (1)-(3)) is absent at the examined providers or, if available, diverse and rathervague. For example, the read or write performance of the memory is not published,and hard disk performance is clustered in non-SSD and SSD hard drives. Regardingprocessor performance, some providers state the clock speed precisely, others use pro-cessor cores or compute cycles to specify the performance. In parallel, some providersintroduce own metrics to describe the processor performance. For instance, Amazondefines the metric Elastic Compute Unit (ECU) and Media Temple introduces a GridPerformance Unit (GPU).
Performance Analysis of Compute Services
The analysis of a system’s performance is essential to better understand its quality.In the use, design and administration of a system, the quantification of performanceattributes of a system according to metrics can be a fundamental factor. Consideringperformance attributes helps to select a system according to its performance, determineor modify its design or detect discrepancies in its behavior. The general goal is tomaximize the performance of a system in a performance-cost trade-off.
To conduct a performance analysis, several performance evaluation strategies can befollowed [31, 77]. Figure 2.7 depicts an overview of four classes of different strategies.Every strategy has its benefits and disadvantages. While using a model of the system istypically cheap to build (emulation and simulation), the real system provides results thatreflect the actual performance behavior (in-situ and benchmarking). Also, exploring asystem’s performance behavior under real workloads is most accurate (in-situ and em-ulation) while modeled workloads give a general evaluation of a system (benchmarkingand simulation) [31].
Compute service consumers are facing a specific situation in regards of performanceanalysis. A need to measure the actual performance of a compute service is due tosystem design tasks, but also in order to single-handedly monitor the quality providedby a compute service. However, in his task to measure a compute service’s perfor-mance behavior, a consumer is restricted to remote access to the system. A restrictedaccess to the target system creates requirements regarding the form of the performancemeasurement.
The following subsections examine how a performance analysis can be conducted bycompute service consumers. In addition, the peculiarities of virtualized systems arediscussed in regards of compute service benchmarking. Also, the nature of metrics usedto represent benchmarks is explained. Finally, repetitions of performance benchmarksin the light of non-deterministic systems are discussed and an overview of existingperformance benchmarking software is provided.
34

2.2. Compute Service Meta-Data
modeled
workload
real
workload
real
system
modeled
system
BenchmarkingIn-Situ
Emulation Simulation
Figure 2.7.: Classification of Performance Evaluations [77]
Performance Benchmarking by Compute Service Consumers From a consumer-side, the access to a compute service in a performance analysis is restricted to the APIoffered by the provider and remote access to VMs. The physical hardware and virtu-alization layer are inaccessible to the consumer. Consequently, a performance analysisdeals with a black box system and must focus on strategies applicable in the givensituation.
An in-situ evaluation is possible by developing a real system running ontop a VM of acompute service and monitoring its behavior in production or testing stage. The results,however, remain very specific to the system. In contrast, performance benchmarkingcan be applied to compute services without necessarily developing a system. Existingbenchmarking software provides systems that generate modeled workload on a VM ofa compute service. The results provide general insights into a system’s performancebehavior and can be compared between systems. However, benchmarking results missthe accuracy and specificity of an in-situ evaluation with a production system.
Moreover, software systems are often operated in a complex environment. Dependingon the environment, a system is confronted with diverse tasks to be dealt with, such ascronjobs, network requests, or operating system maintenance. Therefore, a system canshow a non-deterministic performance level. A benchmark that is repeated on a systemat different points in time can show a variation in the results [28].
Particulary in virtualized systems, a non-deterministic performance degradation for
35

2. Background
processor, memory, and I/O of VMs can be observed [30, 78]. Despite a hardwaresupport for virtualization software, processor performance degrades up to 5%, memoryup to 97%, and for I/O up to 28% according to results by Huber et al. [30] using thePassmark benchmark.
Even though virtualization software aims at an isolation between VMs, the influenceof shared hardware usage is still recognizable [79]. Repeated performance benchmark-ing of compute services has shown that specifically processing power varies betweendifferent VMs of the same service and over time [80]. With AWS EC2’s m1.small com-pute service the available average processor performance is halved in one-third of theavailable VMs due to two distinct processor types. Therefore, a repetition of perfor-mance benchmarks is necessary to gain a clearer overview of the actual performanceand variations to be expected by a service.
This work seizes the insights from performance measurements exposing the behaviorof virtualized compute services and includes benchmarking repetitions. In this regard,it is necessary to define metrics and aggregate benchmarking results from multiple runs.The following paragraphs address these aspects.
Metrics in Performance Benchmarking A metric is the unit in which a bench-mark result can be expressed. The metric defines in which context a value must beinterpreted and indicates that values of an identical metric feature a comparability. Thefeatures available in a comparison depend on the scale of a metric. While a nominalscale does not enable to compare values, an ordinal scale allows for rankings. Besides,interval scales and ratio scales facilitate comparisons in numeric terms. Interval scalessupport to compare values and identify a difference. With ratio scales, values can evenbe compared in relation expressed as a ratio.
Commonly, benchmarks are expressed in metrics correlating with elapsed time or num-ber of completed cycles. Depending on the benchmark metric, a lower or higher valueis more favorable to a system engineer and consumer. Generally, three metric types canbe distinguished for benchmarks [31].
• Higher is Better (HiB). The higher the value expressed in such a benchmarkmetric, the better is the perceived value. E.g., computation cycles, throughput.
• Lower is Better (LiB). The lower the value expressed in such a benchmark metric,the better is the perceived value. E.g., computation time, latency.
• Nominal is Better (NiB). The closer the value expressed in such a benchmarkmetric resides to a defined optimum, the better is the perceived value. The definedoptimum can be an arbitrary value between the maximum and minimum of ascale. E.g., utilization.
36

2.2. Compute Service Meta-Data
Aside from the performance metric, also the variations over multiple measurementsmust be considered. While in deterministic systems variations may be neglectable orabsent, in non-deterministic systems, as in virtualized systems, variations are present.It is necessary to also assess variations, such as standard deviation or coefficient ofvariation, which are typically expressed in LiB metrics.
Repetitions in Performance Benchmarking The performance of hardware re-flected in a benchmark is typically subject to variations over time [28, 31]. Other soft-ware running on a system and the external environment can have an influence on theperformance achieved in a benchmarking. Systems showing non-deterministic varia-tions cannot be captured in a single benchmark run.
Therefore, benchmarking needs to be repeated multiple times to gain meaningful statis-tics. An aggregation of multiple benchmarking runs requires the use of an aggregationfunction to acquire a summarized, single result for comparisons.
From a pessimistic perspective, the minimum function can be an adequate performanceresult aggregation. Conversely, with an optimistic view, the maximum function pro-vides an eligible performance result aggregation. Moreover, mathematics and statisticsoffer more aggregation functions like mean, mode or median which aim at reflecting acentral tendency. In addition, percentiles help to incorporate the variability of bench-marking results. Any of the aggregation functions can be applied to set of measuredbenchmarking results to determine a summarized value.
The following sub-sections present exemplary mean and median aggregation functionsfrom mathematics and statistics.
Median The median is defined for a sample {x1, x2, ..., xn} as follows:
x =
xn+1
2n odd
12 (xn
2+ xn
2 +1) n even
Arithemtic Mean The arithmetic mean is defined for a sample {x1, x2, ..., xn} asfollows:
x = 1/n
ni=1
xi
37

2. Background
Geometric Mean The geometric mean is defined for a sample {x1, x2, ..., xn} asfollows:
x = (
ni=1
xi)1/n
Harmonic Mean The harmonic mean is defined for a sample {x1, x2, ..., xn} asfollows:
x =n
1/x1 + 1/x2 + ...+ 1/xn
Performance Benchmarking Software This work capitalizes on the abundanceof benchmarks and related benchmarking software publicly available to automate com-pute service performance measurements. First of all, the structure of available bench-marking software and several common software packages shall be explored in the fol-lowing. Finally, the Phoronix benchmarking software is presented that serves as a basisfor later software prototypes in this work.
To measure performance aspects of a system in practice, a plethora of benchmarkingsoftware is publicly available and contains implementations of all sorts of benchmarks.Benchmarking software is typically packaged for execution on a wide range of systems.Therefore, benchmarking software exists in multiple versions and implementations fordiverse hardware and operating system variants. Apart from that, software for bench-marks specific to certain system types exist as well, e.g., benchmarks for Unix systemsonly. Then, implementations are only provided for a certain system type.
Several benchmarking software have become more common as tools for measurementsand comparisons than others [36, 37]. A list of examples of popular benchmarkingsoftware is given in table 2.2.
Name Metric
Whetstone [81, 82] Mio. Whetstone Instructions Per Sec. (MWIPS)LINPACK [83] Mio. Floating Point Oper.s Per Sec. (MFLOPS)Dhrystone [84] Program Iteration Completions Per Sec.CPU2006 [85, 86] Run-time Seconds
Table 2.2.: Sample of Common Performance Benchmarks
38

2.2. Compute Service Meta-Data
A large number of benchmarking software executes only a single benchmark task, amicro-benchmark, in a measurement run to gain a benchmark score. In contrast, bench-marking software that comprises a set of benchmark tasks is referred to as a bench-marking suite. Benchmarking suites commonly cover varying performance aspects andbenchmark tasks are executed sequentially [87–90]. The sum of the executed bench-mark tasks, sometimes weighted, equals the final benchmark score a system achieved.A benchmarking suite provides more diverse metrics to compare systems and allowsfor simpler execution of benchmarks. Since executing benchmarking software pack-ages would need multiple steps, a benchmarking suite bundles diverse benchmarkingsoftware packages in a manner that allows a single execution step.
There is existing software that enables bundling of benchmarking software into suites[91, 92]. For example, Phoronix [91] offers a large set of existing benchmarking soft-ware 2 that can be composited to suites and executed on any computer with a PHPinterpreter.
To use Phoronix, a bundle of PHP scripts need to be installed on the target system tobe benchmarked. Using the scripts, a set of benchmarks can be bundled into a suite.Aside from custom assembled suits, predefined suits are available to execute multiplebenchmarks sequentially on the target system. Any benchmarking software neededfor benchmarking is automatically downloaded from Phoronix’s repositories during theprocess. Results are exported as XML files.
In a global parameter, Phoronix can be advised to repeat each benchmark a specificnumber of times or until a maximum standard deviation is underpassed. The Phoronixsoftware aggregates results from multiple runs in an average (arithmetic mean), maxi-mum and minimum score.
2.2.2. VM Images
Compute services offer sets of VM images to consumers in order to simplify the build-ing process of software to be run on their service. In general, VM images differentiateaccording to a range of attributes, from time of creation and access permissions to con-tained software and required disk volume.
In the following, first the extent of available meta-data about VM images is explored.Finally, the field of software management and its relation to VM images is described.
2available on open-benchmarking.com, accessed 2014-01-15.
39

2. Background
Available VM Image Meta-Data
Compute service providers usually offer mechanisms to annotate VM images withmeta-data and make this information accessible via APIs or on their websites. Infor-mation, however, is restricted to few meta-data that describes the status of an image.Table 2.3 shows the different meta-data attributes examined in the APIs of the computeservices AWS EC2, Rackspace Cloud Servers and GoGrid Cloud Servers.
Attribute EC2 Rackspace GoGrid
ID ✓ ✓ ✓Name ✓ ✓ ✓Timestamp Created × ✓ ✓Timestamp Updated × ✓ ✓Status Accessibility (Public, Non-Public) ✓ × ✓Status Availablity (Active, Saving, Deleting) ✓ ✓ ✓Status Progress (Modification Progress) × ✓ ×Operating System × × ✓Price ✓ × ✓Geo Location ✓ × ×File Location ✓ × ✓Owner ✓ × ✓Architecture ✓ × ×Category/Type × × ✓Description Text ✓ × ✓Hypervisor ✓ × ×Disk Volumes ✓ × ×
Table 2.3.: Meta-data Attributes accessible via Compute Service APIs
An open-source software called OpenStack [93] that provides the basis to operate in-frastructures in the private cloud deployment model offers extended support of meta-data for VM images. In addition to the meta-data available at compute service providers,OpenStack allows to associate key-value pairs to any VM image [94]. The meta-data isstored at the VM image service and can be accessed via web service interfaces [95].
Software Management
As VM image contain data and software, a primary concern is to configure softwarebased on the initial state provided by an image. Initially, existing software must be de-tected within a VM of an image to establish a basis for further configurations. The stateof software provided by a VM image can either be repeatedly detected when needed or
40

2.2. Compute Service Meta-Data
persistently stored as meta-data of the image. Based on the current state of an image, anextended software configuration can be built and stored as a new VM image if needed.The process of software configuration may be conducted manually or with methods andtools which help to automate the configuration.
In this regard, the field of configuration management [51, 52] establishes and researchesa wide range of concepts, methods, and tools to manage and detect software configura-tions.
To install software packages on a computer system, diverse methods and tools exist. In-stallation bundlers (e.g., InstallShield [96], DPKG [97]) envelop software packages in aself-contained bundle that can install and uninstall the software package. Besides, pack-age management systems (short: package managers) that access maintained reposito-ries with software packages are able to install and uninstall packages [98]. Furthermore,package managers can resolve dependencies between packages and automatically in-stall required dependent packages. Prominent package manager implementations areAPT based on DPKG [97, 99], YaST [100], and RPM [101].
In conjunction with installation and package manager tools, Operating System Con-figuration Management (OSCM) software builds whole software stacks orchestratingsoftware installations on computers to be remotely managed by the software [102, 103].Depending on the implementation, scripts or declarations describe what actions needto be executed on an operating system to build the stack [104–106]. Package managersand installation bundles help with remotely managing computers by installing softwarepackages constituting a software stack.
OSCM-Managed Computers
OSCM System
OSCMManager
Computer 2
Computer N
OSCM Client
OSCM Client
...
Software Package Repository
Scripts & Files Repository download
download
manage
manage
Computer 1
Figure 2.8.: Typical OSCM System Architecture
41

2. Background
Figure 2.8 depicts the typical architecture of OSCM systems. A manager componenttakes over the part of orchestrating the configuration tasks applied to the managed com-puters. Initially, on every managed computer, a client software needs to be installed.The installation process is typically carried out via remote protocols (e.g., SSH, telnet)by the manager component. By employing repositories, the manager component can letclients remotely download and install software, execute scripts and programs, or insertand replace files with system parameters or data.
In an initial phase of a software stack build, already installed software needs to bedetected to avoid conflicts and skip unnecessary steps. Therefore, existing OSCM im-plementations include a detection component which can document existing softwarepackages and operating system attributes by accessing system tools and package man-agers. The snippet in listing 2.1 provides an example of a system libraries detectionresult documented with Ohai on an Ubuntu Linux system. The Ohai tooling is part ofthe Chef Configuration management system, a OSCM implementation from Opscode[107].
1 . . ." py thon2 . 7 " : {
3 " v e r s i o n " : "2.7.1 −5 ubuntu2 " ," d e s c r i p t i o n " : "An i n t e r a c t i v e high−l e v e l o b j e c t−
5 o r i e n t e d l a n g u a g e ( v e r s i o n 2 . 7 ) "} ,
7 " py thon2 .7−minimal " : {" v e r s i o n " : "2.7.1 −5 ubuntu2 " ,
9 " d e s c r i p t i o n " : "A minimal s u b s e t o f t h e Pythonl a n g u a g e ( v e r s i o n 2 . 7 ) "
11 } ," r e a d l i n e−common " : {
13 " v e r s i o n " : "6.2−0 ubuntu1 " ," d e s c r i p t i o n " : "GNU r e a d l i n e and h i s t o r y l i b r a r i e s ,
15 common f i l e s "} ,
17 " r s y n c " : {" v e r s i o n " : "3.0.7 −2 ubuntu3 " ,
19 " d e s c r i p t i o n " : " f a s t r emote f i l e copy program( l i k e r c p ) "
21 } ,. . .
Listing 2.1: Opscode Chef Ohai Output from a Ubuntu 11.04 Natty System
42

2.3. Formal Decision-Making
2.3. Formal Decision-Making
Decisions have to be made on various levels and situations, from political or strategicbusiness decisions to what to wear on a particular day. One way to settle for a choiceis to stress mathematics and numbers. The field of formal decision-making providesmethods that allow to evaluate options with mathematical tools. Methods of this fieldare described as MCDM methods. All methods in this field allow to define preferencesand constraints regarding multiple criteria and find a pareto-optimal solution.
One strength of a subset of MCDM methods is scoring, which is the ability to expressthe quality of decision options in a value. With a scoring, options can be compared ona scale and differences can be denominated in percentages. In this work, scoring playsan important role to allow compute service consumers to compare services. Therefore,this section is primarily occupied with MCDM methods from a scoring perspective.
The following subsections give an overview of the field of Multi-Criteria Decision-Making and present one method from that field. The presented method, the AnalyticHierarchy Process, will be part of the framework contributed by this work. Conse-quently, an overview and classification of existing methods is given. The comparisonof methods substantiates the motivation to settle for AHP as the method of choice inthe framework presented in chapter 4.
2.3.1. Multi-Criteria Decision-Making (MCDM)
The field of Multi-Criteria Decision-Making (MCDM) engages with the wish to findan optimal solution to a decision problem regarding multiple criteria. Methods of thatfield help to map the quality of alternative solutions to a value, expose pareto-optimalsolutions and determine preferred or non-dominated solutions.
Multi-Attribute Decision-Making vs. Multi-Objective Decision-Making
MCDM can be separated into two groups of decision problems: (1) Multi-AttributeDecision-Making (MADM), and (2) Multi-Objective Decision-Making. While (1) isconcerned with predetermined, discrete solutions, (2) faces competing objective func-tions and constraints that determine viable solutions. In MADM, an evaluation of largesets of discrete solutions, also called search spaces, regarding a decision-maker’s pref-erences can imply high computational efforts. An approach to tackling large searchspaces is translating a multi-attribute decision into a multi-objective decision to find asolution and pick a close, discrete solution.
43
2. Background
Other than multi-attribute-oriented approaches, in multi-objective decision-making, meth-ods find an optimal solution by searching an infinite solution space along multiple di-mensions. A search considers constraints set to a dimension or relations between di-mensions. An optimal solution is either a viable global pareto maximum or minimum.A pareto solution is not a guaranteed optimal discrete solution, since even discrete so-lutions close to a global (pareto) optimum must not necessarily be a globally optimaldiscrete solution. In multi-objective decision-making the plurality of methods originatefrom various decision problems and algorithms.
Multi-Attribute Decision-Making Methods
Multi-Criteria Decision-Making (MCDM) methods can be categorized by the point intime when a decision-maker specifies his preferences, i.e., a priori, interactively, or aposteriori [108]. In Multi-Attribute Decision-Making preferences are always requireda priori [19].
Furthermore, the applicability of a MADM method can be determined by the availableinformation. Figure 2.9 depicts a taxonomy for MADM methods including a rangeof exemplary methods. The amount of information and knowledge about relations be-tween data, e.g., by an ordinal scale, increases the precision of a method. At the sametime, a method must be able to deal with many information and involve knowledgeabout scales in its evaluation. Multiple methods are able to cope with information aboutmultiple attributes and map values on a cardinal scales (see Figure 2.9). The AnalyticHierarchy Process is the only method that also allows hierarchical relations betweenattributes. Also, it is able to normalize attribute values and result values on a [0, 1] ratioscale.
2.3.2. The Analytic Hierarchy Process (AHP)
The Analytic Hierarchy Process (AHP) is a method to make decision based on multiplecriteria [109, 110]. The Analytic Network Process (ANP) is a generalization of thesimpler AHP and extends criteria hierarchies to complex criteria networks. Both crite-ria hierarchies and criteria networks intend to model the real world situation of criteriainfluences more realistic than single dimension value functions. However, the ANP re-quires very complex criteria network definitions and value computations. In most cases,a simple network definition reflecting the special case of a hierarchy is sufficient.
Criteria weights can be determined by pairwise comparisons what is a fundamentalconcept in the AHP. Also, pairwise comparisons help to normalize attribute values ofalternatives to a [0, 1] ratio scale. Using a super matrix filled with weights of a criteriahierarchy and the results of all pairwise attribute comparisons the AHP can computea value on a ratio scale for each alternative. The structure of the super matrix and the
44

2.3. Formal Decision-Making
Figure 2.9.: Taxonomy of Multi-Attribute Decision-Making Methods [19]
numeric operation to gain the scores is explained in the following subsections. Also,the sections introduce extended concepts of the AHP by elaborating on indices and theconcepts of synthesizing modes in rank reversals.
Criteria Hierarchies
A criteria hierarchy models a complex structure of alternatives, criteria, and goals. Inthe AHP criteria hierarchies allow to group criteria. The number of levels in a hierar-chy is not limited. On the top level one or more goals head the hierarchy. Goals canbe diverging or yield towards the same direction. The AHP proposes four merits forgoals: benefits, opportunities, costs, risks (BOCR) [111]. Criteria grouped under goalsmay have metrics that point in a positive or negative direction. For positive metrics ahigher value is better, for negative metrics a lower value is better. Figure 2.10 shows anexample of a goal hierarchy with the two competing goals features (positive) and costs(negative).
A hierarchy structure and its multiple levels influence how weights of criteria are de-termined. The gravity of a criterion relies on the weights of related goals in upperhierarchy levels. The calculation of the final value incorporates all weights of the hier-archy.
45

2. Background
Alternatives
Level 1
Goals
Cloud A Cloud B Cloud C
ReliabilityCustomer Rating
Experience Investment Monthly
CostsFeatures
Figure 2.10.: Example of a AHP Hierarchy
Figure 2.11.: Pairwise Comparison Matrix [112]
Pairwise Comparisons
The AHP uses pairwise comparisons of elements within a hierarchy level to insert cri-teria values into [0, 1] ratio scales and to calculate weights. A pairwise comparisoncan be done for n alternatives Ai by creating a comparison matrix as shown in Fig-ure 2.11. Alternatives must be compared only regarding criteria in the lowest level ofthe hierarchy. Criteria weights are derived from comparisons for each group on everylevel.
A pairwise comparison of alternative Ai in row i and alternative Aj in column j re-garding a criterion results in a comparison value ωi,j that expresses the ratio ωi/ωj ofAi’s value in contrast to Aj . After all pairwise comparisons have been computed, onthe matrix’s diagonal all values will be 1 and under the diagonal are the inverses of thevalues above the diagonal. The normalized comparison result vector ω can be obtainedby calculating the eigenvector with Aω = nω.
To calculate local weights on one level in the hierarchy the comparison matrix is appliedsimilarly. The matrix holds columns and rows for the affected criteria c1 to cn. Again,
46
2.3. Formal Decision-Making
in each cell the two weights are compared with their values with ωi/ωj . The normalizedlocal weights result from the eigenvector with Aω = nω.
Calculation of Rankings and Scores
In the AHP pairwise comparison and normalization of weights and values is the pre-requisite to map alternatives to a final value per goal. The ranking and scores of allalternatives regarding a goal are calculated in two steps. First, global weights ωg mustbe calculated for all criteria on the lowest level (leaf criteria). A global weight ωg iscomputed by multiplying local weights along the path of the hierarchy, from goal to alowest level criterion. Global weights will still remain normalized but reflect the actualweight of a leaf criterion. A final value can be calculated by multiplying the globalweights and the normalized values of leaf criteria and summing up the resulting values.For n leaf criteria, this step can be formally expressed as
ni=1 ωivi,Aj
for alternativeAj . The ranking of all alternatives results from ordering by score.
Using Indices
Indices are an extended variant of applying the AHP to gain a score for alternatives.They allow the combination of scores from parallel AHP results. This is in particularof interest when considering multiple goals. AHP suggests indices based on the fourmerits benefits, opportunities, costs, and risks (BOCR) [111]. This also addresses theneed to differentiate between positive and negative criteria. The four merits imply fourparallel AHP computations with criteria hierarchies. Then all four scores are put into arelation by a function. A simple index for BOCR suggested by Saaty is idx1 = B+O
C+R .A normalization of indices is optional but will map the alternative index values to aratio scale.
Normalization and Idealization
In case an additional alternative or criterion is added into a decision ex post, rank re-versal can occur when using the typical normalization mode. To avoid this behavior,the AHP also offers an idealization mode. While the usually used normalization modemakes pairwise comparisons which result in vectors with a sum of 1, the idealizationmode discards this notion and sets the value for the best element to 1. Other alternativesare assigned a value relative to the value of the best element. The best element is calledthe ideal element.
In idealization mode, rank reversal is avoided when the original ideal element keeps itsoriginal value 1. The values of new elements that are rated better than the original idealelement can achieve a value >1.
47

2. Background
2.4. Theory of Optimal Stopping
As the assessment of many compute services is costly, a mechanism to reduce the num-ber of compute services is beneficial. The notion of stopping in a sequential traversalof the compute service set according to rules is an approach to achieve a cost reduc-tion and budgeting followed in this work. The theory of optimal stopping has alreadydeveloped rules that determine a stop under consideration of predefined criteria. There-fore, the concepts and existing stopping rules from this field shall be examined in thefollowing.
The theory of optimal stopping is concerned with problems incorporating a solvingalgorithm with an infinite or finite number of steps [48, 113]. The intricate questionto be solved is finding a stopping rule that determines to stop at a certain time andmaximizes utility (or minimizes costs).
2.4.1. Stopping Problems
A stopping problem is described by a sequence of independent, random variablesX1, X2, . . . , Xn
whose joint distribution F (·) is assumed known [113, 114]. Then, a sequence of utilityfunctions
u0, u1(x1), u2(x1, x2), . . . , u∞(x1, x2, . . .)
map a valued utility to the observations
X1 = x1, X2 = x2, . . . , Xn = xn
which are one-dimensional. After each observation, one can either decide to stop orkeep on gathering information.
A stopping problem is classified as a finite horizon problem with a finite number n ofobservable random variables. Finite horizon problems are a special case of infinite hori-zon problems and, thus, allow for different stopping rules. A stop is always guaranteedin a finite horizon problem since only a finite number of observations can be made.
2.4.2. Stopping Rules
A stopping rule (1) always leads to a stop and (2) returns an optimal or acceptablesolution in respect of the utility (or costs). The goal of a stopping rule is to lead toa stop to maximize utility, given that every further observation of a random variableXn+1 may discover a better solution but induces costs.
48

2.4. Theory of Optimal Stopping
The following subsections present two famous examples in which a decision-makerfaces problems similar to benchmarking a set of compute services. Similarly to bench-marking, any formerly discovered information and option can be recalled. The givenexamples help to understand Stopping Theory-approaches and the definition of appro-priate stopping rules in the context of an information search – as adapted for bench-marking resp. meta-data assessment in this work. Finally, several standard stoppingrules are presented which target stopping problems where the distribution function ofthe random variables X1, X2, . . . , Xn is unknown.
Secretary Search Example
The search of a secretary is a classic example for stopping rules [115, 116]. Let Xi
be the i-th applicant and X1, . . . , Xn be the random variables for n applicants. Afterevery Xn the employer has to decide for Xn or continue with Xn+1.
For a finite horizon of n jobs, a viable solution to the stopping problem is then to rejectk applicants and accept a later applicant with a value higher than any applicant before.The number k can be calculated as follows [116]
k = n/e
This leads to a stopping rule where approximately 37% of the jobs should be skippedand then the first job with a value higher than all observed jobs should be accepted.
Job Search & House Selling Example
When a prospective employee is searching and applying for a new job, job offers canbe ranked without ties and the search process implies costs for every additional offer[117]. Job offers can be evaluated by the job seeker according to his preferences andare received on a daily basis. Let Xi be the job offer received on day i and X1, . . . , Xn
be the random variables for n days. The costs to receive an offer per day are c > 0, andafter every Xn the job seeker can accept Xn while Xn+1 may result in a higher offer,not known in advance.
The utility of n offers is:
u0 = 0
un(x1, . . . , xn) = xn − n · c for n = 1, 2, . . .
u∞(x1, x2, . . .) = −∞
49

2. Background
Similarly, in a house selling situation, a best offer has to be found while costs for thesearch rise daily for additional living costs and expenditures to host open house events[114]. For a house selling, let Xi be the offer on day i and X1, . . . , Xn be the randomvariables for n days. The costs per day are c > 0, and after every Xn the seller cansettle for the highest Xi while Xn+1 might promise a higher offer.
The utility of n offers is similar to a job search, however, the chance to recall any pastoffer allows to draw a maximum:
u0 = 0
un(x1, . . . , xn) = max(x1, . . . , xn)− n · c for n = 1, 2, . . .
u∞(x1, x2, . . .) = −∞
To gain the highest utility, a stopping rule needs to determine an optimal or acceptableu(X1, . . . , Xn) that serves a seller a high Xi for his real estate. For both cases, theexpected value can support a stopping rule since the distribution is known.
Standard Stopping Rules
There are various stopping rule approaches in the cases of a known or unknown dis-tribution function [118–120]. In the following, stopping rules for the case of unknowndistribution function are presented. Particularly, stopping rules with a reservation wage,a number of cut off observations, a predetermined candidates count, a successive non-candidates count, and the odds algorithm.
Reservation Wage
A viable stopping rule is to stop when a constant value w, referred to as the reservationwage, is surpassed. A simple example is the rule un ≥ w with a predetermined w,which means stop if the value of un is bigger (or equal) the constant value w (reserva-tion wage) [117].
The reservation wage w can be determined as optimal if the distribution F (·) is known[121]. Then, in a job search in a sample of size N , the reservation wage w must befound such that the following statement holds:
c =
N
w
(x− w)dF (x)
Cut Off Rule
A simpler stopping rule is the "cut off rule" [120]. This stopping rule halts with the firstobserved absolute highest value after m observations have been made. The rule doesnot consider occurring costs for additional observations.
50

2.4. Theory of Optimal Stopping
The chances that the highest value is under the first m is mN (for a sample size of N ).
Then, the stopping rule will stop at N as no absolute highest value can be found afterm. In contrast, if between position m and the position of the absolute highest valuemax(x1, . . . , xN ) exists an intermediate highest value, this rule will fail in finding theabsolute highest value max(x1, . . . , xN ).
Generally, m should be a number not too large, in order diminish chances that the high-est values is under the first m observations. At the same time, m must be large enoughto possibly include some higher results, so the stopping rule ends with an absolutehighest number max(x1, . . . , xN ).
Candidate Count Rule
Unlike the cut off rule, the candidate count rule [120] does not ignore any observations.Every observation which increases max(x1, . . . , xn) is a candidate and increases thecount. The parameter m determines after which candidate count a stopping is initiated.The m-th candidate stops the search and is the the highest value result. If an m-thcandidate is not observed, the rule stops after the last observation and the last candidateis the highest value.
Successive Non-candidate Rule
The successive non-candidate rule [120] sets the space between two candidates intoits focus. The stopping rule halts after a certain observation sequence. The sequencerequires that after candidate i further m non-candidates must be observed. Then therule stops the search with the i + 1-th candidate. If no such sequence occurs, the rulestops after the last observation and the last candidate is the highest value.
Odds Algorithm
For the odds algorithm [119], the probability for each observation to discover the bestvalue must be determined. For each observation of random variable xi, the variable Iiindicates whether the observed value is a best value candidate (I = 1) or not (I = 0).A best value candidate is at hand when max(x1, . . . , xn) increases. The probabilitythat variable Ii indicates a best value candidate is expressed by pi.
The odds algorithm defines qi = 1−pi and ri = pi
qiwhich are incorporated in the stop-
ping rule decision. A stopping index s is calculated with the sumsQk = qNqN−1 · · · qkand Rk = rN + rN−1 + · · · + rk. The index s is determined by the first k which letsRk ≥ 1 surpass 1. The stopping rule stops at the first I = 1 after index s has beenpassed. The chance of finding the highest value is RsQs.
51


3. State of the Art and RelatedWork
Before the contributions of this work are presented, this chapter gives an overview ofmeta-data publicly available for compute services. In addition, the state of the art andrelated work to assess and maintain meta-data is surveyed.
The first section is concerned with management of compute service meta-data. Partic-ularly, how compute service meta-data can be stored and made available to consumers.Then, the field of research addressing comparative assessments of compute services isexplored. In this regard, works that introduce methods to assess compute service inrespect of one specific or numerous attributes are presented. Furthermore, methods tocompare compute service according to a single or multiple attributes are presented.
The final two sections are concerned with methods available to assess compute servicesin regards of two particular aspects: (1) performance, (2) VM images. Due to the com-prehensive amount of work in the field of compute service performance benchmarkingmethods, the works most related to this work are highlighted in the former section.Also, approaches to automatically repeat benchmarking processes are explored. Fi-nally, the latter section lays out existing work with approaches to enrich VM imageswith meta-data and to introspect VMs.
3.1. Compute Service Meta-Data Management
Meta-data is used to describe data and assets and has become more extensive overtime [122, 123]. In additions, systems to store and manage the abundance of meta-data are becoming more important, but at the same time more complex, too [122].For example, the quality of a service in terms of latency and throughput is essentialto media file streaming systems and to store observed qualities, a meta-data storagebecomes necessary [124].
In the realm of web services, meta-data has been used to describe properties and qual-ities. The Universal Description, Discovery and Integration (UDDI) specification andrelated description languages, such as web service description language (WSDL) and
53
3. State of the Art and Related Work
web service policy (WS-Policy) as part of WS-* specifications, provide means to de-scribe web services on a technical level or in respect of custom attributes [125, 126].
In a more extensive description approach, semantic technologies attach meta-data toweb services by building a whole ontologies [127, 128]. The semantic web community,however, thrives for searchable web services and matching algorithms, while the focusof this work is the assessment and comparison of cloud compute services which provideweb service interfaces.
Moreover, the use of a web services frequently comes with an agreement between theprovider and consumer. One particular aspect is the service level agreement in whichboth parties agree on qualities, such as response time and availability, of a service. Toenforce an adherence to the agreement, web services are monitored in regards of Qual-ity of Service (QoS) attributes and tested for objective violations with approaches thelikes of WS-Agreement [129] and the web service level agreement (WSLA) framework[130].
Similarly, approaches to enforce service level agreements have been proposed for cloudcompute services [131–135]. All of the approaches commonly collect QoS attributesof compute services, such as latency, performance, and bandwidth, and implicate theexistence of a data model and meta-data storage without describing it.
Moreover, approaches which use semantic technologies to describe compute servicesexist. Sundareswaran et al. [136] propose a list of 10 meta-data attributes used in acompute service ontology and in a selection method. The approach lacks insights onthe management and storage of the meta-data kept in ontologies.
Unlike the aforementioned approaches which miss to describe details of a necessarycompute service meta-data management and storage, Rodero-Merino et al. [137] in-troduce a file based storage for compute service attributes. The approach proposes anextension to the Open Virtualization Format (OVF) to describe compute services withone section of the document (KPISection) containing attributes of a compute servicefreely defined by the provider. The provider is obliged to update the section and con-taining attribute values frequently.
Similarly, [138] extend WSDL documents to describe compute service attributes andstate. Based on the attributes, the approach supports a simple selection of computeservice VMs for clusters of machines. By using WSDL or OVF meta-data is distributedto many decentralized files which has the disadvantage of increased effort for browsingand searching for compute services.
In contrast, CloudHarmony [139] offers an extensive central database of performancemeta-data and a web application that can be used to browse through performance-related meta-data of diverse compute services. Thereby, CloudHarmony has introduceda performance meta-data management system for compute services. Although Cloud-Harmony collects the meta-data with own measurement methods, the system offers no
54

3.2. Comparative Assessments of Compute Services
integration with measurement instruments available to consumers. Therefore, the use ofCloudHarmony is limited to a database of performance meta-data of compute services.Figure 3.1 depicts a screenshot of the performance meta-data database made availablethrough the CloudHarmony website.
Figure 3.1.: Screenshot of CloudHarmony Performance Meta-Data Service
Generally, the amount of meta-data management systems specifically for compute ser-vice meta-data is scarce. CloudHarmony offers a first approach, but does not publishthe data model nor is it integrated with assessment tools that can be used by consumers.Exactly these shortcomings shall be addressed in this work.
3.2. Comparative Assessments of ComputeServices
Assessments are conducted in many contexts to map complex concepts to numbers,thereby building a foundation for comparisons. For example, the SERVQUAL frame-work [140] proposes an empirical assessment method to establish a service’s qualityscore according to consumer perceptions. Similar assessment frameworks have beendeveloped manifold for diverse aspects of services [141–143].
Nonetheless, real world services and e-services differ from compute services in manyaspects which renders existing assessment frameworks too unspecific. Unlike other ser-vices, compute services are defined by attributes, such as the performance the rentedmachines offer, available remote interfaces, and software that can be deployed on the
55

3. State of the Art and Related Work
service (c.f. section 2.1). An assessment would need to take these attributes into ac-count.
The following subsections explore assessment and comparison methods which are par-ticularly applicable to compute services and consider primarily attributes thereof. First,existing methods to assess compute services at run- and non-run-time are presented.Then, a survey of existing approaches to compare cloud and specifically compute ser-vices is carried out.
3.2.1. Assessments of Compute Services
Compute services possess a range of attributes (c.f. sections 2.1 and 2.2) whereof onlyparts can be determined without the actual use of a compute service. For example,Habib et al. [144] propose a trust management system which uses diverse resources,such as audit certificates and questionnaires, to assess the trustworthiness of a cloudprovider. In addition, many other works are concerned with trustworthiness of computeclouds and propose systems to establish trust between providers and consumers [145–147]. Klems et al. [148] incorporate an assessment of compute service price modelsin order to calculate costs for a given system. Similarly, many other researchers haveexamined approaches to measure and predict costs [149, 150] and only a subset can bementioned in this work. All of the aforementioned approaches focus on an evaluationof compute services regarding a specific attribute and draw data from publicly availableresources, often primarily meta-data attributes published by the provider.
In the field of migration planning, compute cloud offerings are assessed and eventuallycompared to identify a preferable fit as a migration target. Frey et al. [151] thereforeintroduce Cloud Environment Constraints (CEC) which test the suitability of a computeservice according to diverse characteristics. The assessment and modeling of character-istics are, however, left to the consumer. Other approaches from the field include cost,risk, and security assessments, and evaluate the expected availability of the system dur-ing a migration [152–154]. Nonetheless, none of the approaches gives comprehensivesupport for the assessment process itself, but rather for the decision based on alreadyassessed data.
All of the aforementioned approaches compile or consider meta-data from propertiesobservable at any time. But, none of the approaches takes attributes of compute servicesinto account which are observable at run-time. In contrast, Ristenpart et al. [155] intro-duce a method to assess compute services at run-time in respect of cross-VM securityand vulnerabilities. Nevertheless, the method lacks a support for reuses of the run-timeassessment scheme for other purposes which is a goal of the framework introduced inthis work.
Many assessment methods focus on the aspect of compute service performance which ismeasured at run-time, too. An overview of the plethora of works proposing approaches
56

3.2. Comparative Assessments of Compute Services
to measure compute service performance is provided in section 3.3.1. Similarly, section3.4 presents methods which allow consumers to introspect VM images of a computeservice at run-time.
3.2.2. Comparisons of Compute Services
The comparison of competing compute services is a major purpose for meta-data. Arange of existing work has proposed methods to compare compute services, but alsoother cloud services.
Rheman et al. [156] furthermore compare multiple MADM methods in an evaluation ofcompute services according to meta-data about performance, hardware and costs. Thecomparison comprises the methods Promethée, TOPSIS, Electre, AHP, min-max/max-min, and compromise programming. The meta-data for a test set of thirteen computeservices is drawn from the CloudHarmony website. The meta-data set includes cost,memory (in GB), a benchmark for harddrives and network (IOP), and values for mem-ory and processor performance using the CloudHarmony Compute Scoring (CCS) met-ric translated into Amazon’s ECU (referred to as CCU) [157, 158]. The survey showsthe applicability of MCDM methods and, specifically, of the AHP for compute ser-vice selection. However, Rehman et al. miss to derive a method that provides meansto create custom scoring functions with a consumer-defined selection of criteria andweights.
A literature survey conducted by Rehman et al. [40] presents existing multi-criteriacloud service selection methods. The methods examined in the survey focus on theproblems of a provider selection and a service selection. Table 3.1 summarizes theresults of the literature survey.
In the following, several of the methods examined in the surveys by Rehman et al. arehighlighted and an overview of methods not covered by the survey is given. The workof Han et al. [160] included in the survey presents a recommender method for cloudproviders. For each provider, network QoS attributes are assessed for offered soft-ware and platform services. In addition, infrastructure services are considered in per-formance measurements conducted on VMs with three types of benchmarks (floatingpoint, fixed point, and memory). The measured benchmarking results are normalizedagainst a reference value measured on a "native" physical machine. A final ranking ofcloud providers is determined from a weighted sum of the averaged network QoS andthe averaged performance measurements.
Similarly, Li et al. [32, 159] propose CloudCmp, a comparison method that incor-porates compute and storage services, and network qualities in an evaluation of cloudproviders. For each of the merits several measurable metrics and measurement methodsare defined. CloudCmp provides an approach with the intention to bring measuremnt
57

3. State of the Art and Related Work
Work Theme Approach
Gocinski et al. [138] State of the art in cloudcomputing, Cloud servicediscovery and selection
Overview and comparisonbetween cloud, grid andcluster computing
Li A. et al. [32, 159] Cloud service comparison,application performanceprediction and cost estima-tion
Cloud benchmarks andtesting of application priorbefore cloud deployment
Han et al. [160] Cloud service recom-mender system
Network QoS and VM per-formance of available ser-vices are proposed as selec-tion criteria
Zeng et al. [38] Cloud service selection Maximum gain and mini-mum cost optimization
Godse and Malik [161] Cloud service selection MCDM, Analytic Hierar-chy Process (AHP)
Table 3.1.: Literature Survey of Cloud-Related Multi-Criteria Selection Methods [40]
methods and comparisons closer together, but misses to link both tightly. Besides, anaggregation of the results to a single score of a provider is missing.
Zeng et al. [38] present simple additive weighting functions to calculate a value repre-senting the gain and cost of selecting a certain compute service. The additive weightingfunctions are then used in a selection algorithm. The algorithm selects the cloud ser-vice with the highest value according to the used additive weight function and tests itsavailability. In case of an unsuccesful initiation of a cloud service the algorithm acceptsa degradation and continues with the next service in the list. Generally, the approachremains vague in regards of a definition of a "cloud service" and its applicability indecisions. It claims to be applicable to any sort of cloud service, but lacks providingcriteria, measurement instruments, or an implementation.
Garg et al. [162] propose SMICloud, a framework and index score to assess and com-pare cloud services in regards of diverse criteria. The work describes the notion ofa global index score to make compute services comparable and drive competition be-tween providers. Nonetheless, the framework lacks comprehensive support for cus-tomization and is not suited for comparisons according to specific attributes and relatedweights.
A comprehensive approach for comparing diverse cloud deployment models (c.f. sec-tion 2.1.1) in respect of diverse workload categories, such as database or web servers,has been proposed with the Multi-Attribute Decision Methodology for Adaption of
58

3.3. Compute Service Performance Measurements and Comparisons
Clouds (MADMAC) by Saripalli and Pingali [39]. The approach introduces an addi-tive weighting method that can be used with a catalog of attributes to select from.
The extensiveness of existing work shows the importance of comparisons betweencloud services and particularly compute services. Many approaches thrive for a gen-eral comparison of services according to a wide range of different attributes. Otherapproaches excel with very specific metrics involved in a comparison. However, noneof the aforementioned approaches provides extensive support to generate a score whichunifies various attributes of compute services, such as performance or security. Particu-larly, the problem of combining attribute values in diverse metrics into a single score isnot addressed. Besides, all approaches lack a concept to integrate measurement meth-ods and a comparison method.
Therefore, the present works aims at supporting cloud consumers with a tool to generatecustom scores to compare compute services in respect of a certain attribute assessed indiverse measurements and described in various metrics. Moreover, this work integratesmeasurement tools and comparisons by introducing a meta-data model.
3.3. Compute Service Performance Measurementsand Comparisons
As performance is one of the prominent features of compute services, there is a largeamount of research works that propose methods of measurement. Due to the inherenthardware changes of compute service data centers and multi-tenant usage of machines,repetitions of measurements can give more extensive insights in respect of variations.Therefore, approaches to automate and repeat compute service performance measure-ments become necessary.
The following subsections first survey existing approaches to measure the performanceof a compute service with benchmarking. Finally, research works coping with the ne-cessity to automate and repeat benchmarking runs in order to capture variations arediscussed.
3.3.1. Compute Service Performance Benchmarking
In a virtualized environment as is a compute service, the actual performance of a pro-vided VM cannot be deduced from hardware figures as with physical systems [30].Consequently, a measurement of an independent and comparable performance bench-mark is necessary to see a compute service in relation to other computer systems’ per-formances.
59

3. State of the Art and Related Work
Benchmarking compute services is not an undiscovered territory. Existing work hasalready succeeded with applying benchmarking to analyze compute services. In par-ticular, Gillam et al. [33] have applied benchmarking to several compute services andconducted a comprehensive study of existing benchmarking software for compute ser-vices. Walker [34] and Jackson et al. [163] have benchmarked the high-performancecomputing capabilities of Amazon EC2, but do not introduce a reusable method.
All of the existing work focuses on providing first measurement results and none hasyet continued to cover the aspects of customizability, automation, and reusability. Noneof the approaches allows a consumer to define a set of performance attributes to bebenchmarked and a support of a variety of compute services is absent. In order to usethe approaches, still extensive manual interaction and systems setups are necessary.These shortcomings are primary goals of the present work.
Moreover, several further approaches should be mentioned which describe a methodfor benchmarking that is either specifically targeted at or at least applicable to computeservices. Binning et al. [43] propose a cloud benchmark that measures cloud servicesin terms of the metrics scalability, cost, peak-load handling, and fault tolerance. Theapproach focuses on web applications, similar to the application described by the TPC-W benchmark [164, 165]. Additionally, different consistency settings on the databaselayer of a web application are incorporated in the approach. Nevertheless, the proposedbenchmarking approach does not address aspects such as performance variations, serverlocations, or scheduling of benchmarking runs.
Sobel et al. [166] developed CloudStone, a benchmarking method that measures per-formance on the application layer. Benchmarking results are gathered in a cost-per-user-per-month metric and reflect the varying costs occuring per served user on differ-ent Amazon EC2 hardware configurations and with different software configurations.From the results, also the maximum number of users can be implicated. The approach,however, only reflects the overall transaction performance of one specific application.Making predictions about the general performance offered by a compute service is notpossible. The method requires a setup of several application servers and a databaseserver.
CloudHarmony [139] publishes a comprehensive database of performance meta-dataon the web. Furthermore, CloudHarmony has introduced benchmarking sets compris-ing multiple benchmarks to cover diverse performance dimensions of compute services.Moreover, a metric named CloudHarmony Compute Scoring (CCS) has been definedbased on a benchmarking set that seeks to become a standard for compute service com-parisons.
Nonetheless, CloudHarmony does not allow users to request or trigger certain perfor-mance measurements. Also, the details of the employed measurement methods areneither available in the public domain nor have they been discussed in the research
60
3.3. Compute Service Performance Measurements and Comparisons
community. In addition, an integration with measurement tools available to computeservice consumers is missing.
Apart from compute service benchmarking, there is existing work that focuses on mea-suring the effects of server consolidation and, in particular, the performance of VMs andthe underlying physical host. For a compute service consumer, the access to the physi-cal host or the hypervisor is typically denied. Nevertheless, an overview of the existingwork exploiting access to the physical host or hypervisor shall be given for the sake ofcompleteness as they provide insights on benchmarking of virtualized environments.
Matthews et al. [14], Jin et al. [16], and Iyer et al. [15] have developed benchmarks andmethods to test the effects of shared resource sharing between VMs. The benchmarkintends to measure the quality of a performance isolation and degradation of VMs whenone or more VMs are under heavy workload.
Makhija et al. [167] propose VMmark, a benchmark that determines the capacity ofa physical host running a VMware hypervisor by using multiple sets of six different,separated virtual machines that stress the system resources with workloads regardingdiverse dimensions including CPU load, RAM load and I/O load, i.e., storage and net-work traffic. The final score considers the number of virtual machine sets, each con-sisting of a mail, java, standby, web, database, and file server, and the benchmarkingresults of each virtual machine in all sets.
Similarly, Casazza et al. [168] define vConsolidate, a benchmark that also aims at mea-suring performance of different workloads on a consolidated server. Mei et al. [169]propose another approach that focuses on network traffic as the constraining dimensionin server consolidation and uses web server workload only.
3.3.2. Automation and Repetition of PerformanceBenchmarks
The physical hardware in data centers of a compute service is not necessarily homoge-neous and performance outcomes can vary over time [80]. Due to overheads induced bythe virtualization software, individual measurements can only give an approximation.The observable performance varies depending on the workload occupying the physi-cal hardware shared between VM instances (c.f. section 2.2.1). Generally, workloadsprocessed in parallel by multiple VMs on a physical system can induce a performancedegradation [30].
The provided information represented by hardware figures and from indivial bench-marking results is not able to capture potential performance variations. Therefore, itis necessary to detect the performance variation interval in a set of measurements over
61

3. State of the Art and Related Work
time. In this regard, none of the aforementioned compute service benchmarking ap-proaches allows to automatically execute benchmarking software and repeat measure-ments. There exist, however, several research works that cope with repetitions andmeasurements of performance variations.
Kalibera et al. [28, 170, 171] have introduced the concept of regression benchmarkingto determine a precise representative performance grade for a system. The conceptassumes a system to be found in a random initial state that leads to a non-deterministicbehavior and influences performance outcomes. The proposed regression approachintroduces an impact factor to capture the variations in repetitions of benchmark runswith multiple samples each. The impact factor is used to detect an initial state of asystem and serves as a corrective factor between benchmarking samples of variousruns. Furthermore, the impact factor together with cost estimations help to determinethe required number of repetitions to presumably obtain precise and reliable results.
Figure 3.2.: Performance Variations on Google’s AppEngine (Python) [13]
Moreover, Iosup et al. [13] benchmarked and recorded variations in the performanceof various cloud services from Amazon and Google, including AWS EC2 and GoogleAppEngine. The statistics collected with more than 10,000 samples each month in2009 proof that a variability is present. For AWS EC2 the deployment latency of VMinstances and for Google AppEngine the execution time of a python Fibonacci compu-tation script was measured. Figure 3.2 illustrates the observed performance variationsof Google’s AppEngine. In addition, Iosup et al. conducted a detailed performanceanalysis of VM clusters on AWS EC2 and GoGrid Cloud [44].
Similarly, Schad et al. [29] benchmarked Amazon EC2 over several weeks and presentcollected performance results and observed variations. For the representation of the
62

3.3. Compute Service Performance Measurements and Comparisons
variations, Schad et al. employ the coefficient of variation as indicator. The perfor-mance meta-data is measured with Ubench for memory and CPU resources, and Bon-nie++ for hard disk resources. Besides, the instance startup time is recorded with acustom approach.
Although approaches to measure performance variations exist, in all of the aforemen-tioned approaches an automation of the benchmarking process itself is absent. Never-theless, several works propose automation for the detection of performance changes.
Kalibera et al. present an approach and generic architecture for automated benchmarks,referred to as regression benchmarking [35]. Regression benchmarking benefits froman automation due to its natural need to repeat measurements in the course of detectingperformance changes. The original approach has evolved to BEEN [172], an architec-ture and system to automate benchmarking of distributed systems. BEEN offers a webinterface from which benchmarking runs can be triggered. The results of a run are au-tomatically stored to a database for later evaluations. Also, benchmarking software isautomatically transferred to the hosts under test from a central repository. The systemarchitecture is depicted in figure 3.3.
Figure 3.3.: Architecture of the BEEN system [172]
An adaption of the approach from Kalibera et al. has been employed to automatebenchmarking runs to detect performance changes of software developed with the monoopen-source development framework [173–176]. The daily builds of the developmentframework have been tested with the regression benchmarking approach for the last few
63

3. State of the Art and Related Work
years. Thereby, factors that influence the performance could be detected in every newbuild of the framework.
Regression benchmarking has further been transferred for middleware benchmarkingby Bulej et al. [177]. The approach extends the former approaches by benchmarkingmiddleware in the environment of a simulated bookstore web application. An adoptionfor cloud compute services has not been developed or published, yet.
In the realm of cloud services and particularly compute services, the research commu-nity has not yet provided applicable approaches. Nonetheless, a promising softwarenamed Phoromatic1 aims to fill the void for remote benchmarking management sys-tems [178]. The system allows to register existing systems and schedule automatedbenchmarking runs using micro-benchmarks from the Phoronix test suite [91]. ThePhoromatic software is only available as online service. Figure 3.4 depicts the userinterface of the Phoromatic online service.
Figure 3.4.: Screenshot of the Phoromatic Online Service
Before benchmarking schedules can be defined, a set of target systems – machines tobe measured – must be registered with the service. Phoromatic cannot automaticallyinstantiate virtual machines at a compute service. Therefore, virtual machines must becreated manually and a registration of the machines as target systems can be achievedvia shell commands and a validation code. Phoromatic requires the Phoronix test suiteto be installed on a target system in order to permit a registration.
1in beta status, as of 2014-04-01.
64
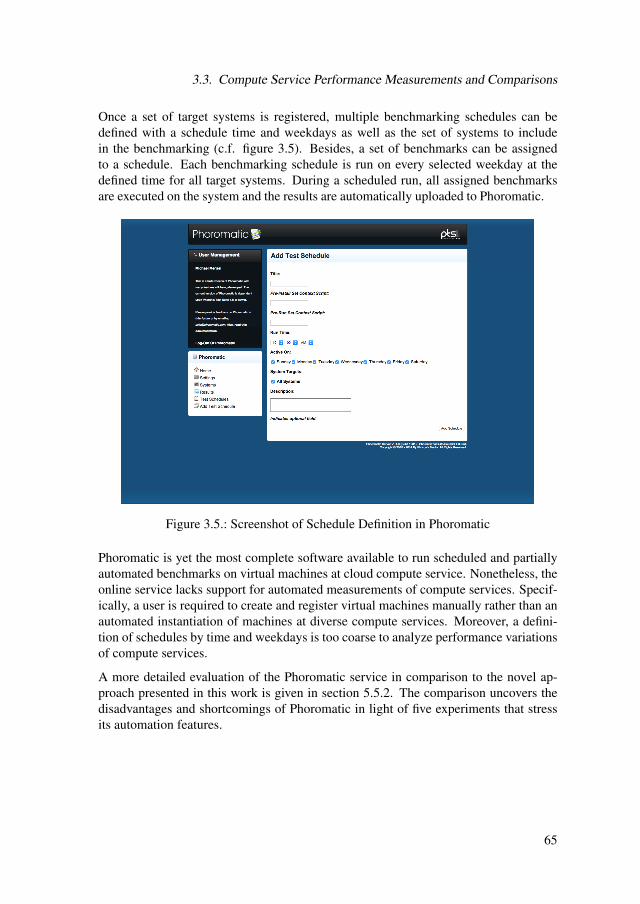
3.3. Compute Service Performance Measurements and Comparisons
Once a set of target systems is registered, multiple benchmarking schedules can bedefined with a schedule time and weekdays as well as the set of systems to includein the benchmarking (c.f. figure 3.5). Besides, a set of benchmarks can be assignedto a schedule. Each benchmarking schedule is run on every selected weekday at thedefined time for all target systems. During a scheduled run, all assigned benchmarksare executed on the system and the results are automatically uploaded to Phoromatic.
Figure 3.5.: Screenshot of Schedule Definition in Phoromatic
Phoromatic is yet the most complete software available to run scheduled and partiallyautomated benchmarks on virtual machines at cloud compute service. Nonetheless, theonline service lacks support for automated measurements of compute services. Specif-ically, a user is required to create and register virtual machines manually rather than anautomated instantiation of machines at diverse compute services. Moreover, a defini-tion of schedules by time and weekdays is too coarse to analyze performance variationsof compute services.
A more detailed evaluation of the Phoromatic service in comparison to the novel ap-proach presented in this work is given in section 5.5.2. The comparison uncovers thedisadvantages and shortcomings of Phoromatic in light of five experiments that stressits automation features.
65

3. State of the Art and Related Work
3.4. Virtual Machine Image Introspections andComparisons
Like with performance meta-data, a compute service consumer might be interestedin VM image meta-data. Particularly, meta-data about image contents is beneficial,as it allows to find images and virtual appliances that align with functional softwarerequirements.
In the following sections, existing work to maintain and assess VM image meta-datais described. First, approaches which aim at packaging meta-data with VM images areexplored. Finally, works that follow the concept of run-time introspections of VM togain meta-data are presented.
3.4.1. VM Image Meta-Data Attachment
Meta-data about contents of VM images, such as installed software and libraries, israther scarce. Meta-data attributes, such as name and description, are typically used todescribe the operating system and software stack contained in a VM image as unstruc-tured text. Frequently, exact information cannot be covered in these attributes due tolength and size restrictions. Additionally, raw text attributes are non-structured and canhardly be parsed for specific information, neither by machines nor humans.
One approach is to enrich VM images with meta-data through annotations on a filebasis. The Reservoir model proposes an extension to the open virtualization format(OVF) which introduces meta-data annotations to the file format [179].
Similarly, Matthews et al. [180] propose to extend OVF with contract meta-data forvarious use cases. The extension aligns with OVF’s XML nature and introduces diverseaspects that can be defined as meta-data of a VM image, such as network policies orreliability requirements.
Dastjerdi et al. [181] consider VM appliance meta-data in a semantic match-makingalgorithm. Meta-data on virtual appliances is stored as virtual units in an appliancemanagement service using semantic technologies. However, the approach does notdefine a catalog of meta-data attributes in addition to information already available fromthe compute service providers. Also, the approach requires providers or contributors tomanually maintain the meta-data.
Another approach that embraces semantic technologies is proposed by Reimer et al.[182] who have recognized a sprawl of virtual machine images. An image is convertedto the Mirage image format along a process which incorporates meta-data extraction.The extraction generates VM image content meta-data that is observed with the Unix
66

3.4. Virtual Machine Image Introspections and Comparisons
command stat. To store the image, the Mirage Library can be employed [183]. How-ever, the content meta-data of an image is described by checksums of files only, tyingthe approach to detection of identical files only. Besides, the approach requires theadoption of a certain format for VM images.
In summary, available meta-data and approaches to collect and maintain meta-data failto incorporate information about VM image contents. An approach to automaticallyextract meta-data about contents of a VM image is yet absent and therefore a primarygoal of this work.
3.4.2. Introspection of VM Image Meta-Data
The concept of introspection describes the process of accessing and monitoring theinternal execution environment of a computer system. The notion of introspectingVMs originates from work addressing security concerns in virtualization technology.Garfinkel et al. have developed an approach to detect intrusions using introspectionsthrough the Virtual Machine Monitor (VMM) of a VM. During an introspection, therunning processes, the memory contents, and the I/O flags of a machine are tested forintrusions. Additionally, Pfoh et al. [24] propose a formal definition of VM introspec-tions in the context of security applications.
As part of an assessment of VM image contents the detection of installed libraries andsoftware is mandatory for a comprehensive meta description. Existing OSCM systems,such as Opscode Chef or Puppet [104–106], are able to detect the fund of libraries andsoftware in a system using available package managers [51, 52]. Thereby, OSCM canlist contents of a VM, once granted remote access. Yet, no system exists that is capableto pair and automate this approach with compute services to extract meta-data aboutVM image contents.
In relation to OSCM systems, Filepp et al. [184] developed a virtual appliance con-figuration approach that installs missing software on VMs and finds a virtual appliancewhich requires lowest effort. The approach uses a repository of appliance configura-tions that has been build based on the Galapagos system [185]. However, the approachis restricted in its flexibility and only detects few well-known enterprise software pack-ages [186].
Moreover, Wilson and Matthew [187] create virtual appliances from multiple softwarepackages with OSCM technologies, but neglect keeping the configuration of appliancesin a meta-data database. Liu [188] shows how configuration meta-data allows an auto-mated operating system configuration of appliances, but aims at configuration settingsonly and misses support for virtual appliances of compute services.
67

3. State of the Art and Related Work
OSCM is a promising technology which is capable to capture the set of available li-braries and software of a system. Yet, it has never been adapted or employed to de-scribe contents of VM images and persist the results as meta-data about VM images ofcompute services. This work seeks to fill the void by adapting OSCM systems to assesscompute services in terms of VM image meta-data.
68

Part II.
Conceptual Framework
69

4. Framework for ComparativeAssessments of Cloud ComputeServices
This chapter presents the methods and models which are part of the framework in-troduced by this work. In particular, this chapter provides an overview of the frame-work and sheds light on the aspect of interactions and relations between methods in theframework. In addition, the extensibility of the framework is discussed in this chap-ter.
Moreover, the models and method are explained in detail. First, a meta-data modelis introduced that enables consumers to attach various meta-data to compute services.Then, an automation model is presented that provides consumers with an archetypeof an automated procedure for run-time assessments of compute service. The frame-work additionally incorporates a method that is capable of assigning scores to computeservices based on available meta-data. The scoring method is furthermore used to facil-itate consumers with a stopping rule. In subsequent assessments of compute services,the stopping rule enforces a cost budget and leads to an early stop with the goal to savecosts.
Finally, a software prototype implementing the scoring method is presented and used inan evaluation. The evaluation employs the prototype in a case study with the industryand to explore its computational complexity in practical experiments. The results showthat the scoring method is applicable in practice and provides trustworthy scores.
This chapter incorporates an evaluation of the scoring method only. Other parts of theframework are evaluated in the context of instantiations in chapters 5 and 6.
4.1. Introduction & Overview
Meta-data captures characteristics and details of a compute service and allows con-sumers to understand and compare the services they are provided with. In chapter 3,the current state of the art to assess and compare compute services as well as sources
71

4. Framework for Comparative Assessments of Cloud Compute Services
and the available amounts of meta-data have been explored. To close the void of assess-ment methods for compute services that empower the consumer, this work introducesa framework of methods and models that enable consumers to single-handedly assessand compare compute services according to meta-data.
The framework facilitates compute service consumers with methods and models to cap-ture assessed meta-data, enforce cost budgets in assessments, and assign scores in routeof a comparison of compute services. The methods serve consumers in assessing com-pute services in respect of diverse characteristics convertible into meta-data. Particu-larly two characteristics are explored in detail in this work. Chapter 5 explains the useof the framework for assessments in terms of performance characteristics, and chapter6 in terms of VM image contents. Both instantiations are built upon a subset of modelsand methods contained in the framework. Figure 4.1 depicts an overview of the modelsand methods constituting the framework.
Conceptual Framework
Performance Assessment
Virtual Machine Image
Assessment...
MADM-based Scoring Method
Cost Budget Stopping Rule
Meta-Data Model
Run-time Assessment Automation Model
Figure 4.1.: Overview of the Conceptual Framework
As shown in figure 4.1, the framework comprises several generic methods and mod-els:
• Cost Budget Stopping Rule
• MADM-based Scoring Method
• Run-time Assessment Automation Model
• Meta-Data Model
At the core of the framework is the Meta-Data Model which provides the basic struc-ture to attach meta-data to compute services. Any instantiation of the data model can
72

4.1. Introduction & Overview
extend the basic structure to fit meta-data about certain characteristics. The Run-timeAssessment Automation Model incorporated in the framework gives a basic layout andprocedure to assess compute services at run-time in an automated manner and store re-sults using the meta-data model. Given structured meta-data, the MADM-based ScoringMethod incorporated in the framework can assign a score to compute services, therebymaking compute services comparable by a single number. Moreover, a Cost BudgetStopping Rule reuses the scoring method to calculate utilities for compute services andsuggest a stop in a sequential assessment. The stopping rule aims at reducing costs byleading to an early stop during assessments of multiple services and enforces a costbudget.
Adapting the generic models and methods, instantiations can be build that target anassessment of a specific characteristic of compute services. In this work, two instantia-tions of the models and methods are presented. Both instantiations adapt subsets of theframework’s models and methods to assess meta-data regarding performance and VMimages respectively.
Nonetheless, the framework leaves space for further instantiations to assess computeservice in regards of other characteristics based on the generic models and methods.Besides, new instantiations may develop new methods that can be reapplied in courseof assessments regarding further characteristics. The framework’s extensibility is dis-cussed in section 4.1.2.
4.1.1. Relations Between Models & Methods
The models and methods are in relation to one-another and can only be used in such.Figure 4.1 reflects the relation between the models and methods. Specifically, the costbudget stopping rule bases on the scoring method to determine a stop. Furthermore, thescoring method draws information from the data model and aggregates it into a singlescore using MADM.
The instantiations to assess compute services in regards of performance and VM imagesuse the meta-data model and intersecting subsets of the framework’s methods. Bothinstantiations assess compute services at run-time and share the notion of a multi-cloudinterface gateway to interact with diverse compute services and providers.
Apart from that, both instantiations shed light on different characteristics of a computeservice and, thereby, complement one another. By instantiating the framework’s meth-ods, a consumer is able to acquire meta-data single-handedly. Performance attributesand descriptions of VM image contents are attached to a compute service in joinabledata models. Thereby, new meta-data about a compute service becomes available ina single database. Consequently, compute services can be compared according to anextensive amount of trustworthy meta-data.
73

4. Framework for Comparative Assessments of Cloud Compute Services
4.1.2. Extensibility of the Framework
Although the framework is complete in its current state, it is generally open to be ex-tended in regards of methods and models. Further methods and models may be includedin future versions of the framework. Similarly, methods and models may be advancedin alignment with a changing cloud environment. New methods and models may ariseas requirement for an assessment of more compute service characteristics and find itsway into the framework as generic concepts.
The assessment of other compute service characteristics would be based on the frame-work’s models and methods. Thereby, the amount of available meta-data about a com-pute service can be extended to further fund decisions. Additional characteristics mustnot necessarily be assessed at run-time as is the case for performance and VM images.An added characteristic, such as credibility or support quality provided by a computeservice, may be assessed from online resources and interviews.
74

4.2. Meta-Data Model
4.2. Meta-Data Model
The meta-data model introduced by this framework serves as an abstract basis to cap-ture all sort of meta-data about compute services. Using the basic meta-data structure,specific data models extending the basic model can be developed to attach meta-dataattributes to compute services. Figure 4.2 depicts a Unified Modeling Language (UML)diagram of the meta-data model provided by the framework.
Provider: StringHardwareConfigShort: StringCPUCores: IntegerRAMSpace: IntegerHardDiskSpace: IntegerArch: StringLocation: String
Compute Service
Name: StringUser
AccessKey: StringSecretKey: String
Credentials
Name: StringValue: Double
Attribute
*
1
1
1
*
1
Figure 4.2.: Basic Meta-Data Model
The basic data model to capture meta-data of compute services comprises four enti-ties: (1) User, (2) Credentials, (3) Compute Service, and (4) Attribute. The user entityrepresents the consumer who has multiple credentials necessary to access compute ser-vices. A compute service are linked to a certain provider and possesses several naturalconfiguration attributes by which it can be distinguished from other compute serviceconfiguration. Additionally, attributes can be attached to compute services which con-sist of a name-value tuple.
75

4. Framework for Comparative Assessments of Cloud Compute Services
4.3. Run-time Assessment Automation Model
With compute service APIs in place, automation of assessments is an obvious goal toreduce manual effort. Particularly assessments at run-time follow the notion of measur-ing characteristics of a compute service from within a VM and via its APIs. A computeservice consumer is capable of accessing a VM via remote protocols and conduct im-mediate observations and measurements, which is in contrast to black box settings withno insights at all [189, 190]. Typically, the APIs provided by compute services demandonly small effort to setup a VM for run-time assessments.
In contrast, non-run-time assessments cannot rely on exploiting VM operations to as-sess a compute service and are rather conducted fully manually. The focus of thisframework, however, are assessments at run-time following the model for automationpresented in this section. The methods and models introduced in this framework tar-get and support automated assessments of compute services at run-time based on thefollowing model.
The automation model describes the general archetypical procedure to conduct assess-ments of diverse compute services at run-time. A method and a system implementedaccording to the model needs to comprise components that provide a user interface, co-ordinate assessment tasks, and grant access to compute services. Besides, repositoriesto persist user parameters and assessment results are required. Figure 4.3 depicts thegeneral automation model using compute services’ APIs.
Compute Service 1
Virtual MachineAutomated Assessment Coordinator
Results Store
Multi-Cloud Interface
Virtual Machine
Compute Service N
Virtual MachineVirtual Machine
...
inject assessment tasks
upload results
User Interface
read/write
User Parameters
read/write
Figure 4.3.: Overview of the Model for Automated Assessments at Run-Time
Furthermore, based on the depicted model a procedure needs to be followed in an as-sessment. Firstly, the user interface gives means to define parameters, such as targetcompute services, before an assessment. Given the parameters, the coordinator ac-cesses a set of compute services to inject assessment tasks. The coordinator must in-
76

4.3. Run-time Assessment Automation Model
stantiate a VM with a preselected image and execute the task in the machine. Each taskgathers insights from within a VM at run-time and uploads the results to a repository.The repository implements the meta-data model described in section 4.2 to capture theassessment results. A user can eventually access the results via the user interface.
The major goal, which the model and the linked procedure pursue, is automation witha minimum degree of human interaction and a maximum degree of configurability.To characterize the pursued level of automation in more detail, a classification shallbe given according to the ten classes defined by Endsley [191–193]. The levels ofautomation as defined by Endsley are depicted in figure 4.4.
Figure 4.4.: Levels of Automation [191]
According to Endsley’s classification, the general automation scheme achieves the au-tomation level Batch Processing. A user’s part is to generate the implementation of anautomated assessment procedure for a particular compute service characteristics. Be-sides, a user can set the parameters and, thereby, select the target compute servicesand details of the assessment procedure. The implemented assessment procedure willthen automatically assess the selected compute services and, hence, implement the as-sessment tasks. Moreover, a user monitors the task implementation and retrieves themeta-data resulting from the assessment.
Moreover, prospective assessments using this framework are expected to develop a cus-tom, concrete implementation of an automated assessment at run-time. Therefore, thetask executed during the assessment must be defined and developed to be compatiblewith VM of the target compute services. Specifically, this requires to prepare the taskto be executable within the environment of a VM, and to package and upload resultsto the repository. The data model implemented by the repository must be capable topersist the uploaded data.
77
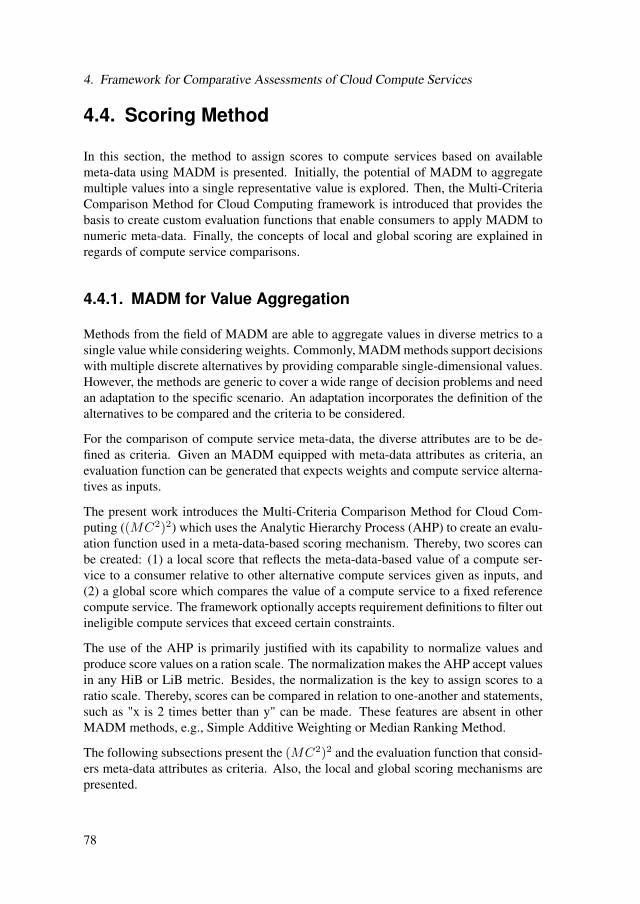
4. Framework for Comparative Assessments of Cloud Compute Services
4.4. Scoring Method
In this section, the method to assign scores to compute services based on availablemeta-data using MADM is presented. Initially, the potential of MADM to aggregatemultiple values into a single representative value is explored. Then, the Multi-CriteriaComparison Method for Cloud Computing framework is introduced that provides thebasis to create custom evaluation functions that enable consumers to apply MADM tonumeric meta-data. Finally, the concepts of local and global scoring are explained inregards of compute service comparisons.
4.4.1. MADM for Value Aggregation
Methods from the field of MADM are able to aggregate values in diverse metrics to asingle value while considering weights. Commonly, MADM methods support decisionswith multiple discrete alternatives by providing comparable single-dimensional values.However, the methods are generic to cover a wide range of decision problems and needan adaptation to the specific scenario. An adaptation incorporates the definition of thealternatives to be compared and the criteria to be considered.
For the comparison of compute service meta-data, the diverse attributes are to be de-fined as criteria. Given an MADM equipped with meta-data attributes as criteria, anevaluation function can be generated that expects weights and compute service alterna-tives as inputs.
The present work introduces the Multi-Criteria Comparison Method for Cloud Com-puting ((MC2)2) which uses the Analytic Hierarchy Process (AHP) to create an evalu-ation function used in a meta-data-based scoring mechanism. Thereby, two scores canbe created: (1) a local score that reflects the meta-data-based value of a compute ser-vice to a consumer relative to other alternative compute services given as inputs, and(2) a global score which compares the value of a compute service to a fixed referencecompute service. The framework optionally accepts requirement definitions to filter outineligible compute services that exceed certain constraints.
The use of the AHP is primarily justified with its capability to normalize values andproduce score values on a ration scale. The normalization makes the AHP accept valuesin any HiB or LiB metric. Besides, the normalization is the key to assign scores to aratio scale. Thereby, scores can be compared in relation to one-another and statements,such as "x is 2 times better than y" can be made. These features are absent in otherMADM methods, e.g., Simple Additive Weighting or Median Ranking Method.
The following subsections present the (MC2)2 and the evaluation function that consid-ers meta-data attributes as criteria. Also, the local and global scoring mechanisms arepresented.
78

4.4. Scoring Method
4.4.2. Evaluations with the (MC2)2
The Multi-Criteria Comparison Method for Cloud Computing ((MC2)2) presented inthis subsection proposes a generic, linear process that ultimately leads to an evaluationfunction. The process incorporates several steps from a definition of the scenario, al-ternatives, and criteria to an evaluation and ranking of alternatives. The informationgathered within the process is the basis to develop an evaluation function f(·) as a cus-tomized instance of a MADM method. The (MC2)2 can be used to develop evaluationfunctions of different natures, such as weighted sum and weighted product evaluationfunctions.
The process to gain an evaluation function f(·) suggests a step-by-step order to gatherthe needed parameters. First, a scenario and, thereby, a number of alternatives are de-fined. Next, relevant criteria and requirements are identified. A multi-criteria decision-making method is then chosen and subsequently configured. The configuration incor-porates defining the criteria and requirements as parameters of the selected decision-making method. The result is a custom evaluation function that can be used to evaluatethe alternatives under consideration.
Figure 4.5.: The Process within the (MC2)2
Figure 4.5 depicts the process steps, each of which is described in further detail in thefollowing subsections.
79

4. Framework for Comparative Assessments of Cloud Compute Services
Define Scenario
A scenario specifies the particular situation under consideration. Therefore, a scenariodescription incorporates the business and IT context, the environment, the goals, andthe constraints. Thereby, the description of the scenario sets the scope and objectivesfor the evaluation method to be created. Comprehensive expertise and experience isrequired to define the scenario, and sufficient effort should be spent to facilitate thesubsequent steps.
Define Alternatives
When using (MC2)2, at least two alternatives must be defined for a given scenario.The process of defining alternatives requires a research of the available options andassociated attributes. The alternatives are typically given by the decision scenario.
Every alternative aims at being a solution to the scenario’s goals. An attribute is acharacteristic or property, preferably common to all alternatives, that can be assigneda value. Every pair of alternatives differs in the value of at least one attribute. Oth-erwise, the two alternatives are identical or an additional attribute to differentiate thealternatives should be introduced.
Identifying attributes of an alternative involves expertise, creativity, and experience,often from multiple stakeholders. The attribute identification process can also be sup-ported with external information sources, such as literature, databases, or documenta-tions [194]. It is possible to perform this search process systematically by first searchingfor a set of important attributes and then assigning values to each attribute, for each al-ternative. At the end, each alternative is defined by the values assigned to its set ofattributes.
Define Criteria
Despite attributes providing a data source for an evaluation, in MADM methods a setof criteria must be defined. The definition of criteria selects attributes to be consideredin the evaluation function and describes relations and dependencies between attributes.For example, criteria can be structured in hierarchies or networks to model the realworld more precisely. Therefore, one of the fundamental steps within (MC2)2 is thedefinition of criteria. Having completed this step, requirements can be derived from thecriteria.
The set of attributes determined during the definition of alternatives serve as a sourceto derive the set of criteria. Criteria add information to attributes that are necessary fora use in MADM methods. A criterion consists of a topic (or question) to be examined
80

4.4. Scoring Method
and has a type, either qualitative or quantitative, and a direction, either positive ornegative.
In case of a quantitative criterion, a scale of measurement has to be defined. Qualita-tive criteria do not necessarily rely on a scale as they are not measurable. Not everyMADM method is capable of considering qualitative criteria and require transformingqualitative criteria into quantitative criteria.
Furthermore, criteria influence the value of an alternative either positively or negatively.In particular, a criterion can be positive for an alternative the higher the value (higher isbetter) or the lower the value (lower is better). According to Saaty [195], criteria shouldbe clustered into four merits: benefits, opportunities, costs, and risks. While criteria ofthe types benefits and opportunities are positive, criteria of the types costs and risks arenegative. Nevertheless, other criteria type categories can be introduced as well. Table1 shows four example criteria in the realm of performance meta-data where criterion#1 is a quantitative criterion with nominal scale, #2 is a quantitative criterion with ratioscale, and #3 is a qualitative criterion.
# Question Type Possible Values
1 How high is the per-formance of the sys-tem?
quantitative, nominalscale
low, medium, high
2 How many FLOPScan be achieved?
quantitative, ratioscale
0$-∞$
3 How do you likethe system’s perfor-mance?
qualitative —
Table 4.1.: Example Criteria for Performance Characteristics
To strive towards a precise evaluation of the alternatives, an extensive set of criteriamust be defined. Pardee and Kirkwood [196] give three objectives to be pursued duringthe finding of attributes and corresponding criteria.
1. Completeness and Exhaustiveness
2. Mutually exclusive items only
3. Restrict to criteria of highest degree of importance
After all criteria have been identified and defined regarding their type and direction,they can be set into relation. Depending on the MADM, the criteria can be organizedas a set, in a hierarchy or in a network.
81

4. Framework for Comparative Assessments of Cloud Compute Services
Value Type Req. Type Boolean Expression
Numerical Exclusive Max γ < vr
Numerical Inclusive Max γ ≤ vrNumerical Exclusive Min γ > vr
Numerical Inclusive Min γ ≥ vrNon-numerical Equals γ = sr
Non-numerical OneOf γ ∈ S = {sr1, . . . , srn}
Table 4.2.: Common Requirement Types
Define Requirements
In order to remove ineligible alternatives, requirements can be defined to filter out al-ternatives which are not feasible within the constraints of the given scenario. A require-ment of a scenario is expressed as a constraint that demands a certain value, or defines aminimum or maximum boundary for a value. The definition of a requirement can referto a criterion or requires the definition of a new criterion outside the criteria set. Table4.2 lists available requirement types to define constraints.
Requirements can be defined for a value γ of the alternatives regarding a criterion as anumerical boundary vr or a non-numerical boundary sr. Numerical boundaries can beexclusive (<, >) or inclusive (≤, ≥). Non-numerical boundaries can be a single valuesr or a set of boundary values S. Instead of the equal operator = which tests for absoluteidentical string values, more sophisticated operators that weaken the requirement arethinkable, such as a substring test or regular expressions.
The procedure of filtering can be performed for minimum constraints with a conjunc-tive satisficing method and respectively for maximum constraints with a disjunctivesatisficing method [19].
Choose Multi-Criteria Decision-Making Method
A range of MADM methods are eligible upon which a custom evaluation function canbe constituted. An overview and comparison of different MADM methods can be foundin [197][19]. The method has to be chosen according to the preferences of a decision-maker. For comparisons between alternatives, the evaluation function should producescore values, and not just pair-wise ratios or unvalued ranking. Therefore, the (MC2)2
recommends the use of weighted sum MADM methods like the AHP. Unlike weightedproduct functions that only reflect pair-wise ratios of alternatives, weighted sum func-tions allow for score values that reflect the absolute quality of an alternative. A score
82

4.4. Scoring Method
has the advantage of result conservation without the need to reapply the evaluationfunction.
The (MC2)2 suggests the Analytic Hierarchy Process (AHP) [195][198] as a favorableweighted sum MADM method, due to its ability to incorporate complex criteria hierar-chies in an evaluation. Criteria hierarchies enable a more realistic modelling of criteriadependencies. Moreover, AHP employs pair-wise comparisons for normalization andto support the use of qualitative criteria. The use of pair-wise comparisons for normal-ization succeeds to assign values to both, quantitative and qualitative criteria on a ratioscale. However, qualitative criteria values are derived from subjective ratings.
Configure Multi-Criteria Decision-Making Method
Before an evaluation function can be build and the evaluation results can be calcu-lated using the function, it is necessary to configure the selected MADM method. Thistypically means setting parameters, such as calculation schemes, criteria, and normal-ization processes. Whether a configuration is needed or not depends on the MADM ofchoice.
For example, in the AHP the criteria hierarchy and the index to aggregate multiple hi-erarchies must be defined. The structure of a criteria hierarchy defined for the AHPentails effects on the ability to weight criteria against one-another and on the computa-tional complexity. Generally, two distinct criteria hierarchy structures are followed: (1)a simple single-level hierarchy, and (2) a hierarchy with criteria groups. Figures 4.6aand 4.6b illustrate the two typical and simple criteria hierarchies.
In a single-level criteria hierarchy, all criteria are grouped into two goals according totheir metric: (1) positive goal for higher is better (HIB) metrics, and (2) negative goalfor lower is better (LIB) metrics. The HIB goal subsumes all criteria that increase thecompute service’s score the higher the values of the criteria. Oppositely, the LIB goalsubsumes all criteria with negative effects. Finally, the evaluation with AHP uses theindex HIB
LIB to relate both goals to another and to determine the final score value. Thestructure of the proposed simple criteria hierarchy is illustrated in figure 4.6a.
A grouped criteria hierarchy introduces an additional level of goals which groups cri-teria by meta-data characteristic. Thereby, the user can express a preference towards acertain characteristic by assigning a higher weight to the corresponding goal. Again, aHIBLIB index determines the final score value. The structure of a grouped criteria hierar-chy is depicted in figure 4.6b.
Generally, additional levels introduced into the hierarchy through groups change theeffort for weighting and how a decision-maker can influence weights of criteria. Thelocal weight of a single criterion (within a group) is multiplied with the weight of thegroup (and the weight of all other grouping nodes on the shortest path to the root).
83
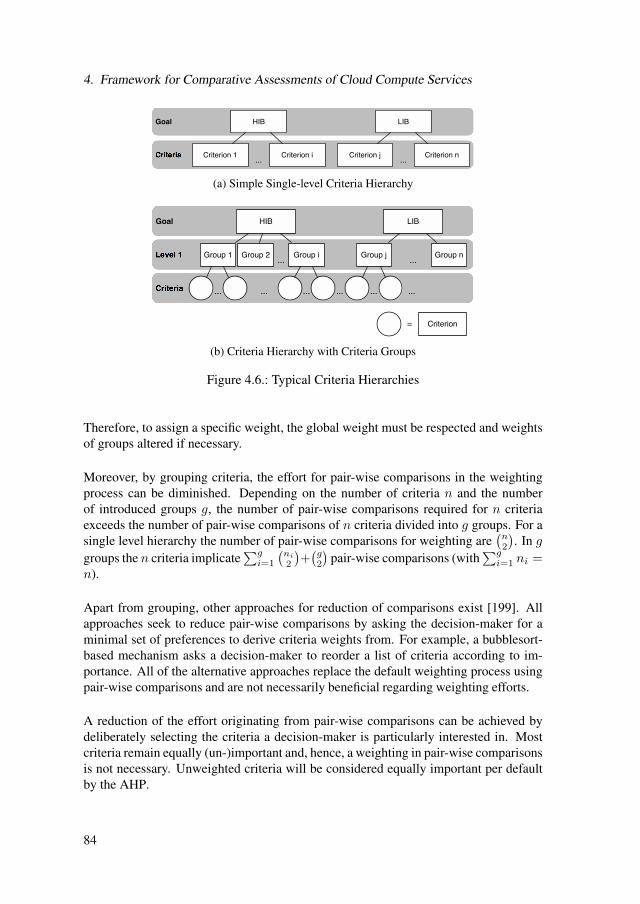
4. Framework for Comparative Assessments of Cloud Compute Services
Criteria
Goal
Criterion 1 Criterion i
HIB
Criterion j Criterion n
LIB
... ...
(a) Simple Single-level Criteria Hierarchy
Level 1
Criteria
Goal HIB LIB
Group 1 Group 2 Group i Group j Group n
... ...... ... ......
= Criterion
... ...
(b) Criteria Hierarchy with Criteria Groups
Figure 4.6.: Typical Criteria Hierarchies
Therefore, to assign a specific weight, the global weight must be respected and weightsof groups altered if necessary.
Moreover, by grouping criteria, the effort for pair-wise comparisons in the weightingprocess can be diminished. Depending on the number of criteria n and the numberof introduced groups g, the number of pair-wise comparisons required for n criteriaexceeds the number of pair-wise comparisons of n criteria divided into g groups. For asingle level hierarchy the number of pair-wise comparisons for weighting are
n2
. In g
groups the n criteria implicateg
i=1
ni
2
+g2
pair-wise comparisons (with
gi=1 ni =
n).
Apart from grouping, other approaches for reduction of comparisons exist [199]. Allapproaches seek to reduce pair-wise comparisons by asking the decision-maker for aminimal set of preferences to derive criteria weights from. For example, a bubblesort-based mechanism asks a decision-maker to reorder a list of criteria according to im-portance. All of the alternative approaches replace the default weighting process usingpair-wise comparisons and are not necessarily beneficial regarding weighting efforts.
A reduction of the effort originating from pair-wise comparisons can be achieved bydeliberately selecting the criteria a decision-maker is particularly interested in. Mostcriteria remain equally (un-)important and, hence, a weighting in pair-wise comparisonsis not necessary. Unweighted criteria will be considered equally important per defaultby the AHP.
84

4.4. Scoring Method
Resulting Evaluation Function
Figure 4.7.: Schema of a Resulting Evaluation Function
A schematic representation of the resulting evaluation function is depicted in figure4.7. Given requirements are used to filter out alternatives that cannot fulfill one of therequirements. Following, all remaining alternatives are evaluated by the given criteriawith the MADM of choice. To rank the alternatives, the alternatives can be sorted bytheir evaluation results. The alternative ranked as #1 is the preferable choice accordingto its overall value.
In case a weighted sum MADM method like the AHP is chosen, an evaluation functionf(aj ,W,Aaj , R) →→ vaj ∈ (0, 1) is generated with the (MC2)2. Function f(·) is for-mulated in Equation 4.1. The function returns vaj
, which is the sum of the weightedvalues of all attributes α of an alternative aj . The attributes are matching the corre-sponding set of criteria that was defined for the evaluation function. If the given re-quirements R are satisfied then vaj
∈ (0, 1), otherwise the function returns vaj= 0.
f(aj ,W,Aaj, R) =
|Aaj
|i=0
wiχ(αi,aj ) ∀r ∈ R : r = true
0 else
→→ vaj∈ (0, 1)
(4.1)
The function f(·) has the parameters aj , which is the j-th alternative to evaluate, andset Asj of attributes, where αi,sj ∈ Asj is the i-th attribute of sj . In addition, the set ofweightsW must be given as parameter, wherewi ∈W is the weight of the i-th attribute.For W the constraint sumWwi = 1 must be satisfied to maintain the normalization.
85

4. Framework for Comparative Assessments of Cloud Compute Services
The value of an attribute is determined with the function χ(·), for example, χ(αi,sj ) forthe i-th attribute of sj . Furthermore, an optional set R can be given which contains allrequirements that need to be satisfied. Table 4.3 lists all parameters of the evaluationfunction.
Parameter Description
aj ∈ S The j-th alternative to be evaluated by the function f(·)αi,sj ∈ Asj The i-th attribute of compute service sjwi ∈W The weight of the i-th attributeχ(αi,sj ) The function to gain the value of the i-th attributer ∈ R A requirement that needs to be satisfied
Table 4.3.: List of Symbols in the Evaluation Function f(·)
An evaluation function f(·) resulting from (MC2)2 is reusable with custom alternativesand associated attributes, weights, and requirements in decisions within the definedscenario’s context.
Apply Resulting Evaluation Function
The resulting custom evaluation function is able to filter out ineligible alternatives andto calculate scores. Based on the scores, substantiated, rational decisions can be madeby comparing and ranking alternatives. The evaluation function can be applied to anyset of alternatives, associated attributes and requirements which must be given as pa-rameters.
4.4.3. Local Scoring
For the comparison of a set of compute services, an evaluation function created withthe (MC2)2 generates a local scoring. The function would accept the proposed crite-ria hierarchy and the meta-data as parameters. Each compute service’s local score isexpressed relative to the other scores on a (0,1) scale, and all scores sum up to a valueof 1. The use of normalization also for indices that combine multiple goal scores isassumed.
The function also allows to select different criteria and adjust weights. After a re-computation using the altered evaluation function, updated scores can be gained for theset of compute services. Also, when adding another compute service to the set, theevaluation function needs to be reapplied and the scoring will change.
86

4.4. Scoring Method
The locality of this evaluation function is due to the scale which is specific to a set ofcompute services. The sum of all scores in the compute service set will always be 1 fora local scoring. The local scoring immediately reflects the percentage of suitability –in regards of defined criteria and weights – for each compute service. However, resultscan only be interpreted in the context of the particular set of compute services the scalehas been created for. A comparison of local scores from different compute service setsis not valid.
4.4.4. Global Scoring
A score determined for a compute service in a local scoring is normalized in relationto other alternative compute services. Consequently, the scale introduced in a localscoring is only applicable to this specific set of compute services. In its original mode,AHP calculates scores on a (0,1) scale per goal where the sum of the scores is 1. Whenan additional compute service is added, the scores would change to retain the sum of1.
To avoid the change of scores, AHP can be applied in an ideal mode synthesizationmethod for the calculation of idealized scores. After a first local scoring with AHP, thebest compute service can be chosen as ideal compute service and will be scored with avalue of 1. Thereby, an idealized scale forms around the ideal compute service servingas the reference score. In ideal mode, any compute services introduced later are scoredrelative to the ideal compute service. In case the added compute service has a higherscore than the reference score, it exceeds the value of 1 to reflect a correct ratio.
Figure 4.8 illustrates a normalized and an idealized scale of three compute services. Inthis figure, compute service 2 serves as the ideal reference in the idealized scale.
!"#$$%
!"&'(%
!")&&%
!"#$%&'()*+,-.+/0"#'12+
3"$456)+/)#7'0)+8+ 3"$456)+/)#7'0)+9+ 3"$456)+/)#7'0)+:+
(a) Example of Normalized Scale
!"#$%&
'"(((&
("%)$&
(&
("#&
'&
'"#&
!&
!"#&
*&
!"#$%&'()'*+,-'(.( !"#$%&'()'*+,-'(/( !"#$%&'()'*+,-'(0(
!"#$1*'2(&"(!"#$%&'()'*+,-'(/(
32'14,5'2(678()-"*,9:(
(b) Example of Idealized Scale
Figure 4.8.: Example of Normalized vs. Idealized Scale
The ideal mode of AHP can furthermore be used to compare compute services to areference compute service in a global scoring. Therefore, one certain compute service
87

4. Framework for Comparative Assessments of Cloud Compute Services
is declared as a reference or benchmark. Every compute service’s global score is calcu-lated by the evaluation function used with two compute services as parameters: (1) thecompute service to be scored, (2) the reference compute service.
Every calculated score is to be seen in context of the reference compute service and ex-pressed as multiples of the reference score. Moreover, a global score is only comparableto global scores calculated with the identical set of criteria and weights.
88

4.5. Cost Budgeting Stopping Rule
4.5. Cost Budgeting Stopping Rule
In a search of a high scoring compute service with subsequent assessments costs can besaved by ending the process early. Particularly when it seems unlikely that one of theoutstanding assessments identifies a compute service with a more favorable score. Thestopping rule presented in this section bases its stopping decision on costs, a computeservice score from the scoring method (c.f. section 4.4), and a cost budget. First,the cost calculation needed in a stopping decision is explained. Then, the setting ofa stopping rule for compute service assessments is defined. Finally, suitable standardstopping rules are presented before a novel bespoke stopping rule adapted specificallyto compute service assessments is introduced that considers cost budgets and exploits apreliminary order.
4.5.1. Cost Calculation
To enforce a cost budget, the stopping rule must be aware how much costs accruewith every additional assessment of a compute service. The costs generated by anassessment comprise the bill for using the compute service and the effort to carry out theassessment task. Besides, costs for the preparation and planning of the assessment, aswell as for necessary resources occupied or purchased for the assessment project needto be considered. The following cost factors have a considerable effect as operationalexpenditures in the course of compute service assessments:
• Staff
• Resource usage for Assessment Implementation
• Compute service usage
• Network traffic
Additionally, capital expenditures may occur as requirement to conduct a compute ser-vice assessment, such as licenses for assessment and evaluation software.
The overall costs can be divided into expenditures for the project and operational ex-penditures per compute service. For the stopping rule to work, costs must be brokendown per compute service. Therefore, the project expenditures must be divided by thetotal number of compute services, whereas compute service costs can be assigned di-rectly. Since project expenditures are assigned to each compute service with the sameamount, these can be left out. Ultimately, the total costs for assessing one specificcompute service i must be defined as ci.
Nevertheless, a perfect calculation of the per compute service assessment costs can beforfeit in exchange for simplicity. Although the fidelity of the stopping rule may suffer,
89

4. Framework for Comparative Assessments of Cloud Compute Services
a simple cost calculation remains a valid option in case costs cannot be determinedprecisely for all of the cost factors. Possible simplifications are (1) identical costs cifor every compute service i and (2) inclusion of a subset of operational cost items. Forthe latter, the compute service usage is a factor immediately observable after a firstcompute service has been assessed.
4.5.2. Compute Service Scores & Ordering
One important aspect of in a sequential assessment using a stopping rule is the distri-bution of expected scores among the compute services under consideration. As none oronly little meta-data is available beforehand beforehand, a distribution of scores amongthe compute services is unclear.
As costs for assessing compute services can exceed targeted budgets, only a fractionof the finite compute service set, called the sample, is actually traversed. Hence, it isimpossible to assess perfect information in the search for a compute service. Conse-quently, the sample of traversed services includes the absolute highest scoring computeservice only by chance.
For this reason, a deliberate choice of compute services to be included in the sample canincrease the chance to include highest scoring compute services in the search. The sam-ple can be influenced by defining a strict order for the sequential assessment process.An approximation of the ideal order can be achieved by preferring compute servicesthat potentially score higher according to priorly available information.
Although the available meta-data regarding a compute service is scarce without a single-handed assessment, providers and other public sources provide numbers and descrip-tions that may allow to anticipate a scoring order. When no prior knowledge aboutmeta-data is available, a random ordering must be assumed. Implicitly, however, thechances to include the highest performing compute service in the sample decrease.
Generally, there are two situations that lead to different sequential assessment orders:
• Manual order according to prior information and use of custom probability dis-tributions
• Random order and use of single probability distribution
The following subsections will give insights on the two situations and describe theeffects of an anticipated order and probability distribution.
90

4.5. Cost Budgeting Stopping Rule
Manual Order According to Prior Information
With prior information about meta-data attributes of any of the compute services, the setof services can be transmuted into an ordered list. Such information can be drawn fromsources, such as the SLAs published on the providers’ websites, results of assessmentsin the past, or experiences from other consumers. Composing an ordered list involvespicking services and adding them to the list in a descending order, starting from thehighest guessed score. The guessing of a score must be aligned with the defined evalu-ation function, particularly under consideration of the criteria and weights incorporatedin the evaluation function.
The guessed score for Si resembles the µ of the custom distribution function for Si.Additionally, with a σ the confidence of the guessed value can be expressed. Theguessed scores interpreted as µ and confidence values σ leads to different distributionfunctions Fi(·) for all Si.
Figure 4.9 depicts the observed distribution of scores for an example list with N com-pute services that was ordered according to prior information. The distribution of thescores is not strictly descending in this example. Since prior information is commonlyincomplete and imprecise, the fidelity of an approximated order is commonly unpre-dictable.
Figure 4.9.: Distribution of Expected Scores Among Ordered Compute Services
Nevertheless, an approximated order has advantages over a random order. Althoughthe fidelity is unpredictable, chances are that the order outperforms a random order invarious regards. Costs may reduce due to an earlier stop of the sequential assessment
91

4. Framework for Comparative Assessments of Cloud Compute Services
process. Besides, the chances increase that the actual highest scoring compute serviceis in the traversed sample.
Random Order
In absence of any prior information, the scores can be expected to be distributed ran-domly among all compute services. The actual value si of a variable Si is observed withan assessment of the compute service and determined as score value by applying theevaluation function f(·). The randomly distributed variables S1, . . . ,Sn are describedby a distribution function F (·). Generally, the actual distribution function F (·) is typ-ically not know for compute services but can be approached by standard distributions,such as a Gaussian or Poission distribution. The distribution of the score values amongthe traversed compute service sample influences the behavior of the stopping rule.
Assumed the random distribution is a well known distribution function, such as a Gaus-sian or Poisson distribution, the reservation wage stopping rule is able to determine thestopping index in advance (c.f. section 2.4.2). The costs accruing in the use of otherstopping rules are unforeseeable. The number of traversed compute services is un-known in advance for a random order and random distribution. An example of observedscore values for N compute randomly ordered services is depicted in figure 4.10.
Figure 4.10.: Random Distribution of Expected Scores Among Unordered ComputeServices
The example shows the observed random score values of a sample of N compute ser-vices. Every service is represented by one score value which is the result of applyingan evaluation function to aggregate the assessed meta-data attributes.
92

4.5. Cost Budgeting Stopping Rule
It shall be noted that in absence of a distribution function F (·) some common stoppingrules cannot calculate a halt. For example, the optimal reservation wage cannot becalculated without knowing the distribution F (·) together with µ and σ.
4.5.3. Stopping Rules
A stopping rule for the assessment of compute services faces a finite horizon prob-lem and will always lead to a stop. When sequentially assessing different computeservices, a sequence of n random variables S1, . . . ,Sn is mapped to the observationss1, . . . , sn:
S1 = s1, . . . ,Sn = sn
The observed si are a number representing a compute service. Potentially, the numberof is calculated with an evaluation function f(·) from the scoring method which isapplied to the available multi-dimensional meta-data. Thereby, the compute servicesare represented by number comparable on a ratio scale which is required by the stoppingrule. Furthermore, for every assessment of a compute service corresponding to Si costsof ci occur. In addition, for the traversed sample of observations, highest utility can berecalled with a sequence of utility functions ui(·):
u0, u1(s1), u2(s1, s2), . . . , un(s1, s2, . . . , sn)
with ui = max si being the utility of the highest performing provider according toscoring function f(·) after conducting n service benchmarks. The utility is on a scaledefined by f(·) and, hence, not comparable to the costs occuring in the assessment. Thefollowing equation shows the expression seeked to be maximized by a stopping rule forcosts ci increasing with each additional step:
maxun −ni
ci
Depending on the scale of the scoring function f(·), the absolute utility may changeover time. The scoring function can be configured with a local and global scoringmode. The global scoring variant requires to define the first assessed compute serviceas the reference with score = 1. In the global scoring variant, the absolute utility andscores are maintained. The local scoring variant implicates that all measured computeservices are re-scored relative to one another with every additional assessment result.Thereby, the utility and scores can change over iterations.
93

4. Framework for Comparative Assessments of Cloud Compute Services
Standard Stopping Rules
The stopping problem is similar to the class of house selling problems with recall [114].The observed result of any previously traversed, hence assessed compute service ina sample can be recalled. The distribution of the scoring outcomes retrieved in anassessment are typically unknown. Thus, the problem can be categorized as a finitehorizon problem with no information. However, an order can often be derived fromprevious assessments or publicly available meta-data.
For standard stopping rules, similar problems, such as the house selling or job searchproblem [114, 117, 121], optimize the utility in relation to the occured costs. Giventhe utility un can be mapped to a cost metric, well-known standard stopping rules forthe class of house selling problems with recall could be applied [114, 117]. Besides, adistribution function for the random variables needs to be defined.
However, with the scoring function f(·), the utility and costs remain on different scalesand cannot outweigh one another. Generally, mapping assessment results to a monetaryvalue requires a specific mapping function which needs to be identified first. For everydecision-maker a assessment result has a different value and a mapping to a monetaryvalue seems an unfeasible task. Additionally, the random distribution of the variablesSi is not clear and rather non-deterministic.
Therefore, only standard stopping rules focusing on un and without the need for adistribution function are considered as applicable stopping rules. The standard stoppingrules presented in the following are the reservation wage rule, cut off rule, candidatecount rule, successive non-candidate rule, and the odds algorithm. Nonetheless, it shallbe noted that standard stopping rules lack a support for a cost budget.
Reservation Wage Rule
For the reservation wage, a certain expected outcome must be defined based on theglobal scoring. To define a reservation wage, a certain compute service or comparablesystem could be used as a reference. Then all scores are determined in relation to theinitial score of the reference system. The rule will stop with the first compute servicewhich scores at least as high as the reference score.
The rule is very well suited to find a compute service which satisfies specified require-ments. However, for finding the highest scoring compute service, the rule is highlydepending on the reference system. A very low scoring reference system may leadto an early stop and the highest scoring compute service is not observed. In contrast,an extremely high scoring reference system will lead to an observation of all computeservices and result in maximum costs.
Cut Off Rule
94

4.5. Cost Budgeting Stopping Rule
The cut off rule is generally applicable to a wide range of stopping problems. In thiscase, the parameter m determines how many compute service score observations areskipped before the first upcoming candidate is accepted. A candidate increases un witha new highest score Sn.
If the set of compute services to traverse is ordered according to prior information, thehighest scoring compute service may be included in the first m observations. Then,the cut off rule would not find another candidate after m observations and generatemaximum costs.
Candidate Count Rule
Given the candidate count parameterm, the stopping rule ignores the firstm candidatesand stops at the m + 1-th candidate. A candidate is an observation that increases unwith its score Sn being the absolute highest so far.
The candidate count-based rule may struggle with compute service sets that are or-dered according to prior information. The probability that the highest ranked computeservice is observed under the first candidates depends on the correctness of the order.If the decision-maker provided an order with few errors, the rule traverses all computeservices before it stops and thereby generates maximum costs.
Successive Non-Candidate Rule
The successive non-candidate rule seeks for the sequential pattern of at least m non-candidates in between two candidates. The latter candidate leads to the stop and is thefinal result of the compute service search.
The rule expects candidates to have a certain distance and to be distributed over the setof compute services. In a compute service set ordered according to prior information,the candidates are more likely to be found in the beginning of the observations. There-fore, the rule can lead to a maximum expenditure in an assessment when the distancem turns out to be defined as too large.
Odds Algorithm
For the odds algorithm, a definition of a probability that Si is a candidate must bedefined for all i ∈ [1, N ]. But even with prior information an estimation of the proba-bilities is impossible.
Generally, however, the probability to discover a candidate with the new highest valuecan be described as pi = 1/i. Thereby, the discovery of a candidate in the next observa-tion is as likely as any of the previous observation to be the candidate. The probability1/i declines with every further observations which reflects that it becomes less likelythat a new candidate is found with fewer observations left.
Other probability setups can thought of as well. For example, pi = 1/2 for all i whichexpresses that every additional observation has a 50:50-chance to become a candidate.
95

4. Framework for Comparative Assessments of Cloud Compute Services
Similarly, pi = 1/N is thinkable which defines an identical likelihood for all obser-vations to be a candidate. Then, however, the odds algorithm will observe all Si andgenerate maximum costs.
Stopping Rule for Compute Services Assessments
All of the existing standard stopping rules are unable to explicitly consider cost budgets.Also, part of the standard stopping rules expect the score outcomes to be described bydistributions (e.g., uniform, Gaussian). Most importantly, all existing stopping rulesignore priorly available information that indicates an anticipated order of compute ser-vices. And, the score outcomes need to be mapped to a currency in order to compensatecosts. Therefore, the present work introduces a heuristic-based stopping rule that ex-ploits ordered compute service sets and treats scores and costs in a distinguished man-ner. In addition, the stopping rule considers a predefined cost budget and determines aduly end of the assessment process.
Based on the assumption that the order of the compute service set is correct, the firstassessed compute service would achieve the maximum score and the score decreaseswith every later observed service. Therefore, the principal of the stopping rule is tocontinue the assessment process while the observed score values increase. Thereby, theorder of the set is proved incorrect and, thus, the assessment must continue to seize theopportunity of finding a service with a new maximum score.
For the trend analysis of the score, a function χ is needed that detects an increase in theoverall utility in step n. Function χn returns 0 if observation sn increases the utility byadding a new maximum score:
χn =
1 un(sn, . . . , sn) ≤ un−1(s1, . . . , sn−1)
0 else
To relax the stopping decision according to the utility increment detection and to al-low for a configuration of the stopping rule, the increment detection function χ is usedin a sliding window of size ω. The sliding window comprises the last ω observationssn−ω, . . . , sn. The function λn reflects the number of missing utility increments (orconsecutive assessed scores lower than the current maximum) within the sliding win-dow:
λn =
ni=n−ω
χi
The parameter ϵ can be declared to enforce a maximum allowed lambda.
96
4.5. Cost Budgeting Stopping Rule
Using the defined cost budget cmax, a sliding window size of ω, and the permittednumber of outstanding consecutive score increments ϵ, the stopping rule ϕ can be de-fined as a sequence of binary decision functions. Given the observations s1, . . . , sn, itis denoted as:
ϕ = (ϕ0(ϵ), ϕ1(ϵ, s1), . . . , ϕn(ϵ, s1, . . . , sn))
with
ϕn(ϵ, s1, . . . , sn) =
1 ¬(λn ≤ ϵ ∧
ni ci ≤ cmax)
0 else
where value of 1 leads to a stopping after n observations and a value of 0 to a contin-uation of the assessment. A halt is triggered by the stopping rule when either the costssurpass the cost budget cmax or the number of missing utility increments within thesliding window surpasses ϵ. The probability of stopping after n observations thus isdefined as:
ψn(S1, . . . ,Sn) =
n−1j=1
(1− ϕj(S1, . . . ,Sj))
· ϕn(S1, . . . ,Sn)To serve the reader with a more readable representation, the formal definition of thestopping rule is transformed into an algorithm. In the following, a pseudo code repre-sentation of the stopping rule algorithm is presented:
Require: ω ← window size, ϵ← min. number of incrementsRequire: T ← compute services set, C ← assessment costsRequire: λ← 0, increment← false, window ← queue[ω]
for Si ∈ S(window), ci ∈ C dosi ← f(Si)if si ≥ max{si ∈ window} thenλ← λ+ 1
elseλ← λ− 1
end ifif ¬(λ ≤ ϵ ∧
ni ci ≤ cmax) then
BREAKend ifwindow.push(si)
end for
97

4. Framework for Comparative Assessments of Cloud Compute Services
4.6. Software Prototype implementing the ScoringMethod
The Hoopla software prototype aims at providing the necessary basis for compar-isons of compute service meta-data. The prototype is an instantiation of the (MC2)2
framework which is used for comparisons in the presented compute service assessmentframework.
The implementation of Hoopla is divided into one component providing a library thatimplements the AHP and into a web application which wraps the library and extends itwith a graphical user interface to support the comparison process.
Both, the library called AotearoaLib, following the name Aotearoa of an early (MC2)2
implementation, and the web application Hoopla are presented in the following subsec-tions. First, the library is presented that gives the decision-making basis and, then, theweb application is introduced.
AotearoaLib Library
The AotearoaLib library has been created to serve as a basis for later instantiations ofconcepts in the framework that incorporate decision-making and evaluation. The libraryis reused in a prototype to instantiate the stopping rule for automated benchmarkingwhich is presented in section 5.4.
AotearoaLib implements the AHP to support criteria hierarchies, pair-wise compar-isons, quantitative and qualitative criteria, and diverse index calculations. The libraryis implemented in Java and provides a programming interface to drive Decisions. Also,Decisions can be transmuted into DecisionTemplates for later reuse. Every Decisionconsists of two ordered lists that contain multiple Alternatives and at least one Goal.Each Goal spans a tree of criteria where a Goal has multiple Criterion children, againin an ordered list. Also, every Criterion can have multiple Criterion children. The de-scribed entities in the data model of the programming interface and their relations aredepicted as a UML class diagram in figure 4.11.
The programming interface furthermore includes the AnalyticHierarchyProcess classthat implements the evaluation logic of the AHP. A new process is started with provid-ing a Decision object in the constructor. The class discloses the method evaluate whichexpects a list of evaluation matrices as parameters. The matrices represent the results ofpairwise comparisons between the alternatives regarding the leaf criteria under a goalof the criteria hierarchy. The matrices list must be give in the order of the goals and leafcriteria in the ordered tree of Criterion objects. Additionally, the comparison matricesmust follow the order of the alternatives in the Decision object.
98

4.6. Software Prototype implementing the Scoring Method
NameDecision
NameWeight
Alternative
NameCriterionTypeLocalWeight
Criterion
NameGoalTypeLocalWeight
Goal
*
1
*1
Name
DecisionTemplate
*
1
2..*1
2..*1
Figure 4.11.: The AotearoaLib Data Model
Moreover, matrices can be defined to set the weights of the criteria. Alternatively, theweights can be defined in the data model. The entities Alternative, Goals, and Criterionpossess an attribute weight (or localWeight) that exposes this functionality.
To allow the use of matrices without manually creating multi-dimensional arrays, thelibrary employs the JAMA package [200] that provides constructs from linear algebraas Java classes. The matrices are not only used as an input parameter for evaluationmatrices, but also internally in value normalization using matrix multiplications and tocompute the AHP evaluation results in parallel threads.
The implementation of the AHP returns four result maps each mapping alternativesto normalized values. The four result maps comprise the calculated values of all al-ternatives regarding the positive goals, the negative goals, the additive index, and themultiplicative index.
A code example showing the general usage of the AotearoaLib programming interfaceis given in section B.1 in the Appendix.
Web Application
The Hoopla additionally provides a web application that comes with a graphical userinterface. While the AotearoaLib library allows developers to evaluate alternatives and
99

4. Framework for Comparative Assessments of Cloud Compute Services
apply the AHP, the web application exploits its user interface to guide decision-makersthrough a structured decision process.
An early-stage prototype was developed under the name Aotearoa. The premature ver-sion helped to collect requirements from users and evolve the Aotearoa prototype tothe Hoopla web application over multiple iterations. After conducting interviews withthe industry, the requirements became clear and the Hoopla was developed that extendsAotearoa with support for templates. From the interviews a first template for cloud in-frastructure decisions has evolved, which is due to the decision-makers involved in theinterviews.
The Hoopla has been developed on the Google AppEngine Platform [201] using theGoogle Web Toolkit (GWT) [202] to enable a rich graphical user interface. For com-plex and custom components, smartGWT [203] provides a a library of complex com-ponents. With the help of smartGWT, a complex criteria hierarchy input componentwas developed which allows to define and select criteria and sort them in a hierar-chy. The frontend serves a user with a graphical user interface and guides through thedecision-making process based on (MC2)2. The backend incorporates the aotearoaLibto manage data in a data model and to compute evaluation results using the AHP im-plementation. To persist the data model, the AppEngine datastore service is used. Toallow for user accounts in the system, the AppEngine user service is used. Figure 4.12illustrates the architecture of the AppEngine-based Hoopla web application.
AppEngine Platform
Hoopla Web Application
GWT Frontend Backend (aotearoaLib)
(MC2
)2
Process
AHP Implementation
DecisionData Model
GAE Datastore Service
GAE User Service
User
Figure 4.12.: The Hoopla Architecture
The web application reflects the process of (MC2)2 in its graphical user interface byfollowing a 7-step process. A user first starts a new Decision by assigning a name anddescription. Then, alternatives are defined in a subsequent step. In step 3, the goals andcriteria hierarchy can be created with a custom input component. For each goal andcriteria pairing derived from the hierarchy a user can specify the importance accordingto his preferences in step 4. A slider input component supports a [-10, 10]-Likert scale
100
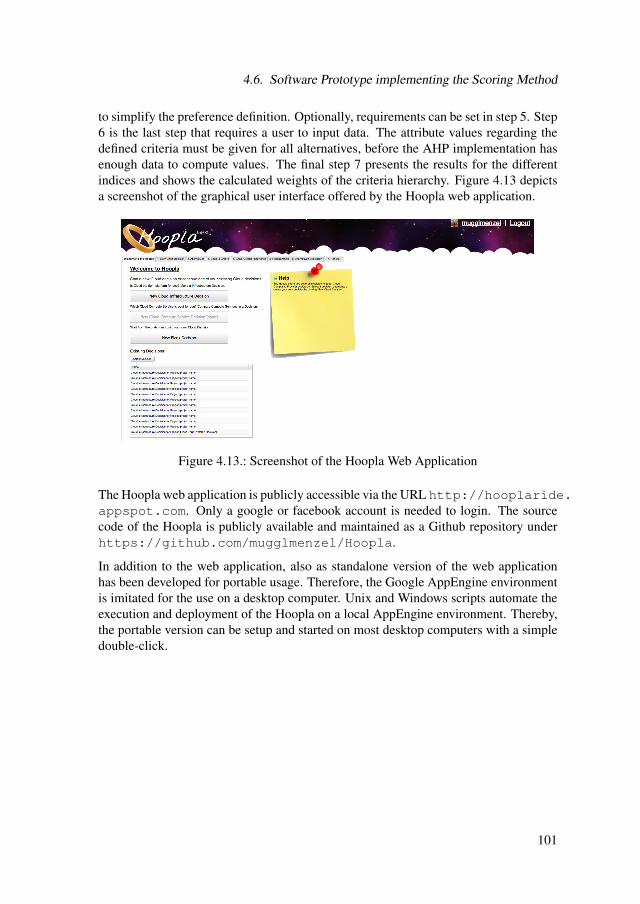
4.6. Software Prototype implementing the Scoring Method
to simplify the preference definition. Optionally, requirements can be set in step 5. Step6 is the last step that requires a user to input data. The attribute values regarding thedefined criteria must be given for all alternatives, before the AHP implementation hasenough data to compute values. The final step 7 presents the results for the differentindices and shows the calculated weights of the criteria hierarchy. Figure 4.13 depictsa screenshot of the graphical user interface offered by the Hoopla web application.
Figure 4.13.: Screenshot of the Hoopla Web Application
The Hoopla web application is publicly accessible via the URL http://hooplaride.appspot.com. Only a google or facebook account is needed to login. The sourcecode of the Hoopla is publicly available and maintained as a Github repository underhttps://github.com/mugglmenzel/Hoopla.
In addition to the web application, also as standalone version of the web applicationhas been developed for portable usage. Therefore, the Google AppEngine environmentis imitated for the use on a desktop computer. Unix and Windows scripts automate theexecution and deployment of the Hoopla on a local AppEngine environment. Thereby,the portable version can be setup and started on most desktop computers with a simpledouble-click.
101

4. Framework for Comparative Assessments of Cloud Compute Services
4.7. Evaluation of the MADM-based ScoringMethod
The MADM-based scoring method is the basis for comparisons of compute servicesaccording to meta-data attributes. The proposed method calculates a scoring valuewith an AHP-based aggregation of meta-data attributes to address research questionRQ1b:
RQ1b. Can MADM support the aggregation of multiple meta-data at-tributes into a subjective value for a compute service?
The implemented software prototype (c.f. section 4.6) asserts the feasibility of the scor-ing method concept. Furthermore, the scoring method approach has been evaluatedwith decision-makers from the industry in a case study. Interviews with the decision-makers give insights in the applicability of the approach, particularly in terms of per-ceived effort and trust. The software prototype and the case study have already beenpublished and discussed with peers in the research community [204].
In a comparison of meta-data attributes of multiple compute services, the approachinduces a certain computational complexity to determine the score of each computeservice. In research question RQ1c, the computational complexity is demanded to beexamined:
RQ1c. How is the computational complexity of using MADM to comparecompute services regarding meta-data?
The evaluation of the scoring method includes an analysis of the computational com-plexity. Specifically, a formal definition using the big O notation and experiments withthe software prototype shall lead to a response to RQ1c. Peers in the research commu-nity have already involved in a discussion about the computational complexity of thepresented AHP-based scoring method and its applicability in practice [205].
This section is divided into two subsections: the first subsection presents the resultsfrom interviews conducted with decision-makers in the industry. In the final subsection,an analysis of the computational complexity of the scoring method is driven and find-ings from experiments to verify the analytic examinations are presented. Particularly,the computational complexity is defined using the big O notation and then examined inexperiments concerning the influence of variable factors, such as the number of com-pute services, criteria, and criteria grouping. Also, insights in the time complexities inpractical scenarios with performance meta-data are given.
102

4.7. Evaluation of the MADM-based Scoring Method
4.7.1. Case Study with the Industry
To evaluate the suitability of the scoring method for decision-makers, interviews withactual users were to be conducted. Initially, suitable and available participants for acase study needed to be contacted. A research project in collaboration with TelekomLaboratories offered a platform to engage participants from the industry. One of theproject’s goals was the development of a scoring method in the cloud context.
After a web application (c.f. section 4.6) had been developed as a software prototype,participants were needed which would use the prototype in practice. The web appli-cation supports the definition of alternatives, goals & criteria hierarchies, and allowsusers to weight goals and criteria with Likert-scale sliders in pair-wise comparisons.From the given parameters, the AHP is followed by the software. With manually pro-vided attribute values, a scoring is calculated and presented to the decision-maker. Thepartner Telekom Laboratories invited suitable decision-makers from T-Systems, an in-ternational IT and communications technology provider, for participation. The webapplication was announced as prospective new software to support consulting projectswith customers.
The selection process for the study aimed for experts in favor of quantity. Consequently,the case study was conducted with two consultants from T-Systems who have manyyears of experience with consulting customers regarding IT infrastructure. Both par-ticipants invested several man-hours per week over several months to test the softwareprototype and participate in the study.
The participants have used the MADM web application to develop a scoring in an in-frastructure decision with the alternatives on-premise data center and T-Systems infras-tructure services. The case study resembles a frequent decision faced by the participantsin consultancy projects with customers of T-Systems. The two participants developeda goals & criteria hierarchy and applied a weighting. Also, attribute values originatingfrom active projects were fed to the web application to gain a scoring.
After the participants had finished testing the tool over several weeks, a qualitativesurvey was conducted to gain insights in the perceived quality of the approach. Astructured feedback form (c.f. chapter C in the appendix) prepared to conduct the surveywas discarded in favor of in-depth individual interviews [206]. The individual semi-structured and open interviews were carried out via telephone in 1-2 hour discussions.The topics of the semi-structured interviews are based on the structured feedback form.Particularly, the participants were asked for open feedback in the following resorts:
Transparency How transparent and comprehensible is the scoring process?
Effort/Speed How much time is consumed to arrive at a scoring?
Trust How much do you trust the correctness of the presented score?
103

4. Framework for Comparative Assessments of Cloud Compute Services
Both participants were confronted with the resorts and the according question. In theirresponse, they were free to describe their experiences with the tool and particularlypros and cons. Also, a comparison to the currently active decision-making or scoringprocess was a suggested part of the feedback.
The responses in the individual interviews after a case study with participants fromthe industry have been captured as written protocols. The following list represents anaggregation of the feedback provided by the case study participants:
Transparency Albeit the feature being yet absent in the software prototype, the ap-proach promises to allow a precise documentation of a decision. The participantsemphasized the possibility to recall the weight factors determined by a decision-maker to be an important characteristic. It allows to argument the reason of ascoring outcome and to drive a sensitivity analysis in iterations. However, theweights defined by the decision-maker should be presented in a comprehensibleform. The general transparency is perceived higher than in a decision withouttool support. The possibility to compare scores on a ratio scale has comforted theparticipants in their decision-making.
Effort/Speed The overall effort of scoring several alternatives is acceptable from theperspective of the participants. Over the case study, the participants learned thatthe criteria hierarchy heavily influences the later effort for a weighting of the cri-teria. The number of criteria and grouping in the hierarchy are factors to consider,when it comes to a reduction of the weighting effort. Also, filling out all attributevalues manually can become unbearable. The participants see a need to integratedata sources to feed attribute values automatically into the system.
Trust The participants explained that since the approach has a scientific backgroundand has been discussed in diverse works in the mathematical field, a trust in thecorrectness of the score is given. The participants expect a decision-maker to trustthe criteria hierarchy (and set of criteria) if both have been prepared by experts.
Over the in-depth interview, the participants stated that the approach is applicable tofind a scoring for alternatives and to support funded decisions. They expect the ap-proach to be used in addition to the current decision-making in industry projects. Pri-marily, the approach supports the currently made decisions with a number-orientedperspective. A Web application software prototype helps to explore past scorings and,thereby, allows a decision-maker to use the tool for documentation purposes.
In summary, research question RQ1b has partly been explored with decision-makersfrom the industry in a case study. Although the case study focuses on IT infrastructuredecisions, insights in respect of the applicability of the MADM-based approach couldbe gained. The overall results from in-depth interviews with industry experts indicatethat the approach provides a support to carry out a structured and funded scoring ofalternatives and facilitates comparisons. Given the participants are trusted industry
104
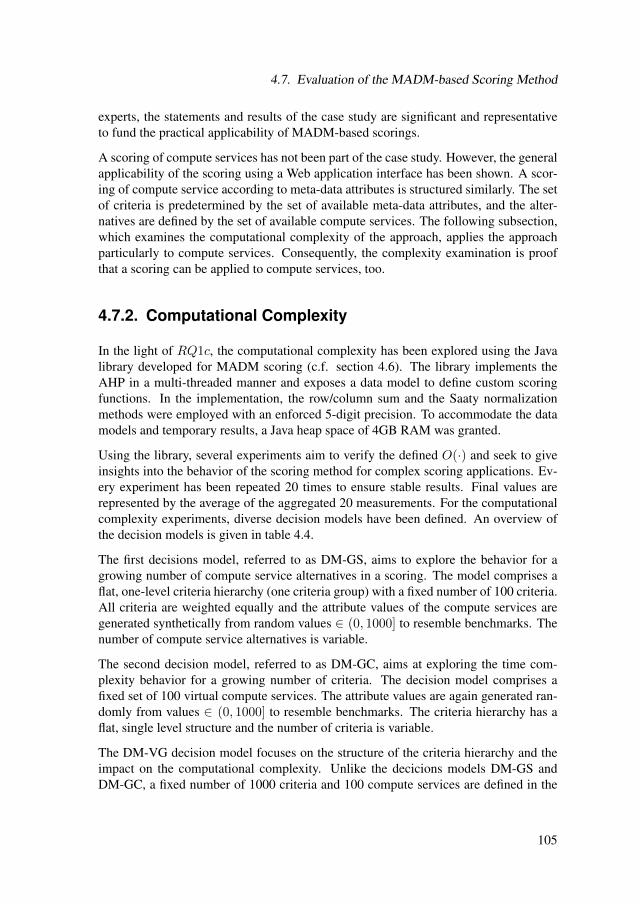
4.7. Evaluation of the MADM-based Scoring Method
experts, the statements and results of the case study are significant and representativeto fund the practical applicability of MADM-based scorings.
A scoring of compute services has not been part of the case study. However, the generalapplicability of the scoring using a Web application interface has been shown. A scor-ing of compute service according to meta-data attributes is structured similarly. The setof criteria is predetermined by the set of available meta-data attributes, and the alter-natives are defined by the set of available compute services. The following subsection,which examines the computational complexity of the approach, applies the approachparticularly to compute services. Consequently, the complexity examination is proofthat a scoring can be applied to compute services, too.
4.7.2. Computational Complexity
In the light of RQ1c, the computational complexity has been explored using the Javalibrary developed for MADM scoring (c.f. section 4.6). The library implements theAHP in a multi-threaded manner and exposes a data model to define custom scoringfunctions. In the implementation, the row/column sum and the Saaty normalizationmethods were employed with an enforced 5-digit precision. To accommodate the datamodels and temporary results, a Java heap space of 4GB RAM was granted.
Using the library, several experiments aim to verify the defined O(·) and seek to giveinsights into the behavior of the scoring method for complex scoring applications. Ev-ery experiment has been repeated 20 times to ensure stable results. Final values arerepresented by the average of the aggregated 20 measurements. For the computationalcomplexity experiments, diverse decision models have been defined. An overview ofthe decision models is given in table 4.4.
The first decisions model, referred to as DM-GS, aims to explore the behavior for agrowing number of compute service alternatives in a scoring. The model comprises aflat, one-level criteria hierarchy (one criteria group) with a fixed number of 100 criteria.All criteria are weighted equally and the attribute values of the compute services aregenerated synthetically from random values ∈ (0, 1000] to resemble benchmarks. Thenumber of compute service alternatives is variable.
The second decision model, referred to as DM-GC, aims at exploring the time com-plexity behavior for a growing number of criteria. The decision model comprises afixed set of 100 virtual compute services. The attribute values are again generated ran-domly from values ∈ (0, 1000] to resemble benchmarks. The criteria hierarchy has aflat, single level structure and the number of criteria is variable.
The DM-VG decision model focuses on the structure of the criteria hierarchy and theimpact on the computational complexity. Unlike the decicions models DM-GS andDM-GC, a fixed number of 1000 criteria and 100 compute services are defined in the
105

4. Framework for Comparative Assessments of Cloud Compute Services
decision model. The attribute values are generated synthetically with random values∈ (0, 1000]. The criteria hierarchy structure changes over the experiments.
Decision Model # of Criteria # of Compute Services # of Criteria Groups
DM-GS 100 variable 1DM-GC variable 100 1DM-VG 1000 100 variable
Table 4.4.: Decision Models used for Experiments
The first set of experiments explores the computational complexity in regards of thecompute service set and attributes set involved in the scoring. A second set of experi-ments researches the computational complexity concerning the grouping of criteria ina criteria hierarchy. Finally, results from experiments testing the time consumptionto compute a scoring for realistic numbers of compute services and attributes are pre-sented.
General Computational Complexity
The computational complexity of the MADM-based scoring method is related to thenumber of scored services in S, number of requirements in R, as well as the number ofcriteria (with linked attributes) in A. According to the big O notation, the O(·) of theAHP-based scoring method can be described as following:
O
|S| ∗ |R|
requirements check
+
|A|2
weights normalization
+ |A| ∗|S|2
value normalization
+ |A| ∗ |S| score calculation
The O(·) resembles the theoretical upper bound, whereas in practice, depending onthe implementation, the computational complexity can be lower than the O function.Specifically, as only a range of subsets of attributes must be normalized. When at-tributes are grouped within the hierarchy, only attributes under the same parent criterionor goal need to be compared.
Using the software library, the general computational complexity could be exploredin experiments based on the decision models DM-GS and DM-GC. For the decisionmodel DM-GS, the number of compute service alternatives is increased by additional100 virtual compute services in each iteration. In contrast, the decision model DM-GC fixes the number of compute service alternatives to 100 and increases the numberof criteria. In each iteration, 100 additional criteria and linked attribute values areintroduced to the criteria hierarchy. A requirements check is discarded in both modelsas it is optional in a scoring and would diminish the number of compute services.
106
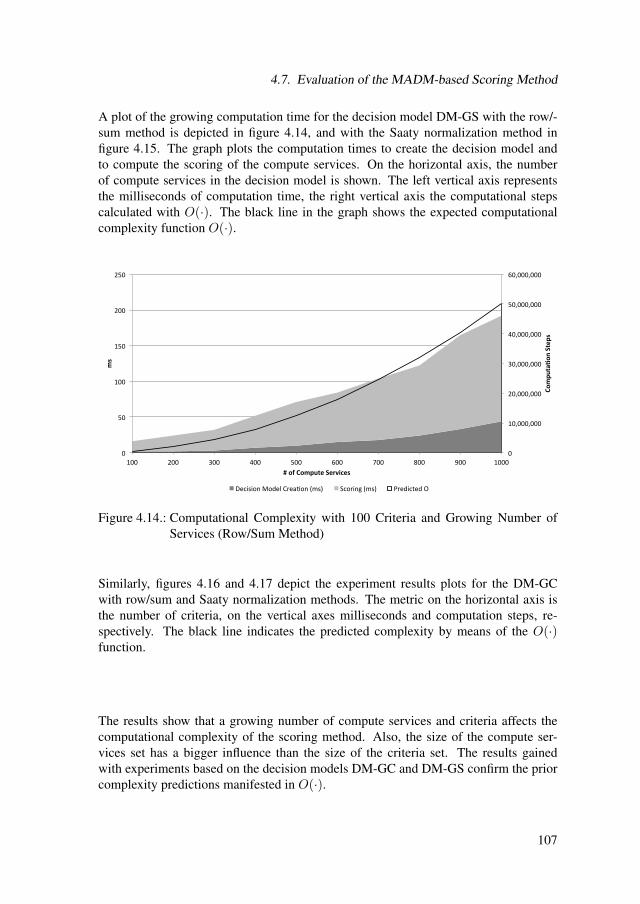
4.7. Evaluation of the MADM-based Scoring Method
A plot of the growing computation time for the decision model DM-GS with the row/-sum method is depicted in figure 4.14, and with the Saaty normalization method infigure 4.15. The graph plots the computation times to create the decision model andto compute the scoring of the compute services. On the horizontal axis, the numberof compute services in the decision model is shown. The left vertical axis representsthe milliseconds of computation time, the right vertical axis the computational stepscalculated with O(·). The black line in the graph shows the expected computationalcomplexity function O(·).
0
10,000,000
20,000,000
30,000,000
40,000,000
50,000,000
60,000,000
0
50
100
150
200
250
100 200 300 400 500 600 700 800 900 1000
Compu
ta(o
n Step
s
ms
# of Compute Services
Decision Model Crea:on (ms) Scoring (ms) Predicted O
Figure 4.14.: Computational Complexity with 100 Criteria and Growing Number ofServices (Row/Sum Method)
Similarly, figures 4.16 and 4.17 depict the experiment results plots for the DM-GCwith row/sum and Saaty normalization methods. The metric on the horizontal axis isthe number of criteria, on the vertical axes milliseconds and computation steps, re-spectively. The black line indicates the predicted complexity by means of the O(·)function.
The results show that a growing number of compute services and criteria affects thecomputational complexity of the scoring method. Also, the size of the compute ser-vices set has a bigger influence than the size of the criteria set. The results gainedwith experiments based on the decision models DM-GC and DM-GS confirm the priorcomplexity predictions manifested in O(·).
107

4. Framework for Comparative Assessments of Cloud Compute Services
0
10,000,000
20,000,000
30,000,000
40,000,000
50,000,000
60,000,000
0
20,000
40,000
60,000
80,000
100,000
120,000
140,000
100 200 300 400 500 600 700 800 900 1000
Compu
ta(o
n Step
s
ms
# of Compute Services
Decision Model Crea:on (ms) Scoring (ms) Predicted O
Figure 4.15.: Computational Complexity with 100 Criteria and Growing Number ofServices (Saaty Method)
0
1,000,000
2,000,000
3,000,000
4,000,000
5,000,000
6,000,000
0
20
40
60
80
100
120
100 200 300 400 500 600 700 800 900 1000
Compu
ta(o
n Step
s
ms
# of Criteria
Decision Model Crea:on (ms) Scoring (ms) Predicted O
Figure 4.16.: Computational Complexity with 100 Compute Services and GrowingNumber of Criteria (Row/Sum Method)
Effect of Criteria Grouping
Apart from the set of compute services and the set of attributes that affect the compu-tational complexity, the structure of the criteria hierarchy may have an influence on thecomputational complexity, too.
108

4.7. Evaluation of the MADM-based Scoring Method
0
1,000,000
2,000,000
3,000,000
4,000,000
5,000,000
6,000,000
0
200
400
600
800
1,000
1,200
100 200 300 400 500 600 700 800 900 1000
Compu
ta(o
n Step
s
ms
# of Criteria
Decision Model Crea:on (ms) Scoring (ms) Predicted O
Figure 4.17.: Computational Complexity with 100 Compute Services and GrowingNumber of Criteria (Saaty Method)
A closer analysis of the pair-wise comparisons involved in a score calculation revealsthe influence of the criteria hierarchy and particularly grouping of criteria. While asingle-group hierarchy implicates
|A|2
pair-wise comparisons during a normalization,
a hierarchy with g groups leads to pair-wise comparisons described by the followingexpression:
gi=1
|Ai|2
+
g
2
with
gi=0
Ai = A
With g criteria groups, the O(·) needs to be adjusted to the following:
O
|S| ∗ |R|
requirements check
+(
gi=1
|Ai|2
+
g
2
)
weights normalization
+ |A| ∗|S|2
value normalization
+ |A| ∗ |S| score calculation
To explore the effect of criteria groups, experiments were conducted that stress the soft-ware library with different hierarchy structures. A static number of compute servicesand attributes in the experiments permits to observe only the effect of criteria groups.
For the experiments, the decision model DM-VG provides the basis with a set of 100compute services and 1000 criteria. The row/sum method is used for normalizations.The experiments distinguish in their focus on the criteria hierarchy structure from the
109

4. Framework for Comparative Assessments of Cloud Compute Services
earlier experiments. Particularly, the effect of grouping criteria in subsets of diversesizes under a goal in the criteria hierarchy is explored.
In each iteration, the number of criteria groups and, thereby, the number of criteriawithin a group is altered. Thereby, the number of pair-wise comparisons to normalizethe attribute values linked to criteria in a group is affected.
Figure 4.18 depicts the results from the experiments. The horizontal axes reflect thegrowing number of criteria within a group and the total number of criteria groups in thehierarchy, respectively. The metrics used on the vertical axes are milliseconds for themeasured computation times and computation steps for the predicted O.
1000 500
334
250
200
167
143
125
112
100
50
34
25
20
17
15
13
12
10
5 4 3 2 2 2 2 2 1
0
200,000
400,000
600,000
800,000
1,000,000
1,200,000
0
50
100
150
200
250
300
350
400
450
1 2 3 4 5 6 7 8 9 10
20
30
40
50
60
70
80
90 100
200
300
400
500
600
700
800
900 1000
# of Criteria Groups
Compu
ta0o
n Step
s
ms
# of Criteria per Group
Decision Model Crea:on (ms) Scoring (ms) Predicted O
Figure 4.18.: Computational Complexity with 100 Compute Services, 1000 Criteriaand Growing Group Size
The experiment results shed light on the effect of criteria groups. As the results show, asweet spot exists for the criteria group sizing. Also, the most extreme settings with onegroup for all criteria or a single group per criterion have a maximum negative effect onthe computational complexity.
Computation Times in Practice
Aside the experiments concerning the computational complexity, an experiment to ac-quire computation times for realistic scenarios has been carried out. Using the decisionmodel DM-GC as a basis, this experiment measures the computation times for varyingnumber of criteria and compute services. The relevant scenarios selected for the mea-surements are combinations of compute services and criteria sets with 5, 10, and 20items. The numbers align with the sizes of CloudHarmony Summary Benchmark sets
110

4.7. Evaluation of the MADM-based Scoring Method
[139] and the OpenBenchmarking.org test suites [207] and, thus, resemble exemplarybut realistic scenarios of performance meta-data comparisons.
As observed in first test runs of the experiment, high variations occur due to smallcomputation times of under 1 ms and overhead from java classes used in the softwarelibrary. Therefore, the number of repetitions has been increased to 10,000 to guaranteereliable results.
Table 4.5 lists the observed computation times for realistic criteria and compute ser-vice set sizes. In addition, table 4.6 lists the results for the Saaty normalization methodinstead of the row/sum method. The computation times comprise the creation of thedecision model and the evaluation using the AHP implementation in the software li-brary.
Criteria/Compute Services 5 10 20 30
5 0.46 ms 0.51 ms 0.53 ms 0.80 ms10 0.99 ms 0.97 ms 1.14 ms 1.26 ms20 1.58 ms 1.76 ms 2.25 ms 2.13 ms30 1.74 ms 1.91 ms 2.21 ms 2.61 ms
Table 4.5.: Computation Times in 4 Realistic Scenarios (Row/Sum Method)
Criteria/Compute Services 5 10 20 30
5 0.43 ms 0.49 ms 0.58 ms 0.83 ms10 0.83 ms 0.92 ms 1.13 ms 1.47 ms20 1.47 ms 1.64 ms 1.97 ms 2.63 ms30 1.53 ms 1.86 ms 2.49 ms 3.60 ms
Table 4.6.: Computation Times in 4 Realistic Scenarios (Saaty Method)
As the results in tables 4.5 and 4.6 reveal, the computation times in realistic scenarioswith 5-30 compute services and criteria are rather neglectable. Even with the morecomplex Saaty normalization method, times do not exceed 3.6 ms for realistic scenar-ios. In a comparison of compute services according to diverse meta-data attributes, ascoring can be gained almost instantaneously.
111


Part III.
Instantiation
113


5. Assessments of ComputeService Performance atRun-time
In this chapter, an approach for assessing and comparing cloud compute services ac-cording to performance is introduced. The approach describes how performance bench-marks can be applied to capture performance attributes of diverse compute services.
Moreover, the scoring method is employed with the Analytic Hierarchy Process to ag-gregate multiple performance attributes into a score to compare compute services. Thescoring method is further used to build a utility function in a stopping rule. Thereby,measurements can be conducted under a cost budget in a stopping rule approach. Figure5.1 summarizes the models and methods used from the framework.
MADM-based Scoring Method
Cost Budget Stopping Rule
Meta-Data Model
Run-time Assessment Automation Model
Figure 5.1.: The Framework’s Models & Methods used for Performance Assessment
The diverse contributions regarding run-time assessments of compute services’ perfor-mance presented in this chapter are the following:
Automated Performance Benchmarking
115

5. Assessments of Compute Service Performance at Run-time
The concept of automated performance benchmarking of compute services with rep-etitions and scheduling orients on the framework’s automation model and extends theframework’s meta-data model for its purposes. Particularly, an extension of the com-pute service assessment framework’s meta-data model is introduced to attach perfor-mance meta-data, gained from benchmarks, to compute services. To realize an automa-tion of performance benchmarks, the automation model of the framework is extendedand adapted to execute benchmarking software as assessment task. Furthermore, userparameters defined in the Roadmap Definition Language provide means to define repe-titions and to schedule start times for automated performance measurement runs.
Scoring & Comparisons
Assessed performance attributes allow for comparisons between competing computeservices. Using the benchmarking results from the extended meta-data model, computeservices can be compared in multiple dimensions of benchmarks, e.g., concerning theresult of a LINPACK or a Whetstone benchmark. A single-dimensional value on a ratioscale comforts comparisons and a sorting of compute services according to the entiretyof benchmarking results captured. The framework’s scoring method using MADM,specifically the AHP, is employed to realize a mapping of multiple benchmarking re-sults to a comparable, single-dimensional score.
Stopping RuleBesides, costs accrue by leasing compute service resources over the time span of a per-formance benchmarking. For performance measurements, the framework’s stoppingrule is configured to enforce a cost budget and exploit priorly known hardware figuresof compute services.
This chapter is structured as follows: first, a method to automate, schedule and repeatcompute service performance benchmarking is introduced in section 5.1. Then, section5.2 explains how the framework’s scoring method can be employed using the meta-data gained from the measurement method. Besides, an adaption of the framework’sstopping rule with cost budget is presented in section 5.3.
Finally, a software prototype implementing the automated performance measurementmethod and the stopping rules is introduced in section 5.4 to proof the feasibility ofthe concepts. Using the software prototype, evaluations of the automated performancebenchmarking method and the stopping rule are carried out in sections 5.5 and 5.6. Ex-periments validate the capabilities of the automated performance benchmarking methodand explore its promptitude. An evaluation of the stopping rule proofs its ability to en-force a cost budget and shows its advantages over standard stopping rules.
116

5.1. Automated Performance Benchmarking of Compute Services
5.1. Automated Performance Benchmarking ofCompute Services
The assessment of a compute service’s performance can be achieved in distinct ways.The performance of a system can be analyzed in a simulation and emulation, or canbe measured in-situ and with benchmarking (c.f. section 2.2.1). For compute services,generating a system model appears an unnecessary act generating overhead since thereal system, the compute service, can be accessed via APIs with small effort.
In regards of workloads, compute services can be monitored and measured under realworkloads (in-situ) or with synthetic workloads with benchmarking. To gain in-situresults, a software application with a monitoring component would be needed that isstressed with workloads from users or a workload generator. A benchmarking approachgenerates a synthetic workload with small software programs without preparation ef-forts. Measurements with benchmarking, hence, can be conducted with less effort andare the approach pursued in this work.
The basis for an assessment of performance attributes of compute services is the novelautomated performance benchmarking method presented in this section. For that mat-ter, particularly the aspect of heterogeneity in compute service performance quality isof interest. To address that aspect, scheduling of performance measurements in regardsof time frames and frequency is incorporated in the method.
Automated Performance Benchmarking Procedure
Process Model
Meta-Data Model
Roadmap Definition
Language
Compute ServicesCompute Services
Figure 5.2.: Overview of the Automated Performance Benchmarking Method
As part of the method, a procedure to execute automated measurements is presentedwhich builds upon the automation model of the assessment framework (c.f. section
117

5. Assessments of Compute Service Performance at Run-time
4.3). Furthermore, a Roadmap Definition Language is introduced to describe perfor-mance measurement schedules and repetitions. Besides, an extension of the meta-datamodel to persist measurement results and roadmap definitions is described. Moreover,a process model that leads consumers through the planning and execution of assessmentwith the method is introduced.
From the process model a consumer defines parameters expressed in a roadmap defi-nition in the data model and hands it to the automated benchmarking procedure. Theprocedure considers the parameter and conducts benchmarking runs of the selectedcompute services accordingly. The results are then persisted in the data model and be-come available to the consumer. Figure 5.2 depicts the parts of the method and theirinteractions.
This section is structured as follows. First, the procedure, which bases on the frame-work’s automation model, is explained. Then, with the procedure in mind the aspects ofrepetition and result aggregation are discussed and the Roadmap Definition Languageis introduced. Following, the extended meta-data model is presented which, aside frombenchmarking results, can hold definitions in the priorly introduced Roadmap Defini-tion Language. The process model then guides a consumer in his interactions with theprocedure and data model within the method. Finally, diverse aspects of the approach,such as costs and limitations, are discussed.
5.1.1. Automated Performance Benchmarking Procedure
While performance benchmarks have already been adapted for compute services (c.f.chapter 3), a method to automate and aggregate compute service measurements overtime is novel. An automation of performance measurements calls for a procedure thatincorporates an execution of benchmarks on compute services without user interaction.This subsection presents a procedure that builds upon the blueprint automation modelcontained in the framework presented in section 4.3.
The original procedure blueprint must be extended to meet a range of requirementsto fit the context of automated compute service measurements. For measuring multi-ple compute service targets regarding diverse characteristics with various schedules, away to parameterize the measurement procedure must be in place. Initially, the set ofcompute services and benchmarks to consider for measurements need to be defined.Furthermore, to level out heterogeneity in a compute service’s hardware and averagemultiple measurements, a schedule of multiple measurement phases must be definable.As past measurements verified, only a range of measurements over multiple time spanscan guarantee enough data to gain meaningful results.
Multiple components are involved in the procedure of measuring compute services withperformance benchmarks. Figure 5.3 illustrates the components involved in the proce-dure of the automated performance measurement approach.
118

5.1. Automated Performance Benchmarking of Compute Services
Compute Service 1
Virtual MachineAutomated Benchmarking
Coordinator
User Roadmaps &
Results Store
Multi-Cloud Interface
Benchmark Repository
Virtual Machine
Compute Service N
Virtual MachineVirtual Machine
...
download benchmarks
inject script
upload results
Scheduler
User Interface
read/write
Executor
Figure 5.3.: Overview of the Automated Performance Measurement Procedure
The main component for automated measurements, the Automatic Benchmarking Co-ordinator, coordinates benchmarks according to user preferences using a multi-cloudinterface. With an included Scheduler component, performance benchmarks can berepeated over time given scheduling rules. Executable benchmarking software is main-tained in a Benchmark Repository that is accessible publicly and, therefore, also fromany compute service.
In order to define parameters, a user interface allows to define roadmaps, which sched-ules measurements of a selection of compute services with a set of benchmarking soft-ware. Roadmaps as well as results can be stored and retrieved from the User Roadmaps& Results Store.
Given the roadmaps defined by a user, the main component coordinates a measurementtriggered by the scheduler. Then, by using the Multi-Cloud Interface component, a vir-tual machine at each selected compute service is instantiated. Access to the machinevia remote protocols like SSH enables an injection of scripts that download and exe-cute the set of benchmarking software. Finally, the results of a benchmarking run areuploaded to the Results Store.
The data model to store user preferences and results in the User Roadmaps & ResultsStore is introduced in section 5.1.3. The process model, which describes the interactionof the user and the components in detail, is presented in section 5.1.4.
119

5. Assessments of Compute Service Performance at Run-time
5.1.2. Repetitions and Benchmarking Result Aggregation
The procedure introduced in the previous section provides means to automatically con-duct performance measurements and, thereby, assess compute service performancemeta-data. Such measurements can even be collected over long time spans usingroadmaps. With repetitions of a measurement, the confidence that the measured valueis accurate can be assured. In compute services, a variability between multiple mea-surements is expected due to a non-deterministic behavior caused by environmentalinfluences, such hardware upgrades or varying simultaneous workload from multipleconsumers [13, 80]. One particular influence is the fact that a VM provided by theservice shares physical resources with other consumer’s VMs . Although the virtual-ization layer aims to allocate resources to certain VMs, an interference can often not beeliminated [30].
The influences can change over time, depending on the resource usage of other con-sumers. During periods of high demand, resources may see a high utilization by con-sumers. For example, web servers on compute services may be accessed more fre-quently in the evening, or servers hosting online shops are facing high workloads in themonth before holidays.
The following subsections address the need to repeat performance measurements overtime and present functions to aggregate multiple measurements. First, the roadmap def-inition language is introduced to allow consumers a definition of benchmarking sched-ules. Furthermore, the aspects of variability, repetitions and the aggregation of multiplebenchmarking results are discussed.
Roadmap Definition Language
The present approach introduces roadmaps to capture external influences over time.While measurements can be spread and repeated over months or years, variations inperformance benchmarking results can also occur within short time spans. Therefore,the approach supports a definition of repetitions on different levels of a roadmap. Figure5.4 illustrates the levels of a roadmap that allow for repetitions.
While the two upper levels aim to cover repetitions over years, months and days, thelower level aims at subsequential repetitions within minutes or seconds. The illustratedstructure reflects the components of a roadmap. Within the approach, a roadmap isan entity that contains all information to define repetitions of performance measure-ments.
To define a roadmap, multiple roadmap entries can be defined in a scheduling languagecalled roadmap definition language. The language includes concepts to define repeti-tions on all levels, and to reference previously defined benchmarking sets
120

5.1. Automated Performance Benchmarking of Compute Services
Benchmark 1
Execution
Benchmark n
Execution
Roadmap Entry 1 Execution
Roadmap 1 Execution
Roadmap Entry n Execution
Benchmark 1
Execution
Benchmark n
Execution
Repetitions
...
... ...
Legend:
Figure 5.4.: Available Levels to Induce Repetitions
The syntax of the roadmap definition language is a derivation of the format used inthe Unix cron job scheduler. The grammar of the roadmap definition language can beexpressed in Backus-Naur-Form as follows:
121

5. Assessments of Compute Service Performance at Run-time
⟨roadmap entry⟩ |= ⟨time⟩ ⟨days⟩ ⟨months⟩ ⟨repeat⟩ ⟨identifiers⟩ ⟨metrics⟩
⟨time⟩ |= ⟨minutes⟩ ⟨hours⟩⟨days⟩ |= ⟨days of month⟩ ⟨days of week⟩
⟨months⟩ |= ∗ | ∗/⟨month⟩ | ⟨month⟩⟨repeat⟩ |= ⟨repeat entry⟩ ⟨repeat benchmarks⟩
⟨identifiers⟩ |= ⟨benchmark set⟩ ⟨CS set⟩⟨metrics⟩ |= ⟨aggregation function⟩ ⟨variation metric⟩
⟨minutes⟩ |= ∗ | ∗/⟨minute⟩ | ⟨minute⟩⟨hours⟩ |= ∗ | ∗/⟨hour⟩ | ⟨hour⟩
⟨days of month⟩ |= ∗ | ∗/⟨day of month⟩ | ⟨day of month⟩⟨days of week⟩ |= ∗ | ∗/⟨day of week⟩ | ⟨day of week⟩⟨benchmark set⟩ |= benchmark set identifier
⟨CS set⟩ |= compute service set identifier
⟨aggregation function⟩ |= harmonic | geometric | max | min⟨variation metric⟩ |= standard deviation | Coefficient of Variation
⟨minute⟩ |= 0 . . . 59⟨hour⟩ |= 0 . . . 23
⟨day of month⟩ |= 1 . . . 31⟨day of week⟩ |= 0 . . . 6 | Mon . . . Sun
⟨month⟩ |= 1 . . . 12⟨repeat entry⟩ |= 0 . . . 99
⟨repeat benchmarks⟩ |= 0 . . . 99
Like the cron syntax, the roadmap definition language incorporates the use of wildcards(*) to facilitate scheduled repetitions. Every roadmap entry can have a fixed number or awildcard for the minutes, hours, day of month (or day of week), and months parameter.A fixed number leads to an execution at that specific point. For example, when settingthe first parameters as "1 1 1 1 1" the scheduler will run the benchmarks on 01:01hat 1st January if it is a Tuesday. With wildcards, the execution is processed for everyvalue of that parameter. For example, when setting the first parameters as "* * * * *"the scheduler will run the benchmarks every minute of every hour at every day of everymonth at any weekday.
122

5.1. Automated Performance Benchmarking of Compute Services
Additionally, the number of repetitions for benchmark execution and entry executioncan be defined. The number of benchmark repetitions defines how often each bench-mark in a benchmark set is repeated during the execution. The number of entry rep-etitions determines how many consecutive executions of the roadmap entry are trig-gered.
Variability, Repetitions and Aggregation
To gain representative data using roadmaps, the defined number of repetitions needs tobe sufficing. At the same time, the more measurements are made the higher the resourcecosts and efforts. This leads to the questions how many measurements must be made atleast.
The variability of a system’s performance behavior can be expressed by the variance ofa measured sample, represented by s2. If the distribution of the performance variabilityis known beforehand, the number of necessary measurements to guarantee a certainaccuracy can be determined. Given a system’s performance variability with mean µand variance s2 in a normal distribution, the minimal sample size n can be calculatedin regards of the required confidence [31].
The demanded accuracy must be defined as r in percent, e.g., 5%. Additionally, anallowed chance of error α must be defined as the confidence level 100(1−α). Given α,the confidence interval is determined by the allowed chance of error in the left part ofequation 5.1. The z-score of a 100(1−α) confidence level can be found by referring toz-score tables. Given the required r, the according confidence interval can be calculatedusing the right part of equation 5.1.
x± z100(1−α)s√n= x(1± r
100) (5.1)
Equation 5.1 is the basis to determine the minimal size of a sample n. To achieve acertain accuracy r and chance of error α, equation 5.1 can be transformed into equation5.2.
n = (100sz100(1−α)
rx)2 (5.2)
Without prior knowledge of a system’s performance variability, the minimal size of thesample can only be determined iteratively. Then, benchmarking may continue untilthe results undercut a certain boundary of the sample standard deviation (s), e.g., 0.03.A s-boundary has the advantage that it can be formulated in the same metric as themean.
123
5. Assessments of Compute Service Performance at Run-time
Aside from s boundaries, limits can also be expressed for the Coefficient of Variation(CV). The CV is dimensionless and allows to express a boundary independently fromthe metric used in a measurement. Equation 5.3 defines the CV regarding the mean µand standard deviation σ (or s for samples).
CV =σ
µ(5.3)
Independently from requirements in terms of accuracy, there should always be a fixedmaximum of repetitions to restrain effort and resource costs. If the variability of theresults pertain, further benchmarking will not improve the accuracy and measurementscan be stopped. The variability of the system must be accepted and captured using thestandard deviation s or the CV.
The set of benchmark results originating from multiple repetitions, however, needs tobe converted into a single value. As results from repetitions are all expressed in theidentical metric, an aggregated value can be drawn from averaging functions. For that,the geometric and harmonic means, amongst others, can be applied.
5.1.3. Data Model for Roadmap Scheduling andMeasurement Results
In order to retain gathered benchmarking results and to define benchmarking tasks, theframework’s meta-data model is refined to the needs. The data model defines whichdata is relevant to the automated benchmarking procedure. Also, it describes the struc-ture to guarantee a uniform access to data for the components involved in the automatedbenchmarking procedure. A UML class diagram representation of the data model is de-picted in figure 5.5.
To embrace the definition of benchmarking tasks, the data model incorporates entitiesof the type Roadmap and the related type Roadmap Entry. A roadmap comprises a setof roadmap entries and is owned by a User. Every entry consists of a Benchmark Setand a Compute Service Set which are combined with a Schedule.
Benchmark and compute service sets can be referenced with an identifier. The identifiersimplifies the process of defining roadmap entries via the user interface component.Using the identifiers, a roadmap entry can be composed from a compute service set anda benchmark set identifier, and a schedule expressed in a text format (see section 5.1.4).Consequently, a roadmap entry defines at which time certain compute services must bemeasured with benchmarking software.
A set of benchmarks is described by an identifier and comprises a list of benchmarkingsoftware represented by Benchmark entities. Each benchmark entity has a name anda metric. Similarly, a set of compute services has an identifier and incorporates a list
124

5.1. Automated Performance Benchmarking of Compute Services
Provider: StringHardwareConfigShort: StringCPUCores: IntegerRAMSpace: IntegerHardDiskSpace: IntegerArch: StringLocation: String
Compute Service
Identifier: StringCompute Service Set
Identifier: StringBenchmark Set
Name: StringMetric: String
Benchmark
Value: DoubleDeviation: Double
Benchmarking Result
Roadmap Entry
Roadmap
*
1
*
1
1
1
*
1
*
1
1
1
1
1
1
1
Timestamp: DateRoadmap Entry Run
*
1
ScheduleMonth: IntegerDayOfWeek: IntegerDayOfMonth: IntegerHour: IntegerMinute: Integer
*
1
Name: StringUser
*
1
AccessKey: StringSecretKey: String
Credentials*
1
1
1
Figure 5.5.: Data Model of the Automated Performance Benchmarking Method
of compute services. A Compute Service is defined by a hardware configuration, alocation, and optionally a short name as a label for the hardware configuration. Besides,a user can attach Credentials to each compute service which is required for automatedaccess through the multi-cloud interface component.
Aside from benchmarking task definitions, the data model is capable of capturingbenchmarking results. Roadmap entries will lead to the execution of benchmarkingsoftware on compute services which produces a measured values. For every combina-tion of a benchmarking software executed on a compute service, a value needs to beretained.
In addition, it must be possible to relate a measured values to a roadmap entry. There-fore, upon execution of a roadmap entry, a Roadmap Entry Run entity with a timestampcan be added to the data model. For every recorded run, measured values can be storedas Benchmarking Result entities. The results are each in relation to a roadmap entry run,thus, allowing to relate results to a timestamp and roadmap of a user. This enables theaccess and an aggregation of the performance meta-data gained from the benchmarkingprocess.
125

5. Assessments of Compute Service Performance at Run-time
5.1.4. Process Model for Using the AutomatedBenchmarking Procedure
For using the performance measurement procedure, an extended view that involves aconsumer describes preparation steps and sets them in context of the automated mea-surements. Aside from steps performed by a compute service consumer, a system im-plementing the procedure is involved. A representation of the process model in BPMN[208] is depicted in figure 5.6.
Figure 5.6.: User Involvement in an Automated Benchmarking Process
The process model reflects the two participating parties in an automated performancemeasurement of compute services: (1) a user with the intend to gain performance re-sults, (2) an implementation of the measurement procedure. On the user-side, stepsincorporate parametrizing the system to have it measure compute services with thebenchmarks of interest to the user. In conjunction, on the system side, an implementa-tion of the procedure executes measurements according to the user’s parameters. Thefollowing subsections describe the steps involved in the measurement process in moredetail.
Requirements and Targets Definition
Initially, the goals of a performance measurement need to be defined. Requirements forcompute services, such as only compute services in Europe or only 64-Bit platforms,help to determine the set of compute services later on. In parallel, requirements forbenchmarks, such as floating point metric or memory random write metric, help todetermine suitable benchmarks. Additionally, rules regarding the frequency and periodof measurements need to be clarified, e.g., every 4 weeks or Monday to Friday at 12amand 4pm. The rules are the basis to define a roadmap to schedule measurements.
126
5.1. Automated Performance Benchmarking of Compute Services
Compute Service Set
Given a list of supported compute services a subset needs to be filtered out which ad-heres to the requirements defined priorly. Apart from the requirements, costs play asignificant role in the definition of the compute service set. Every measurement impliescost for the use of the particular compute services differing in prices. Hence, the sizeof the set should fit the budget available for measurements.
Besides, the compute services included in the set can be selected by numerous criteria,depending on the preferences and goals of the consumer. Criteria like required mini-mum hardware configurations and locations of the hardware used in a compute service.In the end, a set of compute services from various providers must be defined. Everycompute service is defined by a provider, a provider-specific identifier, and a provider-specific location. For example, a compute service could be defined by "Amazon EC2","m2.xlarge", and "us-east-1". A user can be supported in the definition with lists ofvalid values.
To grant access to compute services, a user must give his consumer credentials to thesystem. Typically, a SSH key is needed to remotely access machines. Besides, anauthentication token (typically a pair of an access key and a secret key) is required toaccess the API of a provider for a user. Using the API, the benchmarking approach caninstantiate new VMs for measurements or access existing machines.
Benchmark Set
In parallel to the compute service set, the set of benchmarks to conduct on the computeservices needs to be defined. The set should respect the requirements formulated in thefirst step. Again, since benchmarks are not executed in parallel on a single machine, thecost for the use of the compute service increases with every benchmark. Depending onthe pricing precision – by second, hour or day –, the number of benchmark executionsfitting in a segment varies. In case of significant deviations between benchmarkingrounds, the duration of a benchmarking execution, and hence the cost, becomes unpre-dictable.
Roadmap Definition
In order to observe performance attributes over a certain time span, a roadmap needsto be be defined. A roadmap represents a manual schedule of benchmarking runs withperiodical repetitions. In order to define a roadmap, the planned repetitions must be ex-pressed in the roadmap definition language (c.f. section 5.1.2). The formulated sched-ule statements set the frequency of repetitions for the execution of a set of benchmarks
127

5. Assessments of Compute Service Performance at Run-time
on a set of compute services. Also, the number of repetitions of a benchmark set andeach benchmark can be defined.
To decrease the length of a statement, a priorly defined set of benchmarks and set ofcompute services can be referenced via identifiers. The benchmark set and computeservice set identifiers declare which benchmarks to run on which compute services.The sets have been defined in the previous steps.
To express complex schedules, multiple entries for the same benchmark and computeservice set can be created. In addition, the use of extended wildcards (i.e., */[expression])allows to define repetitions explicitly. For example, when setting the first parametersto "*/5 * * * *" an execution for every five minutes is scheduled. Following moreexamples of roadmap entries with valid syntax:
• */15 * * * * benchmark-set-1 compute-service-set-7
• 0 12 * * * benchmark-set-3 compute-service-set-2
Roadmap Scheduling
The scheduler considers roadmap entries made available in the user roadmaps database(cf. figure 5.3). Based on the database entries, the scheduler derives a schedule orderand when to trigger a benchmarking run. The scheduling timeline is divided into oneminute segments, which is the smallest unit possible in the roadmap definition lan-guage. Every minute, the schedule queue is consulted to find out if roadmap entries arescheduled for execution. If the next entry is to be executed in the current minute, theexecution of a roadmap entry takes place.
Roadmap Execution
In the execution phase, a roadmap entry is handed over from the scheduler to the ex-ecutor component. The executor initiates an automated benchmarking process whichexecutes a benchmarking suite on a Virtual Machine. Once the benchmarking suitefinished its measurements, the executor component terminates the process.
From a roadmap entry, the compute service set identifier leads to the compute servicesconsidered by the executor. For every compute service, a VM is instantiated via themulti-cloud interface. Using given SSH keypairs, the machine can be accessed andprepared by the executor.
Once a connection to the instantiated VM has been established, a benchmarking suitecan be compiled using the benchmark set identifier. Therefore, the benchmarks in-cluded in the defined benchmark set are downloaded from the benchmark repositoryand compiled into a benchmarking suite.
128

5.1. Automated Performance Benchmarking of Compute Services
The benchmarking suite can then be executed as a single program to conduct measure-ments. After the benchmarking suite has finished, the measurement results need to beuploaded to the user roadmap & results store. Ultimately, the executor is signaled thetermination of the benchmarking and ends the process. Therefore, the VM is stoppedvia the multi-cloud interface.
Depending on the implementation, multiple compute services are measured in parallelor subsequently. Roadmap entries scheduled at the same time should be processed inparallel.
Result Evaluation
Ultimately, the user can access collected performance meta-data from the benchmark-ing process via the results store. The user interface can provide raw data downloadsand include graphical visualizations for the benchmarking results, such as histogramcharts or tables. Using the collected meta-data, a user can conduct further analysis orincorporate the benchmark results in decisions.
5.1.5. Costs, Timeliness & Target Audience
The costs for the benchmarking primarily accrue from leasing machines from the com-pute services. The Amazon Web Services (AWS) EC2 compute services, for example,charge between $0.01 and $7 per hour per VM. Depending on the number of bench-marking scripts, one or multiple hours are needed to assess the performance. In theworst case of five repetitions, a duration of three hours per benchmarking run, and themost expensive EC2 compute service, costs can sum up to $105 for benchmarking asingle compute service. When defining a roadmap, the number of repetitions shouldbe aligned with the available cost budget as costs may run out of hand, specifically, forexpensive compute services.
As the example with EC2’s most expensive compute service shows, permanently bench-marking all available compute services with a range of benchmarking scripts and anensuring number of repetitions can exceed even biggest cost budgets. The approach isprimarily suitable to benchmark a few compute services regarding specific character-istics employing well-selected benchmarking scripts. A wider use is only achievableby pooling the cost budgets of various compute service consumers and benchmark allservices in a joint effort.
It is important to note that the approach can, furthermore, only provide representativeand timely results to a certain level. This is due to two major factors: (1) the approachcan only benchmark a sample, and (2) compute services are constantly changing. Evenwith many repetitions or parallel executions, only a subset of the physical machines and
129

5. Assessments of Compute Service Performance at Run-time
VMs of a compute service are benchmarked. Therefore, the benchmarking results areonly representative for the sample of VMs observed at the time of the benchmarking.Moreover, as cloud providers purchase new hardware to maintain and expand their datacenters, every future benchmarking result may show different results. The frequencyand dimensions of hardware upgrades are different between providers and cannot bepredicted.
Nevertheless, scheduled benchmarking runs help to identify a trend in the long-term(months or years) influenced by a provider’s hardware purchases. In contrast, repeti-tions can only determine the gravity of performance variations due to heterogeneousphysical machines in a provider’s data centers. Again, the heterogeneity expressed inmetrics, such as the standard deviation, is only valid for the examined sample.
All in all, the representativeness and timeliness of a compute service benchmarkingapproach are limited. Nonetheless, consumers can benefit from the results of smallersamples and determine a minimum and average performance capacity available for asystem under development. As several experiments show (c.f. section 5.5.4), variationsin benchmarking results of compute services are existent but limited in their gravity.Hence, measured performance attributes can support predictions and are valuable inplanning tasks, such as capacity planning. Moreover, benchmarking results from sam-ples of different compute services give consumers a basis for more precise comparisonsthan using the scarce performance meta-data published by cloud providers.
130

5.2. Compute Service Performance Scoring
5.2. Compute Service Performance Scoring
Performance benchmarking results are commonly expressed as comparable numbers.Therefore, the MADM-based scoring method offered by the framework can adaptedfor performance scorings. Thereby, compute services become comparable according toscorings based on performance meta-data.
In this section, a MADM-based scoring method is introduced that uses the AHP to mapmultiple benchmarking results to a single score. First, the advantages and reasons fora single-dimensional value are explored. Then, the (MC2)2 framework is presentedthat provides a process to define a specific evaluation function that enables as scor-ing. Finally, two scoring mechanisms for compute service performance meta-data arepresented.
5.2.1. Scoring for Performance Meta-Data
When assessing performance meta-data of compute services with various benchmarks,the outcome is an array of performance attributes. A comparison of compute servicesbased on an array of performance attributes is rather cumbersome. A consumer mightset a focus on some of her preferred attributes. But then a range of assessed meta-datais ignored in a comparison.
Furthermore, a comparison according to an array of assessed performance attributeswhile pertaining distinct preferences for attributes is complex. A consumer needs tolook at pairs of compute services and compare them according to each attribute. Whiledoing so, he would need to remember which attributes are more important. For fewattributes and compute services, a manual comparison seems legit. However, the prob-lem becomes intricate when a consumer tries to identify a favorite from large arrays ofattributes and numerous compute services. Then, a mathematical scheme that aggre-gates the performance attributes into a single-dimensional value is able to decrease thecomplexity of comparisons for a consumer.
5.2.2. Aggregation Scheme Requirements
The major challenge for an aggregation scheme is to map multiple performance at-tributes to a single value while guaranteeing an identical influence from every attribute.Otherwise, the single-dimensional value reflects one attribute more than others. As per-formance attributes are measured on distinguished scales, attributes with large numberswould influence the aggregated value stronger than attributes with small values. Be-sides, some attributes are more favorable the higher the number, such as operations per
131
5. Assessments of Compute Service Performance at Run-time
second, and others are less favorable the higher the number, such as seconds. There-fore, the direction of an attribute’s scale, which is either positive or negative, must beconsidered.
The effects of mixed scales become clear with an example. When mapping two perfor-mance attributes declared as Whetstone (HIB) and Dhrystone (LIB) benchmark results(cf. section 2.2.1) to a single-dimensional value by summing up both benchmark val-ues to a total, the scales must be equal to gain comparable results. Let two computeservices be considered in this example. In a comparison, the sum of the performanceattribute values would be 2,000,120 (Whetstone: 2 Mio. MWIPS, Dhrystone: 120 sec.)and 1,900,030 (Whetstone: 1.9 Mio. MWIPS, Dhrystone: 30 sec.).
Consequently, the first compute service shows a higher total values. Now, let the Dhry-stone benchmark be slightly more important to a consumer. Then, the better single-dimensional value contradicts the expected outcome. Actually, the second computeservice shows a better result for the Dhrystone which is not reflected in the overallscore. The contrarily directed scales with very different values lead to irritating state-ments with a simple sum function.
Therefore, an aggregation scheme is needed that can map an array of mixed perfor-mance metrics to a single-dimensional metric, while normalizing unequal and contraryscales. In addition, the preferences of a consumer regarding the assessed performanceattributes must be considered as well.
5.2.3. Weighted Compute Service Performance Scores
The (MC2)2 provides the basis to generate an evaluation function for scoring mech-anisms. To facilitate comparisons of compute service configurations regarding perfor-mance meta-data, the (MC2)2 incorporated in the assessment framework can be usedto generate an evaluation function. For that purpose, it is necessary to follow the stepsand gather the input parameters to configure the evaluation function. As suggested inthe (MC2)2, the AHP is used as a MADM method that supports normalization of dis-tinct metrics into a single score. The advantage of the AHP is to support hierarchieswhich gives more flexibility in the definition of criteria relations and, thereby, a moreprecise weighting.
The scenario to be defined in the (MC2)2 is the comparison of compute service con-figurations according to assessed performance meta-data. Clearly, the compute serviceconfigurations are the alternatives to compare. Moreover, performance meta-data mustbe defined as attributes and serve as the basis for criteria. The AHP requires to struc-ture criteria in a hierarchy. Thereby, the configuration of the evaluation function iscompleted. Consequently, for generating an evaluation function with (MC2)2 criteriamust be defined in a hierarchy as the solely left task.
132

5.2. Compute Service Performance Scoring
To apply the evaluation function, compute service configurations together with associ-ated performance attributes, weights, and requirements must be provided as parameters(c.f. 4.1). The performance meta-data, particularly the benchmarking results, are as-signed to the function as attributes. In addition, weights need to be defined which aredetermined in pair-wise comparisons of criteria. Besides, requirements derived fromthe criteria can optionally be defined and are an instrument left to a decision-maker incompute service comparisons.
The following subsections describe the configuration of a (MC2)2 evaluation functionfor the purpose of compute service scoring. In this regard, the use of performanceattributes as criteria, the structure of the criteria hierarchy and the determination ofweights are explored. Moreover, two distinct scoring mechanisms, local and globalscoring, using different forms of evaluation functions are presented.
Attributes, Criteria Hierarchy and Weights
The benchmarking results of a compute service serve as attributes and the regardedcompute services are mapped to alternatives. While defining alternatives and a scenarioin the (MC2)2 is trivial, it is demanding to specify and structure the set of criteria. Theperformance attributes of compute services that are linked to benchmarking results (c.f.5.1) can be transformed into criteria for a comparison of compute services. In thetransformation of a benchmark result to a criterion, both, the benchmark result valueand the observed variance factor, can be included as criteria. The criteria derived fromthe benchmarking results should maintain the original metrics which are commonlydescribing a ratio scale.
Apart from the definition of criteria, finding an adequate criteria hierarchy dependson the set of considered performance meta-data respectively benchmarks. This workproposes two schemes to structure criteria in hierarchies: (1) a simple single-level hier-archy, and (2) a hierarchy that groups benchmarks by resource type.
The structure of a criteria hierarchy should be aligned to the number of criteria. Withmany criteria it is reasonable to introduce groups and assign weights to the groups.For fewer criteria, a simple single-level hierarchy is sufficient and facilitates maximuminfluence on the importance of criteria through immediate pair-wise comparisons forweighting.
Local & Global Scoring
The resulting evaluation function for scoring is used with AHP and, thus, can be em-ployed in two distinct modes: (1) local scoring, (2) global scoring. While a local scoring
133

5. Assessments of Compute Service Performance at Run-time
Criteria
Goal
Benchmark 1 Benchmark i
HIB
Benchmark j Benchmark n
LIB
... ...
(a) Simple Criteria Hierarchy of Performance Criteria
Level 1
Criteria
Goal HIB LIB
CPU MEM IO CPU MEM IO
... ...... ... ......
= Benchmark
(b) Criteria Hierarchy with Resource Type Groups
mode gives means to compare multiple compute services on a [0,1] scale, a global scor-ing mode chooses a reference compute service. Thereby, a global scoring mode sup-ports portable results as any compute service is measured against the reference score.In contrast, the local score is very good to show how much a certain compute servicedominates other compute services in regards of their scores.
For the global mode to be used for portable and globally comparable scores, the criteriahierarchy of performance benchmarks and assigned weights need to be fixed. In otherwords, a very specific evaluation function needs to be defined that comprises a fixedset of benchmarks in a hierarchy and fixed weights. The capability to conduct portableglobal comparisons and hence traded with a lack of customizability.
For comparisons of compute services according to performance, both modes are em-ployable depending on the situation. The global scoring mode requires a benchmarkingset and scoring standard and thereby enables consumers to exchange and compare re-sults. In contrast, the local scoring mode helps a consumer to retain easily interpretablescores of a set of compute services that he measured single-handedly with a custom setof benchmarks.
134

5.3. Performance Benchmarking with the Cost Budgeting Stopping Rule
5.3. Performance Benchmarking with the CostBudgeting Stopping Rule
In the search for a highest performing compute service, the costs of benchmarkinga large set of compute services with many benchmarks can grow to overburdeningamounts. Incorporating both, the priorly introduced automated benchmarking methodand the scoring method, the presented stopping rule considers cost budgets in the bench-marking process. By employing the automated benchmarking method, a continuousprocess sequentially assesses the performance of compute services. After each assessedcompute service, the stopping rule uses the scoring mechanism to compute the chanceof finding a better performing compute service. At the same time, the costs of continu-ing the performance meta-data assessment need to be considered.
As compute service provider publish performance meta-data to a certain extent, priorknowledge can be used in the process. Although the published data is not sufficient fordecisions and system engineering tasks, it indicates a rough preliminary order regardingthe performance score of the compute services.
The following subsections propose a cost calculation scheme applicable with the au-tomated benchmark method and describe the influence of prior knowledge about per-formance meta-data. Furthermore, the use of the scoring method for observations inthe context of the stopping rule is explained. Also, the influence of the distribution ofperformance scores among the compute services is discussed. Finally, the use of theframework’s stopping rule for performance assessments of multiple compute servicesis explained.
5.3.1. Cost Calculation
Costs caused by the benchmarking of a compute service mainly relate to efforts in plan-ning, executing and evaluating benchmarks. The following cost factors have a consid-erable effect as operational expenditures in the course of performance assessments:
• Staff
• Resource usage for Automated Benchmarking Coordinator and Databases
• Compute service usage
• Network traffic
Additionally, capital expenditures may occur as requirement to conduct a performanceassessment, such as licenses for benchmarking and evaluation software.
135
5. Assessments of Compute Service Performance at Run-time
The aggregated sum of all expected costs adds up to the total costs for benchmarking asingle compute service ci > 0 (referred to as per compute service benchmarking costs).Typically, each service raises different costs ci due to different compute service pricingmodels. In a simpler but less precise variant ci can be identical.
5.3.2. Performance Scores as Observation of ComputeServices
An employed stopping rule needs to come to a Boolean decision regarding the contin-uation of the benchmarking process. A stopping decision is commonly made based onall priorly and the currently observed value. For a benchmarking process, it is necessaryto define which values are observable and how these can be employed as an indicatorfor a stopping rule.
In the beginning of a benchmarking process, every compute service is represented bya random variable Si before it has been observed. During an observation, the computeservice is benchmarked regarding multiple benchmarks to assess a range of perfor-mance attribute values.
With multiple performance attributes, such as multiple benchmarking results, diversecompute services might indicate a best performance in the multitude of attributes.Therefore, the local scoring evaluation function f(·) that maps multi-dimensional per-formance attribute values to a single score value is used as the representation (or ob-served value) of a compute service (c.f. section 5.2).
According to the scoring method, a score is determined in either of two possible modes:(1) idealized, (2) normalized. The idealized variant requires to define a certain computeservice as the reference with score = 1. The normalized variant implicates that allmeasured compute services are scored relative to one another. Thereby, the scorescan change with every additional assessment result in the process. Therefore, for thestopping rule the idealized is favorable with the first compute service representing thereference score. Thereby, also the recalculation of scores in every step is avoided.
Given the scores, a rank of the highest performing compute service can be determined.The score enables a stopping rule to identify the absolute highest performing computeservice within the set of priorly observed compute services at any stage of a assessmentprocess. Given the scores Si of all benchmarking results, the currently highest observedutility is un.
5.3.3. Compute Service Order and Prior Information
As the stopping rule provided by the framework benefits from a custom order, scoresand ranking must be anticipated given the available information from public sources.
136
5.3. Performance Benchmarking with the Cost Budgeting Stopping Rule
Although the sources with performance meta-data about compute services are yet scarce,several sources, such as blogs, benchmark databases, and provider websites, disclosehardware figures which can be used to derive a ranking of the compute services set (c.f.section 2.2.1). Higher hardware figures in terms of numbers, such as CPU cores oramount of memory, indicate a ranking.
Which hardware figures a considered for an anticipated ranking depends on the evalua-tion function and the criteria incorporated in the scoring. Only hardware figures relatedto incorporated criteria are of interest. Besides, the weights in the evaluation functiondetermine which hardware figures are more important. The set of compute servicesmust then be ordered by the rough hardware figures, in descending order of expectedscores.
5.3.4. Configuration of the Stopping Rule
The stopping rule provided by the framework can be employed to urge an early stop insequential benchmarking process without any major modifications. The set of computeservices and the costs for benchmarking need be defined as stopping rule parameters.
Besides, the parameters for a cost budget of cmax, a sliding window of ω, and scoreincrement control constant ϵ remain available. Thereby, the stopping rule benchmarksa set of compute services subsequently while monitoring score increments within thesliding window and enforcing the cost budget.
As mentioned before, the utility gained from each additional benchmarking step is de-fined through the scoring function f(·), which is based on the benchmarking results.The goal is to maximize the utility un under consideration of the sum of all costs ci andthe cost budget.
The following equation shows the expression that the stopping rule seeks to maxi-mize:
maxun −ni
ci
137

5. Assessments of Compute Service Performance at Run-time
5.4. Software Prototype for Automated ComputeService Performance Benchmarking withStopping Rule
The Balloon Race implements the concept of automated, scheduled compute serviceperformance meta-data assessment with a stopping rule. The Balloon Race incorporatesthe AoetaroaLib to implement a stopping rule that is enabled when a cost budget wasdefined. The Ballon Race exposes a reusable library called LibIntelliCloudBench anda web application wrapping the library together with a user interface.
5.4.1. LibIntelliCloudBench Library
The LibIntelliCloudBench library contains the logic to automatically start a VM in-stance, to inject and execute benchmarking software, and to download the results. Forinstantiating and connecting to VMs, the library uses jClouds, a multi-cloud interfacelibrary [9]. The jClouds library maintains a support for various cloud providers andoffers a unified interface to manage and connect to VMs on different compute services.Furthermore, jClouds provides a database of available compute services, geographicalregions and compute service (hardware) configurations which is reused in LibIntelli-CloudBench.
The Phoronix benchmarking software is employed to bundle and execute sets of micro-benchmarks on a VM. The Phoronix benchmarking software (version 5.2.0) is bun-dled with the LibIntelliCloudBench library and the benchmarking scripts are hosted ina repository managed by the publishers of the Phoronix software. Alternatively, thebenchmarking scripts and custom scripts can be placed in an online storage (e.g., anAWS S3 bucket). Any VM downloads only the necessary benchmarking scripts fromthe repository.
The set of available micro-benchmarks is slimmed down to scripts that are known tosucceed on remote server machines. Particularly, micro-benchmarks for measuringgraphics and battery performance are excluded from the set. A detailed list is given insection B.2 in the appendix.
Moreover, the stopping rule approach is implemented and included in the LibIntelli-CloudBench library supporting cost budgets and sliding window sizes ∈ [0, 7]. Whichstopping rule to use can be specified via the API of the library. By default, a non-stopping rule is selected which traverses all compute services specified in the set forbenchmarking. An overview of the library’s architecture is depicted in figure 5.8.
The library exposes a programming interface in Java that allows to trigger benchmark-ing executions. The use of the CloudBenchService demands a minimal configuration
138

5.4. Software Prototype for Automated Compute Service Performance Benchmarking with Stopping Rule
LibIntelliCloudBench
Compute Service
Virtual Machine
jClouds Library
S3 Bucket with Phoronix
Benchmarking Scripts
Virtual Machine
download
inject script
fetch results
Sopping Rule Executor Component
AoteroaLib
MySQL Database for
Results
Figure 5.8.: Architecture of LibIntelliCloudBench
via the CloudBenchServiceConfig class before an execution. A CloudBenchService-Config comprises a StoppingRuleConfig, where the sliding window size and cost budgetcan be defined, and a set of ComputeServices from the jClouds library and Benchmarks.After a successful execution, the CloudBenchService allows to recall a CloudBenchSer-viceResult. A result is defined by the ComputeService, the Benchmark, and the Result-Data. The ResultData is extracted from the XML files produced by the Phoronix micro-benchmarks and converted into a Java data structure. For every Benchmark and Com-puteService combination, multiple corresponding ResultData items can exist. Eachitem represents the extracted result value and metric measured in a benchmarking run.A simplified representation of a UML class diagram of the programming interface isillustrated in figure 5.9.
CloudBenchServiceConfig
CostBudgetSlidingWindow
StoppingRuleConfig
IdentifierProviderGeoLocationHardwareConfigShort
ComputeService
Identifier
Benchmark
1
1
*
1
*
1
CloudBenchService
CloudBenchServiceResult
1
1
1
1
1
1
*
1
MetricValue
ResultData
*
1
Figure 5.9.: Data Model LibIntelliCloudBench
The class diagram shows the two major attributes: (1) the configuration, and (2) theset of results. To initiate a benchmarking process, the configuration options need to begiven and then the startBenchmarking() method must be called. Eventually, the processfinishes and signals it with an optional callback that can be set in the configuration. Bynow, the results data structure has been filled from the XML files that were generated
139

5. Assessments of Compute Service Performance at Run-time
by the Phoronix micro-benchmarks on the VMs.
The source code of the library is available as part of a Github repository under https://github.com/mugglmenzel/intellicloudbench.
5.4.2. Web Application
The Balloon Race web application has been developed with the intention to providean interface to automated benchmarking for non-programmers. Therefore, the BalloonRace is realized as a web application with a graphical user interface using the Vaadinframework [209]. The Vaadin framework provides components for a graphical userinterface similar to and compatible with GWT [202] and smartGWT [203].
Moreover, the LibIntelliCloudBench is integrated into the Balloon Race web applica-tion to execute benchmarking processes. The library takes compute service and bench-marking script sets as configuration parameters, and accepts an optional stopping ruledefinition. In a stopping rule definition, the sliding window size and a cost budget canbe defined.
The Balloon Race has been implemented for the Google AppEngine [201] and for Tom-cat application servers [210] with a MySQL database [211]. Figure 5.10 depicts thearchitecture for the Tomcat version of Balloon Race.
Balloon Race
Backend
LibIntelliCloudBench
Frontend
Compute Service 1
Virtual Machine
MySQL Database for
User Roadmaps &
Results
jClouds Library
S3 Bucket with Phoronix
Benchmarking Scripts
Virtual Machine
Compute Service N
Virtual MachineVirtual Machine
...
download
inject script
fetch results
Cron4J Scheduler
Vaadin GUI Stopping Rule Executor Component
UserAoteroaLib
Figure 5.10.: Architecture of the Ballon Race Web Application
In the graphical user interface, a user is guided through three steps, from computeservice selection via benchmark selection to stopping rule configuration. The listedcompute service configurations are drawn from the jClouds library and differentiated byprovider, geographical location, and hardware configuration. A user can select multiplecompute services and provide the credentials for the diverse providers, in the first step.
140

5.4. Software Prototype for Automated Compute Service Performance Benchmarking with Stopping Rule
In the second step, the list of micro-benchmarks matches the ones available from theemployed Phoronix software. The last configuration step allows to define a cost budgetand define the sliding window for the stopping rule. By setting no cost budget andsliding window, the stopping rule can be omitted. Figure 5.11 depicts a screenshot ofthe web application.
Figure 5.11.: Screenshot of the Ballon Race Web Application
In regards of the roadmap definition language, the prototype spares a graphical inter-face to define roadmaps, but provides a programming interface. Definitions are storedin the database and translated into scheduled jobs with the cron4j library [212]. A defi-nition takes a set of compute services and benchmarking scripts, and a cron schedulingstring with repetitions parameter as defined by the roadmap definition language. Thedefinition is stored in the database with the sets and the cron scheduling string includ-ing the repetitions parameter. When a scheduled job is triggered by cron4j, it reads thecompute services and benchmarking scripts sets from the database and uses them asparameters for a new benchmarking execution. On every boot of the web applicationall roadmap entries in the database are scheduled as cron4j jobs. New roadmap entriesare scheduled upon creation.
The source code of the Balloon Race is available as a Github repository under https://github.com/mugglmenzel/BalloonRace.
141
5. Assessments of Compute Service Performance at Run-time
5.5. Evaluation of the Automated PerformanceBenchmarking Method
To evaluate the proposed automated performance benchmarking method, this sectionexplores the validity and quality of the approach, particularly in the light of researchquestion RQ1a:
RQ1a. How can compute services be assessed at run-time in an automatedmanner?
More specifically, research questionRQ3 is explored in this section to answerRQ1a inregards of performance assessments. Thereby, not only the applicability of the frame-work is proofed but also the feasibility of run-time assessments of compute services ingeneral.
RQ3. How can performance be assessed at run-time from multiple computeservices in an automated manner?
The effective implementation of a software prototype (c.f. section 5.4) serves as proofof the feasibility of the concept. The software prototype and the concept of the methodhave already been reviewed by and discussed by peers in the research community [80].The results published in the research community showed the validity of the approachaccording to a performance benchmarking of several compute service over time. Thefollowing sections structure the results from the validation according to experimentswith the software prototype. Moreover, this work adds a comparison with existing ap-proaches and examines the promptitude of the approach using the software prototype.
First, the procedure to validate the approach in five experiments and the observed vali-dation results are presented. Then, a comparison of the proposed approach to existingapproaches is established. Next, the promptitude of the prototype is explored and theresults from the observed overhead measurements are presented. In the final section,the findings from a range of measurements are presented that indicate variations inperformance outcomes of compute services.
5.5.1. Validation of the Automated PerformanceBenchmarking Approach
The proposed automated performance benchmarking approach shall be validated byexample using the software prototype. Therefore, the approach is tested in five use caseexperiments that stress the claims and capabilities of the approach.
First, the experiments and the experiment setup are described and a hypothesis is for-mulated. Finally, results are presented and a conclusion is drawn.
142

5.5. Evaluation of the Automated Performance Benchmarking Method
Experiments & Hypothesis
The set of experiments increase in complexity with each step. Specifically, the sub-sequent experiments vary in respect of the number of micro-benchmarks and computeservices involved. Thereby, the prototype is stressed in regards of its basic support ofvarious micro-benchmarks and of multiple compute services.
Repetitions are a considerable aspect of the proposed approach that enables to measurethe performance of a compute services in the long term together with variations. Afurther experiment tests the capabilities to repeat micro-benchmarks. Additionally, thescheduling feature of the approach is covered in a specific use case with a performancebenchmarking task scheduled in the future.
EXP-A. Basic Experiment The basic experiment test the applicability of the proto-type for running a single micro-benchmark on a single compute service.
EXP-B. Multiple Benchmarks Experiment An extended experiment involves mul-tiple, distinct micro-benchmarking results to be measured from a single computeservice.
EXP-C. Multiple Compute Services Experiment An experiment in which mul-tiple micro-benchmarking scripts must be executed against multiple, distinct com-pute services.
EXP-D. Repetitions Experiment The experiment tests the capability to repeat micro-benchmarks.
EXP-E. Scheduling Experiment In order to test the ability to schedule performancebenchmarking tasks, an experiment comprising a measurement of one micro-benchmark on a single compute service three hours later is setup.
The overarching validation test constitutes from all four experiments and tests the fol-lowing two hypothesis in the light of the research question RQ1a.
H0 The approach respectively the software prototype does not provide support for au-tomated performance benchmarking of compute services or only limited supportand, thus, fails in one or more experiments.
H1 The approach respectively the software prototype provides support for automatedperformance benchmarking of compute services and, thus, succeeds in all exper-iments.
The null hypothesis H0 holds the default position that the proposed approach cannotproof the claim of enabling automated performance benchmarking of compute services.In contrast, the hypothesis H1 is proofed if the prototype succeeds in the experimentsaltogether. Given the experiment results, a first evaluation in terms of RQ3 and RQ1acan be stated using H0 and H1.
143

5. Assessments of Compute Service Performance at Run-time
To research the hypothesis H1, the software prototype has been tested in experiments.Therefore, in each experiment a small program was implemented that uses the soft-ware prototype. To realize the experiments, the small programs employ the softwareprototype with distinct configuration parameters, namely the set of selected micro-benchmarking scripts, the compute services set, and the repetition and scheduling pa-rameters.
For experiment EXP-A, the compute service AWS EC2 t1.micro in region us-east-1 wasselected and the micro-benchmarking script Sudokut. In experiment EXP-B, the scriptsCrafty and Sudokut were selected for the AWS compute service t1.micro in regionus-east-1. Experiment EXP-C extends EXP-B by adding the Rackspace Standard1 inLondon to the set of selected compute services.
The experiments EXP-D and EXP-E address the repetition and scheduling parametersof a roadmap. All experiments EXP-A to EXP-C used a default repetition count ofthree. In experiment EXP-D, the experiment EXP-A was conducted with a repetitioncount of five. For the scheduling task in experiment EXP-E, the roadmap definitionlanguage was used to execute experiment EXP-A every full hour, which succeededthree times in a row.
Results & Conclusion
From the experiments, several observations could be made and conclusions can bedrawn. One aspect revealed by the experiments is the level of automation providedby the prototype. The experiments EXP-A to EXP-E were conducted by configuringthe software prototype using programs in experiment setups. From there on the exe-cution continued in an automated manner. Implicitly, the observed level of automationcan be described as batch processing according to Endsley [193].
Furthermore, the experiments aim at confirming hypothesisH1. The experiments EXP-A to EXP-E conducted with the software prototype show that the prototype and, hence,the approach fulfills its claims in respect of hypothesis H1. All experiments were com-pleted with positive results, implicating an automation and support for repetitions andscheduling are present. To guarantee reliable results, the experiments with the softwareprototype were each repeated multiple times, at least three times each.
The confirmation of hypothesis H1 implies an answer to research question RQ3 can begiven. The software prototype shows a viable solution to assess the performance of acompute service at run-time in an automated manner. Thereby, indirectly RQ1a is ad-dressed which questions the feasibility of an automation of assessments. The existenceof a solution to automated assessments of compute services’ performance proofs alsothe existence of automated assessments in general.
144
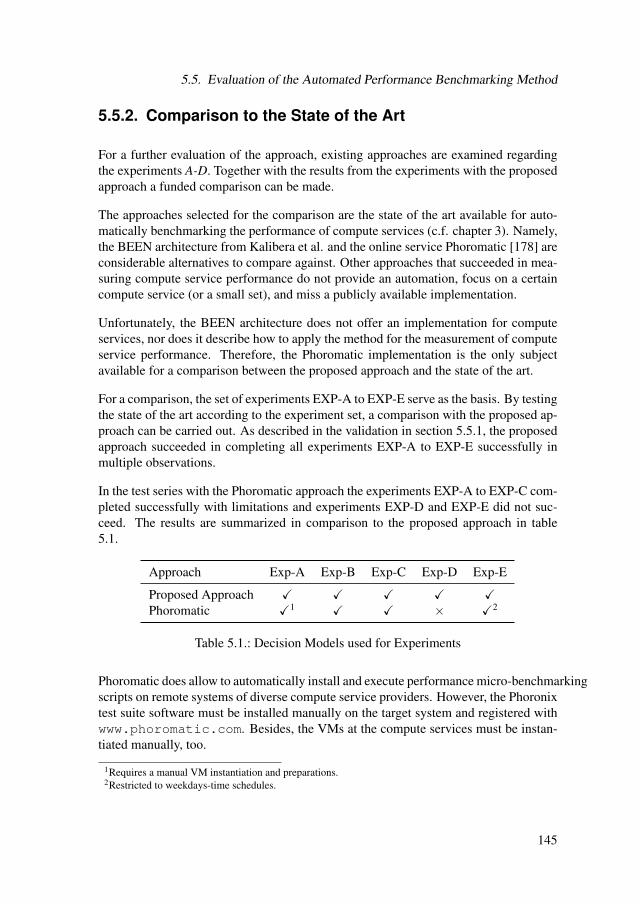
5.5. Evaluation of the Automated Performance Benchmarking Method
5.5.2. Comparison to the State of the Art
For a further evaluation of the approach, existing approaches are examined regardingthe experiments A-D. Together with the results from the experiments with the proposedapproach a funded comparison can be made.
The approaches selected for the comparison are the state of the art available for auto-matically benchmarking the performance of compute services (c.f. chapter 3). Namely,the BEEN architecture from Kalibera et al. and the online service Phoromatic [178] areconsiderable alternatives to compare against. Other approaches that succeeded in mea-suring compute service performance do not provide an automation, focus on a certaincompute service (or a small set), and miss a publicly available implementation.
Unfortunately, the BEEN architecture does not offer an implementation for computeservices, nor does it describe how to apply the method for the measurement of computeservice performance. Therefore, the Phoromatic implementation is the only subjectavailable for a comparison between the proposed approach and the state of the art.
For a comparison, the set of experiments EXP-A to EXP-E serve as the basis. By testingthe state of the art according to the experiment set, a comparison with the proposed ap-proach can be carried out. As described in the validation in section 5.5.1, the proposedapproach succeeded in completing all experiments EXP-A to EXP-E successfully inmultiple observations.
In the test series with the Phoromatic approach the experiments EXP-A to EXP-C com-pleted successfully with limitations and experiments EXP-D and EXP-E did not suc-ceed. The results are summarized in comparison to the proposed approach in table5.1.
Approach Exp-A Exp-B Exp-C Exp-D Exp-E
Proposed Approach ✓ ✓ ✓ ✓ ✓Phoromatic ✓1 ✓ ✓ × ✓2
Table 5.1.: Decision Models used for Experiments
Phoromatic does allow to automatically install and execute performance micro-benchmarkingscripts on remote systems of diverse compute service providers. However, the Phoronixtest suite software must be installed manually on the target system and registered withwww.phoromatic.com. Besides, the VMs at the compute services must be instan-tiated manually, too.
1Requires a manual VM instantiation and preparations.2Restricted to weekdays-time schedules.
145

5. Assessments of Compute Service Performance at Run-time
A support for scheduled execution is available, but restricted to weekday and time se-lection. Thereby, a daily execution of performance measurements is achieved. Morecomplex scheduling definitions, such as monthly or hourly schedules, are not avail-able.
Also, parameters for defining repetitions and scheduled runs of certain micro-benchmarkingscript executions is absent. Repetitions can partially be achieved by creating manyscheduled executions with identical or similar starting times.
5.5.3. Results of the Promptitude Measurements
To gain further insights, in the experiments EXP-A to EXP-C the duration to completethe steps involved in a performance measurement were recorded. Additionally, forEXP-E the observable delay and punctuality of the cron4j-based implementation weremeasured. With insights in the promptitude of the software prototype, an evaluation ofthe practical applicability of the approach is pursued.
By injecting a time logging mechanism, the practical promptitude of gaining perfor-mance benchmarking results from the software prototype could be measured. There-fore, the durations to complete the sequential steps involved in a benchmarking run arecaptured by logging a timestamp before and after each of the steps.
The promptitude constitutes from the duration of the four steps instantiate VMs, de-ploy software, download benchmarking scripts, run benchmarking scripts, and uploadresults. The first three steps can be summarized as preparation overhead, while thelatter two steps are involved with the bulk of measuring the performance of a computeservice.
Figure 5.12 depicts the results from the promptitude measurements for all experimentsEXP-A to EXP-C as stacked bars. For experiment EXP-C which benchmarks multiplecompute services, the total duration equals the maximum duration of benchmarking thewhole compute services set as measurements are conducted in parallel.
The results show that the preparation overhead affects the total time to conduct thebenchmarking with less than 220 seconds in all experiments. Particularly, the overheadaccounted for 45.56% of the total time in experiment EXP-A, 17.92% in EXP-B, and21.59% in EXP-C. The overhead constitutes from instantiating VMs and deployingnecessary software and libraries. The duration to complete the preparation overheadwas exhibited as rather stable over all experiment repetitions. However, in experimentEXP-C the duration and, thus, the overhead increased due to the VM instantiation delayof the compute service Rackspace Standard1.
As the experiments reveal, the duration of the subsequent steps for downloading andexecuting benchmarking scripts, and uploading measurement results is immediatelylinked to the number of selected scripts involved. During the experiments, a variation
146

5.5. Evaluation of the Automated Performance Benchmarking Method
0
200,000
400,000
600,000
800,000
1,000,000
1,200,000
EXP-‐A EXP-‐B EXP-‐C
Millisecon
ds Upload Results
Run Benchm. Scripts
Download Benchm. Scripts
Deploy SoFware
InstanHate VMs
Figure 5.12.: Measured Durations in Experiments EXP-A to EXP-C
in the number of selected micro-benchmarks resulted in diverse total times. Similarly,experiments with multiple compute services confirm that the duration of the bench-marking step depends heavily on the performance of the compute service under test(c.f. section 5.5.4).
As experiment EXP-C shows, the deployment of the benchmarking software and setupof the host VM depends mainly on the performance of the VM. The setup on theRackspace Standard1 compute service took half the time of the worse performing AWSt1.micro compute service.
In contrast, the network bandwidth between the system orchestrating the performancemeasurement process and the host VM at the compute service is neglectable at to-day’s standards already. The necessary basic software is about 800 kilobyte large.The benchmarking scripts, however, can be many megabytes large (e.g., Crafty is 45megabytes) and network bandwidth of the compute service can become a source ofdelay during the download benachmarking scripts step.
For experiment EXP-E, an average delay of 9 milliseconds and a maximum delay of24 milliseconds could be observed over 100 scheduled test executions. The delay isinduced by the scheduling business logic, which is based on the cron4j library [212],and occurs before the measurement process itself is triggered.
147

5. Assessments of Compute Service Performance at Run-time
5.5.4. Statistics for AWS EC2 Compute Services
In addition to the validity and promptitude analysis, the software prototype has beenused to gain performance meta-data for AWS EC2 compute services over several months.Particularly, statistics about the compute services m1.small, m1.medium, and m1.largewere assessed with repeated performance measurements. For the measurements, mul-tiple micro-benchmarking scripts from the Phoronix test suite were used.
With the software prototype’s support for repetitions, the measurements could be con-ducted over several months to explore potential performance variations. The results forthe the m1.small, m1.medium, and m1.large compute services concerning the lower-is-better processor micro-benchmarks "Crafty", "dcraw", and "Sudokut" are depictedin figure 5.13. Figure 5.14 depicts the results for the higher-is-better processor micro-benchmarks "John The Ripper", "OpenSSL", "Opstone Singular Value Decomposition(SVD)", and "Opstone Sparse-Vector Scalar Product (SVSP)". The figures also includeerror indicators that reflect the standard deviation of the results gained from multipleruns over month.
0.00
100.00
200.00
300.00
400.00
500.00
600.00
Cra-y dcraw Sudokut
Millisecon
ds (LiB)
AWS Small
AWS Medium
AWS Large
Figure 5.13.: Assessed Performance Meta-Data for EC2 Compute Services (LiB)
The results confirm a difference in available computation capacity for the compute ser-vices m1.small, m1.medium, and m1.large, in this particular order. Between m1.smalland m1.medium, the difference can be as much as double the performance or half thecomputation time for tasks, respectively. Besides, as indicated by the standard devia-tion, the gravity of performance variations differs between the compute services. Them1.small compute service configuration proofs to show the most stable performanceoutcomes over the multiple iterations. Depending on the micro-benchmark, the varia-tions of the m1.small and m1.large compute services expressed as standard deviation
148

5.5. Evaluation of the Automated Performance Benchmarking Method
0
100
200
300
400
500
600
700
800
John The Ripper OpenSSL Opstone Singular Value DecomposiBon
Opstone Sparse-‐Vector Scalar
Product
Benchm
ark Metric
(HiB)
AWS Small
AWS Medium
AWS Large
Figure 5.14.: Assessed Performance Meta-Data for EC2 Compute Services (HiB)
can be up to 16% (m1.small) respectively 14% (m1.large).
A further analysis of the available processor hardware disclosed by the employed Ubuntuoperating system provided additional information to identify a possible reason for per-formance variations. For that the software prototype has been extended with a customscript that executes an additional command on the host system to retrieve and uploadthe CPU information. Table 5.2 lists the odds of observing a certain processor type ofthe EC2 compute services m1.small, m1.medium, and m1.large. The results are basedon run-time inspections of 462 m1.small, 72 m1.medium, and 186 m1.large VM instan-tiations. Besides, the processor scores published by "Passmark" [213, 214] originatingfrom processor hardware tests are included in the table.
Processor Type Passmark m1.small m1.medium m1.large
AMD Opteron 2218 HE 1471 32.9% - -AMD Opteron 2374 HE 4642 - - 0.54%Intel Xeon E5345 2882 - 12.5% -Intel Xeon E5410 3448 - 87.5% -Intel Xeon E5430 4008 67.1% - 99.46%
Table 5.2.: Frequency of Processor Types per EC2 Compute Service
As the numbers in table 5.2 indicate, the processor types assigned by the computeservices when instantiating a VM are inconstant. While the m1.large provides a "IntelXeon E5430" processor type in more than 99% of the cases, the m1.small may return an"AMD Opteron 2218 HE" instead in almost every third VM instantiation. In addition,
149
5. Assessments of Compute Service Performance at Run-time
the m1.medium compute service alternates between the "Intel Xeon E5345" and "IntelXeon E5410" processor types.
All in all, the "Passmark" scores and the benchmarking results assert that differentprocessor types mean different performance outcomes. This is particularly interestingas EC2’s m1.small compute service assigns very different processor types and chargethe same price. An indicator for alternating processor types or variable performancecannot be found on AWS’s website or in any white papers.
The results from AWS EC2 confirm the importance of a novel approach for single-handed assessments of compute service performance. As with AWS, the performancefigures published by compute service providers may not be trusted. The actual perfor-mance outcomes can vary over time or simply differ tremendously from the officiallyannounced numbers.
150

5.6. Evaluation of the Performance Benchmarking Stopping Rule
5.6. Evaluation of the Performance BenchmarkingStopping Rule
A primary feature of the stopping rule presented in this work is to consider a cost budgetin a sequential performance measurement process with multiple compute services. Be-sides, the rule aims at saving time and cost when an approximate order of the computeservice set by performance outcome is given.
The stopping rule has been developed to address research question RQ2:
RQ2. How can costs for run-time assessments of multiple compute servicesbe budgeted?
The concept of the stopping rule has been presented to and discussed in the researchcommunity [215]. The implementation of the stopping rule in a software prototype (c.f.section 5.4) asserts the feasibility and conceptual validity of the approach. Furthermore,the suitability of the proposed stopping rule in compute service benchmarking scenariosis tested in a validation by example which focuses primarily on the cost budget support.Besides, a comparison with standard stopping rules allows for a detailed evaluation ofthe stopping rule’s limitations and shortcomings.
The first subsection presents the validation procedure that inspects the stopping rule’scost budget feature. Then, a comparison with standard stopping rules is conducted.Finally, the results and findings from the validation and comparison are presented.
5.6.1. Validation of the Performance Benchmarking StoppingRule
A common requirement for stopping rules is to always lead to a stop (eventual stop-ping). In the case of compute service benchmarking, the stopping rule is always appliedto a finite number of services. The heuristic of the proposed stopping rule only contin-ues if the set of compute services is not completely traversed. After a full traversal of thefinite compute service sample set, the stopping rule will stop the performance bench-marking procedure and the requirement of eventual stopping is thereby satisfied.
Aside from eventual stopping, the stopping rule claims support for cost budgets. There-fore, the ability to stop within a cost budget is tested in an experiment. For the exper-iment, a sufficiently large compute service set must be defined that exceeds the costbudget according to a rough estimate. The stopping rule is employed in a sequentialbenchmarking of the compute services with respect to a single micro-benchmark.
The outcome of the experiment is tested against the following hypotheses in the lightof research question RQ2:
151
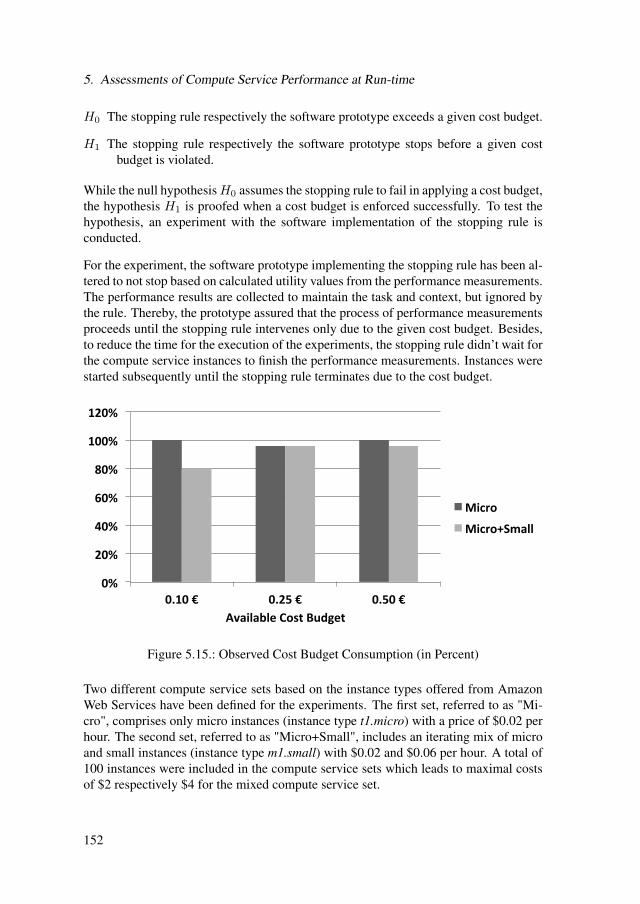
5. Assessments of Compute Service Performance at Run-time
H0 The stopping rule respectively the software prototype exceeds a given cost budget.
H1 The stopping rule respectively the software prototype stops before a given costbudget is violated.
While the null hypothesisH0 assumes the stopping rule to fail in applying a cost budget,the hypothesis H1 is proofed when a cost budget is enforced successfully. To test thehypothesis, an experiment with the software implementation of the stopping rule isconducted.
For the experiment, the software prototype implementing the stopping rule has been al-tered to not stop based on calculated utility values from the performance measurements.The performance results are collected to maintain the task and context, but ignored bythe rule. Thereby, the prototype assured that the process of performance measurementsproceeds until the stopping rule intervenes only due to the given cost budget. Besides,to reduce the time for the execution of the experiments, the stopping rule didn’t wait forthe compute service instances to finish the performance measurements. Instances werestarted subsequently until the stopping rule terminates due to the cost budget.
0%
20%
40%
60%
80%
100%
120%
0.10 € 0.25 € 0.50 € Available Cost Budget
Micro
Micro+Small
Figure 5.15.: Observed Cost Budget Consumption (in Percent)
Two different compute service sets based on the instance types offered from AmazonWeb Services have been defined for the experiments. The first set, referred to as "Mi-cro", comprises only micro instances (instance type t1.micro) with a price of $0.02 perhour. The second set, referred to as "Micro+Small", includes an iterating mix of microand small instances (instance type m1.small) with $0.02 and $0.06 per hour. A total of100 instances were included in the compute service sets which leads to maximal costsof $2 respectively $4 for the mixed compute service set.
152

5.6. Evaluation of the Performance Benchmarking Stopping Rule
The proposed stopping rule’s cost budget feature was tested for cost budgets of $0.1,$0.25, and $0.5 with the aforementioned compute service sets. In all six possible com-binations of compute services and budgets, the proposed stopping rule did not permita violation of the cost budget. Depending on the compute service set and the hourlycosts, the available budget was consumed to a certain degree. How much of the budgetwas consumed is in direct relation to the granularity of the hourly costs. Figure 5.15depicts the cost budget consumption for the two sets "Micro" and "Micro+Small" inpercent.
The results confirm the hypothesis H1 at least for the 6 explored experiments. Thereby,the results give a foundation to state that the proposed stopping rule serves as an answerto research question RQ2. The proposed stopping rule shows that costs can be budgetedin the course of measuring the performance of multiple compute services.
5.6.2. Comparison to Standard Stopping Rules
The stopping rule proposed in this work incorporates a heuristic that exploits an ap-proximate ordering of the compute services. To evaluate the quality of the heuristic,a comparison with existing standard stopping rules is conducted. The comparison iscapable of identifying the existence of a potential advantage of the proposed stoppingrule (PSR) over the standard stopping rules cut off rule (COR), candidate count rule(CCR), successive non-candidate rule (SNCR), and odds algorithm (OA).
For the comparison, the standard stopping rules and the proposed heuristic-based stop-ping rule are compared in several scenarios. The scenarios differentiate in the order ofn incorporated compute services, with n = 10. Theoretically, n! = 3628800 possibleorders could be explored to compare the rules.
For an in-depth examination of the stopping rules, four particular orders are selected:perfect order, perfect order with one switched pair, perfect order with two switchedpairs, and reversed perfect order. Particularly, the first three orders are expected to re-semble very common cases when prior information, such as hardware figures, is avail-able. In each of the order scenario, the observations the stopping rules are going tomake are predetermined for the sake of repeatable experiments. The exact performancescore values of the predetermined ten observations are defined by the order scenarios.
In each of the scenarios, the proposed stopping rules and the standard stopping rules arecompared according to the factors best compute service found, rank of best candidate,and stopping index. The first factor indicates whether a stopping rule succeeded in find-ing the highest scoring compute service in the set. In case it was not found, the secondfactor reflects the global rank of the best candidate that was identified by the stoppingrule. The last factor aims at exposing how much cost the stopping rule generates due tothe number of measured compute services.
153

5. Assessments of Compute Service Performance at Run-time
The stopping rules are tested with every possible parameter value, e.g., cut off obser-vations, candidate count, or non-candidate count. Unlike the other stopping rules, theOA has no value-oriented parameters, but a formula must be defined for parameter pi.Therefore, the OA is constantly used with the parameter pi = 1
i . In the comparison,the parameters setups achieving the best results are presented for each stopping rule.The results of an arbitrary parameter setup are presented if all parameters setups of astopping rule return the same results.
Scenario 1: Perfect Order
In the perfect order scenario, the situation that prior information proofs correct is cre-ated. The observed score values are decreasing with every additional measurementresult of a compute service. This scenario is presumed to occur frequently when avail-able hardware figures of compute services indicate the perfect order. The observedscores in descending order are depicted in figure 5.16.
0 0.2 0.4 0.6 0.8 1
1.2 1.4
1 2 3 4 5 6 7 8 9 10
Performan
ce Score
Index
Perfect Order
Figure 5.16.: Perfect Order
Based on the perfectly ordered score observations, the stopping rules halt at differentindices in the benchmarking process. The best stopping outcomes have been achievedwith m = 1 for all rules. Table 5.3 contains the results for all stopping rules in the bestparameter setup.
The results show that particularly the proposed stopping rule (PSR) outperforms allother stopping rules clearly. In a perfect order scenario, all other stopping rules traversethe whole compute service set. Albeit the index of the highest scoring compute serviceis 1, all stopping rules (except the proposed rule) incur maximal costs in their search.
154
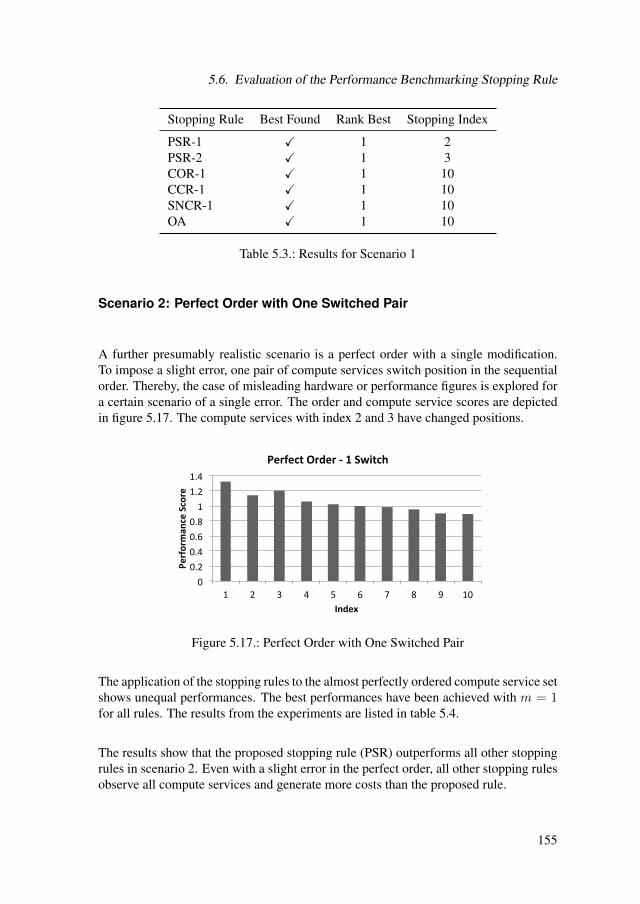
5.6. Evaluation of the Performance Benchmarking Stopping Rule
Stopping Rule Best Found Rank Best Stopping Index
PSR-1 ✓ 1 2PSR-2 ✓ 1 3COR-1 ✓ 1 10CCR-1 ✓ 1 10SNCR-1 ✓ 1 10OA ✓ 1 10
Table 5.3.: Results for Scenario 1
Scenario 2: Perfect Order with One Switched Pair
A further presumably realistic scenario is a perfect order with a single modification.To impose a slight error, one pair of compute services switch position in the sequentialorder. Thereby, the case of misleading hardware or performance figures is explored fora certain scenario of a single error. The order and compute service scores are depictedin figure 5.17. The compute services with index 2 and 3 have changed positions.
0 0.2 0.4 0.6 0.8 1
1.2 1.4
1 2 3 4 5 6 7 8 9 10
Performan
ce Score
Index
Perfect Order -‐ 1 Switch
Figure 5.17.: Perfect Order with One Switched Pair
The application of the stopping rules to the almost perfectly ordered compute service setshows unequal performances. The best performances have been achieved with m = 1for all rules. The results from the experiments are listed in table 5.4.
The results show that the proposed stopping rule (PSR) outperforms all other stoppingrules in scenario 2. Even with a slight error in the perfect order, all other stopping rulesobserve all compute services and generate more costs than the proposed rule.
155

5. Assessments of Compute Service Performance at Run-time
Stopping Rule Best Found Rank Best Stopping Index
PSR-1 ✓ 1 2PSR-2 ✓ 1 5COR-1 ✓ 1 10CCR-1 ✓ 1 10SNCR-1 ✓ 1 10OA ✓ 1 10
Table 5.4.: Results for Scenario 2
Scenario 3: Perfect Order with Two Switched Pairs
In scenario 3, the error rate in the perfect order is further increased. Therefore, anadditional pair switch is imposed. Thereby, the case of imperfect information about theperformance score of 4 compute services due to misleading hardware or performancefigures is created. Figure 5.18 presents the order that includes two switched computeservice pairs and is derived from the perfect order. The indices 1 and 2, and 3 and 4have switched positions in comparison to the perfect order.
0 0.2 0.4 0.6 0.8 1
1.2 1.4
1 2 3 4 5 6 7 8 9 10
Performan
ce Score
Index
Perfect Order -‐ 2 Switches
Figure 5.18.: Perfect Order with Two Switched Pairs
The stopping rules have been applied with all possible values form (except for the OA).The best results were achieved with m = 1. Table 5.5 lists the finding for all stoppingrules. For detailed explanations the table includes the results for m ∈ 1, 2 for mostrules.
For two errors in the perfect order, two stopping rules, namely COR-1 and CCR-1, areable to outperform the proposed rule. Instead of 3 observations, COR-1 and CCR-1only need 2 observations to stop and find the best scoring compute service. Neverthe-less, when increasing m to 2, the proposed stopping rule outperforms all other rules.
156

5.6. Evaluation of the Performance Benchmarking Stopping Rule
Stopping Rule Best Found Rank Best Stopping Index
PSR-1 ✓ 1 3PSR-2 ✓ 1 6COR-1 ✓ 1 2COR-2 ✓ 1 10CCR-1 ✓ 1 2CCR-2 ✓ 1 10SNCR-1 ✓ 1 10OA ✓ 1 10
Table 5.5.: Results for Scenario 3
Scenario 4: Reversed Perfect Order
To give a contrasting scenario, the compute service set of the perfect order is reversed.Thereby, a stopping rule needs to measure all compute services to discover the absolutehighest scoring service. Although the order is obviously the reversed copy of scenario1, the reversed order is depicted in figure 5.19 nonetheless.
0 0.2 0.4 0.6 0.8 1
1.2 1.4
1 2 3 4 5 6 7 8 9 10
Performan
ce Score
Index
Reversed Order
Figure 5.19.: Reversed Perfect Order
For the comparison, the same stopping rule setups with m ∈ 1, 2 are used to show theirperformances in the contrasting reversed perfect order. The findings with regards to theperformance of the stopping rules are listed in table 5.6.
As the results show, only the proposed stopping rule and the rule SNCR-1 are able todetermine the absolute highest scoring compute service in the set. All other rules haltbefore the 10th index and miss the highest scoring service. The cut off and candidatecount rules succeed withm ≥ 9, the odds algorithm would need a different pi definitionto succeed.
157

5. Assessments of Compute Service Performance at Run-time
Stopping Rule Best Found Rank Best Stopping Index
PSR-1 ✓ 1 10PSR-2 ✓ 1 10COR-1 × 9 2COR-2 × 8 3CCR-1 × 9 2CCR-2 × 8 3SNCR-1 ✓ 1 10SNCR-2 ✓ 1 10OA × 3 8
Table 5.6.: Results for Scenario 3
The reversed order scenario shows that the proposed rule not only succeeds in perfectorder, but also in a very imperfect order. Other rules need a scenario-specific configu-ration of the m variable.
158

6. Assessments of Virtual MachineImage Contents at Run-time
One essential aspect of compute services is the use of prepared VM images and virtualappliances. Both provide an operating system and an optional software stack that isavailable upon instantiation of a VM. While bare VM images typically provide onlythe operating system, virtual appliances come with a full configured software stack.The latter reduces the development time for the majority of system setups on VMs.
Meta-data that describes the contents of available VM images is however yet absent.The assessment of available VM images and virtual appliances requires an approachthat can describe and document the contents as meta-data attached to VM images.
In this chapter, a method for assessing VM image meta-data is presented. The methodis capable of automatically instantiating VMs of VM images to gain immediate access.Thereby, VMs can be introspected regarding installed software packages at runtime.Using the assessed data, a database of VM image meta-data can be build that serves asa basis for a range of applications, such as VM duplication or search.
The method presented in this chapter instantiates the abstract concepts of the computeservice assessment framework introduced in chapter 4. An overview of the conceptsreused from the framework is depicted in figure 6.1. The framework’s meta-data modelis extended to accommodate VM image meta-data. Moreover, the run-time assessmentautomation model is adapted to provide a procedure for automated VM image intro-spections.
A stopping rule similar to the rule presented in section 5 could be introduced for VMimage assessments as well. However, a dynamically determined, premature stoppingof the VM image assessment process appears unreasonable. Meta-data of VM imagesis typically immutable and thus can be permanently stored and retrieved when needed.Instead of that, the present method offers a parameter to adjust the number of VMimages to inspect and thereby gives means for a cost budgeting.
First, a data model to describe VM image meta-data is introduced. Then, the procedureto automatically introspect VM images is presented and the involved components areexplained in detail. Finally, means to compare VM images within and across computeservice providers are provided.
159

6. Assessments of Virtual Machine Image Contents at Run-time
MADM-based Scoring Method
Cost Budget Stopping Rule
Meta-Data Model
Run-time Assessment Automation Model
Figure 6.1.: The Framework’s Models & Methods used for VM Image Assessment
6.1. Virtual Machine Image Meta-Data Model
As a basis for future applications, the following data model shall provide a structuredand queriable source of information about assessed VM image meta-data. The datamodel depicted in figure 6.2 extends the framework’s basis meta-data model whichconsiders a superset of meta-data available through compute cloud APIs (c.f. table2.3). The present model adds a structure to accommodate meta-data gained from usingthe introspection method .
ImageId: StringName: StringDescription: SrtringRepository: StringArchitecture: StringOperatingSystem: StringGeoLocation: StringFilePath: StringCategory: StringHypervisor: StringTimestampCreated: DateTimestampUpdated: Date
VirtualMachineImage
Name: StringVersion: StringAttributeMap: Map<String,String>
Software
Name: StringVersion: StringAttributeMap: Map<String,String>
ProgrammingLanguage
*1
*
1
OwnerId: StringName: StringRole: String
Owner *1
Provider
ProviderId: StringName: String
*
1
Figure 6.2.: The VM Image Meta-Data Model
The data model describes VM images as VirtualMachineImages which belong to aprovider (Provider) and have an owner (Owner). Aside from directly associated at-tributes, VirtualMachineImages consist of software packages (Software) and supportprogramming languages ProgrammingLanguage.
The Software and ProgrammingLanguage entities allow to hold information on the soft-ware stack and configuration retrieved via an introspection. Both, Software and Pro-
160

6.1. Virtual Machine Image Meta-Data Model
grammingLanguage, contain an AttributeMap attribute that allows to store arbitraryadditional information as key-value pairs. Also, all data is typed as String to support allsorts of data formats as attributes like "Version" can be a number "3.0" or a non-numerictext "3.0-milestone".
161

6. Assessments of Virtual Machine Image Contents at Run-time
6.2. Introspection of Virtual Machine Images
The following sections describe the components of the method for an automated meta-data assessment of compute services regarding available VM images and, in particular,virtual appliances with complex configurations. Particularly, a procedure for an auto-mated introspection of VM image contents is introduced.
First, the procedure is presented to give an overview of the introduced components andtheir interactions. Then, the components to discover VM images in repositories and tointrospect VM image contents are explained in detail.
6.2.1. Automated VM Image Introspection Procedure
Compute service providers maintain repositories of VM images. Depending on theprovisioning model of the repository, the user community can publish VM images inthe repository as well. The number of VM images in a repository can grow extensivelylarge. Therefore, an assessment of VM image meta-data requires an automation. On ofthe goals of the procedure for automated VM image introspections is to minimize userinteraction in order to execute in batches. In addition, the procedure must be capableof accessing diverse repositories from distinct compute service providers. Generally,the presented procedure is based on the blueprint automation model of the frameworkintroduced in chapter 4.
To give means for a parameterization of a VM image introspection, the present pro-cedure provides a user interface that allows to define the repositories and VM imagesto be considered. Besides, the meta-data to be assessed can be defined as a parameter,too.
The procedure incorporates multiple components that carry out different tasks in a VMimage introspection. Figure 6.3 illustrates the components involved in the VM imageintrospection procedure.
An introspection of multiple VM images is coordinated by the main component Auto-matic Introspection Coordinator. It considers user preferences from the User Prefer-ences Store that can be defined via the User Interface component. The user interfaceallows to define VM image repositories together with required credentials for remoteaccess to a repository. Furthermore, lists of VM images (using an identifier) and filterscan be specified that determine which images are considered in a meta-data assess-ment.
In the initial phase of a meta-data assessment, the Discoverer component accesses theVM image repository and and detects the set of included VM images. The set can thenbe matched with the user’s preferences, such as blacklists, whitelists, or filters.
162

6.2. Introspection of Virtual Machine Images
Compute Service Provider 1
Automatic Introspection Coordinator
User Parameters &
Results Store
Multi-Cloud Interface VM Image Repository
Virtual Machine
Compute Service Provider N
Virtual Machine
...
introspect
upload results
User Interface
read/write
Discoverer
instantiate
Crawler
Figure 6.3.: Overview of the Automated VM Image Introspection Procedure
Based on the final set of VM images to be introspected, the Crawler component instan-tiates the images for an introspection using the Multi-Cloud Interface. Then, it accessesthe running VMs and starts the introspection. Eventually, the results of an introspectionare uploaded from within the VM to the Results Store which implements the VM imagemeta-data model.
6.2.2. Discoverer Component
The goal of the Discoverer component is to specify a list from available VM images inrepositories and by adhering to requirements formulated by the user. Figure 6.4 depictsan overview of the process that leads to a final discovery list.
The Discoverer takes a list of Repositories and Lists & Filters as inputs from the UserParameters Store. A repository is a uniquely identified location where VM image meta-data of a compute service provider can be accessed. For example, Amazon EC2 offersan API that allows fetching a list of all AMIs from EC2 repositories in different regions.The Discoverer outputs a Discovery list for each repository, i.e. a list of identifiers ofVM images that have been found in the repository and match the filter criteria.
Filters are provider-specific or even repository-specific, since different compute cloudslikely provide differently named and detailed meta-data. There are two types of nega-tive filters: (1) user-defined K.O. criteria, and (2) user-defined block-lists. K.O. criteriaremove unwanted VM images from the discovery list, such as images with commercial
163
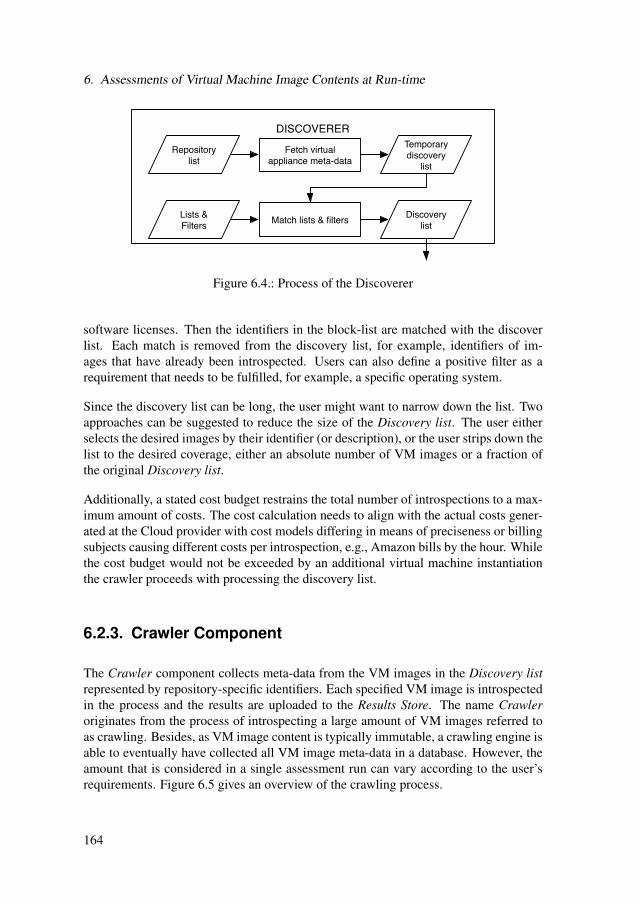
6. Assessments of Virtual Machine Image Contents at Run-time
DISCOVERER
Repository
list
Lists &
Filters
Fetch virtual
appliance meta-data
Match lists & filtersDiscovery
list
Temporary
discovery
list
Figure 6.4.: Process of the Discoverer
software licenses. Then the identifiers in the block-list are matched with the discoverlist. Each match is removed from the discovery list, for example, identifiers of im-ages that have already been introspected. Users can also define a positive filter as arequirement that needs to be fulfilled, for example, a specific operating system.
Since the discovery list can be long, the user might want to narrow down the list. Twoapproaches can be suggested to reduce the size of the Discovery list. The user eitherselects the desired images by their identifier (or description), or the user strips down thelist to the desired coverage, either an absolute number of VM images or a fraction ofthe original Discovery list.
Additionally, a stated cost budget restrains the total number of introspections to a max-imum amount of costs. The cost calculation needs to align with the actual costs gener-ated at the Cloud provider with cost models differing in means of preciseness or billingsubjects causing different costs per introspection, e.g., Amazon bills by the hour. Whilethe cost budget would not be exceeded by an additional virtual machine instantiationthe crawler proceeds with processing the discovery list.
6.2.3. Crawler Component
The Crawler component collects meta-data from the VM images in the Discovery listrepresented by repository-specific identifiers. Each specified VM image is introspectedin the process and the results are uploaded to the Results Store. The name Crawleroriginates from the process of introspecting a large amount of VM images referred toas crawling. Besides, as VM image content is typically immutable, a crawling engine isable to eventually have collected all VM image meta-data in a database. However, theamount that is considered in a single assessment run can vary according to the user’srequirements. Figure 6.5 gives an overview of the crawling process.
164

6.2. Introspection of Virtual Machine Images
CRAWLER
Split
functionSplit the list
List
partitionList
partitionPartition of
the list
Launch VM instance
Start Crawler
instanceStart Crawler
instanceStart Crawler
instance
Install configuration
management agent
Collect and download
meta-data
VM image
meta-data
Results Store
Discovery
list
Figure 6.5.: Process of the Crawler
The Discovery list is processed in parallel by multiple Crawler instances. If the userprovides a split function, the Discovery list can be segmented into multiple partitions.Each partition is processed by a separate Crawler instance. A Crawler instance can bea separate thread or process on the same server, or a separate (virtual) server.
Each Crawler instance runs the following sequential process for each VM image in aDiscover list partition:
1. Launch an instance of the VM image (if possible)
2. Upload and install a configuration management agent on the running instance
3. Execute the agent with parameters, collect the requested meta-data and downloadthe meta-data to a central database
The initial step employs the Multi-Cloud Interface to a compute service in order tolaunch an instance of a VM image. Typically, VM images can only be instantiated
165

6. Assessments of Virtual Machine Image Contents at Run-time
using the corresponding provider’s compute services. If the instantiation of the VMimage fails, the process stops and meta-data for that image cannot be assessed.
The second step requires remote access to the running VM and a channel to uploadagent software. For Linux operating system instances, the agent software bundle canbe uploaded with ssh. An installer script installs the agent software according to thedetected operating system (i.e., Linux distribution). Of course, existing agents of con-figuration management software packages can be used in this step, e.g., Puppet’s facter[216] or Chef Ohai [107].
In the third step, the agent is executed and collects meta-data from package manager, byexecuting programs that return information about the system, and by inspecting knowndirectories. The User Parameters Store is consulted to determine which meta-data tocollect. All collected data is uploaded by the agent to the Results Store.
166

6.3. Search and Comparison of Virtual Machine Images
6.3. Search and Comparison of Virtual MachineImages
Being in possession of a database of VM images meta-data gives the chance for a rangeof applications, such as software usage statistics and analysis of software dependencyand software complexity trends. One particular aspect is the search of a VM image withspecific preconfigured content and the comparison of VM images.
Unlike performance meta-data of compute services, the contents of VM images aredescribed non-numerically. Therefore, a comparison on a numerical scale that allowsstatements, such as "x is two times better than y" is not feasible. A text-based compar-ison can only apply a matchmaking algorithm that employs string-based tests.
In a search, the available requirement types are restricted to non-numerical text-orientedrequirements, as listed in table 6.1. Using a conjunctive and disjunctive satisficingmethod [19], alternatives can be filtered by the given requirements.
Req. Type Boolean Expression
Equals γ = sr
OneOf γ ∈ S = {sr1, . . . , srn}
Table 6.1.: Non-Numerical Requirement Types
For VM image meta-data, the set of contained software packages and programminglanguages (c.f. section 6.1) can be used in requirement definitions. A suitable VM im-age can thereby be searched by the contents that have been assessed with the presentedintrospection method.
Moreover, comparisons of VM images can be based on assessed contents as well. Acomparison can be conducted in a matchmaking of VM images. Therefore, the meta-data attributes of two VM images are matched, including the set of software pack-ages and programming languages. Consequently, the number of meta-data matchesand misses indicates the similarity of the images.
167
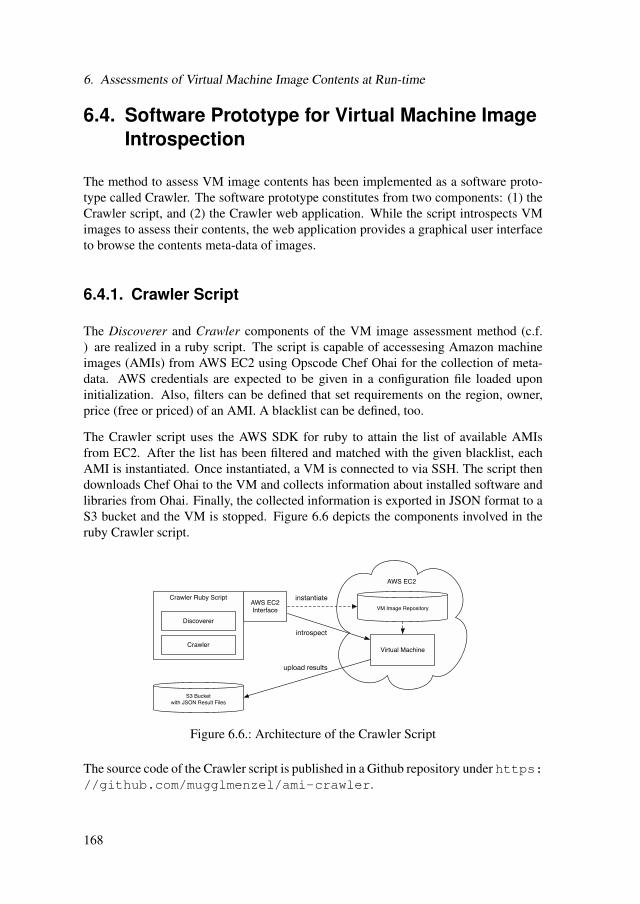
6. Assessments of Virtual Machine Image Contents at Run-time
6.4. Software Prototype for Virtual Machine ImageIntrospection
The method to assess VM image contents has been implemented as a software proto-type called Crawler. The software prototype constitutes from two components: (1) theCrawler script, and (2) the Crawler web application. While the script introspects VMimages to assess their contents, the web application provides a graphical user interfaceto browse the contents meta-data of images.
6.4.1. Crawler Script
The Discoverer and Crawler components of the VM image assessment method (c.f.) are realized in a ruby script. The script is capable of accessesing Amazon machineimages (AMIs) from AWS EC2 using Opscode Chef Ohai for the collection of meta-data. AWS credentials are expected to be given in a configuration file loaded uponinitialization. Also, filters can be defined that set requirements on the region, owner,price (free or priced) of an AMI. A blacklist can be defined, too.
The Crawler script uses the AWS SDK for ruby to attain the list of available AMIsfrom EC2. After the list has been filtered and matched with the given blacklist, eachAMI is instantiated. Once instantiated, a VM is connected to via SSH. The script thendownloads Chef Ohai to the VM and collects information about installed software andlibraries from Ohai. Finally, the collected information is exported in JSON format to aS3 bucket and the VM is stopped. Figure 6.6 depicts the components involved in theruby Crawler script.
AWS EC2
Crawler Ruby Script
S3 Bucket
with JSON Result Files
AWS EC2 Interface VM Image Repository
Virtual Machine
introspect
upload results
Discoverer
instantiate
Crawler
Figure 6.6.: Architecture of the Crawler Script
The source code of the Crawler script is published in a Github repository under https://github.com/mugglmenzel/ami-crawler.
168
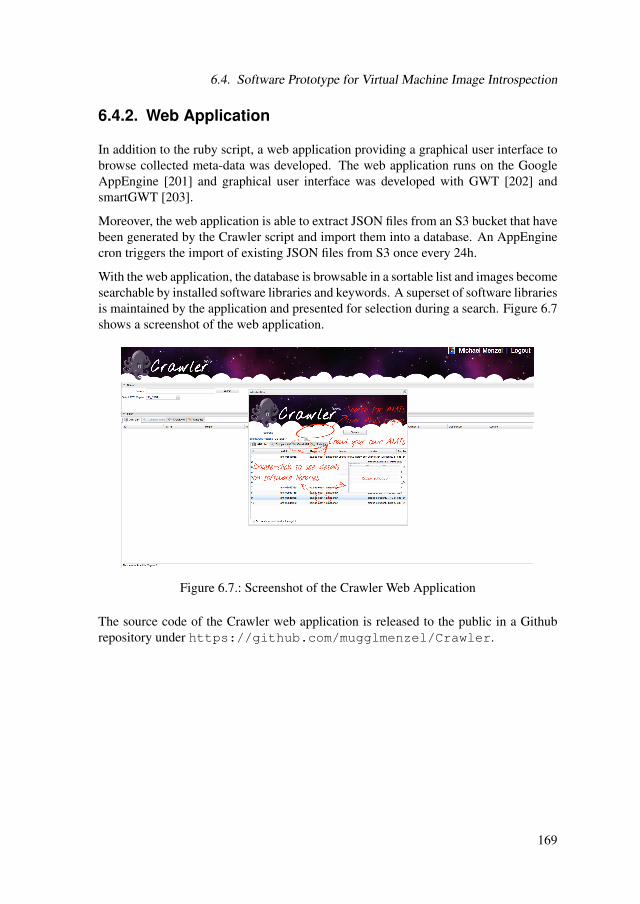
6.4. Software Prototype for Virtual Machine Image Introspection
6.4.2. Web Application
In addition to the ruby script, a web application providing a graphical user interface tobrowse collected meta-data was developed. The web application runs on the GoogleAppEngine [201] and graphical user interface was developed with GWT [202] andsmartGWT [203].
Moreover, the web application is able to extract JSON files from an S3 bucket that havebeen generated by the Crawler script and import them into a database. An AppEnginecron triggers the import of existing JSON files from S3 once every 24h.
With the web application, the database is browsable in a sortable list and images becomesearchable by installed software libraries and keywords. A superset of software librariesis maintained by the application and presented for selection during a search. Figure 6.7shows a screenshot of the web application.
Figure 6.7.: Screenshot of the Crawler Web Application
The source code of the Crawler web application is released to the public in a Githubrepository under https://github.com/mugglmenzel/Crawler.
169

6. Assessments of Virtual Machine Image Contents at Run-time
6.5. Evaluation of the VM Image IntrospectionMethod
The proposed VM image introspection method provides an automated approach to as-sess contents of images by introspecting a running VM. In respect of RQ4, an evalua-tion has to test the applicability of the proposed method:
RQ4. How can Virtual Machine image contents be assessed at run-timefrom multiple compute services in an automated manner?
The instantiation of the VM image introspection method in a software prototype (c.f.section 6.4) proofs the approach’s feasibility. The method and the software prototypehas been subject to discussions with peers in the research community [217]. This workpresents the validation of the method conducted by employing the software prototypein an example with diverse VM images. Besides, the promptitude of automated VMimage introspections is measured.
In the following, the first section explains how the validation with an introspection ofvarious VM images takes place. Then, the findings of the promptitude experimentswith the software prototype are presented. The final section provides statistics derivedfrom meta-data about the AWS EC2 compute service collected with the software pro-totype.
6.5.1. Validation of the VM Image Introspection Approach
The validation aims at verifying the feasibility and applicability of the approach. Inparticular, an experiment which seeks to introspect the contents of diverse VM imagesin the repository of the compute service AWS EC2. The experiment is conducted toresearch the following hypotheses in the light of RQ4:
H0 The introspection approach respectively the software prototype fails to collect meta-data about contents of a VM image.
H1 The introspection approach respectively the software prototype collects meta-dataabout contents of a VM image.
While the null hypothesis H0 holds true if the introspection approach fails, the hy-pothesis H1 is proofed when meta-data describing the contents of a VM image wereassessed successfully. To test the hypothesis, an experiment with the software imple-mentation of the introspection approach is conducted. In the experiment an exemplaryintrospection seeks to proof the applicability of the software prototype (see section 6.4)by introspecting a range of VM images from the compute service AWS EC2.
170

6.5. Evaluation of the VM Image Introspection Method
In preparation of the experiment, the software prototype has been fed with a unknownAMIs list of four different EC2 Ubuntu Linux images from Bitnami [67]. Namely,the prepared VM images from Bitnami are a Wordpress blog software machine (ami-14c5277c), a LAMP stack machine (ami-f85fa990), a JBoss application server machine(ami-c79588ae), and a Gitlab versioning software machine (ami-1203fe7a). Using theAMIs list, the software prototype was executed in three repeated runs per image whichis to assure repeatable results.
The software prototype uses the Chef Ohai client to collect system meta-data and in-stalled libraries and software. Upon completion, the prototype exports the introspectedVM image content meta-data into JSON files on the cloud storage service AWS S3.
To verify the correctness of the detected VM image contents, the exported JSON fileswere compared to the actually installed list of VM images retrieved with the followingshell command:
sudo dpkg --get-selections
For all of the tested VM images, the comparison proofed the approach is capable ofcollecting VM image content meta-data. The exported JSON files were identical in ev-ery of the repeated runs. Therefore, hypothesis H1 is proofed and a positive statementin the light of the research question RQ4 can be made. Using the proposed approachimplemented in the software prototype, the contents of diverse VM images could beassessed at run-time. Besides, an evidence of the feasibility of RQ4 proofs also the ex-istence of automated assessments in general. Thereby, RQ1a is addressed in parallel.
The experiment is based on the software prototype using a prior configuration with a listof AMIs. Given the configuration, the execution ofthe introspection task was executedin an automated manner. Therefore, the level of automation achieved by the methodand software prototype is classified as batch processing according to Endsley [193].
6.5.2. Results of the Promptitude Measurements
Apart from a validation of the approach, promptitude measurements give insights inthe applicability in a practical context. In order to record the promptitude of an intro-spection, the validation experiments with four different VM images have been extendedwith a time measurement. Additionally, the introspection has been tested for two dif-ferent compute service configurations, namely the AWS EC2 instance types t1.microand m1.small.
In the experiments, the duration of the whole introspection process was measured in twostages: (1) VM image instantiation, and (2) introspection. Thereby, the whole durationof the VM image contents assessement process results from the sum of the measured
171

6. Assessments of Virtual Machine Image Contents at Run-time
durations in both stages. As in the validation, the four EC2 AMIs from Bitnami [67]with Wordpress, LAMP, JBoss, and Gitlab are used. To ensure reliable results, theexperiments were repeated three times.
Figures 6.8a and 6.8b depict the promptitude measurement results for the t1.micro andm1.small instance types, respectively. The graph shows that the instantiation is respon-sible for a small share of the total duration. In average, the instantiation required 22,443ms for micro instances and 21,280 ms for small instances.
The introspection stage induces the major delay in the total promptitude (∼87% microinstances, ∼86% small instances). The measurement results show that an introspectionof micro instances took 152,767 ms and of small instances 134,133 ms in average. Theavailable compute power has a direct influence on the promptitude of the introspectionstage. Observations with system monitors discovered that system processes after thestart of the system can induce a delay.
0
50,000
100,000
150,000
200,000
250,000
300,000
ami-‐14c5277c ami-‐f85fa990 ami-‐c79588ae ami-‐1203fe7a
Millisecon
ds
Measured Promp1tude (with t1.micro)
Instan7a7on Introspec7on
(a) Promptitude Results for Micro In-stances
0
50,000
100,000
150,000
200,000
250,000
ami-‐14c5277c ami-‐f85fa990 ami-‐c79588ae ami-‐1203fe7a
Millisecon
ds
Measured Promp1tude (with m1.small)
Instan7a7on Introspec7on
(b) Promptitude Results for Small Instances
From the recorded measurements, a variation in the promptitude was observed for dif-ferent compute services. As depicted in figures 6.9a and 6.9b, the standard deviationis variable for micro and small instances. For micro instances, a maximum standarddeviation of 167,036 ms (∼72%) and minimum of 13,952 ms (∼20%) for the intro-spection stage can be observed. For small instances, the maximum standard deviationof the introspection stage is 85,278 ms (∼54%) and the minimum standard deviation is15,980 ms (∼19%).
All in all, the promptitude show variations which differ in gravity between computeservice. Overall, the measured promptitude for a VM image content assessment processnever exceeded 401 seconds in total in all experiments.
6.5.3. Statistics for AWS EC2 Compute Services
Apart from assessing the contents of few selected VM images, the method can also beemployed to gain statistics about whole repositories. As an extension to the hithertoevaluation of the introspection approach, a wide range of VM images provided in the
172

6.5. Evaluation of the VM Image Introspection Method
0
50,000
100,000
150,000
200,000
ami-‐14c5277c ami-‐f85fa990 ami-‐c79588ae ami-‐1203fe7a
Millisecon
ds
Standard Devia1on (with t1.micro)
Instan7a7on Introspec7on
(a) Promptitude Standard Deviation for Mi-cro Instances (in ms)
0
20,000
40,000
60,000
80,000
100,000
ami-‐14c5277c ami-‐f85fa990 ami-‐c79588ae ami-‐1203fe7a
Millisecon
ds
Standard Devia1on (with m1.small)
Instan8a8on Introspec8on
(b) Promptitude Standard Deviation forSmall Instances (in ms)
Ubuntu package name Installation count
perl 863python 710ruby1.8 399python2.6 247python2.7 263
openssh-server 869vim-tiny 843vim 502subversion 23git-core 8
Table 6.2.: Software Package Count (Canonical and Alestic.com)
EC2 repositories by Alestic.com and Canonical have been assessed. Both, Alestic.comand Canonical, prepare AMIs with varying Ubuntu Linux operating systems and offerthem to the community of EC2 users for free.
To gain statistics, 869 of 981 AMIs from Alestic.com and Canonical were assessedwith the software prototype implementing the introspection method. The other 112AMIs could not be assessed due to problems over establishing a SSH connection (withusers root, ubuntu, ec2-user).
Based on the assessed VM image contents, the frequency of certain software in UbuntuLinux images on EC2 can be determined. Table 6.2 presents the frequency statistics forsoftware packages in EC2 Ubuntu AMIs from Alestic.com and Canonical. The upperpart of the table shows the installation count of the top five programming languagepackages, and the bottom part the installation count of the top five software packages.
Apart from observed software frequencies, further statistics could be generated from themeta-data assessment results. One particularity of the explored compute service EC2is the separation of the global VM image repository into sub-repositories in diverse
173

6. Assessments of Virtual Machine Image Contents at Run-time
Figure 6.10.: Number of AMIs per Amazon EC2 Region
regions. To gain an understanding how the regions compare, the number of AMIs inthe diverse regions has been determined via the EC2 API. The results are illustrated ina pie chart in figure 6.10.
Moreover, AMIs available in EC2 (aggregated over all regions) could be grouped by themeta-data attributes operating system, processor architecture, and commercial license.The results from the grouping by meta-data attribute are presented as bar charts infigure 6.11. The numbers show clearly that Linux is the predominant operating systemin available AMIs. Also, most AMIs are based on a i386 32-bit processor architecture.Interestingly, the larger share of AMIs is provided for free. However, software in theAMIs may still require a license (referred to as bring your own license).
(a) Operating System (b) Processor Architecture (c) Commercial License
Figure 6.11.: Meta-Data Attributes of AMIs in All Regions
174

Part IV.
Finale
175


7. Conclusions, Discussion &Outlook
This final chapter completes the present work with a retrospection and final thoughts.First, the findings, research outcomes and contributions of this work are summarizedand conclusions are drawn. Finally, the contributions of the present work are discussedand an outlook with open research questions is given, which leaves further explorationsto future work.
7.1. Conclusions
This work started with the observation that compute service offerings lack compre-hensive meta-data to support detailed comparisons and engineering decisions. Themeta-data published by compute service providers is scarce and not necessarily reli-able, particularly to describe performance characteristics and contents of VM imagerepositories. Both aspects have been of eminent interest in this work.
In regards of performance, the amount of meta-data is specifically limited when a cloudconsumer needs to identify suitable compute services providing the necessary capacityfor a software system. Also, tools are missing when a consumer seeks to monitorvicissitudes of the provided performance characteristics of a service.
The current state of the art lacks an automated approach to measure the performance ofa compute service according to schedules and over time. Approaches which offer au-tomation aspects and thereby are able to repeat and schedule benchmarking runs havenot yet been adapted to target compute services. In contrast, approaches to benchmarkcompute services lack an automation, and need to be manually adapted to diverse com-pute services.
Moreover, in the realm of assessing VM image meta-data from compute services, exist-ing approaches expect full image file access and do not gain meta-data about contents.The research community has already explored machine introspections for security pur-poses which, however, does not incorporate support for meta-data collection or accessthrough remote interfaces of compute services.
177

7. Conclusions, Discussion & Outlook
The identification of a scarcity in reliable compute service meta-data lead to the follow-ing research question:
How can cloud compute services be assessedat run-time regarding meta-data?
The principal research question is split into several subordinated questions which thiswork aims to answer and evaluate. In this regard, a framework of methods and modelsto assess compute service meta-data in an automated manner has been proposed. Themethods of the framework leverage client-side remote access and collect meta-datafrom within VMs at run-time. In addition, the framework features support for com-parisons of compute services based on a scoring. Thereby, compute cloud consumersare enabled to single-handedly assess and compare meta-data attributes of compute ser-vices.
The framework is furthermore instantiated to treat specifically two aspects of computeservices, namely performance and VM image contents. Consequently, compute cloudconsumers are provided with concrete methods to assess and compare compute servicesaccording to both aspects.
In the following, a summary of this work’s contributions is given and conclusions aredrawn.
Automated Compute Service AssessmentsAs part of the framework a blueprint model for the automation of assessments is pro-posed. The model describes necessary steps assess compute services at run-time and ascheme for the communication with compute services via remote protocols. Based onthe automation model two instantiations are presented that enable consumers to assesscompute services in an automated manner regarding two specific characteristics: (1)performance, (2) VM image contents.
To gain performance meta-data of compute services, the model is reused in a method tomeasure performance of compute services at run-time. A proposed performance mea-surement method supports a scheduling and repetition of measurement tasks to observethe performance behavior of compute services over time. Exploiting remote access of-fered by compute services, the approach executes benchmarking scripts from the client-side to conduct measurements. Collected performance benchmarking results are struc-tured and attached to compute services as meta-data using the framework’s meta-datamodel. An implementation of a software prototype shows the feasibility of the methodand serves as the basis for further evaluations. The aspects of automation, schedulingand repetition of compute service performance benchmarking has been validated andcompared to the state of the art. Besides, an examination of the promptitude of the soft-ware prototype showed that the induced overhead to prepare VMs for benchmarking atrun-time never surpasses 220 seconds and, thereby, confirms the applicability in prac-tice. The scheduling component of the prototype sustains an average impreciseness of9 milliseconds in execution delay (with a maximum of 24 milliseconds).
178

7.1. Conclusions
The second instantiation of the automation model enables consumers to automaticallyassess the contents of VM images provided in repositories of compute services. Partic-ularly, the approach introspects the software libraries and packages included in a VMimage from a client at run-time. A VM image is instantiated as VM on the correspond-ing compute service and accessed via remote protocols. With an established remoteconnection in place, information from package managers and other operating systemtools is extracted from the running VM. The list of detected software contents is at-tached to a VM image and stored as meta-data in a central database. An evaluationwith a software prototype proofed the feasibility of the concept and revealed that an in-trospection of AWS EC2 VM images never surpasses 401 seconds according to a rangeof experiments.
Compute Service Scoring & ComparisonsBased on the meta-data gained from automated assessments, a further method of theframework introduces a scoring and, thereby, enables consumers to compare com-pute services according to a single value. The method combines multiple meta-dataattributes into a single score value. The calculation is based on a weighted criteria hi-erarchy linked to the performance attributes and uses the Analytic Hierarchy Process.The resulting scores are normalized and mapped to a ratio scale for comparisons. Aninstantiation for performance assessments of compute services adapt the method forcomparisons according to performance attributes. A software prototype implement-ing the performance assessment instantiation proofs the feasibility and served as basisfor a case study with the industry. In addition, the computational complexity of themethod has been examined for growing numbers of compute services and performanceattributes to be considered. While doing so, the influence of the structure of criteriahierarchies on the computational complexity has been explored. The findings indicatethat with a growing number of attributes, grouping should be considered to decreasethe computational complexity. In realistic scenarios with no more than 30 performanceattributes and compute services, the software prototype is able to calculate the weightedand normalized score values with 5-digit precision within 3.6 milliseconds.
Cost Budgeting Stopping RuleTo counter costs accruing from assessments of compute services, the framework in-corporates a stopping rule approach. The stopping rule binds the maximum numberof observable compute services to a given cost budget. In an instantiation for perfor-mance measurements, the framework’s stopping rule is configured to support sequentialobservations of compute services with performance benchmarks. An implementationof the instantiations stopping rule asserts the feasibility of the approach. Moreover,experiments proof that the rule guarantees to stop the execution of performance bench-marking runs before a certain cost budget is spent. Apart from the budget, the stoppingrule pursues minimizing costs when a prior order of the compute services regardingperformance scores is provided. According to a comparison with other stopping rulesin the course of the evaluation, the rule outperforms or equals the spendings of standardstopping rules when the set of compute services is in perfect or near perfect order.
179

7. Conclusions, Discussion & Outlook
Overall, the framework gives answers to the posed research questions and contributesa framework of evaluated models and methods to the research community. The intro-duced methods give means to assess and compare compute services regarding diversecharacteristics. Instantiations apply the framework’s methods and models to assesscompute services in terms of performance and VM image contents.
An implementation of the methods in multiple software prototypes proofed the correct-ness and feasibility of the concepts and applicability in practice. The experiment resultsfrom the software prototypes served as the basis for an evaluation of the research ques-tions. Existent limitations are subject to a discussion and might be addressed by futurework – which is the matter of the next section.
180

7.2. Discussion & Outlook
7.2. Discussion & Outlook
The present work contributes a yet applicable framework of compute service assess-ment models and methods to the research community. Despite the fact that the findingsof an evaluation indicate a validity and applicability of the methods, limitations are dueto be discussed. Besides, there is certainly plenty of room for improvements, exten-sions and a dissemination of the results. In the following, the limitations and aspects offuture work are discussed for each of the methods incorporated in the framework andparticularly their instantiations.
Automated Compute Service AssessmentsThe automation model is strictly bound to compute services with accessible remoteinterfaces integrated into an implementation. The assumption made is that the remoteinterfaces support a completely automated management of VMs and the establishementof remote sessions to them. If any of the steps requires manual interaction on the clientside, a full batch execution cannot be realized and the level of automation is lowered.
The instantiations of the automation model raise further discussable points. It mustbe mentioned that the measurement of performance attributes of a compute serviceusing benchmarking scripts at run-time is tied to two aspects: (1) exploitation of re-mote access interfaces to VMs and (2) benchmarking based on synthetic workloads.As benchmarking only captures performance characteristics regarding synthetic work-loads, other measurement approaches might be more suitable for different performanceanalysis scenarios. For example, an in-situ method can gain insights with the actualsoftware in place and non-synthetic workloads.
However, an in-situ measurement requires a deployment of the software system andusers to generate the workload. For an automation of the measurement, the deploymentof the software system needs to be automated in the process, too. Besides, when actualusers generate the in-situ workload, a measurement cannot be initiated ad-hoc, but iscarried out over the long-term. Otherwise, a workload generator needs to be preparedfor this purpose, such as Rain [218].
In case both issues are addressed, namely the introduction of an automated softwaredeployment and a workload generator, in-situ measurements may well be integratedinto the proposed performance measurement method. Nevertheless, such an integrationis subject to future work.
In contrast, measurements with a simulation or emulation method are contrary to theproposed method. Both, simulation and emulation, void the access to the real system,but require to build an imitation of the system. Typically, the details of a system undertest, being a compute service, are typically hidden from a consumer and treated as abusiness secret by the provider. Therefore, building an imitation of the compute servicethat resembles the behavior is a rather implausible undertaking.
181

7. Conclusions, Discussion & Outlook
Moreover, an examination of the software prototype’s promptitude demonstrated thatperformance benchmarking requires minutes or hours of time per run. For popular usecases, such as capacity planning for a software system, first performance meta-databeing available within hours is acceptable. In other use cases, a more responsive oreven real time performance monitoring may be of interest. With the proposed run-time benchmarking approach, real time performance meta-data seems not achievable.Nonetheless, a reduction of the overhead and measures to increase the promptitude aresubject to future work. Furthermore, a use of the approach in a server-side setting drivenby compute service providers is a yet unexplored alternative.
A further aspect of compute services reveals a limitation of the approach. The com-puter hardware and resource allocation algorithms may change in quick iterations overtime. The hardware purchased by cloud providers to expand and maintain data cen-ters advances together with technological progress. A benchmarking approach from aconsumer perspective (with client-side access) faces a black box and can only captureperformance characteristics at a certain point in time. An exact and timely representa-tion of a compute service’s performance specification may rather be achieved by morecostly monitoring approaches, used on the client or server-side.
Despite CloudHarmony [139] having built a first database of performance meta-data,one future effort is to build databases that host large amounts of compute service per-formance meta-data. With the methods and software prototypes presented in this work,the measurements can be conducted by many cloud consumers in a joint effort. We planto establish the software prototype as a widely used web application which enables anycompute cloud consumer to conduct performance measurements. The possibility toconfigure repetitions and schedule executions of performance benchmarks gives con-sumers further power and insights how the compute services’ performances vary andevolve over time. The meta-data creates the need for applications that can aggregateand illustrate results from multiple repetitions and allow users to browse through per-formance meta-data histograms.
As with the automated performance benchmarking method, the automated VM imageintrospection method leverages the run-time and operates from a client-side. A certainoverhead induces a delay which affects the promptitude of VM introspections. The aim-ing for real time results from introspections using the proposed method seems unlikelyin this case as well.
A comprehensive database of meta-data about VM image contents of diverse computeservices is a future task that implicates extensive costs. To counter the costs, a jointeffort from the community of cloud consumers is needed. Fortunately, each VM imageis typically immutable and needs to be introspected only once. We plan to manifestthe software prototype as a public web application that is used by many compute cloudconsumer to introspect VM images.
182

7.2. Discussion & Outlook
The future of VM image repositories is yet blurry. The number of engaged institutionscreating VM images for community-driven repositories, such as with AWS EC2, indi-cate an immense growth in the coming years. Aside from that, AWS has launched amarketplace for commercial VM images which could add to the growth rate in the fu-ture. The assessment of all VM images in a timely manner could become a Sisypheantask in the future. However, the proposed approach allows compute cloud consumersto focus on few VM images they have identified as particularly interesting. On thecontrary, compute cloud providers can integrate the introspection method within theircompute services on the server-side to take over the task for their consumers.
Compute Service Scoring & ComparisonsThe scoring method proofed as applicable in practice according to a case study andinterviews with the industry. As stated by users of the software prototype, MADMprovides a suitable approach for comparisons of alternatives. A further validation ofthe prototype confirms that performance attributes of compute services can be mappedto a single score. The computational complexity, however, is growing exponentially.Nonetheless, computation times are acceptable with typical numbers of compute ser-vices and performance attributes and never exceeded 3.6 milliseconds in realistic sce-narios. While the AHP allows for very precise comparisons on a ratio scale, simplerapproaches, such as lexicographic methods that focus on one or few high priority crite-ria, may be sufficient as well.
A major task for the future is to establish standard scorings with fixed sets of per-formance attributes, provided hierarchies and predetermined weights. Thereby, inex-perienced decision-makers and consumers can start with a common standard scoring.Nonetheless, an obvious merit of the AHP approach is that given the database of per-formance meta-data, every consumer can compare compute services with a customconfiguration of selected attributes, weights and hierarchy structure.
Cost Budgeting Stopping RuleThe presented stopping rule is specifically adapted the situation that prior information isavailable. Only then the stopping rule is surely successful and can outperform standardstopping rules. Nevertheless, as the experiments with common scenarios indicate, theproposed stopping rule can outperform or equalize standard stopping rules in manycases.
Moreover, the rule ensures a cost budget is never exceeded within the sequential assess-ment process. However, the proposed stopping rule does not utilize the given budget toa full extent. Bin packing algorithms promise an approach to optimally use the givencost budget. Moreover, the presented stopping rule lacks a support for a time budget.
Apart from a time budget, a parallelization of the yet sequential assessment processis a promising approach to overcome time budgets. Observations, however, are thenmade in parallel and, thus, potentially in random order. A stopping rule would need to
183

7. Conclusions, Discussion & Outlook
cope with randomly made observations of a pre-ordered compute service set, and stillenforce a cost budget.
Final RemarksOverall, this work provides a yet applicable and complete solution in regards of theinitially observed problem and posed research questions. The methods of the proposedframework have been discussed with peers in the research community and throughoutthis document. Although the methods and prototypes arrived at a complete state inregards of the addressed problems, they leave room for enhancements, extensions, andcompeting approaches.
Specific extensions can be made in the realm of additional compute service aspectsyet to be assessed. Further instantiations of the framework can provide consumerswith means to assess and compare compute services regarding an extended range ofattributes.
Hopefully, this work engages other researchers to devote energy into the developmentof meta-data-related approaches to further enrich and simplify the evaluation, choice,comparison, and consumption of cloud compute services for consumers.
184

Appendix
185


A. Performance Meta-Data onCompute Service Websites
The websites have been accessed on March 23, 2014.
Figure A.1.: AWS EC2 Performance Meta-Data
Figure A.2.: GoGrid Performance Meta-Data
187
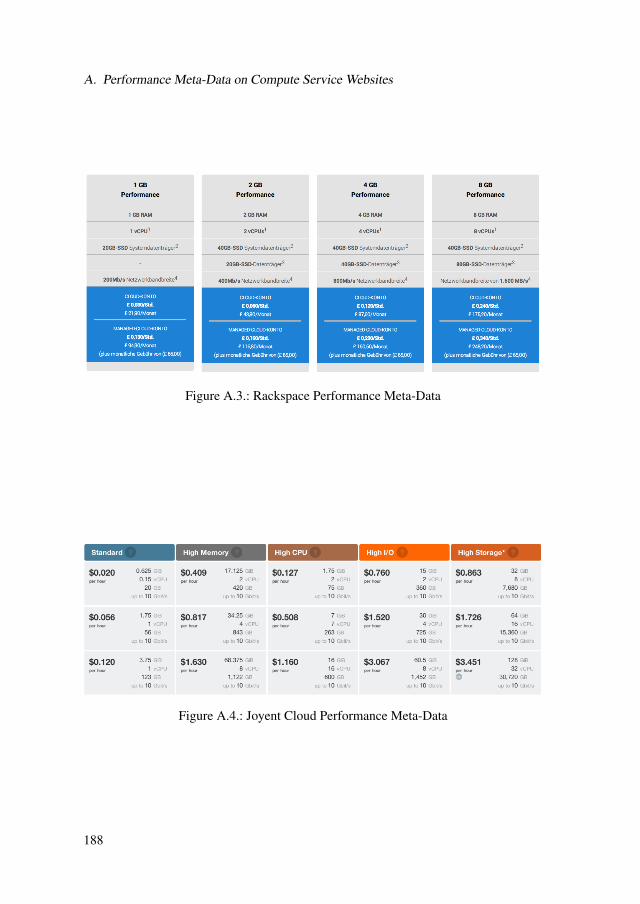
A. Performance Meta-Data on Compute Service Websites
Figure A.3.: Rackspace Performance Meta-Data
Figure A.4.: Joyent Cloud Performance Meta-Data
188

B. Implementation Details & CodeExamples
B.1. Example of AotearoaLib ProgrammingInterface
Dec i s ion < A l t e r n a t i v e > d e c i s i o n =2 new Dec i s ion < A l t e r n a t i v e > ( ) ;
d e c i s i o n . setName ( " Compute S e r v i c e P r o v i d e r S e l e c t i o n " ) ;4
Goal g1 = new Goal ( " C o s t s " ) ;6 g1 . s e tGoa lType ( GoalType . NEGATIVE ) ;
Goal g2 = new Goal ( " Pe r fo rmance " ) ;8
/ / C o s t s10 C r i t e r i o n c11 = new C r i t e r i o n ( " Hour ly C o s t s " ) ;
C r i t e r i o n c12 = new C r i t e r i o n ( " I n i t i a l C o s t s " ) ;12 g1 . a d d C h i l d ( c11 ) ;
g1 . a d d C h i l d ( c12 ) ;14
/ / Per formance16 C r i t e r i o n c21 = new C r i t e r i o n ( "LINPACK" ) ;
C r i t e r i o n c22 = new C r i t e r i o n ( "WHETSTONE" ) ;18 g2 . a d d C h i l d ( c21 ) ;
g2 . a d d C h i l d ( c22 ) ;20
/ / d e f i n i n g A l t e r n a t i v e s22 A l t e r n a t i v e a1 = new A l t e r n a t i v e ( ) ;
a1 . setName ( " Amazon Web S e r v i c e s EC2" ) ;24 A l t e r n a t i v e a2 = new A l t e r n a t i v e ( ) ;
a2 . setName ( " Rackspace Cloud " ) ;26 A l t e r n a t i v e a3 = new A l t e r n a t i v e ( ) ;
a3 . setName ( " Ter remark vCloud " ) ;28
d e c i s i o n . addGoal ( g1 ) ;30 d e c i s i o n . addGoal ( g2 ) ;
32 d e c i s i o n . a d d A l t e r n a t i v e ( a1 ) ;d e c i s i o n . a d d A l t e r n a t i v e ( a2 ) ;
34 d e c i s i o n . a d d A l t e r n a t i v e ( a3 ) ;
36
A n a l y t i c H i e r a r c h y P r o c e s s ahp =38 new A n a l y t i c H i e r a r c h y P r o c e s s ( d e c i s i o n ) ;
189
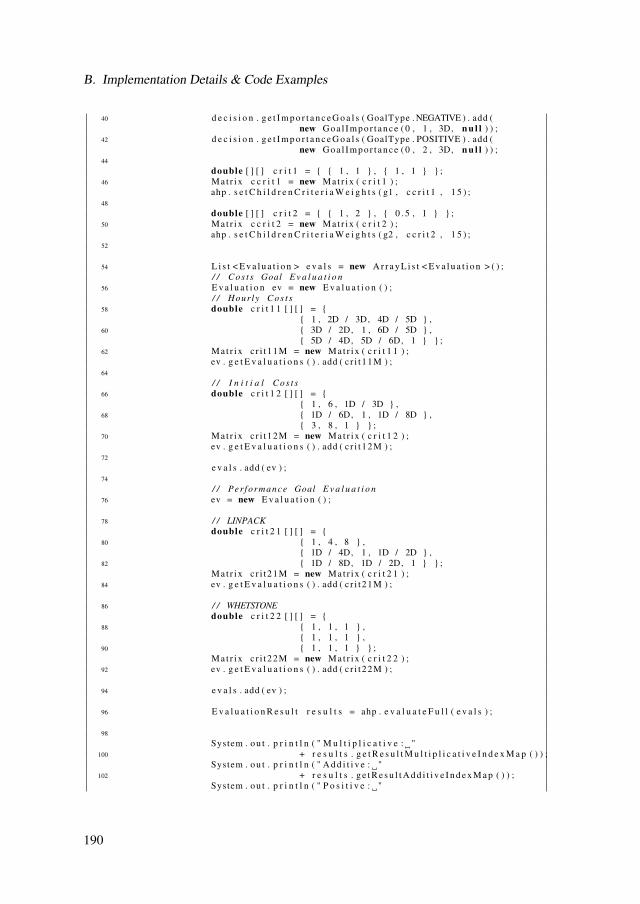
B. Implementation Details & Code Examples
40 d e c i s i o n . g e t I m p o r t a n c e G o a l s ( GoalType . NEGATIVE ) . add (new G o a l I m p o r t a n c e ( 0 , 1 , 3D, n u l l ) ) ;
42 d e c i s i o n . g e t I m p o r t a n c e G o a l s ( GoalType . POSITIVE ) . add (new G o a l I m p o r t a n c e ( 0 , 2 , 3D, n u l l ) ) ;
44
double [ ] [ ] c r i t 1 = { { 1 , 1 } , { 1 , 1 } } ;46 Ma t r ix c c r i t 1 = new Ma t r ix ( c r i t 1 ) ;
ahp . s e t C h i l d r e n C r i t e r i a W e i g h t s ( g1 , c c r i t 1 , 1 5 ) ;48
double [ ] [ ] c r i t 2 = { { 1 , 2 } , { 0 . 5 , 1 } } ;50 Ma t r ix c c r i t 2 = new Ma t r ix ( c r i t 2 ) ;
ahp . s e t C h i l d r e n C r i t e r i a W e i g h t s ( g2 , c c r i t 2 , 1 5 ) ;52
54 L i s t < E v a l u a t i o n > e v a l s = new A r r a y L i s t < E v a l u a t i o n > ( ) ;/ / C o s t s Goal E v a l u a t i o n
56 E v a l u a t i o n ev = new E v a l u a t i o n ( ) ;/ / Hour ly C o s t s
58 double c r i t 1 1 [ ] [ ] = {{ 1 , 2D / 3D, 4D / 5D } ,
60 { 3D / 2D, 1 , 6D / 5D } ,{ 5D / 4D, 5D / 6D, 1 } } ;
62 Ma t r ix c r i t 11M = new Ma t r ix ( c r i t 1 1 ) ;ev . g e t E v a l u a t i o n s ( ) . add ( c r i t 11M ) ;
64
/ / I n i t i a l C o s t s66 double c r i t 1 2 [ ] [ ] = {
{ 1 , 6 , 1D / 3D } ,68 { 1D / 6D, 1 , 1D / 8D } ,
{ 3 , 8 , 1 } } ;70 Ma t r ix c r i t 12M = new Ma t r ix ( c r i t 1 2 ) ;
ev . g e t E v a l u a t i o n s ( ) . add ( c r i t 12M ) ;72
e v a l s . add ( ev ) ;74
/ / Per formance Goal E v a l u a t i o n76 ev = new E v a l u a t i o n ( ) ;
78 / / LINPACKdouble c r i t 2 1 [ ] [ ] = {
80 { 1 , 4 , 8 } ,{ 1D / 4D, 1 , 1D / 2D } ,
82 { 1D / 8D, 1D / 2D, 1 } } ;Ma t r i x c r i t 21M = new Ma t r ix ( c r i t 2 1 ) ;
84 ev . g e t E v a l u a t i o n s ( ) . add ( c r i t 21M ) ;
86 / / WHETSTONEdouble c r i t 2 2 [ ] [ ] = {
88 { 1 , 1 , 1 } ,{ 1 , 1 , 1 } ,
90 { 1 , 1 , 1 } } ;Ma t r i x c r i t 22M = new Ma t r ix ( c r i t 2 2 ) ;
92 ev . g e t E v a l u a t i o n s ( ) . add ( c r i t 22M ) ;
94 e v a l s . add ( ev ) ;
96 E v a l u a t i o n R e s u l t r e s u l t s = ahp . e v a l u a t e F u l l ( e v a l s ) ;
98
System . o u t . p r i n t l n ( " M u l t i p l i c a t i v e : "100 + r e s u l t s . g e t R e s u l t M u l t i p l i c a t i v e I n d e x M a p ( ) ) ;
System . o u t . p r i n t l n ( " A d d i t i v e : "102 + r e s u l t s . g e t R e s u l t A d d i t i v e I n d e x M a p ( ) ) ;
System . o u t . p r i n t l n ( " P o s i t i v e : "
190

B.2. Excluded Micro-benchmarks in LibIntelliCloudBench
104 + r e s u l t s . g e t R e s u l t P o s i t i v e G o a l s M a p ( ) ) ;System . o u t . p r i n t l n ( " N e g a t i v e : "
106 + r e s u l t s . g e t R e s u l t N e g a t i v e G o a l s M a p ( ) ) ;
B.2. Excluded Micro-benchmarks inLibIntelliCloudBench
The LibIntelliCloudBench library excludes all micro-benchmarks of the category "Graph-ics" from the Phoronix test suite. Additionally, the blacklist comprises the followingbenchmarks named by their Phoronix internal identifier:
• aio-stress-1.1.0
• battery-power-usage-1.0.0
• bork-1.0.0
• bullet-1.1.0
• compilebench-1.0.0
• encode-ogg-1.4.0
• encode-wavpack-1.2.0
• espeak-1.3.0
• etqw-demo-iqc-1.0.0
• ffte-1.0.1
• gcrypt-1.0.0
• gnupg-1.3.1
• hdparm-read-1.0.0
• idle-1.1.0
• idle-power-usage-1.0.0
• interbench-1.0.1
• java-scimark2-1.1.1
• jgfxbat-1.1.0
191

B. Implementation Details & Code Examples
• juliagpu-1.2.0
• luxmark-1.0.0
• mandelbulbgpu-1.2.0
• mandelgpu-1.2.0
• mencoder-1.3.0
• nexuiz-iqc-1.0.0
• npb-1.1.1
• pgbench-1.4.0
• pyopencl-1.0.0
• smallpt-gpu-1.2.0
• scimark2-1.1.1
• sqlite-1.8.0
• stresscpu2-1.0.1
• sunflow-1.1.0
• systester-1.0.0
• tachyon-1.1.0
• tscp-1.0.0
• ttsiod-renderer-1.3.0
• xplane9-iqc-1.0.0
192

C. Original Interview Form for aMADM Software Prototype
On the following pages, the structured interview originally developed for the decision-makers of the industry partner T-Systems. Due to time restrictions, the original feed-back form was not filled out by the decision-makers. Instead an unstructured interviewwas conducted.
193

„Aotearoa“ Software Prototype Feedback Form
Please fill out this form to give feedback regarding your personal process of defining a Decision Template. The form uses the method of semi-‐structured interviews and consists of several questions that allow to record all issues you faced during your definition process (of the Decision Template). In particular, two types of questions are employed to capture your personal experiences: rating questions that ask for a rating from 1 to 9, and free text questions that offer to write down all experiences (no limitations).
Role of participant in the decision-‐making process:
____________________________
Transparency
How is your experienced level of transparency in the decision-‐making process by using the prototype (1: intransparent – 9: transparent): ___ [1-‐9]
Experiences and issues regarding the transparency in the decision-‐making process (How is the perceived transparency in the decision-‐making process when using the prototype?):
____________________________
____________________________
Speed
Please estimate the time needed to finish the decision-‐making process (without re-‐evaluation): ___ minutes
Experiences and issues regarding the speed of the decision-‐making process (How is the perceived time spent in the decision-‐making process when using the prototype?):
____________________________
____________________________

Trust and Correctness
How much do you trust in the correctness of the results of the decision-‐making process when using the prototype (1: untrusting – 9: trusting): ___ [1-‐9]
Experiences and issues regarding the correctness of the decision-‐making process (How is the perceived correctness in the decision-‐making process when using the prototype?):
____________________________
____________________________
How would you compare the Aotearoa decision-‐making process to the regular, original process in your organization?
Which decision-‐making process is more transparent?: ________ [original or Aotearoa]
How much more transparent would you rate the more transparent decision-‐making process (1: equally fast – 9: much more transparent)?: ___ [1-‐9]
Which decision-‐making process is faster?: ________ [original or Aotearoa]
How much faster would you rate the faster decision-‐making process (1: equally fast – 9: much faster)?: ___ [1-‐9]
Which decision-‐making process results do you trust more regarding correctness?: ________ [original or Aotearoa]
How much more trustful would you rate the more trustful decision-‐making process (1: equally trustful – 9: much more trustful)?: ___ [1-‐9]
What is your personal level of experiences with the original decision-‐making process (1: beginner – 9: expert)?: ___ [1-‐9] (Comment: You can use indicators such as frequency of involvement in the original process, or last time being involved)

Usability
Usability of Aotearoa prototype’s user inteface ( 1: bad – 9: good): ___ [1-‐9]
Comments about the prototype’s usability (improvements, missing support?):
____________________________
____________________________
Reuse
Did you have to modify the template you created with the Decision template form in the first place?: ___ [yes, no]
How would you rate the effort to modify the template to your actual needs (1: no effort – 9: immense effort)?: ___ [1-‐9]
Were you able to reuse a template for multiple decisions?: ___ [yes, no]
How would you rate the effort to modify the template to new needs in subsequent decisions (1: no effort – 9: immense effort)?: ___ [1-‐9]
Experiences and issues regarding the reusability of decision templates:
____________________________
____________________________
Any additional comments related to the whole decision-‐making support tool prototype Aotearoa:
____________________________
____________________________

List of Figures
1.1. A Consumer Measuring Compute Service Performance Meta-Data . . . 51.2. Overview of Research Process . . . . . . . . . . . . . . . . . . . . . . 121.3. Overview of Research Paths . . . . . . . . . . . . . . . . . . . . . . . 131.4. Published Material Overview . . . . . . . . . . . . . . . . . . . . . . . 18
2.1. Service Models and Layers in the Cloud Stack [8] . . . . . . . . . . . . 262.2. Example Structure of a Xen Hypervisor [50] . . . . . . . . . . . . . . . 282.3. Software on VM Images and Appliances . . . . . . . . . . . . . . . . . 302.4. Overview of VM Image Repository Contents . . . . . . . . . . . . . . 302.5. Exemplary Access Channels to a Compute Service . . . . . . . . . . . 322.6. Structure of Compute Service Hardware Configuration Meta-Data [10] . 332.7. Classification of Performance Evaluations [77] . . . . . . . . . . . . . 352.8. Typical OSCM System Architecture . . . . . . . . . . . . . . . . . . . 412.9. Taxonomy of Multi-Attribute Decision-Making Methods [19] . . . . . . 452.10. Example of a AHP Hierarchy . . . . . . . . . . . . . . . . . . . . . . . 462.11. Pairwise Comparison Matrix [112] . . . . . . . . . . . . . . . . . . . . 46
3.1. Screenshot of CloudHarmony Performance Meta-Data Service . . . . . 553.2. Performance Variations on Google’s AppEngine (Python) [13] . . . . . 623.3. Architecture of the BEEN system [172] . . . . . . . . . . . . . . . . . 633.4. Screenshot of the Phoromatic Online Service . . . . . . . . . . . . . . 643.5. Screenshot of Schedule Definition in Phoromatic . . . . . . . . . . . . 65
4.1. Overview of the Conceptual Framework . . . . . . . . . . . . . . . . . 724.2. Basic Meta-Data Model . . . . . . . . . . . . . . . . . . . . . . . . . . 754.3. Overview of the Model for Automated Assessments at Run-Time . . . . 764.4. Levels of Automation [191] . . . . . . . . . . . . . . . . . . . . . . . . 774.5. The Process within the (MC2)2 . . . . . . . . . . . . . . . . . . . . . 794.6. Typical Criteria Hierarchies . . . . . . . . . . . . . . . . . . . . . . . . 844.7. Schema of a Resulting Evaluation Function . . . . . . . . . . . . . . . 854.8. Example of Normalized vs. Idealized Scale . . . . . . . . . . . . . . . 874.9. Distribution of Expected Scores Among Ordered Compute Services . . 914.10. Random Distribution of Expected Scores Among Unordered Compute
Services . . . . . . . . . . . . . . . . . . . . . . . . . . . . . . . . . . 924.11. The AotearoaLib Data Model . . . . . . . . . . . . . . . . . . . . . . . 99
197
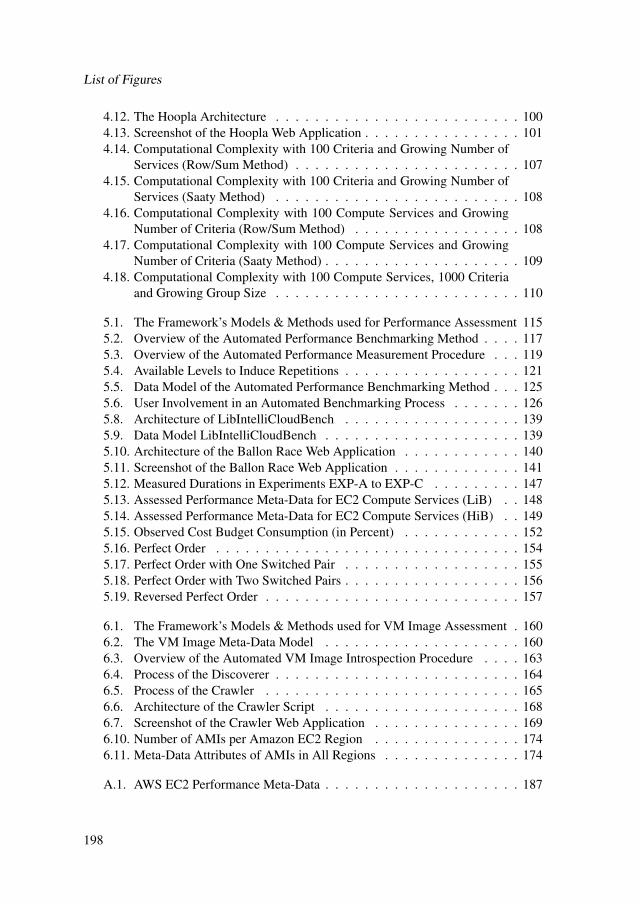
List of Figures
4.12. The Hoopla Architecture . . . . . . . . . . . . . . . . . . . . . . . . . 1004.13. Screenshot of the Hoopla Web Application . . . . . . . . . . . . . . . . 1014.14. Computational Complexity with 100 Criteria and Growing Number of
Services (Row/Sum Method) . . . . . . . . . . . . . . . . . . . . . . . 1074.15. Computational Complexity with 100 Criteria and Growing Number of
Services (Saaty Method) . . . . . . . . . . . . . . . . . . . . . . . . . 1084.16. Computational Complexity with 100 Compute Services and Growing
Number of Criteria (Row/Sum Method) . . . . . . . . . . . . . . . . . 1084.17. Computational Complexity with 100 Compute Services and Growing
Number of Criteria (Saaty Method) . . . . . . . . . . . . . . . . . . . . 1094.18. Computational Complexity with 100 Compute Services, 1000 Criteria
and Growing Group Size . . . . . . . . . . . . . . . . . . . . . . . . . 110
5.1. The Framework’s Models & Methods used for Performance Assessment 1155.2. Overview of the Automated Performance Benchmarking Method . . . . 1175.3. Overview of the Automated Performance Measurement Procedure . . . 1195.4. Available Levels to Induce Repetitions . . . . . . . . . . . . . . . . . . 1215.5. Data Model of the Automated Performance Benchmarking Method . . . 1255.6. User Involvement in an Automated Benchmarking Process . . . . . . . 1265.8. Architecture of LibIntelliCloudBench . . . . . . . . . . . . . . . . . . 1395.9. Data Model LibIntelliCloudBench . . . . . . . . . . . . . . . . . . . . 1395.10. Architecture of the Ballon Race Web Application . . . . . . . . . . . . 1405.11. Screenshot of the Ballon Race Web Application . . . . . . . . . . . . . 1415.12. Measured Durations in Experiments EXP-A to EXP-C . . . . . . . . . 1475.13. Assessed Performance Meta-Data for EC2 Compute Services (LiB) . . 1485.14. Assessed Performance Meta-Data for EC2 Compute Services (HiB) . . 1495.15. Observed Cost Budget Consumption (in Percent) . . . . . . . . . . . . 1525.16. Perfect Order . . . . . . . . . . . . . . . . . . . . . . . . . . . . . . . 1545.17. Perfect Order with One Switched Pair . . . . . . . . . . . . . . . . . . 1555.18. Perfect Order with Two Switched Pairs . . . . . . . . . . . . . . . . . . 1565.19. Reversed Perfect Order . . . . . . . . . . . . . . . . . . . . . . . . . . 157
6.1. The Framework’s Models & Methods used for VM Image Assessment . 1606.2. The VM Image Meta-Data Model . . . . . . . . . . . . . . . . . . . . 1606.3. Overview of the Automated VM Image Introspection Procedure . . . . 1636.4. Process of the Discoverer . . . . . . . . . . . . . . . . . . . . . . . . . 1646.5. Process of the Crawler . . . . . . . . . . . . . . . . . . . . . . . . . . 1656.6. Architecture of the Crawler Script . . . . . . . . . . . . . . . . . . . . 1686.7. Screenshot of the Crawler Web Application . . . . . . . . . . . . . . . 1696.10. Number of AMIs per Amazon EC2 Region . . . . . . . . . . . . . . . 1746.11. Meta-Data Attributes of AMIs in All Regions . . . . . . . . . . . . . . 174
A.1. AWS EC2 Performance Meta-Data . . . . . . . . . . . . . . . . . . . . 187
198

List of Figures
A.2. GoGrid Performance Meta-Data . . . . . . . . . . . . . . . . . . . . . 187A.3. Rackspace Performance Meta-Data . . . . . . . . . . . . . . . . . . . . 188A.4. Joyent Cloud Performance Meta-Data . . . . . . . . . . . . . . . . . . 188
199


List of Tables
2.1. Meta-data Attributes available on Provider Websites . . . . . . . . . . . 332.2. Sample of Common Performance Benchmarks . . . . . . . . . . . . . . 382.3. Meta-data Attributes accessible via Compute Service APIs . . . . . . . 40
3.1. Literature Survey of Cloud-Related Multi-Criteria Selection Methods[40] . . . . . . . . . . . . . . . . . . . . . . . . . . . . . . . . . . . . 58
4.1. Example Criteria for Performance Characteristics . . . . . . . . . . . . 814.2. Common Requirement Types . . . . . . . . . . . . . . . . . . . . . . . 824.3. List of Symbols in the Evaluation Function f(·) . . . . . . . . . . . . . 864.4. Decision Models used for Experiments . . . . . . . . . . . . . . . . . . 1064.5. Computation Times in 4 Realistic Scenarios (Row/Sum Method) . . . . 1114.6. Computation Times in 4 Realistic Scenarios (Saaty Method) . . . . . . 111
5.1. Decision Models used for Experiments . . . . . . . . . . . . . . . . . . 1455.2. Frequency of Processor Types per EC2 Compute Service . . . . . . . . 1495.3. Results for Scenario 1 . . . . . . . . . . . . . . . . . . . . . . . . . . . 1555.4. Results for Scenario 2 . . . . . . . . . . . . . . . . . . . . . . . . . . . 1565.5. Results for Scenario 3 . . . . . . . . . . . . . . . . . . . . . . . . . . . 1575.6. Results for Scenario 3 . . . . . . . . . . . . . . . . . . . . . . . . . . . 158
6.1. Non-Numerical Requirement Types . . . . . . . . . . . . . . . . . . . 1676.2. Software Package Count (Canonical and Alestic.com) . . . . . . . . . . 173
201


Acronyms
AHP Analytic Hierarchy Process
ANP Analytic Network Process
API Application Programming Interface
AWS Amazon Web Services
CCS CloudHarmony Compute Scoring
CV Coefficient of Variation
IaaS Infrastructure-as-a-Service
IT Information Technology
MADM Multi-Attribute Decision-Making
(MC2)2 Multi-Criteria Comparison Method for Cloud Computing
MCDM Multi-Criteria Decision-Making
OSCM Operating System Configuration Management
PaaS Platform-as-a-Service
QoS Quality of Service
SaaS Software-as-a-Service
SSH Secure Shell
UML Unified Modeling Language
VM Virtual Machine
VMM Virtual Machine Monitor
VPN Virtual Private Network
203


Literature
[1] J. Y. Thong. “An integrated model of information systems adoption in smallbusinesses”. In: Journal of management information systems 15.4 (1999),pp. 187–214.
[2] D. Amor. The e-business (R) evolution: Living and Working in an Intercon-nected World. Prentice Hall PTR Upper Saddle River, NJ., 2000.
[3] D. Menasce. “Scaling for e-business”. In: Modeling, Analysis and Simulationof Computer and Telecommunication Systems, 2000. Proceedings. 8th Interna-tional Symposium on. IEEE, 2000, pp. 511–513.
[4] R. Kalakota and M. Robinson. E-business 2.0: Roadmap for Success. Addison-Wesley Professional, 2001.
[5] C. D. Patel and A. J. Shah. Cost model for planning, development and opera-tion of a data center. Tech. rep. Internet Systems and Storage Laboratory, HPLaboratories Palo Alto, 2005.
[6] C. Baun, J. Nimis, M. Kunze, and S. Tai. Cloud computing: Web-based dynamicIT services. Springer, 2011.
[7] P. Mell and T. Grance. The NIST Definition of Cloud Computing, Recommenda-tions of the National Institute of Standards and Technology. Tech. rep. NationalInstitute of Standards and Technology, 2011.
[8] A. Lenk, M. Klems, J. Nimis, S. Tai, and T. Sandholm. “What’s inside theCloud? An architectural map of the Cloud landscape”. In: Proceedings of the2009 ICSE Workshop on Software Engineering Challenges of Cloud Comput-ing. IEEE Computer Society. IEEE, 2009, pp. 23–31.
[9] The Apache Software Foundation. jClouds Java Library. 2013. URL: http://www.jclouds.org (visited on Sept. 8, 2013).
[10] R. Prodan and S. Ostermann. “A survey and taxonomy of infrastructure asa service and web hosting cloud providers”. In: Grid Computing, 2009 10thIEEE/ACM International Conference on. IEEE, 2009, pp. 17–25.
[11] M. A. Vouk. “Cloud computing–issues, research and implementations”. In:Journal of Computing and Information Technology 16.4 (2004), pp. 235–246.
205

Literature
[12] F. Galán, A. Sampaio, L. Rodero-Merino, I. Loy, V. Gil, and L. M. Vaquero.“Service specification in cloud environments based on extensions to open stan-dards”. In: Proceedings of the Fourth International ICST Conference on COM-munication System softWAre and middlewaRE. COMSWARE ’09. Dublin, Ire-land: ACM, 2009, 19:1–19:12.
[13] A. Iosup, N. Yigitbasi, and D. Epema. “On the Performance Variability of Pro-duction Cloud Services”. In: Cluster, Cloud and Grid Computing (CCGrid),2011 11th IEEE/ACM International Symposium on. IEEE, 2011, pp. 104–113.
[14] J. N. Matthews, W. Hu, M. Hapuarachchi, T. Deshane, D. Dimatos, G. Hamil-ton, M. McCabe, and J. Owens. “Quantifying the performance isolation prop-erties of virtualization systems”. In: Proceedings of the 2007 Workshop on Ex-perimental Computer Science. ACM. New York, NY, USA: ACM, 2007, p. 6.
[15] R. Iyer, R. Illikkal, O. Tickoo, L. Zhao, P. Apparao, and D. Newell. “VM3:Measuring, modeling and managing VM shared resources”. In: Computer Net-works 53.17 (2009), pp. 2873–2887.
[16] H. Jin, W. Cao, P. Yuan, and X. Xie. “VSCBenchmark: Benchmark for Dy-namic Server Performance of Virtualization Technology”. In: Proceedings ofthe 1st International Forum on Next-generation Multicore/Manycore Technolo-gies. IFMT ’08. Cairo, Egypt: ACM, 2008, 5:1–5:8.
[17] G. W. Torrance, W. Furlong, D. Feeny, and M. Boyle. “Multi-attribute prefer-ence functions”. In: Pharmacoeconomics 7.6 (1995), pp. 503–520.
[18] T. L. Saaty and L. G. Vargas. “How to Make a Decision”. In: Models, Methods,Concepts & Applications of the Analytic Hierarchy Process. Springer, 2012,pp. 1–21.
[19] K Yoon and C. L. Hwang. Multiple Attribute Decision Making: An Introduction.Sage Publications, 1995.
[20] J. Wei, X. Zhang, G. Ammons, V. Bala, and P. Ning. “Managing Security ofVirtual Machine Images in a Cloud Environment”. In: Proceedings of the 2009ACM Workshop on Cloud Computing Security. CCSW ’09. Chicago, Illinois,USA: ACM, 2009, pp. 91–96.
[21] D. Nurmi, R. Wolski, C. Grzegorczyk, G. Obertelli, S. Soman, L. Youseff, andD. Zagorodnov. “The Eucalyptus Open-Source Cloud-Computing System”. In:Cluster Computing and the Grid, 2009. CCGRID ’09. 9th IEEE/ACM Interna-tional Symposium on. IEEE, 2009, pp. 124–131.
[22] B. Sotomayor, R. S. Montero, I. Llorente, and I. Foster. “Virtual InfrastructureManagement in Private and Hybrid Clouds”. In: Internet Computing, IEEE 13.5(2009), pp. 14–22.
206

Literature
[23] T. Garfinkel, M. Rosenblum, et al. “A Virtual Machine Introspection BasedArchitecture for Intrusion Detection.” In: Proceedings of the Network andDistributed System Security Symposium. Vol. 3. The Internet Society, 2003,pp. 191–206.
[24] J. Pfoh, C. Schneider, and C. Eckert. “A formal model for virtual machine in-trospection”. In: Proceedings of the 1st ACM workshop on Virtual machine se-curity. ACM. New York, NY, USA: ACM, 2009, pp. 1–10.
[25] H. Miller and J. Veiga. “Cloud Computing: Will Commodity Services BenefitUsers Long Term?” In: IT Professional 11.6 (2009), pp. 57–59.
[26] D. A. Menasce and V. A. Almeida. Capacity Planning for Web Services: met-rics, models, and methods. Prentice Hall Upper Saddle River, 2002.
[27] D. A. Menasce, V. A. Almeida, L. W. Dowdy, and L. Dowdy. Performanceby design: computer capacity planning by example. Prentice Hall Professional,2004.
[28] T. Kalibera, L. Bulej, and P. Tuma. “Benchmark precision and random ini-tial state”. In: in Proceedings of the 2005 International Symposium on Per-formance Evaluation of Computer and Telecommunications Systems (SPECTS2005. SCS, 2005, pp. 853–862.
[29] J. Schad, J. Dittrich, and J.-A. Quiané-Ruiz. “Runtime measurements in thecloud: observing, analyzing, and reducing variance”. In: Proceedings of theVLDB Endowment 3 (1-2 2010), pp. 460–471.
[30] N. Huber, M. von Quast, M. Hauck, and S. Kounev. “Evaluating and Model-ing Virtualization Performance Overhead for Cloud Environments”. In: Pro-ceedings of the 1st International Conference on Cloud Computing and ServicesScience (CLOSER 2011). Vol. 1. SciTePress, 2011, pp. 7–9.
[31] R. Jain. The art of computer systems performance analysis. Vol. 182. John Wi-ley & Sons Chichester, 1991.
[32] A. Li, X. Yang, S. Kandula, and M. Zhang. “CloudCmp: comparing publiccloud providers”. In: Proceedings of the 10th annual conference on Internetmeasurement. ACM. ACM, 2010, pp. 1–14.
[33] L. Gillam, B. Li, J. OLoughlin, and A. Tomar. “Fair Benchmarking for CloudComputing systems”. In: Journal of Cloud Computing: Advances, Systems andApplications 2.1 (2013), p. 6.
[34] E. Walker. “Benchmarking amazon EC2 for high-performance scientific com-puting”. In: USENIX Login 33.5 (2008), pp. 18–23.
[35] T. Kalibera, L. Bulej, and P. Tuma. “Generic Environment for Full Automationof Benchmarking.” In: SOQUA/TECOS 58 (2004), pp. 125–132.
[36] R. P. Weicker. “An overview of common benchmarks”. In: Computer 23.12(1990), pp. 65–75.
207

Literature
[37] R. P. Weicker. “A detailed look at some popular benchmarks”. In: Parallel Com-puting 17.10 (1991), pp. 1153–1172.
[38] W. Zeng, Y. Zhao, and J. Zeng. “Cloud service and service selection algorithmresearch”. In: Proceedings of the first ACM/SIGEVO Summit on Genetic andEvolutionary Computation - GEC ’09 (2009), p. 1045.
[39] P. Saripalli and G. Pingali. “MADMAC: Multiple Attribute Decision Method-ology for Adoption of Clouds”. In: Cloud Computing (CLOUD), 2011 IEEEInternational Conference on. IEEE, 2011, pp. 316–323.
[40] Z. U. Rehman, F. K. Hussain, and O. K. Hussain. “Towards Multi-criteria CloudService Selection”. In: Proceedings of the 2011 Fifth International Conferenceon Innovative Mobile and Internet Services in Ubiquitous Computing. IEEE,June 2011, pp. 44–48.
[41] T. Saaty. “Making and validating complex decisions with the AHP/ANP”. In:Journal of Systems Science and Systems Engineering 14.1 (2005), pp. 1–36.
[42] E. Deelman, G. Singh, M. Livny, B. Berriman, and J. Good. “The Cost of DoingScience on the Cloud: The Montage Example”. In: Proceedings of the 2008ACM/IEEE Conference on Supercomputing. SC ’08. Austin, Texas: IEEE Press,2008, 50:1–50:12.
[43] C. Binnig, D. Kossmann, T. Kraska, and S. Loesing. “How is the Weather To-morrow?: Towards a Benchmark for the Cloud”. In: Proceedings of the SecondInternational Workshop on Testing Database Systems. DBTest ’09. Providence,Rhode Island: ACM, 2009, 9:1–9:6.
[44] A. Iosup, S. Ostermann, M. Yigitbasi, R. Prodan, T. Fahringer, and D. H. J.Epema. “Performance Analysis of Cloud Computing Services for Many-TasksScientific Computing”. In: Parallel and Distributed Systems, IEEE Transac-tions on 22.6 (2011), pp. 931–945.
[45] Y. Bakos. “The Emerging Role of Electronic Marketplaces on the Internet”. In:Commun. ACM 41.8 (Aug. 1998), pp. 35–42.
[46] J. Y. Bakos. “Reducing buyer search costs: implications for electronic market-places”. In: Management science 43.12 (1997), pp. 1676–1692.
[47] S. Moorthy, B. T. Ratchford, and D. Talukdar. “Consumer Information SearchRevisited: Theory and Empirical Analysis”. English. In: Journal of ConsumerResearch 23.4 (1997), pp. 263–277.
[48] J. J. McCall. “The economics of information and optimal stopping rules”. In:The Journal of Business 38.3 (1965), pp. 300–317.
[49] G. J. Stigler. “The economics of information”. In: The journal of political econ-omy 69.3 (1961), pp. 213–225.
208

Literature
[50] P. Barham, B. Dragovic, K. Fraser, S. Hand, T. Harris, A. Ho, R. Neugebauer,I. Pratt, and A. Warfield. “Xen and the art of virtualization”. In: ACM SIGOPSOperating Systems Review 37.5 (2003), pp. 164–177.
[51] J. Estublier. “Software Configuration Management: A Roadmap”. In: Proceed-ings of the Conference on The Future of Software Engineering. ICSE ’00. Lim-erick, Ireland: ACM, 2000, pp. 279–289.
[52] W. F. Tichy. “Tools for software configuration management”. In: Proceedingsof the International Workshop on Software Version and Configuration Control(SCM). Vol. 30. Berichte des German Chapter of the ACM. Teubner, 1988,pp. 1–20.
[53] M. Shaw. “What makes good research in software engineering?” In: Interna-tional Journal on Software Tools for Technology Transfer 4.1 (2002), pp. 1–7.
[54] L. M. Vaquero, L. Rodero-Merino, J. Caceres, and M. Lindner. “A break in theclouds: towards a cloud definition”. In: ACM SIGCOMM Computer Communi-cation Review 39.1 (2008), pp. 50–55.
[55] M. Armbrust, A. Fox, R. Griffith, A. D. Joseph, R. Katz, A. Konwinski, G. Lee,D. Patterson, A. Rabkin, I. Stoica, et al. “A View of Cloud Computing”. In:Communications of the ACM 53.4 (2010), pp. 50–58.
[56] L. Barroso, J. Dean, and U. Holzle. “Web search for a planet: The Google clus-ter architecture”. In: Micro, IEEE 23.2 (2003), pp. 22–28.
[57] Amazon Web Services, Inc. Elastic Compute Cloud (EC2). 2014. URL: http://aws.amazon.com/ec2/ (visited on Jan. 17, 2014).
[58] Rackspace, Inc. The Rackspace Public Cloud. 2013-07-21. 2013. URL: http://www.rackspace.com/cloud/ (visited on July 21, 2013).
[59] R. Woollen. “The Internal Design of Salesforce.Com’s Multi-tenant Architec-ture”. In: Proceedings of the 1st ACM Symposium on Cloud Computing. SoCC’10. Indianapolis, Indiana, USA: ACM, 2010, pp. 161–161.
[60] Highscalability.com. YouTube Architecture. 2014. URL: http : / /highscalability . com / youtube - architecture (visited onJan. 17, 2014).
[61] VMware, Inc. VMware vSphere Hypervisor. 2013. URL: http : / / www .vmware.com/products/vsphere-hypervisor (visited on Sept. 6,2013).
[62] Red Hat, Inc. Red Hat Enterprise Virtualization. Accessed September-2013.2013. URL: http : / / www . redhat . com / products / cloud -computing/virtualization/ (visited on Sept. 8, 2013).
[63] M. Rosenblum and T. Garfinkel. “Virtual machine monitors: Current technol-ogy and future trends”. In: Computer 38.5 (2005), pp. 39–47.
209

Literature
[64] GoGrid, LLC. Cloud Servers. 2014. URL: http://www.gogrid.com/products/cloud-servers (visited on Jan. 15, 2014).
[65] Amazon Web Services, Inc. AWS Marketplace. Sept. 2013. URL: https://aws.amazon.com/marketplace (visited on Sept. 8, 2013).
[66] The Cloud Market. The Cloud Market. 2013. URL: http : / /thecloudmarket.com/ (visited on Sept. 8, 2013).
[67] BitNami. BitNami.com. 2013. URL: http://bitnami.com/ (visited onSept. 8, 2013).
[68] R. L. Grossman. “The case for cloud computing”. In: IT professional 11.2(2009), pp. 23–27.
[69] Amazon Web Services, Inc. How AWS pricing works. 2012. URL: http://media.amazonwebservices.com/AWS_Pricing_Overview.pdf(visited on Apr. 21, 2012).
[70] Rackspace, Inc. Rackspace Cloud Server Pricing. 2013. URL: http://www.rackspace.com/cloud/servers/pricing/ (visited on July 21,2013).
[71] Microsoft. Cloud Services Pricing Details. 2013. URL: http : / / www .windowsazure . com / en - us / pricing / details / cloud -services/ (visited on Nov. 25, 2013).
[72] Amazon Web Services, Inc. Amazon Web Services. Sept. 2013. URL: http://aws.amazon.com (visited on Sept. 8, 2013).
[73] 1&1. Dynamic Cloud Servers. 2014. URL: http://hosting.1und1.com/dynamic-cloud-server (visited on Jan. 15, 2014).
[74] T. Metsch, A. Edmonds, R. Nyren, and A. Papaspyrou. Open Cloud ComputingInterface–Core. Open Grid Forum, Open Cloud Computing Interface (OCCI)Working Group. 2011. URL: http://ogf.org/documents/GFD.183.pdf (visited on Nov. 21, 2013).
[75] T. Metsch and A. Edmonds. Open Cloud Computing Interface–Infrastructure.Open Grid Forum, Open Cloud Computing Interface (OCCI) Working Group.2011. URL: http://ogf.org/documents/GFD.184.pdf (visited onNov. 21, 2013).
[76] D. Davis and G. Pilz. Cloud Infrastructure Management Interface (CIMI)Model and RESTful HTTP-based Protocol. Tech. rep. Technical Report, Dis-tributed Management Work Force (DMTF), 2012.
[77] F. Desprez, G. Fox, E. Jeannot, K. Keahey, et al. Supporting ExperimentalComputer Science. Anglais. Rapport de recherche RR-8035. INRIA, July 2012,p. 29.
210

Literature
[78] M. Hauck, J. Happe, and R. Reussner. “Towards Performance Prediction forCloud Computing Environments based on Goal-oriented Measurements.” In:CLOSER. 2011, pp. 616–622.
[79] R. Krebs, C. Momm, and S. Kounev. “Metrics and techniques for quantifyingperformance isolation in cloud environments”. In: Science of Computer Pro-gramming 90, Part B.0 (2014). Special Issue on Component-Based SoftwareEngineering and Software Architecture, pp. 116 –134.
[80] A. Lenk, M. Menzel, J. Lipsky, S. Tai, and P. Offermann. “What Are You Payingfor? Performance Benchmarking for Infrastructure-as-a-Service Offerings”. In:Proceedings of the 2011 IEEE International Conference on Cloud Computing(CLOUD). IEEE. Washington, D.C., USA: IEEE, 2011, pp. 484–491.
[81] B. Randall and L. J. Russell. Algol-60 Implementation. Orlando, FL, USA: Aca-demic Press, Inc., 1964.
[82] H. J. Curnow and B. A. Wichmann. “A synthetic benchmark”. In: The Com-puter Journal 19.1 (1976), pp. 43–49.
[83] J. Dongarra. “The LINPACK Benchmark: An explanation”. In: Supercom-puting. Ed. by E. Houstis, T. Papatheodorou, and C. Polychronopoulos.Vol. 297. Lecture Notes in Computer Science. Springer Berlin Heidelberg,1988, pp. 456–474.
[84] R. P. Weicker. “Dhrystone: A Synthetic Systems Programming Benchmark”.In: Commun. ACM 27.10 (Oct. 1984), pp. 1013–1030.
[85] J. L. Henning. “SPEC CPU2006 Benchmark Descriptions”. In: SIGARCHComput. Archit. News 34.4 (Sept. 2006), pp. 1–17.
[86] K. M. Dixit. “The SPEC benchmarks”. In: Parallel Computing 17.10–11 (1991). <ce:title>Benchmarking of high performance supercomput-ers</ce:title>, pp. 1195 –1209.
[87] M. Guthaus, J. Ringenberg, D. Ernst, T. Austin, T. Mudge, and R. Brown.“MiBench: A free, commercially representative embedded benchmark suite”.In: Workload Characterization, 2001. WWC-4. 2001 IEEE International Work-shop on. IEEE, 2001, pp. 3–14.
[88] V. Aslot, M. Domeika, R. Eigenmann, G. Gaertner, W. Jones, and B. Parady.“SPEComp: A New Benchmark Suite for Measuring Parallel Computer Perfor-mance”. English. In: OpenMP Shared Memory Parallel Programming. Ed. byR. Eigenmann and M. Voss. Vol. 2104. Lecture Notes in Computer Science.Springer Berlin Heidelberg, 2001, pp. 1–10.
[89] C. Bienia, S. Kumar, J. P. Singh, and K. Li. “The PARSEC Benchmark Suite:Characterization and Architectural Implications”. In: Proceedings of the 17thInternational Conference on Parallel Architectures and Compilation Tech-niques. PACT ’08. Toronto, Ontario, Canada: ACM, 2008, pp. 72–81.
211

Literature
[90] W. Gentzsch, D. Girou, A. Kennedy, H. Lederer, J. Reetz, M. Riedel, A. Schott,A. Vanni, M. Vazquez, and J. Wolfrat. “DEISA—Distributed European Infras-tructure for Supercomputing Applications”. English. In: Journal of Grid Com-puting 9.2 (2011), pp. 259–277.
[91] P. Media. Phoronix Test Suite. 2014. URL: http :/ / www .phoronix -test-suite.com/ (visited on Jan. 15, 2014).
[92] I. Team. Inqusitor. 2014. URL: http://www.inquisitor.ru/about/(visited on Jan. 15, 2014).
[93] The OpenStack Foundation. OpenStack Cloud Software. 2014. URL: https://www.openstack.org/ (visited on Mar. 20, 2014).
[94] The OpenStack Project. OpenStack Manuals - Image metadata. 2014. URL:http://docs.openstack.org/image-guide/content/image-metadata.html (visited on Mar. 20, 2014).
[95] The OpenStack Project. OpenStack Manuals - Requesting Detailed Metadataon Public VM Images. 2014. URL: http://docs.openstack.org/api/openstack-image-service/1.1/content/requesting-detailed-metadata-on-public-vm-images.html (visited onMar. 20, 2014).
[96] B. Baker. The Official InstallShield for Windows Installer Developer’s Guide.M & T Books, 2001.
[97] I. Murdock. “Overview of the Debian GNU/Linux System”. In: Linux Journal1994.6es (Oct. 1994).
[98] A. van der Hoek and A. L. Wolf. “Software release management forcomponent-based software”. In: Software: Practice and Experience 33.1(2003), pp. 77–98.
[99] Software in the Public Interest, Inc. Advanced Package Tool (APT). 2014. URL:https://wiki.debian.org/Apt (visited on Jan. 15, 2014).
[100] Novell. YaST - Yet another Setup Tool. 2014. URL: http://en.opensuse.org/YaST (visited on Jan. 15, 2014).
[101] M. Ewing and E. Troan. “The RPM packaging system”. In: Proceedings of theFirst Conference on Freely Redistributable Software, Cambridge, MA, USA.1996.
[102] M. Burgess. “Cfengine: a site configuration engine”. In: USENIX Computingsystems. Vol. 8. USENIX Association, 1995, pp. 309–337.
[103] M. Burgess and R. Ralston. “Distributed resource administration usingcfengine”. In: Software: Practice and Experience 27.9 (1997), pp. 1083–1101.
[104] D. Ressman and J. Valdés. “Use of CFengine for Automated, Multi-PlatformSoftware and Patch Distribution”. In: LISA. USENIX Association, 2000,pp. 207–218.
212

Literature
[105] I. Opscode. Chef Software. 2014. URL: http://www.getchef.com/chef/ (visited on Jan. 15, 2014).
[106] Puppet Labs, Inc. Puppet. 2014. URL: http://puppetlabs.com/ (visitedon Jan. 15, 2014).
[107] Opscode, Inc. Chef Ohai Software. 2014. URL: http://docs.opscode.com/ohai.html (visited on Jan. 15, 2014).
[108] C. L. Hwang, A. S. M. Masud, et al. Multiple objective decision making-methods and applications. Vol. 164. Springer, 1979.
[109] T. L. Saaty. What is the analytic hierarchy process? Springer, 1988.
[110] T. L. Saaty. “How to make a decision: The analytic hierarchy process”. In:European Journal of Operational Research 48.1 (Sept. 1990), pp. 9–26.
[111] T. L. Saaty. “Fundamentals of the analytic network process—multiple networkswith benefits, costs, opportunities and risks”. In: journal of systems science andsystems engineering 13.3 (2004), pp. 348–379.
[112] T. L. Saaty. “Relative measurement and its generalization in decision makingwhy pairwise comparisons are central in mathematics for the measurement ofintangible factors the analytic hierarchy/network process”. English. In: RAC-SAM - Revista de la Real Academia de Ciencias Exactas, Fisicas y Naturales.Serie A. Matematicas 102.2 (2008), pp. 251–318.
[113] Y. Chow and H. Robbins. “On optimal stopping rules”. In: Probability Theoryand Related Fields 2.1 (1963), pp. 33–49.
[114] T. S. Ferguson. Optimal Stopping and Applications. 2012. URL: http://www.math.ucla.edu/~tom/Stopping/Contents.html (visited onJan. 14, 2014).
[115] J. P. Gilbert and F. Mosteller. “Recognizing the maximum of a sequence”. In:Selected Papers of Frederick Mosteller. Springer, 2006, pp. 355–398.
[116] T. S. Ferguson. “Who solved the secretary problem?” In: Statistical science 4.3(1989), pp. 282–289.
[117] S. A. Lippman and J. McCall. “The economics of job search: A survey”. In:Economic inquiry 14.2 (1976), pp. 155–189.
[118] W. E. Stein, D. A. Seale, and A. Rapoport. “Analysis of heuristic solutions tothe best choice problem”. In: European Journal of Operational Research 151.1(2003), pp. 140 –152.
[119] F. T. Bruss. “Sum the Odds to One and Stop”. English. In: The Annals of Prob-ability 28.3 (2000), pp. 1384–1391.
[120] D. A. Seale and A. Rapoport. “Sequential Decision Making with RelativeRanks: An Experimental Investigation of the "Secretary Problem"”. In: Orga-nizational Behavior and Human Decision Processes 69.3 (1997), pp. 221 –236.
213

Literature
[121] J. J. McCall. “Economics of information and job search”. In: The QuarterlyJournal of Economics (1970), pp. 113–126.
[122] A. Sen. “Metadata Management: Past, Present and Future”. In: Decis. SupportSyst. 37.1 (Apr. 2004), pp. 151–173.
[123] A. Tannenbaum. Metadata Solutions: Using Metamodels, Repositories, Xml,and Enterprise Portals to Generate Information on Demand. Boston, MA,USA: Addison-Wesley Longman Publishing Co., Inc., 2001.
[124] E. Madja, A. Hafid, R. Dssouli, G. v.Bochmann, and J. Gecsei. “Meta-datamodelling for quality of service (QoS) management in the World Wide Web(WWW)”. In: Multimedia Modeling, 1998. MMM ’98. Proceedings. 1998.1998, pp. 223–230.
[125] A. ShaikhAli, O. Rana, R. Al-Ali, and D. Walker. “UDDIe: an extended reg-istry for Web services”. In: Applications and the Internet Workshops, 2003.Proceedings. 2003 Symposium on. 2003, pp. 85–89.
[126] M. Papazoglou. Web services: principles and technology. Pearson Education,2008.
[127] K. Sivashanmugam, K. Verma, A. P. Sheth, and J. A. Miller. “Adding Seman-tics to Web Services Standards.” In: International Conference on Web Services.2003, pp. 395–401.
[128] S. A. McIlraith, T. C. Son, and H. Zeng. “Semantic Web Services”. In: IEEEIntelligent Systems 16.2 (2001), pp. 46–53.
[129] A. Andrieux, K. Czajkowski, A. Dan, K. Keahey, H. Ludwig, T. Nakata, J.Pruyne, J. Rofrano, S. Tuecke, and M. Xu. “Web services agreement specifica-tion (WS-Agreement)”. In: Open Grid Forum. Vol. 128. 2007.
[130] A. Keller and H. Ludwig. “The WSLA Framework: Specifying and MonitoringService Level Agreements for Web Services”. English. In: Journal of Networkand Systems Management 11.1 (2003), pp. 57–81.
[131] P. Patel, A. H. Ranabahu, and A. P. Sheth. “Service level agreement in cloudcomputing”. In: Cloud Workshops at OOPSLA’09 (2009).
[132] R. Buyya, R. Ranjan, and R. Calheiros. “InterCloud: Utility-Oriented Federa-tion of Cloud Computing Environments for Scaling of Application Services”.English. In: Algorithms and Architectures for Parallel Processing. Ed. by C.-H.Hsu, L. Yang, J. Park, and S.-S. Yeo. Vol. 6081. Lecture Notes in ComputerScience. Springer Berlin Heidelberg, 2010, pp. 13–31.
[133] M. Wang, X. Wu, W. Zhang, F. Ding, J. Zhou, and G. Pei. “A ConceptualPlatform of SLA in Cloud Computing”. In: Dependable, Autonomic and Se-cure Computing (DASC), 2011 IEEE Ninth International Conference on. 2011,pp. 1131–1135.
214

Literature
[134] S. Venticinque, R. Aversa, B. Di Martino, M. Rak, and D. Petcu. “A CloudAgency for SLA Negotiation and Management”. English. In: Euro-Par 2010Parallel Processing Workshops. Ed. by M. Guarracino, F. Vivien, J. Träff, M.Cannatoro, M. Danelutto, A. Hast, F. Perla, A. Knüpfer, B. Di Martino, andM. Alexander. Vol. 6586. Lecture Notes in Computer Science. Springer BerlinHeidelberg, 2011, pp. 587–594.
[135] M. Alhamad, T. Dillon, and E. Chang. “Conceptual SLA framework for cloudcomputing”. In: Digital Ecosystems and Technologies (DEST), 2010 4th IEEEInternational Conference on. 2010, pp. 606–610.
[136] S. Sundareswaran, A. Squicciarini, and D. Lin. “A Brokerage-Based Approachfor Cloud Service Selection”. In: Cloud Computing (CLOUD), 2012 IEEE 5thInternational Conference on. 2012, pp. 558–565.
[137] L. Rodero-Merino, L. M. Vaquero, V. Gil, F. Galán, J. Fontán, R. S. Montero,and I. M. Llorente. “From infrastructure delivery to service management inclouds”. In: Future Generation Computer Systems 26.8 (2010), pp. 1226 –1240.
[138] A. Goscinski and M. Brock. “Toward dynamic and attribute based publication,discovery and selection for cloud computing”. In: Future Generation ComputerSystems 26.7 (2010), pp. 947 –970.
[139] CloudHarmony.com. CloudHarmony Web Application. 2011. URL: http://cloudharmony.com/ (visited on Feb. 4, 2011).
[140] A Parasuraman, V. A. Zeithaml, and L. L. Berry. “Servqual”. In: Journal ofretailing 64.1 (1988), pp. 12–40.
[141] J. Santos. “EâARservice quality: a model of virtual service quality dimensions”.In: Managing Service Quality: An International Journal 13.3 (2003), pp. 233–246.
[142] P. Saripalli and B. Walters. “Quirc: A quantitative impact and risk assessmentframework for cloud security”. In: Cloud Computing (CLOUD), 2010 IEEE 3rdInternational Conference on. IEEE. 2010, pp. 280–288.
[143] E. Cristobal, C. Flavián, and M. Guinalíu. “Perceived eâARservice quality(PeSQ)”. In: Managing Service Quality: An International Journal 17.3 (2007),pp. 317–340.
[144] S. Habib, S. Ries, and M. Muhlhauser. “Towards a Trust Management Systemfor Cloud Computing”. In: Trust, Security and Privacy in Computing and Com-munications (TrustCom), 2011 IEEE 10th International Conference on. 2011,pp. 933–939.
[145] J. Abawajy. “Determining Service Trustworthiness in Intercloud ComputingEnvironments”. In: Pervasive Systems, Algorithms, and Networks (ISPAN),2009 10th International Symposium on. 2009, pp. 784–788.
215
Literature
[146] K. Khan and Q. Malluhi. “Establishing Trust in Cloud Computing”. In: IT Pro-fessional 12.5 (2010), pp. 20–27.
[147] S. Pearson, Y. Shen, and M. Mowbray. “A Privacy Manager for Cloud Comput-ing”. English. In: Cloud Computing. Ed. by M. Jaatun, G. Zhao, and C. Rong.Vol. 5931. Lecture Notes in Computer Science. Springer Berlin Heidelberg,2009, pp. 90–106.
[148] M. Klems, J. Nimis, and S. Tai. “Do Clouds Compute? A Framework for Esti-mating the Value of Cloud Computing”. English. In: Designing E-Business Sys-tems. Markets, Services, and Networks. Ed. by C. Weinhardt, S. Luckner, andJ. Stößer. Vol. 22. Lecture Notes in Business Information Processing. SpringerBerlin Heidelberg, 2009, pp. 110–123.
[149] X. Li, Y. Li, T. Liu, J. Qiu, and F. Wang. “The Method and Tool of Cost Anal-ysis for Cloud Computing”. In: Cloud Computing, 2009. CLOUD ’09. IEEEInternational Conference on. 2009, pp. 93–100.
[150] Y. Chen and R. Sion. “To Cloud or Not to Cloud?: Musings on Costs and Vi-ability”. In: Proceedings of the 2Nd ACM Symposium on Cloud Computing.SOCC ’11. Cascais, Portugal: ACM, 2011, 29:1–29:7.
[151] S. Frey, W. Hasselbring, and B. Schnoor. “Automatic conformance checking formigrating software systems to cloud infrastructures and platforms”. In: Journalof Software: Evolution and Process 25.10 (2013), pp. 1089–1115.
[152] A. Khajeh-Hosseini, I. Sommerville, J. Bogaerts, and P. Teregowda. “DecisionSupport Tools for Cloud Migration in the Enterprise”. In: Cloud Computing(CLOUD), 2011 IEEE International Conference on. 2011, pp. 541–548.
[153] B. Johnson and Y. Qu. “A Holistic Model for Making Cloud Migration Deci-sion: A Consideration of Security, Architecture and Business Economics”. In:Parallel and Distributed Processing with Applications (ISPA), 2012 IEEE 10thInternational Symposium on. 2012, pp. 435–441.
[154] M. Hajjat, X. Sun, Y.-W. E. Sung, D. Maltz, S. Rao, K. Sripanidkulchai, and M.Tawarmalani. “Cloudward Bound: Planning for Beneficial Migration of Enter-prise Applications to the Cloud”. In: Proceedings of the ACM SIGCOMM 2010Conference. SIGCOMM ’10. New Delhi, India: ACM, 2010, pp. 243–254.
[155] T. Ristenpart, E. Tromer, H. Shacham, and S. Savage. “Hey, You, Get off of MyCloud: Exploring Information Leakage in Third-party Compute Clouds”. In:Proceedings of the 16th ACM Conference on Computer and CommunicationsSecurity. CCS ’09. Chicago, Illinois, USA: ACM, 2009, pp. 199–212.
[156] Z. ur Rehman, O. Hussain, and F. Hussain. “Iaas Cloud Selection using MCDMMethods”. In: e-Business Engineering (ICEBE), 2012 IEEE Ninth InternationalConference on. IEEE, 2012, pp. 246–251.
216

Literature
[157] Jason Read, CloudHarmony.com. What is an ECU? CPU Benchmarking in theCloud. 2014. URL: http://blog.cloudharmony.com/2010/05/what-is-ecu-cpu-benchmarking-in-cloud.html (visited onMar. 17, 2014).
[158] Jason Read, CloudHarmony.com. Cloud Server Performance Benchmarking.2014. URL: http://blog.cloudharmony.com/2010/03/cloud-server- performance- benchmarking.html (visited on Mar. 17,2014).
[159] A. Li, X. Yang, S. Kandula, and M. Zhang. “CloudCmp: shopping for a cloudmade easy”. In: USENIX HotCloud (2010).
[160] S.-M. Han, M. M. Hassan, C.-W. Yoon, and E.-N. Huh. “Efficient Service Rec-ommendation System for Cloud Computing Market”. In: Proceedings of the2Nd International Conference on Interaction Sciences: Information Technol-ogy, Culture and Human. ICIS ’09. Seoul, Korea: ACM, 2009, pp. 839–845.
[161] M. Godse and S. Mulik. “An Approach for Selecting Software-as-a-Service(SaaS) Product”. In: Cloud Computing (CLOUD), 2009 IEEE InternationalConference on. IEEE, 2009, pp. 155–158.
[162] S. Garg, S. Versteeg, and R. Buyya. “SMICloud: A Framework for Comparingand Ranking Cloud Services”. In: Utility and Cloud Computing (UCC), 2011Fourth IEEE International Conference on. 2011, pp. 210–218.
[163] K. Jackson, L. Ramakrishnan, K. Muriki, S. Canon, S. Cholia, J. Shalf, H.Wasserman, and N. Wright. “Performance Analysis of High Performance Com-puting Applications on the Amazon Web Services Cloud”. In: 2nd IEEE In-ternational Conference on Cloud Computing Technology and Science. IEEE.2010, pp. 159–168.
[164] D. Menascé. “TPC-W: A benchmark for e-commerce”. In: IEEE Internet Com-puting 6.3 (2002), pp. 83–87.
[165] Transaction Processing Performance Council (TPC). TPC-W Benchmark. 2011.URL: http://www.tpc.org/tpcw/ (visited on Jan. 20, 2011).
[166] W. Sobel, S. Subramanyam, A. Sucharitakul, J. Nguyen, H. Wong, S. Patil,A. Fox, and D. Patterson. “Cloudstone: Multi-platform, multi-language bench-mark and measurement tools for web 2.0”. In: Proc. of CCA. Citeseer. 2008.
[167] V. Makhija, B. Herndon, P. Smith, L. Roderick, E. Zamost, and J. Anderson.“VMmark: A scalable benchmark for virtualized systems”. In: VMware Inc,CA, Tech. Rep. VMware-TR-2006-002, September (2006).
[168] J. Casazza, M. Greenfield, and K. Shi. “Redefining server performance charac-terization for virtualization benchmarking”. In: Intel Technology Journal 10.3(2006), pp. 243–251.
217

Literature
[169] Y. Mei, L. Liu, X. Pu, and S. Sivathanu. “Performance Measurements and Anal-ysis of Network I/O Applications in Virtualized Cloud”. In: Cloud Computing(CLOUD), 2010 IEEE 3rd International Conference on. i/o trhoughput for VMson same physical host. IEEE, 2010, pp. 59 –66.
[170] T. Kalibera and R. Jones. “Rigorous Benchmarking in Reasonable Time”. In:Proceedings of the 2013 International Symposium on Memory Management.ISMM ’13. Seattle, Washington, USA: ACM, 2013, pp. 63–74.
[171] T. Kalibera and R. Jones. “Rigorous Benchmarking in Reasonable Time”. In:SIGPLAN Not. 48.11 (June 2013), pp. 63–74.
[172] T. Kalibera, J. Lehotsky, D. Majda, B. Repcek, M. Tomcanyi, A. Tomecek,P. Tuma, and J. Urban. “Automated Benchmarking and Analysis Tool”. In:Proceedings of the 1st International Conference on Performance EvaluationMethodolgies and Tools. valuetools ’06. Pisa, Italy: ACM, 2006, pp. 1–10.
[173] The Mono Project. Mono Cross Platform Open-Source .NET DevelopmentFramework. 2014. URL: http://www.mono-project.com/ (visitedon Mar. 20, 2014).
[174] T. Kalibera and P. Tuma. “Precise Regression Benchmarking with Random Ef-fects: Improving Mono Benchmark Results”. In: Formal Methods and Stochas-tic Models for Performance Evaluation. Ed. by Horvóth, András and Telek,Miklós. Vol. 4054. Lecture Notes in Computer Science. Springer Berlin Hei-delberg, 2006, pp. 63–77.
[175] T. Kalibera, L. Bulej, and P. Tuma. “Automated detection of performance re-gressions: the mono experience”. In: Modeling, Analysis, and Simulation ofComputer and Telecommunication Systems, 2005. 13th IEEE InternationalSymposium on. IEEE, 2005, pp. 183–190.
[176] T. Kalibera, L. Bulej, and P. Tuma. “Quality Assurance in Performance: Eval-uating Mono Benchmark Results”. In: Quality of Software Architectures andSoftware Quality. Ed. by R. Reussner, J. Mayer, J. Stafford, S. Overhage,S. Becker, and P. Schroeder. Vol. 3712. Lecture Notes in Computer Science.Springer Berlin Heidelberg, 2005, pp. 271–288.
[177] L. Bulej, T. Kalibera, and P. Tuma. “Repeated results analysis for middlewareregression benchmarking”. In: Performance Evaluation 60.1âAŽÄì4 (2005).Performance Modeling and Evaluation of High-Performance Parallel and Dis-tributed Systems, pp. 345 –358.
[178] P. Media. Phoromatic Web Application (Beta). 2014. URL: http://www.phoromatic.com/ (visited on Jan. 15, 2014).
[179] B. Rochwerger, D. Breitgand, E. Levy, a. Galis, et al. “The Reservoir model andarchitecture for open federated cloud computing”. In: IBM Journal of Researchand Development 53.4 (July 2009), 4:1–4:11.
218
Literature
[180] J. Matthews, T. Garfinkel, C. Hoff, and J. Wheeler. “Virtual Machine Contractsfor Datacenter and Cloud Computing Environments”. In: Proceedings of the1st Workshop on Automated Control for Datacenters and Clouds. ACDC ’09.Barcelona, Spain: ACM, 2009, pp. 25–30.
[181] A. Dastjerdi, S. Tabatabaei, and R. Buyya. “An Effective Architecture forAutomated Appliance Management System Applying Ontology-Based CloudDiscovery”. In: Cluster, Cloud and Grid Computing (CCGrid), 2010 10thIEEE/ACM International Conference on. IEEE, 2010, pp. 104–112.
[182] D. Reimer, A. Thomas, G. Ammons, T. Mummert, B. Alpern, and V. Bala.“Opening black boxes: using semantic information to combat virtual machineimage sprawl”. In: Proceedings of the fourth ACM SIGPLAN/SIGOPS inter-national conference on Virtual execution environments. VEE ’08. Seattle, WA,USA: ACM, 2008, pp. 111–120.
[183] G. Ammons, V. Bala, T. Mummert, D. Reimer, and X. Zhang. “Virtual MachineImages As Structured Data: The Mirage Image Library”. In: Proceedings of the3rd USENIX Conference on Hot Topics in Cloud Computing. HotCloud’11.Portland, OR: USENIX Association, 2011, pp. 22–22.
[184] R. Filepp, L. Shwartz, C. Ward, R. Kearney, K. Cheng, C. Young, and Y.Ghosheh. “Image selection as a service for cloud computing environments”.In: Service-Oriented Computing and Applications (SOCA), 2010 IEEE Inter-national Conference on. IEEE, 2010, pp. 1 –8.
[185] K. Magoutis, M. Devarakonda, N. Joukov, and N. G. Vogl. “Galapagos: Model-driven discovery of end-to-end application-storage relationships in distributedsystems”. In: IBM Journal of Research and Development 52.4.5 (2008), pp. 367–377.
[186] IBM. Tivoli Application Dependency Discovery Manager. 2012. URL: http://www- 01.ibm.com/software/tivoli/products/taddm/(visited on May 26, 2012).
[187] M. S. Wilson. “Constructing and managing appliances for cloud deploymentsfrom repositories of reusable components”. In: Proceedings of the 2009 confer-ence on Hot topics in cloud computing. HotCloud’09. San Diego, California:USENIX Association, 2009, pp. 1–5.
[188] H. Liu. “Rapid application configuration in Amazon cloud using configurablevirtual appliances”. In: Proceedings of the 2011 ACM Symposium on AppliedComputing. SAC ’11. TaiChung, Taiwan: ACM, 2011, pp. 147–154.
[189] A. C. Arpaci-Dusseau and R. H. Arpaci-Dusseau. “Information and control ingray-box systems”. In: ACM SIGOPS Operating Systems Review. Vol. 35. 5.New York, NY, USA: ACM, 2001, pp. 43–56.
219

Literature
[190] T. Wood, P. Shenoy, A. Venkataramani, and M. Yousif. “Sandpiper: Black-boxand gray-box resource management for virtual machines”. In: Computer Net-works 53.17 (2009), pp. 2923–2938.
[191] M. R. Endsley. “Level of automation effects on performance, situation aware-ness and workload in a dynamic control task”. In: Ergonomics 42.3 (1999).PMID: 10048306, pp. 462–492.
[192] R Parasuraman, T. B. Sheridan, and C. D. Wickens. “A model for types and lev-els of human interaction with automation.” In: IEEE transactions on systems,man, and cybernetics. Part A, Systems and humans : a publication of the IEEESystems, Man, and Cybernetics Society 30.3 (May 2000), pp. 286–97.
[193] M. R. Endsley. “Level of Automation: Integrating Humans and Automated Sys-tems”. In: Proceedings of the Human Factors and Ergonomics Society AnnualMeeting 41.1 (1997), pp. 200–204.
[194] R. L. Keeney and H Raiffa. Decisions with multiple objectives. CambridgeBooks. Cambridge University Press, 1993.
[195] T. Saaty. Theory and Applications of the Analytic Network Process - DecisionMaking with Benefits, Opportunities, Costs, and Risks. Ed. by T. Saaty. RWSPublications, USA, 2005, p. 352.
[196] F. Pardee, T. Kirkwood, K. MacCrimmon, J. Miller, C. Phillips, J. Ranftl, K.Smith, and D. Whitcomb. “Measurement and evaluation of transportation sys-tem effectiveness”. In: RAND Memorandum. RAND Corporation, USA, 1969.
[197] D. Baker, D. Bridges, R. Hunter, G. Johnson, J. Krupa, J. Murphy, and K.Sorenson. “Guidebook to decision-making methods”. In: Washington DC: USDepartment of Energy. WSRC-IM-2002-00002 (2001).
[198] T. Saaty. “Decision making—the analytic hierarchy and network processes(AHP/ANP)”. In: Journal of systems science and systems engineering 13.1(2004), pp. 1–35.
[199] J. Karlsson, S. Olsson, and K. Ryan. “Improved practical support for large-scalerequirements prioritising”. English. In: Requirements Engineering 2.1 (1997),pp. 51–60.
[200] J. Hicklin, C. Moler, P. Webb, R. F. Boisvert, B. Miller, R. Pozo, and K. Rem-ington. JAMA : A Java Matrix Package. 2014. URL: http://math.nist.gov/javanumerics/jama/ (visited on Mar. 27, 2014).
[201] Google, Inc. Google AppEngine. 2014. URL: https : / / appengine .google.com/ (visited on Mar. 27, 2014).
[202] Google, Inc. Google Web Toolkit. 2014. URL: http://www.gwtproject.org (visited on Mar. 27, 2014).
[203] Isomorphic Software. SmartGWT. 2014. URL: https://code.google.com/p/smartgwt/ (visited on Mar. 27, 2014).
220

Literature
[204] M. Menzel, M. Schönherr, and S. Tai. “(MC2)2: Criteria, Requirements and aSoftware Prototype for Cloud Infrastructure Decisions”. In: Software: Practiceand Experience (2011).
[205] M. Menzel and R. Ranjan. “CloudGenius: Decision Support for Web ServerCloud Migration”. In: Proceedings of the 21st International Conference onWorld Wide Web. ACM. Lyon, France: ACM, 2012, pp. 979–988.
[206] S. Hove and B. Anda. “Experiences from conducting semi-structured inter-views in empirical software engineering research”. In: Software Metrics, 2005.11th IEEE International Symposium. IEEE, 2005, 10 pp.–23.
[207] P. Media. OpenBenchmarking.org. 2014. URL: http : / / www .openbenchmarking.org (visited on Mar. 27, 2014).
[208] Object Management Group. Business Process Model and Notation (BPMN)Specification, Version 2.0. 2011. URL: http://www.omg.org/spec/BPMN/2.0/ (visited on Sept. 12, 2013).
[209] Vaadin Ltd. Vaadin Java Framework. 2014. URL: https://vaadin.com(visited on Mar. 27, 2014).
[210] The Apache Software Foundation. Apache Tomcat. 2014. URL: http : / /tomcat.apache.org/ (visited on Mar. 27, 2014).
[211] Oracle Corporation. MySQL Database System. 2014. URL: http://www.mysql.com/ (visited on Mar. 27, 2014).
[212] Sauron Software. cron4j. 2014. URL: http://www.sauronsoftware.it/projects/cron4j/ (visited on Mar. 27, 2014).
[213] PassMark Software. CPU List. 2014. URL: http://www.cpubenchmark.net/ (visited on Mar. 27, 2014).
[214] PassMark Software. PassMark Software - PC Benchmark and Test Software.2011. URL: http://www.passmark.com/ (visited on Feb. 4, 2011).
[215] S. Haak and M. Menzel. “Autonomic Benchmarking for Cloud Infrastructures:An Economic Optimization Model”. In: Proceedings of the 1st ACM/IEEEworkshop on Autonomic computing in economics. ACM. Karlsruhe, Germany:ACM, 2011, pp. 27–32.
[216] Puppet Labs, Inc. Puppet Facter. 2014. URL: http : / / projects .puppetlabs.com/projects/facter (visited on Jan. 15, 2014).
[217] M. Menzel, M. Klems, H. A. Le, and S. Tai. “A Configuration Crawler for Vir-tual Appliances in Compute Clouds”. In: Proceedings of the 1st InternationalConference on Cloud Engineering (IC2E). IEEE. San Francisco, USA: IEEE,2013, pp. 201–209.
221

Literature
[218] A. Beitch, B. Liu, T. Yung, R. Griffith, A. Fox, and D. A. Patterson. “Rain: Aworkload generation toolkit for cloud computing applications”. In: ElectricalEngineering and Computer Sciences University of California at Berkeley, Whitepaper UCB/EECS-2010-14 (2010).
222

C: 40M: 2Y: 10 K: 0
C: 76M: 47Y: 30K: 5
ISBN 978-3-7375-5175-5
C: 40M: 2Y: 10 K: 0
C: 76M: 47Y: 30K: 5
ComparativeAssessment of Cloud
Compute Services usingRun-Time Meta-Data
Michael MenzelM
icha
el M
enze
l: Co
mpa
rativ
e As
sess
men
t of C
loud
Com
pute
Ser
vice
s usi
ng R
un-T
ime
Met
a-D
ata