Communities - Vista Land
143
Beyond Communities 2010 ANNUAL REPORT
-
Upload
khangminh22 -
Category
Documents
-
view
2 -
download
0
Transcript of Communities - Vista Land

Beyond Communities
2010 ANNUAL REPORT

Residential Estates
Mixed Use of Commercial Developmentand Shophouses
ICT and BPO Centers
Healthcare andEducation Campuses

Commercial CenterDevelopment
Residential Condominium Development
Corporate Business Development
Healthcare andEducation Campuses
Sucat Metro Railway Station
Commercial Retail Hubsby the Lake
Masterplanned Cities

20Vista LandCONTENTSAt a Glance 4
Profile of aSound Investment 6
At the Helm/Financial Highlights 7
Chairman’s Message 8
President’s Report 12
Interview withthe Founder 17
In the Vista Studio 19
Review of Operations 40
Camella Homeowners 44
Corporate Governance 46
CorporateSocial Responsibility 52
Board of Directors 54
Management Committee 56
Management Discussionand Analysis 58
Financial Statements 66
Shareholder Information 140
20MASTERPLANNED CITIES
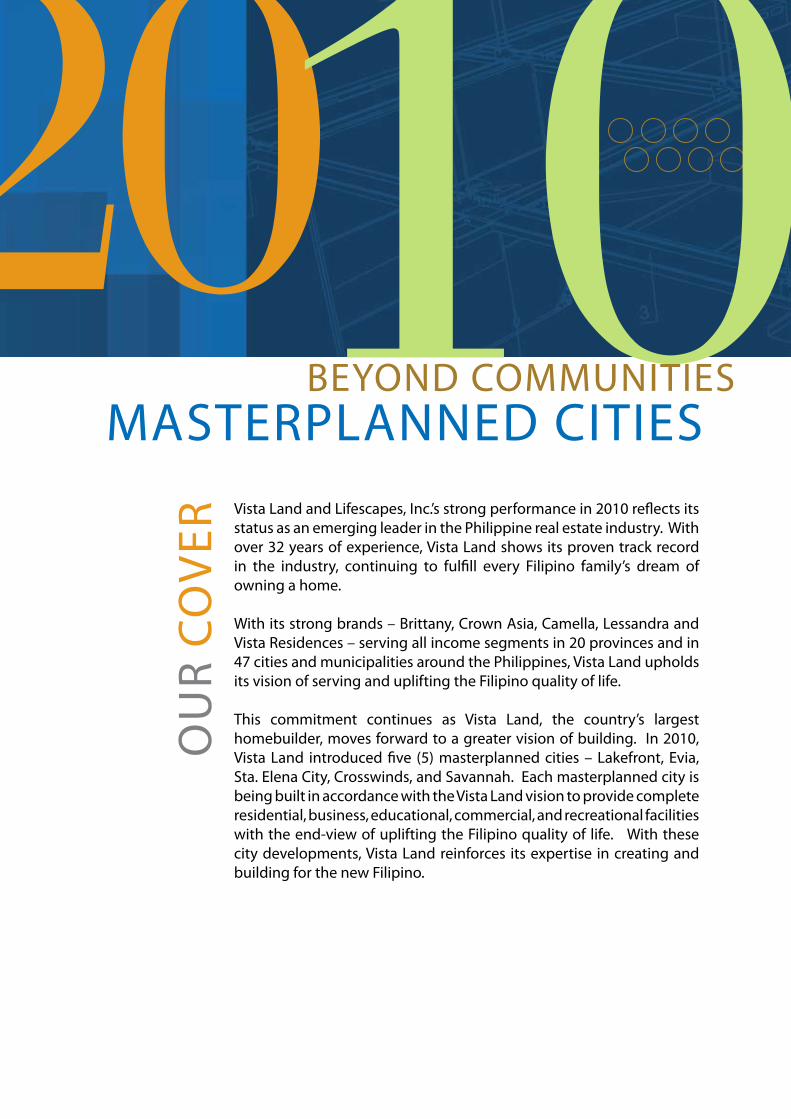
Vista Land and Lifescapes, Inc.’s strong performance in 2010 reflects its status as an emerging leader in the Philippine real estate industry. With over 32 years of experience, Vista Land shows its proven track record in the industry, continuing to fulfill every Filipino family’s dream of owning a home.
With its strong brands – Brittany, Crown Asia, Camella, Lessandra and Vista Residences – serving all income segments in 20 provinces and in 47 cities and municipalities around the Philippines, Vista Land upholds its vision of serving and uplifting the Filipino quality of life.
This commitment continues as Vista Land, the country’s largest homebuilder, moves forward to a greater vision of building. In 2010, Vista Land introduced five (5) masterplanned cities – Lakefront, Evia, Sta. Elena City, Crosswinds, and Savannah. Each masterplanned city is being built in accordance with the Vista Land vision to provide complete residential, business, educational, commercial, and recreational facilities with the end-view of uplifting the Filipino quality of life. With these city developments, Vista Land reinforces its expertise in creating and building for the new Filipino.
OU
R C
OV
ER
10BEYOND COMMUNITIES
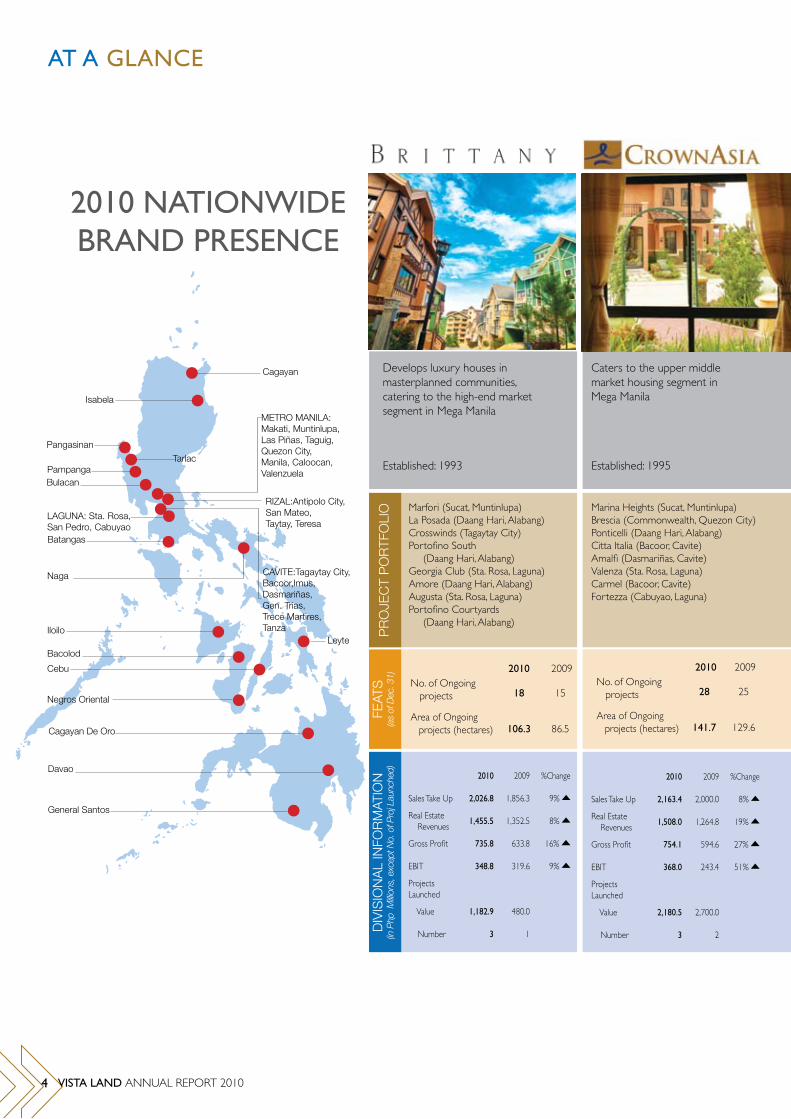
Develops luxury houses in masterplanned communities, catering to the high-end market segment in Mega Manila
Established: 1993
2010 2009No. of Ongoing projects 18 15
Area of Ongoing projects (hectares) 106.3 86.5
2010 2009No. of Ongoing projects 28 25
Area of Ongoing projects (hectares) 141.7 129.6
Marfori (Sucat, Muntinlupa)La Posada (Daang Hari, Alabang)Crosswinds (Tagaytay City)Portofino South
(Daang Hari, Alabang)Georgia Club (Sta. Rosa, Laguna)Amore (Daang Hari, Alabang)Augusta (Sta. Rosa, Laguna)Portofino Courtyards
(Daang Hari, Alabang)
Marina Heights (Sucat, Muntinlupa) Brescia (Commonwealth, Quezon City) Ponticelli (Daang Hari, Alabang) Citta Italia (Bacoor, Cavite) Amalfi (Dasmariñas, Cavite) Valenza (Sta. Rosa, Laguna) Carmel (Bacoor, Cavite) Fortezza (Cabuyao, Laguna)
Caters to the upper middle market housing segment in Mega Manila
Established: 1995
PR
OJE
CT
PO
RTF
OLI
OD
IVIS
ION
AL
INFO
RM
ATIO
N(in
Php
Milli
ons,
exc
ept N
o. o
f Pro
j Lau
nche
d)FE
ATS
(as
of D
ec. 3
1)
2010 2009 %Change
Sales Take Up 2,026.8 1,856.3 9%
Real Estate Revenues
1,455.5 1,352.5 8%
Gross Profit 735.8 633.8 16%
EBIT 348.8 319.6 9%
Projects Launched
Value 1,182.9 480.0
Number 3 1
2010 2009 %Change
Sales Take Up 2,163.4 2,000.0 8%
Real Estate Revenues
1,508.0 1,264.8 19%
Gross Profit 754.1 594.6 27%
EBIT 368.0 243.4 51%
Projects Launched
Value 2,180.5 2,700.0
Number 3 2
General Santos
Cagayan
METRO MANILA:Makati, Muntinlupa,Las Piñas, Taguig, Quezon City, Manila, Caloocan, Valenzuela
CAVITE:Tagaytay City, Bacoor,Imus, Dasmariñas, Gen. Trias, Trece Martires, Tanza
Naga
RIZAL:Antipolo City, San Mateo,Taytay, Teresa
LAGUNA: Sta. Rosa, San Pedro, Cabuyao
Isabela
Pangasinan
Tarlac
Leyte
PampangaBulacan
Batangas
Iloilo
Bacolod
Negros Oriental
Cebu
Cagayan De Oro
Davao
2010 NATIONWIDE BRAND PRESENCE
AT A GLANCE
4 VISTA LAND ANNUAL REPORT 2010
Marina Heights (Sucat, Muntinlupa) Brescia (Commonwealth, Quezon City) Ponticelli (Daang Hari, Alabang) Citta Italia (Bacoor, Cavite) Amalfi (Dasmariñas, Cavite) Valenza (Sta. Rosa, Laguna) Carmel (Bacoor, Cavite) Fortezza (Cabuyao, Laguna)
2010 2009No. of Ongoing projects 13 11
Area of Ongoing projects (hectares) 3.0 2.6
Wil Tower (Eugenio Lopez Drive, Quezon City)
Avant at the Fort (Bonifacio Global City) Pinecrest (New Manila, Quezon City) KL Mosaic (Legazpi Village, Makati City) Trevi Towers (Pasong Tamo, Makati City) Crown Tower (Sampaloc, Manila) Symphony Tower
(South Triangle, Quezon City)Mosaic (Legazpi Village, Makati City)
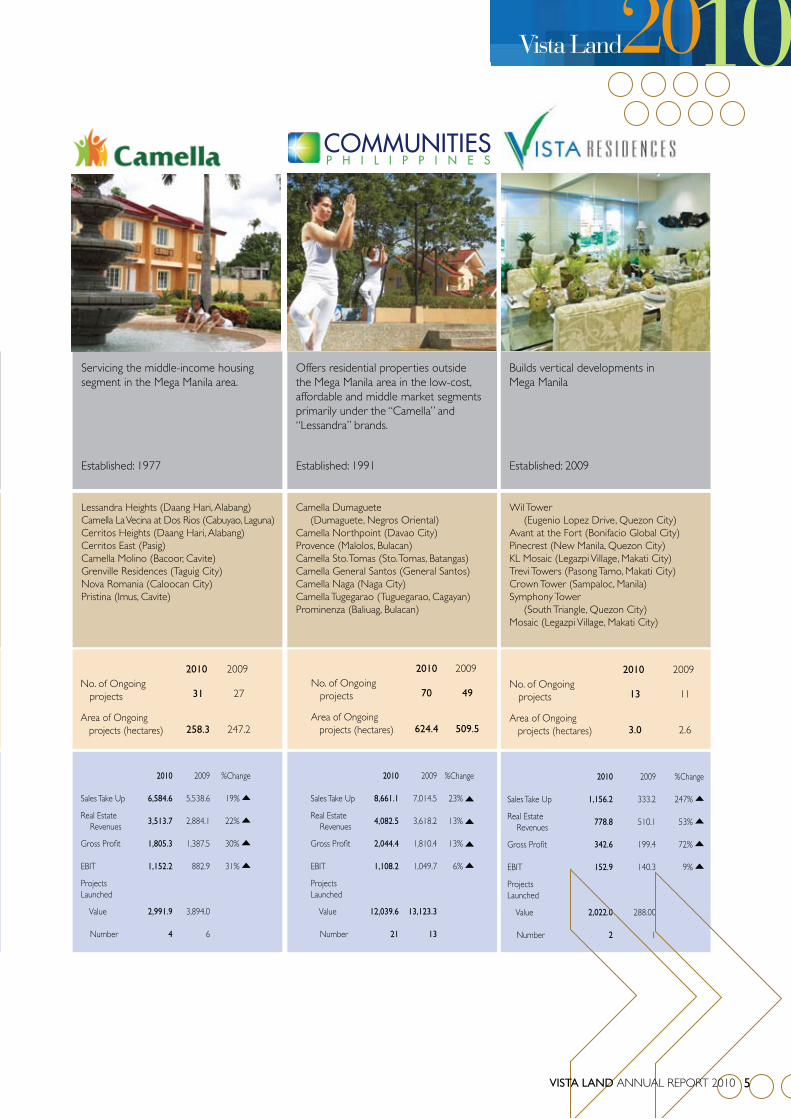
Builds vertical developments in Mega Manila
Established: 2009
2010 2009 %Change
Sales Take Up 1,156.2 333.2 247%
Real Estate Revenues
778.8 510.1 53%
Gross Profit 342.6 199.4 72%
EBIT 152.9 140.3 9%
Projects Launched
Value 2,022.0 288.00
Number 2 1
2010 2009No. of Ongoing projects 31 27
Area of Ongoing projects (hectares) 258.3 247.2
Lessandra Heights (Daang Hari, Alabang) Camella La Vecina at Dos Rios (Cabuyao, Laguna) Cerritos Heights (Daang Hari, Alabang) Cerritos East (Pasig) Camella Molino (Bacoor, Cavite) Grenville Residences (Taguig City) Nova Romania (Caloocan City) Pristina (Imus, Cavite)
Servicing the middle-income housing segment in the Mega Manila area.
Established: 1977
2010 2009 %Change
Sales Take Up 6,584.6 5,538.6 19%
Real Estate Revenues
3,513.7 2,884.1 22%
Gross Profit 1,805.3 1,387.5 30%
EBIT 1,152.2 882.9 31%
Projects Launched
Value 2,991.9 3,894.0
Number 4 6
VISTA LAND ANNUAL REPORT 2010 5
2010 2009No. of Ongoing projects 70 49
Area of Ongoing projects (hectares) 624.4 509.5
Camella Dumaguete (Dumaguete, Negros Oriental)
Camella Northpoint (Davao City) Provence (Malolos, Bulacan) Camella Sto. Tomas (Sto. Tomas, Batangas) Camella General Santos (General Santos) Camella Naga (Naga City) Camella Tugegarao (Tuguegarao, Cagayan) Prominenza (Baliuag, Bulacan)
Offers residential properties outside the Mega Manila area in the low-cost, affordable and middle market segments primarily under the “Camella” and “Lessandra” brands.
Established: 1991
2010 2009 %Change
Sales Take Up 8,661.1 7,014.5 23%
Real Estate Revenues
4,082.5 3,618.2 13%
Gross Profit 2,044.4 1,810.4 13%
EBIT 1,108.2 1,049.7 6%
Projects Launched
Value 12,039.6 13,123.3
Number 21 13
COMMUNITIESP H I L I P P I N E S

SImpLIfyING ACCESSIbILITy
ENCOURAGING DIVERSITy
UNIfyING fAmILy
RESpECTING LEGACy
CELEbRATING HOSpITALITy
In this monolithic approach in development, Evia brings together four major destinations south of Manila – a natural formula for diversity. This divergence fuses the various requirements of differing clientele through its triad of urban areas – each with an emphasis on appreciating a family’s needs.
An array of San Francisco-inspired residential enclaves that offers leisure and lifestyle choices, Lakefront’s luxury homes and condominium suites revitalize the metropolitan south. Strategically located in Sucat, Lakefront’s four major access points spell interconnectivity, with its proximity to the airport, schools, malls, as well as the commercial business districts of Makati, The Fort, Ortigas, and Alabang. Lakefront is the sought after address in the Metro South.
Connecting distance between family members has been apparent in Savannah development in Iloilo. More than just responding to every Filipino’s dream of owning a home, Savannah has always focused on looking after the family’s need to be together, ensuring the proximity of the client’s houses with their places of work, business, and education.
Having a “Modern Head with a Traditional Heart” epitomizes the Sta. Elena City, as it melds the concept of a homecoming for individuals who long for the comforts of nature. Within Sta. Elena City, an affinity with nature easily comes within their reach.
Transporting the concept of a Swiss mountain landscape into the Philippines has come into fruition through Crosswinds. With over 20,000 specially-grown pine trees dotting its rolling terrain, Crosswinds evokes a stunning vista within a well-planned community. Perfect “Christmases” can be celebrated throughout the year within this cool and lush setting. With facilities for recreation, relaxation, and entertainment, Crosswinds is the perfect place to celebrate life.
pROfILE Of A SOUND INVESTmENT
6 VISTA LAND ANNUAL REPORT 2010
AT THE HELm
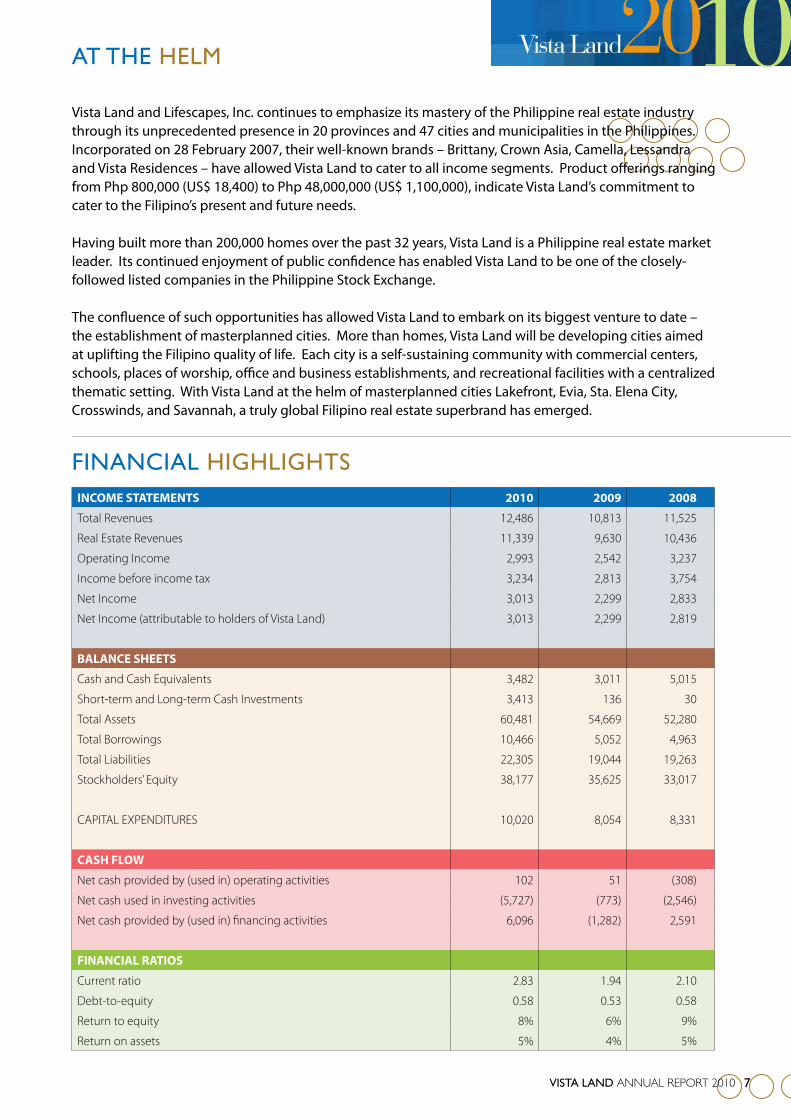
fINANCIAL HIGHLIGHTSINCOME STATEMENTS 2010 2009 2008
Total Revenues 12,486 10,813 11,525
Real Estate Revenues 11,339 9,630 10,436
Operating Income 2,993 2,542 3,237
Income before income tax 3,234 2,813 3,754
Net Income 3,013 2,299 2,833
Net Income (attributable to holders of Vista Land) 3,013 2,299 2,819
BALANCE SHEETS
Cash and Cash Equivalents 3,482 3,011 5,015
Short-term and Long-term Cash Investments 3,413 136 30
Total Assets 60,481 54,669 52,280
Total Borrowings 10,466 5,052 4,963
Total Liabilities 22,305 19,044 19,263
Stockholders’ Equity 38,177 35,625 33,017
CAPITAL EXPENDITURES 10,020 8,054 8,331
CASH FLOW
Net cash provided by (used in) operating activities 102 51 (308)
Net cash used in investing activities (5,727) (773) (2,546)
Net cash provided by (used in) financing activities 6,096 (1,282) 2,591
FINANCIAL RATIOS
Current ratio 2.83 1.94 2.10
Debt-to-equity 0.58 0.53 0.58
Return to equity 8% 6% 9%
Return on assets 5% 4% 5%
Vista Land and Lifescapes, Inc. continues to emphasize its mastery of the Philippine real estate industry through its unprecedented presence in 20 provinces and 47 cities and municipalities in the Philippines. Incorporated on 28 February 2007, their well-known brands – Brittany, Crown Asia, Camella, Lessandra and Vista Residences – have allowed Vista Land to cater to all income segments. Product offerings ranging from Php 800,000 (US$ 18,400) to Php 48,000,000 (US$ 1,100,000), indicate Vista Land’s commitment to cater to the Filipino’s present and future needs.
Having built more than 200,000 homes over the past 32 years, Vista Land is a Philippine real estate market leader. Its continued enjoyment of public confidence has enabled Vista Land to be one of the closely-followed listed companies in the Philippine Stock Exchange.
The confluence of such opportunities has allowed Vista Land to embark on its biggest venture to date – the establishment of masterplanned cities. More than homes, Vista Land will be developing cities aimed at uplifting the Filipino quality of life. Each city is a self-sustaining community with commercial centers, schools, places of worship, office and business establishments, and recreational facilities with a centralized thematic setting. With Vista Land at the helm of masterplanned cities Lakefront, Evia, Sta. Elena City, Crosswinds, and Savannah, a truly global Filipino real estate superbrand has emerged.
VISTA LAND ANNUAL REPORT 2010 7
Dear Fellow Shareholders
2010 was a solid year for your
company. Having emerged from
the global financial crisis relatively
unscathed, our performance, in
many respects, exceeded market
expectations. Vista Land’s net income
exceeded PHP3 billion on the back of
PHP11.3 billion in revenues. We have
kept a close eye on our operating
expenses while improving our gross
profit margin from around 48% during
the previous year to slightly over
50%. Notwithstanding intensifying
competition, our position as the
largest, most preferred developer
of house and lot packages in the
Philippines, remains unquestioned.
For house and lot packages – in all
segments – whether in the high, mid,
or low-end – Vista Land is still the
country’s runaway leader.
Vista Land is on track to outperform
once again in 2011 and we are excited
to take on the new challenges coming
our way. While we recognize that the
outlook for the Philippine economy
and the property sector is bright, we
also know that such optimism brings
with it increased competition. In the
years ahead, the leading real estate
players are expected to redouble their
efforts to grab a larger market share
and, perhaps, enter new segments.
As such, we have harnessed our
considerable resources to map out a
strategic plan that should ensure that
Vista Land remains at the forefront
among the key industry players. This
will mean paying close attention
not only to retaining our leadership
in housing, but also to capitalizing
on opportunities in other related
areas, such as the development of
mid-rise buildings and commercial
establishments that cater to both
the retail and the office sectors. It
will also entail making our presence
CHAIRmAN’S mESSAGE
8 VISTA LAND ANNUAL REPORT 2010

Marcelino C. MendozaChairman
9

CHAIRmAN’S mESSAGE
accelerating infrastructure development
and, if successful, should be a boon to
the country and to the property sector in
particular.
The macroeconomic outlook continues
to be positive. After a record 7.8% GDP
growth in 2010, a 5% to 6% official GDP
growth target has been set for 2011, with
an unofficial higher “fighting target” of
7% to 8%. With a benign inflationary
environment, low interest rates, and
a strengthening peso, the country is
expected to see an upgrade in its credit
ratings from the international credit
rating agencies.
In recent years, Business Process
Outsourcing (BPO) has been one of the
bright spots in our economy and will
no doubt remain an economic pillar in
the future. Growing at a 20+% pace and
currently employing more than 520,000
people, total BPO revenues reached
almost US$9 billion in 2010. It is widely
known that BPO has been one of the key
drivers of the real estate market and this
is expected to continue. Already, the
country has been dubbed the “Call Center
more strongly felt through an aggressive
project pipeline and continued expansion
around the country. Our CEO, in her
message, will outline in more detail some
of the strategic plans that have been
formulated by our management team.
The election of a new government
invariably brings with it fresh hope, from
both inside and outside our borders, that
the prevailing situation in our country
will improve significantly. The entry
of a new administration in 2010 thus
comes with heightened expectations
that the domestic business environment
will become “friendlier” and more level;
hence, attracting more capital than in
the past. The importance of this cannot
be overemphasized given that the
amount of foreign direct investment
into the Philippines has been grossly
inadequate, especially when compared
to the inflows into neighboring countries.
As part of its program to address this
weakness, the new government is
pushing for major projects to be financed
and implemented through Public-
Private Sector Partnerships (PPP). PPP
is being promoted as a key catalyst for
10 VISTA LAND ANNUAL REPORT 2010

Capital of the World,” a title once held by
our Indian neighbors. This has helped
spur demand in the property sector as
employees seek dwellings within close
proximity to their workplace.
Remittance flows, too, have been robust
and continue to hit record levels. In 2010,
official remittances reached $18.7 billion
and are expected to breach the US$20
billion mark in 2011. The mortgage
financing market has also contributed
to a fairly hospitable environment for
property buyers with fixed rates at single
digit levels and available tenors going
beyond twenty years. These are indeed
good times for the real estate industry in
the Philippines.
I am pleased to report that we have
taken full advantage of the favorable
economy and strengthening industry
growth and will work hard to maintain
our performance standards. However, the
global economic crisis, which for some
is fast becoming a distant memory, has
not been forgotten by our group. Yes, we
are optimistic about the future, but we
remain vigilant, knowing that such prudence
has helped us maintain our performance
standards throughout the recent economic
turmoil.
To all our partners, thank you for your
unwavering support.
MARCELINO C. MENDOZAChairman
VISTA LAND ANNUAL REPORT 2010 11
Dear Fellow Stakeholders
The year in review, I am happy to report, began and ended on a positive note. As our Chairman stated in his message, we exceeded many of our key targets this year. For the first time, our company’s quarterly sales take up breached the PHP5 billion mark to start the year, and we were successful in bringing about an improvement in sales take up every quarter thereafter. Revenues hit a record PHP11.3 billion and company earnings exceeded PHP3 billion. There is every indication that 2011 will prove to be a record year for the company in terms of sales take up, revenues, and net income.
We continued to expand our presence nationwide and, we now have residential subdivisions in 20 provinces and 47 cities and municipalities nationwide, having launched 33 projects with an estimated total value of PHP20.4 billion By a wide margin, Vista Land is the number one property developer selling house and lot packages in the Philippines. In 2010, we delivered more than 5,400 houses. To date, we have built more than 200,000 houses for Filipinos from all walks of life and, we are proud to report that all our brands – Brittany, Crown Asia, Camella, Lessandra, and Vista Residences – are rapidly growing in popularity.
We believe that the real estate sector is in the midst of an upswing and we are determined to execute plans that will allow
us to benefit from the increasing demand. Although Vista Land is primarily a housing developer, we do possess considerable expertise in other facets of the business. Vista Land is not new to developing mid-rise and high-rise projects, with 16 vertical developments ongoing. We also have in-house expertise in the planning and construction of commercial centers. As such, while we have certainly not taken our eye off the house and lot market segment, our medium to long-term strategic initiatives will involve the development of major masterplanned communities in key urban areas that will cater to the needs, beyond housing, of the community at large.
In the succeeding years, we are focusing on five flagship projects that will have a significant impact on revenue growth. These are – The Lakefront in Sucat, Muntinlupa, Evia in the Las Piñas-Cavite area, Sta. Elena City in Sta. Rosa, Laguna, Crosswinds in Tagaytay, and Savannah in Iloilo.
The Lakefront is a 60-hectare community about 10 kilometers from the central business district. Included in the completed residential subdivisions are: San Francisco-inspired La Posada, which was completed in 2006; Presidio, a picturesque cluster of eight buildings complete with amenities; and Brittany’s Marfori, an 18-storey building turned over in 2008. In view of resurgent demand for dwellings in mid-rise buildings,
pRESIDENT’S REpORT
12 VISTA LAND ANNUAL REPORT 2010

Benjamarie Therese N. SerranoPresident & Chief Executive Of ficer
13
pRESIDENT’S REpORT
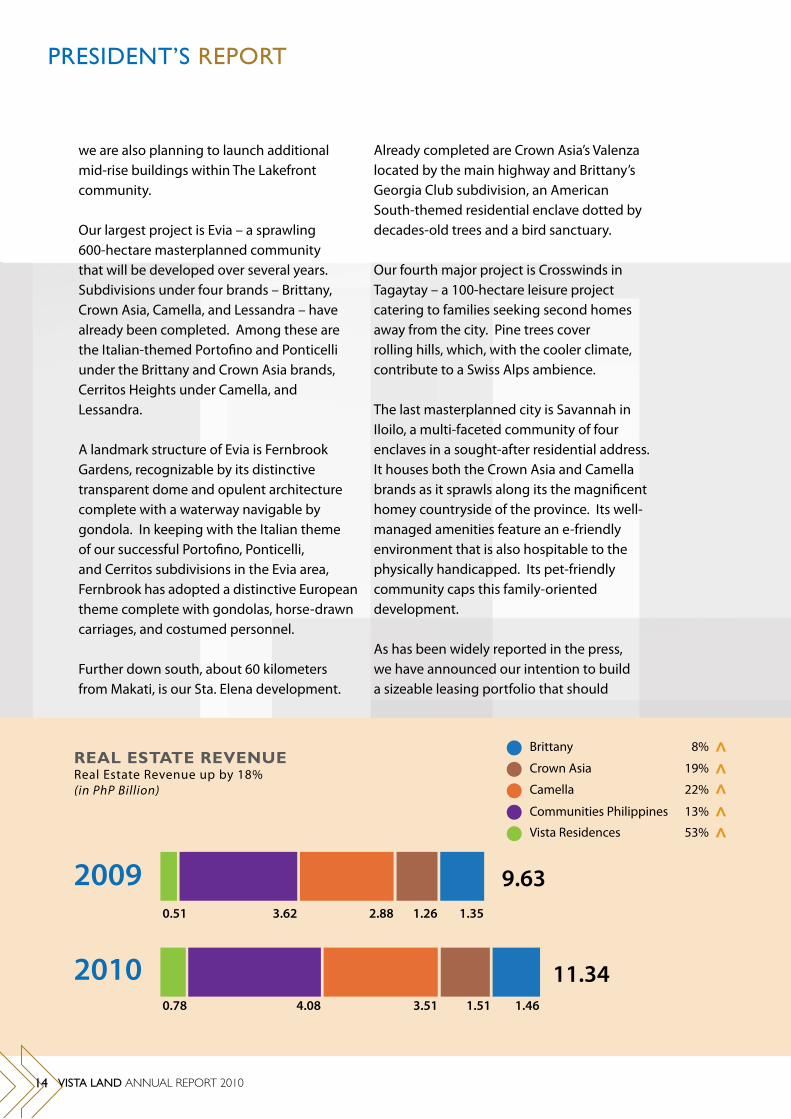
REAL ESTATE REVENUEReal Estate Revenue up by 18%(in PhP Billion)
Already completed are Crown Asia’s Valenza located by the main highway and Brittany’s Georgia Club subdivision, an American South-themed residential enclave dotted by decades-old trees and a bird sanctuary.
Our fourth major project is Crosswinds in Tagaytay – a 100-hectare leisure project catering to families seeking second homes away from the city. Pine trees cover rolling hills, which, with the cooler climate, contribute to a Swiss Alps ambience.
The last masterplanned city is Savannah in Iloilo, a multi-faceted community of four enclaves in a sought-after residential address. It houses both the Crown Asia and Camella brands as it sprawls along its the magnificent homey countryside of the province. Its well-managed amenities feature an e-friendly environment that is also hospitable to the physically handicapped. Its pet-friendly community caps this family-oriented development.
As has been widely reported in the press, we have announced our intention to build a sizeable leasing portfolio that should
we are also planning to launch additional mid-rise buildings within The Lakefront community.
Our largest project is Evia – a sprawling 600-hectare masterplanned community that will be developed over several years. Subdivisions under four brands – Brittany, Crown Asia, Camella, and Lessandra – have already been completed. Among these are the Italian-themed Portofino and Ponticelli under the Brittany and Crown Asia brands, Cerritos Heights under Camella, and Lessandra.
A landmark structure of Evia is Fernbrook Gardens, recognizable by its distinctive transparent dome and opulent architecture complete with a waterway navigable by gondola. In keeping with the Italian theme of our successful Portofino, Ponticelli, and Cerritos subdivisions in the Evia area, Fernbrook has adopted a distinctive European theme complete with gondolas, horse-drawn carriages, and costumed personnel. Further down south, about 60 kilometers from Makati, is our Sta. Elena development.
20093.62 2.880.51 1.26 1.35
20104.08 3.510.78 1.51 1.46
Brittany 8%
Crown Asia 19%
Camella 22%
Communities Philippines 13%
Vista Residences 53%
9.63
11.34
14 VISTA LAND ANNUAL REPORT 2010
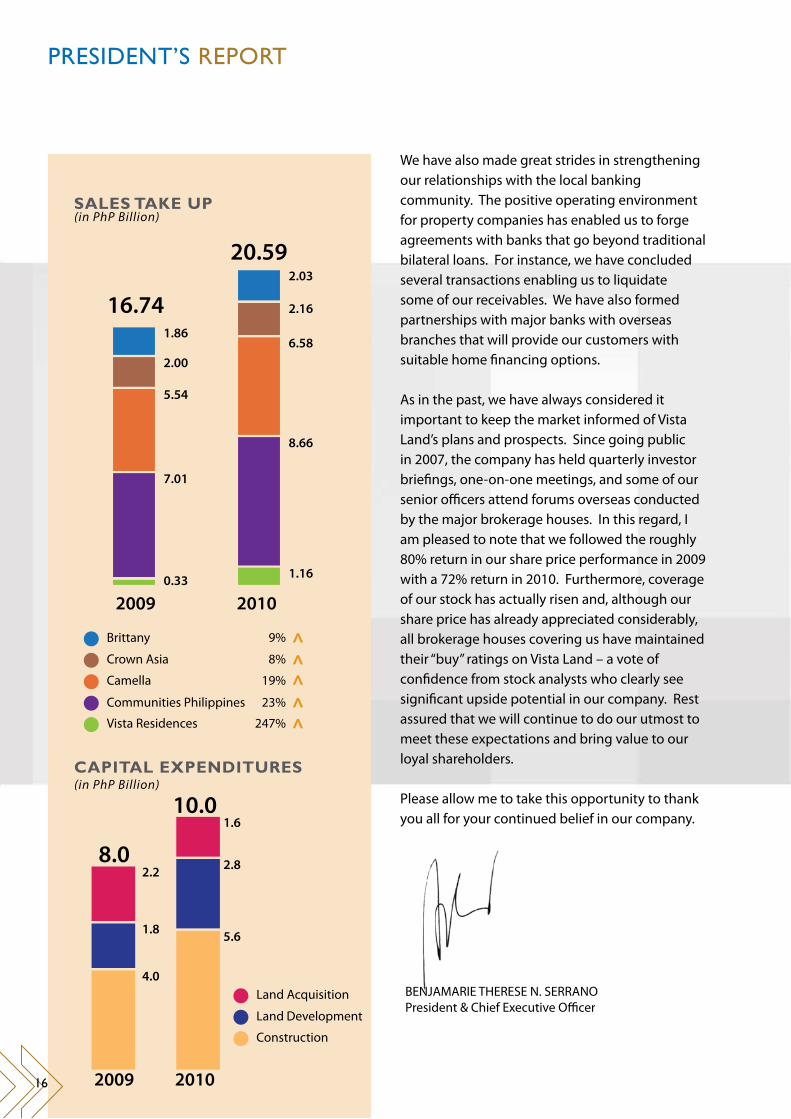
2009 2010REVENUE DISTRIBUTION
generate about PHP1 billion in revenues in about five years. Our foray into the leasing market will not require us to acquire additional land. In many of our major projects, we have already reserved a portion of land for commercial purposes. Today, having reached critical mass in many of these projects, we intend to move forward to the commercial development phase. We are currently negotiating with anchor tenants for key projects and we expect agreements to be concluded within the year. We ended the year with 1,662 hectares of land, which will take about 10 years to develop. Any further acquisitions of land will be undertaken with a view to a relatively rapid turnaround in project development.
The plans I have enumerated will require significant cash outlays over the medium term – our capital expenditure program for the next three years alone will total about PHP45 billion. We have therefore taken steps towards funding part of our capital expenditure budget. I am happy to report that our successful debut in the international bond market during the
fourth quarter raised US$100 million for the company. In addition to diversifying our sources of financing, this endeavour should improve our standing in the international investing community as we gradually establish a strong, positive track record. We have adopted appropriate strategies to hedge the foreign exchange risk of this dollar debt, and will continue to do the same for any future foreign currency borrowings.
Brittany
Crown Asia
Camella
Communities Philippines
Vista Residences30%14%
5% 38%
13%
31%
7%
13%
13%
36%
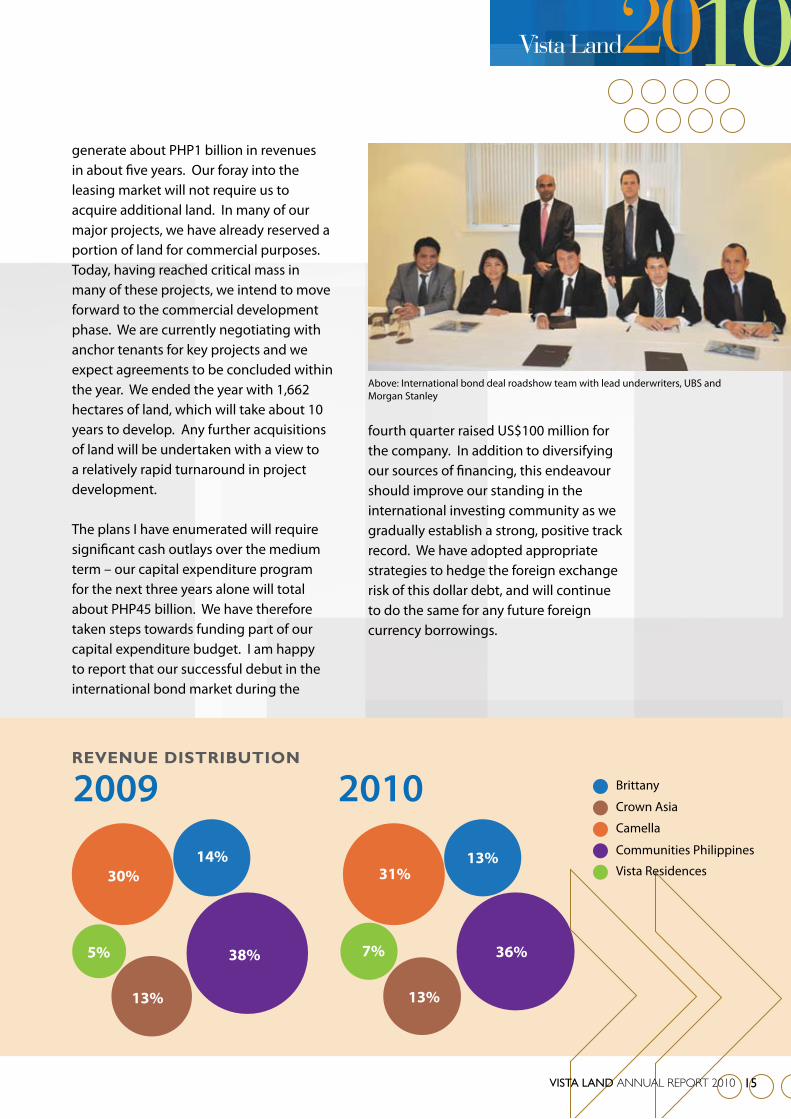
Above: International bond deal roadshow team with lead underwriters, UBS and Morgan Stanley
VISTA LAND ANNUAL REPORT 2010 15
pRESIDENT’S REpORT
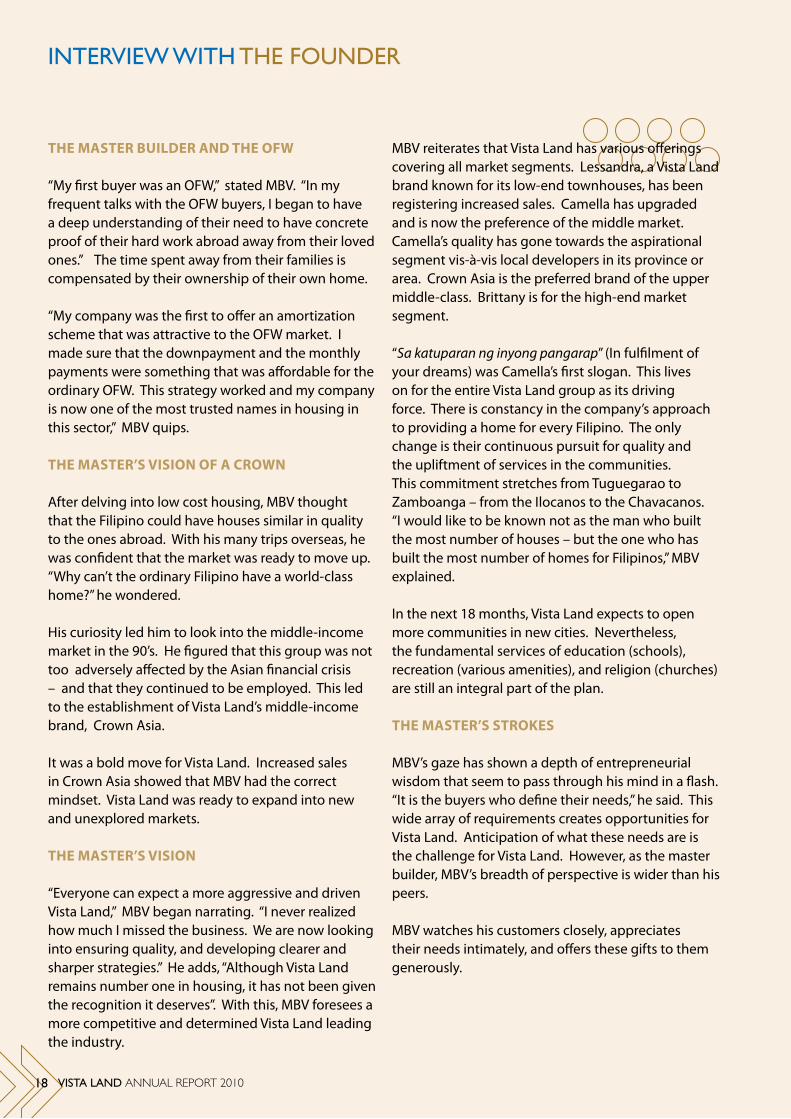
CAPITAL EXPENDITURES
We have also made great strides in strengthening our relationships with the local banking community. The positive operating environment for property companies has enabled us to forge agreements with banks that go beyond traditional bilateral loans. For instance, we have concluded several transactions enabling us to liquidate some of our receivables. We have also formed partnerships with major banks with overseas branches that will provide our customers with suitable home financing options.
As in the past, we have always considered it important to keep the market informed of Vista Land’s plans and prospects. Since going public in 2007, the company has held quarterly investor briefings, one-on-one meetings, and some of our senior officers attend forums overseas conducted by the major brokerage houses. In this regard, I am pleased to note that we followed the roughly 80% return in our share price performance in 2009 with a 72% return in 2010. Furthermore, coverage of our stock has actually risen and, although our share price has already appreciated considerably, all brokerage houses covering us have maintained their “buy” ratings on Vista Land – a vote of confidence from stock analysts who clearly see significant upside potential in our company. Rest assured that we will continue to do our utmost to meet these expectations and bring value to our loyal shareholders.
Please allow me to take this opportunity to thank you all for your continued belief in our company.
BENJAMARIE THERESE N. SERRANOPresident & Chief Executive Officer
Brittany 9%
Land Acquisition
Crown Asia 8%
Land Development
Camella 19%
Construction
Communities Philippines 23%
Vista Residences 247%
1.86
2.03
2.00
2.16
0.33 1.16
5.54
6.58
7.01
16.74
2009
2009
2010
2010
8.66
20.59
SALES TAKE UP(in PhP Billion)
(in PhP Billion)
4.0
1.8
2.28.0
5.6
2.8
1.610.0
16

INTERVIEW WITH THE fOUNDER
Sen. Manuel B. Villar, founder of Vista Land & Lifescapes, Inc., reminisced on the company’s humble beginnings in the 70s. “All I know is that I did not want to be employed,” the Senator, fondly known as MBV, stated. With experience obtained from helping his mother buy and sell seafood, he knew that it was his destiny to become an entrepreneur.
After graduating from the University of the Philippines with a degree in Accountancy, MBV tried his hand in expanding the family’s seafood business. However, this initial attempt was unsuccessful. Hence, he decided to be an employee – working for Sycip Gorres Velayo & Co. and an investment bank. His employment exposed him to the construction industry. With an employee loan, he purchased two trucks and began selling gravel and sand. It was in this venture where he learned the housing business. At the age of 25, his first company, Camella, was born.
MBV’s first Camella house and lot buyer was an Overseas Filipino Worker (OFW). This first purchase commenced his affinity with OFWs and enabled him to understand their needs, wants, goals and aspirations. Succeeding buyers consisted mostly of OFWs who perceived Camella as the company that understood what they wanted in a home. To date, more than 200,000 homes have been built by Camella. Vista Land, its holding company, has been the premiere housing developer in the Philippines.
MBV’s success in business led to a desire to help his countrymen. He ran and won a congressional seat in Las Pinas. He earned the respect of his colleagues and his contstituents as he became the Speaker of the House. After his stint in the Lower House, he became a Senator and led the august body as Senate President.
The Tale of a master builder and His Communities
We are now looking into ensuring quality, and developing clearer and sharper strategies.
VISTA LAND ANNUAL REPORT 2010 17
THE MASTER BuILdER ANd THE OFW
“My first buyer was an OFW,” stated MBV. “In my frequent talks with the OFW buyers, I began to have a deep understanding of their need to have concrete proof of their hard work abroad away from their loved ones.” The time spent away from their families is compensated by their ownership of their own home.
“My company was the first to offer an amortization scheme that was attractive to the OFW market. I made sure that the downpayment and the monthly payments were something that was affordable for the ordinary OFW. This strategy worked and my company is now one of the most trusted names in housing in this sector,” MBV quips.
THE MASTER’S VISION OF A CROWN
After delving into low cost housing, MBV thought that the Filipino could have houses similar in quality to the ones abroad. With his many trips overseas, he was confident that the market was ready to move up. “Why can’t the ordinary Filipino have a world-class home?” he wondered.
His curiosity led him to look into the middle-income market in the 90’s. He figured that this group was not too adversely affected by the Asian financial crisis – and that they continued to be employed. This led to the establishment of Vista Land’s middle-income brand, Crown Asia.
It was a bold move for Vista Land. Increased sales in Crown Asia showed that MBV had the correct mindset. Vista Land was ready to expand into new and unexplored markets.
THE MASTER’S VISION
“Everyone can expect a more aggressive and driven Vista Land,” MBV began narrating. “I never realized how much I missed the business. We are now looking into ensuring quality, and developing clearer and sharper strategies.” He adds, “Although Vista Land remains number one in housing, it has not been given the recognition it deserves”. With this, MBV foresees a more competitive and determined Vista Land leading the industry.
INTERVIEW WITH THE fOUNDER
MBV reiterates that Vista Land has various offerings covering all market segments. Lessandra, a Vista Land brand known for its low-end townhouses, has been registering increased sales. Camella has upgraded and is now the preference of the middle market. Camella’s quality has gone towards the aspirational segment vis-à-vis local developers in its province or area. Crown Asia is the preferred brand of the upper middle-class. Brittany is for the high-end market segment.
“Sa katuparan ng inyong pangarap” (In fulfilment of your dreams) was Camella’s first slogan. This lives on for the entire Vista Land group as its driving force. There is constancy in the company’s approach to providing a home for every Filipino. The only change is their continuous pursuit for quality and the upliftment of services in the communities. This commitment stretches from Tuguegarao to Zamboanga – from the Ilocanos to the Chavacanos. “I would like to be known not as the man who built the most number of houses – but the one who has built the most number of homes for Filipinos,” MBV explained.
In the next 18 months, Vista Land expects to open more communities in new cities. Nevertheless, the fundamental services of education (schools), recreation (various amenities), and religion (churches) are still an integral part of the plan.
THE MASTER’S STROkES
MBV’s gaze has shown a depth of entrepreneurial wisdom that seem to pass through his mind in a flash. “It is the buyers who define their needs,” he said. This wide array of requirements creates opportunities for Vista Land. Anticipation of what these needs are is the challenge for Vista Land. However, as the master builder, MBV’s breadth of perspective is wider than his peers.
MBV watches his customers closely, appreciates their needs intimately, and offers these gifts to them generously.
18 VISTA LAND ANNUAL REPORT 2010

IN THE VISTA STUDIOA Master dips his brush into the first hue of paint on his palette. He looks at his blank canvass and embarks on a journey to create an obra maestra. His brush touches the white canvass – a slow but passionate transformation towards the Master’s imagination. This artistic expression transcends the canvass as it aims to evoke the same passion and awe from its future spectators. Each one is a crescendo offered as a feast for one’s vision.
Each Vista Land development is a canvass that embosses the concept and the design inspired by international scenery and perfected in its local adaptation. It transcends symmetry as each element evokes poetry. The proportion of beauty and functionality pervades social classes and nationalities, as these are influenced by the market’s expectations. The geometry of each view is a scenery to behold and remembered for a lifetime. The consistency in executing each part celebrates the grandeur of the whole.
A master plan aims to meld together differing tones, textures, sounds, sights, and cultures. It provokes one’s dream of building their life, their family. A resident’s family rests soundly in its serene albeit stimulating surroundings painted on Vista Land’s canvass.
VISTA LAND ANNUAL REPORT 2010 19

A Living Community. masterplanned for Accessibility.

Driven by a vision of building homes for every Filipino
family, Vista Land, the Philippine’s largest home builder,
turns Lakefront into Sucat’s sought after premier address.

Lakefront, the 60-hectare masterplanned and San Francisco-inspired development,
transforms the once quiet locale of Sucat into a thriving residential community
bustling with life. It is home to Vista Land’s five residential enclaves, each filled with
vibrancy and its own diverse personality. With luxury homes in La Posada, Marina
Heights, and Victorianne, the ready-for-occupancy condominium suites, and units
at The Marfori, and the Presidio, Lakefront is notably identified as the only urban
development in Metro Manila that has an unobstructed 180 degree view of the
Laguna de Bay and Sierra Madre Mountain ranges.
Lakefront exudes with promise and opportunity of interminable growth. It is the site
of fresh and innovative things of a rising community, revitalizing the metropolitan
south. There will be four major access points — through East Service Road by
the Sucat Exit, other side of the East Service Road which is a kilometer away from
the Bicutan Exit, the South Railway spanning Clark, Pampanga and Bicol, and the
Circumferential Road 6 (C-6) link that leads all the way north to Marikina. The said
future C-6 link will serve as a gateway to the growing southern cities of Santa Rosa and
Cavite.
Having the interconnectivity and the guarantee of easy access, with verdant greens,
fresh bay breeze, and fantastic views of Laguna Bay and the Sierra Madre Mountains,
living in Lakefront is akin to having a daily getaway.
mASTERpLANNED CITIES
22 VISTA LAND ANNUAL REPORT 2010

With Vista Land’s more than 30 years of home-
building experience and eye for detail, homeowners
are assured of round-the-clock security coupled
with exclusive and exceptional amenities that
are available in all of its enclaves. It also has its
very own lifestyle and entertainment complex
spanning eight hectares that will soon become
home to offices, business process outsourcing (BPO)
facilities, as well as various commercial enterprises.
Lakefront offers practical living without
compromising the bliss of having a home with
scenic views and fresh air. It simply puts forward
the opportunity to enjoy and experience the best of
both worlds.
Lakefront is a living community, masterplanned for
accessibility.
Lakefront offerspractical livingwithout compromisingthe bliss of havinga home with scenicview and fresh air.
VISTA LAND ANNUAL REPORT 2010 23

mASTERpLANNED CITIES
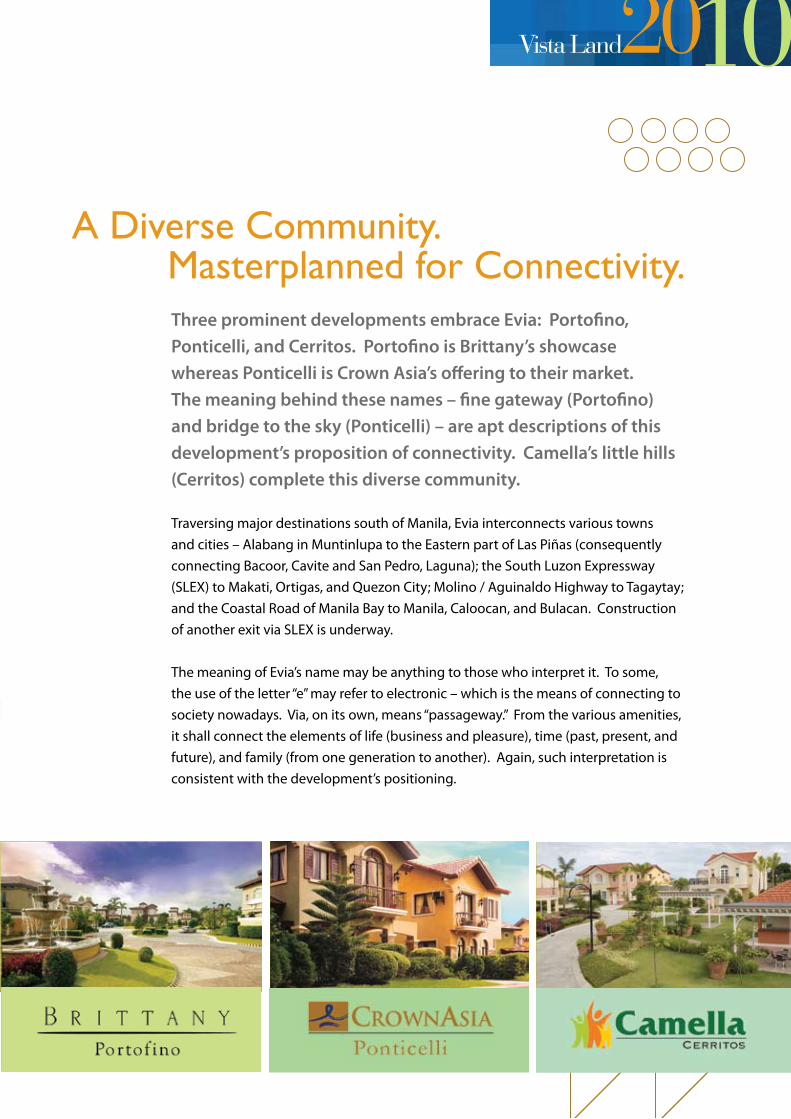
Three prominent developments embrace Evia: Portofino, Ponticelli, and Cerritos. Portofino is Brittany’s showcase whereas Ponticelli is Crown Asia’s offering to their market. The meaning behind these names – fine gateway (Portofino) and bridge to the sky (Ponticelli) – are apt descriptions of this development’s proposition of connectivity. Camella’s little hills (Cerritos) complete this diverse community.
Traversing major destinations south of Manila, Evia interconnects various towns and cities – Alabang in Muntinlupa to the Eastern part of Las Piñas (consequently connecting Bacoor, Cavite and San Pedro, Laguna); the South Luzon Expressway (SLEX) to Makati, Ortigas, and Quezon City; Molino / Aguinaldo Highway to Tagaytay; and the Coastal Road of Manila Bay to Manila, Caloocan, and Bulacan. Construction of another exit via SLEX is underway.
The meaning of Evia’s name may be anything to those who interpret it. To some, the use of the letter “e” may refer to electronic – which is the means of connecting to society nowadays. Via, on its own, means “passageway.” From the various amenities, it shall connect the elements of life (business and pleasure), time (past, present, and future), and family (from one generation to another). Again, such interpretation is consistent with the development’s positioning.
A Diverse Community. masterplanned for Connectivity.
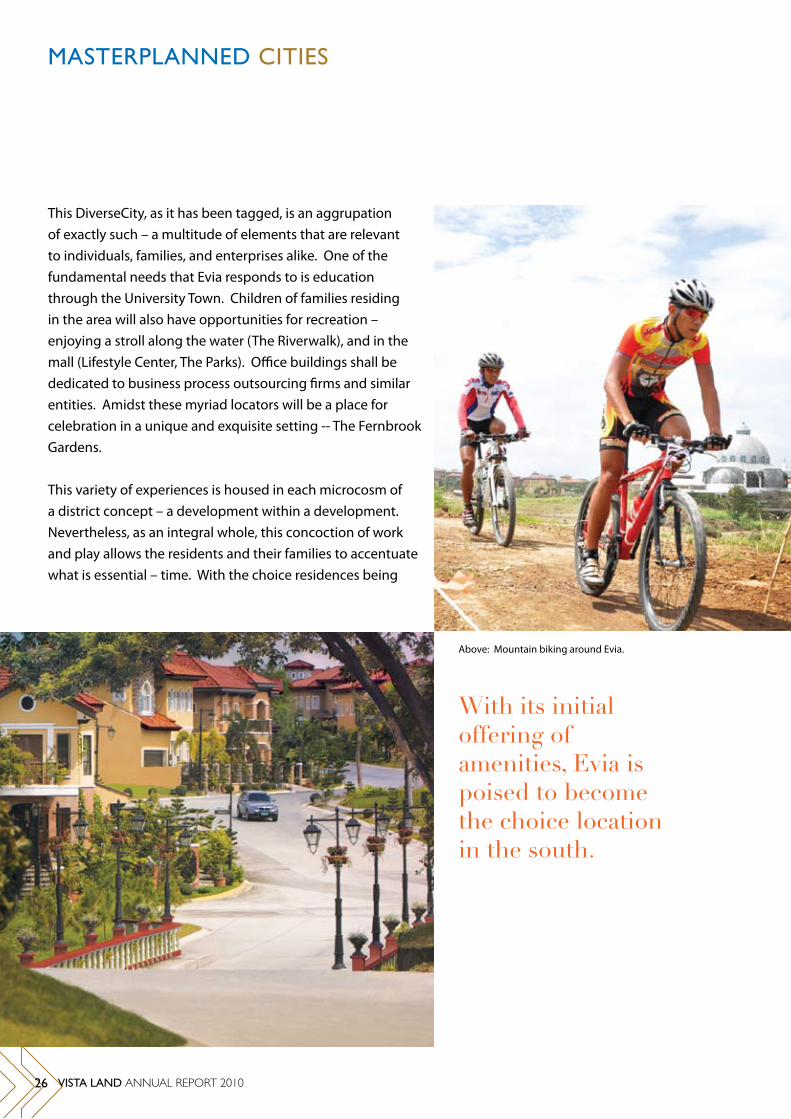
This DiverseCity, as it has been tagged, is an aggrupation of exactly such – a multitude of elements that are relevant to individuals, families, and enterprises alike. One of the fundamental needs that Evia responds to is education through the University Town. Children of families residing in the area will also have opportunities for recreation – enjoying a stroll along the water (The Riverwalk), and in the mall (Lifestyle Center, The Parks). Office buildings shall be dedicated to business process outsourcing firms and similar entities. Amidst these myriad locators will be a place for celebration in a unique and exquisite setting -- The Fernbrook Gardens.
This variety of experiences is housed in each microcosm of a district concept – a development within a development. Nevertheless, as an integral whole, this concoction of work and play allows the residents and their families to accentuate what is essential – time. With the choice residences being
mASTERpLANNED CITIES
With its initialoffering of amenities, Evia is poised to becomethe choice location in the south.
Above: Mountain biking around Evia.
26 VISTA LAND ANNUAL REPORT 2010

offered at varying price points, parents who want their children to enjoy the same lifestyle they have may do so through Amore. On the other hand, for professionals who want to enjoy the fruits of their labor, Ponticelli is the brand. Portofino is the choice for more exclusivity.
With its initial offering of amenities, Evia is poised to become the premier location in the South. Its features seek to develop the different facets of the individual and the community. Work, education, leisure, worship, sports and celebration are each given due recognition.
This newfound interpretation of masterplanning is called Evia.
Above: Evia’s Fernbrook Gardens at night. Below (L-R): The covered bridge, the gondola at the river, and the gilded carriage at Fernbrook Gardens.

mASTERpLANNED CITIES

A Traditional Community.masterplanned for Style.
The charm of the old world enthralls modern day residents. The masterplanned city of Sta. Elena City located in the town of Sta. Rosa in Laguna, represents both tradition and modernization at its heart. With the influx of industrial, manufacturing, and service companies at its fringes, Sta. Elena City flourishes in its own style with its classic look and architecture. It affixes on its signature of old-world purity a rapidly progressing environment.
mASTERpLANNED CITIES
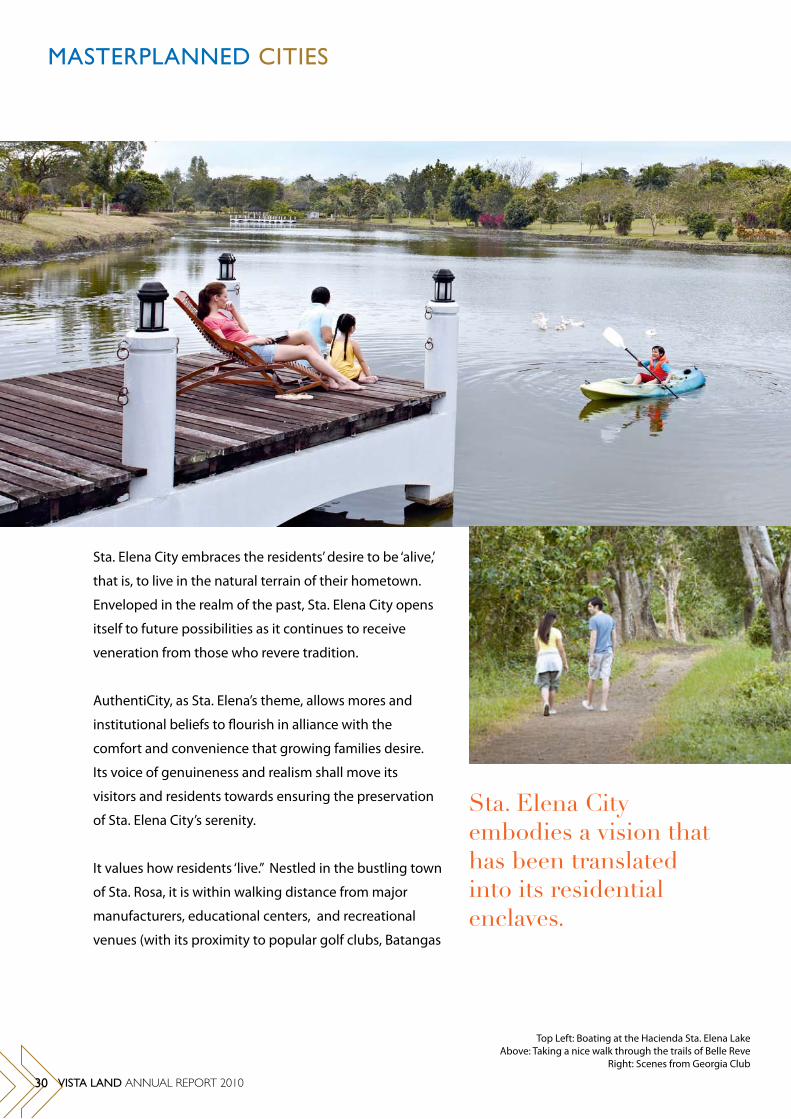
Sta. Elena City embraces the residents’ desire to be ‘alive,’
that is, to live in the natural terrain of their hometown.
Enveloped in the realm of the past, Sta. Elena City opens
itself to future possibilities as it continues to receive
veneration from those who revere tradition.
AuthentiCity, as Sta. Elena’s theme, allows mores and
institutional beliefs to flourish in alliance with the
comfort and convenience that growing families desire.
Its voice of genuineness and realism shall move its
visitors and residents towards ensuring the preservation
of Sta. Elena City’s serenity.
It values how residents ‘live.” Nestled in the bustling town
of Sta. Rosa, it is within walking distance from major
manufacturers, educational centers, and recreational
venues (with its proximity to popular golf clubs, Batangas
Sta. Elena City embodies a vision that has been translated into its residential enclaves.
Top Left: Boating at the Hacienda Sta. Elena Lake Above: Taking a nice walk through the trails of Belle Reve
Right: Scenes from Georgia Club
30 VISTA LAND ANNUAL REPORT 2010
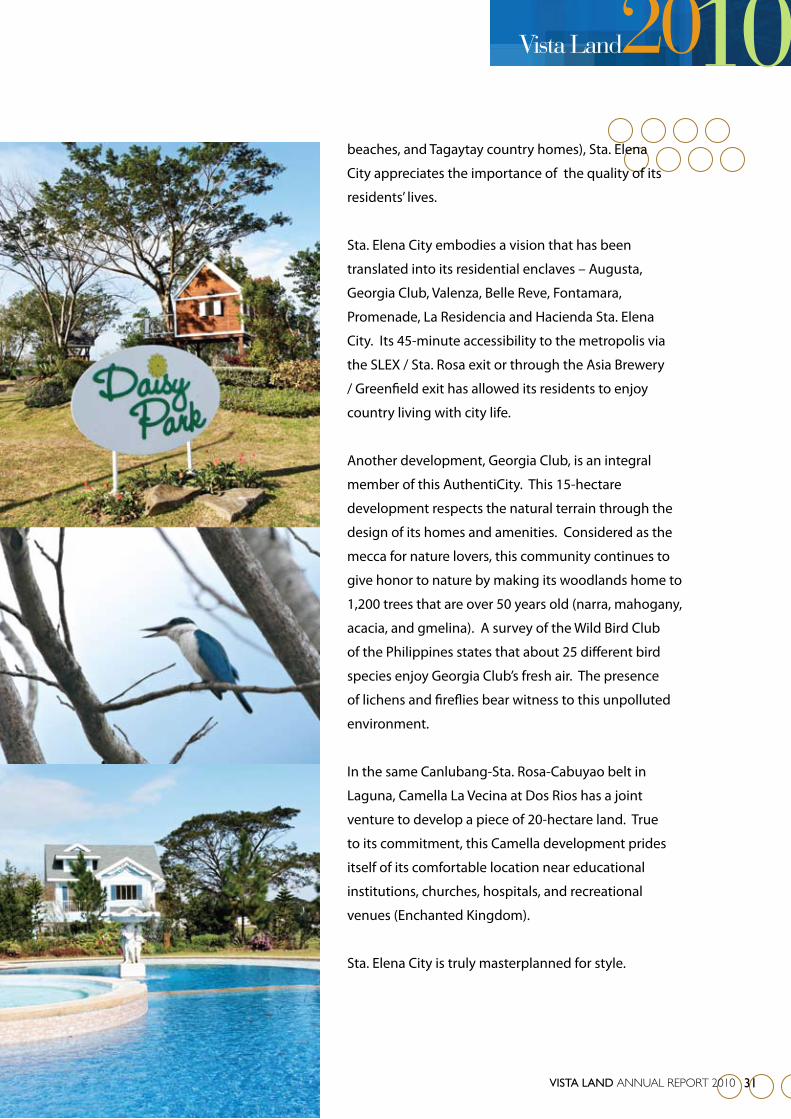
beaches, and Tagaytay country homes), Sta. Elena
City appreciates the importance of the quality of its
residents’ lives.
Sta. Elena City embodies a vision that has been
translated into its residential enclaves – Augusta,
Georgia Club, Valenza, Belle Reve, Fontamara,
Promenade, La Residencia and Hacienda Sta. Elena
City. Its 45-minute accessibility to the metropolis via
the SLEX / Sta. Rosa exit or through the Asia Brewery
/ Greenfield exit has allowed its residents to enjoy
country living with city life.
Another development, Georgia Club, is an integral
member of this AuthentiCity. This 15-hectare
development respects the natural terrain through the
design of its homes and amenities. Considered as the
mecca for nature lovers, this community continues to
give honor to nature by making its woodlands home to
1,200 trees that are over 50 years old (narra, mahogany,
acacia, and gmelina). A survey of the Wild Bird Club
of the Philippines states that about 25 different bird
species enjoy Georgia Club’s fresh air. The presence
of lichens and fireflies bear witness to this unpolluted
environment.
In the same Canlubang-Sta. Rosa-Cabuyao belt in
Laguna, Camella La Vecina at Dos Rios has a joint
venture to develop a piece of 20-hectare land. True
to its commitment, this Camella development prides
itself of its comfortable location near educational
institutions, churches, hospitals, and recreational
venues (Enchanted Kingdom).
Sta. Elena City is truly masterplanned for style.
VISTA LAND ANNUAL REPORT 2010 31

An International Community. masterplanned for Hospitality.
Rolling out the quintessential experience of hospitality in the Philippines allows a unique experience in a grand setting at Crosswinds – a leisure and family destination with a year-round Christmas theme. Crosswinds is the epitome of Philippine hospitality in a refined setting.
Amidst a rolling terrain lined with verdant and lush pine tree “forests,” Crosswinds has Swiss chalets, a clubhouse, recreational areas, leisure activities, and a residential condominium. It also allows non-homeowners to sample the Crosswinds experience with a hotel run in partnership with Hotel International, Inc. (HII). Families who enjoy the refuge of this mountain retreat will be filled with the knowledge of how to enjoy nature as it should be. A haven for individuals and families who want to get


away from the harried city life, it is swathed with 20,000 pine trees – coolly welcoming them to this exclusive place 2,500 feet above sea level in the resort city of Tagaytay.
This 100-hectare prime land has been divided into four distinct enclaves: The Swiss Quadrilles (four homes to a structure), The Grand Quartier (a medium-rise condominium overlooking Tagaytay’s grandeur), Deux Pointe (two homes to a structure), and Custom Home Sites (design-your-own chalet). These features are stamped with Brittany’s highest standards – designed together with their respective owners – with each addition becoming a contribution to their magnum opus nestled in Tagaytay.
Residents of The Swiss Quadrilles shall enjoy the intricate architecture of their home on the “hillside.” Following the natural contour and curve of the land, the inviting surroundings allow enjoyment of serenity and tranquil surroundings.
mASTERpLANNED CITIES
Top right: Elegant dining at the Grand QuartierBelow right: The swimming pool and jacuzziBelow: Al fresco cafes within Crosswinds
34 VISTA LAND ANNUAL REPORT 2010
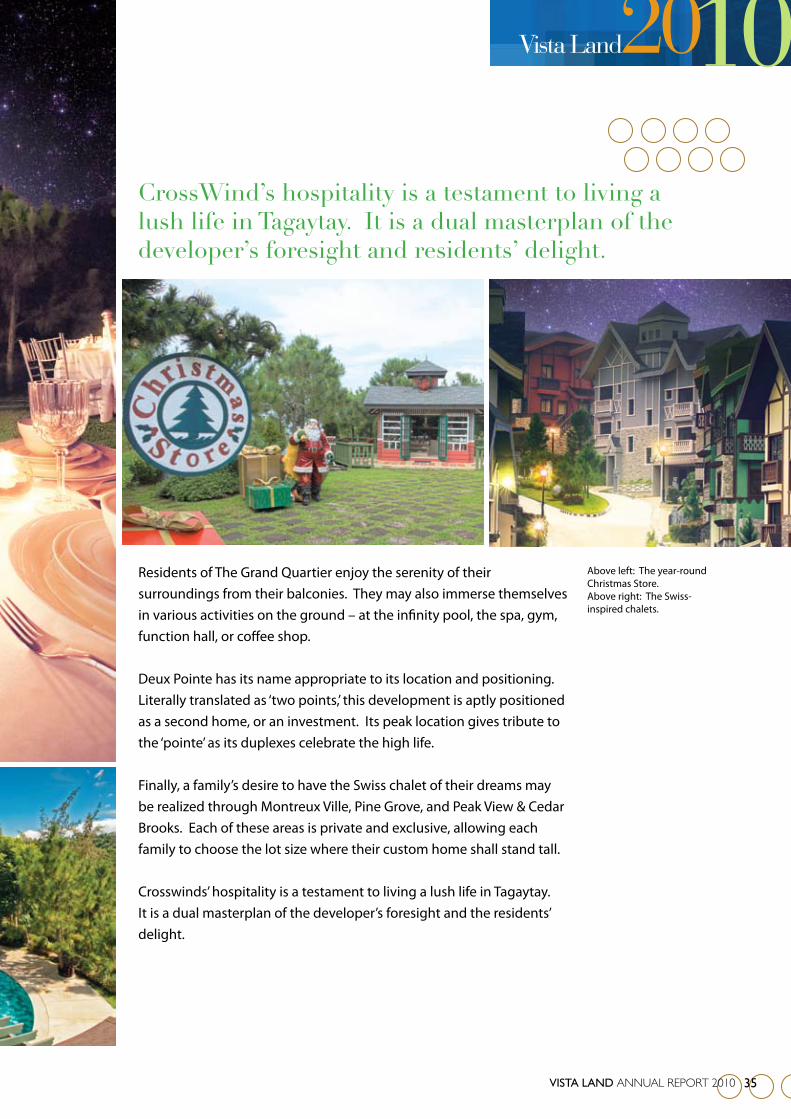
Above left: The year-round Christmas Store.Above right: The Swiss-inspired chalets.
CrossWind’s hospitality is a testament to living a lush life in Tagaytay. It is a dual masterplan of the developer’s foresight and residents’ delight.
Residents of The Grand Quartier enjoy the serenity of their surroundings from their balconies. They may also immerse themselves in various activities on the ground – at the infinity pool, the spa, gym, function hall, or coffee shop.
Deux Pointe has its name appropriate to its location and positioning. Literally translated as ‘two points,’ this development is aptly positioned as a second home, or an investment. Its peak location gives tribute to the ‘pointe’ as its duplexes celebrate the high life.
Finally, a family’s desire to have the Swiss chalet of their dreams may be realized through Montreux Ville, Pine Grove, and Peak View & Cedar Brooks. Each of these areas is private and exclusive, allowing each family to choose the lot size where their custom home shall stand tall.
Crosswinds’ hospitality is a testament to living a lush life in Tagaytay. It is a dual masterplan of the developer’s foresight and the residents’ delight.
VISTA LAND ANNUAL REPORT 2010 35

A Unified Community. masterplanned for families.
Known as the “Queen City of the South,” Iloilo has evolved from just being one of the major provinces of the Philippines to an economic, cultural, and heritage center in the Visayas region. Its strategic location has made it one of the most accessible cities in the Philippines - the city is only 45 minutes by plane and 18 hours by ship from Manila. (From Cebu, another recognized urban province of the country, Iloilo is only 25 minutes by plane.) Iloilo City is widely recognized as one of the business and government gateways to the Visayas region.
mASTERpLANNED CITIES

Georgia International School at Savannah Savannah’s clubhouse and swiming pools
mASTERpLANNED CITIES
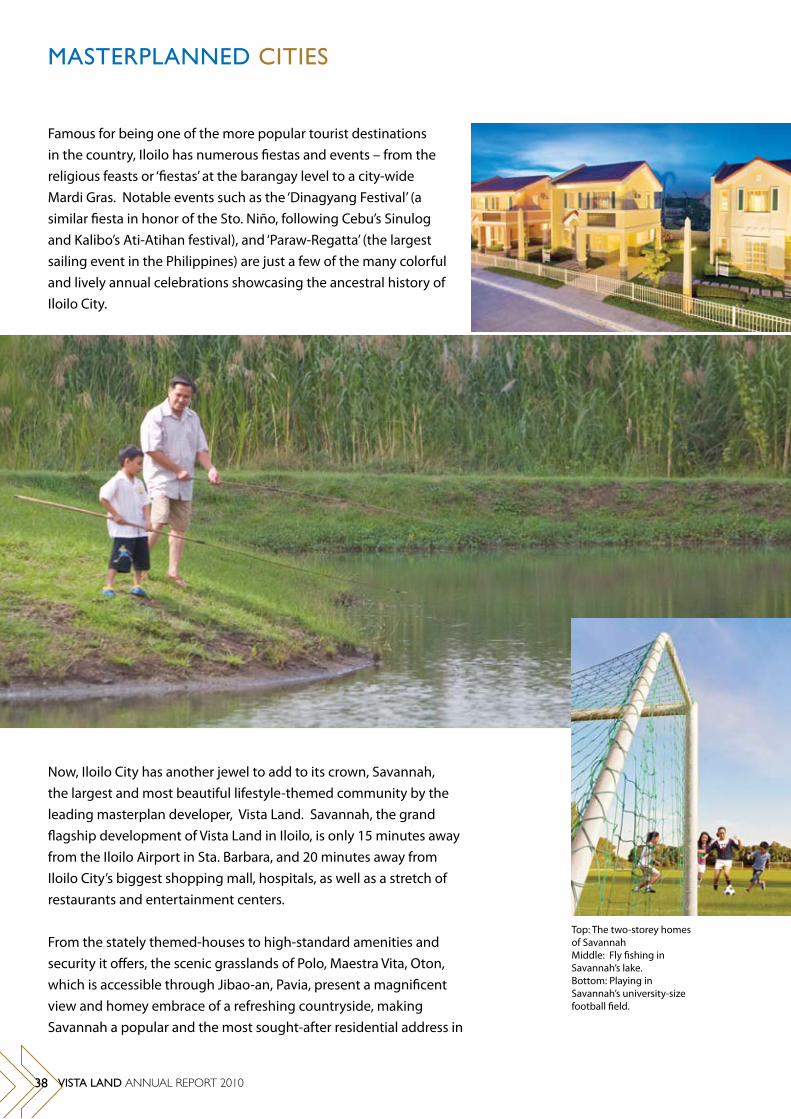
Famous for being one of the more popular tourist destinations in the country, Iloilo has numerous fiestas and events – from the religious feasts or ‘fiestas’ at the barangay level to a city-wide Mardi Gras. Notable events such as the ‘Dinagyang Festival’ (a similar fiesta in honor of the Sto. Niño, following Cebu’s Sinulog and Kalibo’s Ati-Atihan festival), and ‘Paraw-Regatta’ (the largest sailing event in the Philippines) are just a few of the many colorful and lively annual celebrations showcasing the ancestral history of Iloilo City.
Now, Iloilo City has another jewel to add to its crown, Savannah, the largest and most beautiful lifestyle-themed community by the leading masterplan developer, Vista Land. Savannah, the grand flagship development of Vista Land in Iloilo, is only 15 minutes away from the Iloilo Airport in Sta. Barbara, and 20 minutes away from Iloilo City’s biggest shopping mall, hospitals, as well as a stretch of restaurants and entertainment centers.
From the stately themed-houses to high-standard amenities and security it offers, the scenic grasslands of Polo, Maestra Vita, Oton, which is accessible through Jibao-an, Pavia, present a magnificent view and homey embrace of a refreshing countryside, making Savannah a popular and the most sought-after residential address in
Top: The two-storey homes of SavannahMiddle: Fly fishing in Savannah’s lake.Bottom: Playing in Savannah’s university-size football field.
38 VISTA LAND ANNUAL REPORT 2010
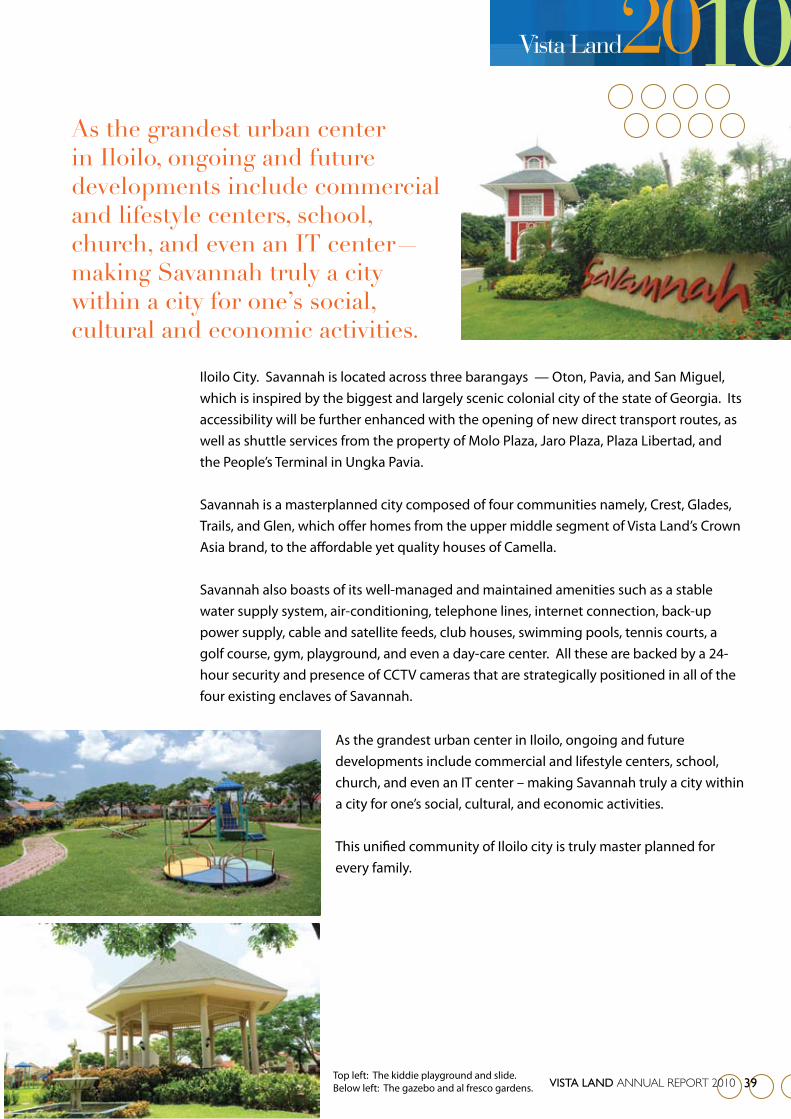
Iloilo City. Savannah is located across three barangays — Oton, Pavia, and San Miguel, which is inspired by the biggest and largely scenic colonial city of the state of Georgia. Its accessibility will be further enhanced with the opening of new direct transport routes, as well as shuttle services from the property of Molo Plaza, Jaro Plaza, Plaza Libertad, and the People’s Terminal in Ungka Pavia.
Savannah is a masterplanned city composed of four communities namely, Crest, Glades, Trails, and Glen, which offer homes from the upper middle segment of Vista Land’s Crown Asia brand, to the affordable yet quality houses of Camella.
Savannah also boasts of its well-managed and maintained amenities such as a stable water supply system, air-conditioning, telephone lines, internet connection, back-up power supply, cable and satellite feeds, club houses, swimming pools, tennis courts, a golf course, gym, playground, and even a day-care center. All these are backed by a 24-hour security and presence of CCTV cameras that are strategically positioned in all of the four existing enclaves of Savannah.
As the grandest urban center in Iloilo, ongoing and future developments include commercial and lifestyle centers, school,church, and even an IT center— making Savannah truly a city within a city for one’s social, cultural and economic activities.
As the grandest urban center in Iloilo, ongoing and future developments include commercial and lifestyle centers, school, church, and even an IT center – making Savannah truly a city within a city for one’s social, cultural, and economic activities.
This unified community of Iloilo city is truly master planned for every family.
Top left: The kiddie playground and slide.Below left: The gazebo and al fresco gardens. VISTA LAND ANNUAL REPORT 2010 39
REVIEW OF OPERATIONS
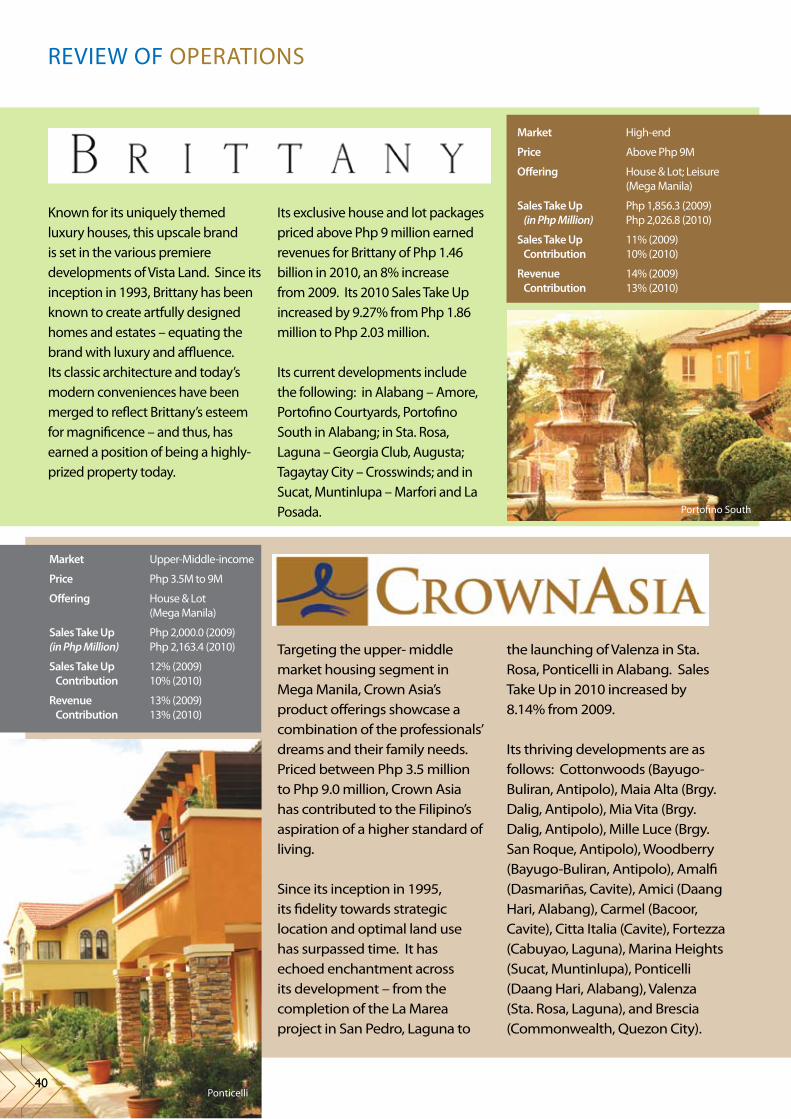
Targeting the upper- middle market housing segment in Mega Manila, Crown Asia’s product offerings showcase a combination of the professionals’ dreams and their family needs. Priced between Php 3.5 million to Php 9.0 million, Crown Asia has contributed to the Filipino’s aspiration of a higher standard of living.
Since its inception in 1995, its fidelity towards strategic location and optimal land use has surpassed time. It has echoed enchantment across its development – from the completion of the La Marea project in San Pedro, Laguna to
Market High-end
Price Above Php 9M
Offering House & Lot; Leisure (Mega Manila)
Sales Take Up (in Php Million)
Php 1,856.3 (2009)Php 2,026.8 (2010)
Sales Take Up Contribution
11% (2009)10% (2010)
Revenue Contribution
14% (2009)13% (2010)
Market Upper-Middle-income
Price Php 3.5M to 9M
Offering House & Lot(Mega Manila)
Sales Take Up(in Php Million)
Php 2,000.0 (2009)Php 2,163.4 (2010)
Sales Take Up Contribution
12% (2009)10% (2010)
Revenue Contribution
13% (2009)13% (2010)
Known for its uniquely themed luxury houses, this upscale brand is set in the various premiere developments of Vista Land. Since its inception in 1993, Brittany has been known to create artfully designed homes and estates – equating the brand with luxury and affluence. Its classic architecture and today’s modern conveniences have been merged to reflect Brittany’s esteem for magnificence – and thus, has earned a position of being a highly-prized property today.
Its exclusive house and lot packages priced above Php 9 million earned revenues for Brittany of Php 1.46 billion in 2010, an 8% increase from 2009. Its 2010 Sales Take Up increased by 9.27% from Php 1.86 million to Php 2.03 million.
Its current developments include the following: in Alabang – Amore, Portofino Courtyards, Portofino South in Alabang; in Sta. Rosa, Laguna – Georgia Club, Augusta; Tagaytay City – Crosswinds; and in Sucat, Muntinlupa – Marfori and La Posada.
the launching of Valenza in Sta. Rosa, Ponticelli in Alabang. Sales Take Up in 2010 increased by 8.14% from 2009.
Its thriving developments are as follows: Cottonwoods (Bayugo-Buliran, Antipolo), Maia Alta (Brgy. Dalig, Antipolo), Mia Vita (Brgy. Dalig, Antipolo), Mille Luce (Brgy. San Roque, Antipolo), Woodberry (Bayugo-Buliran, Antipolo), Amalfi (Dasmariñas, Cavite), Amici (Daang Hari, Alabang), Carmel (Bacoor, Cavite), Citta Italia (Cavite), Fortezza (Cabuyao, Laguna), Marina Heights (Sucat, Muntinlupa), Ponticelli (Daang Hari, Alabang), Valenza (Sta. Rosa, Laguna), and Brescia (Commonwealth, Quezon City).
40
Portofino South
Ponticelli
The roots of Vista Land’s Camella began in the early 70s with its first development project undertaken by its founder, Manuel B. Villar, Jr. With his leadership and vision, Vista Land continues to fulfill the hopes and aspirations of the Filipino family.
Over the years, Camella has evolved to become the country’s trusted and most preferred brand when it
comes to housing. Servicing the middle, affordable and low-cost housing sector as well, it boasts of value for money family homes and lifestyle residences still suited with Vista Land’s notion of ensuring efficient and effective execution of its master plan.
Camella contributed Php 3.51 billion in revenues in 2010, a 30% increase from 2009. Its Sales Take Up in 2010 increased by 18.9% from Php 5.5 billion to Php 6.6 billion. With more than three decades of experience in real estate, its offerings of single-family residences and affordable homes have been coupled with accessible locations in key areas around the metropolis. It has also ventured into two-
Market Middle Income
Price Below Php 3.5M
Offering House & Lot (Mega Manila)
2010 Sales Take Up (in Php Million)
Php 5,538.6 (2009)Php 6,584.9 (2010)
Sales Take Up Contribution
33% (2009)32% (2010)
Revenue Contribution
30% (2009)31% (2010)
storey townhomes and low-rise condominiums.
Its current developments across the country are as follows: La Montagna Estates (Teresa, Rizal), Cerritos East (Pasig City), El Paseo (Novaliches, Quezon City), Grande Vita (Bignay Road, Valenzuela), Nova Romania (Novaliches, Quezon City), Siena Villas (Caloocan City), Tierra del Sueño (San Jose del Monte, Bulacan), Bella Vista (Gen. Trias, Cavite), Cerritos (Daang Hari, Alabang), Colina (San Pedro, Laguna), Lessandra (Bacoor / Dasmariñas, Cavite), Merida (BF Resort, Las Piñas), Siena Villas (Bacoor, Cavite), Terrassa (Imus, Cavite), Tierra del Fuego (Gen. Trias, Cavite).
VISTA LAND ANNUAL REPORT 2010 41

Communities Philippines has a vision of building world-class homes for every Filipino family and masterplanned cities across the nation under the flagship brand of Camella and Lessandra. From the northern to the southern part of the Metropolis, Communities’ registers a bullish market presence with a revenue of Php 4.08 billion in 2010, a 13% increase from 2009.
Its developments include the following: Camella Northpoint (Davao City), Provence (Malolos, Bulacan), Camella Sto. Tomas (Sto. Tomas, Batangas), Positano (Davao City), Camella General Santos (General Santos), Camella Naga (Naga City), Camella Tuguegarao (Tuguegarao, Cagayan), and Prominenza (Baliuag, Bulacan).
Market All price points; primarily Camella and Lessandra Brands
Offering House & Lot (outside Mega Manila)
2010 Sales Take Up (in Php Million)
Php 7,014.5 (2009)Php 8,661.1 (2010)
Sales Take Up Contribution
42% (2009)42% (2010)
Revenue Contribution
38% (2009)36% (2010)
A Brand’s CommitmentThe OFW has been instrumental in building this brand – and they have continued to be a major market. It renews this promise to this sector in December 2010 through a nationwide Christmas Tree Lighting Ceremony, an exclusive event for seafarers and their families, in partnership with SmartLink.
REVIEW OF OPERATIONS
42 VISTA LAND ANNUAL REPORT 2010
The Plans and ProspectsLessandra, Camella’s townhouse modules, continues to expand in the peripheries of Metro Manila – Cavite, Bulacan, and Batangas. It has also extended its reach to Bicol, Cebu, Iloilo, Bacolod, Davao, and Cagayan de Oro in the last quarter of 2010, two new enclaves – Orchard and Pine Grove – will open in Iloilo.
COMMUNITIESP H I L I P P I N E S

Market Low to High-end
Price Php 1.9M to 16M
Offering Vertical projects (Mega Manila)
2010 Sales Take Up (in Php Million)
Php 333.2 (4Q 2009)Php 1,156.2 (2010)
Sales Take Up Contribution
2% (2009)6% (2010)
Revenue Contribution
5% (2009)7% (2010)
The venture into vertical development began in 2004 when Vista Land launched Marfori Towers at Muntinlupa City – its first residential condominium offering. After three years, the premiere home builder has 13 condominium projects in varying degrees of development – completed, under construction, or expected to rise in the future.
Although Vista Residences is a relatively new player in this high-rise or multi-level property development industry, it brings its three-decade experience of building homes, developing properties, and creating masterplanned communities. It
has also integrated its expertise in space planning, and flair for finding accessible and attractive locations here. In addition, Vista Residences displays the company’s commitment to assume a chief role in this sector, creating greater awareness of Vista Land’s capabilities as well as enhancing efficiencies in their resource distribution.
Vista Residences has assumed responsibility for the portfolio of home condominium projects previously held by Vista Land subsidiaries such as Brittany, Crown Asia, and Camella Homes. Vista Residences contributed Php 778.8 million in revenues in 2010, 53% increase from 2009.
Its current developments include the following: Mosaic (Greenbelt, Makati City), KL Mosaic (Legazpi Village, Makati City), Salcedo Square (Salcedo Village, Makati City), Laureano de Trevi (Chino Roces, Makati City), Avant (The Fort, Taguig City), Pacific Residences Tower (Taguig City), Symphony Tower (South Triangle, Quezon City), Pine Crest (New Manila, Quezon City), Madison Place (Cubao, Quezon City), Wil Tower (Eugenio Lopez Drive, Quezon City), The Currency (Ortigas, Pasig City), Crown Tower (Sampaloc, Manila) and Northpoint in Davao City.
VISTA LAND ANNUAL REPORT 2010 43

Ernie and Belen Celestino looked back to their early married life and recounted their first step towards their future. In the 70s, the couple worked at San Miguel Corporation (SMC) where Mrs. Celestino was part of the Accounting department, and Mr. Celestino was a salesman. As employees, they had the opportunity to avail of several benefits not only for themselves but also for their family.
Of first Houses and Vista Land: One of the first Among Camella Homeowners
CAMELLA HOMEOWNERS
THE FIRST STEP
Their company’s housing loan allowed the Celestinos to have their own home. Mrs. Celestino narrated that they initially wanted to purchase a lot, as they felt that they did not have the time to get into the details of building a house. It was in 1978 when they began to look for one. The couple went to various cities in the Metro but it was at Camella in Las Piñas where they felt at home. Apart from having a peaceful environment, it was the hassle-free relationship that they experienced with Camella that made the Celestinos make the final decision of purchasing a lot.
The relationship went further as the couple hired Camella to construct their house. Their home was finished in 1980 and they immediately moved-in. Camella provided additional help in refining and maintaining the Celestino home in the first few years of their stay.
TAkINg A LEAP TO THE PRESENT
Today, the same house has become witness to the various changes in the Celestinos’ family life. Camille, their eldest child, is a doctor and is currently a radiologist at the National Kidney Institute. Ernesto, their second child, is a banking professional. The youngest son, Francis, is studying a multimedia course at the De La Salle-College of Saint Benilde.
The Celestino home serves as a haven for the Celestino family’s activities. Upon their retirement from SMC, the Celestino couple decided to enter into

entrepreneurial and educational endeavours. As Mrs. Celestino values her personal growth through education, she decided to take up a Master’s degree in Business Administration at the Polytechnic University of the Philippines (PUP). She concurrently conducts integral review classes for Certified Public Accountants and teaches cost accounting at the Dr. Filemon C. Aguilar Memorial College in Las Piñas.
On the other hand, Mr. Celestino manages their “bread house” located just in front of their home. They are well-known for their pandesal, a popular fare in their neighborhood. This entrepreneurial venture has allowed Mr. Celestino not only to have time for the family but also to guide their children on all their “firsts” as well.
LOOkINg THROugH A HOMEOWNER’S LENS
Well-maintained and secure are just two descriptions for the Celestinos’ haven – that goes beyond the borders of their house. Their location is very accessible -- many transportation options are available near their home. Going to and from Las Pinas to the business districts of Makati, Ortigas and Quezon City is a breeze.
Caring for the homeowners is apparent through the different programs and activities that the Camella Homeowners’ Association conducts – a fund-raising initiative for the subdivision’s chapel, Christmas and Halloween parties, summer outings, Santacruzans, and basic services, such as waste segregation and. garbage collection. The sense of community pervades throughout Camella as the homeowners
It was the hassle-free relationship that they experienced with Camella that made the Celestinos make the final decision of purchasing a lot.
willingly share their time and resources to ensure the success of these activities.
With their positive experience in Camella Las Pinas, the Celestinos are contemplating on purchasing another Camella property – particularly in Cebu where Mrs. Celestino was originally from. Their beautiful family in their pristine house is a testament to the fact that the Celestinos found the perfect place to live and raise their children in Camella.
Ernie and Belen Celestino with their daughter Camille in the lawn of their Camella home.
VISTA LAND ANNUAL REPORT 2010 45

CORPORATE GOVERNANCE
binding Success and Corporate Governance
The Board of Directors and Management, employees and shareholders, believe that corporate governance is a necessary component of what constitutes sound strategic business management and will therefore undertake every effort necessary to create awareness within the organization as soon as possible.
The Board of Directors (the “Board”) shall be primarily responsible for the governance of the corporation.
STOCkHOLdERS’ RIgHTS
The Board respects the rights of its stockholders as provided in the Corporation Code.
Voting RightsEach stockholder has the right to vote on all matters that require their consent or approval.
They have the right to elect, remove, and replace directors. They can also vote on certain corporate acts in accordance with the Corporation Code.
Cumulative voting shall be used in the election of directors. A director shall not be removed without cause if it will deny minority shareholders representation in the Board.
Pre-emptive rightsAll stockholders shall have pre-emptive rights, unless the same is denied in the articles of incorporation or an amendment thereto. They shall have the right to subscribe to the capital stock of the Corporation. The Articles of Incorporation shall lay down the specific rights and powers of shareholders with respect to the particular shares they hold, all of which shall be protected by law so long as they shall not be in conflict with the Corporation Code.
46 VISTA LAND ANNUAL REPORT 2010
The annual stockholders’ meeting

Right to inspect corporate books and recordsAll shareholders shall be allowed to inspect corporate books and records including minutes of Board meetings and stock registries in accordance with the Corporation Code and shall be furnished with annual reports, including financial statements, without cost or restrictions.
Right to informationThe Shareholders shall be provided, upon request, with periodic reports which disclose personal and professional information about the directors and officers and certain other matters such as their holdings of the company’s shares, dealings with the company, relationships among directors and key officers, and the aggregate compensation of directors and officers.
The minority shareholders shall be granted the right to propose the holding of a meeting, and the right to propose items in the agenda of the meeting, provided the items are for legitimate business purposes.
The minority shareholders shall have access to any and all information relating to matters for which the management is accountable for and to those relating to matters for which the management shall include such information and, if not included, then the minority shareholders shall be allowed to propose to include such matters in the agenda of stockholders’ meeting, being within the definition of “legitimate purposes.”
dividendsShareholders shall have the right to receive dividends subject to the discretion of the Board.
The company shall be compelled to declare dividends when its retained earnings shall be in excess of 100% of its paid-in capital stock, except: a) when justified by definite corporate expansion projects or programs approved by the Board or b) when the corporation is prohibited under any loan agreement with any financial institution or creditor, whether local or foreign, from declaring dividends without its consent, and such consent has not been secured; or c) when it can be clearly shown that such retention is necessary under special circumstances obtaining in the Corporation, such as when there is a need for special reserve for probable contingencies.
STAkEHOLdER RELATIONS
Vista Land exercises transparency when dealing with shareholders, customers, employees, and trade partners. The company ensures that these transactions adhere to fair business practices in order to establish long-term and mutually beneficial relationships.
Shareholder Meeting and Voting ProceduresStockholders are informed at least 15 business days before the scheduled meeting of the date, time, and place of the validation of proxies. In 2010, Notices of the 2010 AGM were sent to the stockholders on May 21, 2010. Voting procedures on the matters presented for approval of the stockholders in the AGM are set out in the Definitive Information Statement.
Shareholder and Investor RelationsVista Land responds to information requests from the investing community and keeps shareholders informed through timely disclosures to the Philippine Stock Exchange (PSE), regular quarterly
VISTA LAND ANNUAL REPORT 2010 47
briefings, AGMs, investor conferences, website, emails, and telephone calls.
The company, through the Investor Relations Group under Corporate Finance, holds regular briefings and meetings with investment and financial analysts.
dISCLOSuRE ANd TRANSPARENCY
The essence of corporate governance is transparency. The more transparent the internal workings of the corporation are, the more difficult it will be for Management and dominant stockholders to mismanage the corporation or misappropriate its assets.
It is therefore essential that all material information about the corporation, which could adversely affect its viability or the interests of the stockholders, should be publicly and timely disclosed. Such information should include, among others, earnings results, acquisition, or disposition of assets, off balance sheet transactions, related party transactions, and direct and indirect remuneration of members of the Board and Management. All such information should be disclosed through the appropriate Exchange mechanisms and submissions to the Commission.
Ownership StructureThe top 20 shareholders, including the shareholdings of certain record and beneficial owners who own more than 5% of its capital stock, its directors and key officers, are disclosed annually in its Definitive Information Statement distributed to shareholders prior to the AGM.
Financial ReportingVista Land provides the investing community with regular updates on operating and financial information through adequate and timely disclosures filed with the SEC and the PSE.
Consolidated audited financial statements are submitted to the SEC on or before the prescribed period and are distributed to the shareholders prior to the AGM.
Vista Land’s financial statements conform to Philippine Accounting Standards and Philippine Financial Reporting Standards, which are all in compliance with International Accounting Standards.
Quarterly financial results, on the other hand, are released and are duly disclosed to the SEC and PSE in accordance with the prescribed rules. The results are also presented to financial and investment analysts through a quarterly analyst’s briefing. These disclosures are posted on the company’s corporate website.
In addition to compliance with structural reportorial requirements, the company discloses in a timely manner market-sensitive information such as dividend declarations, joint ventures and acquisitions, sale and divestment of significant assets that affect the share price performance.
ACCOuNTABILITY ANd AudIT
Corporate Secretary. The Corporate Secretary is responsible for the safekeeping and preservation of the integrity of the minutes of the meetings of the Board and its committees, and other official
CORPORATE GOVERNANCE
48 VISTA LAND ANNUAL REPORT 2010

records of the Corporation. She will work fairly and objectively with the Board, Management, and stockholders. She must also be aware of the laws, rules, and regulations necessary in the performance of her duties.
Compliance Officer. The Compliance Officer shall directly report to the Chairman of the Board. He shall monitor compliance with the provisions and requirements of this Manual and the rules and regulations of regulatory agencies and, if any violations are found, report the matter to the Board and recommend the imposition of appropriate disciplinary action on the responsible parties and the adoption of measures to prevent a repetition of the violation.
External Auditor. The accounting firm of SGV & Company served as the company’s external auditors for the fiscal years 2009 and 2010.
The external auditor is selected and appointed by the shareholders upon the recommendation of the Board and rotated every five years or earlier in accordance with SEC regulations. The external auditor’s main function is to facilitate the environment of good corporate governance as reflected in the company’s financial records and reports, through the conduct of an independent annual audit on the company’s business and rendition of an objective opinion on the reasonableness of such records and reports.
The external auditors are expected to attend the AGM of the company and respond to appropriate questions during the meeting. They also have the opportunity to make a statement if they so desire. In instances when the external auditor suspects fraud or error during its conduct of audit, they are
required to disclose and express their findings on the matter.
Internal AuditInternal audit is carried out by Internal Audit Group (IAG), which helps the organization accomplish its objectives by bringing a systematic, disciplined approach to evaluate and improve the effectiveness of risk management, control, and governance processes. IAG reports to the Audit Committee.
IAG is responsible for identifying and evaluating significant risk exposures and contributes to the improvement of risk management and control systems by assessing adequacy and effectiveness of controls covering the organization’s governance, operations and information systems. By evaluating their effectiveness and efficiency, and by promoting continuous improvement, the group maintains effective controls of their responsibilities and functions.
Vista Land’s quarterly analysts’ briefing conducted by senior management team.
VISTA LAND ANNUAL REPORT 2010 49

BOARd OF dIRECTORS
The Board of Directors (the “Board”) shall be primarily responsible for the governance of the Corporation. Corollary to setting the policies for the accomplishment of the corporate objectives, it shall provide an independent check on Management. The term “Management” as used herein shall refer to the body given the authority by the Board to implement the policies it has laid down in the conduct of the business of the Corporation.
CompositionThe Board shall be composed of at least five (5), but not more than fifteen (15), members who are elected by the stockholders; and at least two (2) independent directors or such number of independent directors that constitutes twenty percent (20%) of the members of the Board, whichever is lesser, but in no case less than two (2).
The membership of the Board may be a combination of executive and non-executive directors (which include independent directors) in order that no director or small group of
directors can dominate the decision making process.
The non-executive directors should possess such qualifications and stature that would enable them to participate effectively in the deliberations of the Board.
Chairman The Chairman of the Board, President and Chief Executive Officer have been separated to foster an appropriate balance of power, increased accountability, and better capacity for independent decision making by the Board.
Board PerformanceThe Board holds regular meetings. To assist the directors in the discharge of their duties, each director is given access to the Corporate Secretary and Assistant Corporate Secretary, who serve as counsel to the board of directors and at the same time communicate with the Board, management, the company’s shareholders and the investing public.
In 2010, the Board held seven meetings. Below is a record of attendance of the directors at these meetings and at the AGM:
DIRECTOR’S NAME Jan 8
Apr 12
Jun 15
Jun 28
Aug 13
Sep 15
Sep 20
Marcelino C. Mendoza P P P P P - -
Benjamarie Therese N. Serrano P P - P P P P
Manuel Paolo A. Villar P P - P P P P
Cynthia J. Javarez P P P P P P P
Mark A. Villar P - - P P n/a n/a
Marilou O. Adea P P P P - - -
Ruben O. Fruto P P P P P P P
Maribeth C. Tolentino* n/a n/a n/a n/a - P
*Elected on June 28, 2010 to serve the unexpired term of Mr. Mark A. Villar who resigned from the Board on the said date.
CORPORATE GOVERNANCE
50 VISTA LAND ANNUAL REPORT 2010
Vista Land’s management team answering various queries from analysts.
Board CommitteesTo assist the Board in complying with the principles of good corporate governance, the Board created three committees.
Nomination Committee. There are three directors that comprise the Nomination Committee, one of which is an independent director: Marcelino C. Mendoza (Chairman), Maribeth C. Tolentino, and Ruben O. Fruto (Independent Director). This committee reviews and evaluates the qualifications of all persons nominated to the Board and other appointments that require Board approval, and to assess the effectiveness of the Board’s processes and procedures in the election or replacement of directors.
Compensation and Remuneration Committee. Three directors comprise the Compensation and Remuneration Committee, one of whom is an independent director: Benjamarie Therese N. Serrano (Chairman), Manuel Paolo A. Villar, and Marilou O. Adea (Independent Director). This committee establishes the formal and transparent procedure for developing a policy on executive remunerations, and fixing remuneration packages of corporate officers and directors. It also provides oversight over remuneration of senior management and other key personnel, ensuring that compensation is consistent with the corporation’s culture, strategy, and control environment.
Audit Committee. The Audit Committee has three members, two of which are independent directors: Marilou O. Adea (Independent Director), Ruben O. Fruto (Independent Director), and Cynthia J. Javarez. This committee assists the Board in performing an oversight responsibility for the financial reporting process, system of
internal control, audit process, and monitoring of compliance with applicable laws, rules and regulations. It also provides oversight over Management’s activities in managing credit, market, liquidity, operational, legal, and other risks of the corporation. This includes a regular receipt from Management of information on risk exposures and risk management activities.
MANAgEMENT
Management is primarily responsible for the day-to-day operations and business of the company. The annual compensation of the Chairman/CEO and the top eight senior executives of the company are set out in the Definitive Information Statement distributed to shareholders.
COMPLIANCE MONITORINg
The Compliance Officer is responsible for monitoring compliance by the company with the provisions and requirements of good corporate governance.
On June 2010, the Board Directors amended its Manual of Corporate Governance in compliance with the Revised Code of Corporate Governance issued by the Securities and Exchange Commission.
WEBSITE
Up-to-date information on the company’s corporate structure, products and services, results of business operations, financial statements, career opportunities and other relevant information on the company may be found at its official website www.vistaland.com.ph.
VISTA LAND ANNUAL REPORT 2010 51

CORPORATE SOCIAL RESPONSIBILITY
Community, client, and corporation are the triune consideration in the field of corporate social responsibility (CSR). Beyond a company’s commitment to the individual, CSR permeates the life and strife of communities. These same stakeholders are the main targets for communicating Vista Land’s accountability towards the environment, its own employees, the company’s affiliates, and their organization in general.
After having applied for a C level rating in the Global Rating InitiativeTM (GRI), a network-based organization that pioneered the world’s most widely used sustainability reporting framework,1 Vista Land is ready to move towards more sophisticated
albeit grounded CSR initiatives. The organization’s philosophy is that of immersion (across all levels of the corporation), deep involvement (of employees), and that of having a wholistic appreciation of Vista Land’s impact to society. Phrases such as “minimize this” or “maximize that” are inadequate to ensure the achievement of the triple bottomline.
Over time, its CSR efforts have evolved from Greenscapes (having planted trees in more than 3,500 hectares of land in the Philippines) to permeate their genuine concern for their employees’ welfare. Employability through cross-posting and enriching activities at work is a conscious effort of management.
True performance management pervades across levels such that the onus of recruitment is based on ability, not on discriminating demographics such as age and gender. Individuals who have the competency to contribute – and are willing to commit – are welcome to the Vista Land family. It is through this that the quantity – and quality – of jobs are maintained. Employees’ morale redounds to boosting a booming business.
“A home for every Filipino,” Vista Land’s battlecry is the underlying premise in the company’s CSR efforts. Beyond the physical structure of their products, the company also enjoins its officers and employees to share their time in helping the less fortunate
A Wholistic Approach to Vista’s Societal plan
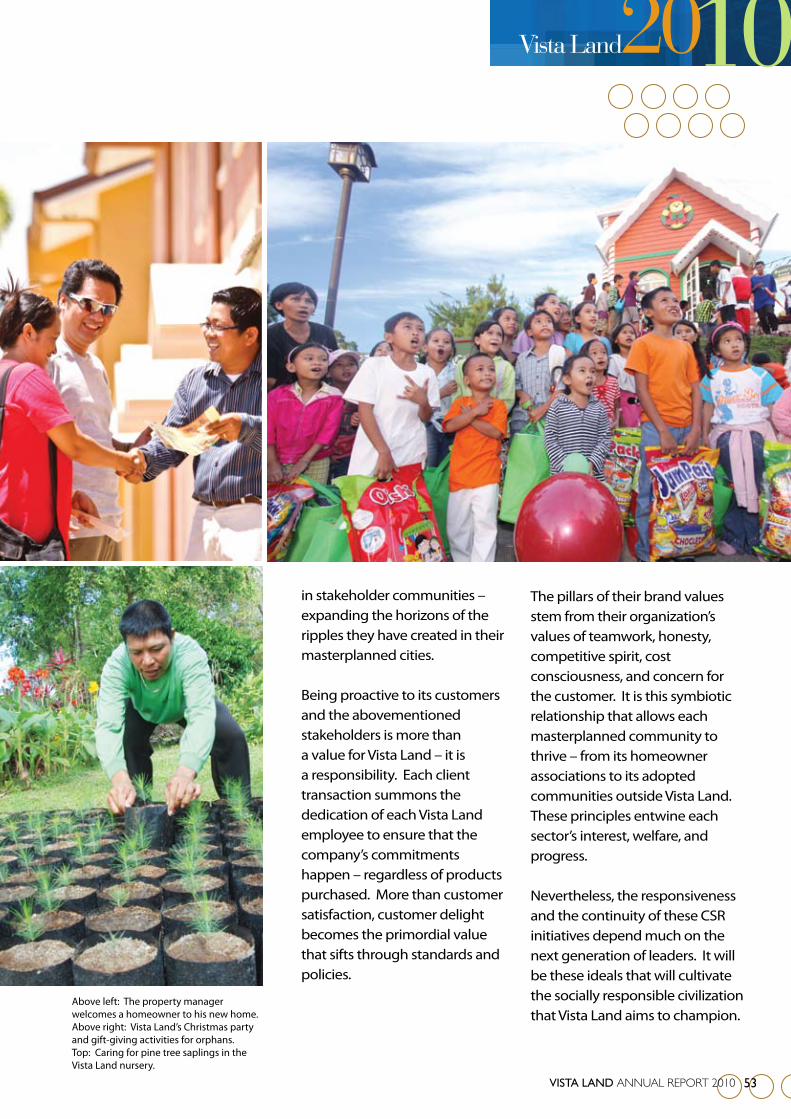
in stakeholder communities – expanding the horizons of the ripples they have created in their masterplanned cities.
Being proactive to its customers and the abovementioned stakeholders is more than a value for Vista Land – it is a responsibility. Each client transaction summons the dedication of each Vista Land employee to ensure that the company’s commitments happen – regardless of products purchased. More than customer satisfaction, customer delight becomes the primordial value that sifts through standards and policies.
The pillars of their brand values stem from their organization’s values of teamwork, honesty, competitive spirit, cost consciousness, and concern for the customer. It is this symbiotic relationship that allows each masterplanned community to thrive – from its homeowner associations to its adopted communities outside Vista Land. These principles entwine each sector’s interest, welfare, and progress.
Nevertheless, the responsiveness and the continuity of these CSR initiatives depend much on the next generation of leaders. It will be these ideals that will cultivate the socially responsible civilization that Vista Land aims to champion.
Above left: The property manager welcomes a homeowner to his new home.Above right: Vista Land’s Christmas party and gift-giving activities for orphans.Top: Caring for pine tree saplings in the Vista Land nursery.
VISTA LAND ANNUAL REPORT 2010 53

BOARD OF DIRECTORS
Marcelino C. MendozaChairman of the Board
Mr. Mendoza, 56, is the Chief Operating Officer of MGS Corporation. He was President of Camella Homes, Inc. from 2001to 2003, and Chief Operating Officer of Communities Philippines, Inc. from 1992 to 1995. He has a Masters Degree in Business Administration (Ateneo de Manila University) and a Certificate in Advance Course in Successful Communities fromthe Harvard University Graduate School of Design. Mr. Mendoza is a member of the Phi Kappa Phi International Honor Society. Well respected in the Philippine real estate industry, Mr. Mendoza has served as President and Chairman of the Board (1996to 1998) and Board Adviser (1999 to present) of the Subdivision and Housing Developers Association (SHDA).
Ms. Serrano, 48, graduated from the University of the Philippines with a degreeof Bachelor of Arts in Economics and from the Asian Institute of Manaement with a Masters degree in Business Management.She is presently the President and Chief Executive Officer of Vista Land. She was Presidentof Brittany Corporation from 2004 to 2007. She was Chief Operating Officer of Crown Asia from 1995to 2003 after holding various other positions in the MB Villar Group of Companies since 1991. She was also connected with the AFP Retirement and Separation Benefits System from 1985 to 1988.
Mr. Villar, 34, graduated fromthe University of Pennsylvania, Philadelphia, USA with a Bachelor of Science in Economics and a Bachelor of Applied Science. He was a consultant for McKinsey & Co. in the United States from 1999 to 2001. He joined Crown Asia in 2001 as Head of Corporate Planning.
Ms. Javarez, 47, graduated from the University of the East with a degree in Bachelor of Science in Business Administration major in Accounting. She is a Certified Public Accountant. She took a Management Development Program at the Asian Institute of Management. She is currently the Controller of Vista Land and Head of the Tax and Audit groupafter holding various other positions in the MB Villar Group of Companies since 1985.
Benjamarie Therese N. SerranoDirector, President and Chief Executive Of f icer
Manuel Paolo A. VillarDirector and Chief Financial Of f icer
Cynthia J. JavarezDirector and Controller
54 VISTA LAND ANNUAL REPORT 2010

Ms. Tolentino, 45, is currently the Managing Director of Camella Homes, Inc. She is also the President of the subsidiary corporation Household Development Corporation. Ms. Tolentino was previously the General Manager of Golden Haven Memorial Park, Inc. from 1999 to 2005. She holds a Bachelor of Science degree in Business Administration Major in Accounting, Magna cum Laude, from the University of the East, Manila. Ms. Tolentino is a certified Public Accountant.
Mr. Fruto, 72, graduated with the degree of Bachelor of Laws from the Ateneo de Manila University in 1961. He was formerly a partner in the law firm of Feria, Lugtu & La O’ and the Oben, Fruto & Ventura Law Office. In February 1987 he was the Chief Legal Counsel and Senior Vice President of the Development Bank of the Philippines. He was the Undersecretary of Finance from March 1990 to May 1991. Presently aside from engaging in private law practice specializing in corporate and civil litigation, he is also General Counsel of Wallem Maritime Services, Inc.; Vice-Chairman of Toyota Balintawak, Inc.; Director and Vice-President of China Shipping Manila Agency, Inc.; and Director and Treasurer of Padre Burgos Realty, Inc. He is also a Consultant and the designated Corporate Secretary of Subic Bay Metropolitan Authority.
Ms. Adea, 59, is currently the Court Appointed Rehabilitation Receiver of Anna-Lynns, Inc. and Manuela Corporation. Ms. Adea served previously as Project Director for Site Acquisition of Digital Telecommunications Phils. Inc. from 2000 to 2002, Executive Director for FBO Management Network, Inc. from 1989 to 2000 and BF Homes, Inc. in Receivership from 1988 to 1994 and Vice President for L&H Resources Management Corporation from 1986 to 1988. Ms. Adea holds a Degree in Bachelor of Science in Business Administration major in Marketing Management from the University of the Philippines.
Ms. Santos, 48, graduated cum laude with the degree of Bachelor of Arts, Major in history from the University of the Philippines in 1981, and with the degree of Bachelor of Laws also from the University of the Philippines in 1985. She is a practicing lawyer and Senior partner of Picazo Buyco Tan Fider & Santos Law Offices and Corporate Secretary of various Philippine companies, including public companies ATR KimEng Financial Corporation and Assistant Corporate Secretary of Metro Pacific Investments Corporation.
Maribeth C. TolentinoDirector
Ruben O. FrutoIndependent Director
Marilou O. AdeaIndependent Director
gemma M. SantosCorporate Secretary
VISTA LAND ANNUAL REPORT 2010 55

MANAGEMENT COMMITTEE
Benjamarie Therese N. SerranoPresident & Chief Executive Officer
Manuel Paolo A. VillarChief Financial Officer
Cynthia J. JavarezController
Ricardo B. Tan, Jr.SVP-Finance& Chief Information Officer
56 VISTA LAND ANNUAL REPORT 2010

Red J. RosalesManaging Director -Vista Residences
Mary Lee S. SadiasaManaging Director - Brittany
Ma. Leni d. LuyaManaging Director - Crown Asia
Maribeth C. TolentinoManaging Director - Camella Homes
Jerylle Luz C. QuismundoManaging Director -Communities Philippines
VISTA LAND ANNUAL REPORT 2010 57
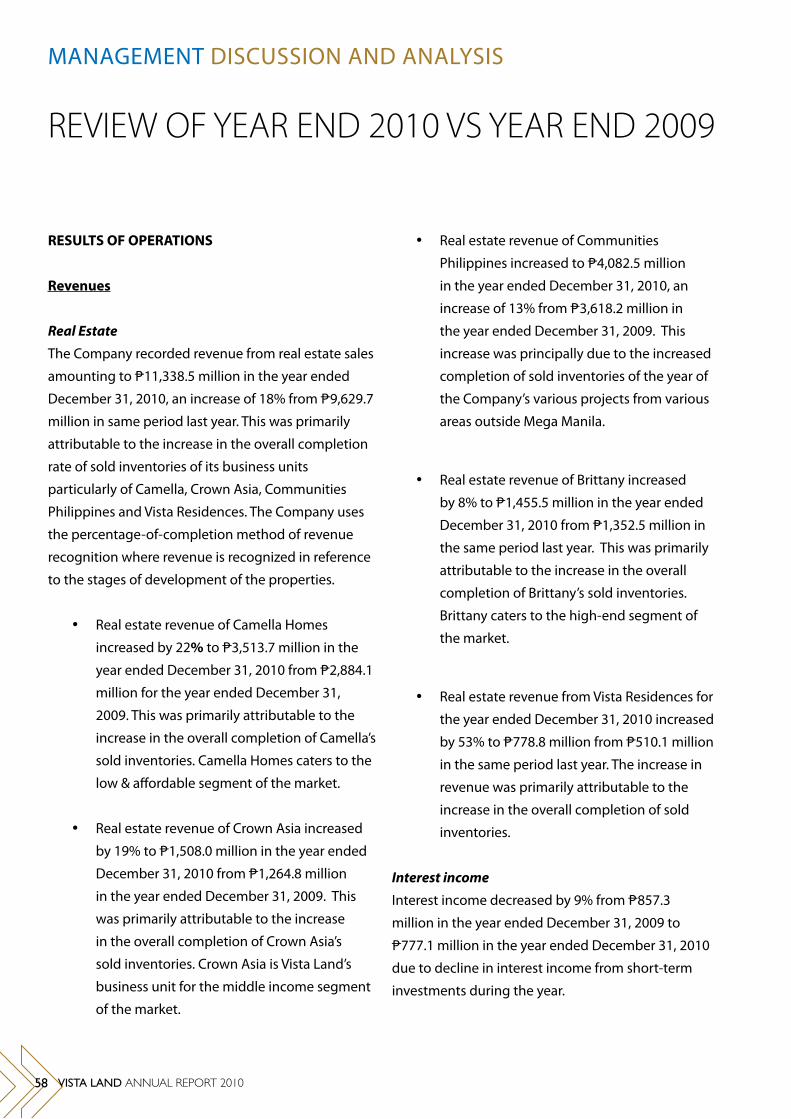
RESuLTS OF OPERATIONS
Revenues
Real EstateThe Company recorded revenue from real estate sales
amounting to 11,338.5 million in the year ended
December 31, 2010, an increase of 18% from 9,629.7
million in same period last year. This was primarily
attributable to the increase in the overall completion
rate of sold inventories of its business units
particularly of Camella, Crown Asia, Communities
Philippines and Vista Residences. The Company uses
the percentage-of-completion method of revenue
recognition where revenue is recognized in reference
to the stages of development of the properties.
Real estate revenue of Camella Homes •
increased by 22% to 3,513.7 million in the
year ended December 31, 2010 from 2,884.1
million for the year ended December 31,
2009. This was primarily attributable to the
increase in the overall completion of Camella’s
sold inventories. Camella Homes caters to the
low & affordable segment of the market.
Real estate revenue of Crown Asia increased •
by 19% to 1,508.0 million in the year ended
December 31, 2010 from 1,264.8 million
in the year ended December 31, 2009. This
was primarily attributable to the increase
in the overall completion of Crown Asia’s
sold inventories. Crown Asia is Vista Land’s
business unit for the middle income segment
of the market.
Real estate revenue of Communities •
Philippines increased to 4,082.5 million
in the year ended December 31, 2010, an
increase of 13% from 3,618.2 million in
the year ended December 31, 2009. This
increase was principally due to the increased
completion of sold inventories of the year of
the Company’s various projects from various
areas outside Mega Manila.
Real estate revenue of Brittany increased •
by 8% to 1,455.5 million in the year ended
December 31, 2010 from 1,352.5 million in
the same period last year. This was primarily
attributable to the increase in the overall
completion of Brittany’s sold inventories.
Brittany caters to the high-end segment of
the market.
Real estate revenue from Vista Residences for •
the year ended December 31, 2010 increased
by 53% to 778.8 million from 510.1 million
in the same period last year. The increase in
revenue was primarily attributable to the
increase in the overall completion of sold
inventories.
Interest incomeInterest income decreased by 9% from 857.3
million in the year ended December 31, 2009 to
777.1 million in the year ended December 31, 2010
due to decline in interest income from short-term
investments during the year.
MANAGEMENT DISCUSSION AND ANALYSIS
REVIEW OF YEAR END 2010 VS YEAR END 2009
58 VISTA LAND ANNUAL REPORT 2010
Equity in net gain of an associateEquity in net gain of an associate decreased by 95%
from 45.9 million in the year ended December 31,
2009 to 2.4 million in the year ended December 31,
2010 due to the lower net income reported by an
associate.
Dividend incomeDividend income decreased by 87% from 0.19 million
in the year ended December 31, 2009 to 0.03 million
in the year ended December 31, 2010 due to the lower
dividend declared from investments.
MiscellaneousMiscellaneous income increased by 31% from
279.7 million in the year ended December 31, 2009 to
367.5 million in the year ended December 31, 2010
due to increase in real estate sales deposit forfeitures.
Costs and Expenses
Cost and expenses increased by 16% to 9,251.9
million in the year ended December 31, 2010 from
8,000.0 million in the year ended December 31,
2009. Costs and expenses as a percentage of real
estate revenue decreased from 83% in the year
ended December 31, 2009 to 82% in the year ended
December 31, 2010. The 1% net decrease in the
account was primarily attributable to the following:
Cost of real estate sales increased by 13% from •
5,004.0 million in the year ended December
31, 2009 to 5,656.3 million in the year ended
December 31, 2010 primarily due to the
increase in the overall recorded sales of Vista
Land’s business units.
Operating expenses increased by 29% from •
2,083.6 million in the year ended December
31, 2009 to 2,689.5 million in the year ended
December 31, 2010 primarily due to the
following:
an increase in commissions from o
532.1 million in the year ended
December 31, 2009 to 662.4 million
in the year ended December 31, 2010
resulting from marketing activities
implemented by the Company during
the period.
an increase in advertising o
and promotions expenses to
628.5 million in the year ended
December 31, 2010 from
556.9 million in the year ended
December 31, 2009 due to marketing
activities implemented by the
Company during the period.
an increase in salaries, wages o
and employee benefits from
255.2 million in the year ended
December 31, 2009 to 325.8 million
in the year ended December 31,
2010 resulting from increase in total
number of employees.
VISTA LAND ANNUAL REPORT 2010 59

Interest and financing charges increased by •
23% from 593.0 million in the year ended
December 31, 2009 to 730.2 million in
the year ended December 31, 2010 due to
increase in interest bearing payables during
the year.
Foreign exchange loss increased •
from 0.6 million in the year ended
December 31, 2009 to 15.9 million in the
year ended December 31, 2010 due to the
increase in foreign currency denominated
liabilities and depreciation of the reporting
currency for the period.
Loss on Settlement of Loan
The Company recorded a loss on settlement of loan
amounting to 115.9 million in the year ended
December 31, 2010 and 318.8 million in the year
ended December 31, 2009 from the settlement of
long-term notes.
Loss on Writedown of AFS
The Company recorded a loss on writedown of
investments in unquoted equity shares amounting to
44.0 million during the year.
Provision for Income Tax
Provision for income tax decreased by
57% from 513.5 million in the year ended
December 31, 2009 to 220.7 million in the year
ended December 31, 2010 primarily due to a lower
taxable income reported for the year.
Net Income
As a result of the foregoing, the Company’s net
income increased by 31% to 3,013.0 million in the
year ended December 31, 2010 from 2,299.4 million
in the year ended December 31, 2009.
For the year ended December 31, 2010, there were
no seasonal aspects that had material effect on the
financial condition or results of operations of the
Company. Neither were there any trends, events or
uncertainties that have had or that are reasonably
expected to have a material impact on the net sales
or revenues or income from continuing operations.
The Company is not aware of events that will cause a
material change in the relationship between the costs
and revenues.
There are no significant elements of income or loss
that arise from the Company’s continuing operations.
MANAGEMENT DISCUSSION AND ANALYSIS
60 VISTA LAND ANNUAL REPORT 2010

FINANCIAL CONdITION
As of December 31, 2010 vs. December 31, 2009
Total assets as of December 31, 2010 were
60,481.3 million compared to 54,668.3 million as of
December 31, 2009, or an 11% increase. This was due
to the following:
Cash and cash equivalents including short •
term and long-term cash investments
increased by 3,748.3 million from 3,146.6
million as of December 31, 2009 to 6,894.9
million as of December 31, 2010 primarily
due to the proceeds from issuance of notes
payable in the fourth quarter of 2010.
Receivables increased by 5% from • 18,137.6
million to 19,073.6 million due to the
revenue recognized during for the period.
Real estate inventories and land for future •
development increased by 6% from 28,721.7
million to P30,540.7 million due to land
acquisitions made during the year.
Property and equipment increased by 29% •
from 92.2 million to 118.9 million due to
acquisitions made during the year.
Interests in joint ventures increased by 22% •
or P336.7 million, from 1,550.9 million
as of December 31, 2009 to 1,887.7 as of
December 31, 2010 due primarily to the
advances made by the Company to its joint
venture partners.
Other assets decreased by 40% from • 2,004.6
million as of December 31, 2009 to
1,201.5 million as of December 31, 2010
due primarily to decrease in investments
in unquoted equity shares and input and
creditable withholding taxes.
Total liabilities as of December 31, 2010 were
22,304.8 million compared to 19,043.6 million as of
December 31, 2009, or a 17% increase. This was due
to the following:
Accounts and other payables decreased •
by 13% from 5,430.0 million as of
December 31, 2009 to 4,710.0 million as of
December 31, 2010 due to payments made
during the period.
Interest bearing bank loans and loans •
payable representing the sold portion of the
Company’s installment contracts receivables
with recourse, increased by 36% from
4,556.5 million as of December 31, 2009 to
6,207.9 million as of December 31, 2010 due
to availment of additional loans during the
year.
Notes payable pertains to US $100.0 •
million notes issued by the Company with
a carrying amount of 4,257.9 million as of
December 31, 2010.
VISTA LAND ANNUAL REPORT 2010 61
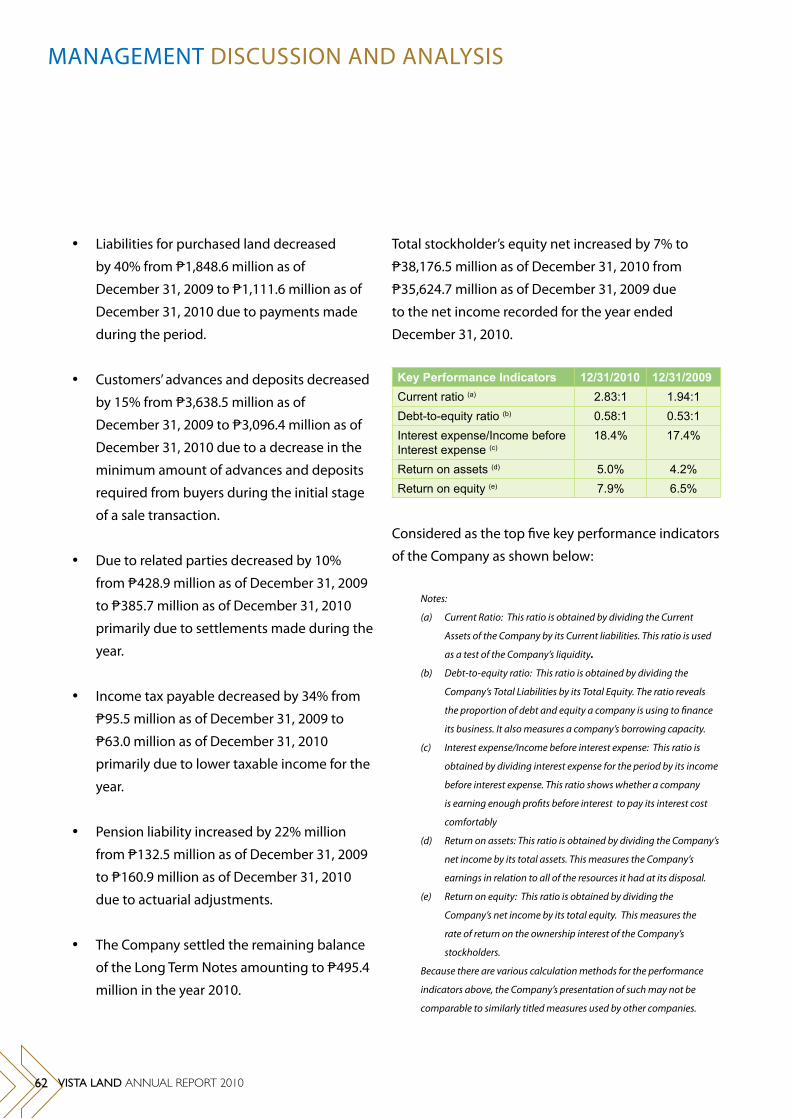
Liabilities for purchased land decreased •
by 40% from 1,848.6 million as of
December 31, 2009 to 1,111.6 million as of
December 31, 2010 due to payments made
during the period.
Customers’ advances and deposits decreased •
by 15% from 3,638.5 million as of
December 31, 2009 to 3,096.4 million as of
December 31, 2010 due to a decrease in the
minimum amount of advances and deposits
required from buyers during the initial stage
of a sale transaction.
Due to related parties decreased by 10% •
from 428.9 million as of December 31, 2009
to 385.7 million as of December 31, 2010
primarily due to settlements made during the
year.
Income tax payable decreased by 34% from •
95.5 million as of December 31, 2009 to
63.0 million as of December 31, 2010
primarily due to lower taxable income for the
year.
Pension liability increased by 22% million •
from 132.5 million as of December 31, 2009
to 160.9 million as of December 31, 2010
due to actuarial adjustments.
The Company settled the remaining balance •
of the Long Term Notes amounting to 495.4
million in the year 2010.
Total stockholder’s equity net increased by 7% to
38,176.5 million as of December 31, 2010 from
35,624.7 million as of December 31, 2009 due
to the net income recorded for the year ended
December 31, 2010.
Key Performance Indicators 12/31/2010 12/31/2009Current ratio (a) 2.83:1 1.94:1Debt-to-equity ratio (b) 0.58:1 0.53:1Interest expense/Income before Interest expense (c)
18.4% 17.4%
Return on assets (d) 5.0% 4.2%Return on equity (e) 7.9% 6.5%
Considered as the top five key performance indicators
of the Company as shown below:
Notes:
Current Ratio: This ratio is obtained by dividing the Current (a)
Assets of the Company by its Current liabilities. This ratio is used
as a test of the Company’s liquidity.
Debt-to-equity ratio: This ratio is obtained by dividing the (b)
Company’s Total Liabilities by its Total Equity. The ratio reveals
the proportion of debt and equity a company is using to finance
its business. It also measures a company’s borrowing capacity.
Interest expense/Income before interest expense: This ratio is (c)
obtained by dividing interest expense for the period by its income
before interest expense. This ratio shows whether a company
is earning enough profits before interest to pay its interest cost
comfortably
Return on assets: This ratio is obtained by dividing the Company’s (d)
net income by its total assets. This measures the Company’s
earnings in relation to all of the resources it had at its disposal.
Return on equity: This ratio is obtained by dividing the (e)
Company’s net income by its total equity. This measures the
rate of return on the ownership interest of the Company’s
stockholders.
Because there are various calculation methods for the performance
indicators above, the Company’s presentation of such may not be
comparable to similarly titled measures used by other companies.
MANAGEMENT DISCUSSION AND ANALYSIS
62 VISTA LAND ANNUAL REPORT 2010

Current ratio as of December 31, 2010 increased
from that of December 31, 2009 due to increase
in cash and cash equivalents, current portion of
receivables and real estate inventories and land
for future development during the year and
decrease primarily in income taxes payable and
current portion of bank loans and loans payable
and liabilities for purchased land.
Debt-to-equity ratio increased due to the increase
in the total liabilities brought by the issuance of
notes payable during the year.
Interest expense as a percentage of income
before interest expense increased in the year
ended December 31, 2010 compared to the ratio
for the year ended December 31, 2009 due to an
increase in interest bearing liabilities for the year.
Return on assets improved for December 31,
2010 compared to that of December 31, 2009 due
primarily to the higher level of net income and
higher level of total assets for the year.
Return on equity increased due to a higher net
income reported for the year ended December
31, 2010.
Material Changes to the Company’s Balance Sheet as of december 31, 2010 compared to december 31, 2009 (increase/decrease of 5% or more)
Cash and cash equivalents including short term
and long-term cash investments increased by
119% from 3,146.6 million as of December 31,
2009 to 6,894.9 million as of December 31, 2010
primarily due to the proceeds from issuance of
notes payable in the fourth quarter of 2010.
Receivables increased by 5% from 18,137.6
million to 19,073.6 million due to the revenue
recognized during for the period.
Real estate inventories and land for future
development increased by 6% from 28,721.7
million to 30,540.7 million due to land
acquisitions made during the year.
Property and equipment increased by 29%
from 92.2 million to 118.9 million due to
acquisitions made during the year.
Interests in joint ventures increased by 22% from
1,550.9 million as of December 31, 2009 to
1,887.7 as of December 31, 2010 due primarily
to the advances made by the Company to its joint
venture partners.
Other assets decreased by 40% from 2,004.6
million as of December 31, 2009 to 1,201.5
million as of December 31, 2010 due primarily
to decrease in investments in unquoted equity
shares and input and creditable withholding
taxes.
Accounts and other payables decreased by 13%
from 5,430.0 million as of December 31, 2009 to
4,710.0 million as of December 31, 2010 due to
payments made during the period.
VISTA LAND ANNUAL REPORT 2010 63

Interest bearing bank loans and loans payable
representing the sold portion of the Company’s
installment contracts receivables with recourse,
increased by 36% 2010 from 4,556.5 million
as of December 31, 2009 to 6,207.9 million as
of December 31, due to availment of additional
loans during the year.
Notes payable pertains to US $100.0 million notes
issued by the Company with a carrying amount of
4,257.9 million as of December 31, 2010.
Liabilities for purchased land decreased by 40%
from 1,848.6 million as of December 31, 2009 to
1,111.6 million as of December 31, 2010 due to
payments made during the period.
Customers’ advances and deposits decreased
by 15% from 3,638.5 million as of December
31, 2009 to 3,096.4 million as of December 31,
2010 due to a decrease in the minimum amount
of advances and deposits required from buyers
during the initial stage of a sale transaction.
Due to related parties decreased by 10% from
428.9 million as of December 31, 2009 to 385.7
million as of December 31, 2010 primarily due to
settlements made during the year.
Income tax payable decreased by 34% from 95.5
million as of December 31, 2009 to 63.0 million
as of December 31, 2010 primarily due to lower
taxable income for the year.
Pension liability increased by 22% million from
132.5 million as of December 31, 2009 to 160.9
million as of December 31, 2010 due to actuarial
adjustments.
The Company settled the remaining balance of the
Long Term Notes amounting to 495.4 million in
the year 2010.
Total stockholder’s equity net increased by 7% to
38,176.5 million as of December 31, 2010 from
35,624.7 million as of December 31, 2009 due
to the net income recorded for the year ended
December 31, 2010.
Material Changes to the Company’s Statement of income for the year ended december 31, 2010 compared to the year ended december 31, 2009 (increase/decrease of 5% or more)
Revenue from real estate sales increased by
18% to 11,338.5 million in the year ended
December 31, 2010 from 9,629.7 million as of
December 31, 2009 primarily to the increase in the
overall completion rate of sold inventories of the
Company’s business units.
Equity in net gain of an associate decreased by 95%
from 45.9 million in the year ended December 31,
2009 to 2.4 million in the year ended December
31, 2010 due to the lower net income reported by
an associate.
Interest income decreased by 9% from 857.3
million in the year ended December 31, 2009 to
777.1 million in the year ended December 31,
2010 due to decline in interest income from short-
term investments during the year.
MANAGEMENT DISCUSSION AND ANALYSIS
64 VISTA LAND ANNUAL REPORT 2010
Dividend income decreased by 87% from 0.19
million in the year ended December 31, 2009 to
0.03 million in the year ended December 31,
2010 due to the lower dividend declared from
investments.
Miscellaneous income increased by 31% from
279.7 million in the year ended December
31, 2009 to 367.5 million in the year ended
December 31, 2010 due to increase in real estate
sales deposit forfeitures.
Cost of real estate sales increased by 13%
from 5,004.0 million in the year ended
December 31, 2009 to 5,656.3 million in the
year ended December 31, 2010 primarily due to
the increase in the overall recorded sales of Vista
Land’s business units.
Operating expenses increased by 29%
from 2,083.6 million in the year ended
December 31, 2009 to 2,689.5 million in the
year ended December 31, 2010 primarily due
to the increase in commissions and advertising
and promotions expenses due to marketing
activities, and salaries, wages and employee
benefits resulting from increase in total number
of employees, an increase in.
Interest and financing charges increased by
23% from 593.0 million in the year ended
December 31, 2009 to 730.2 million in the year
ended December 31, 2010 due to increase in
interest bearing payables during the year.
Foreign exchange loss increased from 0.6 million
in the year ended December 31, 2009 to 15.9
million in the year ended December 31, 2010 due
to the increase in foreign currency denominated
liabilities and depreciation of the reporting
currency for the period.
The Company recorded a loss on settlement of
loan amounting to 115.9 million in the year
ended December 31, 2010 and 318.8 million
in the year ended December 31, 2009 from the
settlement of long-term notes.
The Company recorded a loss on writedown
of investments in unquoted equity shares
amounting to 44.0 million during the year.
Provision for income tax decreased by
57% from 513.5 million in the year ended
December 31, 2009 to 220.7 million in the year
ended December 31, 2010 primarily due to a
lower taxable income reported for the year.
There are no other material changes in the
Company’s financial position (changes of 5% or
more) and condition that will warrant a more
detailed discussion. Further, there are no material
events and uncertainties known to management
that would impact or change reported financial
information and condition on the Company.
VISTA LAND ANNUAL REPORT 2010 65

66 VISTA LAND ANNUAL REPORT 2010
The management of Vista Land & Lifescapes, Inc. and its subsidiaries is responsible for all information and representations contained in the consolidated balance sheets as of December 31, 2010 and 2009 and the consolidated statements of income, consolidated statements of changes in equity and consolidated statements of cash flows for each of the three years in the period ended December 31, 2010 and the summary of significant accounting polices and other explanatory notes. The consolidated financial statements have been prepared in accordance with the Philippine Financial Reporting Standards and reflect amounts that are based on the best estimates and informed judgment of management with an appropriate consideration to materiality.
In this regard, management maintains a system of accounting and reporting which provides for the necessary internal controls to ensure that transactions are properly authorized and recorded, assets are safeguarded against unauthorized use or disposition and liabilities are recognized. The management likewise discloses to the Company’s audit committee and its external auditor: (i) all significant deficiencies in the design or operation of internal controls that could adversely affect its ability to record, process, and report financial data; (ii) material weaknesses in the internal controls; and (iii) any fraud that involves management or other employees who exercise significant roles in internal controls.
The Board of Directors reviews the financial statements before such statements are approved and submitted to the stockholders of the Company.
SyCip, Gorres, Velayo & Co., the independent auditors appointed by the stockholders, has audited the consolidated financial statements of the Company in accordance with Philippine Standards on Auditing and has expressed their opinion on the fairness of presentation upon completion of such audit in its report to the Board of Directors and stockholders.
MARCELINO C. MENDOZAChairman, Board of Directors
BENJAMARIE THERESE N. SERRANO MANUEL PAOLO A. VILLARPresident and Chief Executive Officer Chief Financial Officer
STATEMENT OF MANAGEMENT’S RESPONSIBILITYFOR FINANCIAL STATEMENTS

VISTA LAND ANNUAL REPORT 2010 67
68 VISTA LAND ANNUAL REPORT 2010
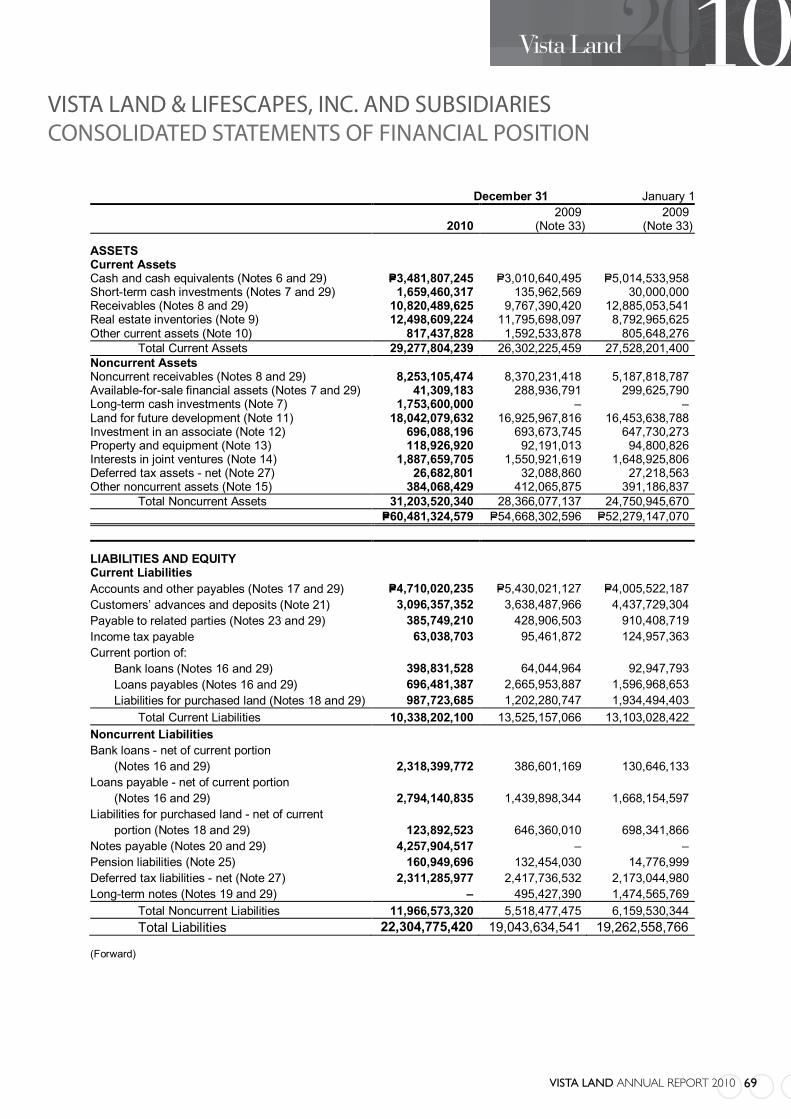
VISTA LAND ANNUAL REPORT 2010 69*SGVMC115372*
VISTA LAND & LIFESCAPES, INC. AND SUBSIDIARIES CONSOLIDATED STATEMENTS OF FINANCIAL POSITION December 31 January 1
2010 2009
(Note 33) 2009
(Note 33)
ASSETS Current Assets Cash and cash equivalents (Notes 6 and 29) P=3,481,807,245 P=3,010,640,495 P=5,014,533,958 Short-term cash investments (Notes 7 and 29) 1,659,460,317 135,962,569 30,000,000 Receivables (Notes 8 and 29) 10,820,489,625 9,767,390,420 12,885,053,541 Real estate inventories (Note 9) 12,498,609,224 11,795,698,097 8,792,965,625 Other current assets (Note 10) 817,437,828 1,592,533,878 805,648,276 Total Current Assets 29,277,804,239 26,302,225,459 27,528,201,400 Noncurrent Assets Noncurrent receivables (Notes 8 and 29) 8,253,105,474 8,370,231,418 5,187,818,787 Available-for-sale financial assets (Notes 7 and 29) 41,309,183 288,936,791 299,625,790 Long-term cash investments (Note 7) 1,753,600,000 – – Land for future development (Note 11) 18,042,079,632 16,925,967,816 16,453,638,788 Investment in an associate (Note 12) 696,088,196 693,673,745 647,730,273 Property and equipment (Note 13) 118,926,920 92,191,013 94,800,826 Interests in joint ventures (Note 14) 1,887,659,705 1,550,921,619 1,648,925,806 Deferred tax assets - net (Note 27) 26,682,801 32,088,860 27,218,563 Other noncurrent assets (Note 15) 384,068,429 412,065,875 391,186,837 Total Noncurrent Assets 31,203,520,340 28,366,077,137 24,750,945,670 P=60,481,324,579 P=54,668,302,596 P=52,279,147,070
LIABILITIES AND EQUITY Current Liabilities Accounts and other payables (Notes 17 and 29) P=4,710,020,235 P=5,430,021,127 P=4,005,522,187 Customers’ advances and deposits (Note 21) 3,096,357,352 3,638,487,966 4,437,729,304 Payable to related parties (Notes 23 and 29) 385,749,210 428,906,503 910,408,719 Income tax payable 63,038,703 95,461,872 124,957,363 Current portion of: Bank loans (Notes 16 and 29) 398,831,528 64,044,964 92,947,793 Loans payables (Notes 16 and 29) 696,481,387 2,665,953,887 1,596,968,653 Liabilities for purchased land (Notes 18 and 29) 987,723,685 1,202,280,747 1,934,494,403 Total Current Liabilities 10,338,202,100 13,525,157,066 13,103,028,422 Noncurrent Liabilities Bank loans - net of current portion
(Notes 16 and 29) 2,318,399,772 386,601,169 130,646,133 Loans payable - net of current portion
(Notes 16 and 29) 2,794,140,835 1,439,898,344 1,668,154,597 Liabilities for purchased land - net of current
portion (Notes 18 and 29) 123,892,523 646,360,010 698,341,866 Notes payable (Notes 20 and 29) 4,257,904,517 – – Pension liabilities (Note 25) 160,949,696 132,454,030 14,776,999 Deferred tax liabilities - net (Note 27) 2,311,285,977 2,417,736,532 2,173,044,980 Long-term notes (Notes 19 and 29) – 495,427,390 1,474,565,769 Total Noncurrent Liabilities 11,966,573,320 5,518,477,475 6,159,530,344 Total Liabilities 22,304,775,420 19,043,634,541 19,262,558,766
(Forward)
VISTA LAND & LIFESCAPES, INC. AND SUBSIDIARIESCONSOLIDATED STATEMENTS OF FINANCIAL POSITION

70 VISTA LAND ANNUAL REPORT 2010
*SGVMC115372*
- 2 - December 31 January 1
2010 2009
(Note 33) 2009
(Note 33)
Equity (Note 30) Equity attributable to equity holders of Vista
Land & Lifescapes, Inc. Capital stock P=8,538,740,614 P=8,538,740,614 P=8,538,740,614 Additional paid-in capital 19,328,509,860 19,328,509,860 19,305,275,668 Retained earnings 10,309,298,685 7,757,417,581 5,739,787,852 Unrealized gain on available-for-sale financial assets – – 472,619 Treasury shares (Notes 4 and 30) – – (616,885,476) 38,176,549,159 35,624,668,055 32,967,391,277 Non-controlling interests – – 49,197,027 Total Equity 38,176,549,159 35,624,668,055 33,016,588,304 P=60,481,324,579 P=54,668,302,596 P=52,279,147,070 See accompanying Notes to Consolidated Financial Statements.
VISTA LAND & LIFESCAPES, INC. AND SUBSIDIARIESCONSOLIDATED STATEMENTS OF FINANCIAL POSITION

VISTA LAND ANNUAL REPORT 2010 71*SGVMC115372*
VISTA LAND & LIFESCAPES, INC. AND SUBSIDIARIES CONSOLIDATED STATEMENTS OF COMPREHENSIVE INCOME Years Ended December 31 2010 2009 2008
REVENUE Real estate P=11,338,533,300 P=9,629,663,010 P=10,435,822,103 Interest income (Note 22) 777,122,025 857,296,120 821,702,486 Miscellaneous income (Note 26) 367,482,455 279,747,532 257,541,622 12,483,137,780 10,766,706,662 11,515,066,211
COSTS AND EXPENSES Costs of real estate sales (Note 9) 5,656,325,105 5,003,984,152 5,273,025,863 Operating expenses (Note 24) 2,689,509,894 2,083,572,435 1,925,967,026 Interest and other financing charges (Note 22) 730,233,810 592,982,136 391,415,253 9,076,068,809 7,680,538,723 7,590,408,142
OTHER INCOME (EXPENSES) Equity in net income of an associate (Note 12) 2,414,451 45,943,472 10,225,092 Dividend income 25,099 194,340 – Foreign exchange losses - net (Notes 19 and 20) (15,883,820) (611,212) (180,896,764) Loss on settlement of loans (Note 19) (115,867,546) (318,810,422) – Loss on writedown of available-for-sale financial assets (Note 7) (44,038,378) – – (173,350,194) (273,283,822) (170,671,672)
INCOME BEFORE INCOME TAX 3,233,718,777 2,812,884,117 3,753,986,397
PROVISION FOR INCOME TAX (Note 27) 220,745,680 513,475,947 920,850,348
NET INCOME 3,012,973,097 2,299,408,170 2,833,136,049
OTHER COMPREHENSIVE INCOME Unrealized gain on available-for-sale financial
assets (Note 7) − − 472,619 Net change on fair value of available-for-sale
financial assets transferred to profit or loss (Note 7) − (472,619) −
TOTAL COMPREHENSIVE INCOME P=3,012,973,097 P=2,298,935,551 P=2,833,608,668
NET INCOME ATTRIBUTABLE TO: Equity holders of Vista Land & Lifescapes, Inc. P=3,012,973,097 P=2,299,408,170 P=2,819,203,031 Non-controlling interests – − 13,933,018 P=3,012,973,097 P=2,299,408,170 P=2,833,136,049
TOTAL COMPREHENSIVE INCOME ATTRIBUTABLE TO:
Equity holders of Vista Land & Lifescapes, Inc. P=3,012,973,097 P=2,298,935,551 P=2,819,675,650 Non-controlling interests – − 13,933,018 P=3,012,973,097 P=2,298,935,551 P=2,833,608,668
Basic/Diluted Earnings Per Share (Note 28) P=0.356 P=0.278 P=0.335 See accompanying Notes to Consolidated Financial Statements.
VISTA LAND & LIFESCAPES, INC. AND SUBSIDIARIESCONSOLIDATED STATEMENTS OF COMPREHENSIVE INCOME
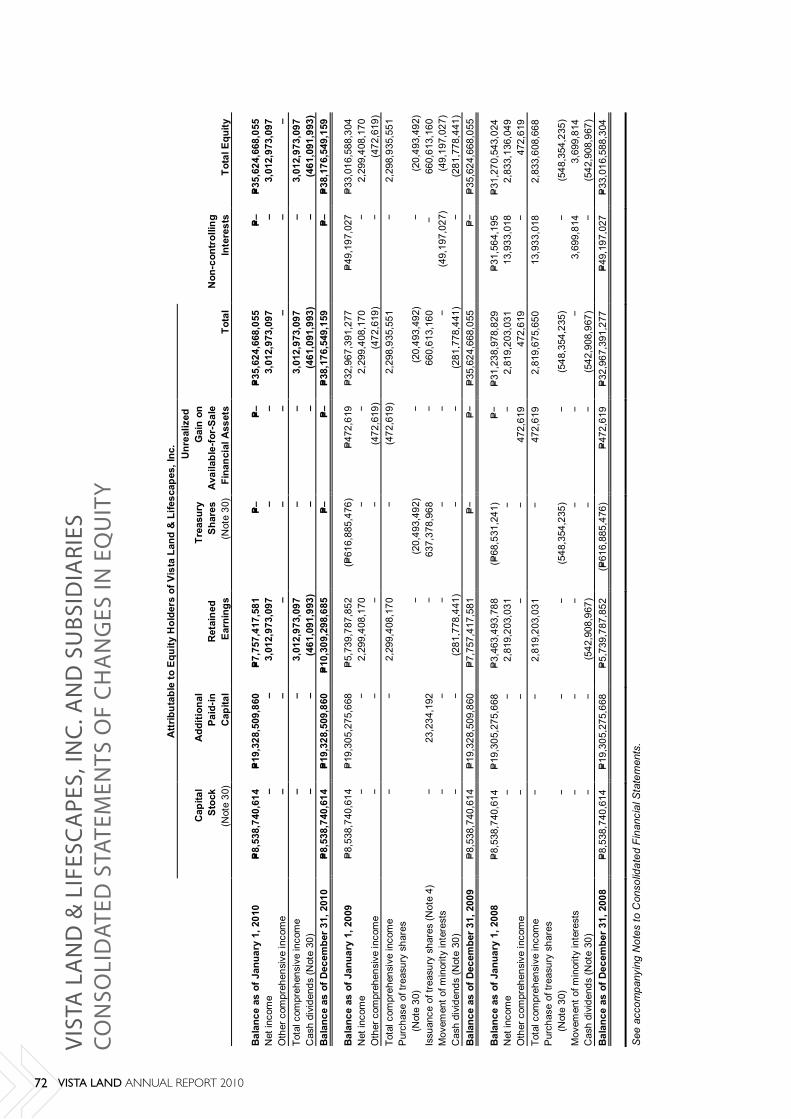
72 VISTA LAND ANNUAL REPORT 2010
*SGVMC115372*
VIST
A L
AN
D &
LIF
ESC
APE
S, IN
C. A
ND
SU
BSI
DIA
RIE
S C
ON
SOLI
DA
TED
STA
TEM
ENTS
OF
CH
AN
GES
IN E
QU
ITY
A
ttrib
utab
le to
Equ
ity H
olde
rs o
f Vis
ta L
and
& L
ifesc
apes
, Inc
.
Cap
ital
Stoc
k (N
ote
30)
Add
ition
al
Paid
-in
Cap
ital
Ret
aine
d
Earn
ings
Trea
sury
Sh
ares
(N
ote
30)
Unr
ealiz
ed
Gai
n on
A
vaila
ble-
for-
Sale
Fi
nanc
ial A
sset
s To
tal
Non
-con
trol
ling
Inte
rest
s To
tal E
quity
Bal
ance
as
of J
anua
ry 1
, 201
0 P=8
,538
,740
,614
P=1
9,32
8,50
9,86
0 P=7
,757
,417
,581
P=–
P=–
P=3
5,62
4,66
8,05
5 P=–
P=3
5,62
4,66
8,05
5 N
et in
com
e –
– 3,
012,
973,
097
– –
3,01
2,97
3,09
7 –
3,01
2,97
3,09
7 O
ther
com
preh
ensi
ve in
com
e –
– –
– –
– –
– To
tal c
ompr
ehen
sive
inco
me
– –
3,01
2,97
3,09
7 –
– 3,
012,
973,
097
– 3,
012,
973,
097
Cas
h di
vide
nds
(Not
e 30
) –
– (4
61,0
91,9
93)
– –
(461
,091
,993
) –
(461
,091
,993
) B
alan
ce a
s of
Dec
embe
r 31,
201
0 P=8
,538
,740
,614
P=1
9,32
8,50
9,86
0 P=1
0,30
9,29
8,68
5 P=–
P=–
P=3
8,17
6,54
9,15
9 P=–
P=3
8,17
6,54
9,15
9
Bal
ance
as
of J
anua
ry 1
, 200
9 P=
8,53
8,74
0,61
4
P=19
,305
,275
,668
P=
5,73
9,78
7,85
2 (P=
616,
885,
476)
P=
472,
619
P=32
,967
,391
,277
P=
49,1
97,0
27
P=33
,016
,588
,304
N
et in
com
e −
− 2,
299,
408,
170
− −
2,29
9,40
8,17
0 −
2,29
9,40
8,17
0 O
ther
com
preh
ensi
ve in
com
e −
− −
− (4
72,6
19)
(472
,619
) −
(472
,619
) To
tal c
ompr
ehen
sive
inco
me
− −
2,29
9,40
8,17
0 −
(472
,619
) 2,
298,
935,
551
− 2,
298,
935,
551
Pur
chas
e of
trea
sury
sha
res
(N
ote
30)
− (2
0,49
3,49
2)
− (2
0,49
3,49
2)
− (2
0,49
3,49
2)
Issu
ance
of t
reas
ury
shar
es (N
ote
4)
− 23
,234
,192
−
637,
378,
968
− 66
0,61
3,16
0 −
66
0,61
3,16
0 M
ovem
ent o
f min
ority
inte
rest
s −
− −
− −
− (4
9,19
7,02
7)
(49,
197,
027)
C
ash
divi
dend
s (N
ote
30)
− −
(281
,778
,441
) −
− (2
81,7
78,4
41)
− (2
81,7
78,4
41)
Bal
ance
as
of D
ecem
ber 3
1, 2
009
P=8,
538,
740,
614
P=19
,328
,509
,860
P=
7,75
7,41
7,58
1 P=−
P=−
P=35
,624
,668
,055
P=−
P=35
,624
,668
,055
Bal
ance
as
of J
anua
ry 1
, 200
8 P=
8,53
8,74
0,61
4 P=
19,3
05,2
75,6
68
P=3,
463,
493,
788
(P=68
,531
,241
) P=−
P=31
,238
,978
,829
P=
31,5
64,1
95
P=31
,270
,543
,024
N
et in
com
e −
− 2,
819,
203,
031
− −
2,81
9,20
3,03
1 13
,933
,018
2,
833,
136,
049
Oth
er c
ompr
ehen
sive
inco
me
− −
− −
472,
619
472,
619
− 47
2,61
9 To
tal c
ompr
ehen
sive
inco
me
− −
2,81
9,20
3,03
1 −
472,
619
2,81
9,67
5,65
0 13
,933
,018
2,
833,
608,
668
Pur
chas
e of
trea
sury
sha
res
(N
ote
30)
− −
− (5
48,3
54,2
35)
− (5
48,3
54,2
35)
− (5
48,3
54,2
35)
Mov
emen
t of m
inor
ity in
tere
sts
− −
− −
− −
3,69
9,81
4 3,
699,
814
Cas
h di
vide
nds
(Not
e 30
) −
− (5
42,9
08,9
67)
− −
(542
,908
,967
) −
(542
,908
,967
) B
alan
ce a
s of
Dec
embe
r 31,
200
8 P=
8,53
8,74
0,61
4 P=
19,3
05,2
75,6
68
P=5,
739,
787,
852
(P=61
6,88
5,47
6)
P=47
2,61
9 P=
32,9
67,3
91,2
77
P=49
,197
,027
P=
33,0
16,5
88,3
04
See
acc
ompa
nyin
g N
otes
to C
onso
lidat
ed F
inan
cial
Sta
tem
ents
.
VIST
A L
AN
D &
LIF
ESC
APE
S, IN
C. A
ND
SU
BSID
IARI
ESCO
NSO
LID
ATED
STA
TEM
ENTS
OF
CH
AN
GES
IN E
QU
ITY
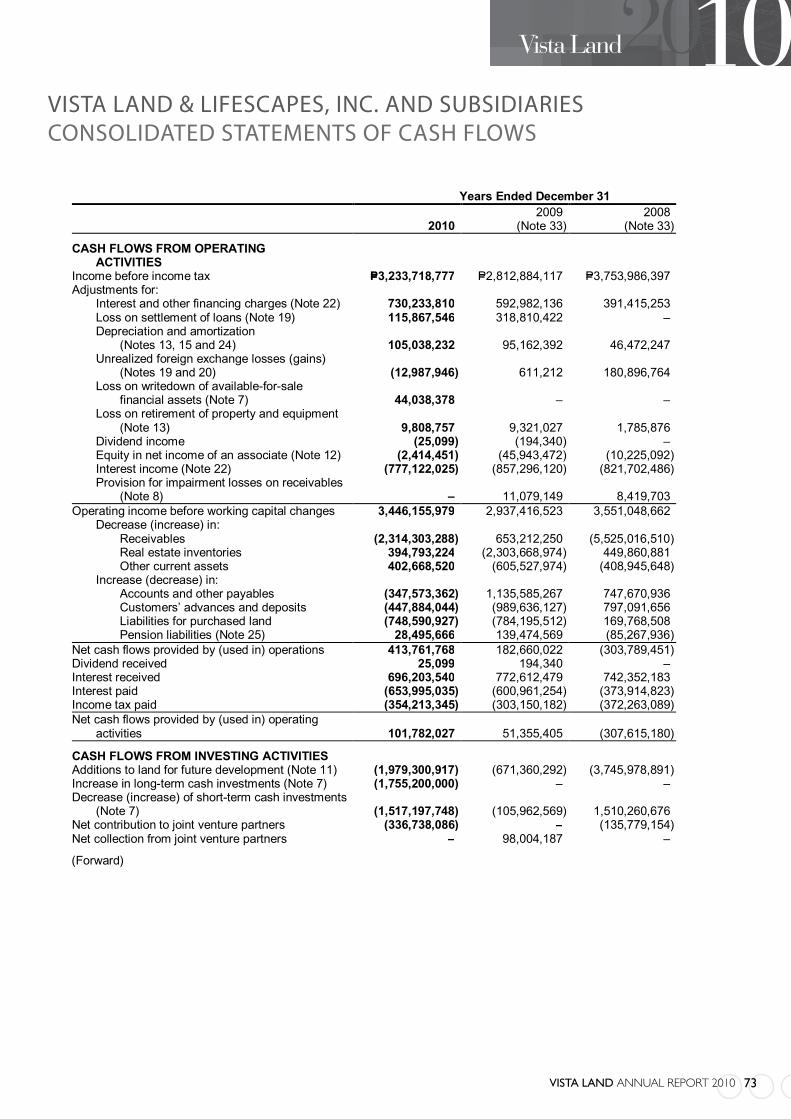
VISTA LAND ANNUAL REPORT 2010 73*SGVMC115372*
VISTA LAND & LIFESCAPES, INC. AND SUBSIDIARIES CONSOLIDATED STATEMENTS OF CASH FLOWS Years Ended December 31
2010 2009
(Note 33) 2008
(Note 33)
CASH FLOWS FROM OPERATING ACTIVITIES Income before income tax P=3,233,718,777 P=2,812,884,117 P=3,753,986,397 Adjustments for: Interest and other financing charges (Note 22) 730,233,810 592,982,136 391,415,253 Loss on settlement of loans (Note 19) 115,867,546 318,810,422 – Depreciation and amortization (Notes 13, 15 and 24) 105,038,232 95,162,392 46,472,247 Unrealized foreign exchange losses (gains) (Notes 19 and 20) (12,987,946) 611,212 180,896,764 Loss on writedown of available-for-sale financial assets (Note 7) 44,038,378 – – Loss on retirement of property and equipment (Note 13) 9,808,757 9,321,027 1,785,876 Dividend income (25,099) (194,340) – Equity in net income of an associate (Note 12) (2,414,451) (45,943,472) (10,225,092) Interest income (Note 22) (777,122,025) (857,296,120) (821,702,486) Provision for impairment losses on receivables (Note 8) – 11,079,149 8,419,703 Operating income before working capital changes 3,446,155,979 2,937,416,523 3,551,048,662 Decrease (increase) in: Receivables (2,314,303,288) 653,212,250 (5,525,016,510) Real estate inventories 394,793,224 (2,303,668,974) 449,860,881 Other current assets 402,668,520 (605,527,974) (408,945,648) Increase (decrease) in: Accounts and other payables (347,573,362) 1,135,585,267 747,670,936 Customers’ advances and deposits (447,884,044) (989,636,127) 797,091,656 Liabilities for purchased land (748,590,927) (784,195,512) 169,768,508 Pension liabilities (Note 25) 28,495,666 139,474,569 (85,267,936) Net cash flows provided by (used in) operations 413,761,768 182,660,022 (303,789,451) Dividend received 25,099 194,340 – Interest received 696,203,540 772,612,479 742,352,183 Interest paid (653,995,035) (600,961,254) (373,914,823) Income tax paid (354,213,345) (303,150,182) (372,263,089) Net cash flows provided by (used in) operating activities 101,782,027 51,355,405 (307,615,180)
CASH FLOWS FROM INVESTING ACTIVITIES Additions to land for future development (Note 11) (1,979,300,917) (671,360,292) (3,745,978,891) Increase in long-term cash investments (Note 7) (1,755,200,000) – – Decrease (increase) of short-term cash investments (Note 7) (1,517,197,748) (105,962,569) 1,510,260,676 Net contribution to joint venture partners (336,738,086) – (135,779,154) Net collection from joint venture partners – 98,004,187 –
(Forward)
VISTA LAND & LIFESCAPES, INC. AND SUBSIDIARIESCONSOLIDATED STATEMENTS OF CASH FLOWS

74 VISTA LAND ANNUAL REPORT 2010
*SGVMC115372*
- 2 - Years Ended December 31
2010 2009
(Note 33) 2008
(Note 33) Acquisition of property and equipment (Note 13) (P=103,997,159) (P=53,853,349) (P=70,379,252) Increase in other noncurrent assets (37,072,634) (62,633,032) (110,179,429) Net cash acquired with the acquisition of a subsidiary (Note 4) – 12,338,024 – Proceeds from disposal of available-for-sale financial assets 2,097,428 10,688,999 5,561,653 Net cash used in investing activities (5,727,409,116) (772,778,032) (2,546,494,397)
CASH FLOWS FROM FINANCING ACTIVITIES Proceeds from: Bank loans 2,373,907,731 270,000,000 3,798,000,000 Loans payable 2,640,462,431 1,502,453,791 – Notes payable 4,265,368,820 – – Payments of: Long-term notes (72,842,349) (1,297,948,801) 117,221,379 Bank loans (107,322,564) (42,947,793) (609,596,838) Loans payable (1,944,584,255) (979,425,567) Increase (decrease) in payable to related parties (597,927,625) (383,133,507) 380,276,468 Payment of dividends declared (Note 30) (461,091,993) (281,778,440) (542,908,967) Payments to noncontrolling interests (Note 30) – (49,197,027) (3,699,814) Acquisition of treasury shares (Note 30) – (20,493,492) (548,354,235) Net cash provided by (used in) financing activities 6,095,970,196 (1,282,470,836) 2,590,937,993
NET INCREASE (DECREASE) IN CASH AND CASH EQUIVALENTS 470,343,107 (2,003,893,463) (263,171,584)
EFFECT OF CHANGE IN EXCHANGE RATES ON CASH AND CASH EQUIVALENTS 823,643 – –
CASH AND CASH EQUIVALENTS AT BEGINNING OF YEAR 3,010,640,495 5,014,533,958 5,277,705,542
CASH AND CASH EQUIVALENTS AT END OF YEAR (Note 6) P=3,481,807,245 P=3,010,640,495 P=5,014,533,958 See accompanying Notes to Consolidated Financial Statements.
VISTA LAND ANNUAL REPORT 2010 75
*SGVMC115372*
VISTA LAND & LIFESCAPES, INC. AND SUBSIDIARIES NOTES TO CONSOLIDATED FINANCIAL STATEMENTS 1. Corporate Information
Vista Land & Lifescapes, Inc. (the Parent Company) was incorporated in the Republic of the Philippines and registered with the Securities and Exchange Commission (SEC) on February 28, 2007. The Parent Company’s registered office address and principal place of business is at 3rd Level Starmall Las Piñas, CV Starr Avenue, Pamplona, Las Piñas City. The Parent Company is a publicly-listed investment holding company which is 58.11% owned by Fine Properties, Inc, 9.11% owned by Polar Property Holdings, Inc. and the rest by the public.
The Parent Company is the holding company of the Vista Group (the Group) which is comprised of the following domestic subsidiaries:
1) Camella Homes, Inc. (CHI) and Subsidiaries; 2) Brittany Corporation (Brittany); 3) Crown Asia Properties, Inc. (CAPI); 4) Communities Philippines, Inc. (CPI) and Subsidiaries; and 5) Vista Residences, Inc. (VRI)
The Group is engaged mainly in the development of residential subdivisions and construction of housing and condominium units. The Group offers a range of products from socialized and affordable housing to middle income and high-end subdivision house and lots and condominium projects.
2. Basis of Preparation and Summary of Significant Accounting Policies
Basis of Preparation The accompanying consolidated financial statements of the Group have been prepared on a historical cost basis, except for available-for-sale (AFS) financial assets that have been measured at fair value. The consolidated financial statements are presented in Philippine Peso (P=) which is the functional and presentation currency of the Parent Company, and all amounts are rounded off to the nearest Philippine Peso unless otherwise indicated.
Statement of Compliance The consolidated financial statements of the Group have been prepared in compliance with Philippine Financial Reporting Standards (PFRS).
Basis of Consolidation Basis of consolidation from January 1, 2010 The consolidated financial statements comprise the financial statements of the Group as at December 31, 2010, 2009 and January 1, 2009 and for the years ended December 31, 2010, 2009 and 2008.
VISTA LAND & LIFESCAPES, INC. AND SUBSIDIARIESNOTES TO CONSOLIDATED FINANCIAL STATEMENTS
76 VISTA LAND ANNUAL REPORT 2010
- 2 -
*SGVMC115372*
Subsidiaries are fully consolidated from the date of acquisition, being the date on which the Group obtains control, and continue to be consolidated until the date when such control ceases. The financial statements of the subsidiaries are prepared for the same reporting period as the Parent Company, using consistent accounting policies. All intra-group balances, transactions, unrealized gains and losses resulting from intra-group transactions and dividends are eliminated in full.
Non-controlling interests represent the portion of profit or loss and net assets in subsidiaries not wholly-owned and are presented separately in the consolidated statement of comprehensive income and consolidated statement of changes in equity and within equity in the consolidated statement of financial position, separately from the Parent Company’s equity.
Losses within a subsidiary are attributed to the non-controlling interests even if that results in a deficit balance.
A change in the ownership interest of a subsidiary, without a loss of control, is accounted for as an equity transaction. If the Group loses control over a subsidiary, it:
Derecognizes the assets (including goodwill) and liabilities of the subsidiary, the carrying
amount of any non-controlling interest and the cumulative translation differences, recorded in equity.
Recognizes the fair value of the consideration received, the fair value of any investment
retained and any surplus or deficit in profit or loss.
Reclassifies the Parent Company’s share of components previously recognized in other comprehensive income to profit or loss or retained earnings, as appropriate.
Basis of consolidation prior to January 1, 2010 Certain of the above-mentioned requirements were applied on a prospective basis. The following differences, however, are carried forward in certain instances from the previous basis of consolidation:
Acquisitions of non-controlling interests, prior to January 1, 2010, were accounted for using
the parent entity extension method, whereby, the difference between the consideration and the book value of the share of the net assets acquired were recognized in goodwill.
Losses incurred by the Group were attributed to non-controlling interest until the balance was
reduced to nil. Any further excess losses were attributed to the parent, unless non-controlling interest had a binding obligation to cover these. Losses prior to January 1, 2010 were not reallocated between non-controlling interest and the parent shareholders.
Upon loss of control, the Group accounted for the investment retained at its proportionate
share of net asset value at the date control was lost. The carrying value of such investments at January 1, 2010 has not been restated.
VISTA LAND & LIFESCAPES, INC. AND SUBSIDIARIESNOTES TO CONSOLIDATED FINANCIAL STATEMENTS
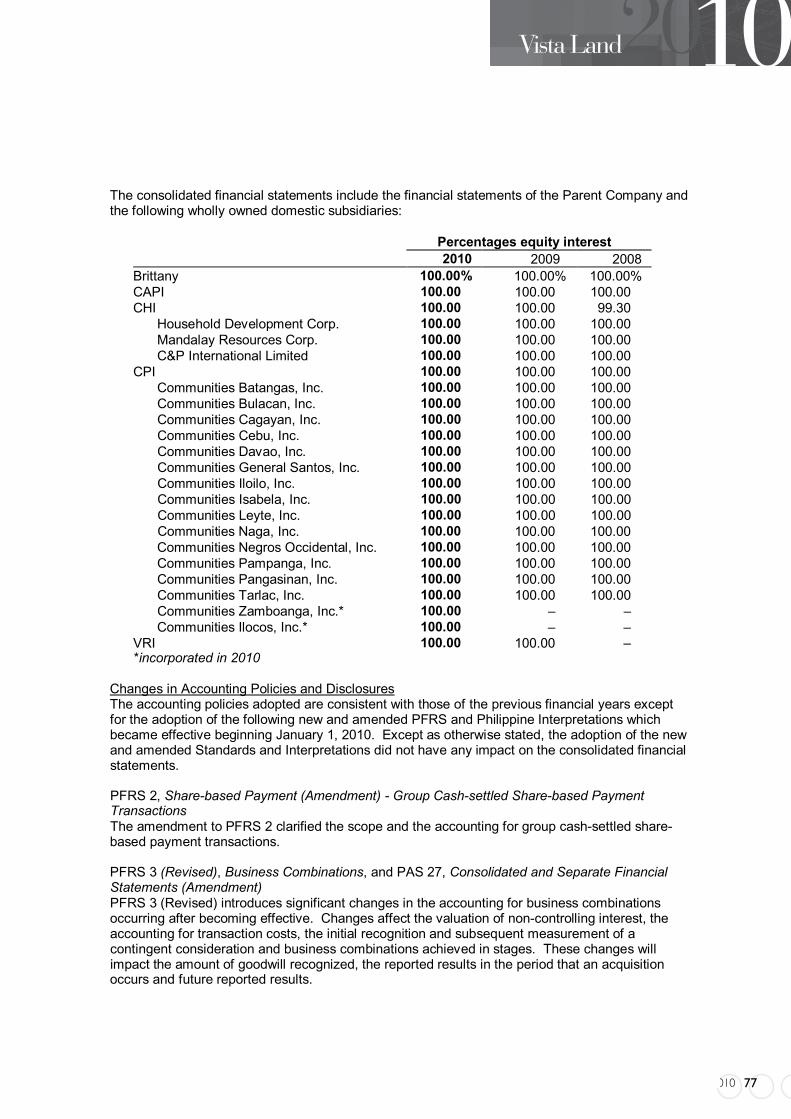
VISTA LAND ANNUAL REPORT 2010 77
- 3 -
*SGVMC115372*
The consolidated financial statements include the financial statements of the Parent Company and the following wholly owned domestic subsidiaries:
Percentages equity interest 2010 2009 2008 Brittany 100.00% 100.00% 100.00% CAPI 100.00 100.00 100.00 CHI 100.00 100.00 99.30 Household Development Corp. 100.00 100.00 100.00 Mandalay Resources Corp. 100.00 100.00 100.00 C&P International Limited 100.00 100.00 100.00 CPI 100.00 100.00 100.00 Communities Batangas, Inc. 100.00 100.00 100.00 Communities Bulacan, Inc. 100.00 100.00 100.00 Communities Cagayan, Inc. 100.00 100.00 100.00 Communities Cebu, Inc. 100.00 100.00 100.00 Communities Davao, Inc. 100.00 100.00 100.00 Communities General Santos, Inc. 100.00 100.00 100.00 Communities Iloilo, Inc. 100.00 100.00 100.00 Communities Isabela, Inc. 100.00 100.00 100.00 Communities Leyte, Inc. 100.00 100.00 100.00 Communities Naga, Inc. 100.00 100.00 100.00 Communities Negros Occidental, Inc. 100.00 100.00 100.00 Communities Pampanga, Inc. 100.00 100.00 100.00 Communities Pangasinan, Inc. 100.00 100.00 100.00 Communities Tarlac, Inc. 100.00 100.00 100.00 Communities Zamboanga, Inc.* 100.00 – – Communities Ilocos, Inc.* 100.00 – – VRI 100.00 100.00 –
*incorporated in 2010 Changes in Accounting Policies and Disclosures The accounting policies adopted are consistent with those of the previous financial years except for the adoption of the following new and amended PFRS and Philippine Interpretations which became effective beginning January 1, 2010. Except as otherwise stated, the adoption of the new and amended Standards and Interpretations did not have any impact on the consolidated financial statements.
PFRS 2, Share-based Payment (Amendment) - Group Cash-settled Share-based Payment Transactions The amendment to PFRS 2 clarified the scope and the accounting for group cash-settled share-based payment transactions. PFRS 3 (Revised), Business Combinations, and PAS 27, Consolidated and Separate Financial Statements (Amendment) PFRS 3 (Revised) introduces significant changes in the accounting for business combinations occurring after becoming effective. Changes affect the valuation of non-controlling interest, the accounting for transaction costs, the initial recognition and subsequent measurement of a contingent consideration and business combinations achieved in stages. These changes will impact the amount of goodwill recognized, the reported results in the period that an acquisition occurs and future reported results.

78 VISTA LAND ANNUAL REPORT 2010
- 4 -
*SGVMC115372*
PAS 27 (Amended) requires that a change in the ownership interest of a subsidiary (without loss of control) is accounted for as a transaction with owners in their capacity as owners. Therefore, such transactions will no longer give rise to goodwill, nor will it give rise to a gain or loss.
Furthermore, the Amendment changes the accounting for losses incurred by the subsidiary as well as the loss of control of a subsidiary. The changes by PFRS 3 (Revised) and PAS 27 (Amended) affect acquisitions or loss of control of subsidiaries and transactions with non-controlling interests after January 1, 2010.
PAS 39, Financial Instruments: Recognition and Measurement (Amendment) - Eligible Hedged Items The Amendment clarifies that an entity is permitted to designate a portion of the fair value changes or cash flow variability of a financial instrument as a hedged item. This also covers the designation of inflation as a hedged risk or portion in particular situations. The Group has concluded that the Amendment will have no impact on its financial position or performance as it has not entered into any such hedges.
Philippine Interpretation 17, Distribution of Non-cash Assets to Owners This Philippine Interpretation provides guidance on accounting for arrangements whereby an entity distributes non-cash assets to shareholders either as a distribution of reserves or as dividends.
Improvements to PFRS Improvements to PFRS, an omnibus of amendments to standards, deal primarily with a view to removing inconsistencies and clarifying wording. There are separate transitional provisions for each standard. The adoption of the following amendments resulted in changes to accounting policies but did not have any impact on the financial position or performance of the Group.
Improvements to PFRSs 2008
PFRS 5, Noncurrent Assets Held for Sale and Discontinued Operations: clarifies that the disclosures required in respect of noncurrent assets and disposal groups classified as held for sale or discontinued operations are only those set out in PFRS 5. The disclosure requirements of other PFRS only apply if specifically required for such noncurrent assets or discontinued operations.
Improvements to PFRSs 2009
PFRS 2, Share-based Payment: the Amendment clarifies that the contribution of a business on formation of a joint venture and combinations under common control are not within the scope of PFRS 2 even though they are out of scope of PFRS 3.
PFRS 8, Operating Segments: clarifies that segment assets and liabilities need only be
reported when those assets and liabilities are included in measures that are used by the chief operating decision maker.
PAS 1, Presentation of Financial Statements: the Amendment clarifies that the terms of a
liability that could result, at anytime, in its settlement by the issuance of equity instruments at the option of the counterparty do not affect its classification.
VISTA LAND & LIFESCAPES, INC. AND SUBSIDIARIESNOTES TO CONSOLIDATED FINANCIAL STATEMENTS

VISTA LAND ANNUAL REPORT 2010 79
- 5 -
*SGVMC115372*
PAS 7, Statement of Cash Flows: states that only expenditure that results in recognizing an
asset can be classified as a cash flow from investing activities.
PAS 17, Leases: the Amendment now requires that leases of land are classified as either ‘finance’ or ‘operating’ in accordance with the general principles of PAS 17. The amendments will be applied retrospectively.
PAS 36, Impairment of Assets: the Amendment clarifies that the largest unit permitted for
allocating goodwill, acquired in a business combination, is the operating segment as defined in PFRS 8 before aggregation for reporting purposes.
PAS 38, Intangible Assets: the Amendment clarifies that if an intangible asset acquired in a
business combination is identifiable only with another intangible asset, the acquirer may recognize the group of intangible assets as a single asset provided the individual assets have similar useful lives. It also clarifies that the valuation techniques presented for determining the fair value of intangible assets acquired in a business combination that are not traded in active markets are only examples and are not restrictive on the methods that can be used.
PAS 39, Financial Instruments: Recognition and Measurement: the Amendment clarifies the
following: i. that a prepayment option is considered closely related to the host contract when the
exercise price of a prepayment option reimburses the lender up to the approximate present value of lost interest for the remaining term of the host contract.
ii. that the scope exemption for contracts between an acquirer and a vendor in a business combination to buy or sell an acquiree at a future date applies only to binding forward contracts, and not derivative contracts where further actions by either party are still to be taken.
iii. that gains or losses on cash flow hedges of a forecast transaction that subsequently results in the recognition of a financial instrument or on cash flow hedges of recognized financial instruments should be reclassified in the period that the hedged forecast cash flows affect profit or loss.
Philippine Interpretation IFRIC 9, Reassessment of Embedded Derivatives: the Amendment
clarifies that it does not apply to possible reassessment at the date of acquisition, to embedded derivatives in contracts acquired in a business combination between entities or businesses under common control or the formation of joint venture.
Philippine Interpretation IFRIC16, Hedge of a Net Investment in a Foreign Operation: the
Amendment states that, in a hedge of a net investment in a foreign operation, qualifying hedging instruments may be held by any entity or entities within the group, including the foreign operation itself, as long as the designation, documentation and effectiveness requirements of PAS 39 that relate to a net investment hedge are satisfied.
Future Changes in Accounting Policies The Group will adopt the following standards and interpretations enumerated below when these become effective. Except as otherwise indicated, the Group does not expect the adoption of these new and amended PFRS and Philippine Interpretations to have significant impact on the consolidated financial statements.
80 VISTA LAND ANNUAL REPORT 2010
- 6 -
*SGVMC115372*
Effective 2011
PAS 24 (Amended), Related Party Disclosures The amended standard is effective for annual periods beginning on or after January 1, 2011. It clarified the definition of a related party to simplify the identification of such relationships and to eliminate inconsistencies in its application. The revised standard introduces a partial exemption of disclosure requirements for government-related entities. Early adoption is permitted for either the partial exemption for government-related entities or for the entire standard.
PAS 32 (Amendment), Financial Instruments: Presentation - Classification of Rights Issues The amendment to PAS 32 is effective for annual periods beginning on or after February 1, 2010 and amended the definition of a financial liability in order to classify rights issues (and certain options or warrants) as equity instruments in cases where such rights are given pro rata to all of the existing owners of the same class of an entity’s non-derivative equity instruments, or to acquire a fixed number of the entity’s own equity instruments for a fixed amount in any currency.
Philippine Interpretation IFRIC14 (Amendment), Prepayments of a Minimum Funding Requirement The Amendment to Philippine Interpretation 14 is effective for annual periods beginning on or after January 1, 2011, with retrospective application. The Amendment provides guidance on assessing the recoverable amount of a net pension asset and permits an entity to treat the prepayment of a minimum funding requirement as an asset.
Philippine Interpretation IFRIC19, Extinguishing Financial Liabilities with Equity Instruments This Philippine Interpretation is effective for annual periods beginning on or after July 1, 2010. The Philippine Interpretation clarifies that equity instruments issued to a creditor to extinguish a financial liability qualify as consideration paid. The equity instruments issued are measured at their fair value. In case that this cannot be reliably measured, the instruments are measured at the fair value of the liability extinguished. Any gain or loss is recognized immediately in profit or loss. Improvements to PFRS 2010 The omnibus amendments to PFRSs issued in May 2010 were issued primarily with a view to removing inconsistencies and clarifying wordings. The amendments are effective for annual periods beginning January 1, 2011, except as otherwise stated. The Group has not yet adopted the following amendments and anticipates that these changes will have no material effects on the consolidated financial statements.
PFRS 3 (Revised), Business Combination
This Amendment clarifies that the Amendments to PFRS 7, Financial Instruments: Disclosures, PAS 32 and PAS 39 that eliminate the exemption for contingent consideration, do not apply to contingent consideration that arose from business combinations whose acquisition dates precede the application of PFRS 3 (as revised in 2008).
It also limits the scope of the measurement choices that only the components of non-controlling interest that are present ownership interests that entitle their holders to a proportionate share of the entity’s net assets, in the event of liquidation, shall be measured either at fair value or at the present ownership instruments’ proportionate share of the acquiree’s identifiable net assets. Other components of non-controlling interest are measured at their acquisition date fair value, unless another measurement basis is required by another PFRS.
VISTA LAND & LIFESCAPES, INC. AND SUBSIDIARIESNOTES TO CONSOLIDATED FINANCIAL STATEMENTS
VISTA LAND ANNUAL REPORT 2010 81
- 7 -
*SGVMC115372*
The amendment also requires an entity (in a business combination) to account for the replacement of the acquiree’s share-based payment transactions (whether obliged or voluntarily), i.e., split between consideration and post combination expenses. However, if the entity replaces the acquiree’s awards that expire as a consequence of the business combination, these are recognized as post-combination expenses. It further specifies the accounting for share-based payment transactions that the acquirer does not exchange for its own awards: if vested - they are part of non-controlling interest and measured at their market- based measure; if unvested - they are measured at market based value as if granted at acquisition date, and allocated between non-controlling interest and post-combination expense.
PFRS 7, Financial Instruments: Disclosures
This Amendment emphasizes the interaction between quantitative and qualitative disclosures and the nature and extent of risks associated with financial instruments. The amendments to quantitative and credit risk disclosures are as follows:
a. Clarify that only financial assets whose carrying amount does not reflect the maximum
exposure to credit risk need to provide further disclosure of the amount that represents the maximum exposure to such risk.
b. Requires, for all financial assets, disclosure of the financial effect of collateral held as security and other credit enhancements regarding the amount that best represents the maximum exposure to credit risk (e.g., a description of the extent to which collateral mitigates credit risk).
c. Remove disclosure of the collateral held as security, other credit enhancements and an estimate of their fair value for financial assets that are past due but not impaired, and financial assets that are individually determined to be impaired.
d. Remove the requirement to specifically disclose financial assets renegotiated to avoid becoming past due or impaired.
e. Clarify that the additional disclosure required for financial assets obtained by taking possession of collateral or other credit enhancements are only applicable to assets still held at the reporting date.
PAS 1, Presentation of Financial Statements
This Amendment clarifies that an entity will present an analysis of other comprehensive income for each component of equity, either in the statement of changes in equity or in the notes to the financial statements.
PAS 27, Consolidated and Separate Financial Statements
This Amendment clarifies that the consequential amendments from PAS 27 made to PAS 21, The Effect of Changes in Foreign Exchange Rates, PAS 28, Investments in Associates and PAS 31, Interests in Joint Ventures apply prospectively for annual periods beginning on or after July 1, 2009 or earlier when PAS 27 is applied earlier.
Philippine Interpretation IFRIC13, Customer Loyalty Programmes
This Amendment clarifies that when the fair value of award credits is measured based on the value of the awards for which they could be redeemed, the amount of discounts or incentives otherwise granted to customers not participating in the award credit scheme, is to be taken into account.
82 VISTA LAND ANNUAL REPORT 2010
- 8 -
*SGVMC115372*
Effective 2012
Philippine Interpretation IFRIC15, Agreement for the Construction of Real Estate This Philippine Interpretation, effective for annual periods beginning on or after January 1, 2012, covers accounting for revenue and associated expenses by entities that undertake the construction of real estate directly or through subcontractors. The Philippine Interpretation requires that revenue on construction of real estate be recognized only upon completion, except when such contract qualifies as construction contract to be accounted for under PAS 11, Construction Contracts, or involves rendering of services in which case revenue is recognized based on stage of completion. Contracts involving provision of services with the construction materials and where the risks and reward of ownership are transferred to the buyer on a continuous basis will also be accounted for based on stage of completion.
The adoption of this Philippine Interpretation may significantly affect the determination of the revenue and the corresponding costs, and the related real estate trade receivables, customers’ deposits, inventories, deferred tax liabilities and retained earnings accounts. The adoption of this Philippine Interpretation will be accounted for retrospectively, and will result to restatement of prior period financial statements. The Group is in the process of quantifying the impact of adoption of this Philippine Interpretation when it becomes effective in 2012.
PAS 12 (Amendment), Income Taxes - Deferred Tax: Recovery of Underlying Assets The amendment to PAS 12 is effective for annual periods beginning on or after January 1, 2012. It provides a practical solution to the problem of assessing whether recovery of an asset will be through use or sale. It introduces a presumption that recovery of the carrying amount of an asset will normally be through sale.
PFRS 7 (Amendments), Financial Instruments: Disclosures - Disclosures - Transfers of Financial Assets The amendments to PFRS 7 are effective for annual periods beginning on or after July 1, 2011. The amendments will allow users of financial statements to improve their understanding of transfer transactions of financial assets (for example, securitizations), including understanding the possible effects of any risks that may remain with the entity that transferred the assets. The amendments also require additional disclosures if a disproportionate amount of transfer transactions are undertaken around the end of a reporting period.
Effective 2013
PFRS 9, Financial Instruments: Classification and Measurement PFRS 9, as issued in 2010, reflects the first phase of the work on the replacement of PAS 39 and applies to classification and measurement of financial assets and financial liabilities as defined in PAS 39. The Standard is effective for annual periods beginning on or after January 1, 2013. In subsequent phases, hedge accounting and derecognition will be addressed. The completion of this project is expected in second quarter of 2011. The adoption of the first phase of PFRS 9 will have an effect on the classification and measurement of the Group’s financial assets. The Group will quantify the effect in conjunction with the other phases, when issued, to present a comprehensive picture.
VISTA LAND & LIFESCAPES, INC. AND SUBSIDIARIESNOTES TO CONSOLIDATED FINANCIAL STATEMENTS

VISTA LAND ANNUAL REPORT 2010 83
- 9 -
*SGVMC115372*
Cash and Cash Equivalents Cash includes cash on hand and in banks. Cash equivalents are short-term, highly liquid investments that are readily convertible to known amounts of cash with original maturities of three months or less from dates of placement and that are subject to an insignificant risk of changes in value.
Short-term and Long-term Cash Investments
Short-term cash investments consist of money market placements made for varying periods of more than three (3) months and up to nine (9) months while long-term cash investments consist of money market placements made for varying periods of more than one (1) year. These investments earn interest at the respective short-term and long-term investment rates.
Financial Assets and Financial Liabilities Date of recognition The Group recognizes a financial asset or a financial liability in the consolidated statement of financial position when it becomes a party to the contractual provisions of the instrument. Purchases or sales of financial assets that require delivery of assets within the time frame established by regulation or convention in the marketplace are recognized on the trade date, which is the date when the Group commits to purchase or sell the asset.
Initial recognition of financial instruments All financial assets and financial liabilities are initially recognized at fair value. Except for financial assets and liabilities at fair value through profit or loss (FVPL), the initial measurement of financial assets and liabilities include transaction costs. The Group classifies its financial assets in the following categories: financial assets at FVPL, held-to-maturity (HTM) financial assets, AFS financial assets, and loans and receivables. The Group classifies its financial liabilities as financial liabilities at FVPL or other financial liabilities. The classification depends on the purpose for which the investments were acquired and whether these are quoted in an active market. The financial assets of the Group are of the nature of loans and receivable and AFS financial assets, while its financial liabilities are of the nature of other financial liabilities. Management determines the classification at initial recognition and re-evaluates such designation, where allowed and appropriate, at every reporting date.
Financial instruments are classified as liability or equity in accordance with the substance of the contractual arrangement. Interest, dividends, gains and losses relating to a financial instrument or a component that is a financial liability, are reported as expense or income. Distributions to holders of financial instruments classified as equity are charged directly to equity net of any related income tax benefits.
The Group’s financial instruments are in the nature of loans and receivables, AFS financial assets and other financial liabilities.
Determination of fair value The fair value for financial instruments traded in active markets at the reporting date is based on its quoted market price or dealer price quotations (bid price for long positions and ask price for short positions), without any deduction for transaction costs. When current bid and ask prices are not available, the price of the most recent transaction provides evidence of the current fair value as long as there has not been a significant change in economic circumstances since the time of the transaction.

84 VISTA LAND ANNUAL REPORT 2010
- 10 -
*SGVMC115372*
For all other financial instruments not listed in an active market, the fair value is determined by using appropriate valuation techniques. Valuation techniques include net present value techniques, comparison to similar instruments for which market observable prices exist, option pricing models, and other relevant valuation models.
Day 1 profit Where the transaction price in a non-active market is different to the fair value from other observable current market transactions in the same instrument or based on a valuation technique whose variables include only data from observable market, the Group recognizes the difference between the transaction price and fair value (a ‘Day 1’ profit) in profit or loss unless it qualifies for recognition as some other type of asset or liability. In cases where inputs to the valuation technique are not observable, the difference between the transaction price and model value is only recognized in profit or loss when the inputs become observable or when the instrument is derecognized. For each transaction, the Group determines the appropriate method of recognizing the ‘Day 1’ profit amount.
Loans and receivables Loans and receivables are nonderivative financial assets with fixed or determinable payments that are not quoted in an active market. They are not entered into with the intention of immediate or short-term resale and are not classified as financial assets held-for-trading, designated as AFS or as financial assets at FVPL. Receivables are recognized initially at fair value, which normally pertains to the billable amount. After initial measurement, loans and receivables are subsequently measured at amortized cost using the effective interest rate method, less allowance for impairment losses. Amortized cost is calculated by taking into account any discount or premium on acquisition and fees that are an integral part of the effective interest rate. The amortization, if any, is included in profit or loss. The losses arising from impairment of receivables are recognized in profit or loss. These financial assets are included in current assets if maturity is within 12 months from the reporting date. Otherwise, these are classified as noncurrent assets.
This accounting policy applies primarily to the Group’s cash and cash equivalents, short-term investments and receivables except for receivable from contractors and receivable from brokers.
AFS financial assets AFS financial assets are nonderivative financial assets that are designated as such or do not qualify to be classified or designated as financial assets at FVPL, HTM investments or loans and receivables. These are purchased and held indefinitely, and may be sold in response to liquidity requirements or changes in market conditions.
After initial measurement, AFS financial assets are measured at fair value. The unrealized gains and losses arising from the fair valuation of AFS financial assets are excluded from reported earnings and are reported in the other comprehensive income (OCI).
When the investment is disposed of, the cumulative gain or loss previously recognized in OCI is recognized as miscellaneous income in profit or loss. Where the Group holds more than one investment in the same security these are deemed to be disposed of on a first-in first-out basis. Interest earned on holding AFS financial assets are reported as interest income using the effective interest rate. Dividends earned on holding AFS financial assets are recognized in profit or loss as part of miscellaneous income when the right to receive payment has been established. The losses arising from impairment of such investments are recognized as provisions for impairment losses in profit or loss.
VISTA LAND & LIFESCAPES, INC. AND SUBSIDIARIESNOTES TO CONSOLIDATED FINANCIAL STATEMENTS
VISTA LAND ANNUAL REPORT 2010 85
- 11 -
*SGVMC115372*
When the fair value of AFS financial assets cannot be measured reliably because of lack of reliable estimates of future cash flows and discount rates necessary to calculate the fair value of unquoted equity instruments, these investments are carried at cost, less any impairment losses.
The Group’s AFS financial assets pertain to investments in unquoted equity securities included under “Other noncurrent assets” account in the consolidated statement of financial position.
As of January 1, 2009, a portion of the AFS financial assets comprise of quoted and unquoted equity securities while as of December 31, 2010 and 2009, AFS financial assets comprise of unquoted equity securities only.
Other financial liabilities Other financial liabilities are initially recognized at the fair value of the consideration received less directly attributable transaction costs.
After initial recognition, other financial liabilities are subsequently measured at amortized cost using the effective interest method. Amortized cost is calculated by taking into account any discount or premium on the issue and fees that are an integral part of the effective interest rate. Gains and losses are recognized in profit or loss when the liabilities are derecognized, as well as through the amortization process. Any effects of restatement of foreign currency-denominated liabilities are recognized in profit or loss.
This accounting policy applies primarily to the Group’s bank loans, loans payable, accounts and other payables, liabilities for purchased land, payable to related parties and long-term notes and other liabilities that meet the above definition (other than liabilities covered by other accounting standards, such as pension liability, income tax payable and deferred tax liabilities).
Derecognition of Financial Assets and Financial Liabilities Financial asset A financial asset (or, where applicable, a part of a group of financial assets) is derecognized where: (a) the rights to receive cash flows from the assets have expired; (b) the Group retains the right to receive cash flows from the asset, but has assumed an obligation to pay them in full without material delay to a third-party under a “pass-through” arrangement; or (c) the Group has transferred its right to receive cash flows from the asset and either: (i) has transferred substantially all the risks and rewards of the asset, or (ii) has neither transferred nor retained the risks and rewards of the asset but has transferred control of the asset.
Where the Group has transferred its rights to receive cash flows from an asset or has entered into a pass-through arrangement, and has neither transferred nor retained substantially all the risks and rewards of the asset nor transferred control of the asset, the asset is recognized to the extent of the Group’s continuing involvement in the asset. Continuing involvement that takes the form of a guarantee over the transferred asset is measured at the lower of the original carrying amount of the asset and the maximum amount of consideration that the Group could be required to repay.
Financial liability A financial liability is derecognized when the obligation under the liability is discharged or cancelled or has expired. Where an existing financial liability is replaced by another from the same lender on substantially different terms, or the terms of an existing liability are substantially modified, such an exchange or modification is treated as a derecognition of the original liability and the recognition of a new liability, and the difference in the respective carrying amounts is recognized in profit or loss.
86 VISTA LAND ANNUAL REPORT 2010
- 12 -
*SGVMC115372*
Impairment of Financial Assets The Group assesses at each reporting date whether there is objective evidence that a financial asset or group of financial assets is impaired. A financial asset or a group of financial assets is deemed to be impaired if, and only if, there is objective evidence of impairment as a result of one or more events that has occurred after the initial recognition of the asset (an incurred ‘loss event’) and that loss event (or events) has an impact on the estimated future cash flows of the financial asset or the group of financial assets that can be reliably estimated. Evidence of impairment may include indications that the borrower or a group of borrowers is experiencing significant financial difficulty, default or delinquency in interest or principal payments, and where observable data indicate that there is measurable decrease in the estimated future cash flows, such as changes in arrears or economic conditions that correlate with defaults.
Loans and receivables For loans and receivables carried at amortized cost, the Group first assesses whether an objective evidence of impairment exists individually for financial assets that are individually significant. If there is objective evidence that an impairment loss has been incurred, the amount of the loss is measured as the difference between the assets’ carrying amount and the present value of the estimated future cash flows (excluding future credit losses that have not been incurred). If it is determined that no objective evidence of impairment exists for an individually assessed financial asset, the asset, together with the other assets that are not individually significant and were thus not individually assessed for impairment, is included in a group of financial assets with similar credit risk characteristics and that group of financial assets is collectively assessed for impairment. Assets that are individually assessed for impairment and for which an impairment loss is or continues to be recognized are not included in a collective assessment of impairment.
For the purpose of a collective evaluation of impairment, financial assets are grouped on the basis of credit risk characteristics such as selling price of the lots and residential houses, past-due status and term.
Future cash flows in a group of financial assets that are collectively evaluated for impairment are estimated on the basis of historical loss experience for assets with credit risk characteristics similar to those in the group. Historical loss experience is adjusted on the basis of current observable data to reflect the effects of current conditions that did not affect the period on which the historical loss experience is based and to remove the effects of conditions in the historical period that do not exist currently. The methodology and assumptions used for estimating future cash flows are reviewed regularly by the Group to reduce any differences between loss estimates and actual loss experience.
The carrying amount of the asset is reduced through use of an allowance account and the amount of loss is charged to profit or loss. Loans, together with the associated allowance accounts, are written off when there is no realistic prospect of future recovery and all collateral has been realized. If, in a subsequent year, the amount of the estimated impairment loss decreases because of an event occurring after the impairment was recognized, the previously recognized impairment loss is reversed. Any subsequent reversal of an impairment loss is recognized in profit or loss, to the extent that the carrying value of the asset does not exceed its amortized cost at the reversal date.
VISTA LAND & LIFESCAPES, INC. AND SUBSIDIARIESNOTES TO CONSOLIDATED FINANCIAL STATEMENTS
VISTA LAND ANNUAL REPORT 2010 87
- 13 -
*SGVMC115372*
AFS financial assets carried at fair value In case of equity investments classified as AFS financial assets, impairment indicators would include a significant or prolonged decline in the fair value of the investments below their corresponding cost. Where there is evidence of impairment, the cumulative loss - measured as the difference between the acquisition cost and the current fair value, less any impairment loss on that financial asset previously recognized in OCI is removed from OCI and recognized in profit or loss. Impairment losses on equity investments are not reversed through the profit and loss. Increases in fair value after impairment are recognized directly in OCI.
AFS financial assets carried at cost If there is an objective evidence that an impairment loss on an unquoted equity instrument that is not carried at fair value because its fair value cannot be reliably measured, the amount of the loss is measured as the difference between the carrying amount and the present value of estimated future cash flows discounted at the current market rate of return for a similar financial asset.
Offsetting Financial Instruments Financial assets and financial liabilities are offset and the net amount reported in the consolidated statement of financial position if, and only if, there is a currently enforceable legal right to offset the recognized amounts and there is an intention to settle on a net basis, or to realize the asset and settle the liability simultaneously.
Real Estate Inventories Real estate inventories consist of subdivision land, residential houses and lots and condominium units for sale and development. These are properties acquired or being constructed for sale in the ordinary course of business rather than to be held for rental or capital appreciation. These are held as inventory and are measured at the lower of cost and net realizable value (NRV).
Cost includes: Acquisition cost of subdivision land Amounts paid to contractors for construction and development of subdivision land and
residential units Capitalized borrowing costs, planning and design costs, cost of site preparation, professional
fees for legal services, property transfer taxes, construction overheads and other related costs.
Nonrefundable commissions paid to sales or marketing agents on the sale of real estate units are expensed when paid.
NRV is the estimated selling price in the ordinary course of the business, based on market prices at the reporting date, less costs to complete and the estimated costs of sale.
The cost of inventory recognized in profit or loss on disposal is determined with reference to the specific costs incurred on the property sold and an allocation of any non-specific costs based on the relative size of the property sold.
Land for Future Development
Land for future development consist of properties for future developments and are carried at the lower of cost or NRV. NRV is the estimated selling price in the ordinary course of business, less cost to complete and costs of sale. Costs include cost incurred for development and improvements of the properties. Upon start of development, the related cost of the land is transferred to real estate inventories.
88 VISTA LAND ANNUAL REPORT 2010
- 14 -
*SGVMC115372*
Prepaid Expenses Prepaid expenses are carried at cost less the amortized portion. These typically comprise prepayments for marketing fees, taxes and licenses, rentals and insurance.
Investment in an Associate The investment in an associate is accounted for under the equity method of accounting. An associate is an entity in which the Group has significant influence and which is neither a subsidiary nor a joint venture.
An investment in an associate is accounted for using the equity method from the day it becomes an associate. On acquisition of investment, the excess of the cost of investment over the investor’s share in the net fair value of the investee’s identifiable assets, liabilities and contingent liabilities is included in the carrying amount of the investment and not amortized. Any excess of the investor’s share of the net fair value of the associate’s identifiable assets, liabilities and contingent liabilities over the cost of the investment is excluded from the carrying amount of the investment, and is instead included as income in the determination of the share in the earnings of the investees.
Under the equity method, the investment in an associate is carried in the consolidated statement of financial position at cost plus post-acquisition changes in the Group’s share in the net assets of the associate, less any impairment in values. The profit or loss reflects the share of the results of the operations of the investee companies reflected as “Equity in net income of an associate”. The Group’s share of post-acquisition movements in the investee’s equity reserves is recognized directly in equity. Profits and losses resulting from transactions between the Group and the investee company are eliminated to the extent of the interest in the investee company and for unrealized losses to the extent that there is no evidence of impairment of the asset transferred. Dividends received are treated as a reduction of the carrying value of the investment.
The reporting date of the investee company and the Group is identical and its accounting policies conform to those used by the Group for like transactions and events in similar circumstances.
Beginning January 1, 2010, upon loss of significant influence over the associate, the Group measures and recognizes any retaining investment at its fair value. Any difference between the carrying amount of the associate upon loss of significant influence and the fair value of the retained investment and proceeds from disposal is recognized in profit or loss.
The Group has a reciprocal holding in Polar Property Holdings, Inc. (PPHI). The Group takes up its share on its associate’s profit excluding the equity income arising on the reciprocal holding. An adjustment is also made to reduce the Group’s equity balance and its investment in an associate by its effective percentage of ownership on its own shares.
Property and Equipment Property and equipment are carried at cost less accumulated depreciation and amortization and any impairment in value.
The initial cost of property and equipment consists of its purchase price, including import duties, taxes and any directly attributable costs of bringing the asset to its working condition and location for its intended use. Expenditures incurred after the property and equipment have been put into operation, such as repairs and maintenance are normally charged against operations in the period in which the costs are incurred. All other repair and maintenance costs are recognized in profit or loss as incurred.
VISTA LAND & LIFESCAPES, INC. AND SUBSIDIARIESNOTES TO CONSOLIDATED FINANCIAL STATEMENTS

VISTA LAND ANNUAL REPORT 2010 89
- 15 -
*SGVMC115372*
Depreciation and amortization of property and equipment commences once the property and equipment are available for use and computed using the straight-line basis over the estimated useful life of property and equipment as follows:
Years Building and building improvements 20 Transportation equipment 2 to 5 Office furniture, fixtures and equipment 2 to 5 Construction equipment 2 to 5 Other fixed assets 1 to 5
Building improvements are amortized on a straight-line basis over the term of the lease or the estimated useful life of the asset, whichever is shorter.
The useful lives and depreciation and amortization method are reviewed annually to ensure that the period and method of depreciation and amortization are consistent with the expected pattern of economic benefits from items of property and equipment.
When property and equipment are retired or otherwise disposed of, the cost of the related accumulated depreciation and amortization and accumulated provision for impairment losses, if any, are removed from the accounts and any resulting gain or loss is credited to or charged against current operations.
Fully depreciated property and equipment are retained in the accounts until they are no longer in use and no further depreciation is charged against current operations.
Interests in Joint Ventures Interests in joint ventures (JV), where the venturer has joint control, represent one or more assets, usually in the form of cash, contributed to, or acquired for the purpose of the joint venture and dedicated to the purposes of the JV. The assets are used to obtain benefits for the venturers. Each venturer may take a share of the output from the assets and each bears an agreed share of the expenses incurred. These JV do not involve the establishment of a corporation, partnership or other entity, or a financial structure that is separate from the venturers themselves. Each venturer has control over its share of future economic benefits through its share of the jointly controlled asset.
System Development Costs Costs associated with developing or maintaining computer software programs are recognized as expense as incurred. Costs that are directly associated with identifiable and unique software controlled by the Group and will generate economic benefits exceeding costs beyond one year, are recognized as intangible assets to be measured at cost less accumulated amortization and provision for impairment losses, if any.
System development costs, recognized as assets, are amortized using the straight-line method over their useful lives, but not exceeding a period of three years. Where an indication of impairment exists, the carrying amount of computer system development costs is assessed and written down immediately to its recoverable amount.
90 VISTA LAND ANNUAL REPORT 2010
- 16 -
*SGVMC115372*
Business Combination Business combination between entities under common control Business combination between entities under common control is accounted under historical cost basis similar to pooling of interest method. Under pooling of interest method, the assets and liabilities of the combining entities are reflected at their carrying amounts. No adjustments are made to reflect fair values, or recognize any new assets or liabilities. No ‘new’ goodwill is recognized as a result of the combination. The only goodwill that is recognized is any existing goodwill relating to either of the combining entities. Any difference between the consideration paid and the equity ‘acquired’ is reflected in additional-paid-in capital. The consolidated statement of comprehensive income reflects the results of the combining entities for the full year, irrespective of when the combination took place. Comparatives are presented as if the entities had always been combined.
The combined entities accounted for by the pooling of interests method reports results of operations for the period in which the combination occurs as though the entities had been combined as of the beginning of the period. The effects of intercompany transactions on current assets, current liabilities, revenue, and cost of sales for the periods presented and on retained earnings at the beginning of the periods presented are eliminated.
Business combination (other than under common control) and goodwill
From January 1, 2010 Business combinations are accounted for using the acquisition method. The cost of an acquisition is measured as the aggregate of the consideration transferred, measured at acquisition date fair value and the amount of any non-controlling interest in the acquiree. For each business combination, the acquirer measures the non-controlling interest in the acquiree either at fair value or at the proportionate share of the acquiree’s identifiable net assets. Acquisition costs incurred are expensed and included in administrative expenses.
When the Group acquires a business, it assesses the financial assets and liabilities assumed for appropriate classification and designation in accordance with the contractual terms, economic circumstances and pertinent conditions as at the acquisition date. This includes the separation of embedded derivatives in host contracts by the acquiree.
If the business combination is achieved in stages, the acquisition date fair value of the acquirer’s previously held equity interest in the acquiree is remeasured to fair value at the acquisition date through profit or loss.
Any contingent consideration to be transferred by the acquirer will be recognized at fair value at the acquisition date. Subsequent changes to the fair value of the contingent consideration which is deemed to be an asset or liability, will be recognized in accordance with PAS 39 either in profit or loss or as a change to other comprehensive income. If the contingent consideration is classified as equity, it should not be remeasured until it is finally settled within equity.
Goodwill is initially measured at cost being the excess of the aggregate of the consideration transferred and the amount recognised for non-controlling interest over the net identifiable assets acquired and liabilities assumed. If this consideration is lower than the fair value of the net assets of the subsidiary acquired, the difference is recognized in profit or loss.
VISTA LAND & LIFESCAPES, INC. AND SUBSIDIARIESNOTES TO CONSOLIDATED FINANCIAL STATEMENTS

VISTA LAND ANNUAL REPORT 2010 91
- 17 -
*SGVMC115372*
Following initial recognition, goodwill is measured at cost less any accumulated impairment loss. Goodwill is reviewed for impairment, annually or more frequently if events or changes in circumstances indicate that the carrying value may be impaired. For purposes of impairment testing, goodwill acquired in a business combination is, from the acquisition date, allocated to each of the Group’s cash-generating units (CGUs), or groups of CGUs, that are expected to benefit from the synergies of the combination, irrespective of whether other assets or liabilities of the Group are assigned to those units or groups of units. Each unit or group of units to which the goodwill is allocated should:
represent the lowest level within the Group at which the goodwill is monitored for internal
management purposes; and not be larger than an operating segment determined in accordance with PFRS 8.
Impairment is determined by assessing the recoverable amount of the CGU (or group of CGUs), to which the goodwill relates. Where the recoverable amount of the CGU (or group of CGUs) is less than the carrying amount, an impairment loss is recognized. Where goodwill forms part of a CGU (or group of CGUs) and part of the operation within that unit is disposed of, the goodwill associated with the operation disposed of is included in the carrying amount of the operation when determining the gain or loss on disposal of the operation. Goodwill disposed of in these circumstances is measured based on the relative values of the operation disposed of and the portion of the CGU retained. If the acquirer’s interest in the net fair value of the identifiable assets, liabilities and contingent liabilities exceeds the cost of the business combination, the acquirer shall recognize immediately in the consolidated statement of comprehensive income any excess remaining after reassessment.
Prior to January 1, 2010 In comparison to the above-mentioned requirements, the following differences applied:
Business combinations were accounted for using the purchase method. Transaction costs directly attributable to the acquisition formed part of the acquisition costs. The non-controlling interest (formerly known as minority interest) was measured at the proportionate share of the acquiree’s identifiable net assets.
Business combinations achieved in stages were accounted for as separate steps. Any additional acquired share of interest did not affect previously recognized goodwill.
When the Group acquired a business, embedded derivatives separated from the host contract by the acquiree were not reassessed on acquisition unless the business combination resulted in a change in the terms of the contract that significantly modified the cash flows that otherwise would have been required under the contract.
Contingent consideration was recognized if, and only if, the Group had a present obligation, the economic outflow was more likely than not and a reliable estimate was determinable. Subsequent adjustments to the contingent consideration were recognized as part of goodwill.
Goodwill acquired in a business combination is initially measured at cost, being the excess of the cost of the business combination over the Group’s interest in the net fair value of the identifiable assets, liabilities and contingent liabilities of the acquired entity at the date of acquisition.

92 VISTA LAND ANNUAL REPORT 2010
- 18 -
*SGVMC115372*
If the initial accounting for a business combination can only be determined on a provisional basis by the end of the period in which the combination is effected because either the fair values to be assigned to the acquiree’s identifiable assets, liabilities or contingent liabilities or the cost of the combination can be determined only provisionally, the Parent Company accounts for the combination using those provisional values. The Parent Company recognizes any adjustment to those provisional values as a result of completing the initial accounting within 12 months from the acquisition date.
Impairment of Nonfinancial Assets This accounting policy relates to property and equipment, investment in an associate, interests in joint ventures, model house accessories and system development costs.
The Group assesses as at reporting date whether there is an indication that nonfinancial assets may be impaired. If any such indication exists, or when annual impairment testing for an asset is required, the Group makes an estimate of the asset’s recoverable amount. An asset’s recoverable amount is calculated as the higher of the asset’s or cash-generating unit’s fair value less costs to sell and its value in use and is determined for an individual asset, unless the asset does not generate cash inflows that are largely independent of those assets or groups of assets. Where the carrying amount of an asset exceeds its recoverable amount, the asset is considered impaired and is written down to its recoverable amount. In assessing value in use, the estimated future cash flows are discounted to their present value using a pre-tax discount rate that reflects current market assessment of the time value of money and the risks specific to the asset. Impairment losses of continuing operations are recognized in profit or loss in those expense categories consistent with the function of the impaired asset.
For assets excluding goodwill, an assessment is made at each reporting date as to whether there is an indication that previously recognized impairment losses may no longer exist or may have decreased. If such indication exists, the recoverable amount is estimated. A previously recognized impairment loss is reversed only if there has been a change in the estimates used to determine the asset’s recoverable amount since the last impairment loss was recognized. If that is the case, the carrying amount of the asset is increased to its recoverable amount. That increased amount cannot exceed the carrying amount that would have been determined, net of depreciation and amortization, had no impairment loss been recognized for the asset in prior years. Such reversal is recognized in profit or loss unless the asset is carried at revalued amount, in which case the reversal is treated as revaluation increase in the other comprehensive income. After such reversal, the depreciation and amortization charge is adjusted in future periods to allocate the asset’s revised carrying amount, less any residual value, on a systematic basis over its remaining useful life.
The following criteria are also applied in assessing impairment of specific assets:
Investment in an associate After application of the equity method, the Group determines whether it is necessary to recognize any additional impairment loss with respect to the Group’s net investment in the investee companies. The Group determines at each reporting date whether there is any objective evidence that the investment in an associate is impaired. If this is the case, the Group calculates the amount of impairment as being the difference between the recoverable amount and the carrying value of the investee company and recognizes the difference in profit or loss.
VISTA LAND & LIFESCAPES, INC. AND SUBSIDIARIESNOTES TO CONSOLIDATED FINANCIAL STATEMENTS

VISTA LAND ANNUAL REPORT 2010 93
- 19 -
*SGVMC115372*
Revenue and Cost Recognition Revenue is recognized to the extent that it is probable that the economic benefits will flow to the Group and the revenue can be reliably measured.
Real estate revenue For real estate sales, the Group assesses whether it is probable that the economic benefits will flow to the Group when the sales prices are collectible. Collectibility of the sales price is demonstrated by the buyer’s commitment to pay, which in turn is supported by substantial initial and continuing investments that give the buyer a stake in the property sufficient that the risk of loss through default motivates the buyer to honor its obligation to the seller. Collectibility is also assessed by considering factors such as the credit standing of the buyer, age and location of the property.
Revenue from sales of completed real estate projects is accounted for using the full accrual method. In accordance with Philippine Interpretations Committee, Q&A 2006-01, the percentage-of-completion method is used to recognize income from sales of projects where the Group has material obligations under the sales contract to complete the project after the property is sold, the equitable interest has been transferred to the buyer, construction is beyond preliminary stage (i.e., engineering, design work, construction contracts execution, site clearance and preparation, excavation and the building foundation are finished, and the costs incurred or to be incurred can be measured reliably). Under this method, revenue is recognized as the related obligations are fulfilled, measured principally on the basis of the estimated completion of a physical proportion of the contract work.
Any excess of collections over the recognized receivables are included in the “Customers’ advances and deposits” account in the liabilities section of the consolidated statement of financial position.
When a sale of real estate does not meet the requirements for revenue recognition, the sale is accounted for under the deposit method. Under this method, revenue is not recognized, and the receivable from the buyer is not recorded. The real estate inventories continue to be reported on the consolidated statement of financial position as “Real estate inventories” and the related liability as deposits under “Customers’ advances and deposits”.
Cost of real estate sales is recognized consistent with the revenue recognition method applied. Cost of subdivision land and condominium units sold before the completion of the development is determined on the basis of the acquisition cost of the land plus its full development costs, which include estimated costs for future development works, as determined by the Group’s in-house technical staff.
Interest income Interest is recognized as it accrues (using the effective interest method i.e, the rate that exactly discounts estimated future cash receipts through the expected life of the financial instrument to the net carrying amount of the financial asset).
Dividend income Dividend income is recognized when the Group’s right to receive payment is established.

94 VISTA LAND ANNUAL REPORT 2010
- 20 -
*SGVMC115372*
Pension Cost Pension cost is actuarially determined using the projected unit credit method. This method reflects services rendered by employees up to the date of valuation and incorporates assumptions concerning employees’ projected salaries. Actuarial valuations are conducted with sufficient regularity, with option to accelerate when significant changes to underlying assumptions occur. Pension cost includes current service cost, interest cost, expected return on any plan assets, actuarial gains and losses and the effect of any curtailments or settlements.
The Group recognizes gains or losses on curtailment or settlement of a defined benefit plan when the curtailment or settlement occurs. Losses on settlements or curtailments are measured at the date on which the Group becomes demonstrably committed to the transaction. Gains on settlements or curtailments are measured at the date on which all parties, whose consent is required, are irrevocably committed. The gains or losses on curtailment or settlement shall comprise the following:
any resulting change in the present value of the defined benefit obligation; any resulting change in fair value of plans; and any related actuarial gains and losses and past service cost that had not previously been
recognized.
The net pension liability recognized in the consolidated statement of financial position in respect of the defined benefit pension plan is the present value of the defined benefit obligation at the reporting date less the fair value of the plan assets, together with adjustments for unrecognized actuarial gains or losses and past service costs that shall be recognized in later periods. The defined benefit obligation is calculated by an independent actuary using the projected unit credit method. The present value of the defined benefit obligation is determined using risk-free interest rate of government bonds that have terms to maturity approximating to the terms of the related pension liability or applying a single weighted average discount rate that reflects the estimated timing and amount of benefit payments.
The actuarial gains and losses arising from experience adjustments and changes in actuarial assumptions are immediately charged to or credited to profit or loss.
Past service cost, if any, is recognized immediately in income, unless the changes to the pension plan are conditional on the employees remaining in service for a specified period of time (the vesting period). In this case, the past service cost is amortized on a straight-line basis over the vesting period.
Income Tax Current tax Current tax assets and liabilities for the current and prior periods are measured at the amount expected to be recovered from or paid to the taxation authorities. The tax rates and tax laws used to compute the amount are those that are enacted or substantively enacted by the reporting date.
Deferred tax Deferred income tax is provided using the liability method on temporary differences, with certain exceptions, at the reporting date between the tax bases of assets and liabilities and their carrying amounts for financial reporting purposes.
VISTA LAND & LIFESCAPES, INC. AND SUBSIDIARIESNOTES TO CONSOLIDATED FINANCIAL STATEMENTS
VISTA LAND ANNUAL REPORT 2010 95
- 21 -
*SGVMC115372*
Deferred tax liabilities are recognized for all taxable temporary differences, with certain exceptions. Deferred tax assets are recognized for all deductible temporary differences, carryforward benefit of unused tax credits from excess of minimum corporate income tax (MCIT) over the regular corporate income tax and unused net operating loss carryover (NOLCO), to the extent that it is probable that taxable income will be available against which the deductible temporary differences and carryforward benefits of unused tax credits from MCIT and NOLCO can be utilized.
The carrying amount of deferred tax assets is reviewed at each reporting date and reduced to the extent that it is no longer probable that sufficient taxable income will be available to allow the deferred tax assets to be utilized. Unrecognized deferred tax assets are reassessed at each reporting date and are recognized to the extent that it has become probable that future taxable income will allow the deferred tax asset to be recovered.
Deferred tax assets and liabilities are measured at the tax rate that is expected to apply in the period when the asset is realized or the liability is settled, based on tax rates and tax laws that have been enacted or substantively enacted at the reporting date.
Deferred tax assets and deferred tax liabilities are offset if a legally enforceable right exists to set off current tax assets against current tax liabilities, and the deferred taxes relate to the same taxable entity and the same taxation authority.
Commission The Group recognizes commission when services are rendered by the broker. The commission expense is accrued upon receipt of down payment from the buyer comprising a substantial portion of the contract price and the capacity to pay and credit worthiness of buyers have been reasonably established for sales under the deferred cash payment arrangement.
Expenses Direct operating expenses and general and administrative expenses, except for lease agreements, are recognized as they are incurred.
Operating Leases The determination of whether an arrangement is, or contains a lease is based on the substance of the arrangement at inception date of whether the fulfillment of the arrangement is dependent on the use of a specific asset or assets or the arrangement conveys a right to use the asset. A reassessment is made after inception of the lease only if one of the following applies: (a) there is a change in contractual terms, other than a renewal or extension of the arrangement; (b) a renewal option is exercised or extension granted, unless the term of the renewal or extension was initially included in the lease term; (c) there is a change in the determination of whether fulfillment is dependent on a specified asset; or (d) there is a substantial change to the asset.
Where a reassessment is made, lease accounting shall commence or cease from the date when the change in circumstances gave rise to the reassessment for scenarios (a), (c) or (d) and at the date of renewal or extension period for scenario (b).
Group as lessee Leases where the lessor retains substantially all the risks and benefits of the ownership of the asset are classified as operating leases. Fixed lease payments are recognized as expense on a straight-line basis over the lease term while the variable rent is recognized as an expense based on the terms of the lease contract.
96 VISTA LAND ANNUAL REPORT 2010
- 22 -
*SGVMC115372*
Foreign Currency Transactions The consolidated financial statements are presented as Philippine Peso, which is also the Parent Company’s functional currency.
Each entity in the Group determines its own functional currency and items included in the financial statements of each entity are measured using that functional currency. Transactions in foreign currencies are initially recorded in the functional currency rate ruling at the date of the transaction. Monetary assets and liabilities denominated in foreign currencies are retranslated at the functional currency rate of exchange ruling at the reporting date. All differences are taken to profit or loss.
Provisions Provisions are recognized when the Group has a present obligation (legal or constructive) as a result of a past event, it is probable that an outflow of resources embodying economic benefits will be required to settle the obligation and a reliable estimate can be made of the amount of the obligation. Where the Group expects a provision to be reimbursed, the reimbursement is recognized as a separate asset but only when the reimbursement is virtually certain. If the effect of the time value of money is material, provisions are determined by discounting the expected future cash flows at a pre-tax rate that reflects current market assessments of the time value of money and, where appropriate, the risks specific to the liability. Where discounting is used, the increase in the provision due to the passage of time is recognized as interest expense. Provisions are reviewed at each reporting date and adjusted to reflect the current best estimate.
Borrowing Costs Borrowing costs directly attributable to the acquisition or construction of an asset that necessarily takes a substantial period of time to get ready for its intended use or sale are capitalized as part of the cost of the respective assets (included in “Real estate inventories” account in the consolidated statement of financial position). All other borrowing costs are expensed in the period in which they occur. Borrowing costs consist of interest and other costs that an entity incurs in connection with the borrowing of funds.
The interest capitalized is calculated using the Group’s weighted average cost of borrowings after adjusting for borrowings associated with specific developments. Where borrowings are associated with specific developments, the amounts capitalized is the gross interest incurred on those borrowings less any investment income arising on their temporary investment.
Interest is capitalized from the commencement of the development work until the date of practical completion. The capitalization of finance costs is suspended if there are prolonged periods when development activity is interrupted. Interest is also capitalized on the purchase cost of a site of property acquired specifically for redevelopment but only where activities necessary to prepare the asset for redevelopment are in progress.
Equity When the shares are sold at premium, the difference between the proceeds at the par value is credited to “Additional paid-in capital” account. Direct costs incurred related to equity issuance are chargeable to “Additional paid-in capital” account. If additional paid-in capital is not sufficient, the excess is charged against retained earnings. When the Group issues more than one class of stock, a separate account is maintained for each class of stock and the number of shares issued.
VISTA LAND & LIFESCAPES, INC. AND SUBSIDIARIESNOTES TO CONSOLIDATED FINANCIAL STATEMENTS

VISTA LAND ANNUAL REPORT 2010 97
- 23 -
*SGVMC115372*
Retained earnings represent accumulated earnings of the Group less dividends declared.
Own equity instruments which are reacquired (treasury shares) are recognized at cost and deducted from equity. No gain or loss is recognized in profit or loss on the purchase, sale, issue or cancellation of the Group’s own equity instruments. Any difference between the carrying amount and the consideration, if reissued, is recognized in additional paid-in capital. Voting rights related to treasury shares are nullified for the Group and no dividends are allocated to them respectively. When the shares are retired, the capital stock account is reduced by its par value and the excess of cost over par value upon retirement is debited to additional paid-in capital to the extent of the specific or average additional paid-in capital when the shares were issued and to retained earnings for the remaining balance.
Basic and Diluted Earnings Per Share (EPS) EPS is computed by dividing net income for the year attributable to common stockholders by the weighted average number of common shares issued and outstanding during the year adjusted for any subsequent stock dividends declared. Diluted EPS is computed by dividing net income for the year by the weighted average number of common shares issued and outstanding during the year after giving effect to assumed conversion of potential common shares. The calculation of diluted EPS does not assume conversion, exercise, or other issue of potential common shares that would have an antidilutive effect on earnings per share.
As of December 31, 2010, 2009 and 2008, the Group has no dilutive potential common shares.
Operating Segments The Group’s operating businesses are organized and managed separately according to the nature of the products and services provided, with each segment representing a strategic business unit that offers different products and serves different markets. Financial information on operating segments is presented in Note 5 to the consolidated financial statements.
Contingencies Contingent liabilities are not recognized in the consolidated financial statements. These are disclosed unless the possibility of an outflow of resources embodying economic benefits is remote. Contingent assets are not recognized in the consolidated financial statements but disclosed when an inflow of economic benefits is probable.
Events After the Reporting Date Post year-end events that provide additional information about the Group’s position at the reporting date (adjusting events) are reflected in the consolidated financial statements. Post year-end events that are not adjusting events are disclosed in the consolidated financial statements when material.
3. Significant Accounting Judgments and Estimates
The preparation of accompanying consolidated financial statements in compliance with PFRS requires management to make estimates and assumptions that affect the amounts reported in the consolidated financial statements and accompanying notes. The estimates and assumptions used in the consolidated financial statements are based upon management’s evaluation of relevant facts and circumstances as at the date of the consolidated financial statements. Actual results could differ from such estimates.
98 VISTA LAND ANNUAL REPORT 2010
- 24 -
*SGVMC115372*
Estimates and judgments are continually evaluated and are based on historical experience and other factors, including expectations of future events that are believed to be reasonable under the circumstances.
Judgments In the process of applying the Group’s accounting policies, management has made the following judgments, apart from those involving estimations, which have the most significant effect on the amounts recognized in the consolidated financial statements:
Revenue and cost recognition Selecting an appropriate revenue recognition method for a particular real estate sale transaction requires certain judgments based on, among others:
Buyer’s commitment on the sale which may be ascertained through the significance of the
buyer’s initial investment; and Stage of completion of the project.
Distinction between real estate inventories and land for future development The Group determines whether a property will be classified as Real estate inventories or Land for future development. In making this judgment, the Group considers whether the property will be sold in the normal operating cycle (Real estate inventories) or whether it will be retained as part of the Group’s strategic landbanking activities for development or sale in the medium or long-term (Land for future development).
Collectibility of the sales price For real estate sales, in determining whether the sales prices are collectible, the Group considers that initial and continuing investments by the buyer of about 5% would demonstrate the buyer’s commitment to pay.
Operating lease commitments - the Group as lessee The Group has entered into contract of lease for some of the office space it occupies. The Group has determined that all significant risks and benefits of ownership on these properties will be retained by the lessor. In determining significant risks and benefits of ownership, the Group considered, among others, the significance of the lease term as compared with the estimated useful life of the related asset. The Group accordingly accounted for these as operating leases.
Impairment of AFS financial assets carried at cost The Group follows the guidance of PAS 39 in determining when an asset is impaired. This determination requires significant judgment. In making this judgment, the Group evaluates, among other factors, the duration and extent to which the fair value of an investment is less than its cost; the financial health of and near-term business outlook of the investee, including factors such as industry and sector performance, changes in technology and operational and financing cash flow.
Contingencies The Group is currently involved in various legal proceedings. The estimate of probable costs for the resolution of these claims has been developed in consultation with outside counsel handling the defense in these matters and is based upon an analysis of potential results. The Group currently does not believe that these proceedings will have a material effect on the Group’s financial position (see Note 32).
VISTA LAND & LIFESCAPES, INC. AND SUBSIDIARIESNOTES TO CONSOLIDATED FINANCIAL STATEMENTS
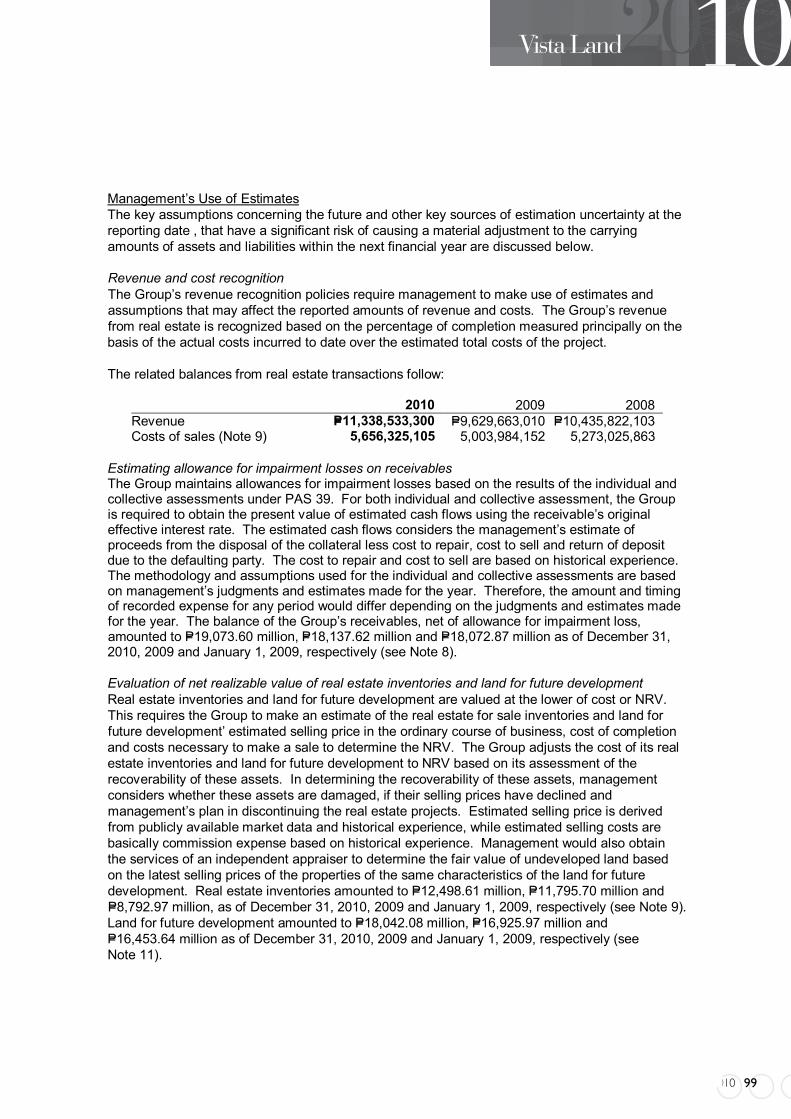
VISTA LAND ANNUAL REPORT 2010 99
- 25 -
*SGVMC115372*
Management’s Use of Estimates The key assumptions concerning the future and other key sources of estimation uncertainty at the reporting date , that have a significant risk of causing a material adjustment to the carrying amounts of assets and liabilities within the next financial year are discussed below.
Revenue and cost recognition The Group’s revenue recognition policies require management to make use of estimates and assumptions that may affect the reported amounts of revenue and costs. The Group’s revenue from real estate is recognized based on the percentage of completion measured principally on the basis of the actual costs incurred to date over the estimated total costs of the project.
The related balances from real estate transactions follow:
2010 2009 2008 Revenue P=11,338,533,300 P=9,629,663,010 P=10,435,822,103 Costs of sales (Note 9) 5,656,325,105 5,003,984,152 5,273,025,863
Estimating allowance for impairment losses on receivables The Group maintains allowances for impairment losses based on the results of the individual and collective assessments under PAS 39. For both individual and collective assessment, the Group is required to obtain the present value of estimated cash flows using the receivable’s original effective interest rate. The estimated cash flows considers the management’s estimate of proceeds from the disposal of the collateral less cost to repair, cost to sell and return of deposit due to the defaulting party. The cost to repair and cost to sell are based on historical experience. The methodology and assumptions used for the individual and collective assessments are based on management’s judgments and estimates made for the year. Therefore, the amount and timing of recorded expense for any period would differ depending on the judgments and estimates made for the year. The balance of the Group’s receivables, net of allowance for impairment loss, amounted to P=19,073.60 million, P=18,137.62 million and P=18,072.87 million as of December 31, 2010, 2009 and January 1, 2009, respectively (see Note 8).
Evaluation of net realizable value of real estate inventories and land for future development Real estate inventories and land for future development are valued at the lower of cost or NRV. This requires the Group to make an estimate of the real estate for sale inventories and land for future development’ estimated selling price in the ordinary course of business, cost of completion and costs necessary to make a sale to determine the NRV. The Group adjusts the cost of its real estate inventories and land for future development to NRV based on its assessment of the recoverability of these assets. In determining the recoverability of these assets, management considers whether these assets are damaged, if their selling prices have declined and management’s plan in discontinuing the real estate projects. Estimated selling price is derived from publicly available market data and historical experience, while estimated selling costs are basically commission expense based on historical experience. Management would also obtain the services of an independent appraiser to determine the fair value of undeveloped land based on the latest selling prices of the properties of the same characteristics of the land for future development. Real estate inventories amounted to P=12,498.61 million, P=11,795.70 million and P=8,792.97 million, as of December 31, 2010, 2009 and January 1, 2009, respectively (see Note 9). Land for future development amounted to P=18,042.08 million, P=16,925.97 million and P=16,453.64 million as of December 31, 2010, 2009 and January 1, 2009, respectively (see Note 11).
100 VISTA LAND ANNUAL REPORT 2010
- 26 -
*SGVMC115372*
Evaluation of impairment The Group reviews investment in an associate, interests in joint ventures, property and equipment and system development costs for impairment of value. This includes considering certain indications of impairment such as significant changes in asset usage, significant decline in assets’ market value, obsolescence or physical damage of an asset, significant underperformance relative to expected historical or projected future operating results and significant negative industry or economic trends.
The Group estimates the recoverable amount as the higher of the fair value les cost to sell and value in use. In determining the present value of estimated future cash flows expected to be generated from the continued use of the assets, the Group is required to make estimates and assumptions that may affect investment in an associate, property and equipment and system development cost. The fair value less costs to sell calculation is based on available data from binding sales transactions in an arm’s length transaction of similar assets or observable market prices less incremental costs for disposing of the asset. The value in use calculation is based on a discounted cash flow model. The cash flows are derived from the budget for the next five years and do not include restructuring activities that the Group is not yet committed to or significant future investments that will enhance the asset’s performance of the cash generating unit being tested. The recoverable amount is most sensitive to the discount rate used for the discounted cash flow model as well as the expected future cash inflows and the growth rate used for extrapolation purposes.
Based on management assessment as of December 31, 2010, 2009 and January 1, 2009, no indicators of impairment exist for investment in an associate, property and equipment, and systems development costs. The aggregate carrying values of investment in an associate, property and equipment and system development costs amounted to P=831.15 million, P=835.27 million and P=809.24 million as of December 31, 2010, 2009 and January 1, 2009, respectively (see Notes 12, 13 and 15).
Estimating useful lives of property and equipment The Group estimates the useful lives of property and equipment based on the period over which the assets are expected to be available for use. The estimated useful lives of property and equipment are reviewed at least annually and are updated if expectations differ from previous estimates due to physical wear and tear and technical or commercial obsolescence on the use of these property and equipment. It is possible that future results of operations could be materially affected by changes in these estimates brought about by changes in factors mentioned above. Property and equipment amounted to P=118.93 million, P=92.19 million and P=94.80 million as of December 31, 2010, 2009 and January 1, 2009, respectively (see Note 13).
Recognizing deferred tax assets The Group reviews the carrying amounts of deferred income taxes at each reporting date and reduces deferred tax assets to the extent that it is no longer probable that sufficient taxable income will be available to allow all or part of the deferred tax assets to be utilized. However, there is no assurance that the Group will generate sufficient taxable income to allow all or part of deferred tax assets to be utilized. The Group looks at its projected performance in assessing the sufficiency of future taxable income. As of December 31, 2010, the Group has unrecognized deferred tax assets amounting to P= 471.57 million (see Note 27).
VISTA LAND & LIFESCAPES, INC. AND SUBSIDIARIESNOTES TO CONSOLIDATED FINANCIAL STATEMENTS

VISTA LAND ANNUAL REPORT 2010 101
- 27 -
*SGVMC115372*
Estimating pension obligation and other retirement benefits The determination of the Group’s pension liabilities is dependent on selection of certain assumptions used by actuaries in calculating such amounts. Those assumptions are described in Note 25 and include among others, discount rates, expected returns on plan assets and rates of salary increase. While the Group believes that the assumptions are reasonable and appropriate, significant differences in actual experience or significant changes in assumptions may materially affect retirement obligations. See Note 25 to the consolidated financial statements for the related balances.
Fair value of financial instruments Where the fair values of financial assets and financial liabilities recorded in the consolidated statement of financial position cannot be derived from active markets, they are determined using internal valuation techniques using generally accepted market valuation models. The inputs to these models are taken from observable markets where possible, but where this is not feasible, estimates are used in establishing fair values. These estimates may include considerations of liquidity, volatility, and correlation. Certain financial assets and liabilities were initially recorded at its fair value by using the discounted cash flow methodology (see Note 29).
4. Business Combinations
Acquisition of VRI On October 29, 2009, the Parent Company acquired from PPHI and various shareholders, 100% ownership of VRI for a total consideration of P=661.61 million. The Parent Company accounted for the acquisition using the purchase method.
The Group acquired VRI to consolidate the development and selling of all vertical and high-rise condominium projects of the Group under a new brand name “Vista Residences”. The brand consolidation is intended to have a clearer and stronger market identity of the Group’s vertical development projects. Moreover, the acquisition of VRI is part of the Group’s strategic focus to broaden its real estate portfolio and increase its revenue base. The Group indirectly acquired four mixed residential and commercial condominium projects of VRI namely, the Symphony Tower 1, Presidio Complex, Madison Place Tower and Crown Tower. Accordingly, VRI’s financial statements are consolidated on a line-by-line basis with that of the Group as of December 31, 2009.
The net assets recognized in the December 31, 2009 financial statements were based on a provisional assessment of fair value as the Group had sought an independent valuation for the assets owned by VRI.
The accounting for business combination was done provisionally due to lack of proper fair value estimate of assets acquired and liabilities assumed as of to date.
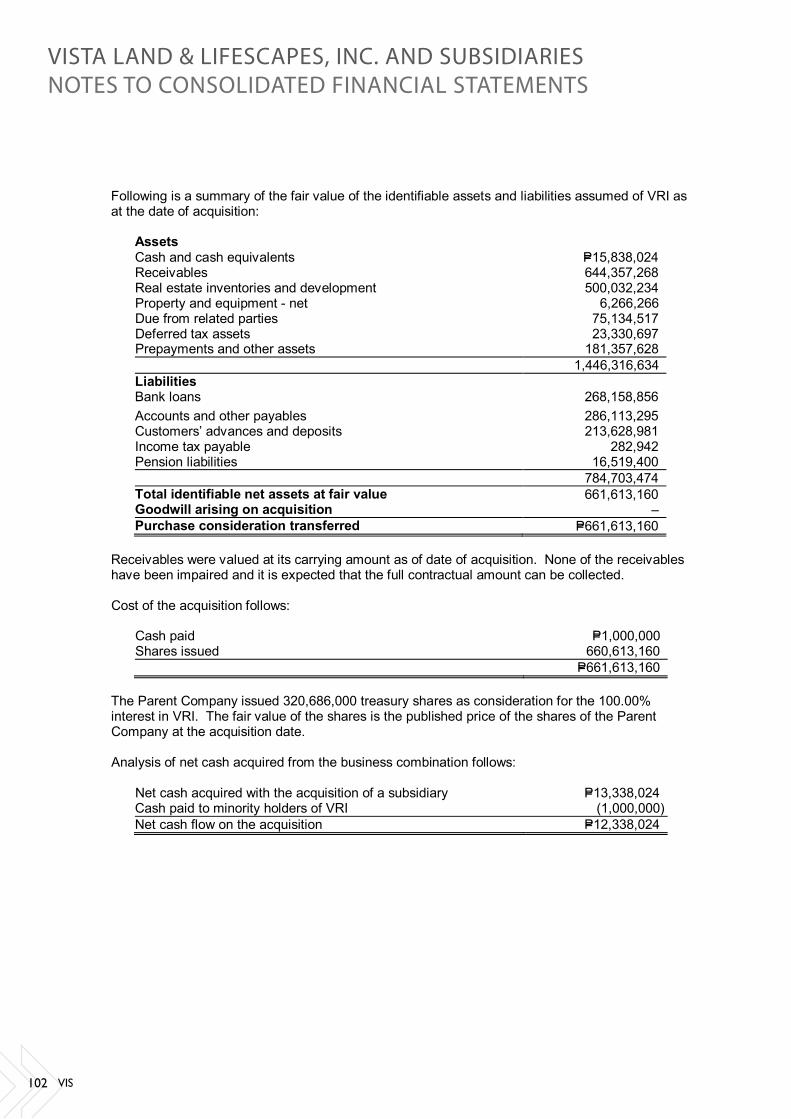
102 VISTA LAND ANNUAL REPORT 2010
- 28 -
*SGVMC115372*
Following is a summary of the fair value of the identifiable assets and liabilities assumed of VRI as at the date of acquisition:
Assets Cash and cash equivalents P=15,838,024 Receivables 644,357,268 Real estate inventories and development 500,032,234 Property and equipment - net 6,266,266 Due from related parties 75,134,517 Deferred tax assets 23,330,697 Prepayments and other assets 181,357,628 1,446,316,634 Liabilities Bank loans 268,158,856 Accounts and other payables 286,113,295 Customers’ advances and deposits 213,628,981 Income tax payable 282,942 Pension liabilities 16,519,400 784,703,474 Total identifiable net assets at fair value 661,613,160 Goodwill arising on acquisition – Purchase consideration transferred P=661,613,160
Receivables were valued at its carrying amount as of date of acquisition. None of the receivables have been impaired and it is expected that the full contractual amount can be collected.
Cost of the acquisition follows:
Cash paid P=1,000,000 Shares issued 660,613,160 P=661,613,160
The Parent Company issued 320,686,000 treasury shares as consideration for the 100.00% interest in VRI. The fair value of the shares is the published price of the shares of the Parent Company at the acquisition date.
Analysis of net cash acquired from the business combination follows:
Net cash acquired with the acquisition of a subsidiary P=13,338,024 Cash paid to minority holders of VRI (1,000,000) Net cash flow on the acquisition P=12,338,024
VISTA LAND & LIFESCAPES, INC. AND SUBSIDIARIESNOTES TO CONSOLIDATED FINANCIAL STATEMENTS

VISTA LAND ANNUAL REPORT 2010 103
- 29 -
*SGVMC115372*
From the date of acquisition, VRI has contributed P=518.18 million of revenue and P=105.82 million to the income before income tax of the Group. If the combination had taken place at the beginning of the year, consolidated revenue would have been P=11,412.62 million and the net income for the Group would have been P=2,405.22 million.
In 2010, the Parent Company finalized its purchased price allocation and there were no significant changes to the fair values of the assets acquired and liabilities assumed of VRI.
5. Segment Information
For management purposes, the Group’s operating segments are organized and managed separately according to the nature of the products provided, with each segment representing a strategic business unit that offers different products and serves different markets. The Group has two reportable operating segments as follows:
Horizontal Projects This segment pertains to the housing market segment of the Group. It caters on the development and sale of residential lots and units.
Vertical Projects This segment caters on the development and sale of residential high-rise condominium projects across the Philippines. Vertical home projects involve dealing with longer gestation periods and has requirements that are different from those of horizontal homes.
Management monitors the operating results of its business units separately for the purpose of making decisions about resource allocation and performance assessment. Segment performance is evaluated based on segment operating income or loss before income tax. Segment operating income or loss before income tax is based on the same accounting policies as consolidated operating income or loss. The Group has no intersegment revenues. No operating segments have been aggregated to form the above reportable operating business segments. The chief operating decision-maker (CODM) has been identified as the chief executive officer. The CODM reviews the Group’s internal reports in order to assess performance of the Group.
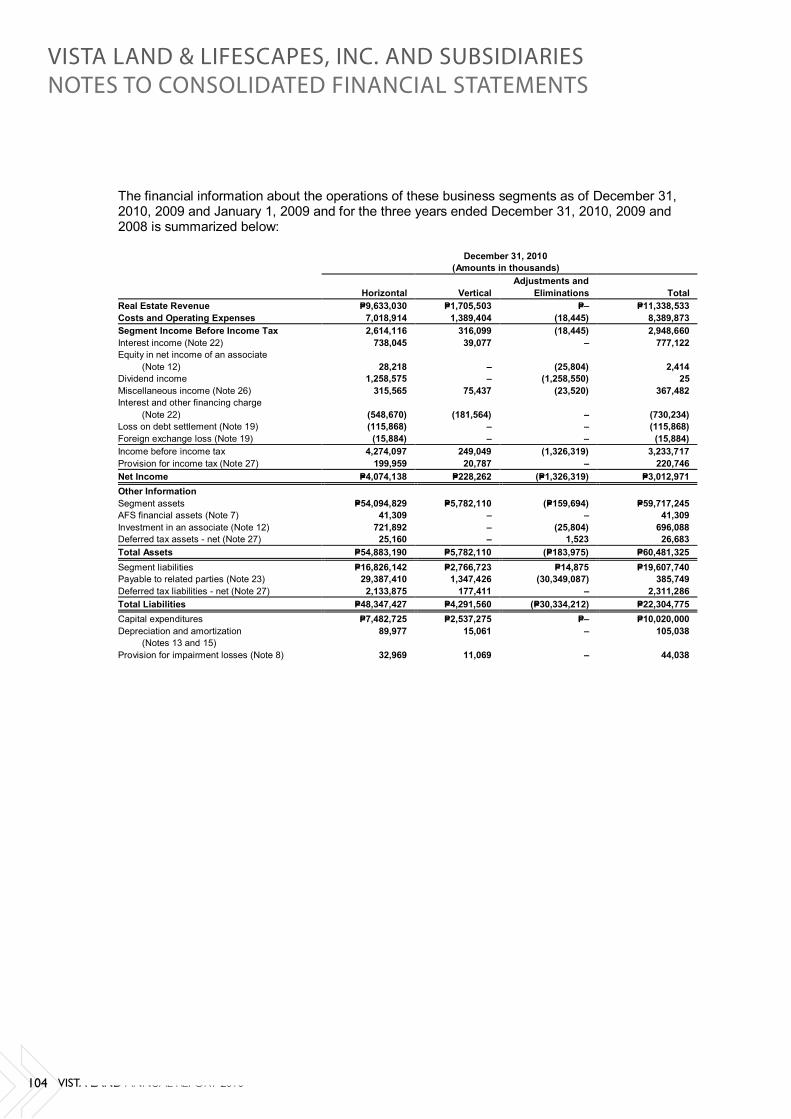
104 VISTA LAND ANNUAL REPORT 2010
- 30 -
*SGVMC115372*
The financial information about the operations of these business segments as of December 31, 2010, 2009 and January 1, 2009 and for the three years ended December 31, 2010, 2009 and 2008 is summarized below:
December 31, 2010 (Amounts in thousands)
Horizontal
Vertical Adjustments and
Eliminations Total Real Estate Revenue P=9,633,030 P=1,705,503 P=– P=11,338,533 Costs and Operating Expenses 7,018,914 1,389,404 (18,445) 8,389,873 Segment Income Before Income Tax 2,614,116 316,099 (18,445) 2,948,660 Interest income (Note 22) 738,045 39,077 – 777,122 Equity in net income of an associate (Note 12) 28,218 – (25,804) 2,414 Dividend income 1,258,575 – (1,258,550) 25 Miscellaneous income (Note 26) 315,565 75,437 (23,520) 367,482 Interest and other financing charge
(Note 22)
(548,670)
(181,564) – (730,234) Loss on debt settlement (Note 19) (115,868) – – (115,868) Foreign exchange loss (Note 19) (15,884) – – (15,884) Income before income tax 4,274,097 249,049 (1,326,319) 3,233,717 Provision for income tax (Note 27) 199,959 20,787 – 220,746 Net Income P=4,074,138 P=228,262 (P=1,326,319) P=3,012,971 Other Information Segment assets P=54,094,829 P=5,782,110 (P=159,694) P=59,717,245 AFS financial assets (Note 7) 41,309 – – 41,309 Investment in an associate (Note 12) 721,892 – (25,804) 696,088 Deferred tax assets - net (Note 27) 25,160 – 1,523 26,683 Total Assets P=54,883,190 P=5,782,110 (P=183,975) P=60,481,325 Segment liabilities P=16,826,142 P=2,766,723 P=14,875 P=19,607,740 Payable to related parties (Note 23) 29,387,410 1,347,426 (30,349,087) 385,749 Deferred tax liabilities - net (Note 27) 2,133,875 177,411 – 2,311,286 Total Liabilities P=48,347,427 P=4,291,560 (P=30,334,212) P=22,304,775 Capital expenditures P=7,482,725 P=2,537,275 P=– P=10,020,000 Depreciation and amortization (Notes 13 and 15)
89,977 15,061 – 105,038
Provision for impairment losses (Note 8) 32,969 11,069 – 44,038
VISTA LAND & LIFESCAPES, INC. AND SUBSIDIARIESNOTES TO CONSOLIDATED FINANCIAL STATEMENTS
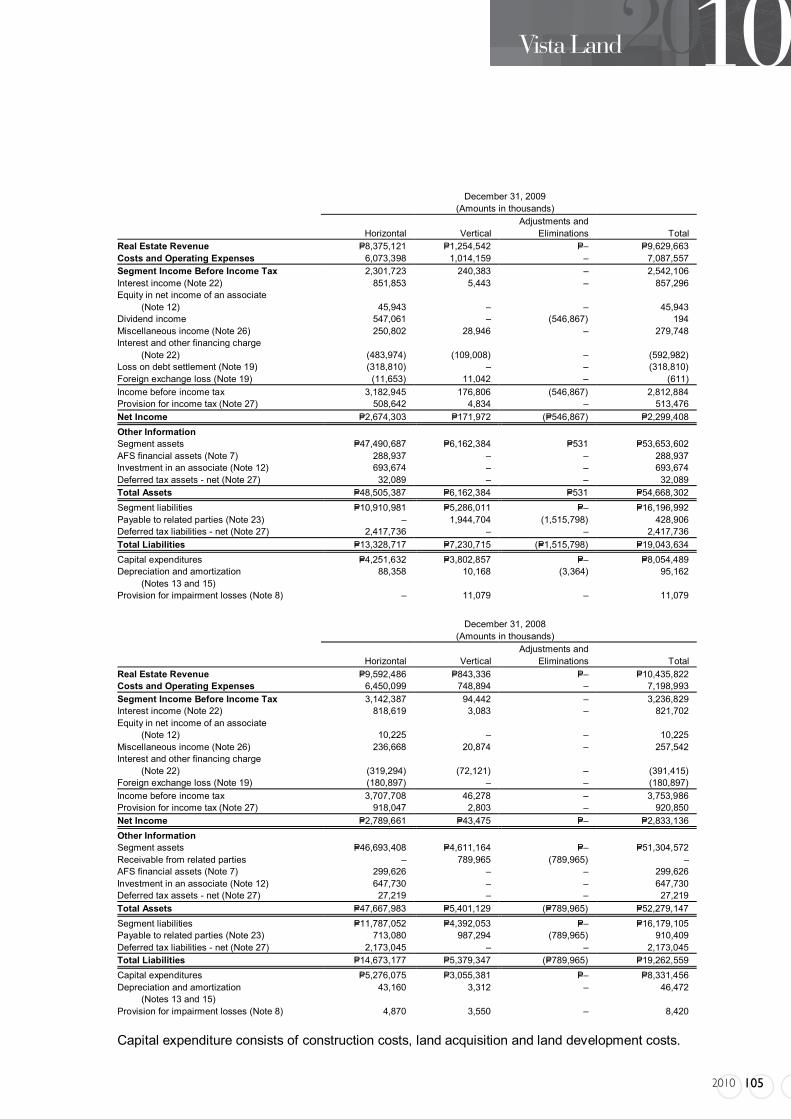
VISTA LAND ANNUAL REPORT 2010 105
- 31 -
*SGVMC115372*
December 31, 2009 (Amounts in thousands)
Horizontal
Vertical Adjustments and
Eliminations Total Real Estate Revenue P=8,375,121 P=1,254,542 P=– P=9,629,663 Costs and Operating Expenses 6,073,398 1,014,159 – 7,087,557 Segment Income Before Income Tax 2,301,723 240,383 – 2,542,106 Interest income (Note 22) 851,853 5,443 – 857,296 Equity in net income of an associate (Note 12) 45,943 – – 45,943 Dividend income 547,061 – (546,867) 194 Miscellaneous income (Note 26) 250,802 28,946 – 279,748 Interest and other financing charge
(Note 22)
(483,974)
(109,008) – (592,982) Loss on debt settlement (Note 19) (318,810) – – (318,810) Foreign exchange loss (Note 19) (11,653) 11,042 – (611) Income before income tax 3,182,945 176,806 (546,867) 2,812,884 Provision for income tax (Note 27) 508,642 4,834 – 513,476 Net Income P=2,674,303 P=171,972 (P=546,867) P=2,299,408 Other Information Segment assets P=47,490,687 P=6,162,384 P=531 P=53,653,602 AFS financial assets (Note 7) 288,937 – – 288,937 Investment in an associate (Note 12) 693,674 – – 693,674 Deferred tax assets - net (Note 27) 32,089 – – 32,089 Total Assets P=48,505,387 P=6,162,384 P=531 P=54,668,302 Segment liabilities P=10,910,981 P=5,286,011 P=– P=16,196,992 Payable to related parties (Note 23) – 1,944,704 (1,515,798) 428,906 Deferred tax liabilities - net (Note 27) 2,417,736 – – 2,417,736 Total Liabilities P=13,328,717 P=7,230,715 (P=1,515,798) P=19,043,634 Capital expenditures P=4,251,632 P=3,802,857 P=– P=8,054,489 Depreciation and amortization (Notes 13 and 15)
88,358 10,168 (3,364) 95,162
Provision for impairment losses (Note 8) – 11,079 – 11,079
December 31, 2008 (Amounts in thousands)
Horizontal
Vertical Adjustments and
Eliminations Total Real Estate Revenue P=9,592,486 P=843,336 P=– P=10,435,822 Costs and Operating Expenses 6,450,099 748,894 – 7,198,993 Segment Income Before Income Tax 3,142,387 94,442 – 3,236,829 Interest income (Note 22) 818,619 3,083 – 821,702 Equity in net income of an associate (Note 12) 10,225 – – 10,225 Miscellaneous income (Note 26) 236,668 20,874 – 257,542 Interest and other financing charge
(Note 22)
(319,294)
(72,121) – (391,415) Foreign exchange loss (Note 19) (180,897) – – (180,897) Income before income tax 3,707,708 46,278 – 3,753,986 Provision for income tax (Note 27) 918,047 2,803 – 920,850 Net Income P=2,789,661 P=43,475 P=– P=2,833,136 Other Information Segment assets P=46,693,408 P=4,611,164 P=– P=51,304,572 Receivable from related parties – 789,965 (789,965) – AFS financial assets (Note 7) 299,626 – – 299,626 Investment in an associate (Note 12) 647,730 – – 647,730 Deferred tax assets - net (Note 27) 27,219 – – 27,219 Total Assets P=47,667,983 P=5,401,129 (P=789,965) P=52,279,147 Segment liabilities P=11,787,052 P=4,392,053 P=– P=16,179,105 Payable to related parties (Note 23) 713,080 987,294 (789,965) 910,409 Deferred tax liabilities - net (Note 27) 2,173,045 – – 2,173,045 Total Liabilities P=14,673,177 P=5,379,347 (P=789,965) P=19,262,559 Capital expenditures P=5,276,075 P=3,055,381 P=– P=8,331,456 Depreciation and amortization (Notes 13 and 15)
43,160 3,312 – 46,472
Provision for impairment losses (Note 8) 4,870 3,550 – 8,420
Capital expenditure consists of construction costs, land acquisition and land development costs.

106 VISTA LAND ANNUAL REPORT 2010
VISTA LAND & LIFESCAPES, INC. AND SUBSIDIARIESNOTES TO CONSOLIDATED FINANCIAL STATEMENTS

VISTA LAND ANNUAL REPORT 2010 107
- 33 -
*SGVMC115372*
8. Receivables
This account consists of:
December 31 January 1 2010 2009 2009 Installment contracts receivable P=16,140,816,767 P=15,702,478,476 P=16,019,521,931 Accrued interest receivable 51,408,905 24,435,724 146,434,100 Accounts receivable Contractors 1,433,459,774 1,123,224,373 1,649,697,016 Buyers 777,852,445 656,019,148 725,281,338 Brokers 82,362,666 20,819,070 15,503,388 Employees 18,114,616 9,078,370 7,604,890 Others 883,911,020 926,540,430 183,690,510 19,387,926,193 18,462,595,591 18,747,733,173 Less allowance for impairment
losses (314,331,094) (324,973,753) (674,860,845) 19,073,595,099 18,137,621,838 18,072,872,328 Less noncurrent portion 8,253,105,474 8,370,231,418 5,187,818,787
P=10,820,489,625 P=9,767,390,420 P=12,885,053,541
Installment contracts receivable Installment contracts receivable consist of accounts collectible in equal monthly installments with various terms up to a maximum of fifteen years. The corresponding titles to the subdivision units sold under this arrangement are transferred to the buyers only upon full payment of the contract price. The installment contracts receivable are interest-bearing except for those that are with installment schemes within two years. Interest rates on installment contracts receivables range from 16.00% and 19.00%.
Receivable from contractors Receivable from contractors are recouped every progress billing payment date depending on the percentage of accomplishment.
Receivable from buyers
Receivables from buyers pertain to sale of real estate units owned by joint venture partners that were sold by the Group by virtue of a marketing agreement between the Group and the joint venture partners. These sales do not form part of the Group's revenue and collections from buyers are remitted to the joint venture partners net of any marketing fees agreed by the parties.
Receivable from brokers
Receivable from brokers are recouped every progress billing depending on the collection milestone and submission of necessary buyer’s documents.
Receivable from employees
Receivable from employees pertains to cash advances for retitling costs, taxes and other site related expenses.
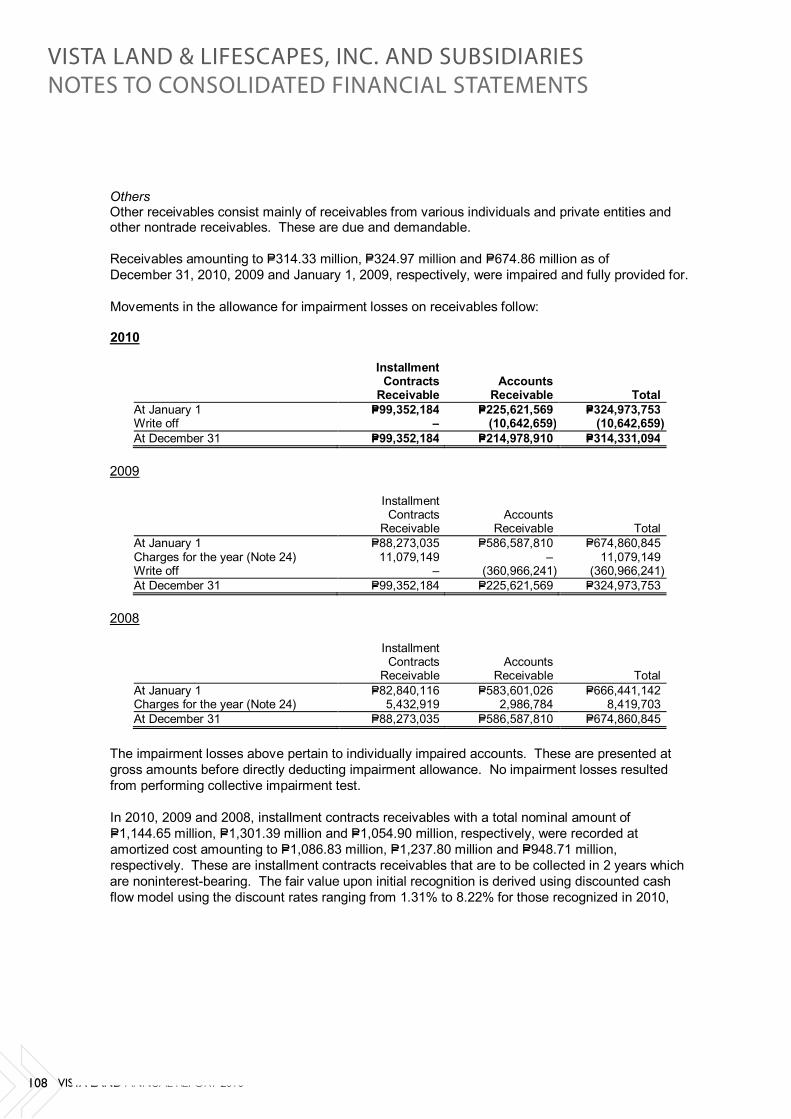
108 VISTA LAND ANNUAL REPORT 2010
- 34 -
*SGVMC115372*
Others Other receivables consist mainly of receivables from various individuals and private entities and other nontrade receivables. These are due and demandable.
Receivables amounting to P=314.33 million, P=324.97 million and P=674.86 million as of December 31, 2010, 2009 and January 1, 2009, respectively, were impaired and fully provided for. Movements in the allowance for impairment losses on receivables follow:
2010
Installment Contracts
Receivable Accounts
Receivable Total At January 1 P=99,352,184 P=225,621,569 P=324,973,753 Write off – (10,642,659) (10,642,659) At December 31 P=99,352,184 P=214,978,910 P=314,331,094
2009
Installment Contracts
Receivable Accounts
Receivable Total At January 1 P=88,273,035 P=586,587,810 P=674,860,845 Charges for the year (Note 24) 11,079,149 – 11,079,149 Write off – (360,966,241) (360,966,241) At December 31 P=99,352,184 P=225,621,569 P=324,973,753
2008
Installment Contracts
Receivable Accounts
Receivable Total At January 1 P=82,840,116 P=583,601,026 P=666,441,142 Charges for the year (Note 24) 5,432,919 2,986,784 8,419,703 At December 31 P=88,273,035 P=586,587,810 P=674,860,845
The impairment losses above pertain to individually impaired accounts. These are presented at gross amounts before directly deducting impairment allowance. No impairment losses resulted from performing collective impairment test.
In 2010, 2009 and 2008, installment contracts receivables with a total nominal amount of P=1,144.65 million, P=1,301.39 million and P=1,054.90 million, respectively, were recorded at amortized cost amounting to P=1,086.83 million, P=1,237.80 million and P=948.71 million, respectively. These are installment contracts receivables that are to be collected in 2 years which are noninterest-bearing. The fair value upon initial recognition is derived using discounted cash flow model using the discount rates ranging from 1.31% to 8.22% for those recognized in 2010,
VISTA LAND & LIFESCAPES, INC. AND SUBSIDIARIESNOTES TO CONSOLIDATED FINANCIAL STATEMENTS

VISTA LAND ANNUAL REPORT 2010 109
- 35 -
*SGVMC115372*
4.69% to 11.20% for those recognized in 2009 and 5.00% to 12.00% for those recognized in 2008. Interest income recognized from these receivables amounted to P=80.92 million, P=84.68 million and P=79.35 million in 2010, 2009 and 2008, respectively. The unamortized discount amounted to P=66.43 million, P=89.12 million, and P=126.30 million as of December 31, 2010, 2009 and January 1, 2009, respectively. Movement in unamortized discount arising from noninterest-bearing receivables is as follows:
2010 2009 2008 Balance at beginning of year P=89,118,030 P=126,299,472 P=72,790,601 Additions 54,960,161 47,502,199 132,859,174 Accretion (Note 22) (77,651,839) (84,683,641) (79,350,303) Balance at end of year P=66,426,352 P=89,118,030 P=126,299,472
In 2010, 2009 and 2008, the Group entered into various purchase agreements with financial institutions whereby the Group sold its installment contracts receivables on a with recourse basis. The purchase agreements provide that the Group should substitute defaulted contracts to sell with other contracts to sell of equivalent value. The Group still retains the sold receivables in the installment contracts receivables account and records the proceeds from these sales as loans payable (see Note 16). The carrying value of installment contracts receivables sold amounted to P=3,567.77 million, P=4,229.22 million and P=3,372.00 million in 2010, 2009 and 2008, respectively.
In 2010 and 2009, the Group entered into agreement with various financial institutions whereby the Group sold its installment contracts receivables on a without recourse basis at discount rate of 5.00% and 14.00%, respectively. The carrying value of sold receivables amounted to P=1.42 billion in 2010 and P=1.50 billion in 2009. Proceeds received from the purchasing financial institutions and discount on sold receivables recorded by the Group amounted to P=1.37 billion and P=46.57 million in 2010, respectively, and P=1.43 billion and P=66.00 million in 2009, respectively. The discount has been included under “Interest and other financing charges” account in profit or loss.
9. Real Estate Inventories This account consists of:
December 31 January 1
2010 2009
(Note 33) 2009
(Note 33) Subdivision land for sale and development P=14,091,236,267 P=13,172,183,157 P=12,600,279,766 Less reserve for land development costs 5,764,316,116 5,397,717,742 5,700,237,993 8,326,920,151 7,774,465,415 6,900,041,773 Residential house units for sale and development 1,492,295,854 1,440,913,179 1,892,923,852 Condominium units for sale and development 2,679,393,219 2,580,319,503 – 4,171,689,073 4,021,232,682 1,892,923,852 P=12,498,609,224 P=11,795,698,097 P=8,792,965,625
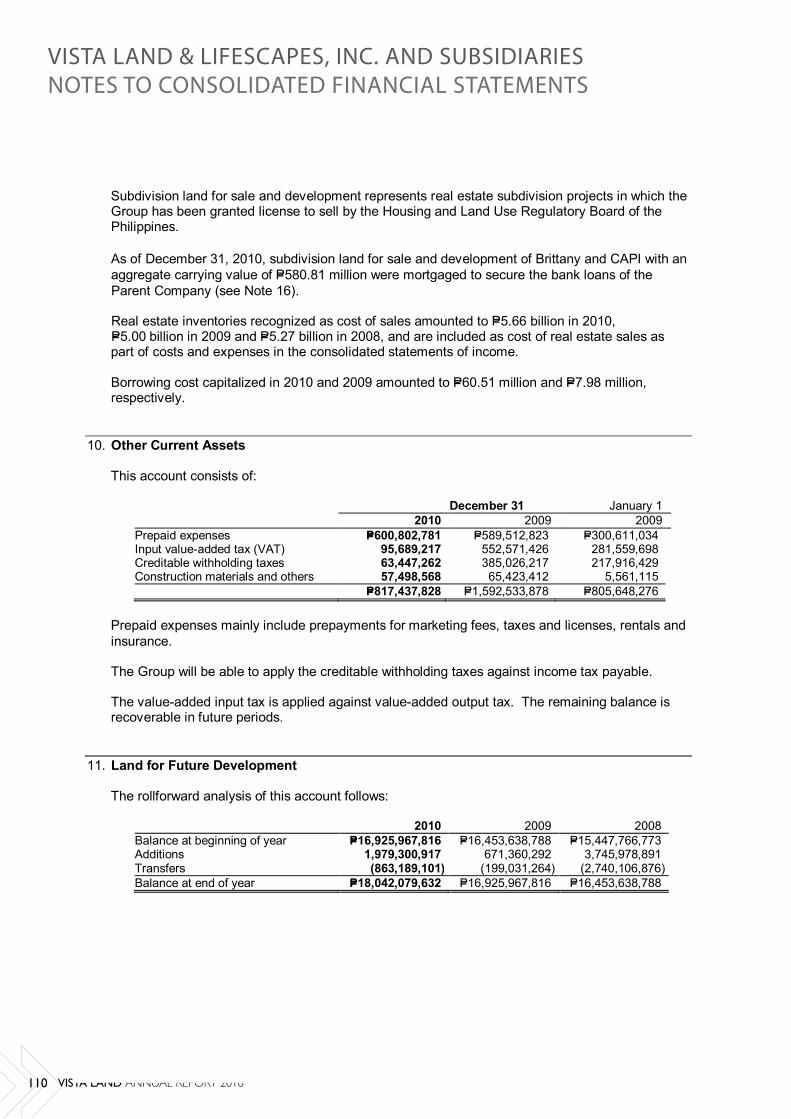
110 VISTA LAND ANNUAL REPORT 2010
- 36 -
*SGVMC115372*
Subdivision land for sale and development represents real estate subdivision projects in which the Group has been granted license to sell by the Housing and Land Use Regulatory Board of the Philippines. As of December 31, 2010, subdivision land for sale and development of Brittany and CAPI with an aggregate carrying value of P=580.81 million were mortgaged to secure the bank loans of the Parent Company (see Note 16).
Real estate inventories recognized as cost of sales amounted to P=5.66 billion in 2010, P=5.00 billion in 2009 and P=5.27 billion in 2008, and are included as cost of real estate sales as part of costs and expenses in the consolidated statements of income.
Borrowing cost capitalized in 2010 and 2009 amounted to P=60.51 million and P=7.98 million, respectively.
10. Other Current Assets
This account consists of:
December 31 January 1 2010 2009 2009 Prepaid expenses P=600,802,781 P=589,512,823 P=300,611,034 Input value-added tax (VAT) 95,689,217 552,571,426 281,559,698 Creditable withholding taxes 63,447,262 385,026,217 217,916,429 Construction materials and others 57,498,568 65,423,412 5,561,115 P=817,437,828 P=1,592,533,878 P=805,648,276
Prepaid expenses mainly include prepayments for marketing fees, taxes and licenses, rentals and insurance.
The Group will be able to apply the creditable withholding taxes against income tax payable.
The value-added input tax is applied against value-added output tax. The remaining balance is recoverable in future periods.
11. Land for Future Development
The rollforward analysis of this account follows:
2010 2009 2008 Balance at beginning of year P=16,925,967,816 P=16,453,638,788 P=15,447,766,773 Additions 1,979,300,917 671,360,292 3,745,978,891 Transfers (863,189,101) (199,031,264) (2,740,106,876) Balance at end of year P=18,042,079,632 P=16,925,967,816 P=16,453,638,788
VISTA LAND & LIFESCAPES, INC. AND SUBSIDIARIESNOTES TO CONSOLIDATED FINANCIAL STATEMENTS
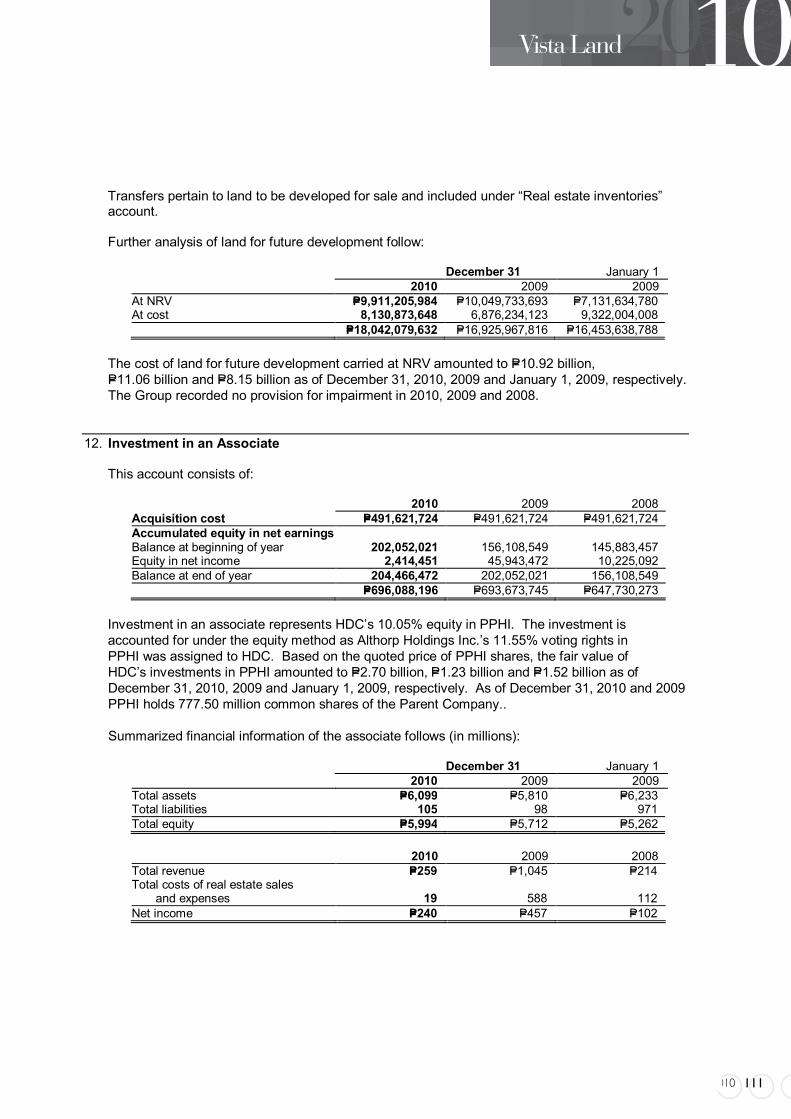
VISTA LAND ANNUAL REPORT 2010 111
- 37 -
*SGVMC115372*
Transfers pertain to land to be developed for sale and included under “Real estate inventories” account. Further analysis of land for future development follow:
December 31 January 1 2010 2009 2009 At NRV P=9,911,205,984 P=10,049,733,693 P=7,131,634,780 At cost 8,130,873,648 6,876,234,123 9,322,004,008 P=18,042,079,632 P=16,925,967,816 P=16,453,638,788
The cost of land for future development carried at NRV amounted to P=10.92 billion, P=11.06 billion and P=8.15 billion as of December 31, 2010, 2009 and January 1, 2009, respectively. The Group recorded no provision for impairment in 2010, 2009 and 2008.
12. Investment in an Associate
This account consists of:
2010 2009 2008 Acquisition cost P=491,621,724 P=491,621,724 P=491,621,724 Accumulated equity in net earnings Balance at beginning of year 202,052,021 156,108,549 145,883,457 Equity in net income 2,414,451 45,943,472 10,225,092 Balance at end of year 204,466,472 202,052,021 156,108,549 P=696,088,196 P=693,673,745 P=647,730,273
Investment in an associate represents HDC’s 10.05% equity in PPHI. The investment is accounted for under the equity method as Althorp Holdings Inc.’s 11.55% voting rights in PPHI was assigned to HDC. Based on the quoted price of PPHI shares, the fair value of HDC’s investments in PPHI amounted to P=2.70 billion, P=1.23 billion and P=1.52 billion as of December 31, 2010, 2009 and January 1, 2009, respectively. As of December 31, 2010 and 2009 PPHI holds 777.50 million common shares of the Parent Company..
Summarized financial information of the associate follows (in millions):
December 31 January 1 2010 2009 2009 Total assets P=6,099 P=5,810 P=6,233 Total liabilities 105 98 971 Total equity P=5,994 P=5,712 P=5,262
2010 2009 2008 Total revenue P=259 P=1,045 P=214 Total costs of real estate sales and expenses 19 588 112 Net income P=240 P=457 P=102
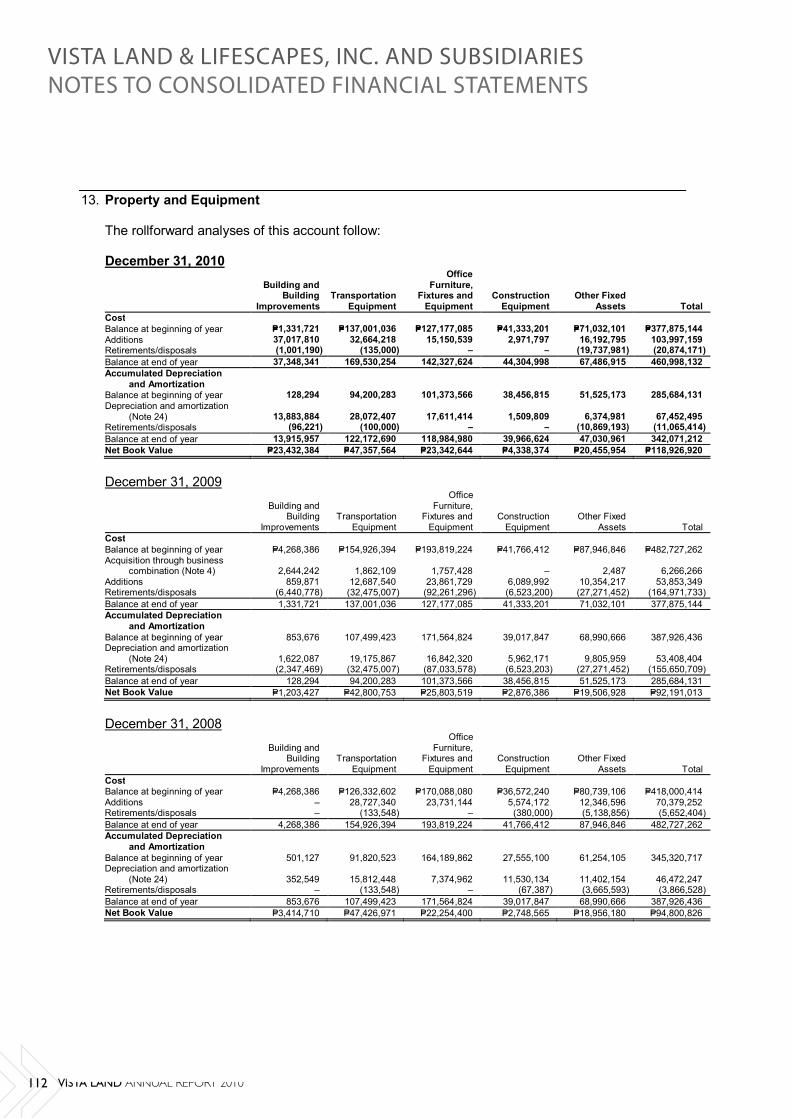
112 VISTA LAND ANNUAL REPORT 2010
- 38 -
*SGVMC115372*
13. Property and Equipment
The rollforward analyses of this account follow:
December 31, 2010
Building and Building
Improvements Transportation
Equipment
Office Furniture,
Fixtures and Equipment
Construction Equipment
Other Fixed Assets Total
Cost Balance at beginning of year P=1,331,721 P=137,001,036 P=127,177,085 P=41,333,201 P=71,032,101 P=377,875,144 Additions 37,017,810 32,664,218 15,150,539 2,971,797 16,192,795 103,997,159 Retirements/disposals (1,001,190) (135,000) – – (19,737,981) (20,874,171) Balance at end of year 37,348,341 169,530,254 142,327,624 44,304,998 67,486,915 460,998,132 Accumulated Depreciation and Amortization Balance at beginning of year 128,294 94,200,283 101,373,566 38,456,815 51,525,173 285,684,131 Depreciation and amortization (Note 24) 13,883,884 28,072,407 17,611,414 1,509,809 6,374,981 67,452,495 Retirements/disposals (96,221) (100,000) – – (10,869,193) (11,065,414) Balance at end of year 13,915,957 122,172,690 118,984,980 39,966,624 47,030,961 342,071,212 Net Book Value P=23,432,384 P=47,357,564 P=23,342,644 P=4,338,374 P=20,455,954 P=118,926,920
December 31, 2009
Building and Building
Improvements Transportation
Equipment
Office Furniture,
Fixtures and Equipment
Construction Equipment
Other Fixed Assets Total
Cost Balance at beginning of year P=4,268,386 P=154,926,394 P=193,819,224 P=41,766,412 P=87,946,846 P=482,727,262 Acquisition through business combination (Note 4) 2,644,242 1,862,109 1,757,428 – 2,487 6,266,266 Additions 859,871 12,687,540 23,861,729 6,089,992 10,354,217 53,853,349 Retirements/disposals (6,440,778) (32,475,007) (92,261,296) (6,523,200) (27,271,452) (164,971,733) Balance at end of year 1,331,721 137,001,036 127,177,085 41,333,201 71,032,101 377,875,144 Accumulated Depreciation and Amortization Balance at beginning of year 853,676 107,499,423 171,564,824 39,017,847 68,990,666 387,926,436 Depreciation and amortization (Note 24) 1,622,087 19,175,867 16,842,320 5,962,171 9,805,959 53,408,404 Retirements/disposals (2,347,469) (32,475,007) (87,033,578) (6,523,203) (27,271,452) (155,650,709) Balance at end of year 128,294 94,200,283 101,373,566 38,456,815 51,525,173 285,684,131 Net Book Value P=1,203,427 P=42,800,753 P=25,803,519 P=2,876,386 P=19,506,928 P=92,191,013
December 31, 2008
Building and Building
Improvements Transportation
Equipment
Office Furniture,
Fixtures and Equipment
Construction Equipment
Other Fixed Assets Total
Cost Balance at beginning of year P=4,268,386 P=126,332,602 P=170,088,080 P=36,572,240 P=80,739,106 P=418,000,414 Additions – 28,727,340 23,731,144 5,574,172 12,346,596 70,379,252 Retirements/disposals – (133,548) – (380,000) (5,138,856) (5,652,404) Balance at end of year 4,268,386 154,926,394 193,819,224 41,766,412 87,946,846 482,727,262 Accumulated Depreciation and Amortization Balance at beginning of year 501,127 91,820,523 164,189,862 27,555,100 61,254,105 345,320,717 Depreciation and amortization (Note 24) 352,549 15,812,448 7,374,962 11,530,134 11,402,154 46,472,247 Retirements/disposals – (133,548) – (67,387) (3,665,593) (3,866,528) Balance at end of year 853,676 107,499,423 171,564,824 39,017,847 68,990,666 387,926,436 Net Book Value P=3,414,710 P=47,426,971 P=22,254,400 P=2,748,565 P=18,956,180 P=94,800,826
VISTA LAND & LIFESCAPES, INC. AND SUBSIDIARIESNOTES TO CONSOLIDATED FINANCIAL STATEMENTS
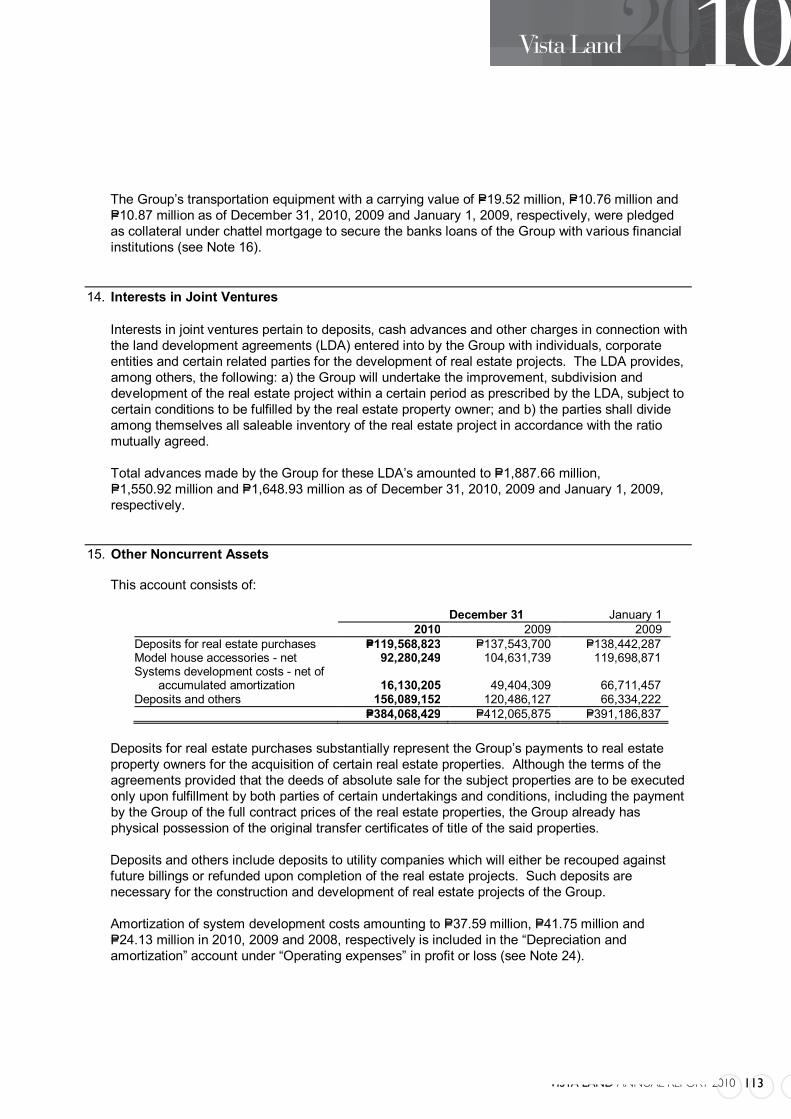
VISTA LAND ANNUAL REPORT 2010 113
- 39 -
*SGVMC115372*
The Group’s transportation equipment with a carrying value of P=19.52 million, P=10.76 million and P=10.87 million as of December 31, 2010, 2009 and January 1, 2009, respectively, were pledged as collateral under chattel mortgage to secure the banks loans of the Group with various financial institutions (see Note 16).
14. Interests in Joint Ventures
Interests in joint ventures pertain to deposits, cash advances and other charges in connection with the land development agreements (LDA) entered into by the Group with individuals, corporate entities and certain related parties for the development of real estate projects. The LDA provides, among others, the following: a) the Group will undertake the improvement, subdivision and development of the real estate project within a certain period as prescribed by the LDA, subject to certain conditions to be fulfilled by the real estate property owner; and b) the parties shall divide among themselves all saleable inventory of the real estate project in accordance with the ratio mutually agreed. Total advances made by the Group for these LDA’s amounted to P=1,887.66 million, P=1,550.92 million and P=1,648.93 million as of December 31, 2010, 2009 and January 1, 2009, respectively.
15. Other Noncurrent Assets
This account consists of:
December 31 January 1 2010 2009 2009 Deposits for real estate purchases P=119,568,823 P=137,543,700 P=138,442,287 Model house accessories - net 92,280,249 104,631,739 119,698,871 Systems development costs - net of accumulated amortization 16,130,205 49,404,309 66,711,457 Deposits and others 156,089,152 120,486,127 66,334,222 P=384,068,429 P=412,065,875 P=391,186,837
Deposits for real estate purchases substantially represent the Group’s payments to real estate property owners for the acquisition of certain real estate properties. Although the terms of the agreements provided that the deeds of absolute sale for the subject properties are to be executed only upon fulfillment by both parties of certain undertakings and conditions, including the payment by the Group of the full contract prices of the real estate properties, the Group already has physical possession of the original transfer certificates of title of the said properties. Deposits and others include deposits to utility companies which will either be recouped against future billings or refunded upon completion of the real estate projects. Such deposits are necessary for the construction and development of real estate projects of the Group.
Amortization of system development costs amounting to P=37.59 million, P=41.75 million and P=24.13 million in 2010, 2009 and 2008, respectively is included in the “Depreciation and amortization” account under “Operating expenses” in profit or loss (see Note 24).

114 VISTA LAND ANNUAL REPORT 2010
- 40 -
*SGVMC115372*
16. Bank Loans and Loans Payable
Bank Loans Bank loans pertain to the borrowings of the Group from various local financial institutions. Further analysis is provided below:
December 31 January 1 2010 2009 2009 Parent company P=2,268,305,400 P=270,000,000 P=– Subsidiaries 448,925,900 180,646,133 223,593,926 2,717,231,300 450,646,133 223,593,926 Less current portion 398,831,528 64,044,964 92,947,793 P=2,318,399,772 P=386,601,169 P=130,646,133
The Parent Company obtained a peso-denominated bank loan from a local bank amounting to P=270.00 million which bears fixed interest rate of 7.50% and will mature on November 18, 2010. The loan is secured by a real estate mortgage over certain properties of CAPI with a book value amounting to P=450.0 million. On November 18, 2010, the Parent Company renewed the term loan with the local bank for another year with interest at 6.50%.
On July 30, 2010, the Parent Company obtained a peso-denominated bank loan from a local bank amounting to P=207.34 million which bear fixed interest rate of 8.39% and will mature on July 30, 2013. The loan is secured by real estate mortgage of certain properties of Brittany and CAPI with a book value amounting to P=296.00 million (see Note 9).
On November 2, 2010, the Parent Company obtained a peso-denominated bank loan from a local bank amounting to P=199.23 million which bear fixed interest rate of 7.83% and will mature on October 31, 2013. The loan is secured by real estate mortgage of certain properties of Brittany and CAPI with a book value amounting to P=284.61 million (see Note 9).
On December 9, 2010, the Parent Company obtained a peso-denominated bank loan from a local bank amounting to P=1,600.00 million which bear fixed interest rate of 6.50% and will mature on December 6, 2015. The loan is secured by a hold-out on the US dollar deposits amounting to US$40.00 million (see Note 7).
The bank loans of the Parent Company and certain subsidiaries provide for certain restrictions and requirements with respect to, among others, payment of dividends, incurrence of additional liabilities, investment and guaranties, mergers or consolidations or other material changes in their ownership, corporate set-up or management, acquisition of treasury stock, disposition and mortgage of assets and maintenance of financial ratios at certain levels. These restrictions and requirements were complied with by the Group as of December 31, 2010, 2009 and January 1, 2009. Banks loans amounting to P=10.67 million, P=6.34 million and P=6.27 million as of December 31, 2010, 2009 and January 1, 2009, respectively, were secured by a chattel mortgage on the Group’s transportation equipment (see Note 13).
VISTA LAND & LIFESCAPES, INC. AND SUBSIDIARIESNOTES TO CONSOLIDATED FINANCIAL STATEMENTS
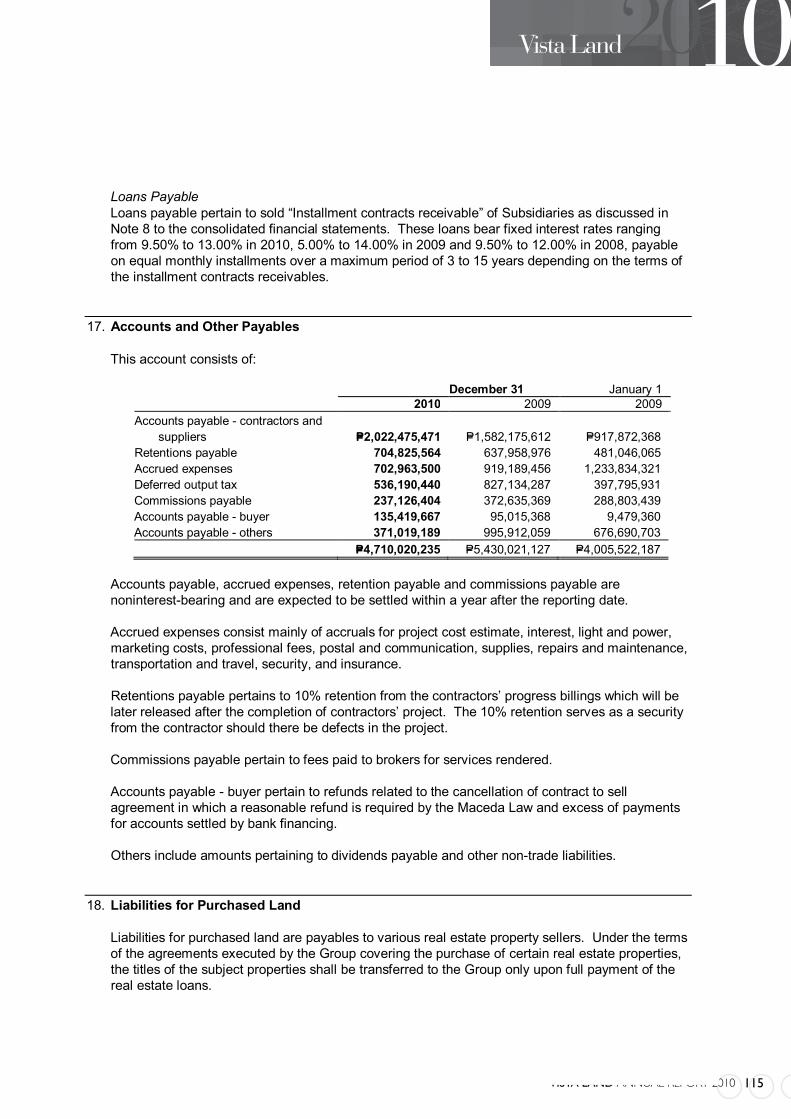
VISTA LAND ANNUAL REPORT 2010 115
- 41 -
*SGVMC115372*
Loans Payable Loans payable pertain to sold “Installment contracts receivable” of Subsidiaries as discussed in Note 8 to the consolidated financial statements. These loans bear fixed interest rates ranging from 9.50% to 13.00% in 2010, 5.00% to 14.00% in 2009 and 9.50% to 12.00% in 2008, payable on equal monthly installments over a maximum period of 3 to 15 years depending on the terms of the installment contracts receivables.
17. Accounts and Other Payables
This account consists of:
December 31 January 1 2010 2009 2009 Accounts payable - contractors and suppliers P=2,022,475,471 P=1,582,175,612 P=917,872,368 Retentions payable 704,825,564 637,958,976 481,046,065 Accrued expenses 702,963,500 919,189,456 1,233,834,321 Deferred output tax 536,190,440 827,134,287 397,795,931 Commissions payable 237,126,404 372,635,369 288,803,439 Accounts payable - buyer 135,419,667 95,015,368 9,479,360 Accounts payable - others 371,019,189 995,912,059 676,690,703 P=4,710,020,235 P=5,430,021,127 P=4,005,522,187
Accounts payable, accrued expenses, retention payable and commissions payable are noninterest-bearing and are expected to be settled within a year after the reporting date. Accrued expenses consist mainly of accruals for project cost estimate, interest, light and power, marketing costs, professional fees, postal and communication, supplies, repairs and maintenance, transportation and travel, security, and insurance. Retentions payable pertains to 10% retention from the contractors’ progress billings which will be later released after the completion of contractors’ project. The 10% retention serves as a security from the contractor should there be defects in the project.
Commissions payable pertain to fees paid to brokers for services rendered. Accounts payable - buyer pertain to refunds related to the cancellation of contract to sell agreement in which a reasonable refund is required by the Maceda Law and excess of payments for accounts settled by bank financing.
Others include amounts pertaining to dividends payable and other non-trade liabilities.
18. Liabilities for Purchased Land
Liabilities for purchased land are payables to various real estate property sellers. Under the terms of the agreements executed by the Group covering the purchase of certain real estate properties, the titles of the subject properties shall be transferred to the Group only upon full payment of the real estate loans.
116 VISTA LAND ANNUAL REPORT 2010
- 42 -
*SGVMC115372*
In 2009, the Group acquired certain land properties which are payable over a period of one to three years. Such liabilities for purchased land with a nominal amount of P=1,139.85 million were initially recorded at fair value resulting to a discount of P=206.37 million. The fair value is derived using the discounted cash flow model using the discount rate ranging from 6.29% to 10.00% with effective interest rate ranging from 5.92% to 9.84%. The unamortized discount amounted to P=19.54 million and P=28.23 million as of December 31, 2010 and 2009, respectively.
Accretion of P=11.57 million, P=60.16 million and P=17.68 million is recorded as interest expense in 2010, 2009 and 2008, respectively (see Note 22).
19. Long-term Notes
The Long-Term Notes (LTN) is payable over 15 years, was initially recorded at present value of P=1.29 billion (US$26.52 million) with discount amounting to P=982 million (US$20.25 million). The LTN was translated to Philippine peso using the USD/Peso foreign exchange rate as of December 31 and January 1, 2009 of P=46.20 and P=47.52 to US$1.00, respectively. This resulted to a foreign exchange gain of P=1.89 million in 2010 and foreign exchange loss of P=0.61 million and P=180.90 million in 2009 and 2008, respectively, which are presented in profit or loss. Interest rates for LTNs range from 1.00% to 5.00% over certain contractual periods with effective interest rate of 8.59%.
The total amount of interest expense recognized in 2010, 2009 and 2008 pertaining to accretion of LTNs amounted to P=16.32 million, P=62.72 million and P=115.44 million, respectively (see Note 22).
In 2009, the Group settled LTNs amounting to P=1,019.77 million (US$28.53 million) which resulted to a loss amounting to P=318.81 million presented under “Loss on settlement of loans” in profit or loss pertaining to the unamortized discount of the settled amount.
In 2010, the LTNs were fully settled which resulted to a loss amounting to P=115.87 million. 20. Notes Payable
On September 30, 2010, the Parent Company issued US$100.00 million notes (the Notes) with a term of five years from the issue date. The interest rate is 8.25% per annum payable semi-annually in arrears on March 30 and September 30 of each year commencing on March 30, 2011. The Notes are unconditionally and irrevocably guaranteed by the subsidiaries of the Parent Company. Other pertinent provisions of the Notes follow: Redemption at the option of noteholders The Parent Company will, at the option of any noteholder, redeem such Note on September 30, 2013 at its principal amount.
VISTA LAND & LIFESCAPES, INC. AND SUBSIDIARIESNOTES TO CONSOLIDATED FINANCIAL STATEMENTS
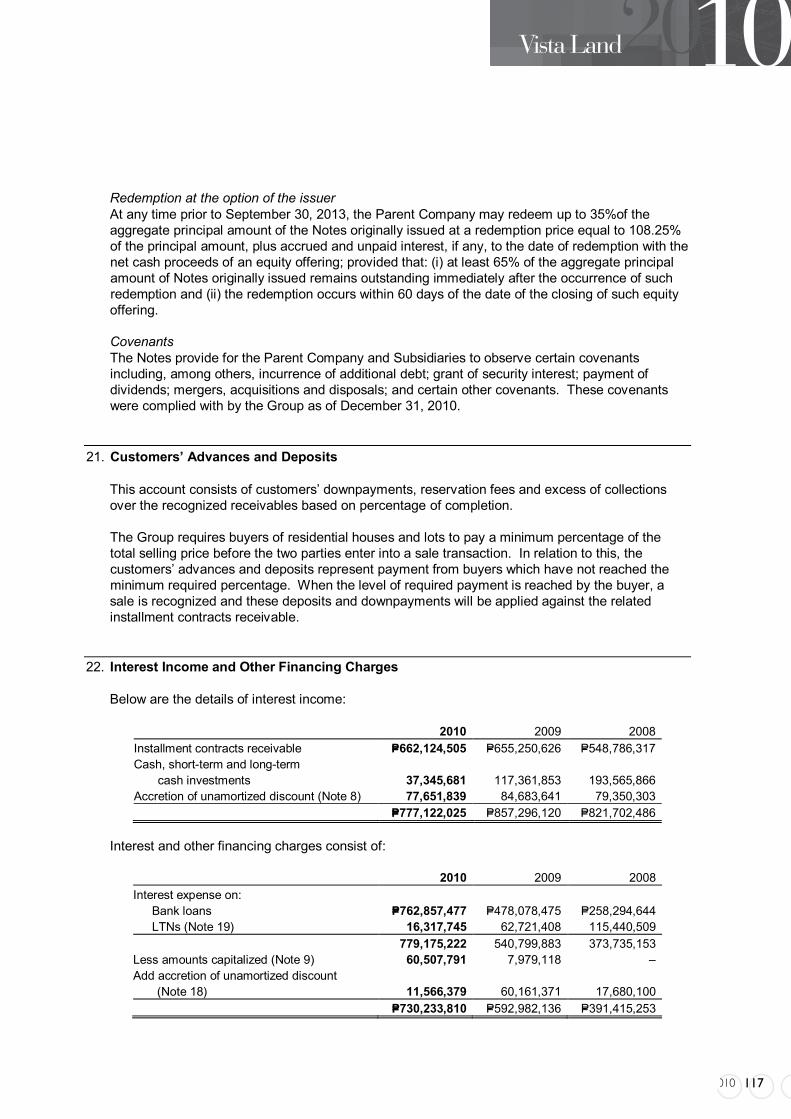
VISTA LAND ANNUAL REPORT 2010 117
- 43 -
*SGVMC115372*
Redemption at the option of the issuer At any time prior to September 30, 2013, the Parent Company may redeem up to 35%of the aggregate principal amount of the Notes originally issued at a redemption price equal to 108.25% of the principal amount, plus accrued and unpaid interest, if any, to the date of redemption with the net cash proceeds of an equity offering; provided that: (i) at least 65% of the aggregate principal amount of Notes originally issued remains outstanding immediately after the occurrence of such redemption and (ii) the redemption occurs within 60 days of the date of the closing of such equity offering. Covenants The Notes provide for the Parent Company and Subsidiaries to observe certain covenants including, among others, incurrence of additional debt; grant of security interest; payment of dividends; mergers, acquisitions and disposals; and certain other covenants. These covenants were complied with by the Group as of December 31, 2010.
21. Customers’ Advances and Deposits
This account consists of customers’ downpayments, reservation fees and excess of collections over the recognized receivables based on percentage of completion.
The Group requires buyers of residential houses and lots to pay a minimum percentage of the total selling price before the two parties enter into a sale transaction. In relation to this, the customers’ advances and deposits represent payment from buyers which have not reached the minimum required percentage. When the level of required payment is reached by the buyer, a sale is recognized and these deposits and downpayments will be applied against the related installment contracts receivable.
22. Interest Income and Other Financing Charges
Below are the details of interest income:
2010 2009 2008 Installment contracts receivable P=662,124,505 P=655,250,626 P=548,786,317 Cash, short-term and long-term cash investments 37,345,681 117,361,853 193,565,866 Accretion of unamortized discount (Note 8) 77,651,839 84,683,641 79,350,303 P=777,122,025 P=857,296,120 P=821,702,486
Interest and other financing charges consist of:
2010 2009 2008 Interest expense on:
Bank loans P=762,857,477 P=478,078,475 P=258,294,644 LTNs (Note 19) 16,317,745 62,721,408 115,440,509 779,175,222 540,799,883 373,735,153
Less amounts capitalized (Note 9) 60,507,791 7,979,118 – Add accretion of unamortized discount (Note 18) 11,566,379 60,161,371 17,680,100 P=730,233,810 P=592,982,136 P=391,415,253
118 VISTA LAND ANNUAL REPORT 2010
- 44 -
*SGVMC115372*
The capitalization rate used to determine the borrowings eligible for capitalization is 8.80% in 2010 and 14.5% in 2009.
The total interest and other financing charges include interest expense arising from the accretion of LTNs amounting to P=16.32 million, P=62.72 million and P=115.44 million in 2010, 2009, and 2008, respectively, and from the accretion of liabilities for purchased land amounting to P=11.57 million, P=60.16 million and P=17.68 million in 2010, 2009, and 2008, respectively.
23. Related Party Transactions
Parties are considered to be related if one party has the ability, directly or indirectly, to control the other party in making financial and operating decisions or the parties are subject to common control or common significant influence (referred to herein as “affiliates”). Related parties may be individuals or corporate entities.
The Group in their regular conduct of business has entered into transactions with affiliates and
other related parties principally consisting of advances and reimbursement of expenses and purchase and sale of real estate properties. The Group’s policy is to settle its intercompany receivables and payables on a net basis. Transactions entered by the Group with related parties are made at normal market prices.
The consolidated statement of financial position include the following amounts resulting from the foregoing transactions which represent amounts receivable (payable) to related parties as of December 31, 2010, 2009 and January 1, 2009:
December 31 January 1 2010 2009 2009 Corporate shareholders (P=472,312,762) (P=478,355,166) (P=970,770,270) Other affiliates 86,563,552 49,448,663 60,361,551 (P=385,749,210) (P=428,906,503) (P=910,408,719)
Outstanding balances at year-end are unsecured, interest free and settlement occurs in cash. As
of December 31, 2010, 2009 and January 1, 2009, the Parent Company has not made any provision for impairment loss relating to amounts owed by related parties. This assessment is undertaken each financial year by examining the financial position of the related party and the market in which the related party operates.
There are balances and transactions within the Group, principally consisting of dividends,
advances, reimbursement of expenses and management income, which are eliminated in full. Except as stated in Notes 16 and 20 to the consolidated financial statements, there have been no
guarantees provided or received for any related party receivables or payables. The compensation of key management personnel by benefit type follows:
2010 2009 2008 Short-term employee benefits P=68,100,110 P=61,840,600 P=41,630,000 Post-employment benefits 10,746,910 9,656,000 (34,669,600) P=78,847,020 P=71,496,600 P=6,960,400
VISTA LAND & LIFESCAPES, INC. AND SUBSIDIARIESNOTES TO CONSOLIDATED FINANCIAL STATEMENTS
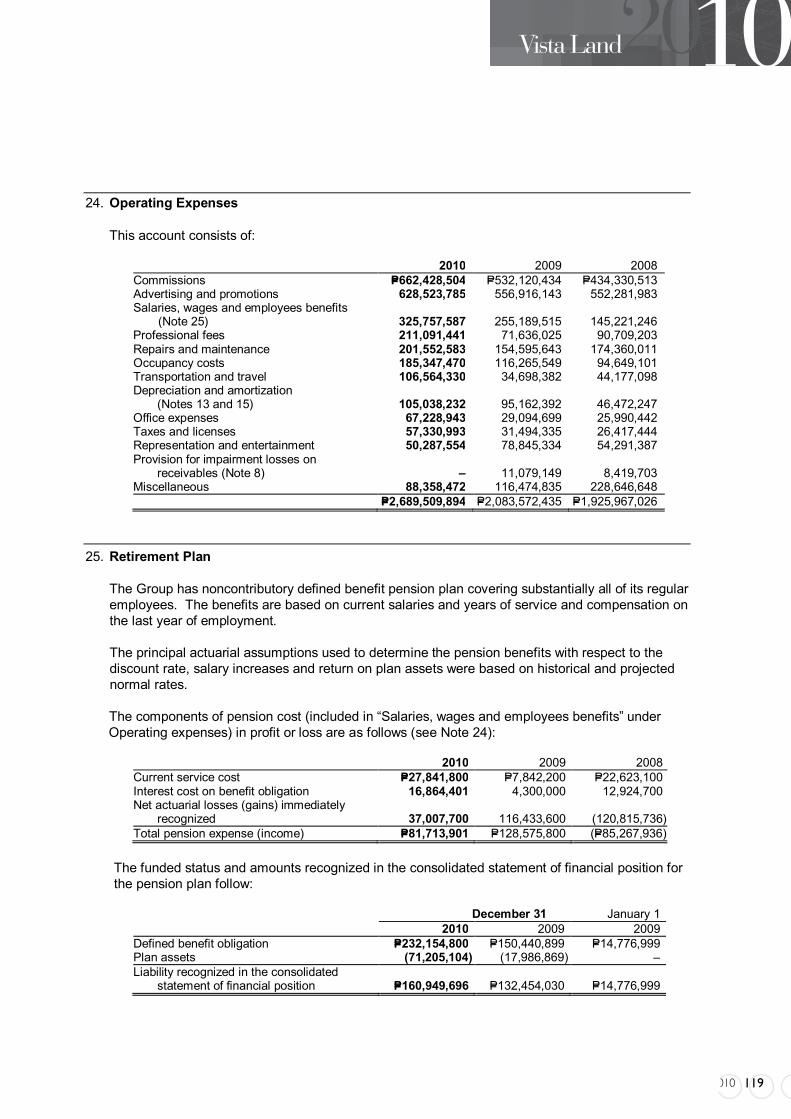
VISTA LAND ANNUAL REPORT 2010 119
- 45 -
*SGVMC115372*
24. Operating Expenses
This account consists of:
2010 2009 2008 Commissions P=662,428,504 P=532,120,434 P=434,330,513 Advertising and promotions 628,523,785 556,916,143 552,281,983 Salaries, wages and employees benefits
(Note 25) 325,757,587 255,189,515 145,221,246 Professional fees 211,091,441 71,636,025 90,709,203 Repairs and maintenance 201,552,583 154,595,643 174,360,011 Occupancy costs 185,347,470 116,265,549 94,649,101 Transportation and travel 106,564,330 34,698,382 44,177,098 Depreciation and amortization (Notes 13 and 15) 105,038,232 95,162,392 46,472,247 Office expenses 67,228,943 29,094,699 25,990,442 Taxes and licenses 57,330,993 31,494,335 26,417,444 Representation and entertainment 50,287,554 78,845,334 54,291,387 Provision for impairment losses on receivables (Note 8) – 11,079,149 8,419,703 Miscellaneous 88,358,472 116,474,835 228,646,648 P=2,689,509,894 P=2,083,572,435 P=1,925,967,026
25. Retirement Plan
The Group has noncontributory defined benefit pension plan covering substantially all of its regular employees. The benefits are based on current salaries and years of service and compensation on the last year of employment.
The principal actuarial assumptions used to determine the pension benefits with respect to the discount rate, salary increases and return on plan assets were based on historical and projected normal rates. The components of pension cost (included in “Salaries, wages and employees benefits” under Operating expenses) in profit or loss are as follows (see Note 24):
2010 2009 2008 Current service cost P=27,841,800 P=7,842,200 P=22,623,100 Interest cost on benefit obligation 16,864,401 4,300,000 12,924,700 Net actuarial losses (gains) immediately recognized 37,007,700 116,433,600 (120,815,736) Total pension expense (income) P=81,713,901 P=128,575,800 (P=85,267,936)
The funded status and amounts recognized in the consolidated statement of financial position for the pension plan follow:
December 31 January 1 2010 2009 2009 Defined benefit obligation P=232,154,800 P=150,440,899 P=14,776,999 Plan assets (71,205,104) (17,986,869) – Liability recognized in the consolidated
statement of financial position P=160,949,696 P=132,454,030 P=14,776,999
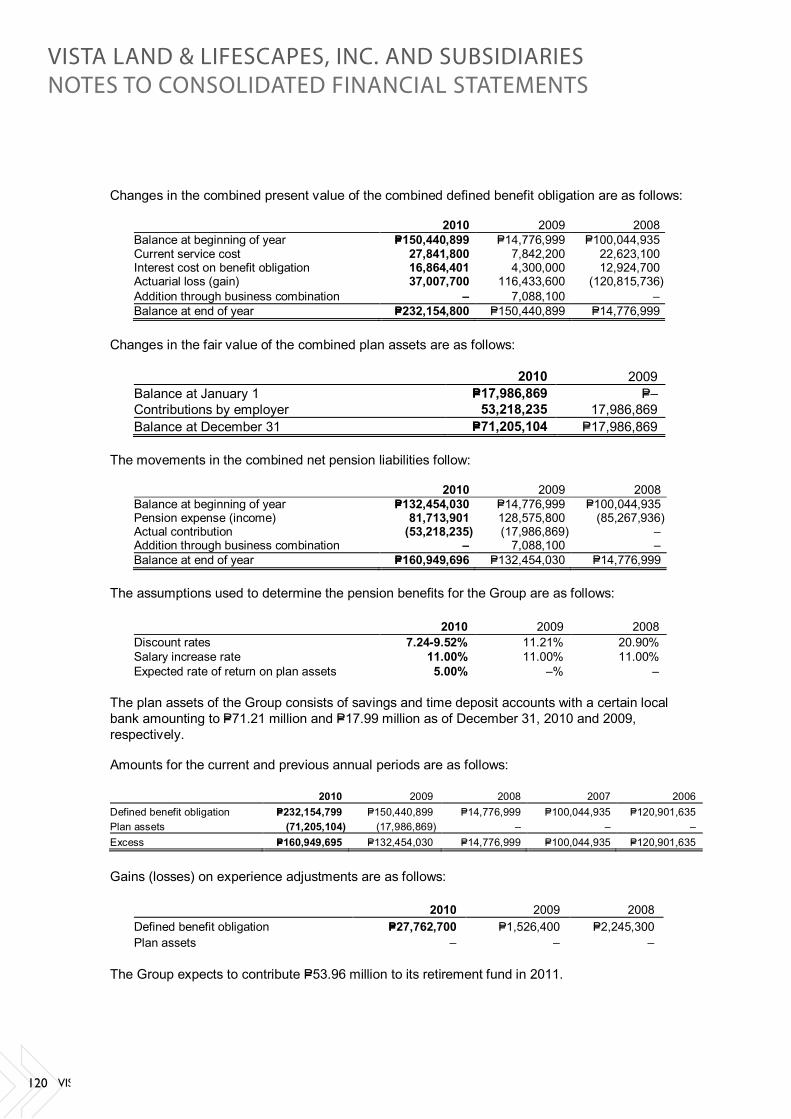
120 VISTA LAND ANNUAL REPORT 2010
- 46 -
*SGVMC115372*
Changes in the combined present value of the combined defined benefit obligation are as follows:
2010 2009 2008 Balance at beginning of year P=150,440,899 P=14,776,999 P=100,044,935 Current service cost 27,841,800 7,842,200 22,623,100 Interest cost on benefit obligation 16,864,401 4,300,000 12,924,700 Actuarial loss (gain) 37,007,700 116,433,600 (120,815,736) Addition through business combination – 7,088,100 – Balance at end of year P=232,154,800 P=150,440,899 P=14,776,999
Changes in the fair value of the combined plan assets are as follows:
2010 2009 Balance at January 1 P=17,986,869 P=– Contributions by employer 53,218,235 17,986,869 Balance at December 31 P=71,205,104 P=17,986,869
The movements in the combined net pension liabilities follow:
2010 2009 2008 Balance at beginning of year P=132,454,030 P=14,776,999 P=100,044,935 Pension expense (income) 81,713,901 128,575,800 (85,267,936) Actual contribution (53,218,235) (17,986,869) – Addition through business combination – 7,088,100 – Balance at end of year P=160,949,696 P=132,454,030 P=14,776,999
The assumptions used to determine the pension benefits for the Group are as follows:
2010 2009 2008 Discount rates 7.24-9.52% 11.21% 20.90% Salary increase rate 11.00% 11.00% 11.00% Expected rate of return on plan assets 5.00% –% –
The plan assets of the Group consists of savings and time deposit accounts with a certain local bank amounting to P=71.21 million and P=17.99 million as of December 31, 2010 and 2009, respectively.
Amounts for the current and previous annual periods are as follows:
2010 2009 2008 2007 2006 Defined benefit obligation P=232,154,799 P=150,440,899 P=14,776,999 P=100,044,935 P=120,901,635 Plan assets (71,205,104) (17,986,869) – – – Excess P=160,949,695 P=132,454,030 P=14,776,999 P=100,044,935 P=120,901,635
Gains (losses) on experience adjustments are as follows:
2010 2009 2008 Defined benefit obligation P=27,762,700 P=1,526,400 P=2,245,300 Plan assets – – –
The Group expects to contribute P=53.96 million to its retirement fund in 2011.
VISTA LAND & LIFESCAPES, INC. AND SUBSIDIARIESNOTES TO CONSOLIDATED FINANCIAL STATEMENTS

VISTA LAND ANNUAL REPORT 2010 121
- 47 -
*SGVMC115372*
26. Miscellaneous Income
Miscellaneous income mostly pertains to income from forfeited reservation fees and partial payments from customers whose sales contracts are cancelled before completion of required downpayment.
27. Income Tax
Provision for income tax consists of:
2010 2009 2008 Current P=321,790,176 P=273,654,692 P=385,771,939 Deferred (101,044,496) 239,821,255 535,078,409 P=220,745,680 P=513,475,947 P=920,850,348
The reconciliation of the provision for income tax computed at the statutory income tax rate to the provision for income tax shown in profit or loss follows:
2010 2009 2008 Provision for income tax computed at the statutory income tax rate 30.00% 30.00% 35.00% Additions to (reductions in) income tax resulting from: Change in unrecognized deferred tax assets 3.03% 4.09% 2.37% Nondeductible interest and other expenses 0.06% 1.09% 0.18% Expired MCIT and NOLCO 0.00% – 0.01% Interest income already subjected to final tax (0.10%) (2.98%) (1.73%) Equity in net income of an associate (0.02%) (0.49%) (0.10%) Dividend income (0.00%) (0.00%) – Tax-exempt income (16.46%) (13.45%) (7.82%) Others (9.68%) – – Effect of change in statutory tax rate – – (3.39%) Provision for income tax 6.83% 18.26% 24.52%

122 VISTA LAND ANNUAL REPORT 2010
- 48 -
*SGVMC115372*
The components of the Group’s deferred taxes are as follows:
Net deferred tax assets:
December 31 January 1 2010 2009 2009 Deferred tax assets on: NOLCO P=127,653,187 P=73,568,847 P=89,525,485 Accrual of retirement costs 10,919,024 9,605,475 3,576,560 Unrealized foreign exchange losses 10,908,267 6,999,457 5,886,333 Carryforward benefit of MCIT 5,165,531 3,844,757 2,072,377 Unamortized discount on receivables 4,401,541 5,078,260 903,056 Allowance for probable losses – – 1,065,000 Excess of book basis over tax basis of deferred gross profit on real estate sales – 2,216,679 – 159,047,550 101,313,475 103,028,811 Deferred tax liabilities on: Unrealized gain on real estate transactions 117,902,252 69,224,615 75,694,019 Capitalized interest and other expenses 14,462,497 – – Unamortized discount on rawlands payable – – 116,229 132,364,749 69,224,615 75,810,248 P=26,682,801 P=32,088,860 P=27,218,563
Net deferred tax liabilities:
December 31 January 1 2010 2009 2009 Deferred tax assets on: Allowance for probable losses P=148,017,485 P=97,791,041 P=275,806,414 NOLCO 68,228,932 59,001,184 45,334,268 Accrual of retirement costs 36,756,950 20,794,554 2,604,360 Unrealized foreign exchange losses 19,682,261 – 49,404,950 Unamortized discount on receivables 15,789,902 18,256,457 25,314,915 Carryforward benefit of MCIT – 4,066,659 11,079,056 288,475,530 199,909,895 409,543,963 Deferred tax liabilities on: Unrealized gain on real estate transactions 2,561,685,705 2,298,618,706 2,572,945,787 Capitalized interest and other expenses 29,583,120 835,167 – Discount on rawlands payable 8,145,140 841,882 9,643,156 Retirement income 347,542 – – Discount on long term notes – 312,886,948 – Unrealized foreign exchange gain – 4,463,724 – 2,599,761,507 2,617,646,427 2,582,588,943 P=2,311,285,977 P=2,417,736,532 P=2,173,044,980
VISTA LAND & LIFESCAPES, INC. AND SUBSIDIARIESNOTES TO CONSOLIDATED FINANCIAL STATEMENTS
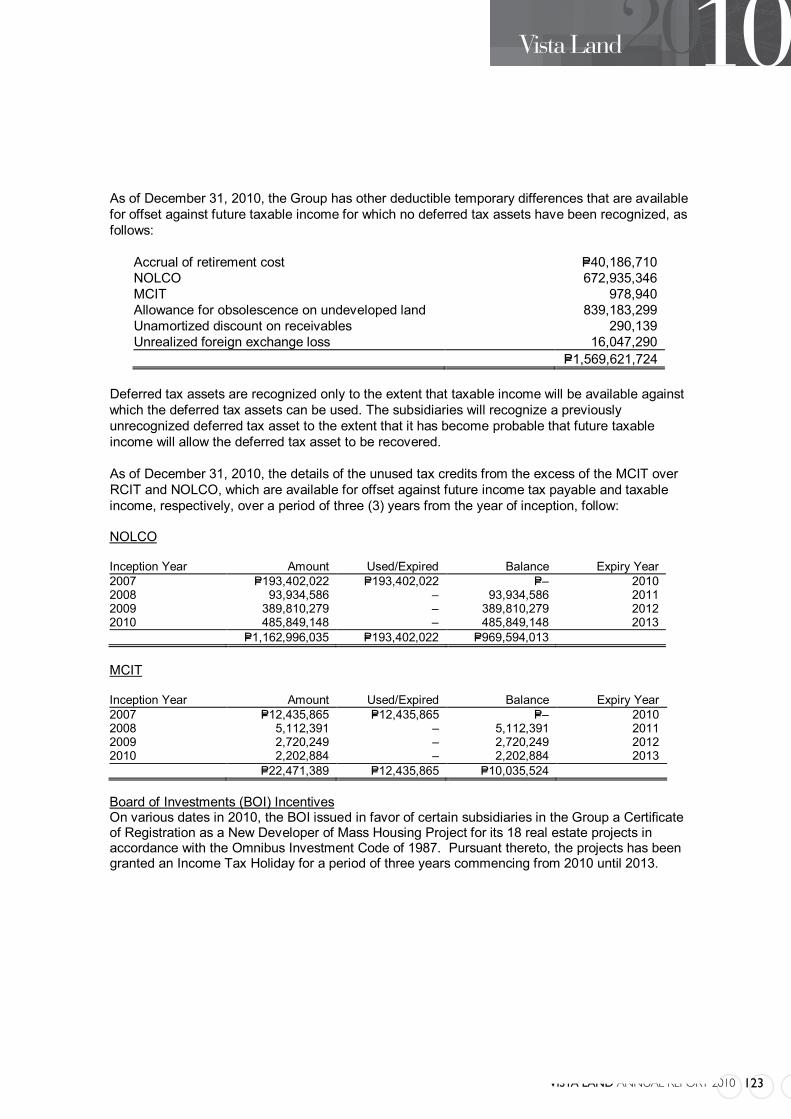
VISTA LAND ANNUAL REPORT 2010 123
- 49 -
*SGVMC115372*
As of December 31, 2010, the Group has other deductible temporary differences that are available for offset against future taxable income for which no deferred tax assets have been recognized, as follows:
Accrual of retirement cost P=40,186,710 NOLCO 672,935,346 MCIT 978,940 Allowance for obsolescence on undeveloped land 839,183,299 Unamortized discount on receivables 290,139 Unrealized foreign exchange loss 16,047,290
P=1,569,621,724 Deferred tax assets are recognized only to the extent that taxable income will be available against which the deferred tax assets can be used. The subsidiaries will recognize a previously unrecognized deferred tax asset to the extent that it has become probable that future taxable income will allow the deferred tax asset to be recovered. As of December 31, 2010, the details of the unused tax credits from the excess of the MCIT over RCIT and NOLCO, which are available for offset against future income tax payable and taxable income, respectively, over a period of three (3) years from the year of inception, follow:
NOLCO
Inception Year Amount Used/Expired Balance Expiry Year 2007 P=193,402,022 P=193,402,022 P=– 2010 2008 93,934,586 – 93,934,586 2011 2009 389,810,279 – 389,810,279 2012 2010 485,849,148 – 485,849,148 2013 P=1,162,996,035 P=193,402,022 P=969,594,013
MCIT
Inception Year Amount Used/Expired Balance Expiry Year 2007 P=12,435,865 P=12,435,865 P=– 2010 2008 5,112,391 – 5,112,391 2011 2009 2,720,249 – 2,720,249 2012 2010 2,202,884 – 2,202,884 2013 P=22,471,389 P=12,435,865 P=10,035,524
Board of Investments (BOI) Incentives On various dates in 2010, the BOI issued in favor of certain subsidiaries in the Group a Certificate of Registration as a New Developer of Mass Housing Project for its 18 real estate projects in accordance with the Omnibus Investment Code of 1987. Pursuant thereto, the projects has been granted an Income Tax Holiday for a period of three years commencing from 2010 until 2013.
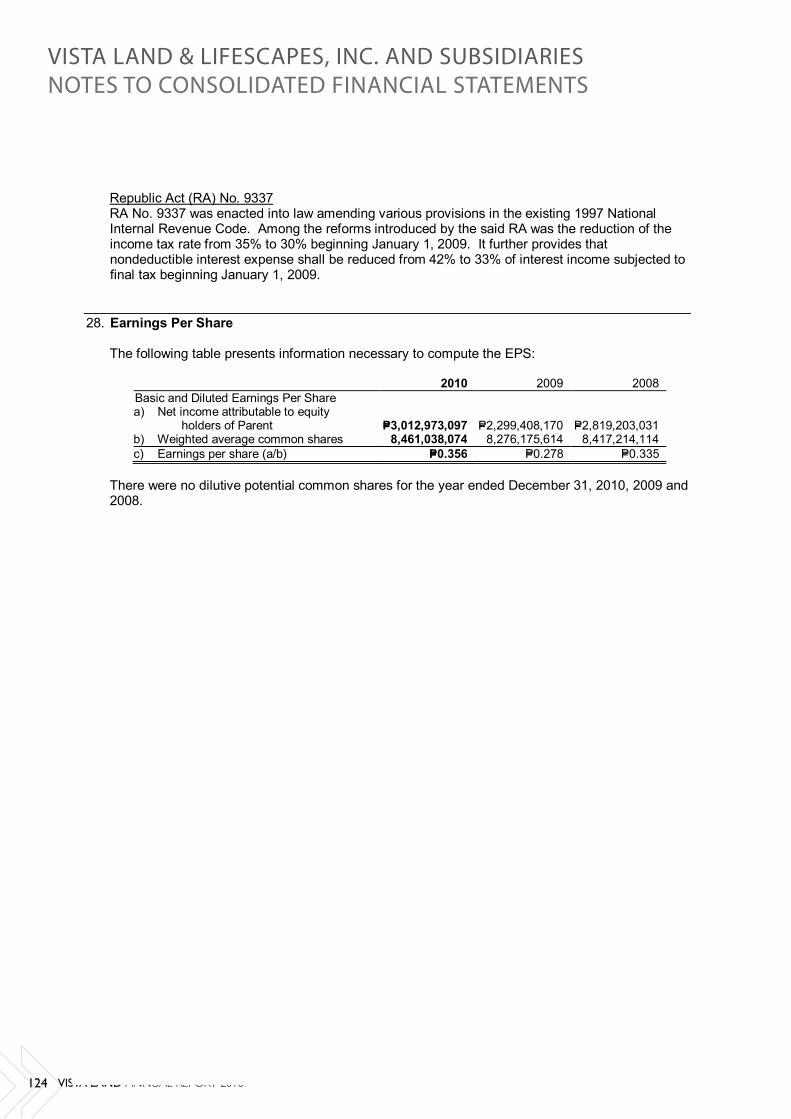
124 VISTA LAND ANNUAL REPORT 2010
- 50 -
*SGVMC115372*
Republic Act (RA) No. 9337 RA No. 9337 was enacted into law amending various provisions in the existing 1997 National Internal Revenue Code. Among the reforms introduced by the said RA was the reduction of the income tax rate from 35% to 30% beginning January 1, 2009. It further provides that nondeductible interest expense shall be reduced from 42% to 33% of interest income subjected to final tax beginning January 1, 2009.
28. Earnings Per Share
The following table presents information necessary to compute the EPS:
2010 2009 2008 Basic and Diluted Earnings Per Share a) Net income attributable to equity
holders of Parent P=3,012,973,097 P=2,299,408,170 P=2,819,203,031 b) Weighted average common shares 8,461,038,074 8,276,175,614 8,417,214,114 c) Earnings per share (a/b) P=0.356 P=0.278 P=0.335
There were no dilutive potential common shares for the year ended December 31, 2010, 2009 and 2008.
VISTA LAND & LIFESCAPES, INC. AND SUBSIDIARIESNOTES TO CONSOLIDATED FINANCIAL STATEMENTS
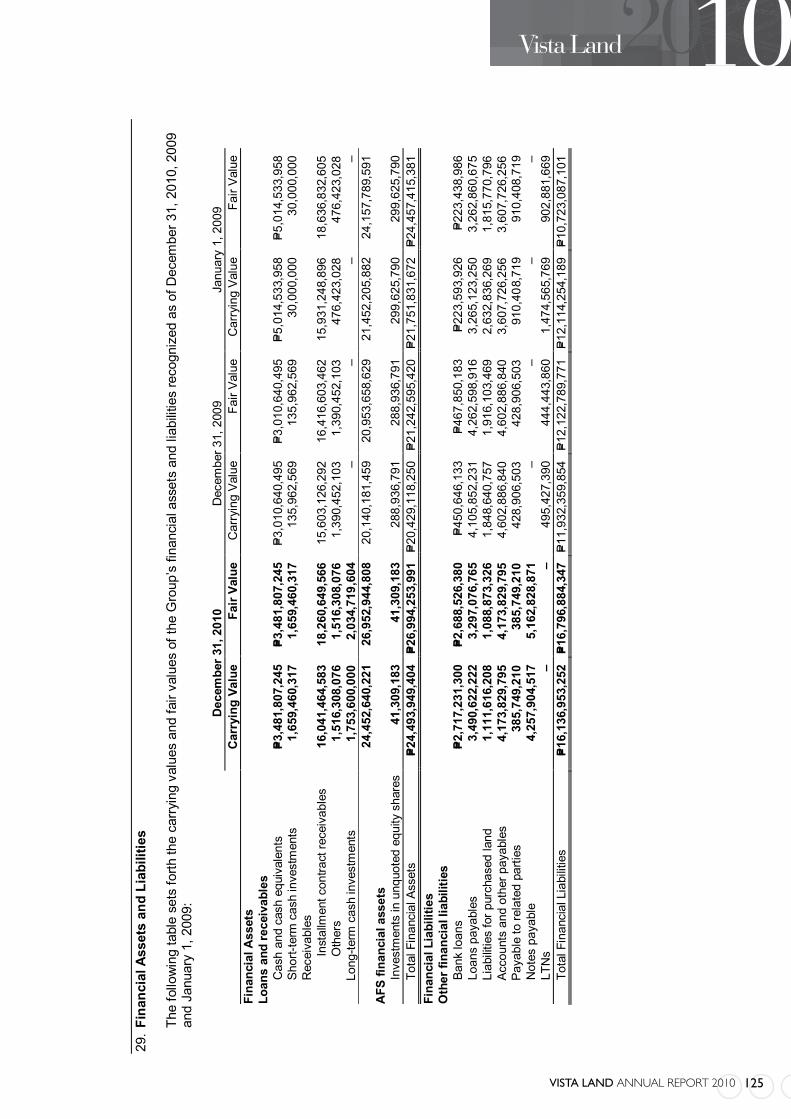
VISTA LAND ANNUAL REPORT 2010 125
- 51
-
*SGVMC115372*
29.
Fina
ncia
l Ass
ets
and
Liab
ilitie
s
The
follo
win
g ta
ble
sets
forth
the
carr
ying
val
ues
and
fair
valu
es o
f the
Gro
up’s
fina
ncia
l ass
ets
and
liabi
litie
s re
cogn
ized
as
of D
ecem
ber 3
1, 2
010,
200
9 an
d Ja
nuar
y 1,
200
9:
Dec
embe
r 31,
201
0 D
ecem
ber 3
1, 2
009
Janu
ary
1, 2
009
C
arry
ing
Valu
e Fa
ir Va
lue
Car
ryin
g Va
lue
Fair
Valu
e C
arry
ing
Valu
e Fa
ir Va
lue
Fina
ncia
l Ass
ets
Loan
s an
d re
ceiv
able
s
Cas
h an
d ca
sh e
quiv
alen
ts
P=3,4
81,8
07,2
45
P=3,4
81,8
07,2
45
P=3,0
10,6
40,4
95
P=3,0
10,6
40,4
95
P=5,0
14,5
33,9
58
P=5,0
14,5
33,9
58
Sh
ort-t
erm
cas
h in
vest
men
ts
1,65
9,46
0,31
7 1,
659,
460,
317
135,
962,
569
135,
962,
569
30,0
00,0
00
30,0
00,0
00
R
ecei
vabl
es
Inst
allm
ent c
ontra
ct re
ceiv
able
s 16
,041
,464
,583
18
,260
,649
,566
15
,603
,126
,292
16
,416
,603
,462
15
,931
,248
,896
18
,636
,832
,605
O
ther
s 1,
516,
308,
076
1,51
6,30
8,07
6 1,
390,
452,
103
1,39
0,45
2,10
3 47
6,42
3,02
8 47
6,42
3,02
8
Long
-term
cas
h in
vest
men
ts
1,75
3,60
0,00
0 2,
034,
719,
604
– –
– –
24
,452
,640
,221
26
,952
,944
,808
20
,140
,181
,459
20
,953
,658
,629
21
,452
,205
,882
24
,157
,789
,591
A
FS fi
nanc
ial a
sset
s
Inve
stm
ents
in u
nquo
ted
equi
ty s
hare
s 41
,309
,183
41
,309
,183
28
8,93
6,79
1 28
8,93
6,79
1 29
9,62
5,79
0 29
9,62
5,79
0 To
tal F
inan
cial
Ass
ets
P=24,
493,
949,
404
P=26,
994,
253,
991
P=20,
429,
118,
250
P=21,
242,
595,
420
P=21,
751,
831,
672
P=24,
457,
415,
381
Fina
ncia
l Lia
bilit
ies
Oth
er fi
nanc
ial l
iabi
litie
s
Bank
loan
s P=2
,717
,231
,300
P=2
,688
,526
,380
P=4
50,6
46,1
33
P=467
,850
,183
P=2
23,5
93,9
26
P=223
,438
,986
Loan
s pa
yabl
es
3,49
0,62
2,22
2 3,
297,
076,
765
4,10
5,85
2,23
1 4,
262,
598,
916
3,26
5,12
3,25
0 3,
262,
860,
675
Li
abilit
ies
for p
urch
ased
land
1,
111,
616,
208
1,08
8,87
3,32
6 1,
848,
640,
757
1,91
6,10
3,46
9 2,
632,
836,
269
1,81
5,77
0,79
6
Acco
unts
and
oth
er p
ayab
les
4,17
3,82
9,79
5 4,
173,
829,
795
4,60
2,88
6,84
0 4,
602,
886,
840
3,60
7,72
6,25
6 3,
607,
726,
256
Pa
yabl
e to
rela
ted
parti
es
385,
749,
210
385,
749,
210
428,
906,
503
428,
906,
503
910,
408,
719
910,
408,
719
N
otes
pay
able
4,
257,
904,
517
5,16
2,82
8,87
1 –
– –
–
LTN
s –
– 49
5,42
7,39
0 44
4,44
3,86
0 1,
474,
565,
769
902,
881,
669
Tota
l Fin
anci
al L
iabi
litie
s P=1
6,13
6,95
3,25
2 P=1
6,79
6,88
4,34
7 P=1
1,93
2,35
9,85
4 P=1
2,12
2,78
9,77
1 P=1
2,11
4,25
4,18
9 P=1
0,72
3,08
7,10
1

126 VISTA LAND ANNUAL REPORT 2010
- 52 -
*SGVMC115372*
The following methods and assumptions were used to estimate the fair value of each class of financial instrument for which it is practicable to estimate such value:
Cash and cash equivalents and short-term cash investments: Due to the short-term nature of the account, the fair value of cash and cash equivalents and short-term cash investments approximate the carrying amounts in the consolidated statements of financial position.
Installment contracts receivables: Estimated fair value of installment contracts receivables is based on the discounted value of future cash flows using the prevailing interest rates for similar types of receivables as of the reporting date using the remaining terms of maturity. The discount rate used ranged from 2.50% to 8.15% in 2010, 5.11% to 9.38% in 2009 and from 6.0% to 8.0% in 2008.
Other receivables: due to the short-term nature of the account, the fair value of other receivables approximates the carrying amounts.
Long-term cash investments: The fair values are based on the discounted value of future cash flows using the applicable rates for similar types of instruments. The discount rate used ranges from 1.30% to 4.96% in 2010.
Payable to related parties: due to the short-term nature of the account, carrying amounts approximate their fair values.
AFS financial assets: for AFS investment in unquoted equity securities, these are carried and presented at cost since fair value is not reasonably determine due to the unpredictable nature of future cash flows and without any other suitable methods of arriving at a reliable fair value.
The AFS financial assets carried at cost are preferred shares of a utility company issued to the Group as a consequence of its subscription to the electricity services of the said utility company needed for the Group’s residential units. The said preferred shares have no active market and the Group does not intend to dispose these because these are directly related to the continuity of its business.
Accounts and other payables: fair values of accounts and other payables approximate their carrying amounts in the consolidated statement of financial position due to the short-term nature of the transactions.
Bank loans, loans payable, notes payable, liabilities for purchased land and LTNs: estimated fair values of bank loans, liabilities for purchased land and LTNs are based on the discounted value of future cash flows using the applicable rates for similar types of loans. Interest rates used in discounting cash flows ranges from 6.50% to 15.50% in 2010, 4.27% to 9.38% in 2009 and 6.70% to 7.50% in 2008 using the remaining terms to maturity.
VISTA LAND & LIFESCAPES, INC. AND SUBSIDIARIESNOTES TO CONSOLIDATED FINANCIAL STATEMENTS
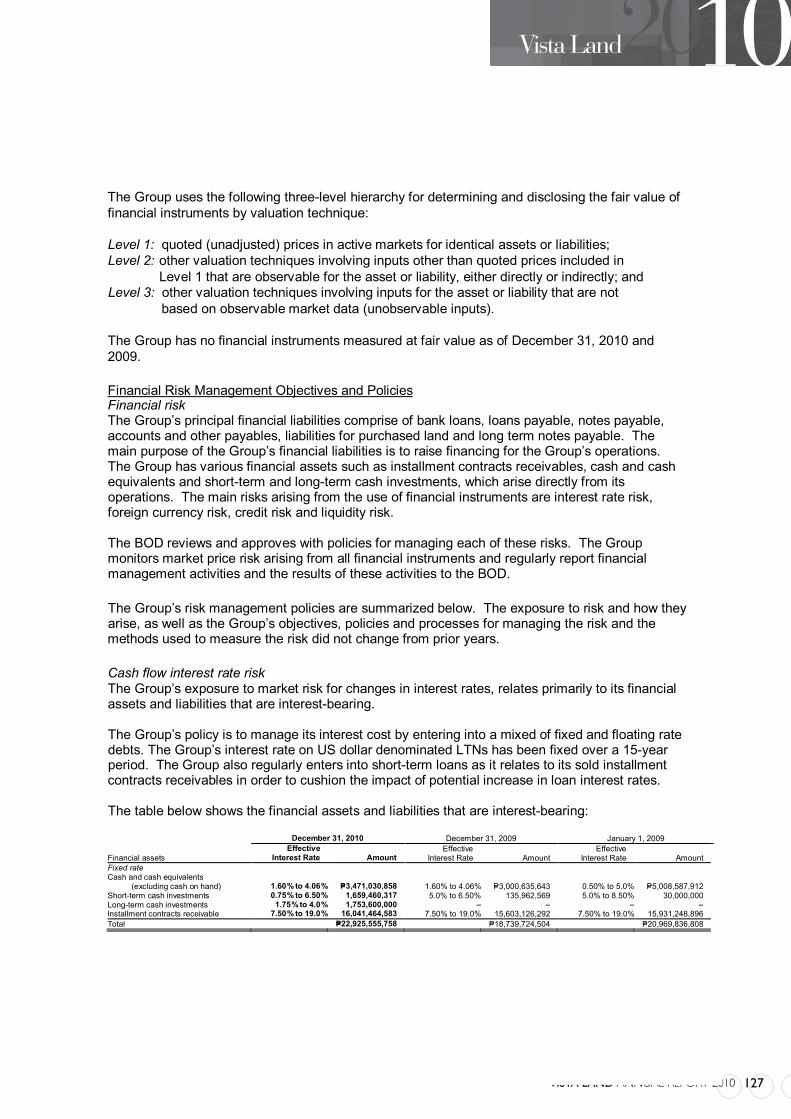
VISTA LAND ANNUAL REPORT 2010 127
- 53 -
*SGVMC115372*
The Group uses the following three-level hierarchy for determining and disclosing the fair value of financial instruments by valuation technique:
Level 1: quoted (unadjusted) prices in active markets for identical assets or liabilities; Level 2: other valuation techniques involving inputs other than quoted prices included in
Level 1 that are observable for the asset or liability, either directly or indirectly; and Level 3: other valuation techniques involving inputs for the asset or liability that are not based on observable market data (unobservable inputs).
The Group has no financial instruments measured at fair value as of December 31, 2010 and 2009.
Financial Risk Management Objectives and Policies Financial risk The Group’s principal financial liabilities comprise of bank loans, loans payable, notes payable, accounts and other payables, liabilities for purchased land and long term notes payable. The main purpose of the Group’s financial liabilities is to raise financing for the Group’s operations. The Group has various financial assets such as installment contracts receivables, cash and cash equivalents and short-term and long-term cash investments, which arise directly from its operations. The main risks arising from the use of financial instruments are interest rate risk, foreign currency risk, credit risk and liquidity risk.
The BOD reviews and approves with policies for managing each of these risks. The Group monitors market price risk arising from all financial instruments and regularly report financial management activities and the results of these activities to the BOD.
The Group’s risk management policies are summarized below. The exposure to risk and how they arise, as well as the Group’s objectives, policies and processes for managing the risk and the methods used to measure the risk did not change from prior years.
Cash flow interest rate risk The Group’s exposure to market risk for changes in interest rates, relates primarily to its financial assets and liabilities that are interest-bearing.
The Group’s policy is to manage its interest cost by entering into a mixed of fixed and floating rate debts. The Group’s interest rate on US dollar denominated LTNs has been fixed over a 15-year period. The Group also regularly enters into short-term loans as it relates to its sold installment contracts receivables in order to cushion the impact of potential increase in loan interest rates.
The table below shows the financial assets and liabilities that are interest-bearing:
December 31, 2010 December 31, 2009 January 1, 2009
Financial assets Effective
Interest Rate Amount Effective
Interest Rate Amount Effective
Interest Rate Amount Fixed rate Cash and cash equivalents (excluding cash on hand) 1.60% to 4.06% P=3,471,030,858 1.60% to 4.06% P=3,000,635,643 0.50% to 5.0% P=5,008,587,912 Short-term cash investments 0.75% to 6.50% 1,659,460,317 5.0% to 6.50% 135,962,569 5.0% to 8.50% 30,000,000 Long-term cash investments 1.75% to 4.0% 1,753,600,000 – – – – Installment contracts receivable 7.50% to 19.0% 16,041,464,583 7.50% to 19.0% 15,603,126,292 7.50% to 19.0% 15,931,248,896 Total P=22,925,555,758 P=18,739,724,504 P=20,969,836,808

128 VISTA LAND ANNUAL REPORT 2010
- 54 -
*SGVMC115372*
December 31, 2010 December 31, 2009 January 1, 2009
Effective
Interest Rate Amount Effective
Interest Rate Amount Effective
Interest Rate Amount Financial liabilities Floating rate Bank loans 91-day treasury 91-day treasury 91-day treasury
bill rates plus of0.125% to 1.0% P=–
bill rates plus of0.125% to 1.0% P=1,870,000
bill rates plus of0.125% to 1.0% P=24,080,100
Fixed rate Notes payable 8.25% 4,257,904,517 – – – – Bank loans 9.50% to 12.0% 2,717,231,300 9.50% to 12.0% 448,776,133 9.50% to 12.0% 199,513,826 Loans payable 9.50% to 13.0% 3,490,622,222 5.0% to 14.0% 4,105,852,231 9.50% to 12.0% 3,265,123,250 Liabilities for purchased land 8.25% 38,653,734 – – – – LTNs – – 8.59% 495,427,390 8.59% 1,474,565,769 P=10,504,411,773 P=5,051,925,754 P=4,963,282,945
The following table demonstrates the sensitivity to a reasonably possible change in interest rates until its next annual reporting date with all other variables held constant, of the Group’s income before tax (due to effect of floating rate borrowings). There is no impact on the Group’s equity other than those already affecting the net income.
2010 2009 2008
Increase/decrease
in interest rate Effect on income
before income tax Increase/decrease
in interest rate Effect on income
before income tax Increase/decrease
in interest rate Effect on income
before income tax Peso +25 bps P=– +25 bps (P=4,675) +25 bps (P=60,200) -25 bps – -25 bps 4,675 -25 bps 60,200
The assumed movement in basis points for interest rate sensitivity analysis is based on the currently observable market environment, showing no material movements as in prior years. Other than the potential impact on income before income tax, there is no other effect on other comprehensive income.
Foreign exchange risk The Group’s foreign exchange risk results primarily from movements of the Philippine peso against the United States Dollar (USD). Approximately 19.40%, 2.69% and 7.76% of the debt of the Group as of December 31, 2010, 2009 and January 1, 2009, respectively, are denominated in USD. The Group’s foreign currency-denominated debt comprises of the Bonds in 2010 and the LTNs in 2009 and 2008. Below are the carrying values and the amounts in US$ of these foreign currency denominated financial assets and liabilities. December 31, 2010 December 31, 2009 January 1, 2009 Peso US$ Peso US$ Peso US$Cash and cash equivalents P=229,136,468 US$5,226,653 P=– US$– P=– US$–Short-term cash investments 1,534,400,000 35,000,000 – – – –Long-term cash investments 1,753,600,000 40,000,000 – – – –Notes payable 4,257,904,517 97,123,734 – – – –LTNs – – 495,427,390 10,723,537 1,474,565,769 31,030,424 In translating the foreign currency- denominated monetary assets in peso amounts, the exchange rates used were P=43.84 to US$1.00, P=46.20 to US$1.00, and P=47.52 to US$1.00, the Philippine Peso - US dollar exchange rates as of December 31, 2010, 2009 and January 1, 2009, respectively. The following table demonstrates the sensitivity to a reasonably possible change in the US dollar exchange rate until its next annual reporting date, with all other variables held constant, of the Group’s 2010 profit before tax (due to changes in the fair value of monetary assets and liabilities) as of December 31, 2010, 2009 and 2008.
VISTA LAND & LIFESCAPES, INC. AND SUBSIDIARIESNOTES TO CONSOLIDATED FINANCIAL STATEMENTS

VISTA LAND ANNUAL REPORT 2010 129
- 55 -
*SGVMC115372*
December 31, 2010 December 31, 2009 January 1, 2009
Increase/Decrease
in US Dollarrate
Effect on income
before tax
Increase/Decrease
in US Dollarrate
Effect on income
before tax
Increase/Decrease
in US Dollarrate
Effect on income
before tax Cash and cash equivalents +0.02% P=45,827 –% P=– –% P=– -0.02% (45,827) –% – –% – Short-term cash investments +0.02% 306,880 –% – –% – -0.02% (306,880) –% – –% – Long-term cash investments +0.02% 350,720 –% – –% – -0.02% (350,720) –% – –% – Notes payable +0.02% (851,581) –% – –% – -0.02% 851,581 –% – –% – LTNs –% – +0.02% (99,085) +0.02% (294,913) –% – -0.02% 99,085 –0.02% 294,913
The assumed movement in basis points for foreign exchange sensitivity analysis is based on the currently observable market environment, showing no material movements as in prior years.
There are no items affecting equity except for those having impact on profit or loss.
Credit risk The Group transacts only with recognized and creditworthy third parties. The Group’s receivables are monitored on an ongoing basis resulting to manageable exposure to bad debts. Real estate buyers are subject to standard credit check procedures, which are calibrated based on the payment scheme offered. The Group’s respective credit management units conduct a comprehensive credit investigation and evaluation of each buyer to establish creditworthiness.
Receivable balances are being monitored on a regular basis to ensure timely execution of necessary intervention efforts. In addition, the credit risk for installment contracts receivables is mitigated as the Group has the right to cancel the sales contract without need for any court action and take possession of the subject house in case of refusal by the buyer to pay on time the due installment contracts receivable. This risk is further mitigated because the corresponding title to the subdivision units sold under this arrangement is transferred to the buyers only upon full payment of the contract price.
With respect to credit risk arising from the other financial assets of the Group, which are comprised of cash and cash equivalents, short-term and long-term cash investments and AFS financial assets, the Group’s exposure to credit risk arises from default of the counterparty, with a maximum exposure equal to the carrying amount of these instruments. The Group manages its cash by maintaining cash accounts with banks which have demonstrated financial soundness for several years. The Group’s investments in AFS are incidental to its housing projects and are considered by the Group to be of high quality because these are investments with the biggest electric utility company in the country.

130 VISTA LAND ANNUAL REPORT 2010
- 56 -
*SGVMC115372*
The table below shows the comparative summary of maximum credit risk exposure on financial assets as of December 31, 2010, 2009 and January 1, 2009:
December 31 January 1 2010 2009 2009 Loans and Receivables Cash and cash equivalents
(excluding cash on hand) P=3,471,030,858 P=3,000,635,643 P=5,008,587,912 Short-term cash investments 1,659,460,317 135,962,569 30,000,000 Receivables Installment contracts receivables 16,140,816,767 15,702,478,476 16,019,521,931 Others 1,731,286,986 1,616,073,672 1,063,010,838 Long-term cash investments 1,753,600,000 – –
24,756,194,928 20,455,150,360 22,121,120,681 AFS Financial Assets Investments in unquoted equity shares 41,309,183 288,936,791 299,625,790
P=24,797,504,111 P=20,744,087,151 P=22,420,746,471
The maximum exposure is shown gross, before the effect of mitigation through the use of collateral agreements. The subject lots and residential houses sold are held as collateral for the all installment contracts receivables.
Given the Group’s diverse base of counterparties, it is not exposed to large concentrations of credit risk. As of December 31, 2010, 2009 and January 1, 2009, the aging analyses of past due but not impaired receivables, presented per class are as follows: December 31, 2010 Neither Past Total of Past Impaired Due Nor Past Due But Not Impaired Due But Not Financial Impaired <30 days 30-60 days 60-90 days >90 days Impaired Assets Total Installment contract receivables P=15,470,729,536 P=127,298,650 P=79,490,473 P=51,557,707 P=312,388,217 P=570,735,047 P=99,352,184 P=16,140,816,767 Other receivables 1,172,844,158 18,231,704 24,277,837 40,898,314 260,056,063 343,463,918 214,978,910 1,731,286,986 Total P=16,643,573,694 P=145,530,354 P=103,768,310 P=92,456,021 P=572,444,280 P=914,198,965 P=314,331,094 P=17,872,103,753
December 31, 2009 Neither Past Total of Past Impaired Due Nor Past Due But Not Impaired Due But Not Financial Impaired <30 days 30-60 days 60-90 days >90 days Impaired Assets Total Installment contract receivables P=15,395,639,468 P=24,342,317 P=24,056,950 P=18,747,771 P=140,339,786 P=207,486,824 P=99,352,184 P=15,702,478,476 Other receivables 1,372,122,530 2,150,422 2,125,213 1,656,195 12,397,743 18,329,573 225,621,569 1,616,073,672 Total P=16,767,761,998 P=26,492,739 P=26,182,163 P=20,403,966 P=152,737,529 P=225,816,397 P=324,973,753 P=17,318,552,148
January 1, 2009 Neither Past Total of Past Impaired Due Nor Past Due But Not Impaired Due But Not Financial Impaired <30 days 30-60 days 60-90 days >90 days Impaired Assets Total Installment contract receivables P=15,110,551,828 P=271,507,002 P=225,161,985 P=129,799,797 P=194,228,284 P=820,697,068 P=88,273,035 P=16,019,521,931 Other receivables 469,501,542 1,166,751 – – 5,754,735 6,921,486 586,587,810 1,063,010,838 Total P=15,580,053,370 P=272,673,753 P=225,161,985 P=129,799,797 P=199,983,019 P=827,618,554 P=674,860,845 P=17,082,532,769
Those accounts that are considered neither past due nor impaired are receivables without any default in payments and those accounts wherein the management has assessed that recoverability is high.
VISTA LAND & LIFESCAPES, INC. AND SUBSIDIARIESNOTES TO CONSOLIDATED FINANCIAL STATEMENTS

VISTA LAND ANNUAL REPORT 2010 131
- 57
-
*SGVMC115372*
Th
e re
stru
ctur
ed a
ccou
nts
out o
f the
tota
l nei
ther
pas
t due
nor
impa
ired
rece
ivab
les
are
P=31
5.43
mill
ion,
P=90
1.34
milli
on a
nd P=
134.
72 m
illio
n as
of
Dec
embe
r 31,
201
0, 2
009
and
Janu
ary
1, 2
009,
resp
ectiv
ely.
The
agg
rega
te fa
ir va
lue
of c
olla
tera
ls o
f ins
tallm
ent c
ontra
cts
rece
ivab
le th
at a
re p
ast d
ue
but n
ot im
paire
d as
of D
ecem
ber 3
1, 2
010,
200
9 an
d Ja
nuar
y 1,
200
9 am
ount
ed to
P=55
7.41
milli
on, P=
2,42
4.1
mill
ion
and
P=1,
317.
34 m
illio
n, re
spec
tivel
y.
Th
e ta
bles
bel
ow s
how
the
cred
it qu
ality
of t
he G
roup
’s fi
nanc
ial a
sset
s as
of D
ecem
ber 3
1, 2
010,
200
9 an
d Ja
nuar
y 1,
200
9, g
ross
of a
llow
ance
for
impa
irmen
t los
ses:
Dec
embe
r 31,
201
0
N
eith
er p
ast d
ue n
or im
paire
d Pa
st d
ue b
ut
Hig
h gr
ade
Med
ium
gra
de
Low
gra
de
Tota
l no
t im
paire
d Im
paire
d To
tal
Cas
h an
d ca
sh e
quiv
alen
ts
(e
xclu
ding
cas
h on
han
d)
P=3,4
71,0
30,8
58
P=–
P=–
P=3,4
71,0
30,8
58
P=–
P=–
P=3,4
71,0
30,8
58
Shor
t-ter
m c
ash
inve
stm
ents
1,
659,
460,
317
– –
1,65
9,46
0,31
7 –
– 1,
659,
460,
317
Rec
eiva
bles
In
stal
lmen
t con
tract
s re
ceiv
able
15
,424
,447
,347
47
,804
,832
–
15,4
72,2
52,1
79
570,
735,
047
97,8
29,5
41
16,1
40,8
16,7
67
O
ther
s 1,
152,
665,
277
– –
1,15
2,66
5,27
7 36
2,12
0,15
5 21
6,50
1,55
4 1,
731,
286,
986
Long
-term
cas
h in
vest
men
ts
1,75
3,60
0,00
0 –
– 1,
753,
600,
000
– –
1,75
3,60
0,00
0 To
tal l
oans
and
rece
ivab
les
23,4
61,2
03,7
99
47,8
04,8
32
23
,509
,008
,631
93
2,85
5,20
2 31
4,33
1,09
5 24
,756
,194
,928
AF
S fin
anci
al a
sset
s 41
,309
,183
–
– 41
,309
,183
–
– 41
,309
,183
P=23,
502,
512,
982
P=47,
804,
832
P=–
P=23,
550,
317,
814
P=932
,855
,202
P=3
14,3
31,0
95
P=24,
797,
504,
111
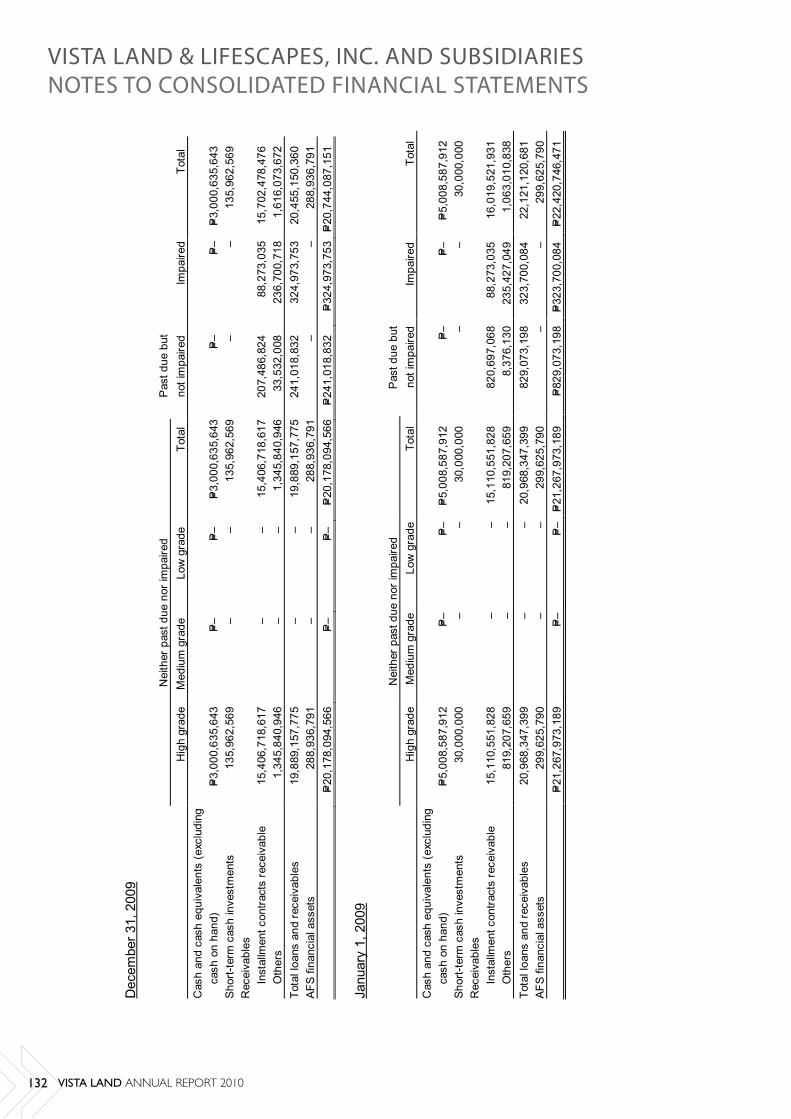
132 VISTA LAND ANNUAL REPORT 2010
- 58
-
*SGVMC115372*
D
ecem
ber 3
1, 2
009
Nei
ther
pas
t due
nor
impa
ired
Pas
t due
but
H
igh
grad
e M
ediu
m g
rade
Lo
w g
rade
To
tal
not i
mpa
ired
Impa
ired
Tota
l C
ash
and
cash
equ
ival
ents
(exc
ludi
ng
cash
on
hand
) P=
3,00
0,63
5,64
3 P=
– P=
– P=
3,00
0,63
5,64
3P=
– P=
– P=
3,00
0,63
5,64
3 Sh
ort-t
erm
cas
h in
vest
men
ts
135,
962,
569
– –
135,
962,
569
– –
135,
962,
569
Rec
eiva
bles
Inst
allm
ent c
ontra
cts
rece
ivab
le
15,4
06,7
18,6
17
– –
15,4
06,7
18,6
1720
7,48
6,82
4 88
,273
,035
15
,702
,478
,476
Oth
ers
1,34
5,84
0,94
6 –
– 1,
345,
840,
946
33,5
32,0
08
236,
700,
718
1,61
6,07
3,67
2 To
tal l
oans
and
rece
ivab
les
19,8
89,1
57,7
75
– –
19,8
89,1
57,7
7524
1,01
8,83
2 32
4,97
3,75
3 20
,455
,150
,360
AF
S fin
anci
al a
sset
s 28
8,93
6,79
1 –
– 28
8,93
6,79
1–
– 28
8,93
6,79
1
P=20
,178
,094
,566
P=
– P=
– P=
20,1
78,0
94,5
66P=
241,
018,
832
P=32
4,97
3,75
3 P=
20,7
44,0
87,1
51
Ja
nuar
y 1,
200
9
N
eith
er p
ast d
ue n
or im
paire
d P
ast d
ue b
ut
Hig
h gr
ade
Med
ium
gra
de
Low
gra
de
Tota
l no
t im
paire
d Im
paire
d To
tal
Cas
h an
d ca
sh e
quiv
alen
ts (e
xclu
ding
ca
sh o
n ha
nd)
P=5,
008,
587,
912
P=–
P=–
P=5,
008,
587,
912
P=–
P=–
P=5,
008,
587,
912
Shor
t-ter
m c
ash
inve
stm
ents
30
,000
,000
–
– 30
,000
,000
–
– 30
,000
,000
R
ecei
vabl
es
Inst
allm
ent c
ontra
cts
rece
ivab
le
15,1
10,5
51,8
28
– –
15,1
10,5
51,8
28
820,
697,
068
88,2
73,0
35
16,0
19,5
21,9
31
O
ther
s 81
9,20
7,65
9 –
– 81
9,20
7,65
9 8,
376,
130
235,
427,
049
1,06
3,01
0,83
8 To
tal l
oans
and
rece
ivab
les
20,9
68,3
47,3
99
– –
20,9
68,3
47,3
99
829,
073,
198
323,
700,
084
22,1
21,1
20,6
81
AFS
finan
cial
ass
ets
299,
625,
790
– –
299,
625,
790
– –
299,
625,
790
P=
21,2
67,9
73,1
89
P=–
P=–
P=21
,267
,973
,189
P=
829,
073,
198
P=32
3,70
0,08
4 P=
22,4
20,7
46,4
71
VISTA LAND & LIFESCAPES, INC. AND SUBSIDIARIESNOTES TO CONSOLIDATED FINANCIAL STATEMENTS
VISTA LAND ANNUAL REPORT 2010 133
- 59 -
*SGVMC115372*
High grade cash and cash equivalents and short-term and long-term cash investments are money market placements and working cash fund placed, invested or deposited in local banks belonging to the top ten banks in the Philippines in terms of resources and profitability.
The Group’s high-grade receivables pertain to receivables from related parties and third parties which, based on experience, are highly collectible or collectible on demand, and of which exposure to bad debt is not significant. Installment contract receivables under bank-financing are assessed to be high grade since accounts under bank-financing undergone credit evaluation performed by two parties, the Group and the respective bank, thus credit evaluation underwent a more stringent criteria resulting to higher probability of having good quality receivables.
Medium grade accounts are active accounts with minimal to regular instances of payment default, due to ordinary/common collection issues. These accounts are typically not impaired as the counterparties generally respond to credit actions and update their payments accordingly.
Low grade accounts are accounts which have probability of impairment based on historical trend.
Based on the Group’s experience, its loans and receivables are highly collectible or collectible on demand. The receivables are collateralized by the corresponding real estate properties. In few cases of buyer defaults, the Group can repossess the collateralized properties and held it for sale in the ordinary course of business at the prevailing market price. The total of repossessed properties included in the “Real estate inventories” account in the consolidated statement of financial position amounted to P=506.72 million, P=507.67 million and P=467.30 million as of December 31, 2010, 2009 and January 1, 2009, respectively. The Group performs certain repair activities on the said repossessed assets in order to put their condition at a marketable state. Costs incurred in bringing the repossessed assets to its marketable state are included in their carrying amounts.
The Group did not accrue any interest income on impaired financial assets.
Liquidity Risk The Group monitors its cash flow position, debt maturity profile and overall liquidity position in assessing its exposure to liquidity risk. The Group maintains a level of cash deemed sufficient to finance its cash requirements. Operating expenses and working capital requirements are sufficiently funded through cash collections. The Group’s loan maturity profile is regularly reviewed to ensure availability of funding through adequate credit facilities with banks and other financial institutions.
The extent and nature of exposures to liquidity risk and how they arise as well as the Group’s objectives, policies and processes for managing the risk and the methods used to measure the risk are the same for 2010, 2009 and 2008. Maturity Profile of Financial Assets and Liabilities The tables below summarize the maturity profile of the Group’s financial assets and liabilities as of December 31, 2010, 2009 and January 1, 2009 based on undiscounted contractual payments, including interest receivable and payable.

134 VISTA LAND ANNUAL REPORT 2010
- 60 -
*SGVMC115372*
December 31, 2010
On Demand
1 to 3 Months
3 to 12 Months
1 to 5 Years Total
Financial Assets Loans and receivables Cash and cash equivalents P=3,441,929,900 P=39,877,345 P=– P=– P=3,481,807,245 Short-term cash investments – 1,659,460,317 – – 1,659,460,317 Receivables Installment contracts receivables 778,760,658 1,385,896,901 3,918,524,149 14,133,134,534 20,216,316,242 Others 1,718,537,842 – 12,749,144 1,731,286,986 Long-term cash investment – – – 2,082,219,836 2,082,219,836 Total undiscounted financial assets P=5,939,228,400 P=3,085,234,563 P=3,931,273,293 P=16,215,354,370 P=29,171,090,626 Financial Liabilities Financial liabilities at amortized cost Bank loans P=48,424,275 P=206,973,448 P=452,862,513 P=2,213,860,533 P=2,922,120,769Loans payable – – 1,567,999,602 2,899,071,372 4,467,070,974Accounts payable and other payables 1,194,706,696 251,026,223 1,939,315,389 788,781,487 4,173,829,795Liabilities for purchased land 346,995,529 116,757,527 374,084,680 294,866,975 1,132,704,711Payable to related parties 385,749,210 – – – 385,749,210Notes payable – 180,103,442 183,088,582 5,795,784,853 6,158,976,877Total undiscounted financial liabilities P=1,975,875,710 P=754,860,640 P=4,517,350,766 P=11,992,365,220 P=19,240,452,336
December 31, 2009
On Demand 1 to
3 Months 3 to
12 Months 1 to
5 Years Total Financial Assets Loans and receivables Cash and cash equivalents P=3,010,640,495 P=– P=– P=– P=3,010,640,495 Short-term cash investments – 135,962,569 – – 135,962,569 Receivables Installment contracts receivables 600,454,850 3,600,454,850 3,220,455,388 8,370,231,418 15,791,596,506 Others 1,616,073,672 – – – 1,616,073,672 Total undiscounted financial assets P=5,227,169,017 P=3,736,417,419 P=3,220,455,388 P=8,370,231,418 P=20,554,273,242 Financial Liabilities Financial liabilities at amortized cost Bank loans P=43,857,732 P=22,959,585 P=233,482,557 P=200,914,946 P=501,214,820 Loans payable 359,273,825 188,080,359 1,912,642,721 1,645,855,326 4,105,852,231 Accounts payable and other payables 4,602,886,840 – – – 4,602,886,840 Liabilities for purchased land 730,774,218 233,283,214 238,223,315 646,360,010 1,848,640,757 LTNs – – – 495,427,390 495,427,390 Payable to related parties 428,906,503 – – – 428,906,503 Total undiscounted financial liabilities P=6,165,699,118 P=444,323,158 P=2,384,348,593 P=2,988,557,672 P=11,982,928,541
VISTA LAND & LIFESCAPES, INC. AND SUBSIDIARIESNOTES TO CONSOLIDATED FINANCIAL STATEMENTS
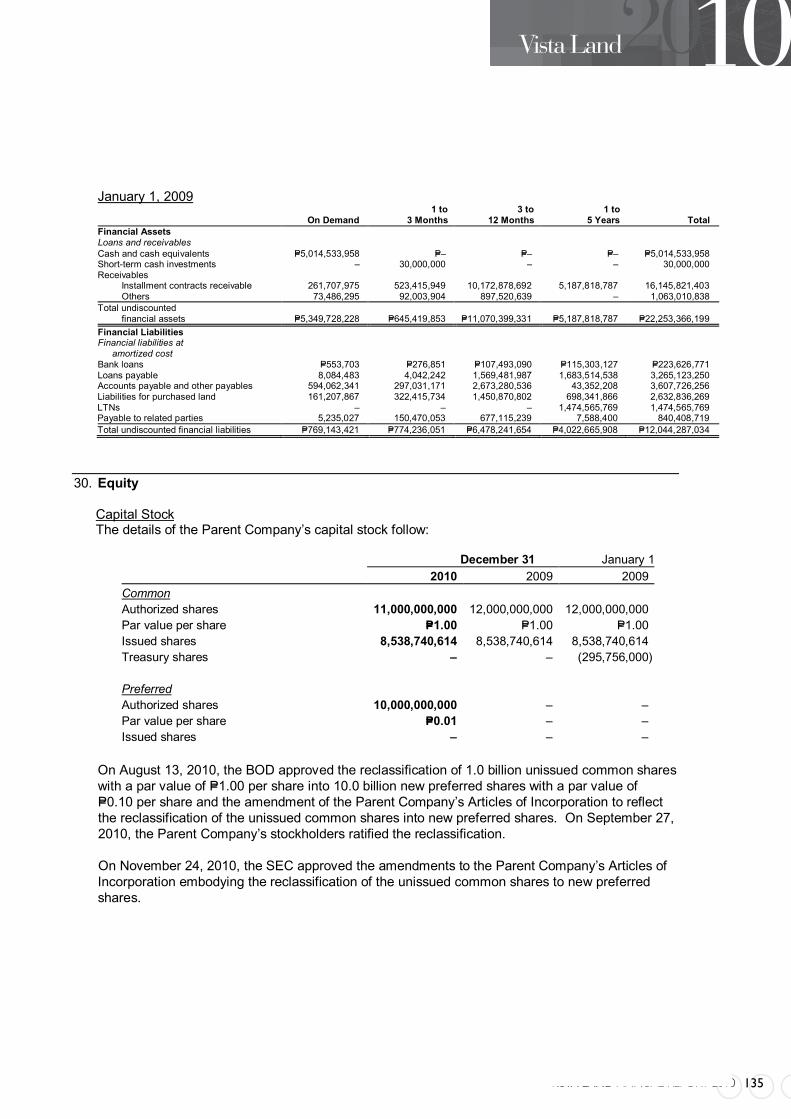
VISTA LAND ANNUAL REPORT 2010 135
- 61 -
*SGVMC115372*
January 1, 2009
On Demand 1 to
3 Months 3 to
12 Months 1 to
5 Years Total Financial Assets Loans and receivables Cash and cash equivalents P=5,014,533,958 P=– P=– P=– P=5,014,533,958 Short-term cash investments – 30,000,000 – – 30,000,000 Receivables Installment contracts receivable 261,707,975 523,415,949 10,172,878,692 5,187,818,787 16,145,821,403 Others 73,486,295 92,003,904 897,520,639 – 1,063,010,838 Total undiscounted financial assets P=5,349,728,228 P=645,419,853 P=11,070,399,331 P=5,187,818,787 P=22,253,366,199 Financial Liabilities Financial liabilities at amortized cost Bank loans P=553,703 P=276,851 P=107,493,090 P=115,303,127 P=223,626,771 Loans payable 8,084,483 4,042,242 1,569,481,987 1,683,514,538 3,265,123,250 Accounts payable and other payables 594,062,341 297,031,171 2,673,280,536 43,352,208 3,607,726,256 Liabilities for purchased land 161,207,867 322,415,734 1,450,870,802 698,341,866 2,632,836,269 LTNs – – – 1,474,565,769 1,474,565,769 Payable to related parties 5,235,027 150,470,053 677,115,239 7,588,400 840,408,719 Total undiscounted financial liabilities P=769,143,421 P=774,236,051 P=6,478,241,654 P=4,022,665,908 P=12,044,287,034
30. Equity
Capital Stock The details of the Parent Company’s capital stock follow:
December 31 January 1 2010 2009 2009 Common Authorized shares 11,000,000,000 12,000,000,000 12,000,000,000 Par value per share P=1.00 P=1.00 P=1.00 Issued shares 8,538,740,614 8,538,740,614 8,538,740,614 Treasury shares – – (295,756,000) Preferred Authorized shares 10,000,000,000 – – Par value per share P=0.01 – – Issued shares – – –
On August 13, 2010, the BOD approved the reclassification of 1.0 billion unissued common shares with a par value of P=1.00 per share into 10.0 billion new preferred shares with a par value of P=0.10 per share and the amendment of the Parent Company’s Articles of Incorporation to reflect the reclassification of the unissued common shares into new preferred shares. On September 27, 2010, the Parent Company’s stockholders ratified the reclassification.
On November 24, 2010, the SEC approved the amendments to the Parent Company’s Articles of Incorporation embodying the reclassification of the unissued common shares to new preferred shares.
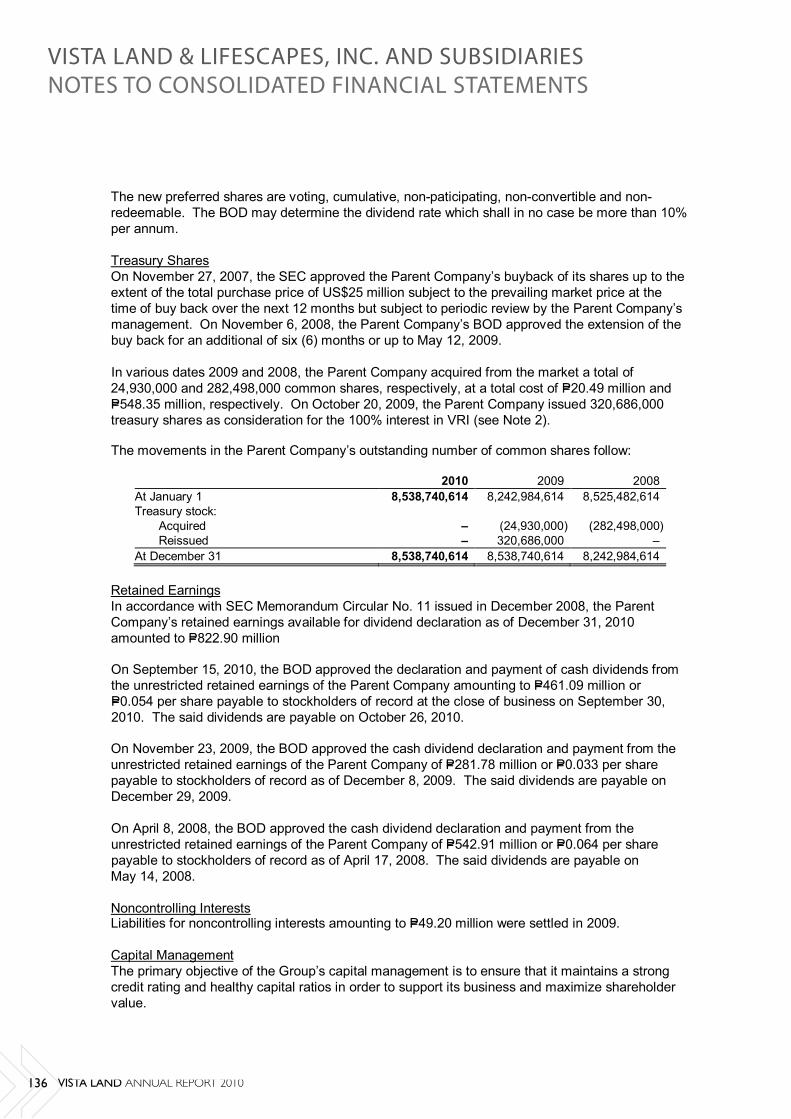
136 VISTA LAND ANNUAL REPORT 2010
- 62 -
*SGVMC115372*
The new preferred shares are voting, cumulative, non-paticipating, non-convertible and non-redeemable. The BOD may determine the dividend rate which shall in no case be more than 10% per annum. Treasury Shares On November 27, 2007, the SEC approved the Parent Company’s buyback of its shares up to the extent of the total purchase price of US$25 million subject to the prevailing market price at the time of buy back over the next 12 months but subject to periodic review by the Parent Company’s management. On November 6, 2008, the Parent Company’s BOD approved the extension of the buy back for an additional of six (6) months or up to May 12, 2009.
In various dates 2009 and 2008, the Parent Company acquired from the market a total of 24,930,000 and 282,498,000 common shares, respectively, at a total cost of P=20.49 million and P=548.35 million, respectively. On October 20, 2009, the Parent Company issued 320,686,000 treasury shares as consideration for the 100% interest in VRI (see Note 2).
The movements in the Parent Company’s outstanding number of common shares follow:
2010 2009 2008 At January 1 8,538,740,614 8,242,984,614 8,525,482,614 Treasury stock: Acquired – (24,930,000) (282,498,000) Reissued – 320,686,000 – At December 31 8,538,740,614 8,538,740,614 8,242,984,614
Retained Earnings In accordance with SEC Memorandum Circular No. 11 issued in December 2008, the Parent Company’s retained earnings available for dividend declaration as of December 31, 2010 amounted to P=822.90 million
On September 15, 2010, the BOD approved the declaration and payment of cash dividends from the unrestricted retained earnings of the Parent Company amounting to P=461.09 million or P=0.054 per share payable to stockholders of record at the close of business on September 30, 2010. The said dividends are payable on October 26, 2010.
On November 23, 2009, the BOD approved the cash dividend declaration and payment from the unrestricted retained earnings of the Parent Company of P=281.78 million or P=0.033 per share payable to stockholders of record as of December 8, 2009. The said dividends are payable on December 29, 2009.
On April 8, 2008, the BOD approved the cash dividend declaration and payment from the unrestricted retained earnings of the Parent Company of P=542.91 million or P=0.064 per share payable to stockholders of record as of April 17, 2008. The said dividends are payable on May 14, 2008.
Noncontrolling Interests
Liabilities for noncontrolling interests amounting to P=49.20 million were settled in 2009.
Capital Management The primary objective of the Group’s capital management is to ensure that it maintains a strong credit rating and healthy capital ratios in order to support its business and maximize shareholder value.
VISTA LAND & LIFESCAPES, INC. AND SUBSIDIARIESNOTES TO CONSOLIDATED FINANCIAL STATEMENTS

VISTA LAND ANNUAL REPORT 2010 137
- 63 -
*SGVMC115372*
The Group manages its capital structure and makes adjustments to it, in light of changes in economic conditions. To maintain or adjust the capital structure, the Group may adjust the dividend payment to shareholders or issue new shares. The Group considers as capital the equity attributable to equity holders of the Group.
The following table shows the component of the Parent Company’s equity as of December 31, 2010, 2009 and January 1, 2009:
December 31 January 1 2010 2009 2009 Total paid-up capital P=27,867,250,474 P=27,867,250,474 P=27,844,016,282 Retained earnings 10,309,298,685 7,757,417,581 5,739,787,852 Unrealized gain on AFS financial assets – – 472,619 Treasury shares – – (616,885,476) P=38,176,549,159 P=35,624,668,055 P=32,967,391,277
31. Notes to Consolidated Statements of Cash Flows
The Group’s noncash investing and financing activities pertain to the following: a) Transfer of real estate inventories in 2010 amounting to P=174.01 million by a certain related
party to the Group which resulted to decrease in available-for-sale financial assets and increase in real estate inventories;
b) Conversion of sold receivables from a “with recourse basis” to “without recourse basis” with total carrying value of P=1,419.97 million in 2010;
c) Payment of LTNs by a certain related party amounting to P=554.77 million in 2010; d) Transfers from land for future development amounting to real estate inventories amounting to
P=863.19 million, P=199.03 million and P=2,740.11 million in 2010, 2009 and 2008, respectively; and
e) Acquisition of VRI in exchange of treasury shares amounting to P=661.61 million in 2009. 32. Contingencies
The Group has various contingent liabilities from legal cases arising from the ordinary course of business which are either pending decision by the courts or are currently being contested by the Group, the outcome of which are not presently determinable.
In the opinion of the management and its legal counsel, the eventual liability under these lawsuits or claims, if any, will not have a material or adverse effect in the Group’s financial position and results of operations.
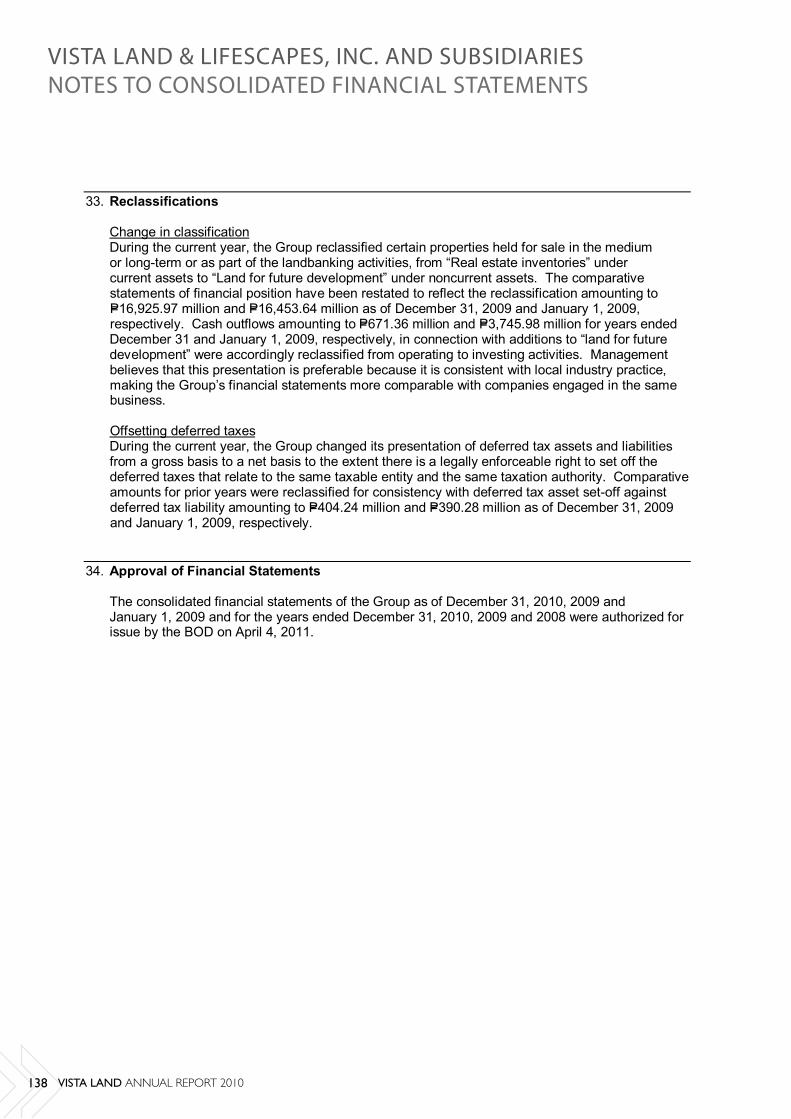
138 VISTA LAND ANNUAL REPORT 2010
- 64 -
*SGVMC115372*
33. Reclassifications
Change in classification During the current year, the Group reclassified certain properties held for sale in the medium or long-term or as part of the landbanking activities, from “Real estate inventories” under current assets to “Land for future development” under noncurrent assets. The comparative statements of financial position have been restated to reflect the reclassification amounting to P=16,925.97 million and P=16,453.64 million as of December 31, 2009 and January 1, 2009, respectively. Cash outflows amounting to P=671.36 million and P=3,745.98 million for years ended December 31 and January 1, 2009, respectively, in connection with additions to “land for future development” were accordingly reclassified from operating to investing activities. Management believes that this presentation is preferable because it is consistent with local industry practice, making the Group’s financial statements more comparable with companies engaged in the same business. Offsetting deferred taxes During the current year, the Group changed its presentation of deferred tax assets and liabilities from a gross basis to a net basis to the extent there is a legally enforceable right to set off the deferred taxes that relate to the same taxable entity and the same taxation authority. Comparative amounts for prior years were reclassified for consistency with deferred tax asset set-off against deferred tax liability amounting to P=404.24 million and P=390.28 million as of December 31, 2009 and January 1, 2009, respectively.
34. Approval of Financial Statements
The consolidated financial statements of the Group as of December 31, 2010, 2009 and January 1, 2009 and for the years ended December 31, 2010, 2009 and 2008 were authorized for issue by the BOD on April 4, 2011.
VISTA LAND & LIFESCAPES, INC. AND SUBSIDIARIESNOTES TO CONSOLIDATED FINANCIAL STATEMENTS

VISTA LAND & LIFESCAPES, INC.
CAMELLA HOMES, INC.
BRITTANY CORPORATION
CROWN ASIA PROPERTIES, INC.
COMMUNITIES PHILIPPINES, INC.
VISTA RESIDENCES, INC.
Registered Address:3rd Level Starmall Las PiñasC.V. Starr Avenue, Pamplona,1746 Las Piñas City,Philippines Office Address:UGF Worldwide Corporate CenterShaw Boulevard,1552 Mandaluyong CityPhilippines Tel +63 2 5845308/05Fax +63 2 5845731 www.vistaland.com.ph
2nd Floor, The Marfori TowerLakefront, East Service Road,Sucat, 1770 Muntinlupa City,PhilippinesTel +63 2 7949988 to 94Fax +63 2 7949995 www.brittany.com.ph
2nd Floor The Wharf at LakefrontKm. 20 East Service Road, Sucat 1770 Muntinlupa CityPhilippinesTel +63 2 8661582Fax +63 2 8371408 www.crownasia.com.ph
UGF Worldwide Corporate CenterShaw Boulevard,1552 Mandaluyong CityPhilippinesTel +63 2 5313486 ext 107Fax +63 2 5341377 ext 103 www.camella.com.ph
UGF Worldwide Corporate CenterShaw Boulevard,1552 Mandaluyong CityPhilippinesTel +63 2 5841176 +63 2 5841183Fax +63 2 5841178 www.vistaresidences.com.ph
South-based Communities3rd Level Metropolis MallAlabang, Muntinlupa CityPhilippinesTel +63 2 7721096Fax +63 2 7721093 North-based CommunitiesUGF Worldwide Corporate CenterShaw Boulevard,1552 Mandaluyong CityPhilippinesTel +63 2 5313486 ext 101Fax +63 2 5341377 ext 102 East-based CommunitiesUGF Worldwide Corporate CenterShaw Boulevard,1552 Mandaluyong CityPhilippinesTel +63 2 5313486 ext 101 +63 2 5841176Fax +63 2 5341377 ext 102 +63 2 5841178 www.camella.com.ph
SHAREHOLDER INFORMATION
VISTA LAND ANNUAL REPORT 2010 139

InstitutionalInvestor Inquiries
Shareholder Services and Assistance
For inquiries please write or call Vista Land & Lifescapes, Inc.’s
Investor Relations Group.
UGF Worldwide Corporate Center
Shaw Boulevard
1552 Mandaluyong City
Philippines
Tel: +63 2 5845730 ext 108
Fax: +63 2 5845731
For inquiries regarding dividend payments,
change of address and account status, lost or
damaged stock certificates, please write or call:
Securities Transfer Services, Inc.
G/F Benpres Building
Exchange Road corner Meralco Avenue
Ortigas Center, Pasig City
Metro Manila, Philippines
Tel: +63 2 4900060
Fax: +63 2 6317148
Concept, Content Design and Layout:
ArtOne Design & Communications, Inc.
Photography: Albert Labrador
Edwin Tuyay
140 VISTA LAND ANNUAL REPORT 2010

Las Piñas Business CenterNational Road, TalonLas Piñas City, PhilippinesTel: +63 2 8745758Fax: +63 2 8126947www.vistaland.com.ph