OLIVE VISTA MIDDLE SCΗOOL DRAFT IvITIAL STUDu ...
639
OLIVE VISTA MIDDLE SCHOOL SEISMIC MODERNIZATION OF THE PHYSICAL EDUCATION AND MULTI-PURPOSE ROOM/LUNCH PAVILION/STUDENT STORE BUILDINGS LOS ANGELES UNIFIED SCHOOL DISTRICT JUNE 2015 DRAFT INITIAL STUDY / MITIGATED NEGATIVE DECLARATION
-
Upload
khangminh22 -
Category
Documents
-
view
0 -
download
0
Transcript of OLIVE VISTA MIDDLE SCΗOOL DRAFT IvITIAL STUDu ...

Olive vista Middle schOOlseisMic MOdernizatiOn Of the Physical educatiOn and
Multi-PurPOse rOOM/lunch PaviliOn/student stOre Buildings
lOs angeles unified schOOl district
June 2015
draft initial study /Mitigated negative declaratiOn

appendix a
air Quality Worksheets anD moDelling
OliveVistaMiddleSchoolDraftNDAppendixA,AirQualityWorksheetsA.1ConstructionandOperational:ModelInputs
A.2 ConstructionEmissions
Construction:CaliforniaEmissionsEstimatorModelRuns
A.3 OperationalEmissions–ExistingSite
Operations–ExistingSite:CaliforniaEmissionsEstimatorModelRuns
A.4 OperationalEmissions–Project
Operations–Project:CaliforniaEmissionsEstimatorModelRuns
Operations‐Charbroiler

AppendixA.1ModelInputs
ConstructionandOperational:ModelInputs

Olive Vista Middle School ND
Air Quality ‐ Information Provided by Client
Proposed Project Existing Land Use (to be demolished)
Land Use Type Value Units Land Use Type Value Units Notes
Gymnasium 19,917 sf Gymnasium 18,362 sf will be replaced by new Play Field
Multi‐Purpose Building 17,555 sf Covered Shelter
Lunch Pavillion 9,346 sf Multi‐Purpose Building 16,627 sf will be replaced by new MPR
Covered Shelter 2,444 sf Lunch Pavillion 11,912 sf will be replaced by new Pavillion
Total Outdoor Area 11,790 sf Play Field (Turf) 0.65 sf will be replaced by new Gym
Play Field (Turf) 0.65 acre
TOTAL AREA 49,262 sf
Parking Lot Name Existing Spaces Proposed Spaces
Parking Lot C 60 82
Parking Lot D 20 0
Total New Spaces 82
Graded Area 4.6 acres
Construction Schedule
Phase Start End Length (days)
Construction of MPR and
Gym, Demolition of MPR 6/14/2016 6/13/2018 522
Demolition Gym 6/14/2018 8/12/2018 42
Operational Year 2018
Soil Exported 7721.23 CY
Soil Imported 3427.53 CY
Net Soil Export 4293.7 CY
Haul Truck Capacity 8 CY
Haul Trucks Needed 537 trucks
No construction schedule can be provided yet, because still in design phase. Equipment breakdown for PCR to formulate based on past projects.

Olive Vista Middle School ND
Air Quality ‐ Construction Schedule
Construction Activity Phase Start Date End Date No. of Work Days Demo CY Demo Truck Trips Export CY Import CY Vendor Trips Worker Trips Haul Truck Trips
Demolition of MPB 6/14/2016 9/27/2016 76 3079 385
Grading/Excavation 9/28/2016 11/30/2016 46 7721 3428 537
Foundation 12/1/2016 4/1/2017 87
Building Construction 4/2/2017 3/1/2018 239
Architectural Coating 3/2/2018 5/13/2018 51
Paving 5/14/2018 6/13/2018 23
Demolition of Gym 6/14/2018 8/12/2018 42 3400 425
Demolition Estimate Value Unit
MPR Area (sf) *DD PDF* 16,627 sq. ft.
Assumed Height 20 ft
MPR Volume (cf) 332,540 cubic ft.
Material Volume Percentage 25 %
MPR Demolition Volume 83135 cubic ft.
MPR Demolition Volume 3079 CY
Gym Area (sf) *DD PDF* 18,362 sq. ft.
Assumed Height 20 ft
Gym Volume (cf) 367,240 cubic ft.
Material Volume Percentage 25 %
Gym Demolition Volume 91,810 cubic ft.
Gym Demolition Volume 3400 CY
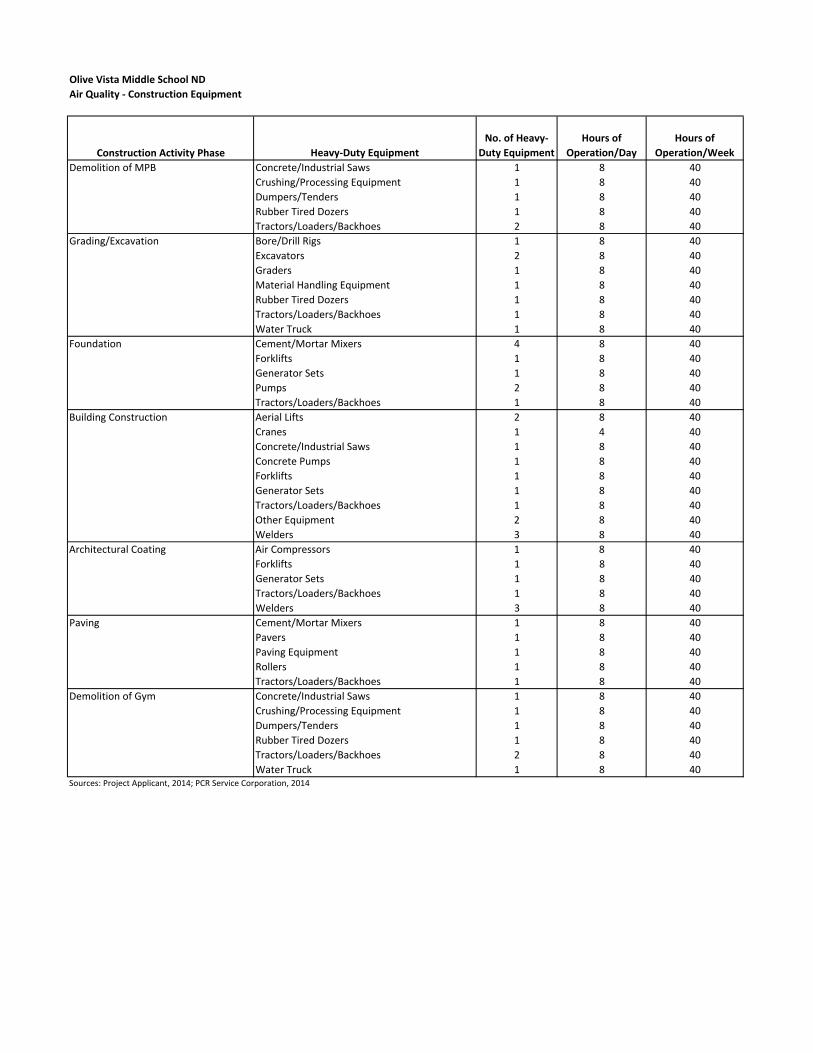
Olive Vista Middle School ND
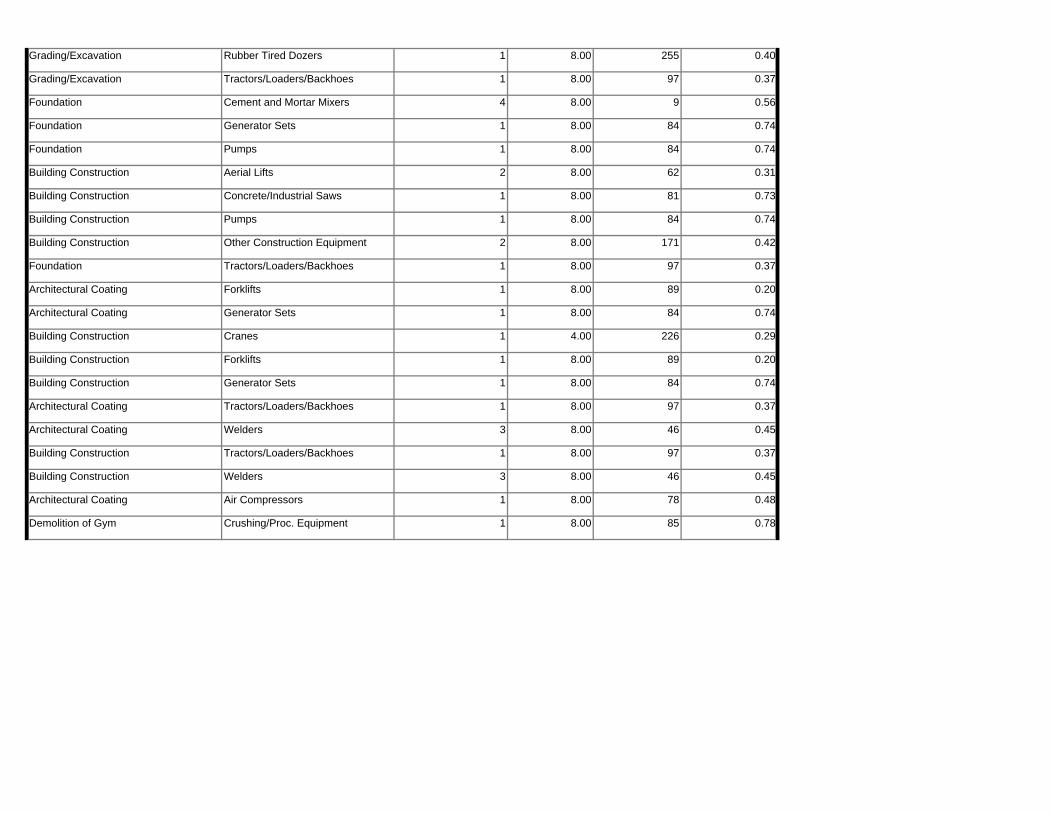
Air Quality ‐ Construction Equipment
Heavy‐Duty Equipment
No. of Heavy‐
Duty Equipment
Hours of
Operation/Day
Hours of
Operation/Week
Demolition of MPB Concrete/Industrial Saws 1 8 40
Crushing/Processing Equipment 1 8 40
Dumpers/Tenders 1 8 40
Rubber Tired Dozers 1 8 40
Tractors/Loaders/Backhoes 2 8 40
Grading/Excavation Bore/Drill Rigs 1 8 40
Excavators 2 8 40
Graders 1 8 40
Material Handling Equipment 1 8 40
Rubber Tired Dozers 1 8 40
Tractors/Loaders/Backhoes 1 8 40
Water Truck 1 8 40
Foundation Cement/Mortar Mixers 4 8 40
Forklifts 1 8 40
Generator Sets 1 8 40
Pumps 2 8 40
Tractors/Loaders/Backhoes 1 8 40
Building Construction Aerial Lifts 2 8 40
Cranes 1 4 40
Concrete/Industrial Saws 1 8 40
Concrete Pumps 1 8 40
Forklifts 1 8 40
Generator Sets 1 8 40
Tractors/Loaders/Backhoes 1 8 40
Other Equipment 2 8 40
Welders 3 8 40
Architectural Coating Air Compressors 1 8 40
Forklifts 1 8 40
Generator Sets 1 8 40
Tractors/Loaders/Backhoes 1 8 40
Welders 3 8 40
Paving Cement/Mortar Mixers 1 8 40
Pavers 1 8 40
Paving Equipment 1 8 40
Rollers 1 8 40
Tractors/Loaders/Backhoes 1 8 40
Demolition of Gym Concrete/Industrial Saws 1 8 40
Crushing/Processing Equipment 1 8 40
Dumpers/Tenders 1 8 40
Rubber Tired Dozers 1 8 40
Tractors/Loaders/Backhoes 2 8 40
Water Truck 1 8 40Sources: Project Applicant, 2014; PCR Service Corporation, 2014
Construction Activity Phase

AppendixA.2ConstructionEmissions
Construction:CaliforniaEmissionsEstimatorModelRuns

Off-road Equipment - See Construction Equipment List
Off-road Equipment - See Construction Equipment List
1.3 User Entered Comments & Non-Default Data
Project Characteristics -
Land Use -
Construction Phase - See Construction Schedule
Off-road Equipment - See Construction Equipment List
Off-road Equipment - See Construction Equipment List
CO2 Intensity (lb/MWhr)
1227.89 CH4 Intensity (lb/MWhr)
0.029 N2O Intensity (lb/MWhr)
0.006
31
Climate Zone 11 Operational Year 2018
Utility Company Los Angeles Department of Water & Power
1.2 Other Project Characteristics
Urbanization Urban Wind Speed (m/s) 2.2 Precipitation Freq (Days)
Movie Theater (No Matinee) 17.50 1000sqft 0.40 17,500.00 0
Health Club 19.90 1000sqft 0.46 19,900.00 0
City Park 0.65 Acre 0.65 28,314.00 0
Parking Lot 80.00 Space 0.72 32,000.00 0
Population
Other Non-Asphalt Surfaces 11.80 1000sqft 0.27 11,800.00 0
1.1 Land Usage
Land Uses Size Metric Lot Acreage Floor Surface Area
CalEEMod Version: CalEEMod.2013.2.1 Page 1 of 1 Date: 11/19/2014 12:19 PM
Olive Vista Middle SchoolSouth Coast Air Basin, Summer
1.0 Project Characteristics

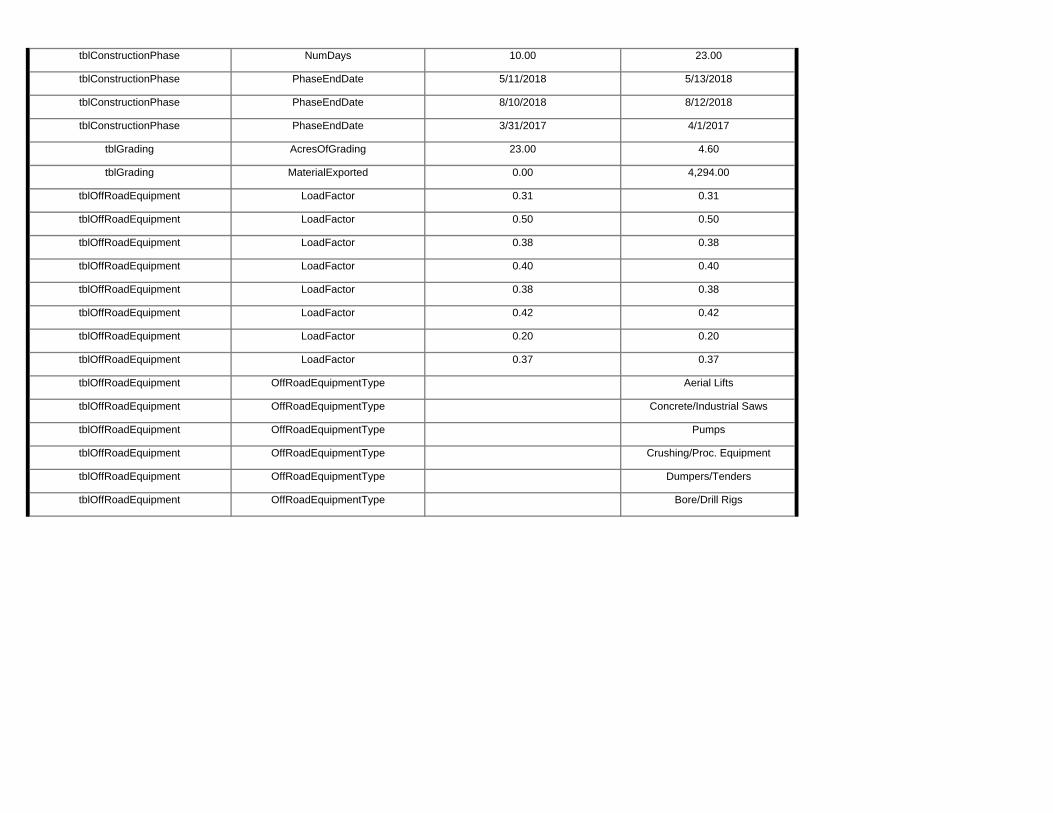
tblOffRoadEquipment OffRoadEquipmentType Aerial Lifts
tblOffRoadEquipment OffRoadEquipmentType Concrete/Industrial Saws
tblOffRoadEquipment LoadFactor 0.20 0.20
tblOffRoadEquipment LoadFactor 0.37 0.37
tblOffRoadEquipment LoadFactor 0.38 0.38
tblOffRoadEquipment LoadFactor 0.42 0.42
tblOffRoadEquipment LoadFactor 0.38 0.38
tblOffRoadEquipment LoadFactor 0.40 0.40
tblOffRoadEquipment LoadFactor 0.31 0.31
tblOffRoadEquipment LoadFactor 0.50 0.50
tblGrading AcresOfGrading 23.00 4.60
tblGrading MaterialExported 0.00 4,294.00
tblConstructionPhase PhaseEndDate 8/10/2018 8/12/2018
tblConstructionPhase PhaseEndDate 3/31/2017 4/1/2017
tblConstructionPhase NumDays 10.00 23.00
tblConstructionPhase PhaseEndDate 5/11/2018 5/13/2018
tblConstructionPhase NumDays 6.00 46.00
tblConstructionPhase NumDays 10.00 87.00
tblConstructionPhase NumDays 20.00 76.00
tblConstructionPhase NumDays 20.00 42.00
tblConstructionPhase NumDays 10.00 51.00
tblConstructionPhase NumDays 220.00 239.00
Demolition -
Grading - See Construction Assumptions
Construction Off-road Equipment Mitigation -
Table Name Column Name Default Value New Value
Off-road Equipment - See Construction Equipment List
Off-road Equipment - See Construction Equipment List
Off-road Equipment - See Construction Equipment List
Trips and VMT -

tblProjectCharacteristics OperationalYear 2014 2018
tblTripsAndVMT WorkerTripNumber 30.00 20.00
tblOffRoadEquipment UsageHours 6.00 8.00
tblOffRoadEquipment UsageHours 7.00 8.00
tblOffRoadEquipment UsageHours 8.00 4.00
tblOffRoadEquipment UsageHours 7.00 8.00
tblOffRoadEquipment OffRoadEquipmentUnitAmount 2.00 1.00
tblOffRoadEquipment UsageHours 6.00 8.00
tblOffRoadEquipment OffRoadEquipmentUnitAmount 3.00 2.00
tblOffRoadEquipment OffRoadEquipmentUnitAmount 3.00 2.00
tblOffRoadEquipment OffRoadEquipmentUnitAmount 2.00 1.00
tblOffRoadEquipment OffRoadEquipmentUnitAmount 2.00 1.00
tblOffRoadEquipment OffRoadEquipmentType Dumpers/Tenders
tblOffRoadEquipment OffRoadEquipmentUnitAmount 1.00 4.00
tblOffRoadEquipment OffRoadEquipmentType Welders
tblOffRoadEquipment OffRoadEquipmentType Crushing/Proc. Equipment
tblOffRoadEquipment OffRoadEquipmentType Generator Sets
tblOffRoadEquipment OffRoadEquipmentType Tractors/Loaders/Backhoes
tblOffRoadEquipment OffRoadEquipmentType Other Construction Equipment
tblOffRoadEquipment OffRoadEquipmentType Forklifts
tblOffRoadEquipment OffRoadEquipmentType Generator Sets
tblOffRoadEquipment OffRoadEquipmentType Pumps
tblOffRoadEquipment OffRoadEquipmentType Off-Highway Trucks
tblOffRoadEquipment OffRoadEquipmentType Forklifts
tblOffRoadEquipment OffRoadEquipmentType Excavators
tblOffRoadEquipment OffRoadEquipmentType Other Material Handling Equipment
tblOffRoadEquipment OffRoadEquipmentType Dumpers/Tenders
tblOffRoadEquipment OffRoadEquipmentType Bore/Drill Rigs
tblOffRoadEquipment OffRoadEquipmentType Pumps
tblOffRoadEquipment OffRoadEquipmentType Crushing/Proc. Equipment

0.00 0.00 0.00 0.00 0.00 0.0047.93 0.00 23.94 53.70 0.00 18.16
NBio-CO2 Total CO2 CH4 N20 CO2e
Percent Reduction
0.00 0.00 0.00 0.00
Exhaust PM10
PM10 Total
Fugitive PM2.5
Exhaust PM2.5
PM2.5 Total
Bio- CO2ROG NOx CO SO2 Fugitive PM10
0.0000 18,350.9847
18,350.9847
3.8297 0.0000 18,431.4077
4.0744 7.8202 11.8946 1.7479 7.3907 9.1386Total 49.6546 145.7874 112.4233 0.1888
0.0000 5,651.6570
5,651.6570 1.0013 0.0000 5,672.6849
0.6267 2.2930 2.9197 0.1684 2.2012 2.36962018 38.3628 39.5982 36.0091 0.0604
0.0000 5,715.4901
5,715.4901 1.0371 0.0000 5,737.2692
0.6267 2.6664 3.2931 0.1684 2.5575 2.72592017 5.7640 44.1959 37.0116 0.0604
0.0000 6,983.8376
6,983.8376 1.7912 0.0000 7,021.4535
2.8210 2.8608 5.6818 1.4111 2.6320 4.04302016 5.5278 61.9933 39.4025 0.0680
Total CO2 CH4 N2O CO2e
Year lb/day lb/day
PM10 Total
Fugitive PM2.5
Exhaust PM2.5
PM2.5 Total
Bio- CO2 NBio- CO2
Mitigated Construction
ROG NOx CO SO2 Fugitive PM10
Exhaust PM10
0.0000 18,350.9848
18,350.9848
3.8297 0.0000 18,431.4077
7.8252 7.8202 15.6392 3.7751 7.3907 11.1658Total 49.6546 145.7874 112.4233 0.1888
0.0000 5,651.6570
5,651.6570 1.0013 0.0000 5,672.6849
0.6329 2.2930 2.9197 0.1684 2.2012 2.36962018 38.3628 39.5982 36.0091 0.0604
0.0000 5,715.4901
5,715.4901 1.0371 0.0000 5,737.2692
0.6267 2.6664 3.2931 0.1684 2.5575 2.72592017 5.7640 44.1959 37.0116 0.0604
0.0000 6,983.8376
6,983.8376 1.7912 0.0000 7,021.4535
6.5656 2.8608 9.4264 3.4383 2.6320 6.07022016 5.5278 61.9933 39.4025 0.0680
NBio- CO2
Total CO2 CH4 N2O CO2e
Year lb/day lb/day
Exhaust PM10
PM10 Total
Fugitive PM2.5
Exhaust PM2.5
PM2.5 Total
Bio- CO2
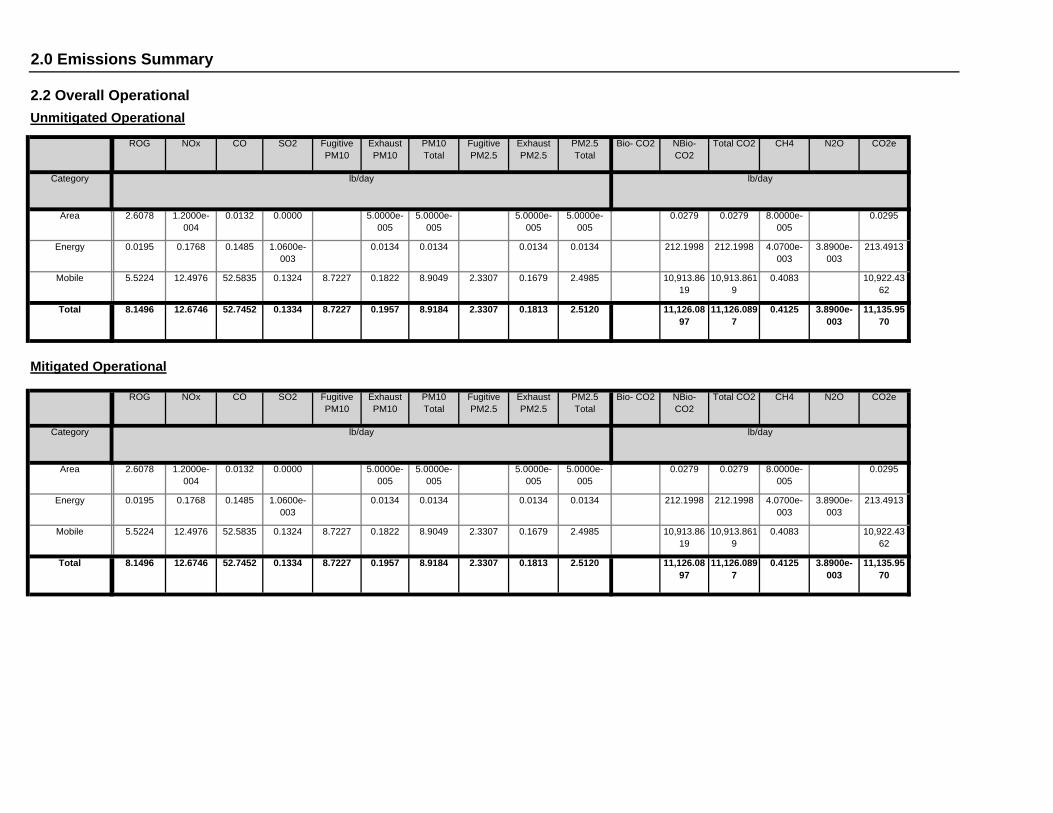
2.0 Emissions Summary
2.1 Overall Construction (Maximum Daily Emission)Unmitigated Construction
ROG NOx CO SO2 Fugitive PM10

Foundation Forklifts 1 8.00 89 0.20
Grading/Excavation Off-Highway Trucks 1 8.00 400 0.38
Grading/Excavation Graders 1 8.00 174 0.41
Grading/Excavation Other Material Handling Equipment 1 8.00 167 0.40
Grading/Excavation Excavators 2 8.00 162 0.38
Demolition of MPB Tractors/Loaders/Backhoes 2 8.00 97 0.37
Demolition of MPB Rubber Tired Dozers 1 8.00 255 0.40
Grading/Excavation Bore/Drill Rigs 1 8.00 205 0.50
Demolition of MPB Dumpers/Tenders 1 8.00 16 0.38
Demolition of MPB Crushing/Proc. Equipment 1 8.00 85 0.78
Load Factor
Demolition of MPB Concrete/Industrial Saws 1 8.00 81 0.73
OffRoad Equipment
Phase Name Offroad Equipment Type Amount Usage Hours Horse Power
42
Acres of Grading (Site Preparation Phase): 0
Acres of Grading (Grading Phase): 0
Acres of Paving: 0
Residential Indoor: 0; Residential Outdoor: 0; Non-Residential Indoor: 117,711; Non-Residential Outdoor: 39,237 (Architectural Coating –
7 Demolition of Gym Demolition 6/14/2018 8/12/2018 5
51
6 Paving Paving 5/14/2018 6/13/2018 5 23
5 Architectural Coating Architectural Coating 3/2/2018 5/13/2018 5
87
4 Building Construction Building Construction 4/2/2017 3/1/2018 5 239
3 Foundation Paving 12/1/2016 4/1/2017 5
76
2 Grading/Excavation Grading 9/28/2016 11/30/2016 5 46
End Date Num Days Week
Num Days Phase Description
1 Demolition of MPB Demolition 6/14/2016 9/27/2016 5
3.0 Construction Detail
Construction Phase
Phase Number
Phase Name Phase Type Start Date

Demolition of Gym Dumpers/Tenders 1 8.00 16 0.38
Demolition of Gym Crushing/Proc. Equipment 1 8.00 85 0.78
Architectural Coating Air Compressors 1 8.00 78 0.48
Building Construction Welders 3 8.00 46 0.45
Building Construction Tractors/Loaders/Backhoes 1 8.00 97 0.37
Architectural Coating Welders 3 8.00 46 0.45
Architectural Coating Tractors/Loaders/Backhoes 1 8.00 97 0.37
Building Construction Generator Sets 1 8.00 84 0.74
Building Construction Forklifts 1 8.00 89 0.20
Building Construction Cranes 1 4.00 226 0.29
Architectural Coating Generator Sets 1 8.00 84 0.74
Architectural Coating Forklifts 1 8.00 89 0.20
Foundation Tractors/Loaders/Backhoes 1 8.00 97 0.37
Building Construction Other Construction Equipment 2 8.00 171 0.42
Building Construction Pumps 1 8.00 84 0.74
Building Construction Concrete/Industrial Saws 1 8.00 81 0.73
Building Construction Aerial Lifts 2 8.00 62 0.31
Foundation Pumps 1 8.00 84 0.74
Foundation Generator Sets 1 8.00 84 0.74
Foundation Cement and Mortar Mixers 4 8.00 9 0.56
Grading/Excavation Tractors/Loaders/Backhoes 1 8.00 97 0.37
Grading/Excavation Rubber Tired Dozers 1 8.00 255 0.40

Water Exposed Area
6.90 20.00 LD_Mix HDT_Mix HHDT
3.1 Mitigation Measures Construction
Demolition of Gym 6 15.00 0.00 84.00 14.70
14.70 6.90 20.00 LD_Mix HDT_Mix HHDT
6.90 20.00 LD_Mix HDT_Mix HHDT
Paving 5 13.00 0.00 0.00
Architectural Coating 7 9.00 0.00 0.00 14.70
14.70 6.90 20.00 LD_Mix HDT_Mix HHDT
6.90 20.00 LD_Mix HDT_Mix HHDT
Building Construction 13 46.00 18.00 0.00
Foundation 12 20.00 0.00 0.00 14.70
14.70 6.90 20.00 LD_Mix HDT_Mix HHDT
6.90 20.00 LD_Mix HDT_Mix HHDT
Grading/Excavation 8 20.00 0.00 537.00
Demolition of MPB 6 15.00 0.00 113.00 14.70
Worker Trip Length
Vendor Trip Length
Hauling Trip Length
Worker Vehicle Class
Vendor Vehicle Class
Hauling Vehicle Class
Trips and VMT
Phase Name Offroad Equipment Count
Worker Trip Number
Vendor Trip Number
Hauling Trip Number
Demolition of Gym Tractors/Loaders/Backhoes 2 8.00 97 0.37
Demolition of Gym Rubber Tired Dozers 1 8.00 255 0.40
Foundation Rollers 2 8.00 80 0.38
Demolition of Gym Concrete/Industrial Saws 1 8.00 81 0.73
Paving Tractors/Loaders/Backhoes 1 8.00 97 0.37
Paving Rollers 1 8.00 80 0.38
Paving Paving Equipment 1 8.00 130 0.36
Paving Pavers 1 8.00 125 0.42
Paving Cement and Mortar Mixers 1 8.00 9 0.56
Foundation Paving Equipment 1 8.00 130 0.36
Foundation Pavers 1 8.00 125 0.42

0.0000 2,888.9227
2,888.9227 0.6138 2,901.8129
0.1257 1.9559 2.0815 0.0190 1.8641 1.8832Total 3.4819 30.8875 23.8069 0.0291
0.0000 2,888.9227
2,888.9227 0.6138 2,901.8129
1.9559 1.9559 1.8641 1.8641Off-Road 3.4819 30.8875 23.8069 0.0291
0.0000 0.00000.1257 0.0000 0.1257 0.0190 0.0000 0.0190Fugitive Dust
Total CO2 CH4 N2O CO2e
Category lb/day lb/day
PM10 Total
Fugitive PM2.5
Exhaust PM2.5
PM2.5 Total
Bio- CO2 NBio- CO2
Mitigated Construction On-Site
ROG NOx CO SO2 Fugitive PM10
Exhaust PM10
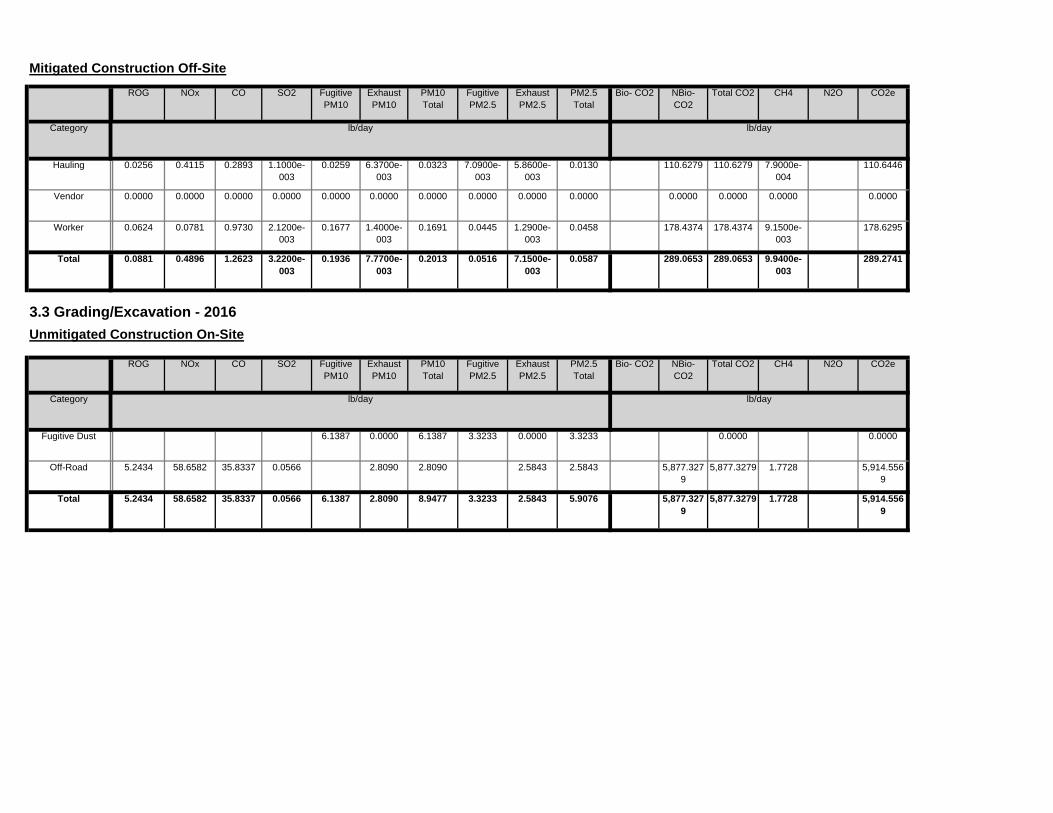
289.0653 289.0653 9.9400e-003
289.27410.1936 7.7700e-003
0.2013 0.0516 7.1500e-003
0.0587Total 0.0881 0.4896 1.2623 3.2200e-003
178.4374 178.4374 9.1500e-003
178.62950.1677 1.4000e-003
0.1691 0.0445 1.2900e-003
0.0458Worker 0.0624 0.0781 0.9730 2.1200e-003
0.0000 0.0000 0.0000 0.00000.0000 0.0000 0.0000 0.0000 0.0000 0.0000Vendor 0.0000 0.0000 0.0000 0.0000
110.6279 110.6279 7.9000e-004
110.64460.0259 6.3700e-003
0.0323 7.0900e-003
5.8600e-003
0.0130Hauling 0.0256 0.4115 0.2893 1.1000e-003
Total CO2 CH4 N2O CO2e
Category lb/day lb/day
PM10 Total
Fugitive PM2.5
Exhaust PM2.5
PM2.5 Total
Bio- CO2 NBio- CO2
Unmitigated Construction Off-Site
ROG NOx CO SO2 Fugitive PM10
Exhaust PM10
2,888.9227
2,888.9227 0.6138 2,901.8129
0.3223 1.9559 2.2781 0.0488 1.8641 1.9129Total 3.4819 30.8875 23.8069 0.0291
2,888.9227
2,888.9227 0.6138 2,901.8129
1.9559 1.9559 1.8641 1.8641Off-Road 3.4819 30.8875 23.8069 0.0291
0.0000 0.00000.3223 0.0000 0.3223 0.0488 0.0000 0.0488Fugitive Dust
NBio- CO2
Total CO2 CH4 N2O CO2e
Category lb/day lb/day
Exhaust PM10
PM10 Total
Fugitive PM2.5
Exhaust PM2.5
PM2.5 Total
Bio- CO2
3.2 Demolition of MPB - 2016Unmitigated Construction On-Site
ROG NOx CO SO2 Fugitive PM10
5,877.3279
5,877.3279 1.7728 5,914.5569
6.1387 2.8090 8.9477 3.3233 2.5843 5.9076Total 5.2434 58.6582 35.8337 0.0566
5,877.3279
5,877.3279 1.7728 5,914.5569
2.8090 2.8090 2.5843 2.5843Off-Road 5.2434 58.6582 35.8337 0.0566
0.0000 0.00006.1387 0.0000 6.1387 3.3233 0.0000 3.3233Fugitive Dust
Total CO2 CH4 N2O CO2e
Category lb/day lb/day
PM10 Total
Fugitive PM2.5
Exhaust PM2.5
PM2.5 Total
Bio- CO2 NBio- CO2
3.3 Grading/Excavation - 2016Unmitigated Construction On-Site
ROG NOx CO SO2 Fugitive PM10
Exhaust PM10
289.0653 289.0653 9.9400e-003
289.27410.1936 7.7700e-003
0.2013 0.0516 7.1500e-003
0.0587Total 0.0881 0.4896 1.2623 3.2200e-003
178.4374 178.4374 9.1500e-003
178.62950.1677 1.4000e-003
0.1691 0.0445 1.2900e-003
0.0458Worker 0.0624 0.0781 0.9730 2.1200e-003
0.0000 0.0000 0.0000 0.00000.0000 0.0000 0.0000 0.0000 0.0000 0.0000Vendor 0.0000 0.0000 0.0000 0.0000
110.6279 110.6279 7.9000e-004
110.64460.0259 6.3700e-003
0.0323 7.0900e-003
5.8600e-003
0.0130Hauling 0.0256 0.4115 0.2893 1.1000e-003
Total CO2 CH4 N2O CO2e
Category lb/day lb/day
PM10 Total
Fugitive PM2.5
Exhaust PM2.5
PM2.5 Total
Bio- CO2 NBio- CO2
Mitigated Construction Off-Site
ROG NOx CO SO2 Fugitive PM10
Exhaust PM10
0.0000 5,877.3279
5,877.3279 1.7728 5,914.5569
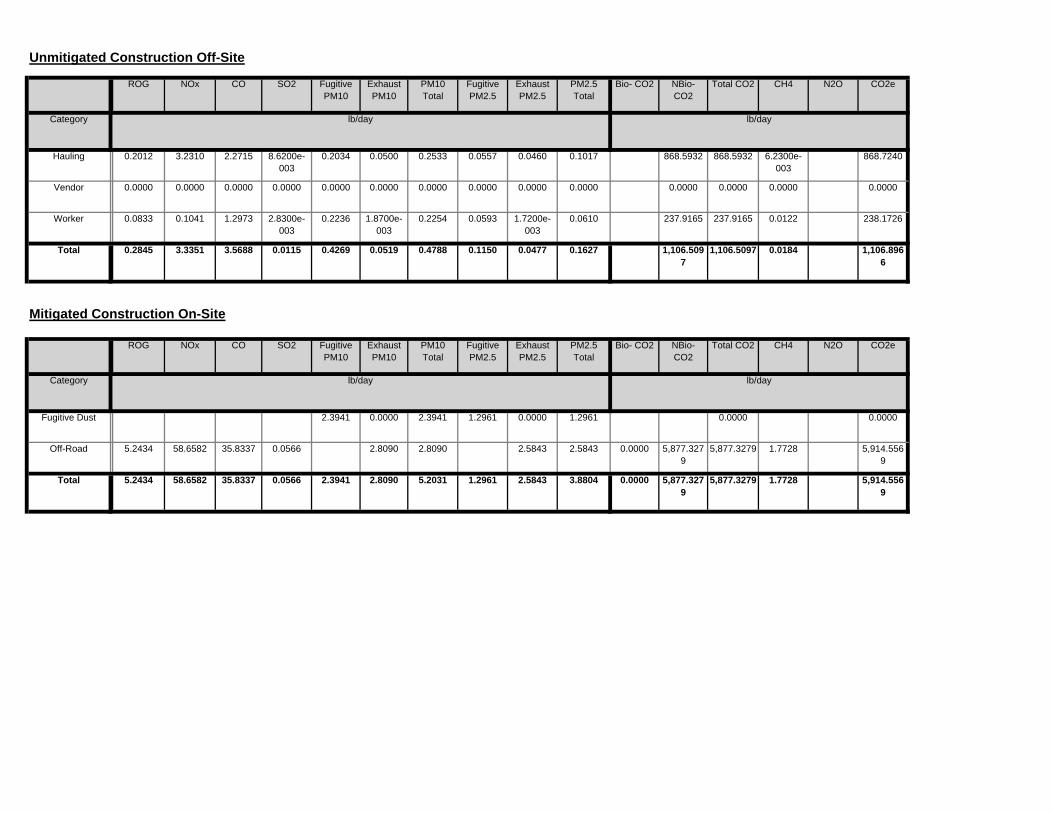
2.3941 2.8090 5.2031 1.2961 2.5843 3.8804Total 5.2434 58.6582 35.8337 0.0566
0.0000 5,877.3279
5,877.3279 1.7728 5,914.5569
2.8090 2.8090 2.5843 2.5843Off-Road 5.2434 58.6582 35.8337 0.0566
0.0000 0.00002.3941 0.0000 2.3941 1.2961 0.0000 1.2961Fugitive Dust
Total CO2 CH4 N2O CO2e
Category lb/day lb/day
PM10 Total
Fugitive PM2.5
Exhaust PM2.5
PM2.5 Total
Bio- CO2 NBio- CO2
Mitigated Construction On-Site
ROG NOx CO SO2 Fugitive PM10
Exhaust PM10
1,106.5097
1,106.5097 0.0184 1,106.8966
0.4269 0.0519 0.4788 0.1150 0.0477 0.1627Total 0.2845 3.3351 3.5688 0.0115
237.9165 237.9165 0.0122 238.17260.2236 1.8700e-003
0.2254 0.0593 1.7200e-003
0.0610Worker 0.0833 0.1041 1.2973 2.8300e-003
0.0000 0.0000 0.0000 0.00000.0000 0.0000 0.0000 0.0000 0.0000 0.0000Vendor 0.0000 0.0000 0.0000 0.0000
868.5932 868.5932 6.2300e-003
868.72400.2034 0.0500 0.2533 0.0557 0.0460 0.1017Hauling 0.2012 3.2310 2.2715 8.6200e-003
Total CO2 CH4 N2O CO2e
Category lb/day lb/day
PM10 Total
Fugitive PM2.5
Exhaust PM2.5
PM2.5 Total
Bio- CO2 NBio- CO2
Unmitigated Construction Off-Site
ROG NOx CO SO2 Fugitive PM10
Exhaust PM10
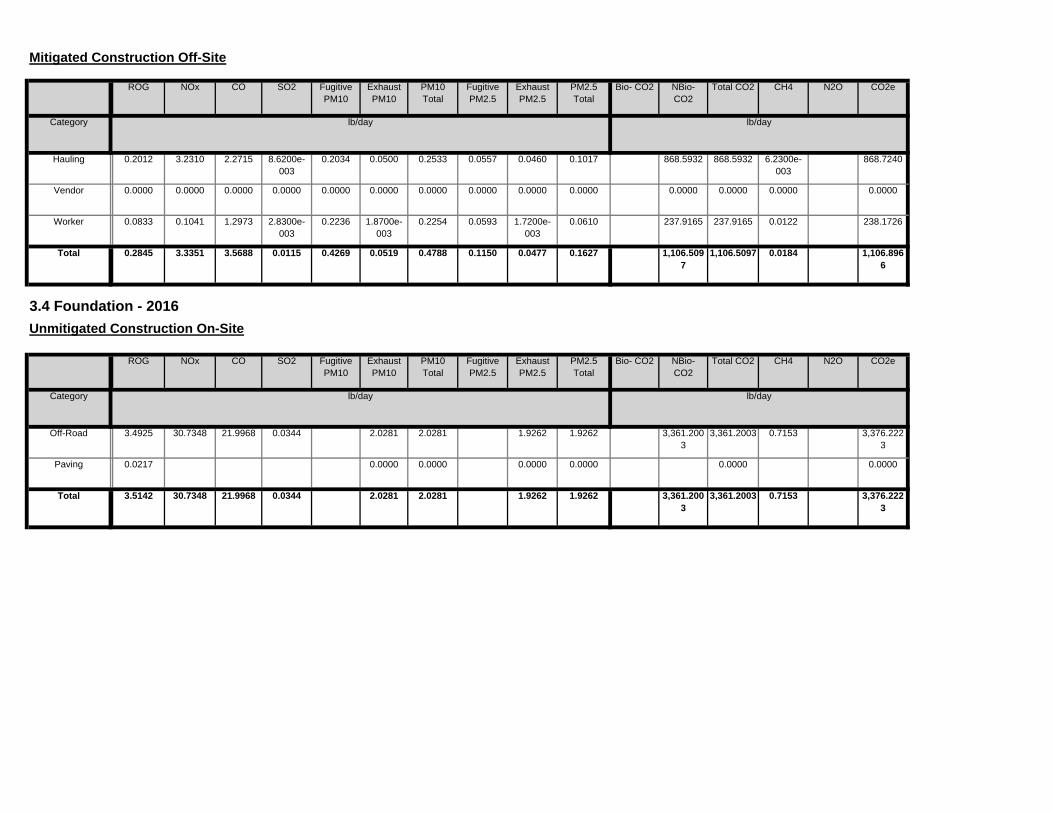
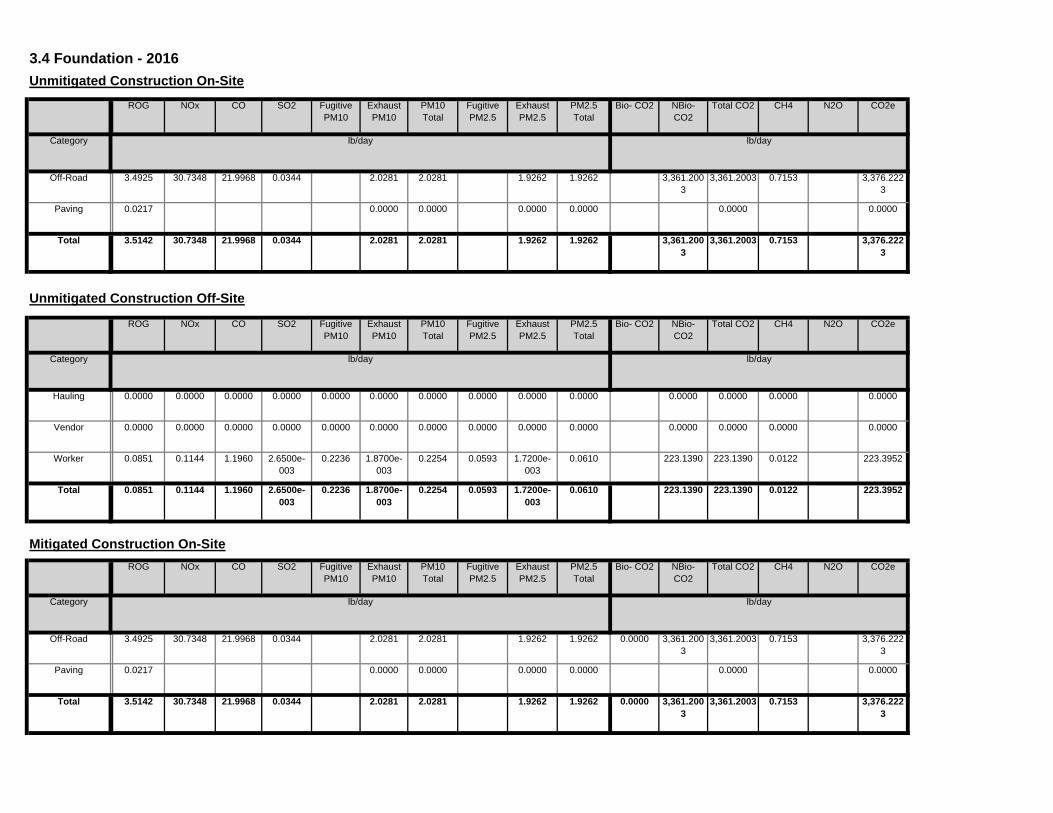
3,361.2003
3,361.2003 0.7153 3,376.2223
2.0281 2.0281 1.9262 1.9262Total 3.5142 30.7348 21.9968 0.0344
0.0000 0.00000.0000 0.0000 0.0000 0.0000Paving 0.0217
3,361.2003
3,361.2003 0.7153 3,376.2223
2.0281 2.0281 1.9262 1.9262Off-Road 3.4925 30.7348 21.9968 0.0344
Total CO2 CH4 N2O CO2e
Category lb/day lb/day
PM10 Total
Fugitive PM2.5
Exhaust PM2.5
PM2.5 Total
Bio- CO2 NBio- CO2
3.4 Foundation - 2016Unmitigated Construction On-Site
ROG NOx CO SO2 Fugitive PM10
Exhaust PM10
1,106.5097
1,106.5097 0.0184 1,106.8966
0.4269 0.0519 0.4788 0.1150 0.0477 0.1627Total 0.2845 3.3351 3.5688 0.0115
237.9165 237.9165 0.0122 238.17260.2236 1.8700e-003
0.2254 0.0593 1.7200e-003
0.0610Worker 0.0833 0.1041 1.2973 2.8300e-003
0.0000 0.0000 0.0000 0.00000.0000 0.0000 0.0000 0.0000 0.0000 0.0000Vendor 0.0000 0.0000 0.0000 0.0000
868.5932 868.5932 6.2300e-003
868.72400.2034 0.0500 0.2533 0.0557 0.0460 0.1017Hauling 0.2012 3.2310 2.2715 8.6200e-003
Total CO2 CH4 N2O CO2e
Category lb/day lb/day
PM10 Total
Fugitive PM2.5
Exhaust PM2.5
PM2.5 Total
Bio- CO2 NBio- CO2
Mitigated Construction Off-Site
ROG NOx CO SO2 Fugitive PM10
Exhaust PM10

0.0000 3,361.2003
3,361.2003 0.7153 3,376.2223
2.0281 2.0281 1.9262 1.9262Total 3.5142 30.7348 21.9968 0.0344
0.0000 0.00000.0000 0.0000 0.0000 0.0000Paving 0.0217
0.0000 3,361.2003
3,361.2003 0.7153 3,376.2223
2.0281 2.0281 1.9262 1.9262Off-Road 3.4925 30.7348 21.9968 0.0344
Total CO2 CH4 N2O CO2e
Category lb/day lb/day
PM10 Total
Fugitive PM2.5
Exhaust PM2.5
PM2.5 Total
Bio- CO2 NBio- CO2
Mitigated Construction On-Site
ROG NOx CO SO2 Fugitive PM10
Exhaust PM10
237.9165 237.9165 0.0122 238.17260.2236 1.8700e-003
0.2254 0.0593 1.7200e-003
0.0610Total 0.0833 0.1041 1.2973 2.8300e-003
237.9165 237.9165 0.0122 238.17260.2236 1.8700e-003
0.2254 0.0593 1.7200e-003
0.0610Worker 0.0833 0.1041 1.2973 2.8300e-003
0.0000 0.0000 0.0000 0.00000.0000 0.0000 0.0000 0.0000 0.0000 0.0000Vendor 0.0000 0.0000 0.0000 0.0000
0.0000 0.0000 0.0000 0.00000.0000 0.0000 0.0000 0.0000 0.0000 0.0000Hauling 0.0000 0.0000 0.0000 0.0000
Total CO2 CH4 N2O CO2e
Category lb/day lb/day
PM10 Total
Fugitive PM2.5
Exhaust PM2.5
PM2.5 Total
Bio- CO2 NBio- CO2
Unmitigated Construction Off-Site
ROG NOx CO SO2 Fugitive PM10
Exhaust PM10
3,331.3474
3,331.3474 0.7021 3,346.0924
1.8327 1.8327 1.7400 1.7400Total 3.2177 28.3900 21.8359 0.0344
0.0000 0.00000.0000 0.0000 0.0000 0.0000Paving 0.0217
3,331.3474
3,331.3474 0.7021 3,346.0924
1.8327 1.8327 1.7400 1.7400Off-Road 3.1960 28.3900 21.8359 0.0344
Total CO2 CH4 N2O CO2e
Category lb/day lb/day
PM10 Total
Fugitive PM2.5
Exhaust PM2.5
PM2.5 Total
Bio- CO2 NBio- CO2
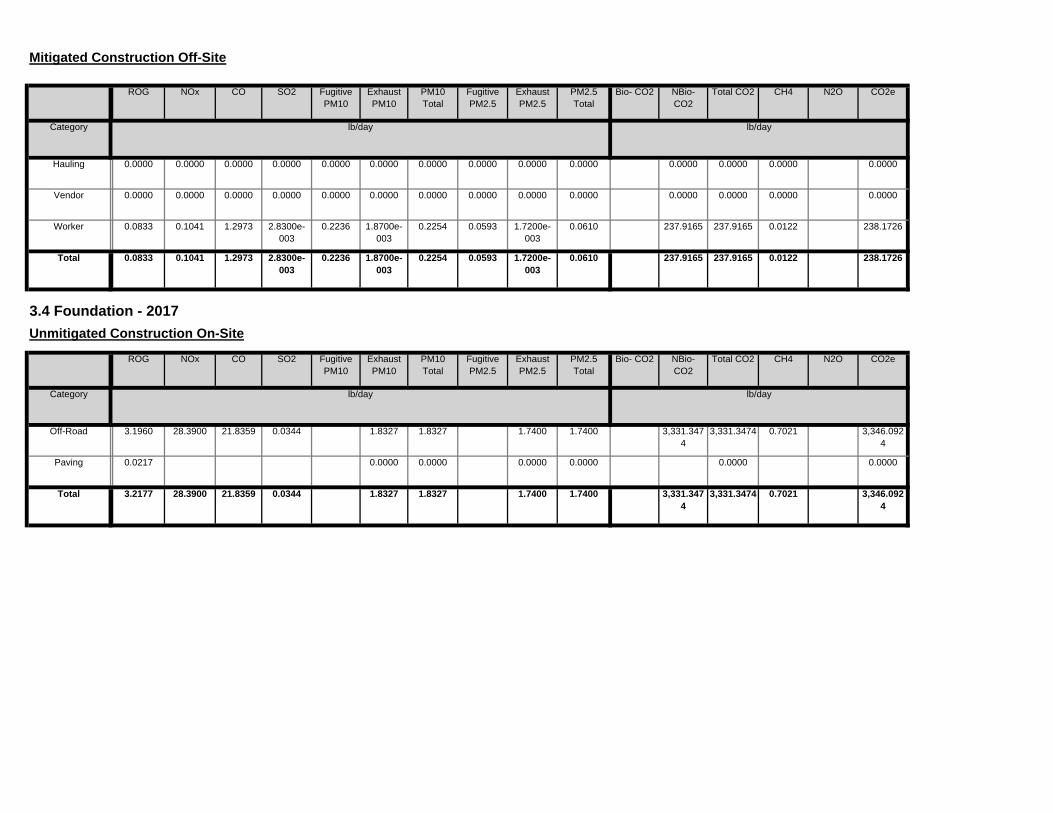
3.4 Foundation - 2017Unmitigated Construction On-Site
ROG NOx CO SO2 Fugitive PM10
Exhaust PM10
237.9165 237.9165 0.0122 238.17260.2236 1.8700e-003
0.2254 0.0593 1.7200e-003
0.0610Total 0.0833 0.1041 1.2973 2.8300e-003
237.9165 237.9165 0.0122 238.17260.2236 1.8700e-003
0.2254 0.0593 1.7200e-003
0.0610Worker 0.0833 0.1041 1.2973 2.8300e-003
0.0000 0.0000 0.0000 0.00000.0000 0.0000 0.0000 0.0000 0.0000 0.0000Vendor 0.0000 0.0000 0.0000 0.0000
0.0000 0.0000 0.0000 0.00000.0000 0.0000 0.0000 0.0000 0.0000 0.0000Hauling 0.0000 0.0000 0.0000 0.0000
Total CO2 CH4 N2O CO2e
Category lb/day lb/day
PM10 Total
Fugitive PM2.5
Exhaust PM2.5
PM2.5 Total
Bio- CO2 NBio- CO2
Mitigated Construction Off-Site
ROG NOx CO SO2 Fugitive PM10
Exhaust PM10

228.8115 228.8115 0.0113 229.04790.2236 1.8000e-003
0.2254 0.0593 1.6600e-003
0.0610Total 0.0749 0.0940 1.1741 2.8300e-003
228.8115 228.8115 0.0113 229.04790.2236 1.8000e-003
0.2254 0.0593 1.6600e-003
0.0610Worker 0.0749 0.0940 1.1741 2.8300e-003
0.0000 0.0000 0.0000 0.00000.0000 0.0000 0.0000 0.0000 0.0000 0.0000Vendor 0.0000 0.0000 0.0000 0.0000
0.0000 0.0000 0.0000 0.00000.0000 0.0000 0.0000 0.0000 0.0000 0.0000Hauling 0.0000 0.0000 0.0000 0.0000
Total CO2 CH4 N2O CO2e
Category lb/day lb/day
PM10 Total
Fugitive PM2.5
Exhaust PM2.5
PM2.5 Total
Bio- CO2 NBio- CO2
Mitigated Construction Off-SiteROG NOx CO SO2 Fugitive
PM10Exhaust PM10
0.0000 3,331.3474
3,331.3474 0.7021 3,346.0924
1.8327 1.8327 1.7400 1.7400Total 3.2177 28.3900 21.8359 0.0344
0.0000 0.00000.0000 0.0000 0.0000 0.0000Paving 0.0217
0.0000 3,331.3474
3,331.3474 0.7021 3,346.0924
1.8327 1.8327 1.7400 1.7400Off-Road 3.1960 28.3900 21.8359 0.0344
Total CO2 CH4 N2O CO2e
Category lb/day lb/day
PM10 Total
Fugitive PM2.5
Exhaust PM2.5
PM2.5 Total
Bio- CO2 NBio- CO2
Mitigated Construction On-Site
ROG NOx CO SO2 Fugitive PM10
Exhaust PM10
228.8115 228.8115 0.0113 229.04790.2236 1.8000e-003
0.2254 0.0593 1.6600e-003
0.0610Total 0.0749 0.0940 1.1741 2.8300e-003
228.8115 228.8115 0.0113 229.04790.2236 1.8000e-003
0.2254 0.0593 1.6600e-003
0.0610Worker 0.0749 0.0940 1.1741 2.8300e-003
0.0000 0.0000 0.0000 0.00000.0000 0.0000 0.0000 0.0000 0.0000 0.0000Vendor 0.0000 0.0000 0.0000 0.0000
0.0000 0.0000 0.0000 0.00000.0000 0.0000 0.0000 0.0000 0.0000 0.0000Hauling 0.0000 0.0000 0.0000 0.0000
Total CO2 CH4 N2O CO2e
Category lb/day lb/day
PM10 Total
Fugitive PM2.5
Exhaust PM2.5
PM2.5 Total
Bio- CO2 NBio- CO2
Unmitigated Construction Off-Site
ROG NOx CO SO2 Fugitive PM10
Exhaust PM10
0.0000 4,802.8227
4,802.8227 1.0085 4,824.0010
2.6396 2.6396 2.5329 2.5329Total 5.4540 42.5562 32.6227 0.0500
0.0000 4,802.8227
4,802.8227 1.0085 4,824.0010
2.6396 2.6396 2.5329 2.5329Off-Road 5.4540 42.5562 32.6227 0.0500
Total CO2 CH4 N2O CO2e
Category lb/day lb/day
PM10 Total
Fugitive PM2.5
Exhaust PM2.5
PM2.5 Total
Bio- CO2 NBio- CO2
Mitigated Construction On-Site
ROG NOx CO SO2 Fugitive PM10
Exhaust PM10
912.6674 912.6674 0.0286 913.26830.6267 0.0268 0.6535 0.1684 0.0246 0.1931Total 0.3100 1.6397 4.3889 0.0104
526.2665 526.2665 0.0259 526.81010.5142 4.1400e-003
0.5183 0.1364 3.8100e-003
0.1402Worker 0.1722 0.2163 2.7004 6.5100e-003
386.4009 386.4009 2.7300e-003
386.45810.1125 0.0227 0.1352 0.0321 0.0208 0.0529Vendor 0.1378 1.4234 1.6886 3.9100e-003
0.0000 0.0000 0.0000 0.00000.0000 0.0000 0.0000 0.0000 0.0000 0.0000Hauling 0.0000 0.0000 0.0000 0.0000
Total CO2 CH4 N2O CO2e
Category lb/day lb/day
PM10 Total
Fugitive PM2.5
Exhaust PM2.5
PM2.5 Total
Bio- CO2 NBio- CO2
Unmitigated Construction Off-Site
ROG NOx CO SO2 Fugitive PM10
Exhaust PM10
4,802.8227
4,802.8227 1.0085 4,824.0010
2.6396 2.6396 2.5329 2.5329Total 5.4540 42.5562 32.6227 0.0500
4,802.8227
4,802.8227 1.0085 4,824.0010
2.6396 2.6396 2.5329 2.5329Off-Road 5.4540 42.5562 32.6227 0.0500
Total CO2 CH4 N2O CO2e
Category lb/day lb/day
PM10 Total
Fugitive PM2.5
Exhaust PM2.5
PM2.5 Total
Bio- CO2 NBio- CO2
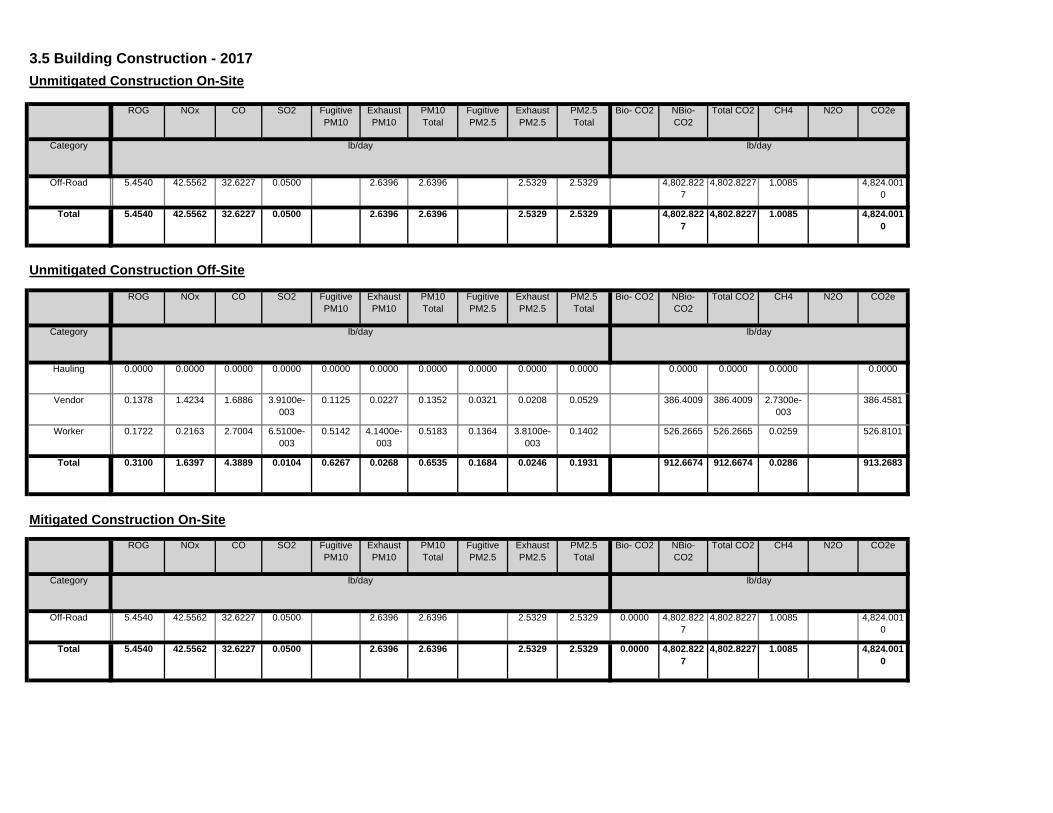
3.5 Building Construction - 2017Unmitigated Construction On-Site
ROG NOx CO SO2 Fugitive PM10
Exhaust PM10

886.6056 886.6056 0.0267 887.16710.6267 0.0254 0.6521 0.1684 0.0234 0.1918Total 0.2845 1.5033 4.0623 0.0104
506.6843 506.6843 0.0240 507.18890.5142 4.0300e-003
0.5182 0.1364 3.7300e-003
0.1401Worker 0.1552 0.1962 2.4535 6.5100e-003
379.9213 379.9213 2.7100e-003
379.97820.1125 0.0214 0.1339 0.0321 0.0196 0.0517Vendor 0.1293 1.3071 1.6088 3.9100e-003
0.0000 0.0000 0.0000 0.00000.0000 0.0000 0.0000 0.0000 0.0000 0.0000Hauling 0.0000 0.0000 0.0000 0.0000
Total CO2 CH4 N2O CO2e
Category lb/day lb/day
PM10 Total
Fugitive PM2.5
Exhaust PM2.5
PM2.5 Total
Bio- CO2 NBio- CO2
Unmitigated Construction Off-Site
ROG NOx CO SO2 Fugitive PM10
Exhaust PM10
4,765.0515
4,765.0515 0.9746 4,785.5179
2.2676 2.2676 2.1779 2.1779Total 4.7809 38.0949 31.9468 0.0500
4,765.0515
4,765.0515 0.9746 4,785.5179
2.2676 2.2676 2.1779 2.1779Off-Road 4.7809 38.0949 31.9468 0.0500
Total CO2 CH4 N2O CO2e
Category lb/day lb/day
PM10 Total
Fugitive PM2.5
Exhaust PM2.5
PM2.5 Total
Bio- CO2 NBio- CO2
3.5 Building Construction - 2018Unmitigated Construction On-Site
ROG NOx CO SO2 Fugitive PM10
Exhaust PM10
912.6674 912.6674 0.0286 913.26830.6267 0.0268 0.6535 0.1684 0.0246 0.1931Total 0.3100 1.6397 4.3889 0.0104
526.2665 526.2665 0.0259 526.81010.5142 4.1400e-003
0.5183 0.1364 3.8100e-003
0.1402Worker 0.1722 0.2163 2.7004 6.5100e-003
386.4009 386.4009 2.7300e-003
386.45810.1125 0.0227 0.1352 0.0321 0.0208 0.0529Vendor 0.1378 1.4234 1.6886 3.9100e-003
0.0000 0.0000 0.0000 0.00000.0000 0.0000 0.0000 0.0000 0.0000 0.0000Hauling 0.0000 0.0000 0.0000 0.0000
Total CO2 CH4 N2O CO2e
Category lb/day lb/day
PM10 Total
Fugitive PM2.5
Exhaust PM2.5
PM2.5 Total
Bio- CO2 NBio- CO2
Mitigated Construction Off-Site
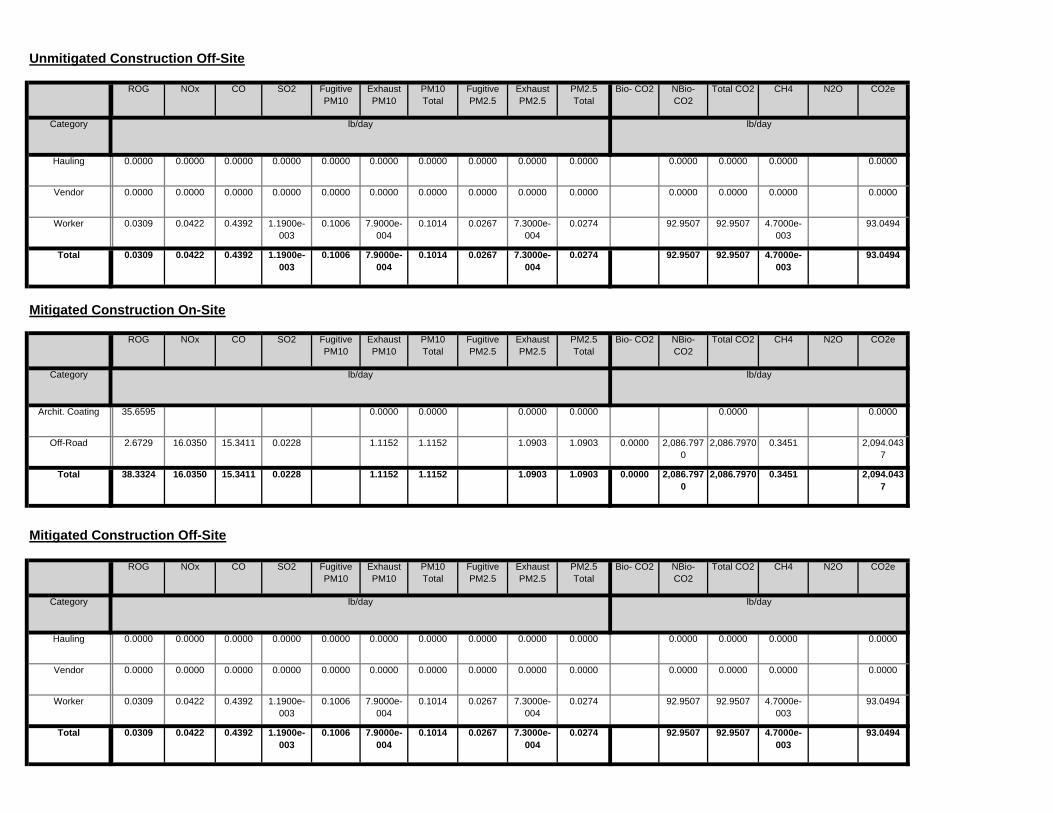
ROG NOx CO SO2 Fugitive PM10
Exhaust PM10

2,086.7970
2,086.7970 0.3451 2,094.0437
1.1152 1.1152 1.0903 1.0903Total 38.3324 16.0350 15.3411 0.0228
2,086.7970
2,086.7970 0.3451 2,094.0437
1.1152 1.1152 1.0903 1.0903Off-Road 2.6729 16.0350 15.3411 0.0228
0.0000 0.00000.0000 0.0000 0.0000 0.0000Archit. Coating 35.6595
Total CO2 CH4 N2O CO2e
Category lb/day lb/day
PM10 Total
Fugitive PM2.5
Exhaust PM2.5
PM2.5 Total
Bio- CO2 NBio- CO2
3.6 Architectural Coating - 2018Unmitigated Construction On-Site
ROG NOx CO SO2 Fugitive PM10
Exhaust PM10
886.6056 886.6056 0.0267 887.16710.6267 0.0254 0.6521 0.1684 0.0234 0.1918Total 0.2845 1.5033 4.0623 0.0104
506.6843 506.6843 0.0240 507.18890.5142 4.0300e-003
0.5182 0.1364 3.7300e-003
0.1401Worker 0.1552 0.1962 2.4535 6.5100e-003
379.9213 379.9213 2.7100e-003
379.97820.1125 0.0214 0.1339 0.0321 0.0196 0.0517Vendor 0.1293 1.3071 1.6088 3.9100e-003
0.0000 0.0000 0.0000 0.00000.0000 0.0000 0.0000 0.0000 0.0000 0.0000Hauling 0.0000 0.0000 0.0000 0.0000
Total CO2 CH4 N2O CO2e
Category lb/day lb/day
PM10 Total
Fugitive PM2.5
Exhaust PM2.5
PM2.5 Total
Bio- CO2 NBio- CO2
Mitigated Construction Off-Site
ROG NOx CO SO2 Fugitive PM10
Exhaust PM10
0.0000 4,765.0515
4,765.0515 0.9746 4,785.5179
2.2676 2.2676 2.1779 2.1779Total 4.7809 38.0949 31.9468 0.0500
0.0000 4,765.0515
4,765.0515 0.9746 4,785.5179
2.2676 2.2676 2.1779 2.1779Off-Road 4.7809 38.0949 31.9468 0.0500
Total CO2 CH4 N2O CO2e
Category lb/day lb/day
PM10 Total
Fugitive PM2.5
Exhaust PM2.5
PM2.5 Total
Bio- CO2 NBio- CO2
Mitigated Construction On-Site
ROG NOx CO SO2 Fugitive PM10
Exhaust PM10

0.0000 2,086.7970
2,086.7970 0.3451 2,094.0437
1.1152 1.1152 1.0903 1.0903Total 38.3324 16.0350 15.3411 0.0228
0.0000 2,086.7970
2,086.7970 0.3451 2,094.0437
1.1152 1.1152 1.0903 1.0903Off-Road 2.6729 16.0350 15.3411 0.0228
0.0000 0.00000.0000 0.0000 0.0000 0.0000Archit. Coating 35.6595
Total CO2 CH4 N2O CO2e
Category lb/day lb/day
PM10 Total
Fugitive PM2.5
Exhaust PM2.5
PM2.5 Total
Bio- CO2 NBio- CO2
Mitigated Construction On-Site
ROG NOx CO SO2 Fugitive PM10
Exhaust PM10
99.1339 99.1339 4.7000e-003
99.23260.1006 7.9000e-004
0.1014 0.0267 7.3000e-004
0.0274Total 0.0304 0.0384 0.4800 1.2700e-003
99.1339 99.1339 4.7000e-003
99.23260.1006 7.9000e-004
0.1014 0.0267 7.3000e-004
0.0274Worker 0.0304 0.0384 0.4800 1.2700e-003
0.0000 0.0000 0.0000 0.00000.0000 0.0000 0.0000 0.0000 0.0000 0.0000Vendor 0.0000 0.0000 0.0000 0.0000
0.0000 0.0000 0.0000 0.00000.0000 0.0000 0.0000 0.0000 0.0000 0.0000Hauling 0.0000 0.0000 0.0000 0.0000
Total CO2 CH4 N2O CO2e
Category lb/day lb/day
PM10 Total
Fugitive PM2.5
Exhaust PM2.5
PM2.5 Total
Bio- CO2 NBio- CO2
Unmitigated Construction Off-Site
ROG NOx CO SO2 Fugitive PM10
Exhaust PM10

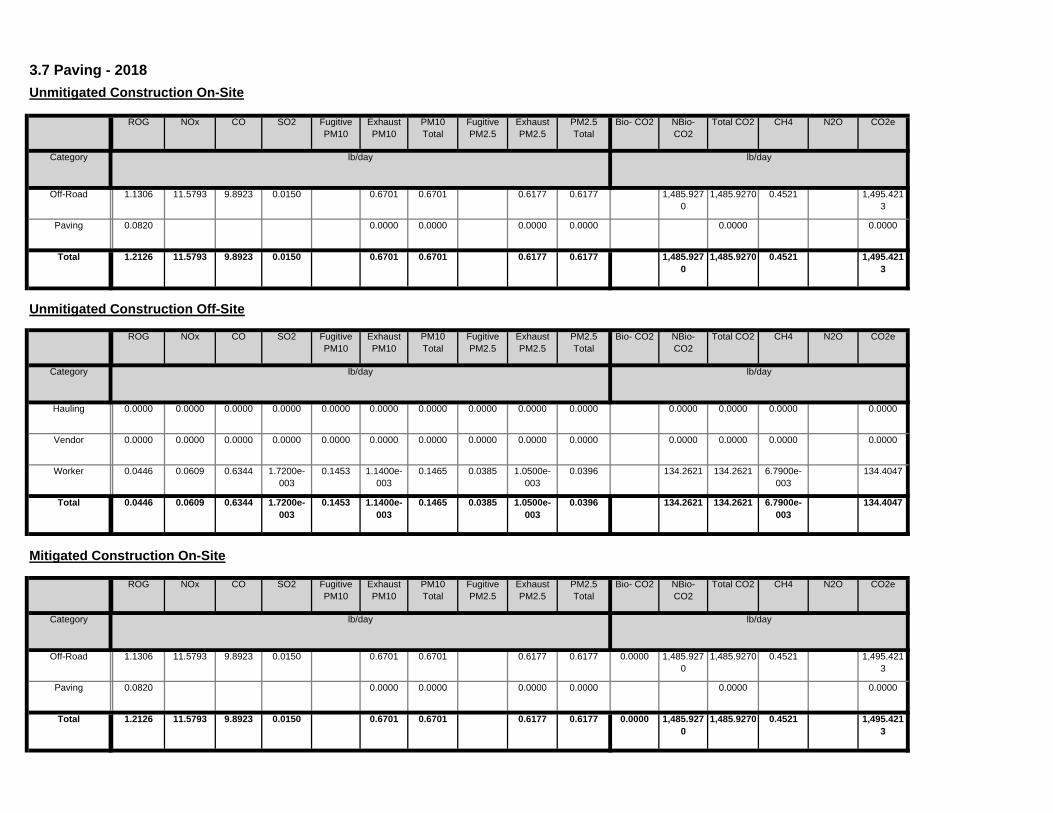
1,485.9270
1,485.9270 0.4521 1,495.4213
0.6701 0.6701 0.6177 0.6177Total 1.2126 11.5793 9.8923 0.0150
0.0000 0.00000.0000 0.0000 0.0000 0.0000Paving 0.0820
1,485.9270
1,485.9270 0.4521 1,495.4213
0.6701 0.6701 0.6177 0.6177Off-Road 1.1306 11.5793 9.8923 0.0150
Total CO2 CH4 N2O CO2e
Category lb/day lb/day
PM10 Total
Fugitive PM2.5
Exhaust PM2.5
PM2.5 Total
Bio- CO2 NBio- CO2
3.7 Paving - 2018Unmitigated Construction On-Site
ROG NOx CO SO2 Fugitive PM10
Exhaust PM10
99.1339 99.1339 4.7000e-003
99.23260.1006 7.9000e-004
0.1014 0.0267 7.3000e-004
0.0274Total 0.0304 0.0384 0.4800 1.2700e-003
99.1339 99.1339 4.7000e-003
99.23260.1006 7.9000e-004
0.1014 0.0267 7.3000e-004
0.0274Worker 0.0304 0.0384 0.4800 1.2700e-003
0.0000 0.0000 0.0000 0.00000.0000 0.0000 0.0000 0.0000 0.0000 0.0000Vendor 0.0000 0.0000 0.0000 0.0000
0.0000 0.0000 0.0000 0.00000.0000 0.0000 0.0000 0.0000 0.0000 0.0000Hauling 0.0000 0.0000 0.0000 0.0000
Total CO2 CH4 N2O CO2e
Category lb/day lb/day
PM10 Total
Fugitive PM2.5
Exhaust PM2.5
PM2.5 Total
Bio- CO2 NBio- CO2
Mitigated Construction Off-Site
ROG NOx CO SO2 Fugitive PM10
Exhaust PM10

0.0000 1,485.9270
1,485.9270 0.4521 1,495.4213
0.6701 0.6701 0.6177 0.6177Total 1.2126 11.5793 9.8923 0.0150
0.0000 0.00000.0000 0.0000 0.0000 0.0000Paving 0.0820
0.0000 1,485.9270
1,485.9270 0.4521 1,495.4213
0.6701 0.6701 0.6177 0.6177Off-Road 1.1306 11.5793 9.8923 0.0150
Total CO2 CH4 N2O CO2e
Category lb/day lb/day
PM10 Total
Fugitive PM2.5
Exhaust PM2.5
PM2.5 Total
Bio- CO2 NBio- CO2
Mitigated Construction On-Site
ROG NOx CO SO2 Fugitive PM10
Exhaust PM10
143.1934 143.1934 6.7900e-003
143.33600.1453 1.1400e-003
0.1465 0.0385 1.0500e-003
0.0396Total 0.0439 0.0555 0.6934 1.8400e-003
143.1934 143.1934 6.7900e-003
143.33600.1453 1.1400e-003
0.1465 0.0385 1.0500e-003
0.0396Worker 0.0439 0.0555 0.6934 1.8400e-003
0.0000 0.0000 0.0000 0.00000.0000 0.0000 0.0000 0.0000 0.0000 0.0000Vendor 0.0000 0.0000 0.0000 0.0000
0.0000 0.0000 0.0000 0.00000.0000 0.0000 0.0000 0.0000 0.0000 0.0000Hauling 0.0000 0.0000 0.0000 0.0000
Total CO2 CH4 N2O CO2e
Category lb/day lb/day
PM10 Total
Fugitive PM2.5
Exhaust PM2.5
PM2.5 Total
Bio- CO2 NBio- CO2
Unmitigated Construction Off-Site
ROG NOx CO SO2 Fugitive PM10
Exhaust PM10

2,839.9101
2,839.9101 0.5870 2,852.2367
0.4304 1.5299 1.9602 0.0652 1.4568 1.5220Total 2.8792 25.8757 22.0111 0.0291
2,839.9101
2,839.9101 0.5870 2,852.2367
1.5299 1.5299 1.4568 1.4568Off-Road 2.8792 25.8757 22.0111 0.0291
0.0000 0.00000.4304 0.0000 0.4304 0.0652 0.0000 0.0652Fugitive Dust
Total CO2 CH4 N2O CO2e
Category lb/day lb/day
PM10 Total
Fugitive PM2.5
Exhaust PM2.5
PM2.5 Total
Bio- CO2 NBio- CO2
3.8 Demolition of Gym - 2018Unmitigated Construction On-Site
ROG NOx CO SO2 Fugitive PM10
Exhaust PM10
143.1934 143.1934 6.7900e-003
143.33600.1453 1.1400e-003
0.1465 0.0385 1.0500e-003
0.0396Total 0.0439 0.0555 0.6934 1.8400e-003
143.1934 143.1934 6.7900e-003
143.33600.1453 1.1400e-003
0.1465 0.0385 1.0500e-003
0.0396Worker 0.0439 0.0555 0.6934 1.8400e-003
0.0000 0.0000 0.0000 0.00000.0000 0.0000 0.0000 0.0000 0.0000 0.0000Vendor 0.0000 0.0000 0.0000 0.0000
0.0000 0.0000 0.0000 0.00000.0000 0.0000 0.0000 0.0000 0.0000 0.0000Hauling 0.0000 0.0000 0.0000 0.0000
Total CO2 CH4 N2O CO2e
Category lb/day lb/day
PM10 Total
Fugitive PM2.5
Exhaust PM2.5
PM2.5 Total
Bio- CO2 NBio- CO2
Mitigated Construction Off-Site
ROG NOx CO SO2 Fugitive PM10
Exhaust PM10
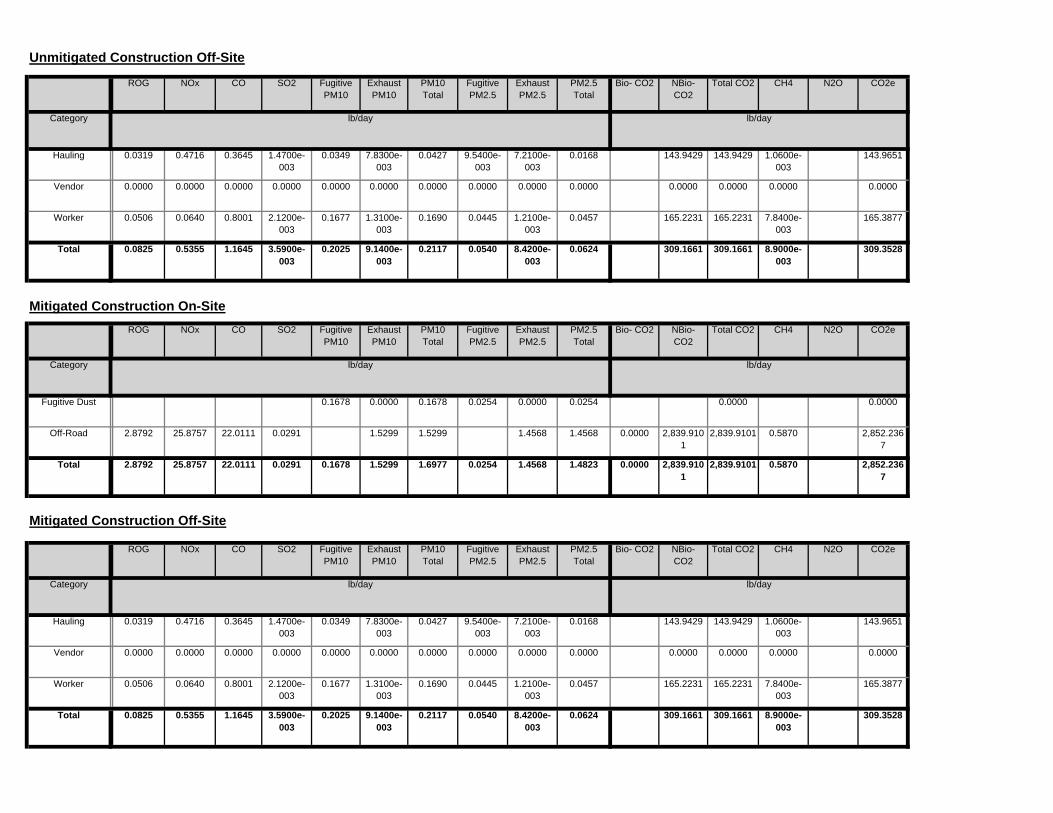
309.1661 309.1661 8.9000e-003
309.35280.2025 9.1400e-003
0.2117 0.0540 8.4200e-003
0.0624Total 0.0825 0.5355 1.1645 3.5900e-003
165.2231 165.2231 7.8400e-003
165.38770.1677 1.3100e-003
0.1690 0.0445 1.2100e-003
0.0457Worker 0.0506 0.0640 0.8001 2.1200e-003
0.0000 0.0000 0.0000 0.00000.0000 0.0000 0.0000 0.0000 0.0000 0.0000Vendor 0.0000 0.0000 0.0000 0.0000
143.9429 143.9429 1.0600e-003
143.96510.0349 7.8300e-003
0.0427 9.5400e-003
7.2100e-003
0.0168Hauling 0.0319 0.4716 0.3645 1.4700e-003
Total CO2 CH4 N2O CO2e
Category lb/day lb/day
PM10 Total
Fugitive PM2.5
Exhaust PM2.5
PM2.5 Total
Bio- CO2 NBio- CO2
Mitigated Construction Off-Site
ROG NOx CO SO2 Fugitive PM10
Exhaust PM10
0.0000 2,839.9101
2,839.9101 0.5870 2,852.2367
0.1678 1.5299 1.6977 0.0254 1.4568 1.4823Total 2.8792 25.8757 22.0111 0.0291
0.0000 2,839.9101
2,839.9101 0.5870 2,852.2367
1.5299 1.5299 1.4568 1.4568Off-Road 2.8792 25.8757 22.0111 0.0291
0.0000 0.00000.1678 0.0000 0.1678 0.0254 0.0000 0.0254Fugitive Dust
Total CO2 CH4 N2O CO2e
Category lb/day lb/day
PM10 Total
Fugitive PM2.5
Exhaust PM2.5
PM2.5 Total
Bio- CO2 NBio- CO2
Mitigated Construction On-SiteROG NOx CO SO2 Fugitive
PM10Exhaust PM10
309.1661 309.1661 8.9000e-003
309.35280.2025 9.1400e-003
0.2117 0.0540 8.4200e-003
0.0624Total 0.0825 0.5355 1.1645 3.5900e-003
165.2231 165.2231 7.8400e-003
165.38770.1677 1.3100e-003
0.1690 0.0445 1.2100e-003
0.0457Worker 0.0506 0.0640 0.8001 2.1200e-003
0.0000 0.0000 0.0000 0.00000.0000 0.0000 0.0000 0.0000 0.0000 0.0000Vendor 0.0000 0.0000 0.0000 0.0000
143.9429 143.9429 1.0600e-003
143.96510.0349 7.8300e-003
0.0427 9.5400e-003
7.2100e-003
0.0168Hauling 0.0319 0.4716 0.3645 1.4700e-003
Total CO2 CH4 N2O CO2e
Category lb/day lb/day
PM10 Total
Fugitive PM2.5
Exhaust PM2.5
PM2.5 Total
Bio- CO2 NBio- CO2
Unmitigated Construction Off-Site
ROG NOx CO SO2 Fugitive PM10
Exhaust PM10

CalEEMod Version: CalEEMod.2013.2.1 Page 1 of 1 Date: 11/19/2014 12:11 PM
Olive Vista Middle SchoolSouth Coast Air Basin, Winter
1.0 Project Characteristics
1.1 Land Usage
Land Uses Size Metric Lot Acreage Floor Surface Area Population
Other Non-Asphalt Surfaces 11.80 1000sqft 0.27 11,800.00 0
Parking Lot 80.00 Space 0.72 32,000.00 0
City Park 0.65 Acre 0.65 28,314.00 0
Health Club 19.90 1000sqft 0.46 19,900.00 0
Movie Theater (No Matinee) 17.50 1000sqft 0.40 17,500.00 0
1.2 Other Project Characteristics
Urbanization Urban Wind Speed (m/s) 2.2 Precipitation Freq (Days) 31
Climate Zone 11 Operational Year 2018
Utility Company Los Angeles Department of Water & Power
CO2 Intensity (lb/MWhr)
1227.89 CH4 Intensity (lb/MWhr)
0.029 N2O Intensity (lb/MWhr)
0.006

1.3 User Entered Comments & Non-Default Data
Project Characteristics -
Land Use -
Construction Phase - See Construction Schedule
Off-road Equipment - See Construction Equipment List
Off-road Equipment - See Construction Equipment List
Off-road Equipment - See Construction Equipment List
Off-road Equipment - See Construction Equipment List
Off-road Equipment - See Construction Equipment List
Off-road Equipment - See Construction Equipment List
Off-road Equipment - See Construction Equipment List
Trips and VMT -
Demolition -
Grading - See Construction Assumptions
Construction Off-road Equipment Mitigation -
Table Name Column Name Default Value New Value
tblConstructionPhase NumDays 10.00 51.00
tblConstructionPhase NumDays 220.00 239.00
tblConstructionPhase NumDays 20.00 76.00
tblConstructionPhase NumDays 20.00 42.00
tblConstructionPhase NumDays 6.00 46.00
tblConstructionPhase NumDays 10.00 87.00
tblConstructionPhase NumDays 10.00 23.00
tblConstructionPhase PhaseEndDate 5/11/2018 5/13/2018
tblConstructionPhase PhaseEndDate 8/10/2018 8/12/2018
tblConstructionPhase PhaseEndDate 3/31/2017 4/1/2017
tblGrading AcresOfGrading 23.00 4.60
tblGrading MaterialExported 0.00 4,294.00
tblOffRoadEquipment LoadFactor 0.31 0.31
tblOffRoadEquipment LoadFactor 0.50 0.50
tblOffRoadEquipment LoadFactor 0.38 0.38
tblOffRoadEquipment LoadFactor 0.40 0.40
tblOffRoadEquipment LoadFactor 0.38 0.38
tblOffRoadEquipment LoadFactor 0.42 0.42
tblOffRoadEquipment LoadFactor 0.20 0.20
tblOffRoadEquipment LoadFactor 0.37 0.37
tblOffRoadEquipment OffRoadEquipmentType Aerial Lifts
tblOffRoadEquipment OffRoadEquipmentType Concrete/Industrial Saws
tblOffRoadEquipment OffRoadEquipmentType Pumps
tblOffRoadEquipment OffRoadEquipmentType Crushing/Proc. Equipment
tblOffRoadEquipment OffRoadEquipmentType Dumpers/Tenders
tblOffRoadEquipment OffRoadEquipmentType Bore/Drill Rigs

tblOffRoadEquipment OffRoadEquipmentType Excavators
tblOffRoadEquipment OffRoadEquipmentType Other Material Handling Equipment
tblOffRoadEquipment OffRoadEquipmentType Off-Highway Trucks
tblOffRoadEquipment OffRoadEquipmentType Forklifts
tblOffRoadEquipment OffRoadEquipmentType Generator Sets
tblOffRoadEquipment OffRoadEquipmentType Pumps
tblOffRoadEquipment OffRoadEquipmentType Other Construction Equipment
tblOffRoadEquipment OffRoadEquipmentType Forklifts
tblOffRoadEquipment OffRoadEquipmentType Generator Sets
tblOffRoadEquipment OffRoadEquipmentType Tractors/Loaders/Backhoes
tblOffRoadEquipment OffRoadEquipmentType Welders
tblOffRoadEquipment OffRoadEquipmentType Crushing/Proc. Equipment
tblOffRoadEquipment OffRoadEquipmentType Dumpers/Tenders
tblOffRoadEquipment OffRoadEquipmentUnitAmount 1.00 4.00
tblOffRoadEquipment OffRoadEquipmentUnitAmount 2.00 1.00
tblOffRoadEquipment OffRoadEquipmentUnitAmount 2.00 1.00
tblOffRoadEquipment OffRoadEquipmentUnitAmount 3.00 2.00
tblOffRoadEquipment OffRoadEquipmentUnitAmount 3.00 2.00
tblOffRoadEquipment OffRoadEquipmentUnitAmount 2.00 1.00
tblOffRoadEquipment UsageHours 6.00 8.00
tblOffRoadEquipment UsageHours 8.00 4.00
tblOffRoadEquipment UsageHours 7.00 8.00
tblOffRoadEquipment UsageHours 6.00 8.00
tblOffRoadEquipment UsageHours 7.00 8.00
2014 2018
tblTripsAndVMT WorkerTripNumber 30.00 20.00
tblProjectCharacteristics OperationalYear

NOx CO SO2 Fugitive PM10
Fugitive PM2.5
Exhaust PM2.5
PM2.5 Total
Bio- CO2
2.0 Emissions Summary2.1 Overall Construction (Maximum Daily Emission)Unmitigated Construction
ROG NBio- CO2
Total CO2 CH4 N2O CO2e
Year lb/day lb/day
Exhaust PM10
PM10 Total
2016 5.5410 62.1206 39.6323 0.0678 6.5656 2.8610 9.4266 3.4383 2.6321 6.0703 0.0000 6,966.9974
6,966.9974 1.7913 0.0000 7,004.6150
2017 5.7802 44.2522 37.1489 0.0600 0.6267 2.6666 3.2933 0.1684 2.5577 2.7261 0.0000 5,679.4868
5,679.4868 1.0372 0.0000 5,701.2677
2018 38.3633 39.6490 36.1548 0.0600 0.6329 2.2932 2.9199 0.1684 2.2014 2.3698 0.0000 5,616.8557
5,616.8557 1.0014 0.0000 5,637.8854
Total 49.6845 146.0218 112.9360 0.1877 3.8299 0.0000 18,343.7681
7.8252 7.8208 15.6398 3.7751 7.3912 11.1663
SO2 Fugitive PM10
Exhaust PM10
0.0000 18,263.3398
18,263.3398
PM2.5 Total
Bio- CO2 NBio- CO2
Mitigated Construction
ROG NOx CO Total CO2 CH4 N2O CO2e
Year lb/day lb/day
PM10 Total
Fugitive PM2.5
Exhaust PM2.5
2016 5.5410 62.1206 39.6323 0.0678 2.8210 2.8610 5.6820 1.4111 2.6321 4.0431 0.0000 6,966.9974
6,966.9974 1.7913 0.0000 7,004.6150
2017 5.7802 44.2522 37.1489 0.0600 0.6267 2.6666 3.2933 0.1684 2.5577 2.7261 0.0000 5,679.4868
5,679.4868 1.0372 0.0000 5,701.2677
2018 38.3633 39.6490 36.1548 0.0600 0.6267 2.2932 2.9199 0.1684 2.2014 2.3698 0.0000 5,616.8557
5,616.8557 1.0014 0.0000 5,637.8854
Total 49.6845 146.0218 112.9360 0.1877 4.0744 7.8208 11.8952 1.7479 7.3912 9.1391 0.0000 18,263.3398
18,263.3398
3.8299 0.0000 18,343.7681
ROG NOx CO SO2 Fugitive PM10
Exhaust PM10
PM10 Total
Fugitive PM2.5
Exhaust PM2.5
PM2.5 Total
Bio- CO2 NBio-CO2 Total CO2 CH4 N20 CO2e
Percent Reduction
0.00 0.00 0.00 0.00 0.00 0.00 0.0047.93 0.00 23.94 53.70 0.00 18.15 0.00 0.00 0.00

3.0 Construction Detail
Construction Phase
Phase Number
Phase Name Phase Type Start Date End Date Num Days Week
Num Days Phase Description
1 Demolition of MPB Demolition 6/14/2016 9/27/2016 5 76
2 Grading/Excavation Grading 9/28/2016 11/30/2016 5 46
3 Foundation Paving 12/1/2016 4/1/2017 5 87
4 Building Construction Building Construction 4/2/2017 3/1/2018 5 239
23
5 Architectural Coating Architectural Coating 3/2/2018 5/13/2018 5
8/12/2018 5
51
6 Paving Paving 5/14/2018 6/13/2018 5
42
Acres of Grading (Site Preparation Phase): 0
Acres of Grading (Grading Phase): 0
Acres of Paving: 0
Residential Indoor: 0; Residential Outdoor: 0; Non-Residential Indoor: 117,711; Non-Residential Outdoor: 39,237 (Architectural Coating –
7 Demolition of Gym Demolition 6/14/2018
OffRoad Equipment
Phase Name Offroad Equipment Type Amount Usage Hours Horse Power Load Factor
Demolition of MPB Concrete/Industrial Saws 1 8.00 81 0.73
Demolition of MPB Crushing/Proc. Equipment 1 8.00 85 0.78
Demolition of MPB Dumpers/Tenders 1 8.00 16 0.38
Grading/Excavation Bore/Drill Rigs 1 8.00 205 0.50
Demolition of MPB Rubber Tired Dozers 1 8.00 255 0.40
Demolition of MPB Tractors/Loaders/Backhoes 2 8.00 97 0.37
Grading/Excavation Excavators 2 8.00 162 0.38
Grading/Excavation Other Material Handling Equipment 1 8.00 167 0.40
Grading/Excavation Graders 1 8.00 174 0.41
Grading/Excavation Off-Highway Trucks 1 8.00 400 0.38
Foundation Forklifts 1 8.00 89 0.20
Grading/Excavation Rubber Tired Dozers 1 8.00 255 0.40
Grading/Excavation Tractors/Loaders/Backhoes 1 8.00 97 0.37
Foundation Cement and Mortar Mixers 4 8.00 9 0.56
Foundation Generator Sets 1 8.00 84 0.74
Foundation Pumps 1 8.00 84 0.74
Building Construction Aerial Lifts 2 8.00 62 0.31
Building Construction Concrete/Industrial Saws 1 8.00 81 0.73
Building Construction Pumps 1 8.00 84 0.74
Building Construction Other Construction Equipment 2 8.00 171 0.42
Foundation Tractors/Loaders/Backhoes 1 8.00 97 0.37
Architectural Coating Forklifts 1 8.00 89 0.20
Architectural Coating Generator Sets 1 8.00 84 0.74
Building Construction Cranes 1 4.00 226 0.29
Building Construction Forklifts 1 8.00 89 0.20
Building Construction Generator Sets 1 8.00 84 0.74
Architectural Coating Tractors/Loaders/Backhoes 1 8.00 97 0.37
Architectural Coating Welders 3 8.00 46 0.45
Building Construction Tractors/Loaders/Backhoes 1 8.00 97 0.37
Building Construction Welders 3 8.00 46 0.45
Architectural Coating Air Compressors 1 8.00 78 0.48
Demolition of Gym Crushing/Proc. Equipment 1 8.00 85 0.78

Demolition of Gym Dumpers/Tenders 1 8.00 16 0.38
Foundation Pavers 1 8.00 125 0.42
Foundation Paving Equipment 1 8.00 130 0.36
Paving Cement and Mortar Mixers 1 8.00 9 0.56
Paving Pavers 1 8.00 125 0.42
Paving Paving Equipment 1 8.00 130 0.36
Paving Rollers 1 8.00 80 0.38
Paving Tractors/Loaders/Backhoes 1 8.00 97 0.37
Demolition of Gym Concrete/Industrial Saws 1 8.00 81 0.73
Foundation Rollers 2 8.00 80 0.38
Demolition of Gym Rubber Tired Dozers 1 8.00 255 0.40
Demolition of Gym Tractors/Loaders/Backhoes 2 8.00 97 0.37
Trips and VMT
Phase Name Offroad Equipment Count
Worker Trip Number
Vendor Trip Number
Hauling Trip Number
Worker Trip Length
Vendor Trip Length
Hauling Trip Length
Worker Vehicle Class
Vendor Vehicle Class
Hauling Vehicle Class
Demolition of MPB 6 15.00 0.00 113.00 14.70 6.90 20.00 LD_Mix HDT_Mix HHDT
Grading/Excavation 8 20.00 0.00 537.00 14.70 6.90 20.00 LD_Mix HDT_Mix HHDT
Foundation 12 20.00 0.00 0.00 14.70 6.90 20.00 LD_Mix HDT_Mix HHDT
Building Construction 13 46.00 18.00 0.00 14.70 6.90 20.00 LD_Mix HDT_Mix HHDT
Architectural Coating 7 9.00 0.00 0.00 14.70 6.90 20.00 LD_Mix HDT_Mix HHDT
Paving 5 13.00 0.00 0.00 14.70 6.90 20.00 LD_Mix HDT_Mix HHDT
LD_Mix HDT_Mix HHDTDemolition of Gym 6 15.00 0.00 84.00 14.70 6.90 20.00

3.1 Mitigation Measures Construction
NOx CO SO2 Fugitive PM10
Fugitive PM2.5
Exhaust PM2.5
PM2.5 Total
Bio- CO2
Water Exposed Area
3.2 Demolition of MPB - 2016Unmitigated Construction On-Site
ROG NBio- CO2
Total CO2 CH4 N2O CO2e
Category lb/day lb/day
Exhaust PM10
PM10 Total
Fugitive Dust 0.3223 0.0000 0.3223 0.0488 0.0000 0.0488 0.0000 0.0000
Off-Road 3.4819 30.8875 23.8069 0.0291 1.9559 1.9559 1.8641 1.8641 2,888.9227
2,888.9227 0.6138 2,901.8129
Total 3.4819 30.8875 23.8069 0.0291 0.6138 2,901.8129
0.3223 1.9559 2.2781 0.0488 1.8641 1.9129
SO2 Fugitive PM10
Exhaust PM10
2,888.9227
2,888.9227
PM2.5 Total
Bio- CO2 NBio- CO2
Unmitigated Construction Off-Site
ROG NOx CO Total CO2 CH4 N2O CO2e
Category lb/day lb/day
PM10 Total
Fugitive PM2.5
Exhaust PM2.5
Hauling 0.0271 0.4264 0.3315 1.1000e-003
0.0259 6.3800e-003
0.0323 7.0900e-003
5.8700e-003
0.0130 110.3652 110.3652 8.0000e-004
110.3821
Vendor 0.0000 0.0000 0.0000 0.0000 0.0000 0.0000 0.0000 0.0000 0.0000 0.0000 0.0000 0.0000 0.0000 0.0000
Worker 0.0638 0.0858 0.8970 1.9900e-003
0.1677 1.4000e-003
0.1691 0.0445 1.2900e-003
0.0458 167.3543 167.3543 9.1500e-003
167.5464
Total 0.0909 0.5122 1.2285 3.0900e-003
9.9500e-003
277.92850.1936 7.7800e-003
0.2014 0.0516 7.1600e-003
0.0587 277.7195 277.7195

SO2 Fugitive PM10
Exhaust PM10
PM2.5 Total
Bio- CO2 NBio- CO2
Mitigated Construction On-Site
ROG NOx CO Total CO2 CH4 N2O CO2e
Category lb/day lb/day
PM10 Total
Fugitive PM2.5
Exhaust PM2.5
Fugitive Dust 0.1257 0.0000 0.1257 0.0190 0.0000 0.0190 0.0000 0.0000
Off-Road 3.4819 30.8875 23.8069 0.0291 1.9559 1.9559 1.8641 1.8641 0.0000 2,888.9227
2,888.9227 0.6138 2,901.8129
Total 3.4819 30.8875 23.8069 0.0291 0.6138 2,901.8129
0.1257 1.9559 2.0815 0.0190 1.8641 1.8832
SO2 Fugitive PM10
Exhaust PM10
0.0000 2,888.9227
2,888.9227
PM2.5 Total
Bio- CO2 NBio- CO2
Mitigated Construction Off-Site
ROG NOx CO Total CO2 CH4 N2O CO2e
Category lb/day lb/day
PM10 Total
Fugitive PM2.5
Exhaust PM2.5
Hauling 0.0271 0.4264 0.3315 1.1000e-003
0.0259 6.3800e-003
0.0323 7.0900e-003
5.8700e-003
0.0130 110.3652 110.3652 8.0000e-004
110.3821
Vendor 0.0000 0.0000 0.0000 0.0000 0.0000 0.0000 0.0000 0.0000 0.0000 0.0000 0.0000 0.0000 0.0000 0.0000
Worker 0.0638 0.0858 0.8970 1.9900e-003
0.1677 1.4000e-003
0.1691 0.0445 1.2900e-003
0.0458 167.3543 167.3543 9.1500e-003
167.5464
Total 0.0909 0.5122 1.2285 3.0900e-003
9.9500e-003
277.92850.1936 7.7800e-003
0.2014 0.0516 7.1600e-003
0.0587
SO2 Fugitive PM10
Exhaust PM10
277.7195 277.7195
PM2.5 Total
Bio- CO2 NBio- CO2
3.3 Grading/Excavation - 2016Unmitigated Construction On-Site
ROG NOx CO Total CO2 CH4 N2O CO2e
Category lb/day lb/day
PM10 Total
Fugitive PM2.5
Exhaust PM2.5
Fugitive Dust 6.1387 0.0000 6.1387 3.3233 0.0000 3.3233 0.0000 0.0000
Off-Road 5.2434 58.6582 35.8337 0.0566 2.8090 2.8090 2.5843 2.5843 5,877.3279
5,877.3279 1.7728 5,914.5569
Total 5.2434 58.6582 35.8337 0.0566 1.7728 5,914.5569
6.1387 2.8090 8.9477 3.3233 2.5843 5.9076 5,877.3279
5,877.3279
SO2 Fugitive PM10
Exhaust PM10
PM2.5 Total
Bio- CO2 NBio- CO2
Unmitigated Construction Off-Site
ROG NOx CO Total CO2 CH4 N2O CO2e
Category lb/day lb/day
PM10 Total
Fugitive PM2.5
Exhaust PM2.5
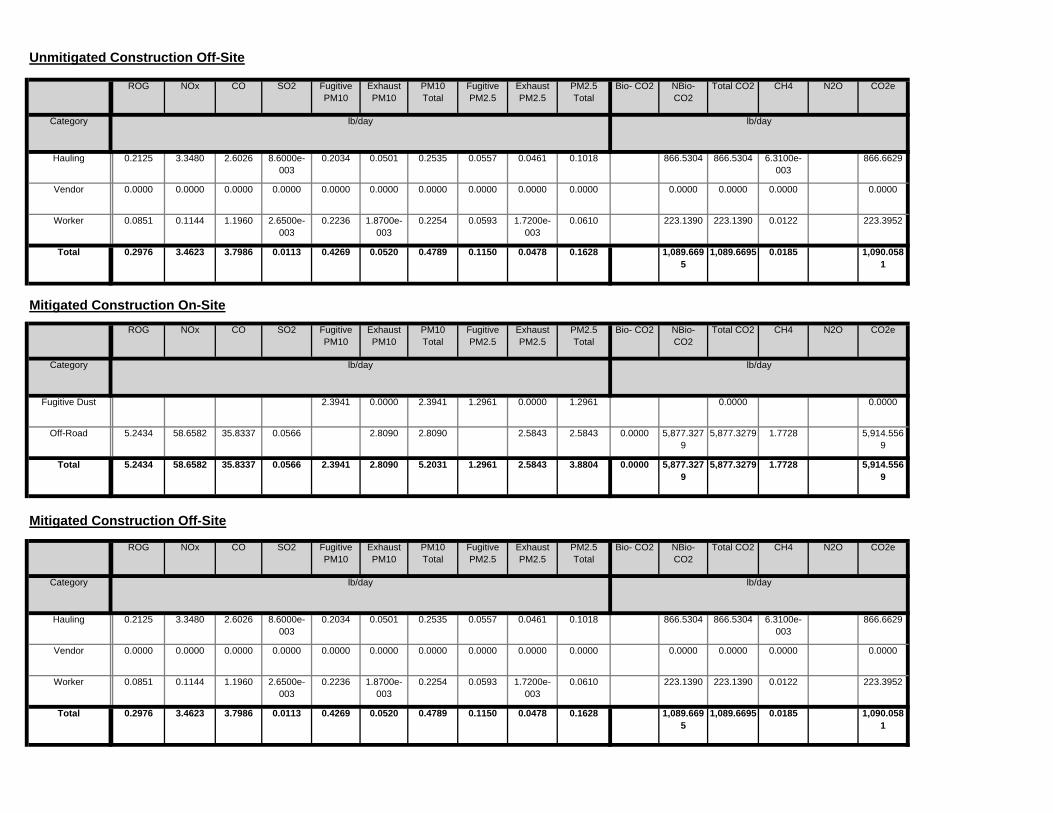
Hauling 0.2125 3.3480 2.6026 8.6000e-003
0.2034 0.0501 0.2535 0.0557 0.0461 0.1018 866.5304 866.5304 6.3100e-003
866.6629
Vendor 0.0000 0.0000 0.0000 0.0000 0.0000 0.0000 0.0000 0.0000 0.0000 0.0000 0.0000 0.0000 0.0000 0.0000
Worker 0.0851 0.1144 1.1960 2.6500e-003
0.2236 1.8700e-003
0.2254 0.0593 1.7200e-003
0.0610 223.1390 223.1390 0.0122 223.3952
Total 0.2976 3.4623 3.7986 0.0113 0.0185 1,090.0581
0.4269 0.0520 0.4789 0.1150 0.0478 0.1628
SO2 Fugitive PM10
Exhaust PM10
1,089.6695
1,089.6695
PM2.5 Total
Bio- CO2 NBio- CO2
Mitigated Construction On-Site
ROG NOx CO Total CO2 CH4 N2O CO2e
Category lb/day lb/day
PM10 Total
Fugitive PM2.5
Exhaust PM2.5
Fugitive Dust 2.3941 0.0000 2.3941 1.2961 0.0000 1.2961 0.0000 0.0000
Off-Road 5.2434 58.6582 35.8337 0.0566 2.8090 2.8090 2.5843 2.5843 0.0000 5,877.3279
5,877.3279 1.7728 5,914.5569
Total 5.2434 58.6582 35.8337 0.0566 1.7728 5,914.5569
2.3941 2.8090 5.2031 1.2961 2.5843 3.8804
SO2 Fugitive PM10
Exhaust PM10
0.0000 5,877.3279
5,877.3279
PM2.5 Total
Bio- CO2 NBio- CO2
Mitigated Construction Off-Site
ROG NOx CO Total CO2 CH4 N2O CO2e
Category lb/day lb/day
PM10 Total
Fugitive PM2.5
Exhaust PM2.5
Hauling 0.2125 3.3480 2.6026 8.6000e-003
0.2034 0.0501 0.2535 0.0557 0.0461 0.1018 866.5304 866.5304 6.3100e-003
866.6629
Vendor 0.0000 0.0000 0.0000 0.0000 0.0000 0.0000 0.0000 0.0000 0.0000 0.0000 0.0000 0.0000 0.0000 0.0000
Worker 0.0851 0.1144 1.1960 2.6500e-003
0.2236 1.8700e-003
0.2254 0.0593 1.7200e-003
0.0610 223.1390 223.1390 0.0122 223.3952
Total 0.2976 3.4623 3.7986 0.0113 0.0185 1,090.0581
0.4269 0.0520 0.4789 0.1150 0.0478 0.1628 1,089.6695
1,089.6695
SO2 Fugitive PM10
Exhaust PM10
PM2.5 Total
Bio- CO2 NBio- CO2
3.4 Foundation - 2016Unmitigated Construction On-Site
ROG NOx CO Total CO2 CH4 N2O CO2e
Category lb/day lb/day
PM10 Total
Fugitive PM2.5
Exhaust PM2.5
Off-Road 3.4925 30.7348 21.9968 0.0344 2.0281 2.0281 1.9262 1.9262 3,361.2003
3,361.2003 0.7153 3,376.2223
Paving 0.0217 0.0000 0.0000 0.0000 0.0000 0.0000 0.0000
Total 3.5142 30.7348 21.9968 0.0344 0.7153 3,376.2223
2.0281 2.0281 1.9262 1.9262
SO2 Fugitive PM10
Exhaust PM10
3,361.2003
3,361.2003
PM2.5 Total
Bio- CO2 NBio- CO2
Unmitigated Construction Off-Site
ROG NOx CO Total CO2 CH4 N2O CO2e
Category lb/day lb/day
PM10 Total
Fugitive PM2.5
Exhaust PM2.5
Hauling 0.0000 0.0000 0.0000 0.0000 0.0000 0.0000 0.0000 0.0000 0.0000 0.0000 0.0000 0.0000 0.0000 0.0000
Vendor 0.0000 0.0000 0.0000 0.0000 0.0000 0.0000 0.0000 0.0000 0.0000 0.0000 0.0000 0.0000 0.0000 0.0000
Worker 0.0851 0.1144 1.1960 2.6500e-003
0.2236 1.8700e-003
0.2254 0.0593 1.7200e-003
0.0610 223.1390 223.1390 0.0122 223.3952
Total 0.0851 0.1144 1.1960 2.6500e-003
0.0122 223.39520.2236 1.8700e-003
0.2254 0.0593 1.7200e-003
0.0610
SO2 Fugitive PM10
Exhaust PM10
223.1390 223.1390
PM2.5 Total
Bio- CO2 NBio- CO2
Mitigated Construction On-SiteROG NOx CO Total CO2 CH4 N2O CO2e
Category lb/day lb/day
PM10 Total
Fugitive PM2.5
Exhaust PM2.5
Off-Road 3.4925 30.7348 21.9968 0.0344 2.0281 2.0281 1.9262 1.9262 0.0000 3,361.2003
3,361.2003 0.7153 3,376.2223
Paving 0.0217 0.0000 0.0000 0.0000 0.0000 0.0000 0.0000
Total 3.5142 30.7348 21.9968 0.0344 0.7153 3,376.2223
2.0281 2.0281 1.9262 1.9262 0.0000 3,361.2003
3,361.2003

SO2 Fugitive PM10
Exhaust PM10
PM2.5 Total
Bio- CO2 NBio- CO2
Mitigated Construction Off-Site
ROG NOx CO Total CO2 CH4 N2O CO2e
Category lb/day lb/day
PM10 Total
Fugitive PM2.5
Exhaust PM2.5
Hauling 0.0000 0.0000 0.0000 0.0000 0.0000 0.0000 0.0000 0.0000 0.0000 0.0000 0.0000 0.0000 0.0000 0.0000
Vendor 0.0000 0.0000 0.0000 0.0000 0.0000 0.0000 0.0000 0.0000 0.0000 0.0000 0.0000 0.0000 0.0000 0.0000
Worker 0.0851 0.1144 1.1960 2.6500e-003
0.2236 1.8700e-003
0.2254 0.0593 1.7200e-003
0.0610 223.1390 223.1390 0.0122 223.3952
Total 0.0851 0.1144 1.1960 2.6500e-003
0.0122 223.39520.2236 1.8700e-003
0.2254 0.0593 1.7200e-003
0.0610
SO2 Fugitive PM10
Exhaust PM10
223.1390 223.1390
PM2.5 Total
Bio- CO2 NBio- CO2
3.4 Foundation - 2017Unmitigated Construction On-Site
ROG NOx CO Total CO2 CH4 N2O CO2e
Category lb/day lb/day
PM10 Total
Fugitive PM2.5
Exhaust PM2.5
Off-Road 3.1960 28.3900 21.8359 0.0344 1.8327 1.8327 1.7400 1.7400 3,331.3474
3,331.3474 0.7021 3,346.0924
Paving 0.0217 0.0000 0.0000 0.0000 0.0000 0.0000 0.0000
Total 3.2177 28.3900 21.8359 0.0344 0.7021 3,346.0924
1.8327 1.8327 1.7400 1.7400
SO2 Fugitive PM10
Exhaust PM10
3,331.3474
3,331.3474
PM2.5 Total
Bio- CO2 NBio- CO2
Unmitigated Construction Off-Site
ROG NOx CO Total CO2 CH4 N2O CO2e
Category lb/day lb/day
PM10 Total
Fugitive PM2.5
Exhaust PM2.5
Hauling 0.0000 0.0000 0.0000 0.0000 0.0000 0.0000 0.0000 0.0000 0.0000 0.0000 0.0000 0.0000 0.0000 0.0000
Vendor 0.0000 0.0000 0.0000 0.0000 0.0000 0.0000 0.0000 0.0000 0.0000 0.0000 0.0000 0.0000 0.0000 0.0000
Worker 0.0764 0.1033 1.0784 2.6500e-003
0.2236 1.8000e-003
0.2254 0.0593 1.6600e-003
0.0610 214.5692 214.5692 0.0113 214.8056
Total 0.0764 0.1033 1.0784 2.6500e-003
0.0113 214.80560.2236 1.8000e-003
0.2254 0.0593 1.6600e-003
0.0610 214.5692 214.5692

SO2 Fugitive PM10
Exhaust PM10
PM2.5 Total
Bio- CO2 NBio- CO2
Mitigated Construction On-Site
ROG NOx CO Total CO2 CH4 N2O CO2e
Category lb/day lb/day
PM10 Total
Fugitive PM2.5
Exhaust PM2.5
Off-Road 3.1960 28.3900 21.8359 0.0344 1.8327 1.8327 1.7400 1.7400 0.0000 3,331.3474
3,331.3474 0.7021 3,346.0924
Paving 0.0217 0.0000 0.0000 0.0000 0.0000 0.0000 0.0000
Total 3.2177 28.3900 21.8359 0.0344 0.7021 3,346.0924
1.8327 1.8327 1.7400 1.7400
SO2 Fugitive PM10
Exhaust PM10
0.0000 3,331.3474
3,331.3474
PM2.5 Total
Bio- CO2 NBio- CO2
Mitigated Construction Off-Site
ROG NOx CO Total CO2 CH4 N2O CO2e
Category lb/day lb/day
PM10 Total
Fugitive PM2.5
Exhaust PM2.5
Hauling 0.0000 0.0000 0.0000 0.0000 0.0000 0.0000 0.0000 0.0000 0.0000 0.0000 0.0000 0.0000 0.0000 0.0000
Vendor 0.0000 0.0000 0.0000 0.0000 0.0000 0.0000 0.0000 0.0000 0.0000 0.0000 0.0000 0.0000 0.0000 0.0000
Worker 0.0764 0.1033 1.0784 2.6500e-003
0.2236 1.8000e-003
0.2254 0.0593 1.6600e-003
0.0610 214.5692 214.5692 0.0113 214.8056
Total 0.0764 0.1033 1.0784 2.6500e-003
0.0113 214.80560.2236 1.8000e-003
0.2254 0.0593 1.6600e-003
0.0610
SO2 Fugitive PM10
Exhaust PM10
214.5692 214.5692
PM2.5 Total
Bio- CO2 NBio- CO2
3.5 Building Construction - 2017Unmitigated Construction On-Site
ROG NOx CO Total CO2 CH4 N2O CO2e
Category lb/day lb/day
PM10 Total
Fugitive PM2.5
Exhaust PM2.5
Off-Road 5.4540 42.5562 32.6227 0.0500 2.6396 2.6396 2.5329 2.5329 4,802.8227
4,802.8227 1.0085 4,824.0010
Total 5.4540 42.5562 32.6227 0.0500 1.0085 4,824.0010
2.6396 2.6396 2.5329 2.5329 4,802.8227
4,802.8227

SO2 Fugitive PM10
Exhaust PM10
PM2.5 Total
Bio- CO2 NBio- CO2
Unmitigated Construction Off-Site
ROG NOx CO Total CO2 CH4 N2O CO2e
Category lb/day lb/day
PM10 Total
Fugitive PM2.5
Exhaust PM2.5
Hauling 0.0000 0.0000 0.0000 0.0000 0.0000 0.0000 0.0000 0.0000 0.0000 0.0000 0.0000 0.0000 0.0000 0.0000
Vendor 0.1505 1.4585 2.0458 3.8900e-003
0.1125 0.0229 0.1354 0.0321 0.0210 0.0531 383.1550 383.1550 2.8100e-003
383.2140
Worker 0.1756 0.2375 2.4804 6.1000e-003
0.5142 4.1400e-003
0.5183 0.1364 3.8100e-003
0.1402 493.5091 493.5091 0.0259 494.0528
Total 0.3262 1.6960 4.5262 9.9900e-003
0.0287 877.26670.6267 0.0270 0.6537 0.1684 0.0249 0.1933
SO2 Fugitive PM10
Exhaust PM10
876.6641 876.6641
PM2.5 Total
Bio- CO2 NBio- CO2
Mitigated Construction On-Site
ROG NOx CO Total CO2 CH4 N2O CO2e
Category lb/day lb/day
PM10 Total
Fugitive PM2.5
Exhaust PM2.5
Off-Road 5.4540 42.5562 32.6227 0.0500 2.6396 2.6396 2.5329 2.5329 0.0000 4,802.8227
4,802.8227 1.0085 4,824.0010
Total 5.4540 42.5562 32.6227 0.0500 1.0085 4,824.0010
2.6396 2.6396 2.5329 2.5329
SO2 Fugitive PM10
Exhaust PM10
0.0000 4,802.8227
4,802.8227
PM2.5 Total
Bio- CO2 NBio- CO2
Mitigated Construction Off-Site
ROG NOx CO Total CO2 CH4 N2O CO2e
Category lb/day lb/day
PM10 Total
Fugitive PM2.5
Exhaust PM2.5
Hauling 0.0000 0.0000 0.0000 0.0000 0.0000 0.0000 0.0000 0.0000 0.0000 0.0000 0.0000 0.0000 0.0000 0.0000
Vendor 0.1505 1.4585 2.0458 3.8900e-003
0.1125 0.0229 0.1354 0.0321 0.0210 0.0531 383.1550 383.1550 2.8100e-003
383.2140
Worker 0.1756 0.2375 2.4804 6.1000e-003
0.5142 4.1400e-003
0.5183 0.1364 3.8100e-003
0.1402 493.5091 493.5091 0.0259 494.0528
Total 0.3262 1.6960 4.5262 9.9900e-003
0.0287 877.26670.6267 0.0270 0.6537 0.1684 0.0249 0.1933 876.6641 876.6641

SO2 Fugitive PM10
Exhaust PM10
PM2.5 Total
Bio- CO2 NBio- CO2
3.5 Building Construction - 2018Unmitigated Construction On-Site
ROG NOx CO Total CO2 CH4 N2O CO2e
Category lb/day lb/day
PM10 Total
Fugitive PM2.5
Exhaust PM2.5
Off-Road 4.7809 38.0949 31.9468 0.0500 2.2676 2.2676 2.1779 2.1779 4,765.0515
4,765.0515 0.9746 4,785.5179
Total 4.7809 38.0949 31.9468 0.0500 0.9746 4,785.5179
2.2676 2.2676 2.1779 2.1779
SO2 Fugitive PM10
Exhaust PM10
4,765.0515
4,765.0515
PM2.5 Total
Bio- CO2 NBio- CO2
Unmitigated Construction Off-Site
ROG NOx CO Total CO2 CH4 N2O CO2e
Category lb/day lb/day
PM10 Total
Fugitive PM2.5
Exhaust PM2.5
Hauling 0.0000 0.0000 0.0000 0.0000 0.0000 0.0000 0.0000 0.0000 0.0000 0.0000 0.0000 0.0000 0.0000 0.0000
Vendor 0.1407 1.3387 1.9632 3.8800e-003
0.1125 0.0216 0.1341 0.0321 0.0198 0.0519 376.7230 376.7230 2.8000e-003
376.7817
Worker 0.1579 0.2154 2.2448 6.1000e-003
0.5142 4.0300e-003
0.5182 0.1364 3.7300e-003
0.1401 475.0812 475.0812 0.0240 475.5858
Total 0.2987 1.5541 4.2080 9.9800e-003
0.0268 852.36750.6267 0.0256 0.6523 0.1684 0.0236 0.1920
SO2 Fugitive PM10
Exhaust PM10
851.8042 851.8042
PM2.5 Total
Bio- CO2 NBio- CO2
Mitigated Construction On-Site
ROG NOx CO Total CO2 CH4 N2O CO2e
Category lb/day lb/day
PM10 Total
Fugitive PM2.5
Exhaust PM2.5
Off-Road 4.7809 38.0949 31.9468 0.0500 2.2676 2.2676 2.1779 2.1779 0.0000 4,765.0515
4,765.0515 0.9746 4,785.5179
Total 4.7809 38.0949 31.9468 0.0500 0.9746 4,785.5179
2.2676 2.2676 2.1779 2.1779 0.0000 4,765.0515
4,765.0515

SO2 Fugitive PM10
Exhaust PM10
PM2.5 Total
Bio- CO2 NBio- CO2
Mitigated Construction Off-Site
ROG NOx CO Total CO2 CH4 N2O CO2e
Category lb/day lb/day
PM10 Total
Fugitive PM2.5
Exhaust PM2.5
Hauling 0.0000 0.0000 0.0000 0.0000 0.0000 0.0000 0.0000 0.0000 0.0000 0.0000 0.0000 0.0000 0.0000 0.0000
Vendor 0.1407 1.3387 1.9632 3.8800e-003
0.1125 0.0216 0.1341 0.0321 0.0198 0.0519 376.7230 376.7230 2.8000e-003
376.7817
Worker 0.1579 0.2154 2.2448 6.1000e-003
0.5142 4.0300e-003
0.5182 0.1364 3.7300e-003
0.1401 475.0812 475.0812 0.0240 475.5858
Total 0.2987 1.5541 4.2080 9.9800e-003
0.0268 852.36750.6267 0.0256 0.6523 0.1684 0.0236 0.1920
SO2 Fugitive PM10
Exhaust PM10
851.8042 851.8042
PM2.5 Total
Bio- CO2 NBio- CO2
3.6 Architectural Coating - 2018Unmitigated Construction On-Site
ROG NOx CO Total CO2 CH4 N2O CO2e
Category lb/day lb/day
PM10 Total
Fugitive PM2.5
Exhaust PM2.5
Archit. Coating 35.6595 0.0000 0.0000 0.0000 0.0000 0.0000 0.0000
Off-Road 2.6729 16.0350 15.3411 0.0228 1.1152 1.1152 1.0903 1.0903 2,086.7970
2,086.7970 0.3451 2,094.0437
Total 38.3324 16.0350 15.3411 0.0228 0.3451 2,094.0437
1.1152 1.1152 1.0903 1.0903 2,086.7970
2,086.7970
SO2 Fugitive PM10
Exhaust PM10
PM2.5 Total
Bio- CO2 NBio- CO2
Unmitigated Construction Off-Site
ROG NOx CO Total CO2 CH4 N2O CO2e
Category lb/day lb/day
PM10 Total
Fugitive PM2.5
Exhaust PM2.5
Hauling 0.0000 0.0000 0.0000 0.0000 0.0000 0.0000 0.0000 0.0000 0.0000 0.0000 0.0000 0.0000 0.0000 0.0000
Vendor 0.0000 0.0000 0.0000 0.0000 0.0000 0.0000 0.0000 0.0000 0.0000 0.0000 0.0000 0.0000 0.0000 0.0000
Worker 0.0309 0.0422 0.4392 1.1900e-003
0.1006 7.9000e-004
0.1014 0.0267 7.3000e-004
0.0274 92.9507 92.9507 4.7000e-003
93.0494
Total 0.0309 0.0422 0.4392 1.1900e-003
4.7000e-003
93.04940.1006 7.9000e-004
0.1014 0.0267 7.3000e-004
0.0274
SO2 Fugitive PM10
Exhaust PM10
92.9507 92.9507
PM2.5 Total
Bio- CO2 NBio- CO2
Mitigated Construction On-Site
ROG NOx CO Total CO2 CH4 N2O CO2e
Category lb/day lb/day
PM10 Total
Fugitive PM2.5
Exhaust PM2.5
Archit. Coating 35.6595 0.0000 0.0000 0.0000 0.0000 0.0000 0.0000
Off-Road 2.6729 16.0350 15.3411 0.0228 1.1152 1.1152 1.0903 1.0903 0.0000 2,086.7970
2,086.7970 0.3451 2,094.0437
Total 38.3324 16.0350 15.3411 0.0228 0.3451 2,094.0437
1.1152 1.1152 1.0903 1.0903
SO2 Fugitive PM10
Exhaust PM10
0.0000 2,086.7970
2,086.7970
PM2.5 Total
Bio- CO2 NBio- CO2
Mitigated Construction Off-Site
ROG NOx CO Total CO2 CH4 N2O CO2e
Category lb/day lb/day
PM10 Total
Fugitive PM2.5
Exhaust PM2.5
Hauling 0.0000 0.0000 0.0000 0.0000 0.0000 0.0000 0.0000 0.0000 0.0000 0.0000 0.0000 0.0000 0.0000 0.0000
Vendor 0.0000 0.0000 0.0000 0.0000 0.0000 0.0000 0.0000 0.0000 0.0000 0.0000 0.0000 0.0000 0.0000 0.0000
Worker 0.0309 0.0422 0.4392 1.1900e-003
0.1006 7.9000e-004
0.1014 0.0267 7.3000e-004
0.0274 92.9507 92.9507 4.7000e-003
93.0494
Total 0.0309 0.0422 0.4392 1.1900e-003
4.7000e-003
93.04940.1006 7.9000e-004
0.1014 0.0267 7.3000e-004
0.0274 92.9507 92.9507
SO2 Fugitive PM10
Exhaust PM10
PM2.5 Total
Bio- CO2 NBio- CO2
3.7 Paving - 2018Unmitigated Construction On-Site
ROG NOx CO Total CO2 CH4 N2O CO2e
Category lb/day lb/day
PM10 Total
Fugitive PM2.5
Exhaust PM2.5
Off-Road 1.1306 11.5793 9.8923 0.0150 0.6701 0.6701 0.6177 0.6177 1,485.9270
1,485.9270 0.4521 1,495.4213
Paving 0.0820 0.0000 0.0000 0.0000 0.0000 0.0000 0.0000
Total 1.2126 11.5793 9.8923 0.0150 0.4521 1,495.4213
0.6701 0.6701 0.6177 0.6177
SO2 Fugitive PM10
Exhaust PM10
1,485.9270
1,485.9270
PM2.5 Total
Bio- CO2 NBio- CO2
Unmitigated Construction Off-Site
ROG NOx CO Total CO2 CH4 N2O CO2e
Category lb/day lb/day
PM10 Total
Fugitive PM2.5
Exhaust PM2.5
Hauling 0.0000 0.0000 0.0000 0.0000 0.0000 0.0000 0.0000 0.0000 0.0000 0.0000 0.0000 0.0000 0.0000 0.0000
Vendor 0.0000 0.0000 0.0000 0.0000 0.0000 0.0000 0.0000 0.0000 0.0000 0.0000 0.0000 0.0000 0.0000 0.0000
Worker 0.0446 0.0609 0.6344 1.7200e-003
0.1453 1.1400e-003
0.1465 0.0385 1.0500e-003
0.0396 134.2621 134.2621 6.7900e-003
134.4047
Total 0.0446 0.0609 0.6344 1.7200e-003
6.7900e-003
134.40470.1453 1.1400e-003
0.1465 0.0385 1.0500e-003
0.0396
SO2 Fugitive PM10
Exhaust PM10
134.2621 134.2621
PM2.5 Total
Bio- CO2 NBio- CO2
Mitigated Construction On-Site
ROG NOx CO Total CO2 CH4 N2O CO2e
Category lb/day lb/day
PM10 Total
Fugitive PM2.5
Exhaust PM2.5
Off-Road 1.1306 11.5793 9.8923 0.0150 0.6701 0.6701 0.6177 0.6177 0.0000 1,485.9270
1,485.9270 0.4521 1,495.4213
Paving 0.0820 0.0000 0.0000 0.0000 0.0000 0.0000 0.0000
Total 1.2126 11.5793 9.8923 0.0150 0.4521 1,495.4213
0.6701 0.6701 0.6177 0.6177 0.0000 1,485.9270
1,485.9270

SO2 Fugitive PM10
Exhaust PM10
PM2.5 Total
Bio- CO2 NBio- CO2
Mitigated Construction Off-Site
ROG NOx CO Total CO2 CH4 N2O CO2e
Category lb/day lb/day
PM10 Total
Fugitive PM2.5
Exhaust PM2.5
Hauling 0.0000 0.0000 0.0000 0.0000 0.0000 0.0000 0.0000 0.0000 0.0000 0.0000 0.0000 0.0000 0.0000 0.0000
Vendor 0.0000 0.0000 0.0000 0.0000 0.0000 0.0000 0.0000 0.0000 0.0000 0.0000 0.0000 0.0000 0.0000 0.0000
Worker 0.0446 0.0609 0.6344 1.7200e-003
0.1453 1.1400e-003
0.1465 0.0385 1.0500e-003
0.0396 134.2621 134.2621 6.7900e-003
134.4047
Total 0.0446 0.0609 0.6344 1.7200e-003
6.7900e-003
134.40470.1453 1.1400e-003
0.1465 0.0385 1.0500e-003
0.0396
SO2 Fugitive PM10
Exhaust PM10
134.2621 134.2621
PM2.5 Total
Bio- CO2 NBio- CO2
3.8 Demolition of Gym - 2018Unmitigated Construction On-Site
ROG NOx CO Total CO2 CH4 N2O CO2e
Category lb/day lb/day
PM10 Total
Fugitive PM2.5
Exhaust PM2.5
Fugitive Dust 0.4304 0.0000 0.4304 0.0652 0.0000 0.0652 0.0000 0.0000
Off-Road 2.8792 25.8757 22.0111 0.0291 1.5299 1.5299 1.4568 1.4568 2,839.9101
2,839.9101 0.5870 2,852.2367
Total 2.8792 25.8757 22.0111 0.0291 0.5870 2,852.2367
0.4304 1.5299 1.9602 0.0652 1.4568 1.5220 2,839.9101
2,839.9101

SO2 Fugitive PM10
Exhaust PM10
PM2.5 Total
Bio- CO2 NBio- CO2
Unmitigated Construction Off-SiteROG NOx CO Total CO2 CH4 N2O CO2e
Category lb/day lb/day
PM10 Total
Fugitive PM2.5
Exhaust PM2.5
Hauling 0.0334 0.4886 0.4219 1.4700e-003
0.0349 7.8500e-003
0.0427 9.5400e-003
7.2200e-003
0.0168 143.6006 143.6006 1.0700e-003
143.6232
Vendor 0.0000 0.0000 0.0000 0.0000 0.0000 0.0000 0.0000 0.0000 0.0000 0.0000 0.0000 0.0000 0.0000 0.0000
Worker 0.0515 0.0702 0.7320 1.9900e-003
0.1677 1.3100e-003
0.1690 0.0445 1.2100e-003
0.0457 154.9178 154.9178 7.8400e-003
155.0823
Total 0.0849 0.5588 1.1539 3.4600e-003
8.9100e-003
298.70550.2025 9.1600e-003
0.2117 0.0540 8.4300e-003
0.0625
SO2 Fugitive PM10
Exhaust PM10
298.5184 298.5184
PM2.5 Total
Bio- CO2 NBio- CO2
Mitigated Construction On-Site
ROG NOx CO Total CO2 CH4 N2O CO2e
Category lb/day lb/day
PM10 Total
Fugitive PM2.5
Exhaust PM2.5
Fugitive Dust 0.1678 0.0000 0.1678 0.0254 0.0000 0.0254 0.0000 0.0000
Off-Road 2.8792 25.8757 22.0111 0.0291 1.5299 1.5299 1.4568 1.4568 0.0000 2,839.9101
2,839.9101 0.5870 2,852.2367
Total 2.8792 25.8757 22.0111 0.0291 0.5870 2,852.2367
0.1678 1.5299 1.6977 0.0254 1.4568 1.4823
SO2 Fugitive PM10
Exhaust PM10
0.0000 2,839.9101
2,839.9101
PM2.5 Total
Bio- CO2 NBio- CO2
Mitigated Construction Off-Site
ROG NOx CO Total CO2 CH4 N2O CO2e
Category lb/day lb/day
PM10 Total
Fugitive PM2.5
Exhaust PM2.5
Hauling 0.0334 0.4886 0.4219 1.4700e-003
0.0349 7.8500e-003
0.0427 9.5400e-003
7.2200e-003
0.0168 143.6006 143.6006 1.0700e-003
143.6232
Vendor 0.0000 0.0000 0.0000 0.0000 0.0000 0.0000 0.0000 0.0000 0.0000 0.0000 0.0000 0.0000 0.0000 0.0000
Worker 0.0515 0.0702 0.7320 1.9900e-003
0.1677 1.3100e-003
0.1690 0.0445 1.2100e-003
0.0457 154.9178 154.9178 7.8400e-003
155.0823
Total 0.0849 0.5588 1.1539 3.4600e-003
8.9100e-003
298.70550.2025 9.1600e-003
0.2117 0.0540 8.4300e-003
0.0625 298.5184 298.5184

AppendixA.3OperationalEmissions–ExistingSite
Operations–ExistingSite:CaliforniaEmissionsEstimatorModelRuns

CalEEMod Version: CalEEMod.2013.2.1 Page 1 of 1 Date: 11/24/2014 4:02 PM
Olive Vista Middle SchoolSouth Coast Air Basin, Summer
1.0 Project Characteristics
1.1 Land Usage
Land Uses Size Metric Lot Acreage Floor Surface Area Population
Other Non-Asphalt Surfaces 11.90 1000sqft 0.27 11,900.00 0
Parking Lot 80.00 Space 0.72 32,000.00 0
City Park 0.65 Acre 0.65 28,314.00 0
Health Club 18.40 1000sqft 0.42 18,400.00 0
Movie Theater (No Matinee) 16.60 1000sqft 0.38 16,600.00 0
1.2 Other Project Characteristics
Urbanization Urban Wind Speed (m/s) 2.2 Precipitation Freq (Days) 31
Climate Zone 11 Operational Year 2018
Utility Company Los Angeles Department of Water & Power
CO2 Intensity (lb/MWhr)
1227.89 CH4 Intensity (lb/MWhr)
0.029 N2O Intensity (lb/MWhr)
0.006
1.3 User Entered Comments & Non-Default Data
Project Characteristics -
Land Use -
Table Name Column Name Default Value New Value
2014 2018
tblTripsAndVMT HaulingTripNumber 0.00 537.00
tblProjectCharacteristics OperationalYear
2.0 Emissions Summary
SO2 Fugitive PM10
Exhaust PM10
PM2.5 Total
Bio- CO2 NBio- CO2
2.2 Overall OperationalUnmitigated Operational
ROG NOx CO Total CO2 CH4 N2O CO2e
Category lb/day lb/day
PM10 Total
Fugitive PM2.5
Exhaust PM2.5
Area 2.6078 1.2000e-004
0.0132 0.0000 5.0000e-005
5.0000e-005
5.0000e-005
5.0000e-005
0.0279 0.0279 8.0000e-005
0.0295
Energy 0.0195 0.1768 0.1485 1.0600e-003
0.0134 0.0134 0.0134 0.0134 212.1998 212.1998 4.0700e-003
3.8900e-003
213.4913
Mobile 5.5224 12.4976 52.5835 0.1324 8.7227 0.1822 8.9049 2.3307 0.1679 2.4985 10,913.8619
10,913.8619
0.4083 10,922.4362
Total 8.1496 12.6746 52.7452 0.1334 0.4125 3.8900e-003
11,135.9570
8.7227 0.1957 8.9184 2.3307 0.1813 2.5120
SO2 Fugitive PM10
Exhaust PM10
11,126.0897
11,126.0897
PM2.5 Total
Bio- CO2 NBio- CO2
Mitigated Operational
ROG NOx CO Total CO2 CH4 N2O CO2e
Category lb/day lb/day
PM10 Total
Fugitive PM2.5
Exhaust PM2.5
Area 2.6078 1.2000e-004
0.0132 0.0000 5.0000e-005
5.0000e-005
5.0000e-005
5.0000e-005
0.0279 0.0279 8.0000e-005
0.0295
Energy 0.0195 0.1768 0.1485 1.0600e-003
0.0134 0.0134 0.0134 0.0134 212.1998 212.1998 4.0700e-003
3.8900e-003
213.4913
Mobile 5.5224 12.4976 52.5835 0.1324 8.7227 0.1822 8.9049 2.3307 0.1679 2.4985 10,913.8619
10,913.8619
0.4083 10,922.4362
Total 8.1496 12.6746 52.7452 0.1334 8.7227 0.1957 8.9184 2.3307 0.1813 2.5120 11,126.0897
11,126.0897
0.4125 3.8900e-003
11,135.9570

ROG NOx CO SO2 Fugitive PM10
Exhaust PM10
PM10 Total
Fugitive PM2.5
Exhaust PM2.5
PM2.5 Total
Bio- CO2 NBio-CO2 Total CO2 CH4 N20 CO2e
Percent Reduction
0.00 0.00 0.00 0.00 0.00 0.00 0.00 0.00 0.00 0.00 0.00 0.00 0.00 0.00 0.00 0.00
CO SO2 Fugitive PM10
Fugitive PM2.5
Exhaust PM2.5
PM2.5 Total
Bio- CO2
4.0 Operational Detail - Mobile
4.1 Mitigation Measures MobileROG NOx NBio-
CO2Total CO2 CH4 N2O CO2e
Category lb/day lb/day
Exhaust PM10
PM10 Total
Mitigated 5.5224 12.4976 52.5835 0.1324 8.7227 0.1822 8.9049 2.3307 0.1679 2.4985 10,913.8619
10,913.8619
0.4083 10,922.4362
Unmitigated 5.5224 12.4976 52.5835 0.1324 8.7227 0.1822 8.9049 2.3307 0.1679 2.4985 10,913.8619
10,913.8619
0.4083 10,922.4362
4.2 Trip Summary Information
Average Daily Trip Rate Unmitigated MitigatedLand Use Weekday Saturday Sunday Annual VMT Annual VMT
City Park 1.03 1.03 1.03 2,974 2,974Health Club 605.91 384.01 491.83 1,193,251 1,193,251
Movie Theater (No Matinee) 1,328.00 1,328.00 1328.00 2,814,055 2,814,055Other Non-Asphalt Surfaces 0.00 0.00 0.00
Parking Lot 0.00 0.00 0.00Total 1,934.95 1,713.04 1,820.87 4,010,280 4,010,280

4.3 Trip Type Information
Miles Trip % Trip Purpose %
Land Use H-W or C-W H-S or C-C H-O or C-NW H-W or C-W
H-S or C-C H-O or C-NW Primary Diverted Pass-by
City Park 16.60 8.40 6.90 33.00 48.00 19.00 66 28 6
Health Club 16.60 8.40 6.90 16.90 64.10 19.00 52 39 9
Movie Theater (No Matinee) 16.60 8.40 6.90 1.80 79.20 19.00 66 17 17
Other Non-Asphalt Surfaces 16.60 8.40 6.90 0.00 0.00 0.00 0 0 0
Parking Lot 16.60 8.40 6.90 0.00 0.00 0.00 0 0 0
LDA LDT1 LDT2 MDV LHD1 LHD2 MHD HHD OBUS UBUS MCY
0.004362 0.000588 0.002117
5.0 Energy Detail
SBUS MH
0.512137 0.059943 0.180601 0.139123
NOx CO SO2 Fugitive PM10
0.001940 0.0025020.042256 0.006647 0.016115 0.031670
Fugitive PM2.5
Exhaust PM2.5
PM2.5 Total
Bio- CO2
4.4 Fleet MixHistorical Energy Use: N
5.1 Mitigation Measures Energy
ROG NBio- CO2
Total CO2 CH4 N2O CO2e
Category lb/day lb/day
Exhaust PM10
PM10 Total
NaturalGas Mitigated
0.0195 0.1768 0.1485 1.0600e-003
0.0134 0.0134 0.0134 0.0134 212.1998 212.1998 4.0700e-003
3.8900e-003
213.4913
NaturalGas Unmitigated
0.0195 0.1768 0.1485 1.0600e-003
212.1998 4.0700e-003
3.8900e-003
213.49130.0134 0.0134 0.0134 0.0134 212.1998

CO SO2 Fugitive PM10
Exhaust PM10
Exhaust PM2.5
PM2.5 Total
Bio- CO2 NBio- CO2
5.2 Energy by Land Use - NaturalGasUnmitigated
NaturalGas Use
ROG NOx Total CO2 CH4 N2O CO2e
Land Use kBTU/yr lb/day lb/day
PM10 Total
Fugitive PM2.5
Health Club 948.23 0.0102 0.0930 0.0781 5.6000e-004
7.0700e-003
7.0700e-003
7.0700e-003
7.0700e-003
111.5565 111.5565 2.1400e-003
2.0500e-003
112.2354
Movie Theater (No Matinee)
855.468 9.2300e-003
0.0839 0.0705 5.0000e-004
6.3700e-003
6.3700e-003
6.3700e-003
6.3700e-003
100.6434 100.6434 1.9300e-003
1.8500e-003
101.2559
Other Non-Asphalt Surfaces
0 0.0000 0.0000 0.0000 0.0000 0.0000 0.0000 0.0000 0.0000 0.0000 0.0000 0.0000 0.0000 0.0000
Parking Lot 0 0.0000 0.0000 0.0000 0.0000 0.0000 0.0000 0.0000 0.0000 0.0000 0.0000 0.0000 0.0000 0.0000
City Park 0 0.0000 0.0000 0.0000 0.0000 0.0000 0.0000 0.0000 0.0000 0.0000 0.0000 0.0000 0.0000 0.0000
Total 0.0195 0.1768 0.1485 1.0600e-003
212.1998 4.0700e-003
3.9000e-003
213.49130.0134 0.0134 0.0134 0.0134
CO SO2 Fugitive PM10
Exhaust PM10
212.1998
Exhaust PM2.5
PM2.5 Total
Bio- CO2 NBio- CO2
Mitigated
NaturalGas Use
ROG NOx Total CO2 CH4 N2O CO2e
Land Use kBTU/yr lb/day lb/day
PM10 Total
Fugitive PM2.5
Movie Theater (No Matinee)
0.855468 9.2300e-003
0.0839 0.0705 5.0000e-004
6.3700e-003
6.3700e-003
6.3700e-003
6.3700e-003
100.6434 100.6434 1.9300e-003
1.8500e-003
101.2559
Other Non-Asphalt Surfaces
0 0.0000 0.0000 0.0000 0.0000 0.0000 0.0000 0.0000 0.0000 0.0000 0.0000 0.0000 0.0000 0.0000
Parking Lot 0 0.0000 0.0000 0.0000 0.0000 0.0000 0.0000 0.0000 0.0000 0.0000 0.0000 0.0000 0.0000 0.0000
City Park 0 0.0000 0.0000 0.0000 0.0000 0.0000 0.0000 0.0000 0.0000 0.0000 0.0000 0.0000 0.0000 0.0000
Health Club 0.94823 0.0102 0.0930 0.0781 5.6000e-004
7.0700e-003
7.0700e-003
7.0700e-003
7.0700e-003
111.5565 111.5565 2.1400e-003
2.0500e-003
112.2354
Total 0.0195 0.1768 0.1485 1.0600e-003
4.0700e-003
3.9000e-003
213.49130.0134 0.0134 0.0134 0.0134 212.1998 212.1998
6.0 Area Detail
6.1 Mitigation Measures Area
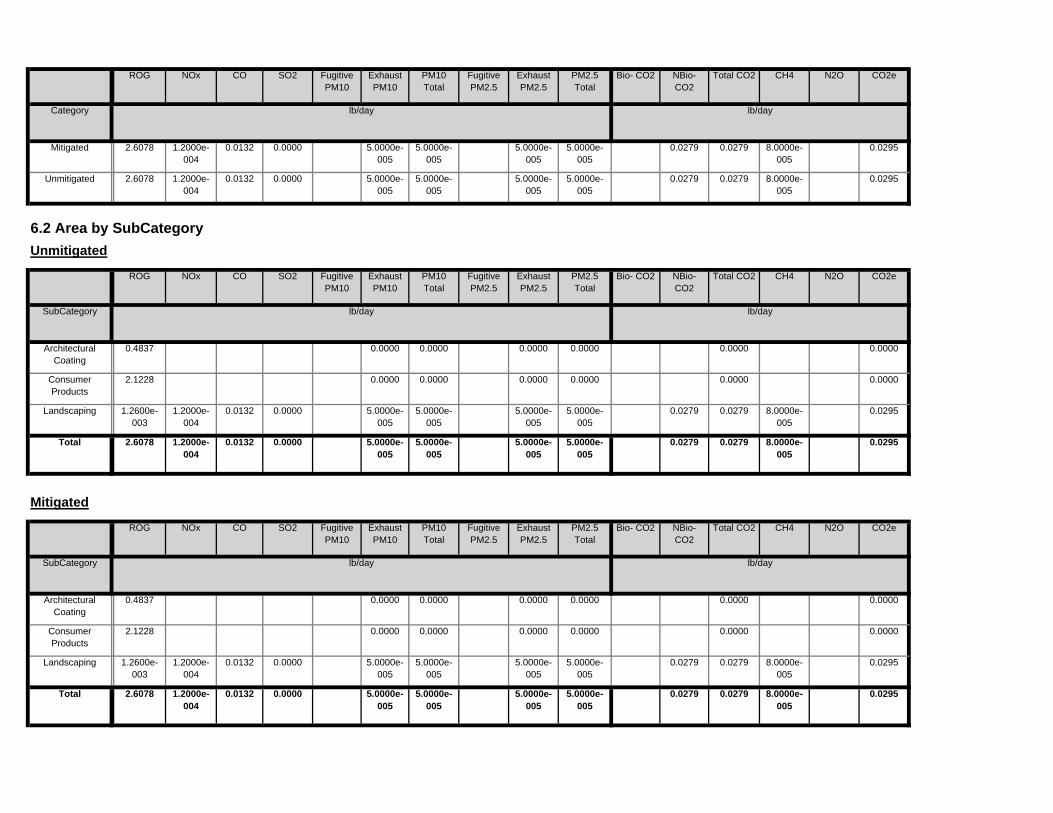
CO SO2 Fugitive PM10
Fugitive PM2.5
Exhaust PM2.5
PM2.5 Total
Bio- CO2ROG NOx NBio- CO2
Total CO2 CH4 N2O CO2e
Category lb/day lb/day
Exhaust PM10
PM10 Total
Mitigated 2.6078 1.2000e-004
0.0132 0.0000 5.0000e-005
5.0000e-005
5.0000e-005
5.0000e-005
0.0279 0.0279 8.0000e-005
0.0295
Unmitigated 2.6078 1.2000e-004
0.0132 0.0000 8.0000e-005
0.02955.0000e-005
5.0000e-005
5.0000e-005
5.0000e-005
SO2 Fugitive PM10
Exhaust PM10
0.0279 0.0279
PM2.5 Total
Bio- CO2 NBio- CO2
6.2 Area by SubCategoryUnmitigated
ROG NOx CO Total CO2 CH4 N2O CO2e
SubCategory lb/day lb/day
PM10 Total
Fugitive PM2.5
Exhaust PM2.5
Architectural Coating
0.4837 0.0000 0.0000 0.0000 0.0000 0.0000 0.0000
Consumer Products
2.1228 0.0000 0.0000 0.0000 0.0000 0.0000 0.0000
Landscaping 1.2600e-003
1.2000e-004
0.0132 0.0000 5.0000e-005
5.0000e-005
5.0000e-005
5.0000e-005
0.0279 0.0279 8.0000e-005
0.0295
Total 2.6078 1.2000e-004
0.0132 0.0000 8.0000e-005
0.02955.0000e-005
5.0000e-005
5.0000e-005
5.0000e-005
SO2 Fugitive PM10
Exhaust PM10
0.0279 0.0279
PM2.5 Total
Bio- CO2 NBio- CO2
Mitigated
ROG NOx CO Total CO2 CH4 N2O CO2e
SubCategory lb/day lb/day
PM10 Total
Fugitive PM2.5
Exhaust PM2.5
Architectural Coating
0.4837 0.0000 0.0000 0.0000 0.0000 0.0000 0.0000
Consumer Products
2.1228 0.0000 0.0000 0.0000 0.0000 0.0000 0.0000
Landscaping 1.2600e-003
1.2000e-004
0.0132 0.0000 5.0000e-005
5.0000e-005
5.0000e-005
5.0000e-005
0.0279 0.0279 8.0000e-005
0.0295
Total 2.6078 1.2000e-004
0.0132 0.0000 5.0000e-005
5.0000e-005
5.0000e-005
5.0000e-005
0.0279 0.0279 8.0000e-005
0.0295

tblProjectCharacteristics OperationalYear 2014 2018
tblTripsAndVMT HaulingTripNumber 0.00 537.00
Table Name Column Name Default Value New Value
1.3 User Entered Comments & Non-Default Data
Project Characteristics -
Land Use -
CO2 Intensity (lb/MWhr)
1227.89 CH4 Intensity (lb/MWhr)
0.029 N2O Intensity (lb/MWhr)
0.006
31
Climate Zone 11 Operational Year 2018
Utility Company Los Angeles Department of Water & Power
1.2 Other Project Characteristics
Urbanization Urban Wind Speed (m/s) 2.2 Precipitation Freq (Days)
Movie Theater (No Matinee) 16.60 1000sqft 0.38 16,600.00 0
Health Club 18.40 1000sqft 0.42 18,400.00 0
City Park 0.65 Acre 0.65 28,314.00 0
Parking Lot 80.00 Space 0.72 32,000.00 0
Population
Other Non-Asphalt Surfaces 11.90 1000sqft 0.27 11,900.00 0
1.1 Land Usage
Land Uses Size Metric Lot Acreage Floor Surface Area
CalEEMod Version: CalEEMod.2013.2.1 Page 1 of 1 Date: 11/24/2014 4:00 PM
Olive Vista Middle SchoolSouth Coast Air Basin, Winter
1.0 Project Characteristics

0.00 0.00 0.00 0.00 0.00 0.000.00 0.00 0.00 0.00 0.00 0.00
NBio-CO2 Total CO2 CH4 N20 CO2e
Percent Reduction
0.00 0.00 0.00 0.00
Exhaust PM10
PM10 Total
Fugitive PM2.5
Exhaust PM2.5
PM2.5 Total
Bio- CO2ROG NOx CO SO2 Fugitive PM10
10,603.1438
10,603.1438
0.4130 3.8900e-003
10,613.0227
8.7227 0.1967 8.9194 2.3307 0.1823 2.5129Total 8.3656 13.2724 53.6295 0.1268
10,390.9161
10,390.9161
0.4089 10,399.5020
8.7227 0.1832 8.9059 2.3307 0.1688 2.4994Mobile 5.7384 13.0955 53.4677 0.1258
212.1998 212.1998 4.0700e-003
3.8900e-003
213.49130.0134 0.0134 0.0134 0.0134Energy 0.0195 0.1768 0.1485 1.0600e-003
0.0279 0.0279 8.0000e-005
0.02955.0000e-005
5.0000e-005
5.0000e-005
5.0000e-005
Area 2.6078 1.2000e-004
0.0132 0.0000
Total CO2 CH4 N2O CO2e
Category lb/day lb/day
PM10 Total
Fugitive PM2.5
Exhaust PM2.5
Mitigated Operational
ROG NOx CO SO2 Fugitive PM10
Exhaust PM10
10,603.1438
10,603.1438
PM2.5 Total
Bio- CO2 NBio- CO2
0.4130 3.8900e-003
10,613.0227
8.7227 0.1967 8.9194 2.3307 0.1823 2.5129Total 8.3656 13.2724 53.6295 0.1268
10,390.9161
10,390.9161
0.4089 10,399.5020
8.7227 0.1832 8.9059 2.3307 0.1688 2.4994Mobile 5.7384 13.0955 53.4677 0.1258
212.1998 212.1998 4.0700e-003
3.8900e-003
213.49130.0134 0.0134 0.0134 0.0134Energy 0.0195 0.1768 0.1485 1.0600e-003
0.0279 0.0279 8.0000e-005
0.02955.0000e-005
5.0000e-005
5.0000e-005
5.0000e-005
Area 2.6078 1.2000e-004
0.0132 0.0000
Total CO2 CH4 N2O CO2e
Category lb/day lb/day
PM10 Total
Fugitive PM2.5
Exhaust PM2.5
Unmitigated Operational
ROG NOx CO SO2 Fugitive PM10
Exhaust PM10
PM2.5 Total
Bio- CO2 NBio- CO2
2.2 Overall Operational
2.0 Emissions Summary

0.001940 0.0025020.042256 0.006647 0.016115 0.031670 0.004362 0.000588 0.002117
SBUS MH
0.512137 0.059943 0.180601 0.139123
LHD2 MHD HHD OBUS UBUS MCY
0.00 0.00 0 0 0
LDA LDT1 LDT2 MDV LHD1
0.00 0.00 0 0 0
Parking Lot 16.60 8.40 6.90 0.00
79.20 19.00 66 17 17
Other Non-Asphalt Surfaces 16.60 8.40 6.90 0.00
64.10 19.00 52 39 9
Movie Theater (No Matinee) 16.60 8.40 6.90 1.80
48.00 19.00 66 28 6
Health Club 16.60 8.40 6.90 16.90
H-S or C-C H-O or C-NW Primary Diverted Pass-by
City Park 16.60 8.40 6.90 33.00
4.3 Trip Type Information
Miles Trip % Trip Purpose %
Land Use H-W or C-W H-S or C-C H-O or C-NW H-W or C-W
Total 1,934.95 1,713.04 1,820.87 4,010,280 4,010,280Parking Lot 0.00 0.00 0.00
Other Non-Asphalt Surfaces 0.00 0.00 0.00Movie Theater (No Matinee) 1,328.00 1,328.00 1328.00 2,814,055 2,814,055
Health Club 605.91 384.01 491.83 1,193,251 1,193,251
Annual VMT
City Park 1.03 1.03 1.03 2,974 2,974
4.2 Trip Summary Information
Average Daily Trip Rate Unmitigated MitigatedLand Use Weekday Saturday Sunday Annual VMT
10,390.9161
10,390.9161
0.4089 10,399.5020
8.7227 0.1832 8.9059 2.3307 0.1688 2.4994Unmitigated 5.7384 13.0955 53.4677 0.1258
10,390.9161
10,390.9161
0.4089 10,399.5020
8.7227 0.1832 8.9059 2.3307 0.1688 2.4994Mitigated 5.7384 13.0955 53.4677 0.1258
NBio- CO2
Total CO2 CH4 N2O CO2e
Category lb/day lb/day
Exhaust PM10
PM10 Total
4.0 Operational Detail - Mobile
4.1 Mitigation Measures Mobile
ROG NOx CO SO2 Fugitive PM10
Fugitive PM2.5
Exhaust PM2.5
PM2.5 Total
Bio- CO2

212.1998 212.1998 4.0700e-003
3.9000e-003
213.49130.0134 0.0134 0.0134 0.0134Total 0.0195 0.1768 0.1485 1.0600e-003
0.0000 0.0000 0.0000 0.0000 0.00000.0000 0.0000 0.0000 0.0000City Park 0 0.0000 0.0000 0.0000 0.0000
0.0000 0.0000 0.0000 0.0000 0.00000.0000 0.0000 0.0000 0.0000Parking Lot 0 0.0000 0.0000 0.0000 0.0000
0.0000 0.0000 0.0000 0.0000 0.00000.0000 0.0000 0.0000 0.0000Other Non-Asphalt Surfaces
0 0.0000 0.0000 0.0000 0.0000
100.6434 100.6434 1.9300e-003
1.8500e-003
101.25596.3700e-003
6.3700e-003
6.3700e-003
6.3700e-003
Movie Theater (No Matinee)
855.468 9.2300e-003
0.0839 0.0705 5.0000e-004
111.5565 111.5565 2.1400e-003
2.0500e-003
112.23547.0700e-003
7.0700e-003
7.0700e-003
7.0700e-003
Health Club 948.23 0.0102 0.0930 0.0781 5.6000e-004
Total CO2 CH4 N2O CO2e
Land Use kBTU/yr lb/day lb/day
PM10 Total
Fugitive PM2.5
5.2 Energy by Land Use - NaturalGasUnmitigated
NaturalGas Use
ROG NOx CO SO2 Fugitive PM10
Exhaust PM10
212.1998
Exhaust PM2.5
PM2.5 Total
Bio- CO2 NBio- CO2
212.1998 4.0700e-003
3.8900e-003
213.49130.0134 0.0134 0.0134 0.0134NaturalGas Unmitigated
0.0195 0.1768 0.1485 1.0600e-003
212.1998 212.1998 4.0700e-003
3.8900e-003
213.49130.0134 0.0134 0.0134 0.0134NaturalGas Mitigated
0.0195 0.1768 0.1485 1.0600e-003
NBio- CO2
Total CO2 CH4 N2O CO2e
Category lb/day lb/day
Exhaust PM10
PM10 Total
Fugitive PM2.5
Exhaust PM2.5
PM2.5 Total
Bio- CO2
4.4 Fleet MixHistorical Energy Use: N
5.1 Mitigation Measures Energy
ROG NOx CO SO2 Fugitive PM10
5.0 Energy Detail

0.0279 0.0279 8.0000e-005
0.02955.0000e-005
5.0000e-005
5.0000e-005
5.0000e-005
Unmitigated 2.6078 1.2000e-004
0.0132 0.0000
0.0279 0.0279 8.0000e-005
0.02955.0000e-005
5.0000e-005
5.0000e-005
5.0000e-005
Mitigated 2.6078 1.2000e-004
0.0132 0.0000
NBio- CO2
Total CO2 CH4 N2O CO2e
Category lb/day lb/day
Exhaust PM10
PM10 Total
6.0 Area Detail
6.1 Mitigation Measures Area
ROG NOx CO SO2 Fugitive PM10
212.1998 212.1998
Fugitive PM2.5
Exhaust PM2.5
PM2.5 Total
Bio- CO2
4.0700e-003
3.9000e-003
213.49130.0134 0.0134 0.0134 0.0134Total 0.0195 0.1768 0.1485 1.0600e-003
0.0000 0.0000 0.0000 0.0000 0.00000.0000 0.0000 0.0000 0.0000City Park 0 0.0000 0.0000 0.0000 0.0000
0.0000 0.0000 0.0000 0.0000 0.00000.0000 0.0000 0.0000 0.0000Parking Lot 0 0.0000 0.0000 0.0000 0.0000
0.0000 0.0000 0.0000 0.0000 0.00000.0000 0.0000 0.0000 0.0000Other Non-Asphalt Surfaces
0 0.0000 0.0000 0.0000 0.0000
100.6434 100.6434 1.9300e-003
1.8500e-003
101.25596.3700e-003
6.3700e-003
6.3700e-003
6.3700e-003
Movie Theater (No Matinee)
0.855468 9.2300e-003
0.0839 0.0705 5.0000e-004
111.5565 111.5565 2.1400e-003
2.0500e-003
112.23547.0700e-003
7.0700e-003
7.0700e-003
7.0700e-003
Health Club 0.94823 0.0102 0.0930 0.0781 5.6000e-004
Total CO2 CH4 N2O CO2e
Land Use kBTU/yr lb/day lb/day
PM10 Total
Fugitive PM2.5
Mitigated
NaturalGas Use
ROG NOx CO SO2 Fugitive PM10
Exhaust PM10
Exhaust PM2.5
PM2.5 Total
Bio- CO2 NBio- CO2

0.0279 0.0279 8.0000e-005
0.02955.0000e-005
5.0000e-005
5.0000e-005
5.0000e-005
Total 2.6078 1.2000e-004
0.0132 0.0000
0.0279 0.0279 8.0000e-005
0.02955.0000e-005
5.0000e-005
5.0000e-005
5.0000e-005
Landscaping 1.2600e-003
1.2000e-004
0.0132 0.0000
0.0000 0.00000.0000 0.0000 0.0000 0.0000Consumer Products
2.1228
0.0000 0.00000.0000 0.0000 0.0000 0.0000Architectural Coating
0.4837
Total CO2 CH4 N2O CO2e
SubCategory lb/day lb/day
PM10 Total
Fugitive PM2.5
Exhaust PM2.5
Mitigated
ROG NOx CO SO2 Fugitive PM10
Exhaust PM10
0.0279 0.0279
PM2.5 Total
Bio- CO2 NBio- CO2
8.0000e-005
0.02955.0000e-005
5.0000e-005
5.0000e-005
5.0000e-005
Total 2.6078 1.2000e-004
0.0132 0.0000
0.0279 0.0279 8.0000e-005
0.02955.0000e-005
5.0000e-005
5.0000e-005
5.0000e-005
Landscaping 1.2600e-003
1.2000e-004
0.0132 0.0000
0.0000 0.00000.0000 0.0000 0.0000 0.0000Consumer Products
2.1228
0.0000 0.00000.0000 0.0000 0.0000 0.0000Architectural Coating
0.4837
Total CO2 CH4 N2O CO2e
SubCategory lb/day lb/day
PM10 Total
Fugitive PM2.5
Exhaust PM2.5
Unmitigated
ROG NOx CO SO2 Fugitive PM10
Exhaust PM10
PM2.5 Total
Bio- CO2 NBio- CO2
6.2 Area by SubCategory

AppendixA.3OperationalEmissions–Project
Operations–Project:CaliforniaEmissionsEstimatorModelRuns
Operations–Charbroiler

CalEEMod Version: CalEEMod.2013.2.1 Page 1 of 1 Date: 11/19/2014 12:19 PM
Olive Vista Middle SchoolSouth Coast Air Basin, Summer
1.0 Project Characteristics
1.1 Land Usage
Land Uses Size Metric Lot Acreage Floor Surface Area Population
Other Non-Asphalt Surfaces 11.80 1000sqft 0.27 11,800.00 0
Parking Lot 80.00 Space 0.72 32,000.00 0
City Park 0.65 Acre 0.65 28,314.00 0
Health Club 19.90 1000sqft 0.46 19,900.00 0
Movie Theater (No Matinee) 17.50 1000sqft 0.40 17,500.00 0
1.2 Other Project Characteristics
Urbanization Urban Wind Speed (m/s) 2.2 Precipitation Freq (Days) 31
Climate Zone 11 Operational Year 2018
Utility Company Los Angeles Department of Water & Power
CO2 Intensity (lb/MWhr)
1227.89 CH4 Intensity (lb/MWhr)
0.029 N2O Intensity (lb/MWhr)
0.006
1.3 User Entered Comments & Non-Default Data
Project Characteristics -
Land Use -
Construction Phase - See Construction Schedule
Off-road Equipment - See Construction Equipment List
Off-road Equipment - See Construction Equipment List
Off-road Equipment - See Construction Equipment List
Off-road Equipment - See Construction Equipment List

Off-road Equipment - See Construction Equipment List
Off-road Equipment - See Construction Equipment List
Off-road Equipment - See Construction Equipment List
Trips and VMT -
Demolition -
Grading - See Construction Assumptions
Construction Off-road Equipment Mitigation -
Table Name Column Name Default Value New Value
tblConstructionPhase NumDays 10.00 51.00
tblConstructionPhase NumDays 220.00 239.00
tblConstructionPhase NumDays 20.00 76.00
tblConstructionPhase NumDays 20.00 42.00
tblConstructionPhase NumDays 6.00 46.00
tblConstructionPhase NumDays 10.00 87.00
tblConstructionPhase NumDays 10.00 23.00
tblConstructionPhase PhaseEndDate 5/11/2018 5/13/2018
tblConstructionPhase PhaseEndDate 8/10/2018 8/12/2018
tblConstructionPhase PhaseEndDate 3/31/2017 4/1/2017
tblGrading AcresOfGrading 23.00 4.60
tblGrading MaterialExported 0.00 4,294.00
tblOffRoadEquipment LoadFactor 0.31 0.31
tblOffRoadEquipment LoadFactor 0.50 0.50
tblOffRoadEquipment LoadFactor 0.38 0.38
tblOffRoadEquipment LoadFactor 0.40 0.40
tblOffRoadEquipment LoadFactor 0.38 0.38
tblOffRoadEquipment LoadFactor 0.42 0.42
tblOffRoadEquipment LoadFactor 0.20 0.20
tblOffRoadEquipment LoadFactor 0.37 0.37
tblOffRoadEquipment OffRoadEquipmentType Aerial Lifts
tblOffRoadEquipment OffRoadEquipmentType Concrete/Industrial Saws
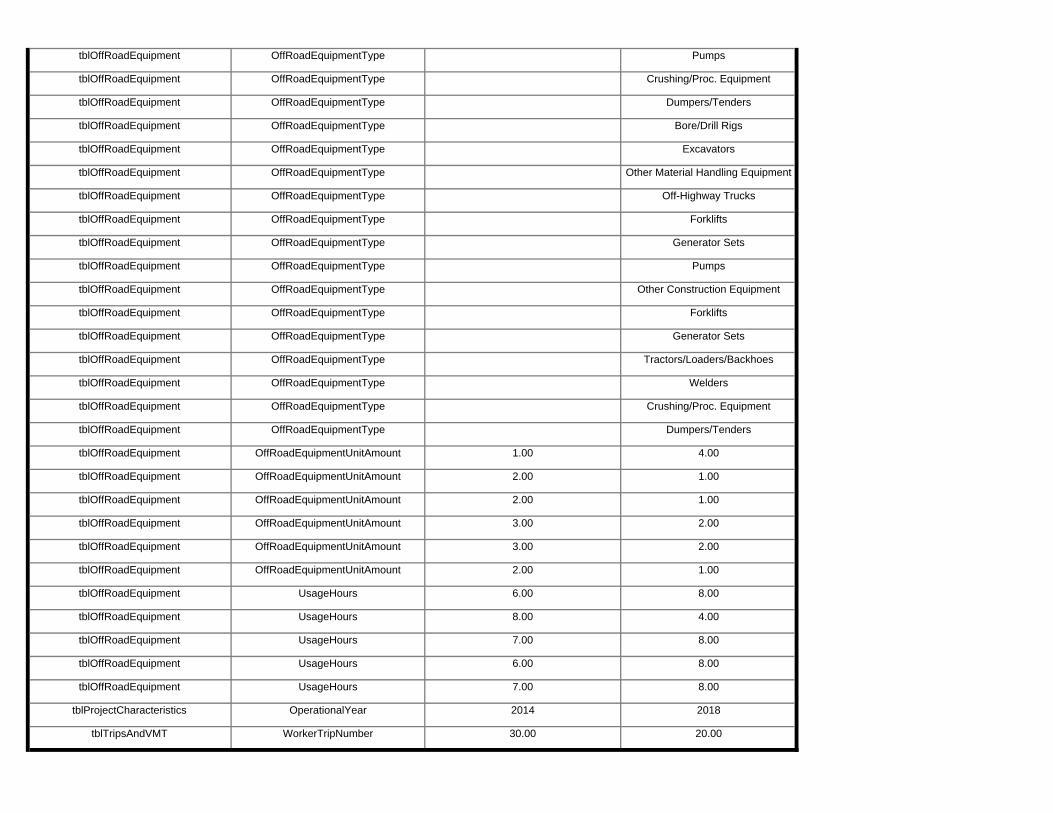
tblOffRoadEquipment OffRoadEquipmentType Pumps
tblOffRoadEquipment OffRoadEquipmentType Crushing/Proc. Equipment
tblOffRoadEquipment OffRoadEquipmentType Dumpers/Tenders
tblOffRoadEquipment OffRoadEquipmentType Bore/Drill Rigs
tblOffRoadEquipment OffRoadEquipmentType Excavators
tblOffRoadEquipment OffRoadEquipmentType Other Material Handling Equipment
tblOffRoadEquipment OffRoadEquipmentType Off-Highway Trucks
tblOffRoadEquipment OffRoadEquipmentType Forklifts
tblOffRoadEquipment OffRoadEquipmentType Generator Sets
tblOffRoadEquipment OffRoadEquipmentType Pumps
tblOffRoadEquipment OffRoadEquipmentType Other Construction Equipment
tblOffRoadEquipment OffRoadEquipmentType Forklifts
tblOffRoadEquipment OffRoadEquipmentType Generator Sets
tblOffRoadEquipment OffRoadEquipmentType Tractors/Loaders/Backhoes
tblOffRoadEquipment OffRoadEquipmentType Welders
tblOffRoadEquipment OffRoadEquipmentType Crushing/Proc. Equipment
tblOffRoadEquipment OffRoadEquipmentType Dumpers/Tenders
tblOffRoadEquipment OffRoadEquipmentUnitAmount 1.00 4.00
tblOffRoadEquipment OffRoadEquipmentUnitAmount 2.00 1.00
tblOffRoadEquipment OffRoadEquipmentUnitAmount 2.00 1.00
tblOffRoadEquipment OffRoadEquipmentUnitAmount 3.00 2.00
tblOffRoadEquipment OffRoadEquipmentUnitAmount 3.00 2.00
tblOffRoadEquipment OffRoadEquipmentUnitAmount 2.00 1.00
tblOffRoadEquipment UsageHours 6.00 8.00
tblOffRoadEquipment UsageHours 8.00 4.00
tblOffRoadEquipment UsageHours 7.00 8.00
tblOffRoadEquipment UsageHours 6.00 8.00
tblOffRoadEquipment UsageHours 7.00 8.00
2014 2018
tblTripsAndVMT WorkerTripNumber 30.00 20.00
tblProjectCharacteristics OperationalYear

SO2 Fugitive PM10
Exhaust PM10
PM2.5 Total
Bio- CO2 NBio- CO2
2.2 Overall OperationalUnmitigated Operational
ROG NOx CO Total CO2 CH4 N2O CO2e
Category lb/day lb/day
PM10 Total
Fugitive PM2.5
Exhaust PM2.5
Area 2.6679 1.3000e-004
0.0134 0.0000 5.0000e-005
5.0000e-005
5.0000e-005
5.0000e-005
0.0284 0.0284 8.0000e-005
0.0301
Energy 0.0208 0.1890 0.1587 1.1300e-003
0.0144 0.0144 0.0144 0.0144 226.7507 226.7507 4.3500e-003
4.1600e-003
228.1307
Mobile 5.8690 13.2821 55.8840 0.1407 9.2703 0.1936 9.4639 2.4770 0.1784 2.6554 11,599.0260
11,599.0260
0.4339 11,608.1385
Total 8.5577 13.4712 56.0562 0.1418 0.4384 4.1600e-003
11,836.2993
9.2703 0.2080 9.4783 2.4770 0.1928 2.6698
SO2 Fugitive PM10
Exhaust PM10
11,825.8051
11,825.8051
PM2.5 Total
Bio- CO2 NBio- CO2
Mitigated Operational
ROG NOx CO Total CO2 CH4 N2O CO2e
Category lb/day lb/day
PM10 Total
Fugitive PM2.5
Exhaust PM2.5
Area 2.6679 1.3000e-004
0.0134 0.0000 5.0000e-005
5.0000e-005
5.0000e-005
5.0000e-005
0.0284 0.0284 8.0000e-005
0.0301
Energy 0.0208 0.1890 0.1587 1.1300e-003
0.0144 0.0144 0.0144 0.0144 226.7507 226.7507 4.3500e-003
4.1600e-003
228.1307
Mobile 5.8690 13.2821 55.8840 0.1407 9.2703 0.1936 9.4639 2.4770 0.1784 2.6554 11,599.0260
11,599.0260
0.4339 11,608.1385
Total 8.5577 13.4712 56.0562 0.1418 9.2703 0.2080 9.4783 2.4770 0.1928 2.6698 11,825.8051
11,825.8051
0.4384 4.1600e-003
11,836.2993
ROG NOx CO SO2 Fugitive PM10
Exhaust PM10
PM10 Total
Fugitive PM2.5
Exhaust PM2.5
PM2.5 Total
Bio- CO2 NBio-CO2 Total CO2 CH4 N20 CO2e
Percent Reduction
0.00 0.00 0.00 0.00 0.00 0.00 0.00 0.00 0.00 0.00 0.00 0.00 0.00 0.00 0.00 0.00

CO SO2 Fugitive PM10
Fugitive PM2.5
Exhaust PM2.5
PM2.5 Total
Bio- CO2
4.0 Operational Detail - Mobile
4.1 Mitigation Measures MobileROG NOx NBio-
CO2Total CO2 CH4 N2O CO2e
Category lb/day lb/day
Exhaust PM10
PM10 Total
Mitigated 5.8690 13.2821 55.8840 0.1407 9.2703 0.1936 9.4639 2.4770 0.1784 2.6554 11,599.0260
11,599.0260
0.4339 11,608.1385
Unmitigated 5.8690 13.2821 55.8840 0.1407 9.2703 0.1936 9.4639 2.4770 0.1784 2.6554 11,599.0260
11,599.0260
0.4339 11,608.1385
4.2 Trip Summary Information
Average Daily Trip Rate Unmitigated MitigatedLand Use Weekday Saturday Sunday Annual VMT Annual VMT
City Park 1.03 1.03 1.03 2,974 2,974Health Club 655.31 415.31 531.93 1,290,527 1,290,527
Movie Theater (No Matinee) 1,400.00 1,400.00 1400.00 2,966,624 2,966,624Other Non-Asphalt Surfaces 0.00 0.00 0.00
Parking Lot 0.00 0.00 0.00Total 2,056.34 1,816.35 1,932.96 4,260,125 4,260,125
4.3 Trip Type Information
Miles Trip % Trip Purpose %
Land Use H-W or C-W H-S or C-C H-O or C-NW H-W or C-W
H-S or C-C H-O or C-NW Primary Diverted Pass-by
City Park 16.60 8.40 6.90 33.00 48.00 19.00 66 28 6
Health Club 16.60 8.40 6.90 16.90 64.10 19.00 52 39 9
Movie Theater (No Matinee) 16.60 8.40 6.90 1.80 79.20 19.00 66 17 17
Other Non-Asphalt Surfaces 16.60 8.40 6.90 0.00 0.00 0.00 0 0 0
Parking Lot 16.60 8.40 6.90 0.00 0.00 0.00 0 0 0
LDA LDT1 LDT2 MDV LHD1 LHD2 MHD HHD OBUS UBUS MCY
0.004362 0.000588 0.002117
SBUS MH
0.512137 0.059943 0.180601 0.139123 0.001940 0.0025020.042256 0.006647 0.016115 0.031670

5.0 Energy Detail
NOx CO SO2 Fugitive PM10
Fugitive PM2.5
Exhaust PM2.5
PM2.5 Total
Bio- CO2
4.4 Fleet MixHistorical Energy Use: N
5.1 Mitigation Measures Energy
ROG NBio- CO2
Total CO2 CH4 N2O CO2e
Category lb/day lb/day
Exhaust PM10
PM10 Total
NaturalGas Mitigated
0.0208 0.1890 0.1587 1.1300e-003
0.0144 0.0144 0.0144 0.0144 226.7507 226.7507 4.3500e-003
4.1600e-003
228.1307
NaturalGas Unmitigated
0.0208 0.1890 0.1587 1.1300e-003
226.7507 4.3500e-003
4.1600e-003
228.13070.0144 0.0144 0.0144 0.0144
CO SO2 Fugitive PM10
Exhaust PM10
226.7507
Exhaust PM2.5
PM2.5 Total
Bio- CO2 NBio- CO2
5.2 Energy by Land Use - NaturalGasUnmitigated
NaturalGas Use
ROG NOx Total CO2 CH4 N2O CO2e
Land Use kBTU/yr lb/day lb/day
PM10 Total
Fugitive PM2.5
Movie Theater (No Matinee)
901.849 9.7300e-003
0.0884 0.0743 5.3000e-004
6.7200e-003
6.7200e-003
6.7200e-003
6.7200e-003
106.0999 106.0999 2.0300e-003
1.9500e-003
106.7456
Other Non-Asphalt Surfaces
0 0.0000 0.0000 0.0000 0.0000 0.0000 0.0000 0.0000 0.0000 0.0000 0.0000 0.0000 0.0000 0.0000
Parking Lot 0 0.0000 0.0000 0.0000 0.0000 0.0000 0.0000 0.0000 0.0000 0.0000 0.0000 0.0000 0.0000 0.0000
City Park 0 0.0000 0.0000 0.0000 0.0000 0.0000 0.0000 0.0000 0.0000 0.0000 0.0000 0.0000 0.0000 0.0000
Health Club 1025.53 0.0111 0.1005 0.0845 6.0000e-004
7.6400e-003
7.6400e-003
7.6400e-003
7.6400e-003
120.6508 120.6508 2.3100e-003
2.2100e-003
121.3850
Total 0.0208 0.1890 0.1587 1.1300e-003
226.7507 4.3400e-003
4.1600e-003
228.13070.0144 0.0144 0.0144 0.0144 226.7507

CO SO2 Fugitive PM10
Exhaust PM10
Exhaust PM2.5
PM2.5 Total
Bio- CO2 NBio- CO2
Mitigated
NaturalGas Use
ROG NOx Total CO2 CH4 N2O CO2e
Land Use kBTU/yr lb/day lb/day
PM10 Total
Fugitive PM2.5
Movie Theater (No Matinee)
0.901849 9.7300e-003
0.0884 0.0743 5.3000e-004
6.7200e-003
6.7200e-003
6.7200e-003
6.7200e-003
106.0999 106.0999 2.0300e-003
1.9500e-003
106.7456
Other Non-Asphalt Surfaces
0 0.0000 0.0000 0.0000 0.0000 0.0000 0.0000 0.0000 0.0000 0.0000 0.0000 0.0000 0.0000 0.0000
Parking Lot 0 0.0000 0.0000 0.0000 0.0000 0.0000 0.0000 0.0000 0.0000 0.0000 0.0000 0.0000 0.0000 0.0000
City Park 0 0.0000 0.0000 0.0000 0.0000 0.0000 0.0000 0.0000 0.0000 0.0000 0.0000 0.0000 0.0000 0.0000
Health Club 1.02553 0.0111 0.1005 0.0845 6.0000e-004
7.6400e-003
7.6400e-003
7.6400e-003
7.6400e-003
120.6508 120.6508 2.3100e-003
2.2100e-003
121.3850
Total 0.0208 0.1890 0.1587 1.1300e-003
4.3400e-003
4.1600e-003
228.13070.0144 0.0144 0.0144 0.0144
CO SO2 Fugitive PM10
226.7507 226.7507
Fugitive PM2.5
Exhaust PM2.5
PM2.5 Total
Bio- CO2
6.0 Area Detail
6.1 Mitigation Measures Area
ROG NOx NBio- CO2
Total CO2 CH4 N2O CO2e
Category lb/day lb/day
Exhaust PM10
PM10 Total
Mitigated 2.6679 1.3000e-004
0.0134 0.0000 5.0000e-005
5.0000e-005
5.0000e-005
5.0000e-005
0.0284 0.0284 8.0000e-005
0.0301
Unmitigated 2.6679 1.3000e-004
0.0134 0.0000 8.0000e-005
0.03015.0000e-005
5.0000e-005
5.0000e-005
5.0000e-005
0.0284 0.0284

SO2 Fugitive PM10
Exhaust PM10
PM2.5 Total
Bio- CO2 NBio- CO2
6.2 Area by SubCategoryUnmitigated
ROG NOx CO Total CO2 CH4 N2O CO2e
SubCategory lb/day lb/day
PM10 Total
Fugitive PM2.5
Exhaust PM2.5
Architectural Coating
0.4983 0.0000 0.0000 0.0000 0.0000 0.0000 0.0000
Consumer Products
2.1684 0.0000 0.0000 0.0000 0.0000 0.0000 0.0000
Landscaping 1.2800e-003
1.3000e-004
0.0134 0.0000 5.0000e-005
5.0000e-005
5.0000e-005
5.0000e-005
0.0284 0.0284 8.0000e-005
0.0301
Total 2.6679 1.3000e-004
0.0134 0.0000 8.0000e-005
0.03015.0000e-005
5.0000e-005
5.0000e-005
5.0000e-005
SO2 Fugitive PM10
Exhaust PM10
0.0284 0.0284
PM2.5 Total
Bio- CO2 NBio- CO2
Mitigated
ROG NOx CO Total CO2 CH4 N2O CO2e
SubCategory lb/day lb/day
PM10 Total
Fugitive PM2.5
Exhaust PM2.5
Architectural Coating
0.4983 0.0000 0.0000 0.0000 0.0000 0.0000 0.0000
Consumer Products
2.1684 0.0000 0.0000 0.0000 0.0000 0.0000 0.0000
Landscaping 1.2800e-003
1.3000e-004
0.0134 0.0000 5.0000e-005
5.0000e-005
5.0000e-005
5.0000e-005
0.0284 0.0284 8.0000e-005
0.0301
Total 2.6679 1.3000e-004
0.0134 0.0000 5.0000e-005
5.0000e-005
5.0000e-005
5.0000e-005
0.0284 0.0284 8.0000e-005
0.0301

CO2 Intensity (lb/MWhr)
1227.89 CH4 Intensity (lb/MWhr)
0.029 N2O Intensity (lb/MWhr)
0.006
31
Climate Zone 11 Operational Year 2018
Utility Company Los Angeles Department of Water & Power
1.2 Other Project Characteristics
Urbanization Urban Wind Speed (m/s) 2.2 Precipitation Freq (Days)
Movie Theater (No Matinee) 17.50 1000sqft 0.40 17,500.00 0
Health Club 19.90 1000sqft 0.46 19,900.00 0
City Park 0.65 Acre 0.65 28,314.00 0
Parking Lot 80.00 Space 0.72 32,000.00 0
Population
Other Non-Asphalt Surfaces 11.80 1000sqft 0.27 11,800.00 0
1.1 Land Usage
Land Uses Size Metric Lot Acreage Floor Surface Area
CalEEMod Version: CalEEMod.2013.2.1 Page 1 of 1 Date: 11/19/2014 12:11 PM
Olive Vista Middle SchoolSouth Coast Air Basin, Winter
1.0 Project Characteristics

tblConstructionPhase NumDays 6.00 46.00
tblConstructionPhase NumDays 10.00 87.00
tblConstructionPhase NumDays 20.00 76.00
tblConstructionPhase NumDays 20.00 42.00
tblConstructionPhase NumDays 10.00 51.00
tblConstructionPhase NumDays 220.00 239.00
Demolition -
Grading - See Construction Assumptions
Construction Off-road Equipment Mitigation -
Table Name Column Name Default Value New Value
Off-road Equipment - See Construction Equipment List
Off-road Equipment - See Construction Equipment List
Off-road Equipment - See Construction Equipment List
Off-road Equipment - See Construction Equipment List
Off-road Equipment - See Construction Equipment List
Trips and VMT -
1.3 User Entered Comments & Non-Default Data
Project Characteristics -
Land Use -
Construction Phase - See Construction Schedule
Off-road Equipment - See Construction Equipment List
Off-road Equipment - See Construction Equipment List

tblOffRoadEquipment OffRoadEquipmentType Dumpers/Tenders
tblOffRoadEquipment OffRoadEquipmentType Bore/Drill Rigs
tblOffRoadEquipment OffRoadEquipmentType Pumps
tblOffRoadEquipment OffRoadEquipmentType Crushing/Proc. Equipment
tblOffRoadEquipment OffRoadEquipmentType Aerial Lifts
tblOffRoadEquipment OffRoadEquipmentType Concrete/Industrial Saws
tblOffRoadEquipment LoadFactor 0.20 0.20
tblOffRoadEquipment LoadFactor 0.37 0.37
tblOffRoadEquipment LoadFactor 0.38 0.38
tblOffRoadEquipment LoadFactor 0.42 0.42
tblOffRoadEquipment LoadFactor 0.38 0.38
tblOffRoadEquipment LoadFactor 0.40 0.40
tblOffRoadEquipment LoadFactor 0.31 0.31
tblOffRoadEquipment LoadFactor 0.50 0.50
tblGrading AcresOfGrading 23.00 4.60
tblGrading MaterialExported 0.00 4,294.00
tblConstructionPhase PhaseEndDate 8/10/2018 8/12/2018
tblConstructionPhase PhaseEndDate 3/31/2017 4/1/2017
tblConstructionPhase NumDays 10.00 23.00
tblConstructionPhase PhaseEndDate 5/11/2018 5/13/2018

tblProjectCharacteristics OperationalYear 2014 2018
tblTripsAndVMT WorkerTripNumber 30.00 20.00
tblOffRoadEquipment UsageHours 6.00 8.00
tblOffRoadEquipment UsageHours 7.00 8.00
tblOffRoadEquipment UsageHours 8.00 4.00
tblOffRoadEquipment UsageHours 7.00 8.00
tblOffRoadEquipment OffRoadEquipmentUnitAmount 2.00 1.00
tblOffRoadEquipment UsageHours 6.00 8.00
tblOffRoadEquipment OffRoadEquipmentUnitAmount 3.00 2.00
tblOffRoadEquipment OffRoadEquipmentUnitAmount 3.00 2.00
tblOffRoadEquipment OffRoadEquipmentUnitAmount 2.00 1.00
tblOffRoadEquipment OffRoadEquipmentUnitAmount 2.00 1.00
tblOffRoadEquipment OffRoadEquipmentType Dumpers/Tenders
tblOffRoadEquipment OffRoadEquipmentUnitAmount 1.00 4.00
tblOffRoadEquipment OffRoadEquipmentType Welders
tblOffRoadEquipment OffRoadEquipmentType Crushing/Proc. Equipment
tblOffRoadEquipment OffRoadEquipmentType Generator Sets
tblOffRoadEquipment OffRoadEquipmentType Tractors/Loaders/Backhoes
tblOffRoadEquipment OffRoadEquipmentType Other Construction Equipment
tblOffRoadEquipment OffRoadEquipmentType Forklifts
tblOffRoadEquipment OffRoadEquipmentType Generator Sets
tblOffRoadEquipment OffRoadEquipmentType Pumps
tblOffRoadEquipment OffRoadEquipmentType Off-Highway Trucks
tblOffRoadEquipment OffRoadEquipmentType Forklifts
tblOffRoadEquipment OffRoadEquipmentType Excavators
tblOffRoadEquipment OffRoadEquipmentType Other Material Handling Equipment

0.00 0.00 0.00 0.00 0.00 0.000.00 0.00 0.00 0.00 0.00 0.00
NBio-CO2 Total CO2 CH4 N20 CO2e
Percent Reduction
0.00 0.00 0.00 0.00
Exhaust PM10
PM10 Total
Fugitive PM2.5
Exhaust PM2.5
PM2.5 Total
Bio- CO2ROG NOx CO SO2 Fugitive PM10
11,270.0289
11,270.0289
0.4390 4.1600e-003
11,280.5354
9.2703 0.2091 9.4794 2.4770 0.1938 2.6707Total 8.7872 14.1066 56.9958 0.1348
11,043.2498
11,043.2498
0.4345 11,052.3747
9.2703 0.1947 9.4650 2.4770 0.1794 2.6563Mobile 6.0985 13.9175 56.8236 0.1336
226.7507 226.7507 4.3500e-003
4.1600e-003
228.13070.0144 0.0144 0.0144 0.0144Energy 0.0208 0.1890 0.1587 1.1300e-003
0.0284 0.0284 8.0000e-005
0.03015.0000e-005
5.0000e-005
5.0000e-005
5.0000e-005
Area 2.6679 1.3000e-004
0.0134 0.0000
Total CO2 CH4 N2O CO2e
Category lb/day lb/day
PM10 Total
Fugitive PM2.5
Exhaust PM2.5
PM2.5 Total
Bio- CO2 NBio- CO2
Mitigated Operational
ROG NOx CO SO2 Fugitive PM10
Exhaust PM10
11,270.0289
11,270.0289
0.4390 4.1600e-003
11,280.5354
9.2703 0.2091 9.4794 2.4770 0.1938 2.6707Total 8.7872 14.1066 56.9958 0.1348
11,043.2498
11,043.2498
0.4345 11,052.3747
9.2703 0.1947 9.4650 2.4770 0.1794 2.6563Mobile 6.0985 13.9175 56.8236 0.1336
226.7507 226.7507 4.3500e-003
4.1600e-003
228.13070.0144 0.0144 0.0144 0.0144Energy 0.0208 0.1890 0.1587 1.1300e-003
0.0284 0.0284 8.0000e-005
0.03015.0000e-005
5.0000e-005
5.0000e-005
5.0000e-005
Area 2.6679 1.3000e-004
0.0134 0.0000
Total CO2 CH4 N2O CO2e
Category lb/day lb/day
PM10 Total
Fugitive PM2.5
Exhaust PM2.5
PM2.5 Total
Bio- CO2 NBio- CO2
2.2 Overall OperationalUnmitigated Operational
ROG NOx CO SO2 Fugitive PM10
Exhaust PM10

0.001940 0.002502 0.004362 0.000588 0.002117
SBUS MH
0.512137 0.059943 0.180601 0.139123 0.042256 0.006647 0.016115 0.031670
LHD2 MHD HHD OBUS UBUS MCY
0.00 0.00 0 0 0
LDA LDT1 LDT2 MDV LHD1
0.00 0.00 0 0 0
Parking Lot 16.60 8.40 6.90 0.00
79.20 19.00 66 17 17
Other Non-Asphalt Surfaces 16.60 8.40 6.90 0.00
64.10 19.00 52 39 9
Movie Theater (No Matinee) 16.60 8.40 6.90 1.80
48.00 19.00 66 28 6
Health Club 16.60 8.40 6.90 16.90
H-S or C-C H-O or C-NW Primary Diverted Pass-by
City Park 16.60 8.40 6.90 33.00
4.3 Trip Type Information
Miles Trip % Trip Purpose %
Land Use H-W or C-W H-S or C-C H-O or C-NW H-W or C-W
Total 2,056.34 1,816.35 1,932.96 4,260,125 4,260,125Parking Lot 0.00 0.00 0.00
Other Non-Asphalt Surfaces 0.00 0.00 0.00Movie Theater (No Matinee) 1,400.00 1,400.00 1400.00 2,966,624 2,966,624
Health Club 655.31 415.31 531.93 1,290,527 1,290,527
Annual VMT
City Park 1.03 1.03 1.03 2,974 2,974
4.2 Trip Summary Information
Average Daily Trip Rate Unmitigated MitigatedLand Use Weekday Saturday Sunday Annual VMT
11,043.2498
11,043.2498
0.4345 11,052.3747
9.2703 0.1947 9.4650 2.4770 0.1794 2.6563Unmitigated 6.0985 13.9175 56.8236 0.1336
11,043.2498
11,043.2498
0.4345 11,052.3747
9.2703 0.1947 9.4650 2.4770 0.1794 2.6563Mitigated 6.0985 13.9175 56.8236 0.1336
NBio- CO2
Total CO2 CH4 N2O CO2e
Category lb/day lb/day
Exhaust PM10
PM10 Total
Fugitive PM2.5
Exhaust PM2.5
PM2.5 Total
Bio- CO2
4.0 Operational Detail - Mobile
4.1 Mitigation Measures Mobile
ROG NOx CO SO2 Fugitive PM10

226.7507 226.7507 4.3400e-003
4.1600e-003
228.13070.0144 0.0144 0.0144 0.0144Total 0.0208 0.1890 0.1587 1.1300e-003
120.6508 120.6508 2.3100e-003
2.2100e-003
121.38507.6400e-003
7.6400e-003
7.6400e-003
7.6400e-003
Health Club 1025.53 0.0111 0.1005 0.0845 6.0000e-004
0.0000 0.0000 0.0000 0.0000 0.00000.0000 0.0000 0.0000 0.0000City Park 0 0.0000 0.0000 0.0000 0.0000
0.0000 0.0000 0.0000 0.0000 0.00000.0000 0.0000 0.0000 0.0000Parking Lot 0 0.0000 0.0000 0.0000 0.0000
0.0000 0.0000 0.0000 0.0000 0.00000.0000 0.0000 0.0000 0.0000Other Non-Asphalt Surfaces
0 0.0000 0.0000 0.0000 0.0000
106.0999 106.0999 2.0300e-003
1.9500e-003
106.74566.7200e-003
6.7200e-003
6.7200e-003
6.7200e-003
Movie Theater (No Matinee)
901.849 9.7300e-003
0.0884 0.0743 5.3000e-004
Total CO2 CH4 N2O CO2e
Land Use kBTU/yr lb/day lb/day
PM10 Total
Fugitive PM2.5
Exhaust PM2.5
PM2.5 Total
Bio- CO2 NBio- CO2
5.2 Energy by Land Use - NaturalGasUnmitigated
NaturalGas Use
ROG NOx CO SO2 Fugitive PM10
Exhaust PM10
226.7507 226.7507 4.3500e-003
4.1600e-003
228.13070.0144 0.0144 0.0144 0.0144NaturalGas Unmitigated
0.0208 0.1890 0.1587 1.1300e-003
226.7507 226.7507 4.3500e-003
4.1600e-003
228.13070.0144 0.0144 0.0144 0.0144NaturalGas Mitigated
0.0208 0.1890 0.1587 1.1300e-003
NBio- CO2
Total CO2 CH4 N2O CO2e
Category lb/day lb/day
Exhaust PM10
PM10 Total
Fugitive PM2.5
Exhaust PM2.5
PM2.5 Total
Bio- CO2
4.4 Fleet MixHistorical Energy Use: N
5.1 Mitigation Measures Energy
ROG NOx CO SO2 Fugitive PM10
5.0 Energy Detail
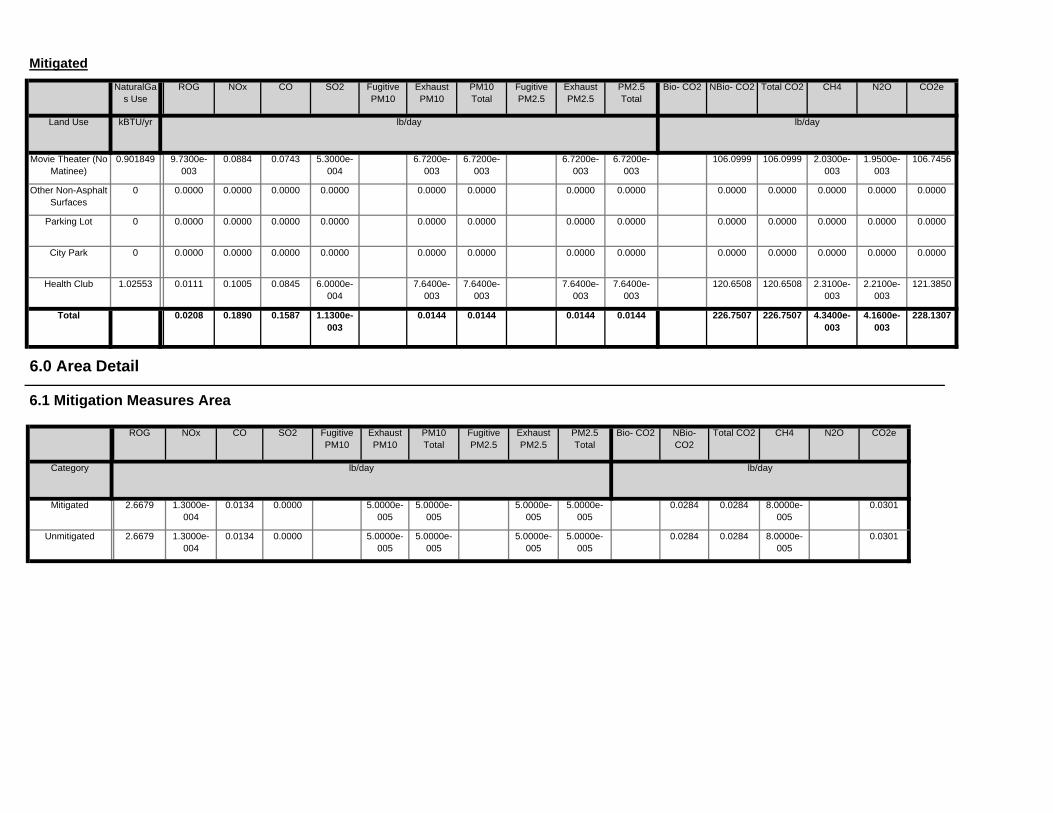
0.0284 0.0284 8.0000e-005
0.03015.0000e-005
5.0000e-005
5.0000e-005
5.0000e-005
Unmitigated 2.6679 1.3000e-004
0.0134 0.0000
0.0284 0.0284 8.0000e-005
0.03015.0000e-005
5.0000e-005
5.0000e-005
5.0000e-005
Mitigated 2.6679 1.3000e-004
0.0134 0.0000
NBio- CO2
Total CO2 CH4 N2O CO2e
Category lb/day lb/day
Exhaust PM10
PM10 Total
Fugitive PM2.5
Exhaust PM2.5
PM2.5 Total
Bio- CO2
6.0 Area Detail
6.1 Mitigation Measures Area
ROG NOx CO SO2 Fugitive PM10
226.7507 226.7507 4.3400e-003
4.1600e-003
228.13070.0144 0.0144 0.0144 0.0144Total 0.0208 0.1890 0.1587 1.1300e-003
120.6508 120.6508 2.3100e-003
2.2100e-003
121.38507.6400e-003
7.6400e-003
7.6400e-003
7.6400e-003
Health Club 1.02553 0.0111 0.1005 0.0845 6.0000e-004
0.0000 0.0000 0.0000 0.0000 0.00000.0000 0.0000 0.0000 0.0000City Park 0 0.0000 0.0000 0.0000 0.0000
0.0000 0.0000 0.0000 0.0000 0.00000.0000 0.0000 0.0000 0.0000Parking Lot 0 0.0000 0.0000 0.0000 0.0000
0.0000 0.0000 0.0000 0.0000 0.00000.0000 0.0000 0.0000 0.0000Other Non-Asphalt Surfaces
0 0.0000 0.0000 0.0000 0.0000
106.0999 106.0999 2.0300e-003
1.9500e-003
106.74566.7200e-003
6.7200e-003
6.7200e-003
6.7200e-003
Movie Theater (No Matinee)
0.901849 9.7300e-003
0.0884 0.0743 5.3000e-004
Total CO2 CH4 N2O CO2e
Land Use kBTU/yr lb/day lb/day
PM10 Total
Fugitive PM2.5
Exhaust PM2.5
PM2.5 Total
Bio- CO2 NBio- CO2
MitigatedNaturalGa
s UseROG NOx CO SO2 Fugitive
PM10Exhaust PM10
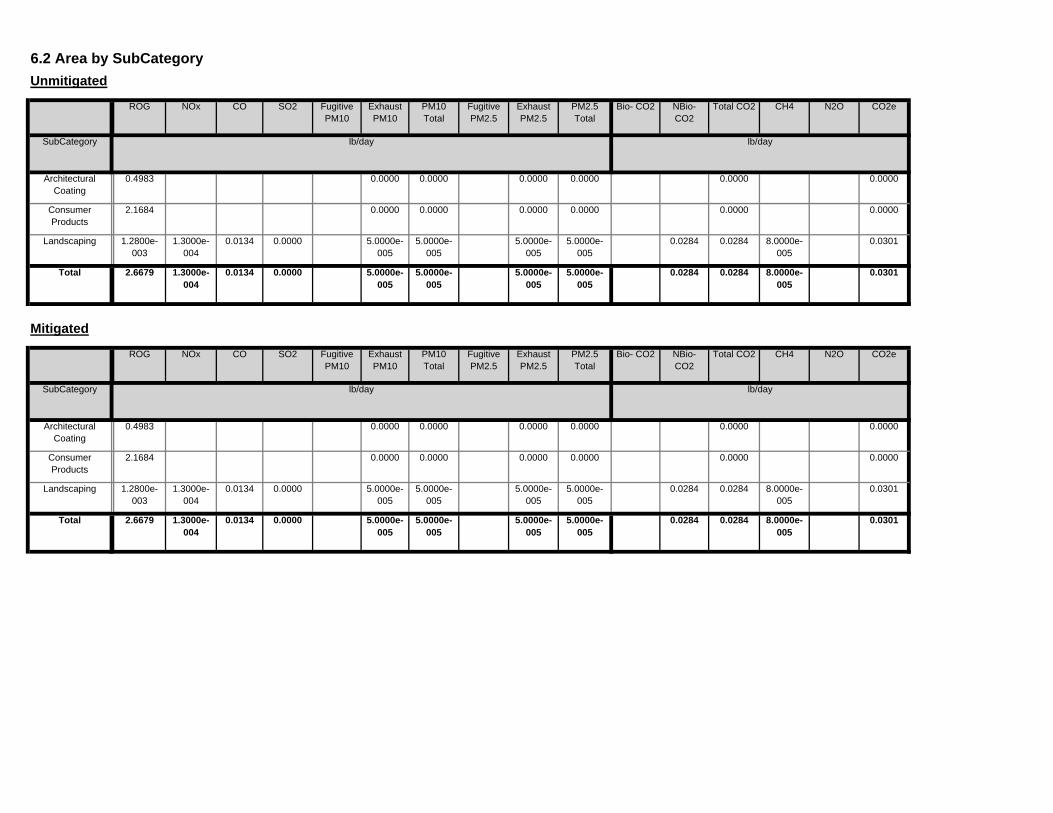
0.0284 0.0284 8.0000e-005
0.03015.0000e-005
5.0000e-005
5.0000e-005
5.0000e-005
Total 2.6679 1.3000e-004
0.0134 0.0000
0.0284 0.0284 8.0000e-005
0.03015.0000e-005
5.0000e-005
5.0000e-005
5.0000e-005
Landscaping 1.2800e-003
1.3000e-004
0.0134 0.0000
0.0000 0.00000.0000 0.0000 0.0000 0.0000Consumer Products
2.1684
0.0000 0.00000.0000 0.0000 0.0000 0.0000Architectural Coating
0.4983
Total CO2 CH4 N2O CO2e
SubCategory lb/day lb/day
PM10 Total
Fugitive PM2.5
Exhaust PM2.5
PM2.5 Total
Bio- CO2 NBio- CO2
Mitigated
ROG NOx CO SO2 Fugitive PM10
Exhaust PM10
0.0284 0.0284 8.0000e-005
0.03015.0000e-005
5.0000e-005
5.0000e-005
5.0000e-005
Total 2.6679 1.3000e-004
0.0134 0.0000
0.0284 0.0284 8.0000e-005
0.03015.0000e-005
5.0000e-005
5.0000e-005
5.0000e-005
Landscaping 1.2800e-003
1.3000e-004
0.0134 0.0000
0.0000 0.00000.0000 0.0000 0.0000 0.0000Consumer Products
2.1684
0.0000 0.00000.0000 0.0000 0.0000 0.0000Architectural Coating
0.4983
Total CO2 CH4 N2O CO2e
SubCategory lb/day lb/day
PM10 Total
Fugitive PM2.5
Exhaust PM2.5
PM2.5 Total
Bio- CO2 NBio- CO2
6.2 Area by SubCategoryUnmitigated
ROG NOx CO SO2 Fugitive PM10
Exhaust PM10

Operations–Charbroiler

LAUSD Olive Vista Middle SchoolDraft EIRAir Quality - Operational Emissions
Estimated Stationary Source Emissions - Charbroiler
Number of Per Order Quantity3
Source1 Orders QuantityVOC PM10 (orders/day) (lb/order) (lb/day) VOC PM10 VOC PM10
Kitchen in Multi-Purpose BuildingCharbroiler - Chicken 1.82 10.48 628.50 0.25 157.1 86% 83% 0.04 0.28 Charbroiler - 25% fat Hamburger 3.94 32.65 628.50 0.25 157.1 86% 83% 0.09 0.87 Total Emissions 0.13 1.15
Outdoor Event by Gymnasium Snack Bar?Charbroiler - 25% fat Hamburger 3.94 32.65 3,771.00 0.25 942.8 86% 83% 0.52 5.23 Total Emissions 0.52 5.23
Notes:1. Source type is representative of charbroiled food likely to be prepared during on-site special events.2. South Coast Air Quality Management District, Emission Factors for Commercial Cooking Operations, http://www.aqmd.gov/rules/proposed/1138/PAR1138PDSR_AppendixI.pdf. Accessed May 2014.3.4.
5. It is assumed that PM10 emissions also represent PM2.5 emissions.6.
Source: PCR Services Corporation, 2014.
For major outdoor events, the Applicant shall limit on-site charbroiling for event attendees to 600 charbroiled meals per day.
South Coast Air Quality Management District Rule 1138 (Control of Emissions from Restaurant Operations) regulates PM10 and VOC emissions from fast-food restaurants with charbroilers. Catalytic oxidizers reduce VOC emissions by approximately 86 percent and PM10 emissions by approximately 83 percent.
Uncontrolled Emission Factors2
(lb/1000 lb)Controlled Emissions5
(pounds/day)Emissions Controls4
(percent reduction)
Quantity of meats cooked is based on a 50/50 split between chicken and hamburgers based on the school occupancy.
appendix B
comPrehensive geotechnical rePort, ProPoseD neW mPr, lunch shelter, anD gymnasium, olive vista
miDDle school, 14600 tyler street, sylmar, california, PrePareD for lausD by grouP Delta consultants, inc.,
on may 9, 2014.Air Quality Worksheets and Modelling


COMPREHENSIVE GEOTECHNICAL REPORT
Proposed New MPR, Lunch Shelter, and Gymnasium
Olive Vista Middle School
14600 Tyler Street, Sylmar, California
May 9, 2014 GDC Project No. LA-1190

370 Amapola Avenue, Suite 212, Torrance, CA 90501 TEL: (310) 320-5100Anaheim – Irvine – Ontario – Sacramento – San Diego – Torrance – Victorville www.GroupDelta.com
Los Angeles Unified School District May 9, 2014 333 South Beaudry Avenue, 23rd Floor LA-1190 Los Angeles, CA 90017
Attention: Mr. Doc Nghiem
Subject: Comprehensive Geotechnical Report Proposed New Multi-Purpose Room (MPR), Lunch Shelter, and Gymnasium Olive Vista Middle School 14600 Tyler Street, Sylmar, California
Dear Mr. Nghiem,
GROUP DELTA CONSULTANTS, INC. (GDC) is pleased to submit this Comprehensive Geotechnical Report for the proposed new MPR, lunch shelter, gymnasium and covered walkways planned for the Olive Vista Middle School campus.
We appreciate the opportunity to provide geotechnical and geological services for this project. If you have any questions pertaining to this report, or if we can be of further service, please do not hesitate to contact us.
Sincerely, Group Delta Consultants
Thomas D. Swantko, G.E 813 Steven H. Kolthoff, C.E.G. #1965 Principal Geotechnical Engineer Senior Geologist, Exp. 8/313/15
Stephanie Gunawan Project Engineer
Distribution: (8) copies to addressee; CD

N:\Projects\1100-1199\LA-1190 Olive Vista Middle School Improvements\Report\LA1190 LAUSD Olive Vista Report Final050914.docx
Table of Contents
1.0 INTRODUCTION ........................................................................................................................ 1
1.1 Project Description ........................................................................................................................ 1
1.2 Scope of Work ............................................................................................................................... 1
2.0 GEOLOGY AND SEISMIC SETTING .............................................................................................. 2
2.1 Regional Geology .......................................................................................................................... 2
2.2 Local Geology ................................................................................................................................ 2
2.3 Oil Fields ........................................................................................................................................ 2
2.4 Seismic Setting .............................................................................................................................. 2
2.5 Aerial Photography Analysis ......................................................................................................... 3
3.0 SITE CONDITIONS ...................................................................................................................... 4
3.1 Surface Conditions ........................................................................................................................ 4
3.2 Subsurface Conditions .................................................................................................................. 4
3.2.1 Field Exploration ................................................................................................................... 4
3.2.2 Laboratory Testing Program ................................................................................................. 4
3.2.3 Subsurface Conditions .......................................................................................................... 4
3.2.4 Ground Water ....................................................................................................................... 5
4.0 GEOLOGICAL HAZARD EVALUATION AND SEISMIC DESIGN ....................................................... 5
4.2 Ground Surface Rupture ............................................................................................................... 5
4.3 Seismic Ground Motion Values ..................................................................................................... 6
4.4 Local Historic Earthquakes ............................................................................................................ 6
4.5 Secondary Seismic Effects ............................................................................................................. 6
4.5.1 Liquefaction and Seismic Settlement .................................................................................... 6
4.5.2 Slope Instability ..................................................................................................................... 7
4.5.3 Tsunami and Seiches Potential ............................................................................................. 7
4.5.4 Ground Lurching ................................................................................................................... 7
4.5.5 Flood Hazard ......................................................................................................................... 7
4.5.6 Oil Field Gas Potentials ......................................................................................................... 8
4.5.7 Other Geologic Hazards or Considerations ........................................................................... 8
5.0 DISCUSSION AND RECOMMENDATIONS ................................................................................... 8
5.1 General .......................................................................................................................................... 8
5.2 Demolition .................................................................................................................................... 8

N:\Projects\1100-1199\LA-1190 Olive Vista Middle School Improvements\Report\LA1190 LAUSD Olive Vista Report Final050914.docx
5.3 Removals ....................................................................................................................................... 8
5.4 Earthwork ...................................................................................................................................... 9
5.5 Temporary Excavations ............................................................................................................... 10
5.6 Shallow Foundations ................................................................................................................... 10
5.6.1 Bearing ................................................................................................................................ 10
5.6.2 Settlement ........................................................................................................................... 11
5.6.3 Lateral Resistance ............................................................................................................... 11
5.7 Pile Foundations .......................................................................................................................... 11
5.7.1 Axial Capacity ...................................................................................................................... 11
5.7.2 Lateral Capacity ................................................................................................................... 11
5.7.3 Pile Installation .................................................................................................................... 12
5.7.4 Pile Settlement .................................................................................................................... 12
5.8 Slab-on-Grade / Flatwork ............................................................................................................ 12
5.9 Site Drainage ............................................................................................................................... 13
5.10 Utility Installations ...................................................................................................................... 13
5.11 Soil Corrosivity ............................................................................................................................ 13
5.12 Expansion Potential..................................................................................................................... 14
5.13 Environmental Issues .................................................................................................................. 14
6.0 PERCOLATION TEST CALCULATIONS AND DISCUSSIONS .......................................................... 15
7.0 POST GEOTECHNICAL SERVICES .............................................................................................. 16
8.0 LIMITATIONS .......................................................................................................................... 16
9.0 REFERENCES ........................................................................................................................... 17
N:\Projects\1100-1199\LA-1190 Olive Vista Middle School Improvements\Report\LA1190 LAUSD Olive Vista Report Final050914.docx
LIST OF FIGURES
Figure 1 Vicinity Map
Figure 2 Site Plan
Figure 3 Geologic Cross Section A-A’
Figure 4 Geologic Cross Section B-B’
Figure 5 Quaternary Geologic Map
Figure 6 Southern California Fault Map
Figure 7 Surface Effects Map of the San Fernando Earthquake Area
Figure 8 Historically Highest Groundwater Elevation Contour
Figure 9 Axial Pile Capacity
LIST OF APPENDICES
Appendix A Field Exploration
Appendix B Laboratory Program
Appendix C CBC 2013/ASCE 7-10 Acceleration Response Spectra
Appendix D Blake, 2000 EQSearch Results
Appendix E Lateral Pile Capacity
Appendix F Percolation Test Results and Calculations

N:\Projects\1100-1199\LA-1190 Olive Vista Middle School Improvements\Report\LA1190 LAUSD Olive Vista Report Final050914.docx
COMPREHENSIVE GEOTECHNICAL REPORT
PROPOSED NEW LUNCH SHELTER, MULTI PURPOSE ROOM (MPR), AND GYMNASIUM
OLIVE VISTA MIDDLE SCHOOL - LOS ANGELES UNIFIED SCHOOL DISTRICT
SYLMAR, CALIFORNIA
1.0 INTRODUCTION
This Comprehensive Geotechnical Report has been prepared for the design and construction of the
proposed lunch shelter, MPR, gymnasium, and covered walkways at Olive Vista Middle School. The
project investigation also included performing two percolation tests in the southeast portion of the
campus. The general location of the school is shown in Figure 1 and a site plan is shown in Figure 2.
In 2011, we performed a Comprehensive Geotechnical Investigation for the seismic retrofit of the lunch
shelter. Our findings from that investigation is documented in our report dated October 4, 2011, and the
findings are also utilized in the preparation of this report.
1.1 Project Description
The new gym will be located in the south side of the campus, just north of Fellows Avenue. The proposed
gym will have a footprint of about 20,000 square feet. The new MPR and the lunch shelter are planned to
be constructed along the north side of the campus, just south of Borden Avenue, and will have a combined
footprint of approximately 30,000 square feet. The improvements will also include two covered walkways
connecting buildings in the north-south and east-west directions. Structural details and foundation
loadings are not available at this time. The campus is also considering to utilize an existing playfield in the
southeast part of the campus for on-site infiltration of rain runoff.
1.2 Scope of Work
Our scope of work included the following:
• A site visit by our field engineer to perform a reconnaissance and mark the proposed exploration
locations.
• Performance of six (6) geotechnical borings and four (4) Cone Penetration Tests (CPTs).
• Performance of two (2) additional geotechnical borings for the percolation tests.
• Review of available published geologic/geotechnical reports, geologic publications and maps
pertaining to the site area, including our 2011 Comprehensive Geotechnical Report.
• Preparation of a report summarizing our evaluations and recommendations regarding the
geologic and seismic hazards affecting development of the site, and the results of the percolation
tests. The geologic and seismic hazard recommendations are to be in accordance with the CBC,
Title 24 of the CCR and CDMG Note 48, including the discussion of the historical seismicity of the
site area; surface fault rupture potential; anticipated ground accelerations, analysis of the
seismic ground motion for the site in accordance with the 2013 California Building Code/ASCE 7-
10; liquefaction potential, potential for any other secondary seismic effects, or the potential for
any other geological or seismic hazards to affect the site.
• Submission of eight (8) copies of the report and a CD copy.

Comprehensive Geotechnical Report Page 2 Olive Vista Middle School May 9, 2014
N:\Projects\1100-1199\LA-1190 Olive Vista Middle School Improvements\Report\LA1190 LAUSD Olive Vista Report Final050914.docx
2.0 GEOLOGY AND SEISMIC SETTING
The geology and seismic setting of the campus was summarized in our 2011 report. For convenience this
discussion is included below.
2.1 Regional Geology
Geologically the campus is located in the San Fernando Valley, in the Northwestern Block of the Los
Angeles Basin, which is the part of the Transverse Ranges Geomorphic Provence of California. The Los
Angeles Basin has upper Cretaceous sediments, Tertiary and Quaternary marine and non-marine
sedimentary and alluvial sediments, which are thousands of feet thick. Below the thick accumulations of
sediments are crystalline Basement Complexes that are Mid Cretaceous and older. A regional geologic
map is presented in Figure 5.
2.2 Local Geology
The site is located on the alluvial plains derived from the San Gabriel Mountains. This portion of the plains
is mapped as young alluvial fan deposits. These Holocene deposits consist of inter-beds of loose to
moderately dense layers of sand, silty sand with minor amounts of clay.
2.3 Oil Fields
There are three oil fields located in the general proximity of the site. The Cascade Oil Field, which is about
3.1 miles west, the Mission Oil Field is about 3.7 miles southwest and the Pacoima Oil Field is about 3.3
miles south of the site. Because of their distance from the site, they do not appear to pose an oil field gas
or hydrocarbon hazard to the site. The closest wildcat or exploratory well was drilled approximately 3.1
miles to the west.
2.4 Seismic Setting
The site is located within the seismically active area of southern California, and as such, the site has the
potential to experience strong ground shaking, fault rupture, liquefaction and other geological hazards. A
fault map showing the location of site with respect to known active faults is shown in Figure 6.
The site is not located within an Alquist-Priolo (AP) Special Study Zone. However, the site is located within
a City of Los Angeles Fault Rupture Study Area (FRSA) (Safety Element, 1996), which defines a broad area
affected by ground movements during the 1971 San Fernando Earthquake. Additional discussion of both
the AP Zones and the FSRA is provided in section 4.2 below.
Previously, the site experienced strong ground shaking from the February 9, 1971 moment magnitude
(Mw) 6.6 San Fernando Earthquake. Ground rupture was concentrated along the foothills of the San
Gabriel Mountains to the north and a zone through the valley about a mile to the south. The San Fernando
fault has been determined to be associated with the Sierra Madre fault and is now named the San
Fernando segment of the Sierra Madre Fault zone. If during one seismic event multiple segments of the
Sierra Madre Fault move simultaneously, an earthquake of Mw of 7.2 could develop. The San Fernando
Earthquake caused over $500 million in damage and 65 deaths with the greatest concentration of damage
in the Sylmar area.

Comprehensive Geotechnical Report Page 3 Olive Vista Middle School May 9, 2014
N:\Projects\1100-1199\LA-1190 Olive Vista Middle School Improvements\Report\LA1190 LAUSD Olive Vista Report Final050914.docx
During the San Fernando Earthquake, faulting was concentrated along the north (Santa Susana) and south
(San Fernando) segments of the Sierra Madre Fault zone. There was no faulting documented on the
campus. The closest fault break during the San Fernando Earthquake occurred about 0.9 miles north of
the campus on the Santa Susana segment. On the Alquist-Priolo (AP) map, a minor break was zoned about
1,000 feet southwest of the site, and the San Fernando segment is mapped about a mile south of the site.
The next closest identified fault near the site, which has Holocene movement, is the Northridge Fault.
This fault is located about 1.5 miles south of the site. This is a thrust fault and has the potential to generate
a maximum Mw 6.9 earthquake.
Other nearby active faults includes the Santa Susana thrust fault (Mw 6.9) and Verdugo thrust fault (Mw
6.9), located approximately 2.8 and 3.8 miles west and south-southeast of north south of the site. The
Strike-slip San Gabriel fault is 4.2 miles north of the site and could generate a Mw 7.3 earthquake. The
Holser fault (Mw 6.8) is located approximately 9.2 miles north. The Simi-Santa Rosa fault is approximately
14 miles west and the Hollywood fault is approximately 15 miles south of the campus. Both these faults
have strike-slip movement and have the potential to generate magnitude MW 6.9 and 6.7 earthquakes,
respectively.
Locally, minor fractures were mapped traversing paved roadways and structural damage was observed in
farm buildings in isolated areas north and east of the campus. Figure 7 (CDMG, 1975) shows surface effects
of the 1971 San Fernando Earthquake in the vicinity of the campus. The closest buildings with structural
damage are located across Borden Avenue and along Polk Street, northeast of the intersection of Borden
Avenue and Polk Street from the campus. No fractures or structural damage was mapped on the campus
or in the general vicinity south of the campus. Uplift of 4 feet was noted to have occurred north of the
fault rupture in the San Gabriel Mountains. South of the fault rupture zone, uplift was documented to be
0 to around 1 foot.
An inspection of campus structures was performed by a team of structural engineers from Caltech and
the State Office of Architecture and Construction, who measured minor uplift and settlement around the
campus structures (CalTech, 1974). Settlement of 1.5 inches was observed in Building B, at the north end
of campus. Additionally, some settlement was observed in the north and south bearing walls of the
Multipurpose Building, although the magnitude of settlement was not indicated. There were also minor
amounts of settlement and uplift noticed for the school slabs and walkways. Since historical ground water
is greater than 50 feet from the surface, any settlement observed is likely due to dry sand settlement and
not liquefaction. A combination of dry sand settlement and ground shaking may be the cause of the
nearby paved road fractures and structural damage to local farm buildings.
2.5 Aerial Photography Analysis
Aerial photographs on www.historicaerials.com were reviewed for the period from 1952 to 2005. In a
1952 photo, the site consisted of an open space parcel surrounded by citrus orchards and farm buildings
with many of the roads unpaved. The nearby Sylmar Elementary School is visible in the photo, just east
of the site across Borden Avenue. A 1959 aerial photograph shows portions of the campus have already
been constructed, however, the surrounding area remained occupied by open land and orchards at that
time. Review of the 1969 and 1972 photos indicates that minor residential development began occurring
throughout the area, and more of the streets were paved. In the 1972 aerial photo, the farm buildings

Comprehensive Geotechnical Report Page 4 Olive Vista Middle School May 9, 2014
N:\Projects\1100-1199\LA-1190 Olive Vista Middle School Improvements\Report\LA1190 LAUSD Olive Vista Report Final050914.docx
and street fractures, as discussed in Section 2.4 above, could not be delineated. In the 1977, 1978 and
1980 aerial photos, a slight increase of residential development of the pre-existing orchards is visible.
Review of the 2003 and 2005 aerial photos shows the orchards have generally been eliminated by
residential development.
3.0 SITE CONDITIONS
3.1 Surface Conditions
The campus is bordered on the northwest by Tyler Street, on the northeast by Borden Avenue, to the
southeast by Polk Street and on the southwest by Fellows Avenue. The locations for the new buildings
are indicated on Figure 2. The new Multipurpose Building and lunch shelter will be located in the north-
central area of the campus, near Borden Avenue, in the area currently occupied by the existing MPR and
lunch shelter. The new gym will be located in the south-central area of the campus. The site for the
covered walkway is west of the new gym. The topography of the site is relatively flat with an elevation of
approximately 1280 feet.
3.2 Subsurface Conditions
3.2.1 Field Exploration
A total of twelve (12) geotechnical explorations were performed at the site, at the locations shown in
Figure 2, including eight geotechnical borings and four Cone Penetration Tests (CPTs). The explorations
were advanced to depths of between 10 to 50 feet. Two of the borings were drilled for the percolation
tests. The drilling was performed under the continuous technical supervision of our field engineer, who
maintained a detailed log of the soils encountered and assisted in obtaining soil samples. Additional
details of the field exploration program, including copies of the boring logs and CPT results, are included
in Appendix A. During our 2011 investigation, a total of two borings and two CPTs were performed at the
site for the new MPR/lunch shelter. The locations of our previous explorations are shown in Figure 2 and
the logs are also included in Appendix A.
3.2.2 Laboratory Testing Program
The soil samples obtained from the borings were taken to our laboratory for further visual examination
and laboratory testing. Laboratory test results assist in classifying samples, for evaluating their physical
properties and engineering characteristics, and in correlating soils across the site. The laboratory testing
is supplemented by the results of the Standard Penetration Tests (SPT) sampling conducted in the borings,
and the CPT data, which provide additional means to evaluate in situ soil properties, such as density, shear
strength and compressibility. Details of the laboratory testing program, including test results from the
recent and the 2011 investigation, are included in Appendix B.
3.2.3 Subsurface Conditions
Geologic cross-sections showing the general conditions encountered in the borings are presented in
Figures 3 and 4. Based on our recent and previous explorations, in general, the borings in the vicinity of
the proposed lunch shelter area encountered approximately 3 feet of fill soils overlying native alluvial soils
consisting of alternating layers of loose to dense silty sands and sands to the maximum depth explored of
Comprehensive Geotechnical Report Page 5 Olive Vista Middle School May 9, 2014
N:\Projects\1100-1199\LA-1190 Olive Vista Middle School Improvements\Report\LA1190 LAUSD Olive Vista Report Final050914.docx
51.5 feet. In the vicinity of the proposed gym area, the explorations above a depth of about 20 feet,
generally encountered layers of loose to medium dense silty sands and sand. Below approximately 20
feet, the explorations encountered layers of firm/stiff silt/sandy silt soils that were up to about 6 feet. The
silt layers generally alternate with medium dense sands/silty sands.
The sands and silty sands generally had equivalent Standard Penetration N-value ranging from about 6 to
45. The silt and sandy silts had SPT N-Value equivalents ranging from 6 to 14. Typical CPT cone tip
resistance, qc, for the native alluvium generally ranges from 40 to 400 tsf. Any old fill present should be
considered uncertified fill, and should be removed and recompacted.
3.2.4 Ground Water
Ground water was not encountered in the borings, which extended to a maximum depth of 51.5 feet
below the ground surface. According to the Seismic Hazard Report for the San Fernando 7.5’ Quadrangles,
CGS SHZ Report 15, and the historically highest Ground Water Map presented in Figure 8 indicates the
highest historic groundwater level in the vicinity of the site ranges from 110 feet to 120 feet below the
ground surface.
4.0 GEOLOGICAL HAZARD EVALUATION AND SEISMIC DESIGN
The geological hazard evaluation and seismic design of the project location was summarized in our 2011
report. However, for convenience we have included the section in this report. The seismic ground motion
parameters are updated in accordance with CBC 2013, and ASCE 7-10.4.1 Seismic Design Considerations.
The geologic-seismic hazards evaluation for this project addresses requirements of Title 24 of the
California Code of Regulations and California Geological Survey Checklist for Review of Geologic/Seismic
Reports for California Public Schools, Hospitals, and Essential Services Building (CGS Note 48).
4.2 Ground Surface Rupture
The site is not located in an Alquist-Priolo (AP) Special Study Fault Zone. However, the site is located
within a City of Los Angeles Fault Rupture Study Area (FRSA) (Safety Element, 1996). The purpose of the
Safety Element is to minimize the risk associated with natural disasters or the release of hazardous
materials, and is "intended to be the primary vehicle for relating local safety planning to land use planning
decisions." The State Public Resources Code Section 2699 requires that a safety element take into account
available seismic hazard maps prepared pursuant to the Alquist-Priolo Earthquake Fault Zoning Act.
Review of the AP map indicates that the subject site is located between two segments of the Sierra Madre
Fault. The Santa Susana Segment runs east-west approximately 1 mile north of the site, and the San
Fernando Segment runs generally east-west approximately 1 mile south of the site. An isolated ground
break was mapped and zoned as an AP Earthquake Fault about 1,000 feet southwest of the site. No known
active or non-active faults, at this time, are mapped as crossing the site, nor are any nearby faults trending
towards the site.
After the 1971 San Fernando Earthquake, the campus was investigated by structural engineers from
California Institute of Technology (CalTech) and the State of California, Office of Architecture and
Construction (CalTech, 1974). Generally minor (non-hazardous) structural distress was observed, and

Comprehensive Geotechnical Report Page 6 Olive Vista Middle School May 9, 2014
N:\Projects\1100-1199\LA-1190 Olive Vista Middle School Improvements\Report\LA1190 LAUSD Olive Vista Report Final050914.docx
while some buildings exhibited minor settlements, ground rupture was not observed on the campus.
Based on this review of published literature and site-specific earthquake history, the possibility of ground
surface fault rupture occurring at the site is considered to be low.
4.3 Seismic Ground Motion Values
The subject site is not located within an AP special study fault zone or within a State Seismic Hazard Zone,
but it does fall within a Fault Rupture Study Area designated by the City of Los Angeles Safety Element.
Therefore, a site-specific ground motion hazard study is required.
Effective January 1, 2014, seismic design parameters have to conform to 2013 CBC/ASCE 7-10.
Additionally, according to Section 1616A of CBC 2013 – Modification to ASCE 7-10, a site-specific ground
motion hazard analysis shall be performed if a building site is assigned to Seismic Category E and F. The
subject site is located where the mapped spectral acceleration parameter at 1 second period, S1, is greater
than 0.75 (i.e., S1 = 1.08g), and the building has a Risk Category III. Hence, Seismic Design Category E does
apply for the proposed structure at the site (Section 11.6 of ASCE 7-10), and a site specific ground motion
hazard analysis is required for the building
A site-specific acceleration response spectrum was constructed in accordance with ASCE 7-10 Chapter 21,
as described in Appendix C. The summary of the Design Acceleration Parameters are the following:
SDS = 1.58 g SD1 = 1.25 g
and
PGAM= 1.10 g
Where PGAM corresponds to the site-specific geometric mean peak ground acceleration.
4.4 Local Historic Earthquakes
EQSEARCH 3.0 (Blake, 2000) and the USGS data base were used to identify and summarize the local
historic earthquakes with magnitudes of 5 to 9 that occurred within 60 miles (100 km) of the site during
the past 200 years. The search results are provided in Appendix D. The closest earthquake to the site was
the Mw 6.6 San Fernando event that occurred in 1971 that was about 6 miles from the epicenter, only 1
mile away from a surface break, and generated an estimated acceleration of 0.4 to 0.5 g. Using EQSEARCH
3.0 (Blake, 2000), the site acceleration was calculated to be about 0.31g. The largest earthquake
magnitude occurring within the 60 miles search range was the 1952 Mw 7.7 Tehachapi earthquake which
was about 57 miles to the north.
4.5 Secondary Seismic Effects
Potential secondary seismic effects for any site include liquefaction and associated ground settlement,
slope instability, tsunami and seiches, and ground lurching. These potential effects are discussed in the
following sections.
4.5.1 Liquefaction and Seismic Settlement
Liquefaction involves a sudden loss in strength of a saturated, cohesionless soil (predominantly sand)
caused by cyclic loading such as an earthquake. This phenomenon results in elevated pore-water

Comprehensive Geotechnical Report Page 7 Olive Vista Middle School May 9, 2014
N:\Projects\1100-1199\LA-1190 Olive Vista Middle School Improvements\Report\LA1190 LAUSD Olive Vista Report Final050914.docx
pressures that temporarily transform the soil into a fluid mass resulting in vertical settlement and could
include lateral deformations. Typically, liquefaction occurs in areas where groundwater is less than 50
feet from the surface and where the soils are comprised of predominantly poorly consolidated sands.
Seismic ground motions can also induce settlement without liquefaction occurring, including within dry
sands above the water table.
The site is not located within a State Earthquake Induced Liquefaction Zone Seismic Hazard Zone for the
San Fernando Quadrangle, 1998. According to the City of Los Angeles Safety Element, the site is located
within a City of Los Angeles Liquefiable Area (Safety Element, 1996). However, since the historical high
ground water is approximately 110 to 120 feet below the ground surface, the soils underlying the site are
not anticipated to liquefy. However, due to the loose to medium dense nature of the onsite sandy soils,
dry seismic settlement is a possibility.
The dry seismic settlement potential was analyzed using the simplified procedures recommended by
NCEER (Youd and Idriss, 1997, 2001). For estimating seismic ground settlements, we used the method
proposed by Tokimatsu and Seed (1987). We estimate that the maximum predicted dynamic settlement
based on the CPT data ranges will be approximately 1-inch, with a differential settlement expected to be
on the order of 0.5 inches occurring over the width of the structure. No surface manifestation of
liquefaction in the form of sand boils and no loss of bearing capacity is anticipated.
4.5.2 Slope Instability
The site is not located within a State Earthquake Induced Landslide Zone Seismic Hazard Zone and the
ground surface in the vicinity of the site is essentially flat. Therefore, seismic slope instability is not an
issue for this site.
4.5.3 Tsunami and Seiches Potential
All low-lying areas along California’s coast are subject to potentially dangerous tsunamis. Tsunamis are
long-period waves generated primarily from distant and local submarine earthquakes, landslides, or
volcanic eruptions. The elevation of the school site is about 1280 feet and separated by the Santa Monica
Mountains from the coast. Therefore, the potential for a tsunami is not a consideration for this site.
There are no reservoirs or lakes identified in the upper elevations above the site. The potential for seiches
is low.
4.5.4 Ground Lurching
Ground lurching usually develops during seismic events along cliffs, ridges, stream banks and/or along the
ridge of artificial embankments. The general topography of the site is flat. Therefore the potential risk of
ground lurching is remote.
4.5.5 Flood Hazard
FEMA classifies the site as being in Zone X, which is an area with less than 0.2% annual probability of
flooding. The city of Los Angeles Safety Element shows that the school campus is not in a 100 or 500 year
storm zone. The site is not within a City of Los Angeles Safety Element inundation zone.

Comprehensive Geotechnical Report Page 8 Olive Vista Middle School May 9, 2014
N:\Projects\1100-1199\LA-1190 Olive Vista Middle School Improvements\Report\LA1190 LAUSD Olive Vista Report Final050914.docx
4.5.6 Oil Field Gas Potentials
The site is not in a known or established methane zone. The school site is located about 3.1 miles east of
the Cascade Field, about 3.7 miles northeast of the Mission Oil Field and about 3.3 miles north from the
Pacoima Oil Field. The nearest wildcat oil well is indicated to be located approximately 3.1 miles west of
the site. The potential for methane, hydrogen sulfide and other natural gas should be low due to the
geology and distance of the field from the site.
4.5.7 Other Geologic Hazards or Considerations
The site is not in a known natural asbestos, volcanic eruption or radon area. Since the site is near a
residential area and was built on agricultural land, asbestos from fireproofing, household chemicals, lead
from paint, total petroleum hydrocarbons from cars or trucks and/or Industrial and residential pesticides
and herbicides such as arsenic could be present. Old abandoned septic systems could be locally
encountered during grading.
5.0 DISCUSSION AND RECOMMENDATIONS
5.1 General
Based on the findings of our field explorations and engineering analyses, it is our opinion that the site is
suitable for the proposed construction from a geotechnical standpoint. Up to about 3 to 4 feet of possible
fill was encountered in our borings. The native alluvial soils underlying the fill generally consist of loose
to dense silty sands and sands. The upper 3 to 4 feet of sand in each boring may be possible fill or native
soils processed during the original grading. Any existing fill or loose soils present should be recompacted.
We recommend that the building sites be overexcavated and recompacted to a minimum depth of 4 feet
below finished grade to provide a uniform pad for support. In pavement areas a minimum of 2 feet of
overexcavation and removal should be performed. Following proper grading, the proposed structures
can be supported on conventional shallow foundations founded in new structural fill or firm native soils.
As an alternative drilled piles can be used for support of heavy column loads or settlement sensitive
structures. Geotechnical recommendations for site grading and foundation design are provided in the
following sections.
5.2 Demolition
Prior to the start of grading, demolition will be required to remove portions of the existing MPR and lunch
shelter buildings, flatwork, hardscape, or any other existing improvements within the project area. . It
should also be anticipated that the remnants of previous construction may also be encountered anywhere
within the site. Any voids created by the demolition and nay disturbed soils should also be properly
backfilled to the limits determined by the project geotechnical engineer.
The civil engineer should identify the presence and location of all existing utilities. Precautions should be
taken to remove, relocate or protect existing utilities, as appropriate.
5.3 Removals
Possible existing fill and/or loose native soils were encountered in the borings to a depth of up to 3 to 4
feet. Any existing fill should be considered to be uncertified and should not be used for support of

Comprehensive Geotechnical Report Page 9 Olive Vista Middle School May 9, 2014
N:\Projects\1100-1199\LA-1190 Olive Vista Middle School Improvements\Report\LA1190 LAUSD Olive Vista Report Final050914.docx
structures, pavement or hardscape. We recommend that the building sites be overexcavated and
recompacted to a minimum depth of 4 feet below finished grade to provide a uniform pad for support. In
pavement areas a minimum of 2 feet of overexcavation and removal should be performed. The removals
should extend 5 feet outside building lines or for a distance equal to the depth of removal, whichever is
greater. The actual limits for removals and recompaction should be determined by the project
geotechnical engineer during grading, based on the actual conditions encountered.
5.4 Earthwork
All grading should conform to the requirements of the 2013 California Building Code, and the general
grading recommendations outlined below.
1. The grading contractor is responsible for notifying the project geotechnical engineer of a pre-grading
meeting prior to the start of excavation/grading operations and anytime that the operations are
resumed after an interruption.
2. Prior to the start of earthwork existing improvements will require demolition. Existing foundations to
remain in place should be protected. The project civil engineer should locate any existing utilities in
the area. Existing utilities should be removed, relocated or protected, as appropriate.
3. Our field explorations encountered possible fill to a depth of up to 3 to 4 feet. It should be anticipated
that fill could be locally deeper. Any existing uncertified fill should be excavated, as discussed in
Section 5.3. Building pads should be overexcavated and recompacted to a minimum depth of 4 feet
below finished grade to provide a uniform pad for support. In pavement areas a minimum of 2 feet
of overexcavation and removal should be performed. Removals should extend to the limits
determined by the geotechnical engineer.
4. The sides of temporary excavations made in the sandy soils should be sloped at 1 (horizontal) to 1
(vertical) or flatter. The need for forming should be anticipated for the foundation.
5. The bottoms of excavations should be brought to optimum moisture content and compacted to 95
percent relative compaction in accordance with the maximum dry density determined by ASTM D-
1557.
6. Any structural fill or backfill placed under footings, slabs and pavement should be compacted to at
least 95 percent. Fill placed in non-structural areas should be compacted to at least 90 percent.
7. All structural fill soils should be sandy soils, free of highly expansive clay, organics, debris, rocks greater
than 3 inches in any dimension, and other deleterious material. The existing sandy soils at the site
are acceptable for use as fill. All fill soils shall be approved by the project geotechnical engineer.
Import soils should be approved before being brought to the site.
8. All earthwork and grading should be performed under the observation of GDC. Compaction testing
of the fill soils shall be performed at the discretion of GDC. Testing should be performed for
approximately every 2 feet in fill thickness or 500 cubic yards of fill placed, whichever occur first. If
specified compaction is not achieved, additional compactive effort, moisture conditioning of the fill
soils, and/or removal and recompaction of the below-minimum-compaction soils will be required.
9. All materials used for asphalt concrete and aggregate base shall conform to the current “Green Book,”
or the equivalent, and shall be compacted to at least 95 percent relative compaction.

Comprehensive Geotechnical Report Page 10 Olive Vista Middle School May 9, 2014
N:\Projects\1100-1199\LA-1190 Olive Vista Middle School Improvements\Report\LA1190 LAUSD Olive Vista Report Final050914.docx
10. If, in the opinion of the geotechnical engineer, contractor, or owner, an unsafe condition is created or
encountered during grading, all work in the area shall be stopped until measures can be taken to
mitigate the unsafe condition. An unsafe condition shall be considered any condition that creates a
danger to workers, on-site structures, on-site construction, or any off-site properties or persons.
5.5 Temporary Excavations
Temporary excavations made in the near surface existing sandy soils should be sloped at 1 (horizontal) to
1 (vertical), or flatter. Forming should be planned for foundations.
If shoring is required locally, either cantilever or braced shoring can be utilized depending on the
acceptance criteria for deflection of the retained excavation and for settlement of the ground adjacent to
the shoring. Cantilevered shoring can be utilized if some deflection is acceptable. Where shoring is used
to support and protect existing foundations and excessive deflection cannot be tolerated, braced shoring
may be used.
Cantilever shoring should be designed for an active earth pressure equivalent to a fluid weighing 40 pcf.
Braced temporary shoring should be designed for a lateral earth pressure of 20H, applied as a uniform
pressure to the full height of the shoring. These lateral earth pressures assume level backfill conditions
and do not include surcharging from adjacent foundations, and if needed, these values can be evaluated
separately on a case-by-case basis. Granular soils (silty sands and sands) are present at the site, and have
the potential for caving if left unsupported. Lagging will be required to support/retain any sandy and
unstable soils and also in any zones where water seeping is encountered.
Surcharge loads, such as vehicular traffic, heavy construction equipment, and stockpiled materials, should
be kept away from the top of temporary excavations a horizontal distance at least equal to the depth of
excavation. Surface drainage should be controlled and prevented from running down the slope face.
Ponding water should not be allowed within the excavation. Construction equipment and foot traffic
should be kept off excavation slopes to minimize disturbance/sloughing.
All excavation slopes and shoring systems should meet the minimum requirements of the Occupational
Safety and Health (OSHA) Standards. Maintaining safe and stable slopes on excavations is the
responsibility of the contractor and will depend on the nature of the soils and groundwater conditions
encountered and his method of excavation. Excavations during construction should be carried out in such
a manner that failure or ground movement will not occur. The contractor should perform any additional
studies deemed necessary to supplement the information contained in this report for the purpose of
planning and executing his excavation plan.
5.6 Shallow Foundations
5.6.1 Bearing
Following proper site grading, the planned improvements associated with the development can be
supported on shallow foundations placed in new structural fill or firm undisturbed native soil. An option
for deep foundations is also provided in the next section should piles be required. The footings should
have a minimum embedment of at least 1.5 feet below the lowest adjacent grade. Footings with a
minimum width of 3 feet may be designed for an allowable bearing pressure of 2,500 psf. The allowable

Comprehensive Geotechnical Report Page 11 Olive Vista Middle School May 9, 2014
N:\Projects\1100-1199\LA-1190 Olive Vista Middle School Improvements\Report\LA1190 LAUSD Olive Vista Report Final050914.docx
bearing pressure may be increased by 250 psf for each foot of width or embedment, up to a maximum
bearing pressure of 3,500 psf. These values for bearing are net values and do not include the weight of
the footing. The allowable bearing pressure can be increased by one-third for temporary loads associated
with wind and seismic loading.
Forming should be planned for footing installations in the sandy soils. All foundation excavations should
be checked by the project geotechnical engineer before the placement of reinforcing steel. Any loose or
soft soils found should be excavated and replaced with structural fill. The limits for the excavation should
be determined by the geotechnical engineer.
As an alternate to shallow foundations, and for structures with heavy column loads or settlement sensitive
structures drilled and cast in place concrete piles may be used for support. Pile foundations are discuss
in Section 5.7.
5.6.2 Settlement
The estimated total static settlement of properly designed and constructed footings with a maximum
column load of 150 kips will be on the order of 1 inch, or less. Differential settlement between equally
loaded columns is expected to be on the order of 1/4 inch. Settlement will occur due to elastic
compression of the supporting sands; and the majority of settlement is expected to be completed shortly
after construction. Potential for dry sand settlement during earthquakes is discussed in Section 4.5.1
above.
5.6.3 Lateral Resistance
Resistance to lateral loads can be provided by friction developed between the bottom of the footings and
the supporting soil, and by the passive soil pressure developed on the face of the footing. For design
purposes an allowable coefficient of friction of 0.35 may be used. The allowable passive pressure for
undisturbed native soils or compacted structural fill may be taken as an equivalent fluid pressure of 300
pcf. Both values include a factor of safety of about 1.5 and passive and sliding resistance may be used in
combination without reduction.
5.7 Pile Foundations
As an alternative, the proposed new buildings may also be supported by drilled and cast in place concrete
piles. Recommendations for the design and construction of 24-inch drilled piers are provided below.
5.7.1 Axial Capacity
We evaluated the axial capacities for 24-inch diameter drilled piers using the computer program SHAFT
6.0 (Ensoft, 2007). Allowable compressive axial pile capacities for the piers are shown in Figure 8. These
values have a factor of safety of 2.0. Piles should be installed with a minimum center to center spacing of
3 diameters. The minimum depth of the drilled piles should be 25 feet.
5.7.2 Lateral Capacity
The lateral pile capacity for the 24-inch drilled piers were assessed using the program LPILE 5.0 (Ensoft,
2004), for 0.5-inch and 1/4-inch of pile head deflection, under free head and fixed head conditions. Elastic
pile behavior was assumed. Results of the analysis are included in Table 2 below, and the LPILE output is

Comprehensive Geotechnical Report Page 12 Olive Vista Middle School May 9, 2014
N:\Projects\1100-1199\LA-1190 Olive Vista Middle School Improvements\Report\LA1190 LAUSD Olive Vista Report Final050914.docx
documented in Appendix E, and includes the pile head shear and maximum bending moment. We can
provide results for other pile diameters and pile head deflections, if needed. The values in Table 2 consider
the transient nature of the loads; therefore, no increase in the capacity should be used.
For the fixed head condition, the design lateral load will be controlled by the moment transfer capacity of
the pile connection at the cap and should be evaluated by the structural engineer. For transient seismic
loads, the shear capacities shown in Table 2 are considered to be allowable loads. However, a factor of
safety of 1.2 should be used with the maximum moments indicated.
Table 2. Summary of Lateral Pile Analysis
Analysis Type Pile Head Deflection
0.25-inch 0.5-inch
Free-Head Condition
Pile Head Shear (kips) 11 21.5
Maximum Bending Moment (ft-kips) 49 94
Depth to Maximum Bending Moment (ft) 8 8
Fixed-Head Condition
Pile Head Shear (kips) 30 57.5
Maximum Bending Moment (ft-kips) -150 -292
5.7.3 Pile Installation
Piles will be drilled through existing fill and into exiting native soils, consisting of sands, silty sands, and
sandy silts. The contractor should be prepared to use casing if caving zones are encountered. Should
local perched water be encountered in the drill holes, the shaft should be pumped dry before placing
concrete. Concrete should be conveyed to the bottom of the pile shaft by tremie, and should not be
allowed to fall freely, which can cause segregation of the aggregate. The concrete should be placed and
allowed to setup before an adjacent pile is drilled. All pile excavations should be observed and approved
before placing steel and concrete by the project geotechnical engineer.
5.7.4 Pile Settlement
Settlement of properly installed piles under an allowable load of up to 80 kips is expected to be less than
1/2 inch. Differential settlement between adjacent equally loaded piles is expected to be less than 1/4
inch. Settlement should occur rapidly and should essentially be complete shortly after application of the
load.
5.8 Slab-on-Grade / Flatwork
Concrete slabs will be supported on sandy structural fill prepared in accordance with the above
recommendations. To reduce the potential for moisture transmission through slabs where moisture
sensitive covering will be installed, we recommend that a vapor retarder shall be used. In accordance with
ACI 302.2R-06, the material must comply with the requirements of ASTM E 1745, “Standard Specification
for Water Vapor Retarders Used in Contact with Soil or Granular Fill under Concrete Slabs,” and have a
permeance of less than 0.01 perms per ASTM E96. The installation of the moisture barrier should comply
with ASTM E 1643-09.

Comprehensive Geotechnical Report Page 13 Olive Vista Middle School May 9, 2014
N:\Projects\1100-1199\LA-1190 Olive Vista Middle School Improvements\Report\LA1190 LAUSD Olive Vista Report Final050914.docx
Reference is made to ACI 302.2R, Section 7.2 concerning whether to place 2 inches of sand over the
barrier, which states that the anticipated benefits and risks associated with the specified location of the
vapor retarder should be reviewed by the structural and civil engineers and architect.
5.9 Site Drainage
The site should be graded to maintain positive drainage, so all runoff is properly collected and conveyed
to proper disposal in approved storm drains or drainage devices. The area around foundations should be
sloped at 2 percent to drain runoff away and prevent ponding of water.
5.10 Utility Installations
The bedding for any new sewer and water service pipelines should be a minimum of 4 inches thick and
should consist of clean sand, No. 4 concrete aggregate or gravel, and should have a sand equivalent of not
less than 30. The pipe zone material, which extends to a level 12 inches above the pipe should consist of
sand and should have a sand equivalent of no less than 30, and a maximum rock size of 1 inch. All imported
materials should be approved by the project geotechnical engineer before being brought onsite.
Trench zone backfill extends from a level 12 inches above the pipe to finished subgrade. Trench zone
material should have a maximum size of 2 inches and should contain no organics or other deleterious
materials. All fill soils should be approved by the project geotechnical engineer. Soils proposed to be
imported should be approved before being brought on site.
All bedding and backfill materials should be mechanically compacted to at least 90 percent relative
compaction. Jetting or flooding of backfill should not be permitted.
5.11 Soil Corrosivity
A representative sample of the near surface soil encountered in the boring was tested to evaluate
corrosion characteristics. The summary of the test results is provided in Table 3 below:
Table 3. Summary of Corrosion Test Results
Boring No. Depth (ft) pH Soluble Sulfate
Content (ppm)
Soluble Chloride
Content (ppm)
Minimum Resistivity
(ohm-cm)
B-1 0-5 7.9 <100 <100 7,484
B-6 0-5 7.6 <100 <100 8,843
B-1 (2011) 0-5 8.3 <100 <100 10,395
Based on the test results above, the near surface soils generally have negligible soluble sulfate and
chloride content. The tested samples were also found to have mild to moderate corrosion potential based
on the minimum resistivity test. The following correlation in Table 4 can generally be used between
electrical resistivity and corrosion potential:
Comprehensive Geotechnical Report Page 14 Olive Vista Middle School May 9, 2014
N:\Projects\1100-1199\LA-1190 Olive Vista Middle School Improvements\Report\LA1190 LAUSD Olive Vista Report Final050914.docx
Table 4. Electrical Resistivity and Corrosion Potential
Electrical Resistivity (Ohm-cm) Corrosion Potential
Less than 1,000 Severe
1,000 – 2,000 Corrosive
2,000 – 10,000 Moderate
Greater than 10,000 Mild
On the basis of the laboratory testing, the test samples are classified as having a mild to moderate
potential for buried metals. Specific assessment and alternatives for corrosion protection should be
provided by a corrosion consultant.
5.12 Expansion Potential
The near-surface soils at the site consist of predominantly sands. Based on our laboratory testing, the
near-surface soils have very low expansion potential.
5.13 Environmental Issues
Evaluation of environmental issues for this project and their impact on site development are outside the
scope of our work and are the responsibility of the project environmental consultant.

Comprehensive Geotechnical Report Page 15 Olive Vista Middle School May 9, 2014
N:\Projects\1100-1199\LA-1190 Olive Vista Middle School Improvements\Report\LA1190 LAUSD Olive Vista Report Final050914.docx
6.0 PERCOLATION TEST CALCULATIONS AND DISCUSSIONS
Falling head permeability tests were conducted in the wells established in Borings B-7 and B-8, in general
accordance with ASTM 5912-96. The well casing was filled with water and then the level of water in the
well was recorded at approximately 15 minute-intervals.
For calculation of the permeability, the following formula derived by Jarvis (1953) as recommended in the
Ground Water Manual (US Bureau of Reclamation) was used:
K = (r1)2 / (2A t) {[(sinh –1 (A/re))/2] ln[ (2H1-A)/ (2H2-A)] - ln[ (2H1 H2-A H2)/ (2 H1 H2-A H1)]}
Where: K = average permeability of test section: m/sec, ft/sec A = length of the test section: m, ft (3 or 5 feet) r1 = inside radius of drop pipe: m, ft (0.167 feet)
re = effective radius of test section: m, ft (0.334 feet)
t = time intervals t1-t0 , t2-t1, seconds
sinh –1 = inverse hyperbolic sine
ln = natural logarithm H = length of the water column from bottom of the test interval to water surface in the stand pipe,
meters (feet) H0, H1, H2 lengths at time of measurement t0 , t1, and t2 etc.
The calculated results are summarized in the Table 5 below. The calculations are provided in Appendix G
and were performed in accordance with the USBR Groundwater Manual (1985).
Table 5. Summary of the On-Site Permeability Tests
Test Well Zone Evaluated
(feet below grade)
Field Permeability
(cm/sec)
Permeability Rate
(in/hr)
B-7 15-20 1.3E-05 0.02
B-8 15-20 1.2E-05 0.02
Based on the City of Los Angeles Standard Urban Stormwater Mitigation Plan (SUSMP) Infiltration
Requirements and Guidelines, the minimum percolation rate is required to be at a minimum of 0.5 inch
per hour. Based on the results of our in-situ percolation testing, the calculated permeability at the site is
approximately 0.02 inch per hour, which is significantly lower than SUSMP infiltration requirements, i.e.
0.5 inch per hour. On this basis, infiltration at the subject site appears to be impractical.

Comprehensive Geotechnical Report Page 16 Olive Vista Middle School May 9, 2014
N:\Projects\1100-1199\LA-1190 Olive Vista Middle School Improvements\Report\LA1190 LAUSD Olive Vista Report Final050914.docx
7.0 POST GEOTECHNICAL SERVICES
Post construction geotechnical services will be required during design and construction. It is
recommended that GDC review the project plans and specifications prior to finalization. During
construction, the site grading should be performed under the observation and testing of the project
geotechnical engineer. This includes the demolition, approval of excavated bottoms, proof rolling,
removals, placement of compacted fill and backfill, and the placement and compaction of subbase and
base material, and the compaction of asphalt.
8.0 LIMITATIONS
The conclusions and recommendations contained in this report are professional opinions, intended for
the use of LAUSD and their design consultants. This report has been prepared solely for the design of the
improvements described herein, and may not contain sufficient information for other uses. The
recommendations should not be extrapolated to areas not covered by this report, or used for other
facilities without the review and approval of GDC. If this report, or portions of this report, are provided
to contractors, or included in specifications, it should be understood that they are provided for
information only.
Our investigation and evaluations were performed in accordance with generally accepted local standards
using that degree of care and skill ordinarily exercised under similar circumstances by reputable
geotechnical consultants practicing in this or similar localities. No other warranty, expressed or implied,
is made as to the professional advice included in this report.
The recommendations for this project are, to a high degree, dependent upon development and
implementation of proper pavement specifications and a careful quality control program. The
recommendations are also made contingent on the opportunity for GDC to observe grading operations and
subgrade/base preparation. If parties other than GDC are engaged to provide geotechnical services, they
must be notified that they will be required to assume complete responsibility for the geotechnical phase of
the project by concurring with the recommendations in this report or providing alternate recommendations
as deemed appropriate.
Comprehensive Geotechnical Report Page 17 Olive Vista Middle School May 9, 2014
N:\Projects\1100-1199\LA-1190 Olive Vista Middle School Improvements\Report\LA1190 LAUSD Olive Vista Report Final050914.docx
9.0 REFERENCES
ASCE Standard, “Minimum Design Loads for Buildings and Other Structures.” ASCE/SEI 7-10, 2010.
Blake, T. F., 2000, "EQ Search Computer Program to search for historic earthquakes per distance to a site
from Digitized California Earthquake Data," 1989-2000.
Boore, D.M., Joyner, W.B. and Fumal, T.E., 1997, Empirical near-source attenuation relationships for
horizontal and vertical components of peak ground acceleration, peak ground velocity, and pseudo-
absolute acceleration response spectra: Seismological Research Letters, v. 68, p. 154-179.
Campbell, K.W., 1997, Attenuation Relationships for Shallow Crustal Earthquakes Based on California
Strong Motion Data: Seismological Research Letters, v. 68, p. 180-189.
California Building Code (CBC), 2013, published by International Code Counsel, Inc., Illinois, California.
California Department of Conservation, California Geological Survey, 2010, Geological Compilation of
Quaternary of the Los Angeles 60’ x 30’ Geologic Map.
California Department of Conservation, Division of Mines and Geology, 2000, Quaternary Geology of the
San Fernando Valley, Los Angeles County, California, Map Sheet 50.
California Department of Conservation, California Geological Survey, 2005, Radon Potential in Southern
Los Angeles County, Special Report 182.
California Department of Conservation, Division of Mines and Geology, 1998, “Seismic Hazard Zones of
the San Fernando 7.5-Minute Quadrangle, Los Angeles County, CA.”
California Department of Conservation, Division of Mines and Geology, 1997, revised 2001 “Seismic
Hazard Evaluation of the San Fernando 7.5-Minute Quadrangle, Orange County, CA,” SHZR 15.
California Division of Mines and Geology (CDMG), California Department of Conservation, 1990, “Fault-
Rupture Hazard Zones in California, Alquist-Priolo Special Studies Zones Act of 1972,” Special Publication
42, Department of Conservation, California Division of Mines and Geology.
California Department of Conservation, Division of Mines and Geology, 1975, San Fernando, California
Earthquake of 9 February, 1971, Bulletin 196.
California Department of Conservation, Division of Mines and Geology, “California Historical Earthquakes
M> 5.5 http://redirect.conservation.ca.gov/cgs/rghm/quakes/ historical/hiseq.asp.”
California Institute of Technology, 1974, The Performance of Public School Plants During the San Fernando
Earthquake.
Caltech Earthquake Engineering Research Laboratory, June 1971, Engineering Features of the San
Fernando Earthquake of February 9, 1971, Paul C. Jennings, editor, EERL 71-02.
City of Los Angeles, 1996, Seismic Safety Element for the City of Los Angeles, Department of City Planning,
Los Angeles, California.

Comprehensive Geotechnical Report Page 18 Olive Vista Middle School May 9, 2014
N:\Projects\1100-1199\LA-1190 Olive Vista Middle School Improvements\Report\LA1190 LAUSD Olive Vista Report Final050914.docx
Dibblee, Thomas W. Jr., 1989, Geologic Map of the San Fernando Quadrangle, Los Angeles California, The
Dibblee Foundation Maps.
ESRI/FEMA, Project Impact Hazard Site, www.esri.com/hazards/makemap.html
Martin, G.R., and Lew, M. (Editors), 1999, “Recommended Procedures for Implementation of DMG Special
Publication 117, Guidelines for Analyzing and Mitigating Liquefaction Hazards in California,” Organized
through the Southern California Earthquake Center (SCEC), University of Southern California, March 1999,
pp. 17-21.
Pacific Section AAPG, 1958, Guide to the Geology and Oil Fields of the Los Angeles and Ventura Regions,
Ed, J. Higgins, AAPG-SEPM Annual Meeting 3/10-13/58.
Tokimatsu, Kohji, and Seed, H.B., 1987, “ Evaluation of Settlements in Sands Due to Earthquake Shaking,”
Journal of Geotechnical Engineering, Vol. 113, No. 8, Proc. Paper No. 21706.
USGS, 2008: National Seismic Hazard Maps - Fault Parameters,
http://geohazards.usgs.gov/cfusion/hazfaults_search/hf_search_main.cfm
USGS Earthquake Hazard Program, http://earthquake.usgs.gov/regional/neic/
Working Group on California Earthquake Probability, “Seismic Hazards in Southern California: Probable
Earthquakes, 1994-2024”, Bulletin of the Seismological Society of America, Vol. 85, No. 2, pp. 379-439,
April, 1995.
Southern California Earthquake Center, 2009, Southern California Faults Information website:
http://www.data.scec.org/fault_index/hollyflt.html
Yerkes et al, 1965, “Geology, Los Angeles, California – An Introduction”, Geological Survey Professional
Paper, 420-A.
Youd, T.L. and Idriss, I.M. (Editors), 1997, “Summary Report, Proceedings of the NCEER Workshop on
Evaluation of Liquefaction Resistance of Soils,” Salt Lake City, Utah, January 5-6, 1996, NCEER Technical
Report-97-0022, Buffalo, New York.
Youd, T. L., et al., 2001,“ Liquefaction Resistance of Soils: Summary Report from the 1996 NCEER and 1998
NCEER/NSF Workshops on Evaluation of Liquefaction Resistance of Soils, Journal of Geotechnical and Geo-
environmental Engineering, Vol. 127, No. 10.
Youngs, R.R., Chiou, S.-J., Silva, W.J. and Humphrey, J.R., 1997, Stochastic point-source modeling of ground
motions in the Cascadia Region: Seismological Research Letters, v. 68, p. 74-85.
Ziony, J.I., Editor,1985, "Evaluating Earthquakes in the Los Angeles Region--An Earth Science Perspective",
United States Geological Survey Professional Paper 1360.
Comprehensive Geotechnical Report Page 19 Olive Vista Middle School May 9, 2014
N:\Projects\1100-1199\LA-1190 Olive Vista Middle School Improvements\Report\LA1190 LAUSD Olive Vista Report Final050914.docx
FIGURES
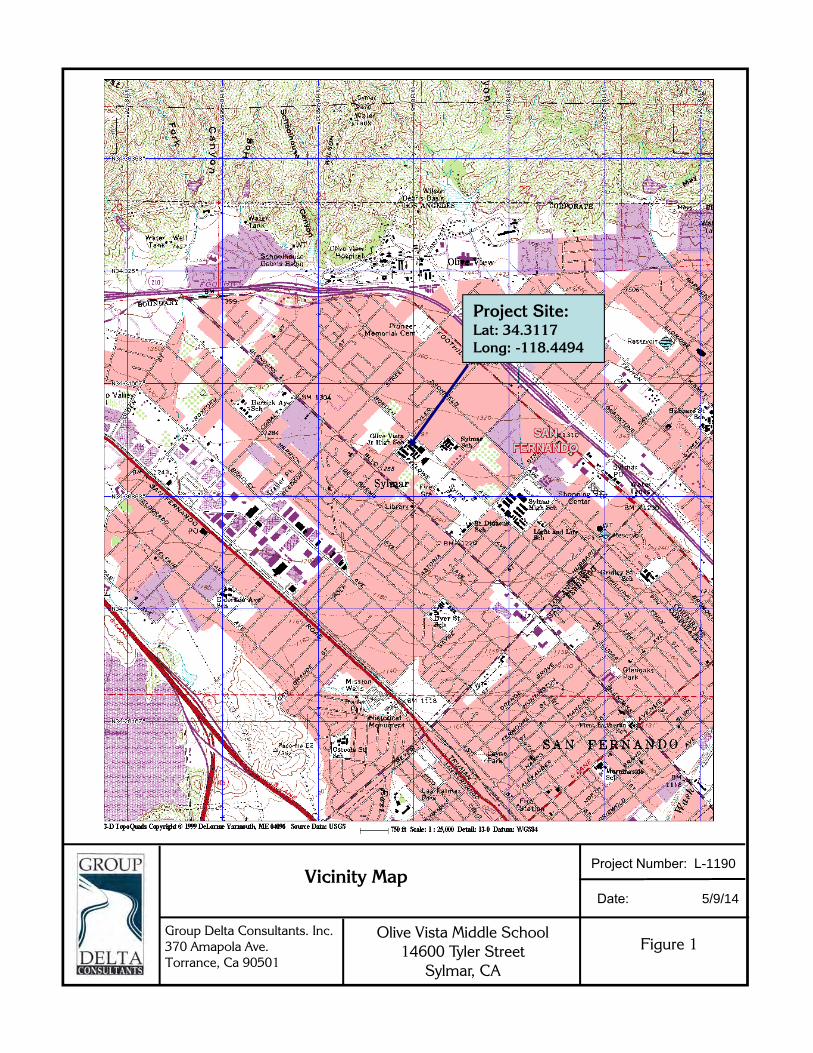
Figure 1
Vicinity Map
Group Delta Consultants. Inc.370 Amapola Ave.Torrance, Ca 90501
Olive Vista Middle School 14600 Tyler Street
Sylmar, CA
Project Number: L-1190
Date: 5/9/14
Project Site:Lat: 34.3117Long: -118.4494
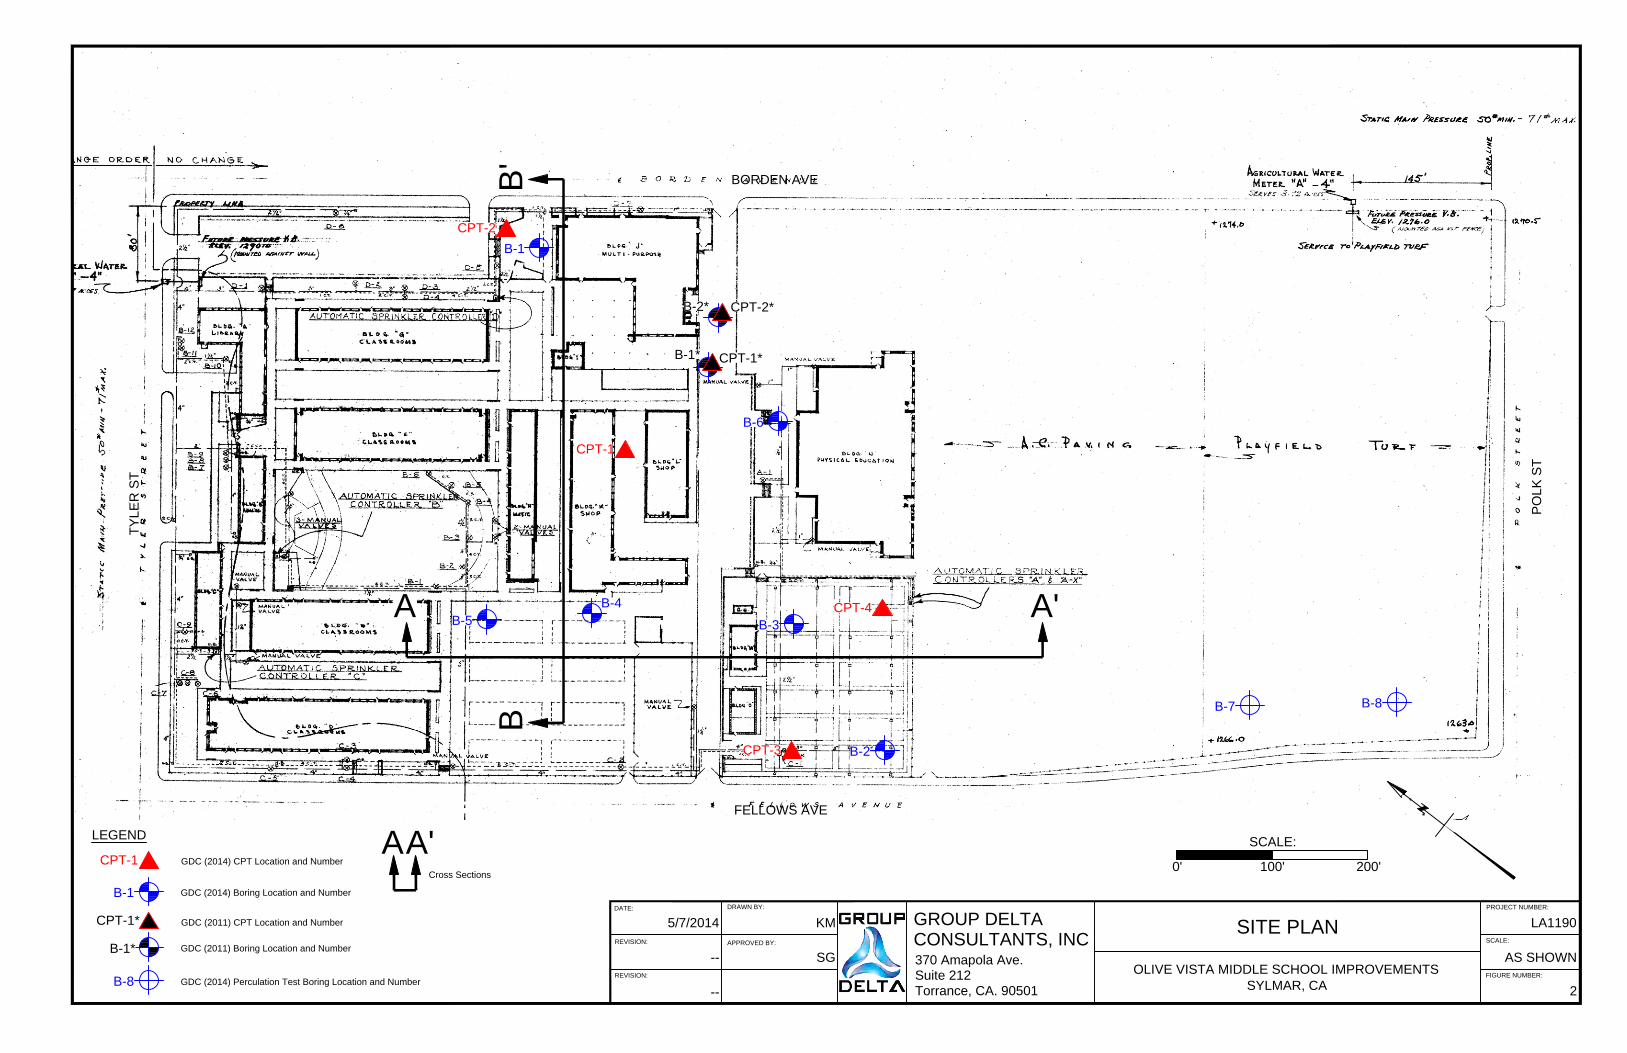
PROJECT NUMBER:
DATE:
SCALE:
DRAWN BY:
APPROVED BY:
FIGURE NUMBER:
REVISION:
370 Amapola Ave.
Suite 212
Torrance, CA. 90501
GROUP DELTA
CONSULTANTS, INC
REVISION:
-- SG
KM5/7/2014
2--
SITE PLAN
B-1
B-2*
B-1*
B-6
B-3
B-2
B-7
B-8
B-5
CPT-2
CPT-1
CPT-2*
CPT-1*
CPT-4
CPT-3
FELLOWS AVE
BORDEN AVE
PO
LK
S
T
TY
LE
R S
T
GDC (2014) CPT Location and Number
GDC (2014) Boring Location and Number
GDC (2011) CPT Location and Number
GDC (2011) Boring Location and Number
B-1
CPT-1
CPT-1*
B-1*
LEGEND
LA1190
AS SHOWN
OLIVE VISTA MIDDLE SCHOOL IMPROVEMENTS
SYLMAR, CA
B-4
B-8GDC (2014) Perculation Test Boring Location and Number
SCALE:
0' 100' 200'
A A'
BB
'
Cross Sections
AA'
stephanieg
Polygon
stephanieg
Polygonal Line
stephanieg
Rectangle
stephanieg
Polygonal Line
stephanieg
Rectangle
stephanieg
Rectangle
stephanieg
Typewritten Text
PROPOSED MPR
stephanieg
Typewritten Text
PROPOSED LUNCH SHELTER
stephanieg
Line
stephanieg
Line
stephanieg
Line
stephanieg
Typewritten Text
PROPOSED COVERED WALKWAY
stephanieg
Polygon
stephanieg
Typewritten Text
PROPOSED GYMNASIUM
stephanieg
Typewritten Text
PROPOSED COVERED WALKWAY
stephanieg
Line

Qc (tsf)Qc (tsf)
1220
1230
1240
1250
1260
1270
1280
1290
1300E
LEV
ATI
ON
(ft)
1220
1230
1240
1250
1260
1270
1280
1290
1300
ELE
VA
TIO
N (f
t)
CPT-3 CPT-4
A A'
EL 1279 ftEL 1278 ft
PROJECT NUMBER:DATE:
SCALE:
DRAWN BY:
APPROVED BY:
FIGURE NUMBER:
REVISION:
370 Amapola Ave.Suite 212Torrance, CA. 90501
GROUP DELTACONSULTANTS, INC
REVISION:
-- SG
KM5/6/2014 LA1190
AS SHOWN
3--
CROSS SECTION A-A'
OLIVE VISTA MIDDLE SCHOOL IMPROVEMENTSSYLMAR, CA
E.G.
NOTESOME BORINGS/CPT'S ARE SHOWN PROJECTED.
LEGENDSPT N-Value
Blowcounts of Modified California Ring Sample
1020 (R)
Existing GradeE.G.GDC (2014) CPT Location, Number and ElevationC-3GDC (2014) Boring Location, Number and Elevation
0' 40'
10'
TO Tyler St TO Polk St

Qc (tsf)Qc (tsf)
1220
1230
1240
1250
1260
1270
1280
1290
1300E
LEV
ATI
ON
(ft)
1220
1230
1240
1250
1260
1270
1280
1290
1300
ELE
VA
TIO
N (f
t)
B B'
CPT-1
CPT-2
CPT-2*CPT-1*EL1291 ft EL1291 ft EL1291 ft
EL1296 ft
Qc (tsf)
Qc (tsf)
PROJECT NUMBER:DATE:
SCALE:
DRAWN BY:
APPROVED BY:
FIGURE NUMBER:
REVISION:
370 Amapola Ave.Suite 212Torrance, CA. 90501
GROUP DELTACONSULTANTS, INC
REVISION:
-- SG
KM5/6/2014 LA1190
AS SHOWN
4--
CROSS SECTION B-B'
OLIVE VISTA MIDDLE SCHOOL IMPROVEMENTSSYLMAR, CA
E.G.
LEGENDSPT N-Value
Blowcounts of Modified California Ring Sample
1020 (R)
Existing GradeE.G.
NOTESOME BORINGS/CPT'S ARE SHOWN PROJECTED.
GDC (2014) CPT Location, Number and ElevationC-1GDC (2014) Boring Location, Number and Elevation
True Location of BoringGDC (2011) CPT Location, Number and ElevationC-1*GDC (2011) Boring Location, Number and Elevation
0' 40'
10'
TO Borden AveTO Fellows Ave

Project Site
Reference: Geologic Compilation of Quaternary Surficial Deposits in Southern California, Los Angeles, 30’ x 60’ Quadrangle (California Geological Survey, July 2010).
N
Figure 5
Regional Geology Map
Group Delta Consultants. Inc.370 Amapola Ave.Torrance, Ca 90501
Olive Vista Middle School 14600 Tyler Street
Sylmar, CA
Project Number: L-1190
Date: 5/9/14

Project Site
Figure 6
Regional Fault Map
Group Delta Consultants. Inc.370 Amapola Ave.Torrance, Ca 90501
Olive Vista Middle School 14600 Tyler Street
Sylmar, CA
Project Number: L-1190
Date: 5/9/14

Project Site
Figure 7
Surface Effects Map of the San Fernando Earthquake Area
Group Delta Consultants. Inc.370 Amapola Ave.Torrance, Ca 90501
Olive Vista Middle School 14600 Tyler Street
Sylmar, CA
Project Number: L-1190
Date: 5/9/14
Reference: California Division of Mines and Geology, 1975, Surface Effects Map of the San Fernando Earthquake Area, San Fernando, California Earthquake of 9 February 1971, Bulletin 196.
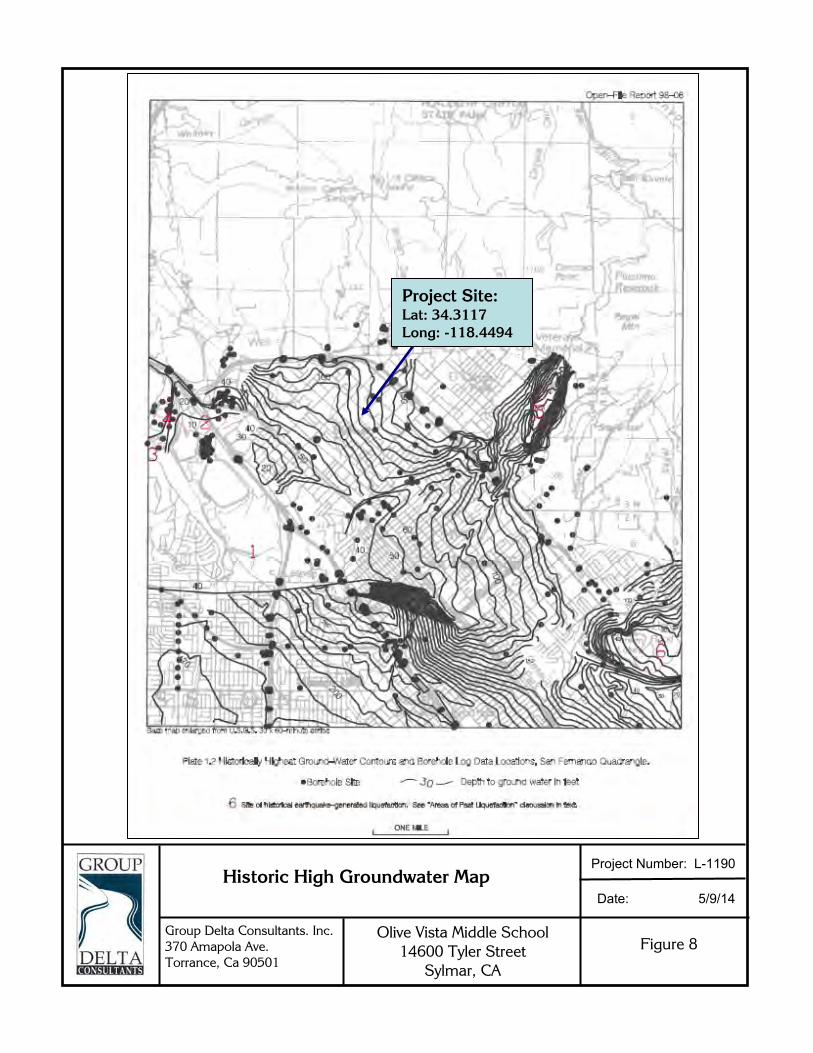
Figure 8
Historic High Groundwater Map
Group Delta Consultants. Inc.370 Amapola Ave.Torrance, Ca 90501
Olive Vista Middle School 14600 Tyler Street
Sylmar, CA
Project Number: L-1190
Date: 5/9/14
Project Site:Lat: 34.3117Long: -118.4494

Figure 9
Axial Pile Capacity
Group Delta Consultants. Inc.370 Amapola Ave.Torrance, Ca 90501
Olive Vista Middle School 14600 Tyler Street
Sylmar, CA
Project Number: L-1190
Date: 5/9/14
0
5
10
15
20
25
30
0 20 40 60 80 100 120 140
Axial Capacity, Q (kips)D
epth
(fee
t)
2 ft dia.

APPENDIX A
FIELD EXPLORATION

Field Exploration May 9, 2014 Olive Vista Middle School Page A‐1 Sylmar, California
APPENDIX A
FIELD EXPLORATION Group Delta Consultants Inc. (GDC) performed a field exploration program at the subject site on April 16, 2014. The field exploration program included drilling eight geotechnical borings (including two for percolation tests), and four Cone Penetration Test soundings (CPT). The borings were drilled using hollow stem auger drilling equipment. GDC has also previously performed a subsurface investigation in 2011. The locations of recent and previous explorations are shown on Figure 2 of the main report. The borings were drilled to approximate depths of 10 to 50 feet below the existing grade. The CPT soundings were advanced to approximate depths of 45 to 50 feet below the existing grade. The explorations were performed under the continuous technical supervision of our field geologist, who also maintained detailed logs of the soils encountered, classified the materials, and assisted in obtaining soil samples. Subsurface materials encountered in the borings were visually classified and logged in accordance with the Unified Soil Classification System (USCS). Relatively undisturbed modified California ring samples and Standard Penetration Tests (SPT) samples were taken in the boring at depth interval of 5 feet. In addition, bulk samples were taken within the upper 5 feet in selected borings. The locations of sampling are indicated on the log. The driven samples were obtained with a 3‐inch O.D. split‐barrel sampler lined with 1‐inch high brass rings. The sampler was driven into the soil using a 140‐pound hammer falling a distance of 30 inches. The number of blows required to drive the sampler 12 inches into the soil is recorded on the boring logs. The Standard Penetration Tests (SPT) were conducted in accordance with ASTM D 1586, using a standard 2‐inch outside diameter, 1.375‐inch inside diameter, split‐spoon sampler. The SPT sampler was driven into the soil using a 140‐pound hammer free‐falling 30 inches. The N‐value blow counts are shown directly on the boring logs. All samples were sealed to prevent moisture loss and returned to our laboratory for additional visual examination and laboratory testing. A discussion of the laboratory testing program, including test results, is provided in Appendix B. The CPT probes were performed in general accordance to ASTM D3441‐86. A CPT sounding is performed by pushing a conical tipped steel probe with a cylindrical friction sleeve into soil while simultaneously recording the end bearing and side friction resistance. The conical tip had a 60‐degree apex angle and a projected cross sectional area of 1.55 square inches and is advanced with a hydraulic ram. The cylindrical friction sleeve has a surface area of 23.25 square inches. Both the tip and sleeve have outside diameters of 1.4 inch. As the probe is advanced, electronic instruments measure and record both the tip resistance and the frictional resistance on the sleeve. The tip and frictional resistance are then analyzed, using available correlations, to estimate soil classification, density, strength and compressibility of subsurface materials. Unlike soil borings, in which drive samples are generally taken every 5 feet, CPT soundings provide a continuous record of soil properties with depth. Boring logs and CPT logs of the recent and previous (2011) investigations are included in this Appendix.

KEY FOR SOIL CLASSIFICATION
GROUP SYMBOL
GW Well-graded gravel, gravel with sand, little or no finesGP Poorly-graded gravel, gravel with sand, little or no finesGM Silty gravel, silty gravel with sand, silty or non-plastic finesGC Clayey gravel, clayey gravel with sand, clayey or plastic finesSW Well-graded sand, sand with gravel, little or no finesSP Poorly-graded sand, sand with gravel, little or no finesSM Silty sand, silty sand with gravel, silty or non-plastic finesSC Clayey sand, clayey sand with gravel, clayey or plastic finesML Inorganic silt, sandy silt, gravelly silt, or clayey silt with low plasticityCL Inorganic clay of low to medium plasticity, sandy clay, gravelly clay, silty clay, Lean ClayOL Low to medium plasticity Silt or Clay with significant organic content (vegetative matter)MH Inorganic elastic silt, sandy silt, gravelly silt, or clayey silt of medium to high plasticityCH Inorganic clay of high plasticity, Fat ClayOH Medium to high plasticity Silt or Clay with significant organic content (vegetative matter)PT Peat or other highly organic soils
Note: Dual symbols are used for coarse grained soils with 5 to 12% fines (ex: SP-SM), and for soils with Atterberg Limits falling in the CL-ML band in the Plasticity Chart. Borderline classifications between groups may be indicated by two symbols separated by a slash (ex: CL/CH, SW/GW).
Blowcount SPT1
(CAL)2Consistency
Blowcount3
SPT1
(CAL)2Consistency
Undrained Shear
Strenth3, Su
(ksf) <2
(<3) Very Soft < 0.25
2-4 (3-6) Soft 0.25 -0.50
5-10 (7-15) Loose 5-8
(7-12) Firm 0.50 - 1.0
11-30 (16-45) Med. Dense 9-15
(13-22) Stiff 1.0 - 2
31-50 (46-75) Dense 16-30
(23-45) Very Stiff 2.0 - 4.0
>50 (>75) Very Dense >31
(>45) Hard >4.0
Grain Size Classification
Fine Medium Coarse Fine CoarseUS Std Sieve No. 200 No. 40 No. 10 No. 4 3/4" 3" 12"
Grain Size (mm) 0.075 0.425 2 4.75 19.1 76.2 304.8
Classification of earth materials shown on the logs is based on field inspectionand should not be construed to imply laboratory analysis unless so stated.
Granular Soil Gradation ParametersCoefficient of Uniformity: Cu = D60 / D10
Coefficient of Curvature: CC= (D30)2 / (D10 x D60)
D10= 10% of the soil is finer than this diameter D30= 30% of the soil is finer than this diameter D30= 60% of the soil is finer than this diameter
GroupSymbol Gradation or Plasticity Requirement
SW Cu>6 and Cc between 1 and 3GW Cu>4 and Cc between 1 and 3
GP or SP Clean gravel or sand not meeting requirement for GW or SWGM or SM Plots below "A" Line on Plasticity Chart or PI < 4GC or SC Plots above "A" Line on Plasticity Chart and PI > 7
0-4 (0-6) Very Loose
2. Number of blows of a 140-lb. hammer falling 30-inches to drive a 3-inch OD (2.42-inch ID) California Ring Sampler the final 12-inches of driving.3. Undrained shear strength of cohesive soils predicted from field blowcounts is generally unreliable. Where possible, consistency should be based on Su data from pocket penetrometer, torvane, or laboratory testing.
CLASSIFICATION CRITERIA BASED ON LABORATORY TESTS
CLAY AND SILT SAND GRAVEL COBBLES BOULDERS
DRY - Absence of moisture, dusty, dry to the touch MOIST- Damp but no visible water WET- Visible free water, usually soil is below water table
CONSISTENCY NOTES:1. Number of blows of a 140-lb. hammer falling 30-inches to drive a 2-inch OD (1.375-inch ID) SPT Sampler [ASTM D-1585] the final 12-inches of driving
CONSISTENCY CLASSIFICATION MOISTURE CLASSIFICATIONCOARSE GRAINED SOILS FINE GRAINED SOILS
FIN
E G
RA
INE
D S
OIL
S
(5
0% o
r mor
e fin
es p
assi
ng
the
No.
200
Sie
ve) SILTS AND CLAYS
(Liquid Limit less than 50)
SILTS AND CLAYS (Liquid Limit 50 or more)
HIGHLY ORGANIC SOILS
UNIFIED SOIL CLASSIFICATION SYSTEM (ASTM D-2487)PRIMARY DIVISIONS SECONDARY DIVISIONS
CO
AR
SE
GR
AIN
ED
SO
ILS
(le
ss th
an 5
0% fi
nes
pass
ing
the
No.
20
0 S
ieve
)
GRAVEL (% GRAVEL >
% SAND)
CLEAN GRAVEL (Less than 5% fines)
"DIRTY" GRAVEL (More than 12% fines)
SAND (% SAND >. % GRAVEL)
CLEAN SAND (Less than 5% fines)
"DIRTY" SAND (More than 12% fines)
PLASTICITY CHART
0
10
20
30
40
50
60
0 20 40 60 80 100
LIQUID LIMIT, LL
PLA
STIC
ITY
IND
EX, P
I
CL or OL
CH or OH
ML or OL
MH or OH
CL-ML
"A" Line=0.73*(LL-20)
FIGURE A-0

BULK, CAL, SPT-Refers to the sampling method asdescribed below
BULK-Refers to collecting sample by method ofplacing disturbed soil into a large plastic bag
CAL (CALIFORNIA MODIFIED)- A 3.0" o.d. split tubesampler lined with 2.42" i.d. metal sample ringsgenerally driven into the soil by a 400 lbs hammer freefalling 24 inches.
SPT (STANDARD PENETRATION TEST)- A 2.0" o.d.split spoon sampler with a 1.375"i.d. driven into the soilwith a 140 lbs hammer free falling a height of 30 inches
ABBREVIATION FOR OTHER TESTS
AL=Atterberg Limits GS=Grain SizeAnalysesCN=Consolidation PP=Pocket PenCO=Corrosivity RV=R-ValueCP=Laboratory Compaction WA=Wash on #200SieveDS=Direct Shear EI=Expansion IndexLL=Liquid Limit TV=TorvaneES=Environmental Sample
GR
AP
HIC
LOG
LOGGED BY1 of 1
PE
NE
TRA
TIO
N R
ES
ISTA
NC
E(B
LOW
S /
6 IN
)
CHECKED BY
5
10
15
20
PROJECT NUMBER
THIS SUMMARY APPLIES ONLY AT THE LOCATIONOF THIS BORING AND AT THE TIME OF DRILLING.SUBSURFACE CONDITIONS MAY DIFFER AT OTHERLOCATIONS AND MAY CHANGE AT THIS LOCATIONWITH THE PASSAGE OF TIME. THE DATAPRESENTED IS A SIMPLIFICATION OF THE ACTUALCONDITIONS ENCOUNTERED.
ATT
ER
BE
RG
LIM
ITS
LL:P
L:PI
TOTAL DEPTH (ft)
SHEET NO.
DESCRIPTION AND CLASSIFICATION
PROJECT NAME
ELE
VA
TIO
N(fe
et)
MO
ISTU
RE
(%)
GROUP DELTA CONSULTANTS, INC.
0 / na
DRILLING METHOD
FIGURE A-1
LOG OF TEST BORINGSITE LOCATION
SA
MP
LE N
O.
DRILLING COMPANY
DR
Y D
EN
SIT
Y(p
cf)
OTH
ER
TES
TS
DE
PTH
(fee
t)
GROUND ELEV (ft)
Torrance, CA 90501
DRILLING EQUIPMENT
NOTES
% P
ASSI
NG
#20
0
START
BORING DIA. (in)
FINISH
BORING
SAMPLING METHOD
DEPTH/ELEV. GROUND WATER (ft)
LEGEND
SA
MP
LE T
YP
E
370 Amapola Avenue, Suite 212
PO
CK
ET
PE
N(ts
f)
GD
C_L
OG
_BO
RIN
G_1
A_L
A2
A-1
LE
GE
ND
.GP
J G
DC
LOG
.GD
T 1
1/4/
09

CONCRETE (4").
Silty SAND (SM); brown; moist; mostly fine to mediumSAND; some fines; trace concrete fragments; nonplastic.-driller noted abundant of concrete fragments; hole movedapproximately 4 feet west due to concerns of the presence ofutility lines.
-medium dense; light brown.
-dense.
-medium dense.
-dense.
35
CR
DS
B-1
S-2
R-3
S-4
R-5
578
132429
1196
212738
15
53
15
65
2.0
2.7
4.9
4.4
4.9
124
128
Sylmar, CA
P. Kashighandi
NOTES
BORING DIA. (in)
GR
AP
HIC
LOG
LOGGED BY
8TOTAL DEPTH (ft)
Choice Drilling Hollow Stem Auger
FINISH
SPT & ModCal
DR
ILLI
NG
ME
THO
D
DURING DRILLINGDRIVE SAMPLER TYPE(S) & SIZE (ID)
/ na
THIS SUMMARY APPLIES ONLY AT THE LOCATIONOF THIS BORING AND AT THE TIME OF DRILLING.SUBSURFACE CONDITIONS MAY DIFFER AT OTHERLOCATIONS AND MAY CHANGE AT THIS LOCATIONWITH THE PASSAGE OF TIME. THE DATAPRESENTED IS A SIMPLIFICATION OF THE ACTUALCONDITIONS ENCOUNTERED.
SHEET NO.
SA
MP
LE N
O.
DRILLING COMPANY4/16/2014
ELE
VA
TIO
N(fe
et)
5
10
15
20
PO
CK
ET
PE
N (T
SF)
PROJECT NUMBER
1 of 2
BLO
W/F
T "N
"
DRILLING METHOD
Olive Vista Middle School
CHECKED BY
31.5
BORING RECORD HOLE ID
AFTER DRILLING
SA
MP
LE T
YP
E
FIGURE
A-2 a
DE
PTH
(fee
t)
GROUND ELEV (ft)
OTH
ER
TES
TS
START
Limited Access Rig
DESCRIPTION AND CLASSIFICATION
PROJECT NAME
B-1
PA
SS
ING
#20
0 (%
)
SITE LOCATION
1295 / na
S. Gunawan
1290
1285
1280
1275
HAMMER EFFICIENCY (ERi)HAMMER TYPE (WEIGHT/DROP)
DRILL RIG
DEPTH/ELEV. GW (ft)
4/16/2014
PE
NE
TRA
TIO
N R
ES
ISTA
NC
E(B
LOW
S /
6 IN
)
MO
ISTU
RE
(%)
DR
Y D
EN
SIT
Y (P
CF)
ATT
ER
BE
RG
LIM
ITS
(LL:
PL:P
I)
LA-1190
Hammer: 140 lbs., Drop: 30 in.
370 Amaploa Ave., Suite 212Torrance, CA 90501
GROUP DELTA CONSULTANTS, INC.
GD
C_L
OG
_BO
RIN
G_2
011
LA
1190
- O
LIV
E V
ISTA
.GP
J G
DC
LOG
.GD
T 5
/7/1
4

Silty SAND (SM), continued-medium dense.
-dense.
Boring terminated at 31.5 feet.Groundwater not encountered.Boring backfilled with soil cuttings and patched with concrete.
34S-6
R-7
777
131928
14
47
5.4
8.3 125
Sylmar, CA
P. Kashighandi
NOTES
BORING DIA. (in)
GR
AP
HIC
LOG
LOGGED BY
8TOTAL DEPTH (ft)
Choice Drilling Hollow Stem Auger
FINISH
SPT & ModCal
DR
ILLI
NG
ME
THO
D
DURING DRILLINGDRIVE SAMPLER TYPE(S) & SIZE (ID)
/ na
THIS SUMMARY APPLIES ONLY AT THE LOCATIONOF THIS BORING AND AT THE TIME OF DRILLING.SUBSURFACE CONDITIONS MAY DIFFER AT OTHERLOCATIONS AND MAY CHANGE AT THIS LOCATIONWITH THE PASSAGE OF TIME. THE DATAPRESENTED IS A SIMPLIFICATION OF THE ACTUALCONDITIONS ENCOUNTERED.
SHEET NO.
SA
MP
LE N
O.
DRILLING COMPANY4/16/2014
ELE
VA
TIO
N(fe
et)
30
35
40
45
PO
CK
ET
PE
N (T
SF)
PROJECT NUMBER
2 of 2
BLO
W/F
T "N
"
DRILLING METHOD
Olive Vista Middle School
CHECKED BY
31.5
BORING RECORD HOLE ID
AFTER DRILLING
SA
MP
LE T
YP
E
FIGURE
A-2 b
DE
PTH
(fee
t)
GROUND ELEV (ft)
OTH
ER
TES
TS
START
Limited Access Rig
DESCRIPTION AND CLASSIFICATION
PROJECT NAME
B-1
PA
SS
ING
#20
0 (%
)
SITE LOCATION
1295 / na
S. Gunawan
1265
1260
1255
1250
HAMMER EFFICIENCY (ERi)HAMMER TYPE (WEIGHT/DROP)
DRILL RIG
DEPTH/ELEV. GW (ft)
4/16/2014
PE
NE
TRA
TIO
N R
ES
ISTA
NC
E(B
LOW
S /
6 IN
)
MO
ISTU
RE
(%)
DR
Y D
EN
SIT
Y (P
CF)
ATT
ER
BE
RG
LIM
ITS
(LL:
PL:P
I)
LA-1190
Hammer: 140 lbs., Drop: 30 in.
370 Amaploa Ave., Suite 212Torrance, CA 90501
GROUP DELTA CONSULTANTS, INC.
GD
C_L
OG
_BO
RIN
G_2
011
LA
1190
- O
LIV
E V
ISTA
.GP
J G
DC
LOG
.GD
T 5
/7/1
4
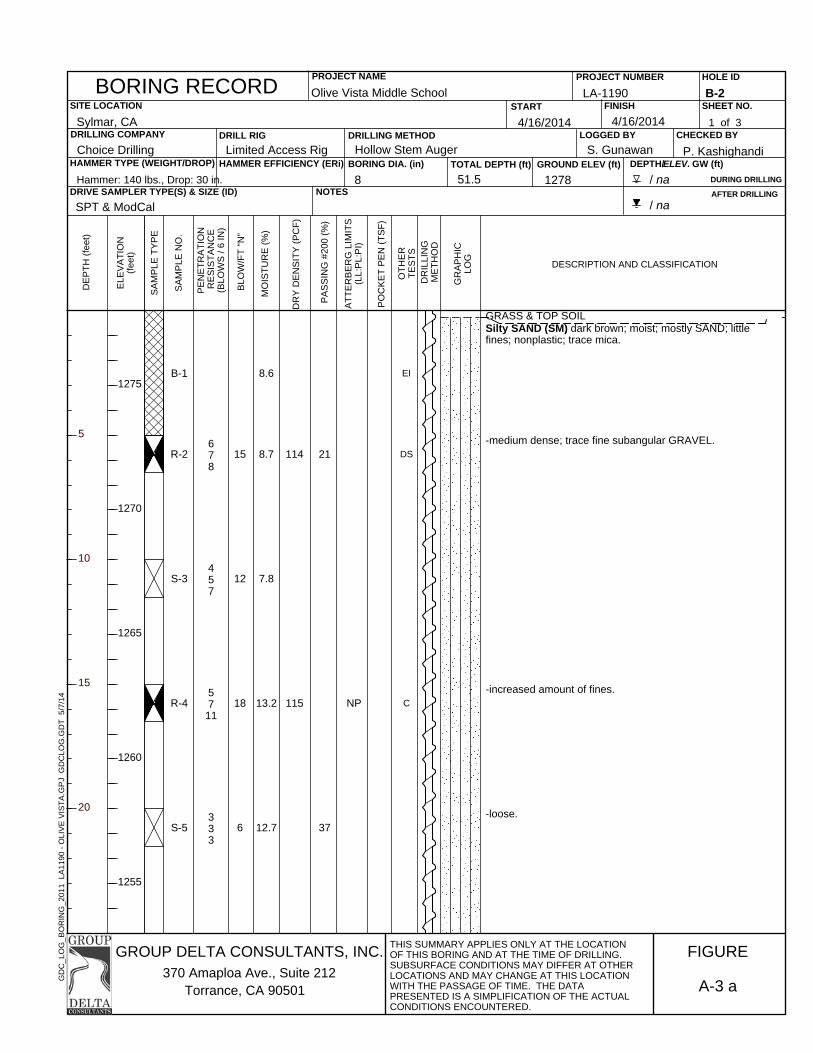
GRASS & TOP SOILSilty SAND (SM); dark brown; moist; mostly SAND; littlefines; nonplastic; trace mica.
-medium dense; trace fine subangular GRAVEL.
-increased amount of fines.
-loose.
21
37
EI
DS
C
B-1
R-2
S-3
R-4
S-5
678
457
5711
333
15
12
18
6
8.6
8.7
7.8
13.2
12.7
114
115 NP
Sylmar, CA
P. Kashighandi
NOTES
BORING DIA. (in)
GR
AP
HIC
LOG
LOGGED BY
8TOTAL DEPTH (ft)
Choice Drilling Hollow Stem Auger
FINISH
SPT & ModCal
DR
ILLI
NG
ME
THO
D
DURING DRILLINGDRIVE SAMPLER TYPE(S) & SIZE (ID)
/ na
THIS SUMMARY APPLIES ONLY AT THE LOCATIONOF THIS BORING AND AT THE TIME OF DRILLING.SUBSURFACE CONDITIONS MAY DIFFER AT OTHERLOCATIONS AND MAY CHANGE AT THIS LOCATIONWITH THE PASSAGE OF TIME. THE DATAPRESENTED IS A SIMPLIFICATION OF THE ACTUALCONDITIONS ENCOUNTERED.
SHEET NO.
SA
MP
LE N
O.
DRILLING COMPANY4/16/2014
ELE
VA
TIO
N(fe
et)
5
10
15
20
PO
CK
ET
PE
N (T
SF)
PROJECT NUMBER
1 of 3
BLO
W/F
T "N
"
DRILLING METHOD
Olive Vista Middle School
CHECKED BY
51.5
BORING RECORD HOLE ID
AFTER DRILLING
SA
MP
LE T
YP
E
FIGURE
A-3 a
DE
PTH
(fee
t)
GROUND ELEV (ft)
OTH
ER
TES
TS
START
Limited Access Rig
DESCRIPTION AND CLASSIFICATION
PROJECT NAME
B-2
PA
SS
ING
#20
0 (%
)
SITE LOCATION
1278 / na
S. Gunawan
1275
1270
1265
1260
1255
HAMMER EFFICIENCY (ERi)HAMMER TYPE (WEIGHT/DROP)
DRILL RIG
DEPTH/ELEV. GW (ft)
4/16/2014
PE
NE
TRA
TIO
N R
ES
ISTA
NC
E(B
LOW
S /
6 IN
)
MO
ISTU
RE
(%)
DR
Y D
EN
SIT
Y (P
CF)
ATT
ER
BE
RG
LIM
ITS
(LL:
PL:P
I)
LA-1190
Hammer: 140 lbs., Drop: 30 in.
370 Amaploa Ave., Suite 212Torrance, CA 90501
GROUP DELTA CONSULTANTS, INC.
GD
C_L
OG
_BO
RIN
G_2
011
LA
1190
- O
LIV
E V
ISTA
.GP
J G
DC
LOG
.GD
T 5
/7/1
4

(Silty SAND (SM), continued)-medium dense, increased amount of fines.
Well-Graded SAND with SILT (SW-SM); dense; mix ofbrown and gray; mostly fine to coarse SAND; trace finesubangular GRAVEL; few fines; nonplastic.
Silty SAND (SM); medium dense; brown; moist; mostly fineto medium SAND; little fines; trace fine subangular GRAVEL;nonplastic.
-dense. 2-inch diameter GRAVEL in tip of sampler.
8
C DS
R-6
S-7
R-8
S-9
R-10
7810
678
122642
778
172328
18
15
68
15
51
15.0
10.3
6.0
7.6
11.5
114
110
121
NP
Sylmar, CA
P. Kashighandi
NOTES
BORING DIA. (in)
GR
AP
HIC
LOG
LOGGED BY
8TOTAL DEPTH (ft)
Choice Drilling Hollow Stem Auger
FINISH
SPT & ModCal
DR
ILLI
NG
ME
THO
D
DURING DRILLINGDRIVE SAMPLER TYPE(S) & SIZE (ID)
/ na
THIS SUMMARY APPLIES ONLY AT THE LOCATIONOF THIS BORING AND AT THE TIME OF DRILLING.SUBSURFACE CONDITIONS MAY DIFFER AT OTHERLOCATIONS AND MAY CHANGE AT THIS LOCATIONWITH THE PASSAGE OF TIME. THE DATAPRESENTED IS A SIMPLIFICATION OF THE ACTUALCONDITIONS ENCOUNTERED.
SHEET NO.
SA
MP
LE N
O.
DRILLING COMPANY4/16/2014
ELE
VA
TIO
N(fe
et)
30
35
40
45
PO
CK
ET
PE
N (T
SF)
PROJECT NUMBER
2 of 3
BLO
W/F
T "N
"
DRILLING METHOD
Olive Vista Middle School
CHECKED BY
51.5
BORING RECORD HOLE ID
AFTER DRILLING
SA
MP
LE T
YP
E
FIGURE
A-3 b
DE
PTH
(fee
t)
GROUND ELEV (ft)
OTH
ER
TES
TS
START
Limited Access Rig
DESCRIPTION AND CLASSIFICATION
PROJECT NAME
B-2
PA
SS
ING
#20
0 (%
)
SITE LOCATION
1278 / na
S. Gunawan
1250
1245
1240
1235
1230
HAMMER EFFICIENCY (ERi)HAMMER TYPE (WEIGHT/DROP)
DRILL RIG
DEPTH/ELEV. GW (ft)
4/16/2014
PE
NE
TRA
TIO
N R
ES
ISTA
NC
E(B
LOW
S /
6 IN
)
MO
ISTU
RE
(%)
DR
Y D
EN
SIT
Y (P
CF)
ATT
ER
BE
RG
LIM
ITS
(LL:
PL:P
I)
LA-1190
Hammer: 140 lbs., Drop: 30 in.
370 Amaploa Ave., Suite 212Torrance, CA 90501
GROUP DELTA CONSULTANTS, INC.
GD
C_L
OG
_BO
RIN
G_2
011
LA
1190
- O
LIV
E V
ISTA
.GP
J G
DC
LOG
.GD
T 5
/7/1
4

Poorly-Graded SAND with SILT (SP-SM); dense; mix ofbrown and gray; mostly fine to coarse SAND; few fines;nonplastic.Boring terminated at 51.5 feet.Groundwater not encountered.Boring backfilled with soil cuttings.
S-11151822
40 6.0
Sylmar, CA
P. Kashighandi
NOTES
BORING DIA. (in)
GR
AP
HIC
LOG
LOGGED BY
8TOTAL DEPTH (ft)
Choice Drilling Hollow Stem Auger
FINISH
SPT & ModCal
DR
ILLI
NG
ME
THO
D
DURING DRILLINGDRIVE SAMPLER TYPE(S) & SIZE (ID)
/ na
THIS SUMMARY APPLIES ONLY AT THE LOCATIONOF THIS BORING AND AT THE TIME OF DRILLING.SUBSURFACE CONDITIONS MAY DIFFER AT OTHERLOCATIONS AND MAY CHANGE AT THIS LOCATIONWITH THE PASSAGE OF TIME. THE DATAPRESENTED IS A SIMPLIFICATION OF THE ACTUALCONDITIONS ENCOUNTERED.
SHEET NO.
SA
MP
LE N
O.
DRILLING COMPANY4/16/2014
ELE
VA
TIO
N(fe
et)
55
60
65
70
PO
CK
ET
PE
N (T
SF)
PROJECT NUMBER
3 of 3
BLO
W/F
T "N
"
DRILLING METHOD
Olive Vista Middle School
CHECKED BY
51.5
BORING RECORD HOLE ID
AFTER DRILLING
SA
MP
LE T
YP
E
FIGURE
A-3 c
DE
PTH
(fee
t)
GROUND ELEV (ft)
OTH
ER
TES
TS
START
Limited Access Rig
DESCRIPTION AND CLASSIFICATION
PROJECT NAME
B-2
PA
SS
ING
#20
0 (%
)
SITE LOCATION
1278 / na
S. Gunawan
1225
1220
1215
1210
1205
HAMMER EFFICIENCY (ERi)HAMMER TYPE (WEIGHT/DROP)
DRILL RIG
DEPTH/ELEV. GW (ft)
4/16/2014
PE
NE
TRA
TIO
N R
ES
ISTA
NC
E(B
LOW
S /
6 IN
)
MO
ISTU
RE
(%)
DR
Y D
EN
SIT
Y (P
CF)
ATT
ER
BE
RG
LIM
ITS
(LL:
PL:P
I)
LA-1190
Hammer: 140 lbs., Drop: 30 in.
370 Amaploa Ave., Suite 212Torrance, CA 90501
GROUP DELTA CONSULTANTS, INC.
GD
C_L
OG
_BO
RIN
G_2
011
LA
1190
- O
LIV
E V
ISTA
.GP
J G
DC
LOG
.GD
T 5
/7/1
4

GRASS & TOP SOIL.Silty SAND (SM); dark brown and gray; moist; mostly fine tocoarse SAND; little to some fines; trace mica; nonplastic.
-medium dense; 3/4-inch diameter sub-angular gravel in tip ofsampler.
Poorly-Graded SAND (SP); medium dense; brown; moist;mostly fine to coarse SAND; trace fines; trace mica;nonplastic.
Silty SAND (SM); medium dense; dark brown; moist; mostlyfine to medium SAND; some fines; trace mica; nonplastic.
Sandy SILT/Silty SAND (ML/SM); firm; brown; moist; nearlyequal amount of fines and fine to medium SAND; few clayclasts; nonplastic.
30 DS
B-1
R-2
S-3
R-4
S-5
5610
567
789
344
16
13
17
8
7.2
10.6
4.1
9.8
14.9
110
116
NP
Sylmar, CA
P. Kashighandi
NOTES
BORING DIA. (in)
GR
AP
HIC
LOG
LOGGED BY
8TOTAL DEPTH (ft)
Choice Drilling Hollow Stem Auger
FINISH
SPT & ModCal
DR
ILLI
NG
ME
THO
D
DURING DRILLINGDRIVE SAMPLER TYPE(S) & SIZE (ID)
/ na
THIS SUMMARY APPLIES ONLY AT THE LOCATIONOF THIS BORING AND AT THE TIME OF DRILLING.SUBSURFACE CONDITIONS MAY DIFFER AT OTHERLOCATIONS AND MAY CHANGE AT THIS LOCATIONWITH THE PASSAGE OF TIME. THE DATAPRESENTED IS A SIMPLIFICATION OF THE ACTUALCONDITIONS ENCOUNTERED.
SHEET NO.
SA
MP
LE N
O.
DRILLING COMPANY4/16/2014
ELE
VA
TIO
N(fe
et)
5
10
15
20
PO
CK
ET
PE
N (T
SF)
PROJECT NUMBER
1 of 2
BLO
W/F
T "N
"
DRILLING METHOD
Olive Vista Middle School
CHECKED BY
31.5
BORING RECORD HOLE ID
AFTER DRILLING
SA
MP
LE T
YP
E
FIGURE
A-4 a
DE
PTH
(fee
t)
GROUND ELEV (ft)
OTH
ER
TES
TS
START
Limited Access Rig
DESCRIPTION AND CLASSIFICATION
PROJECT NAME
B-3
PA
SS
ING
#20
0 (%
)
SITE LOCATION
1279 / na
K. Madamba
1275
1270
1265
1260
1255
HAMMER EFFICIENCY (ERi)HAMMER TYPE (WEIGHT/DROP)
DRILL RIG
DEPTH/ELEV. GW (ft)
4/16/2014
PE
NE
TRA
TIO
N R
ES
ISTA
NC
E(B
LOW
S /
6 IN
)
MO
ISTU
RE
(%)
DR
Y D
EN
SIT
Y (P
CF)
ATT
ER
BE
RG
LIM
ITS
(LL:
PL:P
I)
LA-1190
Hammer: 140 lbs., Drop: 30 in.
370 Amaploa Ave., Suite 212Torrance, CA 90501
GROUP DELTA CONSULTANTS, INC.
GD
C_L
OG
_BO
RIN
G_2
011
LA
1190
- O
LIV
E V
ISTA
.GP
J G
DC
LOG
.GD
T 5
/7/1
4

SIlty SAND (SM); medium dense; brown; moist; mostlySAND; little fines; trace fine GRAVEL; few clay clasts;nonplastic.
SILT (ML); stiff; brown; mostly fines; few fine to mediumSAND; trace mica; nonplastic.
Boring terminated at 31.5 feet.Groundwater not encountered.Boring backfilled with soil cuttings.
19R-6
S-7
81524
567
39
13
9.2
15.7
124
NP
Sylmar, CA
P. Kashighandi
NOTES
BORING DIA. (in)
GR
AP
HIC
LOG
LOGGED BY
8TOTAL DEPTH (ft)
Choice Drilling Hollow Stem Auger
FINISH
SPT & ModCal
DR
ILLI
NG
ME
THO
D
DURING DRILLINGDRIVE SAMPLER TYPE(S) & SIZE (ID)
/ na
THIS SUMMARY APPLIES ONLY AT THE LOCATIONOF THIS BORING AND AT THE TIME OF DRILLING.SUBSURFACE CONDITIONS MAY DIFFER AT OTHERLOCATIONS AND MAY CHANGE AT THIS LOCATIONWITH THE PASSAGE OF TIME. THE DATAPRESENTED IS A SIMPLIFICATION OF THE ACTUALCONDITIONS ENCOUNTERED.
SHEET NO.
SA
MP
LE N
O.
DRILLING COMPANY4/16/2014
ELE
VA
TIO
N(fe
et)
30
35
40
45
PO
CK
ET
PE
N (T
SF)
PROJECT NUMBER
2 of 2
BLO
W/F
T "N
"
DRILLING METHOD
Olive Vista Middle School
CHECKED BY
31.5
BORING RECORD HOLE ID
AFTER DRILLING
SA
MP
LE T
YP
E
FIGURE
A-4 b
DE
PTH
(fee
t)
GROUND ELEV (ft)
OTH
ER
TES
TS
START
Limited Access Rig
DESCRIPTION AND CLASSIFICATION
PROJECT NAME
B-3
PA
SS
ING
#20
0 (%
)
SITE LOCATION
1279 / na
K. Madamba
1250
1245
1240
1235
1230
HAMMER EFFICIENCY (ERi)HAMMER TYPE (WEIGHT/DROP)
DRILL RIG
DEPTH/ELEV. GW (ft)
4/16/2014
PE
NE
TRA
TIO
N R
ES
ISTA
NC
E(B
LOW
S /
6 IN
)
MO
ISTU
RE
(%)
DR
Y D
EN
SIT
Y (P
CF)
ATT
ER
BE
RG
LIM
ITS
(LL:
PL:P
I)
LA-1190
Hammer: 140 lbs., Drop: 30 in.
370 Amaploa Ave., Suite 212Torrance, CA 90501
GROUP DELTA CONSULTANTS, INC.
GD
C_L
OG
_BO
RIN
G_2
011
LA
1190
- O
LIV
E V
ISTA
.GP
J G
DC
LOG
.GD
T 5
/7/1
4

ASPHALT (4").Silty SAND (SM); dark brown; moist; mostly fine to coarseSAND; some fines; trace of subangular GRAVEL; nonplastic.
Poorly-Graded SAND; medum dense; light brown; gray;moist; mostly fine to medium SAND; trace fines; nonplastic.
Silty SAND (SM); loose; dark brown; moist; mostly fine tomedium SAND; little fines; nonplastic.
Boring terminated at 11.5 feet.Groundwater not encountered.Boring backfilled with soil cuttings and asphalt patched.
EIB-1
R-2
S-3
91218
333
30
6
7.9
3.0
6.8
104
Sylmar, CA
P. Kashighandi
NOTES
BORING DIA. (in)
GR
AP
HIC
LOG
LOGGED BY
8TOTAL DEPTH (ft)
Choice Drilling Hollow Stem Auger
FINISH
SPT & ModCal
DR
ILLI
NG
ME
THO
D
DURING DRILLINGDRIVE SAMPLER TYPE(S) & SIZE (ID)
/ na
THIS SUMMARY APPLIES ONLY AT THE LOCATIONOF THIS BORING AND AT THE TIME OF DRILLING.SUBSURFACE CONDITIONS MAY DIFFER AT OTHERLOCATIONS AND MAY CHANGE AT THIS LOCATIONWITH THE PASSAGE OF TIME. THE DATAPRESENTED IS A SIMPLIFICATION OF THE ACTUALCONDITIONS ENCOUNTERED.
SHEET NO.
SA
MP
LE N
O.
DRILLING COMPANY4/16/2014
ELE
VA
TIO
N(fe
et)
5
10
15
20
PO
CK
ET
PE
N (T
SF)
PROJECT NUMBER
1 of 1
BLO
W/F
T "N
"
DRILLING METHOD
Olive Vista Middle School
CHECKED BY
11.5
BORING RECORD HOLE ID
AFTER DRILLING
SA
MP
LE T
YP
E
FIGURE
A-5
DE
PTH
(fee
t)
GROUND ELEV (ft)
OTH
ER
TES
TS
START
Limited Access Rig
DESCRIPTION AND CLASSIFICATION
PROJECT NAME
B-4
PA
SS
ING
#20
0 (%
)
SITE LOCATION
1287 / na
K. Madamba
1285
1280
1275
1270
1265
HAMMER EFFICIENCY (ERi)HAMMER TYPE (WEIGHT/DROP)
DRILL RIG
DEPTH/ELEV. GW (ft)
4/16/2014
PE
NE
TRA
TIO
N R
ES
ISTA
NC
E(B
LOW
S /
6 IN
)
MO
ISTU
RE
(%)
DR
Y D
EN
SIT
Y (P
CF)
ATT
ER
BE
RG
LIM
ITS
(LL:
PL:P
I)
LA-1190
Hammer: 140 lbs., Drop: 30 in.
370 Amaploa Ave., Suite 212Torrance, CA 90501
GROUP DELTA CONSULTANTS, INC.
GD
C_L
OG
_BO
RIN
G_2
011
LA
1190
- O
LIV
E V
ISTA
.GP
J G
DC
LOG
.GD
T 5
/7/1
4

ASPHALT (3").Silty SAND (SM); dark brown; moist; mostly fine to mediumSAND; some fines; nonplastic.
-medium dense; brown.
Sandy SILT (ML); stiff; light brown; moist; mostly fines;some fine to coars SAND; nonplastic.
Boring terminated at 11.5 feet.Groundwater not encountered.Boring backfilled with soil cuttings and asphalt patched.
14 DS
B-1
R-2
S-3
7911
455
20
10
7.3
5.9
3.7
110
NP
Sylmar, CA
P. Kashighandi
NOTES
BORING DIA. (in)
GR
AP
HIC
LOG
LOGGED BY
8TOTAL DEPTH (ft)
Choice Drilling Hollow Stem Auger
FINISH
SPT & ModCal
DR
ILLI
NG
ME
THO
D
DURING DRILLINGDRIVE SAMPLER TYPE(S) & SIZE (ID)
/ na
THIS SUMMARY APPLIES ONLY AT THE LOCATIONOF THIS BORING AND AT THE TIME OF DRILLING.SUBSURFACE CONDITIONS MAY DIFFER AT OTHERLOCATIONS AND MAY CHANGE AT THIS LOCATIONWITH THE PASSAGE OF TIME. THE DATAPRESENTED IS A SIMPLIFICATION OF THE ACTUALCONDITIONS ENCOUNTERED.
SHEET NO.
SA
MP
LE N
O.
DRILLING COMPANY4/16/2014
ELE
VA
TIO
N(fe
et)
5
10
15
20
PO
CK
ET
PE
N (T
SF)
PROJECT NUMBER
1 of 1
BLO
W/F
T "N
"
DRILLING METHOD
Olive Vista Middle School
CHECKED BY
11.5
BORING RECORD HOLE ID
AFTER DRILLING
SA
MP
LE T
YP
E
FIGURE
A-6
DE
PTH
(fee
t)
GROUND ELEV (ft)
OTH
ER
TES
TS
START
Limited Access Rig
DESCRIPTION AND CLASSIFICATION
PROJECT NAME
B-5
PA
SS
ING
#20
0 (%
)
SITE LOCATION
1289 / na
K. Madamba
1285
1280
1275
1270
1265
HAMMER EFFICIENCY (ERi)HAMMER TYPE (WEIGHT/DROP)
DRILL RIG
DEPTH/ELEV. GW (ft)
4/16/2014
PE
NE
TRA
TIO
N R
ES
ISTA
NC
E(B
LOW
S /
6 IN
)
MO
ISTU
RE
(%)
DR
Y D
EN
SIT
Y (P
CF)
ATT
ER
BE
RG
LIM
ITS
(LL:
PL:P
I)
LA-1190
Hammer: 140 lbs., Drop: 30 in.
370 Amaploa Ave., Suite 212Torrance, CA 90501
GROUP DELTA CONSULTANTS, INC.
GD
C_L
OG
_BO
RIN
G_2
011
LA
1190
- O
LIV
E V
ISTA
.GP
J G
DC
LOG
.GD
T 5
/7/1
4

ASPHALT (4").Silty SAND (SM); brown; mostly fine to coarse SAND; littleto some fines; nonplastic.
-loose.
-medium dense; fine to medium SAND.
Boring terminated at 11.5 feet.Groundwater not encountered.Boring backfilled with soil cuttings and asphalt patched.
CRB-1
S-2
R-3
335
71217
8
29
6.9
3.4
4.1 116
Sylmar, CA
P. Kashighandi
NOTES
BORING DIA. (in)
GR
AP
HIC
LOG
LOGGED BY
8TOTAL DEPTH (ft)
Choice Drilling Hollow Stem Auger
FINISH
SPT & ModCal
DR
ILLI
NG
ME
THO
D
DURING DRILLINGDRIVE SAMPLER TYPE(S) & SIZE (ID)
/ na
THIS SUMMARY APPLIES ONLY AT THE LOCATIONOF THIS BORING AND AT THE TIME OF DRILLING.SUBSURFACE CONDITIONS MAY DIFFER AT OTHERLOCATIONS AND MAY CHANGE AT THIS LOCATIONWITH THE PASSAGE OF TIME. THE DATAPRESENTED IS A SIMPLIFICATION OF THE ACTUALCONDITIONS ENCOUNTERED.
SHEET NO.
SA
MP
LE N
O.
DRILLING COMPANY4/16/2014
ELE
VA
TIO
N(fe
et)
5
10
15
20
PO
CK
ET
PE
N (T
SF)
PROJECT NUMBER
1 of 1
BLO
W/F
T "N
"
DRILLING METHOD
Olive Vista Middle School
CHECKED BY
11.5
BORING RECORD HOLE ID
AFTER DRILLING
SA
MP
LE T
YP
E
FIGURE
A-7
DE
PTH
(fee
t)
GROUND ELEV (ft)
OTH
ER
TES
TS
START
Limited Access Rig
DESCRIPTION AND CLASSIFICATION
PROJECT NAME
B-6
PA
SS
ING
#20
0 (%
)
SITE LOCATION
1283 / na
K. Madamba
1280
1275
1270
1265
1260
HAMMER EFFICIENCY (ERi)HAMMER TYPE (WEIGHT/DROP)
DRILL RIG
DEPTH/ELEV. GW (ft)
4/16/2014
PE
NE
TRA
TIO
N R
ES
ISTA
NC
E(B
LOW
S /
6 IN
)
MO
ISTU
RE
(%)
DR
Y D
EN
SIT
Y (P
CF)
ATT
ER
BE
RG
LIM
ITS
(LL:
PL:P
I)
LA-1190
Hammer: 140 lbs., Drop: 30 in.
370 Amaploa Ave., Suite 212Torrance, CA 90501
GROUP DELTA CONSULTANTS, INC.
GD
C_L
OG
_BO
RIN
G_2
011
LA
1190
- O
LIV
E V
ISTA
.GP
J G
DC
LOG
.GD
T 5
/7/1
4

GRASS & TOP SOIL.Silty SAND (SM); dark brown; moist; mostly SAND; somefines; nonplastic.
-GRAVEL/COBBLE fragments 1-2" in diameter.
No sampling until 20 feet.
Silty SAND (SM); dark brown; moist; mostly SAND; somefines; nonplastic.
Boring terminated at 22 feet.Groundwater not encountered.Boring converted to temporary well for percolation test.
B-1
B-2
Sylmar, CA
P. Kashighandi
NOTES
BORING DIA. (in)
GR
AP
HIC
LOG
LOGGED BY
8TOTAL DEPTH (ft)
Choice Drilling Hollow Stem Auger
FINISH
SPT & ModCal
DR
ILLI
NG
ME
THO
D
DURING DRILLINGDRIVE SAMPLER TYPE(S) & SIZE (ID)
/ na
THIS SUMMARY APPLIES ONLY AT THE LOCATIONOF THIS BORING AND AT THE TIME OF DRILLING.SUBSURFACE CONDITIONS MAY DIFFER AT OTHERLOCATIONS AND MAY CHANGE AT THIS LOCATIONWITH THE PASSAGE OF TIME. THE DATAPRESENTED IS A SIMPLIFICATION OF THE ACTUALCONDITIONS ENCOUNTERED.
SHEET NO.
SA
MP
LE N
O.
DRILLING COMPANY4/16/2014
ELE
VA
TIO
N(fe
et)
5
10
15
20
PO
CK
ET
PE
N (T
SF)
PROJECT NUMBER
1 of 1
BLO
W/F
T "N
"
DRILLING METHOD
Olive Vista Middle School
CHECKED BY
22
BORING RECORD HOLE ID
AFTER DRILLING
SA
MP
LE T
YP
E
FIGURE
A-8
DE
PTH
(fee
t)
GROUND ELEV (ft)
OTH
ER
TES
TS
START
Limited Access Rig
DESCRIPTION AND CLASSIFICATION
PROJECT NAME
B-7
PA
SS
ING
#20
0 (%
)
SITE LOCATION
1272 / na
K. Madamba
1270
1265
1260
1255
1250
HAMMER EFFICIENCY (ERi)HAMMER TYPE (WEIGHT/DROP)
DRILL RIG
DEPTH/ELEV. GW (ft)
4/16/2014
PE
NE
TRA
TIO
N R
ES
ISTA
NC
E(B
LOW
S /
6 IN
)
MO
ISTU
RE
(%)
DR
Y D
EN
SIT
Y (P
CF)
ATT
ER
BE
RG
LIM
ITS
(LL:
PL:P
I)
LA-1190
Hammer: 140 lbs., Drop: 30 in.
370 Amaploa Ave., Suite 212Torrance, CA 90501
GROUP DELTA CONSULTANTS, INC.
GD
C_L
OG
_BO
RIN
G_2
011
LA
1190
- O
LIV
E V
ISTA
.GP
J G
DC
LOG
.GD
T 5
/7/1
4
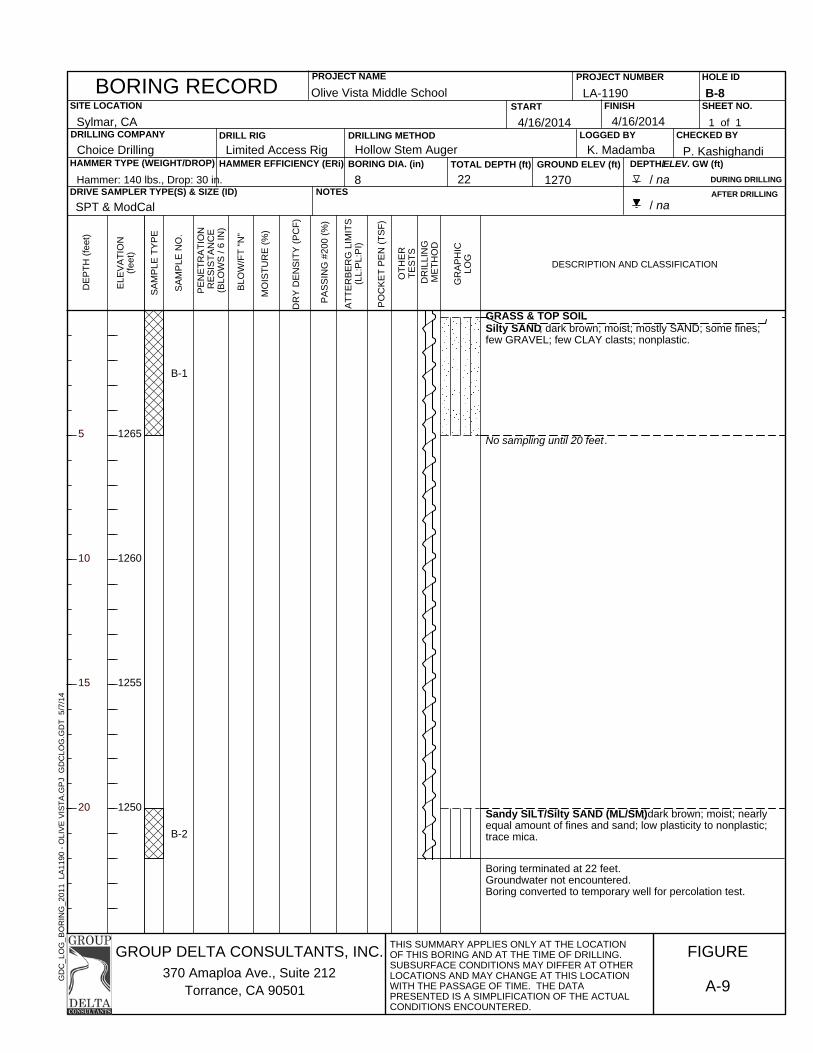
GRASS & TOP SOIL.Silty SAND; dark brown; moist; mostly SAND; some fines;few GRAVEL; few CLAY clasts; nonplastic.
No sampling until 20 feet.
Sandy SILT/Silty SAND (ML/SM); dark brown; moist; nearlyequal amount of fines and sand; low plasticity to nonplastic;trace mica.
Boring terminated at 22 feet.Groundwater not encountered.Boring converted to temporary well for percolation test.
B-1
B-2
Sylmar, CA
P. Kashighandi
NOTES
BORING DIA. (in)
GR
AP
HIC
LOG
LOGGED BY
8TOTAL DEPTH (ft)
Choice Drilling Hollow Stem Auger
FINISH
SPT & ModCal
DR
ILLI
NG
ME
THO
D
DURING DRILLINGDRIVE SAMPLER TYPE(S) & SIZE (ID)
/ na
THIS SUMMARY APPLIES ONLY AT THE LOCATIONOF THIS BORING AND AT THE TIME OF DRILLING.SUBSURFACE CONDITIONS MAY DIFFER AT OTHERLOCATIONS AND MAY CHANGE AT THIS LOCATIONWITH THE PASSAGE OF TIME. THE DATAPRESENTED IS A SIMPLIFICATION OF THE ACTUALCONDITIONS ENCOUNTERED.
SHEET NO.
SA
MP
LE N
O.
DRILLING COMPANY4/16/2014
ELE
VA
TIO
N(fe
et)
5
10
15
20
PO
CK
ET
PE
N (T
SF)
PROJECT NUMBER
1 of 1
BLO
W/F
T "N
"
DRILLING METHOD
Olive Vista Middle School
CHECKED BY
22
BORING RECORD HOLE ID
AFTER DRILLING
SA
MP
LE T
YP
E
FIGURE
A-9
DE
PTH
(fee
t)
GROUND ELEV (ft)
OTH
ER
TES
TS
START
Limited Access Rig
DESCRIPTION AND CLASSIFICATION
PROJECT NAME
B-8
PA
SS
ING
#20
0 (%
)
SITE LOCATION
1270 / na
K. Madamba
1265
1260
1255
1250
HAMMER EFFICIENCY (ERi)HAMMER TYPE (WEIGHT/DROP)
DRILL RIG
DEPTH/ELEV. GW (ft)
4/16/2014
PE
NE
TRA
TIO
N R
ES
ISTA
NC
E(B
LOW
S /
6 IN
)
MO
ISTU
RE
(%)
DR
Y D
EN
SIT
Y (P
CF)
ATT
ER
BE
RG
LIM
ITS
(LL:
PL:P
I)
LA-1190
Hammer: 140 lbs., Drop: 30 in.
370 Amaploa Ave., Suite 212Torrance, CA 90501
GROUP DELTA CONSULTANTS, INC.
GD
C_L
OG
_BO
RIN
G_2
011
LA
1190
- O
LIV
E V
ISTA
.GP
J G
DC
LOG
.GD
T 5
/7/1
4

6.3
7.1
8.3
7.0
30
105
108
5" A.C over 6.5" Base
Artificial Fill (AF)
Silty Sand with Gravel(SM) , dark brown, moist, fine tomedium grained sand, angular gravelsAlluvium (Qa)
Silty Sand (SM) , dark brown, moist, fine to medium sand
Sand with Silt (SP-SM) , dark brown, moist, loose, fine tomedium grained sand, micaceous
-Medium Dense
Silty Sand (SM) , dark brown, moist, loose, fine grainedsand, micaceous
-Medium Dense
B-1
S-2
R-3
S-4
R-5
334
7915
344
7810
GR
AP
HIC
LOG
LOGGED BY1 of 2
PE
NE
TRA
TIO
NR
ES
ISTA
NC
E(B
LOW
S /
6 IN
)
CHECKED BY
5
10
15
20
PROJECT NUMBER
Olive Vista Middle School Seismic Retrofit
8/23/2011
ATT
ER
BE
RG
LIM
ITS
LL:P
L:P
I
TOTAL DEPTH (ft)
SHEET NO.
Hammer: 140 lbs., Drop: 30 in.
DESCRIPTION AND CLASSIFICATION
PROJECT NAME
ELE
VA
TIO
N(fe
et)
MO
ISTU
RE
(%)
GROUP DELTA CONSULTANTS, INC.
31.5 / na
DRILLING METHOD
LOG OF TEST BORINGSITE LOCATION
SA
MP
LE N
O.
DRILLING COMPANY8/23/2011
Choice Hollow Stem Auger DMD
DR
Y D
EN
SIT
Y(p
cf)
8"
OTH
ER
TES
TS
CME 75 (LAR)
DE
PTH
(fee
t)
GROUND ELEV (ft)
Torrance, CA 90501
DRILLING EQUIPMENT
NOTES
% P
AS
SIN
G #
200
START
BORING DIA. (in)
L-1015FINISH
BORING
SAMPLING METHOD
4600 Tyler Street, Sylmar, ca
DEPTH/ELEV. GROUND WATER (ft)
B-1
SA
MP
LE T
YP
E
370 Amapola Avenue, Suite 212
PO
CK
ET
PE
N(ts
f)
THIS SUMMARY APPLIES ONLY AT THE LOCATION OFTHIS BORING AND AT THE TIME OF DRILLING.SUBSURFACE CONDITIONS MAY DIFFER AT OTHERLOCATIONS AND MAY CHANGE AT THIS LOCATIONWITH THE PASSAGE OF TIME. THE DATA PRESENTEDIS A SIMPLIFICATION OF THE ACTUAL CONDITIONSENCOUNTERED.
KC
GD
C_L
OG
_BO
RIN
G_1
A_L
A2
L-1
015
BO
RIN
G L
OG
S.G
PJ
GD
CLO
G.G
DT
9/3
0/11

5.9
10.8104
- Layer of gravels/cobbles
Sandy Silt to Silty Sand (ML/SM) , light brown, moist, verystiff/medium dense, some oxidation
Total Depth: 31.5 FeetGroundwater: Not encountered to the maximumd epthexploredFill: Approximately 3 FeetBoring backfilled with tamped cuttings and asphalt patchedupon completion
S-6
R-7
71213
81112
GR
AP
HIC
LOG
LOGGED BY2 of 2
PE
NE
TRA
TIO
NR
ES
ISTA
NC
E(B
LOW
S /
6 IN
)
CHECKED BY
30
35
40
45
PROJECT NUMBER
Olive Vista Middle School Seismic Retrofit
8/23/2011
ATT
ER
BE
RG
LIM
ITS
LL:P
L:P
I
TOTAL DEPTH (ft)
SHEET NO.
Hammer: 140 lbs., Drop: 30 in.
DESCRIPTION AND CLASSIFICATION
PROJECT NAME
ELE
VA
TIO
N(fe
et)
MO
ISTU
RE
(%)
GROUP DELTA CONSULTANTS, INC.
31.5 / na
DRILLING METHOD
LOG OF TEST BORINGSITE LOCATION
SA
MP
LE N
O.
DRILLING COMPANY8/23/2011
Choice Hollow Stem Auger DMD
DR
Y D
EN
SIT
Y(p
cf)
8"
OTH
ER
TES
TS
CME 75 (LAR)
DE
PTH
(fee
t)
GROUND ELEV (ft)
Torrance, CA 90501
DRILLING EQUIPMENT
NOTES
% P
AS
SIN
G #
200
START
BORING DIA. (in)
L-1015FINISH
BORING
SAMPLING METHOD
4600 Tyler Street, Sylmar, ca
DEPTH/ELEV. GROUND WATER (ft)
B-1
SA
MP
LE T
YP
E
370 Amapola Avenue, Suite 212
PO
CK
ET
PE
N(ts
f)
THIS SUMMARY APPLIES ONLY AT THE LOCATION OFTHIS BORING AND AT THE TIME OF DRILLING.SUBSURFACE CONDITIONS MAY DIFFER AT OTHERLOCATIONS AND MAY CHANGE AT THIS LOCATIONWITH THE PASSAGE OF TIME. THE DATA PRESENTEDIS A SIMPLIFICATION OF THE ACTUAL CONDITIONSENCOUNTERED.
KC
GD
C_L
OG
_BO
RIN
G_1
A_L
A2
L-1
015
BO
RIN
G L
OG
S.G
PJ
GD
CLO
G.G
DT
9/3
0/11

9.0
4.7
6.4
9.2
25
32
103
110
5" A.C. over 7" Base
Artificial Fill (af)
Silty Sand with Gravel (SM) , dark brown, moist, fine tomedium grained sand, angular gravel, trace 5" cobble
Alluvium (Qa)
Silty Sand (SM) , dark brown, moist, loose to mediumdense, fine to medium grained sand, trace gravel
-Fine to coarse grained sand, low silt content
-Trace gravel
-1" gravels
B-1
R-2
S-3
R-4
S-5
666
567
91012
344
GR
AP
HIC
LOG
LOGGED BY1 of 3
PE
NE
TRA
TIO
NR
ES
ISTA
NC
E(B
LOW
S /
6 IN
)
CHECKED BY
5
10
15
20
PROJECT NUMBER
Olive Vista Middle School Seismic Retrofit
8/23/2011
ATT
ER
BE
RG
LIM
ITS
LL:P
L:P
I
TOTAL DEPTH (ft)
SHEET NO.
Hammer: 140 lbs., Drop: 30 in.
DESCRIPTION AND CLASSIFICATION
PROJECT NAME
ELE
VA
TIO
N(fe
et)
MO
ISTU
RE
(%)
GROUP DELTA CONSULTANTS, INC.
51.5 / na
DRILLING METHOD
LOG OF TEST BORINGSITE LOCATION
SA
MP
LE N
O.
DRILLING COMPANY8/23/2011
Choice Hollow Stem Auger DMD
DR
Y D
EN
SIT
Y(p
cf)
8"
OTH
ER
TES
TS
CME 75 (LAR)
DE
PTH
(fee
t)
GROUND ELEV (ft)
Torrance, CA 90501
DRILLING EQUIPMENT
NOTES
% P
AS
SIN
G #
200
START
BORING DIA. (in)
L-1015FINISH
BORING
SAMPLING METHOD
4600 Tyler Street, Sylmar, ca
DEPTH/ELEV. GROUND WATER (ft)
B-2
SA
MP
LE T
YP
E
370 Amapola Avenue, Suite 212
PO
CK
ET
PE
N(ts
f)
THIS SUMMARY APPLIES ONLY AT THE LOCATION OFTHIS BORING AND AT THE TIME OF DRILLING.SUBSURFACE CONDITIONS MAY DIFFER AT OTHERLOCATIONS AND MAY CHANGE AT THIS LOCATIONWITH THE PASSAGE OF TIME. THE DATA PRESENTEDIS A SIMPLIFICATION OF THE ACTUAL CONDITIONSENCOUNTERED.
KC
GD
C_L
OG
_BO
RIN
G_1
A_L
A2
L-1
015
BO
RIN
G L
OG
S.G
PJ
GD
CLO
G.G
DT
9/3
0/11

9.6
13.7
17.1
4.6
3.2
109
108
105
-Fine to coarse grained sand, trace clay
-Few clay
Sand (SP) , light brown, moist, medium dense, tracegravel, trace silt
-3" Clay layer
Sand (SP) , light brown, moist, medium dense, medium tocoarse grained sand
-Dense
R-6
S-7
R-8
S-10
R-10
888
467
81013
121313
212933
GR
AP
HIC
LOG
LOGGED BY2 of 3
PE
NE
TRA
TIO
NR
ES
ISTA
NC
E(B
LOW
S /
6 IN
)
CHECKED BY
30
35
40
45
PROJECT NUMBER
Olive Vista Middle School Seismic Retrofit
8/23/2011
ATT
ER
BE
RG
LIM
ITS
LL:P
L:P
I
TOTAL DEPTH (ft)
SHEET NO.
Hammer: 140 lbs., Drop: 30 in.
DESCRIPTION AND CLASSIFICATION
PROJECT NAME
ELE
VA
TIO
N(fe
et)
MO
ISTU
RE
(%)
GROUP DELTA CONSULTANTS, INC.
51.5 / na
DRILLING METHOD
LOG OF TEST BORINGSITE LOCATION
SA
MP
LE N
O.
DRILLING COMPANY8/23/2011
Choice Hollow Stem Auger DMD
DR
Y D
EN
SIT
Y(p
cf)
8"
OTH
ER
TES
TS
CME 75 (LAR)
DE
PTH
(fee
t)
GROUND ELEV (ft)
Torrance, CA 90501
DRILLING EQUIPMENT
NOTES
% P
AS
SIN
G #
200
START
BORING DIA. (in)
L-1015FINISH
BORING
SAMPLING METHOD
4600 Tyler Street, Sylmar, ca
DEPTH/ELEV. GROUND WATER (ft)
B-2
SA
MP
LE T
YP
E
370 Amapola Avenue, Suite 212
PO
CK
ET
PE
N(ts
f)
THIS SUMMARY APPLIES ONLY AT THE LOCATION OFTHIS BORING AND AT THE TIME OF DRILLING.SUBSURFACE CONDITIONS MAY DIFFER AT OTHERLOCATIONS AND MAY CHANGE AT THIS LOCATIONWITH THE PASSAGE OF TIME. THE DATA PRESENTEDIS A SIMPLIFICATION OF THE ACTUAL CONDITIONSENCOUNTERED.
KC
GD
C_L
OG
_BO
RIN
G_1
A_L
A2
L-1
015
BO
RIN
G L
OG
S.G
PJ
GD
CLO
G.G
DT
9/3
0/11

4.7-Dense
Total Depth: 51.5 FeetGroundwater: Not encountered to the maximum depthexploredFill: Approximately 4 FeetBoring backfilled with tamped soil cuttings and patchedupon completion
S-11 131724
GR
AP
HIC
LOG
LOGGED BY3 of 3
PE
NE
TRA
TIO
NR
ES
ISTA
NC
E(B
LOW
S /
6 IN
)
CHECKED BY
55
60
65
70
PROJECT NUMBER
Olive Vista Middle School Seismic Retrofit
8/23/2011
ATT
ER
BE
RG
LIM
ITS
LL:P
L:P
I
TOTAL DEPTH (ft)
SHEET NO.
Hammer: 140 lbs., Drop: 30 in.
DESCRIPTION AND CLASSIFICATION
PROJECT NAME
ELE
VA
TIO
N(fe
et)
MO
ISTU
RE
(%)
GROUP DELTA CONSULTANTS, INC.
51.5 / na
DRILLING METHOD
LOG OF TEST BORINGSITE LOCATION
SA
MP
LE N
O.
DRILLING COMPANY8/23/2011
Choice Hollow Stem Auger DMD
DR
Y D
EN
SIT
Y(p
cf)
8"
OTH
ER
TES
TS
CME 75 (LAR)
DE
PTH
(fee
t)
GROUND ELEV (ft)
Torrance, CA 90501
DRILLING EQUIPMENT
NOTES
% P
AS
SIN
G #
200
START
BORING DIA. (in)
L-1015FINISH
BORING
SAMPLING METHOD
4600 Tyler Street, Sylmar, ca
DEPTH/ELEV. GROUND WATER (ft)
B-2
SA
MP
LE T
YP
E
370 Amapola Avenue, Suite 212
PO
CK
ET
PE
N(ts
f)
THIS SUMMARY APPLIES ONLY AT THE LOCATION OFTHIS BORING AND AT THE TIME OF DRILLING.SUBSURFACE CONDITIONS MAY DIFFER AT OTHERLOCATIONS AND MAY CHANGE AT THIS LOCATIONWITH THE PASSAGE OF TIME. THE DATA PRESENTEDIS A SIMPLIFICATION OF THE ACTUAL CONDITIONSENCOUNTERED.
KC
GD
C_L
OG
_BO
RIN
G_1
A_L
A2
L-1
015
BO
RIN
G L
OG
S.G
PJ
GD
CLO
G.G
DT
9/3
0/11


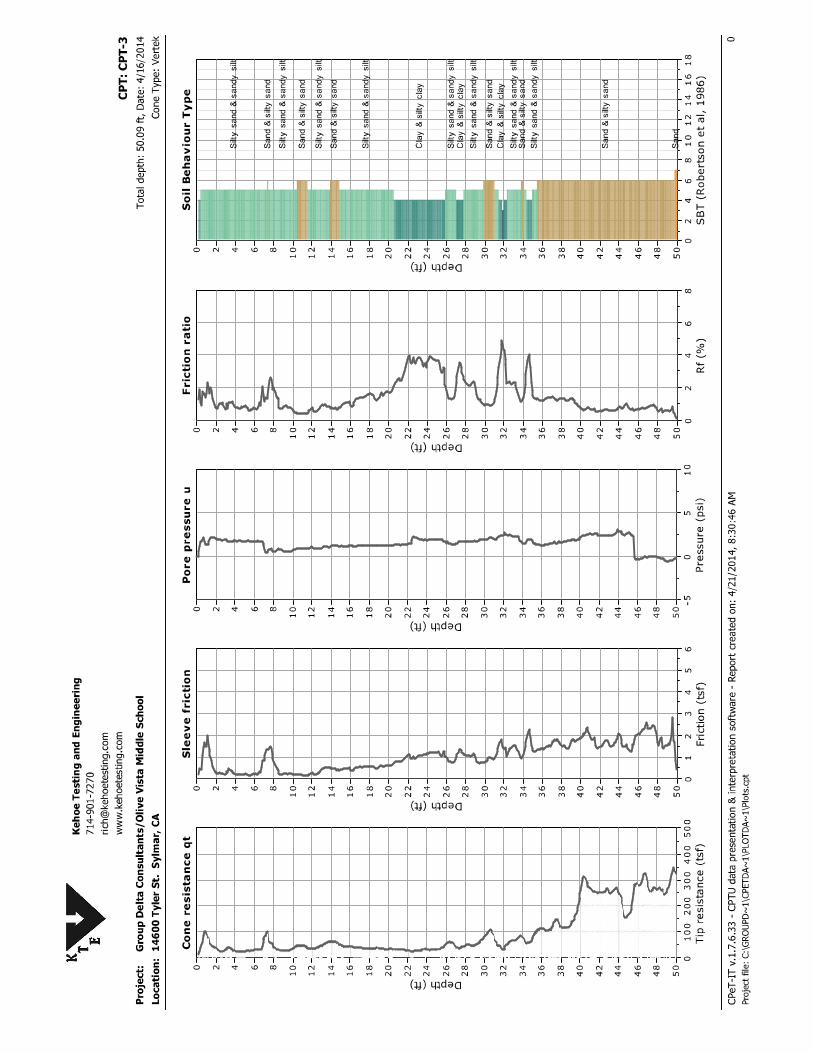
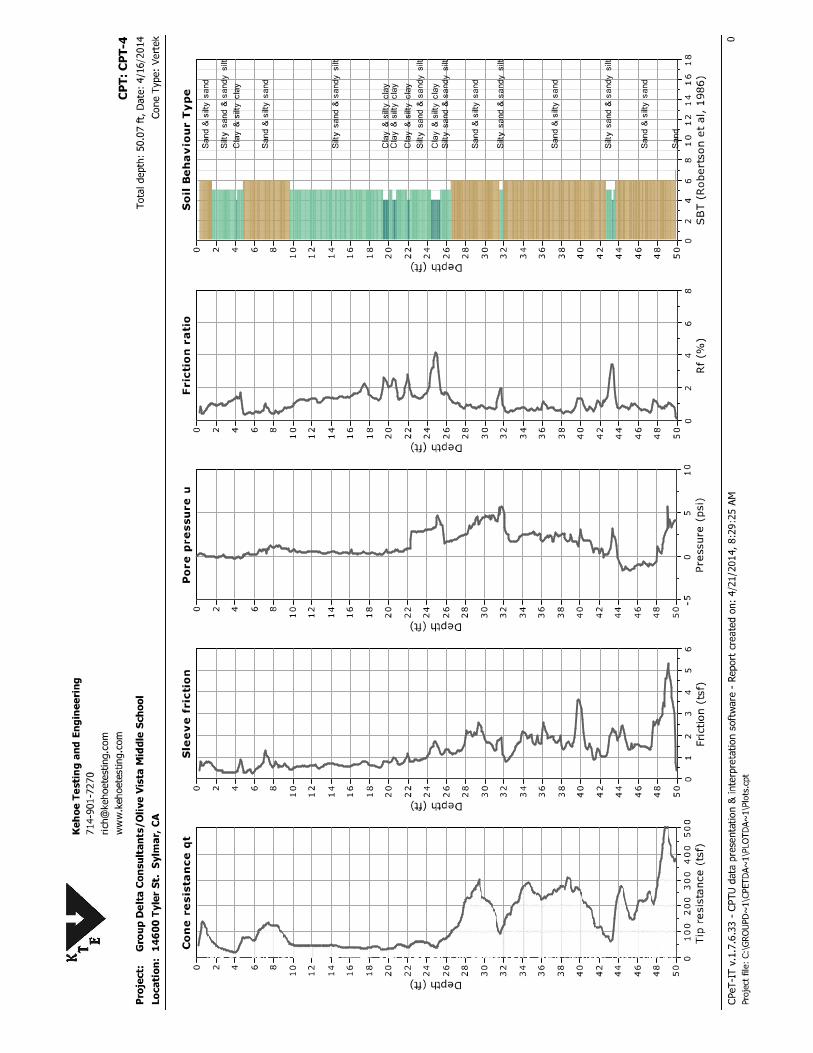

Group Delta ConsultantsOperator: RS/JCSounding: C-02.cCone Used: DSG1023
CPT Date/Time: 9/29/2011 8:32:Location: Olive Vista MiddJob Number: L-1015
Maximum Depth = 50.52 feet Depth Increment = 0.164 feet
*Soil behavior type and SPT based on data from UBC-1983
Tip Resistance
Qt (Ton/ft^2) 5000
0
5
10
15
20
25
30
35
40
45
50
Depth(ft)
Local Friction
Fs (Ton/ft^2) 100
Friction Ratio
Fs/Qt (%) 100
Soil Behavior Type*
Zone: UBC-1983
1 sensitive fine grained 2 organic material 3 clay
4 silty clay to clay 5 clayey silt to silty clay 6 sandy silt to clayey silt
7 silty sand to sandy silt 8 sand to silty sand 9 sand
10 gravelly sand to sand 11 very stiff fine grained (*) 12 sand to clayey sand (*)
120
SPT N*
60% Hammer900
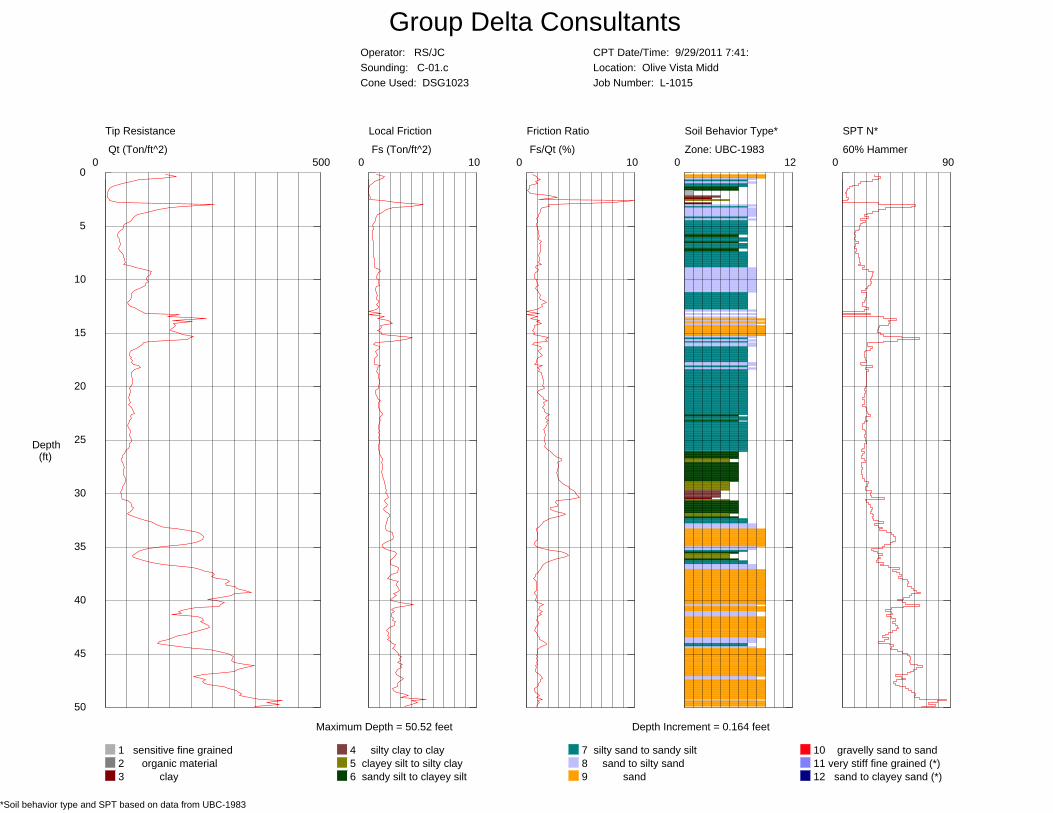
Group Delta ConsultantsOperator: RS/JCSounding: C-01.cCone Used: DSG1023
CPT Date/Time: 9/29/2011 7:41:Location: Olive Vista MiddJob Number: L-1015
Maximum Depth = 50.52 feet Depth Increment = 0.164 feet
*Soil behavior type and SPT based on data from UBC-1983
Tip Resistance
Qt (Ton/ft^2) 5000
0
5
10
15
20
25
30
35
40
45
50
Depth(ft)
Local Friction
Fs (Ton/ft^2) 100
Friction Ratio
Fs/Qt (%) 100
Soil Behavior Type*
Zone: UBC-1983
1 sensitive fine grained 2 organic material 3 clay
4 silty clay to clay 5 clayey silt to silty clay 6 sandy silt to clayey silt
7 silty sand to sandy silt 8 sand to silty sand 9 sand
10 gravelly sand to sand 11 very stiff fine grained (*) 12 sand to clayey sand (*)
120
SPT N*
60% Hammer900
APPENDIX B
LABORATORY TESTING

Laboratory Testing May 9, 2014 Olive Vista Middle School Page B‐1 Sylmar, California
APPENDIX B LABORATORY TESTING
B.1 General Laboratory testing was performed to aid in the classification of soils encountered in the borings and to evaluate their physical properties and engineering characteristics. A description of the laboratory testing program is provided below. The laboratory testing was supplemented by the Standard Penetration Tests (SPT) performed in the borings, and the CPT data, which provide an evaluation of insitu properties, such as density, strength and compressibility. B.2 Soil Classification The subsurface materials were classified visually in the field using the Unified Soil Classification System (USCS), in accordance with ASTM Test Methods D‐2487 and D 2488. Soil classifications were modified as necessary based on further inspection and testing in the laboratory. The soil classifications are presented on the key for soil classification and on the boring logs in Appendix C. B.3 Moisture Content and Dry Unit Weight The field moisture and dry unit weight of each relatively undisturbed sample were determined in general accordance with ASTM D‐2216 and ASTM D‐2937. Test results are presented on the boring logs. B.4 Atterberg Limits Soil plasticity was evaluated by measuring the Atterberg limits. This test includes Liquid Limit (LL) and Plastic Limit (PL) tests to determine the Plasticity Index (PI) in accordance with ASTM D4318. Results of these tests are illustrated in the plasticity charts shown in Figure B‐1A through B‐1C, and on the boring logs in Appendix A. B.5 Percent Passing No. 200 Sieve Determination of fines verses coarser soil particles was performed by the percent #200 Sieve test. Representative samples were dried, weighed, soaked in water until individual soil particles were separated, and then washed on the No. 200 sieve. The percentage of fines (i.e., soil passing #200 sieve) are shown on the boring logs. B.6 Consolidation The consolidation characteristics of the foundation soils were determined by performing one‐dimensional consolidation in general accordance with ASTM D2435, using a floating ring consolidometer and dead weight system. Results of the tests are presented in Figures B‐6 and B‐7. B.7 Direct Shear Direct shear tests were performed on selected samples in accordance with ASTM D‐3080. After the initial weight and volume measurements were made, the sample was placed in a calibrated shear machine and a selected normal load was applied. Each sample was then saturated and allowed to consolidate, and then were sheared under a constant strain to failure. Shear stress and sample deformations were monitored throughout the test. The test results are presented in Figure B‐1 through B‐5.
Laboratory Testing May 9, 2014 Olive Vista Middle School Page B‐2 Sylmar, California
B.8 Soil Expansion Index Representative grab samples of existing fill soil was collected from the site and tested to determine the expansion index. Testing was performed according to ASTM D4829. The results of the test are presented in Table B‐1. B.9 Pocket Penetrometer Tests The shear strength of cohesive samples was evaluated using a pocket penetrometer. The pocket penetrometer is a hand held testing device, consisting of a small probe connected to a calibrated spring. As the probe is pushed into the soil a standardized distance, the spring compresses and records the unconfined compressive strength. The shear strength obtained from the pocket penetrometer is shown directly on the boring logs. B.10 Soil Corrosivity Corrosivity testing was performed on a representative soil sample of the near surface material, and included soil pH (Caltrans CT‐643), water‐soluble chlorides (Caltrans CT‐422), water‐soluble sulfates (Caltrans CT‐417) and electrical resistivity (Caltrans CT‐643). The test results are summarized in Table D‐2 below. LIST OF FIGURES Figures B‐1 through B‐5 Direct Shear Test Results Figures B‐6 and B‐7 Consolidation Test Results
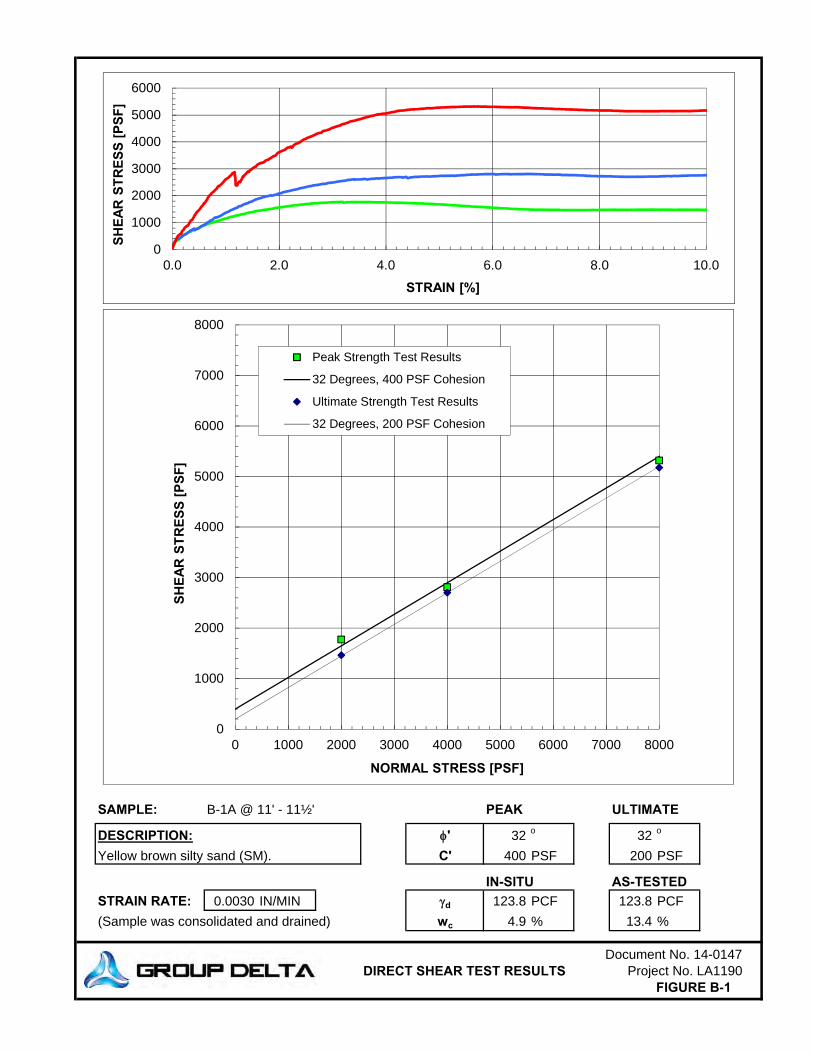
SAMPLE: B-1A @ 11' - 11½' PEAK ULTIMATE
DESCRIPTION: ' 32 o 32 o
Yellow brown silty sand (SM). C' 400 PSF 200 PSF
IN-SITU AS-TESTEDSTRAIN RATE: 0.0030 IN/MIN d 123.8 PCF 123.8 PCF(Sample was consolidated and drained) wc 4.9 % 13.4 %
Document No. 14-0147DIRECT SHEAR TEST RESULTS Project No. LA1190
FIGURE B-1
0
1000
2000
3000
4000
5000
6000
0.0 2.0 4.0 6.0 8.0 10.0
SHEA
R S
TRES
S [P
SF]
STRAIN [%]
0
1000
2000
3000
4000
5000
6000
7000
8000
0 1000 2000 3000 4000 5000 6000 7000 8000
SHEA
R S
TRES
S [P
SF]
NORMAL STRESS [PSF]
Peak Strength Test Results
32 Degrees, 400 PSF Cohesion
Ultimate Strength Test Results
32 Degrees, 200 PSF Cohesion

SAMPLE: B-2 @ 6' - 6½' PEAK ULTIMATE
DESCRIPTION: ' 35 o 35 o
Dark yellow brown silty sand (SM). C' 300 PSF 200 PSF
IN-SITU AS-TESTEDSTRAIN RATE: 0.0030 IN/MIN d 114.1 PCF 114.1 PCF(Sample was consolidated and drained) wc 8.7 % 17.7 %
Document No. 14-0147DIRECT SHEAR TEST RESULTS Project No. LA1190
FIGURE B-2
0
1000
2000
3000
4000
0.0 2.0 4.0 6.0 8.0 10.0
SHEA
R S
TRES
S [P
SF]
STRAIN [%]
0
500
1000
1500
2000
2500
3000
3500
4000
0 500 1000 1500 2000 2500 3000 3500 4000
SHEA
R S
TRES
S [P
SF]
NORMAL STRESS [PSF]
Peak Strength Test Results
35 Degrees, 300 PSF Cohesion
Ultimate Strength Test Results
35 Degrees, 200 PSF Cohesion

SAMPLE: B-2 @ 26' - 26½' PEAK ULTIMATE
DESCRIPTION: ' 32 o 32 o
Dark yellow brown silty sand (SM). C' 300 PSF 150 PSF
IN-SITU AS-TESTEDSTRAIN RATE: 0.0030 IN/MIN d 112.6 PCF 112.6 PCF(Sample was consolidated and drained) wc 13.5 % 18.4 %
Document No. 14-0147DIRECT SHEAR TEST RESULTS Project No. LA1190
FIGURE B-3
0
1000
2000
3000
4000
5000
6000
0.0 2.0 4.0 6.0 8.0 10.0
SHEA
R S
TRES
S [P
SF]
STRAIN [%]
0
1000
2000
3000
4000
5000
6000
7000
8000
0 1000 2000 3000 4000 5000 6000 7000 8000
SHEA
R S
TRES
S [P
SF]
NORMAL STRESS [PSF]
Peak Strength Test Results
32 Degrees, 300 PSF Cohesion
Ultimate Strength Test Results
32 Degrees, 150 PSF Cohesion

SAMPLE: B-3 @ 16' - 16½' PEAK ULTIMATE
DESCRIPTION: ' 28 o 28 o
Dark yellow brown sandy silt (ML). C' 800 PSF 700 PSF
IN-SITU AS-TESTEDSTRAIN RATE: 0.0030 IN/MIN d 116.1 PCF 116.1 PCF(Sample was consolidated and drained) wc 9.8 % 16.7 %
Document No. 14-0147DIRECT SHEAR TEST RESULTS Project No. LA1190
FIGURE B-4
0
1000
2000
3000
4000
5000
6000
0.0 2.0 4.0 6.0 8.0 10.0
SHEA
R S
TRES
S [P
SF]
STRAIN [%]
0
1000
2000
3000
4000
5000
6000
7000
8000
0 1000 2000 3000 4000 5000 6000 7000 8000
SHEA
R S
TRES
S [P
SF]
NORMAL STRESS [PSF]
Peak Strength Test Results
28 Degrees, 800 PSF Cohesion
Ultimate Strength Test Results
28 Degrees, 700 PSF Cohesion
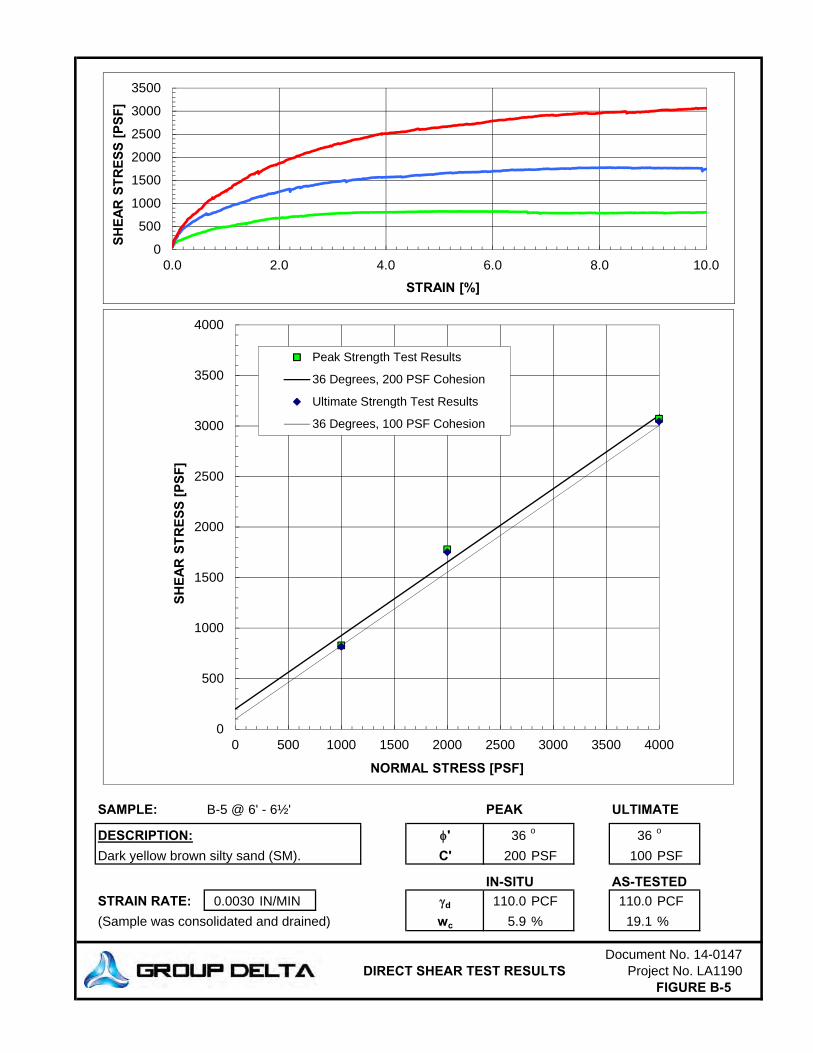
SAMPLE: B-5 @ 6' - 6½' PEAK ULTIMATE
DESCRIPTION: ' 36 o 36 o
Dark yellow brown silty sand (SM). C' 200 PSF 100 PSF
IN-SITU AS-TESTEDSTRAIN RATE: 0.0030 IN/MIN d 110.0 PCF 110.0 PCF(Sample was consolidated and drained) wc 5.9 % 19.1 %
Document No. 14-0147DIRECT SHEAR TEST RESULTS Project No. LA1190
FIGURE B-5
0
500
1000
1500
2000
2500
3000
3500
0.0 2.0 4.0 6.0 8.0 10.0
SHEA
R S
TRES
S [P
SF]
STRAIN [%]
0
500
1000
1500
2000
2500
3000
3500
4000
0 500 1000 1500 2000 2500 3000 3500 4000
SHEA
R S
TRES
S [P
SF]
NORMAL STRESS [PSF]
Peak Strength Test Results
36 Degrees, 200 PSF Cohesion
Ultimate Strength Test Results
36 Degrees, 100 PSF Cohesion

Sample: Results Initial FinalB-2 @ 16' - 16½' Cv: 0.24 [in2/min] Height: 1.0000 0.9813 [in]
Ps: 320 [psf] Dry Density: 114.7 116.9 [pcf]Description: Pc: 2077 [psf] Void Ratio (e): 0.45 0.42
Dark yellow brown silty sand (SM) Cc: 0.072 Water Content: 13.2 15.8 [%]Cs: 0.018 Saturation: 78 100 [%]
Note: To find the traditional compression (Cc) and swell (Cs) indices, the values in strain domain were multiply by 1.45 (or 1+e)
Document No. 14-0147CONSOLIDATION RESULTS Project No. LA1190
FIGURE B-6
-1%
0%
1%
2%
3%
4%
5%
6%
7%
8%10 100 1000 10000 100000
Stra
in [%
]
Stress [psf]
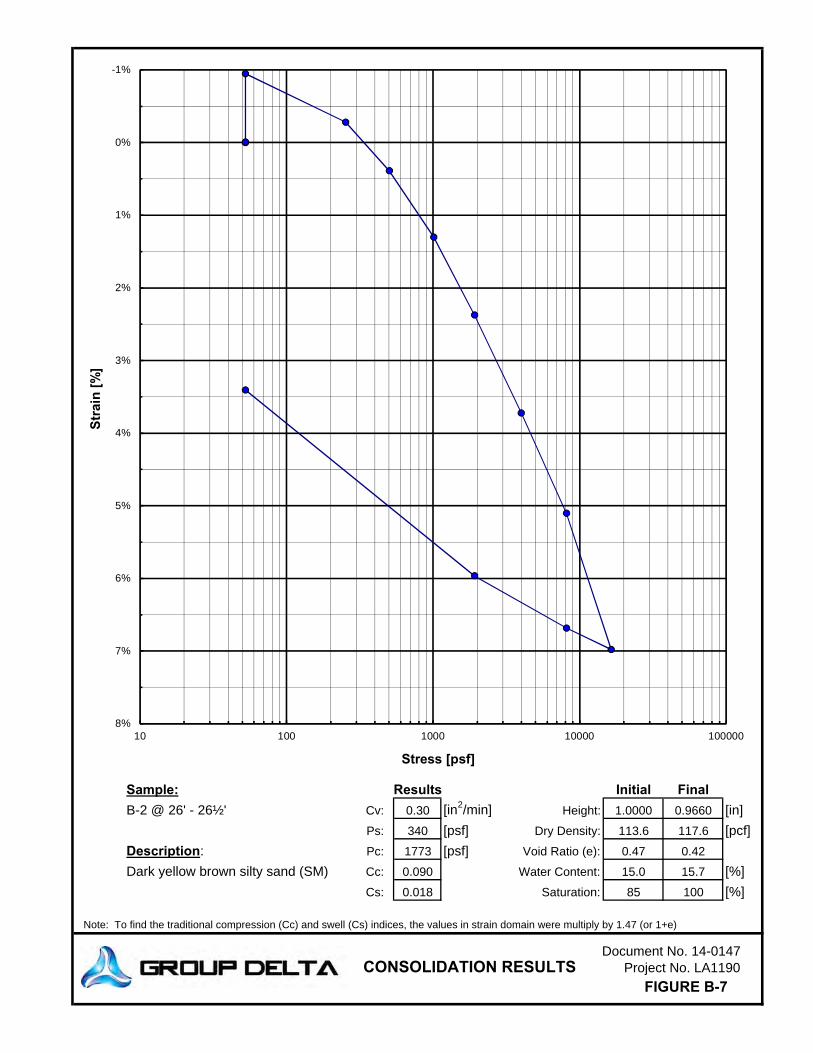
Sample: Results Initial FinalB-2 @ 26' - 26½' Cv: 0.30 [in2/min] Height: 1.0000 0.9660 [in]
Ps: 340 [psf] Dry Density: 113.6 117.6 [pcf]Description: Pc: 1773 [psf] Void Ratio (e): 0.47 0.42
Dark yellow brown silty sand (SM) Cc: 0.090 Water Content: 15.0 15.7 [%]Cs: 0.018 Saturation: 85 100 [%]
Note: To find the traditional compression (Cc) and swell (Cs) indices, the values in strain domain were multiply by 1.47 (or 1+e)
Document No. 14-0147CONSOLIDATION RESULTS Project No. LA1190
FIGURE B-7
-1%
0%
1%
2%
3%
4%
5%
6%
7%
8%10 100 1000 10000 100000
Stra
in [%
]
Stress [psf]

APPENDIX C
CBC 2013/ASCE 7‐10 ACCELERATION RESPONSE SPECTRA

CBC 2013 Site‐Specific Seismic Response Spectrum May 9, 2014 Olive Vista Middle School Page C‐1 Sylmar, California
APPENDIX C CBC 2013/ASCE 7‐10 SITE‐SPECIFIC SEISMIC ACCELERATION
RESPONSE SPECTRUM C.1 Introduction In accordance with CBC 2013 Section 1616A – Modification to ASCE 7‐10, a ground motion hazard analysis shall be performed if a building site is assigned to Seismic Design Category E or F. The subject site has a mapped spectral response acceleration at 1‐second greater than 0.75 (S1 = 1.08), and the building has a Risk Category III. Therefore, according to Section 11.6 of ASCE 7‐10, the building site is assigned to Seismic Design Category E, and thus, a ground motion hazard analysis shall be performed. In accordance with CBC 2013, the three Next Generation Attenuation (NGA) relations used for the 2008 USGS seismic hazards maps for the Western United States (WUS), i.e., Boore–Atkinson (2008), Campbell–Bozorgnia (2008), and Chiou–Youngs (2008), shall be utilized to determine the site‐specific ground motion. The site‐specific Probabilistic Site Hazard Analyses (PSHA) for structures that incorporate the NGA relations shall use the maximum rotated component of ground motion. The site‐specific Deterministic Seismic Hazard Analyses (DSHA) for structures that incorporate the NGA relations shall use the 84th percentile of the maximum rotated component of ground motion. The acceleration response spectrum provided in this appendix is constructed in general accordance with CBC 2013 and ASCE 7‐10 Chapter 21. C.2 Construction of Probabilistic MCE The probabilistic risk‐targeted MCE spectral response accelerations are taken as the spectral response accelerations represented by a 5 percent damped acceleration response spectrum having a 1 percent probability of collapse within a 50‐yr. period. The probabilistic risk‐targeted MCE spectral response accelerations were determined as the product of the risk coefficient, CR, and the spectral response acceleration from a 5% damped acceleration response spectrum having a 2% probability of exceedance within a 50‐year period. The probabilistic MCE with a 2% probability of exceedance in 50 years was constructed using the USGS 2008 Interactive Deaggregations online program (https://geohazards.usgs.gov/deaggint/2008/), which reports the average value of three NGA relations as mentioned above. We have assumed a VS,30 of 300 m/s, the average VS,30 of site class D, in our seismic hazard analysis. To adjust the geometric mean to the maximum rotated response, a maximum/Geomean ratio of 1.1 is applied to periods 0 to 0.5 seconds and a maximum/Geomean ratio of 1.3 is applied to periods 1 to 4 seconds (Charles A. Kircher, EERI Seminar on NGA Models, September 2009). The probabilistic MCE acceleration response spectrum is shown in Figure C‐1.
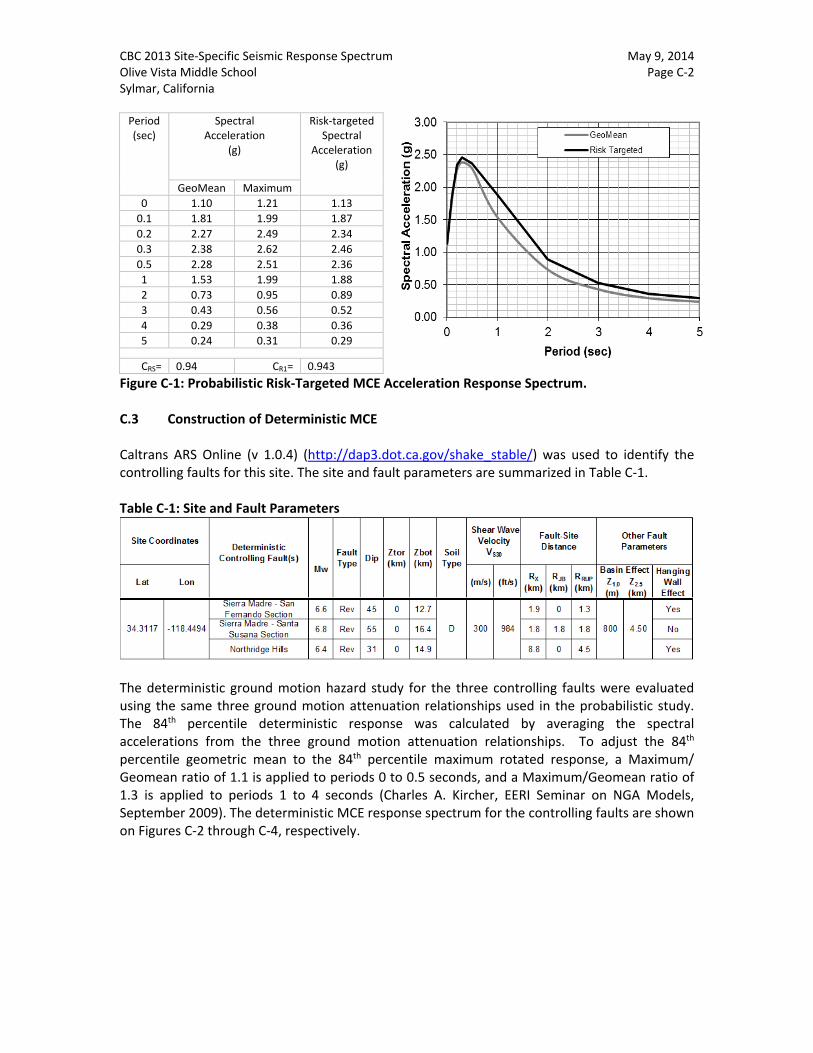
CBC 2013 Site‐Specific Seismic Response Spectrum May 9, 2014 Olive Vista Middle School Page C‐2 Sylmar, California
Period (sec)
Spectral Acceleration
(g)
Risk‐targetedSpectral
Acceleration(g)
GeoMean Maximum
0 1.10 1.21 1.13
0.1 1.81 1.99 1.87
0.2 2.27 2.49 2.34
0.3 2.38 2.62 2.46
0.5 2.28 2.51 2.36
1 1.53 1.99 1.88
2 0.73 0.95 0.89
3 0.43 0.56 0.52
4 0.29 0.38 0.36
5 0.24 0.31 0.29
CRS= 0.94 CR1= 0.943
Figure C‐1: Probabilistic Risk‐Targeted MCE Acceleration Response Spectrum. C.3 Construction of Deterministic MCE Caltrans ARS Online (v 1.0.4) (http://dap3.dot.ca.gov/shake_stable/) was used to identify the controlling faults for this site. The site and fault parameters are summarized in Table C‐1. Table C‐1: Site and Fault Parameters
The deterministic ground motion hazard study for the three controlling faults were evaluated using the same three ground motion attenuation relationships used in the probabilistic study. The 84th percentile deterministic response was calculated by averaging the spectral accelerations from the three ground motion attenuation relationships. To adjust the 84th percentile geometric mean to the 84th percentile maximum rotated response, a Maximum/ Geomean ratio of 1.1 is applied to periods 0 to 0.5 seconds, and a Maximum/Geomean ratio of 1.3 is applied to periods 1 to 4 seconds (Charles A. Kircher, EERI Seminar on NGA Models, September 2009). The deterministic MCE response spectrum for the controlling faults are shown on Figures C‐2 through C‐4, respectively.

CBC 2013 Site‐Specific Seismic Response Spectrum May 9, 2014 Olive Vista Middle School Page C‐3 Sylmar, California
Period (sec)
Spectral Acceleration (g)
GeoMean Maximum
0 1.24 1.36
0.1 1.88 2.07
0.2 2.30 2.53
0.3 2.52 2.77
0.5 2.62 2.88
1 1.86 2.42
2 0.84 1.09
3 0.44 0.57
4 0.28 0.36
5 0.21 0.27
Figure C‐2: Deterministic Response Spectrum for Sierra Madre Fault – San Fernando Section
Period (sec)
Spectral Acceleration (g)
GeoMean Maximum
0 0.93 1.02
0.1 1.48 1.63
0.2 1.92 2.11
0.3 2.12 2.33
0.5 2.18 2.40
1 1.54 2.01
2 0.75 0.98
3 0.45 0.58
4 0.31 0.40
5 0.23 0.31
Figure C‐3: Deterministic Response Spectrum for Sierra Madre Fault – Santa Susana Section
Period (sec)
Spectral Acceleration (g)
GeoMean Maximum
0 1.13 1.24
0.1 1.86 2.05
0.2 2.24 2.46
0.3 2.36 2.60
0.5 2.27 2.49
1 1.46 1.90
2 0.59 0.76
3 0.28 0.37
4 0.17 0.22
5 0.12 0.16
Figure C‐4: Deterministic Response Spectrum for Northridge Hills Fault A deterministic response spectrum envelope was constructed by using the higher spectral

CBC 2013 Site‐Specific Seismic Response Spectrum May 9, 2014 Olive Vista Middle School Page C‐4 Sylmar, California
accelerations of the three controlling faults. This deterministic envelope is then compared with the deterministic lower limit in accordance with Figure 21.2‐1 of ASCE 7‐10 Chapter 21. We then selected the higher values of the two as the deterministic MCE spectrum. The result is shown in Figure C‐4.
Deterministic MCE
Period (sec)
Sa (g)
0 1.36
0.1 2.07
0.2 2.53
0.3 2.77
0.5 2.88
1 2.42
2 1.09
3 0.58
4 0.40
5 0.31
Figure C‐4: Deterministic MCE Response Spectrum C.4 Site Specific MCE According to Section 21.2.3 of ASCE 7‐10, “the site‐specific MCE spectral response acceleration at any period shall be taken as the lesser of the spectral response accelerations from the probabilistic MCE and the deterministic MCE”. Figure C‐5 shows the comparison of probabilistic MCE and deterministic MCE.
Site Specific MCE
Period Sa
(sec) (g)
0 1.13
0.1 1.87
0.2 2.34
0.3 2.46
0.5 2.36
1 1.88
2 0.89
3 0.52
4 0.36
5 0.29
Figure C‐5: Site‐Specific MCE Response Spectrum

CBC 2013 Site‐Specific Seismic Response Spectrum May 9, 2014 Olive Vista Middle School Page C‐5 Sylmar, California
C.5 Design Response Spectrum In accordance with ASCE 7‐10 Section 21.3, the design spectral response acceleration at any period shall be taken as 2/3 of the MCE spectral acceleration. The design spectral response accelerations at any period shall not be taken less than 80% of the general code spectrum, which is constructed based on ASCE 7‐10, Figure 11.4.1. The site‐specific design response spectrum is shown in Figure C‐6.
2/3 Site Specific MCE General Code
(ASCE 7‐10, Figure 11.4.1) Design Spectrum
Period (sec)
Sa (g)
Period (sec)
Sa (g)
80%*Sa (g)
Period (sec)
Sa (g)
0 0.76 0.00 0.79 0.63 0 0.76
0.1 1.25 0.11 1.98 1.58 0.1 1.58
0.2 1.56 0.22 1.98 1.58 0.2 1.58
0.3 1.64 0.55 1.98 1.58 0.3 1.64
0.5 1.57 0.80 1.35 1.08 0.5 1.58
1 1.25 1.0 1.08 0.86 1 1.25
2 0.60 1.1 0.98 0.78 2 0.6
3 0.35 1.2 0.90 0.72 3 0.35
4 0.24 1.4 0.77 0.62 4 0.24
5 0.19 1.6 0.67 0.54 5 0.19
2.0 0.54 0.43
3.0 0.36 0.29
4.0 0.27 0.22
5.0 0.22 0.17
8.0 0.13 0.11
Figure C‐6: Site‐Specific Design Response Spectrum
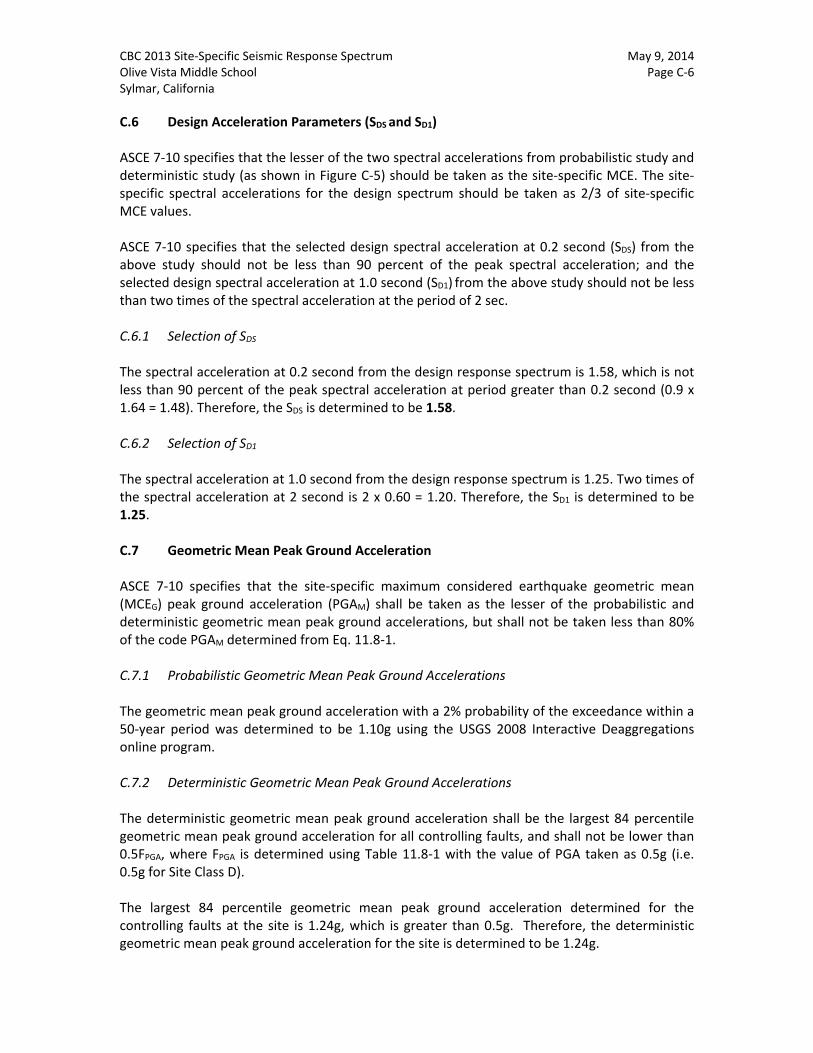
CBC 2013 Site‐Specific Seismic Response Spectrum May 9, 2014 Olive Vista Middle School Page C‐6 Sylmar, California
C.6 Design Acceleration Parameters (SDS and SD1) ASCE 7‐10 specifies that the lesser of the two spectral accelerations from probabilistic study and deterministic study (as shown in Figure C‐5) should be taken as the site‐specific MCE. The site‐specific spectral accelerations for the design spectrum should be taken as 2/3 of site‐specific MCE values. ASCE 7‐10 specifies that the selected design spectral acceleration at 0.2 second (SDS) from the above study should not be less than 90 percent of the peak spectral acceleration; and the selected design spectral acceleration at 1.0 second (SD1) from the above study should not be less than two times of the spectral acceleration at the period of 2 sec. C.6.1 Selection of SDS
The spectral acceleration at 0.2 second from the design response spectrum is 1.58, which is not less than 90 percent of the peak spectral acceleration at period greater than 0.2 second (0.9 x 1.64 = 1.48). Therefore, the SDS is determined to be 1.58. C.6.2 Selection of SD1
The spectral acceleration at 1.0 second from the design response spectrum is 1.25. Two times of the spectral acceleration at 2 second is 2 x 0.60 = 1.20. Therefore, the SD1 is determined to be 1.25. C.7 Geometric Mean Peak Ground Acceleration ASCE 7‐10 specifies that the site‐specific maximum considered earthquake geometric mean (MCEG) peak ground acceleration (PGAM) shall be taken as the lesser of the probabilistic and deterministic geometric mean peak ground accelerations, but shall not be taken less than 80% of the code PGAM determined from Eq. 11.8‐1. C.7.1 Probabilistic Geometric Mean Peak Ground Accelerations The geometric mean peak ground acceleration with a 2% probability of the exceedance within a 50‐year period was determined to be 1.10g using the USGS 2008 Interactive Deaggregations online program. C.7.2 Deterministic Geometric Mean Peak Ground Accelerations The deterministic geometric mean peak ground acceleration shall be the largest 84 percentile geometric mean peak ground acceleration for all controlling faults, and shall not be lower than 0.5FPGA, where FPGA is determined using Table 11.8‐1 with the value of PGA taken as 0.5g (i.e. 0.5g for Site Class D). The largest 84 percentile geometric mean peak ground acceleration determined for the controlling faults at the site is 1.24g, which is greater than 0.5g. Therefore, the deterministic geometric mean peak ground acceleration for the site is determined to be 1.24g.

CBC 2013 Site‐Specific Seismic Response Spectrum May 9, 2014 Olive Vista Middle School Page C‐7 Sylmar, California
C.7.3 Site‐Specific Geometric Mean (MCEG) Peak Ground Acceleration (PGAM) The lesser of the probabilistic and deterministic geometric mean peak ground accelerations is 1.10g. 80% of the code PGAM determined from Eq. 11.8‐1 is 0.8 x 1.129g = 0.90g. The lesser of the probabilistic and deterministic geometric mean peak ground is not less than 80% of the code PGAM determined from Eq. 11.8‐1. Therefore, the site‐specific MCEG peak ground acceleration at the site is 1.10g.

APPENDIX D
BLAKE, 2000 EQSEARCH RESULTS

************************* * * * E Q S E A R C H * * * * Version 3.00 * * * ************************* ESTIMATION OF PEAK ACCELERATION FROM CALIFORNIA EARTHQUAKE CATALOGS JOB NUMBER: L-xxxx DATE: 09-06-2011 JOB NAME: Olive View MS EARTHQUAKE-CATALOG-FILE NAME: ALLQUAKE.DAT MAGNITUDE RANGE: MINIMUM MAGNITUDE: 5.00 MAXIMUM MAGNITUDE: 9.00 SITE COORDINATES: SITE LATITUDE: 34.3114 SITE LONGITUDE: 118.4500 SEARCH DATES: START DATE: 1811 END DATE: 2011 SEARCH RADIUS: 60.0 mi 96.6 km ATTENUATION RELATION: 14) Campbell & Bozorgnia (1997 Rev.) - Alluvium UNCERTAINTY (M=Median, S=Sigma): M Number of Sigmas: 0.0 ASSUMED SOURCE TYPE: DS [SS=Strike-slip, DS=Reverse-slip, BT=Blind-thrust] SCOND: 0 Depth Source: A Basement Depth: 5.00 km Campbell SSR: 0 Campbell SHR: 0 COMPUTE PEAK HORIZONTAL ACCELERATION MINIMUM DEPTH VALUE (km): 3.0
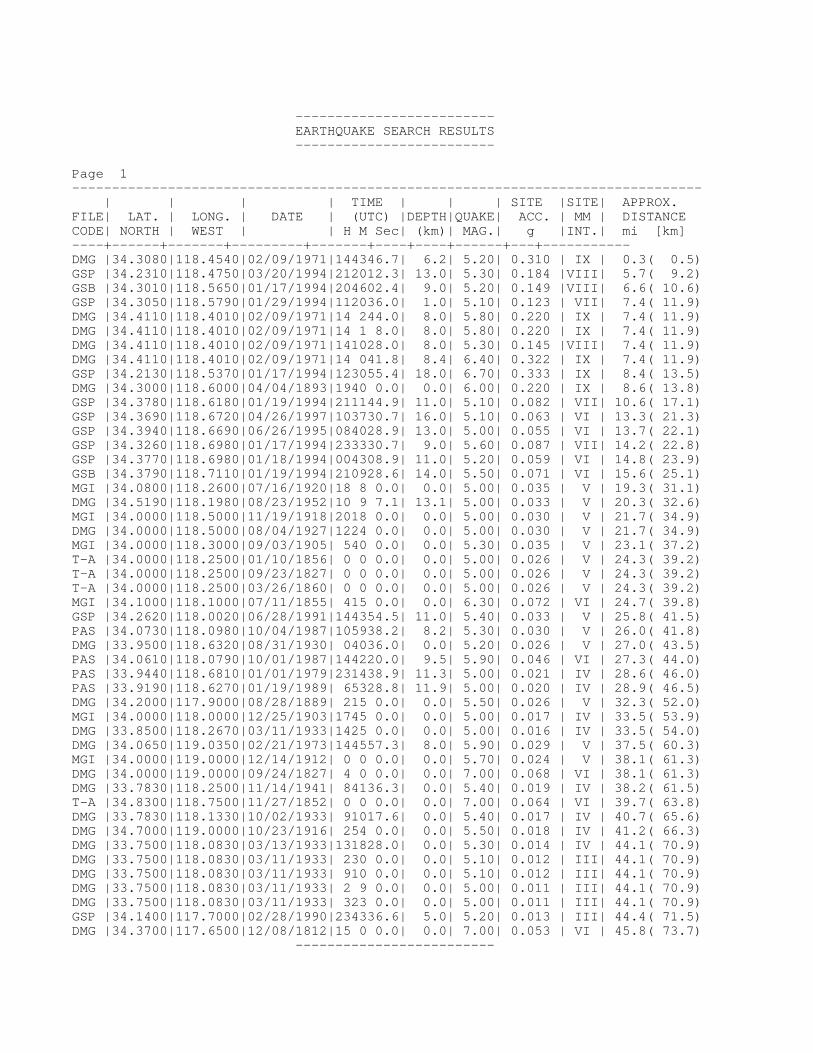
------------------------- EARTHQUAKE SEARCH RESULTS ------------------------- Page 1 ------------------------------------------------------------------------------- | | | | TIME | | | SITE |SITE| APPROX. FILE| LAT. | LONG. | DATE | (UTC) |DEPTH|QUAKE| ACC. | MM | DISTANCE CODE| NORTH | WEST | | H M Sec| (km)| MAG.| g |INT.| mi [km] ----+------+-------+---------+-------+----+----+------+---+----------- DMG |34.3080|118.4540|02/09/1971|144346.7| 6.2| 5.20| 0.310 | IX | 0.3( 0.5) GSP |34.2310|118.4750|03/20/1994|212012.3| 13.0| 5.30| 0.184 |VIII| 5.7( 9.2) GSB |34.3010|118.5650|01/17/1994|204602.4| 9.0| 5.20| 0.149 |VIII| 6.6( 10.6) GSP |34.3050|118.5790|01/29/1994|112036.0| 1.0| 5.10| 0.123 | VII| 7.4( 11.9) DMG |34.4110|118.4010|02/09/1971|14 244.0| 8.0| 5.80| 0.220 | IX | 7.4( 11.9) DMG |34.4110|118.4010|02/09/1971|14 1 8.0| 8.0| 5.80| 0.220 | IX | 7.4( 11.9) DMG |34.4110|118.4010|02/09/1971|141028.0| 8.0| 5.30| 0.145 |VIII| 7.4( 11.9) DMG |34.4110|118.4010|02/09/1971|14 041.8| 8.4| 6.40| 0.322 | IX | 7.4( 11.9) GSP |34.2130|118.5370|01/17/1994|123055.4| 18.0| 6.70| 0.333 | IX | 8.4( 13.5) DMG |34.3000|118.6000|04/04/1893|1940 0.0| 0.0| 6.00| 0.220 | IX | 8.6( 13.8) GSP |34.3780|118.6180|01/19/1994|211144.9| 11.0| 5.10| 0.082 | VII| 10.6( 17.1) GSP |34.3690|118.6720|04/26/1997|103730.7| 16.0| 5.10| 0.063 | VI | 13.3( 21.3) GSP |34.3940|118.6690|06/26/1995|084028.9| 13.0| 5.00| 0.055 | VI | 13.7( 22.1) GSP |34.3260|118.6980|01/17/1994|233330.7| 9.0| 5.60| 0.087 | VII| 14.2( 22.8) GSP |34.3770|118.6980|01/18/1994|004308.9| 11.0| 5.20| 0.059 | VI | 14.8( 23.9) GSB |34.3790|118.7110|01/19/1994|210928.6| 14.0| 5.50| 0.071 | VI | 15.6( 25.1) MGI |34.0800|118.2600|07/16/1920|18 8 0.0| 0.0| 5.00| 0.035 | V | 19.3( 31.1) DMG |34.5190|118.1980|08/23/1952|10 9 7.1| 13.1| 5.00| 0.033 | V | 20.3( 32.6) MGI |34.0000|118.5000|11/19/1918|2018 0.0| 0.0| 5.00| 0.030 | V | 21.7( 34.9) DMG |34.0000|118.5000|08/04/1927|1224 0.0| 0.0| 5.00| 0.030 | V | 21.7( 34.9) MGI |34.0000|118.3000|09/03/1905| 540 0.0| 0.0| 5.30| 0.035 | V | 23.1( 37.2) T-A |34.0000|118.2500|01/10/1856| 0 0 0.0| 0.0| 5.00| 0.026 | V | 24.3( 39.2) T-A |34.0000|118.2500|09/23/1827| 0 0 0.0| 0.0| 5.00| 0.026 | V | 24.3( 39.2) T-A |34.0000|118.2500|03/26/1860| 0 0 0.0| 0.0| 5.00| 0.026 | V | 24.3( 39.2) MGI |34.1000|118.1000|07/11/1855| 415 0.0| 0.0| 6.30| 0.072 | VI | 24.7( 39.8) GSP |34.2620|118.0020|06/28/1991|144354.5| 11.0| 5.40| 0.033 | V | 25.8( 41.5) PAS |34.0730|118.0980|10/04/1987|105938.2| 8.2| 5.30| 0.030 | V | 26.0( 41.8) DMG |33.9500|118.6320|08/31/1930| 04036.0| 0.0| 5.20| 0.026 | V | 27.0( 43.5) PAS |34.0610|118.0790|10/01/1987|144220.0| 9.5| 5.90| 0.046 | VI | 27.3( 44.0) PAS |33.9440|118.6810|01/01/1979|231438.9| 11.3| 5.00| 0.021 | IV | 28.6( 46.0) PAS |33.9190|118.6270|01/19/1989| 65328.8| 11.9| 5.00| 0.020 | IV | 28.9( 46.5) DMG |34.2000|117.9000|08/28/1889| 215 0.0| 0.0| 5.50| 0.026 | V | 32.3( 52.0) MGI |34.0000|118.0000|12/25/1903|1745 0.0| 0.0| 5.00| 0.017 | IV | 33.5( 53.9) DMG |33.8500|118.2670|03/11/1933|1425 0.0| 0.0| 5.00| 0.016 | IV | 33.5( 54.0) DMG |34.0650|119.0350|02/21/1973|144557.3| 8.0| 5.90| 0.029 | V | 37.5( 60.3) MGI |34.0000|119.0000|12/14/1912| 0 0 0.0| 0.0| 5.70| 0.024 | V | 38.1( 61.3) DMG |34.0000|119.0000|09/24/1827| 4 0 0.0| 0.0| 7.00| 0.068 | VI | 38.1( 61.3) DMG |33.7830|118.2500|11/14/1941| 84136.3| 0.0| 5.40| 0.019 | IV | 38.2( 61.5) T-A |34.8300|118.7500|11/27/1852| 0 0 0.0| 0.0| 7.00| 0.064 | VI | 39.7( 63.8) DMG |33.7830|118.1330|10/02/1933| 91017.6| 0.0| 5.40| 0.017 | IV | 40.7( 65.6) DMG |34.7000|119.0000|10/23/1916| 254 0.0| 0.0| 5.50| 0.018 | IV | 41.2( 66.3) DMG |33.7500|118.0830|03/13/1933|131828.0| 0.0| 5.30| 0.014 | IV | 44.1( 70.9) DMG |33.7500|118.0830|03/11/1933| 230 0.0| 0.0| 5.10| 0.012 | III| 44.1( 70.9) DMG |33.7500|118.0830|03/11/1933| 910 0.0| 0.0| 5.10| 0.012 | III| 44.1( 70.9) DMG |33.7500|118.0830|03/11/1933| 2 9 0.0| 0.0| 5.00| 0.011 | III| 44.1( 70.9) DMG |33.7500|118.0830|03/11/1933| 323 0.0| 0.0| 5.00| 0.011 | III| 44.1( 70.9) GSP |34.1400|117.7000|02/28/1990|234336.6| 5.0| 5.20| 0.013 | III| 44.4( 71.5) DMG |34.3700|117.6500|12/08/1812|15 0 0.0| 0.0| 7.00| 0.053 | VI | 45.8( 73.7) -------------------------

EARTHQUAKE SEARCH RESULTS ------------------------- Page 2 ------------------------------------------------------------------------------- | | | | TIME | | | SITE |SITE| APPROX. FILE| LAT. | LONG. | DATE | (UTC) |DEPTH|QUAKE| ACC. | MM | DISTANCE CODE| NORTH | WEST | | H M Sec| (km)| MAG.| g |INT.| mi [km] ----+------+-------+---------+-------+----+----+------+---+----------- PAS |34.9430|118.7430|06/10/1988|23 643.0| 6.8| 5.40| 0.014 | IV | 46.7( 75.1) DMG |34.8670|118.9330|09/21/1941|1953 7.2| 0.0| 5.20| 0.012 | III| 47.2( 75.9) DMG |33.7000|118.0670|03/11/1933| 85457.0| 0.0| 5.10| 0.011 | III| 47.6( 76.5) DMG |33.7000|118.0670|03/11/1933| 51022.0| 0.0| 5.10| 0.011 | III| 47.6( 76.5) DMG |34.9000|118.9000|10/23/1916| 244 0.0| 0.0| 6.00| 0.022 | IV | 48.0( 77.3) DMG |34.3000|117.6000|07/30/1894| 512 0.0| 0.0| 6.00| 0.022 | IV | 48.5( 78.0) DMG |33.6830|118.0500|03/11/1933| 658 3.0| 0.0| 5.50| 0.014 | IV | 49.1( 78.9) DMG |34.9000|118.9500|08/01/1952|13 430.0| 0.0| 5.10| 0.010 | III| 49.6( 79.8) T-A |34.9200|118.9200|05/23/1857| 0 0 0.0| 0.0| 5.00| 0.009 | III| 49.8( 80.1) T-A |34.9200|118.9200|01/20/1857| 0 0 0.0| 0.0| 5.00| 0.009 | III| 49.8( 80.1) DMG |34.8000|119.1000|09/05/1883|1230 0.0| 0.0| 6.00| 0.021 | IV | 50.0( 80.5) DMG |34.9500|118.8670|07/21/1952|121936.0| 0.0| 5.30| 0.012 | III| 50.0( 80.5) DMG |34.2700|117.5400|09/12/1970|143053.0| 8.0| 5.40| 0.012 | III| 52.0( 83.7) DMG |34.9320|118.9760|03/01/1963| 02557.9| 13.9| 5.00| 0.009 | III| 52.2( 84.1) DMG |35.0000|118.8330|07/23/1952| 75319.0| 0.0| 5.40| 0.012 | III| 52.3( 84.1) DMG |35.0000|118.8330|07/23/1952|181351.0| 0.0| 5.20| 0.010 | III| 52.3( 84.1) DMG |34.9410|118.9870|11/15/1961| 53855.5| 10.7| 5.00| 0.009 | III| 53.1( 85.5) DMG |33.6170|118.0170|03/14/1933|19 150.0| 0.0| 5.10| 0.009 | III| 54.0( 86.9) DMG |34.3000|117.5000|07/22/1899|2032 0.0| 0.0| 6.50| 0.028 | V | 54.2( 87.2) DMG |33.6170|117.9670|03/11/1933| 154 7.8| 0.0| 6.30| 0.023 | IV | 55.3( 89.1) DMG |34.9830|118.9830|05/23/1954|235243.0| 0.0| 5.10| 0.009 | III| 55.4( 89.1) DMG |34.1000|119.4000|05/19/1893| 035 0.0| 0.0| 5.50| 0.012 | III| 56.2( 90.4) DMG |35.0000|119.0000|07/21/1952|12 531.0| 0.0| 6.40| 0.024 | V | 56.9( 91.5) DMG |35.0000|119.0000|02/16/1919|1557 0.0| 0.0| 5.00| 0.008 | II | 56.9( 91.5) DMG |35.0000|119.0170|07/21/1952|115214.0| 0.0| 7.70| 0.066 | VI | 57.4( 92.4) DMG |35.0000|119.0170|01/12/1954|233349.0| 0.0| 5.90| 0.016 | IV | 57.4( 92.4) DMG |33.5750|117.9830|03/11/1933| 518 4.0| 0.0| 5.20| 0.009 | III| 57.4( 92.4) DMG |35.0000|119.0330|07/21/1952|12 2 0.0| 0.0| 5.60| 0.012 | III| 57.9( 93.2) PAS |33.6710|119.1110|09/04/1981|155050.3| 5.0| 5.30| 0.010 | III| 58.2( 93.6) MGI |34.0000|117.5000|12/16/1858|10 0 0.0| 0.0| 7.00| 0.037 | V | 58.4( 93.9) DMG |35.1500|118.6330|01/27/1954|141948.0| 0.0| 5.00| 0.007 | II | 58.8( 94.7) DMG |35.1330|118.7670|07/21/1952|194122.0| 0.0| 5.50| 0.011 | III| 59.5( 95.8) ******************************************************************************* -END OF SEARCH- 80 EARTHQUAKES FOUND WITHIN THE SPECIFIED SEARCH AREA. TIME PERIOD OF SEARCH: 1811 TO 2011 LENGTH OF SEARCH TIME: 201 years THE EARTHQUAKE CLOSEST TO THE SITE IS ABOUT 0.3 MILES (0.5 km) AWAY. LARGEST EARTHQUAKE MAGNITUDE FOUND IN THE SEARCH RADIUS: 7.7 LARGEST EARTHQUAKE SITE ACCELERATION FROM THIS SEARCH: 0.333 g
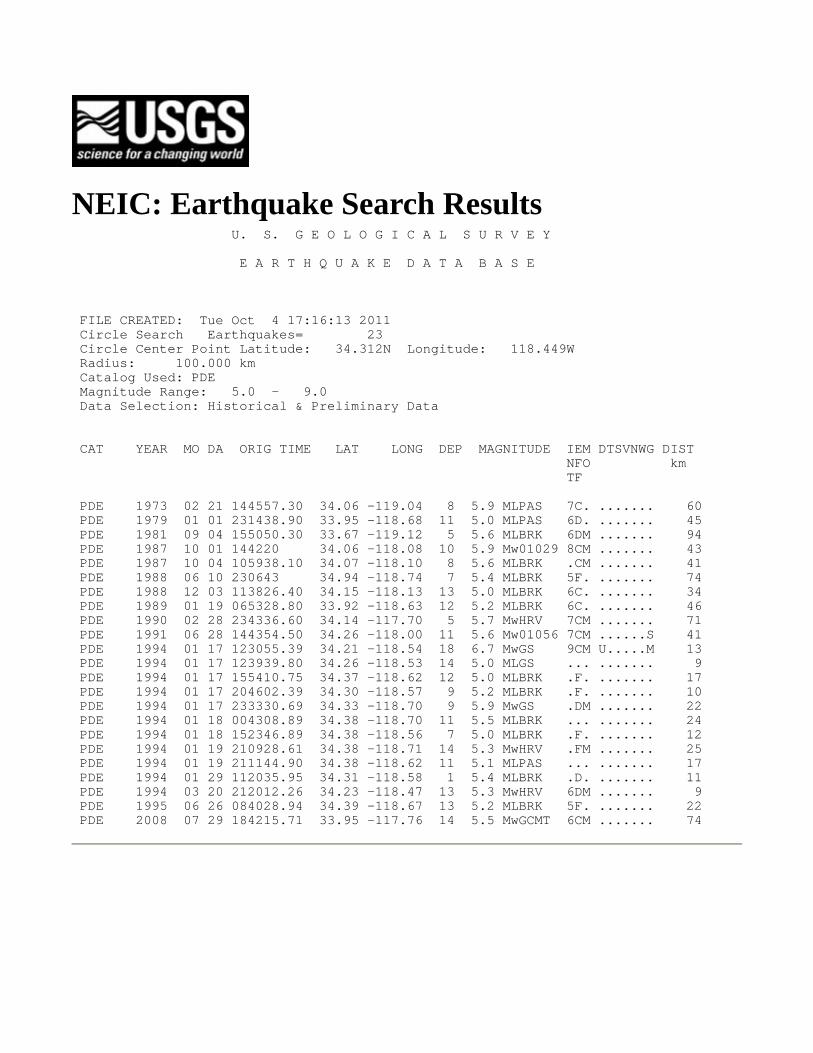
NEIC: Earthquake Search Results U. S. G E O L O G I C A L S U R V E Y E A R T H Q U A K E D A T A B A S E FILE CREATED: Tue Oct 4 17:16:13 2011 Circle Search Earthquakes= 23 Circle Center Point Latitude: 34.312N Longitude: 118.449W Radius: 100.000 km Catalog Used: PDE Magnitude Range: 5.0 - 9.0 Data Selection: Historical & Preliminary Data CAT YEAR MO DA ORIG TIME LAT LONG DEP MAGNITUDE IEM DTSVNWG DIST NFO km TF PDE 1973 02 21 144557.30 34.06 -119.04 8 5.9 MLPAS 7C. ....... 60 PDE 1979 01 01 231438.90 33.95 -118.68 11 5.0 MLPAS 6D. ....... 45 PDE 1981 09 04 155050.30 33.67 -119.12 5 5.6 MLBRK 6DM ....... 94 PDE 1987 10 01 144220 34.06 -118.08 10 5.9 Mw01029 8CM ....... 43 PDE 1987 10 04 105938.10 34.07 -118.10 8 5.6 MLBRK .CM ....... 41 PDE 1988 06 10 230643 34.94 -118.74 7 5.4 MLBRK 5F. ....... 74 PDE 1988 12 03 113826.40 34.15 -118.13 13 5.0 MLBRK 6C. ....... 34 PDE 1989 01 19 065328.80 33.92 -118.63 12 5.2 MLBRK 6C. ....... 46 PDE 1990 02 28 234336.60 34.14 -117.70 5 5.7 MwHRV 7CM ....... 71 PDE 1991 06 28 144354.50 34.26 -118.00 11 5.6 Mw01056 7CM ......S 41 PDE 1994 01 17 123055.39 34.21 -118.54 18 6.7 MwGS 9CM U.....M 13 PDE 1994 01 17 123939.80 34.26 -118.53 14 5.0 MLGS ... ....... 9 PDE 1994 01 17 155410.75 34.37 -118.62 12 5.0 MLBRK .F. ....... 17 PDE 1994 01 17 204602.39 34.30 -118.57 9 5.2 MLBRK .F. ....... 10 PDE 1994 01 17 233330.69 34.33 -118.70 9 5.9 MwGS .DM ....... 22 PDE 1994 01 18 004308.89 34.38 -118.70 11 5.5 MLBRK ... ....... 24 PDE 1994 01 18 152346.89 34.38 -118.56 7 5.0 MLBRK .F. ....... 12 PDE 1994 01 19 210928.61 34.38 -118.71 14 5.3 MwHRV .FM ....... 25 PDE 1994 01 19 211144.90 34.38 -118.62 11 5.1 MLPAS ... ....... 17 PDE 1994 01 29 112035.95 34.31 -118.58 1 5.4 MLBRK .D. ....... 11 PDE 1994 03 20 212012.26 34.23 -118.47 13 5.3 MwHRV 6DM ....... 9 PDE 1995 06 26 084028.94 34.39 -118.67 13 5.2 MLBRK 5F. ....... 22 PDE 2008 07 29 184215.71 33.95 -117.76 14 5.5 MwGCMT 6CM ....... 74

NEIC: Earthquake Search Results U. S. G E O L O G I C A L S U R V E Y E A R T H Q U A K E D A T A B A S E FILE CREATED: Tue Oct 4 17:17:55 2011 Circle Search Earthquakes= 61 Circle Center Point Latitude: 34.312N Longitude: 118.449W Radius: 100.000 km Catalog Used: USHIS Magnitude Range: 5.0 - 9.0 Data Selection: Significant U.S. Earthquakes (USHIS) CAT YEAR MO DA ORIG TIME LAT LONG DEP MAGNITUDE IEM DTSVNWG DIST NFO km TF USHIS 1769 07 28 33.90 -117.80 6.0 MLELL 8F. ....... 75 USHIS 1812 12 08 15 34.37 -117.65 6.9 MLCDMG 8F. ....... 73 USHIS 1827 09 24 04 34.00 -119.00 5.5 MLCDMG 6F. ....... 61 USHIS 1855 07 11 0415 34.10 -118.10 6.0 MLELL 8F. ....... 39 USHIS 1858 12 16 10 34.00 -117.50 6.0 MLELL 8F. ....... 94 USHIS 1889 08 28 0215 34.10 -117.90 5.2 MLCDMG 6F. ....... 55 USHIS 1893 04 04 1940 34.30 -118.60 5.4 MLCDMG 8F. ....... 13 USHIS 1893 05 19 0035 34.10 -119.40 5.5 MLCDMG 5F. ....... 90 USHIS 1894 07 30 0512 34.30 -117.60 5.9 MLCDMG 6F. ....... 78 USHIS 1899 07 22 0046 34.20 -117.40 5.5 MLCDMG 6F. ....... 97 USHIS 1899 07 22 2032 34.30 -117.50 6.5 MLCDMG 8F. ....... 87 USHIS 1916 10 23 0244 34.90 -118.90 6.0 MSCFR 7F. ....... 77 USHIS 1916 10 23 0254 34.70 -119.00 5.5 MLCDMG 5F. ....... 66 USHIS 1919 02 16 1557 35.00 -119.00 5.0 MLCDMG 7F. ....... 91 USHIS 1926 06 29 2321 34.50 -119.50 5.5 MLCDMG 7F. ....... 98 USHIS 1927 08 04 1224 34.00 -118.50 5.3 UKJON 6F. ....... 34 USHIS 1928 04 18 2140 34.10 -119.30 5.2 UKJON 3F. ....... 81 USHIS 1930 08 05 1125 34.50 -119.50 5.0 MLCDMG 6F. ....... 98 USHIS 1930 08 31 004038 34.03 -118.64 15 5.2 MSGR 7F. ....... 35 USHIS 1933 03 11 015407.80 33.62 -117.97 16 6.3 MLPAS 8F. ....... 89 USHIS 1933 03 11 0209 33.75 -118.08 16 5.0 MLPAS ... ....... 70 USHIS 1933 03 11 0230 33.75 -118.08 16 5.1 MLPAS ... ....... 70 USHIS 1933 03 11 0323 33.75 -118.08 16 5.0 MLPAS ... ....... 70 USHIS 1933 03 11 051022 33.70 -118.07 16 5.1 MLPAS ... ....... 76 USHIS 1933 03 11 051804 33.57 -117.98 16 5.2 MLPAS ... ....... 93 USHIS 1933 03 11 065803 33.68 -118.05 16 5.5 MLPAS ... ....... 78 USHIS 1933 03 11 085457 33.70 -118.07 16 5.1 MLPAS ... ....... 76 USHIS 1933 03 11 0910 33.75 -118.08 16 5.1 MLPAS ... ....... 70 USHIS 1933 03 11 1425 33.85 -118.27 16 5.0 MLPAS ... ....... 53 USHIS 1933 03 13 131828 33.75 -118.08 16 5.3 MLPAS 4F. ....... 70

USHIS 1933 03 14 190150 33.62 -118.02 16 5.1 MLPAS ... ....... 86 USHIS 1933 10 02 091017.60 33.78 -118.13 16 5.4 MLPAS 6F. ....... 65 USHIS 1941 09 21 195307.20 34.87 -118.93 16 5.2 MLPAS 5F. ....... 75 USHIS 1941 11 14 084136.30 33.78 -118.25 16 5.4 MSGR 8F. ....... 61 USHIS 1952 07 21 115214 35.00 -119.02 16 7.2 MLBLT EF. ....... 92 USHIS 1952 07 21 1202 35.00 -119.03 16 5.6 MLPAS .F. ....... 93 USHIS 1952 07 21 120531 35.00 -119.00 16 6.4 MLPAS 5F. ....... 91 USHIS 1952 07 21 121936 34.95 -118.87 16 5.3 MLPAS .F. ....... 80 USHIS 1952 07 21 151358 35.18 -118.65 16 5.1 MLPAS 6F. ....... 98 USHIS 1952 07 21 194122 35.13 -118.77 16 5.5 MLPAS 5F. ....... 95 USHIS 1952 07 23 075319 35.00 -118.83 16 5.4 MLPAS 7F. ....... 84 USHIS 1952 07 23 181351 35.00 -118.83 16 5.2 MLPAS 6F. ....... 84 USHIS 1952 08 01 130430 34.90 -118.95 16 5.1 MLPAS 5F. ....... 79 USHIS 1952 08 23 100907.10 34.52 -118.20 13 5.0 MLPAS 6F. ....... 32 USHIS 1954 01 12 233349 35.00 -119.02 16 5.9 MLPAS 7F. ....... 92 USHIS 1954 01 27 141948 35.15 -118.63 16 5.0 MLPAS 5F. ....... 94 USHIS 1954 05 23 235243 34.98 -118.98 16 5.1 MLPAS 4F. ....... 89 USHIS 1961 11 15 053855.50 34.94 -118.99 11 5.0 MLPAS 6F. ....... 85 USHIS 1963 03 01 002557.90 34.93 -118.97 14 5.0 MLPAS 5F. ....... 83 USHIS 1970 09 12 143053 34.27 -117.54 8 5.4 MLPAS 7F. ....... 83 USHIS 1971 02 09 140041.80 34.41 -118.40 8 6.4 MLKJ EF. ....... 11 USHIS 1971 02 09 140108 34.41 -118.40 8 5.8 MLPAS ... ....... 11 USHIS 1971 02 09 140244 34.41 -118.40 8 5.8 MLPAS ... ....... 11 USHIS 1971 02 09 141028 34.41 -118.40 8 5.3 MLPAS 5F. ....... 11 USHIS 1971 02 09 144346.70 34.31 -118.45 6 5.2 MLPAS .F. ....... 0 USHIS 1973 02 21 144557.20 34.10 -119.04 17 5.9 MLPAS 7F. ....... 59 USHIS 1981 09 04 155050.40 33.66 -119.09 5 5.3 MLBRK 6F. ....... 93 USHIS 1987 10 01 144220 34.06 -118.08 10 5.9 MwHAV 8F. ....... 44 USHIS 1987 10 04 105938.20 34.07 -118.10 8 5.2 MwHAV 7F. ....... 41 USHIS 1988 06 10 230643 34.94 -118.74 7 5.4 MLGP 5F. ....... 74 USHIS 1989 01 19 065328.80 33.92 -118.63 12 5.0 MLGP 6F. ....... 46

NEIC: Earthquake Search Results U. S. G E O L O G I C A L S U R V E Y E A R T H Q U A K E D A T A B A S E FILE CREATED: Tue Oct 4 17:20:03 2011 Circle Search Earthquakes= 52 Circle Center Point Latitude: 34.312N Longitude: 118.449W Radius: 100.000 km Catalog Used: CDMG Magnitude Range: 5.0 - 9.0 Data Selection: California (CDMG) CAT YEAR MO DA ORIG TIME LAT LONG DEP MAGNITUDE IEM DTSVNWG DIST NFO km TF CDMG 1812 12 08 15 33.70 -117.90 6.9 UKCDMG 7.. ....... 84 CDMG 1827 09 24 04 34.00 -119.00 5.5 UKCDMG 6.. ....... 61 CDMG 1889 08 28 0215 34.10 -117.90 5.2 UKCDMG 6.. ....... 55 CDMG 1893 04 04 1940 34.30 -118.60 5.4 UKCDMG 8.. ....... 13 CDMG 1893 05 19 0035 34.10 -119.40 5.5 UKCDMG 6.. ....... 90 CDMG 1894 07 30 0512 34.30 -117.60 5.9 UKCDMG 6.. ....... 78 CDMG 1899 07 22 0046 34.20 -117.40 5.5 UKCDMG 7.. ....... 97 CDMG 1899 07 22 2032 34.30 -117.50 6.5 UKCDMG 8.. ....... 87 CDMG 1916 10 23 0244 34.90 -118.90 6.0 MLRI 7.. ....... 77 CDMG 1916 10 23 0254 34.70 -119.00 5.5 UKTO 5.. ....... 66 CDMG 1919 02 16 1557 35.00 -119.00 5.0 UKTO 7.. ....... 91 CDMG 1926 06 29 2321 34.50 -119.50 5.5 UKTO 7C. ....... 98 CDMG 1927 08 04 1224 34.00 -118.50 5.0 UKTO 6.. ....... 34 CDMG 1930 08 05 1125 34.50 -119.50 5.0 UKTO 7.. ....... 98 CDMG 1930 08 31 004036 33.95 -118.63 5.2 MLEH 7.. ....... 43 CDMG 1933 03 11 015407.80 33.62 -117.97 6.3 MLPAS 9D. ....... 88 CDMG 1933 03 11 0209 33.75 -118.08 5.0 MLPAS ... ....... 70 CDMG 1933 03 11 0230 33.75 -118.08 5.1 MLPAS ... ....... 70 CDMG 1933 03 11 0323 33.75 -118.08 5.0 MLPAS ... ....... 70 CDMG 1933 03 11 051022 33.70 -118.07 5.1 MLPAS ... ....... 76 CDMG 1933 03 11 051804 33.58 -117.98 5.2 MLPAS ... ....... 92 CDMG 1933 03 11 065803 33.68 -118.05 5.5 MLPAS ... ....... 78 CDMG 1933 03 11 085457 33.70 -118.07 5.1 MLPAS ... ....... 76 CDMG 1933 03 11 0910 33.75 -118.08 5.1 MLPAS ... ....... 70 CDMG 1933 03 11 1425 33.85 -118.27 5.0 MLPAS ... ....... 53 CDMG 1933 03 13 131828 33.75 -118.08 5.3 MLPAS 4.. ....... 70 CDMG 1933 03 14 190150 33.62 -118.02 5.1 MLPAS ... ....... 86 CDMG 1933 10 02 091017.60 33.78 -118.13 5.4 MLPAS 6.. ....... 65 CDMG 1941 09 21 195307.20 34.87 -118.93 5.2 MLPAS 6.. ....... 75 CDMG 1941 11 14 084136.30 33.78 -118.25 5.4 MLPAS 8D. ....... 61 CDMG 1952 07 21 115214 35.00 -119.02 7.7 MLPAS ED. ....... 92 CDMG 1952 07 21 1202 35.00 -119.03 5.6 MLPAS .F. ....... 93

CDMG 1952 07 21 120531 35.00 -119.00 6.4 MLPAS 5.. ....... 91 CDMG 1952 07 21 121936 34.95 -118.87 5.3 MLPAS .F. ....... 80 CDMG 1952 07 21 151358 35.18 -118.65 5.1 MLPAS .F. ....... 98 CDMG 1952 07 21 194122 35.13 -118.77 5.5 MLPAS 5.. ....... 95 CDMG 1952 07 23 075319 35.00 -118.83 5.4 MLPAS 7.. ....... 84 CDMG 1952 07 23 181351 35.00 -118.83 5.2 MLPAS 6.. ....... 84 CDMG 1952 08 01 130430 34.90 -118.95 5.1 MLPAS 5.. ....... 79 CDMG 1952 08 23 100907.10 34.52 -118.20 13 5.0 MLPAS 6.. ....... 32 CDMG 1954 01 12 233349 35.00 -119.02 5.9 MLPAS 8.. ....... 92 CDMG 1954 01 27 141948 35.15 -118.63 5.0 MLPAS 6.. ....... 94 CDMG 1954 05 23 235243 34.98 -118.98 5.1 MLPAS 4.. ....... 89 CDMG 1961 11 15 053855.50 34.94 -118.99 10 5.0 MLPAS 6.. ....... 85 CDMG 1963 03 01 002557.90 34.93 -118.98 13 5.0 MLPAS 6.. ....... 84 CDMG 1970 09 12 143053 34.27 -117.54 8 5.4 MLPAS 7.. ....... 83 CDMG 1971 02 09 140041.80 34.41 -118.40 8 6.4 MLPAS ED. ....... 11 CDMG 1971 02 09 140108 34.41 -118.40 8 5.8 MLPAS ... ....... 11 CDMG 1971 02 09 140244 34.41 -118.40 8 5.8 MLPAS ... ....... 11 CDMG 1971 02 09 141028 34.41 -118.40 8 5.3 MLPAS 5.. ....... 11 CDMG 1971 02 09 144346.70 34.31 -118.45 6 5.2 MLPAS .F. ....... 0 CDMG 1973 02 21 144557.30 34.06 -119.04 8 5.9 MLPAS 7D. ....... 60
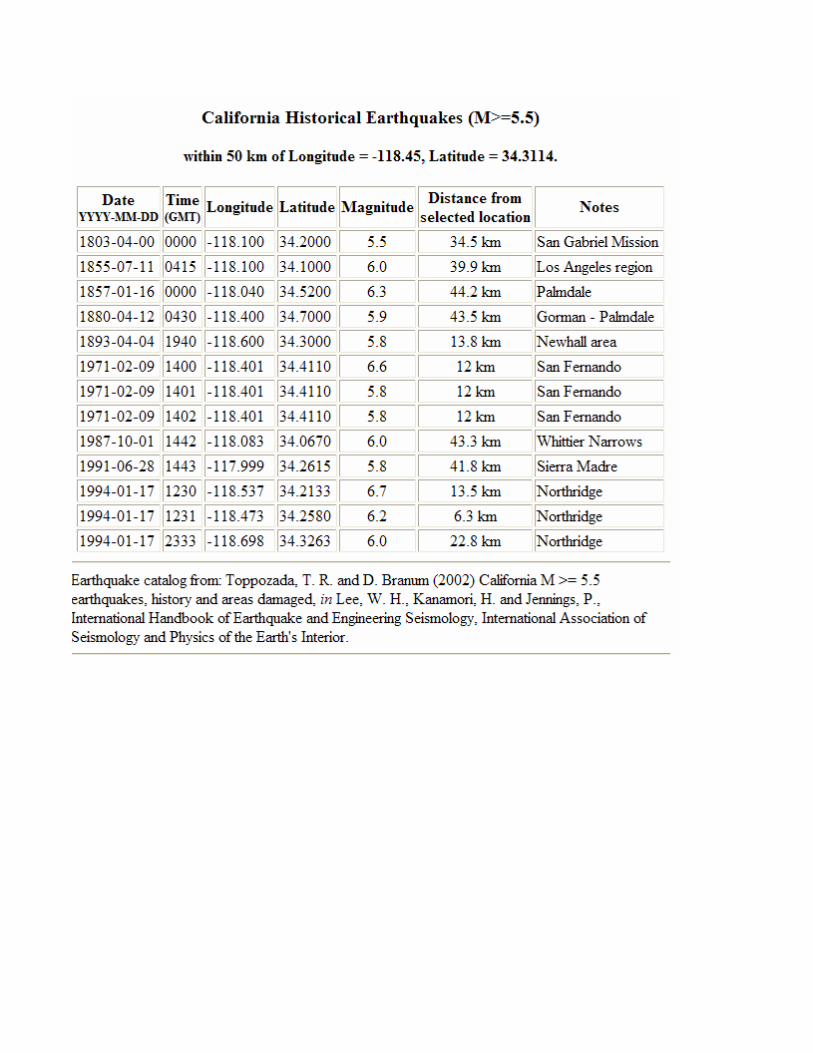


APPENDIX E
LATERAL PILE CAPACITY
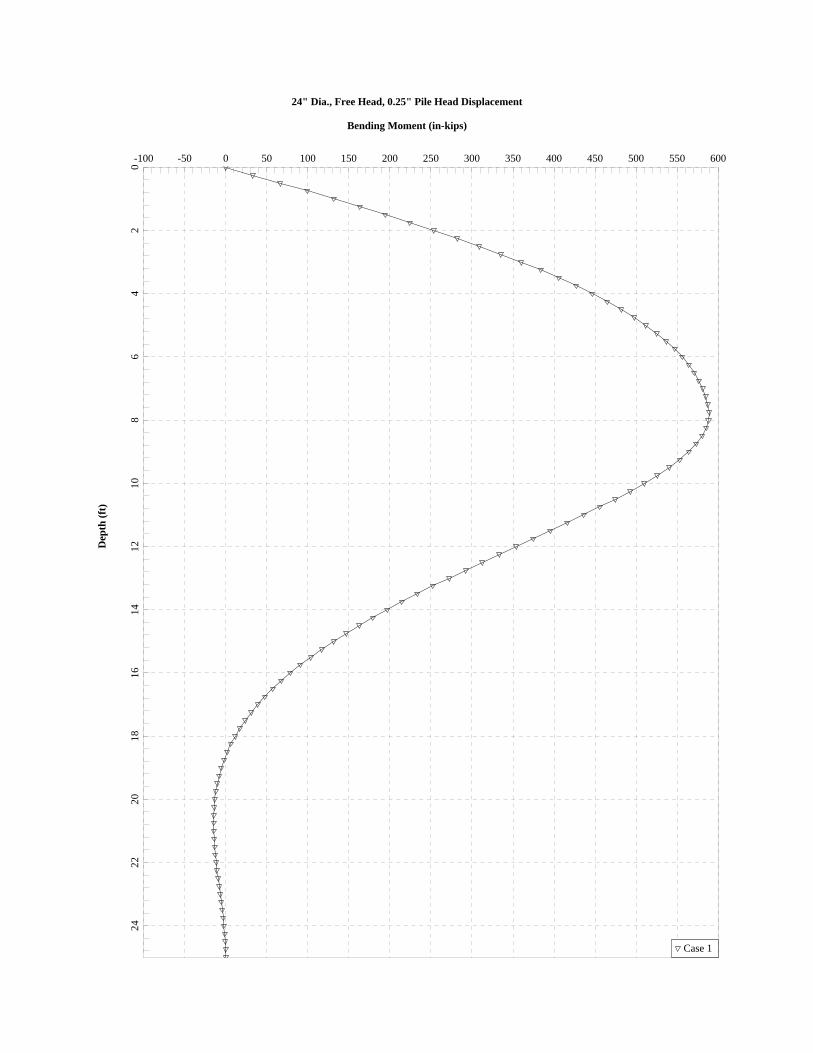
Bending Moment (in-kips)
24" Dia., Free Head, 0.25" Pile Head DisplacementD
epth
(ft
)
-100 -50 0 50 100 150 200 250 300 350 400 450 500 550 600
02
46
810
1214
1618
2022
24
Case 1

Lateral Deflection (in)
24" Dia., Free Head, 0.25" Pile Head DisplacementD
epth
(ft
)
0 0.02 0.04 0.06 0.08 0.1 0.12 0.14 0.16 0.18 0.2 0.22 0.24
02
46
810
1214
1618
2022
24
Case 1

Shear Force (kips)
24" Dia., Free Head, 0.25" Pile Head DisplacementD
epth
(ft
)
-6 -4 -2 0 2 4 6 8 10 12
02
46
810
1214
1618
2022
24
Case 1
Shear Force (kips)
24" Dia., Free Head, 0.25" Pile Head DisplacementD
epth
(ft
)
-6 -4 -2 0 2 4 6 8 10 1
02
46
810
1214
1618
2022
24
Case 1

Bending Moment (in-kips)
24" Dia., Free Head, 0.5" Pile Head DisplacementD
epth
(ft
)
-100 0 100 200 300 400 500 600 700 800 900 1000 1100 1200
02
46
810
1214
1618
2022
24
Case 1

Lateral Deflection (in)
24" Dia., Free Head, 0.5" Pile Head DisplacementD
epth
(ft
)
-0.1 -0.05 0 0.05 0.1 0.15 0.2 0.25 0.3 0.35 0.4 0.45 0.5
02
46
810
1214
1618
2022
24
Case 1

Shear Force (kips)
24" Dia., Free Head, 0.5" Pile Head DisplacementD
epth
(ft
)
-20 -15 -10 -5 0 5 10 15 20 25 30
02
46
810
1214
1618
2022
24
Case 1
Shear Force (kips)
24" Dia., Free Head, 0.5" Pile Head DisplacementD
epth
(ft
)
-20 -15 -10 -5 0 5 10 15 20 25 3
02
46
810
1214
1618
2022
24
Case 1

Bending Moment (in-kips)
24" Dia., Fixed Head, 0.25" Pile Head DisplacementD
epth
(ft
)
-1800 -1600 -1400 -1200 -1000 -800 -600 -400 -200 0 200 400 600
02
46
810
1214
1618
2022
24
Case 1

Lateral Deflection (in)
24" Dia., Fixed Head, 0.25" Pile Head DisplacementD
epth
(ft
)
0 0.02 0.04 0.06 0.08 0.1 0.12 0.14 0.16 0.18 0.2 0.22 0.24
02
46
810
1214
1618
2022
24
Case 1

Shear Force (kips)
24" Dia., Fixed Head, 0.25" Pile Head DisplacementD
epth
(ft
)
-10 -5 0 5 10 15 20 25 30 35 40
02
46
810
1214
1618
2022
24
Case 1
Shear Force (kips)
24" Dia., Fixed Head, 0.25" Pile Head DisplacementD
epth
(ft
)
-10 -5 0 5 10 15 20 25 30 35 4
02
46
810
1214
1618
2022
24
Case 1

Bending Moment (in-kips)
24" Dia., Fixed Head, 0.5" Pile Head DisplacementD
epth
(ft
)
-4000 -3500 -3000 -2500 -2000 -1500 -1000 -500 0 500 1000 1500 2000
02
46
810
1214
1618
2022
24
Case 1

Lateral Deflection (in)
24" Dia., Fixed Head, 0.5" Pile Head DisplacementD
epth
(ft
)
-0.1 -0.05 0 0.05 0.1 0.15 0.2 0.25 0.3 0.35 0.4 0.45 0.5 0.55 0.6
02
46
810
1214
1618
2022
24
Case 1

Shear Force (kips)
24" Dia., Fixed Head, 0.5" Pile Head DisplacementD
epth
(ft
)
-20 -10 0 10 20 30 40 50 60
02
46
810
1214
1618
2022
24
Case 1

APPENDIX F
PERCOLATION TEST RESULTS AND CALCULATION

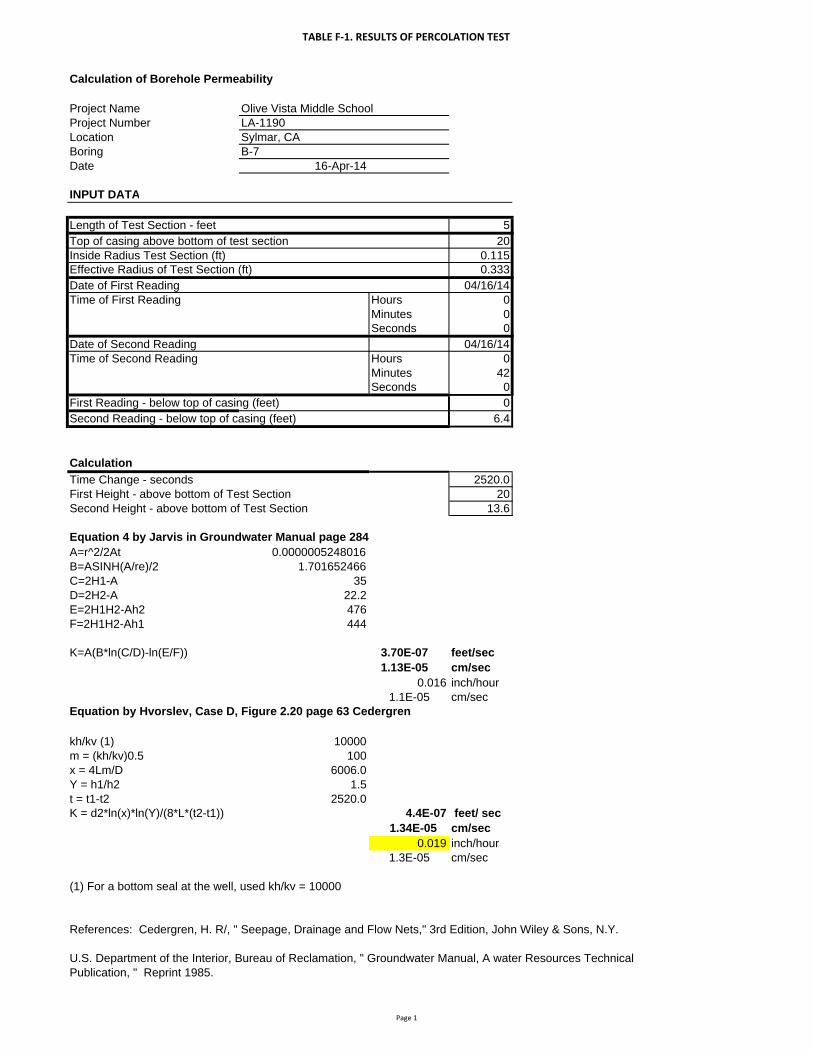
TABLE F‐1. RESULTS OF PERCOLATION TEST
Calculation of Borehole Permeability
Project Name Olive Vista Middle SchoolProject Number LA-1190Location Sylmar, CABoring B-7Date 16-Apr-14
INPUT DATA
Length of Test Section - feet 5Top of casing above bottom of test section 20Inside Radius Test Section (ft) 0.115Effective Radius of Test Section (ft) 0.333Date of First Reading 04/16/14Time of First Reading Hours 0
Minutes 0 Seconds 0
Date of Second Reading 04/16/14Time of Second Reading Hours 0
Minutes 42 Seconds 0
First Reading - below top of casing (feet) 0Second Reading - below top of casing (feet) 6.4
CalculationTime Change - seconds 2520.0First Height - above bottom of Test Section 20Second Height - above bottom of Test Section 13.6
Equation 4 by Jarvis in Groundwater Manual page 284A=r^2/2At 0.0000005248016B=ASINH(A/re)/2 1.701652466C=2H1-A 35D=2H2-A 22.2E=2H1H2-Ah2 476F=2H1H2-Ah1 444
K=A(B*ln(C/D)-ln(E/F)) 3.70E-07 feet/sec1.13E-05 cm/sec
0.016 inch/hour1.1E-05 cm/sec
Equation by Hvorslev, Case D, Figure 2.20 page 63 Cedergren
kh/kv (1) 10000m = (kh/kv)0.5 100x = 4Lm/D 6006.0Y = h1/h2 1.5t = t1-t2 2520.0K = d2*ln(x)*ln(Y)/(8*L*(t2-t1)) 4.4E-07 feet/ sec
1.34E-05 cm/sec0.019 inch/hour
1.3E-05 cm/sec
(1) For a bottom seal at the well, used kh/kv = 10000
References: Cedergren, H. R/, " Seepage, Drainage and Flow Nets," 3rd Edition, John Wiley & Sons, N.Y.
U.S. Department of the Interior, Bureau of Reclamation, " Groundwater Manual, A water Resources Technical Publication, " Reprint 1985.
Page 1

TABLE F‐2. RESULTS OF PERCOLATION TEST
Calculation of Borehole Permeability
Project Name Olive Vista Middle SchoolProject Number LA-1190Location Sylmar, CABoring B-8Date 16-Apr-14
INPUT DATA
Length of Test Section - feet 5Top of casing above bottom of test section 20Inside Radius Test Section (ft) 0.115Effective Radius of Test Section (ft) 0.333Date of First Reading 04/16/14Time of First Reading Hours 0
Minutes 0 Seconds 0
Date of Second Reading 04/16/14Time of Second Reading Hours 0
Minutes 41 Seconds 0
First Reading - below top of casing (feet) 0Second Reading - below top of casing (feet) 5.9
CalculationTime Change - seconds 2460.0First Height - above bottom of Test Section 20Second Height - above bottom of Test Section 14.1
Equation 4 by Jarvis in Groundwater Manual page 284A=r^2/2At 0.0000005376016B=ASINH(A/re)/2 1.701652466C=2H1-A 35D=2H2-A 23.2E=2H1H2-Ah2 493.5F=2H1H2-Ah1 464
K=A(B*ln(C/D)-ln(E/F)) 3.43E-07 feet/sec1.05E-05 cm/sec
0.015 inch/hour1.0E-05 cm/sec
Equation by Hvorslev, Case D, Figure 2.20 page 63 Cedergren
kh/kv (1) 10000m = (kh/kv)0.5 100x = 4Lm/D 6006.0Y = h1/h2 1.4t = t1-t2 2460.0K = d2*ln(x)*ln(Y)/(8*L*(t2-t1)) 4.1E-07 feet/ sec
1.25E-05 cm/sec0.018 inch/hour
1.2E-05 cm/sec
(1) For a bottom seal at the well, used kh/kv = 10000
References: Cedergren, H. R/, " Seepage, Drainage and Flow Nets," 3rd Edition, John Wiley & Sons, N.Y.
U.S. Department of the Interior, Bureau of Reclamation, " Groundwater Manual, A water Resources Technical Publication, " Reprint 1985.
Page 1
appendix c
Phase i environmental site assessment olive vista miDDle school, 14600 tyler street, sylmar, california
91342” (“Phase i esa”) PrePareD for lausD by clark seif clark, inc., on June 27, 2014.


PHASE I ENVIRONMENTAL SITE ASSESSMENT Olive Vista Middle School 14600 Tyler Street Sylmar, California 91342
Submitted to Los Angeles Unified School District Office of Environmental Health and Safety
LAUSD Work Authorization Number: E-305749-1CSC
Prepared by Clark Seif Clark, Inc.
110 Pine Avenue, Suite 925 Long Beach, California 90802 Tel: (562) 435-8080 Fax: (562) 590-8795 CSC Project Number: 4006791
June 27, 2014

-i-
TABLE OF CONTENTS 1.0 EXECUTIVE SUMMARY ................................................................................................ 1
1.1 Current Property Description ....................................................................................................... 2 1.2 Historical Property Summary ....................................................................................................... 2 1.3 Off-Site Summary ........................................................................................................................ 2 1.4 Conclusions and Recommendations............................................................................................. 3 1.4.1 Conclusions ........................................................................................................................... 3 1.4.2 Recommendation .................................................................................................................. 3 2.0 INTRODUCTION............................................................................................................... 4
2.1 Objective ...................................................................................................................................... 4 2.2 Scope of Services ......................................................................................................................... 4 2.3 Significant Assumptions .............................................................................................................. 5 2.4 Limitations and Exceptions .......................................................................................................... 6 2.5 Special Terms and Conditions...................................................................................................... 6 2.6 User Reliance ............................................................................................................................... 6
3.0 PROPERTY DESCRIPTION ............................................................................................ 7 3.1 Location and Legal Descriptions.................................................................................................. 7 3.2 Description of Property Features.................................................................................................. 7 3.3 Current Uses of the Property ........................................................................................................ 7 3.3.1 Methodology .............................................................................................................................. 7 3.3.2 Observations .............................................................................................................................. 7 3.3.3 Current Use Assessment ............................................................................................................ 7
3.4 Current Uses of Surrounding Properties ...................................................................................... 8 3.5 Topographic Setting ..................................................................................................................... 8 3.5.1 General Site Setting .............................................................................................................. 8 3.5.2 Nearest Surface Water Body ................................................................................................. 8 3.5.3 Nearest Location of Ecological Interest ................................................................................ 8
3.6 Regional Geology ......................................................................................................................... 8 3.6.1 Geologic Setting.................................................................................................................... 8 3.6.2 Nearest Special Study (Alquist-Priolo Act) Zone ................................................................. 9 3.6.3 Potential for Liquefaction and Landslides ............................................................................ 9

Olive Vista Middle School Phase I Environmental Site Assessment June 27, 2014
-ii-
3.6.4 Potential for Flooding ........................................................................................................... 9 3.6.5 Radon .................................................................................................................................... 9 3.6.6 Methane................................................................................................................................. 9
3.7 Regional Hydrogeology ............................................................................................................. 10 3.7.1 Hydrogeologic Setting ........................................................................................................ 10 3.7.2 Groundwater Well Information........................................................................................... 10 3.7.3 Nearest Groundwater Production Well ............................................................................... 10 4.0 HISTORICAL REVIEW ................................................................................................. 10
4.1 Summary of Historical Review Findings ................................................................................... 11 4.2 Building Permit Review ............................................................................................................. 15 4.3 Environmental Lien and Activity and Use Limitations Review ................................................ 15 4.4 Additional Historical Record Sources ........................................................................................ 15 4.5 Historical Uses and Operations of the Property ......................................................................... 15 4.6 Historical Review of Surrounding Properties ............................................................................ 15
5.0 REGULATORY AGENCY INFORMATION ............................................................... 16 5.1 Property Permits ......................................................................................................................... 16 5.2 Standard Environmental Record Sources ................................................................................... 16 5.3 Summary of Federal Agency Database Record Findings .......................................................... 18 5.4 State and Tribal Database Records............................................................................................. 20 5.5 EDR Proprietary Databases ........................................................................................................ 22 5.6 Additional Record Sources......................................................................................................... 22 5.6.1 Division of Oil, Gas, and Geothermal Resources ............................................................... 22 5.6.2 California State Fire Marshal, Pipeline Safety Division ..................................................... 22 5.6.3 South Coast Air Quality Management District ................................................................... 22 5.6.4 Los Angeles Department of Water and Power ................................................................... 22 5.6.5 Southern California Gas ...................................................................................................... 23 5.6.6 Los Angeles Regional Water Quality Control Board (ñRWQCBô) .................................... 23 5.6.7 Los Angeles County Public Health Investigation (ñPHIò) ................................................. 23 5.6.8 North Hollywood Sanitation District .................................................................................. 23 5.6.9 Department of Toxic Substances Control (DTSC) ............................................................. 23 5.6.10 Environmental Protection Agency (USEPA) ...................................................................... 23 5.6.11 Office of Environmental Health Hazard Assessment (ñOEHHAò) .................................... 23 5.6.12 City of Los Angeles Fire Department ................................................................................. 24

Olive Vista Middle School Phase I Environmental Site Assessment June 27, 2014
-iii-
6.0 SITE ISSUES ..................................................................................................................... 24 6.1 Previous Investigations .............................................................................................................. 24 6.2 Chemical and Hazardous Material Handling and Storage ......................................................... 24 6.3 Storage Tanks and Clarifiers ...................................................................................................... 24 6.4 Asbestos, Lead-Based Paint and Pesticides ............................................................................... 25 6.5 Polychlorinated Biphenyls (PCBs)............................................................................................. 25 6.6 Evidence of Environmental Concern ......................................................................................... 25 6.6.1 Stained Soil, Pavement, and Concrete ................................................................................ 25 6.6.2 Stressed Vegetation ............................................................................................................. 25 6.6.3 Drums .................................................................................................................................. 25 6.6.4 Air Quality .......................................................................................................................... 25 7.0 SCHOOL SITE ENVIRONMENTAL SCREENING CRITERIA FINDINGS ......... 25
7.1 High Voltage Power Transmission Lines................................................................................... 25 7.2 Railroads..................................................................................................................................... 25 7.3 Hazardous Disposal Sites ........................................................................................................... 25 7.4 Hazardous Material Pipelines..................................................................................................... 26 7.5 Airports....................................................................................................................................... 26 7.6 High-Pressure Water Pipelines, Reservoirs, Water or Fuel Storage Tanks ............................... 26 7.7 Major Roadways ........................................................................................................................ 26 7.8 Geological Special Studies Zone................................................................................................ 26 7.9 Flood and Inundation ................................................................................................................. 26 7.10 Border Zone Property ............................................................................................................. 27
8.0 FINDINGS ......................................................................................................................... 27 8.1 Subject Property ......................................................................................................................... 27 8.2 Nearby Properties ....................................................................................................................... 28 8.3 Tier 1 Vapor Encroachment Screen ........................................................................................... 30 8.4 Orphan Properties ....................................................................................................................... 31 8.5 Data Gaps ................................................................................................................................... 31
9.0 OPINIONS ......................................................................................................................... 31 9.1 Recognized Environmental Conditions (Current, Controlled and Historic) .............................. 31 9.2 De Minimis Conditions .............................................................................................................. 31 9.3 Vapor Encroachment Conditions ............................................................................................... 32

Olive Vista Middle School Phase I Environmental Site Assessment June 27, 2014
-iv-
10.0 CONCLUSIONS ........................................................................................................... 32 10.1 Recognized Environmental Conditions .................................................................................. 33 10.2 Tier 1 Vapor Encroachment Screen ........................................................................................ 33 10.3 Data Gaps ............................................................................................................................... 33 10.4 Items of Concern .................................................................................................................... 33 10.5 Recommendations .................................................................................................................. 33
11.0 SPECIAL TERMS AND CONDITIONS .................................................................... 34 11.1 Limitations and Exceptions of Assessment ............................................................................ 34 11.2 Limiting Conditions and Methodology Used ......................................................................... 34
12.0 STATEMENT OF INDEPENDENCE ........................................................................ 34 13.0 ADDITIONAL SERVICES .......................................................................................... 35 14.0 REFERENCES .............................................................................................................. 35 15.0 ................................. 35 16.0 QUALIFICATIONS OF ENVIRONMENTAL PROFESSIONALS ....................... 35 17.0 LIST OF APPENDICES ............................................................................................... 36
Location Map Assessorôs Parcel Map Subject and Nearby Facilities Radius Map APPENDICES IN BINDER AND ON COMPACT DISC Subject Property Photographs Appendix A Aerial Photographs Appendix B Sanborn Fire Insurance Maps Appendix CHistoric Topographical Maps Appendix D EDR Radius Map Report with GeoCheck Appendix E SUPPLEMENTAL APPENDICIES ON COMPACT DISC ONLY City Directory Abstracts Appendix F City of Los Angeles Building Department Permits Appendix G School Site Environmental Screening Criteria Checklist Appendix H References Appendix I Environmental Professional(s) Qualifications Appendix J Supplemental EDR Database Search Reports Appendix K Miscellaneous Documentation Appendix L

-1-
PHASE I ENVIRONMENTAL SITE ASSESSMENT Olive Vista Middle School APN 2505-025-900 14600 Tyler Street Sylmar, California 91342
1.0 EXECUTIVE SUMMARY
Clark Seif Clark, Inc. (ñCSCò) performed a Phase I Environmental Site Assessment in conformance with the scope and limitations of American Society for Testing and Materials ("ASTM") "Standard Practice for Environmental Site Assessments: Phase I Environmental Site Assessment Process", E 1527-13 (ñPhase I ESAò), for the facility identified as Olive Vista Middle School addressed as 14600 Tyler Street, Sylmar, Los Angeles County, California (ñSubject Propertyò). The purpose of this Phase I ESA is to provide background information. The Subject Property is currently occupied by a Los Angeles Unified School District (ñLAUSDò) middle school that opened in 1958. The land for development of the Olive Vista Middle School was acquired by LAUSD in 1954 from the Lakeside and Polk Development Corporations. Prior to that time, the Subject Property and surrounding area were in agricultural use dating back to the mid-1800s. Scattered residential development in the general area is evident beginning in the late 1930s. The Subject Property is located between Tyler Street on the northerly boundary, Polk Street on the southerly boundary, Borden Avenue on the easterly boundary and Fellows Avenue on the westerly boundary. The surrounding area is primarily residential in the northerly, northeasterly and northwesterly directions, and institutional or commercial to the southerly, southeasterly and southwesterly directions. Sylmar Elementary School is located to the east southeast; Sylmar Park, a library and a Los Angeles Department of Water and Power substation to the south; and Los Angeles City Fire Station 91 to the south southeast. There are no industrial sites within one-half mile of the Subject Property. The closest commercial area is located approximately 500 feet to the south southwest at the corner of Polk Street and Glenoaks Boulevard. There are no high voltage transmission lines or freeways within 500 feet of the Subject Property. This Phase I Environmental Assessment has not revealed any current, controlled or historic Recognized Environmental Conditions (ñRECò) present at the Subject Property. The term REC
means the presence or likely presence of any hazardous substances or petroleum products on a property under conditions that indicate an existing release, a past release or a material threat of a release of any hazardous substances or petroleum products into structures on the property or into the ground, groundwater or surface water of the property. The term includes hazardous
substances or petroleum products even under conditions in compliance with laws. CSC performed another component of LAUSDôs environmental site assessment process by researching and completing a School Site Environmental Screening Criteria Checklist (Appendix H). This checklist was developed to acquire information regarding safety issues that are of
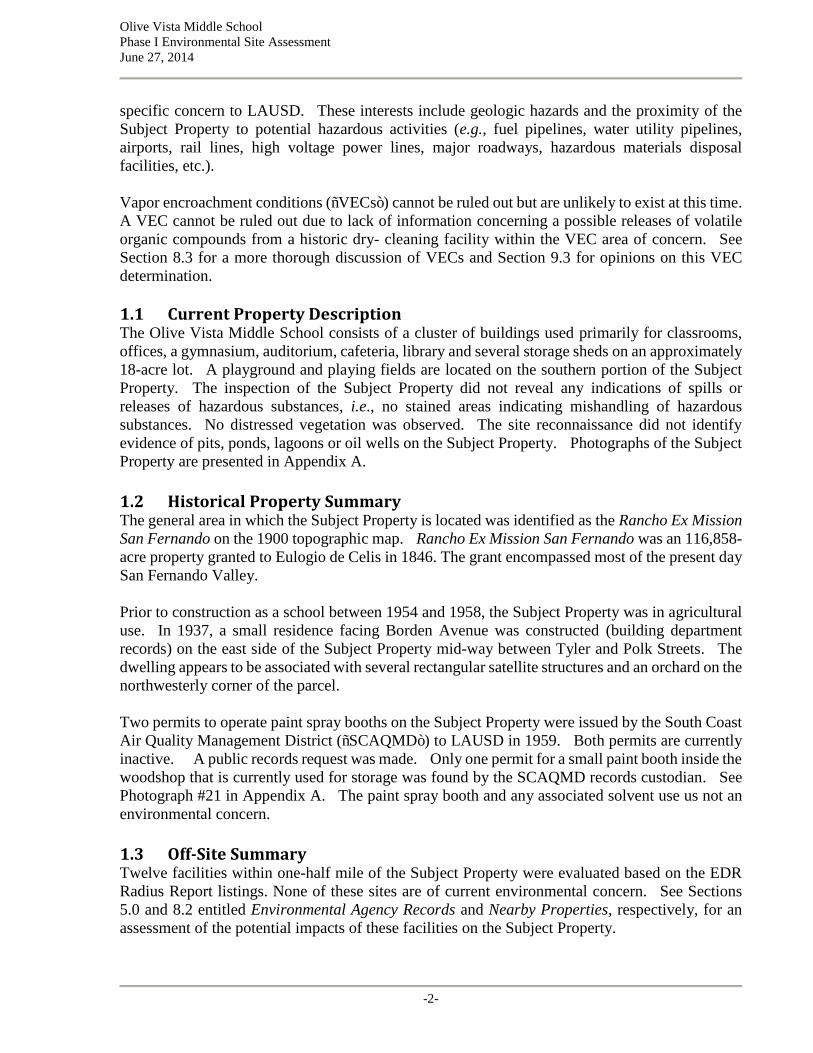
Olive Vista Middle School Phase I Environmental Site Assessment June 27, 2014
-2-
specific concern to LAUSD. These interests include geologic hazards and the proximity of the Subject Property to potential hazardous activities (e.g., fuel pipelines, water utility pipelines, airports, rail lines, high voltage power lines, major roadways, hazardous materials disposal facilities, etc.). Vapor encroachment conditions (ñVECsò) cannot be ruled out but are unlikely to exist at this time. A VEC cannot be ruled out due to lack of information concerning a possible releases of volatile organic compounds from a historic dry- cleaning facility within the VEC area of concern. See Section 8.3 for a more thorough discussion of VECs and Section 9.3 for opinions on this VEC determination. 1.1 Current Property Description The Olive Vista Middle School consists of a cluster of buildings used primarily for classrooms, offices, a gymnasium, auditorium, cafeteria, library and several storage sheds on an approximately 18-acre lot. A playground and playing fields are located on the southern portion of the Subject Property. The inspection of the Subject Property did not reveal any indications of spills or releases of hazardous substances, i.e., no stained areas indicating mishandling of hazardous substances. No distressed vegetation was observed. The site reconnaissance did not identify evidence of pits, ponds, lagoons or oil wells on the Subject Property. Photographs of the Subject Property are presented in Appendix A. 1.2 Historical Property Summary The general area in which the Subject Property is located was identified as the Rancho Ex Mission
San Fernando on the 1900 topographic map. Rancho Ex Mission San Fernando was an 116,858- acre property granted to Eulogio de Celis in 1846. The grant encompassed most of the present day San Fernando Valley. Prior to construction as a school between 1954 and 1958, the Subject Property was in agricultural use. In 1937, a small residence facing Borden Avenue was constructed (building department records) on the east side of the Subject Property mid-way between Tyler and Polk Streets. The dwelling appears to be associated with several rectangular satellite structures and an orchard on the northwesterly corner of the parcel. Two permits to operate paint spray booths on the Subject Property were issued by the South Coast Air Quality Management District (ñSCAQMDò) to LAUSD in 1959. Both permits are currently inactive. A public records request was made. Only one permit for a small paint booth inside the woodshop that is currently used for storage was found by the SCAQMD records custodian. See Photograph #21 in Appendix A. The paint spray booth and any associated solvent use us not an environmental concern. 1.3 Off-Site Summary Twelve facilities within one-half mile of the Subject Property were evaluated based on the EDR Radius Report listings. None of these sites are of current environmental concern. See Sections 5.0 and 8.2 entitled Environmental Agency Records and Nearby Properties, respectively, for an assessment of the potential impacts of these facilities on the Subject Property.

Olive Vista Middle School Phase I Environmental Site Assessment June 27, 2014
-3-
The Tier 1 Vapor Encroachment Screen (ñTier 1 VESò) revealed that a vapor encroachment condition (ñVECò) resulting from a release of volatile organic compounds cannot be ruled out due to a release from a historic dry cleaners within the VEC area of concern. However, CSC is of the opinion that a VEC is unlikely to exist due to site-specific conditions. See Section 8.3 entitled Tier 1 Vapor Encroachment Screen for a more thorough discussion and Section 9.3 for opinions. 1.4 Conclusions and Recommendations
1.4.1 Conclusions No current, controlled or historic RECs as defined in the ASTM E 1527-13 Standard are known to be present on the subject or directly adjoining properties as of the date of this report. The Tier 1 vapor encroachment screening (ñTier 1 VESò) revealed that a vapor encroachment condition (ñVECò) resulting from a release of volatile organic compounds cannot be ruled out but due to site-specific conditions, a VEC is unlikely to exist for a historic dry cleaning operation addressed as 13060 Glenoaks Boulevard. See Section 8.3 entitled Tier 1 Vapor Encroachment
Screen and Section 9.3 of this report for a more thorough discussion. This assessment revealed several items of concern that are not classified as RECs, CRECs, HRECs or de minimus conditions under the ASTM E 1527-13 Standard:
Due to prior agricultural use of organochlorine compounds (termiticides, herbicides and pesticides), there may be residual compounds of concern in surficial soils.
The Subject Property is located approximately 1,200 feet from an Alquist-Priolo Act Special Studies Zone.
The Subject Property is within a zip code for which elevated radon concentrations (above 4.0 pCi/L) of radon have been reported for 14 out of 65 tests conducted.
Due to the age of the buildings, asbestos and lead-based paint may be present.
A high pressure (>200 psi) natural gas pipeline is located approximately 661 feet from the westerly boundary of the Subject Property.
No data gaps in historical information were identified that would materially affect the opinions and conclusions expressed in this report.
1.4.2 Recommendation This Phase I ESA was prepared for background information purposes. Based on the possibility of historic termiticide, herbicide, pesticide and lead-based paint use and the potential for vapor encroachment conditions on the undeveloped south southwesterly section of the Subject Property, LAUSD should consider the potential impact of these findings prior to construction of any new buildings on the undeveloped south southwesterly section of the Subject Property or any other project that would require significant site grading and excavation activities that would generate surplus soil for export to another school site. CSC does not recommend any further subsurface investigations at this time.
Olive Vista Middle School Phase I Environmental Site Assessment June 27, 2014
-4-
2.0 INTRODUCTION
2.1 Objective The purpose of the assessment is to identify potential environmental concerns with current and previous uses of the Subject Property and adjoining properties in general accordance with the requirements of ASTM Standard E1527-13 Standard Practice for Environmental Site
Assessments: Phase I Environmental Site Assessment Process. A second component of LAUSDôs environmental site assessment process is completion of the School Site Environmental
Screening Criteria Checklist, which was developed to acquire information regarding safety issues that are of specific concern to LAUSD during the preparation of California Environmental Quality Act (ñCEQAò) documents, i.e., environmental impact reports and negative declarations. These CEQA-related interests include geologic hazards and the proximity of the Subject Property to potential hazardous activities (e.g., fuel pipelines, water utility pipelines, airports, rail lines, high voltage power lines, major roadways, hazardous materials disposal facilities, etc.). 2.2 Scope of Services In conducting the Phase I ESA for LAUSD, CSC performed the following activities in accordance with the contracted scope of services: Site Reconnaissance: CSC conducted a visual survey of the Subject Property to verify, to the extent possible, current uses and improvements of the Subject Property, past uses of the Subject Property, current uses of adjacent properties, and evidence of existing and historical hazardous material use, disposal, storage, and releases on the Subject Property and/or adjacent properties. CSC documented the Subject Property reconnaissance with field notes and digital camera photographs (Appendix A). Historical Review: CSC conducted a historical review to evaluate the past and present use of the Subject Property. This included an examination of aerial photographs (Appendix B), Sanborn Fire Insurance Maps (Appendix C), historical topographic maps (Appendix D), any identified regulatory/health agency files (Appendix F) City Directory Abstracts (Appendix D), and building department permits (Appendix G) to discover or verify previous environmental activities that may have impacted the Subject Property. Regulatory Agency Review: CSC evaluated available agency records, including information provided in the EDR Radius Map Report with GeoCheck (Appendix E) to assess any hazardous material use, storage, releases, or remediation at the Subject Property and/or surrounding properties. Property Permits: CSC reviewed City of Los Angeles building permits as part of the historical and current use assessment for the Subject Property and adjoining properties that may have the potential to impact the Subject Property (Appendix G). Agency File Review: In addition, CSC requested agency file reviews of any pertinent documents from the California State Fire Marshal (ñCSFMò), Los Angeles County Department of Public Works Sanitation Bureau, City of Los Angeles Department of Water and Power, the Office of Environmental Health Hazard Assessment (ñOEHHAò) and the Environmental Protection Agency

Olive Vista Middle School Phase I Environmental Site Assessment June 27, 2014
-5-
(ñEPAò) regarding the Subject Property in accordance with the Environmental School Site Screening Criteria Check List (Appendix H). Property Issues: CSC assessed the on-site presence, if any, of current and historical hazardous material handling, use, storage, and releases, including storm water and wastewater management. Physical Setting: CSC assessed the regional geology, regional hydrogeology, and topographic setting of the Subject Property based on information provided by the United States Geological Survey (ñUSGSò), the California Department of Conservation Division of Mines and Geology (ñDMGò), and the California Department of Conservation Division of Oil, Gas, and Geothermal Resources (ñDOGGRò).
LAUSD Checklist: CSC completed the School Site Environmental Screening Criteria Checklist (Appendix H) for CEQA-related issues of concern by contacting applicable agencies or utility companies and online database sources. Off-Site Issues: CSC observed the adjoining properties from public right-of-ways to determine if there were any indications of hazardous materials use, storage or waste handling and any visible signs of releases and spills. Database Review: CSC reviewed published governmental agency databases identified by EDR to identify facilities within ASTM-specified radii of the Subject Property with a reported environmental incident or concern. Report Preparation: CSC has presented its findings, opinions and conclusions with supporting documentation in the Appendices in this Phase I ESA Report. 2.3 Significant Assumptions Based on Los Angeles County Assessor parcel information, Sanborn Fire Insurance map review, and Subject Property reconnaissance, one of the significant assumptions made was that the potential current and historical addresses associated with the Subject Property fell within a single street address: 14600 Tyler Street, Sylmar, CA 91342. Facilities within one-eighth mile of the Subject Properties are assumed the most likely to have the potential for any RECs that would impact the Subject Properties. However, facilities within one-half mile of the Subject Property were evaluated and reported in Section 8.0 entitled Findings
to ensure that any operations with hazardous air emissions were considered in evaluating potential offsite impacts and the potential for a VEC. The database search results of interest in conducting a Tier 1 Vapor Encroachment Screen (òVESò) in accordance with ASTM E 2600-10 are:
Federal NPL site list Federal CERCLIS list Federal RCRA CORRACTS facilities list Federal RCRA non-CORRACTS TSD facilities list
Olive Vista Middle School Phase I Environmental Site Assessment June 27, 2014
-6-
Federal RCRA generators list (Subject Property only) Federal institutional control/engineering control registries (Subject Property only) Federal ERNS list (Subject Property only) State and tribal lists of hazardous waste sites identified for investigation or remediation,
i.e., ENVIROSTOR, SLIC, landfill and/or solid waste disposal site lists, leaking storage tank lists (ñLUSTò), registered storage tank lists (Subject Property only), institutional control/engineering control registries (Subject Property only), voluntary cleanup sites and Brownfield sites
Historic Automobile Service Stations and Historic Dry Cleaning Facilities Historic Manufactured Gas Plants
2.4 Limitations and Exceptions As discussed in ASTM Standard Practice E 1527-13, no Phase I ESA can completely eliminate uncertainty regarding the potential for RECs in connection with a site. This investigation is simply intended to reduce uncertainty within reasonable limits of time and cost. CSC is dutiful and diligent in its requests for information. However, government agency records are obtained through a formal request procedure using site-specific information (i.e., usually the street address) provided to CSC. Files are sometimes misfiled, misplaced or mislabeled. CSC cannot warrant or guarantee the accuracy of the government agencyôs efforts. CSC assumes that the search was reliably performed and accurately completed by the government agency. The observations in the Phase I ESA (Section 6.0) are based on conditions readily observable during the site reconnaissance. These observations are typically unable to identify undocumented conditions of subsurface soil, groundwater contamination, or the presence of underground tanks, at the subject or surrounding properties, unless specifically mentioned. The Phase I ESA is not intended to determine the actual presence, or degree or extent of contamination, if any, at the Subject Property. The information contained in this Phase I ESA report has received appropriate technical review and approval. The conclusions represent professional judgments and are based upon the findings of the investigations identified in the report and the interpretation of such data based on our experience and expertise according to the existing standard of care. No other warranty or limitation exists, either expressed or implied. 2.5 Special Terms and Conditions Location data for nearby sites (i.e., sites less than one-half mile from the Subject Property) contained in the Map Findings section of the attached Environmental Data Resources (ñEDRò) report. The EDR Radius Map with GeoCheckÈ Report (Appendix E) is geocoded using information obtained from a variety of public and other sources which may or may not be accurate. 2.6 User Reliance This report was prepared for the exclusive use and benefit of LAUSD. Neither this report nor any information contained in this report may be relied upon by any other party without the prior express written consent of CSC.

Olive Vista Middle School Phase I Environmental Site Assessment June 27, 2014
-7-
This report is intended to be reviewed and used in its entirety. No excerpts may be taken to be representative of the complete findings of this environmental assessment. Other parties reviewing this Phase I ESA report should engage a qualified environmental professional to assist them in understanding the environmental conditions at the site and the qualifications required for the innocent landowner defense to liability under CERCLA. Whether a vapor intrusion condition exists at the Subject Property as a result of soil vapor migration to the subsurface from a nearby facility is a separate determination to be made by the environmental professional. Investigation and evaluation of a vapor intrusion condition is outside the scope of ASTM E1527-13 and ASTM E 2600-10.
3.0 PROPERTY DESCRIPTION
3.1 Location and Legal Descriptions The Olive Vista Middle School was opened in 1958. The Subject Property is located between Tyler Street on the northerly boundary, Polk Street on the southerly boundary, Borden Avenue on the easterly boundary and Fellows Avenue on the westerly boundary.
Current Address Assessor Parcel Number Property Type Associated Historic Address
(Building Department Records)
14600 Tyler Street 2505-025-900 Existing School Site 13251 North Borden Avenue (Dwelling 1937)
The legal description provided in the EDR Lien Report in Appendix K is ñLot 1, in Tract 20724, according to the map or plat thereof, as filed of record in Book 608, Page 5, Los Angeles County State of California.ò
3.2 Description of Property Features The Olive Vista Middle School consists of a cluster of buildings used primarily for classrooms, offices, a gymnasium, auditorium, cafeteria, library and several storage sheds on an approximately 18-acre lot. A playground and a sports field area are located on the southerly portion of the Subject Property. 3.3 Current Uses of the Property
3.3.1 Methodology The on-site inspection of the Subject Property and surrounding area was conducted on April 14, 2014 by Aaron Garrett of CSC.
3.3.2 Observations The Olive Vista Middle School consists of a cluster of buildings used primarily for classrooms, offices, a gymnasium, auditorium, cafeteria, library and several storage sheds. A playground and field area is located on the southerly portion of the Subject Property.
3.3.3 Current Use Assessment The inspection of the Subject Property did not reveal any indications of spills or releases of hazardous substances, that is, no stained areas indicating mishandling of hazardous substances. No distressed vegetation was observed.

Olive Vista Middle School Phase I Environmental Site Assessment June 27, 2014
-8-
The site reconnaissance did not identify evidence of pits, ponds, lagoons or oil wells on the Subject Property.
A description of current chemical usage and storage is discussed in Section 6.2. No inadequate materials management practices were observed during the site reconnaissance. 3.4 Current Uses of Surrounding Properties The surrounding area is primarily residential in the northerly, northeasterly and northwesterly directions, and institutional to the southerly, southeasterly and southwesterly directions. Sylmar Elementary School is located to the east southeast; Sylmar Park, a library and a Los Angeles Department of Water and Power substation to the south; and Los Angeles City Fire Station 91 to the south southeast. There are no industrial sites within one-half mile of the Subject Property. The closest commercial area is located approximately 500 feet to the south southwest at the corner of Polk Street and Glenoaks Boulevard. There are no high voltage transmission lines or freeways within 500 feet of the Subject Property. 3.5 Topographic Setting
3.5.1 General Site Setting According to the EDR Geophysical Setting Report, the Subject Property is at an elevation of approximately 1,291 feet above mean sea level. Subject Property topography is generally flat with a slight regional slope to the south southwest.
3.5.2 Nearest Surface Water Body There are no surface water bodies within one mile of the Subject Property (EDR, 2014). The closest surface water body is the Los Angeles Reservoir. It is located approximately 1.8 miles west of the Subject Property (Google Earth ruler).
3.5.3 Nearest Location of Ecological Interest Special Ecological Areas are ecologically important or fragile land and water areas valuable as plant and animal communities requiring preservation and protection. CSC reviewed Figure 4.3-3 in the City of Los Angeles draft Sylmar Community Plan (ñSCPò). Based on the draft SCP, the nearest location of ecological interest is over three-quarters of a mile from the Subject Property. 3.6 Regional Geology
3.6.1 Geologic Setting This information is taken from the Granada Hills-Knollwood & Sylmar Community Plans
Environmental Impact Report (State Clearinghouse No. 2008021061 & 2008021089). The Sylmar Community Planning Area (ñSylmar CPAò) is located in the northern portion of the San Fernando Valley, which is roughly 22 miles long in an east/west direction and approximately 9 miles wide in a north/south direction. The San Fernando Valley is bounded by the San Gabriel and Santa Susana Mountains to the north, the Santa Monica Mountains to the south, the Verdugo Mountains to the east and the Simi Hills to the west. The Sylmar CPA is located within the Transvers Ranges geomorphic province of California.
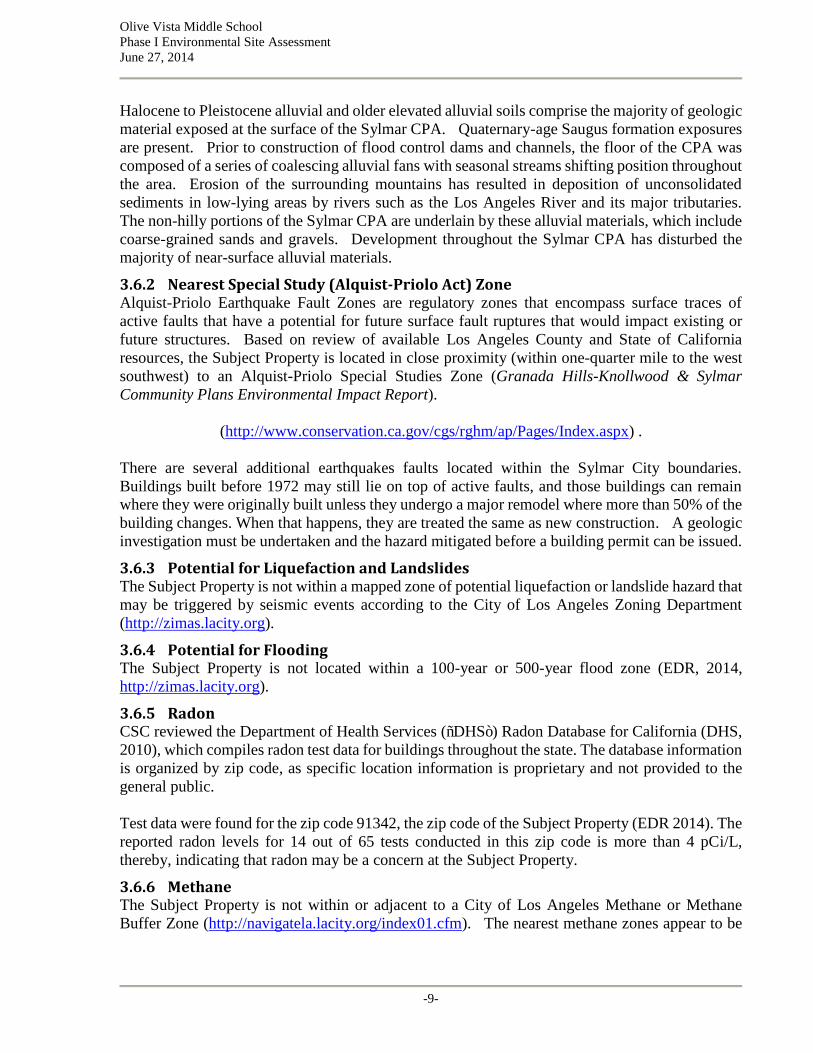
Olive Vista Middle School Phase I Environmental Site Assessment June 27, 2014
-9-
Halocene to Pleistocene alluvial and older elevated alluvial soils comprise the majority of geologic material exposed at the surface of the Sylmar CPA. Quaternary-age Saugus formation exposures are present. Prior to construction of flood control dams and channels, the floor of the CPA was composed of a series of coalescing alluvial fans with seasonal streams shifting position throughout the area. Erosion of the surrounding mountains has resulted in deposition of unconsolidated sediments in low-lying areas by rivers such as the Los Angeles River and its major tributaries. The non-hilly portions of the Sylmar CPA are underlain by these alluvial materials, which include coarse-grained sands and gravels. Development throughout the Sylmar CPA has disturbed the majority of near-surface alluvial materials.
3.6.2 Nearest Special Study (Alquist-Priolo Act) Zone Alquist-Priolo Earthquake Fault Zones are regulatory zones that encompass surface traces of active faults that have a potential for future surface fault ruptures that would impact existing or future structures. Based on review of available Los Angeles County and State of California resources, the Subject Property is located in close proximity (within one-quarter mile to the west southwest) to an Alquist-Priolo Special Studies Zone (Granada Hills-Knollwood & Sylmar
Community Plans Environmental Impact Report).
(http://www.conservation.ca.gov/cgs/rghm/ap/Pages/Index.aspx) . There are several additional earthquakes faults located within the Sylmar City boundaries. Buildings built before 1972 may still lie on top of active faults, and those buildings can remain where they were originally built unless they undergo a major remodel where more than 50% of the building changes. When that happens, they are treated the same as new construction. A geologic investigation must be undertaken and the hazard mitigated before a building permit can be issued.
3.6.3 Potential for Liquefaction and Landslides The Subject Property is not within a mapped zone of potential liquefaction or landslide hazard that may be triggered by seismic events according to the City of Los Angeles Zoning Department (http://zimas.lacity.org).
3.6.4 Potential for Flooding The Subject Property is not located within a 100-year or 500-year flood zone (EDR, 2014, http://zimas.lacity.org).
3.6.5 Radon CSC reviewed the Department of Health Services (ñDHSò) Radon Database for California (DHS, 2010), which compiles radon test data for buildings throughout the state. The database information is organized by zip code, as specific location information is proprietary and not provided to the general public. Test data were found for the zip code 91342, the zip code of the Subject Property (EDR 2014). The reported radon levels for 14 out of 65 tests conducted in this zip code is more than 4 pCi/L, thereby, indicating that radon may be a concern at the Subject Property.
3.6.6 Methane The Subject Property is not within or adjacent to a City of Los Angeles Methane or Methane Buffer Zone (http://navigatela.lacity.org/index01.cfm). The nearest methane zones appear to be

Olive Vista Middle School Phase I Environmental Site Assessment June 27, 2014
-10-
located approximately three miles south and three and one-half mile northwest of the Subject Property. 3.7 Regional Hydrogeology
3.7.1 Hydrogeologic Setting Sylmar is located in the Tujunga/Pacoima Subwatershed of the Los Angeles River. The Subject Property is several miles from the closest area of potential inundation (Granada Hills-Knollwood
& Sylmar Community Plans Environmental Impact Report). The southeast corner of the Sylmar CPA is the only portion of the City that would be subject to inundation from the Pacoima Dam. The Sylmar CPA is within the geographic boundaries of the Sylmar Groundwater Basin of the Upper Los Angeles River Area (òULARAò) basins. The Sylmar Basin is a confined aquifer system separated from the San Fernando Valley Groundwater Basin by the Sylmar Fault Zone in the underlying geology. Groundwater flow is generally to the southeast. Depth to groundwater within this Basin ranges from 15 to 150 feet below ground surface. There are no significant reported contaminant plumes in the Sylmar Basin as of the date of this report (Granada
Hills-Knollwood & Sylmar Community Plans Environmental Impact Report, 2012).
3.7.2 Groundwater Well Information According to the Los Angeles County Department of Public Works website(http://dpw.lacounty.gov/general/wells), there is an active well approximately one-quarter mile (Google Earth ruler) to the east of the Subject Property in the vicinity of Polk Street and Dronfield Avenue (Well #5958B). The depth to groundwater at Well 5958B was reported to be 157.0 feet below ground surface on December 11, 2009.
3.7.3 Nearest Groundwater Production Well No public water supply wells were reported by EDR within the one-mile search radius.
4.0 HISTORICAL REVIEW
Historical aerial photographs (Appendix B) were reviewed to assist in identifying any past practices or structures which may have negatively impacted the Subject Property. EDR's Aerial Photo Decade Package (EDR Inquiry No. 3880855.5) containing photographs dated 1928, 1938, 1947, 1952, 1964, 1972, 1981, 1989, 1994, 2005, 2009, 2010 and 2012 were reviewed. Sanborn Fire Insurance Maps are detailed scale drawings showing the location, materials of construction and use of buildings and structures. Sanborn maps can provide information that is unavailable from other sources regarding the development and uses of a property, including identification of petroleum products and hazardous materials storage areas. Beginning in 1867, Sanborn maps were produced for many of the major urban and industrialized areas of the U.S. EDR reported (Appendix C) that there are no Sanborn maps available for the Subject Property or surrounding properties (Inquiry No. 3880855.3). EDR's Historic Topographic Map collection (Appendix D) was reviewed for coverage of the Subject Properties (EDR Inquiry No. 3880855.4). Maps were reviewed for 1900, 1901, 1935,
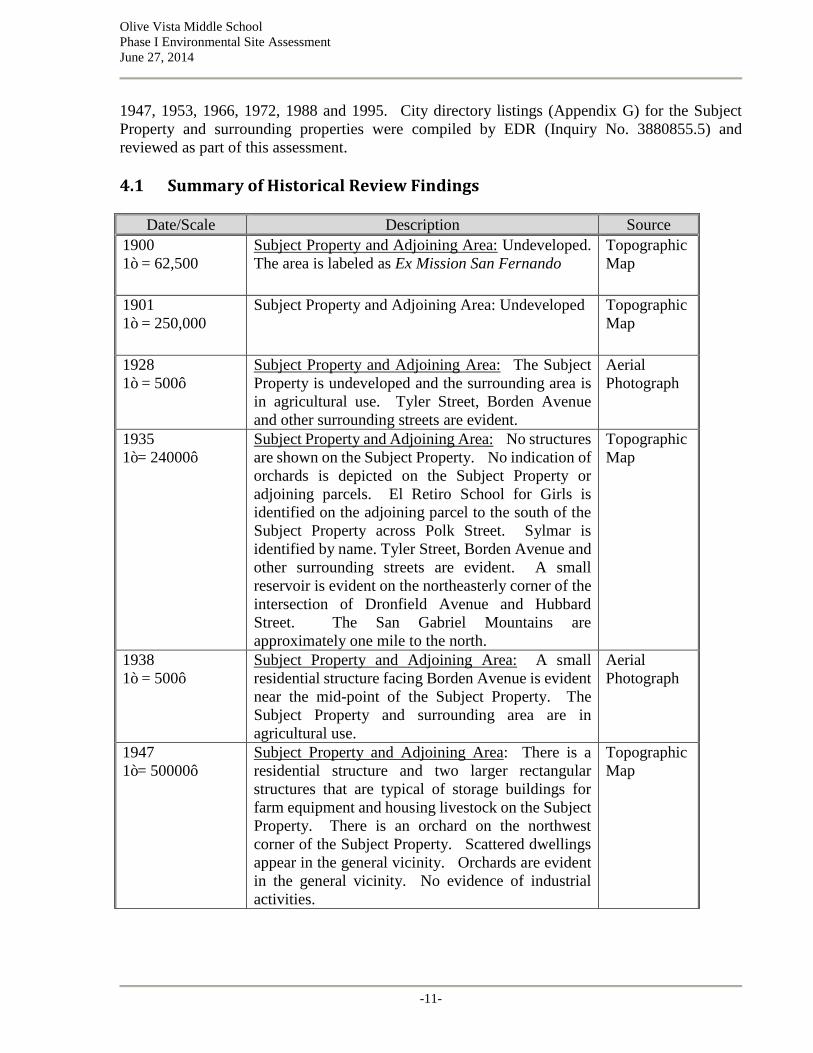
Olive Vista Middle School Phase I Environmental Site Assessment June 27, 2014
-11-
1947, 1953, 1966, 1972, 1988 and 1995. City directory listings (Appendix G) for the Subject Property and surrounding properties were compiled by EDR (Inquiry No. 3880855.5) and reviewed as part of this assessment. 4.1 Summary of Historical Review Findings
Date/Scale Description Source 1900 1ò = 62,500
Subject Property and Adjoining Area: Undeveloped. The area is labeled as Ex Mission San Fernando
Topographic Map
1901 1ò = 250,000
Subject Property and Adjoining Area: Undeveloped Topographic Map
1928 1ò = 500ô
Subject Property and Adjoining Area: The Subject Property is undeveloped and the surrounding area is in agricultural use. Tyler Street, Borden Avenue and other surrounding streets are evident.
Aerial Photograph
1935 1ò= 24000ô
Subject Property and Adjoining Area: No structures are shown on the Subject Property. No indication of orchards is depicted on the Subject Property or adjoining parcels. El Retiro School for Girls is identified on the adjoining parcel to the south of the Subject Property across Polk Street. Sylmar is identified by name. Tyler Street, Borden Avenue and other surrounding streets are evident. A small reservoir is evident on the northeasterly corner of the intersection of Dronfield Avenue and Hubbard Street. The San Gabriel Mountains are approximately one mile to the north.
Topographic Map
1938 1ò = 500ô
Subject Property and Adjoining Area: A small residential structure facing Borden Avenue is evident near the mid-point of the Subject Property. The Subject Property and surrounding area are in agricultural use.
Aerial Photograph
1947 1ò= 50000ô
Subject Property and Adjoining Area: There is a residential structure and two larger rectangular structures that are typical of storage buildings for farm equipment and housing livestock on the Subject Property. There is an orchard on the northwest corner of the Subject Property. Scattered dwellings appear in the general vicinity. Orchards are evident in the general vicinity. No evidence of industrial activities.
Topographic Map

Olive Vista Middle School Phase I Environmental Site Assessment June 27, 2014
-12-
Date/Scale Description Source 1947 1ò = 500ô
Subject Property and Adjoining Area: The Subject Property and adjoining area appears to be used for agriculture. There is an orchard on the northwesterly corner of the Subject Property. Several small structures, most likely dwellings, are visible on and near the Subject Property.
Aerial Photograph
1950 Subject Property and Adjoining Area: There are no listings for the Subject Property. The first telephone listings for residences on Borden Avenue and Tyler Street are reported.
City Directories
1952 1ò = 500ô
Subject Property and Adjoining Area: The Subject Property has been cleared except for the residential structure. Much of the surrounding area is still in agricultural use. The main buildings of Sylmar Elementary School located north across Borden Avenue are visible.
Aerial Photograph
1953 1ò= 24000ô
Subject Property and Adjoining Area: The Subject Property has a single dwelling depicted. The surrounding areas are developed with orchards and dwellings. Sylmar School is evident on an adjoining parcel to the east southeast.
Topographic Map
1962 Subject Property: Olive Vista Junior High School is listed as the occupant of 14600 Tyler Street.
City Directories
1964 1ò = 500ô
Subject Property and Adjoining Area: Olive Vista Junior High School is visible. The surrounding area is lightly developed with small structures. A residential area was visible to the south.
Aerial Photograph
1966 1ò= 24000ô
Subject Property and Adjoining Area: Olive Vista Junior High School is shown. Small orchard remains nearby. Sylmar Park is identified. Surrounding area is depicted as an urban core. Water tank is evident next to small reservoir located on the northeast corner of the intersection of Dronfield Avenue with Hubbard Street.
Topographic Map

Olive Vista Middle School Phase I Environmental Site Assessment June 27, 2014
-13-
Date/Scale Description Source 1970 Subject Property: Olive Vista Junior High School is
still listed as the occupant of 14600 Tyler Street. There were no other city directory entries of environmental significance.
City Directories
1972 1ò = 500ô
Subject Property and Adjoining Area: No significant changes were noted. Olive Vista Middle School is visible. The surrounding area is lightly developed with small structures.
Aerial Photograph
1972 1ò= 24000ô 1988 1ò= 24000ô 1995 1ò= 24000ô
Subject Property and Adjoining Area: There were no other significant changes of environmental concern evident on the 1972, 1988 and 1995 topographic maps.
Topographic Map
1975 Subject Property and Adjoining Area: Olive Vista Junior High School is still listed as the occupant of 14600 Tyler Street. There were no other city directory entries of environmental significance.
City Directories
1980 Subject Property: Olive Vista Junior High School is still listed as the occupant of 14600 Tyler Street.
City Directories
1981 1ò = 500ô
Subject Property and Adjoining: No significant changes from previous aerial photo.
Aerial Photograph
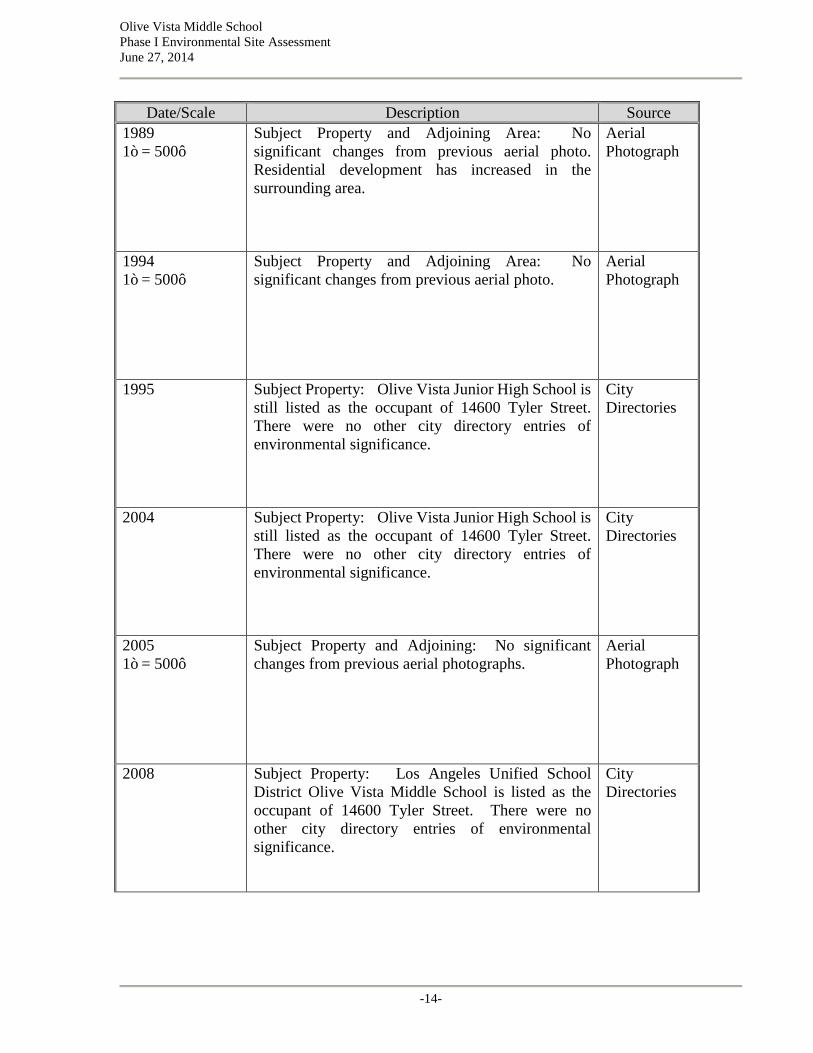
Olive Vista Middle School Phase I Environmental Site Assessment June 27, 2014
-14-
Date/Scale Description Source 1989 1ò = 500ô
Subject Property and Adjoining Area: No significant changes from previous aerial photo. Residential development has increased in the surrounding area.
Aerial Photograph
1994 1ò = 500ô
Subject Property and Adjoining Area: No significant changes from previous aerial photo.
Aerial Photograph
1995 Subject Property: Olive Vista Junior High School is still listed as the occupant of 14600 Tyler Street. There were no other city directory entries of environmental significance.
City Directories
2004 Subject Property: Olive Vista Junior High School is still listed as the occupant of 14600 Tyler Street. There were no other city directory entries of environmental significance.
City Directories
2005 1ò = 500ô
Subject Property and Adjoining: No significant changes from previous aerial photographs.
Aerial Photograph
2008 Subject Property: Los Angeles Unified School District Olive Vista Middle School is listed as the occupant of 14600 Tyler Street. There were no other city directory entries of environmental significance.
City Directories

Olive Vista Middle School Phase I Environmental Site Assessment June 27, 2014
-15-
Date/Scale Description Source 2009, 2010, and 2012 1ò = 500ô
Subject Property and Adjoining Properties: No significant changes from previous aerial photographs.
Aerial Photograph
2013 Subject Property: Los Angeles Unified School District Olive Vista Middle School is listed as the occupant of 14600 Tyler Street. There were no other city directory entries of environmental significance.
City Directories
4.2 Building Permit Review City of Los Angeles Department of Building and Safety files were reviewed on April 8, 2014. There were no building permits of environmental concern. The review revealed that a dwelling addressed as 13251 North Borden Avenue existed on the site circa 1937. 4.3 Environmental Lien and Activity and Use Limitations Review There were no environmental lien and activity and use limitations found in the search conducted by EDR. A copy of the report is included in Appendix K. 4.4 Additional Historical Record Sources LAUSD provided CSC with a ñPlanting Plot Planò from 1957, and the Boundary and Topographical Surveys from 2013. No additional historical environmental reports relevant to the Subject Property or properties surrounding the Subject Property were provided by LAUSD. 4.5 Historical Uses and Operations of the Property Prior to development as a school between 1954 and 1958, the Subject Property was in agricultural use. In 1937, a small residence facing Borden Avenue was constructed according to building permit records. The dwelling and two satellite rectangular structures appears to be associated with an orchard on the northwesterly corner of the Subject Property. Permits to operate paint spray booths on the Subject Property were issued by the South Coast Air Quality Management District (ñSCAQMDò) in 1959. The permits are currently inactive. There is a small paint booth area currently used for storage inside the woodshop. See Photograph #21 in Appendix A. 4.6 Historical Review of Surrounding Properties The general area in which the Subject Property is located was identified as the Rancho Ex Mission
San Fernando on the 1900 topographic map. Rancho Ex Mission San Fernando was an 116,858-acre property granted to Eulogio de Celis in 1846. The grant encompassed most of the

Olive Vista Middle School Phase I Environmental Site Assessment June 27, 2014
-16-
present day San Fernando Valley. Most of the surrounding area was in agricultural use with scattered dwellings from the late 1930s until the early 1950s. The surrounding area is primarily residential in the northerly, northeasterly and northwesterly directions, and institutional to the southerly, southeasterly and southwesterly directions. Sylmar Elementary School is located to the east southeast; Sylmar Park, a library and a Los Angeles Department of Water and Power substation to the south; and Los Angeles City Fire Station 91 to the south southeast. There are no industrial sites within one-half mile of the Subject Property. The closest commercial area is located approximately 500 feet to the south southwest at the corner of Polk Street and Glenoaks Boulevard.
5.0 REGULATORY AGENCY INFORMATION
5.1 Property Permits No property-specific regulatory agency permits were observed or revealed by LAUSD staff during the site visit. See section 5.6.3 for a discussion of inactive and expired South Coast Air Quality Management District permits. 5.2 Standard Environmental Record Sources The EDR Radius Map Report with GeoCheckÈ for the Subject Property and surrounding area has been provided in Appendix E. Documents and lists were reviewed to identify properties or facilities located within the site vicinity that may have the potential to adversely impact environmental conditions at the subject parcel. Current GeoTracker and Envirostor Radius Maps were also reviewed and are included in Appendix E following the EDR Radius Map Report. The complete list of databases searched by EDR is provided in the EDR Radius Map Report (Inquiry Number: 3880855.2 dated March 14, 2014). Key finding are summarized beginning on the following page.
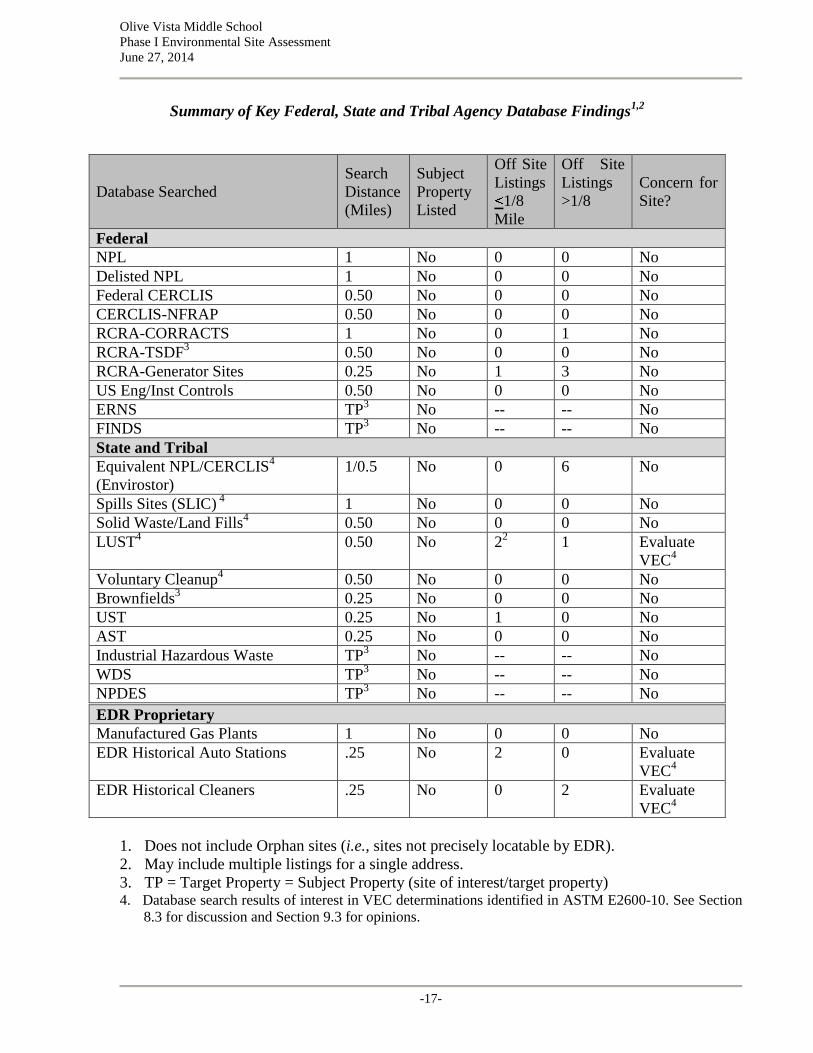
Olive Vista Middle School Phase I Environmental Site Assessment June 27, 2014
-17-
Summary of Key Federal, State and Tribal Agency Database Findings1,2
Database Searched Search Distance (Miles)
Subject Property Listed
Off Site Listings 1/8
Mile
Off Site Listings >1/8
Concern for Site?
Federal NPL 1 No 0 0 No Delisted NPL 1 No 0 0 No Federal CERCLIS 0.50 No 0 0 No CERCLIS-NFRAP 0.50 No 0 0 No RCRA-CORRACTS 1 No 0 1 No RCRA-TSDF3 0.50 No 0 0 No RCRA-Generator Sites 0.25 No 1 3 No US Eng/Inst Controls 0.50 No 0 0 No ERNS TP3 No -- -- No FINDS TP3 No -- -- No State and Tribal Equivalent NPL/CERCLIS4 (Envirostor)
1/0.5 No 0 6 No
Spills Sites (SLIC) 4 1 No 0 0 No Solid Waste/Land Fills4 0.50 No 0 0 No LUST4 0.50 No 22 1 Evaluate
VEC4 Voluntary Cleanup4 0.50 No 0 0 No Brownfields3 0.25 No 0 0 No UST 0.25 No 1 0 No AST 0.25 No 0 0 No Industrial Hazardous Waste TP3 No -- -- No WDS TP3 No -- -- No NPDES TP3 No -- -- No
1. Does not include Orphan sites (i.e., sites not precisely locatable by EDR).
2. May include multiple listings for a single address. 3. TP = Target Property = Subject Property (site of interest/target property)
4. Database search results of interest in VEC determinations identified in ASTM E2600-10. See Section 8.3 for discussion and Section 9.3 for opinions.
EDR Proprietary Manufactured Gas Plants 1 No 0 0 No EDR Historical Auto Stations .25 No 2 0 Evaluate
VEC4 EDR Historical Cleaners .25 No 0 2 Evaluate
VEC4

Olive Vista Middle School Phase I Environmental Site Assessment June 27, 2014
-18-
5.3 Summary of Federal Agency Database Record Findings National Priority List (ñNPLò) The NPL database, also known as Superfund List, is a subset of CERCLIS and identifies sites that are ranked as high priority for remedial action under the Federal Superfund Act. Neither the Subject Property nor any sites located within one mile were identified on the NPL. Delisted National Priority List The National Oil and Hazardous Substance Pollution Contingency Plan (ñNCPò) establishes criteria that the EPA uses to delete sites from the NPL. In accordance with 40 CFR 300.425(e), sites may be deleted from the NPL where no further response is appropriate. Neither the Subject Property nor any sites located within one mile were identified on the Delisted NPL database. Comprehensive Environmental Response, Compensation and Liability Information System (ñCERCLISò) CERCLIS contains data regarding potentially hazardous waste sites that have been reported to the USEPA by the states, municipalities, private companies and private persons, pursuant to Section 103 of the Comprehensive Environmental Response, Compensation and Liability Act (ñCERCLAò). CERCLIS contains sites that are included on the NPL, as well as sites which are in the screening and assessment phase for possible inclusion on the NPL. Neither the Subject Property nor any sites located within one half mile of the Subject Property are listed in the CERCLIS database. CERCLIS-No Further Remedial Action Planned (ñCERCLIS-NFRAPò) As of February 1995, CERCLIS sites designated as No Further Remedial Action Planned (ñNFRAPò) have been removed from the CERCLIS list. NFRAP sites may be sites where, following an initial investigation, no contamination was found, contamination was removed without the need for the site to be placed on the NPL, or the contamination was not considered sufficient to warrant Federal Superfund action or NPL consideration. The Subject Property is not listed in the CERCLIS-NFRAP database. No CERCLIS-NFRAP sites were listed within one mile of the Subject Property. Resource Conservation and Recovery Act ï Corrective Action Tracking System (ñCORRACTSò) RCRAInfo is EPAôs comprehensive information system, providing access to data supporting the Resource Conservation and Recovery Act (ñRCRAò) of 1976 and the Hazardous and Solid Waste Amendments (ñHSWAò) of 1984. RCRAInfo replaces the data recording and reporting abilities of the Resource Conservation and Recovery Information System (ñRCRISò). The database includes selective information regarding sites that generate, transport, store, treat and/or dispose of hazardous waste as defined by RCRA. The RCRA-CORRACTS database identifies TSD

Olive Vista Middle School Phase I Environmental Site Assessment June 27, 2014
-19-
facilities that have conducted or are currently conducting corrective action as regulated under RCRA. The Subject Property is not listed in the RCRA-CORRACTS database. No RCRA-CORRACTS sites are listed within one mile of the Subject Property. RCRA Treatment, Storage and/or Disposal (ñTSDò) Facilities RCRA TSD facilities are required to register hazardous waste activity under RCRA. Neither the Subject Property nor any sites located within one-half mile of the Subject Property were identified on the RCRA-TSD database. RCRA Hazardous Waste Generators Hazardous waste generators tracked under RCRA are classified as Large Quantity Generators (ñLQGò), Small Quantity Generators (ñSQGò) or Conditionally Exempt Small Quantity Generators (ñCESQGò). A RCRA-LQG is defined as a facility that generates over 1,000 kilograms (ñKgò) of hazardous waste, or over 1 Kg of acutely hazardous waste per month. A RCRA-SQG is defined as a facility that generates between 100 Kg and 1,000 Kg of hazardous waste per month. A RCRA-CESQG is defined as a facility that generates less than 100 Kg of hazardous waste, or less than 1 Kg of acutely hazardous waste per month. The Subject Property is listed in the HAZNET database for the removal (offsite disposal) of RCRA wastes. Details are provided in the Facility Report included in Appendix K.
Summary of HAZNET Database Findings for Subject Property
Year Waste Category Tons 2009 Asbestos-Containing Materials 2.8 2009 Other Organic Solids 0.1 2007 Other Inorganic Solids 0.02 2007 Asbestos-Containing Materials 0.4 2006 Other Inorganic Solids 0.15 2006 Other Inorganic Solids 0.14 2006 Other Inorganic Solids 0.02 2002 Asbestos-Containing Materials 0.84 2001 Other Inorganic Solids 0.07 2001 Other Inorganic Solids 0.04 1998 Asbestos-Containing Materials 0.8428 1997 Asbestos-Containing Materials 3.3712
There is one large quantity hazardous waste generator listed that is located one-eighth to one-quarter mile from the Subject Property: Sylmar Elementary School. The named waste was Lead (D008). This facility is not of environmental significance to the Subject Property.
Olive Vista Middle School Phase I Environmental Site Assessment June 27, 2014
-20-
There are three small quantity hazardous waste generators listed within zero to one-quarter mile of the Subject Property: Los Angeles City Fire Station 91, Los Angeles Department of Water and Power (Lead and Selenium) and the Sylmar Library (Nothing Listed). Small quantity generators without any history of violations or notices to comply are not of environmental significance to the Subject Property. Federal Engineering Control/Institutional Control Registries The completion of site cleanup activities may include the implementation of engineering controls as part of the response action. Engineering controls include various forms of caps, building foundations, liners and treatment methods to create pathway elimination for regulated substances to enter environmental media or effect human health. Institutional controls include administrative measures, such as groundwater use restrictions, construction restrictions, property use restrictions and post-remediation care requirements intended to prevent exposure to contaminants remaining on site. Deed restrictions are generally required as part of the institutional controls. Neither the Subject Property nor any sites located within one-half mile of the Subject Property were identified on the Federal Engineering Control or Institutional Control Registries. Emergency Response Notification System (ñERNSò) ERNS is a national database used to collect information regarding reported releases of petroleum products and/or hazardous substances. The database contains information from spill reports submitted to Federal agencies, including the EPA, the US Coast Guard, the National Response Center and the US Department of Transportation. A review of this database was conducted in order to determine whether any spills or incidents involving releases of hazardous substances or petroleum products have occurred at the subject property. Neither the Subject Property nor any sites located within one-half mile of the Subject Property were identified on the ERNS database. 5.4 State and Tribal Equivalent NPL Sites and CERCLIS Sites State and tribal equivalent NPL and CERCLIS databases (ñEnvirostorò) were searched for sites located within one mile and one-half miles of the Subject Property, respectively. The Subject Property was not listed in the ENVIROSTOR database. There is one ENVIROSTOR site listed within one-half mile of the Subject Property: Valley Region SPAN K-8 #1. A Preliminary Endangerment Assessment (òPEAò) was conducted under DTSC oversight. DTSC approved the PEA with a No Further Action Determination. The confirmed chemicals of concern at the site were: Arsenic, Chlordane, DDD, DDE, DDT, Endrin, Lead, Toxaphene, Aldrin, Dieldrin, Heptachlor, HCH (alpha), HCH (beta), HCH (gamma) HCH-technical and Mirex. These chemicals are associated with agricultural use as termiticides, herbicides and pesticides and paints containing lead.

Olive Vista Middle School Phase I Environmental Site Assessment June 27, 2014
-21-
State Spills, Leaks, Investigation & Cleanup Sites (ñSLICò)
A review of the SLIC database was conducted in order to determine whether any spills or incidents involving releases of hazardous substances or petroleum products have occurred at the Subject Property. The Subject Property was not identified in the SLIC database. There are no SLIC sites listed within one-half mile of the Subject Property. State and Tribal Solid Waste Disposal Sites and Landfill Sites (ñSWF/LFò) The state and tribal landfill and solid waste disposal site databases identify active or inactive landfill and transfer station facilities, as well as open dumps that failed to meet RCRA Subtitle D Section 4004 criteria for solid waste landfills or disposal sites. The Subject Property was not identified in the SWF/LF database. State and Tribal Leaking Underground Storage Tank (ñLUSTò) Sites Leaking Underground Storage Tank Sites are properties where releases of hazardous substances or petroleum products from underground storage tanks (ñUSTsò) and/or aboveground storage tanks (ñASTsò) have been identified and reported to state, tribal or local agencies. The Subject Property was not identified in the LUST database. There are two LUST sites, excluding duplicates, listed within one-half mile of the Subject Property: Los Angeles City Fire Station 91 and 7-Eleven Store #21483. The Los Angeles City Fire Station 91 addressed as 14430 Polk Street is approximately 100 feet (property line to property line) south southeast of the Subject Property. In 1999, a fuel release from an UST that affected soil only was discovered. Information from the GeoTracker website indicated that the case was closed in May 2003. See Section 8.3 entitled Vapor Encroachment
Screen for more information concerning potential impacts of this facility on the Subject Property. The 7-Eleven Store #21483 addressed as 14104 Foothill Boulevard is 2,593 feet east northeast of the Subject Property. The case was opened for site assessment in 1992. There is no further information in the GeoTracker database. This facility is not of current environmental concern with respect to the Subject Property. It is a priority Level D site and no assessments or investigations have been conducted. State and Tribal Registered Storage Tank Sites The Subject Property was not listed in any UST databases. The closest UST is located at the Los Angeles City Fire Station 91, which is directly across Polk Street from the Subject Property. State and Tribal Voluntary Cleanup Sites The Subject Property was not identified in the VCP database. There are no VCP sites listed within a half mile of the Subject Property.

Olive Vista Middle School Phase I Environmental Site Assessment June 27, 2014
-22-
State and Tribal Brownfields Sites
Neither the Subject Property nor any sites located within one-half mile of the Subject Property were identified on the state and tribal Brownfields Sites database. 5.5 EDR Proprietary Databases The EDR Proprietary Databases include Historical Dry Cleaners, Manufactured Gas Plants and Historical Auto Stations. National collections of business directories and other collected listings of dry cleaners, manufactured gas plants and historic auto stations were researched by EDR. There are two historic auto stations and two historic dry cleaners within one-quarter mile of the Subject Property. See Section 8.3 entitled Vapor Encroachment Screen for an assessment of the potential impacts these facilities on the Subject Property. There are no manufactured gas plants within one-quarter mile of the Subject Property. 5.6 Additional Record Sources CSC contacted individual agency sources in order to obtain information pertaining to the Subject Property and the surrounding vicinity, as summarized in the following subsections. Correspondence and other documentation from record sources is included in Appendix H.
5.6.1 Division of Oil, Gas, and Geothermal Resources CSC reviewed the Division of Oil, Gas, and Geothermal Resources online map of oil well locations. There are no oil wells located within 1,500 feet of the Subject Property.
5.6.2 California State Fire Marshal, Pipeline Safety Division CSC contacted the State Fire Marshal, Pipeline Safety Division. There are no hazardous materials or oil pipelines located within 1,500 of the Subject Property.
5.6.3 South Coast Air Quality Management District CSC researched the AQMD FIND database, which identifies facilities with AQMD permits, for property addresses associated with the Subject Property. The Subject Property was found and identified as Facility Number 19672. No notices of violations or notices to comply were recorded. Four of the five permits are currently inactive, and the fifth one has expired. Two of the inactive permits were for spray booth paint and solvent operations (#A05573 and #A05574) issued in 1959. Three others were for boilers (two in 1990 and one 1996). See Appendix L. A public records request was made. Only one permit for a small paint booth inside the woodshop that is currently used for storage was found. See Photograph #21 in Appendix A. The paint spray booth and solvent operations are no longer an environmental concern.
5.6.4 Los Angeles Department of Water and Power CSC contacted the Los Angeles Department of Water and Power to identify the presence of any high voltage power lines and electrical substations in the vicinity of the Subject Property. Mr. Mark Sedlacek responded that a typical electrical substation (DS-107) is located approximately 711 feet in a southerly direction from the Subject Property. Only mineral oils have been used in the transformers at this facility.

Olive Vista Middle School Phase I Environmental Site Assessment June 27, 2014
-23-
CSC was referred to Mr. Michael Downs, the East Valley District Engineer, who reported that he did not find any easements for the Subject Property. However, he did report that there is a water pipeline with a maximum pressure of 183 psi located roughly 1300 feet in a northeasterly direction from 14600 Tyler Street. It starts at the intersection of Tyler Street and Dronfield Avenue and heads northeasterly on Tyler Street away from the property. The maximum pressure of the water pipes in the vicinity of the Subject Property is approximately 95 psi.
5.6.5 Southern California Gas CSC reviewed the Southern California Gas Company (ñSCGò) online map (http://www.socalgas.com/safety/pipeline-maps) to locate natural gas transmission lines. There is a natural gas transmission line that runs down Glenoaks Boulevard. This transmission line operates above 200 psi. See map in Appendix H.
According to the Los Angeles County Assessorôs Office the centerline of Glenoaks Boulevard is 661.5 feet in a westerly direction from Fellows Avenue. Fellows Avenue is the westerly boundary of the Subject Property (Personal Communication, LAUSD).
5.6.6 Los Angeles Regional Water Quality Control Board (“RWQCB”) CSC contacted the RWQCB Underground Storage Tank (ñUSTô), SLIC, and Well Investigation Program (ñWIPò) divisions regarding files associated with the Subject Property. No records were found for the Subject Property.
5.6.7 Los Angeles County Public Health Investigation (“PHI”) CSC contacted the PHI to identify any existing records for the addresses associated with the Subject Property. No records were found for the Subject Property.
5.6.8 North Hollywood Sanitation District CSC contacted the City of Los Angeles North Hollywood Sanitation District to identify any existing records for the address associated with the Subject Property. Based on the Permittee Information Sheet provided to CSC by the Bureau of Sanitation, an industrial waste discharge permit was issued for a garbage grinder in the Cafeteria in 2003. No citations for violations have been issued during the past five years.
5.6.9 Department of Toxic Substances Control (“DTSC”) CSC contacted the Cypress and Chatsworth DTSC offices to identify any existing records for the address associated with the Subject Property. No records were found for the Subject Property.
5.6.10 Environmental Protection Agency (“USEPA”) CSC contacted the USEPA to identify any existing records for the address associated with the Subject Property. No records were found for the Subject Property.
5.6.11 Office of Environmental Health Hazard Assessment (“OEHHA”) The Office of Environmental Health Hazard Assessment (OEHHA), on behalf of the California Environmental Protection Agency (ñCalEPAò), provides a Communities Environmental Health Screening Tool: CalEnviroScreen. CalEnviroScreen is a screening methodology that can be used to help identify California communities that are disproportionately burdened by multiple sources of pollution. http://oehha.maps.arcgis.com/apps/OnePane/basicviewer/index.html?appid=a4a95185c71f4817bf03aeae25923695

Olive Vista Middle School Phase I Environmental Site Assessment June 27, 2014
-24-
The tool presents a broad picture of the burdens and vulnerabilities different areas confront from environmental pollutants. It relies on the use of indicators to measure factors that affect pollution impacts in communities: ozone concentrations in air, PM2.5 concentrations in air, diesel particulate matter emissions, use of certain high hazard, high volatility pesticides, toxic releases from facilities, traffic density and drinking water quality. CSC researched this mapping tool to assess the Subject Propertyôs overall burden resulting from multiple sources of pollution. Olive Vista Middle School is located in Census Tract 6037106405. The CalEnviroScreen pollution burden percentile for this census tract is 58. This finding indicates that the Subject Property has a greater pollution burden than 58% of the census tracts in California. CSC contacted OEHHA to identify any existing records for the address associated with the Subject Property. No records were reported for the Subject Property according to the response received on May 23, 2014 from Monet Vela.
5.6.12 City of Los Angeles Fire Department According to the Los Angeles City Fire Department website, all inquiries should be made to PHI. CSC contacted PHI and their response is discussed in Section 5.6.7.
6.0 SITE ISSUES
6.1 Previous Investigations CSC was not provided with any information regarding any previous environmental investigations on the Subject Property by LAUSD.
6.2 Chemical and Hazardous Material Handling and Storage An EDR Facility Report is included in Appendix K. A list of the chemicals used/stored at the Subject Property is included in Appendix L. Hazardous materials used on the Subject Property include gasoline and diesel fuel which is stored in 55-gallon drums in a locked closet area. No staining or evidence of spills was noted in the closet area. Chemicals used for chemistry experiments are kept in a safety cabinet in the chemistry room. No staining or signs of spills was noted in the chemistry area. Other hazardous substances include very small quantities of paint and cleaning supplies, which are of no environmental significance. 6.3 Storage Tanks and Clarifiers No evidence (i.e. fill ports, vent pipes) of underground storage tanks was observed at the time of the reconnaissance. No aboveground storage tanks or clarifiers were observed.
Olive Vista Middle School Phase I Environmental Site Assessment June 27, 2014
-25-
6.4 Asbestos, Lead-Based Paint and Pesticides Due to the age of the current buildings on the Subject Property, there is a potential that the interior and exterior construction materials may contain asbestos and lead-based paint. Additionally, based on the age of the current buildings on the Subject Property, organochlorine pesticides may have been used in landscaped areas.
6.5 Polychlorinated Biphenyls (PCBs) No transformers were observed on the Subject Property. 6.6 Evidence of Environmental Concern
6.6.1 Stained Soil, Pavement, and Concrete Typical oil staining from vehicles was observed on the asphalt of the immediately adjacent street areas and driveways of the Subject Property.
6.6.2 Stressed Vegetation The vegetation observed around the Subject Property perimeter during the Site reconnaissance showed no signs of abnormal biological stress that could indicate subsurface contamination.
6.6.3 Drums No drums were observed on the Subject Property during the Site reconnaissance except as noted in Section 6.2.
6.6.4 Air Quality Fuel odors were noted in the closet area where diesel and gasoline are stored in 55-gallon drums. No other significant odors were noted during the site reconnaissance.
7.0 SCHOOL SITE ENVIRONMENTAL SCREENING CRITERIA FINDINGS
CSC contacted several utility agencies to obtain or confirm information relevant to school site-specific issues. Records for the agency contacts and responses are included in Appendix H. Additionally, information was obtained from topographic maps and the EDR Radius Map Report as indicated below. A completed School Site Environmental Screening Criteria Checklist and supporting documentation is provided in Appendix H.
7.1 High Voltage Power Transmission Lines Based on the EDR maps, site reconnaissance and agency inquiries, there are no high voltage Power Transmission Lines within 1,500 feet of the Subject Property. 7.2 Railroads Based on the EDR maps, site reconnaissance and Thomas Guide map, there are no railroad lines within 1,500 of the Subject Property. 7.3 Hazardous Disposal Sites Based on the EDR Radius Map report, site reconnaissance and agency inquiries, the Subject Property is not a current or former hazardous waste or solid waste disposal site.
Olive Vista Middle School Phase I Environmental Site Assessment June 27, 2014
-26-
The EDR report and agency review indicate that the Subject Property is not within 2,000 feet of a significant hazardous waste disposal site. This information was verified through a search of the City of Los Angeles Zone Information Map Access System (ñZIMASò, http://zimas.lacity.org).
7.4 Hazardous Material Pipelines Based on the EDR Radius Map Report, site reconnaissance and communication from the State Fire Marshalôs Pipeline Safety Division, the Subject Property is not located within 1,500 feet of a hazardous material or oil pipeline. There is a natural gas pipeline located within 661 feet of the Subject Property (Southern California Gas Company Pipeline Map). 7.5 Airports The Subject Property is not located within two miles of an operating airport based on information obtained from the Thomas Guide map, EDR Radius Report, ZIMAS (http://zimas.lacity.org) and site reconnaissance. There is a heliport located approximately one mile west southwest of the Subject Property (EDR Radius Map).
7.6 High-Pressure Water Pipelines, Reservoirs, Water or Fuel Storage Tanks CSC contacted the Los Angeles Department of Water and Power to obtain information regarding the presence of water pipelines and utilities within 1,500 feet of the Subject Property. There is a water pipe with a maximum pressure of 183 psi located roughly 1,300 feet northeasterly of 14600 Tyler Street. It starts at the intersection of Tyler Street and Dronfield Avenue which heads northeasterly on Tyler Street away from the property. The maximum pressure of the water pipes in the vicinity of the Subject Property is approximately 95 psi. The nearest reservoir is approximately 1.8 miles west southwest of the Subject Property (1966 Topographic Map). There are no water tanks on the Subject Property or adjoining properties.
Off-site UST facilities located within one-half mile of the Subject Property are listed below:
Los Angeles City Fire Station 91 14430 Polk Street (32 Feet South Southeast of Subject Property, EDR; 100 Feet Property Line to Property Line, Google Earth Ruler)
General Telephone Company of California 14385 Polk Street (176 Feet East Southeast of Subject Property)
7.7 Major Roadways The closest major roadway is Interstate 210 (Foothill Freeway) which is located approximately one-half mile in an easterly direction from the Subject Property (Google Earth ruler). 7.8 Geological Special Studies Zone The Subject Property is within the Sierra Madre Fault Zone (ZIMAS, http://zimas.lacity.org). It is approximately 1,200 feet from an Alquist-Priolo Act Special Studies Zone.
7.9 Flood and Inundation The Subject Property is not within a Flood and Inundation Zone (ZIMAS, http://zimas.lacity.org).
Olive Vista Middle School Phase I Environmental Site Assessment June 27, 2014
-27-
7.10 Border Zone Property The Subject Property is not in a Border Zone (ZIMAS, http://zimas.lacity.org).
8.0 FINDINGS
The general area in which the Subject Property is located was identified as the Rancho Ex Mission
San Fernando on the 1900 topographic map. Rancho Ex Mission San Fernando was an 116,858-acre property granted to Eulogio de Celis in 1846. The grant encompassed most of the present day San Fernando Valley.
Prior to development as a school that opened in 1958, the Subject Property was primarily in agricultural use. In 1937, a small residence facing Borden Avenue was constructed according to building permit records. The dwelling appears to be associated with rectangular storage or livestock structures, an orchard and row crops on the Subject Property and surrounding area. According to the LAUSD website, there are no industrial facilities immediately adjacent to or within 500 feet of the Subject Property (http://www.lausd-oehs.org/industrial_viewmap.asp). This assessment revealed several items of concern that are not classified as RECs, CRECs, HRECs or de minimus conditions under the ASTM E 1527-13 Standard: Due to prior agricultural use of organochlorine compounds (termiticides, herbicides and pesticides), there may be residual compounds of concern in surficial soils.
The Subject Property is located approximately 1,200 feet from an Alquist-Priolo Act Special Studies Zone
The Subject Property is within a zip code for which elevated radon concentrations (above 4.0 pCi/L) of radon have been reported for 14 out of 65 tests conducted.
Due to the age of the buildings, asbestos and lead-based paint may be present. The Subject Property is located approximately 661 feet in an easterly direction from a high pressure (>200 psi) natural gas pipeline.
8.1 Subject Property The on-site inspection, historical information and government agency review of the Subject Property has revealed no evidence of RECs, CRECs and/or HRECs in connection with the Subject Property. Several items of concern have been identified. See Section 9.0 (Opinions) of this report for a more thorough discussion of the results of this assessment with regards to the Subject Property. Additional documentation regarding the Subject Property is included in Appendix K:
EDR Facility Site Report EDR Environmental LienSearch Report EDR Property Tax Map Report
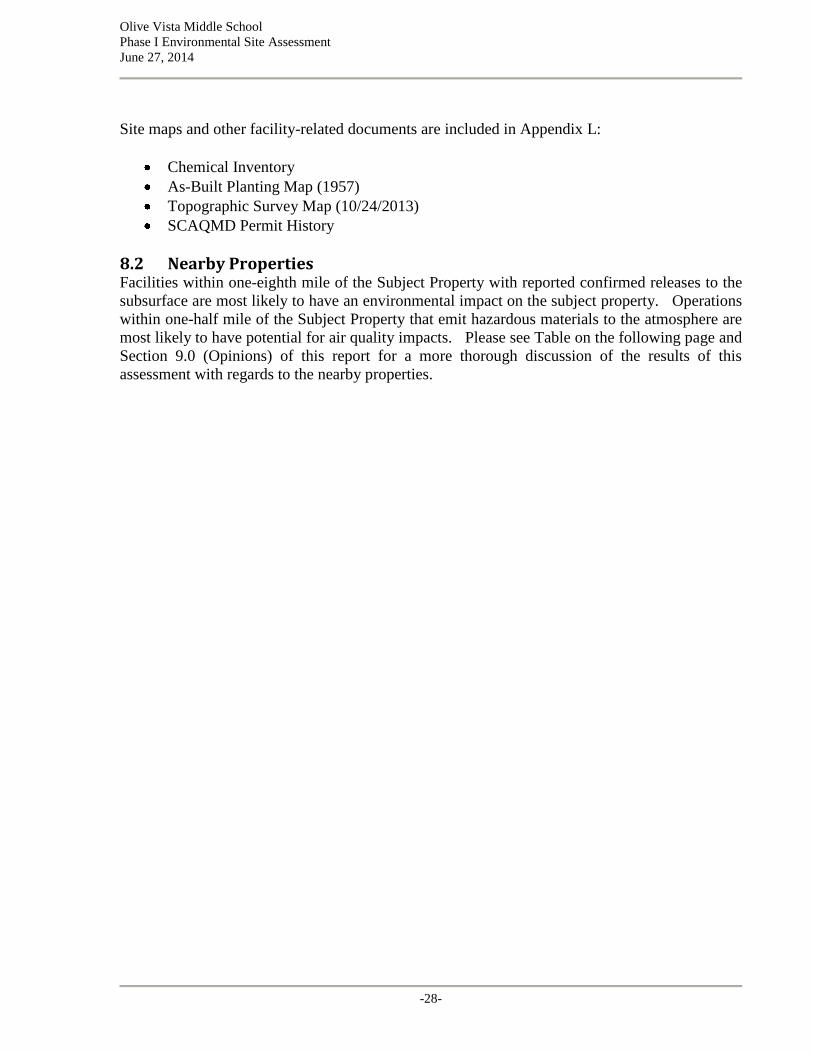
Olive Vista Middle School Phase I Environmental Site Assessment June 27, 2014
-28-
Site maps and other facility-related documents are included in Appendix L:
Chemical Inventory As-Built Planting Map (1957) Topographic Survey Map (10/24/2013) SCAQMD Permit History
8.2 Nearby Properties Facilities within one-eighth mile of the Subject Property with reported confirmed releases to the subsurface are most likely to have an environmental impact on the subject property. Operations within one-half mile of the Subject Property that emit hazardous materials to the atmosphere are most likely to have potential for air quality impacts. Please see Table on the following page and Section 9.0 (Opinions) of this report for a more thorough discussion of the results of this assessment with regards to the nearby properties.

Olive Vista Middle School Phase I Environmental Site Assessment June 27, 2014
-29-
Commercial and Institutional Facilities within One-Half Mile of Subject Property
Facility Name/Address Distance & Direction from Subject Property EDR Database Listings Opinion
LA City Fire Station 91 14430 Polk Street (Adjoining Property)
32 Feet South (EDR) 100 Feet South Southeast (Google Earth Ruler) Property Line to Property Line
CA FID UST SWEEPS UST LUST UST (S104773349) HIST UST RCRA SQL FINDS
VEC can be ruled out based on site-specific conditions. See opinion in Section 9.3 (LUST Case Closed 2003)
General Telephone Co 14385 Polk Street
176 Feet East Southeast SWEEPS UST EMI EDR US Hist Auto Station UST
Not of current environmental concern; see opinion in Section 9.3.
JC Mobile Auto Service 14511 Polk Street
449 Feet South Southeast EDR US Hist Auto Station (2004, 2005)
Not of current environmental concern; see opinion in Section 9.3
Sylmar Elementary School 13291 Phillippi Avenue (Adjoining Property)
678 Feet East Northeast RCRA-LQG Not of current environmental concern
Sylmar Cleaners (2001) MIJ Cleaners (2003, 2005) 13060 Glenoaks Boulevard
697 Feet South EDR US Hist Cleaners VEC cannot be ruled out but is unlikely to exist due to site-specific conditions. Property line to property line <660 feet.
Johnson Brothers 13060 Glenoaks Boulevard
697 Feet South CA FID UST SWEEPS UST
VEC can be ruled out; see opinion in Section 9.3
Sylmar Library 13059 Glenoaks Boulevard
705 Feet South Southwest
RCRA-SQG FINDS
Not of current environmental concern
S and G Recycling 13036 Glenoaks Boulevard
711 Feet South SWRCY (Glass, Plastic, Bimetal)
Not of current environmental concern
LA DPW 13077 Glenoaks Boulevard
711 Feet South Southwest
RCRA-SQG Not of current environmental concern
First Class Carpet Cleaning 14580 El Casco Street
1,083 Feet North EDR US Hist Cleaners Not of current environmental concern
Valley Region SPAN K-8 #1 Dronfield Avenue/Bledsoe Street
1,979 Feet North SCH Envirostor
Not of current environmental concern
7-Eleven Store #21483 14104 Foothill Boulevard
2,593 Feet East Northeast
LUST (S101586601) CA FID UST SWEEPS UST CDL (Illegal Drug Lab)
Not of current environmental concern; see opinion in Section 9.3

Olive Vista Middle School Phase I Environmental Site Assessment June 27, 2014
-30-
8.3 Tier 1 Vapor Encroachment Screen According to the American Society of Testing and Materials Standard Guide for Vapor Encroachment Screening on Property Involved in Real Estate Transactions (ñASTM E2600-10ò), the purpose of a Tier 1 Vapor Encroachment Screen (ñTier 1 VESò) is to use Phase I ESA-type information to determine if a vapor encroachment condition (ñVECò) exists at the subject site. The area of concern (ñAOCò) for nearby sites is one-third of a mile ( 1,760 feet) around the subject site, unless the use of a shorter distance such as for petroleum hydrocarbon chemicals of concern (ñCOCò) is provided by subsection 8.3.2 of ASTM Standard Practice E 2600-10. The AOC for petroleum hydrocarbon COCs is one-tenth mile (528 feet). The Tier 1 vapor encroachment screening (ñTier 1 VESò) revealed that vapor encroachment conditions (ñVECò) resulting from a release of dry cleaning solvents from a nearby historic dry cleaning facility cannot be ruled out. This facility is within the ASTM E 2600 VEC Area of Concern. Receipt of a copy of the SCAQMD permits for a Paint Spray Booth and Solvent Operations revealed that the permits were for a Devilbiss Dry Floor-Type Model. The operation of a paint spray booth on the Subject Property is no longer of environmental concern. See Section 9.3 for a discussion of CSC opinions on these VEC screen findings.
Summary of Tier 1 Vapor Encroachment Screen Findings
1. PHc = Petroleum Hydrocarbon Solvents, Motor Fuels, Waste Oil, Fuel Oil 2. PCE = Perchloroethylene
Address COC Distance & Direction VEC Determination Exists Can Be Ruled Out
Olive Vista Middle School 14600 Tyler Street VOCs 0 Feet No
Yes. Copies of paint spray booth permit received from SCAQMD revealed that the only paint spray booth permit found was for a dry design.
LA City Fire Station 91 14430 Polk Street PHc1 100 Feet South
Southeast No Yes, LUST/Case Closed 2003: See Section 9.3 for opinion.
General Telephone Co. 14385 Polk Street PHc 176 Feet East
Southeast No Yes, Registered UST: No releases
JC Mobile Auto Service 14511 Polk Street PHc 449 Feet South
Southeast No Yes, Historic UST: 2004/2005: No releases
First Class Carpet Cleaning 14580 El Casco Street None 1,083 Feet North No Yes, Carpet Cleaning Operation: No use
of VOCs
Sylmar Cleaners MIJ Cleaners 13060 Glenoaks Blvd.
PCE2
697 Feet South (EDR) ~500 Feet South Southwest Property Line to Property Line (Google Earth)
No No, but is unlikely to exist. Cleaners/Historic 2001-2005: No Data

Olive Vista Middle School Phase I Environmental Site Assessment June 27, 2014
-31-
8.4 Orphan Properties Orphan properties are sites contained in government record reports that cannot be geographically mapped or geocoded due to an inadequate or incomplete address in the government database or computer map file. The list of orphan properties contained in the EDR Radius Map Report (Appendix D) for the Subject Property was reviewed. No sites were identified which would be of environmental significance to the Subject Property. 8.5 Data Gaps No user or owner questionnaires were completed; however, it is unlikely the questionnaires would have provided any information that would change the outcome of this report and, therefore, this data gap is considered insignificant.
No information concerning the possible use and storage of termiticides, pesticides and herbicides on the Subject Property was uncovered during the performance of this Phase I ESA. This finding is an item of concern. No other data gaps were identified that would materially impact the opinions and conclusion expressed in this report.
9.0 OPINIONS
9.1 Recognized Environmental Conditions (Current, Controlled and Historic)
The on-site inspection, historical information, and government agency record review of the Subject Property have revealed no evidence of current, controlled or historical RECs in connection with the Subject Property. See Section 10.5 entitled Recommendations.
This assessment revealed several items of concern that are not classified as RECs, CRECs, HRECs or de minimus conditions under the ASTM E 1527-13 Standard. No further subsurface investigations are necessary as of the date of this report.
Based on the information contained in the EDR Radius Map Report for the Subject Property, nearby sites (i.e., sites less than one-half mile away) are not of current environmental concern except as discussed in Section 9.3 entitled Vapor Encroachment Screen.
9.2 De Minimis Conditions The on-site inspection did not reveal any de minimis conditions at the Subject Property. A de
minimis condition generally does not present a threat to human health or the environment and generally would not be the subject of an enforcement action if brought to the attention of appropriate governmental agencies. Conditions determined to be de minimis are not recognized environmental conditions. De minimis conditions do not include conditions classified as recognized environmental conditions or controlled recognized environmental conditions.

Olive Vista Middle School Phase I Environmental Site Assessment June 27, 2014
-32-
9.3 Vapor Encroachment Conditions The Tier 1 VES revealed that a vapor encroachment condition (ñVECò) resulting from a release of petroleum hydrocarbons can be ruled out. However, a release of volatile organic compounds from an historic dry cleaning facility located within the Area of Concern cannot be ruled out. The presence of residual petroleum hydrocarbon in the soil that can generate contaminated soil vapor or residual contaminated soil vapor does not present a vapor encroachment condition to the Subject Property. According to the September 2012 California State Water Resources Control Board's "Leaking Underground Fuel Tank Guidance Manual":
Biodegradation of Vapor-Phase Constituents Research has shown that vapor-phase
petroleum constituents (BTEX has been most studied) from subsurface sources are usually
biodegraded to very low or non-detectable concentrations within a few feet of the ground
surface due to aerobic biodegradation, except in the case of high-concentration sources
very close to and directly beneath the basement or slab of a building (Abreu, et al. 2009;
Davis, et al. 2009; McHugh, et al. 2010). USEPA released an Information Paper (EPA
2011) that focused on the growing body of literature documenting the significant
bio-attenuation of petroleum vapors in the vadose zone, and the difference between the
natural attenuation of petroleum vapors and chlorinated solvent vapors.
Because the distance from the location of the leaking underground storage tank or tanks associated with the Los Angeles City Fire Station 91 to the schoolôs property line is approximately 100 feet not 32 feet as reported by EDR, CSC is of the opinion that due to site-specific conditions, a VEC does not exist. CSC is of the opinion that the historic operations of a paint spray booth and solvent usage on the Subject Property would not pose a current vapor encroachment condition because there are no reported violations in SCAQMDôs FIND database or records associated with the facility. The permits issued in 1959 by SCAQMD were for Devilbliss Dry Floor Models. The presence of residual dry cleaning solvents in the soil that can generate contaminated soil vapor or residual contaminated soil vapor does present a potential vapor encroachment condition to the Subject Property on the undeveloped south southwesterly section of the Subject Property. Because the potential for vapor encroachment conditions could not be ruled out, LAUSD should re-consider the potential impact of this finding prior to construction of any new buildings on the undeveloped south southwesterly section of the Subject Property. CSC is of the opinion that a VEC cannot be ruled out but is unlikely to exist due to site-specific conditions.
10.0 CONCLUSIONS
CSC performed a Phase I Environmental Site Assessment in conformance with the scope and limitations of American Society for Testing and Materials ("ASTM") "Standard Practice for Environmental Site Assessments: Phase I Environmental Site Assessment Process", E 1527-13, for the property identified as Olive Vista Middle School addressed as 14600 Tyler Street, Sylmar, Los Angeles County, California.
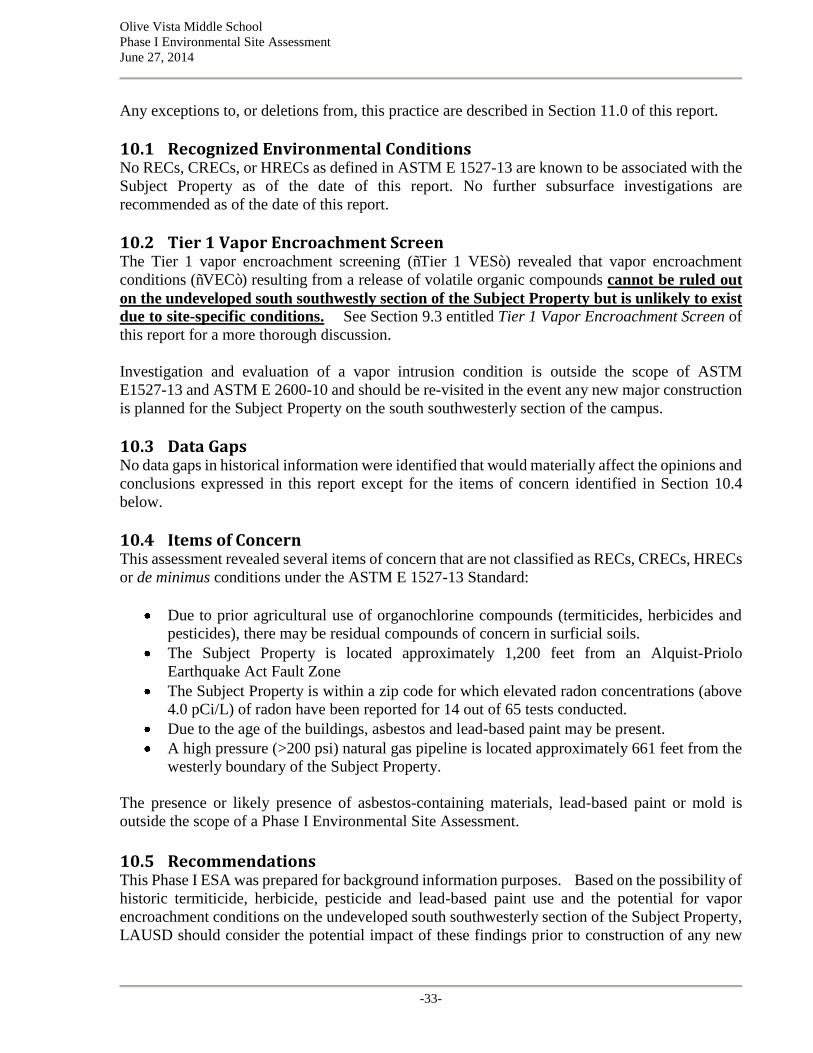
Olive Vista Middle School Phase I Environmental Site Assessment June 27, 2014
-33-
Any exceptions to, or deletions from, this practice are described in Section 11.0 of this report. 10.1 Recognized Environmental Conditions No RECs, CRECs, or HRECs as defined in ASTM E 1527-13 are known to be associated with the Subject Property as of the date of this report. No further subsurface investigations are recommended as of the date of this report. 10.2 Tier 1 Vapor Encroachment Screen The Tier 1 vapor encroachment screening (ñTier 1 VESò) revealed that vapor encroachment conditions (ñVECò) resulting from a release of volatile organic compounds cannot be ruled out on the undeveloped south southwestly section of the Subject Property but is unlikely to exist due to site-specific conditions. See Section 9.3 entitled Tier 1 Vapor Encroachment Screen of this report for a more thorough discussion. Investigation and evaluation of a vapor intrusion condition is outside the scope of ASTM E1527-13 and ASTM E 2600-10 and should be re-visited in the event any new major construction is planned for the Subject Property on the south southwesterly section of the campus. 10.3 Data Gaps No data gaps in historical information were identified that would materially affect the opinions and conclusions expressed in this report except for the items of concern identified in Section 10.4 below. 10.4 Items of Concern This assessment revealed several items of concern that are not classified as RECs, CRECs, HRECs or de minimus conditions under the ASTM E 1527-13 Standard:
Due to prior agricultural use of organochlorine compounds (termiticides, herbicides and pesticides), there may be residual compounds of concern in surficial soils.
The Subject Property is located approximately 1,200 feet from an Alquist-Priolo Earthquake Act Fault Zone
The Subject Property is within a zip code for which elevated radon concentrations (above 4.0 pCi/L) of radon have been reported for 14 out of 65 tests conducted.
Due to the age of the buildings, asbestos and lead-based paint may be present. A high pressure (>200 psi) natural gas pipeline is located approximately 661 feet from the westerly boundary of the Subject Property.
The presence or likely presence of asbestos-containing materials, lead-based paint or mold is outside the scope of a Phase I Environmental Site Assessment. 10.5 Recommendations This Phase I ESA was prepared for background information purposes. Based on the possibility of historic termiticide, herbicide, pesticide and lead-based paint use and the potential for vapor encroachment conditions on the undeveloped south southwesterly section of the Subject Property, LAUSD should consider the potential impact of these findings prior to construction of any new

Olive Vista Middle School Phase I Environmental Site Assessment June 27, 2014
-34-
buildings on the undeveloped south southwesterly section of the Subject Property or any other project that would require significant site grading and excavation activities that would generate surplus soil for export to another school site. CSC does not recommend any further subsurface investigations at this time.
11.0 SPECIAL TERMS AND CONDITIONS
11.1 Limitations and Exceptions of Assessment CSC has performed this assessment in accordance with ASTM Standard Practice for Environmental Site Assessments E1527-13 and the School Site Environmental Screening Criteria
Checklist (Appendix H).
11.2 Limiting Conditions and Methodology Used This report is based upon data and information obtained during the site visit performed by CSC personnel to the Subject Property identified herein and is based solely upon the condition of the Subject Property on the date of such inspection, supplemented by information and data obtained by CSC from other commercial and regulatory agency sources identified in Appendix I.
The evaluation and conclusions contained in this report have been prepared in light of the expertise and experience of CSC. However, in evaluating the Subject Property, CSC has relied in good faith upon representations and information furnished by sources identified in Appendix I with respect to operations and existing Subject Property conditions and the historic uses of the Subject Property to the extent that they have not been contradicted by data obtained from other individuals or regulatory agency database searches.
CSC has performed this work, made findings, and proposed recommendations described in this report in accordance with the ASTM Standard Practice for Environmental Site Assessments E1527-13 and the School Site Environmental Screening Criteria Checklist. This warranty stands in lieu of all other warranties, expressed or implied. While this report can be used as a guide, it must be understood that it is neither a rejection nor an endorsement of the Subject Property as an operating school site.
12.0 STATEMENT OF INDEPENDENCE
CSC is a privately held company and is not affiliated with any financial institution or other corporate entity. CSC is retained as an independent contractor to LAUSD to provide objective, impartial investigatory or analytical services regarding environmentally regulated hazardous or toxic materials.
CSC has no present or contemplated future ownership interest or financial interest in the real estate that is the subject of this Environmental Assessment Report; and CSC has no personal interest with respect to the subject matter of the Environmental Assessment Report or the parties involved. CSC has no relationship with the Subject Property or the owners thereof that would prevent an independent analysis of the environmental or other conditions of the Subject Property.

Olive Vista Middle School Phase I Environmental Site Assessment June 27, 2014
-35-
13.0 ADDITIONAL SERVICES
Additional services such as investigation of non-scope considerations and/or business environmental risk issues (e.g., asbestos-containing building materials, radon, lead-based paint, mold, lead in drinking water, wetlands, regulatory compliance, cultural and historic resources, industrial hygiene, health and safety, ecological resources, endangered species, indoor air quality [excluding vapor encroachment conditions] and high-voltage power lines), a broader scope of assessment, more detailed conclusions, liability/risk evaluations, remediation techniques, etc., are beyond the scope of services under Title 40 CFR Part 312 and are not included in this Phase I ESA except as noted in Section 2.2 entitled Scope-of-Work. CSC contacted individual agency sources in order to obtain information pertaining to the Subject Property and the surrounding vicinity. These sources are identified in Appendix I entitled References .
14.0 REFERENCES
See Appendix I.
15.0 SIGNATURES OF ENVIRONMENTAL PROFESSIONALS
Aaron Garrett, Environmental Project Manager
Dave Broadbent, Technical Director
Joan Greenwood, Quality Assurance Officer
16.0 QUALIFICATIONS OF ENVIRONMENTAL PROFESSIONALS
Mr. Garrett, Ms. Greenwood and Mr. Broadbent declare that to the best of our knowledge and belief, we meet the definition of Environmental Professional as defined in Section 312.10 of 40 CFR 312 and that we have the specific qualifications based on education, training and experience to assess a property of the nature, history and setting of the subject property. We have developed and performed the all appropriate inquiries in conformance with the standards and practices set forth in 40 CFR Part 312. Mr. Garrettôs, Ms. Greenwoodôs and Mr. Broadbentôs specific qualifications are provided in Appendix J of this report.

Olive Vista Middle School Phase I Environmental Site Assessment June 27, 2014
-36-
17.0 LIST OF APPENDICES
Subject Property Photographs Appendix A Aerial Photographs Appendix B Sanborn Fire Insurance Maps Appendix C Historic Topographical Maps Appendix D EDR Radius Map Report with GeoCheck Appendix E City Directory Abstracts Appendix F City of Los Angeles Building Department Permits Appendix G School Site Environmental Screening Criteria Checklist Appendix H References Appendix I Environmental Professional(s) Qualifications Appendix J Supplemental EDR Database Search Reports Appendix K Miscellaneous Documentation Appendix L

1. Location Map 2. Assessorôs Parcel Map 3. Subject and Nearby Facilities Radius Map

©19
97 T
hom
as B
ros.
Map
s
14600 Tyler St, Los Angeles, 91342, Page & Grid 481 J3
H J A B
2
3
4
H J A B
2
3
4
481 482


EDR Inc.EDR Inc.EDR Inc.EDR Inc.EDR Inc.EDR Inc.EDR Inc.EDR Inc.EDR Inc.EDR Inc.EDR Inc.EDR Inc.EDR Inc.EDR Inc.EDR Inc.EDR Inc.EDR Inc.EDR Inc.EDR Inc.EDR Inc.EDR Inc.EDR Inc.EDR Inc.EDR Inc.EDR Inc.EDR Inc.EDR Inc.EDR Inc.EDR Inc.EDR Inc.EDR Inc.EDR Inc.EDR Inc.EDR Inc.EDR Inc.EDR Inc.EDR Inc.EDR Inc.EDR Inc.EDR Inc.
2,593 Feet ENE
1,979 Feet N
678 Feet ENE
449 Feet SSE697 Feet S
176 Feet ESE
S & G Recycling, 711 Feet SSE
1,083 Feet N
Sylmar Library & LA DPW Substation Current Location of Fire Station 91

Appendix A Subject Property Photographs


1. Front Entrance of Olive Vista Middle School
2. Northern portion of the school

3. Northern portion of the school
4. Eastern side of the school

5. Southern-most portion of the School
6. Asphalt parking area on central portion of the School
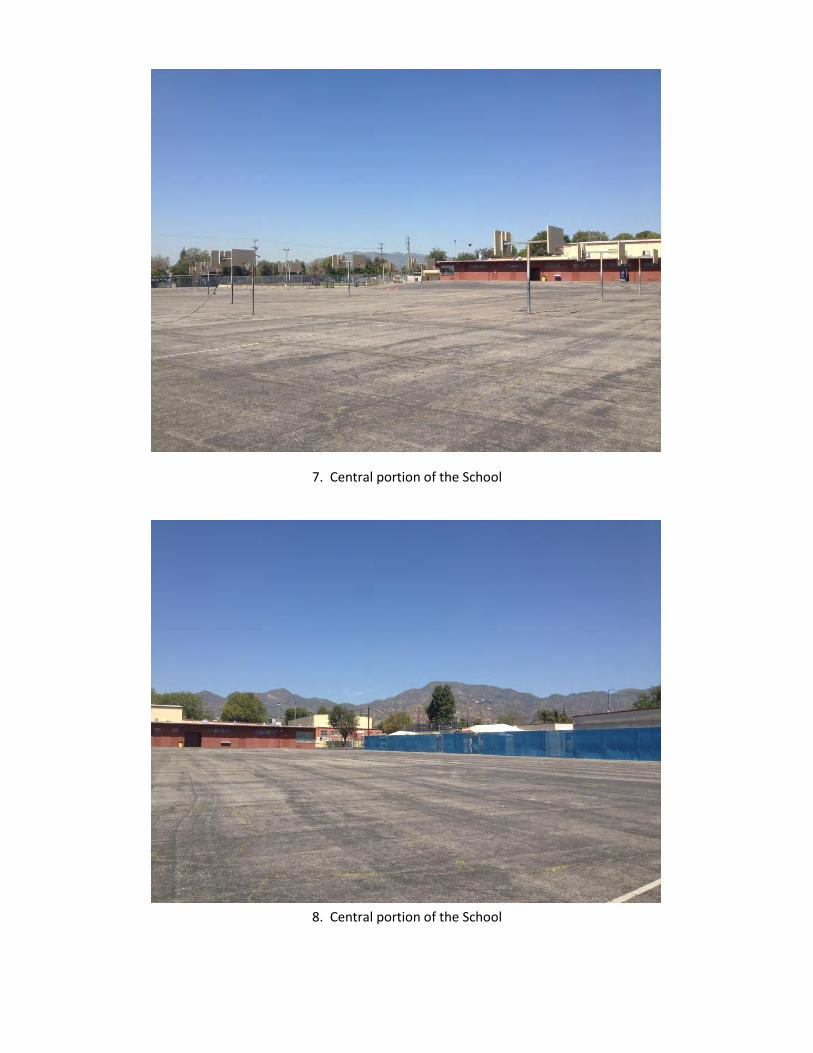
7. Central portion of the School
8. Central portion of the School
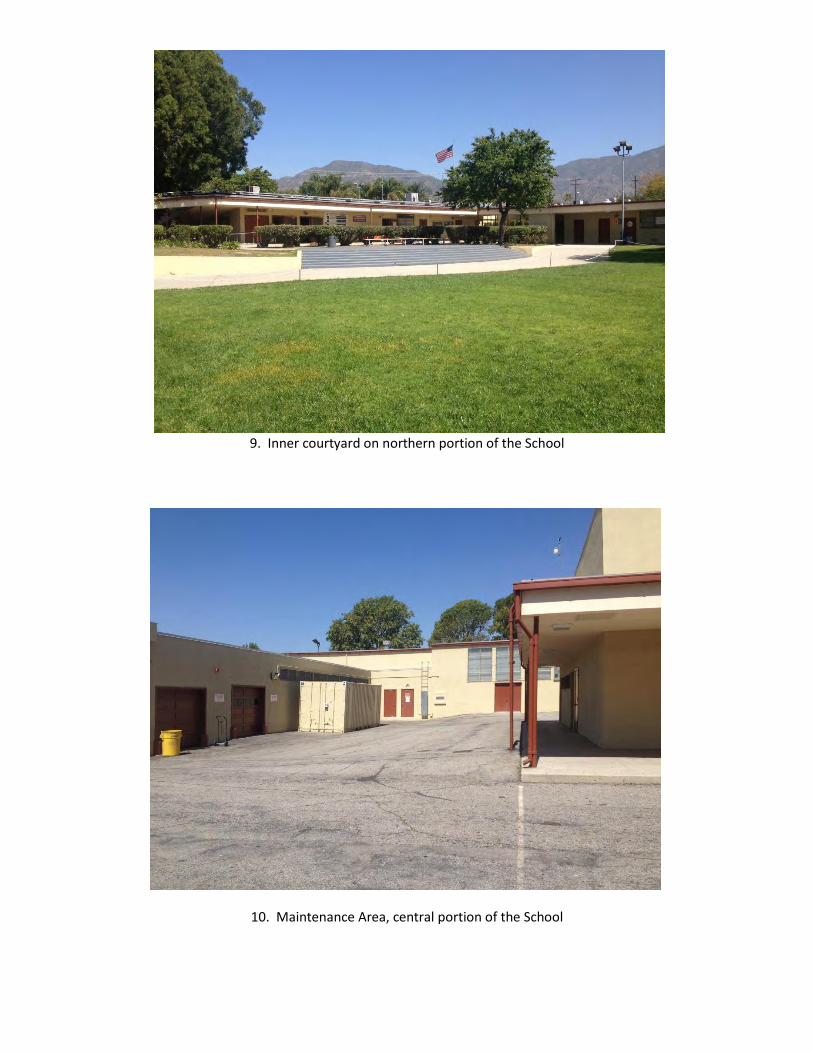
9. Inner courtyard on northern portion of the School
10. Maintenance Area, central portion of the School

11. Paint and Flammable Storage Areas
12. Interior of Flammable Storage Area

13. Maintenance cleaning supplies
14. Maintenance supplies

15. School Supplies
16. Chemistry materials

17. Classroom
18. Classroom

19. Woodshop exterior
20. Woodshop interior

21. Paint booth inside woodshop
22. Central/eastern area of the school

23. Central/eastern area of the school
24. Eastern area of the school
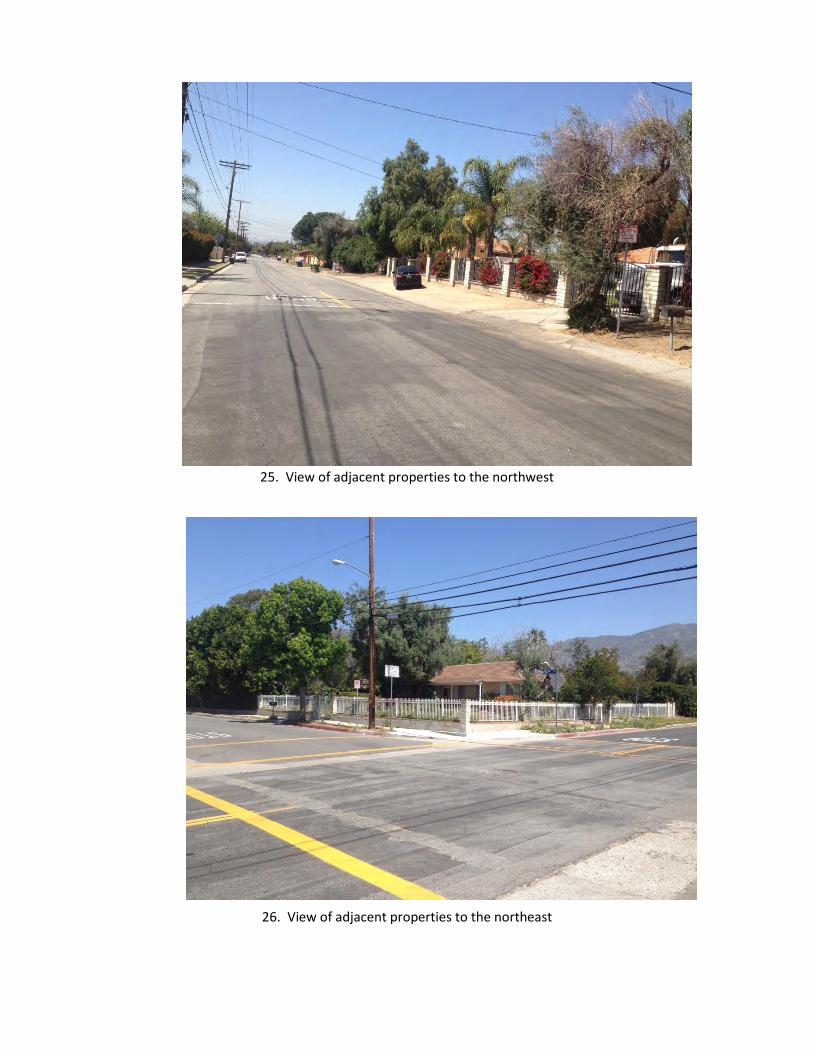
25. View of adjacent properties to the northwest
26. View of adjacent properties to the northeast

27. View of adjacent property to the south
28. View along Polk Avenue to the west

Appendix B Aerial Photographs

The EDR Aerial Photo Decade Package
Olive Vista Middle School
14600 Tyler Street
Sylmar, CA 91342
Inquiry Number: 3880855.11
March 14, 2014

EDR Aerial Photo Decade Package
Environmental Data Resources, Inc. (EDR) Aerial Photo Decade Package is a screening tool designed to assistenvironmental professionals in evaluating potential liability on a target property resulting from past activities. EDR’sprofessional researchers provide digitally reproduced historical aerial photographs, and when available, provide one photoper decade.
When delivered electronically by EDR, the aerial photo images included with this report are for ONE TIME USEONLY. Further reproduction of these aerial photo images is prohibited without permission from EDR. For moreinformation contact your EDR Account Executive.
Thank you for your business.Please contact EDR at 1-800-352-0050
with any questions or comments.
Disclaimer - Copyright and Trademark Notice
This Report contains certain information obtained from a variety of public and other sources reasonably available to Environmental Data Resources, Inc.It cannot be concluded from this Report that coverage information for the target and surrounding properties does not exist from other sources. NOWARRANTY EXPRESSED OR IMPLIED, IS MADE WHATSOEVER IN CONNECTION WITH THIS REPORT. ENVIRONMENTAL DATARESOURCES, INC. SPECIFICALLY DISCLAIMS THE MAKING OF ANY SUCH WARRANTIES, INCLUDING WITHOUT LIMITATION,MERCHANTABILITY OR FITNESS FOR A PARTICULAR USE OR PURPOSE. ALL RISK IS ASSUMED BY THE USER. IN NO EVENT SHALLENVIRONMENTAL DATA RESOURCES, INC. BE LIABLE TO ANYONE, WHETHER ARISING OUT OF ERRORS OR OMISSIONS, NEGLIGENCE,ACCIDENT OR ANY OTHER CAUSE, FOR ANY LOSS OF DAMAGE, INCLUDING, WITHOUT LIMITATION, SPECIAL, INCIDENTAL,CONSEQUENTIAL, OR EXEMPLARY DAMAGES. ANY LIABILITY ON THE PART OF ENVIRONMENTAL DATA RESOURCES, INC. IS STRICTLYLIMITED TO A REFUND OF THE AMOUNT PAID FOR THIS REPORT. Purchaser accepts this Report AS IS. Any analyses, estimates, ratings,environmental risk levels or risk codes provided in this Report are provided for illustrative purposes only, and are not intended to provide, nor should theybe interpreted as providing any facts regarding, or prediction or forecast of, any environmental risk for any property. Only a Phase I Environmental SiteAssessment performed by an environmental professional can provide information regarding the environmental risk for any property. Additionally, theinformation provided in this Report is not to be construed as legal advice.
Copyright 2014 by Environmental Data Resources, Inc. All rights reserved. Reproduction in any media or format, in whole or in part, of any report or mapof Environmental Data Resources, Inc., or its affiliates, is prohibited without prior written permission.
EDR and its logos (including Sanborn and Sanborn Map) are trademarks of Environmental Data Resources, Inc. or its affiliates. All other trademarksused herein are the property of their respective owners.

Date EDR Searched Historical Sources:Aerial PhotographyMarch 14, 2014
Target Property:14600 Tyler Street
Sylmar, CA 91342
Year Scale Details Source
1928 Aerial Photograph. Scale: 1"=500' Flight Year: 1928 Fairchild
1938 Aerial Photograph. Scale: 1"=500' Flight Year: 1938 EDR
1947 Aerial Photograph. Scale: 1"=500' Flight Year: 1947 Tubis
1952 Aerial Photograph. Scale: 1"=500' Flight Year: 1952 EDR
1964 Aerial Photograph. Scale: 1"=500' Flight Year: 1964 EDR
1972 Aerial Photograph. Scale: 1"=500' Flight Year: 1972 EDR
1981 Aerial Photograph. Scale: 1"=500' Flight Year: 1981 AMI
1989 Aerial Photograph. Scale: 1"=500' Flight Year: 1989 USGS
1994 Aerial Photograph. Scale: 1"=500' /DOQQ - acquisition dates: 1994 EDR
2005 Aerial Photograph. Scale: 1"=500' Flight Year: 2005 EDR
2009 Aerial Photograph. Scale: 1"=500' Flight Year: 2009 EDR
2010 Aerial Photograph. Scale: 1"=500' Flight Year: 2010 EDR
2012 Aerial Photograph. Scale: 1"=500' Flight Year: 2012 EDR
3880855.112
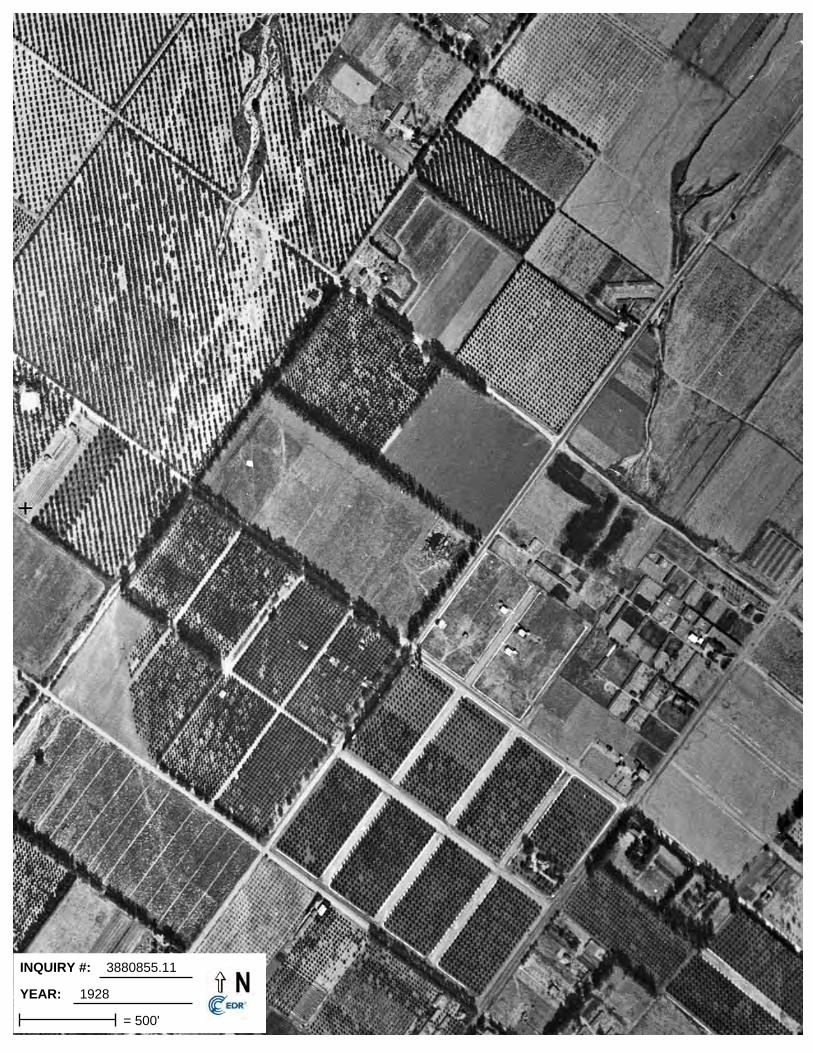
INQUIRY #:
YEAR:
3880855.11
1928
= 500'
aaron garrett
Polygonal Line

INQUIRY #:
YEAR:
3880855.11
1938
= 500'
aaron garrett
Polygonal Line

INQUIRY #:
YEAR:
3880855.11
1947
= 500'
aaron garrett
Polygonal Line

INQUIRY #:
YEAR:
3880855.11
1952
= 500'
aaron garrett
Polygonal Line
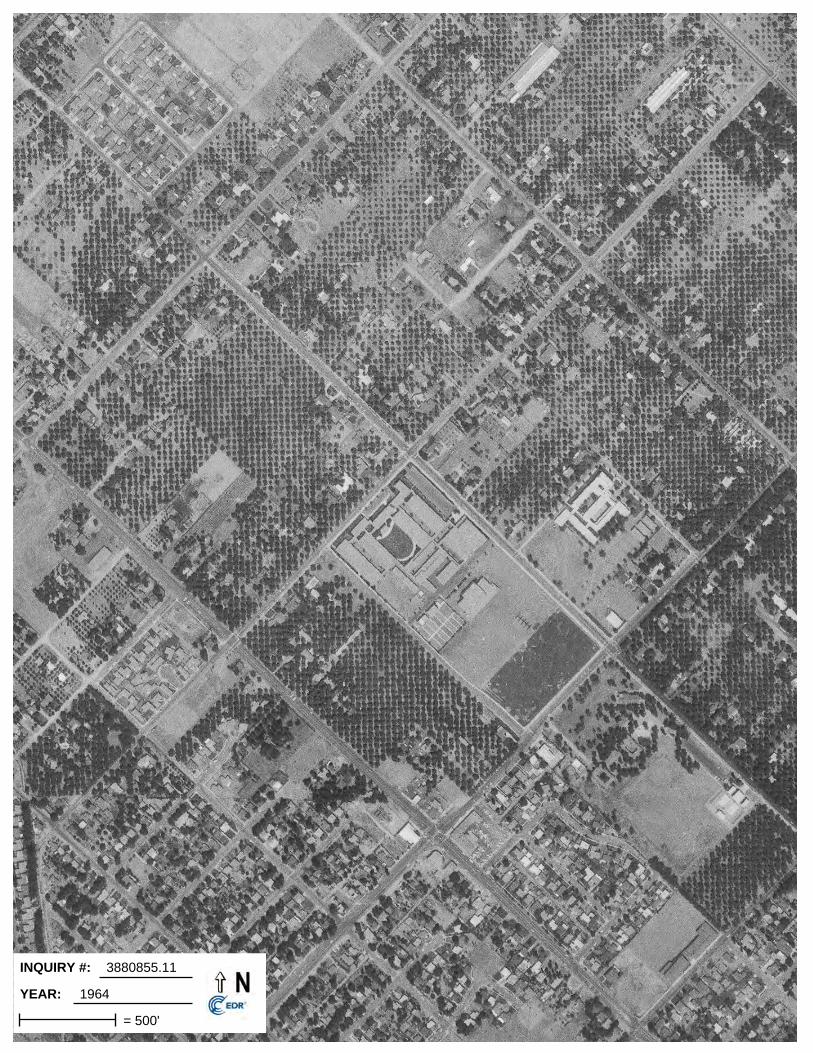
INQUIRY #:
YEAR:
3880855.11
1964
= 500'
aaron garrett
Polygonal Line
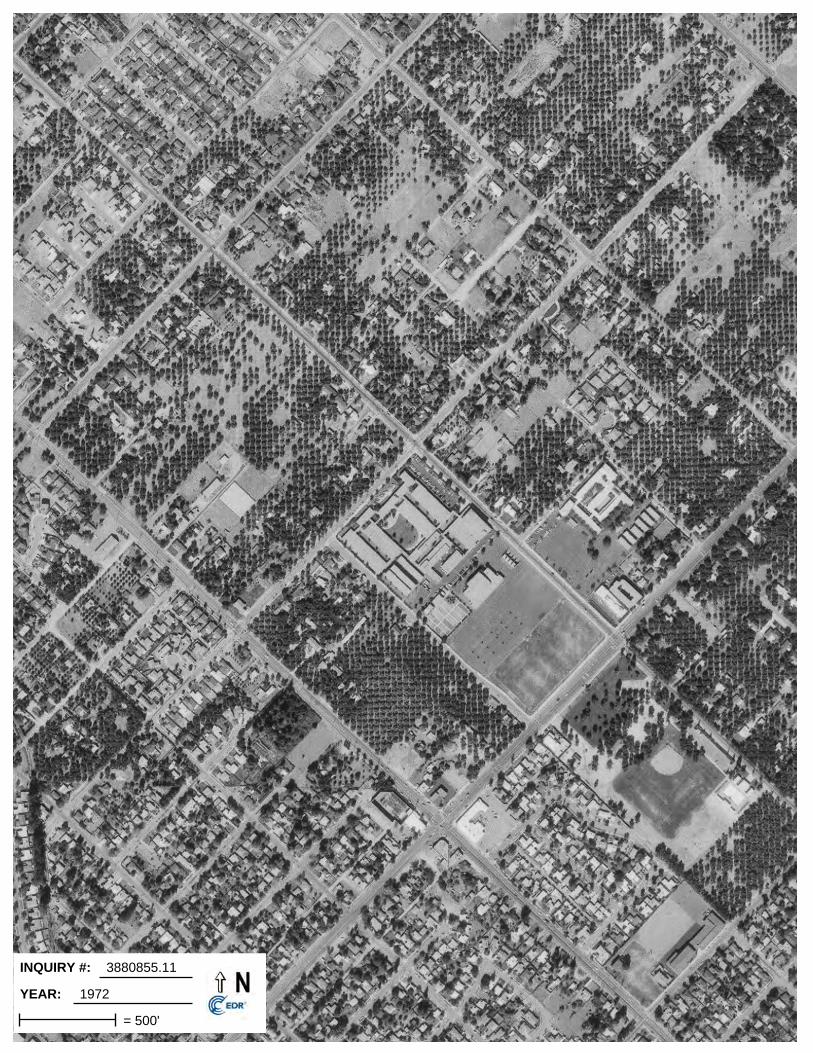
INQUIRY #:
YEAR:
3880855.11
1972
= 500'
aaron garrett
Polygonal Line
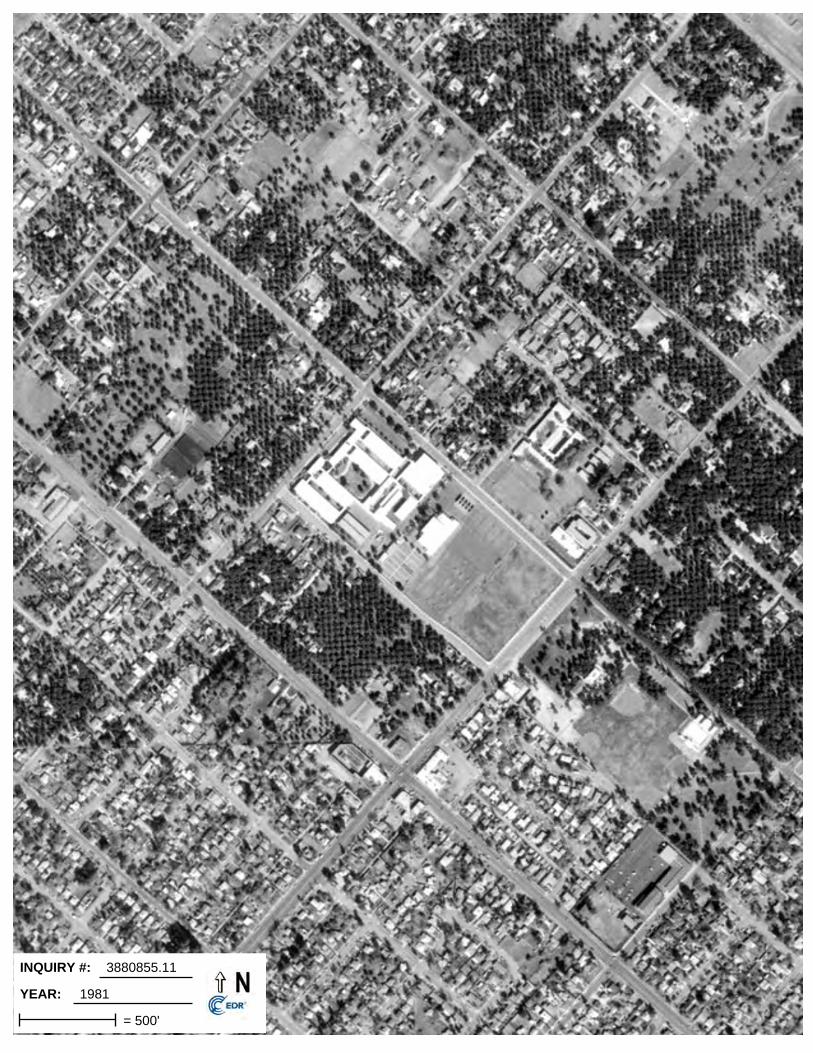
INQUIRY #:
YEAR:
3880855.11
1981
= 500'
aaron garrett
Polygonal Line

INQUIRY #:
YEAR:
3880855.11
1989
= 500'
joan greenwood
Polygonal Line

INQUIRY #:
YEAR:
3880855.11
1994
= 500'
joan greenwood
Polygonal Line

INQUIRY #:
YEAR:
3880855.11
2005
= 500'
joan greenwood
Polygon
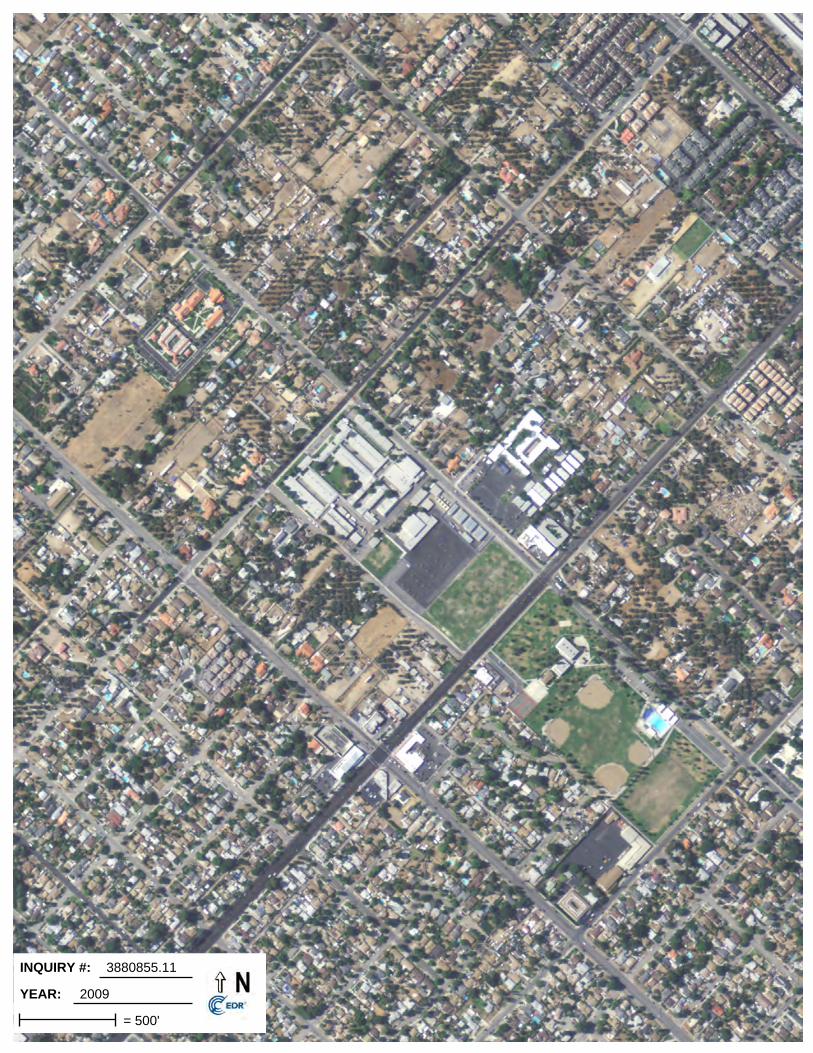
INQUIRY #:
YEAR:
3880855.11
2009
= 500'
joan greenwood
Polygonal Line

INQUIRY #:
YEAR:
3880855.11
2010
= 500'
aaron garrett
Polygonal Line

INQUIRY #:
YEAR:
3880855.11
2012
= 500'
aaron garrett
Polygonal Line

Appendix C Sanborn Fire Insurance Maps

Certified Sanborn® Map Report
Olive Vista Middle School
14600 Tyler Street
Sylmar, CA 91342
Inquiry Number: 3880855.3
March 14, 2014

Certified Sanborn® Map Report 3/14/14
Site Name:Olive Vista Middle School14600 Tyler StreetSylmar, CA 91342
Client Name:Clark Seif Clark, Inc.110 Pine AvenueLong Beach, CA 90802
Contact: Aaron GarrettEDR Inquiry # 3880855.3
The Sanborn Library has been searched by EDR and maps covering the target property location as provided by ClarkSeif Clark, Inc. were identified for the years listed below. The Sanborn Library is the largest, most complete collection offire insurance maps. The collection includes maps from Sanborn, Bromley, Perris & Browne, Hopkins, Barlow, andothers. Only Environmental Data Resources Inc. (EDR) is authorized to grant rights for commercial reproduction ofmaps by the Sanborn Library LLC, the copyright holder for the collection. Results can be authenticated by visitingwww.edrnet.com/sanborn.
The Sanborn Library is continually enhanced with newly identified map archives. This report accesses all maps in thecollection as of the day this report was generated.
Certified Sanborn Results:
Site Name: Olive Vista Middle SchoolAddress: 14600 Tyler StreetCity, State, Zip: Sylmar, CA 91342Cross Street:P.O. # NAProject: 4006791Certification # 7EDE-48DF-8EC5
Library of Congress
University Publications of America
EDR Private Collection
The Sanborn Library LLC Since 1866™
The Sanborn Library includes more than 1.2 millionfire insurance maps from Sanborn, Bromley, Perris &Browne, Hopkins, Barlow and others which trackhistorical property usage in approximately 12,000American cities and towns. Collections searched:
Sanborn® Library search resultsCertification # 7EDE-48DF-8EC5
UNMAPPED PROPERTYThis report certifies that the complete holdings of the SanbornLibrary, LLC collection have been searched based on clientsupplied target property information, and fire insurance mapscovering the target property were not found.
Limited Permission To Make CopiesClark Seif Clark, Inc. (the client) is permitted to make up to FIVE photocopies of this Sanborn Map transmittal and each fire insurance mapaccompanying this report solely for the limited use of its customer. No one other than the client is authorized to make copies. Upon request madedirectly to an EDR Account Executive, the client may be permitted to make a limited number of additional photocopies. This permission isconditioned upon compliance by the client, its customer and their agents with EDR's copyright policy; a copy of which is available upon request.
Disclaimer - Copyright and Trademark noticeThis Report contains certain information obtained from a variety of public and other sources reasonably available to Environmental Data Resources, Inc. It cannot beconcluded from this Report that coverage information for the target and surrounding properties does not exist from other sources. NO WARRANTY EXPRESSED ORIMPLIED, IS MADE WHATSOEVER IN CONNECTION WITH THIS REPORT. ENVIRONMENTAL DATA RESOURCES, INC. SPECIFICALLY DISCLAIMS THEMAKING OF ANY SUCH WARRANTIES, INCLUDING WITHOUT LIMITATION, MERCHANTABILITY OR FITNESS FOR A PARTICULAR USE OR PURPOSE. ALLRISK IS ASSUMED BY THE USER. IN NO EVENT SHALL ENVIRONMENTAL DATA RESOURCES, INC. BE LIABLE TO ANYONE, WHETHER ARISING OUT OFERRORS OR OMISSIONS, NEGLIGENCE, ACCIDENT OR ANY OTHER CAUSE, FOR ANY LOSS OF DAMAGE, INCLUDING, WITHOUT LIMITATION, SPECIAL,INCIDENTAL CONSEQUENTIAL, OR EXEMPLARY DAMAGES. ANY LIABILITY ON THE PART OF ENVIRONMENTAL DATA RESOURCES, INC. IS STRICTLYLIMITED TO A REFUND OF THE AMOUNT PAID FOR THIS REPORT. Purchaser accepts this Report "AS IS". Any analyses, estimates, ratings, environmental risklevels or risk codes provided in this Report are provided for illustrative purposes only, and are not intended to provide, nor should they be interpreted as providingany facts regarding, or prediction or forecast of, any environmental risk for any property. Only a Phase I Environmental Site Assessment performed by anenvironmental professional can provide information regarding the environmental risk for any property. Additionally, the information provided in this Report is not to beconstrued as legal advice.
Copyright 2014 by Environmental Data Resources, Inc. All rights reserved. Reproduction in any media or format, in whole or in part, of any report or map ofEnvironmental Data Resources, Inc., or its affiliates, is prohibited without prior written permission.
EDR and its logos (including Sanborn and Sanborn Map) are trademarks of Environmental Data Resources, Inc. or its affiliates. All other trademarks used herein arethe property of their respective owners.
3880855 - 3 page 2

Appendix D Historic Topographical Maps

EDR Historical Topographic Map Report
Olive Vista Middle School
14600 Tyler Street
Sylmar, CA 91342
Inquiry Number: 3880855.4
March 14, 2014
EDR Historical Topographic Map Report
Environmental Data Resources, Inc.s (EDR) Historical Topographic Map Report is designed to assist professionals inevaluating potential liability on a target property resulting from past activities. EDRs Historical Topographic Map Reportincludes a search of a collection of public and private color historical topographic maps, dating back to the early 1900s.
Thank you for your business.Please contact EDR at 1-800-352-0050
with any questions or comments.
Disclaimer - Copyright and Trademark Notice
This Report contains certain information obtained from a variety of public and other sources reasonably available to Environmental Data Resources, Inc.It cannot be concluded from this Report that coverage information for the target and surrounding properties does not exist from other sources. NOWARRANTY EXPRESSED OR IMPLIED, IS MADE WHATSOEVER IN CONNECTION WITH THIS REPORT. ENVIRONMENTAL DATARESOURCES, INC. SPECIFICALLY DISCLAIMS THE MAKING OF ANY SUCH WARRANTIES, INCLUDING WITHOUT LIMITATION,MERCHANTABILITY OR FITNESS FOR A PARTICULAR USE OR PURPOSE. ALL RISK IS ASSUMED BY THE USER. IN NO EVENT SHALLENVIRONMENTAL DATA RESOURCES, INC. BE LIABLE TO ANYONE, WHETHER ARISING OUT OF ERRORS OR OMISSIONS, NEGLIGENCE,ACCIDENT OR ANY OTHER CAUSE, FOR ANY LOSS OF DAMAGE, INCLUDING, WITHOUT LIMITATION, SPECIAL, INCIDENTAL,CONSEQUENTIAL, OR EXEMPLARY DAMAGES. ANY LIABILITY ON THE PART OF ENVIRONMENTAL DATA RESOURCES, INC. IS STRICTLYLIMITED TO A REFUND OF THE AMOUNT PAID FOR THIS REPORT. Purchaser accepts this Report AS IS. Any analyses, estimates, ratings,environmental risk levels or risk codes provided in this Report are provided for illustrative purposes only, and are not intended to provide, nor should theybe interpreted as providing any facts regarding, or prediction or forecast of, any environmental risk for any property. Only a Phase I Environmental SiteAssessment performed by an environmental professional can provide information regarding the environmental risk for any property. Additionally, theinformation provided in this Report is not to be construed as legal advice.
Copyright 2014 by Environmental Data Resources, Inc. All rights reserved. Reproduction in any media or format, in whole or in part, of any report or mapof Environmental Data Resources, Inc., or its affiliates, is prohibited without prior written permission.
EDR and its logos (including Sanborn and Sanborn Map) are trademarks of Environmental Data Resources, Inc. or its affiliates. All other trademarksused herein are the property of their respective owners.
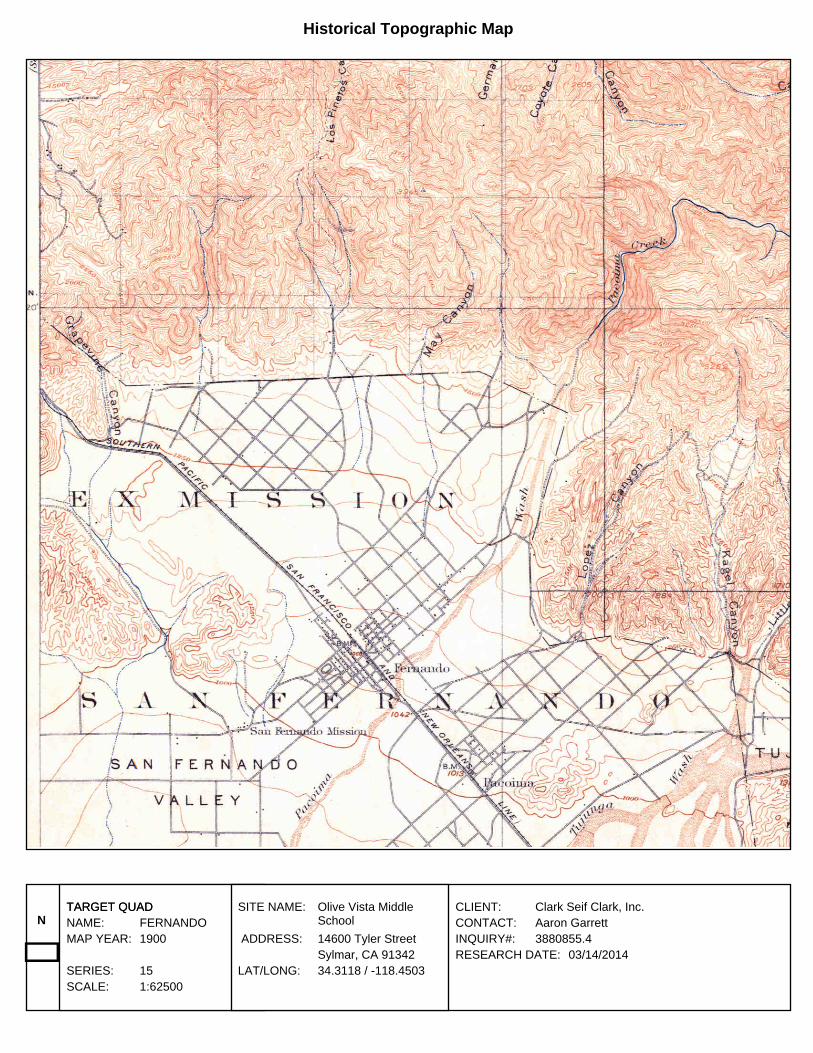
Historical Topographic Map
→
NTARGET QUADTARGET QUADNAME: FERNANDOMAP YEAR: 1900
SERIES: 15SCALE: 1:62500
SITE NAME: Olive Vista MiddleSchool
ADDRESS: 14600 Tyler StreetSylmar, CA 91342
LAT/LONG: 34.3118 / -118.4503
CLIENT: Clark Seif Clark, Inc.CONTACT: Aaron GarrettINQUIRY#: 3880855.4RESEARCH DATE: 03/14/2014

Historical Topographic Map
→
NTARGET QUADTARGET QUADNAME: SOUTHERN CA SHEET 1MAP YEAR: 1901
SERIES: 60SCALE: 1:250000
SITE NAME: Olive Vista MiddleSchool
ADDRESS: 14600 Tyler StreetSylmar, CA 91342
LAT/LONG: 34.3118 / -118.4503
CLIENT: Clark Seif Clark, Inc.CONTACT: Aaron GarrettINQUIRY#: 3880855.4RESEARCH DATE: 03/14/2014

Historical Topographic Map
→
NTARGET QUADTARGET QUADNAME: SYLMARMAP YEAR: 1935
SERIES: 6SCALE: 1:24000
SITE NAME: Olive Vista MiddleSchool
ADDRESS: 14600 Tyler StreetSylmar, CA 91342
LAT/LONG: 34.3118 / -118.4503
CLIENT: Clark Seif Clark, Inc.CONTACT: Aaron GarrettINQUIRY#: 3880855.4RESEARCH DATE: 03/14/2014
joan greenwood
Polygonal Line

Historical Topographic Map
→
NTARGET QUADTARGET QUADNAME: SAN FERNANDOMAP YEAR: 1947
SERIES: 15SCALE: 1:50000
SITE NAME: Olive Vista MiddleSchool
ADDRESS: 14600 Tyler StreetSylmar, CA 91342
LAT/LONG: 34.3118 / -118.4503
CLIENT: Clark Seif Clark, Inc.CONTACT: Aaron GarrettINQUIRY#: 3880855.4RESEARCH DATE: 03/14/2014
joan greenwood
Polygonal Line

Historical Topographic Map
→
NTARGET QUADTARGET QUADNAME: SAN FERNANDOMAP YEAR: 1953
SERIES: 7.5SCALE: 1:24000
SITE NAME: Olive Vista MiddleSchool
ADDRESS: 14600 Tyler StreetSylmar, CA 91342
LAT/LONG: 34.3118 / -118.4503
CLIENT: Clark Seif Clark, Inc.CONTACT: Aaron GarrettINQUIRY#: 3880855.4RESEARCH DATE: 03/14/2014
joan greenwood
Polygonal Line

Historical Topographic Map
→
NTARGET QUADTARGET QUADNAME: SAN FERNANDOMAP YEAR: 1966
SERIES: 7.5SCALE: 1:24000
SITE NAME: Olive Vista MiddleSchool
ADDRESS: 14600 Tyler StreetSylmar, CA 91342
LAT/LONG: 34.3118 / -118.4503
CLIENT: Clark Seif Clark, Inc.CONTACT: Aaron GarrettINQUIRY#: 3880855.4RESEARCH DATE: 03/14/2014
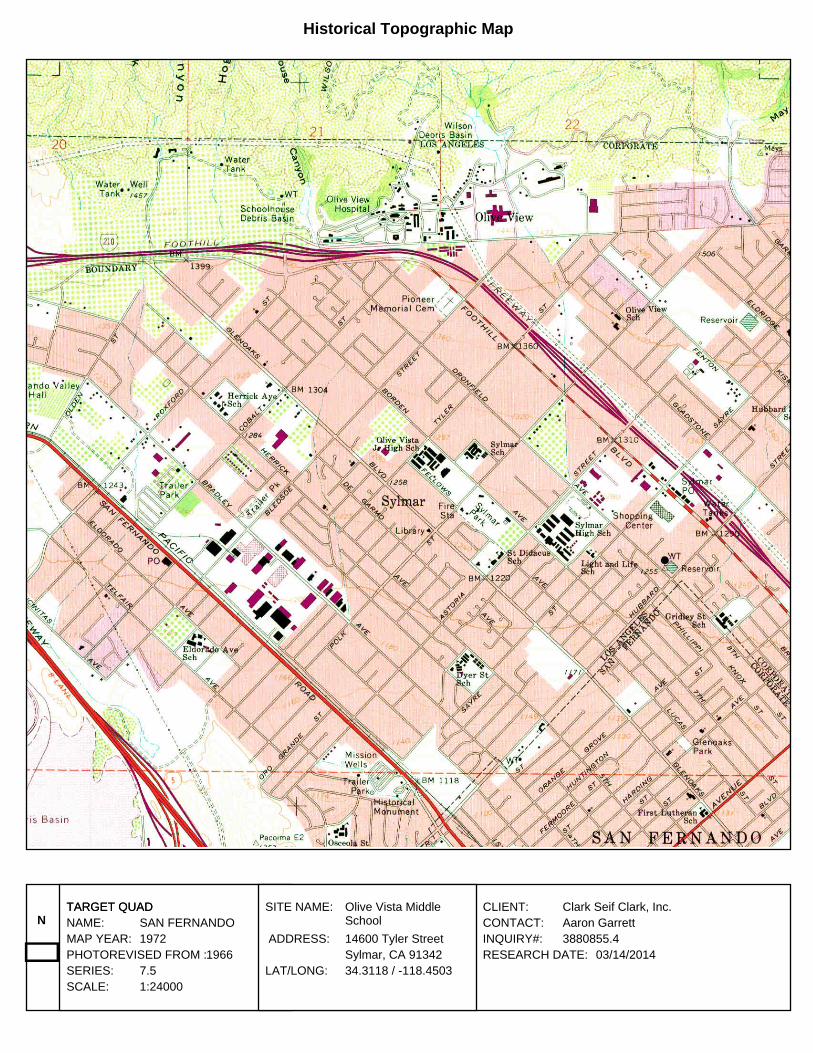
Historical Topographic Map
→
NTARGET QUADTARGET QUADNAME: SAN FERNANDOMAP YEAR: 1972PHOTOREVISED FROM :1966SERIES: 7.5SCALE: 1:24000
SITE NAME: Olive Vista MiddleSchool
ADDRESS: 14600 Tyler StreetSylmar, CA 91342
LAT/LONG: 34.3118 / -118.4503
CLIENT: Clark Seif Clark, Inc.CONTACT: Aaron GarrettINQUIRY#: 3880855.4RESEARCH DATE: 03/14/2014

Historical Topographic Map
→
NTARGET QUADTARGET QUADNAME: SAN FERNANDOMAP YEAR: 1988PHOTOREVISED FROM :1966SERIES: 7.5SCALE: 1:24000
SITE NAME: Olive Vista MiddleSchool
ADDRESS: 14600 Tyler StreetSylmar, CA 91342
LAT/LONG: 34.3118 / -118.4503
CLIENT: Clark Seif Clark, Inc.CONTACT: Aaron GarrettINQUIRY#: 3880855.4RESEARCH DATE: 03/14/2014

Historical Topographic Map
→
NTARGET QUADTARGET QUADNAME: SAN FERNANDOMAP YEAR: 1995
SERIES: 7.5SCALE: 1:24000
SITE NAME: Olive Vista MiddleSchool
ADDRESS: 14600 Tyler StreetSylmar, CA 91342
LAT/LONG: 34.3118 / -118.4503
CLIENT: Clark Seif Clark, Inc.CONTACT: Aaron GarrettINQUIRY#: 3880855.4RESEARCH DATE: 03/14/2014

Appendix E EDR Radius Map Report with GeoCheck

FORM-LBB-LMI
®kcehCoeG htiw tropeR ™paM suidaR RDE ehT
6 Armstrong Road, 4th floorShelton, CT 06484Toll Free: 800.352.0050www.edrnet.com
Olive Vista Middle School14600 Tyler StreetSylmar, CA 91342
Inquiry Number: 3880855.2sMarch 14, 2014
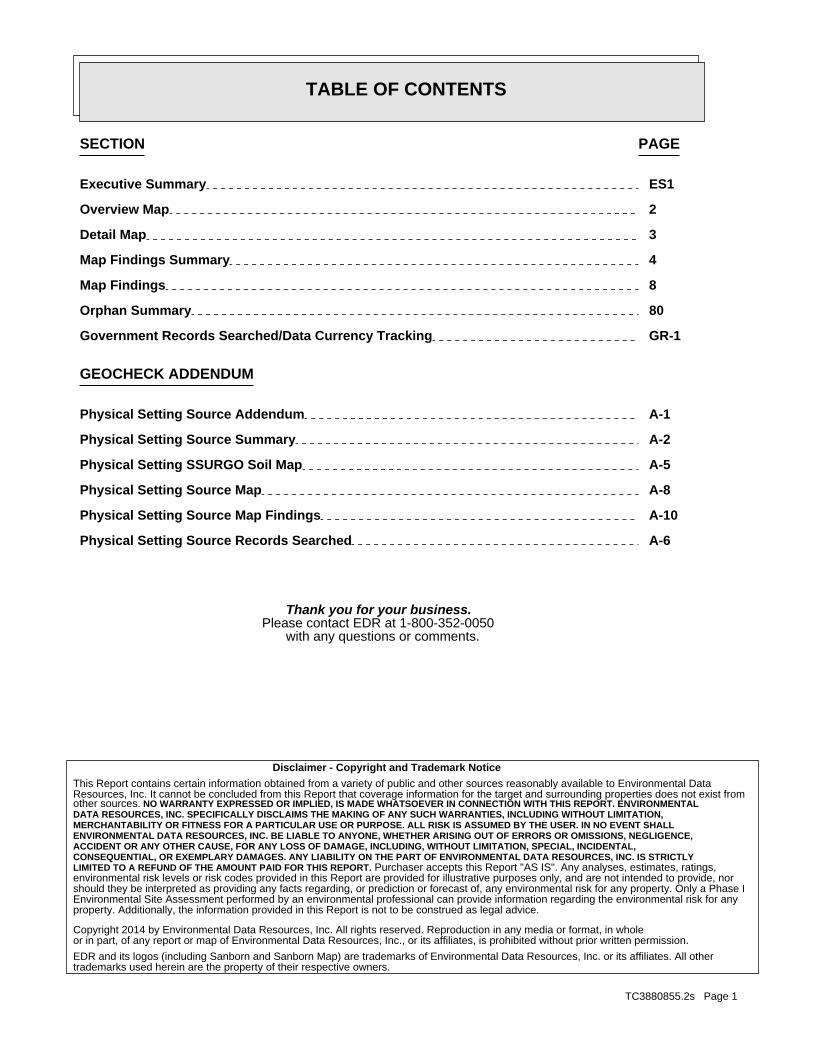
SECTION PAGE
Executive Summary ES1
Overview Map 2
Detail Map 3
Map Findings Summary 4
Map Findings 8
Orphan Summary 80
Government Records Searched/Data Currency Tracking GR-1
GEOCHECK ADDENDUM
Physical Setting Source Addendum A-1
Physical Setting Source Summary A-2
Physical Setting SSURGO Soil Map A-5
Physical Setting Source Map A-8
Physical Setting Source Map Findings A-10
Physical Setting Source Records Searched A-6
TC3880855.2s Page 1
Thank you for your business.Please contact EDR at 1-800-352-0050
with any questions or comments.
Disclaimer - Copyright and Trademark Notice
This Report contains certain information obtained from a variety of public and other sources reasonably available to Environmental DataResources, Inc. It cannot be concluded from this Report that coverage information for the target and surrounding properties does not exist fromother sources. NO WARRANTY EXPRESSED OR IMPLIED, IS MADE WHATSOEVER IN CONNECTION WITH THIS REPORT. ENVIRONMENTALDATA RESOURCES, INC. SPECIFICALLY DISCLAIMS THE MAKING OF ANY SUCH WARRANTIES, INCLUDING WITHOUT LIMITATION,MERCHANTABILITY OR FITNESS FOR A PARTICULAR USE OR PURPOSE. ALL RISK IS ASSUMED BY THE USER. IN NO EVENT SHALLENVIRONMENTAL DATA RESOURCES, INC. BE LIABLE TO ANYONE, WHETHER ARISING OUT OF ERRORS OR OMISSIONS, NEGLIGENCE,ACCIDENT OR ANY OTHER CAUSE, FOR ANY LOSS OF DAMAGE, INCLUDING, WITHOUT LIMITATION, SPECIAL, INCIDENTAL,CONSEQUENTIAL, OR EXEMPLARY DAMAGES. ANY LIABILITY ON THE PART OF ENVIRONMENTAL DATA RESOURCES, INC. IS STRICTLYLIMITED TO A REFUND OF THE AMOUNT PAID FOR THIS REPORT. Purchaser accepts this Report "AS IS". Any analyses, estimates, ratings,environmental risk levels or risk codes provided in this Report are provided for illustrative purposes only, and are not intended to provide, norshould they be interpreted as providing any facts regarding, or prediction or forecast of, any environmental risk for any property. Only a Phase IEnvironmental Site Assessment performed by an environmental professional can provide information regarding the environmental risk for anyproperty. Additionally, the information provided in this Report is not to be construed as legal advice.
Copyright 2014 by Environmental Data Resources, Inc. All rights reserved. Reproduction in any media or format, in wholeor in part, of any report or map of Environmental Data Resources, Inc., or its affiliates, is prohibited without prior written permission.
EDR and its logos (including Sanborn and Sanborn Map) are trademarks of Environmental Data Resources, Inc. or its affiliates. All othertrademarks used herein are the property of their respective owners.
TABLE OF CONTENTS

EXECUTIVE SUMMARY
TC3880855.2s EXECUTIVE SUMMARY 1
A search of available environmental records was conducted by Environmental Data Resources, Inc (EDR).The report was designed to assist parties seeking to meet the search requirements of EPA’s Standardsand Practices for All Appropriate Inquiries (40 CFR Part 312), the ASTM Standard Practice forEnvironmental Site Assessments (E 1527-13) or custom requirements developed for the evaluation ofenvironmental risk associated with a parcel of real estate.
TARGET PROPERTY INFORMATION
ADDRESS
14600 TYLER STREETSYLMAR, CA 91342
COORDINATES
34.3118000 - 34˚ 18’ 42.48’’Latitude (North): 118.4503000 - 118˚ 27’ 1.08’’Longitude (West): Zone 11Universal Tranverse Mercator: 366551.0UTM X (Meters): 3797485.2UTM Y (Meters): 1291 ft. above sea levelElevation:
USGS TOPOGRAPHIC MAP ASSOCIATED WITH TARGET PROPERTY
34118-C4 SAN FERNANDO, CATarget Property Map:1988Most Recent Revision:
AERIAL PHOTOGRAPHY IN THIS REPORT
2012Photo Year:USDASource:
TARGET PROPERTY SEARCH RESULTS
The target property was identified in the following records. For more information on thisproperty see page 8 of the attached EDR Radius Map report:
EPA IDDatabase(s)Site
LAUSD/OLIVE VISTA JH14600 TYLER STSYLMAR, CA 91342
N/AHAZNET
LA UNI SCH DIST, OLIVE VISTA J14600 TYLER STSYLMAR, CA 91342
N/AEMI

EXECUTIVE SUMMARY
TC3880855.2s EXECUTIVE SUMMARY 2
DATABASES WITH NO MAPPED SITES
No mapped sites were found in EDR’s search of available ("reasonably ascertainable ") governmentrecords either on the target property or within the search radius around the target property for thefollowing databases:
STANDARD ENVIRONMENTAL RECORDS
Federal NPL site list
NPL National Priority ListProposed NPL Proposed National Priority List SitesNPL LIENS Federal Superfund Liens
Federal Delisted NPL site list
Delisted NPL National Priority List Deletions
Federal CERCLIS list
CERCLIS Comprehensive Environmental Response, Compensation, and Liability Information SystemFEDERAL FACILITY Federal Facility Site Information listing
Federal CERCLIS NFRAP site List
CERC-NFRAP CERCLIS No Further Remedial Action Planned
Federal RCRA non-CORRACTS TSD facilities list
RCRA-TSDF RCRA - Treatment, Storage and Disposal
Federal RCRA generators list
RCRA-CESQG RCRA - Conditionally Exempt Small Quantity Generator
Federal institutional controls / engineering controls registries
US ENG CONTROLS Engineering Controls Sites ListUS INST CONTROL Sites with Institutional ControlsLUCIS Land Use Control Information System
Federal ERNS list
ERNS Emergency Response Notification System
State- and tribal - equivalent NPL
RESPONSE State Response Sites
State and tribal landfill and/or solid waste disposal site lists
SWF/LF Solid Waste Information System
State and tribal leaking storage tank lists
SLIC Statewide SLIC Cases
EXECUTIVE SUMMARY
TC3880855.2s EXECUTIVE SUMMARY 3
INDIAN LUST Leaking Underground Storage Tanks on Indian Land
State and tribal registered storage tank lists
AST Aboveground Petroleum Storage Tank FacilitiesINDIAN UST Underground Storage Tanks on Indian LandFEMA UST Underground Storage Tank Listing
State and tribal voluntary cleanup sites
VCP Voluntary Cleanup Program PropertiesINDIAN VCP Voluntary Cleanup Priority Listing
ADDITIONAL ENVIRONMENTAL RECORDS
Local Brownfield lists
US BROWNFIELDS A Listing of Brownfields Sites
Local Lists of Landfill / Solid Waste Disposal Sites
DEBRIS REGION 9 Torres Martinez Reservation Illegal Dump Site LocationsODI Open Dump InventoryWMUDS/SWAT Waste Management Unit DatabaseHAULERS Registered Waste Tire Haulers ListingINDIAN ODI Report on the Status of Open Dumps on Indian Lands
Local Lists of Hazardous waste / Contaminated Sites
US CDL Clandestine Drug LabsHIST Cal-Sites Historical Calsites DatabaseSCH School Property Evaluation ProgramToxic Pits Toxic Pits Cleanup Act SitesAOCONCERN San Gabriel Valley Areas of ConcernCDL Clandestine Drug LabsUS HIST CDL National Clandestine Laboratory Register
Local Land Records
LIENS 2 CERCLA Lien InformationLIENS Environmental Liens ListingDEED Deed Restriction Listing
Records of Emergency Release Reports
HMIRS Hazardous Materials Information Reporting SystemCHMIRS California Hazardous Material Incident Report SystemLDS Land Disposal Sites ListingMCS Military Cleanup Sites ListingSPILLS 90 SPILLS 90 data from FirstSearch
Other Ascertainable Records
RCRA NonGen / NLR RCRA - Non Generators
EXECUTIVE SUMMARY
TC3880855.2s EXECUTIVE SUMMARY 4
DOT OPS Incident and Accident DataDOD Department of Defense SitesFUDS Formerly Used Defense SitesCONSENT Superfund (CERCLA) Consent DecreesROD Records Of DecisionUMTRA Uranium Mill Tailings SitesUS MINES Mines Master Index FileTRIS Toxic Chemical Release Inventory SystemTSCA Toxic Substances Control ActFTTS FIFRA/ TSCA Tracking System - FIFRA (Federal Insecticide, Fungicide, & Rodenticide Act)/TSCA (Toxic Substances Control Act)HIST FTTS FIFRA/TSCA Tracking System Administrative Case ListingSSTS Section 7 Tracking SystemsICIS Integrated Compliance Information SystemPADS PCB Activity Database SystemMLTS Material Licensing Tracking SystemRADINFO Radiation Information DatabaseFINDS Facility Index System/Facility Registry SystemRAATS RCRA Administrative Action Tracking SystemRMP Risk Management PlansCA BOND EXP. PLAN Bond Expenditure PlanNPDES NPDES Permits ListingUIC UIC ListingCortese "Cortese" Hazardous Waste & Substances Sites ListHIST CORTESE Hazardous Waste & Substance Site ListCUPA Listings CUPA Resources ListLA Co. Site Mitigation Site Mitigation ListDRYCLEANERS Cleaner FacilitiesLOS ANGELES CO. HMS HMS: Street Number ListWIP Well Investigation Program Case ListENF Enforcement Action ListingINDIAN RESERV Indian ReservationsSCRD DRYCLEANERS State Coalition for Remediation of Drycleaners ListingPCB TRANSFORMER PCB Transformer Registration DatabaseMWMP Medical Waste Management Program ListingCOAL ASH DOE Steam-Electric Plant Operation DataHWT Registered Hazardous Waste Transporter DatabasePROC Certified Processors DatabaseEPA WATCH LIST EPA WATCH LIST2020 COR ACTION 2020 Corrective Action Program ListLEAD SMELTERS Lead Smelter SitesWDS Waste Discharge SystemUS AIRS Aerometric Information Retrieval System Facility SubsystemPRP Potentially Responsible PartiesUS FIN ASSUR Financial Assurance InformationFinancial Assurance Financial Assurance Information ListingCOAL ASH EPA Coal Combustion Residues Surface Impoundments List
EDR HIGH RISK HISTORICAL RECORDS
EDR Exclusive Records
EDR MGP EDR Proprietary Manufactured Gas Plants
EDR RECOVERED GOVERNMENT ARCHIVES
Exclusive Recovered Govt. Archives
RGA LF Recovered Government Archive Solid Waste Facilities List
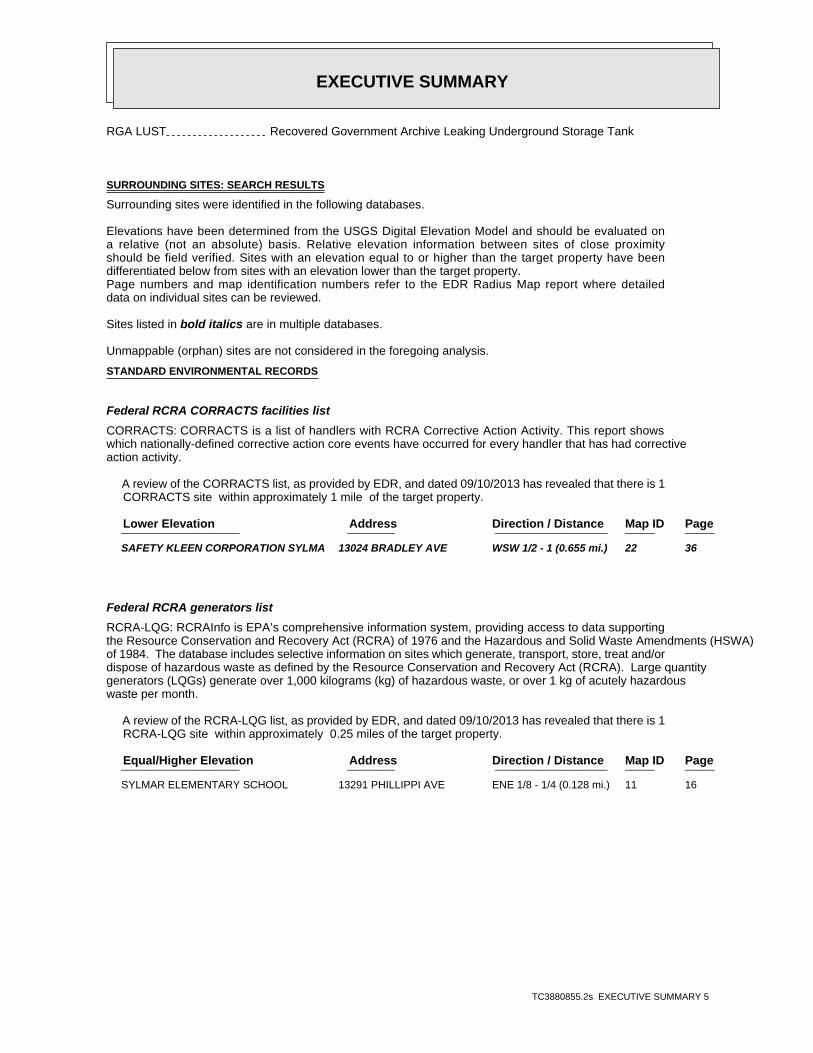
EXECUTIVE SUMMARY
TC3880855.2s EXECUTIVE SUMMARY 5
RGA LUST Recovered Government Archive Leaking Underground Storage Tank
SURROUNDING SITES: SEARCH RESULTS
Surrounding sites were identified in the following databases.
Elevations have been determined from the USGS Digital Elevation Model and should be evaluated ona relative (not an absolute) basis. Relative elevation information between sites of close proximityshould be field verified. Sites with an elevation equal to or higher than the target property have beendifferentiated below from sites with an elevation lower than the target property.Page numbers and map identification numbers refer to the EDR Radius Map report where detaileddata on individual sites can be reviewed.
Sites listed in bold italics are in multiple databases.
Unmappable (orphan) sites are not considered in the foregoing analysis.
STANDARD ENVIRONMENTAL RECORDS
Federal RCRA CORRACTS facilities list
CORRACTS: CORRACTS is a list of handlers with RCRA Corrective Action Activity. This report showswhich nationally-defined corrective action core events have occurred for every handler that has had correctiveaction activity.
A review of the CORRACTS list, as provided by EDR, and dated 09/10/2013 has revealed that there is 1 CORRACTS site within approximately 1 mile of the target property.
PageMap IDDirection / Distance Address Lower Elevation ____________________ ________ ___________________ _____ _____
SAFETY KLEEN CORPORATION SYLMA 13024 BRADLEY AVE WSW 1/2 - 1 (0.655 mi.) 22 36
Federal RCRA generators list
RCRA-LQG: RCRAInfo is EPA’s comprehensive information system, providing access to data supportingthe Resource Conservation and Recovery Act (RCRA) of 1976 and the Hazardous and Solid Waste Amendments (HSWA)of 1984. The database includes selective information on sites which generate, transport, store, treat and/ordispose of hazardous waste as defined by the Resource Conservation and Recovery Act (RCRA). Large quantitygenerators (LQGs) generate over 1,000 kilograms (kg) of hazardous waste, or over 1 kg of acutely hazardouswaste per month.
A review of the RCRA-LQG list, as provided by EDR, and dated 09/10/2013 has revealed that there is 1 RCRA-LQG site within approximately 0.25 miles of the target property.
PageMap IDDirection / Distance Address Equal/Higher Elevation ____________________ ________ ___________________ _____ _____
SYLMAR ELEMENTARY SCHOOL 13291 PHILLIPPI AVE ENE 1/8 - 1/4 (0.128 mi.) 11 16

EXECUTIVE SUMMARY
TC3880855.2s EXECUTIVE SUMMARY 6
RCRA-SQG: RCRAInfo is EPA’s comprehensive information system, providing access to data supportingthe Resource Conservation and Recovery Act (RCRA) of 1976 and the Hazardous and Solid Waste Amendments (HSWA)of 1984. The database includes selective information on sites which generate, transport, store, treat and/ordispose of hazardous waste as defined by the Resource Conservation and Recovery Act (RCRA). Small quantitygenerators (SQGs) generate between 100 kg and 1,000 kg of hazardous waste per month.
A review of the RCRA-SQG list, as provided by EDR, and dated 09/10/2013 has revealed that there are 3 RCRA-SQG sites within approximately 0.25 miles of the target property.
PageMap IDDirection / Distance Address Lower Elevation ____________________ ________ ___________________ _____ _____
LA FIRE STATION 91 14430 POLK ST SE 0 - 1/8 (0.006 mi.) B6 13 LA SYLMAR LIBRARY 13059 GLENOAKS BLVD S 1/8 - 1/4 (0.134 mi.) D14 19 LA DEPARTMENT OF WATER AND POW 13077 GLENOAKS BLVD S 1/8 - 1/4 (0.135 mi.) 16 21
State- and tribal - equivalent CERCLIS
ENVIROSTOR: The Department of Toxic Substances Control’s (DTSC’s) Site Mitigation and BrownfieldsReuse Program’s (SMBRP’s) EnviroStor database identifes sites that have known contamination or sites for whichthere may be reasons to investigate further. The database includes the following site types: FederalSuperfund sites (National Priorities List (NPL)); State Response, including Military Facilities and StateSuperfund; Voluntary Cleanup; and School sites. EnviroStor provides similar information to the informationthat was available in CalSites, and provides additional site information, including, but not limited to,identification of formerly-contaminated properties that have been released for reuse, properties whereenvironmental deed restrictions have been recorded to prevent inappropriate land uses, and riskcharacterization information that is used to assess potential impacts to public health and the environment atcontaminated sites.
A review of the ENVIROSTOR list, as provided by EDR, and dated 11/06/2013 has revealed that there are 6 ENVIROSTOR sites within approximately 1 mile of the target property.
PageMap IDDirection / Distance Address Equal/Higher Elevation ____________________ ________ ___________________ _____ _____
VALLEY REGION SPAN K-8 #1 DRONFIELD AVENUE/BLEDSON 1/4 - 1/2 (0.375 mi.) 18 23Status: No Further Action
CASTLE PRECISION INDUSTRIES 14148 BLEDSOE ST. NNE 1/2 - 1 (0.907 mi.) 24 79Status: Refer: 1248 Local Agency
PageMap IDDirection / Distance Address Lower Elevation ____________________ ________ ___________________ _____ _____
VALLEY-TODECO, INC. 12975 BRADLEY AVENUE SW 1/2 - 1 (0.642 mi.) E20 29Status: Refer: Other Agency
LANCE INDUSTRIES 13001 BRADLEY AVE SW 1/2 - 1 (0.648 mi.) E21 31Status: Refer: Other Agency
SAFETY KLEEN CORPORATION SYLMA 13024 BRADLEY AVE WSW 1/2 - 1 (0.655 mi.) 22 36Status: * Completed
JOHANSON DIELECTRICS INC 15191 BLEDSOE ST WSW 1/2 - 1 (0.883 mi.) 23 56Status: Refer: Other Agency
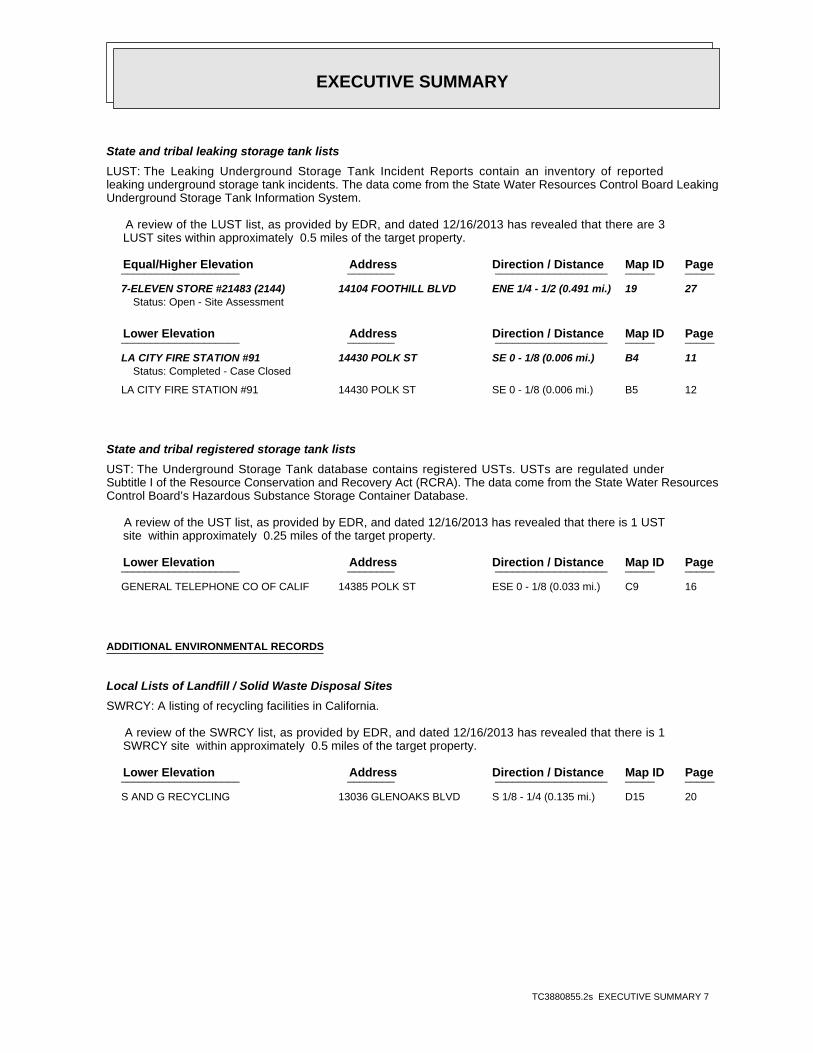
EXECUTIVE SUMMARY
TC3880855.2s EXECUTIVE SUMMARY 7
State and tribal leaking storage tank lists
LUST: The Leaking Underground Storage Tank Incident Reports contain an inventory of reportedleaking underground storage tank incidents. The data come from the State Water Resources Control Board LeakingUnderground Storage Tank Information System.
A review of the LUST list, as provided by EDR, and dated 12/16/2013 has revealed that there are 3 LUST sites within approximately 0.5 miles of the target property.
PageMap IDDirection / Distance Address Equal/Higher Elevation ____________________ ________ ___________________ _____ _____
7-ELEVEN STORE #21483 (2144) 14104 FOOTHILL BLVD ENE 1/4 - 1/2 (0.491 mi.) 19 27Status: Open - Site Assessment
PageMap IDDirection / Distance Address Lower Elevation ____________________ ________ ___________________ _____ _____
LA CITY FIRE STATION #91 14430 POLK ST SE 0 - 1/8 (0.006 mi.) B4 11Status: Completed - Case Closed
LA CITY FIRE STATION #91 14430 POLK ST SE 0 - 1/8 (0.006 mi.) B5 12
State and tribal registered storage tank lists
UST: The Underground Storage Tank database contains registered USTs. USTs are regulated underSubtitle I of the Resource Conservation and Recovery Act (RCRA). The data come from the State Water ResourcesControl Board’s Hazardous Substance Storage Container Database.
A review of the UST list, as provided by EDR, and dated 12/16/2013 has revealed that there is 1 UST site within approximately 0.25 miles of the target property.
PageMap IDDirection / Distance Address Lower Elevation ____________________ ________ ___________________ _____ _____
GENERAL TELEPHONE CO OF CALIF 14385 POLK ST ESE 0 - 1/8 (0.033 mi.) C9 16
ADDITIONAL ENVIRONMENTAL RECORDS
Local Lists of Landfill / Solid Waste Disposal Sites
SWRCY: A listing of recycling facilities in California.
A review of the SWRCY list, as provided by EDR, and dated 12/16/2013 has revealed that there is 1 SWRCY site within approximately 0.5 miles of the target property.
PageMap IDDirection / Distance Address Lower Elevation ____________________ ________ ___________________ _____ _____
S AND G RECYCLING 13036 GLENOAKS BLVD S 1/8 - 1/4 (0.135 mi.) D15 20

EXECUTIVE SUMMARY
TC3880855.2s EXECUTIVE SUMMARY 8
Local Lists of Registered Storage Tanks
CA FID UST: The Facility Inventory Database contains active and inactive underground storage tanklocations. The source is the State Water Resource Control Board.
A review of the CA FID UST list, as provided by EDR, and dated 10/31/1994 has revealed that there are 2 CA FID UST sites within approximately 0.25 miles of the target property.
PageMap IDDirection / Distance Address Lower Elevation ____________________ ________ ___________________ _____ _____
FIRE STATION 91 14430 POLK ST SE 0 - 1/8 (0.006 mi.) B3 10 JOHNSON BROTHERS 13060 GLENOAKS BLVD S 1/8 - 1/4 (0.132 mi.) D13 18
HIST UST: Historical UST Registered Database.
A review of the HIST UST list, as provided by EDR, and dated 10/15/1990 has revealed that there is 1 HIST UST site within approximately 0.25 miles of the target property.
PageMap IDDirection / Distance Address Lower Elevation ____________________ ________ ___________________ _____ _____
LA CITY FIRE STATION #91 14430 POLK ST SE 0 - 1/8 (0.006 mi.) B4 11
SWEEPS UST: Statewide Environmental Evaluation and Planning System. This underground storage tanklisting was updated and maintained by a company contacted by the SWRCB in the early 1990’s. The listing is nolonger updated or maintained. The local agency is the contact for more information on a site on the SWEEPSlist.
A review of the SWEEPS UST list, as provided by EDR, and dated 06/01/1994 has revealed that there are 3 SWEEPS UST sites within approximately 0.25 miles of the target property.
PageMap IDDirection / Distance Address Lower Elevation ____________________ ________ ___________________ _____ _____
FIRE STATION 91 14430 POLK ST SE 0 - 1/8 (0.006 mi.) B3 10 GENERAL TELEPHONE CO OF CALIF 14385 POLK ST ESE 0 - 1/8 (0.033 mi.) C7 15 JOHNSON BROTHERS 13060 GLENOAKS BLVD S 1/8 - 1/4 (0.132 mi.) D13 18
Other Ascertainable Records
Notify 65: Listings of all Proposition 65 incidents reported to counties by the State Water ResourcesControl Board and the Regional Water Quality Control Board. This database is no longer updated by thereporting agency.
A review of the Notify 65 list, as provided by EDR, and dated 10/21/1993 has revealed that there is 1 Notify 65 site within approximately 1 mile of the target property.
PageMap IDDirection / Distance Address Lower Elevation ____________________ ________ ___________________ _____ _____
SAFETY KLEEN CORPORATION SYLMA 13024 BRADLEY AVE WSW 1/2 - 1 (0.655 mi.) 22 36

EXECUTIVE SUMMARY
TC3880855.2s EXECUTIVE SUMMARY 9
HWP: Detailed information on permitted hazardous waste facilities and corrective action("cleanups") tracked in EnviroStor.
A review of the HWP list, as provided by EDR, and dated 11/25/2013 has revealed that there is 1 HWP site within approximately 1 mile of the target property.
PageMap IDDirection / Distance Address Lower Elevation ____________________ ________ ___________________ _____ _____
SAFETY KLEEN CORPORATION SYLMA 13024 BRADLEY AVE WSW 1/2 - 1 (0.655 mi.) 22 36
EDR HIGH RISK HISTORICAL RECORDS
EDR Exclusive Records
EDR US Hist Auto Stat: EDR has searched selected national collections of business directories and has collectedlistings of potential gas station/filling station/service station sites that were available to EDRresearchers. EDR’s review was limited to those categories of sources that might, in EDR’s opinion, includegas station/filling station/service station establishments. The categories reviewed included, but were notlimited to gas, gas station, gasoline station, filling station, auto, automobile repair, auto service station,service station, etc. This database falls within a category of information EDR classifies as "High RiskHistorical Records", or HRHR. EDR’s HRHR effort presents unique and sometimes proprietary data about pastsites and operations that typically create environmental concerns, but may not show up in current governmentrecords searches.
A review of the EDR US Hist Auto Stat list, as provided by EDR, has revealed that there are 2 EDR US Hist Auto Stat sites within approximately 0.25 miles of the target property.
PageMap IDDirection / Distance Address Lower Elevation ____________________ ________ ___________________ _____ _____
Not reported 14385 POLK ST ESE 0 - 1/8 (0.033 mi.) C8 16 Not reported 14511 POLK ST SSE 0 - 1/8 (0.085 mi.) D10 16
EDR US Hist Cleaners: EDR has searched selected national collections of business directories and has collectedlistings of potential dry cleaner sites that were available to EDR researchers. EDR’s review was limited tothose categories of sources that might, in EDR’s opinion, include dry cleaning establishments. The categoriesreviewed included, but were not limited to dry cleaners, cleaners, laundry, laundromat, cleaning/laundry, wash& dry etc. This database falls within a category of information EDR classifies as "High Risk HistoricalRecords", or HRHR. EDR’s HRHR effort presents unique and sometimes proprietary data about past sites andoperations that typically create environmental concerns, but may not show up in current government recordssearches.
A review of the EDR US Hist Cleaners list, as provided by EDR, has revealed that there are 2 EDR US Hist Cleaners sites within approximately 0.25 miles of the target property.
PageMap IDDirection / Distance Address Equal/Higher Elevation ____________________ ________ ___________________ _____ _____
Not reported 14580 EL CASCO ST N 1/8 - 1/4 (0.205 mi.) 17 22
PageMap IDDirection / Distance Address Lower Elevation ____________________ ________ ___________________ _____ _____
Not reported 13060 GLENOAKS BLVD S 1/8 - 1/4 (0.132 mi.) D12 18

EXECUTIVE SUMMARY
TC3880855.2s EXECUTIVE SUMMARY 10
Due to poor or inadequate address information, the following sites were not mapped. Count: 6 records.
Site Name Database(s)____________ ____________
NEWHALL I 5 SR 14 NPDES CDL
CALTRANS D-7/CONSTR/EA07-168004 HAZNETCITY LOS ANGELES HAZNETSAIA MOTOR TRANSPORTATION HAZNETCALTRANS DIST 7 HAZNET

EDR Inc.EDR Inc.EDR Inc.EDR Inc.EDR Inc.EDR Inc.EDR Inc.EDR Inc.EDR Inc.EDR Inc.EDR Inc.EDR Inc.EDR Inc.EDR Inc.EDR Inc.EDR Inc.EDR Inc.EDR Inc.EDR Inc.EDR Inc.EDR Inc.EDR Inc.EDR Inc.EDR Inc.EDR Inc.EDR Inc.EDR Inc.EDR Inc.EDR Inc.EDR Inc.EDR Inc.EDR Inc.EDR Inc.EDR Inc.EDR Inc.EDR Inc.EDR Inc.EDR Inc.EDR Inc.EDR Inc.
0
0
16 80
0
1 6 4 0
1 1 60
1
16
0
11 6 0
0 00
1 6 0 0
1 28
0
1 2 12
1 2 4 0 1 2 00
15 6
0
1 5 6 0
1 5 6 0
1
15
20
1
520
1 5 2 0
1
5 2 0
1 4 8 0
1 4 8 0
1 4 8 0
1 4 8 0
1 4 4 0
1 4 4 01 4 4 0
1 4 4 0
1 4 0 01 4 0 0
1 4 0 0
1 4 0 0
1 3 6 0
1 3 6 0
1 3 6 0
1 3 6 0
1 3 2 0 1 3 2 0
1 3 2 0
1 3 2 0
1 2 8 0
1 2 8 0
1 2 8 0
12
80
1 2 4 0 1 2 4 0
1 2 4 01 2 4 0
1 2 0 0
1 2 0 0
1 2 0 0
1 2 0 0
1 1 6 01 1 6 0
1 1 6 0
1 1 2 0

EDR Inc.EDR Inc.EDR Inc.EDR Inc.EDR Inc.EDR Inc.EDR Inc.EDR Inc.EDR Inc.EDR Inc.EDR Inc.EDR Inc.EDR Inc.EDR Inc.EDR Inc.EDR Inc.EDR Inc.EDR Inc.EDR Inc.EDR Inc.EDR Inc.EDR Inc.EDR Inc.EDR Inc.EDR Inc.EDR Inc.EDR Inc.EDR Inc.EDR Inc.EDR Inc.EDR Inc.EDR Inc.EDR Inc.EDR Inc.EDR Inc.EDR Inc.EDR Inc.EDR Inc.EDR Inc.EDR Inc.
1320
1280
1240
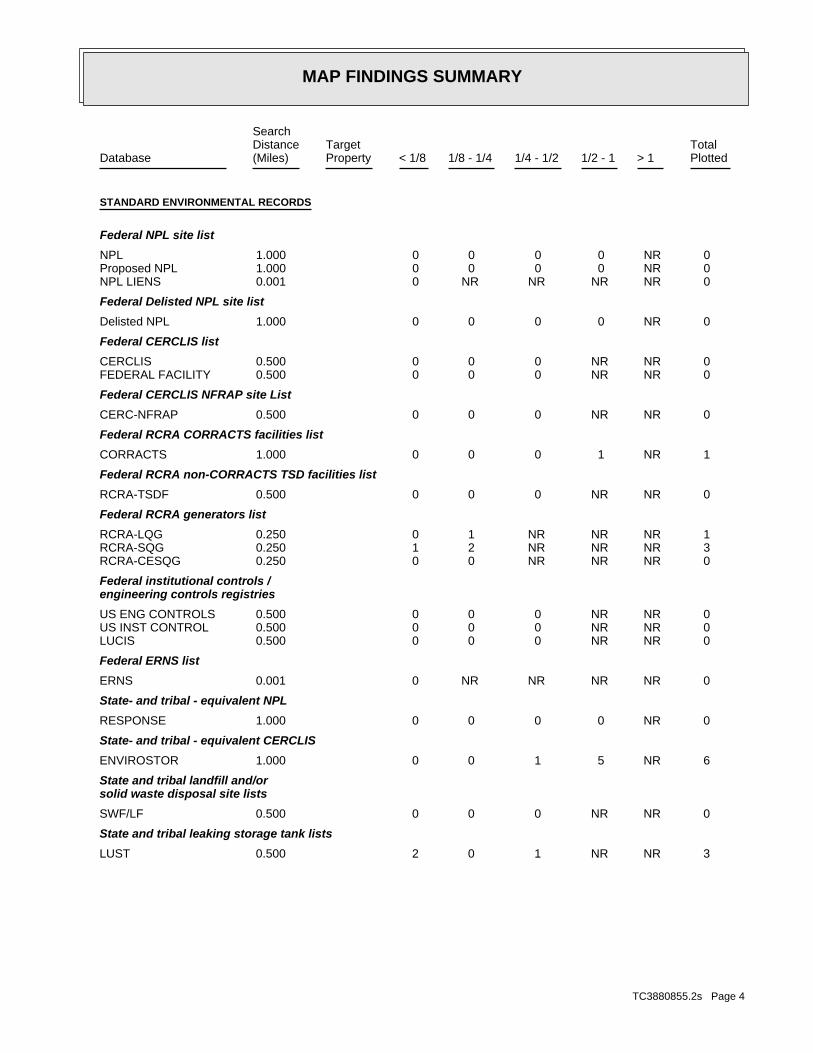
MAP FINDINGS SUMMARY
SearchTargetDistance Total
Database Property(Miles) < 1/8 1/8 - 1/4 1/4 - 1/2 1/2 - 1 > 1 Plotted
STANDARD ENVIRONMENTAL RECORDS
Federal NPL site list
0 NR 0 0 0 0 1.000NPL 0 NR 0 0 0 0 1.000Proposed NPL 0 NR NR NR NR 0 0.001NPL LIENS
Federal Delisted NPL site list
0 NR 0 0 0 0 1.000Delisted NPL
Federal CERCLIS list
0 NR NR 0 0 0 0.500CERCLIS 0 NR NR 0 0 0 0.500FEDERAL FACILITY
Federal CERCLIS NFRAP site List
0 NR NR 0 0 0 0.500CERC-NFRAP
Federal RCRA CORRACTS facilities list
1 NR 1 0 0 0 1.000CORRACTS
Federal RCRA non-CORRACTS TSD facilities list
0 NR NR 0 0 0 0.500RCRA-TSDF
Federal RCRA generators list
1 NR NR NR 1 0 0.250RCRA-LQG 3 NR NR NR 2 1 0.250RCRA-SQG 0 NR NR NR 0 0 0.250RCRA-CESQG
Federal institutional controls /engineering controls registries
0 NR NR 0 0 0 0.500US ENG CONTROLS 0 NR NR 0 0 0 0.500US INST CONTROL 0 NR NR 0 0 0 0.500LUCIS
Federal ERNS list
0 NR NR NR NR 0 0.001ERNS
State- and tribal - equivalent NPL
0 NR 0 0 0 0 1.000RESPONSE
State- and tribal - equivalent CERCLIS
6 NR 5 1 0 0 1.000ENVIROSTOR
State and tribal landfill and/orsolid waste disposal site lists
0 NR NR 0 0 0 0.500SWF/LF
State and tribal leaking storage tank lists
3 NR NR 1 0 2 0.500LUST
TC3880855.2s Page 4

MAP FINDINGS SUMMARY
SearchTargetDistance Total
Database Property(Miles) < 1/8 1/8 - 1/4 1/4 - 1/2 1/2 - 1 > 1 Plotted
0 NR NR 0 0 0 0.500SLIC 0 NR NR 0 0 0 0.500INDIAN LUST
State and tribal registered storage tank lists
1 NR NR NR 0 1 0.250UST 0 NR NR NR 0 0 0.250AST 0 NR NR NR 0 0 0.250INDIAN UST 0 NR NR NR 0 0 0.250FEMA UST
State and tribal voluntary cleanup sites
0 NR NR 0 0 0 0.500VCP 0 NR NR 0 0 0 0.500INDIAN VCP
ADDITIONAL ENVIRONMENTAL RECORDS
Local Brownfield lists
0 NR NR 0 0 0 0.500US BROWNFIELDS
Local Lists of Landfill / SolidWaste Disposal Sites
0 NR NR 0 0 0 0.500DEBRIS REGION 9 0 NR NR 0 0 0 0.500ODI 0 NR NR 0 0 0 0.500WMUDS/SWAT 1 NR NR 0 1 0 0.500SWRCY 0 NR NR NR NR 0 0.001HAULERS 0 NR NR 0 0 0 0.500INDIAN ODI
Local Lists of Hazardous waste /Contaminated Sites
0 NR NR NR NR 0 0.001US CDL 0 NR 0 0 0 0 1.000HIST Cal-Sites 0 NR NR NR 0 0 0.250SCH 0 NR 0 0 0 0 1.000Toxic Pits 0 NR 0 0 0 0 1.000AOCONCERN 0 NR NR NR NR 0 0.001CDL 0 NR NR NR NR 0 0.001US HIST CDL
Local Lists of Registered Storage Tanks
2 NR NR NR 1 1 0.250CA FID UST 1 NR NR NR 0 1 0.250HIST UST 3 NR NR NR 1 2 0.250SWEEPS UST
Local Land Records
0 NR NR NR NR 0 0.001LIENS 2 0 NR NR NR NR 0 0.001LIENS 0 NR NR 0 0 0 0.500DEED
Records of Emergency Release Reports
0 NR NR NR NR 0 0.001HMIRS 0 NR NR NR NR 0 0.001CHMIRS
TC3880855.2s Page 5

MAP FINDINGS SUMMARY
SearchTargetDistance Total
Database Property(Miles) < 1/8 1/8 - 1/4 1/4 - 1/2 1/2 - 1 > 1 Plotted
0 NR NR NR NR 0 0.001LDS 0 NR NR NR NR 0 0.001MCS 0 NR NR NR NR 0 0.001SPILLS 90
Other Ascertainable Records
0 NR NR NR 0 0 0.250RCRA NonGen / NLR 0 NR NR NR NR 0 0.001DOT OPS 0 NR 0 0 0 0 1.000DOD 0 NR 0 0 0 0 1.000FUDS 0 NR 0 0 0 0 1.000CONSENT 0 NR 0 0 0 0 1.000ROD 0 NR NR 0 0 0 0.500UMTRA 0 NR NR NR 0 0 0.250US MINES 0 NR NR NR NR 0 0.001TRIS 0 NR NR NR NR 0 0.001TSCA 0 NR NR NR NR 0 0.001FTTS 0 NR NR NR NR 0 0.001HIST FTTS 0 NR NR NR NR 0 0.001SSTS 0 NR NR NR NR 0 0.001ICIS 0 NR NR NR NR 0 0.001PADS 0 NR NR NR NR 0 0.001MLTS 0 NR NR NR NR 0 0.001RADINFO 0 NR NR NR NR 0 0.001FINDS 0 NR NR NR NR 0 0.001RAATS 0 NR NR NR NR 0 0.001RMP 0 NR 0 0 0 0 1.000CA BOND EXP. PLAN 0 NR NR NR NR 0 0.001NPDES 0 NR NR NR NR 0 0.001UIC 0 NR NR 0 0 0 0.500Cortese 0 NR NR 0 0 0 0.500HIST CORTESE 0 NR NR NR 0 0 0.250CUPA Listings 1 NR 1 0 0 0 1.000Notify 65 0 NR NR NR NR 0 0.001LA Co. Site Mitigation 0 NR NR NR 0 0 0.250DRYCLEANERS 0 NR NR NR NR 0 0.001LOS ANGELES CO. HMS 0 NR NR NR 0 0 0.250WIP 0 NR NR NR NR 0 0.001ENF 1 NR NR NR NR 0 0.001 1HAZNET 1 NR NR NR NR 0 0.001 1EMI 0 NR 0 0 0 0 1.000INDIAN RESERV 0 NR NR 0 0 0 0.500SCRD DRYCLEANERS 0 NR NR NR NR 0 0.001PCB TRANSFORMER 0 NR NR NR 0 0 0.250MWMP 0 NR NR NR NR 0 0.001COAL ASH DOE 0 NR NR NR 0 0 0.250HWT 1 NR 1 0 0 0 1.000HWP 0 NR NR 0 0 0 0.500PROC 0 NR NR NR NR 0 0.001EPA WATCH LIST 0 NR NR NR 0 0 0.2502020 COR ACTION 0 NR NR NR NR 0 0.001LEAD SMELTERS 0 NR NR NR NR 0 0.001WDS
TC3880855.2s Page 6
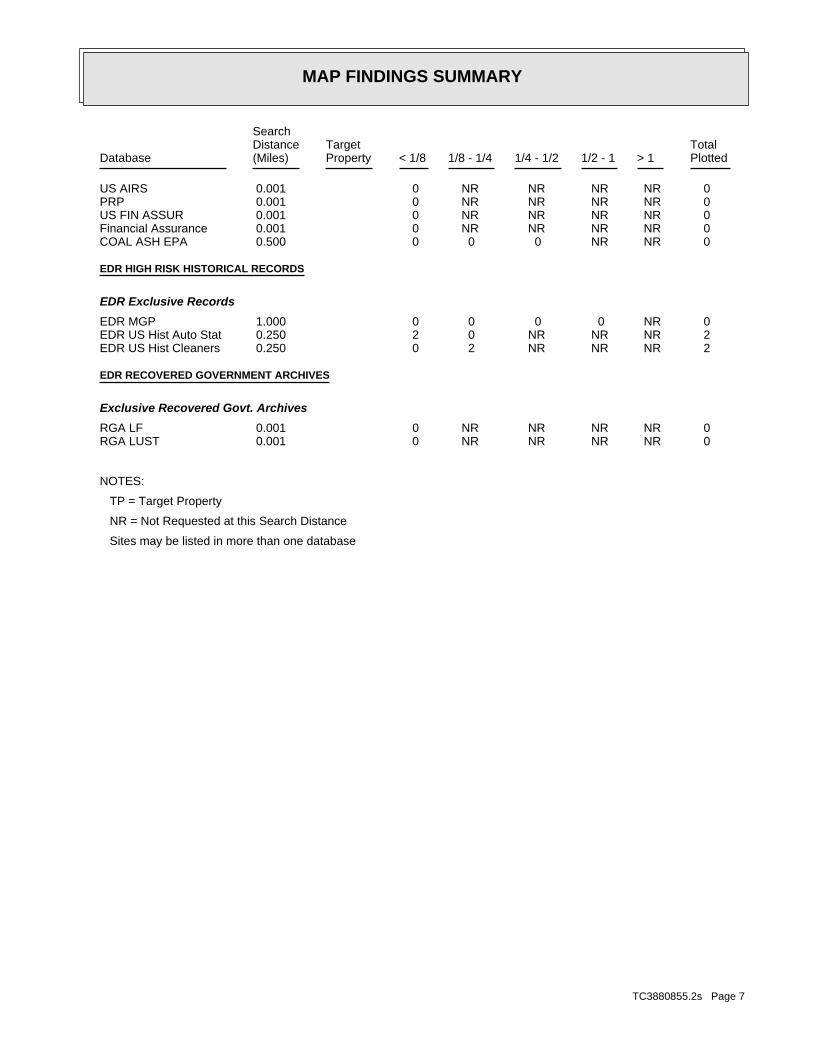
MAP FINDINGS SUMMARY
SearchTargetDistance Total
Database Property(Miles) < 1/8 1/8 - 1/4 1/4 - 1/2 1/2 - 1 > 1 Plotted
0 NR NR NR NR 0 0.001US AIRS 0 NR NR NR NR 0 0.001PRP 0 NR NR NR NR 0 0.001US FIN ASSUR 0 NR NR NR NR 0 0.001Financial Assurance 0 NR NR 0 0 0 0.500COAL ASH EPA
EDR HIGH RISK HISTORICAL RECORDS
EDR Exclusive Records
0 NR 0 0 0 0 1.000EDR MGP 2 NR NR NR 0 2 0.250EDR US Hist Auto Stat 2 NR NR NR 2 0 0.250EDR US Hist Cleaners
EDR RECOVERED GOVERNMENT ARCHIVES
Exclusive Recovered Govt. Archives
0 NR NR NR NR 0 0.001RGA LF 0 NR NR NR NR 0 0.001RGA LUST
NOTES:
TP = Target Property
NR = Not Requested at this Search Distance
Sites may be listed in more than one database
TC3880855.2s Page 7

MAP FINDINGSMap IDDirection
EDR ID NumberDistanceEPA ID NumberDatabase(s)SiteElevation
2137435086Telephone: YI HWA KIM DEPUTY DIRECTORContact: CAD982044075Gepaid: 2007Year:
Los AngelesFacility County: 0.02Tons: (H010-H129) Or (H131-H135) Storage, Bulking, And/Or Transfer Off Site--No Treatment/ReoveryDisposal Method: Other inorganic solid wasteWaste Category: Not reportedTSD County: CAD028409019TSD EPA ID: Not reportedGen County: Los Angeles, CA 900170000Mailing City,St,Zip: 333 S Beaudry Ave 20th FlMailing Address: Not reportedMailing Name: 2137435086Telephone: YI HWA KIM DEPUTY DIRECTORContact: CAD982044075Gepaid: 2007Year:
Los AngelesFacility County: 0.1Tons: (H010-H129) Or (H131-H135) Storage, Bulking, And/Or Transfer Off Site--No Treatment/ReoveryDisposal Method: Other organic solidsWaste Category: Not reportedTSD County: CAD028409019TSD EPA ID: Not reportedGen County: Los Angeles, CA 900170000Mailing City,St,Zip: 333 S BEAUDRY AVE 20TH FLOORMailing Address: Not reportedMailing Name: 2132413199Telephone: SOE AUNG / ECMContact: CAD982044075Gepaid: 2009Year:
Los AngelesFacility County: 2.8Tons: Include On-Site Treatment And/Or Stabilization) Landfill Or Surface Impoundment That Will Be Closed As Landfill( ToDisposal Method: Asbestos containing wasteWaste Category: Not reportedTSD County: AZC950823111TSD EPA ID: Not reportedGen County: Los Angeles, CA 900170000Mailing City,St,Zip: 333 S BEAUDRY AVE 20TH FLOORMailing Address: Not reportedMailing Name: 2132413199Telephone: SOE AUNG / ECMContact: CAD982044075Gepaid: 2009Year:
HAZNET:
Site 1 of 2 in cluster A
Actual:1291 ft.
Property SYLMAR, CA 91342Target 14600 TYLER ST N/AA1 HAZNETLAUSD/OLIVE VISTA JH S113013446
TC3880855.2s Page 8

MAP FINDINGSMap IDDirection
EDR ID NumberDistanceEPA ID NumberDatabase(s)SiteElevation
7 additional CA_HAZNET: record(s) in the EDR Site Report.Click this hyperlink while viewing on your computer to access
Los AngelesFacility County: 0.15Tons: Transfer StationDisposal Method: Other inorganic solid wasteWaste Category: Not reportedTSD County: CAD980884183TSD EPA ID: Not reportedGen County: Los Angeles, CA 900170000Mailing City,St,Zip: 333 S Beaudry Ave 20th FlMailing Address: Not reportedMailing Name: 2137435086Telephone: YI HWA KIM DEPUTY DIRECTORContact: CAD982044075Gepaid: 2006Year:
Los AngelesFacility County: 0.4Tons: Include On-Site Treatment And/Or Stabilization) Landfill Or Surface Impoundment That Will Be Closed As Landfill( ToDisposal Method: Asbestos containing wasteWaste Category: Not reportedTSD County: AZC950823111TSD EPA ID: Not reportedGen County: Los Angeles, CA 900170000Mailing City,St,Zip: 333 S Beaudry Ave 20th FlMailing Address: Not reportedMailing Name:
LAUSD/OLIVE VISTA JH (Continued) S113013446
0Part. Matter 10 Micrometers & Smllr Tons/Yr: 0Particulate Matter Tons/Yr: 0SOX - Oxides of Sulphur Tons/Yr: 0NOX - Oxides of Nitrogen Tons/Yr: 0Carbon Monoxide Emissions Tons/Yr: 0Reactive Organic Gases Tons/Yr: 0Total Organic Hydrocarbon Gases Tons/Yr: Not reportedConsolidated Emission Reporting Rule: Not reportedCommunity Health Air Pollution Info System: SOUTH COAST AQMDAir District Name: 8211SIC Code: SCAir District Name: 19672Facility ID: SCAir Basin: 19County Code: 1990Year:
EMI:
Site 2 of 2 in cluster A
Actual:1291 ft.
Property SYLMAR, CA 91342Target 14600 TYLER ST N/AA2 EMILA UNI SCH DIST, OLIVE VISTA J S103631115
TC3880855.2s Page 9

MAP FINDINGSMap IDDirection
EDR ID NumberDistanceEPA ID NumberDatabase(s)SiteElevation
Not reportedNumber Of Tanks: DIESELContent: PStg: M.V. FUELTank Use: 550Capacity: 07-27-93Actv Date: 19-050-002595-000002Swrcb Tank Id: 2595-2Owner Tank Id: ATank Status: 02-29-88Created Date: 04-05-94Action Date: 04-20-88Referral Date: 44-012042Board Of Equalization: 4Number: 2595Comp Number: ActiveStatus:
2Number Of Tanks: REG UNLEADEDContent: PStg: M.V. FUELTank Use: 1000Capacity: 04-20-88Actv Date: 19-050-002595-000001Swrcb Tank Id: Not reportedOwner Tank Id: ATank Status: 02-29-88Created Date: 04-05-94Action Date: 04-20-88Referral Date: 44-012042Board Of Equalization: 4Number: 2595Comp Number: ActiveStatus:
SWEEPS UST:
ActiveStatus: Not reportedComments: Not reportedEPA ID: Not reportedNPDES Number: Not reportedDUNs Number: Not reportedContact Phone: Not reportedContact: SYLMAR 913420000Mailing City,St,Zip: Not reportedMailing Address 2: 200 N MAIN STREET-ROOMMailing Address: Not reportedMail To: 2134855846Facility Phone: Not reportedSIC Code: Not reportedCortese Code: 00047415Regulated ID: UTNKARegulated By: 19024463Facility ID:
CA FID UST:
32 ft. Site 1 of 4 in cluster B0.006 mi.
Relative:Lower
Actual:1273 ft.
< 1/8 SYLMAR, CA 91342SE SWEEPS UST14430 POLK ST N/AB3 CA FID USTFIRE STATION 91 S101618466
TC3880855.2s Page 10

MAP FINDINGSMap IDDirection
EDR ID NumberDistanceEPA ID NumberDatabase(s)SiteElevation
T0603793054Global Id:
10/08/2000Status Date: Open - Site AssessmentStatus: T0603793054Global Id:
10/07/1999Status Date: Open - Site AssessmentStatus: T0603793054Global Id:
08/02/1999Status Date: Open - Case Begin DateStatus: T0603793054Global Id:
Status History:
Not reportedPhone Number: [email protected]: Los AngelesCity: 320 W. 4TH ST., SUITE 200Address: LOS ANGELES RWQCB (REGION 4)Organization Name: YUE RONGContact Name: Regional Board CaseworkerContact Type: T0603793054Global Id:
Not reportedPhone Number: [email protected]: LOS ANGELESCity: 200 North Main Street, Suite 1780Address: LOS ANGELES, CITY OFOrganization Name: ELOY LUNAContact Name: Local Agency CaseworkerContact Type: T0603793054Global Id:
Contact:
Click here to access the California GeoTracker records for this facility:
Not reportedSite History: AviationPotential Contaminants of Concern: SoilPotential Media Affect: Not reportedFile Location: Not reportedLOC Case Number: 913421634RB Case Number: LOS ANGELES, CITY OFLocal Agency: ELCase Worker: LOS ANGELES, CITY OFLead Agency: 05/30/2003Status Date: Completed - Case ClosedStatus: LUST Cleanup SiteCase Type: -118.4474413Longitude: 34.3095618Latitude: T0603793054Global Id: STATERegion:
LUST:
32 ft. Site 2 of 4 in cluster B0.006 mi.
Relative:Lower
Actual:1273 ft.
< 1/8 SYLMAR, CA 91342SE HIST UST14430 POLK ST N/AB4 LUSTLA CITY FIRE STATION #91 U001567576
TC3880855.2s Page 11
MAP FINDINGSMap IDDirection
EDR ID NumberDistanceEPA ID NumberDatabase(s)SiteElevation
Stock InventorLeak Detection: Not reportedTank Construction: UNLEADEDType of Fuel: PRODUCTTank Used for: 00001000Tank Capacity: Not reportedYear Installed: F59-1Container Num: 001Tank Num:
LOS ANGELES, CA 90012Owner City,St,Zip: 200 N. MAIN STOwner Address: CITY OF LOS ANGELESOwner Name: 8189898691Telephone: Not reportedContact Name: 0001Total Tanks: FIRE STATIONOther Type: OtherFacility Type: 00000047415Facility ID: STATERegion:
HIST UST:
Leak DiscoveryAction: 01/01/1950Date: OtherAction Type: T0603793054Global Id:
Leak ReportedAction: 01/01/1950Date: OtherAction Type: T0603793054Global Id:
Regulatory Activities:
05/30/2003Status Date: Completed - Case ClosedStatus:
LA CITY FIRE STATION #91 (Continued) U001567576
19050Local Agency: UNKStaff: Not reportedW Global ID: T0603793054Global ID: Not reportedAbatement Method Used at the Site: SoilCase Type: Not reportedLocal Case No: Not reportedSubstance Quantity: 1Substance: Leak being confirmedStatus: 913421634Facility Id: Los AngelesCounty: 04Regional Board: 4Region:
LUST REG 4:
32 ft. Site 3 of 4 in cluster B0.006 mi.
Relative:Lower
Actual:1273 ft.
< 1/8 SYLMAR, CA 91342SE 14430 POLK ST N/AB5 LUSTLA CITY FIRE STATION #91 S104773349
TC3880855.2s Page 12
MAP FINDINGSMap IDDirection
EDR ID NumberDistanceEPA ID NumberDatabase(s)SiteElevation
Not reportedSummary: Not reportedAssigned Name: Not reportedSuspended: Not reportedCleanup Fund Id: Not reportedPriority: Not reportedBeneficial Use: PEJLocal Agency Staff: 34.309494 / -1Lat/Long: LUSTProgram: 419 S. SPRING ST., 12TH FL., LOS ANGELES CA 90013RP Address: CITY OF LOS ANGELESResponsible Party: Not reportedOwner Contact: Not reportedOrganization: Not reportedSoil Qualifier: Not reportedGW Qualifier: Not reportedSignificant Interim Remedial Action Taken: Not reportedHist Max MTBE Conc in Soil: Not reportedHist Max MTBE Conc in Groundwater: Not reportedHistorical Max MTBE Date: Not reportedEnforcement Action Date: Not reportedPost Remedial Action Monitoring Began: Not reportedRemedial Action Underway: Not reportedRemediation Plan Submitted: Not reportedPollution Characterization Began: Not reportedPreliminary Site Assessment Began: Not reportedPreliminary Site Assessment Workplan Submitted: UNKSource of Cleanup Funding: 2089.6774254039331362575774819Approx. Dist To Production Well (ft): Not reportedWell Name: Not reportedWater System: CITY OF LA FIRE DEPTOperator: UNKLeak Source: UNKCause of Leak: Not reportedHow Leak Stopped: Repair TankHow Leak Discovered: Not reportedDate the Case was Closed: 10/7/1999Date Case Last Changed on Database: Not reportedDate Leak Stopped: 10/7/1999Date Confirmation Began: Not reportedDate Leak Record Entered: 10/7/1999Date Leak First Reported: 8/2/1999Date Leak Discovered: Not reportedEnforcement Type: Not reportedCross Street:
LA CITY FIRE STATION #91 (Continued) S104773349
200 N MAIN RM EIGHTH HUNDRED CMailing address: CAD981963838EPA ID: SYLMAR, CA 91342 14430 POLK STFacility address: LA FIRE STATION 91Facility name: 03/09/1987Date form received by agency:
RCRA-SQG:
32 ft. Site 4 of 4 in cluster B0.006 mi.
Relative:Lower
Actual:1273 ft.
< 1/8 SYLMAR, CA SE FINDS14430 POLK ST CAD981963838B6 RCRA-SQGLA FIRE STATION 91 1000229479
TC3880855.2s Page 13

MAP FINDINGSMap IDDirection
EDR ID NumberDistanceEPA ID NumberDatabase(s)SiteElevation
FINDS:
No violations foundViolation Status:
NoUsed oil transporter: NoUsed oil transfer facility: NoUsed oil Specification marketer: NoUsed oil fuel marketer to burner: NoUser oil refiner: NoUsed oil processor: NoUsed oil fuel burner: NoFurnace exemption: NoOn-site burner exemption: NoUnderground injection activity: NoTreater, storer or disposer of HW: NoTransporter of hazardous waste: NoRecycler of hazardous waste: NoMixed waste (haz. and radioactive): NoU.S. importer of hazardous waste:
Handler Activities Summary:
Not reportedOwner/Op end date: Not reportedOwner/Op start date: OperatorOwner/Operator Type: MunicipalLegal status: (415) 555-1212Owner/operator telephone: Not reportedOwner/operator country: NOT REQUIRED, ME 99999 NOT REQUIREDOwner/operator address: NOT REQUIREDOwner/operator name:
Not reportedOwner/Op end date: Not reportedOwner/Op start date: OwnerOwner/Operator Type: MunicipalLegal status: (415) 555-1212Owner/operator telephone: Not reportedOwner/operator country: NOT REQUIRED, ME 99999 NOT REQUIREDOwner/operator address: CITY OF LOS ANGELESOwner/operator name:
Owner/Operator Summary:
hazardous waste at any time waste during any calendar month, and accumulates more than 1000 kg of hazardous waste at any time; or generates 100 kg or less of hazardous waste during any calendar month and accumulates less than 6000 kg of Handler: generates more than 100 and less than 1000 kg of hazardousDescription: Small Small Quantity GeneratorClassification: 09EPA Region: Not reportedContact email: (213) 485-7527Contact telephone: USContact country: SYLMAR, CA 90012 14430 POLK STContact address: ENVIRONMENTAL MANAGERContact: LOS ANGELES, CA 90012
LA FIRE STATION 91 (Continued) 1000229479
TC3880855.2s Page 14

MAP FINDINGSMap IDDirection
EDR ID NumberDistanceEPA ID NumberDatabase(s)SiteElevation
corrective action activities required under RCRA.program staff to track the notification, permit, compliance, andand treat, store, or dispose of hazardous waste. RCRAInfo allows RCRAevents and activities related to facilities that generate, transport,Conservation and Recovery Act (RCRA) program through the tracking ofRCRAInfo is a national information system that supports the Resource
facilities.generators, transporters, and treatment, storage, and disposalprovides California with information on hazardous waste shipments forCalifornia Hazardous Waste Tracking System - Datamart (HWTS-DATAMART) Environmental Interest/Information System
110006474467Registry ID:
LA FIRE STATION 91 (Continued) 1000229479
0Part. Matter 10 Micrometers & Smllr Tons/Yr: 0Particulate Matter Tons/Yr: 0SOX - Oxides of Sulphur Tons/Yr: 0NOX - Oxides of Nitrogen Tons/Yr: 0Carbon Monoxide Emissions Tons/Yr: 0Reactive Organic Gases Tons/Yr: 0Total Organic Hydrocarbon Gases Tons/Yr: Not reportedConsolidated Emission Reporting Rule: Not reportedCommunity Health Air Pollution Info System: SOUTH COAST AQMDAir District Name: 4813SIC Code: SCAir District Name: 65803Facility ID: SCAir Basin: 19County Code: 1990Year:
EMI:
1Number Of Tanks: DIESELContent: PStg: M.V. FUELTank Use: 6000Capacity: 04-20-88Actv Date: 19-050-006232-000001Swrcb Tank Id: Not reportedOwner Tank Id: ATank Status: 02-29-88Created Date: 02-25-93Action Date: 02-25-93Referral Date: 44-013241Board Of Equalization: 1Number: 6232Comp Number: ActiveStatus:
SWEEPS UST:
176 ft. Site 1 of 3 in cluster C0.033 mi.
Relative:Lower
Actual:1285 ft.
< 1/8 SYLMAR, CA 91342ESE EMI14385 POLK ST N/AC7 SWEEPS USTGENERAL TELEPHONE CO OF CALIF A S102804016
TC3880855.2s Page 15

MAP FINDINGSMap IDDirection
EDR ID NumberDistanceEPA ID NumberDatabase(s)SiteElevation
14385 POLK STAddress: 2012Year: URBANOS AUTO BODY & PAINT INCName:
14385 POLK STAddress: 2011Year: URBANOS AUTO BODY & PAINT INCName:
EDR Historical Auto Stations:
176 ft. Site 2 of 3 in cluster C0.033 mi.
Relative:Lower
Actual:1285 ft.
< 1/8 SYLMAR, CA 91342ESE 14385 POLK ST N/AC8 EDR US Hist Auto Stat 1015228291
LOS ANGELES, CITY OFPermitting Agency:-118.44643Longitude:34.31056Latitude:24838Facility ID:
UST:
176 ft. Site 3 of 3 in cluster C0.033 mi.
Relative:Lower
Actual:1285 ft.
< 1/8 SYLMAR, CA 91342ESE 14385 POLK ST N/AC9 USTGENERAL TELEPHONE CO OF CALIF U003781186
14511 POLK STAddress: 2005Year: JC MOBILE AUTO SERVICEName:
14511 POLK STAddress: 2004Year: JC MOBILE AUTO SERVICEName:
EDR Historical Auto Stations:
449 ft. Site 1 of 5 in cluster D0.085 mi.
Relative:Lower
Actual:1255 ft.
< 1/8 SYLMAR, CA 91342SSE 14511 POLK ST N/AD10 EDR US Hist Auto Stat 1015230551
LOS ANGELES, CA 90017 20TH FL LAUSD OEHS 333 S BEAUDRY AVEMailing address: CAR000197442EPA ID: SYLMAR, CA 91342 13291 PHILLIPPI AVEFacility address: SYLMAR ELEMENTARY SCHOOLFacility name: 12/11/2008Date form received by agency:
RCRA-LQG:
678 ft.0.128 mi.
Relative:Higher
Actual:1305 ft.
1/8-1/4 SYLMAR, CA 91342ENE 13291 PHILLIPPI AVE CAR00019744211 RCRA-LQGSYLMAR ELEMENTARY SCHOOL 1012175932
TC3880855.2s Page 16

MAP FINDINGSMap IDDirection
EDR ID NumberDistanceEPA ID NumberDatabase(s)SiteElevation
NoUsed oil Specification marketer: NoUsed oil fuel marketer to burner: NoUser oil refiner: NoUsed oil processor: NoUsed oil fuel burner: NoFurnace exemption: NoOn-site burner exemption: NoUnderground injection activity: NoTreater, storer or disposer of HW: NoTransporter of hazardous waste: NoRecycler of hazardous waste: NoMixed waste (haz. and radioactive): NoU.S. importer of hazardous waste:
Handler Activities Summary:
Not reportedOwner/Op end date: 11/14/1989Owner/Op start date: OwnerOwner/Operator Type: DistrictLegal status: Not reportedOwner/operator telephone: USOwner/operator country: LOS ANGELES, CA 90017 333 S BEAUDRY AVEOwner/operator address: LAUSDOwner/operator name:
Not reportedOwner/Op end date: 11/14/1989Owner/Op start date: OperatorOwner/Operator Type: DistrictLegal status: Not reportedOwner/operator telephone: Not reportedOwner/operator country: Not reported Not reportedOwner/operator address: SYLMAR ELEMENTARY SCHOOLOwner/operator name:
Owner/Operator Summary:
100 kg of that material at any time hazardous waste during any calendar month, and accumulates more than from the cleanup of a spill, into or on any land or water, of acutely of any residue or contaminated soil, waste or other debris resulting kg of acutely hazardous waste at any time; or generates 100 kg or less hazardous waste during any calendar month, and accumulates more than 1 waste during any calendar month; or generates 1 kg or less of acutely cleanup of a spill, into or on any land or water, of acutely hazardous residue or contaminated soil, waste or other debris resulting from the during any calendar month; or generates more than 100 kg of any calendar month; or generates more than 1 kg of acutely hazardous waste Handler: generates 1,000 kg or more of hazardous waste during anyDescription: Large Quantity GeneratorClassification: 09EPA Region: [email protected] email: 213-241-3904Contact telephone: USContact country: LOS ANGELES, CA 90017 333 S BEAUDRY AVE 20TH FL LAUSD OEHSContact address: SOE AUNGContact:
SYLMAR ELEMENTARY SCHOOL (Continued) 1012175932
TC3880855.2s Page 17

MAP FINDINGSMap IDDirection
EDR ID NumberDistanceEPA ID NumberDatabase(s)SiteElevation
No violations foundViolation Status:
LEADWaste name: D008Waste code:
Hazardous Waste Summary:
NoUsed oil transporter: NoUsed oil transfer facility:
SYLMAR ELEMENTARY SCHOOL (Continued) 1012175932
13060 GLENOAKS BLVDAddress: 2005Year: M I J CLEANERSName:
13060 GLENOAKS BLVDAddress: 2003Year: MIJ CLEANERSName:
13060 GLENOAKS BLVDAddress: 2001Year: SYLMAR CLEANERSName:
EDR Historical Cleaners:
697 ft. Site 2 of 5 in cluster D0.132 mi.
Relative:Lower
Actual:1250 ft.
1/8-1/4 SYLMAR, CA 91342South 13060 GLENOAKS BLVD N/AD12 EDR US Hist Cleaners 1014987419
6755Comp Number: Not reportedStatus:
SWEEPS UST:
ActiveStatus: Not reportedComments: Not reportedEPA ID: Not reportedNPDES Number: Not reportedDUNs Number: Not reportedContact Phone: Not reportedContact: SYLMAR 913420000Mailing City,St,Zip: Not reportedMailing Address 2: 13060 GLENOAKS BLVDMailing Address: Not reportedMail To: 2130000000Facility Phone: Not reportedSIC Code: Not reportedCortese Code: Not reportedRegulated ID: UTNKARegulated By: 19056337Facility ID:
CA FID UST:
697 ft. Site 3 of 5 in cluster D0.132 mi.
Relative:Lower
Actual:1250 ft.
1/8-1/4 SYLMAR, CA 91342South SWEEPS UST13060 GLENOAKS BLVD N/AD13 CA FID USTJOHNSON BROTHERS S101588103
TC3880855.2s Page 18
MAP FINDINGSMap IDDirection
EDR ID NumberDistanceEPA ID NumberDatabase(s)SiteElevation
Not reportedNumber Of Tanks: Not reportedContent: Not reportedStg: Not reportedTank Use: Not reportedCapacity: Not reportedActv Date: Not reportedSwrcb Tank Id: Not reportedOwner Tank Id: Not reportedTank Status: Not reportedCreated Date: Not reportedAction Date: Not reportedReferral Date: Not reportedBoard Of Equalization: Not reportedNumber:
JOHNSON BROTHERS (Continued) S101588103
NOT REQUIRED, ME 99999 NOT REQUIREDOwner/operator address: NOT REQUIREDOwner/operator name:
Not reportedOwner/Op end date: Not reportedOwner/Op start date: OwnerOwner/Operator Type: MunicipalLegal status: (415) 555-1212Owner/operator telephone: Not reportedOwner/operator country: NOT REQUIRED, ME 99999 NOT REQUIREDOwner/operator address: CITY OF LOS ANGELESOwner/operator name:
Owner/Operator Summary:
hazardous waste at any time waste during any calendar month, and accumulates more than 1000 kg of hazardous waste at any time; or generates 100 kg or less of hazardous waste during any calendar month and accumulates less than 6000 kg of Handler: generates more than 100 and less than 1000 kg of hazardousDescription: Small Small Quantity GeneratorClassification: 09EPA Region: Not reportedContact email: (213) 485-7527Contact telephone: USContact country: SYLMAR, CA 91342 13059 GLENOAKS BLVDContact address: ENVIRONMENTAL MANAGERContact: LOS ANGELES, CA 90012 200 N MAIN RM EIGHTH HUNDREDMailing address: CAD981990005EPA ID: SYLMAR, CA 91342 13059 GLENOAKS BLVDFacility address: LA SYLMAR LIBRARYFacility name: 03/25/1987Date form received by agency:
RCRA-SQG:
705 ft. Site 4 of 5 in cluster D0.134 mi.
Relative:Lower
Actual:1249 ft.
1/8-1/4 SYLMAR, CA 91342South FINDS13059 GLENOAKS BLVD CAD981990005D14 RCRA-SQGLA SYLMAR LIBRARY 1000390552
TC3880855.2s Page 19

MAP FINDINGSMap IDDirection
EDR ID NumberDistanceEPA ID NumberDatabase(s)SiteElevation
corrective action activities required under RCRA.program staff to track the notification, permit, compliance, andand treat, store, or dispose of hazardous waste. RCRAInfo allows RCRAevents and activities related to facilities that generate, transport,Conservation and Recovery Act (RCRA) program through the tracking ofRCRAInfo is a national information system that supports the Resource Environmental Interest/Information System
110002768247Registry ID:
FINDS:
No violations foundViolation Status:
NoUsed oil transporter: NoUsed oil transfer facility: NoUsed oil Specification marketer: NoUsed oil fuel marketer to burner: NoUser oil refiner: NoUsed oil processor: NoUsed oil fuel burner: NoFurnace exemption: NoOn-site burner exemption: NoUnderground injection activity: NoTreater, storer or disposer of HW: NoTransporter of hazardous waste: NoRecycler of hazardous waste: NoMixed waste (haz. and radioactive): NoU.S. importer of hazardous waste:
Handler Activities Summary:
Not reportedOwner/Op end date: Not reportedOwner/Op start date: OperatorOwner/Operator Type: MunicipalLegal status: (415) 555-1212Owner/operator telephone: Not reportedOwner/operator country:
LA SYLMAR LIBRARY (Continued) 1000390552
YAluminium: 07/01/2005Operation Begin Date: NRural: NGrand Father: (818) 362-4008Phone Number: Not reportedWebsite: 91615Mailing Zip Code: CAMailing State: North HollywoodMailing City: P O Box 15772Mailing Address: RC12659Cert Id: 26474Reg Id:
SWRCY:
711 ft. Site 5 of 5 in cluster D0.135 mi.
Relative:Lower
Actual:1247 ft.
1/8-1/4 SYLMAR, CA 91342South 13036 GLENOAKS BLVD N/AD15 SWRCYS AND G RECYCLING S107137802
TC3880855.2s Page 20
MAP FINDINGSMap IDDirection
EDR ID NumberDistanceEPA ID NumberDatabase(s)SiteElevation
Not reportedOperation End Date: N/AAgency Reg ID: Glendy GonzalezOrganization Name: 18806Organization ID: OperationalCert Status: 8:00 am - 3:00 pmSunday Hours Of Operation: 8:00 am - 5:00 pmSaturday Hours Of Operation: 8:00 am - 5:00 pmFriday Hours Of Operation: 8:00 am - 5:00 pmThursday Hours Of Operation: 8:00 am - 5:00 pmWednesday Hours Of Operation: 8:00 am - 5:00 pmTuesday Hours Of Operation: 8:00 am - 5:00 pmMonday Hours Of Operation: N/AAgency: YBimetal: YPlastic: YGlass:
S AND G RECYCLING (Continued) S107137802
Not reportedOwner/Op end date: 04/01/1926Owner/Op start date: OperatorOwner/Operator Type: MunicipalLegal status: Not reportedOwner/operator telephone: USOwner/operator country: Not reported Not reportedOwner/operator address: LA DEPART OF WATER AND POWEROwner/operator name:
Owner/Operator Summary:
hazardous waste at any time waste during any calendar month, and accumulates more than 1000 kg of hazardous waste at any time; or generates 100 kg or less of hazardous waste during any calendar month and accumulates less than 6000 kg of Handler: generates more than 100 and less than 1000 kg of hazardousDescription: Small Small Quantity GeneratorClassification: 09EPA Region: Not reportedContact email: 213-367-0403Contact telephone: USContact country: LOS ANGELES, CA 90012 111 N HOPE ST ROOM 1050Contact address: MARK J SEDLACEKContact: LOS ANGELES, CA 90012 ROOM 1050 111 N HOPE STMailing address: CAR000152264EPA ID: SYLMAR, CA 91342 13077 GLENOAKS BLVDFacility address: LA DEPARTMENT OF WATER AND POWER DS 107Facility name: 04/14/2004Date form received by agency:
RCRA-SQG:
711 ft.0.135 mi.
Relative:Lower
Actual:1252 ft.
1/8-1/4 SYLMAR, CA 91342South 13077 GLENOAKS BLVD CAR00015226416 RCRA-SQGLA DEPARTMENT OF WATER AND POWER DS 107 1007370073
TC3880855.2s Page 21
MAP FINDINGSMap IDDirection
EDR ID NumberDistanceEPA ID NumberDatabase(s)SiteElevation
No violations foundViolation Status:
SELENIUMWaste name: D010Waste code:
LEADWaste name: D008Waste code:
Hazardous Waste Summary:
Small Quantity GeneratorClassification: LA DEPARTMENT OF WATER AND POWER DS 107Facility name: 04/14/2004Date form received by agency:
Historical Generators:
NoUsed oil transporter: NoUsed oil transfer facility: NoUsed oil Specification marketer: NoUsed oil fuel marketer to burner: NoUser oil refiner: NoUsed oil processor: NoUsed oil fuel burner: NoFurnace exemption: NoOn-site burner exemption: NoUnderground injection activity: NoTreater, storer or disposer of HW: NoTransporter of hazardous waste: NoRecycler of hazardous waste: NoMixed waste (haz. and radioactive): NoU.S. importer of hazardous waste:
Handler Activities Summary:
Not reportedOwner/Op end date: 04/01/1926Owner/Op start date: OwnerOwner/Operator Type: MunicipalLegal status: Not reportedOwner/operator telephone: USOwner/operator country: Not reported Not reportedOwner/operator address: LA DEPART OF WATER AND POWEROwner/operator name:
LA DEPARTMENT OF WATER AND POWER DS 107 (Continued) 1007370073
ABUS CLEANINGName:
14580 EL CASCO STAddress: 2005Year: FIRST CLASS CARPET CLEANINGName:
14580 EL CASCO STAddress: 2004Year: FIRST CLASS CARPET CLEANINGName:
EDR Historical Cleaners:
1083 ft.0.205 mi.
Relative:Higher
Actual:1330 ft.
1/8-1/4 SYLMAR, CA 91342North 14580 EL CASCO ST N/A17 EDR US Hist Cleaners 1014994498
TC3880855.2s Page 22

MAP FINDINGSMap IDDirection
EDR ID NumberDistanceEPA ID NumberDatabase(s)SiteElevation
14580 EL CASCO STAddress: 2007Year:
(Continued) 1014994498
2504-005-007Alias Name: APNAlias Type: 2504-005-006Alias Name: APNAlias Type: 2504-005-005Alias Name: APNAlias Type: 2504-005-004Alias Name: APNAlias Type: 2504-005-003Alias Name: APNAlias Type: 2504-005-002Alias Name: APNAlias Type: 2504-005-001Alias Name: SOILPotential Description: 30023-NO, 30043-NO, 30308-NO 30013-NO, 30207-NO, 30313-NO, 30314-NO, 30315-NO, 30316-NO, 30400-NO, 30001-NO, 30004-NO, 30006-NO, 30007-NO, 30008-NO, 30010-NO,Confirmed COC: HCH-technical, Mirex Dieldrin, Heptachlor, HCH (alpha, HCH (beta, HCH (gamma) Lindane, Arsenic, Chlordane, DDD, DDE, DDT, Endrin, Lead, Toxaphene, Aldrin,Potential COC: AGRICULTURAL - ORCHARD, RESIDENTIAL AREAPast Use: Not reported 2504005003, 2504005004, 2504005005, 2504005006, 2504005007, 2504005008 2504-005-006, 2504-005-007, 2504-005-008, 2504005001, 2504005002, 2504-005-001, 2504-005-002, 2504-005-003, 2504-005-004, 2504-005-005,APN: -118.4497Longitude: 34.3187Latitude: School DistrictFunding: NORestricted Use: 06/04/2008Status Date: No Further ActionStatus: Not reportedSpecial Program Status: 18Senate: 39Assembly: 304581Site Code: Southern California Schools & Brownfields OutreachDivision Branch: Shahir HaddadSupervisor: Ivy OsornioProject Manager: DTSC - Site Cleanup ProgramLead Agency Description: SMBRPLead Agency: SMBRPCleanup Oversight Agencies: NONational Priorities List: 6.7Acres: NONE SPECIFIEDSite Mgmt. Req.: SchoolSite Type Detail: School InvestigationSite Type: 60000780Facility ID:
SCH:
1979 ft.0.375 mi.
Relative:Higher
Actual:1355 ft.
1/4-1/2 SYLMAR, CA 91342North ENVIROSTORDRONFIELD AVENUE/BLEDSOE STREET N/A18 SCHVALLEY REGION SPAN K-8 #1 S108974347
TC3880855.2s Page 23

MAP FINDINGSMap IDDirection
EDR ID NumberDistanceEPA ID NumberDatabase(s)SiteElevation
Not reportedSchedule Document Type: Not reportedSchedule Sub Area Name: Not reportedSchedule Area Name: Not reportedFuture Due Date: Not reportedFuture Document Type: Not reportedFuture Sub Area Name: Not reportedFuture Area Name:
DTSC approved the PEA with a No Further Action determinationComments: 05/29/2008Completed Date: Preliminary Endangerment Assessment ReportCompleted Document Type: Not reportedCompleted Sub Area Name: PROJECT WIDECompleted Area Name:
DTSC approved the scoping document with minor commentsComments: 02/08/2008Completed Date: Preliminary Endangerment Assessment WorkplanCompleted Document Type: Not reportedCompleted Sub Area Name: PROJECT WIDECompleted Area Name:
the PEA. agricultural use, LAUSD will submit a project scoping document for Phase I submitted for background purposes. Based on history ofComments: 12/18/2007Completed Date: Other ReportCompleted Document Type: Not reportedCompleted Sub Area Name: PROJECT WIDECompleted Area Name:
Not reportedComments: 06/04/2008Completed Date: Cost Recovery Closeout MemoCompleted Document Type: Not reportedCompleted Sub Area Name: PROJECT WIDECompleted Area Name:
Completed Info:
Envirostor ID NumberAlias Type: 60000780Alias Name: Project Code (Site Code)Alias Type: 304581Alias Name: APNAlias Type: 2504005008Alias Name: APNAlias Type: 2504005007Alias Name: APNAlias Type: 2504005006Alias Name: APNAlias Type: 2504005005Alias Name: APNAlias Type: 2504005004Alias Name: APNAlias Type: 2504005003Alias Name: APNAlias Type: 2504005002Alias Name: APNAlias Type: 2504005001Alias Name: APNAlias Type: 2504-005-008Alias Name: APNAlias Type:
VALLEY REGION SPAN K-8 #1 (Continued) S108974347
TC3880855.2s Page 24

MAP FINDINGSMap IDDirection
EDR ID NumberDistanceEPA ID NumberDatabase(s)SiteElevation
APNAlias Type: 2504005001Alias Name: APNAlias Type: 2504-005-008Alias Name: APNAlias Type: 2504-005-007Alias Name: APNAlias Type: 2504-005-006Alias Name: APNAlias Type: 2504-005-005Alias Name: APNAlias Type: 2504-005-004Alias Name: APNAlias Type: 2504-005-003Alias Name: APNAlias Type: 2504-005-002Alias Name: APNAlias Type: 2504-005-001Alias Name: SOILPotential Description: 30316-NO, 30400-NO, 30023-NO, 30043-NO, 30308-NO 30008-NO, 30010-NO, 30013-NO, 30207-NO, 30313-NO, 30314-NO, 30315-NO, HCH-technical, Mirex, 30001-NO, 30004-NO, 30006-NO, 30007-NO, Dieldrin, Heptachlor, HCH (alpha, HCH (beta, HCH (gamma) Lindane, Arsenic, Chlordane, DDD, DDE, DDT, Endrin, Lead, Toxaphene, Aldrin,Confirmed COC: HCH-technical, Mirex Dieldrin, Heptachlor, HCH (alpha, HCH (beta, HCH (gamma) Lindane, Arsenic, Chlordane, DDD, DDE, DDT, Endrin, Lead, Toxaphene, Aldrin,Potential COC: AGRICULTURAL - ORCHARD, RESIDENTIAL AREAPast Use: Not reported 2504005003, 2504005004, 2504005005, 2504005006, 2504005007, 2504005008 2504-005-006, 2504-005-007, 2504-005-008, 2504005001, 2504005002, 2504-005-001, 2504-005-002, 2504-005-003, 2504-005-004, 2504-005-005,APN: -118.4497Longitude: 34.3187Latitude: School DistrictFunding: NONE SPECIFIEDSite Mgmt. Req.: NORestricted Use: 06/04/2008Status Date: No Further ActionStatus: Not reportedSpecial Program: 18Senate: 39Assembly: 304581Site Code: 60000780Facility ID: Southern California Schools & Brownfields OutreachDivision Branch: Shahir HaddadSupervisor: Ivy OsornioProgram Manager: SMBRPLead Agency: SMBRPRegulatory Agencies: NONPL: 6.7Acres: SchoolSite Type Detailed: School InvestigationSite Type:
ENVIROSTOR:
Not reportedSchedule Revised Date: Not reportedSchedule Due Date:
VALLEY REGION SPAN K-8 #1 (Continued) S108974347
TC3880855.2s Page 25

MAP FINDINGSMap IDDirection
EDR ID NumberDistanceEPA ID NumberDatabase(s)SiteElevation
Not reportedSchedule Revised Date: Not reportedSchedule Due Date: Not reportedSchedule Document Type: Not reportedSchedule Sub Area Name: Not reportedSchedule Area Name: Not reportedFuture Due Date: Not reportedFuture Document Type: Not reportedFuture Sub Area Name: Not reportedFuture Area Name:
DTSC approved the PEA with a No Further Action determinationComments: 05/29/2008Completed Date: Preliminary Endangerment Assessment ReportCompleted Document Type: Not reportedCompleted Sub Area Name: PROJECT WIDECompleted Area Name:
DTSC approved the scoping document with minor commentsComments: 02/08/2008Completed Date: Preliminary Endangerment Assessment WorkplanCompleted Document Type: Not reportedCompleted Sub Area Name: PROJECT WIDECompleted Area Name:
the PEA. agricultural use, LAUSD will submit a project scoping document for Phase I submitted for background purposes. Based on history ofComments: 12/18/2007Completed Date: Other ReportCompleted Document Type: Not reportedCompleted Sub Area Name: PROJECT WIDECompleted Area Name:
Not reportedComments: 06/04/2008Completed Date: Cost Recovery Closeout MemoCompleted Document Type: Not reportedCompleted Sub Area Name: PROJECT WIDECompleted Area Name:
Completed Info:
Envirostor ID NumberAlias Type: 60000780Alias Name: Project Code (Site Code)Alias Type: 304581Alias Name: APNAlias Type: 2504005008Alias Name: APNAlias Type: 2504005007Alias Name: APNAlias Type: 2504005006Alias Name: APNAlias Type: 2504005005Alias Name: APNAlias Type: 2504005004Alias Name: APNAlias Type: 2504005003Alias Name: APNAlias Type: 2504005002Alias Name:
VALLEY REGION SPAN K-8 #1 (Continued) S108974347
TC3880855.2s Page 26

MAP FINDINGSMap IDDirection
EDR ID NumberDistanceEPA ID NumberDatabase(s)SiteElevation
SYLMAR 913420000Mailing City,St,Zip: Not reportedMailing Address 2: 1240 S STATE COLLEGE BLVDMailing Address: Not reportedMail To: 2133624384Facility Phone: Not reportedSIC Code: Not reportedCortese Code: 00003783Regulated ID: UTNKIRegulated By: 19054167Facility ID:
CA FID UST:
Leak DiscoveryAction: 01/01/1950Date: OtherAction Type: T10000005375Global Id:
Leak BeganAction: 01/01/1950Date: OtherAction Type: T10000005375Global Id:
Leak ReportedAction: 01/01/1950Date: OtherAction Type: T10000005375Global Id:
Regulatory Activities:
08/05/1992Status Date: Open - Case Begin DateStatus: T10000005375Global Id:
Status History:
Click here to access the California GeoTracker records for this facility:
Not reportedSite History: Not reportedPotential Contaminants of Concern: Not reportedPotential Media Affect: Not reportedFile Location: Not reportedLOC Case Number: Not reportedRB Case Number: Not reportedLocal Agency: Not reportedCase Worker: SWRCBLead Agency: 08/05/1992Status Date: Open - Site AssessmentStatus: LUST Cleanup SiteCase Type: 0Longitude: 0Latitude: T10000005375Global Id: STATERegion:
LUST:
2593 ft.0.491 mi. CDL
Relative:Higher
Actual:1334 ft.
1/4-1/2 SWEEPS USTSYLMAR, CA 91342ENE CA FID UST14104 FOOTHILL BLVD N/A19 LUST7-ELEVEN STORE #21483 (2144) S101586601
TC3880855.2s Page 27

MAP FINDINGSMap IDDirection
EDR ID NumberDistanceEPA ID NumberDatabase(s)SiteElevation
PRODUCTStg: CHEMICALTank Use: 12000Capacity: Not reportedActv Date: 19-050-000268-000003Swrcb Tank Id: Not reportedOwner Tank Id: Not reportedTank Status: Not reportedCreated Date: Not reportedAction Date: Not reportedReferral Date: 44-002251Board Of Equalization: Not reportedNumber: 268Comp Number: Not reportedStatus:
Not reportedNumber Of Tanks: REG UNLEADEDContent: PRODUCTStg: M.V. FUELTank Use: 12000Capacity: Not reportedActv Date: 19-050-000268-000002Swrcb Tank Id: Not reportedOwner Tank Id: Not reportedTank Status: Not reportedCreated Date: Not reportedAction Date: Not reportedReferral Date: 44-002251Board Of Equalization: Not reportedNumber: 268Comp Number: Not reportedStatus:
3Number Of Tanks: REG UNLEADEDContent: PRODUCTStg: M.V. FUELTank Use: 12000Capacity: Not reportedActv Date: 19-050-000268-000001Swrcb Tank Id: Not reportedOwner Tank Id: Not reportedTank Status: Not reportedCreated Date: Not reportedAction Date: Not reportedReferral Date: 44-002251Board Of Equalization: Not reportedNumber: 268Comp Number: Not reportedStatus:
SWEEPS UST:
InactiveStatus: Not reportedComments: Not reportedEPA ID: Not reportedNPDES Number: Not reportedDUNs Number: Not reportedContact Phone: Not reportedContact:
7-ELEVEN STORE #21483 (2144) (Continued) S101586601
TC3880855.2s Page 28

MAP FINDINGSMap IDDirection
EDR ID NumberDistanceEPA ID NumberDatabase(s)SiteElevation
or drug lab equipment and/or materials were stored. Illegal Drug Lab (L) - location where an illegal drug lab was operatedLab Type: 03/30/2000Date: 200003190Facility ID:
CDL:
Not reportedNumber Of Tanks: UNKNOWNContent:
7-ELEVEN STORE #21483 (2144) (Continued) S101586601
91392Discharge Zip: CaliforniaDischarge State: SylmarDischarge City: PO Box 9205Discharge Address: Valley Todeco IncDischarge Name: Not reportedTermination Date Of Regulatory Measure: Not reportedExpiration Date Of Regulatory Measure: 09/07/2011Effective Date Of Regulatory Measure: Not reportedAdoption Date Of Regulatory Measure: IndustrialProgram Type: 4 19I023315WDID: Not reportedPlace Id: EnrolleeRegulatory Measure Type: 97-03-DWQOrder No: 419873Regulatory Measure Id: 4Region: 0Agency Id: ActiveFacility Status: CAS000001Npdes Number:
40503Discharge Zip: KentuckyDischarge State: LexingtonDischarge City: 2201 Regency Rd Ste 701Discharge Address: McKechnie Investments IncDischarge Name: 09/02/2011Termination Date Of Regulatory Measure: Not reportedExpiration Date Of Regulatory Measure: 12/20/1995Effective Date Of Regulatory Measure: Not reportedAdoption Date Of Regulatory Measure: IndustrialProgram Type: 4 19I012053WDID: Not reportedPlace Id: EnrolleeRegulatory Measure Type: 97-03-DWQOrder No: 190258Regulatory Measure Id: 4Region: 0Agency Id: TerminatedFacility Status: CAS000001Npdes Number:
NPDES:
3390 ft. Site 1 of 2 in cluster E0.642 mi.
Relative:Lower
Actual:1215 ft.
1/2-1 ENVIROSTORSYLMAR, CA 91342SW SLIC12975 BRADLEY AVENUE N/AE20 NPDESVALLEY-TODECO, INC. 1005976559
TC3880855.2s Page 29

MAP FINDINGSMap IDDirection
EDR ID NumberDistanceEPA ID NumberDatabase(s)SiteElevation
71003534Facility ID: Cleanup ChatsworthDivision Branch: Not reportedSupervisor: Not reportedProgram Manager: NONE SPECIFIEDLead Agency: NONE SPECIFIEDRegulatory Agencies: NONPL: Not reportedAcres: Tiered PermitSite Type Detailed: Tiered PermitSite Type:
ENVIROSTOR:
MZStaff:VOCsSubstance:0990SLIC:Site AssessmentFacility Status:4Region:
SLIC REG 4:
Click here to access the California GeoTracker records for this facility:
and on 5/10/11 requiring supplementary remedial action plan. requiring additional investigations in the Plating Department Area, Investigation Report on 10/25/2010. RB issued a letter on 4/14/2011 Dept. Investigation Report on September 15, 2010, and the VOCs the Plating Department at the site. The RP submitted the Plating contamination at the site and hexavalent chromium contamination in Board staff approved workplans for additional delineation of VOC Delineation. In letters dated March 9, 2010 and April 5, 2010, the 2010 approving the Revised Workplan for Completion of VOCs March 7, 2002. Regional Board staff issued a letter dated March 9, been removed since 11/2005. Groundwater monitoring is ongoing since to operate to date. Approximately 17,043 pounds of PCE and TCE have 9/30/06, and was replaced by a DPE systemon 11/21/06 which continues hexavalent chromium. An SVE system operated from 11/23/05 through VOCs (PCE and TCE) and Title 22 metals especially total and Chemicals of concern in soil and groundwater beneath the site includeSite History: Chromium, Other Metal Hydrocarbon, Tetrachloroethylene (PCE), Trichloroethylene (TCE), Other Chlorinated Hydrocarbons, Other Solvent or Non-PetroleumPotential Contaminants of Concern: (uses other than drinking water), Soil, Soil Vapor Aquifer used for drinking water supply, Indoor Air, Other GroundwaterPotential Media Affected: Regional BoardFile Location: 0990RB Case Number: Not reportedLocal Agency: MZCase Worker: Cleanup Program SiteCase Type: -118.460603Longitude: 34.304773Latitude: 204DW00Lead Agency Case Number: LOS ANGELES RWQCB (REGION 4)Lead Agency: SL204DW2400Global Id: 03/23/2010Status Date: Open - Assessment & Interim Remedial ActionFacility Status: STATERegion:
SLIC:
VALLEY-TODECO, INC. (Continued) 1005976559
TC3880855.2s Page 30

MAP FINDINGSMap IDDirection
EDR ID NumberDistanceEPA ID NumberDatabase(s)SiteElevation
Not reportedSchedule Revised Date: Not reportedSchedule Due Date: Not reportedSchedule Document Type: Not reportedSchedule Sub Area Name: Not reportedSchedule Area Name: Not reportedFuture Due Date: Not reportedFuture Document Type: Not reportedFuture Sub Area Name: Not reportedFuture Area Name:
Not reportedComments: Not reportedCompleted Date: Not reportedCompleted Document Type: Not reportedCompleted Sub Area Name: Not reportedCompleted Area Name:
Completed Info:
Envirostor ID NumberAlias Type: 71003534Alias Name: EPA Identification NumberAlias Type: CAT080014103Alias Name: NONE SPECIFIEDPotential Description: NONE SPECIFIED, NONE SPECIFIEDConfirmed COC: NONE SPECIFIEDPotential COC: NONE SPECIFIEDPast Use: NONE SPECIFIEDAPN: -118.4606Longitude: 34.30477Latitude: Not reportedFunding: NONE SPECIFIEDSite Mgmt. Req.: NORestricted Use: Not reportedStatus Date: Refer: Other AgencyStatus: Not reportedSpecial Program: 18Senate: 39Assembly: Not reportedSite Code:
VALLEY-TODECO, INC. (Continued) 1005976559
(818) 367-1811Contact telephone: USContact country: SYLMAR, CA 91342 13001 BRADLEY AVEContact address: ENVIRONMENTAL MANAGERContact: SYLMAR, CA 91342 PO BOX 4156Mailing address: CAD981624323EPA ID: SYLMAR, CA 91342 13001 BRADLEY AVEFacility address: LANCE INDUSTRIESFacility name: 02/26/1987Date form received by agency:
RCRA-SQG:
WDS3422 ft. ENVIROSTORSite 2 of 2 in cluster E0.648 mi. HAZNET
Relative:Lower
Actual:1218 ft.
1/2-1 LA Co. Site MitigationSYLMAR, CA SW FINDS13001 BRADLEY AVE CAD981624323E21 RCRA-SQGLANCE INDUSTRIES 1000168384
TC3880855.2s Page 31

MAP FINDINGSMap IDDirection
EDR ID NumberDistanceEPA ID NumberDatabase(s)SiteElevation
events and activities related to facilities that generate, transport,Conservation and Recovery Act (RCRA) program through the tracking ofRCRAInfo is a national information system that supports the Resource Environmental Interest/Information System
110002728004Registry ID:
FINDS:
No violations foundViolation Status:
NoUsed oil transporter: NoUsed oil transfer facility: NoUsed oil Specification marketer: NoUsed oil fuel marketer to burner: NoUser oil refiner: NoUsed oil processor: NoUsed oil fuel burner: NoFurnace exemption: NoOn-site burner exemption: NoUnderground injection activity: NoTreater, storer or disposer of HW: NoTransporter of hazardous waste: NoRecycler of hazardous waste: NoMixed waste (haz. and radioactive): NoU.S. importer of hazardous waste:
Handler Activities Summary:
Not reportedOwner/Op end date: Not reportedOwner/Op start date: OperatorOwner/Operator Type: PrivateLegal status: (415) 555-1212Owner/operator telephone: Not reportedOwner/operator country: NOT REQUIRED, ME 99999 NOT REQUIREDOwner/operator address: NOT REQUIREDOwner/operator name:
Not reportedOwner/Op end date: Not reportedOwner/Op start date: OwnerOwner/Operator Type: PrivateLegal status: (415) 555-1212Owner/operator telephone: Not reportedOwner/operator country: NOT REQUIRED, ME 99999 NOT REQUIREDOwner/operator address: MANN MARVINOwner/operator name:
Owner/Operator Summary:
hazardous waste at any time waste during any calendar month, and accumulates more than 1000 kg of hazardous waste at any time; or generates 100 kg or less of hazardous waste during any calendar month and accumulates less than 6000 kg of Handler: generates more than 100 and less than 1000 kg of hazardousDescription: Small Small Quantity GeneratorClassification: 09EPA Region: Not reportedContact email:
LANCE INDUSTRIES (Continued) 1000168384
TC3880855.2s Page 32

MAP FINDINGSMap IDDirection
EDR ID NumberDistanceEPA ID NumberDatabase(s)SiteElevation
Unspecified aqueous solutionWaste Category: Not reportedTSD County: CAD097030993TSD EPA ID: Not reportedGen County: SYLMAR, CA 913420000Mailing City,St,Zip: 13001 BRADLEY AVEMailing Address: Not reportedMailing Name: 8183671811Telephone: MARVIN REICHMAN PLANT MGRContact: CAD981624323Gepaid: 2002Year:
Los AngelesFacility County: 2.5Tons: RecyclerDisposal Method: Unspecified aqueous solutionWaste Category: Not reportedTSD County: CAD097030993TSD EPA ID: Not reportedGen County: SYLMAR, CA 913420000Mailing City,St,Zip: 13001 BRADLEY AVEMailing Address: Not reportedMailing Name: 8183671811Telephone: MARVIN REICHMAN PLANT MGRContact: CAD981624323Gepaid: 2002Year:
Los AngelesFacility County: 16.68Tons: RecyclerDisposal Method: Aqueous solution (2 < pH < 12.5) containing reactive anions ...Waste Category: Not reportedTSD County: CAT080033681TSD EPA ID: Not reportedGen County: SYLMAR, CA 913420000Mailing City,St,Zip: 13001 BRADLEY AVEMailing Address: Not reportedMailing Name: 8183671811Telephone: MARVIN REICHMAN PLANT MGRContact: CAD981624323Gepaid: 2003Year:
HAZNET:
10/11/2011Entered Date:Not reportedAssigned To:NoAbated:RO0001412Case ID:StateJurisdiction:SD0000411Site ID:Not reportedFacility ID:
LA Co. Site Mitigation:
corrective action activities required under RCRA.program staff to track the notification, permit, compliance, andand treat, store, or dispose of hazardous waste. RCRAInfo allows RCRA
LANCE INDUSTRIES (Continued) 1000168384
TC3880855.2s Page 33
MAP FINDINGSMap IDDirection
EDR ID NumberDistanceEPA ID NumberDatabase(s)SiteElevation
Not reportedFunding: NONE SPECIFIEDSite Mgmt. Req.: NORestricted Use: Not reportedStatus Date: Refer: Other AgencyStatus: Not reportedSpecial Program: 18Senate: 39Assembly: Not reportedSite Code: 71002890Facility ID: Cleanup ChatsworthDivision Branch: Not reportedSupervisor: Not reportedProgram Manager: NONE SPECIFIEDLead Agency: NONE SPECIFIEDRegulatory Agencies: NONPL: Not reportedAcres: Tiered PermitSite Type Detailed: Tiered PermitSite Type:
ENVIROSTOR:
22 additional CA_HAZNET: record(s) in the EDR Site Report.Click this hyperlink while viewing on your computer to access
Los AngelesFacility County: 2.41Tons: RecyclerDisposal Method: Liquids with pH <= 2 with metalsWaste Category: Not reportedTSD County: CAD097030993TSD EPA ID: Not reportedGen County: SYLMAR, CA 913420000Mailing City,St,Zip: 13001 BRADLEY AVEMailing Address: Not reportedMailing Name: 8183671811Telephone: MARVIN REICHMAN PLANT MGRContact: CAD981624323Gepaid: 2002Year:
Los AngelesFacility County: 1.25Tons: RecyclerDisposal Method: Unspecified oil-containing wasteWaste Category: Not reportedTSD County: AZD980892731TSD EPA ID: Not reportedGen County: SYLMAR, CA 913420000Mailing City,St,Zip: 13001 BRADLEY AVEMailing Address: Not reportedMailing Name: 8183671811Telephone: MARVIN REICHMAN PLANT MGRContact: CAD981624323Gepaid: 2002Year:
Los AngelesFacility County: 3.66Tons: Not reportedDisposal Method:
LANCE INDUSTRIES (Continued) 1000168384
TC3880855.2s Page 34

MAP FINDINGSMap IDDirection
EDR ID NumberDistanceEPA ID NumberDatabase(s)SiteElevation
0Design Flow: Not reportedSecondary Waste Type: Not reportedSecondary Waste: Not reportedPrimary Waste Type: Not reportedWaste2: Not reportedWaste Type2: Not reportedPrimary Waste: Not reportedPrimary Waste Type: Not reportedSIC Code 2: 0SIC Code: Not reportedAgency Type: Not reportedAgency Telephone: Not reportedAgency Contact: 0Agency City,St,Zip: Not reportedAgency Address: LANCE INDUSTRIESAgency Name: Not reportedFacility Contact: Not reportedFacility Telephone: 4Subregion: are assigned by the Regional Board CAS000001 The 1st 2 characters designate the state. The remaining 7NPDES Number: under Waste Discharge Requirements. Active - Any facility with a continuous or seasonal discharge that isFacility Status: Not reportedFacility Type: 4 19I010669Facility ID:
CA WDS:
Not reportedSchedule Revised Date: Not reportedSchedule Due Date: Not reportedSchedule Document Type: Not reportedSchedule Sub Area Name: Not reportedSchedule Area Name: Not reportedFuture Due Date: Not reportedFuture Document Type: Not reportedFuture Sub Area Name: Not reportedFuture Area Name:
Not reportedComments: Not reportedCompleted Date: Not reportedCompleted Document Type: Not reportedCompleted Sub Area Name: Not reportedCompleted Area Name:
Completed Info:
Envirostor ID NumberAlias Type: 71002890Alias Name: EPA (FRS #)Alias Type: 110002728004Alias Name: EPA Identification NumberAlias Type: CAD981624323Alias Name: NONE SPECIFIEDPotential Description: NONE SPECIFIED, NONE SPECIFIEDConfirmed COC: NONE SPECIFIEDPotential COC: NONE SPECIFIEDPast Use: NONE SPECIFIEDAPN: -118.4615Longitude: 34.30549Latitude:
LANCE INDUSTRIES (Continued) 1000168384
TC3880855.2s Page 35

MAP FINDINGSMap IDDirection
EDR ID NumberDistanceEPA ID NumberDatabase(s)SiteElevation
dairy waste ponds. dischargers having waste storage systems with land disposal such as disposal systems, such as septic systems with subsurface disposal, or management practices, facilities with passive waste treatment and cooling water dischargers or thosewho must comply through best Category C - Facilities having no waste treatment systems, such asComplexity: represent no threat to water quality. Level. A Zero (0) may be used to code those NURDS that are found to considered a minor threat to water quality unless coded at a higher to a major or minor threat. Not: All nurds without a TTWQ will be should cause a relatively minor impairment of beneficial uses compared Minor Threat to Water Quality. A violation of a regional board orderTreat To Water: Not reportedPOTW: Not reportedReclamation: 0Baseline Flow:
LANCE INDUSTRIES (Continued) 1000168384
NoTransporter of hazardous waste: YesRecycler of hazardous waste: NoMixed waste (haz. and radioactive): NoU.S. importer of hazardous waste:
Handler Activities Summary:
waste Handler is engaged in the treatment, storage or disposal of hazardousDescription: TSDFClassification: Facility is not located on Indian land. Additional information is not known.Land type: 09EPA Region: Not reportedContact email: (626) 401-0106Contact telephone: Not reportedContact country: Not reported Not reportedContact address: JOHN W MATHEWSContact: ELGIN, IL 90123 920 DAVIS TOAD, 4TH FLOORMailing address: CAT000613992EPA ID: SYLMAR, CA 91342 13024 BRADLEY AVE.Facility address: SAFETY-KLEEN SYSTEMS, INC.Facility name: 03/28/2002Date form received by agency:
RCRA-TSDF:
WDSHWP
ENVIROSTORLA Co. Site Mitigation
Notify 65SWEEPS UST
HIST USTCA FID UST
LUSTHIST CORTESE
3461 ft. NPDES0.655 mi. FINDS
Relative:Lower
Actual:1224 ft.
1/2-1 RCRA-SQGSYLMAR, CA WSW CORRACTS13024 BRADLEY AVE CAT00061399222 RCRA-TSDFSAFETY KLEEN CORPORATION SYLMAR CA 1000224422
TC3880855.2s Page 36
MAP FINDINGSMap IDDirection
EDR ID NumberDistanceEPA ID NumberDatabase(s)SiteElevation
RFA Completed, Assessment was an RFA.Event: 12/18/1990Event date:
Corrective Action Summary:
Large Quantity GeneratorClassification: SAFETY-KLEEN CORP 7-088-01Site name: SAFETY-KLEEN SYSTEMS, INC.Facility name: 04/12/1990Date form received by agency:
Small Quantity GeneratorClassification: SAFETY-KLEEN CORP (7-088-01)Site name: SAFETY-KLEEN SYSTEMS, INC.Facility name: 03/31/1992Date form received by agency:
Large Quantity GeneratorClassification: SAFETY-KLEEN CORPSite name: SAFETY-KLEEN SYSTEMS, INC.Facility name: 03/25/1994Date form received by agency:
Small Quantity GeneratorClassification: SAFETY KLEEN SYSTEMS INCSite name: SAFETY-KLEEN SYSTEMS, INC.Facility name: 09/01/1996Date form received by agency:
Small Quantity GeneratorClassification: SAFETY KLEEN SYSTEMS INCSite name: SAFETY-KLEEN SYSTEMS, INC.Facility name: 07/13/1998Date form received by agency:
Large Quantity GeneratorClassification: SAFETY-KLEEN CORP - SYLMAR, CASite name: SAFETY-KLEEN SYSTEMS, INC.Facility name: 03/04/1999Date form received by agency:
Large Quantity GeneratorClassification: SAFETY-KLEEN SYSTEMS, INC. SYLMARSite name: SAFETY-KLEEN SYSTEMS, INC.Facility name: 10/12/2000Date form received by agency:
Large Quantity GeneratorClassification: SAFETY-KLEEN SYSTEMS, INC.Facility name: 03/28/2002Date form received by agency:
Historical Generators:
NoUsed oil transporter: NoUsed oil transfer facility: NoUsed oil Specification marketer: NoUsed oil fuel marketer to burner: NoUser oil refiner: NoUsed oil processor: NoUsed oil fuel burner: NoFurnace exemption: NoOn-site burner exemption: NoUnderground injection activity: NoTreater, storer or disposer of HW:
SAFETY KLEEN CORPORATION SYLMAR CA (Continued) 1000224422
TC3880855.2s Page 37

MAP FINDINGSMap IDDirection
EDR ID NumberDistanceEPA ID NumberDatabase(s)SiteElevation
Not reported Final penalty amount: Not reported Proposed penalty amount: Not reported Enforcement lead agency: Not reported Enf. disp. status date: Not reported Enf. disposition status: Not reported Enforcement action date: Not reported Enforcement action: StateViolation lead agency: 10/14/1998Date achieved compliance: 02/06/1995Date violation determined: Generators - GeneralArea of violation: FR - 262.10-12.ARegulation violated:
Not reported Paid penalty amount: 4320 Final penalty amount: Not reported Proposed penalty amount: State Enforcement lead agency: Not reported Enf. disp. status date: Not reported Enf. disposition status: 03/17/2003 Enforcement action date: SINGLE SITE CA/FO Enforcement action: StateViolation lead agency: 09/10/2002Date achieved compliance: 06/20/2002Date violation determined: Generators - GeneralArea of violation: Not reportedRegulation violated:
Not reported Paid penalty amount: Not reported Final penalty amount: Not reported Proposed penalty amount: State Enforcement lead agency: Not reported Enf. disp. status date: Not reported Enf. disposition status: 07/16/2002 Enforcement action date: WRITTEN INFORMAL Enforcement action: StateViolation lead agency: 09/10/2002Date achieved compliance: 06/20/2002Date violation determined: Generators - GeneralArea of violation: Not reportedRegulation violated:
Facility Has Received Notices of Violations:
action priority. CA Prioritization, Facility or area was assigned a low correctiveEvent: 10/27/1992Event date:
the facility, or other administrative considerations. risk, timing considerations, the status of corrective action work at conclusion may be the status of closure at the facility, the degree of there is a lack of technical information (IN). Reasons for this it appears to be technically infeasible or inappropriate (NF) or 2- stabilization activity at the present time for reasons other than 1- Stabilization Measures Evaluation,This facility is not amenable toEvent: 10/27/1992Event date:
Corrective Action Process TerminatedEvent: 12/18/1990Event date:
SAFETY KLEEN CORPORATION SYLMAR CA (Continued) 1000224422
TC3880855.2s Page 38
MAP FINDINGSMap IDDirection
EDR ID NumberDistanceEPA ID NumberDatabase(s)SiteElevation
200 Paid penalty amount: 200 Final penalty amount: 200 Proposed penalty amount: State Enforcement lead agency: Not reported Enf. disp. status date: Not reported Enf. disposition status: 02/16/1993 Enforcement action date: INITIAL 3008(A) COMPLIANCE Enforcement action: StateViolation lead agency: 03/23/1993Date achieved compliance: 12/24/1992Date violation determined: Transporters - GeneralArea of violation: FR - 263Regulation violated:
200 Paid penalty amount: 200 Final penalty amount: 200 Proposed penalty amount: State Enforcement lead agency: Not reported Enf. disp. status date: Not reported Enf. disposition status: 02/16/1993 Enforcement action date: INITIAL 3008(A) COMPLIANCE Enforcement action: StateViolation lead agency: 03/23/1993Date achieved compliance: 12/24/1992Date violation determined: TSD - GeneralArea of violation: FR - 270Regulation violated:
Not reported Paid penalty amount: Not reported Final penalty amount: Not reported Proposed penalty amount: Not reported Enforcement lead agency: Not reported Enf. disp. status date: Not reported Enf. disposition status: Not reported Enforcement action date: Not reported Enforcement action: StateViolation lead agency: 09/21/1994Date achieved compliance: 02/17/1994Date violation determined: Generators - GeneralArea of violation: FR - 262.10-12.ARegulation violated:
Not reported Paid penalty amount: Not reported Final penalty amount: Not reported Proposed penalty amount: State Enforcement lead agency: Not reported Enf. disp. status date: Not reported Enf. disposition status: 09/21/1994 Enforcement action date: WRITTEN INFORMAL Enforcement action: StateViolation lead agency: 09/27/1994Date achieved compliance: 09/21/1994Date violation determined: Transporters - GeneralArea of violation: FR - 263Regulation violated:
Not reported Paid penalty amount:
SAFETY KLEEN CORPORATION SYLMAR CA (Continued) 1000224422
TC3880855.2s Page 39

MAP FINDINGSMap IDDirection
EDR ID NumberDistanceEPA ID NumberDatabase(s)SiteElevation
FR - 264.70-77.ERegulation violated:
Not reported Paid penalty amount: Not reported Final penalty amount: Not reported Proposed penalty amount: State Enforcement lead agency: Not reported Enf. disp. status date: Not reported Enf. disposition status: 04/27/1990 Enforcement action date: WRITTEN INFORMAL Enforcement action: StateViolation lead agency: 11/21/1991Date achieved compliance: 03/15/1990Date violation determined: LDR - GeneralArea of violation: FR - 268.7Regulation violated:
Not reported Paid penalty amount: Not reported Final penalty amount: Not reported Proposed penalty amount: State Enforcement lead agency: Not reported Enf. disp. status date: Not reported Enf. disposition status: 04/11/1990 Enforcement action date: WRITTEN INFORMAL Enforcement action: StateViolation lead agency: 05/15/1992Date achieved compliance: 03/21/1990Date violation determined: TSD - Financial RequirementsArea of violation: FR - 264.140-150.HRegulation violated:
Not reported Paid penalty amount: Not reported Final penalty amount: Not reported Proposed penalty amount: Not reported Enforcement lead agency: Not reported Enf. disp. status date: Not reported Enf. disposition status: Not reported Enforcement action date: Not reported Enforcement action: EPAViolation lead agency: 05/15/1992Date achieved compliance: 05/15/1992Date violation determined: TSD - Financial RequirementsArea of violation: FR - 264.140-150.HRegulation violated:
Not reported Paid penalty amount: Not reported Final penalty amount: Not reported Proposed penalty amount: State Enforcement lead agency: Not reported Enf. disp. status date: Not reported Enf. disposition status: 12/23/1992 Enforcement action date: WRITTEN INFORMAL Enforcement action: StateViolation lead agency: 09/17/1993Date achieved compliance: 11/10/1992Date violation determined: TSD - Financial RequirementsArea of violation: FR - 264.140-150.HRegulation violated:
SAFETY KLEEN CORPORATION SYLMAR CA (Continued) 1000224422
TC3880855.2s Page 40

MAP FINDINGSMap IDDirection
EDR ID NumberDistanceEPA ID NumberDatabase(s)SiteElevation
LDR - GeneralArea of violation: FR - 268.7Regulation violated:
Not reported Paid penalty amount: Not reported Final penalty amount: Not reported Proposed penalty amount: State Enforcement lead agency: Not reported Enf. disp. status date: Not reported Enf. disposition status: 04/27/1990 Enforcement action date: WRITTEN INFORMAL Enforcement action: StateViolation lead agency: 11/21/1991Date achieved compliance: 03/15/1990Date violation determined: TSD - Closure/Post-ClosureArea of violation: FR - 264.110-120.GRegulation violated:
Not reported Paid penalty amount: Not reported Final penalty amount: Not reported Proposed penalty amount: Not reported Enforcement lead agency: Not reported Enf. disp. status date: Not reported Enf. disposition status: Not reported Enforcement action date: Not reported Enforcement action: StateViolation lead agency: 11/21/1991Date achieved compliance: 03/15/1990Date violation determined: LDR - GeneralArea of violation: FR - 268 ALLRegulation violated:
Not reported Paid penalty amount: Not reported Final penalty amount: Not reported Proposed penalty amount: State Enforcement lead agency: Not reported Enf. disp. status date: Not reported Enf. disposition status: 04/27/1990 Enforcement action date: WRITTEN INFORMAL Enforcement action: StateViolation lead agency: 11/21/1991Date achieved compliance: 03/15/1990Date violation determined: TSD - GeneralArea of violation: FR - 270Regulation violated:
Not reported Paid penalty amount: Not reported Final penalty amount: Not reported Proposed penalty amount: State Enforcement lead agency: Not reported Enf. disp. status date: Not reported Enf. disposition status: 04/27/1990 Enforcement action date: WRITTEN INFORMAL Enforcement action: StateViolation lead agency: 11/21/1991Date achieved compliance: 03/15/1990Date violation determined: TSD - GeneralArea of violation:
SAFETY KLEEN CORPORATION SYLMAR CA (Continued) 1000224422
TC3880855.2s Page 41
MAP FINDINGSMap IDDirection
EDR ID NumberDistanceEPA ID NumberDatabase(s)SiteElevation
03/15/1990Date violation determined: TSD - Closure/Post-ClosureArea of violation: FR - 264.110-120.GRegulation violated:
Not reported Paid penalty amount: Not reported Final penalty amount: Not reported Proposed penalty amount: State Enforcement lead agency: Not reported Enf. disp. status date: Not reported Enf. disposition status: 04/27/1990 Enforcement action date: WRITTEN INFORMAL Enforcement action: StateViolation lead agency: 11/21/1991Date achieved compliance: 03/15/1990Date violation determined: LDR - GeneralArea of violation: FR - 268 ALLRegulation violated:
Not reported Paid penalty amount: Not reported Final penalty amount: Not reported Proposed penalty amount: Not reported Enforcement lead agency: Not reported Enf. disp. status date: Not reported Enf. disposition status: Not reported Enforcement action date: Not reported Enforcement action: StateViolation lead agency: 11/21/1991Date achieved compliance: 03/15/1990Date violation determined: TSD - GeneralArea of violation: FR - 270Regulation violated:
Not reported Paid penalty amount: Not reported Final penalty amount: Not reported Proposed penalty amount: Not reported Enforcement lead agency: Not reported Enf. disp. status date: Not reported Enf. disposition status: Not reported Enforcement action date: Not reported Enforcement action: StateViolation lead agency: 11/21/1991Date achieved compliance: 03/15/1990Date violation determined: TSD - GeneralArea of violation: FR - 264.70-77.ERegulation violated:
Not reported Paid penalty amount: Not reported Final penalty amount: Not reported Proposed penalty amount: Not reported Enforcement lead agency: Not reported Enf. disp. status date: Not reported Enf. disposition status: Not reported Enforcement action date: Not reported Enforcement action: StateViolation lead agency: 11/21/1991Date achieved compliance: 03/15/1990Date violation determined:
SAFETY KLEEN CORPORATION SYLMAR CA (Continued) 1000224422
TC3880855.2s Page 42

MAP FINDINGSMap IDDirection
EDR ID NumberDistanceEPA ID NumberDatabase(s)SiteElevation
Not reportedArea of violation: COMPLIANCE EVALUATION INSPECTION ON-SITEEvaluation: 04/20/2007Evaluation date:
Evaluation Action Summary:
Not reported Paid penalty amount: Not reported Final penalty amount: Not reported Proposed penalty amount: State Enforcement lead agency: Not reported Enf. disp. status date: Not reported Enf. disposition status: 05/20/1987 Enforcement action date: WRITTEN INFORMAL Enforcement action: StateViolation lead agency: 09/25/1987Date achieved compliance: 05/20/1987Date violation determined: TSD - GeneralArea of violation: FR - 270Regulation violated:
Not reported Paid penalty amount: Not reported Final penalty amount: Not reported Proposed penalty amount: State Enforcement lead agency: Not reported Enf. disp. status date: Not reported Enf. disposition status: 07/06/1987 Enforcement action date: WRITTEN INFORMAL Enforcement action: StateViolation lead agency: 09/25/1987Date achieved compliance: 05/20/1987Date violation determined: TSD - GeneralArea of violation: FR - 270Regulation violated:
Not reported Paid penalty amount: Not reported Final penalty amount: Not reported Proposed penalty amount: Not reported Enforcement lead agency: Not reported Enf. disp. status date: Not reported Enf. disposition status: Not reported Enforcement action date: Not reported Enforcement action: StateViolation lead agency: 05/15/1990Date achieved compliance: 08/19/1987Date violation determined: Formal Enforcement Agreement or OrderArea of violation: FR - FEARegulation violated:
Not reported Paid penalty amount: Not reported Final penalty amount: Not reported Proposed penalty amount: Not reported Enforcement lead agency: Not reported Enf. disp. status date: Not reported Enf. disposition status: Not reported Enforcement action date: Not reported Enforcement action: StateViolation lead agency: 11/21/1991Date achieved compliance:
SAFETY KLEEN CORPORATION SYLMAR CA (Continued) 1000224422
TC3880855.2s Page 43

MAP FINDINGSMap IDDirection
EDR ID NumberDistanceEPA ID NumberDatabase(s)SiteElevation
StateEvaluation lead agency: 09/17/1993Date achieved compliance: TSD - Financial RequirementsArea of violation: FINANCIAL RECORD REVIEWEvaluation: 11/10/1992Evaluation date:
State Contractor/GranteeEvaluation lead agency: Not reportedDate achieved compliance: Not reportedArea of violation: COMPLIANCE EVALUATION INSPECTION ON-SITEEvaluation: 03/18/1993Evaluation date:
State Contractor/GranteeEvaluation lead agency: Not reportedDate achieved compliance: Not reportedArea of violation: COMPLIANCE EVALUATION INSPECTION ON-SITEEvaluation: 06/16/1993Evaluation date:
State Contractor/GranteeEvaluation lead agency: Not reportedDate achieved compliance: Not reportedArea of violation: COMPLIANCE EVALUATION INSPECTION ON-SITEEvaluation: 06/17/1993Evaluation date:
State Contractor/GranteeEvaluation lead agency: 09/21/1994Date achieved compliance: Generators - GeneralArea of violation: COMPLIANCE EVALUATION INSPECTION ON-SITEEvaluation: 02/17/1994Evaluation date:
StateEvaluation lead agency: 09/27/1994Date achieved compliance: Transporters - GeneralArea of violation: COMPLIANCE EVALUATION INSPECTION ON-SITEEvaluation: 09/21/1994Evaluation date:
State Contractor/GranteeEvaluation lead agency: 10/14/1998Date achieved compliance: Generators - GeneralArea of violation: COMPLIANCE EVALUATION INSPECTION ON-SITEEvaluation: 02/06/1995Evaluation date:
StateEvaluation lead agency: Not reportedDate achieved compliance: Not reportedArea of violation: COMPLIANCE EVALUATION INSPECTION ON-SITEEvaluation: 10/14/1998Evaluation date:
StateEvaluation lead agency: 09/10/2002Date achieved compliance: Generators - GeneralArea of violation: COMPLIANCE EVALUATION INSPECTION ON-SITEEvaluation: 06/20/2002Evaluation date:
StateEvaluation lead agency: Not reportedDate achieved compliance:
SAFETY KLEEN CORPORATION SYLMAR CA (Continued) 1000224422
TC3880855.2s Page 44
MAP FINDINGSMap IDDirection
EDR ID NumberDistanceEPA ID NumberDatabase(s)SiteElevation
Formal Enforcement Agreement or OrderArea of violation: COMPLIANCE SCHEDULE EVALUATIONEvaluation: 08/19/1987Evaluation date:
StateEvaluation lead agency: 11/21/1991Date achieved compliance: LDR - GeneralArea of violation: COMPLIANCE EVALUATION INSPECTION ON-SITEEvaluation: 03/15/1990Evaluation date:
StateEvaluation lead agency: 11/21/1991Date achieved compliance: TSD - Closure/Post-ClosureArea of violation: COMPLIANCE EVALUATION INSPECTION ON-SITEEvaluation: 03/15/1990Evaluation date:
StateEvaluation lead agency: 11/21/1991Date achieved compliance: TSD - GeneralArea of violation: COMPLIANCE EVALUATION INSPECTION ON-SITEEvaluation: 03/15/1990Evaluation date:
StateEvaluation lead agency: 05/15/1992Date achieved compliance: TSD - Financial RequirementsArea of violation: FINANCIAL RECORD REVIEWEvaluation: 03/21/1990Evaluation date:
StateEvaluation lead agency: Not reportedDate achieved compliance: Not reportedArea of violation: FINANCIAL RECORD REVIEWEvaluation: 03/21/1991Evaluation date:
EPAEvaluation lead agency: 05/15/1992Date achieved compliance: TSD - Financial RequirementsArea of violation: FINANCIAL RECORD REVIEWEvaluation: 02/14/1992Evaluation date:
EPAEvaluation lead agency: Not reportedDate achieved compliance: Not reportedArea of violation: FINANCIAL RECORD REVIEWEvaluation: 05/15/1992Evaluation date:
StateEvaluation lead agency: 03/23/1993Date achieved compliance: TSD - GeneralArea of violation: COMPLIANCE EVALUATION INSPECTION ON-SITEEvaluation: 11/09/1992Evaluation date:
StateEvaluation lead agency: 03/23/1993Date achieved compliance: Transporters - GeneralArea of violation: COMPLIANCE EVALUATION INSPECTION ON-SITEEvaluation: 11/09/1992Evaluation date:
SAFETY KLEEN CORPORATION SYLMAR CA (Continued) 1000224422
TC3880855.2s Page 45
MAP FINDINGSMap IDDirection
EDR ID NumberDistanceEPA ID NumberDatabase(s)SiteElevation
Not reportedOriginal schedule date: All Other Support Services 56199NAICS Code(s): corrective action priority CA075LO - CA Prioritization, Facility or area was assigned a lowAction: 19921027Actual Date: ENTIRE FACILITYArea Name: 09EPA Region: CAT000613992EPA ID:
Not reportedSchedule end date: Not reportedOriginal schedule date: All Other Support Services 56199NAICS Code(s): considerations corrective action work at the facility, or other, administrative facility, the degree of risk, timing considerations, the status of (IN). Reasons for this conclusion may be the status of, closure at the inappropriate (NF) or (2) there is a lack of technical, information other than (1) it appears to be technically, infeasible or amenable to stabilization activity at the, present time for reasons CA225NR - Stabilization Measures Evaluation, This facility is, notAction: 19921027Actual Date: ENTIRE FACILITYArea Name: 09EPA Region: CAT000613992EPA ID:
Not reportedSchedule end date: Not reportedOriginal schedule date: All Other Support Services 56199NAICS Code(s): CA999 - Corrective Action Process TerminatedAction: 19901218Actual Date: ENTIRE FACILITYArea Name: 09EPA Region: CAT000613992EPA ID:
Not reportedSchedule end date: Not reportedOriginal schedule date: All Other Support Services 56199NAICS Code(s): CA050RF - RFA Completed, Assessment was an RFAAction: 19901218Actual Date: ENTIRE FACILITYArea Name: 09EPA Region: CAT000613992EPA ID:
CORRACTS:
StateEvaluation lead agency: 09/25/1987Date achieved compliance: TSD - GeneralArea of violation: COMPLIANCE EVALUATION INSPECTION ON-SITEEvaluation: 05/20/1987Evaluation date:
StateEvaluation lead agency: 05/15/1990Date achieved compliance:
SAFETY KLEEN CORPORATION SYLMAR CA (Continued) 1000224422
TC3880855.2s Page 46

MAP FINDINGSMap IDDirection
EDR ID NumberDistanceEPA ID NumberDatabase(s)SiteElevation
LUST Cleanup SiteCase Type: -118.4618831Longitude: 34.3070567Latitude: T0603702271Global Id: STATERegion:
LUST:
913421598Reg Id: LTNKAReg By: 19Facility County Code: CORTESERegion:
HIST CORTESE:
91342Discharge Zip: CaliforniaDischarge State: SylmarDischarge City: 13024 Bradley AveDischarge Address: Safety KleenDischarge Name: Not reportedTermination Date Of Regulatory Measure: Not reportedExpiration Date Of Regulatory Measure: 03/30/1992Effective Date Of Regulatory Measure: Not reportedAdoption Date Of Regulatory Measure: IndustrialProgram Type: 4 19I002034WDID: Not reportedPlace Id: EnrolleeRegulatory Measure Type: 97-03-DWQOrder No: 188883Regulatory Measure Id: 4Region: 0Agency Id: ActiveFacility Status: CAS000001Npdes Number:
NPDES:
HAZARDOUS WASTE BIENNIAL REPORTER
corrective action activities required under RCRA.program staff to track the notification, permit, compliance, andand treat, store, or dispose of hazardous waste. RCRAInfo allows RCRAevents and activities related to facilities that generate, transport,Conservation and Recovery Act (RCRA) program through the tracking ofRCRAInfo is a national information system that supports the Resource
facilities.generators, transporters, and treatment, storage, and disposalprovides California with information on hazardous waste shipments forCalifornia Hazardous Waste Tracking System - Datamart (HWTS-DATAMART) Environmental Interest/Information System
110000887826Registry ID:
FINDS:
Not reportedSchedule end date:
SAFETY KLEEN CORPORATION SYLMAR CA (Continued) 1000224422
TC3880855.2s Page 47
MAP FINDINGSMap IDDirection
EDR ID NumberDistanceEPA ID NumberDatabase(s)SiteElevation
04Regional Board: 4Region:
LUST REG 4:
Leak ReportedAction: 01/01/1950Date: OtherAction Type: T0603702271Global Id:
Regulatory Activities:
07/28/1994Status Date: Completed - Case ClosedStatus: T0603702271Global Id:
02/10/1986Status Date: Open - RemediationStatus: T0603702271Global Id:
09/26/1983Status Date: Open - Case Begin DateStatus: T0603702271Global Id:
Status History:
Not reportedPhone Number: [email protected]: LOS ANGELESCity: 200 North Main Street, Suite 1780Address: LOS ANGELES, CITY OFOrganization Name: ELOY LUNAContact Name: Local Agency CaseworkerContact Type: T0603702271Global Id:
Not reportedPhone Number: [email protected]: Los AngelesCity: 320 W. 4TH ST., SUITE 200Address: LOS ANGELES RWQCB (REGION 4)Organization Name: YUE RONGContact Name: Regional Board CaseworkerContact Type: T0603702271Global Id:
Contact:
Click here to access the California GeoTracker records for this facility:
Not reportedSite History: AviationPotential Contaminants of Concern: SoilPotential Media Affect: Not reportedFile Location: Not reportedLOC Case Number: 913421598RB Case Number: LOS ANGELES, CITY OFLocal Agency: ELCase Worker: LOS ANGELES, CITY OFLead Agency: 07/28/1994Status Date: Completed - Case ClosedStatus:
SAFETY KLEEN CORPORATION SYLMAR CA (Continued) 1000224422
TC3880855.2s Page 48

MAP FINDINGSMap IDDirection
EDR ID NumberDistanceEPA ID NumberDatabase(s)SiteElevation
7-28-94 FROM LA FIRE STATED THAT CASE WAS REFERREDTO RWQCB IN ERROR. CASE WAS REFERRED TO RWQCB BY LA FIRE 9-26-83. LTR DATEDSummary: Not reportedAssigned Name: Not reportedSuspended: Not reportedCleanup Fund Id: Not reportedPriority: Not reportedBeneficial Use: PEJLocal Agency Staff: 34.3070567 / -1Lat/Long: LUSTProgram: 777 BIG TIMBER RD, ELGIN, ILLINOIS 60120RP Address: SAFETY-KLEEN CORP.Responsible Party: Not reportedOwner Contact: Not reportedOrganization: Not reportedSoil Qualifier: Not reportedGW Qualifier: Not reportedSignificant Interim Remedial Action Taken: Not reportedHist Max MTBE Conc in Soil: Not reportedHist Max MTBE Conc in Groundwater: Not reportedHistorical Max MTBE Date: Not reportedEnforcement Action Date: Not reportedPost Remedial Action Monitoring Began: 2/10/1986Remedial Action Underway: Not reportedRemediation Plan Submitted: Not reportedPollution Characterization Began: Not reportedPreliminary Site Assessment Began: Not reportedPreliminary Site Assessment Workplan Submitted: UNKSource of Cleanup Funding: 4406.2840567471488977840291317Approx. Dist To Production Well (ft): Not reportedWell Name: Not reportedWater System: OLD CASENO WAS 081391-01Operator: UNKLeak Source: UNKCause of Leak: Not reportedHow Leak Stopped: Not reportedHow Leak Discovered: 7/28/1994Date the Case was Closed: 7/28/1994Date Case Last Changed on Database: Not reportedDate Leak Stopped: Not reportedDate Confirmation Began: 8/12/1991Date Leak Record Entered: 9/26/1983Date Leak First Reported: Not reportedDate Leak Discovered: Not reportedEnforcement Type: Not reportedCross Street: 19050Local Agency: UNKStaff: Not reportedW Global ID: T0603702271Global ID: Not reportedAbatement Method Used at the Site: SoilCase Type: Not reportedLocal Case No: Not reportedSubstance Quantity: 1Substance: Case ClosedStatus: 913421598Facility Id: Los AngelesCounty:
SAFETY KLEEN CORPORATION SYLMAR CA (Continued) 1000224422
TC3880855.2s Page 49

MAP FINDINGSMap IDDirection
EDR ID NumberDistanceEPA ID NumberDatabase(s)SiteElevation
PRODUCTTank Used for: 00012000Tank Capacity: 1979Year Installed: 03Container Num: 003Tank Num:
Visual, Stock InventorLeak Detection: .1875 inchesTank Construction: Not reportedType of Fuel: WASTETank Used for: 00001000Tank Capacity: 1979Year Installed: 02Container Num: 002Tank Num:
Visual, Stock InventorLeak Detection: .25 inchesTank Construction: Not reportedType of Fuel: WASTETank Used for: 00012000Tank Capacity: 1979Year Installed: 01Container Num: 001Tank Num:
ELGIN, IL 60120Owner City,St,Zip: 655 BIG TIMBER ROADOwner Address: SAFETY-KLEEN CORP.Owner Name: 3126978460Telephone: RANDY SCHEURNContact Name: 0003Total Tanks: PARTS WASHER SER. CTOther Type: OtherFacility Type: 00000004794Facility ID: STATERegion:
HIST UST:
ActiveStatus: Not reportedComments: Not reportedEPA ID: Not reportedNPDES Number: Not reportedDUNs Number: Not reportedContact Phone: Not reportedContact: SYLMAR 913420000Mailing City,St,Zip: Not reportedMailing Address 2: 13024 BRADLEY AVEMailing Address: Not reportedMail To: 8188994323Facility Phone: Not reportedSIC Code: Not reportedCortese Code: 00004794Regulated ID: UTNKARegulated By: 19003169Facility ID:
CA FID UST:
CASE WAS SOIL ONLY ACCORDING TO LTR.
SAFETY KLEEN CORPORATION SYLMAR CA (Continued) 1000224422
TC3880855.2s Page 50

MAP FINDINGSMap IDDirection
EDR ID NumberDistanceEPA ID NumberDatabase(s)SiteElevation
Not reportedNumber Of Tanks: UNKNOWNContent: PRODUCTStg: CHEMICALTank Use: 12000Capacity: Not reportedActv Date: 19-050-000391-000003Swrcb Tank Id: Not reportedOwner Tank Id: Not reportedTank Status: Not reportedCreated Date: Not reportedAction Date: Not reportedReferral Date: 44-011150Board Of Equalization: Not reportedNumber: 391Comp Number: Not reportedStatus:
Not reportedNumber Of Tanks: UNKNOWNContent: PRODUCTStg: CHEMICALTank Use: 1000Capacity: Not reportedActv Date: 19-050-000391-000002Swrcb Tank Id: Not reportedOwner Tank Id: Not reportedTank Status: Not reportedCreated Date: Not reportedAction Date: Not reportedReferral Date: 44-011150Board Of Equalization: Not reportedNumber: 391Comp Number: Not reportedStatus:
3Number Of Tanks: UNKNOWNContent: PRODUCTStg: CHEMICALTank Use: 12000Capacity: Not reportedActv Date: 19-050-000391-000001Swrcb Tank Id: Not reportedOwner Tank Id: Not reportedTank Status: Not reportedCreated Date: Not reportedAction Date: Not reportedReferral Date: 44-011150Board Of Equalization: Not reportedNumber: 391Comp Number: Not reportedStatus:
SWEEPS UST:
Visual, Stock InventorLeak Detection: .25 inchesTank Construction: Not reportedType of Fuel:
SAFETY KLEEN CORPORATION SYLMAR CA (Continued) 1000224422
TC3880855.2s Page 51

MAP FINDINGSMap IDDirection
EDR ID NumberDistanceEPA ID NumberDatabase(s)SiteElevation
Completed Info:
Envirostor ID NumberAlias Type: 80001791Alias Name: Project Code (Site Code)Alias Type: 300235Alias Name: EPA (FRS #)Alias Type: 110000887826Alias Name: EPA Identification NumberAlias Type: CAT000613992Alias Name: APNAlias Type: 2506019012Alias Name: NONE SPECIFIEDPotential Description: NONE SPECIFIED, NONE SPECIFIEDConfirmed COC: NONE SPECIFIEDPotential COC: NONE SPECIFIEDPast Use: 2506019012APN: -118.4577Longitude: 34.30716Latitude: Not reportedFunding: NONE SPECIFIEDSite Mgmt. Req.: NORestricted Use: 01/01/2008Status Date: * CompletedStatus: Not reportedSpecial Program: 18Senate: 39Assembly: 300235Site Code: 80001791Facility ID: Cleanup ChatsworthDivision Branch: * UnknownSupervisor: Not reportedProgram Manager: S EPLead Agency: US EPARegulatory Agencies: NONPL: 0Acres: Corrective ActionSite Type Detailed: Corrective ActionSite Type:
ENVIROSTOR:
05/11/2004Entered Date:Not reportedAssigned To:NoAbated:RO0012137Case ID:StateJurisdiction:SD0012137Site ID:FA0005631Facility ID:
LA Co. Site Mitigation:
91342-3831Incident Description: Not reportedDischarge Date: Not reportedFacility Type: Not reportedBoard File Number: Not reportedStaff Initials: Not reportedDate Reported:
Notify 65:
SAFETY KLEEN CORPORATION SYLMAR CA (Continued) 1000224422
TC3880855.2s Page 52

MAP FINDINGSMap IDDirection
EDR ID NumberDistanceEPA ID NumberDatabase(s)SiteElevation
Historical - Non-OperatingFacility Type: CAT000613992EPA Id:
04/24/1990Actual Date: New Operating Permit - APPLICATION PART B RECEIVEDEvent Description: CONTAIN1, TANK1, TANK2, TANK3, TANK4Unit Names: Historical - Non-OperatingFacility Type: CAT000613992EPA Id:
04/29/1988Actual Date: New Operating Permit - CALL-IN LETTER ISSUEDEvent Description: CONTAIN1, TANK1, TANK2, TANK3, TANK4Unit Names: Historical - Non-OperatingFacility Type: CAT000613992EPA Id:
Activities:
Not reportedPublic Information Officer: 18Senate District: 39Assembly District: 300235Site Code: Not reportedSupervisor: Not reportedTeam: Not reportedFacility Size: Historical - Non-OperatingFacility Type: -118.4609Longitude: 34.30629Latitude: CLOSEDCleanup Status: CAT000613992EPA Id:
HWP:
Not reportedSchedule Revised Date: Not reportedSchedule Due Date: Not reportedSchedule Document Type: Not reportedSchedule Sub Area Name: Not reportedSchedule Area Name: Not reportedFuture Due Date: Not reportedFuture Document Type: Not reportedFuture Sub Area Name: Not reportedFuture Area Name:
Not reportedComments: 12/18/1990Completed Date: * CA Process is TerminatedCompleted Document Type: Not reportedCompleted Sub Area Name: PROJECT WIDECompleted Area Name:
Not reportedComments: 12/18/1990Completed Date: RCRA Facility Assessment ReportCompleted Document Type: Not reportedCompleted Sub Area Name: PROJECT WIDECompleted Area Name:
Not reportedComments: 10/27/1992Completed Date: Interim Measures QuestionnaireCompleted Document Type: Not reportedCompleted Sub Area Name: PROJECT WIDECompleted Area Name:
SAFETY KLEEN CORPORATION SYLMAR CA (Continued) 1000224422
TC3880855.2s Page 53
MAP FINDINGSMap IDDirection
EDR ID NumberDistanceEPA ID NumberDatabase(s)SiteElevation
04/19/1994Actual Date: Emergency Permit - FINAL PERMIT (EXPIRES)Event Description: CONTAINER1Unit Names: Historical - Non-OperatingFacility Type: CAT000613992EPA Id:
12/21/1990Actual Date: Renewal - Historical - APPLICATION PART B RECEIVEDEvent Description: CONTAIN1, OTHRTRT1, TANKSTR1Unit Names: Historical - Non-OperatingFacility Type: CAT000613992EPA Id:
10/26/1990Actual Date: Renewal - Historical - APPLICATION PART A RECEIVEDEvent Description: CONTAIN1, OTHRTRT1, TANKSTR1Unit Names: Historical - Non-OperatingFacility Type: CAT000613992EPA Id:
01/21/1994Actual Date: Emergency Permit - FINAL PERMITEvent Description: CONTAINER1Unit Names: Historical - Non-OperatingFacility Type: CAT000613992EPA Id:
06/30/1992Actual Date: Renewal - Historical - FINAL PERMIT RENEWALEvent Description: CONTAIN1, OTHRTRT1, TANKSTR1Unit Names: Historical - Non-OperatingFacility Type: CAT000613992EPA Id:
10/26/1990Actual Date: New Operating Permit - APPLICATION PART A RECEIVEDEvent Description: CONTAIN1, TANK1, TANK2, TANK3, TANK4Unit Names: Historical - Non-OperatingFacility Type: CAT000613992EPA Id:
09/12/1991Actual Date: Renewal - Historical - TECHNICAL COMPLETE LETTEREvent Description: CONTAIN1, OTHRTRT1, TANKSTR1Unit Names: Historical - Non-OperatingFacility Type: CAT000613992EPA Id:
12/23/1991Actual Date: New Operating Permit - PUBLIC COMMENT (BEGIN)Event Description: CONTAIN1, TANK1, TANK2, TANK3, TANK4Unit Names: Historical - Non-OperatingFacility Type: CAT000613992EPA Id:
06/25/1992Actual Date: New Operating Permit - FINAL PERMIT (EFFECTIVE)Event Description: CONTAIN1, TANK1, TANK2, TANK3, TANK4Unit Names: Historical - Non-OperatingFacility Type: CAT000613992EPA Id:
06/30/1992Actual Date: New Operating Permit - FINAL PERMITEvent Description: CONTAIN1, TANK1, TANK2, TANK3, TANK4Unit Names:
SAFETY KLEEN CORPORATION SYLMAR CA (Continued) 1000224422
TC3880855.2s Page 54

MAP FINDINGSMap IDDirection
EDR ID NumberDistanceEPA ID NumberDatabase(s)SiteElevation
processing operation of whatever nature, including mining, gravel semisolid wastes from any servicing, producing, manufacturing or Industrial - Facility that treats and/or disposes of liquid orFacility Type: 4 19I002034Facility ID:
CA WDS:
300235Alias: Project Code (Site Code)Alias Type: Historical - Non-OperatingFacility Type: CAT000613992EPA Id:
110000887826Alias: FRSAlias Type: Historical - Non-OperatingFacility Type: CAT000613992EPA Id:
Alias:
02/23/1996Actual Date: Closure Final - ISSUE CLOSURE VERIFICATIONEvent Description: TANKTRT1 CONTAIN1, CONTAINER1, OTHRTRT1, TANK1, TANK2, TANK3, TANK4, TANKSTR1,Unit Names: Historical - Non-OperatingFacility Type: CAT000613992EPA Id:
06/22/1995Actual Date: Closure Final - RECEIVE CLOSURE CERTIFICATIONEvent Description: TANKTRT1 CONTAIN1, CONTAINER1, OTHRTRT1, TANK1, TANK2, TANK3, TANK4, TANKSTR1,Unit Names: Historical - Non-OperatingFacility Type: CAT000613992EPA Id:
Closure:
09/27/1994Actual Date: Renewal - Historical - PERMIT TERMINATED - TERMINATION APPROVEDEvent Description: CONTAIN1, OTHRTRT1, TANKSTR1Unit Names: Historical - Non-OperatingFacility Type: CAT000613992EPA Id:
04/29/1994Actual Date: Renewal - Historical - PUBLIC COMMENT (BEGIN)Event Description: CONTAIN1, OTHRTRT1, TANKSTR1Unit Names: Historical - Non-OperatingFacility Type: CAT000613992EPA Id:
09/12/1991Actual Date: New Operating Permit - TECHNICAL COMPLETE LETTEREvent Description: CONTAIN1, TANK1, TANK2, TANK3, TANK4Unit Names: Historical - Non-OperatingFacility Type: CAT000613992EPA Id:
08/31/1994Actual Date: Renewal - Historical - PERMIT TERMINATED - TERMINATION RECEIVEDEvent Description: CONTAIN1, OTHRTRT1, TANKSTR1Unit Names: Historical - Non-OperatingFacility Type: CAT000613992EPA Id:
SAFETY KLEEN CORPORATION SYLMAR CA (Continued) 1000224422
TC3880855.2s Page 55

MAP FINDINGSMap IDDirection
EDR ID NumberDistanceEPA ID NumberDatabase(s)SiteElevation
dairy waste ponds. dischargers having waste storage systems with land disposal such as disposal systems, such as septic systems with subsurface disposal, or management practices, facilities with passive waste treatment and cooling water dischargers or thosewho must comply through best Category C - Facilities having no waste treatment systems, such asComplexity: represent no threat to water quality. Level. A Zero (0) may be used to code those NURDS that are found to considered a minor threat to water quality unless coded at a higher to a major or minor threat. Not: All nurds without a TTWQ will be should cause a relatively minor impairment of beneficial uses compared Minor Threat to Water Quality. A violation of a regional board orderTreat To Water: Not reportedPOTW: Not reportedReclamation: 0Baseline Flow: 0Design Flow: Not reportedSecondary Waste Type: Not reportedSecondary Waste: Not reportedPrimary Waste Type: Not reportedWaste2: Not reportedWaste Type2: Not reportedPrimary Waste: Not reportedPrimary Waste Type: Not reportedSIC Code 2: 0SIC Code: PrivateAgency Type: 9163864917Agency Telephone: MATTHEWS JOHNAgency Contact: Sacramento 958281822Agency City,St,Zip: 8711 Elder Creek Rd Ste 700Agency Address: SAFETY KLEENAgency Name: MATTHEWS JOHNFacility Contact: 6264010106Facility Telephone: 4Subregion: are assigned by the Regional Board CAS000001 The 1st 2 characters designate the state. The remaining 7NPDES Number: under Waste Discharge Requirements. Active - Any facility with a continuous or seasonal discharge that isFacility Status: pumping. repairing, oil production, storage and disposal operations, water washing, geothermal operations, air conditioning, ship building and
SAFETY KLEEN CORPORATION SYLMAR CA (Continued) 1000224422
RICHARD BESUContact: SYLMAR, CA 91342 BLEDSOE STREET BLEDSOE STREETMailing address: CAD983649229EPA ID: SYLMAR, CA 91342 15191 BLEDSOE STREETFacility address: JOHANSON DIELECTRICS, INC.Facility name: 03/06/2012Date form received by agency:
RCRA-LQG:
4661 ft. US AIRS0.883 mi. ENVIROSTOR
Relative:Lower
Actual:1215 ft.
1/2-1 EMISYLMAR, CA 91342WSW TRIS15191 BLEDSOE ST 91342JHNSN1519123 RCRA-LQGJOHANSON DIELECTRICS INC 1000818981
TC3880855.2s Page 56

MAP FINDINGSMap IDDirection
EDR ID NumberDistanceEPA ID NumberDatabase(s)SiteElevation
NoUsed oil Specification marketer: NoUsed oil fuel marketer to burner: NoUser oil refiner: NoUsed oil processor: NoUsed oil fuel burner: NoFurnace exemption: NoOn-site burner exemption: NoUnderground injection activity: NoTreater, storer or disposer of HW: NoTransporter of hazardous waste: NoRecycler of hazardous waste: NoMixed waste (haz. and radioactive): NoU.S. importer of hazardous waste:
Handler Activities Summary:
Not reportedOwner/Op end date: 01/01/1994Owner/Op start date: OwnerOwner/Operator Type: PrivateLegal status: Not reportedOwner/operator telephone: Not reportedOwner/operator country: SYLMAR, CA 91342 BLEDSOE STREETOwner/operator address: JOHANSON DIELECTRICS, INC.Owner/operator name:
Not reportedOwner/Op end date: 01/01/1994Owner/Op start date: OperatorOwner/Operator Type: PrivateLegal status: Not reportedOwner/operator telephone: Not reportedOwner/operator country: SYLMAR, CA 91342 BLEDSOE STREETOwner/operator address: JOHANSON DIELECTRICS, INC.Owner/operator name:
Owner/Operator Summary:
100 kg of that material at any time hazardous waste during any calendar month, and accumulates more than from the cleanup of a spill, into or on any land or water, of acutely of any residue or contaminated soil, waste or other debris resulting kg of acutely hazardous waste at any time; or generates 100 kg or less hazardous waste during any calendar month, and accumulates more than 1 waste during any calendar month; or generates 1 kg or less of acutely cleanup of a spill, into or on any land or water, of acutely hazardous residue or contaminated soil, waste or other debris resulting from the during any calendar month; or generates more than 100 kg of any calendar month; or generates more than 1 kg of acutely hazardous waste Handler: generates 1,000 kg or more of hazardous waste during anyDescription: Large Quantity GeneratorClassification: PrivateLand type: 09EPA Region: Not reportedContact email: (818) 364-9800Contact telephone: Not reportedContact country: SYLMAR, CA 91342 BLEDSOE STREETContact address:
JOHANSON DIELECTRICS INC (Continued) 1000818981
TC3880855.2s Page 57
MAP FINDINGSMap IDDirection
EDR ID NumberDistanceEPA ID NumberDatabase(s)SiteElevation
CLOSED CUP FLASH POINT TESTER. ANOTHER METHOD OF DETERMINING THE LESS THAN 140 DEGREES FAHRENHEIT AS DETERMINED BY A PENSKY-MARTENS IGNITABLE HAZARDOUS WASTES ARE THOSE WASTES WHICH HAVE A FLASHPOINT OFWaste name: D001Waste code:
Hazardous Waste Summary:
Large Quantity GeneratorClassification: JOHANSON DIELECTRICS INCSite name: JOHANSON DIELECTRICS, INC.Facility name: 09/23/1992Date form received by agency:
Large Quantity GeneratorClassification: JOHANSON DIELECTRICS, INC.Facility name: 05/31/1994Date form received by agency:
Large Quantity GeneratorClassification: JOHANSON DIELECTRICS, INC.Facility name: 02/28/1996Date form received by agency:
Large Quantity GeneratorClassification: JOHANSON DIELECTRICS INCSite name: JOHANSON DIELECTRICS, INC.Facility name: 09/01/1996Date form received by agency:
Large Quantity GeneratorClassification: JOHANSON DIELECTRICS, INC.Facility name: 03/16/1999Date form received by agency:
Large Quantity GeneratorClassification: JOHANSON DIELECTRICS, INC.Facility name: 10/12/2000Date form received by agency:
Large Quantity GeneratorClassification: JOHANSON DIELECTRICS, INC.Facility name: 02/25/2002Date form received by agency:
Large Quantity GeneratorClassification: JOHANSON DIELECTRICS INCSite name: JOHANSON DIELECTRICS, INC.Facility name: 03/10/2004Date form received by agency:
Large Quantity GeneratorClassification: JOHANSON DIELECTRICS, INC.Facility name: 01/25/2006Date form received by agency:
Large Quantity GeneratorClassification: JOHANSON DIELECTRICS, INC.Facility name: 01/31/2008Date form received by agency:
Large Quantity GeneratorClassification: JOHANSON DIELECTRICS, INC.Facility name: 06/15/2010Date form received by agency:
Historical Generators:
NoUsed oil transporter: NoUsed oil transfer facility:
JOHANSON DIELECTRICS INC (Continued) 1000818981
TC3880855.2s Page 58

MAP FINDINGSMap IDDirection
EDR ID NumberDistanceEPA ID NumberDatabase(s)SiteElevation
PLATING ON CARBON STEEL; AND (6) CHEMICAL ETCHING AND MILLING OF STEEL; (5) CLEANING/STRIPPING ASSOCIATED WITH TIN, ZINC AND ALUMINUM ON CARBON STEEL; (4) ALUMINUM OR ZINC-ALUMINUM PLATING ON CARBON (2) TIN PLATING ON CARBON STEEL; (3) ZINC PLATING (SEGREGATED BASIS) FROM THE FOLLOWING PROCESSES: (1) SULFURIC ACID ANODIZING OF ALUMINUM; WASTEWATER TREATMENT SLUDGES FROM ELECTROPLATING OPERATIONS EXCEPTWaste name: F006Waste code:
THESE SPENT SOLVENTS AND SPENT SOLVENT MIXTURES. LISTED IN F001, F002, OR F004; AND STILL BOTTOMS FROM THE RECOVERY OF ONE OR MORE OF THE ABOVE NON-HALOGENATED SOLVENTS OR THOSE SOLVENTS CONTAINING, BEFORE USE, A TOTAL OF TEN PERCENT OR MORE (BY VOLUME) OF 2-ETHOXYETHANOL, AND 2-NITROPROPANE; ALL SPENT SOLVENT MIXTURES/BLENDS KETONE, CARBON DISULFIDE, ISOBUTANOL, PYRIDINE, BENZENE, THE FOLLOWING SPENT NON-HALOGENATED SOLVENTS: TOLUENE, METHYL ETHYLWaste name: F005Waste code:
MIXTURES. BOTTOMS FROM THE RECOVERY OF THESE SPENT SOLVENTS AND SPENT SOLVENT MORE OF THOSE SOLVENTS LISTED IN F001, F002, F004, AND F005, AND STILL SOLVENTS, AND, A TOTAL OF TEN PERCENT OR MORE (BY VOLUME) OF ONE OR CONTAINING, BEFORE USE, ONE OR MORE OF THE ABOVE NON-HALOGENATED NON-HALOGENATED SOLVENTS; AND ALL SPENT SOLVENT MIXTURES/BLENDS MIXTURES/BLENDS CONTAINING, BEFORE USE, ONLY THE ABOVE SPENT ALCOHOL, CYCLOHEXANONE, AND METHANOL; ALL SPENT SOLVENT ACETATE, ETHYL BENZENE, ETHYL ETHER, METHYL ISOBUTYL KETONE, N-BUTYL THE FOLLOWING SPENT NON-HALOGENATED SOLVENTS: XYLENE, ACETONE, ETHYLWaste name: F003Waste code:
METHYL ETHYL KETONEWaste name: D035Waste code:
SILVERWaste name: D011Waste code:
LEADWaste name: D008Waste code:
CADMIUMWaste name: D006Waste code:
BARIUMWaste name: D005Waste code:
DISPOSED, THE WASTE WOULD BE A CORROSIVE HAZARDOUS WASTE. THESE CAUSTIC OR ACID SOLUTIONS BECOME CONTAMINATED AND MUST BE USED BY MANY INDUSTRIES TO CLEAN METAL PARTS PRIOR TO PAINTING. WHEN OR DEGREASE PARTS. HYDROCHLORIC ACID, A SOLUTION WITH A LOW PH, IS CAUSTIC SOLUTION WITH A HIGH PH, IS OFTEN USED BY INDUSTRIES TO CLEAN CONSIDERED TO BE A CORROSIVE HAZARDOUS WASTE. SODIUM HYDROXIDE, A A WASTE WHICH HAS A PH OF LESS THAN 2 OR GREATER THAN 12.5 ISWaste name: D002Waste code:
WHICH WOULD BE CONSIDERED AS IGNITABLE HAZARDOUS WASTE. MATERIAL. LACQUER THINNER IS AN EXAMPLE OF A COMMONLY USED SOLVENT WHICH CAN BE OBTAINED FROM THE MANUFACTURER OR DISTRIBUTOR OF THE FLASH POINT OF A WASTE IS TO REVIEW THE MATERIAL SAFETY DATA SHEET,
JOHANSON DIELECTRICS INC (Continued) 1000818981
TC3880855.2s Page 59

MAP FINDINGSMap IDDirection
EDR ID NumberDistanceEPA ID NumberDatabase(s)SiteElevation
MIXTURES. BOTTOMS FROM THE RECOVERY OF THESE SPENT SOLVENTS AND SPENT SOLVENT MORE OF THOSE SOLVENTS LISTED IN F001, F002, F004, AND F005, AND STILL SOLVENTS, AND, A TOTAL OF TEN PERCENT OR MORE (BY VOLUME) OF ONE OR CONTAINING, BEFORE USE, ONE OR MORE OF THE ABOVE NON-HALOGENATED NON-HALOGENATED SOLVENTS; AND ALL SPENT SOLVENT MIXTURES/BLENDS MIXTURES/BLENDS CONTAINING, BEFORE USE, ONLY THE ABOVE SPENT ALCOHOL, CYCLOHEXANONE, AND METHANOL; ALL SPENT SOLVENT ACETATE, ETHYL BENZENE, ETHYL ETHER, METHYL ISOBUTYL KETONE, N-BUTYL THE FOLLOWING SPENT NON-HALOGENATED SOLVENTS: XYLENE, ACETONE, ETHYLWaste name: F003Waste code:
41900Amount (Lbs): METHYL ETHYL KETONEWaste name: D035Waste code:
68491Amount (Lbs): SILVERWaste name: D011Waste code:
120695Amount (Lbs): LEADWaste name: D008Waste code:
56474Amount (Lbs): CADMIUMWaste name: D006Waste code:
41615Amount (Lbs): BARIUMWaste name: D005Waste code:
22935Amount (Lbs): DISPOSED, THE WASTE WOULD BE A CORROSIVE HAZARDOUS WASTE. THESE CAUSTIC OR ACID SOLUTIONS BECOME CONTAMINATED AND MUST BE USED BY MANY INDUSTRIES TO CLEAN METAL PARTS PRIOR TO PAINTING. WHEN OR DEGREASE PARTS. HYDROCHLORIC ACID, A SOLUTION WITH A LOW PH, IS CAUSTIC SOLUTION WITH A HIGH PH, IS OFTEN USED BY INDUSTRIES TO CLEAN CONSIDERED TO BE A CORROSIVE HAZARDOUS WASTE. SODIUM HYDROXIDE, A A WASTE WHICH HAS A PH OF LESS THAN 2 OR GREATER THAN 12.5 ISWaste name: D002Waste code:
58938Amount (Lbs): WHICH WOULD BE CONSIDERED AS IGNITABLE HAZARDOUS WASTE. MATERIAL. LACQUER THINNER IS AN EXAMPLE OF A COMMONLY USED SOLVENT WHICH CAN BE OBTAINED FROM THE MANUFACTURER OR DISTRIBUTOR OF THE FLASH POINT OF A WASTE IS TO REVIEW THE MATERIAL SAFETY DATA SHEET, CLOSED CUP FLASH POINT TESTER. ANOTHER METHOD OF DETERMINING THE LESS THAN 140 DEGREES FAHRENHEIT AS DETERMINED BY A PENSKY-MARTENS IGNITABLE HAZARDOUS WASTES ARE THOSE WASTES WHICH HAVE A FLASHPOINT OFWaste name: D001Waste code:
Annual Waste Handled:
Last Biennial Reporting Year: 2013
Biennial Reports:
ALUMINUM.
JOHANSON DIELECTRICS INC (Continued) 1000818981
TC3880855.2s Page 60

MAP FINDINGSMap IDDirection
EDR ID NumberDistanceEPA ID NumberDatabase(s)SiteElevation
EPAViolation lead agency: 03/27/2009Date achieved compliance: 08/07/2008Date violation determined: Generators - Pre-transportArea of violation: Not reportedRegulation violated:
Not reported Paid penalty amount: 5000 Final penalty amount: Not reported Proposed penalty amount: EPA Enforcement lead agency: Not reported Enf. disp. status date: Not reported Enf. disposition status: 03/26/2009 Enforcement action date: SINGLE SITE CA/FO Enforcement action: EPAViolation lead agency: 03/27/2009Date achieved compliance: 08/07/2008Date violation determined: Generators - Pre-transportArea of violation: Not reportedRegulation violated:
Not reported Paid penalty amount: Not reported Final penalty amount: Not reported Proposed penalty amount: EPA Enforcement lead agency: Not reported Enf. disp. status date: Not reported Enf. disposition status: 12/23/2008 Enforcement action date: LETTER OF INTENT TO INITIATE ENFORCEMENT ACTION Enforcement action: EPAViolation lead agency: 03/27/2009Date achieved compliance: 08/07/2008Date violation determined: Generators - Pre-transportArea of violation: Not reportedRegulation violated:
Facility Has Received Notices of Violations:
6048Amount (Lbs): ALUMINUM. PLATING ON CARBON STEEL; AND (6) CHEMICAL ETCHING AND MILLING OF STEEL; (5) CLEANING/STRIPPING ASSOCIATED WITH TIN, ZINC AND ALUMINUM ON CARBON STEEL; (4) ALUMINUM OR ZINC-ALUMINUM PLATING ON CARBON (2) TIN PLATING ON CARBON STEEL; (3) ZINC PLATING (SEGREGATED BASIS) FROM THE FOLLOWING PROCESSES: (1) SULFURIC ACID ANODIZING OF ALUMINUM; WASTEWATER TREATMENT SLUDGES FROM ELECTROPLATING OPERATIONS EXCEPTWaste name: F006Waste code:
39600Amount (Lbs): THESE SPENT SOLVENTS AND SPENT SOLVENT MIXTURES. LISTED IN F001, F002, OR F004; AND STILL BOTTOMS FROM THE RECOVERY OF ONE OR MORE OF THE ABOVE NON-HALOGENATED SOLVENTS OR THOSE SOLVENTS CONTAINING, BEFORE USE, A TOTAL OF TEN PERCENT OR MORE (BY VOLUME) OF 2-ETHOXYETHANOL, AND 2-NITROPROPANE; ALL SPENT SOLVENT MIXTURES/BLENDS KETONE, CARBON DISULFIDE, ISOBUTANOL, PYRIDINE, BENZENE, THE FOLLOWING SPENT NON-HALOGENATED SOLVENTS: TOLUENE, METHYL ETHYLWaste name: F005Waste code:
10154Amount (Lbs):
JOHANSON DIELECTRICS INC (Continued) 1000818981
TC3880855.2s Page 61

MAP FINDINGSMap IDDirection
EDR ID NumberDistanceEPA ID NumberDatabase(s)SiteElevation
91259Facility ID: SCAir Basin: 19County Code: 1996Year:
EMI:
3 additional US_TRIS: record(s) in the EDR Site Report.Click this hyperlink while viewing on your computer to access
TRIS:
StateEvaluation lead agency: Not reportedDate achieved compliance: Not reportedArea of violation: COMPLIANCE EVALUATION INSPECTION ON-SITEEvaluation: 10/19/2007Evaluation date:
EPAEvaluation lead agency: 03/27/2009Date achieved compliance: Generators - Pre-transportArea of violation: COMPLIANCE EVALUATION INSPECTION ON-SITEEvaluation: 08/07/2008Evaluation date:
EPAEvaluation lead agency: 03/27/2009Date achieved compliance: Generators - Pre-transportArea of violation: SIGNIFICANT NON-COMPLIEREvaluation: 08/07/2008Evaluation date:
EPAEvaluation lead agency: 03/27/2009Date achieved compliance: Generators - Pre-transportArea of violation: NOT A SIGNIFICANT NON-COMPLIEREvaluation: 03/27/2009Evaluation date:
Evaluation Action Summary:
Not reported Paid penalty amount: Not reported Final penalty amount: Not reported Proposed penalty amount: EPA Enforcement lead agency: Not reported Enf. disp. status date: Not reported Enf. disposition status: 09/19/2008 Enforcement action date: Not reported Enforcement action: EPAViolation lead agency: 03/27/2009Date achieved compliance: 08/07/2008Date violation determined: Generators - Pre-transportArea of violation: Not reportedRegulation violated:
Not reported Paid penalty amount: Not reported Final penalty amount: Not reported Proposed penalty amount: EPA Enforcement lead agency: Not reported Enf. disp. status date: Not reported Enf. disposition status: 11/06/2008 Enforcement action date: Not reported Enforcement action:
JOHANSON DIELECTRICS INC (Continued) 1000818981
TC3880855.2s Page 62

MAP FINDINGSMap IDDirection
EDR ID NumberDistanceEPA ID NumberDatabase(s)SiteElevation
13Total Organic Hydrocarbon Gases Tons/Yr: Not reportedConsolidated Emission Reporting Rule: Not reportedCommunity Health Air Pollution Info System: SOUTH COAST AQMDAir District Name: 3679SIC Code: SCAir District Name: 91259Facility ID: SCAir Basin: 19County Code: 1999Year:
0Part. Matter 10 Micrometers & Smllr Tons/Yr: 0Particulate Matter Tons/Yr: 0SOX - Oxides of Sulphur Tons/Yr: 0NOX - Oxides of Nitrogen Tons/Yr: 0Carbon Monoxide Emissions Tons/Yr: 9Reactive Organic Gases Tons/Yr: 12Total Organic Hydrocarbon Gases Tons/Yr: Not reportedConsolidated Emission Reporting Rule: Not reportedCommunity Health Air Pollution Info System: SOUTH COAST AQMDAir District Name: 3679SIC Code: SCAir District Name: 91259Facility ID: SCAir Basin: 19County Code: 1998Year:
0Part. Matter 10 Micrometers & Smllr Tons/Yr: 0Particulate Matter Tons/Yr: 0SOX - Oxides of Sulphur Tons/Yr: 0NOX - Oxides of Nitrogen Tons/Yr: 0Carbon Monoxide Emissions Tons/Yr: 11Reactive Organic Gases Tons/Yr: 13Total Organic Hydrocarbon Gases Tons/Yr: Not reportedConsolidated Emission Reporting Rule: Not reportedCommunity Health Air Pollution Info System: SOUTH COAST AQMDAir District Name: 3679SIC Code: SCAir District Name: 91259Facility ID: SCAir Basin: 19County Code: 1997Year:
0Part. Matter 10 Micrometers & Smllr Tons/Yr: 0Particulate Matter Tons/Yr: 0SOX - Oxides of Sulphur Tons/Yr: 0NOX - Oxides of Nitrogen Tons/Yr: 0Carbon Monoxide Emissions Tons/Yr: 17Reactive Organic Gases Tons/Yr: 21Total Organic Hydrocarbon Gases Tons/Yr: Not reportedConsolidated Emission Reporting Rule: Not reportedCommunity Health Air Pollution Info System: SOUTH COAST AQMDAir District Name: 3679SIC Code: SCAir District Name:
JOHANSON DIELECTRICS INC (Continued) 1000818981
TC3880855.2s Page 63

MAP FINDINGSMap IDDirection
EDR ID NumberDistanceEPA ID NumberDatabase(s)SiteElevation
0Part. Matter 10 Micrometers & Smllr Tons/Yr: 0Particulate Matter Tons/Yr: 0SOX - Oxides of Sulphur Tons/Yr: 0NOX - Oxides of Nitrogen Tons/Yr: 0Carbon Monoxide Emissions Tons/Yr: 7Reactive Organic Gases Tons/Yr: 13Total Organic Hydrocarbon Gases Tons/Yr: Not reportedConsolidated Emission Reporting Rule: Not reportedCommunity Health Air Pollution Info System: SOUTH COAST AQMDAir District Name: 3679SIC Code: SCAir District Name: 91259Facility ID: SCAir Basin: 19County Code: 2002Year:
0Part. Matter 10 Micrometers & Smllr Tons/Yr: 0Particulate Matter Tons/Yr: 0SOX - Oxides of Sulphur Tons/Yr: 0NOX - Oxides of Nitrogen Tons/Yr: 0Carbon Monoxide Emissions Tons/Yr: 18Reactive Organic Gases Tons/Yr: 22Total Organic Hydrocarbon Gases Tons/Yr: BConsolidated Emission Reporting Rule: YCommunity Health Air Pollution Info System: SOUTH COAST AQMDAir District Name: 3679SIC Code: SCAir District Name: 91259Facility ID: SCAir Basin: 19County Code: 2001Year:
0Part. Matter 10 Micrometers & Smllr Tons/Yr: 0Particulate Matter Tons/Yr: 0SOX - Oxides of Sulphur Tons/Yr: 0NOX - Oxides of Nitrogen Tons/Yr: 0Carbon Monoxide Emissions Tons/Yr: 11Reactive Organic Gases Tons/Yr: 13Total Organic Hydrocarbon Gases Tons/Yr: Not reportedConsolidated Emission Reporting Rule: Not reportedCommunity Health Air Pollution Info System: SOUTH COAST AQMDAir District Name: 3679SIC Code: SCAir District Name: 91259Facility ID: SCAir Basin: 19County Code: 2000Year:
0Part. Matter 10 Micrometers & Smllr Tons/Yr: 0Particulate Matter Tons/Yr: 0SOX - Oxides of Sulphur Tons/Yr: 0NOX - Oxides of Nitrogen Tons/Yr: 0Carbon Monoxide Emissions Tons/Yr: 11Reactive Organic Gases Tons/Yr:
JOHANSON DIELECTRICS INC (Continued) 1000818981
TC3880855.2s Page 64

MAP FINDINGSMap IDDirection
EDR ID NumberDistanceEPA ID NumberDatabase(s)SiteElevation
3679SIC Code: SCAir District Name: 91259Facility ID: SCAir Basin: 19County Code: 2006Year:
.051843555Part. Matter 10 Micrometers & Smllr Tons/Yr: .053245Particulate Matter Tons/Yr: .00243SOX - Oxides of Sulphur Tons/Yr: .5292NOX - Oxides of Nitrogen Tons/Yr: .1429Carbon Monoxide Emissions Tons/Yr: 4.190432723Reactive Organic Gases Tons/Yr: 6.82267Total Organic Hydrocarbon Gases Tons/Yr: Not reportedConsolidated Emission Reporting Rule: Not reportedCommunity Health Air Pollution Info System: SOUTH COAST AQMDAir District Name: 3679SIC Code: SCAir District Name: 91259Facility ID: SCAir Basin: 19County Code: 2005Year:
0.04Part. Matter 10 Micrometers & Smllr Tons/Yr: 0.0462998Particulate Matter Tons/Yr: 0.002616SOX - Oxides of Sulphur Tons/Yr: 0.41NOX - Oxides of Nitrogen Tons/Yr: 0.1103Carbon Monoxide Emissions Tons/Yr: 7.12Reactive Organic Gases Tons/Yr: 13.31591Total Organic Hydrocarbon Gases Tons/Yr: Not reportedConsolidated Emission Reporting Rule: YCommunity Health Air Pollution Info System: SOUTH COAST AQMDAir District Name: 3679SIC Code: SCAir District Name: 91259Facility ID: SCAir Basin: 19County Code: 2004Year:
0Part. Matter 10 Micrometers & Smllr Tons/Yr: 0Particulate Matter Tons/Yr: 0SOX - Oxides of Sulphur Tons/Yr: 0NOX - Oxides of Nitrogen Tons/Yr: 0Carbon Monoxide Emissions Tons/Yr: 7Reactive Organic Gases Tons/Yr: 13Total Organic Hydrocarbon Gases Tons/Yr: Not reportedConsolidated Emission Reporting Rule: Not reportedCommunity Health Air Pollution Info System: SOUTH COAST AQMDAir District Name: 3679SIC Code: SCAir District Name: 91259Facility ID: SCAir Basin: 19County Code: 2003Year:
JOHANSON DIELECTRICS INC (Continued) 1000818981
TC3880855.2s Page 65

MAP FINDINGSMap IDDirection
EDR ID NumberDistanceEPA ID NumberDatabase(s)SiteElevation
0.14000000000000001Carbon Monoxide Emissions Tons/Yr: 7.0070230000000002Reactive Organic Gases Tons/Yr: 7.7831614836473504Total Organic Hydrocarbon Gases Tons/Yr: Not reportedConsolidated Emission Reporting Rule: Not reportedCommunity Health Air Pollution Info System: SOUTH COAST AQMDAir District Name: 3675SIC Code: SCAir District Name: 91259Facility ID: SCAir Basin: 19County Code: 2009Year:
.031023571695Part. Matter 10 Micrometers & Smllr Tons/Yr: .0317749275Particulate Matter Tons/Yr: .002403SOX - Oxides of Sulphur Tons/Yr: .52NOX - Oxides of Nitrogen Tons/Yr: .14Carbon Monoxide Emissions Tons/Yr: 6.317824780412282807Reactive Organic Gases Tons/Yr: 7.264681838549539311Total Organic Hydrocarbon Gases Tons/Yr: Not reportedConsolidated Emission Reporting Rule: Not reportedCommunity Health Air Pollution Info System: SOUTH COAST AQMDAir District Name: 3675SIC Code: SCAir District Name: 91259Facility ID: SCAir Basin: 19County Code: 2008Year:
.028Part. Matter 10 Micrometers & Smllr Tons/Yr: .028Particulate Matter Tons/Yr: .002SOX - Oxides of Sulphur Tons/Yr: .485NOX - Oxides of Nitrogen Tons/Yr: .13Carbon Monoxide Emissions Tons/Yr: 8.778Reactive Organic Gases Tons/Yr: 12.67128855152473281Total Organic Hydrocarbon Gases Tons/Yr: Not reportedConsolidated Emission Reporting Rule: Not reportedCommunity Health Air Pollution Info System: SOUTH COAST AQMDAir District Name: 3679SIC Code: SCAir District Name: 91259Facility ID: SCAir Basin: 19County Code: 2007Year:
.028Part. Matter 10 Micrometers & Smllr Tons/Yr: .028Particulate Matter Tons/Yr: .002SOX - Oxides of Sulphur Tons/Yr: .485NOX - Oxides of Nitrogen Tons/Yr: .13Carbon Monoxide Emissions Tons/Yr: 8.778Reactive Organic Gases Tons/Yr: 12.67128855152473281Total Organic Hydrocarbon Gases Tons/Yr: Not reportedConsolidated Emission Reporting Rule: Not reportedCommunity Health Air Pollution Info System: SOUTH COAST AQMDAir District Name:
JOHANSON DIELECTRICS INC (Continued) 1000818981
TC3880855.2s Page 66

MAP FINDINGSMap IDDirection
EDR ID NumberDistanceEPA ID NumberDatabase(s)SiteElevation
Completed Info:
Envirostor ID NumberAlias Type: 71003170Alias Name: EPA (FRS #)Alias Type: 110000476921Alias Name: EPA Identification NumberAlias Type: CAD983649229Alias Name: NONE SPECIFIEDPotential Description: NONE SPECIFIED, NONE SPECIFIEDConfirmed COC: NONE SPECIFIEDPotential COC: NONE SPECIFIEDPast Use: NONE SPECIFIEDAPN: -118.4654Longitude: 34.30651Latitude: Not reportedFunding: NONE SPECIFIEDSite Mgmt. Req.: NORestricted Use: Not reportedStatus Date: Refer: Other AgencyStatus: Not reportedSpecial Program: 18Senate: 39Assembly: Not reportedSite Code: 71003170Facility ID: Cleanup ChatsworthDivision Branch: Not reportedSupervisor: Not reportedProgram Manager: NONE SPECIFIEDLead Agency: NONE SPECIFIEDRegulatory Agencies: NONPL: Not reportedAcres: Tiered PermitSite Type Detailed: Tiered PermitSite Type:
ENVIROSTOR:
4.2100100000000001E-2Part. Matter 10 Micrometers & Smllr Tons/Yr: 0.04258Particulate Matter Tons/Yr: 0.00332SOX - Oxides of Sulphur Tons/Yr: 0.72019999999999995NOX - Oxides of Nitrogen Tons/Yr: 0.19389999999999999Carbon Monoxide Emissions Tons/Yr: 8.4089600000000004Reactive Organic Gases Tons/Yr: 9.6312261159669799Total Organic Hydrocarbon Gases Tons/Yr: Not reportedConsolidated Emission Reporting Rule: Not reportedCommunity Health Air Pollution Info System: SOUTH COAST AQMDAir District Name: 3675SIC Code: SCAir District Name: 91259Facility ID: SCAir Basin: 19County Code: 2010Year:
3.0401592000000002E-2Part. Matter 10 Micrometers & Smllr Tons/Yr: 3.0752000000000002E-2Particulate Matter Tons/Yr: 2.5500000000000002E-3SOX - Oxides of Sulphur Tons/Yr: 0.55000000000000004NOX - Oxides of Nitrogen Tons/Yr:
JOHANSON DIELECTRICS INC (Continued) 1000818981
TC3880855.2s Page 67
MAP FINDINGSMap IDDirection
EDR ID NumberDistanceEPA ID NumberDatabase(s)SiteElevation
MULTI MEDIA INSPECTION - LEVEL 2 OR GREATERNational action type: TITLE V PERMITSAir program:
Not reportedPenalty amount: 020301Date achieved: MULTI MEDIA INSPECTION - LEVEL 2 OR GREATERNational action type: SIP SOURCEAir program:
000000000Penalty amount: 010320Date achieved: MULTI MEDIA INSPECTION - LEVEL 2 OR GREATERNational action type: TITLE V PERMITSAir program:
000000000Penalty amount: 000107Date achieved: MULTI MEDIA INSPECTION - LEVEL 2 OR GREATERNational action type: TITLE V PERMITSAir program:
Compliance and Enforcement Major Issues:
Not reportedCurrent HPV: LOCAL GOVERNMENT ALL OTHER FACILITIES NOT OWNED OR OPERATED BY A FEDERAL, STATE, ORGovt facility: THRESHOLDS ACTUAL OR POTENTIAL EMISSIONS ARE ABOVE THE APPLICABLE MAJOR SOURCEDefault classification: IN COMPLIANCE - INSPECTIONDefault compliance status: Electronic Capacitor ManufacturingNAIC code description: 334414North Am. industrial classf: ELECTRONIC COMPONENTS, NECSic code desc: 3679Sic code: 024Air quality cntrl region: Not reportedDunn & Bradst #: 09Region code: LOS ANGELESCounty: SYLMAR, CA 91342 15191 BLEDSOE STPlant address: JOHANSON DIELECTRICS INCPlant name: 110006835461EPA plant ID:
Compliance and Violation Data Major Sources:
AIRS (AFS):
Not reportedSchedule Revised Date: Not reportedSchedule Due Date: Not reportedSchedule Document Type: Not reportedSchedule Sub Area Name: Not reportedSchedule Area Name: Not reportedFuture Due Date: Not reportedFuture Document Type: Not reportedFuture Sub Area Name: Not reportedFuture Area Name:
Not reportedComments: Not reportedCompleted Date: Not reportedCompleted Document Type: Not reportedCompleted Sub Area Name: Not reportedCompleted Area Name:
JOHANSON DIELECTRICS INC (Continued) 1000818981
TC3880855.2s Page 68

MAP FINDINGSMap IDDirection
EDR ID NumberDistanceEPA ID NumberDatabase(s)SiteElevation
Not reportedPenalty amount: 040226Date achieved: MULTI MEDIA INSPECTION - LEVEL 2 OR GREATERNational action type: SIP SOURCEAir program:
Not reportedPenalty amount: 040122Date achieved: STATE CONDUCTED PCE/ ON-SITENational action type: SIP SOURCEAir program:
Not reportedPenalty amount: 040122Date achieved: STATE CONDUCTED PCE/ ON-SITENational action type: TITLE V PERMITSAir program:
Not reportedPenalty amount: 030404Date achieved: STATE CONDUCTED FCE / ON-SITENational action type: TITLE V PERMITSAir program:
Not reportedPenalty amount: 030328Date achieved: STATE CONDUCTED PCE/ ON-SITENational action type: TITLE V PERMITSAir program:
Not reportedPenalty amount: 030307Date achieved: COMPLIANCE CERTIFICATION STATE REVIEWNational action type: TITLE V PERMITSAir program:
Not reportedPenalty amount: 020930Date achieved: STATE CONDUCTED FCE / ON-SITENational action type: SIP SOURCEAir program:
Not reportedPenalty amount: 020930Date achieved: STATE CONDUCTED FCE / ON-SITENational action type: TITLE V PERMITSAir program:
Not reportedPenalty amount: 020806Date achieved: COMPLIANCE CERTIFICATION EPA REVIEWNational action type: TITLE V PERMITSAir program:
Not reportedPenalty amount: 020305Date achieved: COMPLIANCE CERTIFICATION STATE REVIEWNational action type: SIP SOURCEAir program:
Not reportedPenalty amount: 020305Date achieved: COMPLIANCE CERTIFICATION STATE REVIEWNational action type: TITLE V PERMITSAir program:
Not reportedPenalty amount: 020301Date achieved:
JOHANSON DIELECTRICS INC (Continued) 1000818981
TC3880855.2s Page 69

MAP FINDINGSMap IDDirection
EDR ID NumberDistanceEPA ID NumberDatabase(s)SiteElevation
STATE CONDUCTED PCE/ ON-SITENational action type: TITLE V PERMITSAir program:
Not reportedPenalty amount: 060228Date achieved: COMPLIANCE CERTIFICATION STATE REVIEWNational action type: SIP SOURCEAir program:
Not reportedPenalty amount: 060228Date achieved: COMPLIANCE CERTIFICATION STATE REVIEWNational action type: TITLE V PERMITSAir program:
Not reportedPenalty amount: 050818Date achieved: STATE CONDUCTED PCE/ ON-SITENational action type: SIP SOURCEAir program:
Not reportedPenalty amount: 050818Date achieved: STATE CONDUCTED PCE/ ON-SITENational action type: TITLE V PERMITSAir program:
Not reportedPenalty amount: 050818Date achieved: STATE CONDUCTED FCE / ON-SITENational action type: TITLE V PERMITSAir program:
Not reportedPenalty amount: 050818Date achieved: STATE CONDUCTED FCE / ON-SITENational action type: SIP SOURCEAir program:
Not reportedPenalty amount: 050227Date achieved: COMPLIANCE CERTIFICATION STATE REVIEWNational action type: SIP SOURCEAir program:
Not reportedPenalty amount: 050227Date achieved: COMPLIANCE CERTIFICATION STATE REVIEWNational action type: TITLE V PERMITSAir program:
Not reportedPenalty amount: 040226Date achieved: MULTI MEDIA INSPECTION - LEVEL 2 OR GREATERNational action type: TITLE V PERMITSAir program:
Not reportedPenalty amount: 040226Date achieved: STATE CONDUCTED FCE / ON-SITENational action type: TITLE V PERMITSAir program:
Not reportedPenalty amount: 040226Date achieved: STATE CONDUCTED FCE / ON-SITENational action type: SIP SOURCEAir program:
JOHANSON DIELECTRICS INC (Continued) 1000818981
TC3880855.2s Page 70

MAP FINDINGSMap IDDirection
EDR ID NumberDistanceEPA ID NumberDatabase(s)SiteElevation
Not reportedPenalty amount: 070816Date achieved: STATE CONDUCTED PCE/ ON-SITENational action type: TITLE V PERMITSAir program:
Not reportedPenalty amount: 070816Date achieved: STATE CONDUCTED FCE / ON-SITENational action type: TITLE V PERMITSAir program:
Not reportedPenalty amount: 070816Date achieved: STATE CONDUCTED PCE/ ON-SITENational action type: SIP SOURCEAir program:
Not reportedPenalty amount: 070307Date achieved: TITLE V COMPLIANCE CERT DUE/RECEIVED BYNational action type: TITLE V PERMITSAir program:
Not reportedPenalty amount: 070228Date achieved: COMPLIANCE CERTIFICATION STATE REVIEWNational action type: SIP SOURCEAir program:
Not reportedPenalty amount: 070228Date achieved: COMPLIANCE CERTIFICATION STATE REVIEWNational action type: TITLE V PERMITSAir program:
Not reportedPenalty amount: 060822Date achieved: S/L REQ (O/O COND) STACK TEST/NOT OBSV BUT REVWDNational action type: SIP SOURCEAir program:
Not reportedPenalty amount: 060822Date achieved: S/L REQ (O/O COND) STACK TEST/NOT OBSV BUT REVWDNational action type: TITLE V PERMITSAir program:
Not reportedPenalty amount: 060818Date achieved: STATE CONDUCTED FCE / ON-SITENational action type: SIP SOURCEAir program:
Not reportedPenalty amount: 060818Date achieved: STATE CONDUCTED FCE / ON-SITENational action type: TITLE V PERMITSAir program:
Not reportedPenalty amount: 060818Date achieved: STATE CONDUCTED PCE/ ON-SITENational action type: SIP SOURCEAir program:
Not reportedPenalty amount: 060818Date achieved:
JOHANSON DIELECTRICS INC (Continued) 1000818981
TC3880855.2s Page 71

MAP FINDINGSMap IDDirection
EDR ID NumberDistanceEPA ID NumberDatabase(s)SiteElevation
COMPLIANCE CERTIFICATION STATE REVIEWNational action type: SIP SOURCEAir program:
Not reportedPenalty amount: 090315Date achieved: COMPLIANCE CERTIFICATION STATE REVIEWNational action type: TITLE V PERMITSAir program:
Not reportedPenalty amount: 090228Date achieved: TITLE V ANN COMPL CERT DUE/RCV BY PERMIT AUTHORITYNational action type: TITLE V PERMITSAir program:
Not reportedPenalty amount: 090228Date achieved: TITLE V ANN COMPL CERT DUE/RCV BY PERMIT AUTHORITYNational action type: SIP SOURCEAir program:
Not reportedPenalty amount: 080720Date achieved: STATE CONDUCTED PCE/ ON-SITENational action type: TITLE V PERMITSAir program:
Not reportedPenalty amount: 080720Date achieved: STATE CONDUCTED FCE / ON-SITENational action type: SIP SOURCEAir program:
Not reportedPenalty amount: 080720Date achieved: STATE CONDUCTED PCE/ ON-SITENational action type: SIP SOURCEAir program:
Not reportedPenalty amount: 080720Date achieved: STATE CONDUCTED FCE / ON-SITENational action type: TITLE V PERMITSAir program:
Not reportedPenalty amount: 080304Date achieved: TITLE V COMPLIANCE CERT DUE/RECEIVED BYNational action type: TITLE V PERMITSAir program:
Not reportedPenalty amount: 080301Date achieved: COMPLIANCE CERTIFICATION STATE REVIEWNational action type: TITLE V PERMITSAir program:
Not reportedPenalty amount: 080301Date achieved: COMPLIANCE CERTIFICATION STATE REVIEWNational action type: SIP SOURCEAir program:
Not reportedPenalty amount: 070816Date achieved: STATE CONDUCTED FCE / ON-SITENational action type: SIP SOURCEAir program:
JOHANSON DIELECTRICS INC (Continued) 1000818981
TC3880855.2s Page 72

MAP FINDINGSMap IDDirection
EDR ID NumberDistanceEPA ID NumberDatabase(s)SiteElevation
Not reportedPenalty amount: 100428Date achieved: STATE CONDUCTED FCE / ON-SITENational action type: TITLE V PERMITSAir program:
Not reportedPenalty amount: 100415Date achieved: STATE CONDUCTED PCE/ ON-SITENational action type: TITLE V PERMITSAir program:
Not reportedPenalty amount: 100415Date achieved: STATE CONDUCTED PCE/ ON-SITENational action type: SIP SOURCEAir program:
Not reportedPenalty amount: 100302Date achieved: TITLE V COMPLIANCE CERT DUE/RECEIVED BYNational action type: TITLE V PERMITSAir program:
Not reportedPenalty amount: 100225Date achieved: TITLE V ANN COMPL CERT DUE/RCV BY PERMIT AUTHORITYNational action type: SIP SOURCEAir program:
Not reportedPenalty amount: 100225Date achieved: TITLE V ANN COMPL CERT DUE/RCV BY PERMIT AUTHORITYNational action type: TITLE V PERMITSAir program:
Not reportedPenalty amount: 090329Date achieved: STATE CONDUCTED FCE / ON-SITENational action type: SIP SOURCEAir program:
Not reportedPenalty amount: 090329Date achieved: STATE CONDUCTED FCE / ON-SITENational action type: TITLE V PERMITSAir program:
Not reportedPenalty amount: 090319Date achieved: TITLE V COMPLIANCE CERT DUE/RECEIVED BYNational action type: TITLE V PERMITSAir program:
Not reportedPenalty amount: 090315Date achieved: STATE CONDUCTED PCE/ ON-SITENational action type: SIP SOURCEAir program:
Not reportedPenalty amount: 090315Date achieved: STATE CONDUCTED PCE/ ON-SITENational action type: TITLE V PERMITSAir program:
Not reportedPenalty amount: 090315Date achieved:
JOHANSON DIELECTRICS INC (Continued) 1000818981
TC3880855.2s Page 73
MAP FINDINGSMap IDDirection
EDR ID NumberDistanceEPA ID NumberDatabase(s)SiteElevation
STATE CONDUCTED PCE/ ON-SITENational action type: TITLE V PERMITSAir program:
Not reportedPenalty amount: 110824Date achieved: STATE CONDUCTED PCE/ ON-SITENational action type: SIP SOURCEAir program:
Not reportedPenalty amount: 110824Date achieved: COMPLIANCE CERTIFICATION STATE REVIEWNational action type: SIP SOURCEAir program:
Not reportedPenalty amount: 110701Date achieved: STATE CONDUCTED PCE/ ON-SITENational action type: TITLE V PERMITSAir program:
Not reportedPenalty amount: 110701Date achieved: STATE CONDUCTED PCE/ ON-SITENational action type: SIP SOURCEAir program:
Not reportedPenalty amount: 110303Date achieved: TITLE V ANN COMPL CERT DUE/RCV BY PERMIT AUTHORITYNational action type: TITLE V PERMITSAir program:
Not reportedPenalty amount: 110303Date achieved: TITLE V ANN COMPL CERT DUE/RCV BY PERMIT AUTHORITYNational action type: SIP SOURCEAir program:
Not reportedPenalty amount: 101202Date achieved: S/L REQ (O/O COND) STACK TEST/NOT OBSV BUT REVWDNational action type: TITLE V PERMITSAir program:
Not reportedPenalty amount: 101202Date achieved: S/L REQ (O/O COND) STACK TEST/NOT OBSV BUT REVWDNational action type: SIP SOURCEAir program:
Not reportedPenalty amount: 100428Date achieved: STATE CONDUCTED FCE / ON-SITENational action type: SIP SOURCEAir program:
Not reportedPenalty amount: 100428Date achieved: COMPLIANCE CERTIFICATION STATE REVIEWNational action type: TITLE V PERMITSAir program:
Not reportedPenalty amount: 100428Date achieved: COMPLIANCE CERTIFICATION STATE REVIEWNational action type: SIP SOURCEAir program:
JOHANSON DIELECTRICS INC (Continued) 1000818981
TC3880855.2s Page 74

MAP FINDINGSMap IDDirection
EDR ID NumberDistanceEPA ID NumberDatabase(s)SiteElevation
Not reportedPenalty amount: 120302Date achieved: STATE CONDUCTED FCE / ON-SITENational action type: TITLE V PERMITSAir program:
Not reportedPenalty amount: 120302Date achieved: COMPLIANCE CERTIFICATION STATE REVIEWNational action type: SIP SOURCEAir program:
Not reportedPenalty amount: 120302Date achieved: STATE CONDUCTED PCE/ ON-SITENational action type: TITLE V PERMITSAir program:
Not reportedPenalty amount: 120302Date achieved: STATE CONDUCTED PCE/ ON-SITENational action type: SIP SOURCEAir program:
Not reportedPenalty amount: 120302Date achieved: COMPLIANCE CERTIFICATION STATE REVIEWNational action type: TITLE V PERMITSAir program:
Not reportedPenalty amount: 120302Date achieved: STATE CONDUCTED FCE / ON-SITENational action type: SIP SOURCEAir program:
Not reportedPenalty amount: 120229Date achieved: TITLE V ANN COMPL CERT DUE/RCV BY PERMIT AUTHORITYNational action type: SIP SOURCEAir program:
Not reportedPenalty amount: 120229Date achieved: TITLE V ANN COMPL CERT DUE/RCV BY PERMIT AUTHORITYNational action type: TITLE V PERMITSAir program:
Not reportedPenalty amount: 110829Date achieved: S/L REQ (O/O COND) STACK TEST/NOT OBSV BUT REVWDNational action type: TITLE V PERMITSAir program:
Not reportedPenalty amount: 110829Date achieved: S/L REQ (O/O COND) STACK TEST/NOT OBSV BUT REVWDNational action type: SIP SOURCEAir program:
Not reportedPenalty amount: 110824Date achieved: COMPLIANCE CERTIFICATION STATE REVIEWNational action type: TITLE V PERMITSAir program:
Not reportedPenalty amount: 110824Date achieved:
JOHANSON DIELECTRICS INC (Continued) 1000818981
TC3880855.2s Page 75
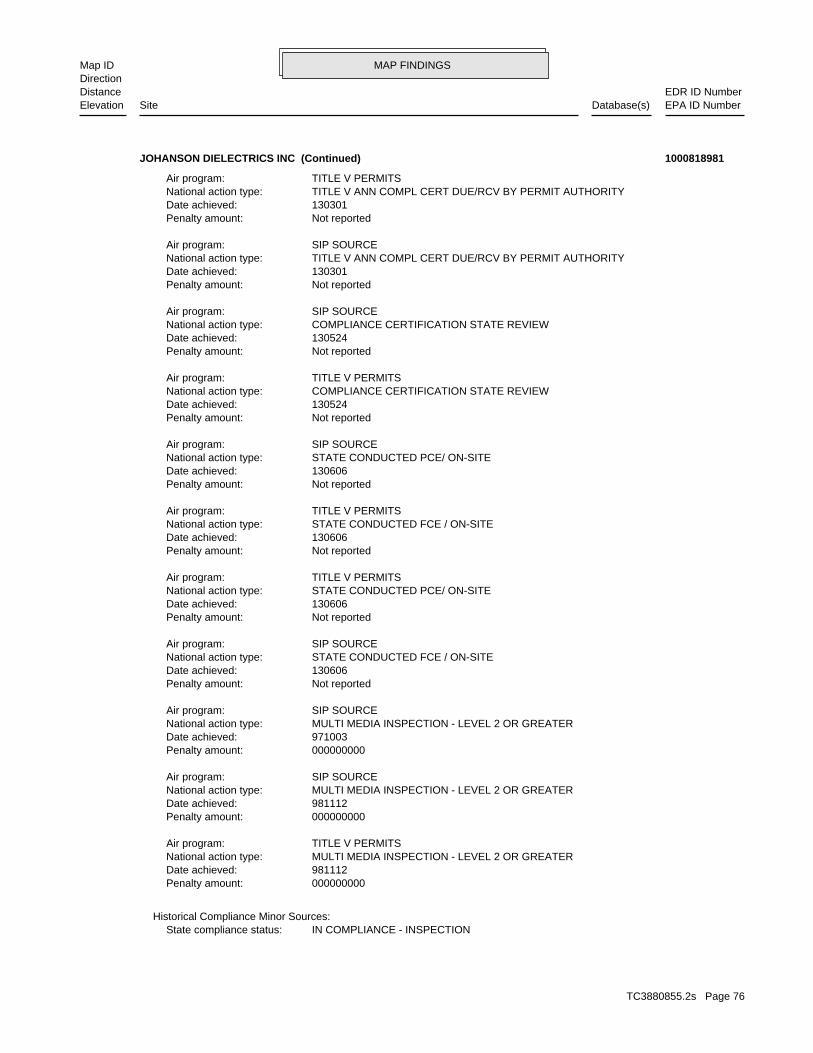
MAP FINDINGSMap IDDirection
EDR ID NumberDistanceEPA ID NumberDatabase(s)SiteElevation
IN COMPLIANCE - INSPECTIONState compliance status:Historical Compliance Minor Sources:
000000000Penalty amount: 981112Date achieved: MULTI MEDIA INSPECTION - LEVEL 2 OR GREATERNational action type: TITLE V PERMITSAir program:
000000000Penalty amount: 981112Date achieved: MULTI MEDIA INSPECTION - LEVEL 2 OR GREATERNational action type: SIP SOURCEAir program:
000000000Penalty amount: 971003Date achieved: MULTI MEDIA INSPECTION - LEVEL 2 OR GREATERNational action type: SIP SOURCEAir program:
Not reportedPenalty amount: 130606Date achieved: STATE CONDUCTED FCE / ON-SITENational action type: SIP SOURCEAir program:
Not reportedPenalty amount: 130606Date achieved: STATE CONDUCTED PCE/ ON-SITENational action type: TITLE V PERMITSAir program:
Not reportedPenalty amount: 130606Date achieved: STATE CONDUCTED FCE / ON-SITENational action type: TITLE V PERMITSAir program:
Not reportedPenalty amount: 130606Date achieved: STATE CONDUCTED PCE/ ON-SITENational action type: SIP SOURCEAir program:
Not reportedPenalty amount: 130524Date achieved: COMPLIANCE CERTIFICATION STATE REVIEWNational action type: TITLE V PERMITSAir program:
Not reportedPenalty amount: 130524Date achieved: COMPLIANCE CERTIFICATION STATE REVIEWNational action type: SIP SOURCEAir program:
Not reportedPenalty amount: 130301Date achieved: TITLE V ANN COMPL CERT DUE/RCV BY PERMIT AUTHORITYNational action type: SIP SOURCEAir program:
Not reportedPenalty amount: 130301Date achieved: TITLE V ANN COMPL CERT DUE/RCV BY PERMIT AUTHORITYNational action type: TITLE V PERMITSAir program:
JOHANSON DIELECTRICS INC (Continued) 1000818981
TC3880855.2s Page 76
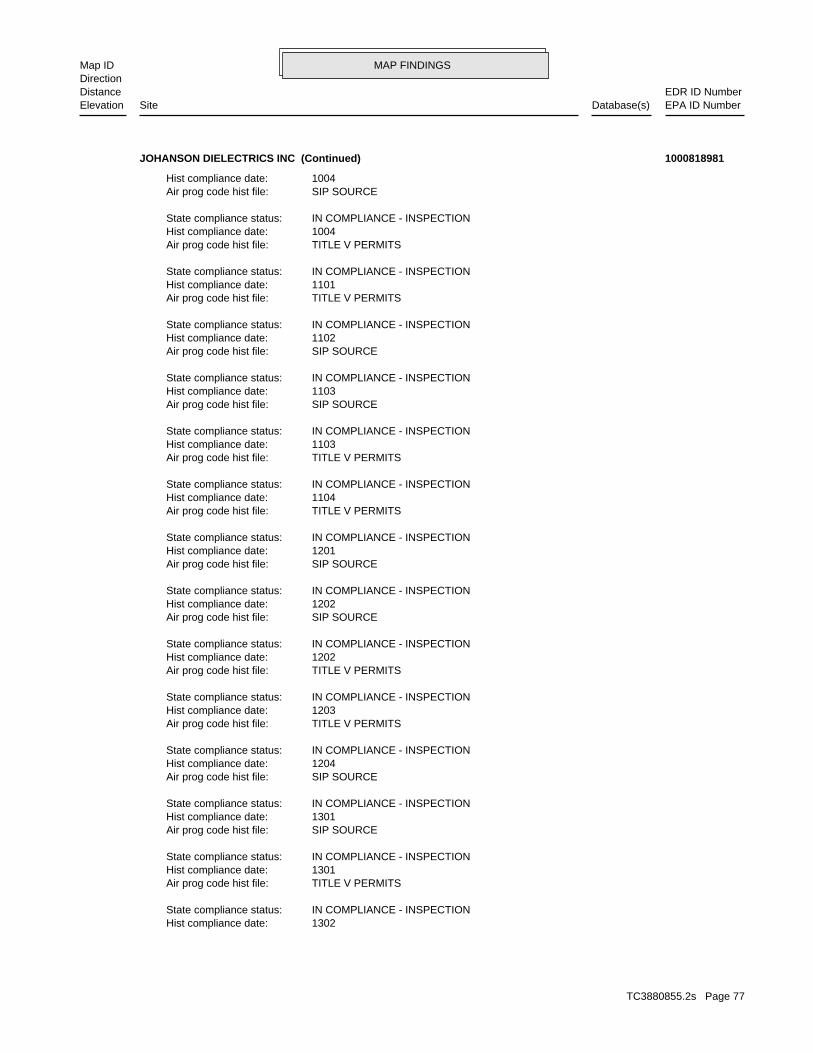
MAP FINDINGSMap IDDirection
EDR ID NumberDistanceEPA ID NumberDatabase(s)SiteElevation
1302Hist compliance date: IN COMPLIANCE - INSPECTIONState compliance status:
TITLE V PERMITSAir prog code hist file: 1301Hist compliance date: IN COMPLIANCE - INSPECTIONState compliance status:
SIP SOURCEAir prog code hist file: 1301Hist compliance date: IN COMPLIANCE - INSPECTIONState compliance status:
SIP SOURCEAir prog code hist file: 1204Hist compliance date: IN COMPLIANCE - INSPECTIONState compliance status:
TITLE V PERMITSAir prog code hist file: 1203Hist compliance date: IN COMPLIANCE - INSPECTIONState compliance status:
TITLE V PERMITSAir prog code hist file: 1202Hist compliance date: IN COMPLIANCE - INSPECTIONState compliance status:
SIP SOURCEAir prog code hist file: 1202Hist compliance date: IN COMPLIANCE - INSPECTIONState compliance status:
SIP SOURCEAir prog code hist file: 1201Hist compliance date: IN COMPLIANCE - INSPECTIONState compliance status:
TITLE V PERMITSAir prog code hist file: 1104Hist compliance date: IN COMPLIANCE - INSPECTIONState compliance status:
TITLE V PERMITSAir prog code hist file: 1103Hist compliance date: IN COMPLIANCE - INSPECTIONState compliance status:
SIP SOURCEAir prog code hist file: 1103Hist compliance date: IN COMPLIANCE - INSPECTIONState compliance status:
SIP SOURCEAir prog code hist file: 1102Hist compliance date: IN COMPLIANCE - INSPECTIONState compliance status:
TITLE V PERMITSAir prog code hist file: 1101Hist compliance date: IN COMPLIANCE - INSPECTIONState compliance status:
TITLE V PERMITSAir prog code hist file: 1004Hist compliance date: IN COMPLIANCE - INSPECTIONState compliance status:
SIP SOURCEAir prog code hist file: 1004Hist compliance date:
JOHANSON DIELECTRICS INC (Continued) 1000818981
TC3880855.2s Page 77
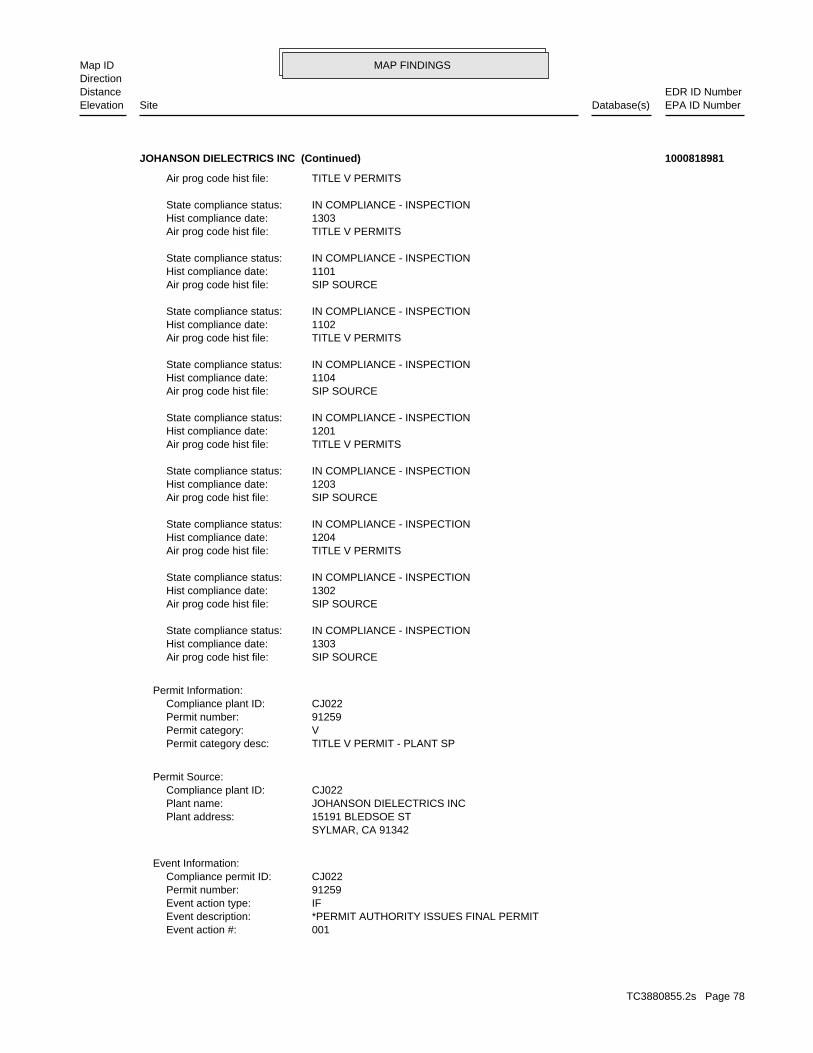
MAP FINDINGSMap IDDirection
EDR ID NumberDistanceEPA ID NumberDatabase(s)SiteElevation
001Event action #: *PERMIT AUTHORITY ISSUES FINAL PERMITEvent description: IFEvent action type: 91259Permit number: CJ022Compliance permit ID:
Event Information:
SYLMAR, CA 91342 15191 BLEDSOE STPlant address: JOHANSON DIELECTRICS INCPlant name: CJ022Compliance plant ID:
Permit Source:
TITLE V PERMIT - PLANT SPPermit category desc: VPermit category: 91259Permit number: CJ022Compliance plant ID:
Permit Information:
SIP SOURCEAir prog code hist file: 1303Hist compliance date: IN COMPLIANCE - INSPECTIONState compliance status:
SIP SOURCEAir prog code hist file: 1302Hist compliance date: IN COMPLIANCE - INSPECTIONState compliance status:
TITLE V PERMITSAir prog code hist file: 1204Hist compliance date: IN COMPLIANCE - INSPECTIONState compliance status:
SIP SOURCEAir prog code hist file: 1203Hist compliance date: IN COMPLIANCE - INSPECTIONState compliance status:
TITLE V PERMITSAir prog code hist file: 1201Hist compliance date: IN COMPLIANCE - INSPECTIONState compliance status:
SIP SOURCEAir prog code hist file: 1104Hist compliance date: IN COMPLIANCE - INSPECTIONState compliance status:
TITLE V PERMITSAir prog code hist file: 1102Hist compliance date: IN COMPLIANCE - INSPECTIONState compliance status:
SIP SOURCEAir prog code hist file: 1101Hist compliance date: IN COMPLIANCE - INSPECTIONState compliance status:
TITLE V PERMITSAir prog code hist file: 1303Hist compliance date: IN COMPLIANCE - INSPECTIONState compliance status:
TITLE V PERMITSAir prog code hist file:
JOHANSON DIELECTRICS INC (Continued) 1000818981
TC3880855.2s Page 78

MAP FINDINGSMap IDDirection
EDR ID NumberDistanceEPA ID NumberDatabase(s)SiteElevation
20061006Event date:
JOHANSON DIELECTRICS INC (Continued) 1000818981
Not reportedSchedule Revised Date: Not reportedSchedule Due Date: Not reportedSchedule Document Type: Not reportedSchedule Sub Area Name: Not reportedSchedule Area Name: Not reportedFuture Due Date: Not reportedFuture Document Type: Not reportedFuture Sub Area Name: Not reportedFuture Area Name:
Not reportedComments: Not reportedCompleted Date: Not reportedCompleted Document Type: Not reportedCompleted Sub Area Name: Not reportedCompleted Area Name:
Completed Info:
Envirostor ID NumberAlias Type: 19990045Alias Name: NONE SPECIFIEDPotential Description: NONE SPECIFIED, NONE SPECIFIEDConfirmed COC: NONE SPECIFIEDPotential COC: NONE SPECIFIEDPast Use: NONE SPECIFIEDAPN: 0Longitude: 0Latitude: Not ApplicableFunding: NONE SPECIFIEDSite Mgmt. Req.: NORestricted Use: 09/01/2004Status Date: Refer: 1248 Local AgencyStatus: Not reportedSpecial Program: 20Senate: 39Assembly: Not reportedSite Code: 19990045Facility ID: Cleanup CypressDivision Branch: Referred - Not AssignedSupervisor: Not reportedProgram Manager: NONE SPECIFIEDLead Agency: NONE SPECIFIEDRegulatory Agencies: NONPL: Not reportedAcres: EvaluationSite Type Detailed: EvaluationSite Type:
ENVIROSTOR:
4787 ft.0.907 mi.
Relative:Higher
Actual:1444 ft.
1/2-1 SYLMAR, CA 91342NNE 14148 BLEDSOE ST. N/A24 ENVIROSTORCASTLE PRECISION INDUSTRIES S106665629
TC3880855.2s Page 79

ORPHAN SUMMARY
City EDR ID Site Name Site Address Zip Database(s)
Count: 6 records.
LOS ANGELES S113154164 CALTRANS D-7/CONSTR/EA07-168004 RTE 5/14 PM R71.2-R74.0 91342 HAZNETLOS ANGELES S112882954 CITY LOS ANGELES 14565/14569/14573 POLK ST 91342 HAZNETLOS ANGELES COUNTY S107532211 28.15 MI.MARKER ON ANGELES CRE CDLSYLMAR S112902018 SAIA MOTOR TRANSPORTATION I-5 2MILES S OF STATE ROUTE 14 91342 HAZNETSYLMAR S113137489 CALTRANS DIST 7 RTE 5 SB/NB KP 63.4-72.6 91342 HAZNETSYLMAR S111215645 NEWHALL I 5 SR 14 I 5 SR 14 SAN FERNANDO RD OFF 91342 NPDES
TC3880855.2s Page 80

To maintain currency of the following federal and state databases, EDR contacts the appropriate governmental agencyon a monthly or quarterly basis, as required.
Number of Days to Update: Provides confirmation that EDR is reporting records that have been updated within 90 daysfrom the date the government agency made the information available to the public.
STANDARD ENVIRONMENTAL RECORDS
Federal NPL site list
NPL: National Priority ListNational Priorities List (Superfund). The NPL is a subset of CERCLIS and identifies over 1,200 sites for prioritycleanup under the Superfund Program. NPL sites may encompass relatively large areas. As such, EDR provides polygoncoverage for over 1,000 NPL site boundaries produced by EPA’s Environmental Photographic Interpretation Center(EPIC) and regional EPA offices.
Date of Government Version: 10/25/2013Date Data Arrived at EDR: 11/11/2013Date Made Active in Reports: 01/28/2014Number of Days to Update: 78
Source: EPATelephone: N/ALast EDR Contact: 01/21/2014Next Scheduled EDR Contact: 04/21/2014Data Release Frequency: Quarterly
NPL Site Boundaries
Sources:
EPA’s Environmental Photographic Interpretation Center (EPIC)Telephone: 202-564-7333
EPA Region 1 EPA Region 6Telephone 617-918-1143 Telephone: 214-655-6659
EPA Region 3 EPA Region 7Telephone 215-814-5418 Telephone: 913-551-7247
EPA Region 4 EPA Region 8Telephone 404-562-8033 Telephone: 303-312-6774
EPA Region 5 EPA Region 9Telephone 312-886-6686 Telephone: 415-947-4246
EPA Region 10Telephone 206-553-8665
Proposed NPL: Proposed National Priority List SitesA site that has been proposed for listing on the National Priorities List through the issuance of a proposed rulein the Federal Register. EPA then accepts public comments on the site, responds to the comments, and places onthe NPL those sites that continue to meet the requirements for listing.
Date of Government Version: 10/25/2013Date Data Arrived at EDR: 11/11/2013Date Made Active in Reports: 01/28/2014Number of Days to Update: 78
Source: EPATelephone: N/ALast EDR Contact: 01/09/2014Next Scheduled EDR Contact: 04/21/2014Data Release Frequency: Quarterly
NPL LIENS: Federal Superfund LiensFederal Superfund Liens. Under the authority granted the USEPA by CERCLA of 1980, the USEPA has the authorityto file liens against real property in order to recover remedial action expenditures or when the property ownerreceived notification of potential liability. USEPA compiles a listing of filed notices of Superfund Liens.
Date of Government Version: 10/15/1991Date Data Arrived at EDR: 02/02/1994Date Made Active in Reports: 03/30/1994Number of Days to Update: 56
Source: EPATelephone: 202-564-4267Last EDR Contact: 08/15/2011Next Scheduled EDR Contact: 11/28/2011Data Release Frequency: No Update Planned
TC3880855.2s Page GR-1
GOVERNMENT RECORDS SEARCHED / DATA CURRENCY TRACKING

Federal Delisted NPL site list
DELISTED NPL: National Priority List DeletionsThe National Oil and Hazardous Substances Pollution Contingency Plan (NCP) establishes the criteria that theEPA uses to delete sites from the NPL. In accordance with 40 CFR 300.425.(e), sites may be deleted from theNPL where no further response is appropriate.
Date of Government Version: 10/25/2013Date Data Arrived at EDR: 11/11/2013Date Made Active in Reports: 01/28/2014Number of Days to Update: 78
Source: EPATelephone: N/ALast EDR Contact: 01/09/2014Next Scheduled EDR Contact: 04/21/2014Data Release Frequency: Quarterly
Federal CERCLIS list
CERCLIS: Comprehensive Environmental Response, Compensation, and Liability Information SystemCERCLIS contains data on potentially hazardous waste sites that have been reported to the USEPA by states, municipalities,private companies and private persons, pursuant to Section 103 of the Comprehensive Environmental Response, Compensation,and Liability Act (CERCLA). CERCLIS contains sites which are either proposed to or on the National PrioritiesList (NPL) and sites which are in the screening and assessment phase for possible inclusion on the NPL.
Date of Government Version: 10/25/2013Date Data Arrived at EDR: 11/11/2013Date Made Active in Reports: 02/13/2014Number of Days to Update: 94
Source: EPATelephone: 703-412-9810Last EDR Contact: 02/28/2014Next Scheduled EDR Contact: 06/09/2014Data Release Frequency: Quarterly
FEDERAL FACILITY: Federal Facility Site Information listingA listing of National Priority List (NPL) and Base Realignment and Closure (BRAC) sites found in the ComprehensiveEnvironmental Response, Compensation and Liability Information System (CERCLIS) Database where EPA Federal FacilitiesRestoration and Reuse Office is involved in cleanup activities.
Date of Government Version: 05/31/2013Date Data Arrived at EDR: 07/08/2013Date Made Active in Reports: 12/06/2013Number of Days to Update: 151
Source: Environmental Protection AgencyTelephone: 703-603-8704Last EDR Contact: 01/10/2014Next Scheduled EDR Contact: 04/21/2014Data Release Frequency: Varies
Federal CERCLIS NFRAP site List
CERCLIS-NFRAP: CERCLIS No Further Remedial Action PlannedArchived sites are sites that have been removed and archived from the inventory of CERCLIS sites. Archived statusindicates that, to the best of EPA’s knowledge, assessment at a site has been completed and that EPA has determinedno further steps will be taken to list this site on the National Priorities List (NPL), unless information indicatesthis decision was not appropriate or other considerations require a recommendation for listing at a later time.This decision does not necessarily mean that there is no hazard associated with a given site; it only means that,based upon available information, the location is not judged to be a potential NPL site.
Date of Government Version: 10/25/2013Date Data Arrived at EDR: 11/11/2013Date Made Active in Reports: 02/13/2014Number of Days to Update: 94
Source: EPATelephone: 703-412-9810Last EDR Contact: 02/28/2014Next Scheduled EDR Contact: 06/09/2014Data Release Frequency: Quarterly
Federal RCRA CORRACTS facilities list
CORRACTS: Corrective Action ReportCORRACTS identifies hazardous waste handlers with RCRA corrective action activity.
TC3880855.2s Page GR-2
GOVERNMENT RECORDS SEARCHED / DATA CURRENCY TRACKING
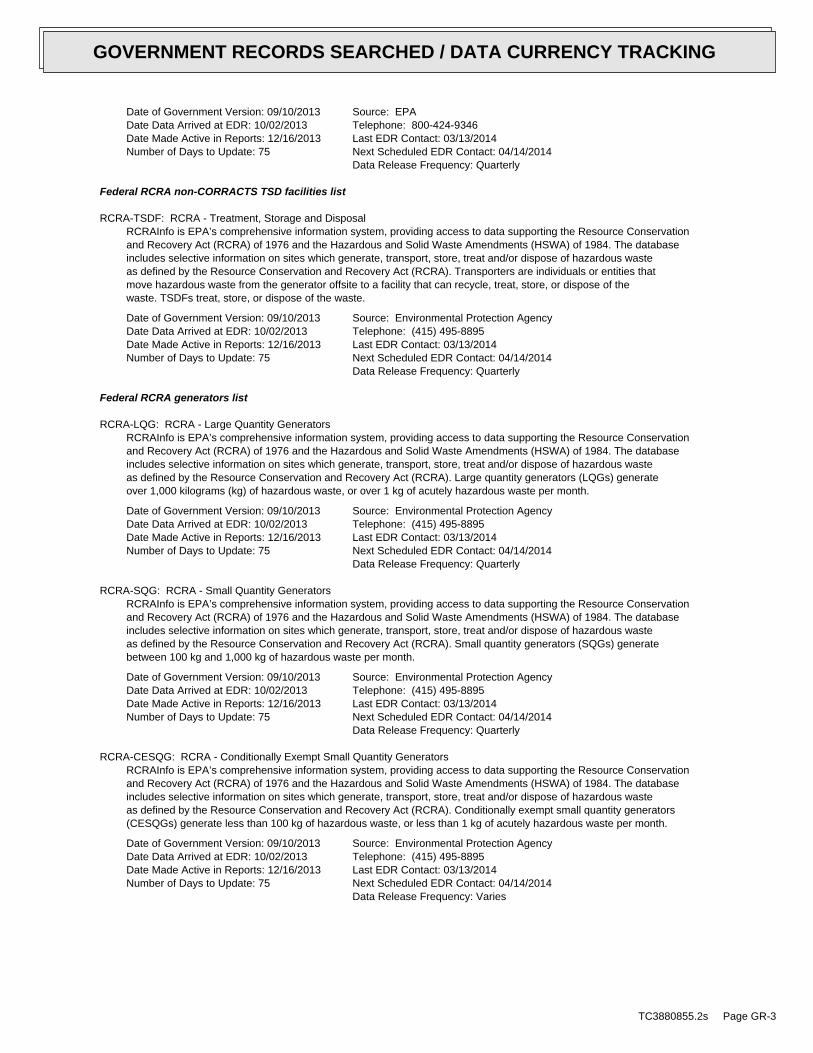
Date of Government Version: 09/10/2013Date Data Arrived at EDR: 10/02/2013Date Made Active in Reports: 12/16/2013Number of Days to Update: 75
Source: EPATelephone: 800-424-9346Last EDR Contact: 03/13/2014Next Scheduled EDR Contact: 04/14/2014Data Release Frequency: Quarterly
Federal RCRA non-CORRACTS TSD facilities list
RCRA-TSDF: RCRA - Treatment, Storage and DisposalRCRAInfo is EPA’s comprehensive information system, providing access to data supporting the Resource Conservationand Recovery Act (RCRA) of 1976 and the Hazardous and Solid Waste Amendments (HSWA) of 1984. The databaseincludes selective information on sites which generate, transport, store, treat and/or dispose of hazardous wasteas defined by the Resource Conservation and Recovery Act (RCRA). Transporters are individuals or entities thatmove hazardous waste from the generator offsite to a facility that can recycle, treat, store, or dispose of thewaste. TSDFs treat, store, or dispose of the waste.
Date of Government Version: 09/10/2013Date Data Arrived at EDR: 10/02/2013Date Made Active in Reports: 12/16/2013Number of Days to Update: 75
Source: Environmental Protection AgencyTelephone: (415) 495-8895Last EDR Contact: 03/13/2014Next Scheduled EDR Contact: 04/14/2014Data Release Frequency: Quarterly
Federal RCRA generators list
RCRA-LQG: RCRA - Large Quantity GeneratorsRCRAInfo is EPA’s comprehensive information system, providing access to data supporting the Resource Conservationand Recovery Act (RCRA) of 1976 and the Hazardous and Solid Waste Amendments (HSWA) of 1984. The databaseincludes selective information on sites which generate, transport, store, treat and/or dispose of hazardous wasteas defined by the Resource Conservation and Recovery Act (RCRA). Large quantity generators (LQGs) generateover 1,000 kilograms (kg) of hazardous waste, or over 1 kg of acutely hazardous waste per month.
Date of Government Version: 09/10/2013Date Data Arrived at EDR: 10/02/2013Date Made Active in Reports: 12/16/2013Number of Days to Update: 75
Source: Environmental Protection AgencyTelephone: (415) 495-8895Last EDR Contact: 03/13/2014Next Scheduled EDR Contact: 04/14/2014Data Release Frequency: Quarterly
RCRA-SQG: RCRA - Small Quantity GeneratorsRCRAInfo is EPA’s comprehensive information system, providing access to data supporting the Resource Conservationand Recovery Act (RCRA) of 1976 and the Hazardous and Solid Waste Amendments (HSWA) of 1984. The databaseincludes selective information on sites which generate, transport, store, treat and/or dispose of hazardous wasteas defined by the Resource Conservation and Recovery Act (RCRA). Small quantity generators (SQGs) generatebetween 100 kg and 1,000 kg of hazardous waste per month.
Date of Government Version: 09/10/2013Date Data Arrived at EDR: 10/02/2013Date Made Active in Reports: 12/16/2013Number of Days to Update: 75
Source: Environmental Protection AgencyTelephone: (415) 495-8895Last EDR Contact: 03/13/2014Next Scheduled EDR Contact: 04/14/2014Data Release Frequency: Quarterly
RCRA-CESQG: RCRA - Conditionally Exempt Small Quantity GeneratorsRCRAInfo is EPA’s comprehensive information system, providing access to data supporting the Resource Conservationand Recovery Act (RCRA) of 1976 and the Hazardous and Solid Waste Amendments (HSWA) of 1984. The databaseincludes selective information on sites which generate, transport, store, treat and/or dispose of hazardous wasteas defined by the Resource Conservation and Recovery Act (RCRA). Conditionally exempt small quantity generators(CESQGs) generate less than 100 kg of hazardous waste, or less than 1 kg of acutely hazardous waste per month.
Date of Government Version: 09/10/2013Date Data Arrived at EDR: 10/02/2013Date Made Active in Reports: 12/16/2013Number of Days to Update: 75
Source: Environmental Protection AgencyTelephone: (415) 495-8895Last EDR Contact: 03/13/2014Next Scheduled EDR Contact: 04/14/2014Data Release Frequency: Varies
TC3880855.2s Page GR-3
GOVERNMENT RECORDS SEARCHED / DATA CURRENCY TRACKING
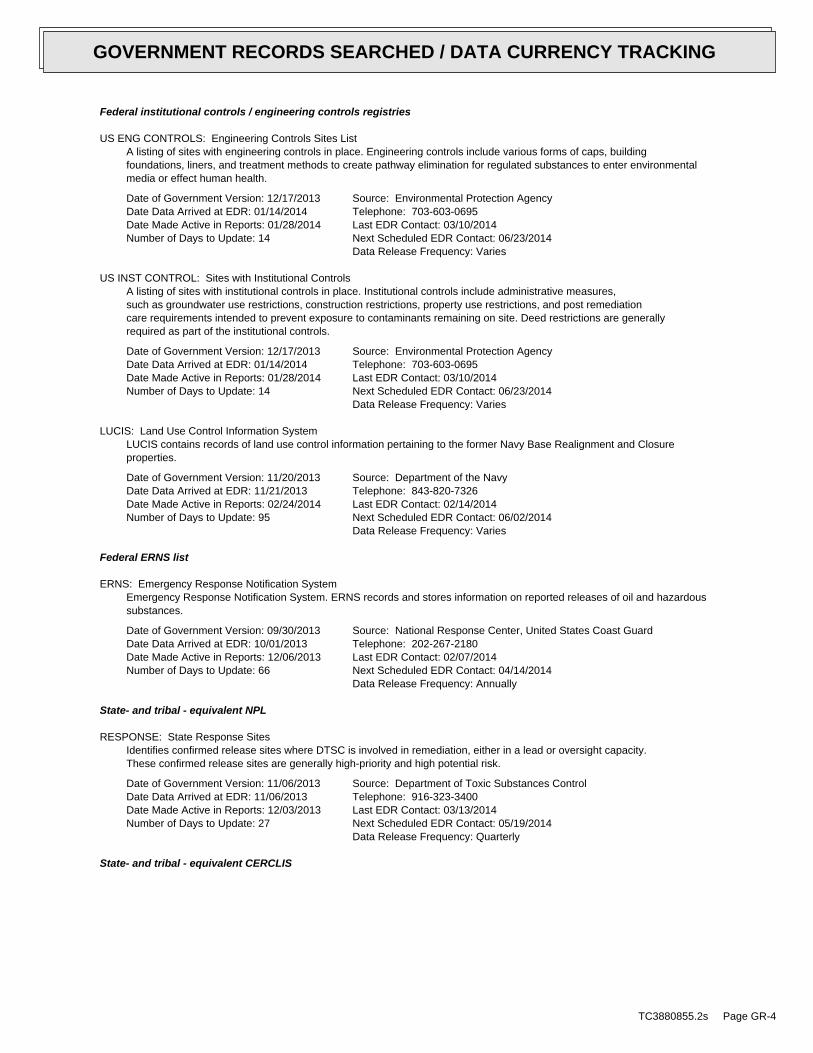
Federal institutional controls / engineering controls registries
US ENG CONTROLS: Engineering Controls Sites ListA listing of sites with engineering controls in place. Engineering controls include various forms of caps, buildingfoundations, liners, and treatment methods to create pathway elimination for regulated substances to enter environmentalmedia or effect human health.
Date of Government Version: 12/17/2013Date Data Arrived at EDR: 01/14/2014Date Made Active in Reports: 01/28/2014Number of Days to Update: 14
Source: Environmental Protection AgencyTelephone: 703-603-0695Last EDR Contact: 03/10/2014Next Scheduled EDR Contact: 06/23/2014Data Release Frequency: Varies
US INST CONTROL: Sites with Institutional ControlsA listing of sites with institutional controls in place. Institutional controls include administrative measures,such as groundwater use restrictions, construction restrictions, property use restrictions, and post remediationcare requirements intended to prevent exposure to contaminants remaining on site. Deed restrictions are generallyrequired as part of the institutional controls.
Date of Government Version: 12/17/2013Date Data Arrived at EDR: 01/14/2014Date Made Active in Reports: 01/28/2014Number of Days to Update: 14
Source: Environmental Protection AgencyTelephone: 703-603-0695Last EDR Contact: 03/10/2014Next Scheduled EDR Contact: 06/23/2014Data Release Frequency: Varies
LUCIS: Land Use Control Information SystemLUCIS contains records of land use control information pertaining to the former Navy Base Realignment and Closureproperties.
Date of Government Version: 11/20/2013Date Data Arrived at EDR: 11/21/2013Date Made Active in Reports: 02/24/2014Number of Days to Update: 95
Source: Department of the NavyTelephone: 843-820-7326Last EDR Contact: 02/14/2014Next Scheduled EDR Contact: 06/02/2014Data Release Frequency: Varies
Federal ERNS list
ERNS: Emergency Response Notification SystemEmergency Response Notification System. ERNS records and stores information on reported releases of oil and hazardoussubstances.
Date of Government Version: 09/30/2013Date Data Arrived at EDR: 10/01/2013Date Made Active in Reports: 12/06/2013Number of Days to Update: 66
Source: National Response Center, United States Coast GuardTelephone: 202-267-2180Last EDR Contact: 02/07/2014Next Scheduled EDR Contact: 04/14/2014Data Release Frequency: Annually
State- and tribal - equivalent NPL
RESPONSE: State Response SitesIdentifies confirmed release sites where DTSC is involved in remediation, either in a lead or oversight capacity.These confirmed release sites are generally high-priority and high potential risk.
Date of Government Version: 11/06/2013Date Data Arrived at EDR: 11/06/2013Date Made Active in Reports: 12/03/2013Number of Days to Update: 27
Source: Department of Toxic Substances ControlTelephone: 916-323-3400Last EDR Contact: 03/13/2014Next Scheduled EDR Contact: 05/19/2014Data Release Frequency: Quarterly
State- and tribal - equivalent CERCLIS
TC3880855.2s Page GR-4
GOVERNMENT RECORDS SEARCHED / DATA CURRENCY TRACKING

ENVIROSTOR: EnviroStor DatabaseThe Department of Toxic Substances Control’s (DTSC’s) Site Mitigation and Brownfields Reuse Program’s (SMBRP’s)EnviroStor database identifes sites that have known contamination or sites for which there may be reasons to investigatefurther. The database includes the following site types: Federal Superfund sites (National Priorities List (NPL));State Response, including Military Facilities and State Superfund; Voluntary Cleanup; and School sites. EnviroStorprovides similar information to the information that was available in CalSites, and provides additional site information,including, but not limited to, identification of formerly-contaminated properties that have been released forreuse, properties where environmental deed restrictions have been recorded to prevent inappropriate land uses,and risk characterization information that is used to assess potential impacts to public health and the environmentat contaminated sites.
Date of Government Version: 11/06/2013Date Data Arrived at EDR: 11/06/2013Date Made Active in Reports: 12/03/2013Number of Days to Update: 27
Source: Department of Toxic Substances ControlTelephone: 916-323-3400Last EDR Contact: 03/13/2014Next Scheduled EDR Contact: 05/19/2014Data Release Frequency: Quarterly
State and tribal landfill and/or solid waste disposal site lists
SWF/LF (SWIS): Solid Waste Information SystemActive, Closed and Inactive Landfills. SWF/LF records typically contain an inve ntory of solid waste disposalfacilities or landfills. These may be active or i nactive facilities or open dumps that failed to meet RCRA Section4004 criteria for solid waste landfills or disposal sites.
Date of Government Version: 11/18/2013Date Data Arrived at EDR: 11/21/2013Date Made Active in Reports: 01/02/2014Number of Days to Update: 42
Source: Department of Resources Recycling and RecoveryTelephone: 916-341-6320Last EDR Contact: 02/18/2014Next Scheduled EDR Contact: 06/02/2014Data Release Frequency: Quarterly
State and tribal leaking storage tank lists
LUST REG 6V: Leaking Underground Storage Tank Case ListingLeaking Underground Storage Tank locations. Inyo, Kern, Los Angeles, Mono, San Bernardino counties.
Date of Government Version: 06/07/2005Date Data Arrived at EDR: 06/07/2005Date Made Active in Reports: 06/29/2005Number of Days to Update: 22
Source: California Regional Water Quality Control Board Victorville Branch Office (6)Telephone: 760-241-7365Last EDR Contact: 09/12/2011Next Scheduled EDR Contact: 12/26/2011Data Release Frequency: No Update Planned
LUST REG 8: Leaking Underground Storage TanksCalifornia Regional Water Quality Control Board Santa Ana Region (8). For more current information, please referto the State Water Resources Control Board’s LUST database.
Date of Government Version: 02/14/2005Date Data Arrived at EDR: 02/15/2005Date Made Active in Reports: 03/28/2005Number of Days to Update: 41
Source: California Regional Water Quality Control Board Santa Ana Region (8)Telephone: 909-782-4496Last EDR Contact: 08/15/2011Next Scheduled EDR Contact: 11/28/2011Data Release Frequency: Varies
LUST REG 9: Leaking Underground Storage Tank ReportOrange, Riverside, San Diego counties. For more current information, please refer to the State Water ResourcesControl Board’s LUST database.
Date of Government Version: 03/01/2001Date Data Arrived at EDR: 04/23/2001Date Made Active in Reports: 05/21/2001Number of Days to Update: 28
Source: California Regional Water Quality Control Board San Diego Region (9)Telephone: 858-637-5595Last EDR Contact: 09/26/2011Next Scheduled EDR Contact: 01/09/2012Data Release Frequency: No Update Planned
TC3880855.2s Page GR-5
GOVERNMENT RECORDS SEARCHED / DATA CURRENCY TRACKING

LUST: Geotracker’s Leaking Underground Fuel Tank ReportLeaking Underground Storage Tank Incident Reports. LUST records contain an inventory of reported leaking undergroundstorage tank incidents. Not all states maintain these records, and the information stored varies by state. Formore information on a particular leaking underground storage tank sites, please contact the appropriate regulatoryagency.
Date of Government Version: 12/16/2013Date Data Arrived at EDR: 12/17/2013Date Made Active in Reports: 01/04/2014Number of Days to Update: 18
Source: State Water Resources Control BoardTelephone: see region listLast EDR Contact: 12/17/2013Next Scheduled EDR Contact: 03/31/2014Data Release Frequency: Quarterly
LUST REG 7: Leaking Underground Storage Tank Case ListingLeaking Underground Storage Tank locations. Imperial, Riverside, San Diego, Santa Barbara counties.
Date of Government Version: 02/26/2004Date Data Arrived at EDR: 02/26/2004Date Made Active in Reports: 03/24/2004Number of Days to Update: 27
Source: California Regional Water Quality Control Board Colorado River Basin Region (7)Telephone: 760-776-8943Last EDR Contact: 08/01/2011Next Scheduled EDR Contact: 11/14/2011Data Release Frequency: No Update Planned
LUST REG 4: Underground Storage Tank Leak ListLos Angeles, Ventura counties. For more current information, please refer to the State Water Resources ControlBoard’s LUST database.
Date of Government Version: 09/07/2004Date Data Arrived at EDR: 09/07/2004Date Made Active in Reports: 10/12/2004Number of Days to Update: 35
Source: California Regional Water Quality Control Board Los Angeles Region (4)Telephone: 213-576-6710Last EDR Contact: 09/06/2011Next Scheduled EDR Contact: 12/19/2011Data Release Frequency: No Update Planned
LUST REG 2: Fuel Leak ListLeaking Underground Storage Tank locations. Alameda, Contra Costa, Marin, Napa, San Francisco, San Mateo, SantaClara, Solano, Sonoma counties.
Date of Government Version: 09/30/2004Date Data Arrived at EDR: 10/20/2004Date Made Active in Reports: 11/19/2004Number of Days to Update: 30
Source: California Regional Water Quality Control Board San Francisco Bay Region (2)Telephone: 510-622-2433Last EDR Contact: 09/19/2011Next Scheduled EDR Contact: 01/02/2012Data Release Frequency: Quarterly
LUST REG 3: Leaking Underground Storage Tank DatabaseLeaking Underground Storage Tank locations. Monterey, San Benito, San Luis Obispo, Santa Barbara, Santa Cruz counties.
Date of Government Version: 05/19/2003Date Data Arrived at EDR: 05/19/2003Date Made Active in Reports: 06/02/2003Number of Days to Update: 14
Source: California Regional Water Quality Control Board Central Coast Region (3)Telephone: 805-542-4786Last EDR Contact: 07/18/2011Next Scheduled EDR Contact: 10/31/2011Data Release Frequency: No Update Planned
LUST REG 6L: Leaking Underground Storage Tank Case ListingFor more current information, please refer to the State Water Resources Control Board’s LUST database.
Date of Government Version: 09/09/2003Date Data Arrived at EDR: 09/10/2003Date Made Active in Reports: 10/07/2003Number of Days to Update: 27
Source: California Regional Water Quality Control Board Lahontan Region (6)Telephone: 530-542-5572Last EDR Contact: 09/12/2011Next Scheduled EDR Contact: 12/26/2011Data Release Frequency: No Update Planned
TC3880855.2s Page GR-6
GOVERNMENT RECORDS SEARCHED / DATA CURRENCY TRACKING
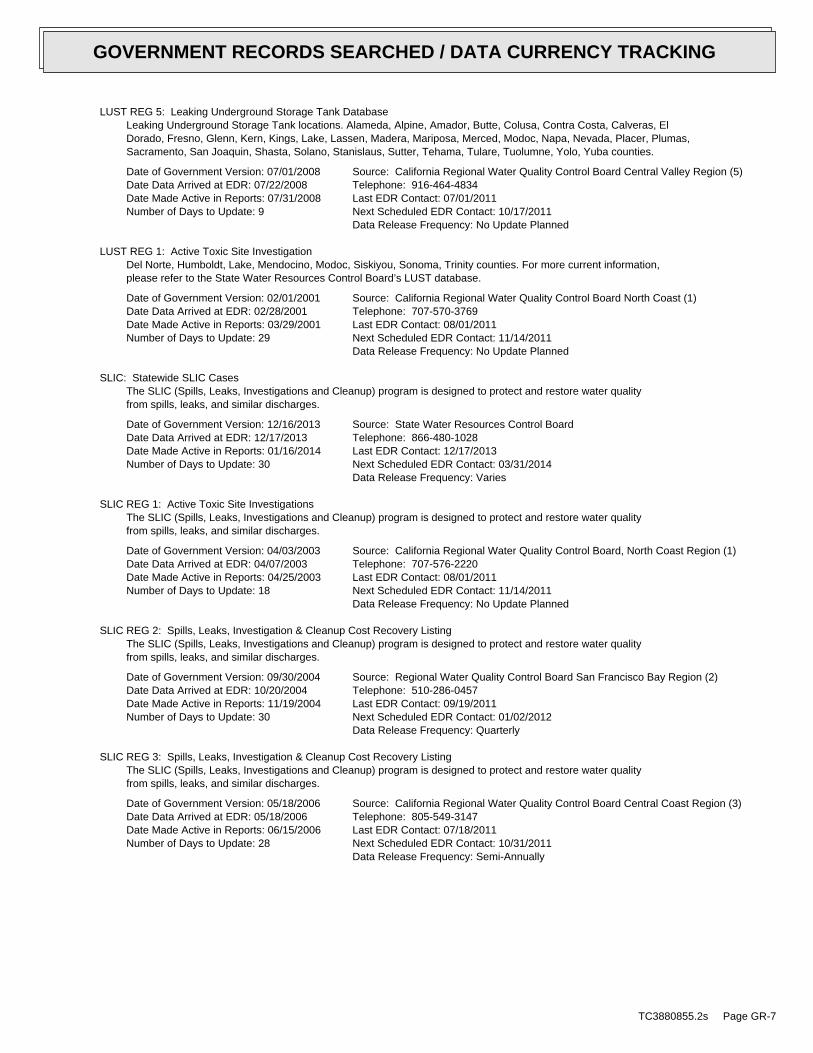
LUST REG 5: Leaking Underground Storage Tank DatabaseLeaking Underground Storage Tank locations. Alameda, Alpine, Amador, Butte, Colusa, Contra Costa, Calveras, ElDorado, Fresno, Glenn, Kern, Kings, Lake, Lassen, Madera, Mariposa, Merced, Modoc, Napa, Nevada, Placer, Plumas,Sacramento, San Joaquin, Shasta, Solano, Stanislaus, Sutter, Tehama, Tulare, Tuolumne, Yolo, Yuba counties.
Date of Government Version: 07/01/2008Date Data Arrived at EDR: 07/22/2008Date Made Active in Reports: 07/31/2008Number of Days to Update: 9
Source: California Regional Water Quality Control Board Central Valley Region (5)Telephone: 916-464-4834Last EDR Contact: 07/01/2011Next Scheduled EDR Contact: 10/17/2011Data Release Frequency: No Update Planned
LUST REG 1: Active Toxic Site InvestigationDel Norte, Humboldt, Lake, Mendocino, Modoc, Siskiyou, Sonoma, Trinity counties. For more current information,please refer to the State Water Resources Control Board’s LUST database.
Date of Government Version: 02/01/2001Date Data Arrived at EDR: 02/28/2001Date Made Active in Reports: 03/29/2001Number of Days to Update: 29
Source: California Regional Water Quality Control Board North Coast (1)Telephone: 707-570-3769Last EDR Contact: 08/01/2011Next Scheduled EDR Contact: 11/14/2011Data Release Frequency: No Update Planned
SLIC: Statewide SLIC CasesThe SLIC (Spills, Leaks, Investigations and Cleanup) program is designed to protect and restore water qualityfrom spills, leaks, and similar discharges.
Date of Government Version: 12/16/2013Date Data Arrived at EDR: 12/17/2013Date Made Active in Reports: 01/16/2014Number of Days to Update: 30
Source: State Water Resources Control BoardTelephone: 866-480-1028Last EDR Contact: 12/17/2013Next Scheduled EDR Contact: 03/31/2014Data Release Frequency: Varies
SLIC REG 1: Active Toxic Site InvestigationsThe SLIC (Spills, Leaks, Investigations and Cleanup) program is designed to protect and restore water qualityfrom spills, leaks, and similar discharges.
Date of Government Version: 04/03/2003Date Data Arrived at EDR: 04/07/2003Date Made Active in Reports: 04/25/2003Number of Days to Update: 18
Source: California Regional Water Quality Control Board, North Coast Region (1)Telephone: 707-576-2220Last EDR Contact: 08/01/2011Next Scheduled EDR Contact: 11/14/2011Data Release Frequency: No Update Planned
SLIC REG 2: Spills, Leaks, Investigation & Cleanup Cost Recovery ListingThe SLIC (Spills, Leaks, Investigations and Cleanup) program is designed to protect and restore water qualityfrom spills, leaks, and similar discharges.
Date of Government Version: 09/30/2004Date Data Arrived at EDR: 10/20/2004Date Made Active in Reports: 11/19/2004Number of Days to Update: 30
Source: Regional Water Quality Control Board San Francisco Bay Region (2)Telephone: 510-286-0457Last EDR Contact: 09/19/2011Next Scheduled EDR Contact: 01/02/2012Data Release Frequency: Quarterly
SLIC REG 3: Spills, Leaks, Investigation & Cleanup Cost Recovery ListingThe SLIC (Spills, Leaks, Investigations and Cleanup) program is designed to protect and restore water qualityfrom spills, leaks, and similar discharges.
Date of Government Version: 05/18/2006Date Data Arrived at EDR: 05/18/2006Date Made Active in Reports: 06/15/2006Number of Days to Update: 28
Source: California Regional Water Quality Control Board Central Coast Region (3)Telephone: 805-549-3147Last EDR Contact: 07/18/2011Next Scheduled EDR Contact: 10/31/2011Data Release Frequency: Semi-Annually
TC3880855.2s Page GR-7
GOVERNMENT RECORDS SEARCHED / DATA CURRENCY TRACKING
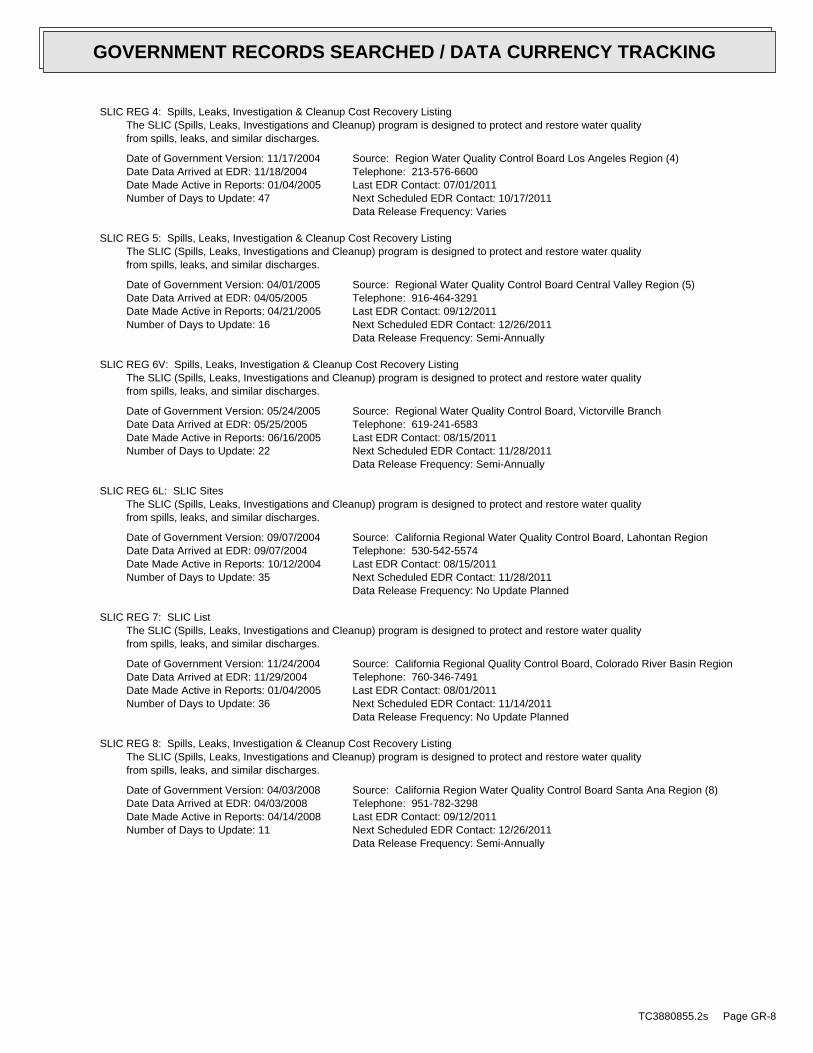
SLIC REG 4: Spills, Leaks, Investigation & Cleanup Cost Recovery ListingThe SLIC (Spills, Leaks, Investigations and Cleanup) program is designed to protect and restore water qualityfrom spills, leaks, and similar discharges.
Date of Government Version: 11/17/2004Date Data Arrived at EDR: 11/18/2004Date Made Active in Reports: 01/04/2005Number of Days to Update: 47
Source: Region Water Quality Control Board Los Angeles Region (4)Telephone: 213-576-6600Last EDR Contact: 07/01/2011Next Scheduled EDR Contact: 10/17/2011Data Release Frequency: Varies
SLIC REG 5: Spills, Leaks, Investigation & Cleanup Cost Recovery ListingThe SLIC (Spills, Leaks, Investigations and Cleanup) program is designed to protect and restore water qualityfrom spills, leaks, and similar discharges.
Date of Government Version: 04/01/2005Date Data Arrived at EDR: 04/05/2005Date Made Active in Reports: 04/21/2005Number of Days to Update: 16
Source: Regional Water Quality Control Board Central Valley Region (5)Telephone: 916-464-3291Last EDR Contact: 09/12/2011Next Scheduled EDR Contact: 12/26/2011Data Release Frequency: Semi-Annually
SLIC REG 6V: Spills, Leaks, Investigation & Cleanup Cost Recovery ListingThe SLIC (Spills, Leaks, Investigations and Cleanup) program is designed to protect and restore water qualityfrom spills, leaks, and similar discharges.
Date of Government Version: 05/24/2005Date Data Arrived at EDR: 05/25/2005Date Made Active in Reports: 06/16/2005Number of Days to Update: 22
Source: Regional Water Quality Control Board, Victorville BranchTelephone: 619-241-6583Last EDR Contact: 08/15/2011Next Scheduled EDR Contact: 11/28/2011Data Release Frequency: Semi-Annually
SLIC REG 6L: SLIC SitesThe SLIC (Spills, Leaks, Investigations and Cleanup) program is designed to protect and restore water qualityfrom spills, leaks, and similar discharges.
Date of Government Version: 09/07/2004Date Data Arrived at EDR: 09/07/2004Date Made Active in Reports: 10/12/2004Number of Days to Update: 35
Source: California Regional Water Quality Control Board, Lahontan RegionTelephone: 530-542-5574Last EDR Contact: 08/15/2011Next Scheduled EDR Contact: 11/28/2011Data Release Frequency: No Update Planned
SLIC REG 7: SLIC ListThe SLIC (Spills, Leaks, Investigations and Cleanup) program is designed to protect and restore water qualityfrom spills, leaks, and similar discharges.
Date of Government Version: 11/24/2004Date Data Arrived at EDR: 11/29/2004Date Made Active in Reports: 01/04/2005Number of Days to Update: 36
Source: California Regional Quality Control Board, Colorado River Basin RegionTelephone: 760-346-7491Last EDR Contact: 08/01/2011Next Scheduled EDR Contact: 11/14/2011Data Release Frequency: No Update Planned
SLIC REG 8: Spills, Leaks, Investigation & Cleanup Cost Recovery ListingThe SLIC (Spills, Leaks, Investigations and Cleanup) program is designed to protect and restore water qualityfrom spills, leaks, and similar discharges.
Date of Government Version: 04/03/2008Date Data Arrived at EDR: 04/03/2008Date Made Active in Reports: 04/14/2008Number of Days to Update: 11
Source: California Region Water Quality Control Board Santa Ana Region (8)Telephone: 951-782-3298Last EDR Contact: 09/12/2011Next Scheduled EDR Contact: 12/26/2011Data Release Frequency: Semi-Annually
TC3880855.2s Page GR-8
GOVERNMENT RECORDS SEARCHED / DATA CURRENCY TRACKING
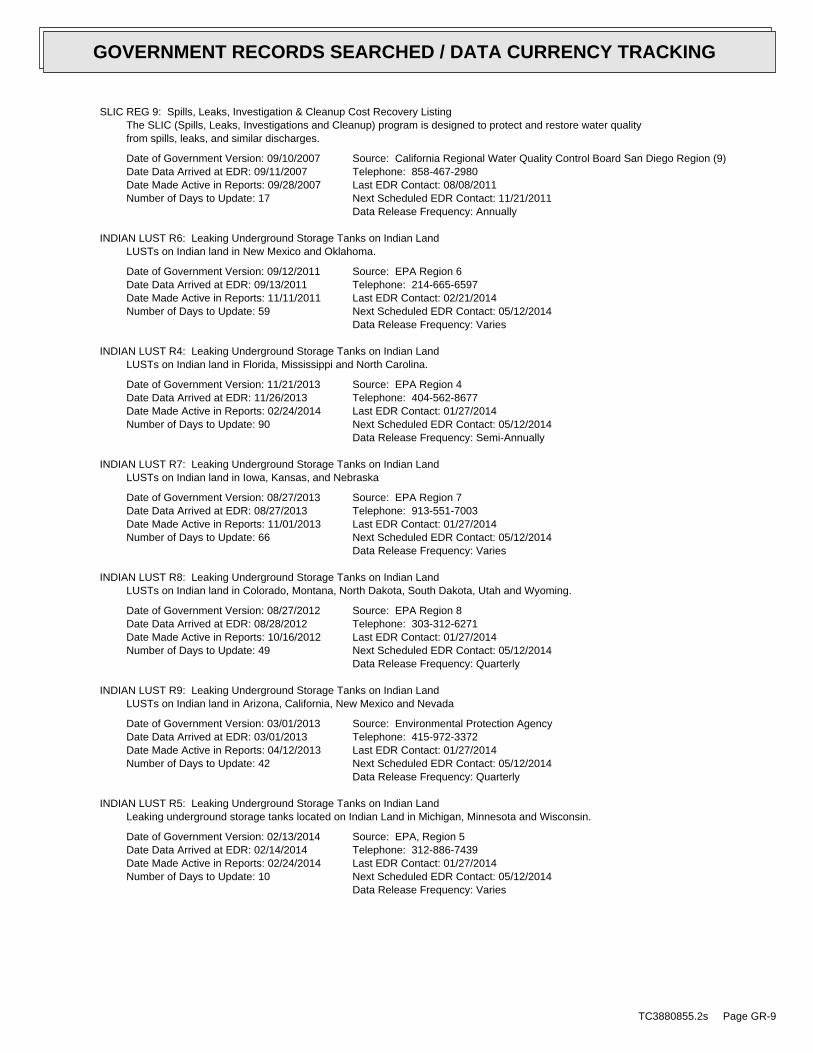
SLIC REG 9: Spills, Leaks, Investigation & Cleanup Cost Recovery ListingThe SLIC (Spills, Leaks, Investigations and Cleanup) program is designed to protect and restore water qualityfrom spills, leaks, and similar discharges.
Date of Government Version: 09/10/2007Date Data Arrived at EDR: 09/11/2007Date Made Active in Reports: 09/28/2007Number of Days to Update: 17
Source: California Regional Water Quality Control Board San Diego Region (9)Telephone: 858-467-2980Last EDR Contact: 08/08/2011Next Scheduled EDR Contact: 11/21/2011Data Release Frequency: Annually
INDIAN LUST R6: Leaking Underground Storage Tanks on Indian LandLUSTs on Indian land in New Mexico and Oklahoma.
Date of Government Version: 09/12/2011Date Data Arrived at EDR: 09/13/2011Date Made Active in Reports: 11/11/2011Number of Days to Update: 59
Source: EPA Region 6Telephone: 214-665-6597Last EDR Contact: 02/21/2014Next Scheduled EDR Contact: 05/12/2014Data Release Frequency: Varies
INDIAN LUST R4: Leaking Underground Storage Tanks on Indian LandLUSTs on Indian land in Florida, Mississippi and North Carolina.
Date of Government Version: 11/21/2013Date Data Arrived at EDR: 11/26/2013Date Made Active in Reports: 02/24/2014Number of Days to Update: 90
Source: EPA Region 4Telephone: 404-562-8677Last EDR Contact: 01/27/2014Next Scheduled EDR Contact: 05/12/2014Data Release Frequency: Semi-Annually
INDIAN LUST R7: Leaking Underground Storage Tanks on Indian LandLUSTs on Indian land in Iowa, Kansas, and Nebraska
Date of Government Version: 08/27/2013Date Data Arrived at EDR: 08/27/2013Date Made Active in Reports: 11/01/2013Number of Days to Update: 66
Source: EPA Region 7Telephone: 913-551-7003Last EDR Contact: 01/27/2014Next Scheduled EDR Contact: 05/12/2014Data Release Frequency: Varies
INDIAN LUST R8: Leaking Underground Storage Tanks on Indian LandLUSTs on Indian land in Colorado, Montana, North Dakota, South Dakota, Utah and Wyoming.
Date of Government Version: 08/27/2012Date Data Arrived at EDR: 08/28/2012Date Made Active in Reports: 10/16/2012Number of Days to Update: 49
Source: EPA Region 8Telephone: 303-312-6271Last EDR Contact: 01/27/2014Next Scheduled EDR Contact: 05/12/2014Data Release Frequency: Quarterly
INDIAN LUST R9: Leaking Underground Storage Tanks on Indian LandLUSTs on Indian land in Arizona, California, New Mexico and Nevada
Date of Government Version: 03/01/2013Date Data Arrived at EDR: 03/01/2013Date Made Active in Reports: 04/12/2013Number of Days to Update: 42
Source: Environmental Protection AgencyTelephone: 415-972-3372Last EDR Contact: 01/27/2014Next Scheduled EDR Contact: 05/12/2014Data Release Frequency: Quarterly
INDIAN LUST R5: Leaking Underground Storage Tanks on Indian LandLeaking underground storage tanks located on Indian Land in Michigan, Minnesota and Wisconsin.
Date of Government Version: 02/13/2014Date Data Arrived at EDR: 02/14/2014Date Made Active in Reports: 02/24/2014Number of Days to Update: 10
Source: EPA, Region 5Telephone: 312-886-7439Last EDR Contact: 01/27/2014Next Scheduled EDR Contact: 05/12/2014Data Release Frequency: Varies
TC3880855.2s Page GR-9
GOVERNMENT RECORDS SEARCHED / DATA CURRENCY TRACKING

INDIAN LUST R1: Leaking Underground Storage Tanks on Indian LandA listing of leaking underground storage tank locations on Indian Land.
Date of Government Version: 02/01/2013Date Data Arrived at EDR: 05/01/2013Date Made Active in Reports: 11/01/2013Number of Days to Update: 184
Source: EPA Region 1Telephone: 617-918-1313Last EDR Contact: 01/30/2014Next Scheduled EDR Contact: 05/12/2014Data Release Frequency: Varies
INDIAN LUST R10: Leaking Underground Storage Tanks on Indian LandLUSTs on Indian land in Alaska, Idaho, Oregon and Washington.
Date of Government Version: 11/06/2013Date Data Arrived at EDR: 11/07/2013Date Made Active in Reports: 12/06/2013Number of Days to Update: 29
Source: EPA Region 10Telephone: 206-553-2857Last EDR Contact: 01/27/2014Next Scheduled EDR Contact: 05/12/2014Data Release Frequency: Quarterly
State and tribal registered storage tank lists
UST: Active UST FacilitiesActive UST facilities gathered from the local regulatory agencies
Date of Government Version: 12/16/2013Date Data Arrived at EDR: 12/17/2013Date Made Active in Reports: 01/07/2014Number of Days to Update: 21
Source: SWRCBTelephone: 916-341-5851Last EDR Contact: 12/17/2013Next Scheduled EDR Contact: 03/31/2014Data Release Frequency: Semi-Annually
AST: Aboveground Petroleum Storage Tank FacilitiesA listing of aboveground storage tank petroleum storage tank locations.
Date of Government Version: 08/01/2009Date Data Arrived at EDR: 09/10/2009Date Made Active in Reports: 10/01/2009Number of Days to Update: 21
Source: California Environmental Protection AgencyTelephone: 916-327-5092Last EDR Contact: 01/03/2014Next Scheduled EDR Contact: 04/21/2014Data Release Frequency: Quarterly
INDIAN UST R7: Underground Storage Tanks on Indian LandThe Indian Underground Storage Tank (UST) database provides information about underground storage tanks on Indianland in EPA Region 7 (Iowa, Kansas, Missouri, Nebraska, and 9 Tribal Nations).
Date of Government Version: 12/31/2012Date Data Arrived at EDR: 02/28/2013Date Made Active in Reports: 04/12/2013Number of Days to Update: 43
Source: EPA Region 7Telephone: 913-551-7003Last EDR Contact: 01/27/2014Next Scheduled EDR Contact: 05/12/2014Data Release Frequency: Varies
INDIAN UST R1: Underground Storage Tanks on Indian LandThe Indian Underground Storage Tank (UST) database provides information about underground storage tanks on Indianland in EPA Region 1 (Connecticut, Maine, Massachusetts, New Hampshire, Rhode Island, Vermont and ten TribalNations).
Date of Government Version: 02/01/2013Date Data Arrived at EDR: 05/01/2013Date Made Active in Reports: 01/27/2014Number of Days to Update: 271
Source: EPA, Region 1Telephone: 617-918-1313Last EDR Contact: 01/30/2014Next Scheduled EDR Contact: 05/12/2014Data Release Frequency: Varies
TC3880855.2s Page GR-10
GOVERNMENT RECORDS SEARCHED / DATA CURRENCY TRACKING
INDIAN UST R4: Underground Storage Tanks on Indian LandThe Indian Underground Storage Tank (UST) database provides information about underground storage tanks on Indianland in EPA Region 4 (Alabama, Florida, Georgia, Kentucky, Mississippi, North Carolina, South Carolina, Tennesseeand Tribal Nations)
Date of Government Version: 11/21/2013Date Data Arrived at EDR: 11/26/2013Date Made Active in Reports: 02/24/2014Number of Days to Update: 90
Source: EPA Region 4Telephone: 404-562-9424Last EDR Contact: 01/27/2014Next Scheduled EDR Contact: 05/12/2014Data Release Frequency: Semi-Annually
INDIAN UST R5: Underground Storage Tanks on Indian LandThe Indian Underground Storage Tank (UST) database provides information about underground storage tanks on Indianland in EPA Region 5 (Michigan, Minnesota and Wisconsin and Tribal Nations).
Date of Government Version: 02/13/2014Date Data Arrived at EDR: 02/14/2014Date Made Active in Reports: 02/24/2014Number of Days to Update: 10
Source: EPA Region 5Telephone: 312-886-6136Last EDR Contact: 01/27/2014Next Scheduled EDR Contact: 05/12/2014Data Release Frequency: Varies
INDIAN UST R10: Underground Storage Tanks on Indian LandThe Indian Underground Storage Tank (UST) database provides information about underground storage tanks on Indianland in EPA Region 10 (Alaska, Idaho, Oregon, Washington, and Tribal Nations).
Date of Government Version: 02/05/2013Date Data Arrived at EDR: 02/06/2013Date Made Active in Reports: 04/12/2013Number of Days to Update: 65
Source: EPA Region 10Telephone: 206-553-2857Last EDR Contact: 01/27/2014Next Scheduled EDR Contact: 05/12/2014Data Release Frequency: Quarterly
INDIAN UST R9: Underground Storage Tanks on Indian LandThe Indian Underground Storage Tank (UST) database provides information about underground storage tanks on Indianland in EPA Region 9 (Arizona, California, Hawaii, Nevada, the Pacific Islands, and Tribal Nations).
Date of Government Version: 07/29/2013Date Data Arrived at EDR: 07/30/2013Date Made Active in Reports: 12/06/2013Number of Days to Update: 129
Source: EPA Region 9Telephone: 415-972-3368Last EDR Contact: 01/27/2014Next Scheduled EDR Contact: 05/12/2014Data Release Frequency: Quarterly
INDIAN UST R8: Underground Storage Tanks on Indian LandThe Indian Underground Storage Tank (UST) database provides information about underground storage tanks on Indianland in EPA Region 8 (Colorado, Montana, North Dakota, South Dakota, Utah, Wyoming and 27 Tribal Nations).
Date of Government Version: 07/29/2013Date Data Arrived at EDR: 08/01/2013Date Made Active in Reports: 11/01/2013Number of Days to Update: 92
Source: EPA Region 8Telephone: 303-312-6137Last EDR Contact: 01/27/2014Next Scheduled EDR Contact: 05/12/2014Data Release Frequency: Quarterly
INDIAN UST R6: Underground Storage Tanks on Indian LandThe Indian Underground Storage Tank (UST) database provides information about underground storage tanks on Indianland in EPA Region 6 (Louisiana, Arkansas, Oklahoma, New Mexico, Texas and 65 Tribes).
Date of Government Version: 01/29/2014Date Data Arrived at EDR: 01/29/2014Date Made Active in Reports: 03/12/2014Number of Days to Update: 42
Source: EPA Region 6Telephone: 214-665-7591Last EDR Contact: 01/27/2014Next Scheduled EDR Contact: 05/12/2014Data Release Frequency: Semi-Annually
TC3880855.2s Page GR-11
GOVERNMENT RECORDS SEARCHED / DATA CURRENCY TRACKING

FEMA UST: Underground Storage Tank ListingA listing of all FEMA owned underground storage tanks.
Date of Government Version: 01/01/2010Date Data Arrived at EDR: 02/16/2010Date Made Active in Reports: 04/12/2010Number of Days to Update: 55
Source: FEMATelephone: 202-646-5797Last EDR Contact: 01/13/2014Next Scheduled EDR Contact: 04/28/2014Data Release Frequency: Varies
State and tribal voluntary cleanup sites
INDIAN VCP R1: Voluntary Cleanup Priority ListingA listing of voluntary cleanup priority sites located on Indian Land located in Region 1.
Date of Government Version: 09/17/2013Date Data Arrived at EDR: 10/01/2013Date Made Active in Reports: 12/06/2013Number of Days to Update: 66
Source: EPA, Region 1Telephone: 617-918-1102Last EDR Contact: 01/03/2014Next Scheduled EDR Contact: 04/14/2014Data Release Frequency: Varies
VCP: Voluntary Cleanup Program PropertiesContains low threat level properties with either confirmed or unconfirmed releases and the project proponentshave request that DTSC oversee investigation and/or cleanup activities and have agreed to provide coverage forDTSC’s costs.
Date of Government Version: 11/06/2013Date Data Arrived at EDR: 11/06/2013Date Made Active in Reports: 12/03/2013Number of Days to Update: 27
Source: Department of Toxic Substances ControlTelephone: 916-323-3400Last EDR Contact: 03/13/2014Next Scheduled EDR Contact: 05/19/2014Data Release Frequency: Quarterly
INDIAN VCP R7: Voluntary Cleanup Priority LisitngA listing of voluntary cleanup priority sites located on Indian Land located in Region 7.
Date of Government Version: 03/20/2008Date Data Arrived at EDR: 04/22/2008Date Made Active in Reports: 05/19/2008Number of Days to Update: 27
Source: EPA, Region 7Telephone: 913-551-7365Last EDR Contact: 04/20/2009Next Scheduled EDR Contact: 07/20/2009Data Release Frequency: Varies
ADDITIONAL ENVIRONMENTAL RECORDS
Local Brownfield lists
US BROWNFIELDS: A Listing of Brownfields SitesBrownfields are real property, the expansion, redevelopment, or reuse of which may be complicated by the presenceor potential presence of a hazardous substance, pollutant, or contaminant. Cleaning up and reinvesting in theseproperties takes development pressures off of undeveloped, open land, and both improves and protects the environment.Assessment, Cleanup and Redevelopment Exchange System (ACRES) stores information reported by EPA Brownfieldsgrant recipients on brownfields properties assessed or cleaned up with grant funding as well as information onTargeted Brownfields Assessments performed by EPA Regions. A listing of ACRES Brownfield sites is obtained fromCleanups in My Community. Cleanups in My Community provides information on Brownfields properties for which informationis reported back to EPA, as well as areas served by Brownfields grant programs.
Date of Government Version: 09/24/2013Date Data Arrived at EDR: 09/24/2013Date Made Active in Reports: 12/06/2013Number of Days to Update: 73
Source: Environmental Protection AgencyTelephone: 202-566-2777Last EDR Contact: 02/25/2014Next Scheduled EDR Contact: 04/07/2014Data Release Frequency: Semi-Annually
Local Lists of Landfill / Solid Waste Disposal Sites
TC3880855.2s Page GR-12
GOVERNMENT RECORDS SEARCHED / DATA CURRENCY TRACKING

ODI: Open Dump InventoryAn open dump is defined as a disposal facility that does not comply with one or more of the Part 257 or Part 258Subtitle D Criteria.
Date of Government Version: 06/30/1985Date Data Arrived at EDR: 08/09/2004Date Made Active in Reports: 09/17/2004Number of Days to Update: 39
Source: Environmental Protection AgencyTelephone: 800-424-9346Last EDR Contact: 06/09/2004Next Scheduled EDR Contact: N/AData Release Frequency: No Update Planned
DEBRIS REGION 9: Torres Martinez Reservation Illegal Dump Site LocationsA listing of illegal dump sites location on the Torres Martinez Indian Reservation located in eastern RiversideCounty and northern Imperial County, California.
Date of Government Version: 01/12/2009Date Data Arrived at EDR: 05/07/2009Date Made Active in Reports: 09/21/2009Number of Days to Update: 137
Source: EPA, Region 9Telephone: 415-947-4219Last EDR Contact: 01/27/2014Next Scheduled EDR Contact: 05/12/2014Data Release Frequency: No Update Planned
WMUDS/SWAT: Waste Management Unit DatabaseWaste Management Unit Database System. WMUDS is used by the State Water Resources Control Board staff and theRegional Water Quality Control Boards for program tracking and inventory of waste management units. WMUDS is composedof the following databases: Facility Information, Scheduled Inspections Information, Waste Management Unit Information,SWAT Program Information, SWAT Report Summary Information, SWAT Report Summary Data, Chapter 15 (formerly Subchapter15) Information, Chapter 15 Monitoring Parameters, TPCA Program Information, RCRA Program Information, ClosureInformation, and Interested Parties Information.
Date of Government Version: 04/01/2000Date Data Arrived at EDR: 04/10/2000Date Made Active in Reports: 05/10/2000Number of Days to Update: 30
Source: State Water Resources Control BoardTelephone: 916-227-4448Last EDR Contact: 02/10/2014Next Scheduled EDR Contact: 05/26/2014Data Release Frequency: No Update Planned
SWRCY: Recycler DatabaseA listing of recycling facilities in California.
Date of Government Version: 12/16/2013Date Data Arrived at EDR: 12/17/2013Date Made Active in Reports: 01/07/2014Number of Days to Update: 21
Source: Department of ConservationTelephone: 916-323-3836Last EDR Contact: 12/17/2013Next Scheduled EDR Contact: 03/31/2014Data Release Frequency: Quarterly
HAULERS: Registered Waste Tire Haulers ListingA listing of registered waste tire haulers.
Date of Government Version: 11/20/2013Date Data Arrived at EDR: 11/25/2013Date Made Active in Reports: 12/31/2013Number of Days to Update: 36
Source: Integrated Waste Management BoardTelephone: 916-341-6422Last EDR Contact: 02/14/2014Next Scheduled EDR Contact: 06/02/2014Data Release Frequency: Varies
INDIAN ODI: Report on the Status of Open Dumps on Indian LandsLocation of open dumps on Indian land.
Date of Government Version: 12/31/1998Date Data Arrived at EDR: 12/03/2007Date Made Active in Reports: 01/24/2008Number of Days to Update: 52
Source: Environmental Protection AgencyTelephone: 703-308-8245Last EDR Contact: 11/04/2013Next Scheduled EDR Contact: 02/17/2014Data Release Frequency: Varies
TC3880855.2s Page GR-13
GOVERNMENT RECORDS SEARCHED / DATA CURRENCY TRACKING

Local Lists of Hazardous waste / Contaminated Sites
US CDL: Clandestine Drug LabsA listing of clandestine drug lab locations. The U.S. Department of Justice ("the Department") provides thisweb site as a public service. It contains addresses of some locations where law enforcement agencies reportedthey found chemicals or other items that indicated the presence of either clandestine drug laboratories or dumpsites.In most cases, the source of the entries is not the Department, and the Department has not verified the entryand does not guarantee its accuracy. Members of the public must verify the accuracy of all entries by, for example,contacting local law enforcement and local health departments.
Date of Government Version: 12/04/2013Date Data Arrived at EDR: 12/10/2013Date Made Active in Reports: 02/13/2014Number of Days to Update: 65
Source: Drug Enforcement AdministrationTelephone: 202-307-1000Last EDR Contact: 03/04/2014Next Scheduled EDR Contact: 06/16/2014Data Release Frequency: Quarterly
HIST CAL-SITES: Calsites DatabaseThe Calsites database contains potential or confirmed hazardous substance release properties. In 1996, CaliforniaEPA reevaluated and significantly reduced the number of sites in the Calsites database. No longer updated by thestate agency. It has been replaced by ENVIROSTOR.
Date of Government Version: 08/08/2005Date Data Arrived at EDR: 08/03/2006Date Made Active in Reports: 08/24/2006Number of Days to Update: 21
Source: Department of Toxic Substance ControlTelephone: 916-323-3400Last EDR Contact: 02/23/2009Next Scheduled EDR Contact: 05/25/2009Data Release Frequency: No Update Planned
SCH: School Property Evaluation ProgramThis category contains proposed and existing school sites that are being evaluated by DTSC for possible hazardousmaterials contamination. In some cases, these properties may be listed in the CalSites category depending on thelevel of threat to public health and safety or the environment they pose.
Date of Government Version: 11/06/2013Date Data Arrived at EDR: 11/06/2013Date Made Active in Reports: 12/03/2013Number of Days to Update: 27
Source: Department of Toxic Substances ControlTelephone: 916-323-3400Last EDR Contact: 03/13/2014Next Scheduled EDR Contact: 05/19/2014Data Release Frequency: Quarterly
TOXIC PITS: Toxic Pits Cleanup Act SitesToxic PITS Cleanup Act Sites. TOXIC PITS identifies sites suspected of containing hazardous substances where cleanuphas not yet been completed.
Date of Government Version: 07/01/1995Date Data Arrived at EDR: 08/30/1995Date Made Active in Reports: 09/26/1995Number of Days to Update: 27
Source: State Water Resources Control BoardTelephone: 916-227-4364Last EDR Contact: 01/26/2009Next Scheduled EDR Contact: 04/27/2009Data Release Frequency: No Update Planned
CDL: Clandestine Drug LabsA listing of drug lab locations. Listing of a location in this database does not indicate that any illegal druglab materials were or were not present there, and does not constitute a determination that the location eitherrequires or does not require additional cleanup work.
Date of Government Version: 06/30/2013Date Data Arrived at EDR: 09/03/2013Date Made Active in Reports: 10/10/2013Number of Days to Update: 37
Source: Department of Toxic Substances ControlTelephone: 916-255-6504Last EDR Contact: 02/24/2014Next Scheduled EDR Contact: 04/28/2014Data Release Frequency: Varies
TC3880855.2s Page GR-14
GOVERNMENT RECORDS SEARCHED / DATA CURRENCY TRACKING

US HIST CDL: National Clandestine Laboratory RegisterA listing of clandestine drug lab locations. The U.S. Department of Justice ("the Department") provides thisweb site as a public service. It contains addresses of some locations where law enforcement agencies reportedthey found chemicals or other items that indicated the presence of either clandestine drug laboratories or dumpsites.In most cases, the source of the entries is not the Department, and the Department has not verified the entryand does not guarantee its accuracy. Members of the public must verify the accuracy of all entries by, for example,contacting local law enforcement and local health departments.
Date of Government Version: 09/01/2007Date Data Arrived at EDR: 11/19/2008Date Made Active in Reports: 03/30/2009Number of Days to Update: 131
Source: Drug Enforcement AdministrationTelephone: 202-307-1000Last EDR Contact: 03/04/2014Next Scheduled EDR Contact: 06/16/2014Data Release Frequency: No Update Planned
Local Lists of Registered Storage Tanks
CA FID UST: Facility Inventory DatabaseThe Facility Inventory Database (FID) contains a historical listing of active and inactive underground storagetank locations from the State Water Resource Control Board. Refer to local/county source for current data.
Date of Government Version: 10/31/1994Date Data Arrived at EDR: 09/05/1995Date Made Active in Reports: 09/29/1995Number of Days to Update: 24
Source: California Environmental Protection AgencyTelephone: 916-341-5851Last EDR Contact: 12/28/1998Next Scheduled EDR Contact: N/AData Release Frequency: No Update Planned
UST MENDOCINO: Mendocino County UST DatabaseA listing of underground storage tank locations in Mendocino County.
Date of Government Version: 09/23/2009Date Data Arrived at EDR: 09/23/2009Date Made Active in Reports: 10/01/2009Number of Days to Update: 8
Source: Department of Public HealthTelephone: 707-463-4466Last EDR Contact: 03/03/2014Next Scheduled EDR Contact: 06/16/2014Data Release Frequency: Annually
HIST UST: Hazardous Substance Storage Container DatabaseThe Hazardous Substance Storage Container Database is a historical listing of UST sites. Refer to local/countysource for current data.
Date of Government Version: 10/15/1990Date Data Arrived at EDR: 01/25/1991Date Made Active in Reports: 02/12/1991Number of Days to Update: 18
Source: State Water Resources Control BoardTelephone: 916-341-5851Last EDR Contact: 07/26/2001Next Scheduled EDR Contact: N/AData Release Frequency: No Update Planned
SWEEPS UST: SWEEPS UST ListingStatewide Environmental Evaluation and Planning System. This underground storage tank listing was updated andmaintained by a company contacted by the SWRCB in the early 1990’s. The listing is no longer updated or maintained.The local agency is the contact for more information on a site on the SWEEPS list.
Date of Government Version: 06/01/1994Date Data Arrived at EDR: 07/07/2005Date Made Active in Reports: 08/11/2005Number of Days to Update: 35
Source: State Water Resources Control BoardTelephone: N/ALast EDR Contact: 06/03/2005Next Scheduled EDR Contact: N/AData Release Frequency: No Update Planned
Local Land Records
LIENS 2: CERCLA Lien InformationA Federal CERCLA (’Superfund’) lien can exist by operation of law at any site or property at which EPA has spentSuperfund monies. These monies are spent to investigate and address releases and threatened releases of contamination.CERCLIS provides information as to the identity of these sites and properties.
TC3880855.2s Page GR-15
GOVERNMENT RECORDS SEARCHED / DATA CURRENCY TRACKING

Date of Government Version: 02/06/2013Date Data Arrived at EDR: 04/25/2013Date Made Active in Reports: 05/10/2013Number of Days to Update: 15
Source: Environmental Protection AgencyTelephone: 202-564-6023Last EDR Contact: 01/27/2014Next Scheduled EDR Contact: 05/12/2014Data Release Frequency: Varies
LIENS: Environmental Liens ListingA listing of property locations with environmental liens for California where DTSC is a lien holder.
Date of Government Version: 01/17/2014Date Data Arrived at EDR: 01/21/2014Date Made Active in Reports: 02/11/2014Number of Days to Update: 21
Source: Department of Toxic Substances ControlTelephone: 916-323-3400Last EDR Contact: 03/10/2014Next Scheduled EDR Contact: 06/23/2014Data Release Frequency: Varies
DEED: Deed Restriction ListingSite Mitigation and Brownfields Reuse Program Facility Sites with Deed Restrictions & Hazardous Waste ManagementProgram Facility Sites with Deed / Land Use Restriction. The DTSC Site Mitigation and Brownfields Reuse Program(SMBRP) list includes sites cleaned up under the program’s oversight and generally does not include currentor former hazardous waste facilities that required a hazardous waste facility permit. The list represents deedrestrictions that are active. Some sites have multiple deed restrictions. The DTSC Hazardous Waste ManagementProgram (HWMP) has developed a list of current or former hazardous waste facilities that have a recorded landuse restriction at the local county recorder’s office. The land use restrictions on this list were required bythe DTSC HWMP as a result of the presence of hazardous substances that remain on site after the facility (orpart of the facility) has been closed or cleaned up. The types of land use restriction include deed notice, deedrestriction, or a land use restriction that binds current and future owners.
Date of Government Version: 12/09/2013Date Data Arrived at EDR: 12/10/2013Date Made Active in Reports: 01/03/2014Number of Days to Update: 24
Source: DTSC and SWRCBTelephone: 916-323-3400Last EDR Contact: 03/11/2014Next Scheduled EDR Contact: 06/23/2014Data Release Frequency: Semi-Annually
Records of Emergency Release Reports
HMIRS: Hazardous Materials Information Reporting SystemHazardous Materials Incident Report System. HMIRS contains hazardous material spill incidents reported to DOT.
Date of Government Version: 12/31/2013Date Data Arrived at EDR: 01/03/2014Date Made Active in Reports: 02/24/2014Number of Days to Update: 52
Source: U.S. Department of TransportationTelephone: 202-366-4555Last EDR Contact: 01/03/2014Next Scheduled EDR Contact: 01/13/2014Data Release Frequency: Annually
CHMIRS: California Hazardous Material Incident Report SystemCalifornia Hazardous Material Incident Reporting System. CHMIRS contains information on reported hazardous materialincidents (accidental releases or spills).
Date of Government Version: 10/14/2013Date Data Arrived at EDR: 10/30/2013Date Made Active in Reports: 12/03/2013Number of Days to Update: 34
Source: Office of Emergency ServicesTelephone: 916-845-8400Last EDR Contact: 01/30/2014Next Scheduled EDR Contact: 05/12/2014Data Release Frequency: Varies
LDS: Land Disposal Sites ListingThe Land Disposal program regulates of waste discharge to land for treatment, storage and disposal in waste managementunits.
Date of Government Version: 12/16/2013Date Data Arrived at EDR: 12/17/2013Date Made Active in Reports: 01/04/2014Number of Days to Update: 18
Source: State Water Qualilty Control BoardTelephone: 866-480-1028Last EDR Contact: 12/17/2013Next Scheduled EDR Contact: 03/31/2014Data Release Frequency: Quarterly
TC3880855.2s Page GR-16
GOVERNMENT RECORDS SEARCHED / DATA CURRENCY TRACKING
MCS: Military Cleanup Sites ListingThe State Water Resources Control Board and nine Regional Water Quality Control Boards partner with the Departmentof Defense (DoD) through the Defense and State Memorandum of Agreement (DSMOA) to oversee the investigationand remediation of water quality issues at military facilities.
Date of Government Version: 12/16/2013Date Data Arrived at EDR: 12/17/2013Date Made Active in Reports: 01/04/2014Number of Days to Update: 18
Source: State Water Resources Control BoardTelephone: 866-480-1028Last EDR Contact: 12/17/2013Next Scheduled EDR Contact: 03/31/2014Data Release Frequency: Quarterly
SPILLS 90: SPILLS90 data from FirstSearchSpills 90 includes those spill and release records available exclusively from FirstSearch databases. Typically,they may include chemical, oil and/or hazardous substance spills recorded after 1990. Duplicate records that arealready included in EDR incident and release records are not included in Spills 90.
Date of Government Version: 06/06/2012Date Data Arrived at EDR: 01/03/2013Date Made Active in Reports: 02/22/2013Number of Days to Update: 50
Source: FirstSearchTelephone: N/ALast EDR Contact: 01/03/2013Next Scheduled EDR Contact: N/AData Release Frequency: No Update Planned
Other Ascertainable Records
RCRA NonGen / NLR: RCRA - Non GeneratorsRCRAInfo is EPA’s comprehensive information system, providing access to data supporting the Resource Conservationand Recovery Act (RCRA) of 1976 and the Hazardous and Solid Waste Amendments (HSWA) of 1984. The databaseincludes selective information on sites which generate, transport, store, treat and/or dispose of hazardous wasteas defined by the Resource Conservation and Recovery Act (RCRA). Non-Generators do not presently generate hazardouswaste.
Date of Government Version: 09/10/2013Date Data Arrived at EDR: 10/02/2013Date Made Active in Reports: 12/16/2013Number of Days to Update: 75
Source: Environmental Protection AgencyTelephone: (415) 495-8895Last EDR Contact: 03/13/2014Next Scheduled EDR Contact: 04/14/2014Data Release Frequency: Varies
DOT OPS: Incident and Accident DataDepartment of Transporation, Office of Pipeline Safety Incident and Accident data.
Date of Government Version: 07/31/2012Date Data Arrived at EDR: 08/07/2012Date Made Active in Reports: 09/18/2012Number of Days to Update: 42
Source: Department of Transporation, Office of Pipeline SafetyTelephone: 202-366-4595Last EDR Contact: 02/06/2014Next Scheduled EDR Contact: 05/19/2014Data Release Frequency: Varies
DOD: Department of Defense SitesThis data set consists of federally owned or administered lands, administered by the Department of Defense, thathave any area equal to or greater than 640 acres of the United States, Puerto Rico, and the U.S. Virgin Islands.
Date of Government Version: 12/31/2005Date Data Arrived at EDR: 11/10/2006Date Made Active in Reports: 01/11/2007Number of Days to Update: 62
Source: USGSTelephone: 888-275-8747Last EDR Contact: 01/15/2014Next Scheduled EDR Contact: 04/28/2014Data Release Frequency: Semi-Annually
FUDS: Formerly Used Defense SitesThe listing includes locations of Formerly Used Defense Sites properties where the US Army Corps of Engineersis actively working or will take necessary cleanup actions.
TC3880855.2s Page GR-17
GOVERNMENT RECORDS SEARCHED / DATA CURRENCY TRACKING

Date of Government Version: 12/31/2011Date Data Arrived at EDR: 02/26/2013Date Made Active in Reports: 03/13/2013Number of Days to Update: 15
Source: U.S. Army Corps of EngineersTelephone: 202-528-4285Last EDR Contact: 03/10/2014Next Scheduled EDR Contact: 06/23/2014Data Release Frequency: Varies
CONSENT: Superfund (CERCLA) Consent DecreesMajor legal settlements that establish responsibility and standards for cleanup at NPL (Superfund) sites. Releasedperiodically by United States District Courts after settlement by parties to litigation matters.
Date of Government Version: 12/31/2013Date Data Arrived at EDR: 01/24/2014Date Made Active in Reports: 02/24/2014Number of Days to Update: 31
Source: Department of Justice, Consent Decree LibraryTelephone: VariesLast EDR Contact: 12/26/2013Next Scheduled EDR Contact: 04/14/2014Data Release Frequency: Varies
ROD: Records Of DecisionRecord of Decision. ROD documents mandate a permanent remedy at an NPL (Superfund) site containing technicaland health information to aid in the cleanup.
Date of Government Version: 11/25/2013Date Data Arrived at EDR: 12/12/2013Date Made Active in Reports: 02/24/2014Number of Days to Update: 74
Source: EPATelephone: 703-416-0223Last EDR Contact: 03/11/2014Next Scheduled EDR Contact: 06/23/2014Data Release Frequency: Annually
UMTRA: Uranium Mill Tailings SitesUranium ore was mined by private companies for federal government use in national defense programs. When the millsshut down, large piles of the sand-like material (mill tailings) remain after uranium has been extracted fromthe ore. Levels of human exposure to radioactive materials from the piles are low; however, in some cases tailingswere used as construction materials before the potential health hazards of the tailings were recognized.
Date of Government Version: 09/14/2010Date Data Arrived at EDR: 10/07/2011Date Made Active in Reports: 03/01/2012Number of Days to Update: 146
Source: Department of EnergyTelephone: 505-845-0011Last EDR Contact: 02/25/2014Next Scheduled EDR Contact: 06/09/2014Data Release Frequency: Varies
US MINES: Mines Master Index FileContains all mine identification numbers issued for mines active or opened since 1971. The data also includesviolation information.
Date of Government Version: 08/01/2013Date Data Arrived at EDR: 09/05/2013Date Made Active in Reports: 10/03/2013Number of Days to Update: 28
Source: Department of Labor, Mine Safety and Health AdministrationTelephone: 303-231-5959Last EDR Contact: 03/05/2014Next Scheduled EDR Contact: 06/16/2014Data Release Frequency: Semi-Annually
TRIS: Toxic Chemical Release Inventory SystemToxic Release Inventory System. TRIS identifies facilities which release toxic chemicals to the air, water andland in reportable quantities under SARA Title III Section 313.
Date of Government Version: 12/31/2011Date Data Arrived at EDR: 07/31/2013Date Made Active in Reports: 09/13/2013Number of Days to Update: 44
Source: EPATelephone: 202-566-0250Last EDR Contact: 02/26/2014Next Scheduled EDR Contact: 06/09/2014Data Release Frequency: Annually
TSCA: Toxic Substances Control ActToxic Substances Control Act. TSCA identifies manufacturers and importers of chemical substances included on theTSCA Chemical Substance Inventory list. It includes data on the production volume of these substances by plantsite.
TC3880855.2s Page GR-18
GOVERNMENT RECORDS SEARCHED / DATA CURRENCY TRACKING
Date of Government Version: 12/31/2006Date Data Arrived at EDR: 09/29/2010Date Made Active in Reports: 12/02/2010Number of Days to Update: 64
Source: EPATelephone: 202-260-5521Last EDR Contact: 12/26/2013Next Scheduled EDR Contact: 04/07/2014Data Release Frequency: Every 4 Years
FTTS: FIFRA/ TSCA Tracking System - FIFRA (Federal Insecticide, Fungicide, & Rodenticide Act)/TSCA (Toxic Substances Control Act)FTTS tracks administrative cases and pesticide enforcement actions and compliance activities related to FIFRA,TSCA and EPCRA (Emergency Planning and Community Right-to-Know Act). To maintain currency, EDR contacts theAgency on a quarterly basis.
Date of Government Version: 04/09/2009Date Data Arrived at EDR: 04/16/2009Date Made Active in Reports: 05/11/2009Number of Days to Update: 25
Source: EPA/Office of Prevention, Pesticides and Toxic SubstancesTelephone: 202-566-1667Last EDR Contact: 02/24/2014Next Scheduled EDR Contact: 06/09/2014Data Release Frequency: Quarterly
FTTS INSP: FIFRA/ TSCA Tracking System - FIFRA (Federal Insecticide, Fungicide, & Rodenticide Act)/TSCA (Toxic Substances Control Act)A listing of FIFRA/TSCA Tracking System (FTTS) inspections and enforcements.
Date of Government Version: 04/09/2009Date Data Arrived at EDR: 04/16/2009Date Made Active in Reports: 05/11/2009Number of Days to Update: 25
Source: EPATelephone: 202-566-1667Last EDR Contact: 02/24/2014Next Scheduled EDR Contact: 06/09/2014Data Release Frequency: Quarterly
HIST FTTS: FIFRA/TSCA Tracking System Administrative Case ListingA complete administrative case listing from the FIFRA/TSCA Tracking System (FTTS) for all ten EPA regions. Theinformation was obtained from the National Compliance Database (NCDB). NCDB supports the implementation of FIFRA(Federal Insecticide, Fungicide, and Rodenticide Act) and TSCA (Toxic Substances Control Act). Some EPA regionsare now closing out records. Because of that, and the fact that some EPA regions are not providing EPA Headquarterswith updated records, it was decided to create a HIST FTTS database. It included records that may not be includedin the newer FTTS database updates. This database is no longer updated.
Date of Government Version: 10/19/2006Date Data Arrived at EDR: 03/01/2007Date Made Active in Reports: 04/10/2007Number of Days to Update: 40
Source: Environmental Protection AgencyTelephone: 202-564-2501Last EDR Contact: 12/17/2007Next Scheduled EDR Contact: 03/17/2008Data Release Frequency: No Update Planned
HIST FTTS INSP: FIFRA/TSCA Tracking System Inspection & Enforcement Case ListingA complete inspection and enforcement case listing from the FIFRA/TSCA Tracking System (FTTS) for all ten EPAregions. The information was obtained from the National Compliance Database (NCDB). NCDB supports the implementationof FIFRA (Federal Insecticide, Fungicide, and Rodenticide Act) and TSCA (Toxic Substances Control Act). SomeEPA regions are now closing out records. Because of that, and the fact that some EPA regions are not providingEPA Headquarters with updated records, it was decided to create a HIST FTTS database. It included records thatmay not be included in the newer FTTS database updates. This database is no longer updated.
Date of Government Version: 10/19/2006Date Data Arrived at EDR: 03/01/2007Date Made Active in Reports: 04/10/2007Number of Days to Update: 40
Source: Environmental Protection AgencyTelephone: 202-564-2501Last EDR Contact: 12/17/2008Next Scheduled EDR Contact: 03/17/2008Data Release Frequency: No Update Planned
SSTS: Section 7 Tracking SystemsSection 7 of the Federal Insecticide, Fungicide and Rodenticide Act, as amended (92 Stat. 829) requires allregistered pesticide-producing establishments to submit a report to the Environmental Protection Agency by March1st each year. Each establishment must report the types and amounts of pesticides, active ingredients and devicesbeing produced, and those having been produced and sold or distributed in the past year.
TC3880855.2s Page GR-19
GOVERNMENT RECORDS SEARCHED / DATA CURRENCY TRACKING
Date of Government Version: 12/31/2009Date Data Arrived at EDR: 12/10/2010Date Made Active in Reports: 02/25/2011Number of Days to Update: 77
Source: EPATelephone: 202-564-4203Last EDR Contact: 01/28/2014Next Scheduled EDR Contact: 05/12/2014Data Release Frequency: Annually
ICIS: Integrated Compliance Information SystemThe Integrated Compliance Information System (ICIS) supports the information needs of the national enforcementand compliance program as well as the unique needs of the National Pollutant Discharge Elimination System (NPDES)program.
Date of Government Version: 07/20/2011Date Data Arrived at EDR: 11/10/2011Date Made Active in Reports: 01/10/2012Number of Days to Update: 61
Source: Environmental Protection AgencyTelephone: 202-564-5088Last EDR Contact: 10/09/2014Next Scheduled EDR Contact: 04/28/2014Data Release Frequency: Quarterly
PADS: PCB Activity Database SystemPCB Activity Database. PADS Identifies generators, transporters, commercial storers and/or brokers and disposersof PCB’s who are required to notify the EPA of such activities.
Date of Government Version: 06/01/2013Date Data Arrived at EDR: 07/17/2013Date Made Active in Reports: 11/01/2013Number of Days to Update: 107
Source: EPATelephone: 202-566-0500Last EDR Contact: 01/28/2014Next Scheduled EDR Contact: 04/28/2014Data Release Frequency: Annually
MLTS: Material Licensing Tracking SystemMLTS is maintained by the Nuclear Regulatory Commission and contains a list of approximately 8,100 sites whichpossess or use radioactive materials and which are subject to NRC licensing requirements. To maintain currency,EDR contacts the Agency on a quarterly basis.
Date of Government Version: 07/22/2013Date Data Arrived at EDR: 08/02/2013Date Made Active in Reports: 11/01/2013Number of Days to Update: 91
Source: Nuclear Regulatory CommissionTelephone: 301-415-7169Last EDR Contact: 03/10/2014Next Scheduled EDR Contact: 06/23/2014Data Release Frequency: Quarterly
RADINFO: Radiation Information DatabaseThe Radiation Information Database (RADINFO) contains information about facilities that are regulated by U.S.Environmental Protection Agency (EPA) regulations for radiation and radioactivity.
Date of Government Version: 01/09/2014Date Data Arrived at EDR: 01/10/2014Date Made Active in Reports: 03/12/2014Number of Days to Update: 61
Source: Environmental Protection AgencyTelephone: 202-343-9775Last EDR Contact: 01/10/2014Next Scheduled EDR Contact: 04/21/2014Data Release Frequency: Quarterly
FINDS: Facility Index System/Facility Registry SystemFacility Index System. FINDS contains both facility information and ’pointers’ to other sources that contain moredetail. EDR includes the following FINDS databases in this report: PCS (Permit Compliance System), AIRS (AerometricInformation Retrieval System), DOCKET (Enforcement Docket used to manage and track information on civil judicialenforcement cases for all environmental statutes), FURS (Federal Underground Injection Control), C-DOCKET (CriminalDocket System used to track criminal enforcement actions for all environmental statutes), FFIS (Federal FacilitiesInformation System), STATE (State Environmental Laws and Statutes), and PADS (PCB Activity Data System).
Date of Government Version: 11/18/2013Date Data Arrived at EDR: 02/27/2014Date Made Active in Reports: 03/12/2014Number of Days to Update: 13
Source: EPATelephone: (415) 947-8000Last EDR Contact: 03/14/2014Next Scheduled EDR Contact: 06/23/2014Data Release Frequency: Quarterly
TC3880855.2s Page GR-20
GOVERNMENT RECORDS SEARCHED / DATA CURRENCY TRACKING

RAATS: RCRA Administrative Action Tracking SystemRCRA Administration Action Tracking System. RAATS contains records based on enforcement actions issued under RCRApertaining to major violators and includes administrative and civil actions brought by the EPA. For administrationactions after September 30, 1995, data entry in the RAATS database was discontinued. EPA will retain a copy ofthe database for historical records. It was necessary to terminate RAATS because a decrease in agency resourcesmade it impossible to continue to update the information contained in the database.
Date of Government Version: 04/17/1995Date Data Arrived at EDR: 07/03/1995Date Made Active in Reports: 08/07/1995Number of Days to Update: 35
Source: EPATelephone: 202-564-4104Last EDR Contact: 06/02/2008Next Scheduled EDR Contact: 09/01/2008Data Release Frequency: No Update Planned
RMP: Risk Management PlansWhen Congress passed the Clean Air Act Amendments of 1990, it required EPA to publish regulations and guidancefor chemical accident prevention at facilities using extremely hazardous substances. The Risk Management ProgramRule (RMP Rule) was written to implement Section 112(r) of these amendments. The rule, which built upon existingindustry codes and standards, requires companies of all sizes that use certain flammable and toxic substancesto develop a Risk Management Program, which includes a(n): Hazard assessment that details the potential effectsof an accidental release, an accident history of the last five years, and an evaluation of worst-case and alternativeaccidental releases; Prevention program that includes safety precautions and maintenance, monitoring, and employeetraining measures; and Emergency response program that spells out emergency health care, employee training measuresand procedures for informing the public and response agencies (e.g the fire department) should an accident occur.
Date of Government Version: 11/01/2013Date Data Arrived at EDR: 12/12/2013Date Made Active in Reports: 02/13/2014Number of Days to Update: 63
Source: Environmental Protection AgencyTelephone: 202-564-8600Last EDR Contact: 01/27/2014Next Scheduled EDR Contact: 05/12/2014Data Release Frequency: Varies
BRS: Biennial Reporting SystemThe Biennial Reporting System is a national system administered by the EPA that collects data on the generationand management of hazardous waste. BRS captures detailed data from two groups: Large Quantity Generators (LQG)and Treatment, Storage, and Disposal Facilities.
Date of Government Version: 12/31/2011Date Data Arrived at EDR: 02/26/2013Date Made Active in Reports: 04/19/2013Number of Days to Update: 52
Source: EPA/NTISTelephone: 800-424-9346Last EDR Contact: 02/28/2014Next Scheduled EDR Contact: 06/09/2014Data Release Frequency: Biennially
CA BOND EXP. PLAN: Bond Expenditure PlanDepartment of Health Services developed a site-specific expenditure plan as the basis for an appropriation ofHazardous Substance Cleanup Bond Act funds. It is not updated.
Date of Government Version: 01/01/1989Date Data Arrived at EDR: 07/27/1994Date Made Active in Reports: 08/02/1994Number of Days to Update: 6
Source: Department of Health ServicesTelephone: 916-255-2118Last EDR Contact: 05/31/1994Next Scheduled EDR Contact: N/AData Release Frequency: No Update Planned
UIC: UIC ListingA listing of wells identified as underground injection wells, in the California Oil and Gas Wells database.
Date of Government Version: 09/25/2013Date Data Arrived at EDR: 12/17/2013Date Made Active in Reports: 01/07/2014Number of Days to Update: 21
Source: Deaprtment of ConservationTelephone: 916-445-2408Last EDR Contact: 12/17/2013Next Scheduled EDR Contact: 03/31/2014Data Release Frequency: Varies
TC3880855.2s Page GR-21
GOVERNMENT RECORDS SEARCHED / DATA CURRENCY TRACKING

NPDES: NPDES Permits ListingA listing of NPDES permits, including stormwater.
Date of Government Version: 11/19/2013Date Data Arrived at EDR: 11/21/2013Date Made Active in Reports: 01/02/2014Number of Days to Update: 42
Source: State Water Resources Control BoardTelephone: 916-445-9379Last EDR Contact: 02/18/2014Next Scheduled EDR Contact: 06/02/2014Data Release Frequency: Quarterly
CORTESE: "Cortese" Hazardous Waste & Substances Sites ListThe sites for the list are designated by the State Water Resource Control Board (LUST), the Integrated WasteBoard (SWF/LS), and the Department of Toxic Substances Control (Cal-Sites).
Date of Government Version: 12/30/2013Date Data Arrived at EDR: 12/31/2013Date Made Active in Reports: 02/11/2014Number of Days to Update: 42
Source: CAL EPA/Office of Emergency InformationTelephone: 916-323-3400Last EDR Contact: 12/31/2013Next Scheduled EDR Contact: 04/14/2014Data Release Frequency: Quarterly
HIST CORTESE: Hazardous Waste & Substance Site ListThe sites for the list are designated by the State Water Resource Control Board [LUST], the Integrated Waste Board[SWF/LS], and the Department of Toxic Substances Control [CALSITES]. This listing is no longer updated by thestate agency.
Date of Government Version: 04/01/2001Date Data Arrived at EDR: 01/22/2009Date Made Active in Reports: 04/08/2009Number of Days to Update: 76
Source: Department of Toxic Substances ControlTelephone: 916-323-3400Last EDR Contact: 01/22/2009Next Scheduled EDR Contact: N/AData Release Frequency: No Update Planned
NOTIFY 65: Proposition 65 RecordsListings of all Proposition 65 incidents reported to counties by the State Water Resources Control Board and theRegional Water Quality Control Board. This database is no longer updated by the reporting agency.
Date of Government Version: 10/21/1993Date Data Arrived at EDR: 11/01/1993Date Made Active in Reports: 11/19/1993Number of Days to Update: 18
Source: State Water Resources Control BoardTelephone: 916-445-3846Last EDR Contact: 12/17/2013Next Scheduled EDR Contact: 04/07/2014Data Release Frequency: No Update Planned
DRYCLEANERS: Cleaner FacilitiesA list of drycleaner related facilities that have EPA ID numbers. These are facilities with certain SIC codes:power laundries, family and commercial; garment pressing and cleaner’s agents; linen supply; coin-operated laundriesand cleaning; drycleaning plants, except rugs; carpet and upholster cleaning; industrial launderers; laundry andgarment services.
Date of Government Version: 09/10/2013Date Data Arrived at EDR: 09/11/2013Date Made Active in Reports: 10/16/2013Number of Days to Update: 35
Source: Department of Toxic Substance ControlTelephone: 916-327-4498Last EDR Contact: 03/10/2014Next Scheduled EDR Contact: 06/23/2014Data Release Frequency: Annually
WIP: Well Investigation Program Case ListWell Investigation Program case in the San Gabriel and San Fernando Valley area.
Date of Government Version: 07/03/2009Date Data Arrived at EDR: 07/21/2009Date Made Active in Reports: 08/03/2009Number of Days to Update: 13
Source: Los Angeles Water Quality Control BoardTelephone: 213-576-6726Last EDR Contact: 12/26/2013Next Scheduled EDR Contact: 04/14/2014Data Release Frequency: Varies
TC3880855.2s Page GR-22
GOVERNMENT RECORDS SEARCHED / DATA CURRENCY TRACKING

ENF: Enforcement Action ListingA listing of Water Board Enforcement Actions. Formal is everything except Oral/Verbal Communication, Notice ofViolation, Expedited Payment Letter, and Staff Enforcement Letter.
Date of Government Version: 08/09/2013Date Data Arrived at EDR: 08/13/2013Date Made Active in Reports: 10/08/2013Number of Days to Update: 56
Source: State Water Resoruces Control BoardTelephone: 916-445-9379Last EDR Contact: 02/10/2014Next Scheduled EDR Contact: 05/05/2014Data Release Frequency: Varies
HAZNET: Facility and Manifest DataFacility and Manifest Data. The data is extracted from the copies of hazardous waste manifests received each yearby the DTSC. The annual volume of manifests is typically 700,000 - 1,000,000 annually, representing approximately350,000 - 500,000 shipments. Data are from the manifests submitted without correction, and therefore many containsome invalid values for data elements such as generator ID, TSD ID, waste category, and disposal method.
Date of Government Version: 12/31/2012Date Data Arrived at EDR: 07/16/2013Date Made Active in Reports: 08/26/2013Number of Days to Update: 41
Source: California Environmental Protection AgencyTelephone: 916-255-1136Last EDR Contact: 01/17/2014Next Scheduled EDR Contact: 04/28/2014Data Release Frequency: Annually
EMI: Emissions Inventory DataToxics and criteria pollutant emissions data collected by the ARB and local air pollution agencies.
Date of Government Version: 12/31/2010Date Data Arrived at EDR: 06/25/2013Date Made Active in Reports: 08/22/2013Number of Days to Update: 58
Source: California Air Resources BoardTelephone: 916-322-2990Last EDR Contact: 12/26/2013Next Scheduled EDR Contact: 04/07/2014Data Release Frequency: Varies
INDIAN RESERV: Indian ReservationsThis map layer portrays Indian administered lands of the United States that have any area equal to or greaterthan 640 acres.
Date of Government Version: 12/31/2005Date Data Arrived at EDR: 12/08/2006Date Made Active in Reports: 01/11/2007Number of Days to Update: 34
Source: USGSTelephone: 202-208-3710Last EDR Contact: 01/15/2014Next Scheduled EDR Contact: 04/28/2014Data Release Frequency: Semi-Annually
SCRD DRYCLEANERS: State Coalition for Remediation of Drycleaners ListingThe State Coalition for Remediation of Drycleaners was established in 1998, with support from the U.S. EPA Officeof Superfund Remediation and Technology Innovation. It is comprised of representatives of states with establisheddrycleaner remediation programs. Currently the member states are Alabama, Connecticut, Florida, Illinois, Kansas,Minnesota, Missouri, North Carolina, Oregon, South Carolina, Tennessee, Texas, and Wisconsin.
Date of Government Version: 03/07/2011Date Data Arrived at EDR: 03/09/2011Date Made Active in Reports: 05/02/2011Number of Days to Update: 54
Source: Environmental Protection AgencyTelephone: 615-532-8599Last EDR Contact: 01/20/2014Next Scheduled EDR Contact: 05/05/2014Data Release Frequency: Varies
Financial Assurance 2: Financial Assurance Information ListingA listing of financial assurance information for solid waste facilities. Financial assurance is intended to ensurethat resources are available to pay for the cost of closure, post-closure care, and corrective measures if theowner or operator of a regulated facility is unable or unwilling to pay.
Date of Government Version: 11/18/2013Date Data Arrived at EDR: 11/19/2013Date Made Active in Reports: 12/31/2013Number of Days to Update: 42
Source: California Integrated Waste Management BoardTelephone: 916-341-6066Last EDR Contact: 02/14/2014Next Scheduled EDR Contact: 06/02/2014Data Release Frequency: Varies
TC3880855.2s Page GR-23
GOVERNMENT RECORDS SEARCHED / DATA CURRENCY TRACKING

Financial Assurance 1: Financial Assurance Information ListingFinancial Assurance information
Date of Government Version: 01/28/2014Date Data Arrived at EDR: 01/30/2014Date Made Active in Reports: 02/11/2014Number of Days to Update: 12
Source: Department of Toxic Substances ControlTelephone: 916-255-3628Last EDR Contact: 01/27/2014Next Scheduled EDR Contact: 05/05/2014Data Release Frequency: Varies
COAL ASH EPA: Coal Combustion Residues Surface Impoundments ListA listing of coal combustion residues surface impoundments with high hazard potential ratings.
Date of Government Version: 08/17/2010Date Data Arrived at EDR: 01/03/2011Date Made Active in Reports: 03/21/2011Number of Days to Update: 77
Source: Environmental Protection AgencyTelephone: N/ALast EDR Contact: 03/11/2014Next Scheduled EDR Contact: 06/23/2014Data Release Frequency: Varies
PCB TRANSFORMER: PCB Transformer Registration DatabaseThe database of PCB transformer registrations that includes all PCB registration submittals.
Date of Government Version: 02/01/2011Date Data Arrived at EDR: 10/19/2011Date Made Active in Reports: 01/10/2012Number of Days to Update: 83
Source: Environmental Protection AgencyTelephone: 202-566-0517Last EDR Contact: 01/30/2014Next Scheduled EDR Contact: 05/12/2014Data Release Frequency: Varies
MWMP: Medical Waste Management Program ListingThe Medical Waste Management Program (MWMP) ensures the proper handling and disposal of medical waste by permittingand inspecting medical waste Offsite Treatment Facilities (PDF) and Transfer Stations (PDF) throughout thestate. MWMP also oversees all Medical Waste Transporters.
Date of Government Version: 09/20/2013Date Data Arrived at EDR: 12/11/2013Date Made Active in Reports: 01/04/2014Number of Days to Update: 24
Source: Department of Public HealthTelephone: 916-558-1784Last EDR Contact: 03/10/2014Next Scheduled EDR Contact: 06/23/2014Data Release Frequency: Varies
COAL ASH DOE: Sleam-Electric Plan Operation DataA listing of power plants that store ash in surface ponds.
Date of Government Version: 12/31/2005Date Data Arrived at EDR: 08/07/2009Date Made Active in Reports: 10/22/2009Number of Days to Update: 76
Source: Department of EnergyTelephone: 202-586-8719Last EDR Contact: 01/13/2014Next Scheduled EDR Contact: 04/28/2014Data Release Frequency: Varies
HWT: Registered Hazardous Waste Transporter DatabaseA listing of hazardous waste transporters. In California, unless specifically exempted, it is unlawful for anyperson to transport hazardous wastes unless the person holds a valid registration issued by DTSC. A hazardouswaste transporter registration is valid for one year and is assigned a unique registration number.
Date of Government Version: 01/13/2014Date Data Arrived at EDR: 01/14/2014Date Made Active in Reports: 02/11/2014Number of Days to Update: 28
Source: Department of Toxic Substances ControlTelephone: 916-440-7145Last EDR Contact: 01/14/2014Next Scheduled EDR Contact: 04/28/2014Data Release Frequency: Quarterly
HWP: EnviroStor Permitted Facilities ListingDetailed information on permitted hazardous waste facilities and corrective action ("cleanups") tracked in EnviroStor.
TC3880855.2s Page GR-24
GOVERNMENT RECORDS SEARCHED / DATA CURRENCY TRACKING
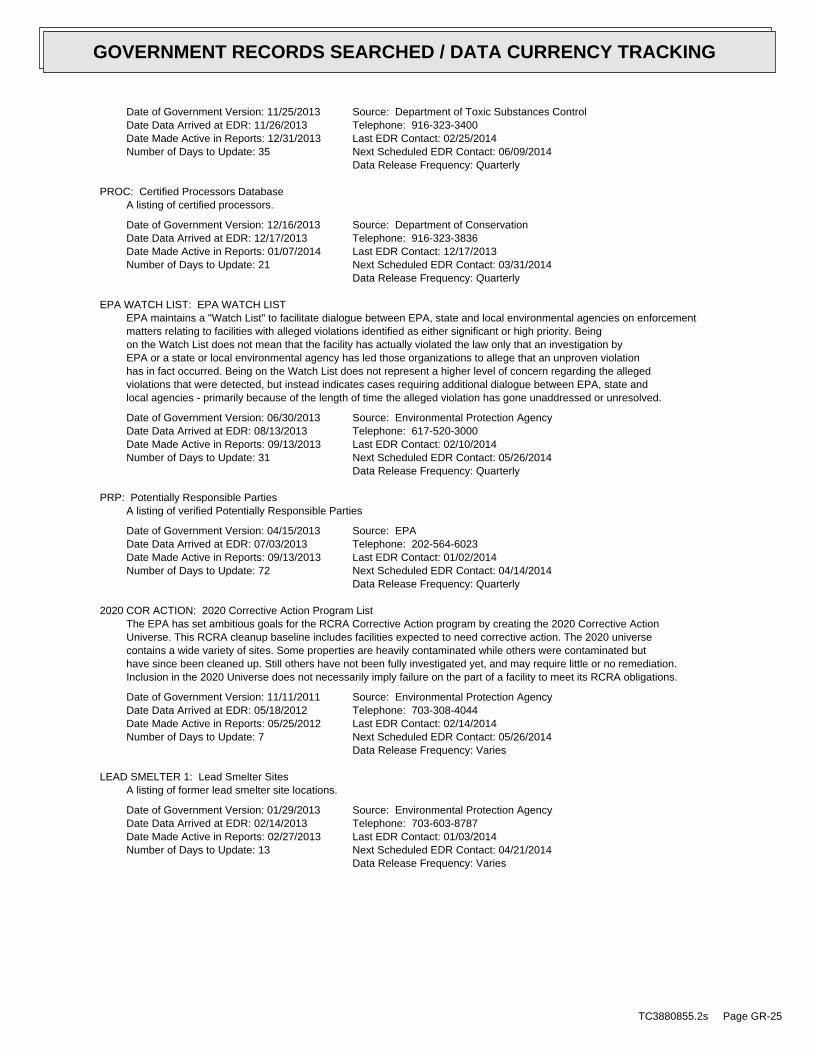
Date of Government Version: 11/25/2013Date Data Arrived at EDR: 11/26/2013Date Made Active in Reports: 12/31/2013Number of Days to Update: 35
Source: Department of Toxic Substances ControlTelephone: 916-323-3400Last EDR Contact: 02/25/2014Next Scheduled EDR Contact: 06/09/2014Data Release Frequency: Quarterly
PROC: Certified Processors DatabaseA listing of certified processors.
Date of Government Version: 12/16/2013Date Data Arrived at EDR: 12/17/2013Date Made Active in Reports: 01/07/2014Number of Days to Update: 21
Source: Department of ConservationTelephone: 916-323-3836Last EDR Contact: 12/17/2013Next Scheduled EDR Contact: 03/31/2014Data Release Frequency: Quarterly
EPA WATCH LIST: EPA WATCH LISTEPA maintains a "Watch List" to facilitate dialogue between EPA, state and local environmental agencies on enforcementmatters relating to facilities with alleged violations identified as either significant or high priority. Beingon the Watch List does not mean that the facility has actually violated the law only that an investigation byEPA or a state or local environmental agency has led those organizations to allege that an unproven violationhas in fact occurred. Being on the Watch List does not represent a higher level of concern regarding the allegedviolations that were detected, but instead indicates cases requiring additional dialogue between EPA, state andlocal agencies - primarily because of the length of time the alleged violation has gone unaddressed or unresolved.
Date of Government Version: 06/30/2013Date Data Arrived at EDR: 08/13/2013Date Made Active in Reports: 09/13/2013Number of Days to Update: 31
Source: Environmental Protection AgencyTelephone: 617-520-3000Last EDR Contact: 02/10/2014Next Scheduled EDR Contact: 05/26/2014Data Release Frequency: Quarterly
PRP: Potentially Responsible PartiesA listing of verified Potentially Responsible Parties
Date of Government Version: 04/15/2013Date Data Arrived at EDR: 07/03/2013Date Made Active in Reports: 09/13/2013Number of Days to Update: 72
Source: EPATelephone: 202-564-6023Last EDR Contact: 01/02/2014Next Scheduled EDR Contact: 04/14/2014Data Release Frequency: Quarterly
2020 COR ACTION: 2020 Corrective Action Program ListThe EPA has set ambitious goals for the RCRA Corrective Action program by creating the 2020 Corrective ActionUniverse. This RCRA cleanup baseline includes facilities expected to need corrective action. The 2020 universecontains a wide variety of sites. Some properties are heavily contaminated while others were contaminated buthave since been cleaned up. Still others have not been fully investigated yet, and may require little or no remediation.Inclusion in the 2020 Universe does not necessarily imply failure on the part of a facility to meet its RCRA obligations.
Date of Government Version: 11/11/2011Date Data Arrived at EDR: 05/18/2012Date Made Active in Reports: 05/25/2012Number of Days to Update: 7
Source: Environmental Protection AgencyTelephone: 703-308-4044Last EDR Contact: 02/14/2014Next Scheduled EDR Contact: 05/26/2014Data Release Frequency: Varies
LEAD SMELTER 1: Lead Smelter SitesA listing of former lead smelter site locations.
Date of Government Version: 01/29/2013Date Data Arrived at EDR: 02/14/2013Date Made Active in Reports: 02/27/2013Number of Days to Update: 13
Source: Environmental Protection AgencyTelephone: 703-603-8787Last EDR Contact: 01/03/2014Next Scheduled EDR Contact: 04/21/2014Data Release Frequency: Varies
TC3880855.2s Page GR-25
GOVERNMENT RECORDS SEARCHED / DATA CURRENCY TRACKING

LEAD SMELTER 2: Lead Smelter SitesA list of several hundred sites in the U.S. where secondary lead smelting was done from 1931and 1964. These sitesmay pose a threat to public health through ingestion or inhalation of contaminated soil or dust
Date of Government Version: 04/05/2001Date Data Arrived at EDR: 10/27/2010Date Made Active in Reports: 12/02/2010Number of Days to Update: 36
Source: American Journal of Public HealthTelephone: 703-305-6451Last EDR Contact: 12/02/2009Next Scheduled EDR Contact: N/AData Release Frequency: No Update Planned
FEDLAND: Federal and Indian LandsFederally and Indian administrated lands of the United States. Lands included are administrated by: Army Corpsof Engineers, Bureau of Reclamation, National Wild and Scenic River, National Wildlife Refuge, Public Domain Land,Wilderness, Wilderness Study Area, Wildlife Management Area, Bureau of Indian Affairs, Bureau of Land Management,Department of Justice, Forest Service, Fish and Wildlife Service, National Park Service.
Date of Government Version: 12/31/2005Date Data Arrived at EDR: 02/06/2006Date Made Active in Reports: 01/11/2007Number of Days to Update: 339
Source: U.S. Geological SurveyTelephone: 888-275-8747Last EDR Contact: 01/15/2014Next Scheduled EDR Contact: 04/28/2014Data Release Frequency: N/A
WDS: Waste Discharge SystemSites which have been issued waste discharge requirements.
Date of Government Version: 06/19/2007Date Data Arrived at EDR: 06/20/2007Date Made Active in Reports: 06/29/2007Number of Days to Update: 9
Source: State Water Resources Control BoardTelephone: 916-341-5227Last EDR Contact: 02/24/2014Next Scheduled EDR Contact: 06/09/2014Data Release Frequency: Quarterly
US FIN ASSUR: Financial Assurance InformationAll owners and operators of facilities that treat, store, or dispose of hazardous waste are required to provideproof that they will have sufficient funds to pay for the clean up, closure, and post-closure care of their facilities.
Date of Government Version: 11/20/2013Date Data Arrived at EDR: 12/03/2013Date Made Active in Reports: 02/13/2014Number of Days to Update: 72
Source: Environmental Protection AgencyTelephone: 202-566-1917Last EDR Contact: 02/14/2014Next Scheduled EDR Contact: 06/02/2014Data Release Frequency: Quarterly
US AIRS MINOR: Air Facility System DataA listing of minor source facilities.
Date of Government Version: 10/23/2013Date Data Arrived at EDR: 11/06/2013Date Made Active in Reports: 12/06/2013Number of Days to Update: 30
Source: EPATelephone: 202-564-5962Last EDR Contact: 12/26/2013Next Scheduled EDR Contact: 04/14/2014Data Release Frequency: Annually
US AIRS (AFS): Aerometric Information Retrieval System Facility Subsystem (AFS)The database is a sub-system of Aerometric Information Retrieval System (AIRS). AFS contains compliance dataon air pollution point sources regulated by the U.S. EPA and/or state and local air regulatory agencies. Thisinformation comes from source reports by various stationary sources of air pollution, such as electric power plants,steel mills, factories, and universities, and provides information about the air pollutants they produce. Action,air program, air program pollutant, and general level plant data. It is used to track emissions and compliancedata from industrial plants.
Date of Government Version: 10/23/2013Date Data Arrived at EDR: 11/06/2013Date Made Active in Reports: 12/06/2013Number of Days to Update: 30
Source: EPATelephone: 202-564-5962Last EDR Contact: 12/26/2013Next Scheduled EDR Contact: 04/14/2014Data Release Frequency: Annually
TC3880855.2s Page GR-26
GOVERNMENT RECORDS SEARCHED / DATA CURRENCY TRACKING

EDR HIGH RISK HISTORICAL RECORDS
EDR Exclusive Records
EDR MGP: EDR Proprietary Manufactured Gas PlantsThe EDR Proprietary Manufactured Gas Plant Database includes records of coal gas plants (manufactured gas plants)compiled by EDR’s researchers. Manufactured gas sites were used in the United States from the 1800’s to 1950’sto produce a gas that could be distributed and used as fuel. These plants used whale oil, rosin, coal, or a mixtureof coal, oil, and water that also produced a significant amount of waste. Many of the byproducts of the gas production,such as coal tar (oily waste containing volatile and non-volatile chemicals), sludges, oils and other compoundsare potentially hazardous to human health and the environment. The byproduct from this process was frequentlydisposed of directly at the plant site and can remain or spread slowly, serving as a continuous source of soiland groundwater contamination.
Date of Government Version: N/ADate Data Arrived at EDR: N/ADate Made Active in Reports: N/ANumber of Days to Update: N/A
Source: EDR, Inc.Telephone: N/ALast EDR Contact: N/ANext Scheduled EDR Contact: N/AData Release Frequency: No Update Planned
EDR US Hist Auto Stat: EDR Exclusive Historic Gas StationsEDR has searched selected national collections of business directories and has collected listings of potentialgas station/filling station/service station sites that were available to EDR researchers. EDR’s review was limitedto those categories of sources that might, in EDR’s opinion, include gas station/filling station/service stationestablishments. The categories reviewed included, but were not limited to gas, gas station, gasoline station,filling station, auto, automobile repair, auto service station, service station, etc. This database falls withina category of information EDR classifies as "High Risk Historical Records", or HRHR. EDR’s HRHR effort presentsunique and sometimes proprietary data about past sites and operations that typically create environmental concerns,but may not show up in current government records searches.
Date of Government Version: N/ADate Data Arrived at EDR: N/ADate Made Active in Reports: N/ANumber of Days to Update: N/A
Source: EDR, Inc.Telephone: N/ALast EDR Contact: N/ANext Scheduled EDR Contact: N/AData Release Frequency: Varies
EDR US Hist Cleaners: EDR Exclusive Historic Dry CleanersEDR has searched selected national collections of business directories and has collected listings of potentialdry cleaner sites that were available to EDR researchers. EDR’s review was limited to those categories of sourcesthat might, in EDR’s opinion, include dry cleaning establishments. The categories reviewed included, but werenot limited to dry cleaners, cleaners, laundry, laundromat, cleaning/laundry, wash & dry etc. This database fallswithin a category of information EDR classifies as "High Risk Historical Records", or HRHR. EDR’s HRHR effortpresents unique and sometimes proprietary data about past sites and operations that typically create environmentalconcerns, but may not show up in current government records searches.
Date of Government Version: N/ADate Data Arrived at EDR: N/ADate Made Active in Reports: N/ANumber of Days to Update: N/A
Source: EDR, Inc.Telephone: N/ALast EDR Contact: N/ANext Scheduled EDR Contact: N/AData Release Frequency: Varies
EDR US Hist Auto Stat: EDR Proprietary Historic Gas Stations - Cole
Date of Government Version: N/ADate Data Arrived at EDR: N/ADate Made Active in Reports: N/ANumber of Days to Update: N/A
Source: N/ATelephone: N/ALast EDR Contact: N/ANext Scheduled EDR Contact: N/AData Release Frequency: Varies
TC3880855.2s Page GR-27
GOVERNMENT RECORDS SEARCHED / DATA CURRENCY TRACKING
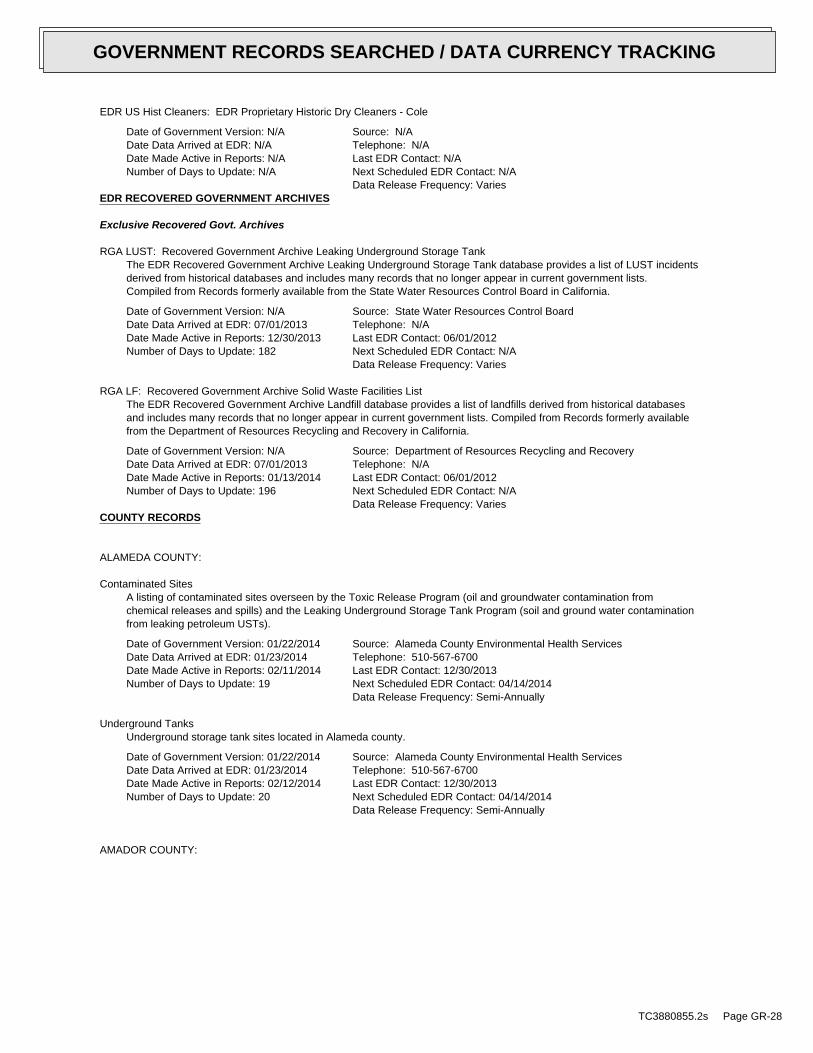
EDR US Hist Cleaners: EDR Proprietary Historic Dry Cleaners - Cole
Date of Government Version: N/ADate Data Arrived at EDR: N/ADate Made Active in Reports: N/ANumber of Days to Update: N/A
Source: N/ATelephone: N/ALast EDR Contact: N/ANext Scheduled EDR Contact: N/AData Release Frequency: Varies
EDR RECOVERED GOVERNMENT ARCHIVES
Exclusive Recovered Govt. Archives
RGA LUST: Recovered Government Archive Leaking Underground Storage TankThe EDR Recovered Government Archive Leaking Underground Storage Tank database provides a list of LUST incidentsderived from historical databases and includes many records that no longer appear in current government lists.Compiled from Records formerly available from the State Water Resources Control Board in California.
Date of Government Version: N/ADate Data Arrived at EDR: 07/01/2013Date Made Active in Reports: 12/30/2013Number of Days to Update: 182
Source: State Water Resources Control BoardTelephone: N/ALast EDR Contact: 06/01/2012Next Scheduled EDR Contact: N/AData Release Frequency: Varies
RGA LF: Recovered Government Archive Solid Waste Facilities ListThe EDR Recovered Government Archive Landfill database provides a list of landfills derived from historical databasesand includes many records that no longer appear in current government lists. Compiled from Records formerly availablefrom the Department of Resources Recycling and Recovery in California.
Date of Government Version: N/ADate Data Arrived at EDR: 07/01/2013Date Made Active in Reports: 01/13/2014Number of Days to Update: 196
Source: Department of Resources Recycling and RecoveryTelephone: N/ALast EDR Contact: 06/01/2012Next Scheduled EDR Contact: N/AData Release Frequency: Varies
COUNTY RECORDS
ALAMEDA COUNTY:
Contaminated SitesA listing of contaminated sites overseen by the Toxic Release Program (oil and groundwater contamination fromchemical releases and spills) and the Leaking Underground Storage Tank Program (soil and ground water contaminationfrom leaking petroleum USTs).
Date of Government Version: 01/22/2014Date Data Arrived at EDR: 01/23/2014Date Made Active in Reports: 02/11/2014Number of Days to Update: 19
Source: Alameda County Environmental Health ServicesTelephone: 510-567-6700Last EDR Contact: 12/30/2013Next Scheduled EDR Contact: 04/14/2014Data Release Frequency: Semi-Annually
Underground TanksUnderground storage tank sites located in Alameda county.
Date of Government Version: 01/22/2014Date Data Arrived at EDR: 01/23/2014Date Made Active in Reports: 02/12/2014Number of Days to Update: 20
Source: Alameda County Environmental Health ServicesTelephone: 510-567-6700Last EDR Contact: 12/30/2013Next Scheduled EDR Contact: 04/14/2014Data Release Frequency: Semi-Annually
AMADOR COUNTY:
TC3880855.2s Page GR-28
GOVERNMENT RECORDS SEARCHED / DATA CURRENCY TRACKING

CUPA Facility ListCupa Facility List
Date of Government Version: 12/05/2013Date Data Arrived at EDR: 12/10/2013Date Made Active in Reports: 01/03/2014Number of Days to Update: 24
Source: Amador County Environmental HealthTelephone: 209-223-6439Last EDR Contact: 03/10/2014Next Scheduled EDR Contact: 06/23/2014Data Release Frequency: Varies
BUTTE COUNTY:
CUPA Facility ListingCupa facility list.
Date of Government Version: 08/01/2013Date Data Arrived at EDR: 08/02/2013Date Made Active in Reports: 08/22/2013Number of Days to Update: 20
Source: Public Health DepartmentTelephone: 530-538-7149Last EDR Contact: 01/13/2014Next Scheduled EDR Contact: 04/28/2014Data Release Frequency: No Update Planned
CALVERAS COUNTY:
CUPA Facility ListingCupa Facility Listing
Date of Government Version: 09/30/2013Date Data Arrived at EDR: 10/01/2013Date Made Active in Reports: 11/26/2013Number of Days to Update: 56
Source: Calveras County Environmental HealthTelephone: 209-754-6399Last EDR Contact: 12/30/2013Next Scheduled EDR Contact: 04/14/2014Data Release Frequency: Quarterly
COLUSA COUNTY:
CUPA Facility ListCupa facility list.
Date of Government Version: 12/05/2013Date Data Arrived at EDR: 12/05/2013Date Made Active in Reports: 01/27/2014Number of Days to Update: 53
Source: Health & Human ServicesTelephone: 530-458-0396Last EDR Contact: 03/13/2014Next Scheduled EDR Contact: 05/26/2014Data Release Frequency: Varies
CONTRA COSTA COUNTY:
Site ListList includes sites from the underground tank, hazardous waste generator and business plan/2185 programs.
Date of Government Version: 11/18/2013Date Data Arrived at EDR: 11/19/2013Date Made Active in Reports: 12/31/2013Number of Days to Update: 42
Source: Contra Costa Health Services DepartmentTelephone: 925-646-2286Last EDR Contact: 02/05/2014Next Scheduled EDR Contact: 05/19/2014Data Release Frequency: Semi-Annually
DEL NORTE COUNTY:
TC3880855.2s Page GR-29
GOVERNMENT RECORDS SEARCHED / DATA CURRENCY TRACKING

CUPA Facility ListCupa Facility list
Date of Government Version: 01/09/2013Date Data Arrived at EDR: 01/10/2013Date Made Active in Reports: 02/25/2013Number of Days to Update: 46
Source: Del Norte County Environmental Health DivisionTelephone: 707-465-0426Last EDR Contact: 11/04/2013Next Scheduled EDR Contact: 02/17/2014Data Release Frequency: Varies
EL DORADO COUNTY:
CUPA Facility ListCUPA facility list.
Date of Government Version: 11/18/2013Date Data Arrived at EDR: 11/19/2013Date Made Active in Reports: 01/14/2014Number of Days to Update: 56
Source: El Dorado County Environmental Management DepartmentTelephone: 530-621-6623Last EDR Contact: 02/04/2014Next Scheduled EDR Contact: 05/19/2014Data Release Frequency: Varies
FRESNO COUNTY:
CUPA Resources ListCertified Unified Program Agency. CUPA’s are responsible for implementing a unified hazardous materials and hazardouswaste management regulatory program. The agency provides oversight of businesses that deal with hazardous materials,operate underground storage tanks or aboveground storage tanks.
Date of Government Version: 12/31/2013Date Data Arrived at EDR: 01/14/2014Date Made Active in Reports: 02/11/2014Number of Days to Update: 28
Source: Dept. of Community HealthTelephone: 559-445-3271Last EDR Contact: 01/13/2014Next Scheduled EDR Contact: 04/28/2014Data Release Frequency: Semi-Annually
HUMBOLDT COUNTY:
CUPA Facility ListCUPA facility list.
Date of Government Version: 12/16/2013Date Data Arrived at EDR: 12/17/2013Date Made Active in Reports: 01/07/2014Number of Days to Update: 21
Source: Humboldt County Environmental HealthTelephone: N/ALast EDR Contact: 02/24/2014Next Scheduled EDR Contact: 06/09/2014Data Release Frequency: Varies
IMPERIAL COUNTY:
CUPA Facility ListCupa facility list.
Date of Government Version: 01/27/2014Date Data Arrived at EDR: 01/28/2014Date Made Active in Reports: 02/11/2014Number of Days to Update: 14
Source: San Diego Border Field OfficeTelephone: 760-339-2777Last EDR Contact: 01/27/2014Next Scheduled EDR Contact: 05/12/2014Data Release Frequency: Varies
INYO COUNTY:
TC3880855.2s Page GR-30
GOVERNMENT RECORDS SEARCHED / DATA CURRENCY TRACKING
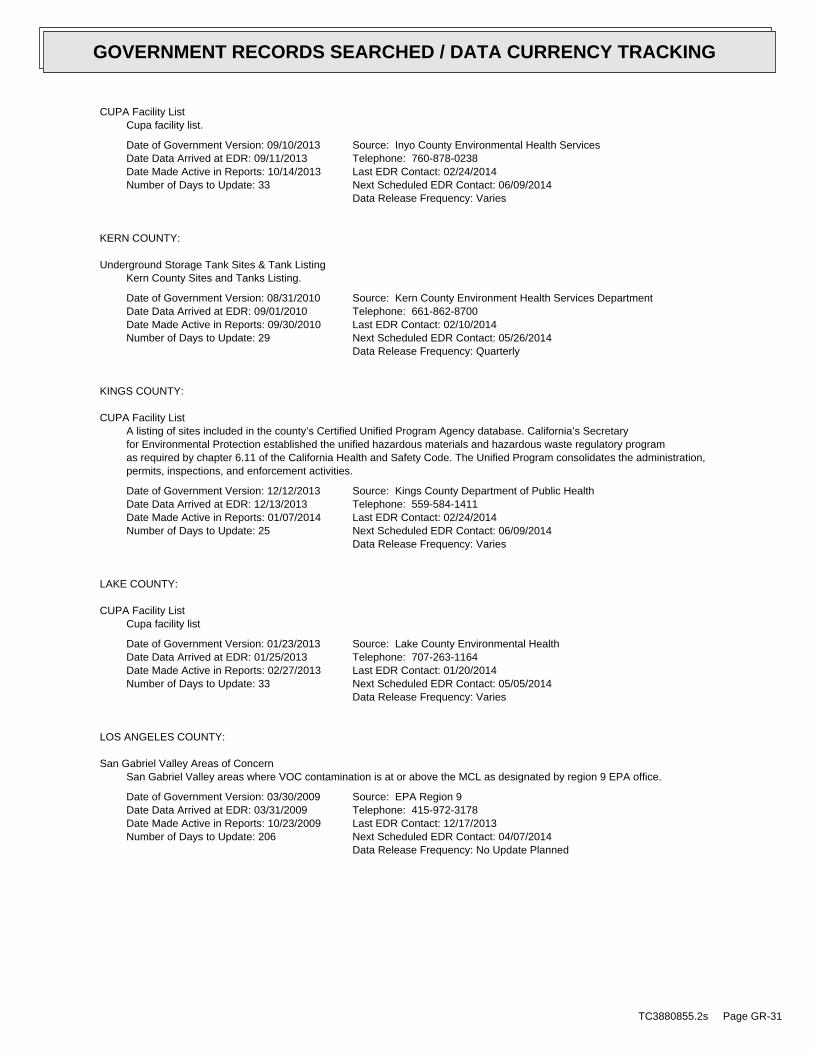
CUPA Facility ListCupa facility list.
Date of Government Version: 09/10/2013Date Data Arrived at EDR: 09/11/2013Date Made Active in Reports: 10/14/2013Number of Days to Update: 33
Source: Inyo County Environmental Health ServicesTelephone: 760-878-0238Last EDR Contact: 02/24/2014Next Scheduled EDR Contact: 06/09/2014Data Release Frequency: Varies
KERN COUNTY:
Underground Storage Tank Sites & Tank ListingKern County Sites and Tanks Listing.
Date of Government Version: 08/31/2010Date Data Arrived at EDR: 09/01/2010Date Made Active in Reports: 09/30/2010Number of Days to Update: 29
Source: Kern County Environment Health Services DepartmentTelephone: 661-862-8700Last EDR Contact: 02/10/2014Next Scheduled EDR Contact: 05/26/2014Data Release Frequency: Quarterly
KINGS COUNTY:
CUPA Facility ListA listing of sites included in the county’s Certified Unified Program Agency database. California’s Secretaryfor Environmental Protection established the unified hazardous materials and hazardous waste regulatory programas required by chapter 6.11 of the California Health and Safety Code. The Unified Program consolidates the administration,permits, inspections, and enforcement activities.
Date of Government Version: 12/12/2013Date Data Arrived at EDR: 12/13/2013Date Made Active in Reports: 01/07/2014Number of Days to Update: 25
Source: Kings County Department of Public HealthTelephone: 559-584-1411Last EDR Contact: 02/24/2014Next Scheduled EDR Contact: 06/09/2014Data Release Frequency: Varies
LAKE COUNTY:
CUPA Facility ListCupa facility list
Date of Government Version: 01/23/2013Date Data Arrived at EDR: 01/25/2013Date Made Active in Reports: 02/27/2013Number of Days to Update: 33
Source: Lake County Environmental HealthTelephone: 707-263-1164Last EDR Contact: 01/20/2014Next Scheduled EDR Contact: 05/05/2014Data Release Frequency: Varies
LOS ANGELES COUNTY:
San Gabriel Valley Areas of ConcernSan Gabriel Valley areas where VOC contamination is at or above the MCL as designated by region 9 EPA office.
Date of Government Version: 03/30/2009Date Data Arrived at EDR: 03/31/2009Date Made Active in Reports: 10/23/2009Number of Days to Update: 206
Source: EPA Region 9Telephone: 415-972-3178Last EDR Contact: 12/17/2013Next Scheduled EDR Contact: 04/07/2014Data Release Frequency: No Update Planned
TC3880855.2s Page GR-31
GOVERNMENT RECORDS SEARCHED / DATA CURRENCY TRACKING

HMS: Street Number ListIndustrial Waste and Underground Storage Tank Sites.
Date of Government Version: 03/28/2013Date Data Arrived at EDR: 06/17/2013Date Made Active in Reports: 08/21/2013Number of Days to Update: 65
Source: Department of Public WorksTelephone: 626-458-3517Last EDR Contact: 01/13/2014Next Scheduled EDR Contact: 04/28/2014Data Release Frequency: Semi-Annually
List of Solid Waste FacilitiesSolid Waste Facilities in Los Angeles County.
Date of Government Version: 01/20/2014Date Data Arrived at EDR: 01/21/2014Date Made Active in Reports: 02/11/2014Number of Days to Update: 21
Source: La County Department of Public WorksTelephone: 818-458-5185Last EDR Contact: 01/21/2014Next Scheduled EDR Contact: 05/05/2014Data Release Frequency: Varies
City of Los Angeles LandfillsLandfills owned and maintained by the City of Los Angeles.
Date of Government Version: 03/05/2009Date Data Arrived at EDR: 03/10/2009Date Made Active in Reports: 04/08/2009Number of Days to Update: 29
Source: Engineering & Construction DivisionTelephone: 213-473-7869Last EDR Contact: 01/20/2014Next Scheduled EDR Contact: 05/05/2014Data Release Frequency: Varies
Site Mitigation ListIndustrial sites that have had some sort of spill or complaint.
Date of Government Version: 01/30/2013Date Data Arrived at EDR: 02/21/2013Date Made Active in Reports: 03/25/2013Number of Days to Update: 32
Source: Community Health ServicesTelephone: 323-890-7806Last EDR Contact: 01/20/2014Next Scheduled EDR Contact: 05/05/2014Data Release Frequency: Annually
City of El Segundo Underground Storage TankUnderground storage tank sites located in El Segundo city.
Date of Government Version: 10/21/2013Date Data Arrived at EDR: 10/25/2013Date Made Active in Reports: 11/27/2013Number of Days to Update: 33
Source: City of El Segundo Fire DepartmentTelephone: 310-524-2236Last EDR Contact: 01/20/2014Next Scheduled EDR Contact: 05/05/2014Data Release Frequency: Semi-Annually
City of Long Beach Underground Storage TankUnderground storage tank sites located in the city of Long Beach.
Date of Government Version: 03/28/2003Date Data Arrived at EDR: 10/23/2003Date Made Active in Reports: 11/26/2003Number of Days to Update: 34
Source: City of Long Beach Fire DepartmentTelephone: 562-570-2563Last EDR Contact: 01/30/2014Next Scheduled EDR Contact: 05/12/2014Data Release Frequency: Annually
City of Torrance Underground Storage TankUnderground storage tank sites located in the city of Torrance.
Date of Government Version: 07/15/2013Date Data Arrived at EDR: 07/18/2013Date Made Active in Reports: 08/20/2013Number of Days to Update: 33
Source: City of Torrance Fire DepartmentTelephone: 310-618-2973Last EDR Contact: 01/13/2014Next Scheduled EDR Contact: 04/28/2014Data Release Frequency: Semi-Annually
MADERA COUNTY:
TC3880855.2s Page GR-32
GOVERNMENT RECORDS SEARCHED / DATA CURRENCY TRACKING

CUPA Facility ListA listing of sites included in the county’s Certified Unified Program Agency database. California’s Secretaryfor Environmental Protection established the unified hazardous materials and hazardous waste regulatory programas required by chapter 6.11 of the California Health and Safety Code. The Unified Program consolidates the administration,permits, inspections, and enforcement activities.
Date of Government Version: 12/09/2013Date Data Arrived at EDR: 12/10/2013Date Made Active in Reports: 02/20/2014Number of Days to Update: 72
Source: Madera County Environmental HealthTelephone: 559-675-7823Last EDR Contact: 02/24/2014Next Scheduled EDR Contact: 06/09/2014Data Release Frequency: Varies
MARIN COUNTY:
Underground Storage Tank SitesCurrently permitted USTs in Marin County.
Date of Government Version: 01/03/2014Date Data Arrived at EDR: 01/09/2014Date Made Active in Reports: 02/12/2014Number of Days to Update: 34
Source: Public Works Department Waste ManagementTelephone: 415-499-6647Last EDR Contact: 01/03/2014Next Scheduled EDR Contact: 04/21/2014Data Release Frequency: Semi-Annually
MERCED COUNTY:
CUPA Facility ListCUPA facility list.
Date of Government Version: 11/21/2013Date Data Arrived at EDR: 11/25/2013Date Made Active in Reports: 02/24/2014Number of Days to Update: 91
Source: Merced County Environmental HealthTelephone: 209-381-1094Last EDR Contact: 03/10/2014Next Scheduled EDR Contact: 06/09/2014Data Release Frequency: Varies
MONO COUNTY:
CUPA Facility ListCUPA Facility List
Date of Government Version: 12/02/2013Date Data Arrived at EDR: 12/03/2013Date Made Active in Reports: 01/02/2014Number of Days to Update: 30
Source: Mono County Health DepartmentTelephone: 760-932-5580Last EDR Contact: 03/03/2014Next Scheduled EDR Contact: 06/16/2014Data Release Frequency: Varies
MONTEREY COUNTY:
CUPA Facility ListingCUPA Program listing from the Environmental Health Division.
Date of Government Version: 01/09/2014Date Data Arrived at EDR: 01/10/2014Date Made Active in Reports: 02/14/2014Number of Days to Update: 35
Source: Monterey County Health DepartmentTelephone: 831-796-1297Last EDR Contact: 02/24/2014Next Scheduled EDR Contact: 06/09/2014Data Release Frequency: Varies
NAPA COUNTY:
TC3880855.2s Page GR-33
GOVERNMENT RECORDS SEARCHED / DATA CURRENCY TRACKING
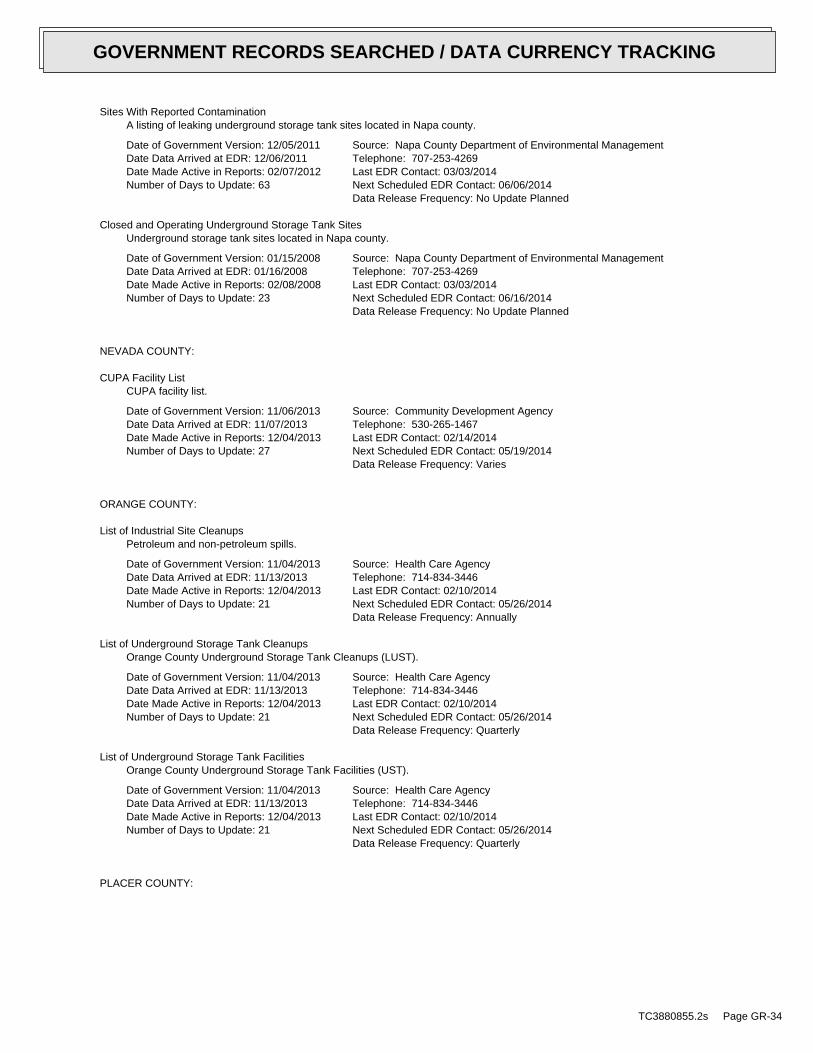
Sites With Reported ContaminationA listing of leaking underground storage tank sites located in Napa county.
Date of Government Version: 12/05/2011Date Data Arrived at EDR: 12/06/2011Date Made Active in Reports: 02/07/2012Number of Days to Update: 63
Source: Napa County Department of Environmental ManagementTelephone: 707-253-4269Last EDR Contact: 03/03/2014Next Scheduled EDR Contact: 06/06/2014Data Release Frequency: No Update Planned
Closed and Operating Underground Storage Tank SitesUnderground storage tank sites located in Napa county.
Date of Government Version: 01/15/2008Date Data Arrived at EDR: 01/16/2008Date Made Active in Reports: 02/08/2008Number of Days to Update: 23
Source: Napa County Department of Environmental ManagementTelephone: 707-253-4269Last EDR Contact: 03/03/2014Next Scheduled EDR Contact: 06/16/2014Data Release Frequency: No Update Planned
NEVADA COUNTY:
CUPA Facility ListCUPA facility list.
Date of Government Version: 11/06/2013Date Data Arrived at EDR: 11/07/2013Date Made Active in Reports: 12/04/2013Number of Days to Update: 27
Source: Community Development AgencyTelephone: 530-265-1467Last EDR Contact: 02/14/2014Next Scheduled EDR Contact: 05/19/2014Data Release Frequency: Varies
ORANGE COUNTY:
List of Industrial Site CleanupsPetroleum and non-petroleum spills.
Date of Government Version: 11/04/2013Date Data Arrived at EDR: 11/13/2013Date Made Active in Reports: 12/04/2013Number of Days to Update: 21
Source: Health Care AgencyTelephone: 714-834-3446Last EDR Contact: 02/10/2014Next Scheduled EDR Contact: 05/26/2014Data Release Frequency: Annually
List of Underground Storage Tank CleanupsOrange County Underground Storage Tank Cleanups (LUST).
Date of Government Version: 11/04/2013Date Data Arrived at EDR: 11/13/2013Date Made Active in Reports: 12/04/2013Number of Days to Update: 21
Source: Health Care AgencyTelephone: 714-834-3446Last EDR Contact: 02/10/2014Next Scheduled EDR Contact: 05/26/2014Data Release Frequency: Quarterly
List of Underground Storage Tank FacilitiesOrange County Underground Storage Tank Facilities (UST).
Date of Government Version: 11/04/2013Date Data Arrived at EDR: 11/13/2013Date Made Active in Reports: 12/04/2013Number of Days to Update: 21
Source: Health Care AgencyTelephone: 714-834-3446Last EDR Contact: 02/10/2014Next Scheduled EDR Contact: 05/26/2014Data Release Frequency: Quarterly
PLACER COUNTY:
TC3880855.2s Page GR-34
GOVERNMENT RECORDS SEARCHED / DATA CURRENCY TRACKING

Master List of FacilitiesList includes aboveground tanks, underground tanks and cleanup sites.
Date of Government Version: 12/09/2013Date Data Arrived at EDR: 12/10/2013Date Made Active in Reports: 01/07/2014Number of Days to Update: 28
Source: Placer County Health and Human ServicesTelephone: 530-745-2363Last EDR Contact: 03/10/2014Next Scheduled EDR Contact: 06/23/2014Data Release Frequency: Semi-Annually
RIVERSIDE COUNTY:
Listing of Underground Tank Cleanup SitesRiverside County Underground Storage Tank Cleanup Sites (LUST).
Date of Government Version: 01/14/2014Date Data Arrived at EDR: 01/15/2014Date Made Active in Reports: 02/11/2014Number of Days to Update: 27
Source: Department of Environmental HealthTelephone: 951-358-5055Last EDR Contact: 12/19/2013Next Scheduled EDR Contact: 04/07/2014Data Release Frequency: Quarterly
Underground Storage Tank Tank ListUnderground storage tank sites located in Riverside county.
Date of Government Version: 01/14/2014Date Data Arrived at EDR: 01/15/2014Date Made Active in Reports: 02/12/2014Number of Days to Update: 28
Source: Department of Environmental HealthTelephone: 951-358-5055Last EDR Contact: 12/19/2013Next Scheduled EDR Contact: 04/07/2014Data Release Frequency: Quarterly
SACRAMENTO COUNTY:
Toxic Site Clean-Up ListList of sites where unauthorized releases of potentially hazardous materials have occurred.
Date of Government Version: 11/21/2013Date Data Arrived at EDR: 01/09/2014Date Made Active in Reports: 02/11/2014Number of Days to Update: 33
Source: Sacramento County Environmental ManagementTelephone: 916-875-8406Last EDR Contact: 01/06/2014Next Scheduled EDR Contact: 04/21/2014Data Release Frequency: Quarterly
Master Hazardous Materials Facility ListAny business that has hazardous materials on site - hazardous material storage sites, underground storage tanks,waste generators.
Date of Government Version: 11/21/2013Date Data Arrived at EDR: 01/09/2014Date Made Active in Reports: 02/11/2014Number of Days to Update: 33
Source: Sacramento County Environmental ManagementTelephone: 916-875-8406Last EDR Contact: 01/06/2014Next Scheduled EDR Contact: 04/21/2014Data Release Frequency: Quarterly
SAN BERNARDINO COUNTY:
Hazardous Material PermitsThis listing includes underground storage tanks, medical waste handlers/generators, hazardous materials handlers,hazardous waste generators, and waste oil generators/handlers.
TC3880855.2s Page GR-35
GOVERNMENT RECORDS SEARCHED / DATA CURRENCY TRACKING

Date of Government Version: 11/26/2013Date Data Arrived at EDR: 11/27/2013Date Made Active in Reports: 12/31/2013Number of Days to Update: 34
Source: San Bernardino County Fire Department Hazardous Materials DivisionTelephone: 909-387-3041Last EDR Contact: 02/10/2014Next Scheduled EDR Contact: 05/26/2014Data Release Frequency: Quarterly
SAN DIEGO COUNTY:
Hazardous Materials Management Division DatabaseThe database includes: HE58 - This report contains the business name, site address, business phone number, establishment’H’ permit number, type of permit, and the business status. HE17 - In addition to providing the same informationprovided in the HE58 listing, HE17 provides inspection dates, violations received by the establishment, hazardouswaste generated, the quantity, method of storage, treatment/disposal of waste and the hauler, and informationon underground storage tanks. Unauthorized Release List - Includes a summary of environmental contamination casesin San Diego County (underground tank cases, non-tank cases, groundwater contamination, and soil contaminationare included.)
Date of Government Version: 09/23/2013Date Data Arrived at EDR: 09/24/2013Date Made Active in Reports: 10/17/2013Number of Days to Update: 23
Source: Hazardous Materials Management DivisionTelephone: 619-338-2268Last EDR Contact: 03/10/2014Next Scheduled EDR Contact: 06/23/2014Data Release Frequency: Quarterly
Solid Waste FacilitiesSan Diego County Solid Waste Facilities.
Date of Government Version: 10/31/2013Date Data Arrived at EDR: 11/19/2013Date Made Active in Reports: 12/31/2013Number of Days to Update: 42
Source: Department of Health ServicesTelephone: 619-338-2209Last EDR Contact: 02/14/2014Next Scheduled EDR Contact: 05/12/2014Data Release Frequency: Varies
Environmental Case ListingThe listing contains all underground tank release cases and projects pertaining to properties contaminated withhazardous substances that are actively under review by the Site Assessment and Mitigation Program.
Date of Government Version: 03/23/2010Date Data Arrived at EDR: 06/15/2010Date Made Active in Reports: 07/09/2010Number of Days to Update: 24
Source: San Diego County Department of Environmental HealthTelephone: 619-338-2371Last EDR Contact: 03/10/2014Next Scheduled EDR Contact: 06/23/2014Data Release Frequency: No Update Planned
SAN FRANCISCO COUNTY:
Local Oversite FacilitiesA listing of leaking underground storage tank sites located in San Francisco county.
Date of Government Version: 09/19/2008Date Data Arrived at EDR: 09/19/2008Date Made Active in Reports: 09/29/2008Number of Days to Update: 10
Source: Department Of Public Health San Francisco CountyTelephone: 415-252-3920Last EDR Contact: 02/10/2014Next Scheduled EDR Contact: 05/26/2014Data Release Frequency: Quarterly
Underground Storage Tank InformationUnderground storage tank sites located in San Francisco county.
Date of Government Version: 11/29/2010Date Data Arrived at EDR: 03/10/2011Date Made Active in Reports: 03/15/2011Number of Days to Update: 5
Source: Department of Public HealthTelephone: 415-252-3920Last EDR Contact: 02/10/2014Next Scheduled EDR Contact: 05/26/2014Data Release Frequency: Quarterly
SAN JOAQUIN COUNTY:
TC3880855.2s Page GR-36
GOVERNMENT RECORDS SEARCHED / DATA CURRENCY TRACKING

San Joaquin Co. USTA listing of underground storage tank locations in San Joaquin county.
Date of Government Version: 12/18/2013Date Data Arrived at EDR: 12/19/2013Date Made Active in Reports: 01/08/2014Number of Days to Update: 20
Source: Environmental Health DepartmentTelephone: N/ALast EDR Contact: 12/17/2013Next Scheduled EDR Contact: 04/07/2014Data Release Frequency: Semi-Annually
SAN LUIS OBISPO COUNTY:
CUPA Facility ListCupa Facility List.
Date of Government Version: 11/21/2013Date Data Arrived at EDR: 11/25/2013Date Made Active in Reports: 02/27/2014Number of Days to Update: 94
Source: San Luis Obispo County Public Health DepartmentTelephone: 805-781-5596Last EDR Contact: 02/24/2014Next Scheduled EDR Contact: 06/09/2014Data Release Frequency: Varies
SAN MATEO COUNTY:
Business InventoryList includes Hazardous Materials Business Plan, hazardous waste generators, and underground storage tanks.
Date of Government Version: 01/13/2014Date Data Arrived at EDR: 01/14/2014Date Made Active in Reports: 02/11/2014Number of Days to Update: 28
Source: San Mateo County Environmental Health Services DivisionTelephone: 650-363-1921Last EDR Contact: 12/16/2013Next Scheduled EDR Contact: 03/31/2014Data Release Frequency: Annually
Fuel Leak ListA listing of leaking underground storage tank sites located in San Mateo county.
Date of Government Version: 12/12/2013Date Data Arrived at EDR: 12/17/2013Date Made Active in Reports: 01/07/2014Number of Days to Update: 21
Source: San Mateo County Environmental Health Services DivisionTelephone: 650-363-1921Last EDR Contact: 12/12/2013Next Scheduled EDR Contact: 03/31/2014Data Release Frequency: Semi-Annually
SANTA BARBARA COUNTY:
CUPA Facility ListingCUPA Program Listing from the Environmental Health Services division.
Date of Government Version: 09/08/2011Date Data Arrived at EDR: 09/09/2011Date Made Active in Reports: 10/07/2011Number of Days to Update: 28
Source: Santa Barbara County Public Health DepartmentTelephone: 805-686-8167Last EDR Contact: 02/24/2014Next Scheduled EDR Contact: 06/09/2014Data Release Frequency: Varies
SANTA CLARA COUNTY:
Cupa Facility ListCupa facility list
TC3880855.2s Page GR-37
GOVERNMENT RECORDS SEARCHED / DATA CURRENCY TRACKING

Date of Government Version: 12/03/2013Date Data Arrived at EDR: 12/04/2013Date Made Active in Reports: 01/27/2014Number of Days to Update: 54
Source: Department of Environmental HealthTelephone: 408-918-1973Last EDR Contact: 03/03/2014Next Scheduled EDR Contact: 06/16/2014Data Release Frequency: Varies
HIST LUST - Fuel Leak Site Activity ReportA listing of open and closed leaking underground storage tanks. This listing is no longer updated by the county.Leaking underground storage tanks are now handled by the Department of Environmental Health.
Date of Government Version: 03/29/2005Date Data Arrived at EDR: 03/30/2005Date Made Active in Reports: 04/21/2005Number of Days to Update: 22
Source: Santa Clara Valley Water DistrictTelephone: 408-265-2600Last EDR Contact: 03/23/2009Next Scheduled EDR Contact: 06/22/2009Data Release Frequency: No Update Planned
LOP ListingA listing of leaking underground storage tanks located in Santa Clara county.
Date of Government Version: 12/02/2013Date Data Arrived at EDR: 12/03/2013Date Made Active in Reports: 01/02/2014Number of Days to Update: 30
Source: Department of Environmental HealthTelephone: 408-918-3417Last EDR Contact: 03/03/2014Next Scheduled EDR Contact: 06/16/2014Data Release Frequency: Annually
Hazardous Material FacilitiesHazardous material facilities, including underground storage tank sites.
Date of Government Version: 11/12/2013Date Data Arrived at EDR: 11/15/2013Date Made Active in Reports: 01/03/2014Number of Days to Update: 49
Source: City of San Jose Fire DepartmentTelephone: 408-535-7694Last EDR Contact: 02/10/2014Next Scheduled EDR Contact: 05/26/2014Data Release Frequency: Annually
SANTA CRUZ COUNTY:
CUPA Facility ListCUPA facility listing.
Date of Government Version: 12/09/2013Date Data Arrived at EDR: 12/10/2013Date Made Active in Reports: 01/03/2014Number of Days to Update: 24
Source: Santa Cruz County Environmental HealthTelephone: 831-464-2761Last EDR Contact: 02/24/2014Next Scheduled EDR Contact: 06/09/2014Data Release Frequency: Varies
SHASTA COUNTY:
CUPA Facility ListCupa Facility List.
Date of Government Version: 12/03/2013Date Data Arrived at EDR: 12/04/2013Date Made Active in Reports: 01/02/2014Number of Days to Update: 29
Source: Shasta County Department of Resource ManagementTelephone: 530-225-5789Last EDR Contact: 02/24/2014Next Scheduled EDR Contact: 06/09/2014Data Release Frequency: Varies
SOLANO COUNTY:
TC3880855.2s Page GR-38
GOVERNMENT RECORDS SEARCHED / DATA CURRENCY TRACKING

Leaking Underground Storage TanksA listing of leaking underground storage tank sites located in Solano county.
Date of Government Version: 12/16/2013Date Data Arrived at EDR: 12/18/2013Date Made Active in Reports: 01/08/2014Number of Days to Update: 21
Source: Solano County Department of Environmental ManagementTelephone: 707-784-6770Last EDR Contact: 12/12/2013Next Scheduled EDR Contact: 03/31/2014Data Release Frequency: Quarterly
Underground Storage TanksUnderground storage tank sites located in Solano county.
Date of Government Version: 12/16/2013Date Data Arrived at EDR: 12/19/2013Date Made Active in Reports: 01/08/2014Number of Days to Update: 20
Source: Solano County Department of Environmental ManagementTelephone: 707-784-6770Last EDR Contact: 12/12/2013Next Scheduled EDR Contact: 03/31/2014Data Release Frequency: Quarterly
SONOMA COUNTY:
Cupa Facility ListCupa Facility list
Date of Government Version: 12/31/2013Date Data Arrived at EDR: 01/02/2014Date Made Active in Reports: 02/11/2014Number of Days to Update: 40
Source: County of Sonoma Fire & Emergency Services DepartmentTelephone: 707-565-1174Last EDR Contact: 12/30/2013Next Scheduled EDR Contact: 04/14/2014Data Release Frequency: Varies
Leaking Underground Storage Tank SitesA listing of leaking underground storage tank sites located in Sonoma county.
Date of Government Version: 01/03/2014Date Data Arrived at EDR: 01/03/2014Date Made Active in Reports: 02/11/2014Number of Days to Update: 39
Source: Department of Health ServicesTelephone: 707-565-6565Last EDR Contact: 12/30/2013Next Scheduled EDR Contact: 04/14/2014Data Release Frequency: Quarterly
SUTTER COUNTY:
Underground Storage TanksUnderground storage tank sites located in Sutter county.
Date of Government Version: 12/10/2013Date Data Arrived at EDR: 12/11/2013Date Made Active in Reports: 01/04/2014Number of Days to Update: 24
Source: Sutter County Department of AgricultureTelephone: 530-822-7500Last EDR Contact: 03/10/2014Next Scheduled EDR Contact: 06/23/2014Data Release Frequency: Semi-Annually
TUOLUMNE COUNTY:
CUPA Facility ListCupa facility list
Date of Government Version: 11/04/2013Date Data Arrived at EDR: 11/06/2013Date Made Active in Reports: 12/04/2013Number of Days to Update: 28
Source: Divison of Environmental HealthTelephone: 209-533-5633Last EDR Contact: 01/27/2014Next Scheduled EDR Contact: 05/12/2014Data Release Frequency: Varies
VENTURA COUNTY:
TC3880855.2s Page GR-39
GOVERNMENT RECORDS SEARCHED / DATA CURRENCY TRACKING

Business Plan, Hazardous Waste Producers, and Operating Underground TanksThe BWT list indicates by site address whether the Environmental Health Division has Business Plan (B), WasteProducer (W), and/or Underground Tank (T) information.
Date of Government Version: 10/29/2013Date Data Arrived at EDR: 11/21/2013Date Made Active in Reports: 01/14/2014Number of Days to Update: 54
Source: Ventura County Environmental Health DivisionTelephone: 805-654-2813Last EDR Contact: 02/18/2014Next Scheduled EDR Contact: 06/02/2014Data Release Frequency: Quarterly
Inventory of Illegal Abandoned and Inactive SitesVentura County Inventory of Closed, Illegal Abandoned, and Inactive Sites.
Date of Government Version: 12/01/2011Date Data Arrived at EDR: 12/01/2011Date Made Active in Reports: 01/19/2012Number of Days to Update: 49
Source: Environmental Health DivisionTelephone: 805-654-2813Last EDR Contact: 01/03/2014Next Scheduled EDR Contact: 04/21/2014Data Release Frequency: Annually
Listing of Underground Tank Cleanup SitesVentura County Underground Storage Tank Cleanup Sites (LUST).
Date of Government Version: 05/29/2008Date Data Arrived at EDR: 06/24/2008Date Made Active in Reports: 07/31/2008Number of Days to Update: 37
Source: Environmental Health DivisionTelephone: 805-654-2813Last EDR Contact: 02/17/2014Next Scheduled EDR Contact: 06/02/2014Data Release Frequency: Quarterly
Medical Waste Program ListTo protect public health and safety and the environment from potential exposure to disease causing agents, theEnvironmental Health Division Medical Waste Program regulates the generation, handling, storage, treatment anddisposal of medical waste throughout the County.
Date of Government Version: 10/02/2013Date Data Arrived at EDR: 10/30/2013Date Made Active in Reports: 11/27/2013Number of Days to Update: 28
Source: Ventura County Resource Management AgencyTelephone: 805-654-2813Last EDR Contact: 10/28/2013Next Scheduled EDR Contact: 02/11/2014Data Release Frequency: Quarterly
Underground Tank Closed Sites ListVentura County Operating Underground Storage Tank Sites (UST)/Underground Tank Closed Sites List.
Date of Government Version: 11/26/2013Date Data Arrived at EDR: 12/18/2013Date Made Active in Reports: 01/08/2014Number of Days to Update: 21
Source: Environmental Health DivisionTelephone: 805-654-2813Last EDR Contact: 12/16/2013Next Scheduled EDR Contact: 03/31/2014Data Release Frequency: Quarterly
YOLO COUNTY:
Underground Storage Tank Comprehensive Facility ReportUnderground storage tank sites located in Yolo county.
Date of Government Version: 12/18/2013Date Data Arrived at EDR: 12/24/2013Date Made Active in Reports: 01/08/2014Number of Days to Update: 15
Source: Yolo County Department of HealthTelephone: 530-666-8646Last EDR Contact: 12/17/2013Next Scheduled EDR Contact: 04/07/2014Data Release Frequency: Annually
YUBA COUNTY:
TC3880855.2s Page GR-40
GOVERNMENT RECORDS SEARCHED / DATA CURRENCY TRACKING

CUPA Facility ListCUPA facility listing for Yuba County.
Date of Government Version: 12/06/2013Date Data Arrived at EDR: 12/10/2013Date Made Active in Reports: 01/04/2014Number of Days to Update: 25
Source: Yuba County Environmental Health DepartmentTelephone: 530-749-7523Last EDR Contact: 12/06/2013Next Scheduled EDR Contact: 02/17/2014Data Release Frequency: Varies
OTHER DATABASE(S)
Depending on the geographic area covered by this report, the data provided in these specialty databases may or may not becomplete. For example, the existence of wetlands information data in a specific report does not mean that all wetlands in thearea covered by the report are included. Moreover, the absence of any reported wetlands information does not necessarilymean that wetlands do not exist in the area covered by the report.
CT MANIFEST: Hazardous Waste Manifest DataFacility and manifest data. Manifest is a document that lists and tracks hazardous waste from the generator throughtransporters to a tsd facility.
Date of Government Version: 07/30/2013Date Data Arrived at EDR: 08/19/2013Date Made Active in Reports: 10/03/2013Number of Days to Update: 45
Source: Department of Energy & Environmental ProtectionTelephone: 860-424-3375Last EDR Contact: 02/21/2014Next Scheduled EDR Contact: 06/02/2014Data Release Frequency: Annually
NJ MANIFEST: Manifest InformationHazardous waste manifest information.
Date of Government Version: 12/31/2011Date Data Arrived at EDR: 07/19/2012Date Made Active in Reports: 08/28/2012Number of Days to Update: 40
Source: Department of Environmental ProtectionTelephone: N/ALast EDR Contact: 01/17/2014Next Scheduled EDR Contact: 04/28/2014Data Release Frequency: Annually
NY MANIFEST: Facility and Manifest DataManifest is a document that lists and tracks hazardous waste from the generator through transporters to a TSDfacility.
Date of Government Version: 11/01/2013Date Data Arrived at EDR: 11/07/2013Date Made Active in Reports: 11/18/2013Number of Days to Update: 11
Source: Department of Environmental ConservationTelephone: 518-402-8651Last EDR Contact: 03/12/2014Next Scheduled EDR Contact: 05/19/2014Data Release Frequency: Annually
PA MANIFEST: Manifest InformationHazardous waste manifest information.
Date of Government Version: 12/31/2012Date Data Arrived at EDR: 07/24/2013Date Made Active in Reports: 08/19/2013Number of Days to Update: 26
Source: Department of Environmental ProtectionTelephone: 717-783-8990Last EDR Contact: 01/20/2014Next Scheduled EDR Contact: 05/05/2014Data Release Frequency: Annually
RI MANIFEST: Manifest informationHazardous waste manifest information
Date of Government Version: 12/31/2012Date Data Arrived at EDR: 06/21/2013Date Made Active in Reports: 08/05/2013Number of Days to Update: 45
Source: Department of Environmental ManagementTelephone: 401-222-2797Last EDR Contact: 02/24/2014Next Scheduled EDR Contact: 06/09/2014Data Release Frequency: Annually
TC3880855.2s Page GR-41
GOVERNMENT RECORDS SEARCHED / DATA CURRENCY TRACKING

WI MANIFEST: Manifest InformationHazardous waste manifest information.
Date of Government Version: 12/31/2012Date Data Arrived at EDR: 08/09/2013Date Made Active in Reports: 09/27/2013Number of Days to Update: 49
Source: Department of Natural ResourcesTelephone: N/ALast EDR Contact: 12/11/2013Next Scheduled EDR Contact: 03/31/2014Data Release Frequency: Annually
Oil/Gas Pipelines: This data was obtained by EDR from the USGS in 1994. It is referred to by USGS as GeoData Digital Line Graphsfrom 1:100,000-Scale Maps. It was extracted from the transportation category including some oil, but primarilygas pipelines.
Electric Power Transmission Line DataSource: Rextag Strategies Corp.Telephone: (281) 769-2247U.S. Electric Transmission and Power Plants Systems Digital GIS Data
Sensitive Receptors: There are individuals deemed sensitive receptors due to their fragile immune systems and special sensitivityto environmental discharges. These sensitive receptors typically include the elderly, the sick, and children. While the location of allsensitive receptors cannot be determined, EDR indicates those buildings and facilities - schools, daycares, hospitals, medical centers,and nursing homes - where individuals who are sensitive receptors are likely to be located.
AHA Hospitals:Source: American Hospital Association, Inc.Telephone: 312-280-5991The database includes a listing of hospitals based on the American Hospital Association’s annual survey of hospitals.
Medical Centers: Provider of Services ListingSource: Centers for Medicare & Medicaid ServicesTelephone: 410-786-3000A listing of hospitals with Medicare provider number, produced by Centers of Medicare & Medicaid Services,a federal agency within the U.S. Department of Health and Human Services.
Nursing HomesSource: National Institutes of HealthTelephone: 301-594-6248Information on Medicare and Medicaid certified nursing homes in the United States.
Public SchoolsSource: National Center for Education StatisticsTelephone: 202-502-7300The National Center for Education Statistics’ primary database on elementaryand secondary public education in the United States. It is a comprehensive, annual, national statisticaldatabase of all public elementary and secondary schools and school districts, which contains data that arecomparable across all states.
Private SchoolsSource: National Center for Education StatisticsTelephone: 202-502-7300The National Center for Education Statistics’ primary database on private school locations in the United States.
Daycare Centers: Licensed FacilitiesSource: Department of Social ServicesTelephone: 916-657-4041
Flood Zone Data: This data, available in select counties across the country, was obtained by EDR in 2003 & 2011 from the FederalEmergency Management Agency (FEMA). Data depicts 100-year and 500-year flood zones as defined by FEMA.
NWI: National Wetlands Inventory. This data, available in select counties across the country, was obtained by EDRin 2002, 2005 and 2010 from the U.S. Fish and Wildlife Service.
Scanned Digital USGS 7.5’ Topographic Map (DRG)Source: United States Geologic SurveyA digital raster graphic (DRG) is a scanned image of a U.S. Geological Survey topographic map. The map imagesare made by scanning published paper maps on high-resolution scanners. The raster imageis georeferenced and fit to the Universal Transverse Mercator (UTM) projection.
TC3880855.2s Page GR-42
GOVERNMENT RECORDS SEARCHED / DATA CURRENCY TRACKING

STREET AND ADDRESS INFORMATION
© 2010 Tele Atlas North America, Inc. All rights reserved. This material is proprietary and the subject of copyright protectionand other intellectual property rights owned by or licensed to Tele Atlas North America, Inc. The use of this material is subjectto the terms of a license agreement. You will be held liable for any unauthorized copying or disclosure of this material.
TC3880855.2s Page GR-43
GOVERNMENT RECORDS SEARCHED / DATA CURRENCY TRACKING

TC3880855.2s Page A-1
geologic strata.of the soil, and nearby wells. Groundwater flow velocity is generally impacted by the nature of theGroundwater flow direction may be impacted by surface topography, hydrology, hydrogeology, characteristics
2. Groundwater flow velocity. 1. Groundwater flow direction, and
Assessment of the impact of contaminant migration generally has two principal investigative components:
forming an opinion about the impact of potential contaminant migration.EDR’s GeoCheck Physical Setting Source Addendum is provided to assist the environmental professional in
1988Most Recent Revision:34118-C4 SAN FERNANDO, CATarget Property Map:
USGS TOPOGRAPHIC MAP
1291 ft. above sea levelElevation:3797485.2UTM Y (Meters): 366551.0UTM X (Meters): Zone 11Universal Tranverse Mercator: 118.4503 - 118˚ 27’ 1.08’’Longitude (West): 34.3118 - 34˚ 18’ 42.48’’Latitude (North):
TARGET PROPERTY COORDINATES
SYLMAR, CA 9134214600 TYLER STREETOLIVE VISTA MIDDLE SCHOOL
TARGET PROPERTY ADDRESS
®GEOCHECK - PHYSICAL SETTING SOURCE ADDENDUM®

TC3880855.2s Page A-2
should be field verified.on a relative (not an absolute) basis. Relative elevation information between sites of close proximitySource: Topography has been determined from the USGS 7.5’ Digital Elevation Model and should be evaluated
SURROUNDING TOPOGRAPHY: ELEVATION PROFILES
Ele
vatio
n (f
t)E
leva
tion
(ft)
TP
TP0 1/2 1 Miles
✩Target Property Elevation: 1291 ft.
North South
West East
1156
1170
1182
1195
1209
1223
1238
1256
1276
1291
1306
1322
1339
1357
1375
1393
1414
1439
14871277
1277
1276
1275
1272
1264
1274
1280
1287
1291
1292
1296
1299
1300
1301
1304
1309
1320
1331
General SSWGeneral Topographic Gradient:TARGET PROPERTY TOPOGRAPHY
should contamination exist on the target property, what downgradient sites might be impacted.assist the environmental professional in forming an opinion about the impact of nearby contaminated properties or,Surface topography may be indicative of the direction of surficial groundwater flow. This information can be used toTOPOGRAPHIC INFORMATION
collected on nearby properties, and regional groundwater flow information (from deep aquifers).sources of information, such as surface topographic information, hydrologic information, hydrogeologic datausing site-specific well data. If such data is not reasonably ascertainable, it may be necessary to rely on otherGroundwater flow direction for a particular site is best determined by a qualified environmental professionalGROUNDWATER FLOW DIRECTION INFORMATION
®GEOCHECK - PHYSICAL SETTING SOURCE SUMMARY®

TC3880855.2s Page A-3
Not Reported
GENERAL DIRECTIONLOCATIONGROUNDWATER FLOWFROM TPMAP ID
hydrogeologically, and the depth to water table.authorities at select sites and has extracted the date of the report, groundwater flow direction as determinedflow at specific points. EDR has reviewed reports submitted by environmental professionals to regulatoryEDR has developed the AQUIFLOW Information System to provide data on the general direction of groundwater
AQUIFLOW®
Search Radius: 1.000 Mile.
Not found Status:1.25 miles Search Radius:
Site-Specific Hydrogeological Data*:
* ©1996 Site−specific hydrogeological data gathered by CERCLIS Alerts, Inc., Bainbridge Island, WA. All rights reserved. All of the information and opinions presented are those of the cited EPA report(s), which were completed undera Comprehensive Environmental Response Compensation and Liability Information System (CERCLIS) investigation.
contamination exist on the target property, what downgradient sites might be impacted.environmental professional in forming an opinion about the impact of nearby contaminated properties or, shouldof groundwater flow direction in the immediate area. Such hydrogeologic information can be used to assist theHydrogeologic information obtained by installation of wells on a specific site can often be an indicatorHYDROGEOLOGIC INFORMATION
YES - refer to the Overview Map and Detail MapNOT AVAILABLE
NATIONAL WETLAND INVENTORYNWI ElectronicData CoverageNWI Quad at Target Property
Not ReportedAdditional Panels in search area:
06037C - FEMA DFIRM Flood dataFlood Plain Panel at Target Property:
YES - refer to the Overview Map and Detail MapLOS ANGELES, CA
FEMA FLOOD ZONEFEMA FloodElectronic DataTarget Property County
and bodies of water).Refer to the Physical Setting Source Map following this summary for hydrologic information (major waterways
contamination exist on the target property, what downgradient sites might be impacted.the environmental professional in forming an opinion about the impact of nearby contaminated properties or, shouldSurface water can act as a hydrologic barrier to groundwater flow. Such hydrologic information can be used to assistHYDROLOGIC INFORMATION
®GEOCHECK - PHYSICAL SETTING SOURCE SUMMARY®

TC3880855.2s Page A-4
Map, USGS Digital Data Series DDS - 11 (1994).of the Conterminous U.S. at 1:2,500,000 Scale - a digital representation of the 1974 P.B. King and H.M. BeikmanGeologic Age and Rock Stratigraphic Unit Source: P.G. Schruben, R.E. Arndt and W.J. Bawiec, Geology
ROCK STRATIGRAPHIC UNIT GEOLOGIC AGE IDENTIFICATION
Stratifed SequenceCategory:CenozoicEra:QuaternarySystem:QuaternarySeries:QCode: (decoded above as Era, System & Series)
at which contaminant migration may be occurring.Geologic information can be used by the environmental professional in forming an opinion about the relative speedGEOLOGIC INFORMATION IN GENERAL AREA OF TARGET PROPERTY
move more quickly through sandy-gravelly types of soils than silty-clayey types of soils.characteristics data collected on nearby properties and regional soil information. In general, contaminant plumesto rely on other sources of information, including geologic age identification, rock stratigraphic unit and soilusing site specific geologic and soil strata data. If such data are not reasonably ascertainable, it may be necessaryGroundwater flow velocity information for a particular site is best determined by a qualified environmental professionalGROUNDWATER FLOW VELOCITY INFORMATION
®GEOCHECK - PHYSICAL SETTING SOURCE SUMMARY®
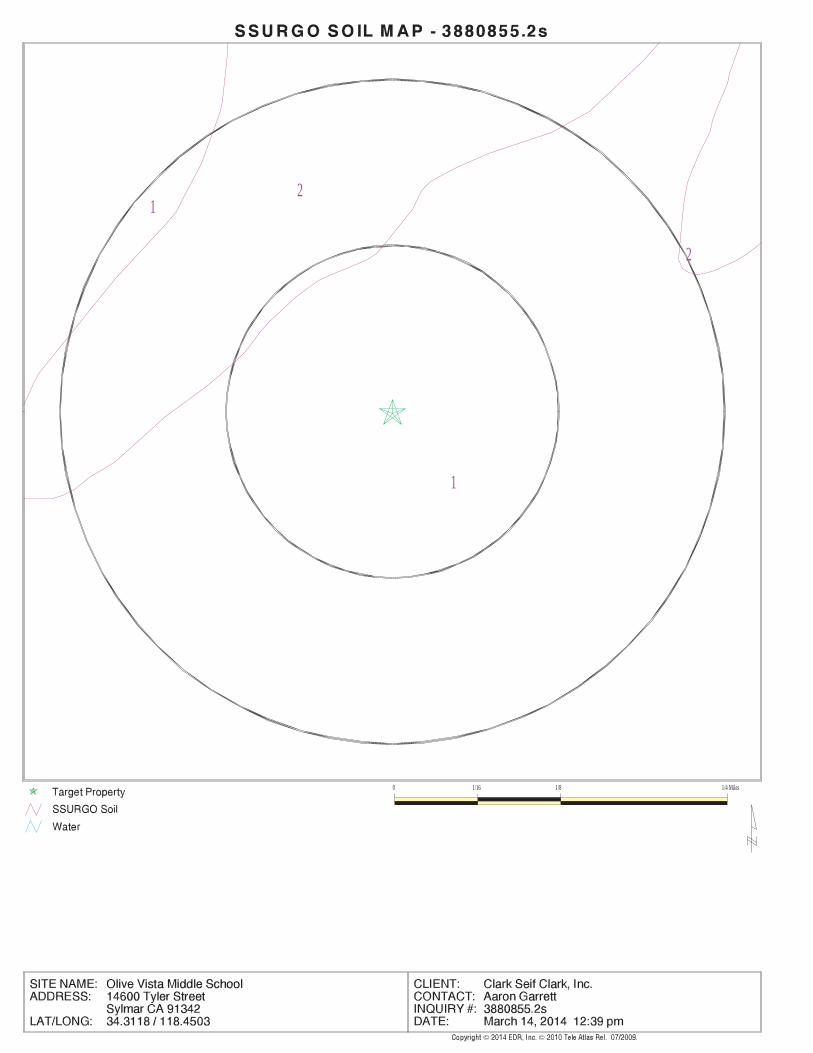
EDR Inc.EDR Inc.EDR Inc.EDR Inc.EDR Inc.EDR Inc.EDR Inc.EDR Inc.EDR Inc.EDR Inc.EDR Inc.EDR Inc.EDR Inc.EDR Inc.EDR Inc.EDR Inc.EDR Inc.EDR Inc.EDR Inc.EDR Inc.EDR Inc.EDR Inc.EDR Inc.EDR Inc.EDR Inc.EDR Inc.EDR Inc.EDR Inc.EDR Inc.EDR Inc.EDR Inc.EDR Inc.EDR Inc.EDR Inc.EDR Inc.EDR Inc.EDR Inc.EDR Inc.EDR Inc.EDR Inc.
2
1
1
2
0 1/16 1/8 1/4 Miles

TC3880855.2s Page A-6
Somewhat excessively drainedSoil Drainage Class:
excessively drained sands and gravels.Class A - High infiltration rates. Soils are deep, well drained toHydrologic Group:
sandSoil Surface Texture:
TujungaSoil Component Name:
Soil Map ID: 2
Min: 6.6Max: 8.4
Min: 4Max: 14
50%), silt.limit less thanClays (liquidSOILS, Silts andFINE-GRAINED
Soils.200), Siltypassing No.than 35 pct.Materials (moreSilt-Clayloam72 inches40 inches 2
Min: 6.1Max: 8.4
Min: 14Max: 42
Silty Sand.Sands with fines,SOILS, Sands,COARSE-GRAINED
Soils.200), Siltypassing No.than 35 pct.Materials (moreSilt-Clayfine sandy loam40 inches 0 inches 1
Soil Layer Information
Boundary Classification Saturatedhydraulicconductivitymicro m/sec
Layer Upper Lower Soil Texture Class AASHTO Group Unified Soil Soil Reaction(pH)
> 0 inchesDepth to Watertable Min:
> 0 inchesDepth to Bedrock Min:
HighCorrosion Potential - Uncoated Steel:
Hydric Status: Not hydricSoil Drainage Class:
Not reportedHydrologic Group:
fine sandy loamSoil Surface Texture:
CapistranoSoil Component Name:
Soil Map ID: 1
in a landscape. The following information is based on Soil Conservation Service SSURGO data.for privately owned lands in the United States. A soil map in a soil survey is a representation of soil patternsSurvey (NCSS) and is responsible for collecting, storing, maintaining and distributing soil survey informationThe U.S. Department of Agriculture’s (USDA) Soil Conservation Service (SCS) leads the National Cooperative Soil
DOMINANT SOIL COMPOSITION IN GENERAL AREA OF TARGET PROPERTY
®GEOCHECK - PHYSICAL SETTING SOURCE SUMMARY®

TC3880855.2s Page A-7
FEDERAL USGS WELL INFORMATION
LOCATIONFROM TPWELL IDMAP ID
1.000State DatabaseNearest PWS within 0.001 milesFederal FRDS PWS1.000Federal USGS
WELL SEARCH DISTANCE INFORMATION
SEARCH DISTANCE (miles)DATABASE
opinion about the impact of contaminant migration on nearby drinking water wells.professional in assessing sources that may impact ground water flow direction, and in forming anEDR Local/Regional Water Agency records provide water well information to assist the environmental
LOCAL / REGIONAL WATER AGENCY RECORDS
Min: 6.1Max: 7.8
Min: 42Max: 141
Silty Sand.Sands with fines,SOILS, Sands,COARSE-GRAINED
Sand.Gravel andFragments,200), Stonepassing No.pct. or lessmaterials (35Granularsand59 inches11 inches 2
Min: 6.1Max: 7.8
Min: 42Max: 141
Silty Sand.Sands with fines,SOILS, Sands,COARSE-GRAINED
Sand.Gravel andFragments,200), Stonepassing No.pct. or lessmaterials (35Granularsand11 inches 0 inches 1
Soil Layer Information
Boundary Classification Saturatedhydraulicconductivitymicro m/sec
Layer Upper Lower Soil Texture Class AASHTO Group Unified Soil Soil Reaction(pH)
> 0 inchesDepth to Watertable Min:
> 0 inchesDepth to Bedrock Min:
LowCorrosion Potential - Uncoated Steel:
Hydric Status: Not hydric
®GEOCHECK - PHYSICAL SETTING SOURCE SUMMARY®

TC3880855.2s Page A-8
1/2 - 1 Mile South2144 A81/2 - 1 Mile South2145 A71/2 - 1 Mile South2143 A61/2 - 1 Mile South2141 A51/2 - 1 Mile South2142 A4
STATE DATABASE WELL INFORMATION
LOCATIONFROM TPWELL IDMAP ID
Note: PWS System location is not always the same as well location.
No PWS System Found
FEDERAL FRDS PUBLIC WATER SUPPLY SYSTEM INFORMATION
LOCATIONFROM TPWELL IDMAP ID
1/2 - 1 Mile SEUSGS40000142865 31/2 - 1 Mile SEUSGS40000142867 21/2 - 1 Mile EastUSGS40000142897 1
FEDERAL USGS WELL INFORMATION
LOCATIONFROM TPWELL IDMAP ID
®GEOCHECK - PHYSICAL SETTING SOURCE SUMMARY®

EDR Inc.EDR Inc.EDR Inc.EDR Inc.EDR Inc.EDR Inc.EDR Inc.EDR Inc.EDR Inc.EDR Inc.EDR Inc.EDR Inc.EDR Inc.EDR Inc.EDR Inc.EDR Inc.EDR Inc.EDR Inc.EDR Inc.EDR Inc.EDR Inc.EDR Inc.EDR Inc.EDR Inc.EDR Inc.EDR Inc.EDR Inc.EDR Inc.EDR Inc.EDR Inc.EDR Inc.EDR Inc.EDR Inc.EDR Inc.EDR Inc.EDR Inc.EDR Inc.EDR Inc.EDR Inc.EDR Inc.
2
20
8
164 0
16
40
20
40 2
20
01
96
1 9 2 0
19
20
18
80
1 8 8 0
18
80
1 8 4 0
18
40
1 18
1
8
18 0
01
8
0
1 8 0 0
17
6 0
1 7 6 0
1
7
17
1 7 6 0
1 7 6 0
20
17
17
20
1 7 20
1 720
1 7 2 0
16
80
1
16
80
1 680 1 6 8
1 6 8 0
1 6 8 0
16
40
16
40
1 640
1 6 4 0
16
40
1 6 40
1 6 40
1 1 6 000
12
00
1 1 60
1
16
0
11 6 0
1280
120
0 13
00
16 0 0
16
0
16
00
16
00
16
00
1 6 0 0
1 6 0 0
1 6 0 0
12
801
280
12
40
1 2 40 1 2 0
0
1 20
0
60
15
6 01
56 0
1 5 60
15
60
1 5 60
1 5 6 01 5 20
1
52
0
15
20 1
520
1 5 2 0
1
5 2 0
1 4 8 0
1 4 8 0
1 4 8 0
1 4 8 0
1 4 4 0
1 4 4 01 4 4 0
1 4 4 0
1 4 0 01 4 0 0
1 4 0 0
1 4 0 0
6 01 3 6 0
1 3 6 0
1 3 6 0
1 3 6 0
1 3 2 0 1 3 2 0
1 3 2 0
1 3 2 0
8 0
1 2 8 0
1 2 8 0
1 2 80
12
80
1 2 4 0 1 2 4 0
1 2 4 01 2 4 02 0 0
1 2 0 0
1 2 0 0
1 2 0 0
1 2 0 0
11 6
01 1 6 0
1 1 6 01 1 6 0
1 1 6 0
1 1 2 0
1 1 2 0
CA
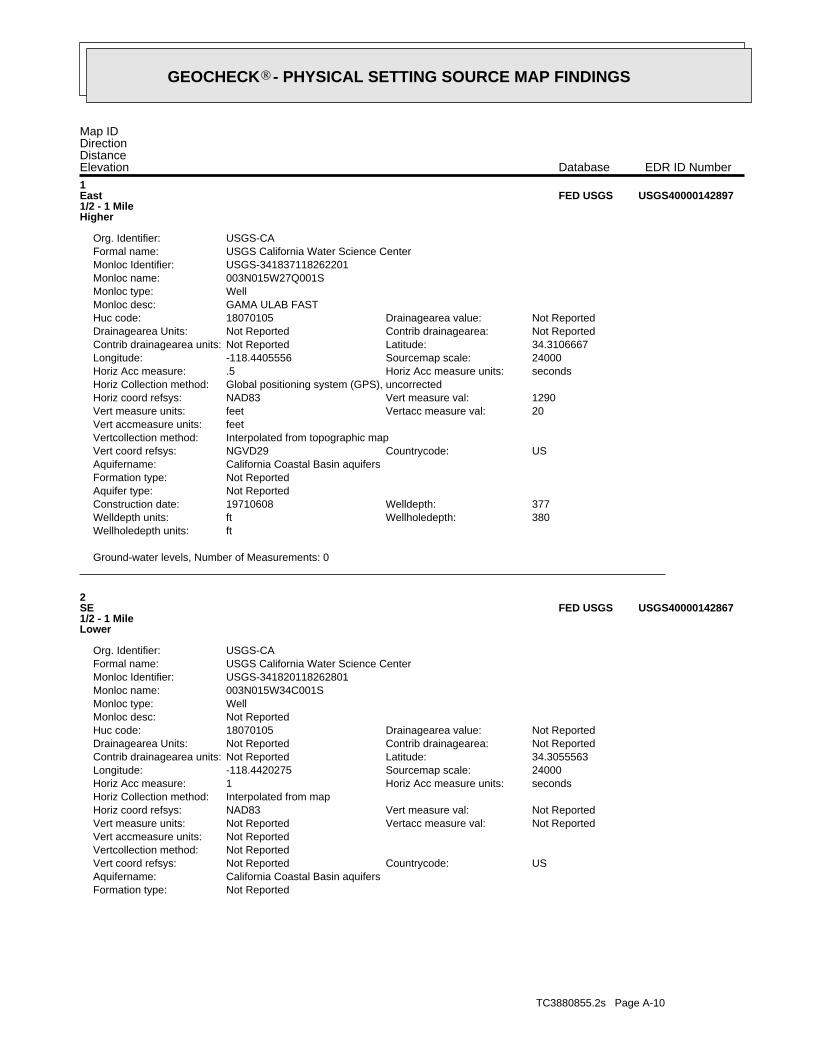
TC3880855.2s Page A-10
Not ReportedFormation type:California Coastal Basin aquifersAquifername:
USCountrycode:Not ReportedVert coord refsys:Not ReportedVertcollection method:Not ReportedVert accmeasure units:
Not ReportedVertacc measure val:Not ReportedVert measure units:Not ReportedVert measure val:NAD83Horiz coord refsys:
Interpolated from mapHoriz Collection method:secondsHoriz Acc measure units:1Horiz Acc measure:24000Sourcemap scale:-118.4420275Longitude:34.3055563Latitude:Not ReportedContrib drainagearea units:Not ReportedContrib drainagearea:Not ReportedDrainagearea Units:Not ReportedDrainagearea value:18070105Huc code:
Not ReportedMonloc desc:WellMonloc type:003N015W34C001SMonloc name:USGS-341820118262801Monloc Identifier:USGS California Water Science CenterFormal name:USGS-CAOrg. Identifier:
2SE1/2 - 1 MileLower
USGS40000142867FED USGS
Ground-water levels, Number of Measurements: 0
ftWellholedepth units:380Wellholedepth:ftWelldepth units:377Welldepth:19710608Construction date:
Not ReportedAquifer type:Not ReportedFormation type:California Coastal Basin aquifersAquifername:
USCountrycode:NGVD29Vert coord refsys:Interpolated from topographic mapVertcollection method:feetVert accmeasure units:
20Vertacc measure val:feetVert measure units:1290Vert measure val:NAD83Horiz coord refsys:
Global positioning system (GPS), uncorrectedHoriz Collection method:secondsHoriz Acc measure units:.5Horiz Acc measure:24000Sourcemap scale:-118.4405556Longitude:34.3106667Latitude:Not ReportedContrib drainagearea units:Not ReportedContrib drainagearea:Not ReportedDrainagearea Units:Not ReportedDrainagearea value:18070105Huc code:
GAMA ULAB FASTMonloc desc:WellMonloc type:003N015W27Q001SMonloc name:USGS-341837118262201Monloc Identifier:USGS California Water Science CenterFormal name:USGS-CAOrg. Identifier:
1East1/2 - 1 MileHigher
USGS40000142897FED USGS
Map IDDirectionDistanceElevation EDR ID NumberDatabase
®GEOCHECK - PHYSICAL SETTING SOURCE MAP FINDINGS®

TC3880855.2s Page A-11
LOS ANGELESArea Served:657422Connections:3700000Pop Served:
LOS ANGELES, CA 90051P.O. BOX 51111, ROOM 1420
Organization That Operates System:LOS ANGELES-CITY, DEPT. OF WATER & POWERSystem Name:1910067System Number:MISSION WELL 02 - INACTIVESource Name:
UndefinedPrecision:341800.0 1182700.0Source Lat/Long:Inactive RawWell Status:Well/GroundwaterWater Type:WELL/AMBNT/MUN/INTAKE/SUPPLYStation Type:15District Number:Los AngelesCounty:1910067056FRDS Number:METUser ID:02N/15W-04B03 SPrime Station Code:
Water System Information:
A4South1/2 - 1 MileLower
2142CA WELLS
Ground-water levels, Number of Measurements: 0
ftWellholedepth units:500Wellholedepth:ftWelldepth units:500Welldepth:Not ReportedConstruction date:
Not ReportedAquifer type:Not ReportedFormation type:California Coastal Basin aquifersAquifername:
USCountrycode:Not ReportedVert coord refsys:Not ReportedVertcollection method:Not ReportedVert accmeasure units:
Not ReportedVertacc measure val:Not ReportedVert measure units:Not ReportedVert measure val:NAD83Horiz coord refsys:
Interpolated from mapHoriz Collection method:secondsHoriz Acc measure units:1Horiz Acc measure:24000Sourcemap scale:-118.4398052Longitude:34.304723Latitude:Not ReportedContrib drainagearea units:Not ReportedContrib drainagearea:Not ReportedDrainagearea Units:Not ReportedDrainagearea value:18070105Huc code:
Not ReportedMonloc desc:WellMonloc type:003N015W34B002SMonloc name:USGS-341817118262002Monloc Identifier:USGS California Water Science CenterFormal name:USGS-CAOrg. Identifier:
3SE1/2 - 1 MileLower
USGS40000142865FED USGS
Ground-water levels, Number of Measurements: 0
ftWellholedepth units:325Wellholedepth:ftWelldepth units:325Welldepth:Not ReportedConstruction date:
Not ReportedAquifer type:
®GEOCHECK - PHYSICAL SETTING SOURCE MAP FINDINGS®

TC3880855.2s Page A-12
MISSION WELL 07Source Name:1 Mile (One Minute)Precision:341800.1 1182700.1Source Lat/Long:Active RawWell Status:Well/GroundwaterWater Type:WELL/AMBNT/MUN/INTAKEStation Type:15District Number:Los AngelesCounty:1910067060FRDS Number:METUser ID:02N/15W-04B10 SPrime Station Code:
Water System Information:
A7South1/2 - 1 MileLower
2145CA WELLS
LOS ANGELESArea Served:657422Connections:3700000Pop Served:
LOS ANGELES, CA 90051P.O. BOX 51111, ROOM 1420
Organization That Operates System:LOS ANGELES-CITY, DEPT. OF WATER & POWERSystem Name:1910067System Number:MISSION WELL 04 - INACTIVESource Name:
UndefinedPrecision:341800.0 1182700.0Source Lat/Long:Inactive RawWell Status:Well/GroundwaterWater Type:WELL/AMBNT/MUN/INTAKE/SUPPLYStation Type:15District Number:Los AngelesCounty:1910067057FRDS Number:METUser ID:02N/15W-04B05 SPrime Station Code:
Water System Information:
A6South1/2 - 1 MileLower
2143CA WELLS
LOS ANGELESArea Served:657422Connections:3700000Pop Served:
LOS ANGELES, CA 90051P.O. BOX 51111, ROOM 1420
Organization That Operates System:LOS ANGELES-CITY, DEPT. OF WATER & POWERSystem Name:1910067System Number:MISSION WELL 01 - INACTIVESource Name:
UndefinedPrecision:341800.0 1182700.0Source Lat/Long:Inactive RawWell Status:Well/GroundwaterWater Type:WELL/AMBNT/MUN/INTAKE/SUPPLYStation Type:15District Number:Los AngelesCounty:1910067055FRDS Number:METUser ID:02N/15W-04B02 SPrime Station Code:
Water System Information:
A5South1/2 - 1 MileLower
2141CA WELLS
Map IDDirectionDistanceElevation EDR ID NumberDatabase
®GEOCHECK - PHYSICAL SETTING SOURCE MAP FINDINGS®

TC3880855.2s Page A-13
NITRATE (AS NO3)Chemical:27.1 MG/LFindings:21-MAR-13Sample Collected:
TRICHLOROETHYLENEChemical:1.83 UG/LFindings:21-MAR-13Sample Collected:
NITRATE (AS NO3)Chemical:26.9 MG/LFindings:26-FEB-13Sample Collected:
TRICHLOROETHYLENEChemical:1.65 UG/LFindings:26-FEB-13Sample Collected:
FLUORIDE (F) (NATURAL-SOURCE)Chemical:0.298 MG/LFindings:26-FEB-13Sample Collected:
NITRATE (AS NO3)Chemical:26.2 MG/LFindings:31-JAN-13Sample Collected:
TRICHLOROETHYLENEChemical:1.12 UG/LFindings:31-JAN-13Sample Collected:
NITRATE (AS NO3)Chemical:25.6 MG/LFindings:18-DEC-12Sample Collected:
TRICHLOROETHYLENEChemical:0.891 UG/LFindings:18-DEC-12Sample Collected:
BROMIDEChemical:0.151 MG/LFindings:30-NOV-12Sample Collected:
NITRATE (AS NO3)Chemical:26.8 MG/LFindings:30-NOV-12Sample Collected:
TRICHLOROETHYLENEChemical:1.02 UG/LFindings:30-NOV-12Sample Collected:
FLUORIDE (F) (NATURAL-SOURCE)Chemical:0.272 MG/LFindings:30-NOV-12Sample Collected:
NITRATE (AS NO3)Chemical:26. MG/LFindings:29-OCT-12Sample Collected:
TRICHLOROETHYLENEChemical:0.537 UG/LFindings:29-OCT-12Sample Collected:
NITRATE (AS NO3)Chemical:26.4 MG/LFindings:25-SEP-12Sample Collected:
TRICHLOROETHYLENEChemical:1.56 UG/LFindings:25-SEP-12Sample Collected:
NITRATE (AS NO3)Chemical:25.9 MG/LFindings:28-AUG-12Sample Collected:
TRICHLOROETHYLENEChemical:1.29 UG/LFindings:28-AUG-12Sample Collected:
LOS ANGELESArea Served:657422Connections:3700000Pop Served:
LOS ANGELES, CA 90051P.O. BOX 51111, ROOM 1420
Organization That Operates System:LOS ANGELES-CITY, DEPT. OF WATER & POWERSystem Name:1910067System Number:
®GEOCHECK - PHYSICAL SETTING SOURCE MAP FINDINGS®
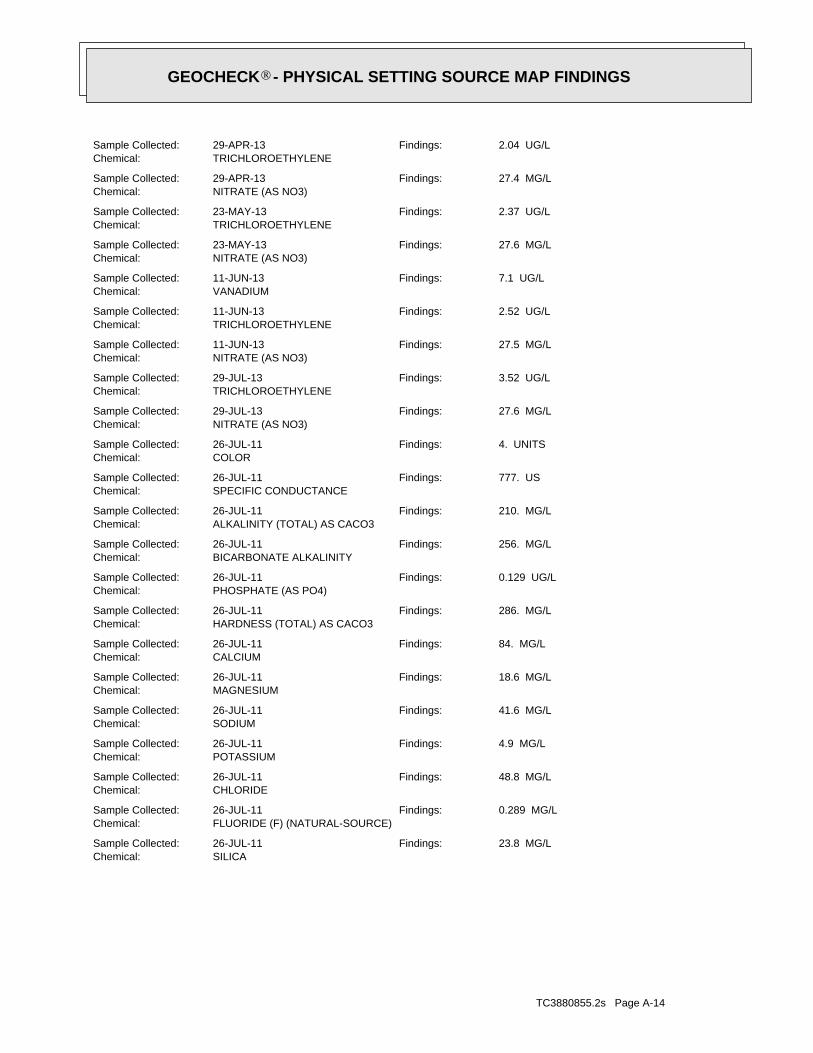
TC3880855.2s Page A-14
SILICAChemical:23.8 MG/LFindings:26-JUL-11Sample Collected:
FLUORIDE (F) (NATURAL-SOURCE)Chemical:0.289 MG/LFindings:26-JUL-11Sample Collected:
CHLORIDEChemical:48.8 MG/LFindings:26-JUL-11Sample Collected:
POTASSIUMChemical:4.9 MG/LFindings:26-JUL-11Sample Collected:
SODIUMChemical:41.6 MG/LFindings:26-JUL-11Sample Collected:
MAGNESIUMChemical:18.6 MG/LFindings:26-JUL-11Sample Collected:
CALCIUMChemical:84. MG/LFindings:26-JUL-11Sample Collected:
HARDNESS (TOTAL) AS CACO3Chemical:286. MG/LFindings:26-JUL-11Sample Collected:
PHOSPHATE (AS PO4)Chemical:0.129 UG/LFindings:26-JUL-11Sample Collected:
BICARBONATE ALKALINITYChemical:256. MG/LFindings:26-JUL-11Sample Collected:
ALKALINITY (TOTAL) AS CACO3Chemical:210. MG/LFindings:26-JUL-11Sample Collected:
SPECIFIC CONDUCTANCEChemical:777. USFindings:26-JUL-11Sample Collected:
COLORChemical:4. UNITSFindings:26-JUL-11Sample Collected:
NITRATE (AS NO3)Chemical:27.6 MG/LFindings:29-JUL-13Sample Collected:
TRICHLOROETHYLENEChemical:3.52 UG/LFindings:29-JUL-13Sample Collected:
NITRATE (AS NO3)Chemical:27.5 MG/LFindings:11-JUN-13Sample Collected:
TRICHLOROETHYLENEChemical:2.52 UG/LFindings:11-JUN-13Sample Collected:
VANADIUMChemical:7.1 UG/LFindings:11-JUN-13Sample Collected:
NITRATE (AS NO3)Chemical:27.6 MG/LFindings:23-MAY-13Sample Collected:
TRICHLOROETHYLENEChemical:2.37 UG/LFindings:23-MAY-13Sample Collected:
NITRATE (AS NO3)Chemical:27.4 MG/LFindings:29-APR-13Sample Collected:
TRICHLOROETHYLENEChemical:2.04 UG/LFindings:29-APR-13Sample Collected:
®GEOCHECK - PHYSICAL SETTING SOURCE MAP FINDINGS®
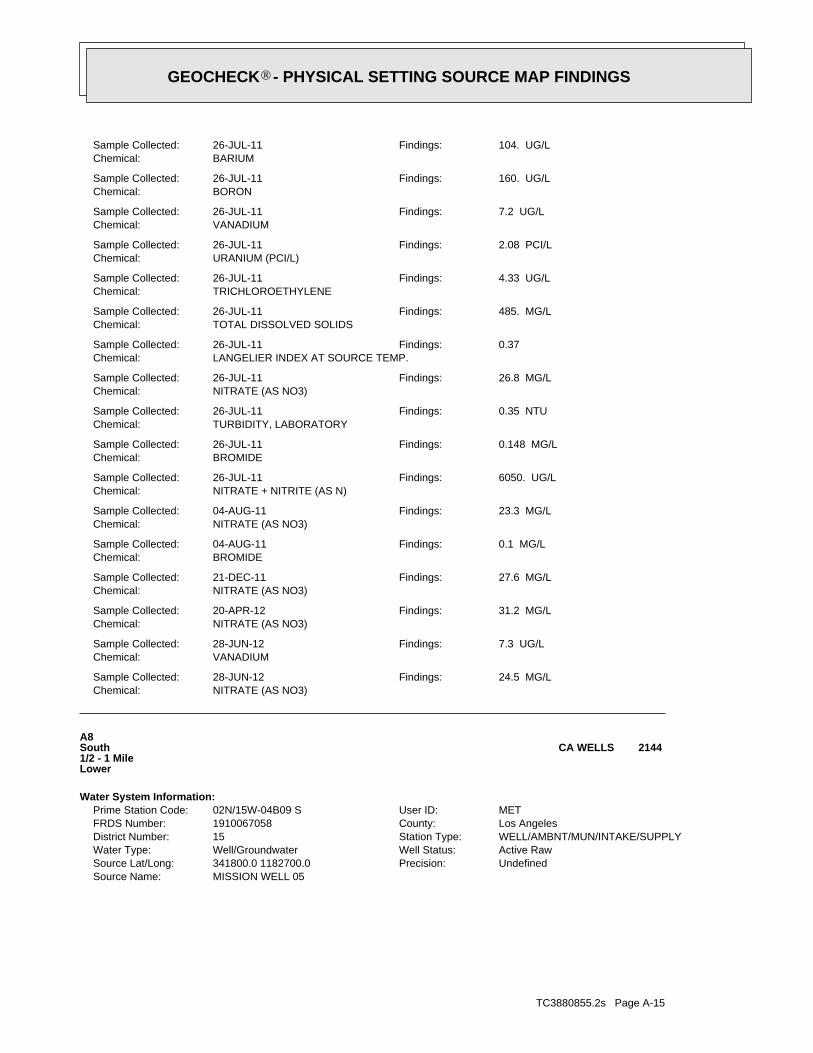
TC3880855.2s Page A-15
MISSION WELL 05Source Name:UndefinedPrecision:341800.0 1182700.0Source Lat/Long:Active RawWell Status:Well/GroundwaterWater Type:WELL/AMBNT/MUN/INTAKE/SUPPLYStation Type:15District Number:Los AngelesCounty:1910067058FRDS Number:METUser ID:02N/15W-04B09 SPrime Station Code:
Water System Information:
A8South1/2 - 1 MileLower
2144CA WELLS
NITRATE (AS NO3)Chemical:24.5 MG/LFindings:28-JUN-12Sample Collected:
VANADIUMChemical:7.3 UG/LFindings:28-JUN-12Sample Collected:
NITRATE (AS NO3)Chemical:31.2 MG/LFindings:20-APR-12Sample Collected:
NITRATE (AS NO3)Chemical:27.6 MG/LFindings:21-DEC-11Sample Collected:
BROMIDEChemical:0.1 MG/LFindings:04-AUG-11Sample Collected:
NITRATE (AS NO3)Chemical:23.3 MG/LFindings:04-AUG-11Sample Collected:
NITRATE + NITRITE (AS N)Chemical:6050. UG/LFindings:26-JUL-11Sample Collected:
BROMIDEChemical:0.148 MG/LFindings:26-JUL-11Sample Collected:
TURBIDITY, LABORATORYChemical:0.35 NTUFindings:26-JUL-11Sample Collected:
NITRATE (AS NO3)Chemical:26.8 MG/LFindings:26-JUL-11Sample Collected:
LANGELIER INDEX AT SOURCE TEMP.Chemical:0.37Findings:26-JUL-11Sample Collected:
TOTAL DISSOLVED SOLIDSChemical:485. MG/LFindings:26-JUL-11Sample Collected:
TRICHLOROETHYLENEChemical:4.33 UG/LFindings:26-JUL-11Sample Collected:
URANIUM (PCI/L)Chemical:2.08 PCI/LFindings:26-JUL-11Sample Collected:
VANADIUMChemical:7.2 UG/LFindings:26-JUL-11Sample Collected:
BORONChemical:160. UG/LFindings:26-JUL-11Sample Collected:
BARIUMChemical:104. UG/LFindings:26-JUL-11Sample Collected:
®GEOCHECK - PHYSICAL SETTING SOURCE MAP FINDINGS®
TC3880855.2s Page A-16
LOS ANGELESArea Served:657422Connections:3700000Pop Served:
LOS ANGELES, CA 90051P.O. BOX 51111, ROOM 1420
Organization That Operates System:LOS ANGELES-CITY, DEPT. OF WATER & POWERSystem Name:1910067System Number:
®GEOCHECK - PHYSICAL SETTING SOURCE MAP FINDINGS®

TC3880855.2s Page A-17
Not ReportedNot ReportedNot ReportedNot ReportedBasementNot ReportedNot ReportedNot ReportedNot ReportedLiving Area - 2nd Floor0%0%100%0.300 pCi/LLiving Area - 1st Floor
% >20 pCi/L% 4-20 pCi/L% <4 pCi/LAverage ActivityArea
Number of sites tested: 1
Federal Area Radon Information for Zip Code: 91342
: Zone 3 indoor average level < 2 pCi/L. : Zone 2 indoor average level >= 2 pCi/L and <= 4 pCi/L. Note: Zone 1 indoor average level > 4 pCi/L.
Federal EPA Radon Zone for LOS ANGELES County: 2
146591342
______________________> 4 pCi/LNum TestsZipcode
Radon Test Results
State Database: CA Radon
AREA RADON INFORMATION
®GEOCHECK - PHYSICAL SETTING SOURCE MAP FINDINGSRADON
®

TOPOGRAPHIC INFORMATION
USGS 7.5’ Digital Elevation Model (DEM)Source: United States Geologic SurveyEDR acquired the USGS 7.5’ Digital Elevation Model in 2002 and updated it in 2006. The 7.5 minute DEM correspondsto the USGS 1:24,000- and 1:25,000-scale topographic quadrangle maps. The DEM provides elevation datawith consistent elevation units and projection.
Scanned Digital USGS 7.5’ Topographic Map (DRG)Source: United States Geologic SurveyA digital raster graphic (DRG) is a scanned image of a U.S. Geological Survey topographic map. The map imagesare made by scanning published paper maps on high-resolution scanners. The raster imageis georeferenced and fit to the Universal Transverse Mercator (UTM) projection.
HYDROLOGIC INFORMATION
Flood Zone Data: This data, available in select counties across the country, was obtained by EDR in 2003 & 2011 from the FederalEmergency Management Agency (FEMA). Data depicts 100-year and 500-year flood zones as defined by FEMA.
NWI: National Wetlands Inventory. This data, available in select counties across the country, was obtained by EDRin 2002, 2005 and 2010 from the U.S. Fish and Wildlife Service.
HYDROGEOLOGIC INFORMATION
AQUIFLOW Information SystemR
Source: EDR proprietary database of groundwater flow informationEDR has developed the AQUIFLOW Information System (AIS) to provide data on the general direction of groundwater
flow at specific points. EDR has reviewed reports submitted to regulatory authorities at select sites and hasextracted the date of the report, hydrogeologically determined groundwater flow direction and depth to water tableinformation.
GEOLOGIC INFORMATION
Geologic Age and Rock Stratigraphic UnitSource: P.G. Schruben, R.E. Arndt and W.J. Bawiec, Geology of the Conterminous U.S. at 1:2,500,000 Scale - A digitalrepresentation of the 1974 P.B. King and H.M. Beikman Map, USGS Digital Data Series DDS - 11 (1994).
STATSGO: State Soil Geographic DatabaseSource: Department of Agriculture, Natural Resources Conservation ServicesThe U.S. Department of Agriculture’s (USDA) Natural Resources Conservation Service (NRCS) leads the nationalConservation Soil Survey (NCSS) and is responsible for collecting, storing, maintaining and distributing soilsurvey information for privately owned lands in the United States. A soil map in a soil survey is a representationof soil patterns in a landscape. Soil maps for STATSGO are compiled by generalizing more detailed (SSURGO)soil survey maps.
SSURGO: Soil Survey Geographic DatabaseSource: Department of Agriculture, Natural Resources Conservation Services (NRCS)Telephone: 800-672-5559SSURGO is the most detailed level of mapping done by the Natural Resources Conservation Services, mappingscales generally range from 1:12,000 to 1:63,360. Field mapping methods using national standards are used toconstruct the soil maps in the Soil Survey Geographic (SSURGO) database. SSURGO digitizing duplicates theoriginal soil survey maps. This level of mapping is designed for use by landowners, townships and countynatural resource planning and management.
TC3880855.2s Page A-6
PHYSICAL SETTING SOURCE RECORDS SEARCHED

LOCAL / REGIONAL WATER AGENCY RECORDS
FEDERAL WATER WELLS
PWS: Public Water SystemsSource: EPA/Office of Drinking WaterTelephone: 202-564-3750Public Water System data from the Federal Reporting Data System. A PWS is any water system which provides water to at
least 25 people for at least 60 days annually. PWSs provide water from wells, rivers and other sources.
PWS ENF: Public Water Systems Violation and Enforcement DataSource: EPA/Office of Drinking WaterTelephone: 202-564-3750Violation and Enforcement data for Public Water Systems from the Safe Drinking Water Information System (SDWIS) after
August 1995. Prior to August 1995, the data came from the Federal Reporting Data System (FRDS).
USGS Water Wells: USGS National Water Inventory System (NWIS)This database contains descriptive information on sites where the USGS collects or has collected data on surfacewater and/or groundwater. The groundwater data includes information on wells, springs, and other sources of groundwater.
STATE RECORDS
Water Well DatabaseSource: Department of Water ResourcesTelephone: 916-651-9648
California Drinking Water Quality DatabaseSource: Department of Public HealthTelephone: 916-324-2319The database includes all drinking water compliance and special studies monitoring for the state of California
since 1984. It consists of over 3,200,000 individual analyses along with well and water system information.
OTHER STATE DATABASE INFORMATION
California Oil and Gas Well LocationsSource: Department of ConservationTelephone: 916-323-1779Oil and Gas well locations in the state.
RADON
State Database: CA RadonSource: Department of Health ServicesTelephone: 916-324-2208Radon Database for California
Area Radon InformationSource: USGSTelephone: 703-356-4020The National Radon Database has been developed by the U.S. Environmental Protection Agency(USEPA) and is a compilation of the EPA/State Residential Radon Survey and the National Residential Radon Survey.The study covers the years 1986 - 1992. Where necessary data has been supplemented by information collected atprivate sources such as universities and research institutions.
EPA Radon ZonesSource: EPATelephone: 703-356-4020Sections 307 & 309 of IRAA directed EPA to list and identify areas of U.S. with the potential for elevated indoorradon levels.
TC3880855.2s Page A-7
PHYSICAL SETTING SOURCE RECORDS SEARCHED
OTHER
Airport Landing Facilities: Private and public use landing facilitiesSource: Federal Aviation Administration, 800-457-6656
Epicenters: World earthquake epicenters, Richter 5 or greaterSource: Department of Commerce, National Oceanic and Atmospheric Administration
California Earthquake Fault Lines: The fault lines displayed on EDR’s Topographic map are digitized quaternary fault lines,prepared in 1975 by the United State Geological Survey. Additional information (also from 1975) regarding activity at specific faultlines comes from California’s Preliminary Fault Activity Map prepared by the California Division of Mines and Geology.
STREET AND ADDRESS INFORMATION
© 2010 Tele Atlas North America, Inc. All rights reserved. This material is proprietary and the subject of copyright protectionand other intellectual property rights owned by or licensed to Tele Atlas North America, Inc. The use of this material is subjectto the terms of a license agreement. You will be held liable for any unauthorized copying or disclosure of this material.
TC3880855.2s Page A-8
PHYSICAL SETTING SOURCE RECORDS SEARCHED

LINK TO THIS MAP
MAP AN ADDRESS:
SIGNIFIES A CLOSED SITE
Leaking Underground Tank (LUST) Cleanup Sites
Other Cleanup Sites Land Disposal Sites Military Sites WDR Sites Irrigated Lands Regulatory
Program Permitted Underground
Storage Tank (UST) Facilities
Monitoring Wells** ZOOM IN TO SEE MWS
DTSC Cleanup Sites DTSC Haz Waste Permit
Site List - EXPORT TO EXCEL
2 Sites
LAYERS
MAP SIZE
OPTIONS
M ap data ©2014 Google
SHOW SITES WITHIN FEET OF THE FOLLOWING ADDRESS: Go
SITE LISTSITE NAME GLOBAL ID FAC ID STATUS ADDRESS CITYGENERAL TELEPHONE CO OF CALIF 24838 14385 POLK ST SYLMARLA CITY FIRE STATION #91 T0603793054 COMPLETED - CASE CLOSED 14430 POLK ST SYLMAR
Measure a Distance
GeoTracker http://geotracker.waterboards.ca.gov/map/?global_id=T0603793054
1 of 1 5/7/2014 12:40 PM
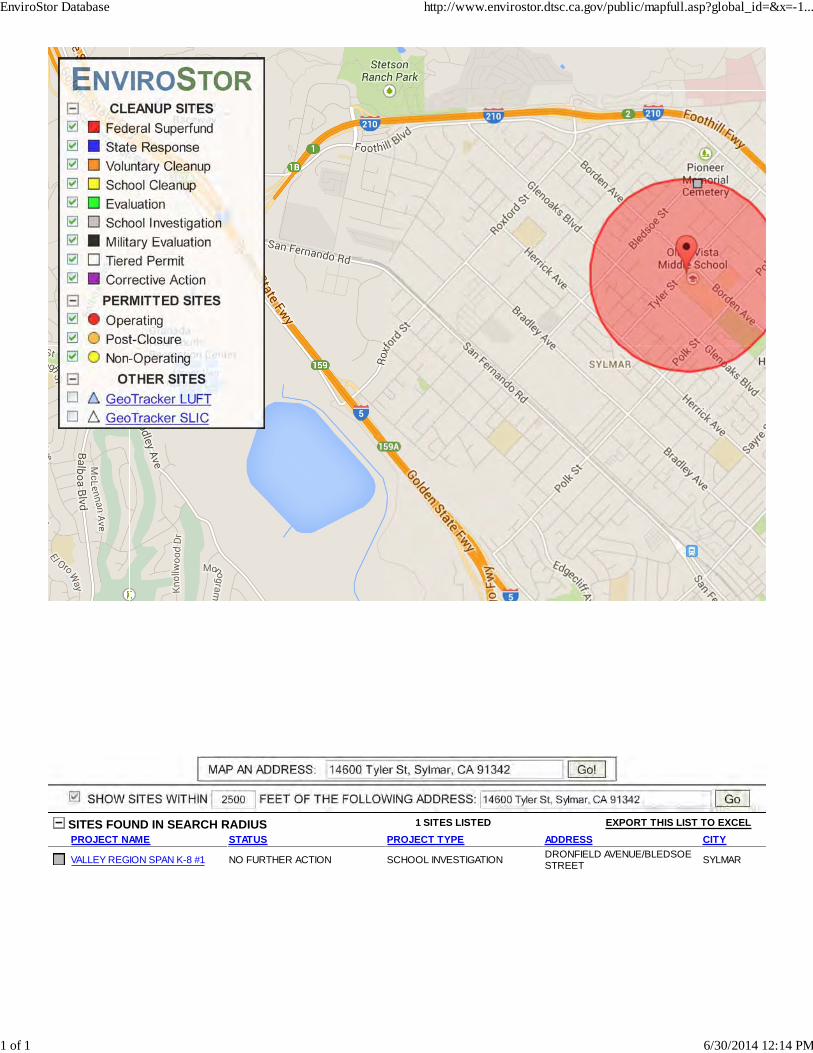
M ap data ©2014 GoogleReport a m ap error
SITES FOUND IN SEARCH RADIUS 1 SITES LISTED EXPORT THIS LIST TO EXCEL PROJECT NAME STATUS PROJECT TYPE ADDRESS CITY
VALLEY REGION SPAN K-8 #1 NO FURTHER ACTION SCHOOL INVESTIGATION DRONFIELD AVENUE/BLEDSOESTREET SYLMAR
EnviroStor Database http://www.envirostor.dtsc.ca.gov/public/mapfull.asp?global_id=&x=-1...
1 of 1 6/30/2014 12:14 PM

Last updated on Monday, March 31, 2014
Powered by FRS
http://iaspub.epa.gov/enviro/fii_foia.fii_retrieve
A search of the databases did not locate any environmental recordsusing the search criteria provided below.
Search CriteriaStreet Number: 14600Street Name: TYLER
City Name: SYLMAR (LOS ANGELES)State: CA
Zip Code: 91342Query executed at: Mon 31-Mar-2014 19:48:05
Databases Searched
Please contact appropriate state agency(s) who may have additional information.
DisclaimerThis summary report is provided solely for informational purposes. It does not provide legal advice, have legally binding effect, or expressly or implicitly create, expand, or limitany legal rights, obligations, responsibilities, expectations, or benefits in regard to any person. EPA maintains the application to enhance public access to environmentalinformation. This service has continual data updates, and we will correct errors brought to our attention, as appropriate.
MyPropertyInfo http://iaspub.epa.gov/enviro/fii_foia.fii_retrieve
1 of 1 3/31/2014 4:50 PM
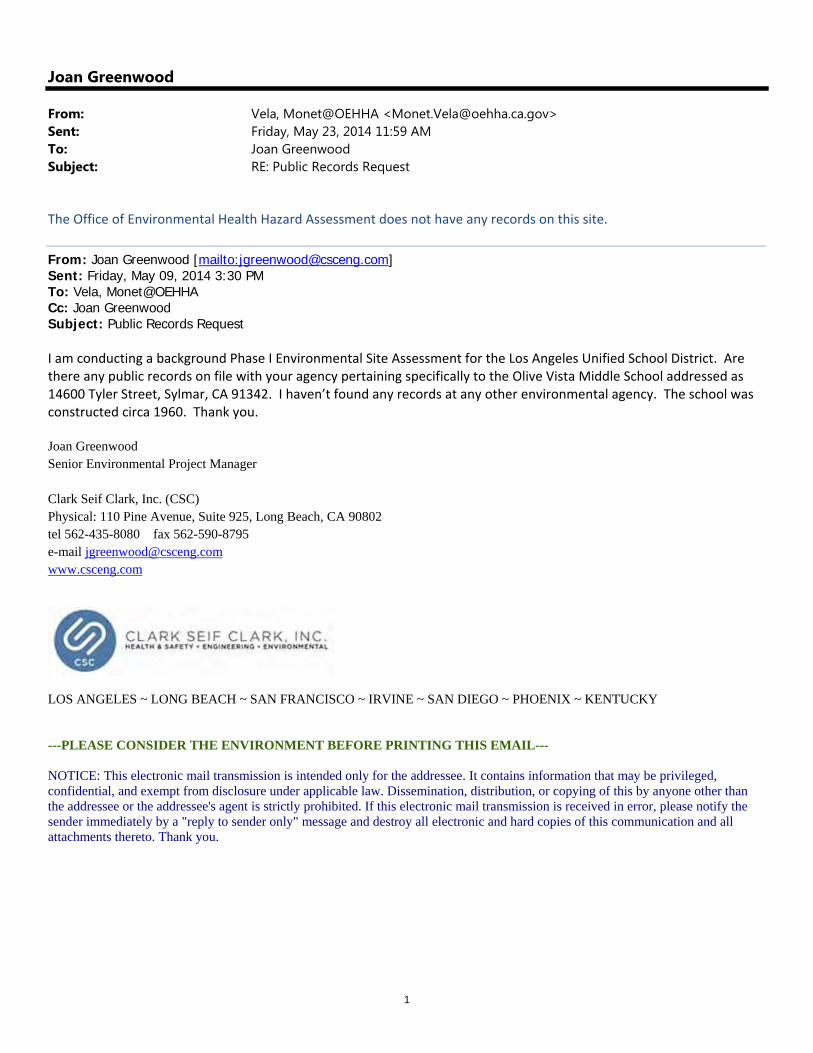
1
Joan Greenwood
From: Vela, Monet@OEHHA <[email protected]>Sent: Friday, May 23, 2014 11:59 AMTo: Joan GreenwoodSubject: RE: Public Records Request
The Office of Environmental Health Hazard Assessment does not have any records on this site.
From: Joan Greenwood [mailto:[email protected]] Sent: Friday, May 09, 2014 3:30 PM To: Vela, Monet@OEHHA Cc: Joan Greenwood Subject: Public Records Request I am conducting a background Phase I Environmental Site Assessment for the Los Angeles Unified School District. Are there any public records on file with your agency pertaining specifically to the Olive Vista Middle School addressed as 14600 Tyler Street, Sylmar, CA 91342. I haven’t found any records at any other environmental agency. The school was constructed circa 1960. Thank you. Joan Greenwood Senior Environmental Project Manager Clark Seif Clark, Inc. (CSC) Physical: 110 Pine Avenue, Suite 925, Long Beach, CA 90802 tel 562-435-8080 fax 562-590-8795 e-mail [email protected] www.csceng.com
LOS ANGELES ~ LONG BEACH ~ SAN FRANCISCO ~ IRVINE ~ SAN DIEGO ~ PHOENIX ~ KENTUCKY ---PLEASE CONSIDER THE ENVIRONMENT BEFORE PRINTING THIS EMAIL--- NOTICE: This electronic mail transmission is intended only for the addressee. It contains information that may be privileged, confidential, and exempt from disclosure under applicable law. Dissemination, distribution, or copying of this by anyone other than the addressee or the addressee's agent is strictly prohibited. If this electronic mail transmission is received in error, please notify the sender immediately by a "reply to sender only" message and destroy all electronic and hard copies of this communication and all attachments thereto. Thank you.


CalEnviroScreen 2.0 (draft) All Results Map
Sources: Esri, DeLorme, HERE, TomTom, Intermap, increment P Corp.,GEBCO, USGS, FAO, NPS, NRCAN, GeoBase, IGN, Kadaster NL,
April 26, 20140 0.075 0.150.0375 mi
0 0.1 0.20.05 km
1:4,514
oehha_arcgis
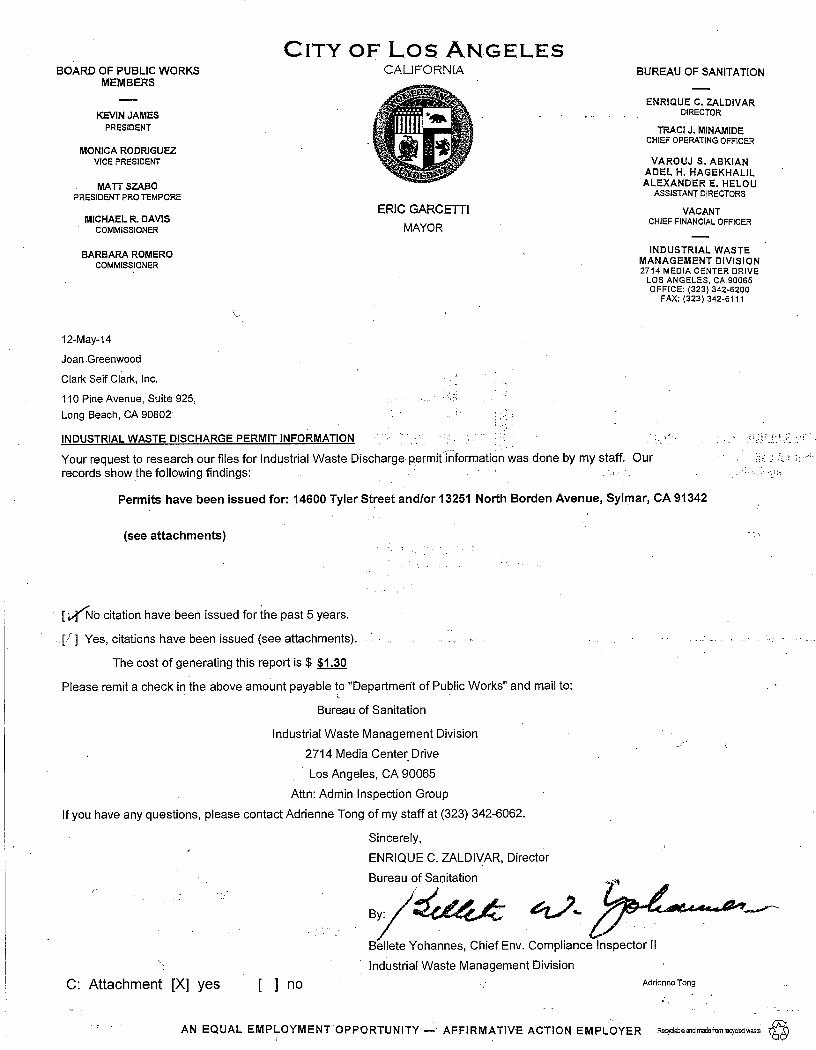


Appendix F City Directory Abstracts
Olive Vista Middle School
14600 Tyler StreetSylmar, CA 91342
Inquiry Number: 3880855.5March 14, 2014
The EDR-City Directory Abstract
6 Armstrong RoadShelton, CT 06484800.352.0050www.edrnet.comEnvironmental Data Resources IncEnvironmental Data Resources IncEnvironmental Data Resources IncEnvironmental Data Resources Inc

TABLE OF CONTENTS
SECTION
Executive Summary
Findings
City Directory Images
Thank you for your business. Please contact EDR at 1-800-352-0050
with any questions or comments.
Disclaimer - Copyright and Trademark Notice
This Report contains certain information obtained from a variety of public and other sources reasonably available to Environmental Data Resources, Inc. It cannot be concluded from this Report that coverage information for the target and surrounding properties does not exist from other sources. NO WARRANTY EXPRESSED OR IMPLIED, IS MADE WHATSOEVER IN CONNECTION WITH THIS REPORT. ENVIRONMENTAL DATA RESOURCES, INC. SPECIFICALLY DISCLAIMS THE MAKING OF ANY SUCH WARRANTIES, INCLUDING WITHOUT LIMITATION, MERCHANTABILITY OR FITNESS FOR A PARTICULAR USE OR PURPOSE. ALL RISK IS ASSUMED BY THE USER. IN NO EVENT SHALL ENVIRONMENTAL DATA RESOURCES, INC. BE LIABLE TO ANYONE, WHETHER ARISING OUT OF ERRORS OR OMISSIONS, NEGLIGENCE, ACCIDENT OR ANY OTHER CAUSE, FOR ANY LOSS OR DAMAGE, INCLUDING, WITHOUT LIMITATION, SPECIAL, INCIDENTAL, CONSEQUENTIAL, OR EXEMPLARY DAMAGES. ANY LIABILITY ON THE PART OF ENVIRONMENTAL DATA RESOURCES, INC. IS STRICTLY LIMITED TO A REFUND OF THE AMOUNT PAID FOR THIS REPORT. Purchaser accepts this Report "AS IS". Any analyses, estimates, ratings, environmental risk levels or risk codes provided in this Report are provided for illustrative purposes only, and are not intended to provide, nor should they be interpreted as providing any facts regarding, or prediction orforecast of, any environmental risk for any property. Only a Phase I Environmental Site Assessment performed by an environmental professional can provide information regarding the environmental risk for any property. Additionally, the information provided in this Report is not to be construed as legal advice.
Copyright 2013 by Environmental Data Resources, Inc. All rights reserved. Reproduction in any media or format, in whole or in part, of any report or map of Environmental Data Resources, Inc. or its affiliates is prohibited without prior written permission.
EDR and its logos (including Sanborn and Sanborn Map) are trademarks of Environmental Data Resources, Inc. or its affiliates. All other trademarks used herein are the property of their respective owners.

EXECUTIVE SUMMARY
DESCRIPTION
Environmental Data Resources, Inc.’s (EDR) City Directory Abstract is a screening tool designed to assist environmental professionals in evaluating potential liability on a target property resulting from past activities. EDR’s City Directory Abstract includes a search and abstract of available city directory data. For each address, the directory lists the name of the corresponding occupant at five year intervals.
Business directories including city, cross reference and telephone directories were reviewed, if available, at approximately five year intervals for the years spanning 1920 through 2013. This report compiles information gathered in this review by geocoding the latitude and longitude of properties identified and gathering information about properties within 660 feet of the target property.
A summary of the information obtained is provided in the text of this report.
RESEARCH SUMMARY
The following research sources were consulted in the preparation of this report. An "X" indicates where information was identified in the source and provided in this report.
Source TPYear Adjoining Text Abstract Source Image
2013 Cole Information Services X X X -
2008 Cole Information Services X X X -
2006 Haines Company - - - -
2004 Haines Company X X X -
2003 Haines & Company - - - -
2001 Haines & Company, Inc. - - - -
2000 Pacific Bell Telephone - - - -
1999 Haines Company - - - -
1996 GTE - - - -
1995 Pacific Bell X X X -
1992 PACIFIC BELL WHITE PAGES - - - -
1991 Pacific Bell X X X -
1990 Pacific Bell - - - -
1986 Pacific Bell - - - -
1985 Pacific Bell - X X -
1981 Pacific Telephone - - - -
1980 Pacific Telephone X X X -
1976 Pacific Telephone - - - -
1975 Pacific Telephone X X X -
1972 R. L. Polk & Co. - - - -
1971 Pacific Telephone - - - -
1970 Pacific Telephone X X X -
1969 Pacific Telephone - - - -
1967 Pacific Telephone - - - -
1966 Pacific Telephone - - - -
3880855- 5 Page 1

EXECUTIVE SUMMARY
Source TPYear Adjoining Text Abstract Source Image
1965 Pacific Telephone - - - -
1964 Pacific Telephone - - - -
1963 Pacific Telephone - - - -
1962 Pacific Telephone X X X -
1961 Luskey Brothers & Co - - - -
1960 General Telephone Company Publishers - - - -
1958 Pacific Telephone - - - -
1957 Pacific Telephone - - - -
1956 Pacific Telephone - X X -
1955 Home Directory Service - - - -
1954 R. L. Polk & Co. - - - -
1952 Los Angeles Directory Co. - - - -
1951 Pacific Directory Co. - - - -
1950 Pacific Telephone - X X -
1949 Los Angeles Directory Co. - - - -
1948 Associated Telephone Company, Ltd. - - - -
1947 Pacific Directory Co. - - - -
1946 Western Directory Co. - - - -
1945 The Glendale Directory Co. - - - -
1944 R. L. Polk & Co. - - - -
1942 Los Angeles Directory Co. - - - -
1940 Glendale Directory Co. - - - -
1939 Los Angeles Directory Co. - - - -
1938 Los Angeles Directory Co. - - - -
1937 Los Angeles Directory Co. - - - -
1936 Los Angeles Directory Co. - - - -
1935 Los Angeles Directory Co. - - - -
1934 Los Angeles Directory Co. - - - -
1933 Los Angeles Directory Co. - - - -
1932 Los Angeles Directory Co. - - - -
1931 Los Angeles Directory Co. - - - -
1930 Glendale Directory Co. - - - -
1929 Los Angeles Directory Co. - - - -
1928 Los Angeles Directory Co. - - - -
1927 Kaasen Directory Company Publishers - - - -
1926 Los Angeles Directory Co. - - - -
1925 Los Angeles Directory Co. - - - -
1924 Los Angeles Directory Co. - - - -
1923 Los Angeles Directory Co. - - - -
1921 Los Angeles Directory Co. - - - -
1920 Los Angeles Directory Co. - - - -
3880855- 5 Page 2

EXECUTIVE SUMMARY
SELECTED ADDRESSES
The following addresses were selected by the client, for EDR to research. An "X" indicates where information was identified.
Address Type Findings
13291 Phillippi Avenue Client Entered X
13302 Borden Ave Client Entered X
13298 Borden Avenue Client Entered X
13109 Borden Ave Client Entered
14469 Polk St Client Entered X
14464 Polk St Client Entered X
14384 Polk St Client Entered X
14581 Tyler St Client Entered X
3880855- 5 Page 3

FINDINGS
TARGET PROPERTY INFORMATION
ADDRESS
14600 Tyler StreetSylmar, CA 91342
FINDINGS DETAIL
Target Property research detail.
TYLER ST
14600 TYLER ST
Year Uses Source
2013 OLIVE VISTA MIDDLE SCHOOL Cole Information Services
2008 LOS ANGELES UNIFID SCHOOL DST Cole Information Services
OLIVE VISTA MIDDLE SCHOOL Cole Information Services
2004 HIGH SCHOOL Haines Company
OLIVEVISTAJUNIOR Haines Company
1995 Olive Vista Junior High School Pacific Bell
1991 Olive Vista Junior High School Pacific Bell
Oliveas Veronica Syl Pacific Bell
1980 OLIVE VISTA JR HIGH SCHOOL Pacific Telephone
1975 Olive Vista Jr High School Pacific Telephone
1970 OLIVE VISTA JR HIGH SCHOOL Pacific Telephone
1962 OLIVE VISTA JR HIGH SCHOOL Pacific Telephone
3880855- 5 Page 4

FINDINGS
ADJOINING PROPERTY DETAIL
The following Adjoining Property addresses were researched for this report. Detailed findings are provided for each address.
BORDEN AVE
13109 BORDEN AVE
Year Uses Source
2013 SYLMAR NEIGHBORHOOD COUNCIL Cole Information Services
2008 CITY OF LOS ANGELES Cole Information Services
SAN FERNANDO VALLEY INTERFAITH COUNC
Cole Information Services
SYLMAR RECREATION CENTER Cole Information Services
13270 BORDEN AVE
Year Uses Source
2004 MESSNER Darrell Haines Company
1991 Overton Earl L Pacific Bell
Messner Richard Pacific Bell
Messner Darrell Pacific Bell
1985 Overton Eari L Pacific Bell
Messner Darrell Pacific Bell
1970 DE BREE YVONNE Pacific Telephone
DE BREE YVONNE Pacific Telephone
1962 CROSS ADAM W Pacific Telephone
1956 CROSS ADAM W Pacific Telephone
1950 COOPER RAYMOND CARL R Pacific Telephone
COOPER RAYMOND CARL R Pacific Telephone
13278 BORDEN AVE
Year Uses Source
2004 COURTNEYPau I Haines Company
1995 Courtney Paul Pacific Bell
1991 Courtney Paul Pacific Bell
1985 Courtney Paul Pacific Bell
1980 COURTNEY PAUL Pacific Telephone
1975 Courtney Paul Pacific Telephone
3880855- 5 Page 5

Year Uses Source
FINDINGS
13286 BORDEN AVE
Year Uses Source
2004 GONZALEZJuan Haines Company
GARCIA Jesus Haines Company
1991 Sanchez Jesus G Pacific Bell
1985 Price Russel Pacific Bell
Prices Pacific Bell
Price S Pacific Bell
Prices Pacific Bell
Price S Pacific Bell
1980 FRETWELL FRED A Pacific Telephone
PRICE RUSSEL SYLMAR Pacific Telephone
1975 Fretwell Fred A Pacific Telephone
Price Russel Pacific Telephone
1970 FRETWELL FRED A Pacific Telephone
FRETWELL FRED A Pacific Telephone
1950 BIGBEE CHAS A R Pacific Telephone
BIGBEE CHAS A R Pacific Telephone
13288 BORDEN AVE
Year Uses Source
2013 A & B LOCKSMITH SERVICE Cole Information Services
2008 A & B LOCKSMITH SERVICE Cole Information Services
2004 BARANOWSKI Donald Haines Company
1995 Baranowski Donald Pacific Bell
1962 RUEHLE JERRY C Pacific Telephone
13292 BORDEN AVE
Year Uses Source
2004 OROZCOBernha Haines Company
1985 Harness Robt L Pacific Bell
1980 HARNESS ROBT L Pacific Telephone
1975 Harness Robt L Pacific Telephone
1970 KATZENMEYER ROBT Pacific Telephone
KATZENMEYER ROBT Pacific Telephone
13298 BORDEN AVE
Year Uses Source
2004 CHAVEZ Hulson Pamela Haines Company
1995 Duenez Raul Pacific Bell
3880855- 5 Page 6

Year Uses Source
FINDINGS
Year Uses Source
1995 Loaiza Francisco Pacific Bell
1991 Loaiza Francisco Pacific Bell
Loaiza Santiago Pacific Bell
1985 Gresci Joe Pacific Bell
Gresci Mary Pacific Bell
Grese J T Pacific Bell
1980 GRESCI JOE Pacific Telephone
1975 Santoro Tony Pacific Telephone
1970 SANTORO TONY Pacific Telephone
SANTORO TONY Pacific Telephone
1962 SLONNEGER M H Pacific Telephone
Borden Ave
13302 Borden Ave
Year Uses Source
2004 DILLSFrank J Haines Company
1995 Dills Frank J Pacific Bell
1991 Dills Frank d Pacific Bell
1985 Dills Frank J Pacific Bell
1980 DILLS FRANK J Pacific Telephone
1975 Dills Frank J Pacific Telephone
1970 DILLS FRANK J Pacific Telephone
DILLS FRANK J Pacific Telephone
BORDEN AVE
13304 BORDEN AVE
Year Uses Source
2004 SALAMANCA Consuelo Haines Company
1991 Erb Michael Pacific Bell
LA Rescue Inc Pacific Bell
LA Research Inc Pacific Bell
Erb RI Pacific Bell
1980 GERBERICK EDLA Pacific Telephone
1975 Gerberick Edla Pacific Telephone
1970 GERBERICK EDLA Pacific Telephone
GERBERICK EDLA Pacific Telephone
1962 GERBERICK EDLA Pacific Telephone
3880855- 5 Page 7

Year Uses Source
FINDINGS
13315 BORDEN AVE
Year Uses Source
2004 TORRES Manrbel S Haines Company
1995 Hull Robt M Pacific Bell
1991 Hull Robt M Pacific Bell
1985 Hull Robt M Pacific Bell
1980 HULL ROBT M Pacific Telephone
1975 Cassidy Timothy L Pacific Telephone
13316 BORDEN AVE
Year Uses Source
1962 ERB CHAS A Pacific Telephone
13323 BORDEN AVE
Year Uses Source
2004 DELGaudio Sal Haines Company
1991 Flore Leonor Pacific Bell
1985 Fiore Leonor Pacific Bell
13326 BORDEN AVE
Year Uses Source
2004 SORENSEN Eric Haines Company
1985 West Tinsley D Pacific Bell
1980 WEST TINSLEY D Pacific Telephone
1975 West Tinsley D Pacific Telephone
1970 WEST TINSLEY D Pacific Telephone
WEST TINSLEY D Pacific Telephone
1956 SMITH BENJ H Pacific Telephone
13330 BORDEN AVE
Year Uses Source
2004 OCANNISTRACIAnlhony Haines Company
1985 Tortorici Frank Pacific Bell
1970 JANSON CHAS K Pacific Telephone
JANSON CHAS K Pacific Telephone
13341 BORDEN AVE
Year Uses Source
2004 BRAMIREZJess Haines Company
1985 Rodriguez Rodney Pacific Bell
Rodriguez Roberto P Pacific Bell
3880855- 5 Page 8
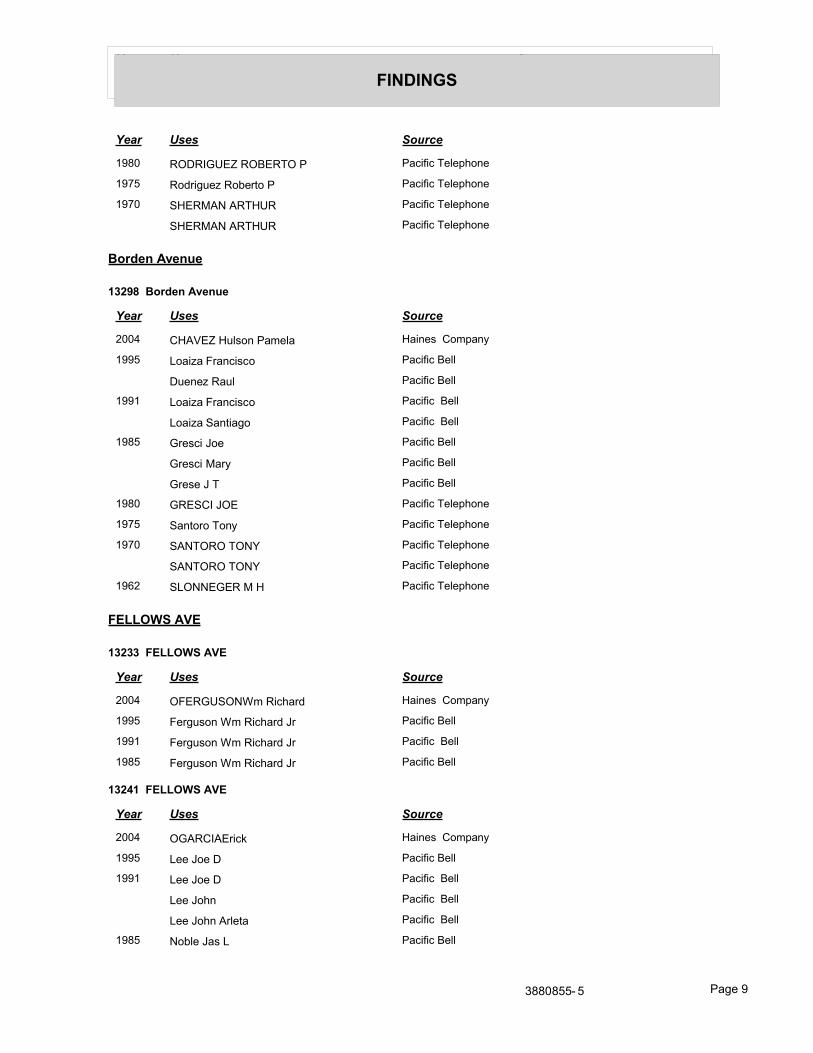
Year Uses Source
FINDINGS
Year Uses Source
1980 RODRIGUEZ ROBERTO P Pacific Telephone
1975 Rodriguez Roberto P Pacific Telephone
1970 SHERMAN ARTHUR Pacific Telephone
SHERMAN ARTHUR Pacific Telephone
Borden Avenue
13298 Borden Avenue
Year Uses Source
2004 CHAVEZ Hulson Pamela Haines Company
1995 Loaiza Francisco Pacific Bell
Duenez Raul Pacific Bell
1991 Loaiza Francisco Pacific Bell
Loaiza Santiago Pacific Bell
1985 Gresci Joe Pacific Bell
Gresci Mary Pacific Bell
Grese J T Pacific Bell
1980 GRESCI JOE Pacific Telephone
1975 Santoro Tony Pacific Telephone
1970 SANTORO TONY Pacific Telephone
SANTORO TONY Pacific Telephone
1962 SLONNEGER M H Pacific Telephone
FELLOWS AVE
13233 FELLOWS AVE
Year Uses Source
2004 OFERGUSONWm Richard Haines Company
1995 Ferguson Wm Richard Jr Pacific Bell
1991 Ferguson Wm Richard Jr Pacific Bell
1985 Ferguson Wm Richard Jr Pacific Bell
13241 FELLOWS AVE
Year Uses Source
2004 OGARCIAErick Haines Company
1995 Lee Joe D Pacific Bell
1991 Lee Joe D Pacific Bell
Lee John Pacific Bell
Lee John Arleta Pacific Bell
1985 Noble Jas L Pacific Bell
3880855- 5 Page 9
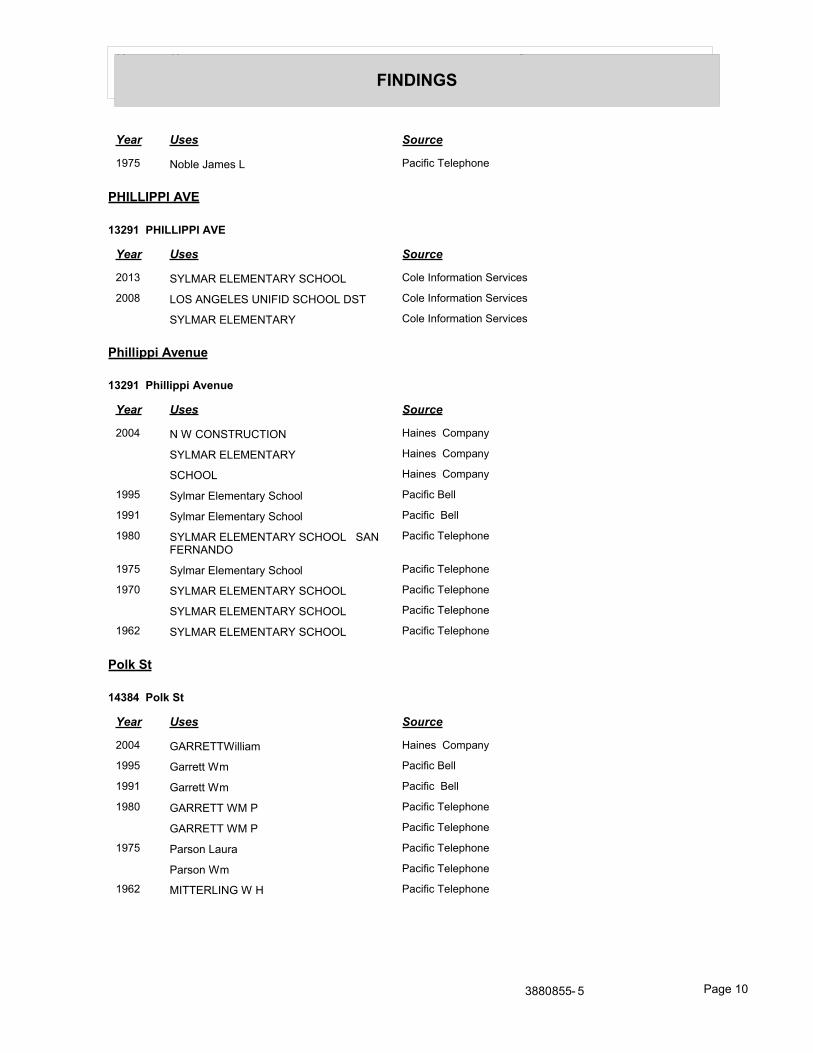
Year Uses Source
FINDINGS
Year Uses Source
1975 Noble James L Pacific Telephone
PHILLIPPI AVE
13291 PHILLIPPI AVE
Year Uses Source
2013 SYLMAR ELEMENTARY SCHOOL Cole Information Services
2008 LOS ANGELES UNIFID SCHOOL DST Cole Information Services
SYLMAR ELEMENTARY Cole Information Services
Phillippi Avenue
13291 Phillippi Avenue
Year Uses Source
2004 N W CONSTRUCTION Haines Company
SYLMAR ELEMENTARY Haines Company
SCHOOL Haines Company
1995 Sylmar Elementary School Pacific Bell
1991 Sylmar Elementary School Pacific Bell
1980 SYLMAR ELEMENTARY SCHOOL SAN FERNANDO
Pacific Telephone
1975 Sylmar Elementary School Pacific Telephone
1970 SYLMAR ELEMENTARY SCHOOL Pacific Telephone
SYLMAR ELEMENTARY SCHOOL Pacific Telephone
1962 SYLMAR ELEMENTARY SCHOOL Pacific Telephone
Polk St
14384 Polk St
Year Uses Source
2004 GARRETTWilliam Haines Company
1995 Garrett Wm Pacific Bell
1991 Garrett Wm Pacific Bell
1980 GARRETT WM P Pacific Telephone
GARRETT WM P Pacific Telephone
1975 Parson Laura Pacific Telephone
Parson Wm Pacific Telephone
1962 MITTERLING W H Pacific Telephone
3880855- 5 Page 10

Year Uses Source
FINDINGS
14464 Polk St
Year Uses Source
2004 AGUIRRESalvador Haines Company
1970 PIERT FRED Pacific Telephone
PIERT FRED Pacific Telephone
1956 BARTEL MATTHEW J Pacific Telephone
14469 Polk St
Year Uses Source
2004 ARIASAngel Haines Company
1995 Womack R B Pacific Bell
1991 Womack RB Pacific Bell
Womack RH Nor Pacific Bell
Womack Sha Ron Pacific Bell
Womack Vincent Pacific Bell
Womack T Pacific Bell
1985 Womack R Bl Pacific Bell
1980 WOMACK R B Pacific Telephone
1975 Womack R B Pacific Telephone
1962 RAYMONDO CHAS Pacific Telephone
TYLER ST
14520 TYLER ST
Year Uses Source
2004 MAHONY Dorolhy Haines Company
1975 Eddy F Iva Pacific Telephone
Eddy Marcia A Pacific Telephone
Graver Fred D Pacific Telephone
1970 GRAVER FRED O Pacific Telephone
GRAVER FRED O Pacific Telephone
14532 TYLER ST
Year Uses Source
2004 SILVAJorge Haines Company
1995 Saetermoe C Pacific Bell
Howard Andrew Pacific Bell
1980 DAWSON JOY A Pacific Telephone
BUCK JEFFREY & JOY Pacific Telephone
1975 Green Rick Pacific Telephone
3880855- 5 Page 11

Year Uses Source
FINDINGS
Year Uses Source
1970 JAGERIUS FRANK G Pacific Telephone
JAGERIUS FRANK G Pacific Telephone
1962 FARLEY WM F Pacific Telephone
1956 FARLEY WM F Pacific Telephone
14533 TYLER ST
Year Uses Source
2004 HERNANDEZJerry Haines Company
HERNANDEZJerry Haines Company
1991 Yuhos C&D Pacific Bell
Yuhl M Pacific Bell
1975 Corey Bill Pacific Telephone
1962 COSCIA GERALD Pacific Telephone
1950 STANICK ROBT R SAN FERNANDO Pacific Telephone
STANICK ROBT R SAN FERNANDO Pacific Telephone
14545 TYLER ST
Year Uses Source
2004 KYROUZJames Haines Company
1962 KYROUZ JAS G Pacific Telephone
Tyler St
14581 Tyler St
Year Uses Source
2004 HERNANDEZ Rosemary Haines Company
1991 RVP Constructor Co Pacific Bell
1980 DELUNA ENRIQUE Pacific Telephone
DE LUNA IRENE Pacific Telephone
1962 LINDHOLM ROBT E Pacific Telephone
1956 LINDHOLM ROBT E Pacific Telephone
TYLER ST
14591 TYLER ST
Year Uses Source
2004 ALDANAJesus Haines Company
1985 Bicklord M Pacific Bell
Bickford Lillian Pacific Bell
Bickford Geo Pacific Bell
3880855- 5 Page 12

Year Uses Source
FINDINGS
Year Uses Source
1980 BICKFORD GEO Pacific Telephone
BICKFORD LILLIAN Pacific Telephone
1975 Bickford Geo M Pacific Telephone
1970 KIMMEL WM L Pacific Telephone
KIMMEL WM L Pacific Telephone
14601 TYLER ST
Year Uses Source
2004 OAGUIRREJesus Haines Company
AGUIRRECarmen Haines Company
1970 RINGLEB PAUL W Pacific Telephone
RINGLEB PAUL W Pacific Telephone
1962 RINGLEB PAUL W Pacific Telephone
1956 REAM WM R JR Pacific Telephone
14615 TYLER ST
Year Uses Source
2004 REYNAR Amelia Haines Company
REYNARWillis Haines Company
1995 Reynar A M & Willis H Pacific Bell
1985 Reynar A M & Willis H Pacific Bell
1980 REYNAR A M & WILLIS H Pacific Telephone
1975 Reynar A M Pacific Telephone
1970 REYNAR A M Pacific Telephone
REYNAR A M Pacific Telephone
1962 REYNAR WILLIS H Pacific Telephone
1956 MONSKE LEON S R Pacific Telephone
1950 MONSKE LEON S R Pacific Telephone
MONSKE LEON S R Pacific Telephone
14625 TYLER ST
Year Uses Source
2004 /e ORELLANA Edmundo Haines Company
1985 Dincau C L Pacific Bell
1980 DINCAU D A Pacific Telephone
1975 Dincau D A Pacific Telephone
1970 DINCAU D A Pacific Telephone
DINCAU D A Pacific Telephone
1962 DINCAU D A Pacific Telephone
3880855- 5 Page 13

Year Uses Source
FINDINGS
Year Uses Source
1956 DINCAU D A R Pacific Telephone
14636 TYLER ST
Year Uses Source
2004 NAJRJas Haines Company
1995 Najr Jas Pacific Bell
1991 Naka Robt H Pacific Bell
Najr Jas Pacific Bell
14637 TYLER ST
Year Uses Source
2004 COOPER Susan Haines Company
1991 Swendeman Marjorie L Pacific Bell
Swenlin Brian C North Hollywood Pacific Bell
1985 Swendeman Marjorie L Pacific Bell
1980 SWENDEMAN MARJORIE L Pacific Telephone
1975 Swendeman Marjorie L Pacific Telephone
1970 SWENDEMAN MARJORIE L Pacific Telephone
SWENDEMAN MARJORIE L Pacific Telephone
1962 SWENDEMAN MARJORIE L Pacific Telephone
1956 SWENDEMAN MARJORIE L R Pacific Telephone
1950 SWENDEMAN MARJORIE L R Pacific Telephone
SWENDEMAN MARJORIE L R Pacific Telephone
14648 TYLER ST
Year Uses Source
2004 SWAGNIERE Ronald Haines Company
1995 Fun Baskets Pacific Bell
1991 Brigham Scott Pacific Bell
1985 Brigham Steven L Phd Pacific Bell
Brigham Scott Pacific Bell
1975 Baltzley Phil Pacific Telephone
1970 MOORE CLARENCE J Pacific Telephone
MOORE CLARENCE J Pacific Telephone
1962 MOORE CLARENCE J Pacific Telephone
1956 ATWOOD MELVIN A Pacific Telephone
1950 ATWOOD MELVIN A R Pacific Telephone
ATWOOD MELVIN A R Pacific Telephone
3880855- 5 Page 14
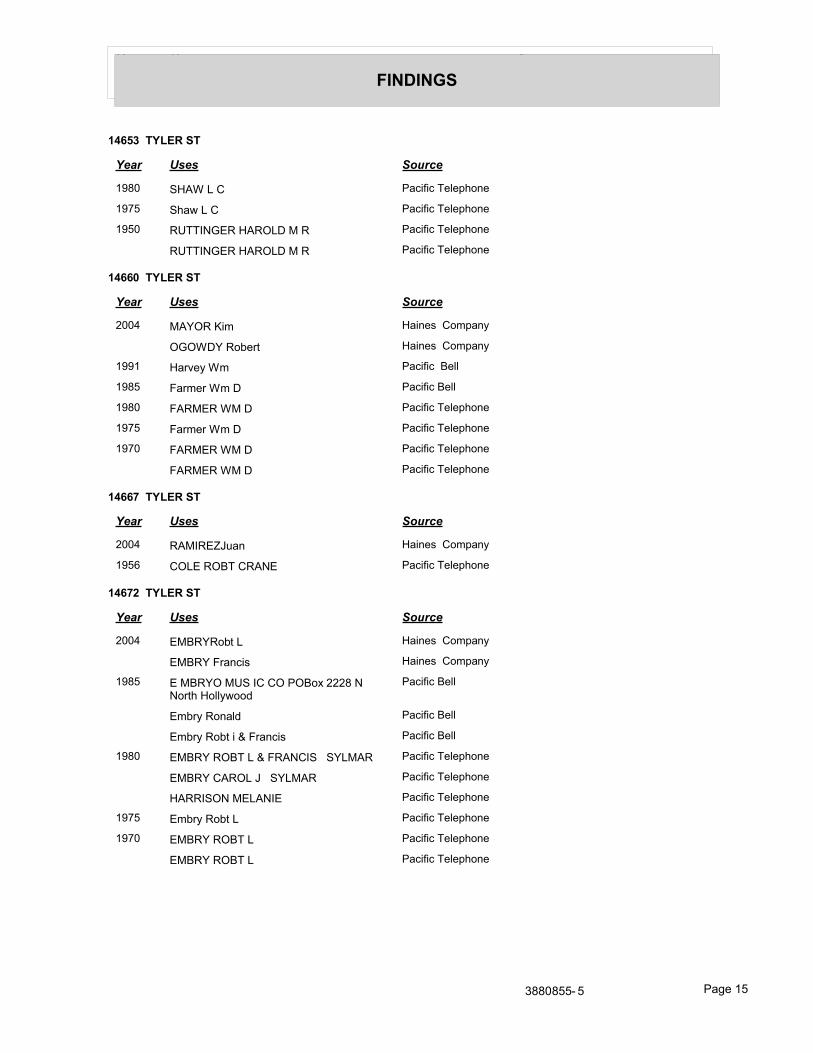
Year Uses Source
FINDINGS
14653 TYLER ST
Year Uses Source
1980 SHAW L C Pacific Telephone
1975 Shaw L C Pacific Telephone
1950 RUTTINGER HAROLD M R Pacific Telephone
RUTTINGER HAROLD M R Pacific Telephone
14660 TYLER ST
Year Uses Source
2004 MAYOR Kim Haines Company
OGOWDY Robert Haines Company
1991 Harvey Wm Pacific Bell
1985 Farmer Wm D Pacific Bell
1980 FARMER WM D Pacific Telephone
1975 Farmer Wm D Pacific Telephone
1970 FARMER WM D Pacific Telephone
FARMER WM D Pacific Telephone
14667 TYLER ST
Year Uses Source
2004 RAMIREZJuan Haines Company
1956 COLE ROBT CRANE Pacific Telephone
14672 TYLER ST
Year Uses Source
2004 EMBRYRobt L Haines Company
EMBRY Francis Haines Company
1985 E MBRYO MUS IC CO POBox 2228 N North Hollywood
Pacific Bell
Embry Ronald Pacific Bell
Embry Robt i & Francis Pacific Bell
1980 EMBRY ROBT L & FRANCIS SYLMAR Pacific Telephone
EMBRY CAROL J SYLMAR Pacific Telephone
HARRISON MELANIE Pacific Telephone
1975 Embry Robt L Pacific Telephone
1970 EMBRY ROBT L Pacific Telephone
EMBRY ROBT L Pacific Telephone
3880855- 5 Page 15
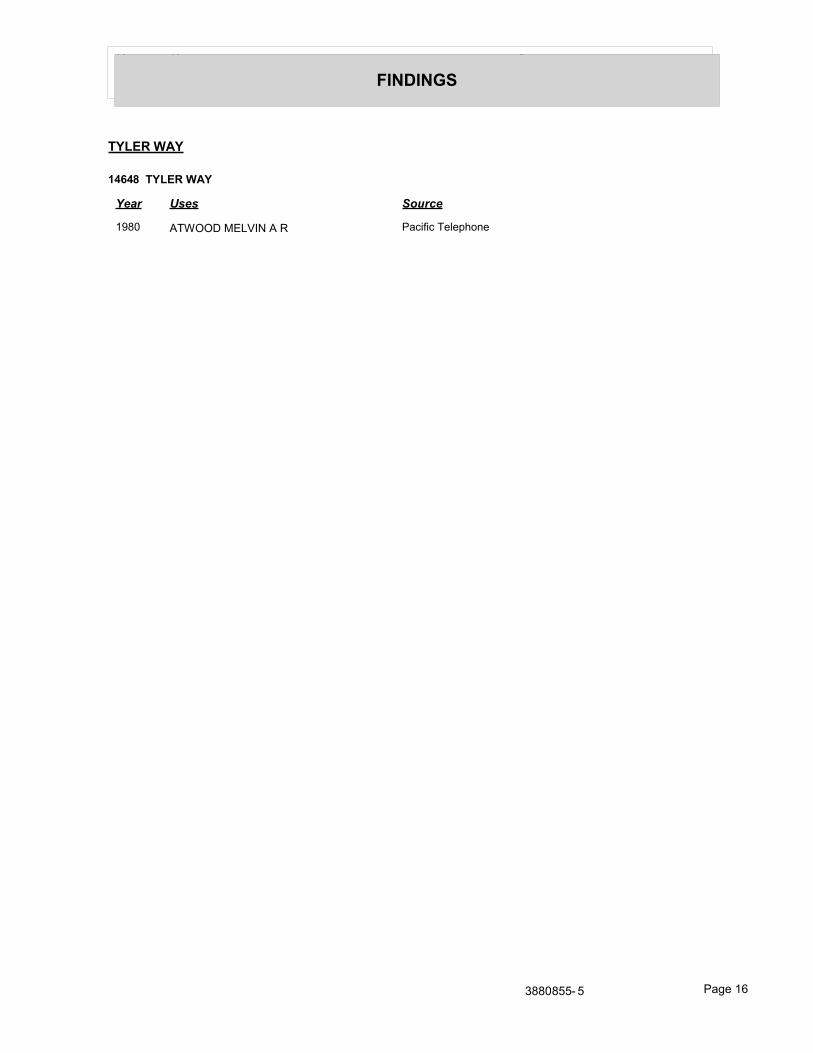
Year Uses Source
FINDINGS
TYLER WAY
14648 TYLER WAY
Year Uses Source
1980 ATWOOD MELVIN A R Pacific Telephone
3880855- 5 Page 16

FINDINGS
TARGET PROPERTY: ADDRESS NOT IDENTIFIED IN RESEARCH SOURCE
The following Target Property addresses were researched for this report, and the addresses were not identified in the research source.
Address Researched Address Not Identified in Research Source
14600 Tyler Street 2006, 2003, 2001, 2000, 1999, 1996, 1992, 1990, 1986, 1985, 1981, 1976, 1972, 1971, 1969, 1967, 1966, 1965, 1964, 1963, 1961, 1960, 1958, 1957, 1956, 1955, 1954, 1952, 1951, 1950, 1949, 1948, 1947, 1946, 1945, 1944, 1942, 1940, 1939, 1938, 1937, 1936, 1935, 1934, 1933, 1932, 1931, 1930, 1929, 1928, 1927, 1926, 1925, 1924, 1923, 1921, 1920
ADJOINING PROPERTY: ADDRESSES NOT IDENTIFIED IN RESEARCH SOURCE
The following Adjoining Property addresses were researched for this report, and the addresses were not identified in research source.
Address Researched Address Not Identified in Research Source
13109 Borden Ave 2013, 2008, 2006, 2004, 2003, 2001, 2000, 1999, 1996, 1995, 1992, 1991, 1990, 1986, 1985, 1981, 1980, 1976, 1975, 1972, 1971, 1970, 1969, 1967, 1966, 1965, 1964, 1963, 1962, 1961, 1960, 1958, 1957, 1956, 1955, 1954, 1952, 1951, 1950, 1949, 1948, 1947, 1946, 1945, 1944, 1942, 1940, 1939, 1938, 1937, 1936, 1935, 1934, 1933, 1932, 1931, 1930, 1929, 1928, 1927, 1926, 1925, 1924, 1923, 1921, 1920
13109 BORDEN AVE 2006, 2004, 2003, 2001, 2000, 1999, 1996, 1995, 1992, 1991, 1990, 1986, 1985, 1981, 1980, 1976, 1975, 1972, 1971, 1970, 1969, 1967, 1966, 1965, 1964, 1963, 1962, 1961, 1960, 1958, 1957, 1956, 1955, 1954, 1952, 1951, 1950, 1949, 1948, 1947, 1946, 1945, 1944, 1942, 1940, 1939, 1938, 1937, 1936, 1935, 1934, 1933, 1932, 1931, 1930, 1929, 1928, 1927, 1926, 1925, 1924, 1923, 1921, 1920
13233 FELLOWS AVE 2013, 2008, 2006, 2003, 2001, 2000, 1999, 1996, 1992, 1990, 1986, 1981, 1980, 1976, 1975, 1972, 1971, 1970, 1969, 1967, 1966, 1965, 1964, 1963, 1962, 1961, 1960, 1958, 1957, 1956, 1955, 1954, 1952, 1951, 1950, 1949, 1948, 1947, 1946, 1945, 1944, 1942, 1940, 1939, 1938, 1937, 1936, 1935, 1934, 1933, 1932, 1931, 1930, 1929, 1928, 1927, 1926, 1925, 1924, 1923, 1921, 1920
13241 FELLOWS AVE 2013, 2008, 2006, 2003, 2001, 2000, 1999, 1996, 1992, 1990, 1986, 1981, 1980, 1976, 1972, 1971, 1970, 1969, 1967, 1966, 1965, 1964, 1963, 1962, 1961, 1960, 1958, 1957, 1956, 1955, 1954, 1952, 1951, 1950, 1949, 1948, 1947, 1946, 1945, 1944, 1942, 1940, 1939, 1938, 1937, 1936, 1935, 1934, 1933, 1932, 1931, 1930, 1929, 1928, 1927, 1926, 1925, 1924, 1923, 1921, 1920
13270 BORDEN AVE 2013, 2008, 2006, 2003, 2001, 2000, 1999, 1996, 1995, 1992, 1990, 1986, 1981, 1980, 1976, 1975, 1972, 1971, 1969, 1967, 1966, 1965, 1964, 1963, 1961, 1960, 1958, 1957, 1955, 1954, 1952, 1951, 1949, 1948, 1947, 1946, 1945, 1944, 1942, 1940, 1939, 1938, 1937, 1936, 1935, 1934, 1933, 1932, 1931, 1930, 1929, 1928, 1927, 1926, 1925, 1924, 1923, 1921, 1920
13278 BORDEN AVE 2013, 2008, 2006, 2003, 2001, 2000, 1999, 1996, 1992, 1990, 1986, 1981, 1976, 1972, 1971, 1970, 1969, 1967, 1966, 1965, 1964, 1963, 1962, 1961, 1960, 1958, 1957, 1956, 1955, 1954, 1952, 1951, 1950, 1949, 1948, 1947, 1946, 1945, 1944, 1942, 1940, 1939, 1938, 1937, 1936, 1935, 1934, 1933, 1932, 1931, 1930, 1929, 1928, 1927, 1926, 1925, 1924, 1923, 1921, 1920

FINDINGS
Address Researched Address Not Identified in Research Source
13286 BORDEN AVE 2013, 2008, 2006, 2003, 2001, 2000, 1999, 1996, 1995, 1992, 1990, 1986, 1981, 1976, 1972, 1971, 1969, 1967, 1966, 1965, 1964, 1963, 1962, 1961, 1960, 1958, 1957, 1956, 1955, 1954, 1952, 1951, 1949, 1948, 1947, 1946, 1945, 1944, 1942, 1940, 1939, 1938, 1937, 1936, 1935, 1934, 1933, 1932, 1931, 1930, 1929, 1928, 1927, 1926, 1925, 1924, 1923, 1921, 1920
13288 BORDEN AVE 2013, 2008, 2006, 2003, 2001, 2000, 1999, 1996, 1992, 1991, 1990, 1986, 1985, 1981, 1980, 1976, 1975, 1972, 1971, 1970, 1969, 1967, 1966, 1965, 1964, 1963, 1961, 1960, 1958, 1957, 1956, 1955, 1954, 1952, 1951, 1950, 1949, 1948, 1947, 1946, 1945, 1944, 1942, 1940, 1939, 1938, 1937, 1936, 1935, 1934, 1933, 1932, 1931, 1930, 1929, 1928, 1927, 1926, 1925, 1924, 1923, 1921, 1920
13288 BORDEN AVE 2006, 2004, 2003, 2001, 2000, 1999, 1996, 1995, 1992, 1991, 1990, 1986, 1985, 1981, 1980, 1976, 1975, 1972, 1971, 1970, 1969, 1967, 1966, 1965, 1964, 1963, 1962, 1961, 1960, 1958, 1957, 1956, 1955, 1954, 1952, 1951, 1950, 1949, 1948, 1947, 1946, 1945, 1944, 1942, 1940, 1939, 1938, 1937, 1936, 1935, 1934, 1933, 1932, 1931, 1930, 1929, 1928, 1927, 1926, 1925, 1924, 1923, 1921, 1920
13291 PHILLIPPI AVE 2006, 2004, 2003, 2001, 2000, 1999, 1996, 1995, 1992, 1991, 1990, 1986, 1985, 1981, 1980, 1976, 1975, 1972, 1971, 1970, 1969, 1967, 1966, 1965, 1964, 1963, 1962, 1961, 1960, 1958, 1957, 1956, 1955, 1954, 1952, 1951, 1950, 1949, 1948, 1947, 1946, 1945, 1944, 1942, 1940, 1939, 1938, 1937, 1936, 1935, 1934, 1933, 1932, 1931, 1930, 1929, 1928, 1927, 1926, 1925, 1924, 1923, 1921, 1920
13291 Phillippi Avenue 2013, 2008, 2006, 2003, 2001, 2000, 1999, 1996, 1992, 1990, 1986, 1985, 1981, 1976, 1972, 1971, 1969, 1967, 1966, 1965, 1964, 1963, 1961, 1960, 1958, 1957, 1956, 1955, 1954, 1952, 1951, 1950, 1949, 1948, 1947, 1946, 1945, 1944, 1942, 1940, 1939, 1938, 1937, 1936, 1935, 1934, 1933, 1932, 1931, 1930, 1929, 1928, 1927, 1926, 1925, 1924, 1923, 1921, 1920
13292 BORDEN AVE 2013, 2008, 2006, 2003, 2001, 2000, 1999, 1996, 1995, 1992, 1991, 1990, 1986, 1981, 1976, 1972, 1971, 1969, 1967, 1966, 1965, 1964, 1963, 1962, 1961, 1960, 1958, 1957, 1956, 1955, 1954, 1952, 1951, 1950, 1949, 1948, 1947, 1946, 1945, 1944, 1942, 1940, 1939, 1938, 1937, 1936, 1935, 1934, 1933, 1932, 1931, 1930, 1929, 1928, 1927, 1926, 1925, 1924, 1923, 1921, 1920
13298 BORDEN AVE 2013, 2008, 2006, 2003, 2001, 2000, 1999, 1996, 1992, 1990, 1986, 1981, 1976, 1972, 1971, 1969, 1967, 1966, 1965, 1964, 1963, 1961, 1960, 1958, 1957, 1956, 1955, 1954, 1952, 1951, 1950, 1949, 1948, 1947, 1946, 1945, 1944, 1942, 1940, 1939, 1938, 1937, 1936, 1935, 1934, 1933, 1932, 1931, 1930, 1929, 1928, 1927, 1926, 1925, 1924, 1923, 1921, 1920
13298 Borden Avenue 2013, 2008, 2006, 2003, 2001, 2000, 1999, 1996, 1992, 1990, 1986, 1981, 1976, 1972, 1971, 1969, 1967, 1966, 1965, 1964, 1963, 1961, 1960, 1958, 1957, 1956, 1955, 1954, 1952, 1951, 1950, 1949, 1948, 1947, 1946, 1945, 1944, 1942, 1940, 1939, 1938, 1937, 1936, 1935, 1934, 1933, 1932, 1931, 1930, 1929, 1928, 1927, 1926, 1925, 1924, 1923, 1921, 1920
13302 Borden Ave 2013, 2008, 2006, 2003, 2001, 2000, 1999, 1996, 1992, 1990, 1986, 1981, 1976, 1972, 1971, 1969, 1967, 1966, 1965, 1964, 1963, 1962, 1961, 1960, 1958, 1957, 1956, 1955, 1954, 1952, 1951, 1950, 1949, 1948, 1947, 1946, 1945, 1944, 1942, 1940, 1939, 1938, 1937, 1936, 1935, 1934, 1933, 1932, 1931, 1930, 1929, 1928, 1927, 1926, 1925, 1924, 1923, 1921, 1920
13304 BORDEN AVE 2013, 2008, 2006, 2003, 2001, 2000, 1999, 1996, 1995, 1992, 1990, 1986, 1985, 1981, 1976, 1972, 1971, 1969, 1967, 1966, 1965, 1964, 1963, 1961, 1960, 1958, 1957, 1956, 1955, 1954, 1952, 1951, 1950, 1949, 1948, 1947, 1946, 1945, 1944, 1942, 1940, 1939, 1938, 1937, 1936, 1935, 1934, 1933, 1932, 1931, 1930, 1929, 1928, 1927, 1926, 1925, 1924, 1923, 1921, 1920
13315 BORDEN AVE 2013, 2008, 2006, 2003, 2001, 2000, 1999, 1996, 1992, 1990, 1986, 1981, 1976, 1972, 1971, 1970, 1969, 1967, 1966, 1965, 1964, 1963, 1962, 1961, 1960, 1958, 1957, 1956, 1955, 1954, 1952, 1951, 1950, 1949, 1948, 1947, 1946, 1945, 1944, 1942, 1940, 1939, 1938, 1937, 1936, 1935, 1934, 1933, 1932, 1931, 1930, 1929, 1928, 1927, 1926, 1925, 1924, 1923, 1921, 1920

FINDINGS
Address Researched Address Not Identified in Research Source
13316 BORDEN AVE 2013, 2008, 2006, 2004, 2003, 2001, 2000, 1999, 1996, 1995, 1992, 1991, 1990, 1986, 1985, 1981, 1980, 1976, 1975, 1972, 1971, 1970, 1969, 1967, 1966, 1965, 1964, 1963, 1961, 1960, 1958, 1957, 1956, 1955, 1954, 1952, 1951, 1950, 1949, 1948, 1947, 1946, 1945, 1944, 1942, 1940, 1939, 1938, 1937, 1936, 1935, 1934, 1933, 1932, 1931, 1930, 1929, 1928, 1927, 1926, 1925, 1924, 1923, 1921, 1920
13323 BORDEN AVE 2013, 2008, 2006, 2003, 2001, 2000, 1999, 1996, 1995, 1992, 1990, 1986, 1981, 1980, 1976, 1975, 1972, 1971, 1970, 1969, 1967, 1966, 1965, 1964, 1963, 1962, 1961, 1960, 1958, 1957, 1956, 1955, 1954, 1952, 1951, 1950, 1949, 1948, 1947, 1946, 1945, 1944, 1942, 1940, 1939, 1938, 1937, 1936, 1935, 1934, 1933, 1932, 1931, 1930, 1929, 1928, 1927, 1926, 1925, 1924, 1923, 1921, 1920
13326 BORDEN AVE 2013, 2008, 2006, 2003, 2001, 2000, 1999, 1996, 1995, 1992, 1991, 1990, 1986, 1981, 1976, 1972, 1971, 1969, 1967, 1966, 1965, 1964, 1963, 1962, 1961, 1960, 1958, 1957, 1955, 1954, 1952, 1951, 1950, 1949, 1948, 1947, 1946, 1945, 1944, 1942, 1940, 1939, 1938, 1937, 1936, 1935, 1934, 1933, 1932, 1931, 1930, 1929, 1928, 1927, 1926, 1925, 1924, 1923, 1921, 1920
13330 BORDEN AVE 2013, 2008, 2006, 2003, 2001, 2000, 1999, 1996, 1995, 1992, 1991, 1990, 1986, 1981, 1980, 1976, 1975, 1972, 1971, 1969, 1967, 1966, 1965, 1964, 1963, 1962, 1961, 1960, 1958, 1957, 1956, 1955, 1954, 1952, 1951, 1950, 1949, 1948, 1947, 1946, 1945, 1944, 1942, 1940, 1939, 1938, 1937, 1936, 1935, 1934, 1933, 1932, 1931, 1930, 1929, 1928, 1927, 1926, 1925, 1924, 1923, 1921, 1920
13341 BORDEN AVE 2013, 2008, 2006, 2003, 2001, 2000, 1999, 1996, 1995, 1992, 1991, 1990, 1986, 1981, 1976, 1972, 1971, 1969, 1967, 1966, 1965, 1964, 1963, 1962, 1961, 1960, 1958, 1957, 1956, 1955, 1954, 1952, 1951, 1950, 1949, 1948, 1947, 1946, 1945, 1944, 1942, 1940, 1939, 1938, 1937, 1936, 1935, 1934, 1933, 1932, 1931, 1930, 1929, 1928, 1927, 1926, 1925, 1924, 1923, 1921, 1920
14384 Polk St 2013, 2008, 2006, 2003, 2001, 2000, 1999, 1996, 1992, 1990, 1986, 1985, 1981, 1976, 1972, 1971, 1970, 1969, 1967, 1966, 1965, 1964, 1963, 1961, 1960, 1958, 1957, 1956, 1955, 1954, 1952, 1951, 1950, 1949, 1948, 1947, 1946, 1945, 1944, 1942, 1940, 1939, 1938, 1937, 1936, 1935, 1934, 1933, 1932, 1931, 1930, 1929, 1928, 1927, 1926, 1925, 1924, 1923, 1921, 1920
14464 Polk St 2013, 2008, 2006, 2003, 2001, 2000, 1999, 1996, 1995, 1992, 1991, 1990, 1986, 1985, 1981, 1980, 1976, 1975, 1972, 1971, 1969, 1967, 1966, 1965, 1964, 1963, 1962, 1961, 1960, 1958, 1957, 1955, 1954, 1952, 1951, 1950, 1949, 1948, 1947, 1946, 1945, 1944, 1942, 1940, 1939, 1938, 1937, 1936, 1935, 1934, 1933, 1932, 1931, 1930, 1929, 1928, 1927, 1926, 1925, 1924, 1923, 1921, 1920
14469 Polk St 2013, 2008, 2006, 2003, 2001, 2000, 1999, 1996, 1992, 1990, 1986, 1981, 1976, 1972, 1971, 1970, 1969, 1967, 1966, 1965, 1964, 1963, 1961, 1960, 1958, 1957, 1956, 1955, 1954, 1952, 1951, 1950, 1949, 1948, 1947, 1946, 1945, 1944, 1942, 1940, 1939, 1938, 1937, 1936, 1935, 1934, 1933, 1932, 1931, 1930, 1929, 1928, 1927, 1926, 1925, 1924, 1923, 1921, 1920
14520 TYLER ST 2013, 2008, 2006, 2003, 2001, 2000, 1999, 1996, 1995, 1992, 1991, 1990, 1986, 1985, 1981, 1980, 1976, 1972, 1971, 1969, 1967, 1966, 1965, 1964, 1963, 1962, 1961, 1960, 1958, 1957, 1956, 1955, 1954, 1952, 1951, 1950, 1949, 1948, 1947, 1946, 1945, 1944, 1942, 1940, 1939, 1938, 1937, 1936, 1935, 1934, 1933, 1932, 1931, 1930, 1929, 1928, 1927, 1926, 1925, 1924, 1923, 1921, 1920
14532 TYLER ST 2013, 2008, 2006, 2003, 2001, 2000, 1999, 1996, 1992, 1991, 1990, 1986, 1985, 1981, 1976, 1972, 1971, 1969, 1967, 1966, 1965, 1964, 1963, 1961, 1960, 1958, 1957, 1955, 1954, 1952, 1951, 1950, 1949, 1948, 1947, 1946, 1945, 1944, 1942, 1940, 1939, 1938, 1937, 1936, 1935, 1934, 1933, 1932, 1931, 1930, 1929, 1928, 1927, 1926, 1925, 1924, 1923, 1921, 1920
14533 TYLER ST 2013, 2008, 2006, 2003, 2001, 2000, 1999, 1996, 1995, 1992, 1990, 1986, 1985, 1981, 1980, 1976, 1972, 1971, 1970, 1969, 1967, 1966, 1965, 1964, 1963, 1961, 1960, 1958, 1957, 1956, 1955, 1954, 1952, 1951, 1949, 1948, 1947, 1946, 1945, 1944, 1942, 1940, 1939, 1938, 1937, 1936, 1935, 1934, 1933, 1932, 1931, 1930, 1929, 1928, 1927, 1926, 1925, 1924, 1923, 1921, 1920

FINDINGS
Address Researched Address Not Identified in Research Source
14545 TYLER ST 2013, 2008, 2006, 2003, 2001, 2000, 1999, 1996, 1995, 1992, 1991, 1990, 1986, 1985, 1981, 1980, 1976, 1975, 1972, 1971, 1970, 1969, 1967, 1966, 1965, 1964, 1963, 1961, 1960, 1958, 1957, 1956, 1955, 1954, 1952, 1951, 1950, 1949, 1948, 1947, 1946, 1945, 1944, 1942, 1940, 1939, 1938, 1937, 1936, 1935, 1934, 1933, 1932, 1931, 1930, 1929, 1928, 1927, 1926, 1925, 1924, 1923, 1921, 1920
14581 Tyler St 2013, 2008, 2006, 2003, 2001, 2000, 1999, 1996, 1995, 1992, 1990, 1986, 1985, 1981, 1976, 1975, 1972, 1971, 1970, 1969, 1967, 1966, 1965, 1964, 1963, 1961, 1960, 1958, 1957, 1955, 1954, 1952, 1951, 1950, 1949, 1948, 1947, 1946, 1945, 1944, 1942, 1940, 1939, 1938, 1937, 1936, 1935, 1934, 1933, 1932, 1931, 1930, 1929, 1928, 1927, 1926, 1925, 1924, 1923, 1921, 1920
14591 TYLER ST 2013, 2008, 2006, 2003, 2001, 2000, 1999, 1996, 1995, 1992, 1991, 1990, 1986, 1981, 1976, 1972, 1971, 1969, 1967, 1966, 1965, 1964, 1963, 1962, 1961, 1960, 1958, 1957, 1956, 1955, 1954, 1952, 1951, 1950, 1949, 1948, 1947, 1946, 1945, 1944, 1942, 1940, 1939, 1938, 1937, 1936, 1935, 1934, 1933, 1932, 1931, 1930, 1929, 1928, 1927, 1926, 1925, 1924, 1923, 1921, 1920
14601 TYLER ST 2013, 2008, 2006, 2003, 2001, 2000, 1999, 1996, 1995, 1992, 1991, 1990, 1986, 1985, 1981, 1980, 1976, 1975, 1972, 1971, 1969, 1967, 1966, 1965, 1964, 1963, 1961, 1960, 1958, 1957, 1955, 1954, 1952, 1951, 1950, 1949, 1948, 1947, 1946, 1945, 1944, 1942, 1940, 1939, 1938, 1937, 1936, 1935, 1934, 1933, 1932, 1931, 1930, 1929, 1928, 1927, 1926, 1925, 1924, 1923, 1921, 1920
14615 TYLER ST 2013, 2008, 2006, 2003, 2001, 2000, 1999, 1996, 1992, 1991, 1990, 1986, 1981, 1976, 1972, 1971, 1969, 1967, 1966, 1965, 1964, 1963, 1961, 1960, 1958, 1957, 1955, 1954, 1952, 1951, 1949, 1948, 1947, 1946, 1945, 1944, 1942, 1940, 1939, 1938, 1937, 1936, 1935, 1934, 1933, 1932, 1931, 1930, 1929, 1928, 1927, 1926, 1925, 1924, 1923, 1921, 1920
14625 TYLER ST 2013, 2008, 2006, 2003, 2001, 2000, 1999, 1996, 1995, 1992, 1991, 1990, 1986, 1981, 1976, 1972, 1971, 1969, 1967, 1966, 1965, 1964, 1963, 1961, 1960, 1958, 1957, 1955, 1954, 1952, 1951, 1950, 1949, 1948, 1947, 1946, 1945, 1944, 1942, 1940, 1939, 1938, 1937, 1936, 1935, 1934, 1933, 1932, 1931, 1930, 1929, 1928, 1927, 1926, 1925, 1924, 1923, 1921, 1920
14636 TYLER ST 2013, 2008, 2006, 2003, 2001, 2000, 1999, 1996, 1992, 1990, 1986, 1985, 1981, 1980, 1976, 1975, 1972, 1971, 1970, 1969, 1967, 1966, 1965, 1964, 1963, 1962, 1961, 1960, 1958, 1957, 1956, 1955, 1954, 1952, 1951, 1950, 1949, 1948, 1947, 1946, 1945, 1944, 1942, 1940, 1939, 1938, 1937, 1936, 1935, 1934, 1933, 1932, 1931, 1930, 1929, 1928, 1927, 1926, 1925, 1924, 1923, 1921, 1920
14637 TYLER ST 2013, 2008, 2006, 2003, 2001, 2000, 1999, 1996, 1995, 1992, 1990, 1986, 1981, 1976, 1972, 1971, 1969, 1967, 1966, 1965, 1964, 1963, 1961, 1960, 1958, 1957, 1955, 1954, 1952, 1951, 1949, 1948, 1947, 1946, 1945, 1944, 1942, 1940, 1939, 1938, 1937, 1936, 1935, 1934, 1933, 1932, 1931, 1930, 1929, 1928, 1927, 1926, 1925, 1924, 1923, 1921, 1920
14648 TYLER ST 2013, 2008, 2006, 2003, 2001, 2000, 1999, 1996, 1992, 1990, 1986, 1981, 1980, 1976, 1972, 1971, 1969, 1967, 1966, 1965, 1964, 1963, 1961, 1960, 1958, 1957, 1955, 1954, 1952, 1951, 1949, 1948, 1947, 1946, 1945, 1944, 1942, 1940, 1939, 1938, 1937, 1936, 1935, 1934, 1933, 1932, 1931, 1930, 1929, 1928, 1927, 1926, 1925, 1924, 1923, 1921, 1920
14648 TYLER WAY 2013, 2008, 2006, 2004, 2003, 2001, 2000, 1999, 1996, 1995, 1992, 1991, 1990, 1986, 1985, 1981, 1976, 1975, 1972, 1971, 1970, 1969, 1967, 1966, 1965, 1964, 1963, 1962, 1961, 1960, 1958, 1957, 1956, 1955, 1954, 1952, 1951, 1950, 1949, 1948, 1947, 1946, 1945, 1944, 1942, 1940, 1939, 1938, 1937, 1936, 1935, 1934, 1933, 1932, 1931, 1930, 1929, 1928, 1927, 1926, 1925, 1924, 1923, 1921, 1920
14653 TYLER ST 2013, 2008, 2006, 2004, 2003, 2001, 2000, 1999, 1996, 1995, 1992, 1991, 1990, 1986, 1985, 1981, 1976, 1972, 1971, 1970, 1969, 1967, 1966, 1965, 1964, 1963, 1962, 1961, 1960, 1958, 1957, 1956, 1955, 1954, 1952, 1951, 1949, 1948, 1947, 1946, 1945, 1944, 1942, 1940, 1939, 1938, 1937, 1936, 1935, 1934, 1933, 1932, 1931, 1930, 1929, 1928, 1927, 1926, 1925, 1924, 1923, 1921, 1920
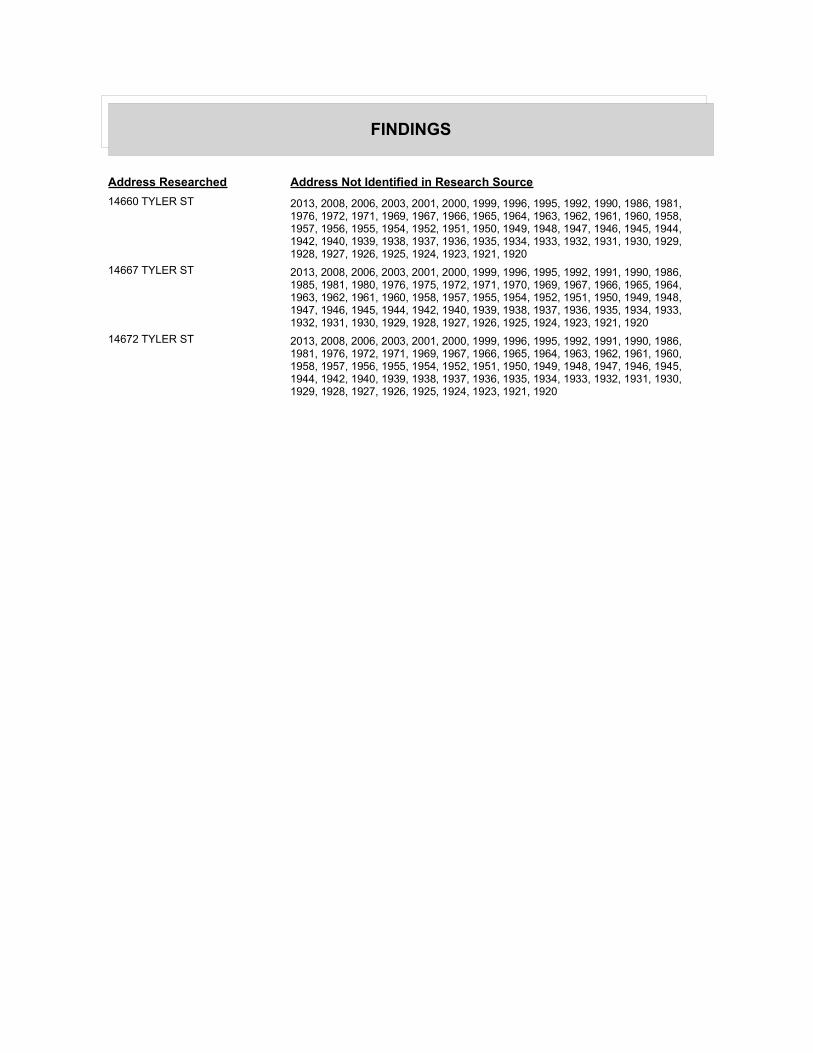
FINDINGS
Address Researched Address Not Identified in Research Source
14660 TYLER ST 2013, 2008, 2006, 2003, 2001, 2000, 1999, 1996, 1995, 1992, 1990, 1986, 1981, 1976, 1972, 1971, 1969, 1967, 1966, 1965, 1964, 1963, 1962, 1961, 1960, 1958, 1957, 1956, 1955, 1954, 1952, 1951, 1950, 1949, 1948, 1947, 1946, 1945, 1944, 1942, 1940, 1939, 1938, 1937, 1936, 1935, 1934, 1933, 1932, 1931, 1930, 1929, 1928, 1927, 1926, 1925, 1924, 1923, 1921, 1920
14667 TYLER ST 2013, 2008, 2006, 2003, 2001, 2000, 1999, 1996, 1995, 1992, 1991, 1990, 1986, 1985, 1981, 1980, 1976, 1975, 1972, 1971, 1970, 1969, 1967, 1966, 1965, 1964, 1963, 1962, 1961, 1960, 1958, 1957, 1955, 1954, 1952, 1951, 1950, 1949, 1948, 1947, 1946, 1945, 1944, 1942, 1940, 1939, 1938, 1937, 1936, 1935, 1934, 1933, 1932, 1931, 1930, 1929, 1928, 1927, 1926, 1925, 1924, 1923, 1921, 1920
14672 TYLER ST 2013, 2008, 2006, 2003, 2001, 2000, 1999, 1996, 1995, 1992, 1991, 1990, 1986, 1981, 1976, 1972, 1971, 1969, 1967, 1966, 1965, 1964, 1963, 1962, 1961, 1960, 1958, 1957, 1956, 1955, 1954, 1952, 1951, 1950, 1949, 1948, 1947, 1946, 1945, 1944, 1942, 1940, 1939, 1938, 1937, 1936, 1935, 1934, 1933, 1932, 1931, 1930, 1929, 1928, 1927, 1926, 1925, 1924, 1923, 1921, 1920

Appendix G City of Los Angeles Building Permits


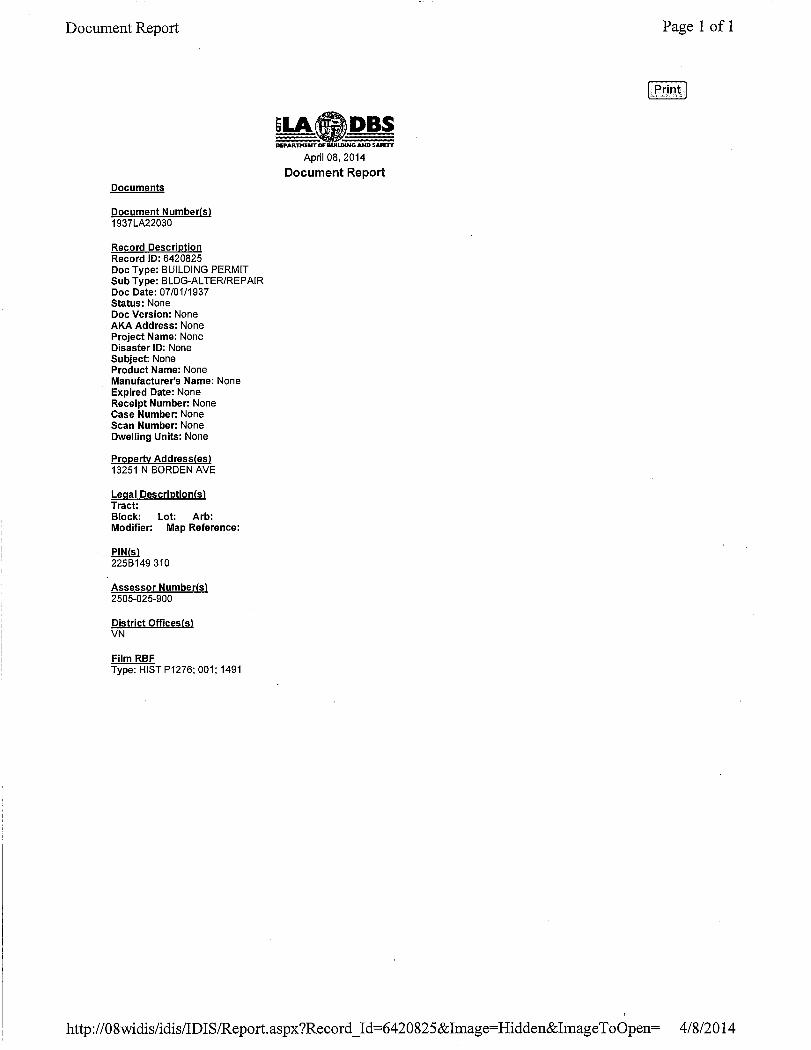


Olive Vista Middle School
14600 Tyler StreetSylmar, CA 91342
Inquiry Number: 3880855.8March 14, 2014
EDR Building Permit ReportTarget Property and Adjoining Properties
6 Armstrong RoadShelton, CT 06484800.352.0050www.edrnet.comEnvironmental Data Resources IncEnvironmental Data Resources IncEnvironmental Data Resources IncEnvironmental Data Resources Inc

TABLE OF CONTENTS
SECTION
About This Report
Executive Summary
Findings
Glossary
Thank you for your business. Please contact EDR at 1-800-352-0050
with any questions or comments.
Disclaimer - Copyright and Trademark Notice
This Report contains certain information obtained from a variety of public and other sources reasonably available to Environmental Data Resources, Inc. It cannot be concluded from this Report that coverage information for the target and surrounding properties does not exist from other sources. NO WARRANTY EXPRESSED OR IMPLIED, IS MADE WHATSOEVER IN CONNECTION WITH THIS REPORT. ENVIRONMENTAL DATA RESOURCES, INC. SPECIFICALLY DISCLAIMS THE MAKING OF ANY SUCH WARRANTIES, INCLUDING WITHOUT LIMITATION, MERCHANTABILITY OR FITNESS FOR A PARTICULAR USE OR PURPOSE. ALL RISK IS ASSUMED BY THE USER. IN NO EVENT SHALL ENVIRONMENTAL DATA RESOURCES, INC. BE LIABLE TO ANYONE, WHETHER ARISING OUT OF ERRORS OR OMISSIONS, NEGLIGENCE, ACCIDENT OR ANY OTHER CAUSE, FOR ANY LOSS OR DAMAGE, INCLUDING, WITHOUT LIMITATION, SPECIAL, INCIDENTAL, CONSEQUENTIAL, OR EXEMPLARY DAMAGES. ANY LIABILITY ON THE PART OF ENVIRONMENTAL DATA RESOURCES, INC. IS STRICTLY LIMITED TO A REFUND OF THE AMOUNT PAID FOR THIS REPORT. Purchaser accepts this Report "AS IS". Any analyses, estimates, ratings, environmental risk levels or risk codes provided in this Report are provided for illustrative purposes only, and are not intended to provide, nor should they be interpreted as providing any facts regarding, or prediction orforecast of, any environmental risk for any property. Only a Phase I Environmental Site Assessment performed by an environmental professional can provide information regarding the environmental risk for any property. Additionally, the information provided in this Report is not to be construed as legal advice.
Copyright 2013 by Environmental Data Resources, Inc. All rights reserved. Reproduction in any media or format, in whole or in part, of any report or map of Environmental Data Resources, Inc. or its affiliates is prohibited without prior written permission.
EDR and its logos (including Sanborn and Sanborn Map) are trademarks of Environmental Data Resources, Inc. or its affiliates. All other trademarks used herein are the property of their respective owners.

EDR BUILDING PERMIT REPORT
About This Report
The EDR Building Permit Report provides a practical and efficient method to search building department records for indications of environmental conditions. Generated via a search of municipal building permit records gathered from more than 1,600 cities nationwide, this report will assist you in meeting the search requirements of EPA’s Standards and Practices for All Appropriate Inquiries (40 CFR Part 312), the ASTM Standard Practice for Environmental Site Assessments (E 1527-13), or custom requirements developed for the evaluation of environmental risk associated with a parcel of real estate.
Building permit data can be used to identify current and/or former operations and structures/features of environmental concern. The data can provide information on a target property and adjoining properties such as the presence of underground storage tanks, pump islands, sumps, drywells, etc., as well as information regarding water, sewer, natural gas, electrical connection dates, and current/former septic tanks.
ASTM and EPA Requirements
ASTM E 1527-13 lists building department records as a "standard historical source," as detailed in § 8.3.4.7: “Building Department Records - The term building department records means those records of the local government in which the property is located indicating permission of the local government to construct, alter, or demolish improvements on the property.” ASTM also states that “Uses in the area surrounding the property shall be identified in the report, but this task is required only to the extent that this information is revealed in the course of researching the property itself.”
EPA’s Standards and Practices for All Appropriate Inquires (AAI) states: "§312.24: Reviews of historical sources of information. (a) Historical documents and records must be reviewed for the purposes of achieving the objectives and performance factors of §312.20(e) and (f). Historical documents and records may include, but are not limited to, aerial photographs, fire insurance maps, building department records, chain of title documents, and land use records.”
Methodology
EDR has developed the EDR Building Permit Report through our partnership with BuildFax, the nation’s largest repository of building department records. BuildFax collects, updates, and manages building department records from local municipal governments. The database now includes 30 million permits, on more than 10 million properties across 1,600 cities in the United States.
The EDR Building Permit Report comprises local municipal building permit records, gathered directly from local jurisdictions, including both target property and adjoining properties. Years of coverage vary by municipality. Data reported includes (where available): date of permit, permit type, permit number, status, valuation, contractor company, contractor name, and description.
Incoming permit data is checked at seven stages in a regimented quality control process, from initial data source interview, to data preparation, through final auditing. To ensure the building department is accurate, each of the seven quality control stages contains, on average, 15 additional quality checks, resulting in a process of approximately 105 quality control “touch points.”
For more information about the EDR Building Permit Report, please contact your EDR Account Executive at (800) 352-0050.

EXECUTIVE SUMMARY: SEARCH DOCUMENTATION
A search of building department records was conducted by Environmental Data Resources, Inc (EDR) on behalf of Clark Seif Clark, Inc. on Mar 14, 2014.
TARGET PROPERTY
14600 Tyler Street
Sylmar, CA 91342
SEARCH METHODS
EDR searches available lists for both the Target Property and Surrounding Properties.
RESEARCH SUMMARY
Building permits identified: YES
The following research sources were consulted in the preparation of this report. An "X" indicates where information was identified in the source and provided in this report.
Los Angeles
Source TPYear Adjoining
2013 City of Los Angeles, Department of Building and Safety
2012 City of Los Angeles, Department of Building and Safety X
2011 City of Los Angeles, Department of Building and Safety X
2010 City of Los Angeles, Department of Building and Safety X
2009 City of Los Angeles, Department of Building and Safety X
2008 City of Los Angeles, Department of Building and Safety X
2007 City of Los Angeles, Department of Building and Safety X
2006 City of Los Angeles, Department of Building and Safety X
2005 City of Los Angeles, Department of Building and Safety X
2004 City of Los Angeles, Department of Building and Safety X
2003 City of Los Angeles, Department of Building and Safety X
2002 City of Los Angeles, Department of Building and Safety X
2001 City of Los Angeles, Department of Building and Safety X
2000 City of Los Angeles, Department of Building and Safety X
1999 City of Los Angeles, Department of Building and Safety X
1998 City of Los Angeles, Department of Building and Safety
1997 City of Los Angeles, Department of Building and Safety X
1996 City of Los Angeles, Department of Building and Safety
1995 City of Los Angeles, Department of Building and Safety
1994 City of Los Angeles, Department of Building and Safety
1993 City of Los Angeles, Department of Building and Safety
1992 City of Los Angeles, Department of Building and Safety
1991 City of Los Angeles, Department of Building and Safety
1990 City of Los Angeles, Department of Building and Safety
1989 City of Los Angeles, Department of Building and Safety
1988 City of Los Angeles, Department of Building and Safety
3880855- 8 Page 1
BUILDING DEPARTMENT RECORDS SEARCHED
Name: Los Angeles
Years: 1988-2013
Source: City of Los Angeles, Department of Building and Safety, SYLMAR, CAPhone: (213) 482-6800
Name: Los Angeles CountyYears: 1994-2014
Source: Los Angeles County, Building and Safety, LOS ANGELES, CA
Phone: (626) 458-6368
Name: San Francisco
Years: 1977-2014
Source: City and County of San Francisco, Communications Division, SAN FRANCISCO, CAPhone: (415) 558-6088
3880855- 8 Page 2
TARGET PROPERTY FINDINGS
TARGET PROPERTY DETAIL
14600 Tyler Street
Sylmar, CA 91342
No Permits Found
3880855- 8 Page 3

ADJOINING PROPERTY FINDINGS
ADJOINING PROPERTY DETAIL
The following Adjoining Property addresses were researched for this report. Detailed findings are provided for each address.
BORDEN AVE
13270 BORDEN AVE
Date: 7/11/2000
Permit Type:
Description: Plan Check Replace damaged roof framing per Type V
Permit Description: Bldg-Alter/Repair
Work Class:
Proposed Use: 1 or 2 Family Dwelling
Permit Number: 000162000012834
Status:
Valuation: $9,000.00
Contractor Company:
Contractor Name: OWNER-BUILDER
Date: 6/23/2000
Permit Type:
Description: No Plan Check REPLACE WATER HEATER
Permit Description: Plumbing
Work Class:
Proposed Use: 1 or 2 Family Dwelling
Permit Number: 000422000009641
Status:
Valuation: $0.00
Contractor Company:
Contractor Name: OWNER-BUILDER
3880855- 8 Page 4

Year Uses Source
ADJOINING PROPERTY FINDINGS
Date: 6/23/2000
Permit Type:
Description: No Plan Check INSTALL 1 A/C UNIT AND 1 FURNACE EXISTIN
Permit Description: HVAC
Work Class:
Proposed Use: 1 or 2 Family Dwelling
Permit Number: 000442000005305
Status:
Valuation: $0.00
Contractor Company:
Contractor Name: OWNER-BUILDER
Date: 5/8/2000
Permit Type:
Description: No Plan Check T/O EXISTING ROOF. RESHEET WITH 1/2" CDX
Permit Description: Bldg-Alter/Repair
Work Class:
Proposed Use: 1 or 2 Family Dwelling
Permit Number: 000162000008327
Status:
Valuation: $6,000.00
Contractor Company:
Contractor Name: OWNER-BUILDER
13278 BORDEN AVE
Date: 9/13/2006
Permit Type:
Description: No Plan Check replace fau &condensing unit & replace d
Permit Description: HVAC
Work Class:
Proposed Use: 1 or 2 Family Dwelling
Permit Number: 060449000009773
Status:
Valuation: $0.00
Contractor Company:
Contractor Name: PROGRESSIVE SERVICE
3880855- 8 Page 5

Year Uses Source
ADJOINING PROPERTY FINDINGS
Date: 3/24/2004
Permit Type:
Description: No Plan Check INSTALL A/C UNIT.
Permit Description: HVAC
Work Class:
Proposed Use: 1 or 2 Family Dwelling
Permit Number: 040442000003038
Status:
Valuation: $0.00
Contractor Company:
Contractor Name: ALL SEASON HEATING AND COOLING
Date: 10/6/2003
Permit Type:
Description: Plan Check REVISE PERMIT TO CHANGE FROM CONC. SLAB
Permit Description: Bldg-Alter/Repair
Work Class:
Proposed Use: 1 or 2 Family Dwelling
Permit Number: 030142000101367
Status:
Valuation: $301.00
Contractor Company:
Contractor Name: OWNER-BUILDER
Date: 3/19/2003
Permit Type:
Description: Plan Check Addition to the front (4'6" x 20'6") and
Permit Description: Bldg-Addition
Work Class:
Proposed Use: 1 or 2 Family Dwelling
Permit Number: 030147000001367
Status:
Valuation: $39,000.00
Contractor Company:
Contractor Name: OWNER-BUILDER
3880855- 8 Page 6
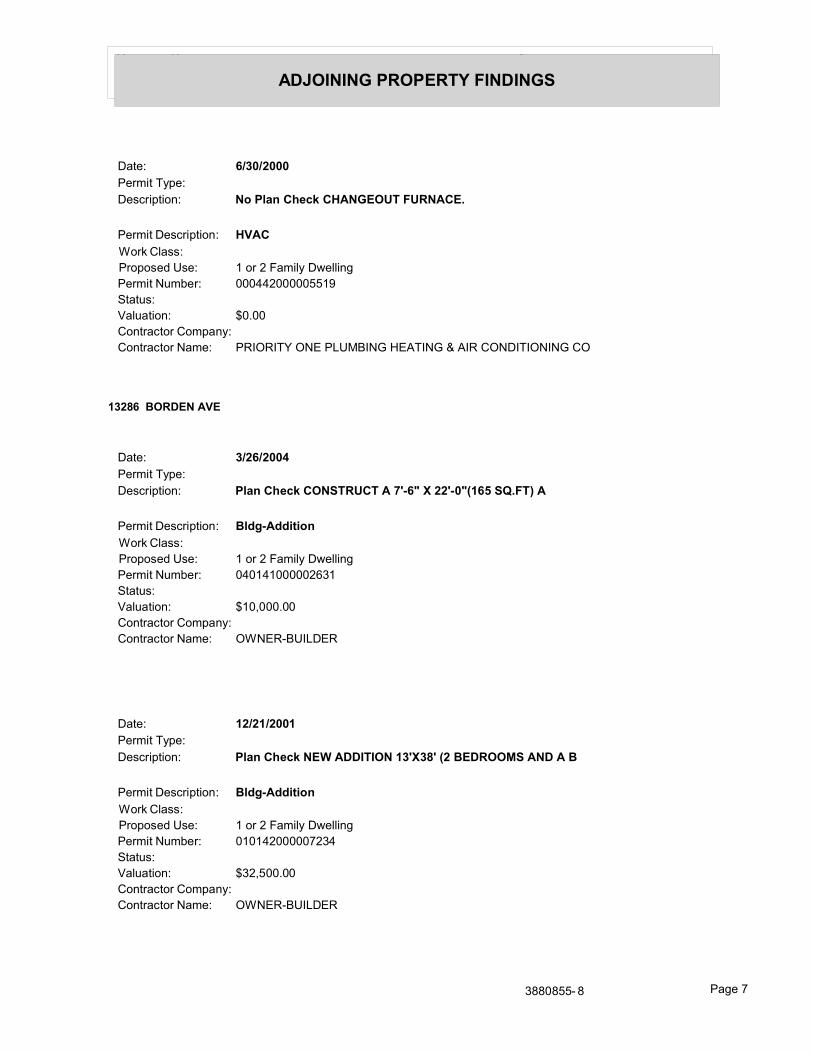
Year Uses Source
ADJOINING PROPERTY FINDINGS
Date: 6/30/2000
Permit Type:
Description: No Plan Check CHANGEOUT FURNACE.
Permit Description: HVAC
Work Class:
Proposed Use: 1 or 2 Family Dwelling
Permit Number: 000442000005519
Status:
Valuation: $0.00
Contractor Company:
Contractor Name: PRIORITY ONE PLUMBING HEATING & AIR CONDITIONING CO
13286 BORDEN AVE
Date: 3/26/2004
Permit Type:
Description: Plan Check CONSTRUCT A 7'-6" X 22'-0"(165 SQ.FT) A
Permit Description: Bldg-Addition
Work Class:
Proposed Use: 1 or 2 Family Dwelling
Permit Number: 040141000002631
Status:
Valuation: $10,000.00
Contractor Company:
Contractor Name: OWNER-BUILDER
Date: 12/21/2001
Permit Type:
Description: Plan Check NEW ADDITION 13'X38' (2 BEDROOMS AND A B
Permit Description: Bldg-Addition
Work Class:
Proposed Use: 1 or 2 Family Dwelling
Permit Number: 010142000007234
Status:
Valuation: $32,500.00
Contractor Company:
Contractor Name: OWNER-BUILDER
3880855- 8 Page 7

Year Uses Source
ADJOINING PROPERTY FINDINGS
13292 BORDEN AVE
Date: 7/25/2012
Permit Type:
Description: No Plan Check 200 AMP SERVICE UPGRADE.
Permit Description: Electrical
Work Class:
Proposed Use: 1 or 2 Family Dwelling
Permit Number: 120412000017342
Status:
Valuation: $0.00
Contractor Company:
Contractor Name: OWNER-BUILDER
13298 BORDEN AVE
C.O. Issued Date: 11/2/2010
Date: 10/15/2010
Permit Type:
Description: Plan Check (N) EQUINE KEEPING STRUCTURE "TUFF SHED
Permit Description: Bldg-New
Work Class:
Proposed Use: 1 or 2 Family Dwelling Misc. Bldg or Structure
Permit Number: 090102000001027
Status:
Valuation: $7,920.00
Contractor Company:
Contractor Name: OWNER-BUILDER
3880855- 8 Page 8

Year Uses Source
ADJOINING PROPERTY FINDINGS
Date: 10/29/2003
Permit Type:
Description: Plan Check PROPOSED NEW 16'x48' DETACHED EQUINE KEE
Permit Description: Bldg-New
Work Class:
Proposed Use: 1 or 2 Family Dwelling Misc. Bldg or Structure
Permit Number: 030102000003394
Status:
Valuation: $15,000.00
Contractor Company:
Contractor Name: OWNER-BUILDER
13304 BORDEN AVE
Date: 4/2/2004
Permit Type:
Description: Plan Check 14'X19' FAMILY ROOM ADDITION TO (E) SFD
Permit Description: Bldg-Addition
Work Class:
Proposed Use: 1 or 2 Family Dwelling
Permit Number: 040142000001901
Status:
Valuation: $35,000.00
Contractor Company:
Contractor Name: OWNER-BUILDER
Date: 2/15/2000
Permit Type:
Description: No Plan Check INSTALL EQ VALVE
Permit Description: Plumbing
Work Class:
Proposed Use: 1 or 2 Family Dwelling
Permit Number: 000422000002472
Status:
Valuation: $0.00
Contractor Company:
Contractor Name: OWNER-BUILDER
3880855- 8 Page 9

Year Uses Source
ADJOINING PROPERTY FINDINGS
Date: 9/9/1999
Permit Type:
Description: Plan Check Convert existing 20' x 23'-6" two-car ga
Permit Description: Bldg-Addition
Work Class:
Proposed Use: 1 or 2 Family Dwelling Single Family Residence
Permit Number: 990142000004961
Status:
Valuation: $18,000.00
Contractor Company:
Contractor Name: OWNER-BUILDER
13316 BORDEN AVE
Date: 3/13/2009
Permit Type:
Description: No Plan Check COPPER REPIPE.
Permit Description: Plumbing
Work Class:
Proposed Use: 1 or 2 Family Dwelling
Permit Number: 090422000003971
Status:
Valuation: $0.00
Contractor Company:
Contractor Name: ALLEN VERN PLUMBING INC
3880855- 8 Page 10

Year Uses Source
ADJOINING PROPERTY FINDINGS
13326 BORDEN AVE
Date: 5/3/2004
Permit Type:
Description: No Plan Check SERVICE UPGRADE AND ADD SUB-PANEL.
Permit Description: Electrical
Work Class:
Proposed Use: 1 or 2 Family Dwelling
Permit Number: 040412000010690
Status:
Valuation: $0.00
Contractor Company:
Contractor Name: OWNER-BUILDER
Date: 5/3/2004
Permit Type:
Description: No Plan Check INSTALL SUB-WATER METER.
Permit Description: Plumbing
Work Class:
Proposed Use: 1 or 2 Family Dwelling
Permit Number: 040422000012630
Status:
Valuation: $0.00
Contractor Company:
Contractor Name: OWNER-BUILDER
Date: 8/6/1999
Permit Type:
Description: No Plan Check INSTALL SUB WATER METER
Permit Description: Plumbing
Work Class:
Proposed Use: 1 or 2 Family Dwelling
Permit Number: 990422000010601
Status:
Valuation: $0.00
Contractor Company:
Contractor Name: OWNER-BUILDER
3880855- 8 Page 11
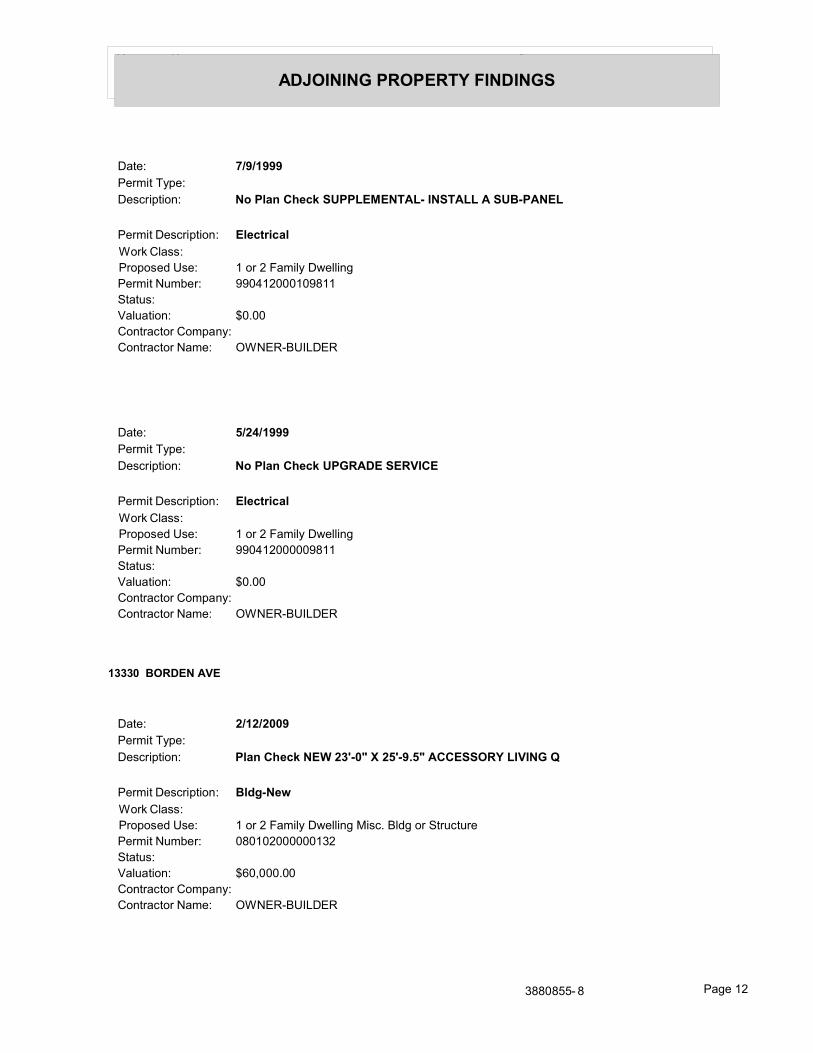
Year Uses Source
ADJOINING PROPERTY FINDINGS
Date: 7/9/1999
Permit Type:
Description: No Plan Check SUPPLEMENTAL- INSTALL A SUB-PANEL
Permit Description: Electrical
Work Class:
Proposed Use: 1 or 2 Family Dwelling
Permit Number: 990412000109811
Status:
Valuation: $0.00
Contractor Company:
Contractor Name: OWNER-BUILDER
Date: 5/24/1999
Permit Type:
Description: No Plan Check UPGRADE SERVICE
Permit Description: Electrical
Work Class:
Proposed Use: 1 or 2 Family Dwelling
Permit Number: 990412000009811
Status:
Valuation: $0.00
Contractor Company:
Contractor Name: OWNER-BUILDER
13330 BORDEN AVE
Date: 2/12/2009
Permit Type:
Description: Plan Check NEW 23'-0" X 25'-9.5" ACCESSORY LIVING Q
Permit Description: Bldg-New
Work Class:
Proposed Use: 1 or 2 Family Dwelling Misc. Bldg or Structure
Permit Number: 080102000000132
Status:
Valuation: $60,000.00
Contractor Company:
Contractor Name: OWNER-BUILDER
3880855- 8 Page 12

Year Uses Source
ADJOINING PROPERTY FINDINGS
Date: 7/17/2008
Permit Type:
Description: No Plan Check "COMPLY WITH DEPARTMENT ORDER effective
Permit Description: Plumbing
Work Class:
Proposed Use: 1 or 2 Family Dwelling
Permit Number: 080422000013459
Status:
Valuation: $0.00
Contractor Company:
Contractor Name: OWNER-BUILDER
Date: 7/6/2004
Permit Type:
Description: No Plan Check INSTALL SUB WATER METER
Permit Description: Plumbing
Work Class:
Proposed Use: 1 or 2 Family Dwelling
Permit Number: 040422000019647
Status:
Valuation: $0.00
Contractor Company:
Contractor Name: OWNER-BUILDER
3880855- 8 Page 13
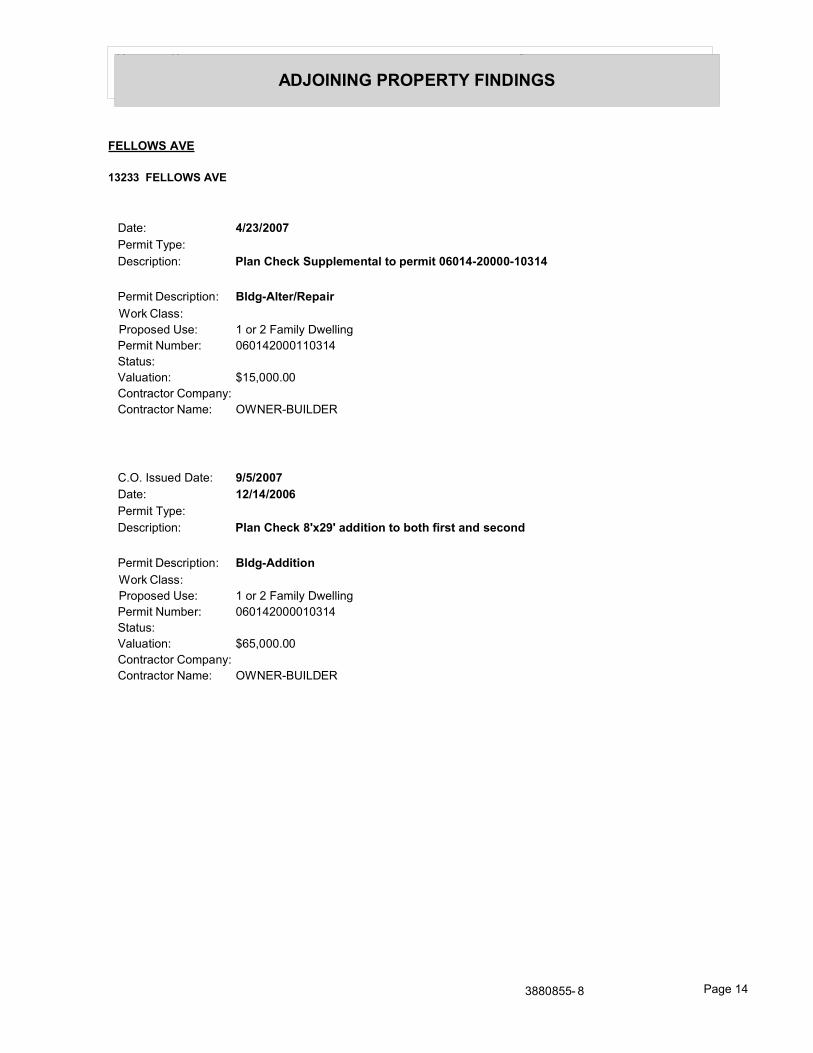
Year Uses Source
ADJOINING PROPERTY FINDINGS
FELLOWS AVE
13233 FELLOWS AVE
Date: 4/23/2007
Permit Type:
Description: Plan Check Supplemental to permit 06014-20000-10314
Permit Description: Bldg-Alter/Repair
Work Class:
Proposed Use: 1 or 2 Family Dwelling
Permit Number: 060142000110314
Status:
Valuation: $15,000.00
Contractor Company:
Contractor Name: OWNER-BUILDER
C.O. Issued Date: 9/5/2007
Date: 12/14/2006
Permit Type:
Description: Plan Check 8'x29' addition to both first and second
Permit Description: Bldg-Addition
Work Class:
Proposed Use: 1 or 2 Family Dwelling
Permit Number: 060142000010314
Status:
Valuation: $65,000.00
Contractor Company:
Contractor Name: OWNER-BUILDER
3880855- 8 Page 14

Year Uses Source
ADJOINING PROPERTY FINDINGS
13241 FELLOWS AVE
Date: 7/12/2012
Permit Type:
Description: No Plan Check 200 AMP ELECTRICAL PANEL CHECK
Permit Description: Electrical
Work Class:
Proposed Use: 1 or 2 Family Dwelling
Permit Number: 120412000016155
Status:
Valuation: $0.00
Contractor Company:
Contractor Name: OWNER-BUILDER
Date: 12/21/2007
Permit Type:
Description: Plan Check SUPPLEMENTAL TO PERMIT # 06014 - 20000 -
Permit Description: Bldg-Alter/Repair
Work Class:
Proposed Use: 1 or 2 Family Dwelling
Permit Number: 060142000107674
Status:
Valuation: $301.00
Contractor Company:
Contractor Name: OWNER-BUILDER
Date: 7/31/2007
Permit Type:
Description: Plan Check ORIGINAL PERMIT, ADD'N OF PLAYRM AND (E)
Permit Description: Bldg-Alter/Repair
Work Class:
Proposed Use: 1 or 2 Family Dwelling
Permit Number: 060102000104022
Status:
Valuation: $10,000.00
Contractor Company:
Contractor Name: OWNER-BUILDER
3880855- 8 Page 15

Year Uses Source
ADJOINING PROPERTY FINDINGS
Date: 5/18/2007
Permit Type:
Description: Plan Check SUPP. PERMIT, STRUCT. REVISION ON ACCE
Permit Description: Bldg-Alter/Repair
Work Class:
Proposed Use: 1 or 2 Family Dwelling
Permit Number: 060102000204022
Status:
Valuation: $10,200.00
Contractor Company:
Contractor Name: OWNER-BUILDER
C.O. Issued Date: 5/29/2007
Date: 10/18/2006
Permit Type:
Description: Plan Check GARAGE/ STORAGE.
Permit Description: Bldg-New
Work Class:
Proposed Use: 1 or 2 Family Dwelling Private Garage
Permit Number: 060102000004022
Status:
Valuation: $50,000.00
Contractor Company:
Contractor Name: OWNER-BUILDER
C.O. Issued Date: 6/27/2008
Date: 10/18/2006
Permit Type:
Description: Plan Check ADD'N OF PLAYROOM AND GARAGE CONVERSION
Permit Description: Bldg-Addition
Work Class:
Proposed Use: 1 or 2 Family Dwelling Single Family Residence
Permit Number: 060142000007674
Status:
Valuation: $110,000.00
Contractor Company:
Contractor Name: OWNER-BUILDER
3880855- 8 Page 16

Year Uses Source
ADJOINING PROPERTY FINDINGS
TYLER ST
14532 TYLER ST
C.O. Issued Date: 8/11/2009
Date: 12/12/2008
Permit Type:
Description: Plan Check CONVERT STORAGE TO REC ROOM WIH 1/2 BATH
Permit Description: Bldg-Alter/Repair
Work Class:
Proposed Use: 1 or 2 Family Dwelling Misc. Bldg or Structure
Permit Number: 080162000020871
Status:
Valuation: $5,000.00
Contractor Company:
Contractor Name: OWNER-BUILDER
Date: 9/7/2005
Permit Type:
Description: Plan Check SUPPLEMENTAL PERMIT TO REDUCE PROPOSED A
Permit Description: Bldg-Alter/Repair
Work Class:
Proposed Use: 1 or 2 Family Dwelling
Permit Number: 050142000207025
Status:
Valuation: $301.00
Contractor Company:
Contractor Name: OWNER-BUILDER
3880855- 8 Page 17
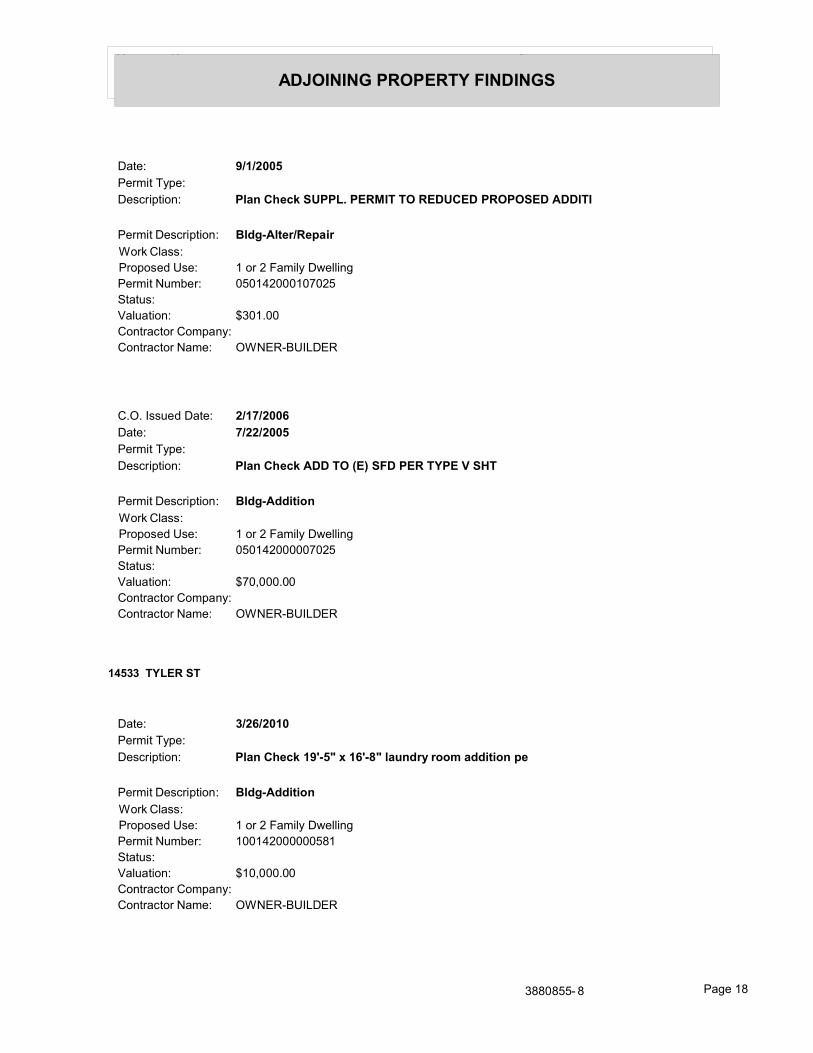
Year Uses Source
ADJOINING PROPERTY FINDINGS
Date: 9/1/2005
Permit Type:
Description: Plan Check SUPPL. PERMIT TO REDUCED PROPOSED ADDITI
Permit Description: Bldg-Alter/Repair
Work Class:
Proposed Use: 1 or 2 Family Dwelling
Permit Number: 050142000107025
Status:
Valuation: $301.00
Contractor Company:
Contractor Name: OWNER-BUILDER
C.O. Issued Date: 2/17/2006
Date: 7/22/2005
Permit Type:
Description: Plan Check ADD TO (E) SFD PER TYPE V SHT
Permit Description: Bldg-Addition
Work Class:
Proposed Use: 1 or 2 Family Dwelling
Permit Number: 050142000007025
Status:
Valuation: $70,000.00
Contractor Company:
Contractor Name: OWNER-BUILDER
14533 TYLER ST
Date: 3/26/2010
Permit Type:
Description: Plan Check 19'-5" x 16'-8" laundry room addition pe
Permit Description: Bldg-Addition
Work Class:
Proposed Use: 1 or 2 Family Dwelling
Permit Number: 100142000000581
Status:
Valuation: $10,000.00
Contractor Company:
Contractor Name: OWNER-BUILDER
3880855- 8 Page 18

Year Uses Source
ADJOINING PROPERTY FINDINGS
Date: 10/19/2001
Permit Type:
Description: Plan Check 130 L.F. OF 6' HIGH MAX. BLOCK FENCE WAL
Permit Description: Nonbldg-New
Work Class:
Proposed Use: 1 or 2 Family Dwelling Misc. Bldg or Structure
Permit Number: 010202000002984
Status:
Valuation: $6,500.00
Contractor Company:
Contractor Name: OWNER-BUILDER
14581 TYLER ST
Date: 11/9/2005
Permit Type:
Description: No Plan Check COMPLY WITH DEPARTMENT ORDER DATED 7-4-0
Permit Description: Bldg-Alter/Repair
Work Class:
Proposed Use: 1 or 2 Family Dwelling
Permit Number: 050162000024247
Status:
Valuation: $6,500.00
Contractor Company:
Contractor Name: G E C ROOFING
3880855- 8 Page 19
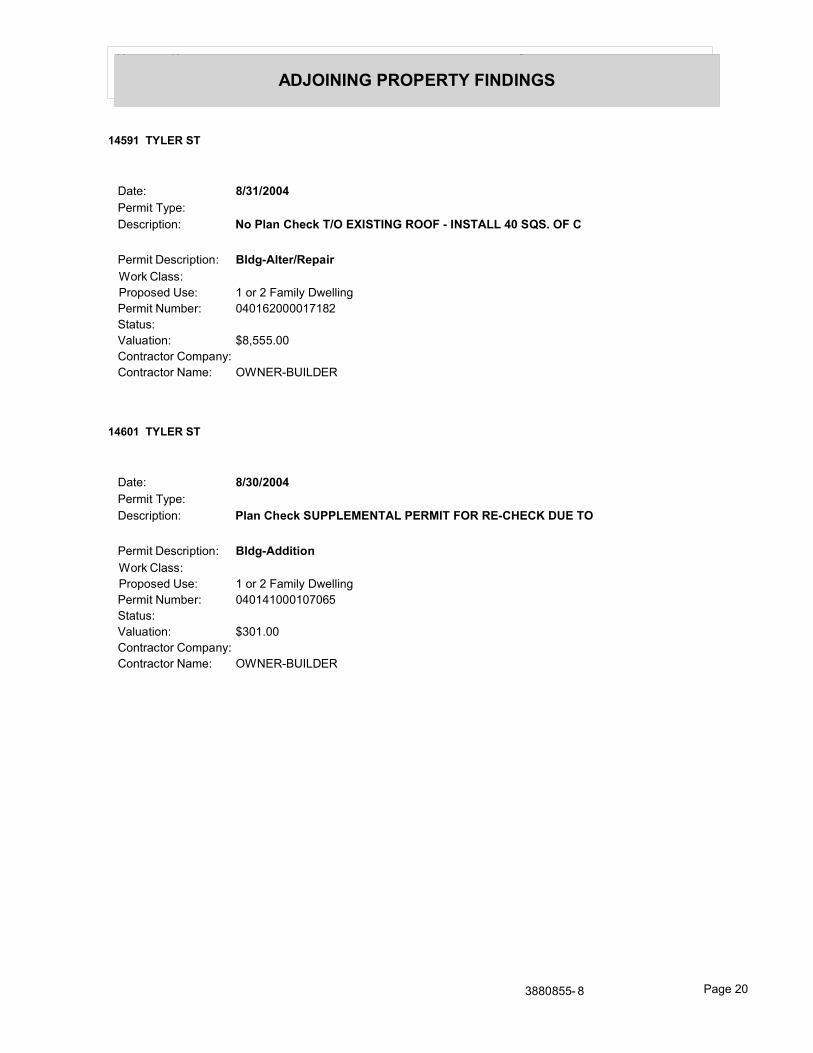
Year Uses Source
ADJOINING PROPERTY FINDINGS
14591 TYLER ST
Date: 8/31/2004
Permit Type:
Description: No Plan Check T/O EXISTING ROOF - INSTALL 40 SQS. OF C
Permit Description: Bldg-Alter/Repair
Work Class:
Proposed Use: 1 or 2 Family Dwelling
Permit Number: 040162000017182
Status:
Valuation: $8,555.00
Contractor Company:
Contractor Name: OWNER-BUILDER
14601 TYLER ST
Date: 8/30/2004
Permit Type:
Description: Plan Check SUPPLEMENTAL PERMIT FOR RE-CHECK DUE TO
Permit Description: Bldg-Addition
Work Class:
Proposed Use: 1 or 2 Family Dwelling
Permit Number: 040141000107065
Status:
Valuation: $301.00
Contractor Company:
Contractor Name: OWNER-BUILDER
3880855- 8 Page 20
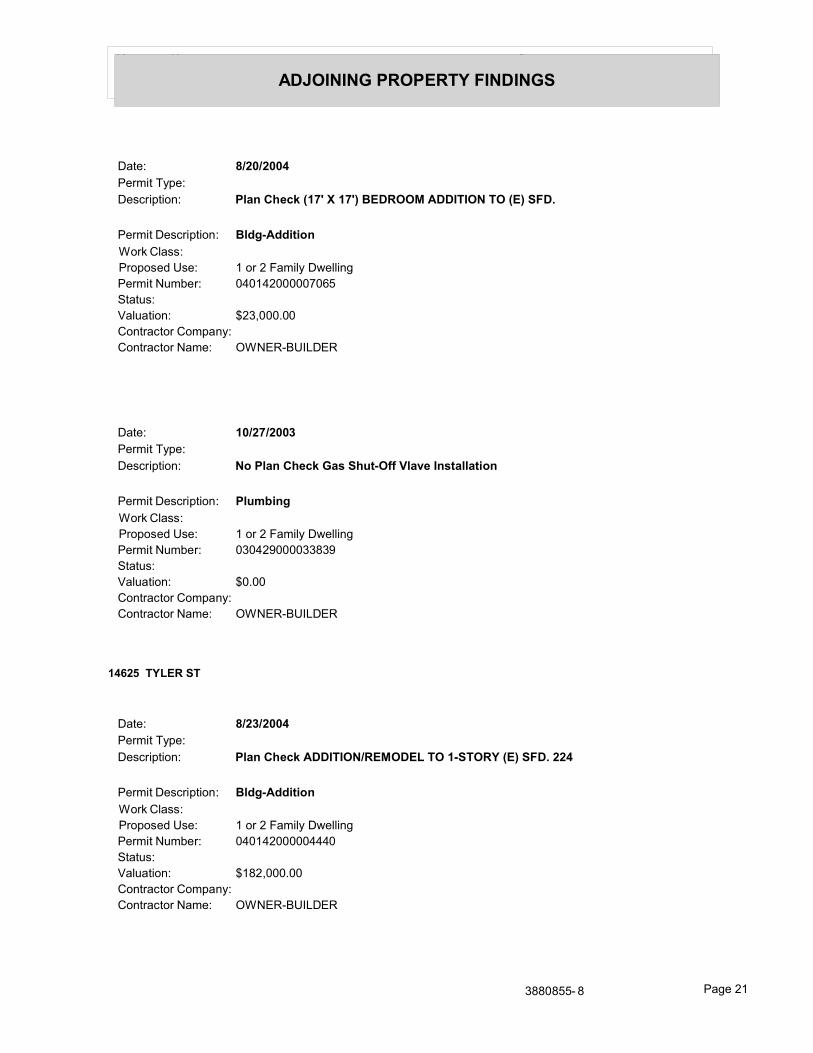
Year Uses Source
ADJOINING PROPERTY FINDINGS
Date: 8/20/2004
Permit Type:
Description: Plan Check (17' X 17') BEDROOM ADDITION TO (E) SFD.
Permit Description: Bldg-Addition
Work Class:
Proposed Use: 1 or 2 Family Dwelling
Permit Number: 040142000007065
Status:
Valuation: $23,000.00
Contractor Company:
Contractor Name: OWNER-BUILDER
Date: 10/27/2003
Permit Type:
Description: No Plan Check Gas Shut-Off Vlave Installation
Permit Description: Plumbing
Work Class:
Proposed Use: 1 or 2 Family Dwelling
Permit Number: 030429000033839
Status:
Valuation: $0.00
Contractor Company:
Contractor Name: OWNER-BUILDER
14625 TYLER ST
Date: 8/23/2004
Permit Type:
Description: Plan Check ADDITION/REMODEL TO 1-STORY (E) SFD. 224
Permit Description: Bldg-Addition
Work Class:
Proposed Use: 1 or 2 Family Dwelling
Permit Number: 040142000004440
Status:
Valuation: $182,000.00
Contractor Company:
Contractor Name: OWNER-BUILDER
3880855- 8 Page 21

Year Uses Source
ADJOINING PROPERTY FINDINGS
14636 TYLER ST
Date: 8/23/2000
Permit Type:
Description: Plan Check Build 6'-high block wall fence (approx.
Permit Description: Nonbldg-New
Work Class:
Proposed Use: 1 or 2 Family Dwelling Misc. Bldg or Structure
Permit Number: 000202000002350
Status:
Valuation: $2,700.00
Contractor Company:
Contractor Name: OWNER-BUILDER
14637 TYLER ST
Date: 11/17/2003
Permit Type:
Description: Plan Check PROPOSED 18'x27'8"ADDITION PER TYPE V SH
Permit Description: Bldg-Addition
Work Class:
Proposed Use: 1 or 2 Family Dwelling
Permit Number: 030142000009132
Status:
Valuation: $40,000.00
Contractor Company:
Contractor Name: OWNER-BUILDER
3880855- 8 Page 22

Year Uses Source
ADJOINING PROPERTY FINDINGS
Date: 11/13/2003
Permit Type:
Description: Plan Check ADD 117 SF LAUNDRY AREA AND 380 SF 2-CAR
Permit Description: Bldg-Addition
Work Class:
Proposed Use: 1 or 2 Family Dwelling
Permit Number: 030141000009114
Status:
Valuation: $39,000.00
Contractor Company:
Contractor Name: OWNER-BUILDER
Date: 11/12/2003
Permit Type:
Description: Plan Check CONVERT AN EXISTING BEDROOM TO A STUDY A
Permit Description: Bldg-Addition
Work Class:
Proposed Use: 1 or 2 Family Dwelling
Permit Number: 030142000009099
Status:
Valuation: $37,500.00
Contractor Company:
Contractor Name: OWNER-BUILDER
14653 TYLER ST
Date: 6/27/2003
Permit Type:
Description: Plan Check Add 12'-0"x 27'-0" to (e) carport in rea
Permit Description: Bldg-New
Work Class:
Proposed Use: 1 or 2 Family Dwelling Private Garage
Permit Number: 030102000002392
Status:
Valuation: $3,900.00
Contractor Company:
Contractor Name: OWNER-BUILDER
3880855- 8 Page 23

Year Uses Source
ADJOINING PROPERTY FINDINGS
Date: 4/4/2002
Permit Type:
Description: Plan Check Proposed 20'-0"x27'-0" detached carport
Permit Description: Bldg-New
Work Class:
Proposed Use: 1 or 2 Family Dwelling Private Garage
Permit Number: 020102000000939
Status:
Valuation: $6,500.00
Contractor Company:
Contractor Name: OWNER-BUILDER
Date: 4/3/2002
Permit Type:
Description: No Plan Check INSTALL SINK IN GARAGE/TACKROOM/BATHROOM
Permit Description: Plumbing
Work Class:
Proposed Use: 1 or 2 Family Dwelling
Permit Number: 020422000007922
Status:
Valuation: $0.00
Contractor Company:
Contractor Name: OWNER-BUILDER
14660 TYLER ST
Date: 5/13/2002
Permit Type:
Description: No Plan Check UPGRADE SERVICE TO 200 AMPS
Permit Description: Electrical
Work Class:
Proposed Use: 1 or 2 Family Dwelling
Permit Number: 020412000010187
Status:
Valuation: $0.00
Contractor Company:
Contractor Name: MYERS ALAN CHARLES
3880855- 8 Page 24

Year Uses Source
ADJOINING PROPERTY FINDINGS
Date: 11/30/1999
Permit Type:
Description: No Plan Check INSTALL E.Q. SEISMIC VALVE
Permit Description: Plumbing
Work Class:
Proposed Use: 1 or 2 Family Dwelling
Permit Number: 990422000016408
Status:
Valuation: $0.00
Contractor Company:
Contractor Name: OWNER-BUILDER
14667 TYLER ST
Date: 12/3/2012
Permit Type:
Description: No Plan Check Complete work done under previously expi red permit 06010-30000-04982. 95% completed as determined by inspection.
Permit Description: Bldg-Alter/Repair
Work Class:
Proposed Use: 1 or 2 Family Dwelling Misc. Bldg or Structure
Permit Number: 120162000024241
Status:
Valuation: $900.00
Contractor Company:
Contractor Name: OWNER-BUILDER
3880855- 8 Page 25

Year Uses Source
ADJOINING PROPERTY FINDINGS
Date: 12/3/2012
Permit Type:
Description: No Plan Check Complete work done under previously expi red permit 06014-30000-09978 95% completed as determined by inspection.
Permit Description: Bldg-Alter/Repair
Work Class:
Proposed Use: 1 or 2 Family Dwelling Single Family Residence
Permit Number: 120162000024245
Status:
Valuation: $501.00
Contractor Company:
Contractor Name: OWNER-BUILDER
Date: 12/3/2012
Permit Type:
Description: No Plan Check Complete work done under previously expi red permit 04047-20000-01995. 95% completed as determined by inspection.
Permit Description: Swimming-Pool/Spa
Work Class:
Proposed Use: 1 or 2 Family Dwelling Suimming Pools/Spa
Permit Number: 120472000001246
Status:
Valuation: $1,000.00
Contractor Company:
Contractor Name: OWNER-BUILDER
Date: 8/17/2010
Permit Type:
Description: Plan Check SUPPLEMENTAL TO PERMIT # 06010-30000-049
Permit Description: Bldg-Addition
Work Class:
Proposed Use: 1 or 2 Family Dwelling Misc. Bldg or Structure
Permit Number: 060103000204982
Status:
Valuation: $18,000.00
Contractor Company:
Contractor Name: OWNER-BUILDER
3880855- 8 Page 26

Year Uses Source
ADJOINING PROPERTY FINDINGS
Date: 6/23/2010
Permit Type:
Description: No Plan Check SUPPLEMENTAL PERMIT TO RENEW EXPIRED PER
Permit Description: Swimming-Pool/Spa
Work Class:
Proposed Use: 1 or 2 Family Dwelling
Permit Number: 040472000101995
Status:
Valuation: $2,000.00
Contractor Company:
Contractor Name: OWNER-BUILDER
Date: 6/23/2010
Permit Type:
Description: No Plan Check SUPPLEMENTAL PERMIT TO RENEW EXPIRED PER
Permit Description: Bldg-Alter/Repair
Work Class:
Proposed Use: 1 or 2 Family Dwelling
Permit Number: 060102000104982
Status:
Valuation: $1,800.00
Contractor Company:
Contractor Name: OWNER-BUILDER
Date: 6/23/2010
Permit Type:
Description: No Plan Check SUPPLEMENTAL PERMIT TO RENEW EXPIRED PER
Permit Description: Bldg-Alter/Repair
Work Class:
Proposed Use: 1 or 2 Family Dwelling
Permit Number: 060142000109978
Status:
Valuation: $850.00
Contractor Company:
Contractor Name: OWNER-BUILDER
3880855- 8 Page 27

Year Uses Source
ADJOINING PROPERTY FINDINGS
Date: 11/14/2006
Permit Type:
Description: Plan Check 20'X60' PATIO COVER WITH ATT 3'X20' TREL
Permit Description: Bldg-New
Work Class:
Proposed Use: 1 or 2 Family Dwelling Misc. Bldg or Structure
Permit Number: 060103000004982
Status:
Valuation: $18,000.00
Contractor Company:
Contractor Name: OWNER-BUILDER
Date: 11/14/2006
Permit Type:
Description: Plan Check 12'6" X7'-6" IRR ONE STORY ADDITION AT R
Permit Description: Bldg-Addition
Work Class:
Proposed Use: 1 or 2 Family Dwelling Single Family Residence
Permit Number: 060143000009978
Status:
Valuation: $8,500.00
Contractor Company:
Contractor Name: OWNER-BUILDER
Date: 11/16/2004
Permit Type:
Description: Plan Check REMODEL (E) POOL/SPA AND ADD WATERFALL.
Permit Description: Swimming-Pool/Spa
Work Class:
Proposed Use: 1 or 2 Family Dwelling Suimming Pools/Spa
Permit Number: 040472000001995
Status:
Valuation: $20,000.00
Contractor Company:
Contractor Name: RIGO'S CONSTRUCTION
3880855- 8 Page 28

Year Uses Source
ADJOINING PROPERTY FINDINGS
Date: 4/25/2003
Permit Type:
Description: Plan Check EXTEND BALCONY TO THE REAR OF THE BUILDI
Permit Description: Bldg-Addition
Work Class:
Proposed Use: 1 or 2 Family Dwelling Single Family Residence
Permit Number: 010141000100678
Status:
Valuation: $5,600.00
Contractor Company:
Contractor Name: OWNER-BUILDER
Date: 2/10/2003
Permit Type:
Description: No Plan Check TEMPORARY POWER POLE
Permit Description: Electrical
Work Class:
Proposed Use: 1 or 2 Family Dwelling
Permit Number: 030411000002912
Status:
Valuation: $0.00
Contractor Company:
Contractor Name: NATIONAL CONSTRUCTION RENTALS
Date: 10/18/2002
Permit Type:
Description: Plan Check 2-STORY ADDITION & REMODEL.
Permit Description: Bldg-Addition
Work Class:
Proposed Use: 1 or 2 Family Dwelling Single Family Residence
Permit Number: 010141000000678
Status:
Valuation: $531,344.00
Contractor Company:
Contractor Name: OWNER-BUILDER
3880855- 8 Page 29

Year Uses Source
ADJOINING PROPERTY FINDINGS
Date: 9/19/2002
Permit Type:
Description: No Plan Check BACKFILL (E) SEPTIC SYSTEM
Permit Description: Grading
Work Class:
Proposed Use: 1 or 2 Family Dwelling Grading Non-Hill
Permit Number: 020302000002455
Status:
Valuation: $50.00
Contractor Company:
Contractor Name: TAYLOR GENE
Date: 9/6/2002
Permit Type:
Description: No Plan Check INSTALL PRIVATE SEWAGE DISPOSAL SYSTEM
Permit Description: Plumbing
Work Class:
Proposed Use: 1 or 2 Family Dwelling
Permit Number: 020422000026743
Status:
Valuation: $0.00
Contractor Company:
Contractor Name: TAYLOR GENE
Date: 7/25/2001
Permit Type:
Description: No Plan Check INSTALL PRIVATE SEWAGE DISPOSAL SYSTEM.
Permit Description: Plumbing
Work Class:
Proposed Use: 1 or 2 Family Dwelling
Permit Number: 010422000011205
Status:
Valuation: $0.00
Contractor Company:
Contractor Name: OWNER-BUILDER
3880855- 8 Page 30

Year Uses Source
ADJOINING PROPERTY FINDINGS
Date: 5/27/1999
Permit Type:
Description: Plan Check New swimming pool and spa per standard p
Permit Description: Swimming-Pool/Spa
Work Class:
Proposed Use: 1 or 2 Family Dwelling Suimming Pools/Spa
Permit Number: 990472000000064
Status:
Valuation: $20,000.00
Contractor Company:
Contractor Name: OWNER-BUILDER
Date: 10/7/1997
Permit Type:
Description: No Plan Check REPLACE 14 WINDOWS SAME SIZE AND CHANGE
Permit Description: Bldg-Alter/Repair
Work Class:
Proposed Use: 1 or 2 Family Dwelling
Permit Number: 970161000023073
Status:
Valuation: $3,500.00
Contractor Company:
Contractor Name: SALAZAR JUAN GARZA
Date: 7/10/1997
Permit Type:
Description: Plan Check add 25'6"x23' carport & add 20'x18' cove
Permit Description: Bldg-Addition
Work Class:
Proposed Use: 1 or 2 Family Dwelling
Permit Number: 970142000003086
Status:
Valuation: $12,300.00
Contractor Company:
Contractor Name: OWNER-BUILDER
3880855- 8 Page 31

Year Uses Source
ADJOINING PROPERTY FINDINGS
14672 TYLER ST
Date: 7/25/2012
Permit Type:
Description: No Plan Check Replace approximately 60' of copper wate r main from meter to the house.
Permit Description: Plumbing
Work Class:
Proposed Use: 1 or 2 Family Dwelling
Permit Number: 120429000013474
Status:
Valuation: $0.00
Contractor Company:
Contractor Name: RESCUE ROOTER
Date: 3/9/2011
Permit Type:
Description: No Plan Check Replacing 60' of main sewer on property
Permit Description: Plumbing
Work Class:
Proposed Use: 1 or 2 Family Dwelling
Permit Number: 110429000004053
Status:
Valuation: $0.00
Contractor Company:
Contractor Name: RESCUE ROOTER
3880855- 8 Page 32

GLOSSARY
General Building Department concepts
. ICC: The International Code Council. The governing body for the building/development codes used by all jurisdictions who’ve adopted the ICC guidelines. MOST of the US has done this. Canada, Mexico, and other countries use ICC codes books and guides as well. There are a few states who have added guidelines to the ICC codes to better fit their needs. For example, California has added seismic retrofit requirements for most commercial structures.
. Building Department (Permitting Authority, Building Codes, Inspections Department, Building and Inspections): This is the department in a jurisdiction where an owner or contractor goes to obtain permits and inspections for building, tearing down, remodeling, adding to, re-roofing, moving or otherwise making changes to any structure, Residential or Commercial.
. Jurisdiction: This is the geographic area representing the properties over which a Permitting Authority has responsibility.. GC: General Contractor. Usually the primary contractor hired for any Residential or Commercial construction work.. Sub: Subordinate contracting companies or subcontractors. Usually a “trades” contractor working for the GC. These contractors generally have an area of expertise in which they are licensed like Plumbing, Electrical, Heating and Air systems, Gas Systems, Pools etc. (called “trades”).
. Journeymen: Sub contractors who have their own personal licenses in one or more trades and work for different contracting companies, wherever they are needed or there is work..
.HVAC (Mechanical, Heating & Air companies): HVAC = Heating, Ventilation, and Air Conditioning.
ELEC (Electrical, TempPole, TPole, TPower, Temporary Power, Panel, AMP Change, Power Release): Electrical permits can be pulled for many reasons. The most common reason is to increase the AMPs of power in an electrical power panel. This requires a permit in almost every jurisdiction. Other commons reason for Electrical permits is to insert a temporary power pole at a new construction site. Construction requires electricity, and in a new development, power has yet to be run to the lot. The temporary power pole is usually the very first permit pulled for new development. The power is released to the home owner when construction is complete and this sometimes takes the form of a Power Release permit or inspection.
.
. “Pull” a permit: To obtain and pay for a building permit.
. CBO: Chief Building Official
Planning Department: The department in the development process where the building /structural plans are reviewed for their completeness and compliance with building codes. Zoning Department: The department in the development process where the site plans are reviewed for their compliance with the regulations associated with the zoning district in which they are situated.. Zoning District: A pre-determined geographic boundary within a jurisdiction where certain types of structures are permitted / prohibited. Examples are Residential structure, Commercial/Retail structures, Industrial/Manufacturing structures etc. Each zoning district has regulations associated with it like the sizes of the lots, the density of the structures on the lots, the number of parking spaces required for certain types of structures on the lots etc.
.
. PIN (TMS, GIS ID, Parcel#): Property Identification Number and Tax Map System number.
. State Card (Business license): A license card issued to a contractor to conduct business.
Building Inspector (Inspector): The inspector is a building department employee that inspects building construction for compliance to codes.. C.O.: Certificate of Occupancy. This is the end of the construction process and designates that the owners now have permission to occupy a structure after its building is complete. Sometimes also referred to as a Certificate of Compliance.
GLOSSARY
Permit Content Definitions
. Permit Number: The alphanumerical designation assigned to a permit for tracking within the building department system. Sometimes the permit number gives clues to its role, e.g. a "PL" prefix may designate a plumbing permit.
. Description: A field on the permit form that allows the building department to give a brief description of the work being done. More often than not, this is the most important field for EP’s to find clues to the prior use(s) of the property.
. Permit Type: Generally a brief designation of the type of job being done. For example BLDG-RES, BLDG-COM, ELEC, MECH etc.
Sample Building Permit Data
Date: Nov 09, 2000 Permit Type: Bldg -New Permit Number: 101000000405 Status: Valuation: $1,000,000.00 Contractor Company: OWNER-BUILDER Contractor Name:
Description: New one store retail (SAV-ON) with drive-thru pharmacy. Certificate of Occupancy.

Appendix H School Site Environmental Screening Criteria Checklist

Olive Vista Middle School Appendix H June 9, 2014 Page 1 of 4
School Site Environmental Screening Criteria Checklist Health and Safety Criteria Yes No Comments High-voltage Power Transmission Lines [CCR, Title 5, 14010; CDE Selection and Approval Guide, 2000] Is the Olive Vista Middle School site within 100 feet from the edge of an easement for a 50-133 kV line?
CSC contacted the City of Los Angeles Department of Water and Power (òDWPò). There is a DPW electrical substation addressed as 13077 Glenoaks Boulevard located approximately 711 feet south of the Subject Property (EDR Radius Map). DWP responded that it does not have any easements for high-voltage power transmission lines within 1,500 of the Subject Property.
Is the Olive Vista Middle School site within 150 feet from the edge of an easement for a 220-230 kV line?
CSC contacted Southern California Edison Company. The company responded that it does not service the area. The EDR radius map shows a high voltage transmission line located just over one-half mile in an easterly direction from the Subject Property on the far side of the I-210 Freeway.
Is the Olive Vista Middle School site within 350 feet from the edge of an easement for a 500-550 kV line?
Railroads [CCR, Title 5, 14010; CDE Selection and Approval Guide, 2000] Is the Olive Vista Middle School site within 1,500 feet of a railroad track easement? (If yes, is the track a main line or a spur?)
Based on a historic topographic map for 1900, a railroad line was located approximately one-mile in a westerly direction from the Subject Property. The railroad line was situated on the eastern side of San Fernando Road. The area has been redeveloped and no railroad line is evident on the current Google Earth 2014 aerial map. The railroad line location is not within the coverage area of the historic aerial maps provided by EDR.
Hazardous Disposal Sites [Edu. Code 17213(a)(1)-(3); Health and Safety Code 25220; CDE Selection and Approval Guide, 2000] Is the Olive Vista Middle School site a current or former hazardous or solid waste disposal site? (If yes, have all wastes been removed?)
Per EDR report.
Does the Olive Vista Middle School site contain one or more aboveground or underground pipeline(s) that carry hazardous substances, materials, or waste? (Natural gas supply to school or neighborhood excluded.)
There are no oil or gas pipelines on the Subject Property (EDR Radius Map Report and Site Reconnaissance). CSC contacted the Office of the State Fire Marshall, Pipeline Safety Division. Lisa Dowdy responded that there are no pipelines jurisdictional to the State Fire Marshall in the vicinity of the Subject Property.

Olive Vista Middle School Appendix H June 9, 2014 Page 2 of 4
School Site Environmental Screening Criteria Checklist (Continued) Health and Safety Criteria Yes No Comments Is the Olive Vista Middle School site located near or downwind from a stockyard, fertilizer plant, soil processing operation, auto dismantling facility, sewage treatment plant, or potentially hazardous facilities?
Per EDR report and Site Reconnaissance.
Has the Olive Vista Middle School site been designated a border zone property by DTSC, or is the Subject Property within 2,000 feet of a significant disposal of hazardous waste?
Per EDR report and City of Los Angeles ZIMAS report.
Gasoline or Sewer Pipelines [Edu. Code 17213(a)(3)] Are there any pipelines located above or underground on or near to the Olive Vista Middle School site that are used for hazardous substances, fuel, or natural gas? (Natural gas supply to school or neighborhood excluded.)
CSC contacted the Office of the State Fire Marshall, Pipeline Safety Division. Lisa Dowdy responded that there are no pipelines jurisdictional to the State Fire Marshall in the vicinity of the Subject Property. CSC viewed the Southern California Gas Company online interactive map for Los Angeles. This map illustrates a high pressure (>200 psi) natural gas pipeline situated on Glenoaks Boulevard. The accuracy of this map is +/- 500 feet. According to the Los Angeles County Assessorôs Office the centerline of Glenoaks Boulevard is 661.5 feet to the west of Fellows Avenue. Fellows Avenue is the westerly boundary of the Subject Property.
Airports [Edu. Code 17213(a)-(e); CCR, Title 5, 14011(k)] Is the Olive Vista Middle School site located within two nautical miles of an operating airport?
Per Thomas Guide, site reconnaissance, ZIMAS and topographic maps, there are no operating airports within two nautical miles of the Subject Property. The closest heliport is located at Merle Norman Cosmetics at 15200 Bledsoe Street in Sylmar This heliport is located approximately 4,500 feet west southwest of the Subject Property.
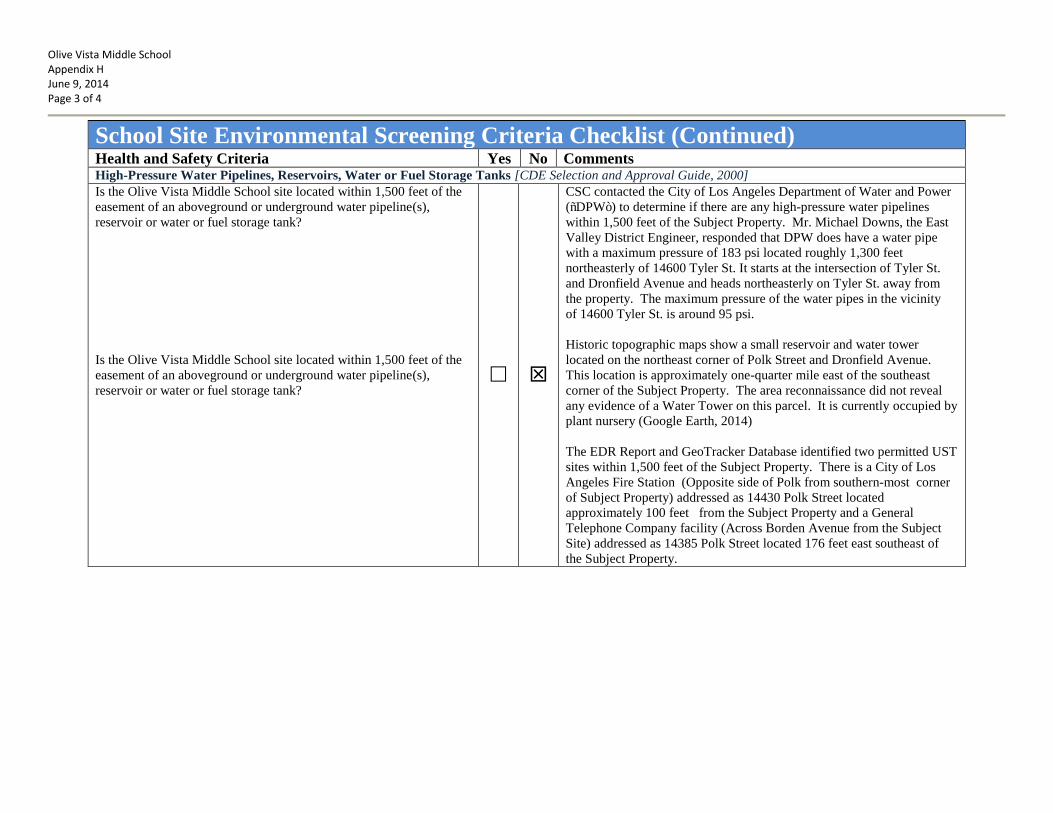
Olive Vista Middle School Appendix H June 9, 2014 Page 3 of 4
School Site Environmental Screening Criteria Checklist (Continued) Health and Safety Criteria Yes No Comments High-Pressure Water Pipelines, Reservoirs, Water or Fuel Storage Tanks [CDE Selection and Approval Guide, 2000] Is the Olive Vista Middle School site located within 1,500 feet of the easement of an aboveground or underground water pipeline(s), reservoir or water or fuel storage tank? Is the Olive Vista Middle School site located within 1,500 feet of the easement of an aboveground or underground water pipeline(s), reservoir or water or fuel storage tank?
CSC contacted the City of Los Angeles Department of Water and Power (ñDPWò) to determine if there are any high-pressure water pipelines within 1,500 feet of the Subject Property. Mr. Michael Downs, the East Valley District Engineer, responded that DPW does have a water pipe with a maximum pressure of 183 psi located roughly 1,300 feet northeasterly of 14600 Tyler St. It starts at the intersection of Tyler St. and Dronfield Avenue and heads northeasterly on Tyler St. away from the property. The maximum pressure of the water pipes in the vicinity of 14600 Tyler St. is around 95 psi. Historic topographic maps show a small reservoir and water tower located on the northeast corner of Polk Street and Dronfield Avenue. This location is approximately one-quarter mile east of the southeast corner of the Subject Property. The area reconnaissance did not reveal any evidence of a Water Tower on this parcel. It is currently occupied by plant nursery (Google Earth, 2014) The EDR Report and GeoTracker Database identified two permitted UST sites within 1,500 feet of the Subject Property. There is a City of Los Angeles Fire Station (Opposite side of Polk from southern-most corner of Subject Property) addressed as 14430 Polk Street located approximately 100 feet from the Subject Property and a General Telephone Company facility (Across Borden Avenue from the Subject Site) addressed as 14385 Polk Street located 176 feet east southeast of the Subject Property.
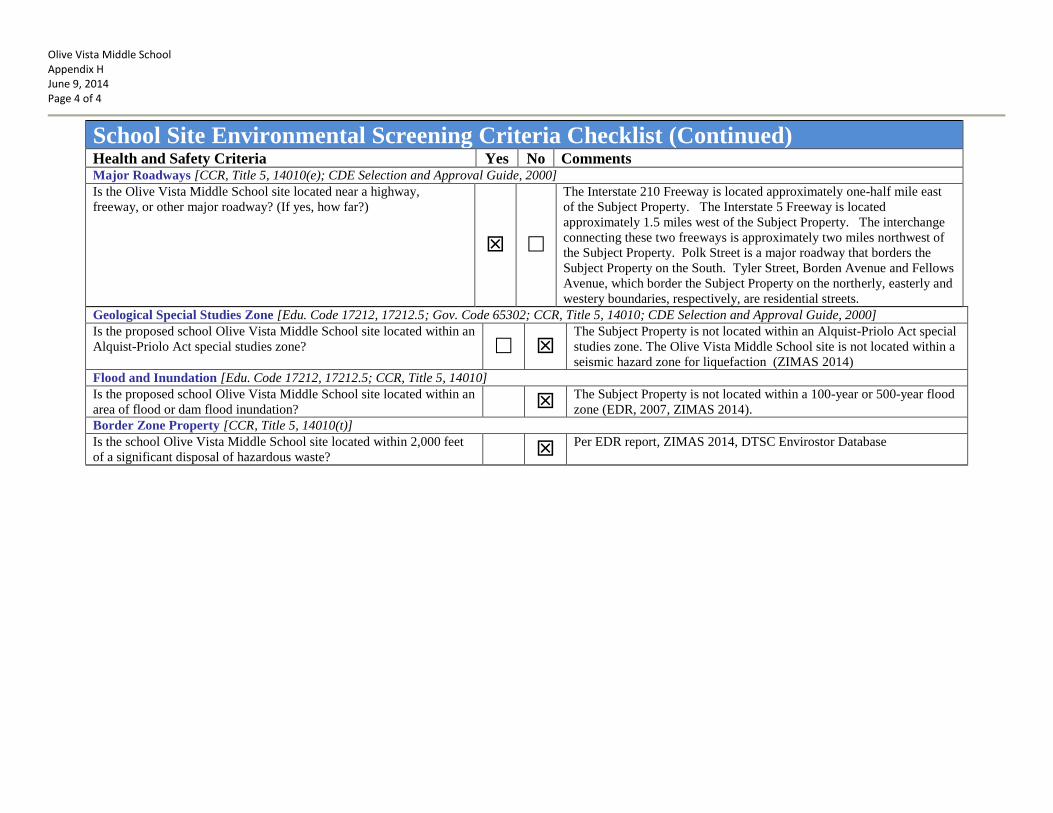
Olive Vista Middle School Appendix H June 9, 2014 Page 4 of 4
School Site Environmental Screening Criteria Checklist (Continued) Health and Safety Criteria Yes No Comments Major Roadways [CCR, Title 5, 14010(e); CDE Selection and Approval Guide, 2000] Is the Olive Vista Middle School site located near a highway, freeway, or other major roadway? (If yes, how far?)
The Interstate 210 Freeway is located approximately one-half mile east of the Subject Property. The Interstate 5 Freeway is located approximately 1.5 miles west of the Subject Property. The interchange connecting these two freeways is approximately two miles northwest of the Subject Property. Polk Street is a major roadway that borders the Subject Property on the South. Tyler Street, Borden Avenue and Fellows Avenue, which border the Subject Property on the northerly, easterly and westery boundaries, respectively, are residential streets.
Geological Special Studies Zone [Edu. Code 17212, 17212.5; Gov. Code 65302; CCR, Title 5, 14010; CDE Selection and Approval Guide, 2000] Is the proposed school Olive Vista Middle School site located within an Alquist-Priolo Act special studies zone?
The Subject Property is not located within an Alquist-Priolo Act special studies zone. The Olive Vista Middle School site is not located within a seismic hazard zone for liquefaction (ZIMAS 2014)
Flood and Inundation [Edu. Code 17212, 17212.5; CCR, Title 5, 14010] Is the proposed school Olive Vista Middle School site located within an area of flood or dam flood inundation?
The Subject Property is not located within a 100-year or 500-year flood zone (EDR, 2007, ZIMAS 2014).
Border Zone Property [CCR, Title 5, 14010(t)] Is the school Olive Vista Middle School site located within 2,000 feet of a significant disposal of hazardous waste?
Per EDR report, ZIMAS 2014, DTSC Envirostor Database

Conditions of Use | Privacy PolicyCopyright © 2007 State of California
Search for Regulatory Maps
Navigate to your area of interest by entering inan address, selecting an affected city or county orusing the navigation tools on the map. Then clickon any of the quadrangles (boxes) to find outwhat maps/data is available. See legend belowfor descriptions.
Affected Counties
Affected Cities
( Search by address, county, city & state or zipcode )
Legend
Earthquake Fault Zones
Landslide and Liquefaction Zones
Fault zones, Landslide and Liquefaction Zones
Map results
Learn more about the maps.
California Geological Survey - CGS's Information Warehouse. http://www.quake.ca.gov/gmaps/WH/regulatorymaps.htm
1 of 1 5/1/2014 11:40 AM

English Español
Help Center
Search or Ask a question here
Safety
Safety at Home and Work
Contractor Safety
Emergency Information
Pipeline Safety
Aliso Canyon StorageFacility Project
Playa del Rey StorageOperations
Safety Brochures
Scam Alert!
Facebook *
Twitter *
YouTube *
Service for Home
Start Service Online
Move Service Online
More Time To Pay YourBill?
Service for Business
Information by Industry
Ways to Save Energyand Money
Rebates
Clean Energy Solutions
Advanced Meter
Energy Resource Center
Natural Gas Vehicles
Sustainability
Serving Communities
Gas Safety
The Energy ofCommunity
About Us
Our Site
Help Center
Regulatory Filings
Site Map
Accessibility
Connect with Us
Home Safety Pipeline Maps LA
Dark Blue
Gas Transmission and High Pressure DistributionPipeline Interactive Map - LA
Enter your zip code or address.
Transmission Lines: Generally large diameter pipelines that operate at pressures above 200 psi and transport gas fromsupply points to the gas distribution system.
Light Blue High Pressure Distribution Lines: Pipelines that operate at pressures above 60 psi and deliver gas in smaller volumes to thelower pressure distribution system.
Accuracy of pipeline locations can vary +/- 500 feet.
Information from this website should never be used as a substitute for calling 811 two business days before digging.
Southern California Gas Company (SoCalGas) is providing this map as a courtesy and for general information purposes only. It does notrepresent that the information contained herein is accurate for any particular purpose, and therefore disclaims all warranties, expressedor implied, including the warranty of fitness for a particular purpose. Independent verification from experts should be obtained prior toany specific use. Recipient accepts full responsibility for any consequences associated with use of this information.
For YourHome
For YourBusiness
Safety
Innovation
CustomerService
SoCalGas - Gas Transmission and High Pressure Distribution Pipeline Int... http://www.socalgas.com/safety/pipeline-maps/LA.shtml
1 of 2 5/8/2014 2:51 PM

Instagram *
Newsletter
* By clicking the link, you will leave socalgas.com and transfer directly to the website of a third party provider which is not part of Southern California Gas Company. The Terms and Conditions and Privacy Policy on that websitewill apply.
Southern California Gas Company is a subsidiary of Sempra Energy®. © 1998 - 2014 Southern California Gas Company. SoCalGas® is a registered trademark of Southern California Gas Company. The trademarks used herein are the property of their respective owners. All rights reserved.
Rebates
Check Your Appliances
Create an OnlineAccount
Save Energy and Money
CNG Refueling
Homebuilder Services
California AdvancedHomes Program
Monthly Gas Prices
Newsroom
Careers
Terms and Conditions
Privacy Notice
Privacy Policy
SoCalGas - Gas Transmission and High Pressure Distribution Pipeline Int... http://www.socalgas.com/safety/pipeline-maps/LA.shtml
2 of 2 5/8/2014 2:51 PM

1
Joan Greenwood
From: Downs, Michael <[email protected]>Sent: Thursday, May 15, 2014 6:39 AMTo: Joan GreenwoodSubject: RE: Follow Up on Sylmar LAUSD Property
Hi Joan, We do have a water pipe with a maximum pressure of 183 psi located roughly 1300 feet northeasterly of 14600 Tyler St. It starts at the intersection of Tyler St. and Dronfield Ave. and heads northeasterly on Tyler St. away from the property. The maximum pressure of the water pipes in the vicinity of 14600 Tyler St. is around 95 psi. Michael Downs LADWP – Water System East Valley District Engineer (213) 367‐1235
From: Joan Greenwood [mailto:[email protected]] Sent: Thursday, May 08, 2014 5:26 PM To: Downs, Michael Subject: Follow Up on Sylmar LAUSD Property Importance: High Thanks for your response on April 4. What I need to know is whether or not there are any high pressure water lines in the vicinity, i.e., within 1,500 feet of 14600 Tyler Street in Sylmar 91342. It is a hazard issue of concern to LAUSD. Thanks. Joan Greenwood Senior Environmental Project Manager Clark Seif Clark, Inc. (CSC) Physical: 110 Pine Avenue, Suite 925, Long Beach, CA 90802 tel 562-435-8080 fax 562-590-8795 e-mail [email protected] www.csceng.com
LOS ANGELES ~ LONG BEACH ~ SAN FRANCISCO ~ IRVINE ~ SAN DIEGO ~ PHOENIX ~ KENTUCKY ---PLEASE CONSIDER THE ENVIRONMENT BEFORE PRINTING THIS EMAIL--- NOTICE: This electronic mail transmission is intended only for the addressee. It contains information that may be privileged, confidential, and exempt from disclosure under applicable law. Dissemination, distribution, or copying of this by anyone other than the addressee or the addressee's agent is strictly prohibited. If this electronic mail transmission is received in error, please notify the

2
sender immediately by a "reply to sender only" message and destroy all electronic and hard copies of this communication and all attachments thereto. Thank you.
-------------------------Confidentiality Notice-------------------------- This electronic message transmission contains information from the Los Angeles Department of Water and Power, which may be confidential. If you are not the intended recipient, be aware that any disclosure, copying, distribution or use of the content of this information is prohibited. If you have received this communication in error, please notify us immediately by e-mail and delete the original message and any attachment without reading or saving in any manner.

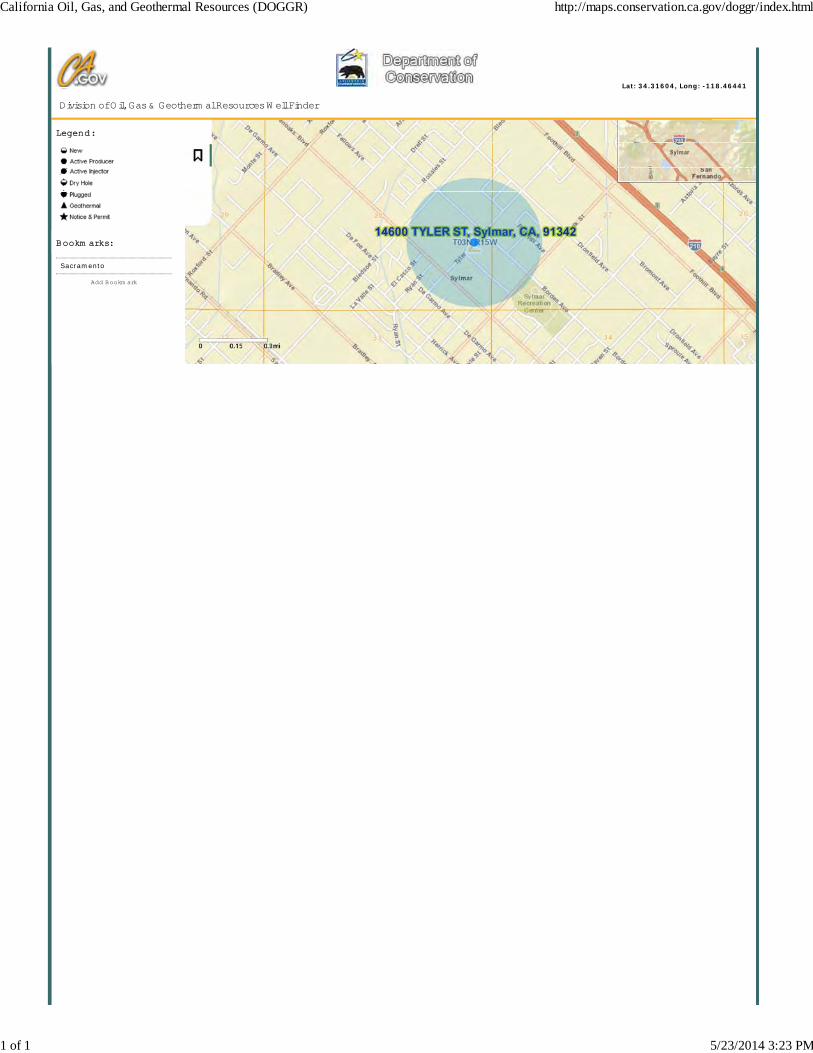
Lat: 34.31604, Long: -118.46441
Division of Oil, Gas & Geotherm al Resources W ell Finder
Legend:
Bookm arks:
Add Bookm ark
Sacramento
California Oil, Gas, and Geothermal Resources (DOGGR) http://maps.conservation.ca.gov/doggr/index.html
1 of 1 5/23/2014 3:23 PM
2
5
3
11
7
4
12
6
8
15
9
1 14
10
13
Wilmington
Torrance
Dominguez
Potrero
Seal Beach
El Segundo
Inglewood
Long Beach
Playa Del Rey
Salt Lake
Las Cienegas
Beverly Hills
Aliso Canyon
Rosecrans
Lawndale
Belmont Offshore
Hyperion
Oat Mountain
Cheviot Hills
Howard Townsite
Los Angeles City
Alondra
Sawtelle
Gaffey (Abd)
Venice Beach (Abd)
Union Station
Long Beach Airport
Los Angeles Downtown
South Rosecrans
South Salt Lake
Cascade
San Vicente
Pacoima
Boyle Heights (Abd)
Mission (Abd.)
East Rosecrans
Horse Meadows (Abd.)
Sherman (Abd)
Mission (Abd.)
SAND
IEGO
FRWY
VANOWEN ST
VICTORY BLVD
SN
OR
MA
ND
IEA
V
VENTURA BLVD
ROSCOE BLVD
FOOTHILL BLVD
FOOTHILLFRW
Y
WILSHIRE BLVD
HA
RB
OR
FRW
Y
RONALDREGAN
W 3RD ST
TAM
PA
AV
LASSEN ST
BA
LBO
AB
LVD
HO
LLYW
OO
DFR
WY
MULHOLLAND DR
DE
SO
TO
AV
SANTA MONICA FRWY
SM
AIN
ST
SE
PU
LVE
DA
BLV
D
WO
OD
LEY
AV
SATICOY ST
BURBANK BLVD
GOLDENSTATE
FRWY
RE
SE
DA
BLV
D
RIVERSIDE DR
GLENOAKSBLVD
PARTHENIA ST
AV
ALO
NB
LVD
SANFERNANDO
RD
DEVONSHIRE ST
LAU
RE
LC
AN
YO
NB
LVD
WO
OD
MA
NA
V
VENICE BLVD
SC
EN
TRA
LA
V
RINALDI ST
CO
RB
INA
V
WIN
NE
TKA
AV
LINCOLN BLVD
SLA
BR
EA
AV
BEVERLY BLVD
VAN NUYS BLVD
SH
OO
VE
RS
T
W PICO BLVD
MELROSE AV
HO
OP
ER
AV
SFIG
UE
RO
AS
T
W OLYMPIC BLVD
CULVER
BLVD
LIN
DLE
YA
V
TUJU
NG
AA
V
PASADENA FRWY
SB
RO
AD
WA
Y
VIN
ELA
ND
AV
WH
ITS
ET
TA
V
OXNARD ST
SS
AN
PE
DR
OS
T
E 4TH ST
SH
OU
PA
V
MAGNOLIA BLVD
W SLAUSON AV
LAN
KE
RS
HIM
BLV
D
E 1ST ST
SHELDONST
W ADAMS BLVD
TOP
AN
GA
CA
NY
ON
BLV
D
14THST
KE
STE
RA
V
MOORPARK ST
WIL
BU
RA
V
W SUNSET BLVD
W 54TH ST
FULT
ON
AV
OVERLANDAV
SANTAMONIC
ABLVD
CHATSWORTH ST
SA
V52
GLE
ND
ALE
FRW
Y
RODEO RD
SV
AN
NE
SS
AV
YORK BLVD
VENTURA FRWY
SANTA ANA FRWY
SAWTELLE
BLVD
STRATHERN ST
FRANKLIN AV
OSBORNE ST
OCEANAV
WELLS DR
SS
OT
OS
T
MA
SO
NA
V
SBUNDY
DR
CO
MP
TON
AV
PAXTONST
FALL
BR
OO
KA
V
WH
ITE
OA
KA
V
NB
EV
ER
LYD
R
CO
LFA
XA
V
ZELZA
HA
V
LA TUNA CANYON RD
8TH
AV
OW
EN
SM
OU
THA
V
MAINST
PALMS BLVD
WOLIV
EAV
26THST
CO
LDW
ATE
RC
AN
YO
NA
V
*****
VALLEYCIRCLE
BLVD
SU
NLA
ND
BLV
D
W 25TH ST
HA
ZELT
INE
AV
SW
ES
TE
RN
AV
W VERNON AV
MONTANAAV
VISD
ELM
AR
EXPOSITION BLVD
HOLLYWOOD BLVD
W 8TH ST
PICO BLVD
NSO
TOST
W WASHINGTON BLVD
E GAGE AV
N BROADWAY
VETERANAV
SP
AC
IFIC
AV
W GAGE AV
PIERCE ST
VA
NN
ES
SA
V
E SLAUSON AV
W FLORENCE AV
E IMPERIAL HWY
E 7TH ST
SHERMAN WY
N FIGUEROA ST
CESAR E. CHAVEZ AV
SG
AF
FEY
ST
POMONA FRWY
SAN BERNARDINO FRWY
W ALAMEDA AV
AV
IATI
ON
BLV
D
PLUMMER ST
PA
CIF
ICB
LVD
ALLEN
AV
E 6TH ST
POLKST
MO
TOR
AV
N MAIN ST
LOW
ELL
AV
VIN
ES
T
E OLYMPIC BLVD
FIGU
ER
OA
ST
SHI
LLST
TELFAIRAV
E 103RD ST
VA
NA
LDE
NA
V
SCO
TTR
D
NG
AF
FEY
ST
CA
BR
ILLO
AV
PACIFIC COAST HWY
W 48TH ST
GLE
ND
ALE
BLV
D
HAU
SER
BLVD
SBARRINGTON
AV
W 6TH ST
INGLEW
OO
DBLVD E VERNON AV
EB
ST
WHITTIER BLVD
MA
ND
EV
ILLEC
AN
YO
NR
D
E 92ND ST
5THST
MARTIN LUTHER KING JR BLVD
RO
SC
OM
AR
ER
D
ROSE AV
E 120TH ST
W MANCHESTER AV
W ANAHEIM ST
GRIFFITH PARK DR
W VERDUGO AV
W CENTURY BLVD
SAN FERNANDO MISSION BLVD
W 9TH ST
LATIJE
RABLV
D
E WASHINGTON BLVD
SAYREST
E 41ST ST
WENTWORTH ST
E ANAHEIM ST
W TEMPLE ST
BENEDICTCANYON
DR
N GLENOAKS BLVD
SR
OB
ER
TSO
NB
LVD
STOCKER
ST
MARINA FRWY
BROADWAY
BANDINI BLVD
WO
OD
LAK
EA
V
E SEPULVEDA BLVD
PERSH
ING
DR
PLA
TTA
V
NH
OLL
YW
OO
DW
Y
NS
AN
T AFE
AV
LOS FELIZ BLVD
W MAGNOLIA BLVD
SV
ER
MO
NT
AV
E 223RD ST
HERRICK AV
PACIFICAV
PASSAV
ALAM
EDA
ST
NH
IGH
LAN
DA
V
HUBBARDST
TERRA BELLA ST
SAL
AMED
AST
NSAN
FERNANDORD
BLEDSOE
ST
NORDHOFF ST
CALN
EVA
DR
ELEVADO AV
NBEV
ERLY
GLEN
BLVD
EA
GLE
RO
CK
BLV
D
W BURBANK BLVD
W KENNETH RD
MYRAAV
CA
NO
GA
AV
NA
RB
ON
NE
AV
OCEAN PARK BLVD
VALLEY BLVD
W B ST
WE
ST
BLV
D
WGLENOAKS BLVD
W 190TH ST
WESTCHESTER PKWY
ROXFORDST
FIRESTONE BLVD
SHEPARD ST
W 182ND ST
TER
MIN
AL
ISLA
ND
FRW
Y
E 8THST
EN
CIN
OA
V
NV
IRG
ILA
V
PA
LISA
DE
SD
R
W 228TH ST
CARSON ST
AR
LIN
GTO
NA
V
COLORADO BLVD
CHANDLER BLVD
AVE SAN LUIS
ZOO DR
VE
RM
ON
TA
V
W 223RD ST
NW
ES
TER
NA
V
W 120TH ST
WE
STE
RN
AV
NADEAU ST
SB
OY
LEA
V
SG
LEN
DA
LEA
V
SILVERLA
KEBLV
D
WESTW
OODBLVD
SONORAAV
CYPRESSAV
SA
DA
MS
ST
SUN
ION
AV
COLORADO
AV
NHIL
LST
COLISEUM ST
BRADLEYAV
CO
LLIS
AV
W 19TH ST
NLA
BR
EA
AV
TRUMANST
SFR
EM
ON
TA
V
DIVISION ST
NFA
IRFA
XA
V
LOP
EZ
CA
NY
ON
RD
W LOMITA BLVD
MO
NTER
EYRD
NA
LAM
ED
AS
T
NB
UE
NA
VIS
TA
ST
SUNSET BLVD
LON
GB
EA
CH
BLV
D
E 12TH ST
TUXFORDST
E MARIPOSA AV
FLETCHER
DR
JEFF
ER
SON
BLV
D
SLA
CIE
NE
GA
BLV
D
APPERSON ST
E 3RD ST
MERIDIAN ST
MILE
SA
V
EOLIV
EAV
NG
OW
ER
ST
NAVE
50
E CARSON ST
E WILSON AV
YOSEMITE DR
E 38TH ST
MANNING
AV
7THST
SBE
VERLY
GLEN
BLVD
BE
VE
RW
ILD
R
SA
NTA
FEA
V
W ROSECRANS AV
SESNON BLVD
OLYMPIC BLVD
WMAIN
ST
HIL
GA
RD
AV
CR
EN
SH
AW
BLV
D
SANTA SUSANA PASS RD
FOREST LAWN DR
SH
AR
BO
RB
LVD
E 55TH ST
CLARK ST
OR
OV
ISTA
AV
PENROSE ST
I ST
HONOLULU AV
SAN VICENTE BLVD
SAL
VARA
DOST
HILLH
UR
ST
AV
4THST
E 108TH ST
WABASH AV
120TH ST
LITTLE TUJUNGA RD
CO
LEA
V
CHASE ST
FOX ST
W OCEAN BLVD
MULHOLLAND HWY
ALONZO
AV
W SEPULVEDA BLVD
CENTINELA AV
SIE
RR
AH
WY
W JEFFERSON BLVD
SM
ON
AB
LVD
PALOS
VERD
ESD
RE
N SANFERNANDO
BLVD
BO
STO
NA
V
W 90TH ST
W 18TH ST
SV
ER
DU
GO
RD
SS
EP
ULV
ED
AB
LVD
MORGAN ST
NA
V54
EL PASO DR
CHATSWORTHDR
GAVINA
AV
LA LOMA RD
NCANON
DR
AIR
PO
RT
BLV
D
E GRAND AV
SAN JOSE ST
SFA
IRF
AX
AV
HUNTINGTON DR N
E CENTURY BLVD
ERWIN ST
FRE
MO
NT
AV
ADMIRALTY WY
E CHEVY CHASE DR
SW
ILTO
NP
L
20THST
WEBB
AV
CALABASAS RD
MACLAY ST
GAYLEY AV
NSEPULVEDA
BLVD
MT
GLE
AS
ON
AV
OV
ER
HIL
LD
R
BIG TUJUNGA CANYON RD
PICO AV
W ARTESIA BLVD
HA
YV
EN
HU
RS
TA
VN
KENTERAV
PALOS VERDES DR N
DUMETZ RD
SIN
GLE
WO
OD
AV
W5TH ST
WOODCLIFF
RD
WALG
ROVE
AV
FLO
WER
ST
LON
GB
EA
CH
FRW
Y
CA
HU
EN
GA
BLV
D
CAPITOL DR
CREST RD
W CENTINELA AV
N KENNETHRD
ARROYOAV
IDAHO
AV
NCAHUENGA
BLVDW
VALLEY VISTA BLVD
HIGHLAND
AV
E ADAMS BLVD
VICTORY PL
E DOMINGUEZ ST
MCLAUG
HLINAV
THE OLD ROAD
NB
UN
DY
DR
EC
AH
UE
NG
AB
LVD
BRADDOCKDR
FER
ND
ELL
DR
SOLI
VEST
E LOMITA BLVD
SV
IRG
ILA
V
23RDST
N INDIANA ST
MEDFORD ST
TOPHAM ST
STAD
IUM
WY
S HUBBARDAV
VER
DU
GO
RD
POPLAR BLVD
E COLDEN AV
E HYDE PARK BLVD
NV
ER
DU
GO
RD
GARDENA FRWY
W WILSON AV
W MARINE AV
OCEAN BLVD
ARLETAAV
NH
OO
VE
RS
T
SS
AN
TAFE
AV
W CARSON ST
GLENCOEAV
LOU
ISE
AV
SD
OW
NE
YR
D
CAMARILLO ST
DEL AMO BLVD
PLAZADEL AMO
W MANCHESTER BLVD
SA
RR
OY
OB
LVD
E 23RD ST
CH
ALO
NR
D
NG
AR
DN
ER
ST
E FLORENCE AV
NB
RO
NS
ON
AV
SHORT AV
WLOS FELIZ RD
PE
OR
IAS
T
AVENUE64
CADILLAC AV
NC
RE
SC
EN
TH
EIG
HTS
BLV
D
E LEXINGTON DRSA
NF
ELI
CIA
NO
DR
EDISON BLVD
SB
RA
ND
BLV
DN
EW
YO
RK
AV
S SATICOY ST
GLENWOOD RD
16TH ST
W 108TH ST
ROSITA ST
S VICTORYBLVD
NC
EN
TR
AL
AV
CONCORD AV
W TORRANCE BLVD
IMPERIAL HWY
W 23RD ST
E 192ND ST
W GRAND AV
W 135TH ST
S PAS DL MAR
E EL SEGUNDO BLVD
SG
RE
VIL
LEA
AV
CENTURYPARK
E
FENTONAV
E STOCKER ST
NFRONT
ST
WASHINGTON BLVD
JUSTICE ST
DO
LOR
ES
ST
LEONIS BLVD
W 7TH ST
N MISSION RD
E 54TH ST
COHASSET ST
BRANFORDST
W ALONDRA BLVD
HA
SK
ELL
AV
E MOUNTAIN ST
STA
TES
T
HYPERION
AV
EARLE
ST
W ALHAMBRA RD
W DORAN ST
BRIS
TOL
PKW
Y
TORRANCE BLVD
TRU
BA
AV
ES
HE
LMA
NA
V
W HILLCREST BLVD
E 124TH ST
PA
SA
DE
NA
AV
W IMPERIAL HWY
E VICTORIA ST
SANTA ANA BLVD S
SANTA CARLOTTA ST
S SUNSET CANYON DR
NP
AC
IFICA
V
SCOTT AV
NB
AR
RIN
GT
ON
AV
VIA
MA
RIN
A
DISTRICT BLVD
HOLLOWAY DR
W COLDEN AV
CENTURY BLVD
NGRAND
AV
W CALIFORNIA BLVD
CITY TERRACE DR
SS
AN
TEFE
AV
E GARDENA BLVD
MIR
ALE
STE
DR
SLAUSON AV
W GARDENA BLVD
ALAMEDA
AV
ARTESIA BLVD
VE
SP
ER
AV
WILLO
WBR
OO
KAV
E ROSECRANS AV
EVERDUGO
AV
W EL SEGUNDO BLVD
CE
NTE
RS
T
3RD ST
ARBOR VITAE ST
E 213TH ST
NPAS
SA
V
NORDHOFF PLPARTHENIA PL
SA
ND
IEG
O
ENTRADA
DR
SANTA ANA ST
CIRCLE DR
*****
*****
W FLORENCE AV
*****
*****
SHERMAN WY
*****
*****
*****
*****
SATICOY ST
STRATHERN ST
SSEPULVEDA
BLVD
*****
PACIFIC COAST HWY
HA
RB
OR
FRW
Y
****
*
*****
20THST
*****
*****
****
*
*****
HA
YV
EN
HU
RS
TA
V
*****
SFI
GU
ER
OA
ST
BURBANK BLVD
****
*
E FLORENCE AV
*****
*****
**********
*****
*****
W IMPERIAL HWY
SATICOY ST
*****
W SLAUSON AV
*****
*****
****
*
*****
*****
GLE
NO
AK
SB
LVD
*****
*****
*****
*****
**********
*****
*****
*****
*****
PEORIAST
*****
*****
*****
WE
STE
RN
AV
PICO BLVD
*****
*****
GO
LDE
NS
TATE
FRW
Y
****
*
*****
SHERMAN WY
*****
*****
SH
OO
VE
RS
T
*****
*****
*****
*****
*****
W SUNSET BLVD
*****
SD
OW
NEY
RD
*****
*****
MULHOLLAND DR
*****
*****
SM
AIN
ST
MARINA FRWY
*****
SW
ES
TE
RN
AV
*****
*****
*****
HA
YV
EN
HU
RS
TA
V
E 54TH ST
E 108TH ST
SV
ER
MO
NT
AV
LON
GB
EA
CH
FRW
Y
*****
NM
ISSI
ON
RD
*****
CR
ENSH
AWBL
VD
****
*
SEPULVEDA BLVD
*****
SA
ND
IEG
OFR
WY
*****
LOU
ISE
AV
*****
*****
SFA
IRFA
XA
V
*****
*****
****
*
E 213TH ST
SM
AINST
AR
LIN
GTO
NA
V
*****
SH
OO
VE
RS
T
*****
****
*
W 6TH ST
*****
*****
CHANDLER BLVD
*****
*****
WH
ITE
OA
KA
V
SN
OR
MA
ND
IEA
V
*****
OXNARD ST
*****
SFIG
UE
RO
AS
T
*****
****
*
*****
SHERMAN WY
AV
ALO
NB
LVD
*****
*****
PACIFICAV
WIL
BU
RA
V
SHERMAN WY
SM
AIN
ST
*****
*****
WE
STE
RN
AV
W JEFFERSON BLVD E 8TH ST
*****
*****
SA
LAM
ED
AS
T
****
*
VE
RM
ON
TA
V
SW
ES
TE
RN
AV
*****
*****
SMAIN
ST
*****
*****
SV
ER
MO
NT
AV
*****
SW
ES
TE
RN
AV
****
*
*****
*****
*****
*****
SP
AC
IFIC
AV
*****
*****
*****
*****
*****
CHATSWORTH ST
*****
*****
*****
HA
SK
ELL
AV
*****
*****
*****
*****
*****
*****FRANKLIN AV
*****
*****
BRADLEYAV
W WASHINGTON BLVD
*****
WSUNSET BLVD
LOU
ISE
AV
****
*
*****
SAN VICENTE BLVD
STRATHERN ST
*****
SANDIEGO
FRWY
*****
BROADWAY
SLA
CIE
NE
GA
BLV
D
SS
AN
TAFE
AV
*****
****
*
*****
CO
MP
TON
AV
SESNON BLVD
*****
SHERMAN WY
*****
*****
CA
NO
GA
AV
*****
*****
HA
SK
ELL
AV
ROSCOEBLVD
*****
*****
NFI
GU
ERO
AST
*****
STA
TES
T
SSEPULVEDA
BLVD
7THST
*****
*****
WESTE
RNAV
****
*
*****
W 135TH ST
W 6TH ST
*****
*****
W ANAHEIM ST
*****
PLUMMER ST
SANTA MONICA FRWY
*****
*****
****
*
VA
NA
LDE
NA
V
CHANDLER BLVD
****
*
*****
****
*
*****
PLUMMER ST
NORDHOFF ST NORDHOFF ST
SC
EN
TRA
LA
V
RE
SE
DA
BLV
D
LOP
EZ
CA
NY
ON
RD
OXNARD ST
*****
*****
*****
*****
IMPERIAL HWY
MA
INS
T
SV
ER
MO
NT
AV
*****
WENTWORTH ST
Long Beach
Compton
Har
bor
Fwy
Golden State Fwy
Prepared by GIS Mapping, Bureau of Engineering, Dept. of Public Works - 03/31/04
JAMES K. HAHNMAYOR
GARY LEE MOORE, P.E.CITY ENGINEER
Methane Zone
Methane Buffer Zone
Council District Boundary0 0.4 0.8 1.2 1.6 2 2.4 2.80.2
Miles
COPYRIGHT (C) 2002 Bureau of Engineering, City of Los Angeles.This map shall not be copied or reproduced, all or any part thereof,whether by distribution or resale, without the prior written permission
of the CITY ENGINEER.
Anita- D:\home\z68ewj\requests\aug03\r1311\r1311_combined_methane&methane_buffer_zones
METHANE AND METHANE BUFFER ZONESMETHANE AND METHANE BUFFER ZONES
Pacific
Ocean
San Pedro
Santa Monica
Beverly Hills
San Fernando
S a n t a M o n i c a M o u n t a i n s
CITY OF LOS ANGELES
BASIC GRID MAPCITY OF LOS ANGELES
BUREAU OF ENGINEERING
Ordinance 175,790
5
210
5
405
10
10
60
110
710
105
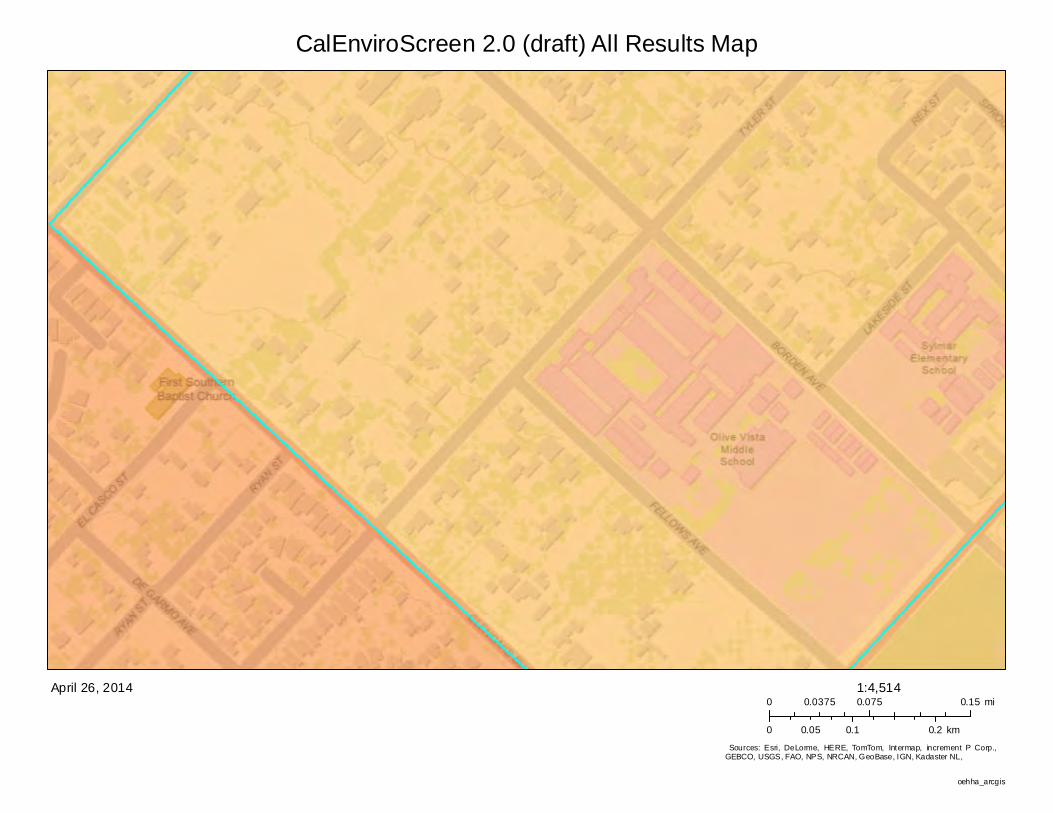
CalEnviroScreen 2.0 (draft) All Results Map
Sources: Esri, DeLorme, HERE, TomTom, Intermap, increment P Corp.,GEBCO, USGS, FAO, NPS, NRCAN, GeoBase, IGN, Kadaster NL,
April 26, 20140 0.075 0.150.0375 mi
0 0.1 0.20.05 km
1:4,514
oehha_arcgis


Appendix I References
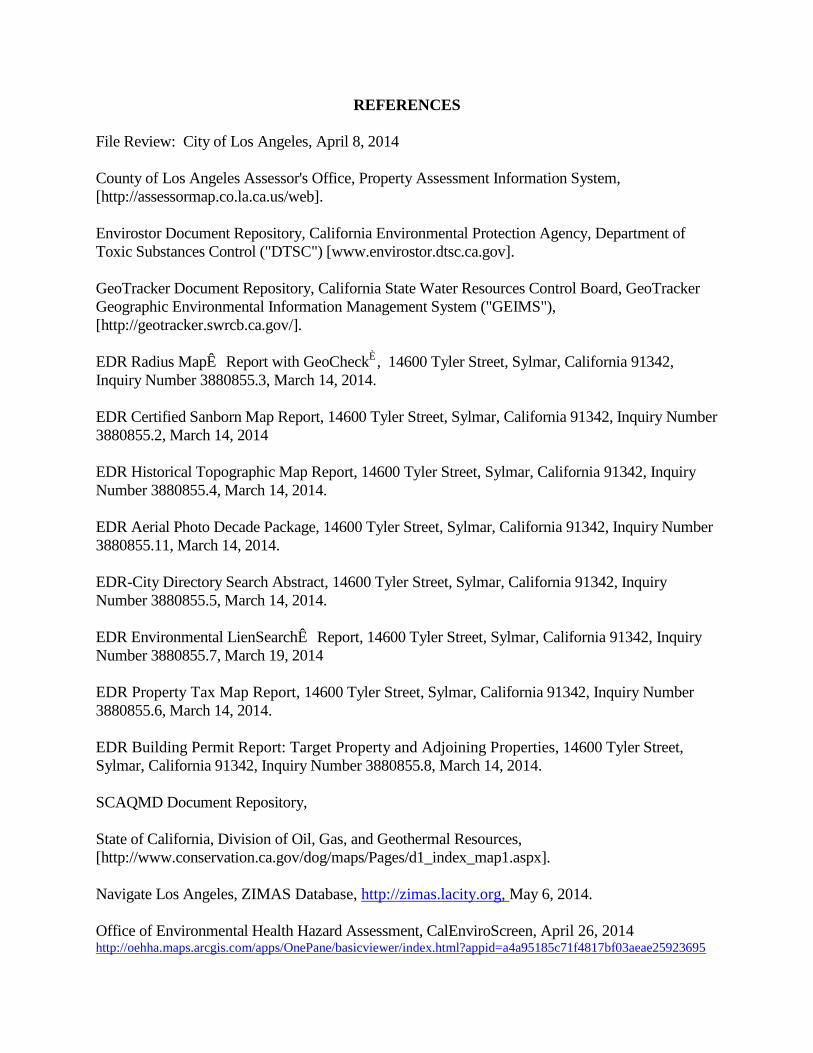
REFERENCES
File Review: City of Los Angeles, April 8, 2014 County of Los Angeles Assessor's Office, Property Assessment Information System, [http://assessormap.co.la.ca.us/web]. Envirostor Document Repository, California Environmental Protection Agency, Department of Toxic Substances Control ("DTSC") [www.envirostor.dtsc.ca.gov]. GeoTracker Document Repository, California State Water Resources Control Board, GeoTracker Geographic Environmental Information Management System ("GEIMS"), [http://geotracker.swrcb.ca.gov/]. EDR Radius MapÊ Report with GeoCheckÈ, 14600 Tyler Street, Sylmar, California 91342, Inquiry Number 3880855.3, March 14, 2014. EDR Certified Sanborn Map Report, 14600 Tyler Street, Sylmar, California 91342, Inquiry Number 3880855.2, March 14, 2014 EDR Historical Topographic Map Report, 14600 Tyler Street, Sylmar, California 91342, Inquiry Number 3880855.4, March 14, 2014. EDR Aerial Photo Decade Package, 14600 Tyler Street, Sylmar, California 91342, Inquiry Number 3880855.11, March 14, 2014. EDR-City Directory Search Abstract, 14600 Tyler Street, Sylmar, California 91342, Inquiry Number 3880855.5, March 14, 2014. EDR Environmental LienSearchÊ Report, 14600 Tyler Street, Sylmar, California 91342, Inquiry Number 3880855.7, March 19, 2014 EDR Property Tax Map Report, 14600 Tyler Street, Sylmar, California 91342, Inquiry Number 3880855.6, March 14, 2014. EDR Building Permit Report: Target Property and Adjoining Properties, 14600 Tyler Street, Sylmar, California 91342, Inquiry Number 3880855.8, March 14, 2014. SCAQMD Document Repository, State of California, Division of Oil, Gas, and Geothermal Resources, [http://www.conservation.ca.gov/dog/maps/Pages/d1_index_map1.aspx]. Navigate Los Angeles, ZIMAS Database, http://zimas.lacity.org, May 6, 2014. Office of Environmental Health Hazard Assessment, CalEnviroScreen, April 26, 2014 http://oehha.maps.arcgis.com/apps/OnePane/basicviewer/index.html?appid=a4a95185c71f4817bf03aeae25923695

California Department of Conservation, September 21, 2012 http://www.conservation.ca.gov/cgs/rghm/ap/Pages/Index.aspx. Granada Hills-Knollwood & Sylmar Community Plans Environmental Impact Report (State Clearinghouse No. 2008021061 & 2008021089), 2012.

Appendix J Environmental Professional(s) Qualifications

Environmental Professional(s) Qualifications Aaron Garrett: Mr. Garrett is an Environmental Project Manager at CSC Targhee with over nine years of experience in the environmental field. He holds a Bachelor’s degree in Environmental Technology from Long Beach State University and is in progress with a Masters degree in Environmental Engineering. Prior to joining CSC Targhee, Mr. Garrett had been involved with numerous projects that have involved environmental assessments, subsurface investigations, remedial activities, industrial hygiene, and occupational health and safety. At CSC Targhee, Mr. Garrett prepares technical reports and conducts site assessments and investigations. Dave Broadbent: Mr. Broadbent is CSC Targhee’s Technical Director. He is a member of ASTM Committee E50 on Environmental Assessment, Risk Management and Corrective Action. He has also served as the litigation support Team Leader for approximately 95 environmental expense recovery actions. He has over 30 years of experience in hazardous waste management, environmental chemistry, regulatory affairs and emergency chemical spill response. Mr. Broadbent has been with CSC Targhee for over 25 years. At CSC Targhee, Mr. Broadbent prepares work plans, supervises clean-up efforts, performs ASTM environmental site assessments and prepares or amends permits applications for clients. Mr. Broadbent was previously Operations Manager for International Technology’s unit under contract to the EPA for providing nationwide emergency waste site mitigation activities and demonstrating prototype hazardous waste treatment operations.

AARON R. GARRETT ENVIRONMENT ENGINEERING PROJECT MANAGER
PROFESSIONAL QUALIFICATIONS Environmental engineer with over eight years of experience working on projects involving hazardous waste/materials in soil and groundwater as well as industrial hygiene and occupational H&S.
Excavation/Removal of Oil-impacted Soil and Oversight of Oil Well Abandonment, Belmont HS, City of Los Angeles: Remedial excavation of oil impacted soil discovered during grading of track field and re-abandonment of an oil well per DOGGR standard. Methane Investigations, City of Los Angeles: Conducted numerous methane investigations to comply with City of Los Angeles requirements under Methane Ordinance No. 175790. Coordinated and implemented field investigations, conducted methane and subsurface gas monitoring, and prepared reports with recommendations for methane mitigation systems in compliance with requirements of the ordinance. Implementation of Remedial Action Plans (RAPs) at Two Los Angeles Unified School District (LAUSD) Sites: Remedial activities included excavation and disposal of soils impacted with metals, pesticides, volatile organic compounds (VOCs), petroleum hydrocarbons, polychlorinated biphenyls (PCBs), and/or polynuclear aromatic compounds. Field screening of soils for arsenic and lead, using an XRF analyzer, was employed at both of these sites, when needed. Also, soil impacted with VOCs at one of the sites was treated on site by ex-situ vapor extraction. Other activities included collection of confirmation soil and soil vapor samples, site mapping, removal of an underground storage tank (UST), air sampling for potential contaminants and dust monitoring, oversight of backfill/site restoration, compiling data, and report preparation for regulatory agency submittal. Oversight of Remedial Excavation of Debris and Lead-Impacted Soil, Los Angeles: Field activities included using the XRF analyzer to guide and determine limits of remedial excavation. Encountered impacted soils mixed with debris and/or fill material, which was segregated from clean material. Soil was primarily disposed of as California RCRA hazardous waste. The excavation was conducted under regulatory agency oversight. Remediation of a Dry Cleaner PCE Release, Orange County: Activities included initial environmental assessment, subsurface characterizations, and remediation by vapor extraction with regulatory oversight. Oversight of On-Site Treatment of Lead- and Copper-Impacted Soil, South Gate: Stockpiled soil with elevated concentrations of metals was treated on site and disposed offsite as
R e s u m e 2 o f 2
nonhazardous material. Project activities included confirmation sampling and analysis, site mapping, and report preparation for regulatory approval. Coordination and Oversight of Removal of Brine Pond Engineered Cap (Part of the Domestic and Industrial Wastewater Disposal System for a Former Paper Product Manufacture), Riverside: Excavation activities consisted of removing the different types of materials from the existing engineered cap and separating the material, based on the characteristics of the soil/material, into appropriate stockpiles to ensure proper placement/disposal. The removal was conducted under regulatory agency oversight. Investigation of a Precious Metal Refinery, El Monte: Conducted an extensive subsurface investigation at a former industrial business (precious metal refinery), located in El Monte, CA. The site was being redeveloped into a park, and the investigation was conducted to further characterize subsurface soil and soil gas, as requested by the lead regulatory agency. Projects activities included site mapping, collection and analysis of soil and soil gas samples, and preparation of a subsequent report for regulatory agency submittal. Asbestos Survey of Former Public Works Facility, Long Beach: The survey included the collection of building material samples from numerous structures located on the facility and interpretation of laboratory analysis. Mold spore samples (air and tape-lifts) were also collected and analyzed from one of the structures. PROFESSIONAL EXPERIENCE
Clark Seif Clark, Inc., Environmental Engineering Project Manager, August 2013 to Present
Andersen Environmental, Project Engineer, February 2013 to July 2013 SCS Engineers, Long Beach, CA - Staff Engineer, December 2005 to February 2013 Teledyne Relays, Hawthorne, CA - EHS Staff, December 2004 to December 2005
MS - Environmental Engineering, California State University Long Beach, in progress BS - Environmental Engineering Technology, California State University Long Beach, 2005

January 2014
JOAN GREENWOOD CLARK SEIF CLARK, INC. 110 PINE AVENUE, SUITE 925 LONG BEACH, CA 90802
SENIOR PROJECT MANAGER/QUALITY ASSURANCE MANAGER (562) 435-8080
Education
B. A. Chemistry, Wheaton College, Norton, Massachusetts, 1970
Northeastern University (300 hours of evaluated learning in graduate-level chemistry courses), Boston, Massachusetts, 1971-1973
Babson College, Wellesley, Massachusetts (180 hours of evaluated learning in graduate-level courses in communication and business management), 1974-1975
Certificate in Strategic Environmental Management (240 hours of evaluated learning), University of California, Irvine, April 2005
Advisory Appointments
Initiating Committee and Stakeholder Group Representative: Long Beach Community Partnerships 4 Results directed by the National Civic League (2000-2002), development of performance measurements and progress indicators for City Departments
I-710 Improvement Project, Community Advisory Committee
Roundtable Advisory Committee, Gateway Cities Council of Governments, Air Quality Action Plan, July-November 2012
7th
Council District Appointee to the I-710 Community Advisory Committee
Sustainable City Commissioner, City of Long Beach (February 2007-Present)
Environmental Advisory Commission, State Senator Alan Lowenthal, May 2006 -- present
Community Representative, Land Use and Transportation Element Update Planning Initiative, City of Long Beach (September 2004)
Water Quality Committee, Los Angeles and San Gabriel Rivers Watershed Council (2002-2003)
Technical Advisory Committee, City of Long Beach 6th
Street and DeForest Park Wetlands Feasibility Study (2001-2002)
San Gabriel and Lower Los Angeles Rivers and Mountains Conservancy (RMC) Watershed Open Space Plan -- Working Group Member (2002)
Water Resources subcommittee chair and Sustainable City Program subcommittee member: Long Beach Strategic Plan 2010 Environmental Task Force (1999-2000)
Community Representative: Los Angeles River Alternative Flood Control Study, LACDPW (1996-97)
Community Representative: Long Beach Naval Complex Restoration Advisory Board (1994-1996)
Community Representative: Stormwater Best Management Practices Study at the Los Angeles Zoo (1999-2000) Summary of Professional Qualifications Joan Greenwood has over 20 years of program and project management experience. She has developed strengths in strategic environmental program planning, environmental quality management programs (ISO 14001), environmental sustainability, and technical evaluations as a member of the litigation support team and environmental risk communications. Ms. Greenwood is familiar with all levels of CEQA and NEPA documentation and recently serviced as the Project Director for a portfolio of eight sites selected for construction of new State courthouses. She has a certificate in strategic environmental management from the University of California, Irvine, where she completed supplemental courses in CEQA/NEPA compliance, environmental modeling and risk assessments. She has completed 40 hours of training required for verifying greenhouse gas emission reports. In addition, she has completed Turner Construction’s 39-hour training course for Construction Project Management, which included a 3-hour module on construction site safety. Ms. Greenwood is an analytical chemist with over 35 years of professional experience. She has extensive expertise implementing sampling and analysis projects requiring knowledge of Standard Methods for Drinking Water, EPA SW-846 Test Methods for Solid Wastes (soils, wastewater, surface and ground waters) and field measurement techniques such as

January 2014
immunoassays and x-ray fluorescence. These methods are all applicable to site characterization using the U. S. EPA TRIAD Strategy. From 1974 through 1990 as a technical manager for several manufacturers of scientific instrumentation, Ms. Greenwood developed and revised analytical methods, made recommendations for new products, critiqued and recommended changes to user interfaces, wrote training manuals for equipment and data logging systems, and conducted numerous workshops and training courses throughout the world. She later served as a senior corporate manager and product manager in firms transitioning from startup to being an industry leader. She has given lectures at universities and at meetings of professional societies and commercial real estate groups on emerging topics of interest. She has published papers on analytical methodologies in peer-reviewed professional journals. Recent Project Experience Since joining the firm in 2000, Ms. Greenwood has focused on emerging environmental management issues: storm water and dry season urban runoff Best Management Practices (BMPs), metal ecotoxicity, industrial ecology, healthy community initiatives, phytoremediation, and Brownfield programs; keeps staff up-to-date on a wide range of pending technical and regulatory issues that may have major impact on clients; under the supervision of a professional engineer or geologist, assists in collecting, organizing, and analyzing data for soil and groundwater investigations and remediation projects; gathers, reviews, and interprets data; accurately produces proposals, letters, and reports; investigates NCP, NEPA and CEQA issues; prepares Quality Assurance Project Plans and work plans; conducts monitoring of soil-vapor extraction remediation systems in compliance with South Coast Air Quality Management District permits; oversees well abandonments conducted by subcontractors; prepares Storm Water Pollution Prevention Plans for remediation sites; and reviews fact witness depositions describing hazardous materials management practices and field investigations as part of the litigation support practice. SENIOR PRODUCT MANAGER/REGIONAL ACCOUNT MANAGER -- Developed new products and methods for field instrumentation and continuous monitoring equipment developed for both environmental and industrial operations (pH, conductivity, Photoionization Analyzers, Gas Chromatographs and X-Ray Fluorescence Spectrometers); traveled to industrial facilities throughout the Western United States and Canada to assist in development of fence line monitoring of chemical emissions (toxic and greenhouses gases) at major chemical plants. PRINCIPAL CONSULTANT/PROJECT MANAGER -- Provided project management services and to a wide range of clients and process-scale purification systems for biopharmaceuticals; assisted a factory in the central area of the People's Republic of China with technology sourcing and financial assistance from the World Bank for an animal feed additive manufacturing facility LABORATORY DIRECTOR/PROGRAM MANAGER – Managed a staff of 35 analysts who conducted over 1,000 soil, surface, storm and groundwater samples per week in accordance with U.S. EPA and Regional Water Quality Control Board requirements; Ms. Greenwood was responsible for (1) implementing and managing a Total Quality Management ("TQM") program, (2) providing technical oversight for a computerized information management system for tracking laboratory project files; (3) reviewing project files and reports to ensure compliance with the company's national QA/QC protocols and client-specified contract requirements; (4) conducting training courses covering the U.S. EPA Data Quality Objectives ("DQO") process, chain-of-custody requirements and selection of appropriate analytical methods and overseeing sampling and analysis programs conducted by geologists and engineers responsible for environmental investigations, groundwater monitoring programs and remedial actions at local refineries and retail fuel stations and (5) serving as the Program Manager for major contracts with Chevron and Arco. Registrations
California Environmental Assessor, #08155
National Environmental Property Assessor, #331310 Continuing Education Seminars and Workshops
Construction Project Management, Turner Construction, 39-Hour Training for Subcontractors, Spring 2010

January 2014
Greenhouse Gas Emissions, California Air Resources Board, 40-Hour Training for Verification of Greenhouse Gas Emissions Reports, July 2009
Success Through Education at the Port, The Port of Los Angeles Small Business Program, January – March 2008
OSHA Hazardous Waste Operations and Emergency Response 40-Hour Training & Annual 8-Hour Refresher Classes
AAI & Liability: Prepare, Preserve and Protect, Environmental Data Resources, Inc., March 2006
Use of California Human Health Screening Levels (CHHLS) in Evaluation of Contaminated Properties, California EPA, March 2005
California Land Reuse and Revitalization Act of 2004, California EPA, March 2005
Property Due Diligence: Tools of the Trade, Environmental Data Resources, Inc., April 2004
University of California, Los Angeles, Extension School of Public Policy: Land Use and Planning: Updates, Trends and Assessments; Habitat Conservation Planning; CEQA Update 2002, CEQA Compliance Workshop
University of California, Irvine, Extension Program: Chemical and Physical Principles of Environmental Management, Biological Principles of Environmental Management, Legal and Regulatory Framework of Environmental Management, Computer Modeling Lab (Environmental Applications of Air, Water and GIS Programs), Assessment and Remediation of Environmental Contamination; Introduction to Environmental Assessments and Auditing, Environmental Applications of Risk Management and Environmental Land Planning and Management
AEHS, Inc., Conference (Workshops and Seminars for CEUs): Analysis of Petroleum Hydrocarbons in Soils, Bioremediation, Methane Gas: Technical and Legal Challenges to Residential and Commercial Development, Brownfields Redevelopment: Opportunity v. Risk, Remediation Strategies for Hydrocarbon Contaminated Soils and Groundwater, Practical Remediation of Volatile Organic Compounds in Soils and Groundwater, Challenges to Contaminant Transport Models for Soils, 1992-2001
Project Management for Environmental Professionals, Groundwater Technology, Inc., 1991
Health and Safety Training for Project Managers, Groundwater Technology, Inc., 1992
Legacy Project, California Resources Agency, Southern California Session, 2002
Achieving Success in the TMDL Program, Los Angeles Regional Water Quality Control Board, September 29, 1999
Beyond BMPs: Integrated Storm Water Management Opportunities for Multiple Benefits in the Chino Basin, Chino Basin Watermaster, July 25, 2001
California Chamber of Commerce, Hazardous Waste Management Workshop, 1992
American Chemical Society, Two-Day Workshops: Environmental Law and Regulations, Environmental QA/QC and Laboratory Health and Safety, 1992-1993
Publications and Presentations (Partial List)
Environmental Forensics from the Perspective of An Analytical Chemist, Southern California Chapter of the American Board of Industrial Hygienists, March 2009
Sustainability and the Environment: A Transdisciplinary Approach to Urban Planning, University of Southern California, Guest Lecturer (undergraduate course in urban planning), April 2003
Brownfields Basics, January 2005 General Meeting of the Realty Investment Association of Orange County
Brownfield Programs for Redevelopment of Contaminated Properties, CRIA Certification Program Workshop, Realty Investment Association of Orange County, October 2004
Water Quality Indicators in Urban Rivers and Estuaries: A Rigorous Scientific Approach for Monitoring and Assessments Conducted by Volunteers, Headwaters to Oceans Conference, Long Beach, October 2003
Photosensitized Reactions of Thymine and Uracil, Undergraduate Thesis, 1970

Appendix K Supplemental EDR Database Search Reports

™tropeR etiS RDE
6 Armstrong Road, 4th floorShelton, CT 06484Toll Free: 800.352.0050www.edrnet.com
LAUSD/OLIVE VISTA JH14600 TYLER STSYLMAR, CA 91342
Inquiry Number: May 9, 2014

The EDR-Site Report is a comprehensive presentation of government filings on a facility identified inTM
a search of federal, state and local environmental databases. The report is divided into three sections:
Section 1: Facility Summary . . . . . . . . . . . . . . . . . . . . . . . . . . . . . . . . . . . . . . . . . . . . . . . . . . . . . . . . Page 3
Summary of facility filings including a review of the following areas: waste management,waste disposal, multi-media issues, and Superfund liability.
Section 2: Facility Detail Reports . . . . . . . . . . . . . . . . . . . . . . . . . . . . . . . . . . . . . . . . . . . . . . . . . . . . Page 4
All available detailed information from databases where sites are identified.
Section 3: Databases and Update Information. . . . . . . . . . . . . . . . . . . . . . . . . . . . . . . . . . . . . . . . . . Page 7
Name, source, update dates, contact phone number and description of each of the databasesfor this report.
Thank you for your business.Please contact EDR at 1-800-352-0050
with any questions or comments.
Disclaimer - Copyright and Trademark Notice
This report contains information obtained from a variety of public and other sources reasonably available to Environmental DataResources , Inc. It cannot be concluded from this Report that coverage information for the target and surrounding properties does not exist fromother sources. NO WARRANTY EXPRESSED OR IMPLIED, IS MADE WHATSOEVER IN CONNECTION WITH THIS REPORT. ENVIRONMENTALDATA RESOURCES, INC. SPECIFICALLY DISCLAIMS THE MAKING OF ANYSUCH WARRANTIES, INCLUDING WITHOUT LIMITATION,MERCHANTABILITY OR FITNESS FOR A PARTICULAR USE OR PURPOSE. ALL RISK IS ASSUMED BY THE USER. IN NO EVENT SHALLENVIRONMENTAL DATA RESOURCES, INC. BE LIABLE TO ANYONE, WHETHER ARISING OUT OF ERRORS OR OMISSIONS, NEGLIGENCE,ACCIDENT OR ANY OTHER CAUSE, FOR ANY LOSS OR DAMAGE, INCLUDING, WITHOUT LIMITATION, SPECIAL, INCIDENTAL, CONSEQUENTIAL, OR EXEMPLARY DAMAGES.ANY LIABILITY ON THE PART OF ENVIRONMENTAL DATA RESOURCES, INC. IS STRICTLYLIMITED TO A REFUND OF THE AMOUNT PAID FOR THIS REPORT.Purchaser accepts this report "AS IS". Any analyses, estimates, ratings, or risk codes provided in this report are provided for illustrative purposes only, and are not intended to provide, norshould they be interpreted as providing any facts regarding, or prediction or forecast of, any environmental risk for any property. Only a Phase IEnvironmental Site Assesment performed by an environmental professional can produce information regarding the environmental risk for any property. Additionally, the information provided in this Report is not to be construed as legal advice.
Copyright 2008 by Environmental Data Resources, Inc. All rights reserved. Reproduction in any media or format, in wholeor in part, of any report or map of Environmental Data Resources, Inc., or its affiliates, is prohibited without prior written permission.
EDR and its logos (including Sanborn and Sanborn Map) are trademarks of Environmental Data Resources, Inc. or its affiliates. All othertrademarks used herein are the property of their respective owners.
TABLE OF CONTENTS
Report# Prepared for / May 9, 2014 Page# 2 of 7
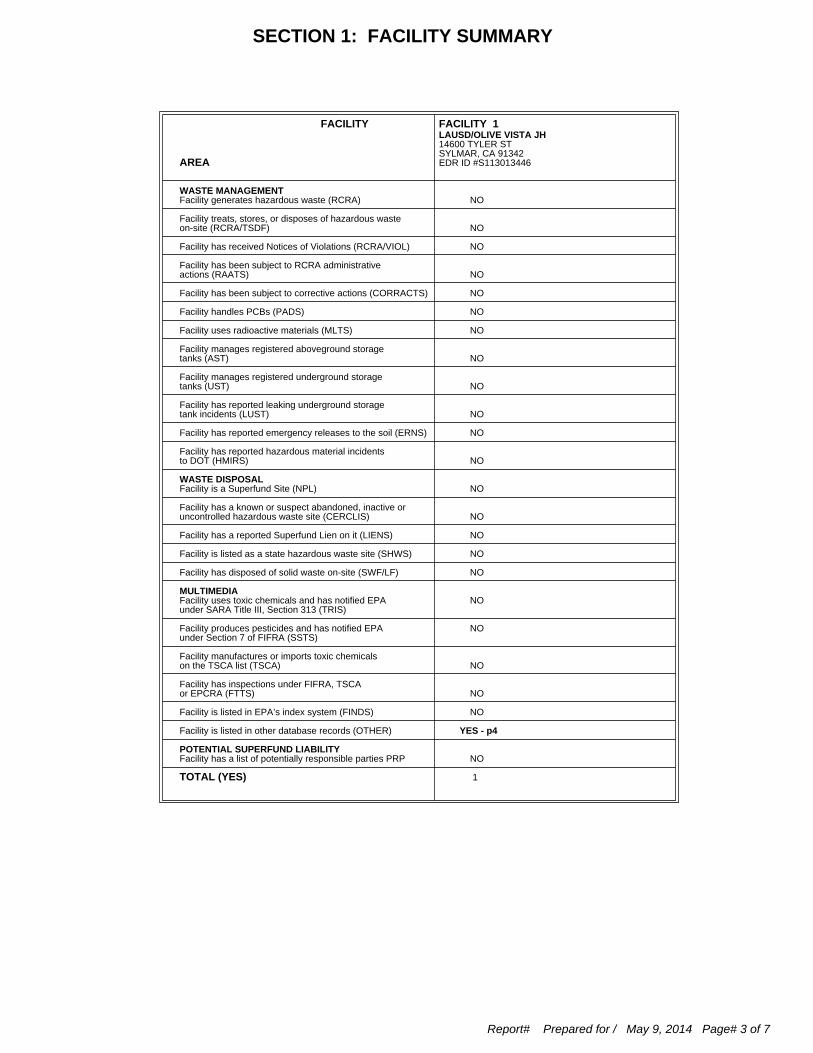
FACILITY 1 FACILITY LAUSD/OLIVE VISTA JH 14600 TYLER ST SYLMAR, CA 91342 AREA EDR ID #S113013446
WASTE MANAGEMENT NOFacility generates hazardous waste (RCRA)
Facility treats, stores, or disposes of hazardous waste NOon-site (RCRA/TSDF)
NOFacility has received Notices of Violations (RCRA/VIOL)
Facility has been subject to RCRA administrative NOactions (RAATS)
NOFacility has been subject to corrective actions (CORRACTS)
NOFacility handles PCBs (PADS)
NOFacility uses radioactive materials (MLTS)
Facility manages registered aboveground storage NOtanks (AST)
Facility manages registered underground storage NOtanks (UST)
Facility has reported leaking underground storage NOtank incidents (LUST)
NOFacility has reported emergency releases to the soil (ERNS)
Facility has reported hazardous material incidents NOto DOT (HMIRS)
WASTE DISPOSAL NOFacility is a Superfund Site (NPL)
Facility has a known or suspect abandoned, inactive or NOuncontrolled hazardous waste site (CERCLIS)
NOFacility has a reported Superfund Lien on it (LIENS)
NOFacility is listed as a state hazardous waste site (SHWS)
NOFacility has disposed of solid waste on-site (SWF/LF)
MULTIMEDIA NOFacility uses toxic chemicals and has notified EPA under SARA Title III, Section 313 (TRIS)
NOFacility produces pesticides and has notified EPA under Section 7 of FIFRA (SSTS)
Facility manufactures or imports toxic chemicals NOon the TSCA list (TSCA)
Facility has inspections under FIFRA, TSCA NOor EPCRA (FTTS)
NOFacility is listed in EPA’s index system (FINDS)
YES - p4 Facility is listed in other database records (OTHER)
POTENTIAL SUPERFUND LIABILITY NOFacility has a list of potentially responsible parties PRP
TOTAL (YES) 1
SECTION 1: FACILITY SUMMARY
Report# Prepared for / May 9, 2014 Page# 3 of 7

MULTIMEDIA
Facility is listed in other database records
DATABASE: Other Database Records (OTHER)
LAUSD/OLIVE VISTA JH14600 TYLER STSYLMAR, CA 91342EDR ID #S113013446
HAZNET: 2009Year: CAD982044075Gepaid: SOE AUNG / ECMContact: 2132413199Telephone: Not reportedMailing Name: 333 S BEAUDRY AVE 20TH FLOORMailing Address: Los Angeles, CA 900170000Mailing City,St,Zip: Not reportedGen County: AZC950823111TSD EPA ID: Not reportedTSD County: Asbestos containing wasteWaste Category: Landfill Or Surface Impoundment That Will Be Closed As Landfill( To IncludeDisposal Method: On-Site Treatment And/Or Stabilization) 2.8Tons: Los AngelesFacility County:
2009Year: CAD982044075Gepaid: SOE AUNG / ECMContact: 2132413199Telephone: Not reportedMailing Name: 333 S BEAUDRY AVE 20TH FLOORMailing Address: Los Angeles, CA 900170000Mailing City,St,Zip: Not reportedGen County: CAD028409019TSD EPA ID: Not reportedTSD County: Other organic solidsWaste Category: Storage, Bulking, And/Or Transfer Off Site--No Treatment/Reovery (H010-H129) OrDisposal Method: (H131-H135) 0.1Tons: Los AngelesFacility County:
2007Year: CAD982044075Gepaid: YI HWA KIM DEPUTY DIRECTORContact: 2137435086Telephone: Not reportedMailing Name: 333 S Beaudry Ave 20th FlMailing Address: Los Angeles, CA 900170000Mailing City,St,Zip: Not reportedGen County: CAD028409019TSD EPA ID: Not reportedTSD County: Other inorganic solid wasteWaste Category: Storage, Bulking, And/Or Transfer Off Site--No Treatment/Reovery (H010-H129) OrDisposal Method: (H131-H135) 0.02Tons: Los AngelesFacility County:
2007Year: CAD982044075Gepaid: YI HWA KIM DEPUTY DIRECTORContact: 2137435086Telephone: Not reportedMailing Name: 333 S Beaudry Ave 20th FlMailing Address: Los Angeles, CA 900170000Mailing City,St,Zip: Not reportedGen County: AZC950823111TSD EPA ID: Not reportedTSD County: Asbestos containing wasteWaste Category: Landfill Or Surface Impoundment That Will Be Closed As Landfill( To IncludeDisposal Method: On-Site Treatment And/Or Stabilization) 0.4Tons: Los AngelesFacility County:
2006Year: CAD982044075Gepaid: YI HWA KIM DEPUTY DIRECTORContact: 2137435086Telephone: Not reportedMailing Name:
SECTION 2: FACILITY DETAIL REPORTS
Report# Prepared for / May 9, 2014 Page# 4 of 7
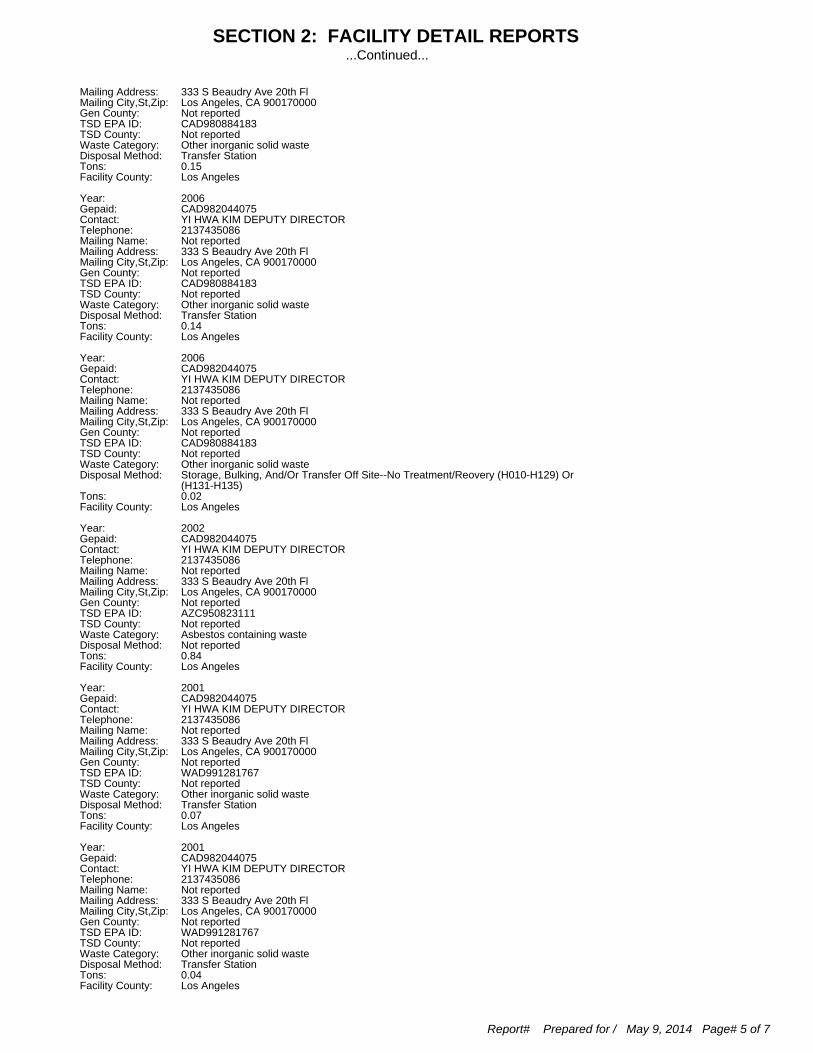
333 S Beaudry Ave 20th FlMailing Address: Los Angeles, CA 900170000Mailing City,St,Zip: Not reportedGen County: CAD980884183TSD EPA ID: Not reportedTSD County: Other inorganic solid wasteWaste Category: Transfer StationDisposal Method: 0.15Tons: Los AngelesFacility County:
2006Year: CAD982044075Gepaid: YI HWA KIM DEPUTY DIRECTORContact: 2137435086Telephone: Not reportedMailing Name: 333 S Beaudry Ave 20th FlMailing Address: Los Angeles, CA 900170000Mailing City,St,Zip: Not reportedGen County: CAD980884183TSD EPA ID: Not reportedTSD County: Other inorganic solid wasteWaste Category: Transfer StationDisposal Method: 0.14Tons: Los AngelesFacility County:
2006Year: CAD982044075Gepaid: YI HWA KIM DEPUTY DIRECTORContact: 2137435086Telephone: Not reportedMailing Name: 333 S Beaudry Ave 20th FlMailing Address: Los Angeles, CA 900170000Mailing City,St,Zip: Not reportedGen County: CAD980884183TSD EPA ID: Not reportedTSD County: Other inorganic solid wasteWaste Category: Storage, Bulking, And/Or Transfer Off Site--No Treatment/Reovery (H010-H129) OrDisposal Method: (H131-H135) 0.02Tons: Los AngelesFacility County:
2002Year: CAD982044075Gepaid: YI HWA KIM DEPUTY DIRECTORContact: 2137435086Telephone: Not reportedMailing Name: 333 S Beaudry Ave 20th FlMailing Address: Los Angeles, CA 900170000Mailing City,St,Zip: Not reportedGen County: AZC950823111TSD EPA ID: Not reportedTSD County: Asbestos containing wasteWaste Category: Not reportedDisposal Method: 0.84Tons: Los AngelesFacility County:
2001Year: CAD982044075Gepaid: YI HWA KIM DEPUTY DIRECTORContact: 2137435086Telephone: Not reportedMailing Name: 333 S Beaudry Ave 20th FlMailing Address: Los Angeles, CA 900170000Mailing City,St,Zip: Not reportedGen County: WAD991281767TSD EPA ID: Not reportedTSD County: Other inorganic solid wasteWaste Category: Transfer StationDisposal Method: 0.07Tons: Los AngelesFacility County:
2001Year: CAD982044075Gepaid: YI HWA KIM DEPUTY DIRECTORContact: 2137435086Telephone: Not reportedMailing Name: 333 S Beaudry Ave 20th FlMailing Address: Los Angeles, CA 900170000Mailing City,St,Zip: Not reportedGen County: WAD991281767TSD EPA ID: Not reportedTSD County: Other inorganic solid wasteWaste Category: Transfer StationDisposal Method: 0.04Tons: Los AngelesFacility County:
SECTION 2: FACILITY DETAIL REPORTS...Continued...
Report# Prepared for / May 9, 2014 Page# 5 of 7
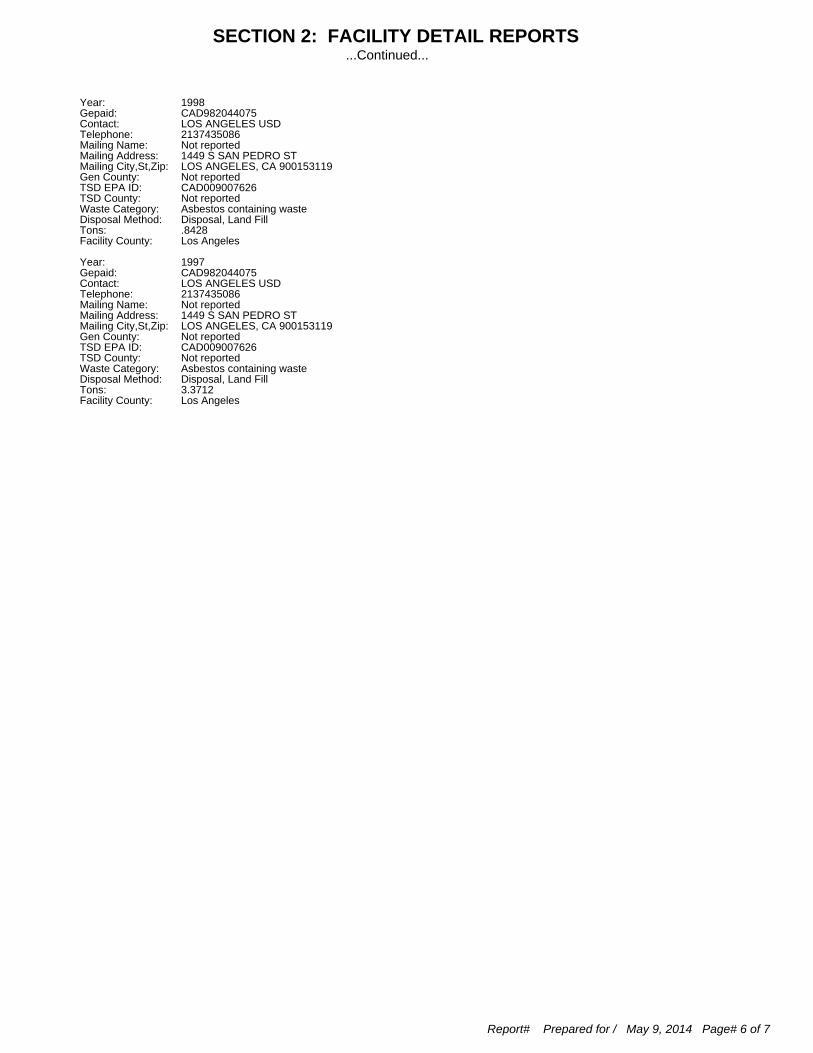
1998Year: CAD982044075Gepaid: LOS ANGELES USDContact: 2137435086Telephone: Not reportedMailing Name: 1449 S SAN PEDRO STMailing Address: LOS ANGELES, CA 900153119Mailing City,St,Zip: Not reportedGen County: CAD009007626TSD EPA ID: Not reportedTSD County: Asbestos containing wasteWaste Category: Disposal, Land FillDisposal Method: .8428Tons: Los AngelesFacility County:
1997Year: CAD982044075Gepaid: LOS ANGELES USDContact: 2137435086Telephone: Not reportedMailing Name: 1449 S SAN PEDRO STMailing Address: LOS ANGELES, CA 900153119Mailing City,St,Zip: Not reportedGen County: CAD009007626TSD EPA ID: Not reportedTSD County: Asbestos containing wasteWaste Category: Disposal, Land FillDisposal Method: 3.3712Tons: Los AngelesFacility County:
SECTION 2: FACILITY DETAIL REPORTS...Continued...
Report# Prepared for / May 9, 2014 Page# 6 of 7

To maintain currency of the following federal, state and local databases, EDR contacts the appropriate government agency on a monthlyor quarterly basis as required.
Elapsed ASTM days: Provides confirmation that this report meets or exceeds the 90-day updatingrequirement of the ASTM standard.
DATABASES FOUND IN THIS REPORT
CA HAZNET: Facility and Manifest DataSource: California Environmental Protection AgencyTelephone: 916-255-1136
Facility and Manifest Data. The data is extracted from the copies of hazardous waste manifestsreceived each year by the DTSC. The annual volume of manifests is typically 700,000 - 1,000,000annually, representing approximately 350,000 - 500,000 shipments. Data are from the manifestssubmitted without correction, and therefore many contain some invalid values for data elementssuch as generator ID, TSD ID, waste category, and disposal method.
Date of Government Version: 12/31/2012 Date of Last EDR Contact: 04/18/2014Database Release Frequency: Annually Date of Next Scheduled Update: 07/28/2014
SECTION 3: DATABASES AND UPDATE DATES
Report# Prepared for / May 9, 2014 Page# 7 of 7
Olive Vista Middle School14600 Tyler StreetSylmar, CA
Inquiry Number: 3880855.7March 19, 2014
6 Armstrong Road 4th FloorShelton, CT 06484800.352.0050www.edrnet.com

EDR Environmental LienSearch™ Report
The EDR Environmental LienSearch Report provides results from a search of available current land title records forenvironmental cleanup liens and other activity and use limitations, such as engineering controls and institutionalcontrols.
A network of professional, trained researchers, following established procedures, uses client supplied addressinformation to:
• search for parcel information and/or legal description;• search for ownership information;• research official land title documents recorded at jurisdictional agencies such as recorders' offices, registries of
deeds, county clerks' offices, etc.;• access a copy of the deed;• search for environmental encumbering instrument(s) associated with the deed;• provide a copy of any environmental encumbrance(s) based upon a review of key words in the instrument(s)
(title, parties involved, and description); and• provide a copy of the deed or cite documents reviewed.
Thank you for your business.Please contact EDR at 1-800-352-0050
with any questions or comments.
Disclaimer - Copyright and Trademark Notice
This report was prepared for the use of Environmental Data Resources, Inc., and Nationwide EnvironmentalTitle Research LLC, exclusively. This report is neither a guarantee of title, a commitment to insure, or a policyof title insurance. NO WARRANTY, EXPRESSED OR IMPLIED, IS MADE WHATSOEVER INCONNECTION WTH THIS REPORT. Environmental Data Resources, Inc. (EDR) and NationwideEnvironmental Title Research LLC specifically disclaim the making of any such warranties, including withoutlimitation, merchantability or fitness for a particular use or purpose. The information contained in this report isretrieved as it is recorded from the various agencies that make it available. The total liability is limited to thefee paid for this report.
Copyright 2012 by Environmental Data Resources, Inc. All rights reserved. Reproduction in any media orformat, in whole or in part, of any report or map of Environmental Data Resources, Inc., or its affiliates, isprohibited without prior written permission.
EDR and its logos are trademarks of Environmental Data Resources, Inc. or its affiliates.All other trademarksused herein are the property of their respective owners.
EDR Environmental LienSearch™ Report
TARGET PROPERTY INFORMATION
ADDRESS
Olive Vista Middle School
14600 Tyler Street
Sylmar, CA
RESEARCH SOURCE
Source 1: Los Angeles County Assessor
Source 2: Los Angeles County Recorder
DEED INFORMATION
Deed 1:
Type of Deed: Deed
Grantor: Lakeside Development Co., a corportion
Grantee: Los Angeles High School District of Los Angeles County
Deed Recorded: 05/19/1954
Instrument: 1202
Deed 2:
Type of Deed: Deed
Grantor: Polk Development Co., a corporation
Grantee: Los Angeles High School District of Los Angeles County
Deed Recorded: 05/19/1954
Instrument: 1203
LEGAL DESCRIPTION
Lot 1, in Tract 20724, according to the map or plat thereof, as filed of record in Book 608, Page 5, Los Angeles County, Stateof California
Property Identifier: 2505-025-900
ENVIRONMENTAL LIEN
Found: Not Found:
OTHER ACTIVITY AND USE LIMITATIONS (AULs)
Found: Not Found:

EDR Environmental LienSearch™ Report
Deed - Exhibit


Olive Vista Middle School
14600 Tyler StreetSylmar, CA 91342
Inquiry Number: 3880855.6March 14, 2014
The EDR Property Tax Map Report
6 Armstrong RoadShelton, CT 06484800.352.0050www.edrnet.comEnvironmental Data Resources IncEnvironmental Data Resources IncEnvironmental Data Resources IncEnvironmental Data Resources Inc
EDR Property Tax Map Report
Environmental Data Resources, Inc.'s EDR Property Tax Map Report is designed to assist environmental professionals in evaluating potential environmental conditions on a target property by understanding property boundaries and other characteristics. The report includes a search of available property tax maps, which include information on boundaries for the target property and neighboring properties, addresses, parcel identification numbers, as well as other data typically used in property location and identification.
Thank you for your business. Please contact EDR at 1-800-352-0050
with any questions or comments.
Disclaimer - Copyright and Trademark Notice
This Report contains certain information obtained from a variety of public and other sources reasonably available to Environmental Data Resources, Inc. It cannot be concluded from this Report that coverage information for the target and surrounding properties does not exist from other sources. NO WARRANTY EXPRESSED OR IMPLIED, IS MADE WHATSOEVER IN CONNECTION WITH THIS REPORT. ENVIRONMENTAL DATA RESOURCES, INC. SPECIFICALLY DISCLAIMS THE MAKING OF ANY SUCH WARRANTIES, INCLUDING WITHOUT LIMITATION, MERCHANTABILITY OR FITNESS FOR A PARTICULAR USE OR PURPOSE. ALL RISK IS ASSUMED BY THE USER. IN NO EVENT SHALL ENVIRONMENTAL DATA RESOURCES, INC. BE LIABLE TO ANYONE, WHETHER ARISING OUT OF ERRORS OR OMISSIONS, NEGLIGENCE, ACCIDENT OR ANY OTHER CAUSE, FOR ANY LOSS OR DAMAGE, INCLUDING, WITHOUT LIMITATION, SPECIAL, INCIDENTAL, CONSEQUENTIAL, OR EXEMPLARY DAMAGES. ANY LIABILITY ON THE PART OF ENVIRONMENTAL DATA RESOURCES, INC. IS STRICTLY LIMITED TO A REFUND OF THE AMOUNT PAID FOR THIS REPORT. Purchaser accepts this Report "AS IS". Any analyses, estimates, ratings, environmental risk levels or risk codes provided in this Report are provided for illustrative purposes only, and are not intended to provide, nor should they be interpreted as providing any facts regarding, or prediction orforecast of, any environmental risk for any property. Only a Phase I Environmental Site Assessment performed by an environmental professional can provide information regarding the environmental risk for any property. Additionally, the information provided in this Report is not to be construed as legal advice.
Copyright 2013 by Environmental Data Resources, Inc. All rights reserved. Reproduction in any media or format, in whole or in part, of any report or map of Environmental Data Resources, Inc. or its affiliates is prohibited without prior written permission.
EDR and its logos (including Sanborn and Sanborn Map) are trademarks of Environmental Data Resources, Inc. or its affiliates. All other trademarks used herein are the property of their respective owners.

3880855.6 Page 2

Appendix L Miscellaneous Documentation


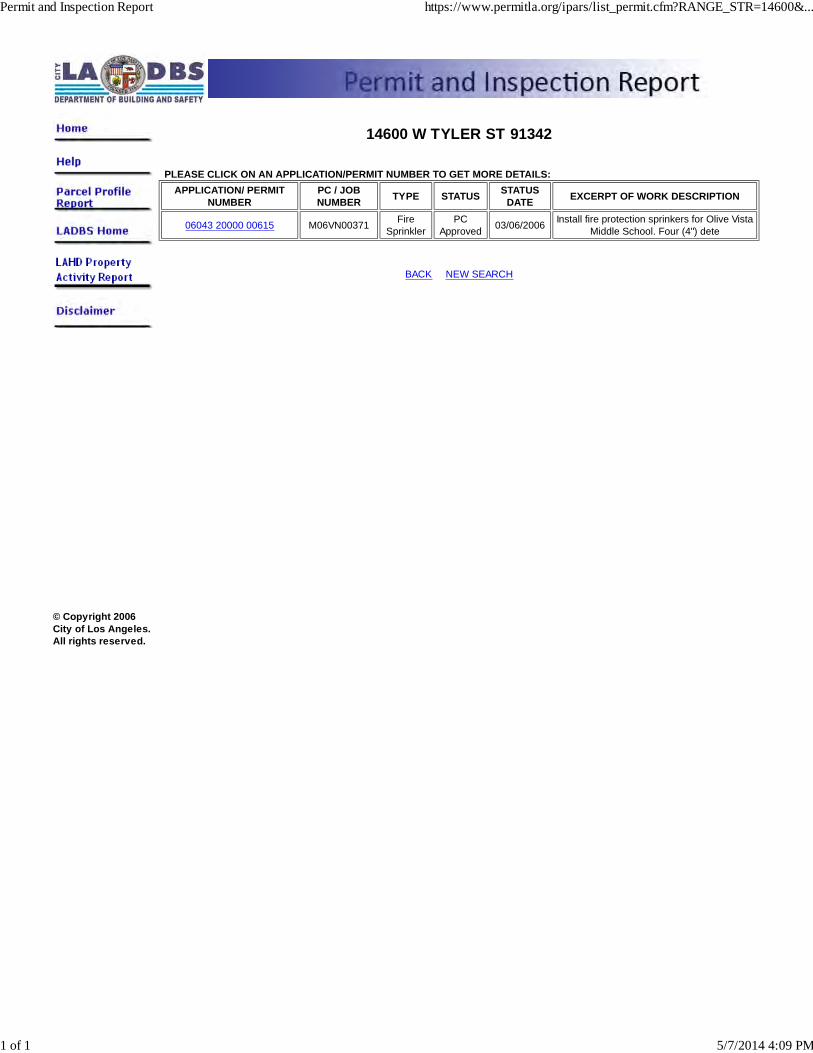
© Copyright 2006City of Los Angeles.All rights reserved.
14600 W TYLER ST 91342
PLEASE CLICK ON AN APPLICATION/PERMIT NUMBER TO GET MORE DETAILS:APPLICATION/ PERMIT
NUMBERPC / JOBNUMBER TYPE STATUS STATUS
DATE EXCERPT OF WORK DESCRIPTION
06043 20000 00615 M06VN00371 FireSprinkler
PCApproved 03/06/2006 Install fire protection sprinkers for Olive Vista
Middle School. Four (4") dete
BACK NEW SEARCH
Permit and Inspection Report https://www.permitla.org/ipars/list_permit.cfm?RANGE_STR=14600&...
1 of 1 5/7/2014 4:09 PM
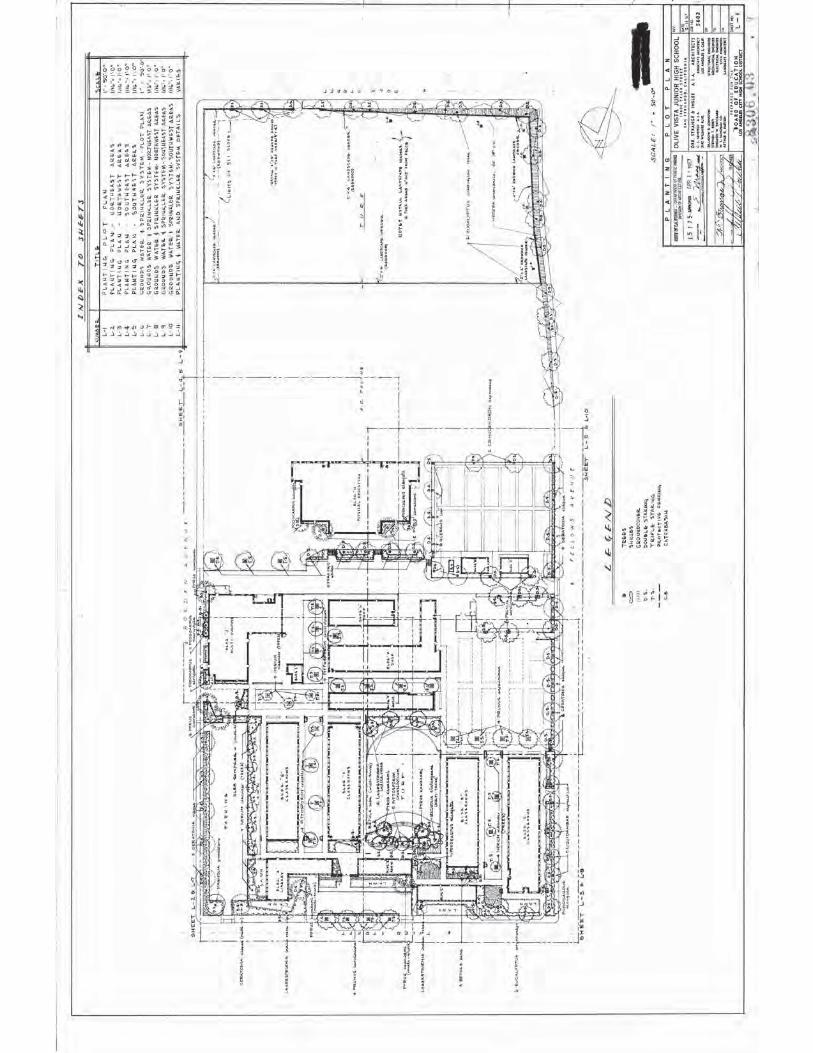
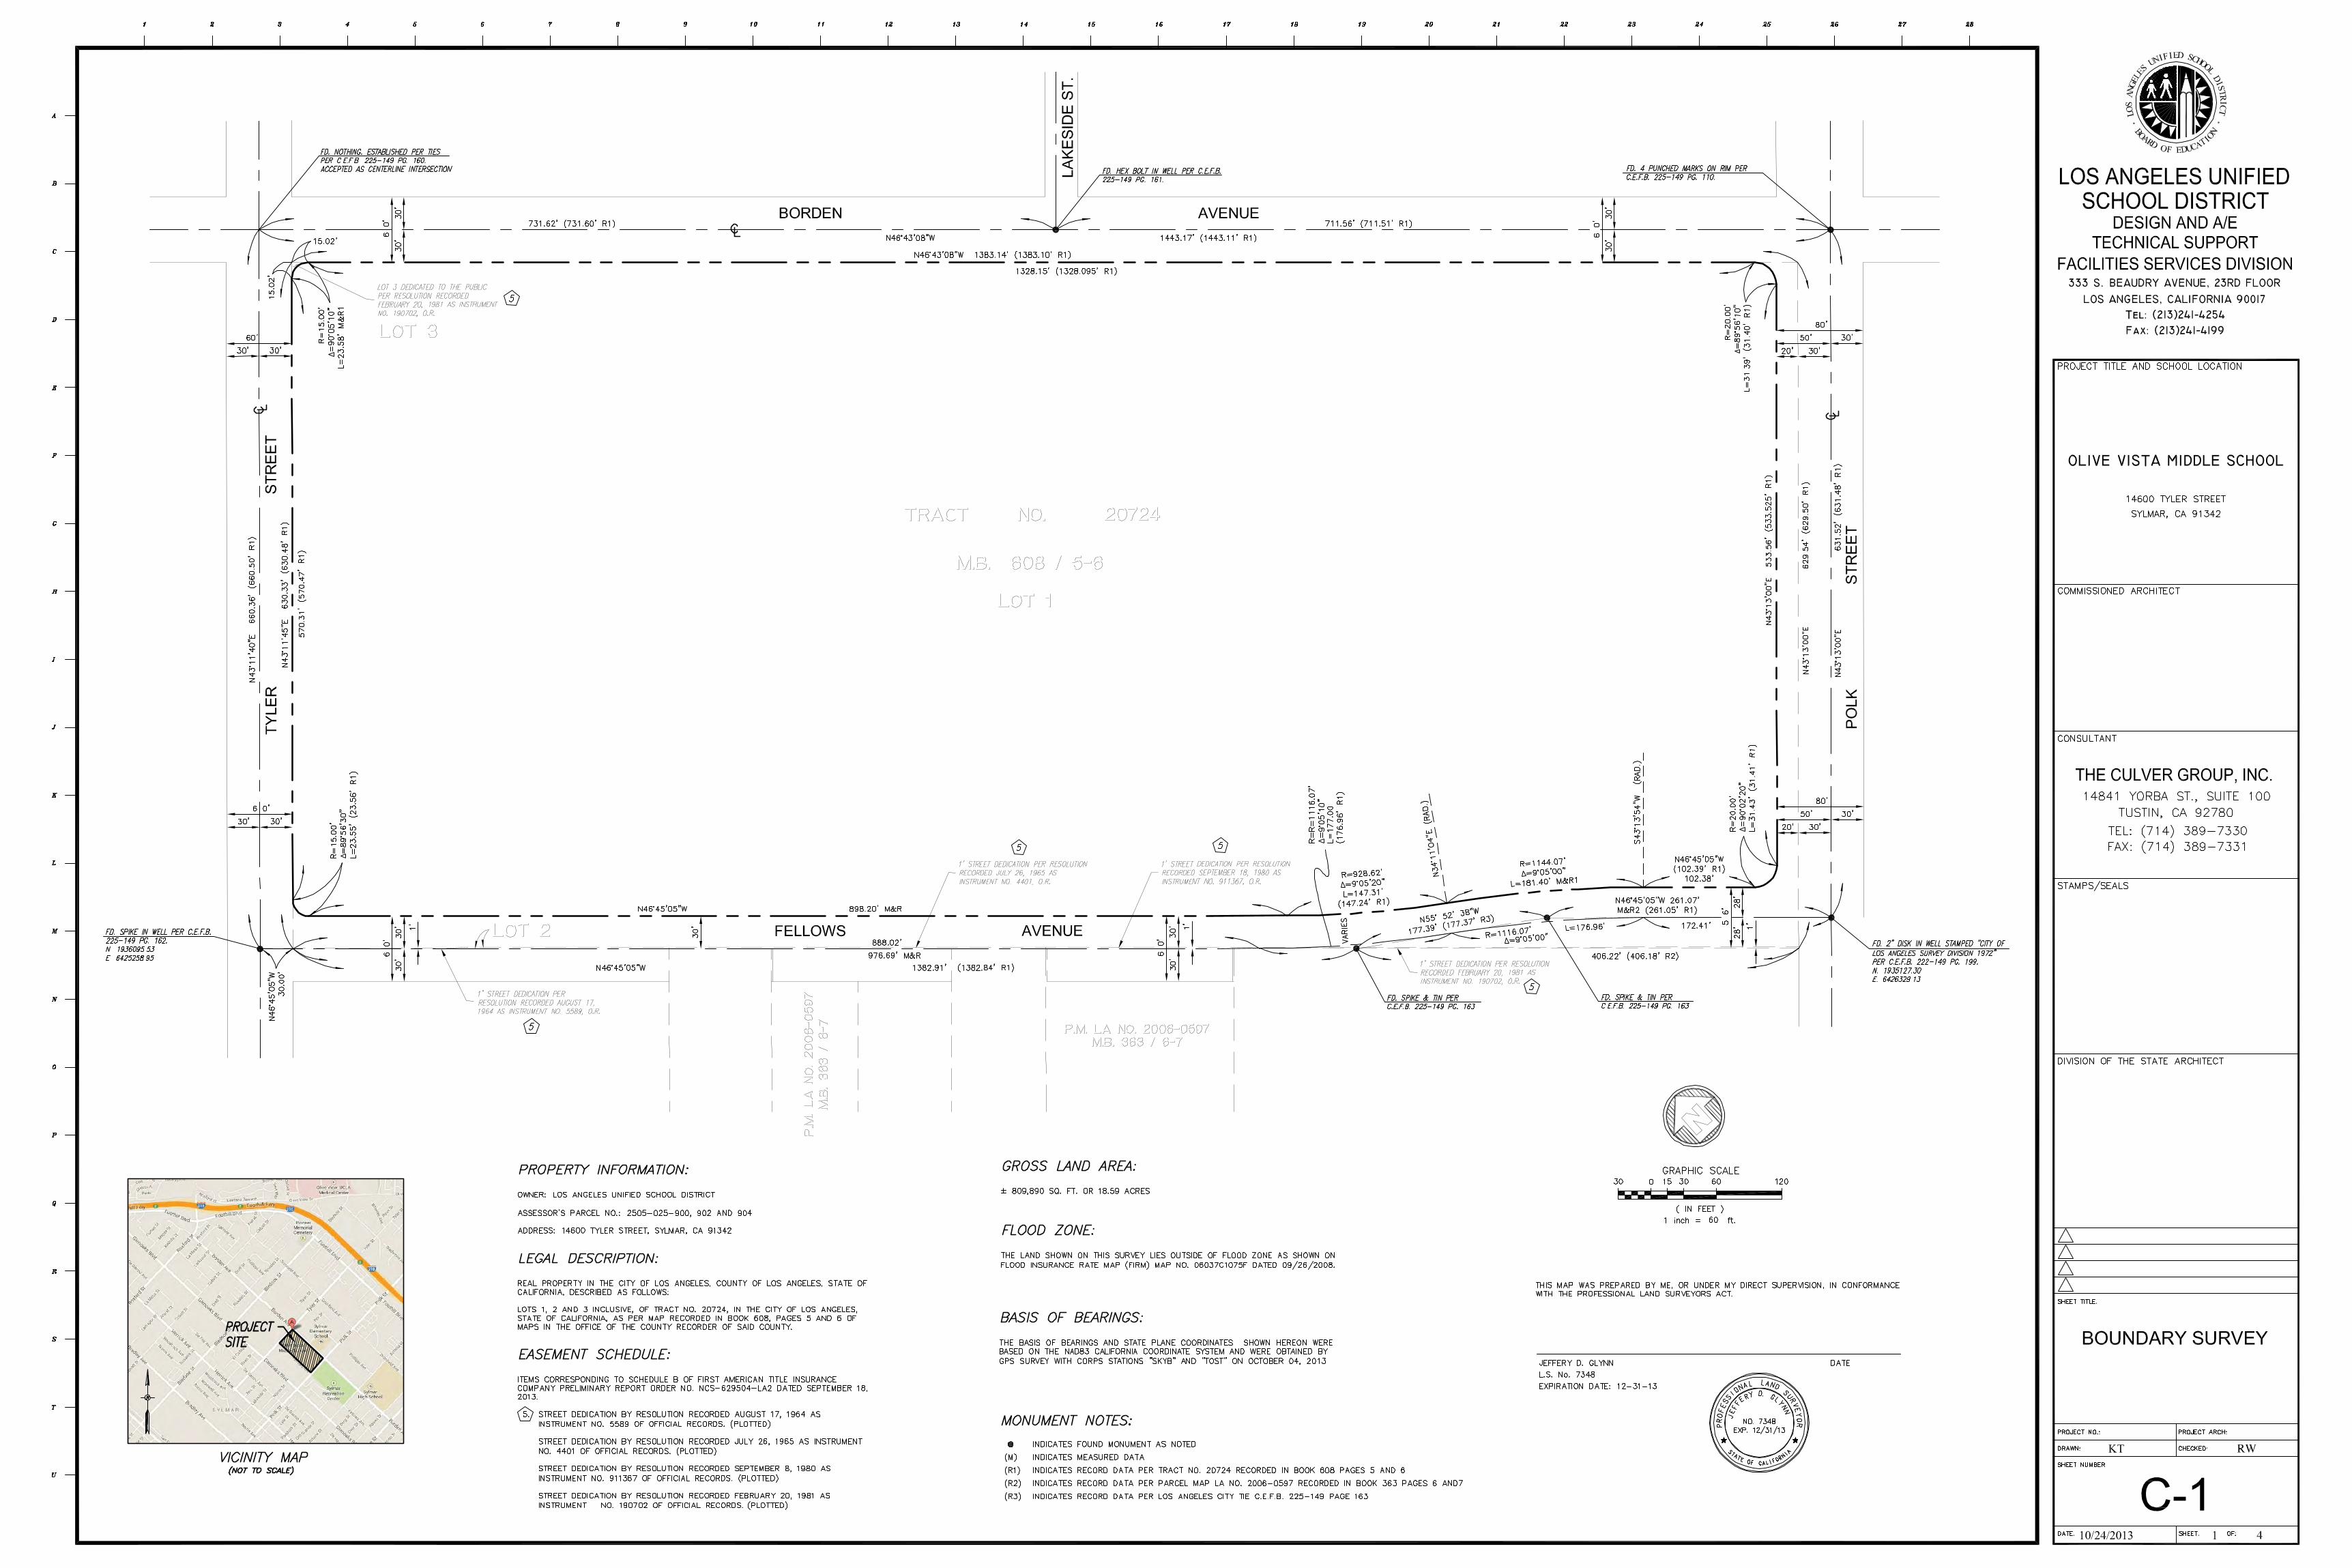


appendix d
site hyDrology anD hyDraulics rePort for olive vista miDDle school neW mPr & gymnasium builDings, 14600
tyler street, sylmar, california 91342” (“hyDrology rePort”) PrePareD for lausD by vca engineers, inc., on
november 4, 2014Noise Measurement Data and Calculations


Los Ange les I rv ine 3951 Medford Street , Los Ange les CA 90063 2151 Miche lson Dr. # 242, I rv ine , CA 92612 Te l : 323 ‐729 ‐6098 ▪ Fax : 323 ‐729 ‐6043 Te l : 949 ‐679 ‐0870 ▪ Fax : 949 ‐679 ‐9370 e ‐mai l : vca@vcaeng .com www.vcaeng.com
C I V I L S T R U C T U R A L M B E D B E S B E
QUALITY SERVICE
COMMITMENT
V C A E N G I N E E R S , I N C.
SITE HYDROLOGY AND HYDRAULICS REPORT
FOR
OLIVE VISTA MIDDLE SCHOOL
NEW MPR & GYMNASIUM BUILDINGS
14600 Tyler Street Sylmar, CA 91342
November 4, 2014
Prepared For: Los Angeles Unified School District
1055 W. 7th Street Los Angeles, CA 90071
Prepared by:
VIRGIL C. AOANAN, P.E. S.E., QSD

Los Ange les I rv ine 3951 Medford Street , Los Ange les CA 90063 2151 Miche lson Dr. # 242, I rv ine , CA 92612 Te l : 323 ‐729 ‐6098 ▪ Fax : 323 ‐729 ‐6043 Te l : 949 ‐679 ‐0870 ▪ Fax : 949 ‐679 ‐9370 e ‐mai l : vca@vcaeng .com www.vcaeng.com
1
V C A ENGINEERS, INC. CIVIL ■ STRUCTURAL MBE ■ DBE ■ SBE
QUALITY SERVICE
COMMITMENT
Los Angeles Unified School District 1055 W. 7th Street Los Angeles, California 90071 Subject: OLIVE VISTA MS – NEW MPR & GYMNASIUM BUILDINGS 14600 Tyler Street Sylmar, CA 91342 To Whom It May Concern, We are pleased to submit this letter report regarding the Hydrology and Hydraulics Report for the Olive Vista Middle School – New MPR & Gymnasium Buildings Project. This report is comprised of three sections: Narrative Report and Results
This includes Introduction and Scope, Project Site Hydrology, Project Site Hydraulics, Stormwater Mitigation, Best Management Practices, and Project Conclusions and Recommendations
Calculations This includes modeling and calculation results of the hydrology and hydraulics analysis and BMP
calculations and sizing.
Appendix This includes rainfall information, utility plans, operation and maintenance guidelines for BMPs used in this project.
Los Ange les I rv ine 3951 Medford Street , Los Ange les CA 90063 2151 Miche lson Dr. # 242, I rv ine , CA 92612 Te l : 323 ‐729 ‐6098 ▪ Fax : 323 ‐729 ‐6043 Te l : 949 ‐679 ‐0870 ▪ Fax : 949 ‐679 ‐9370 e ‐mai l : vca@vcaeng .com www.vcaeng.com
2
V C A ENGINEERS, INC. CIVIL ■ STRUCTURAL MBE ■ DBE ■ SBE
QUALITY SERVICE
COMMITMENT
TableofContents
1.0 INTRODUCTION....................................................................................................... 4
1.1 SCOPE .......................................................................................................................... 4
1.2 STANDARDS............................................................................................................... 4
2.0 SITE DESCRIPTION ................................................................................................. 4
2.1 PROJECT LOCATION ................................................................................................ 4
2.2 EXISTING SITE CONDITIONS AND STORM DRAINAGE SYSTEM ................... 4
2.2.1 EXISTING SITE IMPROVEMENTS ........................................................ 4 2.2.2 EXISTING DRAINAGE PATTERN ......................................................... 5
2.3 GEOLOGICAL CONDITIONS.................................................................................... 5
2.3.1 GEOTECHNICAL REPORT ..................................................................... 5 2.3.2 SOIL TYPE ................................................................................................. 5 2.3.3 GROUNDWATER LEVEL........................................................................ 6 2.3.4 LIQUEFACTION ....................................................................................... 6 2.3.5 LANDSLIDES ............................................................................................ 6 2.3.6 PERCOLATION RATE ............................................................................. 6
2.4 PROPOSED STORM DRAINAGE SYSTEM ............................................................. 7
2.4.1 DEVELOPMENT AREA ........................................................................... 7 2.4.2 PROPOSED RUNOFF CONVEYANCE AND DISCHARGE SYSTEM 7
3.0 SITE HYDROLOGY .................................................................................................. 8
3.1 HYDROLOGY DATA ................................................................................................. 8
3.1.1 ISOHYETAL MAP .................................................................................... 8 3.1.2 DESIGN FREQUENCY ............................................................................. 8 3.1.3 RAINFALL DEPTH ................................................................................... 8 3.1.4 SOIL TYPE ................................................................................................. 8
3.2 STORMWATER DISCHARGE FOR THE EXISTING SITE ..................................... 8
3.3 STORMWATER DISCHARGE FOR THE PROPOSED SITE ................................... 8
3.3.2 RUNOFF FLOW AND VOLUME ............................................................. 8
4.0 PROJECT SITE HYDRAULICS .............................................................................. 9

Los Ange les I rv ine 3951 Medford Street , Los Ange les CA 90063 2151 Miche lson Dr. # 242, I rv ine , CA 92612 Te l : 323 ‐729 ‐6098 ▪ Fax : 323 ‐729 ‐6043 Te l : 949 ‐679 ‐0870 ▪ Fax : 949 ‐679 ‐9370 e ‐mai l : vca@vcaeng .com www.vcaeng.com
3
V C A ENGINEERS, INC. CIVIL ■ STRUCTURAL MBE ■ DBE ■ SBE
QUALITY SERVICE
COMMITMENT
4.1 BASIS OF DESIGN ...................................................................................................... 9
4.2 PROPOSED HYDRAULICS SYSTEM ....................................................................... 9
4.3 CARRIER PIPE DESIGN ............................................................................................. 9
4.4 CATCH BASIN DESIGN ............................................................................................. 9
5.0 STORMWATER MITIGATION .............................................................................. 9
5.1 LOW IMPACT DEVELOPMENT (LID) PLAN ......................................................... 9
6.0 BEST MANAGEMENT PRACTICES ................................................................... 10
6.1 CATCH BASIN .......................................................................................................... 10
6.2 CONTINOUS DEFLECTIVE SEPARATION (CDS) ............................................... 11
6.3 CONTINOUS DEFLECTIVE SEPARATION (CDS) ............................................... 11
7.0 PROJECT CONCLUSIONS AND RECOMMENDATIONS .............................. 11
Los Ange les I rv ine 3951 Medford Street , Los Ange les CA 90063 2151 Miche lson Dr. # 242, I rv ine , CA 92612 Te l : 323 ‐729 ‐6098 ▪ Fax : 323 ‐729 ‐6043 Te l : 949 ‐679 ‐0870 ▪ Fax : 949 ‐679 ‐9370 e ‐mai l : vca@vcaeng .com www.vcaeng.com
4
V C A ENGINEERS, INC. CIVIL ■ STRUCTURAL MBE ■ DBE ■ SBE
QUALITY SERVICE
COMMITMENT
1.0 INTRODUCTION
1.1 SCOPE This Hydrology and Hydraulics Report summarizes the stormwater management for the Olive Vista MS – New MPR & Gymnasium Buildings Project. This Report calculates the stormwater runoff generated by the site, the conveyance and discharge system of the runoff, and the stormwater mitigation system using approved Best Management Practices.
1.2 STANDARDS The standards below were used in the design of the site's stormwater management:
1. School Design Guide – Los Angeles Unified School District (January 2014) 2. Los Angeles Unified School District (LAUSD) Stormwater Technical Manual (October
2009) 3. LA County Department of Public Works Hydrology Manual (2006) 4. County of Los Angeles Department of Public Works Low Impact Development
Standards Manual (February 2014)
2.0 SITE DESCRIPTION
2.1 PROJECT LOCATION Olive Vista Middle School is located at 14600 Tyler Street, Sylmar, California 91342. Its approximate coordinates as obtained from Google Earth is Longitude: 34.312172 N and Latitude: 118.450627 W. The project site consists of approximately 4.60 acres.
2.2 EXISTING SITE CONDITIONS AND STORM DRAINAGE SYSTEM
2.2.1 EXISTING SITE IMPROVEMENTS The current site consists of three existing structures- a multi-purpose building (MPR), gymnasium building, and agriculture building. These buildings will be demolished and a new MPR and gymnasium will be constructed. A new lawn and parking lot are also part of this project.
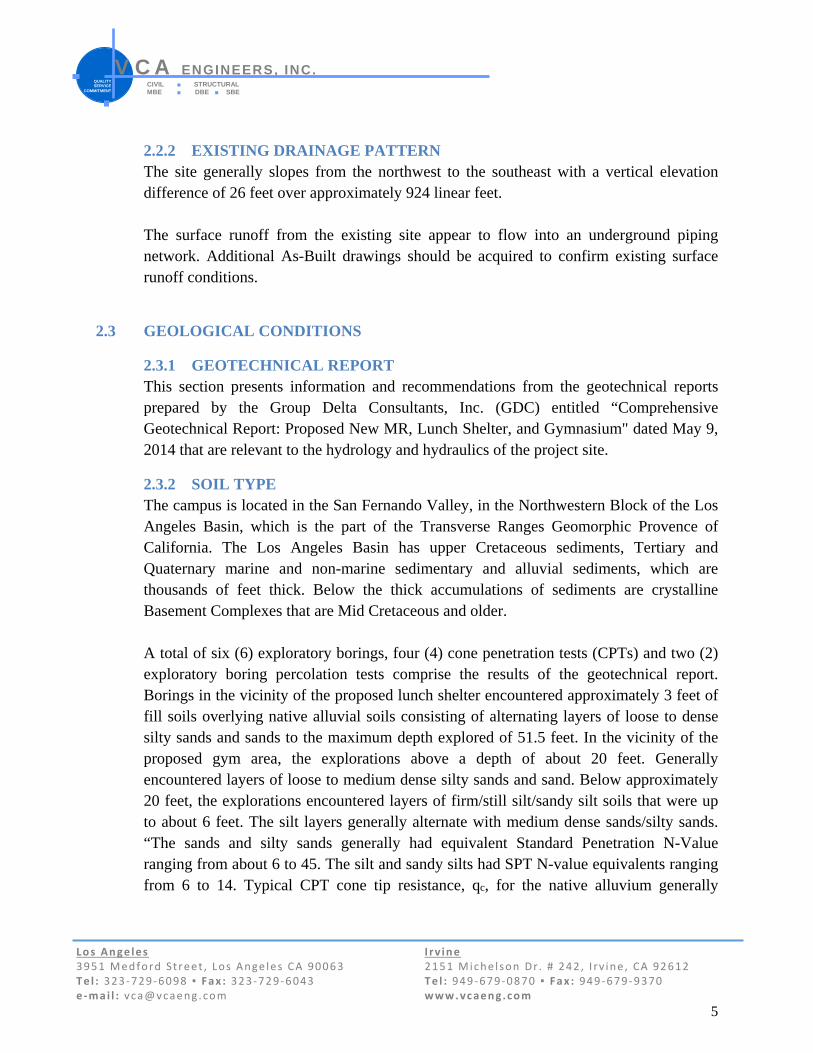
Los Ange les I rv ine 3951 Medford Street , Los Ange les CA 90063 2151 Miche lson Dr. # 242, I rv ine , CA 92612 Te l : 323 ‐729 ‐6098 ▪ Fax : 323 ‐729 ‐6043 Te l : 949 ‐679 ‐0870 ▪ Fax : 949 ‐679 ‐9370 e ‐mai l : vca@vcaeng .com www.vcaeng.com
5
V C A ENGINEERS, INC. CIVIL ■ STRUCTURAL MBE ■ DBE ■ SBE
QUALITY SERVICE
COMMITMENT
2.2.2 EXISTING DRAINAGE PATTERN The site generally slopes from the northwest to the southeast with a vertical elevation difference of 26 feet over approximately 924 linear feet. The surface runoff from the existing site appear to flow into an underground piping network. Additional As-Built drawings should be acquired to confirm existing surface runoff conditions.
2.3 GEOLOGICAL CONDITIONS
2.3.1 GEOTECHNICAL REPORT This section presents information and recommendations from the geotechnical reports prepared by the Group Delta Consultants, Inc. (GDC) entitled “Comprehensive Geotechnical Report: Proposed New MR, Lunch Shelter, and Gymnasium" dated May 9, 2014 that are relevant to the hydrology and hydraulics of the project site.
2.3.2 SOIL TYPE The campus is located in the San Fernando Valley, in the Northwestern Block of the Los Angeles Basin, which is the part of the Transverse Ranges Geomorphic Provence of California. The Los Angeles Basin has upper Cretaceous sediments, Tertiary and Quaternary marine and non-marine sedimentary and alluvial sediments, which are thousands of feet thick. Below the thick accumulations of sediments are crystalline Basement Complexes that are Mid Cretaceous and older. A total of six (6) exploratory borings, four (4) cone penetration tests (CPTs) and two (2) exploratory boring percolation tests comprise the results of the geotechnical report. Borings in the vicinity of the proposed lunch shelter encountered approximately 3 feet of fill soils overlying native alluvial soils consisting of alternating layers of loose to dense silty sands and sands to the maximum depth explored of 51.5 feet. In the vicinity of the proposed gym area, the explorations above a depth of about 20 feet. Generally encountered layers of loose to medium dense silty sands and sand. Below approximately 20 feet, the explorations encountered layers of firm/still silt/sandy silt soils that were up to about 6 feet. The silt layers generally alternate with medium dense sands/silty sands. “The sands and silty sands generally had equivalent Standard Penetration N-Value ranging from about 6 to 45. The silt and sandy silts had SPT N-value equivalents ranging from 6 to 14. Typical CPT cone tip resistance, qc, for the native alluvium generally

Los Ange les I rv ine 3951 Medford Street , Los Ange les CA 90063 2151 Miche lson Dr. # 242, I rv ine , CA 92612 Te l : 323 ‐729 ‐6098 ▪ Fax : 323 ‐729 ‐6043 Te l : 949 ‐679 ‐0870 ▪ Fax : 949 ‐679 ‐9370 e ‐mai l : vca@vcaeng .com www.vcaeng.com
6
V C A ENGINEERS, INC. CIVIL ■ STRUCTURAL MBE ■ DBE ■ SBE
QUALITY SERVICE
COMMITMENT
ranges from 40 to 400 tsf. Any old fill present should be considered uncertified fill, and should be removed and recompacted.” (Geotechnical Report, Page 5)
2.3.3 GROUNDWATER LEVEL “Ground Water was not encountered in the borings, which extended to a maximum depth of 51.5 feet below the ground surface. According to the Seismic hazard Report for the San Fernando 7.5’ Quadrangles, CGS SHZ Report 15, and the historically highest Ground Water Map presented the highest historic groundwater level in the vicinity of the site ranges from 110 feet to 120 feet below the ground surface.” (Geotechnical Report, Page 5)
2.3.4 LIQUEFACTION The geotechnical report states that the site is not located within a State Earthquake Induced Liquefaction Zone Seismic Hazard Zone for the San Fernando Quadrangle, 1998. According to the City of Los Angeles Safety Element, the site is located within the City of Los Angeles Liquefiable Area (Safety Element, 1996). However, since the historical high ground water is approximately 110 feet to 120 feet below the ground surface, the soils underlying the site is not anticipated to liquefy. However, due to the loose to medium dense nature of the onsite sandy soils, dry seismic settlement is a possibility.
2.3.5 LANDSLIDES The site is not located within a State Earthquake Induced Landslide Zone Seismic Hazard Zone and the ground surface in the vicinity of the site is essentially flat. Therefore, seismic slope instability is not an issue for the site.
2.3.6 PERCOLATION RATE A percolation test was performed in wells established in Borings B-7 and B-8, in general accordance with ASTM 5912-96. Based on the City of Los Angeles Standard Urban Stormwater Mitigation Plan (SUSMP) Infiltration Requirements and Guidelines, the minimum percolation rate is required to be at a minimum of 0.5 inch per hour. Based on the results of field testing, the calculated permeability at the site is approximately 0.02 inch per hour, which is significantly lower than SUSMP infiltration requirements. “Infiltration at the subject site appears to be impractical.” (Geotechnical Report, Page 15)

Los Ange les I rv ine 3951 Medford Street , Los Ange les CA 90063 2151 Miche lson Dr. # 242, I rv ine , CA 92612 Te l : 323 ‐729 ‐6098 ▪ Fax : 323 ‐729 ‐6043 Te l : 949 ‐679 ‐0870 ▪ Fax : 949 ‐679 ‐9370 e ‐mai l : vca@vcaeng .com www.vcaeng.com
7
V C A ENGINEERS, INC. CIVIL ■ STRUCTURAL MBE ■ DBE ■ SBE
QUALITY SERVICE
COMMITMENT
2.4 PROPOSED STORM DRAINAGE SYSTEM
2.4.1 DEVELOPMENT AREA For the proposed site, 80.2% or 3.69 acres is impervious. The rest is pervious. A comparison of existing conditions and proposed conditions is presented in Table 1. Table 1 - Proposed Site Pervious and Impervious Areas
Site Condition Pervious Area (acres)
Impervious Area (acres)
% Pervious % Impervious
Existing 0.77 3.83 16.8 83.2 Proposed 0.91 3.69 19.8 80.2
2.4.2 PROPOSED RUNOFF CONVEYANCE AND DISCHARGE SYSTEM
The grading of the new facility still generally slopes from the northeast to the southwest. The change of grade between the high point upstream and low point downstream is 25 feet over approximately 1157 linear feet.
Stormwater runoff will be conveyed through surface flow and an underground piping network. All of the site (except the south parking lot) storm water will enter a detention tank which will be sized to hold the first flush. The detention tank will also be sized to hold the difference in the pre-development and post-development 25-year discharge, this ensures that the post-development site discharges less than or equal the discharge of the pre-development site. Stormwater leaves the site through parkway drains along Fellows Avenue.
All runoff that enters the site storm drain system will go through one or more BMPs. These BMPs include a continuous deflective separation (CDS) unit and filters installed in catch basins. BMPs are further explained in Section 6.0.

Los Ange les I rv ine 3951 Medford Street , Los Ange les CA 90063 2151 Miche lson Dr. # 242, I rv ine , CA 92612 Te l : 323 ‐729 ‐6098 ▪ Fax : 323 ‐729 ‐6043 Te l : 949 ‐679 ‐0870 ▪ Fax : 949 ‐679 ‐9370 e ‐mai l : vca@vcaeng .com www.vcaeng.com
8
V C A ENGINEERS, INC. CIVIL ■ STRUCTURAL MBE ■ DBE ■ SBE
QUALITY SERVICE
COMMITMENT
3.0 SITE HYDROLOGY
3.1 HYDROLOGY DATA
3.1.1 ISOHYETAL MAP The hydrology data and design criteria described in this section were used in the calculations. They were obtained from the LA County Department of Public Works (LACDPW) Hydrology Manual.
Based on its Google Earth coordinates, the project site was determined to be within the San Fernando Isohyetal Map (I-H1.36) of the LACDPW Hydrology Manual. Appendix A includes the isohyetal maps related to this project.
3.1.2 DESIGN FREQUENCY Drainage design calculations are based on the 25-year isohyetal as required by the L.A. City Bureau of Engineering.
3.1.3 RAINFALL DEPTH Based on the Isohyetal Map, the rainfall for the project site is 7.2 inches for a 50-year, 24-hour storm event and 6.32 inches for a 25-year, 24-hour storm event.
3.1.4 SOIL TYPE The Isohyetal Map indicates a numerical soil classification of 005 (Hanford Fine Sandy Loam) for the site. This approximates the soil classification provided by the Geotechnical Report, which was discussed in Section 2.3.
3.2 STORMWATER DISCHARGE FOR THE EXISTING SITE The stormwater runoff currently produced by the pre-development site was calculated using the software HydroCalc provided by the LA County Department of Public Work (shown in Calculation A). Based on a 25-year 24-hour storm event, the existing site will produce a total of 81,598 cubic feet of stormwater runoff at a peak flow rate of 12.20 cfs. The time of concentration is 9 minutes.
3.3 STORMWATER DISCHARGE FOR THE PROPOSED SITE
3.3.2 RUNOFF FLOW AND VOLUME HydroCalc was used to determine the runoff flow and volume of the proposed site. Based on a 25-year 24-hour storm event, the proposed site will produce a total of 79,339 cubic

Los Ange les I rv ine 3951 Medford Street , Los Ange les CA 90063 2151 Miche lson Dr. # 242, I rv ine , CA 92612 Te l : 323 ‐729 ‐6098 ▪ Fax : 323 ‐729 ‐6043 Te l : 949 ‐679 ‐0870 ▪ Fax : 949 ‐679 ‐9370 e ‐mai l : vca@vcaeng .com www.vcaeng.com
9
V C A ENGINEERS, INC. CIVIL ■ STRUCTURAL MBE ■ DBE ■ SBE
QUALITY SERVICE
COMMITMENT
feet of stormwater runoff at a peak flow rate of 10.88 cfs. The time of concentration is 10 minutes. (Refer to Calculation A)
4.0 PROJECT SITE HYDRAULICS
4.1 BASIS OF DESIGN The analysis of the hydraulic characteristic of the storm drain system is performed using HydroCalc. Manning’s Equation is used to determine the velocity and flow capacities.
4.2 PROPOSED HYDRAULICS SYSTEM Stormwater is conveyed using an underground pipe network which collects surface stormwater through catch basins. Stormwater from the building roofs will be connected directly via hard pipe into the storm drain system. Most stormwater will enter a CDS unit, which captures pollutants such as debris, sediment and oil. Stormwater then enters a detention tank that holds stormwater and gradually releases the stormwater through parkway drains. These parkway drains direct overflow stormwater onto Fellows Avenue.
4.3 CARRIER PIPE DESIGN The proposed drainage lines are sized to a 25-year, 24-hour storm frequency. (refer to Calculation B).
4.4 CATCH BASIN DESIGN The catch basin sizing was designed based on the peak flow (25-year, 24-hour storm) draining into each catch basin. (refer to Calculation B).
5.0 STORMWATER MITIGATION
5.1 LOW IMPACT DEVELOPMENT (LID) PLAN Per the LAUSD Stormwater Technical Manual Low Impact Development, areas with disturbed soil over 1 acre, parking lots of 5,000 square feet or more, or with 25 or more parking spaces, and exposed to stormwater runoff, shall be designed to meet the intent of the Standard Urban Stormwater Mitigation Plan for Los Angeles County.

Los Ange les I rv ine 3951 Medford Street , Los Ange les CA 90063 2151 Miche lson Dr. # 242, I rv ine , CA 92612 Te l : 323 ‐729 ‐6098 ▪ Fax : 323 ‐729 ‐6043 Te l : 949 ‐679 ‐0870 ▪ Fax : 949 ‐679 ‐9370 e ‐mai l : vca@vcaeng .com www.vcaeng.com
10
V C A ENGINEERS, INC. CIVIL ■ STRUCTURAL MBE ■ DBE ■ SBE
QUALITY SERVICE
COMMITMENT
The County of Los Angeles Low Impact Development Standards Manual states that projects are required to manage the difference between the stormwater runoff volume pre- and post-
construction (SWQDv) through on-site retention. Since the post-construction site has a runoff
volume (79,339 CF) less than the pre-construction site (81,958 CF), there is no SWQDv. However, projects are required to treat a specific volume of stormwater runoff (SWQDv) using Low Impact Development. Low Impact Development (LID) is a stormwater management strategy that mitigates the impacts of runoff and stormwater pollution using BMPs that remove or treat runoff pollution at the source. LID practices are designed to protect surface and groundwater quality, maintain the integrity of ecosystems, and preserve the physical integrity of receiving waters by controlling rainfall and stormwater runoff at or close to the source. LID is implemented in the following hierarchy:
1. Infiltration and/or Bioretention 2. Stormwater Runoff Harvest and Use
The Stormwater Quality Design Volume is calculated from the 85th percentile, 24-hour rain event as determined from the Los Angeles County 85th percentile precipitation isohyetal map. This project has an 85th percentile, 24-hour rainfall depth of approximately 1 inches/hour. Using the HydroCalc, the SWQDv is 12,281 CF at a flow rate of 0.766 CFS (refer to Calculation C). The geotechnical report states that infiltration is impractical (refer to Appendix B) therefore infiltration BMPs will not be used. LAUSD currently does not allow capture and use BMPs due to health and safety issues. Since the site is unable to utilize retention-based stormwater quality control measures, alternative compliance measures must be implemented. This project will increase the pervious area of the site and this added vegetation will assist in stormwater quality control. In addition, the site’s stormwater system will utilize source control BMPs to remove sediment, trash, sediment, oil, and debris from stormwater using catch basin filters and a continuous deflective separation mechanical device.
6.0 BEST MANAGEMENT PRACTICES
6.1 CATCH BASIN All catch basins will have a debris catch with sediment filter bag. These filters direct the stormwater runoff to filtration media which will capture solid waste particles and other pollutants

Los Ange les I rv ine 3951 Medford Street , Los Ange les CA 90063 2151 Miche lson Dr. # 242, I rv ine , CA 92612 Te l : 323 ‐729 ‐6098 ▪ Fax : 323 ‐729 ‐6043 Te l : 949 ‐679 ‐0870 ▪ Fax : 949 ‐679 ‐9370 e ‐mai l : vca@vcaeng .com www.vcaeng.com
11
V C A ENGINEERS, INC. CIVIL ■ STRUCTURAL MBE ■ DBE ■ SBE
QUALITY SERVICE
COMMITMENT
from entering the storm drain network. The filters are designed to treat the flow from the 85th percentile rainfall event. The filter for a 12”x12” catch basin filter treats approximately 0.8 CFS and the 24”x24” catch basin filter treats 1.5 CFS. Additionally, all storm drain inlets will have stencils marked “NO DUMPING – DRAINS TO OCEAN” with a graphical icon to discourage illegal dumping.
6.2 CONTINOUS DEFLECTIVE SEPARATION (CDS) The Contech CDS system is a mechanical device which uses continuous deflective separation to screen, separate and trap pollutants in stormwater runoff. The CDS unit is placed near the end of the site stormwater network so that the stormwater runoff from the project site goes through the CDS. The CDS 2015 has a treatment capacity of 0.7 CFS and a maximum hydraulic internal bypass of 10.0 CFS.
6.3 CONTINOUS DEFLECTIVE SEPARATION (CDS) The Operation and Maintenance (O&M) Plan for the site’s BMPs is included in Appendix C.
7.0 PROJECT CONCLUSIONS AND RECOMMENDATIONS After reviewing the results of the hydrology study, VCA Engineers concludes and recommends that:
1. The proposed storm drain system will be designed to convey the peak flow due to a 25-year, 24- hour rainfall event.
2. LID compliance will be attained by treating all stormwater runoff before it is discharge. Runoff will be treated through filters and/or a CDS unit.
It has been a pleasure to be of professional service to you. Please contact us if you have any questions or if we can be of further assistance. Sincerely, VCA ENGINEERS Inc. VIRGIL C. AOANAN, P.E. S.E. PRINCIPAL

Los Ange les I rv ine 3951 Medford Street , Los Ange les CA 90063 2151 Miche lson Dr. # 242, I rv ine , CA 92612 Te l : 323 ‐729 ‐6098 ▪ Fax : 323 ‐729 ‐6043 Te l : 949 ‐679 ‐0870 ▪ Fax : 949 ‐679 ‐9370 e ‐mai l : vca@vcaeng .com www.vcaeng.com
C I V I L S T R U C T U R A L M B E D B E S B E
V C A E N G I N E E R S , I N C.QUALITY SERVICE
COMMITMENT
CALCULATIONS

Los Ange les I rv ine 3951 Medford Street , Los Ange les CA 90063 2151 Miche lson Dr. # 242, I rv ine , CA 92612 Te l : 323 ‐729 ‐6098 ▪ Fax : 323 ‐729 ‐6043 Te l : 949 ‐679 ‐0870 ▪ Fax : 949 ‐679 ‐9370 e ‐mai l : vca@vcaeng .com www.vcaeng.com
CIVIL ■ STRUCTURAL MBE ■ DBE ■ SBE
QUALITY SERVICE
COMMITMENT
V C A ENGINEERS, INC.
CALCULATION A
25-YEAR, 24-HOUR STORM EVENT DISCHARGE

Peak Flow Hydrologic AnalysisFile location: Z:/VCA Projects 4/1023 to XXX/1056-114 LAUSD Olive Vista MS New PE Gymnasium & MPR Buildings/Calcs/Hydrology/Olive Vista MS -Pre-Dev-25.pdfVersion: HydroCalc 0.2.0-beta
Input ParametersProject Name Olive Vista MSSubarea ID Pre-DevArea (ac) 4.6Flow Path Length (ft) 924.0Flow Path Slope (vft/hft) 0.02850-yr Rainfall Depth (in) 7.2Percent Impervious 0.832Soil Type 5Design Storm Frequency 25-yrFire Factor 0LID False
Output ResultsModeled (25-yr) Rainfall Depth (in) 6.3216Peak Intensity (in/hr) 3.0241Undeveloped Runoff Coefficient (Cu) 0.7649Developed Runoff Coefficient (Cd) 0.8773Time of Concentration (min) 8.0Clear Peak Flow Rate (cfs) 12.2039Burned Peak Flow Rate (cfs) 12.203924-Hr Clear Runoff Volume (ac-ft) 1.873224-Hr Clear Runoff Volume (cu-ft) 81598.1439

Peak Flow Hydrologic AnalysisFile location: Z:/VCA Projects 4/1023 to XXX/1056-114 LAUSD Olive Vista MS New PE Gymnasium & MPR Buildings/Calcs/Hydrology/Olive Vista MS - Total Area-Post25.pdfVersion: HydroCalc 0.2.0-beta
Input ParametersProject Name Olive Vista MSSubarea ID Total AreaArea (ac) 4.6Flow Path Length (ft) 1156.77Flow Path Slope (vft/hft) 0.021550-yr Rainfall Depth (in) 7.2Percent Impervious 0.802Soil Type 5Design Storm Frequency 25-yrFire Factor 0LID False
Output ResultsModeled (25-yr) Rainfall Depth (in) 6.3216Peak Intensity (in/hr) 2.723Undeveloped Runoff Coefficient (Cu) 0.7432Developed Runoff Coefficient (Cd) 0.869Time of Concentration (min) 10.0Clear Peak Flow Rate (cfs) 10.8844Burned Peak Flow Rate (cfs) 10.884424-Hr Clear Runoff Volume (ac-ft) 1.821424-Hr Clear Runoff Volume (cu-ft) 79338.8759

Los A ngele s I rv in e
3951 M e dfor d St r ee t , Los An g el e s C A 900 63 2151 M ich e lso n Dr . # 24 2, I rv i ne, C A 9 261 2
Tel : 32 3-7 29- 609 8 ▪ Fa x: 3 23-7 29- 604 3 Tel : 94 9-6 79- 087 0 ▪ Fa x: 9 49-6 79- 937 0
e-ma i l : vca @vca e ng .com www. vcae ng. co m
C I V I L S T R U C T U R A L
M B E D B E S B E
V C A E N G I N E E R S , I N C. QUALITY
SERVICE
COMMITMENT
CALCULATION B
STORM DRAIN PIPE AND CATCH BASIN DESIGN
SUMMERY

������������ ���� ������������������
�������� �� ������� ��������
�������� �������� �!�"�##�����$���� !��� %&��&'���
��(�"�)�*�+,-�! �.-�/.��#��0
������1,���������� 2�0������ ��
�,�-!�3���%�4�'
�������� ���������
������
����
�����
���
!��"�#���$�$����
�����
� ���� � ��� ���%�& � ≥ ≥ ≥ ≥ �� ��� ������ �� �� ≥ ≥ ≥ ≥ ��'(� %���& %��& %��
)& %��& %��
)& %��& %*& %��
)&
�/� 2 ���%� 4�5% ������ � ' � ���%�4 �6 �' '�7 ��'��� �6 82�
�/' / ���'� ���� ����95 � 4 � ���%�4 �6 �' '�7 ��'��� �6 82�
�/4 � ����4 ���� ����4� � � � ���%�4 �6 �' '�7 ��'��� �6 82�
�/� ���%� ���� ������ � �� � ���%�4 �6 �' '�7 ��'��� �6 82�
�/� : ����� 4�9� ������ � �4 � ���%�4 �6 �' '�7 ��'��� �6 82�
�/� �� ����' ���� ���'%% � �� � ���%�4 �6 '� '�7 ��5��� �6 82�
�/9 + ����% 4�%' �����' � �9 � ���%�4 �6 �' '�7 ��'��� �6 82�
�/5 ; ���'� ���� ������ � �% � ���%�4 �6 �' '�7 ��'��� �6 82�
�/% < ��4�� ���� ���''% � '� � ���%�4 �6 �' '�7 ��'��� �6 82�
�/�� � ���'� ���% �����4 � '4 � ���%�4 �6 �' '�7 ��'��� �6 82�
�/�� ���4� ��'� ����'' � '� � ���%�4 �6 �' '�7 ��'��� �6 82�
�/�' " ���%� ��4� �����5 � '9 � ���%�4 �6 �' '�7 ��'��� �6 82�
�/�4 � ����� ���5 ����%� � '% � ���%�4 �6 �' '�7 ��'��� �6 82�
�/��= ) ����� ��4� �����% � 4� � ���%�4 �6 �' '�7 ��'��� �6 82�
�/�� > ��'%� '��% ���'�� � 4� � ���%�4 �6 �' '�7 ��'��� �6 82�
�/�� � ��'�9 ��5� ���'�� � �' � ���%�4 �6 �' '�7 ��'��� �6 82�
�/�9 � ����� ���% ������ � �� � ���%�4 �6 �' '�7 ��'��� �6 82�
�/�5 ��?�'?�'?� ��%%� '�4� ���5�� � �5 5 ��4�%� �6 �' '�7 ��'��� �6 82�
�/�% @ ���44 '��� �����5 � �� � ���%�4 �6 �' '�7 ��'��� �6 82�
�/'� A ���%� '��� ������ � �' � ���%�4 �6 �' '�7 ��'��� �6 82�
�/'� B ����5 ���� ����5� � 9� � ���%�4 �6 �' '�7 ��'��� �6 82�
�/'' /B ���55 ��%5 ����5' � 9' � ���%�4 �6 �' '�7 ��'��� �6 82�
�/'4 1� 4�4�9 '��5 ��'��� � �% �� ��''9' �6 '� '�7 ��5��� �6 82�
�/'� 8 ��9�� 4��4 �����9 � �� 5 ��4�%� �6 '� '�7 ��5��� �6 82�
�/'� C ���'� '��� ���54� � �� � ���%�4 �6 �' '�7 ��'��� �6 82�
�/'� B ���44 '�4� ����'5 � 9� � ���%�4 �6 �' '�7 ��'��� �6 82�
�/'9 �B ����9 '��� ������ � 9� � ���%�4 �6 �' '�7 ��'��� �6 82�
�/'5 2B ����� '�'5 ����'' � 5� � ���%�4 �6 �' '�7 ��'��� �6 82�
�/'% :B ���%� '�45 ����5' � 54 � ���%�4 �6 �' '�7 ��'��� �6 82�
�/4� +B?;B?<B '�5�� ��5% ��'�9' � �C�' ��44�� �6 '� '�7 ��5��� �6 82�
=�:�D� �!��
#���$�$���� !��"�
� ��0��$���E.!��������������>�F ������G'0$H�&'3
���F >�÷�I���×�G'0$H�&'�J�→�"���-.-���!�)�E.���#�K����.�K��(���L�
).��KK����KK�������G�H�F ��%�
+�!���!����!����� �!���G0H�F 4'�' K�& '
�������������������
� �0����!��K�+�!���0��L����0�G+H�F G7��L����0H��G+�� ���!��K�+�!��H
+�� ���!��K�+�!���F G��M���K�+�!��H��G��M���K�+�!��H
���
������
�+,
��� -�.���/���0� 1 ��
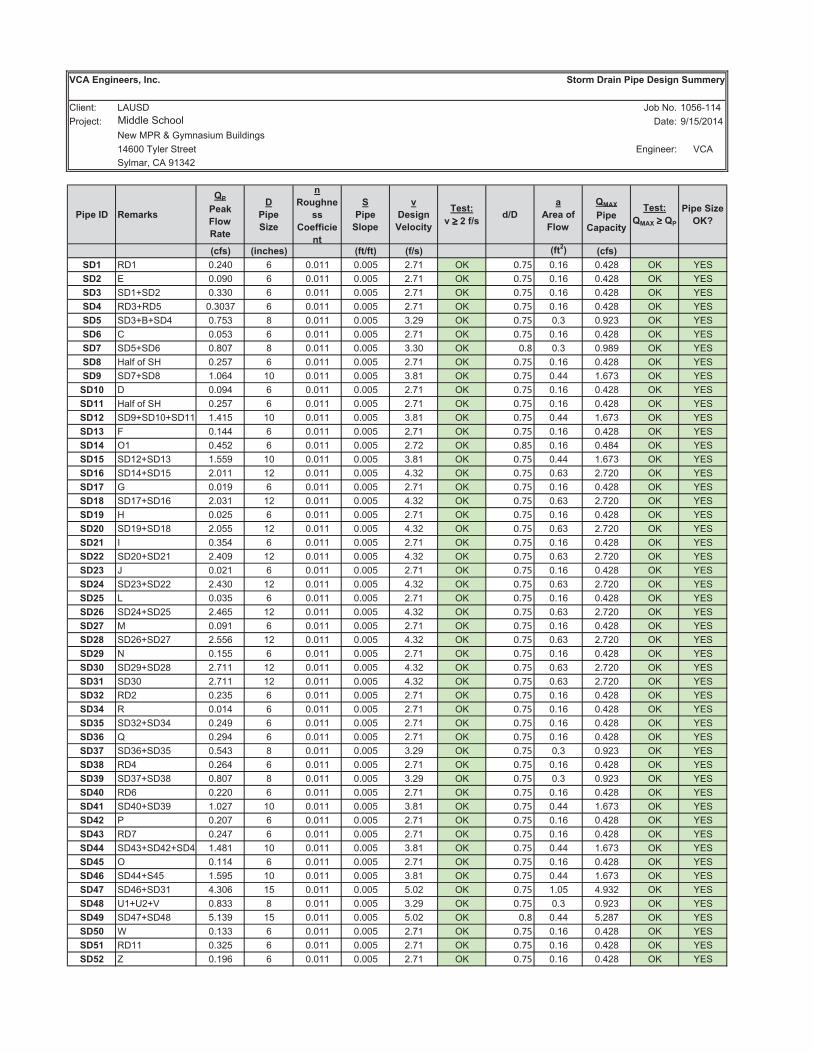
������������ ���� �������������������������
�������� �� ������� ��������
�������� �������������� ��� !"��"#���
��$���%�&�'()� *�+)�,+�����-*
������.(���������� /�-������ 0�
�(�) �1���!�2�#
���� � �����
��
����
�����
���
�
���
��
�
����!�
��
��""���
��
�
���
����
#
�����
�������
$��%
# ≥ ≥ ≥ ≥ &�"'�('�
�
����"
����
�)�*
���
��������
$��%
�)�*�≥≥≥≥���
������ �
+,-
.�"�/ .���!�/ ."�'"�/ ."'�/ ."�&/ .�"�/
��0 % � ��#�� � ����� ����� #�3� 45 ���� ���� ���#6 45 7/�
��& / ���!� � ����� ����� #�3� 45 ���� ���� ���#6 45 7/�
��1 � �8� # ��22� � ����� ����� #�3� 45 ���� ���� ���#6 45 7/�
��2 % 28% � ��2�23 � ����� ����� #�3� 45 ���� ���� ���#6 45 7/�
��3 � 28,8� � ��3�2 6 ����� ����� 2�#! 45 ���� ��2 ��!#2 45 7/�
��4 � ����2 � ����� ����� #�3� 45 ���� ���� ���#6 45 7/�
��5 � �8� � ��6�3 6 ����� ����� 2�2� 45 ��� ��2 ��!6! 45 7/�
��6 9 �:��:��9 ��#�3 � ����� ����� #�3� 45 ���� ���� ���#6 45 7/�
��7 � 38� 6 ����� �� ����� ����� 2�6� 45 ���� ���� ���32 45 7/�
��08 ���!� � ����� ����� #�3� 45 ���� ���� ���#6 45 7/�
��00 9 �:��:��9 ��#�3 � ����� ����� #�3� 45 ���� ���� ���#6 45 7/�
��0& � !8� ��8� �� ����� �� ����� ����� 2�6� 45 ���� ���� ���32 45 7/�
��01 ; ����� � ����� ����� #�3� 45 ���� ���� ���#6 45 7/�
��02 4� ����# � ����� ����� #�3# 45 ���� ���� ���6� 45 7/�
��03 � �#8� �2 ����! �� ����� ����� 2�6� 45 ���� ���� ���32 45 7/�
��04 � ��8� �� #���� �# ����� ����� ��2# 45 ���� ���2 #�3#� 45 7/�
��05 ' ����! � ����� ����� #�3� 45 ���� ���� ���#6 45 7/�
��06 � �38� �� #��2� �# ����� ����� ��2# 45 ���� ���2 #�3#� 45 7/�
��07 9� ���#� � ����� ����� #�3� 45 ���� ���� ���#6 45 7/�
��&8 � �!8� �6 #���� �# ����� ����� ��2# 45 ���� ���2 #�3#� 45 7/�
��&0 < ��2�� � ����� ����� #�3� 45 ���� ���� ���#6 45 7/�
��&& � #�8� #� #���! �# ����� ����� ��2# 45 ���� ���2 #�3#� 45 7/�
��&1 � ���#� � ����� ����� #�3� 45 ���� ���� ���#6 45 7/�
��&2 � #28� ## #��2� �# ����� ����� ��2# 45 ���� ���2 #�3#� 45 7/�
��&3 ���2� � ����� ����� #�3� 45 ���� ���� ���#6 45 7/�
��&4 � #�8� #� #���� �# ����� ����� ��2# 45 ���� ���2 #�3#� 45 7/�
��&5 � ���!� � ����� ����� #�3� 45 ���� ���� ���#6 45 7/�
��&6 � #�8� #3 #���� �# ����� ����� ��2# 45 ���� ���2 #�3#� 45 7/�
��&7 � ����� � ����� ����� #�3� 45 ���� ���� ���#6 45 7/�
��18 � #!8� #6 #�3�� �# ����� ����� ��2# 45 ���� ���2 #�3#� 45 7/�
��10 � 2� #�3�� �# ����� ����� ��2# 45 ���� ���2 #�3#� 45 7/�
��1& % # ��#2� � ����� ����� #�3� 45 ���� ���� ���#6 45 7/�
��12 % ����� � ����� ����� #�3� 45 ���� ���� ���#6 45 7/�
��13 � 2#8� 2� ��#�! � ����� ����� #�3� 45 ���� ���� ���#6 45 7/�
��14 = ��#!� � ����� ����� #�3� 45 ���� ���� ���#6 45 7/�
��15 � 2�8� 2� ����2 6 ����� ����� 2�#! 45 ���� ��2 ��!#2 45 7/�
��16 % � ��#�� � ����� ����� #�3� 45 ���� ���� ���#6 45 7/�
��17 � 238� 26 ��6�3 6 ����� ����� 2�#! 45 ���� ��2 ��!#2 45 7/�
��28 % � ��##� � ����� ����� #�3� 45 ���� ���� ���#6 45 7/�
��20 � ��8� 2! ���#3 �� ����� ����� 2�6� 45 ���� ���� ���32 45 7/�
��2& � ��#�3 � ����� ����� #�3� 45 ���� ���� ���#6 45 7/�
��21 % 3 ��#�3 � ����� ����� #�3� 45 ���� ���� ���#6 45 7/�
��22 � �28� �#8� �� ���6� �� ����� ����� 2�6� 45 ���� ���� ���32 45 7/�
��23 4� ����� � ����� ����� #�3� 45 ���� ���� ���#6 45 7/�
��24 � ��8��� ���!� �� ����� ����� 2�6� 45 ���� ���� ���32 45 7/�
��25 � ��8� 2� ��2�� �� ����� ����� ���# 45 ���� ���� ��!2# 45 7/�
��26 ��8�#80 ��622 6 ����� ����� 2�#! 45 ���� ��2 ��!#2 45 7/�
��27 � �38� �6 ���2! �� ����� ����� ���# 45 ��� ���� ��#63 45 7/�
��38 > ���22 � ����� ����� #�3� 45 ���� ���� ���#6 45 7/�
��30 % �� ��2#� � ����� ����� #�3� 45 ���� ���� ���#6 45 7/�
��3& ? ���!� � ����� ����� #�3� 45 ���� ���� ���#6 45 7/�
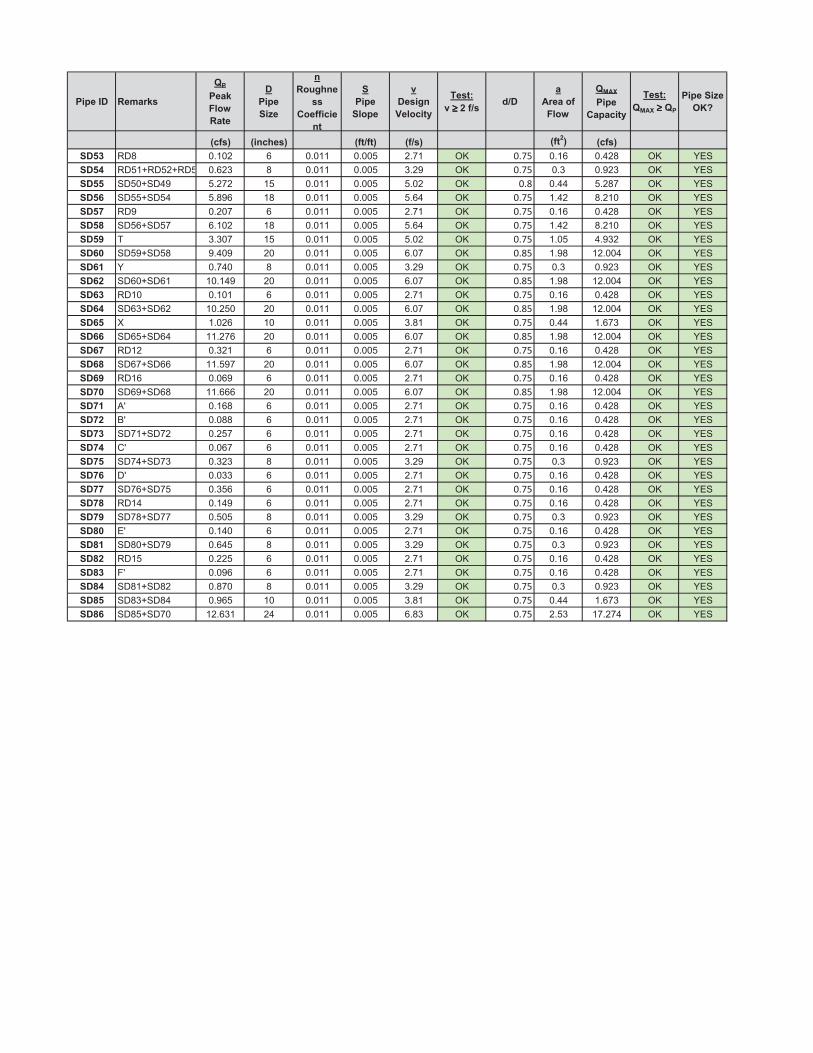
���� � �����
��
����
�����
���
�
���
��
�
����!�
��
��""���
��
�
���
����
#
�����
�������
$��%
# ≥ ≥ ≥ ≥ &�"'�('�
�
����"
����
�)�*
���
��������
$��%
�)�*�≥≥≥≥���
������ �
+,-
.�"�/ .���!�/ ."�'"�/ ."'�/ ."�&/ .�"�/
��31 % 6 ����# � ����� ����� #�3� 45 ���� ���� ���#6 45 7/�
��32 % ��8% �#8% �2 ���#2 6 ����� ����� 2�#! 45 ���� ��2 ��!#2 45 7/�
��33 � ��8� �! ��#3# �� ����� ����� ���# 45 ��� ���� ��#63 45 7/�
��34 � ��8� �� ��6!� �6 ����� ����� ���� 45 ���� ���# 6�#�� 45 7/�
��35 % ! ��#�3 � ����� ����� #�3� 45 ���� ���� ���#6 45 7/�
��36 � ��8� �3 ����# �6 ����� ����� ���� 45 ���� ���# 6�#�� 45 7/�
��37 . 2�2�3 �� ����� ����� ���# 45 ���� ���� ��!2# 45 7/�
��48 � �!8� �6 !���! #� ����� ����� ���3 45 ���� ��!6 �#���� 45 7/�
��40 7 ��3�� 6 ����� ����� 2�#! 45 ���� ��2 ��!#2 45 7/�
��4& � ��8� �� �����! #� ����� ����� ���3 45 ���� ��!6 �#���� 45 7/�
��41 % �� ����� � ����� ����� #�3� 45 ���� ���� ���#6 45 7/�
��42 � �28� �# ���#�� #� ����� ����� ���3 45 ���� ��!6 �#���� 45 7/�
��43 @ ���#� �� ����� ����� 2�6� 45 ���� ���� ���32 45 7/�
��44 � ��8� �� ���#3� #� ����� ����� ���3 45 ���� ��!6 �#���� 45 7/�
��45 % �# ��2#� � ����� ����� #�3� 45 ���� ���� ���#6 45 7/�
��46 � �38� �� ����!3 #� ����� ����� ���3 45 ���� ��!6 �#���� 45 7/�
��47 % �� ����! � ����� ����� #�3� 45 ���� ���� ���#6 45 7/�
��58 � �!8� �6 ������ #� ����� ����� ���3 45 ���� ��!6 �#���� 45 7/�
��50 A� ����6 � ����� ����� #�3� 45 ���� ���� ���#6 45 7/�
��5& ,A ���66 � ����� ����� #�3� 45 ���� ���� ���#6 45 7/�
��51 � 3�8� 3# ��#�3 � ����� ����� #�3� 45 ���� ���� ���#6 45 7/�
��52 �A ����3 � ����� ����� #�3� 45 ���� ���� ���#6 45 7/�
��53 � 3�8� 32 ��2#2 6 ����� ����� 2�#! 45 ���� ��2 ��!#2 45 7/�
��54 A ���22 � ����� ����� #�3� 45 ���� ���� ���#6 45 7/�
��55 � 3�8� 3� ��2�� � ����� ����� #�3� 45 ���� ���� ���#6 45 7/�
��56 % �� ����! � ����� ����� #�3� 45 ���� ���� ���#6 45 7/�
��57 � 368� 33 ����� 6 ����� ����� 2�#! 45 ���� ��2 ��!#2 45 7/�
��68 /A ����� � ����� ����� #�3� 45 ���� ���� ���#6 45 7/�
��60 � 6�8� 3! ����� 6 ����� ����� 2�#! 45 ���� ��2 ��!#2 45 7/�
��6& % �� ��##� � ����� ����� #�3� 45 ���� ���� ���#6 45 7/�
��61 ;A ���!� � ����� ����� #�3� 45 ���� ���� ���#6 45 7/�
��62 � 6�8� 6# ��63� 6 ����� ����� 2�#! 45 ���� ��2 ��!#2 45 7/�
��63 � 628� 6� ��!�� �� ����� ����� 2�6� 45 ���� ���� ���32 45 7/�
��64 � 6�8� 3� �#��2� #� ����� ����� ��62 45 ���� #��2 �3�#3� 45 7/�


Los Angele s I rv in e 3951 M e dfor d St r ee t , Los An g el e s C A 900 63 2151 M ich e lso n Dr . # 24 2, I rv i ne, C A 9 261 2 Tel : 32 3-7 29- 609 8 ▪ Fa x: 3 23-7 29- 604 3 Tel : 94 9-6 79- 087 0 ▪ Fa x: 9 49-6 79- 937 0 e-ma i l : vca @vca e ng .com www. vcae ng. co m
C I V I L S T R U C T U R A L M B E D B E S B E
V C A E N G I N E E R S , I N C. QUALITY SERVICE
COMMITMENT
CALCULATION C
STORMWATER QUALITY DESIGN VOLUME (SQDv)
CALCULATIONS
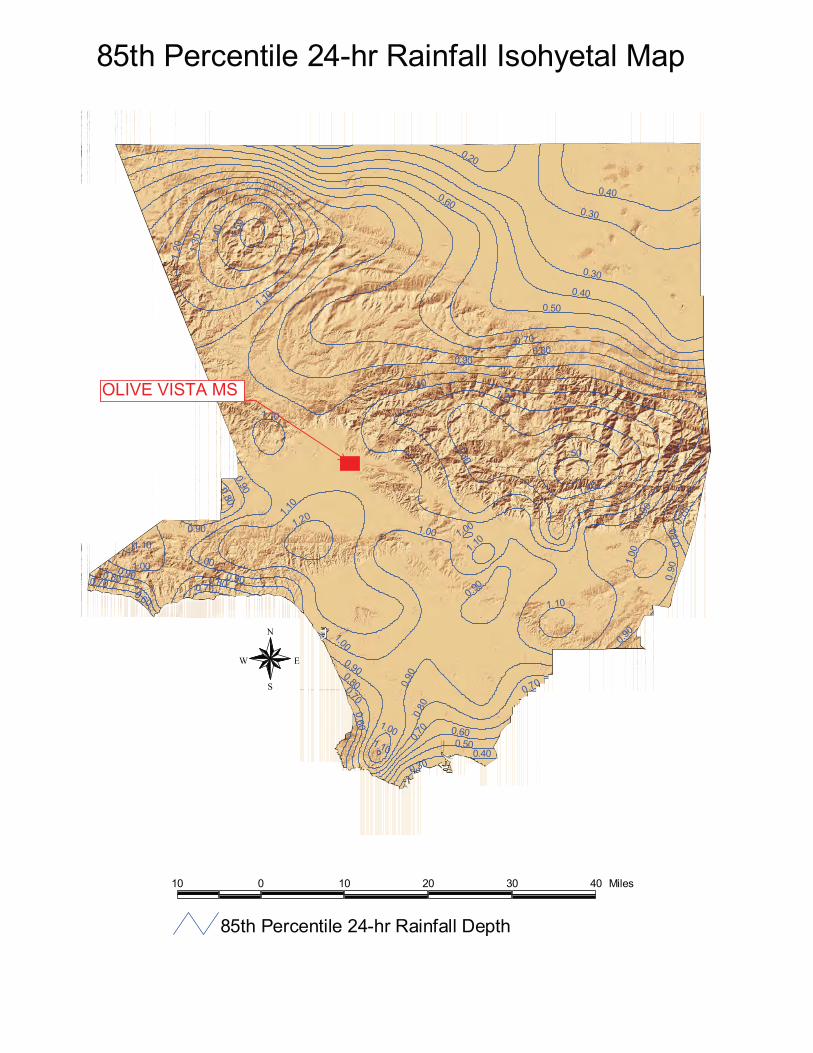
0.60
0.70
0.80
1.00
0.90
0.50
0.40
0.30
1.101.20
1.30
0.20
1.40
1.50
1.00
1.40
0.80
0.30
0.900.90
0.800.80
0.700.70
1.00
0.50
0.70
1.10
1.00
1.10
0.70
1.50
1.10
1.201.
10
1.10
0.80
1.30
0.60
0.90
0.90
1.20
0.90
0.70
0.60
0.90
1.00
0.60
0.40
1.10
0.800.70
0.90
1.00 1.00
0.40
1.000.90
0.80
0.30
1.10
0.90
85th Percentile 24-hr Rainfall Isohyetal Map
10 0 10 20 30 40 Miles
N
EW
S
85th Percentile 24-hr Rainfall Depth
OLIVE VISTA MS

Peak Flow Hydrologic AnalysisFile location: C:/Users/sshams/Desktop/Olive Vista MS - Total Site- 85th Percentile.pdfVersion: HydroCalc 0.2.0-beta
Input ParametersProject Name Olive Vista MSSubarea ID Total Site- 85th PercentileArea (ac) 4.6Flow Path Length (ft) 1156.77Flow Path Slope (vft/hft) 0.021585th Percentile Rainfall Depth (in) 1.0Percent Impervious 0.802Soil Type 5Design Storm Frequency 85th percentile stormFire Factor 0LID True
Output ResultsModeled (85th percentile storm) Rainfall Depth (in) 1.0Peak Intensity (in/hr) 0.2245Undeveloped Runoff Coefficient (Cu) 0.1Developed Runoff Coefficient (Cd) 0.7416Time of Concentration (min) 40.0Clear Peak Flow Rate (cfs) 0.7659Burned Peak Flow Rate (cfs) 0.765924-Hr Clear Runoff Volume (ac-ft) 0.281924-Hr Clear Runoff Volume (cu-ft) 12281.1483

Los Ange les I rv ine 3951 Medford Street , Los Ange les CA 90063 2151 Miche lson Dr. # 242, I rv ine , CA 92612 Te l : 323 ‐729 ‐6098 ▪ Fax : 323 ‐729 ‐6043 Te l : 949 ‐679 ‐0870 ▪ Fax : 949 ‐679 ‐9370 e ‐mai l : vca@vcaeng .com www.vcaeng.com
C I V I L S T R U C T U R A L M B E D B E S B E
V C A E N G I N E E R S , I N C.QUALITY SERVICE
COMMITMENT
APPENDIX

Los Ange les I rv ine 3951 Medford Street , Los Ange les CA 90063 2151 Miche lson Dr. # 242, I rv ine , CA 92612 Te l : 323 ‐729 ‐6098 ▪ Fax : 323 ‐729 ‐6043 Te l : 949 ‐679 ‐0870 ▪ Fax : 949 ‐679 ‐9370 e ‐mai l : vca@vcaeng .com www.vcaeng.com
CIVIL ■ STRUCTURAL MBE ■ DBE ■ SBE
QUALITY SERVICE
COMMITMENT
V C A ENGINEERS, INC.
APPENDIX A
ISOHYET MAP

���
���
���
���
���
���
���
���
���
���
���
���
���
�����
���� ���� �����
�����
�
����
�����
�����
���
���
���
���
������
���
���
���
����
�
���
���
���
��
��
��
���
�
���
���
����
���
��
���
���
����
�������
������
��
���
���
���
��
���
��
���
���
���
��
���
���
���
���
���
��
����
��
���
���
����
���
���
���
����
����
������
����
���
���
��
��
���
���
���
����
���
���
���
���
���
���
���
���
��
���
��
���
���
�
�
�
���������������������������������������������
������������������������������������������ �
����������
����������������������
� � � � �����
�������������� �� ���
����������� �� ���
�
���
��
��
��
���� ��
��
�
���
����
���
������ ��
��
�
�� ���
�� ���!���!!
�� � �!���!!
� � ���!���!!
� � ���!���!!
���
��"���
�������
��
����
������������
��
�����
���
���������
������
Olive Vista MS

Los Ange les I rv ine 3951 Medford Street , Los Ange les CA 90063 2151 Miche lson Dr. # 242, I rv ine , CA 92612 Te l : 323 ‐729 ‐6098 ▪ Fax : 323 ‐729 ‐6043 Te l : 949 ‐679 ‐0870 ▪ Fax : 949 ‐679 ‐9370 e ‐mai l : vca@vcaeng .com www.vcaeng.com
CIVIL ■ STRUCTURAL MBE ■ DBE ■ SBE
QUALITY SERVICE
COMMITMENT
V C A ENGINEERS, INC.
APPENDIX B
PERCOLATION TEST RESULTS
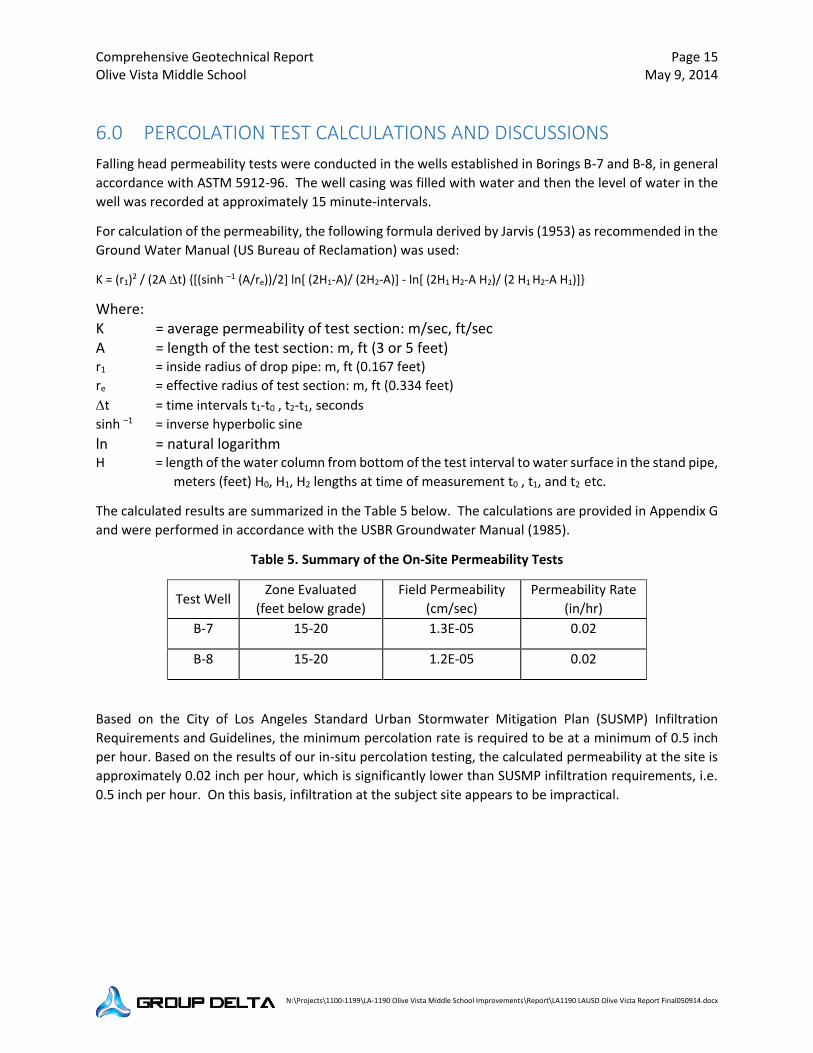
Comprehensive Geotechnical Report Page 15 Olive Vista Middle School May 9, 2014
N:\Projects\1100-1199\LA-1190 Olive Vista Middle School Improvements\Report\LA1190 LAUSD Olive Vista Report Final050914.docx
6.0 PERCOLATION TEST CALCULATIONS AND DISCUSSIONS
Falling head permeability tests were conducted in the wells established in Borings B-7 and B-8, in general
accordance with ASTM 5912-96. The well casing was filled with water and then the level of water in the
well was recorded at approximately 15 minute-intervals.
For calculation of the permeability, the following formula derived by Jarvis (1953) as recommended in the
Ground Water Manual (US Bureau of Reclamation) was used:
K = (r1)2 / (2A t) {[(sinh –1 (A/re))/2] ln[ (2H1-A)/ (2H2-A)] - ln[ (2H1 H2-A H2)/ (2 H1 H2-A H1)]}
Where: K = average permeability of test section: m/sec, ft/sec A = length of the test section: m, ft (3 or 5 feet) r1 = inside radius of drop pipe: m, ft (0.167 feet)
re = effective radius of test section: m, ft (0.334 feet)
t = time intervals t1-t0 , t2-t1, seconds
sinh –1 = inverse hyperbolic sine
ln = natural logarithm H = length of the water column from bottom of the test interval to water surface in the stand pipe,
meters (feet) H0, H1, H2 lengths at time of measurement t0 , t1, and t2 etc.
The calculated results are summarized in the Table 5 below. The calculations are provided in Appendix G
and were performed in accordance with the USBR Groundwater Manual (1985).
Table 5. Summary of the On-Site Permeability Tests
Test Well Zone Evaluated
(feet below grade)
Field Permeability
(cm/sec)
Permeability Rate
(in/hr)
B-7 15-20 1.3E-05 0.02
B-8 15-20 1.2E-05 0.02
Based on the City of Los Angeles Standard Urban Stormwater Mitigation Plan (SUSMP) Infiltration
Requirements and Guidelines, the minimum percolation rate is required to be at a minimum of 0.5 inch
per hour. Based on the results of our in-situ percolation testing, the calculated permeability at the site is
approximately 0.02 inch per hour, which is significantly lower than SUSMP infiltration requirements, i.e.
0.5 inch per hour. On this basis, infiltration at the subject site appears to be impractical.

Los Ange les I rv ine 3951 Medford Street , Los Ange les CA 90063 2151 Miche lson Dr. # 242, I rv ine , CA 92612 Te l : 323 ‐729 ‐6098 ▪ Fax : 323 ‐729 ‐6043 Te l : 949 ‐679 ‐0870 ▪ Fax : 949 ‐679 ‐9370 e ‐mai l : vca@vcaeng .com www.vcaeng.com
CIVIL ■ STRUCTURAL MBE ■ DBE ■ SBE
QUALITY SERVICE
COMMITMENT
V C A ENGINEERS, INC.
APPENDIX C
BMP OPERATION AND MAINTENANCE PLANS
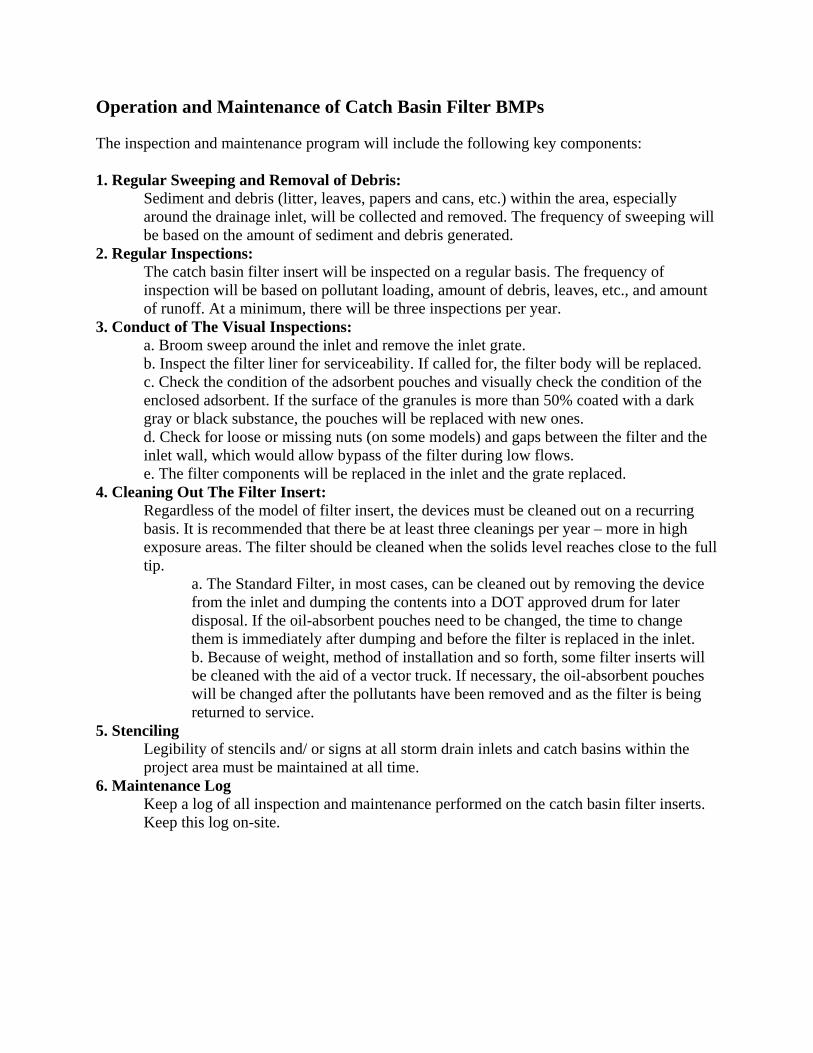
Operation and Maintenance of Catch Basin Filter BMPs The inspection and maintenance program will include the following key components: 1. Regular Sweeping and Removal of Debris:
Sediment and debris (litter, leaves, papers and cans, etc.) within the area, especially around the drainage inlet, will be collected and removed. The frequency of sweeping will be based on the amount of sediment and debris generated.
2. Regular Inspections: The catch basin filter insert will be inspected on a regular basis. The frequency of inspection will be based on pollutant loading, amount of debris, leaves, etc., and amount of runoff. At a minimum, there will be three inspections per year.
3. Conduct of The Visual Inspections: a. Broom sweep around the inlet and remove the inlet grate. b. Inspect the filter liner for serviceability. If called for, the filter body will be replaced. c. Check the condition of the adsorbent pouches and visually check the condition of the enclosed adsorbent. If the surface of the granules is more than 50% coated with a dark gray or black substance, the pouches will be replaced with new ones. d. Check for loose or missing nuts (on some models) and gaps between the filter and the inlet wall, which would allow bypass of the filter during low flows. e. The filter components will be replaced in the inlet and the grate replaced.
4. Cleaning Out The Filter Insert: Regardless of the model of filter insert, the devices must be cleaned out on a recurring basis. It is recommended that there be at least three cleanings per year – more in high exposure areas. The filter should be cleaned when the solids level reaches close to the full tip.
a. The Standard Filter, in most cases, can be cleaned out by removing the device from the inlet and dumping the contents into a DOT approved drum for later disposal. If the oil-absorbent pouches need to be changed, the time to change them is immediately after dumping and before the filter is replaced in the inlet. b. Because of weight, method of installation and so forth, some filter inserts will be cleaned with the aid of a vector truck. If necessary, the oil-absorbent pouches will be changed after the pollutants have been removed and as the filter is being returned to service.
5. Stenciling Legibility of stencils and/ or signs at all storm drain inlets and catch basins within the project area must be maintained at all time.
6. Maintenance Log Keep a log of all inspection and maintenance performed on the catch basin filter inserts. Keep this log on-site.
CDS® Inspection and Maintenance Guide
ENGINEERED SOLUTIONS

Maintenance The CDS system should be inspected at regular intervals and maintained when necessary to ensure optimum performance. The rate at which the system collects pollutants will depend more heavily on site activities than the size of the unit. For example, unstable soils or heavy winter sanding will cause the grit chamber to fill more quickly but regular sweeping of paved surfaces will slow accumulation.
Inspection Inspection is the key to effective maintenance and is easily performed. Pollutant transport and deposition may vary from year to year and regular inspections will help ensure that the system is cleaned out at the appropriate time. At a minimum, inspections should be performed twice per year (e.g. spring and fall) however more frequent inspections may be necessary in climates where winter sanding operations may lead to rapid accumulations, or in equipment washdown areas. Installations should also be inspected more frequently where excessive amounts of trash are expected.
The visual inspection should ascertain that the system components are in working order and that there are no blockages or obstructions in the inlet and separation screen. The inspection should also quantify the accumulation of hydrocarbons, trash, and sediment in the system. Measuring pollutant accumulation can be done with a calibrated dipstick, tape measure or other measuring instrument. If absorbent material is used for enhanced removal of hydrocarbons, the level of discoloration of the sorbent material should also be identified during inspection. It is useful and often required as part of an operating permit to keep a record of each inspection. A simple form for doing so is provided.
Access to the CDS unit is typically achieved through two manhole access covers. One opening allows for inspection and cleanout of the separation chamber (cylinder and screen) and isolated sump. The other allows for inspection and cleanout of sediment captured and retained outside the screen. For deep units, a single manhole access point would allows both sump cleanout and access outside the screen.
The CDS system should be cleaned when the level of sediment has reached 75% of capacity in the isolated sump or when an appreciable level of hydrocarbons and trash has accumulated. If absorbent material is used, it should be replaced when significant discoloration has occurred. Performance will not be impacted until 100% of the sump capacity is exceeded however it is recommended that the system be cleaned prior to that for easier removal of sediment. The level of sediment is easily determined by measuring from finished grade down to the top of the sediment pile. To avoid underestimating the level of sediment in the chamber, the measuring device must be lowered to the top of the sediment pile carefully. Particles at the top of the pile typically offer less resistance to the end of the rod than consolidated particles toward the bottom of the pile. Once this measurement is recorded, it should be compared to the as-built drawing for the unit to determine weather the height of the sediment pile off the bottom of the sump floor exceeds 75% of the total height of isolated sump.
Cleaning Cleaning of a CDS systems should be done during dry weather conditions when no flow is entering the system. The use of a vacuum truck is generally the most effective and convenient method of removing pollutants from the system. Simply remove the manhole covers and insert the vacuum hose into the sump. The system should be completely drained down and the sump fully evacuated of sediment. The area outside the screen should also be cleaned out if pollutant build-up exists in this area.
In installations where the risk of petroleum spills is small, liquid contaminants may not accumulate as quickly as sediment. However, the system should be cleaned out immediately in the event of an oil or gasoline spill should be cleaned out immediately. Motor oil and other hydrocarbons that accumulate on a more routine basis should be removed when an appreciable layer has been captured. To remove these pollutants, it may be preferable to use absorbent pads since they are usually less expensive to dispose than the oil/water emulsion that may be created by vacuuming the oily layer. Trash and debris can be netted out to separate it from the other pollutants. The screen should be power washed to ensure it is free of trash and debris.
Manhole covers should be securely seated following cleaning activities to prevent leakage of runoff into the system from above and also to ensure that proper safety precautions have been followed. Confined space entry procedures need to be followed if physical access is required. Disposal of all material removed from the CDS system should be done in accordance with local regulations. In many jurisdictions, disposal of the sediments may be handled in the same manner as the disposal of sediments removed from catch basins or deep sump manholes.

CDS Diameter Distance from Water Surface Sediment Model to Top of Sediment Pile Storage Capacity
ft m ft m yd3 m3
CDS2015-4 4 1.2 3.0 0.9 0.5 0.4
CDS2015 5 1.5 3.0 0.9 1.3 1.0
CDS2020 5 1.5 3.5 1.1 1.3 1.0
CDS2025 5 1.5 4.0 1.2 1.3 1.0
CDS3020 6 1.8 4.0 1.2 2.1 1.6
CDS3030 6 1.8 4.6 1.4 2.1 1.6
CDS3035 6 1.8 5.0 1.5 2.1 1.6
CDS4030 8 2.4 4.6 1.4 5.6 4.3
CDS4040 8 2.4 5.7 1.7 5.6 4.3
CDS4045 8 2.4 6.2 1.9 5.6 4.3
Table 1: CDS Maintenance Indicators and Sediment Storage Capacities
800.925.5240www.ContechES.com
Support
•Drawingsandspecificationsareavailableatwww.contechstormwater.com.•Site-specificdesignsupportisavailablefromourengineers.©2014ContechEngineeredSolutionsLLC
ContechEngineeredSolutionsLLCprovidessitesolutionsforthecivilengineeringindustry.Contech’sportfolioincludesbridges,drainage,sanitarysewer,stormwater,earthstabilizationandwastewatertreamentproducts.Forinformation,visitwww.ContechES.comorcall800.338.1122
NOTHINGINTHISCATALOGSHOULDBECONSTRUEDASANEXPRESSEDWARRANTYORANIMPLIEDWARRANTYOFMERCHANTABILITYORFITNESSFORANYPARTICULARPURPOSE.SEETHECONTECHSTANDARDCONDITIONOFSALES(VIEWABLEATWWW.CONTECHES.COM/COS)FORMOREINFORMATION.
Theproduct(s)describedmaybeprotectedbyoneormoreofthefollowingUSpatents:5,322,629;5,624,576;5,707,527;5,759,415;5,788,848;5,985,157;6,027,639;6,350,374;6,406,218;6,641,720;6,511,595;6,649,048;6,991,114;6,998,038;7,186,058;7,296,692;7,297,266;7,517,450relatedforeignpatentsorotherpatentspending.
cdsMaintenance 07/14
ENGINEERED SOLUTIONS

CDS Inspection & Maintenance Log
CDSModel: Location:
Water Floatable DescribeMaintenance
Date depthto Layer MaintenancePersonnel
Comments
sediment1 Thickness2 Performed
——————————————————————————————————————————————————————————
——————————————————————————————————————————————————————————
——————————————————————————————————————————————————————————
——————————————————————————————————————————————————————————
——————————————————————————————————————————————————————————
——————————————————————————————————————————————————————————
——————————————————————————————————————————————————————————
——————————————————————————————————————————————————————————
——————————————————————————————————————————————————————————
——————————————————————————————————————————————————————————
——————————————————————————————————————————————————————————
——————————————————————————————————————————————————————————
——————————————————————————————————————————————————————————
——————————————————————————————————————————————————————————
1. The water depth to sediment is determined by taking two measurements with a stadia rod: one measurement from the manhole opening to the top of the sediment pile and the other from the manhole opening to the water surface. If the difference between these measurements is less than the values listed in table 1 the system should be cleaned out. Note:toavoidunderestimatingthevolumeofsedimentinthechamber,themeasuringdevicemustbecarefullyloweredtothetopofthesedimentpile.
2. For optimum performance, the system should be cleaned out when the floating hydrocarbon layer accumulates to an appreciable thickness. In the event of an oil spill, the system should be cleaned immediately.

appendix e
noise Worksheets


Olive Vista Middle School ProjectDraftNDAppendixE,NoiseWorksheetsE.1 ConstructionNoiseCalculationswithoutNoiseBarriers
E.2 ConstructionNoiseCalculationswithNoiseBarriers
E.3 Off‐SiteConstructionTrafficNoiseCalculations

AppendixE.1ConstructionNoiseCalculationswithoutNoiseBarrier

Project: Olive Vista Middle SchoolConstruction Noise Impact on Sensitive Receptors without Noise Barriers
ParametersConstruction Hours: 8 Daytime hours (7 am to 7 pm)
0 Evening hours (7 pm to 10 pm)0 Nighttime hours (10 pm to 7 am)
Leq to L10 factor 3
Calculation
Construction PhaseEquipment Type
No. of Equip.
Reference Noise Level at
50ft, LmaxAcoustical
Usage FactorDistance
(ft) Lmax Leq L10Estimated Noise Shielding, dBA
Distance (ft) Lmax Leq L10
Estimated Noise Shielding, dBA
Demolition of MPB 88 83 85 80Concrete Saw 1 90 20% 60 88 81 84 0 90 85 78 81 0Crushing/Processing Equipmen 1 84 10% 60 82 72 75 0 90 79 69 72 0Dump/Haul Trucks 1 76 20% 60 74 67 70 0 90 71 64 67 0Tractor/Loader/Backhoe 1 80 25% 60 78 72 75 0 90 75 69 72 0Dozer 1 82 40% 60 80 76 79 0 90 77 73 76 0
Grading and Excavation 83 85 62 63Drill Rig Truck 1 79 20% 60 77 70 73 0 400 56 49 52 5Excavator 1 81 40% 60 79 75 78 0 400 58 54 57 5Dozer 1 82 40% 60 80 76 79 0 400 59 55 58 5Graders 1 85 40% 60 83 79 82 0 400 62 58 61 5Tractor/Loader/Backhoe 1 80 25% 60 78 72 75 0 400 57 51 54 5Material handling equipment 1 85 50% 60 83 80 83 0 400 62 59 62 5Water Trucks 1 80 10% 60 78 68 71 0 400 57 47 50 5
Foundation 79 81 58 60Cement and Mortar Mixers 1 79 40% 60 77 73 76 0 400 56 52 55 5Forklift 1 75 10% 60 73 63 66 0 400 52 42 45 5Pumps 1 81 50% 60 79 76 79 0 400 58 55 58 5Generator Sets 1 81 50% 60 79 76 79 0 400 58 55 58 5Tractor/Loader/Backhoe 1 80 25% 60 78 72 75 0 400 57 51 54 5
R1 R2
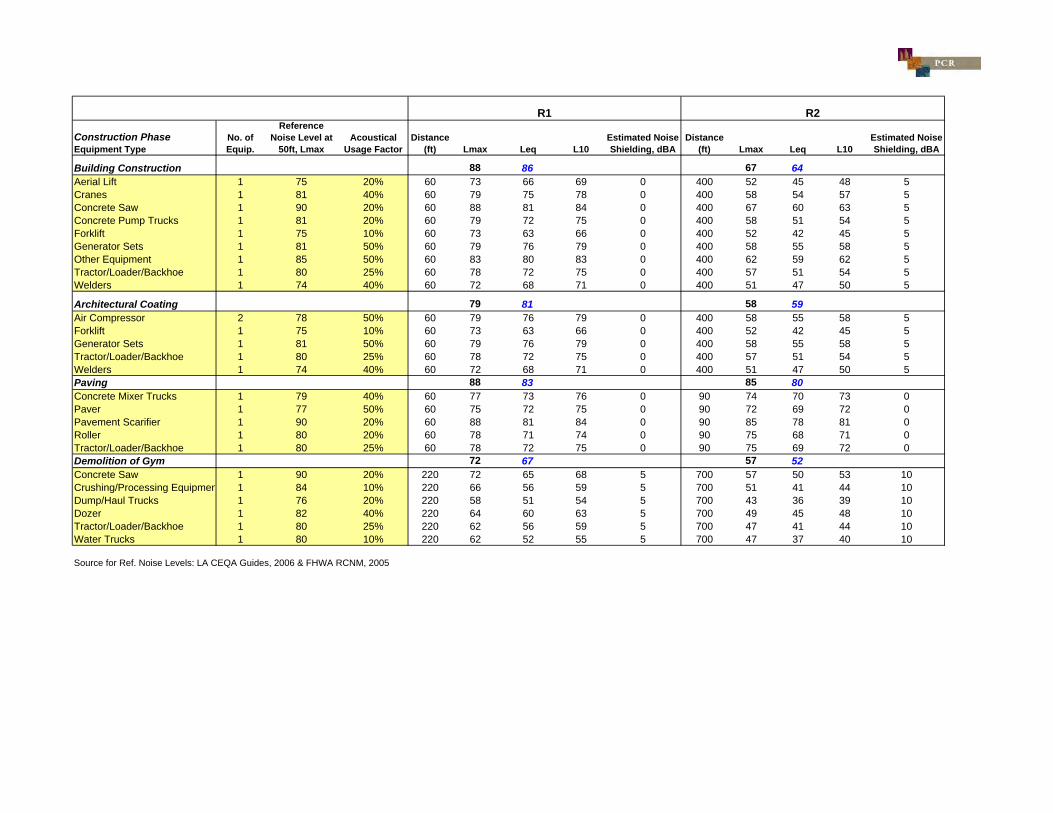
Construction PhaseEquipment Type
No. of Equip.
Reference Noise Level at
50ft, LmaxAcoustical
Usage FactorDistance
(ft) Lmax Leq L10Estimated Noise Shielding, dBA
Distance (ft) Lmax Leq L10
Estimated Noise Shielding, dBA
R1 R2
Building Construction 88 86 67 64Aerial Lift 1 75 20% 60 73 66 69 0 400 52 45 48 5Cranes 1 81 40% 60 79 75 78 0 400 58 54 57 5Concrete Saw 1 90 20% 60 88 81 84 0 400 67 60 63 5Concrete Pump Trucks 1 81 20% 60 79 72 75 0 400 58 51 54 5Forklift 1 75 10% 60 73 63 66 0 400 52 42 45 5Generator Sets 1 81 50% 60 79 76 79 0 400 58 55 58 5Other Equipment 1 85 50% 60 83 80 83 0 400 62 59 62 5Tractor/Loader/Backhoe 1 80 25% 60 78 72 75 0 400 57 51 54 5Welders 1 74 40% 60 72 68 71 0 400 51 47 50 5
Architectural Coating 79 81 58 59Air Compressor 2 78 50% 60 79 76 79 0 400 58 55 58 5Forklift 1 75 10% 60 73 63 66 0 400 52 42 45 5Generator Sets 1 81 50% 60 79 76 79 0 400 58 55 58 5Tractor/Loader/Backhoe 1 80 25% 60 78 72 75 0 400 57 51 54 5Welders 1 74 40% 60 72 68 71 0 400 51 47 50 5Paving 88 83 85 80Concrete Mixer Trucks 1 79 40% 60 77 73 76 0 90 74 70 73 0Paver 1 77 50% 60 75 72 75 0 90 72 69 72 0Pavement Scarifier 1 90 20% 60 88 81 84 0 90 85 78 81 0Roller 1 80 20% 60 78 71 74 0 90 75 68 71 0Tractor/Loader/Backhoe 1 80 25% 60 78 72 75 0 90 75 69 72 0Demolition of Gym 72 67 57 52Concrete Saw 1 90 20% 220 72 65 68 5 700 57 50 53 10Crushing/Processing Equipmen 1 84 10% 220 66 56 59 5 700 51 41 44 10Dump/Haul Trucks 1 76 20% 220 58 51 54 5 700 43 36 39 10Dozer 1 82 40% 220 64 60 63 5 700 49 45 48 10Tractor/Loader/Backhoe 1 80 25% 220 62 56 59 5 700 47 41 44 10Water Trucks 1 80 10% 220 62 52 55 5 700 47 37 40 10
Source for Ref. Noise Levels: LA CEQA Guides, 2006 & FHWA RCNM, 2005

Project: Olive Vista Middle SchoolConstruction Noise Impact on Sensitive Receptors without Noise Barriers
ParametersConstruction Hours: 8 Daytime hours (7 am to 7 pm)
0 Evening hours (7 pm to 10 pm)0 Nighttime hours (10 pm to 7 am)
Leq to L10 factor 3
Calculation
Construction PhaseEquipment Type
No. of Equip.
Reference Noise Level at
50ft, LmaxAcoustical
Usage Factor
Demolition of MPBConcrete Saw 1 90 20%Crushing/Processing Equipmen 1 84 10%Dump/Haul Trucks 1 76 20%Tractor/Loader/Backhoe 1 80 25%Dozer 1 82 40%
Grading and ExcavationDrill Rig Truck 1 79 20%Excavator 1 81 40%Dozer 1 82 40%Graders 1 85 40%Tractor/Loader/Backhoe 1 80 25%Material handling equipment 1 85 50%Water Trucks 1 80 10%
FoundationCement and Mortar Mixers 1 79 40%Forklift 1 75 10%Pumps 1 81 50%Generator Sets 1 81 50%Tractor/Loader/Backhoe 1 80 25%
Distance (ft) Lmax Leq L10
Estimated Noise Shielding, dBA
Distance (ft) Lmax Leq L10
Estimated Noise Shielding, dBA
88 83 71 6660 88 81 84 0 430 71 64 67 060 82 72 75 0 430 65 55 58 060 74 67 70 0 430 57 50 53 060 78 72 75 0 430 61 55 58 060 80 76 79 0 430 63 59 62 0
83 85 62 6460 77 70 73 0 700 56 49 52 060 79 75 78 0 700 58 54 57 060 80 76 79 0 700 59 55 58 060 83 79 82 0 700 62 58 61 060 78 72 75 0 700 57 51 54 060 83 80 83 0 700 62 59 62 060 78 68 71 0 700 57 47 50 0
79 81 58 6060 77 73 76 0 700 56 52 55 060 73 63 66 0 700 52 42 45 060 79 76 79 0 700 58 55 58 060 79 76 79 0 700 58 55 58 060 78 72 75 0 700 57 51 54 0
R3 R4

Construction PhaseEquipment Type
No. of Equip.
Reference Noise Level at
50ft, LmaxAcoustical
Usage Factor
Building ConstructionAerial Lift 1 75 20%Cranes 1 81 40%Concrete Saw 1 90 20%Concrete Pump Trucks 1 81 20%Forklift 1 75 10%Generator Sets 1 81 50%Other Equipment 1 85 50%Tractor/Loader/Backhoe 1 80 25%Welders 1 74 40%
Architectural CoatingAir Compressor 2 78 50%Forklift 1 75 10%Generator Sets 1 81 50%Tractor/Loader/Backhoe 1 80 25%Welders 1 74 40%PavingConcrete Mixer Trucks 1 79 40%Paver 1 77 50%Pavement Scarifier 1 90 20%Roller 1 80 20%Tractor/Loader/Backhoe 1 80 25%Demolition of GymConcrete Saw 1 90 20%Crushing/Processing Equipmen 1 84 10%Dump/Haul Trucks 1 76 20%Dozer 1 82 40%Tractor/Loader/Backhoe 1 80 25%Water Trucks 1 80 10%
Source for Ref. Noise Levels: LA CEQA Guides, 2006 & FHWA RCNM, 2005
Distance (ft) Lmax Leq L10
Estimated Noise Shielding, dBA
Distance (ft) Lmax Leq L10
Estimated Noise Shielding, dBA
R3 R4
88 86 67 6460 73 66 69 0 700 52 45 48 060 79 75 78 0 700 58 54 57 060 88 81 84 0 700 67 60 63 060 79 72 75 0 700 58 51 54 060 73 63 66 0 700 52 42 45 060 79 76 79 0 700 58 55 58 060 83 80 83 0 700 62 59 62 060 78 72 75 0 700 57 51 54 060 72 68 71 0 700 51 47 50 0
79 81 58 5960 79 76 79 0 700 58 55 58 060 73 63 66 0 700 52 42 45 060 79 76 79 0 700 58 55 58 060 78 72 75 0 700 57 51 54 060 72 68 71 0 700 51 47 50 0
88 83 71 6660 77 73 76 0 430 60 56 59 060 75 72 75 0 430 58 55 58 060 88 81 84 0 430 71 64 67 060 78 71 74 0 430 61 54 57 060 78 72 75 0 430 61 55 58 0
69 65 67 62300 69 62 65 5 730 67 60 63 0300 63 53 56 5 730 61 51 54 0300 55 48 51 5 730 53 46 49 0300 61 57 60 5 730 59 55 58 0300 59 53 56 5 730 57 51 54 0300 59 49 52 5 730 57 47 50 0

Project: Olive Vista Middle SchoolConstruction Noise Impact on Sensitive Receptors without Noise Barriers
ParametersConstruction Hours: 8 Daytime hours (7 am to 7 pm)
0 Evening hours (7 pm to 10 pm)0 Nighttime hours (10 pm to 7 am)
Leq to L10 factor 3
Calculation
Construction PhaseEquipment Type
No. of Equip.
Reference Noise Level at
50ft, LmaxAcoustical
Usage Factor
Demolition of MPBConcrete Saw 1 90 20%Crushing/Processing Equipmen 1 84 10%Dump/Haul Trucks 1 76 20%Tractor/Loader/Backhoe 1 80 25%Dozer 1 82 40%
Grading and ExcavationDrill Rig Truck 1 79 20%Excavator 1 81 40%Dozer 1 82 40%Graders 1 85 40%Tractor/Loader/Backhoe 1 80 25%Material handling equipment 1 85 50%Water Trucks 1 80 10%
FoundationCement and Mortar Mixers 1 79 40%Forklift 1 75 10%Pumps 1 81 50%Generator Sets 1 81 50%Tractor/Loader/Backhoe 1 80 25%
Distance (ft) Lmax Leq L10
Estimated Noise Shielding, dBA
Distance (ft) Lmax Leq L10
Estimated Noise Shielding, dBA
93 88 76 7135 93 86 89 0 240 76 69 72 035 87 77 80 0 240 70 60 63 035 79 72 75 0 240 62 55 58 035 83 77 80 0 240 66 60 63 035 85 81 84 0 240 68 64 67 0
88 90 71 7335 82 75 78 0 240 65 58 61 035 84 80 83 0 240 67 63 66 035 85 81 84 0 240 68 64 67 035 88 84 87 0 240 71 67 70 035 83 77 80 0 240 66 60 63 035 88 85 88 0 240 71 68 71 035 83 73 76 0 240 66 56 59 0
84 86 67 6935 82 78 81 0 240 65 61 64 035 78 68 71 0 240 61 51 54 035 84 81 84 0 240 67 64 67 035 84 81 84 0 240 67 64 67 035 83 77 80 0 240 66 60 63 0
Olive Vista Middle School Sylmar Elementary School

Construction PhaseEquipment Type
No. of Equip.
Reference Noise Level at
50ft, LmaxAcoustical
Usage Factor
Building ConstructionAerial Lift 1 75 20%Cranes 1 81 40%Concrete Saw 1 90 20%Concrete Pump Trucks 1 81 20%Forklift 1 75 10%Generator Sets 1 81 50%Other Equipment 1 85 50%Tractor/Loader/Backhoe 1 80 25%Welders 1 74 40%
Architectural CoatingAir Compressor 2 78 50%Forklift 1 75 10%Generator Sets 1 81 50%Tractor/Loader/Backhoe 1 80 25%Welders 1 74 40%PavingConcrete Mixer Trucks 1 79 40%Paver 1 77 50%Pavement Scarifier 1 90 20%Roller 1 80 20%Tractor/Loader/Backhoe 1 80 25%Demolition of GymConcrete Saw 1 90 20%Crushing/Processing Equipmen 1 84 10%Dump/Haul Trucks 1 76 20%Dozer 1 82 40%Tractor/Loader/Backhoe 1 80 25%Water Trucks 1 80 10%
Source for Ref. Noise Levels: LA CEQA Guides, 2006 & FHWA RCNM, 2005
Distance (ft) Lmax Leq L10
Estimated Noise Shielding, dBA
Distance (ft) Lmax Leq L10
Estimated Noise Shielding, dBA
Olive Vista Middle School Sylmar Elementary School
93 90 76 7335 78 71 74 0 240 61 54 57 035 84 80 83 0 240 67 63 66 035 93 86 89 0 240 76 69 72 035 84 77 80 0 240 67 60 63 035 78 68 71 0 240 61 51 54 035 84 81 84 0 240 67 64 67 035 88 85 88 0 240 71 68 71 035 83 77 80 0 240 66 60 63 035 77 73 76 0 240 60 56 59 0
84 85 67 6935 84 81 84 0 240 67 64 67 035 78 68 71 0 240 61 51 54 035 84 81 84 0 240 67 64 67 035 83 77 80 0 240 66 60 63 035 77 73 76 0 240 60 56 59 0
93 88 76 7135 82 78 81 0 240 65 61 64 035 80 77 80 0 240 63 60 63 035 93 86 89 0 240 76 69 72 035 83 76 79 0 240 66 59 62 035 83 77 80 0 240 66 60 63 0
93 88 78 7335 93 86 89 0 210 78 71 74 035 87 77 80 0 210 72 62 65 035 79 72 75 0 210 64 57 60 035 85 81 84 0 210 70 66 69 035 83 77 80 0 210 68 62 65 035 83 73 76 0 210 68 58 61 0

AppendixE.2ConstructionNoiseCalculationswithNoiseBarrier
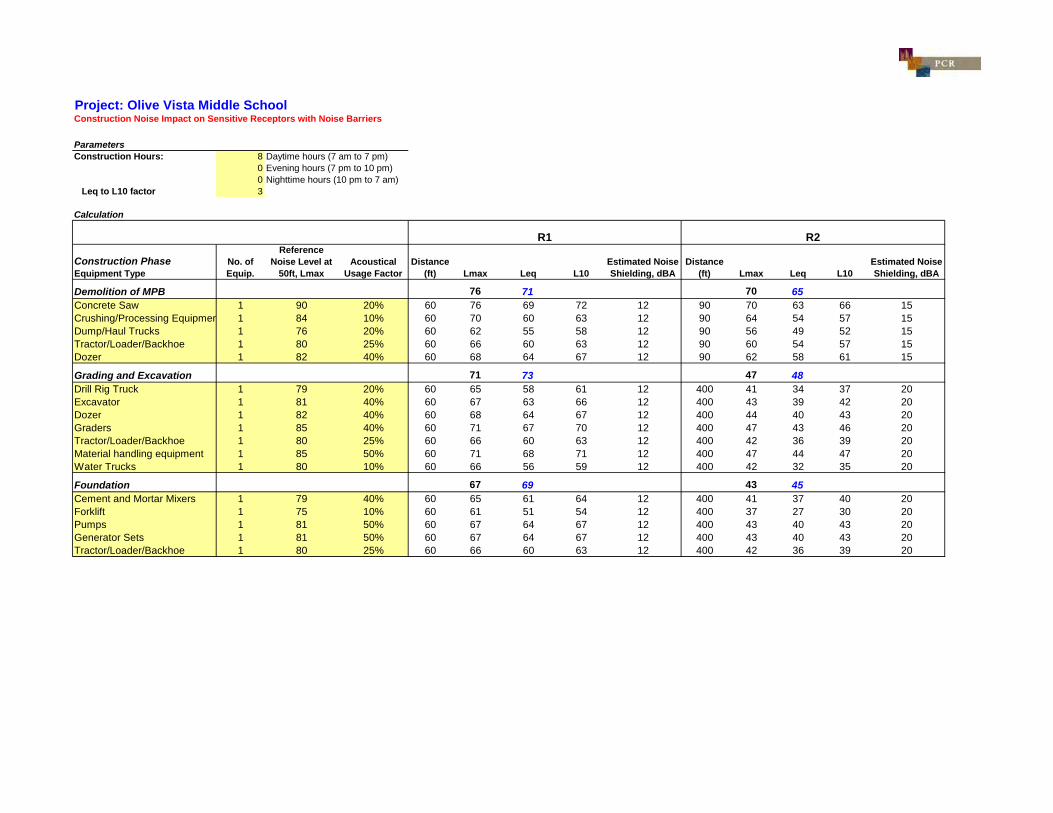
Project: Olive Vista Middle SchoolConstruction Noise Impact on Sensitive Receptors with Noise Barriers
ParametersConstruction Hours: 8 Daytime hours (7 am to 7 pm)
0 Evening hours (7 pm to 10 pm)0 Nighttime hours (10 pm to 7 am)
Leq to L10 factor 3
Calculation
Construction PhaseEquipment Type
No. of Equip.
Reference Noise Level at
50ft, LmaxAcoustical
Usage FactorDistance
(ft) Lmax Leq L10Estimated Noise Shielding, dBA
Distance (ft) Lmax Leq L10
Estimated Noise Shielding, dBA
Demolition of MPB 76 71 70 65Concrete Saw 1 90 20% 60 76 69 72 12 90 70 63 66 15Crushing/Processing Equipmen 1 84 10% 60 70 60 63 12 90 64 54 57 15Dump/Haul Trucks 1 76 20% 60 62 55 58 12 90 56 49 52 15Tractor/Loader/Backhoe 1 80 25% 60 66 60 63 12 90 60 54 57 15Dozer 1 82 40% 60 68 64 67 12 90 62 58 61 15
Grading and Excavation 71 73 47 48Drill Rig Truck 1 79 20% 60 65 58 61 12 400 41 34 37 20Excavator 1 81 40% 60 67 63 66 12 400 43 39 42 20Dozer 1 82 40% 60 68 64 67 12 400 44 40 43 20Graders 1 85 40% 60 71 67 70 12 400 47 43 46 20Tractor/Loader/Backhoe 1 80 25% 60 66 60 63 12 400 42 36 39 20Material handling equipment 1 85 50% 60 71 68 71 12 400 47 44 47 20Water Trucks 1 80 10% 60 66 56 59 12 400 42 32 35 20
Foundation 67 69 43 45Cement and Mortar Mixers 1 79 40% 60 65 61 64 12 400 41 37 40 20Forklift 1 75 10% 60 61 51 54 12 400 37 27 30 20Pumps 1 81 50% 60 67 64 67 12 400 43 40 43 20Generator Sets 1 81 50% 60 67 64 67 12 400 43 40 43 20Tractor/Loader/Backhoe 1 80 25% 60 66 60 63 12 400 42 36 39 20
R1 R2

Construction PhaseEquipment Type
No. of Equip.
Reference Noise Level at
50ft, LmaxAcoustical
Usage FactorDistance
(ft) Lmax Leq L10Estimated Noise Shielding, dBA
Distance (ft) Lmax Leq L10
Estimated Noise Shielding, dBA
R1 R2
Building Construction 76 74 52 49Aerial Lift 1 75 20% 60 61 54 57 12 400 37 30 33 20Cranes 1 81 40% 60 67 63 66 12 400 43 39 42 20Concrete Saw 1 90 20% 60 76 69 72 12 400 52 45 48 20Concrete Pump Trucks 1 81 20% 60 67 60 63 12 400 43 36 39 20Forklift 1 75 10% 60 61 51 54 12 400 37 27 30 20Generator Sets 1 81 50% 60 67 64 67 12 400 43 40 43 20Other Equipment 1 85 50% 60 71 68 71 12 400 47 44 47 20Tractor/Loader/Backhoe 1 80 25% 60 66 60 63 12 400 42 36 39 20Welders 1 74 40% 60 60 56 59 12 400 36 32 35 20
Architectural Coating 67 69 43 44Air Compressor 2 78 50% 60 67 64 67 12 400 43 40 43 20Forklift 1 75 10% 60 61 51 54 12 400 37 27 30 20Generator Sets 1 81 50% 60 67 64 67 12 400 43 40 43 20Tractor/Loader/Backhoe 1 80 25% 60 66 60 63 12 400 42 36 39 20Welders 1 74 40% 60 60 56 59 12 400 36 32 35 20Paving 76 71 70 65Concrete Mixer Trucks 1 79 40% 60 65 61 64 12 90 59 55 58 15Paver 1 77 50% 60 63 60 63 12 90 57 54 57 15Pavement Scarifier 1 90 20% 60 76 69 72 12 90 70 63 66 15Roller 1 80 20% 60 66 59 62 12 90 60 53 56 15Tractor/Loader/Backhoe 1 80 25% 60 66 60 63 12 90 60 54 57 15Demolition of Gym 60 55 42 37Concrete Saw 1 90 20% 220 60 53 56 17 700 42 35 38 25Crushing/Processing Equipmen 1 84 10% 220 54 44 47 17 700 36 26 29 25Dump/Haul Trucks 1 76 20% 220 46 39 42 17 700 28 21 24 25Dozer 1 82 40% 220 52 48 51 17 700 34 30 33 25Tractor/Loader/Backhoe 1 80 25% 220 50 44 47 17 700 32 26 29 25Water Trucks 1 80 10% 220 50 40 43 17 700 32 22 25 25
Source for Ref. Noise Levels: LA CEQA Guides, 2006 & FHWA RCNM, 2005

Project: Olive Vista Middle SchoolConstruction Noise Impact on Sensitive Receptors with Noise Barriers
ParametersConstruction Hours: 8 Daytime hours (7 am to 7 pm)
0 Evening hours (7 pm to 10 pm)0 Nighttime hours (10 pm to 7 am)
Leq to L10 factor 3
Calculation
Construction PhaseEquipment Type
No. of Equip.
Reference Noise Level at
50ft, LmaxAcoustical
Usage Factor
Demolition of MPBConcrete Saw 1 90 20%Crushing/Processing Equipmen 1 84 10%Dump/Haul Trucks 1 76 20%Tractor/Loader/Backhoe 1 80 25%Dozer 1 82 40%
Grading and ExcavationDrill Rig Truck 1 79 20%Excavator 1 81 40%Dozer 1 82 40%Graders 1 85 40%Tractor/Loader/Backhoe 1 80 25%Material handling equipment 1 85 50%Water Trucks 1 80 10%
FoundationCement and Mortar Mixers 1 79 40%Forklift 1 75 10%Pumps 1 81 50%Generator Sets 1 81 50%Tractor/Loader/Backhoe 1 80 25%
Distance (ft) Lmax Leq L10
Estimated Noise Shielding, dBA
Distance (ft) Lmax Leq L10
Estimated Noise Shielding, dBA
76 71 71 6660 76 69 72 12 430 71 64 67 060 70 60 63 12 430 65 55 58 060 62 55 58 12 430 57 50 53 060 66 60 63 12 430 61 55 58 060 68 64 67 12 430 63 59 62 0
71 73 62 6460 65 58 61 12 700 56 49 52 060 67 63 66 12 700 58 54 57 060 68 64 67 12 700 59 55 58 060 71 67 70 12 700 62 58 61 060 66 60 63 12 700 57 51 54 060 71 68 71 12 700 62 59 62 060 66 56 59 12 700 57 47 50 0
67 69 58 6060 65 61 64 12 700 56 52 55 060 61 51 54 12 700 52 42 45 060 67 64 67 12 700 58 55 58 060 67 64 67 12 700 58 55 58 060 66 60 63 12 700 57 51 54 0
R3 R4

Construction PhaseEquipment Type
No. of Equip.
Reference Noise Level at
50ft, LmaxAcoustical
Usage Factor
Building ConstructionAerial Lift 1 75 20%Cranes 1 81 40%Concrete Saw 1 90 20%Concrete Pump Trucks 1 81 20%Forklift 1 75 10%Generator Sets 1 81 50%Other Equipment 1 85 50%Tractor/Loader/Backhoe 1 80 25%Welders 1 74 40%
Architectural CoatingAir Compressor 2 78 50%Forklift 1 75 10%Generator Sets 1 81 50%Tractor/Loader/Backhoe 1 80 25%Welders 1 74 40%PavingConcrete Mixer Trucks 1 79 40%Paver 1 77 50%Pavement Scarifier 1 90 20%Roller 1 80 20%Tractor/Loader/Backhoe 1 80 25%Demolition of GymConcrete Saw 1 90 20%Crushing/Processing Equipmen 1 84 10%Dump/Haul Trucks 1 76 20%Dozer 1 82 40%Tractor/Loader/Backhoe 1 80 25%Water Trucks 1 80 10%
Source for Ref. Noise Levels: LA CEQA Guides, 2006 & FHWA RCNM, 2005
Distance (ft) Lmax Leq L10
Estimated Noise Shielding, dBA
Distance (ft) Lmax Leq L10
Estimated Noise Shielding, dBA
R3 R4
76 74 67 6460 61 54 57 12 700 52 45 48 060 67 63 66 12 700 58 54 57 060 76 69 72 12 700 67 60 63 060 67 60 63 12 700 58 51 54 060 61 51 54 12 700 52 42 45 060 67 64 67 12 700 58 55 58 060 71 68 71 12 700 62 59 62 060 66 60 63 12 700 57 51 54 060 60 56 59 12 700 51 47 50 0
67 69 58 5960 67 64 67 12 700 58 55 58 060 61 51 54 12 700 52 42 45 060 67 64 67 12 700 58 55 58 060 66 60 63 12 700 57 51 54 060 60 56 59 12 700 51 47 50 0
76 71 71 6660 65 61 64 12 430 60 56 59 060 63 60 63 12 430 58 55 58 060 76 69 72 12 430 71 64 67 060 66 59 62 12 430 61 54 57 060 66 60 63 12 430 61 55 58 0
57 53 67 62300 57 50 53 17 730 67 60 63 0300 51 41 44 17 730 61 51 54 0300 43 36 39 17 730 53 46 49 0300 49 45 48 17 730 59 55 58 0300 47 41 44 17 730 57 51 54 0300 47 37 40 17 730 57 47 50 0

Project: Olive Vista Middle SchoolConstruction Noise Impact on Sensitive Receptors with Noise Barriers
ParametersConstruction Hours: 8 Daytime hours (7 am to 7 pm)
0 Evening hours (7 pm to 10 pm)0 Nighttime hours (10 pm to 7 am)
Leq to L10 factor 3
Calculation
Construction PhaseEquipment Type
No. of Equip.
Reference Noise Level at
50ft, LmaxAcoustical
Usage Factor
Demolition of MPBConcrete Saw 1 90 20%Crushing/Processing Equipmen 1 84 10%Dump/Haul Trucks 1 76 20%Tractor/Loader/Backhoe 1 80 25%Dozer 1 82 40%
Grading and ExcavationDrill Rig Truck 1 79 20%Excavator 1 81 40%Dozer 1 82 40%Graders 1 85 40%Tractor/Loader/Backhoe 1 80 25%Material handling equipment 1 85 50%Water Trucks 1 80 10%
FoundationCement and Mortar Mixers 1 79 40%Forklift 1 75 10%Pumps 1 81 50%Generator Sets 1 81 50%Tractor/Loader/Backhoe 1 80 25%
Distance (ft) Lmax Leq L10
Estimated Noise Shielding, dBA
Distance (ft) Lmax Leq L10
Estimated Noise Shielding, dBA
78 73 76 7135 78 71 74 15 240 76 69 72 035 72 62 65 15 240 70 60 63 035 64 57 60 15 240 62 55 58 035 68 62 65 15 240 66 60 63 035 70 66 69 15 240 68 64 67 0
73 75 71 7335 67 60 63 15 240 65 58 61 035 69 65 68 15 240 67 63 66 035 70 66 69 15 240 68 64 67 035 73 69 72 15 240 71 67 70 035 68 62 65 15 240 66 60 63 035 73 70 73 15 240 71 68 71 035 68 58 61 15 240 66 56 59 0
69 71 67 6935 67 63 66 15 240 65 61 64 035 63 53 56 15 240 61 51 54 035 69 66 69 15 240 67 64 67 035 69 66 69 15 240 67 64 67 035 68 62 65 15 240 66 60 63 0
Olive Vista Middle School Sylmar Elementary School
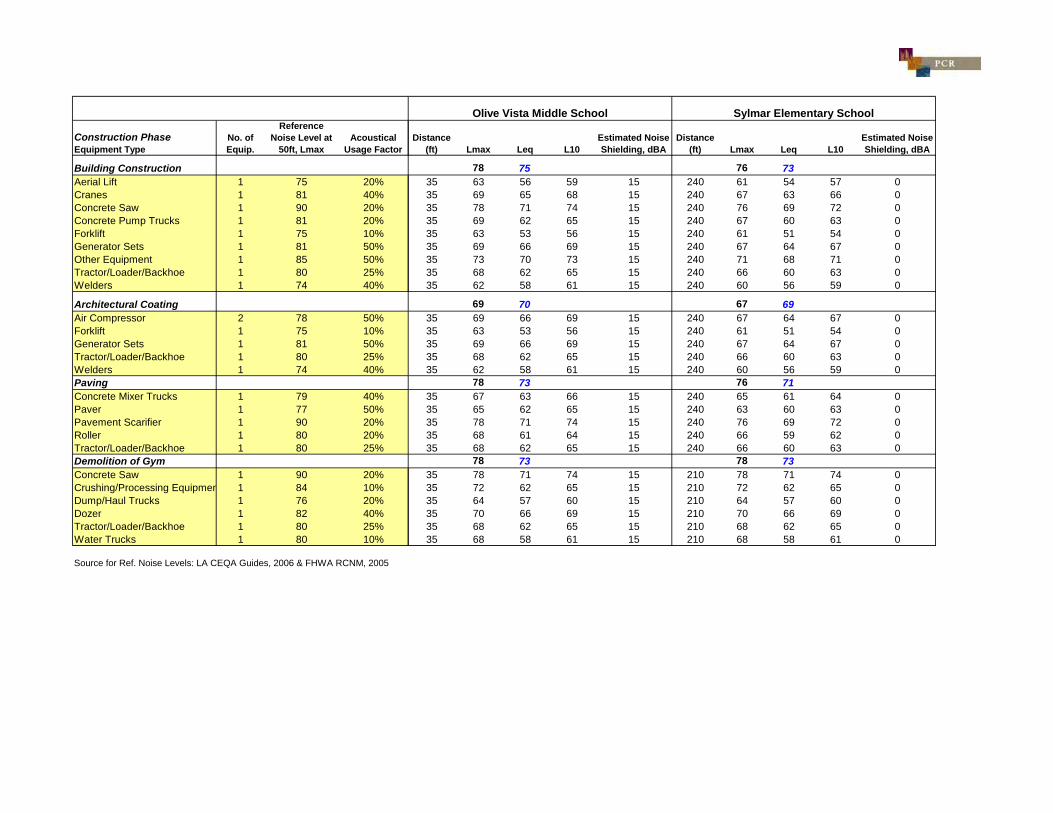
Construction PhaseEquipment Type
No. of Equip.
Reference Noise Level at
50ft, LmaxAcoustical
Usage Factor
Building ConstructionAerial Lift 1 75 20%Cranes 1 81 40%Concrete Saw 1 90 20%Concrete Pump Trucks 1 81 20%Forklift 1 75 10%Generator Sets 1 81 50%Other Equipment 1 85 50%Tractor/Loader/Backhoe 1 80 25%Welders 1 74 40%
Architectural CoatingAir Compressor 2 78 50%Forklift 1 75 10%Generator Sets 1 81 50%Tractor/Loader/Backhoe 1 80 25%Welders 1 74 40%PavingConcrete Mixer Trucks 1 79 40%Paver 1 77 50%Pavement Scarifier 1 90 20%Roller 1 80 20%Tractor/Loader/Backhoe 1 80 25%Demolition of GymConcrete Saw 1 90 20%Crushing/Processing Equipmen 1 84 10%Dump/Haul Trucks 1 76 20%Dozer 1 82 40%Tractor/Loader/Backhoe 1 80 25%Water Trucks 1 80 10%
Source for Ref. Noise Levels: LA CEQA Guides, 2006 & FHWA RCNM, 2005
Distance (ft) Lmax Leq L10
Estimated Noise Shielding, dBA
Distance (ft) Lmax Leq L10
Estimated Noise Shielding, dBA
Olive Vista Middle School Sylmar Elementary School
78 75 76 7335 63 56 59 15 240 61 54 57 035 69 65 68 15 240 67 63 66 035 78 71 74 15 240 76 69 72 035 69 62 65 15 240 67 60 63 035 63 53 56 15 240 61 51 54 035 69 66 69 15 240 67 64 67 035 73 70 73 15 240 71 68 71 035 68 62 65 15 240 66 60 63 035 62 58 61 15 240 60 56 59 0
69 70 67 6935 69 66 69 15 240 67 64 67 035 63 53 56 15 240 61 51 54 035 69 66 69 15 240 67 64 67 035 68 62 65 15 240 66 60 63 035 62 58 61 15 240 60 56 59 0
78 73 76 7135 67 63 66 15 240 65 61 64 035 65 62 65 15 240 63 60 63 035 78 71 74 15 240 76 69 72 035 68 61 64 15 240 66 59 62 035 68 62 65 15 240 66 60 63 0
78 73 78 7335 78 71 74 15 210 78 71 74 035 72 62 65 15 210 72 62 65 035 64 57 60 15 210 64 57 60 035 70 66 69 15 210 70 66 69 035 68 62 65 15 210 68 62 65 035 68 58 61 15 210 68 58 61 0


AppendixE.3Off‐SiteConstructionTrafficNoiseCalculations


Off-Site Traffic Noise Calculations1 of 3
Project: Olive Vista Middle School Project
Off-site Truck Traffic Noise
Existing
Roadway/Segment AM PM ADT ROW 25 Feet 50 Feet ROW 25 Feet 50 FeetFellows Avenue 12 52.3 49.3 47.5 49.3 46.3 44.5Borden Avenue 12 52.3 49.3 47.5 49.3 46.3 44.5-- 0 - - - - - --- 0 - - - - - --- 0 - - - - - -Future No Project
Roadway/Segment AM PM ADT ROW 25 Feet 50 Feet ROW 25 Feet 50 FeetFellows Avenue 0 - - - - - -Borden Avenue 0 - - - - - --- 0 - - - - - --- 0 - - - - - --- 0 - - - - - -Future With Project
Roadway/Segment AM PM ADT ROW 25 Feet 50 Feet ROW 25 Feet 50 FeetFellows Avenue 0 - - - - - -Borden Avenue 0 - - - - - --- 0 - - - - - --- 0 - - - - - --- 0 - - - - - -
Summary
Roadway/SegmentFellows Avenue - - - -Borden Avenue - - - --- - - - --- - - - --- - - - -
At ROWProject
IncrementCumulative Increment
Project Increment
Cumulative Increment
25 ft. from ROW
CNEL
CNEL
CNEL
CNEL
LeqTraffic Volumes
Traffic Volumes
Traffic Volumes
Leq
Leq
TENS 1.1 (Trucks) 12/5/2014

PCR Santa MoniCa
201 Santa Monica Boulevard, Suite 500Santa Monica, California 90401
TEL 310.451.4488FAX 310.451.5279
PCR PaSadena
80 South Lake Avenue, Suite 570Pasadena, California 91101
TEL 626.204.6170FAX 626.204.6171
PCR iRvine
2121 Alton Parkway, Suite 100Irvine, California 92606
TEL 949.753.7001FAX 949.753.7002
www.pcrnet.com