VisTA: Integrating Machine Intelligence with Visualization to ...
10
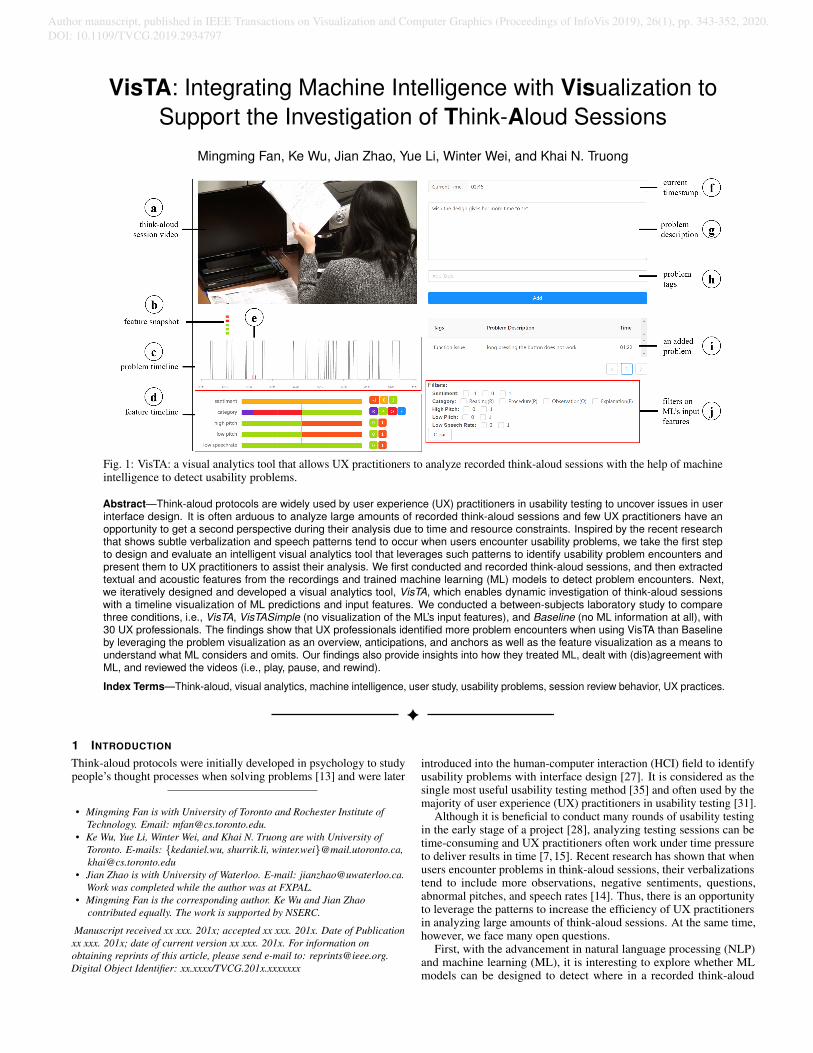
VisTA: Integrating Machine Intelligence with Visualization to Support the Investigation of Think-Aloud Sessions Mingming Fan, Ke Wu, Jian Zhao, Yue Li, Winter Wei, and Khai N. Truong Fig. 1: VisTA: a visual analytics tool that allows UX practitioners to analyze recorded think-aloud sessions with the help of machine intelligence to detect usability problems. Abstract—Think-aloud protocols are widely used by user experience (UX) practitioners in usability testing to uncover issues in user interface design. It is often arduous to analyze large amounts of recorded think-aloud sessions and few UX practitioners have an opportunity to get a second perspective during their analysis due to time and resource constraints. Inspired by the recent research that shows subtle verbalization and speech patterns tend to occur when users encounter usability problems, we take the first step to design and evaluate an intelligent visual analytics tool that leverages such patterns to identify usability problem encounters and present them to UX practitioners to assist their analysis. We first conducted and recorded think-aloud sessions, and then extracted textual and acoustic features from the recordings and trained machine learning (ML) models to detect problem encounters. Next, we iteratively designed and developed a visual analytics tool, VisTA, which enables dynamic investigation of think-aloud sessions with a timeline visualization of ML predictions and input features. We conducted a between-subjects laboratory study to compare three conditions, i.e., VisTA, VisTASimple (no visualization of the ML’s input features), and Baseline (no ML information at all), with 30 UX professionals. The findings show that UX professionals identified more problem encounters when using VisTA than Baseline by leveraging the problem visualization as an overview, anticipations, and anchors as well as the feature visualization as a means to understand what ML considers and omits. Our findings also provide insights into how they treated ML, dealt with (dis)agreement with ML, and reviewed the videos (i.e., play, pause, and rewind). Index Terms—Think-aloud, visual analytics, machine intelligence, user study, usability problems, session review behavior, UX practices. 1 I NTRODUCTION Think-aloud protocols were initially developed in psychology to study people’s thought processes when solving problems [13] and were later • Mingming Fan is with University of Toronto and Rochester Institute of Technology. Email: [email protected]. • Ke Wu, Yue Li, Winter Wei, and Khai N. Truong are with University of Toronto. E-mails: {kedaniel.wu, shurrik.li, winter.wei}@mail.utoronto.ca, [email protected] • Jian Zhao is with University of Waterloo. E-mail: [email protected]. Work was completed while the author was at FXPAL. • Mingming Fan is the corresponding author. Ke Wu and Jian Zhao contributed equally. The work is supported by NSERC. Manuscript received xx xxx. 201x; accepted xx xxx. 201x. Date of Publication xx xxx. 201x; date of current version xx xxx. 201x. For information on obtaining reprints of this article, please send e-mail to: [email protected]. Digital Object Identifier: xx.xxxx/TVCG.201x.xxxxxxx introduced into the human-computer interaction (HCI) field to identify usability problems with interface design [27]. It is considered as the single most useful usability testing method [35] and often used by the majority of user experience (UX) practitioners in usability testing [31]. Although it is beneficial to conduct many rounds of usability testing in the early stage of a project [28], analyzing testing sessions can be time-consuming and UX practitioners often work under time pressure to deliver results in time [7, 15]. Recent research has shown that when users encounter problems in think-aloud sessions, their verbalizations tend to include more observations, negative sentiments, questions, abnormal pitches, and speech rates [14]. Thus, there is an opportunity to leverage the patterns to increase the efficiency of UX practitioners in analyzing large amounts of think-aloud sessions. At the same time, however, we face many open questions. First, with the advancement in natural language processing (NLP) and machine learning (ML), it is interesting to explore whether ML models can be designed to detect where in a recorded think-aloud Author manuscript, published in IEEE Transactions on Visualization and Computer Graphics (Proceedings of InfoVis 2019), 26(1), pp. 343-352, 2020. DOI: 10.1109/TVCG.2019.2934797
-
Upload
khangminh22 -
Category
Documents
-
view
5 -
download
0
Transcript of VisTA: Integrating Machine Intelligence with Visualization to ...
VisTA: Integrating Machine Intelligence with Visualization toSupport the Investigation of Think-Aloud Sessions
Mingming Fan, Ke Wu, Jian Zhao, Yue Li, Winter Wei, and Khai N. Truong
Fig. 1: VisTA: a visual analytics tool that allows UX practitioners to analyze recorded think-aloud sessions with the help of machineintelligence to detect usability problems.
Abstract—Think-aloud protocols are widely used by user experience (UX) practitioners in usability testing to uncover issues in userinterface design. It is often arduous to analyze large amounts of recorded think-aloud sessions and few UX practitioners have anopportunity to get a second perspective during their analysis due to time and resource constraints. Inspired by the recent researchthat shows subtle verbalization and speech patterns tend to occur when users encounter usability problems, we take the first stepto design and evaluate an intelligent visual analytics tool that leverages such patterns to identify usability problem encounters andpresent them to UX practitioners to assist their analysis. We first conducted and recorded think-aloud sessions, and then extractedtextual and acoustic features from the recordings and trained machine learning (ML) models to detect problem encounters. Next,we iteratively designed and developed a visual analytics tool, VisTA, which enables dynamic investigation of think-aloud sessionswith a timeline visualization of ML predictions and input features. We conducted a between-subjects laboratory study to comparethree conditions, i.e., VisTA, VisTASimple (no visualization of the ML’s input features), and Baseline (no ML information at all), with30 UX professionals. The findings show that UX professionals identified more problem encounters when using VisTA than Baselineby leveraging the problem visualization as an overview, anticipations, and anchors as well as the feature visualization as a means tounderstand what ML considers and omits. Our findings also provide insights into how they treated ML, dealt with (dis)agreement withML, and reviewed the videos (i.e., play, pause, and rewind).
Index Terms—Think-aloud, visual analytics, machine intelligence, user study, usability problems, session review behavior, UX practices.
1 INTRODUCTION
Think-aloud protocols were initially developed in psychology to studypeople’s thought processes when solving problems [13] and were later
• Mingming Fan is with University of Toronto and Rochester Institute ofTechnology. Email: [email protected].
• Ke Wu, Yue Li, Winter Wei, and Khai N. Truong are with University ofToronto. E-mails: {kedaniel.wu, shurrik.li, winter.wei}@mail.utoronto.ca,[email protected]
• Jian Zhao is with University of Waterloo. E-mail: [email protected] was completed while the author was at FXPAL.
• Mingming Fan is the corresponding author. Ke Wu and Jian Zhaocontributed equally. The work is supported by NSERC.
Manuscript received xx xxx. 201x; accepted xx xxx. 201x. Date of Publicationxx xxx. 201x; date of current version xx xxx. 201x. For information onobtaining reprints of this article, please send e-mail to: [email protected] Object Identifier: xx.xxxx/TVCG.201x.xxxxxxx
introduced into the human-computer interaction (HCI) field to identifyusability problems with interface design [27]. It is considered as thesingle most useful usability testing method [35] and often used by themajority of user experience (UX) practitioners in usability testing [31].
Although it is beneficial to conduct many rounds of usability testingin the early stage of a project [28], analyzing testing sessions can betime-consuming and UX practitioners often work under time pressureto deliver results in time [7, 15]. Recent research has shown that whenusers encounter problems in think-aloud sessions, their verbalizationstend to include more observations, negative sentiments, questions,abnormal pitches, and speech rates [14]. Thus, there is an opportunityto leverage the patterns to increase the efficiency of UX practitionersin analyzing large amounts of think-aloud sessions. At the same time,however, we face many open questions.
First, with the advancement in natural language processing (NLP)and machine learning (ML), it is interesting to explore whether MLmodels can be designed to detect where in a recorded think-aloud
Author manuscript, published in IEEE Transactions on Visualization and Computer Graphics (Proceedings of InfoVis 2019), 26(1), pp. 343-352, 2020.DOI: 10.1109/TVCG.2019.2934797

session the user likely encounters usability problems. Second, forbetter utilization of the prediction, visualizations can be designedto present the usability problem encounters (referred as problemshereafter) detected by ML and enable effective exploration. Wouldthe visualization improve UX practitioners’ performance or offer thema different perspective to scrutinize usability problems? Third, sincerecent research shows that many UX practitioners have little experienceworking with an artificial intelligence (AI) agent or understand thecapabilities and limitations of ML [10,41,42], how would they perceiveand manage their relationship with ML during their analysis?
In this research, we take the first step toward answering thesequestions by designing and evaluating a visual analytics tool poweredby ML to assist UX practitioners with interactively investigatingvideo-recorded think-aloud sessions.
We first conducted and recorded think-aloud sessions in which eightparticipants used both digital and physical products. We transcribedthe sessions, labeled user-encountered problems as the ground truth,classified verbalizations into categories [8, 12], and automaticallyextracted textual and acoustic features. We used these informationto train a range of ML models, including random forest (RF), supportvector machine (SVM), convolutional neural network (CNN), andrecurrent neural network (RNN), to detect usability problems that usersencountered, and evaluated the model performances.
Following an iterative user-centered design process, we developedVisTA, a visual analytics tool that allows UX practitioners tointeractively explore and analyze recorded think-aloud sessions withmachine intelligence (Fig. 1). The tool presents the ML-inferredproblems along a timeline, as well as the verbalization and speechfeatures that the ML model takes as input, allowing for a betterunderstanding of the model. In addition, VisTA provides a video playerfor browsing recorded sessions, and offers the capabilities of annotatingand tagging identified problems.
To deeply understand how UX practitioners perceive andutilize ML-inferred problems with this visual analytics approach,we conducted a between-subjects controlled study with 30 UXpractitioners. In addition to VisTA, we included a Baseline condition, inwhich UX practitioners did not have the assistance from ML, to learnabout the impact of ML. We also included a VisTASimple condition,in which UX practitioners were only able to see the ML predictions(without showing input features), to evaluate the effect of having accessto these verbalization and speech features in their usage of ML.
In sum, our contributions in this paper are in two-fold:• A novel visual analytics tool, VisTA, to assist UX practitioners
with analyzing recorded think-aloud sessions, which integratesML for usability problem detection with interactive visualizationof ML-inferred usability problems and the ML’s input features aswell as video review and problem annotation functions;
• Results of a controlled user study that quantitatively andqualitatively characterize how UX practitioners used the tool andprovide in-depth insights into how they leveraged and perceivedML in their analysis and how they reviewed think-aloud videos.
2 BACKGROUND AND RELATED WORK
2.1 Think-aloud Verbalizations and Usability ProblemsThink aloud protocol was developed in psychology to study humanthought processes [13]. Later it was introduced into the HCI field tounderstand usability problems [27]. McDonald et al. surveyed the useof the think aloud protocol and found that 90% of the UX practitionersin their study often use it [31] and it was considered as the single mostvaluable usability engineering method [34].
When using think aloud, participants verbalize their thoughtprocesses while carrying out a task. Participants’ verbalizations providedata to understand their thought processes. To safeguard the validity ofthe verbalizations, Ericcson and Simon and a later meta analysis suggestthree guidelines: use a neutral instruction to think aloud that does notrequest specific types of verbalizations; use a think-aloud practicesession to allow participants to become familiar with verbalizing theirthoughts; use a neutral “keep talkin” token to remind participants tothink aloud if they fall into silence [13, 16]. In practice, usability
professionals may not adhere to the three guidelines [5]. For instance,usability evaluators may probe participants, which can cause changesin their behavior [13, 22]. Thus, we followed the three guidelines toconduct think-aloud sessions in this research.
Researchers systematically decomposed users’ verbalizations intomore manageable segments and categorized them into four categories:Reading (R)—read words, phrases, or sentences directly from the deviceor instructions; Procedure (P)—describe his/her current/future actions;Observation (O)—make remarks about the product, instructionsor themselves; and Explanation (E)—explain motivations for theirbehavior [8]. This categorization was further validated by Elling etal. [12] and was often cited by later work [21, 24, 32, 45]. Recently,Fan et al. studied the verbalization categories and speech features (e.g.,pitch, speech rate) of segments in which users encountered problemsand found that when users experienced problems, their verbalizationstend to include the Observation category, negative sentiment, negations,questions, and abnormal pitches and speech rates [14]. Inspired by thisfinding, we extend this line of research by examining if it is possible toautomatically detect problems based on these verbalization and speechfeatures that tend to occur when users encountered problems; and howto integrate such machine intelligence into visual analytics to assist UXpractitioners to better analyze think-aloud sessions.
2.2 Machine Learning for User Experience (UX)As ML is increasingly integrated into products, it is inevitable that UXpractitioners would encounter ML in their workflow. However, a recentsurvey revealed that many UX practitioners struggled to understandthe capabilities and limitations of ML and they often tend to joinprojects after functional decisions have been made [10]. Even if UXpractitioners can join projects early, they often fail to see places whereML could improve UX [42]. Consequently, many UX practitioners areunprepared to effectively leverage ML capabilities [10, 41, 42] where itmay be able to enhance user experience.
To address this problem, some developed education materials thataim to teach UX practitioners technical concepts of ML [19]. Someorganized workshops to bring designers and technologists together toexplore how ML might function as a creative material [17]. Thesework implies that designers should gain technical knowledge of ML.However, a recent interview study with UX practitioners, who had yearsof experience designing ML-enhanced products, found that they knewlittle about how ML works but yet they still could use their “designerlyabstraction” to work with ML [41]. This finding supports that it ispossible for designers to treat ML as “design material” when improvingUX with it [40]. Inspired by this idea, we would like to understandhow UX practitioners would use, perceive, and react to ML by creatingan opportunity for them to work with ML when analyze think-aloudsessions and learn from their experiences.
2.3 Visual Analytics to Facilitate Qualitative ResearchPurely applying machine learning to solve qualitative research tasks canbe challenging. That is because machine learning models are often usedto classify or cluster data into categories, but qualitative researchersmight need more than automatically generated labels. Further, theresults generated by machine learning models may be inaccurate.Researchers attempt to integrate human knowledge and machineintelligence via interactive visualization. For example, Drouhard et al.designed a tool called Aeonium to facilitate collaborative qualitativecoding process [11]. Aeonium highlights ambiguity in qualitativecoding and facilitates the evolution of code definitions.
Moreover, several visualization systems have been proposed toanalyze interaction logs, which helps qualitative researchers recoverusers’ intentions and reasoning processes behind. The interactionlogs can include low-level inputs (e.g., mouse clicks and eye-trackingdata) and high-level actions (e.g., zooming and panning). Heer etal. discussed the design space of interaction histories and proposeda thumbnail-based approach for showing the graph structures ofuser interactions [20]. The HARVEST system aims to capture theprovenance of users’ insights based on their low-level inputs [18].Interaction logs and think-aloud data are used together to help
users recall their strategies in visual analytics systems [9, 30]. Inaddition, various visualization techniques have been proposed fordisplaying eye-tracking data, including point-based, AOI-based, andthose integrating both. Blascheck et al. provided a comprehensivesurvey on this topic [3]. By combining think-aloud, interaction,and eye movement data together, VA2 facilitates the analysis ofmultiple concurrent evaluation results via coordinated views [2]. Also,researchers have investigated user-generated annotations and developedvisual interfaces to assist with the discovery of higher-level patterns inusers’ sense-making processes [43, 44].
While several previous tools utilize think-aloud data for analyzingusers’ behaviors [2, 9, 30], unlike VisTA, verbalization and speechpatterns have not been explored to build ML that detects problems andassists UX practitioners with analyzing think-aloud sessions. Further, itis still an open question how UX practitioners would perceive and workwith ML during their analysis. In this paper, we strive to address this byconducting user studies to compare different conditions of integratingML into the visual analytics system.
3 RESEARCH QUESTIONS
In this work, we explore the following research questions (RQs)to understand how UX practitioners would work with ML in avisualization to analyze video-recorded think-aloud sessions:RQ1: How would UX practitioners leverage ML in their analysis?
How would they use the visualization of ML? Would it help themidentify more problems?
RQ2: How would ML influence UX practitioners’ session reviewstrategies? If so, how many types of strategies are there? Would theytend to review session recordings with more rewinds or pauses?
RQ3: How would UX practitioners perceive and manage therelationship with ML? What are their attitudes? How would theydeal with the agreement, disagreement, and limitations of ML?
We iteratively developed a visual analytics tool, VisTA, thatintegrates machine intelligence and used it as a vehicle to answer theRQs. We designed a controlled study to expose UX practitioners to MLat different levels, and recorded a rich set of quantitative and qualitativedata about their interactions with the tool, their analysis behaviors (e.g.,pauses and rewinds), and their perceived relationship with ML.
In the rest of paper, we first describe how we curated a dataset ofthink-aloud sessions and trained ML models to detect problems (Sec. 4)and how we designed the visual analytics tool (Sec. 5). Next, weexplain our study design and analysis methods (Sec. 6). Finally, wepresent the results and discuss our findings (Sec. 7 & 8).
4 THINK-ALOUD DATASET AND PROBLEM DETECTION
4.1 Data CollectionTo curate a think-aloud dataset, we recruited 8 native English speakers(4 females and 4 males, aged 19–26) to participate in our think-aloudstudy. Participants had diverse education backgrounds includinghumanity, engineering, and sciecnes.
In our think-aloud study, we collected data of participants usingthree different interfaces, including one digital product (i.e., a scienceand technology museum website) and two physical products (i.e., auniversal remote control and a multi-function coffee machine).
During the study, the moderator first played a short video tutorial [36]to demonstrate how to think aloud, and then asked each participant topractice thinking aloud when setting an alarm on an alarm clock. Next,each participant used each of the three products (in a counter-balancedorder) to complete a task while thinking aloud. The tasks were relatedto major functions of the products and were as follows: 1) search for aphoto of the instructions for an early telescope, 2) program the coffeemachine to make two cups of strong-flavored drip coffee at 7:30 in themorning, and 3) program a remote control to operate a DVD player.For physical products, participants were also given a hard-copy of theirinstruction manuals.
All think-aloud sessions were video recorded with audio stream.The average session duration was 222 seconds (σ = 131) for thewebsite, 619 seconds (σ = 195) for the universal remote control, and854 seconds (σ = 251) for the coffee machine.
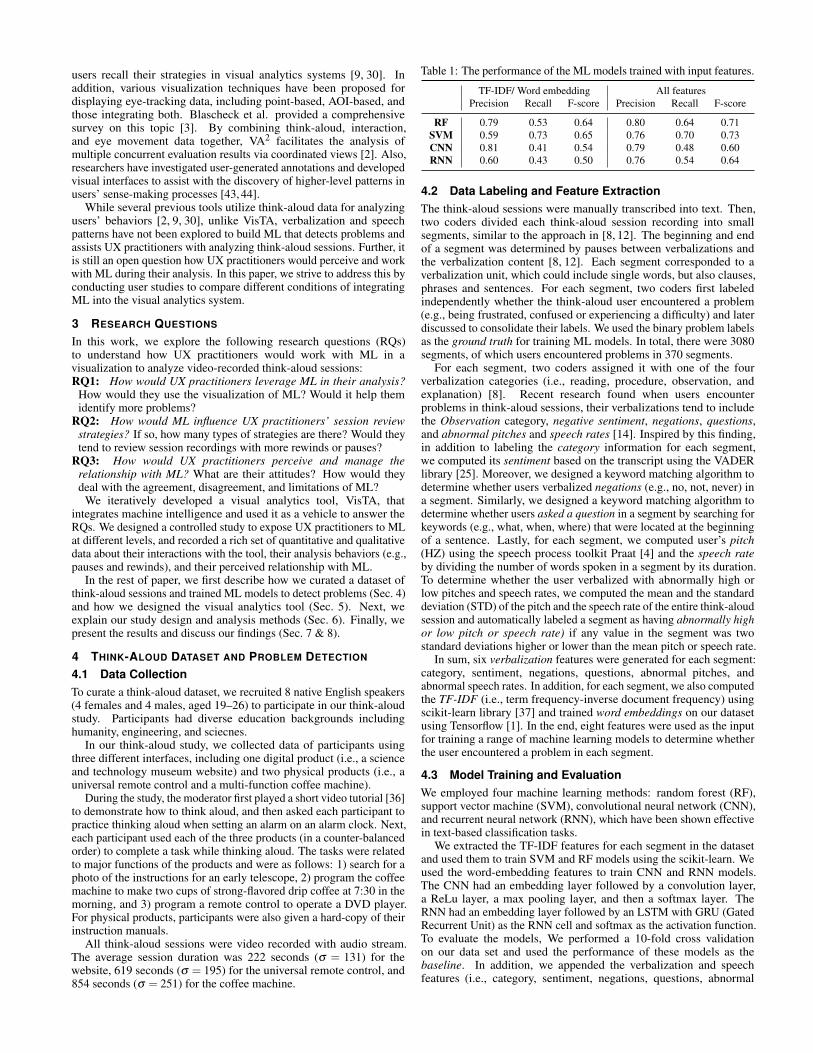
Table 1: The performance of the ML models trained with input features.
TF-IDF/ Word embedding All featuresPrecision Recall F-score Precision Recall F-score
RF 0.79 0.53 0.64 0.80 0.64 0.71SVM 0.59 0.73 0.65 0.76 0.70 0.73CNN 0.81 0.41 0.54 0.79 0.48 0.60RNN 0.60 0.43 0.50 0.76 0.54 0.64
4.2 Data Labeling and Feature ExtractionThe think-aloud sessions were manually transcribed into text. Then,two coders divided each think-aloud session recording into smallsegments, similar to the approach in [8, 12]. The beginning and endof a segment was determined by pauses between verbalizations andthe verbalization content [8, 12]. Each segment corresponded to averbalization unit, which could include single words, but also clauses,phrases and sentences. For each segment, two coders first labeledindependently whether the think-aloud user encountered a problem(e.g., being frustrated, confused or experiencing a difficulty) and laterdiscussed to consolidate their labels. We used the binary problem labelsas the ground truth for training ML models. In total, there were 3080segments, of which users encountered problems in 370 segments.
For each segment, two coders assigned it with one of the fourverbalization categories (i.e., reading, procedure, observation, andexplanation) [8]. Recent research found when users encounterproblems in think-aloud sessions, their verbalizations tend to includethe Observation category, negative sentiment, negations, questions,and abnormal pitches and speech rates [14]. Inspired by this finding,in addition to labeling the category information for each segment,we computed its sentiment based on the transcript using the VADERlibrary [25]. Moreover, we designed a keyword matching algorithm todetermine whether users verbalized negations (e.g., no, not, never) ina segment. Similarly, we designed a keyword matching algorithm todetermine whether users asked a question in a segment by searching forkeywords (e.g., what, when, where) that were located at the beginningof a sentence. Lastly, for each segment, we computed user’s pitch(HZ) using the speech process toolkit Praat [4] and the speech rateby dividing the number of words spoken in a segment by its duration.To determine whether the user verbalized with abnormally high orlow pitches and speech rates, we computed the mean and the standarddeviation (STD) of the pitch and the speech rate of the entire think-aloudsession and automatically labeled a segment as having abnormally highor low pitch or speech rate) if any value in the segment was twostandard deviations higher or lower than the mean pitch or speech rate.
In sum, six verbalization features were generated for each segment:category, sentiment, negations, questions, abnormal pitches, andabnormal speech rates. In addition, for each segment, we also computedthe TF-IDF (i.e., term frequency-inverse document frequency) usingscikit-learn library [37] and trained word embeddings on our datasetusing Tensorflow [1]. In the end, eight features were used as the inputfor training a range of machine learning models to determine whetherthe user encountered a problem in each segment.
4.3 Model Training and EvaluationWe employed four machine learning methods: random forest (RF),support vector machine (SVM), convolutional neural network (CNN),and recurrent neural network (RNN), which have been shown effectivein text-based classification tasks.
We extracted the TF-IDF features for each segment in the datasetand used them to train SVM and RF models using the scikit-learn. Weused the word-embedding features to train CNN and RNN models.The CNN had an embedding layer followed by a convolution layer,a ReLu layer, a max pooling layer, and then a softmax layer. TheRNN had an embedding layer followed by an LSTM with GRU (GatedRecurrent Unit) as the RNN cell and softmax as the activation function.To evaluate the models, We performed a 10-fold cross validationon our data set and used the performance of these models as thebaseline. In addition, we appended the verbalization and speechfeatures (i.e., category, sentiment, negations, questions, abnormal

Fig. 2: An early version of VisTA that visualizes the verbalization andspeech features of the entire think-aloud session to UX evaluators.
pitches, and abnormal speech rates) to the end of the TF-IDF or wordembedding vector for each segment as the input to train the same fourML models. Similarly, we performed 10-fold cross validation.
The results in Table 1 show that verbalization and speech featureshelped improve all ML models’ performance. The SVM modelsperformed the best. CNN and RNN did not outperform SVM or RFprobably because our dataset was relatively small for CNN or RNNto learn optimal hyper parameters . Thus, we decided to use the bestperformed SVM models to predict the problem labels (i.e., whether theuser encountered a problem or not) for all segments of the think-aloudsessions. After this process, all segments in each think-aloud sessionhad a binary ML-inferred problem label.
5 VISTA: VisUAL ANALYTICS FOR T HINK-ALOUD
Following a typical user-centered iterative design process, wedeveloped VisTA that interactively presents the verbalization featuresand the problems detected by ML as described earlier.
5.1 Design PrinciplesOur initial design of VisTA presents the verbalization and speechfeatures of the entire think-aloud session to UX practitioners as a seriesof synchronized timelines (Fig. 2), in addition to the functions that allowevaluators to play the recorded sessions and add problem descriptions.To get a sense of the effectiveness of this design, we recruited 12UX practitioners (8 females and 4 males, aged 22–31) as usabilityevaluators and asked them to use the tool to analyze the recordedthink-aloud sessions. Afterwards, we interviewed them to understandtheir usage and preferences of the tool functionalities. Each studysession lasted about 1.5 hours and each evaluator was compensatedwith $30. Based on the results, we derived two principles to improvethe design of VisTA.
• Be Simple and Informative. Evaluators wanted to have a simpleinterface that offers concise information that they could consultto if need, while allowing them to focus on watching or listeningto the recorded sessions. Although evaluators felt that each ofthe feature can be informative, showing all of them at once wasoverwhelming, as one evaluator pointed out that “because linesare so busy, it is hard to pick up significant areas while reviewingthe session.” Instead of viewing all the raw features and trying to
Fig. 3: The feature timeline shows ML’s main input features in a shorttime window around the current time and updates as the video plays.
figure out important information, they would prefer just havingone condensed type of information while still being able to accessthe raw features if needed.
• Be Interactive and Responsive. Evaluators felt that the function ofclicking anywhere on any timeline to move the session recordingto that timestamp was helpful. In addition, they wanted to interactwith the input features, such as filtering particular features, tobetter understand and leverage the features. Evaluators alsowanted to tag their identified problems with short annotationsto facilitate their analysis.
We adopted these two principles in the redesign of VisTA.Specifically, we integrated the machine intelligence into the analysisflow among other capabilities (Fig. 1). The refined VisTA interfaceprovides a typical video player, a problem timeline that visualizes theML-inferred problems, and a feature timeline that visualizes ML’s inputfeatures on the left, as well as a panel on the right for logging andtagging identified problems and filtering input features.
5.2 Session Reviewing and Problem LoggingA UX evaluator can play and pause the think-aloud video (Fig. 1a)by pressing the ESC key, or fast-forward or backward by pressing theright or left arrow keys. While the video is playing, a red verticalline (Fig. 1e) moves to indicate the current timestamp, which is alsoautomatically updated (Fig. 1f). Evaluators can write a problemdescription (Fig. 1g), add short and reusable problem tags (Fig. 1h),and finally log the problem by pressing the “Add” button.
All problems that the evaluator identified are visualized in theproblem table (Fig. 1i). Clicking a problem entry in the table navigatesthe video to the timestamp on the timeline where the problem wasadded so that the evaluator can replay the video segment if needed.Moreover, the tag area (Fig. 1h) allows the evaluator to create multipletags and attach them to a problem description. VisTA stores all thecreated tags in a dropdown list so that the evaluator can reuse them.
5.3 Visualization of Problems and FeaturesVisTA visualizes ML-inferred problems on the problem timeline(Fig. 1c), following the idea of showing “condensed” information.This design hides the complexity of the raw verbalization and speechfeatures that might be hard for the evaluator to understand in theiranalysis. As this is the primary augmented information to a think-aloudsession video, it is placed directly under the video player to facilitatequick scanning. The long red vertical line on the problem timeline(Fig. 1e) indicates the current time of the video. Further, to allowthe evaluator to access the raw features without being overwhelmed,VisTA only reveals the ML’s main input features in a short time window(e.g., 10 seconds) around the current time in the video, instead of theentire video as in our initial design, on the feature timeline as shownin Fig. 1d and Fig. 3. The start and end of the window are markedwith two short red vertical lines around the current time on the problemtimeline (Fig. 1e). When the evaluator plays the video, the featurevalues on the feature timeline are dynamically updated. As this is aless demanded feature per pilot users’ feedback, it is placed under theproblem timeline.
When the evaluator pauses the video, VisTA shows a snapshot ofthe input features at the current time on the top of the problem timeline(Fig. 4b). It also highlights parts of the video that have the samefeatures. For example, Fig. 4c,d,e contain the same features as thecurrent time as shown in Fig.4b. To help the evaluator better assess howML-inferred problems align with the highlight areas, we color-code

Fig. 4: The revised problem timeline. VisTA highlights all the segmentsthat have the same set of features as the currently paused timestampto help UX evaluators spot where else in the session the same featuresappear and how these areas align with ML-inferred problems.
Fig. 5: VisTASimple has the same functions as VisTA except that itdoes not show the feature timeline or provide the filter function.
the areas where the ML detects problems in blue (Fig. 4c,d) and thosewhere the ML detects no problems in pink (Fig. 4e). When the video isplaying again, the highlight and the feature snapshot will disappear toavoid distraction. When the evaluator adds a problem, VisTA adds afeature snapshot on the top of the problem timeline (Fig. 4a) to help theevaluator remember the location of the problem and what the featureslook like at that time. Meanwhile, VisTA also adds an entry into theproblem table (Fig. 1i). When the evaluator clicks on the snapshot,VisTA highlights all areas that have the same set of features.
Furthermore, as shown in Fig. 1j, VisTA also provides a filterfunction that allows evaluators to manually select a combination offeatures, which automatically highlights the areas on the problemtimeline that have the same set of features. We posit that thehighlighting areas would allow evaluators to better assess how thefeatures of their choice align with the ML-inferred problems.
6 USER STUDY
6.1 DesignTo investigate how UX practitioners would use the problem timelineand the feature timeline in their analysis, we conducted a controlledlaboratory study to compare different versions of VisTA. Morespecifically, we developed VisTASimple that only shows the problemtimeline without the input features (Fig. 5), in order to better understandthe effect of the feature timeline on a UX practitioner’s analysis. Thisalso helps us to investigate how it can affect the user interactions on theproblem timeline. Moreover, to study the effect of the whole ML in theanalysis process, we included a Baseline condition that shares the sameuser interface as VisTASimple except not having the problem timeline.Thus, UX practitioners do not have any access to ML.
Because there are potentially learning effects between conditions, weadopted a between-subjects design for the study. For example, after aparticipant used VisTA, she would know the ML’s input features, whichmight prime her to consider these features in the other two conditions.
6.2 ParticipantsWe recruited 30 UX practitioners from local UX communities at a largemetropolitan area by posting advertisements on social media platforms.They participated in the study as usability evaluators. We randomlyassigned them to the three conditions, thus each having 10 evaluators.
Table 2: The number of problems reported by evaluators (in µ(σ)).
Session 1 Session 2 Session 3
Baseline 3.9 (2.0) 6.2 (2.7) 13.8 (4.8)VisTASimple 5.9 (2.8) 7.1 (2.4) 18.2 (6.6)
VisTA 6.7 (3.3) 8.4 (3.8) 21.2 (5.9)
They self-reported having 1-9 years of experience. The averages for theBaseline, VisTASimple, and VisTA conditions were the same: 3 years(σ = 2,3,2 respectively). Mann Whitney U test found no significantdifference in the years of experience between conditions.
6.3 ProcedureWe conducted the studies in a quiet office room with a 27-inch monitorconnected to a laptop computer. After getting the evaluators’ informedconsent, the moderator explained that their task was to review threerecorded think-aloud sessions to identify when users were confused,frustrated, or experienced problems. The three videos were about usersoperating on three different products (i.e, one website, one universalremote, and one coffee machine), and were randomly chosen from thedataset described in Sec. 4, and the same set of videos was used for allparticipants in the whole study.
In the beginning of the study, evaluators were demonstrated howto use the tool (Baseline, VisTASimple, or VisTA) by loading a trialthink-aloud session, and the moderator answered any questions thatthey had. In each session, before evaluators analyzing the video, themoderator introduced the product and the task that the user workedon in the recorded video. The study lasted about 1.5 hours. We setthe time for reviewing each video to be no more than three times ofits playback length to ensure all the tasks would be completed withinthe study time. After each session, the moderator conducted a briefinterview by asking how they analyzed the video. In the end of thewhole study, evaluators filled in a questionnaire to rate their experiencein using ML (for VisTA and VisTASimple) and their confidence inthe problems that they identified on a 7-point Likert scale. Then, themoderator interviewed evaluators to further understand their confidencein the analysis results and their usages to the problem and the featuretimelines (where appropriate). All interviews were audio-recorded.Each evaluator was compensated with $30.
6.4 Data Capture and AnalysisThe software tool in all three conditions (i.e., Baseline, VisTASimple,and VisTA) recorded evaluators’ interactions during the study.Specifically, it saved all the problem descriptions and theircorresponding timestamps. We analyzed the reported problems tounderstand how evaluators performed in each condition. The tool alsocontinuously recorded pairs of timestamps per second, (SessionTime,VideoTime), when evaluators were analyzing the sessions. Thisreflects the relationship between the timestamps in the analyzed videoand in the study session. We analyzed this information to understandhow evaluators reviewed the sessions (i.e., play, pause, rewind). Weanalyzed the evaluators’ answers to the questions in the questionnaireto understand their usage of the tool. In addition, all interviews withthe evaluators were recorded and transcribed. Two researchers codedthe transcripts independently and then discussed to consolidate theircodes. They then performed affinity diagramming to group the codesand identify the core themes emerged from the data.
7 RESULTS
We present quantitative and qualitative results based on RQs in Sec. 3.
7.1 RQ1: How Would UX Practitioners Leverage ML inTheir Analysis?
7.1.1 Number of reported problemsWe counted the number of problems reported in each condition foreach session (see Table 2). Evaluators found the highest number ofproblems in each session when using VisTA, followed by VisTASimpleand then Baseline. One-way ANOVA found no significance in thenumber of problems identified between conditions for the first (F2,27 =
2.70, p = .09,n2p = .17), and the second session (F2,27 = 1.33, p =
.28,n2p = .09), but found a significant difference for the last session
(F2,27 = 4.13, p = .03,n2p = .23). Post-hoc Bonferroni-Dunn test found
significant difference between Baseline and VisTA.
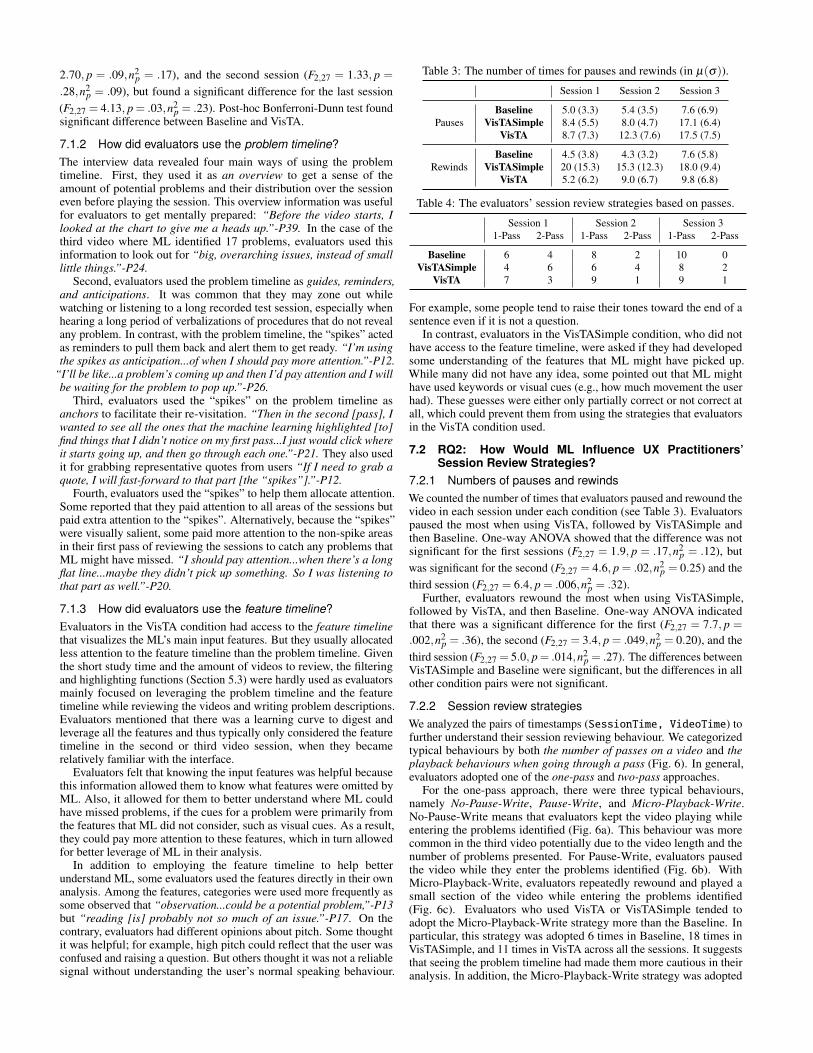
7.1.2 How did evaluators use the problem timeline?The interview data revealed four main ways of using the problemtimeline. First, they used it as an overview to get a sense of theamount of potential problems and their distribution over the sessioneven before playing the session. This overview information was usefulfor evaluators to get mentally prepared: “Before the video starts, Ilooked at the chart to give me a heads up.”-P39. In the case of thethird video where ML identified 17 problems, evaluators used thisinformation to look out for “big, overarching issues, instead of smalllittle things.”-P24.
Second, evaluators used the problem timeline as guides, reminders,and anticipations. It was common that they may zone out whilewatching or listening to a long recorded test session, especially whenhearing a long period of verbalizations of procedures that do not revealany problem. In contrast, with the problem timeline, the “spikes” actedas reminders to pull them back and alert them to get ready. “I’m usingthe spikes as anticipation...of when I should pay more attention.”-P12.
“I’ll be like...a problem’s coming up and then I’d pay attention and I willbe waiting for the problem to pop up.”-P26.
Third, evaluators used the “spikes” on the problem timeline asanchors to facilitate their re-visitation. “Then in the second [pass], Iwanted to see all the ones that the machine learning highlighted [to]find things that I didn’t notice on my first pass...I just would click whereit starts going up, and then go through each one.”-P21. They also usedit for grabbing representative quotes from users “If I need to grab aquote, I will fast-forward to that part [the “spikes”].”-P12.
Fourth, evaluators used the “spikes” to help them allocate attention.Some reported that they paid attention to all areas of the sessions butpaid extra attention to the “spikes”. Alternatively, because the “spikes”were visually salient, some paid more attention to the non-spike areasin their first pass of reviewing the sessions to catch any problems thatML might have missed. “I should pay attention...when there’s a longflat line...maybe they didn’t pick up something. So I was listening tothat part as well.”-P20.
7.1.3 How did evaluators use the feature timeline?Evaluators in the VisTA condition had access to the feature timelinethat visualizes the ML’s main input features. But they usually allocatedless attention to the feature timeline than the problem timeline. Giventhe short study time and the amount of videos to review, the filteringand highlighting functions (Section 5.3) were hardly used as evaluatorsmainly focused on leveraging the problem timeline and the featuretimeline while reviewing the videos and writing problem descriptions.Evaluators mentioned that there was a learning curve to digest andleverage all the features and thus typically only considered the featuretimeline in the second or third video session, when they becamerelatively familiar with the interface.
Evaluators felt that knowing the input features was helpful becausethis information allowed them to know what features were omitted byML. Also, it allowed for them to better understand where ML couldhave missed problems, if the cues for a problem were primarily fromthe features that ML did not consider, such as visual cues. As a result,they could pay more attention to these features, which in turn allowedfor better leverage of ML in their analysis.
In addition to employing the feature timeline to help betterunderstand ML, some evaluators used the features directly in their ownanalysis. Among the features, categories were used more frequently assome observed that “observation...could be a potential problem,”-P13but “reading [is] probably not so much of an issue.”-P17. On thecontrary, evaluators had different opinions about pitch. Some thoughtit was helpful; for example, high pitch could reflect that the user wasconfused and raising a question. But others thought it was not a reliablesignal without understanding the user’s normal speaking behaviour.
Table 3: The number of times for pauses and rewinds (in µ(σ)).
Session 1 Session 2 Session 3
PausesBaseline 5.0 (3.3) 5.4 (3.5) 7.6 (6.9)
VisTASimple 8.4 (5.5) 8.0 (4.7) 17.1 (6.4)VisTA 8.7 (7.3) 12.3 (7.6) 17.5 (7.5)
RewindsBaseline 4.5 (3.8) 4.3 (3.2) 7.6 (5.8)
VisTASimple 20 (15.3) 15.3 (12.3) 18.0 (9.4)VisTA 5.2 (6.2) 9.0 (6.7) 9.8 (6.8)
Table 4: The evaluators’ session review strategies based on passes.
Session 1 Session 2 Session 31-Pass 2-Pass 1-Pass 2-Pass 1-Pass 2-Pass
Baseline 6 4 8 2 10 0VisTASimple 4 6 6 4 8 2
VisTA 7 3 9 1 9 1
For example, some people tend to raise their tones toward the end of asentence even if it is not a question.
In contrast, evaluators in the VisTASimple condition, who did nothave access to the feature timeline, were asked if they had developedsome understanding of the features that ML might have picked up.While many did not have any idea, some pointed out that ML mighthave used keywords or visual cues (e.g., how much movement the userhad). These guesses were either only partially correct or not correct atall, which could prevent them from using the strategies that evaluatorsin the VisTA condition used.
7.2 RQ2: How Would ML Influence UX Practitioners’Session Review Strategies?
7.2.1 Numbers of pauses and rewindsWe counted the number of times that evaluators paused and rewound thevideo in each session under each condition (see Table 3). Evaluatorspaused the most when using VisTA, followed by VisTASimple andthen Baseline. One-way ANOVA showed that the difference was notsignificant for the first sessions (F2,27 = 1.9, p = .17,n2
p = .12), butwas significant for the second (F2,27 = 4.6, p = .02,n2
p = 0.25) and thethird session (F2,27 = 6.4, p = .006,n2
p = .32).Further, evaluators rewound the most when using VisTASimple,
followed by VisTA, and then Baseline. One-way ANOVA indicatedthat there was a significant difference for the first (F2,27 = 7.7, p =
.002,n2p = .36), the second (F2,27 = 3.4, p = .049,n2
p = 0.20), and thethird session (F2,27 = 5.0, p= .014,n2
p = .27). The differences betweenVisTASimple and Baseline were significant, but the differences in allother condition pairs were not significant.
7.2.2 Session review strategiesWe analyzed the pairs of timestamps (SessionTime, VideoTime) tofurther understand their session reviewing behaviour. We categorizedtypical behaviours by both the number of passes on a video and theplayback behaviours when going through a pass (Fig. 6). In general,evaluators adopted one of the one-pass and two-pass approaches.
For the one-pass approach, there were three typical behaviours,namely No-Pause-Write, Pause-Write, and Micro-Playback-Write.No-Pause-Write means that evaluators kept the video playing whileentering the problems identified (Fig. 6a). This behaviour was morecommon in the third video potentially due to the video length and thenumber of problems presented. For Pause-Write, evaluators pausedthe video while they enter the problems identified (Fig. 6b). WithMicro-Playback-Write, evaluators repeatedly rewound and played asmall section of the video while entering the problems identified(Fig. 6c). Evaluators who used VisTA or VisTASimple tended toadopt the Micro-Playback-Write strategy more than the Baseline. Inparticular, this strategy was adopted 6 times in Baseline, 18 times inVisTASimple, and 11 times in VisTA across all the sessions. It suggeststhat seeing the problem timeline had made them more cautious in theiranalysis. In addition, the Micro-Playback-Write strategy was adopted
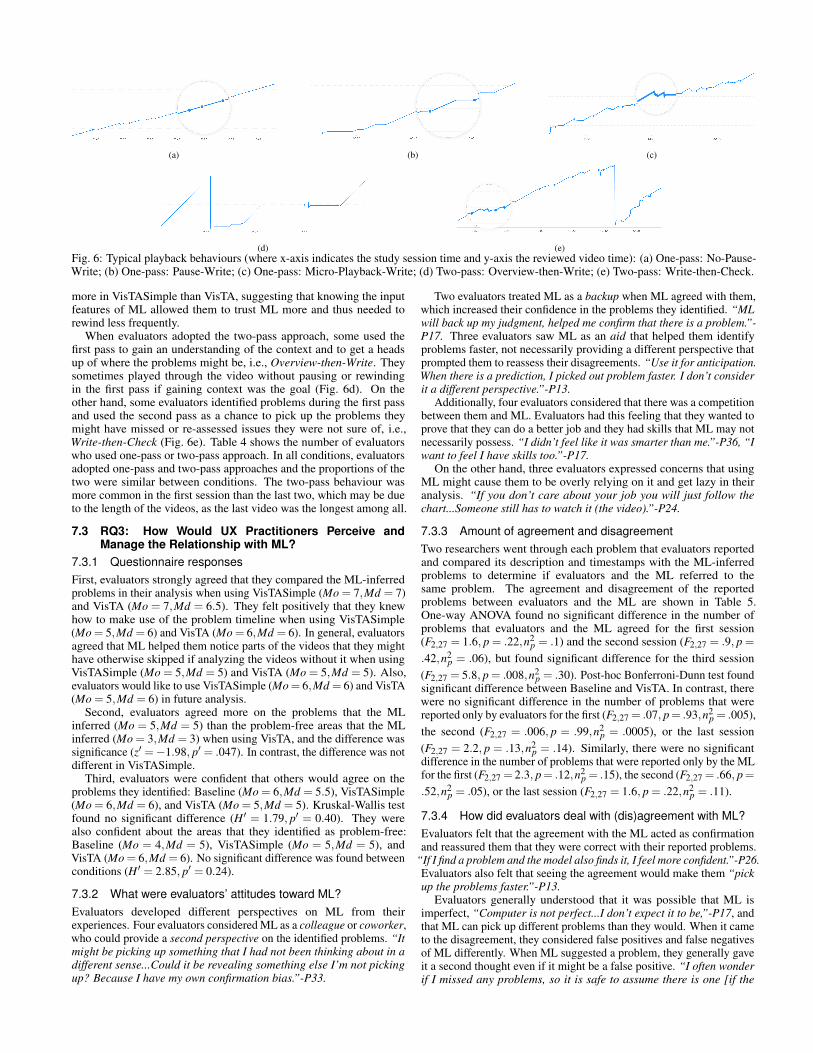
(a) (b) (c)
(d) (e)Fig. 6: Typical playback behaviours (where x-axis indicates the study session time and y-axis the reviewed video time): (a) One-pass: No-Pause-Write; (b) One-pass: Pause-Write; (c) One-pass: Micro-Playback-Write; (d) Two-pass: Overview-then-Write; (e) Two-pass: Write-then-Check.
more in VisTASimple than VisTA, suggesting that knowing the inputfeatures of ML allowed them to trust ML more and thus needed torewind less frequently.
When evaluators adopted the two-pass approach, some used thefirst pass to gain an understanding of the context and to get a headsup of where the problems might be, i.e., Overview-then-Write. Theysometimes played through the video without pausing or rewindingin the first pass if gaining context was the goal (Fig. 6d). On theother hand, some evaluators identified problems during the first passand used the second pass as a chance to pick up the problems theymight have missed or re-assessed issues they were not sure of, i.e.,Write-then-Check (Fig. 6e). Table 4 shows the number of evaluatorswho used one-pass or two-pass approach. In all conditions, evaluatorsadopted one-pass and two-pass approaches and the proportions of thetwo were similar between conditions. The two-pass behaviour wasmore common in the first session than the last two, which may be dueto the length of the videos, as the last video was the longest among all.
7.3 RQ3: How Would UX Practitioners Perceive andManage the Relationship with ML?
7.3.1 Questionnaire responsesFirst, evaluators strongly agreed that they compared the ML-inferredproblems in their analysis when using VisTASimple (Mo = 7,Md = 7)and VisTA (Mo = 7,Md = 6.5). They felt positively that they knewhow to make use of the problem timeline when using VisTASimple(Mo = 5,Md = 6) and VisTA (Mo = 6,Md = 6). In general, evaluatorsagreed that ML helped them notice parts of the videos that they mighthave otherwise skipped if analyzing the videos without it when usingVisTASimple (Mo = 5,Md = 5) and VisTA (Mo = 5,Md = 5). Also,evaluators would like to use VisTASimple (Mo= 6,Md = 6) and VisTA(Mo = 5,Md = 6) in future analysis.
Second, evaluators agreed more on the problems that the MLinferred (Mo = 5,Md = 5) than the problem-free areas that the MLinferred (Mo = 3,Md = 3) when using VisTA, and the difference wassignificance (z′ =−1.98, p′ = .047). In contrast, the difference was notdifferent in VisTASimple.
Third, evaluators were confident that others would agree on theproblems they identified: Baseline (Mo = 6,Md = 5.5), VisTASimple(Mo = 6,Md = 6), and VisTA (Mo = 5,Md = 5). Kruskal-Wallis testfound no significant difference (H ′ = 1.79, p′ = 0.40). They werealso confident about the areas that they identified as problem-free:Baseline (Mo = 4,Md = 5), VisTASimple (Mo = 5,Md = 5), andVisTA (Mo = 6,Md = 6). No significant difference was found betweenconditions (H ′ = 2.85, p′ = 0.24).
7.3.2 What were evaluators’ attitudes toward ML?Evaluators developed different perspectives on ML from theirexperiences. Four evaluators considered ML as a colleague or coworker,who could provide a second perspective on the identified problems. “Itmight be picking up something that I had not been thinking about in adifferent sense...Could it be revealing something else I’m not pickingup? Because I have my own confirmation bias.”-P33.
Two evaluators treated ML as a backup when ML agreed with them,which increased their confidence in the problems they identified. “MLwill back up my judgment, helped me confirm that there is a problem.”-P17. Three evaluators saw ML as an aid that helped them identifyproblems faster, not necessarily providing a different perspective thatprompted them to reassess their disagreements. “Use it for anticipation.When there is a prediction, I picked out problem faster. I don’t considerit a different perspective.”-P13.
Additionally, four evaluators considered that there was a competitionbetween them and ML. Evaluators had this feeling that they wanted toprove that they can do a better job and they had skills that ML may notnecessarily possess. “I didn’t feel like it was smarter than me.”-P36, “Iwant to feel I have skills too.”-P17.
On the other hand, three evaluators expressed concerns that usingML might cause them to be overly relying on it and get lazy in theiranalysis. “If you don’t care about your job you will just follow thechart...Someone still has to watch it (the video).”-P24.
7.3.3 Amount of agreement and disagreementTwo researchers went through each problem that evaluators reportedand compared its description and timestamps with the ML-inferredproblems to determine if evaluators and the ML referred to thesame problem. The agreement and disagreement of the reportedproblems between evaluators and the ML are shown in Table 5.One-way ANOVA found no significant difference in the number ofproblems that evaluators and the ML agreed for the first session(F2,27 = 1.6, p = .22,n2
p = .1) and the second session (F2,27 = .9, p =
.42,n2p = .06), but found significant difference for the third session
(F2,27 = 5.8, p = .008,n2p = .30). Post-hoc Bonferroni-Dunn test found
significant difference between Baseline and VisTA. In contrast, therewere no significant difference in the number of problems that werereported only by evaluators for the first (F2,27 = .07, p= .93,n2
p = .005),the second (F2,27 = .006, p = .99,n2
p = .0005), or the last session(F2,27 = 2.2, p = .13,n2
p = .14). Similarly, there were no significantdifference in the number of problems that were reported only by the MLfor the first (F2,27 = 2.3, p= .12,n2
p = .15), the second (F2,27 = .66, p=.52,n2
p = .05), or the last session (F2,27 = 1.6, p = .22,n2p = .11).
7.3.4 How did evaluators deal with (dis)agreement with ML?Evaluators felt that the agreement with the ML acted as confirmationand reassured them that they were correct with their reported problems.
“If I find a problem and the model also finds it, I feel more confident.”-P26.Evaluators also felt that seeing the agreement would make them “pickup the problems faster.”-P13.
Evaluators generally understood that it was possible that ML isimperfect, “Computer is not perfect...I don’t expect it to be,”-P17, andthat ML can pick up different problems than they would. When it cameto the disagreement, they considered false positives and false negativesof ML differently. When ML suggested a problem, they generally gaveit a second thought even if it might be a false positive. “I often wonderif I missed any problems, so it is safe to assume there is one [if the

Table 5: The agreement and disagreement of reported problems between evaluators and the ML.�: problems that both evaluators and the MLreported;�: problems that only evaluators reported;: problems that only the ML reported. Results are shown as µ(σ).
Session 1 Session 2 Session 3� � � � � �
Baseline 2.0 (1.1) 2.2 (2.1) 3.8 (1.2) 3.4 (.9) 3.4 (2.3) .9 (.8) 9.3 (2.7) 4.4 (2.5) 8.4 (2.3)VisTASimple 3.7 (1.7) 1.9 (1.5) 2.7 (1.5) 3.8 (2.0) 3.3 (2.1) .8 (.8) 12.6 (4.2) 5.6 (3.8) 6.1 (3.1)
VisTA 4.0 (3.0) 2.1 (1.1) 2.3 (2.2) 5.1 (2.4) 3.3 (2.0) .4 (.8) 15.1 (4.7) 6.8 (3.5) 4.0 (3.8)
ML detects it].”-P21. “It is not a big deal if the ML says there is aproblem, I examine it and see nothing there.”-P39. In contrast, if theythought that the think-aloud user encountered a problem but ML did notpoint it out, they generally considered that ML missed the problem andwould more likely choose to trust themselves. “By the third session,I started to really believe that the machine was just purely picking upmore of the audio than the visual. So I think that’s why...I gained a littlebit more confidence.”-P26. In addition, they generally valued recallover precision, which is consistent with the findings of recent research(e.g, [26]). This can be explained by the fact that the goal for evaluatorsis to find potential problems, therefore it is safer to be overly-inclusive,which would introduce false positives, than missing potential problems,which would introduce false negatives.
It is also worth noting that evaluators in VisTASimple generallyput less weight on the ML’s predictions than those in VisTA whendisagreements happened, which is probably because the ML inVisTASimple was more likely to be perceived as a “black-box.” “Idon’t know much about what it is based on and how developed themachine learning is, so I don’t know how much I can trust it.”-P18.
7.3.5 What were the perceived limitations of the ML?Evaluators pointed out a number of limitations based on their usage ofML. First, they noted that ML was often able to detect the momentswhen the user exhibited symptoms of a problem but did not pinpoint thestart and end of the problem. However, observing the problem build-upprocess was important to fully understand it. “There was...what Icall...a lagging factor. I would have liked to see some of those issueshighlighted earlier than some of these spikes on the timeline.”-P14.
Second, evaluators mentioned that ML did not understand thenuances in a user’s personality. For example, some users may prefer tosay negative words even when they did not experience too much of aproblem. “I don’t think computer will pick up nuanced behaviours andpersonalities.”-P17.
Third, they felt that ML did not fully understand the context ofusers’ actions. For example, ML had difficulty picking up repetitionsin actions: when users did something repetitively, it could be a problemeven though all the steps were performed correctly. Additionally, theyfelt that ML did not consider the number of steps taken to complete atask as a factor when detecting problems. For example, taking moresteps than needed could mean a problem although the user completedthe task successfully. Lastly, they felt ML did not fully comprehend thestructures of the tasks (e.g., what (sub)tasks did users struggle with?).
8 DISCUSSION
8.1 The Effect of ML on Evaluators’ AnalysisEvaluators identified more problems when using VisTA than Baseline inall three sessions. The implication is that evaluators had more instancesto understand potential problems when using VisTA. Such differencewas significant for the third session, but not for the first two sessions(Sec. 7.1.1). One possible reason could be that as this was the first timeevaluators had access to ML, they needed time to learn and understandhow to leverage the ML-inferred problems in their analysis over thesessions. Evaluators mentioned that they either did not have much timeto carefully consider the problem timeline or were still testing it in thefirst session. But over time, they were able to develop four generalstrategies (Sec. 7.1.2) to use the problem timeline. These strategiesencouraged evaluators to be more cautious about their analysis, whichwas evident by the fact that evaluators using VisTA paused the videossignificantly more than those using Baseline (Sec. 7.2.2). Anotherpossible reason for non-significance in the first two sessions could be
that these sessions were shorter and contained much fewer problemsthan the last one and thus the potential variations between conditionswould also be smaller. Further research is needed to confirm whetherthe record think-aloud session’s length influences ML’s effectiveness.
Intuitively, an evaluator pointed out, “Without ML, it is much easierto ignore and let go some issues.”-P21. When evaluators were watchinga session to understand the development of a problem, a new problemmight come up, which could take their attention away. If they did notrewind or pause the video in time, they could have missed the locationswhere they would otherwise want to follow up later. In contrast, theproblem timeline acted as an overview, guides, anchors or anticipations,which facilitated evaluators with pinpointing the areas that they wantedto rewind and pause. This was more effective than using the Baselineto check the points that they might have missed. It is worth pointingout that the way in which evaluators used the problem and featuretimelines is inherently tied to their session reviewing behaviour (e.g.,pausing and rewinding), and is eventually tied to the number of reportedproblems. The significant difference in the numbers of problems andin the amounts of pausing and rewinding suggest that a ML-enhancedvisualization is capable of helping evaluators become more cautious oftheir analysis and notice problems that they might have missed.
Despite the evaluators reported more problems when using VisTAthan Baseline, they did not rewind the videos significantly more often.One potential explanation is that the evaluators’ reported problemswere also visualized at the corresponding timestamps on top of theproblem timeline in VisTA (Fig. 4a). The visualization of the reportedproblems might also have acted as anchors, in addition to the ML-inferred problems on the problem timeline, that allowed the evaluatorsto better determine where they should rewind the video.
Although evaluators found more problems using VisTASimple thanBaseline for all three sessions, One-way ANOVA did not find asignificant difference. This could potentially suggest that having accessto the feature timeline might play a role in encouraging evaluators toidentify more problems. One reason could be that since evaluators in theVisTA condition knew what features were considered by ML, they couldbetter infer when ML would make a mistake and focus on those features,such as visual cues, that ML did not consider. Another reason could bethat evaluators leveraged the feature timeline as additional informationin their analysis instead of merely using it to understand ML. However,individual differences between Baseline and VisTASimple could alsocome into play, as we used the between-subjects design and tested eachcondition with only 10 evaluators.
8.2 Attitudes toward ML“Evaluator effect” refers to the fact that different evaluators mightidentify different sets of problems when analyzing the same session [23].Although it is recommended to have more than one UX evaluatoranalyze a usability test session to reduce potential evaluator effect,fewer than 30% UX practitioners actually had an opportunity to workwith others to analyze the same usability test session [15]. Ourstudy reveals that a common attitude toward ML was to treat it asa “colleague” or a “coworker”, who can provide a second perspectiveon their analysis or back up their identified problems. This findingpoints out an opportunity to leverage ML to help reduce the “evaluatoreffect” for UX practitioners, who often operate under resource and timeconstraints [7, 15]. Toward this goal, we have identified three factors toconsider when designing a user interface that leverages ML to offer asecond perspective to UX practitioners.
First, evaluators felt that knowing the severity of the problems thatML identified can help them to prioritize their analysis especially

when they are under time pressure to analyze a large amount of testsessions. Second, evaluators also felt that knowing the confidencelevel of ML in its inferences can be helpful. For example, they couldfilter out the low-confident inferred problems and focus more on thehigh-confident ones, especially when the session is long and has manyinferred problems. Third, evaluators felt that ML would be more like a“colleague” if it could provide explanations for the detected problems.But what explanations are appropriate and how to generate them?Recent research suggested that the taxonomy for explaining ML todesigners is likely “to be radically different from ones used by datascientists” [39]. In fact, evaluators who used VisTA felt that the currentterms used for input features, such as category and sentiment, were toosystem-oriented and hard to interpret. They preferred the features to beexpressed using layman terms, such as the level of surprise, excitement,or frustration. In addition, it might be beneficial to consider multipleexplanations instead of seeking for the best one [38].
8.3 Reliance on MLThree evaluators expressed the concern that this may make UXpractitioners rely on ML too much, thus less diligent in their jobs.However, we did not find any evidence to support this. First, in allthree conditions, evaluators identified problems that the ML did notidentify, and there was no significant difference between conditions.Similarly, in all the conditions, evaluators disagreed on some of theML-inferred problems and there was no significant difference betweenconditions either. These results suggest that evaluators did not justfocus on the ML-inferred problems or took the words from the MLwithout scrutinizing them in the VisTA and VisTASimple conditions.Additionally, some evaluators even felt that there was a competitionbetween them and the ML, making them subconsciously eager to provethat they could find more problems than the ML. It is, however, worthnoting that as our study duration was short, no baseline trust with theML had been established. Consequently, it is hard to determine whetherevaluators would become over-reliance on ML or develop sustainablecooperative strategies in the long run.
Although none of the evaluators solely relied on the ML withoutputting in their own thought during analysis, we identified two waysin which evaluators wanted the ML to be presented. One way is toallow evaluators to analyze a test session by themselves in the first passand then revealing the problem timeline to them in the second pass. Inthis way, the problem timeline would mainly help them confirm theirjudgment or double check if they might have missed any problem. Theother way is to show the problem timeline all the time. The rationalefor this design is that the two-pass reviewing process might not bepractical especially when the session is long. This was evident thatthere were fewer evaluators who adopted the two-pass strategy for thethird video, which was the longest among all (see Table 4). Althoughoffering evaluators an option to turn on and off the problem timelineseems to be a compromised approach, it remains an open question howand when to best present ML to evaluators.
8.4 Trust in MLWe did not explicitly measure evaluators’ trust in ML, however, weidentified two factors from the interviews that could have affected theirtrust, including the sophistication and the amount of disagreement. Thesophistication of ML is determined by the number of features that itconsiders (e.g., audio and visual features) and whether it understandsthe context of the task (e.g., the number of steps required to completea task; meaningless repetitive user actions) or the personality of theuser (e.g., the speaking behavior). Evaluators in all three conditionswere fairly confident in their reported problems no matter how manyproblems they missed. This could suggest that UX practitionersmight suffer from “confirmation bias” [33]. Confirmation bias canbe mitigated by revealing the prior probability of events or inputattributions [6, 29]. For example, it might be helpful to show evaluatorsthe prior probability of catching all the problems from a test session(e.g., 70%) so that they might be more willing to reconsider theirdecisions when the ML disagrees with them. The goal of having ML’ssupport is to encourage evaluators to scrutinize their analysis with the
input of a different perspective from ML. It is, however, not to overlyconvince evaluators to agree with ML as it is still an open questionwhether increasingly agreeing with ML is beneficial for UX analysis.Another way could be to redesign the user interface to prompt evaluatorsto enter the features that they have considered and then ML could pointout the features that they might have neglected. However, how to bestdesign such systems that both deliver ML results and facilitate trustremains to be explored.
8.5 Future WorkWe have identified four directions to explore in the future. First,evaluators felt that it would be informative to know the level ofconfusion or frustration (i.e., the severity of problems) and theconfidence of ML for each identified problem, which could allow themto better prioritize their attention when time and resource is constrained.Future research is needed to design methods for detecting suchinformation. Second, challenges need to be addressed for designing avisual analytics tool that effectively present all the information withoutoverwhelming evaluators. One approach is to allow for turning onand off different functions. Our study results suggested some designconsiderations. For example, while some evaluators preferred toanalyze think-aloud sessions without ML assistance in the first pass andonly see ML-enhanced information in the second pass, others preferredto see ML-enhanced information in one pass to reduce time cost. Third,it is promising to explore ways of describing or explaining ML-inferredproblems using a language familiar to UX practitioners. Future researchshould examine how UX practitioners communicate usability problemswith their colleagues. Fourth, we used supervised learning to detectproblems. Mixed-initiative interaction design, on the other hand, wouldallow a UX evaluator to annotate the ML’s errors from which the MLcan learn and evolve. Although promising, one potential caveat oflearning from a UX evaluator is that the ML might behave more andmore like the evaluator as the evaluator “corrects” the ML. Becauseone critical benefit of the ML is to offer a different perspective onthe analysis, such an overly personalized ML, in the context of UXevaluation, would likely enhance the evaluator’s confirmation biasinstead of helping her spot potentially neglected areas.
9 CONCLUSION
We took the first step to explore how UX practitioners use, perceiveand react to machine intelligence when analyzing recorded think-aloudsessions. We designed a visual analytics tool, VisTA, that presentsML-inferred problems and input features with timeline visualizationsamong other functions to facilitate UX practitioners with their analysis.Our three-session between-subjects controlled study compared VisTA,VisTASimple, and Baseline. Results showed that UX evaluatorsidentified significantly more problems without needing to rewind thevideo more often when using VisTA than Baseline by the last session.Evaluators used the problem timeline as an overview, reminders,anticipations, and anchors to help them allocate their attention, spotareas that they might have otherwise neglected, and better revisit thevideos. They used the feature timeline to understand what featureswere used and omitted by the ML and also used the features directlyas an additional source of information in their analysis. Evaluatorstreated ML as a “colleague” who can offer a different perspective,as an aid that can make the analysis more efficient, or even as a“competitor” who encouraged them to spot more problems to ”beat”it. In addition, evaluators both agreed and disagreed with ML-inferredproblem encounters in all test conditions and did not seem to be overlyreliant on ML. However, long-term deployment study is needed tovalidate this conjecture. Furthermore, they perceived the cost of falsenegatives of ML higher than that of false negatives and valued recallover precision. In addition, evaluators adopted three types of one-passand two types of two-pass session reviewing strategies in each of thethree conditions. Lastly, advanced features in VisTA, such as filteringand highlighting functions, were underused by evaluators. Therefore,in addition to detecting a richer set of information about problems (e.g.,severity, explanation), it is also important to explore ways to deliversuch information so that UX practitioners can better exploit it.
REFERENCES
[1] M. Abadi, P. Barham, J. Chen, Z. Chen, A. Davis, J. Dean, M. Devin,S. Ghemawat, G. Irving, M. Isard, et al. Tensorflow: A system for large-scale machine learning. In Proceedings of the Symposium on OperatingSystems Design and Implementation, pp. 265–283, 2016.
[2] T. Blascheck, M. John, K. Kurzhals, S. Koch, and T. Ertl. Va2: A visualanalytics approach for evaluating visual analytics applications. IEEETransactions on Visualization and Computer Graphics, 22(1):61–70, 2016.doi: 10.1109/TVCG.2015.2467871
[3] T. Blascheck, K. Kurzhals, M. Raschke, M. Burch, D. Weiskopf, andT. Ertl. Visualization of eye tracking data: A taxonomy and survey.Computer Graphics Forum, 36(8):260–284, 2017. doi: 10.1111/cgf.13079
[4] P. Boersma. Praat: doing phonetics by computer. http://www. praat. org/,2006.
[5] T. Boren and J. Ramey. Thinking aloud: Reconciling theory and practice.IEEE transactions on professional communication, 43(3):261–278, 2000.
[6] A. Bussone, S. Stumpf, and D. O’Sullivan. The role of explanations ontrust and reliance in clinical decision support systems. In Proceedingsof the International Conference on Healthcare Informatics, pp. 160–169.IEEE, 2015.
[7] P. K. Chilana, J. O. Wobbrock, and A. J. Ko. Understanding usabilitypractices in complex domains. In Proceedings of the SIGCHI Conferenceon Human Factors in Computing Systems, pp. 2337–2346. ACM, 2010.
[8] L. Cooke. Assessing concurrent think-aloud protocol as a usability testmethod: A technical communication approach. IEEE Transactions onProfessional Communication, 53(3):202–215, 2010.
[9] W. Dou, D. H. Jeong, F. Stukes, W. Ribarsky, H. R. Lipford, and R. Chang.Recovering reasoning processes from user interactions. IEEE ComputerGraphics and Applications, 29(3):52–61, 2009. doi: 10.1109/MCG.2009.49
[10] G. Dove, K. Halskov, J. Forlizzi, and J. Zimmerman. Ux design innovation:Challenges for working with machine learning as a design material. InProceedings of the 2017 CHI Conference on Human Factors in ComputingSystems, pp. 278–288. ACM, 2017.
[11] M. Drouhard, N. Chen, J. Suh, R. Kocielnik, V. Pea-Araya, K. Cen, ,and C. R. Aragon. Aeonium: Visual analytics to support collaborativequalitative coding. In 2017 IEEE Pacific Visualization Symposium(PacificVis), pp. 220–229, 2017. doi: 10.1109/PACIFICVIS.2017.8031598
[12] S. Elling, L. Lentz, and M. De Jong. Combining concurrent think-aloudprotocols and eye-tracking observations: An analysis of verbalizations andsilences. IEEE Transactions on Professional Communication, 55(3):206–220, 2012.
[13] K. A. Ericsson and H. A. Simon. Protocol analysis: Verbal reports asdata. the MIT Press, 1984.
[14] M. Fan, J. Lin, C. Chung, and K. N. Truong. Concurrent think-aloudverbalizations and usability problems. ACM Trans. Comput.-Hum.Interact., 26(5):28:1–28:35, 2019. doi: 10.1145/3325281
[15] A. Følstad, E. Law, and K. Hornbæk. Analysis in practical usabilityevaluation: a survey study. In Proceedings of the SIGCHI Conference onHuman Factors in Computing Systems, pp. 2127–2136. ACM, 2012.
[16] M. C. Fox, K. A. Ericsson, and R. Best. Do procedures for verbal reportingof thinking have to be reactive? a meta-analysis and recommendations forbest reporting methods. Psychological bulletin, 137(2):316, 2011.
[17] M. Gillies, R. Fiebrink, A. Tanaka, J. Garcia, F. Bevilacqua, A. Heloir,F. Nunnari, W. Mackay, S. Amershi, B. Lee, et al. Human-centred machinelearning. In Proceedings of the 2016 CHI Conference Extended Abstractson Human Factors in Computing Systems, pp. 3558–3565. ACM, 2016.
[18] D. Gotz and M. X. Zhou. Characterizing users visual analytic activity forinsight provenance. In 2008 IEEE Symposium on Visual Analytics Scienceand Technology, pp. 123–130, 2008. doi: 10.1109/VAST.2008.4677365
[19] P. Hebron. Machine Learning for Designer. O’Reilly Media, Inc., 2016.[20] J. Heer, J. Mackinlay, C. Stolte, and M. Agrawala. Graphical histories for
visualization: Supporting analysis, communication, and evaluation. IEEETransactions on Visualization and Computer Graphics, 14(6):1189–1196,2008. doi: 10.1109/TVCG.2008.137
[21] M. Hertzum, P. Borlund, and K. B. Kristoffersen. What do thinking-aloud participants say? a comparison of moderated and unmoderatedusability sessions. International Journal of Human-Computer Interaction,31(9):557–570, 2015.
[22] M. Hertzum, K. D. Hansen, and H. H. Andersen. Scrutinising usabilityevaluation: does thinking aloud affect behaviour and mental workload?Behaviour & Information Technology, 28(2):165–181, 2009.
[23] M. Hertzum and N. E. Jacobsen. The evaluator effect: A chilling fact aboutusability evaluation methods. International Journal of Human-ComputerInteraction, 13(4):421–443, 2001.
[24] M. Hori, Y. Kihara, and T. Kato. Investigation of indirect oral operationmethod for think aloud usability testing. In International Conference onHuman Centered Design, pp. 38–46. Springer, 2011.
[25] C. J. Hutto and E. Gilbert. Vader: A parsimonious rule-based model forsentiment analysis of social media text. In Eighth international AAAIconference on weblogs and social media, 2014.
[26] R. Kocielnik, S. Amershi, and P. N. Bennett. Will you accept an imperfectai?: Exploring designs for adjusting end-user expectations of ai systems. InProceedings of the 2019 CHI Conference on Human Factors in ComputingSystems, CHI ’19, pp. 411:1–411:14, 2019.
[27] C. Lewis. Using the’thinking-aloud’method in cognitive interface design.Research Report RC9265, IBM TJ Watson Research Center, 1982.
[28] J. R. Lewis. Usability: lessons learned and yet to be learned. InternationalJournal of Human-Computer Interaction, 30(9):663–684, 2014.
[29] B. Y. Lim and A. K. Dey. Design of an intelligible mobile context-awareapplication. In Proceedings of the 13th international conference on humancomputer interaction with mobile devices and services, pp. 157–166. ACM,2011.
[30] H. R. Lipford, F. Stukes, W. Dou, M. E. Hawkins, and R. Chang. Helpingusers recall their reasoning process. In IEEE Symposium on VisualAnalytics Science and Technology, pp. 187–194, 2010. doi: 10.1109/VAST.2010.5653598
[31] S. McDonald, H. M. Edwards, and T. Zhao. Exploring think-aloudsin usability testing: An international survey. IEEE Transactions onProfessional Communication, 55(1):2–19, 2012.
[32] S. McDonald, T. Zhao, and H. M. Edwards. Dual verbal elicitation: thecomplementary use of concurrent and retrospective reporting within ausability test. International Journal of Human-Computer Interaction,29(10):647–660, 2013.
[33] R. S. Nickerson. Confirmation bias: A ubiquitous phenomenon in manyguises. Review of general psychology, 2(2):175–220, 1998.
[34] J. Nielsen. Usability engineering. Elsevier, 1994.[35] J. Nielsen. Thinking aloud: The# 1 usability tool. Nielsen Norman Group,
16, 2012.[36] J. Nielson. Demonstrate Thinking Aloud by Showing Users a Video, 2014.[37] F. Pedregosa, G. Varoquaux, A. Gramfort, V. Michel, B. Thirion, O. Grisel,
M. Blondel, P. Prettenhofer, R. Weiss, V. Dubourg, et al. Scikit-learn:Machine learning in python. Journal of machine learning research,12(Oct):2825–2830, 2011.
[38] D. Wang, Q. Yang, A. Abdul, and B. Y. Lim. Designing theory-drivenuser-centric explainable ai. In Proceedings of the 2019 CHI Conference onHuman Factors in Computing Systems, CHI ’19, pp. 601:1–601:15, 2019.
[39] Q. Yang. Machine learning as a ux design material: How can we imaginebeyond automation, recommenders, and reminders? In 2018 AAAI SpringSymposium Series, 2018.
[40] Q. Yang, N. Banovic, and J. Zimmerman. Mapping machine learningadvances from hci research to reveal starting places for design innovation.In Proceedings of the 2018 CHI Conference on Human Factors inComputing Systems, p. 130. ACM, 2018.
[41] Q. Yang, A. Scuito, J. Zimmerman, J. Forlizzi, and A. Steinfeld.Investigating how experienced ux designers effectively work with machinelearning. In Proceedings of the 2018 Designing Interactive SystemsConference, pp. 585–596. ACM, 2018.
[42] Q. Yang, J. Zimmerman, A. Steinfeld, and A. Tomasic. Planning adaptivemobile experiences when wireframing. In Proceedings of the 2016 ACMConference on Designing Interactive Systems, pp. 565–576. ACM, 2016.
[43] J. Zhao, M. Glueck, S. Breslav, F. Chevalier, and A. Khan. Annotationgraphs: A graph-based visualization for meta-analysis of data basedon user-authored annotations. IEEE Transactions on Visualization andComputer Graphics, 23(1):261–270, 2017. doi: 10.1109/TVCG.2016.2598543
[44] J. Zhao, M. Glueck, P. Isenberg, F. Chevalier, and A. Khan.Supporting handoff in asynchronous collaborative sensemaking usingknowledge-transfer graphs. IEEE Transactions on Visualization andComputer Graphics, 24(1):340–350, 2017. doi: 10.1109/TVCG.2017.2745279
[45] T. Zhao, S. McDonald, and H. M. Edwards. The impact of two differentthink-aloud instructions in a usability test: a case of just following orders?Behaviour & Information Technology, 33(2):163–183, 2014.