Coincidence of variation in yield and climate in Europe
7
Agriculture, Ecosystems and Environment 139 (2010) 483–489 Contents lists available at ScienceDirect Agriculture, Ecosystems and Environment journal homepage: www.elsevier.com/locate/agee Coincidence of variation in yield and climate in Europe Pirjo Peltonen-Sainio a,∗ , Lauri Jauhiainen a , Miroslav Trnka b , Jörgen E. Olesen c , Pierluigi Calanca d , Henrik Eckersten e , Josef Eitzinger f , Anne Gobin g , Kurt Christian Kersebaum h , Jerzy Kozyra i , Suresh Kumar j , Anna Dalla Marta k , Fabio Micale l , Ben Schaap m , Bernard Seguin n , Arne O. Skjelvåg o , Simone Orlandini k a MTT Agrifood Research Finland, Plant Production, FI-31600 Jokioinen, Finland b Mendel University, Institute of Agriculture Systems and Bioclimatology, Zemedelska 1, 61300 Brno and CzechGlobe – Center for Global Climate Change Impacts Studies, Poˇ ríˇ cí,3b 603 00 Brno, Czech Republic c Aarhus University, Department of Agroecology and Environment, Blichers Allé 20, DK-8830 Tjele, Denmark d Agroscop Reckenholz-Tänikon, Air Pollution and Climate, 8046 Zurich, Switzerland e Swedish University of Agricultural Sciences, Department of Crop Production Ecology, S-750 07 Uppsala, Sweden f University of Natural Resources and Applied Life Sciences (BOKU), Institute of Meteorology, Peter-Jordan Str. 82, A-1190 Vienna, Austria g VITO Flemish Institute for Technological Research, Environmental Modelling Unit, Boeretang 200, BE-2400 Mol, Belgium h Leibniz-Centre for Agricultural Landscape Research, Institute of Landscape Systems Analysis, Eberswalder Str. 84, D-15374 Müncheberg, Germany i Institute of Soil Science and Plant Cultivation, State Research Institute, Czartoryskich 8, 24–100 Puławy, Poland j National University of Ireland, Department of Geography, St. Annes, North Campus, Maynooth, Co., Kildare, Ireland k Department of Plant, Soil and Environmental Science, University of Florence, Piazzale delle Cascine 18, 50144 Firenze, Italy l European Commission, Joint Research Centre, TP 483-21020 Ispra, Italy m Wageningen University and Research Centre, Plant Research International, Agrosystems Research, P.O. Box 616, 6700 AP Wageningen, The Netherlands n INRA, Centre d’Avignon, Site Agroparc, domaine Saint-Paul, F-84914 Avignon cedex 9, France o Norwegian University of Life Sciences, P.O. Box 5003, NO-1432 Ås, Norway article info Article history: Received 29 April 2010 Received in revised form 1 September 2010 Accepted 2 September 2010 Keywords: Barley Oilseed rape Potato Precipitation Solar radiation Sugar beet Temperature Variability Wheat Yield Yield deviation abstract We aimed to characterise the coincidence of yield variations with weather variables for major field crops using long-term datasets and reveal whether there are commonalities across the European agricultural regions. Long-term national and/or regional yield datasets were used from 14 European countries (total of 25 regions). Crops studied were spring and winter barley and wheat, winter oilseed rape, potato and sugar beet. Relative yield deviations were determined for all crops. Meteorological data on monthly means for temperature variables, solar radiation, accumulated precipitation and evapotranspiration were provided for the relevant agricultural regions of each country for 1975–2008. Harmful effects of high precipitation during grain-filling in grain and seed crops and at flowering in oilseed rape were recorded. In potato reduced precipitation at tuber formation was associated with yield penalties. Elevated temperatures had harmful effects for cereals and rapeseed yields. © 2010 Elsevier B.V. All rights reserved. 1. Introduction Despite major developments in cropping systems and tech- nologies, as well as advances in breeding for phenotypic stability, especially in industrialised countries, management of climate- induced fluctuations in yields is often inefficient. The results of such ∗ Corresponding author. Tel.: +358 341882451; fax: +358 341882437. E-mail address: pirjo.peltonen-sainio@mtt.fi (P. Peltonen-Sainio). yield perturbations are reflected as marked changes in global mar- ket prices for crop products, as has been recorded worldwide over recent years. For example, despite the complexity of the global food supply, Lobell and Field (2007) showed that simple indicators of growing season temperatures and precipitation explained 30% or more of year-to-year variations in global average yields for the 6 most grown crops. Farm characteristics, such as intensity of cropping, farm size and land use, contribute to the capacity to resist climate-induced yield variability (Reidsma et al., 2010). Despite local initiatives that 0167-8809/$ – see front matter © 2010 Elsevier B.V. All rights reserved. doi:10.1016/j.agee.2010.09.006
Transcript of Coincidence of variation in yield and climate in Europe

C
PHSAa
b
6c
d
e
f
g
h
i
j
k
l
m
n
o
a
ARRA
KBOPPSSTVWYY
1
nei
0d
Agriculture, Ecosystems and Environment 139 (2010) 483–489
Contents lists available at ScienceDirect
Agriculture, Ecosystems and Environment
journa l homepage: www.e lsev ier .com/ locate /agee
oincidence of variation in yield and climate in Europe
irjo Peltonen-Sainioa,∗, Lauri Jauhiainena, Miroslav Trnkab, Jörgen E. Olesenc, Pierluigi Calancad,enrik Eckerstene, Josef Eitzinger f, Anne Gobing, Kurt Christian Kersebaumh, Jerzy Kozyra i,uresh Kumar j, Anna Dalla Martak, Fabio Micale l, Ben Schaapm, Bernard Seguinn,rne O. Skjelvågo, Simone Orlandinik
MTT Agrifood Research Finland, Plant Production, FI-31600 Jokioinen, FinlandMendel University, Institute of Agriculture Systems and Bioclimatology, Zemedelska 1, 61300 Brno and CzechGlobe – Center for Global Climate Change Impacts Studies, Porící,3b03 00 Brno, Czech RepublicAarhus University, Department of Agroecology and Environment, Blichers Allé 20, DK-8830 Tjele, DenmarkAgroscop Reckenholz-Tänikon, Air Pollution and Climate, 8046 Zurich, SwitzerlandSwedish University of Agricultural Sciences, Department of Crop Production Ecology, S-750 07 Uppsala, SwedenUniversity of Natural Resources and Applied Life Sciences (BOKU), Institute of Meteorology, Peter-Jordan Str. 82, A-1190 Vienna, AustriaVITO Flemish Institute for Technological Research, Environmental Modelling Unit, Boeretang 200, BE-2400 Mol, BelgiumLeibniz-Centre for Agricultural Landscape Research, Institute of Landscape Systems Analysis, Eberswalder Str. 84, D-15374 Müncheberg, GermanyInstitute of Soil Science and Plant Cultivation, State Research Institute, Czartoryskich 8, 24–100 Puławy, PolandNational University of Ireland, Department of Geography, St. Annes, North Campus, Maynooth, Co., Kildare, IrelandDepartment of Plant, Soil and Environmental Science, University of Florence, Piazzale delle Cascine 18, 50144 Firenze, ItalyEuropean Commission, Joint Research Centre, TP 483-21020 Ispra, ItalyWageningen University and Research Centre, Plant Research International, Agrosystems Research, P.O. Box 616, 6700 AP Wageningen, The NetherlandsINRA, Centre d’Avignon, Site Agroparc, domaine Saint-Paul, F-84914 Avignon cedex 9, FranceNorwegian University of Life Sciences, P.O. Box 5003, NO-1432 Ås, Norway
r t i c l e i n f o
rticle history:eceived 29 April 2010eceived in revised form 1 September 2010ccepted 2 September 2010
eywords:arleyilseed rapeotato
a b s t r a c t
We aimed to characterise the coincidence of yield variations with weather variables for major field cropsusing long-term datasets and reveal whether there are commonalities across the European agriculturalregions. Long-term national and/or regional yield datasets were used from 14 European countries (total of25 regions). Crops studied were spring and winter barley and wheat, winter oilseed rape, potato and sugarbeet. Relative yield deviations were determined for all crops. Meteorological data on monthly means fortemperature variables, solar radiation, accumulated precipitation and evapotranspiration were providedfor the relevant agricultural regions of each country for 1975–2008. Harmful effects of high precipitationduring grain-filling in grain and seed crops and at flowering in oilseed rape were recorded. In potatoreduced precipitation at tuber formation was associated with yield penalties. Elevated temperatures had
recipitationolar radiationugar beetemperatureariabilityheat
harmful effects for cereals and rapeseed yields.© 2010 Elsevier B.V. All rights reserved.
ieldield deviation
. Introduction
Despite major developments in cropping systems and tech-ologies, as well as advances in breeding for phenotypic stability,specially in industrialised countries, management of climate-nduced fluctuations in yields is often inefficient. The results of such
∗ Corresponding author. Tel.: +358 341882451; fax: +358 341882437.E-mail address: [email protected] (P. Peltonen-Sainio).
167-8809/$ – see front matter © 2010 Elsevier B.V. All rights reserved.oi:10.1016/j.agee.2010.09.006
yield perturbations are reflected as marked changes in global mar-ket prices for crop products, as has been recorded worldwide overrecent years. For example, despite the complexity of the global foodsupply, Lobell and Field (2007) showed that simple indicators ofgrowing season temperatures and precipitation explained 30% or
more of year-to-year variations in global average yields for the 6most grown crops.Farm characteristics, such as intensity of cropping, farm sizeand land use, contribute to the capacity to resist climate-inducedyield variability (Reidsma et al., 2010). Despite local initiatives that
4 system
astcwyedaan
twdtitotbc
2
2
cclrnci1wb
TA
84 P. Peltonen-Sainio et al. / Agriculture, Eco
ttempt to improve adaptive capacity through crop and cultivarelection, crop diversity and farming systems, there is large varia-ion in yields due to fluctuating and continuously changing weatheronditions (Lobell and Field, 2007; Lobell et al., 2007). Changes ineather conditions do not, however, solely determine the extent of
ield variability. Crops respond variously to the timing of weathervents, such as drought, heavy rains, low and high temperatures,epending on crop and phenotypic stability of the cultivar grownnd management practices. However, weather conditions are alsossociated with the risk of pest and disease outbreaks and the mag-itude of subsequent crop losses.
Lots of work and many papers refer to crop responses at coun-ry or regional level: with this joint study of 14 European countriese aimed to characterise with systematic analyses of long-termatasets covering over 30 years the potential coincidence of varia-ion in yields and weather conditions in major temperate field cropsn Europe. As changes in weather conditions and responses of cropso them likely alter a lot from one region to another, the paramountbjective was to reveal potential commonalities in yield responseso weather across Europe. Hence, we hypothesised that it is possi-le to identify major climatic joint constraint(s) to European fieldrop production.
. Material and methods
.1. Long-term yield datasets for crop yields
Long-term datasets for crop yields (observed yield, Yobs) wereompiled from statistical databases of 14 countries, representingomprehensively four major agricultural regions in Europe. Ire-and represented the British Isles and Tuscany (Italy) was the onlyegion representing the Mediterranean (Table 1). Yields were eitherational or regional mainly depending on how much the growing
onditions differed within the country and how regionally lim-ted the crop cultivation was in a country. Data were collected for975–2008, or for a shorter period if the data from earlier yearsere too scattered to be of high quality, reliable and compara-le. Crops included in the study were spring and winter barley
able 1verage yield (kg ha−1) for various crops and countries and/or regions for 1975–2008 (Ire
Country Region (abbreviation) Agricultural region(Olesen and Bindi,2002)
Crops
Springbarley
Finland Whole country (FIN) Nordic XSweden Uppsala (SWE1) Nordic X
Östergötland (SWE2) Nordic XVästra Götaland (SWE3) Nordic XSkåne (SWE4) Nordic X
Norway Oslo fjord (NOR1) Nordic XSouth-eastern Norway (NOR2) NordicCentral Norway (NOR3) Nordic X
Ireland Whole country (IRE) British Isles XDenmark Whole country (DEN) Western XGermany Hannover (GER1) Western X
Ortenau (GER2) Western XThe Netherlands Whole country (NET) Western XBelgium Whole country (BEL) Western XFrance Whole country (FRA) Western
Picardie (FRA1) WesternCentre (FRA2) WesternPoitou-Charentes (FRA3) WesternMidi-Pyrénées (FRA4) Western
Italy Tuscany (ITA1) MediterraneanSwitzerland Whole country (SWI) AlpineAustria Whole country (AUS) Alpine XPoland Whole country (POL) North-eastern X
Wielkopolska (POL1) North-eastern XCzech Whole country (CZE) North-eastern X
s and Environment 139 (2010) 483–489
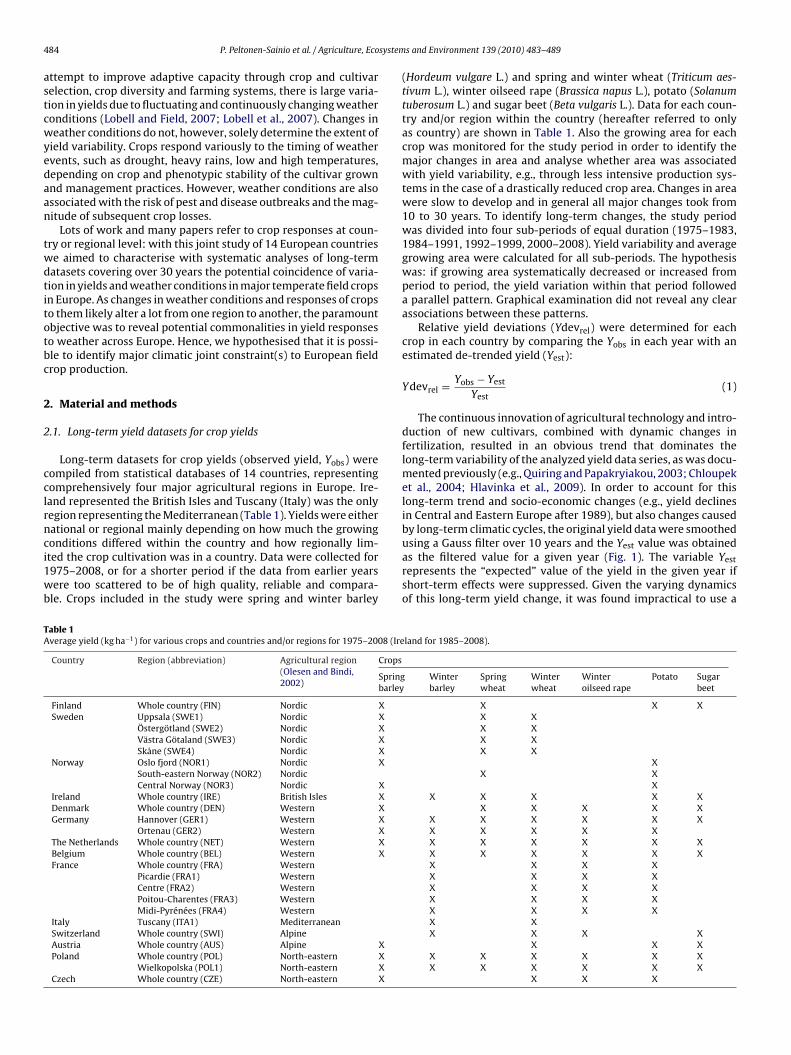
(Hordeum vulgare L.) and spring and winter wheat (Triticum aes-tivum L.), winter oilseed rape (Brassica napus L.), potato (Solanumtuberosum L.) and sugar beet (Beta vulgaris L.). Data for each coun-try and/or region within the country (hereafter referred to onlyas country) are shown in Table 1. Also the growing area for eachcrop was monitored for the study period in order to identify themajor changes in area and analyse whether area was associatedwith yield variability, e.g., through less intensive production sys-tems in the case of a drastically reduced crop area. Changes in areawere slow to develop and in general all major changes took from10 to 30 years. To identify long-term changes, the study periodwas divided into four sub-periods of equal duration (1975–1983,1984–1991, 1992–1999, 2000–2008). Yield variability and averagegrowing area were calculated for all sub-periods. The hypothesiswas: if growing area systematically decreased or increased fromperiod to period, the yield variation within that period followeda parallel pattern. Graphical examination did not reveal any clearassociations between these patterns.
Relative yield deviations (Ydevrel) were determined for eachcrop in each country by comparing the Yobs in each year with anestimated de-trended yield (Yest):
Ydevrel = Yobs − Yest
Yest(1)
The continuous innovation of agricultural technology and intro-duction of new cultivars, combined with dynamic changes infertilization, resulted in an obvious trend that dominates thelong-term variability of the analyzed yield data series, as was docu-mented previously (e.g., Quiring and Papakryiakou, 2003; Chloupeket al., 2004; Hlavinka et al., 2009). In order to account for thislong-term trend and socio-economic changes (e.g., yield declinesin Central and Eastern Europe after 1989), but also changes causedby long-term climatic cycles, the original yield data were smoothed
using a Gauss filter over 10 years and the Yest value was obtainedas the filtered value for a given year (Fig. 1). The variable Yestrepresents the “expected” value of the yield in the given year ifshort-term effects were suppressed. Given the varying dynamicsof this long-term yield change, it was found impractical to use a
land for 1985–2008).
Winterbarley
Springwheat
Winterwheat
Winteroilseed rape
Potato Sugarbeet
X X XX XX XX XX X
XX X
XX X X X X
X X X X XX X X X X XX X X X XX X X X X XX X X X X XX X X XX X X XX X X XX X X XX X X XX XX X X X
X X XX X X X X XX X X X X X
X X X

P. Peltonen-Sainio et al. / Agriculture, Ecosystem
Yobs Yest
7000
6000
)
5000
4000
-1
3000
2000
Win
ter
wh
eat
yiel
d (
kg h
a
Ydevrel
0.3
0.2
0.1
0.0
1000
0
-0.1
-0.2
-0.3
1975
1980
1985
1990
1995
2000
2005
Fd
pbTtepyamfotwa
wupaoCietal1ovop
2
Tlm(tIccl
Years
ig. 1. Observed (Yobs) and estimated (Yest) yields (upper graph) and relative yieldeviation (Ydevrel, lower graph) for winter wheat yields in the Czech Republic.
redefined polynomial function as was used in other studies e.g.,y Quiring and Papakryiakou (2003) and Hlavinka et al. (2009).he selected smoothing window of 10 years accounts for the facthat new crop management technologies and regulations often takeffect on an approximately decadal scale: thus the filtering sup-resses fluctuations occurring on the time scale smaller than 10ears leaving only “long-term” component. Similar effect could bechieved by using running mean but as every data point in thisethod is given the same weight it is not as robust as the Gauss filter
or the same period. The applied method is widely used in analysisf climate series for several decades analysis and its detail descrip-ion is provided by Schönwiese (1985, pp. 189–200). The smoothingas carried by AnClim software package (Stepanek, 2007) that is
vailable at http://www.climahom.eu/AnClim.html.Fig. 1 indicates the values of Yobs, Yest and Ydevrel for winter
heat yields in the Czech Republic. Positive trends in annual yieldp to 1990 could mostly be explained by increasing fertilization,lant breeding and farm innovation (Chloupek et al., 2004). Thepparent yield decline during the 1990s was a direct consequencef socio-economic transformation of the farming industry in thezech Republic after 1989. During this period large-scale changes
n the composition of the farming community were combined withfforts to decrease overall costs through lower levels of fertiliza-ion and crop protection. During the late 1990s the situation in thegriculture sector stabilized, and was followed by increasing yieldevels. It is obvious that the applied method of de-trending using a0-year Gauss filter effectively captures the long-term componentf the crop yield fluctuation (Fig. 1a). The outputs of the process arealues for residuals (hereafter introduced as relative yield deviationr Ydevrel) that describe interannual yield variability over a 30-yeareriod in the region/country (Fig. 1b).
.2. Meteorological variables
The JRC-MARS meteorological database was used in this study.he database includes daily data from more than 5000 meteoro-ogical stations covering the period between 1975 and 2009. The
eteorological station data are interpolated onto a regular mesh25 km × 25 km grid dimension). Before the interpolation process
he meteorological data are treated by a quality check procedure.n order to aggregate the meteorological data into national level,onsidering the specific purpose of this study, a particular pro-edure was developed taking into account the relevance of theand uses: in this case arable land. This procedure consists of as and Environment 139 (2010) 483–489 485
weighted average of all the grids in the territory of each countryaccording to the percentage of arable land present in each grid.Meteorological variables used for this study were monthly meanvalues for minimum, maximum and mean temperature (Tmin, Tmax
and Tmean, respectively; ◦C), solar radiation (SolRad, kJ m−2 d−1),accumulated precipitation (AccPrec, mm) and reference grass evap-otranspiration (ETo, mm d−1). Associations between crop yieldsand monthly means for meteorological variables can often be suc-cessfully applied (Lobell et al., 2007). However, in this study wedetermined typical timings for major phenophases in each cropand country because timing and duration of major growth phasesin crops differed substantially depending on growing region, andcrops also differ considerably in responsiveness to growing condi-tions, depending on stage of phenological development. To timethe major phenophases, data were collected by each co-authoron time of sowing (BBCH00, Lancashire et al., 1991), seedlingemergence (BBCH09–BBCH10), heading (BBCH55–BBCH59) andphysiological maturity (BBCH92) for cereals; timing of sow-ing (BBCH00), seedling emergence (BBCH09), start of flowering(BBCH60–BBCH61), end of flowering (BBCH67–BBCH69) and phys-iological maturity (BBCH87–BBCH89) for winter oilseed rape; timeof planting (GS000) (Jefferies and Lawson, 1991), start of tuberformation (GS530) and harvest for potato; and time of sowing(BBCH00) and harvest for sugar beet. Onset of growing season inspring was determined for winter sown crops according to infor-mation on typical timing of sowings of their spring types. The onlyexception was winter oilseed rape, for which the pre-floweringperiod was considered to be a constant period of 1 month beforestart of flowering. It was not possible to time phenophases for indi-vidual years. Thus, common average start and end days for eachphenophase were used during whole study period. Timing var-ied from country to country. Fixed timing of phenophases did notplay an important role because weather variables were monthlyaverages and small shifts in timing did not have any significantinfluence. Meteorological variables for different phenophases werecalculated using weighted means, i.e., if a period was from mid Juneto mid August, weights were 0.25, 0.50 and 0.25 for June, July andAugust, respectively.
2.3. Association between yield and weather
2.3.1. Single regionAssociations between Ydevrel and means for meteorological
variables for each main growth phase of the crop were charac-terised for each country/region by ranking the years according toYdevrel and then classifying them into three groups, each repre-senting 33% of the years. These groups represented most negative,medium and most positive Ydevrel values. Similar classification wascarried out according to means for each meteorological variablewithin each major growth phase. Characterisation of associa-tions between Ydevrel and meteorological variables was basedon previous classification, which was followed by production of3 × 3 contingency tables, crop by crop, country by country andphenophase by phenophase. Kappa statistics (Fleiss et al., 2003)were then used to measure the associations between each twovariable combinations (Ydevrel vs. meteorological variables). Thekappa coefficient is +1 when there is complete agreement betweentwo variables. When the observed agreement exceeds chanceagreement, kappa is positive, with its magnitude reflecting thestrength of agreement. A positive kappa means that high Ydevrelis often related to a high level of weather variable and negative
Ydevrel to a low level of weather variable. Kappa is negative whenthe observed agreement is less than chance agreement, i.e., highYdevrel is too seldom related to high level of weather variable. Fur-thermore, Cochran–Mantel–Haenszel Statistics were used to teststatistical significance of non-zero correlation (Fleiss et al., 2003).
4 system
Chttst
2
MDa
ucfitotCsat
so
86 P. Peltonen-Sainio et al. / Agriculture, Eco
ochran–Mantel–Haenszel statistics was calculated testing nullypothesis of no association (DF = 1), i.e., the test takes into accounthat levels of weather and Ydevrel were at ordinal scale. Tests whichake the order into account are more specific and often have greatertatistical power. For example, commonly used Pearson Chi-squareest treats levels of variables as nominal.
.3.2. Commonalities across EuropeA multiway table was stratified by country and Cochran–
antel–Haenszel statistics (null hypothesis of no association;F = 1) were used to reveal the most general commonalities amongssociations.
Yield responses to weather variables were originally estimatedsing a random coefficient regression model. Because of severalonvergence problems a simple linear regression analysis was usednally. Means and standard deviation of regression slopes of coun-ries were calculated. Coefficients of determination were calculatedver all countries. Regression slopes were needed to estimatehe practical importance of weather variables because kappa andochran–Mantel–Haenszel statistics were not sufficient. Relation-hips between weather variables and Ydevrel were not linear for
ll countries. Hence, the model resulted in a crude average that atimes slightly underestimated the relationship.Graphical methods were used to check assumptions of regres-ion analysis: a box-plot for normality of residuals and plotsf residuals and predicted values for homogeneity of residuals.
0.450.300.150.00
-0.15
GDEN ( 0.10)
-0.30-0.450.450.300.150.00
-0.15-0.30
FNET (0.09)
-0.450.450.300.150.00
-0.15-0.30-0.450.45
FFRA1 (0.10)
FRA3 F0.300.150.00
-0.15-0.30-0.450.450.30
(0.15)
PSWI (0.08)
0.150.00
-0.15-0.30-0.450.450.300.150.00
POL1 (0.15) C
Years
-0.15-0.30-0.45
1975
1980
1985
1990
1995
2000
2005
Fig. 2. Range of relative yield deviations (Ydevrel) for winter oilseed rape in differe
s and Environment 139 (2010) 483–489
Assumptions were achieved quite well. The distribution was some-times slightly skew (i.e., the left tail was longer for strongly negativeyield differences).
3. Results
An example of a typical range in regional differences in yieldvariability, with the highest deviations (Ydevrel) being close to±40%from estimated yields (Yest), is shown by winter oilseed rape inFig. 2. According to this figure it is also evident that timing ofhigh yield variability differed according to country. Initially whenstudying the coincidence of variation in yield and meteorologicalvariables country by country, associations were established accord-ing to crop, phenophase and country. We found the most frequentand systematic responses throughout Europe for potato when com-pared to those found for sugar beet and grain and seed crops (cf.supplementary material for all significant associations).
The most frequent associations in European growing conditionsbetween Ydevrel and meteorological variables were characterisedwhen analyses were carried out over all countries. In general, eventhough many significant commonalities in associations were found
when compared with the less consistently significant associationsin the country-by-country study, the effects of changes in meteoro-logical variables on yields were quite modest in the pooled datasets.For almost all combinations of crops, main growth phases andmeteorological variables, a limited number of individual countries0.450.300.150.00
-0.15
ER1 (0.09)
-0.30-0.450.450.300.150.00
-0.15-0.30
RA (0.11)
-0.450.450.300.150.00
-0.15-0.30-0.450.45
RA2 (0.14)
RA40.300.150.00
-0.15-0.30-0.450.450.30
(0.13)
OL (0.11)
0.150.00
-0.15-0.30-0.450.450.300.150.00
ZE (0.12)
-0.15-0.30-0.45
1975
1980
1985
1990
1995
2000
2005
nt countries and/regions, 1975–2008 (with S.D.; abbreviations as in Table 1).

P. Peltonen-Sainio et al. / Agriculture, Ecosystems and Environment 139 (2010) 483–489 487
Table 2Linear regression between relative yield deviations (Ydevrel) and meteorological variables for spring and winter barley determined over all countries and regions in Europe.Tmean, Tmin and Tmax, mean, minimum and maximum temperature (◦C); SolRad, solar radiation (1000 × kJ m−2 d−1); AccPrec, accumulated precipitation (mm); ETo, evapo-transpiration (mm d−1). Coefficient of determination (R2) is measured over all countries, while S.D. indicates the deviation depending on country. Average slope indicatesthe response of crop yield (%) to one unit change in meteorological variable.
Meteo-parameter Sowing to emergencea Pre-heading phase Heading to maturity
Average slope S.D. (R2) Average slope S.D. (R2) Average slope S.D. (R2)
Spring barleyTmean 0.12 1.44 (0.03) −1.24 2.14 (0.07) −1.17 2.03 (0.06)Tmin −0.32 1.01 (0.02) −1.51 1.93 (0.06) −1.83 1.73 (0.05)Tmax 0.25 1.36 (0.05) −0.82 1.89 (0.08) −0.63 1.75 (0.06)SolRad 0.90 2.10 (0.07) −0.86 2.60 (0.09) −0.35 1.90 (0.05)AccPrec −0.074 0.068 (0.05) −0.017 0.111 (0.05) −0.016 0.082 (0.04)ETo 3.67 10.92 (0.07) −4.61 11.43 (0.10) −2.46 8.26 (0.07)
Winter barleyTmean 0.08 1.61 (0.04) −1.45 0.71 (0.05) −1.22 1.51 (0.06)Tmin 0.23 1.54 (0.05) −1.54 0.96 (0.06) −2.35 1.41 (0.09)Tmax −0.06 1.64 (0.04) −1.04 0.68 (0.05) −0.55 1.30 (0.04)SolRad −1.27 4.60 (0.02) −0.14 1.40 (0.03) 0.56 1.20 (0.03)
.024
.02
wc
stteattwmahwfiwafmpar
TLF
AccPrec −0.019 0.083 (0.02) −0ETo −1.42 22.88 (0.04) −2
a In winter barley from sowing to onset of growing season in spring.
ere characterised by responses contrary to the general, statisti-ally significant trend across Europe.
For spring barley, positive associations between Ydevrel andolar radiation and evapotranspiration were most obvious, whilehat between Ydevrel and accumulated precipitation was nega-ive from sowing to seedling emergence (Table 2). At pre-headinglevated minimum temperature and evapotranspiration weressociated with yield reductions, while at post-heading yield penal-ies resulted from elevated mean and minimum temperatures. Evenhough significant, responses of spring barley were modest. Forinter barley, no associations were found between Ydevrel andeteorological variables for the period from sowing through winter
nd prior to start of the growing season in spring. At the pre-eading phase, all the other variables were associated negativelyith Ydevrel except maximum temperature, while during grain-lling elevated minimum temperature and higher precipitationere associated with yield penalties across the European regions,
nd higher solar radiation and evapotranspiration enhanced yieldormation. The average responses over all countries were quite
odest. For example, minimum temperature elevated by 1 ◦C atre-heading reduced spring and winter barley yields by 1.5% onverage, and when occurring at post-heading by 1.8% and 2.4%,espectively. When pooled across Europe, 100 mm increase in pre-
able 3inear regression between relative yield deviations (Ydevrel) and meteorological variableor abbreviations see Table 2.
Meteo-parameter Sowing to emergencea Pre-hea
Average slope S.D. (R2) Average
Spring wheatTmean 0.10 0.95 (0.02) −1.31Tmin −0.28 0.98 (0.02) −1.32Tmax 0.18 0.97 (0.03) −0.99SolRad 0.35 1.63 (0.03) −1.05AccPrec −0.039 0.095 (0.04) 0.028ETo 2.07 7.53 (0.03) −5.57
Winter wheatTmean 0.49 1.28 (0.03) 0.06Tmin 0.45 1.17 (0.03) 0.07Tmax 0.51 1.27 (0.03) 0.03SolRad −0.77 2.80 (0.01) −0.37AccPrec 0.006 0.077 (0.01) −0.014ETo 6.66 24.25 (0.04) −0.31
a In winter wheat from sowing to onset of growing season in spring.
0.64 (0.03) −0.068 0.079 (0.05)6.77 (0.04) 0.53 5.68 (0.03)
cipitation during the grain-filling phase was associated with about7% reduction in yield.
Only negative associations were established between Ydevreland meteorological variables in spring wheat: with accumulatedprecipitation prior to seedling emergence, with temperature vari-ables and evapotranspiration at pre-heading and accumulatedprecipitation again during the post-heading phase (Table 3). Onthe other hand, in winter wheat no significant associations werefound for any countries for growth phases preceding heading,while Ydevrel was associated negatively with mean and minimumtemperatures as well as accumulated precipitation during grain-filling.
Commonalities across the countries studied were not apparentfor winter oilseed rape at growth phases prior to onset of flowering,except for the negative association between Ydevrel and maxi-mum temperature during autumn and winter, i.e., from sowingto onset of spring growth (Table 4). At flowering, yield reductionswere associated with elevated mean and minimum temperatures,higher accumulated precipitation and reduced solar radiation and
evapotranspiration. At the seed-filling phase only negative associ-ations were established for winter rapeseed: between Ydevrel andmean and minimum temperatures and precipitation. An increasein these temperature variables by 1 ◦C reduced yield by 2.4% ands for spring and winter wheat determined over all countries and regions in Europe.
ding phase Heading to maturity
slope S.D. (R2) Average slope S.D. (R2)
1.50 (0.04) −0.57 1.70 (0.04)1.30 (0.03) −1.15 1.51 (0.03)1.36 (0.05) −0.19 1.50 (0.05)1.96 (0.07) 0.17 1.53 (0.04)0.131 (0.07) −0.037 0.079 (0.03)7.30 (0.07) −0.33 7.31 (0.05)
1.19 (0.02) −0.89 1.65 (0.06)1.26 (0.02) −1.81 1.40 (0.06)0.96 (0.02) −0.40 1.54 (0.06)1.60 (0.03) 0.03 2.20 (0.06)0.102 (0.04) −0.037 0.074 (0.04)6.64 (0.03) −0.56 8.33 (0.07)

488 P. Peltonen-Sainio et al. / Agriculture, Ecosystems and Environment 139 (2010) 483–489
Table 4Linear regression between relative yield deviations (Ydevrel) and meteorological variables for winter rapeseed determined over all countries and regions in Europe. Forabbreviations see Table 2.
Meteo-parameter Flowering End of flowering to maturity
Average slope S.D. (R2)
Tmean −0.92 0.83 (0.01) −2.43 2.06 (0.08)Tmin −1.47 1.38 (0.03) −3.37 2.34 (0.09)Tmax −0.39 0.88 (0.01) −1.52 1.79 (0.06)SolRad 0.60 1.80 (0.04) −0.20 2.40 (0.05)AccPrec −0.045 0.113 (0.05) −0.061 0.119 (0.04)ETo 1.42 9.34 (0.05) −3.65 8.72 (0.06)
Table 5Linear regression between relative yield deviations (Ydevrel) and meteorological variables for potato and sugar beet determined over all countries and regions in Europe. Forabbreviations see Table 2.
Meteo-parameter Potato Potato Sugar beet
Planting to tuber emergence Tuber emergence to harvest Sowing to harvest
Average slope S.D. (R2) Average slope S.D. (R2) Average slope S.D. (R2)
Tmean 1.17 1.65 (0.05) −2.96 2.47 (0.17) 1.52 3.15 (0.10)Tmin 1.42 1.72 (0.05) −2.67 2.68 (0.10) 1.00 2.08 (0.04)Tmax 0.88 1.58 (0.06) −2.53 2.14 (0.21) 1.63 3.33 (0.13)
6811962
31
tmptbc11ty
4
wgcdwa1
wgaopSmissrai1S
SolRad 0.31 2.20 (0.05) −2.AccPrec 0.002 0.099 (0.04) 0.ETo 2.67 9.09 (0.06) −9.
.4%, respectively, and an increase in accumulated precipitation of00 mm by 6.1% according to pooled datasets.
Numerous commonalities were apparent for potato. Prior touber formation all the meteorological variables except mini-
um temperature and accumulated precipitation were associatedositively with Ydevrel (Table 5). At tuber formation all the associa-ions were negative, except that for the increase in precipitationy 100 mm that increased yields by 12% on average across allountries. On the other hand, increase in mean temperature by◦C reduced yield by 3% and increase in evapotranspiration bymm d−1 reduced yield by 10%. In sugar beet elevated tempera-
ures during the entire period from sowing to harvest sustainedield formation and increases in evapotranspiration.
. Discussion
Coincidence of variation in yield and meteorological variablesas especially frequent and systematic for the vegetatively propa-
ated potato crop when compared with grain and seed producingrops, i.e., cereals and oilseed rape. It is likely that yields of seed pro-ucing crops are more responsive to brief stresses and constraintshen they occur at critical development stages, and are without
bility to compensate for them subsequently (Savin and Nicolas,996, 1999; Peltonen-Sainio et al., 2009a,b).
Lobell and Field (2007) reported clear negative responses ofheat, barley and maize yields to increased temperatures at a
lobal scale. We recorded harmful effects of elevated temperaturest pre-heading (yield determination) and post-heading (realisationf yield potential) periods for spring and winter barley, but also atre-heading of spring wheat and post-heading of winter wheat.imilarly, negative associations between Ydevrel and mean andinimum temperatures were evident for winter oilseed rape dur-
ng flowering and seed-filling phases. Elevated temperatures (heattress at its most extreme) interfered with flowering, grain and seedet through, for example, hastening inflorescence developmental
ate as well as advancing maturity, resulting in incomplete grainnd seed filling, which have also been found in many regional stud-es representing a wide range of environments (Wallwork et al.,998; Aksouh et al., 2001; Morrison and Stewart, 2002; Peltonen-ainio et al., 2007; Ugarte et al., 2007; Rajala et al., 2009). In3.30 (0.19) 1.65 3.50 (0.10)0.132 (0.08) −0.035 0.142 (0.04)
11.12 (0.23) 6.74 16.72 (0.12)
northern growing conditions, the likely means to cope with the ele-vated temperature stress in the future is to loosen responsivenessof developmental rate, but especially hand in hand with efforts toimprove early summer drought resistance (E. Nissilä, Boreal, pers.comm.). In SWE and NOR elevated temperatures during the shortperiod between sowing and seedling emergence was associatedwith enhanced yields in spring barley, but not for spring wheat(cf. supplementary material). For winter barley and wheat no jointtrend in linear temperature effects on yields was demonstrated forthe countries studied. However, grain yield responded non-linearlyto mean winter temperature for winter wheat, with the highestyield at 4.4 ◦C and lower yields both below and above this inflectionpoint (J.E. Olesen, Aarhus Univ, pers. comm.).
In general, due to many other factors that have caused variationin historical yields and also due to use of large, pooled datasets, therecorded effects of elevated temperatures on yields were moderate.A 3 ◦C increase in temperature resulted at most in 7% yield reduc-tion in cereals during grain-filling and 10% in oilseed rape duringseed-filling when averaged over all countries. Hence, this approachwas successful in capturing the central role of elevated temper-atures in causing yield perturbations in Europe, but our methodlikely underestimated the degree of crop response. On the otherhand, technological sophistication and developed farming systemsin Europe (Olesen and Bindi, 2002; Brown and Funk, 2008; Reidsmaand Ewert, 2008; Reidsma et al., 2010) may also have contributedto the moderate crop responses recorded compared with studiescarried out elsewhere. In potato, prior to tuber initiation, lowermean and maximum temperatures as well as solar radiation andevapotranspiration, were associated with yield penalties, especiallyfor FIN and DEN (cf. supplementary material). In general, at tuberformation increases in any of the temperature variables were asso-ciated with a yield penalty (3 ◦C increase in temperature with 8%yield losses), while in sugar beet, higher temperatures (also ele-vated evapotranspiration) generally favoured yield formation.
In contrast to temperature, coincidence of variability in yields
and precipitation events that often holds over very limited timeperiods (especially regarding heavy rains), were less often capturedwith these large scale datasets that accumulated precipitation overeach major phenophase. Nevertheless, some commonalities acrosscountries were found. At seedling emergence phase, higher accu-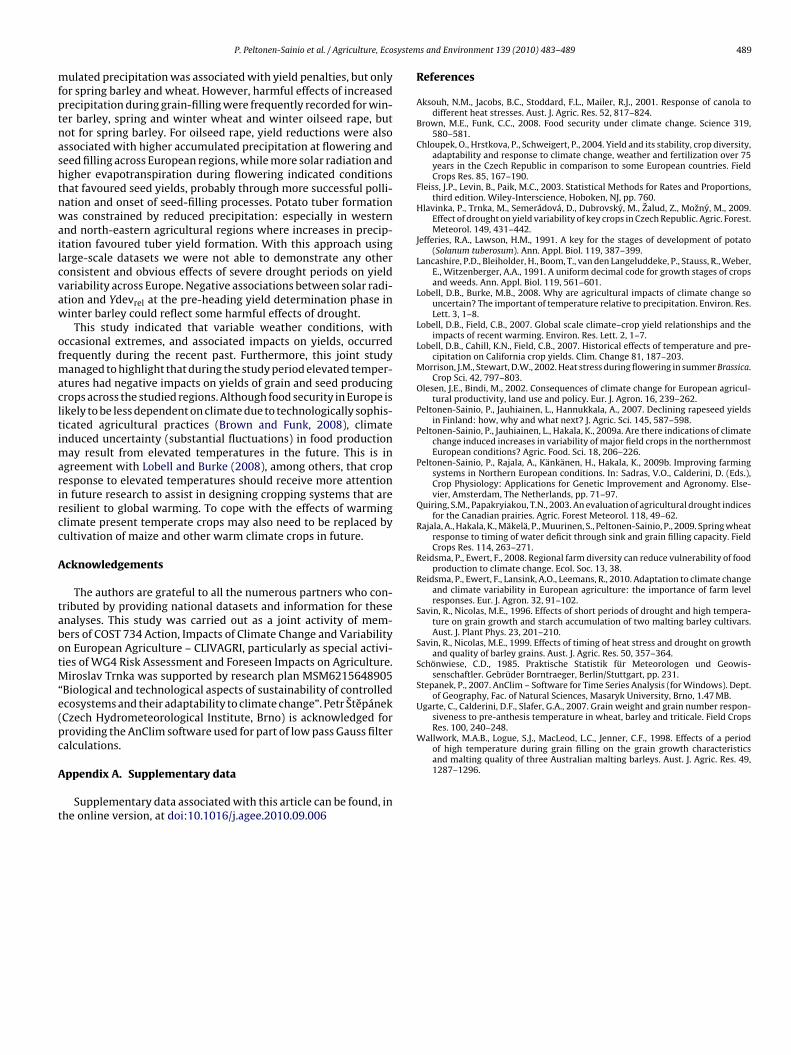
system
mfptnashtnwailcvaw
ofmacltimarircc
A
tabotM“e(pc
A
t
siveness to pre-anthesis temperature in wheat, barley and triticale. Field CropsRes. 100, 240–248.
Wallwork, M.A.B., Logue, S.J., MacLeod, L.C., Jenner, C.F., 1998. Effects of a periodof high temperature during grain filling on the grain growth characteristics
P. Peltonen-Sainio et al. / Agriculture, Eco
ulated precipitation was associated with yield penalties, but onlyor spring barley and wheat. However, harmful effects of increasedrecipitation during grain-filling were frequently recorded for win-er barley, spring and winter wheat and winter oilseed rape, butot for spring barley. For oilseed rape, yield reductions were alsossociated with higher accumulated precipitation at flowering andeed filling across European regions, while more solar radiation andigher evapotranspiration during flowering indicated conditionshat favoured seed yields, probably through more successful polli-ation and onset of seed-filling processes. Potato tuber formationas constrained by reduced precipitation: especially in western
nd north-eastern agricultural regions where increases in precip-tation favoured tuber yield formation. With this approach usingarge-scale datasets we were not able to demonstrate any otheronsistent and obvious effects of severe drought periods on yieldariability across Europe. Negative associations between solar radi-tion and Ydevrel at the pre-heading yield determination phase ininter barley could reflect some harmful effects of drought.
This study indicated that variable weather conditions, withccasional extremes, and associated impacts on yields, occurredrequently during the recent past. Furthermore, this joint study
anaged to highlight that during the study period elevated temper-tures had negative impacts on yields of grain and seed producingrops across the studied regions. Although food security in Europe isikely to be less dependent on climate due to technologically sophis-icated agricultural practices (Brown and Funk, 2008), climatenduced uncertainty (substantial fluctuations) in food production
ay result from elevated temperatures in the future. This is ingreement with Lobell and Burke (2008), among others, that cropesponse to elevated temperatures should receive more attentionn future research to assist in designing cropping systems that areesilient to global warming. To cope with the effects of warminglimate present temperate crops may also need to be replaced byultivation of maize and other warm climate crops in future.
cknowledgements
The authors are grateful to all the numerous partners who con-ributed by providing national datasets and information for thesenalyses. This study was carried out as a joint activity of mem-ers of COST 734 Action, Impacts of Climate Change and Variabilityn European Agriculture – CLIVAGRI, particularly as special activi-ies of WG4 Risk Assessment and Foreseen Impacts on Agriculture.
iroslav Trnka was supported by research plan MSM6215648905Biological and technological aspects of sustainability of controlledcosystems and their adaptability to climate change”. Petr StepánekCzech Hydrometeorological Institute, Brno) is acknowledged forroviding the AnClim software used for part of low pass Gauss filteralculations.
ppendix A. Supplementary data
Supplementary data associated with this article can be found, inhe online version, at doi:10.1016/j.agee.2010.09.006
s and Environment 139 (2010) 483–489 489
References
Aksouh, N.M., Jacobs, B.C., Stoddard, F.L., Mailer, R.J., 2001. Response of canola todifferent heat stresses. Aust. J. Agric. Res. 52, 817–824.
Brown, M.E., Funk, C.C., 2008. Food security under climate change. Science 319,580–581.
Chloupek, O., Hrstkova, P., Schweigert, P., 2004. Yield and its stability, crop diversity,adaptability and response to climate change, weather and fertilization over 75years in the Czech Republic in comparison to some European countries. FieldCrops Res. 85, 167–190.
Fleiss, J.P., Levin, B., Paik, M.C., 2003. Statistical Methods for Rates and Proportions,third edition. Wiley-Interscience, Hoboken, NJ, pp. 760.
Hlavinka, P., Trnka, M., Semerádová, D., Dubrovsky, M., Zalud, Z., Mozny, M., 2009.Effect of drought on yield variability of key crops in Czech Republic. Agric. Forest.Meteorol. 149, 431–442.
Jefferies, R.A., Lawson, H.M., 1991. A key for the stages of development of potato(Solanum tuberosum). Ann. Appl. Biol. 119, 387–399.
Lancashire, P.D., Bleiholder, H., Boom, T., van den Langeluddeke, P., Stauss, R., Weber,E., Witzenberger, A.A., 1991. A uniform decimal code for growth stages of cropsand weeds. Ann. Appl. Biol. 119, 561–601.
Lobell, D.B., Burke, M.B., 2008. Why are agricultural impacts of climate change souncertain? The important of temperature relative to precipitation. Environ. Res.Lett. 3, 1–8.
Lobell, D.B., Field, C.B., 2007. Global scale climate–crop yield relationships and theimpacts of recent warming. Environ. Res. Lett. 2, 1–7.
Lobell, D.B., Cahill, K.N., Field, C.B., 2007. Historical effects of temperature and pre-cipitation on California crop yields. Clim. Change 81, 187–203.
Morrison, J.M., Stewart, D.W., 2002. Heat stress during flowering in summer Brassica.Crop Sci. 42, 797–803.
Olesen, J.E., Bindi, M., 2002. Consequences of climate change for European agricul-tural productivity, land use and policy. Eur. J. Agron. 16, 239–262.
Peltonen-Sainio, P., Jauhiainen, L., Hannukkala, A., 2007. Declining rapeseed yieldsin Finland: how, why and what next? J. Agric. Sci. 145, 587–598.
Peltonen-Sainio, P., Jauhiainen, L., Hakala, K., 2009a. Are there indications of climatechange induced increases in variability of major field crops in the northernmostEuropean conditions? Agric. Food. Sci. 18, 206–226.
Peltonen-Sainio, P., Rajala, A., Känkänen, H., Hakala, K., 2009b. Improving farmingsystems in Northern European conditions. In: Sadras, V.O., Calderini, D. (Eds.),Crop Physiology: Applications for Genetic Improvement and Agronomy. Else-vier, Amsterdam, The Netherlands, pp. 71–97.
Quiring, S.M., Papakryiakou, T.N., 2003. An evaluation of agricultural drought indicesfor the Canadian prairies. Agric. Forest Meteorol. 118, 49–62.
Rajala, A., Hakala, K., Mäkelä, P., Muurinen, S., Peltonen-Sainio, P., 2009. Spring wheatresponse to timing of water deficit through sink and grain filling capacity. FieldCrops Res. 114, 263–271.
Reidsma, P., Ewert, F., 2008. Regional farm diversity can reduce vulnerability of foodproduction to climate change. Ecol. Soc. 13, 38.
Reidsma, P., Ewert, F., Lansink, A.O., Leemans, R., 2010. Adaptation to climate changeand climate variability in European agriculture: the importance of farm levelresponses. Eur. J. Agron. 32, 91–102.
Savin, R., Nicolas, M.E., 1996. Effects of short periods of drought and high tempera-ture on grain growth and starch accumulation of two malting barley cultivars.Aust. J. Plant Phys. 23, 201–210.
Savin, R., Nicolas, M.E., 1999. Effects of timing of heat stress and drought on growthand quality of barley grains. Aust. J. Agric. Res. 50, 357–364.
Schönwiese, C.D., 1985. Praktische Statistik für Meteorologen und Geowis-senschaftler. Gebrüder Borntraeger, Berlin/Stuttgart, pp. 231.
Stepanek, P., 2007. AnClim – Software for Time Series Analysis (for Windows). Dept.of Geography, Fac. of Natural Sciences, Masaryk University, Brno, 1.47 MB.
Ugarte, C., Calderini, D.F., Slafer, G.A., 2007. Grain weight and grain number respon-
and malting quality of three Australian malting barleys. Aust. J. Agric. Res. 49,1287–1296.