Code Coverage for Suite Evaluation by Developers
11
Code Coverage for Suite Evaluation by Developers Rahul Gopinath Oregon State University [email protected] Carlos Jensen Oregon State University [email protected] Alex Groce Oregon State University [email protected] ABSTRACT One of the key concerns of developers testing code is how to determine a test suite’s quality – its ability to find faults. The most common approach in industry is to use code cov- erage as a measure for test suite quality, and diminishing returns in coverage or high absolute coverage as a stopping rule. In testing research, suite quality is often evaluated by measuring a suite’s ability to kill mutants, which are artifi- cially seeded potential faults. Mutation testing is effective but expensive, thus seldom used by practitioners. Deter- mining which criteria best predict mutation kills is therefore critical to practical estimation of test suite quality. Previ- ous work has only used small sets of programs, and usually compares multiple suites for a single program. Practition- ers, however, seldom compare suites — they evaluate one suite. Using suites (both manual and automatically gen- erated) from a large set of real-world open-source projects shows that results for evaluation differ from those for suite- comparison: statement coverage (not block, branch, or path) predicts mutation kills best. Categories and Subject Descriptors D.2.5 [Software Engineering]: Testing and Debugging Test- ing Tools General Terms Measurement, Verification Keywords test frameworks, evaluation of coverage criteria, statistical analysis 1. INTRODUCTION The purpose of software testing is to improve the quality of software, and the primary route to this goal is the de- tection of faults. Unfortunately, the problem of finding all Permission to make digital or hard copies of all or part of this work for personal or classroom use is granted without fee provided that copies are not made or distributed for profit or commercial advantage and that copies bear this notice and the full citation on the first page. To copy otherwise, to republish, to post on servers or to redistribute to lists, requires prior specific permission and/or a fee. Copyright 200X ACM X-XXXXX-XX-X/XX/XX ...$10.00. faults in a program (or proving their absence), for any mean- ingful program, is essentially unsolvable. Testing is therefore always a trade-off between the cost of (further) testing and the potential cost of undiscovered faults in a program. In order to make intelligent decisions about testing, developers need ways to evaluate their current testing efforts in terms of its ability to detect faults. The details of how to make use of such evaluation are likely to be highly project-dependent, but the ability, given a test suite, to predict whether it is effective at finding faults, is basic to most such approaches. The ideal measure of fault detection is, naturally, fault detection. In retrospect, using the set of defects discovered during a software product’s lifetime, the quality of a test suite could be evaluated by measuring its ability to detect those faults (faults never revealed in use might reasonably have little impact on testing decisions). Of course, this is not a practical method for making decisions during devel- opment and testing. Software engineers therefore rely on methods that predict fault detection capability based only on the suite itself and the current version of the software under test (SUT). The most popular such method is the use of code coverage criteria [1]. Code coverage describes structural aspects of the executions of an SUT performed by a test suite. For example, statement coverage indicates which statements in a program’s source code were executed, branch coverage indicates which branches were taken, and path coverage describes (typically in a slightly more complex way, to account for loops) the paths explored in a program’s control flow graph. In software testing research, the gold standard for suite evaluation is generally considered to be actual faults de- tected, but this is, again, in practice difficult to apply even in a research setting [16]. The second most informative mea- sure of suite quality is usually believed to be mutation test- ing [7, 2], which measures the ability of a test suite to de- tect small changes to the source code. Mutation testing subsumes many other code coverage criteria, and has been shown to predict actual fault detection better than other criteria in some settings, but never shown to be worse than traditional code coverage measures. Unfortunately, mutation testing is both difficult to apply and computationally expensive, which has led to the search for “next-best” criteria for predicting suite quality by re- searchers [16, 19]. This effort is highly relevant to real soft- ware developers, who almost never apply mutation testing due to its complexity, expense, and the lack of tool support in many languages. From the point of view of actual soft- ware developers and test engineers, rather than researchers,
-
Upload
iuni-saarland -
Category
Documents
-
view
3 -
download
0
Transcript of Code Coverage for Suite Evaluation by Developers

Code Coverage for Suite Evaluation by Developers
Rahul GopinathOregon State University
Carlos JensenOregon State University
Alex GroceOregon State [email protected]
ABSTRACTOne of the key concerns of developers testing code is howto determine a test suite’s quality – its ability to find faults.The most common approach in industry is to use code cov-erage as a measure for test suite quality, and diminishingreturns in coverage or high absolute coverage as a stoppingrule. In testing research, suite quality is often evaluated bymeasuring a suite’s ability to kill mutants, which are artifi-cially seeded potential faults. Mutation testing is effectivebut expensive, thus seldom used by practitioners. Deter-mining which criteria best predict mutation kills is thereforecritical to practical estimation of test suite quality. Previ-ous work has only used small sets of programs, and usuallycompares multiple suites for a single program. Practition-ers, however, seldom compare suites — they evaluate onesuite. Using suites (both manual and automatically gen-erated) from a large set of real-world open-source projectsshows that results for evaluation differ from those for suite-comparison: statement coverage (not block, branch, or path)predicts mutation kills best.
Categories and Subject DescriptorsD.2.5 [Software Engineering]: Testing and Debugging Test-ing Tools
General TermsMeasurement, Verification
Keywordstest frameworks, evaluation of coverage criteria, statisticalanalysis
1. INTRODUCTIONThe purpose of software testing is to improve the quality
of software, and the primary route to this goal is the de-tection of faults. Unfortunately, the problem of finding all
Permission to make digital or hard copies of all or part of this work forpersonal or classroom use is granted without fee provided that copies arenot made or distributed for profit or commercial advantage and that copiesbear this notice and the full citation on the first page. To copy otherwise, torepublish, to post on servers or to redistribute to lists, requires prior specificpermission and/or a fee.Copyright 200X ACM X-XXXXX-XX-X/XX/XX ...$10.00.
faults in a program (or proving their absence), for any mean-ingful program, is essentially unsolvable. Testing is thereforealways a trade-off between the cost of (further) testing andthe potential cost of undiscovered faults in a program. Inorder to make intelligent decisions about testing, developersneed ways to evaluate their current testing efforts in termsof its ability to detect faults. The details of how to make useof such evaluation are likely to be highly project-dependent,but the ability, given a test suite, to predict whether it iseffective at finding faults, is basic to most such approaches.
The ideal measure of fault detection is, naturally, faultdetection. In retrospect, using the set of defects discoveredduring a software product’s lifetime, the quality of a testsuite could be evaluated by measuring its ability to detectthose faults (faults never revealed in use might reasonablyhave little impact on testing decisions). Of course, this isnot a practical method for making decisions during devel-opment and testing. Software engineers therefore rely onmethods that predict fault detection capability based onlyon the suite itself and the current version of the softwareunder test (SUT). The most popular such method is theuse of code coverage criteria [1]. Code coverage describesstructural aspects of the executions of an SUT performedby a test suite. For example, statement coverage indicateswhich statements in a program’s source code were executed,branch coverage indicates which branches were taken, andpath coverage describes (typically in a slightly more complexway, to account for loops) the paths explored in a program’scontrol flow graph.
In software testing research, the gold standard for suiteevaluation is generally considered to be actual faults de-tected, but this is, again, in practice difficult to apply evenin a research setting [16]. The second most informative mea-sure of suite quality is usually believed to be mutation test-ing [7, 2], which measures the ability of a test suite to de-tect small changes to the source code. Mutation testingsubsumes many other code coverage criteria, and has beenshown to predict actual fault detection better than othercriteria in some settings, but never shown to be worse thantraditional code coverage measures.
Unfortunately, mutation testing is both difficult to applyand computationally expensive, which has led to the searchfor “next-best” criteria for predicting suite quality by re-searchers [16, 19]. This effort is highly relevant to real soft-ware developers, who almost never apply mutation testingdue to its complexity, expense, and the lack of tool supportin many languages. From the point of view of actual soft-ware developers and test engineers, rather than researchers,

however, most studies of suite evaluation are not focusingon their actual needs.
First, researchers typically consider the effectiveness ofcriteria for predicting which of multiple suites for the sameSUT will detect the most faults. For research purposes, thisis the right focus: the primary use of coverage criteria isto compare test-generation methods, where the fundamen-tal question is typically “Which of the following approachesshould we apply to this program to detect the most faults?”In typical development settings, however, the question ismore often “Should we devote more effort to improving thistest suite?” and applying completely different testing meth-ods is not an option. In fact, the suites being evaluated areusually produced by manual effort and the only mitigationfor poor effectiveness considered is adding more manually de-veloped tests. Testing research often focuses on comparingsuites for one SUT; practitioners more often need to simplyevaluate a single suite. It is not clear that the best criteriafor multi-suite comparison, where suites are expected to begenerated by competitive automated methods, are the mosteffective for evaluating a fixed suite.
Second, researchers are far more likely to apply novel cov-erage criteria than practitioners. Many recent papers com-paring criteria either introduce a novel criteron [19] or im-plement a previously proposed but never-implemented cri-teria [16]. While most even moderately popular languages(e.g., Java, C, C++, Python, Haskell) have (multiple) toolsfor measuring statement and branch coverage, relatively fewnon-research tools even offer any variant of path coverage,much less data flow-based [20, 19] or more esoteric measuressuch as predicate-complete test coverage [5, 6]. This limita-tion is particularly important for open source development,where expensive commercial coverage tools are unlikely to beapplied, and developers working together may lack a com-mon high-end development environment. Even criteria aswidely known as the MC/DC coverage required in aerospacecode development [9] lack open source or free tools.
This paper examines the question of coverage criteria assuite quality predictors from the perspective of the non-researcher developer audience, interested in suite evaluation(rather than comparison) and relying on lightweight, widelyavailable, tools and well-known coverage criteria. Giventhe constraints under which real software projects operate,which widely available coverage criteria provide the best es-timation of fault detection? The data in this paper is drawnfrom the evaluation of hundreds of open source projects.While the results are based only on open source Java pro-grams hosted on Github using the popular Maven build sys-tem, it is likely that they apply at minimum to many otherJava projects using other build systems, and may well ap-ply to other languages as well. As a “silver standard” forevaluating suite quality, mutation testing is used, as iden-tifying real faults of hundreds of Java projects was clearlyinfeasible. Our findings show that, in contrast to the resultsof some studies in a research context, statement coverage isgenerally the most effective predictor of suite quality. Thisis not an accident of the nature of manually-produced testsuites; the same relationship also holds for test suites gener-ated by the Randoop tool [31], which uses feedback-directedrandom testing to generate suites. While branch coverageor some variant of path coverage may be most useful formany research contexts, in the context of typical Java opensource projects, at least, a focus on the simple and easily
understood measure of statement coverage is probably mostuseful for predicting suite quality, even if developers are us-ing an automated testing tool.
The primary contributions of this paper are twofold. First,the existence of popular open source repositories makes itpossible to investigate the effectiveness of coverage criteriain a more unbiased, large-scale, and systematic way thanprevious studies, using a large body of very different SUTs soas to limit selection effects. Using the actual test suites fromtypical real projects also ensures that results are relevant toactual testing practices as seen “in the wild.” The additionalavailability of automated testing tools mature enough to ap-ply to this set of projects enables us to draw conclusionsabout both human-generated and automatically-generatedsuites, and to show that results do not depend on this prop-erty of test suites. This enables our second contribution,a practical proposal to developers wishing to evaluate testsuites for open source Java projects. Finally, by showingthat the best criteria for research purposes differ from thosefor practitioners, this paper may indicate that the partic-ular needs and abilities of software testing researchers maylead to less-than-optimal advice to developers whose focus isnot on evaluating testing methods but on producing qualitysoftware.
M Mutation scoreS Statement coverage
S̃ Block coverageB Branch coverageP Path coverageK Project size in LOCT Test suite size in LOCC Cyclomatic complexity
Table 1: Symbols used
2. RELATED WORKA very large body of work considers the question of the
relationship between coverage criteria and fault detection.The most closely related work to ours, which considers someof the same questions from a different perspective (that ofresearchers) is the recent work of Gligoric et al. [16]. Theirwork uses the same statistical approach as this paper, mea-suring both τβ and R2 to examine correlation to mutationkill for a set of criteria, and both studies consider realisti-cally non-adequate suites. However, their work considersonly a set of 15 Java programs and 11 C programs, se-lected not randomly but primarily from container classesused in previous studies and the classic Siemens/SIR sub-jects. Their larger projects (JodaTime, JFreeChart, SQL-Lite, YAFFS2) were chosen opportunistically. Our study ison a much larger scale in terms of subjects and uses a moreprincipled selection process. Most importantly, however, weconsider correlation of criteria across all SUTs, to answerthe question “given a suite for an SUT, which criteria bestpredicts mutation kills for that SUT?” rather than to de-termine, within each SUT, which criteria best ranks varioussuites for that SUT. Gligoric et al. report that branch cov-erage does the best job, overall, of predicting the best suitefor a given SUT, but that acyclic intra-procedural path cov-erage is highly competitive and may better address the issueof ties, which is important in their research/comparison con-text. Inozemtseva et al. [21] investigates the relationship of
various coverage measures and mutation score for differentrandom subsets of test suites. They observe that when thetest suite size is controlled, only low to moderate correlationis present between coverage and effectiveness. This conclu-sion holds for all kinds of coverage measures used. The dif-ference in subjects and focus yields substantially differentresults than ours, as we discuss below.
Budd et al. [7] proposed mutation testing as a strongercriteria than other methods for evaluating test suites. Offutet al. showed that mutation coverage subsumes [29] manyother criteria, including the basic six proposed by Myers [27].
Frankl et al. [13] compared the effectiveness of mutationtesting with all-uses coverage, and found that at highest cov-erage levels, mutation testing was more effective. Andrewset al. compared [2] the fault detection ratio and the muta-tion kill ratio of a large number of test suites, finding theratios were very similar, and hence the faults induced bymutation representative of the real faults in programs. Afollow up study [3] using a large number of test suites froma single program space.c found that the mutation detectionratio and the fault detection ratio are related linearly, withsimilar results for other coverage criteria (0.83 to 0.9). Lin-ear regression on the mutation kill ratio and fault detectionratio showed a high correlation (0.9). Li et al. [24] com-pared four different criteria (mutation, edge pair, all uses,and prime path). They found that mutation-adequate test-ing was able to detect the most hand seeded faults (85%),while other criteria were similar to each other and were inthe range of 65% detection. Similarly, mutation coveragerequired the fewest test cases to satisfy the adequacy crite-ria, while prime path coverage required the most. Therefore,while there are no compellingly large-scale studies of manySUTs selected in a non-biased way to support the effective-ness of mutation testing, it is at least highly plausible as abetter standard than other criteria in the literature.
Frankl and Weiss [12] performed a comparison of branchcoverage and def-use coverage, showing that def-use is moreeffective than branch coverage for fault detection and thereis stronger correlation to fault detection for def-use thanbranch coverage.
Gupta et al. [18] compared the effectiveness and efficiencyof block coverage, branch coverage, and condition coverage,with mutation kill of adequate test suites as their evalu-ation metric. They found that branch coverage adequacywas more effective (killed more mutants) than block cov-erage in all cases, and condition coverage was better thanbranch coverage for methods having composite conditionalstatements. The reverse, however, was true when consider-ing the efficiency (average number of test cases required todetect a fault) of suites.
Kakarla [23] and Inozemtseva [22] demonstrated a linearrelationship between mutation detection ratio and coveragefor individual programs. Inozemtseva’s study used machinelearning techniques to come up with a regression relation,and found that effectiveness is dependent on the number ofmethods in a test suite with a correlation coefficient in therange 0.81 ≤ r ≤ 0.93. The study also found a moderate-to-high correlation by Kendall’s τ in the range 0.61 ≤ τ ≤ 0.81between effectiveness and block coverage when test suitesize was ignored, which reduced when test suite size was ac-counted for. Kakarla found that statement coverage was cor-related to mutation coverage in the range of 0.73 ≤ r ≤ 0.99and 0.57 ≤ τ ≤ 0.94.
Wei et al. [35] examined branch coverage as a quality mea-sure for suites for 14 Eiffel classes, showing that for randomlygenerated suites, branch coverage behavior was consistentacross many runs, while fault detection varied widely. Earlyin random testing, where branch coverage was rising rapidly,current branch coverage had high correlation to fault detec-tion, but branch coverage eventually saturated while faultdetection continued to increase; the correlation at this pointbecame very weak.
Cai et al. [8] investigated correlation between coveragecriteria under different testing profiles: whole test set, func-tional test, random test, normal test, and exceptional test.They investigated block coverage, decision coverage, C-useand P-use criteria. Curiously, they observed that the re-lationship between block coverage and mutant kills was notalways positive. They found that block coverage and mutantkills had a correlation of R2 = 0.781 when considering thewhole test suite, but as low as 0.045 for normal testing andas high as 0.944 for exceptional testing. The correlation be-tween decision coverage and mutation kills was higher thanstatement coverage, for the whole test suite (0.832), rangingfrom normal test (0.368) to exceptional test (0.952).
Namin and Andrews [28] also showed that fault detectionratio (non-linearly) correlated well with block coverage, de-cision coverage, and two different data-flow criteria. Theirresearch suggested that test suite size was a significant factorin the model.
In general, none of this work considered a large, represen-tative, set of open source projects, and many studies con-sidered the within-SUT suite comparison problem, not theproblem of determining if a single suite provides effectivetesting for an SUT, as we do. The variety of reported rank-ings and correlations of criteria can be highly confusing toeven a researcher wishing to compare suites, much less atypical (open source) developer seeking to simply decide ifcurrent testing for a project is likely effective for fault de-tection. Many studies do not even include all of branch,statement, and block coverage, the most readily availablecriteria. Our contribution over related work is a study that(1) uses a large set of open-source projects, (2) uses bothmanually and automatically generated tests, (3) includes allthe criteria of most interest to developers, and (4) focuseson the critical question of single-suite evaluation correlation.
3. METHODOLOGYMethodology was driven by two primary concerns. We
wanted our results to be applicable to the largest set of real-world programs as possible, and should be based on a diverseset of actual test suites constructed by developers, not test-ing researchers. The second was to strive for a statisticallysignificant result, preferring to keep as many experimentalvariables constant as possible. One result of this was to re-strict this study to Java programs. Java is one of the mostwidely used programming languages [14, 34], and choosing asingle language allows us to ensure a consistent definition forcoverage criteria and avoid any difficulties due to variance inmutation operators. As a consequence, our results are onlydirectly applicable to projects written in Java (still a largeportion of the code written today). However, the results arealso likely applicable to other programming languages withsimilar structures. Previous studies [16] do not show majordifferences between criteria effectiveness between Java andC programs, despite Java’s object-oriented nature, inclusion
Project size in LOC
Fre
quen
cy
020
4060
8010
012
0
1 10 100 1000 10000 1e+05 1e+06
AllSelected
µ = 4574η = 904σ = 18795µ = 2739η = 686σ = 8928
Cyclomatic Complexity
Fre
quen
cy
020
4060
8010
012
0
1 2.718 7.389 20.09
AllSelected
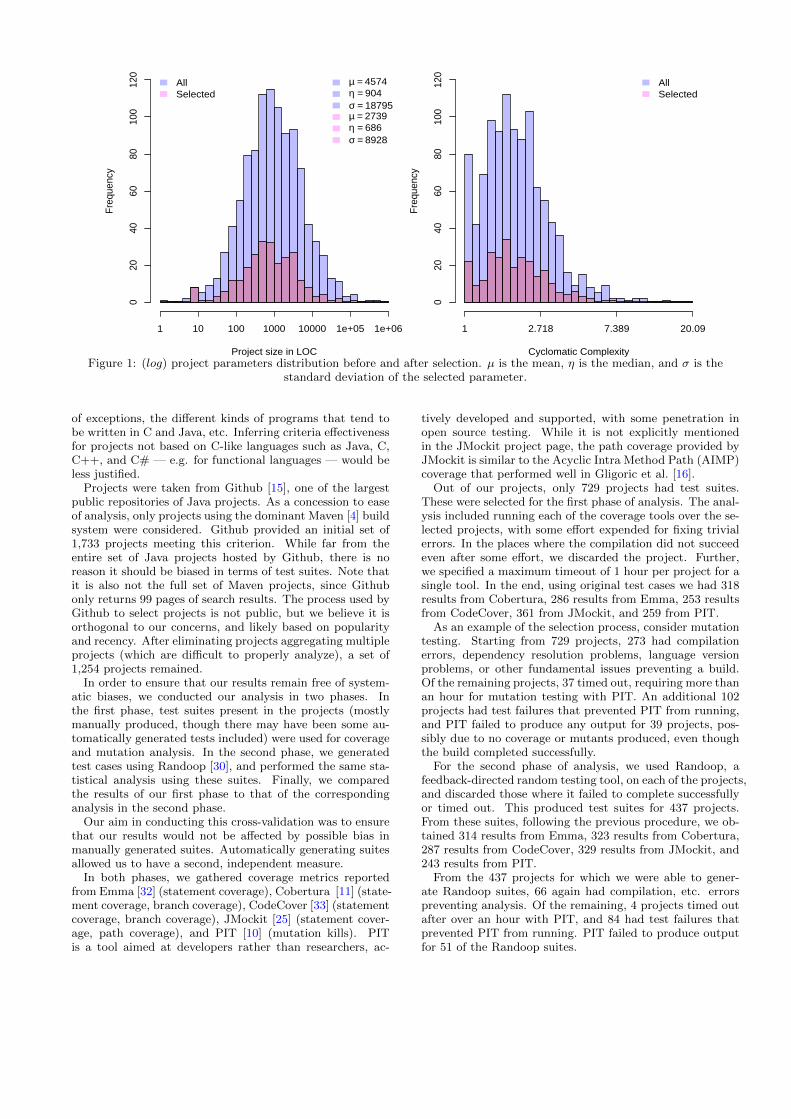
Figure 1: (log) project parameters distribution before and after selection. µ is the mean, η is the median, and σ is thestandard deviation of the selected parameter.
of exceptions, the different kinds of programs that tend tobe written in C and Java, etc. Inferring criteria effectivenessfor projects not based on C-like languages such as Java, C,C++, and C# — e.g. for functional languages — would beless justified.
Projects were taken from Github [15], one of the largestpublic repositories of Java projects. As a concession to easeof analysis, only projects using the dominant Maven [4] buildsystem were considered. Github provided an initial set of1,733 projects meeting this criterion. While far from theentire set of Java projects hosted by Github, there is noreason it should be biased in terms of test suites. Note thatit is also not the full set of Maven projects, since Githubonly returns 99 pages of search results. The process used byGithub to select projects is not public, but we believe it isorthogonal to our concerns, and likely based on popularityand recency. After eliminating projects aggregating multipleprojects (which are difficult to properly analyze), a set of1,254 projects remained.
In order to ensure that our results remain free of system-atic biases, we conducted our analysis in two phases. Inthe first phase, test suites present in the projects (mostlymanually produced, though there may have been some au-tomatically generated tests included) were used for coverageand mutation analysis. In the second phase, we generatedtest cases using Randoop [30], and performed the same sta-tistical analysis using these suites. Finally, we comparedthe results of our first phase to that of the correspondinganalysis in the second phase.
Our aim in conducting this cross-validation was to ensurethat our results would not be affected by possible bias inmanually generated suites. Automatically generating suitesallowed us to have a second, independent measure.
In both phases, we gathered coverage metrics reportedfrom Emma [32] (statement coverage), Cobertura [11] (state-ment coverage, branch coverage), CodeCover [33] (statementcoverage, branch coverage), JMockit [25] (statement cover-age, path coverage), and PIT [10] (mutation kills). PITis a tool aimed at developers rather than researchers, ac-
tively developed and supported, with some penetration inopen source testing. While it is not explicitly mentionedin the JMockit project page, the path coverage provided byJMockit is similar to the Acyclic Intra Method Path (AIMP)coverage that performed well in Gligoric et al. [16].
Out of our projects, only 729 projects had test suites.These were selected for the first phase of analysis. The anal-ysis included running each of the coverage tools over the se-lected projects, with some effort expended for fixing trivialerrors. In the places where the compilation did not succeedeven after some effort, we discarded the project. Further,we specified a maximum timeout of 1 hour per project for asingle tool. In the end, using original test cases we had 318results from Cobertura, 286 results from Emma, 253 resultsfrom CodeCover, 361 from JMockit, and 259 from PIT.
As an example of the selection process, consider mutationtesting. Starting from 729 projects, 273 had compilationerrors, dependency resolution problems, language versionproblems, or other fundamental issues preventing a build.Of the remaining projects, 37 timed out, requiring more thanan hour for mutation testing with PIT. An additional 102projects had test failures that prevented PIT from running,and PIT failed to produce any output for 39 projects, pos-sibly due to no coverage or mutants produced, even thoughthe build completed successfully.
For the second phase of analysis, we used Randoop, afeedback-directed random testing tool, on each of the projects,and discarded those where it failed to complete successfullyor timed out. This produced test suites for 437 projects.From these suites, following the previous procedure, we ob-tained 314 results from Emma, 323 results from Cobertura,287 results from CodeCover, 329 results from JMockit, and243 results from PIT.
From the 437 projects for which we were able to gener-ate Randoop suites, 66 again had compilation, etc. errorspreventing analysis. Of the remaining, 4 projects timed outafter over an hour with PIT, and 84 had test failures thatprevented PIT from running. PIT failed to produce outputfor 51 of the Randoop suites.

*
*
*
*
* *
*
*
*
**
*
*
*
*
*
*
*
*
*
*
*
*
*
**
*
*
*
*
*
*
*
*
*
*
**
**
*
*
*
*
*
*
*
**
*
*
***
*
*
*
**
*
*
**
*
*
*
*
***
*
*
*
**
*
** **
*
*
*
**
*
*
*
**
**
*
*
**
** *
*
*
**
*
*
*
*
*
**
*
*
*
*
**
*
***
*
*
*
*
*
*
*
*
**
*
***
*
* *
*
*
*
**
*
*
**
*
*
*
*
**
*
*
*
**
*
*
**
*
*
*
**
*
**
*
*
*
*
*
*
*
* *
**
*
*
*
*
*
*
*
*
*
*
*
*
*
*
*
*
* ****
*
*
*
*
*
*
*
*
*
***
**
*
*
*
*
*
*
*
*
*
*
*
* *
**
*
*
0.0 0.2 0.4 0.6 0.8 1.0
0.0
0.2
0.4
0.6
0.8
1.0
Original
S
M
●
●
●
●
● ●
●
●
●
●●
●
●
●
●
●
●
●
●
●
●
●
●
●
●●
●
●
●
●
●
●
●
●
●
●
●●
●●
●
●
●
●
●
●
●
●●
●
●
●●●
●
●
●
●●
●
●
●
●
●
●
●
●
●●●
●
●
●
●
●
●
●●●●
●
●
●
●●
●
●
●
●●
●
●
●
●
●●
●● ●
●
●
●
●
●
●
●
●
●
●●
●
●
●
●
●
●
●
●●●
●
●
●
●
●
●
●
●
●●
●
●
●●
●
●●
●
●
●
●●
●
●
●●
●
●
●
●
●
●
●
●
●
●●
●
●
●●
●
●
●
●
●
●
●●
●
●
●
●
●
●
●
●●
●●
●
●
●
●
●
●
●
●
●
●
●
●
●
●
●
●
● ●●●●
●
●
●
●
●
●
●
●
●
●●
●
●●
●
●
●
●
●
●
●
●
●
●
●
●●
●
●
●
●
●
●K ≈ 10K ≈ 104
***
* **
*
**
** * **
**
*
*
*
*
*
***
*
*
*
***
** **
*
**
*
**
**
*
****
*
*
*
*
*
*
*
*
*
*
***
***
*
*
***
*
*
*
*
*
***
*
*
*
***
*
*
*
*
*
*
***
**
*
*
** **
*
*
***
* * ***
*
*
*
*
** **
*
*
*
*
* ** **
*
*
*
**
*
*
** **
*
*
*
*
*
*
*
** **
*
*
*
*
*
*
**
*
*
** *** ** * **
*
*
*
*
**
*
*
*
**
**
*
*
*
*
*
*
*
*
*
*
* *
**
*
*
**
*
*
*
** *****
* **** *
* *
0.0 0.2 0.4 0.6 0.8 1.0
0.0
0.2
0.4
0.6
0.8
1.0
Generated
S
M
●●
●
● ●●
●
●
●
●● ●
●●
●●
●
●
●
●
●
●●●
●
●
●
●
●●
●
● ●●
●
●
●
●
●●
●●
●
●●●●
●
●
●
●
●
●
●
●
●
●
●●
●
●
●●
●
●
●●●
●
●
●
●
●
●●●
●
●
●
●●●
●
●
●
●
●
●
●●
●● ●
●
●
●● ●●
●
●
●●
●
● ● ●●
●
●
●
●
●
●● ●●
●
●
●
●
● ●● ●●
●
●
●
●●
●
●
●● ●●
●
●
●
●
●
●
●
●●
●●
●
●
●
●
●
●
●●
●
●
●● ●●● ●●● ●
●
●
●
●
●
●
●
●
●
●
●
●
●●
●
●
●
●
●
●
●
●
●
●
● ●
●●
●
●
●●
●
●
●
●● ●●●●
●● ●●●
●●
●●
●
●K ≈ 10K ≈ 104
Figure 2: Relation between Statement Coverage and Mutation Kills. The circle represents the magnitude of project size.
The symbols used to indicate various metrics collectedare given in Table 1. The use of S̃ for block coverage ismotivated by the observation that block coverage is a kind ofweighted statement coverage; given source code and a CFG,block coverage can be computed given statement coveragedetails and vice-versa.
Since the coverage and mutation process resulted in arather drastic reduction in sample space, we compared thedistributions for code size and complexity before and afterselection to verify that our procedure did not inordinatelyskew the sample space in at least these dimensions. The sizedistribution histograms for both before and after selectionis provided in Figure 1.
Another important dimension in which a bias could ap-pear is the complexity of programs; perhaps rejection ismuch more common with more complex or simpler pro-grams, which could bias results, since coverage metrics areintimately tied to code complexity (for very simple pro-grams, e.g., statement and path coverage are quite similar).We measured McCabe cyclomatic complexity [26] which pro-vides a measurement of program complexity by counting thenumber of linearly independent execution paths through aprogram. The distributions before and after selections aregiven in Figure 1. These graphs suggest that selection didnot unduly bias the sample in these two key dimensions.
To account for effects of nondeterminism, we ran eachcoverage measurement 10 times, and computed the average.We also made use of multiple tools, as noted above, to ver-ify that the coverage reported was accurate — e.g., Emma,Cobertura, CodeCover and JMockit all give statement cov-erage. Further, Cobertura and CodeCover provided branchcoverage, and JMockit provided path coverage. Thus, wecould compare most coverages provided by most tools andensure they had high correlation to other tools. Further, wecould ensure that the tools were processing all classes andtest cases by examining statement coverage results. Thiswas important because early on, we found that JMockit wasnot including classes that were not covered by any tests in
its calculation of coverage1. Further, we have also removed afew observations (11 in original suites, 14 in Randoop suites)where the statement coverage reported by other tools waszero, and mutation or path coverage was non-zero, as theseindicate some incorrect value from some tool. Our dataset,which includes metrics for all projects before elimination ofoutliers, is available for perusal in Dataverse [17].
4. ANALYSISThe purpose of our analysis is to determine which coverage
criteria that are likely to be used by real-world developersbest predict mutation kill ratios. Our analysis also considersproject and test suite size and cyclomatic complexity to de-termine if these factors affect the utility of coverage criteria.
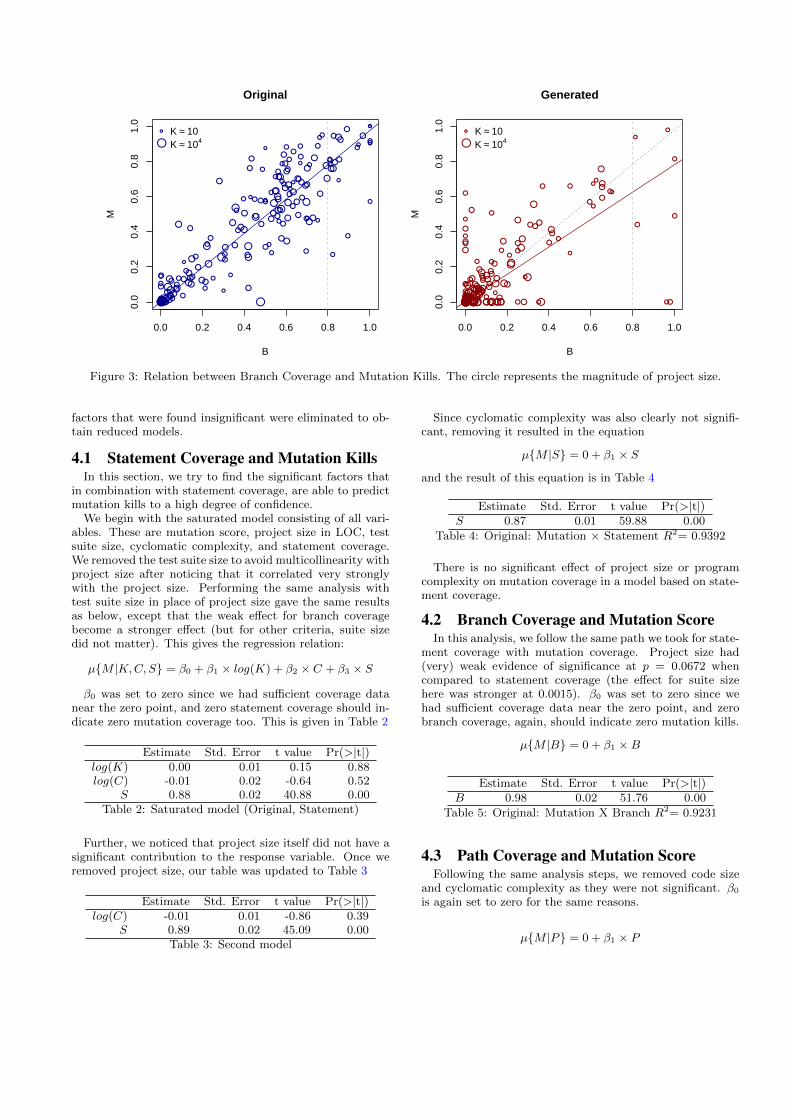
The scatter-plots for mutation kills and statement cov-erage for both original test suites and Randoop-generatedtest suites are shown in Figure 2. It contains 232 pairs fororiginal test suites, and 217 pairs for generated test suites.Similarly, the scatter-plots for mutation kills and branchcoverage for both original test suites and generated suitesis given in Figure 3, with 223 pairs for original test suites,and 191 pairs for generated test suites. The scatter-plotsfor path coverage in Figure 4 contain 214 pairs for originaltest suites, and 183 pairs for generated test suites. Finally,the scatter plots between block coverage and mutation killsare given in Figure 5. The diameter of the circles in allscatter plots correspond to the magnitudes of the projectsizes (log(K)). The central result of these experiments isgenerally visible in these plots: statement coverage appearsto give the best prediction of mutation kills of all criteriadevelopers are likely to use, and this holds for both originaland generated test suites.
We use regression analysis and significance testing to as-certain the contribution of different factors to test suite ef-fectiveness. The correlation coefficient R2 indicates the ef-fectiveness of a model, i.e how much of the variation foundin data is explainable by the parameters of the model. The
1http://code.google.com/p/jmockit/issues/detail?id=305
*
*
*
*
* *
*
*
*
**
*
*
*
*
*
*
*
*
*
*
*
**
*
*
*
*
*
*
*
*
**
**
*
*
*
*
*
*
*
**
*
*
***
*
*
*
**
*
*
**
*
*
*
*
***
*
*
*
**
*
****
*
*
*
**
*
*
*
**
**
*
*
**
** *
*
*
**
*
*
*
*
*
**
*
*
*
*
**
*
***
*
*
*
*
*
*
*
*
**
*
***
*
* *
*
*
*
**
*
*
**
*
*
*
*
**
*
*
*
**
*
*
**
*
*
*
**
*
**
*
*
*
*
*
*
* *
**
*
*
*
*
*
*
*
*
*
*
*
**
*
* ***
*
*
*
*
*
*
*
*
* **
**
*
*
*
*
*
*
*
*
*
*
*
* *
**
*
*
0.0 0.2 0.4 0.6 0.8 1.0
0.0
0.2
0.4
0.6
0.8
1.0
Original
B
M
●
●
●
●
● ●
●
●
●
●●
●
●
●
●
●
●
●
●
●
●
●
●●
●
●
●
●
●
●
●
●
●●
●●
●
●
●
●
●
●
●
●●
●
●
●●●
●
●
●
●●
●
●
●
●
●
●
●
●
●●●
●
●
●
●
●
●
●●●●
●
●
●
●●
●
●
●
●●
●
●
●
●
●●
●● ●
●
●
●
●
●
●
●
●
●
●●
●
●
●
●
●
●
●
●●●
●
●
●
●
●
●
●
●
●●
●
●
●●
●
●●
●
●
●
●●
●
●
●●
●
●
●
●
●
●
●
●
●
●●
●
●
●●
●
●
●
●
●
●
●●
●
●
●
●
●
●
●●
●●
●
●
●
●
●
●
●
●
●
●
●
●
●
●
● ●●●
●
●
●
●
●
●
●
●
●●
●
●●
●
●
●
●
●
●
●
●
●
●
●
●●
●
●
●
●
●
●K ≈ 10K ≈ 104
***
* **
**
** * *
**
*
****
*
*
*
***
****
*
**
*
***
*
****
*
*
*
*
*
*
*
*
*
***
**
*
*
**
*
*
*
*
****
*
* **
*
*
*
**
***
*
*
**
*
*
***
* * ***
*
*
*
*
** **
*
*
*
*
**** *
**
***
*
****
*
*
*
*
*
***
*
*
*
*
*
*
**
*
*
** *** *** **
*
*
*
*
*
*
*
**
*
*
*
*
*
*
*
*
*
*
*
**
*
*
**
*
*
*
******
* *****
**
0.0 0.2 0.4 0.6 0.8 1.0
0.0
0.2
0.4
0.6
0.8
1.0
Generated
B
M
●●
●
● ●●
●
●
●● ●
●
●●
●
●●●●
●
●
●
●
●●
●
●●●
●
●
●
●
●●●
●
●●●●
●
●
●
●
●
●
●
●
●
●●
●●
●
●
●
●●
●
●
●
●
●●●
●
●
● ●●
●
●
●
●●
●●
●●
●
●●
●
●
●●
●
●● ●●
●
●
●
●
●
●● ●●
●
●
●
●
●●●● ●
●●
●●●
●
●●●●
●
●
●
●
●
●●●
●
●
●
●
●
●
●●
●
●
●● ●●● ●●● ●
●
●
●
●
●
●
●
●
●●
●
●
●
●
●
●
●
●
●
●
●
●●
●
●
●●
●
●
●
●●●●●
●● ●●●
●●
●●
●
●K ≈ 10K ≈ 104
Figure 3: Relation between Branch Coverage and Mutation Kills. The circle represents the magnitude of project size.
factors that were found insignificant were eliminated to ob-tain reduced models.
4.1 Statement Coverage and Mutation KillsIn this section, we try to find the significant factors that
in combination with statement coverage, are able to predictmutation kills to a high degree of confidence.
We begin with the saturated model consisting of all vari-ables. These are mutation score, project size in LOC, testsuite size, cyclomatic complexity, and statement coverage.We removed the test suite size to avoid multicollinearity withproject size after noticing that it correlated very stronglywith the project size. Performing the same analysis withtest suite size in place of project size gave the same resultsas below, except that the weak effect for branch coveragebecome a stronger effect (but for other criteria, suite sizedid not matter). This gives the regression relation:
µ{M |K,C, S} = β0 + β1 × log(K) + β2 × C + β3 × S
β0 was set to zero since we had sufficient coverage datanear the zero point, and zero statement coverage should in-dicate zero mutation coverage too. This is given in Table 2
Estimate Std. Error t value Pr(>|t|)log(K) 0.00 0.01 0.15 0.88log(C) -0.01 0.02 -0.64 0.52
S 0.88 0.02 40.88 0.00Table 2: Saturated model (Original, Statement)
Further, we noticed that project size itself did not have asignificant contribution to the response variable. Once weremoved project size, our table was updated to Table 3
Estimate Std. Error t value Pr(>|t|)log(C) -0.01 0.01 -0.86 0.39
S 0.89 0.02 45.09 0.00Table 3: Second model
Since cyclomatic complexity was also clearly not signifi-cant, removing it resulted in the equation
µ{M |S} = 0 + β1 × S
and the result of this equation is in Table 4
Estimate Std. Error t value Pr(>|t|)S 0.87 0.01 59.88 0.00
Table 4: Original: Mutation × Statement R2= 0.9392
There is no significant effect of project size or programcomplexity on mutation coverage in a model based on state-ment coverage.
4.2 Branch Coverage and Mutation ScoreIn this analysis, we follow the same path we took for state-
ment coverage with mutation coverage. Project size had(very) weak evidence of significance at p = 0.0672 whencompared to statement coverage (the effect for suite sizehere was stronger at 0.0015). β0 was set to zero since wehad sufficient coverage data near the zero point, and zerobranch coverage, again, should indicate zero mutation kills.
µ{M |B} = 0 + β1 ×B
Estimate Std. Error t value Pr(>|t|)B 0.98 0.02 51.76 0.00
Table 5: Original: Mutation X Branch R2= 0.9231
4.3 Path Coverage and Mutation ScoreFollowing the same analysis steps, we removed code size
and cyclomatic complexity as they were not significant. β0is again set to zero for the same reasons.
µ{M |P} = 0 + β1 × P

*
*
*
**
*
*
*
* *
*
*
*
*
*
*
*
*
*
*
*
**
*
*
*
*
*
**
**
**
*
*
*
*
*
*
*
**
*
*
***
*
*
*
**
*
*
**
*
*
*
*
***
*
* **
*
****
*
*
*
**
*
*
*
**
**
*
*
*
*
*
*
**
*
*
*
*
*
**
*
*
*
**
*
***
*
*
*
*
*
*
*
*
* *
*
** *
*
* *
*
*
**
*
*
**
*
*
*
*
**
*
*
*
**
*
*
**
*
*
*
*
**
*
*
*
*
*
*
* *
***
*
*
*
*
*
*
*
*
*
*
*
*
*
*
** ***
*
*
*
*
*
*
*
*
** *
**
*
*
*
*
*
*
*
*
*
*
*
**
*
*
*
0.0 0.2 0.4 0.6 0.8 1.0
0.0
0.2
0.4
0.6
0.8
1.0
Original
P
M
●
●
●
●●
●
●
●
● ●
●
●
●
●
●
●
●
●
●
●
●
●●
●
●
●
●
●
●●
●●
●●
●
●
●
●
●
●
●
●●
●
●
●●●
●
●
●
●●
●
●
●
●
●
●
●
●
●●●
●
●●
●
●
●●●●
●
●
●
●●
●
●
●
●●
●
●
●
●
●
●
●
●
●
●
●
●
●
●
●
●●
●
●
●
●
●
●
●●●
●
●
●
●
●
●
●
●
● ●
●
●
●●
●
●●
●
●
●●
●
●
●●
●
●
●
●
●
●
●
●
●
●●
●
●
●●
●
●
●
●
●●
●
●
●
●
●
●
●●
●●●
●
●
●
●
●
●
●
●
●
●
●
●
●
●
●● ●●●
●
●
●
●
●
●
●
●
●●
●
●●
●
●
●
●
●
●
●
●
●
●
●
●●
●
●
●
●
●K ≈ 10K ≈ 104
**
* **
**
** * *
*
*
*
*
*
***
*
***
** **
*
*
*
**
*
*
***
*
*
*
*
*
*
*
*
*
***
**
*
*
* *
*
*
*
*
*
**
****
*
*
*
*
***
*
*
** *
*
*
***
* * ***
*
*
*
* **
*
*
*
*
*** **
*
*
*
**
*
*
** **
*
*
*
*
*
*
*
***
*
*
*
*
*
*
***
* *** ***
*
*
*
*
**
*
*
*** *
*
*
*
*
*
*
*
*
*
*
*
**
*
*
***
*
* * ****
*****
*
0.0 0.2 0.4 0.6 0.8 1.0
0.0
0.2
0.4
0.6
0.8
1.0
Generated
P
M
●
●
● ●●
●
●
●● ●
●
●
●
●
●
●
●●●
●
●
●●
●
● ●●
●
●
●
●●
●
●
●●●
●
●
●
●
●
●
●
●
●
●●
●●
●
●
●
● ●
●
●
●
●
●
●●
●
●●●
●
●
●
●
●●
●●
●
●● ●
●
●
●●
●
● ● ●●●
●
●
●
● ●●
●
●
●
●
●●● ●●
●
●
●
●●
●
●
●● ●●
●
●
●
●
●
●
●
●●
●
●
●
●
●
●
●
●●●
● ●●●●●
●
●
●
●
●
●
●
●
●
●●
● ●
●
●
●
●
●
●
●
●
●
●
●
●●
●
●
●●●
●
● ● ●●●
●●●●
●●●
●
●K ≈ 10K ≈ 104
Figure 4: Relation between Path Coverage and Mutation Kills. The circle represents the magnitude of project size.
Estimate Std. Error t value Pr(>|t|)P 1.27 0.05 25.33 0.00
Table 6: Original: Mutation X Path R2= 0.7496
4.4 Comparing the CriteriaAfter determining that project size, suite size, and cyclo-
matic complexity were essentially ignorable for our purposes,we turned to comparing correlation statistics for all criteria,for both original and Randoop-generated tests. In keepingwith the most recent and extensive studies [16] we reportboth R2 and Kendall τβ correlations. R2 in our context isthe most useful correlation measure, since ideally developerswould like to predict the actual mutation killing effectivenessof a test suite. Kendall τβ is a rank-correlation statistic thatis non-parametric, and therefore should be reliable even ifunderlying relationships are not linear — in our context, itroughly answers the question: given that the ranking be-tween two coverage criteria for suites for projects is suchthat C(X) > C(Y), what is the chance that the ranking ofmutation kills is in agreement with this ranking?
The results from computing R2adj and τβ for each of the
coverage metrics with mutation coverage are given in Ta-ble 7. (O) indicates values for original test suites, and (R)indicates Randoop-generated suites.
R2(O) τβ(O) R2(R) τβ(R)M × S 0.94 0.82 0.72 0.54
M × S̃ 0.93 0.74 0.69 0.48M ×B 0.92 0.77 0.65 0.52M × P 0.75 0.67 0.62 0.49
Table 7: Correlation coefficients (Mutation), p < 0.001
The results are clear: across both original and generatedsuites, statement coverage almost always has the best corre-lation for both R2 and τβ . For predicting mutation kills fortest suites included with projects, branch, statement, andblock coverage all provide a satisfactory method; predic-tions for Randoop-generated suites are more difficult, but
statement coverage still performs relatively well, with suf-ficient power to be useful in practice. Path coverage per-forms poorly on project suites, but was the best method forrandomly generated suites, a surprising result; however, itsimprovement over statement coverage was relatively small,and it does not seem to be nearly as reliable for manuallyproduced suites.
5. WHY STATEMENT COVERAGE?Some previous research (e.g., as recently as 2013 [16]) sug-
gests the use of branch coverage as the best method for pre-dicting suite quality. However, this study was conductedon a small set of programs, a majority of which were algo-rithms and data-structure implementations, and based oncomparing suites for the same SUT rather than predictingthe quality of testing for each SUT in isolation. Moreover,all previous studies tend to include somewhat artificial suitesproduced by testing researchers, rather than focusing on realdeveloper-produced test suites for a large variety of projects.
That statement coverage performs so well in fact agreeswith the conclusion of Gligoric et al. [16] that “for non-adequate suites, criteria that are stronger (in terms of sub-sumption for adequate suites) do not necessarily have betterability to predict mutation scores.” The superiority of state-ment to branch coverage, however, requires some furtherexamination. Figure 8 shows a simple portion of a CFGthat may explain this result. A test suite that covers eitherof branches A or B would result in branch coverage of 50%.However, there are more mutations of branch B than branchA, and (under the assumptions that guide mutation testing)more chances for coding errors.
Modeling the potential impact of the fact that of the pop-ular coverages only statement coverage takes into accountthe size of a code block predicts the observed results. As-sume there are n lines of code in a SUT, and let µ(Si) be themutability (number of mutants) of the ith statement. Forthe SUT there are then
∑ni=1 µ(Si) mutants. This linear re-
lationship is also suggested by our data which shows a high

*
*
*
* *
*
*
**
*
*
*
*
*
*
*
*
*
*
*
*
*
*
*
*
*
*
*
*
*
*
*
*
*
*
*
*
*
*
*
*
*
*
*
*
*
*
*
*
*
*
**
*
*
*
*
*
*
*
*
*
**
**
*
*
**
** *
*
*
**
*
*
*
**
*
*
*
**
*
*
*
*
*
*
*
*
*
*
*
***
*
* *
*
*
**
*
*
*
*
*
*
*
**
*
*
*
*
**
*
*
*
**
*
**
*
*
*
*
*
*
**
*
*
*
*
*
*
*
*
*
*
*
*
*
*
*
**
*
*
*
*
*
*
*
*
** *
*
*
*
*
*
*
*
*
*
* *
* *
0.0 0.2 0.4 0.6 0.8 1.0
0.0
0.2
0.4
0.6
0.8
1.0
Original
S~
M
●
●
●
●●
●
●
●●
●
●
●
●
●
●
●
●
●
●
●
●
●
●
●
●
●
●
●
●
●
●
●
●
●
●
●
●
●
●
●
●
●
●
●
●
●
●
●
●
●
●
●
●
●
●
●
●
●
●
●
●
●
●●
●
●
●
●
●●
●● ●
●
●
●
●
●
●
●
●
●
●
●
●
●
●
●
●
●
●
●
●
●
●
●
●
●
●
●●
●
●●
●
●
●●
●
●
●
●
●
●
●
●
●
●
●
●
●
●●
●
●
●
●
●
●
●●
●
●
●
●
●
●
●●
●
●
●
●
●
●
●
●
●
●
●
●
●
●
●
●●
●
●
●
●
●
●
●
●
●●
●
●
●
●
●
●
●
●
●
●
●●
● ●
●
●K ≈ 10K ≈ 104
***
* **
*
*** * **
**
*
*
*
*
***
*
*
*
**
** **
*
**
*
**
**
*
****
*
*
*
*
*
*
*
*
*
*
**
** *
***
*
*
*
*
*
***
*
*
*
***
*
*
*
*
*
*
**
**
*
*
* **
*
*
***
* ***
*
*
*
*
** **
*
*
*
*
*** *
*
*
*
**
*
*
* *
*
*
*
*
*
*
** **
*
*
*
*
*
*
**
*
** *****
*
*
*
*
**
*
*
**
**
*
*
*
*
*
*
*
*
*
*
* *
**
*
*
**
**
* * ******* *
* *
0.0 0.2 0.4 0.6 0.8 1.0
0.0
0.2
0.4
0.6
0.8
1.0
Generated
S~
M
●●
●
● ●●
●
●
●● ●
●●
●●
●
●
●
●
●●●
●
●
●
●
●
●
● ●●
●
●
●
●
●●
●●
●
●●●●
●
●
●
●
●
●
●
●
●
●
●●
●
●●
●●●
●
●
●
●
●
●●●
●
●
●
●●●
●
●
●
●
●
●
●●
●●
●
●
●●●
●
●
●●
●
● ●●
●
●
●
●
●
●● ●●
●
●
●
●
●●● ●
●
●
●
●●
●
●
● ●
●
●
●
●
●
●
●●
●●
●
●
●
●
●
●
●●
●
●● ●●●● ●
●
●
●
●
●
●
●
●
●
●
●●
●
●
●
●
●
●
●
●
●
●
● ●
●●
●
●
●●
●●
● ● ●●●
●●●●
●
●●
●
●K ≈ 10K ≈ 104
Figure 5: Relation between Block Coverage and Mutation Kills. The circle represents the magnitude of project size.
BA
x<y?x = x + 1
y = y + 1y = y + 1
z = z + 1
Figure 8: Unbalanced branching
correlation – R2 = 0.96 between number of statements andnumber of mutants produced. If we assume that a mutationis detected every time a test suite covers the statement , andwe have a constant mutability k, then we can see that of then× k mutants produced, n× c× k would be detected by atest suite with c as statement coverage ratio. Under idealconditions, mutation kills and statement coverage share asimple relationship.
This formulation also suggests that branch coverage alonecould not be as closely correlated with mutation kills asstatement coverage unless a model includes some way to in-corporate the difference in mutability of program segments,or the assumption that coverage usually results in detectionis very far from reality, and branch execution is a major fac-tor in actual detection ratios for most mutants. For the firstpossibility we draw the readers attention to the fact thatthere was a weak project size effect and fairly strong suitesize effect when we considered branch coverage models.
This also suggests that if we consider basic block cover-age, which is basically statement coverage without mutabil-ity information, the correlation should also be lower thanthe coverage reported by ordinary statement coverage. This
is again borne out by the lower values of R2 and τβ for blockcoverage (M ×B) in Table 7. Why, though, is block cover-age sometimes better correlated than branch coverage, whenboth criteria ignore mutability of code segments? Branchcoverage can “compensate” for missing a block (which al-ways contains at least one mutable statement) by taking abranch that contains no mutable code. In fact, ”missing else”detection is what distinguishes block and branch coverage.
5.1 Statement Coverage and Path CoverageOne result undercutting this simple explanation for the su-
periority of statement coverage, however, is that statementcoverage also better predicts path coverage than branch cov-erage.
Table 8 shows correlations between path coverage, andstatement, branch, and block coverage. Scatter plots ofstatement coverage and branch coverage against path cov-erage are provided in Figure 6 and Figure 7.
These support the conclusion that statement coverage isbetter than branch for this purpose also (the winner betweenblock and statement coverage is less obvious, since blockcoverage performs better for generated suites).
R2(O) τβ(O) R2(R) τβ(R)P × S 0.81 0.68 0.84 0.65
P × S̃ 0.80 0.59 0.87 0.67P ×B 0.80 0.65 0.59 0.45
Table 8: Correlation coefficients (Path), p < 0.001
We do not have any explanation for this effect at thistime, since path coverage, like branch and block coverage,ignores the size of code blocks. It is possible that executingmore statements leads to producing more unusual executionstates, which results in more covered paths, but this is hardto model or investigate.
5.2 Correlation at High Coverage LevelsAn additional interesting question to consider is whether
the superiority of statement coverage for our purposes is an
*
* *
* **
*
*
*
**
*
*
**
*
*
*
**
*
*
** *
**
*
**
*
*
*
*
**
*
*
*
*
*
*
****
*
**
*
*
*
*
**
*
*
*
**
*
*
*
*
*
*
**
*
*
*
*
*
* *
*
*
**
*
*
*
*
***
**
*
*
**
*
*
** *
**
*
* *
*
*
*
*
*
*
*
*
*
*
**
*
*
*
**
*
*
*
*
*
*
*
*
*
*
*
**
*
*
*
* *
*
*
*
*
*
* **
*
*
*
*
***
**
*
**
***
* *
**
*
*
*
*
*
*
*
*
*
**
**
*
**
** *
* ** *
*
**
*
**
**
* *
** *
*
*
**
*
*
*
*
*
*
**
*
*
* *
**
*
*
*
*
*
**
*
*
*
**
*
*
*
*
*
*
*
*
*
*
**
*
**
*
* *
*
*
*
*
*
*
*
*
*
**
*
*
*
*
*
*
**
*
*
*
* **
**
*
*
*
*
**
*
*
*
*
**
*
*
*
*
*
**
**
** *
** *
*
*
*
*
*
*
*
*
*
*
*
*
*
*
*
**
0.0 0.2 0.4 0.6 0.8 1.0
0.0
0.2
0.4
0.6
0.8
1.0
Original
S
P
●
● ●
●●
●
●
●
●
●
●
●
●
●
●
●
●
●
●
●
●
●
●
●●
●●
●
●
●
●
●
●
●
●
●
●
●
●
●
●
●
●●
●●
●
●●
●
●
●
●
●
●
●
●
●
●●
●
●
●
●
●
●
●●
●
●
●
●
●
●●
●
●
●
●
●
●
●
●
●●●
●
●
●
●
●●
●
●
●●●
●●
●
● ●
●
●
●
●
●
●
●
●
●
●
●
●
●
●
●
●●
●
●
●
●
●
●
●
●
●
●
●
●
●
●
●
●
●●
●
●
●
●
●
●●
●
●
●
●
●
●
●
●
●●
●
●
●
●●●
● ●
●●
●
●
●
●
●
●
●
●
●
●●
●●
●
●
●
●●●
●●
●●
●
●
●
●
●●
●
●
●●
●● ●
●
●
●●
●
●
●
●
●
●
●
●
●
●
● ●
●●
●
●
●
●
●
●●
●
●
●
●
●
●
●
●
●
●
●
●
●
●
●
●●
●
●●
●
●●
●
●
●
●
●
●
●
●
●
●●
●
●
●
●
●
●
●
●
●
●
●
● ●
●
●
●
●
●
●
●
●
●●
●
●
●
●●
●
●
●
●
●
●
●
●●
●
●●
●
● ●
●
●
●
●
●
●
●
●
●
●
●
●
●
●
●
●
●
●
●K ≈ 10K ≈ 104
*
**
*
*
*
*
*
*
** *
*
*
**
*
*
**
*
*
*
*
*
**
*
**
*
*
***
**
*
*
*
*
*
*
*
**
**
*
*
*
*
*
*
*
*
*
*
*
*
**
*
*
** *
*
**
**
*
*
*
*
*
*
*
**
*
*
*
* *
*
*
*
*
*
*
*
*
*
***
*
* ***
*
*
*
*
*
*
*
*
*
*
*
*
*
*
*
**
*
*
*
*
**
*
*
*
*
*
***
*
**
*
*
*
*
* **
*
*
*
*
*
*
**
***
*
*
*
**
*
**
*
**
**
**
*
*
*
*
**
*
*
*
*
*
*
**
*
*
*
*
*
*
*
*
*
*
*
*
*
**
*
**
*
*
*
**
*
*
*
**
*
*
*
*
*
* *
*
**
*
* **
**
*
*
*
*
*
*
*
*
*
* *
**
*
*
*
*
*
* *
*
*
*
*
*
*
*
*
*
*
*
*
**
*
*
*
*
*
*
**
*
*
*
**
*
*
***
**
*
**
0.0 0.2 0.4 0.6 0.8 1.0
0.0
0.2
0.4
0.6
0.8
1.0
Generated
S
P
●
●
●
●
●
●
●
●
●
●
●●
●
●
●●
●
●
●
●
●
●
●
●
●
●
●
●
●●
●
●
●●●
●
●
●
●
●
●
●
●
●
●●
●●
●
●
●
●
●
●
●
●
●
●
●
●
●●
●
●
●●
●
●
●
●
●●
●
●
●
●
●
●
●
●
●
●
●
●
●●
●
●
●
●
●
●
●
●
●
●●●
●
● ●●●
●
●
●
●
●
●
●
●
●
●
●
●
●
●
●
●●
●
●
●
●
●●
●
●
●
●
●
●●●
●
●●
●
●
●
●
● ●●
●
●
●
●
●
●
●
●
●●●
●
●
●
●●
●
●
●
●
●●
●●
●
●
●
●
●
●
●
●
●
●
●
●
●
●
●●
●
●
●
●
●
●
●
●
●
●
●
●
●
●
●
●
●●
●
●
●
●
●
●
●
●
●
●
●
●
●
●
●
●●
●
●●
●
● ●●
●
●
●
●
●
●
●
●
●
●
●
● ●
●
●
●
●
●
●
●
● ●
●
●
●
●
●
●
●
●
●
●
●
●
●
●
●
●
●
●
●
●
●●
●
●
●
●
●
●
●
●●
●
●●
●
●●
●
●K ≈ 10K ≈ 104
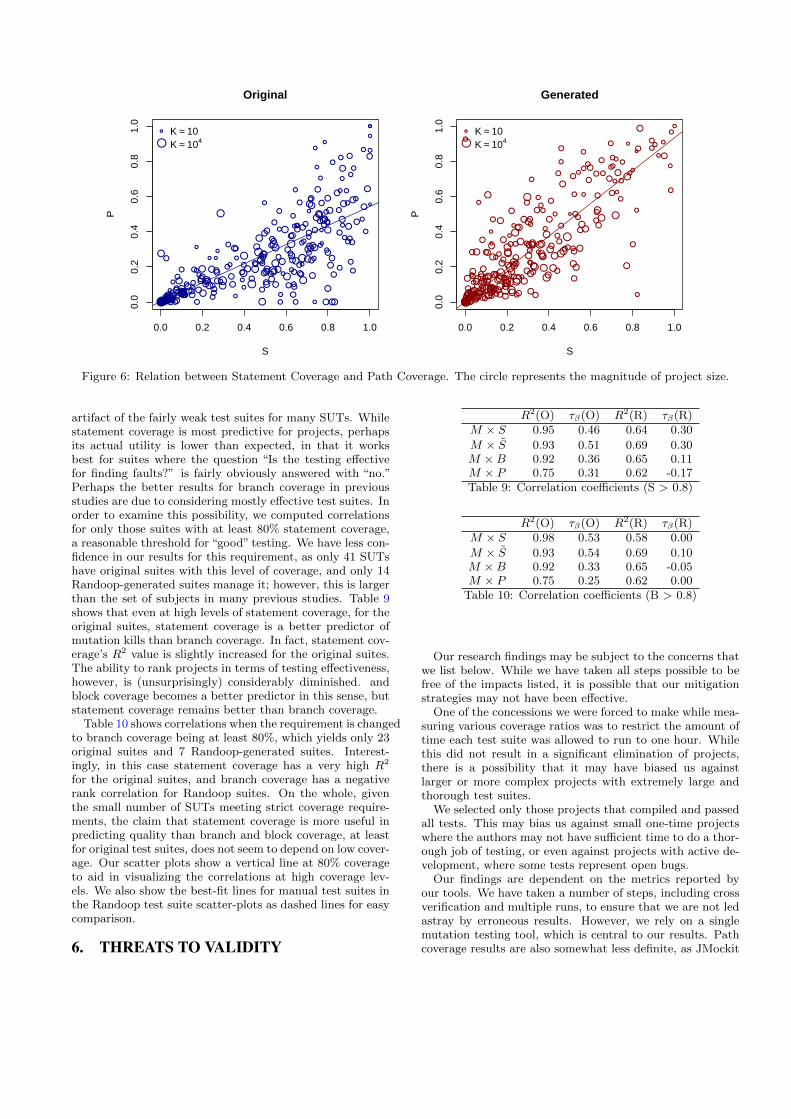
Figure 6: Relation between Statement Coverage and Path Coverage. The circle represents the magnitude of project size.
artifact of the fairly weak test suites for many SUTs. Whilestatement coverage is most predictive for projects, perhapsits actual utility is lower than expected, in that it worksbest for suites where the question “Is the testing effectivefor finding faults?” is fairly obviously answered with “no.”Perhaps the better results for branch coverage in previousstudies are due to considering mostly effective test suites. Inorder to examine this possibility, we computed correlationsfor only those suites with at least 80% statement coverage,a reasonable threshold for “good” testing. We have less con-fidence in our results for this requirement, as only 41 SUTshave original suites with this level of coverage, and only 14Randoop-generated suites manage it; however, this is largerthan the set of subjects in many previous studies. Table 9shows that even at high levels of statement coverage, for theoriginal suites, statement coverage is a better predictor ofmutation kills than branch coverage. In fact, statement cov-erage’s R2 value is slightly increased for the original suites.The ability to rank projects in terms of testing effectiveness,however, is (unsurprisingly) considerably diminished. andblock coverage becomes a better predictor in this sense, butstatement coverage remains better than branch coverage.
Table 10 shows correlations when the requirement is changedto branch coverage being at least 80%, which yields only 23original suites and 7 Randoop-generated suites. Interest-ingly, in this case statement coverage has a very high R2
for the original suites, and branch coverage has a negativerank correlation for Randoop suites. On the whole, giventhe small number of SUTs meeting strict coverage require-ments, the claim that statement coverage is more useful inpredicting quality than branch and block coverage, at leastfor original test suites, does not seem to depend on low cover-age. Our scatter plots show a vertical line at 80% coverageto aid in visualizing the correlations at high coverage lev-els. We also show the best-fit lines for manual test suites inthe Randoop test suite scatter-plots as dashed lines for easycomparison.
6. THREATS TO VALIDITY
R2(O) τβ(O) R2(R) τβ(R)M × S 0.95 0.46 0.64 0.30
M × S̃ 0.93 0.51 0.69 0.30M ×B 0.92 0.36 0.65 0.11M × P 0.75 0.31 0.62 -0.17Table 9: Correlation coefficients (S > 0.8)
R2(O) τβ(O) R2(R) τβ(R)M × S 0.98 0.53 0.58 0.00
M × S̃ 0.93 0.54 0.69 0.10M ×B 0.92 0.33 0.65 -0.05M × P 0.75 0.25 0.62 0.00
Table 10: Correlation coefficients (B > 0.8)
Our research findings may be subject to the concerns thatwe list below. While we have taken all steps possible to befree of the impacts listed, it is possible that our mitigationstrategies may not have been effective.
One of the concessions we were forced to make while mea-suring various coverage ratios was to restrict the amount oftime each test suite was allowed to run to one hour. Whilethis did not result in a significant elimination of projects,there is a possibility that it may have biased us againstlarger or more complex projects with extremely large andthorough test suites.
We selected only those projects that compiled and passedall tests. This may bias us against small one-time projectswhere the authors may not have sufficient time to do a thor-ough job of testing, or even against projects with active de-velopment, where some tests represent open bugs.
Our findings are dependent on the metrics reported byour tools. We have taken a number of steps, including crossverification and multiple runs, to ensure that we are not ledastray by erroneous results. However, we rely on a singlemutation testing tool, which is central to our results. Pathcoverage results are also somewhat less definite, as JMockit

*
* *
* **
*
*
*
**
*
*
**
*
*
*
**
*
**
**
*
**
*
*
*
*
**
*
*
*
*
*
*** *
*
**
*
*
*
*
**
*
*
*
**
*
*
*
*
*
*
**
*
*
*
*
*
* *
*
*
**
*
*
*
*
***
**
*
*
**
*
*
***
**
*
* *
*
*
*
*
*
*
*
*
*
*
**
*
*
*
**
*
*
*
*
*
*
*
*
*
*
*
**
*
*
*
**
*
*
*
*
*
* **
*
*
*
*
**
*
**
*
**
***
* *
**
*
*
*
*
*
*
*
*
*
**
**
*
**
** *
* ** *
*
**
*
**
**
* *
** *
*
*
**
*
*
*
*
*
*
**
*
*
* *
**
*
*
*
*
*
**
*
*
*
**
*
*
*
*
*
*
*
*
*
**
*
**
*
* *
*
*
*
*
*
*
*
*
*
**
*
*
*
*
*
**
*
*
*
* ***
*
*
*
*
**
*
**
**
*
*
*
*
*
**
**
***
** *
*
*
*
*
*
*
*
*
*
*
*
*
*
*
*
**
0.0 0.2 0.4 0.6 0.8 1.0
0.0
0.2
0.4
0.6
0.8
1.0
Original
B
P
●
● ●
●●
●
●
●
●
●
●
●
●
●
●
●
●
●
●
●
●
●●
●●
●
●
●
●
●
●
●
●
●
●
●
●
●
●
●●
● ●
●
●●
●
●
●
●
●
●
●
●
●
●●
●
●
●
●
●
●
●●
●
●
●
●
●
●●
●
●
●
●
●
●
●
●
●●●
●
●
●
●
●●
●
●
●●●
●●
●
● ●
●
●
●
●
●
●
●
●
●
●
●
●
●
●
●
●●
●
●
●
●
●
●
●
●
●
●
●
●
●
●
●
●
●●
●
●
●
●
●
●●
●
●
●
●
●
●
●
●
●●
●
●
●
●●●
● ●
●●
●
●
●
●
●
●
●
●
●
●●
●●
●
●
●
●●●
●●
●●
●
●
●
●
●●
●
●
●●
●●●
●
●
●●
●
●
●
●
●
●
●
●
●
●
● ●
●●
●
●
●
●
●
●●
●
●
●
●
●
●
●
●
●
●
●
●
●
●
●●
●
●●
●
● ●
●
●
●
●
●
●
●
●
●
●●
●
●
●
●
●
●
●
●
●
●
● ●●
●
●
●
●
●
●
●●
●●
●●
●
●
●
●
●
●
●
●●
●
●●
●
● ●
●
●
●
●
●
●
●
●
●
●
●
●
●
●
●
●
●
●
●K ≈ 10K ≈ 104
*
**
*
*
*
*
*
*
***
*
*
**
*
*
*
*
*
*
*
**
*
**
*
*
***
**
*
*
*
*
*
*
*
**
**
*
*
*
*
*
*
*
*
*
*
*
*
**
*
*
** *
*
**
**
*
*
*
*
*
*
*
**
*
*
*
* *
*
*
**
*
*
*
*
***
*
* ** *
*
*
*
*
*
*
*
*
*
*
*
*
*
*
*
**
*
*
*
*
**
*
*
*
*
***
*
**
*
*
*
*
* ***
*
*
*
*
**
**
*
*
*
*
**
*
**
*
**
**
**
*
*
*
*
***
*
*
*
*
**
*
*
*
*
*
*
*
*
*
*
*
*
**
*
*
*
*
*
**
*
*
*
**
*
*
*
*
*
**
*
**
* **
**
*
*
*
*
*
**
*
**
**
*
*
*
*
*
*
*
*
*
*
*
*
*
*
*
*
**
*
*
*
*
*
*
**
*
*
*
**
*
*
***
**
*
**
0.0 0.2 0.4 0.6 0.8 1.0
0.0
0.2
0.4
0.6
0.8
1.0
Generated
B
P
●
●
●
●
●
●
●
●
●
●
●●
●
●
●●
●
●
●
●
●
●
●
●
●
●
●●
●
●
●●●
●
●
●
●
●
●
●
●
●
●●
●●
●
●
●
●
●
●
●
●
●
●
●
●
●●
●
●
●●
●
●
●
●
●●
●
●
●
●
●
●
●
●
●
●
●
●
●●
●
●
●●
●
●
●
●
●●●
●
● ●●
●
●
●
●
●
●
●
●
●
●
●
●
●
●
●
●
●●
●
●
●
●
●●
●
●
●
●
●●●
●
●●
●
●
●
●
● ●●●
●
●
●
●
●
●
●●
●
●
●
●
●●
●
●
●
●
●●
●●
●
●
●
●
●
●
●
●
●
●
●
●
●
●●
●
●
●
●
●
●
●
●
●
●
●
●
●
●
●
●
●
●
●
●
●
●
●
●
●
●
●
●
●
●
●
●●
●
●●
● ●●
●
●
●
●
●
●
●
●
●
●
●●
●
●
●
●
●
●
●
●
●
●
●
●
●
●
●
●
●
●
●
●
●
●
●
●
●
●
●●
●
●
●
●
●
●
●
●●
●
●●
●
●●●
●K ≈ 10K ≈ 104
Figure 7: Relation between Branch Coverage and Path Coverage. The circle represents the magnitude of project size.
is less mature than the other tools, and we do not have asecond path coverage tool to cross-validate results. However,hand examination of results on multiple simple examplesseems to indicate the path coverage reported is correct, andpath coverage is fairly trivial to produce, given the abilityto produce other coverages.
Finally, our findings are restricted to projects using theJava language, using the Maven framework, and standardproject layout. Further, the samples came from a singlerepository (Github), and are all open source projects. Whilenone of these factors are obviously confounding, they maylimit applicability of results in radically different settings,e.g. Haskell development or a commercial software projectwith an extremely large user base and a dedicated QA teamoperating independently of developers.
7. CONCLUSIONMutation testing is one of the best predictors of test suite
quality, in terms of ability to detect actual faults. However,it is also computationally expensive to run, complex to ap-ply, and is generally not used by real-world developers withany frequency. A long-term goal of the testing communityhas therefore been to develop alternative methods for pre-dicting suite quality, for software development purposes and(perhaps primarily) for use in evaluating competing testingtechniques. Unfortunately, the large body of previous stud-ies on this topic have largely considered only a small setof programs, selected opportunistically, sometimes focusedon coverage criteria used as rarely as mutation testing inreal-world projects, and often been constructed around thequestion of predicting the best among multiple suites for asingle SUT. In reality, software developers seldom have theluxury of applying esoteric coverage criteria or choosing be-tween competing test suites. Rather, given an existing testsuite, they want to estimate whether that suite is likely ef-fective at detecting faults, or if more testing effort may bejustified given the cost of faults.
This paper reports the correlation between lightweight,
nearly universally available coverage criteria (statement, block,branch, and path coverage) and mutation kills for hundredsof Java programs, for both the actual test suites includedwith those projects and suites generated by the Randooptesting tool. For both original and generated suites, state-ment coverage is the best predictor for mutation kills, and infact does a relatively good (R2 = 0.94 for original tests and0.72 for generated tests) job of predicting suite quality. SUTsize, code complexity, and suite size did not turn out to beimportant factors in our analysis. A simple model of muta-tion and mutation detection predicts the higher effectivenessof statement coverage, but does not explain why statementcoverage even predicts path coverage better than branchcoverage does, a highly counter-intuitive result. Moreover,while block coverage became more competitive at high state-ment coverage levels, statement coverage still appeared to bethe best method for evaluating high-coverage (80%+ state-ment coverage) suites, with an R2 of 0.98 for suites withbranch coverage ≥ 80%.
The lesson for software developers is somewhat comfort-ing: statement coverage is the most widely available andeasily interpreted coverage criteria, and is also probably thebest coverage criteria for predicting test suite quality in theircontext, over testing effort lifetime. The lesson for softwaretesting researchers is that the question of how coverage cor-relates to suite effectiveness likely has no single correct an-swer, but must be answered with careful attention to thecontext of application, and the selection of a proper popu-lation of subjects and suites to examine.
8. REFERENCES[1] P. Ammann and J. Offutt. Introduction to software
testing. Cambridge University Press, 2008.
[2] J. H. Andrews, L. C. Briand, and Y. Labiche. Ismutation an appropriate tool for testing experiments?In Proceedings of the 27th International Conference onSoftware Engineering, pages 402–411. IEEE, 2005.
[3] J. H. Andrews, L. C. Briand, Y. Labiche, and A. S.Namin. Using mutation analysis for assessing and

comparing testing coverage criteria. IEEETransactions on Software Engineering, 32(8):608–624,2006.
[4] Apache Software Foundation. Apache maven project.http://maven.apache.org.
[5] T. Ball. A theory of predicate-complete test coverageand generation, 2004. Technical report, MicrosoftResearch Technical Report MSR-TR-2004-28.
[6] T. Ball. A theory of predicate-complete test coverageand generation. In Formal Methods for Componentsand Objects, pages 1–22. Springer, 2005.
[7] T. A. Budd, R. J. Lipton, R. A. DeMillo, and F. G.Sayward. Mutation analysis. Yale University,Department of Computer Science, 1979.
[8] X. Cai and M. R. Lyu. The effect of code coverage onfault detection under different testing profiles. In ACMSIGSOFT Software Engineering Notes, volume 30,pages 1–7. ACM, 2005.
[9] J. J. Chilenski. An investigation of three forms of themodified condition decision coverage (MCDC)criterion. Technical report, DTIC Document, 2001.
[10] H. Coles. Pit mutation testing. http://pittest.org/.
[11] M. Doliner and Others. Cobertura - a code coverageutility for java.http://cobertura.github.io/cobertura.
[12] P. G. Frankl and S. N. Weiss. An experimentalcomparison of the effectiveness of branch testing anddata flow testing. IEEE Transactions on SoftwareEngineering, 19:774–787, 1993.
[13] P. G. Frankl, S. N. Weiss, and C. Hu. All-uses vsmutation testing: an experimental comparison ofeffectiveness. Journal of Systems and Software,38(3):235–253, 1997.
[14] GitHub Inc. Github languages.http://www.github.com/languages.
[15] GitHub Inc. Software repository.http://www.github.com.
[16] M. Gligoric, A. Groce, C. Zhang, R. Sharma, M. A.Alipour, and D. Marinov. Comparing non-adequatetest suites using coverage criteria. In ACMInternational Symposium on Software Testing andAnalysis. ACM, 2013.
[17] R. Gopinath. Replication data for: Code coverage forsuite evaluation by developers. Inhttp: // dx. doi. org/ 10. 7910/ DVN/ 24574 . HarvardDataverse Network V1, 2014-01.
[18] A. Gupta and P. Jalote. An approach forexperimentally evaluating effectiveness and efficiencyof coverage criteria for software testing. InternationalJournal on Software Tools for Technology Transfer,10(2):145–160, 2008.
[19] M. M. Hassan and J. H. Andrews. Comparingmulti-point stride coverage and dataflow coverage. InProceedings of the 2013 International Conference onSoftware Engineering, pages 172–181. IEEE Press,2013.
[20] M. Hutchins, H. Foster, T. Goradia, and T. Ostrand.Experiments of the effectiveness of dataflow-andcontrolflow-based test adequacy criteria. InProceedings of the 16th international conference onSoftware engineering, pages 191–200. IEEE Computer
Society Press, 1994.
[21] L. Inozemtseva and R. Holmes. Coverage is notstrongly correlated with test suite effectiveness. InProceedings of the 2014 International Conference onSoftware Engineering, 2014.
[22] L. M. M. Inozemtseva. Predicting test suiteeffectiveness for java programs. Master’s thesis,University of Waterloo, 2012.
[23] S. Kakarla. An analysis of parameters influencing testsuite effectiveness. Master’s thesis, Texas TechUniversity, 2010.
[24] N. Li, U. Praphamontripong, and J. Offutt. Anexperimental comparison of four unit test criteria:Mutation, edge-pair, all-uses and prime path coverage.In International Conference on Software Testing,Verification and Validation Workshops, 2009.ICSTW’09., pages 220–229. IEEE, 2009.
[25] R. Liesenfeld. JMockit - A developer testing toolkitfor Java. http://code.google.com/p/jmockit/.
[26] T. J. McCabe. A complexity measure. IEEETransactions on Software Engineering, (4):308–320,1976.
[27] G. J. Myers. The art of software testing. AWilly-Interscience Pub, 1979.
[28] A. S. Namin and J. H. Andrews. The influence of sizeand coverage on test suite effectiveness. In Proceedingsof the eighteenth international symposium on Softwaretesting and analysis, pages 57–68. ACM, 2009.
[29] A. J. Offutt and J. M. Voas. Subsumption of conditioncoverage techniques by mutation testing. Technicalreport, 1996.
[30] C. Pacheco and M. D. Ernst. Randoop random testgeneration. http://code.google.com/p/randoop.
[31] C. Pacheco, S. K. Lahiri, M. D. Ernst, and T. Ball.Feedback-directed random test generation. InProceedings of the 29th International Conference onSoftware Engineering, pages 75–84. IEEE, 2007.
[32] V. Roubtsov and Others. Emma - a free java codecoverage tool. http://emma.sourceforge.net/.
[33] R. Schmidberger and Others. Codecover - anopen-source glass-box testing tool.http://codecover.org/.
[34] TIOBE. Tiobe index. http://www.tiobe.com/index.php/content/paperinfo/tpci/index.html.
[35] Y. Wei, B. Meyer, and M. Oriol. Is branch coverage agood measure of testing effectiveness? In EmpiricalSoftware Engineering and Verification, pages 194–212.Springer, 2012.