TMS Advanced Mobile Charts DEVELOPERS GUIDE
17
TMS SOFTWARE TMS Advanced Mobile Charts DEVELOPERS GUIDE 1 TMS Advanced Mobile Charts DEVELOPERS GUIDE November 2008 Copyright © 1998 – 2008 by tmssoftware.com bvba Web: http://www.tmssoftware.com Email: info@tmssoftware.com
-
Upload
khangminh22 -
Category
Documents
-
view
3 -
download
0
Transcript of TMS Advanced Mobile Charts DEVELOPERS GUIDE

TMS SOFTWARE TMS Advanced Mobile Charts
DEVELOPERS GUIDE
1
TMS Advanced Mobile Charts DEVELOPERS GUIDE
November 2008 Copyright © 1998 – 2008 by tmssoftware.com bvba
Web: http://www.tmssoftware.com Email: [email protected]

TMS SOFTWARE TMS Advanced Mobile Charts
DEVELOPERS GUIDE
2
Index
TMS Advanced Mobile Charts availability ............................................................................................... 3
TMS Advanced Mobile Charts use ........................................................................................................... 3
TMS Advanced Mobile Charts organisation ............................................................................................ 3
The visual organisation of TMS Advanced Mobile Charts ................................................................... 3
Chart Type Selector ......................................................................................................................... 4
Series Editor Dialog ......................................................................................................................... 5
The programmatic organisation of TMS Advanced Mobile Charts ..................................................... 6
TMS Advanced Mobile Charts important methods and properties ........................................................ 8
1. Chart ...................................................................................................... 8 A) Crosshair .............................................................................................. 8 B) Annotations ........................................................................................... 8 C) Y-Axis .................................................................................................. 9 D) X-Grid .................................................................................................. 9 E) Y-Grid .................................................................................................. 9
2. ChartSerie................................................................................................ 9 A) Global.................................................................................................. 9 B) Marker ............................................................................................... 11 C) Y-Axis range configuration ....................................................................... 11 D) Y-Axis visual configuration of multiple serie values ......................................... 13 E) Pie, Half-Pie / Donut, Half-Donut .............................................................. 14 F) Serie ................................................................................................. 16
Save and restore ChartSerie Points ....................................................................................................... 17
Exporting to PNG, JPEG, BMP, GIF ......................................................................................................... 17

TMS SOFTWARE TMS Advanced Mobile Charts
DEVELOPERS GUIDE
3
TMS Advanced Mobile Charts availability
The TMS Advanced Mobile Charts Component is available for Visual Studio 2005, 2008 Supported OS Versions:
- Windows Mobile 5, Windows Mobile 6
Supported .NET Framework Versions - Compact Framework 2.0, 3.0, 3.5
TMS Advanced Mobile Charts use
The TMS Advanced Mobile Charts is designed to display different kinds of data. From financial and marketing data to monthly business sales, graphical and educative math data. The graphical user interface supports chart types such as bar, line, area, pie and many variants like stacked bar, stacked area, stacked percentage area, stacked percentage bar, donut, half pie, … . TMS Advanced Charts is easy to use with features like annotations, crosshairs, 3D mode and many more.
TMS Advanced Mobile Charts organisation
The visual organisation of TMS Advanced Mobile Charts The Chart Component contains some major elements shown here:

TMS SOFTWARE TMS Advanced Mobile Charts
DEVELOPERS GUIDE
4
1) Title The title can contain left, right or center aligned text.
2) Y-Axis & Y-Grid Display added serie values from a defined minimum to maximum or let the Autorange decide which is the best range. The Y-axis can be set at the left side of the chart, the right side of the chart or both sides. Different Y-axis values can be shown for different series. It also supports display of minor & major Y-values with different font.
3) X-Axis & X-Grid Display x - values per point on the X-Axis. TMS Advanced Mobile Charts can optionally display different x - values for each serie.
4) Serie & Values
Choose from different chart types and show values in normal or stacked percentage modes.
5) Annotations Add an annotation to add text to important points in the serie.
6) CrossHairs Add CrossHairs by tap & hold on the screen.
7) Legend Display the legend text for the number of current chart series added to the chart pane.
Chart Type Selector Choosing the right chart type to visualize your data depends on the data you are using. Below is an overview of the currently existing chart types and when to use them. You can access the Series in the current chart and change the chart type.
Name Type Description
None
Serie is not displayed
Line
Serie is shown as a line from value to value
Bar
Serie is shown as bars with height representing the value
Area
Serie is shown as a filled area
StackedBar
Multiple series joined in stacked bar which shows the summed value of all series of type
StackedBar
StackedArea
Multiple series joined in stacked area which shows the summed value of all series of type
StackedArea
StackedPercentageBar
Same as stacked bar but values per serie are represented by percentage
StackedPercentageArea
Same as stacked area but values per serie are represented by percentage
Pie/HalfPie
Add points and display in an (optionally) exploded pie/HalfPie chart with many
options like slice gradient colors and values.

TMS SOFTWARE TMS Advanced Mobile Charts
DEVELOPERS GUIDE
5
Donut/HalfDonut
Add points and display in an (optionally) exploded donut/HalfDonut chart with the
possibility of multiple donut rings.
Band
Add double points to create a band type chart (similar to area but with without zero
points)
Series Editor Dialog All properties of the TMS Mobile Chart component can be edited at designtime. Therefore an editor is installed in the component palette to easily change properties of the serie, annotation and crosshair elements. In each separate dialog you can remove existing or add new elements and simply cancel or save your changes. Series Editor Dialog
The Series editor dialog is used to change the appearance of the serie, and to change the calculation of the serie values. An important property AutoRange on the Y-axis tab changes the way the minimum and the maximum value are calculated. The Series editor dialog is called by clicking on the three dots in the properties pane of the Chart.
TMS SOFTWARE TMS Advanced Mobile Charts
DEVELOPERS GUIDE
6
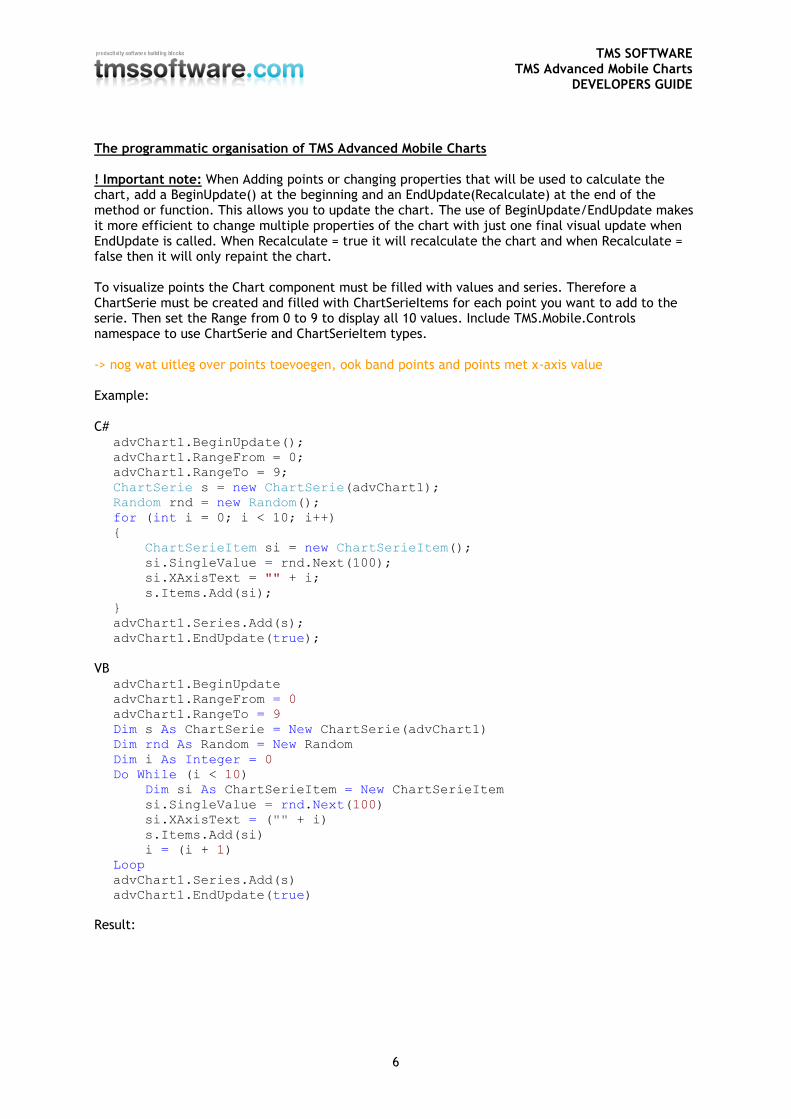
The programmatic organisation of TMS Advanced Mobile Charts ! Important note: When Adding points or changing properties that will be used to calculate the chart, add a BeginUpdate() at the beginning and an EndUpdate(Recalculate) at the end of the method or function. This allows you to update the chart. The use of BeginUpdate/EndUpdate makes it more efficient to change multiple properties of the chart with just one final visual update when EndUpdate is called. When Recalculate = true it will recalculate the chart and when Recalculate = false then it will only repaint the chart. To visualize points the Chart component must be filled with values and series. Therefore a ChartSerie must be created and filled with ChartSerieItems for each point you want to add to the serie. Then set the Range from 0 to 9 to display all 10 values. Include TMS.Mobile.Controls namespace to use ChartSerie and ChartSerieItem types. -> nog wat uitleg over points toevoegen, ook band points and points met x-axis value Example: C#
advChart1.BeginUpdate();
advChart1.RangeFrom = 0;
advChart1.RangeTo = 9;
ChartSerie s = new ChartSerie(advChart1);
Random rnd = new Random();
for (int i = 0; i < 10; i++)
{
ChartSerieItem si = new ChartSerieItem();
si.SingleValue = rnd.Next(100);
si.XAxisText = "" + i;
s.Items.Add(si);
}
advChart1.Series.Add(s);
advChart1.EndUpdate(true);
VB
advChart1.BeginUpdate
advChart1.RangeFrom = 0
advChart1.RangeTo = 9
Dim s As ChartSerie = New ChartSerie(advChart1)
Dim rnd As Random = New Random
Dim i As Integer = 0
Do While (i < 10)
Dim si As ChartSerieItem = New ChartSerieItem
si.SingleValue = rnd.Next(100)
si.XAxisText = ("" + i)
s.Items.Add(si)
i = (i + 1)
Loop
advChart1.Series.Add(s)
advChart1.EndUpdate(true)
Result:

TMS SOFTWARE TMS Advanced Mobile Charts
DEVELOPERS GUIDE
7
To change the look and feel of the chart you can change the start color and end color, you can use a pattern to fill the chart or draw gradients. Below is a sample to illustrate how to change the look and feel of the chart by applying a 3D style. Example: C#
advChart1.BeginUpdate();
advChart1.Series[0].Chart3DOffset = 7;
advChart1.Series[0].Chart3DColor = Color.Red;
advChart1.EndUpdate(false);
VB advChart1.BeginUpdate
advChart1.Series[0].Chart3DOffset = 7
advChart1.Series[0].Chart3DColor = Color.Red
advChart1.EndUpdate(False)
Result:

TMS SOFTWARE TMS Advanced Mobile Charts
DEVELOPERS GUIDE
8
TMS Advanced Mobile Charts important methods and properties
1. Chart
A) Crosshair
Searching values with the Crosshair: When tap-holding on the Chart a context menu becomes visible and allows you to add a crosshair on the position where the menu was visible. The crosshair contains the value on the X-position and searches for a matching value on the Y-position. The crosshair look and feel can be changed per serie.
B) Annotations
Global Adding and removing annotations: You can add multiple annotations per serie. Here is an example to add an annotation and to remove an annotation from the first serie. -> nog wat uitleg hoe annotation text instellen en vasthangen aan specifiek point van een serie via code Add Annotation
Annotation a = new Annotation();
advChart.Annotations.Add(a);
Remove Annotation
advChart.Annotations[0] = null;
Different kinds of annotations There are different kinds of annotations that can be used to mark special points of interest in a series. Balloon, RoundRectangle, Rectangle: Shapes to wrap around the text. Line: a line drawn from top to bottom on the X-position of the point. Offset (X, Y): the text offset from the X, Y- position of the point. Here is a screenshot with the different shapes.

TMS SOFTWARE TMS Advanced Mobile Charts
DEVELOPERS GUIDE
9
C) Y-Axis Auto calculate Y values with the AutoUnit property: The AutoUnit property calculates the best possible value and position based on the minimum and the maximum value. If AutoUnit is false you must set the Major and the Minor unit properties to the difference between the first and the second value you want to see. Example there is a range from 0 to 10. Set the major unit to 2 and the minor unit to 1. Result: MajorUnit 0 – 2 – 4 – 6 – 8 – 10
MinorUnit 0 – 1 – 2 – 3 – 4 – 5 – 6 – 7 – 8 – 9 – 10
D) X-Grid
The X-grid line positions are defined in the same way as the X-axis value positions except that there is no AutoUnit property and the MajorUnit and MinorUnit properties must be filled before you can see the X-grid.
E) Y-Grid
The Y-grid positions are identical to the Y-axis minor and the major unit. The Y-Grid and X-Grid level of depth can be changed with the properties ShowXGridOnTop and ShowYGridOnTop.
2. ChartSerie
A) Global
Adding and removing series: Start the Serie Editor Dialog and click on the “-“icon to remove or the “+” icon to add a serie. You can add multiple series per chart. Here is an example to remove a serie and to add a serie to the chart. Add Serie
advChart.Series.Add();
or
ChartSerie s = new ChartSerie(advChart1);
advChart.Series.Add(s);

TMS SOFTWARE TMS Advanced Mobile Charts
DEVELOPERS GUIDE
10
Remove Serie
advChart.Series[0] = null;
or
advChart.Series.RemoveAt(0);
Adding points with extra parameters: Depending on the type of chart you choose (see different chart types) there are many different methods allowing you to add points to a serie. The easiest way to add points is with the method AddPoint. Example: Adding points for every month of the year. You can quickly add custom text to the X-Axis by using one of the overloaded AddPoint methods.
public enum Months
{
Jan = 1,
Feb = 2,
Mar = 3,
Apr = 4,
May = 5,
Jun = 6,
Jul = 7,
Aug = 8,
Sep = 9,
Oct = 10,
Nov = 11,
Dec = 12
}
private void Form1_Load(object sender, EventArgs e)
{
advChart1.Series.Add();
Random r = new Random();
for (int i = 1; i <= 12; i++)
{
Months m = (Months)i;
advChart1.Series[0].AddPoint(r.Next(10, 100),m.ToString());
}
}
Various method overloads: If some points have a special color, a color can be added, when a custom X-Axis text must be Drawn, etc…. Here is a list of all methods you can use to add points. public void AddPoint(Double SingleValue)
public void AddPoint(Double SingleValue, String XAxisText)
public void AddPoint(Double SingleValue, Double SecondValue)
public void AddPoint(Double SingleValue, Double SecondValue, String XAxisText)
public void AddPoint(Double SingleValue, Color Color)
public void AddPoint(Double SingleValue, Color Color, Color ColorTo, Color Color3D,
String XAxisText)
public void AddPoint(Double SingleValue, Color Color, Color ColorTo, int
PieSliceIndent, String XAxisText)
public void AddPoint(Double SingleValue, Color Color, Color ColorTo, String XAxisText)
Note: Always set the rangefrom and the rangeto to the range of points you have added to the serie.

TMS SOFTWARE TMS Advanced Mobile Charts
DEVELOPERS GUIDE
11
public void AddPoint(Double SingleValue, int PieSliceIndent)
public void AddPoint(Double SingleValue, String XAxisText, Color Color)
public void AddPoint(Double SingleValue, Double SecondValue, Color Color)
public void AddPoint(Double SingleValue, Double SecondValue, Color Color, Color
ColorTo, Color Color3D)
public void AddPoint(Double SingleValue, Double SecondValue, Color Color, Color
ColorTo)
public void AddPoint(Double SingleValue, Color Color, Color ColorTo, int
PieSliceIndent)
public void AddPoint(Double SingleValue, Color Color, Color ColorTo)
public void SetPoint(Double SingleValue, int PointIndex)
public void AddPoint(Double SingleValue, String XAxisText, int PointIndex)
public void SetPoint(Double SingleValue, Double SecondValue, int PointIndex)
public void SetPoint(Double SingleValue, Double SecondValue, String XAxisText, int
PointIndex)
public void SetPoint(Double SingleValue, Color Color, int PointIndex)
public void SetPoint(Double SingleValue, Color Color, Color ColorTo, Color Color3D,
String XAxisText, int PointIndex)
public void SetPoint(Double SingleValue, Color Color, Color ColorTo, int
PieSliceIndent, String XAxisText, int PointIndex)
public void SetPoint(Double SingleValue, Color Color, Color ColorTo, String XAxisText,
int PointIndex)
public void SetPoint(Double SingleValue, int PieSliceIndent, int PointIndex)
public void SetPoint(Double SingleValue, String XAxisText, Color Color, int PointIndex)
public void SetPoint(Double SingleValue, Double SecondValue, Color Color, int
PointIndex)
public void SetPoint(Double SingleValue, Double SecondValue, Color Color, Color
ColorTo, Color Color3D, int PointIndex)
public void SetPoint(Double SingleValue, Double SecondValue, Color Color, Color
ColorTo, int PointIndex)
public void SetPoint(Double SingleValue, Color Color, Color ColorTo, int
PieSliceIndent, int PointIndex)
public void SetPoint(Double SingleValue, Color Color, Color ColorTo, int PointIndex)
public void SetPoint(ChartSerieItem Item, int PointIndex)
public void ClearPoints()
B) Marker
Markers can be added per serie. Here is a sample when adding Markers on a line type chart.
C) Y-Axis range configuration
AutoRange property on the Y-axis: The AutoRange property determines how the series are displayed with an automatically calculated minimum and a maximum value range or with a minimum or maximum that can be programmatically set. There are 5 types you can choose from depending on the chart type you choose. Below is an example which illustrates how the AutoRange calculates the Y-Axis display range.
Result 1: Choosen type: Disabled

TMS SOFTWARE TMS Advanced Mobile Charts
DEVELOPERS GUIDE
12
If Disabled is chosen the Chart does not perform any automatic calculations of minimum or maximum values of the serie. If AutoRange is set to Disabled, the minimum and maximum value must be programmatically set. The minimum or maximum can or cannot correspond to the real minimum and maximum in the serie. In case you want to display the serie within its real minimum/maximum range, set in this example the minimum value to -36 and the maximum value to 38. This has the same effect as setting the property to Enabled which calculates the maximum and the minimum of the added points. In the picture below the maximum is set to 45 and the minimum is set to –45.
Result 2: Chosen type: Enabled If Enabled is chosen the minimum and maximum value are calculated automatically. In the example the minimum value is -37 and the maximum value is 25.
Result 3: Chosen type: EnabledZeroBased Again the minimum and maximum values are calculated automatically but this time the minimumvalue is set to 0 causing all negative values to disappear.

TMS SOFTWARE TMS Advanced Mobile Charts
DEVELOPERS GUIDE
13
Result 4: Chosen type: Common The Common type is only useful if you have more than one serie. If you only have one serie, the Common type will be equivalent as the Enabled type. The Common type can be used to automatically use the minimum/maximum of all calculated minima/maxima of all series with the Common type. Example: We add another serie. The values of the second serie are higher in maximum and lower in minimum. If the Common type is chosen for both series you will get the result below:
Result 5: Chosen type: CommonZeroBased The CommonZeroBased autorange type is similar to the Common type. The maximum value will still be calculated for multiple series but the major difference with the previous Common type is that the minimum value for all series will be set to zero:
D) Y-Axis visual configuration of multiple serie values
Different serie values on the left and/or right size of the Y-axis: You can add multiple series per Chart. Usually the series have a common value range and the autorange mode Common

TMS SOFTWARE TMS Advanced Mobile Charts
DEVELOPERS GUIDE
14
will be chosen. When adding series which do not have a common value range, use the autorange mode Enabled, and set property serie Y-Axis position to left / right / both. You can choose a matching font color for values in the Y-axis that match the serie color for example to easily identify which values belong to which serie. Another feature is formatting of the value. Set a format in the Valueformat property of the serie.
E) Pie, Half-Pie / Donut, Half-Donut
Add pie, half-pie / donut, half-donut with random values, exploded slices and legend: Add a new Chart and add points with the AddPoint method. Many extra parameters can be set to change the look of the pie chart such as exploded pie slices, colored slices, many other options can be set in the Serie Editor. One other important property can be used when stacking donut chart types. On Chart level set donut mode to stacked. Example:
C#
advChart1.BeginUpdate();
ChartSerie s = new ChartSerie(advChart1);
s.ChartType = ChartType.Donut;
s.PieLegendTitle = "Serie 1";
s.PieLegendTitleVisible = true;
s.PieLegendPosition = Position.BottomLeft;
s.ForeColor = Color.White;
Random rnd = new Random();
for (int i = 0; i < 5; i++)
{
ChartSerieItem si = new ChartSerieItem();
si.SingleValue = rnd.Next(20, 70);
si.Color = Color.FromArgb(rnd.Next(255), rnd.Next(255),
rnd.Next(255));
si.XAxisText = "Slice Value " + si.SingleValue;
s.Items.Add(si);
}
ChartSerie s1 = new ChartSerie(advChart1);
s1.ChartType = ChartType.Donut;
s1.PieLegendTitle = "Serie 2";
s1.PieLegendTitleVisible = true;
s1.PieLegendPosition = Position.BottomRight;
s1.ForeColor = Color.White;
for (int i = 0; i < 5; i++)
{
ChartSerieItem si = new ChartSerieItem();
si.SingleValue = rnd.Next(20, 70);
si.Color = Color.FromArgb(rnd.Next(255), rnd.Next(255),
rnd.Next(255));
si.XAxisText = "Slice Value " + si.SingleValue;
s1.Items.Add(si);
}
int w = Screen.PrimaryScreen.Bounds.Width;
int h = Screen.PrimaryScreen.Bounds.Height;
s.PieRadius = w / 4;
s.PieInnerRadius = s.PieRadius / 2;
s.PieTop = -s.PieRadius;

TMS SOFTWARE TMS Advanced Mobile Charts
DEVELOPERS GUIDE
15
s1.PieRadius = s.PieInnerRadius;
s1.PieInnerRadius = s1.PieRadius / 2;
s1.PieTop = -s.PieRadius;
advChart1.Series.Add(s);
advChart1.Series.Add(s1);
advChart1.EndUpdate(true);
VB
advChart1.BeginUpdate
Dim s As ChartSerie = New ChartSerie(advChart1)
s.ChartType = ChartType.Donut
s.PieLegendTitle = "Serie 1"
s.PieLegendTitleVisible = true
s.PieLegendPosition = Position.BottomLeft
s.ForeColor = Color.White
Dim rnd As Random = New Random
Dim i As Integer = 0
Do While (i < 5)
Dim si As ChartSerieItem = New ChartSerieItem
si.SingleValue = rnd.Next(20, 70)
si.Color = Color.FromArgb(rnd.Next(255), rnd.Next(255), rnd.Nex
t(255))
si.XAxisText = ("Slice Value " + si.SingleValue)
s.Items.Add(si)
i = (i + 1)
Loop
Dim s1 As ChartSerie = New ChartSerie(advChart1)
s1.ChartType = ChartType.Donut
s1.PieLegendTitle = "Serie 2"
s1.PieLegendTitleVisible = true
s1.PieLegendPosition = Position.BottomRight
s1.ForeColor = Color.White
Dim i As Integer = 0
Do While (i < 5)
Dim si As ChartSerieItem = New ChartSerieItem
si.SingleValue = rnd.Next(20, 70)
si.Color = Color.FromArgb(rnd.Next(255), rnd.Next(255), rnd.Nex
t(255))
si.XAxisText = ("Slice Value " + si.SingleValue)
s1.Items.Add(si)
i = (i + 1)
Loop
Dim w As Integer = Screen.PrimaryScreen.Bounds.Width
Dim h As Integer = Screen.PrimaryScreen.Bounds.Height
s.PieRadius = (w / 4)
s.PieInnerRadius = (s.PieRadius / 2)
s.PieTop = (s.PieRadius * -1)
s1.PieRadius = s.PieInnerRadius
s1.PieInnerRadius = (s1.PieRadius / 2)
s1.PieTop = (s.PieRadius * -1)
advChart1.Series.Add(s)
advChart1.Series.Add(s1)
advChart1.EndUpdate(true)
Result:

TMS SOFTWARE TMS Advanced Mobile Charts
DEVELOPERS GUIDE
16
F) Serie Display values on chart points: You can show the added values on the chart by checking “Slice Values” in the serie editor or programmatically with ChartSerie.ShowValues = true. In case of stacked (percentage) bars, it can be selected to show summed values or values of each serie. This can be set with Chart.StackedTotals := true.

TMS SOFTWARE TMS Advanced Mobile Charts
DEVELOPERS GUIDE
17
Save and restore ChartSerie Points
The points of the ChartSerie can be saved to a .csv or .xml file. If you close the application and load the .CSV or .XML file, all points will be restored. Here is an example of saving / reloading settings in code. Save settings: advChart1.SaveToCSV(FileName);
or
advChart1.SaveToXML(FileName);
Load settings:
advChart1.LoadFromCSV(FileName);
or
advChart1. LoadFromXML(FileName);
-> sample structure CSV & XML file
Exporting to PNG, JPEG, BMP, GIF
Saving to a Windows bitmap file offers good quality but generates large files. You can save the Chart to different image formats to improve / reduce the size and quality. The image formats currently supported are PNG, JPEG, BMP, GIF. public void SaveChart(String FileName, ImageFormat Format)
The function SaveChart has 2 extra parameters to specify the width and height of the picture: public void SaveChart(String FileName, ImageFormat Format, int Width, int
Height)