COA FY15 presentation - Coats
48
Coats Group plc Introduction to Coats April 2016
-
Upload
khangminh22 -
Category
Documents
-
view
0 -
download
0
Transcript of COA FY15 presentation - Coats

Coats Group plc
Introduction to Coats
April 2016

© Coats Group plc | Introduction to Coats | April 2016 Page 2
Disclaimer
Restricted distribution
This presentation is not for release, publication or distribution, in whole or in part, directly or indirectly, in, into or from any jurisdiction
where to do so would constitute a violation of the relevant laws or regulations of such jurisdiction (the ‘Restricted Jurisdictions’).
Not an offer
This presentation is not intended to and does not constitute, or form part of, any offer to sell or subscribe for or an invitation to purchase
or subscribe for any securities or the solicitation of any vote or approval in any jurisdiction pursuant to the matters contained herein or
otherwise.
Forward-looking statements
This document contains certain forward-looking statements, including statements regarding Coats Group plc’s plans (‘Coats’ or the
‘Company’), objectives and expected performance. Such statements relate to events and depend on circumstances that will occur in the
future and are subject to risks, uncertainties and assumptions. There are a number of factors which could cause actual results and
developments to differ materially from those expressed or implied by such forward-looking statements, including, among others the
enactment of legislation or regulation that may impose costs or restrict activities; the re-negotiation of contracts of licences; fluctuations
in demand and pricing in the industry; fluctuations in exchange controls; changes in government policy and taxations; industrial disputes;
and war and terrorism. These forward-looking statements speak only as at the date of this document.
Not a profit forecast
The financial information contained in this presentation is based on publicly available historic financial information of Coats and is not
intended to be a profit forecast or profit estimate under applicable rules.
Rounding
Due to rounding, numbers presented throughout this document may not add up precisely to the totals provided and percentages may not
precisely reflect the absolute figures.
© Coats Group plc | Introduction to Coats | April 2016 Page 3
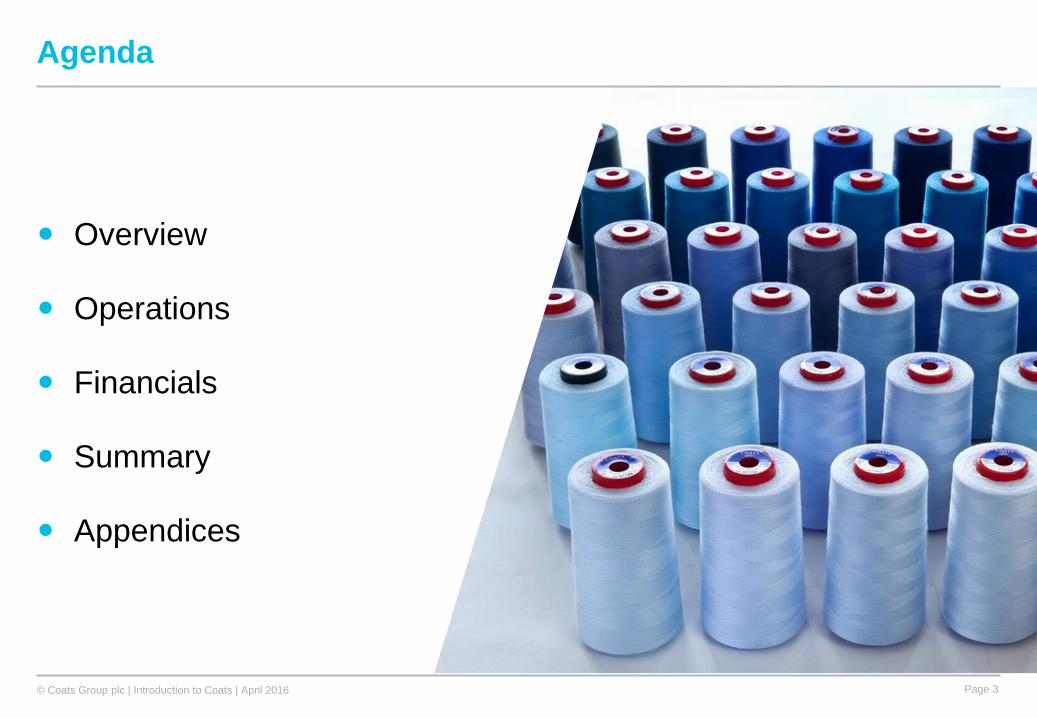
Overview
Operations
Financials
Summary
Appendices
Agenda

Overview

© Coats Group plc | Introduction to Coats | April 2016 Page 5
High technology threads and
yarns from performance
materials for non-apparel
and footwear uses
Apparel, footwear and
accessories thread
Zips and trims products
Coats Global Services
A&F66%Speciality
16%
Crafts18%
Group 2015 1
Operating profit growth 19%
Adjusted EPS growth 38%
Adjusted free cash flow $74m
Return on capital employed 33%
Sales
($1.5bn)
Industrial90%
Crafts9%
Other1%
Employees
(c19,000)
Who we are
World’s leading industrial thread manufacturer and major player in Americas textile crafts
Apparel and
Footwear (A&F)
Foundation and fashion
handknitting
Needlecrafting (inc sewing
and lifestyle fabrics)
Crafts
Industrial
Speciality
Crafts
* See finance slides in appendix for more information

© Coats Group plc | Introduction to Coats | April 2016 Page 6
Where have we come from
Fast forward to 2015/16
Renamed Coats Group plc
Return to LSE on 125th anniversary of listing
Single Board of Directors
First acquisition for >10 years
Continuing to introduce new products/services
Delisting from NZ and Australian exchanges
(June 2016)
In our long pioneering history we like to include
Thomas Edison who used Coats thread in his
experiments to perfect the lightbulb
Rich heritage
Founded over 250 years ago
One of the first truly global firms: started
production in India in late 19th century and in
China in the 1920s
One of founding members of the FT30
Under ownership of NZ based investment firm
(Guinness Peat Group) from 2003-2014
© Coats Group plc | Introduction to Coats | April 2016 Page 7
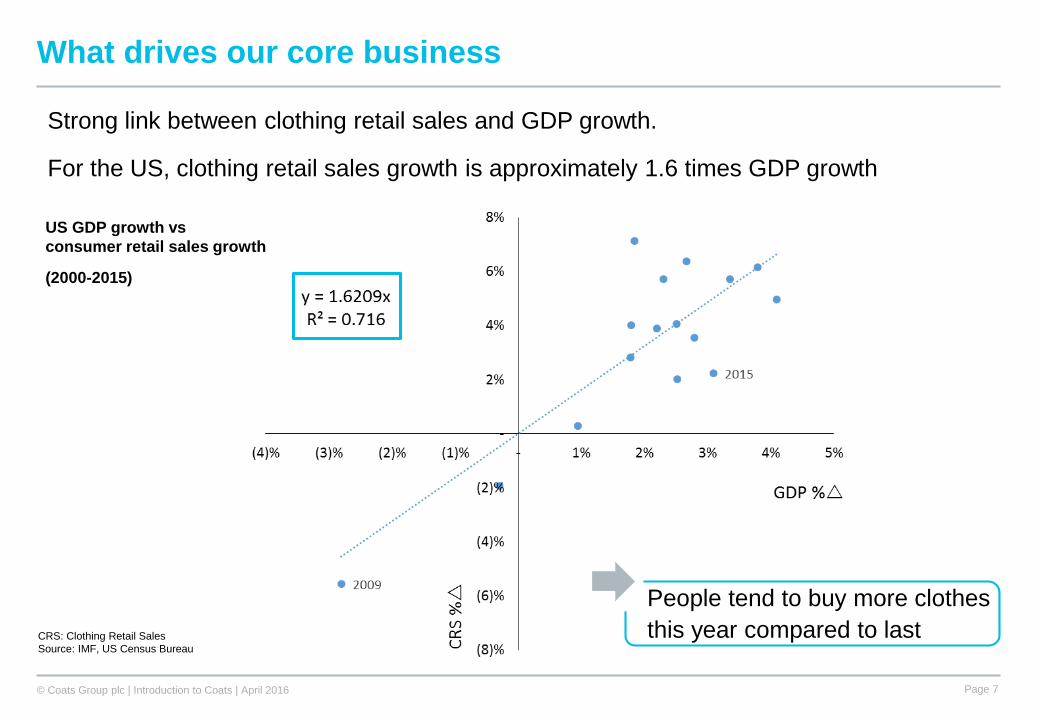
What drives our core business
Strong link between clothing retail sales and GDP growth.
For the US, clothing retail sales growth is approximately 1.6 times GDP growth
CRS: Clothing Retail Sales
Source: IMF, US Census Bureau
US GDP growth vs
consumer retail sales growth
(2000-2015)
People tend to buy more clothes
this year compared to last

© Coats Group plc | Introduction to Coats | April 2016 Page 8
Source: OECD, Standard Chartered Research
Global socio-economic trend to support future growth
Global middle class in 2009 and prediction for 2030
Central and
South America
North AmericaEurope
Asia Pacific
20302009
1bn
100mn
500mn
Northern
Africa
Southern
Africa
Increasing global
demand for apparel
and footwear
Increasing
demand for
consumer products
with Speciality
thread
Asia Pacific moving
from production
base to world’s
largest consumer
market;
Asia Pacific will
challenge developed
economies in
production of high-
end consumer
goods

© Coats Group plc | Introduction to Coats | April 2016 Page 9
Well positioned to take advantage and lead the industry
Strategic hand of cards
Market positions that are several times
bigger than our competition with a
comprehensive range of products
Unparalleled physical global network of
factories, warehouses and IT systems;
operate across six continents at ~50 sites,
with a sales presence in +100 countries
Access to the widest range of A&F, Speciality
and textile craft customers
Market leading brands
‘Human asset base’ with world-leading
expertise, commitment, truly international
capability and highly engaged
Corporate brand reputation
Global. Expert.
Pioneering.
Customers
include
Brands
include

© Coats Group plc | Introduction to Coats | April 2016 Page 10
Led by an experienced Board
Mike Clasper, Chairman
Appointed in Feb 2014
Chairman of Which?, SID at Serco and former NED
at ITV; served as CEO of BAA and Chairman of
HMRC
Paul Forman, Group Chief Executive
Joined in Dec 2009
Wide experience in global manufacturing, as well as
strategy consultancy and M&A advisory
NED at Tate & Lyle and former NED at Brammer;
former CEO at Low & Bonar and MD at Unipart
Rajiv Sharma, CEO Industrial
Joined in Nov 2010
Experience across sales, marketing, M&A, business
development and operations
Previously worked at Westinghouse, Saab,
Honeywell, GE and Shell
Breadth of FTSE 350, geographic, industry and
functional experience
Share ownership across the Board and share based
incentives for senior management
Recruiting a new CFO (previous CFO left on 6 April)

© Coats Group plc | Introduction to Coats | April 2016 Page 11
Five elements to our investment case
Key differentiatorsthat provide a
platform for growth
Strong and defendable core business
Leadership, peopleand systems to deliver growth
Focus on sales, earnings and free cash flow
growth
Targeting known markets through organic and acquisitive growth
3. Defined
growth
strategy
4.
Experienced
management
team
1. Global
market leader
with robust
fundamentals
5. Cash
generative;
consistent
growth
2. Global
presence
and
capabilities

Operations
© Coats Group plc | Introduction to Coats | April 2016 Page 13
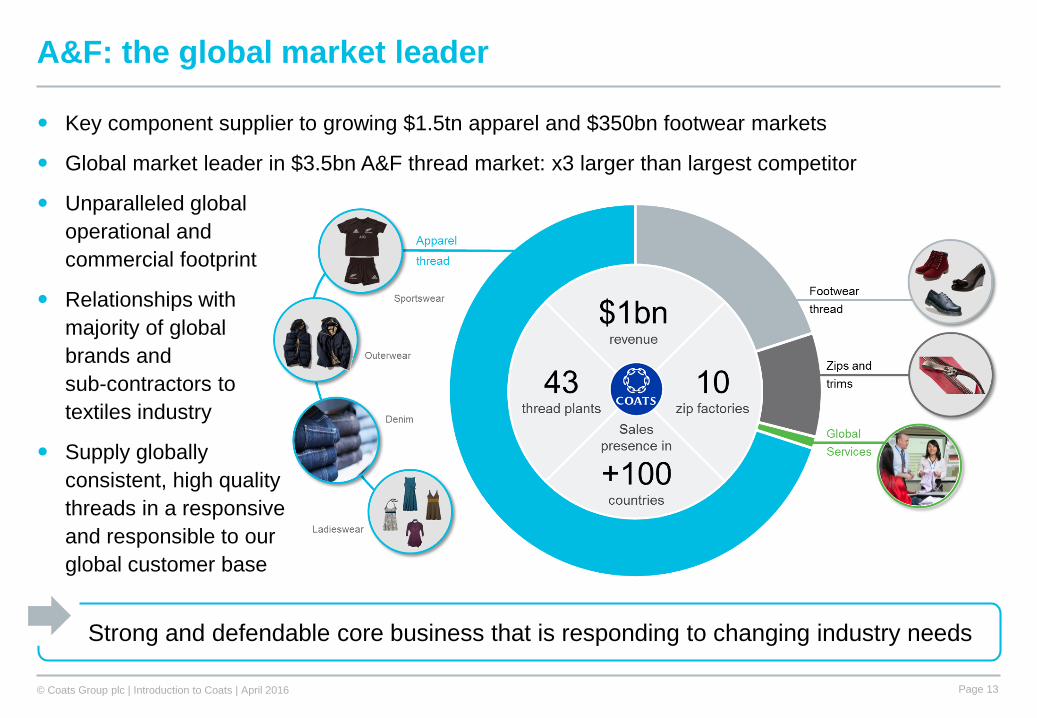
A&F: the global market leader
Key component supplier to growing $1.5tn apparel and $350bn footwear markets
Global market leader in $3.5bn A&F thread market: x3 larger than largest competitor
Unparalleled global
operational and
commercial footprint
Relationships with
majority of global
brands and
sub-contractors to
textiles industry
Supply globally
consistent, high quality
threads in a responsive
and responsible to our
global customer base
Strong and defendable core business that is responding to changing industry needs

© Coats Group plc | Introduction to Coats | April 2016 Page 14
Sales up 5% LFL to $979m in 2015
Double-digit sales growth in key markets -
Bangladesh, Colombia, Mexico, Vietnam
Growth with major brands - strengthened
global accounts programmes
Increased sales in major end-markets eg
outwear, denim and sports footwear
A&F: strong volume growth and digital innovation
Coats Colour Express
World’s fastest, most
accurate thread sampling
service
70% of all sampling now
digital; 85% samples
delivered within two days
eCommerce
Rolled out Q1’15; now live
in 25 markets with ~7,500
customers; accounts for
~50% of all orders
Increased volumes
Share gains and underlying market growth
Digital innovation
Enhanced customer service and productivity

© Coats Group plc | Introduction to Coats | April 2016 Page 15
Speciality: leading position in high growth markets
Produce multiple innovative threads and
yarns for non-apparel and footwear uses
End-markets include automotive,
bedding/furniture and oil and gas
Moved beyond ‘traditional core’ by
expanding into ‘emerging’ products and
‘value added engineered yarns’ (VAEY)
Speciality is a high value
‘GDP+’ market
(1) Universe and addressable market size based on third party report prepared for Coats and internal analysis
Driven by growing consumer and
government demand
– Pace of urbanisation in developing
countries (eg fibre-optic rollout)
– Consumers purchasing more products
with Speciality thread (eg femcare)
– Consumers demanding more innovative
products (eg wearable technology)
– Increasing public sector spending and
safety compliance (eg utility infrastructure)
Speciality universe: ~$30bn1
~$1.8bn1 immediately addressable market
Traditional
Emerging
VAEY
Furniture Airbags
Fibre-optics
Carbon composites
Tea-bags
Flame retardant

© Coats Group plc | Introduction to Coats | April 2016 Page 16
Sales up 8% LFL to $233m in 2015
Extending existing products into Asia and
Latin America; China, India and Mexico all
delivered double-digit growth
Strong uptake in demand for new
products such as engineered
performance fabrics and wire and cable
Supported by our innovation approach
– apply proven technologies to threads
and yarns to improve performance in
existing applications and apply to new
end uses
– track record of delivering
innovative, high value add products
– use virtual network of commercial
and academic partners and in-house
R&D capabilities embedded at sites
Speciality: geographic expansion and innovation
Conductive thread
Metallized thread antenna for
use with revolutionary RFID tag
New product innovation
develop and manufacture clever thin lines
Carbon composites
In our state of the art carbon
room, can twist carbon with other
reinforced fibres like steel
Geographic expansion
driven by urbanisation in developing economies
Automotive
Double digit growth in
key end-market in 2015
Bedding / mattresses
From quilting thread to
aramid thread that meets
flame retardant standards

© Coats Group plc | Introduction to Coats | April 2016 Page 17
Handknitting
Needlecrafting and other
Foundation yarns
Embroidery Lifestyle
fabricsZips Sewing
thread
Crafts: major player in Americas textile crafts
Fashion yarns
North America
Leader in $1.4bn market
Focused channel and
product portfolio
Serve small number of
major retailers ie ‘Category
Captain’ at Walmart for
past five years
Inherently profitable, cash
generative business
Latin America
Leader in $400m market
Wider range of customers
than in US
Brazil main market with
presence in other countries
(eg Mexico and Columbia)
Fluctuating demand in
recent years
UK: small business retained
© Coats Group plc | Introduction to Coats | April 2016 Page 18
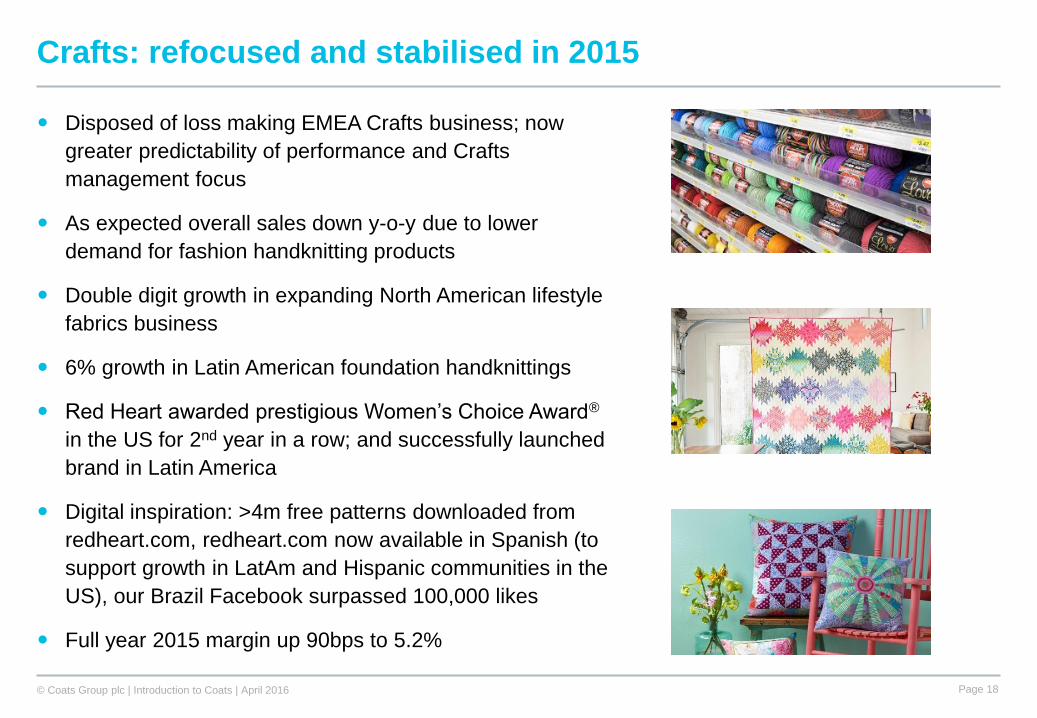
Disposed of loss making EMEA Crafts business; now
greater predictability of performance and Crafts
management focus
As expected overall sales down y-o-y due to lower
demand for fashion handknitting products
Double digit growth in expanding North American lifestyle
fabrics business
6% growth in Latin American foundation handknittings
Red Heart awarded prestigious Women’s Choice Award®
in the US for 2nd year in a row; and successfully launched
brand in Latin America
Digital inspiration: >4m free patterns downloaded from
redheart.com, redheart.com now available in Spanish (to
support growth in LatAm and Hispanic communities in the
US), our Brazil Facebook surpassed 100,000 likes
Full year 2015 margin up 90bps to 5.2%
Crafts: refocused and stabilised in 2015

Financials

© Coats Group plc | Introduction to Coats | April 2016 Page 20
Adjusted EPS (US cents)
2015 financial performance 1
(1) See finance slides in appendix for more information
Adjusted free cash flow (US$m)
Industrial Crafts Group
Sales growth 5% (6)% 3%
Operating profit growth 20% 14% 19%
Operating margin 11.1% 5.2% 9.4%
Three year performance
2.17
3.08
3.96
2013 2014 2015
Return on capital employed
60
88
74
2013 2014 2015
20%
24%
33%
2013 2014 2015
38%

© Coats Group plc | Introduction to Coats | April 2016 Page 21
Geographically diversified
A&F: largest markets are China, India and
Vietnam
Speciality: largest markets are US and Turkey;
growing presence in Asia and LatAm
Crafts: US, LatAm (mainly Brazil) and UK
Customer diversification
No customer (contractor or Crafts retailer)
accounts >10% of group sales
No brand contributes to >10% of group sales
Revenue base
Asia48%
Americas (Ind)18%
Americas (Crafts)
17%
EMEA17%
Group revenue 2015: ~$1.5bn
By region
A&F66%
Speciality16%
Crafts18%
By business

© Coats Group plc | Introduction to Coats | April 2016 Page 22
Materials: raw materials (polyester, nylon,
cotton) and intermediates (grey thread); direct
materials (dyes, cones) and bought-in finished
goods (craft products)
Labour (mfg): ongoing inflationary pressures in
the locations in which we operate
Energy: sourced from local and national grids,
price linked to regional supply / demand
dynamics
Other includes maintenance, insurance and
water
Distribution includes freight and warehousing
Administrative includes corporate costs
Capex at ~1x depreciation
Cost base
Materials40%
Labour (mfg)16%
Energy3%
Other8%
Distribution15%
Administrative15%
Depreciation3%
Pre-exceptional costs 2015: ~$1.35bn

© Coats Group plc | Introduction to Coats | April 2016 Page 23
Productivity, procurement and efficiency improvements
To offset structural labour and energy inflation, look to
deliver productivity, procurement and pricing gains
However in general deflationary environment pricing
becomes challenging
Track record of delivering y-o-y manufacturing productivity
and non-raw material sourcing gains: >$17.5m in 2015
Expanding our network of Lean and Six Sigma experts
In 2015 y-o-y fossil fuel consumption down 7%, electricity
usage down 6% and waste reduced 5%
In 2015 sales per employee up 6%
Overhead reduction programme: following disposal of
EMEA Crafts reviewed cost structures; took $14m
provision in 2015 with benefits realised in H2 2015, 2016
and H1 2017

© Coats Group plc | Introduction to Coats | April 2016 Page 24
1,212
1,2431,213
9.1%
10.3%
11.1%
7.0%
7.5%
8.0%
8.5%
9.0%
9.5%
10.0%
10.5%
11.0%
11.5%
12.0%
950
1,000
1,050
1,100
1,150
1,200
1,250
1,300
2013 2014 2015
Revenue ($m) Operating Margin (%)
341318
277
5.1%
4.3%
5.2%
2.0%
2.5%
3.0%
3.5%
4.0%
4.5%
5.0%
5.5%
6.0%
6.5%
7.0%
0
50
100
150
200
250
300
350
400
2013 2014 2015
Revenue ($m) Margin
Industrial Crafts
111 128 135Operating
Profit ($m)17 14 14
Higher margins in North America;
Latin America impacted by strength of USD
Segmental performance
Revenue impacted by strength of USD;
good growth at constant exchange rates
© Coats Group plc | Introduction to Coats | April 2016 Page 25
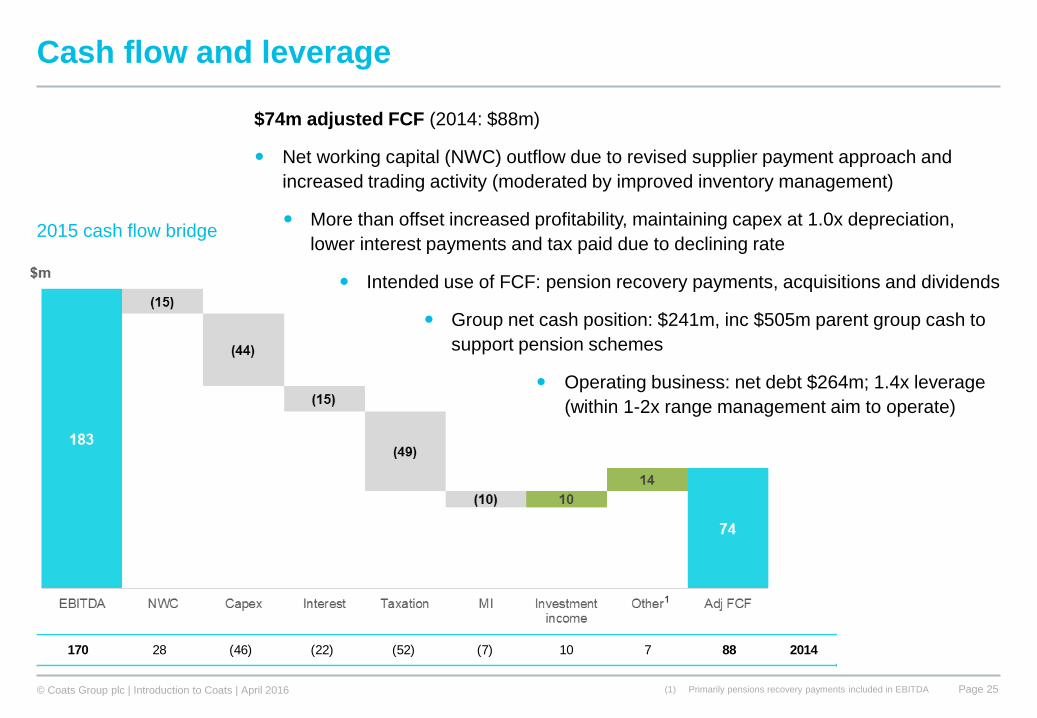
Cash flow and leverage
(1) Primarily pensions recovery payments included in EBITDA
2015 cash flow bridge
$74m adjusted FCF (2014: $88m)
Net working capital (NWC) outflow due to revised supplier payment approach and
increased trading activity (moderated by improved inventory management)
More than offset increased profitability, maintaining capex at 1.0x depreciation,
lower interest payments and tax paid due to declining rate
Intended use of FCF: pension recovery payments, acquisitions and dividends
Group net cash position: $241m, inc $505m parent group cash to
support pension schemes
Operating business: net debt $264m; 1.4x leverage
(within 1-2x range management aim to operate)
170 28 (46) (22) (52) (7) 10 7 88 2014

© Coats Group plc | Introduction to Coats | April 2016 Page 26
Pensions
UK Pensions Regulator (tPR) investigations
2012/13: GPG Board began to distribute proceeds from
asset realisation programme to shareholders
Q2’13: tPR begins investigations into three UK DB schemes
Dec’13: tPR issues Warning Notices (WN) on two legacy
schemes - Brunel and Staveley
2014: reached settlement with one trustee on more than
one occasion; not accepted by tPR
Dec’14: WN received on Coats UK plan
2015: legal process and started Coats triennial process
Feb’16: initiated settlement discussions with all trustees -
committed to retain parent group cash and not return to
shareholders on basis tPR withdraws WNs and Coats has
ability to commence annual dividends and invest in growth
Upfront support could be combination of direct and indirect;
unknown level of ongoing support via recovery payments
If settlement cannot be reached, prepared to litigate – next
step is hearing before Determinations Panel of tPR, unlikely
before H2’16 at earliest
Parent group cash
Brunel and Staveley schemes
Operating business
$505m
(£342m)
Profitable, cash
generative
Coats UK:
$264m (£179m)
Non-UK $47m
B: $72m (£48m)
S: $87m (£59m)
Total assets $2.79bn
Total liabilities: $3.25bn
Net deficit: $469m
Triennial valuations and recovery plans
Brunel: agreed Nov’15 – TP deficit £94m;
recovery plan £5.5m pa over 10 years
Staveley: continue constructive discussions;
believe TP deficit will be ~£100m
Coats: ongoing - anticipate TP deficit will follow
similar pattern; currently pay £14m pa

Summary

© Coats Group plc | Introduction to Coats | April 2016 Page 28
2016 outlook
• Strong performance in 2015 supported by market share gains, product
innovation, lower input prices, productivity and procurement gains
• Put the business on a solid footing for the year ahead
• Will realise incremental savings from overhead reduction programme
• However to grow we need to reinvest to support our growth ambitions
• Furthermore against backdrop of mixed economic conditions (uncertainties in
US and Western European consumer demand, demand from oil and gas
industry and potential for US dollar to further strengthen) group performance
could be adversely impacted
• On balance, Management expects to deliver modest y-o-y growth in
Group pre-exceptional operating profit, with improvements to non-operating
items further benefiting adjusted EPS

© Coats Group plc | Introduction to Coats | April 2016 Page 29
Role of M&A in delivering future growth
Profitable sales growth over last five years
driven purely by organic growth
Looking to access inorganic growth
In May’15 completed first acquisition in >10
years: GSD, a services business, for $5.5m
Comprehensive M&A process in place – from
strategy to post merger integration
Criteria (includes)
Aligned to Speciality, Services (eg GSD) or
Asian geographic expansion in core A&F
business
Manageable risk profile
Compliance with Coats standards
Number of financial metrics (return and value)
– looking for bolt-on transactionsNo external limitations on executing M&A

© Coats Group plc | Introduction to Coats | April 2016 Page 30
Global market leader with robust fundamentals; strong and defendable core
Defined growth strategy and updated market goals
Supported by key differentiators - world class asset base, product and service
(including digital) innovation, highly engaged workforce and corporate responsibility
Delivering EPS growth and generating cash to reinvest in business
Healthy acquisition pipeline to complement organic sales growth and funded internally
Normalising as a UK plc - move to single UK listing in 2016
Initiated settlement discussions on UK pensions investigations
Well positioned for continued sales, earnings and free cash flow growth
Summary

Appendices

© Coats Group plc | Introduction to Coats | April 2016 Page 32
Revenues of US$1.5bn in 2015 – Headquartered in UK; LSE premium listing (COA)
Coats is the world’s leading industrial thread manufacturer and a major player in the
Americas textile crafts market…
World leader with a global presence
Global footprint
We operate on a global
basis employing people
across six continents
with some 30 sites and
a sales presence in
100+ countries
Employees
19,000
Industrial 90%
Crafts 9%
Other 1%
Presence Site

© Coats Group plc | Introduction to Coats | April 2016 Page 33
Rich heritage
Coats is a company with more than 250 years of history
1750s
Coats Group plc
returns to
London stock
market
2015
After a period of different owners
Coats returned to the Stock
Exchange in February 2015,
125 years after its initial listing.
1912One of the world’s largest
companies by market
capitalisation
James and Patrick Clark
began work in Paisley, Scotland
1812Clark’s sewing thread
placed on the market
1890Coats’ initial share offering
takes place on London
Stock Exchange
James Coats establishes first
Ferguslie mill in Paisley
1826
2004
GPG acquisition
completed and
company de-listed
1980s-1990sPeriod of manufacturing decline:
Acquired by Vantona Viyella.
M&A with Tootal, Barbour, and DMC
1896Coats and Clark family
business merger forms:
J. & P. Coats, Ltd
1900s
machinery
1920s
thread mill
1960s manufacturing
J&P Coats
Sewing Cotton
London Stock Exchange 1891
© Coats Group plc | Introduction to Coats | April 2016 Page 34
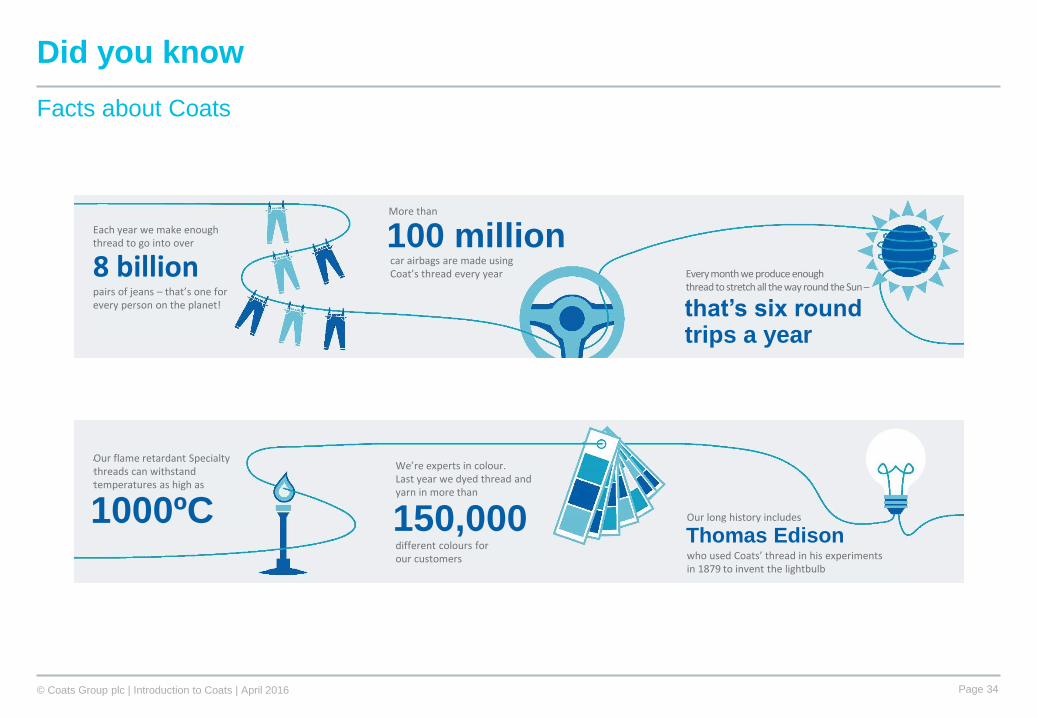
Did you know
Facts about Coats
Each year we make enough thread to go into over
pairs of jeans – that’s one for every person on the planet!
More than
Every month we produce enough thread to stretch all the way round the Sun –
car airbags are made using Coat’s thread every year8 billion100 million
that’s six round trips a year
Our flame retardant Specialty threads can withstand temperatures as high as
We’re experts in colour. Last year we dyed thread and yarn in more than
different colours for our customers
Our long history includes
who used Coats’ thread in his experiments in 1879 to invent the lightbulb
150,000Thomas Edison
1000ºC

© Coats Group plc | Introduction to Coats | April 2016 Page 35
Servicing global markets and customers
Crafts
products
Products and brands
include
End use
applications
include
Industrial
customers
A&F
Speciality

© Coats Group plc | Introduction to Coats | April 2016 Page 36
2018 market goals
The leading
global player in
Speciality
threads and
yarns
The leading value
added partner to
the apparel,
footwear and
accessories
industries
The leading textile
crafts partner /
inspiration source
in chosen markets

© Coats Group plc | Introduction to Coats | April 2016 Page 37
Safe and engaged workforce
72%
77%
80%81%
83%
2011 2012 2013 2014 2015
Industry norm
Employee engagement Recordable incident rate
Global
top 10% Coats global recordable incident rate
vs OSHA average 1
(3 month average)
OSHA
Coats
(1) Occupational Safety and Health Administration, agency of US Department of Labor, average of US textiles mills
12% reduction yoy

© Coats Group plc | Introduction to Coats | April 2016 Page 38
Corporate Responsibility
Our Corporate Responsibility (CR) programme is focused around seven strategic themes
For more information visit: www.coats.com/corporateresponsibility

© Coats Group plc | Introduction to Coats | April 2016 Page 39
2015 highlights
Strong operating performance and improved quality of earnings
Pre-exceptional operating profit up 19% LFL (constant currency); operating margins up 130bps
Adjusted EPS up 38% LFL; reported loss due to discontinued items
Adjusted free cash flow of $74m (2014: $88m)
Return on capital employed increased to 33% (2014: 24%)
Strategic progress
Disposed of loss-making EMEA Crafts business and completed first acquisition (GSD)
Good market share gains in Industrial
Highly engaged and safe workforce
Recordable accident rate down 12%; employee engagement score 83% (in global top 10%)
Normalising as a UK plc
Change of name, combined Board, UK focused share register, intention to delist from NZX and ASX
Pensions investigations: initiated settlement discussions with Trustees of three UK schemes
© Coats Group plc | Introduction to Coats | April 2016 Page 40
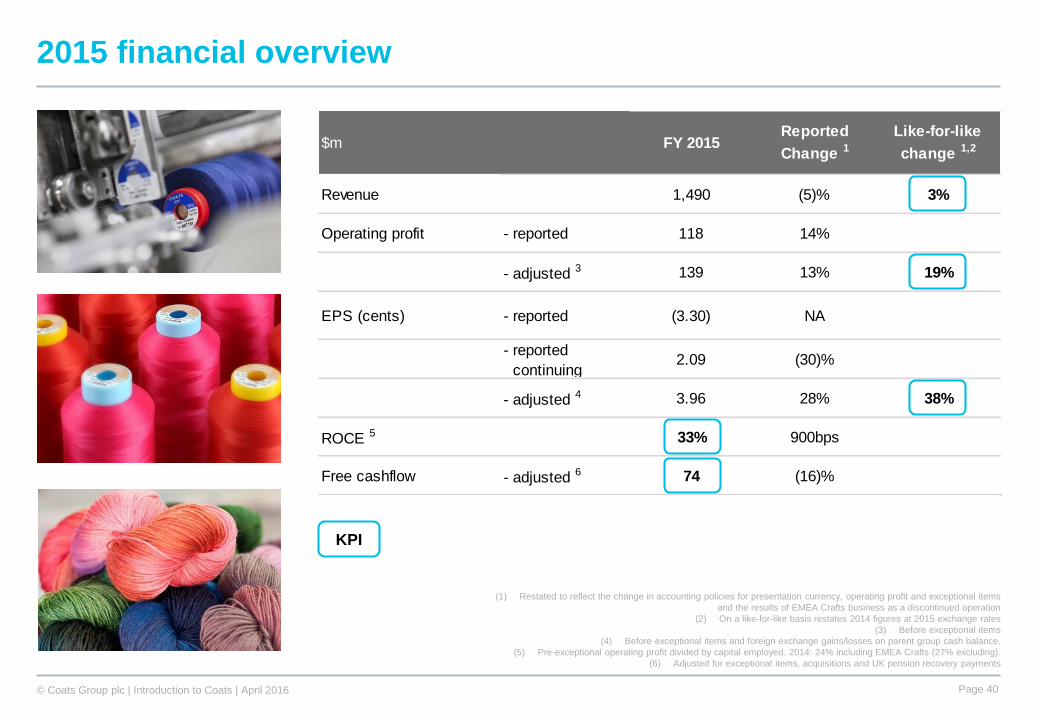
Revenue 1,490 (5)% 3%
Operating profit - reported 118 14%
- adjusted 3 139 13% 19%
EPS (cents) - reported (3.30) NA
- reported
continuing2.09 (30)%
- adjusted 4 3.96 28% 38%
ROCE 5 33% 900bps
Free cashflow - adjusted 6 74 (16)%
$m FY 2015Reported
Change 1
Like-for-like
change 1,2
2015 financial overview
KPI
(1) Restated to reflect the change in accounting policies for presentation currency, operating profit and exceptional items
and the results of EMEA Crafts business as a discontinued operation
(2) On a like-for-like basis restates 2014 figures at 2015 exchange rates
(3) Before exceptional items
(4) Before exceptional items and foreign exchange gains/losses on parent group cash balance.
(5) Pre-exceptional operating profit divided by capital employed. 2014: 24% including EMEA Crafts (27% excluding).
(6) Adjusted for exceptional items, acquisitions and UK pension recovery payments

© Coats Group plc | Introduction to Coats | April 2016 Page 41
Income statement
Adjusted EPS up 28% to 3.96c at
actual currency (up 38% LFL):
• Gross margin up 120bps due to lower
input prices, productivity and non-raw
material procurement improvements
• SD&A%sales 20bps lower than prior
year due to focus on operating costs
• 600bps improvement in underlying
tax rate (see slide 23)
Increase in finance costs due to $19m
FX gain on parent group cash in 2014
(slide 22)
Attributable loss of $46m driven by:
• $23m of exceptional items (see
slide 21)
• $76m charge related to sale of loss-
making EMEA Crafts (see slide 25)
$mBefore
exceptional
items
Exceptional
itemsTotal
Before
exceptional
items
Exceptional
itemsTotal
Revenue 1,490 - 1,490 1,561 - 1,561
Gross Profit 561 (10) 551 568 - 568
SD&A (421) (12) (433) (445) (20) (465)
Operating profit 139 (22) 118 123 (20) 103
Share of profit of JVs 1 (1) - 2 - 2
Finance costs (31) - (31) (8) - (8)
Profit before tax 110 (23) 87 117 (20) 97
Tax (46) 0 (46) (45) (0) (45)
Profit after tax 64 (23) 41 72 (20) 52
Loss from discontinued operations (13) (63) (76) (8) (19) (27)
Profit / (Loss) for the period 51 (86) (35) 64 (39) 25
Minority interest (11) - (11) (10) - (10)
Attributable Profit / (Loss) 40 (86) (46) 54 (39) 15
EPS (cents) - reported (3.30) 1.06
EPS (cents) - reported continuing 2.09 3.00
Adjusted EPS (cents) 3.96 3.09
2015 2014

© Coats Group plc | Introduction to Coats | April 2016 Page 42
Finance costs and foreign exchange movements
Operational
• $3m reduction in interest due to lower cost of local
financing and end of fixed interest rate swaps
• $3m increase in investment income primarily
related to compensation received in respect of an
historical compulsory state financing arrangement
in Latin America
Parent group
• Interest income lower due reduced rate GBP/USD
vs NZD/AUS rate and parent group cash balance
• $3m FX loss (2014: $19m gain) on parent group
cash driven by movements between GBP, NZD
and AUD; cash now held in GBP
Pensions
• $6m increase in IAS19 pensions interest charges
due to higher deficit at end of 2014
$m 2015 2014
Operational items
- Interest on bank and other borrowings (17) (20)
- Investment income from operating activities 5 2
- Other (4) (6)
Total operational items (16) (25)
Parent Group
- Investment income on parent group cash 5 9
- FX (losses) / gains on parent group cash (3) 19
Total group items 2 28
Pension finance costs (17) (11)
Total finance costs (31) (8)

© Coats Group plc | Introduction to Coats | April 2016 Page 43
Taxation
• Reported tax rate 53%
• Underlying tax rate (UTR)1 reduced by 600bps to
35%
- Change in mix as regions with lower statutory
tax rates contributed higher profits
- Reduction in unrelieved losses and withholding
taxes suffered
• UTR has been reduced 20 percentage points in
the last four years
- Benefits EPS and free cash flow
• Tax cash outflow in 2015 of $49m, 38% of
adjusted PBT3 (2014: 48%)
(1) Pre-exceptional items, IAS19 interest and foreign exchange gains/losses on parent group cash
(2) 2012 and 2013 rate based on Coats operating business (as previously reported). 2014 and 2015
based on Coats Group basis
(3) Adjusted for exceptional items
Tax PBT % Tax PBT %
As reported (46) 87 53% (45) 97 47%
Exceptional items (0) 22 (0) 20
JV impairment - 1 - -
FX losses on parent group
cash- 3 - (19)
Pension interest IAS19 0 17 - 11
Underlying tax rate (46) 130 35% (45) 109 41%
Cash outflow (49) 38% (52) 48%
$m 2015 2014
2

© Coats Group plc | Introduction to Coats | April 2016 Page 44
Discontinued - EMEA Crafts
• Loss of $76m in related to sale of
loss-making EMEA Crafts business
• $13m related to trading loss generated for
the year (2014: $7m pre-exceptional loss)
• Loss on disposal of $56m included:
- $17m cash retained in the business and
$37m net working capital sold
- $14m of other assets and liabilities,
including $12m disposal related costs
and completion adjustments
- Partly offset by $12m of pensions and
other liabilities transferred to buyer
• Net exchange loss of $7m
• $24m loss recognised in H2 (H1: $52m)
included additional trading losses, disposal
related costs, completion adjustments and
net exchange loss(1) Includes cash of $2m payable to buyer after 31 July completion
(2) Includes disposal related costs and completion adjustments
$m 2015 H1 H2
Trading loss (13) (6) (7)
Cash retained in the business 1 (17) (17) -
Net working capital (37) (34) (3)
Pensions and other provisions 12 12 -
Other assets and liabilities 2 (14) (7) (7)
Loss on disposal (56) (46) (10)
Historic exchange losses (7) - (7)
Loss from discontinued items (76) (52) (24)

© Coats Group plc | Introduction to Coats | April 2016 Page 45
US environmental - Lower Passaic River (LPR), New Jersey, USA
• US Environmental Protection Agency (EPA) notified Coats, and many other companies, of potential
responsibility for certain historical environmental costs on a 17 mile stretch of the LPR
• In 2015 a Cooperating Parties Group (CPG), of which Coats is one of ~55 members, submitted a
remedial investigation and feasibility study (RI/FS) of the entire 17 miles with an estimated cost of
$518-772m (undiscounted); consequently in H1’15 Coats recorded a $6m charge, net of insurance
• In March 2016 the EPA issued a Record of Decision selecting a remedy for the lower 8 miles at an
estimated cost of $1.38bn (NPV) - did not include a remedial decision for the upper 9 miles;
consequently Coats recorded an additional $6.8m charge
• Coats believes it did not generate any contaminants which are driving remedial actions, it has valid
legal defences, it is a de minimis party and additional parties not currently in the CPG will be
responsible for a significant share of the ultimate costs
• Negotiations among parties and with the EPA, remedial design and implementation of remedial
action are expected to take more than 10 years
• Additional revisions may be appropriate depending on future developments
Non-operating items
© Coats Group plc | Introduction to Coats | April 2016 Page 46
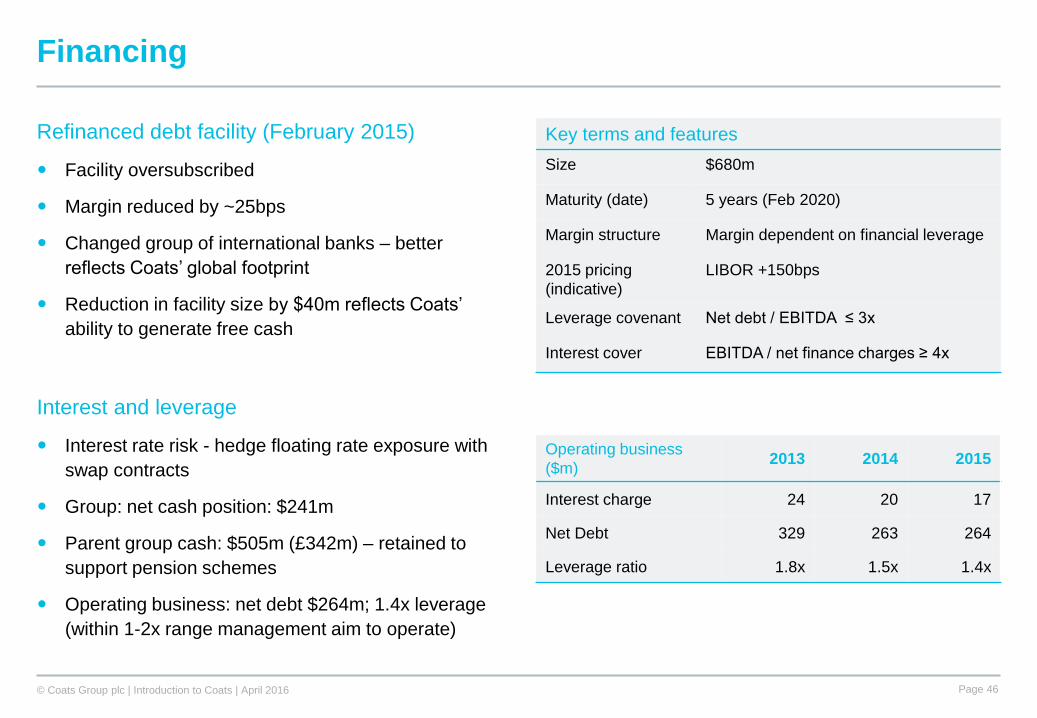
Financing
Refinanced debt facility (February 2015)
Facility oversubscribed
Margin reduced by ~25bps
Changed group of international banks – better
reflects Coats’ global footprint
Reduction in facility size by $40m reflects Coats’
ability to generate free cash
Interest and leverage
Interest rate risk - hedge floating rate exposure with
swap contracts
Group: net cash position: $241m
Parent group cash: $505m (£342m) – retained to
support pension schemes
Operating business: net debt $264m; 1.4x leverage
(within 1-2x range management aim to operate)
Key terms and features
Size $680m
Maturity (date) 5 years (Feb 2020)
Margin structure Margin dependent on financial leverage
2015 pricing
(indicative)
LIBOR +150bps
Leverage covenant Net debt / EBITDA ≤ 3x
Interest cover EBITDA / net finance charges ≥ 4x
Operating business
($m)2013 2014 2015
Interest charge 24 20 17
Net Debt 329 263 264
Leverage ratio 1.8x 1.5x 1.4x
© Coats Group plc | Introduction to Coats | April 2016 Page 47
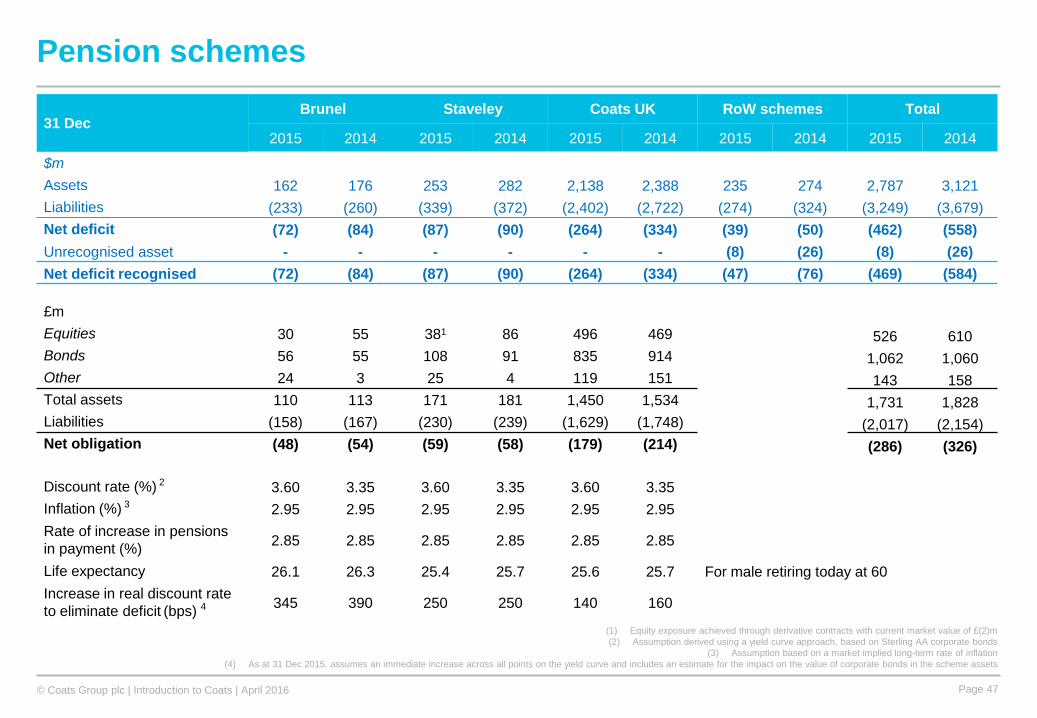
Pension schemes
(1) Equity exposure achieved through derivative contracts with current market value of £(2)m
(2) Assumption derived using a yield curve approach, based on Sterling AA corporate bonds
(3) Assumption based on a market implied long-term rate of inflation
(4) As at 31 Dec 2015. assumes an immediate increase across all points on the yield curve and includes an estimate for the impact on the value of corporate bonds in the scheme assets
31 DecBrunel Staveley Coats UK RoW schemes Total
2015 2014 2015 2014 2015 2014 2015 2014 2015 2014
$m
Assets 162 176 253 282 2,138 2,388 235 274 2,787 3,121
Liabilities (233) (260) (339) (372) (2,402) (2,722) (274) (324) (3,249) (3,679)
Net deficit (72) (84) (87) (90) (264) (334) (39) (50) (462) (558)
Unrecognised asset - - - - - - (8) (26) (8) (26)
Net deficit recognised (72) (84) (87) (90) (264) (334) (47) (76) (469) (584)
£m
Equities 30 55 381 86 496 469 526 610
Bonds 56 55 108 91 835 914 1,062 1,060
Other 24 3 25 4 119 151 143 158
Total assets 110 113 171 181 1,450 1,534 1,731 1,828
Liabilities (158) (167) (230) (239) (1,629) (1,748) (2,017) (2,154)
Net obligation (48) (54) (59) (58) (179) (214) (286) (326)
Discount rate (%) 2 3.60 3.35 3.60 3.35 3.60 3.35
Inflation (%) 3 2.95 2.95 2.95 2.95 2.95 2.95
Rate of increase in pensions
in payment (%)2.85 2.85 2.85 2.85 2.85 2.85
Life expectancy 26.1 26.3 25.4 25.7 25.6 25.7 For male retiring today at 60
Increase in real discount rate
to eliminate deficit (bps) 4345 390 250 250 140 160

© Coats Group plc | Introduction to Coats | April 2016 Page 48
For more information
Jaideep Thatai
Head of Investor Relations
+44 20 8210 5086
Coats Group plc
www.coats.com