An alkaline active feruloyl-CoA synthetase from soil ...
21
RESEARCH ARTICLE An alkaline active feruloyl-CoA synthetase from soil metagenome as a potential key enzyme for lignin valorization strategies Victoria Sodre ´ 1,2☯‡ , Juscema ´ cia Nascimento Araujo 3☯‡ , Thiago Augusto Gonc ¸ alves 2,4☯‡ , Natha ´ lia Vilela 2,4 , Antonio Sergio Kimus Braz 3 , Telma Teixeira Franco 1 , Ma ´ rio de Oliveira Neto 5 , Andre ´ Ricardo de Lima Damasio 2 , Wanius Garcia ID 3 , Fabio Marcio Squina ID 1,4 * 1 Faculty of Chemical Engineering, University of Campinas (UNICAMP), Campinas, SP, Brazil, 2 Department of Biochemistry and Tissue Biology, Institute of Biology, University of Campinas (UNICAMP), Campinas, SP, Brazil, 3 Centro de Ciências Naturais e Humanas, Universidade Federal do ABC (UFABC), Santo Andre ´ , SP, Brazil, 4 Programa de Processos Tecnolo ´ gicos e Ambientais, Universidade de Sorocaba (UNISO), Sorocaba, SP, Brazil, 5 Departamento de Fı ´sica e Biofı ´sica, Instituto de Biociências, Universidade Estadual Paulista (UNESP), Botucatu, SP, Brazil ☯ These authors contributed equally to this work. ‡ These authors are shared first-authors on this work. * [email protected] Abstract Ferulic acid (FA), a low-molecular weight aromatic compound derived from lignin, repre- sents a high-value molecule, used for applications in the cosmetic and pharmaceutical industries. FA can be further enzymatically converted in other commercially interesting mol- ecules, such as vanillin and bioplastics. In several organisms, these transformations often start with a common step of FA activation via CoA-thioesterification, catalyzed by feruloyl- CoA synthetases (Fcs). In this context, these enzymes are of biotechnological interest for conversion of lignin-derived FA into high value chemicals. In this study, we describe the first structural characterization of a prokaryotic Fcs, named FCS1, isolated from a lignin-degrad- ing microbial consortium. The FCS1 optimum pH and temperature were 9 and 37˚C, respec- tively, with Km of 0.12 mM and Vmax of 36.82 U/mg. The circular dichroism spectra indicated a notable secondary structure stability at alkaline pH values and high tempera- tures. This secondary structure stability corroborates the activity data, which remains high until pH 9. The Small Angle X-Ray Scattering analyses resulted on the tertiary/quaternary structure and the low-resolution envelope in solution of FCS1, which was modeled as a homodimer using the hyperthermophilic nucleoside diphosphate-forming acetyl-CoA syn- thetase from Candidatus Korachaeum cryptofilum. This study contributes to the field of research by establishing the first biophysical and structural characterization for Fcs, and our data may be used for comparison against novel enzymes of this class that to be studied in the future. PLOS ONE | https://doi.org/10.1371/journal.pone.0212629 February 25, 2019 1 / 21 a1111111111 a1111111111 a1111111111 a1111111111 a1111111111 OPEN ACCESS Citation: Sodre ´ V, Araujo JN, Gonc ¸alves TA, Vilela N, Braz ASK, Franco TT, et al. (2019) An alkaline active feruloyl-CoA synthetase from soil metagenome as a potential key enzyme for lignin valorization strategies. PLoS ONE 14(2): e0212629. https://doi.org/10.1371/journal.pone.0212629 Editor: Ligia O. Martins, Universidade Nova de Lisboa, PORTUGAL Received: September 10, 2018 Accepted: February 6, 2019 Published: February 25, 2019 Copyright: © 2019 Sodre ´ et al. This is an open access article distributed under the terms of the Creative Commons Attribution License, which permits unrestricted use, distribution, and reproduction in any medium, provided the original author and source are credited. Data Availability Statement: All relevant data are within the paper and its Supporting Information files. Funding: This work was financially supported by grants from Fundac ¸ão de Amparo à Pesquisa do Estado de São Paulo (FAPESP; 15/50590-4, 15/ 50612-8, 17/17275-3 and 17/22669-0) and Conselho Nacional de Desenvolvimento Cientı ´fico e Tecnolo ´gico (CNPq; 305748/2017-3, 305740/ 2017-2 and 304816/2017-5). TAG and JNA were supported by FAPESP fellowship (17/16089-1 and
-
Upload
khangminh22 -
Category
Documents
-
view
0 -
download
0
Transcript of An alkaline active feruloyl-CoA synthetase from soil ...
RESEARCH ARTICLE
An alkaline active feruloyl-CoA synthetase
from soil metagenome as a potential key
enzyme for lignin valorization strategies
Victoria Sodre1,2☯‡, Juscemacia Nascimento Araujo3☯‡, Thiago Augusto Goncalves2,4☯‡,
Nathalia Vilela2,4, Antonio Sergio Kimus Braz3, Telma Teixeira Franco1, Mario de Oliveira
Neto5, Andre Ricardo de Lima Damasio2, Wanius GarciaID3, Fabio Marcio SquinaID
1,4*
1 Faculty of Chemical Engineering, University of Campinas (UNICAMP), Campinas, SP, Brazil,
2 Department of Biochemistry and Tissue Biology, Institute of Biology, University of Campinas (UNICAMP),
Campinas, SP, Brazil, 3 Centro de Ciências Naturais e Humanas, Universidade Federal do ABC (UFABC),
Santo Andre, SP, Brazil, 4 Programa de Processos Tecnologicos e Ambientais, Universidade de Sorocaba
(UNISO), Sorocaba, SP, Brazil, 5 Departamento de Fısica e Biofısica, Instituto de Biociências, Universidade
Estadual Paulista (UNESP), Botucatu, SP, Brazil
☯ These authors contributed equally to this work.
‡ These authors are shared first-authors on this work.
Abstract
Ferulic acid (FA), a low-molecular weight aromatic compound derived from lignin, repre-
sents a high-value molecule, used for applications in the cosmetic and pharmaceutical
industries. FA can be further enzymatically converted in other commercially interesting mol-
ecules, such as vanillin and bioplastics. In several organisms, these transformations often
start with a common step of FA activation via CoA-thioesterification, catalyzed by feruloyl-
CoA synthetases (Fcs). In this context, these enzymes are of biotechnological interest for
conversion of lignin-derived FA into high value chemicals. In this study, we describe the first
structural characterization of a prokaryotic Fcs, named FCS1, isolated from a lignin-degrad-
ing microbial consortium. The FCS1 optimum pH and temperature were 9 and 37˚C, respec-
tively, with Km of 0.12 mM and Vmax of 36.82 U/mg. The circular dichroism spectra
indicated a notable secondary structure stability at alkaline pH values and high tempera-
tures. This secondary structure stability corroborates the activity data, which remains high
until pH 9. The Small Angle X-Ray Scattering analyses resulted on the tertiary/quaternary
structure and the low-resolution envelope in solution of FCS1, which was modeled as a
homodimer using the hyperthermophilic nucleoside diphosphate-forming acetyl-CoA syn-
thetase from Candidatus Korachaeum cryptofilum. This study contributes to the field of
research by establishing the first biophysical and structural characterization for Fcs, and our
data may be used for comparison against novel enzymes of this class that to be studied in
the future.
PLOS ONE | https://doi.org/10.1371/journal.pone.0212629 February 25, 2019 1 / 21
a1111111111
a1111111111
a1111111111
a1111111111
a1111111111
OPEN ACCESS
Citation: Sodre V, Araujo JN, Goncalves TA, Vilela
N, Braz ASK, Franco TT, et al. (2019) An alkaline
active feruloyl-CoA synthetase from soil
metagenome as a potential key enzyme for lignin
valorization strategies. PLoS ONE 14(2): e0212629.
https://doi.org/10.1371/journal.pone.0212629
Editor: Ligia O. Martins, Universidade Nova de
Lisboa, PORTUGAL
Received: September 10, 2018
Accepted: February 6, 2019
Published: February 25, 2019
Copyright: © 2019 Sodre et al. This is an open
access article distributed under the terms of the
Creative Commons Attribution License, which
permits unrestricted use, distribution, and
reproduction in any medium, provided the original
author and source are credited.
Data Availability Statement: All relevant data are
within the paper and its Supporting Information
files.
Funding: This work was financially supported by
grants from Fundacão de Amparo à Pesquisa do
Estado de São Paulo (FAPESP; 15/50590-4, 15/
50612-8, 17/17275-3 and 17/22669-0) and
Conselho Nacional de Desenvolvimento Cientıfico e
Tecnologico (CNPq; 305748/2017-3, 305740/
2017-2 and 304816/2017-5). TAG and JNA were
supported by FAPESP fellowship (17/16089-1 and

Introduction
Lignocellulosic biomass harbors a barely explored mine of fermentable sugars and aromatic
polymers as structural components. The cellulose and lignin fractions represent the first and
second most abundant sources of organic carbon on Earth, respectively, rendering lignocellu-
lose as an attractive possibility for alternative resource of fuels and chemicals [1].
In comparison with first generation biofuels, which utilize sucrose or starch as source of fer-
mentable sugars, the lignocellulosic biomass-reliant second-generation counterparts are con-
sidered more cost-effective and less threatening to food security and land usage policies [2].
Nevertheless, the full implementation of second generation biorefineries is hindered by con-
siderable technological and economical hurdles, including feedstock recovery, biomass pre-
treatment, enzymatic hydrolysis, fermentation optimization and biofuel separation [3,4]. In
this context, lignin conversion and valorization has emerged as a possible solution for both
cost-effectiveness of second-generation biorefineries and excessive reliance on petroleum-
derived chemicals [5–7]. It is predicted that the amount of lignin residue from cellulosic biore-
fineries solely in the USA will reach as much as 62 million tons per year [8], denoting the great
opportunity of valorizing this stream into high-market compounds.
Several research groups are currently focusing in strategies for lignin valorization, mainly
exploring chemical catalysis and biological degradation approaches. The latter revolves around
“mimicking” nature’s strategies for lignin degradation and consequent carbon cycling, mainly
through the identification, characterization and improvement of lignin-degrading organisms
and their enzymes. Traditionally, white-rot fungi are the best characterized lignin degraders
and there is extensive literature on the enzymatic mechanisms of fungal lignin peroxidases
[9,10]. Recently, bacterial degraders have also been the focus of research, not only concerning
their capability of lignin depolymerization, but also the catabolism of aromatic molecules
derived from its breakdown [11–13]. Therefore, there is great opportunity for genetic and met-
abolic engineering of microbial pathways, aiming the conversion of lignin in value-added
products [14–16]. FA is the precursor of subunit guaiacyl in lignin biosynthesis, is near ubiqui-
tous in plant cells walls of various grasses, where it endows structural rigidity and resistance by
cross-linking to pentosan, arabinoxylans and hemicelluloses [17]. As biorefineries adapt to
meet the cellulosic ethanol production goals, it is expected that FA, as other cinnamic acid
derivatives, will play a major role as resources for bioproducts. Indeed, several studies have
demonstrated the successful production of vanillin [18–20] and bioplastics [21] from FA
derived from lignin streams and lignocellulosic biomass.
In prokaryotes, FA catabolism occurs via four major pathways: non β-oxidation, β-oxida-
tion, non-oxidative decarboxylation, and side-chain reduction [22]. The first two pathways
employ Fcs as initial step, by catalyzing the CoA-thioesterification of FA in feruloyl-CoA, with
ATP consumption. The subsequent reactions direct the intermediates towards ring fission by
the central metabolism, usually via vanillin and, posteriorly, through the protocatechuate
4,5-cleavage pathway.
Physiologically, this class of enzymes is of particular importance in the sensing of aromatic
molecules by microorganisms and activation of respective pathways. The product of the reac-
tion catalyzed by Fcs, feruloyl-CoA, binds to a MarR-family transcriptional repressor and
effectively abrogates its ligation to the DNA, thus enabling the expression of genes related to
the degradation of FA and other related p-hydroxycinnamic acids in several species [23–27].
Recently, the metagenomic profiling of a lignin-degrading consortium, originated from soil of
a sugarcane plantation [28], revealed the major metabolic pathways related to degradation of
phenolic compounds, including a number of putative sequences correspondent to Fcs, denot-
ing the catabolism of FA and other p-hydroxycinnamates.
An alkaline active feruloyl-CoA synthetase from soil metagenome
PLOS ONE | https://doi.org/10.1371/journal.pone.0212629 February 25, 2019 2 / 21
2017/16976-8 respectively). VS was supported by
CAPES/PROEXFellowship and FAPESP fellowships
(2018/18101-1 and 2017/05901-7). NV was
supported by CAPES and FAPESP fellowship (17/
08166-6).
Competing interests: The authors have declared
that no competing interests exist.

Currently, the vast majority of scientific articles related to Fcs concentrate on its application
for vanillin production, when combined with the action of an enoyl-CoA hydratase/aldolase
[29–35]. In addition to that, there is literature focusing on the description of Fcs transcrip-
tional regulatory mechanism and its role in FA degradation [36–39]. Currently, there is no
solved structure of prokaryotic Fcs, as well as, a gap of studies analyzing the biophysical prop-
erties of this enzyme. In this study, it is presented a comprehensive biophysical characteriza-
tion and low-resolution envelope, along with the structural stability and biochemical
characteristics, of a Fcs, namely FCS1, which was derived from a lignin degrading consortium.
Materials and methods FCS1
Sequence and architecture analysis
FCS1 sequence (GenBank accession: MG214406) was retrieved, codon-optimized, synthetized
and cloned as previously described [28]. This previous work also showed the enzyme applica-
bility for bioproduction of vanillin, together with an enoyl-CoA hydratase/aldolase. The
domain architecture of the enzyme, named FCS1, was further evaluated using the Pfam and
SMART databases [40–42]. Calculation of biochemical and biophysical parameters for the
putative protein sequence were performed via Protparam [43] online tool. The annotation of
orthologous groups was done by comparison against the EggNOG 4.5.1 database [44]. The
phylogenetic tree was built with MEGA 7 [45].
Expression and purification of recombinant FCS1
The cells from a single colony of E. coli BL21 (DE3) containing the construction pET28a-FCS1
were grown in liquid LB medium supplemented with kanamycin (50 μg/mL) for 16 h at 37˚C
and 200 rpm. 8 mL of the overnight culture were used to inoculate 800 mL of fresh LB-kana-
mycin medium, followed by incubation at 37˚C and 200 rpm until the optical density (OD) at
600 nm reached a value of 0.6–0.8. To induce recombinant protein expression, isopropyl β-D-
1-thiogalactopyranoside (IPTG) was added to the culture to a final concentration of 0.5 mM,
followed by incubation at 30˚C, 200 rpm for 4 h. After expression, the culture media was cen-
trifuged at 10,000 rpm, 4˚C for 15 min and the cell pellet was kept at -20˚C.
The cell pellet was resuspended in buffer A (20 mM sodium phosphate buffer pH 7.0, 100
mM NaCl, 5 mM imidazole) containing 0.3 mg/mL of lysozyme, 1 mM of DNase and 5 mM of
phenylmethane sulfonyl fluoride (PMSF). Following incubation at room temperature for 1 h,
under agitation, the cells were disrupted in ice bath by an ultrasonic processor (10 pulses of 30
s at 30% duty cycle; Ultrasonic Homogenizer 4710 Series, Cole-Palmer Instruments). The solu-
ble protein fractions were obtained by centrifugation for 1 h and 30 min at 8,000 rpm, 4˚C,
and the resulting supernatant was filtered once in 0.45 μm and twice in 0.22 μm filters. The
final solution containing the protein of interest was purified by affinity chromatography in
AKTA Start system (GE Healthcare, Waukesha, WI, USA) using a 5 mL HiTrap Chelating HP
column (GE Healthcare) charged with Co2+ and pre-equilibrated with buffer A. Elution of
FCS1 was achieved using a 0–100% linear gradient of buffer B (20 mM sodium phosphate
buffer pH 7.0, 100 mM NaCl, 500 mM imidazole). Afterwards, the eluted protein was further
purified by size-exclusion chromatography using a Superdex 200 HiLoad 16/600 GL column
(GE Healthcare) in buffer C (20 mM sodium phosphate buffer pH 7.4, 100 mM NaCl). Buffer
Exchange and protein concentration were performed using Amicon device (Merck, USA).
The concentration of purified FCS1 was measured by DeNovix DS-11 spectrophotometer
(ε280nm = 43,570 M-1cm-1) (Uniscience, USA) and by Bradford quantification [46]. Sodium
dodecyl sulfate-polyacrilamide gel electrophoresis (SDS-PAGE) was performed using a 12.5%
gel in a Mini-PROTEAN Tetra System electrophoresis cell (Bio-Rad, Hercules, CA, USA). The
An alkaline active feruloyl-CoA synthetase from soil metagenome
PLOS ONE | https://doi.org/10.1371/journal.pone.0212629 February 25, 2019 3 / 21

gel was stained with Coomassie brilliant blue R250 for 3 h and distained in distilled water
overnight.
Enzymatic assay
The enzymatic assays were adapted from previously described methods [47,48], the schematic
reaction was included in S1 Fig. The reaction mixture (200 μL) contained 2.5 mM of MgCl2,
0.5 mM of FA, 2.0 mM of ATP, 0.4 mM of coenzyme A, 40 ng of purified FCS1 and 100 mM
of potassium phosphate buffer pH 7.8. The activity assay was initiated by the addition of the
enzyme and incubated at 37˚C for 10 min. Following incubation, 150 μL of the reaction were
used to read the absorbance at 345 nm due to formation of feruloyl-CoA (ε345nm = 1.9 x 10⁴
M-1cm-1), using an Epoch2 Microplate Reader spectrophotometer (BioTek, Winooski, VT,
USA).
For determination of kinetic parameters of FCS1, the above reaction was assayed with sub-
strate concentrations ranging from 0.05 mM to 0.50 mM. Mathematical adjustments were
made using the software Graph Pad Prism 5.0 (GraphPad Software) to calculate the parame-
ters. The assays were performed in triplicate and at least three independent experiments were
carried out.
Influence of pH and temperature in enzymatic activity and stability
The temperature range from 15˚C to 90˚C was chosen for determination of FCS1 optimal tem-
perature. A total volume of 200 μL reactions (as described above) were incubated at the tem-
perature range in a T100 thermocycler (BioRad, Hercules, CA, USA) for 5 min, using the assay
do conditions described above.
The enzymatic activity in a range of pHs was assayed in either 100 mM potassium phos-
phate buffer (pHs 5.8–8.0) or 20 mM (acetate-borate-phosphate) buffer (pHs 7.4–9.4). After
stopping FCS1 reaction by heat inactivation (70˚C for 15 min), the was pH neutralized to 7.8
by adding a highly ionic strength buffer (phosphate buffer at 2 M). Then, the volume of 150 μL
of each reaction were collected and absorbance at 345 nm was read immediately. As controls,
reactions without added enzyme were used for each temperature and pH value evaluated. All
reactions and controls were made in triplicate and the average values reported. All initial
assays were conducted with an additional control containing FA and heat-inactivated enzyme.
For thermostability determination, purified FCS1 in 100 mM potassium phosphate buffer
pH 7.0 was incubated at room temperature, 25, 37, 45, 70 and 85˚C for 15, 30 and 60 min. For
evaluation of enzyme stability in different pHs, 400 ng of purified FCS1 was incubated for 1, 5
and 24 h in 20 mM ABF buffer, pH 7.0–10.0, at 4 ºC. Residual activity was assayed as described
in the enzymatic assay topic (incubation at 37˚C for 10 min) and immediately read at 345 nm.
Molecular modeling and conservation analysis
The servers for remote protein homology detection HHPRED [49] and PHYRE2 [50] were
used to search for homologs for FCS1 in the Protein Data Bank (PDB) [51]. Molecular model
for FCS1 was built using homology-modeling methods and the MODELLER software [52].
The alignment of the amino acids sequence of FCS1 against the amino acids sequence of NDP-
forming acetyl-CoA synthetase from the hyperthermophilic archaeon Candidatus Korachaeumcryptofilum (ckcACD) [53] was used as input to the MODELLER software, together with the
atomic coordinates of the latter (PDB 4XYL, dimeric structure) used as template. The homol-
ogy model was modeled as a dimer. The template (PDB 4XYL) has 4 chains (A, B, C and D).
The chains A and B served as templates for the chain A of our model (monomer), while the
chains C and D served as templates for the chain B of our model. Sequences were aligned with
An alkaline active feruloyl-CoA synthetase from soil metagenome
PLOS ONE | https://doi.org/10.1371/journal.pone.0212629 February 25, 2019 4 / 21

Protein BLAST [54]. Conservation analysis was conducted with T-Coffee [55] software using
1.002 sequences with E-value < 1e-100.
Dynamic Light Scattering (DLS)
The hydrodynamic radius (RH) of the FCS1 was determined by dynamic light scattering (Zeta-
sizer, Malvern Instruments Ltd, Malvern, UK). This system employs a fixed scattering angle of
173o. DLS measurements for FCS1 were performed at 1 mg/mL in 20 mM Tris-HCl buffer
adjusted at pH 7. The hydrodynamic radius was converted to molecular mass (kDa) consider-
ing a spherical molecule and using the Zetasizer software.
Small-angle X-ray scattering (SAXS) data collection and analysis
The SAXS measurements were performed at the SAXS beamline of National Synchrotron
Light Laboratory (LNLS, Campinas, Brazil). SAXS measurements for FCS1 were performed at
1 and 5 mg/mL in 20 mM Tris-HCl buffer adjusted at pH 7. The samples were centrifuged at
16,000xg for 10 min (at 4 oC) and then loaded into a 1 mm path length cell made of two thin
parallel mica windows and maintained at 20 oC during the measurements. The wavelength of
the X-ray beam was 1.48 Å and the sample-to-detector distance (1 m) was adjusted to record
the scattering intensity for q values ranging from 0.013 to 0.340 Å-1. A total of five successive
frames of 60 s were recorded for each sample and buffer scattering was measured before each
sample scattering. The X-ray patterns were recorded employing a two-dimensional CCD
detector (MarResearch, USA) and the integration were performed by the FIT2D software [56].
The scattering of water measured on the same sample cell was used to normalize the data to
absolute scale. The distance distribution function was evaluated using the GNOM software
[57]. At least eight dummy atom models (DAMs) were calculated using the DAMMIN soft-
ware [58] without imposing any symmetry restrictions, and the resulting models were com-
pared with each other using the DAMAVER software [59]. The CRYSOL software [60] was
used to generate theoretical scattering curves from the three-dimensional structures. The
atomic coordinates of the low-resolution model of FCS1 are available from the corresponding
author upon request.
Circular dichroism (CD) spectroscopy
The CD spectra were measured using a Jasco J-815 spectropolarimeter. FCS1 concentration
was 10 μM (0.75 mg/mL) in 20 mM acetate–borate–phosphate buffer adjusted at different pH
values (pH 3, 4, 6, 7, 8, 9 and 10). FCS1 was incubated overnight in the corresponding buffer
prior to measurements. All spectra were measured using a 1 mm quartz cuvette at 20 oC over
the wavelength range from 190 to 270 nm. For each pH value, eight scans (obtained on degree
scale, mdeg) were averaged to form the final CD spectrum. Furthermore, CD measurements
were collected at pH 7 and different temperature values (20, 60, 70 and 90 oC). The buffer con-
tribution was subtracted in each of the experiments.
Fluorescence spectroscopy
The Fluorescence emission measurements were performed on a steady-state spectrofluorome-
ter model Cary Eclypse Varian. FCS1 concentration was 5 μM (0.38 mg/mL) in 20 mM ace-
tate–borate–phosphate buffer adjusted at different pH values (pH 3, 4, 6, 7, 8, 9 and 10). FCS1
was incubated overnight in the corresponding buffer prior to measurements. The three trypto-
phan residues of FCS1 were excited at 295 nm (20 oC) and the fluorescence emission was
An alkaline active feruloyl-CoA synthetase from soil metagenome
PLOS ONE | https://doi.org/10.1371/journal.pone.0212629 February 25, 2019 5 / 21

measured from 300 to 450 nm. The buffer contribution was subtracted in each of the experi-
ments. The measurements were made in triplicate and the average values reported.
Electrophoretic light scattering (ELS)
The ELS measurements were performed on a Zetasizer Nano ZS (Malvern) [61,62]. The mea-
surements were performed using a fixed FCS1 concentration of 13.4 μM (1 mg/mL) in 20 mM
acetate–borate–phosphate buffer adjusted at different pH values. FCS1 was incubated over-
night in the corresponding buffer prior to ELS measurements.
Results and discussion
FCS1 sequence has three conserved domains
The domain architecture of FCS1 is characteristic of the superfamily of nucleoside diphos-
phate-forming (NDP-forming) acyl-CoA synthetases, which includes other enzymes that cata-
lyze the CoA-activation of acids in corresponding thioesters, such as ATP citrate lyases,
pimeloyl-CoA synthetases and maloyl-CoA synthetases (Fig 1). Notably, this superfamily also
includes members that catalyze the opposite reaction, through conversion of CoA-thioesters in
acids, coupled with substrate-level phosphorylation (e.g. succinyl-CoA synthetases and NDP-
forming acetyl-CoA synthetases) [63].
The CoA-binding proteins catalyze a myriad of reactions, reflecting the wide array of CoA
binding modes observed in nature [64]. In the case of FCS1, the CoA-binding domain presents
a Rossmann fold, which has been shown to bind the 3’-phosphate moiety of the CoA molecule
in E. coli succinyl-CoA synthetase alpha chain (SCSα, PDB: 1SCU_A) [65]. The same confor-
mation was observed in ckcACD, an NDP-forming acetyl-CoA synthetase with known crystal-
lographic structure, from the hyperthermophilic archaeon ckcACD (PDB: 4XYL_A). Both
examples (ecSCSα and ckcACD) display the thiol group of the CoA molecule pointed towards
a conserved histidine residue, located in the CoA-ligase domain. This residue is also conserved
in FCS1 (His267) and has been shown, in ecSCSα, to be transiently phosphorylated during the
course of the reaction, therefore acting as an intermediate step between ADP + Pi and ATP.
The conserved phospho-histidine residue is also present in FCS1 closest orthologues and
homologues, as shown in Fig 1.
The comparison of FCS1 amino acids sequence against the NCBI-nr database, using the
BLASTp Suite alignment tool, showed high sequential identity values with a CoA-binding pro-
tein from Altererythrobacter sp. Root672 (89% identity, accession number WP_055917331.1),
Altererythrobacter atlanticus (88% identity, accession number WP_046904613.1) and Sphingo-
monadales bacterium 12-68-11 (88% identity, accession number OYW44890.1). The aro-
matic-degrading potential of members from the Sphingomonadales family has been previously
described in the literature, notably Sphingobium sp. SYK-6 [24,38] which has a relatively well-
characterized FA metabolism. In addition, the Altererythrobacter genus has been shown to
populate halotolerant lignocellulose degrading microbial consortia [66] and also to be able to
degrade petroleum-derived aromatics [67,68].
FCS1 is a mesophilic alkaline enzyme
The coding sequence of FCS1 was cloned into pET-28a(+), in fusion with a His6-tag sequence,
for heterologous expression in E. coli BL21(DE3). The presence of the N-terminal His6-tag
allowed purification by affinity chromatography, which was followed by an extra purification
step by size exclusion chromatography (SEC). In Fig 2, an intense band corresponding to the
An alkaline active feruloyl-CoA synthetase from soil metagenome
PLOS ONE | https://doi.org/10.1371/journal.pone.0212629 February 25, 2019 6 / 21

Fig 1. FCS1 domain architecture. FCS1 domain architecture compared against two closest homologues with defined structure from Pyrococcus horikoshii(2CSU); Candidatus Koracheaum cryptofilum (4XYL); and E. coli (1SCU_A), which is related protein succinyl-CoA synthetase, alpha chain. The conserved
catalytic histidine residue is highlighted in the domain architecture. PFAM domains: CoA binding-2, PF13380 (E-value = 8e-23); succynil-CoA like ligase
flavodoxin, PF13607 (E-value = 1e-40); ATP grasp_5, PF13549 (E-value = 9e-58).
https://doi.org/10.1371/journal.pone.0212629.g001
Fig 2. SDS-PAGE gel depicting FCS1 expression and purification steps. Lane M, Molecular Marker (Color Prestained Protein Standard, Broad Range, NEB);
lane 1, culture supernatant fraction immediately after IPTG addition; lane 2, cell pellet after 4 hours of IPTG-induced expression (before lysis for purification);
lane 3, leftover cell pellet after lysis; lane 4, crude extract (35 μg); lane 5, affinity chromatography fraction (10 μg); lanes 6 (2 μg), 7 (12 μg), 8 (5 μg) and 9 (3 μg)
size-exclusion chromatography fractions (elution volumes are shown). See in the supplementary material the metal affinity and size-exclusion column
chromatograms (S2 Fig).
https://doi.org/10.1371/journal.pone.0212629.g002
An alkaline active feruloyl-CoA synthetase from soil metagenome
PLOS ONE | https://doi.org/10.1371/journal.pone.0212629 February 25, 2019 7 / 21

expressed FCS1 can be observed at approximately 80 kDa, which agrees with the predicted
molecular mass of 74.9 kDa.
The Fig 3B represents the optimum pH for FCS1 enzymatic activity. In 100 mM potassium
phosphate buffer, the FCS1 showed poor activity in acidic conditions, which increased rapidly
from pH 7.0 onwards, reaching its maximum at pH 7.8. Using the ABF buffer, the FCS main-
tained accentuated enzymatic activity at alkaline conditions until pH 9. The high enzymatic
activity at alkaline pH was further confirmed by capillary zone electrophoresis, depicting the
appearance of feruloyl-CoA as product of reaction (S3 Fig). The stability of enzyme activity
under alkaline conditions was also monitored after incubation for 1, 5 and 24h in ABF buffer
at pH 7.0, 8.0, 9.0 and 10.0 (Fig 3D). Remarkably, the relative activity remained as high as 60%
and 40% after prolonged incubation (24 h) in pH 8.0 and 9.0, respectively. This feature could
be useful for conversion of lignin streams derived from biorefineries; for instance, Brenelli
et al described a fractionation process based on acidification steps, starting from lignin derived
alkaline treatment of steam-exploded sugarcane bagasse, that resulted on soluble fractions of
pH 8.0 and 9.0 containing FA [69]. According the study, the pH of soluble fractions containing
FA show not only pH 8.0 (9.0) but also pH 4.0, 6.0, and 10.0 [69].
It is important to mention that is advisable caution when spectroscopically assaying Fcs at
alkaline pH values. The UV-spectroscopy characteristics of FA and related compound are
influenced by the nature and pH of the solvent system [70]. Indeed, as can be appreciated in S4
Fig, there is a bathochromic shift of the FA spectra from pHs 8.6 to 10.0. Friedman and Jurgens
[71] have demonstrated that FA remains stable in alkaline pHs and suggested that the pH-
induced change in FA λmax could be due to an equilibrium between ionized (pH 9) and non-
ionized (pH 8) species. According to our data, the optimum pH determined in ABF buffer was
Fig 3. Optimum temperature (A), pH (B), thermostability (C) and pH-stability for FCS1 (D).
https://doi.org/10.1371/journal.pone.0212629.g003
An alkaline active feruloyl-CoA synthetase from soil metagenome
PLOS ONE | https://doi.org/10.1371/journal.pone.0212629 February 25, 2019 8 / 21

9, which is close to the pK value of FA determined by Friedman and Jurgens. Similarly, the
4-hydroxycinnamoyl-CoA hydratase/lyase from Pseudomonas fluorescens AN103, which
uses feruloyl-CoA as substrate, showed an optimum pH value at or close to phenolic ioniza-
tion values for 4-hydroxycinnamoyl-CoA thioester [72]. The lower detectable FCS1 activity
in ABF buffer, compared to phosphate buffer, could be due to buffer influence, rather than
pH-related. It has been shown that different buffer systems could preferentially inhibit or
boost activity in the same pH. This was first observed in cinnamoyl-CoA synthetases by
Gross and Zenk [48], which demonstrated the pH optimum in potassium phosphate buffer
pH 6.7, whilst the same pH in Tris-HCl exhibit activity 70% lower. Similar results were
observed for the activity of an ω-hydroxypalmitate O-feruloyl transferase from potato [73],
which catalyzes the transfer of FA from feruloyl-CoA to 16-palmitic acid: in comparison to
potassium phosphate buffer pH 7.0, activity at the same pH in Tris-HCl buffer was approxi-
mately 40% lower.
The Fig 3A shows the optimum temperature for FCS1 enzymatic activity. The FCS1 opti-
mum temperature was 37˚C, although nearly 100% activity can be obtained at values between
30˚C and 37˚C. This is in agreement to the optimum temperature determined for other two
previously characterized feruloyl-CoA synthetases, isolated from Streptomyces sp. V-1 [35] and
Pseudomonas putida [48]. The FCS1 retains approximately 60% activity in 15˚C. Relative activ-
ity steadily decreases from 37˚C upwards, reaching a minimum of 20% at 70˚C, which remains
stable up to 90˚C.
The FCS1 thermostability (Fig 3C) was determined by incubating the enzyme at 25, 37, 45,
70 and 85˚C for up to 60 min. FCS1 activity remained high and stable at room temperature
(25˚C) during all time points (15, 30 and 60 min); at 37˚C residual activity remained maximal
up to 30 min of incubation and it steadily decreased reaching approximately 60% of residual
activity after 60 min of incubation. At 45˚C, FCS1 residual activity was reduced to 50% after 15
Table 1. Comparison of biochemical parameters from several prokaryotic feruloyl-CoA synthetases.
Organism of origin Enzyme preparation Detection of activity Specific
activity
(U/mg)
Km
(mM)
Vmax
(U/mg)
Kcat/Km
(mM -1. s-1)
Optimum
pH
Optimum
Temperature (˚C)
Reference
Unknown (lignin
consortium)
Heterologous expression in E.
coli and purification
Optical assay�/capillary
electrophoresis
30.7± 0.8 0.1 36.8 371.6 7.8 37 This work
Streptomyces sp. V-1 Heterologous expression in E.
coli and purification
Optical assay��/GC 70.6 0.4 78.2 193.4 7.0 30 [35]
Rhodococcus jostiiRHA1
Heterologous expression in E.
coli and purification
RP-HPLC/LC-MS - 0.1±0.0 - 160.0 - - [39]
Pseudomonas putida Expression and purification
from P. putidaOptical assay� 6.1 75 0.4 - 6.7 37 [48]
Amycolatopsis sp.
HR167
Soluble fraction of crude cell
extracts
Optical assay��/HPLC 105 - - - - - [36]
Pseudomonas sp.
HR199
Soluble fraction of crude
recombinant E. coli cell
extracts
Optical assay��/HPLC 0.2 - - - - - [37]
Sphingomonaspaucimobilis SYK-6
Soluble fraction of crude
recombinant E. coli cell
extracts
Optical assay�/GC-MS 0.1± 0.0 - - - - - [38]
Pseudomonasfluorescens AN103
Soluble fraction of crude cell
extracts
Optical assay� 5.8 - - - - - [74]
�Optical assay quantification done as described by Zenk and Gross [49], with ε345nm = 1.9 x 10⁴ M-1cm-1.
��Optical assay quantification using ε345nm = 10 cm2 μmol-1.
-: not determined/reported.; The error values are shown when available in the cited manuscript.
https://doi.org/10.1371/journal.pone.0212629.t001
An alkaline active feruloyl-CoA synthetase from soil metagenome
PLOS ONE | https://doi.org/10.1371/journal.pone.0212629 February 25, 2019 9 / 21
min of incubation and decreases at a regular rate until reaching a minimum of 20% after 60
min.
The specific activity of FCS1 was spectrophotometrically assayed and calculated based on
the molar extinction coefficient for feruloyl-CoA, that was first determined by Gross and Zenk
(ε345nm = 1.9 x 10⁴ M-1 cm-1) [47], rendering a value of 30.8 ± 0.8 U/mg. The FCS1 displayed
classical Michaelis-Menten kinetics (S5 Fig) the Km and Vmax values were calculated as 0.1
mM and 36.8 U/mg, respectively. The catalytic constant (kcat) is 45.9 s-1 and the catalytic effi-
ciency (Kcat/Km) is 371.6 mM-1 s-1. Table 1 compares the biochemical characteristics of FCS1
and several previously described prokaryotic feruloyl-CoA synthetases.
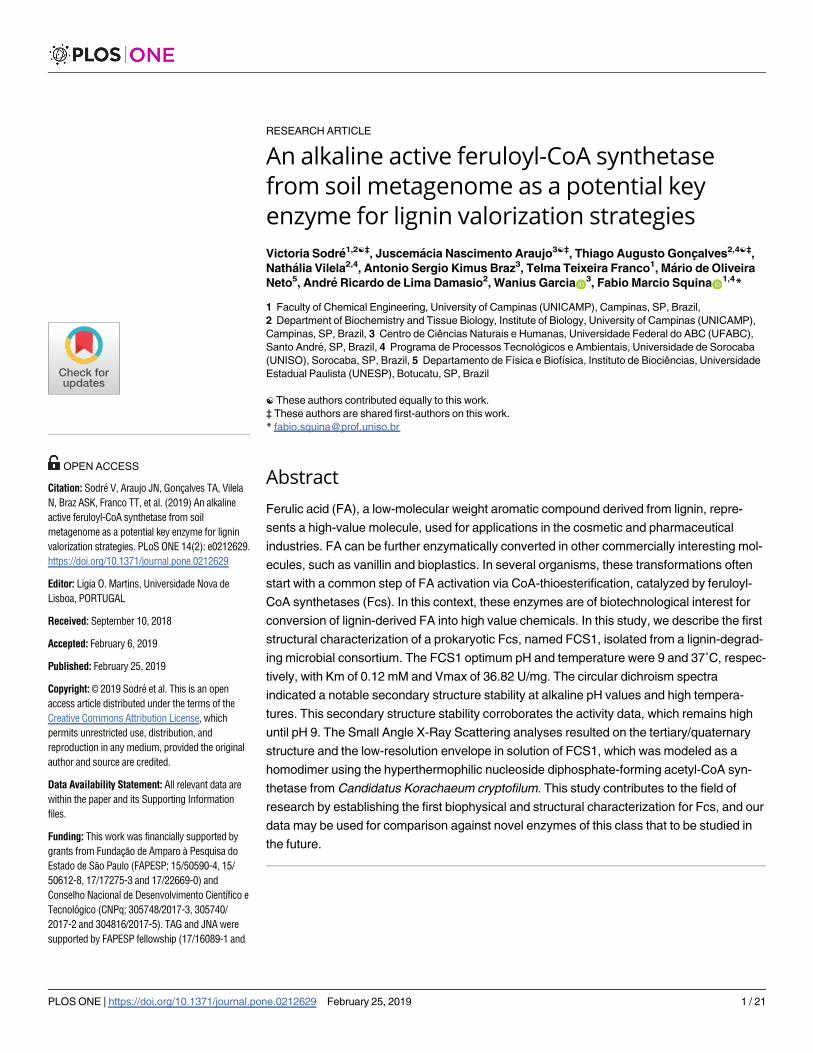
Fig 4. FCS1 homology model. N-terminal is composed by a Rossmann-like fold domain (CoA binding domain) followed by
two domains with a flavodoxin-like fold, while the C-terminal corresponding to an ATP-grasp fold where is localized the ATP-
binding site. CoA and ATP molecules are indicated in the figure and represented by colored spheres. The conserved residue
His267 is represented by pink spheres. Structural distribution of conservation. Conservation degrees were converted into color
gradients: pink—highly conserved (> 90%); white—partially conserved; green—little conserved (< 10%). Highly conserved
residues (pink) are concentrated around the CoA and ATP molecules as well as around the conserved residue His267.
https://doi.org/10.1371/journal.pone.0212629.g004
An alkaline active feruloyl-CoA synthetase from soil metagenome
PLOS ONE | https://doi.org/10.1371/journal.pone.0212629 February 25, 2019 10 / 21
An alkaline active feruloyl-CoA synthetase from soil metagenome
PLOS ONE | https://doi.org/10.1371/journal.pone.0212629 February 25, 2019 11 / 21

FCS1 forms stable homodimers in solution
The three-dimensional structure of the FCS1 was modeled using bioinformatics tools (Fig 4).
The threading methods used indicated that FCS1 presents low sequence identity (35%) when
compared with NDP-forming acetyl-CoA synthetase from the hyperthermophilic archaeon
ckcACD, however it indicated high level of confidence homology (95%) which is a very strong
indicator that FCS1 adopts a highly similar fold to that reported for ckcACD.
After nickel-affinity column, the recombinant FCS1 was applied to a size-exclusion column
(SEC) (S2 Fig). The FCS1 appeared as a single peak in the elution profile with a molecular
mass greater than 105 kDa (the largest molecular mass standard used in the experiment; see S6
Fig), indicating that the protein forms oligomers in solution, as the expected molecular mass
for FCS1 is 75 kDa. Furthermore, when FCS1 was analyzed by DLS in solution, the observed
profile was characteristic of a monodisperse protein in solution (S6 Fig). The value of hydrody-
namic radius determined for FCS1 was 5.2 ± 0.2 nm. This value corresponds to an estimated
molecular mass of 160 ± 15 kDa, considering a spherical molecule in solution, consistent with
a homodimer for FCS1 in solution.
Therefore, FCS1 was modeled as a homodimer using ckcACD crystallographic structure
(PDB 4XYL) as template. The homology model obtained for FCS1 monomer showed two dif-
ferent regions. The N-terminal region is composed of three distinct domains with a mixture of
α and β secondary structures: a domain with a Rossmann-like fold [75] (CoA binding domain)
followed by two domains with a flavodoxin-like fold [76]. The C-terminal region correspond-
ing to an ATP-grasp fold where is localized the ATP-binding site [77]. The final domain dispo-
sition obtained by 3D-modelling is in accordance to the architecture predicted by comparison
against the Pfam and SMART databases. In agreement to the homology model, several highly
conserved residues (highlighted in pink) are concentrated around the CoA and ATP mole-
cules, as well as, around the conserved residue His267.
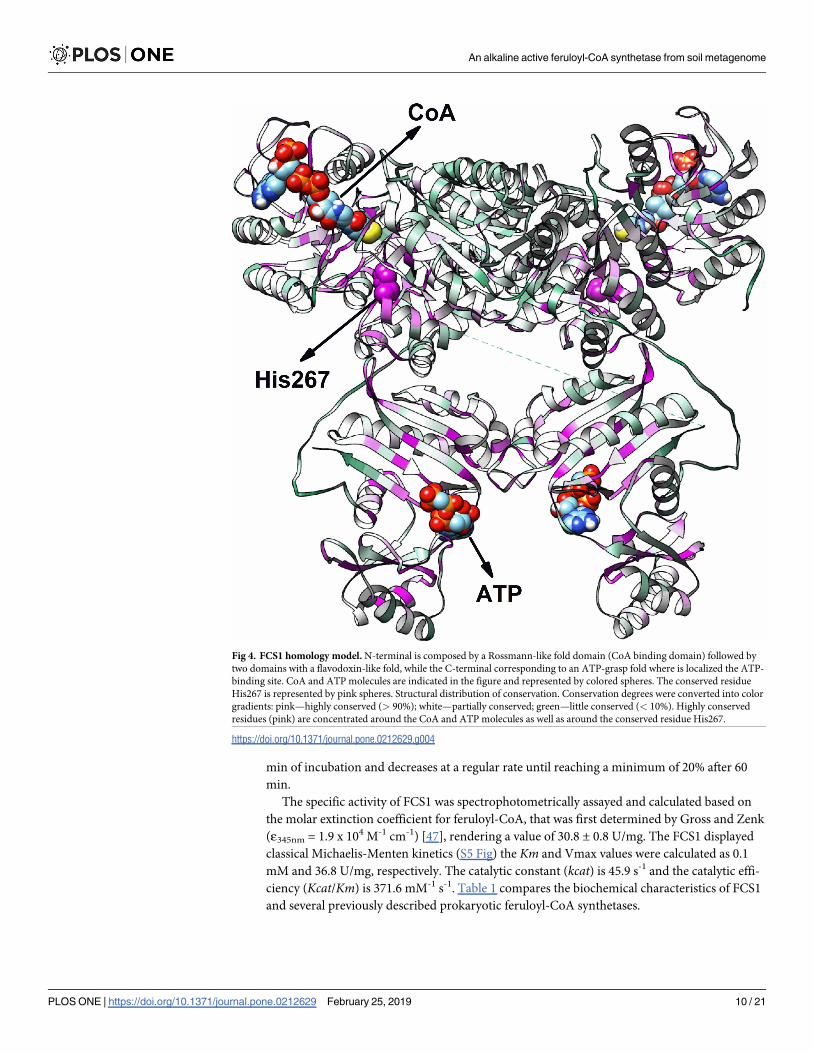
The SAXS analyses were performed to obtain further information about the tertiary/quater-
nary structure of FCS1 and its low-resolution envelope in solution. The X-ray scattering curve
measured at 5 mg/mL for FCS1 (at pH 7 and 20 oC) is shown in Fig 5A. The Guinier plots (at 1
and 5 mg/mL) showed linear behaviors indicating excellent monodispersity (Fig 5B). The
radius of gyration (Rg) determined with the Guinier approximation at 1 and 5 mg/mL were
36.4 ± 1.1 Å and 37.4 ± 0.5 Å, respectively. The distance distribution function (at 5 mg/mL)
determined using the GNOM software (Fig 5C) estimated the maximum dimension (Dmax)
Fig 5. SAXS data measured for FCS1 at pH 7.0 and 20 oC. (A) Experimental SAXS curve (open black circles with errors bars) superimposed on
the theoretical SAXS curves based on the monomeric (red line) and homodimeric (blue line) homology models. The green line was determined
based on the low-resolution model. (B) Guinier plots at 1 and 5 mg/mL. (C) Experimental distance distribution function, P(r), of FCS1 at 20 oC.
The curve has been scaled to a maximum height of 1. (D) Superposition of the low-resolution envelope of FCS1 (obtained by DAMMIN
program) on the homodimeric homology model shown in three different views (the center and right structures were rotated y axis-90o and x axis-
90o in relation to the left structure).
https://doi.org/10.1371/journal.pone.0212629.g005
Table 2. General SAXS results from FCS1.
Parameters Experimental data PDB Model Monomer Model
Homodimer
DAM
Rg (Å) 36.4 ±1.1 (1 mg/mL)
37.4±0.5 (5 mg/mL)
37.2 ±- 0.1 (GNOM)
37.5 34.4 37.5 37.3
Dmax (Å) 120 ± 5 126.6 110.1 128.5 119.1
Resolution (Å) 18.5 - - - 18.5
χ - 1.9 11.3 1.6 1.3
https://doi.org/10.1371/journal.pone.0212629.t002
An alkaline active feruloyl-CoA synthetase from soil metagenome
PLOS ONE | https://doi.org/10.1371/journal.pone.0212629 February 25, 2019 12 / 21

An alkaline active feruloyl-CoA synthetase from soil metagenome
PLOS ONE | https://doi.org/10.1371/journal.pone.0212629 February 25, 2019 13 / 21

and Rg as being 120 ± 5 Å and 37.2 ± 0.1 Å, respectively. The monomeric FCS1 homology
model has a Dmax and Rg of 110.1 Å and 34.4 Å, respectively, values different from those deter-
mined by SAXS analysis. This explains why the theoretical SAXS curve based on the mono-
meric FCS1 homology model does not fit very well (χ = 11.3) in the SAXS data (blue line, Fig
5A). However, the values determined for homodimeric FCS1 homology model (Dmax = 128.5
Å and Rg = 37.5 Å) are in agreement with the results obtained by SAXS analysis. The theoreti-
cal SAXS curve calculated from the homodimeric FCS1 homology model resulted in an excel-
lent fit (χ = 1.6, red line) to SAXS data. In each case, the quality of the fitting can be observed
by the residual plots, where the experimental intensity divided by computed intensity was plot-
ted as a function of the scattering vector q (S7 Fig). Therefore, the SAXS data for FCS1 is con-
sistent with a homodimeric protein in solution arranged with a twofold symmetry [53]. The
low-resolution envelope of FCS1 was determined directly in solution from the SAXS data (Fig
5D). Superposition of the low-resolution envelope and homodimeric FCS1 homology model
showed excellent agreement. A summary of the main SAXS data described in this study is
given in Table 2.
The pH induced conformational changes in the three domains of FCS1
Circular dichroism (CD) spectroscopy was employed to analyze the secondary structure of the
FCS1 in response to pH and temperature. Fig 6A and 6B represents the CD spectra of the
FCS1 measured at different pH values at 20 oC. At pH 7.0 (red line), the CD spectrum of FCS1
was characterized by two minima at 208 and 220 nm, a maximum around 193 nm, and a nega-
tive to positive crossover at 200 nm. The spectrum is characteristic of an α/β protein, where
the two minima at 208 nm and 220 nm are indicative of the presence of α-helical secondary
structure. When the pH value was decreased from 7.0 to 3.0 (Fig 6A), changes were observed
in the profiles of the spectra (mainly at pH 3.0 and 4.0) indicating a pH-induced loss of regular
secondary structures at acidic pH values, in agreement with the marked decrease of the enzy-
matic activity described above. At pH 5.0 (theoretical pI value) the protein precipitated irre-
versibly after overnight incubation. However, when the pH value was increased from 7.0 to
10.0, no significant changes were observed in the profiles of the spectra indicating stability of
second structure under alkaline pH (Fig 6B), which corroborates with the biochemical data
described above.
The secondary structure of FCS1 was also analyzed at different temperatures, as shown in
Fig 7. Even at 70 oC the spectrum profile did not change significantly, indicating that the FCS1
secondary structure is thermostable. However, significant changes in the spectrum profile
were observed when the protein was incubated at 90 oC, indicating partial loss of the regular
secondary structures.
The presence of three tryptophan residues (W212, W450 and W604) was used to monitor
FCS1 conformational changes induced by intrinsic fluorescence spectroscopy. The tryptophan
fluorescence emission can be selectively excited at 295 nm. Fig 6C and 6D show the fluores-
cence emission spectra of FCS1 at different pH values. At pH 6.0, 7.0 and 8.0, the spectra were
characterized by a maximum emission at 338 nm, typical of tryptophan residues partially
exposed to buffer environment. However, at pH values smaller than 6.0 and greater than 8.0,
the spectra were characterized by a maximum emission at 332 nm, indicating that, at these pH
Fig 6. Effect of pH on the secondary and tertiary structures of FCS1 at 20˚C (A) CD spectra as a function of pH. The pH values were 3.0,
4.0, 6.0 and 7.0. (B) CD spectra as a function of pH. The pH values were 7.0, 8.0, 9.0 and 10.0. (C) Effect of pH on the tertiary structure of
FCS1 monitored by intrinsic fluorescence spectroscopy. The pH values were 3.0, 4.0, 6.0 and 7.0. (D) Effect of pH on the tertiary
structure of FCS1 monitored by intrinsic fluorescence spectroscopy. The pH values were 7.0, 8.0, 9.0, 10.0.
https://doi.org/10.1371/journal.pone.0212629.g006
An alkaline active feruloyl-CoA synthetase from soil metagenome
PLOS ONE | https://doi.org/10.1371/journal.pone.0212629 February 25, 2019 14 / 21

Fig 7. (A) Effect of temperature (20, 60, 70 and 90˚C) on the secondary structure of FCS1 at pH 7.0. (B) FCS1 zeta-potential (z) values as a
function of pH variation.
https://doi.org/10.1371/journal.pone.0212629.g007
An alkaline active feruloyl-CoA synthetase from soil metagenome
PLOS ONE | https://doi.org/10.1371/journal.pone.0212629 February 25, 2019 15 / 21

values, the tryptophan residues are more buried inside the protein structure when compared
to pHs 6.0, 7.0 and 8.0. Collectively, these pH-induced conformational changes corroborate
the activity data at different pHs (Fig 4B) and functional stability of enzyme activity under
alkaline conditions (Fig 4C).
As mentioned previously, FCS1 presents a highly conserved histidine residue (His267),
which has been shown to be transiently phosphorylated during catalysis in succinyl-CoA syn-
thetase from Escherichia coli and ADP-forming acetyl-CoA synthetase from Pyrococcus furio-sus [63,65]. This mechanism of intermediate catalysis is favored by the nature of
phosphohistidines, which contain relatively unstable phosphoramidate bonds at nitrogen
atoms, as opposed to other phosphoamino acids that present more stable phosphoester bonds.
In general, phosphoramidate bonds are particularly prone to degradation at acidic pH values,
while remaining stable in basic environments [78]. This chemical behavior could explain FCS1
poor activity at acid pH values and relatively high activity at alkaline pH values, which is in
accordance with the conformational changes here presented.
Finally, the zeta-potential (z) values as a function of pH were determined for FCS1 (Fig 7B).
At pH 3.0 the z was 21.7 ± 1.6 mV and decreased for -27.7 ± 4.8 mV at pH 10.0. The experi-
mental isoelectric point (pI) was estimated to be 5.1, consistent with the theoretical pI
(pI = 5.03, predicted by ProtParam tool). An abrupt variation in the z was observed between
pH 6 and 3 (acid pH values), resulting in repulsion among charged groups that causes the sig-
nificant conformational modifications (in both secondary and tertiary structures) described
above and affecting directly the enzymatic activity [62]. However, at alkaline pH values the z
varies subtly, thus corroborating with the variation in conformation and enzymatic activity
described previously.
Conclusion
The present study brings to light as the first biophysical and structural characterization of a
bacterial Fcs, a class of enzymes of pivotal importance for lignin valorization via conversion of
FA. The FCS1, herein described, was isolated from a lignin-degrading microbial consortium,
denoting its importance in an ecological context as well. Albeit important, there are few thor-
ough characterizations of Fcs in the literature. The FCS1 enzymatic activity remains high in a
range of mesophilic temperatures, as well as neutral and alkaline pH values. We have deter-
mined that FCS1 constitutes a homodimer in solution, which is in agreement to the 3D-archi-
tecture of the closest homologue of known structure. The high activity of FCS1 in higher pH
values could be useful for direct conversion of biorefinery derived lignin-streams, which are
usually obtained via alkaline treatment. Finally, this study could contribute to the field of
research by establishing a structural and biochemical characterization for Fcs.
Supporting information
S1 Fig. The proposed catalytic activity of Fcs from FA.
(TIF)
S2 Fig. (A) HisTrapTMHP affinity chromatograpy profile. Green line indicates the linear gra-
dient of buffer B (20 mM sodium phosphate buffer pH 7.0, 100 mM NaCl, 500 mM imidazole).
Fractions 1 and 2 marked as red numbers were collected to further purification in size-exclu-
sion chromatography. (B) Superdex 200 HiLoad 16/600 GL size exclusion chromatography.
Elution was performed in buffer C (20 mM sodium phosphate buffer pH 7.4, 100 mM NaCl).
(TIF)
An alkaline active feruloyl-CoA synthetase from soil metagenome
PLOS ONE | https://doi.org/10.1371/journal.pone.0212629 February 25, 2019 16 / 21

S3 Fig. Capillary zone electrophoresis of FCS1 enzymatic products at different alkaline
pHs. Enzymatic reactions contained 1 mM FA and 10 μg purified enzyme. After incubation for
5 minutes at 37˚C, the reactions were immediately diluted 1:10 in methanol 100%. All the mea-
surements were made with the P/ACE MDQ capillary electrophoresis system (Beckman Coulter
Inc., USA) equipped with an UV detector. Fused-silica capillaries with inner diameter 50 μm,
outer diameter 365 μm, and total length 35.5 cm (25 cm to the detector) were used. Capillaries
were conditioned with reagents supplied by the Capillary Performance Test Kit (Beckman Coul-
ter Inc., USA). Before and after use, the capillary was rinsed with: Regenerator solution A (10
min, 25.0 psi), Milli-Q purified water (2 min, 25.0 psi) and Capillary Performance Run Buffer A
(4 min, 25.0 psi). Between analyses, the capillar was conditioned with Regenerator A (2 min,
25.0 psi), Milli-Q water (1 min, 25.0 psi) and Performance Buffer A (3 min, 25.0 psi). Samples
were injected for 10 sec, 0.5 psi. Voltage (+25 kV) was then applied for 10 min. Data were col-
lected and processed with 32Karat software (Beckmann Coulter Inc., Fullerton, CA, USA).
(TIF)
S4 Fig. Spectral scanning of FA in different buffer systems. (A) 100 mM potassium phos-
phate buffer. (B) 20 mM ABF buffer. (C) Difference of absorbances in potassium phosphate
and ABF buffers. 0.5 mM of FA was mixed with either 20 mM ABF buffer or 100 mM potas-
sium phosphate buffer, pHs 5.8, 6.2, 6.6, 7.0, 7.4, 7.8, 8.0, 8.2, 8.6, 9.0, 9.4 and 9.8, in a final vol-
ume of 200 μL. The mixtures were placed in a 3mm quartz cuvette and the absorbance in
wavelengths from 200 nm to 700 nm was read using and Epoch2 Microplate Reader spectro-
photometer (BioTek, Winooski, VT, USA).
(TIF)
S5 Fig. FCS1 kinetics (Michaelis-Menten plot).
(TIF)
S6 Fig. Determination of FCS1 molecular weight. (A) Size exclusion chromatography (SEC)
of purified FCS1 on Superdex-200. (B) Size distribution by intensity for purified FCS1 where
dynamic light scattering (DLS) runs were performed at pH 7.0 and 20 oC.
(TIF)
S7 Fig. Residual plots where the experimental intensity divided by computed intensity was
plotted as a function of the scattering vector q. (A) Monomeric model. (B) Homodimeric
model. (C) Dummy Atom Model (DAM).
(TIF)
Author Contributions
Conceptualization: Fabio Marcio Squina.
Data curation: Victoria Sodre, Juscemacia Nascimento Araujo, Thiago Augusto Goncalves,
Nathalia Vilela, Mario de Oliveira Neto, Wanius Garcia.
Formal analysis: Victoria Sodre, Juscemacia Nascimento Araujo, Thiago Augusto Goncalves,
Nathalia Vilela, Antonio Sergio Kimus Braz, Mario de Oliveira Neto, Andre Ricardo de
Lima Damasio, Wanius Garcia.
Funding acquisition: Fabio Marcio Squina.
Investigation: Victoria Sodre, Juscemacia Nascimento Araujo, Thiago Augusto Goncalves,
Nathalia Vilela, Antonio Sergio Kimus Braz, Mario de Oliveira Neto, Wanius Garcia, Fabio
Marcio Squina.
An alkaline active feruloyl-CoA synthetase from soil metagenome
PLOS ONE | https://doi.org/10.1371/journal.pone.0212629 February 25, 2019 17 / 21

Methodology: Victoria Sodre, Juscemacia Nascimento Araujo, Thiago Augusto Goncalves,
Nathalia Vilela, Telma Teixeira Franco, Mario de Oliveira Neto, Wanius Garcia, Fabio Mar-
cio Squina.
Project administration: Fabio Marcio Squina.
Resources: Telma Teixeira Franco, Andre Ricardo de Lima Damasio, Wanius Garcia, Fabio
Marcio Squina.
Supervision: Telma Teixeira Franco, Fabio Marcio Squina.
Validation: Fabio Marcio Squina.
Writing – original draft: Victoria Sodre.
Writing – review & editing: Victoria Sodre, Juscemacia Nascimento Araujo, Thiago Augusto
Goncalves, Nathalia Vilela, Antonio Sergio Kimus Braz, Mario de Oliveira Neto, Andre
Ricardo de Lima Damasio, Wanius Garcia, Fabio Marcio Squina.
References1. Ragauskas A, Beckham G, Biddy M, Chandra R, Chen F, Davis M et al. Lignin Valorization: Improving
Lignin Processing in the Biorefinery. Science. 2014; 344(6185):1246843. https://doi.org/10.1126/
science.1246843 PMID: 24833396
2. Mohr A, Raman S. Lessons from first generation biofuels and implications for the sustainability appraisal
of second-generation biofuels. Energy Policy. 2013; 63:114–122. https://doi.org/10.1016/j.enpol.2013.
08.033 PMID: 24926117
3. Balan V. Current Challenges in Commercially Producing Biofuels from Lignocellulosic Biomass. ISRN
Biotechnol., 2014:1–31.
4. Gomez L, Steele-King C, McQueen-Mason S. Sustainable liquid biofuels from biomass: the writings on
the walls. New Phytol. 2008; 178(3):473–485. https://doi.org/10.1111/j.1469-8137.2008.02422.x PMID:
18373653
5. Varanasi P, Singh P, Auer M, Adams P, Simmons B, Singh S. Survey of renewable chemicals produced
from lignocellulosic biomass during ionic liquid pretreatment. Biotechnol Biofuels. 2013; 6(1):14. https://
doi.org/10.1186/1754-6834-6-14 PMID: 23356589
6. Beckham G, Johnson C, Karp E, Salvachua D, Vardon D. Opportunities and challenges in biological lig-
nin valorization. Curr. Opin. Biotechnol. 2016; 42:40–53. https://doi.org/10.1016/j.copbio.2016.02.030
PMID: 26974563
7. Davis K, Rover M, Brown R, Bai X, Wen Z, Jarboe L. Recovery and Utilization of Lignin Monomers as
Part of the Biorefinery Approach. Energies. 2016; 9(10):808.
8. Grossman A, Wilfred V. Lignin-based polymers and nanomaterials. Curr Opin Biotechnol [Internet].
2019; 56:112–20. Available from: https://doi.org/10.1016/j.copbio.2018.10.009
9. Banci L, Ciofi-Baffoni S, Tien M. Lignin and Mn Peroxidase-Catalyzed Oxidation of Phenolic Lignin Olig-
omers. Biochemistry. 1999; 38(10):3205–3210. https://doi.org/10.1021/bi982139g PMID: 10074376
10. Martınez A, Speranza M, Ruiz-Dueñas F, Ferreira P, Camarero S, Guillen F, et al. Biodegradation of lig-
nocellulosics: microbial, chemical, and enzymatic aspects of the fungal attack of lignin. Int. Microbiol.
2005; 8:195–204. PMID: 16200498
11. Zimmermann W. Degradation of lignin by bacteria. J. Biotechnol. 1990; 13(2–3):119–130.
12. Bugg T, Ahmad M, Hardiman E, Rahmanpour R. Pathways for degradation of lignin in bacteria and
fungi. Nat. Prod. Rep. 2011; 28(12):1883. https://doi.org/10.1039/c1np00042j PMID: 21918777
13. Bugg T, Ahmad M, Hardiman E, Singh R. The emerging role for bacteria in lignin degradation and bio-
product formation. Curr Opin Biotechnol. 2011; 22(3):394–400. https://doi.org/10.1016/j.copbio.2010.
10.009 PMID: 21071202
14. Dellomonaco C, Fava F, Gonzalez R. The path to next generation biofuels: successes and challenges
in the era of synthetic biology. Microb. Cell Fact. 2010; 9(1):3.
15. Salvachua D, Karp E, Nimlos C, Vardon D, Beckham G. Towards lignin consolidated bioprocessing:
simultaneous lignin depolymerization and product generation by bacteria. Green Chem. 2015; 17
(11):4951–4967.
An alkaline active feruloyl-CoA synthetase from soil metagenome
PLOS ONE | https://doi.org/10.1371/journal.pone.0212629 February 25, 2019 18 / 21

16. Alper H, Stephanopoulos G. Engineering for biofuels: exploiting innate microbial capacity or importing
biosynthetic potential? Nat. Rev. Microbiol. 2009; 7(10):715–723. https://doi.org/10.1038/nrmicro2186
PMID: 19756010
17. Rosazza JPN, Huang Z, Dostal L, Volm T, Rousseau B. Biocatalytic transformations of ferulic acid: an
abundant aromatic natural product. J Ind Microbiol. 1995; 15:457–71. PMID: 8821508
18. Plaggenborg R, Overhage J, Loos A, Archer J, Lessard P, Sinskey A et al. Potential of Rhodococcus
strains for biotechnological vanillin production from ferulic acid and eugenol. Appl. Microbiol. Biotechnol.
2006; 72(4):745–755. https://doi.org/10.1007/s00253-005-0302-5 PMID: 16421716
19. Sainsbury P, Hardiman E, Ahmad M, Otani H, Seghezzi N, Eltis L et al. Breaking Down Lignin to High-
Value Chemicals: The Conversion of Lignocellulose to Vanillin in a Gene Deletion Mutant of Rhodococ-
cus jostii RHA1. ACS Chem. Biol. 2013; 8(10):2151–2156. https://doi.org/10.1021/cb400505a PMID:
23898824
20. Kaur B, Chakraborty D. Biotechnological and Molecular Approaches for Vanillin Production: a Review.
Appl Biochem Biotechnol. 2013; 169(4):1353–1372. https://doi.org/10.1007/s12010-012-0066-1
PMID: 23306890
21. Linger J, Vardon D, Guarnieri M, Karp E, Hunsinger G, Franden M et al. Lignin valorization through inte-
grated biological funneling and chemical catalysis. Proc. Natl. Acad. Sci. U.S.A. 2014; 111(33):12013–
12018. https://doi.org/10.1073/pnas.1410657111 PMID: 25092344
22. Mathew S, Abraham T. Bioconversions of Ferulic Acid, an Hydroxycinnamic Acid. Crit. Rev. Microbiol.
2006; 32(3):115–125. https://doi.org/10.1080/10408410600709628 PMID: 16893749
23. Hirakawa H, Schaefer A, Greenberg E, Harwood C. Anaerobic p-coumarate Degradation by Rhodop-
seudomonas palustris and Identification of CouR, a MarR Repressor Protein That Binds p-coumaroyl
Coenzyme A. J. Bacteriol. 2012; 194(8):1960–1967. https://doi.org/10.1128/JB.06817-11 PMID:
22328668
24. Kasai D, Kamimura N, Tani K, Umeda S, Abe T, Fukuda M et al. Characterization of FerC, a MarR-type
transcriptional regulator, involved in transcriptional regulation of the ferulate catabolic operon in Sphin-
gobium sp. strain SYK-6. FEMS Microbiol. Lett. 2012; 332(1):68–75. https://doi.org/10.1111/j.1574-
6968.2012.02576.x PMID: 22515452
25. Calisti C, Ficca A, Barghini P, Ruzzi M. Regulation of ferulic catabolic genes in Pseudomonas fluores-
cens BF13: involvement of a MarR family regulator. Appl Microbiol Biotechnol. 2008; 80(3):475–483.
https://doi.org/10.1007/s00253-008-1557-4 PMID: 18575856
26. Parke D, Ornston L. Hydroxycinnamate (hca) Catabolic Genes from Acinetobacter sp. Strain ADP1 Are
Repressed by HcaR and Are Induced by Hydroxycinnamoyl-Coenzyme A Thioesters. Appl. Environ.
Microbiol. 2003; 69(9):5398–5409. https://doi.org/10.1128/AEM.69.9.5398-5409.2003 PMID:
12957928
27. Otani H, Stogios P, Xu X, Nocek B, Li S, Savchenko A et al. The activity of CouR, a MarR family tran-
scriptional regulator, is modulated through a novel molecular mechanism. Nucleic Acids Res. 2015; 44
(2):595–607. https://doi.org/10.1093/nar/gkv955 PMID: 26400178
28. Moraes E, Alvarez T, Persinoti G, Tomazetto G, Brenelli L, Paixão D et al. Lignolytic-consortium omics
analyses reveal novel genomes and pathways involved in lignin modification and valorization. Biotech-
nol Biofuels. 2018; 11(1): 75.
29. Fleige C, Meyer F, Steinbuchel A. Metabolic Engineering of the Actinomycete Amycolatopsis sp. Strain
ATCC 39116 towards Enhanced Production of Natural Vanillin. Appl. Environ. Microbiol. 2016; 82
(11):3410–3419. https://doi.org/10.1128/AEM.00802-16 PMID: 27037121
30. Ghosh S, Sachan A, Sen S, Mitra A. Microbial transformation of ferulic acid to vanillic acid by Strepto-
myces sannanensis MTCC 6637. J. Ind. Microbiol. Biotechnol. 2006; 34(2):131–138. https://doi.org/10.
1007/s10295-006-0177-1 PMID: 17043806
31. Graf N, Altenbuchner J. Genetic engineering of Pseudomonas putida KT2440 for rapid and high-yield
production of vanillin from ferulic acid. Appl Microbiol Biotechnol. 2013; 98(1):137–149. https://doi.org/
10.1007/s00253-013-5303-1 PMID: 24136472
32. Kaur B, Chakraborty D, Kumar B. Metabolic engineering of Pediococcus acidilactici BD16 for production
of vanillin through ferulic acid catabolic pathway and process optimization using response surface meth-
odology. Appl Microbiol Biotechnol. 2014; 98(20):8539–8551. https://doi.org/10.1007/s00253-014-
5950-x PMID: 25077778
33. Chakraborty D, Gupta G, Kaur B. Metabolic engineering of E. coli top 10 for production of vanillin
through FA catabolic pathway and bioprocess optimization using RSM. Protein Expr. Purif. 2016;
128:123–133. https://doi.org/10.1016/j.pep.2016.08.015 PMID: 27591788
34. Chakraborty D, Selvam A, Kaur B, Wong J, Karthikeyan O. Application of recombinant Pediococcus
acidilactici BD16 (fcs +/ech +) for bioconversion of agrowaste to vanillin. Appl Microbiol Biotechnol.
2017; 101(14):5615–5626. https://doi.org/10.1007/s00253-017-8283-8 PMID: 28432440
An alkaline active feruloyl-CoA synthetase from soil metagenome
PLOS ONE | https://doi.org/10.1371/journal.pone.0212629 February 25, 2019 19 / 21

35. Yang W, Tang H, Ni J, Wu Q, Hua D, Tao F et al. Characterization of Two Streptomyces Enzymes That
Convert Ferulic Acid to Vanillin. PLoS ONE. 2013; 8(6): e67339. https://doi.org/10.1371/journal.pone.
0067339 PMID: 23840666
36. Achterholt S, Priefert H, Steinbuchel A. Identification of Amycolatopsis sp. strain HR167 genes, involved
in the bioconversion of ferulic acid to vanillin. Appl Microbiol Biotechnol. 2000; 54(6):799–807. PMID:
11152072
37. Overhage J, Priefert H, Steinbuchel A. Biochemical and genetic analyses of ferulic acid catabolism in
Pseudomonas sp. Strain HR199. Appl. Environ. Microbiol. 1999; 65(11):4837–47. PMID: 10543794
38. Masai E, Harada K, Peng X, Kitayama H, Katayama Y, Fukuda M. Cloning and Characterization of the
Ferulic Acid Catabolic Genes of Sphingomonas paucimobilis SYK-6. Appl. Environ. Microbiol. 2002; 68
(9):4416–4424. https://doi.org/10.1128/AEM.68.9.4416-4424.2002 PMID: 12200295
39. Otani H, Lee Y, Casabon I, Eltis L. Characterization of p-Hydroxycinnamate Catabolism in a Soil Actino-
bacterium. J. Bacteriol. 2014; 196(24):4293–4303. https://doi.org/10.1128/JB.02247-14 PMID:
25266382
40. Finn R, Coggill P, Eberhardt R, Eddy S, Mistry J, Mitchell A et al. The Pfam protein families database:
towards a more sustainable future. Nucleic Acids Res. 2015; 44(D1): D279–D285. https://doi.org/10.
1093/nar/gkv1344 PMID: 26673716
41. Schultz J, Milpetz F, Bork P, Ponting C. SMART, a simple modular architecture research tool: Identifica-
tion of signaling domains. Proc. Natl. Acad. Sci. U.S.A. 1998; 95(11):5857–5864. PMID: 9600884
42. Letunic I, Doerks T, Bork P. SMART: recent updates, new developments and status in 2015. Nucleic
Acids Res. 2014; 43(D1): D257–D260.
43. Gasteiger E, Hoogland C, Gattiker A, Duvaud S, Wilkins MR, Appel RD et al. Protein identification and
analysis tools on the ExPASy server. in: Walker J.M (Ed.). The Proteomics Protocols Handbook,
Humana Press, 2005, pp. 571–607.
44. Huerta-Cepas J, Szklarczyk D, Forslund K, Cook H, Heller D, Walter M et al. eggNOG 4.5: a hierarchi-
cal orthology framework with improved functional annotations for eukaryotic, prokaryotic and viral
sequences. Nucleic Acids Res. 2015; 44(D1): D286–D293. https://doi.org/10.1093/nar/gkv1248 PMID:
26582926
45. Tamura K, Stecher G, Peterson D, Filipski A, Kumar S. MEGA6: Molecular Evolutionary Genetics Anal-
ysis Version 6.0. Mol Biol Evol. 2013; 30(12):2725–2729. https://doi.org/10.1093/molbev/mst197 PMID:
24132122
46. Bradford M. A Rapid and Sensitive Method for the Quantitation of Microgram Quantities of Protein Utiliz-
ing the Principle of Protein-Dye Binding. Anal. Biochem. 1976; 72(1–2):248–254.
47. Gross GG, Zenk MH. Darstellung und Eigenschaften von Coenzym A-Thiolestern substituierter Zimt-
sauren. Z Naturforschg. 1966; 21b:(683–690).
48. Zenk M, Ulbrich B, Busse J, Stockigt J. Procedure for the enzymatic synthesis and isolation of cinna-
moyl-CoA thiolesters using a bacterial system. Anal. Biochem. 1980; 101(1):182–187. PMID: 7356127
49. Soding J, Biegert A, Lupas A. The HHpred interactive server for protein homology detection and struc-
ture prediction. Nucleic Acids Res. 2005; 33(Web Server): W244–W248. https://doi.org/10.1093/nar/
gki408 PMID: 15980461
50. Kelley L, Sternberg M. Protein structure prediction on the Web: a case study using the Phyre server.
Nat. Protoc. 2009; 4(3):363–371. https://doi.org/10.1038/nprot.2009.2 PMID: 19247286
51. Berman HM, Westbrook J, Feng Z, Gilliland G, Bhat TN, Weissig H et al. The Protein Data Bank.
Nucleic Acids Res. 2000; 28: 235–242. PMID: 10592235
52. Sali A, Blundell T. Comparative Protein Modelling by Satisfaction of Spatial Restraints. J. Mol. Biol.
1993; 234(3):779–815. https://doi.org/10.1006/jmbi.1993.1626 PMID: 8254673
53. Weiße R, Faust A, Schmidt M, Schonheit P, Scheidig A. Structure of NDP-forming Acetyl-CoA synthe-
tase ACD1 reveals a large rearrangement for phosphoryl transfer. Proc. Natl. Acad. Sci. U.S.A. 2016;
113(5): E519–E528. https://doi.org/10.1073/pnas.1518614113 PMID: 26787904
54. Madden TL, Tatusov RL, Zhang J. Applications of network BLAST server. Meth. Enzymol. 1996;
266:131–141. PMID: 8743682
55. Notredame C, Higgins DG, Heringa J.T-Coffee: A novel method for multiple sequence alignments. J
Mol Biol. 200; 302:205–217. https://doi.org/10.1006/jmbi.2000.4042 PMID: 10964570
56. Hammersley AP (1997) FIT2D: An introduction and overview; ESRF internal report, ESRF97HA02T;
European Synchrotron Radiation Facility: Grenoble, France.
57. Svergun D. Determination of the regularization parameter in indirect-transform methods using percep-
tual criteria. J. Appl. Crystallogr. 1992; 25(4):495–503.
An alkaline active feruloyl-CoA synthetase from soil metagenome
PLOS ONE | https://doi.org/10.1371/journal.pone.0212629 February 25, 2019 20 / 21

58. Svergun D. Restoring Low Resolution Structure of Biological Macromolecules from Solution Scattering
Using Simulated Annealing. Biophys. J. 1999; 76(6):2879–2886. https://doi.org/10.1016/S0006-3495
(99)77443-6 PMID: 10354416
59. Volkov V, Svergun D. Uniqueness ofab initioshape determination in small-angle scattering. J. Appl.
Crystallogr. 2003; 36(3):860–864.
60. Svergun D, Barberato C, Koch M. CRYSOL–a Program to Evaluate X-ray Solution Scattering of Biologi-
cal Macromolecules from Atomic Coordinates. J. Appl. Crystallogr. 1995; 28(6):768–773.
61. Jachimska B, Wasilewska M, Adamczyk Z. Characterization of Globular Protein Solutions by Dynamic
Light Scattering, Electrophoretic Mobility, and Viscosity Measurements. Langmuir. 2008; 24(13):6866–
6872. https://doi.org/10.1021/la800548p PMID: 18512882
62. de Oliveira L, da Silva V, Colussi F, Cabral A, de Oliveira Neto M, Squina F et al. Conformational
Changes in a Hyperthermostable Glycoside Hydrolase: Enzymatic Activity Is a Consequence of the
Loop Dynamics and Protonation Balance. PLoS ONE. 2015; 10(2): e0118225. https://doi.org/10.1371/
journal.pone.0118225 PMID: 25723179
63. Brasen C, Schmidt M, Grotzinger J, Schonheit P. Reaction Mechanism and Structural Model of ADP-
forming Acetyl-CoA Synthetase from the Hyperthermophilic Archaeon Pyrococcus furiosus. J. Biol.
Chem. 2008; 283(22):15409–15418. https://doi.org/10.1074/jbc.M710218200 PMID: 18372246
64. Engel C, Wierenga R. The diverse world of coenzyme A binding proteins. Curr. Opin. Struct. Biol. 1996;
6(6):790–797. PMID: 8994879
65. Wolodko WT, Fraser ME, James MN, Bridger WA. The crystal structure of succinyl-CoA synthetase
from Escherichia coli at 2.5-A resolution. J Biol Chem.1994; 269(14):10883–90. PMID: 8144675
66. Cortes-Tolalpa L, Norder J, van Elsas J, Falcao Salles J. Halotolerant microbial consortia able to
degrade highly recalcitrant plant biomass substrate. Appl Microbiol Biotechnol. 2018; 102(6):2913–
2927. https://doi.org/10.1007/s00253-017-8714-6 PMID: 29397428
67. Teramoto M, Suzuki M, Hatmanti A, Harayama S. The potential of Cycloclasticus and Altererythrobac-
ter strains for use in bioremediation of petroleum-aromatic-contaminated tropical marine environments.
J. Biosci. Bioeng. 2010; 110(1):48–52. https://doi.org/10.1016/j.jbiosc.2009.12.008 PMID: 20541115
68. Wu M, Ye X, Chen K, Li W, Yuan J, Jiang X. Bacterial community shift and hydrocarbon transformation
during bioremediation of short-term petroleum-contaminated soil. Environ. Pollut. 2017; 223:657–664.
https://doi.org/10.1016/j.envpol.2017.01.079 PMID: 28196719
69. Brenelli L, Mandelli F, Mercadante A, Rocha G, Rocco S, Craievich A et al. Acidification treatment of lig-
nin from sugarcane bagasse results in fractions of reduced polydispersity and high free-radical scav-
enging capacity. Ind Crops Prod. 2016; 83:94–103.
70. Barberousse H, Roiseux O, Robert C, Paquot M, Deroanne C, Blecker C. Analytical methodologies for
quantification of ferulic acid and its oligomers. J. Sci. Food Agric. 2008; 88(9):1494–1511.
71. Friedman M, Jurgens HS. Effect of pH stability of plant phenolic compounds. J Agric Food Chem. 2000;
48(6):2101–10. PMID: 10888506
72. Mitra A, Kitamura Y, Gasson MJ, Narbad A, Parr AJ, Payne J, et al. 4-Hydroxycinnamoyl-CoA hydra-
tase/lyase (HCHL)—An enzyme of phenylpropanoid chain cleavage from Pseudomonas. Arch Biochem
Biophys. 1999; 365(1):10–6. https://doi.org/10.1006/abbi.1999.1140 PMID: 10222033
73. Lofty S, Negrel J, Javelle F. Formation ofω-feruloyloxypalmitic acid by an enzyme from wound-healing
potato tuber discs. Phytochemistry. 1994; 35(6):1419–24.
74. Narbad A, Gasson MJ. Metabolism of ferulic acid via vanillin using a novel CoA-dependent pathway in a
newly-isolated strain of Pseudomonas fluorescens. Microbiology. 1998; 144(5):1397–405.
75. Rossmann M, Moras D, Olsen K. Chemical and biological evolution of a nucleotide-binding protein.
Nature. 1974; 250(5463):194–199.
76. Heijne G, Blomberg C, Baltscheffsky H. Early evolution of cellular electron transport: Molecular models
for the ferredoxin-rubredoxin-flavodoxin region. Orig Life. 1978; 9(1):27–37. PMID: 724244
77. Fawaz M, Topper M, Firestine S. The ATP-grasp enzymes. Bioorg Chem. 2011; 39(5–6):185–191.
https://doi.org/10.1016/j.bioorg.2011.08.004 PMID: 21920581
78. Klumpp S, Krieglstein J. Phosphorylation and dephosphorylation of histidine residues in proteins. Eur.
J. Biochem. 2002; 269(4):1067–1071. PMID: 11856347
An alkaline active feruloyl-CoA synthetase from soil metagenome
PLOS ONE | https://doi.org/10.1371/journal.pone.0212629 February 25, 2019 21 / 21