Elevated cholesterol in tissues of chicken embryos with hereditary myotonic muscular dystrophy
Upload
independentCategory
view
2download
0
ORIGINAL COMMUNICATION
Co-segregation of DM2 with a recessive CLCN1 mutationin juvenile onset of myotonic dystrophy type 2
Rosanna Cardani • Marzia Giagnacovo • Annalisa Botta • Fabrizio Rinaldi • Alessandra Morgante •
Bjarne Udd • Olayinka Raheem • Sini Penttila • Tiina Suominen • Laura V. Renna •
Valeria Sansone • Enrico Bugiardini • Giuseppe Novelli • Giovanni Meola
Received: 24 December 2011 / Revised: 13 February 2012 / Accepted: 16 February 2012
� Springer-Verlag 2012
Abstract Myotonic dystrophy type 2 (DM2) is a com-
mon adult onset muscular dystrophy caused by a domi-
nantly transmitted (CCTG)n expansion in intron 1 of the
CNBP gene. In DM2 there is no obvious evidence for an
intergenerational increase of expansion size, and no con-
genital cases have been confirmed. We describe the clinical
and histopathological features, and provide the genetic and
molecular explanation for juvenile onset of myotonia in a
14-year-old female with DM2 and her affected mother
presenting with a more severe phenotype despite a later
onset of symptoms. Histological and immunohistochemical
findings correlated with disease severity or age at onset in
both patients. Southern blot on both muscle and blood
samples revealed only a small increase in the CCTG repeat
number through maternal transmission. Fluorescence in
situ hybridization, in combination with MBNL1 immuno-
fluorescence on muscle sections, showed the presence of
mutant mRNA and MBNL1 in nuclear foci; the fluores-
cence intensity and its area appeared to be similar in the
two patients. Splicing analysis of the INSR, CLCN1 and
MBNL1 genes in muscle tissue demonstrates that the level
of aberrant splicing isoforms was lower in the daughter
than in the mother. However, in the CLCN1 gene, a het-
erozygous mutation c.501C[G p.F167L was present in the
R. Cardani � L. V. Renna
Lab of Muscle Histopathology and Molecular Biology,
IRCCS Policlinico San Donato, Milan, Italy
R. Cardani � L. V. Renna
CMN-Neuromuscular Disease Center, IRCCS Policlinico
San Donato, University of Milan, Milan, Italy
M. Giagnacovo
Department of Animal Biology, University of Pavia, Pavia, Italy
A. Botta � F. Rinaldi � A. Morgante
Department of Biopathology and Diagnosing Imaging,
Tor Vergata University of Rome, Rome, Italy
B. Udd � O. Raheem � S. Penttila � T. Suominen
Neuromuscular Research Unit, University of Tampere,
33520 Tampere, Finland
B. Udd
Department of Medical Genetics, Haartman Institute,
University of Helsinki, Helsinki, Finland
B. Udd
Department of Medical Genetics, Folkhalsan Institute
of Genetics, University of Helsinki, P.O. Box 63,
00014 Helsinki, Finland
B. Udd
Department of Neurology, Tampere University Hospital,
33520 Tampere, Finland
B. Udd
Department of Neurology, Vaasa Central Hospital,
65100 Vaasa, Finland
V. Sansone � E. Bugiardini � G. Meola (&)
Department of Neurology, IRCCS Policlinico San Donato,
University of Milan, Via Morandi, 30, San Donato Milanese,
20097 Milan, Italy
e-mail: [email protected]
G. Novelli
San Peter Hospital, Fatebenefratelli, Rome, Italy
G. Novelli
National Agency for the Evaluation of Universities
and Research, ANVUR, Rome, Italy
123
J Neurol
DOI 10.1007/s00415-012-6462-1
daughter’s DNA and found to be maternally inherited.
Biomolecular findings did not explain the unusual young
onset in the daughter. The co-segregation of DM2 with a
recessive CLCN1 mutation provided the explanation for the
unusual clinical findings.
Keywords Myotonic dystrophy type 2 � Juvenile case �Muscle pathology � CLCN1 � Myotonia congenita
Introduction
Myotonic dystrophies (DMs) are the most common adult
onset muscular dystrophy, affecting mainly the skeletal
muscle, heart, and the central nervous system [1]. DMs
have an autosomal dominant inheritance pattern and are
caused by the expansion of similar microsatellites in two
functionally unrelated genes. Myotonic dystrophy type 1
(DM1; OMIM no. 160900) is caused by an expansion of a
CTG repeat within the 30 UTR of the DMPK gene located
on chromosome 19 [2–4], and myotonic dystrophy type 2
(DM2; OMIM no. 602668) is caused by a CCTG repeat
expansion in intron 1 of the CNBP gene located on chro-
mosome 3 [5, 6]. Individuals with DM1 disease have
expansions ranging from 50 to [2.000 repeats. The exp-
ansion in DM2 ranges in size from 75 to 11.000 CCTG
repeats, but the minimum size of a pathogenic expansion is
not known [6]. The pathogenic mechanism common to
both disorders involves a novel RNA gain of function of
the repeat-containing mRNAs transcribed from the mutated
DMPK and CNBP alleles. These expanded transcripts form
foci that are retained in cell nuclei and alter the functions of
RNA binding proteins involved in regulating alternative
splicing and mRNA translation [7]. At least two RNA
binding proteins have been identified to bind the anoma-
lous CUG/CCUG repeat expansions: muscleblind-like 1
(MBNL1) and CUGBP1. These proteins are antagonist
regulators of splicing events, with MBNL1 promoting a
switch to adult isoforms and CUGBP1 inducing retention
of embryonic isoforms of genes that are misregulated in
DMs [8, 9].
DM1 and DM2 share several clinical features; however,
there are some differences in the clinical presentation.
These differences include the muscle groups prominently
affected (distal in DM1 and proximal in DM2) and the
presence of a severe congenital form with mental retarda-
tion in DM1 but not in DM2 where a neonatal/childhood
form has not been confirmed. Moreover, myotonia is
marked in DM1, while it is mild and inconsistent in DM2,
even by electromyography [10]. The muscle biopsies also
show both similar histological features such as central
nucleation, fiber atrophy, and nuclear clump fibers, and
different findings. In DM2 both central nucleation and fiber
atrophy occur preferentially in type 2 fibers, suggesting that
DM2 is predominantly a disease of type 2 fibers [11–13].
In DM1, the onset and severity correlate with repeat
length, and repeat expansions of [1.500 often result in a
severe congenital form of the disease [1, 14]. Intergener-
ational instability of the CTG expansion provides the
molecular basis for the anticipation phenomenon, i.e., a
progressively earlier and more severe manifestation of the
disease and increase in CTG expansion size in successive
generations of DM1 families [15]. In contrast to DM1, in
DM2 no correlation between repeat size and disease
severity and no evidence for intergenerational expansions
have been found [16]. Recent studies have reported DM2
families with heterozygous recessive CLCN1 mutations
[17–19]. CLCN1 maps to chromosome 7q35 and when
mutated causes myotonia congenita (recessive Becker
disease OMIM no. 255700; dominant Thomsen disease
OMIM no. 160800). Co-segregation of DM2 mutation and
recessive CLCN1 mutations have been suggested to influ-
ence the DM2 phenotype [18]. Indeed, Suominen et al. [18]
observed that EMG myotonia occurred in all DM2
co-segregating recessive CLCN1 mutations examined, thus
concluding that DM2 patients in whom the recessive
CLCN1 mutation is present are more likely to be diagnosed
than those without this mutation. In DM1 the coexistence
of recessive CLCN1 mutations was not more frequent than
in controls [18].
In our study we describe the clinical and histopatholo-
gical features, and provide the genetic and molecular
explanation for juvenile onset of myotonia in a 14-year-old
female with DM2 and her affected mother presenting with
a more severe phenotype despite a later onset of symptoms.
Methods
Patients
Two patients, the proband and her daughter, were clinically
evaluated, and reports on other family members were
obtained through the patients, but no other family members
were investigated. Reportedly, symptoms of muscle
weakness and/or muscle stiffness occurred in the proband’s
mother and grandmother. They complained of difficulties
in rising from a sitting position and in releasing their grip.
They died at the ages 64 and 59 years, respectively,
because of a non-specified muscular disease.
Muscle pathology
A biceps brachii muscle biopsy was taken from patient 1 at
the age of 15 years and from patient 2, her mother, at the
age of 45 years. Blood samples and muscle biopsies were
J Neurol
123
used for this study after receiving informed consent from
the patients.
Muscle tissue was fresh-frozen in isopentane cooled in
liquid nitrogen. Histopathological analysis was performed
on serial sections (8 lm) processed for routine histological
or histochemical stainings. A standard myofibrillar ATPase
staining protocol was used after preincubation at pH 4.3,
4.6, and 10.4 [20].
Immunohistochemistry
Serial transverse muscle cryostat sections 6 lm thick were
cut for immunohistochemical staining (IHC). Sections were
air-dried and rehydrated in phosphate buffer pH 7.4 (PBS).
Non-specific binding sites were blocked with normal goat
serum (NGS; DAKO) at a dilution 1:20 in PBS containing 2%
bovine serum albumin (BSA; Sigma-Aldrich) for 20 min at
room temperature. Mouse monoclonal primary antibodies
against two different myosin heavy chain (MHC) isotypes
were used at the following dilutions: MHCfast, 1:400 in
PBS ? 2% BSA (Sigma-Aldrich); MHCslow, 1:400 in
PBS ? 2% BSA (Sigma-Aldrich). Each antibody was applied
for 1 h at room temperature. After washing in PBS 3 times for
5 min, sections were incubated with goat anti-mouse biotin-
ylated secondary antibody diluted 1:300 in PBS ? 2% BSA
for 1 h at room temperature. Nuclei were counterstained with
Mayer’s hematoxylin.
Quantitative evaluation of fiber diameter was made as
described previously by Vihola et al. [11] with Scion Image
(Scion Corporation, Frederick, MD) on images taken with a
light microscope (1609, original magnification). The size
of muscle fibers was assessed by measuring the ‘‘smallest
fiber diameter.’’ All data were elaborated using Microcal
Origin (Microcal Software Inc., Northampton, MA, USA).
The metahistograms were normalized to normal mean
diameter for men and women. Atrophy and hypertrophy
factors were also calculated [20].
Immunohistochemical staining against CLC-1 protein
was also done using two different antibodies pooled
together, a commercial ClC-1 antibody (CLC11-A, Alpha
diagnostic international, San Antonio, TX, USA) and a
ClC-1 antibody generated against the 15 C-terminal amino
acids (a kind gift from K. Metsikko, University of Oulu,
Finland) both at a dilution 1:50. The double immunohis-
tochemical staining was performed on the BenchMark
(Ventana Medical Systems Inc., Tucson, AZ, USA)
immuno-stainer. The immunohistochemical stainings were
performed using the official protocol of the BenchMark
immuno-stainer and visualized with a peroxidase based
detection kit (UltraView Universal DAB detection kit,
Ventana Medical Systems Inc., Tucson, AZ, USA), and the
signal was then amplified (Ventana amplification kit,
Ventana Medical Systems Inc., Tucson, AZ, USA).
Fluorescence in situ hybridization (FISH)
and immunofluorescence
FISH procedure, using RNA (CAGG)5 Texas red labeled
probes (IDT, Coralville, IA, USA), was carried out on
muscle sections as previously reported by Cardani et al.
[21]. Following the 1XSSC post-hybridization wash with-
out DAPI, the immunofluorescence protocol was per-
formed starting from non-specific binding sites blocking
with NGS (DAKO) at a dilution of 1:20 in PBS ? 2% BSA
(Sigma-Aldrich) for 20 min at room temperature. A poly-
clonal rabbit anti-MBNL1 (1:1,000 in PBS ? 2% BSA;
gift from Prof. C.A. Thornton University of Rochester,
New York, USA) was applied overnight at 4�C. After
washing in PBS three times for 5 min, sections were
incubated with Alexa488-labeled goat anti-rabbit secondary
antibody (Molecular Probes, Invitrogen) diluted 5 lg/ml in
PBS ? 2% BSA for 1 h at room temperature. Nuclei were
stained with DAPI, and slides were then mounted with
ProLong (Invitrogen). Sections were examined on a con-
focal microscope (Leica TCS SP2 AOBS).
For quantitative measurement of fluorescence intensity
and the area of ribonuclear inclusions and MBNL1 nuclear
foci, sections were analyzed on a confocal laser scanning
microscopy at 6309 magnification under identical illumi-
nation, exposure, and instrument settings [22].
Genetic analyses
For each subject involved in this study, the DM2 mutations
were detected and measured in both peripheral blood and
muscle tissues. Genomic DNA was extracted from both
tissues using a salting out procedure. Detection of the DM2
mutations was obtained with a long PCR-based method, as
previously reported [23]. Characterization of the DM2
mutation was carried out with a Southern blot procedure
modified according to the protocol described in Nakamori
et al. [24]. Briefly, genomic DNA was digested with
HaeIII, and AluI, fragments were resolved on 0.5% agarose
gel electrophoeresis and then transferred overnight onto a
nylon membrane by alkaline transfer. Blots were then
hybridized with a DIG-labeled (CCTG)5 LNA probe. Blots
were analyzed by using Storm 860 ImageQuant TL Image
Analysis software v7.0 (Amersham Biosciences, Buck-
inghamshire, UK). Expanded fragments were sized by
measuring the bands of major intensity, which presumably
correspond to the more representative alleles.
The 23 exons of the CLCN1 gene were amplified in
patient 1 by PCR using primers previously described [25].
PCR products were purified with a QIAquick column PCR
purification kit (QIAGEN) and analyzed by direct forward
and reverse sequencing, using the DNA sequencing Kit
(Perkin Elmer Applied Biosystems) on an ABI PRISM 310
J Neurol
123
DNA automatic sequencer. Sequences were analyzed with
Sequencher software (Gene Codes Corporation, Ann
Arbor, MI) and compared to the CLCN1 reference
sequence NT_079596. The CLCN1 gene was also analyzed
by cDNA sequencing in patient 1. For cDNA analysis RNA
was extracted from muscle biopsy (Trizol method), and
cDNA was generated using a High-Capacity cDNA
Reverse Transcription Kit (Applied Biosystems, Foster
City, CA, USA). The CLCN1 gene transcript was amplified
by polymerase chain reaction using five overlapping primer
pairs. The CLCN1 exon 4 was sequenced from genomic
DNA of patient 1. Identification of the c.501C\G mutation
in patient 2 was attained by direct sequencing of the
CLCN1 exon 4 in DNA extracted from both blood and
muscle tissues.
Study of INSR, MBNL1, and CLCN1 gene alternative
splicing
The RT-PCR splicing assays for the INSR, MBNL1, and
CLCN1 genes were performed according to reported pro-
tocols [26, 27] using the following pairs of primers
(sequences from 50 to 30 ends): Fw-GCTGCCCAATACCA
GGTCAAC, Rev-TGGTGGGAGAAATGCTGTATGC
(MBNL1 gene splicing), Fw-CATCTCTCCCCAGGCTGT,
Rev-GCATCCTTGTTCCACACT (CLCN1 gene splicing),
Fw-CCAAAGACAGACTCTCAGAT, and Rev-AACATC
GCCAAGGGACCTGC (INSR gene splicing). Total PCR
products, obtained within the linear range of amplification,
were electrophoresed on 3,5 agarose gel for separation.
Quantitative analysis of the amplified products was per-
formed using SybrGreenII-stained gels (Perkin-Elmer Life
Science, MA, USA) scanned on a fluorimager 595
(Amersham Biosciences, Buckinghamshire, UK). The
intensity of each band and the fraction of abnormally
spliced (AS) isoforms (AS-isoforms/total) were quantified
by densitometry using ImageQuant software. Normaliza-
tion of the RT-PCR reactions was based on the expression
level of the glucose phosphate isomerase housekeeping
gene (GPI), and each amplification was carried out in
triplicate using independent cDNA samples.
QRT-PCR analysis of CLCN1 mRNA expression
Total RNA was extracted from muscle samples (P1, P2,
and two control subjects) using the RNeasy mini kit
(Qiagen Co., Valencia, CA, USA). Three micrograms of
total RNA was reverse transcribed according to the cDNA
protocol of the High Capacity cDNA Archive kit (Applied
Biosystem, Foster City, CA, USA). The Hs00163961_m1
Assay-on-demandTM
gene expression product, labeled
with FAM, was used to quantify CLCN1 transcripts. The
b2-miscroglobulin gene (B2M: GenBank accession no.
NM_004048) labeled with VIC dye was chosen as the
housekeeping, internal control gene. We performed each
PCR reaction in triplicate using the Taqman Universal PCR
Master Mix and the ABI PRISM 7000 Sequence Detection
System. A comparative threshold cycle (Ct) was used to
determine CLCN1 expression compared to the calibrator
(median value of control subjects). Hence, steady-state
mRNA levels expressed a n-fold difference relative to the
calibrator. For each sample, the gene Ct value was nor-
malized using the formula DCt = CtCLCN1_CtB2M. To
determine relative expression levels, the following formula
was used: DDCt = DCt sample-DCt calibrator. The value
used to plot relative gene expression was calculated using
the expression 2-DDCT.
Results
Patients
Patient 1. The proband’s 15-year-old daughter was admitted
to our department a few months later because she had com-
plained of grip myotonia since the age of 14. On admission
she also complained of difficulties in starting leg movements,
especially when she had to start climbing stairs and rising
from the squatting position. The symptoms improved with
repetitive movement. Neurological examination revealed
muscles of normal tone and strength. Grip myotonia was
evident, and there was a prominent warm-up phenomenon.
Lid lag was present. Deep tendon reflexes were normal.
Laboratory studies demonstrated normal electrolyte, urea,
creatinine, and lactate dehydrogenase levels. Serum creatine
and lipid profiles were normal. Routine laboratory studies
were normal, including serum creatine levels. EMG showed
myotonic discharges in all muscles examined, but no myo-
pathic changes. EKG, Holter electrocardiographic record-
ings, and echocardiograms were normal.
Patient 2. The proband, a 45-year-old woman, was
admitted to our department because of proximal lower limb
weakness that had progressed since the age of 30. Onset
had been at age 20 with grip myotonia. Family history was
positive for lower limb muscle weakness and grip myoto-
nia in her mother and grandmother. Cataracts had been
removed at age 40. Neurological examination revealed
mild muscle atrophy in the upper limbs but normal muscle
strength. Muscles were of normal strength except for the
neck flexors (grade 4 MRC) and hip flexors (grade 4
MRC). Deep tendon reflexes were uniformly brisk. Grip
myotonia was present, and warm-up was prominent. Rou-
tine laboratory studies were normal except for serum cre-
atine levels (240 U/l). EMG showed myotonic discharges
in the right abductor pollicis brevis. EKG, Holter electro-
cardiographs, and echocardiograms were normal.
J Neurol
123
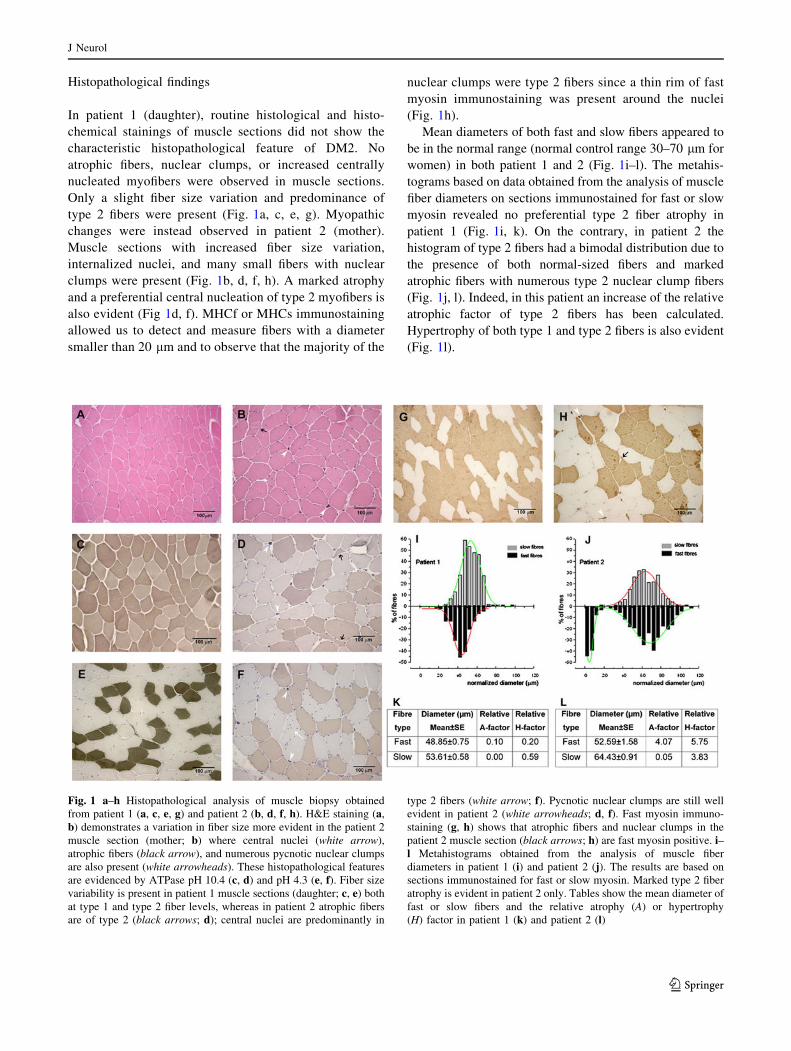
Histopathological findings
In patient 1 (daughter), routine histological and histo-
chemical stainings of muscle sections did not show the
characteristic histopathological feature of DM2. No
atrophic fibers, nuclear clumps, or increased centrally
nucleated myofibers were observed in muscle sections.
Only a slight fiber size variation and predominance of
type 2 fibers were present (Fig. 1a, c, e, g). Myopathic
changes were instead observed in patient 2 (mother).
Muscle sections with increased fiber size variation,
internalized nuclei, and many small fibers with nuclear
clumps were present (Fig. 1b, d, f, h). A marked atrophy
and a preferential central nucleation of type 2 myofibers is
also evident (Fig 1d, f). MHCf or MHCs immunostaining
allowed us to detect and measure fibers with a diameter
smaller than 20 lm and to observe that the majority of the
nuclear clumps were type 2 fibers since a thin rim of fast
myosin immunostaining was present around the nuclei
(Fig. 1h).
Mean diameters of both fast and slow fibers appeared to
be in the normal range (normal control range 30–70 lm for
women) in both patient 1 and 2 (Fig. 1i–l). The metahis-
tograms based on data obtained from the analysis of muscle
fiber diameters on sections immunostained for fast or slow
myosin revealed no preferential type 2 fiber atrophy in
patient 1 (Fig. 1i, k). On the contrary, in patient 2 the
histogram of type 2 fibers had a bimodal distribution due to
the presence of both normal-sized fibers and marked
atrophic fibers with numerous type 2 nuclear clump fibers
(Fig. 1j, l). Indeed, in this patient an increase of the relative
atrophic factor of type 2 fibers has been calculated.
Hypertrophy of both type 1 and type 2 fibers is also evident
(Fig. 1l).
Fig. 1 a–h Histopathological analysis of muscle biopsy obtained
from patient 1 (a, c, e, g) and patient 2 (b, d, f, h). H&E staining (a,
b) demonstrates a variation in fiber size more evident in the patient 2
muscle section (mother; b) where central nuclei (white arrow),
atrophic fibers (black arrow), and numerous pycnotic nuclear clumps
are also present (white arrowheads). These histopathological features
are evidenced by ATPase pH 10.4 (c, d) and pH 4.3 (e, f). Fiber size
variability is present in patient 1 muscle sections (daughter; c, e) both
at type 1 and type 2 fiber levels, whereas in patient 2 atrophic fibers
are of type 2 (black arrows; d); central nuclei are predominantly in
type 2 fibers (white arrow; f). Pycnotic nuclear clumps are still well
evident in patient 2 (white arrowheads; d, f). Fast myosin immuno-
staining (g, h) shows that atrophic fibers and nuclear clumps in the
patient 2 muscle section (black arrows; h) are fast myosin positive. i–l Metahistograms obtained from the analysis of muscle fiber
diameters in patient 1 (i) and patient 2 (j). The results are based on
sections immunostained for fast or slow myosin. Marked type 2 fiber
atrophy is evident in patient 2 only. Tables show the mean diameter of
fast or slow fibers and the relative atrophy (A) or hypertrophy
(H) factor in patient 1 (k) and patient 2 (l)
J Neurol
123
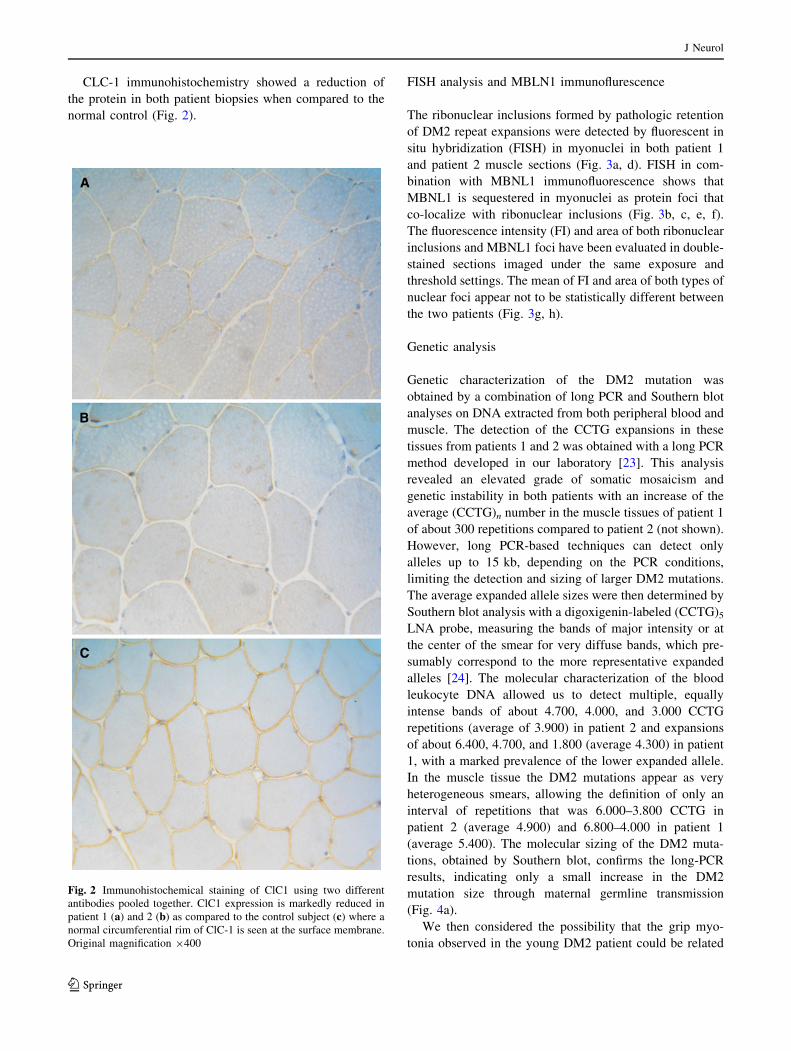
CLC-1 immunohistochemistry showed a reduction of
the protein in both patient biopsies when compared to the
normal control (Fig. 2).
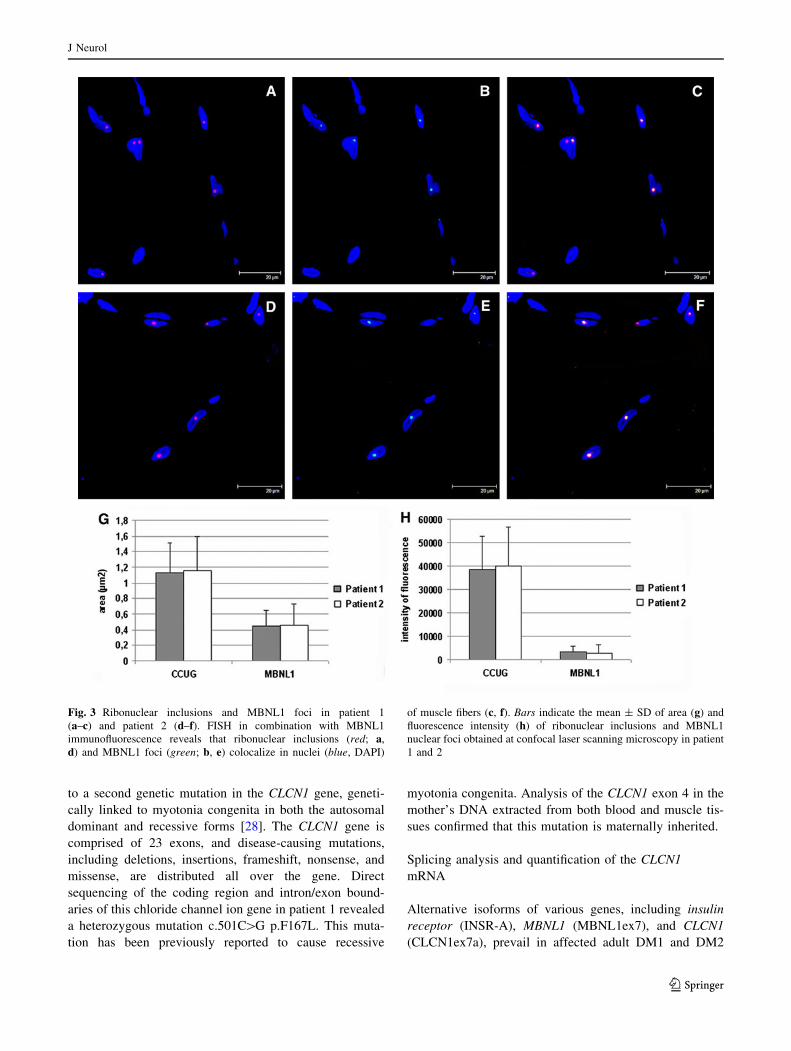
FISH analysis and MBLN1 immunoflurescence
The ribonuclear inclusions formed by pathologic retention
of DM2 repeat expansions were detected by fluorescent in
situ hybridization (FISH) in myonuclei in both patient 1
and patient 2 muscle sections (Fig. 3a, d). FISH in com-
bination with MBNL1 immunofluorescence shows that
MBNL1 is sequestered in myonuclei as protein foci that
co-localize with ribonuclear inclusions (Fig. 3b, c, e, f).
The fluorescence intensity (FI) and area of both ribonuclear
inclusions and MBNL1 foci have been evaluated in double-
stained sections imaged under the same exposure and
threshold settings. The mean of FI and area of both types of
nuclear foci appear not to be statistically different between
the two patients (Fig. 3g, h).
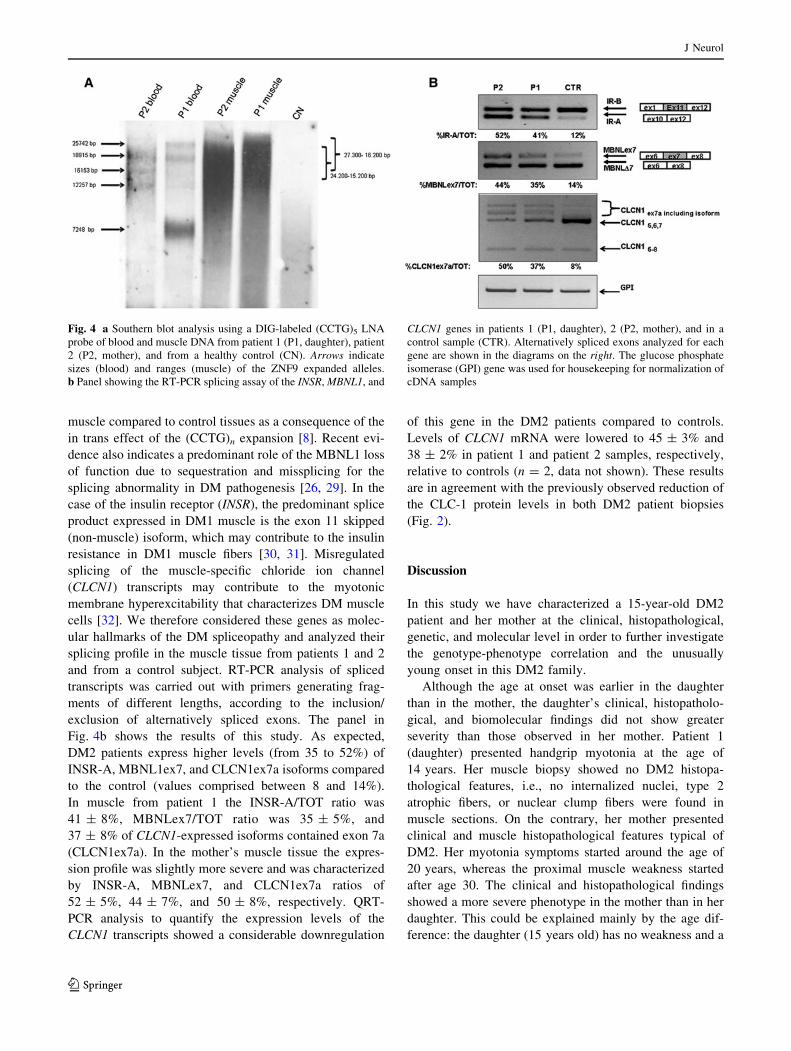
Genetic analysis
Genetic characterization of the DM2 mutation was
obtained by a combination of long PCR and Southern blot
analyses on DNA extracted from both peripheral blood and
muscle. The detection of the CCTG expansions in these
tissues from patients 1 and 2 was obtained with a long PCR
method developed in our laboratory [23]. This analysis
revealed an elevated grade of somatic mosaicism and
genetic instability in both patients with an increase of the
average (CCTG)n number in the muscle tissues of patient 1
of about 300 repetitions compared to patient 2 (not shown).
However, long PCR-based techniques can detect only
alleles up to 15 kb, depending on the PCR conditions,
limiting the detection and sizing of larger DM2 mutations.
The average expanded allele sizes were then determined by
Southern blot analysis with a digoxigenin-labeled (CCTG)5
LNA probe, measuring the bands of major intensity or at
the center of the smear for very diffuse bands, which pre-
sumably correspond to the more representative expanded
alleles [24]. The molecular characterization of the blood
leukocyte DNA allowed us to detect multiple, equally
intense bands of about 4.700, 4.000, and 3.000 CCTG
repetitions (average of 3.900) in patient 2 and expansions
of about 6.400, 4.700, and 1.800 (average 4.300) in patient
1, with a marked prevalence of the lower expanded allele.
In the muscle tissue the DM2 mutations appear as very
heterogeneous smears, allowing the definition of only an
interval of repetitions that was 6.000–3.800 CCTG in
patient 2 (average 4.900) and 6.800–4.000 in patient 1
(average 5.400). The molecular sizing of the DM2 muta-
tions, obtained by Southern blot, confirms the long-PCR
results, indicating only a small increase in the DM2
mutation size through maternal germline transmission
(Fig. 4a).
We then considered the possibility that the grip myo-
tonia observed in the young DM2 patient could be related
Fig. 2 Immunohistochemical staining of ClC1 using two different
antibodies pooled together. ClC1 expression is markedly reduced in
patient 1 (a) and 2 (b) as compared to the control subject (c) where a
normal circumferential rim of ClC-1 is seen at the surface membrane.
Original magnification 9400
J Neurol
123
to a second genetic mutation in the CLCN1 gene, geneti-
cally linked to myotonia congenita in both the autosomal
dominant and recessive forms [28]. The CLCN1 gene is
comprised of 23 exons, and disease-causing mutations,
including deletions, insertions, frameshift, nonsense, and
missense, are distributed all over the gene. Direct
sequencing of the coding region and intron/exon bound-
aries of this chloride channel ion gene in patient 1 revealed
a heterozygous mutation c.501C[G p.F167L. This muta-
tion has been previously reported to cause recessive
myotonia congenita. Analysis of the CLCN1 exon 4 in the
mother’s DNA extracted from both blood and muscle tis-
sues confirmed that this mutation is maternally inherited.
Splicing analysis and quantification of the CLCN1
mRNA
Alternative isoforms of various genes, including insulin
receptor (INSR-A), MBNL1 (MBNL1ex7), and CLCN1
(CLCN1ex7a), prevail in affected adult DM1 and DM2
Fig. 3 Ribonuclear inclusions and MBNL1 foci in patient 1
(a–c) and patient 2 (d–f). FISH in combination with MBNL1
immunofluorescence reveals that ribonuclear inclusions (red; a,
d) and MBNL1 foci (green; b, e) colocalize in nuclei (blue, DAPI)
of muscle fibers (c, f). Bars indicate the mean ± SD of area (g) and
fluorescence intensity (h) of ribonuclear inclusions and MBNL1
nuclear foci obtained at confocal laser scanning microscopy in patient
1 and 2
J Neurol
123
muscle compared to control tissues as a consequence of the
in trans effect of the (CCTG)n expansion [8]. Recent evi-
dence also indicates a predominant role of the MBNL1 loss
of function due to sequestration and missplicing for the
splicing abnormality in DM pathogenesis [26, 29]. In the
case of the insulin receptor (INSR), the predominant splice
product expressed in DM1 muscle is the exon 11 skipped
(non-muscle) isoform, which may contribute to the insulin
resistance in DM1 muscle fibers [30, 31]. Misregulated
splicing of the muscle-specific chloride ion channel
(CLCN1) transcripts may contribute to the myotonic
membrane hyperexcitability that characterizes DM muscle
cells [32]. We therefore considered these genes as molec-
ular hallmarks of the DM spliceopathy and analyzed their
splicing profile in the muscle tissue from patients 1 and 2
and from a control subject. RT-PCR analysis of spliced
transcripts was carried out with primers generating frag-
ments of different lengths, according to the inclusion/
exclusion of alternatively spliced exons. The panel in
Fig. 4b shows the results of this study. As expected,
DM2 patients express higher levels (from 35 to 52%) of
INSR-A, MBNL1ex7, and CLCN1ex7a isoforms compared
to the control (values comprised between 8 and 14%).
In muscle from patient 1 the INSR-A/TOT ratio was
41 ± 8%, MBNLex7/TOT ratio was 35 ± 5%, and
37 ± 8% of CLCN1-expressed isoforms contained exon 7a
(CLCN1ex7a). In the mother’s muscle tissue the expres-
sion profile was slightly more severe and was characterized
by INSR-A, MBNLex7, and CLCN1ex7a ratios of
52 ± 5%, 44 ± 7%, and 50 ± 8%, respectively. QRT-
PCR analysis to quantify the expression levels of the
CLCN1 transcripts showed a considerable downregulation
of this gene in the DM2 patients compared to controls.
Levels of CLCN1 mRNA were lowered to 45 ± 3% and
38 ± 2% in patient 1 and patient 2 samples, respectively,
relative to controls (n = 2, data not shown). These results
are in agreement with the previously observed reduction of
the CLC-1 protein levels in both DM2 patient biopsies
(Fig. 2).
Discussion
In this study we have characterized a 15-year-old DM2
patient and her mother at the clinical, histopathological,
genetic, and molecular level in order to further investigate
the genotype-phenotype correlation and the unusually
young onset in this DM2 family.
Although the age at onset was earlier in the daughter
than in the mother, the daughter’s clinical, histopatholo-
gical, and biomolecular findings did not show greater
severity than those observed in her mother. Patient 1
(daughter) presented handgrip myotonia at the age of
14 years. Her muscle biopsy showed no DM2 histopa-
thological features, i.e., no internalized nuclei, type 2
atrophic fibers, or nuclear clump fibers were found in
muscle sections. On the contrary, her mother presented
clinical and muscle histopathological features typical of
DM2. Her myotonia symptoms started around the age of
20 years, whereas the proximal muscle weakness started
after age 30. The clinical and histopathological findings
showed a more severe phenotype in the mother than in her
daughter. This could be explained mainly by the age dif-
ference: the daughter (15 years old) has no weakness and a
Fig. 4 a Southern blot analysis using a DIG-labeled (CCTG)5 LNA
probe of blood and muscle DNA from patient 1 (P1, daughter), patient
2 (P2, mother), and from a healthy control (CN). Arrows indicate
sizes (blood) and ranges (muscle) of the ZNF9 expanded alleles.
b Panel showing the RT-PCR splicing assay of the INSR, MBNL1, and
CLCN1 genes in patients 1 (P1, daughter), 2 (P2, mother), and in a
control sample (CTR). Alternatively spliced exons analyzed for each
gene are shown in the diagrams on the right. The glucose phosphate
isomerase (GPI) gene was used for housekeeping for normalization of
cDNA samples
J Neurol
123
mild histopathological pattern, and when she reaches the
age of 45, she could display, like her mother, significant
weakness and a significantly altered histopathological
pattern. Therefore, in conclusion, the histological and
immunohistochemical findings correlated with the disease
severity and age at onset in both patients. Southern blot
analysis revealed that the CCTG repetition length was
larger in skeletal muscle than in blood, especially in the
daughter’s tissues, where the DM2 mutation expanded
from about 2.000 (the most represented allele in blood) up
to 6.000 (CCTG)s (upper alleles in muscle). Comparison of
the CCTG repeat number between the daughter’s and
mother’s blood and muscle tissues showed only small
variation of the DM2 mutation (less than 1.000 repetitions).
We can then conclude that the earlier onset observed in the
daughter was not linked to a significant increase in the number
of CCTG repeats through maternal germline transmission.
However, a higher grade of somatic instability seemed to
occur in the daughter’s tissues, but the overall cause and
biological significance of this observation have yet to be
determined. The area and fluorescence intensity of both
ribonuclear inclusions and MBNL1 foci appear to be similar in
the two patients, suggesting that a similar amount of MBNL1
protein is sequestered in ribonuclear foci.
As expected, INSR, ClCN1, and MBNL1 splicing pat-
terns were altered in both patients with the level of aberrant
splicing isoforms slightly lower in the daughter than in the
mother. Co-segregation of DM2 mutation and recessive
CLCN1 mutations have been shown to occur and modify
the DM2 phenotype [18]. The frequency of heterozygous
recessive co-segregating CLCN1 mutations in DM2
patients from Finland and Germany is higher than in the
controls population [18]. However, this frequency was
calculated based not on the total DM2 patient population,
but on patients with a molecular diagnosis of DM2, pos-
sibly indicating a selection bias in molecular diagnostic
referral. It is therefore possible that a large number of DM2
patients without the CLCN1 mutation may remain undi-
agnosed because of a milder phenotype and that the fre-
quency of recessive CLCN1 mutations would be the same
as in the general population. Generally, affected carriers
showed more severe muscle stiffness and more severe
clinical EMG than those having exclusively the CNBP
expansion; hence the CLCN1 mutation may contribute to
exaggerating the DM2 phenotype. The co-segregating
F167L mutation, found in this family was a C–G transition
in CLCN1 exon 4 (position 501) causing an amino acid
change in the D2 domain of the protein. This mutation has
been described in association with the autosomal recessive
form of myotonia congenita and so without a mutation on
the other CLCN1 allele would not be expected to cause a
disease phenotype. However, functional studies in heter-
ologous expression systems have proven that the effect of
this mutation is a slight shift in the Cl potential [33]. Such a
background would have been one plausible explanation for
the early onset of myotonia in both the mother and in the
daughter because DM2 patients already show loss of the
chloride channel protein caused by the abnormal splicing
of the CLCN1 pre-mRNA, which leads to nonsense-medi-
ated decoys of transcripts containing premature termination
codons [32, 34]. Accordingly, the expression levels of the
CLCN1 gene are reduced in DM2 muscles, causing a
decreased chloride conductance and electrical instability.
The analysis of CLCN1 mRNA and protein expression
levels in our two DM2 patients demonstrated either CLCN1
missplicing or downregulation. Given that abnormal
splicing will affect both the normal and the mutant CLCN1
alleles, the consequent loss of functional CLC-1 resulting
from the additive effects of CLCN1 missplicing and
mutation will be even more marked than in patients with
either the DM2 or CLCN1 mutation alone.
Although both patients were proven to be heterozygous
for the c.501C[G mutation in the CLCN1 gene by genomic
sequencing of the exons and their boundaries, knowing the
frequent occurrence of splicing mutations in the gene, the
possibility of co-segregating recessive mutations has still
not been fully excluded.
The clinical, histopathological, and biomolecular charac-
terization of the juvenile onset DM2 family presented in this
study is helpful to clarify the similarities and distinctions
between DM1 and DM2 and therefore better understand the
pathogenetic mechanisms of these diseases. Moreover, this
study demonstrates that when clinical features are uncom-
mon, additional genes and/or modifying factors need to be
explored to account for the phenotype. In this case, the
co-segregation of DM2 with a recessive CLCN1 mutation
provided the explanation for the unusual clinical findings.
Acknowledgment This work was supported by Grant AFM-
MYOTON to Giovanni Meola.
Conflict of interest None.
References
1. Harper PS (2001) Myotonic dystrophy. In: Karpati G, Hilton-
Jones D, Griggs RC (eds) Disorders of voluntary muscle. Uni-
versity Press, Cambridge, pp 541–559
2. Brook JD, McCurrach ME, Harley HG et al (1999) Molecular
basis of myotonic dystrophy: expansion of a trinucleotide (CTG)
repeat at the 30 end of a transcript encoding a protein kinase
family member. Cell 69:799–808
3. Fu YH, Pizzuti A, Fenwick RG Jr et al (1992) An unstable triplet
repeat in a gene related to myotonic muscular dystrophy. Science
255:1256–1258
4. Mahadevan M, Tsilfidis C, Sabourin L et al (1992) Myotonic
dystrophy mutation: an unstable CTG repeat in the 30 untranslated
region of the gene. Science 255:1253–1255
J Neurol
123
5. Ranum LPW, Rasmussen P, Benzow K et al (1999) Genetic mapping
of a second myotonic dystrophy locus. Nat Genet 19:196–198
6. Liquori CL, Ricker K, Moseley ML et al (2001) Myotonic dys-
trophy type 2 caused by a CCTG expansion in intron 1 of ZNF9.
Science 293:816–817
7. Kuyumcu-Martinez NM, Cooper TA (2006) Misregulation of
alternative splicing causes pathogenesis in myotonic dystrophy.
Prog Mol Subcell Biol 44:133–159
8. Osborne J, Thornton CA (2006) RNA-dominant diseases. Hum
Mol Genet 15:R162–R169
9. Meola G, Cardani R (2009) RNA binding proteins in myotonic
dystrophies. In: Denman RB (ed) RNA binding proteins in
development and disease. Research Signpost, Kerala, pp 153–166
10. Meola G, Moxley RT (2004) Myotonic dystrophy type 2 and
related myotonic disorders. J Neurol 251:1173–1182
11. Vihola A, Bassez G, Meola G et al (2003) Histopathological
differences of myotonic dystrophy type 1 (DM1) and PROMM/
DM2. Neurology 60:1854–1857
12. Bassez G, Chapoy E, Bastuji-Garin S et al (2008) Type 2 myo-
tonic dystrophy can be predicted by the combination of type 2
muscle fiber central nucleation and scattered atrophy. J Neuro-
pathol Exp Neurol 67:319–325
13. Pisani V, Panico MB, Terracciano C et al (2008) Preferential
central nucleation of type 2 myofibers is an invariable feature of
myotonic dystrophy type 2. Muscle Nerve 38:1405–1411
14. Tsilfidis C, MacKenzie AE, Mettler G, Barcelo J, Korneluk RG
(1992) Correlation between CTG trinucleotide repeat length and
frequency of severe congenital myotonic dystrophy. Nat Genet
1:192–195
15. Harper PS, Harley HG, Reardon W et al (1992) Review article:
anticipation in myotonic dystrophy: new light on an old problem.
Am J Genet 51:10–16
16. Schoser BGH, Kress W, Walter MC, Halliger-Keller B, ller HL,
Ricker K (2004) Homozygosity for CCTG mutation in myotonic
dystrophy type 2. Brain 127:1868–1877
17. Lamont PJ, Jacob RL, Mastaglia FL et al (2004) An expansion in
the ZNF9 gene causes PROMM in a previously described family
with an incidental CLCN1 mutation. J Neurol Neurosurg Psy-
chiatry 75:343
18. Suominen T, Schoser B, Raheem O et al (2008) High frequency of
co-segregating CLCN1 mutations among myotonic dystrophy type 2
patients from Finland and Germany. J Neurol 255:1731–1736
19. Sun C, Van Ghelue M, Tranebjaerg L et al (2011) Myotonia
congenita and myotonic dystrophy in the same family: coexis-
tence of a CLCN1 mutation and expansion in the CNBP (ZNF9)
gene. Clin Genet 80:574–580
20. Dubowitz V (1985) Muscle biopsy. In: Dubowitz V (ed) A
practical approach. Bailliere Tindall, London
21. Cardani R, Mancinelli E, Sansone V et al (2004) Biomolecular
identification of (CCTG)n mutation in myotonic dystrophy type 2
(DM2) by FISH on muscle biopsy. Eur J Histochem 48:437–442
22. Boi S, Fascio U (1998) A method of quantitative measurement of
fluorescence intensity by confocal laser scanning microscopy.
J Comput Assist Microsc 10:163–166
23. Bonifazi E, Vallo L, Giardina E et al (2004) A long PCR-based
molecular protocol for detecting normal and expanded ZNF9
alleles in myotonic dystrophy type 2. Diagn Mol Pathol 13:164–
166
24. Nakamori M, Sobczak K, Moxley RT 3rd et al (2009) Scaled-
down genetic analysis of myotonic dystrophy type 1 and type 2.
Neuromuscul Disord 19:759–762
25. Lehmann-Horn F, Mailander V, Heine R et al (1995) Myotonia
levior is a chloride channel disorder. Hum Mol Genet 4:1397–
1402
26. Botta A, Rinaldi F, Catalli C et al (2008) The CTG repeat
expansion size correlates with the splicing defects observed in
muscles from myotonic dystrophy type 1 patients. J Med Genet
45:639–646
27. Botta A, Bonifazi E, Vallo L et al (2006) Italian guidelines for
molecular analysis in myotonic dystrophies. Acta Myol 25:23–33
28. Pusch M (2002) Myotonia caused by mutations in the muscle
chloride channel gene CLCN1. Hum Mutat 19:423–434
29. Kanadia RN, Shin J, Yuan Y et al (2006) Reversal of RNA
missplicing and myotonia after muscleblind overexpression in a
mouse poly(CUG) model for myotonic dystrophy. Proc Natl
Acad Sci 103:11748–11753
30. Savkur RS, Philips AV, Cooper TA (2001) Aberrant regulation of
insulin receptor alternative splicing is associated with insulin
resistance in myotonic dystrophy. Nat Genet 29:40–47
31. Savkur RS, Philips AV, Cooper TA et al (2004) Insulin receptor
splicing alteration in myotonic dystrophy type 2. Am J Hum
Genet 74:1309–1313
32. Mankodi A, Takahashi MP, Jiang H et al (2002) Expanded CUG
repeats trigger aberrant splicing of ClC-1 chloride channel pre-
mRNA and hyperexcitability of skeletal muscle in myotonic
dystrophy. Mol Cell 10:35–44
33. Zhang J, Bendahhou S, Sanguinetti MC et al (2000) Functional
consequences of chloride channel gene (CLCN1) mutations
causing myotonia congenita. Neurology 54:937–942
34. Charlet BN, Savkur RS, Singh G et al (2002) Loss of the muscle-
specific chloride channel in type 1 myotonic dystrophy due to
misregulated alternative splicing. Mol Cell 10:45–53
J Neurol
123
Copyright © 2022 FDOKUMEN