Bioresponsive Hyaluronic Acid-Capped Mesoporous Silica Nanoparticles for Targeted Drug Delivery
Upload
khangminh22Category
view
2download
0
pharmaceutics
Article
Co-Delivery of Eugenol and Dacarbazine byHyaluronic Acid-Coated Liposomes for TargetedInhibition of Survivin in Treatment of ResistantMetastatic Melanoma
Harshita Mishra 1, Pawan Kumar Mishra 2 , Zeenat Iqbal 1, Manu Jaggi 3, Alka Madaan 3,Kimi Bhuyan 3, Namita Gupta 3, Neha Gupta 3, Karnika Vats 3, Ritu Verma 3 andSushama Talegaonkar 1,4,*
1 Departmant of Pharmaceutics, School of Pharmaceutical Education and Research, Jamia Hamdard,New Delhi 110062, India; [email protected] (H.M.); [email protected] (Z.I.)
2 Department of Wood Processing, Mendel University in Brno, 61300 Brno, Czech Republic;[email protected]
3 Dabur Research Foundation, Ghaziabad 201010, India; [email protected] (M.J.);[email protected] (A.M.); [email protected] (K.B.);[email protected] (N.G.); [email protected] (N.G.);[email protected] (K.V.); [email protected] (R.V.)
4 Department of Pharmaceutics, Delhi Pharmaceutical Sciences and Research University,Govt. of NCT of Delhi, Pushp Vihar, New Delhi 110017, India
* Correspondence: [email protected]; Tel.: +91-9818453518
Received: 28 January 2019; Accepted: 18 March 2019; Published: 3 April 2019�����������������
Abstract: While melanoma remains a challenge for oncologists, possibilities are being continuouslyexplored to fight resistant metastatic melanoma more effectively. Eugenol is reported to inhibitsurvivin protein in breast cancer cells. Survivin is also overexpressed by melanoma cells, andis known to impart resistance to them against chemotherapy-induced apoptosis. To be able tofight resistant melanoma, we formulated hyaluronic acid (HA)-coated liposomes loaded with aneffective combination of anti-melanoma agents (Dacarbazine and Eugenol), using a solvent injectionmethod. Quality-by-Design (QbD) was applied to optimize and obtain a final formulation withthe desired quality attributes, and within an acceptable size range. The optimized formulationwas then subjected to performance analysis in cell lines. Coated-Dacarbazine Eugenol Liposomeswere found to possess 95.08% cytotoxicity at a dacarbazine concentration of 0.5 µg/mL, whileDacarbazine Solution showed only 10.20% cytotoxicity at the same concentration. The number oflate apoptotic cells was also found to be much higher (45.16% vs. 8.43%). Furthermore, migrationassay and proliferation study also revealed significantly higher inhibition of cell migration andproliferation by Coated-Dacarbazine Eugenol Liposomes, signifying its potential against metastasis.Thus, surface-functionalized dacarbazine- and eugenol-loaded liposomes hold great promise againstresistant and aggressive metastatic melanoma, with much less unwanted cytotoxicity and reduceddoses of the chemotherapeutic agent.
Keywords: Quality by Design (QbD); liposomes; hyaluronic acid; melanoma treatment; survivininhibition; cytotoxicity; apoptosis; migration inhibition
1. Introduction
Melanocytes, while, on the one hand, protecting the skin from harmful ultraviolet radiation intheir normal state, form one of the deadliest cancers when undergoing malignant growth on the other.
Pharmaceutics 2019, 11, 163; doi:10.3390/pharmaceutics11040163 www.mdpi.com/journal/pharmaceutics
Pharmaceutics 2019, 11, 163 2 of 35
Melanoma, which is the cancer of melanocytes, is a highly aggressive cancer, and causes up to 60–80%of skin cancer-related deaths [1,2]. As another matter of concern, the incidence rates of melanomaare continuously on the rise, with an increase of around 56% from 2005 to 2015 [3]. Furthermore, themedian survival of metastatic melanoma (stage IV) patients is very poor, with no more than 10% ofpatients still being alive ten years after the treatment [4].
The major challenge associated with melanoma treatment is the resistance of melanoma cellschemotherapy, which can lead to the failure of the treatment, along with poor response and survivalrates [5,6]. While several studies have been performed on the multidrug resistance of cancer cells [7,8],the inherent resistance of melanoma cells is reported to be due to a protein named survivin. Thesurvivin protein is a member of the inhibitor of apoptosis (IAP) family, and exerts its effects bydirectly inhibiting caspases [9,10]. Several cancer types, including melanoma, have been reported tooverexpress survivin. Survivin protects cancer cells from apoptosis, which is supposed to be inducedby chemotherapy in order to kill cancer cells. Survivin is also known to play an essential role inangiogenesis by promoting the expression of the vascular endothelial growth factor (VEGF) in cancercells [11]. It is reported that inhibiting the function of survivin in melanoma cells can spontaneouslycause apoptosis, impairing the growth of the tumor [12]. Downregulation of survivin has also beenfound to inhibit migration, metastasis, and proliferation of cancer cells, both in vitro and in vivo [13].The fact that it is overexpressed in most cancer cells, but hardly expressed at all in any normal tissue,makes it an attractive target for targeted anti-cancer therapies [14].
Eugenol (4-allyl-1-hydroxy-2-methoxybenzene), the main constituent of clove (Syzygium aromaticum),has been shown to target and inhibit survivin in breast cancer cells, thus inducing apoptosis and tumorinhibition [15]. Additionally, eugenol has specifically shown anti-proliferative and apoptosis-inducingeffects in melanoma in vitro and in vivo [16]. The presence of a hydroxyl group and an aromatic ringin the eugenol structure has been reported to be important for its anti-cancer action [17].
Nanotechnology has a special role in the treatment of cancer, because it enables scientists tospecifically target the cancer cells with anti-cancer drugs, sparing normal tissues, and avoiding anyunwanted side effects, which constitute the major drawback of chemotherapy [18,19]. Nanoagentsloaded with chemotherapeutic drugs and surface-functionalized with ligands, have been formulatedand successfully implemented in the treatment of melanoma [19–22]. However, the design andoptimization of a formulation in the most effort-, time- and cost-effective manner have provenchallenging for scientists. Here, the QbD (Quality by Design) approach comes to the rescue. QbDis a scientific and systematic approach for use in the development of pharmaceutical formulations.It involves defining and taking into consideration all of the parameters that critically affect the finalquality and performance of the formulation. QbD can be focused on defining the aspects of qualitythat need to be optimized [23]. Application of QbD helps in understanding and establishing therelationship between the process parameters and the quality attributes of the formulation. It helpsscientists understand how the critical process parameters should be varied in order to consistentlyproduce a pharmaceutical formulation with the desired quality attributes [23,24].
Bearing the above-stated facts in mind, we formulated dual-loaded, surface-functionalizedliposomes for the targeted anti-resistance therapy of melanoma. Dacarbazine, an alkylatingchemotherapeutic agent, is still the mainstay of melanoma treatment, and it forms the basis formost anti-melanoma combinations [4]. Dacarbazine is combined with eugenol for its survivin-targetingability. Both drugs are loaded in liposomes, and liposomes are finally surface-functionalized withHyaluronic acid (HA) in order to enable the active targeting of CD44 receptors, which are overexpressedby cancer cells [25].
In this case, since two drugs were to be loaded into the liposomes, the QbD was applied ontwo levels. On the first level, single drug (dacarbazine)-loaded liposomes were optimized, and onthe second level, dual-loaded (Dacarbazine + Eugenol) liposomes were optimized by fixing severalparameters based on the results of the first-level QbD. Applying QbD on two levels, and optimizing all
Pharmaceutics 2019, 11, 163 3 of 35
the independent variables in a two-step QbD approach, rather than one, made the whole process morecost-effective and more reproducible.
2. Materials and Methods
Chemicals: Dacarbazine was kindly provided by Intas Pharmaceuticals (Ahmedabad, India).Eugenol (99.9%) was purchased from Sigma Aldrich (St Louis, MO, USA). Lipoid S100 was a generousgift from Lipoid GmbH, Frigenstr. 4, 67065 Ludwigshafen, Germany. All other reagents used were ofanalytical grade and were used without any further purification.
Cell Lines: Cell line studies were carried out in the Cell Biology Department, Dabur ResearchFoundation, Ghaziabad, India. SK-MEL-28 and B16F10 melanoma cell lines were procured from theNational Center for Cell Science (NCCS, Pune, India); The EA.hy.926 cell line was procured from theAmerican Type Culture Collection (ATCC, Rockville, MD, USA).
2.1. Synthesis of Liposomes
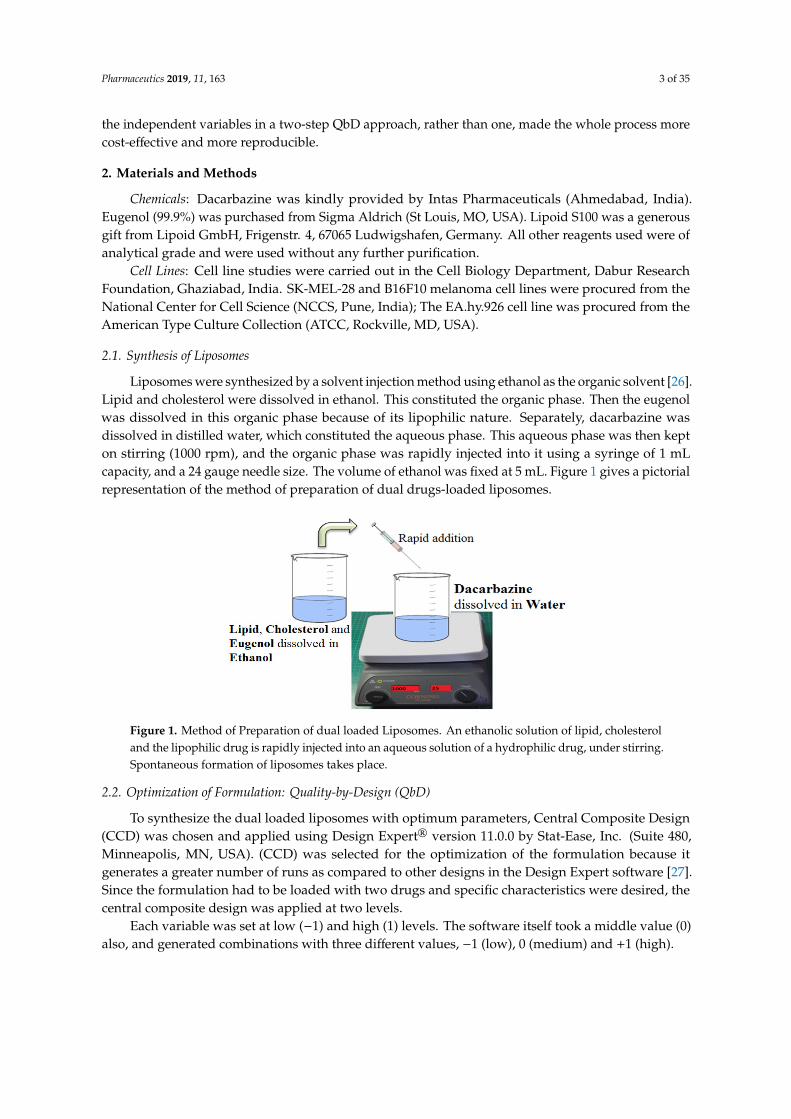
Liposomes were synthesized by a solvent injection method using ethanol as the organic solvent [26].Lipid and cholesterol were dissolved in ethanol. This constituted the organic phase. Then the eugenolwas dissolved in this organic phase because of its lipophilic nature. Separately, dacarbazine wasdissolved in distilled water, which constituted the aqueous phase. This aqueous phase was then kepton stirring (1000 rpm), and the organic phase was rapidly injected into it using a syringe of 1 mLcapacity, and a 24 gauge needle size. The volume of ethanol was fixed at 5 mL. Figure 1 gives a pictorialrepresentation of the method of preparation of dual drugs-loaded liposomes.
Pharmaceutics 2018, 10, x FOR PEER REVIEW 3 of 39
parameters based on the results of the first-level QbD. Applying QbD on two levels, and optimizing all the independent variables in a two-step QbD approach, rather than one, made the whole process more cost-effective and more reproducible.
2. Materials and Methods
Chemicals: Dacarbazine was kindly provided by Intas Pharmaceuticals (Ahmedabad, India). Eugenol (99.9%) was purchased from Sigma Aldrich (St Louis, MO, USA). Lipoid S100 was a generous gift from Lipoid GmbH, Frigenstr. 4, 67065 Ludwigshafen, Germany. All other reagents used were of analytical grade and were used without any further purification.
Cell Lines: Cell line studies were carried out in the Cell Biology Department, Dabur Research Foundation, Ghaziabad, India. SK-MEL-28 and B16F10 melanoma cell lines were procured from the National Center for Cell Science (NCCS, Pune, India); The EA.hy.926 cell line was procured from the American Type Culture Collection (ATCC, Rockville, MD, USA).
2.1. Synthesis of Liposomes
Liposomes were synthesized by a solvent injection method using ethanol as the organic solvent [26]. Lipid and cholesterol were dissolved in ethanol. This constituted the organic phase. Then the eugenol was dissolved in this organic phase because of its lipophilic nature. Separately, dacarbazine was dissolved in distilled water, which constituted the aqueous phase. This aqueous phase was then kept on stirring (1000 rpm), and the organic phase was rapidly injected into it using a syringe of 1 mL capacity, and a 24 gauge needle size. The volume of ethanol was fixed at 5 mL. Figure 1 gives a pictorial representation of the method of preparation of dual drugs-loaded liposomes.
Figure 1. Method of Preparation of dual loaded Liposomes. An ethanolic solution of lipid, cholesterol and the lipophilic drug is rapidly injected into an aqueous solution of a hydrophilic drug, under stirring. Spontaneous formation of liposomes takes place.
2.2. Optimization of Formulation: Quality-by-Design (QbD)
To synthesize the dual loaded liposomes with optimum parameters, Central Composite Design (CCD) was chosen and applied using Design Expert® version 11.0.0 by Stat-Ease, Inc. (Suite 480, Minneapolis, MN, USA). (CCD) was selected for the optimization of the formulation because it generates a greater number of runs as compared to other designs in the Design Expert software [27]. Since the formulation had to be loaded with two drugs and specific characteristics were desired, the central composite design was applied at two levels.
Each variable was set at low (−1) and high (1) levels. The software itself took a middle value (0) also, and generated combinations with three different values, −1 (low), 0 (medium) and +1 (high).
Figure 1. Method of Preparation of dual loaded Liposomes. An ethanolic solution of lipid, cholesteroland the lipophilic drug is rapidly injected into an aqueous solution of a hydrophilic drug, under stirring.Spontaneous formation of liposomes takes place.
2.2. Optimization of Formulation: Quality-by-Design (QbD)
To synthesize the dual loaded liposomes with optimum parameters, Central Composite Design(CCD) was chosen and applied using Design Expert® version 11.0.0 by Stat-Ease, Inc. (Suite 480,Minneapolis, MN, USA). (CCD) was selected for the optimization of the formulation because itgenerates a greater number of runs as compared to other designs in the Design Expert software [27].Since the formulation had to be loaded with two drugs and specific characteristics were desired, thecentral composite design was applied at two levels.
Each variable was set at low (−1) and high (1) levels. The software itself took a middle value (0)also, and generated combinations with three different values, −1 (low), 0 (medium) and +1 (high).
Pharmaceutics 2019, 11, 163 4 of 35
2.2.1. First Level
Initial Risk Assessment
Critical quality attributes (CQAs) are the quality aspects of the final product which are critical forits performance, and are to be optimized. In the present study, particle size and entrapment efficiencywere selected as CQAs for initial risk assessment. Critical material attributes (CMAs) and criticalprocess parameters (CPPs) are the material and process variables, respectively, that are expected toaffect and alter the quality (CQAs) of the final formulation.
According to the literature surveyed and results of the preliminary experiments, various CMAsand CPPs were identified, namely:
CMAs: Lipid concentration, Drug concentration, Lipid: CholesterolCPPs: Water: Ethanol, Stirring speed, Stirring time
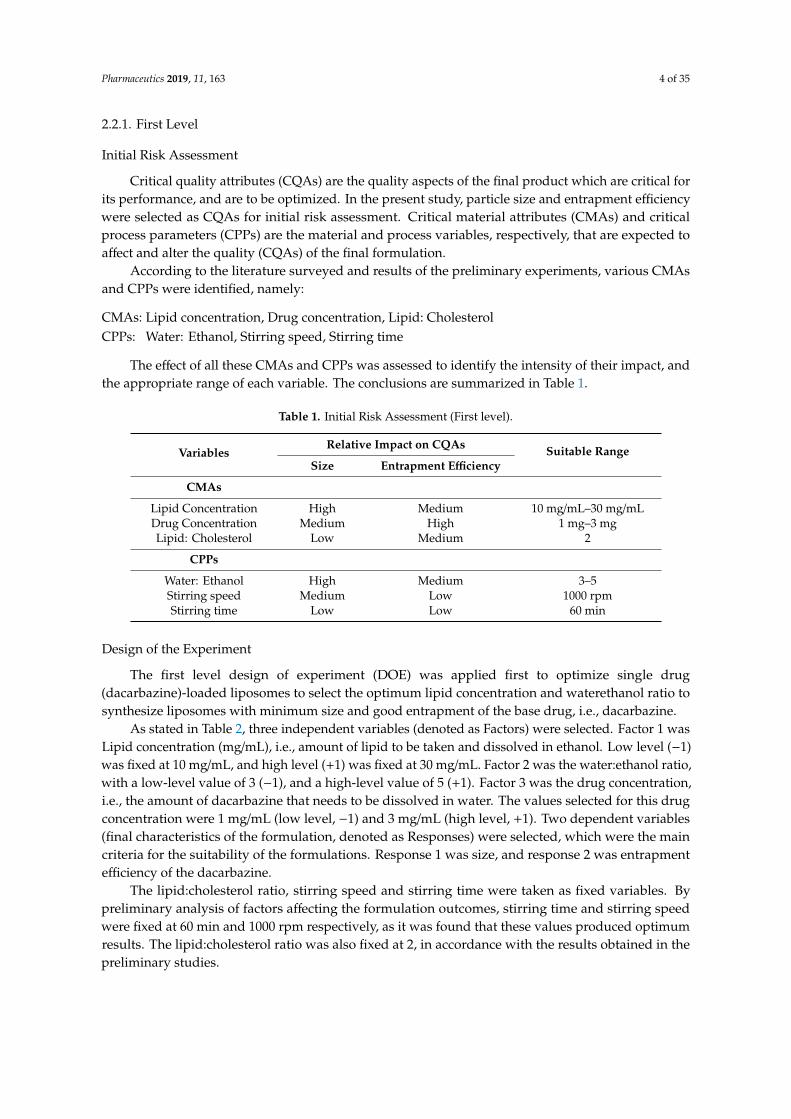
The effect of all these CMAs and CPPs was assessed to identify the intensity of their impact, andthe appropriate range of each variable. The conclusions are summarized in Table 1.
Table 1. Initial Risk Assessment (First level).
VariablesRelative Impact on CQAs Suitable Range
Size Entrapment Efficiency
CMAs
Lipid Concentration High Medium 10 mg/mL–30 mg/mLDrug Concentration Medium High 1 mg–3 mgLipid: Cholesterol Low Medium 2
CPPs
Water: Ethanol High Medium 3–5Stirring speed Medium Low 1000 rpmStirring time Low Low 60 min
Design of the Experiment
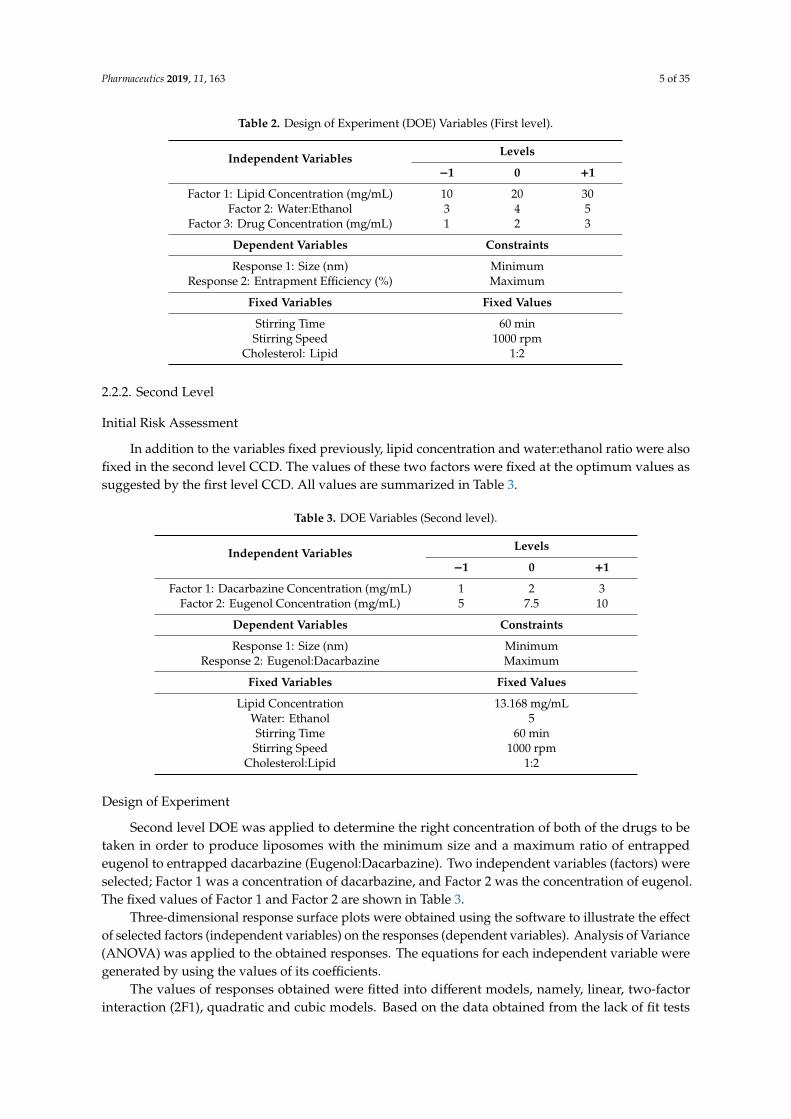
The first level design of experiment (DOE) was applied first to optimize single drug(dacarbazine)-loaded liposomes to select the optimum lipid concentration and waterethanol ratio tosynthesize liposomes with minimum size and good entrapment of the base drug, i.e., dacarbazine.
As stated in Table 2, three independent variables (denoted as Factors) were selected. Factor 1 wasLipid concentration (mg/mL), i.e., amount of lipid to be taken and dissolved in ethanol. Low level (−1)was fixed at 10 mg/mL, and high level (+1) was fixed at 30 mg/mL. Factor 2 was the water:ethanol ratio,with a low-level value of 3 (−1), and a high-level value of 5 (+1). Factor 3 was the drug concentration,i.e., the amount of dacarbazine that needs to be dissolved in water. The values selected for this drugconcentration were 1 mg/mL (low level, −1) and 3 mg/mL (high level, +1). Two dependent variables(final characteristics of the formulation, denoted as Responses) were selected, which were the maincriteria for the suitability of the formulations. Response 1 was size, and response 2 was entrapmentefficiency of the dacarbazine.
The lipid:cholesterol ratio, stirring speed and stirring time were taken as fixed variables. Bypreliminary analysis of factors affecting the formulation outcomes, stirring time and stirring speedwere fixed at 60 min and 1000 rpm respectively, as it was found that these values produced optimumresults. The lipid:cholesterol ratio was also fixed at 2, in accordance with the results obtained in thepreliminary studies.
Pharmaceutics 2019, 11, 163 5 of 35
Table 2. Design of Experiment (DOE) Variables (First level).
Independent Variables Levels
−1 0 +1
Factor 1: Lipid Concentration (mg/mL) 10 20 30Factor 2: Water:Ethanol 3 4 5
Factor 3: Drug Concentration (mg/mL) 1 2 3
Dependent Variables Constraints
Response 1: Size (nm) MinimumResponse 2: Entrapment Efficiency (%) Maximum
Fixed Variables Fixed Values
Stirring Time 60 minStirring Speed 1000 rpm
Cholesterol: Lipid 1:2
2.2.2. Second Level
Initial Risk Assessment
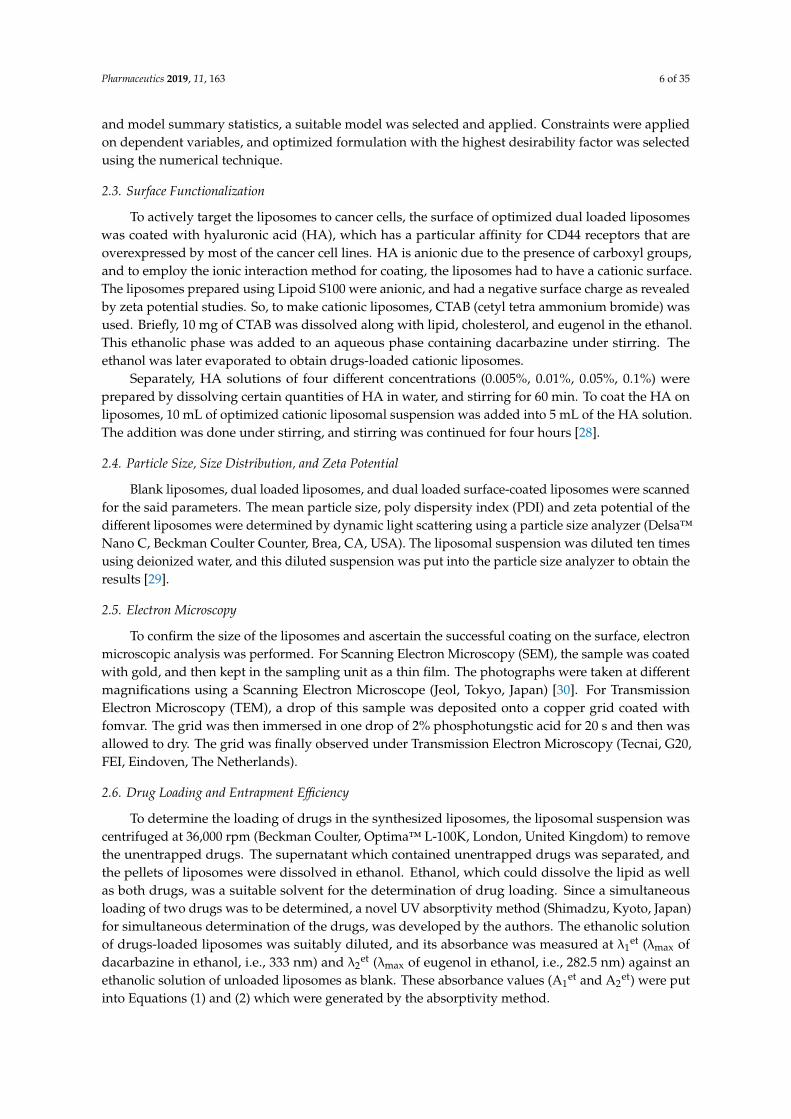
In addition to the variables fixed previously, lipid concentration and water:ethanol ratio were alsofixed in the second level CCD. The values of these two factors were fixed at the optimum values assuggested by the first level CCD. All values are summarized in Table 3.
Table 3. DOE Variables (Second level).
Independent Variables Levels
−1 0 +1
Factor 1: Dacarbazine Concentration (mg/mL) 1 2 3Factor 2: Eugenol Concentration (mg/mL) 5 7.5 10
Dependent Variables Constraints
Response 1: Size (nm) MinimumResponse 2: Eugenol:Dacarbazine Maximum
Fixed Variables Fixed Values
Lipid Concentration 13.168 mg/mLWater: Ethanol 5Stirring Time 60 minStirring Speed 1000 rpm
Cholesterol:Lipid 1:2
Design of Experiment
Second level DOE was applied to determine the right concentration of both of the drugs to betaken in order to produce liposomes with the minimum size and a maximum ratio of entrappedeugenol to entrapped dacarbazine (Eugenol:Dacarbazine). Two independent variables (factors) wereselected; Factor 1 was a concentration of dacarbazine, and Factor 2 was the concentration of eugenol.The fixed values of Factor 1 and Factor 2 are shown in Table 3.
Three-dimensional response surface plots were obtained using the software to illustrate the effectof selected factors (independent variables) on the responses (dependent variables). Analysis of Variance(ANOVA) was applied to the obtained responses. The equations for each independent variable weregenerated by using the values of its coefficients.
The values of responses obtained were fitted into different models, namely, linear, two-factorinteraction (2F1), quadratic and cubic models. Based on the data obtained from the lack of fit tests
Pharmaceutics 2019, 11, 163 6 of 35
and model summary statistics, a suitable model was selected and applied. Constraints were appliedon dependent variables, and optimized formulation with the highest desirability factor was selectedusing the numerical technique.
2.3. Surface Functionalization
To actively target the liposomes to cancer cells, the surface of optimized dual loaded liposomeswas coated with hyaluronic acid (HA), which has a particular affinity for CD44 receptors that areoverexpressed by most of the cancer cell lines. HA is anionic due to the presence of carboxyl groups,and to employ the ionic interaction method for coating, the liposomes had to have a cationic surface.The liposomes prepared using Lipoid S100 were anionic, and had a negative surface charge as revealedby zeta potential studies. So, to make cationic liposomes, CTAB (cetyl tetra ammonium bromide) wasused. Briefly, 10 mg of CTAB was dissolved along with lipid, cholesterol, and eugenol in the ethanol.This ethanolic phase was added to an aqueous phase containing dacarbazine under stirring. Theethanol was later evaporated to obtain drugs-loaded cationic liposomes.
Separately, HA solutions of four different concentrations (0.005%, 0.01%, 0.05%, 0.1%) wereprepared by dissolving certain quantities of HA in water, and stirring for 60 min. To coat the HA onliposomes, 10 mL of optimized cationic liposomal suspension was added into 5 mL of the HA solution.The addition was done under stirring, and stirring was continued for four hours [28].
2.4. Particle Size, Size Distribution, and Zeta Potential
Blank liposomes, dual loaded liposomes, and dual loaded surface-coated liposomes were scannedfor the said parameters. The mean particle size, poly dispersity index (PDI) and zeta potential of thedifferent liposomes were determined by dynamic light scattering using a particle size analyzer (Delsa™Nano C, Beckman Coulter Counter, Brea, CA, USA). The liposomal suspension was diluted ten timesusing deionized water, and this diluted suspension was put into the particle size analyzer to obtain theresults [29].
2.5. Electron Microscopy
To confirm the size of the liposomes and ascertain the successful coating on the surface, electronmicroscopic analysis was performed. For Scanning Electron Microscopy (SEM), the sample was coatedwith gold, and then kept in the sampling unit as a thin film. The photographs were taken at differentmagnifications using a Scanning Electron Microscope (Jeol, Tokyo, Japan) [30]. For TransmissionElectron Microscopy (TEM), a drop of this sample was deposited onto a copper grid coated withfomvar. The grid was then immersed in one drop of 2% phosphotungstic acid for 20 s and then wasallowed to dry. The grid was finally observed under Transmission Electron Microscopy (Tecnai, G20,FEI, Eindoven, The Netherlands).
2.6. Drug Loading and Entrapment Efficiency
To determine the loading of drugs in the synthesized liposomes, the liposomal suspension wascentrifuged at 36,000 rpm (Beckman Coulter, Optima™ L-100K, London, United Kingdom) to removethe unentrapped drugs. The supernatant which contained unentrapped drugs was separated, andthe pellets of liposomes were dissolved in ethanol. Ethanol, which could dissolve the lipid as wellas both drugs, was a suitable solvent for the determination of drug loading. Since a simultaneousloading of two drugs was to be determined, a novel UV absorptivity method (Shimadzu, Kyoto, Japan)for simultaneous determination of the drugs, was developed by the authors. The ethanolic solutionof drugs-loaded liposomes was suitably diluted, and its absorbance was measured at λ1
et (λmax ofdacarbazine in ethanol, i.e., 333 nm) and λ2
et (λmax of eugenol in ethanol, i.e., 282.5 nm) against anethanolic solution of unloaded liposomes as blank. These absorbance values (A1
et and A2et) were put
into Equations (1) and (2) which were generated by the absorptivity method.
Pharmaceutics 2019, 11, 163 7 of 35
A1et = 1005 Cd
et + 72.24 Ceet (1)
A2et = 616 Cd
et + 144.21 Ceet (2)
After solving the simultaneous equations, amount of dacarbazine and amount of eugenol presentin the formulation were determined by multiplying the concentration of dacarbazine (Cd
et) and theconcentration of eugenol (Ce
et) with dilution factors.Drug loading of the formulation with respect to both drugs was calculated by using the following
formula:
Drug Loading (%) = (Amount of drug present in formulation/Total weight of the formulation × 100)
After determining the amount of drugs present in the liposomes, the entrapment efficiency ofboth drugs was calculated by the following formula:
Entrapment efficiency (%) = (Amount of drug entrapped/Total amount of drug used) × 100
2.7. In Vitro Drug Release
The in vitro release study of dual loaded surface-functionalized liposomes was carried outthroughout 72 h, using the dialysis bag method [31]. Phosphate Buffer Saline (PBS) (pH 7.4): Propyleneglycol (9:1) was used as a release medium because both the drugs were soluble in this media, while thelipid was insoluble. The dialysis membrane (MW cut off 8–10 kDa; Spectra/Por® Spectrum Laboratories,Inc., Visalia, CA, USA) was activated before using as per the instructions given on the packaging. Theliposomal suspension was centrifuged as described above. The supernatant was discarded, and pelletswere dispersed in 10 mL of release media. This dispersion was put in a dialysis bag, and the bag wassuspended in 200 mL of receiving phase i.e., PBS (pH 7.4): Propylene glycol (9:1), and placed into anincubator shaker maintained at 37 ◦C and 100 rpm. Aliquots each of 3 mL were withdrawn at varioustime points (up to 72 h). The same volume (3 mL) of the media was replaced after each sampling tomaintain the sink condition during the study. The absorbance of samples withdrawn at different timepoints (and suitably diluted when needed), was measured at λ1 (λmax of dacarbazine in release media,i.e., 331 nm) and λ2 (λmax of eugenol in release media, i.e., 281.5 nm) against pure release media asblank. These absorbance values (A1 and A2) were put into Equations (3) and (4), which were generatedby an absorptivity method developed in house using PBS: Propylene glycol (9:1) as a solvent.
A1 = 949.64 Cd + 30.59 Ce (3)
A2 = 319.93 Cd + 138.36 Ce (4)
After solving the above simultaneous equations, the amount of both the drugs (Cd and Ce) present inthe release media at different time points was calculated.
% Release at any point of time = (Amount of drug present in the release media/Total amount ofdrug present in formulation/dialysis bag) × 100
2.8. Stability Study
To check the stability of the final formulation, the liposomes were lyophilized and stored underrefrigeration (4 ◦C) for four weeks. The particle size, PDI and drug content of the liposomes weredetermined at the end of every week by dispersing in PBS (7.4) to assess the storage stability of theliposomes. Stability of the liposomes was also assessed in cell culture media (Eagle’s minimal essentialmedium (DMEM) + 10% FBS) for three days.
Pharmaceutics 2019, 11, 163 8 of 35
2.9. Cell Line Studies
Growth medium used for cell lines was DMEM + 10% FBS. Growth conditions were 37 ◦C, 95%Humidity, 5% CO2. Sub-culturing was done once the cells were 80–90% confluent in the T-75 cultureflask. Untreated cells with complete medium (10% FBS) served as our complete medium control, cellswith sera free medium (SFM) served as an SFM control, and the cells treated with Paclitaxel/Doxorubicinserved as the Positive control.
2.9.1. MTT Assay
The MTT assay was first performed on the SK-MEL-28 melanoma cell line using the previouslyreported method [31]. The four samples tested were blank liposomes (BL), Dacarbazine solution(DS), Dacarbazine Liposomes (DL), and Dacarbazine + Eugenol Liposomes (DEL). To performthe assay on above-said test samples, cells were plated at a density of 0.5 million/well in 6-wellculture plates, and were incubated for 24 h in a CO2 incubator. 20 µL of 5 mg/mL of MTT3-(4,5-dimethythiazol-2-yl)-2,5-diphenyl tetrazolium bromide solution was added to all the wells,followed by additional incubation for three h at 37 ◦C. The supernatant was aspirated, and 150 µL ofdimethyl sulfoxide (DMSO) was added to each well to dissolve the formazan crystals. The absorbanceof each well was then read at 540 nm using a Synergy HT micro plate-reader.
The percentage cytotoxicity corresponding to each treatment was calculated using the followingformula:
% Cytotoxicity = [R − X)/R] × 100
where X = Absorbance of wells corresponding to treated cells; R = Absorbance of untreated cells (cellsmaintained in DMEM + 10% FBS).
Furthermore, in addition to the above said formulations, the cytotoxicity of final coated Dacarbazine+ Eugenol Liposomes (DELC) was assessed in B16F10 melanoma cells using the same procedureas described.
2.9.2. Apoptosis Assay
Apoptosis profile of the SK-MEL-28 cells treated with formulations was studied by flow cytometryusing Annexin V. Growth medium and growth conditions were kept the same as before. Cells wereplated at a density of 0.5 million/well in 6-well culture plates, and were incubated for 24 h in aCO2 incubator. Cells were sera starved in DMEM + 0%FBS for four hours, and were then treatedwith test samples (DS, DL, DEL, Coated Dacarbazine Liposomes (DLC), and DELC) for 24 h. After24 h, cells were processed for Annexin V assay as follows: Cells were harvested very gently bytrypsinization and centrifuged at 300 g for 5–7 min. The cell pellet was resuspended in 200–300 µL ofPhosphate Buffer Saline (PBS). 100 µL of cell suspension was transferred into pre-labeled tubes forstaining. 100 µL of Nexin reagent (Annexin V/7-AAD, Guava technologies, Merck millipore, Danvers,MA, USA) was added to each tube and mixed gently. Samples were incubated for 20 min at roomtemperature in the dark. Samples were then acquired on a flow cytometer (Guava Technologies,Hayward, California, USA).
2.9.3. Migration Assay
Cell migration analysis was done by the wound healing method on Ea.Hy293 cells. EA.hy926 cellswere counted using a hemocytometer and plated in 12-well plates at the density of 0.2 × 10⁶ cells/wellin medium + 10% FBS. The cells were incubated overnight in the CO2 incubator to allow cell recoveryand exponential growth. Following overnight incubation, these cells were sera starved (DMEM +
0%FBS) for six h. After six h, the cells were washed with PBS, and a small linear scratch (representativewound) was created in the confluent monolayer (middle of the well) by gently scraping with sterile200 µL micropipette tip. Photomicrographs of the scratch were taken at 0 h (Initial time point). Cells
Pharmaceutics 2019, 11, 163 9 of 35
were rinsed with serum-free DMEM and grouped for treatment with test samples (DS, DL, DEL, DLC,DELC). Photomicrographs of the scratch were taken at 0 h, 24 h, 48 h, and 72 h.
The photomicrographs obtained were analyzed for quantitative assessment of the area of woundclosure using ImageJ tool software. Percentage migration with respect to untreated cells at differenttime points was calculated using the following formula:
% Migration = [(MigrationUntreated −MigrationSample)/MigrationUntreated] × 100
The extent of inhibition in cell migration with respect to untreated cells at different time pointswas calculated using the following formula:
% Inhibition = 100% −% Migration of Untreated sample
2.9.4. Proliferation Assay
A proliferation assay also was performed on EA.hy926 cells. After sub culturing, the cells werecounted using the hemocytometer and plated in 96 well plates at the density of 1 × 10⁵ cells/well/180 µLof the growth medium with 10% FBS. After 24 h of incubation in a CO2 incubator, these cells weresera starved by replacing the medium with 0% FBS. The cells were incubated for 24 h. After 24 h, theywere separately treated with 5 test items (DS, DL, DEL, DLC, DELC) at different concentrations inmedium +10% FBS. After three days of incubation, the effect of test formulations on cell proliferationwas determined by calculating the % viability of cells using MTT assay. Serum-free media control cellswere assessed with respect to complete medium control cells.
2.10. Statistical Analysis
All the experiments were performed in triplicate. Excel™ program 2010 (Microsoft™, 36 Redmond,WA, USA) was used to calculate the mean± standard deviation of the obtained data. Data are presentedas the mean ± standard deviation (SD). All statistical analyses were carried out with Statistica 13(TIBCO Software Inc., Palo Alto, CA, USA), using one-way Analysis of Variance (ANOVA) and Tukey’sHSD as the posthoc test. All differences were considered significant at p < 0.05.
3. Results and Discussion
3.1. Synthesis
As mentioned earlier, the liposomes were synthesized by solvent injection method. As per theexperiments conducted by [32], this solvent injection method produces smaller-sized liposomes withcomparatively higher encapsulation efficiencies of the entrapped drug. Lasic [33] had explained thebilayer planar fragments (BPFs) theory for the mechanism of formation of liposomes by the ethanolinjection method. According to this theory, the lipids which are dissolved in ethanol precipitate at thephase boundary of water and ethanol (organic solvent), resulting in the formation of BPFs. When theorganic solvent is completely diffused in the external aqueous phase, vesicle formation takes placeconsequent to self-assembly of BPFs.
3.2. Optimization Using QbD
The formulation was optimized by following the QbD approach. QbD is a more economical andtime effective method, and thus has replaced the hit and trial method for formulation optimization [27].DOE (Design of Experiment) is an integral part of the QbD approach, which involves the use ofthe software to generate “structured” data tables. The software enables us to obtain a graphicalinterpretation of the results and effect of each parameter on the critical quality attributes (CQAs) of theformulation. Central composite design (CCD) was chosen because it generates better factorial design.Also, CCD can be used for working on factors as small as two in number.
Pharmaceutics 2019, 11, 163 10 of 35
3.2.1. First Level
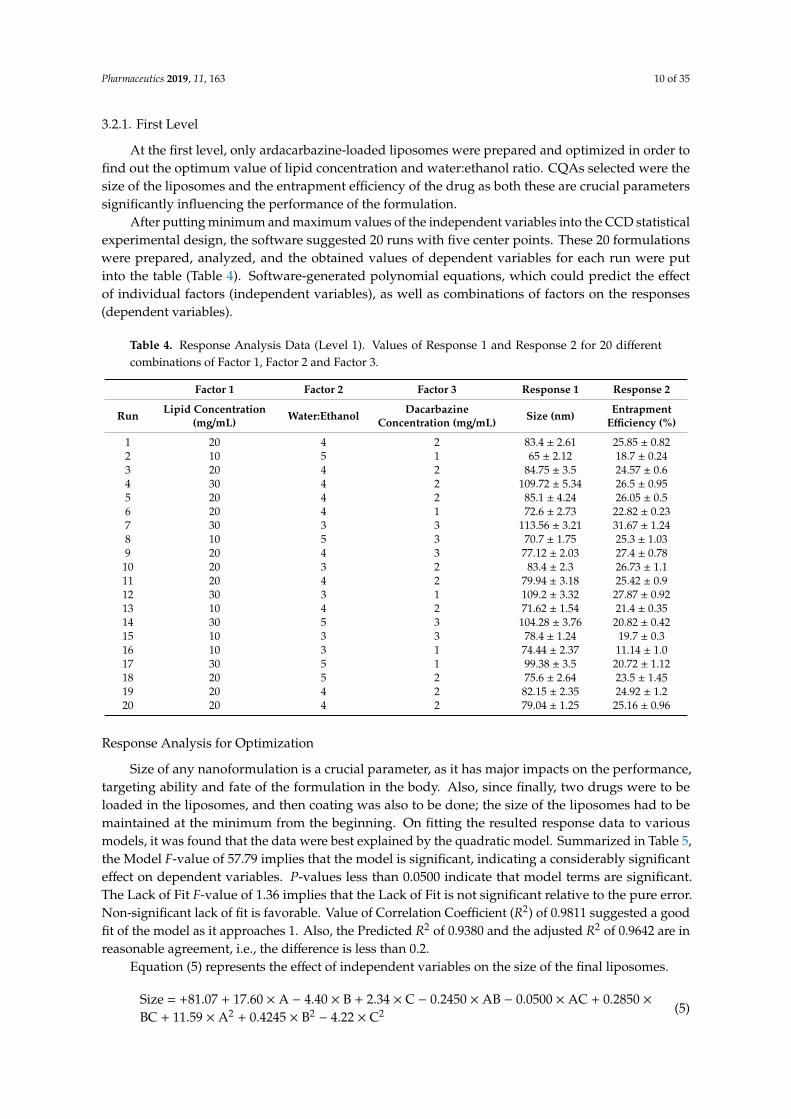
At the first level, only ardacarbazine-loaded liposomes were prepared and optimized in order tofind out the optimum value of lipid concentration and water:ethanol ratio. CQAs selected were thesize of the liposomes and the entrapment efficiency of the drug as both these are crucial parameterssignificantly influencing the performance of the formulation.
After putting minimum and maximum values of the independent variables into the CCD statisticalexperimental design, the software suggested 20 runs with five center points. These 20 formulationswere prepared, analyzed, and the obtained values of dependent variables for each run were putinto the table (Table 4). Software-generated polynomial equations, which could predict the effectof individual factors (independent variables), as well as combinations of factors on the responses(dependent variables).
Table 4. Response Analysis Data (Level 1). Values of Response 1 and Response 2 for 20 differentcombinations of Factor 1, Factor 2 and Factor 3.
Factor 1 Factor 2 Factor 3 Response 1 Response 2
Run Lipid Concentration(mg/mL) Water:Ethanol Dacarbazine
Concentration (mg/mL) Size (nm) EntrapmentEfficiency (%)
1 20 4 2 83.4 ± 2.61 25.85 ± 0.822 10 5 1 65 ± 2.12 18.7 ± 0.243 20 4 2 84.75 ± 3.5 24.57 ± 0.64 30 4 2 109.72 ± 5.34 26.5 ± 0.955 20 4 2 85.1 ± 4.24 26.05 ± 0.56 20 4 1 72.6 ± 2.73 22.82 ± 0.237 30 3 3 113.56 ± 3.21 31.67 ± 1.248 10 5 3 70.7 ± 1.75 25.3 ± 1.039 20 4 3 77.12 ± 2.03 27.4 ± 0.7810 20 3 2 83.4 ± 2.3 26.73 ± 1.111 20 4 2 79.94 ± 3.18 25.42 ± 0.912 30 3 1 109.2 ± 3.32 27.87 ± 0.9213 10 4 2 71.62 ± 1.54 21.4 ± 0.3514 30 5 3 104.28 ± 3.76 20.82 ± 0.4215 10 3 3 78.4 ± 1.24 19.7 ± 0.316 10 3 1 74.44 ± 2.37 11.14 ± 1.017 30 5 1 99.38 ± 3.5 20.72 ± 1.1218 20 5 2 75.6 ± 2.64 23.5 ± 1.4519 20 4 2 82.15 ± 2.35 24.92 ± 1.220 20 4 2 79.04 ± 1.25 25.16 ± 0.96
Response Analysis for Optimization
Size of any nanoformulation is a crucial parameter, as it has major impacts on the performance,targeting ability and fate of the formulation in the body. Also, since finally, two drugs were to beloaded in the liposomes, and then coating was also to be done; the size of the liposomes had to bemaintained at the minimum from the beginning. On fitting the resulted response data to variousmodels, it was found that the data were best explained by the quadratic model. Summarized in Table 5,the Model F-value of 57.79 implies that the model is significant, indicating a considerably significanteffect on dependent variables. P-values less than 0.0500 indicate that model terms are significant.The Lack of Fit F-value of 1.36 implies that the Lack of Fit is not significant relative to the pure error.Non-significant lack of fit is favorable. Value of Correlation Coefficient (R2) of 0.9811 suggested a goodfit of the model as it approaches 1. Also, the Predicted R2 of 0.9380 and the adjusted R2 of 0.9642 are inreasonable agreement, i.e., the difference is less than 0.2.
Equation (5) represents the effect of independent variables on the size of the final liposomes.
Size = +81.07 + 17.60 × A − 4.40 × B + 2.34 × C − 0.2450 × AB − 0.0500 × AC + 0.2850 ×BC + 11.59 × A2 + 0.4245 × B2
− 4.22 × C2 (5)

Pharmaceutics 2019, 11, 163 11 of 35
This equation in terms of coded factors can be used to make predictions about the response for givenlevels of each factor. The coded equation is useful for identifying the relative impact of the factors bycomparing the factor coefficients.
Table 5. Analysis of Variance (ANOVA) Analysis.
Lack of Fit Tests Model Summary Statistics
Response ModelF-Value
Lack of FitF-Value p-Value SD R2 Adjusted
R2Predicted
R2Suggested
Model
Level 1
R1: Size 57.79 1.36 <0.0001 2.72 0.9811 0.9642 0.9380 Quadratic
R2: EntrapmentEfficiency 70.71 2.48 <0.0001 0.7394 0.9845 0.9706 0.9023 Quadratic
Level 2
R1: Size 611.37 1.23 <0.0001 2.09 0.9919 0.9903 0.9866 Linear
R2:Eugenol:Dacarbazine 68.80 1.14 0.0489 0.0863 0.9803 0.9663 0.8992 Quadratic
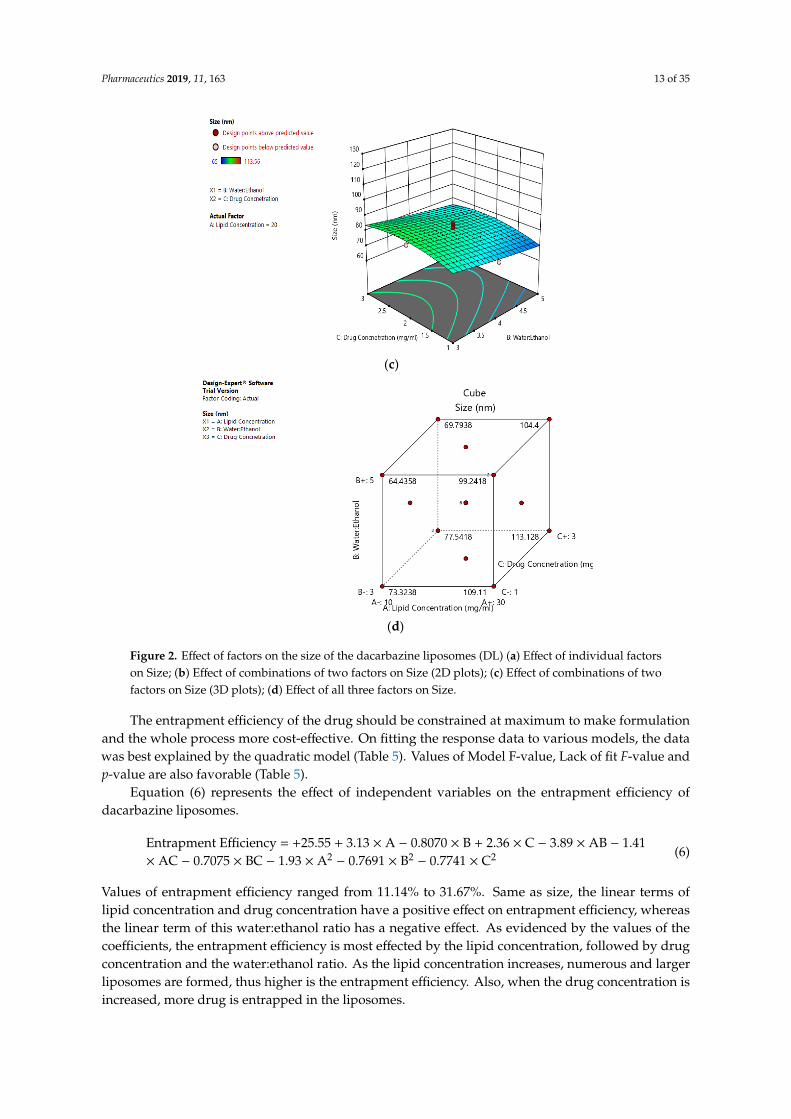
The mean size ranged from 65 nm to 113.56 nm. The values of the coefficients of A, B, and C inthe equation above suggest that the size of the liposomes is most influenced by the lipid concentration,followed by its water:ethanol ratio, and least affected by the drug concentration. The linear terms oflipid concentration and drug concentration have a positive effect on size, whereas the linear term ofthe water:ethanol ratio has a negative effect. Thus, the size of the liposomes increases with an increasein lipid concentration and drug concentration, and decreases with any increase in its water:ethanolratio. Figure 2a–d represents the effect of independent variables on the size of liposomes.
Pharmaceutics 2018, 10, x FOR PEER REVIEW 11 of 39
Equation (5) represents the effect of independent variables on the size of the final liposomes.
Size = +81.07 + 17.60 × A − 4.40 × B + 2.34 × C − 0.2450 × AB − 0.0500 × AC + 0.2850 × BC + 11.59 × A2 + 0.4245 × B2 − 4.22 × C2
(5)
This equation in terms of coded factors can be used to make predictions about the response for given levels of each factor. The coded equation is useful for identifying the relative impact of the factors by comparing the factor coefficients.
The mean size ranged from 65 nm to 113.56 nm. The values of the coefficients of A, B, and C in the equation above suggest that the size of the liposomes is most influenced by the lipid concentration, followed by its water:ethanol ratio, and least affected by the drug concentration. The linear terms of lipid concentration and drug concentration have a positive effect on size, whereas the linear term of the water:ethanol ratio has a negative effect. Thus, the size of the liposomes increases with an increase in lipid concentration and drug concentration, and decreases with any increase in its water:ethanol ratio. Figure 2a–d represents the effect of independent variables on the size of liposomes.
(a)
Figure 2. Cont.
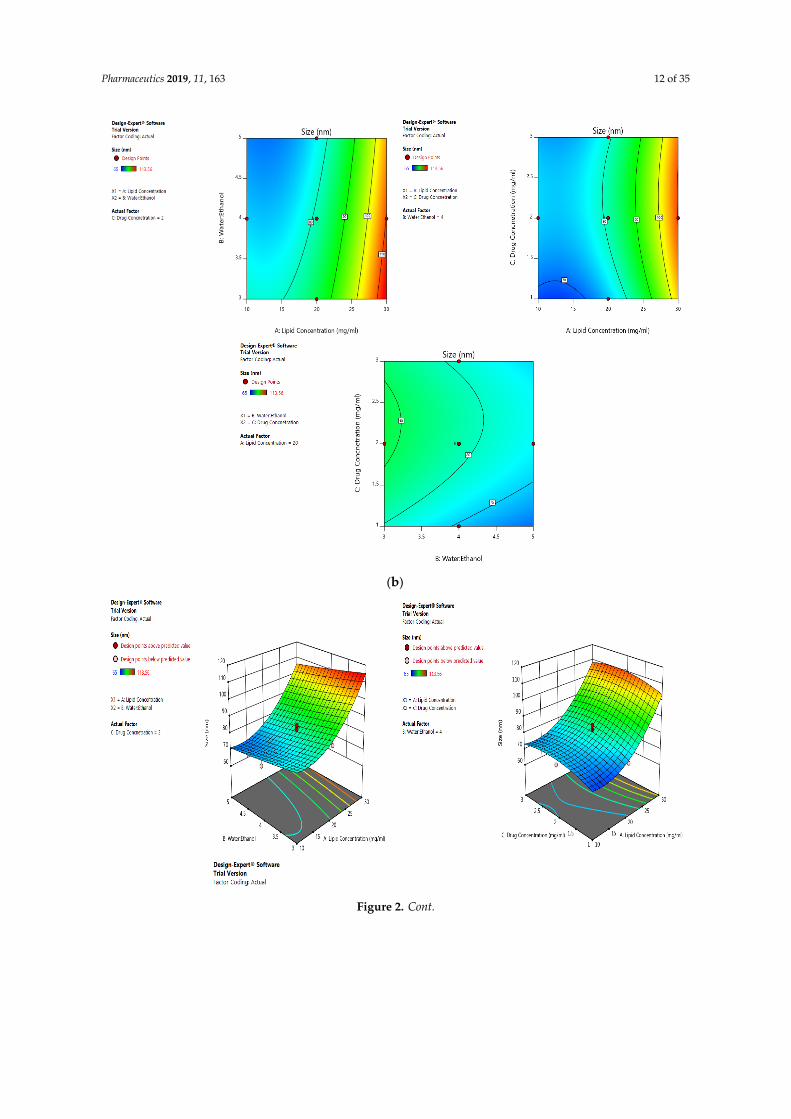
Pharmaceutics 2019, 11, 163 12 of 35Pharmaceutics 2018, 10, x FOR PEER REVIEW 12 of 39
(b)
Pharmaceutics 2018, 10, x FOR PEER REVIEW 13 of 39
(c)
(d)
Figure 2. Effect of factors on the size of the dacarbazine liposomes (DL) (a) Effect of individual factors on Size; (b) Effect of combinations of two factors on Size (2D plots); (c) Effect of combinations of two factors on Size (3D plots); (d) Effect of all three factors on Size.
The entrapment efficiency of the drug should be constrained at maximum to make formulation and the whole process more cost-effective. On fitting the response data to various models, the data
Figure 2. Cont.
Pharmaceutics 2019, 11, 163 13 of 35
Pharmaceutics 2018, 10, x FOR PEER REVIEW 13 of 39
(c)
(d)
Figure 2. Effect of factors on the size of the dacarbazine liposomes (DL) (a) Effect of individual factors on Size; (b) Effect of combinations of two factors on Size (2D plots); (c) Effect of combinations of two factors on Size (3D plots); (d) Effect of all three factors on Size.
The entrapment efficiency of the drug should be constrained at maximum to make formulation and the whole process more cost-effective. On fitting the response data to various models, the data
Figure 2. Effect of factors on the size of the dacarbazine liposomes (DL) (a) Effect of individual factorson Size; (b) Effect of combinations of two factors on Size (2D plots); (c) Effect of combinations of twofactors on Size (3D plots); (d) Effect of all three factors on Size.
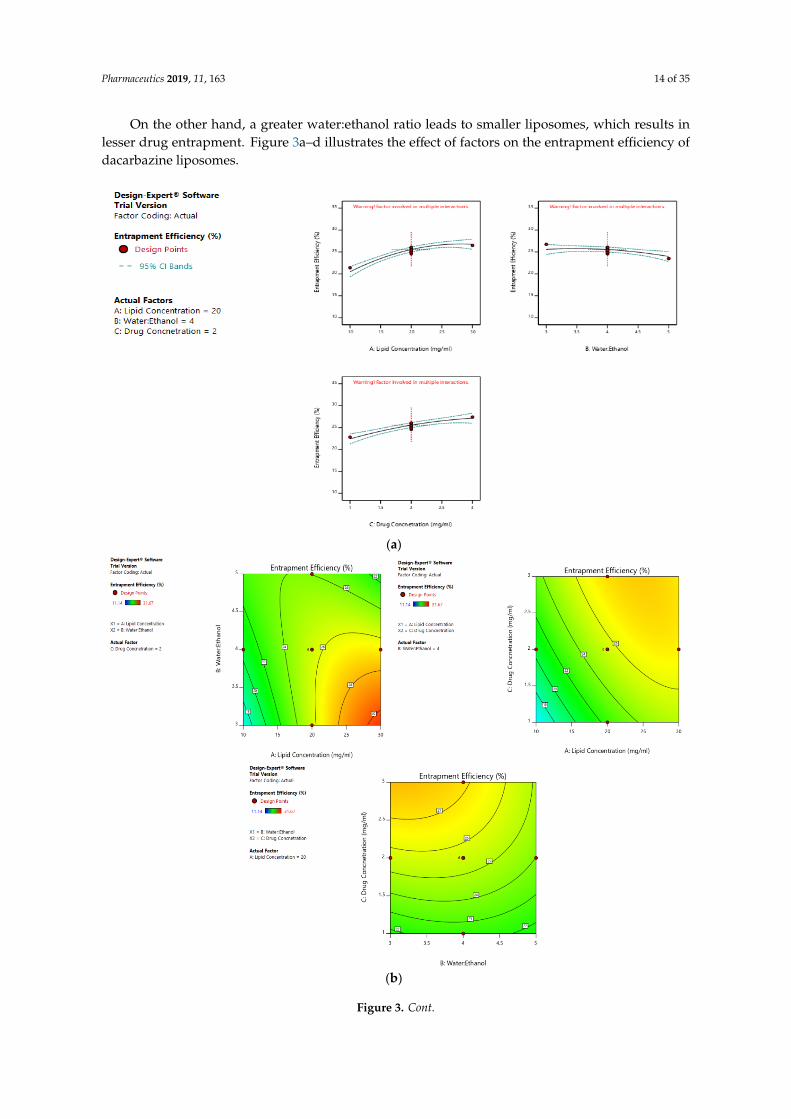
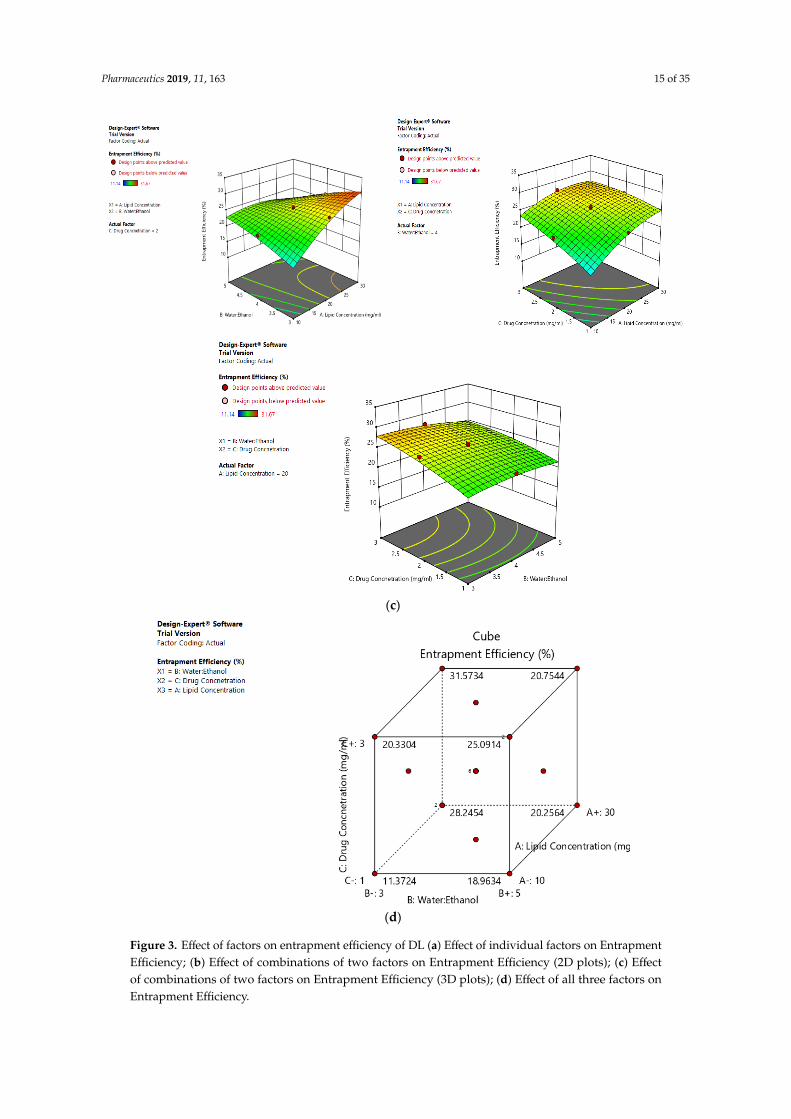
The entrapment efficiency of the drug should be constrained at maximum to make formulationand the whole process more cost-effective. On fitting the response data to various models, the datawas best explained by the quadratic model (Table 5). Values of Model F-value, Lack of fit F-value andp-value are also favorable (Table 5).
Equation (6) represents the effect of independent variables on the entrapment efficiency ofdacarbazine liposomes.
Entrapment Efficiency = +25.55 + 3.13 × A − 0.8070 × B + 2.36 × C − 3.89 × AB − 1.41× AC − 0.7075 × BC − 1.93 × A2
− 0.7691 × B2− 0.7741 × C2 (6)
Values of entrapment efficiency ranged from 11.14% to 31.67%. Same as size, the linear terms oflipid concentration and drug concentration have a positive effect on entrapment efficiency, whereasthe linear term of this water:ethanol ratio has a negative effect. As evidenced by the values of thecoefficients, the entrapment efficiency is most effected by the lipid concentration, followed by drugconcentration and the water:ethanol ratio. As the lipid concentration increases, numerous and largerliposomes are formed, thus higher is the entrapment efficiency. Also, when the drug concentration isincreased, more drug is entrapped in the liposomes.
Pharmaceutics 2019, 11, 163 14 of 35
On the other hand, a greater water:ethanol ratio leads to smaller liposomes, which results inlesser drug entrapment. Figure 3a–d illustrates the effect of factors on the entrapment efficiency ofdacarbazine liposomes.
Pharmaceutics 2018, 10, x FOR PEER REVIEW 15 of 39
(a)
(b)
Figure 3. Cont.
Pharmaceutics 2019, 11, 163 15 of 35Pharmaceutics 2018, 10, x FOR PEER REVIEW 16 of 39
(c)
(d)
Figure 3. Effect of factors on entrapment efficiency of DL (a) Effect of individual factors on Entrapment Efficiency; (b) Effect of combinations of two factors on Entrapment Efficiency (2D plots); (c) Effect of combinations of two factors on Entrapment Efficiency (3D plots); (d) Effect of all three factors on Entrapment Efficiency.
Figure 3. Effect of factors on entrapment efficiency of DL (a) Effect of individual factors on EntrapmentEfficiency; (b) Effect of combinations of two factors on Entrapment Efficiency (2D plots); (c) Effectof combinations of two factors on Entrapment Efficiency (3D plots); (d) Effect of all three factors onEntrapment Efficiency.
Pharmaceutics 2019, 11, 163 16 of 35
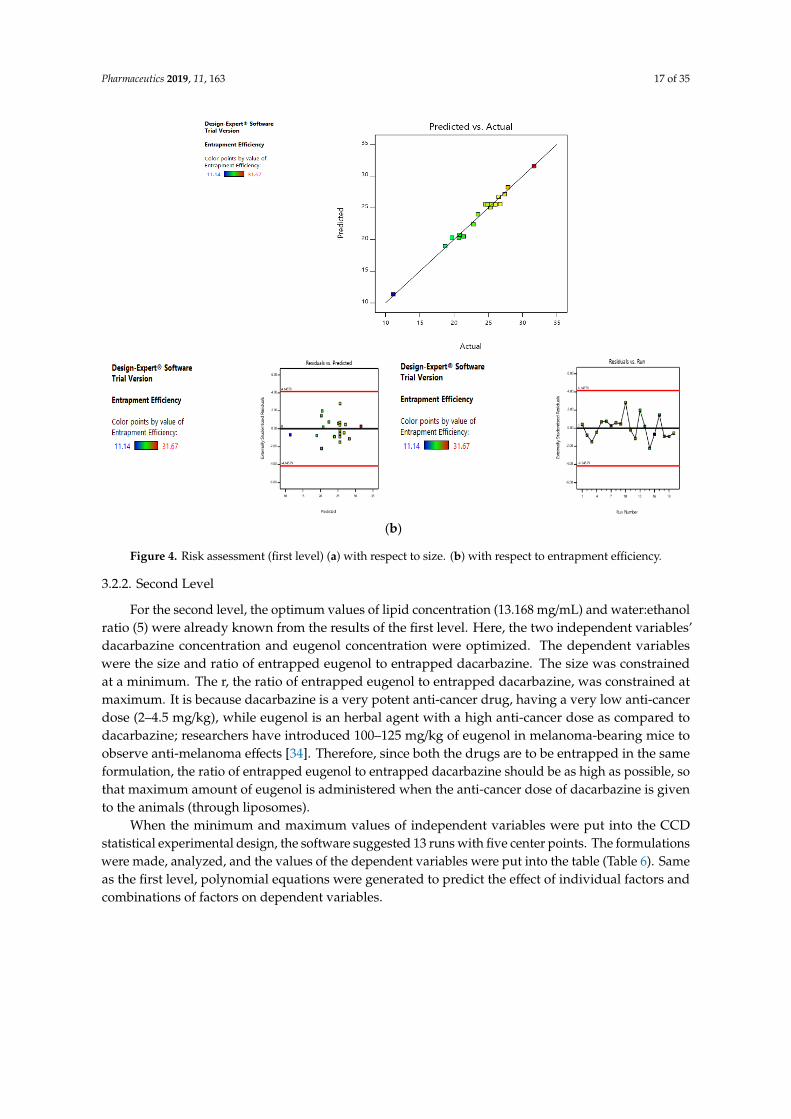
Risk Assessment (First Level)
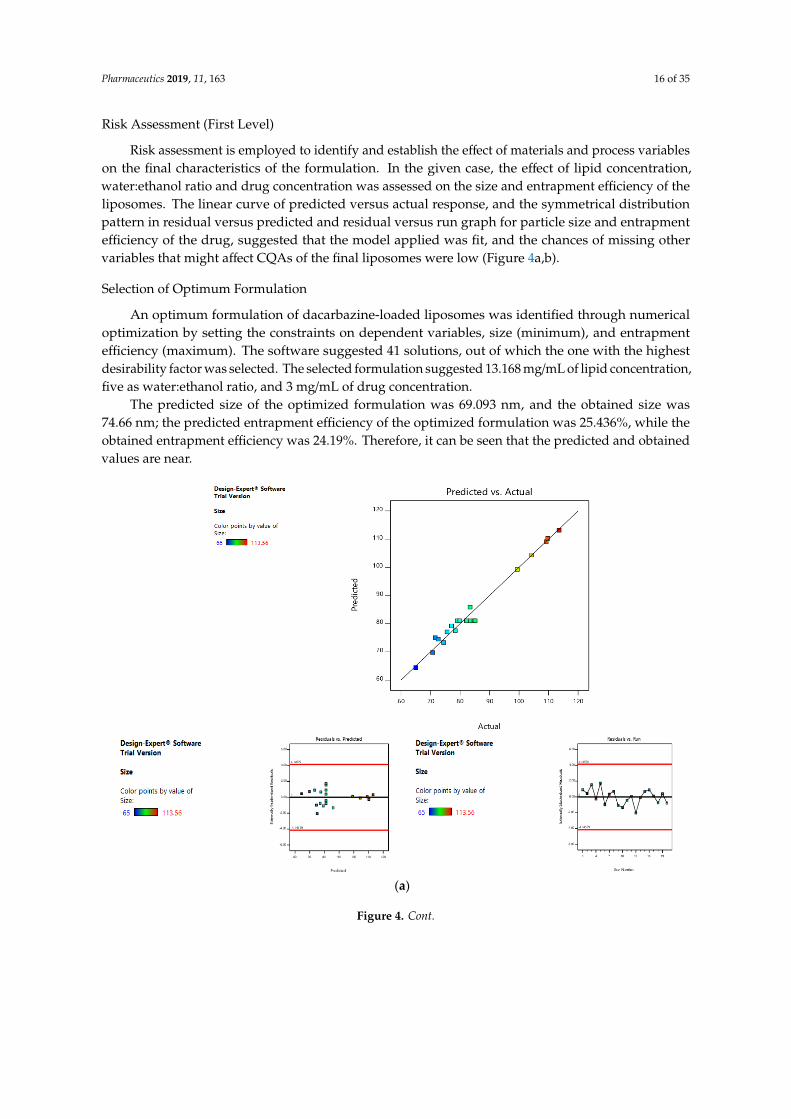
Risk assessment is employed to identify and establish the effect of materials and process variableson the final characteristics of the formulation. In the given case, the effect of lipid concentration,water:ethanol ratio and drug concentration was assessed on the size and entrapment efficiency of theliposomes. The linear curve of predicted versus actual response, and the symmetrical distributionpattern in residual versus predicted and residual versus run graph for particle size and entrapmentefficiency of the drug, suggested that the model applied was fit, and the chances of missing othervariables that might affect CQAs of the final liposomes were low (Figure 4a,b).
Selection of Optimum Formulation
An optimum formulation of dacarbazine-loaded liposomes was identified through numericaloptimization by setting the constraints on dependent variables, size (minimum), and entrapmentefficiency (maximum). The software suggested 41 solutions, out of which the one with the highestdesirability factor was selected. The selected formulation suggested 13.168 mg/mL of lipid concentration,five as water:ethanol ratio, and 3 mg/mL of drug concentration.
The predicted size of the optimized formulation was 69.093 nm, and the obtained size was74.66 nm; the predicted entrapment efficiency of the optimized formulation was 25.436%, while theobtained entrapment efficiency was 24.19%. Therefore, it can be seen that the predicted and obtainedvalues are near.
Pharmaceutics 2018, 10, x FOR PEER REVIEW 17 of 39
Risk Assessment (First Level)
Risk assessment is employed to identify and establish the effect of materials and process variables on the final characteristics of the formulation. In the given case, the effect of lipid concentration, water:ethanol ratio and drug concentration was assessed on the size and entrapment efficiency of the liposomes. The linear curve of predicted versus actual response, and the symmetrical distribution pattern in residual versus predicted and residual versus run graph for particle size and entrapment efficiency of the drug, suggested that the model applied was fit, and the chances of missing other variables that might affect CQAs of the final liposomes were low (Figure 4a,b).
(a)
Figure 4. Cont.
Pharmaceutics 2019, 11, 163 17 of 35Pharmaceutics 2018, 10, x FOR PEER REVIEW 18 of 39
(b)
Figure 4. Risk assessment (first level) (a) with respect to size. (b) with respect to entrapment efficiency.
Selection of Optimum Formulation
An optimum formulation of dacarbazine-loaded liposomes was identified through numerical optimization by setting the constraints on dependent variables, size (minimum), and entrapment efficiency (maximum). The software suggested 41 solutions, out of which the one with the highest desirability factor was selected. The selected formulation suggested 13.168 mg/mL of lipid concentration, five as water:ethanol ratio, and 3 mg/mL of drug concentration.
The predicted size of the optimized formulation was 69.093 nm, and the obtained size was 74.66 nm; the predicted entrapment efficiency of the optimized formulation was 25.436%, while the obtained entrapment efficiency was 24.19%. Therefore, it can be seen that the predicted and obtained values are near.
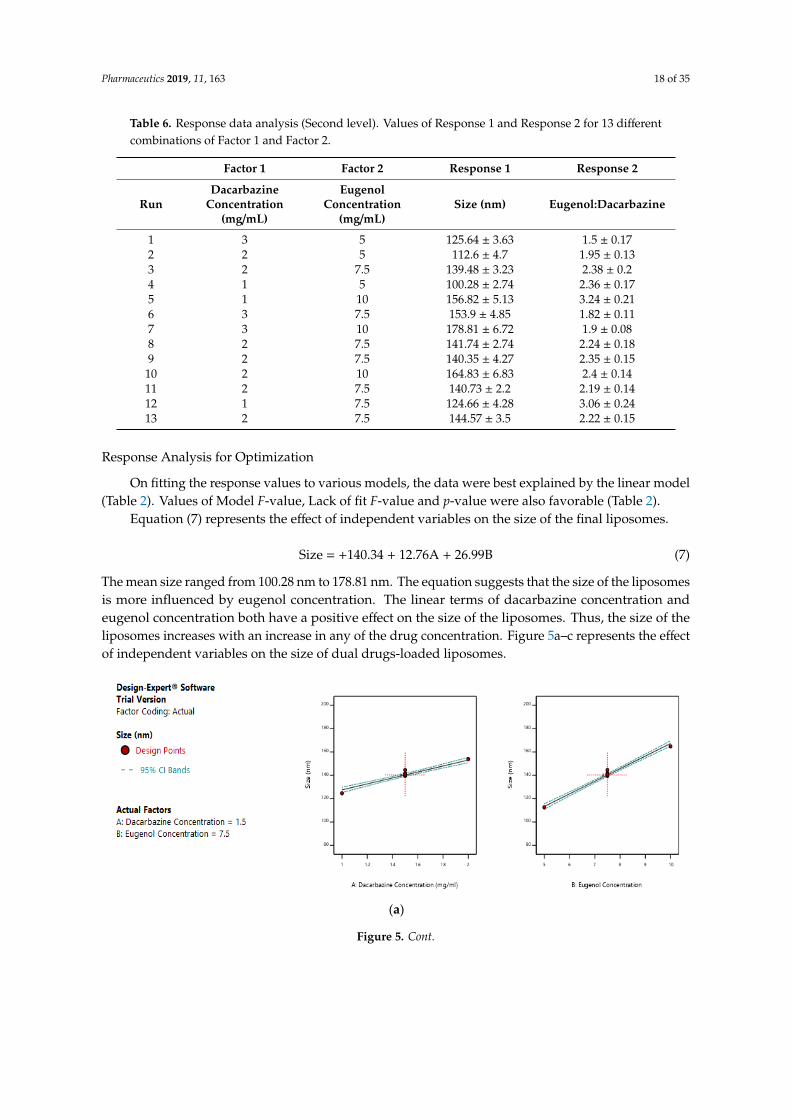
3.2.2. Second Level
For the second level, the optimum values of lipid concentration (13.168 mg/mL) and water:ethanol ratio (5) were already known from the results of the first level. Here, the two independent variables’ dacarbazine concentration and eugenol concentration were optimized. The dependent variables were the size and ratio of entrapped eugenol to entrapped dacarbazine. The size was constrained at a minimum. The r, the ratio of entrapped eugenol to entrapped dacarbazine, was constrained at maximum. It is because dacarbazine is a very potent anti-cancer drug, having a very low anti-cancer dose (2–4.5 mg/kg), while eugenol is an herbal agent with a high anti-cancer dose as compared to dacarbazine; researchers have introduced 100–125 mg/kg of eugenol in melanoma-bearing mice to observe anti-melanoma effects [34]. Therefore, since both the drugs are to be entrapped in the same formulation, the ratio of entrapped eugenol to entrapped dacarbazine should be as high as possible, so that maximum amount of eugenol is administered when the anti-cancer dose of dacarbazine is given to the animals (through liposomes).
When the minimum and maximum values of independent variables were put into the CCD statistical experimental design, the software suggested 13 runs with five center points. The
Figure 4. Risk assessment (first level) (a) with respect to size. (b) with respect to entrapment efficiency.
3.2.2. Second Level
For the second level, the optimum values of lipid concentration (13.168 mg/mL) and water:ethanolratio (5) were already known from the results of the first level. Here, the two independent variables’dacarbazine concentration and eugenol concentration were optimized. The dependent variableswere the size and ratio of entrapped eugenol to entrapped dacarbazine. The size was constrainedat a minimum. The r, the ratio of entrapped eugenol to entrapped dacarbazine, was constrained atmaximum. It is because dacarbazine is a very potent anti-cancer drug, having a very low anti-cancerdose (2–4.5 mg/kg), while eugenol is an herbal agent with a high anti-cancer dose as compared todacarbazine; researchers have introduced 100–125 mg/kg of eugenol in melanoma-bearing mice toobserve anti-melanoma effects [34]. Therefore, since both the drugs are to be entrapped in the sameformulation, the ratio of entrapped eugenol to entrapped dacarbazine should be as high as possible, sothat maximum amount of eugenol is administered when the anti-cancer dose of dacarbazine is givento the animals (through liposomes).
When the minimum and maximum values of independent variables were put into the CCDstatistical experimental design, the software suggested 13 runs with five center points. The formulationswere made, analyzed, and the values of the dependent variables were put into the table (Table 6). Sameas the first level, polynomial equations were generated to predict the effect of individual factors andcombinations of factors on dependent variables.
Pharmaceutics 2019, 11, 163 18 of 35
Table 6. Response data analysis (Second level). Values of Response 1 and Response 2 for 13 differentcombinations of Factor 1 and Factor 2.
Factor 1 Factor 2 Response 1 Response 2
RunDacarbazine
Concentration(mg/mL)
EugenolConcentration
(mg/mL)Size (nm) Eugenol:Dacarbazine
1 3 5 125.64 ± 3.63 1.5 ± 0.172 2 5 112.6 ± 4.7 1.95 ± 0.133 2 7.5 139.48 ± 3.23 2.38 ± 0.24 1 5 100.28 ± 2.74 2.36 ± 0.175 1 10 156.82 ± 5.13 3.24 ± 0.216 3 7.5 153.9 ± 4.85 1.82 ± 0.117 3 10 178.81 ± 6.72 1.9 ± 0.088 2 7.5 141.74 ± 2.74 2.24 ± 0.189 2 7.5 140.35 ± 4.27 2.35 ± 0.1510 2 10 164.83 ± 6.83 2.4 ± 0.1411 2 7.5 140.73 ± 2.2 2.19 ± 0.1412 1 7.5 124.66 ± 4.28 3.06 ± 0.2413 2 7.5 144.57 ± 3.5 2.22 ± 0.15
Response Analysis for Optimization
On fitting the response values to various models, the data were best explained by the linear model(Table 2). Values of Model F-value, Lack of fit F-value and p-value were also favorable (Table 2).
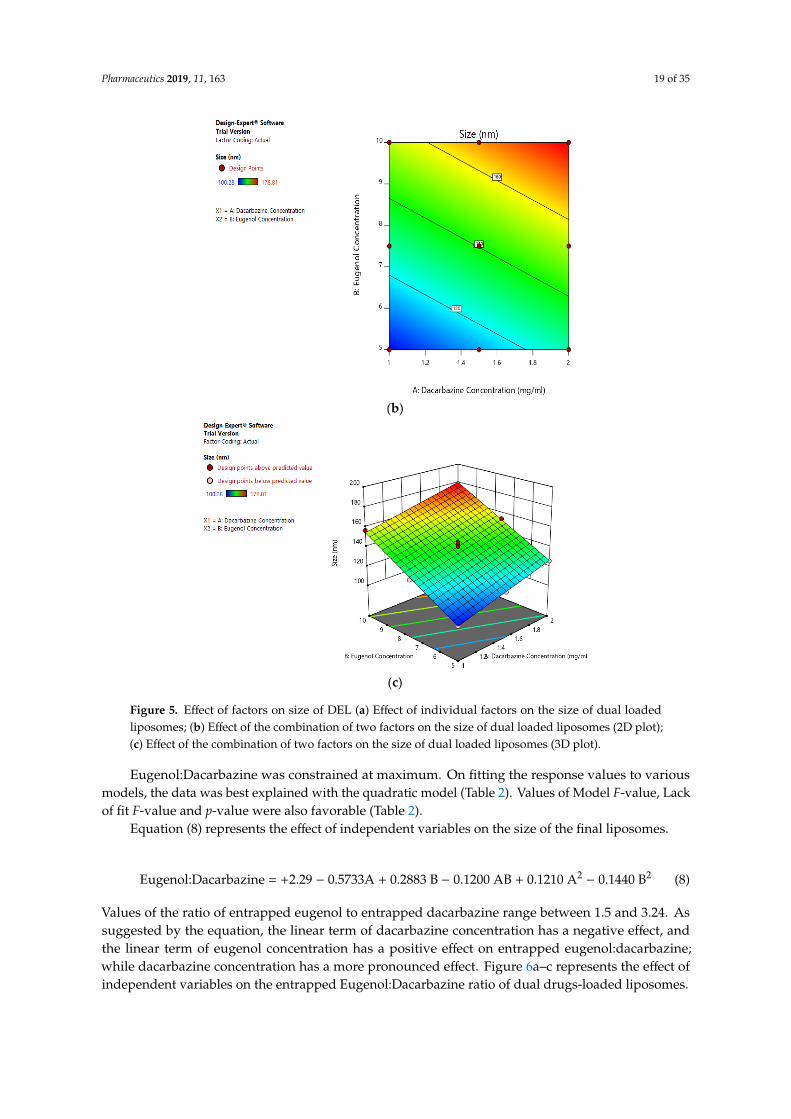
Equation (7) represents the effect of independent variables on the size of the final liposomes.
Size = +140.34 + 12.76A + 26.99B (7)
The mean size ranged from 100.28 nm to 178.81 nm. The equation suggests that the size of the liposomesis more influenced by eugenol concentration. The linear terms of dacarbazine concentration andeugenol concentration both have a positive effect on the size of the liposomes. Thus, the size of theliposomes increases with an increase in any of the drug concentration. Figure 5a–c represents the effectof independent variables on the size of dual drugs-loaded liposomes.
Pharmaceutics 2018, 10, x FOR PEER REVIEW 18 of 34
Table 6. Response data analysis (Second level). Values of Response 1 and Response 2 for 13 different combinations of Factor 1 and Factor 2.
Factor 1 Factor 2 Response 1 Response 2
Run Dacarbazine Concentration (mg/mL)
Eugenol Concentration (mg/mL) Size (nm) Eugenol:Dacarbazine
1 3 5 125.64 ± 3.63 1.5 ± 0.17 2 2 5 112.6 ± 4.7 1.95 ± 0.13 3 2 7.5 139.48 ± 3.23 2.38 ± 0.2 4 1 5 100.28 ± 2.74 2.36 ± 0.17 5 1 10 156.82 ± 5.13 3.24 ± 0.21 6 3 7.5 153.9 ± 4.85 1.82 ± 0.11 7 3 10 178.81 ± 6.72 1.9 ± 0.08 8 2 7.5 141.74 ± 2.74 2.24 ± 0.18 9 2 7.5 140.35 ± 4.27 2.35 ± 0.15
10 2 10 164.83 ± 6.83 2.4 ± 0.14 11 2 7.5 140.73 ± 2.2 2.19 ± 0.14 12 1 7.5 124.66 ± 4.28 3.06 ± 0.24 13 2 7.5 144.57 ± 3.5 2.22 ± 0.15
Response Analysis for Optimization
On fitting the response values to various models, the data were best explained by the linear model (Table 2). Values of Model F-value, Lack of fit F-value and p-value were also favorable (Table 2)
Equation (7) represents the effect of independent variables on the size of the final liposomes.
Size = +140.34 + 12.76A + 26.99B (7)
The mean size ranged from 100.28 nm to 178.81 nm. The equation suggests that the size of the liposomes is more influenced by eugenol concentration. The linear terms of dacarbazine concentration and eugenol concentration both have a positive effect on the size of the liposomes. Thus, the size of the liposomes increases with an increase in any of the drug concentration. Figure 5a–c represents the effect of independent variables on the size of dual drugs-loaded liposomes.
(a)
Figure 5. Cont.
Pharmaceutics 2019, 11, 163 19 of 35Pharmaceutics 2018, 10, x FOR PEER REVIEW 19 of 34
(b)
(c)
Figure 5. Effect of factors on size of DEL (a) Effect of individual factors on the size of dual loaded liposomes; (b) Effect of the combination of two factors on the size of dual loaded liposomes (2D plot); (c) Effect of the combination of two factors on the size of dual loaded liposomes (3D plot).
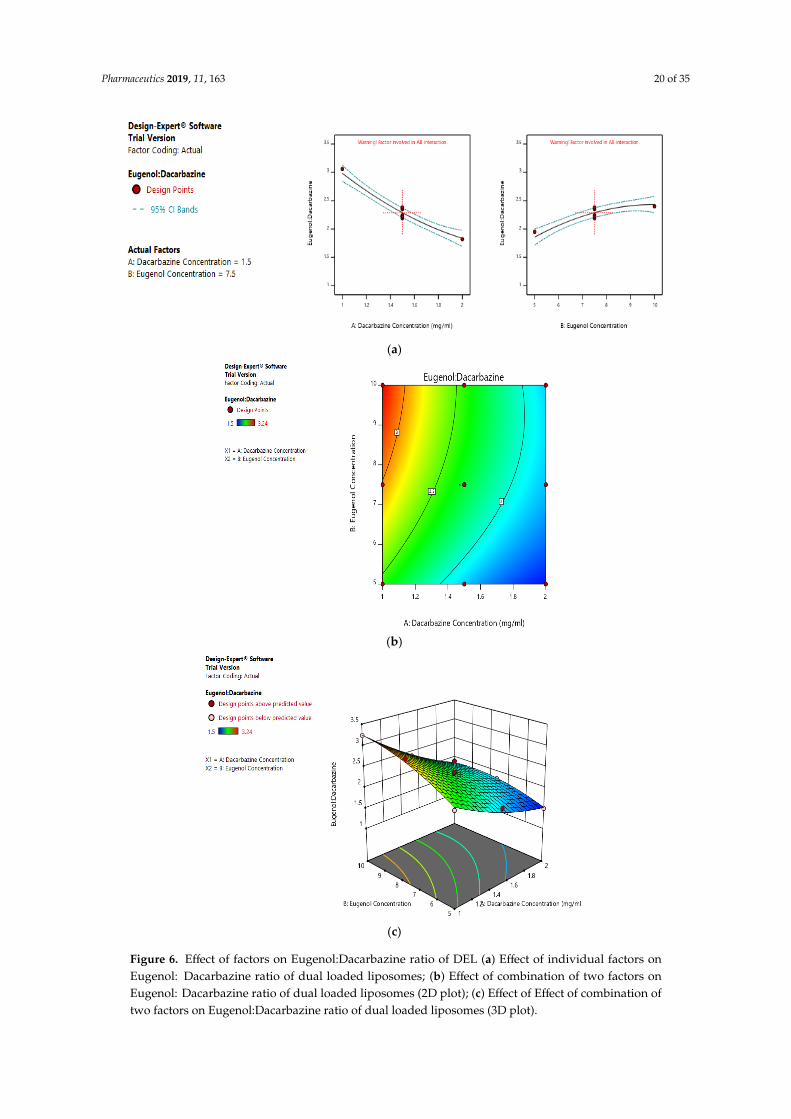
Eugenol:Dacarbazine was constrained at maximum. On fitting the response values to various models, the data was best explained with the quadratic model (Table 2). Values of Model F-value, Lack of fit F-value and p-value were also favorable (Table 2).
Equation (8) represents the effect of independent variables on the size of the final liposomes.
Eugenol:Dacarbazine = +2.29 − 0.5733A + 0.2883 B − 0.1200 AB + 0.1210 A2 − 0.1440 B2 (8)
Values of the ratio of entrapped eugenol to entrapped dacarbazine range between 1.5 and 3.24. As suggested by the equation, the linear term of dacarbazine concentration has a negative effect, and the linear term of eugenol concentration has a positive effect on entrapped eugenol:dacarbazine; while dacarbazine concentration has a more pronounced effect. Figure 6a–c represents the effect of independent variables on the entrapped Eugenol:Dacarbazine ratio of dual drugs-loaded liposomes.
Figure 5. Effect of factors on size of DEL (a) Effect of individual factors on the size of dual loadedliposomes; (b) Effect of the combination of two factors on the size of dual loaded liposomes (2D plot);(c) Effect of the combination of two factors on the size of dual loaded liposomes (3D plot).
Eugenol:Dacarbazine was constrained at maximum. On fitting the response values to variousmodels, the data was best explained with the quadratic model (Table 2). Values of Model F-value, Lackof fit F-value and p-value were also favorable (Table 2).
Equation (8) represents the effect of independent variables on the size of the final liposomes.
Eugenol:Dacarbazine = +2.29 − 0.5733A + 0.2883 B − 0.1200 AB + 0.1210 A2− 0.1440 B2 (8)
Values of the ratio of entrapped eugenol to entrapped dacarbazine range between 1.5 and 3.24. Assuggested by the equation, the linear term of dacarbazine concentration has a negative effect, andthe linear term of eugenol concentration has a positive effect on entrapped eugenol:dacarbazine;while dacarbazine concentration has a more pronounced effect. Figure 6a–c represents the effect ofindependent variables on the entrapped Eugenol:Dacarbazine ratio of dual drugs-loaded liposomes.
Pharmaceutics 2019, 11, 163 20 of 35Pharmaceutics 2018, 10, x FOR PEER REVIEW 22 of 39
(a)
(b)
(c)
Figure 6. Effect of factors on Eugenol:Dacarbazine ratio of DEL (a) Effect of individual factors on Eugenol: Dacarbazine ratio of dual loaded liposomes; (b) Effect of combination of two factors on Eugenol: Dacarbazine ratio of dual loaded liposomes (2D plot); (c) Effect of Effect of combination of two factors on Eugenol:Dacarbazine ratio of dual loaded liposomes (3D plot).
Figure 6. Effect of factors on Eugenol:Dacarbazine ratio of DEL (a) Effect of individual factors onEugenol: Dacarbazine ratio of dual loaded liposomes; (b) Effect of combination of two factors onEugenol: Dacarbazine ratio of dual loaded liposomes (2D plot); (c) Effect of Effect of combination oftwo factors on Eugenol:Dacarbazine ratio of dual loaded liposomes (3D plot).
Pharmaceutics 2019, 11, 163 21 of 35
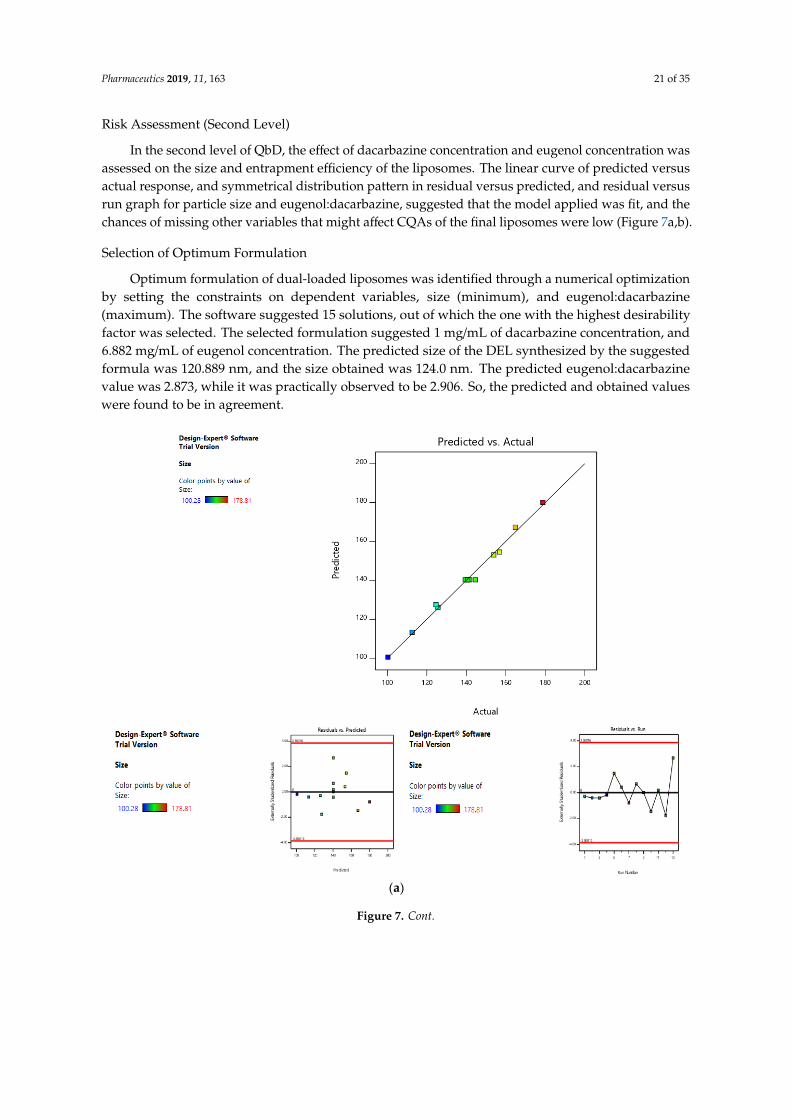
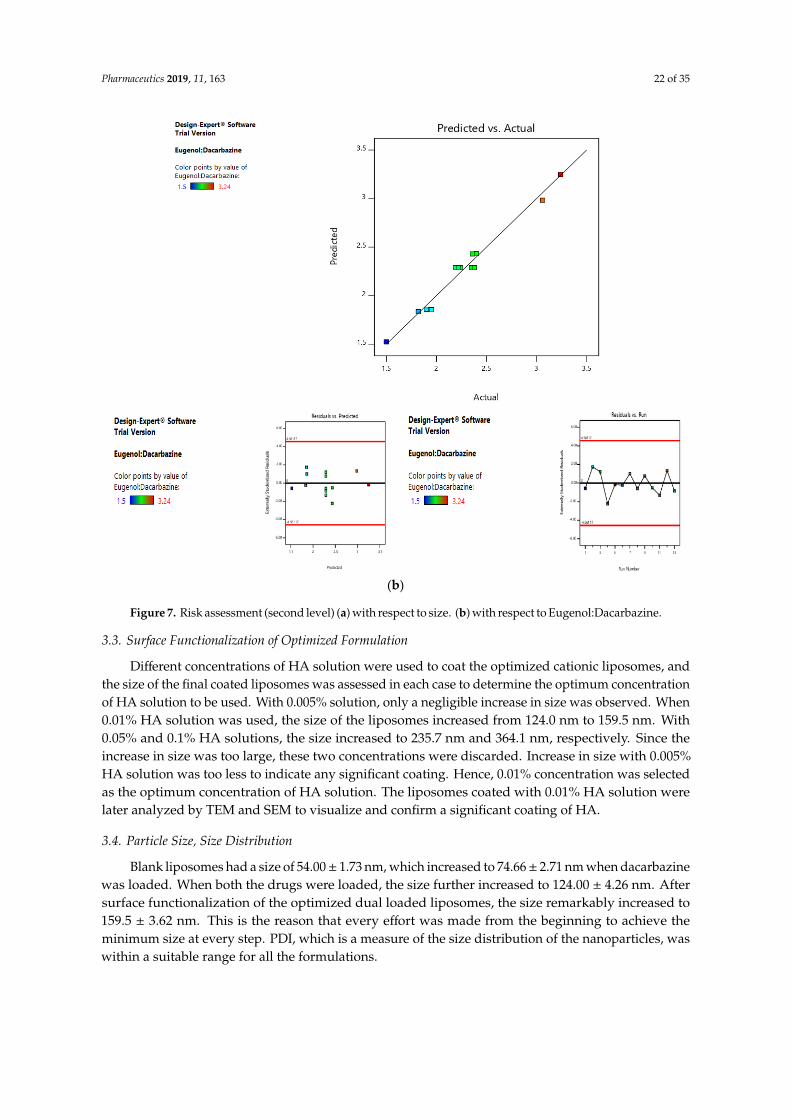
Risk Assessment (Second Level)
In the second level of QbD, the effect of dacarbazine concentration and eugenol concentration wasassessed on the size and entrapment efficiency of the liposomes. The linear curve of predicted versusactual response, and symmetrical distribution pattern in residual versus predicted, and residual versusrun graph for particle size and eugenol:dacarbazine, suggested that the model applied was fit, and thechances of missing other variables that might affect CQAs of the final liposomes were low (Figure 7a,b).
Selection of Optimum Formulation
Optimum formulation of dual-loaded liposomes was identified through a numerical optimizationby setting the constraints on dependent variables, size (minimum), and eugenol:dacarbazine(maximum). The software suggested 15 solutions, out of which the one with the highest desirabilityfactor was selected. The selected formulation suggested 1 mg/mL of dacarbazine concentration, and6.882 mg/mL of eugenol concentration. The predicted size of the DEL synthesized by the suggestedformula was 120.889 nm, and the size obtained was 124.0 nm. The predicted eugenol:dacarbazinevalue was 2.873, while it was practically observed to be 2.906. So, the predicted and obtained valueswere found to be in agreement.
Pharmaceutics 2018, 10, x FOR PEER REVIEW 23 of 39
Risk Assessment (Second level)
In the second level of QbD, the effect of dacarbazine concentration and eugenol concentration was assessed on the size and entrapment efficiency of the liposomes. The linear curve of predicted versus actual response, and symmetrical distribution pattern in residual versus predicted, and residual versus run graph for particle size and eugenol:dacarbazine, suggested that the model applied was fit, and the chances of missing other variables that might affect CQAs of the final liposomes were low (Figure 7a,b).
(a)
Figure 7. Cont.
Pharmaceutics 2019, 11, 163 22 of 35Pharmaceutics 2018, 10, x FOR PEER REVIEW 24 of 39
(b)
Figure 7. Risk assessment (second level) (a) with respect to size. (b) with respect to Eugenol:Dacarbazine.
Selection of Optimum Formulation
Optimum formulation of dual-loaded liposomes was identified through a numerical optimization by setting the constraints on dependent variables, size (minimum), and eugenol:dacarbazine (maximum). The software suggested 15 solutions, out of which the one with the highest desirability factor was selected. The selected formulation suggested 1 mg/mL of dacarbazine concentration, and 6.882 mg/mL of eugenol concentration. The predicted size of the DEL synthesized by the suggested formula was 120.889 nm, and the size obtained was 124.0 nm. The predicted eugenol:dacarbazine value was 2.873, while it was practically observed to be 2.906. So, the predicted and obtained values were found to be in agreement.
3.3. Surface Functionalization of Optimized Formulation
Different concentrations of HA solution were used to coat the optimized cationic liposomes, and the size of the final coated liposomes was assessed in each case to determine the optimum concentration of HA solution to be used. With 0.005% solution, only a negligible increase in size was observed. When 0.01% HA solution was used, the size of the liposomes increased from 124.0 nm to 159.5 nm. With 0.05% and 0.1% HA solutions, the size increased to 235.7 nm and 364.1 nm, respectively. Since the increase in size was too large, these two concentrations were discarded. Increase in size with 0.005% HA solution was too less to indicate any significant coating. Hence, 0.01% concentration was selected as the optimum concentration of HA solution. The liposomes coated with 0.01% HA solution were later analyzed by TEM and SEM to visualize and confirm a significant coating of HA.
Figure 7. Risk assessment (second level) (a) with respect to size. (b) with respect to Eugenol:Dacarbazine.
3.3. Surface Functionalization of Optimized Formulation
Different concentrations of HA solution were used to coat the optimized cationic liposomes, andthe size of the final coated liposomes was assessed in each case to determine the optimum concentrationof HA solution to be used. With 0.005% solution, only a negligible increase in size was observed. When0.01% HA solution was used, the size of the liposomes increased from 124.0 nm to 159.5 nm. With0.05% and 0.1% HA solutions, the size increased to 235.7 nm and 364.1 nm, respectively. Since theincrease in size was too large, these two concentrations were discarded. Increase in size with 0.005%HA solution was too less to indicate any significant coating. Hence, 0.01% concentration was selectedas the optimum concentration of HA solution. The liposomes coated with 0.01% HA solution werelater analyzed by TEM and SEM to visualize and confirm a significant coating of HA.
3.4. Particle Size, Size Distribution
Blank liposomes had a size of 54.00± 1.73 nm, which increased to 74.66± 2.71 nm when dacarbazinewas loaded. When both the drugs were loaded, the size further increased to 124.00 ± 4.26 nm. Aftersurface functionalization of the optimized dual loaded liposomes, the size remarkably increased to159.5 ± 3.62 nm. This is the reason that every effort was made from the beginning to achieve theminimum size at every step. PDI, which is a measure of the size distribution of the nanoparticles, waswithin a suitable range for all the formulations.
Pharmaceutics 2019, 11, 163 23 of 35
3.5. Zeta Potential
As the zeta potential is one of the major determinants of the stability of the nanoformulations,it too was determined. Zeta potential of BL was found to be −9.97 mV, which indicates a moderatestability of the liposomes. The zeta potential of DEL was found to be −8.70, which is nearly the sameas that of the blank liposomes. Since both the drugs are entrapped inside the liposomes, the surfacecharge remains more or less unaltered.
After coating of liposomes with HA (DELC), the zeta potential was −12.8. Here, the negativecharge is supposed to be due to the carboxylic groups of HA present on the surface of the liposomes.This increase in the negative charge of the liposomes indicates towards a successful coating of theliposomes with the electronegative HA.
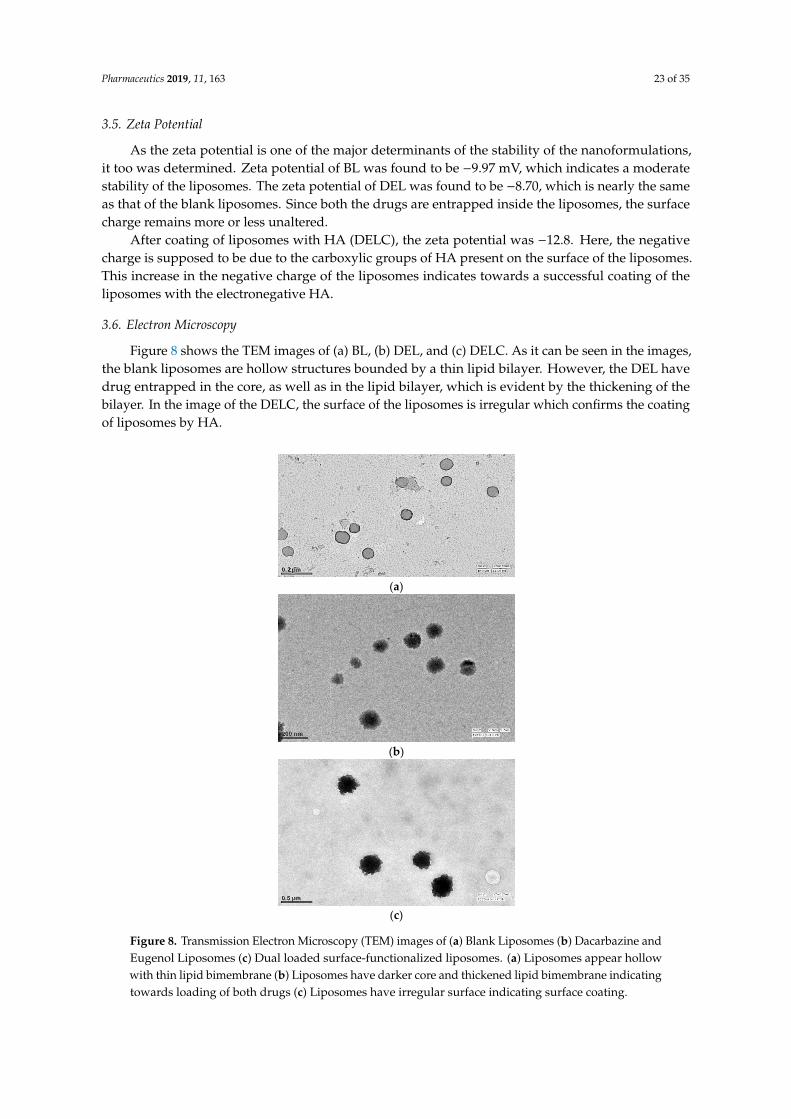
3.6. Electron Microscopy
Figure 8 shows the TEM images of (a) BL, (b) DEL, and (c) DELC. As it can be seen in the images,the blank liposomes are hollow structures bounded by a thin lipid bilayer. However, the DEL havedrug entrapped in the core, as well as in the lipid bilayer, which is evident by the thickening of thebilayer. In the image of the DELC, the surface of the liposomes is irregular which confirms the coatingof liposomes by HA.
Pharmaceutics 2018, 10, x FOR PEER REVIEW 26 of 39
(a)
(b)
(c)
Figure 8. Transmission Electron Microscopy (TEM) images of (a) Blank Liposomes (b) Dacarbazine and Eugenol Liposomes (c) Dual loaded surface-functionalized liposomes. (a) Liposomes appear hollow with thin lipid bimembrane (b) Liposomes have darker core and thickened lipid bimembrane indicating towards loading of both drugs (c) Liposomes have irregular surface indicating surface coating.
Figure 8. Transmission Electron Microscopy (TEM) images of (a) Blank Liposomes (b) Dacarbazine andEugenol Liposomes (c) Dual loaded surface-functionalized liposomes. (a) Liposomes appear hollowwith thin lipid bimembrane (b) Liposomes have darker core and thickened lipid bimembrane indicatingtowards loading of both drugs (c) Liposomes have irregular surface indicating surface coating.
Pharmaceutics 2019, 11, 163 24 of 35
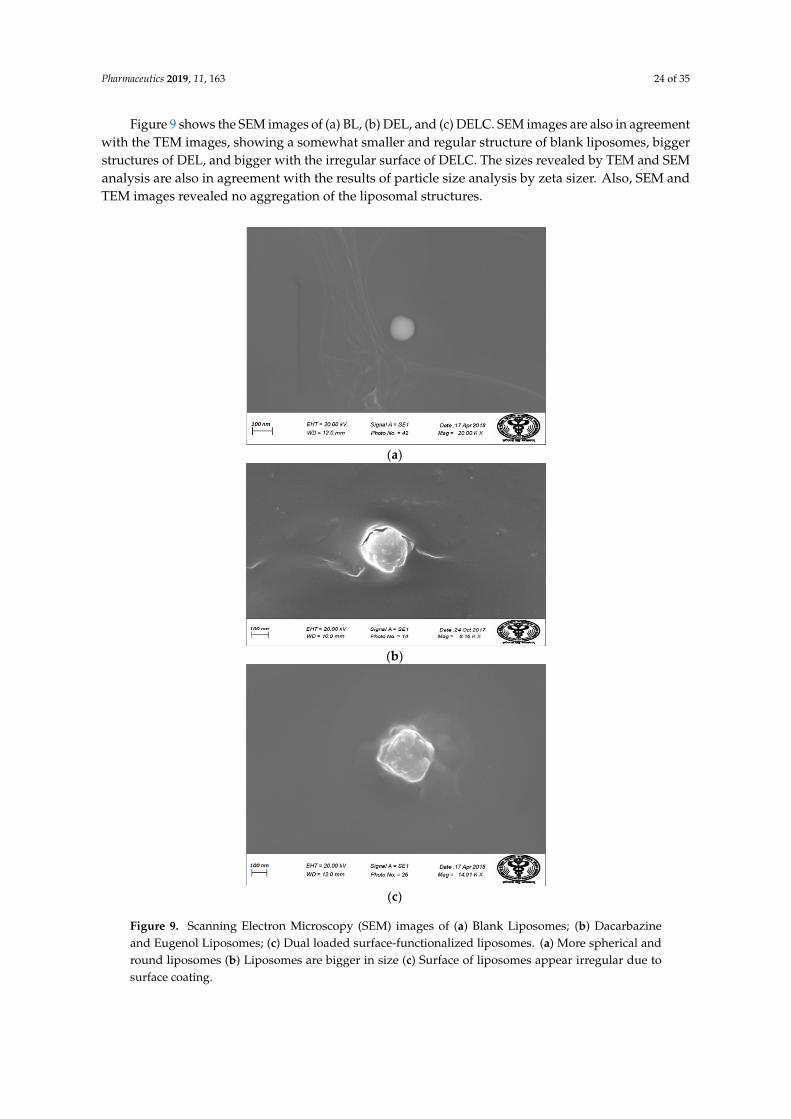
Figure 9 shows the SEM images of (a) BL, (b) DEL, and (c) DELC. SEM images are also in agreementwith the TEM images, showing a somewhat smaller and regular structure of blank liposomes, biggerstructures of DEL, and bigger with the irregular surface of DELC. The sizes revealed by TEM and SEManalysis are also in agreement with the results of particle size analysis by zeta sizer. Also, SEM andTEM images revealed no aggregation of the liposomal structures.
Pharmaceutics 2018, 10, x FOR PEER REVIEW 27 of 39
(a)
(b)
(c)
Figure 9. Scanning Electron Microscopy (SEM) images of (a) Blank Liposomes; (b) Dacarbazine and Eugenol Liposomes; (c) Dual loaded surface-functionalized liposomes. (a) More spherical and round liposomes (b) Liposomes are bigger in size (c) Surface of liposomes appear irregular due to surface coating.
3.7. Drug Loading
The absorbance of the ethanolic solution of drugs-loaded liposomes was measured at λ1et and λ2et, and substituted into Equations (1) and (2) which were then solved to find out the values of Cdet
and Ceet. After multiplying these values with the dilution factor, the concentration of dacarbazine was found to be 4.374 mg, and the concentration of eugenol was found to be 12.714 mg in the liposomes. Calculating the percentages, the Dacarbazine loading was found to be 15.272%, and Eugenol loading was found to be 44.392%.
Figure 9. Scanning Electron Microscopy (SEM) images of (a) Blank Liposomes; (b) Dacarbazineand Eugenol Liposomes; (c) Dual loaded surface-functionalized liposomes. (a) More spherical andround liposomes (b) Liposomes are bigger in size (c) Surface of liposomes appear irregular due tosurface coating.
Pharmaceutics 2019, 11, 163 25 of 35
3.7. Drug Loading
The absorbance of the ethanolic solution of drugs-loaded liposomes was measured at λ1et and
λ2et, and substituted into Equations (1) and (2) which were then solved to find out the values of Cd
et
and Ceet. After multiplying these values with the dilution factor, the concentration of dacarbazine was
found to be 4.374 mg, and the concentration of eugenol was found to be 12.714 mg in the liposomes.Calculating the percentages, the Dacarbazine loading was found to be 15.272%, and Eugenol loadingwas found to be 44.392%.
3.8. Entrapment Efficiency
Since the amount of dacarbazine initially added was 25 mg (1 mg/mL in 25 mL water), and theamount entrapped was 4.374 mg, the entrapment efficiency of dacarbazine was 17.49%.
The amount of Eugenol initially added was 34.41 mg (6.882 mg/mL in 5 mL ethanol), and theamount entrapped was 12.714 mg, so the entrapment efficiency of eugenol was 36.94%.
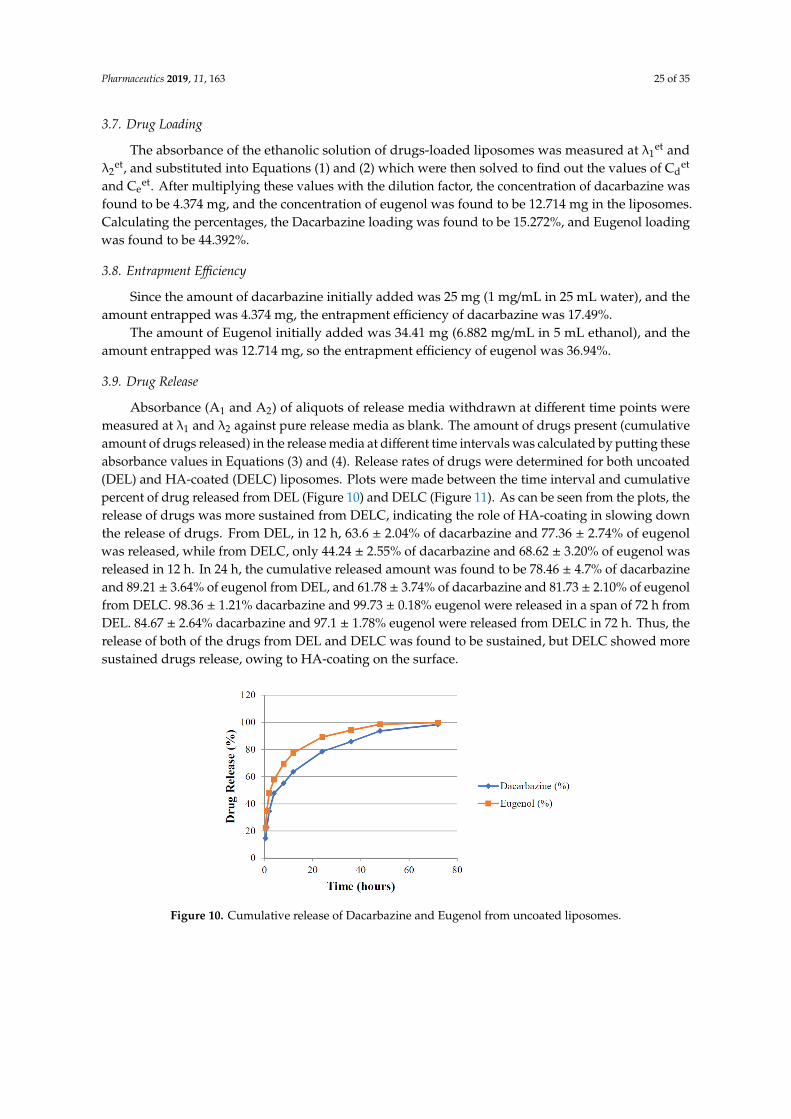
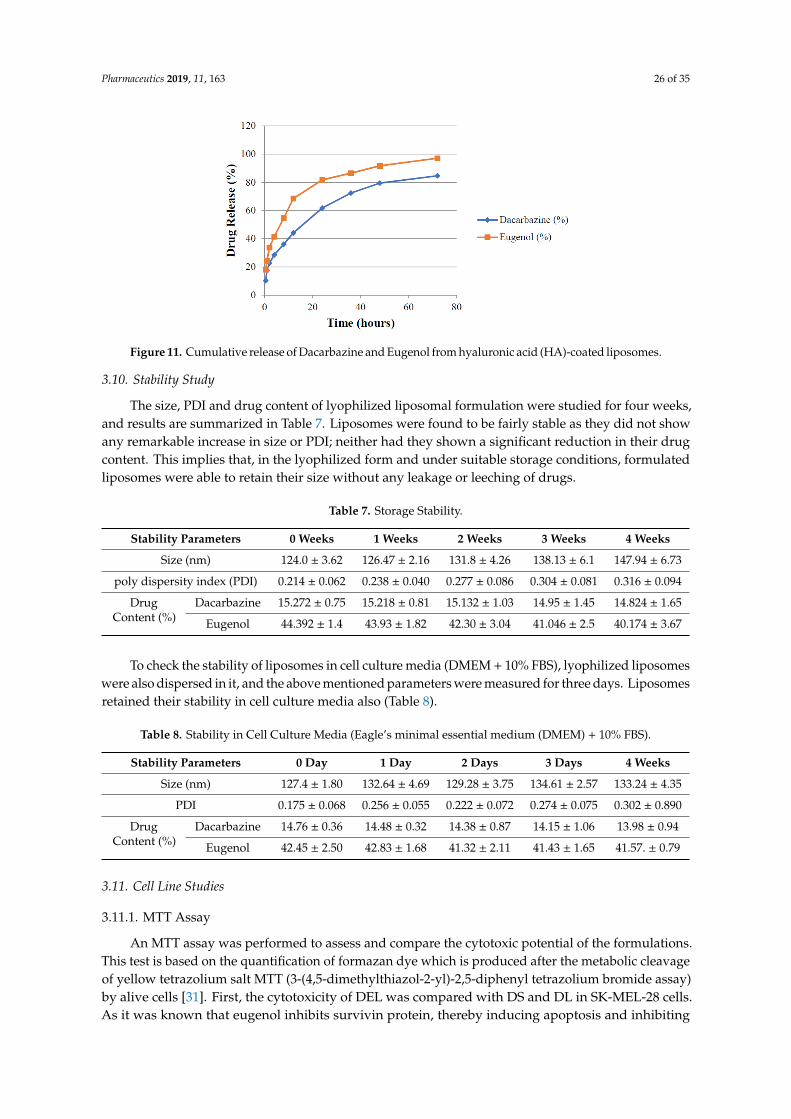
3.9. Drug Release
Absorbance (A1 and A2) of aliquots of release media withdrawn at different time points weremeasured at λ1 and λ2 against pure release media as blank. The amount of drugs present (cumulativeamount of drugs released) in the release media at different time intervals was calculated by putting theseabsorbance values in Equations (3) and (4). Release rates of drugs were determined for both uncoated(DEL) and HA-coated (DELC) liposomes. Plots were made between the time interval and cumulativepercent of drug released from DEL (Figure 10) and DELC (Figure 11). As can be seen from the plots, therelease of drugs was more sustained from DELC, indicating the role of HA-coating in slowing downthe release of drugs. From DEL, in 12 h, 63.6 ± 2.04% of dacarbazine and 77.36 ± 2.74% of eugenolwas released, while from DELC, only 44.24 ± 2.55% of dacarbazine and 68.62 ± 3.20% of eugenol wasreleased in 12 h. In 24 h, the cumulative released amount was found to be 78.46 ± 4.7% of dacarbazineand 89.21 ± 3.64% of eugenol from DEL, and 61.78 ± 3.74% of dacarbazine and 81.73 ± 2.10% of eugenolfrom DELC. 98.36 ± 1.21% dacarbazine and 99.73 ± 0.18% eugenol were released in a span of 72 h fromDEL. 84.67 ± 2.64% dacarbazine and 97.1 ± 1.78% eugenol were released from DELC in 72 h. Thus, therelease of both of the drugs from DEL and DELC was found to be sustained, but DELC showed moresustained drugs release, owing to HA-coating on the surface.
Pharmaceutics 2018, 10, x FOR PEER REVIEW 29 of 39
3.8. Entrapment Efficiency
Since the amount of dacarbazine initially added was 25 mg (1 mg/mL in 25 mL water), and the amount entrapped was 4.374 mg, the entrapment efficiency of dacarbazine was 17.49%.
The amount of Eugenol initially added was 34.41 mg (6.882 mg/mL in 5 mL ethanol), and the amount entrapped was 12.714 mg, so the entrapment efficiency of eugenol was 36.94%.
3.9. Drug Release
Absorbance (A1 and A2) of aliquots of release media withdrawn at different time points were measured at λ1 and λ2 against pure release media as blank. The amount of drugs present (cumulative amount of drugs released) in the release media at different time intervals was calculated by putting these absorbance values in Equations (3) and (4). Release rates of drugs were determined for both uncoated (DEL) and HA-coated (DELC) liposomes. Plots were made between the time interval and cumulative percent of drug released from DEL (Figure 10) and DELC (Figure 11). As can be seen from the plots, the release of drugs was more sustained from DELC, indicating the role of HA-coating in slowing down the release of drugs. From DEL, in 12 h, 63.6 ± 2.04% of dacarbazine and 77.36 ± 2.74% of eugenol was released, while from DELC, only 44.24 ± 2.55% of dacarbazine and 68.62 ± 3.20% of eugenol was released in 12 h. In 24 h, the cumulative released amount was found to be 78.46 ± 4.7% of dacarbazine and 89.21 ± 3.64% of eugenol from DEL, and 61.78 ± 3.74% of dacarbazine and 81.73 ± 2.10% of eugenol from DELC. 98.36 ± 1.21% dacarbazine and 99.73 ± 0.18% eugenol were released in a span of 72 h from DEL. 84.67 ± 2.64% dacarbazine and 97.1 ± 1.78% eugenol were released from DELC in 72 h. Thus, the release of both of the drugs from DEL and DELC was found to be sustained, but DELC showed more sustained drugs release, owing to HA-coating on the surface.
Figure 10. Cumulative release of Dacarbazine and Eugenol from uncoated liposomes.
Figure 10. Cumulative release of Dacarbazine and Eugenol from uncoated liposomes.
Pharmaceutics 2019, 11, 163 26 of 35
Pharmaceutics 2018, 10, x FOR PEER REVIEW 30 of 39
Figure 11. Cumulative release of Dacarbazine and Eugenol from hyaluronic acid (HA)-coated liposomes.
3.10. Stability Study
The size, PDI and drug content of lyophilized liposomal formulation were studied for four weeks, and results are summarized in Table 7. Liposomes were found to be fairly stable as they did not show any remarkable increase in size or PDI; neither had they shown a significant reduction in their drug content. This implies that, in the lyophilized form and under suitable storage conditions, formulated liposomes were able to retain their size without any leakage or leeching of drugs.
To check the stability of liposomes in cell culture media (DMEM + 10% FBS), lyophilized liposomes were also dispersed in it, and the above mentioned parameters were measured for three days. Liposomes retained their stability in cell culture media also (Table 8).
Table 7. Storage Stability
Stability Parameters 0 Weeks 1 Weeks 2 Weeks 3 Weeks 4 Weeks Size (nm) 124.0 ± 3.62 126.47 ± 2.16 131.8 ± 4.26 138.13 ± 6.1 147.94 ± 6.73
poly dispersity index (PDI) 0.214 ± 0.062 0.238 ± 0.040 0.277 ± 0.086 0.304 ± 0.081 0.316 ± 0.094
Drug Content (%) Dacarbazine 15.272 ± 0.75 15.218 ± 0.81 15.132 ± 1.03 14.95 ± 1.45 14.824 ± 1.65
Eugenol 44.392 ± 1.4 43.93 ± 1.82 42.30 ± 3.04 41.046 ± 2.5 40.174 ± 3.67
Table 8. Stability in Cell Culture Media (Eagle's minimal essential medium (DMEM) + 10% FBS).
Stability Parameters 0 Day 1 Day 2 Days 3 Days 4 Weeks Size (nm) 127.4 ± 1.80 132.64 ± 4.69 129.28 ± 3.75 134.61 ± 2.57 133.24 ± 4.35
PDI 0.175 ± 0.068 0.256 ± 0.055 0.222 ± 0.072 0.274 ± 0.075 0.302 ± 0.890
Drug Content (%) Dacarbazine 14.76 ± 0.36 14.48 ± 0.32 14.38 ± 0.87 14.15 ± 1.06 13.98 ± 0.94
Eugenol 42.45 ± 2.50 42.83 ± 1.68 41.32 ± 2.11 41.43 ± 1.65 41.57. ± 0.79
3.11. Cell Line Studies
3.11.1. MTT Assay
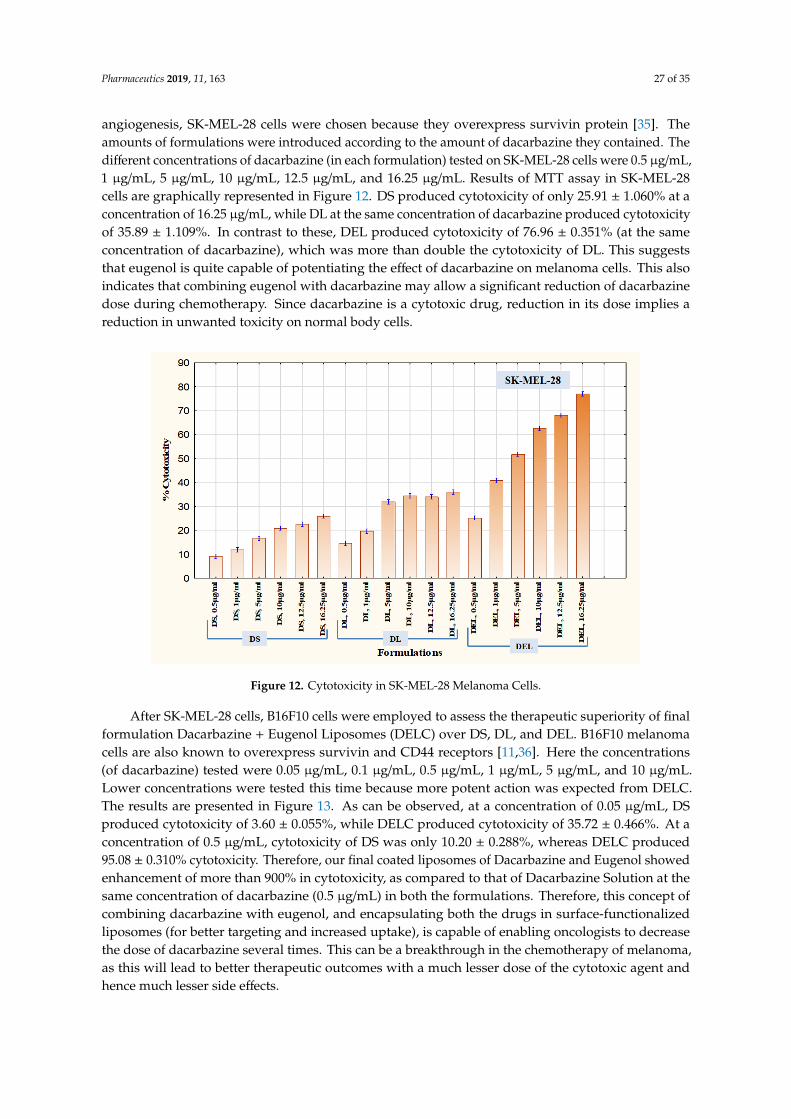
An MTT assay was performed to assess and compare the cytotoxic potential of the formulations. This test is based on the quantification of formazan dye which is produced after the metabolic cleavage of yellow tetrazolium salt MTT (3-(4,5-dimethylthiazol-2-yl)-2,5-diphenyl tetrazolium bromide assay) by alive cells [31]. First, the cytotoxicity of DEL was compared with DS and DL in SK-MEL-28 cells. As it was known that eugenol inhibits survivin protein, thereby inducing apoptosis and inhibiting angiogenesis, SK-MEL-28 cells were chosen because they overexpress survivin protein [35]. The amounts of formulations were introduced according to the amount of dacarbazine they contained. The different concentrations of dacarbazine (in each formulation) tested on SK-MEL-28 cells were 0.5 µg/mL, 1 µg/mL, 5 µg/mL, 10 µg/mL, 12.5 µg/mL, and 16.25 µg/mL. Results of MTT assay in SK-MEL-28 cells are graphically represented in Figure 12. DS produced cytotoxicity of only
Figure 11. Cumulative release of Dacarbazine and Eugenol from hyaluronic acid (HA)-coated liposomes.
3.10. Stability Study
The size, PDI and drug content of lyophilized liposomal formulation were studied for four weeks,and results are summarized in Table 7. Liposomes were found to be fairly stable as they did not showany remarkable increase in size or PDI; neither had they shown a significant reduction in their drugcontent. This implies that, in the lyophilized form and under suitable storage conditions, formulatedliposomes were able to retain their size without any leakage or leeching of drugs.
Table 7. Storage Stability.
Stability Parameters 0 Weeks 1 Weeks 2 Weeks 3 Weeks 4 Weeks
Size (nm) 124.0 ± 3.62 126.47 ± 2.16 131.8 ± 4.26 138.13 ± 6.1 147.94 ± 6.73
poly dispersity index (PDI) 0.214 ± 0.062 0.238 ± 0.040 0.277 ± 0.086 0.304 ± 0.081 0.316 ± 0.094
DrugContent (%)
Dacarbazine 15.272 ± 0.75 15.218 ± 0.81 15.132 ± 1.03 14.95 ± 1.45 14.824 ± 1.65
Eugenol 44.392 ± 1.4 43.93 ± 1.82 42.30 ± 3.04 41.046 ± 2.5 40.174 ± 3.67
To check the stability of liposomes in cell culture media (DMEM + 10% FBS), lyophilized liposomeswere also dispersed in it, and the above mentioned parameters were measured for three days. Liposomesretained their stability in cell culture media also (Table 8).
Table 8. Stability in Cell Culture Media (Eagle’s minimal essential medium (DMEM) + 10% FBS).
Stability Parameters 0 Day 1 Day 2 Days 3 Days 4 Weeks
Size (nm) 127.4 ± 1.80 132.64 ± 4.69 129.28 ± 3.75 134.61 ± 2.57 133.24 ± 4.35
PDI 0.175 ± 0.068 0.256 ± 0.055 0.222 ± 0.072 0.274 ± 0.075 0.302 ± 0.890
DrugContent (%)
Dacarbazine 14.76 ± 0.36 14.48 ± 0.32 14.38 ± 0.87 14.15 ± 1.06 13.98 ± 0.94
Eugenol 42.45 ± 2.50 42.83 ± 1.68 41.32 ± 2.11 41.43 ± 1.65 41.57. ± 0.79
3.11. Cell Line Studies
3.11.1. MTT Assay
An MTT assay was performed to assess and compare the cytotoxic potential of the formulations.This test is based on the quantification of formazan dye which is produced after the metabolic cleavageof yellow tetrazolium salt MTT (3-(4,5-dimethylthiazol-2-yl)-2,5-diphenyl tetrazolium bromide assay)by alive cells [31]. First, the cytotoxicity of DEL was compared with DS and DL in SK-MEL-28 cells.As it was known that eugenol inhibits survivin protein, thereby inducing apoptosis and inhibiting
Pharmaceutics 2019, 11, 163 27 of 35
angiogenesis, SK-MEL-28 cells were chosen because they overexpress survivin protein [35]. Theamounts of formulations were introduced according to the amount of dacarbazine they contained. Thedifferent concentrations of dacarbazine (in each formulation) tested on SK-MEL-28 cells were 0.5 µg/mL,1 µg/mL, 5 µg/mL, 10 µg/mL, 12.5 µg/mL, and 16.25 µg/mL. Results of MTT assay in SK-MEL-28cells are graphically represented in Figure 12. DS produced cytotoxicity of only 25.91 ± 1.060% at aconcentration of 16.25 µg/mL, while DL at the same concentration of dacarbazine produced cytotoxicityof 35.89 ± 1.109%. In contrast to these, DEL produced cytotoxicity of 76.96 ± 0.351% (at the sameconcentration of dacarbazine), which was more than double the cytotoxicity of DL. This suggeststhat eugenol is quite capable of potentiating the effect of dacarbazine on melanoma cells. This alsoindicates that combining eugenol with dacarbazine may allow a significant reduction of dacarbazinedose during chemotherapy. Since dacarbazine is a cytotoxic drug, reduction in its dose implies areduction in unwanted toxicity on normal body cells.
Pharmaceutics 2018, 10, x FOR PEER REVIEW 31 of 39
25.91 ± 1.060% at a concentration of 16.25 µg/mL, while DL at the same concentration of dacarbazine produced cytotoxicity of 35.89 ± 1.109%. In contrast to these, DEL produced cytotoxicity of 76.96 ± 0.351% (at the same concentration of dacarbazine), which was more than double the cytotoxicity of DL. This suggests that eugenol is quite capable of potentiating the effect of dacarbazine on melanoma cells. This also indicates that combining eugenol with dacarbazine may allow a significant reduction of dacarbazine dose during chemotherapy. Since dacarbazine is a cytotoxic drug, reduction in its dose implies a reduction in unwanted toxicity on normal body cells.
After SK-MEL-28 cells, B16F10 cells were employed to assess the therapeutic superiority of final formulation Dacarbazine + Eugenol Liposomes (DELC) over DS, DL, and DEL. B16F10 melanoma cells are also known to overexpress survivin and CD44 receptors [11,36]. Here the concentrations (of dacarbazine) tested were 0.05 µg/mL, 0.1 µg/mL, 0.5 µg/mL, 1 µg/mL, 5 µg/mL, and 10 µg/mL. Lower concentrations were tested this time because more potent action was expected from DELC. The results are presented in Figure 13. As can be observed, at a concentration of 0.05 µg/mL, DS produced cytotoxicity of 3.60 ± 0.055%, while DELC produced cytotoxicity of 35.72 ± 0.466%. At a concentration of 0.5 µg/mL, cytotoxicity of DS was only 10.20 ± 0.288%, whereas DELC produced 95.08 ± 0.310% cytotoxicity. Therefore, our final coated liposomes of Dacarbazine and Eugenol showed enhancement of more than 900% in cytotoxicity, as compared to that of Dacarbazine Solution at the same concentration of dacarbazine (0.5 µg/mL) in both the formulations. Therefore, this concept of combining dacarbazine with eugenol, and encapsulating both the drugs in surface-functionalized liposomes (for better targeting and increased uptake), is capable of enabling oncologists to decrease the dose of dacarbazine several times. This can be a breakthrough in the chemotherapy of melanoma, as this will lead to better therapeutic outcomes with a much lesser dose of the cytotoxic agent and hence much lesser side effects.
Cytotoxicity of blank liposomes was also assessed in both the cell lines to ascertain the safety of the carrier system (data not shown). The blank liposomes were found to be safe with no significant cytotoxicity.
Figure 12. Cytotoxicity in SK-MEL-28 Melanoma Cells. Figure 12. Cytotoxicity in SK-MEL-28 Melanoma Cells.
After SK-MEL-28 cells, B16F10 cells were employed to assess the therapeutic superiority of finalformulation Dacarbazine + Eugenol Liposomes (DELC) over DS, DL, and DEL. B16F10 melanomacells are also known to overexpress survivin and CD44 receptors [11,36]. Here the concentrations(of dacarbazine) tested were 0.05 µg/mL, 0.1 µg/mL, 0.5 µg/mL, 1 µg/mL, 5 µg/mL, and 10 µg/mL.Lower concentrations were tested this time because more potent action was expected from DELC.The results are presented in Figure 13. As can be observed, at a concentration of 0.05 µg/mL, DSproduced cytotoxicity of 3.60 ± 0.055%, while DELC produced cytotoxicity of 35.72 ± 0.466%. At aconcentration of 0.5 µg/mL, cytotoxicity of DS was only 10.20 ± 0.288%, whereas DELC produced95.08 ± 0.310% cytotoxicity. Therefore, our final coated liposomes of Dacarbazine and Eugenol showedenhancement of more than 900% in cytotoxicity, as compared to that of Dacarbazine Solution at thesame concentration of dacarbazine (0.5 µg/mL) in both the formulations. Therefore, this concept ofcombining dacarbazine with eugenol, and encapsulating both the drugs in surface-functionalizedliposomes (for better targeting and increased uptake), is capable of enabling oncologists to decreasethe dose of dacarbazine several times. This can be a breakthrough in the chemotherapy of melanoma,as this will lead to better therapeutic outcomes with a much lesser dose of the cytotoxic agent andhence much lesser side effects.
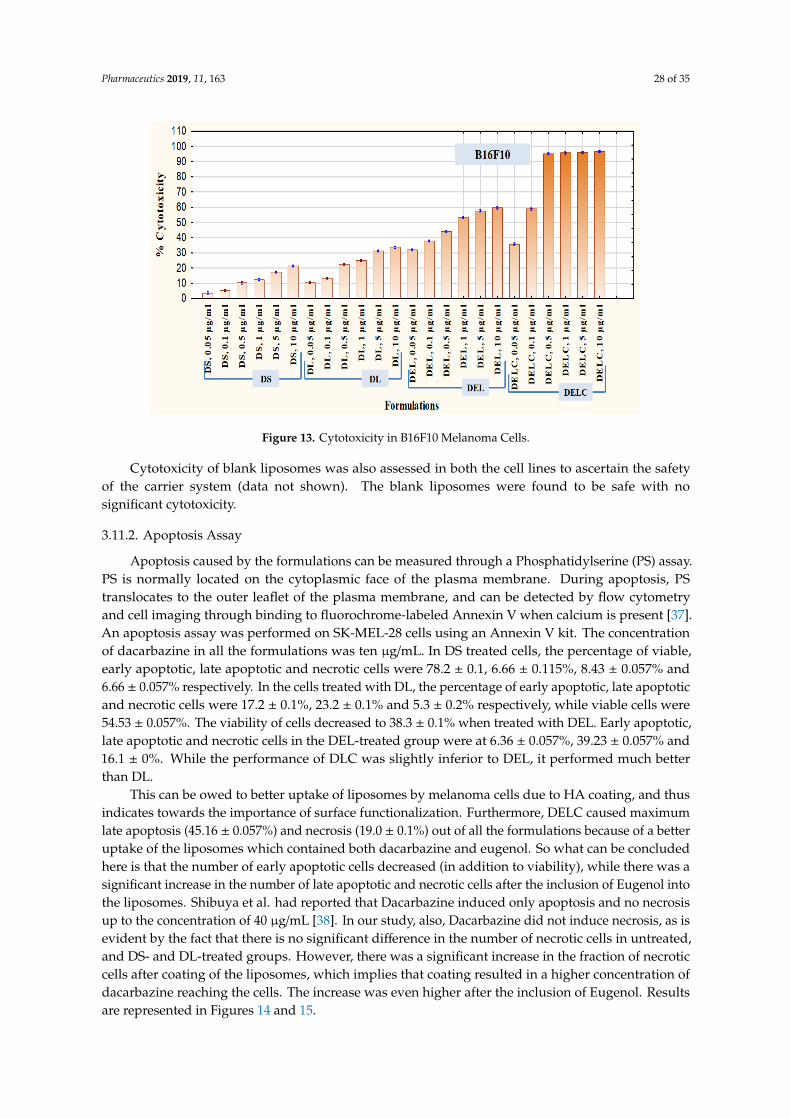
Pharmaceutics 2019, 11, 163 28 of 35
Pharmaceutics 2018, 10, x FOR PEER REVIEW 32 of 39
Figure 13. Cytotoxicity in B16F10 Melanoma Cells.
3.11.2. Apoptosis Assay
Apoptosis caused by the formulations can be measured through a Phosphatidylserine (PS) assay. PS is normally located on the cytoplasmic face of the plasma membrane. During apoptosis, PS translocates to the outer leaflet of the plasma membrane, and can be detected by flow cytometry and cell imaging through binding to fluorochrome-labeled Annexin V when calcium is present [37]. An apoptosis assay was performed on SK-MEL-28 cells using an Annexin V kit. The concentration of dacarbazine in all the formulations was ten µg/mL. In DS treated cells, the percentage of viable, early apoptotic, late apoptotic and necrotic cells were 78.2 ± 0.1, 6.66 ± 0.115%, 8.43 ± 0.057% and 6.66 ± 0.057% respectively. In the cells treated with DL, the percentage of early apoptotic, late apoptotic and necrotic cells were 17.2 ± 0.1%, 23.2 ± 0.1% and 5.3 ± 0.2% respectively, while viable cells were 54.53 ± 0.057%. The viability of cells decreased to 38.3 ± 0.1% when treated with DEL. Early apoptotic, late apoptotic and necrotic cells in the DEL-treated group were at 6.36 ± 0.057%, 39.23 ± 0.057% and 16.1 ± 0%. While the performance of DLC was slightly inferior to DEL, it performed much better than DL.
This can be owed to better uptake of liposomes by melanoma cells due to HA coating, and thus indicates towards the importance of surface functionalization. Furthermore, DELC caused maximum late apoptosis (45.16 ± 0.057%) and necrosis (19.0 ± 0.1%) out of all the formulations because of a better uptake of the liposomes which contained both dacarbazine and eugenol. So what can be concluded here is that the number of early apoptotic cells decreased (in addition to viability), while there was a significant increase in the number of late apoptotic and necrotic cells after the inclusion of Eugenol into the liposomes. Shibuya et al. had reported that Dacarbazine induced only apoptosis and no necrosis up to the concentration of 40 µg/mL [38]. In our study, also, Dacarbazine did not induce necrosis, as is evident by the fact that there is no significant difference in the number of necrotic cells in untreated, and DS- and DL-treated groups. However, there was a significant increase in the fraction of necrotic cells after coating of the liposomes, which implies that coating resulted in a higher concentration of dacarbazine reaching the cells. The increase was even higher after the inclusion of Eugenol. Results are represented in Figures 14 and 15.
Dacarbazine, which is an alkylating chemotherapeutic agent, mainly kills cancer cells by inducing apoptosis and necrosis [39]. However, its effects are not observed to a significant level of its potential, because of the anti-apoptotic ability of the cancer cells, which is imparted to them by survivin. Here, eugenol downregulated the survivin to inhibit the anti-apoptotic ability of melanoma cells. In the absence of survivin, dacarbazine released from the liposomes could exert its apoptotic and necrotic effects more efficiently.
Figure 13. Cytotoxicity in B16F10 Melanoma Cells.
Cytotoxicity of blank liposomes was also assessed in both the cell lines to ascertain the safetyof the carrier system (data not shown). The blank liposomes were found to be safe with nosignificant cytotoxicity.
3.11.2. Apoptosis Assay
Apoptosis caused by the formulations can be measured through a Phosphatidylserine (PS) assay.PS is normally located on the cytoplasmic face of the plasma membrane. During apoptosis, PStranslocates to the outer leaflet of the plasma membrane, and can be detected by flow cytometryand cell imaging through binding to fluorochrome-labeled Annexin V when calcium is present [37].An apoptosis assay was performed on SK-MEL-28 cells using an Annexin V kit. The concentrationof dacarbazine in all the formulations was ten µg/mL. In DS treated cells, the percentage of viable,early apoptotic, late apoptotic and necrotic cells were 78.2 ± 0.1, 6.66 ± 0.115%, 8.43 ± 0.057% and6.66 ± 0.057% respectively. In the cells treated with DL, the percentage of early apoptotic, late apoptoticand necrotic cells were 17.2 ± 0.1%, 23.2 ± 0.1% and 5.3 ± 0.2% respectively, while viable cells were54.53 ± 0.057%. The viability of cells decreased to 38.3 ± 0.1% when treated with DEL. Early apoptotic,late apoptotic and necrotic cells in the DEL-treated group were at 6.36 ± 0.057%, 39.23 ± 0.057% and16.1 ± 0%. While the performance of DLC was slightly inferior to DEL, it performed much betterthan DL.
This can be owed to better uptake of liposomes by melanoma cells due to HA coating, and thusindicates towards the importance of surface functionalization. Furthermore, DELC caused maximumlate apoptosis (45.16 ± 0.057%) and necrosis (19.0 ± 0.1%) out of all the formulations because of a betteruptake of the liposomes which contained both dacarbazine and eugenol. So what can be concludedhere is that the number of early apoptotic cells decreased (in addition to viability), while there was asignificant increase in the number of late apoptotic and necrotic cells after the inclusion of Eugenol intothe liposomes. Shibuya et al. had reported that Dacarbazine induced only apoptosis and no necrosisup to the concentration of 40 µg/mL [38]. In our study, also, Dacarbazine did not induce necrosis, as isevident by the fact that there is no significant difference in the number of necrotic cells in untreated,and DS- and DL-treated groups. However, there was a significant increase in the fraction of necroticcells after coating of the liposomes, which implies that coating resulted in a higher concentration ofdacarbazine reaching the cells. The increase was even higher after the inclusion of Eugenol. Resultsare represented in Figures 14 and 15.
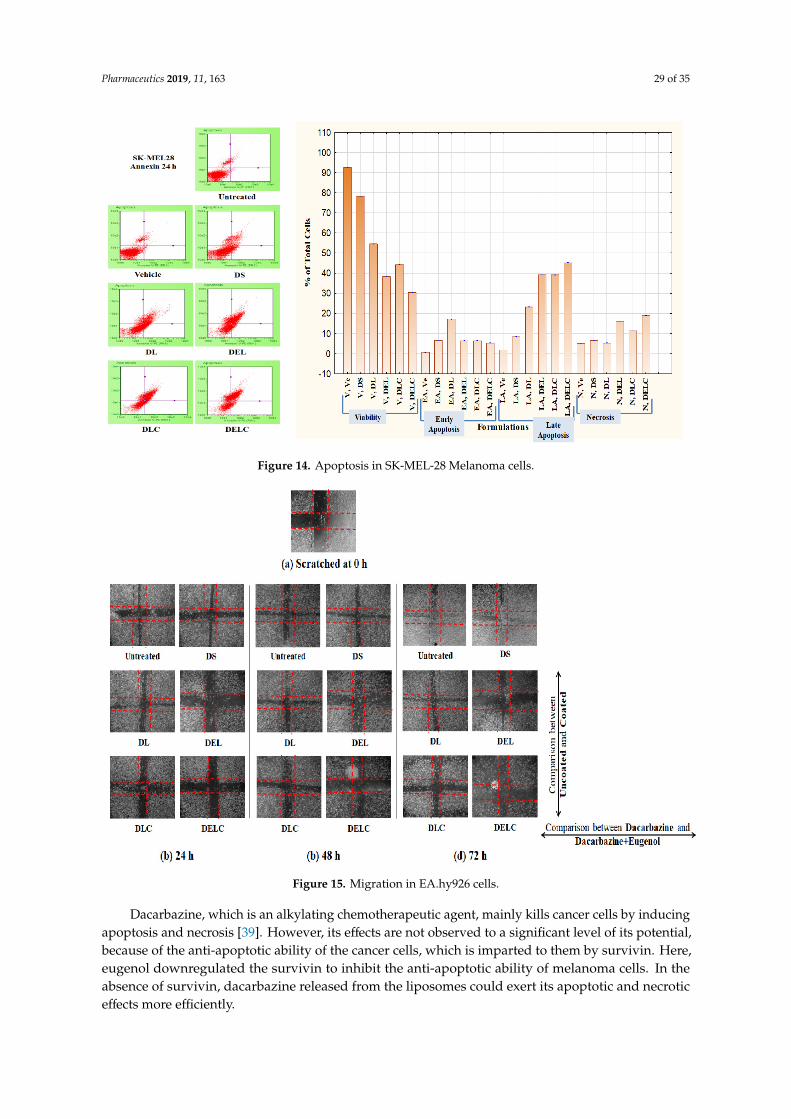
Pharmaceutics 2019, 11, 163 29 of 35
Pharmaceutics 2018, 10, x FOR PEER REVIEW 28 of 34
3.11.2. Apoptosis Assay
Apoptosis caused by the formulations can be measured through a Phosphatidylserine (PS) assay. PS is normally located on the cytoplasmic face of the plasma membrane. During apoptosis, PS translocates to the outer leaflet of the plasma membrane, and can be detected by flow cytometry and cell imaging through binding to fluorochrome-labeled Annexin V when calcium is present [37]. An apoptosis assay was performed on SK-MEL-28 cells using an Annexin V kit. The concentration of dacarbazine in all the formulations was ten µg/mL. In DS treated cells, the percentage of viable, early apoptotic, late apoptotic and necrotic cells were 78.2 ± 0.1, 6.66 ± 0.115%, 8.43 ± 0.057% and 6.66 ± 0.057% respectively. In the cells treated with DL, the percentage of early apoptotic, late apoptotic and necrotic cells were 17.2 ± 0.1%, 23.2 ± 0.1% and 5.3 ± 0.2% respectively, while viable cells were 54.53 ± 0.057%. The viability of cells decreased to 38.3 ± 0.1% when treated with DEL. Early apoptotic, late apoptotic and necrotic cells in the DEL-treated group were at 6.36 ± 0.057%, 39.23 ± 0.057% and 16.1 ± 0%. While the performance of DLC was slightly inferior to DEL, it performed much better than DL.
This can be owed to better uptake of liposomes by melanoma cells due to HA coating, and thus indicates towards the importance of surface functionalization. Furthermore, DELC caused maximum late apoptosis (45.16 ± 0.057%) and necrosis (19.0 ± 0.1%) out of all the formulations because of a better uptake of the liposomes which contained both dacarbazine and eugenol. So what can be concluded here is that the number of early apoptotic cells decreased (in addition to viability), while there was a significant increase in the number of late apoptotic and necrotic cells after the inclusion of Eugenol into the liposomes. Shibuya et al. had reported that Dacarbazine induced only apoptosis and no necrosis up to the concentration of 40 µg/mL [38]. In our study, also, Dacarbazine did not induce necrosis, as is evident by the fact that there is no significant difference in the number of necrotic cells in untreated, and DS- and DL-treated groups. However, there was a significant increase in the fraction of necrotic cells after coating of the liposomes, which implies that coating resulted in a higher concentration of dacarbazine reaching the cells. The increase was even higher after the inclusion of Eugenol. Results are represented in Figures 14 and 15.
Dacarbazine, which is an alkylating chemotherapeutic agent, mainly kills cancer cells by inducing apoptosis and necrosis [39]. However, its effects are not observed to a significant level of its potential, because of the anti-apoptotic ability of the cancer cells, which is imparted to them by survivin. Here, eugenol downregulated the survivin to inhibit the anti-apoptotic ability of melanoma cells. In the absence of survivin, dacarbazine released from the liposomes could exert its apoptotic and necrotic effects more efficiently.
Figure 14. Apoptosis in SK-MEL-28 Melanoma cells.Pharmaceutics 2018, 10, x FOR PEER REVIEW 34 of 39
Figure 15. Migration in EA.hy926 cells.
3.11.3. Migration Assay
Cell migration plays an important part in the invasion and metastasis of tumor to distant sites. Metastasis is a major complication of cancer, and is particularly more common in case of melanoma [40,41]. Melanoma, once metastasized, is almost always fatal [42]. Vascular endothelial cells play significant roles in many physiologically and pathologically important processes, and thus are commonly used to describe mechanisms of inflammation, angiogenesis, tumor growth, migration, and metastasis. EA.hy926 cell line, which is derived as the hybrid of primary human umbilical vein cells (HUVECs) and the continuous human lung carcinoma cell line A549, is presently the best characterized macro-vascular endothelial cell line [43]. Figures 15 and 16 present the results of the migration study performed on EA.hy926 cells. The values of ‘% inhibition of migration’ are calculated concerning untreated, i.e., the migration of untreated cells is assumed to be 100% (inhibition is 0%), and all other values are relative to the migration of the untreated cells. The concentrations of DS, DL and DEL tested were 0.1 µg/mL and 1 µg/mL, while concentrations of DLC and DELC tested were 0.01 µg/mL (data not shown), and 0.1 µg/mL.
At one µg/mL, DS showed an inhibition of 44.13 ± 0.152% at 24 h, which was quite significant, but inhibition drastically decreased to only 7.43 ± 0.057% and 4.3 ± 0.1% at 48 h and 72 h respectively. In the case of DL (1 µg/mL), inhibition was 55.66 ± 0.115%, 45.43 ± 0.152% and 37.73 ± 0.057% at 24 h, 48 h and 72 h, respectively. This indicates towards the somewhat sustained release of dacarbazine from DL, as the decrease in performance was not as steep as DS. In the DEL (1 µg/mL) treated group, there was a remarkable migration inhibition of 116.96 ± 0.057%, 144.43 ± 0.115% and 139.13 ± 0.152% at three different time points. Here comes the role of eugenol, which has contributed significantly in inhibiting the migrating ability of the cells. As we can see, the % inhibition has increased from 24 h to 48 h, and then only slightly decreased at 72 h, this indicates towards the more sustained release of the drugs. In the DLC (0.1 µg/mL) treated group, inhibition was 93.13 ± 0.115%, 88.03 ± 0.57% and 76.7 ± 0.1%. Here, the action was sustained for 72 h, but not as much as in the case of DEL (inhibition has decreased rather than increasing). This shows that Eugenol plays a more significant role (than HA coating) in sustaining the release of dacarbazine. Inhibition in the cells treated with our final formulation DELC (0.1 µg/mL) was the highest; 116.86 ± 0.057%, 118.26 ± 0.115%, and 133.53 ± 0.0115%.
Figure 15. Migration in EA.hy926 cells.
Dacarbazine, which is an alkylating chemotherapeutic agent, mainly kills cancer cells by inducingapoptosis and necrosis [39]. However, its effects are not observed to a significant level of its potential,because of the anti-apoptotic ability of the cancer cells, which is imparted to them by survivin. Here,eugenol downregulated the survivin to inhibit the anti-apoptotic ability of melanoma cells. In theabsence of survivin, dacarbazine released from the liposomes could exert its apoptotic and necroticeffects more efficiently.
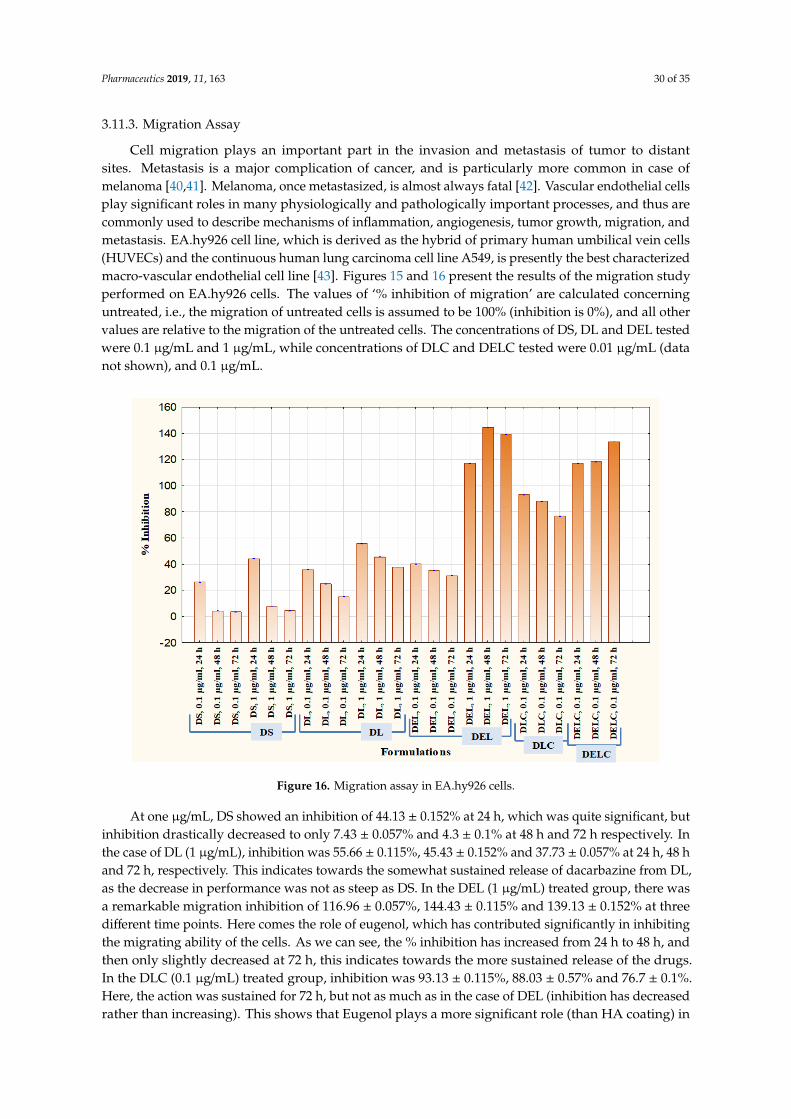
Pharmaceutics 2019, 11, 163 30 of 35
3.11.3. Migration Assay
Cell migration plays an important part in the invasion and metastasis of tumor to distantsites. Metastasis is a major complication of cancer, and is particularly more common in case ofmelanoma [40,41]. Melanoma, once metastasized, is almost always fatal [42]. Vascular endothelial cellsplay significant roles in many physiologically and pathologically important processes, and thus arecommonly used to describe mechanisms of inflammation, angiogenesis, tumor growth, migration, andmetastasis. EA.hy926 cell line, which is derived as the hybrid of primary human umbilical vein cells(HUVECs) and the continuous human lung carcinoma cell line A549, is presently the best characterizedmacro-vascular endothelial cell line [43]. Figures 15 and 16 present the results of the migration studyperformed on EA.hy926 cells. The values of ‘% inhibition of migration’ are calculated concerninguntreated, i.e., the migration of untreated cells is assumed to be 100% (inhibition is 0%), and all othervalues are relative to the migration of the untreated cells. The concentrations of DS, DL and DEL testedwere 0.1 µg/mL and 1 µg/mL, while concentrations of DLC and DELC tested were 0.01 µg/mL (datanot shown), and 0.1 µg/mL.
Pharmaceutics 2018, 10, x FOR PEER REVIEW 35 of 39
It should be noted here that DELC gave similar results as DEL at a concentration one-tenth of it. This indicates that surface coating has improved the performance of the formulation by around ten times. Also, the inhibition continuously increased for 72 h, which implies most sustained action out of all the formulations. It is because of the presence of both; the eugenol and the HA coating.
One interesting point to be noted here is that DLC has performed better than DEL (comparing results of 0.1 µg/mL). This unexpected behavior can be attributed to the fact that EA.hy926 cells overexpress CD44 on the cell surface [44], and HA reportedly binds to EA.hy926 cells [45]. This must have resulted in better uptake of DLC as compared to DEL, which does not have HA coating to bind to CD44 receptors.
Figure 16. Migration assay in EA.hy926 cells.
3.11.4. Proliferation Assay
Cell proliferation is the rapid increase in the number and amount of cells. Cytotoxic anti-cancer drugs kill cells that have a high basal level of proliferation and regeneration [46]. Thus, it is important to assess the effect of eugenol in the enhancement of proliferation when added to dacarbazine. It is usually more effective to test the antiangiogenic potential of pharmaceutical formulations on cells which have a substantial rate of proliferation [47], and so EA.hy926 cells were employed for the proliferation assay also. The results are graphically represented in Figure 17, where % viability of cells after treatment with different formulations is denoted. Concentrations tested were 0.01 µg/mL, 0.1 µg/mL, 0.5 µg/mL, 1 µg/mL, 2.5 µg/mL, 5 µg/mL, and 10 µg/mL. DS at dacarbazine concentration of 10 µg/mL reduced the viability of cells to 77.31 ± 0.47, while DL reduced it to 58.83 ± 0.610%. When eugenol was co-loaded with dacarbazine in the liposomes (DEL), the cell viability decreased to 34.46 ± 0.643% at ten µg/mL. The viability of cells treated with DLC (10 µg/mL) was 27.08 ± 0.605%, which was a little less than DEL because of the same reason as stated above. Most interestingly, the coated liposomes of Dacarbazine and Eugenol (DELC) left only 6.14 ± 0.618% cells viable. The anti-proliferative performance of DELC was much more significant than DS, which is the conventional way of how the dacarbazine is administered.
Figure 16. Migration assay in EA.hy926 cells.
At one µg/mL, DS showed an inhibition of 44.13 ± 0.152% at 24 h, which was quite significant, butinhibition drastically decreased to only 7.43 ± 0.057% and 4.3 ± 0.1% at 48 h and 72 h respectively. Inthe case of DL (1 µg/mL), inhibition was 55.66 ± 0.115%, 45.43 ± 0.152% and 37.73 ± 0.057% at 24 h, 48 hand 72 h, respectively. This indicates towards the somewhat sustained release of dacarbazine from DL,as the decrease in performance was not as steep as DS. In the DEL (1 µg/mL) treated group, there wasa remarkable migration inhibition of 116.96 ± 0.057%, 144.43 ± 0.115% and 139.13 ± 0.152% at threedifferent time points. Here comes the role of eugenol, which has contributed significantly in inhibitingthe migrating ability of the cells. As we can see, the % inhibition has increased from 24 h to 48 h, andthen only slightly decreased at 72 h, this indicates towards the more sustained release of the drugs.In the DLC (0.1 µg/mL) treated group, inhibition was 93.13 ± 0.115%, 88.03 ± 0.57% and 76.7 ± 0.1%.Here, the action was sustained for 72 h, but not as much as in the case of DEL (inhibition has decreasedrather than increasing). This shows that Eugenol plays a more significant role (than HA coating) in

Pharmaceutics 2019, 11, 163 31 of 35
sustaining the release of dacarbazine. Inhibition in the cells treated with our final formulation DELC(0.1 µg/mL) was the highest; 116.86 ± 0.057%, 118.26 ± 0.115%, and 133.53 ± 0.0115%.
It should be noted here that DELC gave similar results as DEL at a concentration one-tenth of it.This indicates that surface coating has improved the performance of the formulation by around tentimes. Also, the inhibition continuously increased for 72 h, which implies most sustained action out ofall the formulations. It is because of the presence of both; the eugenol and the HA coating.
One interesting point to be noted here is that DLC has performed better than DEL (comparingresults of 0.1 µg/mL). This unexpected behavior can be attributed to the fact that EA.hy926 cellsoverexpress CD44 on the cell surface [44], and HA reportedly binds to EA.hy926 cells [45]. This musthave resulted in better uptake of DLC as compared to DEL, which does not have HA coating to bind toCD44 receptors.
3.11.4. Proliferation Assay
Cell proliferation is the rapid increase in the number and amount of cells. Cytotoxic anti-cancerdrugs kill cells that have a high basal level of proliferation and regeneration [46]. Thus, it is importantto assess the effect of eugenol in the enhancement of proliferation when added to dacarbazine. It isusually more effective to test the antiangiogenic potential of pharmaceutical formulations on cellswhich have a substantial rate of proliferation [47], and so EA.hy926 cells were employed for theproliferation assay also. The results are graphically represented in Figure 17, where % viability ofcells after treatment with different formulations is denoted. Concentrations tested were 0.01 µg/mL,0.1 µg/mL, 0.5 µg/mL, 1 µg/mL, 2.5 µg/mL, 5 µg/mL, and 10 µg/mL. DS at dacarbazine concentrationof 10 µg/mL reduced the viability of cells to 77.31 ± 0.47, while DL reduced it to 58.83 ± 0.610%.When eugenol was co-loaded with dacarbazine in the liposomes (DEL), the cell viability decreased to34.46 ± 0.643% at ten µg/mL. The viability of cells treated with DLC (10 µg/mL) was 27.08 ± 0.605%,which was a little less than DEL because of the same reason as stated above. Most interestingly,the coated liposomes of Dacarbazine and Eugenol (DELC) left only 6.14 ± 0.618% cells viable. Theanti-proliferative performance of DELC was much more significant than DS, which is the conventionalway of how the dacarbazine is administered.
Pharmaceutics 2018, 10, x FOR PEER REVIEW 36 of 39
Figure 17. Proliferation Assay in EA.hy926 cells.
4. Conclusions
Keeping the highly resistant and aggressive nature of melanoma in mind, dacarbazine- and eugenol-loaded liposomes were successfully developed for a combinatorial approach against melanoma. The QbD approach enabled us to synthesize the said anti-melanoma formulation with optimum parameters in the most logical manner. Applying this QbD approach at two levels further made the process easier to reproduce, and more cost-effective. Surface functionalization of the formulation made the entire therapy more targeted to spare normal body cells from unwanted toxicity. In-vitro characterization of the nanoliposomes ascertained the utility of the QbD application. This work is a good example and illustration of the successful application and value of the quality by design approach in the development of effective pharmaceutical nanoformulations.
The performance of the formulation as an anti-melanoma agent was assessed by cell line studies. Combining eugenol with dacarbazine resulted in much higher anti-melanoma activity of the formulation. This enhancement is supposed to be due to the inhibition of the anti-apoptotic protein surviving, which is overexpressed in the melanoma cells, and makes them resistant towards apoptosis. Including Eugenol resulted in a downregulation of survivin protein, consequent to which, dacarbazine could perform its function to its maximum potential. This resulted in significantly higher cytotoxicity, increased apoptosis, and much decreased migration and proliferation of the cancer cells. Thus, the combination of dacarbazine and eugenol holds the promise of overcoming the resistance of melanoma cells and any challenges of anti-melanoma therapies. In addition to increased apoptosis and cytotoxicity, this combination also promises to inhibit the metastatic potential of the melanoma.
Since this study has strongly indicated that survivin is inhibited in the presence of eugenol, the result of which is that dacarbazine could perform better, this opens up the scope of analyzing the survivin expression of the melanoma cells before and after treatment. Also, the efficacy of this novel approach can be tested in the in-vivo model to ascertain its applicability. Therefore, survivin expression studies and in-vivo studies can be future prospects to support the importance of the above-mentioned results and inferences.
Author Contributions: Conceptualization, H.M. and P.K.M.; Formal analysis, P.K.M.; Funding acquisition, H.M.; Investigation, H.M., A.M., K.B., N.G. (Namita Gupta), N.G. (Neha Gupta), K.V. and R.V.; Methodology,
Figure 17. Proliferation Assay in EA.hy926 cells.
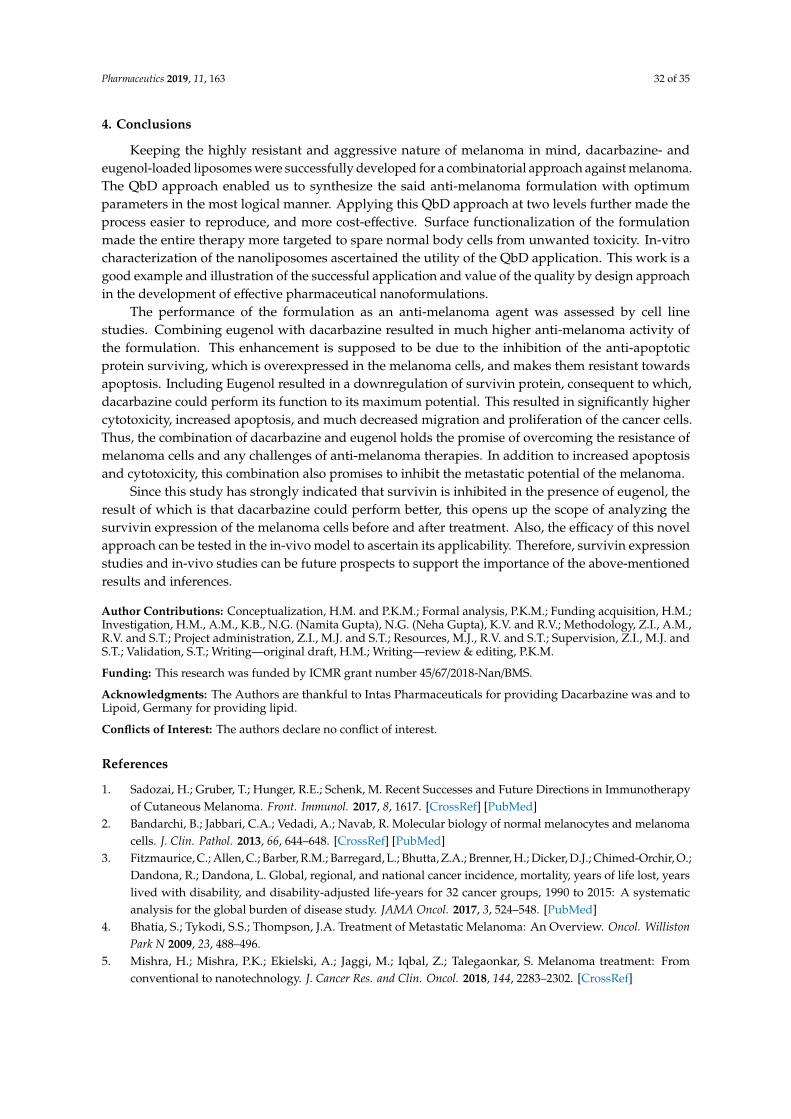
Pharmaceutics 2019, 11, 163 32 of 35
4. Conclusions
Keeping the highly resistant and aggressive nature of melanoma in mind, dacarbazine- andeugenol-loaded liposomes were successfully developed for a combinatorial approach against melanoma.The QbD approach enabled us to synthesize the said anti-melanoma formulation with optimumparameters in the most logical manner. Applying this QbD approach at two levels further made theprocess easier to reproduce, and more cost-effective. Surface functionalization of the formulationmade the entire therapy more targeted to spare normal body cells from unwanted toxicity. In-vitrocharacterization of the nanoliposomes ascertained the utility of the QbD application. This work is agood example and illustration of the successful application and value of the quality by design approachin the development of effective pharmaceutical nanoformulations.
The performance of the formulation as an anti-melanoma agent was assessed by cell linestudies. Combining eugenol with dacarbazine resulted in much higher anti-melanoma activity ofthe formulation. This enhancement is supposed to be due to the inhibition of the anti-apoptoticprotein surviving, which is overexpressed in the melanoma cells, and makes them resistant towardsapoptosis. Including Eugenol resulted in a downregulation of survivin protein, consequent to which,dacarbazine could perform its function to its maximum potential. This resulted in significantly highercytotoxicity, increased apoptosis, and much decreased migration and proliferation of the cancer cells.Thus, the combination of dacarbazine and eugenol holds the promise of overcoming the resistance ofmelanoma cells and any challenges of anti-melanoma therapies. In addition to increased apoptosisand cytotoxicity, this combination also promises to inhibit the metastatic potential of the melanoma.
Since this study has strongly indicated that survivin is inhibited in the presence of eugenol, theresult of which is that dacarbazine could perform better, this opens up the scope of analyzing thesurvivin expression of the melanoma cells before and after treatment. Also, the efficacy of this novelapproach can be tested in the in-vivo model to ascertain its applicability. Therefore, survivin expressionstudies and in-vivo studies can be future prospects to support the importance of the above-mentionedresults and inferences.
Author Contributions: Conceptualization, H.M. and P.K.M.; Formal analysis, P.K.M.; Funding acquisition, H.M.;Investigation, H.M., A.M., K.B., N.G. (Namita Gupta), N.G. (Neha Gupta), K.V. and R.V.; Methodology, Z.I., A.M.,R.V. and S.T.; Project administration, Z.I., M.J. and S.T.; Resources, M.J., R.V. and S.T.; Supervision, Z.I., M.J. andS.T.; Validation, S.T.; Writing—original draft, H.M.; Writing—review & editing, P.K.M.
Funding: This research was funded by ICMR grant number 45/67/2018-Nan/BMS.
Acknowledgments: The Authors are thankful to Intas Pharmaceuticals for providing Dacarbazine was and toLipoid, Germany for providing lipid.
Conflicts of Interest: The authors declare no conflict of interest.
References
1. Sadozai, H.; Gruber, T.; Hunger, R.E.; Schenk, M. Recent Successes and Future Directions in Immunotherapyof Cutaneous Melanoma. Front. Immunol. 2017, 8, 1617. [CrossRef] [PubMed]
2. Bandarchi, B.; Jabbari, C.A.; Vedadi, A.; Navab, R. Molecular biology of normal melanocytes and melanomacells. J. Clin. Pathol. 2013, 66, 644–648. [CrossRef] [PubMed]
3. Fitzmaurice, C.; Allen, C.; Barber, R.M.; Barregard, L.; Bhutta, Z.A.; Brenner, H.; Dicker, D.J.; Chimed-Orchir, O.;Dandona, R.; Dandona, L. Global, regional, and national cancer incidence, mortality, years of life lost, yearslived with disability, and disability-adjusted life-years for 32 cancer groups, 1990 to 2015: A systematicanalysis for the global burden of disease study. JAMA Oncol. 2017, 3, 524–548. [PubMed]
4. Bhatia, S.; Tykodi, S.S.; Thompson, J.A. Treatment of Metastatic Melanoma: An Overview. Oncol. WillistonPark N 2009, 23, 488–496.
5. Mishra, H.; Mishra, P.K.; Ekielski, A.; Jaggi, M.; Iqbal, Z.; Talegaonkar, S. Melanoma treatment: Fromconventional to nanotechnology. J. Cancer Res. and Clin. Oncol. 2018, 144, 2283–2302. [CrossRef]
Pharmaceutics 2019, 11, 163 33 of 35
6. Mishra, H.; Mishra, P.K.; Ekielski, A.; Iqbal, Z.; Jaggi, M.; Talegaonkar, S. Functionalized nanoliposomesloaded with anti survivin and anti angiogenic agents to enhance the activity of chemotherapy againstmelanoma by 4-pronged action. Med. Hypotheses 2018, 116, 141–146. [CrossRef] [PubMed]
7. Kesharwani, S.S.; Kaur, S.; Tummala, H.; Sangamwar, A.T. Overcoming multiple drug resistance in cancerusing polymeric micelles. Expert Opin. Drug Deliv. 2018, 15, 1127–1142. [CrossRef]
8. Kesharwani, S.S.; Kaur, S.; Tummala, H.; Sangamwar, A.T. Multifunctional approaches utilizing polymericmicelles to circumvent multidrug resistant tumors. Colloids Surf. B Biointerfaces 2019, 173, 581–590. [CrossRef]
9. Grossman, D.; McNiff, J.M.; Li, F.; Altieri, D.C. Expression and targeting of the apoptosis inhibitor, survivin,in human melanoma. J. Investig. Dermatol. 1999, 113, 1076–1081. [CrossRef]
10. Helmbach, H.; Rossmann, E.; Kern, M.A.; Schadendorf, D. Drug-resistance in human melanoma. Int. J.Cancer 2001, 93, 617–622. [CrossRef]
11. Fernández, J.G.; Rodríguez, D.A.; Valenzuela, M.; Calderon, C.; Urzúa, U.; Munroe, D.; Rosas, C.; Lemus, D.;Díaz, N.; Wright, M.C. Survivin expression promotes VEGF-induced tumor angiogenesis via PI3K/Aktenhanced β-catenin/Tcf-Lef dependent transcription. Mol. Cancer 2014, 13, 209. [CrossRef]
12. Yamanaka, K.; Nakahara, T.; Yamauchi, T.; Kita, A.; Takeuchi, M.; Kiyonaga, F.; Kaneko, N.; Sasamata, M.Antitumor activity of YM155, a selective small-molecule survivin suppressant, alone and in combinationwith docetaxel in human malignant melanoma models. Clin. Cancer Res. 2011, 17, 5423–5431. [CrossRef][PubMed]
13. Ma, W.-H.; Liu, Y.-C.; Xue, M.-L.; Zheng, Z.; Ge, Y.-L. Downregulation of survivin expression exertsantitumoral effects on mouse breast cancer cells in vitro and in vivo. Oncol. Lett. 2016, 11, 159–167.[CrossRef]
14. Zhang, M.; Sun, Y.-F.; Luo, S. Ani-survivin DNAzymes inhibit cell proliferation and migration in BreastCancer Cell Line MCF-7. Asian Pac. J. Cancer Prev. 2012, 13, 6233–6237. [CrossRef]
15. Al-Sharif, I.; Remmal, A.; Aboussekhra, A. Eugenol triggers apoptosis in breast cancer cells throughE2F1/survivin down-regulation. BMC Cancer 2013, 13, 600. [CrossRef] [PubMed]
16. Slamenová, D.; Horváthová, E.; Wsólová, L.; Šramková, M.; Navarová, J. Investigation of anti-oxidative,cytotoxic, DNA-damaging and DNA-protective effects of plant volatiles eugenol and borneol inhuman-derived HepG2, Caco-2 and VH10 cell lines. Mutat. Res. Toxicol. Environ. Mutagen. 2009,677, 46–52. [CrossRef] [PubMed]
17. Carrasco, A.H.; Espinoza, C.L.; Cardile, V.; Gallardo, C.; Cardona, W.; Lombardo, L.; Catalán, M.K.;Cuellar, F.M.; Russo, A. Eugenol and its synthetic analogues inhibit cell growth of human cancer cells (Part I).J. Braz. Chem. Soc. 2008, 19, 543–548. [CrossRef]
18. Mitra, A.K.; Agrahari, V.; Mandal, A.; Cholkar, K.; Natarajan, C.; Shah, S.; Joseph, M.; Trinh, H.M.; Vaishya, R.;Yang, X.; et al. NOVEL DELIVERY APPROACHES FOR CANCER THERAPEUTICS. J. Control. Release Off. J.Control. Release Soc. 2015, 219, 248–268. [CrossRef]
19. Wickens, J.M.; Alsaab, H.O.; Kesharwani, P.; Bhise, K.; Amin, M.C.I.M.; Tekade, R.K.; Gupta, U.; Iyer, A.K.Recent advances in hyaluronic acid-decorated nanocarriers for targeted cancer therapy. Drug Discov. Today2017, 22, 665–680. [CrossRef]
20. Wang, Y.; Yang, F.; Zhang, H.-X.; Zi, X.-Y.; Pan, X.-H.; Chen, F.; Luo, W.-D.; Li, J.-X.; Zhu, H.-Y.; Hu, Y.-P.Cuprous oxide nanoparticles inhibit the growth and metastasis of melanoma by targeting mitochondria. CellDeath Dis. 2013, 4, e783. [CrossRef]
21. Camerin, M.; Moreno, M.; Marín, M.J.; Schofield, C.L.; Chambrier, I.; Cook, M.J.; Coppellotti, O.; Jori, G.;Russell, D.A. Delivery of a hydrophobic phthalocyanine photosensitizer using PEGylated gold nanoparticleconjugates for the in vivo photodynamic therapy of amelanotic melanoma. Photochem. Photobiol. Sci. 2016,15, 618–625. [CrossRef]
22. Deng, C.; Zhang, Q.; Fu, Y.; Sun, X.; Gong, T.; Zhang, Z. Coadministration of Oligomeric HyaluronicAcid-Modified Liposomes with Tumor-Penetrating Peptide-iRGD Enhances the Antitumor Efficacy ofDoxorubicin against Melanoma. ACS Appl. Mater. Interfaces 2017, 9, 1280–1292. [CrossRef] [PubMed]
23. Yu, L.X. Pharmaceutical Quality by Design: Product and Process Development, Understanding, and Control.Pharm. Res. 2008, 25, 781–791. [CrossRef] [PubMed]
Pharmaceutics 2019, 11, 163 34 of 35
24. Xu, X.; Khan, M.A.; Burgess, D.J. A quality by design (QbD) case study on liposomes containing hydrophilicAPI: I. Formulation, processing design and risk assessment. Int. J. Pharm. 2011, 419, 52–59. [CrossRef][PubMed]
25. Senbanjo, L.T.; Chellaiah, M.A. CD44: A Multifunctional Cell Surface Adhesion Receptor Is a Regulator ofProgression and Metastasis of Cancer Cells. Front. Cell Dev. Biol. 2017, 5, 18. [CrossRef] [PubMed]
26. Sebaaly, C.; Jraij, A.; Fessi, H.; Charcosset, C.; Greige-Gerges, H. Preparation and characterization of cloveessential oil-loaded liposomes. Food Chem. 2015, 178, 52–62. [CrossRef]
27. Kumar, S.; Ali, J.; Baboota, S. Design Expert ® supported optimization and predictive analysis of selegilinenanoemulsion via the olfactory region with enhanced behavioural performance in Parkinson’s disease.Nanotechnology 2016, 27, 435101. [CrossRef]
28. Negi, L.M.; Jaggi, M.; Joshi, V.; Ronodip, K.; Talegaonkar, S. Hyaluronan coated liposomes as the intravenousplatform for delivery of imatinib mesylate in MDR colon cancer. Int. J. Biol. Macromol. 2015, 73, 222–235.[CrossRef]
29. Muley, P.; Kumar, S.; El Kourati, F.; Kesharwani, S.S.; Tummala, H. Hydrophobically modified inulin as anamphiphilic carbohydrate polymer for micellar delivery of paclitaxel for intravenous route. Int. J. Pharm.2016, 500, 32–41. [CrossRef]
30. Kumar, S.; Kesharwani, S.S.; Mathur, H.; Tyagi, M.; Bhat, G.J.; Tummala, H. Molecular complexation ofcurcumin with pH sensitive cationic copolymer enhances the aqueous solubility, stability and bioavailabilityof curcumin. Eur. J. Pharm. Sci. 2016, 82, 86–96. [CrossRef]
31. Sharma, H.; Kumar, K.; Choudhary, C.; Mishra, P.K.; Vaidya, B. Development and characterization of metaloxide nanoparticles for the delivery of anticancer drug. Artif. Cells Nanomed. Biotechnol. 2016, 44, 672–679.[CrossRef] [PubMed]
32. Jaafar-Maalej, C.; Diab, R.; Andrieu, V.; Elaissari, A.; Fessi, H. Ethanol injection method for hydrophilic andlipophilic drug-loaded liposome preparation. J. Liposome Res. 2010, 20, 228–243. [CrossRef]
33. Lasic, D.D. The mechanism of vesicle formation. Biochem. J. 1988, 256, 1–11. [CrossRef]34. Ghosh, R.; Nadiminty, N.; Fitzpatrick, J.E.; Alworth, W.L.; Slaga, T.J.; Kumar, A.P. Eugenol causes melanoma
growth suppression through inhibition of E2F1 transcriptional activity. J. Biol. Chem. 2005, 280, 5812–5819.[CrossRef] [PubMed]
35. Chen, Y.; Kramer, D.L.; Li, F.; Porter, C.W. Loss of inhibitor of apoptosis proteins as a determinant of polyamineanalog-induced apoptosis in human melanoma cells. Oncogene 2003, 22, 4964. [CrossRef] [PubMed]
36. Mummert, M.E.; Mummert, D.I.; Ellinger, L.; Takashima, A. Functional Roles of Hyaluronan in B16-F10Melanoma Growth and Experimental Metastasis in Mice1. Mol. Cancer Ther. 2003, 2, 295–300. [PubMed]
37. Prieto, V.G.; Sadick, N.S.; Shea, C.R. Androgenetic Alopecia: Analysis of Proliferation and Apoptosis. Arch.Dermatol. 2002, 138, 1101–1102. [CrossRef]
38. Shibuya, H.; Kato, Y.; Saito, M.; Isobe, T.; Tsuboi, R.; Koga, M.; Toyota, H.; Mizuguchi, J. Induction ofapoptosis and/or necrosis following exposure to antitumour agents in a melanoma cell line, probably throughmodulation of Bcl-2 family proteins. Melanoma Res. 2003, 13, 457–464. [CrossRef]
39. Sanada, M.; Hidaka, M.; Takagi, Y.; Takano, T.Y.; Nakatsu, Y.; Tsuzuki, T.; Sekiguchi, M. Modes of actions oftwo types of anti-neoplastic drugs, dacarbazine and ACNU, to induce apoptosis. Carcinogenesis 2007, 28,2657–2663. [CrossRef]
40. Feng, T.; Yu, H.; Xia, Q.; Ma, Y.; Yin, H.; Shen, Y.; Liu, X. Cross-talk mechanism between endothelial cells andhepatocellular carcinoma cells via growth factors and integrin pathway promotes tumor angiogenesis andcell migration. Oncotarget 2017, 8, 69577–69593. [CrossRef]
41. McKenzie, J.A.; Liu, T.; Goodson, A.; Grossman, D. Survivin enhances motility of melanoma cells bysupporting Akt activation and α5 integrin upregulation. Cancer Res. 2010, 70, 7927–7937. [CrossRef][PubMed]
42. Tas, F. Metastatic Behavior in Melanoma: Timing, Pattern, Survival, and Influencing Factors. Availableonline: https://www.hindawi.com/journals/jo/2012/647684/ (accessed on 27 September 2018).
43. Expression of Integrins and Adhesive Properties of Human Endothelial Cell Line EA.hy 926. Availableonline: http://cgp.iiarjournals.org/content/2/5/265.abstract (accessed on 12 September 2018).

Pharmaceutics 2019, 11, 163 35 of 35
44. El-Dakdouki, M.H.; El-Boubbou, K.; Kamat, M.; Huang, R.; Abela, G.S.; Kiupel, M.; Zhu, D.C.; Huang, X.CD44 Targeting Magnetic Glyconanoparticles for Atherosclerotic Plaque Imaging. Pharm. Res. 2014, 31, 1426.[CrossRef] [PubMed]
45. Alam, C.; Seed, M.; Freemantle, C.; Brown, J.; Perretti, M.; Carrier, M.; Divwedi, A.; West, D.; Gustafson, S.;Colville-Nash, P. The inhibition of neutrophil-endothelial cell adhesion by hyaluronan independent of CD44.Inflammopharmacology 2005, 12, 535–550. [CrossRef] [PubMed]
46. Feitelson, M.A.; Arzumanyan, A.; Kulathinal, R.J.; Blain, S.W.; Holcombe, R.F.; Mahajna, J.; Marino, M.;Martinez-Chantar, M.L.; Nawroth, R.; Sanchez-Garcia, I.; et al. Sustained proliferation in cancer: Mechanismsand novel therapeutic targets. Semin. Cancer Biol. 2015, 35, S25–S54. [CrossRef]
47. Adair, T.H.; Montani, J.-P. Angiogenesis Assays; Morgan & Claypool Life Sciences: San Rafael, CA, USA, 2010.
© 2019 by the authors. Licensee MDPI, Basel, Switzerland. This article is an open accessarticle distributed under the terms and conditions of the Creative Commons Attribution(CC BY) license (http://creativecommons.org/licenses/by/4.0/).
Copyright © 2022 FDOKUMEN