Density functional theory study of vibrational spectra, and assignment of fundamental modes of...
11
Density-functional theory study of vibrational relaxation of CO stretching excitation on Si„100… Sung Sakong, 1,a Peter Kratzer, 1 Xu Han, 2 Kristian Laß, 2 Oliver Weingart, 2 and Eckart Hasselbrink 2 1 Fachbereich Physik, Universität Duisburg-Essen, Lotharstraße 1, 47048 Duisburg, Germany 2 Fachbereich Chemie, Universität Duisburg-Essen, Universitätstraße 5, 45117 Essen, Germany Received 15 May 2008; accepted 9 September 2008; published online 4 November 2008 A first-principles theory is presented for calculating the lifetime of adsorbate vibrations on semiconductor or insulator surfaces, where dissipation of the vibrational energy to substrate phonons is the dominant relaxation mechanism. As an example, we study the stretching vibration of CO/Si100, where a lifetime of 2.3 ns has been measured recently K. Laß, X. Han, and E. Hasselbrink, J. Chem. Phys. 123, 051102 2005. Density-functional theory DFT calculations for the local modes of the adsorbate, including their anharmonic coupling, are combined with force field calculations for the substrate phonons. Using the DFT–Perdew–Burke–Ernzerhof functional, we have determined the most stable adsorption site for CO on top of the lower Si atom of the Si surface dimer, the local normal modes of CO, and the multidimensional potential energy surface for the CO vibrations. The anharmonic stretching frequency of adsorbed CO obtained in DFT-PBE is 5% lower than the experimental value, while the B3LYP functional reproduces the CO stretching frequency with only 1.4% error. The coupling between the anharmonic vibrational modes and the phonon continuum is evaluated within first-order perturbation theory, and transition rates for the CO vibrational relaxation are calculated using Fermi’s golden rule. The lifetime of 0.5 ns obtained with DFT-PBE is in qualitative agreement with experiment, while using vibrational frequencies from the B3LYP functional gives a much too long lifetime as compared to experiment. We find that the numerical value of the lifetime is very sensitive to the harmonic frequencies used as input to the calculation of the transition rate. An empirical adjustment of these frequencies yields excellent agreement between our theory and experiment. From these calculations we conclude that the most probable microscopic decay channel of the CO stretching mode is into four lateral shift/bending quanta and one phonon. © 2008 American Institute of Physics. DOI: 10.1063/1.2993254 I. INTRODUCTION Since the advent of lasers in surface chemistry, the chal- lenge to initiate nonthermal chemical reactions driven by the energy of intense infrared IR laser irradiation has stimu- lated research in this field. 1 Recent examples are the nonther- mal desorption of hydrogen from a silicon surface following intense IR irradiation, 2 or the nonthermal oxidation of CO on a ruthenium surface triggered by IR laser pulses. 3 With the help of lasers, the possibility of mode-selective control of surface chemical reactions appears within reach. 4 It is crucial to understand the dissipation of energy from the quantized modes of adsorbates to the continuum of sur- face excitations in order to know for how long the energy pumped into an adsorbate vibrational mode by the laser is available for reaction. Apart from being motivated by appli- cations to “hot chemistry,” understanding the damping of adsorbate vibrations is also a subject of fundamental interest since it epitomizes the intricacies of dissipation in open quantum systems. Much has been learned about adsorbate vibrations by applying spectroscopic techniques. One of the best-studied systems is CO adsorbed on metal surfaces. The predominant dissipation channel, excitation of electron hole pairs, gives rise to a rather short lifetime of several picoseconds. 5–10 Even so, CO on metals has become a model system to inves- tigate quantum dynamics. Experiments using coherent tran- sient spectroscopy 11 have been performed, and the CO/Ru system has been used to illustrate the concept of optimal control in surface reactions. 12 In contrast to metals, the vi- brational lifetime of CO adsorbed on an insulator NaCl is much longer, at least several milliseconds. 13,14 This can be rationalized by the fact that electron-hole pair excitations are not possible at the NaCl surface, the energy quantum of the CO vibration being much smaller than the band gap. Hence, on insulators, the much weaker coupling of adsorbate vibra- tions to substrate phonons is the only remaining dissipation channel. Note that the energy transfer between the adsorbate and the substrate must proceed by entire vibrational energy quanta; hence several phonons need to be created simulta- neously to take up the energy of one CO stretch quantum. This multiple excitation process is highly unlikely. In the language of perturbation theory, it is a process of very high order. Consequently, due to the limited number of relaxation channels compatible with energy quantization, the CO stretch vibration is very long lived on insulators. Interestingly, the lifetime of the CO stretch mode on a Electronic mail: [email protected]. THE JOURNAL OF CHEMICAL PHYSICS 129, 174702 2008 0021-9606/2008/12917/174702/11/$23.00 © 2008 American Institute of Physics 129, 174702-1 Downloaded 05 Nov 2008 to 132.252.243.7. Redistribution subject to ASCE license or copyright; see http://jcp.aip.org/jcp/copyright.jsp
-
Upload
stpetersuniversity -
Category
Documents
-
view
0 -
download
0
Transcript of Density functional theory study of vibrational spectra, and assignment of fundamental modes of...
Density-functional theory study of vibrational relaxation of CO stretchingexcitation on Si„100…
Sung Sakong,1,a� Peter Kratzer,1 Xu Han,2 Kristian Laß,2 Oliver Weingart,2 andEckart Hasselbrink2
1Fachbereich Physik, Universität Duisburg-Essen, Lotharstraße 1, 47048 Duisburg, Germany2Fachbereich Chemie, Universität Duisburg-Essen, Universitätstraße 5, 45117 Essen, Germany
�Received 15 May 2008; accepted 9 September 2008; published online 4 November 2008�
A first-principles theory is presented for calculating the lifetime of adsorbate vibrations onsemiconductor or insulator surfaces, where dissipation of the vibrational energy to substratephonons is the dominant relaxation mechanism. As an example, we study the stretching vibration ofCO/Si�100�, where a lifetime of 2.3 ns has been measured recently �K. Laß, X. Han, and E.Hasselbrink, J. Chem. Phys. 123, 051102 �2005��. Density-functional theory �DFT� calculations forthe local modes of the adsorbate, including their anharmonic coupling, are combined with force fieldcalculations for the substrate phonons. Using the DFT–Perdew–Burke–Ernzerhof functional, wehave determined the most stable adsorption site for CO on top of the lower Si atom of the Si surfacedimer, the local normal modes of CO, and the multidimensional potential energy surface for the COvibrations. The anharmonic stretching frequency of adsorbed CO obtained in DFT-PBE is 5% lowerthan the experimental value, while the B3LYP functional reproduces the CO stretching frequencywith only 1.4% error. The coupling between the anharmonic vibrational modes and the phononcontinuum is evaluated within first-order perturbation theory, and transition rates for the COvibrational relaxation are calculated using Fermi’s golden rule. The lifetime of 0.5 ns obtained withDFT-PBE is in qualitative agreement with experiment, while using vibrational frequencies from theB3LYP functional gives a much too long lifetime as compared to experiment. We find that thenumerical value of the lifetime is very sensitive to the harmonic frequencies used as input to thecalculation of the transition rate. An empirical adjustment of these frequencies yields excellentagreement between our theory and experiment. From these calculations we conclude that the mostprobable microscopic decay channel of the CO stretching mode is into four lateral shift/bendingquanta and one phonon. © 2008 American Institute of Physics. �DOI: 10.1063/1.2993254�
I. INTRODUCTION
Since the advent of lasers in surface chemistry, the chal-lenge to initiate nonthermal chemical reactions driven by theenergy of intense infrared �IR� laser irradiation has stimu-lated research in this field.1 Recent examples are the nonther-mal desorption of hydrogen from a silicon surface followingintense IR irradiation,2 or the nonthermal oxidation of CO ona ruthenium surface triggered by IR laser pulses.3 With thehelp of lasers, the possibility of mode-selective control ofsurface chemical reactions appears within reach.4
It is crucial to understand the dissipation of energy fromthe quantized modes of adsorbates to the continuum of sur-face excitations in order to know for how long the energypumped into an adsorbate vibrational mode by the laser isavailable for reaction. Apart from being motivated by appli-cations to “hot chemistry,” understanding the damping ofadsorbate vibrations is also a subject of fundamental interestsince it epitomizes the intricacies of dissipation in openquantum systems.
Much has been learned about adsorbate vibrations byapplying spectroscopic techniques. One of the best-studiedsystems is CO adsorbed on metal surfaces. The predominant
dissipation channel, excitation of electron hole pairs, givesrise to a rather short lifetime of several picoseconds.5–10
Even so, CO on metals has become a model system to inves-tigate quantum dynamics. Experiments using coherent tran-sient spectroscopy11 have been performed, and the CO/Rusystem has been used to illustrate the concept of optimalcontrol in surface reactions.12 In contrast to metals, the vi-brational lifetime of CO adsorbed on an insulator �NaCl� ismuch longer, at least several milliseconds.13,14 This can berationalized by the fact that electron-hole pair excitations arenot possible at the NaCl surface, the energy quantum of theCO vibration being much smaller than the band gap. Hence,on insulators, the much weaker coupling of adsorbate vibra-tions to substrate phonons is the only remaining dissipationchannel. Note that the energy transfer between the adsorbateand the substrate must proceed by entire vibrational energyquanta; hence several phonons need to be created simulta-neously to take up the energy of one CO stretch quantum.This multiple excitation process is highly unlikely. �In thelanguage of perturbation theory, it is a process of very highorder.� Consequently, due to the limited number of relaxationchannels compatible with energy quantization, the COstretch vibration is very long lived on insulators.
Interestingly, the lifetime of the CO stretch mode ona�Electronic mail: [email protected].
THE JOURNAL OF CHEMICAL PHYSICS 129, 174702 �2008�
0021-9606/2008/129�17�/174702/11/$23.00 © 2008 American Institute of Physics129, 174702-1
Downloaded 05 Nov 2008 to 132.252.243.7. Redistribution subject to ASCE license or copyright; see http://jcp.aip.org/jcp/copyright.jsp
Si�100� has been measured recently to be 2.3 ns using time-resolved sum frequency generation,15,16 i.e., it lies betweenthe values for metals and insulators. The same value hasbeen found for the isotopologue 13CO. On the Si surface, thedissipation process of vibrational energy is expected to besimilar to insulators: The vibrational quanta decay intophonons, since the CO stretch quantum �0.25 eV� is smallerthan the surface band gap of Si�100� �1.1 eV�, and thus noelectron-hole pair excitation is possible. In spite of the samedissipation mechanism, the vibrational relaxation of CO isconsiderably faster on the semiconductor surface comparedto the insulator surface. It has been speculated that this couldbe due to the additional localized modes of adsorbed CO�hindered translations and rotations� that arise due to the co-valent character of the CO–Si bonding. These quantizedmodes could take up sizable amounts of energy, with theeffect that only a single phonon is required to balance theenergy of the CO stretch quantum. Therefore, a microscopicstudy for the vibrational relaxation is desirable to elucidatethe underlying physical processes in detail. In particular, atreatment of the vibrational coupling between various localmodes at the CO adsorbate, going beyond normal modeanalysis, is mandatory.
In the present paper, we devise a first-prinicples ap-proach to calculate the adsorbate vibrational lifetime. Whilequantum dissipation, at least in principle, requires an opensystem with inifinitely many degrees of freedom, few de-grees of freedom, namely the local modes of the adsorbate,govern the overall rate of energy decay of CO/Si�100� intothe phonon system. These relevant degrees of freedom areidentified by means of total-energy calculations usingdensity-functional theory �DFT� for a finite system in a slabgeometry. Since electronic excitations could be ruled outexperimentally,16 DFT is suitable for the problem at hand, asthe system is always in its electronic ground state. The cou-pling of the local modes to the phonon modes is describedusing a model Hamiltonian whose parameters are determinedfrom the DFT calculations. To be specific, let us consider thevibrational Hamiltonian of a C atom, an O atom, and Msubstrate atoms.
H = �i=1
3�M+2�
−�2
2mi
�2
�xi2 + V�x1,x2, . . . x3�M+2�� . �1�
The xi are the Cartesian coordinates of the atoms moving onthe adiabatic Born–Oppenheimer surface V, which is �inprinciple� accessible through DFT calculations. We trans-form this problem to a normal mode representation, therebyintroducing a system-bath decomposition.17
H = Ha��/�qj,qj� + Hph��/�Qi,Qi� + H��qj,Qi� . �2�
Here, Ha is the system Hamiltonian depending on the qj, theharmonic amplitudes of local vibrations, where j=1, . . . ,N.These are related to small displacements of the adsorbate andpossibly few substrate atoms to which it is bonded. The num-ber of local modes N, to be treated at a high level of accu-racy, must be selected for each system according to physicalconsiderations. The Qi are normal mode coordinates of thephonon system.
In the present case, we are treating an elemental solid,silicon, i.e., all substrate atoms have the same mass mi
=MSi. For studying the energy dissipation to phonons, it issufficient to treat the phonon system in the harmonic ap-
proximation, i.e., Hph is of the form
Hph = �i=N+1
3�M+2�
−�2
2MSi
�2
�Qi2 +
1
2MSi�i
2Qi2. �3�
Here, �i are the frequencies of K=3M +6−N phonon modes.
For the system Hamiltonian Ha, it is essential to include
the full anharmonic couplings within the system. Ha has thegeneral form
Ha = �i=1
N
Tj + v�q1,q2, . . . qN� , �4�
with Tj being the kinetic energy operator of mode j. v issome potential expressed in the coordinate system defined bythe local harmonic modes qj. It is important to note that theeigenmodes of Ha will in general be different from simpleharmonic oscillations in qj, and we refer to these generaleigenmodes as the full normal modes. The yet unknown po-tential v contains all the information about the anharmoniccoupling between the system modes that is crucial to calcu-late the vibrational lifetime. In the present paper, we willdemonstrate how v and thus the lifetime can be calculatedwith the help of first-principles calculations.
The coupling between the local modes and the phononsis assumed to be weak �else if a phonon couples strongly tothe system, it should be treated as a system degree of free-dom�, and hence this coupling will be treated in time-dependent perturbation theory. In the present paper, we willrestrict ourselves to the first order. For the system CO/Si�001�, this is sufficient since it is always possible to satisfyenergy conservation in the decay of the stretch quantum byproducing several local quanta plus one phonon. In this case,
we may truncate the power series expansion of H� after theleading term in Qi,
H� = �i=N+1
3�M+2�
�i�q1,q2, . . . ,qN�Qi, �5�
since the higher order terms become systematically smallerwithin the criteria of weak vibration-phonon coupling.
Again, the coupling constants �i entering into H� are acces-sible to first-prinicples calculations.
For the specific system of interest, CO/Si�001�, the localbending and shift modes have quantized energies thatamount to about one quarter of the CO stretch quantum.Hence, the CO stretch mode will preferably decay into threeor four shift or bending quanta, thereby creating or annihi-lating one substrate phonon as required by energy conserva-tion. Our goal is to calculate the rate constants for all ener-getically allowed decay channels from first principles, and toidentify the most efficient energy relaxation scheme. Thestructure of this paper is as follows. First, we identify themost stable adsorption site for CO on the Si�100� surface bymeans of DFT calculations. Second, we perform a harmonic
174702-2 Sakong et al. J. Chem. Phys. 129, 174702 �2008�
Downloaded 05 Nov 2008 to 132.252.243.7. Redistribution subject to ASCE license or copyright; see http://jcp.aip.org/jcp/copyright.jsp
mode analysis and identify the modes with highest amplitudeat the C and O atoms. Then, a multidimensional potentialenergy surface �PES� is mapped out for the coordinates be-longing to these modes. After parametrizing this PES, we arein position to calculate the full normal modes and to expandthe associated oscillator wave functions in the basis set de-fined by the harmonic modes. Furthermore, harmonic pho-non eigenvectors are calculated from a slab model of the Sisubstrate using an empirical force field. Combining thisknowledge with the PES data enables us to calculate thesystem-bath coupling term in the Hamiltonian. Finally, ratesfor the transitions between the full normal modes mediatedby emission or absorption of one phonon are calculated usingFermi’s golden rule. In this way, we obtain a parameter-freeexpression for the lifetime of the CO stretch mode that canbe compared to experiment.
II. THEORETICAL METHODS
A. Analytical
Our method for calculating the vibrational lifetimeclosely follows the theoretical framework for system-bathHamiltonians described by Andrianov and Saalfrank.17 Tolink this approach to DFT calculations, we need to makecontact to the Hessian analysis of normal modes in electronicstructure codes. Within the harmonic approximation, the PESis given by
V = V0 +1
2�ij� �2V
�xi � xj�
0xixj = V0 +
1
2�ij
xiDij
�mimj
xj
= V0 +1
2xDx . �6�
Here, we have introduced mass-weighted coordinates xi
=�mixi in addition to the Cartesian coordinates xi of the at-oms. It is numerically convenient to work with mass-
weighted normal modes qj by bringing D in Eq. �6� to diag-onal form,
�ODOT�ij = ��i�2��ij�2. �7�
The eigenvalues of the harmonic normal modes are denotedby � j
�2�, and the matrix O denotes an orthogonal transforma-tion, OT=O−1. The qj are related to the conventional normalmodes in Cartesian representation xi �that diagonalize thedynamical matrix D� by a linear transformation.18 Using thisstarting point, the full system Hamiltonian, Eq. �4�, can bebrought to the form
Ha = �j=1
N
−�� j
�2�
2�aj
† − aj�2 + �j1j2j3¯
Cj1j2j3¯�n=1
N
qnjn, �8�
qj =qj0
�2�aj
† + aj� . �9�
Here Cj1j2j3¯represent the coefficients in a polynomial ex-
pansion of v, qj0=�� / �m� j�2�� is the characteristic length of
the harmonic mode j, and m is the atomic mass unit. Ofcourse, the creation and annihilation operators satisfy the
commutation relations �ai , aj†�=�ij since the vibrational exci-
tations are bosonic. Next, the eigenvectors of the Hamil-tonian Ha are expanded in the basis of harmonic oscillatorfunctions j=� j�qj�,
n = �ijkl¯
nijkl¯i, j,k,l,¯ . �10�
The eigenvectors n are the full normal modes, i.e., solutionsof the anharmonic problem, expressed as a superposition ofthe harmonic modes with coefficients nijkl¯. There is onedominant coefficient indicating the harmonic mode closest tothe full normal mode. For notational convenience, we usethis leading contribution to specify the full normal mode inthe following.
The phonon bath, Eq. �3�, is described within the har-monic approximation by the Hamilton operator
Hph = �i
K
��i�Ai†Ai + 1/2� , �11�
obtained from Eq. �3� by the substitution of Qi= �Qi0 /�2���Ai
†+ Ai�. Here Qi0=�� /MSi�i is the phonon characteristiclength, and the phonon creation and annihilation operators
satisfy the commutation relation �Ai , Aj†�=�ij.
The coupling constant �i for phonon mode i in Eq. �5� isgiven by
�i�q�� =�V
�Qi. �12�
By chain rule, the �i can be expressed by
�i�q�� = �j=1
�v�qj
cji, �13�
cji � �k
�qj
�xk
�xk
�Qi= q� j · Q� i. �14�
In the last equality, the vector notation is used to denote theCartesian displacements of the substrate atoms associatedwith the modes qj and Qi, respectively.18 The cji represent thecoupling strength between vibrational mode j and phonon i.Then, the transition rate from the full normal mode m tomode n is calculated using Fermi’s golden rule,
�mn =
��
i
M
�n�im2Qi02 �Ai + Ai
†2��n − m − ��i� .
�15�
The downward and upward transitions are determined bythe selection rule of N�i
� =N�i�1,
�Ai + Ai†2 = �N�i
+ 1 downward
�N�i upward .
� �16�
The expectation value of phonon density N�iis defined by
the Bose–Einstein factor �N�i= �e��i/kBT−1�−1 at finite tem-
perature T. Thus, in the ground state �T=0 K� only down-ward transitions are possible. Finally, the lifetime of a mode
174702-3 Vibrational relaxation of CO stretching excitation on Si�100� J. Chem. Phys. 129, 174702 �2008�
Downloaded 05 Nov 2008 to 132.252.243.7. Redistribution subject to ASCE license or copyright; see http://jcp.aip.org/jcp/copyright.jsp
is calculated as the inverse of the sum of the rates for allpossible transitions,
�vib =1
�i=1�n,n−i
. �17�
B. Numerical
Electronic properties are calculated using periodic DFTcodes of the Vienna ab initio simulation package �VASP�.19
The electronic exchange and correlation are described withinthe generalized gradient approximation using the Perdew–Burke–Ernzerhof �PBE� functional.20 The ionic cores arerepresented by projector augmented wave potentials21 asconstructed by Kresse and Joubert.22 The electronic wavefunctions are expanded in a plane-wave basis with a cutoffenergy of 400 eV.
The Si substrates are modeled by slabs of ten layers thatare separated by 12 Å vacuum. The four uppermost Si layersare fully relaxed, and the dangling bonds at the lower surfaceof the slab are saturated with hydrogen atoms. Most resultsreported here have been obtained for c�4�2� and p�4�2�surface unit cells for which we have used Monkhorst–Packk-point sets of 4�4 and 2�4, respectively.
The vibrational frequencies are evaluated by a normalmode analysis. The Hessian matrix is constructed using afinite difference method for two different DFT calculations, aperiodic slab calculation with the PBE functional and a clus-ter calculation using the B3LYP functional, together with the6-31G�� Gaussian basis set.23 The calculated harmonic fre-quency of the C–O stretching mode in the gas phase is2123 cm−1 in PBE and 2210 cm−1 in B3LYP. These are insatisfactory agreement with the experimental value of2170 cm−1.24 The calculated anharmonicity of the gas-phaseCO stretch mode is 26 cm−1 in PBE, in good agreement withthe measured value of 27 cm−1.25
In the golden-rule expression for the transition rate, thephonon density of states �DOS� enters. Therefore we requirea highly resolved phonon DOS, as well as the phonon eigen-vectors for a Si surface. The phonon properties are obtainedfrom valence force field calculations using GULP �Ref. 26�with the Brenner27 bond order potential as parametrized byDyson and Smith.28 Phonon calculations for a c�4�2� slab
with 20 atomic layers are performed on a 4�4 Q-pointmesh. In total, K=3840 phonon modes are evaluated. Theslab is terminated by horizontal Si dimers at both surfaces.We note that the force field, in contrast to DFT, yields hori-zontal Si dimers as ground state.28 However, since we do notuse the positions of the Si atoms, but only their displacementvectors in the further calculations, the phonon modes ob-tained from the force field calculations can be considered asacceptable approximation to the true phonon modes.
III. RESULTS
A. Adsorption properties of CO on Si„100…:Ground state properties
We start our DFT study of the CO/Si�100� system byperforming DFT calculations on a clean Si�100� slab withvarious Si dimer configurations using a p�2�1�, p�2�2�, orc�4�2� unit cell. In the p�2�1� unit cell, Si dimers tilted inthe same direction and dimers parallel to the surface arecompared. In the p�2�2� and c�4�2� unit cells, the Sidimers are buckled alternately. The DFT calculations showthat the energetically most favorable dimer structures arep�2�2� and c�4�2� �the two being energetically degener-ated within the accuracy of our calculations�, in agreementwith previous DFT calculations.29 In the p�2�1� symmetry,the parallel dimer configuration is found to be energeticallyunstable, and the dimers tilted in the same direction are lessstable than alternately buckled dimers by 0.17 eV/dimer,again in agreement with previous work.29
The adsorption properties of CO on Si�100� are listed inTable I over various configurations of the Si dimers. Thelargest adsorption energy is found for CO on top of the lowerSi atom in the buckled dimer configurations, in agreementwith scanning tunnel microscope experiments.30 On alter-nately buckled dimer configurations, the adsorption energydecreases with increasing CO coverage. One possible reasonis the increased dipole interaction between CO molecules athigher coverage. However, when all Si dimers are assumedto be tilted in same direction, the adsorption energy is largestat the saturated coverage of CO=0.5.
We calculate the harmonic frequencies of CO on Si�100�by diagonalizing the Hessian matrix. Tests have been per-formed including different numbers of Si substrate atoms
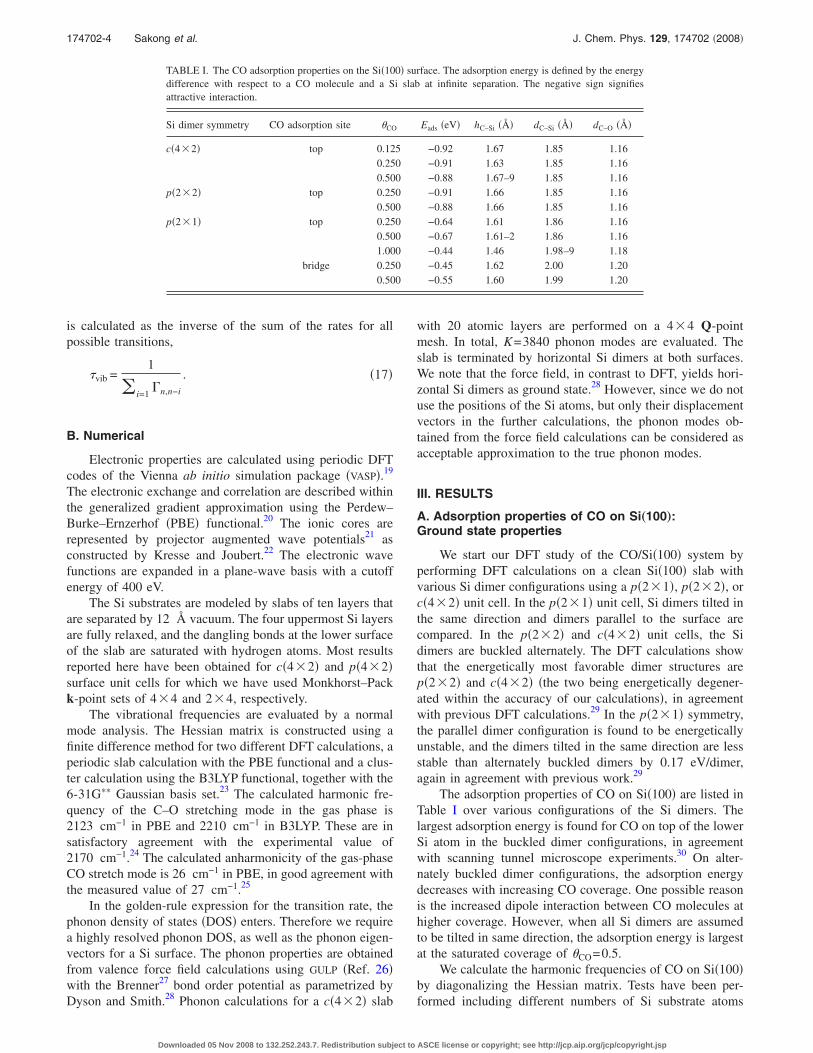
TABLE I. The CO adsorption properties on the Si�100� surface. The adsorption energy is defined by the energydifference with respect to a CO molecule and a Si slab at infinite separation. The negative sign signifiesattractive interaction.
Si dimer symmetry CO adsorption site CO Eads �eV� hC–Si �Å� dC–Si �Å� dC–O �Å�
c�4�2� top 0.125 −0.92 1.67 1.85 1.160.250 −0.91 1.63 1.85 1.160.500 −0.88 1.67–9 1.85 1.16
p�2�2� top 0.250 −0.91 1.66 1.85 1.160.500 −0.88 1.66 1.85 1.16
p�2�1� top 0.250 −0.64 1.61 1.86 1.160.500 −0.67 1.61–2 1.86 1.161.000 −0.44 1.46 1.98–9 1.18
bridge 0.250 −0.45 1.62 2.00 1.200.500 −0.55 1.60 1.99 1.20
174702-4 Sakong et al. J. Chem. Phys. 129, 174702 �2008�
Downloaded 05 Nov 2008 to 132.252.243.7. Redistribution subject to ASCE license or copyright; see http://jcp.aip.org/jcp/copyright.jsp
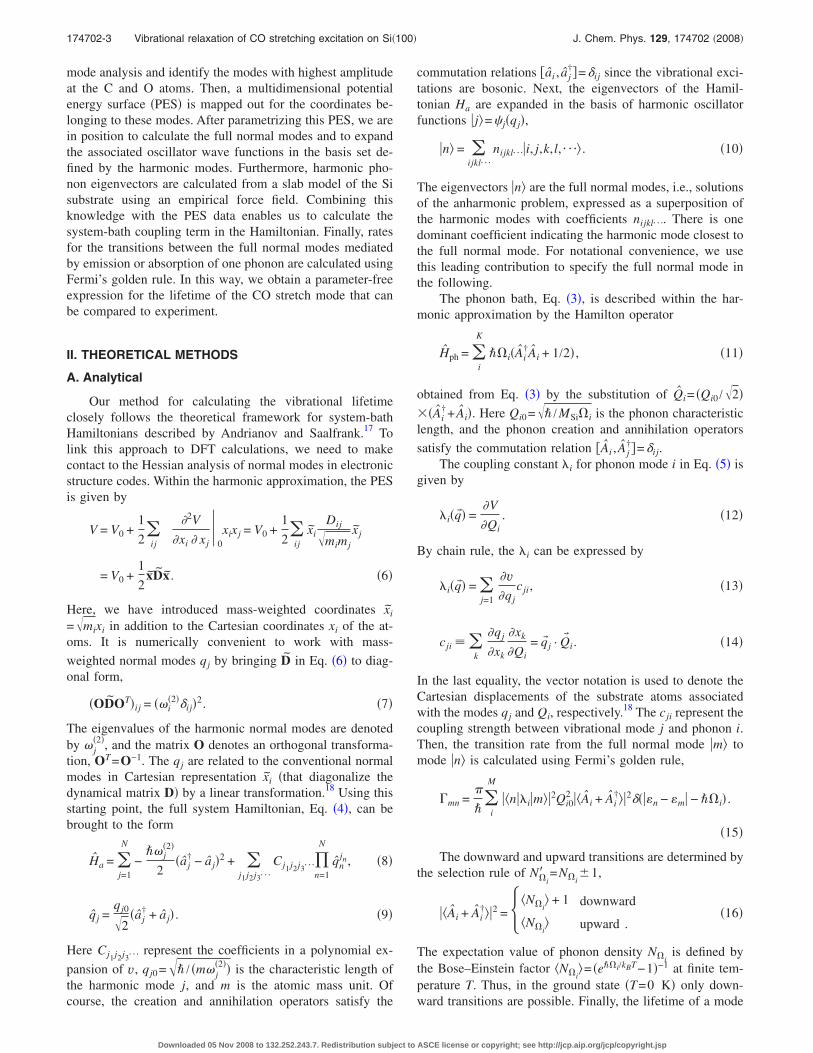
into the Hessian analysis: only the Si atom bonding to theCO, one Si dimer, or all eight Si atoms in the two topmostlayers of the p�2�2� unit cell. We find that the hinderedtranslations parallel to the surface correspond to low-lyingmodes ��50 cm−1�. Since their quanta are very small, thesemodes are not relevant for the relaxation of the CO stretchvibration. The higher-lying modes have been classified ac-cording to the magnitude of the displacement at the C and Oatoms. The four important vibrational modes of CO identi-fied in this way are illustrated in Fig. 1, and the values for theharmonic frequencies for a coverage of 0.25 ML are reportedin Table II. The C–O stretching mode �1
�2� is found at2006 cm−1, and the C–Si stretching �=shift� mode �2
�2� is at507 cm−1. Bending modes are in the plane of the Si dimer��4
�2��, or out of plane ��3�2��, with harmonic frequencies of
429 and 441 cm−1, respectively. These numbers, reportedfrom a calculation including two layers of Si atoms plus theCO, are found to be converged with respect to the size of theHessian matrix.
We note that the calculated adsorption energy of CO andthe shift mode frequency are overestimated and the stretch-ing mode frequency is underestimated compared to the ex-perimental results of Eads=0.48 eV, �1=2081 cm−1, and�2=411 cm−1.31,32 It is well known that the backdonationfrom the surface into the 2� orbital of CO is overestimatedin DFT due to the underestimated highest occupied molecu-lar orbital �HOMO�–lowest unoccupied molecular orbital�LUMO� gap.33,34 The backdonation softens the C–O bond-ing and leads to a smaller C–O stretching frequency and alarger redshift �relative to gas-phase CO� as found in experi-ments. The overestimated binding strength in our calcula-tions suggests that the shift mode frequency we obtained islikely larger than the experimental value. It has been arguedthat cluster calculations using a hybrid functional �B3LYP�
provide a better description of HOMO-LUMO gap and, thus,lead to better agreement with experiments.33 Motivated bythis, we performed a normal mode analysis using a clustermodel of the surface instead of a slab model. Our test calcu-lations with the PBE exchange-correlation functional indi-cate that the Si21H20 cluster reproduces the periodic DFTcalculations well enough, i.e., this cluster appears to be suf-ficiently large �see Table II�. Using the B3LYP functional forthis cluster, as well as a rescaling by empirical factors35 thatalso accounts for the anharmonicity of the vibrations, thefinal results are 2055 and 445 cm−1 for the stretching and theshift mode, respectively. Both values are in better agreementwith experiment than the PBE values. This trend for the vi-brational frequencies is in line with the previous calculationson a metal surface.33
We would like to comment on reports about a new COadsorption configuration �different from the top site� whichhad been reported to be accessible only by molecular beamexperiments.31,36 This site had been associated with a modeobserved at 1701 cm−1. For this kind of CO species, Ima-mura et al.37 proposed a bridge site adsorption over a flat Sidimer. However, we could not verify this description in ourcalculations; rather we find that the bridge site is unstable,and metastable only if mirror symmetry is enforced on thecalculations. Moreover, we believe that the assignment of theobserved vibrational mode at 1701 cm−1 to bridge site ad-sorption is unwarranted: Our calculated stretching mode ofbridge adsorption �using PBE� is higher than 1701 cm−1,while one would expect the calculations to underestimate thetrue frequency following the general trends for the error inDFT calculations. Therefore, it is unlikely that the CO spe-cies at 1701 cm−1 is to be associated with bridge adsorption.This CO adsorption site has only been observed by molecu-lar beam experiments.31 Thus, to explain the spectra, anotheradsorption configuration less favorable than the top site mustbe invoked. This adsorption channel should be open after thesaturation of the top site adsorption. Our preliminary calcu-lations indicate that the rebonded Si atoms at DB steps onvicinal Si�100� for which we calculate a stretching frequencyof 1642 cm−1 �using PBE� are a good candidate for the ex-perimentally measured CO species.
B. Determination of the system-bath Hamiltonian
In the present work, it is our goal to determine theHamiltonian both for the system and the system-bath cou-pling from first principles. For the system degrees of free-dom, this is achieved by computing the multidimensionalPES for CO/Si�100� by DFT calculations. To illustrate our
[100] [100]
[010] [001]
ω1 = 2006 cm−1
ω4 = 429 cm−1
ω2 = 507 cm−1
ω3 = 441 cm−1
FIG. 1. �Color online� Illustration of the four selected vibrational modes ofCO on c�4�2�Si�100� with the coverage of CO=0.25.
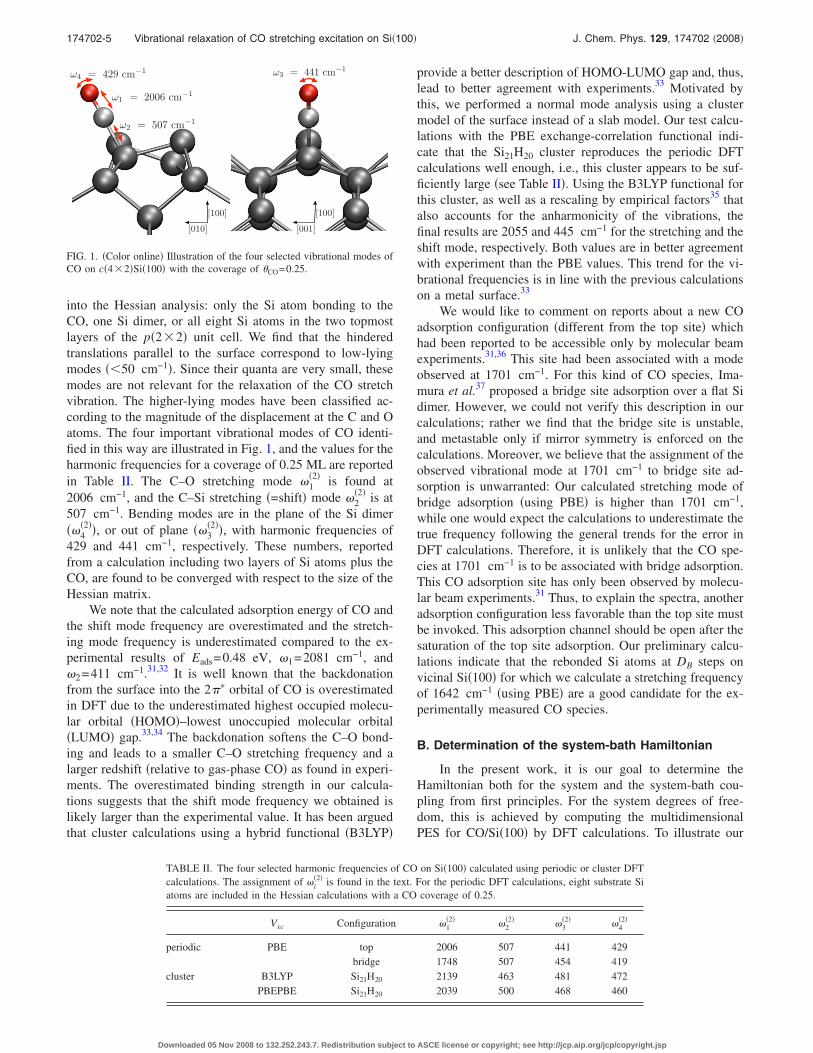
TABLE II. The four selected harmonic frequencies of CO on Si�100� calculated using periodic or cluster DFTcalculations. The assignment of �i
�2� is found in the text. For the periodic DFT calculations, eight substrate Siatoms are included in the Hessian calculations with a CO coverage of 0.25.
Vxc Configuration �1�2� �2
�2� �3�2� �4
�2�
periodic PBE top 2006 507 441 429bridge 1748 507 454 419
cluster B3LYP Si21H20 2139 463 481 472PBEPBE Si21H20 2039 500 468 460
174702-5 Vibrational relaxation of CO stretching excitation on Si�100� J. Chem. Phys. 129, 174702 �2008�
Downloaded 05 Nov 2008 to 132.252.243.7. Redistribution subject to ASCE license or copyright; see http://jcp.aip.org/jcp/copyright.jsp
method, we treat the simplest case �adsorption of a single COmolecule in the c�4�2� unit cell of Si�100��. Then, the PESdefining the system Hamiltonian is four dimensional, N=4,and is spanned by the four vibrational modes illustrated inFig. 1. We use displacements x=� j� juj obtained from linearcombinations of the eigenvectors uj of the dynamical matrixto map out the PES. The C and O atoms, as well as the eightSi atoms of the two topmost surface layers, are displaced. At94 grid points DFT-PBE calculations have been performed,and the calculated total energies are fitted to a polynomial,
EDFT = �ijkl
Nq
Cijkl�1i �2
j �3k�4
l . �18�
The coefficients Cijkl obtained by nonlinear regression definethe potential in v�q� in Eqs. �4� and �8�. We have carefullytested that the order of the polynomial, Nq=6, used in ourexpansion, is sufficient to accurately describe all the quan-tized states needed in the following analysis.
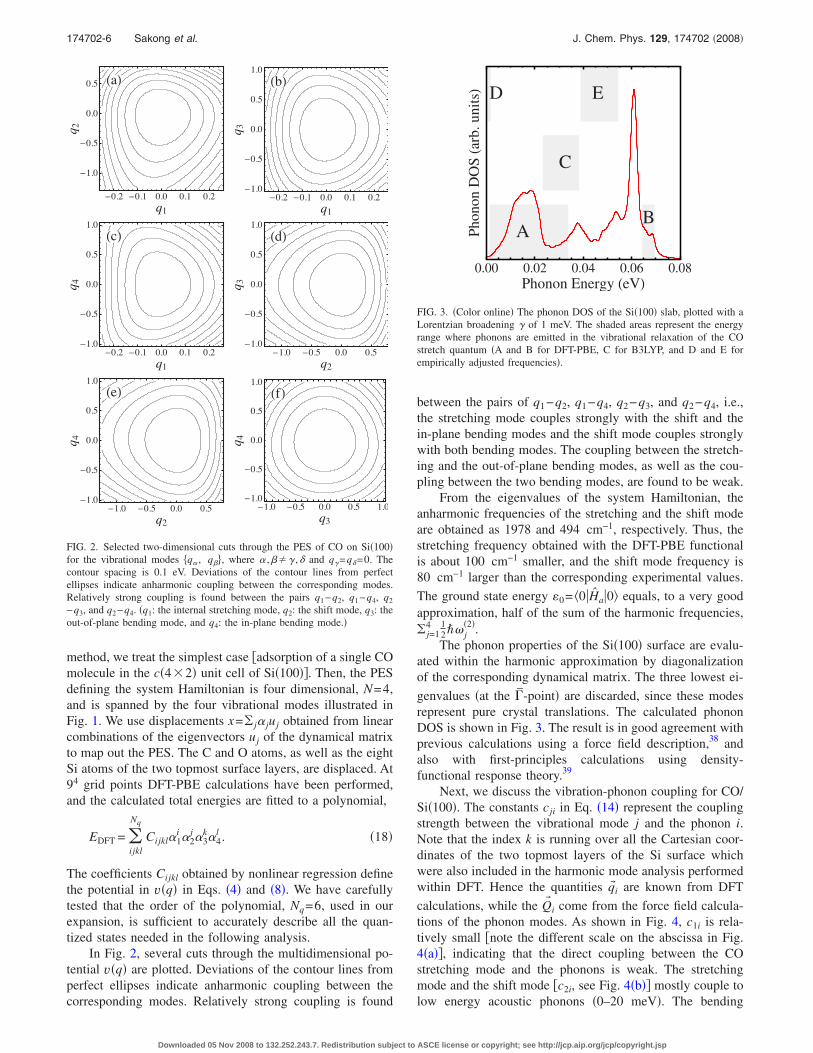
In Fig. 2, several cuts through the multidimensional po-tential v�q� are plotted. Deviations of the contour lines fromperfect ellipses indicate anharmonic coupling between thecorresponding modes. Relatively strong coupling is found
between the pairs of q1−q2, q1−q4, q2−q3, and q2−q4, i.e.,the stretching mode couples strongly with the shift and thein-plane bending modes and the shift mode couples stronglywith both bending modes. The coupling between the stretch-ing and the out-of-plane bending modes, as well as the cou-pling between the two bending modes, are found to be weak.
From the eigenvalues of the system Hamiltonian, theanharmonic frequencies of the stretching and the shift modeare obtained as 1978 and 494 cm−1, respectively. Thus, thestretching frequency obtained with the DFT-PBE functionalis about 100 cm−1 smaller, and the shift mode frequency is80 cm−1 larger than the corresponding experimental values.
The ground state energy 0= �0Ha0 equals, to a very goodapproximation, half of the sum of the harmonic frequencies,� j=1
4 12�� j
�2�.The phonon properties of the Si�100� surface are evalu-
ated within the harmonic approximation by diagonalizationof the corresponding dynamical matrix. The three lowest ei-
genvalues �at the �-point� are discarded, since these modesrepresent pure crystal translations. The calculated phononDOS is shown in Fig. 3. The result is in good agreement withprevious calculations using a force field description,38 andalso with first-principles calculations using density-functional response theory.39
Next, we discuss the vibration-phonon coupling for CO/Si�100�. The constants cji in Eq. �14� represent the couplingstrength between the vibrational mode j and the phonon i.Note that the index k is running over all the Cartesian coor-dinates of the two topmost layers of the Si surface whichwere also included in the harmonic mode analysis performedwithin DFT. Hence the quantities q� i are known from DFT
calculations, while the Q� i come from the force field calcula-tions of the phonon modes. As shown in Fig. 4, c1i is rela-tively small �note the different scale on the abscissa in Fig.4�a��, indicating that the direct coupling between the COstretching mode and the phonons is weak. The stretchingmode and the shift mode �c2i, see Fig. 4�b�� mostly couple tolow energy acoustic phonons �0–20 meV�. The bending
�a�
�0.2 �0.1 0.0 0.1 0.2
�1.0
�0.5
0.0
0.5
q1
q 2�b�
�0.2 �0.1 0.0 0.1 0.2�1.0
�0.5
0.0
0.5
1.0
q1q 3
�c�
�0.2 �0.1 0.0 0.1 0.2�1.0
�0.5
0.0
0.5
1.0
q1
q 4
�d�
�1.0 �0.5 0.0 0.5�1.0
�0.5
0.0
0.5
1.0
q2
q 3
�e�
�1.0 �0.5 0.0 0.5�1.0
�0.5
0.0
0.5
1.0
q2
q 4
�f�
�1.0 �0.5 0.0 0.5 1.0�1.0
�0.5
0.0
0.5
1.0
q3
q 4
FIG. 2. Selected two-dimensional cuts through the PES of CO on Si�100�for the vibrational modes �q� , q��, where � ,��� ,� and q�=q�=0. Thecontour spacing is 0.1 eV. Deviations of the contour lines from perfectellipses indicate anharmonic coupling between the corresponding modes.Relatively strong coupling is found between the pairs q1−q2, q1−q4, q2
−q3, and q2−q4. �q1: the internal stretching mode, q2: the shift mode, q3: theout-of-plane bending mode, and q4: the in-plane bending mode.�
AB
C
D E
0.00 0.02 0.04 0.06 0.08Phonon Energy �eV�
Phon
onD
OS�a
rb.u
nits�
FIG. 3. �Color online� The phonon DOS of the Si�100� slab, plotted with aLorentzian broadening � of 1 meV. The shaded areas represent the energyrange where phonons are emitted in the vibrational relaxation of the COstretch quantum �A and B for DFT-PBE, C for B3LYP, and D and E forempirically adjusted frequencies�.
174702-6 Sakong et al. J. Chem. Phys. 129, 174702 �2008�
Downloaded 05 Nov 2008 to 132.252.243.7. Redistribution subject to ASCE license or copyright; see http://jcp.aip.org/jcp/copyright.jsp
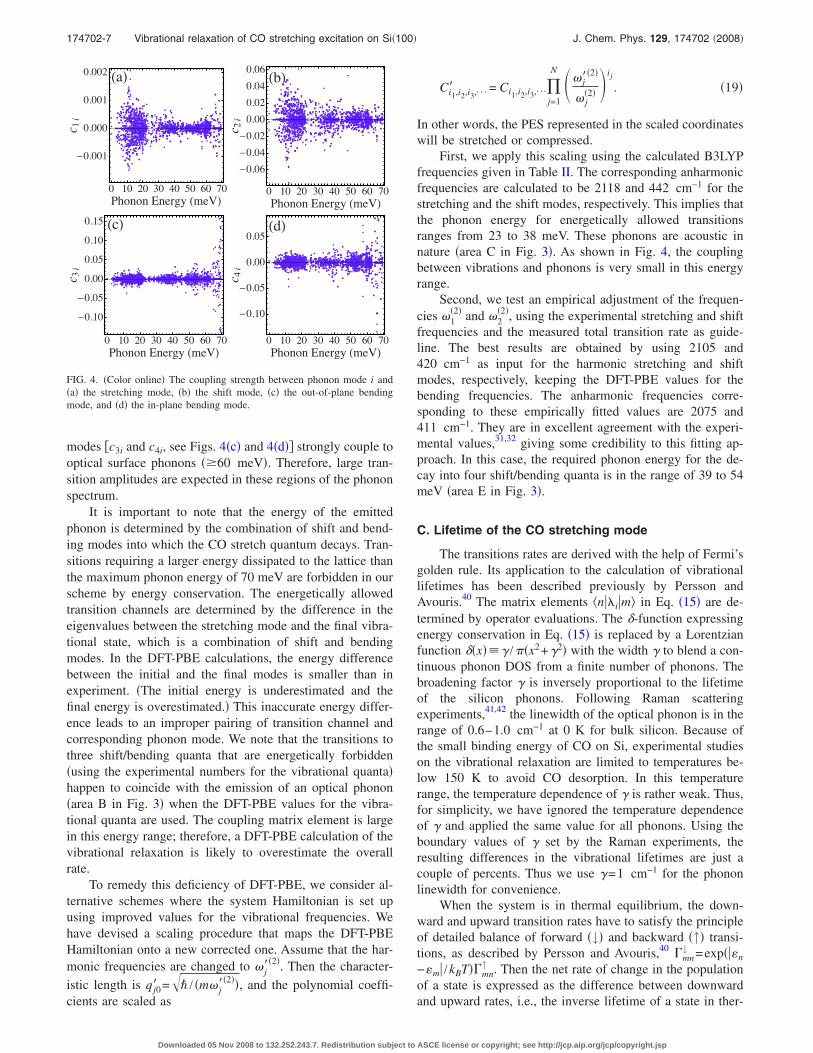
modes �c3i and c4i, see Figs. 4�c� and 4�d�� strongly couple tooptical surface phonons ��60 meV�. Therefore, large tran-sition amplitudes are expected in these regions of the phononspectrum.
It is important to note that the energy of the emittedphonon is determined by the combination of shift and bend-ing modes into which the CO stretch quantum decays. Tran-sitions requiring a larger energy dissipated to the lattice thanthe maximum phonon energy of 70 meV are forbidden in ourscheme by energy conservation. The energetically allowedtransition channels are determined by the difference in theeigenvalues between the stretching mode and the final vibra-tional state, which is a combination of shift and bendingmodes. In the DFT-PBE calculations, the energy differencebetween the initial and the final modes is smaller than inexperiment. �The initial energy is underestimated and thefinal energy is overestimated.� This inaccurate energy differ-ence leads to an improper pairing of transition channel andcorresponding phonon mode. We note that the transitions tothree shift/bending quanta that are energetically forbidden�using the experimental numbers for the vibrational quanta�happen to coincide with the emission of an optical phonon�area B in Fig. 3� when the DFT-PBE values for the vibra-tional quanta are used. The coupling matrix element is largein this energy range; therefore, a DFT-PBE calculation of thevibrational relaxation is likely to overestimate the overallrate.
To remedy this deficiency of DFT-PBE, we consider al-ternative schemes where the system Hamiltonian is set upusing improved values for the vibrational frequencies. Wehave devised a scaling procedure that maps the DFT-PBEHamiltonian onto a new corrected one. Assume that the har-monic frequencies are changed to � j
��2�. Then the character-
istic length is qj0� =�� / �m� j��2��, and the polynomial coeffi-
cients are scaled as
Ci1,i2,i3,¯� = Ci1,i2,i3,¯�j=1
N �� j��2�
� j�2� �ij
. �19�
In other words, the PES represented in the scaled coordinateswill be stretched or compressed.
First, we apply this scaling using the calculated B3LYPfrequencies given in Table II. The corresponding anharmonicfrequencies are calculated to be 2118 and 442 cm−1 for thestretching and the shift modes, respectively. This implies thatthe phonon energy for energetically allowed transitionsranges from 23 to 38 meV. These phonons are acoustic innature �area C in Fig. 3�. As shown in Fig. 4, the couplingbetween vibrations and phonons is very small in this energyrange.
Second, we test an empirical adjustment of the frequen-cies �1
�2� and �2�2�, using the experimental stretching and shift
frequencies and the measured total transition rate as guide-line. The best results are obtained by using 2105 and420 cm−1 as input for the harmonic stretching and shiftmodes, respectively, keeping the DFT-PBE values for thebending frequencies. The anharmonic frequencies corre-sponding to these empirically fitted values are 2075 and411 cm−1. They are in excellent agreement with the experi-mental values,31,32 giving some credibility to this fitting ap-proach. In this case, the required phonon energy for the de-cay into four shift/bending quanta is in the range of 39 to 54meV �area E in Fig. 3�.
C. Lifetime of the CO stretching mode
The transitions rates are derived with the help of Fermi’sgolden rule. Its application to the calculation of vibrationallifetimes has been described previously by Persson andAvouris.40 The matrix elements �n�im in Eq. �15� are de-termined by operator evaluations. The �-function expressingenergy conservation in Eq. �15� is replaced by a Lorentzianfunction ��x��� /�x2+�2� with the width � to blend a con-tinuous phonon DOS from a finite number of phonons. Thebroadening factor � is inversely proportional to the lifetimeof the silicon phonons. Following Raman scatteringexperiments,41,42 the linewidth of the optical phonon is in therange of 0.6–1.0 cm−1 at 0 K for bulk silicon. Because ofthe small binding energy of CO on Si, experimental studieson the vibrational relaxation are limited to temperatures be-low 150 K to avoid CO desorption. In this temperaturerange, the temperature dependence of � is rather weak. Thus,for simplicity, we have ignored the temperature dependenceof � and applied the same value for all phonons. Using theboundary values of � set by the Raman experiments, theresulting differences in the vibrational lifetimes are just acouple of percents. Thus we use �=1 cm−1 for the phononlinewidth for convenience.
When the system is in thermal equilibrium, the down-ward and upward transition rates have to satisfy the principleof detailed balance of forward �↓� and backward �↑� transi-tions, as described by Persson and Avouris,40 �mn
↓ =exp�n
−m /kBT��mn↑ . Then the net rate of change in the population
of a state is expressed as the difference between downwardand upward rates, i.e., the inverse lifetime of a state in ther-
�a�
0 10 20 30 40 50 60 70
�0.001
0.000
0.001
0.002
Phonon Energy �meV�
c 1i
�b�
0 10 20 30 40 50 60 70�0.06�0.04�0.020.000.020.040.06
Phonon Energy �meV�
c 2i
�c�
0 10 20 30 40 50 60 70
�0.10�0.050.000.050.100.15
Phonon Energy �meV�
c 3i
�d�
0 10 20 30 40 50 60 70
�0.10
�0.05
0.00
0.05
Phonon Energy �meV�
c 4i
FIG. 4. �Color online� The coupling strength between phonon mode i and�a� the stretching mode, �b� the shift mode, �c� the out-of-plane bendingmode, and �d� the in-plane bending mode.
174702-7 Vibrational relaxation of CO stretching excitation on Si�100� J. Chem. Phys. 129, 174702 �2008�
Downloaded 05 Nov 2008 to 132.252.243.7. Redistribution subject to ASCE license or copyright; see http://jcp.aip.org/jcp/copyright.jsp
mal equilibrium is �vib−1 =�k=1
m ��m,m−k−�m−k,m�. Hence, thetemperature-dependent lifetime of mode m is given by
1
�vib= �
k=1
m1
�m−k,m= �
k=1
m
�1 − e−m−k−m/kBT��m−k,m↓ , �20�
where �m,n is a transition time from initial mode m to finalmode n. Consequently, in a one-phonon process, there is notemperature dependence of the vibrational lifetime, since thefactor in parenthesis in Eq. �20� and the Bose–Einstein factorcontained in �m−k,m
↓ exactly cancel each other. A temperaturedependence of the equilibrium rate can arise only when twoor more phonons are considered.17,40
However, a highly populated vibrational state induced bylaser pumping is far from thermodynamic equilibrium. Theforward transition, i.e., the decay of the energetically high-lying initial state, is dominant and the energy is quickly dis-sipated among the many lower-lying states. In such a situa-
tion, the contribution of the backward transitions to thelifetime of the initial state may be disregarded and this willgive rise to a temperature dependence of the lifetime. In thecase of CO on Si�100�, as mentioned above, the shift modecouples strongly with the bending modes which finallycouple to phonons. Therefore the energy of the CO stretchquantum, once it has decayed into the shift mode, can easilybe transferred into bending modes and/or phonons, and thebackward transition to the stretching mode is highly unlikely.Hence, it is appropriate to apply a simplified expression forthe lifetime of the CO stretching mode, retaining only theforward transitions.
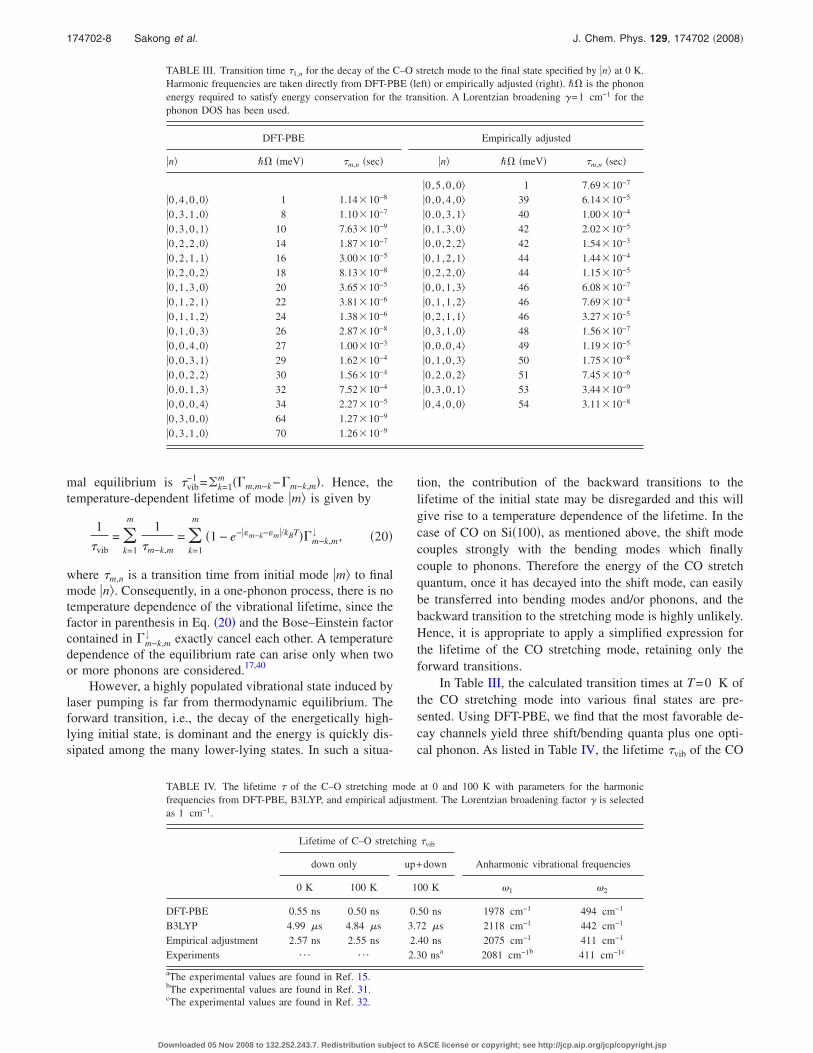
In Table III, the calculated transition times at T=0 K ofthe CO stretching mode into various final states are pre-sented. Using DFT-PBE, we find that the most favorable de-cay channels yield three shift/bending quanta plus one opti-cal phonon. As listed in Table IV, the lifetime �vib of the CO
TABLE III. Transition time �1,n for the decay of the C–O stretch mode to the final state specified by n at 0 K.Harmonic frequencies are taken directly from DFT-PBE �left� or empirically adjusted �right�. �� is the phononenergy required to satisfy energy conservation for the transition. A Lorentzian broadening �=1 cm−1 for thephonon DOS has been used.
DFT-PBE Empirically adjusted
n �� �meV� �m,n �sec� n �� �meV� �m,n �sec�
0,5 ,0 ,0 1 7.69�10−7
0,4 ,0 ,0 1 1.14�10−8 0,0 ,4 ,0 39 6.14�10−5
0,3 ,1 ,0 8 1.10�10−7 0,0 ,3 ,1 40 1.00�10−4
0,3 ,0 ,1 10 7.63�10−9 0,1 ,3 ,0 42 2.02�10−5
0,2 ,2 ,0 14 1.87�10−7 0,0 ,2 ,2 42 1.54�10−3
0,2 ,1 ,1 16 3.00�10−5 0,1 ,2 ,1 44 1.44�10−4
0,2 ,0 ,2 18 8.13�10−8 0,2 ,2 ,0 44 1.15�10−5
0,1 ,3 ,0 20 3.65�10−5 0,0 ,1 ,3 46 6.08�10−7
0,1 ,2 ,1 22 3.81�10−6 0,1 ,1 ,2 46 7.69�10−4
0,1 ,1 ,2 24 1.38�10−6 0,2 ,1 ,1 46 3.27�10−5
0,1 ,0 ,3 26 2.87�10−8 0,3 ,1 ,0 48 1.56�10−7
0,0 ,4 ,0 27 1.00�10−3 0,0 ,0 ,4 49 1.19�10−5
0,0 ,3 ,1 29 1.62�10−4 0,1 ,0 ,3 50 1.75�10−8
0,0 ,2 ,2 30 1.56�10−4 0,2 ,0 ,2 51 7.45�10−6
0,0 ,1 ,3 32 7.52�10−4 0,3 ,0 ,1 53 3.44�10−9
0,0 ,0 ,4 34 2.27�10−5 0,4 ,0 ,0 54 3.11�10−8
0,3 ,0 ,0 64 1.27�10−9
0,3 ,1 ,0 70 1.26�10−9
TABLE IV. The lifetime � of the C–O stretching mode at 0 and 100 K with parameters for the harmonicfrequencies from DFT-PBE, B3LYP, and empirical adjustment. The Lorentzian broadening factor � is selectedas 1 cm−1.
Lifetime of C–O stretching �vib
down only up+down Anharmonic vibrational frequencies
0 K 100 K 100 K �1 �2
DFT-PBE 0.55 ns 0.50 ns 0.50 ns 1978 cm−1 494 cm−1
B3LYP 4.99 �s 4.84 �s 3.72 �s 2118 cm−1 442 cm−1
Empirical adjustment 2.57 ns 2.55 ns 2.40 ns 2075 cm−1 411 cm−1
Experiments ¯ ¯ 2.30 nsa 2081 cm−1b 411 cm−1c
aThe experimental values are found in Ref. 15.bThe experimental values are found in Ref. 31.cThe experimental values are found in Ref. 32.
174702-8 Sakong et al. J. Chem. Phys. 129, 174702 �2008�
Downloaded 05 Nov 2008 to 132.252.243.7. Redistribution subject to ASCE license or copyright; see http://jcp.aip.org/jcp/copyright.jsp
stretch is calculated to be 0.55 ns at 0 K and 0.50 ns at 100K. Although harmonic frequencies in DFT-PBE have limitedaccuracy, as discussed above, the lifetime calculated in thisway is already in qualitative agreement with the experiment,but about four times shorter than the measured value of 2.3ns at 100 K.15,16 Because the phonon energy for the dominanttransition channels is large, induced transitions due to ther-mally excited phonons are unimportant, and the temperaturedependence of the lifetime is found to be small. However, asmentioned above, the relaxation into three quanta appearsunlikely when considering the experimental frequencies. Itsdominance in the DFT-PBE calculations seems to be due tothe insufficient accuracy of this functional in calculating theharmonic frequencies needed as input to the system-bathHamiltonian. Seeking an improved description, we repeatedthe calculations with a system Hamiltonian rescaled to matchthe B3LYP frequencies, as described above. We find verylow transition rates and a very long lifetime of 4.99 �s at 0K and 3.72 �s at 100 K �see Table IV�. We interpret thisfailure of the B3LYP to reproduce the experimental lifetimein the following way: While B3LYP yields improved vibra-tional frequencies �compared to experiment�, this improve-ment is still too small, and the resulting energy differencebetween initial and final vibrational states would require theemission of an acoustic phonon in the decay process, whichis rather inefficient due to the small coupling matrix elementsin this energy range. Hence the B3LYP functional, despitegiving improved accuracy for many quantities in surfacechemistry, is not appropriate for calculating the vibrationallifetime in the CO/Si system.
Finally, we introduce an empirical adjustment in order toreproduce the experimental vibrational frequencies and life-time, as described in Sec. III B. The best results are associ-ated with anharmonic stretching and shift frequencies of2075 and 411 cm−1, yielding a lifetime of 2.40 ns at 100 K.Employing this adjustment, as listed in Table III, we find adominant decay channel into three shift and one in-planebending quantum, plus a phonon of 53 meV. The transitiontime for this decay channel is 3.44 ns at 0 K. Around 82 % ofall excited CO molecules decay via this channel.
At finite temperatures, the possibility of upward transi-tions �i.e., with an energy of the final vibrational state higherthan the initial state� has to be considered, too. For example,for the system Hamiltonian determined within DFT-PBE, atransition from one CO stretch quantum into five shift/bending quanta, thereby absorbing one phonon, is possible.The lifetime of the states consisting of five shift/bendingquanta is very short, of the order of 1 ps, and these statesmostly decay into four shift/bending quanta plus one phonon.In Table IV, the lifetimes accounting for both downward andupward transitions are presented. In all three cases, the con-tribution of the upward transitions is negligibly small, andthe temperature dependence of the lifetime is weak.
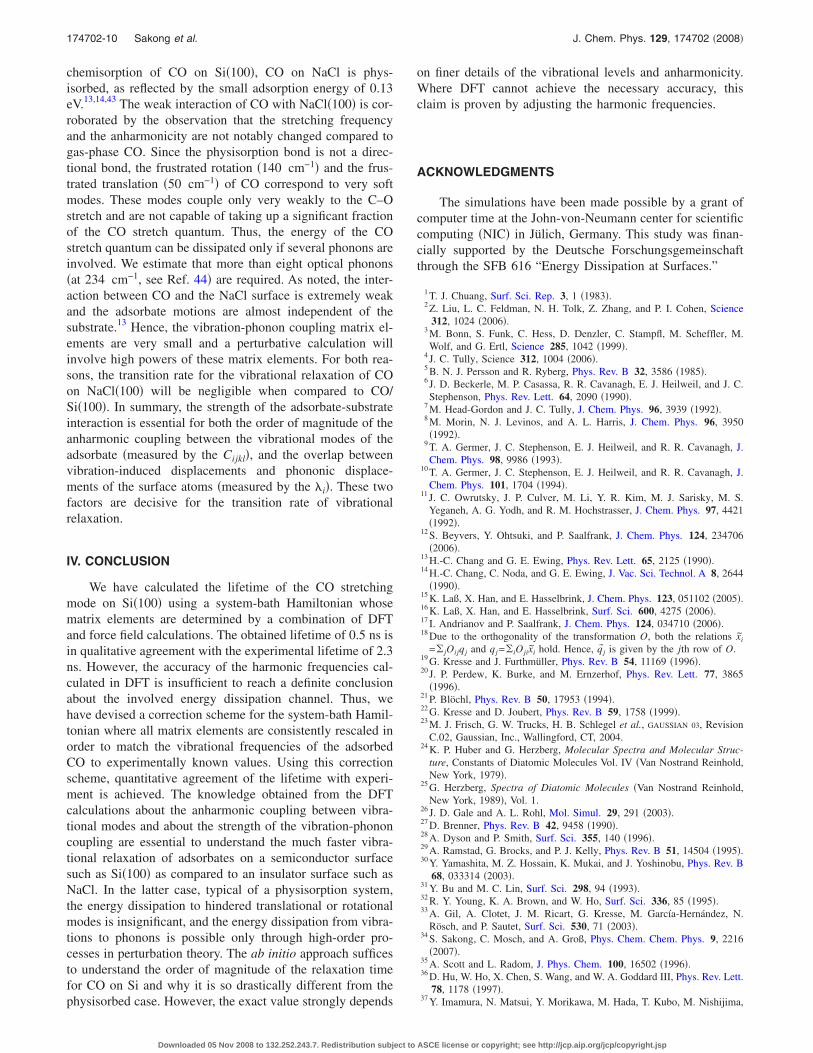
From our calculations, we conclude that the relaxationscheme is very sensitive to the harmonic frequencies of thevibrations which we need as starting point for our analysis.This becomes clear from Fig. 5. A small change in the energydifference between initial and final vibrational states leads toa large deviation of the corresponding energy of the emitted
phonon. When the required phonon energy for the transitionis located in the region of optical bulk phonons, the transitionrates for this decay channel benefit from the high phononDOS in this region. Also, if it is located in the region ofoptical surface phonons, then the strong coupling betweenthe vibrational modes and these phonons, as shown in Fig. 4,leads to high transition rates. This means that the exact val-ues of the vibrational frequencies are essential to determinethe lifetime accurately. Neither the periodic DFT-PBE northe B3LYP cluster calculations yields sufficiently accurateharmonic frequencies. Thus, it is expected that an empiricaladjustment is indispensable for quantitative agreement withexperiments. For the bending modes, experimental frequen-cies are still missing. If these frequencies were measured, amore profound microscopic understanding of the relaxationscheme of the CO stretching mode could be achieved.
In the experiments, the same vibrational lifetime of thestretching mode �2.3 ns� has been found for the isotopologue13CO.15 We have evaluated the vibrational frequencies of theisotopologue, using the same force constant matrix in Eq. �6�as for 12CO but scaled to the 13C mass. 13CO is 4% heavierthan 12CO, thus all the frequencies of 13CO vibrations are1%–2% smaller than for 12CO. The normal mode vectors for13CO vibrations and 12CO vibrations differ only slightly.Thus it is justified to use the same PES data as for 12CO, andto calculate the lifetime by adjusting the harmonic frequen-cies as described above. The systematic downshift of all theterms in the vibrational spectrum has little effect on the tran-sition rates of the different relaxation channels. Hence thecalculated lifetimes are almost the same for the two CO iso-topologues, in good agreement with experiment.
Finally, we would like to address the question why thevibrational lifetime of CO on NaCl is 106 times longer thanon silicon, despite the fact that the band gap of both materi-als is larger than the CO stretch quantum. In contrast to the
Transition channels
�60
�40
�20
20
40
60
Phonon creation
Phonon annihilation
PBE B3LYP empirical
Phonon DOS
(meV)
5ω2−45ω2−4
5ω2−4
4ω2−44ω2−4
4ω2−4
3ω2−4
FIG. 5. �Color online� Relaxation scheme of the CO stretch mode intoshift/bending modes, with creation �lower part� or annihilation �upper part�of one phonon. The levels indicate the energy difference between initial�stretch� and final modes, n−m, which due to energy conservation mustequal the phonon energy, see Eq. �15�.
174702-9 Vibrational relaxation of CO stretching excitation on Si�100� J. Chem. Phys. 129, 174702 �2008�
Downloaded 05 Nov 2008 to 132.252.243.7. Redistribution subject to ASCE license or copyright; see http://jcp.aip.org/jcp/copyright.jsp
chemisorption of CO on Si�100�, CO on NaCl is phys-isorbed, as reflected by the small adsorption energy of 0.13eV.13,14,43 The weak interaction of CO with NaCl�100� is cor-roborated by the observation that the stretching frequencyand the anharmonicity are not notably changed compared togas-phase CO. Since the physisorption bond is not a direc-tional bond, the frustrated rotation �140 cm−1� and the frus-trated translation �50 cm−1� of CO correspond to very softmodes. These modes couple only very weakly to the C–Ostretch and are not capable of taking up a significant fractionof the CO stretch quantum. Thus, the energy of the COstretch quantum can be dissipated only if several phonons areinvolved. We estimate that more than eight optical phonons�at 234 cm−1, see Ref. 44� are required. As noted, the inter-action between CO and the NaCl surface is extremely weakand the adsorbate motions are almost independent of thesubstrate.13 Hence, the vibration-phonon coupling matrix el-ements are very small and a perturbative calculation willinvolve high powers of these matrix elements. For both rea-sons, the transition rate for the vibrational relaxation of COon NaCl�100� will be negligible when compared to CO/Si�100�. In summary, the strength of the adsorbate-substrateinteraction is essential for both the order of magnitude of theanharmonic coupling between the vibrational modes of theadsorbate �measured by the Cijkl�, and the overlap betweenvibration-induced displacements and phononic displace-ments of the surface atoms �measured by the �i�. These twofactors are decisive for the transition rate of vibrationalrelaxation.
IV. CONCLUSION
We have calculated the lifetime of the CO stretchingmode on Si�100� using a system-bath Hamiltonian whosematrix elements are determined by a combination of DFTand force field calculations. The obtained lifetime of 0.5 ns isin qualitative agreement with the experimental lifetime of 2.3ns. However, the accuracy of the harmonic frequencies cal-culated in DFT is insufficient to reach a definite conclusionabout the involved energy dissipation channel. Thus, wehave devised a correction scheme for the system-bath Hamil-tonian where all matrix elements are consistently rescaled inorder to match the vibrational frequencies of the adsorbedCO to experimentally known values. Using this correctionscheme, quantitative agreement of the lifetime with experi-ment is achieved. The knowledge obtained from the DFTcalculations about the anharmonic coupling between vibra-tional modes and about the strength of the vibration-phononcoupling are essential to understand the much faster vibra-tional relaxation of adsorbates on a semiconductor surfacesuch as Si�100� as compared to an insulator surface such asNaCl. In the latter case, typical of a physisorption system,the energy dissipation to hindered translational or rotationalmodes is insignificant, and the energy dissipation from vibra-tions to phonons is possible only through high-order pro-cesses in perturbation theory. The ab initio approach sufficesto understand the order of magnitude of the relaxation timefor CO on Si and why it is so drastically different from thephysisorbed case. However, the exact value strongly depends
on finer details of the vibrational levels and anharmonicity.Where DFT cannot achieve the necessary accuracy, thisclaim is proven by adjusting the harmonic frequencies.
ACKNOWLEDGMENTS
The simulations have been made possible by a grant ofcomputer time at the John-von-Neumann center for scientificcomputing �NIC� in Jülich, Germany. This study was finan-cially supported by the Deutsche Forschungsgemeinschaftthrough the SFB 616 “Energy Dissipation at Surfaces.”
1 T. J. Chuang, Surf. Sci. Rep. 3, 1 �1983�.2 Z. Liu, L. C. Feldman, N. H. Tolk, Z. Zhang, and P. I. Cohen, Science
312, 1024 �2006�.3 M. Bonn, S. Funk, C. Hess, D. Denzler, C. Stampfl, M. Scheffler, M.Wolf, and G. Ertl, Science 285, 1042 �1999�.
4 J. C. Tully, Science 312, 1004 �2006�.5 B. N. J. Persson and R. Ryberg, Phys. Rev. B 32, 3586 �1985�.6 J. D. Beckerle, M. P. Casassa, R. R. Cavanagh, E. J. Heilweil, and J. C.Stephenson, Phys. Rev. Lett. 64, 2090 �1990�.
7 M. Head-Gordon and J. C. Tully, J. Chem. Phys. 96, 3939 �1992�.8 M. Morin, N. J. Levinos, and A. L. Harris, J. Chem. Phys. 96, 3950�1992�.
9 T. A. Germer, J. C. Stephenson, E. J. Heilweil, and R. R. Cavanagh, J.Chem. Phys. 98, 9986 �1993�.
10 T. A. Germer, J. C. Stephenson, E. J. Heilweil, and R. R. Cavanagh, J.Chem. Phys. 101, 1704 �1994�.
11 J. C. Owrutsky, J. P. Culver, M. Li, Y. R. Kim, M. J. Sarisky, M. S.Yeganeh, A. G. Yodh, and R. M. Hochstrasser, J. Chem. Phys. 97, 4421�1992�.
12 S. Beyvers, Y. Ohtsuki, and P. Saalfrank, J. Chem. Phys. 124, 234706�2006�.
13 H.-C. Chang and G. E. Ewing, Phys. Rev. Lett. 65, 2125 �1990�.14 H.-C. Chang, C. Noda, and G. E. Ewing, J. Vac. Sci. Technol. A 8, 2644
�1990�.15 K. Laß, X. Han, and E. Hasselbrink, J. Chem. Phys. 123, 051102 �2005�.16 K. Laß, X. Han, and E. Hasselbrink, Surf. Sci. 600, 4275 �2006�.17 I. Andrianov and P. Saalfrank, J. Chem. Phys. 124, 034710 �2006�.18 Due to the orthogonality of the transformation O, both the relations xi
=� jOijqj and qj =�iOjixi hold. Hence, q� j is given by the jth row of O.19 G. Kresse and J. Furthmüller, Phys. Rev. B 54, 11169 �1996�.20 J. P. Perdew, K. Burke, and M. Ernzerhof, Phys. Rev. Lett. 77, 3865
�1996�.21 P. Blöchl, Phys. Rev. B 50, 17953 �1994�.22 G. Kresse and D. Joubert, Phys. Rev. B 59, 1758 �1999�.23 M. J. Frisch, G. W. Trucks, H. B. Schlegel et al., GAUSSIAN 03, Revision
C.02, Gaussian, Inc., Wallingford, CT, 2004.24 K. P. Huber and G. Herzberg, Molecular Spectra and Molecular Struc-
ture, Constants of Diatomic Molecules Vol. IV �Van Nostrand Reinhold,New York, 1979�.
25 G. Herzberg, Spectra of Diatomic Molecules �Van Nostrand Reinhold,New York, 1989�, Vol. 1.
26 J. D. Gale and A. L. Rohl, Mol. Simul. 29, 291 �2003�.27 D. Brenner, Phys. Rev. B 42, 9458 �1990�.28 A. Dyson and P. Smith, Surf. Sci. 355, 140 �1996�.29 A. Ramstad, G. Brocks, and P. J. Kelly, Phys. Rev. B 51, 14504 �1995�.30 Y. Yamashita, M. Z. Hossain, K. Mukai, and J. Yoshinobu, Phys. Rev. B
68, 033314 �2003�.31 Y. Bu and M. C. Lin, Surf. Sci. 298, 94 �1993�.32 R. Y. Young, K. A. Brown, and W. Ho, Surf. Sci. 336, 85 �1995�.33 A. Gil, A. Clotet, J. M. Ricart, G. Kresse, M. García-Hernández, N.
Rösch, and P. Sautet, Surf. Sci. 530, 71 �2003�.34 S. Sakong, C. Mosch, and A. Groß, Phys. Chem. Chem. Phys. 9, 2216
�2007�.35 A. Scott and L. Radom, J. Phys. Chem. 100, 16502 �1996�.36 D. Hu, W. Ho, X. Chen, S. Wang, and W. A. Goddard III, Phys. Rev. Lett.
78, 1178 �1997�.37 Y. Imamura, N. Matsui, Y. Morikawa, M. Hada, T. Kubo, M. Nishijima,
174702-10 Sakong et al. J. Chem. Phys. 129, 174702 �2008�
Downloaded 05 Nov 2008 to 132.252.243.7. Redistribution subject to ASCE license or copyright; see http://jcp.aip.org/jcp/copyright.jsp
and H. Nakatsuji, Chem. Phys. Lett. 287, 131 �1998�.38 H. M. Tütüncü, S. J. Jenkins, and G. P. Srivastava, Phys. Rev. B 56, 4656
�1997�.39 J. Fritsch and P. Pavone, Surf. Sci. 344, 159 �1995�.40 B. N. J. Persson and P. Avouris, Surf. Sci. 390, 45 �1997�.
41 J. Menéndez and M. Cardona, Phys. Rev. B 29, 2051 �1984�.42 T. R. Hart, R. L. Aggarwal, and B. Lax, Phys. Rev. B 1, 638 �1970�.43 H. H. Richardson, C. Baumann, and G. E. Ewing, Surf. Sci. 185, 15
�1987�.44 J. J. Pireaux, P. A. Thiry, and R. Caudano, Surf. Sci. 162, 132 �1985�.
174702-11 Vibrational relaxation of CO stretching excitation on Si�100� J. Chem. Phys. 129, 174702 �2008�
Downloaded 05 Nov 2008 to 132.252.243.7. Redistribution subject to ASCE license or copyright; see http://jcp.aip.org/jcp/copyright.jsp