Cloud Service Assurance for VMDC 3.0 Design and ... - Cisco
212
CISCO CONFIDENTIAL Cloud Service Assurance for VMDC 3.0 Design and Implementation Guide SDU Version 1.0 December 2012 Americas Headquarters Cisco Systems, Inc. 170 West Tasman Drive San Jose, CA 95134-1706 USA http://www.cisco.com Tel: 408 526-4000 800 553-NETS (6387) Fax: 408 527-0883
-
Upload
khangminh22 -
Category
Documents
-
view
2 -
download
0
Transcript of Cloud Service Assurance for VMDC 3.0 Design and ... - Cisco
C I S C O C O N F I D E N T I A L
Cloud Service Assurance for VMDC 3.0
Design and Implementation Guide
SDU
Version 1.0
December 2012
Americas HeadquartersCisco Systems, Inc.170 West Tasman DriveSan Jose, CA 95134-1706USAhttp://www.cisco.comTel: 408 526-4000
800 553-NETS (6387)Fax: 408 527-0883
C I S C O C O N F I D E N T I A L
THE SPECIFICATIONS AND INFORMATION REGARDING THE PRODUCTS IN THIS MANUAL ARE SUBJECT TO CHANGEWITHOUT NOTICE. ALL STATEMENTS, INFORMATION, AND RECOMMENDATIONS IN THIS MANUAL ARE BELIEVED TO BEACCURATE BUT ARE PRESENTED WITHOUT WARRANTY OF ANY KIND, EXPRESS OR IMPLIED. USERS MUST TAKE FULLRESPONSIBILITY FOR THEIR APPLICATION OF ANY PRODUCTS.
THE SOFTWARE LICENSE AND LIMITED WARRANTY FOR THE ACCOMPANYING PRODUCT ARE SET FORTH IN THEINFORMATION PACKET THAT SHIPPED WITH THE PRODUCT AND ARE INCORPORATED HEREIN BY THIS REFERENCE. IF YOUARE UNABLE TO LOCATE THE SOFTWARE LICENSE OR LIMITED WARRANTY, CONTACT YOUR CISCO REPRESENTATIVE FORA COPY.
The Cisco implementation of TCP header compression is an adaptation of a program developed by the University of California, Berkeley (UCB) aspart of UCB's public domain version of the UNIX operating system. All rights reserved. Copyright 1981, Regents of the University of California.
NOTWITHSTANDING ANY OTHER WARRANTY HEREIN, ALL DOCUMENT FILES AND SOFTWARE OF THESE SUPPLIERS AREPROVIDED "AS IS" WITH ALL FAULTS. CISCO AND THE ABOVE-NAMED SUPPLIERS DISCLAIM ALL WARRANTIES, EXPRESSEDOR IMPLIED, INCLUDING, WITHOUT LIMITATION, THOSE OF MERCHANTABILITY, FITNESS FOR A PARTICULAR PURPOSE ANDNONINFRINGEMENT OR ARISING FROM A COURSE OF DEALING, USAGE, OR TRADE PRACTICE.
IN NO EVENT SHALL CISCO OR ITS SUPPLIERS BE LIABLE FOR ANY INDIRECT, SPECIAL, CONSEQUENTIAL, OR INCIDENTALDAMAGES, INCLUDING, WITHOUT LIMITATION, LOST PROFITS OR LOSS OR DAMAGE TO DATA ARISING OUT OF THE USEOR INABILITY TO USE THIS MANUAL, EVEN IF CISCO OR ITS SUPPLIERS HAVE BEEN ADVISED OF THE POSSIBILITY OF SUCHDAMAGES.
CCVP, the Cisco logo, and Welcome to the Human Network are trademarks of Cisco Systems, Inc.; Changing the Way We Work, Live, Play,and Learn is a service mark of Cisco Systems, Inc.; and Access Registrar, Aironet, Catalyst, CCDA, CCDP, CCIE, CCIP, CCNA, CCNP, CCSP,Cisco, the Cisco Certified Internetwork Expert logo, Cisco IOS, Cisco Press, Cisco Systems, Cisco Systems Capital, the Cisco Systems logo, CiscoUnity, Enterprise/Solver, EtherChannel, EtherFast, EtherSwitch, Fast Step, Follow Me Browsing, FormShare, GigaDrive, HomeLink, InternetQuotient, IOS, iPhone, IP/TV, iQ Expertise, the iQ logo, iQ Net Readiness Scorecard, iQuick Study, LightStream, Linksys, MeetingPlace, MGX,Networkers, Networking Academy, Network Registrar, PIX, ProConnect, ScriptShare, SMARTnet, StackWise, The Fastest Way to IncreaseYour Internet Quotient, and TransPath are registered trademarks of Cisco Systems, Inc. and/or its affiliates in the United States and certain othercountries.
All other trademarks mentioned in this document or Website are the property of their respective owners. The use of the word partner does not implya partnership relationship between Cisco and any other company. (0711R)
Any Internet Protocol (IP) addresses and phone numbers used in this document are not intended to be actual addresses and phone numbers. Anyexamples, command display output, network topology diagrams, and other figures included in the document are shown for illustrative purposesonly. Any use of actual IP addresses or phone numbers in illustrative content is unintentional and coincidental.
Cloud Service Assurance for VMDC 3.0 Design and Implementation Guide 1992-2012 Cisco Systems, Inc. All rights reserved.
Cloud Service Assurance for VMDC 3.0 DIG, v.1.0
iii
C I S C O C O N F I D E N T I A L
C O N T E N T S
C H A P T E R 1 Introduction 1 - 1
1.1 System Purpose 1 - 2
1.2 System Objectives 1 - 3
1.3 Key Benefits of Cloud Service Assurance 1 - 3
1.3.1 Automate Service Enablement 1 - 4
1.3.2 Consolidated Monitoring 1 - 5
1.3.3 Reducing Mean Time to Repair 1 - 5
1.3.4 Northbound OSS and BSS Integration 1 - 6
1.4 CLSA-VMDC 3.0 Summary of Changes 1 - 7
C H A P T E R 2 VMDC System Overview 2 - 1
2.1 VMDC Modular Components 2 - 2
2.2 VMDC System Architecture 2 - 4
C H A P T E R 3 CLSA-VMDC System Architecture 3 - 1
3.1 Functional View 3 - 1
3.2 Component View 3 - 3
3.3 System Components 3 - 4
3.4 Monitored Components and Services 3 - 5
3.5 Key Functions 3 - 6
3.5.1 Automatic Enablement of Service Assurance 3 - 7
3.5.2 Fault Performance, Configuration Data Collection, and Device Modeling 3 - 10
3.5.3 Event Processing 3 - 13
3.5.4 Root Cause Analysis and Service Impact Analysis 3 - 14
3.5.5 Northbound Interface 3 - 19
3.5.6 Performance Management 3 - 30
3.5.7 Dashboards 3 - 31
3.5.8 Reporting 3 - 36
3.5.9 Multi-tenancy 3 - 38
C H A P T E R 4 Zenoss Cloud Service Assurance Overview 4 - 1
4.1 Zenoss CSA Functional Overview 4 - 1
Contents
C I S C O C O N F I D E N T I A L
Cloud Service Assurance for VMDC 3.0 DIG, v.1.0
iv
4.1.1 Dynamic Resource Management 4 - 3
4.1.2 Dynamic Impact and Event Management 4 - 4
4.1.3 Dynamic Analytics and Optimization 4 - 5
4.2 Zenoss CSA Highlights 4 - 6
C H A P T E R 5 System Design Constraints 5 - 1
5.1 System Redundancy and Availability 5 - 1
5.1.1 High Availability Deployment Options 5 - 2
5.1.2 Disaster Recovery Deployment 5 - 5
5.2 System Sizing and Scalability 5 - 5
5.3 System Deployment Models 5 - 8
5.3.1 Business and Operational Deployment Models 5 - 8
5.3.2 CLSA-VMDC Deployment Model 5 - 9
5.3.3 Zenoss CSA Deployment Model 5 - 11
5.4 System Maintenance and Serviceability 5 - 12
C H A P T E R 6 Operational Use Cases 6 - 1
6.1 Discovering DC Devices and Components 6 - 2
6.1.1 Add a Single Device 6 - 2
6.1.2 Add Multiple Devices 6 - 5
6.1.3 Add Multiple Devices with the zenbatchload Utility 6 - 11
6.1.4 Add a UCS Domain 6 - 14
6.1.5 Add VMware vSphere Management Domain 6 - 16
6.1.6 Device Discovery Guidance 6 - 19
6.2 Dashboard Monitoring 6 - 22
6.2.1 Aggregated Systemwide Dashboard 6 - 22
6.2.2 Services Dashboard 6 - 26
6.2.3 Infrastructure Dashboard 6 - 30
6.2.4 Events Dashboard 6 - 33
6.3 Consolidated Resource Monitoring of VMDC Components 6 - 37
6.3.1 Network Resource Monitoring 6 - 37
6.3.2 Services Resource Monitoring 6 - 45
6.3.3 Storage Resource Monitoring 6 - 48
6.3.4 Compute Resource Monitoring 6 - 50
6.4 Tenant Service Impact Analysis and Root Cause Analysis 6 - 52
6.5 Identifying Availability Impact of Shared Resource Faults on Tenant Services 6 - 54
6.6 Identifying Performance Problems Before They Impact Tenants 6 - 60
C H A P T E R 7 CLSA-VMDC 3.0 Enhancements 7 - 1
Contents
C I S C O C O N F I D E N T I A L
Cloud Service Assurance for VMDC 3.0 DIG, v.1.0
v
7.1 EMC 7 - 1
7.1.1 SMI-S Provider Installation and Configuration 7 - 2
7.1.2 Accessing EMC Arrays from the SMI-S Provider 7 - 15
7.1.3 Adding and Monitoring EMC Arrays Within Zenoss 7 - 19
7.2 ASASM 7 - 22
7.3 Nexus 3000 7 - 25
7.4 FabricPath Line Card 7 - 27
7.5 UCS 6200 Fabric Interconnect 7 - 29
7.6 Nexus 1010 7 - 32
7.7 Zenoss Sample Tenant Portal 7 - 33
7.7.1 Sample Tenant Portal 7 - 33
7.7.2 Sample Tenant Portal Installation 7 - 34
7.7.3 Zenoss JSON API 7 - 36
A P P E N D I X A Key Performance Indicators for VMDC A - 1
A.1 Network Key Performance Indicators A - 1
A.2 Services Key Performance Indicators A - 2
A.3 Storage Key Performance Indicators A - 6
A.4 Compute Key Performance Indicators A - 8
G L O S S A R Y Glossary GL - 1

C I S C O C O N F I D E N T I A L
Cloud Service Assurance for VMDC 3.0 DIG, v.1.0
vi
Cloud Service Assurance for VMDC 3.0 DIG, v.1.0
vii
C I S C O C O N F I D E N T I A L
F I G U R E S
Figure 1-1 Cloud SLA Assurance Methodology 1 - 2
Figure 1-2 Key Objectives and Functions of CLSA-VMDC 3.0 1 - 3
Figure 1-3 Key Benefits of Cloud Service Assurance 1 - 4
Figure 1-4 Reducing Mean Time to Repair 1 - 6
Figure 2-1 VMDC Infrastructure Components 2 - 2
Figure 2-2 VMDC PoDs for Scaling the Data Center 2 - 3
Figure 2-3 VMDC ICS for Scaling the Data Center 2 - 4
Figure 2-4 VMDC 2.2 System Architecture 2 - 6
Figure 2-5 VMDC 3.0 System Architecture 2 - 7
Figure 3-1 Functional View of CLSA-VMDC Architecture 3 - 2
Figure 3-2 Component View of CLSA-VMDC Architecture 3 - 4
Figure 3-3 End-to-End Fault and Problem Management Data and Processing Flow 3 - 7
Figure 3-4 Real-time Automatic Discovery of Device Components - Cisco UCS 3 - 8
Figure 3-5 Real-time Automatic Discovery of Tenant Service Impact Model 3 - 9
Figure 3-6 Zenoss Tenant Provisioning Using CIAC Orchestration 3 - 10
Figure 3-7 Unified Monitoring Using Zenoss CSA 3 - 13
Figure 3-8 Node Types 3 - 15
Figure 3-9 Sample Node Policy 3 - 16
Figure 3-10 Tenant Compute Assurance Service Model - Generic Application 3 - 17
Figure 3-11 Edit Notification Timer 3 - 25
Figure 3-12 Single Normalized and Service Abstraction NBI 3 - 27
Figure 3-13 VMDC CSA Integration in Northbound OSS Systems 3 - 28
Figure 3-14 HCS Services and Operational Domains 3 - 29
Figure 3-15 Multi-tiered SIA 3 - 30
Figure 3-16 Aggregated Systemwide Resources Status Dashboard 3 - 31
Figure 3-17 Service Inventory and Status Dashboard 3 - 32
Figure 3-18 Per-service Detailed Dashboard 3 - 33
Figure 3-19 Infrastructure Dashboard 3 - 33
Figure 3-20 Detailed Component Dashboard 3 - 34
Figure 3-21 UCS Server Blade Graphical View 3 - 35
Figure 3-22 Event Dashboard 3 - 36
Figure 3-23 Custom User Groups 3 - 40
Figure 4-1 Key Functions of Zenoss CSA 4 - 2
Figure 4-2 Model-Driven Automation 4 - 3
Figure 4-3 Service Health Dashboard 4 - 4
List of Figures
C I S C O C O N F I D E N T I A L
Cloud Service Assurance for VMDC 3.0 DIG, v.1.0
viii
Figure 4-4 High-Level Architecture 4 - 7
Figure 4-5 Zenoss Product Architecture Overview 4 - 8
Figure 5-1 Distributed Deployment 5 - 2
Figure 5-2 Zenoss Scaling Tiers 5 - 6
Figure 5-3 Zenoss Deployment Model for CLSA-VMDC 5 - 11
Figure 6-1 Adding Single Device 6 - 3
Figure 6-2 Two Nexus 7000s with Three VDCs 6 - 4
Figure 6-3 Nexus 7000 Admin Context 6 - 4
Figure 6-4 Nexus 7000 VDC Component View 6 - 5
Figure 6-5 Add Multiple Devices 6 - 5
Figure 6-6 Add First Device 6 - 6
Figure 6-7 Add Second Device 6 - 7
Figure 6-8 Two Devices Added 6 - 7
Figure 6-9 Change Name 6 - 8
Figure 6-10 Name Changed 6 - 8
Figure 6-11 Autodiscover Devices 6 - 9
Figure 6-12 Discovery Status 6 - 10
Figure 6-13 As Devices are Discovered 6 - 10
Figure 6-14 Model Device 6 - 11
Figure 6-15 Add UCS Option 6 - 15
Figure 6-16 Enter UCS Login Information 6 - 15
Figure 6-17 UCS Component View 6 - 16
Figure 6-18 Create a vSphere Read-only Group or User 6 - 17
Figure 6-19 Add VMware Infrastructure 6 - 17
Figure 6-20 Add VMware Infrastructure Details 6 - 18
Figure 6-21 Link Between vSphere ESXi Host and UCS Profile in Zenoss View 6 - 19
Figure 6-22 Delete VMware Domain Option 6 - 19
Figure 6-23 VMDC Service Assurance Dashboard 6 - 22
Figure 6-24 VMDC Service Assurance Dashboard Column Layout Selection 6 - 23
Figure 6-25 Dashboard Reports a Serious Issue 6 - 24
Figure 6-26 Navigating to Device Class /Devices/VMware 6 - 25
Figure 6-27 Navigating to VMware Infrastructure Events Listing 6 - 25
Figure 6-28 Navigating to servers2 Hosts Overview 6 - 26
Figure 6-29 Navigating to Specific server2 Hosts Events View 6 - 26
Figure 6-30 VMDC Services Dashboard 6 - 27
Figure 6-31 All Tenant Services Shown Down 6 - 29
Figure 6-32 Tenant Services Shown with Multiple States 6 - 30
Figure 6-33 Infrastructure Dashboard Default View 6 - 31
Figure 6-34 VMware Device Class View 6 - 32
Figure 6-35 Example of a Nexus 7000 Device View 6 - 32
Figure 6-36 Example of a Nexus 7000 Port-Channel Sub-component View 6 - 33
Figure 6-37 Initial Event List 6 - 34
List of Figures
C I S C O C O N F I D E N T I A L
Cloud Service Assurance for VMDC 3.0 DIG, v.1.0
ix
Figure 6-38 Event List Sorted Manually According to Severity 6 - 34
Figure 6-39 Event List Filtered by Critical Severity 6 - 35
Figure 6-40 Pre-filtered Event List 6 - 35
Figure 6-41 Event List Filtered on Component "c" 6 - 36
Figure 6-42 Event List Filtered on Component "ch" 6 - 36
Figure 6-43 Event List Filtered on Component "chan" 6 - 36
Figure 6-44 List of All Devices 6 - 37
Figure 6-45 List of Nexus 5000s 6 - 38
Figure 6-46 Nexus 5000 6 - 38
Figure 6-47 Nexus 5000 Port-channels 6 - 39
Figure 6-48 Related Ethernet Interfaces 6 - 39
Figure 6-49 Related VLANs 6 - 40
Figure 6-50 Events Under Device Class Cisco 6500 6 - 40
Figure 6-51 Every Event Under Device Class Cisco 6500 6 - 41
Figure 6-52 Events Under Single Device 6 - 41
Figure 6-53 Events Sorted by Resource 6 - 41
Figure 6-54 Link Down Event 6 - 42
Figure 6-55 Link Down Event Under Component 6 - 42
Figure 6-56 Historical Events 6 - 43
Figure 6-57 False Events on Device 6 - 43
Figure 6-58 Port-channel Status Down 6 - 44
Figure 6-59 Port-channels 23 and 223 6 - 44
Figure 6-60 Events Cleared 6 - 45
Figure 6-61 VSS DSN - Service Modules View 6 - 46
Figure 6-62 VSS DSN - ACE Module View 6 - 46
Figure 6-63 VSS DSN - FWSM View 6 - 47
Figure 6-64 ASA - Device View 6 - 48
Figure 6-65 MDS Component View 6 - 49
Figure 6-66 Nexus 5000 Component View 6 - 49
Figure 6-67 NetApp Component View 6 - 50
Figure 6-68 UCS Component View 6 - 51
Figure 6-69 VMware Component View 6 - 51
Figure 6-70 Dashboard View of a Tenant Service Failure 6 - 52
Figure 6-71 Impact Overview of Tenant Service Failure 6 - 53
Figure 6-72 Switch To Impact Event View from Impact Event Overview 6 - 53
Figure 6-73 Impact Event Errors 6 - 54
Figure 6-74 Expanded View of Tenant Service Failure 6 - 54
Figure 6-75 Compute Service Impact Graph Before Chassis Failure 6 - 56
Figure 6-76 Event Console After Chassis Failure 6 - 57
Figure 6-77 Service Dashboard Indicating Tenant Service Impact 6 - 58
Figure 6-78 Service Impact and Root Cause Event Screen 6 - 58
Figure 6-79 Service Impact Graph After Chassis Failure 6 - 59
List of Figures
C I S C O C O N F I D E N T I A L
Cloud Service Assurance for VMDC 3.0 DIG, v.1.0
x
Figure 6-80 Monitoring Templates 6 - 61
Figure 6-81 Edit Threshold 6 - 62
Figure 6-82 Performance Health Impact Graph 6 - 63
Figure 6-83 Performance Impact Analysis Dashboard 6 - 63
Figure 6-84 Performance Impact Event 6 - 64
Figure 6-85 Service Impact Graph Showing Performance Health 6 - 64
Figure 6-86 Event That Triggered the Performance Impact 6 - 64
Figure 6-87 Historical CPU Utilization on ESXi Host 6 - 65
Figure 6-88 Historical CPU Utilization on Virtual Machine 6 - 65
Figure 7-1 Zenoss EMC Verification Network 7 - 3
Figure 7-2 EMC Powerlink Download Page 7 - 4
Figure 7-3 Initial Window Installation - Select Next 7 - 5
Figure 7-4 Windows Installation Location - Select Next or Change 7 - 6
Figure 7-5 SMI-S Provider Selection - Select Next 7 - 7
Figure 7-6 Final Install Confirmation - Select Install 7 - 8
Figure 7-7 Installation Complete - Select Finish 7 - 9
Figure 7-8 Login Screen for the ECOM Administration Login Page 7 - 14
Figure 7-9 ECOM Administration Page 7 - 15
Figure 7-10 Adding EMC Arrays to Zenoss 7 - 19
Figure 7-11 Adding EMC VNX Array to Zenoss 7 - 20
Figure 7-12 Adding EMC VMAX Array to Zenoss 7 - 20
Figure 7-13 Remove EMC Device from Zenoss 7 - 21
Figure 7-14 Single SMI-S Provider with Multiple VNX Arrays 7 - 21
Figure 7-15 Expanded View Showing Multiple Arrays in One SMI-S Provider 7 - 22
Figure 7-16 Adding a Single Device 7 - 23
Figure 7-17 Adding Multiple Devices 7 - 24
Figure 7-18 Service Module Monitoring 7 - 24
Figure 7-19 VLAN Monitoring 7 - 25
Figure 7-20 ASA Event Monitoring 7 - 25
Figure 7-21 Resource Manager Components for the Nexus 3000 7 - 26
Figure 7-22 Resource Manager KPI Example for the Nexus 3000 7 - 27
Figure 7-23 Line Card Discovery 7 - 27
Figure 7-24 Sample Port-channel KPI Statistics on Line Card 1 7 - 28
Figure 7-25 Sample Interface KPI Statistics on Line Card 2 7 - 28
Figure 7-26 Events on the Line Card 7 - 29
Figure 7-27 UCS 6200 Discovery 7 - 30
Figure 7-28 UCS 6200 KPI Monitoring 7 - 31
Figure 7-29 Sample SNMP Trap Event View 7 - 31
Figure 7-30 Components on the Nexus 1010 7 - 32
Figure 7-31 Virtual Service Blades Discovered on the Nexus 1010 7 - 32
Figure 7-32 Key Performance Indicator Statistics on the Nexus 1010 7 - 33
Figure 7-33 Sample Tenant Portal Architecture 7 - 34
List of Figures
C I S C O C O N F I D E N T I A L
Cloud Service Assurance for VMDC 3.0 DIG, v.1.0
xi
Figure 7-34 Zenoss Sample Portal Login Screen 7 - 35
Figure 7-35 Zenoss Sample Portal Services and Resources Screen 7 - 36
C I S C O C O N F I D E N T I A L
Cloud Service Assurance for VMDC 3.0 DIG, v.1.0
xii
Cloud Service Assurance for VMDC 3.0 DIG, v.1.0
xiii
C I S C O C O N F I D E N T I A L
T A B L E S
Table 1-1 CLSA-VMDC 3.0 Summary of DIG Updates 1 - 7
Table 3-1 Cisco and Third-Party Components Used in CLSA-VMDC 3 - 4
Table 3-2 VMDC 3.0 Components Monitored by CLSA-VMDC 3 - 5
Table 3-3 Service Model Policy Decisions 3 - 17
Table 3-4 Zenoss MIB Fields 3 - 21
Table 3-5 Global User Role Definitions 3 - 39
Table 3-6 Device and Service Group Categories 3 - 39
Table 5-1 Zenoss Sizing Recommendations for Public Cloud Deployments 5 - 6
Table 5-2 Zenoss Sizing Recommendations for Private Cloud Deployments 5 - 7
Table 5-3 Potential Deployment Models 5 - 10
Table 6-1 List of zenbatchload Commands 6 - 11
Table 6-2 Device Discovery Methods 6 - 20
Table 6-3 VMDC Devices and Their Unique Discovery Attributes 6 - 20
Table 6-4 Dashboard Portlet Content Choices 6 - 23
Table 6-5 Service Availability Color Mapping 6 - 27
Table 6-6 Service Performance Color Mapping 6 - 27
Table 6-7 Availability Health Dashboard Examples 6 - 28
Table 6-8 Mapping of Event Severity, Naming, and Color Code 6 - 33
Table 6-9 UCS Components 6 - 50
Table 7-1 EMC VNX to Zenoss Mapping Outline 7 - 22
Table 7-2 EMC VMAX to Zenoss Mapping Outline 7 - 22
Table 7-3 Sample Tenant Portal ZenPack Requirements 7 - 34
Table 7-4 Sample Portal Installation Requirements 7 - 34
Table 7-5 List of JSON API Router Object Classes 7 - 37
Table A-1 Network KPI Statistics for CLSA-VMDC A - 1
Table A-2 Services KPI Statistics for VMDC A - 3
Table A-3 Storage Related KPI Statistics for VMDC A - 6
Table A-4 Compute KPI Statistics for VMDC A - 8

C I S C O C O N F I D E N T I A L
Cloud Service Assurance for VMDC 3.0 DIG, v.1.0
xiv
Cloud Service Assurance for VMDC 3.0 DIG, v.1.0
1-1
C I S C O C O N F I D E N T I A L
C H A P T E R 1Introduction
In recent years, there has been a race by both traditional Service Providers (SPs) and public cloudproviders such as Amazon to capture the cloud services market. SPs have identified the capabilityto offer Service Level Agreements (SLAs) as their key differentiator in the race for the cloud. Inresponse, SPs are deploying virtual private cloud services accessed by Enterprises (cloud consumers)over the SP's IP/MPLS VPN network infrastructure. In addition, lack of trust had been identified asone of the key barriers for Enterprises to purchase cloud services. To gain end customer trust of cloudservices, it is important that a cloud provider offer customers visibility in the performance of theirapplications hosted in the cloud.
SPs have to take measures both in engineering the service and in operating the service to offer theircustomers the SLAs necessary to realize the potential of virtual private cloud differentiation. The term"service assurance" is commonly used to refer to performance management and fault management, i.e.,monitoring and reporting that the service levels are met and identifying/resolving service impactingfaults. More generally, assurance means providing a high level of confidence that a commitment canbe met; this encompasses more than just operation and management aspects, but also includes serviceengineering aspects.
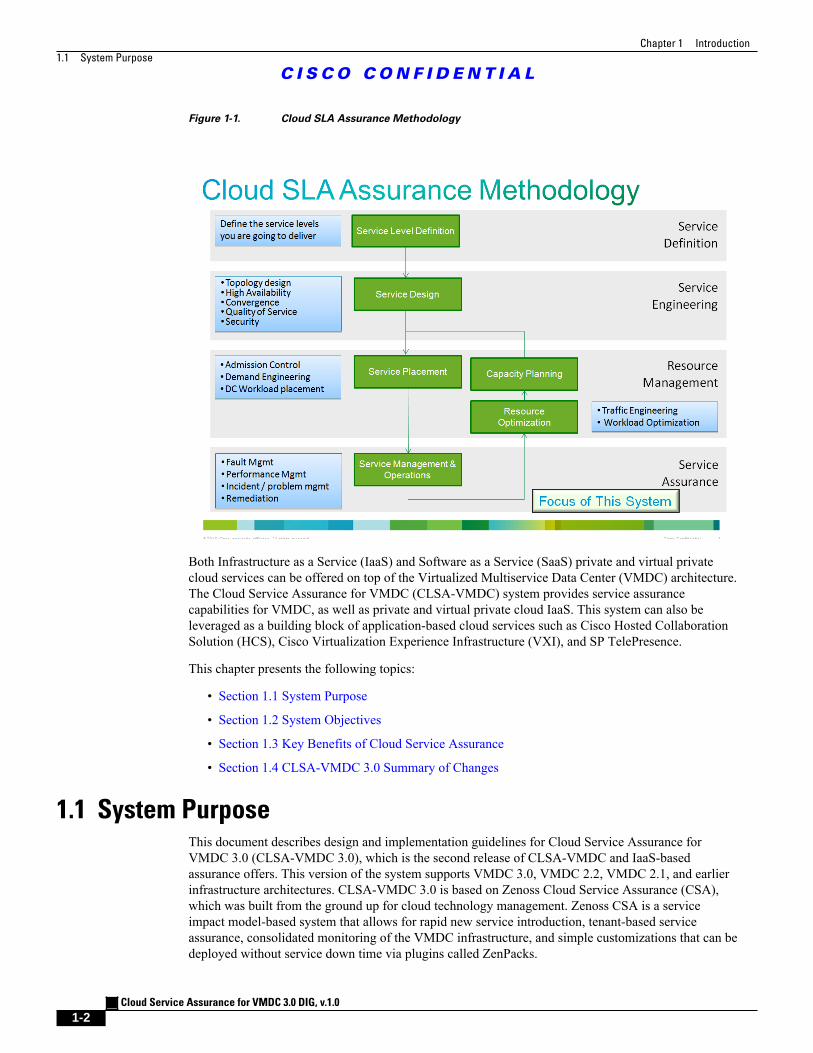
The broader SLA assurance framework with all necessary functions to offer SLAs is illustrated inFigure 1-1. This framework includes service assurance as one of its building blocks, which is the focusof this system and this document. In addition to the virtual private cloud opportunity, service assurancealso plays a role in Enterprise private clouds to enable efficient Day 2 operations and gain visibilitynecessary to optimize resources utilization.
Chapter 1 Introduction
1.1 System Purpose
C I S C O C O N F I D E N T I A L
Cloud Service Assurance for VMDC 3.0 DIG, v.1.0
1-2
Figure 1-1. Cloud SLA Assurance Methodology
Both Infrastructure as a Service (IaaS) and Software as a Service (SaaS) private and virtual privatecloud services can be offered on top of the Virtualized Multiservice Data Center (VMDC) architecture.The Cloud Service Assurance for VMDC (CLSA-VMDC) system provides service assurancecapabilities for VMDC, as well as private and virtual private cloud IaaS. This system can also beleveraged as a building block of application-based cloud services such as Cisco Hosted CollaborationSolution (HCS), Cisco Virtualization Experience Infrastructure (VXI), and SP TelePresence.
This chapter presents the following topics:
• Section 1.1 System Purpose
• Section 1.2 System Objectives
• Section 1.3 Key Benefits of Cloud Service Assurance
• Section 1.4 CLSA-VMDC 3.0 Summary of Changes
1.1 System PurposeThis document describes design and implementation guidelines for Cloud Service Assurance forVMDC 3.0 (CLSA-VMDC 3.0), which is the second release of CLSA-VMDC and IaaS-basedassurance offers. This version of the system supports VMDC 3.0, VMDC 2.2, VMDC 2.1, and earlierinfrastructure architectures. CLSA-VMDC 3.0 is based on Zenoss Cloud Service Assurance (CSA),which was built from the ground up for cloud technology management. Zenoss CSA is a serviceimpact model-based system that allows for rapid new service introduction, tenant-based serviceassurance, consolidated monitoring of the VMDC infrastructure, and simple customizations that can bedeployed without service down time via plugins called ZenPacks.
Chapter 1 Introduction
1.2 System Objectives
C I S C O C O N F I D E N T I A L
Cloud Service Assurance for VMDC 3.0 DIG, v.1.0
1-3
Note While this CLSA-VMDC Design and Implementation Guide (DIG) references the VMDC 3.0 system,previous versions of the VMDC system are also supported. The CLSA-VMDC system also supportsother Data Center (DC) designs, as well as the VCE Vblock and NetApp FlexPod stacks.
Zenoss CSA is a multiservice system that offers real time aggregated dashboards as well as reportingcapabilities. The system can be deployed both in centralized and distributed architecture and allowsfor incremental deployment growth. While it offers rich functionality for IaaS domains, the solutionis lightweight and has open interfaces to allow for simple integration into existing Operations SupportSystem (OSS) and ticketing systems with minimal cost. As such, this solution is positioned not asa replacement, but as a complement to existing Manager-of-Manager (MOM) systems (e.g., IBMNetcool), ticketing systems (e.g., BMC Remedy), and so on.
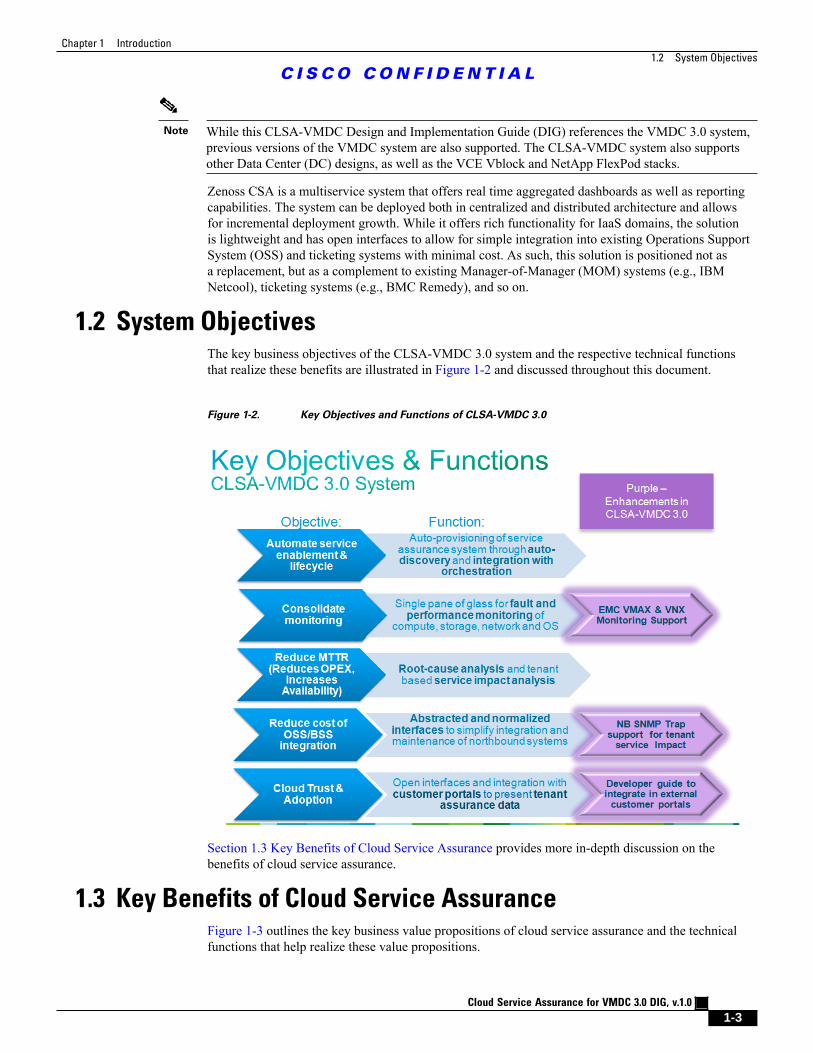
1.2 System ObjectivesThe key business objectives of the CLSA-VMDC 3.0 system and the respective technical functionsthat realize these benefits are illustrated in Figure 1-2 and discussed throughout this document.
Figure 1-2. Key Objectives and Functions of CLSA-VMDC 3.0
Section 1.3 Key Benefits of Cloud Service Assurance provides more in-depth discussion on thebenefits of cloud service assurance.
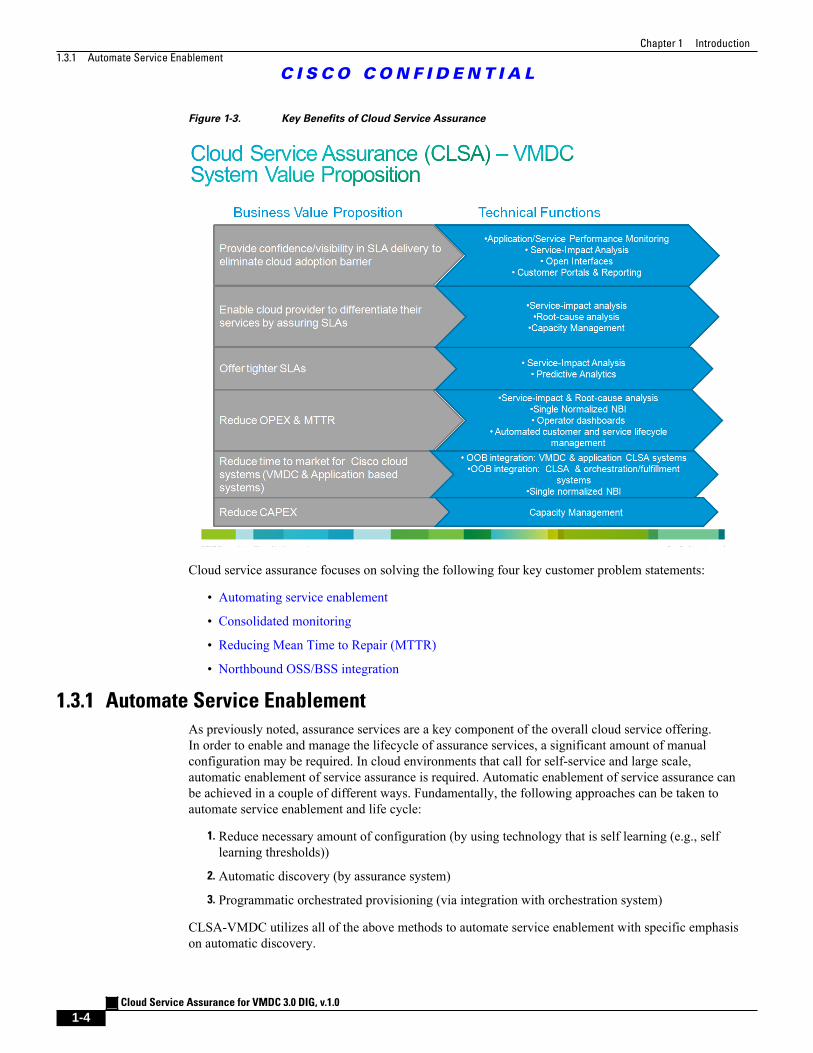
1.3 Key Benefits of Cloud Service AssuranceFigure 1-3 outlines the key business value propositions of cloud service assurance and the technicalfunctions that help realize these value propositions.
Chapter 1 Introduction
1.3.1 Automate Service Enablement
C I S C O C O N F I D E N T I A L
Cloud Service Assurance for VMDC 3.0 DIG, v.1.0
1-4
Figure 1-3. Key Benefits of Cloud Service Assurance
Cloud service assurance focuses on solving the following four key customer problem statements:
• Automating service enablement
• Consolidated monitoring
• Reducing Mean Time to Repair (MTTR)
• Northbound OSS/BSS integration
1.3.1 Automate Service Enablement
As previously noted, assurance services are a key component of the overall cloud service offering.In order to enable and manage the lifecycle of assurance services, a significant amount of manualconfiguration may be required. In cloud environments that call for self-service and large scale,automatic enablement of service assurance is required. Automatic enablement of service assurance canbe achieved in a couple of different ways. Fundamentally, the following approaches can be taken toautomate service enablement and life cycle:
1. Reduce necessary amount of configuration (by using technology that is self learning (e.g., selflearning thresholds))
2. Automatic discovery (by assurance system)
3. Programmatic orchestrated provisioning (via integration with orchestration system)
CLSA-VMDC utilizes all of the above methods to automate service enablement with specific emphasison automatic discovery.
Chapter 1 Introduction
1.3.2 Consolidated Monitoring
C I S C O C O N F I D E N T I A L
Cloud Service Assurance for VMDC 3.0 DIG, v.1.0
1-5
The following types of objects are automatically discovered in CLSA-VMDC:
• Monitored devices (e.g., UCS, Nexus 7000, MDS 9000, etc.)
• Sub-components of devices and their relationships (e.g., UCS chassis, blades, fabric interconnect,etc.)
• Tenant-based Service Impact Analysis (SIA) models for the compute (e.g., tenant VirtualMachine (VM) mapping to service impacting dedicated and shared vCenter and UCSM managedresources)
1.3.2 Consolidated Monitoring
Due to the large number of components and technologies in many of the SP and IT systems, operationsstaff are typically segmented and specialized, and they utilize a number of customized tools. Thisoperations staff division of labor results in a monitoring approach that involves observing multiplescreens and interaction between a number of organizations when trying to solve even the simplestproblems. For example, there are storage operations that are responsible for storage only usingtheir favorite tool, and similarly, there are compute operations with their staff and tools, networkoperations, and applications operations, and so on. This approach not only increases Mean Time toRepair (MTTR), and thus customer dissatisfaction, but it will also be unmanageable for cloud systemsthat are extremely dynamic and deployed at extreme scale. While there will always be a need to havespecialized staff with focused expertise, there must be some consolidation of monitoring products toprovide a single pane of glass that will simplify Tier 1 and 2 operations.
In addition, in order to fully automate some of operations tasks through value add assurance functionssuch as Root Cause Analysis (RCA) and SIA, assurance products need to have visibility of all of thecomponents that work together to deliver the service. While segmented visibility will always existand present challenges in the cloud environment due to business and ownership boundaries, the effortneeds to be made to provide as much visibility as possible. More visibility means more value add fromthe assurance system.
In order to solve visibility challenges, consolidated monitoring and data collection is one of thefundamental functions of any cloud service assurance system. Consolidated monitoring and datacollection needs to be done in the following ways:
• Various domains (applications, compute, storage, network). The cloud assurance systemneeds to provide a single pane of glass to monitor components from various domains.
• Fault and performance data. The cloud assurance system needs to consolidate fault andperformance data and leverage both for all of its higher order functions like RCA and SIA.
• Various data sources, interfaces, and protocols. The cloud assurance system needs to collectdata from multiple data sources and protocols and consolidate this data into unified device andservice models. Some examples of different data sources and protocols are SNMP, syslog, WSAPI, Netflow, customer opened tickets, and so on.
Consolidated monitoring provides the visibility necessary to enable the assurance system to providemore value add, while it can still achieve segmentation of operations through Role-based AccessControl (RBAC) and flexible and configurable filtering capabilities.
1.3.3 Reducing Mean Time to Repair
In high pressure Network Operations Center (NOC) environments, operators handle various typesof faults, isolate the issues, troubleshoot the problems, or escalate the problem to experts. To reducethe end-customer impact, it is very important to continuously improve MTTR. In traditional systems,general guidance for MTTR is less than 30 minutes from problem detection to problem resolution. For
Chapter 1 Introduction
1.3.4 Northbound OSS and BSS Integration
C I S C O C O N F I D E N T I A L
Cloud Service Assurance for VMDC 3.0 DIG, v.1.0
1-6
the cloud system, there is no generally accepted criteria, but expectations are that it will perform atleast no worse than traditional systems.
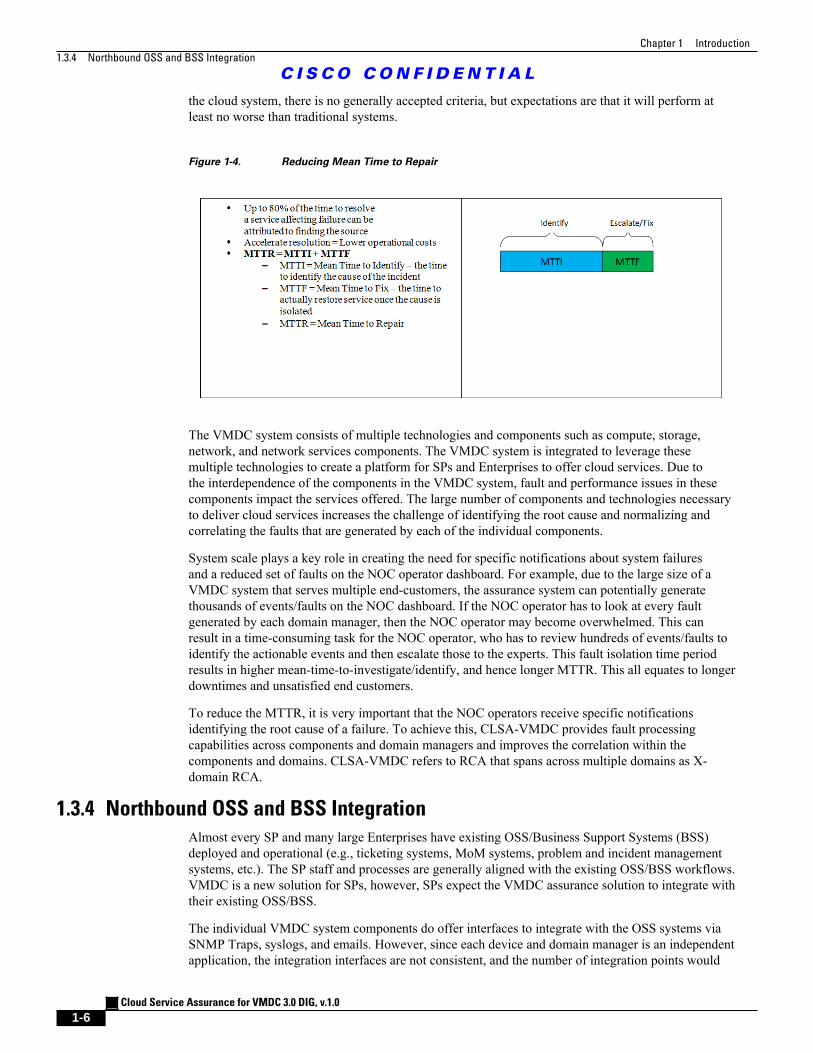
Figure 1-4. Reducing Mean Time to Repair
The VMDC system consists of multiple technologies and components such as compute, storage,network, and network services components. The VMDC system is integrated to leverage thesemultiple technologies to create a platform for SPs and Enterprises to offer cloud services. Due tothe interdependence of the components in the VMDC system, fault and performance issues in thesecomponents impact the services offered. The large number of components and technologies necessaryto deliver cloud services increases the challenge of identifying the root cause and normalizing andcorrelating the faults that are generated by each of the individual components.
System scale plays a key role in creating the need for specific notifications about system failuresand a reduced set of faults on the NOC operator dashboard. For example, due to the large size of aVMDC system that serves multiple end-customers, the assurance system can potentially generatethousands of events/faults on the NOC dashboard. If the NOC operator has to look at every faultgenerated by each domain manager, then the NOC operator may become overwhelmed. This canresult in a time-consuming task for the NOC operator, who has to review hundreds of events/faults toidentify the actionable events and then escalate those to the experts. This fault isolation time periodresults in higher mean-time-to-investigate/identify, and hence longer MTTR. This all equates to longerdowntimes and unsatisfied end customers.
To reduce the MTTR, it is very important that the NOC operators receive specific notificationsidentifying the root cause of a failure. To achieve this, CLSA-VMDC provides fault processingcapabilities across components and domain managers and improves the correlation within thecomponents and domains. CLSA-VMDC refers to RCA that spans across multiple domains as X-domain RCA.
1.3.4 Northbound OSS and BSS Integration
Almost every SP and many large Enterprises have existing OSS/Business Support Systems (BSS)deployed and operational (e.g., ticketing systems, MoM systems, problem and incident managementsystems, etc.). The SP staff and processes are generally aligned with the existing OSS/BSS workflows.VMDC is a new solution for SPs, however, SPs expect the VMDC assurance solution to integrate withtheir existing OSS/BSS.
The individual VMDC system components do offer interfaces to integrate with the OSS systems viaSNMP Traps, syslogs, and emails. However, since each device and domain manager is an independentapplication, the integration interfaces are not consistent, and the number of integration points would
Chapter 1 Introduction
1.4 CLSA-VMDC 3.0 Summary of Changes
C I S C O C O N F I D E N T I A L
Cloud Service Assurance for VMDC 3.0 DIG, v.1.0
1-7
be large (on the order of dozens of interfaces for VMDC system). Although the assurance domainmanager integration northbound with the SP OSS is a one-time task, it needs ongoing maintenance dueto:
• Need for ongoing fine-tuning
• Changes in the underlying system and interfaces (e.g., API changes on southbound devices anddomain managers)
• Deployment of additional instances of domain managers
• Addition of new components and domain managers in future service assurance enhancements
In order to ease the integration of the VMDC system in existing OSS/BSS systems, and thus SPadoption of the VMDC system, the number of integration points between VMDC and the SP's OSS/BSS needs to be reduced. The SP needs to be shielded from all maintenance and changes in theunderlying VMDC system and interfaces unless the change is introducing significant new functionalityto the SP. This can be achieved by providing single normalized interfaces from CLSA-VMDC.
1.4 CLSA-VMDC 3.0 Summary of ChangesCLSA-VMDC 3.0 extends the VMDC assurance solution to provide support for several advancedfeatures and to expand coverage of VMDC device discovery and monitoring. The list below identifiesthe major new features supported in this release:
• Zenoss High Availability Support
• New Zenoss Northbound Service Impact Trap
• New device support for both EMC VMAX and VNX block storage
• Cisco VMDC device families support extended (Nexus, ASA, UCS)
• New Zenoss Sample Tenant Portal
Note CLSA-VMDC version numbering is closely tied to VMDC IaaS releases. As new devices are addedto the VMDC infrastructure, CLSA-VMDC will include new device support for discovery andmonitoring in follow-on releases. Subsequent CLSA-VMDC releases will also continue to enhancesupport for SIA and RCA, expanding coverage out-of-the-box for network infrastructure.
Table 1-1 below lists the document updates associated with these enhancements for ease of reference.
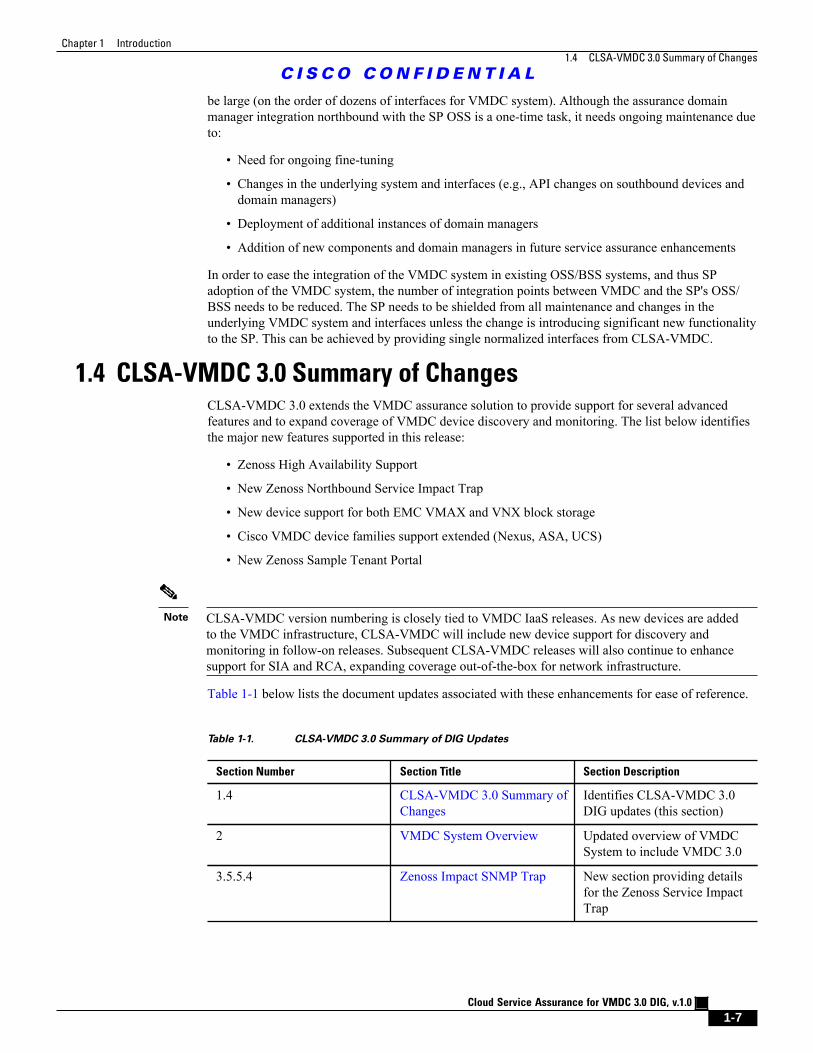
Table 1-1. CLSA-VMDC 3.0 Summary of DIG Updates
Section Number Section Title Section Description
1.4 CLSA-VMDC 3.0 Summary ofChanges
Identifies CLSA-VMDC 3.0DIG updates (this section)
2 VMDC System Overview Updated overview of VMDCSystem to include VMDC 3.0
3.5.5.4 Zenoss Impact SNMP Trap New section providing detailsfor the Zenoss Service ImpactTrap
Chapter 1 Introduction
C I S C O C O N F I D E N T I A L
Cloud Service Assurance for VMDC 3.0 DIG, v.1.0
1-8
Section Number Section Title Section Description
NANA
NA
NANA
NA
NANA
NA
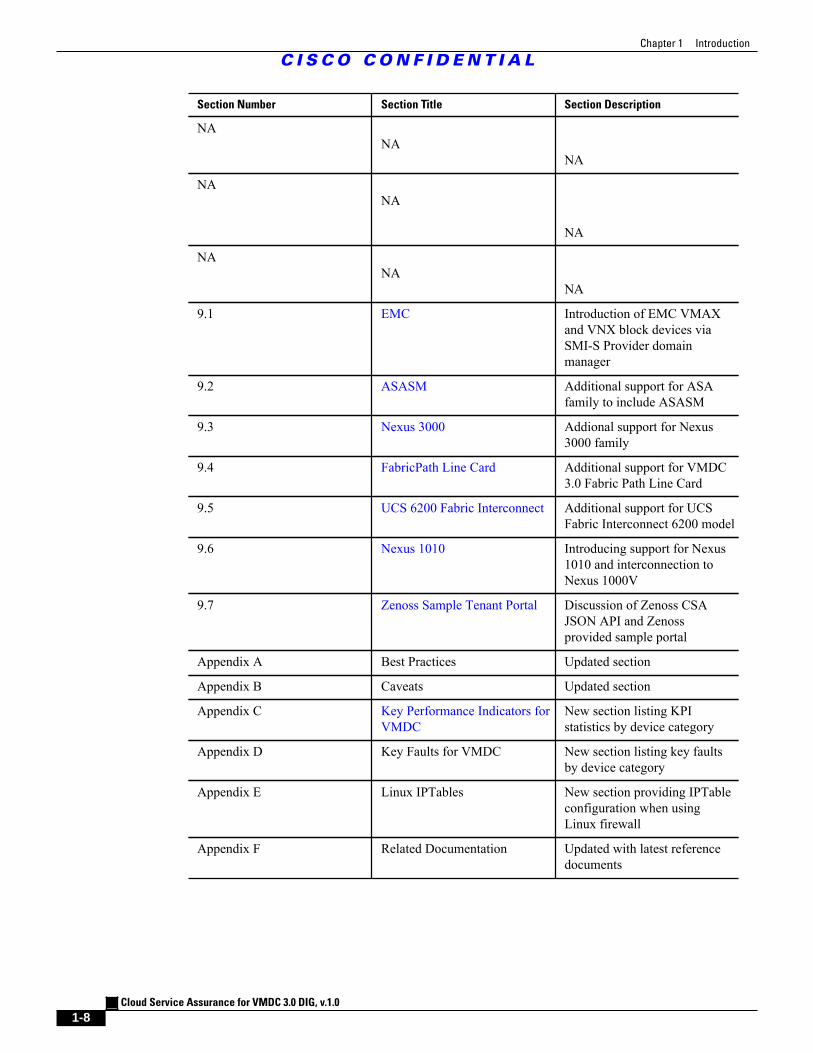
9.1 EMC Introduction of EMC VMAXand VNX block devices viaSMI-S Provider domainmanager
9.2 ASASM Additional support for ASAfamily to include ASASM
9.3 Nexus 3000 Addional support for Nexus3000 family
9.4 FabricPath Line Card Additional support for VMDC3.0 Fabric Path Line Card
9.5 UCS 6200 Fabric Interconnect Additional support for UCSFabric Interconnect 6200 model
9.6 Nexus 1010 Introducing support for Nexus1010 and interconnection toNexus 1000V
9.7 Zenoss Sample Tenant Portal Discussion of Zenoss CSAJSON API and Zenossprovided sample portal
Appendix A Best Practices Updated section
Appendix B Caveats Updated section
Appendix C Key Performance Indicators forVMDC
New section listing KPIstatistics by device category
Appendix D Key Faults for VMDC New section listing key faultsby device category
Appendix E Linux IPTables New section providing IPTableconfiguration when usingLinux firewall
Appendix F Related Documentation Updated with latest referencedocuments
Cloud Service Assurance for VMDC 3.0 DIG, v.1.0
2-1
C I S C O C O N F I D E N T I A L
C H A P T E R 2VMDC System Overview
Cloud Service Assurance for VMDC (CLSA-VMDC) is the service assurance system used to monitorCisco VMDC-based cloud deployments. This chapter provides a brief overview of the VMDC systemand its components.
The VMDC system is the Cisco reference architecture for Infrastructure as a Service (IaaS) clouddeployments. This Cisco IaaS cloud architecture is designed around a set of modular Data Center(DC) components consisting of building blocks of resources called PoDs. A PoD, or Point of Delivery,comprises the Cisco Unified Computing System (UCS), SAN and NAS storage arrays, access(switching) layers, aggregation (switching and routing) layers connecting into the Data Center ServiceNode (DSN)-based services layer, and multiple 10 GE fabric using highly scalable Cisco networkswitches and routers.
The VMDC system is built around the UCS, Nexus 1000V, Nexus 5000 and Nexus 7000 switches,Multilayer Director Switch (MDS), Aggregation Services Router (ASR) 9000, ASR 1000, AdaptiveSecurity Appliance (ASA) 5585-X or Adaptive Security Appliance Services Module (ASASM),Catalyst 6500 DSN, Application Control Engine (ACE), Nexus 1000V, Virtual Security Gateway(VSG), VMware vSphere, EMC VMAX/VNX, and NetApp FAS storage arrays. Cloud serviceorchestration is currently provided by the BMC Cloud Lifecycle Management (CLM) suite, and in thefuture, by Cisco Intelligent Automation for Cloud (CIAC).
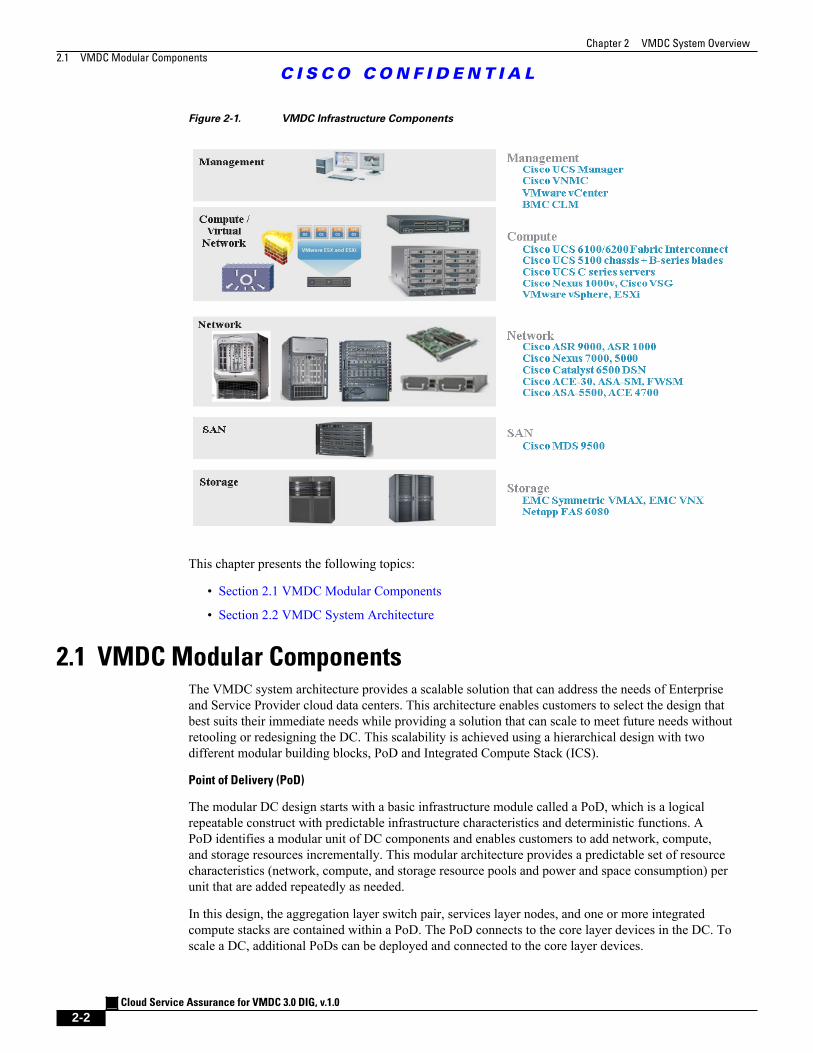
Figure 2-1 provides a synopsis of the functional infrastructure components comprising the VMDCsystem.
Chapter 2 VMDC System Overview
2.1 VMDC Modular Components
C I S C O C O N F I D E N T I A L
Cloud Service Assurance for VMDC 3.0 DIG, v.1.0
2-2
Figure 2-1. VMDC Infrastructure Components
This chapter presents the following topics:
• Section 2.1 VMDC Modular Components
• Section 2.2 VMDC System Architecture
2.1 VMDC Modular ComponentsThe VMDC system architecture provides a scalable solution that can address the needs of Enterpriseand Service Provider cloud data centers. This architecture enables customers to select the design thatbest suits their immediate needs while providing a solution that can scale to meet future needs withoutretooling or redesigning the DC. This scalability is achieved using a hierarchical design with twodifferent modular building blocks, PoD and Integrated Compute Stack (ICS).
Point of Delivery (PoD)
The modular DC design starts with a basic infrastructure module called a PoD, which is a logicalrepeatable construct with predictable infrastructure characteristics and deterministic functions. APoD identifies a modular unit of DC components and enables customers to add network, compute,and storage resources incrementally. This modular architecture provides a predictable set of resourcecharacteristics (network, compute, and storage resource pools and power and space consumption) perunit that are added repeatedly as needed.
In this design, the aggregation layer switch pair, services layer nodes, and one or more integratedcompute stacks are contained within a PoD. The PoD connects to the core layer devices in the DC. Toscale a DC, additional PoDs can be deployed and connected to the core layer devices.
Chapter 2 VMDC System Overview
C I S C O C O N F I D E N T I A L
Cloud Service Assurance for VMDC 3.0 DIG, v.1.0
2-3
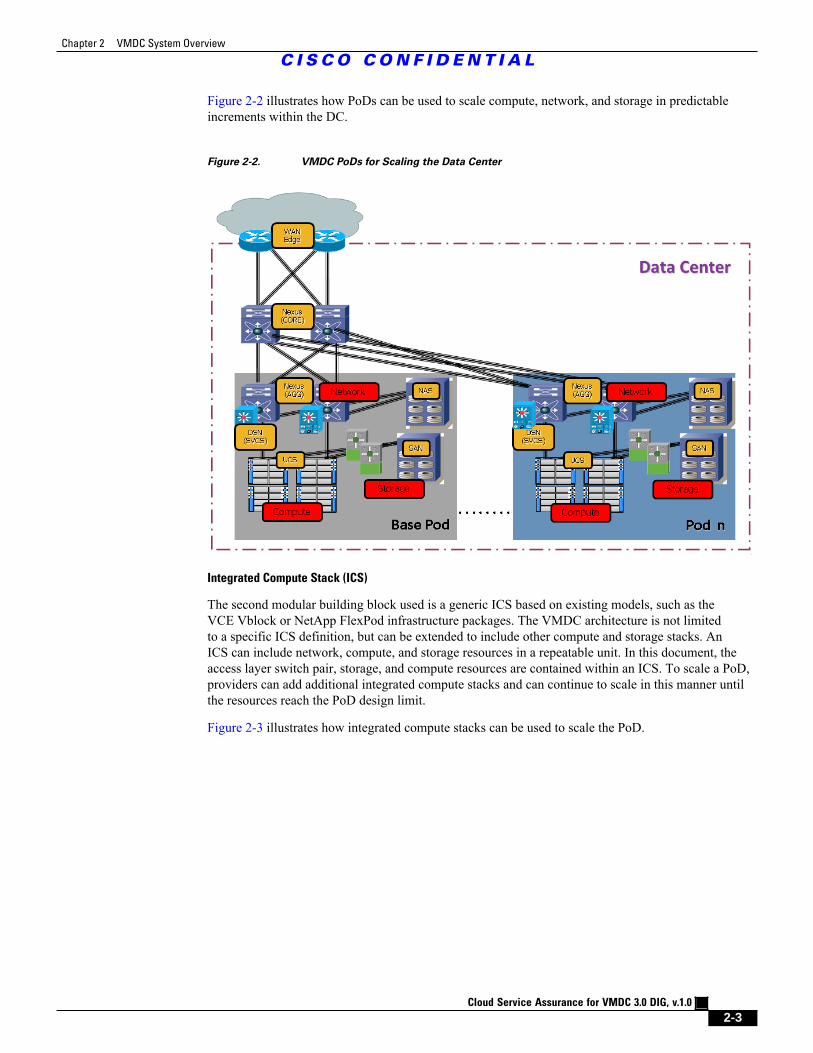
Figure 2-2 illustrates how PoDs can be used to scale compute, network, and storage in predictableincrements within the DC.
Figure 2-2. VMDC PoDs for Scaling the Data Center
Integrated Compute Stack (ICS)
The second modular building block used is a generic ICS based on existing models, such as theVCE Vblock or NetApp FlexPod infrastructure packages. The VMDC architecture is not limitedto a specific ICS definition, but can be extended to include other compute and storage stacks. AnICS can include network, compute, and storage resources in a repeatable unit. In this document, theaccess layer switch pair, storage, and compute resources are contained within an ICS. To scale a PoD,providers can add additional integrated compute stacks and can continue to scale in this manner untilthe resources reach the PoD design limit.
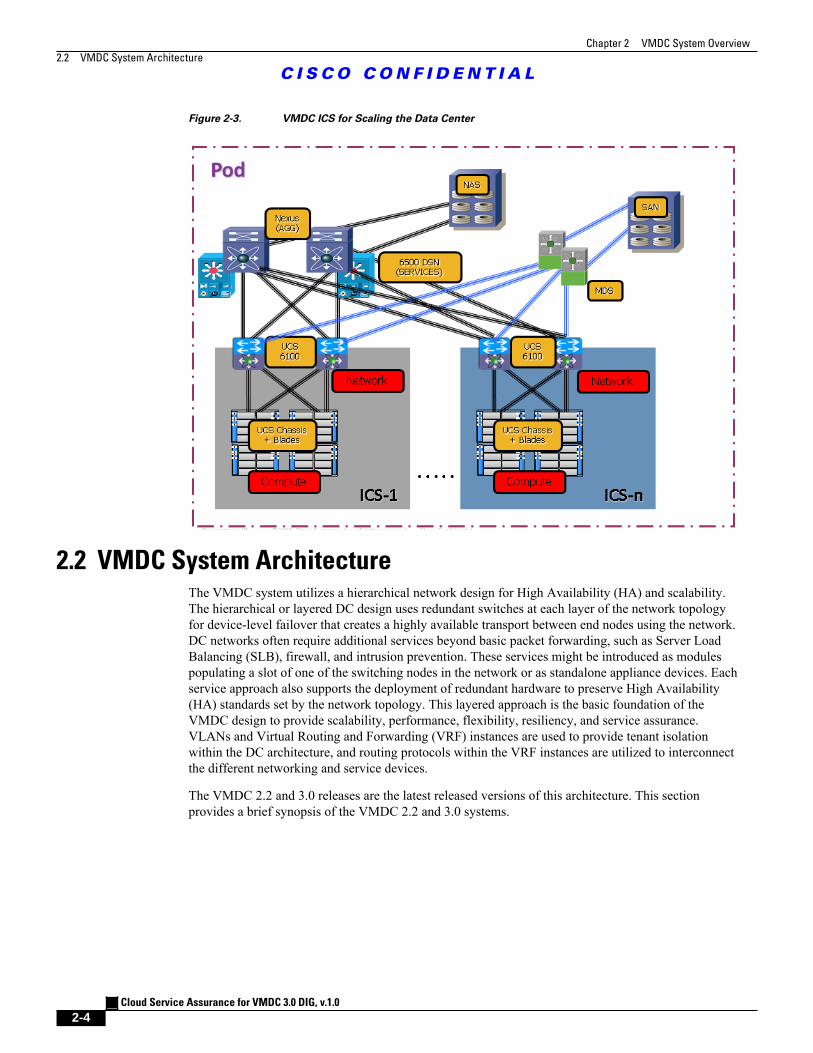
Figure 2-3 illustrates how integrated compute stacks can be used to scale the PoD.
Chapter 2 VMDC System Overview
2.2 VMDC System Architecture
C I S C O C O N F I D E N T I A L
Cloud Service Assurance for VMDC 3.0 DIG, v.1.0
2-4
Figure 2-3. VMDC ICS for Scaling the Data Center
2.2 VMDC System ArchitectureThe VMDC system utilizes a hierarchical network design for High Availability (HA) and scalability.The hierarchical or layered DC design uses redundant switches at each layer of the network topologyfor device-level failover that creates a highly available transport between end nodes using the network.DC networks often require additional services beyond basic packet forwarding, such as Server LoadBalancing (SLB), firewall, and intrusion prevention. These services might be introduced as modulespopulating a slot of one of the switching nodes in the network or as standalone appliance devices. Eachservice approach also supports the deployment of redundant hardware to preserve High Availability(HA) standards set by the network topology. This layered approach is the basic foundation of theVMDC design to provide scalability, performance, flexibility, resiliency, and service assurance.VLANs and Virtual Routing and Forwarding (VRF) instances are used to provide tenant isolationwithin the DC architecture, and routing protocols within the VRF instances are utilized to interconnectthe different networking and service devices.
The VMDC 2.2 and 3.0 releases are the latest released versions of this architecture. This sectionprovides a brief synopsis of the VMDC 2.2 and 3.0 systems.
Chapter 2 VMDC System Overview
C I S C O C O N F I D E N T I A L
Cloud Service Assurance for VMDC 3.0 DIG, v.1.0
2-5
Note For detailed information on the VMDC 2.2 system architecture, refer to the following documents:
• VMDC 2.2 Design Guide
• VMDC 2.2 Implementation Guide
For detailed information on the VMDC 3.0 system architecture, refer to the followingdocuments:
• VMDC 3.0 Design Guide
• VMDC 3.0 Implementation Guide
Information on previous VMDC system releases can be found at VMDC System Releases.
Note While this CLSA-VMDC Design and Implementation Guide (DIG) references the VMDC 2.2 and 3.0systems, previous versions of the VMDC system are also supported. The CLSA-VMDC system alsosupports other DC designs, as well as the VCE Vblock and NetApp FlexPod stacks.
Both the VMDC 2.2 and 3.0 systems utilize a hierarchical multi-tenant DC architecture based onVRF-Lite, with VRF instances and VLANs to provide secure separation between tenants. Besidesscalability, platform, and tenancy model differences, the VMDC 2.2 and 3.0 systems also differin the Layer 2 (L2) technologies utilized within the PoD to provide redundancy and multi-pathingcapabilities.
VMDC 2.2
The VMDC 2.2 architecture utilizes a Virtual Port-Channel (vPC) on the Nexus 7000 and Nexus 5000switches to provide link and chassis redundancy capabilities. Downstream switches (like the UCS6100/6200 Fabric Interconnect and the Catalyst 6500 DSN) dual connect to a pair of Nexus 7000aggregation switches, and the individual cross links across the chassis are bundled into a vPC link.The vPC across the chassis protects against any individual link or chassis failures and also providesL2 multi-pathing across the link members to provide higher aggregated bandwidths. In this design,the Nexus 7000 is utilized as the aggregation switch, while the Nexus 5000 and UCS 6100/6200 act asaccess switches. Only M1 (or M2) linecards are needed on the Nexus 7000 switches in this design.
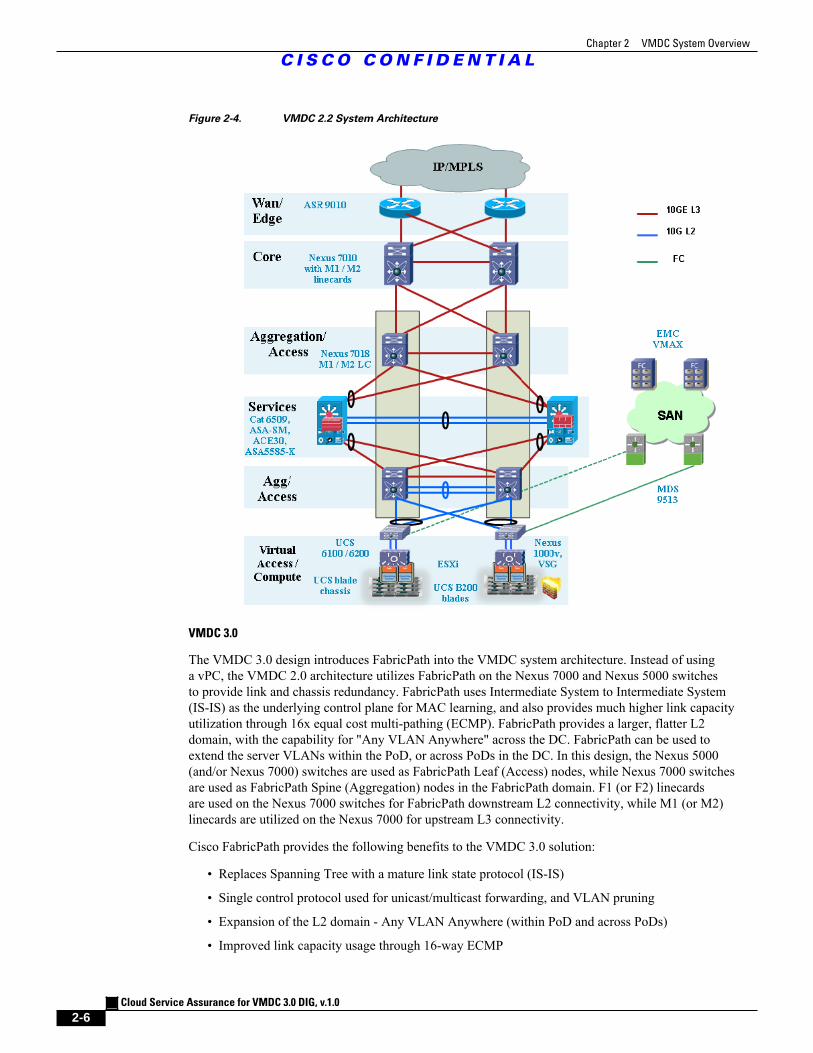
This multi-layered VMDC architecture is comprised of core, aggregation, services, and access layers.This architecture allows for DC modules to be added as demand and load increases. It also providesthe flexibility to create different logical topologies utilizing device virtualization, the insertion ofservice devices, and traditional Layer 3 (L3) and L2 network configurations. Figure 2-4 provides alogical representation of the VMDC 2.2 architecture, with the services layer comprised of the Catalyst6500 DSN, ACE30, and ASASM (or ASA 5585-X).
Chapter 2 VMDC System Overview
C I S C O C O N F I D E N T I A L
Cloud Service Assurance for VMDC 3.0 DIG, v.1.0
2-6
Figure 2-4. VMDC 2.2 System Architecture
VMDC 3.0
The VMDC 3.0 design introduces FabricPath into the VMDC system architecture. Instead of usinga vPC, the VMDC 2.0 architecture utilizes FabricPath on the Nexus 7000 and Nexus 5000 switchesto provide link and chassis redundancy. FabricPath uses Intermediate System to Intermediate System(IS-IS) as the underlying control plane for MAC learning, and also provides much higher link capacityutilization through 16x equal cost multi-pathing (ECMP). FabricPath provides a larger, flatter L2domain, with the capability for "Any VLAN Anywhere" across the DC. FabricPath can be used toextend the server VLANs within the PoD, or across PoDs in the DC. In this design, the Nexus 5000(and/or Nexus 7000) switches are used as FabricPath Leaf (Access) nodes, while Nexus 7000 switchesare used as FabricPath Spine (Aggregation) nodes in the FabricPath domain. F1 (or F2) linecardsare used on the Nexus 7000 switches for FabricPath downstream L2 connectivity, while M1 (or M2)linecards are utilized on the Nexus 7000 for upstream L3 connectivity.
Cisco FabricPath provides the following benefits to the VMDC 3.0 solution:
• Replaces Spanning Tree with a mature link state protocol (IS-IS)
• Single control protocol used for unicast/multicast forwarding, and VLAN pruning
• Expansion of the L2 domain - Any VLAN Anywhere (within PoD and across PoDs)
• Improved link capacity usage through 16-way ECMP
Chapter 2 VMDC System Overview
C I S C O C O N F I D E N T I A L
Cloud Service Assurance for VMDC 3.0 DIG, v.1.0
2-7
• Improved convergence time
• Easy expansion - add additional access or spine nodes in plug-n-play manner
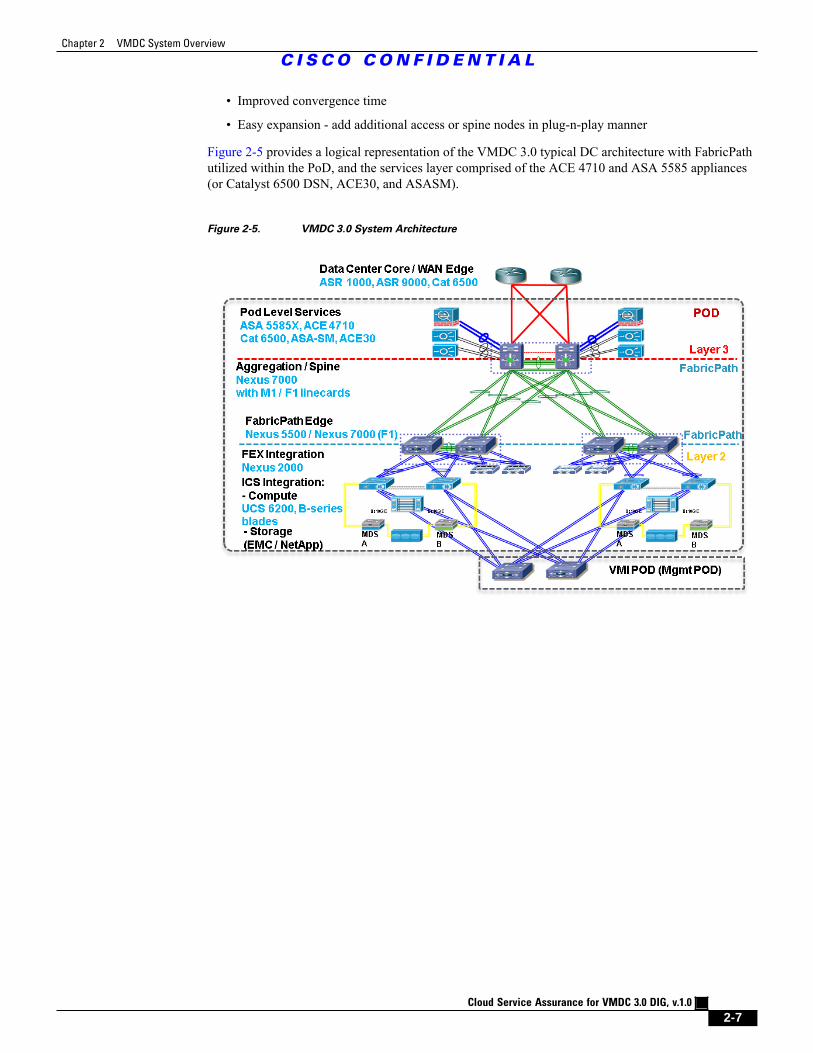
Figure 2-5 provides a logical representation of the VMDC 3.0 typical DC architecture with FabricPathutilized within the PoD, and the services layer comprised of the ACE 4710 and ASA 5585 appliances(or Catalyst 6500 DSN, ACE30, and ASASM).
Figure 2-5. VMDC 3.0 System Architecture
Chapter 2 VMDC System Overview
C I S C O C O N F I D E N T I A L
Cloud Service Assurance for VMDC 3.0 DIG, v.1.0
2-8
Cloud Service Assurance for VMDC 3.0 DIG, v.1.0
3-1
C I S C O C O N F I D E N T I A L
C H A P T E R 3CLSA-VMDC System Architecture
This chapter provides an overview of the Cloud Service Assurance for VMDC (CLSA-VMDC) systemarchitecture.
• Section 3.1 Functional View and Section 3.2 Component View provide the functional andcomponent views of the CLSA-VMDC system architecture.
• Section 3.3 System Components defines the components and interfaces used to deliver thesystem functions.
• Section 3.4 Monitored Components and Services lists the VMDC devices that are monitored byCLSA-VMDC.
• Section 3.5 Key Functions defines the functions of the new architecture.
3.1 Functional ViewFigure 3-1 illustrates the functional framework for CLSA-VMDC. This functionality is deliveredwith one or more of the integrated products/components. In CLSA-VMDC, only a subset of thisfunctionality is available. This section defines the functional layers of this architecture and identifiesthe layers that are available in CLSA-VMDC.
Chapter 3 CLSA-VMDC System Architecture
C I S C O C O N F I D E N T I A L
Cloud Service Assurance for VMDC 3.0 DIG, v.1.0
3-2
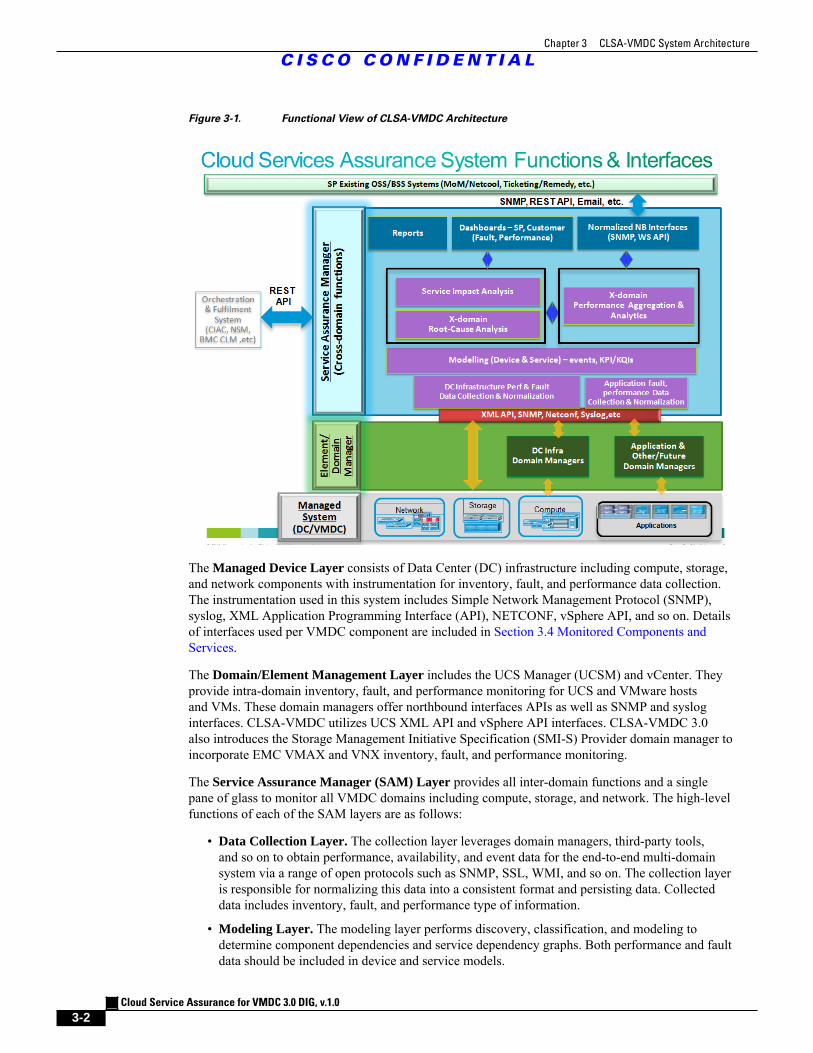
Figure 3-1. Functional View of CLSA-VMDC Architecture
The Managed Device Layer consists of Data Center (DC) infrastructure including compute, storage,and network components with instrumentation for inventory, fault, and performance data collection.The instrumentation used in this system includes Simple Network Management Protocol (SNMP),syslog, XML Application Programming Interface (API), NETCONF, vSphere API, and so on. Detailsof interfaces used per VMDC component are included in Section 3.4 Monitored Components andServices.
The Domain/Element Management Layer includes the UCS Manager (UCSM) and vCenter. Theyprovide intra-domain inventory, fault, and performance monitoring for UCS and VMware hostsand VMs. These domain managers offer northbound interfaces APIs as well as SNMP and sysloginterfaces. CLSA-VMDC utilizes UCS XML API and vSphere API interfaces. CLSA-VMDC 3.0also introduces the Storage Management Initiative Specification (SMI-S) Provider domain manager toincorporate EMC VMAX and VNX inventory, fault, and performance monitoring.
The Service Assurance Manager (SAM) Layer provides all inter-domain functions and a singlepane of glass to monitor all VMDC domains including compute, storage, and network. The high-levelfunctions of each of the SAM layers are as follows:
• Data Collection Layer. The collection layer leverages domain managers, third-party tools,and so on to obtain performance, availability, and event data for the end-to-end multi-domainsystem via a range of open protocols such as SNMP, SSL, WMI, and so on. The collection layeris responsible for normalizing this data into a consistent format and persisting data. Collecteddata includes inventory, fault, and performance type of information.
• Modeling Layer. The modeling layer performs discovery, classification, and modeling todetermine component dependencies and service dependency graphs. Both performance and faultdata should be included in device and service models.
Chapter 3 CLSA-VMDC System Architecture
3.2 Component View
C I S C O C O N F I D E N T I A L
Cloud Service Assurance for VMDC 3.0 DIG, v.1.0
3-3
• Service Model-based Technology. CLSA-VMDC uses service model-based technology whichis described in more detail in Section 3.5.4 Root Cause Analysis and Service Impact Analysisand Section 4 Zenoss Cloud Service Assurance Overview.
• Root Cause Analysis (RCA). Leverages the dependency graph or analytics algorithms todetermine which events are the probable root cause of the problem and which ones are justconsequences that create noise. Therefore, RCA reduces Mean Time to Repair (MTTR). Thereare a number of different approaches to RCA, but most of them can be classified in one of thefollowing technologies:
1. Event correlation rules-based
2. Topology and service model-based
3. Analytics based
• Service-Impact Analysis (SIA). Leverages the dependency graph or analytics algorithms andcollects fault and performance data to do the following:
– Answer who is impacted by the failures
– Prioritize urgency of failure tickets based on business relevance
– Determine whether redundancy protected the service
– Identify failure impacted customers/tenants
– Prevent future failures by identifying potential service impacting technical risks before theyimpact service
– Provide data for SLA measurements and reporting
• Performance Aggregation Layer. This layer aggregates performance data from multipledomains (e.g, storage, network, compute for VMDC), normalizes it in the same format and units,provides threshold crossing alerts to the fault management part of the SAM, trends the data overtime, and in some cases, performs additional analysis of the data.
• Presentation Layer. The presentation layer provides a single view to do both fault andperformance monitoring for the entire system. Presentation is done both via dashboards andreports. CLSA-VMDC includes SP dashboards for both fault and performance.
• Northbound Interface. The Northbound Interface (NBI) is a special form of the presentationlayer where normalized and enriched data is presented to northbound OSS/BSS systems via openinterfaces such as WS API, SNMP, and email.
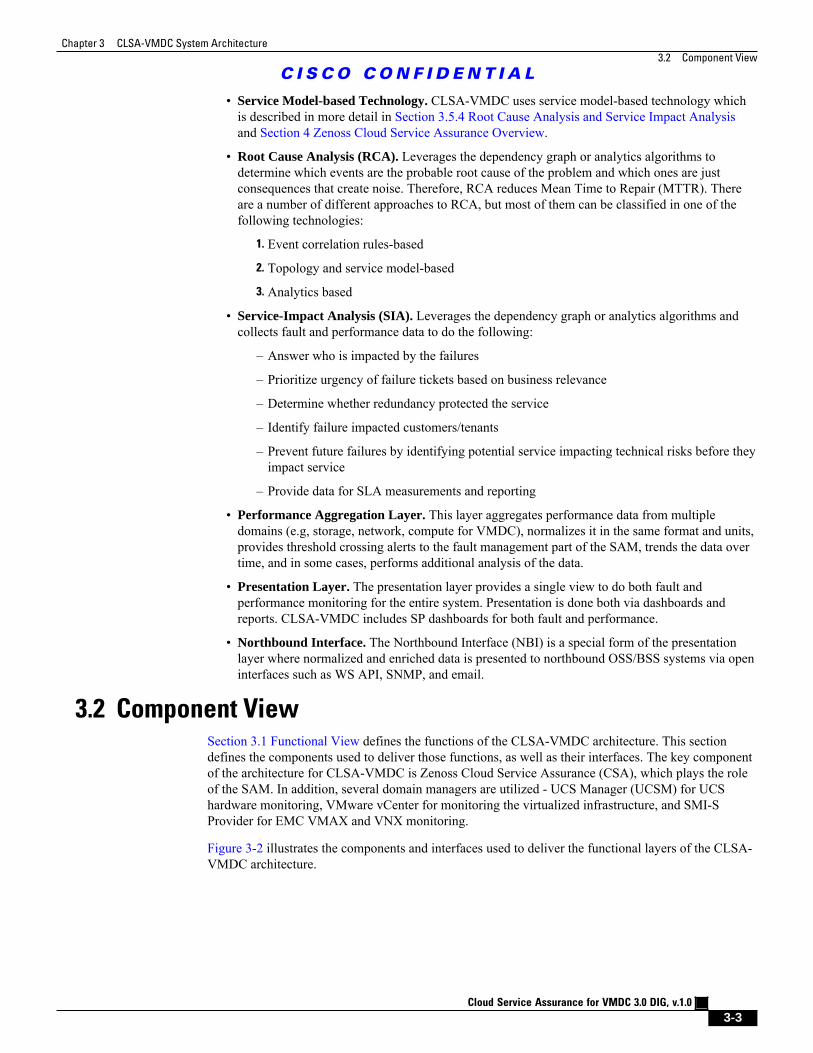
3.2 Component ViewSection 3.1 Functional View defines the functions of the CLSA-VMDC architecture. This sectiondefines the components used to deliver those functions, as well as their interfaces. The key componentof the architecture for CLSA-VMDC is Zenoss Cloud Service Assurance (CSA), which plays the roleof the SAM. In addition, several domain managers are utilized - UCS Manager (UCSM) for UCShardware monitoring, VMware vCenter for monitoring the virtualized infrastructure, and SMI-SProvider for EMC VMAX and VNX monitoring.
Figure 3-2 illustrates the components and interfaces used to deliver the functional layers of the CLSA-VMDC architecture.
Chapter 3 CLSA-VMDC System Architecture
3.3 System Components
C I S C O C O N F I D E N T I A L
Cloud Service Assurance for VMDC 3.0 DIG, v.1.0
3-4
Figure 3-2. Component View of CLSA-VMDC Architecture
Key system interfaces include:
• Southbound interface instrumentation to collect data from managed system devices.
• Northbound interface to integrate with OSS/BSS systems such Manager-of-Managers (MoM)(e.g., IBM Netcool), ticketing systems (e.g., Remedy) and so on. The interfaces available fromCLSA-VMDC are SNMP, JSON API, email, page, commands, and Advanced Message QueuingProtocol (AMQP).
• CLSA-VMDC offers the JSON API interface for integration with orchestration and fulfillmentsystems.
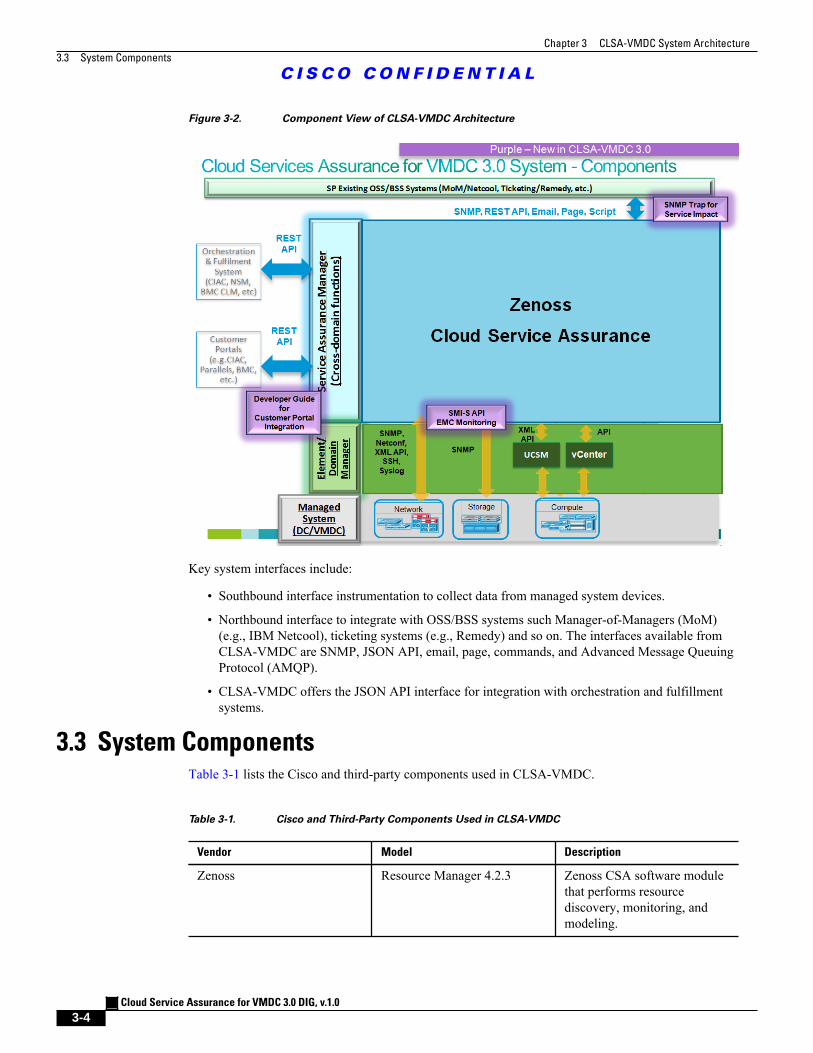
3.3 System ComponentsTable 3-1 lists the Cisco and third-party components used in CLSA-VMDC.
Table 3-1. Cisco and Third-Party Components Used in CLSA-VMDC
Vendor Model Description
Zenoss Resource Manager 4.2.3 Zenoss CSA software modulethat performs resourcediscovery, monitoring, andmodeling.
Chapter 3 CLSA-VMDC System Architecture
3.4 Monitored Components and Services
C I S C O C O N F I D E N T I A L
Cloud Service Assurance for VMDC 3.0 DIG, v.1.0
3-5
Vendor Model Description
Zenoss Impact 4.2.3 Zenoss CSA software modulethat performs service impactdiscovery and analysis.
Zenoss Analytics 4.2.3 Zenoss CSA software modulethat performs long term datatrending, processing, andreporting.
vCenter vCenter 5.0 Domain manager for VMwarebased virtualization
Cisco UCSM 2.0 Domain manager for UCSplatform
EMC SMI-S Provider 4.4.0.1 Domain manager for EMCVMAX and VNX platforms
Note The Zenoss software modules are packaged together as Zenoss CSA 4.2.3.
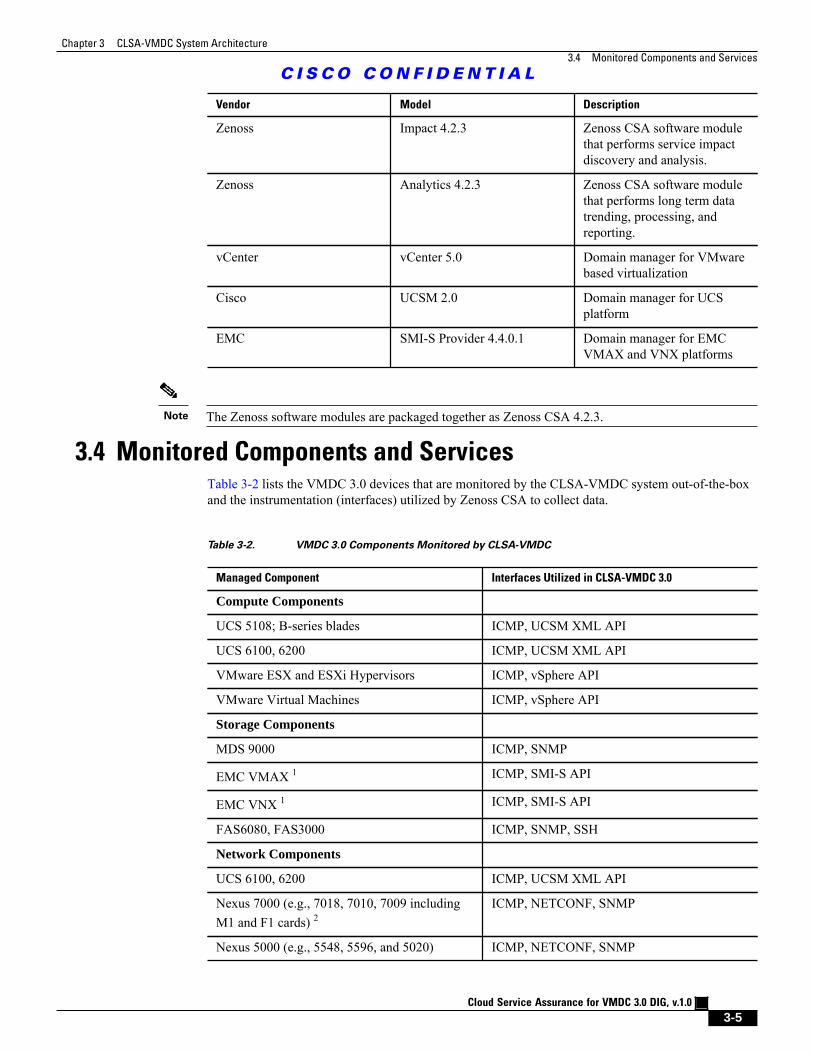
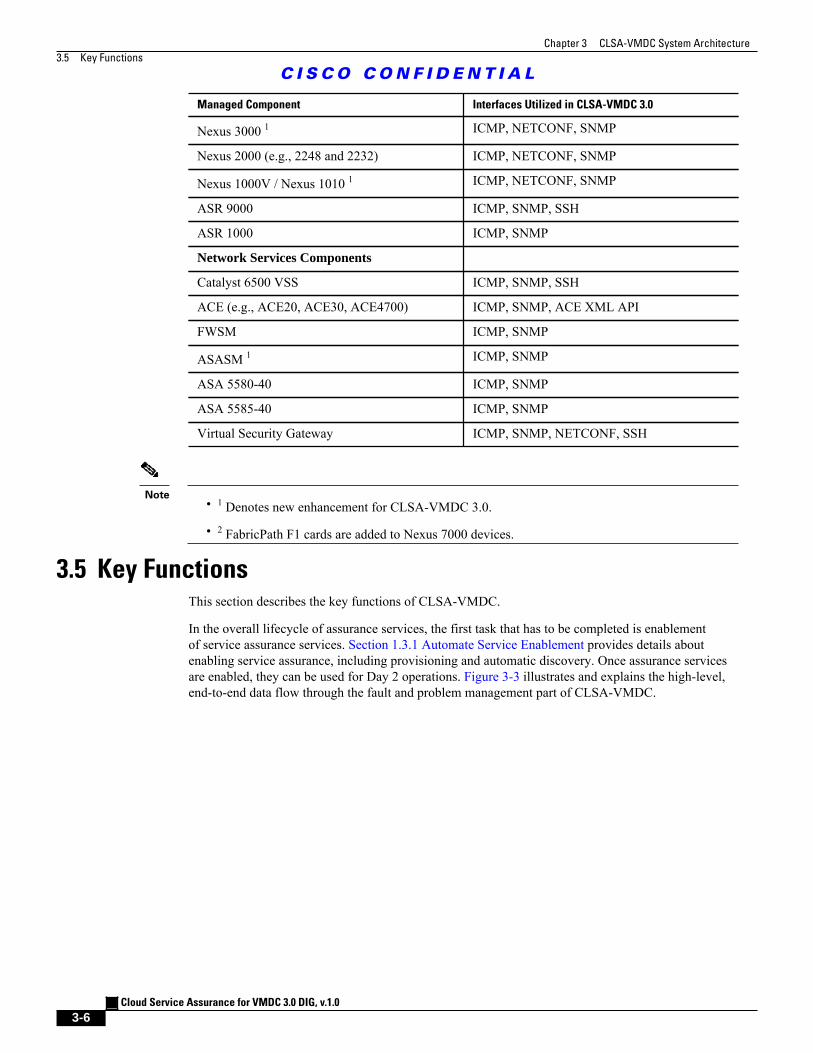
3.4 Monitored Components and ServicesTable 3-2 lists the VMDC 3.0 devices that are monitored by the CLSA-VMDC system out-of-the-boxand the instrumentation (interfaces) utilized by Zenoss CSA to collect data.
Table 3-2. VMDC 3.0 Components Monitored by CLSA-VMDC
Managed Component Interfaces Utilized in CLSA-VMDC 3.0
Compute Components
UCS 5108; B-series blades ICMP, UCSM XML API
UCS 6100, 6200 ICMP, UCSM XML API
VMware ESX and ESXi Hypervisors ICMP, vSphere API
VMware Virtual Machines ICMP, vSphere API
Storage Components
MDS 9000 ICMP, SNMP
EMC VMAX 1 ICMP, SMI-S API
EMC VNX 1 ICMP, SMI-S API
FAS6080, FAS3000 ICMP, SNMP, SSH
Network Components
UCS 6100, 6200 ICMP, UCSM XML API
Nexus 7000 (e.g., 7018, 7010, 7009 includingM1 and F1 cards) 2
ICMP, NETCONF, SNMP
Nexus 5000 (e.g., 5548, 5596, and 5020) ICMP, NETCONF, SNMP
Chapter 3 CLSA-VMDC System Architecture
3.5 Key Functions
C I S C O C O N F I D E N T I A L
Cloud Service Assurance for VMDC 3.0 DIG, v.1.0
3-6
Managed Component Interfaces Utilized in CLSA-VMDC 3.0
Nexus 3000 1 ICMP, NETCONF, SNMP
Nexus 2000 (e.g., 2248 and 2232) ICMP, NETCONF, SNMP
Nexus 1000V / Nexus 1010 1 ICMP, NETCONF, SNMP
ASR 9000 ICMP, SNMP, SSH
ASR 1000 ICMP, SNMP
Network Services Components
Catalyst 6500 VSS ICMP, SNMP, SSH
ACE (e.g., ACE20, ACE30, ACE4700) ICMP, SNMP, ACE XML API
FWSM ICMP, SNMP
ASASM 1 ICMP, SNMP
ASA 5580-40 ICMP, SNMP
ASA 5585-40 ICMP, SNMP
Virtual Security Gateway ICMP, SNMP, NETCONF, SSH
Note • 1 Denotes new enhancement for CLSA-VMDC 3.0.
• 2 FabricPath F1 cards are added to Nexus 7000 devices.
3.5 Key FunctionsThis section describes the key functions of CLSA-VMDC.
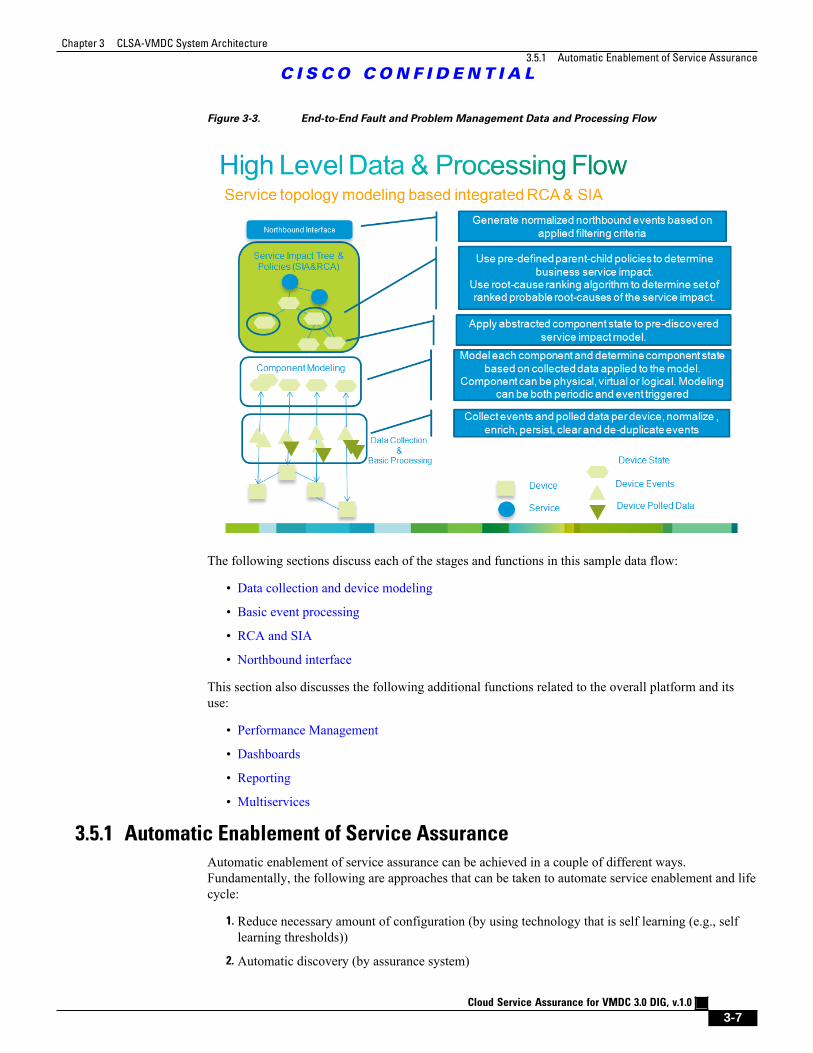
In the overall lifecycle of assurance services, the first task that has to be completed is enablementof service assurance services. Section 1.3.1 Automate Service Enablement provides details aboutenabling service assurance, including provisioning and automatic discovery. Once assurance servicesare enabled, they can be used for Day 2 operations. Figure 3-3 illustrates and explains the high-level,end-to-end data flow through the fault and problem management part of CLSA-VMDC.
Chapter 3 CLSA-VMDC System Architecture
3.5.1 Automatic Enablement of Service Assurance
C I S C O C O N F I D E N T I A L
Cloud Service Assurance for VMDC 3.0 DIG, v.1.0
3-7
Figure 3-3. End-to-End Fault and Problem Management Data and Processing Flow
The following sections discuss each of the stages and functions in this sample data flow:
• Data collection and device modeling
• Basic event processing
• RCA and SIA
• Northbound interface
This section also discusses the following additional functions related to the overall platform and itsuse:
• Performance Management
• Dashboards
• Reporting
• Multiservices
3.5.1 Automatic Enablement of Service Assurance
Automatic enablement of service assurance can be achieved in a couple of different ways.Fundamentally, the following are approaches that can be taken to automate service enablement and lifecycle:
1. Reduce necessary amount of configuration (by using technology that is self learning (e.g., selflearning thresholds))
2. Automatic discovery (by assurance system)
Chapter 3 CLSA-VMDC System Architecture
3.5.1.1 Automatic Discovery
C I S C O C O N F I D E N T I A L
Cloud Service Assurance for VMDC 3.0 DIG, v.1.0
3-8
3. Programmatic orchestrated provisioning (via integration with orchestration system)
CLSA-VMDC focuses on automatic discovery. CLSA-VMDC also provide APIs for programmaticorchestrated provisioning, but they are not integrated or validated with any particular orchestrationsystem. Automatic discovery and APIs are discussed in the following sections.
3.5.1.1 Automatic Discovery
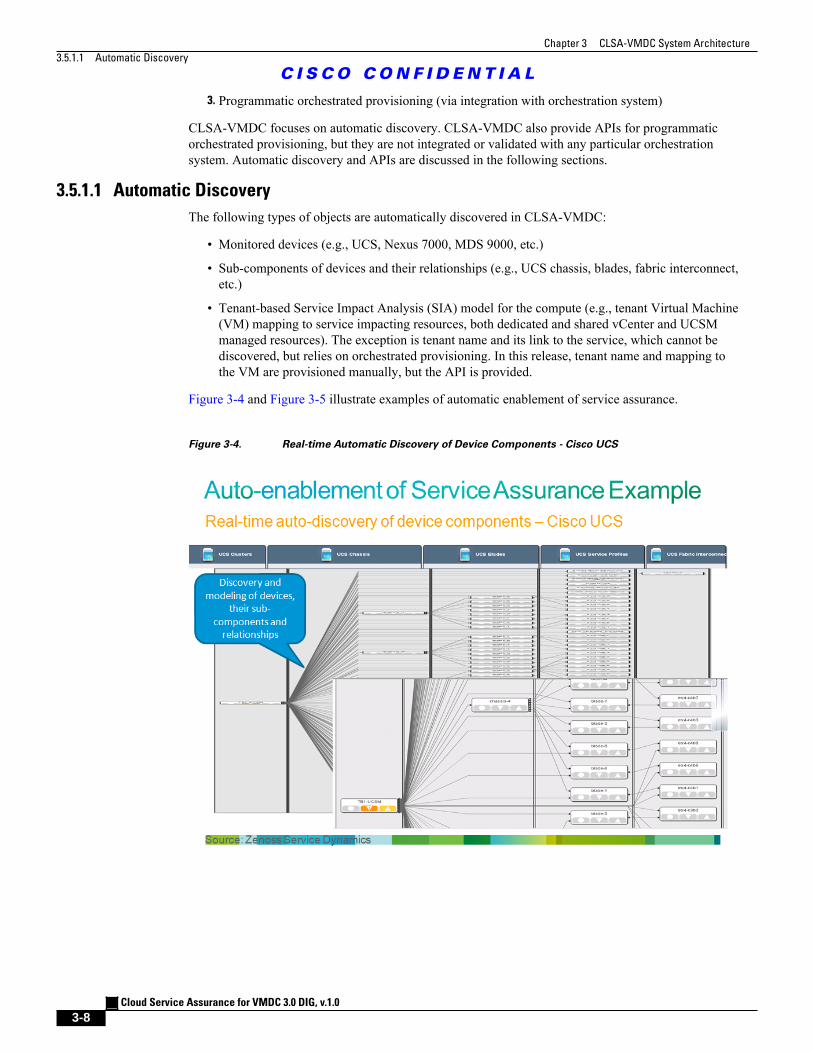
The following types of objects are automatically discovered in CLSA-VMDC:
• Monitored devices (e.g., UCS, Nexus 7000, MDS 9000, etc.)
• Sub-components of devices and their relationships (e.g., UCS chassis, blades, fabric interconnect,etc.)
• Tenant-based Service Impact Analysis (SIA) model for the compute (e.g., tenant Virtual Machine(VM) mapping to service impacting resources, both dedicated and shared vCenter and UCSMmanaged resources). The exception is tenant name and its link to the service, which cannot bediscovered, but relies on orchestrated provisioning. In this release, tenant name and mapping tothe VM are provisioned manually, but the API is provided.
Figure 3-4 and Figure 3-5 illustrate examples of automatic enablement of service assurance.
Figure 3-4. Real-time Automatic Discovery of Device Components - Cisco UCS
Chapter 3 CLSA-VMDC System Architecture
3.5.1.2 Zenoss APIs for Programmatic Provisioning
C I S C O C O N F I D E N T I A L
Cloud Service Assurance for VMDC 3.0 DIG, v.1.0
3-9
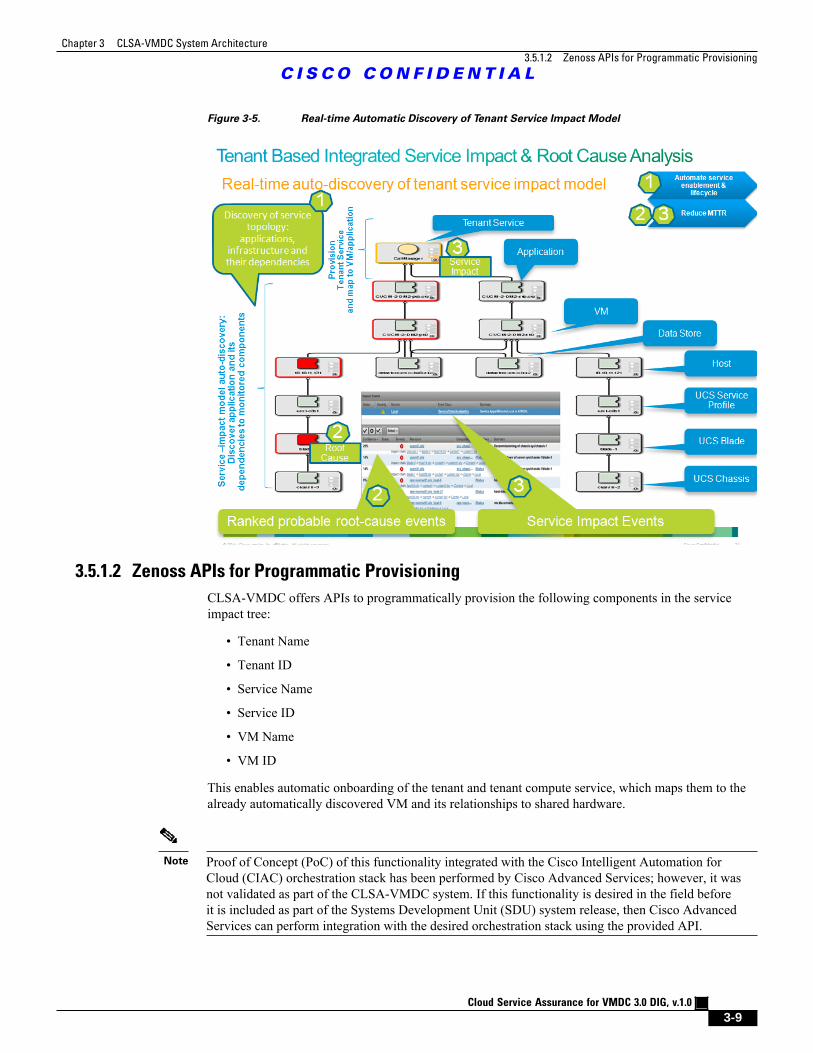
Figure 3-5. Real-time Automatic Discovery of Tenant Service Impact Model
3.5.1.2 Zenoss APIs for Programmatic Provisioning
CLSA-VMDC offers APIs to programmatically provision the following components in the serviceimpact tree:
• Tenant Name
• Tenant ID
• Service Name
• Service ID
• VM Name
• VM ID
This enables automatic onboarding of the tenant and tenant compute service, which maps them to thealready automatically discovered VM and its relationships to shared hardware.
Note Proof of Concept (PoC) of this functionality integrated with the Cisco Intelligent Automation forCloud (CIAC) orchestration stack has been performed by Cisco Advanced Services; however, it wasnot validated as part of the CLSA-VMDC system. If this functionality is desired in the field beforeit is included as part of the Systems Development Unit (SDU) system release, then Cisco AdvancedServices can perform integration with the desired orchestration stack using the provided API.
Chapter 3 CLSA-VMDC System Architecture
3.5.2 Fault Performance, Configuration Data Collection, and Device Modeling
C I S C O C O N F I D E N T I A L
Cloud Service Assurance for VMDC 3.0 DIG, v.1.0
3-10
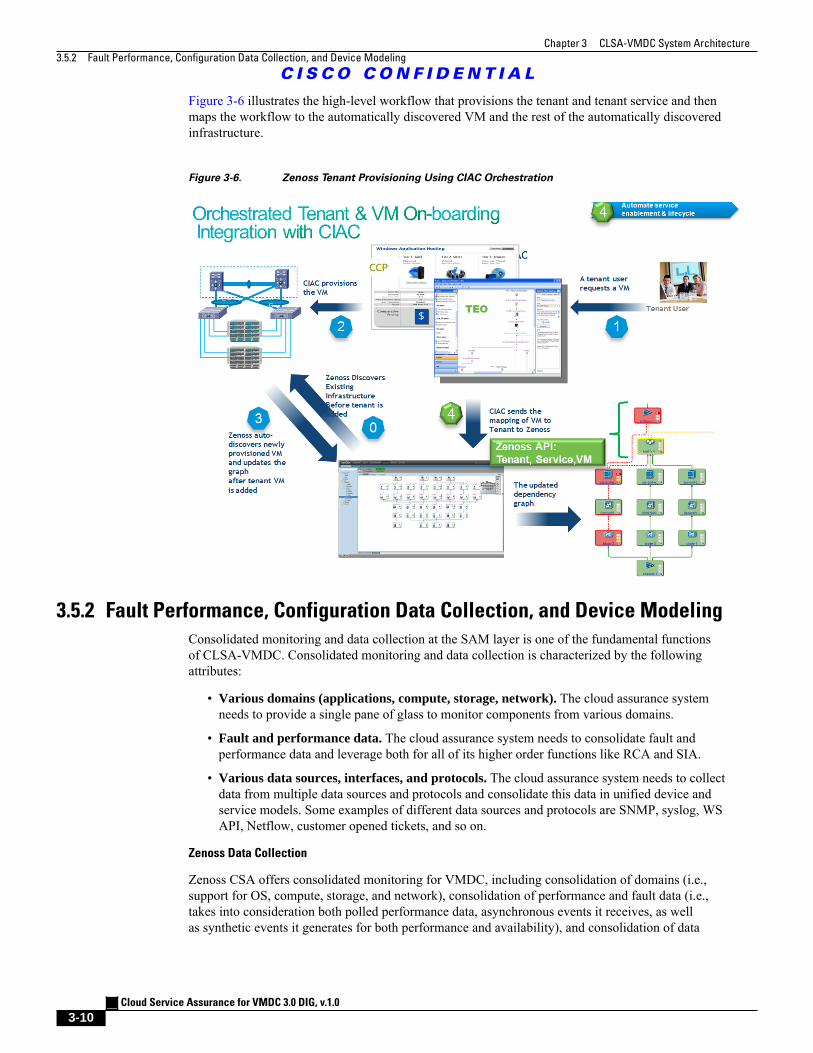
Figure 3-6 illustrates the high-level workflow that provisions the tenant and tenant service and thenmaps the workflow to the automatically discovered VM and the rest of the automatically discoveredinfrastructure.
Figure 3-6. Zenoss Tenant Provisioning Using CIAC Orchestration
3.5.2 Fault Performance, Configuration Data Collection, and Device Modeling
Consolidated monitoring and data collection at the SAM layer is one of the fundamental functionsof CLSA-VMDC. Consolidated monitoring and data collection is characterized by the followingattributes:
• Various domains (applications, compute, storage, network). The cloud assurance systemneeds to provide a single pane of glass to monitor components from various domains.
• Fault and performance data. The cloud assurance system needs to consolidate fault andperformance data and leverage both for all of its higher order functions like RCA and SIA.
• Various data sources, interfaces, and protocols. The cloud assurance system needs to collectdata from multiple data sources and protocols and consolidate this data in unified device andservice models. Some examples of different data sources and protocols are SNMP, syslog, WSAPI, Netflow, customer opened tickets, and so on.
Zenoss Data Collection
Zenoss CSA offers consolidated monitoring for VMDC, including consolidation of domains (i.e.,support for OS, compute, storage, and network), consolidation of performance and fault data (i.e.,takes into consideration both polled performance data, asynchronous events it receives, as wellas synthetic events it generates for both performance and availability), and consolidation of data
Chapter 3 CLSA-VMDC System Architecture
C I S C O C O N F I D E N T I A L
Cloud Service Assurance for VMDC 3.0 DIG, v.1.0
3-11
sources (i.e., device monitoring models utilize multiple data sources such as SNMP, syslog, API, andconsolidate it within unified device model).
Zenoss CSA uses an agentless data collection approach, which is critical for the type of scale expectedin cloud systems. Instead of installing an agent on monitored devices, Zenoss supports a rich set ofprotocols to enable data collection. A list of protocols used for data collection from VMDC devices isincluded in Section 3.4 Monitored Components and Services. The following is a more comprehensivelist of data collection interfaces that the Zenoss CSA platform supports:
Event input:
• SNMP
• Syslog
• XML Remote Procedure Call (RPC)
• JavaScript Object Notation (JSON)/API
• AMQP
• Windows Event Log
Easily configurable protocol usage:
• Secure Shell (SSH)
• Java Management Extensions (JMX)
• Windows Management Instrumentation (WMI)
• Perfmon
• Any script that returns data in a known format (such as Nagios)
Other collection mechanisms (model/performance/event data):
• Internet Control Message Protocol (ICMP)
• Telnet
• JMX
• Hypertext Transfer Protocol (HTTP) - Web Transactions
• Oracle
• Structured Query Language (SQL) Server
• MySQL
• Apache (mod_status)
• memcache
• Splunk Queries
• Simple Mail Transfer Protocol (SMTP)
• Post Office Protocol (POP)
• UCSM XML API
• vSphere Simple Object Access Protocol (SOAP) API
• vCloud Director
• Amazon EC2 and CloudWatch
• Cisco CallManager (AXL)
Chapter 3 CLSA-VMDC System Architecture
C I S C O C O N F I D E N T I A L
Cloud Service Assurance for VMDC 3.0 DIG, v.1.0
3-12
• Domain Name System (DNS)
• Lightweight Directory Access Protocol (LDAP)
• Network Time Protocol (NTP)
• File Transfer Protocol (FTP)
• Internet Relay Chat (IRC)
• Extensible Messaging and Presence Protocol (XMPP)
• Remote Procedure Call (RPC)
• Network News Transfer Protocol (NNTP)
Zenoss Device Modeling
Device modeling in Zenoss goes beyond traditional device discovery; it also uses standardManagement Information Bases (MIBs) to discover interesting aspects of the device and automaticallydefines models for that device type. Once modeled, these learned attributes can be inherited as part ofthe model when a new device of the same type is discovered again. The information below describesvarious attributes of the Zenoss device modeling process.
Initial Zenoss Model (plugins):
• Interfaces to access device and objects of interest (KPI statistics, events, thresholds, etc.) arestatically defined
• Models are assigned to a device class
Device Modeling:
• During individual device discovery, all modeler plug-ins for the device class are automaticallyconsidered, and a model per instance of the device is created.
• After discovery modeling, monitoring and event processing automatically starts.
Device Remodeling:
• Model per device instance can dynamically change in response to events (e.g., blade removed,etc.)
• ZenModelerDeamon - per collector configuration happens every 12 hours
• ZenVMwareDeamon (exception for VMware and remodels every 4 hours)
• List of events that trigger remodeling is configurable (default set exists)
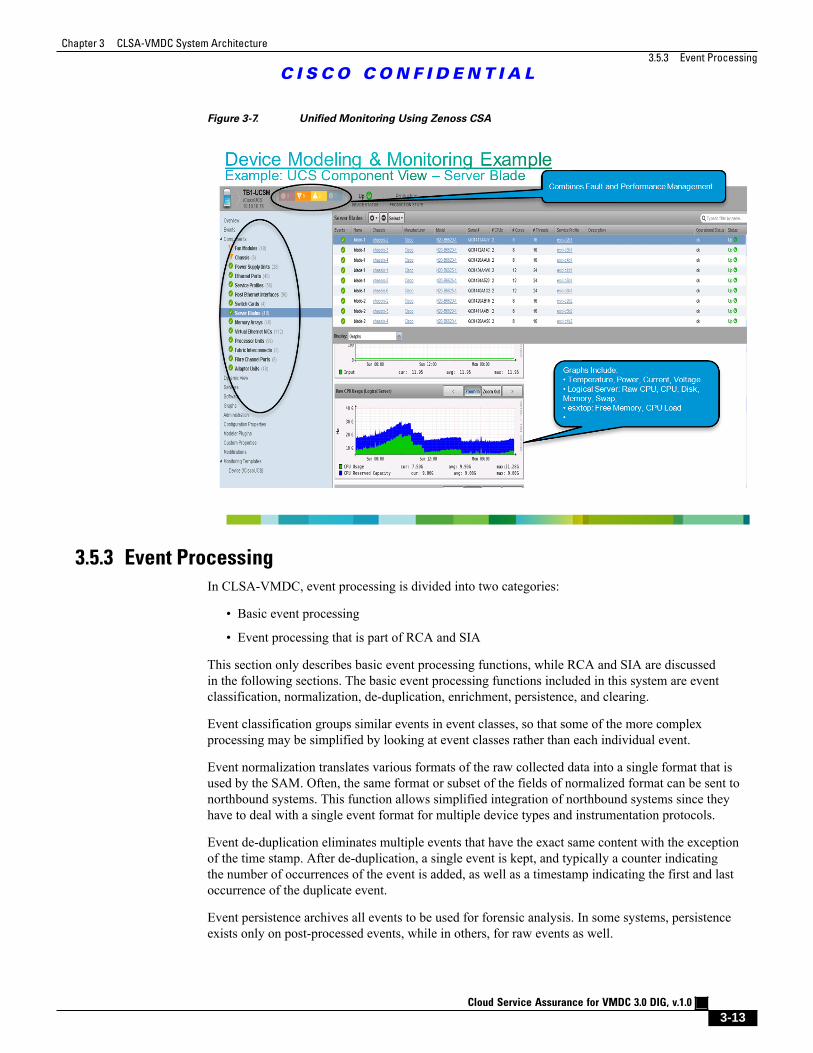
An example of unified monitoring using Zenoss CSA is illustrated in Figure 3-7.
Chapter 3 CLSA-VMDC System Architecture
3.5.3 Event Processing
C I S C O C O N F I D E N T I A L
Cloud Service Assurance for VMDC 3.0 DIG, v.1.0
3-13
Figure 3-7. Unified Monitoring Using Zenoss CSA
3.5.3 Event Processing
In CLSA-VMDC, event processing is divided into two categories:
• Basic event processing
• Event processing that is part of RCA and SIA
This section only describes basic event processing functions, while RCA and SIA are discussedin the following sections. The basic event processing functions included in this system are eventclassification, normalization, de-duplication, enrichment, persistence, and clearing.
Event classification groups similar events in event classes, so that some of the more complexprocessing may be simplified by looking at event classes rather than each individual event.
Event normalization translates various formats of the raw collected data into a single format that isused by the SAM. Often, the same format or subset of the fields of normalized format can be sent tonorthbound systems. This function allows simplified integration of northbound systems since theyhave to deal with a single event format for multiple device types and instrumentation protocols.
Event de-duplication eliminates multiple events that have the exact same content with the exceptionof the time stamp. After de-duplication, a single event is kept, and typically a counter indicatingthe number of occurrences of the event is added, as well as a timestamp indicating the first and lastoccurrence of the duplicate event.
Event persistence archives all events to be used for forensic analysis. In some systems, persistenceexists only on post-processed events, while in others, for raw events as well.
Chapter 3 CLSA-VMDC System Architecture
3.5.4 Root Cause Analysis and Service Impact Analysis
C I S C O C O N F I D E N T I A L
Cloud Service Assurance for VMDC 3.0 DIG, v.1.0
3-14
Event clearing is used to indicate when the original condition for which the event was raised isremoved. Explicit event clearing is done by generating clearing events with the field within theclearing event, which points to the ID of the event that it is clearing. For example, if an interface downevent for a specific interface had an ID of ID1, when the interface goes up again, an event with ID2should be raised, which includes as one of its fields a reference to event ID1. Explicit event clearing isrecommended. In addition to explicit clearing, time-based clearing can be utilized as well. Time-basedclearing clears the event after a specific time interval elapses from the time that the original event wasreceived.
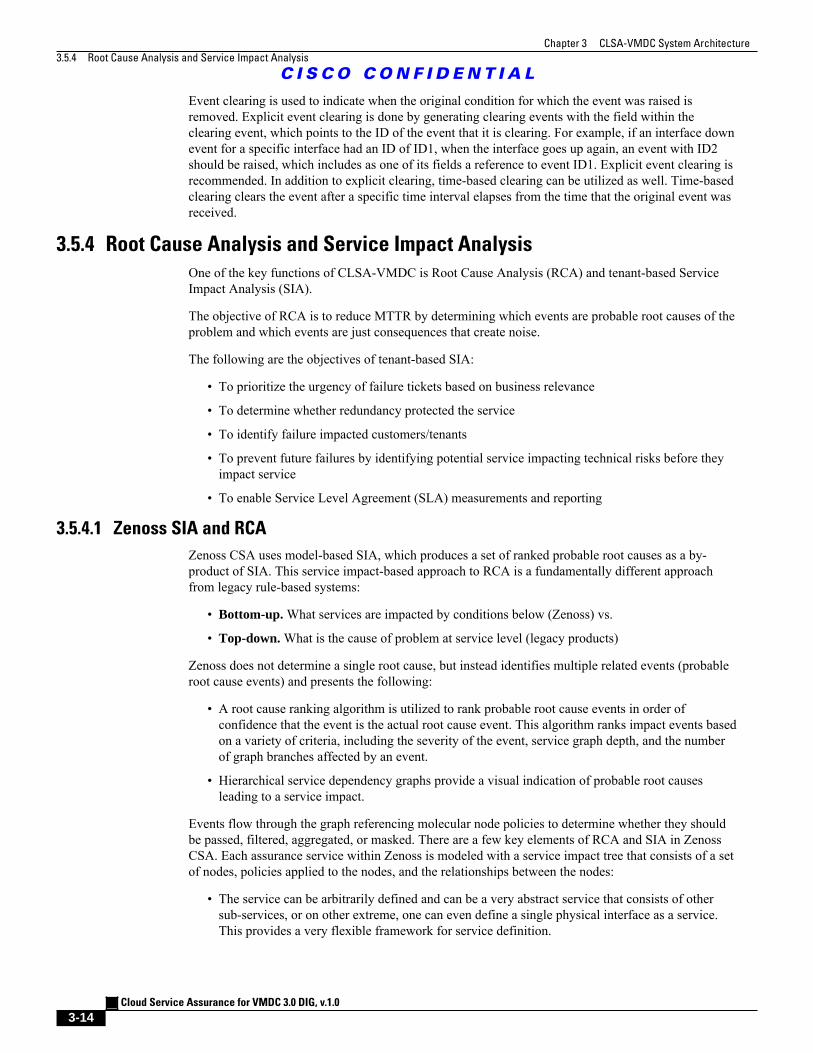
3.5.4 Root Cause Analysis and Service Impact Analysis
One of the key functions of CLSA-VMDC is Root Cause Analysis (RCA) and tenant-based ServiceImpact Analysis (SIA).
The objective of RCA is to reduce MTTR by determining which events are probable root causes of theproblem and which events are just consequences that create noise.
The following are the objectives of tenant-based SIA:
• To prioritize the urgency of failure tickets based on business relevance
• To determine whether redundancy protected the service
• To identify failure impacted customers/tenants
• To prevent future failures by identifying potential service impacting technical risks before theyimpact service
• To enable Service Level Agreement (SLA) measurements and reporting
3.5.4.1 Zenoss SIA and RCA
Zenoss CSA uses model-based SIA, which produces a set of ranked probable root causes as a by-product of SIA. This service impact-based approach to RCA is a fundamentally different approachfrom legacy rule-based systems:
• Bottom-up. What services are impacted by conditions below (Zenoss) vs.
• Top-down. What is the cause of problem at service level (legacy products)
Zenoss does not determine a single root cause, but instead identifies multiple related events (probableroot cause events) and presents the following:
• A root cause ranking algorithm is utilized to rank probable root cause events in order ofconfidence that the event is the actual root cause event. This algorithm ranks impact events basedon a variety of criteria, including the severity of the event, service graph depth, and the numberof graph branches affected by an event.
• Hierarchical service dependency graphs provide a visual indication of probable root causesleading to a service impact.
Events flow through the graph referencing molecular node policies to determine whether they shouldbe passed, filtered, aggregated, or masked. There are a few key elements of RCA and SIA in ZenossCSA. Each assurance service within Zenoss is modeled with a service impact tree that consists of a setof nodes, policies applied to the nodes, and the relationships between the nodes:
• The service can be arbitrarily defined and can be a very abstract service that consists of othersub-services, or on other extreme, one can even define a single physical interface as a service.This provides a very flexible framework for service definition.
Chapter 3 CLSA-VMDC System Architecture
C I S C O C O N F I D E N T I A L
Cloud Service Assurance for VMDC 3.0 DIG, v.1.0
3-15
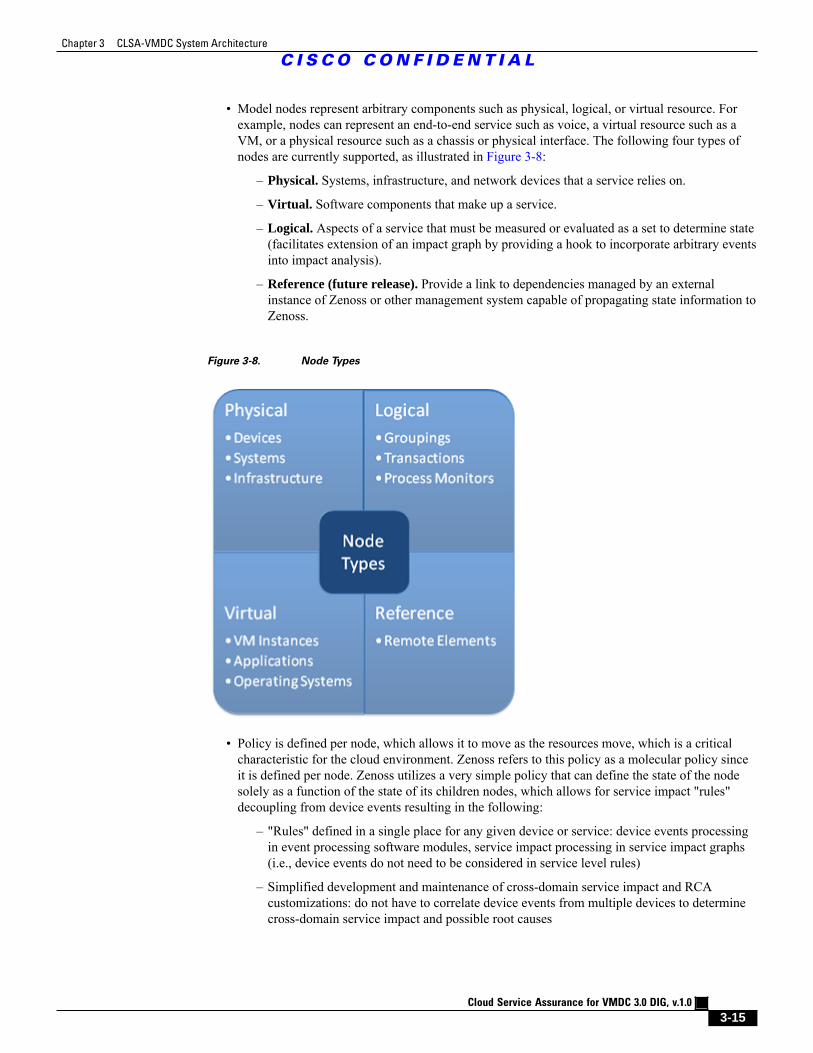
• Model nodes represent arbitrary components such as physical, logical, or virtual resource. Forexample, nodes can represent an end-to-end service such as voice, a virtual resource such as aVM, or a physical resource such as a chassis or physical interface. The following four types ofnodes are currently supported, as illustrated in Figure 3-8:
– Physical. Systems, infrastructure, and network devices that a service relies on.
– Virtual. Software components that make up a service.
– Logical. Aspects of a service that must be measured or evaluated as a set to determine state(facilitates extension of an impact graph by providing a hook to incorporate arbitrary eventsinto impact analysis).
– Reference (future release). Provide a link to dependencies managed by an externalinstance of Zenoss or other management system capable of propagating state information toZenoss.
Figure 3-8. Node Types
• Policy is defined per node, which allows it to move as the resources move, which is a criticalcharacteristic for the cloud environment. Zenoss refers to this policy as a molecular policy sinceit is defined per node. Zenoss utilizes a very simple policy that can define the state of the nodesolely as a function of the state of its children nodes, which allows for service impact "rules"decoupling from device events resulting in the following:
– "Rules" defined in a single place for any given device or service: device events processingin event processing software modules, service impact processing in service impact graphs(i.e., device events do not need to be considered in service level rules)
– Simplified development and maintenance of cross-domain service impact and RCAcustomizations: do not have to correlate device events from multiple devices to determinecross-domain service impact and possible root causes
Chapter 3 CLSA-VMDC System Architecture
3.5.4.2 VMDC Assurance Service Models
C I S C O C O N F I D E N T I A L
Cloud Service Assurance for VMDC 3.0 DIG, v.1.0
3-16
– Note that whenever desired, device events can be used as part of service impact "rules"via use of logical nodes whose rules define how to interpret the service impact of specificevents based on its type and severity.
– Policy can be global or contextual:
– Global policy applies to device/service type in any service graph.
– Contextual policy applies only to device/service in the particular service graph.
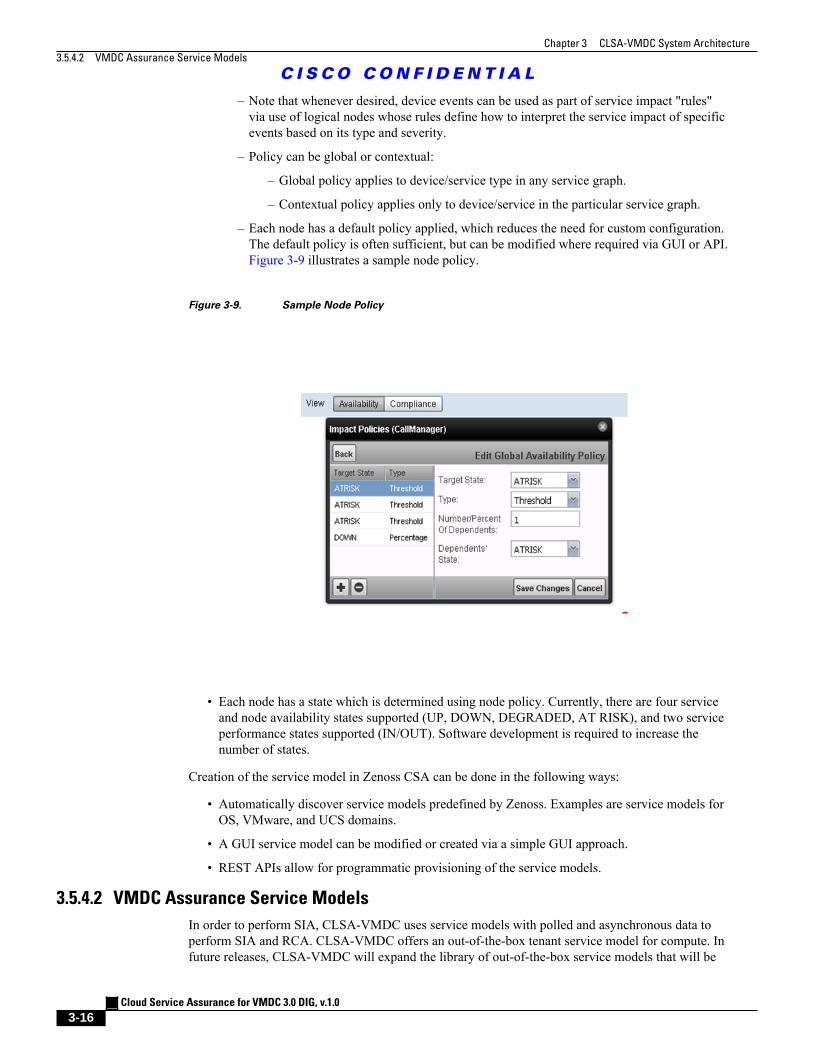
– Each node has a default policy applied, which reduces the need for custom configuration.The default policy is often sufficient, but can be modified where required via GUI or API.Figure 3-9 illustrates a sample node policy.
Figure 3-9. Sample Node Policy
• Each node has a state which is determined using node policy. Currently, there are four serviceand node availability states supported (UP, DOWN, DEGRADED, AT RISK), and two serviceperformance states supported (IN/OUT). Software development is required to increase thenumber of states.
Creation of the service model in Zenoss CSA can be done in the following ways:
• Automatically discover service models predefined by Zenoss. Examples are service models forOS, VMware, and UCS domains.
• A GUI service model can be modified or created via a simple GUI approach.
• REST APIs allow for programmatic provisioning of the service models.
3.5.4.2 VMDC Assurance Service Models
In order to perform SIA, CLSA-VMDC uses service models with polled and asynchronous data toperform SIA and RCA. CLSA-VMDC offers an out-of-the-box tenant service model for compute. Infuture releases, CLSA-VMDC will expand the library of out-of-the-box service models that will be
Chapter 3 CLSA-VMDC System Architecture
C I S C O C O N F I D E N T I A L
Cloud Service Assurance for VMDC 3.0 DIG, v.1.0
3-17
validated and delivered as part of this system. However, note that users can easily customize servicemodels as well as create new ones.
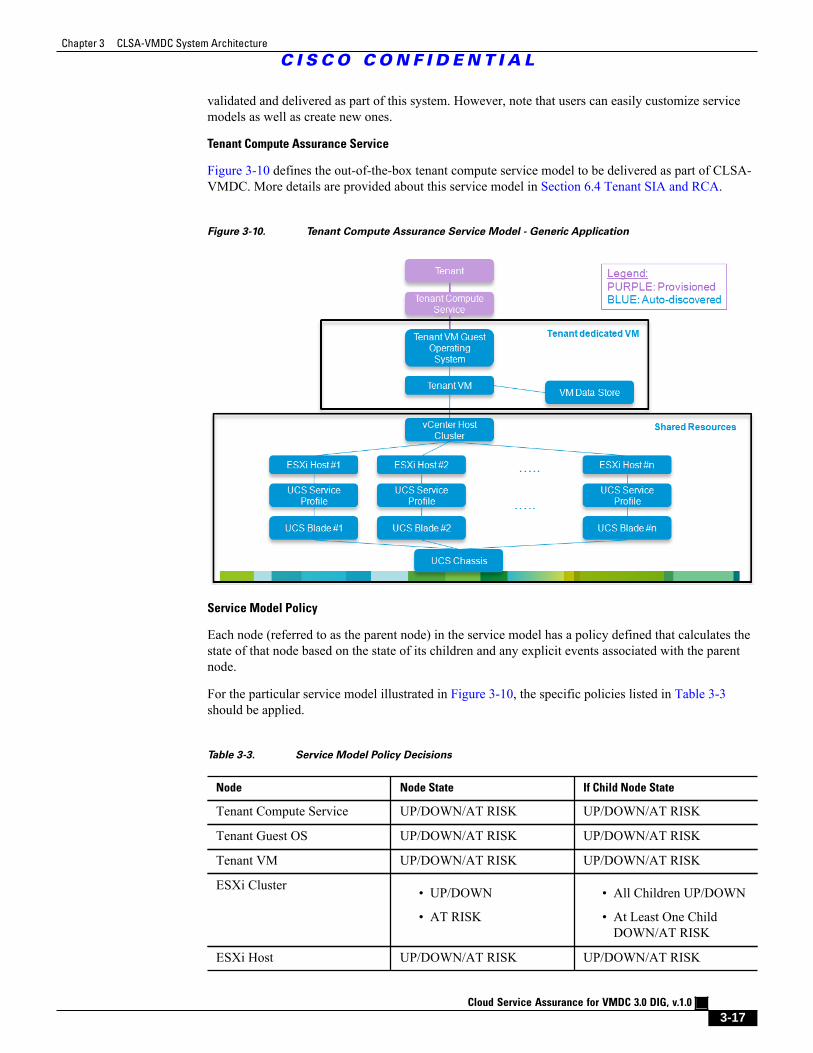
Tenant Compute Assurance Service
Figure 3-10 defines the out-of-the-box tenant compute service model to be delivered as part of CLSA-VMDC. More details are provided about this service model in Section 6.4 Tenant SIA and RCA.
Figure 3-10. Tenant Compute Assurance Service Model - Generic Application
Service Model Policy
Each node (referred to as the parent node) in the service model has a policy defined that calculates thestate of that node based on the state of its children and any explicit events associated with the parentnode.
For the particular service model illustrated in Figure 3-10, the specific policies listed in Table 3-3should be applied.
Table 3-3. Service Model Policy Decisions
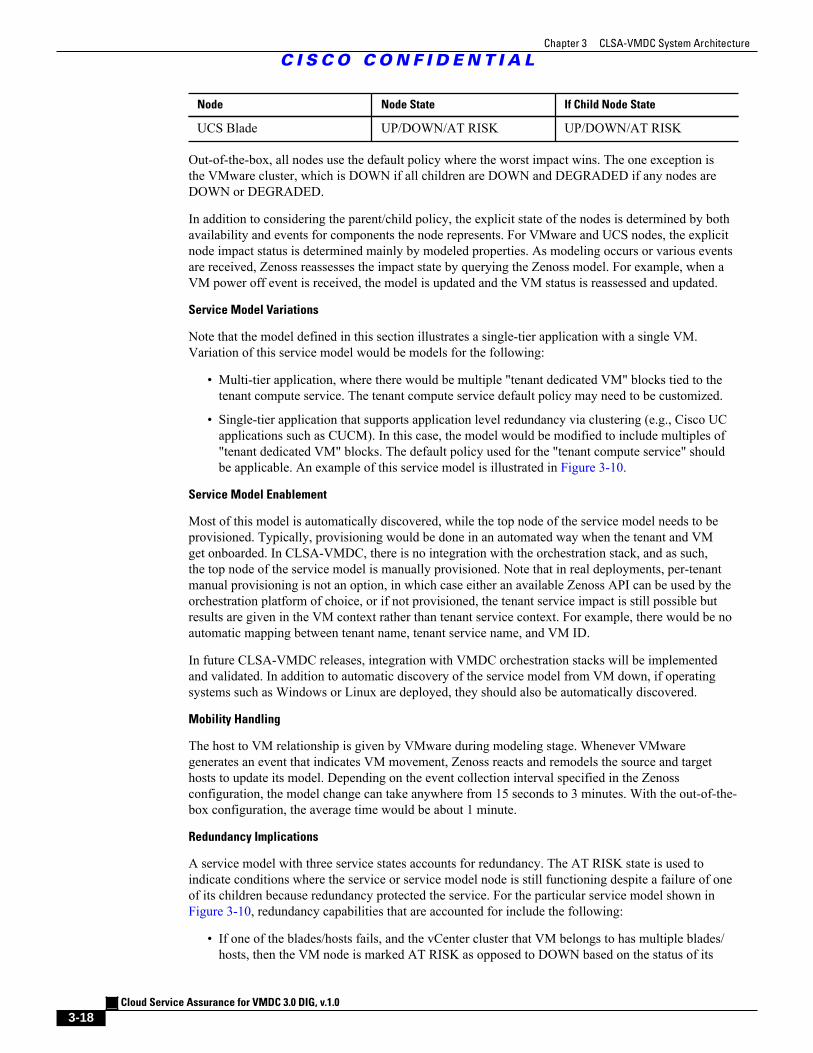
Node Node State If Child Node State
Tenant Compute Service UP/DOWN/AT RISK UP/DOWN/AT RISK
Tenant Guest OS UP/DOWN/AT RISK UP/DOWN/AT RISK
Tenant VM UP/DOWN/AT RISK UP/DOWN/AT RISK
ESXi Cluster • UP/DOWN
• AT RISK
• All Children UP/DOWN
• At Least One ChildDOWN/AT RISK
ESXi Host UP/DOWN/AT RISK UP/DOWN/AT RISK
Chapter 3 CLSA-VMDC System Architecture
C I S C O C O N F I D E N T I A L
Cloud Service Assurance for VMDC 3.0 DIG, v.1.0
3-18
Node Node State If Child Node State
UCS Blade UP/DOWN/AT RISK UP/DOWN/AT RISK
Out-of-the-box, all nodes use the default policy where the worst impact wins. The one exception isthe VMware cluster, which is DOWN if all children are DOWN and DEGRADED if any nodes areDOWN or DEGRADED.
In addition to considering the parent/child policy, the explicit state of the nodes is determined by bothavailability and events for components the node represents. For VMware and UCS nodes, the explicitnode impact status is determined mainly by modeled properties. As modeling occurs or various eventsare received, Zenoss reassesses the impact state by querying the Zenoss model. For example, when aVM power off event is received, the model is updated and the VM status is reassessed and updated.
Service Model Variations
Note that the model defined in this section illustrates a single-tier application with a single VM.Variation of this service model would be models for the following:
• Multi-tier application, where there would be multiple "tenant dedicated VM" blocks tied to thetenant compute service. The tenant compute service default policy may need to be customized.
• Single-tier application that supports application level redundancy via clustering (e.g., Cisco UCapplications such as CUCM). In this case, the model would be modified to include multiples of"tenant dedicated VM" blocks. The default policy used for the "tenant compute service" shouldbe applicable. An example of this service model is illustrated in Figure 3-10.
Service Model Enablement
Most of this model is automatically discovered, while the top node of the service model needs to beprovisioned. Typically, provisioning would be done in an automated way when the tenant and VMget onboarded. In CLSA-VMDC, there is no integration with the orchestration stack, and as such,the top node of the service model is manually provisioned. Note that in real deployments, per-tenantmanual provisioning is not an option, in which case either an available Zenoss API can be used by theorchestration platform of choice, or if not provisioned, the tenant service impact is still possible butresults are given in the VM context rather than tenant service context. For example, there would be noautomatic mapping between tenant name, tenant service name, and VM ID.
In future CLSA-VMDC releases, integration with VMDC orchestration stacks will be implementedand validated. In addition to automatic discovery of the service model from VM down, if operatingsystems such as Windows or Linux are deployed, they should also be automatically discovered.
Mobility Handling
The host to VM relationship is given by VMware during modeling stage. Whenever VMwaregenerates an event that indicates VM movement, Zenoss reacts and remodels the source and targethosts to update its model. Depending on the event collection interval specified in the Zenossconfiguration, the model change can take anywhere from 15 seconds to 3 minutes. With the out-of-the-box configuration, the average time would be about 1 minute.
Redundancy Implications
A service model with three service states accounts for redundancy. The AT RISK state is used toindicate conditions where the service or service model node is still functioning despite a failure of oneof its children because redundancy protected the service. For the particular service model shown inFigure 3-10, redundancy capabilities that are accounted for include the following:
• If one of the blades/hosts fails, and the vCenter cluster that VM belongs to has multiple blades/hosts, then the VM node is marked AT RISK as opposed to DOWN based on the status of its
Chapter 3 CLSA-VMDC System Architecture
3.5.4.3 VMDC RCA and SIA Use Cases
C I S C O C O N F I D E N T I A L
Cloud Service Assurance for VMDC 3.0 DIG, v.1.0
3-19
children. Note that explicit VM related state and events can result in the state of the VM nodebeing down even though the state of its children alone would result in an AT RISK state
• In a case where there is application level redundancy and thus more than one VM and applicationdeployed for single tier applications, there is also service model redundancy built in on theapplication/VM level. For example, a service is AT RISK if one of the application nodes/VMsis DOWN because the remaining application/VM nodes provides redundancy for the failedapplication/VM node.
3.5.4.3 VMDC RCA and SIA Use Cases
Once service impact models are defined, the data is applied to service impact models to maintain real-time state of the service availability and performance, as well as to determine probable root cause ofany failures that may happen. This section provides a list of failure scenarios (use cases) validatedas part of the CLSA-VMDC test effort, for which the out-of-the-box compute service model candetermine correct probable root cause and service state for previously defined services. All of the usecases are validated in an environment where VMware High Availability (HA) is deployed.
See Section 6.4 Tenant Service Impact Analysis and Root Cause Analysis for an example workflowillustrating a UCS switch failure event, including screenshots.
Use Case Name (Fault):
• VM Failure
• VM vNIC failure
• VM vMotion - VM vMotion is not a true fault event, since the VM stays up, however, the impactgraph does track the VM's host swap.
• ESXi host failure
• UCS Blade failure
• UCS chassis failure
• UCS P/S failure
• UCS FEX failure
• UCS 6100 chassis failure
• UCS 6100 interfaces to UCS 5100 failure
• VM CPU degradation (Threshold Crossing Alert (TCA))
• VM Memory degradation (TCA)
• Host CPU degradation (TCA)
• Host Memory degradation (TCA)
3.5.5 Northbound Interface
One of the key, new functions of CLSA-VMDC architecture is a single, normalized NorthboundInterface (NBI) provided by the SAM.
The key objectives of the single, normalized interface are:
• To simplify and reduce the cost of integrating providers existing northbound system withthe CLSA-VMDC system. The provider needs to integrate and maintain just one interface ratherthan multiple dozens of interfaces towards individual devices and/or domain managers. CLSA-VMDC is responsible for absorbing updates related to any relevant changes in the underlyingsystem and devices.
Chapter 3 CLSA-VMDC System Architecture
3.5.5.1 SNMP Northbound Interface
C I S C O C O N F I D E N T I A L
Cloud Service Assurance for VMDC 3.0 DIG, v.1.0
3-20
• To enable CLSA-VMDC to be inserted in various business and operational deploymentenvironments. This is achieved by offering a variety of interface protocols, rich filteringcapabilities, and notifications with tenant awareness.
• To enable CLSA-VMDC to simplify service assurance of overlaid application based systemsthat are deployed on top of VMDC infrastructure. An example of this type of system isthe Hosted Collaboration Solution (HCS). This is achieved by providing tenant service levelnotifications rather than device level notifications, which enables a service overlay (or multi-tier SIA) to be implemented by HCS, and as such, Cloud Service Assurance-HCS (CLSA-HCS)would have to deal with the state of only a handful of services coming from CLSA-VMDC,rather than thousands of events coming from individual VMDC devices.
Zenoss northbound integration is supported via:
• JavaScript Object Notation (JSON)/Representational State Transfer Application ProgrammingInterface (ReST API)
• SNMP Traps (ZENOSS-MIB.txt and ZENOSS-IMPACT-MIB.txt)
• Syslog
• Event queues (AMQP and Java/Python wrappers) and event commands (command line call withevent context)
• SMTP email
Configurable filtering capabilities are offered to provide different data to different northboundconsumers. The following sections describe the interfaces, data, and filtering capabilities in moredetail.
3.5.5.1 SNMP Northbound Interface
One of the key requirements for CLSA-VMDC is to offer asynchronous notifications via SNMP.These notifications are consumed either by the provider's existing northbound systems such as MoM,ticketing, and SLA management systems, or by other Cisco systems deployed on VMDC architecturesuch as HCS.
Regardless of the source or type of the event, all events should be sent using the same normalizedformat. However, as discussed in this chapter, there may be differences in the values of the populatedfields based on the type of events (e.g., service impact events contain information about service nameand state, while device level events do not).
3.5.5.2 Zenoss SNMP Notification Content
Zenoss CSA uses custom Zenoss MIB implementations for northbound notifications. The originalSNMP MIB addresses the resource manager part of the product, but not the service impact part. MIBextensions have been designed to address service impact events and related probable root cause eventsas a part of the this phase of CLSA-VMDC. For a discussion of the new service impact trap, seeSection 3.5.5.4 Zenoss Service Impact SNMP Trap.
Events associated with devices use ZENOSS-MIB for notifications. The ZENOSS-MIB.txt fileis located in the following Zenoss directory: $ZENHOME/share/mibs/site. Device level SNMPnotifications can be sent to multiple destinations. Refer to the Zenoss Cloud Service AssuranceInstallation and Administration Guide for more information regarding notifications.
Table 3-4 maps the fields of Zenoss MIBs to the SAM requirements.
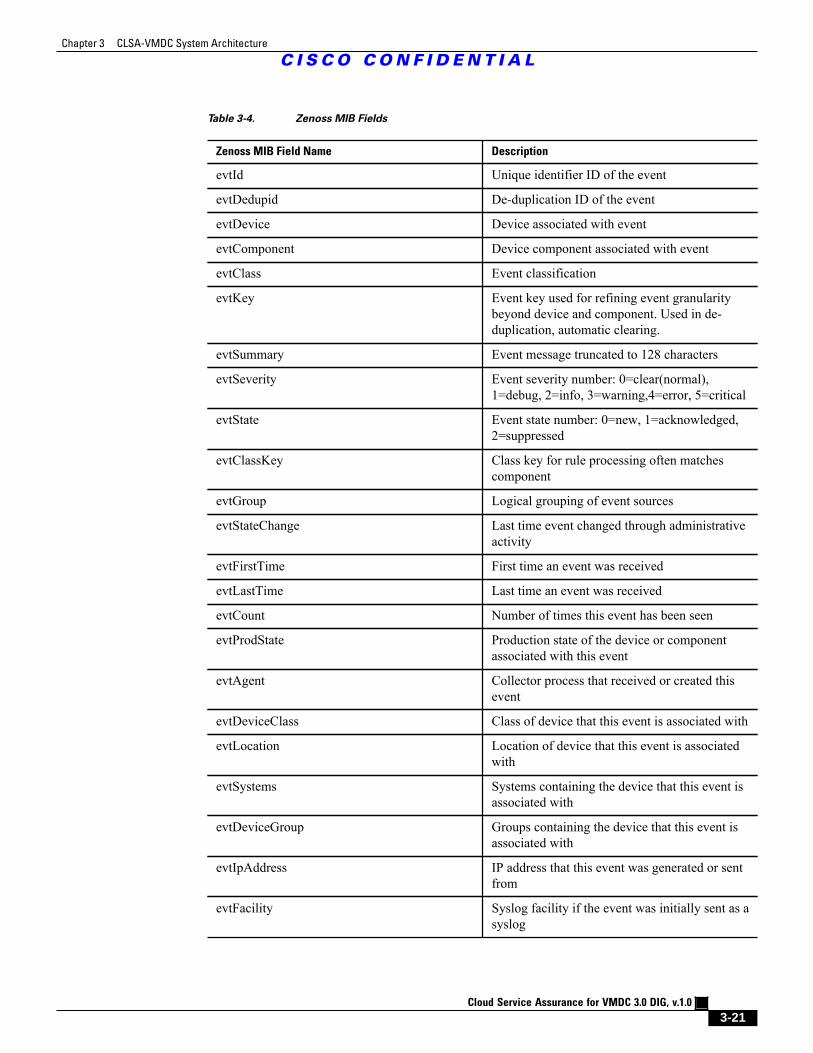
Chapter 3 CLSA-VMDC System Architecture
C I S C O C O N F I D E N T I A L
Cloud Service Assurance for VMDC 3.0 DIG, v.1.0
3-21
Table 3-4. Zenoss MIB Fields
Zenoss MIB Field Name Description
evtId Unique identifier ID of the event
evtDedupid De-duplication ID of the event
evtDevice Device associated with event
evtComponent Device component associated with event
evtClass Event classification
evtKey Event key used for refining event granularitybeyond device and component. Used in de-duplication, automatic clearing.
evtSummary Event message truncated to 128 characters
evtSeverity Event severity number: 0=clear(normal),1=debug, 2=info, 3=warning,4=error, 5=critical
evtState Event state number: 0=new, 1=acknowledged,2=suppressed
evtClassKey Class key for rule processing often matchescomponent
evtGroup Logical grouping of event sources
evtStateChange Last time event changed through administrativeactivity
evtFirstTime First time an event was received
evtLastTime Last time an event was received
evtCount Number of times this event has been seen
evtProdState Production state of the device or componentassociated with this event
evtAgent Collector process that received or created thisevent
evtDeviceClass Class of device that this event is associated with
evtLocation Location of device that this event is associatedwith
evtSystems Systems containing the device that this event isassociated with
evtDeviceGroup Groups containing the device that this event isassociated with
evtIpAddress IP address that this event was generated or sentfrom
evtFacility Syslog facility if the event was initially sent as asyslog
Chapter 3 CLSA-VMDC System Architecture
3.5.5.3 Zenoss Notification Filtering
C I S C O C O N F I D E N T I A L
Cloud Service Assurance for VMDC 3.0 DIG, v.1.0
3-22
Zenoss MIB Field Name Description
evtPriority Syslog priority if the event was initially sent as asyslog
evtNtEvId Windows NT_EVENT_ID if the event wasinitially received from Windows event log
evtOwnerId User that acknowledged this event
evtClearId evtId that cleared this event
evtDevicePriority Priority of the device that this event is associatedwith
evtClassMapping Name of the event class mapping that matchedthis event
3.5.5.3 Zenoss Notification Filtering
Filtering capabilities using Zenoss Triggers can be used to customize notifications based on the needsof different northbound consumers:
• Multiple subscribers/receivers may receive notifications.
• Each notification subscriber/receiver may apply a different filter: one receiver may subscribe toservice events, another may subscribe to compute events, and a third may subscribe to networkevents.
• Each system user should be able to apply different filters.
For more information regarding Triggers, refer to the Zenoss Cloud Service Assurance Installation andAdministration Guide.
3.5.5.4 Zenoss Service Impact SNMP Trap
This section defines the SNMP notification for Zenoss Impact, which is new for CLSA-VMDC 3.0.The following data is available internally within Zenoss Impact for service related events. This datawas used by the notification script in CLSA-VMDC 2.2.
• Service Name
• Severity
• Timestamp
• Service state
• URLs to EventDetail, page to acknowledge and close events, device events
• All events in the impact chain. Each event in impact chain includes:
– Device
– Component
– Device Class
– Event Class
– Severity
– Timestamp
– Message
Chapter 3 CLSA-VMDC System Architecture
C I S C O C O N F I D E N T I A L
Cloud Service Assurance for VMDC 3.0 DIG, v.1.0
3-23
– URLs to EventDetail, page to acknowledge and close events, device events
Zenoss Impact provides a flexible framework to define arbitrary services, including support forhierarchical service nesting. In such environments, the question arises for which nodes and/or levelsof hierarchy notifications should be sent. Services are collected under Service Organizers. A ServiceOrganizer consists of multiple folders and in each folder there is set of services. In Zenoss Impact, thenotification trigger criteria is configured for Service Organizer folders and its services and not basedon individual nodes and their hierarchy level in the impact tree. This approach provides good balancebetween flexibility to select notification trigger criteria and simplicity of implementation.
In order for CLSA-VMDC to send notifications per service instance state change, the appropriatestructure must be created to organize the services. The following sections discuss the folders and thestructure used for the services defined in CLSA-VMDC 3.0.
Service Organizers
Service Organizers are located on the left tab in the Impact GUI.
The Shared Services folder includes:
• Service Name X (e.g., Network Aggregation service, Network Core service, etc.)
• Service Name Y
The Customer Name folder includes:
• Tenant Service 1 (e.g., Tenant Compute service, Tenant Network service, etc.)
• Tenant Service 2
Notification Triggers
The user is able to select services and or/folders for which to send notifications. This action isavailable both in the GUI, as well as via the REST API so that the orchestration system at the time ofonboarding the tenant service can select whether or not to enable notification for the service.
The notification policy should be selectable both per folder or per service instance. This enablessupport for the following use cases:
• Where a single operator or NB system manages and/or provides visibility to all services of singletenant/customer (since one folder is defined per tenant).
• Where different services of the same tenant are managed by different operators/NB systems,e.g., notification for IaaS services are sent to the IaaS operator while notifications for UnifiedCommunications as a Service (UCaaS) services are sent to the UC operator.
Notification Timing
This section defines the guidelines for service impact notification triggers and timing. An attempt ismade to balance any delay in notifications indicating change with excessive noise in events sent dueto transient state during service impact analysis. In order to have the capability to delay some serviceimpact notifications, there is a timer that can be configured (value range 0-10 minutes with default ofthree minutes).
Service impact notifications are triggered when the following events occur:
• If the service state changes (top-level service in each folder):
– The notification indicating a service state change should always be sent immediately,regardless of the value of the notification delay timer. This enables the northbound systemto immediately detect the change. Also, for northbound systems that are using service state
Chapter 3 CLSA-VMDC System Architecture
C I S C O C O N F I D E N T I A L
Cloud Service Assurance for VMDC 3.0 DIG, v.1.0
3-24
notifications to measure service availability and SLA, this immediate notification enablesmore accurate service availability measurements.
– When the service state changes back to UP, the event should serve as a clearing eventfor the previous service state change event. As such, the ID of the service event that it isclearing must be included.
• If the service state does not change, but most a probable root-cause event changes (i.e., rootcause ranked with highest confidence % changes):
– This trigger honors the notification delay timer, and as such, it is sent only if the event isgenerated after the notification timer expires.
The following example shows the use of the notification delay timer and the two notification typeslisted above. Assume that the following conditions exist:
1. The notification delay timer is set to three minutes.
2. The root cause is a UCS blade failure, and the final service state for the IaaS service is AT RISK.
If these conditions exist, the following occurs:
1. At zero seconds, event E1 (VMware event for the VM) arrives. The root cause at that time isRC1= VM Failure.
2. A service impact event is sent northbound indicating that the IaaS state = AT RISK, RC=VM.
3. At one minute, event E2 (VMware event for the host) arrives. The root cause at that time isRC2= Host Failure. Since the notification delay timer is set to three minutes, there are no eventssent northbound due to the change of root-cause events. Only one minute has passed since theservice state change time.
4. At four minutes, event E3 (UCSM event for blade) arrives. The root cause at that time isRC3=UCS blade failure. A service impact event is sent northbound indicating that the IaaS state= AT RISK, RC= Blade.
Figure 3-11 shows the existing capability that Zenoss has to delay notifications and also to send theclearing events. The same capabilities would be extended to the service impact events.
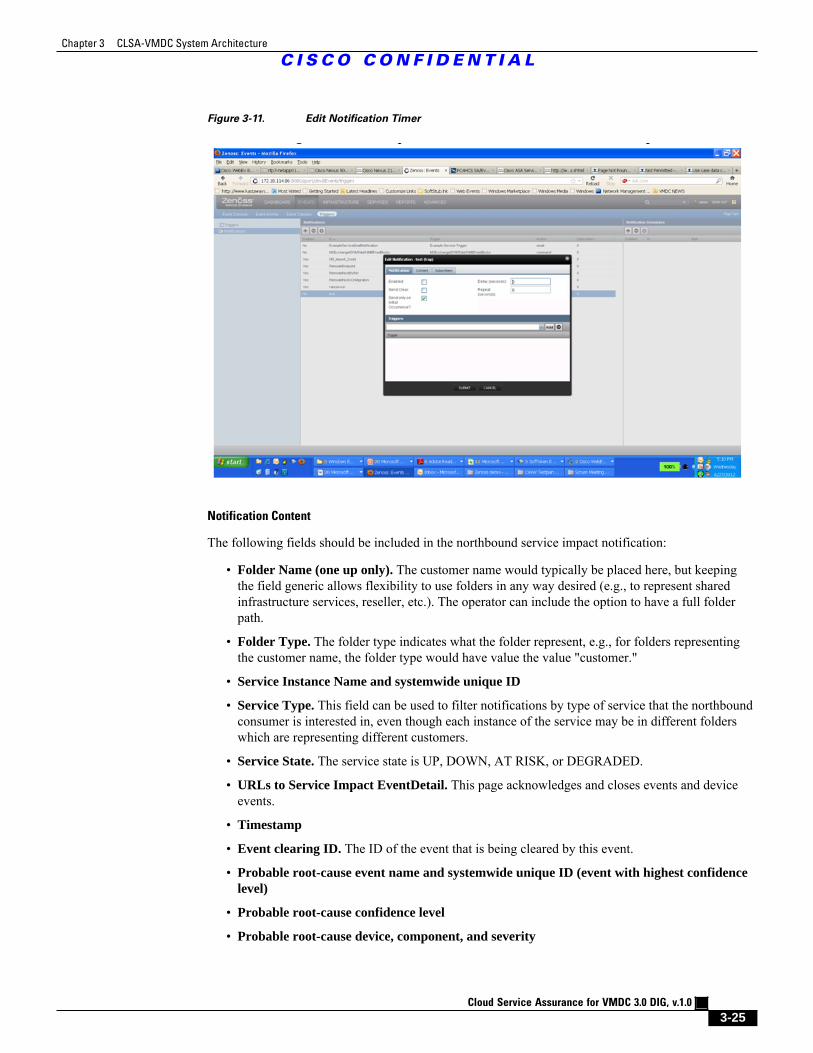
Chapter 3 CLSA-VMDC System Architecture
C I S C O C O N F I D E N T I A L
Cloud Service Assurance for VMDC 3.0 DIG, v.1.0
3-25
Figure 3-11. Edit Notification Timer
Notification Content
The following fields should be included in the northbound service impact notification:
• Folder Name (one up only). The customer name would typically be placed here, but keepingthe field generic allows flexibility to use folders in any way desired (e.g., to represent sharedinfrastructure services, reseller, etc.). The operator can include the option to have a full folderpath.
• Folder Type. The folder type indicates what the folder represent, e.g., for folders representingthe customer name, the folder type would have value the value "customer."
• Service Instance Name and systemwide unique ID
• Service Type. This field can be used to filter notifications by type of service that the northboundconsumer is interested in, even though each instance of the service may be in different folderswhich are representing different customers.
• Service State. The service state is UP, DOWN, AT RISK, or DEGRADED.
• URLs to Service Impact EventDetail. This page acknowledges and closes events and deviceevents.
• Timestamp
• Event clearing ID. The ID of the event that is being cleared by this event.
• Probable root-cause event name and systemwide unique ID (event with highest confidencelevel)
• Probable root-cause confidence level
• Probable root-cause device, component, and severity
Chapter 3 CLSA-VMDC System Architecture
3.5.5.5 WS or ReST API
C I S C O C O N F I D E N T I A L
Cloud Service Assurance for VMDC 3.0 DIG, v.1.0
3-26
• Impact chain and ID to events in impact chain. The ID can be used to retrieve the impactchain via REST API upon receipt of the notification.
• URLs to probable root-cause EventDetail. This page acknowledges and closes events anddevice events.
Note In CLSA-VMDC 3.0, the following fields are not supported: Folder Type, Service Type, and URLs toprobable root-cause event detail. In addition, theEvent Clearing ID is implemented slightly differentlythan proposed above. The Service Instance Name & system wide unique ID is implemented in a fieldcalled zenImpactUUID. The initial and clearing events have the same zenImpactUUID, however theyhave states new and cleared.
Root-cause Event Notification
In addition to sending probable root-cause events as part of service impact notification, there is alsoa need to be able to send only probable root-cause events. For example, in cases of more catastrophicfailures where a single root-cause event impacts a larger number of services, northbound systems thatare not service focused may prefer to receive only one notification representing the root-cause eventand not receive multiple service impacting notifications.
Even in this case, it is desirable to provide the relationship between the root-cause event and theservices it impacted. This can be done by including a list of services impacted by the same root-causeevent in the root-cause event notification URL or ID.
Root-cause notification is not a separate notification in CLSA-VMDC 3.0; instead, the root-causeevent is communicated as a field via the service impact notification.
3.5.5.5 WS or ReST API
The JSON API can be used to obtain the following:
• Device model and attributes data
• Performance data
• Event data
• Service data
Most of the information visible via the GUI can also be obtained via the JSON API.
In addition to retrieving data, the JSON API can also be used for the following:
• Managing events (acknowledge, clear, close)
• Adding devices to be monitored
• Setting production state
• Initiating discovery and modeling of devices
• Managing thresholds
• Managing reports
• Other configurations
More information on the JSON API can be found at the following URL:
http://community.zenoss.org/community/documentation/official_documentation/api
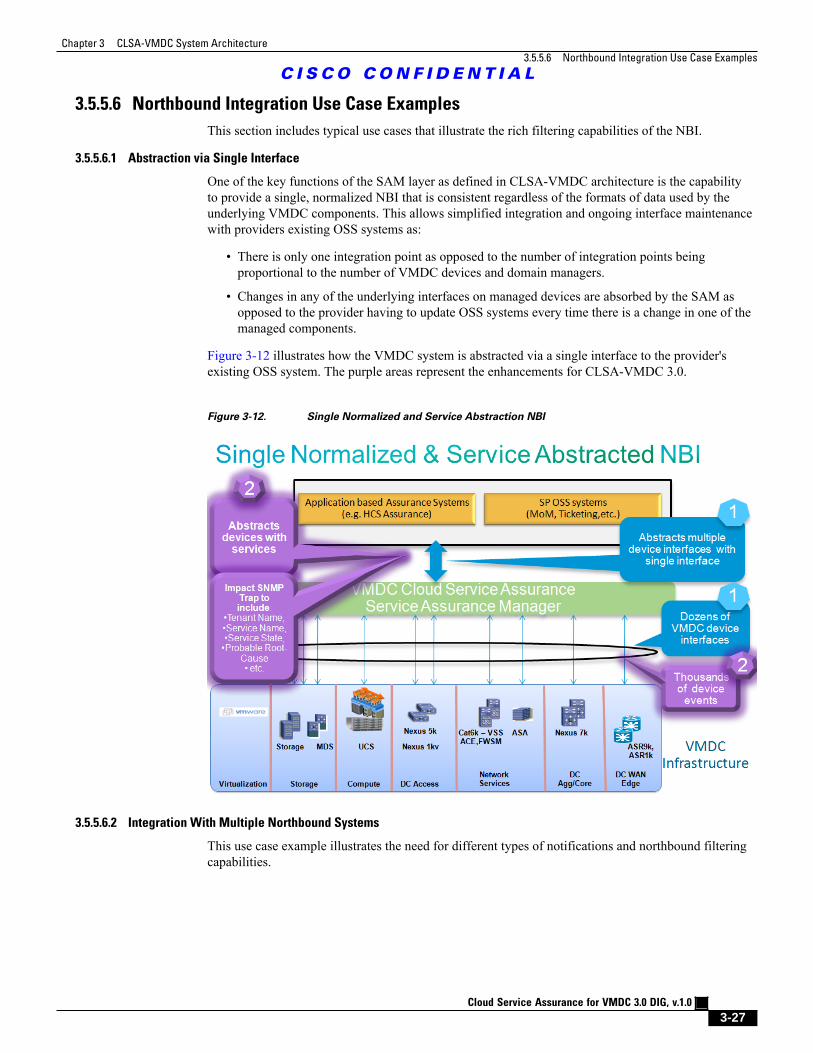
Chapter 3 CLSA-VMDC System Architecture
3.5.5.6 Northbound Integration Use Case Examples
C I S C O C O N F I D E N T I A L
Cloud Service Assurance for VMDC 3.0 DIG, v.1.0
3-27
3.5.5.6 Northbound Integration Use Case Examples
This section includes typical use cases that illustrate the rich filtering capabilities of the NBI.
3.5.5.6.1 Abstraction via Single Interface
One of the key functions of the SAM layer as defined in CLSA-VMDC architecture is the capabilityto provide a single, normalized NBI that is consistent regardless of the formats of data used by theunderlying VMDC components. This allows simplified integration and ongoing interface maintenancewith providers existing OSS systems as:
• There is only one integration point as opposed to the number of integration points beingproportional to the number of VMDC devices and domain managers.
• Changes in any of the underlying interfaces on managed devices are absorbed by the SAM asopposed to the provider having to update OSS systems every time there is a change in one of themanaged components.
Figure 3-12 illustrates how the VMDC system is abstracted via a single interface to the provider'sexisting OSS system. The purple areas represent the enhancements for CLSA-VMDC 3.0.
Figure 3-12. Single Normalized and Service Abstraction NBI
3.5.5.6.2 Integration With Multiple Northbound Systems
This use case example illustrates the need for different types of notifications and northbound filteringcapabilities.
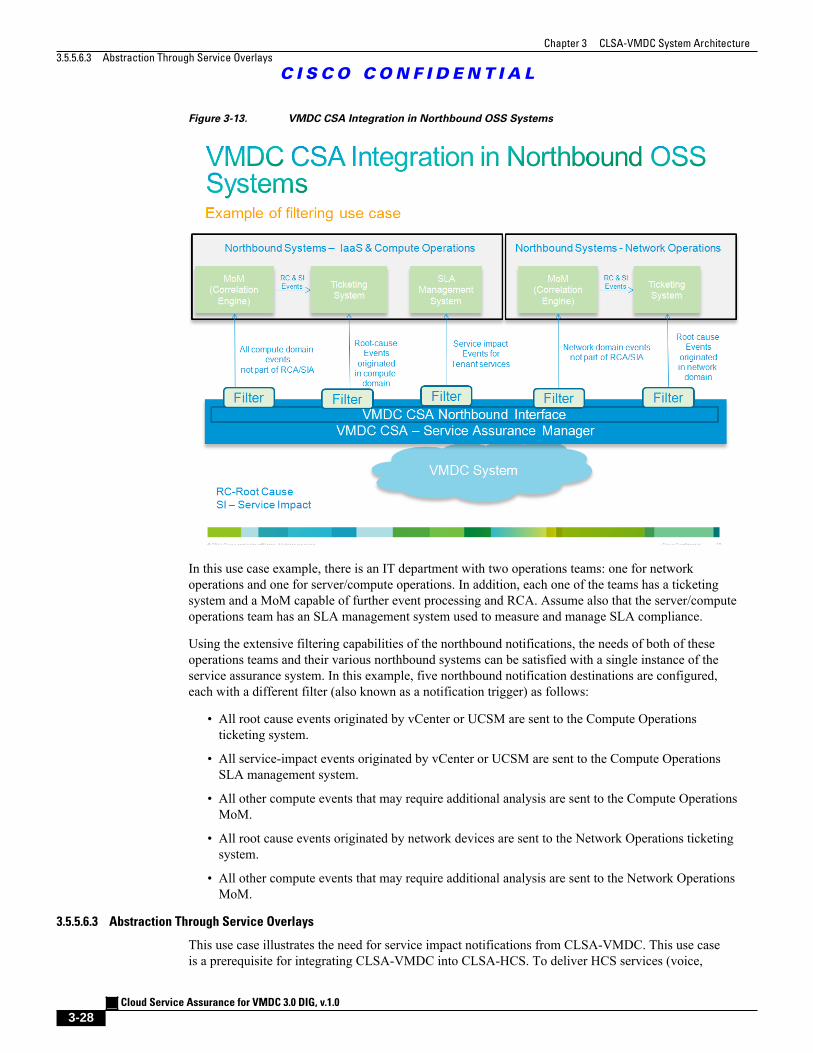
Chapter 3 CLSA-VMDC System Architecture
3.5.5.6.3 Abstraction Through Service Overlays
C I S C O C O N F I D E N T I A L
Cloud Service Assurance for VMDC 3.0 DIG, v.1.0
3-28
Figure 3-13. VMDC CSA Integration in Northbound OSS Systems
In this use case example, there is an IT department with two operations teams: one for networkoperations and one for server/compute operations. In addition, each one of the teams has a ticketingsystem and a MoM capable of further event processing and RCA. Assume also that the server/computeoperations team has an SLA management system used to measure and manage SLA compliance.
Using the extensive filtering capabilities of the northbound notifications, the needs of both of theseoperations teams and their various northbound systems can be satisfied with a single instance of theservice assurance system. In this example, five northbound notification destinations are configured,each with a different filter (also known as a notification trigger) as follows:
• All root cause events originated by vCenter or UCSM are sent to the Compute Operationsticketing system.
• All service-impact events originated by vCenter or UCSM are sent to the Compute OperationsSLA management system.
• All other compute events that may require additional analysis are sent to the Compute OperationsMoM.
• All root cause events originated by network devices are sent to the Network Operations ticketingsystem.
• All other compute events that may require additional analysis are sent to the Network OperationsMoM.
3.5.5.6.3 Abstraction Through Service Overlays
This use case illustrates the need for service impact notifications from CLSA-VMDC. This use caseis a prerequisite for integrating CLSA-VMDC into CLSA-HCS. To deliver HCS services (voice,
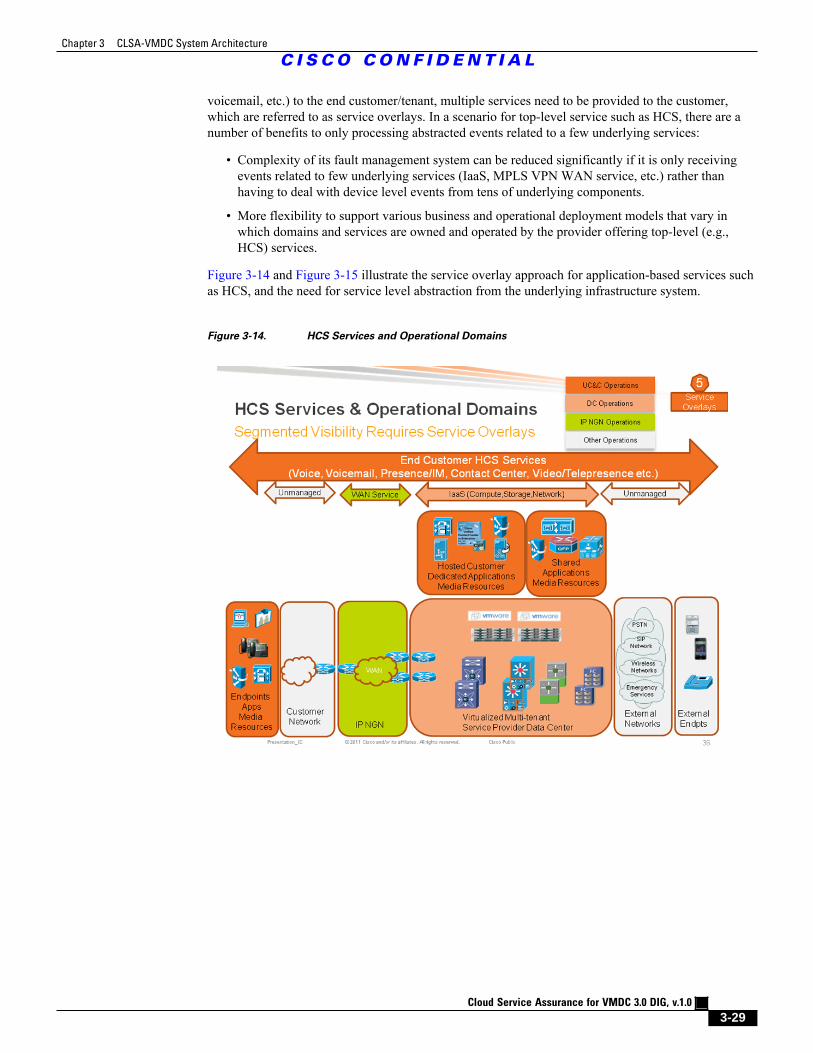
Chapter 3 CLSA-VMDC System Architecture
C I S C O C O N F I D E N T I A L
Cloud Service Assurance for VMDC 3.0 DIG, v.1.0
3-29
voicemail, etc.) to the end customer/tenant, multiple services need to be provided to the customer,which are referred to as service overlays. In a scenario for top-level service such as HCS, there are anumber of benefits to only processing abstracted events related to a few underlying services:
• Complexity of its fault management system can be reduced significantly if it is only receivingevents related to few underlying services (IaaS, MPLS VPN WAN service, etc.) rather thanhaving to deal with device level events from tens of underlying components.
• More flexibility to support various business and operational deployment models that vary inwhich domains and services are owned and operated by the provider offering top-level (e.g.,HCS) services.
Figure 3-14 and Figure 3-15 illustrate the service overlay approach for application-based services suchas HCS, and the need for service level abstraction from the underlying infrastructure system.
Figure 3-14. HCS Services and Operational Domains
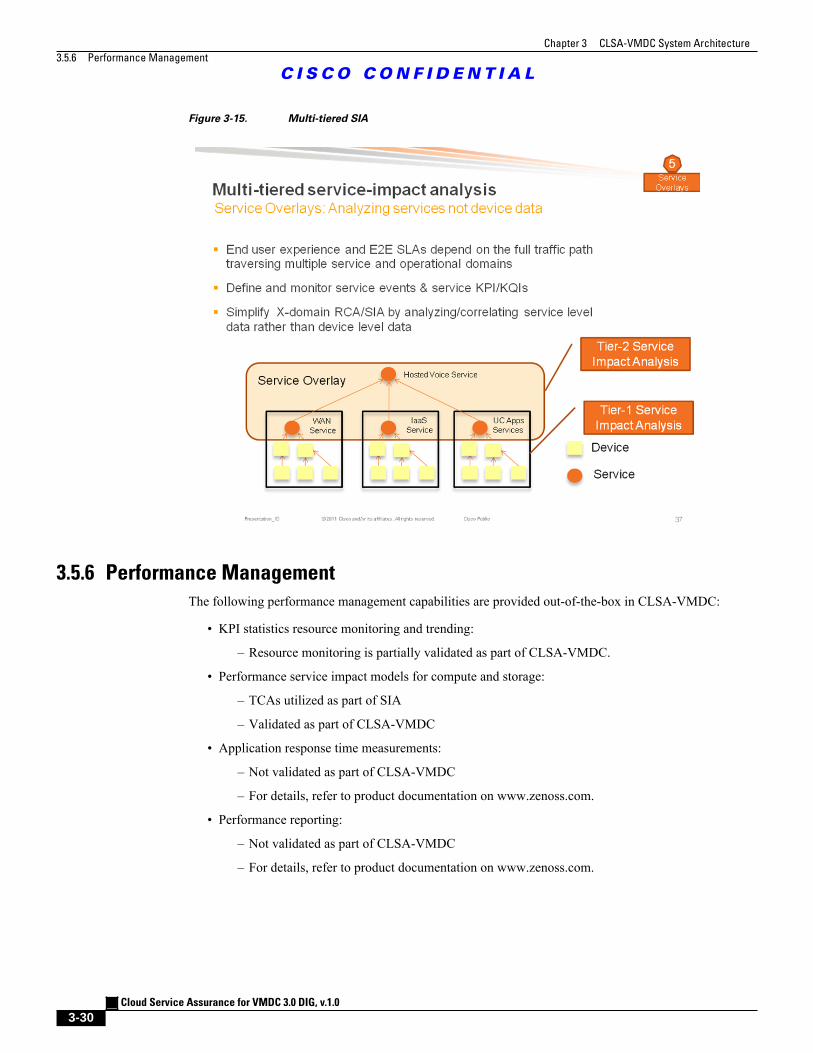
Chapter 3 CLSA-VMDC System Architecture
3.5.6 Performance Management
C I S C O C O N F I D E N T I A L
Cloud Service Assurance for VMDC 3.0 DIG, v.1.0
3-30
Figure 3-15. Multi-tiered SIA
3.5.6 Performance Management
The following performance management capabilities are provided out-of-the-box in CLSA-VMDC:
• KPI statistics resource monitoring and trending:
– Resource monitoring is partially validated as part of CLSA-VMDC.
• Performance service impact models for compute and storage:
– TCAs utilized as part of SIA
– Validated as part of CLSA-VMDC
• Application response time measurements:
– Not validated as part of CLSA-VMDC
– For details, refer to product documentation on www.zenoss.com.
• Performance reporting:
– Not validated as part of CLSA-VMDC
– For details, refer to product documentation on www.zenoss.com.
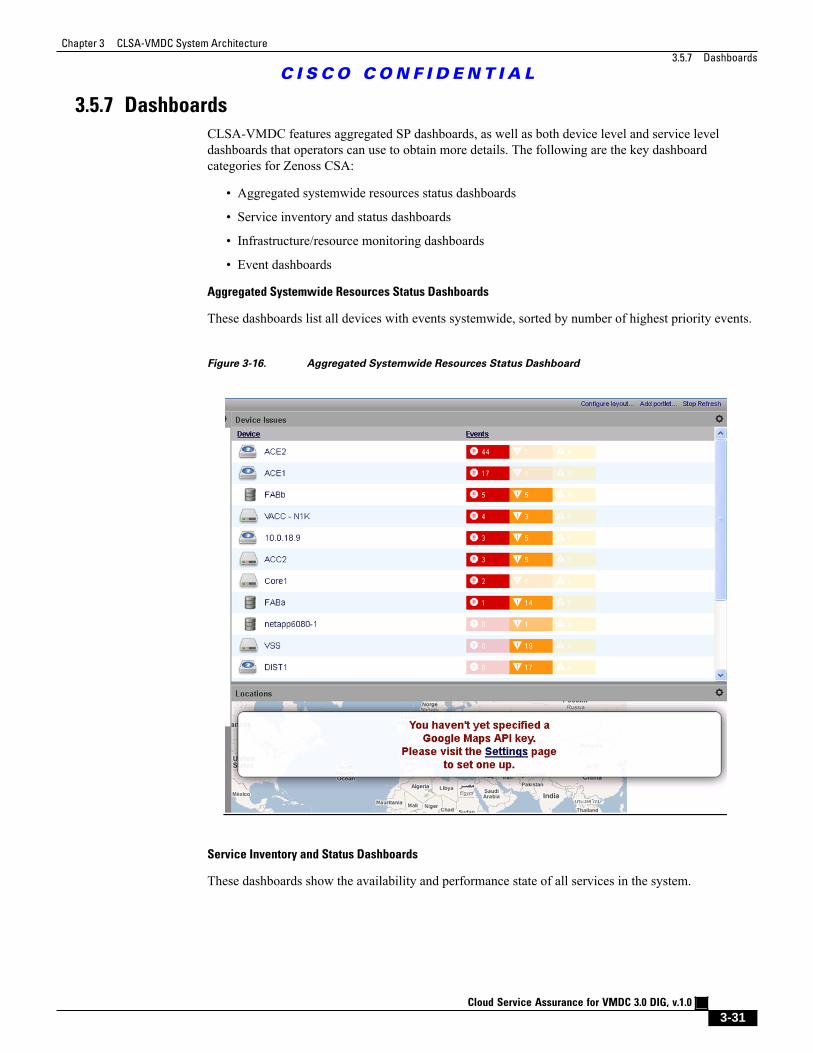
Chapter 3 CLSA-VMDC System Architecture
3.5.7 Dashboards
C I S C O C O N F I D E N T I A L
Cloud Service Assurance for VMDC 3.0 DIG, v.1.0
3-31
3.5.7 Dashboards
CLSA-VMDC features aggregated SP dashboards, as well as both device level and service leveldashboards that operators can use to obtain more details. The following are the key dashboardcategories for Zenoss CSA:
• Aggregated systemwide resources status dashboards
• Service inventory and status dashboards
• Infrastructure/resource monitoring dashboards
• Event dashboards
Aggregated Systemwide Resources Status Dashboards
These dashboards list all devices with events systemwide, sorted by number of highest priority events.
Figure 3-16. Aggregated Systemwide Resources Status Dashboard
Service Inventory and Status Dashboards
These dashboards show the availability and performance state of all services in the system.
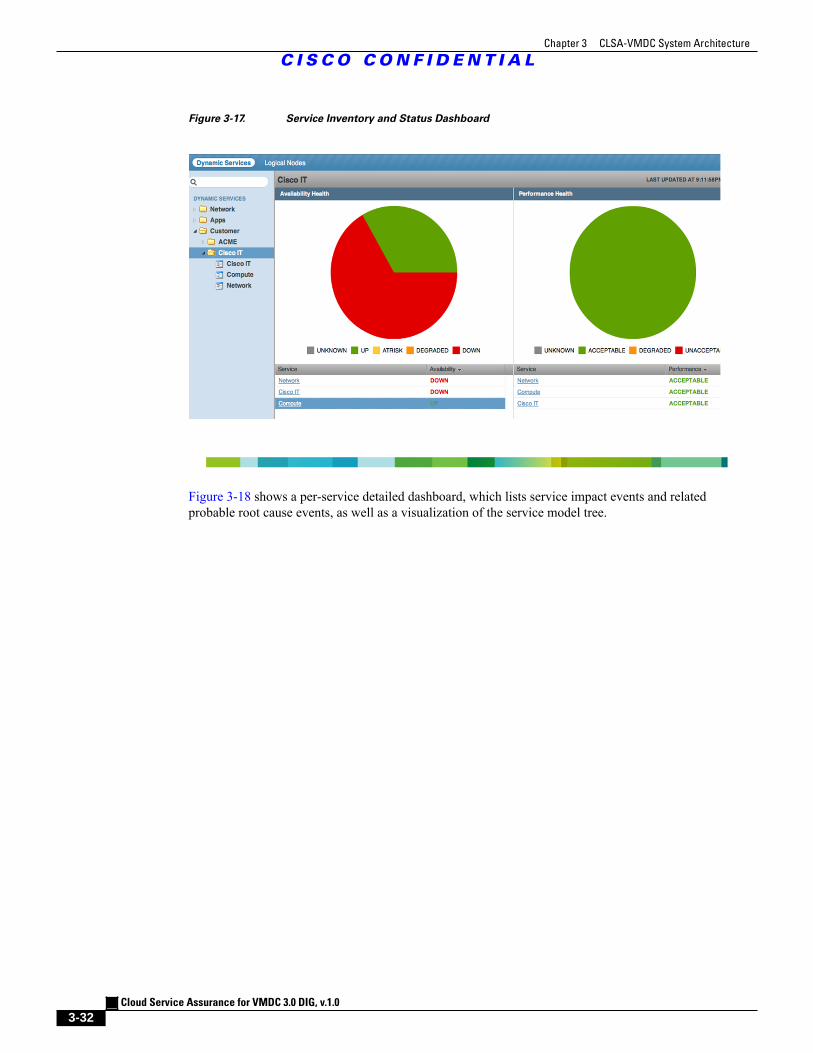
Chapter 3 CLSA-VMDC System Architecture
C I S C O C O N F I D E N T I A L
Cloud Service Assurance for VMDC 3.0 DIG, v.1.0
3-32
Figure 3-17. Service Inventory and Status Dashboard
Figure 3-18 shows a per-service detailed dashboard, which lists service impact events and relatedprobable root cause events, as well as a visualization of the service model tree.
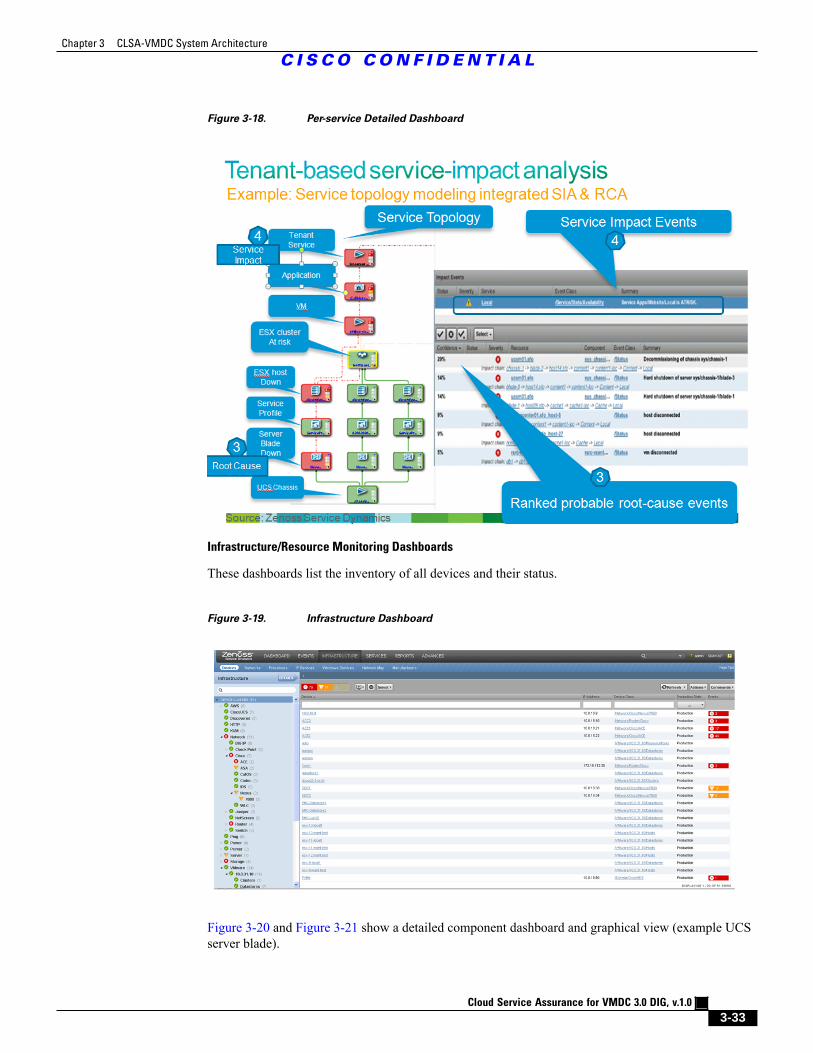
Chapter 3 CLSA-VMDC System Architecture
C I S C O C O N F I D E N T I A L
Cloud Service Assurance for VMDC 3.0 DIG, v.1.0
3-33
Figure 3-18. Per-service Detailed Dashboard
Infrastructure/Resource Monitoring Dashboards
These dashboards list the inventory of all devices and their status.
Figure 3-19. Infrastructure Dashboard
Figure 3-20 and Figure 3-21 show a detailed component dashboard and graphical view (example UCSserver blade).
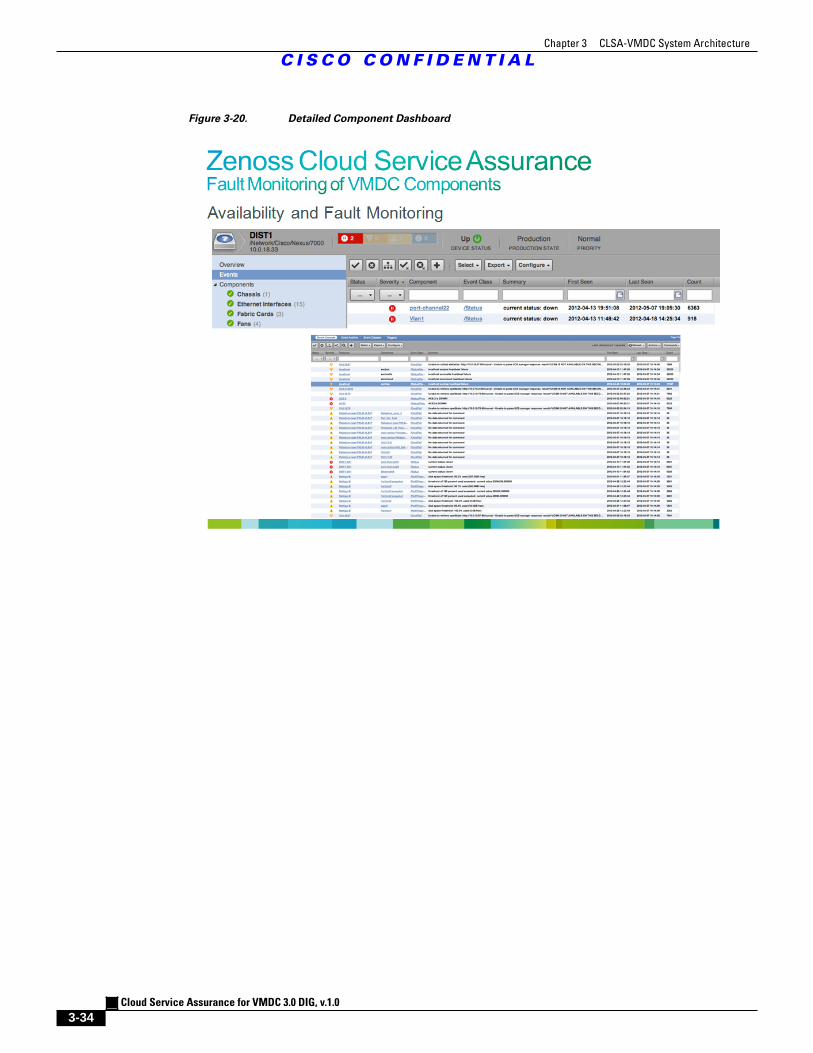
Chapter 3 CLSA-VMDC System Architecture
C I S C O C O N F I D E N T I A L
Cloud Service Assurance for VMDC 3.0 DIG, v.1.0
3-34
Figure 3-20. Detailed Component Dashboard
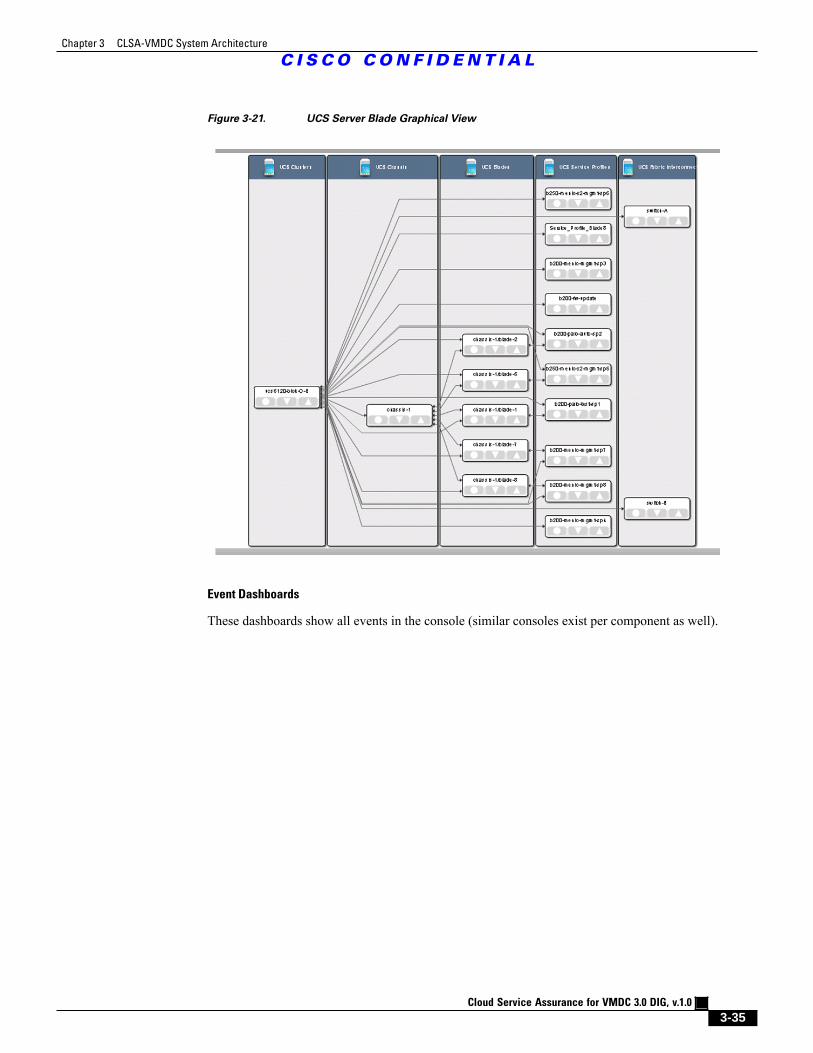
Chapter 3 CLSA-VMDC System Architecture
C I S C O C O N F I D E N T I A L
Cloud Service Assurance for VMDC 3.0 DIG, v.1.0
3-35
Figure 3-21. UCS Server Blade Graphical View
Event Dashboards
These dashboards show all events in the console (similar consoles exist per component as well).
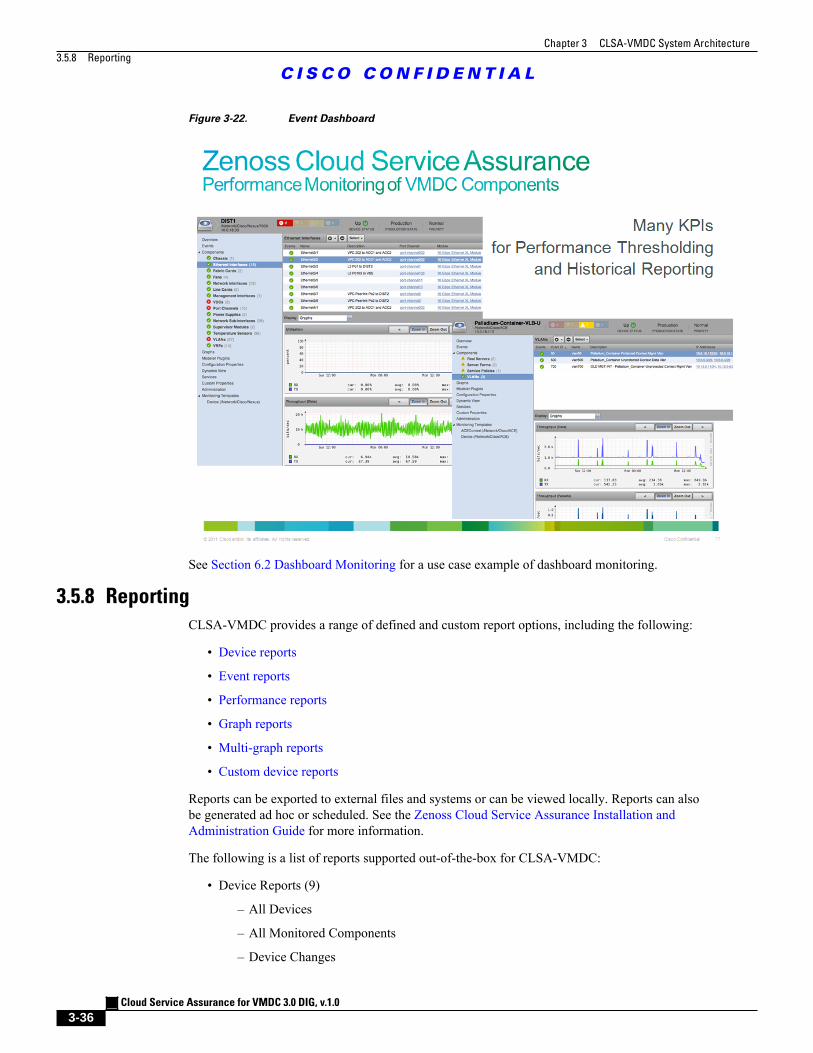
Chapter 3 CLSA-VMDC System Architecture
3.5.8 Reporting
C I S C O C O N F I D E N T I A L
Cloud Service Assurance for VMDC 3.0 DIG, v.1.0
3-36
Figure 3-22. Event Dashboard
See Section 6.2 Dashboard Monitoring for a use case example of dashboard monitoring.
3.5.8 Reporting
CLSA-VMDC provides a range of defined and custom report options, including the following:
• Device reports
• Event reports
• Performance reports
• Graph reports
• Multi-graph reports
• Custom device reports
Reports can be exported to external files and systems or can be viewed locally. Reports can alsobe generated ad hoc or scheduled. See the Zenoss Cloud Service Assurance Installation andAdministration Guide for more information.
The following is a list of reports supported out-of-the-box for CLSA-VMDC:
• Device Reports (9)
– All Devices
– All Monitored Components
– Device Changes
Chapter 3 CLSA-VMDC System Architecture
C I S C O C O N F I D E N T I A L
Cloud Service Assurance for VMDC 3.0 DIG, v.1.0
3-37
– MAC Addresses
– Model Collection Age
– New Devices
– Ping Status Issues
– SNMP Status Issues
– Software Inventory
• Custom Device Reports
• Graph Reports
• Multi-graph Reports
• Event Reports (3)
– All EventClasses
– All EventMappings
– All Heartbeats
• Performance Reports (7)
– Aggregate Reports
– Availability Report
– CPU Utilization
– Filesystem Util Report
– Interface Utilization
– Memory Utilization
– Threshold Summary
• Storage (3)
– Clients
– Licenses
– Disk Firmware
• Enterprise Reports (17)
– Organizer Graphs
– 95th Percentile
– Defined Thresholds
– Interface Volume
– Network Topology
– Customized Performance Templates
– User Event Activity
– Notifications and Triggers by Recipient
– Datapoints by Collector
– Organizer Availability
– Maintenance Windows
Chapter 3 CLSA-VMDC System Architecture
3.5.9 Multi-tenancy
C I S C O C O N F I D E N T I A L
Cloud Service Assurance for VMDC 3.0 DIG, v.1.0
3-38
– Interface Utilization
– Event Time to Resolution
– Data Sources in Use
– Users Group Membership
– Cisco Inventory
– Guest to Datapools
• MSExchange (1)
– MSExchangeAvailability
• VMware (5)
– ESXs
– VMware Utilization
– VMs
– Datastores
– Clusters
• Cisco UCS Reports (2)
– Hardware Inventory
– Free Slots
3.5.9 Multi-tenancy
This section discusses the CLSA-VMDC approach to multi-tenancy. VMDC architecture supportsmulti-tenant delivery, and CLSA-VMDC must therefore support an assurance window into thesetenant services to equip cloud providers with the ability to assure logically distinct customer services.A related topic, Role-Based Access Control (RBAC), is also presented in this section.
CLSA-VMDC multi-tenancy
VMDC provides a multi-tenancy cloud infrastructure by logically separating tenant services that areimplemented on a shared physical infrastructure. Tenants consume a portion of network, storage, andcompute resources that have been allocated from the larger pool represented by the cloud. CLSA-VMDC delivers cloud provider assurance of shared infrastructure devices and their sub-components.In addition, CLSA-VMDC supports the multi-tenancy aspect of the VMDC architecture through theuse of defined Tenant Services.
Zenoss CSA enables an administrator to stitch together service element nodes which taken as a wholecomprise a specific tenant service. A CLSA-VMDC tenant service begins with creation of the topmostelement node named for the tenant. To this tenant node, underlying VMware vSphere and UCS sharedinfrastructure elements can be discovered and attached. See Section 3.5.4.2 VMDC Assurance ServiceModels for more details regarding tenant services.
Using the tenant service modeling feature of CLSA-VMDC, cloud customers' services can be assuredindependently. Elements of the tenant service that are unique to that tenant customer such as specificVM's are visible only to the cloud provider or the service owner. Elements of the service that belongto shared infrastructure, such as a UCS chassis or a storage device are visible across multiple tenantservices, as would be expected. In fact, if a shared device experiences a fault condition, all servicesassociated with that device should be impacted. However, any fault condition associated with uniqueelements of a tenant service are not visible to other tenants.
Chapter 3 CLSA-VMDC System Architecture
C I S C O C O N F I D E N T I A L
Cloud Service Assurance for VMDC 3.0 DIG, v.1.0
3-39
Note This phase of CLSA-VMDC only supports cloud provider visibility into dashboards and service impacttrees. Tenant customer visibility into service impact trees via customer portals will be supported infuture releases.
RBAC Implementation
As a cloud providers' infrastructure increases in scale, it becomes important to provide a segmentationof operations capability to implement a division of responsibility. CLSA-VMDC fulfills this need withits RBAC implementation. Beyond this division of responsibility capability, RBAC can also be used tosupport groups of users with limited visibility into specific tenant services. Table 3-5 lists the out-of-the-box roles that may be used to segment cloud provider operations responsibilities and access.
Table 3-5. Global User Role Definitions
Role Definition
ZenUser Provides global read-only access to systemobjects.
ZenManager Provides global read-write access to systemobjects.
Manager Provides global read-write access to systemobjects and read-write access to the Zope objectdatabase (which includes all devices, users, andevent mappings)
ZenOperator Provides users the ability to manage events, i.e.acknowledge, move to archive, etc.
These predefined roles are global in scope, such that an operator may access all cloud objects, but onlybe allowed certain operations. In addition to these global user roles, users may be defined that are morelimited in scope. These user roles may be assigned to organizational groups to manage a subset of theentire infrastructure or even specific tenant services.
Organizational groups are used to collect subsets of infrastructure and/or services into logicalcategories for segmented operations. Table 3-6 lists the broad group categories and suggested uses foreach group type. Groups can be devised for each tenant such that a customer's tenant services can beassigned to a tenant group.
Table 3-6. Device and Service Group Categories
Group Categories Group Purpose
Group Can be used for collecting similar devices, e.g.all switches group, all compute devices group
Systems Can be used to collect all equipment with aspecific data center, e.g. data center A, datacenter B
Locations Can be used to collect devices by geographicboundaries, e.g. city, state, or even specificdevice rack
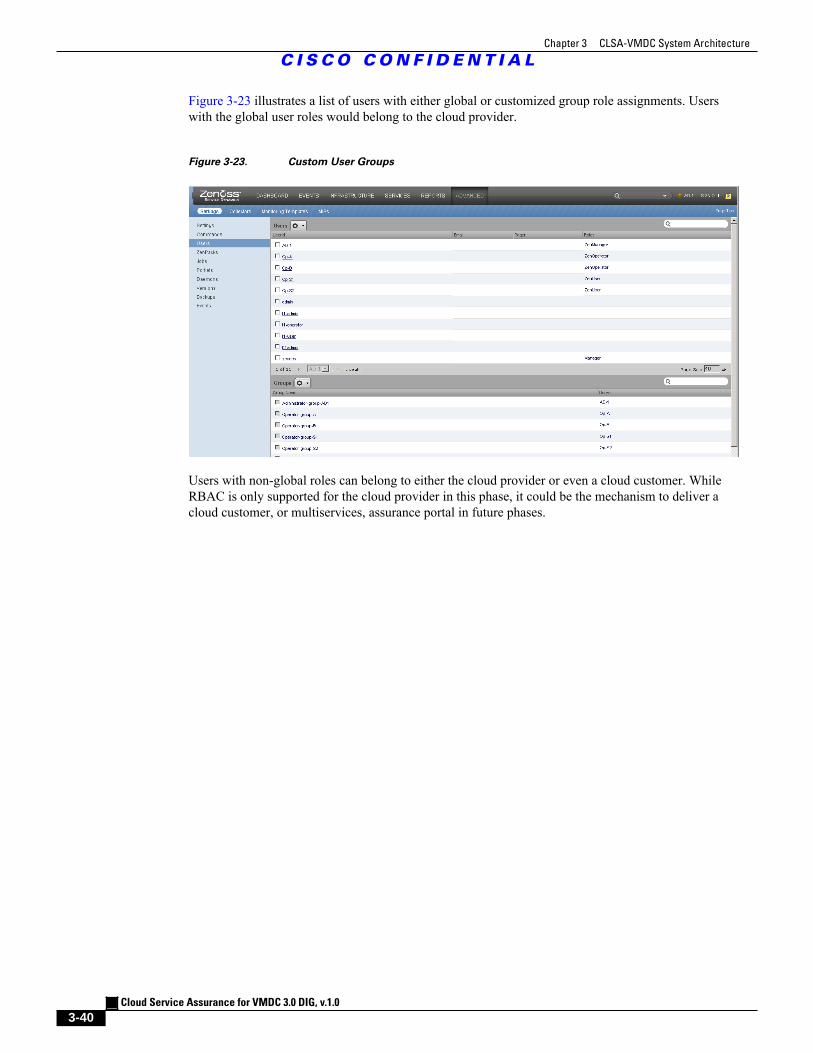
Chapter 3 CLSA-VMDC System Architecture
C I S C O C O N F I D E N T I A L
Cloud Service Assurance for VMDC 3.0 DIG, v.1.0
3-40
Figure 3-23 illustrates a list of users with either global or customized group role assignments. Userswith the global user roles would belong to the cloud provider.
Figure 3-23. Custom User Groups
Users with non-global roles can belong to either the cloud provider or even a cloud customer. WhileRBAC is only supported for the cloud provider in this phase, it could be the mechanism to deliver acloud customer, or multiservices, assurance portal in future phases.
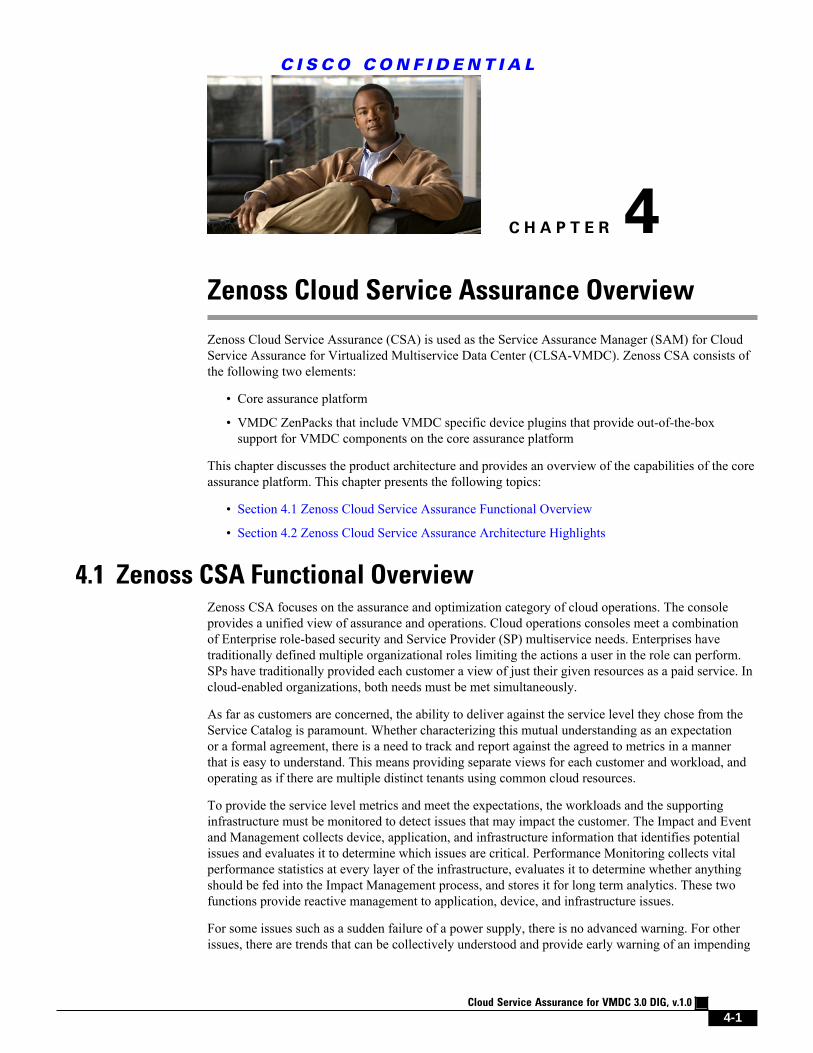
Cloud Service Assurance for VMDC 3.0 DIG, v.1.0
4-1
C I S C O C O N F I D E N T I A L
C H A P T E R 4Zenoss Cloud Service Assurance Overview
Zenoss Cloud Service Assurance (CSA) is used as the Service Assurance Manager (SAM) for CloudService Assurance for Virtualized Multiservice Data Center (CLSA-VMDC). Zenoss CSA consists ofthe following two elements:
• Core assurance platform
• VMDC ZenPacks that include VMDC specific device plugins that provide out-of-the-boxsupport for VMDC components on the core assurance platform
This chapter discusses the product architecture and provides an overview of the capabilities of the coreassurance platform. This chapter presents the following topics:
• Section 4.1 Zenoss Cloud Service Assurance Functional Overview
• Section 4.2 Zenoss Cloud Service Assurance Architecture Highlights
4.1 Zenoss CSA Functional OverviewZenoss CSA focuses on the assurance and optimization category of cloud operations. The consoleprovides a unified view of assurance and operations. Cloud operations consoles meet a combinationof Enterprise role-based security and Service Provider (SP) multiservice needs. Enterprises havetraditionally defined multiple organizational roles limiting the actions a user in the role can perform.SPs have traditionally provided each customer a view of just their given resources as a paid service. Incloud-enabled organizations, both needs must be met simultaneously.
As far as customers are concerned, the ability to deliver against the service level they chose from theService Catalog is paramount. Whether characterizing this mutual understanding as an expectationor a formal agreement, there is a need to track and report against the agreed to metrics in a mannerthat is easy to understand. This means providing separate views for each customer and workload, andoperating as if there are multiple distinct tenants using common cloud resources.
To provide the service level metrics and meet the expectations, the workloads and the supportinginfrastructure must be monitored to detect issues that may impact the customer. The Impact and Eventand Management collects device, application, and infrastructure information that identifies potentialissues and evaluates it to determine which issues are critical. Performance Monitoring collects vitalperformance statistics at every layer of the infrastructure, evaluates it to determine whether anythingshould be fed into the Impact Management process, and stores it for long term analytics. These twofunctions provide reactive management to application, device, and infrastructure issues.
For some issues such as a sudden failure of a power supply, there is no advanced warning. For otherissues, there are trends that can be collectively understood and provide early warning of an impending
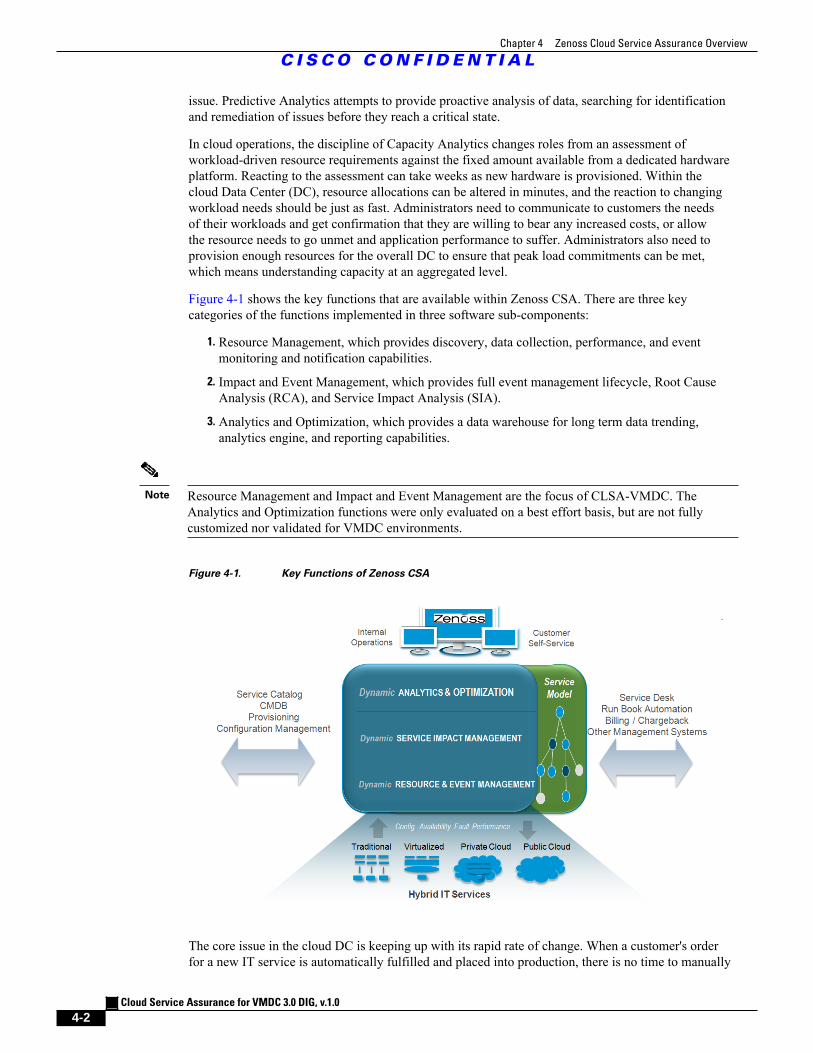
Chapter 4 Zenoss Cloud Service Assurance Overview
C I S C O C O N F I D E N T I A L
Cloud Service Assurance for VMDC 3.0 DIG, v.1.0
4-2
issue. Predictive Analytics attempts to provide proactive analysis of data, searching for identificationand remediation of issues before they reach a critical state.
In cloud operations, the discipline of Capacity Analytics changes roles from an assessment ofworkload-driven resource requirements against the fixed amount available from a dedicated hardwareplatform. Reacting to the assessment can take weeks as new hardware is provisioned. Within thecloud Data Center (DC), resource allocations can be altered in minutes, and the reaction to changingworkload needs should be just as fast. Administrators need to communicate to customers the needsof their workloads and get confirmation that they are willing to bear any increased costs, or allowthe resource needs to go unmet and application performance to suffer. Administrators also need toprovision enough resources for the overall DC to ensure that peak load commitments can be met,which means understanding capacity at an aggregated level.
Figure 4-1 shows the key functions that are available within Zenoss CSA. There are three keycategories of the functions implemented in three software sub-components:
1. Resource Management, which provides discovery, data collection, performance, and eventmonitoring and notification capabilities.
2. Impact and Event Management, which provides full event management lifecycle, Root CauseAnalysis (RCA), and Service Impact Analysis (SIA).
3. Analytics and Optimization, which provides a data warehouse for long term data trending,analytics engine, and reporting capabilities.
Note Resource Management and Impact and Event Management are the focus of CLSA-VMDC. TheAnalytics and Optimization functions were only evaluated on a best effort basis, but are not fullycustomized nor validated for VMDC environments.
Figure 4-1. Key Functions of Zenoss CSA
The core issue in the cloud DC is keeping up with its rapid rate of change. When a customer's orderfor a new IT service is automatically fulfilled and placed into production, there is no time to manually
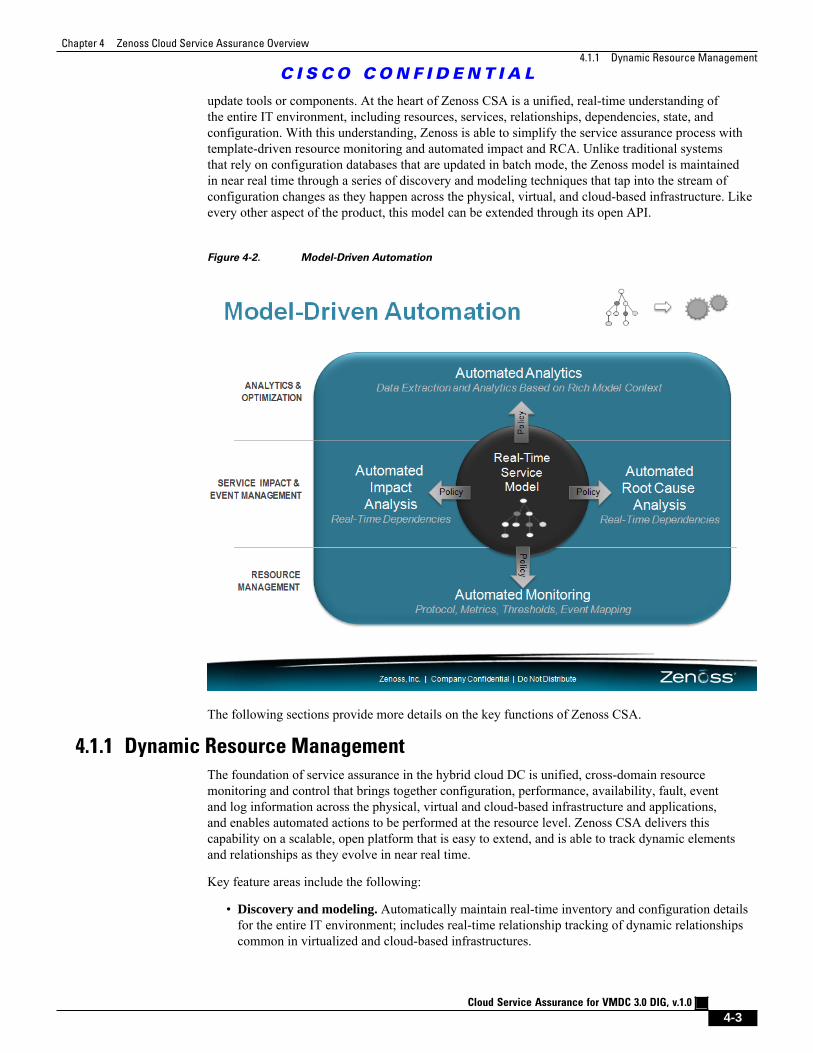
Chapter 4 Zenoss Cloud Service Assurance Overview
4.1.1 Dynamic Resource Management
C I S C O C O N F I D E N T I A L
Cloud Service Assurance for VMDC 3.0 DIG, v.1.0
4-3
update tools or components. At the heart of Zenoss CSA is a unified, real-time understanding ofthe entire IT environment, including resources, services, relationships, dependencies, state, andconfiguration. With this understanding, Zenoss is able to simplify the service assurance process withtemplate-driven resource monitoring and automated impact and RCA. Unlike traditional systemsthat rely on configuration databases that are updated in batch mode, the Zenoss model is maintainedin near real time through a series of discovery and modeling techniques that tap into the stream ofconfiguration changes as they happen across the physical, virtual, and cloud-based infrastructure. Likeevery other aspect of the product, this model can be extended through its open API.
Figure 4-2. Model-Driven Automation
The following sections provide more details on the key functions of Zenoss CSA.
4.1.1 Dynamic Resource Management
The foundation of service assurance in the hybrid cloud DC is unified, cross-domain resourcemonitoring and control that brings together configuration, performance, availability, fault, eventand log information across the physical, virtual and cloud-based infrastructure and applications,and enables automated actions to be performed at the resource level. Zenoss CSA delivers thiscapability on a scalable, open platform that is easy to extend, and is able to track dynamic elementsand relationships as they evolve in near real time.
Key feature areas include the following:
• Discovery and modeling. Automatically maintain real-time inventory and configuration detailsfor the entire IT environment; includes real-time relationship tracking of dynamic relationshipscommon in virtualized and cloud-based infrastructures.
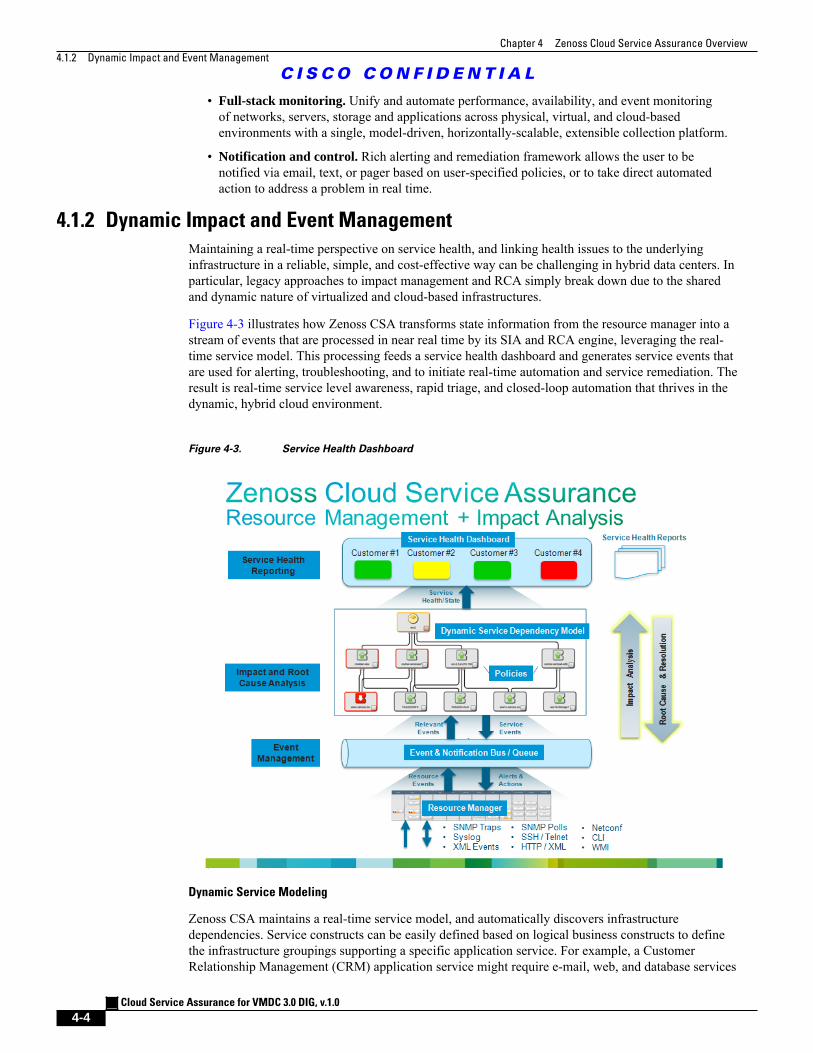
Chapter 4 Zenoss Cloud Service Assurance Overview
4.1.2 Dynamic Impact and Event Management
C I S C O C O N F I D E N T I A L
Cloud Service Assurance for VMDC 3.0 DIG, v.1.0
4-4
• Full-stack monitoring. Unify and automate performance, availability, and event monitoringof networks, servers, storage and applications across physical, virtual, and cloud-basedenvironments with a single, model-driven, horizontally-scalable, extensible collection platform.
• Notification and control. Rich alerting and remediation framework allows the user to benotified via email, text, or pager based on user-specified policies, or to take direct automatedaction to address a problem in real time.
4.1.2 Dynamic Impact and Event Management
Maintaining a real-time perspective on service health, and linking health issues to the underlyinginfrastructure in a reliable, simple, and cost-effective way can be challenging in hybrid data centers. Inparticular, legacy approaches to impact management and RCA simply break down due to the sharedand dynamic nature of virtualized and cloud-based infrastructures.
Figure 4-3 illustrates how Zenoss CSA transforms state information from the resource manager into astream of events that are processed in near real time by its SIA and RCA engine, leveraging the real-time service model. This processing feeds a service health dashboard and generates service events thatare used for alerting, troubleshooting, and to initiate real-time automation and service remediation. Theresult is real-time service level awareness, rapid triage, and closed-loop automation that thrives in thedynamic, hybrid cloud environment.
Figure 4-3. Service Health Dashboard
Dynamic Service Modeling
Zenoss CSA maintains a real-time service model, and automatically discovers infrastructuredependencies. Service constructs can be easily defined based on logical business constructs to definethe infrastructure groupings supporting a specific application service. For example, a CustomerRelationship Management (CRM) application service might require e-mail, web, and database services
Chapter 4 Zenoss Cloud Service Assurance Overview
4.1.3 Dynamic Analytics and Optimization
C I S C O C O N F I D E N T I A L
Cloud Service Assurance for VMDC 3.0 DIG, v.1.0
4-5
to be present in order to operate. These logical definitions define the collection of services requiredfor the CRM service to be considered functional. Once this logical service hierarchy is defined, theapplication or OS instances delivering the service functions are associated and Zenoss CSA takescare of the rest. Using advanced dependency modeling capabilities, Zenoss CSA pulls in all relevantinfrastructure elements. Virtual Machine (VM) partitions, blades, chassis, storage, network interfaces,and a wide variety of device components are all automatically discovered and mapped into the relevantservice dependency graphs.
Dynamic Impact Analysis
Dynamic Impact Analysis identifies which services are affected by conditions in supportingcomponents or infrastructure. For example, a failing fan in a Cisco UCS chassis might result in dozensof virtual machines being moved to new virtual hosts. With Zenoss impact analysis, IT operations candetermine which business services will be affected by the fan failure and can plan corrective actions tominimize service level disruptions.
Dynamic RCA
Dynamic RCA allows IT operators to quickly identify the specific events most likely to be the causeof a service impacting condition. In complex IT environments, it is not uncommon for a singlecomponent failure to cause a cascade of failures, resulting in an event storm totaling thousands ofindividual events. Zenoss CSA includes a proprietary Confidence Ranking Engine built on top ofImpact Analysis to quickly triage these events and identify where IT resources should be applied tocorrect these types of situations. This algorithm filters impact events based on a variety of criteriaincluding severity of the event, service graph depth, and the number of graph branches affected byan event. This ranking algorithm allows IT operators to target resources to address events deemedthe most likely cause of a service failure or degradation. Real world deployments of Zenoss CSAhave validated the effectiveness of the service impact framework by demonstrating significant eventreduction and highly accurate identification of root cause events.
Simple, Modular Policy - "Policy Gates"
Traditional impact managers require complex, top down rule sets to be defined, which require eithera static IT infrastructure or a detailed understanding of all possible infrastructure configurations toidentify service impact or determine root cause. This approach fails in dynamic virtualized or clouddata centers due to the need to maintain hard dependencies on named infrastructure elements. Incontrast, Zenoss CSA uses Policy Gates to define impact rules on an element-by-element basis, androlls up impact results through the current service model to reach conclusions. The design premise ofthis system is that the state of any given element in a service graph is determined by analyzing the stateof the immediate children of that element. A change in the state of a given element is propagated tothe parents of that element, causing the parents to evaluate their own state using their own Policy Gateconfigurations. The net result of this approach is that functions such as event aggregation, filtering, de-duplication and masking are provided automatically, eliminating the need for highly specialized skillsto write impact rules and dramatically reducing human effort in event processing.
Unified, Scale Event Management
Aggregate and manage events for an entire IT environment with a next generation event managementsystem that provides automated event normalization and enrichment, and is easily extended, integrated,and scaled through an embedded message bus. Zenoss CSA is capable of processing in excess of 1,500events per second with a single event processor. Field deployments have shown that the system iscapable of quickly parsing through event storms scaling to thousands of events in seconds, resulting injust a handful of events after processing through the Service Impact and Confidence Ranking.
4.1.3 Dynamic Analytics and Optimization
The final step of the service assurance lifecycle is historical analysis and planning. Deep, cross-domainanalytics are needed to perform capacity planning and drive optimization of the environment. Zenoss
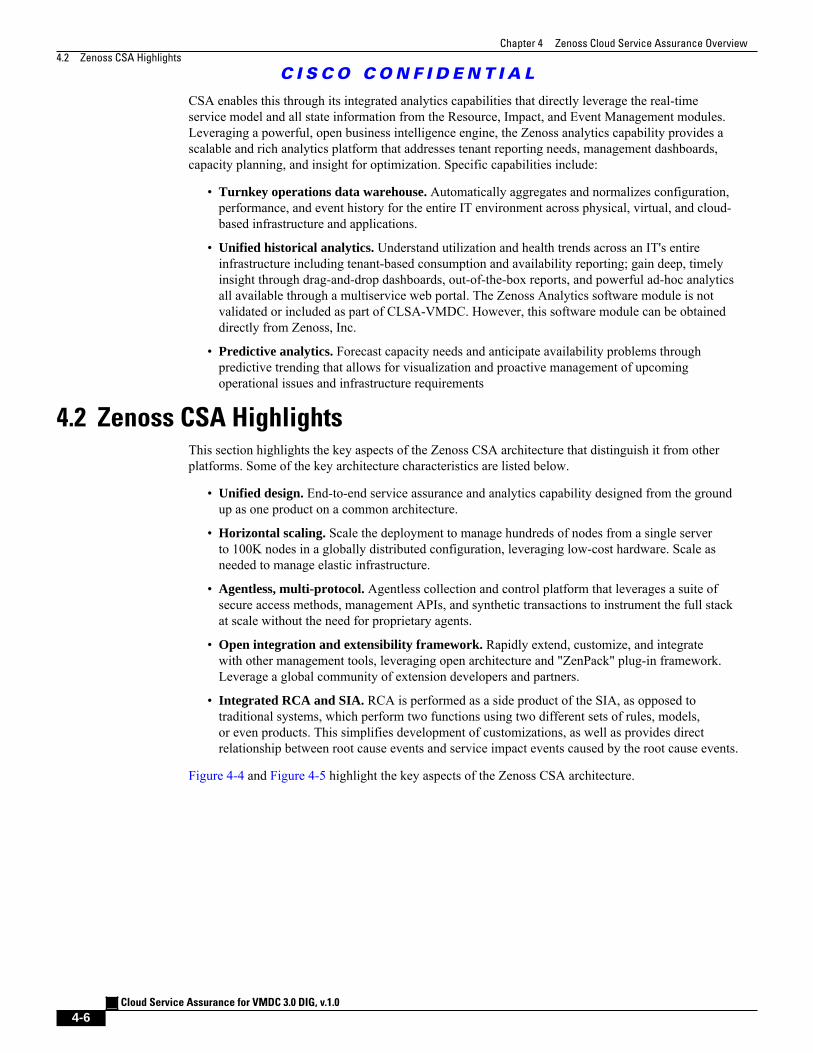
Chapter 4 Zenoss Cloud Service Assurance Overview
4.2 Zenoss CSA Highlights
C I S C O C O N F I D E N T I A L
Cloud Service Assurance for VMDC 3.0 DIG, v.1.0
4-6
CSA enables this through its integrated analytics capabilities that directly leverage the real-timeservice model and all state information from the Resource, Impact, and Event Management modules.Leveraging a powerful, open business intelligence engine, the Zenoss analytics capability provides ascalable and rich analytics platform that addresses tenant reporting needs, management dashboards,capacity planning, and insight for optimization. Specific capabilities include:
• Turnkey operations data warehouse. Automatically aggregates and normalizes configuration,performance, and event history for the entire IT environment across physical, virtual, and cloud-based infrastructure and applications.
• Unified historical analytics. Understand utilization and health trends across an IT's entireinfrastructure including tenant-based consumption and availability reporting; gain deep, timelyinsight through drag-and-drop dashboards, out-of-the-box reports, and powerful ad-hoc analyticsall available through a multiservice web portal. The Zenoss Analytics software module is notvalidated or included as part of CLSA-VMDC. However, this software module can be obtaineddirectly from Zenoss, Inc.
• Predictive analytics. Forecast capacity needs and anticipate availability problems throughpredictive trending that allows for visualization and proactive management of upcomingoperational issues and infrastructure requirements
4.2 Zenoss CSA HighlightsThis section highlights the key aspects of the Zenoss CSA architecture that distinguish it from otherplatforms. Some of the key architecture characteristics are listed below.
• Unified design. End-to-end service assurance and analytics capability designed from the groundup as one product on a common architecture.
• Horizontal scaling. Scale the deployment to manage hundreds of nodes from a single serverto 100K nodes in a globally distributed configuration, leveraging low-cost hardware. Scale asneeded to manage elastic infrastructure.
• Agentless, multi-protocol. Agentless collection and control platform that leverages a suite ofsecure access methods, management APIs, and synthetic transactions to instrument the full stackat scale without the need for proprietary agents.
• Open integration and extensibility framework. Rapidly extend, customize, and integratewith other management tools, leveraging open architecture and "ZenPack" plug-in framework.Leverage a global community of extension developers and partners.
• Integrated RCA and SIA. RCA is performed as a side product of the SIA, as opposed totraditional systems, which perform two functions using two different sets of rules, models,or even products. This simplifies development of customizations, as well as provides directrelationship between root cause events and service impact events caused by the root cause events.
Figure 4-4 and Figure 4-5 highlight the key aspects of the Zenoss CSA architecture.
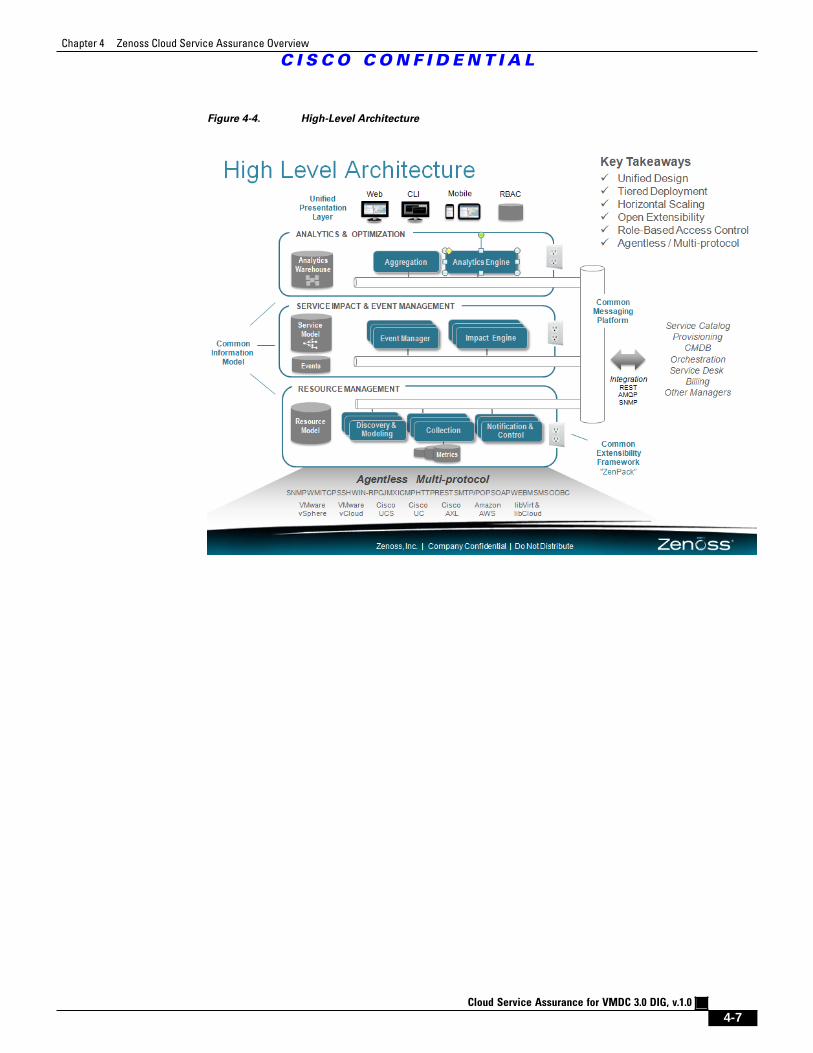
Chapter 4 Zenoss Cloud Service Assurance Overview
C I S C O C O N F I D E N T I A L
Cloud Service Assurance for VMDC 3.0 DIG, v.1.0
4-7
Figure 4-4. High-Level Architecture
Chapter 4 Zenoss Cloud Service Assurance Overview
C I S C O C O N F I D E N T I A L
Cloud Service Assurance for VMDC 3.0 DIG, v.1.0
4-8
Figure 4-5. Zenoss Product Architecture Overview
Cloud Service Assurance for VMDC 3.0 DIG, v.1.0
5-1
C I S C O C O N F I D E N T I A L
C H A P T E R 5System Design Constraints
This chapter discusses the system design constraints of Cloud Service Assurance for VirtualizedMultiservice Data Center (CLSA-VMDC) and describes the specific capabilities of the products used.This chapter presents the following topics:
• Section 5.1 System Redundancy and Availability
• Section 5.2 System Sizing and Scalability
• Section 5.3 System Deployment Models
• Section 5.4 System Maintenance and Serviceability
5.1 System Redundancy and AvailabilityVarious redundancy deployment models and trade-offs for CLSA-VMDC are described in Section 5.3System Deployment Models. This section describes the specific capabilities of the products used.
Zenoss Redundancy Capabilities
Zenoss Service Dynamic supports the following levels of redundancy and Disaster Recovery (DR)capabilities:
• VMware High Availability (HA) within a single Data Center (DC)
• Distributed Replicated Block Device (DRBD) and Linux active-standby HA - for latencies lessthan 20 msec between Zenoss components
• DRBD Proxy for latencies above 20 msec between Zenoss components
As noted in earlier sections, Zenoss Cloud Service Assurance (CSA) subcomponents can be deployedon a single Virtual Machine (VM) or they can be distributed. The following are three subcomponentsthat can be deployed in a distributed fashion:
• The Zenoss Collector is responsible for collecting data (event and performance) from manageddevices.
• The Zenoss Hub provides an aggregation point for multiple collectors (up to 16 collectors can bedeployed per hub).
• The Zenoss Server or Master aggregates hubs, performs analysis of data, and provides the UserInterface (UI).
A distributed architecture allows for both scale growth, as well as flexibility in addressing differentdeployment models based on availability, security, cost, and latency requirements. Customers have
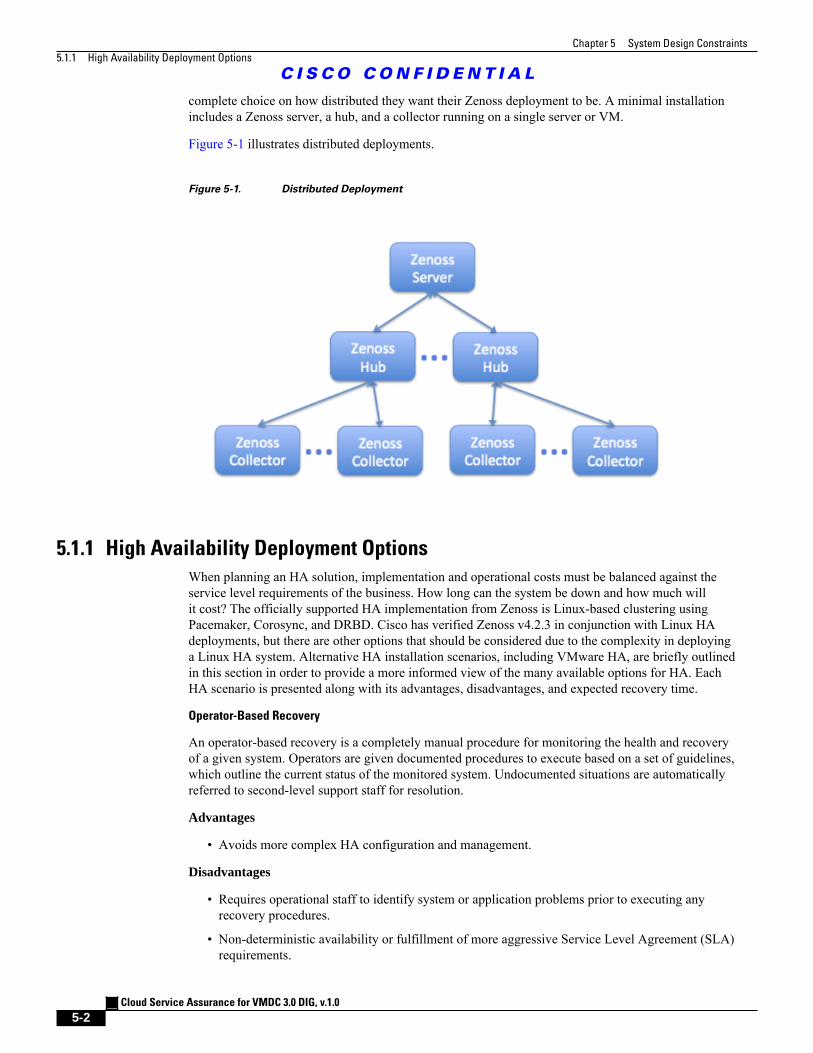
Chapter 5 System Design Constraints
5.1.1 High Availability Deployment Options
C I S C O C O N F I D E N T I A L
Cloud Service Assurance for VMDC 3.0 DIG, v.1.0
5-2
complete choice on how distributed they want their Zenoss deployment to be. A minimal installationincludes a Zenoss server, a hub, and a collector running on a single server or VM.
Figure 5-1 illustrates distributed deployments.
Figure 5-1. Distributed Deployment
5.1.1 High Availability Deployment Options
When planning an HA solution, implementation and operational costs must be balanced against theservice level requirements of the business. How long can the system be down and how much willit cost? The officially supported HA implementation from Zenoss is Linux-based clustering usingPacemaker, Corosync, and DRBD. Cisco has verified Zenoss v4.2.3 in conjunction with Linux HAdeployments, but there are other options that should be considered due to the complexity in deployinga Linux HA system. Alternative HA installation scenarios, including VMware HA, are briefly outlinedin this section in order to provide a more informed view of the many available options for HA. EachHA scenario is presented along with its advantages, disadvantages, and expected recovery time.
Operator-Based Recovery
An operator-based recovery is a completely manual procedure for monitoring the health and recoveryof a given system. Operators are given documented procedures to execute based on a set of guidelines,which outline the current status of the monitored system. Undocumented situations are automaticallyreferred to second-level support staff for resolution.
Advantages
• Avoids more complex HA configuration and management.
Disadvantages
• Requires operational staff to identify system or application problems prior to executing anyrecovery procedures.
• Non-deterministic availability or fulfillment of more aggressive Service Level Agreement (SLA)requirements.
Chapter 5 System Design Constraints
C I S C O C O N F I D E N T I A L
Cloud Service Assurance for VMDC 3.0 DIG, v.1.0
5-3
• Does not protect against data corruption if using shared storage.
• Would require manual data replication if not using shared storage.
VMware HA
VMware HA protects against VM hardware and Operating System (OS) level failures by supportingVM restarts in a clustered ESXi host configuration. Once failure of the active VM is detected, a newVM instance is powered on elsewhere in the cluster. For more detailed information regarding VMwareHA, refer to the vSphere Availability Guide.
Advantages
• Meets more aggressive SLA requirements as the failover requires only the time to boot the VM.
• Implementation is potentially complex, but limited to VMware configuration with no third-partysoftware.
• Recovery procedures for VM failure are automatic.
Disadvantages
• Zenoss does not support the VMware application API for application monitoring.
• Does not protect against data corruption.
• Requires operational staff to execute any recovery procedures when encountering partial VM orapplication failures.
• Only supported within a local data center unless implementing VMware stretched clusterconfigurations.
VMware FT
VMware Fault Tolerance (FT) protects against VM hardware failure by maintaining a fully-synchronized secondary VM. In the event of a primary VM failure, the secondary VM is broughtonline immediately, without a required boot-up or switchover requirement. For more detailedinformation regarding VMware FT, refer to the vSphere Availability Guide.
Advantages
• Meets more aggressive SLA requirements with a minimal downtime switchover in the event offull VM failure.
• Implementation is potentially complex, but limited to VMware configuration with no third-partysoftware.
Disadvantages
• Zenoss does not support the VMware application API for application monitoring.
• Does not protect against data corruption.
• Requires operational staff to execute any recovery procedures when encountering partial VM orapplication failures.
• Application level errors are propagated to secondary device.
• Limited to a single Virtual CPU (vCPU), which could potentially limit use in larger VMDCinstallations.
• Only supported within a local data center.
Linux Clustering
Chapter 5 System Design Constraints
C I S C O C O N F I D E N T I A L
Cloud Service Assurance for VMDC 3.0 DIG, v.1.0
5-4
Linux clustering uses Corosync, Pacemaker, and DRBD to maintain and monitor hardware andapplication health, while maintaining one or more online standby nodes. In the event of hardware orapplication failure, applications are relocated and started on available standby nodes. Linux clusteringwith DRBD is recommended for locations with connections less than 20 msec of delay between thecluster nodes.
Advantages
• The failover procedure is automated.
• Covers both application and system level failures using Corosync and Pacemaker.
• Supported deployment model for Zenoss.
• Can be used to support both VM and physical machine deployments.
• Applicable to both local data center and WAN based remote sites.
Disadvantages
• Implementation is complex.
• Requires additional third-party software and licensing.
• Does not protect against data corruption.
DRBD Proxy
DRBD Proxy allows multiple sites to maintain synchronized filesystems across network connectionsgreater than 20 msec.
Advantages
• Supported deployment model for Zenoss over WAN connections.
• Provides synchronized data replication across WAN connections.
Disadvantages
• Requires additional third-party software and licensing.
• Does not protect against data corruption.
• Does not protect against application failures.
• Requires operational staff to execute any recovery procedures when encountering any failures.
Recovery Time Comparison
Deployment Type Full System
Recovery
Application
Recovery
Tested Local/Remote DC
Operator Based 5-10 minutes(manual)
5-10 minutes(manual)
No Local
VMware HA <5 min(automatic)
<5 min (manual) Yes Local
VMware FT <1 min(automatic)
<1 min (manual) No Local
Linux Clustering <5 min(automatic)
<5 min(automatic)
Yes Local
Chapter 5 System Design Constraints
5.1.2 Disaster Recovery Deployment
C I S C O C O N F I D E N T I A L
Cloud Service Assurance for VMDC 3.0 DIG, v.1.0
5-5
Deployment Type Full System
Recovery
Application
Recovery
Tested Local/Remote DC
DRBD Proxy 5-10 minutes(manual)
5-10 minutes(manual)
Yes Remote
Note The manual process noted in the full system and application recovery columns only covers the amountof time to physically recover the system in the event of a failure. The time from failure to recovery isactually made up of the time required for an operator to acknowledge the failure, identify the problemtype, and execute any recovery procedures. Failure acknowledgement and problem identification areboth variable times based on operator coverage and procedures.
5.1.2 Disaster Recovery Deployment
Disaster Recovery (DR) can be addressed in two ways. First, HA clusters can be distributed acrossgeographically remote data centers when network latency between data centers does not exceed about20 ms. Above that latency, instead of the DRBD continuous replication, it is recommended to useDRBD Proxy, which queues updates based on network loads. With the default Zenoss configuration,DRBD Proxy stores up to 1 Gb of updates in the event of a network outage to the remote site. Storagequeue sizes may be adjusted to match expected monitoring loads.
Distributed collectors can operate independently of the Zenoss master. When a collector starts up, itrequests its configuration from its hub, which means that no collector configuration is required initiallyother than to assign a collector to a hub. The performance data collected by a collector remains localto the collector until requested by a user for viewing in the Zenoss UI. Events are queued up within acollector for a configurable time whenever the connection to the Zenoss master is lost.
5.2 System Sizing and Scalability
Note Scalability and performance testing have not been performed by Cisco as part of this phase; all of thedata in this section is based on product testing and deployment data provided by Zenoss.
Zenoss CSA can be deployed both in a centralized manner on a single VM, as well as in a distributedmanner for larger scale deployments. Referring to Figure 5-2, the Zenoss CSA modular architectureallows for small initial deployments and scaling expansion at two levels:
• Within a single system via distributed collectors and hubs
• Putting multiple systems together via a global dashboard
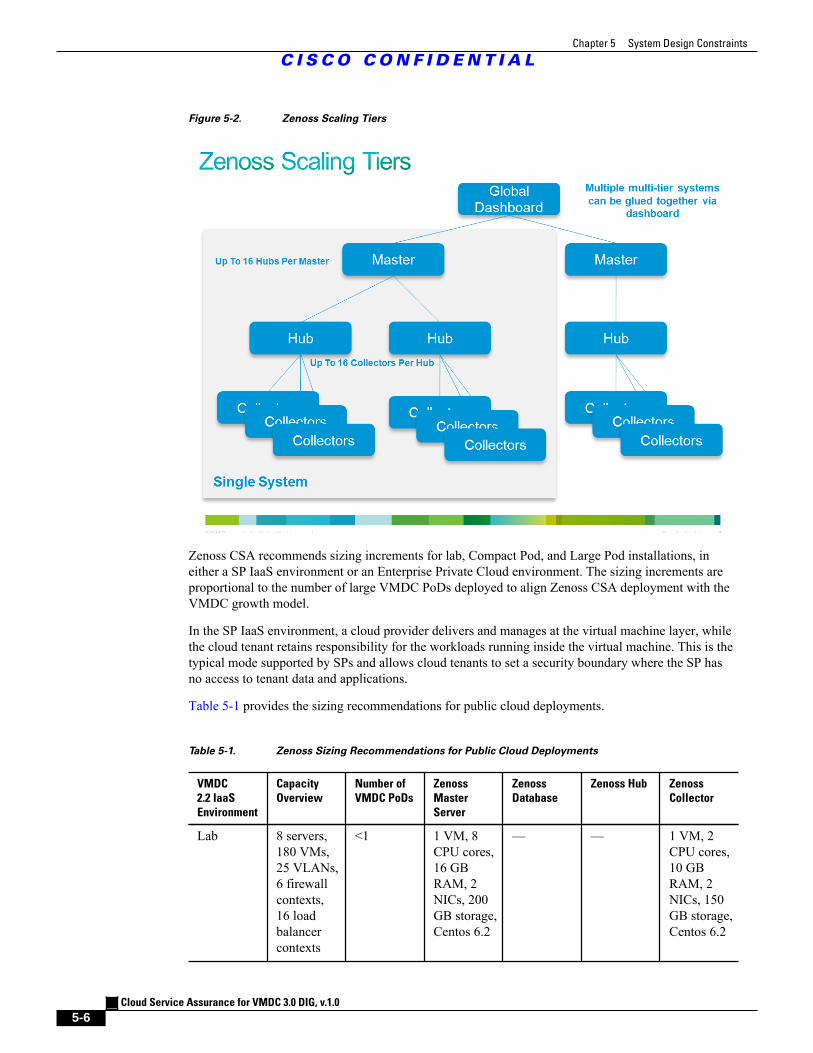
Chapter 5 System Design Constraints
C I S C O C O N F I D E N T I A L
Cloud Service Assurance for VMDC 3.0 DIG, v.1.0
5-6
Figure 5-2. Zenoss Scaling Tiers
Zenoss CSA recommends sizing increments for lab, Compact Pod, and Large Pod installations, ineither a SP IaaS environment or an Enterprise Private Cloud environment. The sizing increments areproportional to the number of large VMDC PoDs deployed to align Zenoss CSA deployment with theVMDC growth model.
In the SP IaaS environment, a cloud provider delivers and manages at the virtual machine layer, whilethe cloud tenant retains responsibility for the workloads running inside the virtual machine. This is thetypical mode supported by SPs and allows cloud tenants to set a security boundary where the SP hasno access to tenant data and applications.
Table 5-1 provides the sizing recommendations for public cloud deployments.
Table 5-1. Zenoss Sizing Recommendations for Public Cloud Deployments
VMDC
2.2 IaaS
Environment
Capacity
Overview
Number of
VMDC PoDs
Zenoss
Master
Server
Zenoss
Database
Zenoss Hub Zenoss
Collector
Lab 8 servers,180 VMs,25 VLANs,6 firewallcontexts,16 loadbalancercontexts
<1 1 VM, 8CPU cores,16 GBRAM, 2NICs, 200GB storage,Centos 6.2
— — 1 VM, 2CPU cores,10 GBRAM, 2NICs, 150GB storage,Centos 6.2
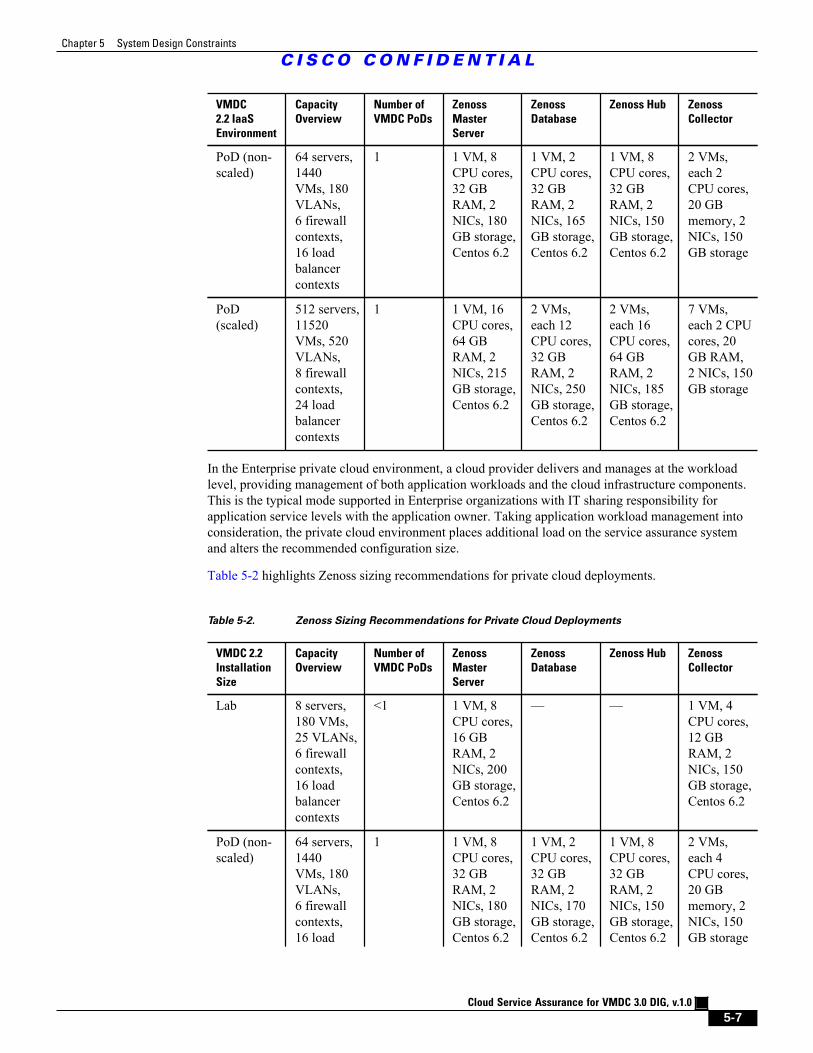
Chapter 5 System Design Constraints
C I S C O C O N F I D E N T I A L
Cloud Service Assurance for VMDC 3.0 DIG, v.1.0
5-7
VMDC
2.2 IaaS
Environment
Capacity
Overview
Number of
VMDC PoDs
Zenoss
Master
Server
Zenoss
Database
Zenoss Hub Zenoss
Collector
PoD (non-scaled)
64 servers,1440VMs, 180VLANs,6 firewallcontexts,16 loadbalancercontexts
1 1 VM, 8CPU cores,32 GBRAM, 2NICs, 180GB storage,Centos 6.2
1 VM, 2CPU cores,32 GBRAM, 2NICs, 165GB storage,Centos 6.2
1 VM, 8CPU cores,32 GBRAM, 2NICs, 150GB storage,Centos 6.2
2 VMs,each 2CPU cores,20 GBmemory, 2NICs, 150GB storage
PoD(scaled)
512 servers,11520VMs, 520VLANs,8 firewallcontexts,24 loadbalancercontexts
1 1 VM, 16CPU cores,64 GBRAM, 2NICs, 215GB storage,Centos 6.2
2 VMs,each 12CPU cores,32 GBRAM, 2NICs, 250GB storage,Centos 6.2
2 VMs,each 16CPU cores,64 GBRAM, 2NICs, 185GB storage,Centos 6.2
7 VMs,each 2 CPUcores, 20GB RAM,2 NICs, 150GB storage
In the Enterprise private cloud environment, a cloud provider delivers and manages at the workloadlevel, providing management of both application workloads and the cloud infrastructure components.This is the typical mode supported in Enterprise organizations with IT sharing responsibility forapplication service levels with the application owner. Taking application workload management intoconsideration, the private cloud environment places additional load on the service assurance systemand alters the recommended configuration size.
Table 5-2 highlights Zenoss sizing recommendations for private cloud deployments.
Table 5-2. Zenoss Sizing Recommendations for Private Cloud Deployments
VMDC 2.2
Installation
Size
Capacity
Overview
Number of
VMDC PoDs
Zenoss
Master
Server
Zenoss
Database
Zenoss Hub Zenoss
Collector
Lab 8 servers,180 VMs,25 VLANs,6 firewallcontexts,16 loadbalancercontexts
<1 1 VM, 8CPU cores,16 GBRAM, 2NICs, 200GB storage,Centos 6.2
— — 1 VM, 4CPU cores,12 GBRAM, 2NICs, 150GB storage,Centos 6.2
PoD (non-scaled)
64 servers,1440VMs, 180VLANs,6 firewallcontexts,16 load
1 1 VM, 8CPU cores,32 GBRAM, 2NICs, 180GB storage,Centos 6.2
1 VM, 2CPU cores,32 GBRAM, 2NICs, 170GB storage,Centos 6.2
1 VM, 8CPU cores,32 GBRAM, 2NICs, 150GB storage,Centos 6.2
2 VMs,each 4CPU cores,20 GBmemory, 2NICs, 150GB storage
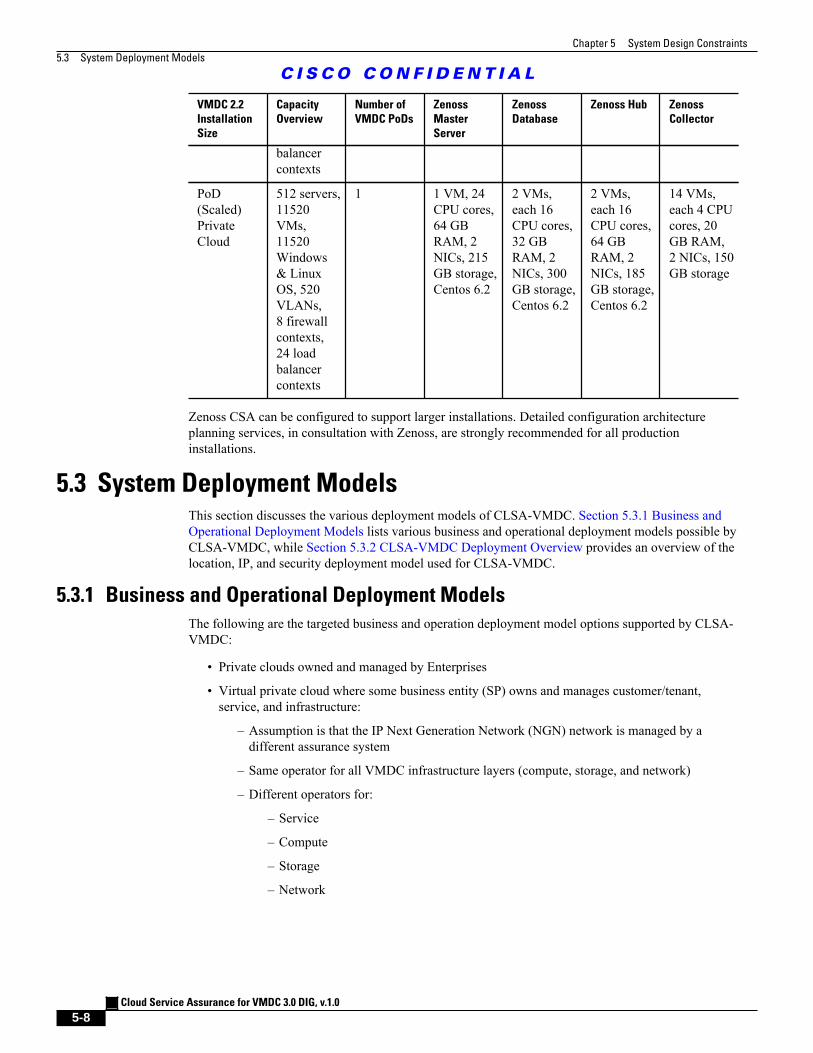
Chapter 5 System Design Constraints
5.3 System Deployment Models
C I S C O C O N F I D E N T I A L
Cloud Service Assurance for VMDC 3.0 DIG, v.1.0
5-8
VMDC 2.2
Installation
Size
Capacity
Overview
Number of
VMDC PoDs
Zenoss
Master
Server
Zenoss
Database
Zenoss Hub Zenoss
Collector
balancercontexts
PoD(Scaled)PrivateCloud
512 servers,11520VMs,11520Windows& LinuxOS, 520VLANs,8 firewallcontexts,24 loadbalancercontexts
1 1 VM, 24CPU cores,64 GBRAM, 2NICs, 215GB storage,Centos 6.2
2 VMs,each 16CPU cores,32 GBRAM, 2NICs, 300GB storage,Centos 6.2
2 VMs,each 16CPU cores,64 GBRAM, 2NICs, 185GB storage,Centos 6.2
14 VMs,each 4 CPUcores, 20GB RAM,2 NICs, 150GB storage
Zenoss CSA can be configured to support larger installations. Detailed configuration architectureplanning services, in consultation with Zenoss, are strongly recommended for all productioninstallations.
5.3 System Deployment ModelsThis section discusses the various deployment models of CLSA-VMDC. Section 5.3.1 Business andOperational Deployment Models lists various business and operational deployment models possible byCLSA-VMDC, while Section 5.3.2 CLSA-VMDC Deployment Overview provides an overview of thelocation, IP, and security deployment model used for CLSA-VMDC.
5.3.1 Business and Operational Deployment Models
The following are the targeted business and operation deployment model options supported by CLSA-VMDC:
• Private clouds owned and managed by Enterprises
• Virtual private cloud where some business entity (SP) owns and manages customer/tenant,service, and infrastructure:
– Assumption is that the IP Next Generation Network (NGN) network is managed by adifferent assurance system
– Same operator for all VMDC infrastructure layers (compute, storage, and network)
– Different operators for:
– Service
– Compute
– Storage
– Network
Chapter 5 System Design Constraints
5.3.2 CLSA-VMDC Deployment Model
C I S C O C O N F I D E N T I A L
Cloud Service Assurance for VMDC 3.0 DIG, v.1.0
5-9
5.3.2 CLSA-VMDC Deployment Model
Some of the key benefits of CLSA-VMDC, as well as the Hosted Collaboration Solution (HCS)system in which CLSA-VMDC is targeted to be integrated, are:
• Support for deployment of tenant's applications in geo-redundant data centers to supportapplication clustering. This implies that a single tenant may have VMs in multiple data centers,and these VMs are part of the same application Active/Active clusters.
• Support for various levels of redundancy, including:
– VMware HA (Simplex SA deployment) is typically used for intra-DC failures. VMwareHA results in assurance service outage, and for maximum service availability, applicationlevel HA is required in addition to VMware HA. However, for deployments where cost isthe key concern, VMware HA without application HA may be the appropriate choice.
– Disaster Recovery (DR) is used for periodic backups of the service assurance system, sothat the system can be recovered in case of complete DC outages. Typically, recovery is notin real time, so some data loss and assurance service outage should be expected.
– SA application HA provides real-time service assurance system recovery and assuranceservice continuity. When deployed in geo-redundant date centers, latency constraints aretypically more stringent than in case of DR.
• Capability to offer maximum visibility by segregating the managed system from the managementsystem. This is especially important for assurance systems in order to detect outages and tocorrectly measure system availability and Service Level Agreement (SLA). If the monitoringsystem is not segregated from the managed system, then it is not able to detect certain failuresof the managed system as the assurance system could experience outages at the same time.Segregation can be done on multiple levels:
– DC level (will refer to as remote assurance system). The assurance system is located ina different DC from the VMDC components that it is monitoring. This can be implementedby placing the assurance system in the dedicated management DC, or can be implementedusing assurance system application level redundancy with a node in DC1 monitoringcomponents in DC2, and the assurance node in DC2 monitoring VMDC components inDC1; both assurance systems have complete service level visibility. Segregation on the DClevel ensures full visibility in any managed system failure, including complete DC failure,and allows SLA measurements for DC outages. This is the preferred deployment modelfor many Service Providers (SPs), especially those offering more traditional services suchas voice where availability expectations are typically very high. For example, the HCSsystem has a requirement to support this model. In this model, latency constraints betweenthe managed system and the assurance system need to be considered. Note that in the caseof the remote assurance deployment model, one may split up components of the assurancesystem such that the data collector layer is placed in the same DC as the managed system,and the rest of the assurance system is remote, which typically reduces latency constraints.
– PoD level (will refer to as colocated assurance system). The assurance system islocated in an access PoD that is dedicated to management applications. In this model,some managed system failures in core and aggregation layers may not be detected as themanagement system itself may temporarily lose connectivity. In this deployment model, inorder to maintain maximum possible visibility, even in the face of failures that could affectthe assurance system itself, the assurance system needs to be deployed with applicationlevel redundancy (clustering for example).
– The Optional remote deployment model can be extended with geo-redundancy supportfor VMDC assurance components, where Service Assurance Manager (SAM) redundancyis extended between management PoDs in geo-graphically distributed data centers. In
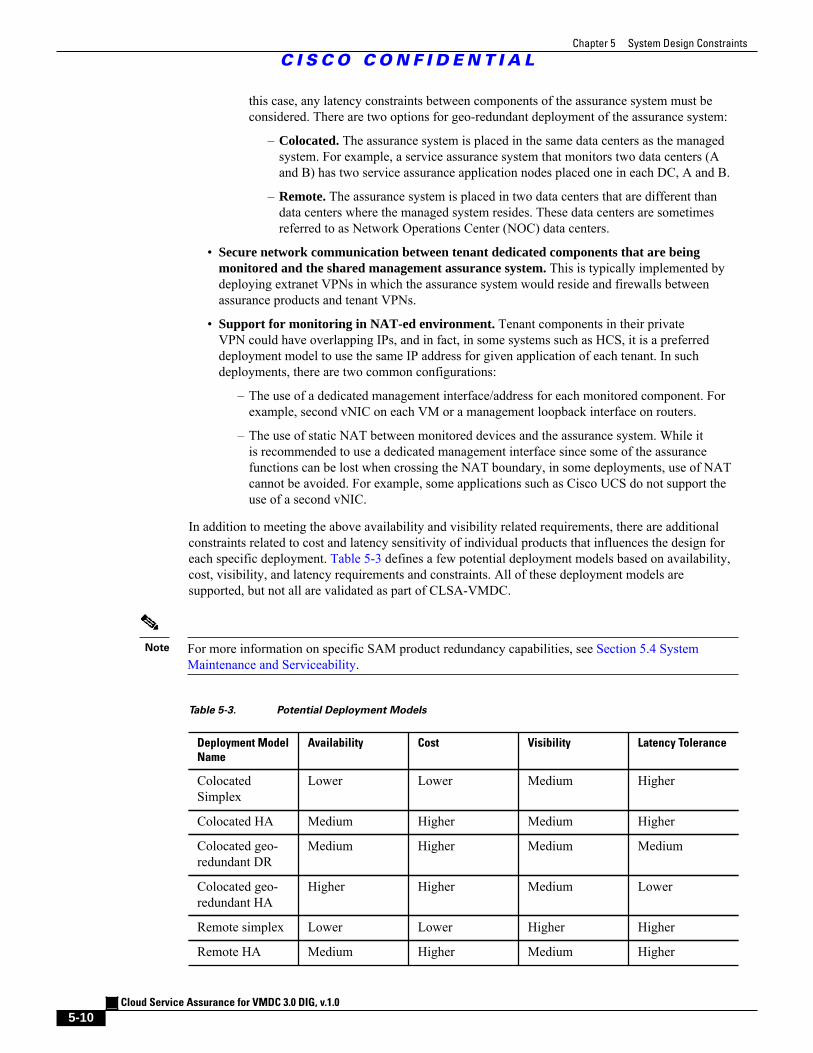
Chapter 5 System Design Constraints
C I S C O C O N F I D E N T I A L
Cloud Service Assurance for VMDC 3.0 DIG, v.1.0
5-10
this case, any latency constraints between components of the assurance system must beconsidered. There are two options for geo-redundant deployment of the assurance system:
– Colocated. The assurance system is placed in the same data centers as the managedsystem. For example, a service assurance system that monitors two data centers (Aand B) has two service assurance application nodes placed one in each DC, A and B.
– Remote. The assurance system is placed in two data centers that are different thandata centers where the managed system resides. These data centers are sometimesreferred to as Network Operations Center (NOC) data centers.
• Secure network communication between tenant dedicated components that are beingmonitored and the shared management assurance system. This is typically implemented bydeploying extranet VPNs in which the assurance system would reside and firewalls betweenassurance products and tenant VPNs.
• Support for monitoring in NAT-ed environment. Tenant components in their privateVPN could have overlapping IPs, and in fact, in some systems such as HCS, it is a preferreddeployment model to use the same IP address for given application of each tenant. In suchdeployments, there are two common configurations:
– The use of a dedicated management interface/address for each monitored component. Forexample, second vNIC on each VM or a management loopback interface on routers.
– The use of static NAT between monitored devices and the assurance system. While itis recommended to use a dedicated management interface since some of the assurancefunctions can be lost when crossing the NAT boundary, in some deployments, use of NATcannot be avoided. For example, some applications such as Cisco UCS do not support theuse of a second vNIC.
In addition to meeting the above availability and visibility related requirements, there are additionalconstraints related to cost and latency sensitivity of individual products that influences the design foreach specific deployment. Table 5-3 defines a few potential deployment models based on availability,cost, visibility, and latency requirements and constraints. All of these deployment models aresupported, but not all are validated as part of CLSA-VMDC.
Note For more information on specific SAM product redundancy capabilities, see Section 5.4 SystemMaintenance and Serviceability.
Table 5-3. Potential Deployment Models
Deployment Model
Name
Availability Cost Visibility Latency Tolerance
ColocatedSimplex
Lower Lower Medium Higher
Colocated HA Medium Higher Medium Higher
Colocated geo-redundant DR
Medium Higher Medium Medium
Colocated geo-redundant HA
Higher Higher Medium Lower
Remote simplex Lower Lower Higher Higher
Remote HA Medium Higher Medium Higher
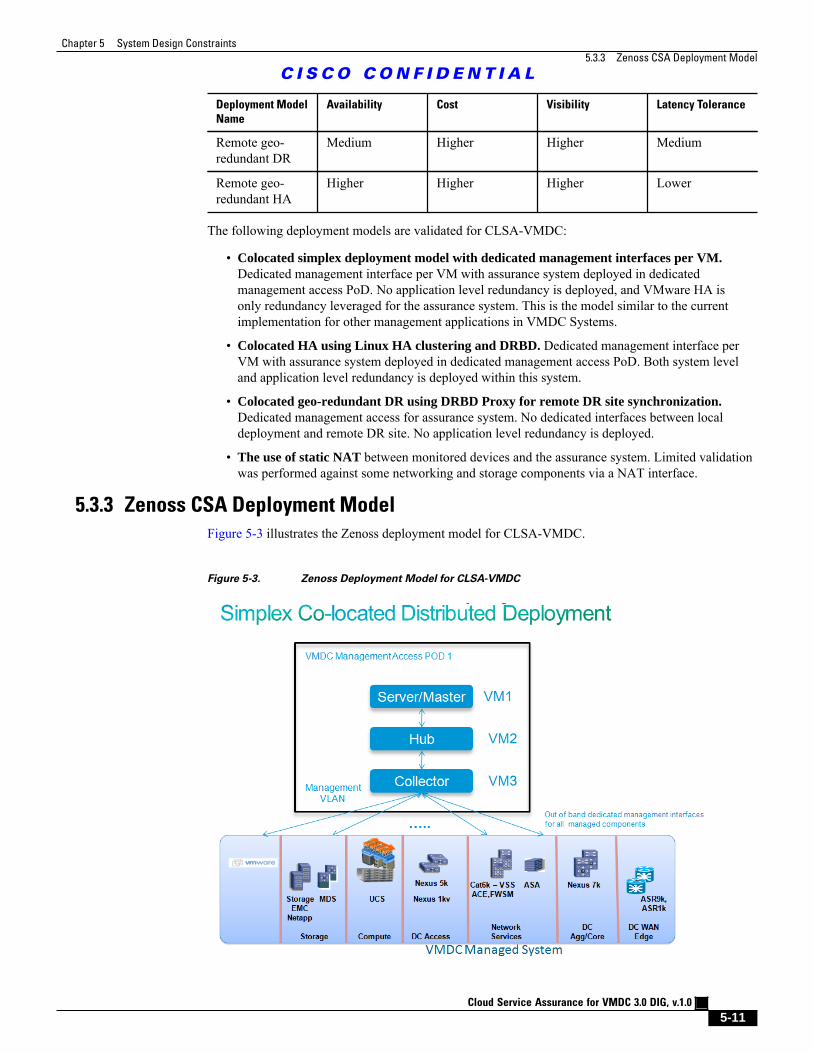
Chapter 5 System Design Constraints
5.3.3 Zenoss CSA Deployment Model
C I S C O C O N F I D E N T I A L
Cloud Service Assurance for VMDC 3.0 DIG, v.1.0
5-11
Deployment Model
Name
Availability Cost Visibility Latency Tolerance
Remote geo-redundant DR
Medium Higher Higher Medium
Remote geo-redundant HA
Higher Higher Higher Lower
The following deployment models are validated for CLSA-VMDC:
• Colocated simplex deployment model with dedicated management interfaces per VM.Dedicated management interface per VM with assurance system deployed in dedicatedmanagement access PoD. No application level redundancy is deployed, and VMware HA isonly redundancy leveraged for the assurance system. This is the model similar to the currentimplementation for other management applications in VMDC Systems.
• Colocated HA using Linux HA clustering and DRBD. Dedicated management interface perVM with assurance system deployed in dedicated management access PoD. Both system leveland application level redundancy is deployed within this system.
• Colocated geo-redundant DR using DRBD Proxy for remote DR site synchronization.Dedicated management access for assurance system. No dedicated interfaces between localdeployment and remote DR site. No application level redundancy is deployed.
• The use of static NAT between monitored devices and the assurance system. Limited validationwas performed against some networking and storage components via a NAT interface.
5.3.3 Zenoss CSA Deployment Model
Figure 5-3 illustrates the Zenoss deployment model for CLSA-VMDC.
Figure 5-3. Zenoss Deployment Model for CLSA-VMDC
Chapter 5 System Design Constraints
5.4 System Maintenance and Serviceability
C I S C O C O N F I D E N T I A L
Cloud Service Assurance for VMDC 3.0 DIG, v.1.0
5-12
Section 5.4 System Maintenance and Serviceability provides more information on the HA capabilitiesof Zenoss CSA. This section only outlines one validated deployment model.
For functional testing, it is sufficient to deploy Zenoss in a centralized fashion on a single VM.However, Zenoss should be deployed in distributed fashion with separate VMs for collector, hub, andmaster in order to allow for growth by adding more collectors as more devices are added. All threeVMs should be deployed in a single, dedicated VLAN and placed in the management access PoD.Each managed component, including VMs, should use a dedicated out-of-band management interface.Optionally, a few Zenoss VMs with a single interface and NAT between them could be deployed.Single VM (master, hub, collector) and split server (VM with master/hub and VM with a collector)deployments were validated by Cisco SDU.
5.4 System Maintenance and ServiceabilityThis section discusses the system maintenance and serviceability constraints for CLSA-VMDC.
Upgrades:
• The user must install/upgrade ZenPacks using the OS command line interface. Refer to InstallingZenPacks and Removing ZenPacks for more information.
• When the Zenoss master is configured in an HA cluster configuration with network-level volumereplication (DRBD), upgrades are not service impacting.
• If Zenoss servers are virtualized, then snapshots can be used to limit the service impact ofupgrades.
Backup and Restore:
• zenbackup and zenrestore tools perform consolidated backups of the MySQL databases,RRD files, and Neo4j database. Refer to the Zenoss Cloud Service Assurance Installation andAdministration Guide for more information.
• Backup and restore backs up the following data:
– Events database
– Zope database, which includes all devices, users, and event mappings
– $ZENHOME/etc directory, which contains configuration files for the system daemons
– $ZENHOME/perf directory, which contains performance data
• Full Zenoss system restore requires a re-installation of the Zenoss software and a zenrestorefrom the backup file created by zenbackup. This includes code customizations done as part ofZenPacks.
• VMware snapshots can also be used for backup and restore.
• See Backup and Recovery for more information on backup and restore procedures.
Cloud Service Assurance for VMDC 3.0 DIG, v.1.0
6-1
C I S C O C O N F I D E N T I A L
C H A P T E R 6Operational Use Cases
Cloud infrastructures present a challenging environment for both cloud Service Providers andEnterprises to assure both highly available and high performance services. By design, the CiscoVirtualized Multiservice Data Center (VMDC) is a physically and logically redundant, virtualizedcloud infrastructure. This design avoids single points of failure and provides High Availability (HA).If a fault should occur on a VMDC component, then it is expected that services using that componentwill continue to operate seamlessly or recover quickly by using an alternate network path or computehost. However, until the fault is repaired, the VMDC service is now "at risk" of a longer durationoutage after any subsequent fault. Cloud Service Assurance for VMDC (CLSA-VMDC) allows cloudoperators to increase their awareness and resolution of this "at risk" condition to reduce preventableoutages and reduce Mean Time to Repair (MTTR).
CLSA-VMDC provides cloud service personnel with different responsibilities the tools to performtimely service assurance tasks. Assurance administrative personnel are concerned with ensuring thecorrect operation of the assurance system and with adding and removing new or at-fault devices tomaintain an accurate representation of the cloud infrastructure. Assurance operations personnel aretasked with the daily operations of monitoring, fault identification and notification. CLSA-VMDCenables both sets of activities for cloud service personnel.
This chapter illustrates the following six cloud service personnel use cases:
1. Section 6.1 Discovering Data Center (DC) Devices and Components. Once CLSA-VMDCis installed, the next administrative task is discovering all of the VMDC components. Whilediscovery is an initial system deployment task, this use case is included here because discoveryis an ongoing activity as the cloud infrastructure changes over time. Assurance administrativepersonnel need to discover new devices following replacement, upgrades and VMDC cloudinfrastructure expansion.
2. Section 6.2 Dashboard Monitoring. Cloud operations personnel daily monitor the cloud byobservation of the aggregated dashboard. This proverbial "single pane of glass" serves as thesummary window for the entire cloud service status. The use case demonstrates that the systemwide dashboard is both customizable and navigable. When a device fault occurs, cloud operatorscan quickly drill down from the dashboard to investigate the issue. This use case also highlightsseveral other dashboards and their features.
3. Section 6.3 Consolidated Resource Monitoring of VMDC Components. Once discovered, eachcloud infrastructure device accumulates a history of Key Performance Indicator (KPI) statistics.Cloud operators can browse these statistics to assess the performance of devices and theircomponents. The graphical presentation also allows the operator to visually identify troublesometrends or cyclic behavior to proactively manage resources. This use case illustrates that as eventsoccur, these KPI graphs can be consulted to identify and replace those resources at risk of failure,thus maintaining a high level of service availability.
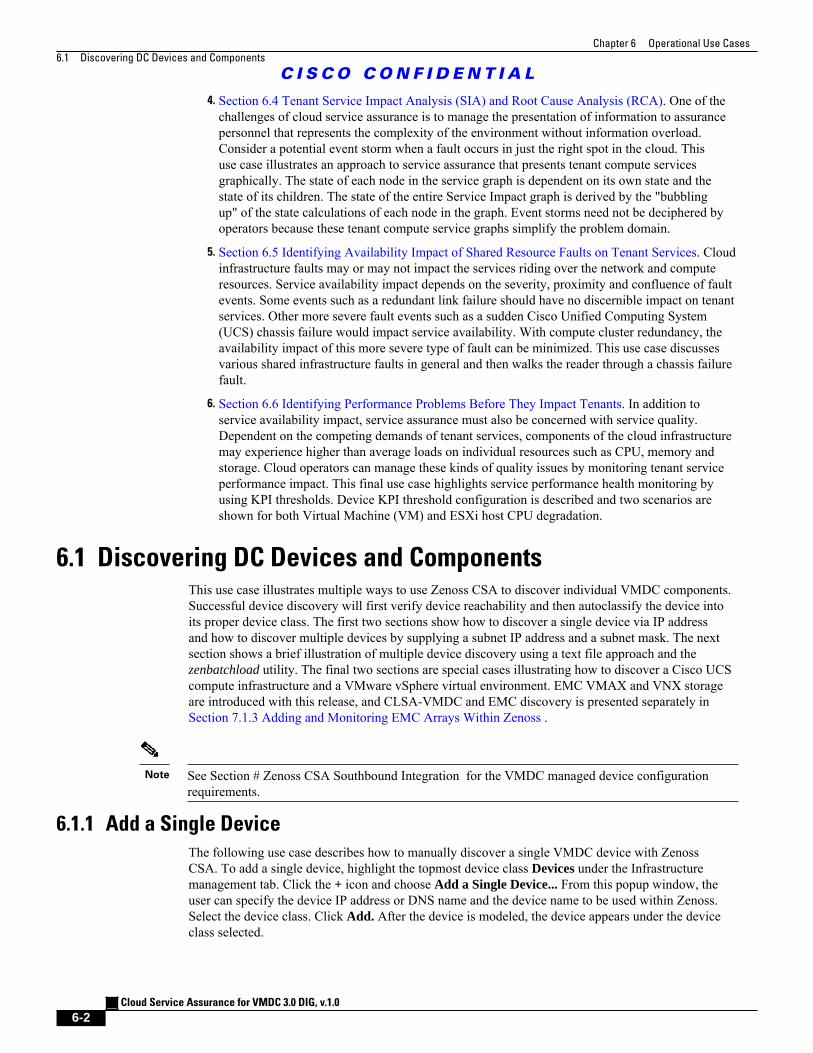
Chapter 6 Operational Use Cases
6.1 Discovering DC Devices and Components
C I S C O C O N F I D E N T I A L
Cloud Service Assurance for VMDC 3.0 DIG, v.1.0
6-2
4. Section 6.4 Tenant Service Impact Analysis (SIA) and Root Cause Analysis (RCA). One of thechallenges of cloud service assurance is to manage the presentation of information to assurancepersonnel that represents the complexity of the environment without information overload.Consider a potential event storm when a fault occurs in just the right spot in the cloud. Thisuse case illustrates an approach to service assurance that presents tenant compute servicesgraphically. The state of each node in the service graph is dependent on its own state and thestate of its children. The state of the entire Service Impact graph is derived by the "bubblingup" of the state calculations of each node in the graph. Event storms need not be deciphered byoperators because these tenant compute service graphs simplify the problem domain.
5. Section 6.5 Identifying Availability Impact of Shared Resource Faults on Tenant Services. Cloudinfrastructure faults may or may not impact the services riding over the network and computeresources. Service availability impact depends on the severity, proximity and confluence of faultevents. Some events such as a redundant link failure should have no discernible impact on tenantservices. Other more severe fault events such as a sudden Cisco Unified Computing System(UCS) chassis failure would impact service availability. With compute cluster redundancy, theavailability impact of this more severe type of fault can be minimized. This use case discussesvarious shared infrastructure faults in general and then walks the reader through a chassis failurefault.
6. Section 6.6 Identifying Performance Problems Before They Impact Tenants. In addition toservice availability impact, service assurance must also be concerned with service quality.Dependent on the competing demands of tenant services, components of the cloud infrastructuremay experience higher than average loads on individual resources such as CPU, memory andstorage. Cloud operators can manage these kinds of quality issues by monitoring tenant serviceperformance impact. This final use case highlights service performance health monitoring byusing KPI thresholds. Device KPI threshold configuration is described and two scenarios areshown for both Virtual Machine (VM) and ESXi host CPU degradation.
6.1 Discovering DC Devices and ComponentsThis use case illustrates multiple ways to use Zenoss CSA to discover individual VMDC components.Successful device discovery will first verify device reachability and then autoclassify the device intoits proper device class. The first two sections show how to discover a single device via IP addressand how to discover multiple devices by supplying a subnet IP address and a subnet mask. The nextsection shows a brief illustration of multiple device discovery using a text file approach and thezenbatchload utility. The final two sections are special cases illustrating how to discover a Cisco UCScompute infrastructure and a VMware vSphere virtual environment. EMC VMAX and VNX storageare introduced with this release, and CLSA-VMDC and EMC discovery is presented separately inSection 7.1.3 Adding and Monitoring EMC Arrays Within Zenoss .
Note See Section # Zenoss CSA Southbound Integration for the VMDC managed device configurationrequirements.
6.1.1 Add a Single Device
The following use case describes how to manually discover a single VMDC device with ZenossCSA. To add a single device, highlight the topmost device class Devices under the Infrastructuremanagement tab. Click the + icon and choose Add a Single Device... From this popup window, theuser can specify the device IP address or DNS name and the device name to be used within Zenoss.Select the device class. Click Add. After the device is modeled, the device appears under the deviceclass selected.
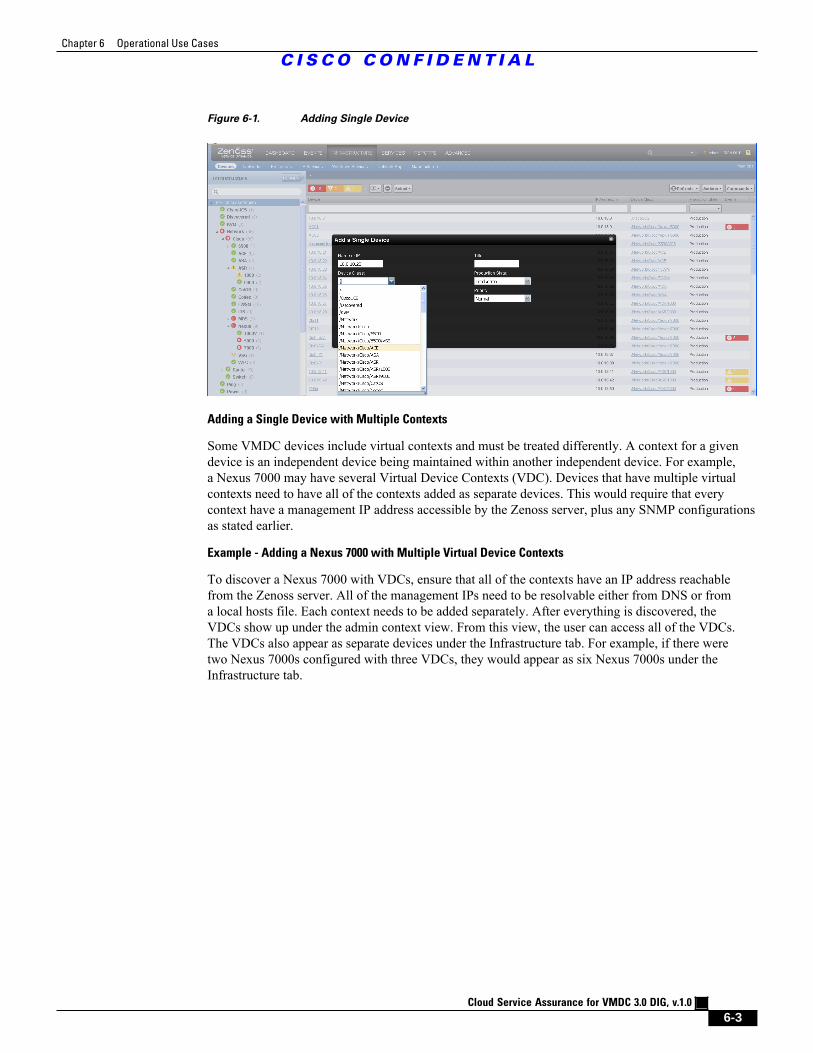
Chapter 6 Operational Use Cases
C I S C O C O N F I D E N T I A L
Cloud Service Assurance for VMDC 3.0 DIG, v.1.0
6-3
Figure 6-1. Adding Single Device
Adding a Single Device with Multiple Contexts
Some VMDC devices include virtual contexts and must be treated differently. A context for a givendevice is an independent device being maintained within another independent device. For example,a Nexus 7000 may have several Virtual Device Contexts (VDC). Devices that have multiple virtualcontexts need to have all of the contexts added as separate devices. This would require that everycontext have a management IP address accessible by the Zenoss server, plus any SNMP configurationsas stated earlier.
Example - Adding a Nexus 7000 with Multiple Virtual Device Contexts
To discover a Nexus 7000 with VDCs, ensure that all of the contexts have an IP address reachablefrom the Zenoss server. All of the management IPs need to be resolvable either from DNS or froma local hosts file. Each context needs to be added separately. After everything is discovered, theVDCs show up under the admin context view. From this view, the user can access all of the VDCs.The VDCs also appear as separate devices under the Infrastructure tab. For example, if there weretwo Nexus 7000s configured with three VDCs, they would appear as six Nexus 7000s under theInfrastructure tab.
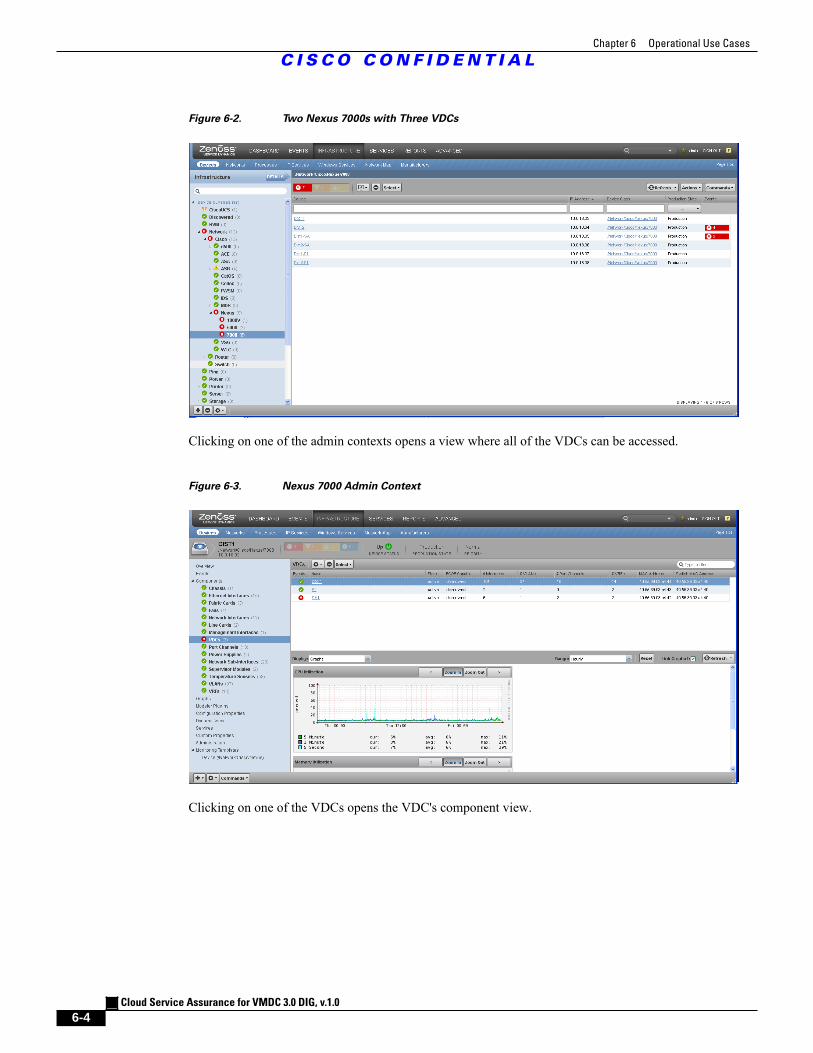
Chapter 6 Operational Use Cases
C I S C O C O N F I D E N T I A L
Cloud Service Assurance for VMDC 3.0 DIG, v.1.0
6-4
Figure 6-2. Two Nexus 7000s with Three VDCs
Clicking on one of the admin contexts opens a view where all of the VDCs can be accessed.
Figure 6-3. Nexus 7000 Admin Context
Clicking on one of the VDCs opens the VDC's component view.
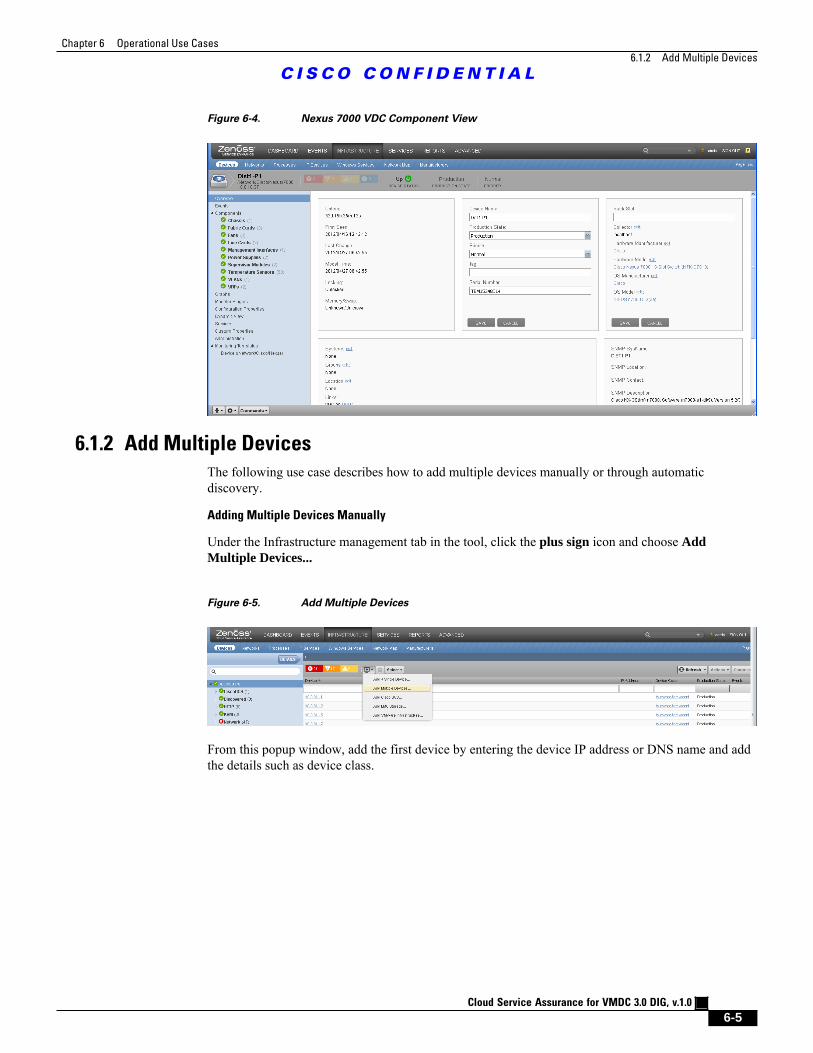
Chapter 6 Operational Use Cases
6.1.2 Add Multiple Devices
C I S C O C O N F I D E N T I A L
Cloud Service Assurance for VMDC 3.0 DIG, v.1.0
6-5
Figure 6-4. Nexus 7000 VDC Component View
6.1.2 Add Multiple Devices
The following use case describes how to add multiple devices manually or through automaticdiscovery.
Adding Multiple Devices Manually
Under the Infrastructure management tab in the tool, click the plus sign icon and choose AddMultiple Devices...
Figure 6-5. Add Multiple Devices
From this popup window, add the first device by entering the device IP address or DNS name and addthe details such as device class.
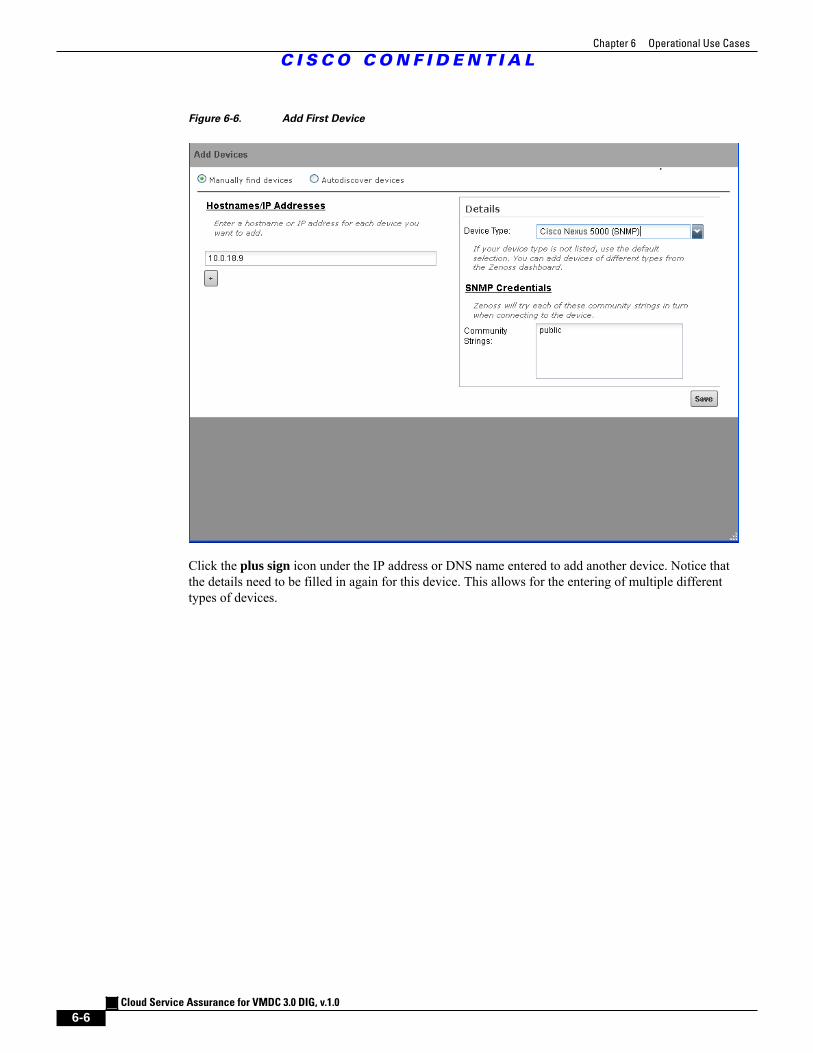
Chapter 6 Operational Use Cases
C I S C O C O N F I D E N T I A L
Cloud Service Assurance for VMDC 3.0 DIG, v.1.0
6-6
Figure 6-6. Add First Device
Click the plus sign icon under the IP address or DNS name entered to add another device. Notice thatthe details need to be filled in again for this device. This allows for the entering of multiple differenttypes of devices.
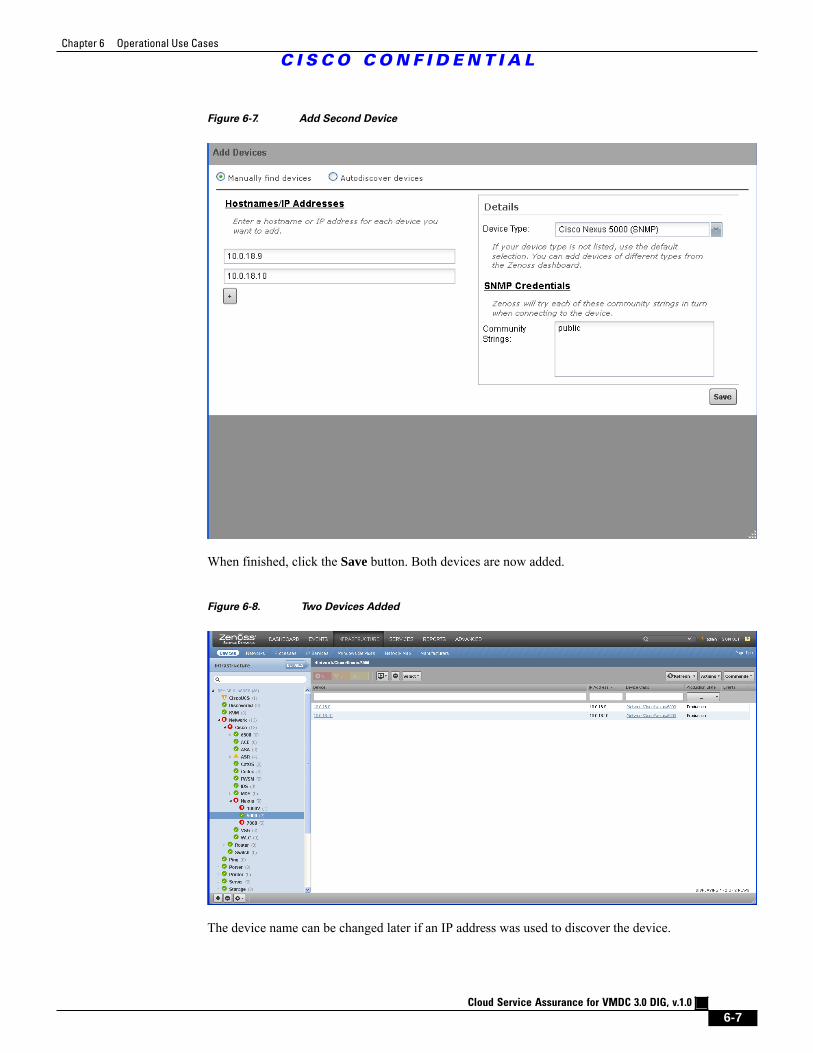
Chapter 6 Operational Use Cases
C I S C O C O N F I D E N T I A L
Cloud Service Assurance for VMDC 3.0 DIG, v.1.0
6-7
Figure 6-7. Add Second Device
When finished, click the Save button. Both devices are now added.
Figure 6-8. Two Devices Added
The device name can be changed later if an IP address was used to discover the device.
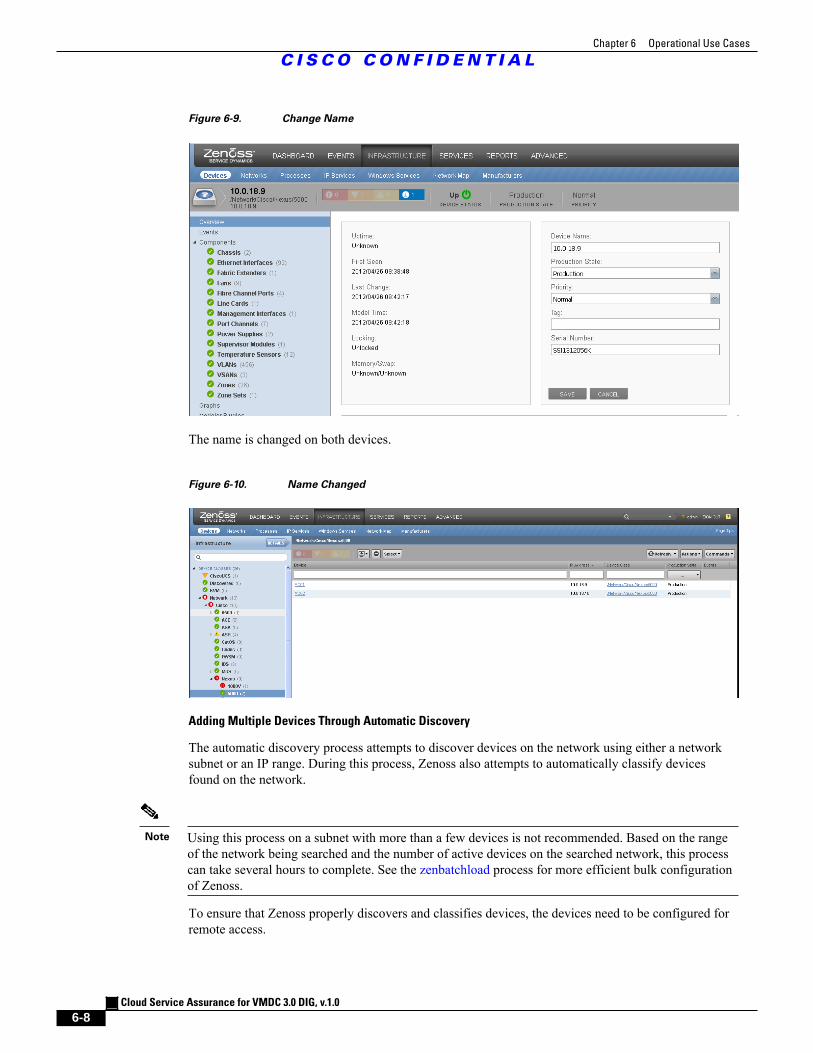
Chapter 6 Operational Use Cases
C I S C O C O N F I D E N T I A L
Cloud Service Assurance for VMDC 3.0 DIG, v.1.0
6-8
Figure 6-9. Change Name
The name is changed on both devices.
Figure 6-10. Name Changed
Adding Multiple Devices Through Automatic Discovery
The automatic discovery process attempts to discover devices on the network using either a networksubnet or an IP range. During this process, Zenoss also attempts to automatically classify devicesfound on the network.
Note Using this process on a subnet with more than a few devices is not recommended. Based on the rangeof the network being searched and the number of active devices on the searched network, this processcan take several hours to complete. See the zenbatchload process for more efficient bulk configurationof Zenoss.
To ensure that Zenoss properly discovers and classifies devices, the devices need to be configured forremote access.
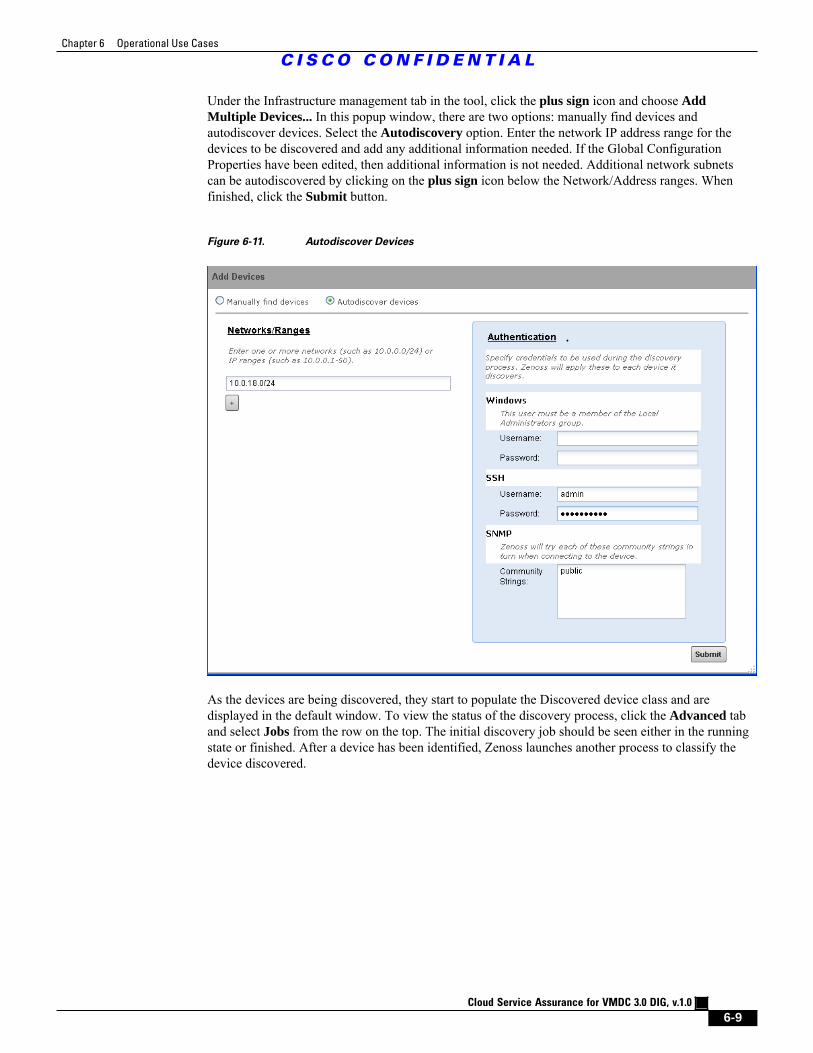
Chapter 6 Operational Use Cases
C I S C O C O N F I D E N T I A L
Cloud Service Assurance for VMDC 3.0 DIG, v.1.0
6-9
Under the Infrastructure management tab in the tool, click the plus sign icon and choose AddMultiple Devices... In this popup window, there are two options: manually find devices andautodiscover devices. Select the Autodiscovery option. Enter the network IP address range for thedevices to be discovered and add any additional information needed. If the Global ConfigurationProperties have been edited, then additional information is not needed. Additional network subnetscan be autodiscovered by clicking on the plus sign icon below the Network/Address ranges. Whenfinished, click the Submit button.
Figure 6-11. Autodiscover Devices
As the devices are being discovered, they start to populate the Discovered device class and aredisplayed in the default window. To view the status of the discovery process, click the Advanced taband select Jobs from the row on the top. The initial discovery job should be seen either in the runningstate or finished. After a device has been identified, Zenoss launches another process to classify thedevice discovered.
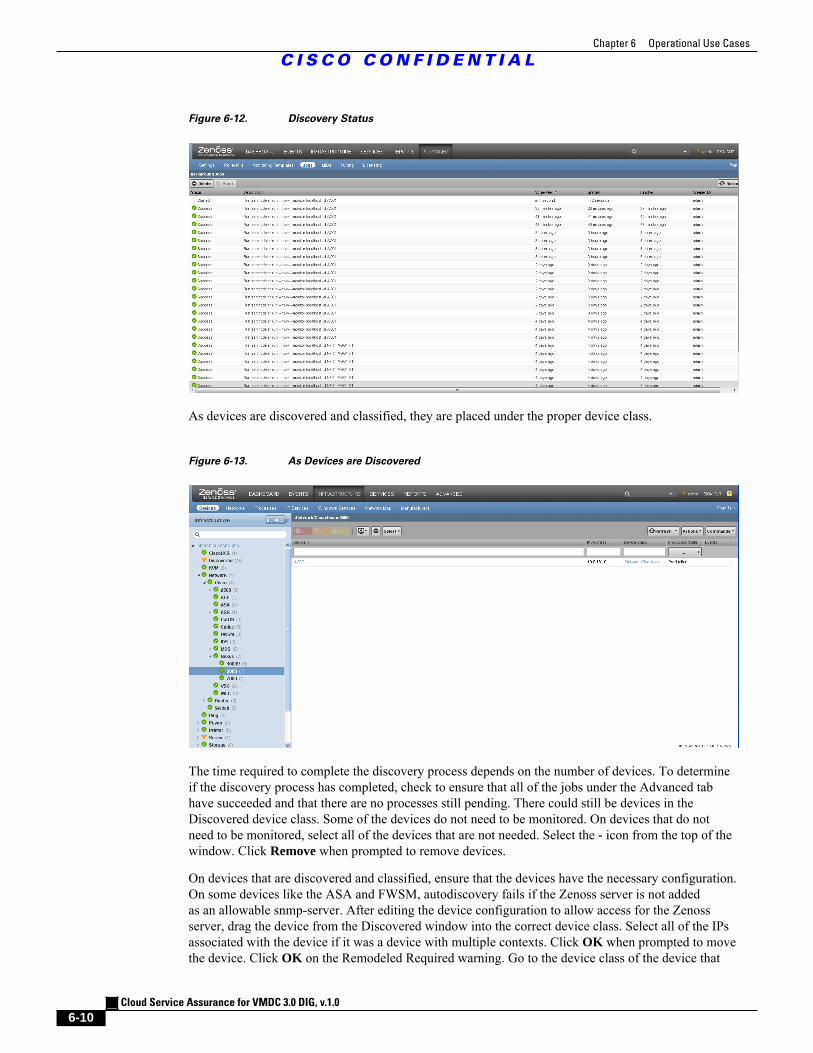
Chapter 6 Operational Use Cases
C I S C O C O N F I D E N T I A L
Cloud Service Assurance for VMDC 3.0 DIG, v.1.0
6-10
Figure 6-12. Discovery Status
As devices are discovered and classified, they are placed under the proper device class.
Figure 6-13. As Devices are Discovered
The time required to complete the discovery process depends on the number of devices. To determineif the discovery process has completed, check to ensure that all of the jobs under the Advanced tabhave succeeded and that there are no processes still pending. There could still be devices in theDiscovered device class. Some of the devices do not need to be monitored. On devices that do notneed to be monitored, select all of the devices that are not needed. Select the - icon from the top of thewindow. Click Remove when prompted to remove devices.
On devices that are discovered and classified, ensure that the devices have the necessary configuration.On some devices like the ASA and FWSM, autodiscovery fails if the Zenoss server is not addedas an allowable snmp-server. After editing the device configuration to allow access for the Zenossserver, drag the device from the Discovered window into the correct device class. Select all of the IPsassociated with the device if it was a device with multiple contexts. Click OK when prompted to movethe device. Click OK on the Remodeled Required warning. Go to the device class of the device that
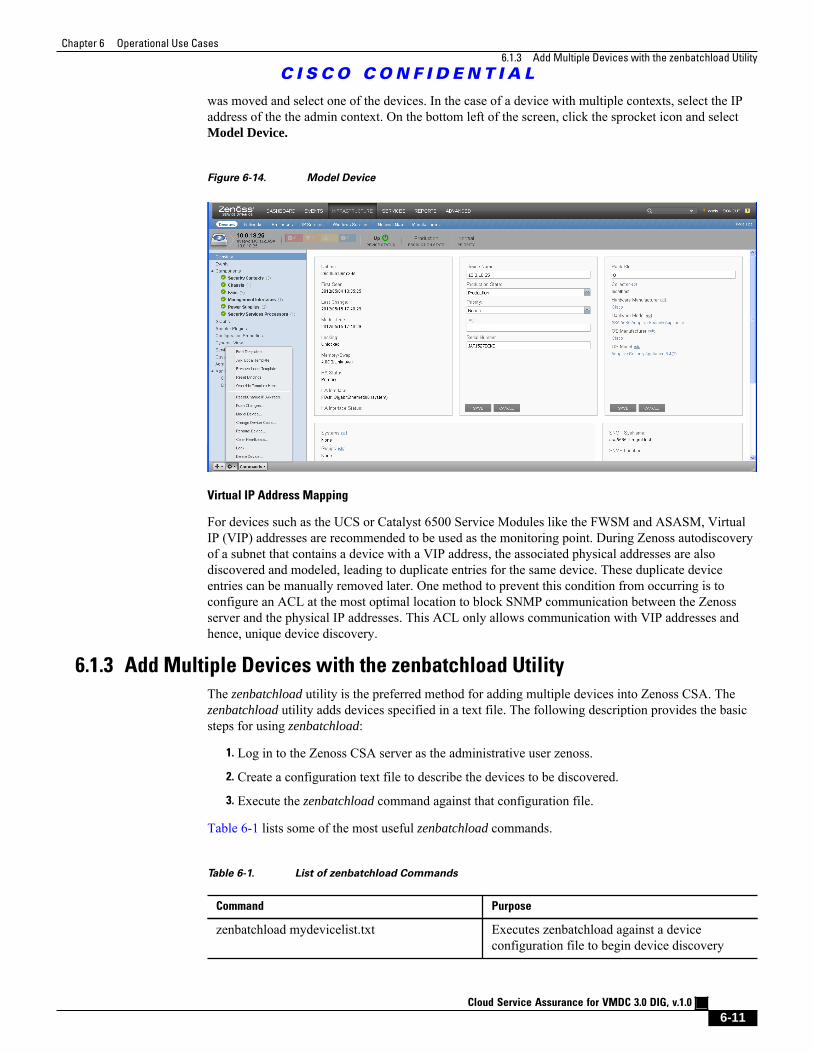
Chapter 6 Operational Use Cases
6.1.3 Add Multiple Devices with the zenbatchload Utility
C I S C O C O N F I D E N T I A L
Cloud Service Assurance for VMDC 3.0 DIG, v.1.0
6-11
was moved and select one of the devices. In the case of a device with multiple contexts, select the IPaddress of the the admin context. On the bottom left of the screen, click the sprocket icon and selectModel Device.
Figure 6-14. Model Device
Virtual IP Address Mapping
For devices such as the UCS or Catalyst 6500 Service Modules like the FWSM and ASASM, VirtualIP (VIP) addresses are recommended to be used as the monitoring point. During Zenoss autodiscoveryof a subnet that contains a device with a VIP address, the associated physical addresses are alsodiscovered and modeled, leading to duplicate entries for the same device. These duplicate deviceentries can be manually removed later. One method to prevent this condition from occurring is toconfigure an ACL at the most optimal location to block SNMP communication between the Zenossserver and the physical IP addresses. This ACL only allows communication with VIP addresses andhence, unique device discovery.
6.1.3 Add Multiple Devices with the zenbatchload Utility
The zenbatchload utility is the preferred method for adding multiple devices into Zenoss CSA. Thezenbatchload utility adds devices specified in a text file. The following description provides the basicsteps for using zenbatchload:
1. Log in to the Zenoss CSA server as the administrative user zenoss.
2. Create a configuration text file to describe the devices to be discovered.
3. Execute the zenbatchload command against that configuration file.
Table 6-1 lists some of the most useful zenbatchload commands.
Table 6-1. List of zenbatchload Commands
Command Purpose
zenbatchload mydevicelist.txt Executes zenbatchload against a deviceconfiguration file to begin device discovery
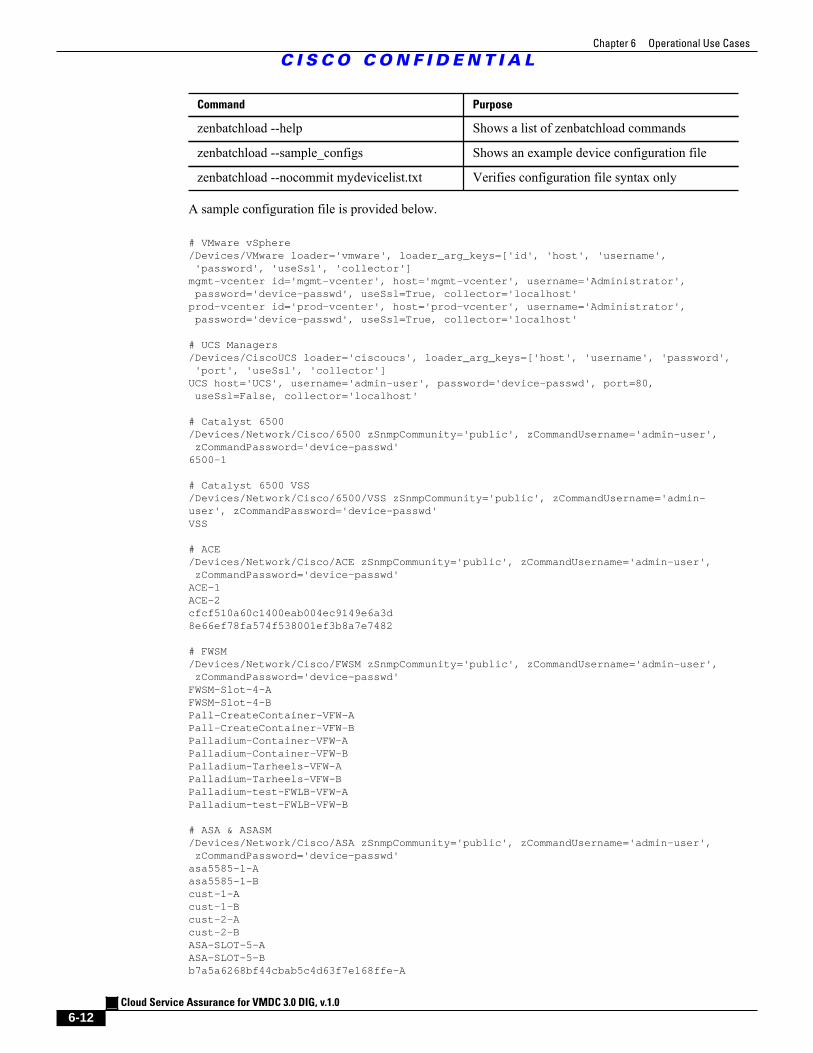
Chapter 6 Operational Use Cases
C I S C O C O N F I D E N T I A L
Cloud Service Assurance for VMDC 3.0 DIG, v.1.0
6-12
Command Purpose
zenbatchload --help Shows a list of zenbatchload commands
zenbatchload --sample_configs Shows an example device configuration file
zenbatchload --nocommit mydevicelist.txt Verifies configuration file syntax only
A sample configuration file is provided below.
# VMware vSphere/Devices/VMware loader='vmware', loader_arg_keys=['id', 'host', 'username', 'password', 'useSsl', 'collector']mgmt-vcenter id='mgmt-vcenter', host='mgmt-vcenter', username='Administrator', password='device-passwd', useSsl=True, collector='localhost'prod-vcenter id='prod-vcenter', host='prod-vcenter', username='Administrator', password='device-passwd', useSsl=True, collector='localhost' # UCS Managers/Devices/CiscoUCS loader='ciscoucs', loader_arg_keys=['host', 'username', 'password', 'port', 'useSsl', 'collector']UCS host='UCS', username='admin-user', password='device-passwd', port=80, useSsl=False, collector='localhost' # Catalyst 6500/Devices/Network/Cisco/6500 zSnmpCommunity='public', zCommandUsername='admin-user', zCommandPassword='device-passwd'6500-1 # Catalyst 6500 VSS/Devices/Network/Cisco/6500/VSS zSnmpCommunity='public', zCommandUsername='admin-user', zCommandPassword='device-passwd'VSS # ACE/Devices/Network/Cisco/ACE zSnmpCommunity='public', zCommandUsername='admin-user', zCommandPassword='device-passwd'ACE-1ACE-2cfcf510a60c1400eab004ec9149e6a3d8e66ef78fa574f538001ef3b8a7e7482 # FWSM/Devices/Network/Cisco/FWSM zSnmpCommunity='public', zCommandUsername='admin-user', zCommandPassword='device-passwd'FWSM-Slot-4-AFWSM-Slot-4-BPall-CreateContainer-VFW-APall-CreateContainer-VFW-BPalladium-Container-VFW-APalladium-Container-VFW-BPalladium-Tarheels-VFW-APalladium-Tarheels-VFW-BPalladium-test-FWLB-VFW-APalladium-test-FWLB-VFW-B # ASA & ASASM/Devices/Network/Cisco/ASA zSnmpCommunity='public', zCommandUsername='admin-user', zCommandPassword='device-passwd'asa5585-1-Aasa5585-1-Bcust-1-Acust-1-Bcust-2-Acust-2-BASA-SLOT-5-AASA-SLOT-5-Bb7a5a6268bf44cbab5c4d63f7e168ffe-A
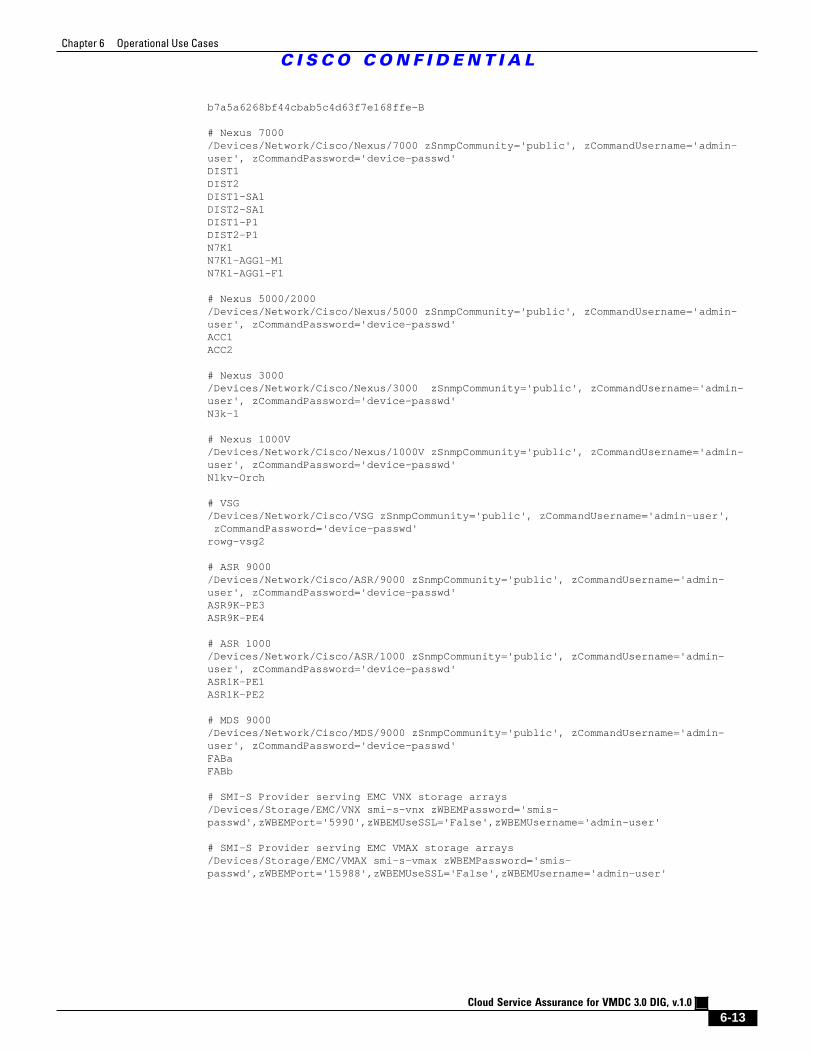
Chapter 6 Operational Use Cases
C I S C O C O N F I D E N T I A L
Cloud Service Assurance for VMDC 3.0 DIG, v.1.0
6-13
b7a5a6268bf44cbab5c4d63f7e168ffe-B # Nexus 7000/Devices/Network/Cisco/Nexus/7000 zSnmpCommunity='public', zCommandUsername='admin-user', zCommandPassword='device-passwd'DIST1DIST2DIST1-SA1DIST2-SA1DIST1-P1DIST2-P1N7K1N7K1-AGG1-M1N7K1-AGG1-F1 # Nexus 5000/2000/Devices/Network/Cisco/Nexus/5000 zSnmpCommunity='public', zCommandUsername='admin-user', zCommandPassword='device-passwd'ACC1ACC2 # Nexus 3000/Devices/Network/Cisco/Nexus/3000 zSnmpCommunity='public', zCommandUsername='admin-user', zCommandPassword='device-passwd'N3k-1 # Nexus 1000V/Devices/Network/Cisco/Nexus/1000V zSnmpCommunity='public', zCommandUsername='admin-user', zCommandPassword='device-passwd'N1kv-Orch # VSG/Devices/Network/Cisco/VSG zSnmpCommunity='public', zCommandUsername='admin-user', zCommandPassword='device-passwd'rowg-vsg2 # ASR 9000/Devices/Network/Cisco/ASR/9000 zSnmpCommunity='public', zCommandUsername='admin-user', zCommandPassword='device-passwd'ASR9K-PE3ASR9K-PE4 # ASR 1000/Devices/Network/Cisco/ASR/1000 zSnmpCommunity='public', zCommandUsername='admin-user', zCommandPassword='device-passwd'ASR1K-PE1ASR1K-PE2 # MDS 9000/Devices/Network/Cisco/MDS/9000 zSnmpCommunity='public', zCommandUsername='admin-user', zCommandPassword='device-passwd'FABaFABb # SMI-S Provider serving EMC VNX storage arrays/Devices/Storage/EMC/VNX smi-s-vnx zWBEMPassword='smis-passwd',zWBEMPort='5990',zWBEMUseSSL='False',zWBEMUsername='admin-user' # SMI-S Provider serving EMC VMAX storage arrays/Devices/Storage/EMC/VMAX smi-s-vmax zWBEMPassword='smis-passwd',zWBEMPort='15988',zWBEMUseSSL='False',zWBEMUsername='admin-user'
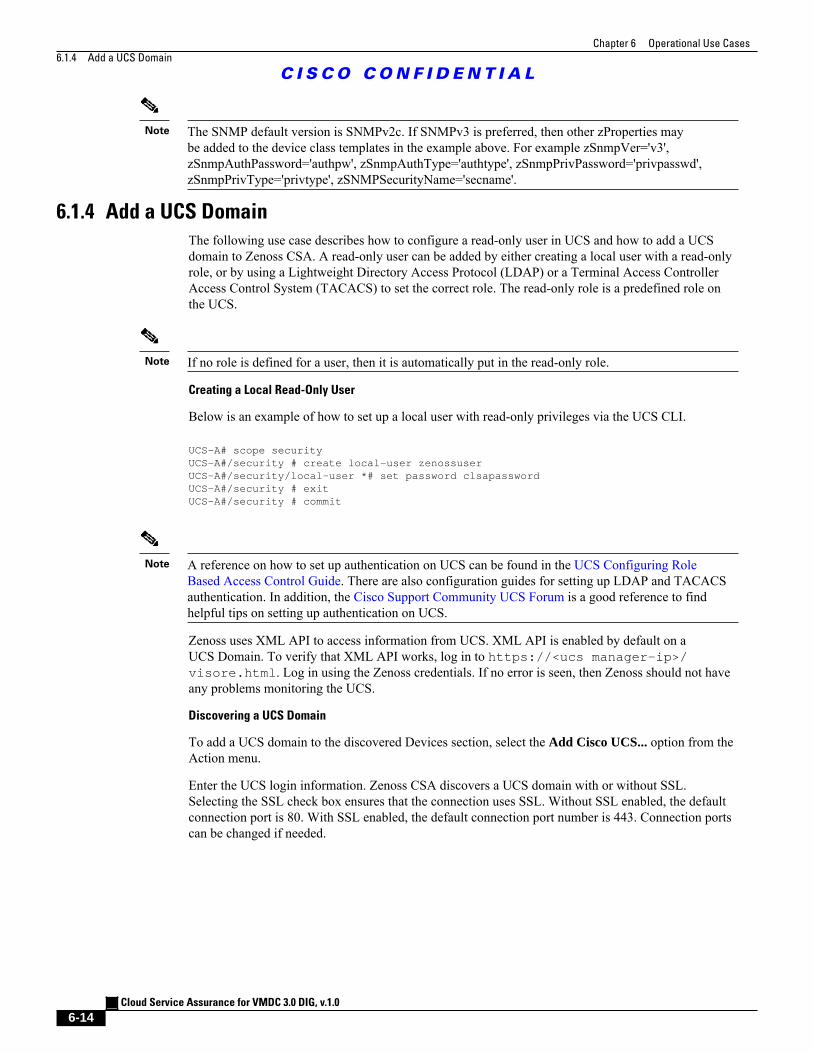
Chapter 6 Operational Use Cases
6.1.4 Add a UCS Domain
C I S C O C O N F I D E N T I A L
Cloud Service Assurance for VMDC 3.0 DIG, v.1.0
6-14
Note The SNMP default version is SNMPv2c. If SNMPv3 is preferred, then other zProperties maybe added to the device class templates in the example above. For example zSnmpVer='v3',zSnmpAuthPassword='authpw', zSnmpAuthType='authtype', zSnmpPrivPassword='privpasswd',zSnmpPrivType='privtype', zSNMPSecurityName='secname'.
6.1.4 Add a UCS Domain
The following use case describes how to configure a read-only user in UCS and how to add a UCSdomain to Zenoss CSA. A read-only user can be added by either creating a local user with a read-onlyrole, or by using a Lightweight Directory Access Protocol (LDAP) or a Terminal Access ControllerAccess Control System (TACACS) to set the correct role. The read-only role is a predefined role onthe UCS.
Note If no role is defined for a user, then it is automatically put in the read-only role.
Creating a Local Read-Only User
Below is an example of how to set up a local user with read-only privileges via the UCS CLI.
UCS-A# scope securityUCS-A#/security # create local-user zenossuserUCS-A#/security/local-user *# set password clsapasswordUCS-A#/security # exitUCS-A#/security # commit
Note A reference on how to set up authentication on UCS can be found in the UCS Configuring RoleBased Access Control Guide. There are also configuration guides for setting up LDAP and TACACSauthentication. In addition, the Cisco Support Community UCS Forum is a good reference to findhelpful tips on setting up authentication on UCS.
Zenoss uses XML API to access information from UCS. XML API is enabled by default on aUCS Domain. To verify that XML API works, log in to https://<ucs manager-ip>/visore.html. Log in using the Zenoss credentials. If no error is seen, then Zenoss should not haveany problems monitoring the UCS.
Discovering a UCS Domain
To add a UCS domain to the discovered Devices section, select the Add Cisco UCS... option from theAction menu.
Enter the UCS login information. Zenoss CSA discovers a UCS domain with or without SSL.Selecting the SSL check box ensures that the connection uses SSL. Without SSL enabled, the defaultconnection port is 80. With SSL enabled, the default connection port number is 443. Connection portscan be changed if needed.
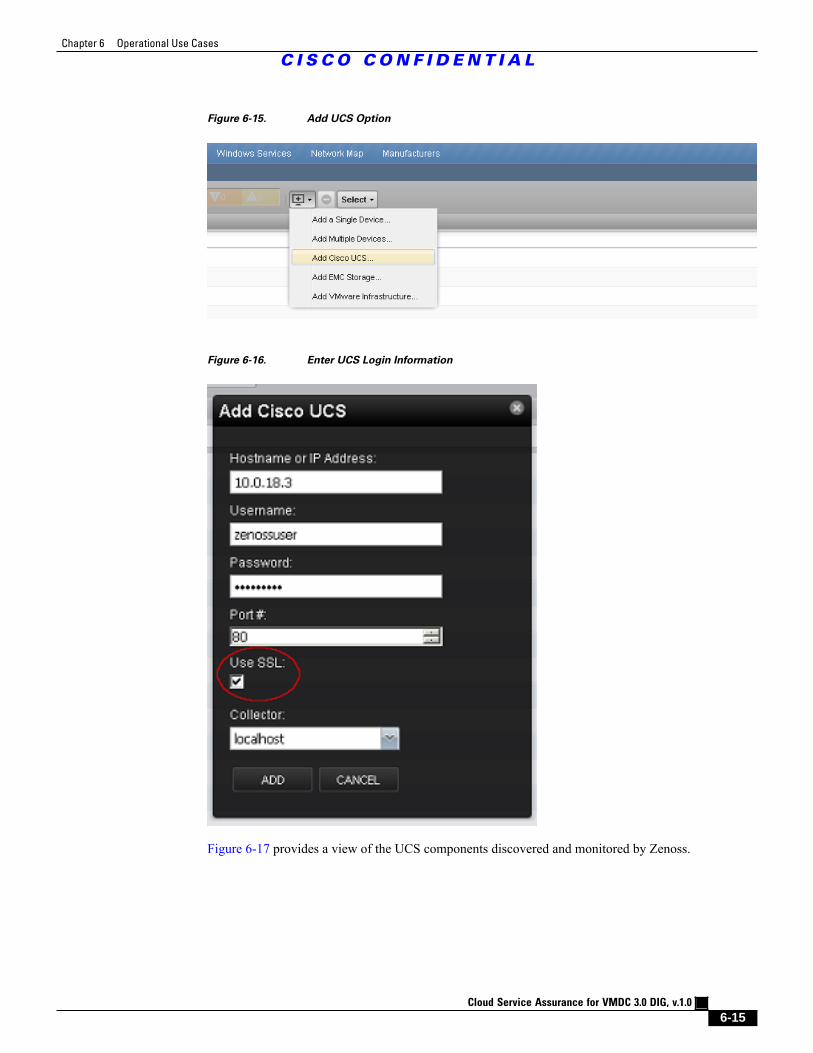
Chapter 6 Operational Use Cases
C I S C O C O N F I D E N T I A L
Cloud Service Assurance for VMDC 3.0 DIG, v.1.0
6-15
Figure 6-15. Add UCS Option
Figure 6-16. Enter UCS Login Information
Figure 6-17 provides a view of the UCS components discovered and monitored by Zenoss.
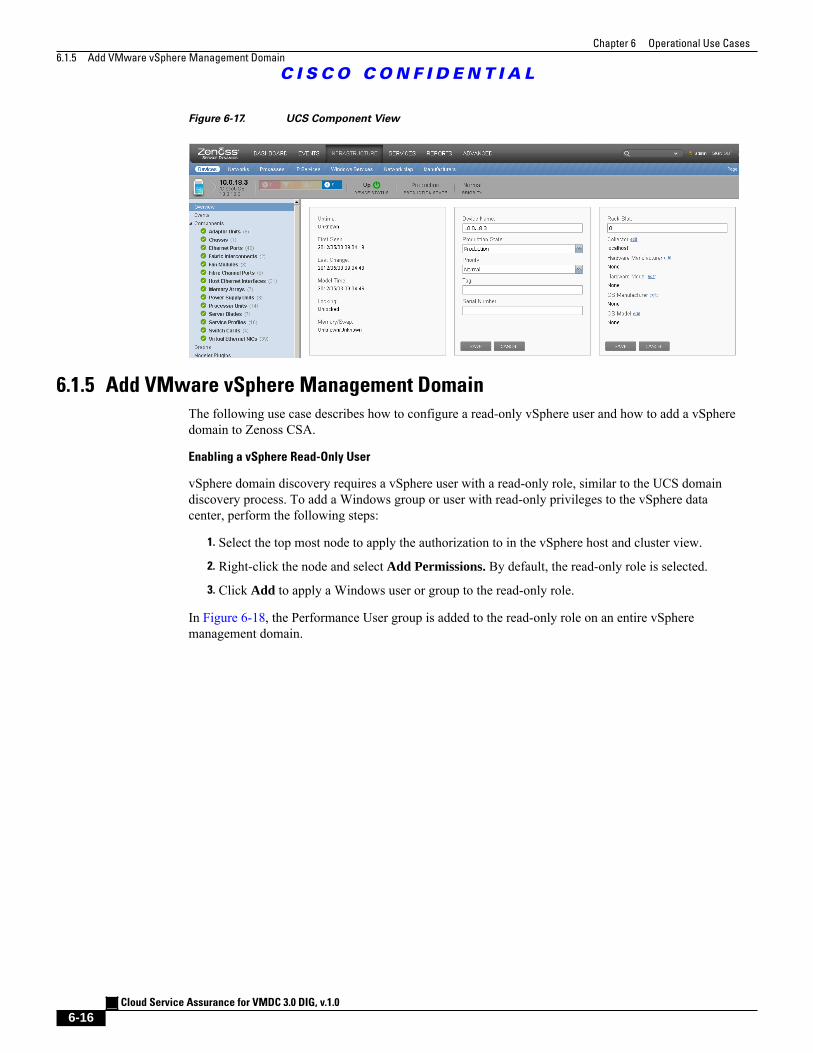
Chapter 6 Operational Use Cases
6.1.5 Add VMware vSphere Management Domain
C I S C O C O N F I D E N T I A L
Cloud Service Assurance for VMDC 3.0 DIG, v.1.0
6-16
Figure 6-17. UCS Component View
6.1.5 Add VMware vSphere Management Domain
The following use case describes how to configure a read-only vSphere user and how to add a vSpheredomain to Zenoss CSA.
Enabling a vSphere Read-Only User
vSphere domain discovery requires a vSphere user with a read-only role, similar to the UCS domaindiscovery process. To add a Windows group or user with read-only privileges to the vSphere datacenter, perform the following steps:
1. Select the top most node to apply the authorization to in the vSphere host and cluster view.
2. Right-click the node and select Add Permissions. By default, the read-only role is selected.
3. Click Add to apply a Windows user or group to the read-only role.
In Figure 6-18, the Performance User group is added to the read-only role on an entire vSpheremanagement domain.
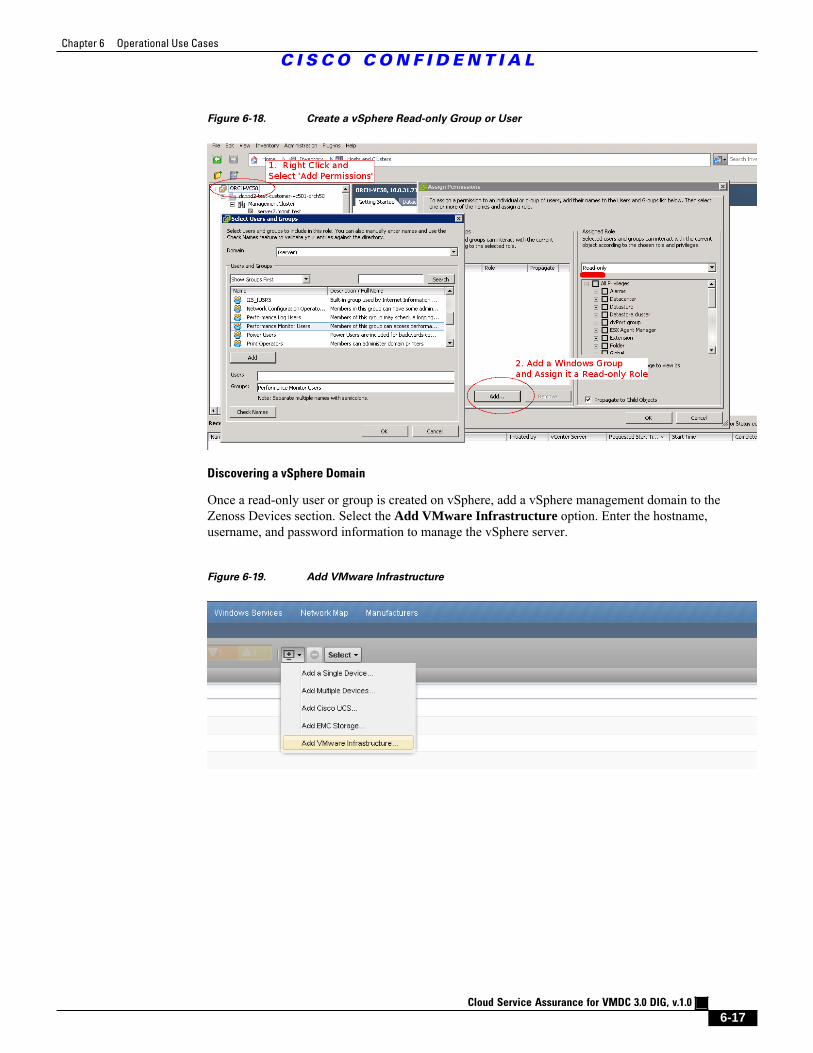
Chapter 6 Operational Use Cases
C I S C O C O N F I D E N T I A L
Cloud Service Assurance for VMDC 3.0 DIG, v.1.0
6-17
Figure 6-18. Create a vSphere Read-only Group or User
Discovering a vSphere Domain
Once a read-only user or group is created on vSphere, add a vSphere management domain to theZenoss Devices section. Select the Add VMware Infrastructure option. Enter the hostname,username, and password information to manage the vSphere server.
Figure 6-19. Add VMware Infrastructure
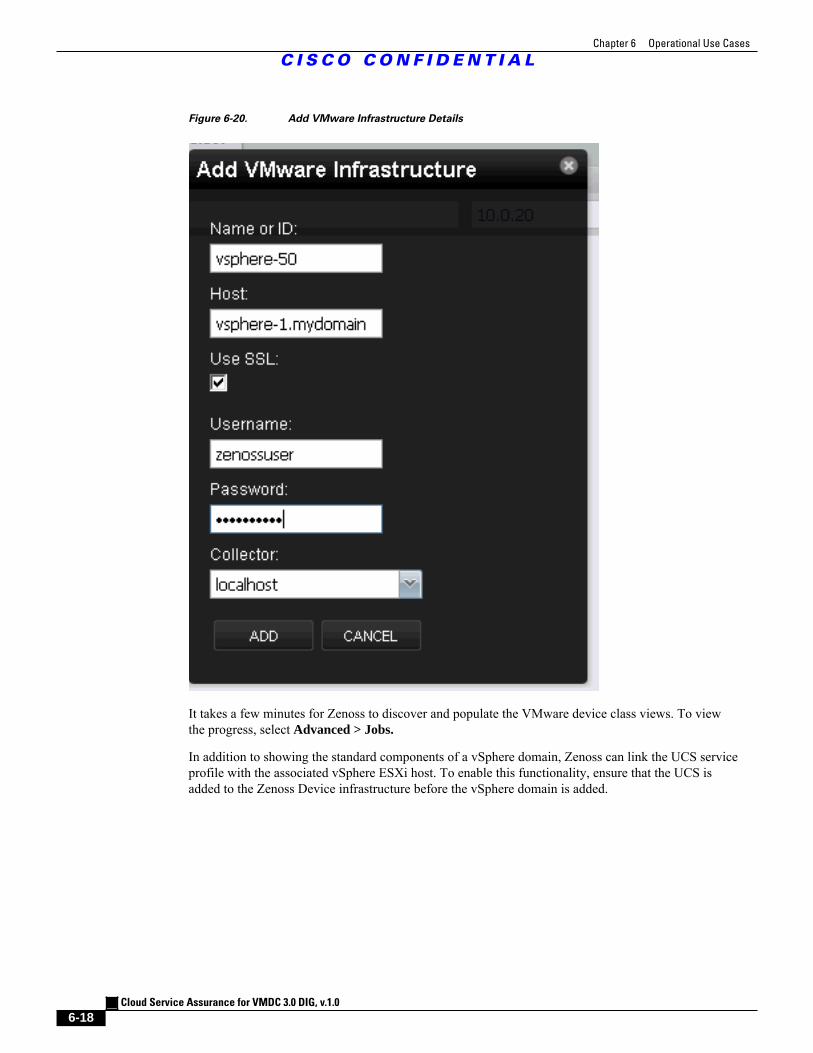
Chapter 6 Operational Use Cases
C I S C O C O N F I D E N T I A L
Cloud Service Assurance for VMDC 3.0 DIG, v.1.0
6-18
Figure 6-20. Add VMware Infrastructure Details
It takes a few minutes for Zenoss to discover and populate the VMware device class views. To viewthe progress, select Advanced > Jobs.
In addition to showing the standard components of a vSphere domain, Zenoss can link the UCS serviceprofile with the associated vSphere ESXi host. To enable this functionality, ensure that the UCS isadded to the Zenoss Device infrastructure before the vSphere domain is added.
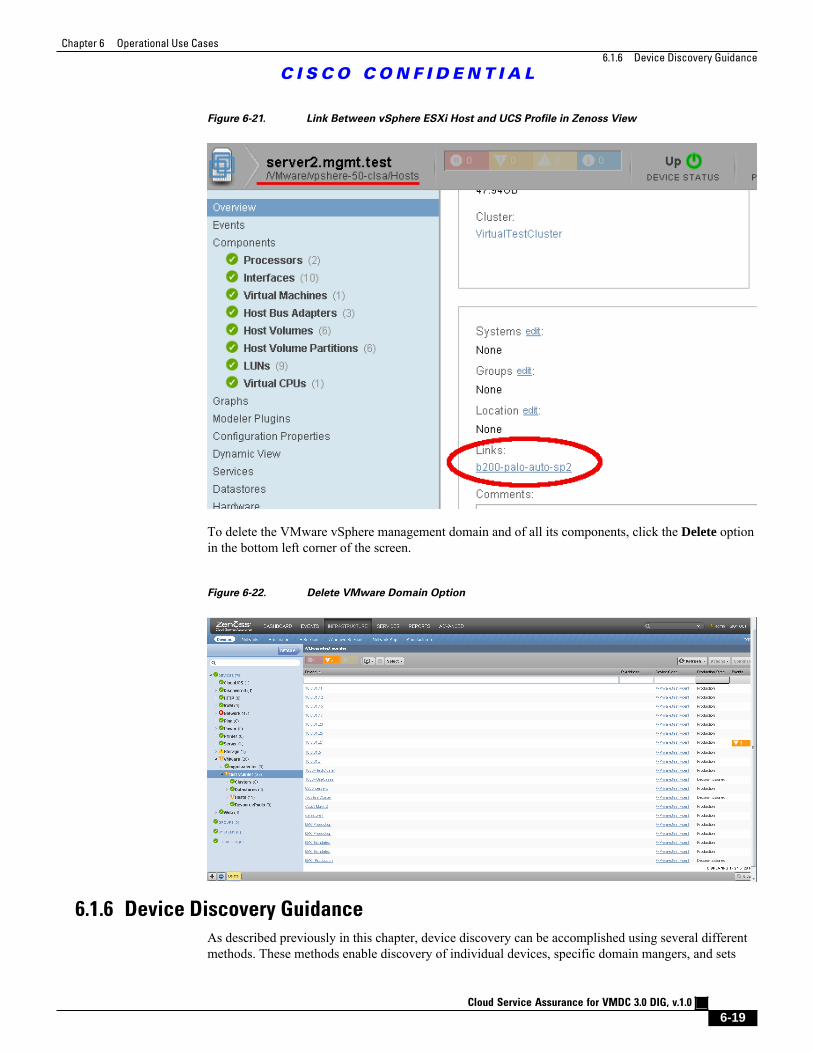
Chapter 6 Operational Use Cases
6.1.6 Device Discovery Guidance
C I S C O C O N F I D E N T I A L
Cloud Service Assurance for VMDC 3.0 DIG, v.1.0
6-19
Figure 6-21. Link Between vSphere ESXi Host and UCS Profile in Zenoss View
To delete the VMware vSphere management domain and of all its components, click the Delete optionin the bottom left corner of the screen.
Figure 6-22. Delete VMware Domain Option
6.1.6 Device Discovery Guidance
As described previously in this chapter, device discovery can be accomplished using several differentmethods. These methods enable discovery of individual devices, specific domain mangers, and sets
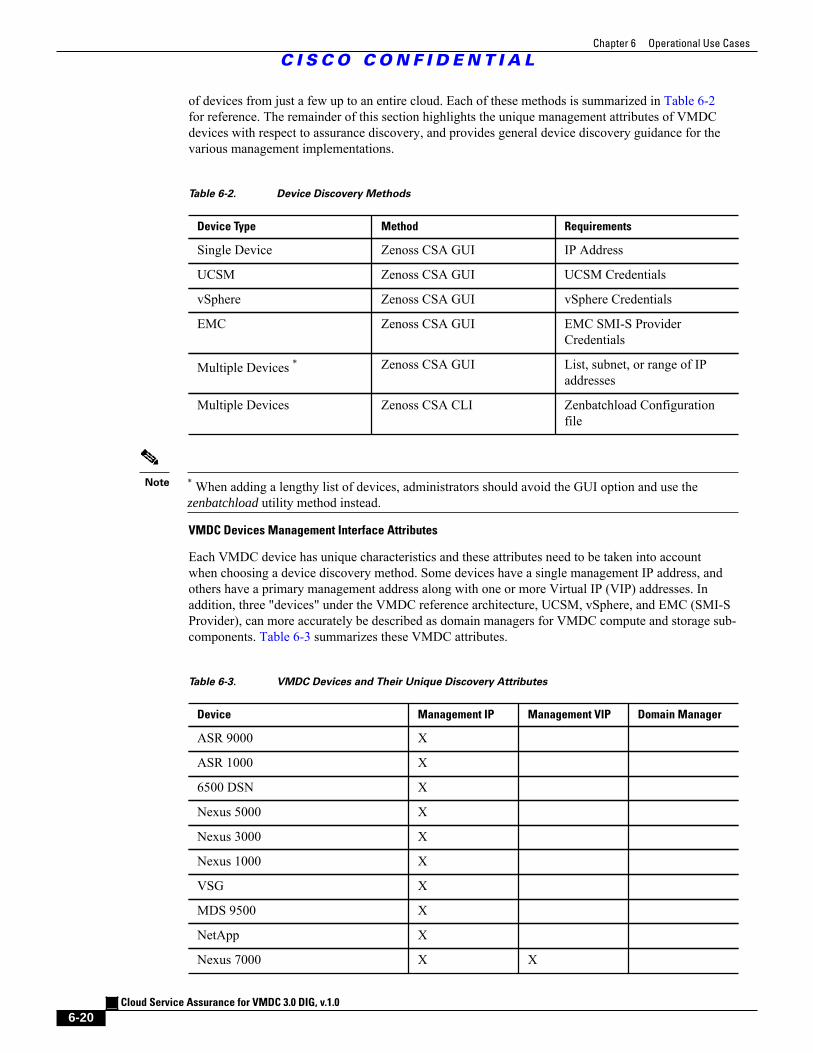
Chapter 6 Operational Use Cases
C I S C O C O N F I D E N T I A L
Cloud Service Assurance for VMDC 3.0 DIG, v.1.0
6-20
of devices from just a few up to an entire cloud. Each of these methods is summarized in Table 6-2for reference. The remainder of this section highlights the unique management attributes of VMDCdevices with respect to assurance discovery, and provides general device discovery guidance for thevarious management implementations.
Table 6-2. Device Discovery Methods
Device Type Method Requirements
Single Device Zenoss CSA GUI IP Address
UCSM Zenoss CSA GUI UCSM Credentials
vSphere Zenoss CSA GUI vSphere Credentials
EMC Zenoss CSA GUI EMC SMI-S ProviderCredentials
Multiple Devices * Zenoss CSA GUI List, subnet, or range of IPaddresses
Multiple Devices Zenoss CSA CLI Zenbatchload Configurationfile
Note * When adding a lengthy list of devices, administrators should avoid the GUI option and use thezenbatchload utility method instead.
VMDC Devices Management Interface Attributes
Each VMDC device has unique characteristics and these attributes need to be taken into accountwhen choosing a device discovery method. Some devices have a single management IP address, andothers have a primary management address along with one or more Virtual IP (VIP) addresses. Inaddition, three "devices" under the VMDC reference architecture, UCSM, vSphere, and EMC (SMI-SProvider), can more accurately be described as domain managers for VMDC compute and storage sub-components. Table 6-3 summarizes these VMDC attributes.
Table 6-3. VMDC Devices and Their Unique Discovery Attributes
Device Management IP Management VIP Domain Manager
ASR 9000 X
ASR 1000 X
6500 DSN X
Nexus 5000 X
Nexus 3000 X
Nexus 1000 X
VSG X
MDS 9500 X
NetApp X
Nexus 7000 X X
Chapter 6 Operational Use Cases
C I S C O C O N F I D E N T I A L
Cloud Service Assurance for VMDC 3.0 DIG, v.1.0
6-21
Device Management IP Management VIP Domain Manager
ACE X X
FWSM X X
ASA/ASASM X X
UCSM 1 X X X
vSphere 2 X X
EMC SMI-S Provider 3 X X
Note • 1 The UCS compute system management implementation is similar to a Hot Standby Router
Protocol (HSRP) setup. The UCSM application runs on a pair of 6100s each with a uniquemanagement IP. The UCSM is typically accessed using a VIP. The 6100 and 5100 compute stackwould be managed through the UCSM and thus do not have separate management IP addressesfor assurance monitoring.
• 2 The vSphere infrastructure system is typically managed using a vSphere vCenter server. AllESXi hosts and their VMs are discovered when the vSphere vCenter is added to the Zenoss CSAdevice list.
• 3 An EMC storage device for both VMAX and VNX can only be accessed through an SMI-S Provider. EMC devices are thus added to the Zenoss CSA device list by adding an SMI-SProvider domain manager.
Guidance for Domain Managers
Domain managers, UCSM, vSphere, and EMC SMI-S should not be autodiscovered. They shouldbe discovered using their unique device specific methods. They may also be discovered using thezenbatchload utility.
Guidance for Devices with Single Management IPs
Devices with single management IP addresses can be discovered individually, as a list of devicesor possibly via subnet autodiscovery. The subnet discovery approach may be more efficient if thesetypes of devices are segregated onto their own smaller subnet segments. If a few unwanted devices arediscovered, they can easily be removed manually.
Devices with Both Management and Virtual IPs
Devices with a combination of management IP and VIP addresses need to be discovered intentionallyand not by autodiscovery. It is recommended that both the IP and VIP address for these devicesbe discovered using the GUI-based add a single device method. Alternatively, they may also bediscovered using the zenbatchload utility. Again, if duplicate devices are unintentionally discovered,they can easily be removed manually.
A Final Word on Discovery
The primary benefit of Zenoss CSA autodiscovery is not so much the initial discovery of a device'smanagement IP, but instead the autodiscovery of that devices' subcomponents and the relationshipsbehind the management address. Once a device is initially discovered, it is then classified bydevice type. Classification allows that device to be modeled and its subcomponents discovered.
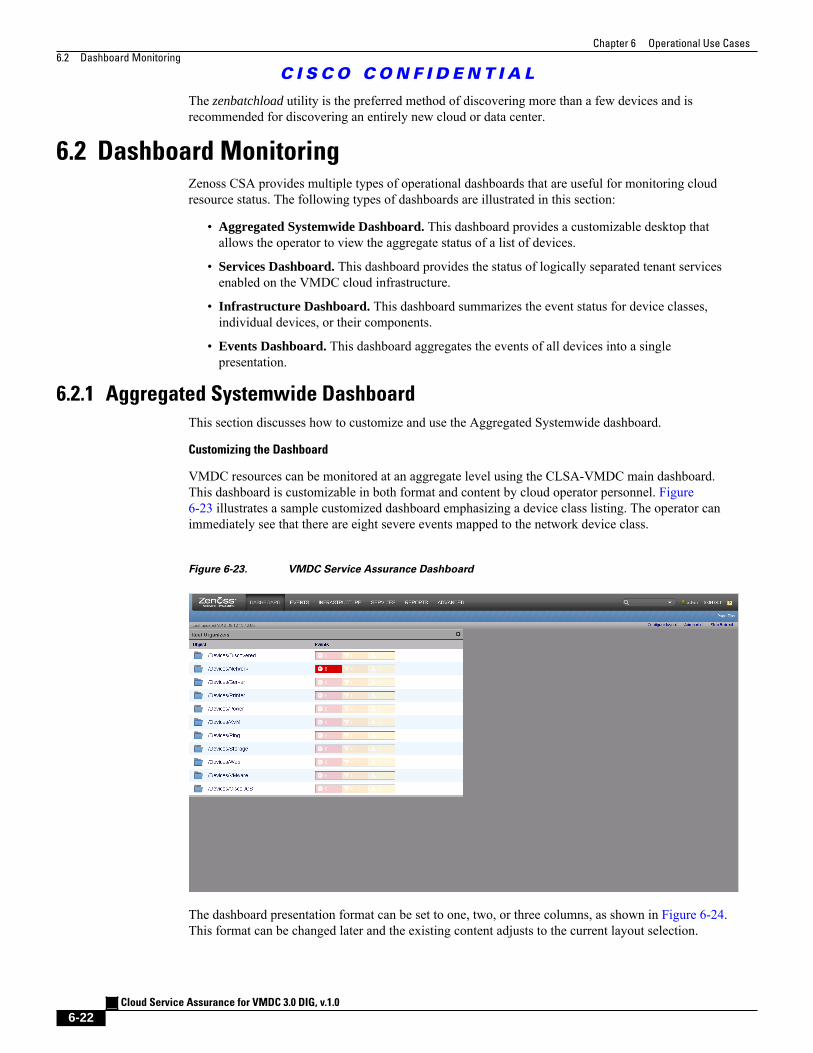
Chapter 6 Operational Use Cases
6.2 Dashboard Monitoring
C I S C O C O N F I D E N T I A L
Cloud Service Assurance for VMDC 3.0 DIG, v.1.0
6-22
The zenbatchload utility is the preferred method of discovering more than a few devices and isrecommended for discovering an entirely new cloud or data center.
6.2 Dashboard MonitoringZenoss CSA provides multiple types of operational dashboards that are useful for monitoring cloudresource status. The following types of dashboards are illustrated in this section:
• Aggregated Systemwide Dashboard. This dashboard provides a customizable desktop thatallows the operator to view the aggregate status of a list of devices.
• Services Dashboard. This dashboard provides the status of logically separated tenant servicesenabled on the VMDC cloud infrastructure.
• Infrastructure Dashboard. This dashboard summarizes the event status for device classes,individual devices, or their components.
• Events Dashboard. This dashboard aggregates the events of all devices into a singlepresentation.
6.2.1 Aggregated Systemwide Dashboard
This section discusses how to customize and use the Aggregated Systemwide dashboard.
Customizing the Dashboard
VMDC resources can be monitored at an aggregate level using the CLSA-VMDC main dashboard.This dashboard is customizable in both format and content by cloud operator personnel. Figure6-23 illustrates a sample customized dashboard emphasizing a device class listing. The operator canimmediately see that there are eight severe events mapped to the network device class.
Figure 6-23. VMDC Service Assurance Dashboard
The dashboard presentation format can be set to one, two, or three columns, as shown in Figure 6-24.This format can be changed later and the existing content adjusts to the current layout selection.
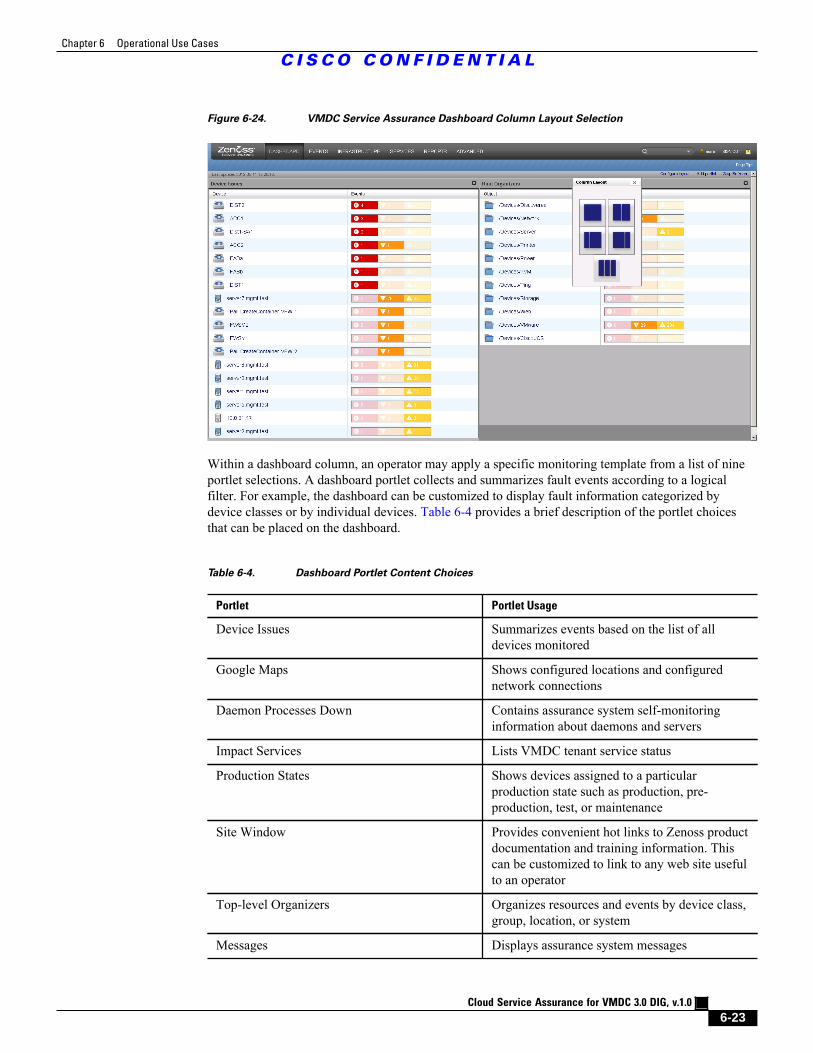
Chapter 6 Operational Use Cases
C I S C O C O N F I D E N T I A L
Cloud Service Assurance for VMDC 3.0 DIG, v.1.0
6-23
Figure 6-24. VMDC Service Assurance Dashboard Column Layout Selection
Within a dashboard column, an operator may apply a specific monitoring template from a list of nineportlet selections. A dashboard portlet collects and summarizes fault events according to a logicalfilter. For example, the dashboard can be customized to display fault information categorized bydevice classes or by individual devices. Table 6-4 provides a brief description of the portlet choicesthat can be placed on the dashboard.
Table 6-4. Dashboard Portlet Content Choices
Portlet Portlet Usage
Device Issues Summarizes events based on the list of alldevices monitored
Google Maps Shows configured locations and configurednetwork connections
Daemon Processes Down Contains assurance system self-monitoringinformation about daemons and servers
Impact Services Lists VMDC tenant service status
Production States Shows devices assigned to a particularproduction state such as production, pre-production, test, or maintenance
Site Window Provides convenient hot links to Zenoss productdocumentation and training information. Thiscan be customized to link to any web site usefulto an operator
Top-level Organizers Organizes resources and events by device class,group, location, or system
Messages Displays assurance system messages
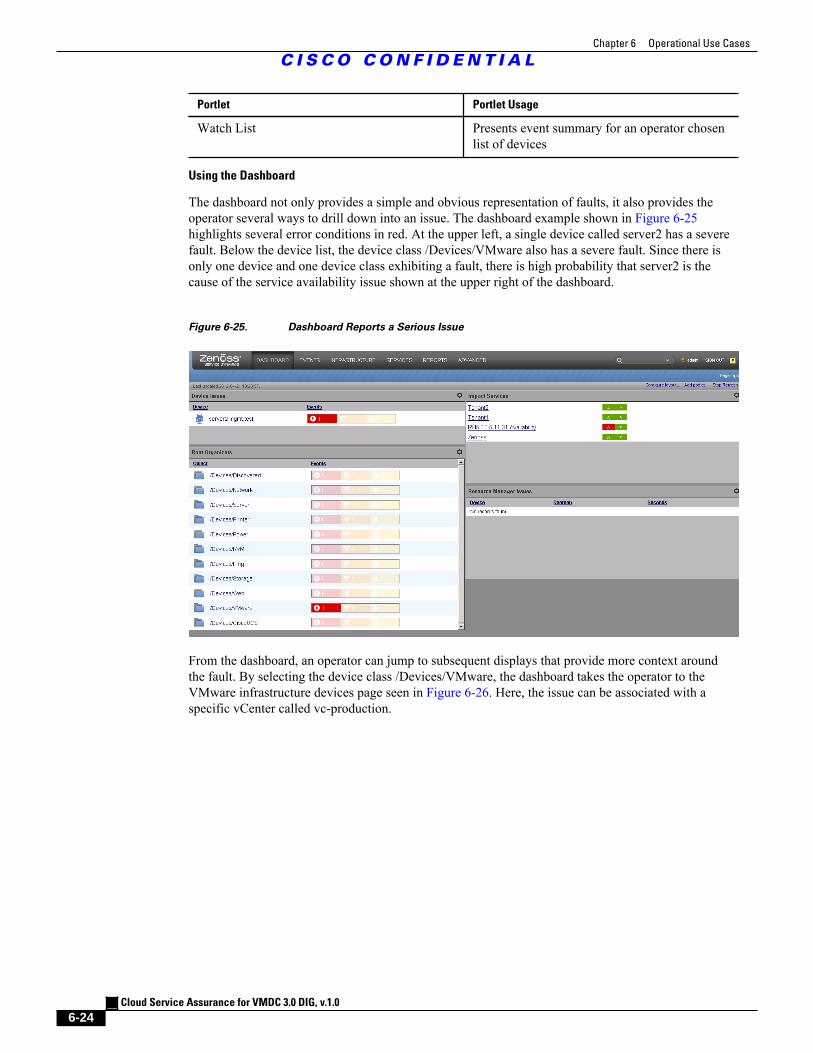
Chapter 6 Operational Use Cases
C I S C O C O N F I D E N T I A L
Cloud Service Assurance for VMDC 3.0 DIG, v.1.0
6-24
Portlet Portlet Usage
Watch List Presents event summary for an operator chosenlist of devices
Using the Dashboard
The dashboard not only provides a simple and obvious representation of faults, it also provides theoperator several ways to drill down into an issue. The dashboard example shown in Figure 6-25highlights several error conditions in red. At the upper left, a single device called server2 has a severefault. Below the device list, the device class /Devices/VMware also has a severe fault. Since there isonly one device and one device class exhibiting a fault, there is high probability that server2 is thecause of the service availability issue shown at the upper right of the dashboard.
Figure 6-25. Dashboard Reports a Serious Issue
From the dashboard, an operator can jump to subsequent displays that provide more context aroundthe fault. By selecting the device class /Devices/VMware, the dashboard takes the operator to theVMware infrastructure devices page seen in Figure 6-26. Here, the issue can be associated with aspecific vCenter called vc-production.
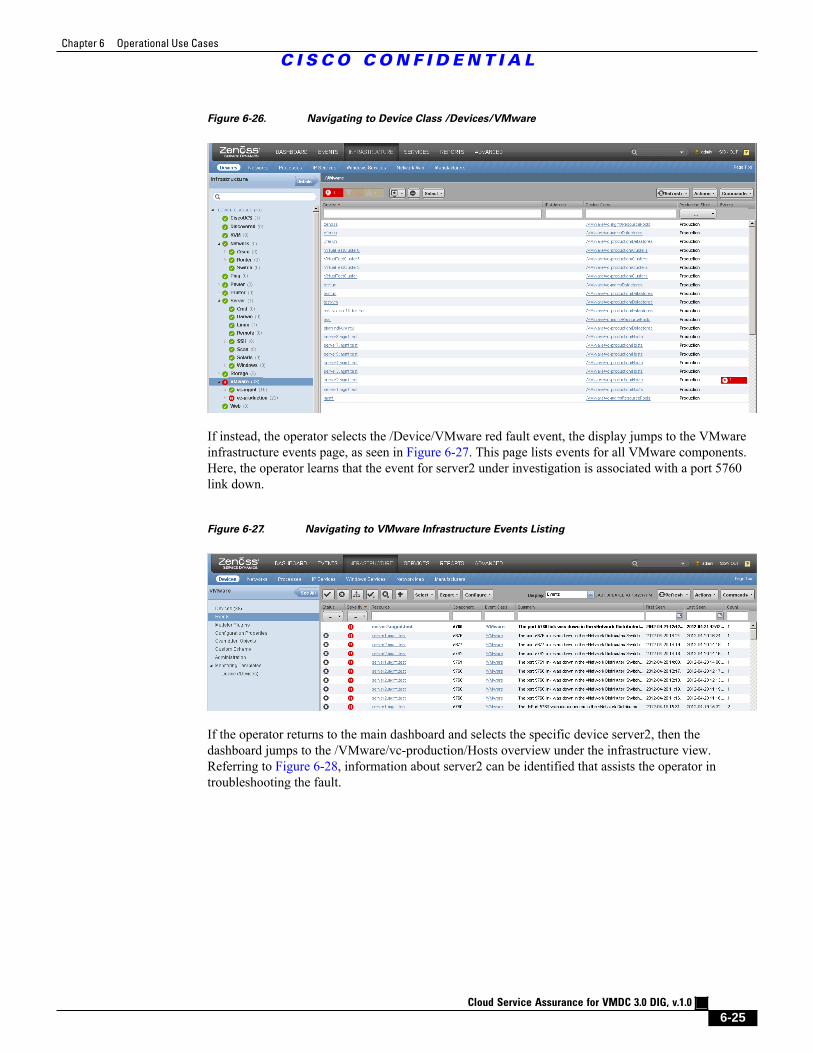
Chapter 6 Operational Use Cases
C I S C O C O N F I D E N T I A L
Cloud Service Assurance for VMDC 3.0 DIG, v.1.0
6-25
Figure 6-26. Navigating to Device Class /Devices/VMware
If instead, the operator selects the /Device/VMware red fault event, the display jumps to the VMwareinfrastructure events page, as seen in Figure 6-27. This page lists events for all VMware components.Here, the operator learns that the event for server2 under investigation is associated with a port 5760link down.
Figure 6-27. Navigating to VMware Infrastructure Events Listing
If the operator returns to the main dashboard and selects the specific device server2, then thedashboard jumps to the /VMware/vc-production/Hosts overview under the infrastructure view.Referring to Figure 6-28, information about server2 can be identified that assists the operator introubleshooting the fault.
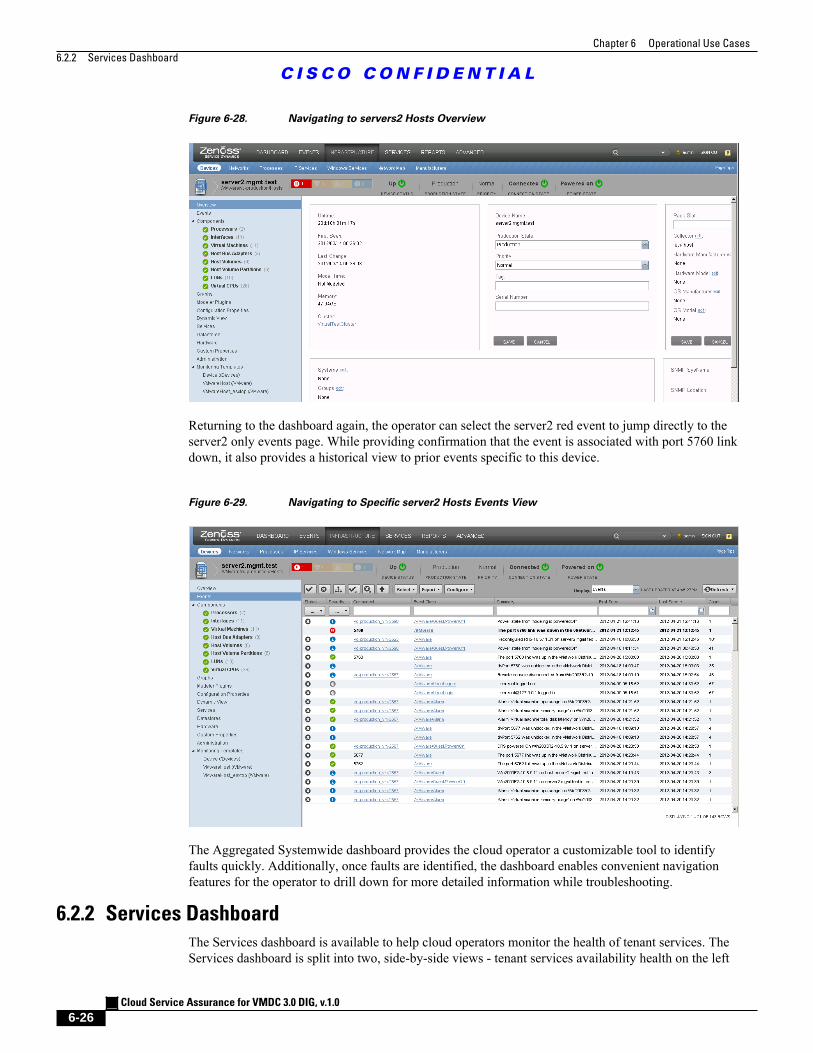
Chapter 6 Operational Use Cases
6.2.2 Services Dashboard
C I S C O C O N F I D E N T I A L
Cloud Service Assurance for VMDC 3.0 DIG, v.1.0
6-26
Figure 6-28. Navigating to servers2 Hosts Overview
Returning to the dashboard again, the operator can select the server2 red event to jump directly to theserver2 only events page. While providing confirmation that the event is associated with port 5760 linkdown, it also provides a historical view to prior events specific to this device.
Figure 6-29. Navigating to Specific server2 Hosts Events View
The Aggregated Systemwide dashboard provides the cloud operator a customizable tool to identifyfaults quickly. Additionally, once faults are identified, the dashboard enables convenient navigationfeatures for the operator to drill down for more detailed information while troubleshooting.
6.2.2 Services Dashboard
The Services dashboard is available to help cloud operators monitor the health of tenant services. TheServices dashboard is split into two, side-by-side views - tenant services availability health on the left
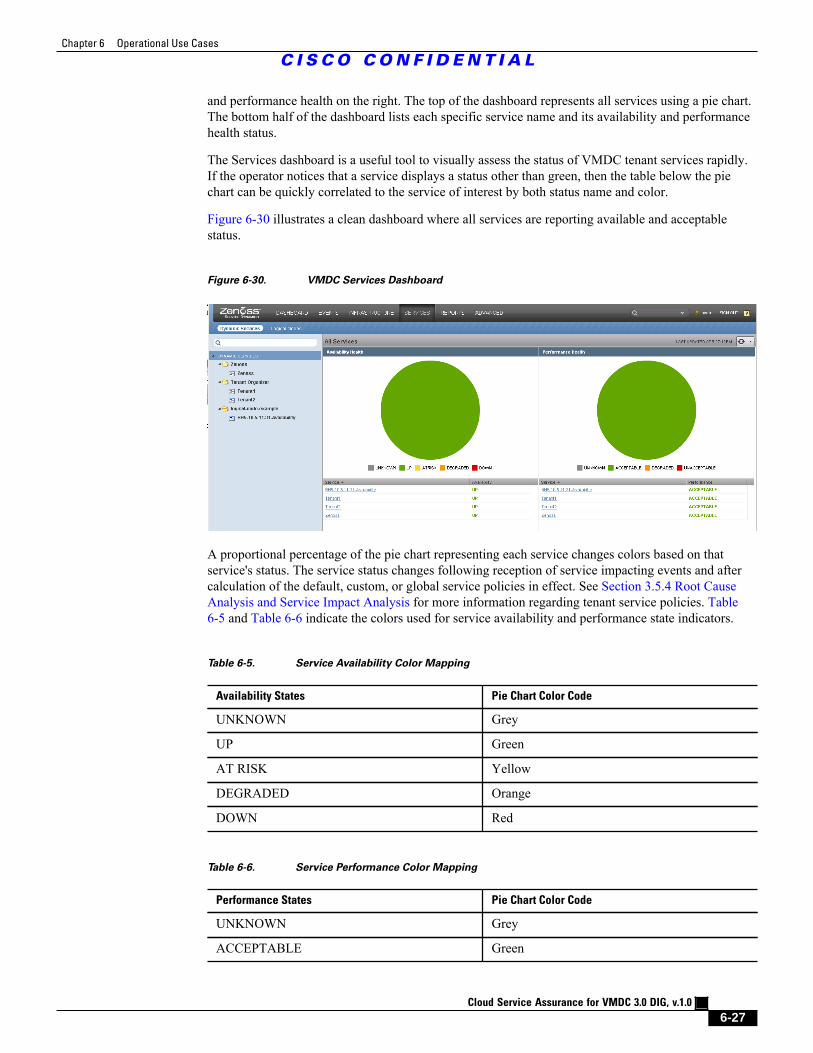
Chapter 6 Operational Use Cases
C I S C O C O N F I D E N T I A L
Cloud Service Assurance for VMDC 3.0 DIG, v.1.0
6-27
and performance health on the right. The top of the dashboard represents all services using a pie chart.The bottom half of the dashboard lists each specific service name and its availability and performancehealth status.
The Services dashboard is a useful tool to visually assess the status of VMDC tenant services rapidly.If the operator notices that a service displays a status other than green, then the table below the piechart can be quickly correlated to the service of interest by both status name and color.
Figure 6-30 illustrates a clean dashboard where all services are reporting available and acceptablestatus.
Figure 6-30. VMDC Services Dashboard
A proportional percentage of the pie chart representing each service changes colors based on thatservice's status. The service status changes following reception of service impacting events and aftercalculation of the default, custom, or global service policies in effect. See Section 3.5.4 Root CauseAnalysis and Service Impact Analysis for more information regarding tenant service policies. Table6-5 and Table 6-6 indicate the colors used for service availability and performance state indicators.
Table 6-5. Service Availability Color Mapping
Availability States Pie Chart Color Code
UNKNOWN Grey
UP Green
AT RISK Yellow
DEGRADED Orange
DOWN Red
Table 6-6. Service Performance Color Mapping
Performance States Pie Chart Color Code
UNKNOWN Grey
ACCEPTABLE Green
Chapter 6 Operational Use Cases
C I S C O C O N F I D E N T I A L
Cloud Service Assurance for VMDC 3.0 DIG, v.1.0
6-28
Performance States Pie Chart Color Code
DEGRADED Orange
UNACCEPTABLE Red
To illustrate the dashboard's usefulness, tenant service policies have been modified according tothe cases in Table 6-7. Once a service availability impacting event occurs, the Service Availabilitydashboard reflects the policies in effect.
Table 6-7. Availability Health Dashboard Examples
Case Description
Case 1 All tenant service policies have been configuredto resolve to down for a specific fault.
Case 2 Each tenant service has been configured toresolve to each of the possible states when asevere fault occurs.
Case 1 is shown in Figure 6-31. In this case, a catastrophic event has occurred to a commoncomponent underlying these specific tenant services, and the service dashboard clearly shows allservices down in red.
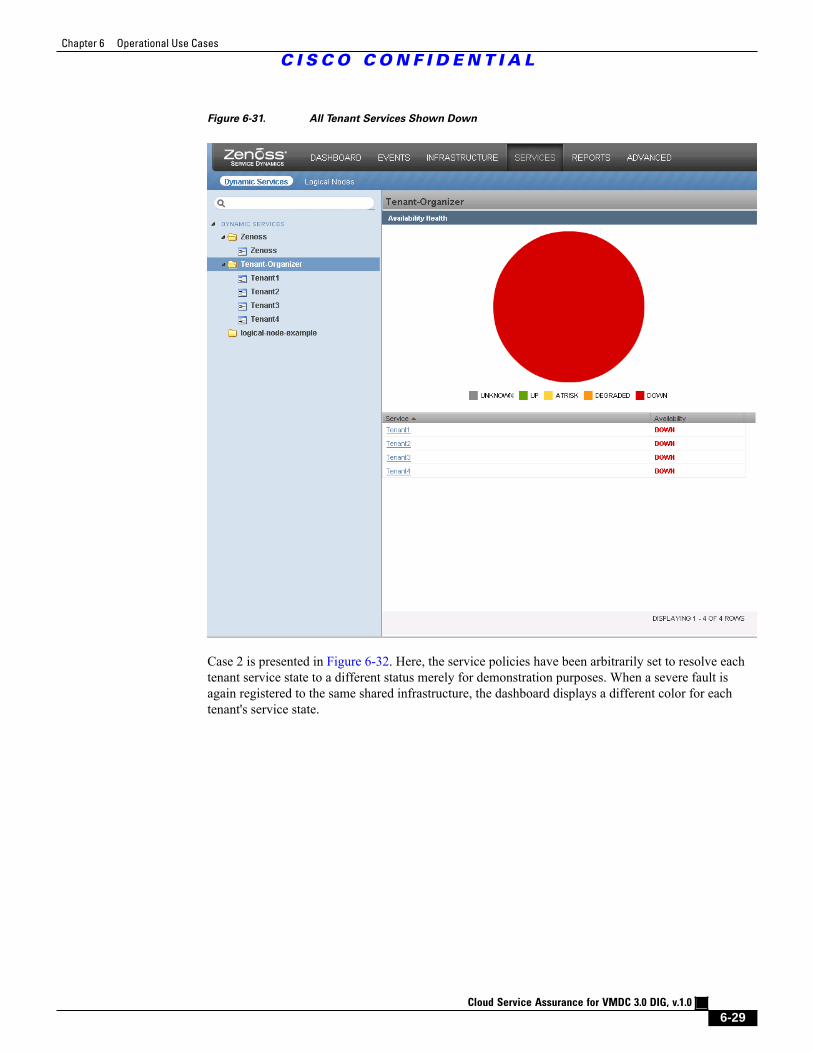
Chapter 6 Operational Use Cases
C I S C O C O N F I D E N T I A L
Cloud Service Assurance for VMDC 3.0 DIG, v.1.0
6-29
Figure 6-31. All Tenant Services Shown Down
Case 2 is presented in Figure 6-32. Here, the service policies have been arbitrarily set to resolve eachtenant service state to a different status merely for demonstration purposes. When a severe fault isagain registered to the same shared infrastructure, the dashboard displays a different color for eachtenant's service state.
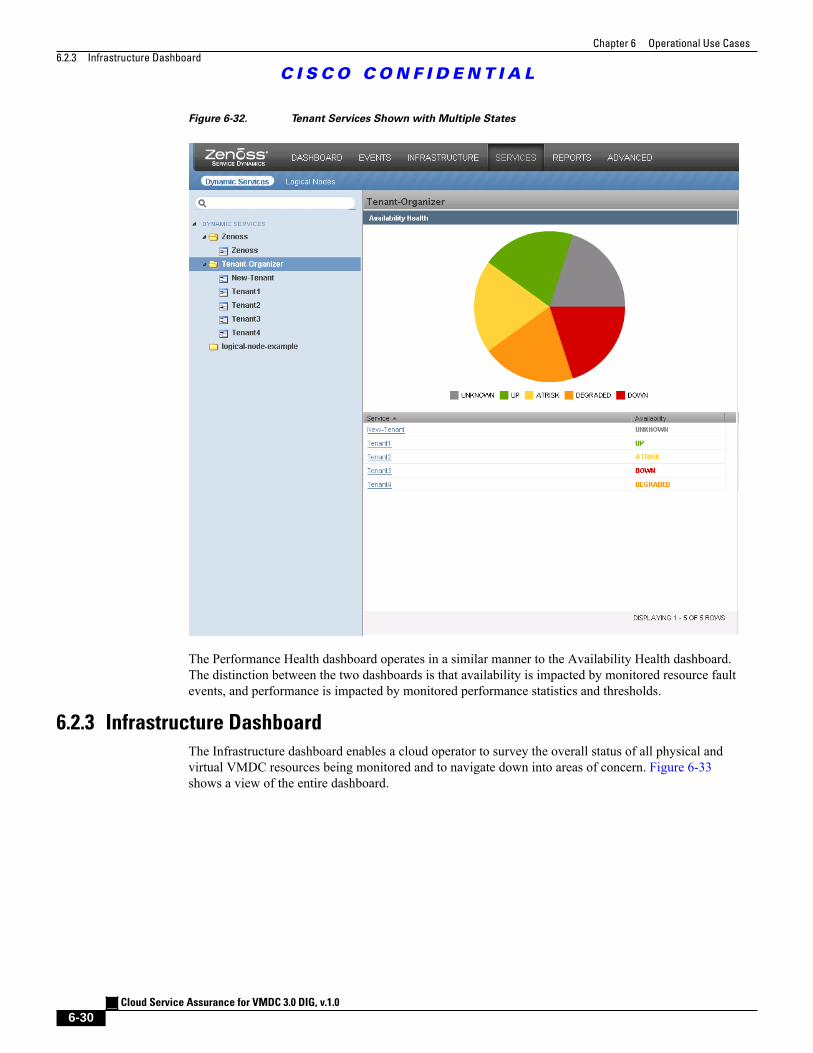
Chapter 6 Operational Use Cases
6.2.3 Infrastructure Dashboard
C I S C O C O N F I D E N T I A L
Cloud Service Assurance for VMDC 3.0 DIG, v.1.0
6-30
Figure 6-32. Tenant Services Shown with Multiple States
The Performance Health dashboard operates in a similar manner to the Availability Health dashboard.The distinction between the two dashboards is that availability is impacted by monitored resource faultevents, and performance is impacted by monitored performance statistics and thresholds.
6.2.3 Infrastructure Dashboard
The Infrastructure dashboard enables a cloud operator to survey the overall status of all physical andvirtual VMDC resources being monitored and to navigate down into areas of concern. Figure 6-33shows a view of the entire dashboard.
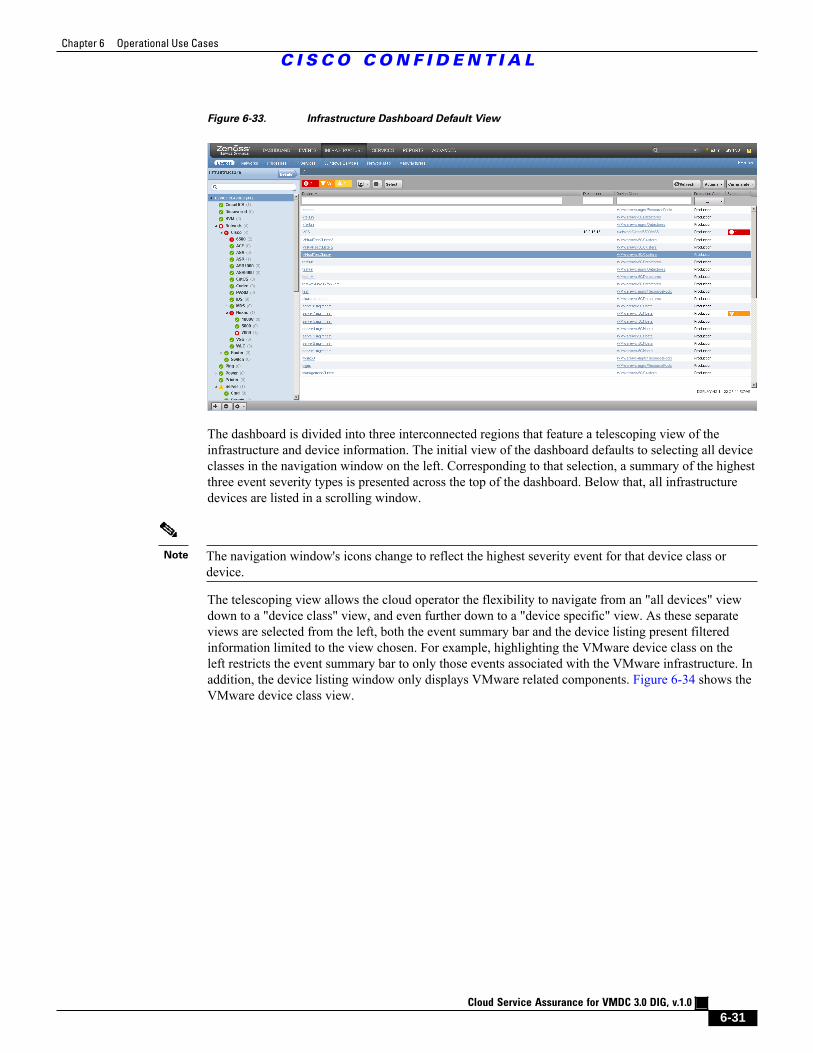
Chapter 6 Operational Use Cases
C I S C O C O N F I D E N T I A L
Cloud Service Assurance for VMDC 3.0 DIG, v.1.0
6-31
Figure 6-33. Infrastructure Dashboard Default View
The dashboard is divided into three interconnected regions that feature a telescoping view of theinfrastructure and device information. The initial view of the dashboard defaults to selecting all deviceclasses in the navigation window on the left. Corresponding to that selection, a summary of the highestthree event severity types is presented across the top of the dashboard. Below that, all infrastructuredevices are listed in a scrolling window.
Note The navigation window's icons change to reflect the highest severity event for that device class ordevice.
The telescoping view allows the cloud operator the flexibility to navigate from an "all devices" viewdown to a "device class" view, and even further down to a "device specific" view. As these separateviews are selected from the left, both the event summary bar and the device listing present filteredinformation limited to the view chosen. For example, highlighting the VMware device class on theleft restricts the event summary bar to only those events associated with the VMware infrastructure. Inaddition, the device listing window only displays VMware related components. Figure 6-34 shows theVMware device class view.
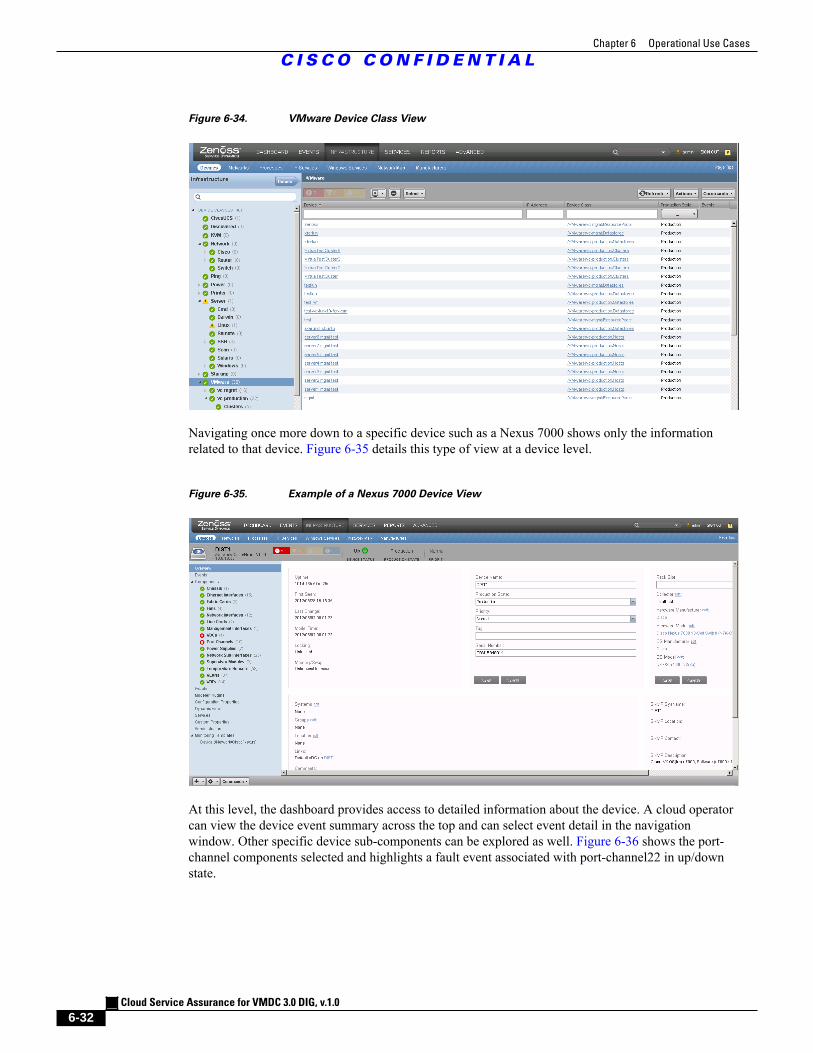
Chapter 6 Operational Use Cases
C I S C O C O N F I D E N T I A L
Cloud Service Assurance for VMDC 3.0 DIG, v.1.0
6-32
Figure 6-34. VMware Device Class View
Navigating once more down to a specific device such as a Nexus 7000 shows only the informationrelated to that device. Figure 6-35 details this type of view at a device level.
Figure 6-35. Example of a Nexus 7000 Device View
At this level, the dashboard provides access to detailed information about the device. A cloud operatorcan view the device event summary across the top and can select event detail in the navigationwindow. Other specific device sub-components can be explored as well. Figure 6-36 shows the port-channel components selected and highlights a fault event associated with port-channel22 in up/downstate.
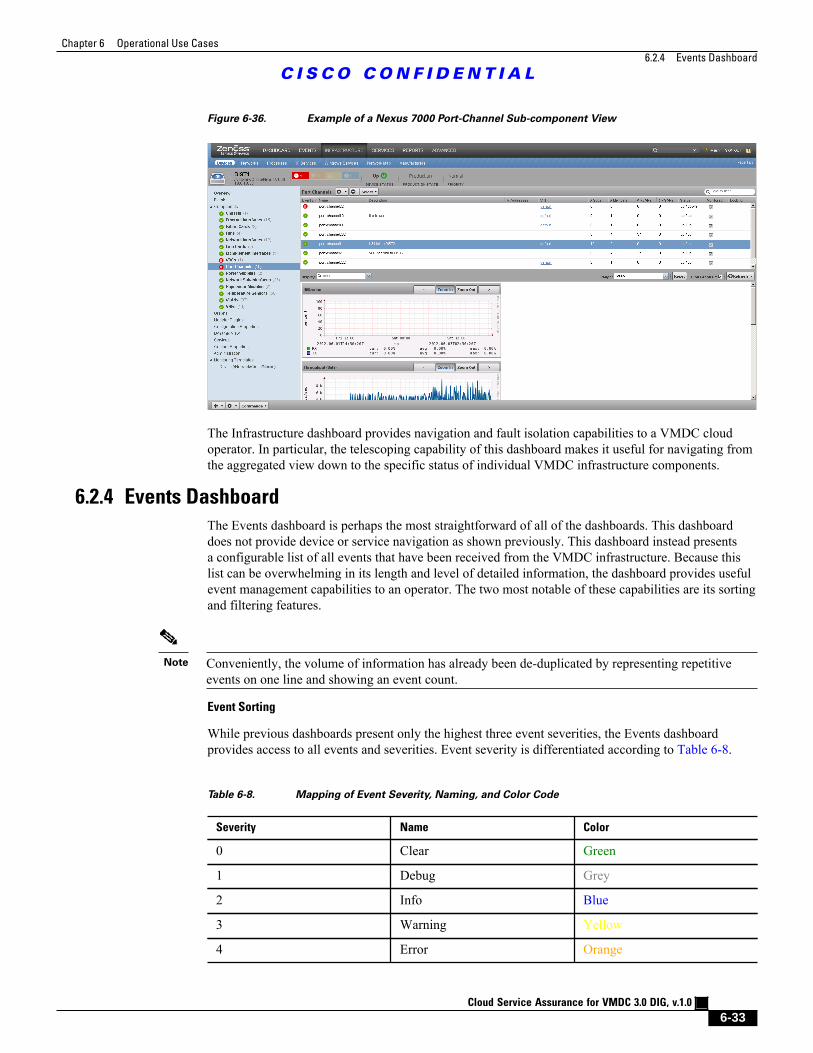
Chapter 6 Operational Use Cases
6.2.4 Events Dashboard
C I S C O C O N F I D E N T I A L
Cloud Service Assurance for VMDC 3.0 DIG, v.1.0
6-33
Figure 6-36. Example of a Nexus 7000 Port-Channel Sub-component View
The Infrastructure dashboard provides navigation and fault isolation capabilities to a VMDC cloudoperator. In particular, the telescoping capability of this dashboard makes it useful for navigating fromthe aggregated view down to the specific status of individual VMDC infrastructure components.
6.2.4 Events Dashboard
The Events dashboard is perhaps the most straightforward of all of the dashboards. This dashboarddoes not provide device or service navigation as shown previously. This dashboard instead presentsa configurable list of all events that have been received from the VMDC infrastructure. Because thislist can be overwhelming in its length and level of detailed information, the dashboard provides usefulevent management capabilities to an operator. The two most notable of these capabilities are its sortingand filtering features.
Note Conveniently, the volume of information has already been de-duplicated by representing repetitiveevents on one line and showing an event count.
Event Sorting
While previous dashboards present only the highest three event severities, the Events dashboardprovides access to all events and severities. Event severity is differentiated according to Table 6-8.
Table 6-8. Mapping of Event Severity, Naming, and Color Code
Severity Name Color
0 Clear Green
1 Debug Grey
2 Info Blue
3 Warning Yellow
4 Error Orange
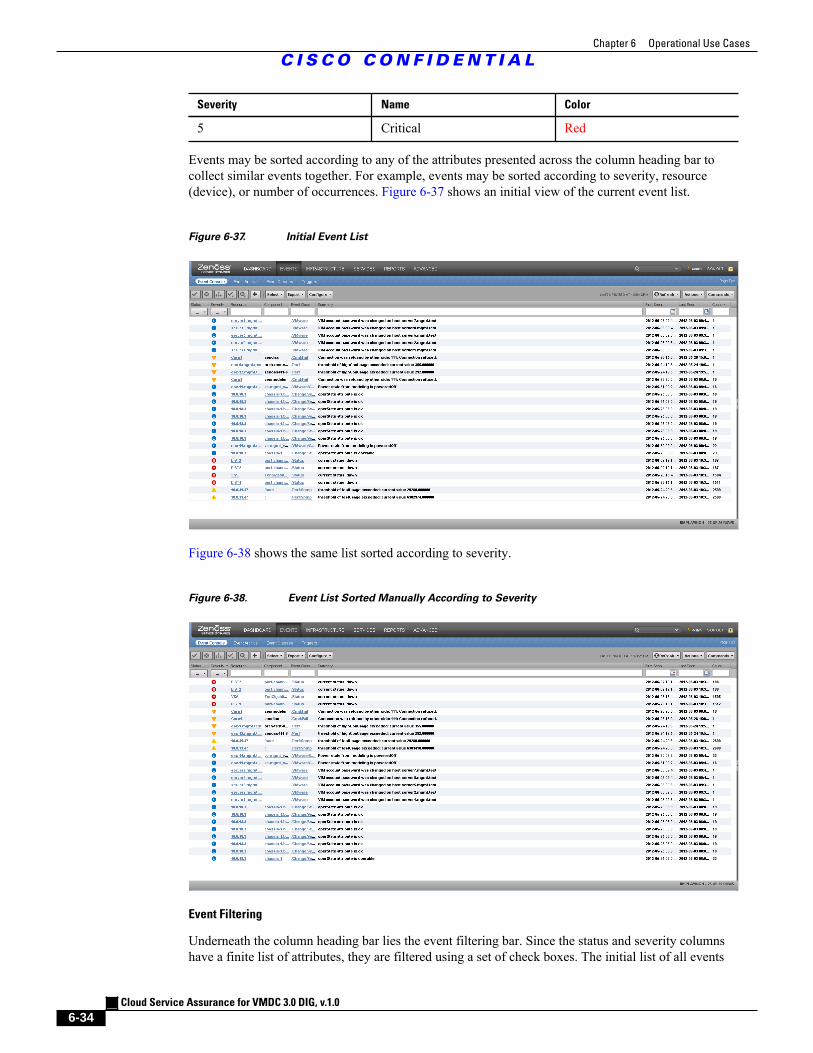
Chapter 6 Operational Use Cases
C I S C O C O N F I D E N T I A L
Cloud Service Assurance for VMDC 3.0 DIG, v.1.0
6-34
Severity Name Color
5 Critical Red
Events may be sorted according to any of the attributes presented across the column heading bar tocollect similar events together. For example, events may be sorted according to severity, resource(device), or number of occurrences. Figure 6-37 shows an initial view of the current event list.
Figure 6-37. Initial Event List
Figure 6-38 shows the same list sorted according to severity.
Figure 6-38. Event List Sorted Manually According to Severity
Event Filtering
Underneath the column heading bar lies the event filtering bar. Since the status and severity columnshave a finite list of attributes, they are filtered using a set of check boxes. The initial list of all events
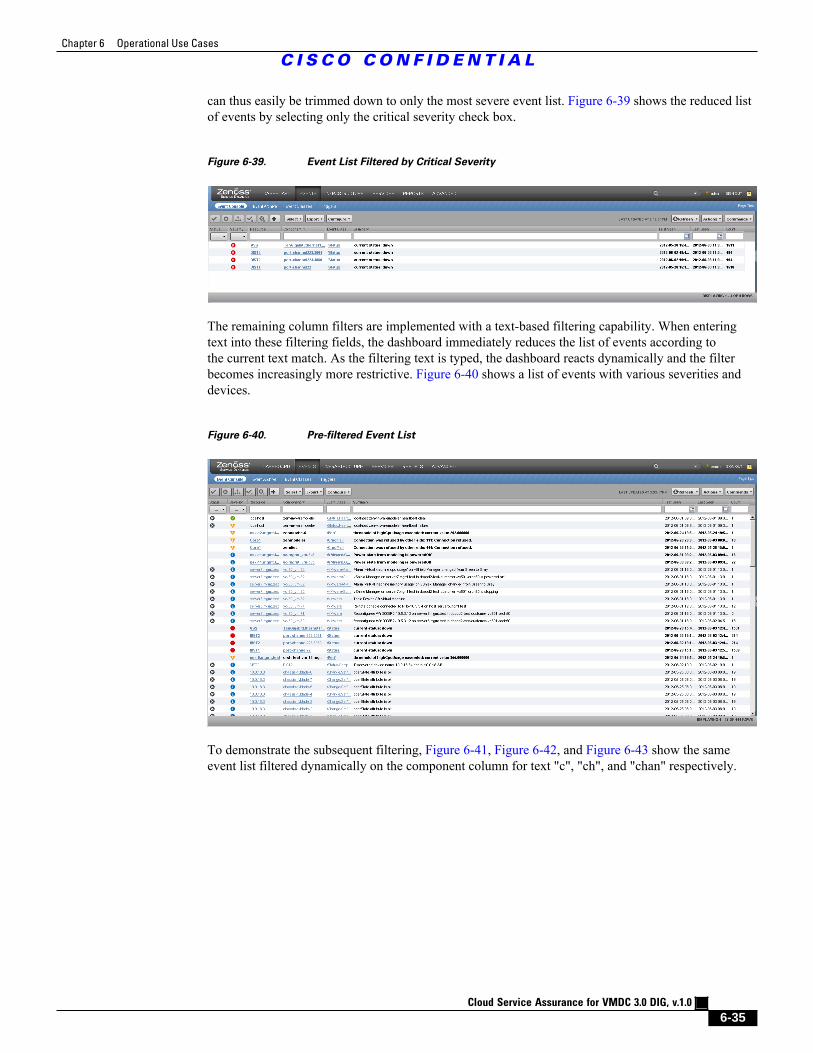
Chapter 6 Operational Use Cases
C I S C O C O N F I D E N T I A L
Cloud Service Assurance for VMDC 3.0 DIG, v.1.0
6-35
can thus easily be trimmed down to only the most severe event list. Figure 6-39 shows the reduced listof events by selecting only the critical severity check box.
Figure 6-39. Event List Filtered by Critical Severity
The remaining column filters are implemented with a text-based filtering capability. When enteringtext into these filtering fields, the dashboard immediately reduces the list of events according tothe current text match. As the filtering text is typed, the dashboard reacts dynamically and the filterbecomes increasingly more restrictive. Figure 6-40 shows a list of events with various severities anddevices.
Figure 6-40. Pre-filtered Event List
To demonstrate the subsequent filtering, Figure 6-41, Figure 6-42, and Figure 6-43 show the sameevent list filtered dynamically on the component column for text "c", "ch", and "chan" respectively.
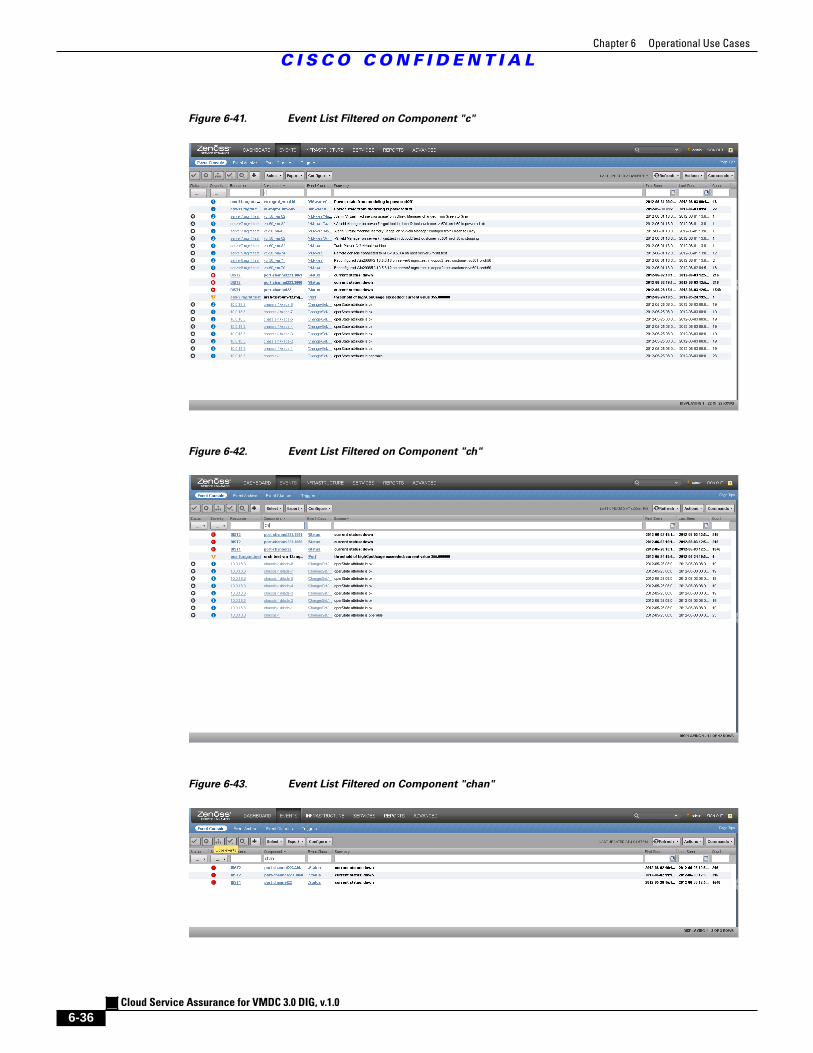
Chapter 6 Operational Use Cases
C I S C O C O N F I D E N T I A L
Cloud Service Assurance for VMDC 3.0 DIG, v.1.0
6-36
Figure 6-41. Event List Filtered on Component "c"
Figure 6-42. Event List Filtered on Component "ch"
Figure 6-43. Event List Filtered on Component "chan"
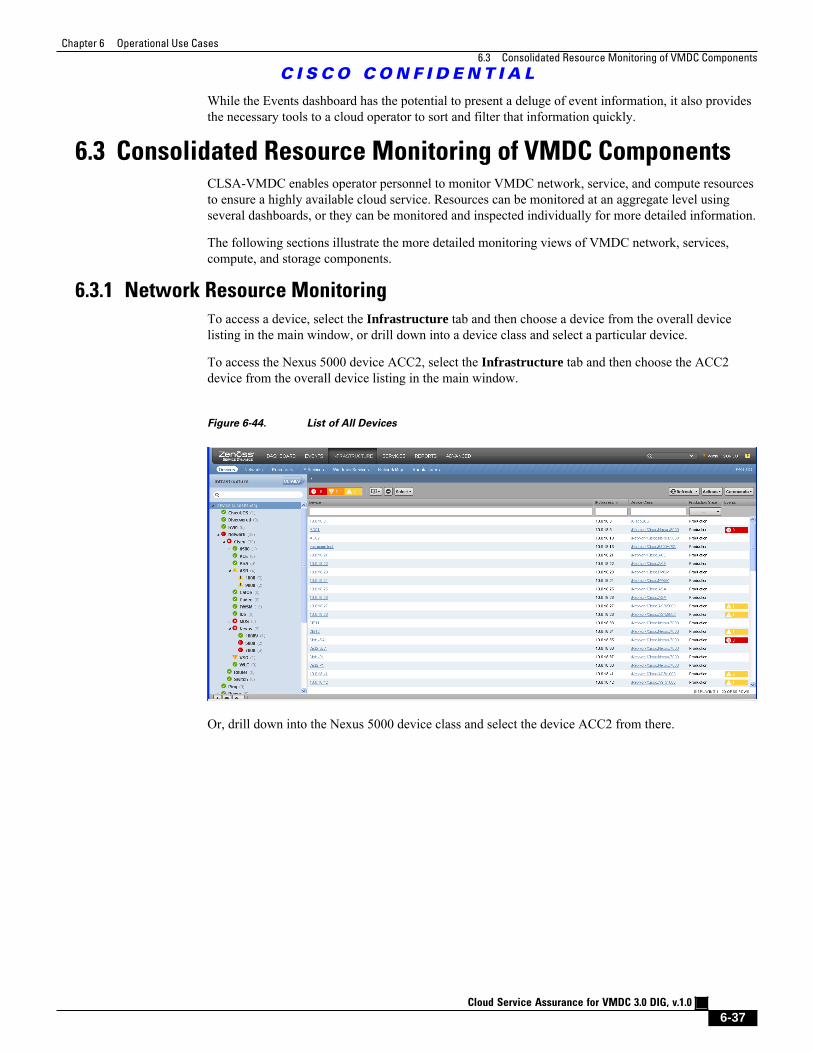
Chapter 6 Operational Use Cases
6.3 Consolidated Resource Monitoring of VMDC Components
C I S C O C O N F I D E N T I A L
Cloud Service Assurance for VMDC 3.0 DIG, v.1.0
6-37
While the Events dashboard has the potential to present a deluge of event information, it also providesthe necessary tools to a cloud operator to sort and filter that information quickly.
6.3 Consolidated Resource Monitoring of VMDC ComponentsCLSA-VMDC enables operator personnel to monitor VMDC network, service, and compute resourcesto ensure a highly available cloud service. Resources can be monitored at an aggregate level usingseveral dashboards, or they can be monitored and inspected individually for more detailed information.
The following sections illustrate the more detailed monitoring views of VMDC network, services,compute, and storage components.
6.3.1 Network Resource Monitoring
To access a device, select the Infrastructure tab and then choose a device from the overall devicelisting in the main window, or drill down into a device class and select a particular device.
To access the Nexus 5000 device ACC2, select the Infrastructure tab and then choose the ACC2device from the overall device listing in the main window.
Figure 6-44. List of All Devices
Or, drill down into the Nexus 5000 device class and select the device ACC2 from there.
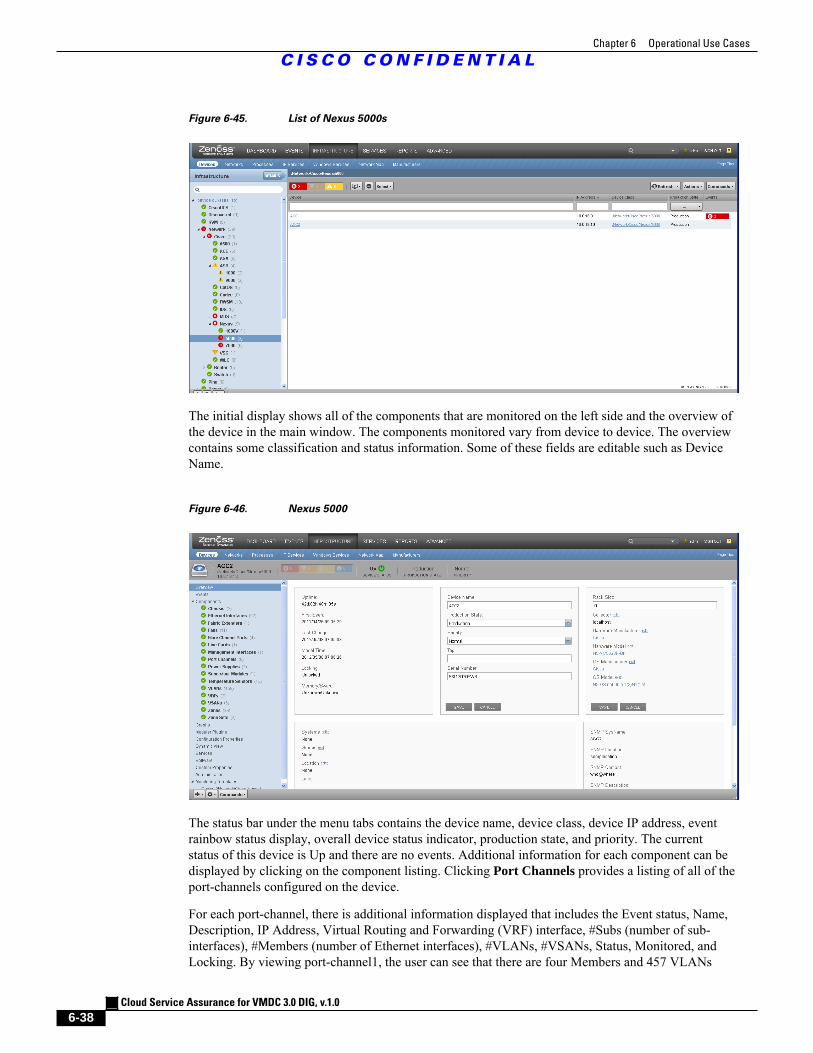
Chapter 6 Operational Use Cases
C I S C O C O N F I D E N T I A L
Cloud Service Assurance for VMDC 3.0 DIG, v.1.0
6-38
Figure 6-45. List of Nexus 5000s
The initial display shows all of the components that are monitored on the left side and the overview ofthe device in the main window. The components monitored vary from device to device. The overviewcontains some classification and status information. Some of these fields are editable such as DeviceName.
Figure 6-46. Nexus 5000
The status bar under the menu tabs contains the device name, device class, device IP address, eventrainbow status display, overall device status indicator, production state, and priority. The currentstatus of this device is Up and there are no events. Additional information for each component can bedisplayed by clicking on the component listing. Clicking Port Channels provides a listing of all of theport-channels configured on the device.
For each port-channel, there is additional information displayed that includes the Event status, Name,Description, IP Address, Virtual Routing and Forwarding (VRF) interface, #Subs (number of sub-interfaces), #Members (number of Ethernet interfaces), #VLANs, #VSANs, Status, Monitored, andLocking. By viewing port-channel1, the user can see that there are four Members and 457 VLANs
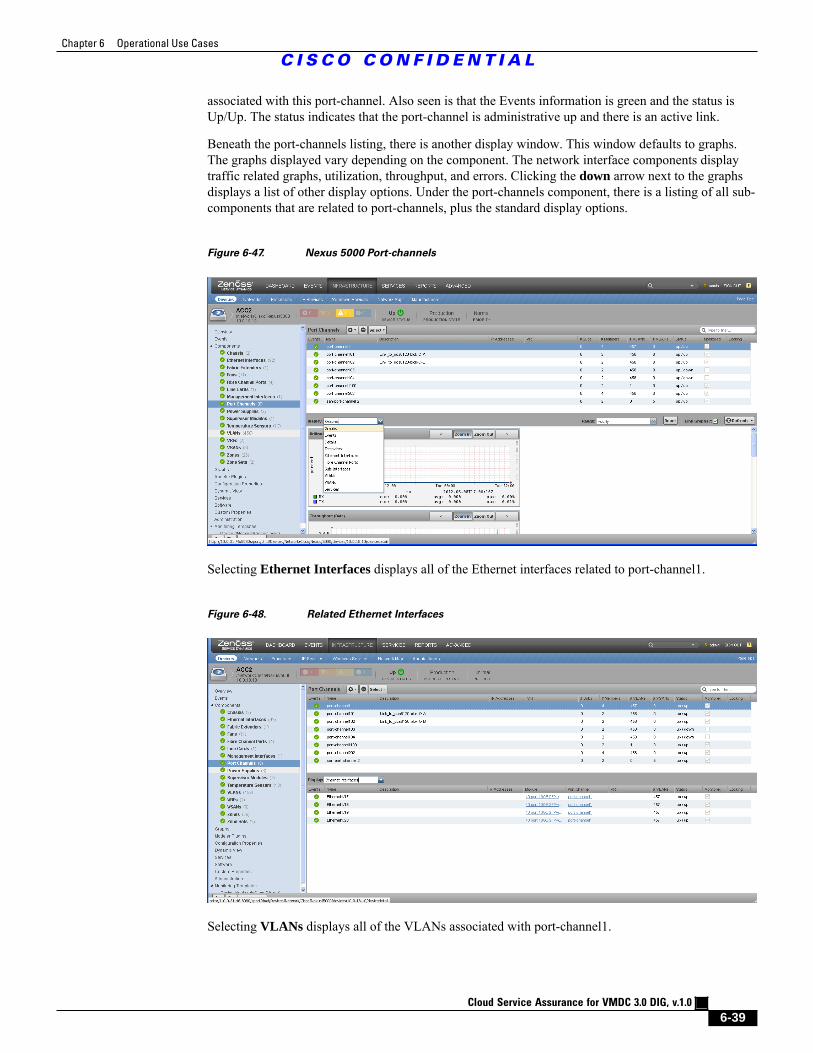
Chapter 6 Operational Use Cases
C I S C O C O N F I D E N T I A L
Cloud Service Assurance for VMDC 3.0 DIG, v.1.0
6-39
associated with this port-channel. Also seen is that the Events information is green and the status isUp/Up. The status indicates that the port-channel is administrative up and there is an active link.
Beneath the port-channels listing, there is another display window. This window defaults to graphs.The graphs displayed vary depending on the component. The network interface components displaytraffic related graphs, utilization, throughput, and errors. Clicking the down arrow next to the graphsdisplays a list of other display options. Under the port-channels component, there is a listing of all sub-components that are related to port-channels, plus the standard display options.
Figure 6-47. Nexus 5000 Port-channels
Selecting Ethernet Interfaces displays all of the Ethernet interfaces related to port-channel1.
Figure 6-48. Related Ethernet Interfaces
Selecting VLANs displays all of the VLANs associated with port-channel1.
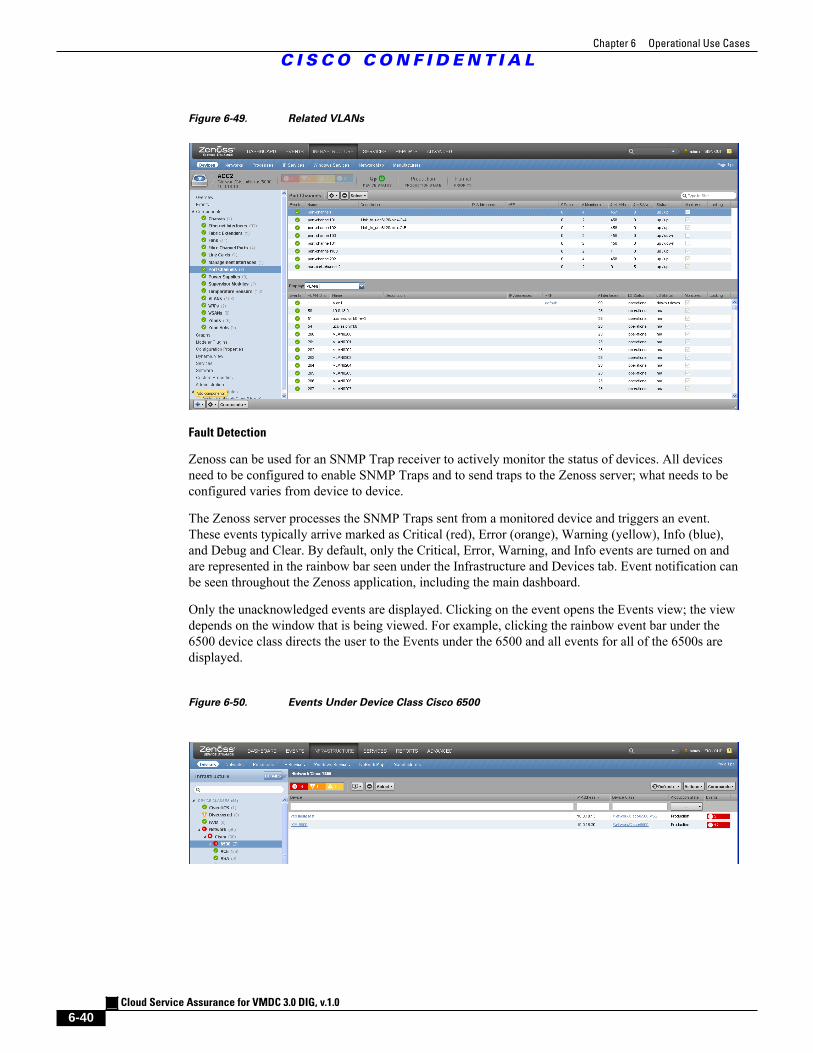
Chapter 6 Operational Use Cases
C I S C O C O N F I D E N T I A L
Cloud Service Assurance for VMDC 3.0 DIG, v.1.0
6-40
Figure 6-49. Related VLANs
Fault Detection
Zenoss can be used for an SNMP Trap receiver to actively monitor the status of devices. All devicesneed to be configured to enable SNMP Traps and to send traps to the Zenoss server; what needs to beconfigured varies from device to device.
The Zenoss server processes the SNMP Traps sent from a monitored device and triggers an event.These events typically arrive marked as Critical (red), Error (orange), Warning (yellow), Info (blue),and Debug and Clear. By default, only the Critical, Error, Warning, and Info events are turned on andare represented in the rainbow bar seen under the Infrastructure and Devices tab. Event notification canbe seen throughout the Zenoss application, including the main dashboard.
Only the unacknowledged events are displayed. Clicking on the event opens the Events view; the viewdepends on the window that is being viewed. For example, clicking the rainbow event bar under the6500 device class directs the user to the Events under the 6500 and all events for all of the 6500s aredisplayed.
Figure 6-50. Events Under Device Class Cisco 6500
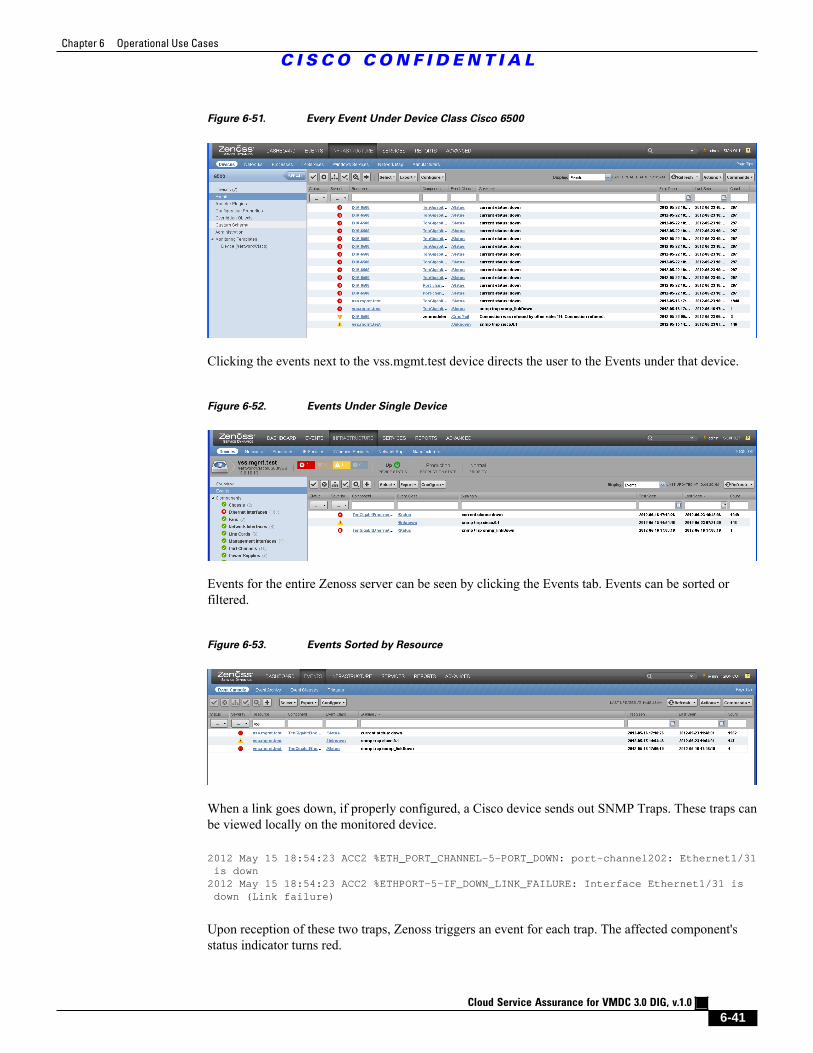
Chapter 6 Operational Use Cases
C I S C O C O N F I D E N T I A L
Cloud Service Assurance for VMDC 3.0 DIG, v.1.0
6-41
Figure 6-51. Every Event Under Device Class Cisco 6500
Clicking the events next to the vss.mgmt.test device directs the user to the Events under that device.
Figure 6-52. Events Under Single Device
Events for the entire Zenoss server can be seen by clicking the Events tab. Events can be sorted orfiltered.
Figure 6-53. Events Sorted by Resource
When a link goes down, if properly configured, a Cisco device sends out SNMP Traps. These traps canbe viewed locally on the monitored device.
2012 May 15 18:54:23 ACC2 %ETH_PORT_CHANNEL-5-PORT_DOWN: port-channel202: Ethernet1/31 is down2012 May 15 18:54:23 ACC2 %ETHPORT-5-IF_DOWN_LINK_FAILURE: Interface Ethernet1/31 is down (Link failure)
Upon reception of these two traps, Zenoss triggers an event for each trap. The affected component'sstatus indicator turns red.
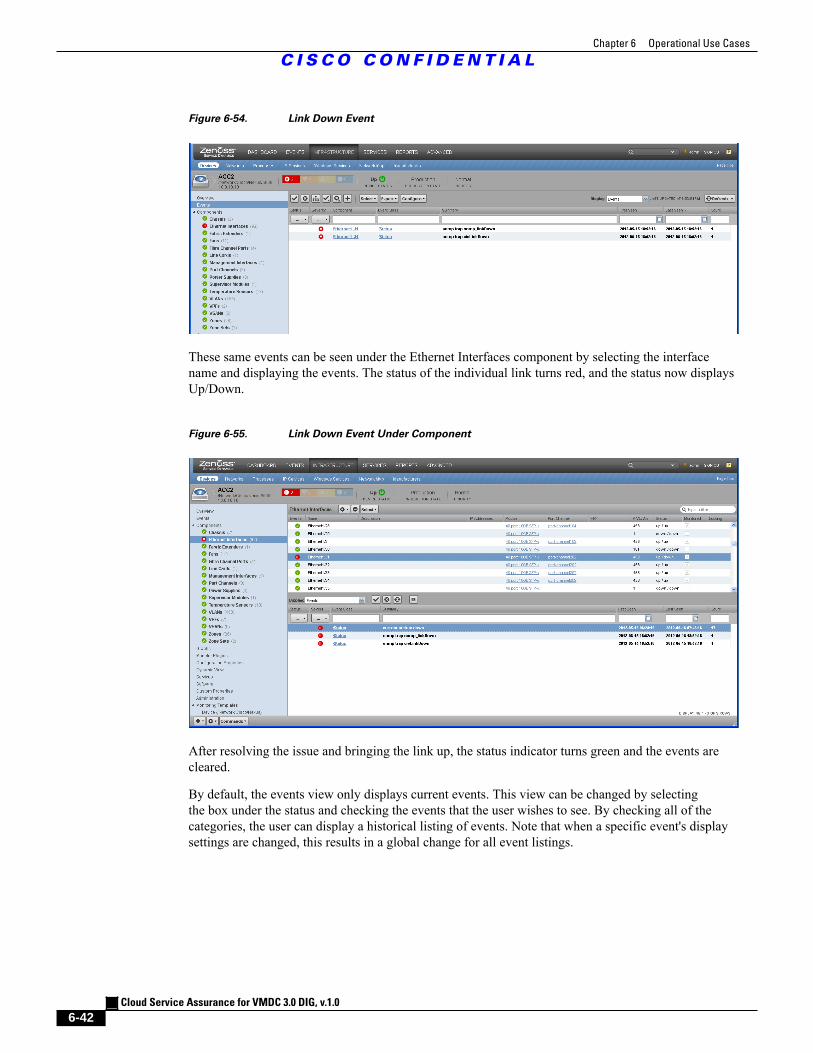
Chapter 6 Operational Use Cases
C I S C O C O N F I D E N T I A L
Cloud Service Assurance for VMDC 3.0 DIG, v.1.0
6-42
Figure 6-54. Link Down Event
These same events can be seen under the Ethernet Interfaces component by selecting the interfacename and displaying the events. The status of the individual link turns red, and the status now displaysUp/Down.
Figure 6-55. Link Down Event Under Component
After resolving the issue and bringing the link up, the status indicator turns green and the events arecleared.
By default, the events view only displays current events. This view can be changed by selectingthe box under the status and checking the events that the user wishes to see. By checking all of thecategories, the user can display a historical listing of events. Note that when a specific event's displaysettings are changed, this results in a global change for all event listings.
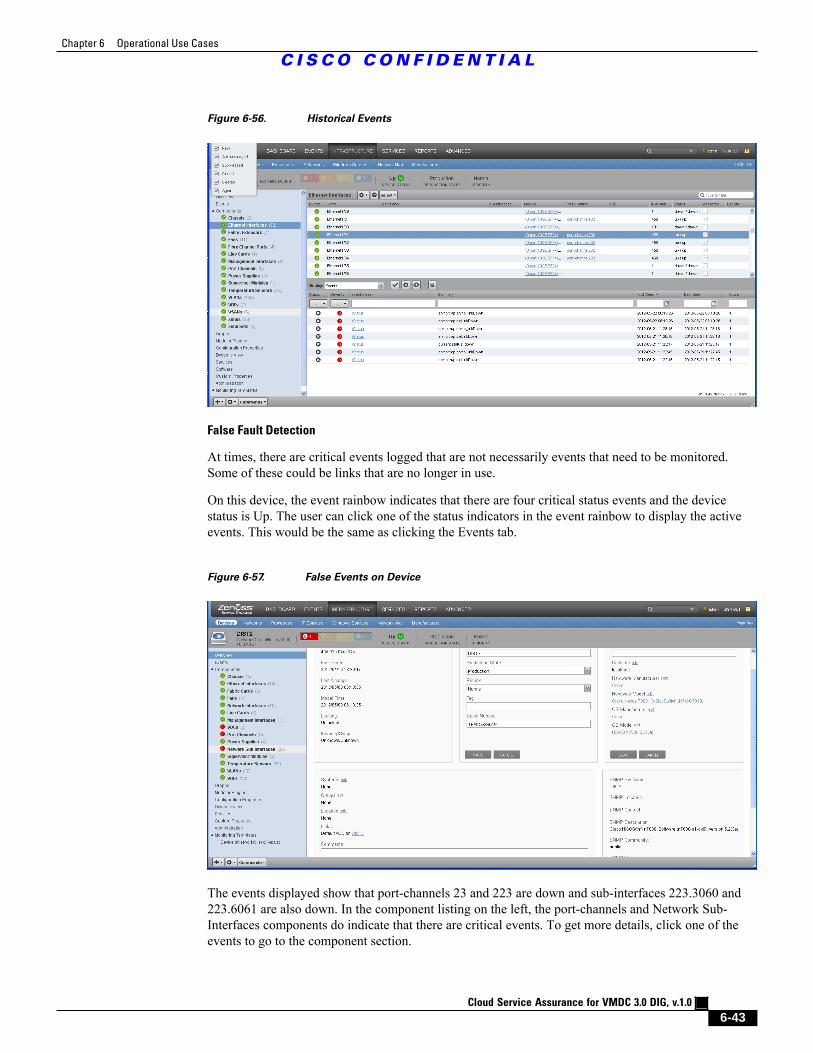
Chapter 6 Operational Use Cases
C I S C O C O N F I D E N T I A L
Cloud Service Assurance for VMDC 3.0 DIG, v.1.0
6-43
Figure 6-56. Historical Events
False Fault Detection
At times, there are critical events logged that are not necessarily events that need to be monitored.Some of these could be links that are no longer in use.
On this device, the event rainbow indicates that there are four critical status events and the devicestatus is Up. The user can click one of the status indicators in the event rainbow to display the activeevents. This would be the same as clicking the Events tab.
Figure 6-57. False Events on Device
The events displayed show that port-channels 23 and 223 are down and sub-interfaces 223.3060 and223.6061 are also down. In the component listing on the left, the port-channels and Network Sub-Interfaces components do indicate that there are critical events. To get more details, click one of theevents to go to the component section.
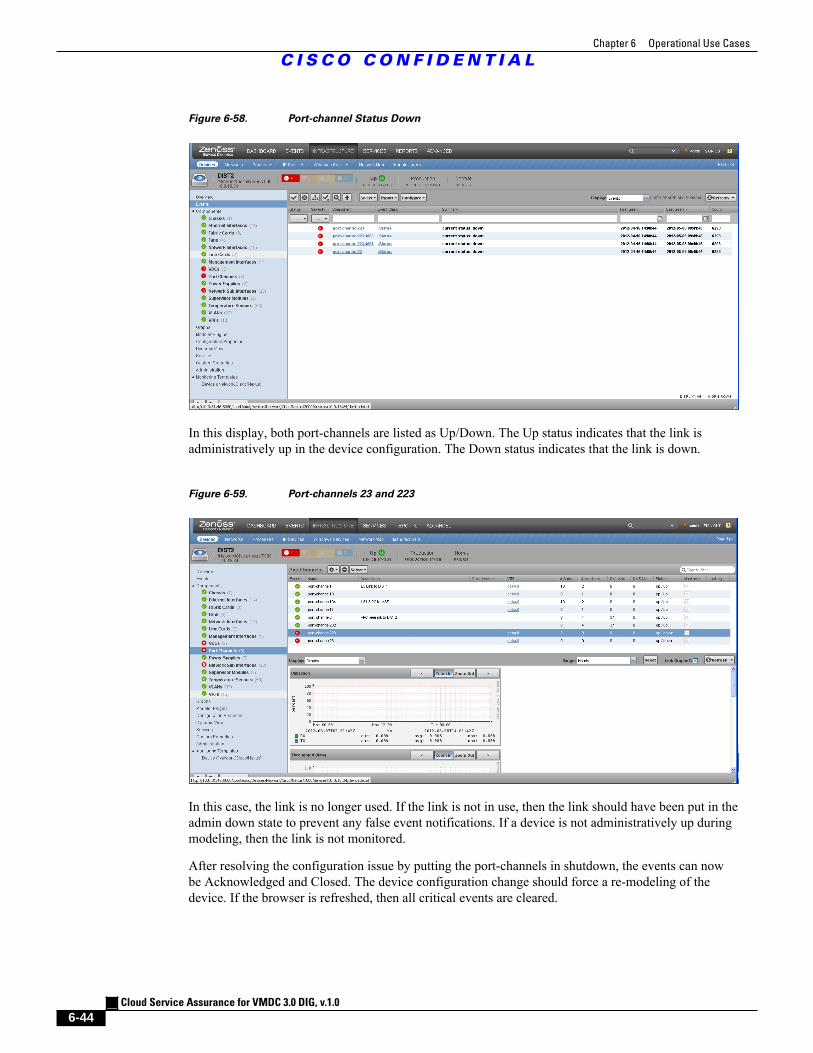
Chapter 6 Operational Use Cases
C I S C O C O N F I D E N T I A L
Cloud Service Assurance for VMDC 3.0 DIG, v.1.0
6-44
Figure 6-58. Port-channel Status Down
In this display, both port-channels are listed as Up/Down. The Up status indicates that the link isadministratively up in the device configuration. The Down status indicates that the link is down.
Figure 6-59. Port-channels 23 and 223
In this case, the link is no longer used. If the link is not in use, then the link should have been put in theadmin down state to prevent any false event notifications. If a device is not administratively up duringmodeling, then the link is not monitored.
After resolving the configuration issue by putting the port-channels in shutdown, the events can nowbe Acknowledged and Closed. The device configuration change should force a re-modeling of thedevice. If the browser is refreshed, then all critical events are cleared.
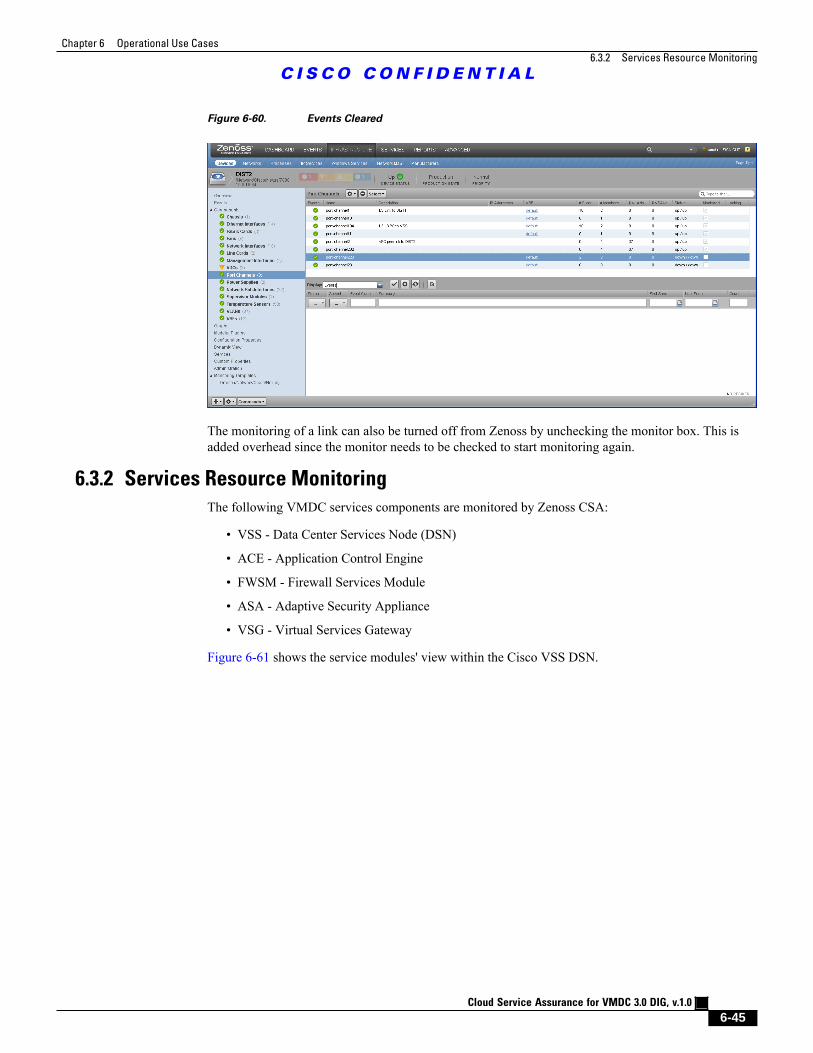
Chapter 6 Operational Use Cases
6.3.2 Services Resource Monitoring
C I S C O C O N F I D E N T I A L
Cloud Service Assurance for VMDC 3.0 DIG, v.1.0
6-45
Figure 6-60. Events Cleared
The monitoring of a link can also be turned off from Zenoss by unchecking the monitor box. This isadded overhead since the monitor needs to be checked to start monitoring again.
6.3.2 Services Resource Monitoring
The following VMDC services components are monitored by Zenoss CSA:
• VSS - Data Center Services Node (DSN)
• ACE - Application Control Engine
• FWSM - Firewall Services Module
• ASA - Adaptive Security Appliance
• VSG - Virtual Services Gateway
Figure 6-61 shows the service modules' view within the Cisco VSS DSN.
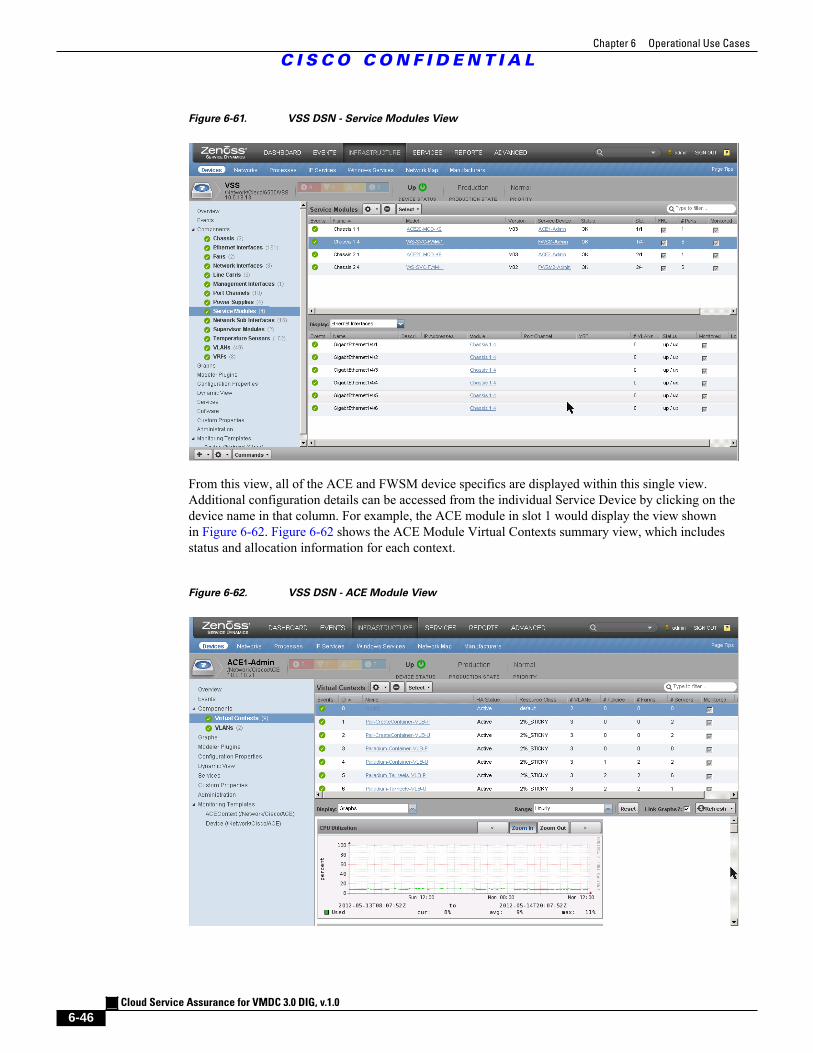
Chapter 6 Operational Use Cases
C I S C O C O N F I D E N T I A L
Cloud Service Assurance for VMDC 3.0 DIG, v.1.0
6-46
Figure 6-61. VSS DSN - Service Modules View
From this view, all of the ACE and FWSM device specifics are displayed within this single view.Additional configuration details can be accessed from the individual Service Device by clicking on thedevice name in that column. For example, the ACE module in slot 1 would display the view shownin Figure 6-62. Figure 6-62 shows the ACE Module Virtual Contexts summary view, which includesstatus and allocation information for each context.
Figure 6-62. VSS DSN - ACE Module View
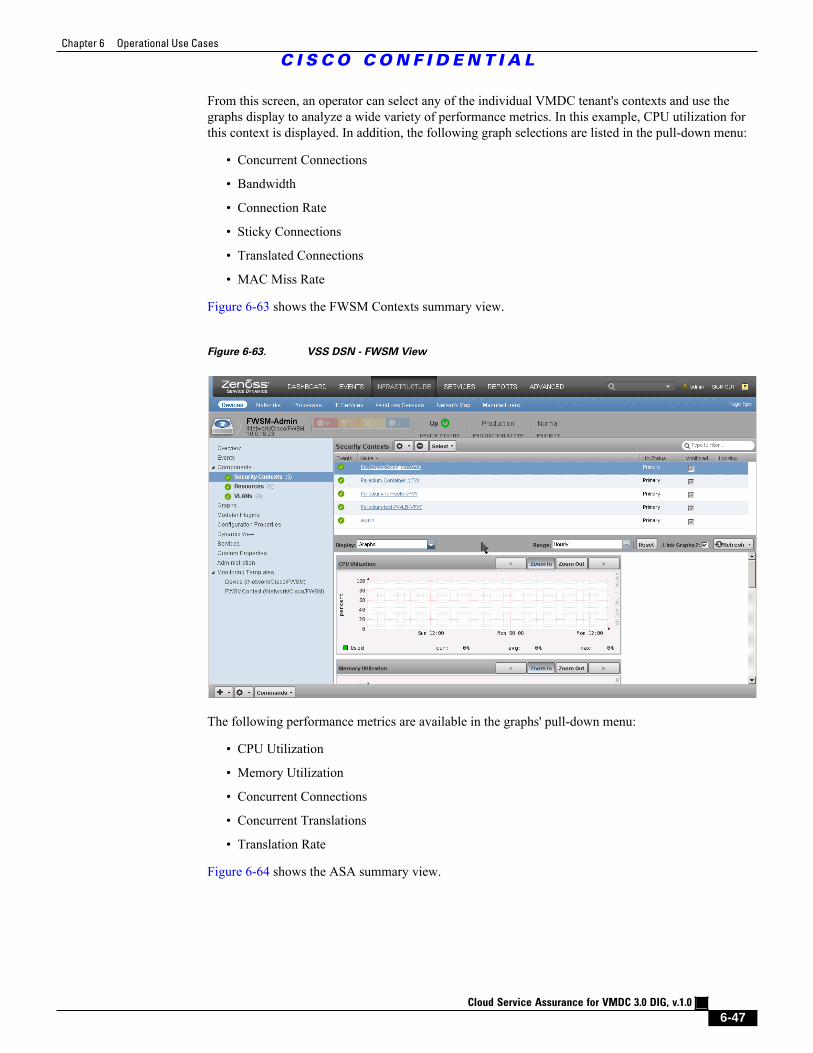
Chapter 6 Operational Use Cases
C I S C O C O N F I D E N T I A L
Cloud Service Assurance for VMDC 3.0 DIG, v.1.0
6-47
From this screen, an operator can select any of the individual VMDC tenant's contexts and use thegraphs display to analyze a wide variety of performance metrics. In this example, CPU utilization forthis context is displayed. In addition, the following graph selections are listed in the pull-down menu:
• Concurrent Connections
• Bandwidth
• Connection Rate
• Sticky Connections
• Translated Connections
• MAC Miss Rate
Figure 6-63 shows the FWSM Contexts summary view.
Figure 6-63. VSS DSN - FWSM View
The following performance metrics are available in the graphs' pull-down menu:
• CPU Utilization
• Memory Utilization
• Concurrent Connections
• Concurrent Translations
• Translation Rate
Figure 6-64 shows the ASA summary view.
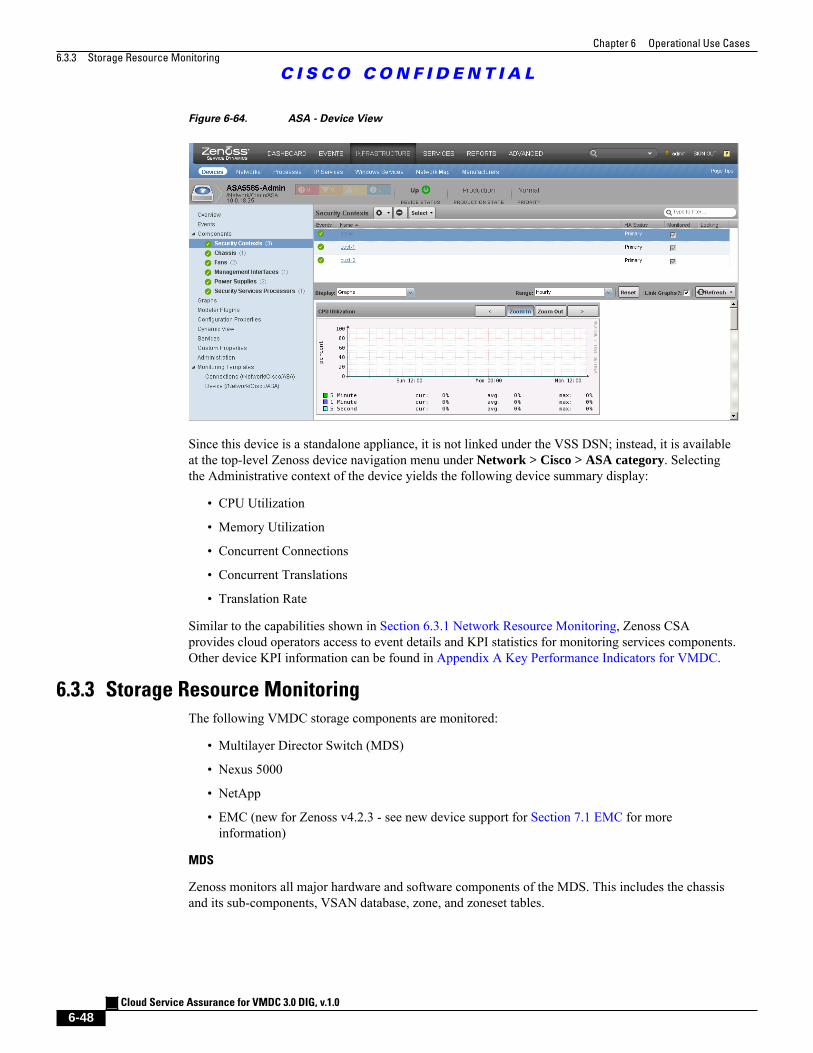
Chapter 6 Operational Use Cases
6.3.3 Storage Resource Monitoring
C I S C O C O N F I D E N T I A L
Cloud Service Assurance for VMDC 3.0 DIG, v.1.0
6-48
Figure 6-64. ASA - Device View
Since this device is a standalone appliance, it is not linked under the VSS DSN; instead, it is availableat the top-level Zenoss device navigation menu under Network > Cisco > ASA category. Selectingthe Administrative context of the device yields the following device summary display:
• CPU Utilization
• Memory Utilization
• Concurrent Connections
• Concurrent Translations
• Translation Rate
Similar to the capabilities shown in Section 6.3.1 Network Resource Monitoring, Zenoss CSAprovides cloud operators access to event details and KPI statistics for monitoring services components.Other device KPI information can be found in Appendix A Key Performance Indicators for VMDC.
6.3.3 Storage Resource Monitoring
The following VMDC storage components are monitored:
• Multilayer Director Switch (MDS)
• Nexus 5000
• NetApp
• EMC (new for Zenoss v4.2.3 - see new device support for Section 7.1 EMC for moreinformation)
MDS
Zenoss monitors all major hardware and software components of the MDS. This includes the chassisand its sub-components, VSAN database, zone, and zoneset tables.
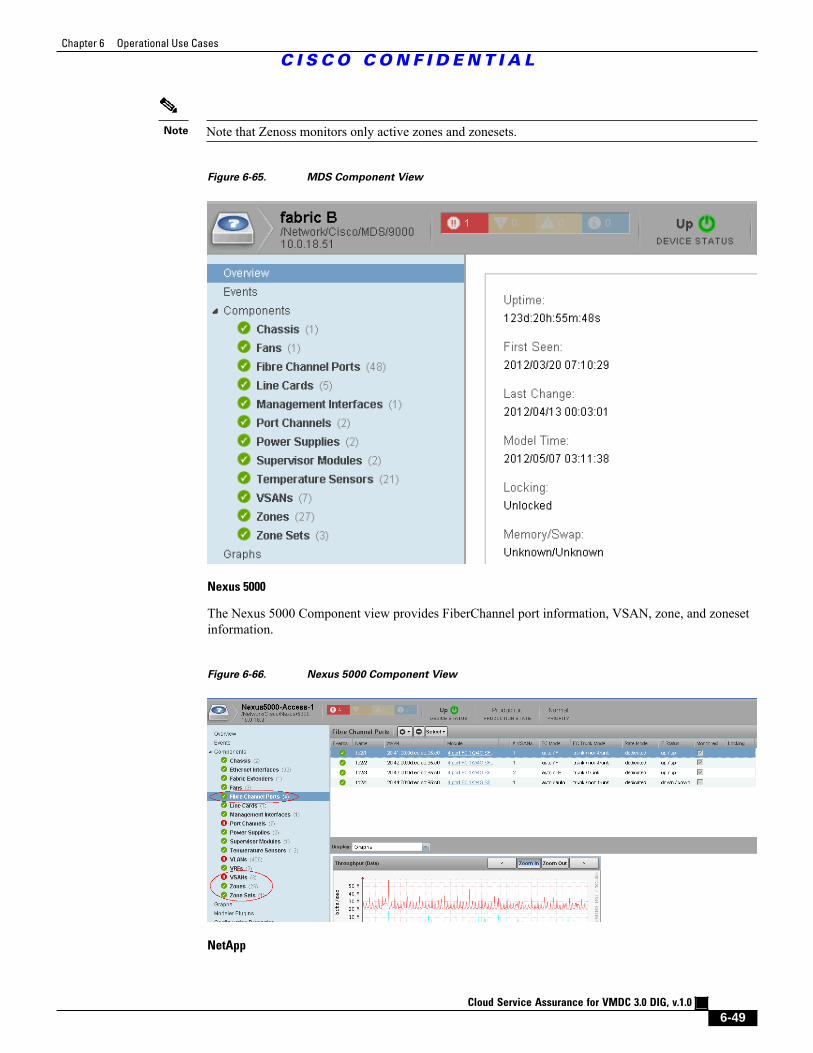
Chapter 6 Operational Use Cases
C I S C O C O N F I D E N T I A L
Cloud Service Assurance for VMDC 3.0 DIG, v.1.0
6-49
Note Note that Zenoss monitors only active zones and zonesets.
Figure 6-65. MDS Component View
Nexus 5000
The Nexus 5000 Component view provides FiberChannel port information, VSAN, zone, and zonesetinformation.
Figure 6-66. Nexus 5000 Component View
NetApp
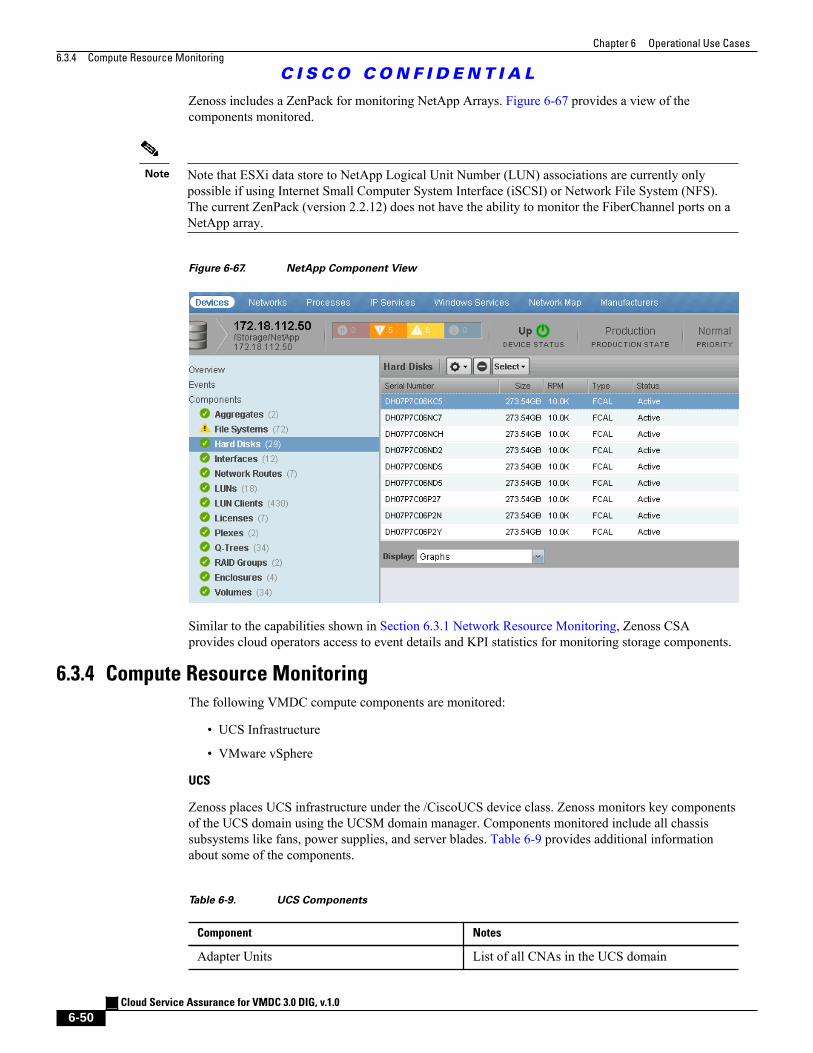
Chapter 6 Operational Use Cases
6.3.4 Compute Resource Monitoring
C I S C O C O N F I D E N T I A L
Cloud Service Assurance for VMDC 3.0 DIG, v.1.0
6-50
Zenoss includes a ZenPack for monitoring NetApp Arrays. Figure 6-67 provides a view of thecomponents monitored.
Note Note that ESXi data store to NetApp Logical Unit Number (LUN) associations are currently onlypossible if using Internet Small Computer System Interface (iSCSI) or Network File System (NFS).The current ZenPack (version 2.2.12) does not have the ability to monitor the FiberChannel ports on aNetApp array.
Figure 6-67. NetApp Component View
Similar to the capabilities shown in Section 6.3.1 Network Resource Monitoring, Zenoss CSAprovides cloud operators access to event details and KPI statistics for monitoring storage components.
6.3.4 Compute Resource Monitoring
The following VMDC compute components are monitored:
• UCS Infrastructure
• VMware vSphere
UCS
Zenoss places UCS infrastructure under the /CiscoUCS device class. Zenoss monitors key componentsof the UCS domain using the UCSM domain manager. Components monitored include all chassissubsystems like fans, power supplies, and server blades. Table 6-9 provides additional informationabout some of the components.
Table 6-9. UCS Components
Component Notes
Adapter Units List of all CNAs in the UCS domain
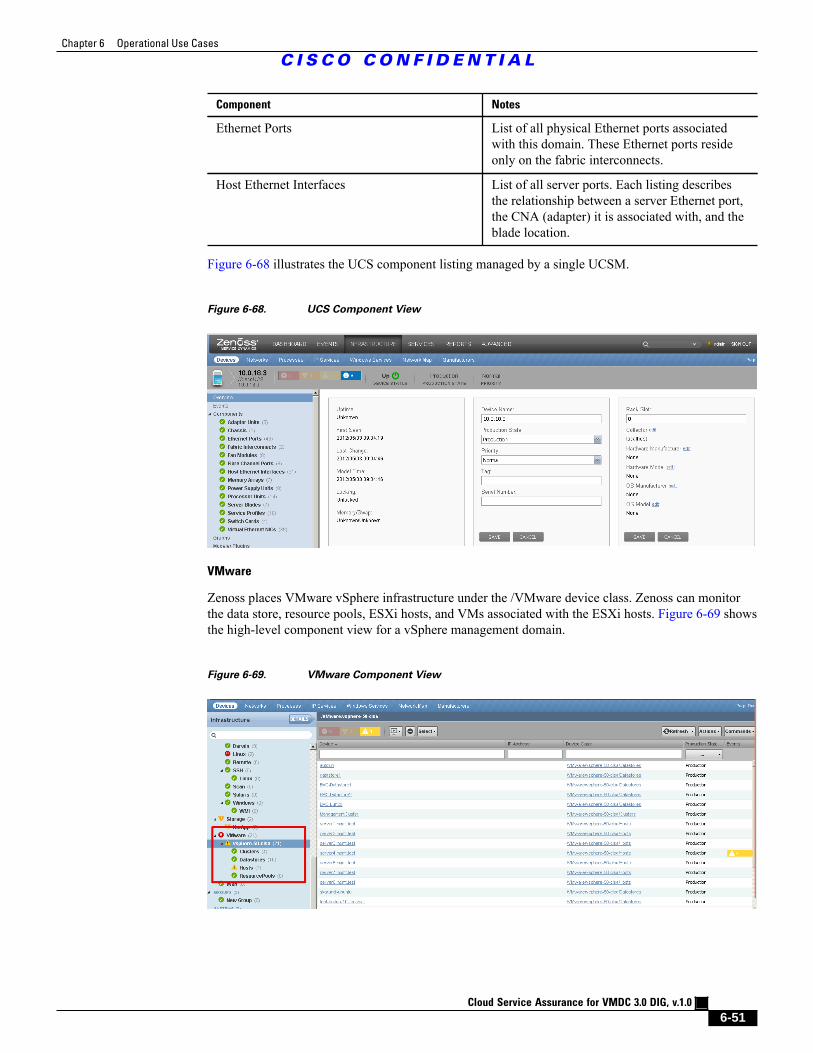
Chapter 6 Operational Use Cases
C I S C O C O N F I D E N T I A L
Cloud Service Assurance for VMDC 3.0 DIG, v.1.0
6-51
Component Notes
Ethernet Ports List of all physical Ethernet ports associatedwith this domain. These Ethernet ports resideonly on the fabric interconnects.
Host Ethernet Interfaces List of all server ports. Each listing describesthe relationship between a server Ethernet port,the CNA (adapter) it is associated with, and theblade location.
Figure 6-68 illustrates the UCS component listing managed by a single UCSM.
Figure 6-68. UCS Component View
VMware
Zenoss places VMware vSphere infrastructure under the /VMware device class. Zenoss can monitorthe data store, resource pools, ESXi hosts, and VMs associated with the ESXi hosts. Figure 6-69 showsthe high-level component view for a vSphere management domain.
Figure 6-69. VMware Component View
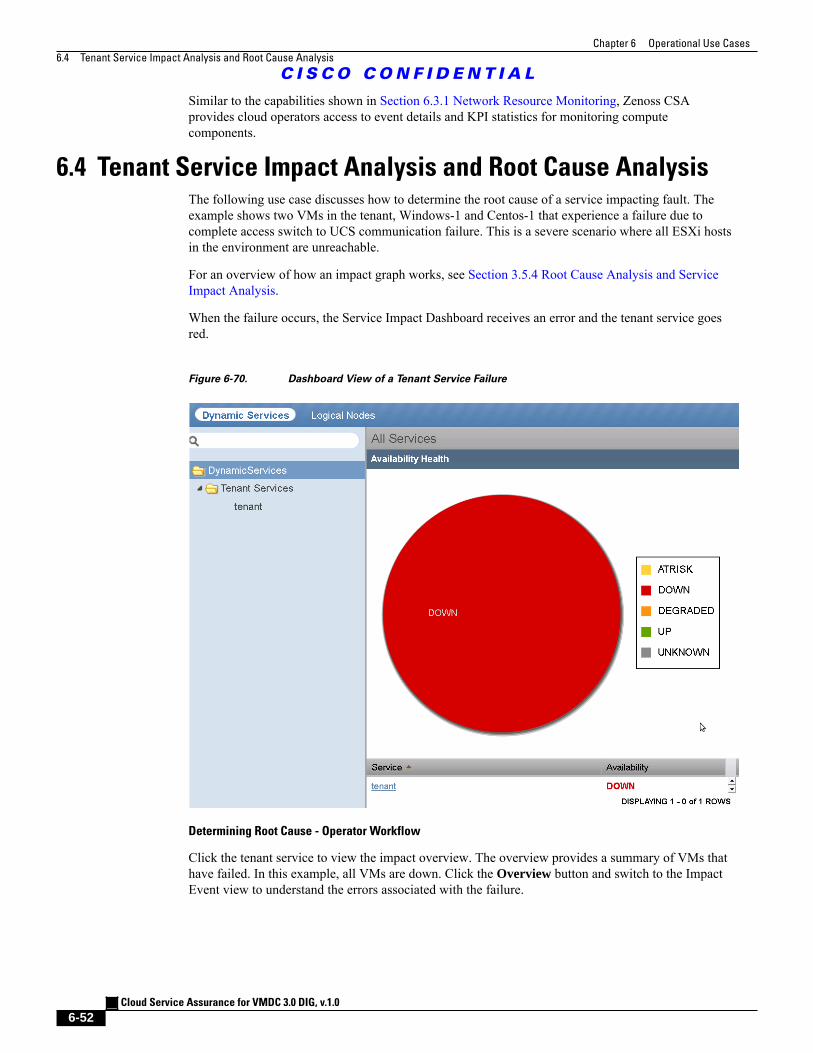
Chapter 6 Operational Use Cases
6.4 Tenant Service Impact Analysis and Root Cause Analysis
C I S C O C O N F I D E N T I A L
Cloud Service Assurance for VMDC 3.0 DIG, v.1.0
6-52
Similar to the capabilities shown in Section 6.3.1 Network Resource Monitoring, Zenoss CSAprovides cloud operators access to event details and KPI statistics for monitoring computecomponents.
6.4 Tenant Service Impact Analysis and Root Cause AnalysisThe following use case discusses how to determine the root cause of a service impacting fault. Theexample shows two VMs in the tenant, Windows-1 and Centos-1 that experience a failure due tocomplete access switch to UCS communication failure. This is a severe scenario where all ESXi hostsin the environment are unreachable.
For an overview of how an impact graph works, see Section 3.5.4 Root Cause Analysis and ServiceImpact Analysis.
When the failure occurs, the Service Impact Dashboard receives an error and the tenant service goesred.
Figure 6-70. Dashboard View of a Tenant Service Failure
Determining Root Cause - Operator Workflow
Click the tenant service to view the impact overview. The overview provides a summary of VMs thathave failed. In this example, all VMs are down. Click the Overview button and switch to the ImpactEvent view to understand the errors associated with the failure.
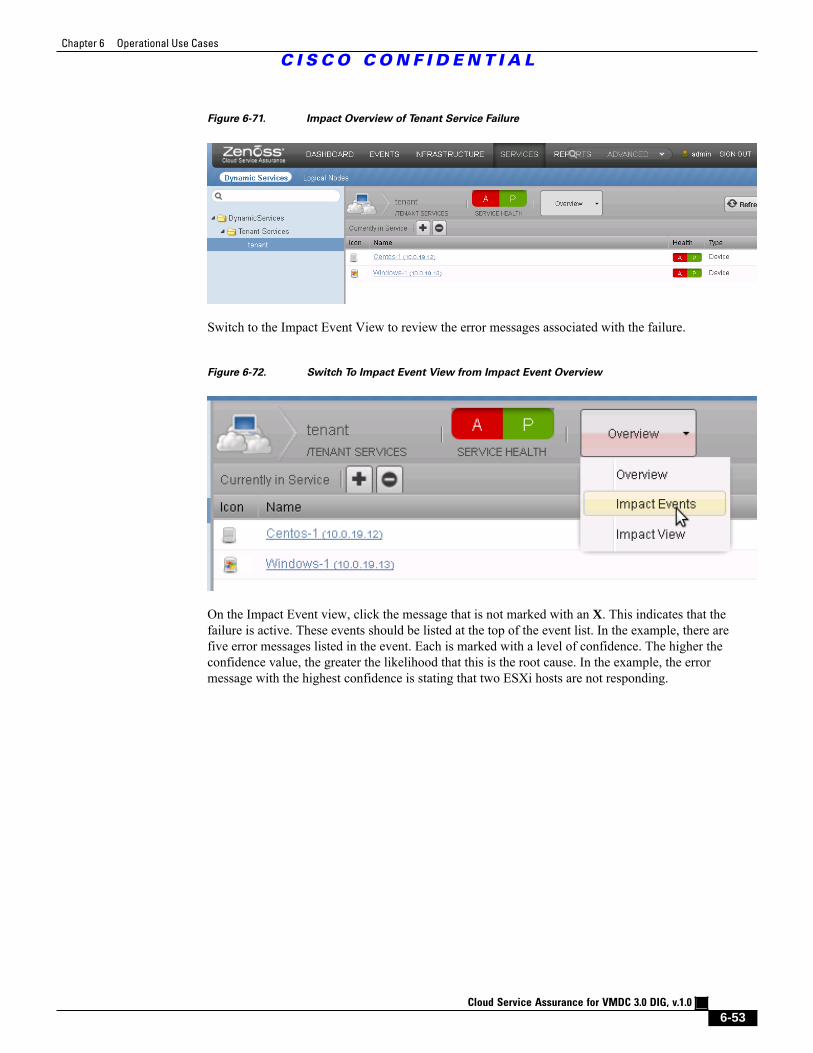
Chapter 6 Operational Use Cases
C I S C O C O N F I D E N T I A L
Cloud Service Assurance for VMDC 3.0 DIG, v.1.0
6-53
Figure 6-71. Impact Overview of Tenant Service Failure
Switch to the Impact Event View to review the error messages associated with the failure.
Figure 6-72. Switch To Impact Event View from Impact Event Overview
On the Impact Event view, click the message that is not marked with an X. This indicates that thefailure is active. These events should be listed at the top of the event list. In the example, there arefive error messages listed in the event. Each is marked with a level of confidence. The higher theconfidence value, the greater the likelihood that this is the root cause. In the example, the errormessage with the highest confidence is stating that two ESXi hosts are not responding.

Chapter 6 Operational Use Cases
6.5 Identifying Availability Impact of Shared Resource Faults on Tenant Services
C I S C O C O N F I D E N T I A L
Cloud Service Assurance for VMDC 3.0 DIG, v.1.0
6-54
Figure 6-73. Impact Event Errors
By switching views from the Impact Events to the Impact Graph, the operator can see that both ESXihosts are down, and there is no impact to the UCS infrastructure. This means that there is no knownissue with the UCS. All ESXi hosts are not responding. Connectivity to the ESXi host is the mostlikely problem and contacting network engineers would be the next step.
Figure 6-74. Expanded View of Tenant Service Failure
6.5 Identifying Availability Impact of Shared Resource Faults on
Tenant ServicesWhen faults occur on shared tenant resources, like the UCS chassis or an ESXi host, multiple tenantservices are affected. Most faults on shared resources do not have an adverse affect on the performance
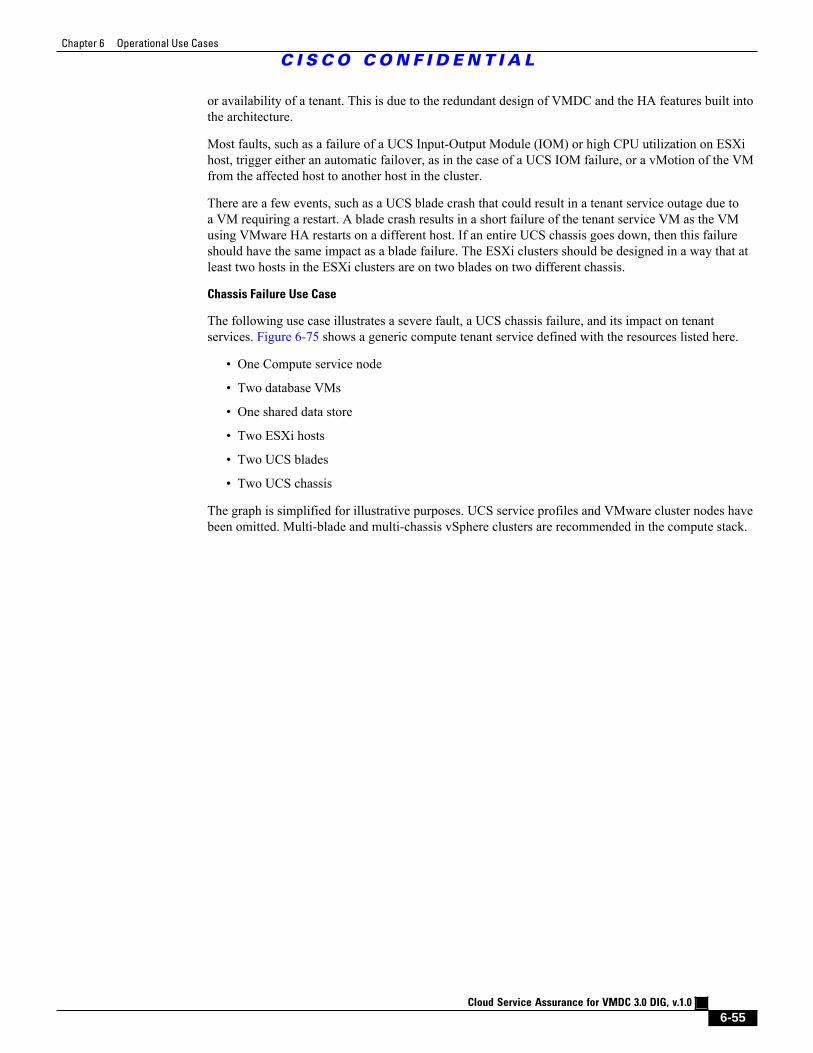
Chapter 6 Operational Use Cases
C I S C O C O N F I D E N T I A L
Cloud Service Assurance for VMDC 3.0 DIG, v.1.0
6-55
or availability of a tenant. This is due to the redundant design of VMDC and the HA features built intothe architecture.
Most faults, such as a failure of a UCS Input-Output Module (IOM) or high CPU utilization on ESXihost, trigger either an automatic failover, as in the case of a UCS IOM failure, or a vMotion of the VMfrom the affected host to another host in the cluster.
There are a few events, such as a UCS blade crash that could result in a tenant service outage due toa VM requiring a restart. A blade crash results in a short failure of the tenant service VM as the VMusing VMware HA restarts on a different host. If an entire UCS chassis goes down, then this failureshould have the same impact as a blade failure. The ESXi clusters should be designed in a way that atleast two hosts in the ESXi clusters are on two blades on two different chassis.
Chassis Failure Use Case
The following use case illustrates a severe fault, a UCS chassis failure, and its impact on tenantservices. Figure 6-75 shows a generic compute tenant service defined with the resources listed here.
• One Compute service node
• Two database VMs
• One shared data store
• Two ESXi hosts
• Two UCS blades
• Two UCS chassis
The graph is simplified for illustrative purposes. UCS service profiles and VMware cluster nodes havebeen omitted. Multi-blade and multi-chassis vSphere clusters are recommended in the compute stack.
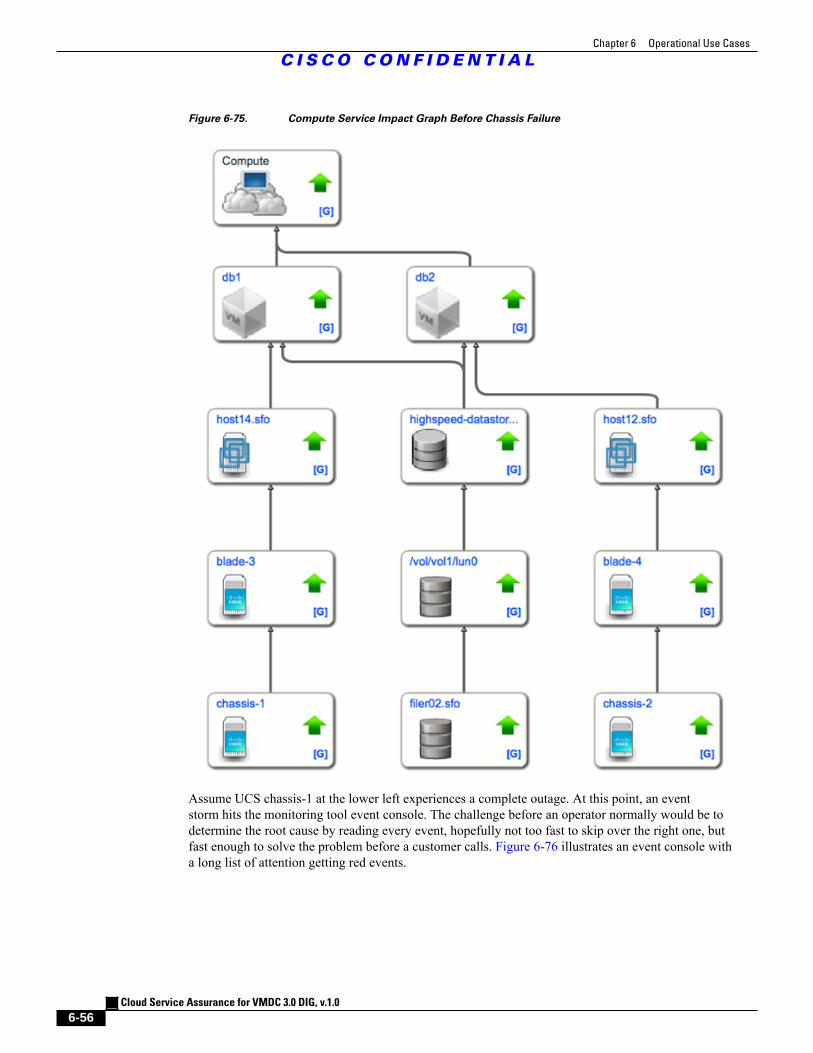
Chapter 6 Operational Use Cases
C I S C O C O N F I D E N T I A L
Cloud Service Assurance for VMDC 3.0 DIG, v.1.0
6-56
Figure 6-75. Compute Service Impact Graph Before Chassis Failure
Assume UCS chassis-1 at the lower left experiences a complete outage. At this point, an eventstorm hits the monitoring tool event console. The challenge before an operator normally would be todetermine the root cause by reading every event, hopefully not too fast to skip over the right one, butfast enough to solve the problem before a customer calls. Figure 6-76 illustrates an event console witha long list of attention getting red events.
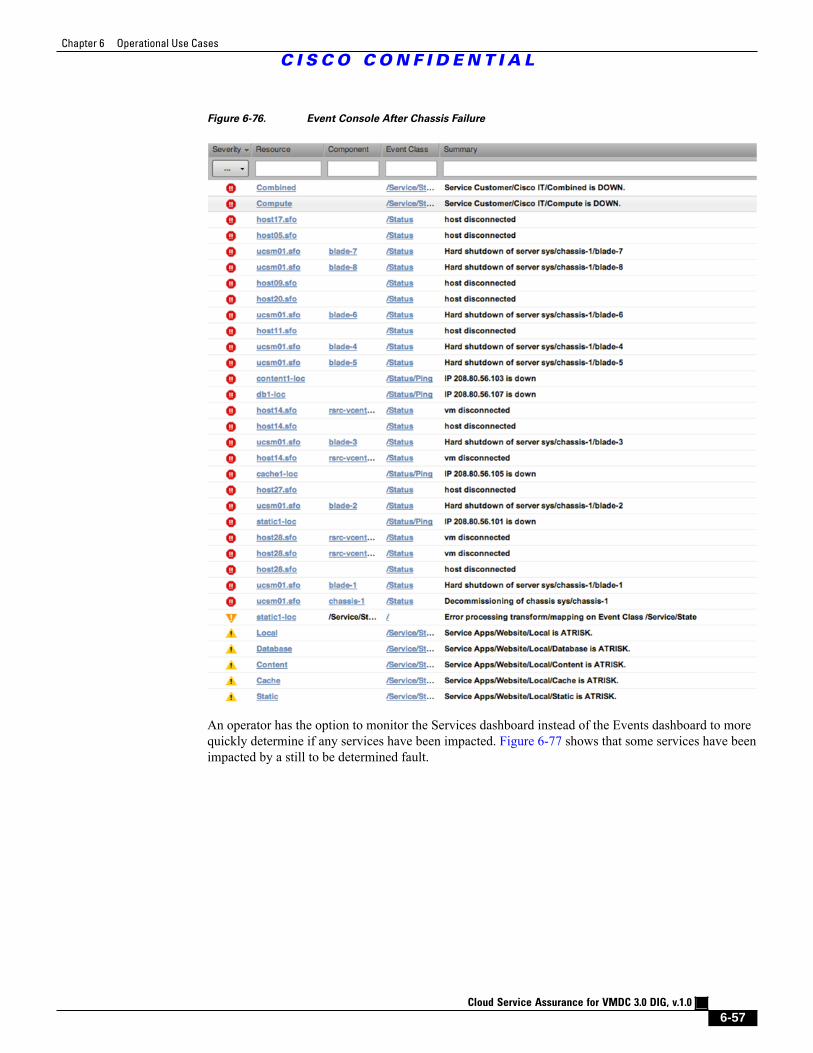
Chapter 6 Operational Use Cases
C I S C O C O N F I D E N T I A L
Cloud Service Assurance for VMDC 3.0 DIG, v.1.0
6-57
Figure 6-76. Event Console After Chassis Failure
An operator has the option to monitor the Services dashboard instead of the Events dashboard to morequickly determine if any services have been impacted. Figure 6-77 shows that some services have beenimpacted by a still to be determined fault.
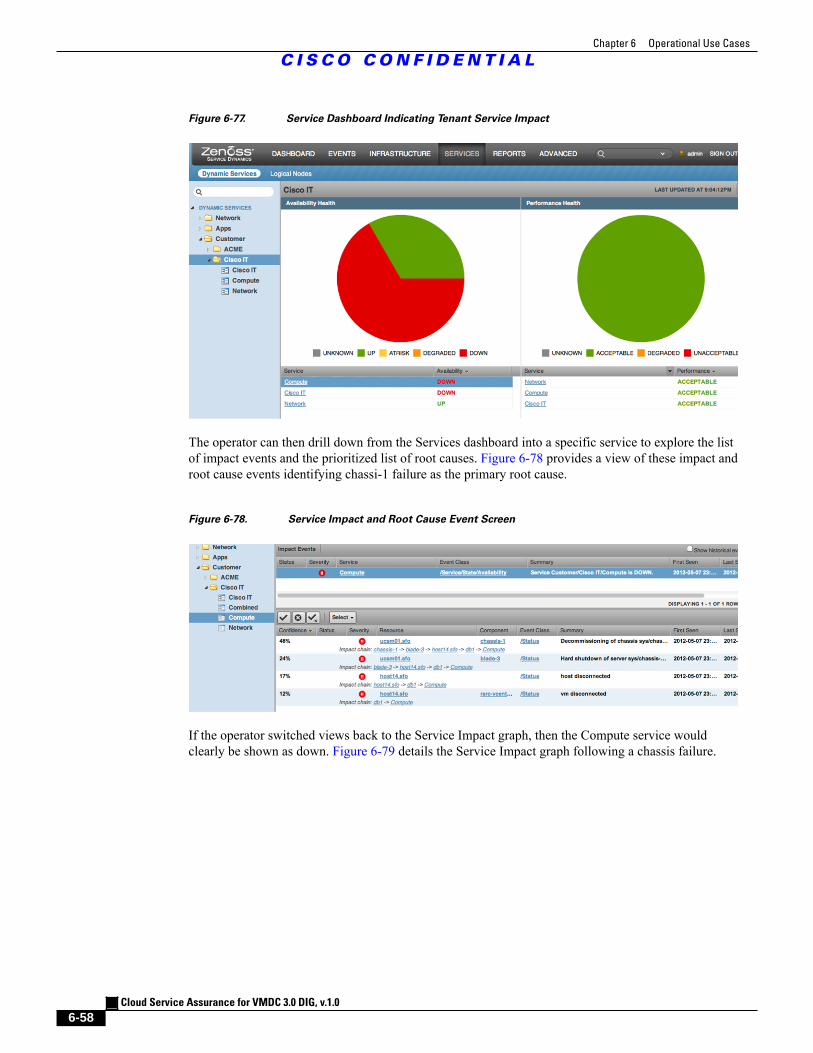
Chapter 6 Operational Use Cases
C I S C O C O N F I D E N T I A L
Cloud Service Assurance for VMDC 3.0 DIG, v.1.0
6-58
Figure 6-77. Service Dashboard Indicating Tenant Service Impact
The operator can then drill down from the Services dashboard into a specific service to explore the listof impact events and the prioritized list of root causes. Figure 6-78 provides a view of these impact androot cause events identifying chassi-1 failure as the primary root cause.
Figure 6-78. Service Impact and Root Cause Event Screen
If the operator switched views back to the Service Impact graph, then the Compute service wouldclearly be shown as down. Figure 6-79 details the Service Impact graph following a chassis failure.
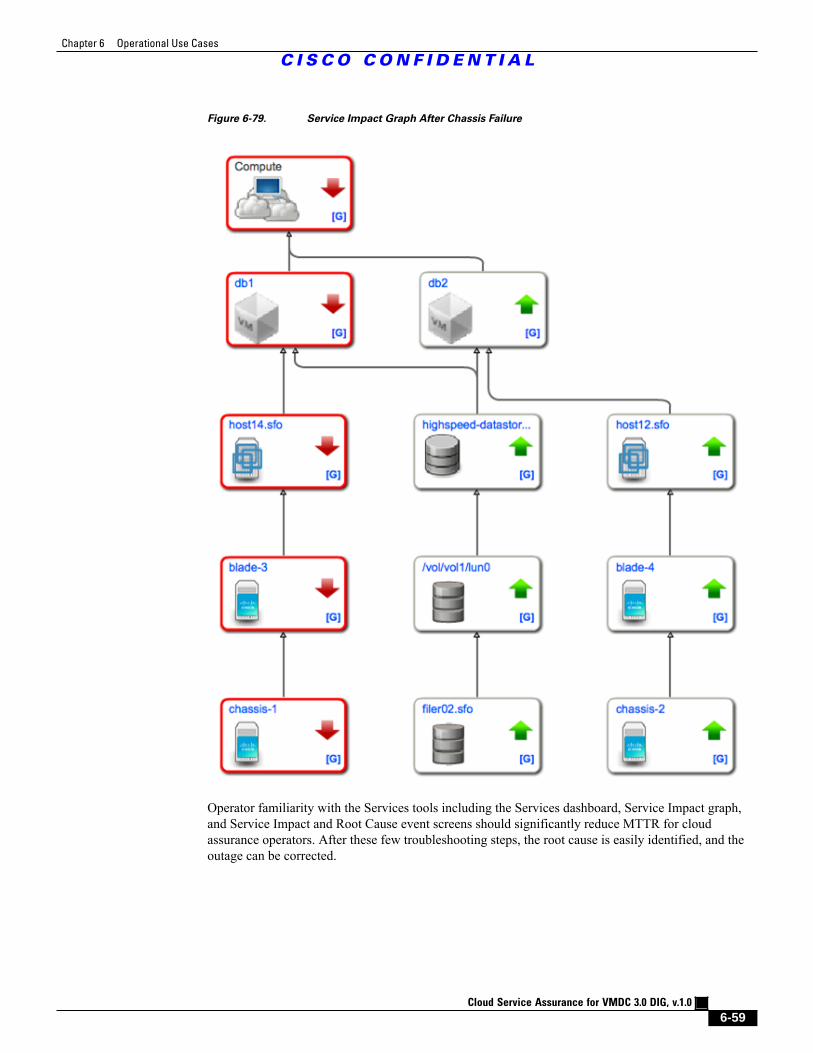
Chapter 6 Operational Use Cases
C I S C O C O N F I D E N T I A L
Cloud Service Assurance for VMDC 3.0 DIG, v.1.0
6-59
Figure 6-79. Service Impact Graph After Chassis Failure
Operator familiarity with the Services tools including the Services dashboard, Service Impact graph,and Service Impact and Root Cause event screens should significantly reduce MTTR for cloudassurance operators. After these few troubleshooting steps, the root cause is easily identified, and theoutage can be corrected.
Chapter 6 Operational Use Cases
6.6 Identifying Performance Problems Before They Impact Tenants
C I S C O C O N F I D E N T I A L
Cloud Service Assurance for VMDC 3.0 DIG, v.1.0
6-60
6.6 Identifying Performance Problems Before They Impact
TenantsCLSA-VMDC reduces the administrative overhead of performance monitoring configuration byenabling performance monitoring centralization. Zenoss CSA performance monitoring is configuredon the Zenoss server, and any pre-configured performance alerts from other domain managers such asVMware are treated as informational so that Zenoss maintains control of performance notification. Forexample, if vSphere sends an alert that the CPU alarm of a server has gone from green to red, this alertdoes not necessarily trigger a change in the tenant service. The performance thresholds on Zenoss CSAwould also have to be crossed to impact a tenant service. The commonly monitored performance itemson an ESXi host and its associated VMs are as follows:
• CPU
• Memory
• Disk usage
Note The general procedures used to configure Zenoss performance monitoring are found in the ZenossCloud Service Assurance Installation and Administration Guide.
The following use case discusses how to configure and identify performance problems before theyimpact tenants.
Performance Threshold Configuration
Thresholds can be added to any device to alert the operator that there could be an issue within a tenantor a group of compute devices. Some examples would be setting memory or CPU thresholds on theVMware ESXi servers or the VMs. Thresholds are set by editing the monitoring templates. From theAdvanced tab, select Monitoring Templates. In this case, the VMware Host template is modified byadding a couple of CPU thresholds and a Memory usage threshold. There are no thresholds configuredby default.
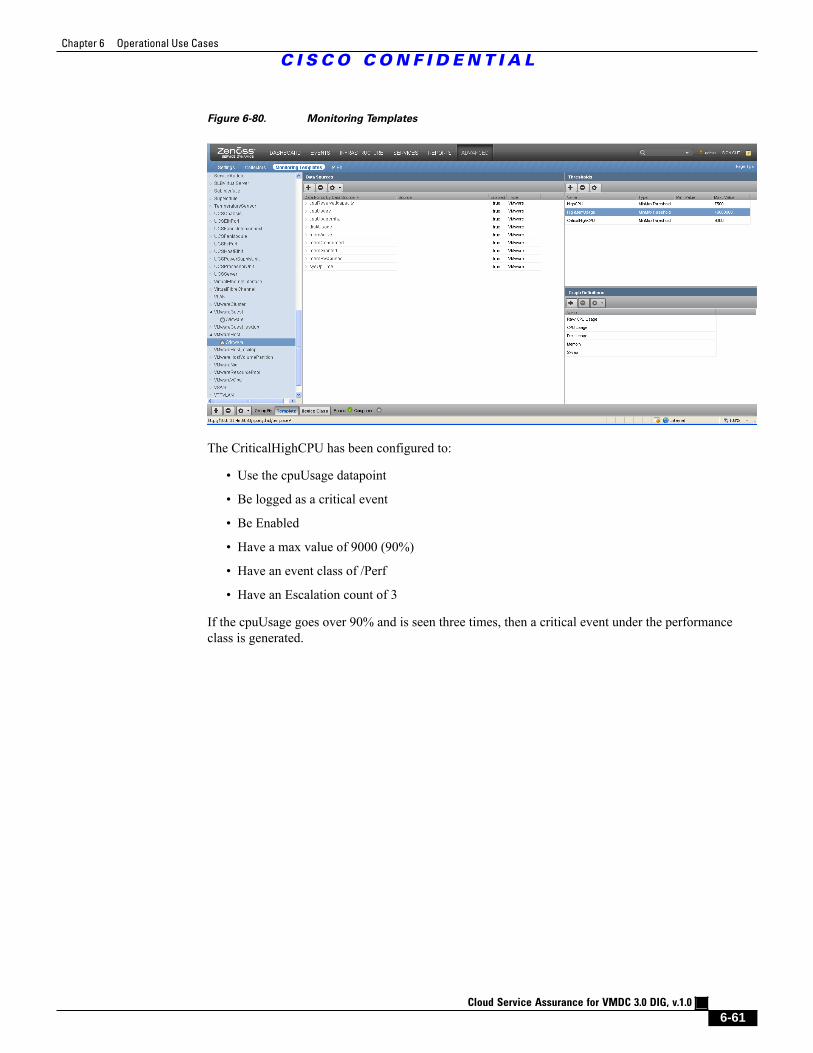
Chapter 6 Operational Use Cases
C I S C O C O N F I D E N T I A L
Cloud Service Assurance for VMDC 3.0 DIG, v.1.0
6-61
Figure 6-80. Monitoring Templates
The CriticalHighCPU has been configured to:
• Use the cpuUsage datapoint
• Be logged as a critical event
• Be Enabled
• Have a max value of 9000 (90%)
• Have an event class of /Perf
• Have an Escalation count of 3
If the cpuUsage goes over 90% and is seen three times, then a critical event under the performanceclass is generated.
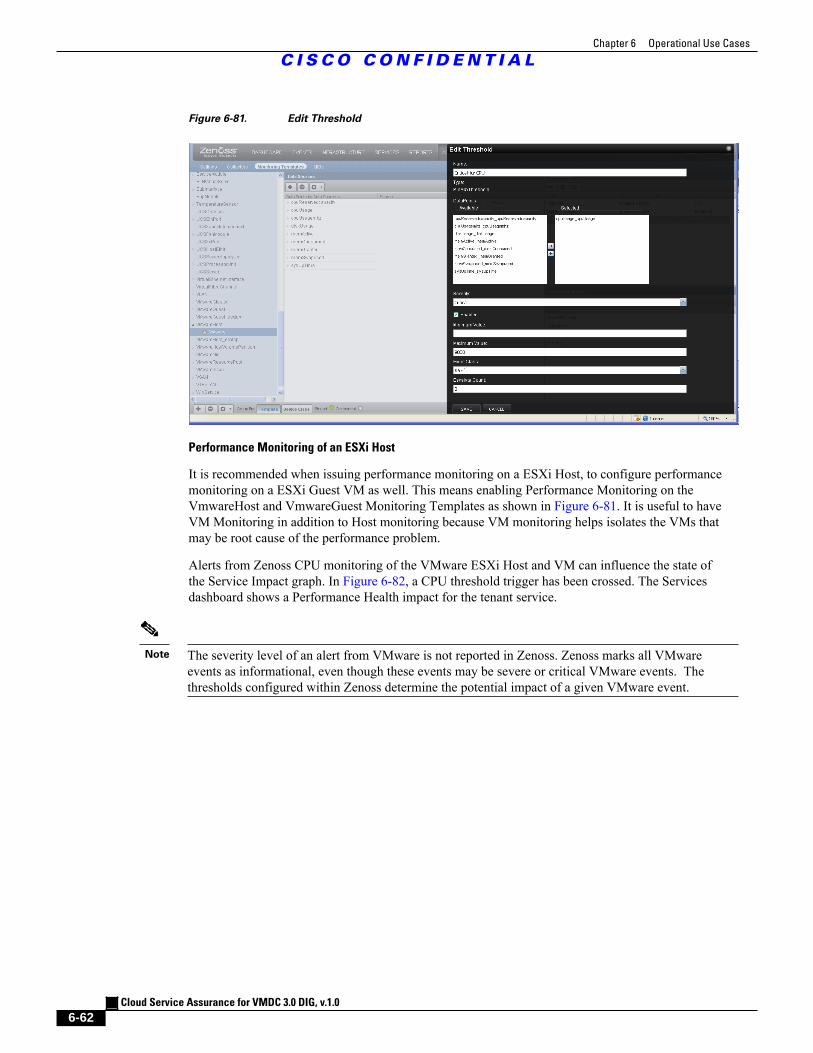
Chapter 6 Operational Use Cases
C I S C O C O N F I D E N T I A L
Cloud Service Assurance for VMDC 3.0 DIG, v.1.0
6-62
Figure 6-81. Edit Threshold
Performance Monitoring of an ESXi Host
It is recommended when issuing performance monitoring on a ESXi Host, to configure performancemonitoring on a ESXi Guest VM as well. This means enabling Performance Monitoring on theVmwareHost and VmwareGuest Monitoring Templates as shown in Figure 6-81. It is useful to haveVM Monitoring in addition to Host monitoring because VM monitoring helps isolates the VMs thatmay be root cause of the performance problem.
Alerts from Zenoss CPU monitoring of the VMware ESXi Host and VM can influence the state ofthe Service Impact graph. In Figure 6-82, a CPU threshold trigger has been crossed. The Servicesdashboard shows a Performance Health impact for the tenant service.
Note The severity level of an alert from VMware is not reported in Zenoss. Zenoss marks all VMwareevents as informational, even though these events may be severe or critical VMware events. Thethresholds configured within Zenoss determine the potential impact of a given VMware event.
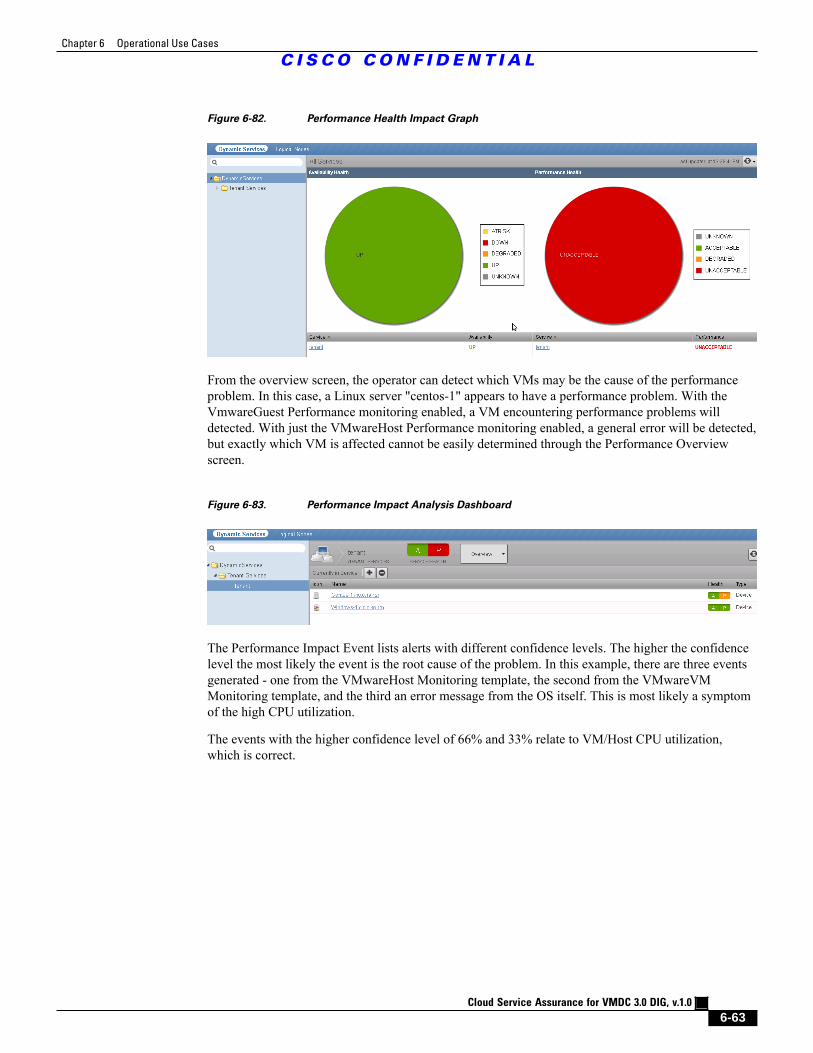
Chapter 6 Operational Use Cases
C I S C O C O N F I D E N T I A L
Cloud Service Assurance for VMDC 3.0 DIG, v.1.0
6-63
Figure 6-82. Performance Health Impact Graph
From the overview screen, the operator can detect which VMs may be the cause of the performanceproblem. In this case, a Linux server "centos-1" appears to have a performance problem. With theVmwareGuest Performance monitoring enabled, a VM encountering performance problems willdetected. With just the VMwareHost Performance monitoring enabled, a general error will be detected,but exactly which VM is affected cannot be easily determined through the Performance Overviewscreen.
Figure 6-83. Performance Impact Analysis Dashboard
The Performance Impact Event lists alerts with different confidence levels. The higher the confidencelevel the most likely the event is the root cause of the problem. In this example, there are three eventsgenerated - one from the VMwareHost Monitoring template, the second from the VMwareVMMonitoring template, and the third an error message from the OS itself. This is most likely a symptomof the high CPU utilization.
The events with the higher confidence level of 66% and 33% relate to VM/Host CPU utilization,which is correct.
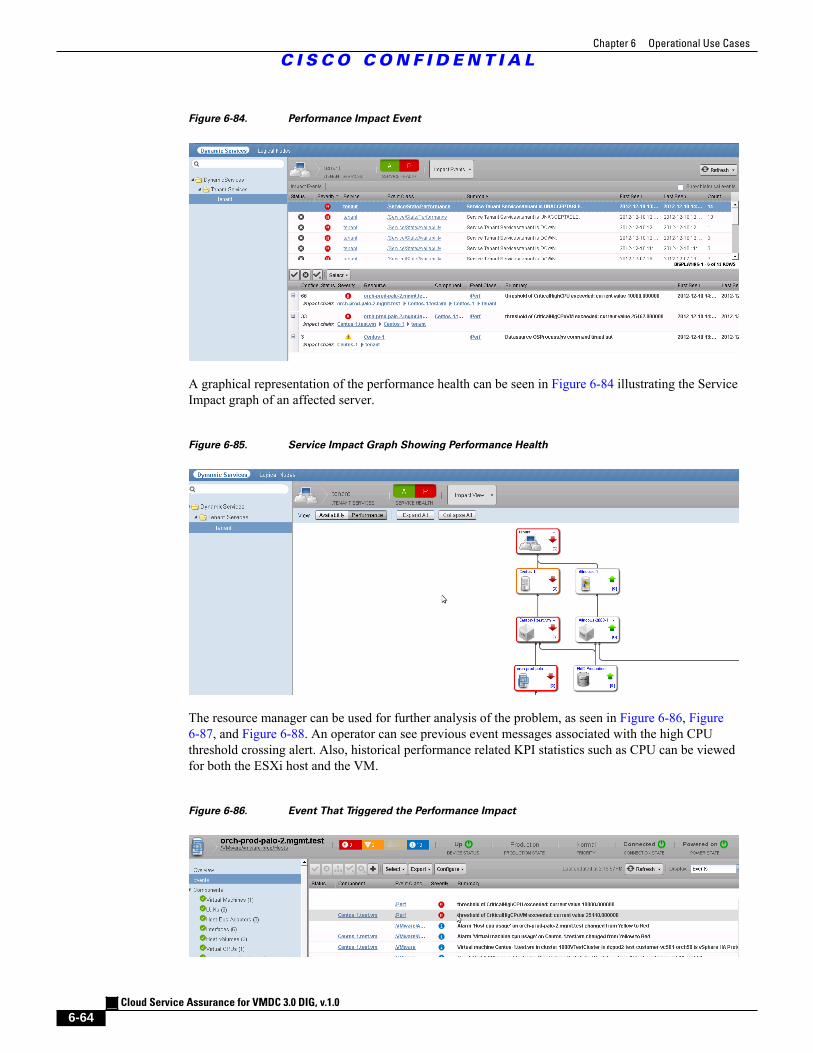
Chapter 6 Operational Use Cases
C I S C O C O N F I D E N T I A L
Cloud Service Assurance for VMDC 3.0 DIG, v.1.0
6-64
Figure 6-84. Performance Impact Event
A graphical representation of the performance health can be seen in Figure 6-84 illustrating the ServiceImpact graph of an affected server.
Figure 6-85. Service Impact Graph Showing Performance Health
The resource manager can be used for further analysis of the problem, as seen in Figure 6-86, Figure6-87, and Figure 6-88. An operator can see previous event messages associated with the high CPUthreshold crossing alert. Also, historical performance related KPI statistics such as CPU can be viewedfor both the ESXi host and the VM.
Figure 6-86. Event That Triggered the Performance Impact
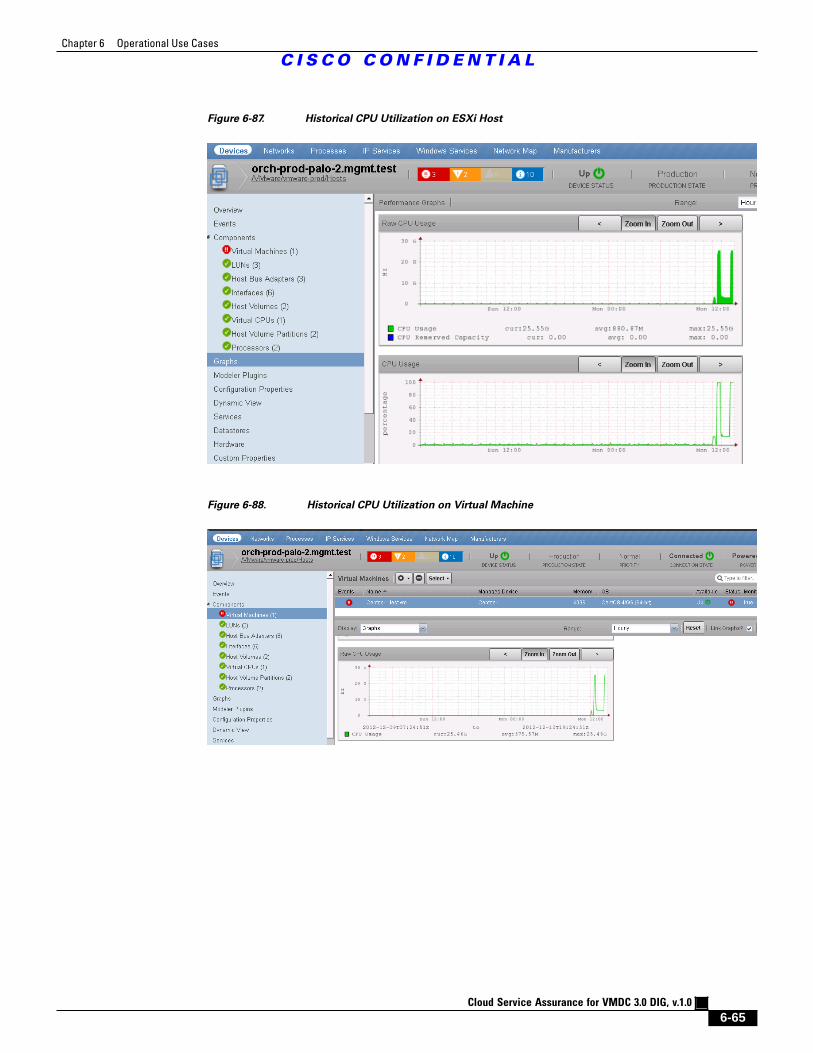
Chapter 6 Operational Use Cases
C I S C O C O N F I D E N T I A L
Cloud Service Assurance for VMDC 3.0 DIG, v.1.0
6-65
Figure 6-87. Historical CPU Utilization on ESXi Host
Figure 6-88. Historical CPU Utilization on Virtual Machine
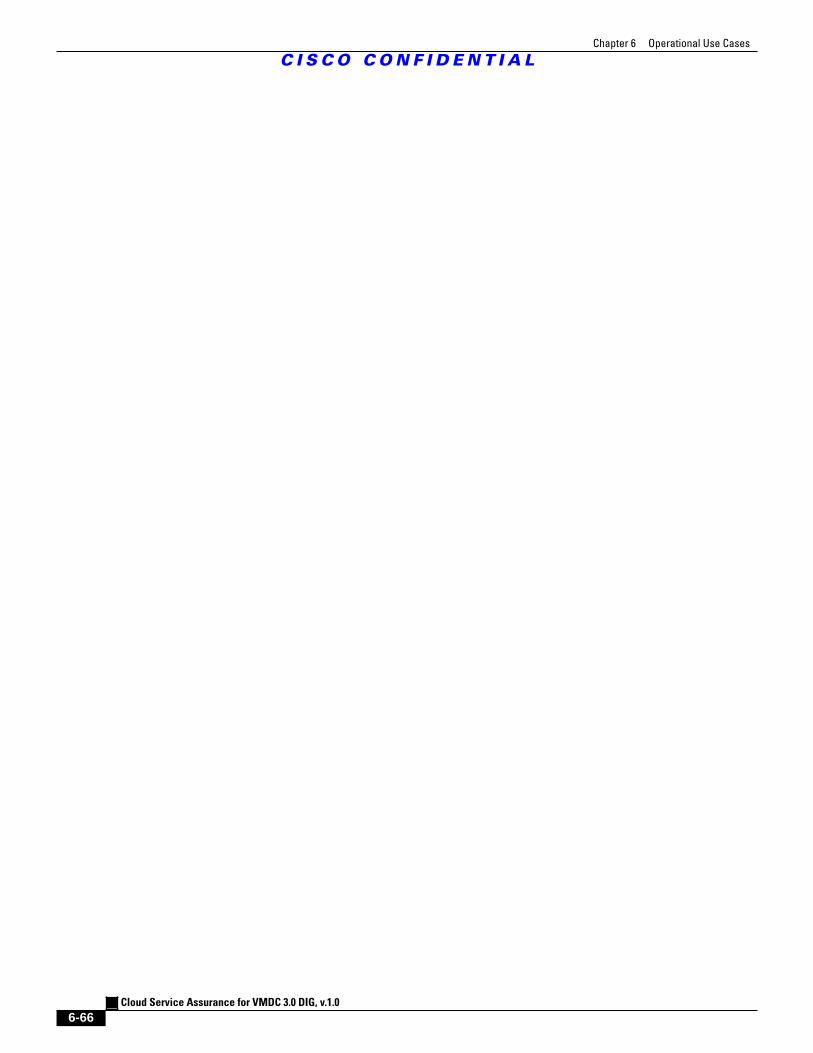
Chapter 6 Operational Use Cases
C I S C O C O N F I D E N T I A L
Cloud Service Assurance for VMDC 3.0 DIG, v.1.0
6-66
Cloud Service Assurance for VMDC 3.0 DIG, v.1.0
7-1
C I S C O C O N F I D E N T I A L
C H A P T E R 7CLSA-VMDC 3.0 Enhancements
Cloud Service Assurance for Virtualized Multiservice Data Center (CLSA-VMDC) 3.0 includesexpanded support for several new features and VMDC device models. This chapter presents thefollowing topics:
• Section 7.1 EMC. Zenoss Cloud Service Assurance (CSA) adds support for EMC VMAXand VNX storage devices. EMC discovery and monitoring is achieved by using EMC'simplementation of the Storage Networking Industry Association (SNIA) Storage ManagementInitiative Specification (SMI-S) Provider interface.
• Section 7.2 Adaptive Security Appliance Services Module (ASASM). Zenoss CSA extendssupport for VMDC load balancing components to include the ASASM.
• Section 7.3 Nexus 3000. While not specifically included in the VMDC Infrastructure as a Service(IaaS) architecture, Nexus 3000 support has been added to Zenoss CSA to meet Cisco fieldrequests.
• Section 7.4 FabricPath Line Card (FPLC). The VMDC 3.0 design incorporates the Nexusswitching product family FabricPath technology. Zenoss CSA adds support for the FPLC.
• Section 7.5 UCS 6200 Fabric Interconnect. The Unified Computing System (UCS) product linehas been extended to support the UCS 6200 Fabric Interconnect model including discovery,monitoring, and compute service impact modeling.
• Section 7.6 Nexus 1010. The Nexus product family has been extended to support discovery andmonitoring of the Nexus 1000V Virtual Supervisor Module (VSM) on the Nexus 1010.
• Section 7.7 Zenoss Sample Tenant Portal. An overview of the Zenoss sample tenant portal andthe JavaScript Object Notation (JSON) Application Programming Interface (API) is presented.
7.1 EMCWith the release of Zenoss 4.2.3, EMC VNX and EMC VMAX storage arrays have been added to thelist of supported storage devices. This section reviews the installation of the infrastructure required forEMC support, along with general use scenarios within Zenoss for monitoring EMC VNX and EMCVMAX arrays.
What is supported?
• EMC VNX Block
• EMC Symmetrix VMAX
What is not supported?
Chapter 7 CLSA-VMDC 3.0 Enhancements
7.1.1 SMI-S Provider Installation and Configuration
C I S C O C O N F I D E N T I A L
Cloud Service Assurance for VMDC 3.0 DIG, v.1.0
7-2
• EMC VNX File (limitation of the EMC Storage Management Initiative Specification (SMI-S)Provider)
• EMC VNX and EMC VMAX being served from the same EMC SMI-S Provider.
• EMC VMAX Connectivity Monitoring (limitation of the EMC SMI-S Provider for fiberconnected VMAX arrays)
• EMC Simulated Arrays
The remainder of this section is split into the following subsections:
• Section 7.1.1 SMI-S Provider Installation and Configuration
• Section 7.1.2 Accessing EMC Arrays from the SMI-S Provider
• Section 7.1.3 Adding and Monitoring EMC Arrays Within Zenoss
7.1.1 SMI-S Provider Installation and Configuration
Zenoss uses the EMC Storage Management Initiative Specification (SMI-S) Provider to gain access tothe EMC VNX and EMC VMAX arrays. This section covers the installation and configuration of theEMC SMI-S Provider. Prior to installing the EMC SMI-S Provider, review the official EMC SMI-Sinstallation manual along with the release notes for the EMC SMI-S Provider, as noted in Appendix #Related Documentation.
Potential EMC SMI-S Provider Installation Conflicts
One resource issue outlined in the release notes includes a specific warning when installing theEMC SMI-S Provider on the same machine as either the EMC Control Center (ECC) or Unisphereapplication. The release notes outline a potential workaround for the conflict, otherwise, it isrecommended that the EMC SMI-S Provider not be installed on the same machine with ECC orUnisphere.
The default ports associated with the EMC SMI-S Provider are 5988 and 5989 for the EMC CommonObject Module (ECOM) server and 5986 and 5986 for Web Services-Management (WS-MAN).Confirm that these ports are not active on the system prior to the installation using the netstat -acommand to show the active ports. Refer to the "Restrict Active Ports" portion of this section forinformation on changing the default ports.
Cisco SDU Verification Network
For the purpose of this document, the network below was used to confirm the functionality of Zenosswith both the EMC VNX and EMC VMAX arrays. The configuration allowed various combinations tobe tested, including the following:
• Microsoft Windows SMI-S Provider
• Linux SMI-S Provider
• Single Array SMI-S Deployments
• Multi-Array Homogeneous SMI-S Provider Deployments
• Heterogeneous SMI-S Provider Deployments
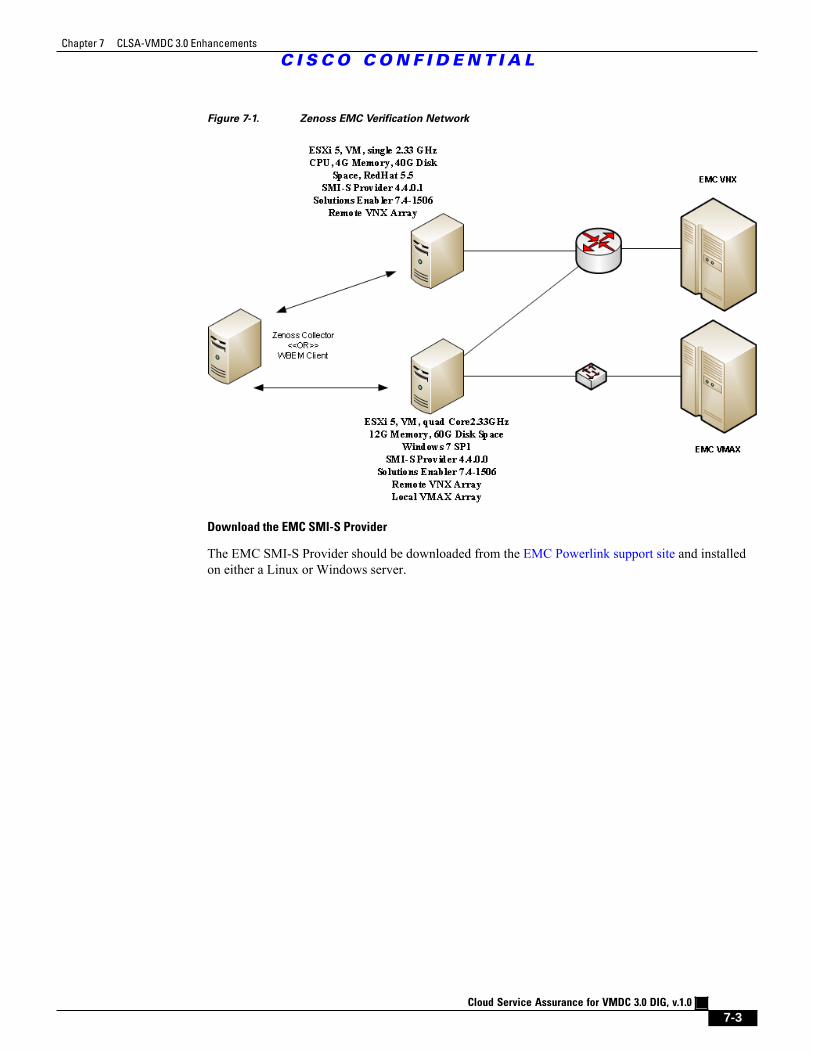
Chapter 7 CLSA-VMDC 3.0 Enhancements
C I S C O C O N F I D E N T I A L
Cloud Service Assurance for VMDC 3.0 DIG, v.1.0
7-3
Figure 7-1. Zenoss EMC Verification Network
Download the EMC SMI-S Provider
The EMC SMI-S Provider should be downloaded from the EMC Powerlink support site and installedon either a Linux or Windows server.
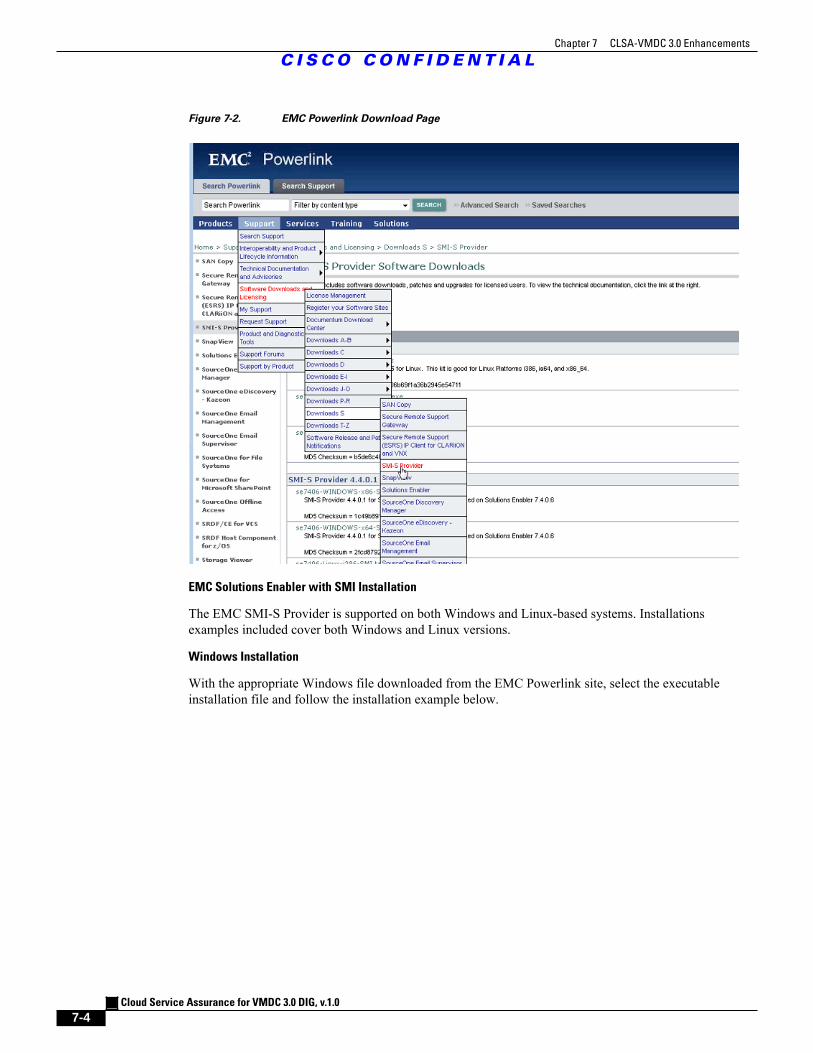
Chapter 7 CLSA-VMDC 3.0 Enhancements
C I S C O C O N F I D E N T I A L
Cloud Service Assurance for VMDC 3.0 DIG, v.1.0
7-4
Figure 7-2. EMC Powerlink Download Page
EMC Solutions Enabler with SMI Installation
The EMC SMI-S Provider is supported on both Windows and Linux-based systems. Installationsexamples included cover both Windows and Linux versions.
Windows Installation
With the appropriate Windows file downloaded from the EMC Powerlink site, select the executableinstallation file and follow the installation example below.
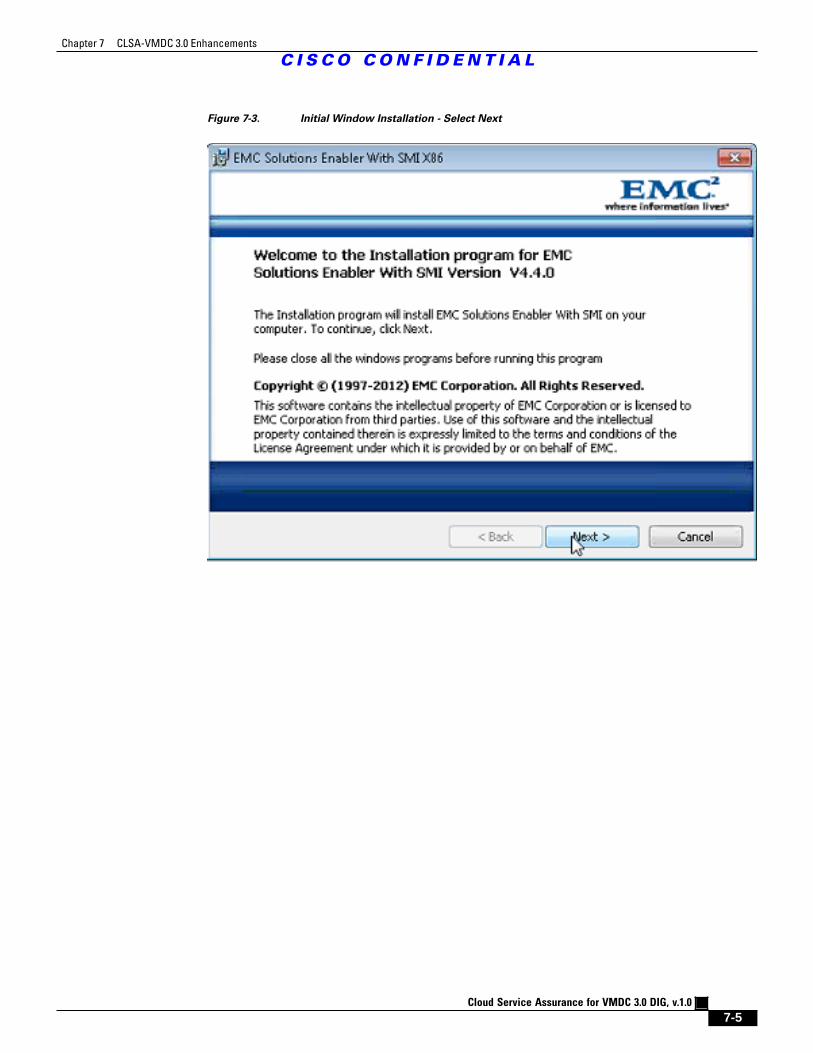
Chapter 7 CLSA-VMDC 3.0 Enhancements
C I S C O C O N F I D E N T I A L
Cloud Service Assurance for VMDC 3.0 DIG, v.1.0
7-5
Figure 7-3. Initial Window Installation - Select Next
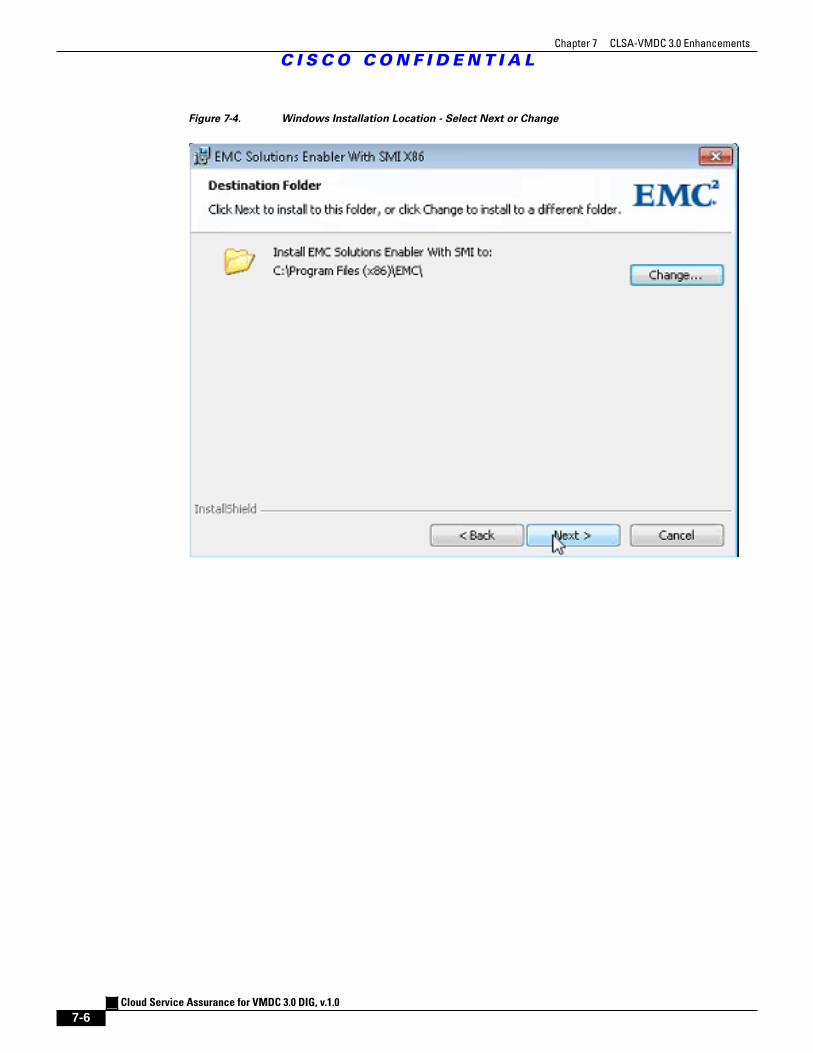
Chapter 7 CLSA-VMDC 3.0 Enhancements
C I S C O C O N F I D E N T I A L
Cloud Service Assurance for VMDC 3.0 DIG, v.1.0
7-6
Figure 7-4. Windows Installation Location - Select Next or Change
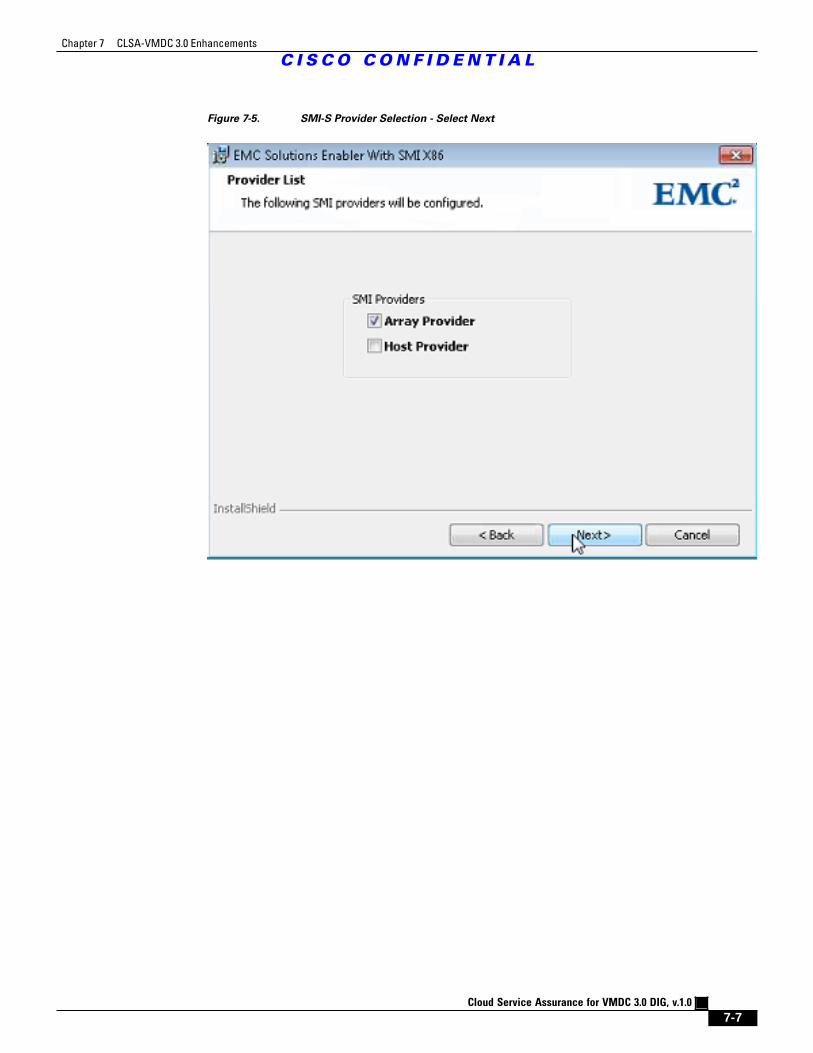
Chapter 7 CLSA-VMDC 3.0 Enhancements
C I S C O C O N F I D E N T I A L
Cloud Service Assurance for VMDC 3.0 DIG, v.1.0
7-7
Figure 7-5. SMI-S Provider Selection - Select Next
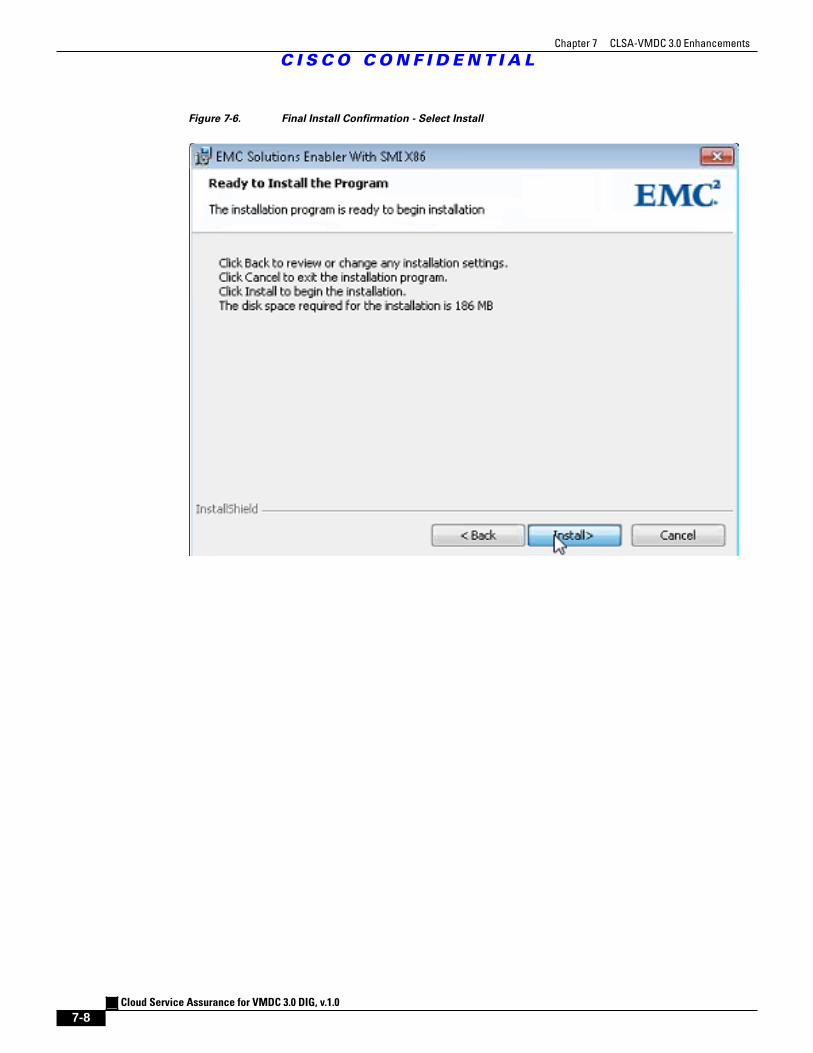
Chapter 7 CLSA-VMDC 3.0 Enhancements
C I S C O C O N F I D E N T I A L
Cloud Service Assurance for VMDC 3.0 DIG, v.1.0
7-8
Figure 7-6. Final Install Confirmation - Select Install
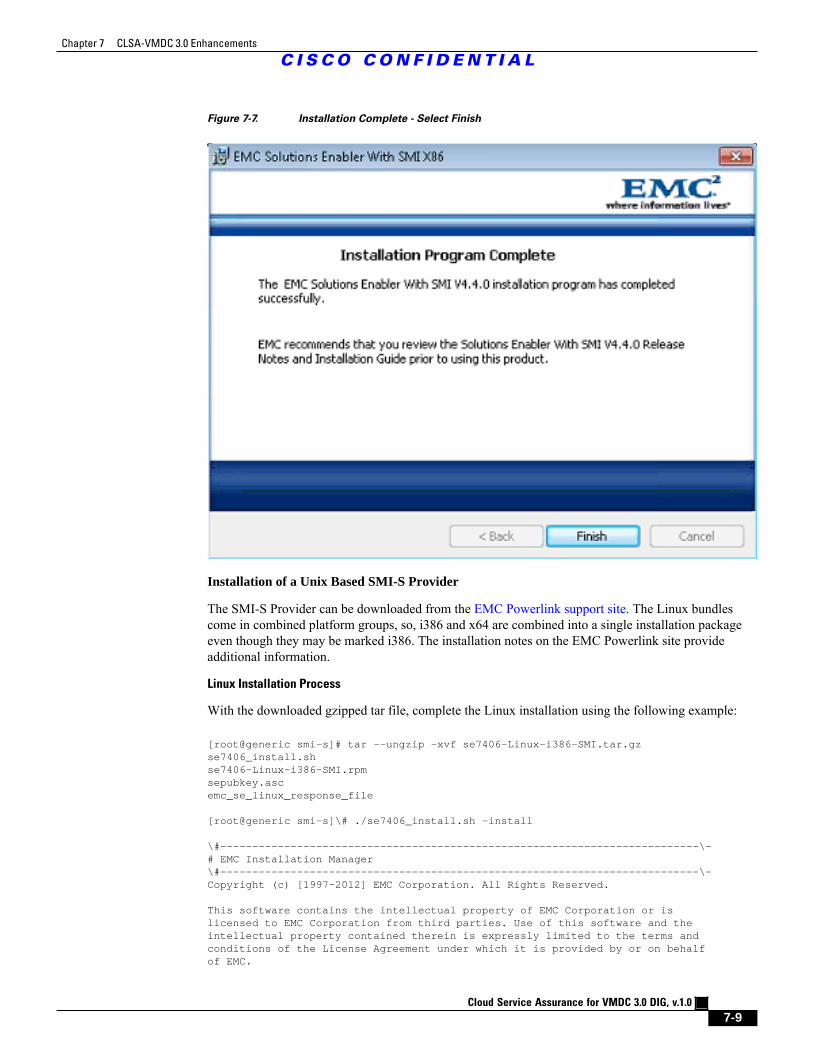
Chapter 7 CLSA-VMDC 3.0 Enhancements
C I S C O C O N F I D E N T I A L
Cloud Service Assurance for VMDC 3.0 DIG, v.1.0
7-9
Figure 7-7. Installation Complete - Select Finish
Installation of a Unix Based SMI-S Provider
The SMI-S Provider can be downloaded from the EMC Powerlink support site. The Linux bundlescome in combined platform groups, so, i386 and x64 are combined into a single installation packageeven though they may be marked i386. The installation notes on the EMC Powerlink site provideadditional information.
Linux Installation Process
With the downloaded gzipped tar file, complete the Linux installation using the following example:
[root@generic smi-s]# tar --ungzip -xvf se7406-Linux-i386-SMI.tar.gzse7406_install.shse7406-Linux-i386-SMI.rpmsepubkey.ascemc_se_linux_response_file [root@generic smi-s]\# ./se7406_install.sh -install \#---------------------------------------------------------------------------\-# EMC Installation Manager\#---------------------------------------------------------------------------\-Copyright (c) [1997-2012] EMC Corporation. All Rights Reserved. This software contains the intellectual property of EMC Corporation or islicensed to EMC Corporation from third parties. Use of this software and theintellectual property contained therein is expressly limited to the terms andconditions of the License Agreement under which it is provided by or on behalfof EMC.
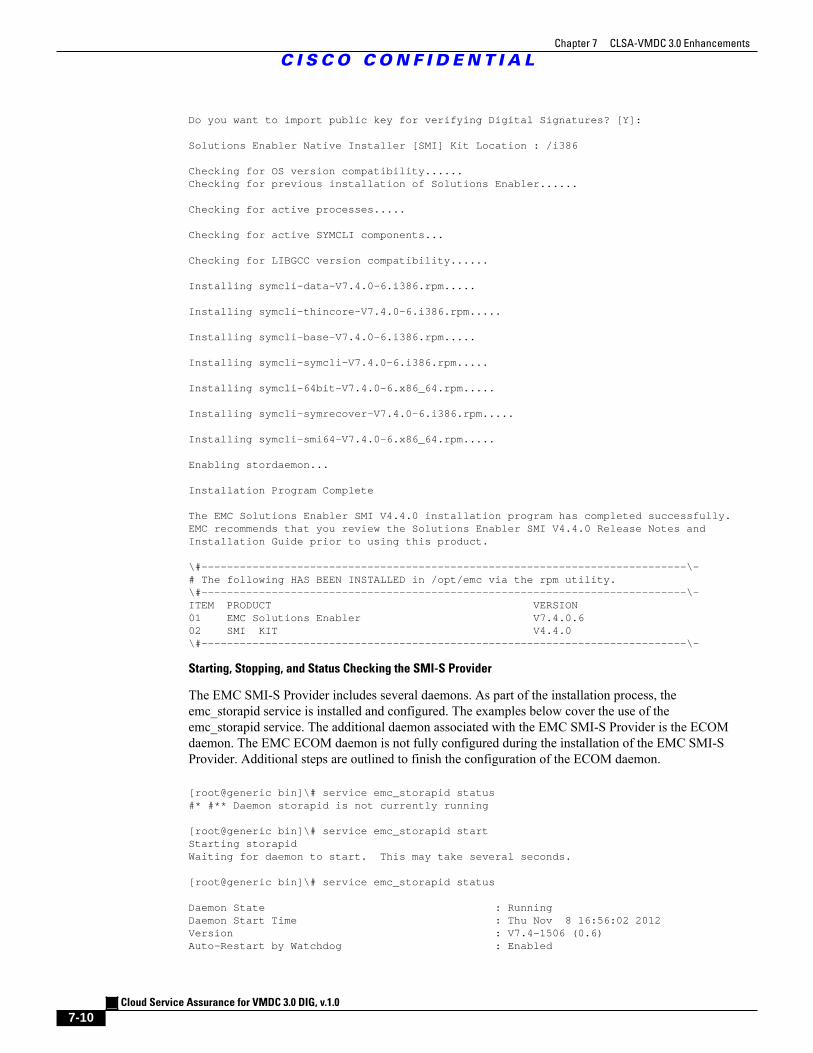
Chapter 7 CLSA-VMDC 3.0 Enhancements
C I S C O C O N F I D E N T I A L
Cloud Service Assurance for VMDC 3.0 DIG, v.1.0
7-10
Do you want to import public key for verifying Digital Signatures? [Y]: Solutions Enabler Native Installer [SMI] Kit Location : /i386 Checking for OS version compatibility......Checking for previous installation of Solutions Enabler...... Checking for active processes..... Checking for active SYMCLI components... Checking for LIBGCC version compatibility...... Installing symcli-data-V7.4.0-6.i386.rpm..... Installing symcli-thincore-V7.4.0-6.i386.rpm..... Installing symcli-base-V7.4.0-6.i386.rpm..... Installing symcli-symcli-V7.4.0-6.i386.rpm..... Installing symcli-64bit-V7.4.0-6.x86_64.rpm..... Installing symcli-symrecover-V7.4.0-6.i386.rpm..... Installing symcli-smi64-V7.4.0-6.x86_64.rpm..... Enabling stordaemon... Installation Program Complete The EMC Solutions Enabler SMI V4.4.0 installation program has completed successfully.EMC recommends that you review the Solutions Enabler SMI V4.4.0 Release Notes andInstallation Guide prior to using this product. \#----------------------------------------------------------------------------\-# The following HAS BEEN INSTALLED in /opt/emc via the rpm utility.\#----------------------------------------------------------------------------\-ITEM PRODUCT VERSION01 EMC Solutions Enabler V7.4.0.602 SMI KIT V4.4.0\#----------------------------------------------------------------------------\-
Starting, Stopping, and Status Checking the SMI-S Provider
The EMC SMI-S Provider includes several daemons. As part of the installation process, theemc_storapid service is installed and configured. The examples below cover the use of theemc_storapid service. The additional daemon associated with the EMC SMI-S Provider is the ECOMdaemon. The EMC ECOM daemon is not fully configured during the installation of the EMC SMI-SProvider. Additional steps are outlined to finish the configuration of the ECOM daemon.
[root@generic bin]\# service emc_storapid status#* #** Daemon storapid is not currently running [root@generic bin]\# service emc_storapid startStarting storapidWaiting for daemon to start. This may take several seconds. [root@generic bin]\# service emc_storapid status Daemon State : RunningDaemon Start Time : Thu Nov 8 16:56:02 2012Version : V7.4-1506 (0.6)Auto-Restart by Watchdog : Enabled
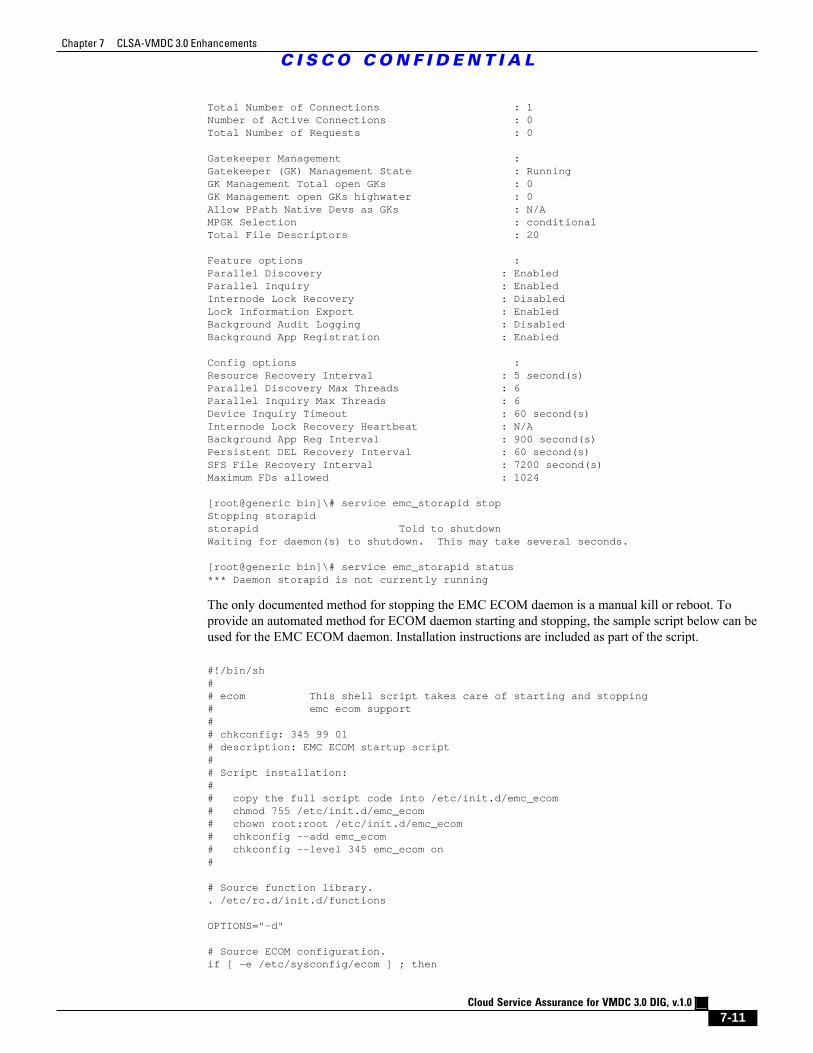
Chapter 7 CLSA-VMDC 3.0 Enhancements
C I S C O C O N F I D E N T I A L
Cloud Service Assurance for VMDC 3.0 DIG, v.1.0
7-11
Total Number of Connections : 1Number of Active Connections : 0Total Number of Requests : 0 Gatekeeper Management :Gatekeeper (GK) Management State : RunningGK Management Total open GKs : 0GK Management open GKs highwater : 0Allow PPath Native Devs as GKs : N/AMPGK Selection : conditionalTotal File Descriptors : 20 Feature options :Parallel Discovery : EnabledParallel Inquiry : EnabledInternode Lock Recovery : DisabledLock Information Export : EnabledBackground Audit Logging : DisabledBackground App Registration : Enabled Config options :Resource Recovery Interval : 5 second(s)Parallel Discovery Max Threads : 6Parallel Inquiry Max Threads : 6Device Inquiry Timeout : 60 second(s)Internode Lock Recovery Heartbeat : N/ABackground App Reg Interval : 900 second(s)Persistent DEL Recovery Interval : 60 second(s)SFS File Recovery Interval : 7200 second(s)Maximum FDs allowed : 1024 [root@generic bin]\# service emc_storapid stopStopping storapidstorapid Told to shutdownWaiting for daemon(s) to shutdown. This may take several seconds. [root@generic bin]\# service emc_storapid status*** Daemon storapid is not currently running
The only documented method for stopping the EMC ECOM daemon is a manual kill or reboot. Toprovide an automated method for ECOM daemon starting and stopping, the sample script below can beused for the EMC ECOM daemon. Installation instructions are included as part of the script.
#!/bin/sh## ecom This shell script takes care of starting and stopping# emc ecom support## chkconfig: 345 99 01# description: EMC ECOM startup script## Script installation:## copy the full script code into /etc/init.d/emc_ecom# chmod 755 /etc/init.d/emc_ecom# chown root:root /etc/init.d/emc_ecom# chkconfig --add emc_ecom# chkconfig --level 345 emc_ecom on# # Source function library.. /etc/rc.d/init.d/functions OPTIONS="-d" # Source ECOM configuration.if [ -e /etc/sysconfig/ecom ] ; then
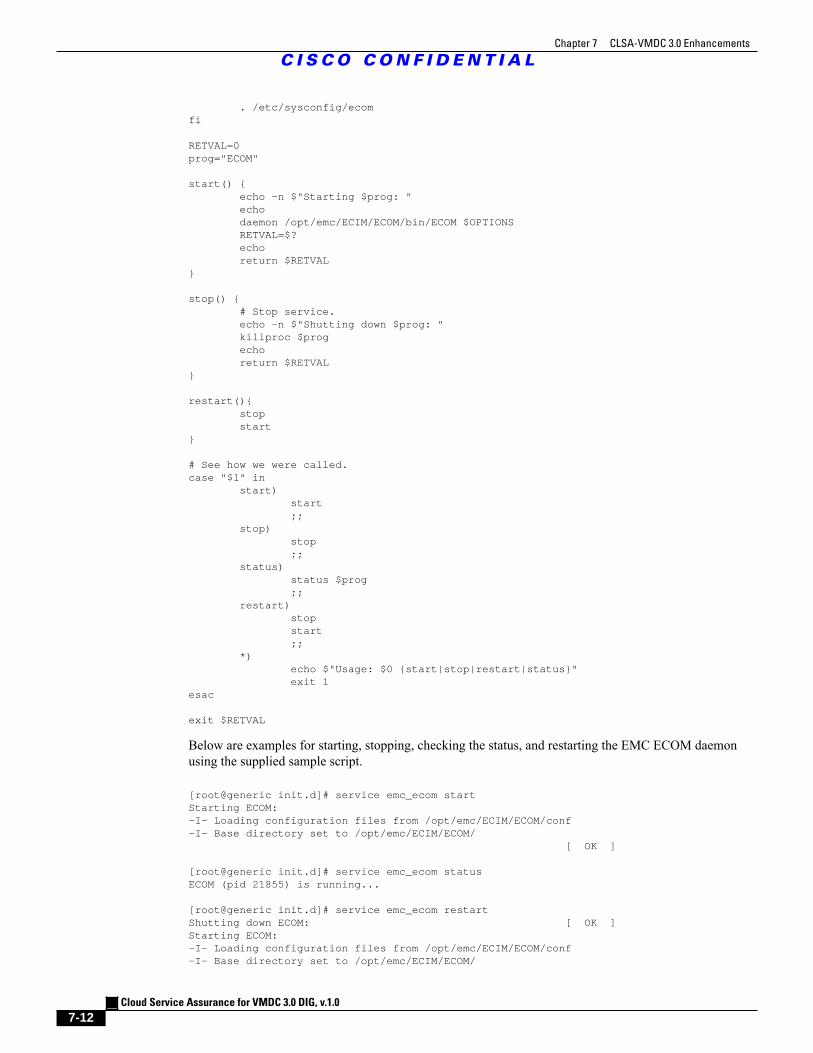
Chapter 7 CLSA-VMDC 3.0 Enhancements
C I S C O C O N F I D E N T I A L
Cloud Service Assurance for VMDC 3.0 DIG, v.1.0
7-12
. /etc/sysconfig/ecomfi RETVAL=0prog="ECOM" start() { echo -n $"Starting $prog: " echo daemon /opt/emc/ECIM/ECOM/bin/ECOM $OPTIONS RETVAL=$? echo return $RETVAL} stop() { # Stop service. echo -n $"Shutting down $prog: " killproc $prog echo return $RETVAL} restart(){ stop start} # See how we were called.case "$1" in start) start ;; stop) stop ;; status) status $prog ;; restart) stop start ;; *) echo $"Usage: $0 {start|stop|restart|status}" exit 1esac exit $RETVAL
Below are examples for starting, stopping, checking the status, and restarting the EMC ECOM daemonusing the supplied sample script.
[root@generic init.d]# service emc_ecom startStarting ECOM:-I- Loading configuration files from /opt/emc/ECIM/ECOM/conf-I- Base directory set to /opt/emc/ECIM/ECOM/ [ OK ] [root@generic init.d]# service emc_ecom statusECOM (pid 21855) is running... [root@generic init.d]# service emc_ecom restartShutting down ECOM: [ OK ]Starting ECOM:-I- Loading configuration files from /opt/emc/ECIM/ECOM/conf-I- Base directory set to /opt/emc/ECIM/ECOM/
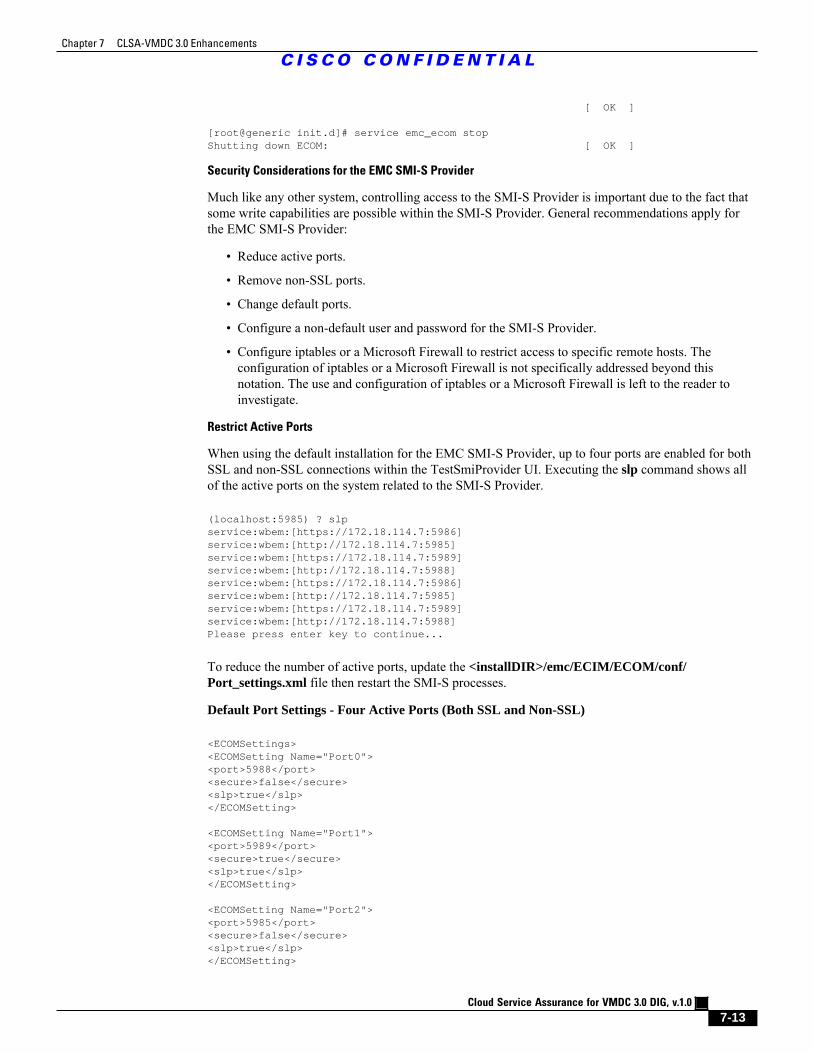
Chapter 7 CLSA-VMDC 3.0 Enhancements
C I S C O C O N F I D E N T I A L
Cloud Service Assurance for VMDC 3.0 DIG, v.1.0
7-13
[ OK ] [root@generic init.d]# service emc_ecom stopShutting down ECOM: [ OK ]
Security Considerations for the EMC SMI-S Provider
Much like any other system, controlling access to the SMI-S Provider is important due to the fact thatsome write capabilities are possible within the SMI-S Provider. General recommendations apply forthe EMC SMI-S Provider:
• Reduce active ports.
• Remove non-SSL ports.
• Change default ports.
• Configure a non-default user and password for the SMI-S Provider.
• Configure iptables or a Microsoft Firewall to restrict access to specific remote hosts. Theconfiguration of iptables or a Microsoft Firewall is not specifically addressed beyond thisnotation. The use and configuration of iptables or a Microsoft Firewall is left to the reader toinvestigate.
Restrict Active Ports
When using the default installation for the EMC SMI-S Provider, up to four ports are enabled for bothSSL and non-SSL connections within the TestSmiProvider UI. Executing the slp command shows allof the active ports on the system related to the SMI-S Provider.
(localhost:5985) ? slpservice:wbem:[https://172.18.114.7:5986]service:wbem:[http://172.18.114.7:5985]service:wbem:[https://172.18.114.7:5989]service:wbem:[http://172.18.114.7:5988]service:wbem:[https://172.18.114.7:5986]service:wbem:[http://172.18.114.7:5985]service:wbem:[https://172.18.114.7:5989]service:wbem:[http://172.18.114.7:5988]Please press enter key to continue...
To reduce the number of active ports, update the <installDIR>/emc/ECIM/ECOM/conf/Port_settings.xml file then restart the SMI-S processes.
Default Port Settings - Four Active Ports (Both SSL and Non-SSL)
<ECOMSettings><ECOMSetting Name="Port0"><port>5988</port><secure>false</secure><slp>true</slp></ECOMSetting> <ECOMSetting Name="Port1"><port>5989</port><secure>true</secure><slp>true</slp></ECOMSetting> <ECOMSetting Name="Port2"><port>5985</port><secure>false</secure><slp>true</slp></ECOMSetting>
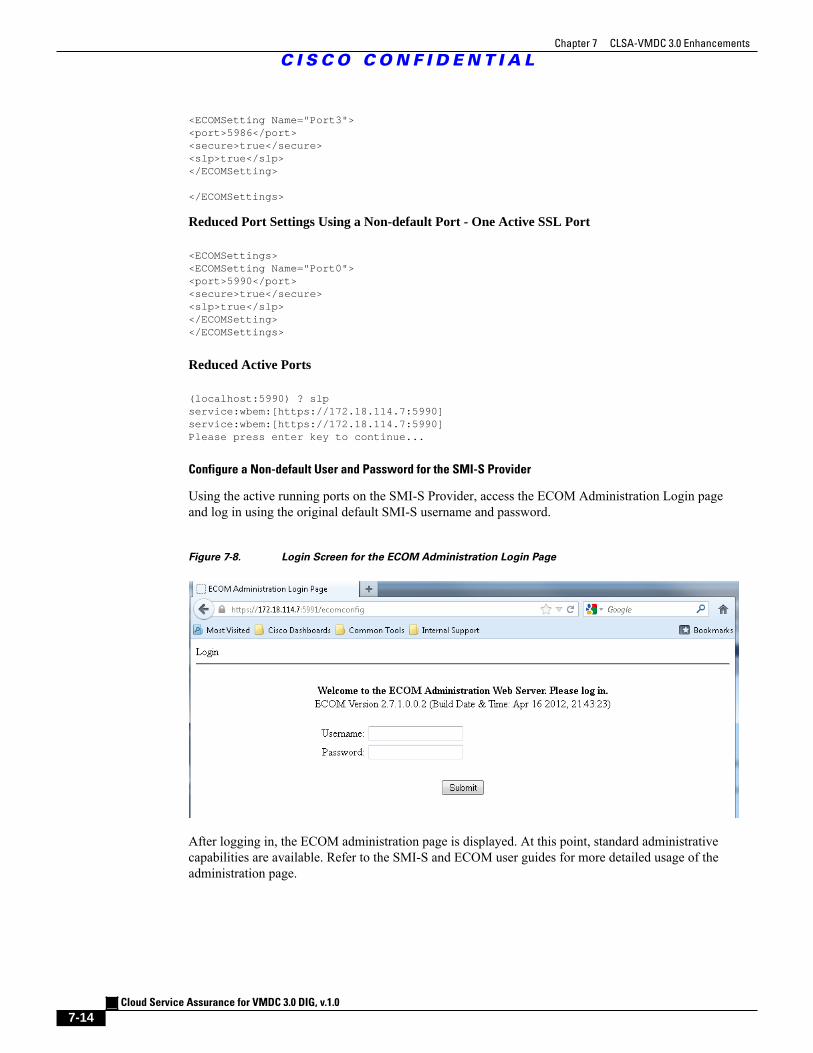
Chapter 7 CLSA-VMDC 3.0 Enhancements
C I S C O C O N F I D E N T I A L
Cloud Service Assurance for VMDC 3.0 DIG, v.1.0
7-14
<ECOMSetting Name="Port3"><port>5986</port><secure>true</secure><slp>true</slp></ECOMSetting> </ECOMSettings>
Reduced Port Settings Using a Non-default Port - One Active SSL Port
<ECOMSettings><ECOMSetting Name="Port0"><port>5990</port><secure>true</secure><slp>true</slp></ECOMSetting></ECOMSettings>
Reduced Active Ports
(localhost:5990) ? slpservice:wbem:[https://172.18.114.7:5990]service:wbem:[https://172.18.114.7:5990]Please press enter key to continue...
Configure a Non-default User and Password for the SMI-S Provider
Using the active running ports on the SMI-S Provider, access the ECOM Administration Login pageand log in using the original default SMI-S username and password.
Figure 7-8. Login Screen for the ECOM Administration Login Page
After logging in, the ECOM administration page is displayed. At this point, standard administrativecapabilities are available. Refer to the SMI-S and ECOM user guides for more detailed usage of theadministration page.
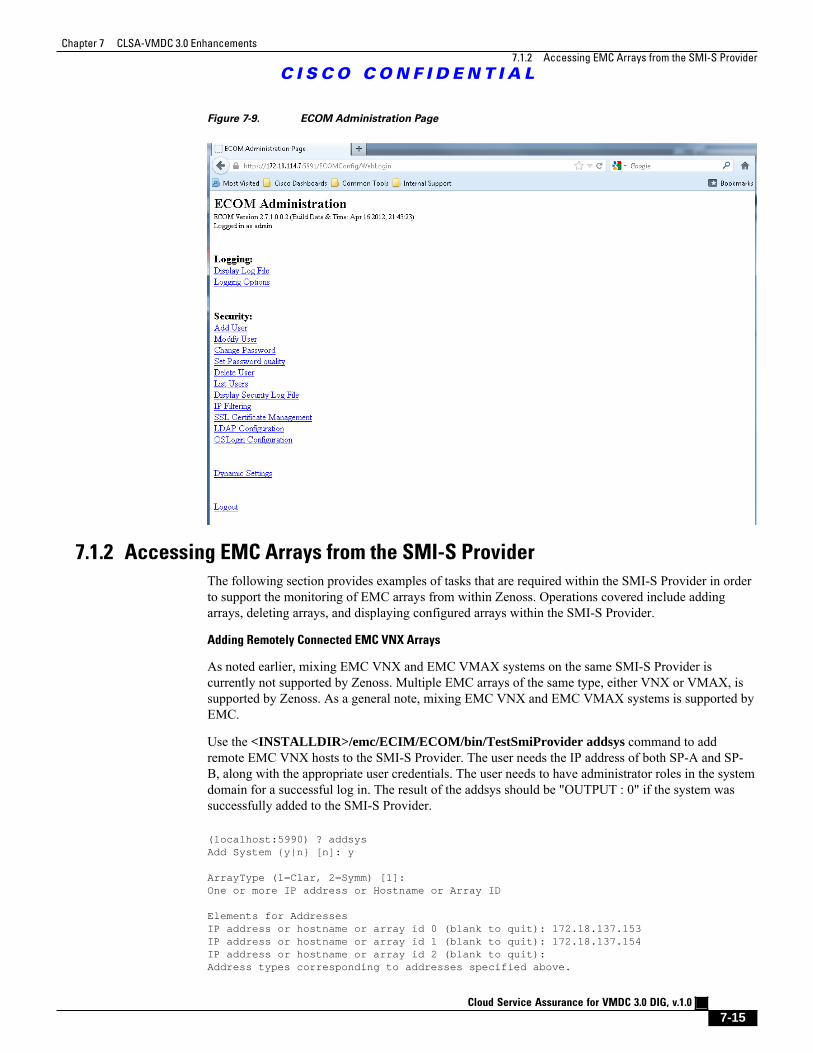
Chapter 7 CLSA-VMDC 3.0 Enhancements
7.1.2 Accessing EMC Arrays from the SMI-S Provider
C I S C O C O N F I D E N T I A L
Cloud Service Assurance for VMDC 3.0 DIG, v.1.0
7-15
Figure 7-9. ECOM Administration Page
7.1.2 Accessing EMC Arrays from the SMI-S Provider
The following section provides examples of tasks that are required within the SMI-S Provider in orderto support the monitoring of EMC arrays from within Zenoss. Operations covered include addingarrays, deleting arrays, and displaying configured arrays within the SMI-S Provider.
Adding Remotely Connected EMC VNX Arrays
As noted earlier, mixing EMC VNX and EMC VMAX systems on the same SMI-S Provider iscurrently not supported by Zenoss. Multiple EMC arrays of the same type, either VNX or VMAX, issupported by Zenoss. As a general note, mixing EMC VNX and EMC VMAX systems is supported byEMC.
Use the <INSTALLDIR>/emc/ECIM/ECOM/bin/TestSmiProvider addsys command to addremote EMC VNX hosts to the SMI-S Provider. The user needs the IP address of both SP-A and SP-B, along with the appropriate user credentials. The user needs to have administrator roles in the systemdomain for a successful log in. The result of the addsys should be "OUTPUT : 0" if the system wassuccessfully added to the SMI-S Provider.
(localhost:5990) ? addsysAdd System {y|n} [n]: y ArrayType (1=Clar, 2=Symm) [1]:One or more IP address or Hostname or Array ID Elements for AddressesIP address or hostname or array id 0 (blank to quit): 172.18.137.153IP address or hostname or array id 1 (blank to quit): 172.18.137.154IP address or hostname or array id 2 (blank to quit):Address types corresponding to addresses specified above.
Chapter 7 CLSA-VMDC 3.0 Enhancements
C I S C O C O N F I D E N T I A L
Cloud Service Assurance for VMDC 3.0 DIG, v.1.0
7-16
(1=URL, 2=IP/Nodename, 3=Array ID)Address Type (0) [default=2]:Address Type (1) [default=2]:User [null]: ********Password [null]: ********++++ EMCAddSystem ++++OUTPUT : 0Legend:0=Success, 1=Not Supported, 2=Unknown, 3=Timeout, 4=Failed 5=Invalid Parameter 4096=Job Queued, 4097=Size Not SupportedNote: Not all above values apply to all methods - see MOF for the method. System : //172.18.114.7/root/emc:Clar_StorageSystem.CreationClassName="Clar_StorageSystem",Name="CLARiiON+APM00111700778" In 24.805600 Seconds Please press enter key to continue...
Adding Locally Connected EMC VMAX Arrays
When adding EMC VMAX arrays to the SMI-S Provider, execute the <INSTALLDIR>/emc/ECIM/ECOM/bin/TestSmiProvider discovery command. For EMC VMAX arrays, the SMI-SProvider accesses the array via the fiber connection. Once added, the discovery process should report"OUTPUT : 0" if the process was successful.
(localhost:5990) ? disco Filter {y|n} [n]: New question Flags {y|n} [n]:++++ EMCDiscoverSystem ++++OUTPUT : 0Legend:0=Success, 1=Not Supported, 2=Unknown, 3=Timeout, 4=Failed 5=Invalid Parameter 4096=Job Queued, 4097=Size Not SupportedNote: Not all above values apply to all methods - see MOF for the method. In 10.872351 Seconds Please press enter key to continue...
Confirming Connected EMC Arrays
With both VNX and VMAX connections, the EMC SMI Provider Tester command dv allows usersto display any connected EMC devices along with supplying all of the various version informationrelated to the SMI-S Provider and the connected EMC devices.
(localhost:5990) ? dv\+++\+ Display version information \+++\+ CIM ObjectManager Name: EMC:172.18.114.7 CIMOM Version: EMC CIM Server Version 2.7.1.0.0.2 SMI-S spec version: 1.6.0 SMI-S Provider version: V4.4.0.1 SMI-S Provider Location: Proxy SMI-S Provider Server:
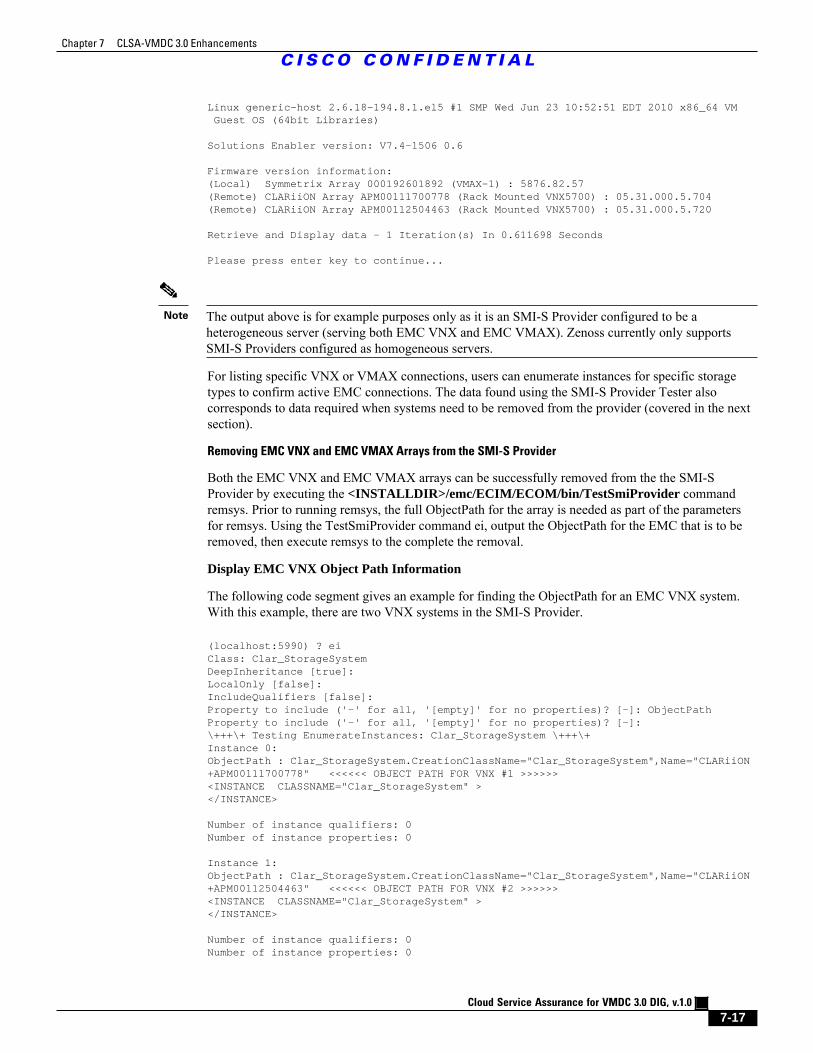
Chapter 7 CLSA-VMDC 3.0 Enhancements
C I S C O C O N F I D E N T I A L
Cloud Service Assurance for VMDC 3.0 DIG, v.1.0
7-17
Linux generic-host 2.6.18-194.8.1.el5 #1 SMP Wed Jun 23 10:52:51 EDT 2010 x86_64 VM Guest OS (64bit Libraries) Solutions Enabler version: V7.4-1506 0.6 Firmware version information:(Local) Symmetrix Array 000192601892 (VMAX-1) : 5876.82.57(Remote) CLARiiON Array APM00111700778 (Rack Mounted VNX5700) : 05.31.000.5.704(Remote) CLARiiON Array APM00112504463 (Rack Mounted VNX5700) : 05.31.000.5.720 Retrieve and Display data - 1 Iteration(s) In 0.611698 Seconds Please press enter key to continue...
Note The output above is for example purposes only as it is an SMI-S Provider configured to be aheterogeneous server (serving both EMC VNX and EMC VMAX). Zenoss currently only supportsSMI-S Providers configured as homogeneous servers.
For listing specific VNX or VMAX connections, users can enumerate instances for specific storagetypes to confirm active EMC connections. The data found using the SMI-S Provider Tester alsocorresponds to data required when systems need to be removed from the provider (covered in the nextsection).
Removing EMC VNX and EMC VMAX Arrays from the SMI-S Provider
Both the EMC VNX and EMC VMAX arrays can be successfully removed from the the SMI-SProvider by executing the <INSTALLDIR>/emc/ECIM/ECOM/bin/TestSmiProvider commandremsys. Prior to running remsys, the full ObjectPath for the array is needed as part of the parametersfor remsys. Using the TestSmiProvider command ei, output the ObjectPath for the EMC that is to beremoved, then execute remsys to the complete the removal.
Display EMC VNX Object Path Information
The following code segment gives an example for finding the ObjectPath for an EMC VNX system.With this example, there are two VNX systems in the SMI-S Provider.
(localhost:5990) ? eiClass: Clar_StorageSystemDeepInheritance [true]:LocalOnly [false]:IncludeQualifiers [false]:Property to include ('-' for all, '[empty]' for no properties)? [-]: ObjectPathProperty to include ('-' for all, '[empty]' for no properties)? [-]:\+++\+ Testing EnumerateInstances: Clar_StorageSystem \+++\+Instance 0:ObjectPath : Clar_StorageSystem.CreationClassName="Clar_StorageSystem",Name="CLARiiON+APM00111700778" <<<<<< OBJECT PATH FOR VNX #1 >>>>>><INSTANCE CLASSNAME="Clar_StorageSystem" ></INSTANCE> Number of instance qualifiers: 0Number of instance properties: 0 Instance 1:ObjectPath : Clar_StorageSystem.CreationClassName="Clar_StorageSystem",Name="CLARiiON+APM00112504463" <<<<<< OBJECT PATH FOR VNX #2 >>>>>><INSTANCE CLASSNAME="Clar_StorageSystem" ></INSTANCE> Number of instance qualifiers: 0Number of instance properties: 0
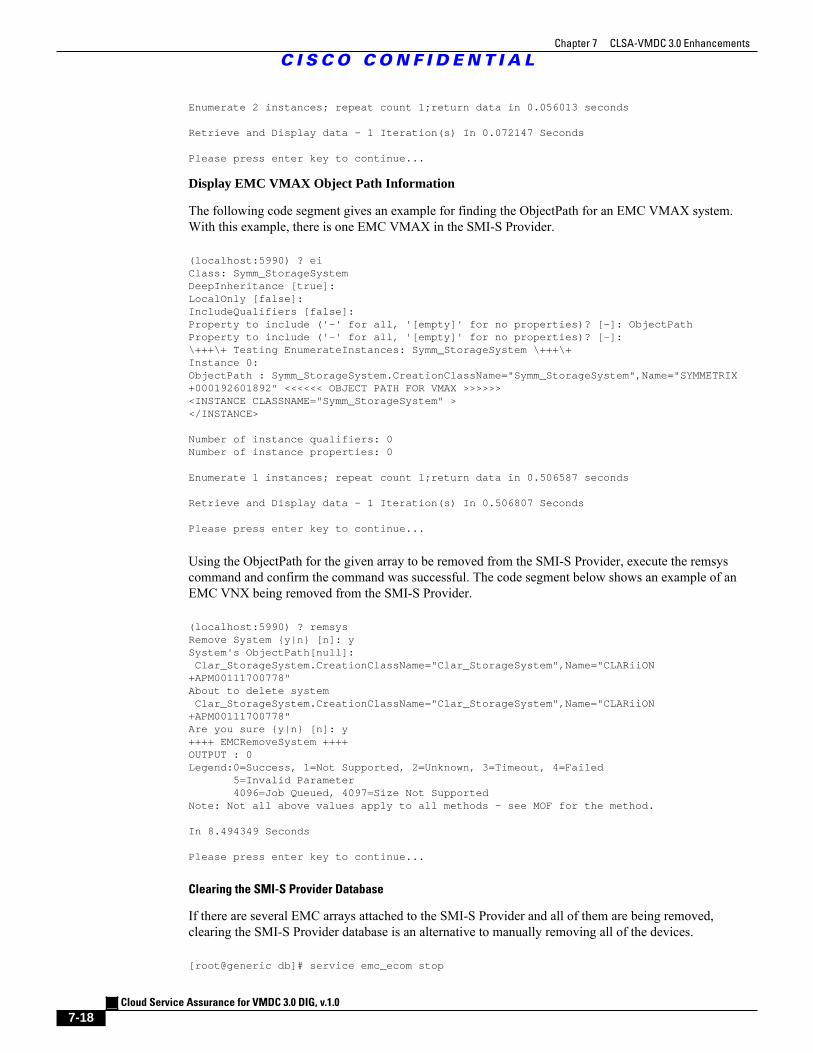
Chapter 7 CLSA-VMDC 3.0 Enhancements
C I S C O C O N F I D E N T I A L
Cloud Service Assurance for VMDC 3.0 DIG, v.1.0
7-18
Enumerate 2 instances; repeat count 1;return data in 0.056013 seconds Retrieve and Display data - 1 Iteration(s) In 0.072147 Seconds Please press enter key to continue...
Display EMC VMAX Object Path Information
The following code segment gives an example for finding the ObjectPath for an EMC VMAX system.With this example, there is one EMC VMAX in the SMI-S Provider.
(localhost:5990) ? eiClass: Symm_StorageSystemDeepInheritance [true]:LocalOnly [false]:IncludeQualifiers [false]:Property to include ('-' for all, '[empty]' for no properties)? [-]: ObjectPathProperty to include ('-' for all, '[empty]' for no properties)? [-]:\+++\+ Testing EnumerateInstances: Symm_StorageSystem \+++\+Instance 0:ObjectPath : Symm_StorageSystem.CreationClassName="Symm_StorageSystem",Name="SYMMETRIX+000192601892" <<<<<< OBJECT PATH FOR VMAX >>>>>><INSTANCE CLASSNAME="Symm_StorageSystem" ></INSTANCE> Number of instance qualifiers: 0Number of instance properties: 0 Enumerate 1 instances; repeat count 1;return data in 0.506587 seconds Retrieve and Display data - 1 Iteration(s) In 0.506807 Seconds Please press enter key to continue...
Using the ObjectPath for the given array to be removed from the SMI-S Provider, execute the remsyscommand and confirm the command was successful. The code segment below shows an example of anEMC VNX being removed from the SMI-S Provider.
(localhost:5990) ? remsysRemove System {y|n} [n]: ySystem's ObjectPath[null]: Clar_StorageSystem.CreationClassName="Clar_StorageSystem",Name="CLARiiON+APM00111700778"About to delete system Clar_StorageSystem.CreationClassName="Clar_StorageSystem",Name="CLARiiON+APM00111700778"Are you sure {y|n} [n]: y++++ EMCRemoveSystem ++++OUTPUT : 0Legend:0=Success, 1=Not Supported, 2=Unknown, 3=Timeout, 4=Failed 5=Invalid Parameter 4096=Job Queued, 4097=Size Not SupportedNote: Not all above values apply to all methods - see MOF for the method. In 8.494349 Seconds Please press enter key to continue...
Clearing the SMI-S Provider Database
If there are several EMC arrays attached to the SMI-S Provider and all of them are being removed,clearing the SMI-S Provider database is an alternative to manually removing all of the devices.
[root@generic db]# service emc_ecom stop
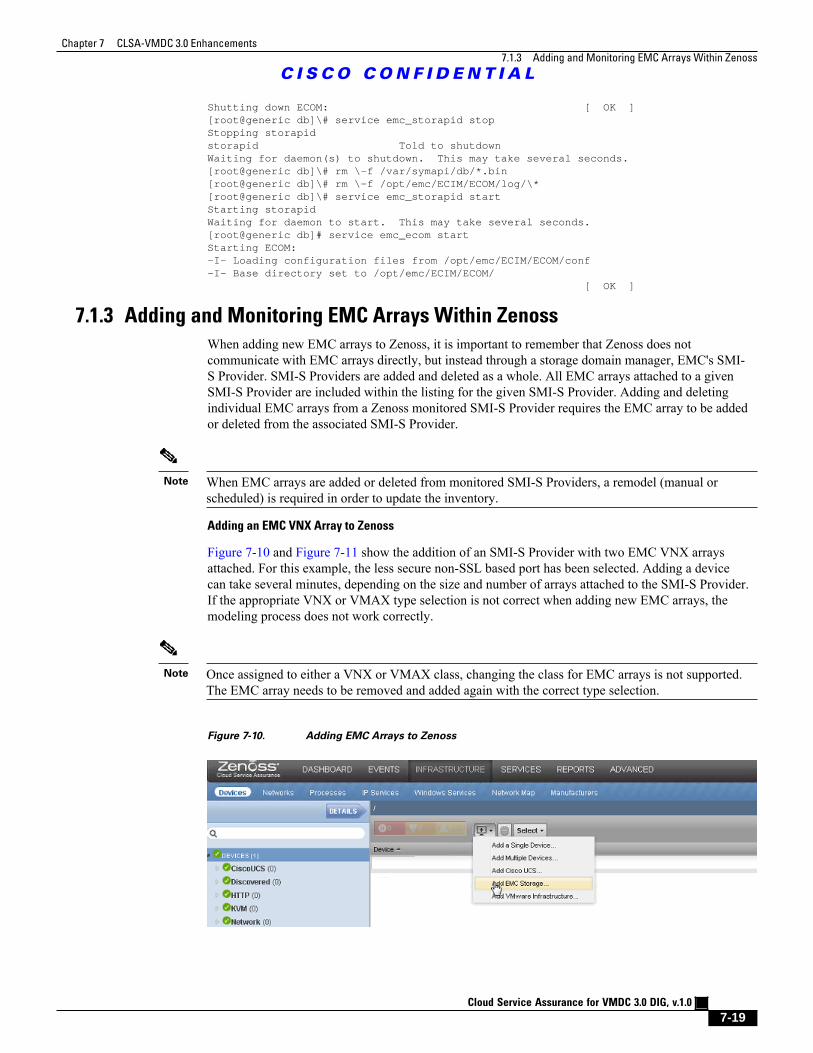
Chapter 7 CLSA-VMDC 3.0 Enhancements
7.1.3 Adding and Monitoring EMC Arrays Within Zenoss
C I S C O C O N F I D E N T I A L
Cloud Service Assurance for VMDC 3.0 DIG, v.1.0
7-19
Shutting down ECOM: [ OK ][root@generic db]\# service emc_storapid stopStopping storapidstorapid Told to shutdownWaiting for daemon(s) to shutdown. This may take several seconds.[root@generic db]\# rm \-f /var/symapi/db/*.bin[root@generic db]\# rm \-f /opt/emc/ECIM/ECOM/log/\*[root@generic db]\# service emc_storapid startStarting storapidWaiting for daemon to start. This may take several seconds.[root@generic db]# service emc_ecom startStarting ECOM:-I- Loading configuration files from /opt/emc/ECIM/ECOM/conf-I- Base directory set to /opt/emc/ECIM/ECOM/ [ OK ]
7.1.3 Adding and Monitoring EMC Arrays Within Zenoss
When adding new EMC arrays to Zenoss, it is important to remember that Zenoss does notcommunicate with EMC arrays directly, but instead through a storage domain manager, EMC's SMI-S Provider. SMI-S Providers are added and deleted as a whole. All EMC arrays attached to a givenSMI-S Provider are included within the listing for the given SMI-S Provider. Adding and deletingindividual EMC arrays from a Zenoss monitored SMI-S Provider requires the EMC array to be addedor deleted from the associated SMI-S Provider.
Note When EMC arrays are added or deleted from monitored SMI-S Providers, a remodel (manual orscheduled) is required in order to update the inventory.
Adding an EMC VNX Array to Zenoss
Figure 7-10 and Figure 7-11 show the addition of an SMI-S Provider with two EMC VNX arraysattached. For this example, the less secure non-SSL based port has been selected. Adding a devicecan take several minutes, depending on the size and number of arrays attached to the SMI-S Provider.If the appropriate VNX or VMAX type selection is not correct when adding new EMC arrays, themodeling process does not work correctly.
Note Once assigned to either a VNX or VMAX class, changing the class for EMC arrays is not supported.The EMC array needs to be removed and added again with the correct type selection.
Figure 7-10. Adding EMC Arrays to Zenoss
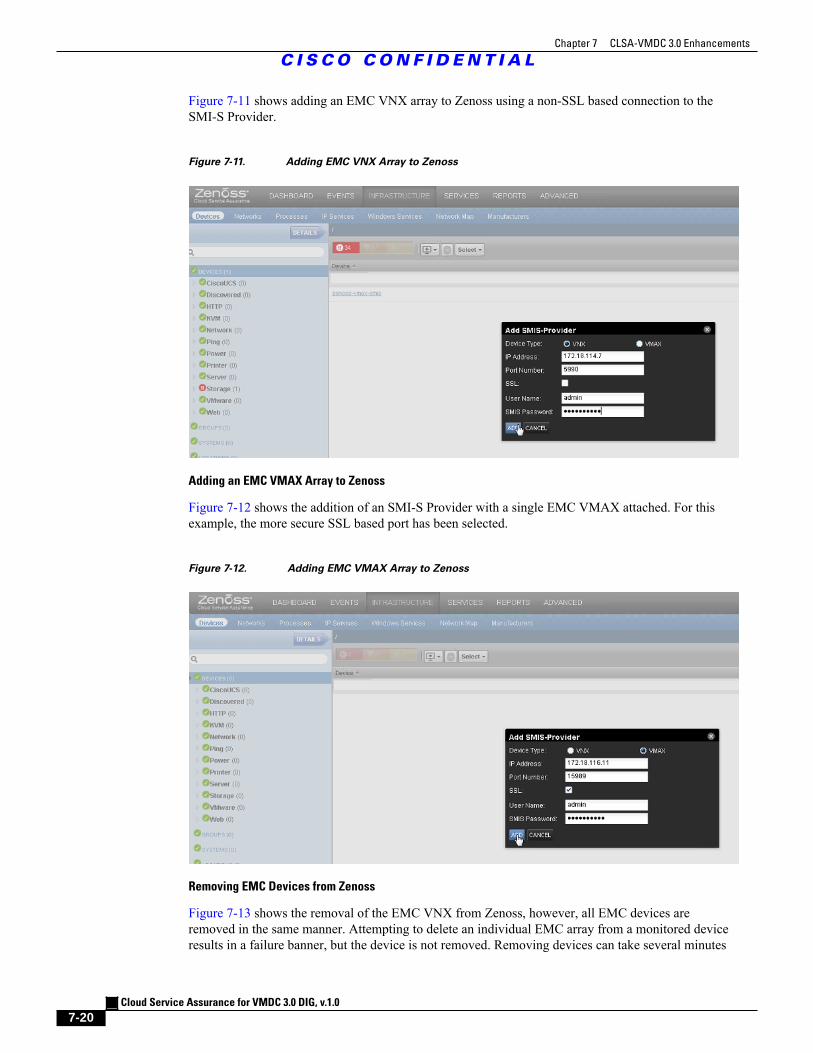
Chapter 7 CLSA-VMDC 3.0 Enhancements
C I S C O C O N F I D E N T I A L
Cloud Service Assurance for VMDC 3.0 DIG, v.1.0
7-20
Figure 7-11 shows adding an EMC VNX array to Zenoss using a non-SSL based connection to theSMI-S Provider.
Figure 7-11. Adding EMC VNX Array to Zenoss
Adding an EMC VMAX Array to Zenoss
Figure 7-12 shows the addition of an SMI-S Provider with a single EMC VMAX attached. For thisexample, the more secure SSL based port has been selected.
Figure 7-12. Adding EMC VMAX Array to Zenoss
Removing EMC Devices from Zenoss
Figure 7-13 shows the removal of the EMC VNX from Zenoss, however, all EMC devices areremoved in the same manner. Attempting to delete an individual EMC array from a monitored deviceresults in a failure banner, but the device is not removed. Removing devices can take several minutes
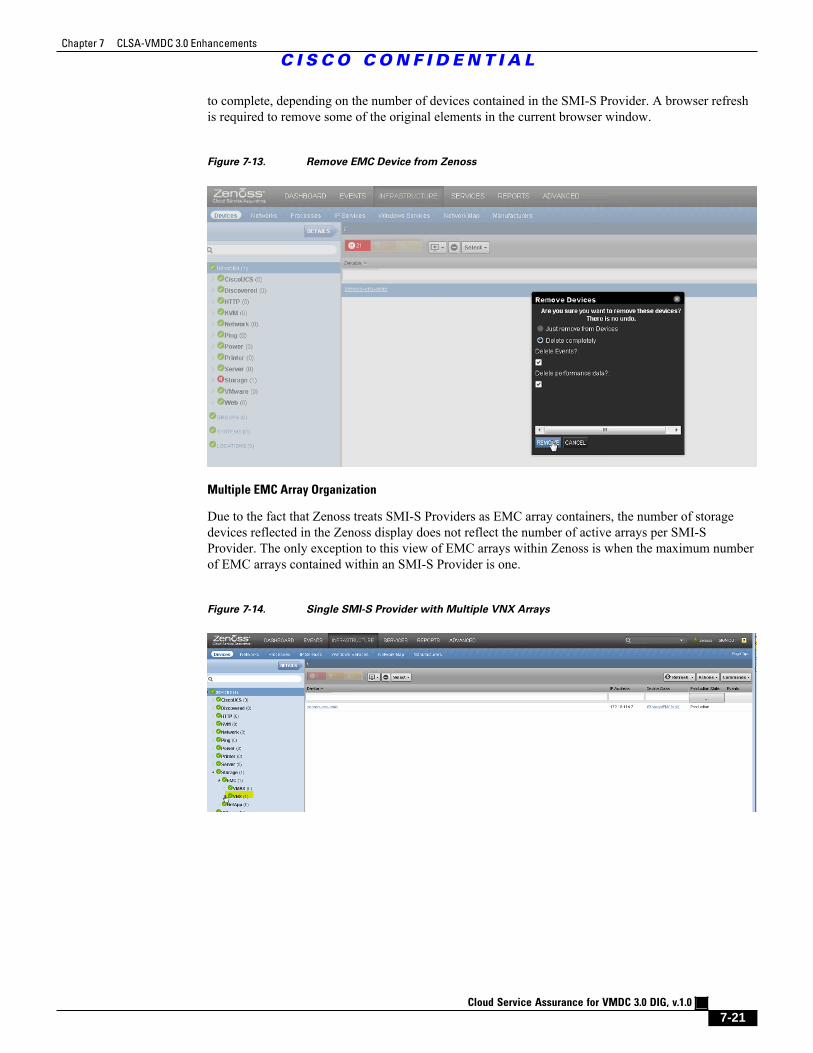
Chapter 7 CLSA-VMDC 3.0 Enhancements
C I S C O C O N F I D E N T I A L
Cloud Service Assurance for VMDC 3.0 DIG, v.1.0
7-21
to complete, depending on the number of devices contained in the SMI-S Provider. A browser refreshis required to remove some of the original elements in the current browser window.
Figure 7-13. Remove EMC Device from Zenoss
Multiple EMC Array Organization
Due to the fact that Zenoss treats SMI-S Providers as EMC array containers, the number of storagedevices reflected in the Zenoss display does not reflect the number of active arrays per SMI-SProvider. The only exception to this view of EMC arrays within Zenoss is when the maximum numberof EMC arrays contained within an SMI-S Provider is one.
Figure 7-14. Single SMI-S Provider with Multiple VNX Arrays
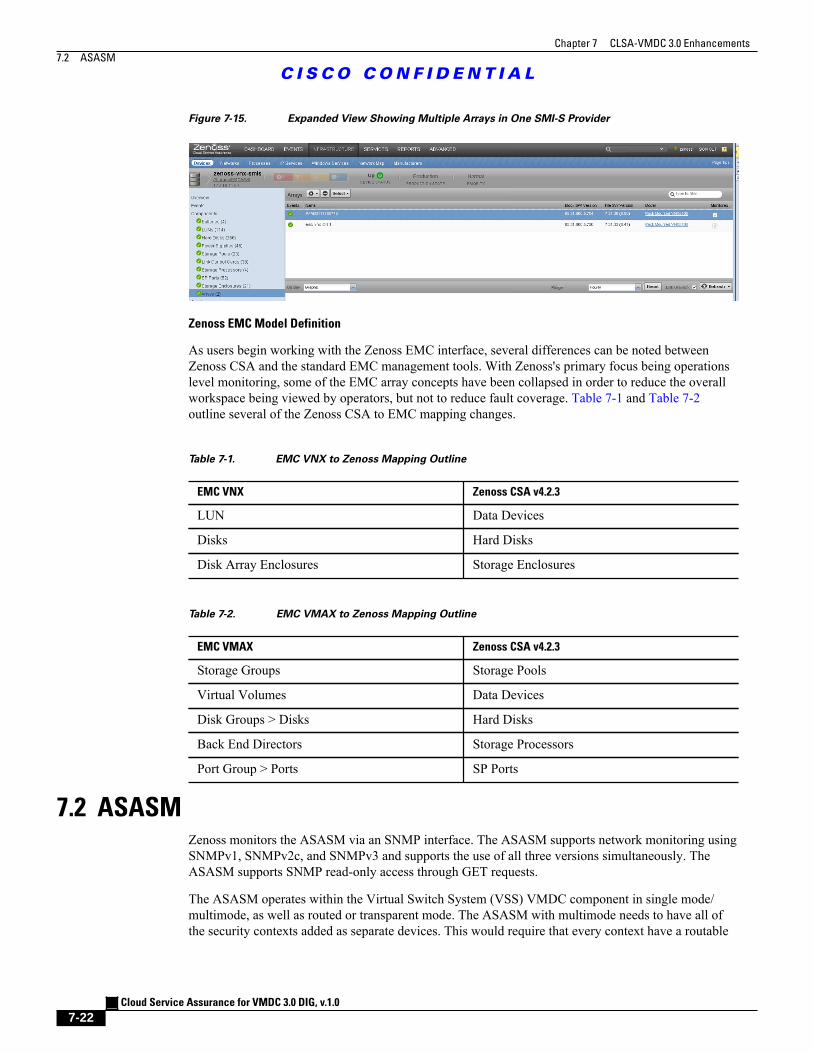
Chapter 7 CLSA-VMDC 3.0 Enhancements
7.2 ASASM
C I S C O C O N F I D E N T I A L
Cloud Service Assurance for VMDC 3.0 DIG, v.1.0
7-22
Figure 7-15. Expanded View Showing Multiple Arrays in One SMI-S Provider
Zenoss EMC Model Definition
As users begin working with the Zenoss EMC interface, several differences can be noted betweenZenoss CSA and the standard EMC management tools. With Zenoss's primary focus being operationslevel monitoring, some of the EMC array concepts have been collapsed in order to reduce the overallworkspace being viewed by operators, but not to reduce fault coverage. Table 7-1 and Table 7-2outline several of the Zenoss CSA to EMC mapping changes.
Table 7-1. EMC VNX to Zenoss Mapping Outline
EMC VNX Zenoss CSA v4.2.3
LUN Data Devices
Disks Hard Disks
Disk Array Enclosures Storage Enclosures
Table 7-2. EMC VMAX to Zenoss Mapping Outline
EMC VMAX Zenoss CSA v4.2.3
Storage Groups Storage Pools
Virtual Volumes Data Devices
Disk Groups > Disks Hard Disks
Back End Directors Storage Processors
Port Group > Ports SP Ports
7.2 ASASMZenoss monitors the ASASM via an SNMP interface. The ASASM supports network monitoring usingSNMPv1, SNMPv2c, and SNMPv3 and supports the use of all three versions simultaneously. TheASASM supports SNMP read-only access through GET requests.
The ASASM operates within the Virtual Switch System (VSS) VMDC component in single mode/multimode, as well as routed or transparent mode. The ASASM with multimode needs to have all ofthe security contexts added as separate devices. This would require that every context have a routable
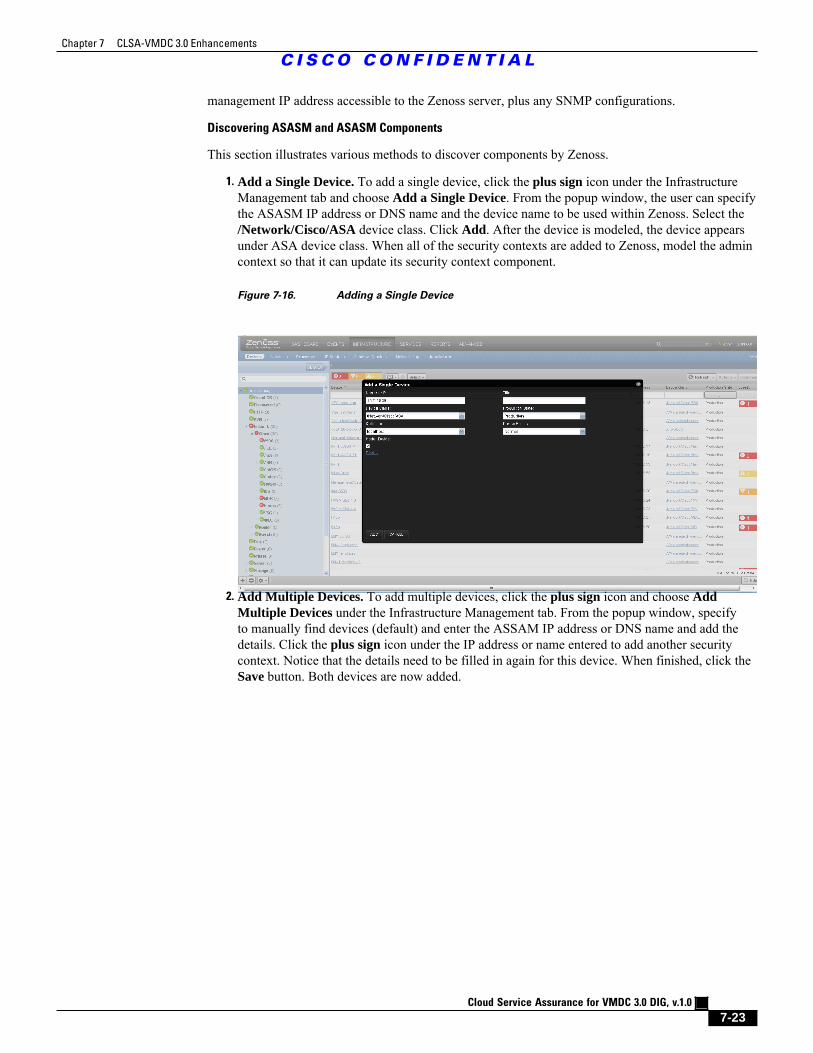
Chapter 7 CLSA-VMDC 3.0 Enhancements
C I S C O C O N F I D E N T I A L
Cloud Service Assurance for VMDC 3.0 DIG, v.1.0
7-23
management IP address accessible to the Zenoss server, plus any SNMP configurations.
Discovering ASASM and ASASM Components
This section illustrates various methods to discover components by Zenoss.
1. Add a Single Device. To add a single device, click the plus sign icon under the InfrastructureManagement tab and choose Add a Single Device. From the popup window, the user can specifythe ASASM IP address or DNS name and the device name to be used within Zenoss. Select the/Network/Cisco/ASA device class. Click Add. After the device is modeled, the device appearsunder ASA device class. When all of the security contexts are added to Zenoss, model the admincontext so that it can update its security context component.
Figure 7-16. Adding a Single Device
2. Add Multiple Devices. To add multiple devices, click the plus sign icon and choose AddMultiple Devices under the Infrastructure Management tab. From the popup window, specifyto manually find devices (default) and enter the ASSAM IP address or DNS name and add thedetails. Click the plus sign icon under the IP address or name entered to add another securitycontext. Notice that the details need to be filled in again for this device. When finished, click theSave button. Both devices are now added.
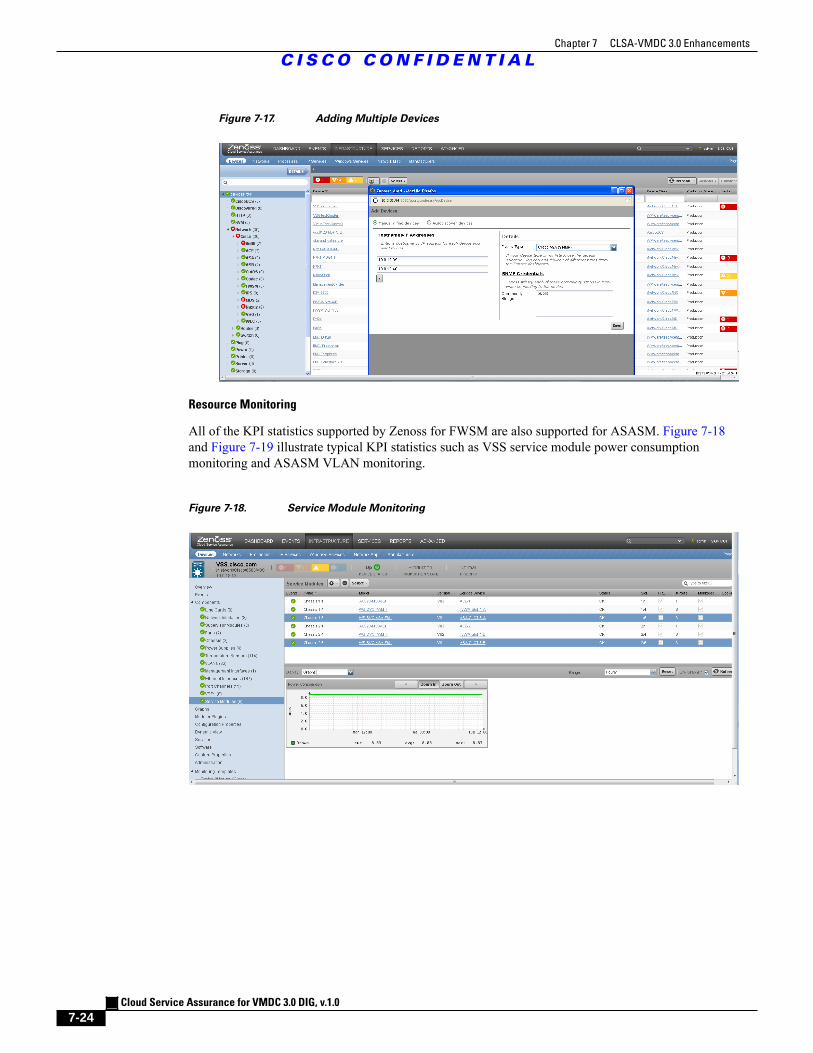
Chapter 7 CLSA-VMDC 3.0 Enhancements
C I S C O C O N F I D E N T I A L
Cloud Service Assurance for VMDC 3.0 DIG, v.1.0
7-24
Figure 7-17. Adding Multiple Devices
Resource Monitoring
All of the KPI statistics supported by Zenoss for FWSM are also supported for ASASM. Figure 7-18and Figure 7-19 illustrate typical KPI statistics such as VSS service module power consumptionmonitoring and ASASM VLAN monitoring.
Figure 7-18. Service Module Monitoring
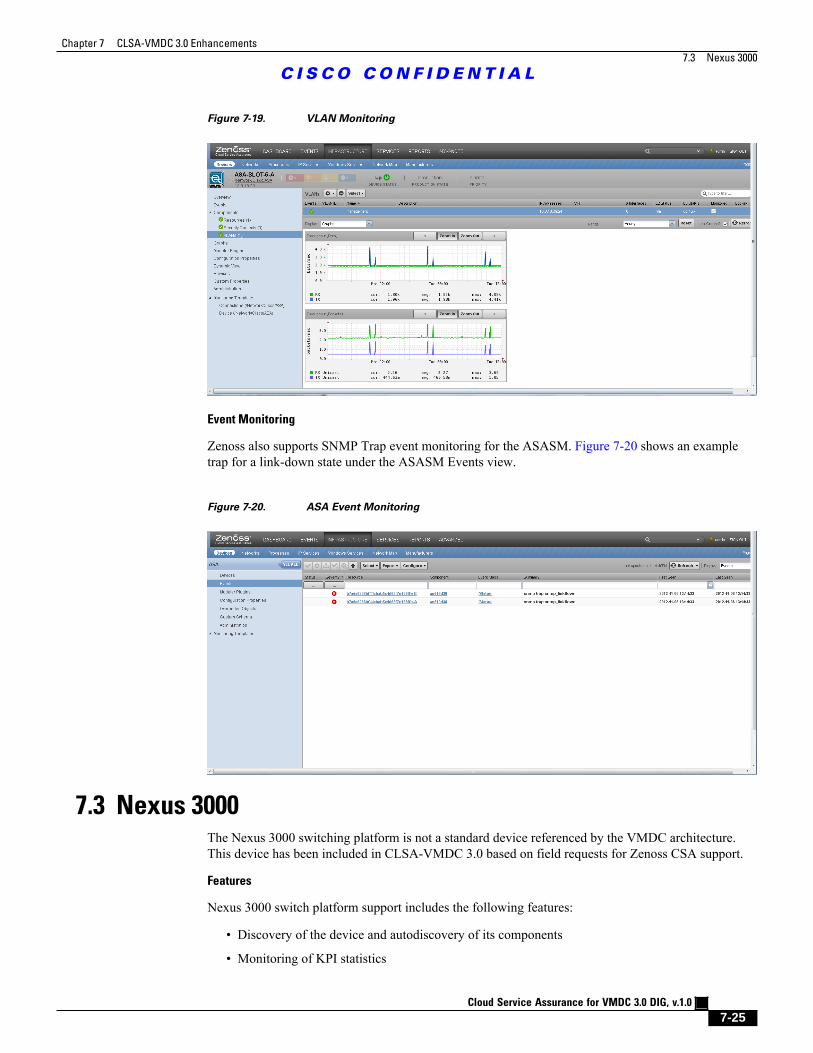
Chapter 7 CLSA-VMDC 3.0 Enhancements
7.3 Nexus 3000
C I S C O C O N F I D E N T I A L
Cloud Service Assurance for VMDC 3.0 DIG, v.1.0
7-25
Figure 7-19. VLAN Monitoring
Event Monitoring
Zenoss also supports SNMP Trap event monitoring for the ASASM. Figure 7-20 shows an exampletrap for a link-down state under the ASASM Events view.
Figure 7-20. ASA Event Monitoring
7.3 Nexus 3000The Nexus 3000 switching platform is not a standard device referenced by the VMDC architecture.This device has been included in CLSA-VMDC 3.0 based on field requests for Zenoss CSA support.
Features
Nexus 3000 switch platform support includes the following features:
• Discovery of the device and autodiscovery of its components
• Monitoring of KPI statistics
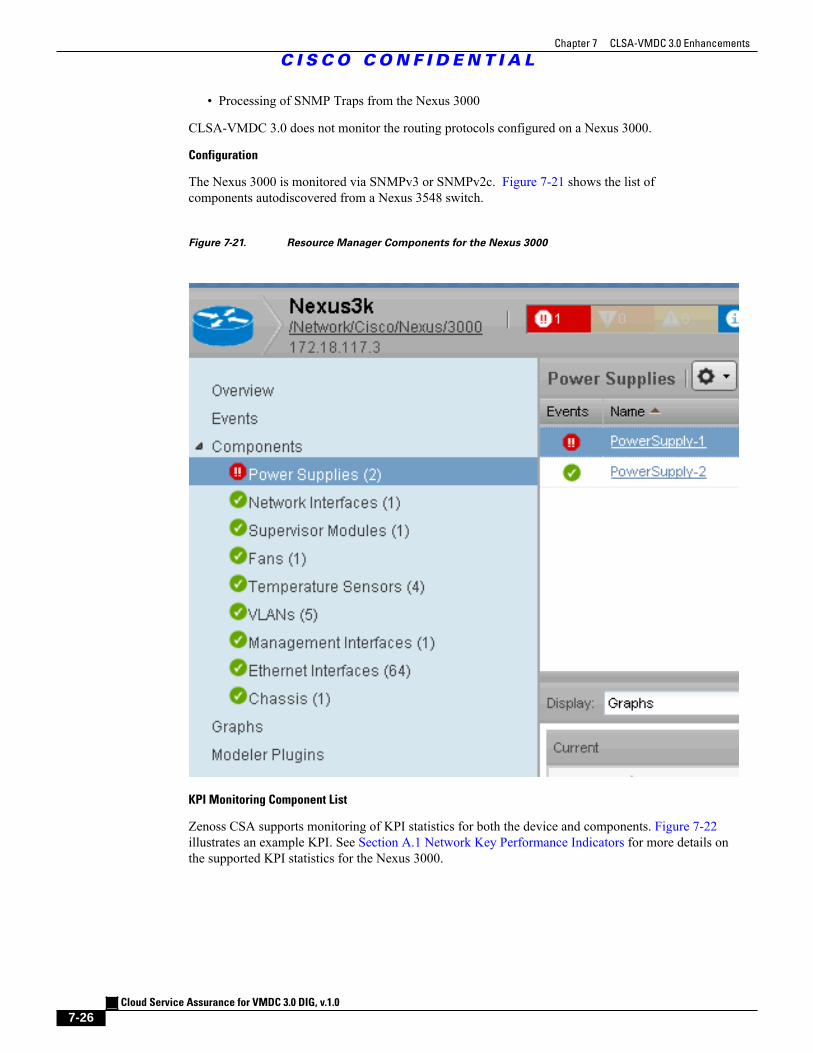
Chapter 7 CLSA-VMDC 3.0 Enhancements
C I S C O C O N F I D E N T I A L
Cloud Service Assurance for VMDC 3.0 DIG, v.1.0
7-26
• Processing of SNMP Traps from the Nexus 3000
CLSA-VMDC 3.0 does not monitor the routing protocols configured on a Nexus 3000.
Configuration
The Nexus 3000 is monitored via SNMPv3 or SNMPv2c. Figure 7-21 shows the list ofcomponents autodiscovered from a Nexus 3548 switch.
Figure 7-21. Resource Manager Components for the Nexus 3000
KPI Monitoring Component List
Zenoss CSA supports monitoring of KPI statistics for both the device and components. Figure 7-22illustrates an example KPI. See Section A.1 Network Key Performance Indicators for more details onthe supported KPI statistics for the Nexus 3000.
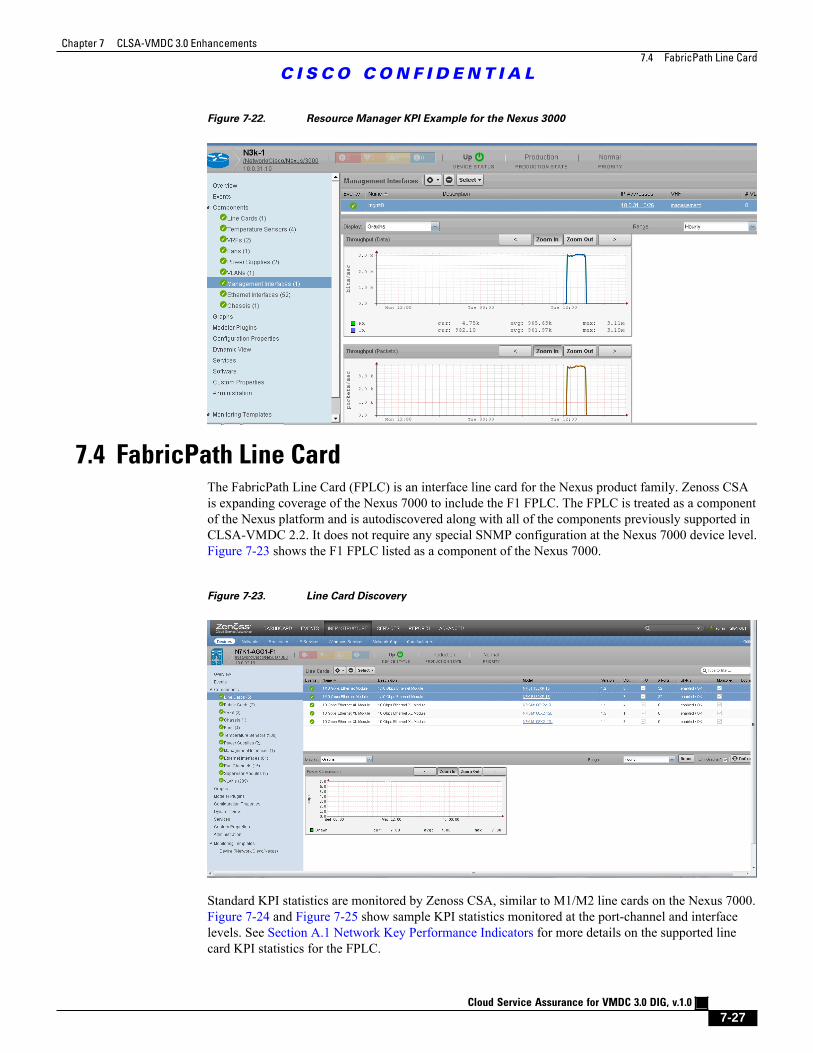
Chapter 7 CLSA-VMDC 3.0 Enhancements
7.4 FabricPath Line Card
C I S C O C O N F I D E N T I A L
Cloud Service Assurance for VMDC 3.0 DIG, v.1.0
7-27
Figure 7-22. Resource Manager KPI Example for the Nexus 3000
7.4 FabricPath Line CardThe FabricPath Line Card (FPLC) is an interface line card for the Nexus product family. Zenoss CSAis expanding coverage of the Nexus 7000 to include the F1 FPLC. The FPLC is treated as a componentof the Nexus platform and is autodiscovered along with all of the components previously supported inCLSA-VMDC 2.2. It does not require any special SNMP configuration at the Nexus 7000 device level.Figure 7-23 shows the F1 FPLC listed as a component of the Nexus 7000.
Figure 7-23. Line Card Discovery
Standard KPI statistics are monitored by Zenoss CSA, similar to M1/M2 line cards on the Nexus 7000.Figure 7-24 and Figure 7-25 show sample KPI statistics monitored at the port-channel and interfacelevels. See Section A.1 Network Key Performance Indicators for more details on the supported linecard KPI statistics for the FPLC.
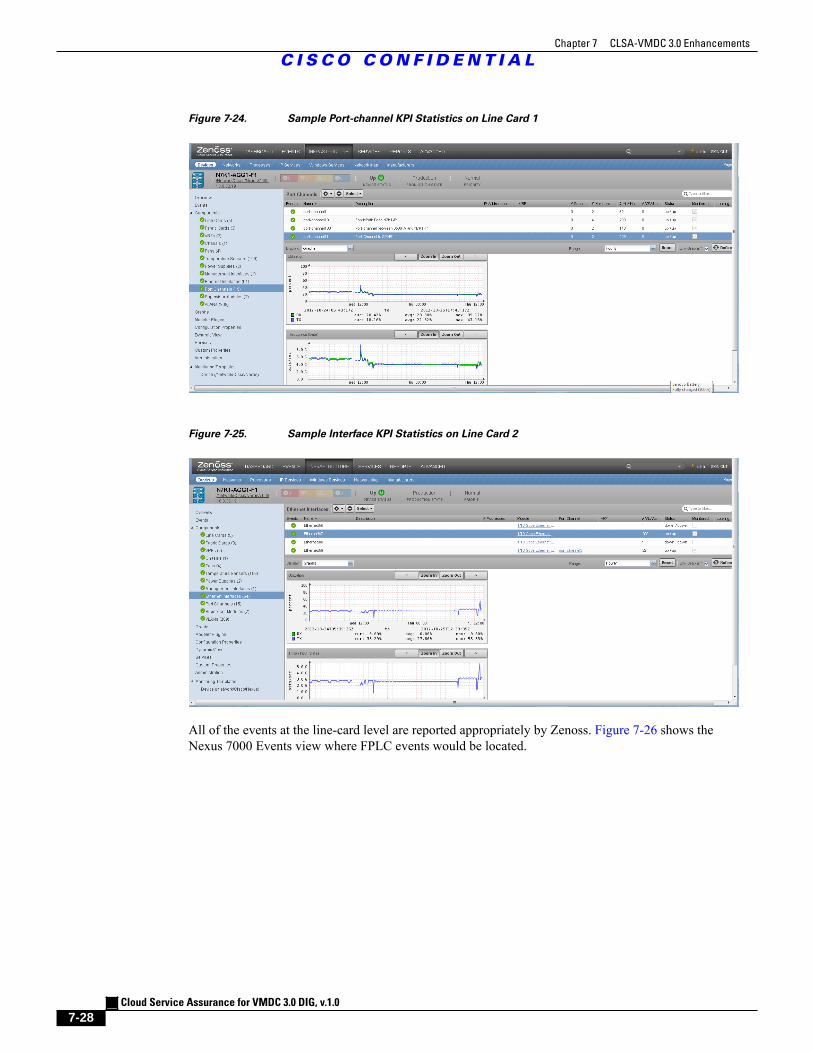
Chapter 7 CLSA-VMDC 3.0 Enhancements
C I S C O C O N F I D E N T I A L
Cloud Service Assurance for VMDC 3.0 DIG, v.1.0
7-28
Figure 7-24. Sample Port-channel KPI Statistics on Line Card 1
Figure 7-25. Sample Interface KPI Statistics on Line Card 2
All of the events at the line-card level are reported appropriately by Zenoss. Figure 7-26 shows theNexus 7000 Events view where FPLC events would be located.
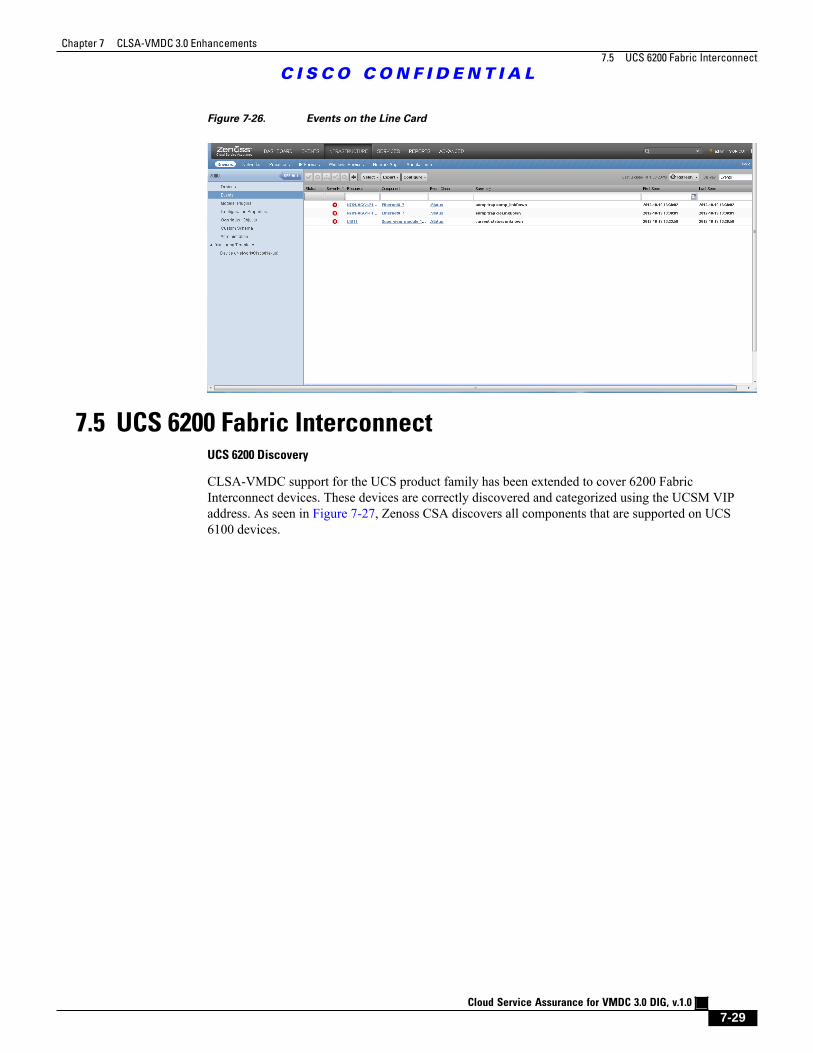
Chapter 7 CLSA-VMDC 3.0 Enhancements
7.5 UCS 6200 Fabric Interconnect
C I S C O C O N F I D E N T I A L
Cloud Service Assurance for VMDC 3.0 DIG, v.1.0
7-29
Figure 7-26. Events on the Line Card
7.5 UCS 6200 Fabric InterconnectUCS 6200 Discovery
CLSA-VMDC support for the UCS product family has been extended to cover 6200 FabricInterconnect devices. These devices are correctly discovered and categorized using the UCSM VIPaddress. As seen in Figure 7-27, Zenoss CSA discovers all components that are supported on UCS6100 devices.
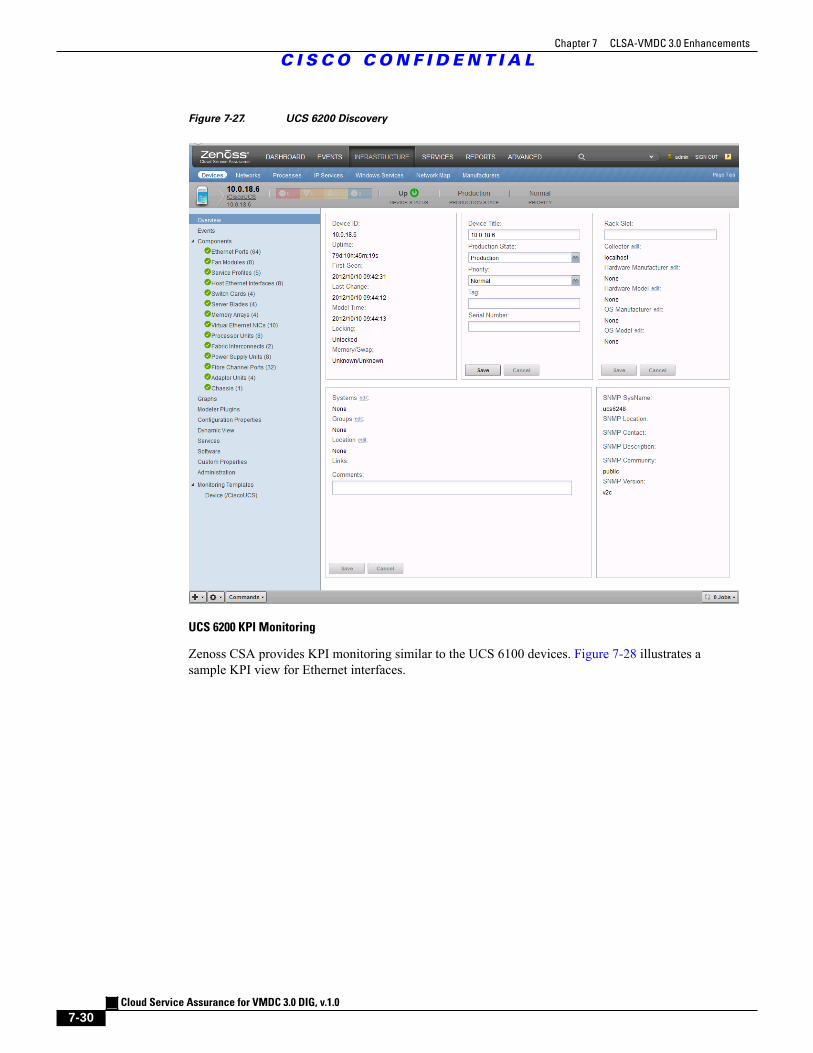
Chapter 7 CLSA-VMDC 3.0 Enhancements
C I S C O C O N F I D E N T I A L
Cloud Service Assurance for VMDC 3.0 DIG, v.1.0
7-30
Figure 7-27. UCS 6200 Discovery
UCS 6200 KPI Monitoring
Zenoss CSA provides KPI monitoring similar to the UCS 6100 devices. Figure 7-28 illustrates asample KPI view for Ethernet interfaces.
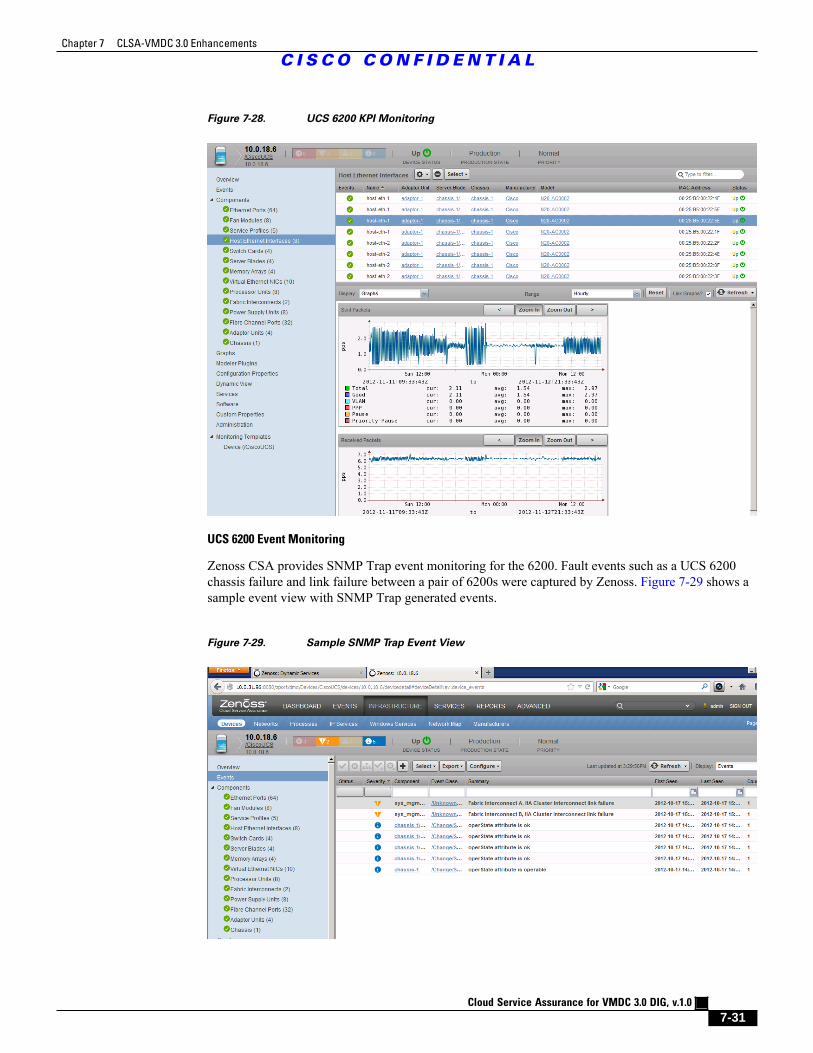
Chapter 7 CLSA-VMDC 3.0 Enhancements
C I S C O C O N F I D E N T I A L
Cloud Service Assurance for VMDC 3.0 DIG, v.1.0
7-31
Figure 7-28. UCS 6200 KPI Monitoring
UCS 6200 Event Monitoring
Zenoss CSA provides SNMP Trap event monitoring for the 6200. Fault events such as a UCS 6200chassis failure and link failure between a pair of 6200s were captured by Zenoss. Figure 7-29 shows asample event view with SNMP Trap generated events.
Figure 7-29. Sample SNMP Trap Event View
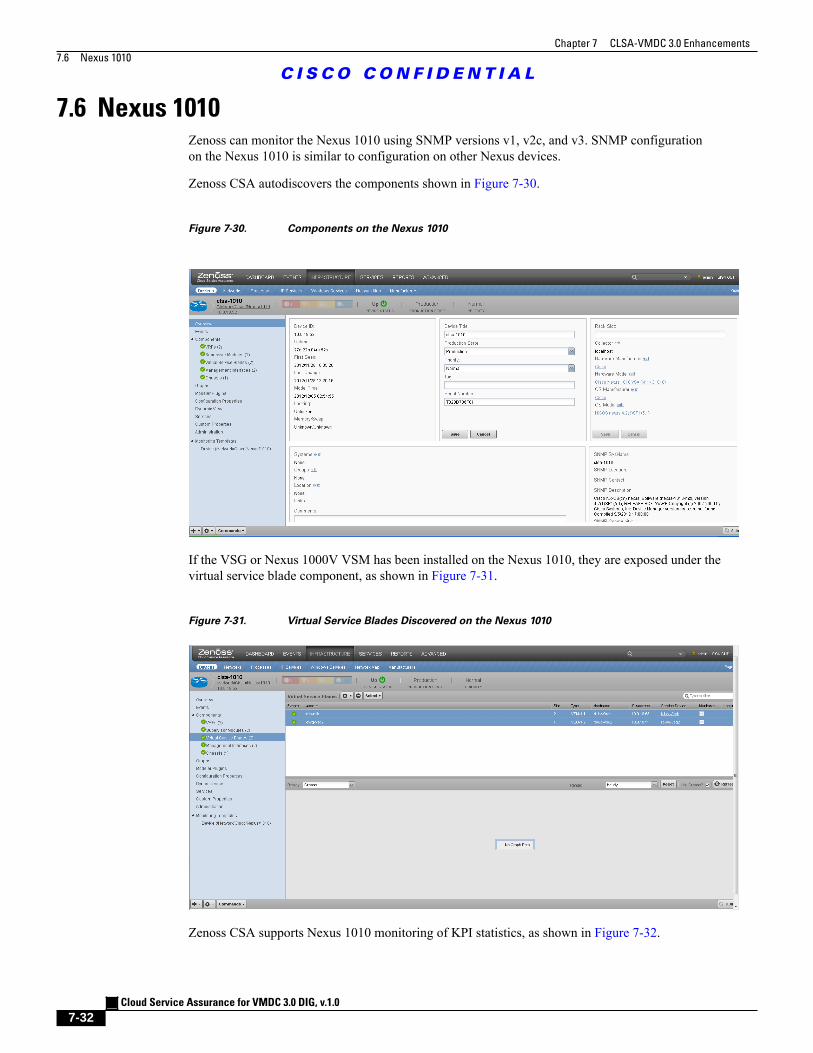
Chapter 7 CLSA-VMDC 3.0 Enhancements
7.6 Nexus 1010
C I S C O C O N F I D E N T I A L
Cloud Service Assurance for VMDC 3.0 DIG, v.1.0
7-32
7.6 Nexus 1010Zenoss can monitor the Nexus 1010 using SNMP versions v1, v2c, and v3. SNMP configurationon the Nexus 1010 is similar to configuration on other Nexus devices.
Zenoss CSA autodiscovers the components shown in Figure 7-30.
Figure 7-30. Components on the Nexus 1010
If the VSG or Nexus 1000V VSM has been installed on the Nexus 1010, they are exposed under thevirtual service blade component, as shown in Figure 7-31.
Figure 7-31. Virtual Service Blades Discovered on the Nexus 1010
Zenoss CSA supports Nexus 1010 monitoring of KPI statistics, as shown in Figure 7-32.
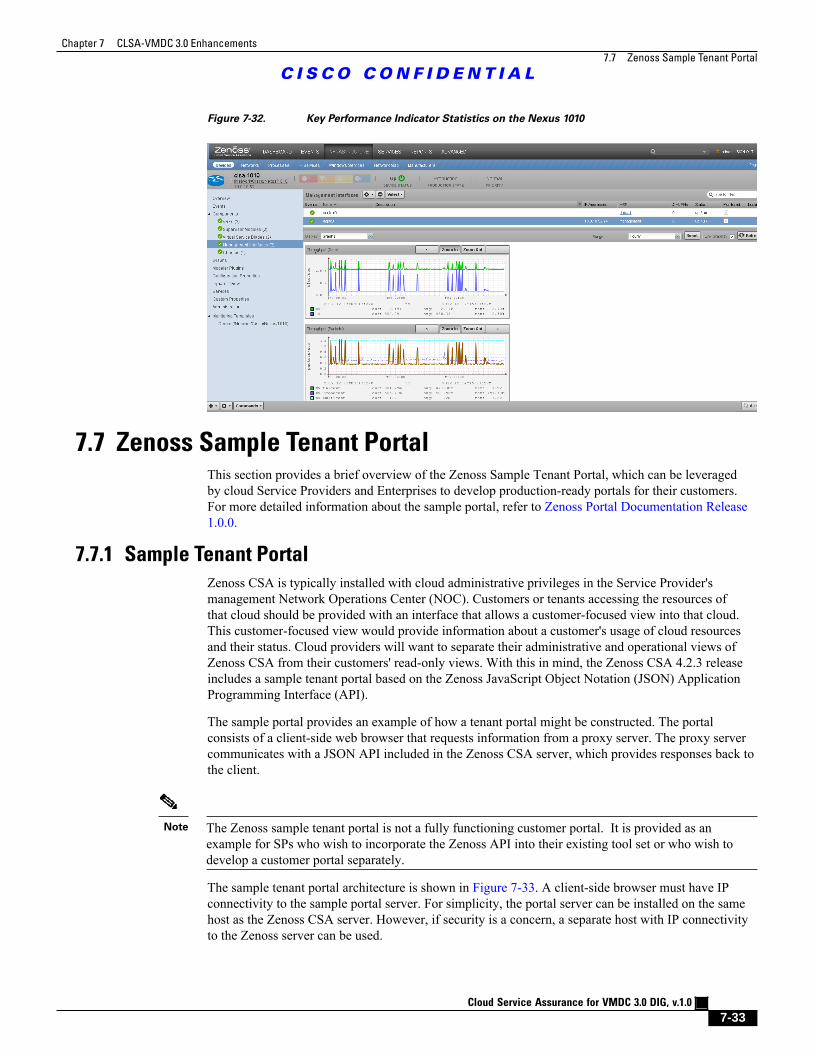
Chapter 7 CLSA-VMDC 3.0 Enhancements
7.7 Zenoss Sample Tenant Portal
C I S C O C O N F I D E N T I A L
Cloud Service Assurance for VMDC 3.0 DIG, v.1.0
7-33
Figure 7-32. Key Performance Indicator Statistics on the Nexus 1010
7.7 Zenoss Sample Tenant PortalThis section provides a brief overview of the Zenoss Sample Tenant Portal, which can be leveragedby cloud Service Providers and Enterprises to develop production-ready portals for their customers.For more detailed information about the sample portal, refer to Zenoss Portal Documentation Release1.0.0.
7.7.1 Sample Tenant Portal
Zenoss CSA is typically installed with cloud administrative privileges in the Service Provider'smanagement Network Operations Center (NOC). Customers or tenants accessing the resources ofthat cloud should be provided with an interface that allows a customer-focused view into that cloud.This customer-focused view would provide information about a customer's usage of cloud resourcesand their status. Cloud providers will want to separate their administrative and operational views ofZenoss CSA from their customers' read-only views. With this in mind, the Zenoss CSA 4.2.3 releaseincludes a sample tenant portal based on the Zenoss JavaScript Object Notation (JSON) ApplicationProgramming Interface (API).
The sample portal provides an example of how a tenant portal might be constructed. The portalconsists of a client-side web browser that requests information from a proxy server. The proxy servercommunicates with a JSON API included in the Zenoss CSA server, which provides responses back tothe client.
Note The Zenoss sample tenant portal is not a fully functioning customer portal. It is provided as anexample for SPs who wish to incorporate the Zenoss API into their existing tool set or who wish todevelop a customer portal separately.
The sample tenant portal architecture is shown in Figure 7-33. A client-side browser must have IPconnectivity to the sample portal server. For simplicity, the portal server can be installed on the samehost as the Zenoss CSA server. However, if security is a concern, a separate host with IP connectivityto the Zenoss server can be used.
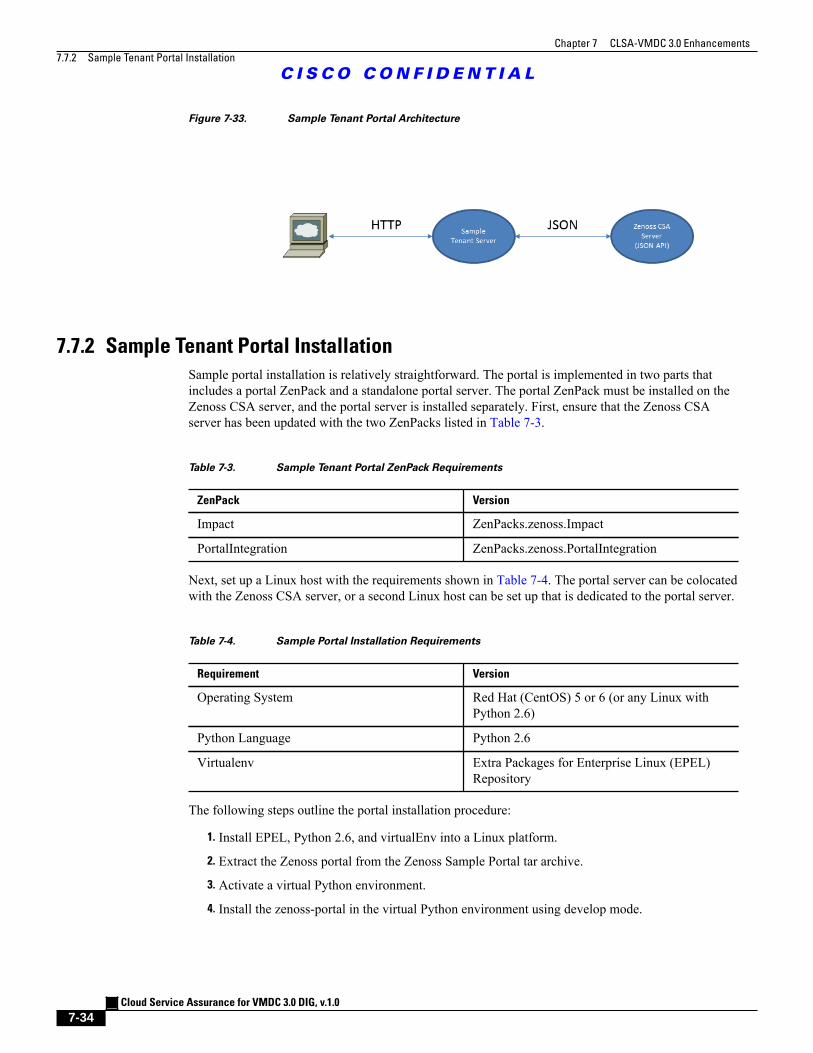
Chapter 7 CLSA-VMDC 3.0 Enhancements
7.7.2 Sample Tenant Portal Installation
C I S C O C O N F I D E N T I A L
Cloud Service Assurance for VMDC 3.0 DIG, v.1.0
7-34
Figure 7-33. Sample Tenant Portal Architecture
7.7.2 Sample Tenant Portal Installation
Sample portal installation is relatively straightforward. The portal is implemented in two parts thatincludes a portal ZenPack and a standalone portal server. The portal ZenPack must be installed on theZenoss CSA server, and the portal server is installed separately. First, ensure that the Zenoss CSAserver has been updated with the two ZenPacks listed in Table 7-3.
Table 7-3. Sample Tenant Portal ZenPack Requirements
ZenPack Version
Impact ZenPacks.zenoss.Impact
PortalIntegration ZenPacks.zenoss.PortalIntegration
Next, set up a Linux host with the requirements shown in Table 7-4. The portal server can be colocatedwith the Zenoss CSA server, or a second Linux host can be set up that is dedicated to the portal server.
Table 7-4. Sample Portal Installation Requirements
Requirement Version
Operating System Red Hat (CentOS) 5 or 6 (or any Linux withPython 2.6)
Python Language Python 2.6
Virtualenv Extra Packages for Enterprise Linux (EPEL)Repository
The following steps outline the portal installation procedure:
1. Install EPEL, Python 2.6, and virtualEnv into a Linux platform.
2. Extract the Zenoss portal from the Zenoss Sample Portal tar archive.
3. Activate a virtual Python environment.
4. Install the zenoss-portal in the virtual Python environment using develop mode.
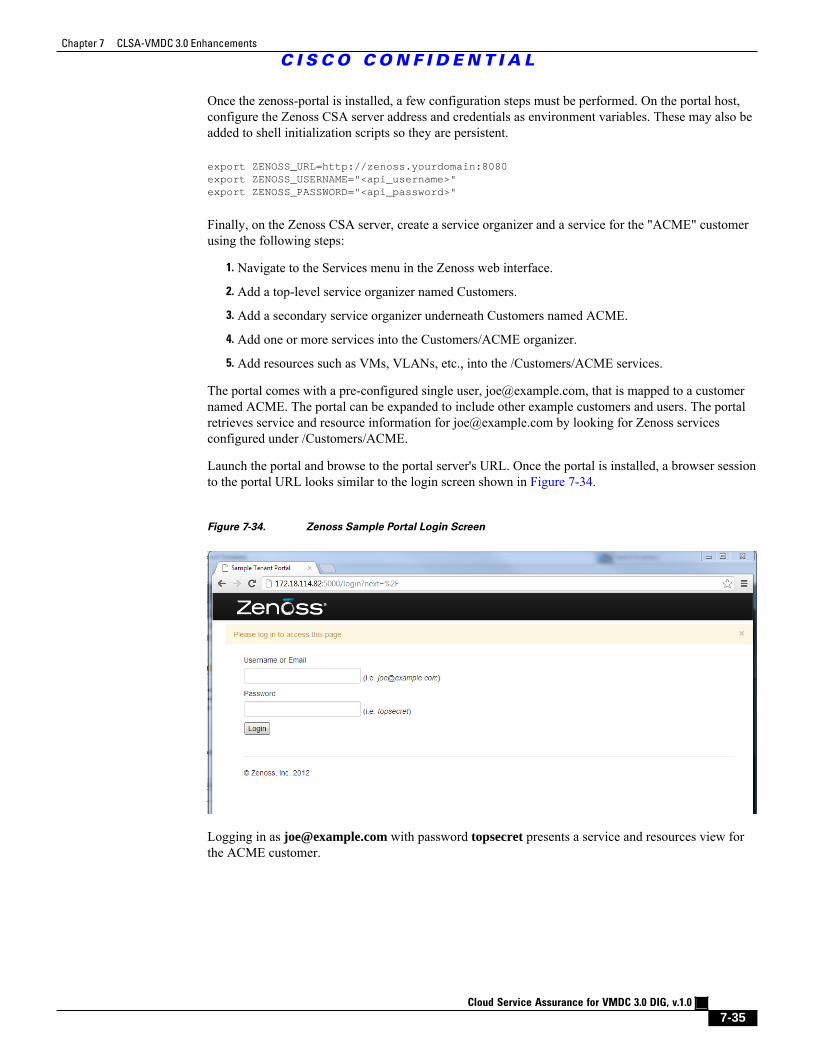
Chapter 7 CLSA-VMDC 3.0 Enhancements
C I S C O C O N F I D E N T I A L
Cloud Service Assurance for VMDC 3.0 DIG, v.1.0
7-35
Once the zenoss-portal is installed, a few configuration steps must be performed. On the portal host,configure the Zenoss CSA server address and credentials as environment variables. These may also beadded to shell initialization scripts so they are persistent.
export ZENOSS_URL=http://zenoss.yourdomain:8080export ZENOSS_USERNAME="<api_username>"export ZENOSS_PASSWORD="<api_password>"
Finally, on the Zenoss CSA server, create a service organizer and a service for the "ACME" customerusing the following steps:
1. Navigate to the Services menu in the Zenoss web interface.
2. Add a top-level service organizer named Customers.
3. Add a secondary service organizer underneath Customers named ACME.
4. Add one or more services into the Customers/ACME organizer.
5. Add resources such as VMs, VLANs, etc., into the /Customers/ACME services.
The portal comes with a pre-configured single user, [email protected], that is mapped to a customernamed ACME. The portal can be expanded to include other example customers and users. The portalretrieves service and resource information for [email protected] by looking for Zenoss servicesconfigured under /Customers/ACME.
Launch the portal and browse to the portal server's URL. Once the portal is installed, a browser sessionto the portal URL looks similar to the login screen shown in Figure 7-34.
Figure 7-34. Zenoss Sample Portal Login Screen
Logging in as [email protected] with password topsecret presents a service and resources view forthe ACME customer.
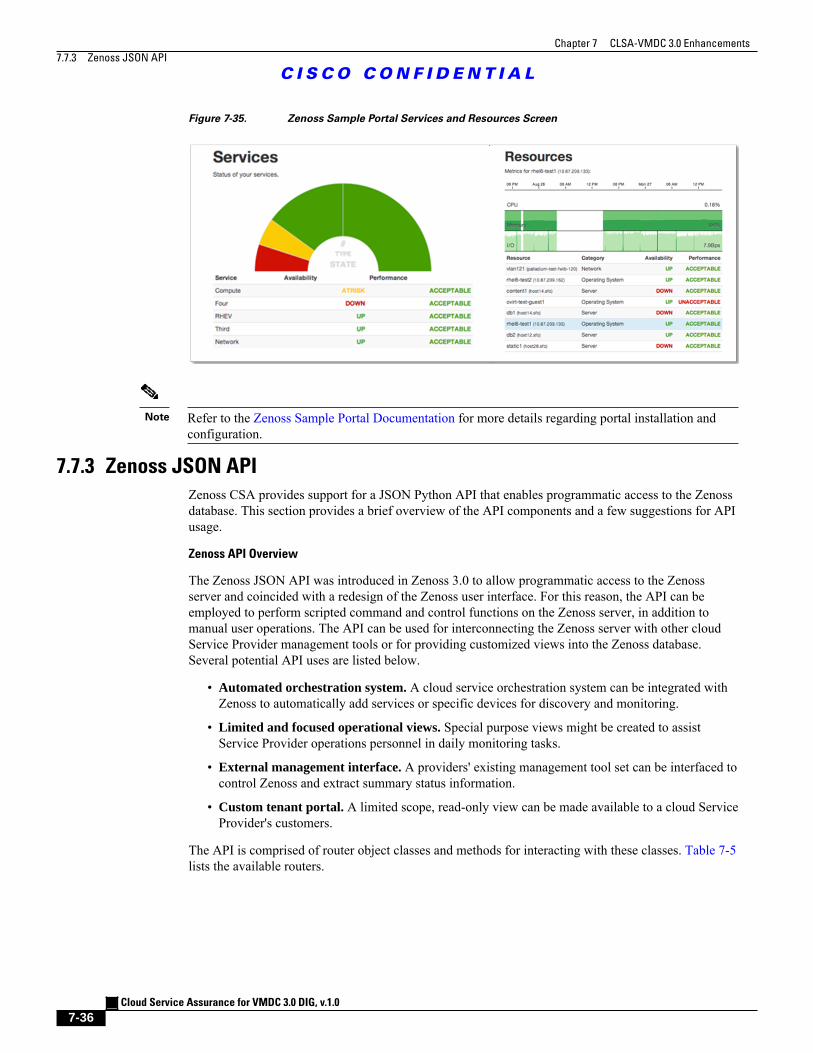
Chapter 7 CLSA-VMDC 3.0 Enhancements
7.7.3 Zenoss JSON API
C I S C O C O N F I D E N T I A L
Cloud Service Assurance for VMDC 3.0 DIG, v.1.0
7-36
Figure 7-35. Zenoss Sample Portal Services and Resources Screen
Note Refer to the Zenoss Sample Portal Documentation for more details regarding portal installation andconfiguration.
7.7.3 Zenoss JSON API
Zenoss CSA provides support for a JSON Python API that enables programmatic access to the Zenossdatabase. This section provides a brief overview of the API components and a few suggestions for APIusage.
Zenoss API Overview
The Zenoss JSON API was introduced in Zenoss 3.0 to allow programmatic access to the Zenossserver and coincided with a redesign of the Zenoss user interface. For this reason, the API can beemployed to perform scripted command and control functions on the Zenoss server, in addition tomanual user operations. The API can be used for interconnecting the Zenoss server with other cloudService Provider management tools or for providing customized views into the Zenoss database.Several potential API uses are listed below.
• Automated orchestration system. A cloud service orchestration system can be integrated withZenoss to automatically add services or specific devices for discovery and monitoring.
• Limited and focused operational views. Special purpose views might be created to assistService Provider operations personnel in daily monitoring tasks.
• External management interface. A providers' existing management tool set can be interfaced tocontrol Zenoss and extract summary status information.
• Custom tenant portal. A limited scope, read-only view can be made available to a cloud ServiceProvider's customers.
The API is comprised of router object classes and methods for interacting with these classes. Table 7-5lists the available routers.
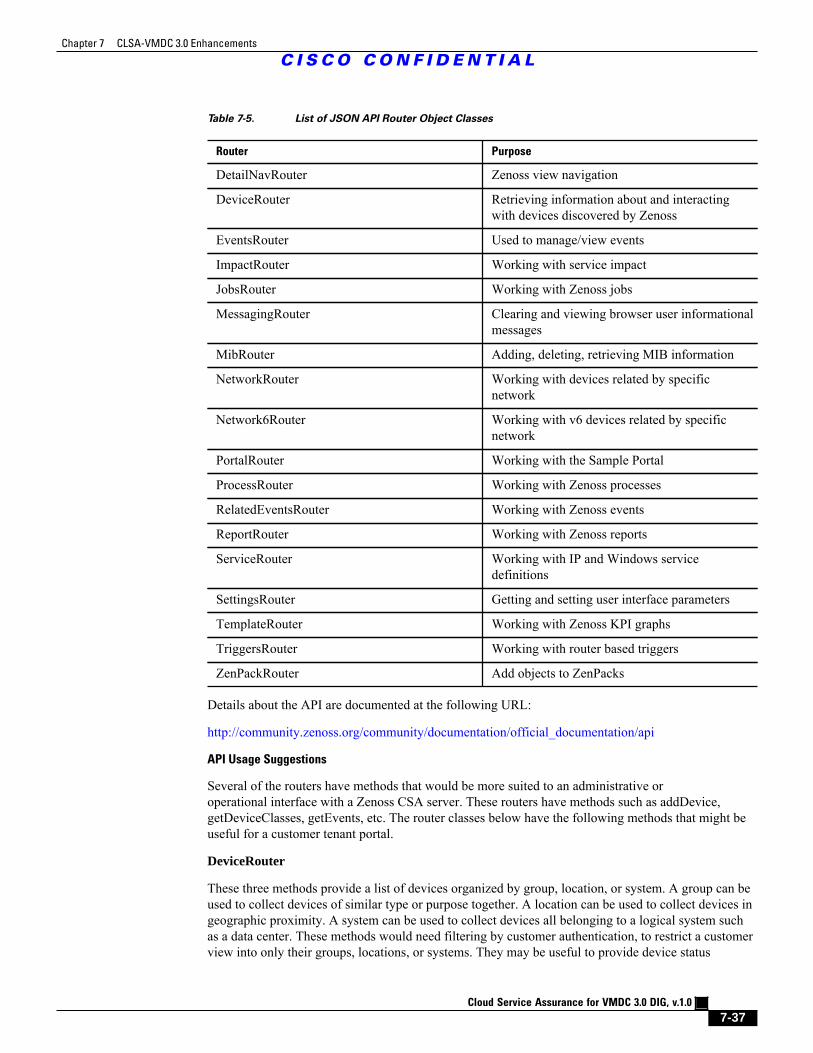
Chapter 7 CLSA-VMDC 3.0 Enhancements
C I S C O C O N F I D E N T I A L
Cloud Service Assurance for VMDC 3.0 DIG, v.1.0
7-37
Table 7-5. List of JSON API Router Object Classes
Router Purpose
DetailNavRouter Zenoss view navigation
DeviceRouter Retrieving information about and interactingwith devices discovered by Zenoss
EventsRouter Used to manage/view events
ImpactRouter Working with service impact
JobsRouter Working with Zenoss jobs
MessagingRouter Clearing and viewing browser user informationalmessages
MibRouter Adding, deleting, retrieving MIB information
NetworkRouter Working with devices related by specificnetwork
Network6Router Working with v6 devices related by specificnetwork
PortalRouter Working with the Sample Portal
ProcessRouter Working with Zenoss processes
RelatedEventsRouter Working with Zenoss events
ReportRouter Working with Zenoss reports
ServiceRouter Working with IP and Windows servicedefinitions
SettingsRouter Getting and setting user interface parameters
TemplateRouter Working with Zenoss KPI graphs
TriggersRouter Working with router based triggers
ZenPackRouter Add objects to ZenPacks
Details about the API are documented at the following URL:
http://community.zenoss.org/community/documentation/official_documentation/api
API Usage Suggestions
Several of the routers have methods that would be more suited to an administrative oroperational interface with a Zenoss CSA server. These routers have methods such as addDevice,getDeviceClasses, getEvents, etc. The router classes below have the following methods that might beuseful for a customer tenant portal.
DeviceRouter
These three methods provide a list of devices organized by group, location, or system. A group can beused to collect devices of similar type or purpose together. A location can be used to collect devices ingeographic proximity. A system can be used to collect devices all belonging to a logical system suchas a data center. These methods would need filtering by customer authentication, to restrict a customerview into only their groups, locations, or systems. They may be useful to provide device status
Chapter 7 CLSA-VMDC 3.0 Enhancements
C I S C O C O N F I D E N T I A L
Cloud Service Assurance for VMDC 3.0 DIG, v.1.0
7-38
information for a customer, but it may be preferable to only provide a logical view of a customer'sservices and not the specific equipment which may be shared in a public cloud.
• getGroups - get a list of all groups
• getLocations - get a list of all locations
• getSystems - get a list of all systems
ImpactRouter
Much of this router class will have administrative methods not likely useful to a CLSA customer. Thefollowing methods may be helpful:
• getDependencies - gets every item currently impacting a dynamic service
• getInfo - retrieve information about a dynamic service
• getInfogetInfoFromGuid - get information about a dynamic service
• getInstances - get a list of dynamic services
• getServices - retrieves info objects for services
• getTree - returns dynamic service tree
RelatedEventsRouter
There are only two methods in this class, but they may be useful when using the customer tenantportal:
• Query - queries for events related to a service event
• Related_services - find services that a given event impacted
PortalRouter
These methods work with the sample portal.
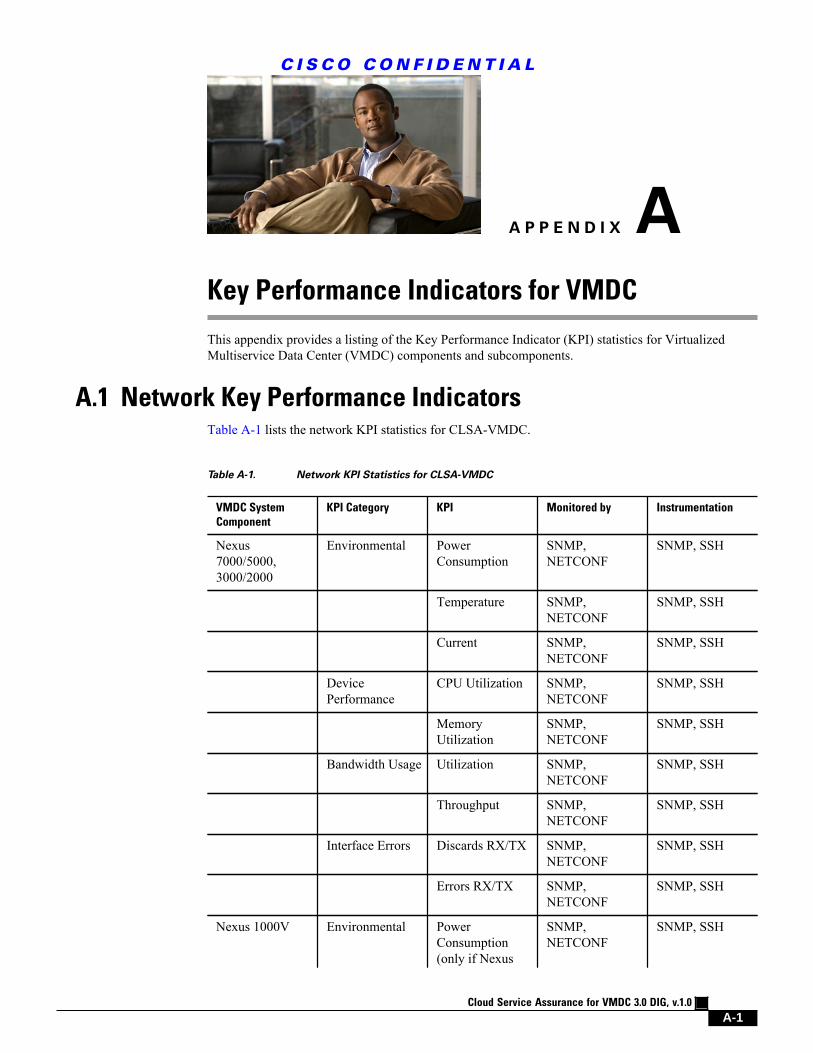
Cloud Service Assurance for VMDC 3.0 DIG, v.1.0
A-1
C I S C O C O N F I D E N T I A L
A P P E N D I X AKey Performance Indicators for VMDC
This appendix provides a listing of the Key Performance Indicator (KPI) statistics for VirtualizedMultiservice Data Center (VMDC) components and subcomponents.
A.1 Network Key Performance IndicatorsTable A-1 lists the network KPI statistics for CLSA-VMDC.
Table A-1. Network KPI Statistics for CLSA-VMDC
VMDC System
Component
KPI Category KPI Monitored by Instrumentation
Nexus7000/5000,3000/2000
Environmental PowerConsumption
SNMP,NETCONF
SNMP, SSH
Temperature SNMP,NETCONF
SNMP, SSH
Current SNMP,NETCONF
SNMP, SSH
DevicePerformance
CPU Utilization SNMP,NETCONF
SNMP, SSH
MemoryUtilization
SNMP,NETCONF
SNMP, SSH
Bandwidth Usage Utilization SNMP,NETCONF
SNMP, SSH
Throughput SNMP,NETCONF
SNMP, SSH
Interface Errors Discards RX/TX SNMP,NETCONF
SNMP, SSH
Errors RX/TX SNMP,NETCONF
SNMP, SSH
Nexus 1000V Environmental PowerConsumption(only if Nexus
SNMP,NETCONF
SNMP, SSH
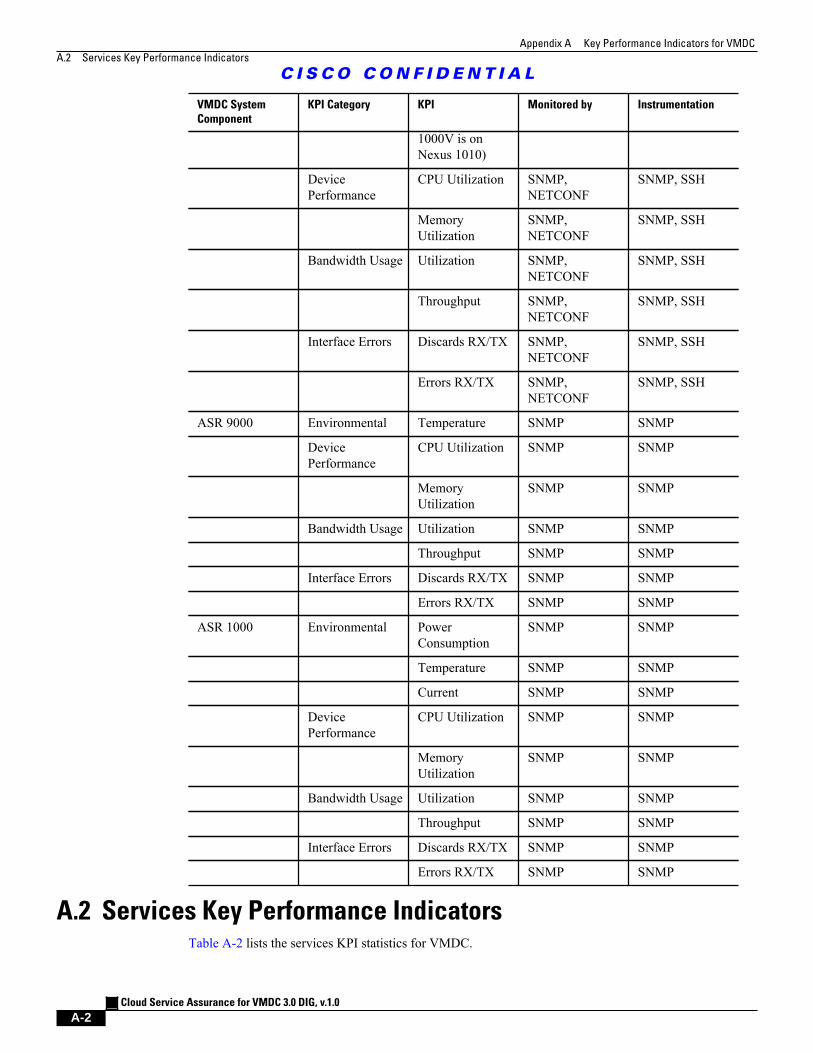
Appendix A Key Performance Indicators for VMDC
A.2 Services Key Performance Indicators
C I S C O C O N F I D E N T I A L
Cloud Service Assurance for VMDC 3.0 DIG, v.1.0
A-2
VMDC System
Component
KPI Category KPI Monitored by Instrumentation
1000V is onNexus 1010)
DevicePerformance
CPU Utilization SNMP,NETCONF
SNMP, SSH
MemoryUtilization
SNMP,NETCONF
SNMP, SSH
Bandwidth Usage Utilization SNMP,NETCONF
SNMP, SSH
Throughput SNMP,NETCONF
SNMP, SSH
Interface Errors Discards RX/TX SNMP,NETCONF
SNMP, SSH
Errors RX/TX SNMP,NETCONF
SNMP, SSH
ASR 9000 Environmental Temperature SNMP SNMP
DevicePerformance
CPU Utilization SNMP SNMP
MemoryUtilization
SNMP SNMP
Bandwidth Usage Utilization SNMP SNMP
Throughput SNMP SNMP
Interface Errors Discards RX/TX SNMP SNMP
Errors RX/TX SNMP SNMP
ASR 1000 Environmental PowerConsumption
SNMP SNMP
Temperature SNMP SNMP
Current SNMP SNMP
DevicePerformance
CPU Utilization SNMP SNMP
MemoryUtilization
SNMP SNMP
Bandwidth Usage Utilization SNMP SNMP
Throughput SNMP SNMP
Interface Errors Discards RX/TX SNMP SNMP
Errors RX/TX SNMP SNMP
A.2 Services Key Performance IndicatorsTable A-2 lists the services KPI statistics for VMDC.
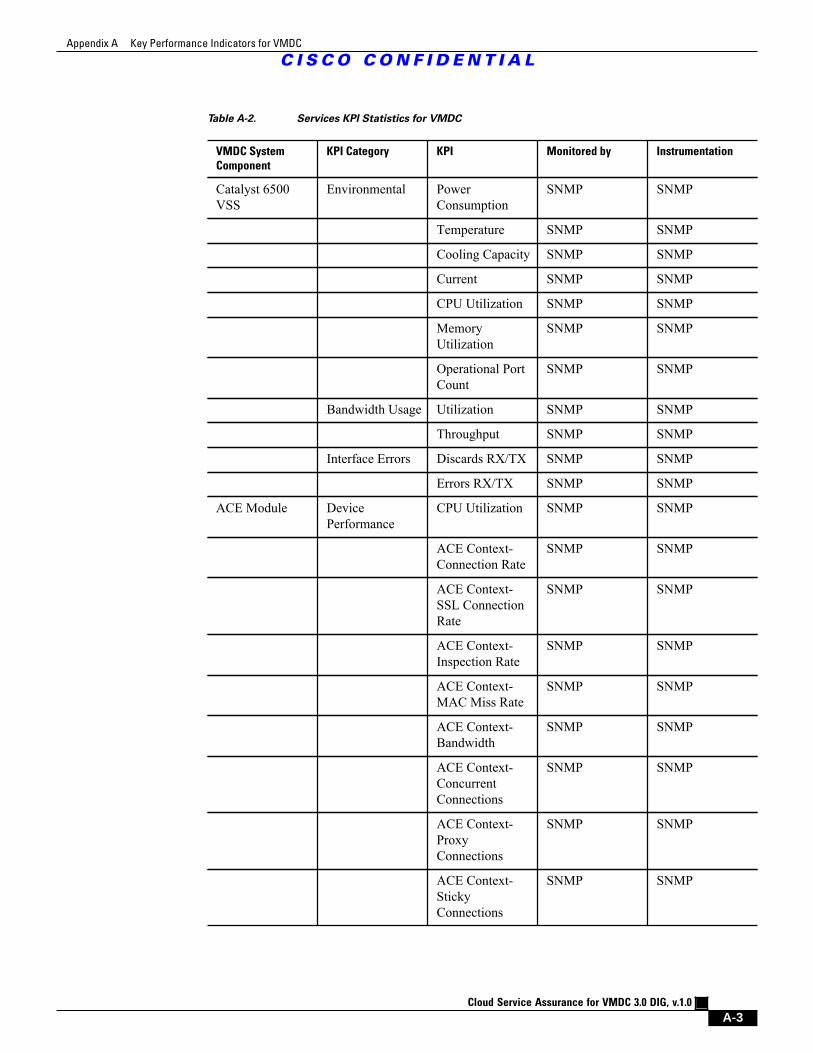
Appendix A Key Performance Indicators for VMDC
C I S C O C O N F I D E N T I A L
Cloud Service Assurance for VMDC 3.0 DIG, v.1.0
A-3
Table A-2. Services KPI Statistics for VMDC
VMDC System
Component
KPI Category KPI Monitored by Instrumentation
Catalyst 6500VSS
Environmental PowerConsumption
SNMP SNMP
Temperature SNMP SNMP
Cooling Capacity SNMP SNMP
Current SNMP SNMP
CPU Utilization SNMP SNMP
MemoryUtilization
SNMP SNMP
Operational PortCount
SNMP SNMP
Bandwidth Usage Utilization SNMP SNMP
Throughput SNMP SNMP
Interface Errors Discards RX/TX SNMP SNMP
Errors RX/TX SNMP SNMP
ACE Module DevicePerformance
CPU Utilization SNMP SNMP
ACE Context-Connection Rate
SNMP SNMP
ACE Context-SSL ConnectionRate
SNMP SNMP
ACE Context-Inspection Rate
SNMP SNMP
ACE Context-MAC Miss Rate
SNMP SNMP
ACE Context-Bandwidth
SNMP SNMP
ACE Context-ConcurrentConnections
SNMP SNMP
ACE Context-ProxyConnections
SNMP SNMP
ACE Context-StickyConnections
SNMP SNMP
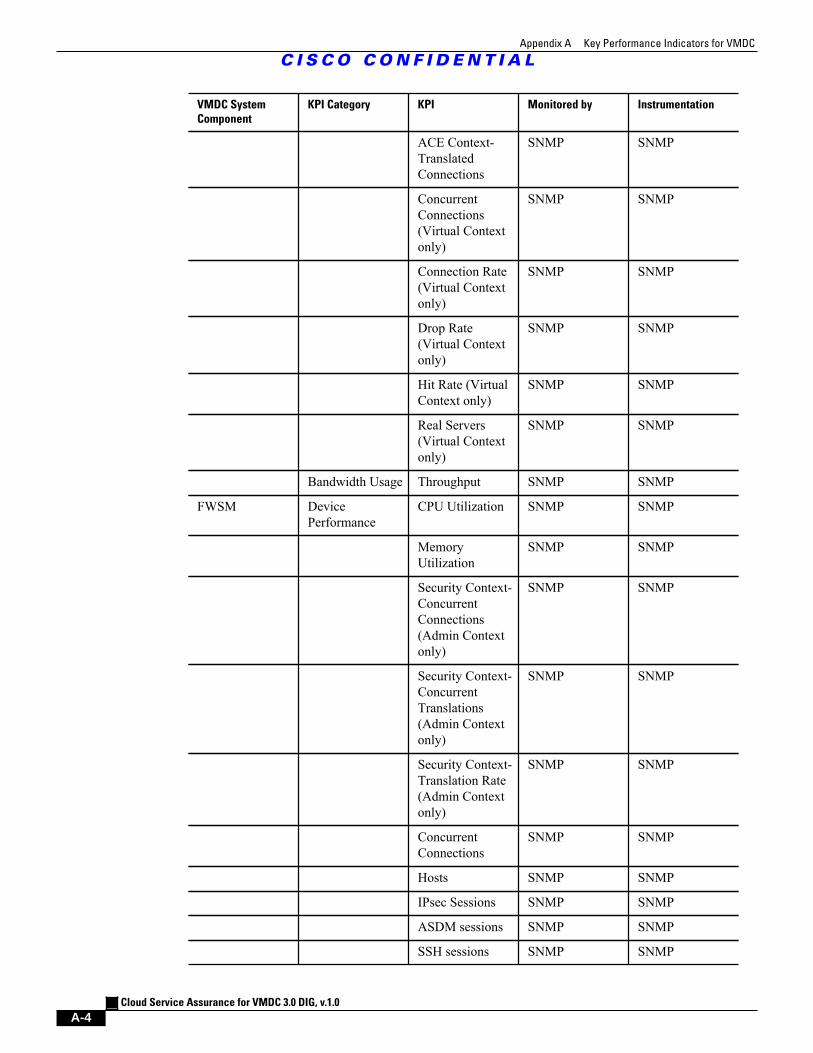
Appendix A Key Performance Indicators for VMDC
C I S C O C O N F I D E N T I A L
Cloud Service Assurance for VMDC 3.0 DIG, v.1.0
A-4
VMDC System
Component
KPI Category KPI Monitored by Instrumentation
ACE Context-TranslatedConnections
SNMP SNMP
ConcurrentConnections(Virtual Contextonly)
SNMP SNMP
Connection Rate(Virtual Contextonly)
SNMP SNMP
Drop Rate(Virtual Contextonly)
SNMP SNMP
Hit Rate (VirtualContext only)
SNMP SNMP
Real Servers(Virtual Contextonly)
SNMP SNMP
Bandwidth Usage Throughput SNMP SNMP
FWSM DevicePerformance
CPU Utilization SNMP SNMP
MemoryUtilization
SNMP SNMP
Security Context-ConcurrentConnections(Admin Contextonly)
SNMP SNMP
Security Context-ConcurrentTranslations(Admin Contextonly)
SNMP SNMP
Security Context-Translation Rate(Admin Contextonly)
SNMP SNMP
ConcurrentConnections
SNMP SNMP
Hosts SNMP SNMP
IPsec Sessions SNMP SNMP
ASDM sessions SNMP SNMP
SSH sessions SNMP SNMP
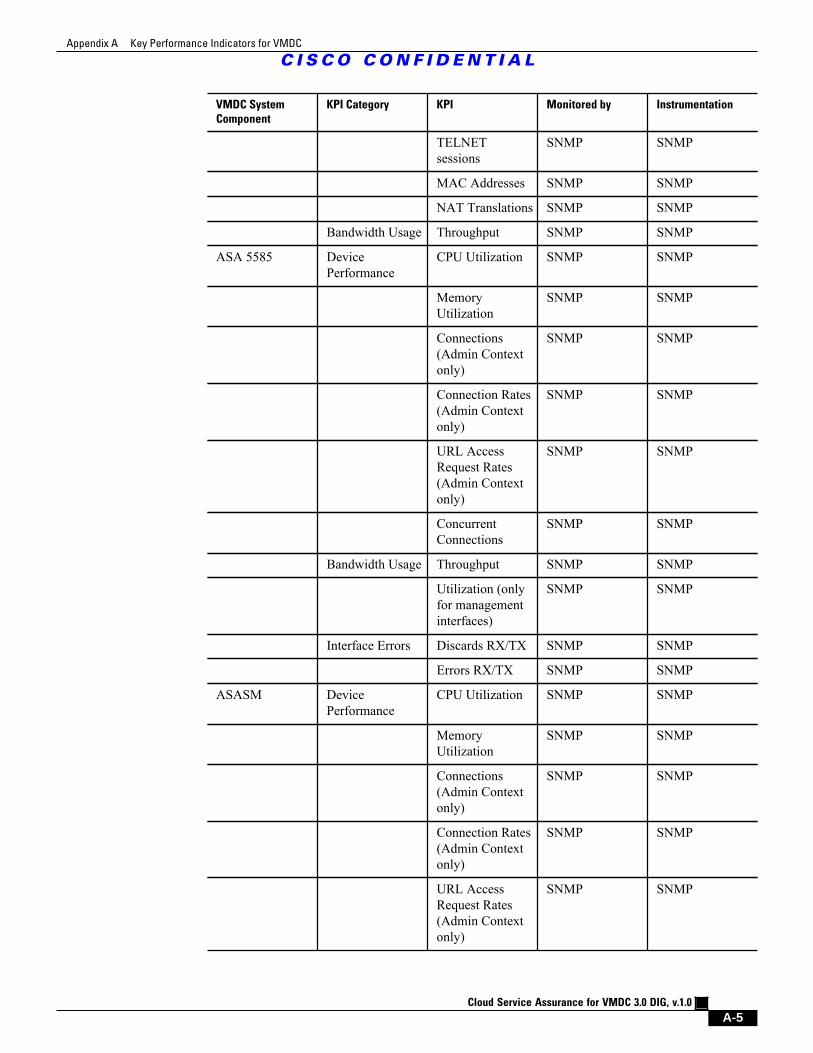
Appendix A Key Performance Indicators for VMDC
C I S C O C O N F I D E N T I A L
Cloud Service Assurance for VMDC 3.0 DIG, v.1.0
A-5
VMDC System
Component
KPI Category KPI Monitored by Instrumentation
TELNETsessions
SNMP SNMP
MAC Addresses SNMP SNMP
NAT Translations SNMP SNMP
Bandwidth Usage Throughput SNMP SNMP
ASA 5585 DevicePerformance
CPU Utilization SNMP SNMP
MemoryUtilization
SNMP SNMP
Connections(Admin Contextonly)
SNMP SNMP
Connection Rates(Admin Contextonly)
SNMP SNMP
URL AccessRequest Rates(Admin Contextonly)
SNMP SNMP
ConcurrentConnections
SNMP SNMP
Bandwidth Usage Throughput SNMP SNMP
Utilization (onlyfor managementinterfaces)
SNMP SNMP
Interface Errors Discards RX/TX SNMP SNMP
Errors RX/TX SNMP SNMP
ASASM DevicePerformance
CPU Utilization SNMP SNMP
MemoryUtilization
SNMP SNMP
Connections(Admin Contextonly)
SNMP SNMP
Connection Rates(Admin Contextonly)
SNMP SNMP
URL AccessRequest Rates(Admin Contextonly)
SNMP SNMP
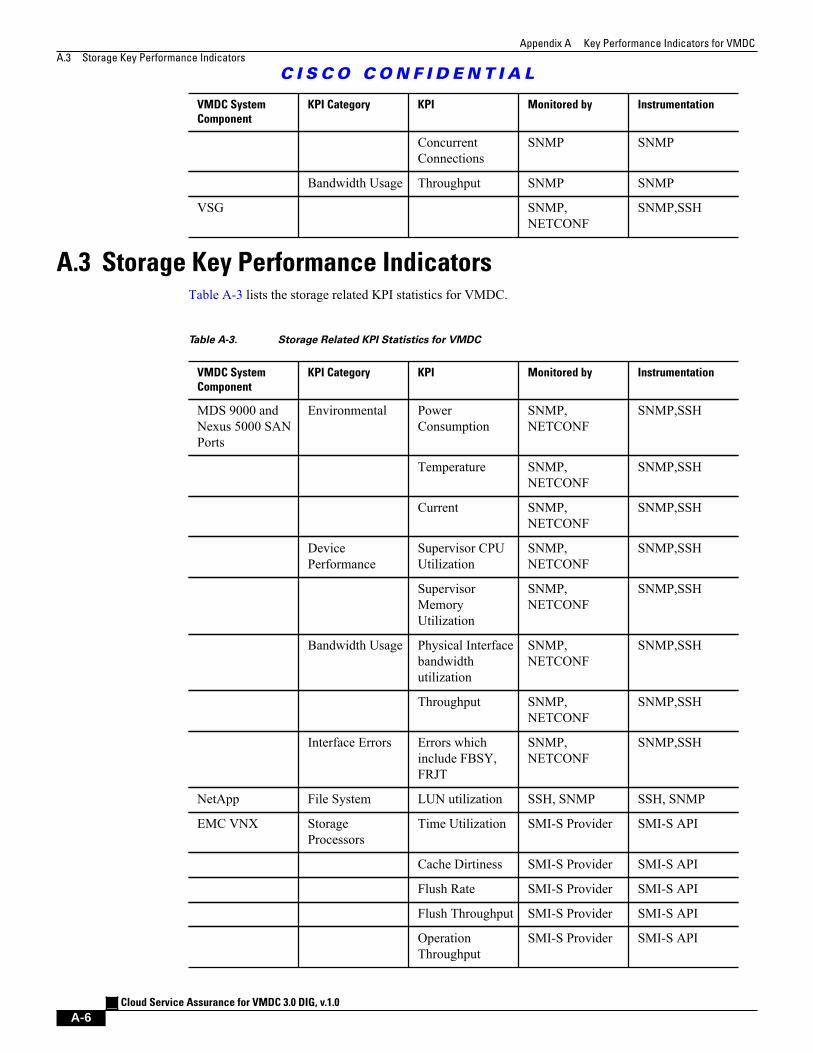
Appendix A Key Performance Indicators for VMDC
A.3 Storage Key Performance Indicators
C I S C O C O N F I D E N T I A L
Cloud Service Assurance for VMDC 3.0 DIG, v.1.0
A-6
VMDC System
Component
KPI Category KPI Monitored by Instrumentation
ConcurrentConnections
SNMP SNMP
Bandwidth Usage Throughput SNMP SNMP
VSG SNMP,NETCONF
SNMP,SSH
A.3 Storage Key Performance IndicatorsTable A-3 lists the storage related KPI statistics for VMDC.
Table A-3. Storage Related KPI Statistics for VMDC
VMDC System
Component
KPI Category KPI Monitored by Instrumentation
MDS 9000 andNexus 5000 SANPorts
Environmental PowerConsumption
SNMP,NETCONF
SNMP,SSH
Temperature SNMP,NETCONF
SNMP,SSH
Current SNMP,NETCONF
SNMP,SSH
DevicePerformance
Supervisor CPUUtilization
SNMP,NETCONF
SNMP,SSH
SupervisorMemoryUtilization
SNMP,NETCONF
SNMP,SSH
Bandwidth Usage Physical Interfacebandwidthutilization
SNMP,NETCONF
SNMP,SSH
Throughput SNMP,NETCONF
SNMP,SSH
Interface Errors Errors whichinclude FBSY,FRJT
SNMP,NETCONF
SNMP,SSH
NetApp File System LUN utilization SSH, SNMP SSH, SNMP
EMC VNX StorageProcessors
Time Utilization SMI-S Provider SMI-S API
Cache Dirtiness SMI-S Provider SMI-S API
Flush Rate SMI-S Provider SMI-S API
Flush Throughput SMI-S Provider SMI-S API
OperationThroughput
SMI-S Provider SMI-S API
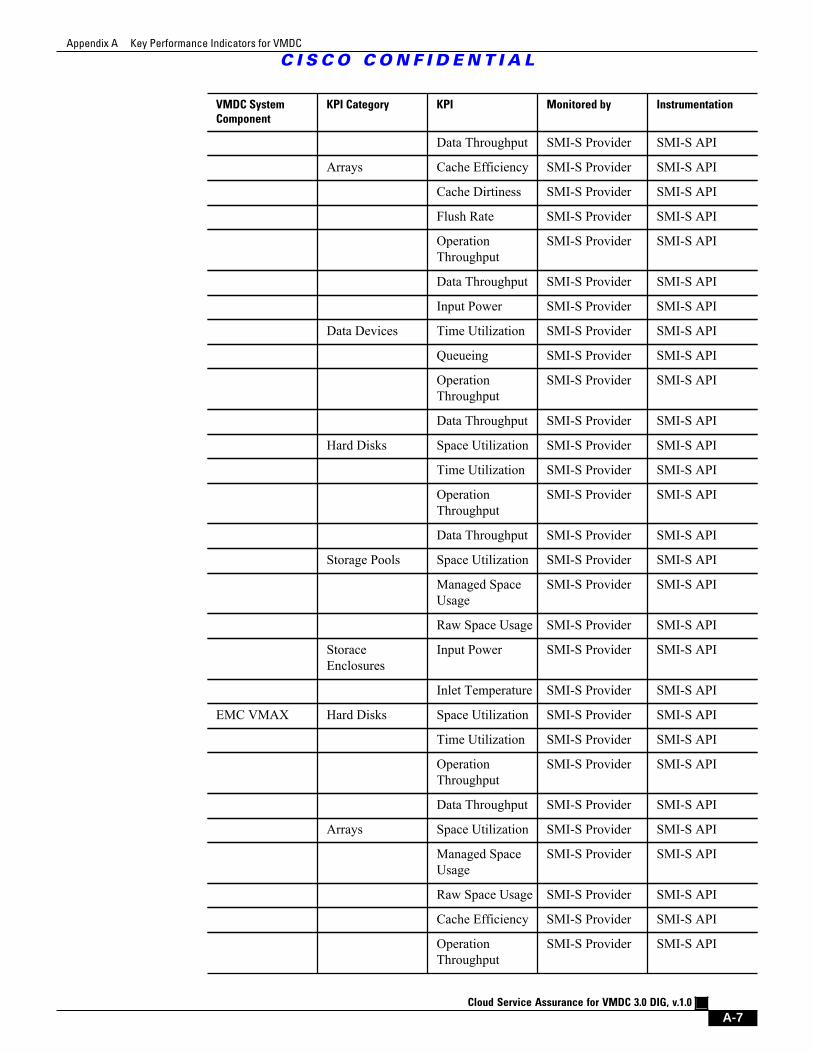
Appendix A Key Performance Indicators for VMDC
C I S C O C O N F I D E N T I A L
Cloud Service Assurance for VMDC 3.0 DIG, v.1.0
A-7
VMDC System
Component
KPI Category KPI Monitored by Instrumentation
Data Throughput SMI-S Provider SMI-S API
Arrays Cache Efficiency SMI-S Provider SMI-S API
Cache Dirtiness SMI-S Provider SMI-S API
Flush Rate SMI-S Provider SMI-S API
OperationThroughput
SMI-S Provider SMI-S API
Data Throughput SMI-S Provider SMI-S API
Input Power SMI-S Provider SMI-S API
Data Devices Time Utilization SMI-S Provider SMI-S API
Queueing SMI-S Provider SMI-S API
OperationThroughput
SMI-S Provider SMI-S API
Data Throughput SMI-S Provider SMI-S API
Hard Disks Space Utilization SMI-S Provider SMI-S API
Time Utilization SMI-S Provider SMI-S API
OperationThroughput
SMI-S Provider SMI-S API
Data Throughput SMI-S Provider SMI-S API
Storage Pools Space Utilization SMI-S Provider SMI-S API
Managed SpaceUsage
SMI-S Provider SMI-S API
Raw Space Usage SMI-S Provider SMI-S API
StoraceEnclosures
Input Power SMI-S Provider SMI-S API
Inlet Temperature SMI-S Provider SMI-S API
EMC VMAX Hard Disks Space Utilization SMI-S Provider SMI-S API
Time Utilization SMI-S Provider SMI-S API
OperationThroughput
SMI-S Provider SMI-S API
Data Throughput SMI-S Provider SMI-S API
Arrays Space Utilization SMI-S Provider SMI-S API
Managed SpaceUsage
SMI-S Provider SMI-S API
Raw Space Usage SMI-S Provider SMI-S API
Cache Efficiency SMI-S Provider SMI-S API
OperationThroughput
SMI-S Provider SMI-S API
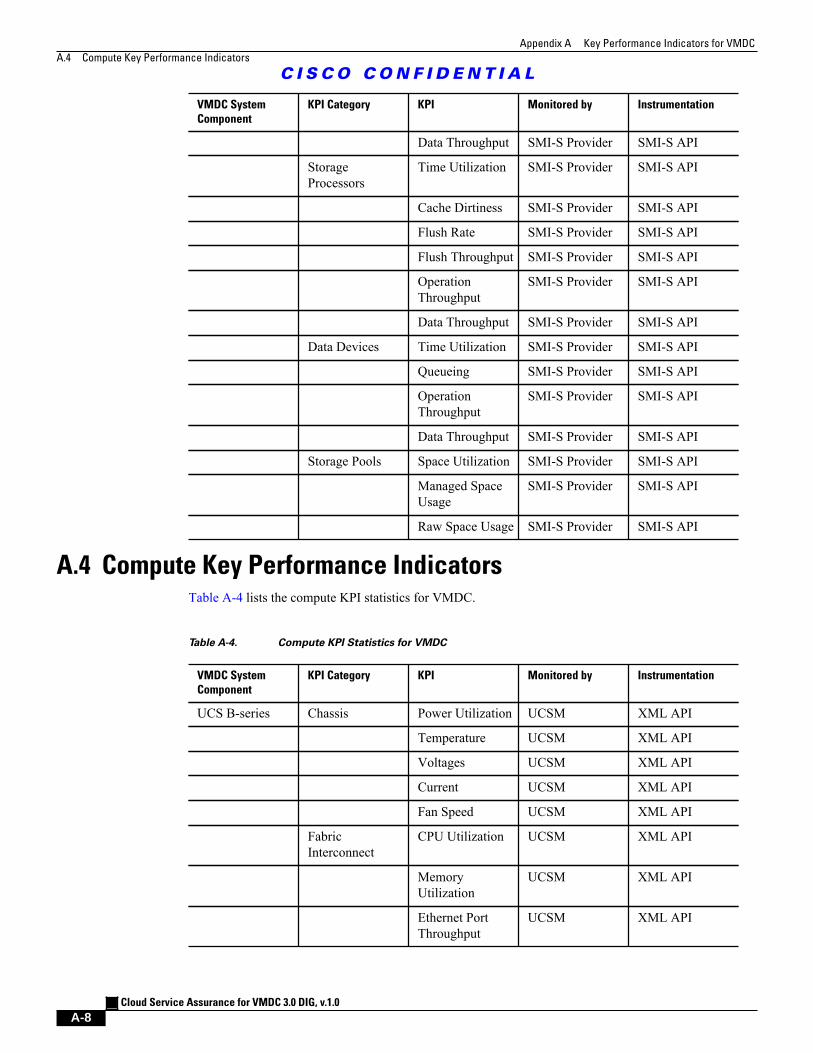
Appendix A Key Performance Indicators for VMDC
A.4 Compute Key Performance Indicators
C I S C O C O N F I D E N T I A L
Cloud Service Assurance for VMDC 3.0 DIG, v.1.0
A-8
VMDC System
Component
KPI Category KPI Monitored by Instrumentation
Data Throughput SMI-S Provider SMI-S API
StorageProcessors
Time Utilization SMI-S Provider SMI-S API
Cache Dirtiness SMI-S Provider SMI-S API
Flush Rate SMI-S Provider SMI-S API
Flush Throughput SMI-S Provider SMI-S API
OperationThroughput
SMI-S Provider SMI-S API
Data Throughput SMI-S Provider SMI-S API
Data Devices Time Utilization SMI-S Provider SMI-S API
Queueing SMI-S Provider SMI-S API
OperationThroughput
SMI-S Provider SMI-S API
Data Throughput SMI-S Provider SMI-S API
Storage Pools Space Utilization SMI-S Provider SMI-S API
Managed SpaceUsage
SMI-S Provider SMI-S API
Raw Space Usage SMI-S Provider SMI-S API
A.4 Compute Key Performance IndicatorsTable A-4 lists the compute KPI statistics for VMDC.
Table A-4. Compute KPI Statistics for VMDC
VMDC System
Component
KPI Category KPI Monitored by Instrumentation
UCS B-series Chassis Power Utilization UCSM XML API
Temperature UCSM XML API
Voltages UCSM XML API
Current UCSM XML API
Fan Speed UCSM XML API
FabricInterconnect
CPU Utilization UCSM XML API
MemoryUtilization
UCSM XML API
Ethernet PortThroughput
UCSM XML API
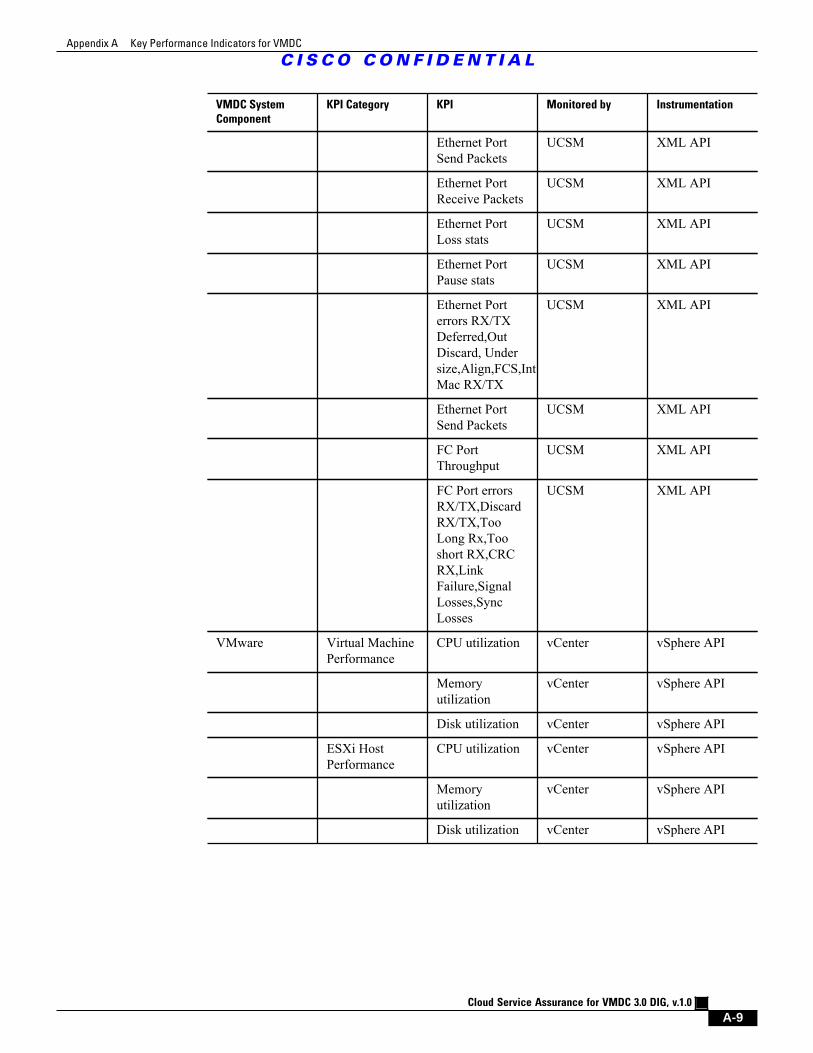
Appendix A Key Performance Indicators for VMDC
C I S C O C O N F I D E N T I A L
Cloud Service Assurance for VMDC 3.0 DIG, v.1.0
A-9
VMDC System
Component
KPI Category KPI Monitored by Instrumentation
Ethernet PortSend Packets
UCSM XML API
Ethernet PortReceive Packets
UCSM XML API
Ethernet PortLoss stats
UCSM XML API
Ethernet PortPause stats
UCSM XML API
Ethernet Porterrors RX/TXDeferred,OutDiscard, Undersize,Align,FCS,IntMac RX/TX
UCSM XML API
Ethernet PortSend Packets
UCSM XML API
FC PortThroughput
UCSM XML API
FC Port errorsRX/TX,DiscardRX/TX,TooLong Rx,Tooshort RX,CRCRX,LinkFailure,SignalLosses,SyncLosses
UCSM XML API
VMware Virtual MachinePerformance
CPU utilization vCenter vSphere API
Memoryutilization
vCenter vSphere API
Disk utilization vCenter vSphere API
ESXi HostPerformance
CPU utilization vCenter vSphere API
Memoryutilization
vCenter vSphere API
Disk utilization vCenter vSphere API
Appendix A Key Performance Indicators for VMDC
C I S C O C O N F I D E N T I A L
Cloud Service Assurance for VMDC 3.0 DIG, v.1.0
A-10
Cloud Service Assurance for VMDC 3.0 DIG, v.1.0
GL-1
C I S C O C O N F I D E N T I A L
G L O S S A R Y
A
ACE Application Control Engine (Cisco)
AMQP Advanced Message Queuing Protocol
API Application Programming Interface
ASA Adaptive Security Appliance (Cisco)
ASR Aggregation Services Router (Cisco)
ASASM Adaptive Security Appliance Services Module (Cisco)
B
BSS Business Support System
C
CIAC Cisco Intelligent Automation for Cloud
CLM Cloud Lifecycle Management (BMC)
CLSA Cloud Service Assurance (Cisco)
CLSA-HCS Cloud Service Assurance for HCS
CLSA-VMDC Cloud Service Assurance for VMDC
CNSM Cisco Network Services Manager
CRM Customer Relationship Management
CSA Cloud Service Assurance (Zenoss)
CUCM Cisco Unified Communications Manager
Glossary
C I S C O C O N F I D E N T I A L
Cloud Service Assurance for VMDC 3.0 DIG, v.1.0
GL-2
D
DDTS Distributed Defect Tracking System
DIG Design and Implementation Guide
DNS Domain Name System
DR Disaster Recovery
DRBD Distributed Replicated Block Device
DSN Data Center Services Node
E
ECC EMC Control Center (EMC)
ECOM EMC Common Object Module (EMC)
F
FC Fibre Channel
FCoE Fibre Channel over Ethernet
FLOGI Fabric Login
FPLC FabricPath Line Card
FT Fault-Tolerant
FTP File Transfer Protocol
FWSM Firewall Services Module
H
HA High Availability
HCS Hosted Collaboration Solution (Cisco)
HSRP Hot Standby Router Protocol
Glossary
C I S C O C O N F I D E N T I A L
Cloud Service Assurance for VMDC 3.0 DIG, v.1.0
GL-3
HT Hyperthreading
HTTP Hypertext Transfer Protocol
I
IaaS Infrastructure as a Service
ICMP Internet Control Message Protocol
ICS Integrated Compute Stack
IOM Input-Output Module
IRC Internet Relay Chat
IS-IS Intermediate System to Intermediate System
iSCSI Internet Small Computer System Interface
J
JAR Java Archive
JMX Java Management Extensions
JSON JavaScript Object Notation
K
KPI Key Performance Indicator
L
L2 Layer 2
L3 Layer 3
L4 Layer 4
L7 Layer 7
LCMC Linux Cluster Management Console
Glossary
C I S C O C O N F I D E N T I A L
Cloud Service Assurance for VMDC 3.0 DIG, v.1.0
GL-4
LDAP Lightweight Directory Access Protocol
LUN Logical Unit Number
M
MDS Multilayer Director Switch
MIB Management Information Base
MoM Manager-of-Managers
MTTF Mean Time to Fix
MTTI Mean Time to Identify
MTTR Mean Time to Repair
N
NAT Network Address Translation
NBI Northbound Interface
NFS Network File System
NGN Next Generation Network
NNTP Network News Transfer Protocol
NOC Network Operations Center
NTP Network Time Protocol
O
OID Object Identifier
OS Operating System
OSS Operations Support System
P
Glossary
C I S C O C O N F I D E N T I A L
Cloud Service Assurance for VMDC 3.0 DIG, v.1.0
GL-5
PoC Proof of Concept
PoD Point of Delivery. The PoD is a basic infrastructure module that is a logical repeatable construct withpredictable infrastructure characteristics and deterministic functions. A PoD identifies a modular unitof data center components and enables customers to add network, compute, and storage resourcesincrementally.
POP Post Office Protocol
PSU Power Supply Unit
Q
QoS Quality of Service
R
RAID Redundant Array of Independent Disks
RBAC Role-Based Access Control
RCA Root Cause Analysis
RPC Remote Procedure Call
RPM RPM Package Manager (Red Hat)
S
SaaS Software as a Service
SAM Service Assurance Manager
SDU Systems Development Unit (Cisco)
SIA Service Impact Analysis
SLA Service Level Agreement
SLB Server Load Balancing
SMTP Simple Mail Transfer Protocol
SMI-S Storage Management Initiative Specification
Glossary
C I S C O C O N F I D E N T I A L
Cloud Service Assurance for VMDC 3.0 DIG, v.1.0
GL-6
SNIA Storage Networking Industry Association
SNMP Simple Network Management Protocol
SNMPv1 Simple Network Management Protocol version 1
SNMPv2c Simple Network Management Protocol version 2c
SNMPv3 Simple Network Management Protocol version 3
SOAP Simple Object Access Protocol
SP Service Provider
SQL Structured Query Language
SSH Secure Shell
SSL Secure Sockets Layer
STONITH Shoot The Other Node In The Head
SVI Switched Virtual Interface
T
TACACS Terminal Access Controller Access Control System
TCA Threshold Crossing Alert
TCP Transmission Control Protocol
U
UCaaS Unified Communications as a Service
UCS Unified Computing System (Cisco)
UCSM Unified Computing System Manager (Cisco)
UI User Interface
V
vCPU Virtual CPU (VMware)
Glossary
C I S C O C O N F I D E N T I A L
Cloud Service Assurance for VMDC 3.0 DIG, v.1.0
GL-7
VEM Virtual Ethernet Module
VIP Virtual IP
VM Virtual Machine
VMDC Virtualized Multiservice Data Center (Cisco)
vPC Virtual Port-Channel
VNMC Virtual Network Management Center
VPDC Virtual Private Data Center
VPN Virtual Private Network
VRF Virtual Routing and Forwarding
VSG Virtual Security Gateway (Cisco)
VSM Virtual Supervisor Module
VSS Virtual Switch System (Cisco)
W
WMI Windows Management Instrumentation
WS-MAN Web Services-Management
X
XMLRPC XML Remote Procedure Call
XMPP Extensible Messaging and Presence Protocol
Glossary
C I S C O C O N F I D E N T I A L
Cloud Service Assurance for VMDC 3.0 DIG, v.1.0
GL-8