Clinical Heterogeneity of Duchenne Muscular Dystrophy (DMD): Definition of Sub-Phenotypes and...
12
Clinical heterogeneity of duchenne muscular dystrophy (DMD): definition of sub-phenotypes and predictive criteria by long-term follow-up. Isabelle Desguerre, Christo Christov, Michele Mayer, Reinhard Zeller, Henri-Marc Becane, Sylvie Bastuji-Garin, France Leturcq, Catherine Chiron, Jamel Chelly, Romain Gherardi To cite this version: Isabelle Desguerre, Christo Christov, Michele Mayer, Reinhard Zeller, Henri-Marc Becane, et al.. Clinical heterogeneity of duchenne muscular dystrophy (DMD): definition of sub- phenotypes and predictive criteria by long-term follow-up.. PLoS ONE, Public Library of Science, 2009, 4 (2), pp.e4347. <10.1371/journal.pone.0004347>. <inserm-00447998> HAL Id: inserm-00447998 http://www.hal.inserm.fr/inserm-00447998 Submitted on 18 Jan 2010
-
Upload
univ-lorraine -
Category
Documents
-
view
3 -
download
0
Transcript of Clinical Heterogeneity of Duchenne Muscular Dystrophy (DMD): Definition of Sub-Phenotypes and...
Clinical heterogeneity of duchenne muscular dystrophy
(DMD): definition of sub-phenotypes and predictive
criteria by long-term follow-up.
Isabelle Desguerre, Christo Christov, Michele Mayer, Reinhard Zeller,
Henri-Marc Becane, Sylvie Bastuji-Garin, France Leturcq, Catherine Chiron,
Jamel Chelly, Romain Gherardi
To cite this version:
Isabelle Desguerre, Christo Christov, Michele Mayer, Reinhard Zeller, Henri-Marc Becane,et al.. Clinical heterogeneity of duchenne muscular dystrophy (DMD): definition of sub-phenotypes and predictive criteria by long-term follow-up.. PLoS ONE, Public Library ofScience, 2009, 4 (2), pp.e4347. <10.1371/journal.pone.0004347>. <inserm-00447998>
HAL Id: inserm-00447998
http://www.hal.inserm.fr/inserm-00447998
Submitted on 18 Jan 2010

HAL is a multi-disciplinary open accessarchive for the deposit and dissemination of sci-entific research documents, whether they are pub-lished or not. The documents may come fromteaching and research institutions in France orabroad, or from public or private research centers.
L’archive ouverte pluridisciplinaire HAL, estdestinee au depot et a la diffusion de documentsscientifiques de niveau recherche, publies ou non,emanant des etablissements d’enseignement et derecherche francais ou etrangers, des laboratoirespublics ou prives.
Clinical Heterogeneity of Duchenne Muscular Dystrophy(DMD): Definition of Sub-Phenotypes and PredictiveCriteria by Long-Term Follow-UpIsabelle Desguerre1,2, Christo Christov2,3, Michele Mayer4, Reinhard Zeller5, Henri-Marc Becane6, Sylvie
Bastuji-Garin7, France Leturcq5,6, Catherine Chiron8, Jamel Chelly5,6, Romain K. Gherardi1,2*
1 Department of Neuropediatrics, Neuromuscular Disease Reference Center ‘‘Garches-Necker-Mondor-Hendaye’’, Necker - Enfants Malades Hospital, Paris, France,
2 Department of Neurosciences, Team 10 INSERM U841 Mondor Biomedical Research Institute, Paris XII University, Creteil, France, 3 Cellular and Tissular Imaging
Plateform, INSERM U841 Mondor Biomedical Research Institute, Creteil, France, 4 Department of Neuropediatrics, Trousseau Hospital, Paris, France, 5 Department of
Biochemistry and Genetics, Cochin-Saint Vincent-de-Paul Hospital Group, Paris, France, 6 CNRS (UMR 8104), Institut Cochin, Universite Paris Descartes, Paris, France,
7 Public Health and Statistics Department Henri Mondor Hospital, Creteil, France, 8 INSERM U663, Paris V University, Paris, France
Abstract
Background: To explore clinical heterogeneity of Duchenne muscular dystrophy (DMD), viewed as a major obstacle to theinterpretation of therapeutic trials
Methodology/Principal Findings: A retrospective single institution long-term follow-up study was carried out in DMDpatients with both complete lack of muscle dystrophin and genotyping. An exploratory series (series 1) was used to assessphenotypic heterogeneity and to identify early criteria predicting future outcome; it included 75 consecutive steroid-freepatients, longitudinally evaluated for motor, respiratory, cardiac and cognitive functions (median follow-up: 10.5 yrs). Avalidation series (series 2) was used to test robustness of the selected predictive criteria; it included 34 more routinelyevaluated patients (age.12 yrs). Multivariate analysis of series 1 classified 70/75 patients into 4 clusters with distinctiveintellectual and motor outcomes: A (early infantile DMD, 20%): severe intellectual and motor outcomes; B (classical DMD,28%): intermediate intellectual and poor motor outcome; C (moderate pure motor DMD, 22%): normal intelligence anddelayed motor impairment; and D (severe pure motor DMD, 30%): normal intelligence and poor motor outcome. Group Apatients had the most severe respiratory and cardiac involvement. Frequency of mutations upstream to exon 30 increasedfrom group A to D, but genotype/phenotype correlations were restricted to cognition (IQ.71: OR 7.7, 95%CI 1.6–20.4,p,0.003). Diagnostic accuracy tests showed that combination of ‘‘clinical onset ,2 yrs’’ with ‘‘mental retardation’’ reliablyassigned patients to group A (sensitivity 0.93, specificity 0.98). Combination of ‘‘lower limb MMT score.6 at 8 yrs’’ with‘‘normal or borderline mental status’’ reliably assigned patients to group C (sensitivity: 1, specificity: 0.94). These criteriawere also predictive of ‘‘early infantile DMD’’ and ‘‘moderate pure motor DMD’’ in series 2.
Conclusions/Significance: DMD can be divided into 4 sub-phenotypes differing by severity of muscle and braindysfunction. Simple early criteria can be used to include patients with similar outcomes in future therapeutic trials.
Citation: Desguerre I, Christov C, Mayer M, Zeller R, Becane H-M, et al. (2009) Clinical Heterogeneity of Duchenne Muscular Dystrophy (DMD): Definition of Sub-Phenotypes and Predictive Criteria by Long-Term Follow-Up. PLoS ONE 4(2): e4347. doi:10.1371/journal.pone.0004347
Editor: Iris Schrijver, Stanford University, United States of America
Received August 28, 2008; Accepted December 8, 2008; Published February 5, 2009
Copyright: � 2009 Desguerre et al. This is an open-access article distributed under the terms of the Creative Commons Attribution License, which permitsunrestricted use, distribution, and reproduction in any medium, provided the original author and source are credited.
Funding: This work was supported by the Association Francaise contre les Myopathies (AFM). The funders had no role in study design, data collection andanalysis, decision to publish, or preparation of the manuscript.
Competing Interests: The authors have declared that no competing interests exist.
* E-mail: [email protected]
Introduction
Affecting approximately one in 3500 males, Duchenne
muscular dystrophy (DMD) is the most common inherited
myopathy whose poor prognosis is well known [1]. DMD has
been classically considered stereotyped in its clinical presentation,
evolution and severity [2,3]. However, inter-individual differences
in terms of motor, respiratory and cardiac involvement had been
reported before the identification of dystrophin [1]. Subsequently,
rare studies documented that identical mutations can produce
DMD phenotypes of different severity [4]. Adding to this clinical
heterogeneity, brain dysfunction is observed in some DMD
patients [5]. As recent preclinical studies have opened avenues
for promising pharmacologic, gene and cell therapies of the disease
[6], in-depth knowledge of DMD natural history is now
mandatory. In fact, phenotypic variations were already shown to
compromise results of clinical trials [7].
In the literature, large DMD series investigated on a follow-up
basis are scant, out-dated or fragmentary. The largest study,
analyzing the history of 473 Dutch DMD patients diagnosed from
1961 to 1982, provides limited information, since neither muscle
biopsy nor genetic analysis was available for most cases, data was
collected by a questionnaire sent to physicians, and clinical
practices were not described [8]. Studies searching for genotype-
phenotype correlations considered the whole spectrum of
dystrophinopathies and not homogenous DMD cohorts [9,10].
PLoS ONE | www.plosone.org 1 February 2009 | Volume 4 | Issue 2 | e4347

Expectedly, inverse correlation was found between severity of
disease and residual amount of dystrophin assessed by immuno-
blotting [10]. Studies comparing muscle testing scores in DMD
patients are mostly cross-sectional [11–13]. Longitudinal evalua-
tion has been limited to respiratory and cardiac functions studies
which demonstrated the beneficial effects of ventilation support
[14,15] and early angiotensin-converting enzyme inhibitor (ACEI)
administration [16].
We report a comprehensive clinical analysis of 75 DMD
patients (series 1), evaluated longitudinally by the same team over
a mean follow-up of .10 yrs. This analysis substantiates DMD’s
clinical heterogeneity and identifies 4 phenotypes with different
outcomes that can be predicted by simple clinical indicators. The
applicability of these indicators was successfully tested in a second
series of 34 patients.
Methods
PatientsDMD diagnosis was performed from 1990 to 2000 at Saint-
Vincent-de-Paul hospital, Paris; in both series 1 and 2, inclusion
criteria were: (i) absence of muscle dystrophin assessed by both
immunohistochemistry (Dys1, 2, 3) and Western blot (dystrophin
bands absent) (moAbs purchased from Novocastra, UK, see
below); (ii) genotyping performed (laboratory of molecular
genetics, Cochin hospital, Paris); (iii) follow-up .4 yrs by the
same team.
Diagnosis and medical care of patients were standardized as
recommanded by the French consortium on DMD management.
Muscle biopsy was used to assess DMD diagnosis on the basis of
histology, immunohistochemistry and Western blot. According to
current rules in France, both children and parents gave written
individual informed consent to participate to the clinico-genetic
study and approval was obtained from the Assistance Publique-
Hopitaux de Paris (APHP) institutional ethics board (CPPRB of
Cochin hospital).
Follow-upChildren from series 1 (n = 75) were systematically evaluated
every six months by a multidisciplinary team for motor,
respiratory, cardiac, and nutritional status and remained steroid-
free. Physiotherapy was performed 2–3 times per week. Lower-
limb contractures were prevented by nocturnal leg orthesis from
age 6, and ultimately treated by tenotomy. Spinal arthrodesis was
systematically performed from age 12. Respiratory care started
when forced vital capacity (FVC) reached 1l or 30% of the
theoretical value and included nocturnal monitoring of capillary
PO2 and PCO2, intermittent positive pressure ventilatory (IPPV)
daily support, and nasal non invasive nocturnal ventilatory (NINV)
support in case of abnormal blood gas levels. Cardiac echogram
was performed yearly and myocardial scintigram immediately
before surgery; ACEIs were administered when left ventricular
ejection fraction (LVEF) reached 55%. Children from series 2
(n = 34) were aged more than 12 yrs at data collection and had
been evaluated and taken in charge at Necker hospital, Paris, using
standard procedures.
Clinical parametersInitial exploration yielded 33 (out of 82) relevant items
describing history of disease, muscle, cardiac, respiratory and
cognitive functions, and genetics (Table 1).
Manual muscle testing (MMT) using the Medical Research
Council (MRC) scale [14] was yearly performed, yielding upper
limb (average value of 265 muscles), lower limb (264 muscles) and
global (269 muscles) scores reported at ages 8 and 10. Respiratory
function was yearly evaluated and 3 indices were derived from
FVC, residual functional capacity (RFC), and residual volume
(RV) expressed relative to theoretical values: (i) FVC decrease
from 10 to 14 yrs (DFCV); (ii) RFC plateauing (age of pulmonary
growth arrest); (iii) onset of RV increase (age of involvement of
expiratory muscles). Cardiac function was yearly assessed and the
age at decrease of LVEF below 55% was considered. Body mass
index determined at age 8 was classified as low, normal, or high
according to reference curves [17]. Electroretinogram was scored
as normal or abnormal.
Cognitive status was evaluated by both general intelligence
assessment (IQ) and educational level. Wechsler Intelligence Scale
[18] was used to measure, from age 6 to 10, verbal performance
and full scale IQ. Patients were conventionally classified [18] as (I)
severely mentally retarded when IQ was ,50 or impossible to
assess because of pronounced behavioural disturbances; (II) mildly
mentally retarded (50,IQ,70); (III) borderline (71,IQ,84); and
(IV) normal (IQ.85 or strictly normal academic level). Were also
considered school delay; the maximal education level reached by
patients, and the type of establishment attended according to the
French educational model (Table 1).
Molecular and protein analysesMuscle proteins were screened by immunihistochemistry and
two multiplex Western blot analyses: (A) combination of Dys8/
6C5 (NLC-DYS2/dystrophin C-ter), Cal3c/2A2 (NLC-CALP-
12A2/calpain 3 exon 8), 35DAG/21B5 (NLC-c-SARC/c-sarco-
glycan), and Ham1/7B6 (NLC-Hamlet/dysferlin) monoclonal
antibodies; (B) combination of Dys4/6D3 (NCL-DYS1/dystro-
phin rod domain), Calp3d/2C4 (NLC-CALP-2C4/calpain 3 exon
1), and ad1/20A6 (NCL-a-SARC/a-sarcoglycan) monoclonal
antibodies (all from Novocastra).
Mutations were conventionally identified [19]. Deletions and
duplications were detected by quantitative fluorescent-PCR using
genomic DNA, and all other types of mutations were detected
either by sequencing of all DMD gene exons and exon-intron
junctions, or by systematic analysis of muscle dystrophin mRNA,
using RT-PCR and sequencing of 14 amplified overlapping
fragments. Abnormalities were substantiated by segregation
analysis [19]. Altered transcripts were inferred from each mutation
[20]. The four internal promoters of the dystrophin gene give rise
to several transcripts. Splicing between promoter-specific first
exons and exons 30, 45, 56, 63 generate respectively the
dystrophin isoforms Dp260, Dp140, DP116, and Dp71. Mutations
before exon 30 only affect full length dystrophin. In addition to it,
the other isoforms are successively affected, as the mutation
progresses after exon 29 towards the C terminus.
Statistical AnalysesTo detect correlations between clinical variables and homog-
enous sub-groups of patients, we used non-linear Categorical
Principal Component Analysis (CatPCA) [21], followed by
Hierarchical Cluster Analysis (HCA) [22]. CatPCA benefits from
optimal scaling, handles together nominal (e.g. initial symptoms),
ordinal (e.g. cognitive status), and interval (e.g. age at ambulation
loss) variables, and is suitable for data recorded with uncertain
units (e.g. MMT scores) [21]. Analysis was performed with SPSS
11.0 software. Original variables were reduced to 2 principal
components with Cronbach’s a$0.70 for each, allowing plotting
of cases in a two dimensional space. Clusters were determined
using Statgraphics Plus 5.0. Their stability was tested by 20
randomisations, each one providing a sample containing half of
patients, and by repeating HCA on each sample; cases that did not
DMD Sub-Phenotypes
PLoS ONE | www.plosone.org 2 February 2009 | Volume 4 | Issue 2 | e4347

Ta
ble
1.
Dat
ad
esc
rib
ing
pat
ien
ts’
his
tory
of
dis
eas
e,
mu
scle
and
cog
nit
ive
fun
ctio
ns
(qu
anti
tati
veva
riab
les
are
me
an6
SD).
His
tory
Ag
ea
tin
itia
lsy
mp
tom
s(y
rs)
Init
ial
sym
pto
m:
psy
cho
mo
tor
de
lay
(%)
Init
ial
sym
pto
m:
ab
no
rma
lg
ait
(%)
Init
ial
sym
pto
m:
hig
hC
K(%
)
Ag
ea
td
iag
no
sis
(yrs
)
Ag
ea
tfo
llo
w-u
pe
nd
-po
int
(yrs
)
Ag
ea
tfi
rst
wa
lkin
g(m
on
ths)
Ag
ea
tlo
sso
fa
mb
ula
tio
n(y
rs)
Ag
ea
tb
eco
min
gch
air
-rid
de
n(y
rs)
Ag
ea
tb
eg
inn
ing
of
ph
ysi
oth
era
py
(yrs
)C
Kle
ve
l(I
U)
Ph
en
oty
pe
fat/
thin
/n
orm
al
(%)
Clu
ste
rA
N=
14
1.3
60
.61
00
00
4.1
62
.11
3.5
63
.72
0.0
67
.99
.06
1.6
8.4
61
.54
.56
2.0
17
76
55
0/2
9/2
1
Clu
ste
rB
N=
19
3.6
61
.71
16
80
5.6
61
.71
5.3
63
.81
6.0
64
.89
.66
1.3
9.5
61
.36
.36
1.4
81
66
32
/42
/26
Clu
ste
rC
N=
16
3.8
62
.00
44
13
7.2
61
.91
6.8
61
.61
5.0
63
.81
2.6
62
.01
1.5
61
.58
.16
2.8
90
00
12
/69
/19
Clu
ste
rD
N=
21
3.3
61
.72
03
31
94
.56
1.9
15
.76
3.4
16
.06
3.4
10
.06
1.4
9.0
6.0
5.4
61
.79
56
62
9/3
8/3
3
Ov
era
llN
=7
53
.06
1.8
62
46
51
05
.36
2.1
15
.46
3.4
16
.86
5.1
10
.36
1.9
9.5
61
.76
.06
2.3
96
80
32
/40
/28
Mu
scle
fun
ctio
n
MM
T9
mu
scle
sa
t8
yrs
MM
Tlo
we
rli
mb
sa
t8
yrs
MM
Tu
pp
er
lim
bs
at
8y
rs
MM
Tfr
om
9m
usc
les
at
10
yrs
MM
Tlo
we
rli
mb
sa
t1
0y
rs
MM
Tu
pp
er
lim
bs
at
10
yrs
Te
stin
go
fq
ua
dri
cep
sa
t1
0y
rs
Ag
elo
we
rli
mb
sco
ntr
act
ure
s(y
rs)
Ag
esc
oli
osi
s(y
rs)
LE
FV
G,
55
%b
efo
re1
0y
rs(%
)
Vit
al
cap
aci
tya
t1
0y
ea
rs(%
)
Ag
ea
bn
orm
al
resi
du
al
vo
lum
e(y
rs)
Clu
ste
rA
N=
14
6.5
60
.76
.76
1.5
6.3
60
.95
.56
1.0
4.8
61
.06
.16
1.1
2.1
60
.46
.36
1.4
11
.66
2.0
37
656
16
8.9
61
.5
Clu
ste
rB
N=
19
6.1
62
.46
.26
2.5
6.0
62
.55
.86
0.8
5.3
61
.26
.36
0.6
2.4
60
.57
.76
1.5
11
.96
1.3
11
756
16
9.4
62
.2
Clu
ste
rC
N=
16
8.0
60
.78
.06
0.7
8.0
60
.87
.06
0.6
6.8
60
.67
.26
0.7
3.1
60
71
0.2
62
.11
3.2
61
.40
806
14
10
.96
1.3
Clu
ste
rD
N=
21
6.8
60
.77
.16
0.7
6.6
61
.05
.66
0.6
5.1
60
.66
.06
0.7
2.5
60
47
.16
0.3
12
.46
1.5
68
16
12
10
.46
2.3
Ov
era
llN
=7
56
.76
1.5
7.0
60
.56
.66
1.6
5.9
60
.95
.56
1.1
6.4
60
.92
.56
06
7.8
62
.11
2.2
61
.62
77
56
15
9.9
62
.0
Co
gn
itio
n
Se
ve
rem
en
tal
reta
rda
tio
n(%
)
Mo
de
rate
me
nta
lre
tard
ati
on
(%)
Ne
uro
psy
cho
log
ica
ld
ysf
un
ctio
n(%
)
No
rma
lm
en
tal
sta
tus
(%)
Ord
ina
rysc
ho
ol
(%)
Mo
tor
ha
nd
ica
pp
ed
sch
oo
l(%
)
Me
nta
lh
an
dic
ap
pe
dsc
ho
ol
(%)
Sch
oo
ld
ela
y.
3y
rs(%
)
Ge
ne
tics
de
leti
on
/mu
tati
on
/d
up
lica
tio
n(%
)
Clu
ste
rA
N=
15
29
57
14
02
14
33
68
66
6/3
3/0
Clu
ste
rB
N=
23
64
25
20
26
63
11
26
90
/5/5
Clu
ste
rC
N=
16
00
31
69
38
62
06
73
/26
/0
Clu
ste
rD
N=
21
00
01
00
86
14
00
71
/19
/10
Ov
era
llN
=7
56
24
27
43
48
43
92
47
7/1
9/4
do
i:10
.13
71
/jo
urn
al.p
on
e.0
00
43
47
.t0
01
DMD Sub-Phenotypes
PLoS ONE | www.plosone.org 3 February 2009 | Volume 4 | Issue 2 | e4347
remain in the same cluster on two HCA were considered
unclassifiable [21]. To identify early predictive indicators of
different outcome patterns, we used a comprehensive set of
diagnostic accuracy tests (sensitivity, specificity, kappa, accuracy,
positive and negative predictive likelihood values), as previously
recommended [23]. These tests were calculated using the
Diagnostic Effectiveness module of SISA [24]. Comparisons in
figures indicate differences between clusters established by multiple
range post-test with (p,0.05), following a significant Kruskal-
Wallis test (Statgraphics 5.0 Plus). Two-sided p-values are
reported, 95% confidence intervals of means or proportions, or
box-and-whisker plots (10th, 25th, 50th, 75th, 90th percentiles)
represent data scatter.
Results
Global population characteristics (Table 1)Follow-up of the 75 patients from series 1 ranged from 4.0 to 18 yrs
(mean 10.2). Most patients (n = 41) were older than 16 at end-point.
Clinical characteristics are listed in table 1. Briefly, 56% of patients
had delayed walking (.18 mo), 56% had never been able to run, and
31% to climb stairs without support. Ability to rise from floor was lost
at 8.3 yrs, and to elevate arms at 13.7 yrs. All patients had scoliosis,
diagnosed from age 9 to 16. Lower limb tenotomies were performed
at 9.6 yrs (n = 42), and spinal arthrodesis at 13.2 yrs (n = 53). Patients
usually had normal respiratory function until 10 yrs. Cardiac failure
was diagnosed in 30% of patients at age 12, 7 died from heart failure
(2 before 15 yrs, 5 after 20 yrs).
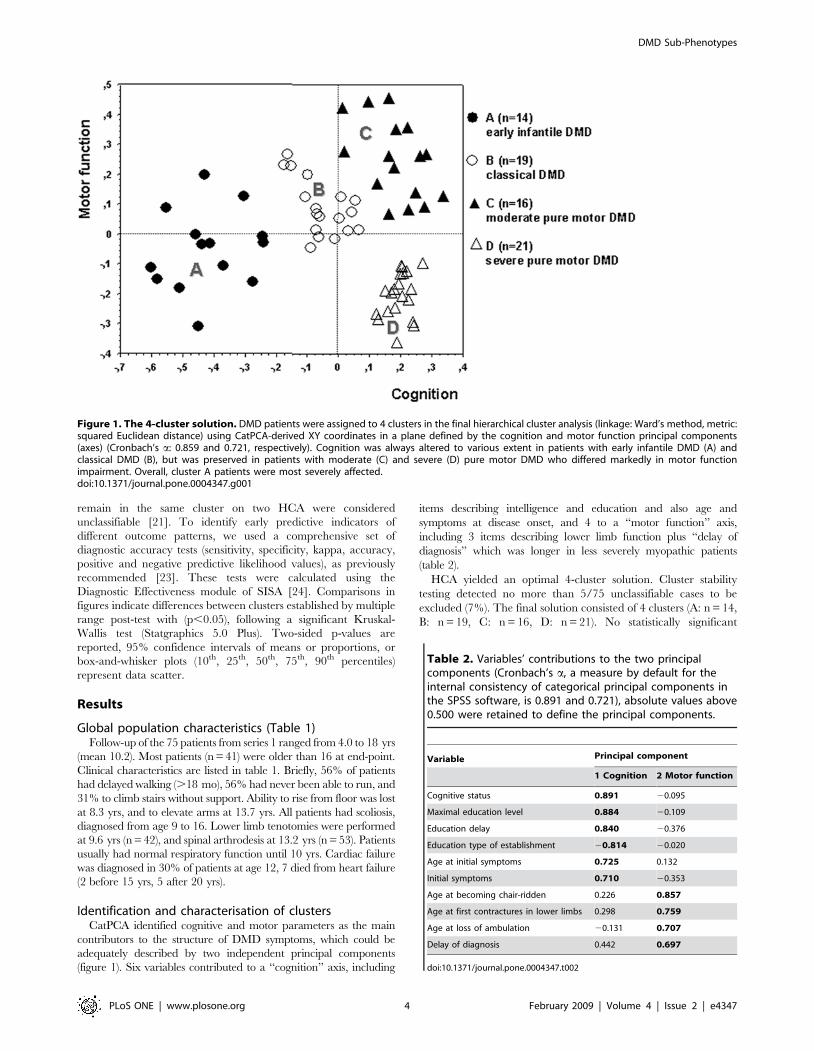
Identification and characterisation of clustersCatPCA identified cognitive and motor parameters as the main
contributors to the structure of DMD symptoms, which could be
adequately described by two independent principal components
(figure 1). Six variables contributed to a ‘‘cognition’’ axis, including
items describing intelligence and education and also age and
symptoms at disease onset, and 4 to a ‘‘motor function’’ axis,
including 3 items describing lower limb function plus ‘‘delay of
diagnosis’’ which was longer in less severely myopathic patients
(table 2).
HCA yielded an optimal 4-cluster solution. Cluster stability
testing detected no more than 5/75 unclassifiable cases to be
excluded (7%). The final solution consisted of 4 clusters (A: n = 14,
B: n = 19, C: n = 16, D: n = 21). No statistically significant
Figure 1. The 4-cluster solution. DMD patients were assigned to 4 clusters in the final hierarchical cluster analysis (linkage: Ward’s method, metric:squared Euclidean distance) using CatPCA-derived XY coordinates in a plane defined by the cognition and motor function principal components(axes) (Cronbach’s a: 0.859 and 0.721, respectively). Cognition was always altered to various extent in patients with early infantile DMD (A) andclassical DMD (B), but was preserved in patients with moderate (C) and severe (D) pure motor DMD who differed markedly in motor functionimpairment. Overall, cluster A patients were most severely affected.doi:10.1371/journal.pone.0004347.g001
Table 2. Variables’ contributions to the two principalcomponents (Cronbach’s a, a measure by default for theinternal consistency of categorical principal components inthe SPSS software, is 0.891 and 0.721), absolute values above0.500 were retained to define the principal components.
Variable Principal component
1 Cognition 2 Motor function
Cognitive status 0.891 20.095
Maximal education level 0.884 20.109
Education delay 0.840 20.376
Education type of establishment 20.814 20.020
Age at initial symptoms 0.725 0.132
Initial symptoms 0.710 20.353
Age at becoming chair-ridden 0.226 0.857
Age at first contractures in lower limbs 0.298 0.759
Age at loss of ambulation 20.131 0.707
Delay of diagnosis 0.442 0.697
doi:10.1371/journal.pone.0004347.t002
DMD Sub-Phenotypes
PLoS ONE | www.plosone.org 4 February 2009 | Volume 4 | Issue 2 | e4347

differences between clusters could be demonstrated for duration of
follow-up: A 10.1 (95% CI: 8.0 to 12.2 yrs), B 9.3 (95% CI: 7.3 to
11.4 yrs), C 9.9 (95% CI: 7.8 to 12.0 yrs), D 11.1 (95% CI: 9.6 to
12.6 yrs), p = 0.47, Kruskal-Wallis test. Clusters were charac-
terised by highly distinctive phenotype and outcome on both
cognition and motor function axes (figure 2, left and right
columns, respectively). Importantly, clinical variables not used to
constitute the model also showed significant differences between
clusters (figures 3,4), thus providing basis for the recognition of 4
distinctive DMD subsets: group A (early infantile DMD, 20%)
very poor intellectual and motor outcomes; group B (classical
DMD, 28%) intermediate intellectual and poor motor outcomes;
group C (moderate pure motor DMD, 22%) normal intelligence
and delayed motor impairment; and D (severe pure motor DMD,
30%) normal intelligence and poor motor outcome.
Group A was characterised by both precocity and severity of
symptoms. Initial symptoms appeared at 1.3 yrs (vs. $3.3 yrs in
other groups) and always consisted of psychomotor delay. Patients
had the poorest mental status (29% IQ,50; 57% IQ 50-70) and
global outcome, as assessed by generally lower cognitive, motor,
cardiac and respiratory (figure 4) indices than other groups; 13/14
(93%, 95% CI: 72 to 99%) of these patients were never able to run
Figure 2. Variables constituting the ‘‘cognition’’ (left) and the ‘‘motor function’’ (right) principal components. Group A patientsmanifested early in life by psychomotor delay. ‘‘Cognitive status’’ measures increased from cluster A to D (the following classification was used: (I)severely mentally retarded; (II) mildly mentally retarded; (III) borderline; (IV) normal). This was also supported by an identical increase of ‘‘maximaleducation level’’ and an inversely symmetrical decrease of ‘‘school delay’’ (p,0.00001 for both, data not shown). Accordingly, 86% of D patientsattended an ordinary educational establishment vs. 38% of C, 26% of B and 21% of A patients (all p,0.007 by Fischer exact test). A and C patients hadvalues at each extremity of the motor function spectrum, also comprising the age of becoming ‘‘wheelchair-ridden’’ (p,0.00001, not shown). ‘‘Delayof diagnosis’’ contributed to the integrity of the second principal component and, notably, to the delineation of cluster D (indicated p values areobtained by Kruskal-Wallis test; clusters were compared by a multiple range post-test with p,0.05).doi:10.1371/journal.pone.0004347.g002
DMD Sub-Phenotypes
PLoS ONE | www.plosone.org 5 February 2009 | Volume 4 | Issue 2 | e4347

versus 48% (95% CI: 48 to 62%) in other groups (p,0.005). They
had the highest CK levels at diagnosis (figure 4); 10/14 (72%u had
cardiomyopathy before 12 yrs, and 13/14 (90%) at 15 yrs.
Group B patients had clinical features and severity similar to the
mean values of the overall DMD population, thus corresponding
to what is considered the common clinical DMD profile in the
literature. They had poor motor outcome (ambulation loss at
9.6 yrs) and mildly impaired mental status; only 3/19 (16%) of
patients with cardiac and respiratory dysfunctions before 12 yrs.
Group B showed significantly better global outcome than group A,
worse mental status than groups C and D, and worse motor status
than group C.
Group C patients had the best motor outcome and almost
normal cognition. Ambulation loss occurred at 12.5 yrs, and
MMT at 8 and 10 yrs was the best measured among DMD
patients in both the lower and the upper limbs; contractures and
scoliosis onsets were delayed (figure 4); Since DMD diagnosis was
delayed in these patients (age 7.2 yrs), physiotherapy was applied
later thus excluding better outcome linked to rehabilitation. BMI
was intriguingly different, 11/16 (69%) (95% CI: 41 to 89%) of
patients being thin vs. 18/54 (33%) (95% CI: 21 to 48%) in other
groups (p,0.02).
Group D patients had a poor motor outcome similar to group
B, but strictly normal cognition. Ambulation loss occurred at
10 yrs. Patients had strictly normal cognitive status and an
educational level similar to this of group C. However, 86% of D
patients attended an ordinary educational establishment vs. 38% of
C, 26% of B and 21% of A patients (all p,0.007 by Fischer exact
test).
Genotype-phenotype correlationMutation was identified in 67 patients, including 77% deletions,
19% punctual mutations, and 4% duplications. Mutations are
predicted to mainly affect expression of transcripts corresponding
to DP427 isoform (mutation in the region of exons 1–29, n = 24),
DP427+DP260 (exons 30–44, n = 18), and DP427+DP260+DP140 (exons 45–55, n = 20). Additional involvement of DP116
(exons 56–62), and of DP116+DP71 (after exon 63) occurred in 2
and 3 patients, respectively.
Clinical classification of patients partially correlated with the
gene affected region (figure 5), as mutations before exon 30 were
found in increasing numbers from group A to D: 18% (A); 29%
(B); 40% (C), and 55% (D). Further, we separately explored
genotype impact on cognition and motor function. We found that
frequency of mutations before exon 30 correlated well with IQ
(IQ.71: OR 7.7, 95%CI: 1.6 to 20.4, p,0.003) and retinogram
(normal retinogram: OR 9.7, p,0.007), whereas no correlation
with any motor parameter could be demonstrated (e.g. age of
ambulation loss .10 yrs: OR 1.2, 95%CI: 0.4 to 3.4, p = 0.44). As
expected, the 3 patients with mutation after exon 63 affecting the
Figure 3. Muscle strength variables not used to constitute the model. C patients had better muscle strength than A, B, or D patients and aretarded onset of scoliosis. These motor parameters, not used in the multivariate analysis, support the validity of the model. ‘‘Age at onset of physicaltherapy’’ trailed behind the evolution of muscle strength and motor function: no clear benefit from therapy could be demonstrated in this series(indicated p values are obtained by Kruskal-Wallis test; clusters were compared by a multiple range post-test with p,0.05).doi:10.1371/journal.pone.0004347.g003
DMD Sub-Phenotypes
PLoS ONE | www.plosone.org 6 February 2009 | Volume 4 | Issue 2 | e4347

brain specific DP71 transcript had severe mental retardation [20]
and were classified in group A.
Selective indicators for patient classificationThen, we examined if a reduced set of criteria could be
sufficient to classify patients. Using diagnostic accuracy tests, we
searched for simple and widely available indicators allowing
discrimination of patients from group A vs. B+C+D, group C vs.
A+B+D, and group B vs. D. Results are listed in tables 3 and 4.
Consistent with the precocity of their psychomotor symptoms,
patients classified in group A were reliably identified by
‘‘psychomotor delay as first symptom’’ (sensitivity: 0.93, specificity:
0.95). In the same way, group C patients, whose motor handicap
less severe had and occurred later in life, could be identified by
‘‘loss of ambulation .11 yrs’’ (sensibility 0.78, specificity 0.96).
These two indicators appeared as suitable and simple surrogate
criteria for recognition of group A and group C patients,
respectively. Combinations of criteria also gave good results.
Combination of ‘‘clinical onset ,2 yrs’’ with ‘‘mental retardation’’
(severe or mild) assigned patients to group A (sensitivity 0.93,
specificity 0.98) with even higher positive predictive value than the
criterion ‘‘psychomotor delay as first manifestation’’ (PPV: 0.93 vs.
0.81). Combination of ‘‘lower limb MMT score.6 at 8 yrs’’ with
‘‘normal or borderline cognitive status’’ most reliably assigned
patients to group C (sensitivity: 1, specificity: 0.94). Compared to
the criterion ‘‘loss of ambulation .11 yrs’’, combined criteria
showed higher accuracy and offered the advantage of being usable
at a much younger age. Combined criteria allowed exclusion of
group A and C patients from the series. In the remaining
population, IQ categorically segregated group D from group B
Figure 4. Pulmonary and cardiac function variables not used to constitute the model. Group A patients had poorest respiratory andmyocardial functions and highest serum CK levels at diagnosis. These variables, not used in the multivariate model, also corroborate its predictiverelevance (indicated p values are obtained by Kruskal-Wallis test; clusters were compared by a multiple range post-test with p,0.05).doi:10.1371/journal.pone.0004347.g004
DMD Sub-Phenotypes
PLoS ONE | www.plosone.org 7 February 2009 | Volume 4 | Issue 2 | e4347

patients. Notably, predictive combinations reliably identified
patients classified by surrogate indicators as early infantile DMD
(table 3) and moderate pure motor DMD (table 4).
To test the robustness of these predictive criteria, we examined
an additional set of 34 unselected DMD patients aged more than
12 (series 2). Files contained data required to retest group A and C
patients (age of onset with type of initial symptoms, n = 32; and
MMT at 8 yrs with mental status evaluation, n = 34), but were not
complete enough to classify patients by the multivariate model.
Surrogate criteria, however, allowed satisfactory recognition of
patients with clinically evident early infantile DMD (‘‘psychomotor
delay as first manifestation’’, n = 8) and with moderate pure motor
DMD (identified a posteriori by ‘‘loss of ambulation .11 yrs’’,
n = 9). Data for major motor parameters such as MMT of lower
limbs, ages at loosing ambulation or at onset of scoliosis, and of
becoming wheel-chair-ridden were very similar for moderate pure
motor DMD patients identified by multivariate analysis (series 1)
or by surrogate criteria (series 2) (not shown). As shown in table 5,
early predictive criteria in combination assigned patients in these
two subgroups, with similarly good efficiency in series 1 and 2.
Discussion
In this study, we substantiated DMD’s clinical heterogeneity
and identified 4 subsets of patients with different cognitive and
motor outcomes. Despite rough correlation of cognitive impair-
ment with the mutated region in the dystrophin gene, and of low
BMI with better motor outcome, neither genotyping nor
nutritional status served to identify DMD subsets, whereas age
and type of symptoms at onset, muscle strength at 8 yrs, and IQ,
did.
Unlike previous studies conducted on the whole spectrum of
dystrophinopathies [9,10], we stringently included patients without
any residual dystrophin at Western blot. Mutation could be
identified in 89% of patients, a satisfactory prevalence for DMD
series. Global characteristics of our DMD population were similar
to those previously reported in terms of ages at diagnosis (5.2 vs.
5.3 yrs), first walking (16 vs. 20 mo), first symptoms (3 vs. 2.4 yrs),
and chair-ridden (10.2 vs. 9.5 yrs) [8].
Admittedly, our study has the drawbacks of any retrospective
clinical investigation, such as variable follow-up duration which
occasionally resulted in missing data for delayed events in the
youngest patients (e.g. spinal arthrodesis or cardiomyopathy). A
long-term follow-up (.10 yrs) prospective study on the global
clinical variables of DMD, however, is unlikely to be undertaken.
A strong point of the study is that patients were followed by the
same medical team, collecting data on a systematic basis twice a
year and maintaining homogeneous practices along the entire
follow-up. For example, none of the patients had received steroids.
Multivariate classification approaches can be applied to small
cohorts [25,26]. They were used for example to subclassify spinal
muscular atrophy patients (n = 102) into 3 severity types [27] or to
delineate specific epilepsy syndromes (n = 72) for therapeutic
purposes [22]. The power of such approaches reside in their ability
Table 3. Simplified indicators of congenital DMD (cluster A) derived from series 1.
Sensitivity Specificity Accuracy Kappa PPV** NPV**
Psychomotor delay as 1st symptomRcongenital DMD defined by cluster analysis* 0.93 0.95 0.94 0.83 0.81 0.98
0.64–1.00 0.84–0.99 0.85–0.98 0.60–1.00 0.57–0.93 0.91–1.00
Age initial symptom ,2 yrs+cognitive status I, II***Rcongenital DMD defined bycluster analysis*
0.93 0.98 0.96 0.91 0.93 0.98
0.64–1.00 0.89–1.00 0.84–0.99 0.68–1.00 0.68–0.98 0.91–1.00
Age initial symptom ,2 yrs+cognitive status I, IIRcongenital DMD defined bysurrogate criterion (psychomotor delay as 1st symptom)*
0.88 1.00 0.97 0.92 1.00 0.94
0.64–0.98 0.92–1.00 0.89–1.00 0.68–1.00 0.78–1.00 0.81–0.99
*Yate’s Chi square: all p = 0.00001, exact 95% confidence limits.**PPV and NPV, positive or negative predictive value.***I: severe mental retardation, II: mild mental retardation (see methods).doi:10.1371/journal.pone.0004347.t003
Figure 5. Genotype/phenotype correlations. Proportion of patients with a mutation upstream to exon 30 steadily increased from group A to D.This ascent correlated with spared cognition (mental status: p,0.0003) but not with motor function (age at ambulation loss: NS) (Fisher’s exact test).Expectedly, the 3 patients with mutation after exon 63 affecting the brain specific DP71 transcript were classified in group A.doi:10.1371/journal.pone.0004347.g005
DMD Sub-Phenotypes
PLoS ONE | www.plosone.org 8 February 2009 | Volume 4 | Issue 2 | e4347

to uncover, without a priori hypotheses, variables that participate to
data structure [28]. These variables may seem poorly relevant
when considered individually, e.g. ‘‘type of educational establish-
ment’’ and ‘‘delay of diagnosis’’ strongly contributed to the stable
4-cluster solution.
The 4 DMD subsets mainly differed by cognitive and motor
involvement.
Group A included 20% of patients with early infantile form of
DMD, somewhat similar to that previously described as congenital
DMD [29]. These patients came early to medical attention
(1.2 yrs) because of psychomotor delay affecting speaking more
than walking. Severe (1/3) to moderate (2/3) mental retardation
was constant. Despite early onset, diagnosis was delayed
considerably and was performed usually when motor deficit had
become obvious. They had the poorest motor, respiratory and
cardiac outcomes, i.e. the most severe striated muscle involvement.
For example, 2/3 of them had cardiac dysfunction before age 12.
Accordingly, the highest CK levels were found in this group.
Finally, patients with psychomotor delay as the initial manifesta-
tion, with marked hyperCKaemia, and who have never been able
run, form an easily recognizable subset of severe DMD.
Group B designated as classical form of DMD, included 28% of
patients with clinical features and functional parameters similar to
the overall DMD population. Despite poor motor outcome and
constant learning difficulties, these patients could not be easily
recognised due to lack of specific or salient clinical characteristics.
Group C (moderate pure motor DMD) included 22% of
patients, sharply contrasting with the others because of a better
muscular status. As a corollary, both DMD diagnosis (7.2 yrs) and
rehabilitation onset were delayed in these patients. Intriguingly,
most of them attended motor handicapped schools, and were thin
according to BMI (69% vs. 31% in other groups, p,0.03). Why
nutritional status in DMD is highly variable remains unclear, but
low BMI in group C patients supports the view that limited burden
of the weakened muscles may be an advantage in DMD [30].
Group D patients (severe pure motor DMD) included 30% of
patients with sharp contrast between severe motor involvements
and perfectly spared cognitive functions. Complementary Western
blot analyses were systematically conducted to explain discrepancy
of muscle involvement in groups C and D patients. They failed to
detect different levels of relevant muscle proteins including
dystroglycans, sarcoglycans, dysferlin, and calpain (data not
shown).
There were inter-group genotypic variations as mutations
before exon 30 increased in numbers from group A to D.
Location of the mutation selectively influenced cognitive but not
motor outcome. When cognition was evaluated separately,
correlations remained incomplete, except for rare mutations
occurring after exon 63 that were exclusively found in group A
and associated with severe mental retardation [20]. Lack of
correlation with motor outcome suggests impact of other factors
than the mutation itself on severity of the myopathy [31]. Whether
these factors implicate genetic components remains to be
established [4]. As genotyping appeared nearly useless to predict
motor outcome, we searched for robust clinical indicators allowing
early classification of almost any DMD patient. Group A patients
Table 4. Simplified indicators of moderate pure motor DMD (cluster C) derived from series 1.
Sensitivity Specificity Accuracy Kappa PPV** NPV**
Ambulation loss .11 yrsRmoderate pure motor DMD defined bycluster analysis*
0.78 0.96 0.91 0.77 0.88 0.93
0.59–0.97 0.91–1.00 0.85–0.98 0.53–1.00 0.71–1.00 0.80–1.00
MMT.6 at 8 yrs plus+cognitive status III, IVRmoderate pure motorDMD defined by cluster analysis*
1 0.94 0.96 0.88 0.83 1.00
0.72–0.99 0.80–0.99 0.84–0.99 0.59–1.00 0.55–0.95 0.80–0.99
MMT.6 at 8 yrs plus+cognitive status III, IVRmoderate pure motorDMD defined by surrogate criterion (ambulation loss .11 yrs)*
0.83 0.94 0.91 0.78 0.83 0.94
0.51–0.97 0.79–0.99 0.78–0.97 0.49–1.00 0.55–0.95 0.81–0.99
*Yate’s Chi square: all p = 0.00001, exact 95% confidence limits.**PPV and NPV, positive or negative predictive value.***III borderline normal, IV normal (see methods).doi:10.1371/journal.pone.0004347.t004
Table 5. Simplified indicators applied to congenital and to moderate pure motor DMD in series 2.
Sensitivity Specificity Accuracy Kappa PPV** NPV**
Age initial symptom ,2 yrs+cognitive status I,II***Rpsychomotor delay as 1st symptom*
0.86 0.96 0.94 0.86 0.86 0.96
0.47–0.97 0.80–0.99 0.77–0.99 0.47–1.00 0.47–0.97 0.80–0.99
MMT.6 at 8 yrs plus+cognitive status III,IV***Rambulation loss .11 yrs*
1.00 0.92 0.94 0.86 0.82 0.94
0.63–0.99 0.73–0.99 0.79–0.99 0.53–1.00 0.52–0.95 0.86–1.00
*Yate’s Chi square: all p = 0.00001, exact 95% confidence limits.**PPV and NPV, positive or negative predictive value.***I severe mental retardation, II mild mental retardation, III borderline normal, IV normal (see methods).doi:10.1371/journal.pone.0004347.t005
DMD Sub-Phenotypes
PLoS ONE | www.plosone.org 9 February 2009 | Volume 4 | Issue 2 | e4347

could be easily recognised from infancy by psychomotor delay
occurring as initial symptom before 2 yrs. Moreover, group C
patients, which clinical status worsens more slowly than usual in
DMD, could be reliably recognised from 8 yrs of age by
combination of ‘‘lower limb MMT score .6’’ with ‘‘normal or
borderline mental status’’. We were unable to use earlier indicators
for this group, e.g. MMT at 6 yrs, because many group C patients
were not diagnosed at this age, due to less severe myopathy and
longer diagnosis delay (usually .4 yrs). Once A and C patients
were excluded, group D patients could be easily distinguished from
group B patients on the grounds of their constantly normal IQ.
With regard to therapeutics, it would be interesting to examine
if ‘‘good responders’’ to steroids belong to a given sub-phenotype
of DMD. More generally, trials, which are in danger of being
inconclusive due to lack of precise knowledge on DMD’s natural
history [7], would strongly benefit from accurate selection of
clinically homogeneous patient subsets. The simple combinations
of robust predictive criteria identified in this study seem
appropriate for this purpose.
Author Contributions
Conceived and designed the experiments: ID CC RG. Performed the
experiments: ID MM RZ HMB FL. Analyzed the data: CC SBG CC JC
RG. Contributed reagents/materials/analysis tools: FL JC. Wrote the
paper: ID CC RG.
References
1. Brooke MH, Fenichel GM, Griggs RC, Mendell JR, Moxley R, et al. (1989)Duchenne muscular dystrophy: patterns of clinical progression and effects of
supportive therapy. Neurology 39: 475–481.
2. Brooke MH, Fenichel GM, Griggs RC, Schumate JB, Pellegrino RJ (1983)Clinical investigation in Duchenne Dystrophy:Determination of the power of
therapeutic trials based on natural history. Muscle Nerve 6: 91–103.3. Mendell JR, Province MA, Griggs RC, Brooke MH, Fenichel GM, et al. (1987)
Clinical investigation of Duchenne muscular dystrophy. A methodology fortherapeutic trials based on natural history controls. Arch Neurol 44: 808–811.
4. Sifringer M, Uhlenberg B, Lammel S, Hanke R, Neumann B, et al. (2004)
Identification of transcripts from a subtraction library which might beresponsible for the mild phenotype in an intrafamilially variable course of
Duchenne muscular dystrophy. Hum Genet 114: 149–156.5. Bushby KM, Apleton R, Anderson LV, Welsch JL, Kelly P, et al. (1995)
Deletion status and intellectual impairment in Duchenne muscular dystrophy.
Dev Med Child Neurol 37: 260–269.6. Kapsa R, Kornberg AJ, Byrne E (2003) Novel therapies for Duchenne muscular
dystrophy. Lancet Neurol 2: 299–310.7. Escolar DM, Buyse G, Henricson E, Leshner R, Florence J, et al. (2005) CINRG
randomised controlled trial of creatine and glutamine in Duchenne musculardystrophy. Ann Neurol 58: 151–155.
8. Van Essen AJ, Verheij JBGM, Reefhuis J, Fidler C, Begeer JH, et al. (2004) The
natural history of Duchenne muscular dystrophy:analysis of data from a Dutchsurvey and review of age–related events. Online Leyden Muscular Dystrophy
pages. Available: http://www.dmd.nl/. Accessed 11 August 2007.9. Bushby K (1992) Genetic and clinical correlation of Xp21 muscular dystrophy.
J Inher Metab Dis 15: 551–564.
10. Nicholson LV, Johnson MA, Bushby KM, Gardner-Medwin D, Curtis A, et al.(1993) Integrated study of 100 patients with Xp21 linked muscular dystrophy
using clinical, genetic, immunochemical and histopathological data. Trendsacross the clinical groups. J Med Genet 30: 728–736.
11. Allsop KG, Ziter FA (1981) Loss of strength and functional decline inDuchenne’s dystrophy. Arch Neurol 38: 406–411.
12. Kilmer DD, Abresch RT, Fowler WM Jr (1993) Serial manual muscle testing in
Duchenne muscular dystrophy. Arch Phys Med Rehabil 74: 1168–1171.13. Mayhew JE, Florence JM, Mayhew TP, Henricson EK, Leshner RT, et al.
(2006) Reliable surrogate outcome measures in multicenter clinical trials ofDuchenne muscular dystrophy. Muscle Nerve 35: 36–42.
14. Jeppesen J, Green A, Steffensen BF, Rahbek J (2003) The Duchenne muscular
dystrophy population in Denmark, 1977–2001: prevalence, incidence andsurvival in relation to the introduction of ventilator use. Neuromuscul Disord 13:
804–812.15. Eagle M, Bourke J, Bullock R Gibson M, Struab V, et al. (2007) Managing
Duchenne muscular dystrophy. The additive effect of spinal surgery and home
nocturnal ventilation in improving survival. Neuromuscul Disord 17: 470–475.
16. Duboc D, Meune C, Lerebours G, Devaux JY, Vaksmann G, et al. (2005) Effect
of Perindopril on the onset and progression of Left Ventricular Dysfunction in
Duchenne Muscular Dystrophy. J Am Coll Cardiol 45: 855–867.
17. Cole TJ, Bellizini MC, Flegal KM, Dietz WH (2000) Establishing a standard
definition for child overweight and obesity worldwide: international survey. BMJ
320: 1240–1243.
18. Wicksell RK, Khilgren M, Melin L, Orvar EO (2004) Specific cognitive deficits
are common in children with Duchenne Muscular Dystrophy. Dev Med and
Child Neurol 46: 154–156.
19. Deburgrave N, Daoud F, Llense S, Barbot JC, Recan D, et al. (2007) Protein–
and mRNA–based phenotype–genotype correlations in DMD/BMD with point
mutations and molecular basis for BMD with nonsense and frameshift mutations
in the DMD gene. Hum Mutat 28: 183–195.
20. Muntoni F, Torelli S, Ferlini A (2003) Dystrophin and mutations:one gene,
several proteins, multiple phenotypes. Lancet Neurol 2: 731–740.
21. Meulman J, Van der Kooij AJ, Heiser WJ (2004) Principal components analysis
with non linear optimal scaling transformations for ordinal and nominal data. In:
Kaplan D, ed. Handbook of quantitative methodolgy for the social sciences.
Thousand Oaks: Sage Publications, Inc. pp 49–70.
22. Kaminska A, Ickowicz A, Plouin P, Bru MF, Dellatollas G, et al. (1999)
Delineation of cryptogenic Lennox Gastaud syndrome and myoclonic astatic
epilepsy using multiple correspondence analysis. Epilepsy Res 36: 15–29.
23. Knottnerus JA, van Weel C, Muris JWM (2002) Evidence base of clinical
diagnosis: evaluation of diagnostic procedures. BMJ 324: 477–480.
24. Uitenbroek DG (1997) SISA Diagnostic accuracy. Available: http://www.
quantitativeskills.com/sisa/statistics/diagnos.htm. Accessed 12 March 2008.
25. Wilcox MA, Wysnzynski DF, Panhuysen CI, Ma Q, Yip A, et al. (2003)
Empirically derived phenotypic subgroups – qualitative and quantitative trait
analyses. BMC Genetics 4(Suppl 1): S15.
26. Wilcox MA, Wysnzynski DF, Panhuysen CI, Ma Q, Yip A, et al. (2005) Two
major spondylarthropathy phenotypes are distinguished by pattern analysis in
multiplex families. Arthritis Rheum 53: 263–271.
27. Chung B, Wong V, Ip P (2004) Spinal muscular amyotrophy: Survival pattern
and functional status. Pediatrics 114: 548–553.
28. Bouvier P, Halperin D, Rey H, Jaffe PD, Laederach J, et al. (1999) Typology
and correlates of sexual abuse in children and youth: multivariate analyses in a
prevalence study in Geneva. Child Abuse Negl 23: 779–790.
29. Prelle A, Medori R, Moggio M, Chan HW, Gallanti A, et al. (1992) Dystrophin
deficiency in a case of congenital myopathy. J Neurol 239: 76–78.
30. Mok E, Beghin L, Gauchon P (2006) Estimation body composition in children
with Duchenne muscular dystrophy:comparison of bioelectrical impedance
analysis and skinfold–thickness measurement. Am J Clin Nutr 83: 63–69.
31. Suthers GK, Davies KE (1992) Phenotypic heterogeneity and the single gene.
Am J Hum Genet 50: 887–891.
DMD Sub-Phenotypes
PLoS ONE | www.plosone.org 10 February 2009 | Volume 4 | Issue 2 | e4347