Clean Air Plan
409
1 1 9 9 9 9 8 8 C C l l e e a a n n A A i i r r P P l l a a n n Santa Barbara County’s plan to attain the state and federal ozone standards FINAL December 1998
-
Upload
khangminh22 -
Category
Documents
-
view
0 -
download
0
Transcript of Clean Air Plan

11999988CClleeaann AAiirr PPllaann
Santa Barbara County’s plan to attain the state and federal ozone standards
FINALDecember 1998
11999988CClleeaann AAiirr PPllaann
Santa Barbara County’s plan to attain the state and federal ozone standards
• Attainment Demonstration – Federal Ozone Standard
• Rate-of-Progress Demonstration – Federal Ozone Standard
• Three Year Update to the 1991 AQAP and 1994 CAP – State Ozone Standard
FINALDecember 1998
Santa Barbara County Santa Barbara CountyAir Pollution Control District Association of Governments26 Castilian Drive, Suite B-23 222 East Anapamu St., Suite 11Goleta, California 93117 Santa Barbara, California 93101(805) 961-8800 (805) 568-2546
BOARD OF DIRECTORS
NAOMI SCHWARTZ JEANNE GRAFFYSupervisor, First District Supervisor, Second DistrictSanta Barbara County Santa Barbara County
GAIL MARSHALL JONI GRAYSupervisor, Third District Supervisor, Fourth DistrictSanta Barbara County Santa Barbara County
TOM URBANSKE RUSS HICKSSupervisor, Fifth District CouncilmemberSanta Barbara County City of Buellton
RICHARD WEINBERG KEN WESTALLCouncilmember CouncilmemberCity of Carpinteria City of Guadalupe
WILLIAM SCHUYLER ELINOR LANGERCouncilmember CouncilmemberCity of Lompoc City of Santa Barbara
ABEL MALDONADO NANCY ORCHARDCouncilmember MayorCity of Santa Maria City of Solvang
EXECUTIVE DIRECTOR
GERALD R. LORDEN
BOARD OF DIRECTORS
NAOMI SCHWARTZ JEANNE GRAFFYSupervisor, First District Supervisor, Second DistrictSanta Barbara County Santa Barbara County
GAIL MARSHALL JONI GRAYSupervisor, Third District Supervisor, Fourth DistrictSanta Barbara County Santa Barbara County
TOM URBANSKE RUSS HICKSSupervisor, Fifth District CouncilmemberSanta Barbara County City of Buellton
RICHARD WEINBERG KEN WESTALLCouncilmember CouncilmemberCity of Carpinteria City of Guadalupe
WILLIAM SCHUYLER ELINOR LANGERCouncilmember CouncilmemberCity of Lompoc City of Santa Barbara
LARRY LAVAGNINO NANCY ORCHARDCouncilmember MayorCity of Santa Maria City of Solvang
AIR POLLUTION CONTROL OFFICER
DOUGLAS W. ALLARD
11999988CClleeaann AAiirr PPllaann
FINALDecember 1998
PROJECT MANAGEMENT
Tom Murphy, SBCAPCD
Michael Powers, SBCAG
PRINCIPAL AUTHORS
Tad Bixler, SBCAPCD
Jim Damkowitch, SBCAG
Jim Fredrickson, SBCAPCD
Brian Lockett, SBCAPCD
Ron Tan, SBCAPCD
CONTRIBUTORS
Alan Ballard Bobbie Bratz Joel Cordes
Terry Dressler Vijaya Jammalamadaka Mike Goldman
Douglas Grapple Kathy Patton Joe Petrini
Duane Sikorski
xiii
GLOSSARY OF TERMS
Acute Health Effect: An adverse heath effect that occurs over a relatively short period of time, (e.g.,minutes, or hours.)
Aerosol: Particles of solid or liquid matter that can remain suspended in the air for long periods of timebecause of extremely small size and lightweight.
Air Basin: An area of the state, often comprising several counties, which is designated by the AirResources Board (ARB) based on similar meteorological and geographical conditions, with considerationgiven to political boundary lines when practical. Using these criteria, the ARB has divided the state into14 air basins. Santa Barbara County is located in the South Central Air Basin, along with San Luis Obispoand Ventura Counties.
Air Pollutant: Any foreign and/or natural substance that is discharged, released, or over propagated intothe atmosphere that may result in adverse effects on humans, animal, vegetation and/or materials. Alsoknown as an air contaminant. Examples include but are not limited to, smoke, charred paper, dust, soot,grime, carbon, fumes, gases, odors, particulate matter, acids, or any combination thereof.
Air Pollution Control District (APCD): The local agency governing air quality issues: proposes andadopts local air pollution rules, enforces those rules, responds to air pollution related complaints, issuespermits to polluting sources, inventories sources of air pollution emissions.
Air Quality Attainment Plan (AQAP): The comprehensive document, required under the CaliforniaClean Air Act (Health and Safety Code Section 40910 et. seq.), which details the programs and controlmeasures to be implemented for the purpose of reducing emissions. Emissions ultimately must be reducedto the extent that measured concentrations of pollutants in the air will not exceed California ambient airquality standards.
Air Quality Simulation Model: A computer program that simulates the transport, dispersion, and transformation ofcompounds emitted into the air and can project the relationship between emissions and air quality.
Air Toxics: A generic term referring to a harmful chemical or group of chemicals in the air. Typically, substancesthat are especially harmful to health, such as those considered under EPA's hazardous air pollutant program orCalifornia's AB 1807 toxic air contaminant program, are considered to be air toxics. Technically, any compound thatis in the air and has the potential to produce adverse health effects is an air toxic.
Airborne Toxic Control Measure (ATCM): A type of control measure, adopted by the ARB (Health and SafetyCode Section 39666 et seq.), which reduces emissions of toxic air contaminants from nonvehicular sources.
Alternate Fuels: Any fuel used for vehicular sources other than standard gasoline or diesel fuels. Theseinclude ethanol, methanol, compressed natural gas, liquid petroleum gas and electricity. Alternative fuelsare cleaner burning and help meet ARB's mobile and stationary emission standards.
Ambient Air: The air occurring at a particular time and place outside of structures. Often used interchangeably
xiv
with "outdoor" air.
Ambient Air Quality Standard: Health and welfare based standards established by the state or federalgovernment for clean outdoor air that identify the maximum acceptable average concentrations of airpollutants during a specified period of time.
Anthropogenic Emissions: Emissions related to human activity or devices.
APCD (Air Pollution Control District): A county agency with authority to regulate stationary, indirect, and areasources of air pollution (e.g., power plants, highway construction, and housing developments) within a given county,and governed by a district air pollution control board composed of the elected county supervisors.
ARB (California Air Resources Board): The State's lead air quality agency, consisting of a nine-member Governor-appointed board. It is responsible for attainment and maintenance of the State and federal air quality standards, and isfully responsible for motor vehicle pollution control. It oversees county and regional air pollution managementprograms.
Area-Wide Source: Stationary sources of pollution (e.g., water heaters, gas furnaces, fireplaces, and residentialwood stoves) that are typically associated with homes and non-industrial sources. The emissions from these sourcesin themselves don’t emit a significant amount of emissions, but when considered collectively with othersimilar sources become significant. The CCAA requires districts to include area-wide sources in the developmentand implementation of the AQAPs.
Atmosphere: The gaseous mass or envelope surrounding the earth. Where air pollutants are emitted into a buildingnot designed specifically as a piece of air pollution control equipment, such emission into the building shall beconsidered an emission into the atmosphere.
Attainment: Achievement of air quality standards.
Attainment Area: A geographic area which is in compliance with the National and/or California Ambient AirQuality Standards (NAAQS OR CAAQS).
Attainment Plan: In general, a plan that details the emission reducing control measures and their implementationschedule necessary to attain air quality standards. In particular, the federal Clean Air Act requires attainment plans fornonattainment areas; these plans must meet several requirements, including requirements related to enforceability andadoption deadlines.
Average Daily Emissions: Annual emissions divided by 365 (the number of days in a year).
BACT (Best Available Control Technology): The most up-to-date methods, systems, techniques, and productionprocesses available to achieve the greatest feasible emission reductions for given regulated air pollutants andprocesses. BACT is a requirement of NSR (New Source Review) and PSD (Prevention of Significant Deterioration). BACT as used in federal law under PSD is defined as an emission limitation based on the maximum degree ofemissions reductions allowable taking into account energy, environmental & economic impacts and other costs. [(CAA Section 169(3)]. The term BACT as used in state law means, an emission limitation that will achieve thelowest achievable emission rates, which means the most stringent of either the most stringent emission limitscontained in the SIP for the class or category of source, (unless it is demonstrated that one limitation is notachievable), or the most stringent emission limit achieved in practice by that class in category of source. “BACT”under state law is more stringent than federal BACT and is equivalent to federal LAER (lowest achievable emissionrate) which applies to NSR permit actions.
xv
In Santa Barbara County, for nonattainment pollutants, BACT for any stationary source is the more stringent of either:a) the most effective emission control device, emission limit, or technique which has been achieved in practice for thetype of equipment comprising such stationary source; or b) any other emission control device or technique determinedafter public hearing to be technologically feasible and cost-effective by the Air Pollution Control Officer; or c) themost stringent limitation contained in any State Implementation Plan. For attainment pollutants, BACT is anemission limitation based on the maximum degree of reduction for each pollutant which would be emitted from anynew or modified stationary source, which on a case-by-case basis, taking into account energy, environmental, andeconomic impacts and other costs, is achievable for such source or modification through application of productionprocesses or available methods, systems, and techniques, including fuel cleaning or treatment or innovative fuelcombustion techniques for control of such pollutant.
BAR (Bureau of Automotive Repair): An agency of the California Department of Consumer Affairs that managesthe implementation of the motor vehicle Inspection and Maintenance Program.
Best Available Mitigation Measures (BAMM): Design or operation measures that are directly relatedto the particular project, and are intended to reduce the number of vehicle trips.
Best Available Retrofit Control Technology (BARCT): An emission limitation based on the maximumdegree of reduction achievable by existing sources, taking into consideration environmental, energy andeconomic needs.
Biogenic Emissions: Emissions originating from natural sources such as vegetation.
California Air Resources Board (ARB or CARB): State of California oversight agency responsible forstatewide air quality issues.
California Ambient Air Quality Standards (CAAQS): Standards set by the State of California for themaximum levels of air pollutants which can exist in the outdoor air without unacceptable effects on human health orthe public welfare. These are more stringent than NAAQS.
California Clean Air Act of 1988 (CCAA): The amendments to the California Health and Safety Coderesulting from the passage of Assembly Bill 2595. A California law passed in 1988 which provides the basis forair quality planning and regulation independent of federal regulations. A major element of the Act is the requirementthat local APCD’s in violation of state ambient air quality standards must prepare attainment plans which identify airquality problems, causes, trends, and actions to be taken to attain and maintain California's air quality standards bythe earliest practicable date.
California Environmental Quality Act (CEQA): A California law which sets forth a process for publicagencies to make informed decisions on discretionary project approvals. The process aids decision makers todetermine whether any environmental impacts are associated with a proposed project. It requires environmentalimpacts associated with a proposed project to be identified, disclosed, and mitigated to the maximum extent feasible.
CFCs (Chlorofluorocarbons): Any of a number of substances consisting of chlorine, fluorine, and carbon. CFCs areused for refrigeration, foam packaging, solvents, and propellants. They have been found to cause depletion of theatmosphere's ozone layer.
Chronic Health Effect: An adverse health effect which occurs over a relatively long period of time (e.g., months oryears).

xvi
CO (Carbon Monoxide): A colorless, odorless gas resulting from the incomplete combustion of fossil fuels. Over80% of the CO emitted in urban areas is contributed by motor vehicles. CO interferes with the blood's ability to carryoxygen to the body's tissues and results in numerous adverse health effects. CO is a criteria air pollutant.
Commute: A home-to-work or work-to-home trip made regularly in connection with employment.
Commute Alternatives: Carpooling, vanpooling, transit, bicycling, and walking as commute modesduring peak period, as well as any Alternative Work Hours Program which results in the use of any modeof transportation for commuting outside of the peak periods.
Compliance Efficiency: The percent of emission sources subject to a control measure that are incompliance with its requirements. EPA recommends that compliance efficiency is assumed to be 80percent unless a District proves otherwise.
Composite Efficiency: The efficiency value which represents the actual effect of a control measure on asource category. Composite efficiency is calculated by finding the product of the control efficiency,percent implementation, the compliance efficiency, and the fraction of the source category affected.
Compressed Work Schedules: Work schedules that compress the traditional 40 hour weekly workperiod into fewer than five days by adopting longer work day such as 4/40 (4-ten hour days), and 9/80(8-nine hour and 1-eight hour days out of every ten work days).
Conformity: Conformity is a process mandated in the federal Clean Air Act to insure that federal actions do notimpede attainment of the federal health standards. General conformity sets out a process that requires federal agenciesto demonstrate that their actions are air quality neutral or beneficial. Transportation conformity sets out a process thatrequires transportation projects that receive federal funding, approvals or permits to demonstrate that their actions areair quality neutral or beneficial.
Congestion: Traffic conditions on roads, highways, or freeways which do not permit movement atoptimal legal speeds.
Congestion Management Program: A state mandated program (Government Code Section 65089a) that requireseach county to prepare a plan to relieve congestion and reduce air pollution.
Consumer Products: Products such as detergents, cleaning compounds, polishes, lawn and garden products,personal care products, and automotive specialty products which are part of our everyday lives and, through consumeruse, may produce air emissions which contribute to air pollution.
Contiguous Property: Two or more parcels of land with a common boundary or that are separated solelyby a public roadway or other public right-of-way.
Contingency Measure: Contingency measures are statute-required back-up control measures to be implemented inthe event of specific conditions. These conditions can include failure to meet interim milestone emission reductiontargets or failure to attain the standard by the statutory attainment date. Both state and federal Clean Air Acts requirethat District plans include contingency measures.
xvii
Control Efficiency: The percent of emissions that are controlled (i.e. not emitted) as a result of somecontrol on a polluting device or process.
Control Measure: A strategy to reduce the emissions of air pollution caused by a specific activity orrelated group of activities. An existing control measure is a measure which is currently being implementedas a rule. A proposed for adoption control measure is a measure that the APCD will be mandated tomake into a rule if the plan is approved by the Board. A further study control measure is a measure thathas the potential of being proposed for adoption, but warrants further study.
Corporate Average Fuel Economy: The sales-weighted average fuel economy of an automobilemanufacturer's annual production; CAFE is also used to refer to the Federal law that mandates thatautomobile manufacturers meet minimum average fuel economy standards.
Cost-Effective: A cost per unit of emission reduction which is lower than or equivalent to the maximumunit costs of the same emission reduction through the use of demonstrated Best Available ControlTechnology, calculated in current year dollars.
Criteria Pollutants: Pollutants for which State or National Ambient Air Quality Standards exist. Criteriapollutants include ozone, carbon monoxide, nitrogen dioxide, sulfur dioxide, lead, sulfates, hydrogensulfide, and particulate matter with a diameter of 10 microns or less.
Design Day Value: For ozone, the state defines that a calculated design day is based on three years ofdata excluding: extreme values, values that result from exceptional events or values attributable tooverwhelming transport from an upwind district. Under federal law, the design day for ozone is the fourthhighest one-hour concentration experienced at an individual monitoring station during the past three years.
Electric Motor Vehicle: A motor vehicle, which uses a battery-powered electric motor as the basis of its operation.Such vehicles emit virtually no air pollutants. Hybrid electric motor vehicles may operate using both electric andgasoline powered motors. Emissions from hybrid electric motor vehicles are also substantially lower thanconventionally powered motor vehicles.
EMFAC: The EMission FACtor model used by ARB to calculate on-road mobile vehicle emissions. This model ispart of ARB’s overall on-road mobile source Mobile Vehicle Emission Inventory (MVEI) model.
Emission Budget: An emission "ceiling" for future transportation emissions that cannot be exceeded.
Emission Forecasting: Estimating air pollutant emissions in future years using population, economic andcontrol projections.
Emission Inventory: An estimate of the amount of pollutants emitted from mobile and stationary sources into theatmosphere over a specific period such as a day or a year.
Emission Offsets: A rule-making concept whereby approval of a new or modified stationary source of air pollution isconditional on the reduction of emissions from other existing stationary sources of air pollution. These reductions arerequired in addition to reductions required by BACT.
Emission Reductions: The amount of emissions that will be reduced due to the implementation of a
xviii
control measure. Emission reductions can be calculated by finding the product of the emissions and thecomposite efficiency, while accounting for existing control.
Emission Standard: The maximum amount of a pollutant that is allowed to be discharged from a polluting sourcesuch as an automobile or smoke stack.
Employment Centers: Locations having a concentration of jobs or employment. Centers may vary insize and density, serving sub-regional or local markets, generally meeting the needs of the immediatepopulation.
Environmental Impact Report (EIR): A document discussing the potential adverse environmentalimpacts of a project required by the California Environmental Quality Act.
Environmental Protection Agency (EPA): The United States agency charged with setting policy andguidelines, and carrying out legal mandates for the protection of national interests in environmental resources.
Ethanol: A clear liquid derived from biomass (also known as "ethyl alcohol" or "grain alcohol").
Exceedance: Ambient pollutant concentrations measured above the applicable ambient air qualitystandards.
Facility: A structure, building, or operation, that has one or more permitted pieces of equipment.
Federal Clean Air Act (FCAA): A federal law passed in 1970 and amended in 1977 and 1990 which forms thebasis for the national air pollution control effort. Basic elements of the act include national ambient air qualitystandards for major air pollutants, air toxics standards, acid rain control measures, and enforcement provisions.
Feasible: Feasibility is most frequently used in the context of "feasible" stationary source controlmeasures. In this context, feasible means Best Available Retrofit Control Technology (see definition,above).
Flexible Fuel Vehicle (FFV): A vehicle capable of operating on any combination of methanol, ethanol,and gasoline.
Fraction Reactive Organic Gases (FROG): The weight fraction of reactive organic gases in emissionsof total organic gases from a source.
FIP (Federal Implementation Plan): In the absence of an approved State Implementation Plan (SIP), a planprepared by the EPA which provides measures that nonattainment areas must take to meet the requirements of theFederal Clean Air Act.
Fugitive Dust: Dust particles which are introduced into the air through certain activities such as soil cultivation, off-road vehicles, or any vehicles operating on open fields or dirt roadways.
Gasoline Tolerant: A term used to describe vehicles that normally operate on methanol but can run ongasoline as well.
Growth Management Plan: A plan for a given geographical region containing demographic projections (i.e.,
xix
housing units, employment, and population) through some specified point in time, and which providesrecommendations for local governments to better manage growth and reduce projected environmental impacts.
Hydrocarbon: Any of a large number of compounds containing various combinations of hydrogen and carbon atoms. They may be emitted into the air as a result of fossil fuel combustion, fuel volatilization, and solvent use, and are amajor contributor to smog. (Also see VOC.)
Incentives: Measures designed to encourage certain actions or behavior. These include inducements forthe use of carpools, buses and other high-occupancy vehicles in place of single occupant automobiletravel. Examples include HOV lanes, preferential parking and financial incentives.
Indirect Source: Any facility, building, structure, or installation, or combination thereof, which generates orattracts mobile source activity that results in emissions of any pollutant (or precursor) for which there is a stateambient air quality standard. Examples of indirect sources include employment sites, shopping centers, sportsfacilities, housing developments, airports, commercial and industrial development, and parking lots and garages.
Indirect Source Control Program: Rules, regulations, local ordinances and land use controls, and other regulatorystrategies of air pollution control districts or local governments used to control or reduce emissions associated withnew and existing indirect sources.
Inspection and Maintenance Program: A motor vehicle inspection program implemented by the BAR. It isdesigned to identify vehicles in need of maintenance and to assure the effectiveness of their emission control systemson a biennial basis. Enacted in 1979 and strengthened in 1990. (Also known as the "Smog Check" program.)
Lead Agency: The public agency which has the principal responsibility to carry out or approve a project.
Level of Service (LOS): A measure of the congested level on a highway facility or intersection basedprimarily on the comparison between the facility's capacity and the traffic volume it carries. Increasinglevels of congestion are designated along a scale from A to F.
Liquified Petroleum Gas (LPG): A gaseous byproduct of petroleum refining that is compressed to aliquified form for sales. LPG consists of butane, propane, or a mixture of the two, and of trace amounts ofpropylene and butylene.
Local Agency: Any public agency other than a state or federal agency.
Low Emission Vehicle (LEV): The LEV standards for passenger cars represent a 70 percent reductionin gasoline-equivalent hydrocarbon and a 50 percent reduction in NOX from ARB’s 1994 standards.
Maintenance Plan: In general, a plan that details the actions necessary to maintain air quality standards. Inparticular, the federal Clean Air Act requires maintenance plans for areas that have been redesignated as attainmentareas.
Memorandum of Understanding (MOU): The Santa Barbara Association of Governments (SBCAG) isthe regional agency responsible for preparing regional transportation plans and programs. Most of theseprograms require the participation of cities, the county, and other affected local agencies. A number ofthese programs also have implications to regional air quality plans such as the Clean Air Plan. Because theSBCAG currently works with cities and the county on regional transportation programs, and because of
xx
the close interaction between many of these programs and the regional air quality plan, the APCD andSBCAG have entered into a Memorandum of Understanding whereby SBCAG is charged withdeveloping the transportation elements of the plan, especially the transportation control measures. TCMsare essentially measures that seek to reduce the use of the single passenger automobile and areimplemented by a number of local agencies such as local cities and the county.Methanol: A colorless, clear liquid derived from natural gas or coal (also known as "methyl alcohol" or"wood alcohol").
Mitigation: A change or alternative to the proposed project which reduces or eliminates its significantadverse environmental impacts. Mitigation can be in the form of traditional offsets, transportation-basedmitigation measures that are directly associated with the project under consideration, or mitigation fees tobe used to secure off site mitigation.
Mobile Source: Sources of air pollution such as automobiles, motorcycles, trucks, buses, off-road vehicles, boatsand airplanes. (Contrast with stationary sources.)
Model Rule: A generically formatted control measure, prepared as a guide for adoption by regulatoryagencies. Model rules have no force of law until they are adopted by a regulatory agency. Historically,model rules were prepared by the California Air Resources Board and given to local Air Pollution ControlDistricts for their consideration. The model rule process has been replaced by the suggested controlmeasure process.
NAAQS (National Ambient Air Quality Standards): Standards set by the federal EPA for the maximum levels ofair pollutants which can exist in the outdoor air without unacceptable effects on human health or the public welfare.
Net Emissions: The actual emissions occurring from a new or modified project after actual on site and offsite mitigation, and other effective mitigation has been applied, as determined by the Air Pollution ControlOfficer.
Nitrogen Oxides (Oxides of Nitrogen, NOx): A general term pertaining to compounds of nitric acid (NO), nitrogendioxide (NO2 ), and other oxides of nitrogen. Nitrogen oxides are typically created during combustion processes, andare major contributors to smog formation and acid deposition. NO 2 is a criteria air pollutant, and may result innumerous adverse health effects; it absorbs blue light, resulting in a brownish-red cast to the atmosphere and reducedvisibility.
Nonattainment Area: A geographic area identified by the EPA and/or ARB as not meeting either NAAQS orCAAQS standards for a given pollutant.
NSR (New Source Review): A program used in development of permits for new or modified industrial facilitieswhich are in a nonattainment area, and which emit nonattainment criteria air pollutants. The two major requirementsof NSR are Best Available Control Technology and Emission Offset.
Outer Continental Shelf: The area of the Pacific Ocean extending twenty-five miles out to sea from theState Tidelands (which extends three miles from the coastline).
Oxygenate: Any oxygen-rich substance added to gasoline to enhance octane and reduce carbonmonoxide emissions.
xxi
Ozone: A strong smelling, pale blue, reactive toxic chemical gas consisting of three oxygen atoms. It is a product ofthe photochemical process involving the sun's energy. Ozone exists in the upper atmosphere ozone layer as well as atthe earth's surface. Ozone at the earth's surface causes numerous adverse health effects and is a criteria air pollutant. Itis a major component of smog.
Ozone Precursors: Chemicals such as hydrocarbons and oxides of nitrogen, occurring either naturally or as a resultof human activities, which contribute to the formation of ozone, a major component of smog.
Park & Ride: A program that permits a patron to drive a vehicle to a transit station, park in the areaprovided for that purpose and ride the transit system to his or her destination.
Peak Period/Peak Hour Demand: The time of most intensive use of a service or facility. In terms oftravel, generally there is a morning and an afternoon peak on streets and highways.
Permit: Written permission and authorization from a government agency that allows for the construction and/oroperation of an emission generating facility or its equipment within certain specified limits or conditions.
Photochemical: Of, relating to, or resulting from the chemical action of radiant energy, especiallysunlight.
Planning Inventory: Emissions inventory from which pollution from natural sources (e.g., seeps,vegetation) are excluded because they are currently not regulated by implementation of APCD rules.
PM (Particulate Matter): Solid or liquid particles of soot, dust, smoke, fumes, and aerosols.
PM10 (Particulate Matter less than 10 microns): A major air pollutant consisting of tiny solid or liquid particles ofsoot, dust, smoke, fumes, and aerosols. The size of the particles (10 microns or smaller, about 0.0004 inches or less)allows them to easily enter the air sacs in the lungs where they may be deposited, resulting in adverse health effects.PM10 also causes visibility reduction and is a criteria air pollutant.
PM2.5 (Particulate Matter less than 2.5 microns): A major air pollutant consisting of tiny solid or liquid particles,generally soot and aerosols. The size of the particles (2.5 microns or smaller, about 0.0001 inches or less) allowsthem to easily enter the air sacs deep in the lungs where they may cause adverse health effects, as noted in severalrecent studies. PM2.5 also causes visibility reduction, but is not considered a criteria air pollutant at this time.
Population Exposure Index: A measurement of overall population exposure to ambient pollutant levelsbased an average per capita exposure and the severity of the exceedance.
Precursor: Any directly emitted pollutant that, when released into the atmosphere, forms or causes to beformed or contributes to the formation of a secondary pollutant for which an ambient air quality standardhas been adopted, or whose presence in the atmosphere will contribute to the violation of one or moreambient air quality standards.
PSD (Prevention of Significant Deterioration): A program used in development of permits for new or modifiedindustrial facilities in an area that is already in attainment. The intent is to prevent an attainment area from becominga non-attainment area. This program, like NSR, can require BACT and, if an AAQS is projected to be exceeded,Emission Offsets.
xxii
Pseudocyclic Oil Well: A cyclic well is an oil well where steam is periodically injected into the wellreservoir to stimulate production, but where the well is unaffected by steam injection occurring in adjacentwells. A pseudocyclic oil well is also periodically steam injected, however, it is affected by steam injectionoccurring in adjacent wells.
Public Transportation : Transportation service by bus, rail para-transit, airplane, and ship offered by anoperator on a regular basis to the general public.
Public Workshop: A workshop held by a public agency for the purpose of informing the public and obtaining itsinput on the development of a regulatory action or control measure by that agency.
Reactive Organic Compound (ROC): See reactive organic gases.
Reactive Organic Gases (ROG): A reactive chemical gas, composed of hydrocarbons, that react with nitrogenoxides and contribute to the formation of ozone. Also known as Volative Organic Compounds (see VOC), oras Non-Methane Organic Compounds (NMOCs). The APCD considers all volatile compounds containingcarbon except the following to be reactive: ethane, methane, carbon monoxide, carbon dioxide, carbonicacid, metallic carbides or carbonates, ammonium carbonates, methyl chloroform (TCA), methylenechloride (dichloromethane), CFC-11, CFC-12, HCFC-22, FC-23, CFC-113, CFC-114, CFC-115, HCFC-123, HCFC-134a, HCFC-141b, HCFC-142b.
Reactivity: A measure of the tendency of a hydrocarbon species to react with nitrogen oxides to formatmospheric ozone.
Reasonable Further Progress: Annual incremental reductions in emissions of the relevant air pollutantand its precursors required to ensure attainment of the applicable air quality standard by the applicabledate.
Reasonably Available Control Technology (RACT): Process changes and/or devices to minimize airpollution from mobile and stationary sources that are cost-effective and readily available.
Reformulated Gasoline: A gasoline whose composition is changed to reduce exhaust emissions.
Retrofit: Modification of a polluting device to make it less polluting.
Ridesharing: A cooperative effort of two or more people to travel together. Examples are carpools,vanpools, buspools, trains, and public transit.
ROP Plan: The 1993 Rate-of-Progress Plan. The 1993 ROP Plan demonstrated that by 1996 existingand proposed control measures reduced emissions of reactive organic gases (ROG) to a level 15% belowthe 1990 baseline inventory.
Santa Barbara Channel: The area of the Pacific Ocean between Santa Barbara County's southern coastand the Channel Islands.
xxiii
Santa Maria Basin: An area of undersea oil reserves off the western coast of Santa Barbara County.
Secondary Pollutants: Pollutants not emitted directly, but formed in the atmosphere through chemicalreactions or transformation of other pollutants (i.e., ozone).
Single Occupant Vehicle (SOV): A motor vehicle occupied by one employee for commute purposes,including motorcycles.
Smog: A combination of smoke, ozone, hydrocarbons, nitrogen oxides, and other chemically reactive compoundswhich, under certain conditions of weather and sunlight, may result in a murky brown haze that causes adverse healtheffects. The primary source of smog in California is motor vehicles.
Smog Check: A vehicle inspection and maintenance exam. Smog Check Program: (See Inspection andMaintenance Program.)
Smoke: A form of air pollution consisting primarily of particulate matter (i.e., particles). Other components of smokeinclude gaseous air pollutants such as hydrocarbons, oxides of nitrogen, and carbon monoxide. Sources of smoke mayinclude fossil fuel combustion, agricultural burning, and other combustion processes.
Solvent : A substance that dissolves another to form a solution.
Source: Something that produces air pollution emissions. Sources can be stationary or mobile, andanthropogenic or natural.
South Coast: The area of Santa Barbara County south of the ridge of the Santa Ynez Mountains andadjacent tidelands.
SO2 (Sulfur Dioxide): A strong smelling, colorless gas that is formed by the combustion of fossil fuels. Powerplants, which may use coal or oil high in sulfur content, can be major sources of SO2. SO2 and other sulfur oxidescontribute to the problem of acid deposition. SO2 is a criteria pollutant.
State Implementation Plan (SIP): A comprehensive plan prepared by each state, mandated by thefederal Clean Air Act, which describes the existing air quality conditions and measures which will be taken toattain and maintain national ambient air quality standards.
State Tidelands: The area of the Pacific Ocean within three miles of the shores of Santa Barbara County.
Stationary Source: A non-mobile structure, building, facility, equipment installation or operation. Examples include oil production facilities, industrial coating operations, a rock crushing facility, andfactories that use large amounts of solvents. A stationary source is classified as having a commonproduction process, located on one or more adjacent properties, and is under the same or commonownership, operation, or control. (Contrast with mobile sources.)
Stationary Source Control Measures: A control measure designed to limit the kind and amount ofpollutants emitted from stationary sources.
Telecommuting: Working at a location other than the conventional office. This place may be the home,or an office other than the employee's primary office. Telecommuting employees can communicate with
xxiv
their offices by telephone.
Total Organic Gases (TOG): Reactive organic gases plus non-reactive organic gases.
Toxic Air Contaminant: An air pollutant, identified in regulation by the ARB, which may cause or contribute to anincrease in deaths or in serious illness, or which may pose a present or potential hazard to human health. TACs areconsidered under a different regulatory process (California Health and Safety Code Section 39650 et seq.) thanpollutants subject to CAAQS. Health effects due to TACs may occur at extremely low levels, and it is typicallydifficult to identify levels of exposure which do not produce adverse health effects.
Transitional Low Emission Vehicle (TLEV): TLEV vehicle standards will be 50 percent lesshydrocarbon emissions than 1993 model-year conventional gasoline vehicles.
Transport: The act of emissions from one source being carried by wind to other locations.
Transportation Control Measure (TCM): Any strategy to reduce vehicle trips, vehicle use, vehiclemiles traveled, vehicle idling, or traffic congestion for the purpose of reducing motor vehicle emissions. TCMs can include encouraging the use of carpools and mass transit. TCM’s include both TransportationDemand Management and Transportation System Management measures.
Transportation Demand Management (TDM): The implementation of measures which encouragepeople to change their mode of travel, or not to make a trip at all, (e. g., ridesharing, pricing incentives,parking management and telecommuting.)
Transportation System Management (TSM): The implementation of measures which improve theefficiency of transportation infrastructure.
Trip: A single or one direction vehicle movement.
UAM (Urban Airshed Model): The three-dimensional photochemical grid model used to simulate ozone formation.Used to project episodic ozone concentrations. (See also air quality simulation model.)
Ultra Low Emission Vehicle (ULEV): ULEV standards would lower gasoline-equivalent hydrocarbonemissions by 85 percent, carbon monoxide by 50 percent, and NOX emissions by 50 percent, from 1993levels.
Vanpool: A van used routinely by six or more employees to commute together. The three basic types ofvanpools are owner-operated, employer-sponsored, and vendor-operated.
Vehicle Miles Traveled (VMT): Number of miles traveled by a given vehicle in a specified time period. This number is sometimes estimated for the entire fleet of on road vehicles.
Violation: A number of measured exceedances of an applicable ambient air quality standard.
Visibility: The distance that atmospheric conditions allow a person to see at a given time and location. Visibilityreduction from air pollution is often due to the presence of sulfur and nitrogen oxides, as well as particulate matter.

xxv
Volatile Organic Compound (VOC): This term is generally used similarly to the term "reactive organicgases" but excludes ethane which the federal government does not consider to be reactive. VOCs arehydrocarbon compounds that exist in the ambient air and contribute to the formation of smog and/or may themselvesbe toxic. VOCs often have an odor, and some examples include gasoline, alcohol, and the solvents used in paints.
Zero Emission Vehicle (ZEV): A vehicle which will maintain zero emissions throughout its lifetime.
xxvi
GLOSSARY OF ACRONYMS
AB 2588 Assembly Bill 2588, The Air Toxic "Hot Spots" Information and AssessmentAct of 1987
AEI Annual Emission InventoryAPCD Air Pollution Control DistrictAPCO Air Pollution Control OfficerAPI American Petroleum InstituteAQAP Air Quality Attainment PlanARB California Air Resources BoardATCM Air Toxic Control MeasureATV All Terrain VehicleAVR Average Vehicle RidershipBACT Best Available Control TechnologyBAMM Best Available Mitigation MeasuresBAR Bureau of Automotive RepairBARCT Best Available Retrofit Control TechnologyBBLS BarrelsBOPD Barrels of Oil Per DayBTU British Thermal UnitCAC Community Advisory CouncilCaltrans California Department of TransportationCAP Clean Air PlanCAPCOA California Air Pollution Control Officers AssociationCARB California Air Resources BoardCCAA California Clean Air Act of 1988CCC California Coastal CommissionCEC California Energy CommissionCEQA California Environmental Quality ActCES Category of Emission SourceCFR Code of Federal RegulationsCMAQ Congestion Mitigation and Air QualityCMP Congestion Management ProgramCNG Compressed Natural GasCO Carbon MonoxideCO2 Carbon DioxideDistrict Santa Barbara County Air Pollution Control DistrictDMV Department of Motor VehiclesDOG Department of Oil and Gas (California)DPR Department of Pesticide RegulationEDS Statewide Emission Data SystemEIR Environmental Impact ReportEKMA Empirical Kinetic Modeling ApproachEPA Environmental Protection Agency (United States)ERC Emissions Reduction Credit
xxvii
ERF Environmental Research FoundationEtO Ethylene OxideFCAA Federal Clean Air ActFCAAA Federal Clean Air Act AmendmentsFFV Flexible Fuel VehicleFIP Federal Implementation PlanFMVCP Federal Motor Vehicle Control ProgramFROG Fraction Reactive Organic GasesFPM10 Fraction Particulate Matter Less Than 10 Microns in DiameterFTIP Federal Transportation Improvement ProgramFTP Federal Emissions Test ProcedureGVR Gasoline Vapor RecoveryH&SC Health & Safety CodeHAP Hazardous Air PollutantH2S Hydrogen SulfideHC HydrocarbonsHDT Heavy Duty TruckHDV Heavy Duty VehicleHOV High Occupancy Vehiclehp HorsepowerIC Internal CombustionIMPROVE Interagency Monitoring of Protected Visual Environments ProgramI&M Inspection and MaintenanceIPM Integrated Pest ManagementIRTA Institute for Research & Technical AssistanceISTEA Intermodal Surface Transportation Efficiency ActISR Indirect Source ReviewITG Innovative Technology GroupLAER Lowest Achievable Emission RateLDT Light Duty TruckLDV Light Duty VehicleLEV Low Emission VehicleLNG Liquefied Natural GasLPG Liquefied Petroleum GasM ThousandMM MillionM85 85 percent Methanol/15 percent Gasoline FuelMDT Medium Duty TruckMDV Medium Duty VehicleMMBTU Million British Thermal UnitsMMSCFD Million Standard Cubic Feet Per DayMOU Memorandum of UnderstandingMSCF Thousand Standard Cubic FeetMTBE Methyl Tertiary-Butyl EtherMVFF Motor Vehicle Fueling Facility (Gas Station)MVRF Motor Vehicle Refurbishing Facility (Auto Body Repair Shop)MVIP Motor Vehicle Inspection Program
xxviii
NAAQS National Ambient Air Quality StandardsNEPA National Environmental Protection ActNESHAPS National Emission Standards for Hazardous Air PollutantsNGL Natural Gas LiquidsNMHC Non-Methane HydrocarbonsNO Nitric OxideNO2 Nitrogen DioxideNOX Oxides of NitrogenNOV Notice of ViolationNSPS New Source Performance StandardsNSR New Source ReviewO3 OzoneOCS Outer Continental ShelfOVA Organic Vapor AnalyzerPAM Photochemical Assessment Monitoring StationPAN Peroxyacyl NitratePb LeadPEI Planning Emission InventoryPM Particulate MatterPM10 Particulate Matter Less Than 10 Microns in Diameterppb Parts Per Billionpphm Parts Per Hundred Millionppm Parts Per MillionPSD Prevention of Significant Deteriorationpsi Pounds Per Square InchPSI Pollution Standards Indexpsia Pounds Per Square Inch Absolute PressurePVC Polyvinyl ChloridePVRV Pressure Vacuum Relief ValvesRACT Reasonably Available Control TechnologyRHC Reactive Hydrocarbons - same as ROGRMD Resource Management Department (Santa Barbara County)ROC Reactive Organic Compounds - same as ROGROG Reactive Organic Gases - same as ROCROP Rate-of-Progress PlanRTP Regional Transportation PlanRVP Reid Vapor PressureSARA Superfund Amendment and Reauthorization ActSBCAPCD Santa Barbara County Air Pollution Control DistrictSBCAG Santa Barbara County Association of GovernmentsSBMTD Santa Barbara Metropolitan Transportation DistrictSCC Source Classification CodeSCCAB South Central Coast Air BasinSCCCAMP South Central Coast Cooperative Aerometric Monitoring Programscf Standard Cubic FeetSCOS Southern California Ozone StudySCR Selective Catalytic Reduction
xxix
SIC Standard Industrial Classification CodeSIP State Implementation PlanSLAMS State and Local Air Monitoring StationsSO2 Sulfur DioxideSO4 SulfatesSOX Oxides of SulfurSOV Single-Occupant VehicleSUV Sport Utility VehicleTAC Toxic Air ContaminantTCM Transportation Control MeasureTDM Transportation Demand ManagementTHC Total HydrocarbonsTLEV Transitional Low Emission VehicleTMP Transportation Management PlanTOC Total Organic CompoundsTOG Total Organic GasesTPD Tons Per DayTPY Tons Per YearTSM Transportation Systems ManagementTSP Total Suspended ParticulatesUAM Urban Airshed Modelug Microgramug/m3 Micrograms Per Cubic MeterULEV Ultra-Low Emission VehicleUSEPA United States Environmental Protection AgencyUTM Universal Transverse MercatorVMT Vehicle Miles TravelledVOC Volatile Organic CompoundsVRS Vapor Recovery SystemZEV Zero Emission Vehicle
i
TABLE OF CONTENTSPage #
EXECUTIVE SUMMARY................................................................................................ EX-1
1. INTRODUCTION.............................................................................................................1-1
1.1 PURPOSE ........................................................................................................1-1
1.2 CURRENT STATE AND FEDERAL REQUIREMENTS ................................1-2
1.3 AIR QUALITY ATTAINMENT PLANNING SUMMARY .............................1-4
1.4 PLAN ORGANIZATION .................................................................................1-6
2. LOCAL AIR QUALITY...................................................................................................2-1
2.1 INTRODUCTION ............................................................................................2-1
2.2 CLIMATE OF SANTA BARBARA COUNTY ................................................2-1
2.3 AIR QUALITY MONITORING.......................................................................2-5
2.3.1 ENHANCED MONITORING ...................................................2-6
2.4 AIR QUALITY OVERVIEW ...........................................................................2-7
2.4.1 OZONE .....................................................................................2-7
2.4.2 CARBON MONOXIDE ............................................................2-8
2.4.3 NITROGEN DIOXIDE .............................................................2-8
2.4.4 SULFUR DIOXIDE ..................................................................2-9
2.4.5 PM10.......................................................................................2-10
2.4.6 LEAD......................................................................................2-10
2.4.7 SULFATES .............................................................................2-11
2.4.8 HYDROGEN SULFIDE..........................................................2-11
2.4.9 VINYL CHLORIDE................................................................2-12
2.4.10 VISIBILITY REDUCING PARTICLES..................................2-12
2.4.11 REGIONAL HAZE .................................................................2-12
2.4.12 TOXIC AIR CONTAMINANTS .............................................2-13
2.5 DISCUSSION OF POLLUTANTS WHICH VIOLATE STANDARDS .........2-14
2.5.1 OZONE ...................................................................................2-14
2.5.1.1 Peak 1-Hour Ozone Levels ...........................................2-14

ii
2.5.1.2 1-Hour Ozone Exceedances..........................................2-15
2.5.1.3 Area Classification for the 1-Hour Ozone Standard.......2-18
2.5.1.4 New Federal 8-Hour Ozone Standard ...........................2-19
2.5.2 PM10 (PARTICULATE MATTER)..........................................2-19
2.5.3 PM2.5 (FINE PARTICULATE MATTER) ...............................2-20
2.6 CONCLUSIONS ............................................................................................2-21
3. EMISSION INVENTORY................................................................................................3-1
3.1 INTRODUCTION ............................................................................................3-1
3.2 POLLUTANTS ................................................................................................3-3
3.3 EMISSION INVENTORY HIERARCHY ........................................................3-3
3.3.1 STATIONARY SOURCES .................................................................3-4
3.3.1.1 Fuel Combustion...................................................................3-4
3.3.1.2 Waste Disposal .....................................................................3-5
3.3.1.3 Cleaning and Surface Coatings ..............................................3-6
3.3.1.4 Petroleum Production and Marketing ....................................3-6
3.3.1.5 Industrial Processes...............................................................3-7
3.3.2 AREA-WIDE SOURCES....................................................................3-7
3.3.2.1 Solvent Evaporation..............................................................3-8
3.3.2.2 Miscellaneous Processes........................................................3-8
3.3.3 MOBILE SOURCES...........................................................................3-9
3.3.3.1 On-Road Motor Vehicles ......................................................3-9
3.3.3.2 Other Mobile Sources .........................................................3-11
3.3.4 NATURAL SOURCES .....................................................................3-13
3.3.4.1 Natural Sources ..................................................................3-13
3.4 1996 ANNUAL EMISSION INVENTORY....................................................3-14
3.4.1 SANTA BARBARA COUNTY EMISSIONS....................................3-15
3.4.2 OCS EMISSIONS.............................................................................3-18
3.5 1990 BASE-YEAR ANNUAL EMISSION INVENTORY .............................3-20
3.6 CONCLUSION ..............................................................................................3-25

iii
4. EMISSION CONTROL MEASURES .............................................................................4-1
4.1 INTRODUCTION ............................................................................................4-1
4.2 EMISSION CONTROL MEASURE MANDATES ..........................................4-2
4.3 EMISSION REDUCTION OVERVIEW ..........................................................4-4
4.4 ADOPTED CONTROL MEASURES...............................................................4-5
4.4.1 Rules 341 and 901 (R-GN-1) Control of Landfill Gas Emissions ..........4-6
4.4.2 Rule 331 (R-PG-1) Fugitive Emission Inspection
and Maintenance..................................................................................4-6
4.4.3 Rule 316 (R-PM-1, R-PM-2, R-PM-3)
Storage and Transfer of Gasoline .........................................................4-7
4.4.4 Rule 344 (R-PP-1) Petroleum Sumps, Pits, and Well Cellars ................4-8
4.4.5 Rule 346 (R-PP-9) Loading of Organic Liquid Cargo Vessels ..............4-9
4.4.6 Rule 343 (R-PT-1) Petroleum Storage Tank Degassing......................4-10
4.4.7 Rule 325 (R-PT-2) Crude Oil Production and Separation
Rule 326 (R-PT-2) Storage of Reactive Organic Compound
Liquids ..............................................................................................4-11
4.4.8 Rule 323 (R-SC-1) Architectural Coatings .........................................4-11
4.4.9 Rule 330 (R-SC-2) Surface Coating of Metal Parts and Products .......4-12
4.4.10 Rule 337 (R-SC-2) Surface Coating of Aircraft or Aerospace
Vehicle Parts and Products ................................................................4-13
4.4.11 Rule 339 (R-SC-4) Motor Vehicle and Mobile Equipment Coating
Operations .........................................................................................4-13
4.4.12 Rule 351 (R-SC-5) Surface Coating of Wood Products......................4-14
4.4.13 Rule 321 (R-SL-2) Control of Degreasing Operations........................4-15
4.4.14 Rule 329 (R-SL-3) Cutback and Emulsified Asphalt
Paving Materials ................................................................................4-16
4.4.15 Rule 349 (R-SL-5) Polyester Resin Operations ..................................4-16
4.4.16 Rule 354 (R-SL-7) Graphic Arts - Letter/Offset Printing....................4-17
4.4.17 Rule 333 (N-IC-1, N-IC-3) Control of Emissions from
Internal Combustion Engines .............................................................4-19
4.4.18 Rule 342 (N-XC-4, N-XC-5, N-XC-6) Control of NOx from

iv
Boilers, Steam Generators and Process Heaters..................................4-20
4.4.19 Rule 359 (N-XC-8) Petroleum Flares and Relief Gas Oxidizers ..........4-20
4.5 PROPOSED CONTROL MEASURES - FEDERAL ROP AND
ATTAINMENT DEMONSTRATION............................................................4-21
4.5.1 Rule 353 (R-SL-9) Control of ROG Emissions from Adhesives
and Sealants.......................................................................................4-21
4.5.2 Rule 352 (N-XC-1, N-XC-2, N-XC-3) Residential and
Commercial Space Water Heaters ......................................................4-22
4.6 CONTIGENCY MEASURES (POST 1999) ...................................................4-23
4.6.1 Revision to Rule 333 (N-IC-1, N-IC-3) Control of Emissions from
Internal Combustion Engines ............................................................4-23
4.7 CALIFORNIA AIR RESOURCES BOARD CONTROL MEASURE.............4-24
4.7.1 ARB R001 - California Diesel Fuel Regulations
(1994 CAP ARB-S4) .........................................................................4-25
4.7.2 ARB R002 - California Phase II Reformulated Gasoline
Regulations (1994 CAP ARB-S5)......................................................4-26
4.7.3 ARB R003 - Consumer Products (1994 CAP ARB-S1) .....................4-27
4.7.4 ARB R004 - Utility Equipment Limits (1994 CAP ARB-S3)..............4-27
4.7.5 ARB R005 - Heavy Duty Off-Road Diesel Engines
(1994 CAP ARB-S8) .........................................................................4-28
4.7.6 ARB R006 - Off-Highway Recreational Vehicles and Engines
(1994 CAP ARB-S9) .........................................................................4-29
4.7.7 ARB R007 - Consumer Products - Aerosol Coatings .........................4-30
4.7.8 M9, M10 - Off-Road Industrial Equipment (Diesel) ...........................4-32
4.7.9 M 11, M12 - Gas and LPG Equipment (25-175 Horsepower) ............4-33
4.7.10 M13 - Marine Vessels ........................................................................4-35
4.7.11 M14 - Locomotives ...........................................................................4-37
4.7.12 M16 - Pleasure Craft..........................................................................4-38
4.7.13 Consumer Products - SIP Reductions.................................................4-40
4.7.14 ARB-Pesticide Measure - Proposed (1994 CAP ARB-S2) .................4-40
4.8 CONCLUSIONS ............................................................................................4-41

v
5. TRANSPORTATION CONTROL MEASURES ............................................................5-1
5.1 INTRODUCTION ............................................................................................5-1
5.2 MEMORANDUM OF UNDERSTANDING.....................................................5-2
5.3 TRANSPORTATION CONTROL MEASURES ..............................................5-2
5.4 EMISSION REDUCTIONS OVERVIEW ........................................................5-3
5.5 ADOPTED MEASURES..................................................................................5-6
5.5.1 TRANSPORTATION CONTROL MEASURES.................................5-6
5.5.1.1 T-1 Trip Reduction Program
T-2 Employer-Based Transportation Demand Management
Programs ........................................................................5-6
5.5.1.2 T-3 Work Schedule Changes.................................................5-7
5.5.1.3 T-4 Areawide Ridesharing.....................................................5-8
5.5.1.4 T-5 Improve Commuter Public Transit Service......................5-8
5.5.1.5 T-7 Traffic Flow Improvements ............................................5-9
5.5.1.6 T-8 Parking Management....................................................5-10
5.5.1.7 T-9 Park & Ride and Fringe Parking ...................................5-10
5.5.1.8 T-10 Bicycling ....................................................................5-11
5.5.1.9 T-13 Accelerated Retirement of Vehicles ............................5-11
5.5.1.10 T-17 Telecommunications ...................................................5-12
5.5.1.11 T-18 Alternative Fuels.........................................................5-13
5.5.1.12 T-19 Public Education Program ..........................................5-13
5.6 CONTINGENCY MEASURES......................................................................5-14
5.6.1 TRANSPORTATION CONTROL MEASURES
5.6.1.1 T-21 Enhanced Inspection and Maintenance Program..........5-14
5.6.1.2 T-22 Mandatory Employer Trip Reduction..........................5-15
5.7 CALIFORNIA AIR RESOURCES BOARD CONTROL MEASURES...........5-16
5.7.1 ARB EMISSION STANDARDS FOR ON-ROAD VEHICLES ........5-16
5.8 1998 CLEAN AIR PLAN TCM PROJECTS...................................................5-18
5.8.1 1994 Clean Air Plan ..............................................................................5-18
5.9 CONCLUSIONS ............................................................................................5-18
vi
6. EMISSION FORECASTING...........................................................................................6-1
6.1 INTRODUCTION ............................................................................................6-1
6.2 EMISSION FORECAST ..................................................................................6-2
6.2.1 ACTIVITY INDICATORS .................................................................6-3
6.2.2 CONTROL MEASURES ....................................................................6-4
6.3 EMISSION INVENTORIES ............................................................................6-4
6.3.1 1996 PLANNING EMISSION INVENTORY:
SANTA BARBARA COUNTY...........................................................6-4
6.3.2 1999 PLANNING EMISSION INVENTORY:
SANTA BARBARA COUNTY...........................................................6-6
6.3.3 2005 PLANNING EMISSION INVENTORY:
SANTA BARBARA COUNTY...........................................................6-7
6.3.4 1996 PLANNING EMISSION INVENTORY:
OUTER CONTINENTAL SHELF ......................................................6-8
6.3.5 1999 PLANNING EMISSION INVENTORY:
OUTER CONTINENTAL SHELF ......................................................6-9
6.3.6 2005 PLANNING EMISSION INVENTORY:
OUTER CONTINENTAL SHELF ...................................................6-10
6.4 CONCLUSIONS ............................................................................................6-11
7. FUTURE AIR QUALITY.................................................................................................7-1
7.1 INTRODUCTION ............................................................................................7-1
7.2 MODELING OBJECTIVES AND METHODOLOGY.....................................7-1
7.2.1 The Urban Airshed Model....................................................................7-3
7.2.2 Modeling Domain ................................................................................7-4
7.2.3 Model Episode Selection......................................................................7-4
7.3 MODEL INPUT PREPARATION....................................................................7-6
7.3.1 Emissions Preparation..........................................................................7-6
7.3.2 Air Quality and Meteorological Data Preparation .................................7-7
7.4 MODEL PERFORMANCE EVALUATION ....................................................7-7

vii
7.5 MODEL RESULTS..........................................................................................7-7
7.5.1 Base Case Simulations .........................................................................7-8
7.5.2 1999 Attainment Demonstration ..........................................................7-8
7.6 DATA ACCESS ...............................................................................................7-9
7.7 IMPACTS OF POLLUTION TRANSPORT
ON SANTA BARBARA COUNTY .................................................................7-9
7.8 CONCLUSIONS ............................................................................................7-11
8. IMPLEMENTATION SUPPORT ACTIVITIES .....................................................8-1
8.1 INTRODUCTION ............................................................................................8-1
8.2 APCD PERMIT REGULATIONS....................................................................8-1
8.3 CONFORMITY REGULATIONS....................................................................8-2
8.3.1 TRANSPORTATION CONFORMITY ...............................................8-3
8.3.2 GENERAL CONFORMITY................................................................8-4
8.4 POLLUTION PREVENTION PROGRAMS ....................................................8-5
8.4.1 INNOVATIVE TECHNOLGOY GROUP...........................................8-5
8.4.2 BUSINESS ASSISTANCE PROGRAM..............................................8-6
8.4.3 PUBLIC OUTREACH PROGRAM.....................................................8-7
8.4.4 TAKE A VACATION FROM YOUR CAR.........................................8-7
8.4.5 CLEAN CITIES PROGRAM ..............................................................8-9
8.5 APCD ENVIRONMENTAL REVIEW PROGRAM.......................................8-10
8.6 LAND USE PLANNING................................................................................8-11
8.7 MOBILE SOURCE/TRANSPORTATION CONTROL POLICIES................8-12
8.7.1 REDUCING EMISSIONS BY VEHICLE CONTROLS....................8-13
8.7.2 ALTERNATIVE FUELS...................................................................8-14
8.7.3 TRAVEL DEMAND MANAGEMENT
AND SYSTEM EFFICIENCY ..........................................................8-14
8.7.4 PROMOTING TRANSIT..................................................................8-15
8.7.5 LAND USE STRATEGIES...............................................................8-15
8.8 CONGESTION MANAGEMENT PROGRAM ..............................................8-17
8.9 CONCLUSIONS ............................................................................................8-18
viii
9. RATE-OF-PROGREESS...........................................................................................9-1
9.1 INTRODUCTION ............................................................................................9-1
9.2 1990 RATE-OF-PROGRESS BASE YEAR INVENTORY..............................9-1
9.3 1999 ROP TARGET.........................................................................................9-3
9.4 FORECAST 1999 ROP INVENTORY.............................................................9-4
9.5 CONCLUSIONS ..............................................................................................9-5
10. STATE AND FEDERAL CLEAN AIR ACT REQUIREMENTS..........................10-1
10.1 INTRODUCTION ..........................................................................................10-1
10.2 1990 FEDERAL CLEAN AIR ACT AMENDMENTS ...................................10-1
10.3 CALIFORNIA CLEAN AIR ACT MANDATES ............................................10-6
10.3.1 TRIENNIAL PROGRESS REPORT .................................................10-6
10.3.2 TRIENNIAL PLAN REVISION .......................................................10-7
10.3.3 OVERALL PLAN REQUIREMENTS ..............................................10-7
10.4 CONCLUSIONS ............................................................................................10-9
11. STATE MANDATED TRIENNIAL PROGRESS REPORT ANDTRIENNIAL PLAN REVISION..............................................................................11-1
11.1 INTRODUCTION ..........................................................................................11-1
11.2 TRIENNIAL PROGRESS REPORT ..............................................................11-2
11.3 TRANSPORTATION PERFORMANCE STANDARDS................................11-3
11.4 TRIENNIAL PLAN REVISION.....................................................................11-3
12. PUBLIC PARTICIPATION ....................................................................................12-1
12.1 INTRODUCTION ..........................................................................................12-1
12.2 CAC COMMENTS.........................................................................................12-3
12.3 CHANGES TO THE 1998 CAP RESULTING FROM CAC
COMMENTS .................................................................................................12-7
12.4 1998 CLEAN AIR PLAN PUBLIC WORKSHOPS ........................................12-8
12.5 WRITTEN COMMENTS AND RESPONSES ON THE 1998
CLEAN AIR PLAN......................................................................................12-26
ix
LIST OF TABLESPage #
TABLE 1-1 Comparison of the 1989 AQAP,1991 AQAP, 1993 ROP Plan, 1994CAP,
and 1998 CAP...................................................................................................1-9
TABLE 2-1 Ambient Air Quality Standards.........................................................................2-24
TABLE 2-2 Air Quality Monitoring Stations - Operational Status and Parameters...............2-26
TABLE 2-3 Design Value Report for Monitoring Stations in Santa Barbara County,
Federal 1-Hour Ozone Standard, 1987-1989 ...................................................2-28
TABLE 2-4 Design Value Report for Monitoring Stations in Santa Barbara County,
Federal 1-Hour Ozone Standard, 1994-1996 ...................................................2-29
TABLE 2-5 1990 Clean Air Act Amendment Attainment Target Dates ...............................2-30
TABLE 2-6 Design Value Report for Monitoring Stations in Santa Barbara County,
Federal 8-Hour Ozone Standard, 1994-1996 ...................................................2-31
TABLE 3-1 1996 Annual Emission Inventory Santa Barbara County....................................3-26
TABLE 3-2 1996 Annual Emission Inventory Outer Continental Shelf .................................3-28
TABLE 3-3 1990 Base-Year Annual Emission Inventory Santa Barbara County...................3-29
TABLE 4-1 APCD Control Measures Evaluated for the 1998 CAP......................................4-43
TABLE 4-2 Emission Control Measures Required to Meet Federal Mandates ......................4-47
TABLE 5-1 1998 Clean Air Plan Transportation Control Measures......................................5-19
TABLE 5-2 1994 Clean Air Plan On-Road Mobile Source Control Measures.......................5-20
TABLE 5-3 1998 Clean Air Plan On-Road Mobile Source Control Measures.......................5-21
TABLE 6-1 1996 Planning Emission Inventory: Santa Barbara County ................................6-12
TABLE 6-2 1999 Planning Emission Inventory: Santa Barbara County ................................6-14
TABLE 6-3 2005 Planning Emission Inventory: Santa Barbara County ................................6-16
TABLE 6-4 1996 Planning Emission Inventory: Outer Continental Shelf ..............................6-18
TABLE 6-5 1999 Planning Emission Inventory: Outer Continental Shelf ..............................6-19
TABLE 6-6 2005 Planning Emission Inventory: Outer Continental Shelf ..............................6-20
TABLE 6-7 1998 Clean Air Plan Activity Indicators and Factors for 1999 and 2005 ............6-21
TABLE 9-1 1990 Base Year Planning Emission Inventory: Santa Barbara County..................9-6
TABLE 9-2 1999 ROG Target Value Calculation...................................................................9-8
TABLE 9-3 1999 Forecast ROG Emissions............................................................................9-9
x
LIST OF TABLES (Concluded)
Page #
TABLE 10-1 Santa Barbara County APCD Rule Activity from 1995-1997..........................10-10
TABLE 11-1 Summary of Emission Reductions for Rule Activity from Rules Adopted or
Implemented from 1995-1997 ..........................................................................11-4
TABLE 11-2 Triennial Plan Revision Requirements ..............................................................11-5
TABLE 12-1 Santa Barbara County Air Pollution Control District Board,
Board Appointed Community Advisory Council (CAC) Members .................12-69
TABLE 12-2 Santa Barbara County Air Pollution Control District Clean Air Plan
Public Presentations ......................................................................................12-70
xi
LIST OF FIGURES
Page #
FIGURE EX-1 Days Exceeding Ozone Standards ................................................................ EX-7
FIGURE EX-2 1996 Planning Emission Inventory................................................................ EX-8
FIGURE 2-1 Past and Present Air Quality Monitoring Stations ............................................2-32
FIGURE 2-2 Current Air Quality Monitoring Stations..........................................................2-33
FIGURE 2-3 Days Exceeding Ozone Standards in Santa Barbara County, 1988-1997 ..........2-34
FIGURE 2-4 Maximum 1-Hour and 8-Hour Carbon Monoxide Concentrations
at Santa Barbara, 1980-1997 ...........................................................................2-35
FIGURE 2-5 Maximum 1-Hour Nitrogen Dioxide Concentrations
at Santa Barbara, 1980-1997 ...........................................................................2-36
FIGURE 2-6 Annual Average Nitrogen Dioxide Concentrations
at Santa Barbara, 1980-1997 ...........................................................................2-36
FIGURE 2-7 Maximum 1-Hour Sulfur Dioxide (SO2) Concentrations
at Santa Maria, 1980-1997 ..............................................................................2-37
FIGURE 2-8 Maximum 3-Hour Sulfur Dioxide (SO2) Concentrations
at Santa Maria, 1980-1997 ..............................................................................2-37
FIGURE 2-9 Maximum 24-Hour Sulfur Dioxide (SO2) Concentrations
at Santa Maria, 1980-1997 ..............................................................................2-38
FIGURE 2-10 Annual Average Sulfur Dioxide (SO2) Concentrations
at Santa Maria, 1980-1997 ..............................................................................2-38
FIGURE 2-11 Maximum 24-Hour Average and Annual Geometric Mean PM10
Concentrations for Santa Barbara and Santa Maria, 1985-1997 .......................2-39
FIGURE 2-12 Annual Arithmetic Mean PM10 Concentrations at Santa Maria, 1984-1997 ......2-40
FIGURE 2-13 Maximum 30-Day Average Lead Concentrations
at Santa Barbara, 1980-1989 ...........................................................................2-41
FIGURE 2-15 Station-by-Station Ozone Standard Exceedances,
SLAMS Stations, 1980-1997 ..........................................................................2-42
FIGURE 2-16 Station-by-Station Ozone Standard Exceedances,
PSD Stations, 1980-1997 ................................................................................2-44

xii
LIST OF FIGURES (Concluded)
Page #
FIGURE 2-17 Exceedances of the California and National Ozone Standards: 1988-1997 .......2-46
FIGURE 2-14 Maximum 24-Hour Sulfate Concentrations at Santa Barbara, 1980-1990.........2-41
FIGURE 3-1 1996 Annual Emission Inventory: Santa Barbara County .................................3-31
FIGURE 3-2 1996 Annual Emission Inventory: Outer Continental Shelf...............................3-34
FIGURE 3-3 1990 Annual Base-Year Emission Inventory: Santa Barbara County................3-37
FIGURE 5-1 On-Road Mobile Source ROG Emission Reductions .......................................5-22
FIGURE 5-2 Tracking Daily Vehicle Miles of Travel, Santa Barbara County .......................5-23
FIGURE 6-1 1996 Planning Emission Inventory: Santa Barbara County...............................6-22
FIGURE 6-2 1999 Planning Emission Inventory: Santa Barbara County...............................6-23
FIGURE 6-3 2005 Planning Emission Inventory: Santa Barbara County...............................6-24
FIGURE 6-4 1996 Planning Emission Inventory: Outer Continental Shelf ............................6-25
FIGURE 6-5 1999 Planning Emission Inventory: Outer Continental Shelf ............................6-26
FIGURE 6-6 2005 Planning Emission Inventory: Outer Continental Shelf ............................6-27
FIGURE 7-1 1984 SCCCAMP Modeling Domain................................................................7-14
FIGURE 9-1 1990 Santa Barbara County Planning ROG Emission Forecast ........................9-10
FIGURE 9-2 1999 Santa Barbara County Planning ROG Emission Forecast ........................9-10
FIGURE 11-2 Population Growth Rate vs. Daily VMT Growth Rate (1987-1996)
Santa Barbara County .....................................................................................11-6
FINAL 1998 CLEAN AIR PLAN APPENDICES
Appendix A: Emission Inventory and Forecasting Documentation
Appendix B: Stationary Source Control Measure Working Papers
Appendix C: Transportation Control Measures& On-Road Mobile Source Emissions Analysis
Appendix D: Ozone Attainment Demonstration

EXECUTIVE SUMMARY
Introduction
Why is This Plan Being Prepared?
What is New in This Plan Revision?
How Was This Plan Revision Prepared?
What Are the Health Effects of Ozone?
Is Air Quality Improving?
What Are the Key Federal Requirements That This Plan Addresses?
What Are the Key State Requirements That This Plan Addresses?
How Has the Emission Inventory Changed?
Where Does Our Human Generated Air Pollution Come From?
Has the Overall Control Strategy Changed?
Does the Plan Show That We Will Meet the
Federal 1-Hour Ozone Standard?
How Will We Address the New Federal Standards for
Ozone and Particulate Matter?
EX - 1
EXECUTIVE SUMMARY
INTRODUCTION
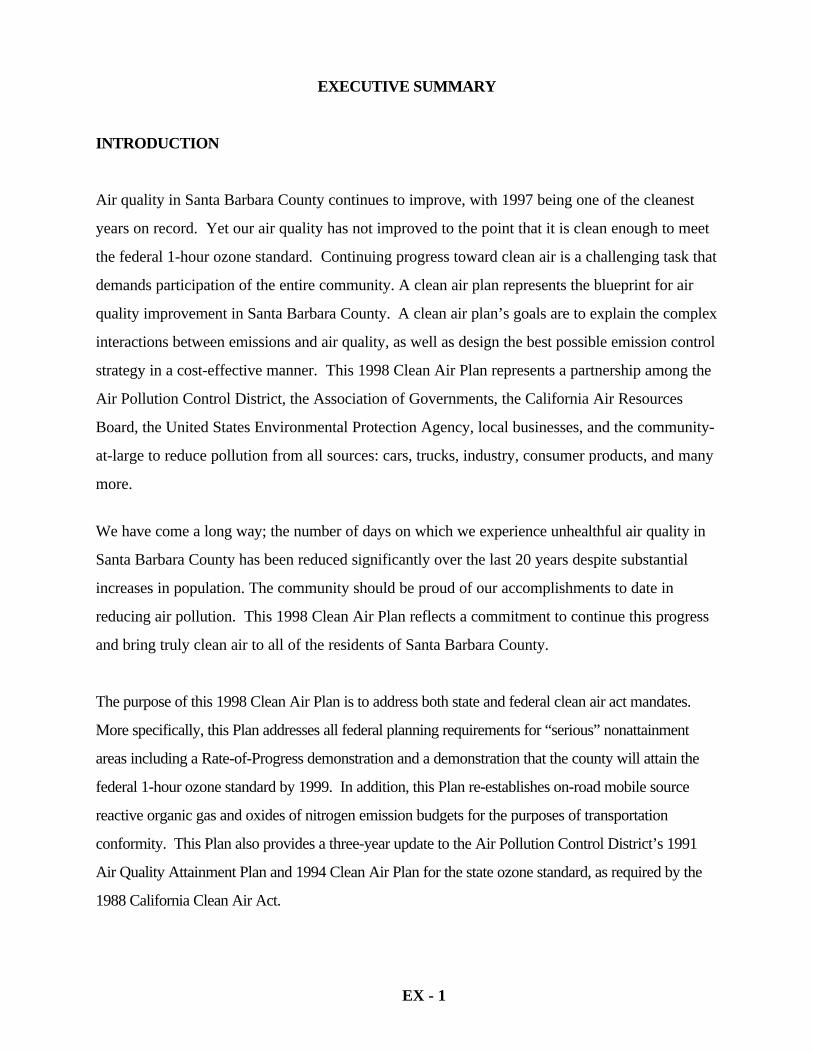
Air quality in Santa Barbara County continues to improve, with 1997 being one of the cleanest
years on record. Yet our air quality has not improved to the point that it is clean enough to meet
the federal 1-hour ozone standard. Continuing progress toward clean air is a challenging task that
demands participation of the entire community. A clean air plan represents the blueprint for air
quality improvement in Santa Barbara County. A clean air plan’s goals are to explain the complex
interactions between emissions and air quality, as well as design the best possible emission control
strategy in a cost-effective manner. This 1998 Clean Air Plan represents a partnership among the
Air Pollution Control District, the Association of Governments, the California Air Resources
Board, the United States Environmental Protection Agency, local businesses, and the community-
at-large to reduce pollution from all sources: cars, trucks, industry, consumer products, and many
more.
We have come a long way; the number of days on which we experience unhealthful air quality in
Santa Barbara County has been reduced significantly over the last 20 years despite substantial
increases in population. The community should be proud of our accomplishments to date in
reducing air pollution. This 1998 Clean Air Plan reflects a commitment to continue this progress
and bring truly clean air to all of the residents of Santa Barbara County.
The purpose of this 1998 Clean Air Plan is to address both state and federal clean air act mandates.
More specifically, this Plan addresses all federal planning requirements for “serious” nonattainment
areas including a Rate-of-Progress demonstration and a demonstration that the county will attain the
federal 1-hour ozone standard by 1999. In addition, this Plan re-establishes on-road mobile source
reactive organic gas and oxides of nitrogen emission budgets for the purposes of transportation
conformity. This Plan also provides a three-year update to the Air Pollution Control District’s 1991
Air Quality Attainment Plan and 1994 Clean Air Plan for the state ozone standard, as required by the
1988 California Clean Air Act.

EX - 2
WHY IS THIS PLAN BEING PREPARED?
The 1990 federal Clean Air Act Amendments established attainment dates and planning deadlines for
ozone nonattainment areas. Under the Amendments, Santa Barbara County was originally classified as
a “moderate” nonattainment area with a statutory attainment date of November 15, 1996. On
December 10, 1997, the United States Environmental Protection Agency (USEPA) issued a final
action finding that Santa Barbara County had not met the federal 1-hour ozone standard by the
statutory attainment date. This action was based upon the USEPA’s review of our local air quality
data for 1994 through 1996 that showed violations of the federal 1-hour ozone standard. As a result of
this action, the entire Santa Barbara County nonattainment area was reclassified from “moderate to
“serious” by operation of federal law. The final action mandates that we continue progress toward the
federal 1-hour ozone standard through the development of a revised Clean Air Plan by January 9,
1999. This document addresses this mandate.
Additionally, under state law, a comprehensive plan must be developed every three years. To
coordinate all applicable state and federal planning requirements, this Plan integrates the technical and
policy issues associated with both ozone standards. This Plan therefore satisfies both state and federal
planning requirements.
WHAT IS NEW IN THIS PLAN REVISION?
Each clean air plan revision represents a snapshot in time, based on the best available current
information. This Plan is similar to the 1994 Clean Air Plan but includes significant new
information. Some key new elements are:
• Updated local air quality information (1997);
• Updated emission inventories for 1990 and 1996;
• Identification of every feasible measure as part of the overall emission control strategy;
• A Rate-of-Progress determination for reactive organic gases; and
• An attainment demonstration for the federal 1-hour ozone standard.

EX - 3
HOW WAS THIS PLAN REVISION PREPARED?
We developed this plan in partnership with the Santa Barbara County Association of Governments
(SBCAG), the California Air Resources Board (ARB), and the United States Environmental
Protection Agency (USEPA). The SBCAG provided future growth projections, developed the
transportation control measures, and estimated the on-road mobile source emissions. The ARB
provided information on statewide mobile source and consumer product control measures. The
USEPA provided information on the status of the control efforts for federally regulated sources.
To help provide important local policy and technical input on Air Pollution Control District (APCD)
clean air plans and rules, the APCD Board of Directors established the Community Advisory Council.
Starting in January of 1998, monthly meetings considered the various components of this Plan. The
information and guidance provided by the Community Advisory Council was, on many occasions,
directly incorporated into this Plan. APCD staff also conducted four public workshops to obtain direct
public input on the Plan.
WHAT ARE THE HEALTH EFFECTS OF OZONE?
The health effects of ozone focus on the respiratory tract. Asthma, bronchitis and other respiratory
disorders are worsened by high ozone concentrations. High ozone concentrations can be especially
harmful to children, elderly people, people with respiratory illnesses, and people who exercise
outdoors. Long-term exposure to moderate levels of ozone can damage even healthy people’s lungs.
Ozone air pollution is also bad for the economy by increasing health care expenses, loss of work due to
illness, and damage to agricultural crops, buildings, paint and rubber.
IS AIR QUALITY IMPROVING?
Santa Barbara County’s air quality is improving, as measured ozone concentrations continue to decline.
In 1997, for example, our monitoring stations recorded only 10 exceedances of the more stringent
state ozone standard and only 1 exceedance of the federal ozone standard. This represents the cleanest
year on record! So far, during 1998, we have experienced 15 exceedances of the state 1-hour ozone

EX - 4
standard and two exceedances of the federal 1-hour ozone standard. Figure Ex-1 shows the number of
state and federal ozone standard exceedances from 1988 through 1997. The most important feature of
Figure EX-1 is the continuing decline of state 1-hour ozone standard exceedances during the last ten
years.
WHAT ARE THE KEY FEDERAL REQUIREMENTS THAT THIS PLAN ADDRESSES?
In November 1990, Congress enacted a series of amendments to the federal Clean Air Act intended to
increase air pollution control efforts throughout the nation. Title 1 of the Act was significantly revised
to address those areas not meeting federal air quality standards. The revisions identified specific
emission reduction goals, Rate-of-Progress requirements, attainment demonstrations, and incorporated
more stringent sanctions for failure to attain or meet interim milestones.
When the USEPA reclassified Santa Barbara County as a “serious” nonattainment area, it triggered a
requirement to submit a revised plan that addresses the “serious” nonattainment requirements outlined
in Section 182(c) of the federal Clean Air Act. This Plan addresses all applicable planning requirements
for “serious” nonattainment areas, including a Rate-of-Progress demonstration and a demonstration
that the county will attain the federal 1-hour ozone standard by 1999. In addition, this Plan re-
establishes on-road mobile source reactive organic gas and oxides of nitrogen emission budgets for the
purposes of transportation conformity.
WHAT ARE THE KEY STATE REQUIREMENTS THAT THIS PLAN ADDRESSES?
The California Clean Air Act was signed into law on September 30, 1988. Key requirements of the
law that this Plan addresses are the Triennial Progress Report (H&SC Section 40924(b)) and the
Triennial Plan Revision (H&SC Section 40925(a)). Additionally, the Plan must provide an annual 5%
emission reduction of ozone precursors, or, if this cannot be done, include every feasible measure as
part of the emission control strategy. Finally, state law requires this Plan to provide for attainment of
the state ambient air quality standards at the earliest practicable date (H&SC Section 40910).

EX - 5
HOW HAS THE EMISSIONS INVENTORY CHANGED?
In this Plan, a 1996 emissions inventory has been developed and used to both adjust the 1990 emissions
inventory and to forecast the 1999 and 2005 inventories. The inventories have been developed in
accordance with ARB and USEPA policies and procedures. The 1996 emissions inventory represents
the most up-to-date inventory established for Santa Barbara County, while the 1990 emissions
inventory is used to calculate the Rate-of-Progress requirements. The emissions inventory follows a
new organizational structure developed by ARB that assigns all air pollution sources into one of four
categories. The four categories are stationary sources, area-wide sources, mobile sources, and natural
sources. On-road mobile source emissions are estimated with the latest approved computer models,
vehicle registration information, and emission factors.
WHERE DOES OUR HUMAN GENERATED AIR POLLUTION COME FROM?
Figure EX-2 shows the Planning Emissions Inventory for 1996. This figure presents the estimated
emissions of reactive organic gases and oxides of nitrogen (precursors that combine to form ozone)
generated locally from human activities and does not include emissions on the Outer Continental Shelf
or those from natural sources (seeps and vegetation). The largest contributor to our locally generated
air pollution is on-road mobile sources (cars and trucks) which combine to contribute over 50% on the
emissions inventory. Other mobile source (boats, planes, trains), the evaporation of solvents,
combustion of fossil fuels, surface cleaning and coating, and petroleum production and marketing
combine to make up the remainder. These sources of pollution are the focus of this Plan since they are
the ones that local, state, and federal controls can address.
HAS THE OVERALL CONTROL STRATEGY CHANGED?
The overall combined reactive organic gas and oxides of nitrogen control strategy remains essentially
the same as that adopted in the 1994 Clean Air Plan with a few small refinements. The 1994 Clean Air
Plan contained: (1) the control measures needed to meet federal requirements for attaining the federal
1-hour ozone standard, and (2) additional control measures needed to address state requirements and
attain the state 1-hour ozone standard. As already mentioned, this Plan evaluates every feasible local

EX - 6
control measure for Santa Barbara County and sets a schedule for control measure adoption. This Plan
also provides updated information on emission control measures approved under the 1994 California
State Implementation Plan.
DOES THE PLAN SHOW THAT WE WILL MEET THE FEDERAL 1-HOUR OZONE
STANDARD?
This Plan demonstrates that we will attain the federal 1-hour ozone standard by 1999. The
demonstration is based on a photochemical modeling assessment of the overall control strategy
proposed in the Plan. However, the impacts of transported pollution from areas outside of our local
control may impact our ability to achieve this milestone.
HOW WILL WE ADDRESS THE NEW FEDERAL STANDARDS FOR OZONE AND
PARTICULATE MATTER?
In light of new public health data, the USEPA has issued new federal standards for ozone and
particulate matter. The new federal ozone standard will be based on an 8-hour averaging time; it will
replace the 1-hour ozone standard once it is attained. Attainment and nonattainment designations for
the 8-hour ozone standard are expected by July 2000. The USEPA also established a new fine
particulate standard (PM2.5) for both a short-term (24-hour) and long-term (annual) averaging period,
as well as changing the form of the existing PM10 standard. Attainment and nonattainment
designations for the new fine particulate standards are expected between 2002 and 2005.
This Plan does not specifically address these new standards, although emission controls and inventories
are analyzed and presented for the year 2005 for informational purposes. The USEPA is currently
developing policies and guidance, as required under the federal Clean Air Act Amendments, for areas
to follow as they plan to meet the new standards. The APCD is participating in this process and
obtaining the required information to assess our attainment status and strategies to address these new
standards.
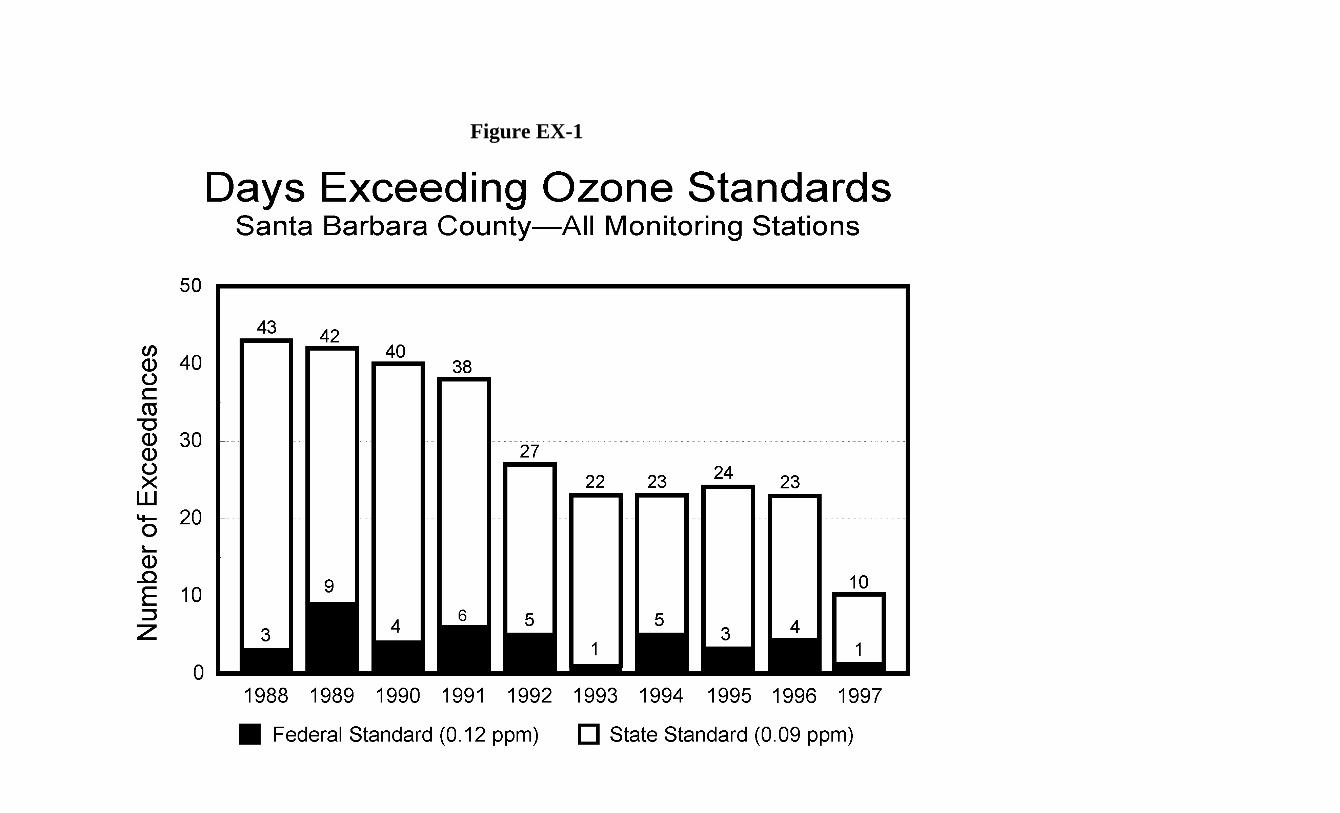
Figure EX-1
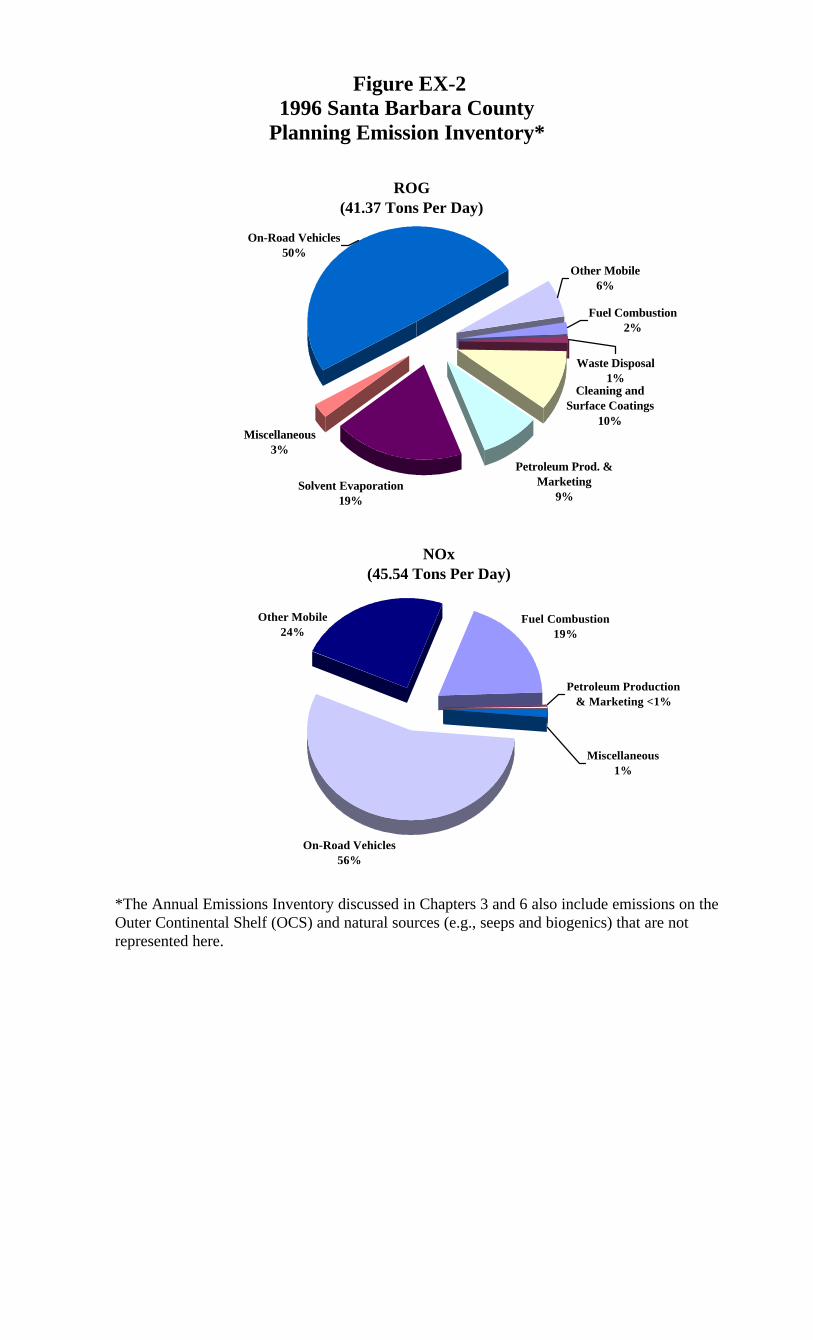
Figure EX-21996 Santa Barbara County
Planning Emission Inventory*
NOx (45.54 Tons Per Day)
On-Road Vehicles56%
Fuel Combustion19%
Petroleum Production& Marketing <1%
Other Mobile24%
Miscellaneous1%
ROG(41.37 Tons Per Day)
Cleaning and Surface Coatings
10%
Petroleum Prod. & Marketing
9%Solvent Evaporation
19%
Miscellaneous3%
Waste Disposal1%
Fuel Combustion2%
Other Mobile6%
On-Road Vehicles50%
*The Annual Emissions Inventory discussed in Chapters 3 and 6 also include emissions on theOuter Continental Shelf (OCS) and natural sources (e.g., seeps and biogenics) that are notrepresented here.

CHAPTER 1
_____________________
INTRODUCTION
Purpose
Current State and Federal Requirements
Air Quality Attainment Planning Summary
Plan Organization
1 - 1
1. INTRODUCTION
1.1 PURPOSE
Clean air is an essential resource to the people of Santa Barbara County. Good air quality
enhances the environment, improves public health, and contributes to the attractiveness of
the area to residents, businesses, and tourists. Fortunately, our air quality has improved
through implementation of prior air quality plans. The purpose of this plan is to continue to
improve air quality in Santa Barbara County as required by both the California Clean Air
Act (CCAA) of 1988 and the Federal Clean Air Act Amendments (FCAAA) of 1990.
Santa Barbara County's air quality has historically violated both the state and federal ozone
standards. Ozone concentrations above these standards adversely affect public health,
diminish the production and quality of many agricultural crops, reduce visibility, degrade
materials, and damage native and ornamental vegetation. Under both the 1990 FCAAA and
the 1988 CCAA, the level of our ozone problem originally resulted in the county being
classified as a “moderate” nonattainment area. On December 10, 1997, the United States
Environmental Protection Agency (USEPA) issued a final action finding that Santa Barbara
County had not attained the federal 1-hour ozone standard by the statutory attainment date
of November 15, 1996, for “moderate” nonattainment areas. As a result of this action, the
entire Santa Barbara County federal nonattainment area was reclassified as a “serious”
nonattainment area by operation of federal law. The final USEPA action mandates that we
continue progress toward the federal 1-hour ozone standard through the development of a
revised Clean Air Plan by January 9, 1999. The purpose of this 1998 Clean Air Plan (1998
CAP) is to comply with these additional federal planning requirements and to address all
applicable state planning requirements.
Specifically, this 1998 CAP addresses all FCAAA planning requirements for “serious”
nonattainment areas including a Rate-of-Progress demonstration and an attainment
demonstration of the federal 1-hour ozone standard by 1999. In addition, this 1998 CAP re-
establishes on-road mobile source reactive organic gas (ROG) and oxides of nitrogen (NOx)

1 - 2
emission budgets for the purposes of transportation conformity. This 1998 CAP also
provides a three-year update to the 1991 Air Quality Attainment Plan and 1994 CAP for the
state ozone standard, as required by the 1988 CCAA.
1.2 CURRENT STATE AND FEDERAL REQUIREMENTS
Section 182(c) of the FCAAA requires all “serious” nonattainment areas to prepare a plan to
reduce ozone forming pollution, and provide a demonstration that the control strategy
proposed in the plan will result in the attainment of the federal 1-hour ozone standard by
1999. This 1998 CAP is the third major planning effort under the 1990 FCAAA and also
complies with the triennial plan progress report and plan revision requirements under the
1988 CCAA. A complete summary of all state and federal Clean Air Act requirements that
apply to Santa Barbara County is provided and discussed in Chapter 10.
The first step in the current federal planning process is to develop a Rate-of-Progress
demonstration that existing and proposed control measures will, between 1996 and 1999,
reduce emissions of reactive organic gases (ROG) by 9 %. This requirement, in conjunction
with the 15 % Rate-of-Progress mandate under Section 182(b), mandates a total ROG
reduction of 24 % between 1990 and 1999, based on the 1990 adjusted base year inventory.
The 1990 adjusted base year inventory accounts for seasonal variations (increases) in
emissions during the ozone season and excludes emissions from natural sources that are
beyond our ability to control. The second phase of the federal planning process uses all
available information to demonstrate that the comprehensive air pollution control strategy in
this 1998 CAP will achieve the federal 1-hour ozone standard by 1999. This demonstration
is accomplished using a photochemical grid model that estimates future year (1999) ozone
concentrations from all sources of air pollution that impact our local air quality.
In addition to the existing federal 1-hour ozone standard, the USEPA promulgated a new 8-
hour ozone standard on July 18, 1997, that is generally more protective of public health than
the 1-hour standard. On July 16, 1997, President Clinton issued a directive to the USEPA
on the implementation of the revised air quality standards for both ozone and particulate
1 - 3
matter. The USEPA subsequently issued draft implementation guidance for the new
standards consistent with the directive on November 17, 1998. The implementation
guidance proposes new attainment designations and classifications, attainment dates,
reasonable further progress requirements, control measure policies and additional guidance
on New Source Review and transportation conformity. While the purpose of this 1998 CAP
is to address the federal 1-hour ozone standard, the strategies outlined in this 1998 CAP are
expected to make progress toward this new 8-hour standard. It is anticipated that area
designations for the new federal 8-hour ozone standard will occur in the year 2000 with
attainment plans due in 2003.
Failure to fully meet the requirements of the FCAAA can lead to federal intervention in our
local air pollution control program. Loss of federal highway funds and increased emission
offset requirements for new stationary sources are possible outcomes under the mandatory
sanctions imposed for failure to meet FCAAA requirements. Failure to attain the federal 1-
hour ozone standard by 1999 could also result in the USEPA reclassifying Santa Barbara
County as “severe” nonattainment area. The strategy outlined in this 1998 CAP is
structured in such a way as to minimize the probability of these events. If Santa Barbara
County is unable to attain the federal 1-hour ozone standard by 1999 due to the impacts of
transported pollution from areas outside our local control, we may request that the USEPA
extend our attainment date. This request would be based upon a new USEPA policy, dated
July 17, 1998, on the extension of attainment dates for downwind transport areas.
California law mandates that APCDs periodically revise and update attainment plans
towards achieving the state 1-hour ozone standard. The effort being undertaken for this
1998 CAP address attainment of the state 1-hour ozone standard, which is more protective
of public health than the federal 1-hour ozone standard. This 1998 CAP will therefore
satisfy all state triennial planning requirements.
The Santa Barbara County 1998 CAP will be forwarded to the California Air Resources
Board (ARB) for their review in January 1999, before being submitted to the USEPA as part
1 - 4
of the State Implementation Plan (SIP). The 1998 CAP is due to the USEPA by January 9,
1999.
1.3 AIR QUALITY ATTAINMENT PLANNING SUMMARY
Several prior air quality plans have been prepared for Santa Barbara County. The first clean
air plan for Santa Barbara County was the 1979 Air Quality Attainment Plan (1979 AQAP)
which was updated in 1982. These two plans were prepared in response to mandates
established by the federal Clean Air Act of 1977. At that time only the southern portion of
the county, the region south of the Santa Ynez Mountains, was in violation of the federal 1-
hour ozone standard. The 1982 update predicted attainment of the federal ozone standard by
1984, but acknowledged that pollution generated on the Outer Continental Shelf (OCS) was
not included in the plan, therefore the county’s ability to attain the federal ozone standard
was uncertain.
The predicted attainment of the federal ozone standard did not occur. As a consequence, the
USEPA called for an update to the 1982 AQAP on March 17, 1986. In response, the county
prepared the 1989 AQAP, which was adopted by the Air Pollution Control District (APCD)
Board of Directors (Santa Barbara County Board of Supervisors) in June of 1990. The 1989
Plan committed the county to adopt and implement over 50 new emission control measures
designed to bring the South County into attainment with the federal ozone standard. Many
of the emission control measures in the 1989 AQAP have been or are in the process of being
adopted as APCD rules.
A 1991 Air Quality Attainment Plan (1991 AQAP) was also prepared. This plan was
required by the California Clean Air Act of 1988 to bring the county into attainment of the
more health protective California ozone standard. The 1991 AQAP was adopted by the
APCD Board of Directors in December 1991 and was approved by the ARB in August
1992.
1 - 5
On November 15, 1990, President Bush signed legislation amending the federal Clean Air
Act (the 1990 FCAAA). The 1990 FCAAA required Santa Barbara County, as a
“moderate” nonattainment area, to submit a Rate-of-Progress Plan to the USEPA by
November 15, 1993, and an attainment demonstration by November 15, 1994. The 1994
Clean Air Plan was adopted by the Santa Barbara County Air Pollution Control District
Board of Directors and formally submitted to the USEPA on November 15, 1994, to address
these new federal mandates. The 1994 CAP included: amendments to the 1993 Rate-of-
Progress (1993 ROP) Plan; an attainment demonstration of the federal ozone standard by
1996; a request for redesignation from a nonattainment area to an attainment area for the
federal ozone standard; and a plan to show maintenance of the federal ozone standard
through the year 2006. The 1994 CAP also provided a three-year update to the 1991 Air
Quality Attainment Plan for the state ozone standard, as required by the California Clean Air
Act of 1988.
On January 8, 1997, the USEPA approved several elements of the 1994 CAP including the
amendments to the 1993 Rate-of-Progress Plan, the base year emission inventory, and the
control strategy. The attainment demonstration element was not approvable by the USEPA
due to violations of the federal 1-hour standard during 1994-1996 and was withdrawn from
the 1994 CAP submittal. Similarly, the USEPA never acted upon the maintenance plan
element due to the measured violations of the federal 1-hour ozone standard.
On December 10, 1997, the USEPA issued a final action finding that Santa Barbara County
had not attained the federal 1-hour ozone standard by the statutory attainment date of
November 15, 1996, for “moderate” nonattainment areas. As a result of this action, the
entire Santa Barbara County nonattainment area was reclassified as a “serious”
nonattainment area by operation of federal law. The final USEPA action mandates that we
continue progress toward the federal 1-hour ozone standard through the development of a
revised Clean Air Plan by January 9, 1999. This 1998 CAP addresses the new federal
planning requirements for “serious” nonattainment areas.
1 - 6
A summary of Santa Barbara County’s state and federal planning activities beginning with
the 1989 AQAP is presented in Table 1-1.
1.4 PLAN ORGANIZATION
Chapter 2, Local Air Quality, provides a summary of Santa Barbara County’s air quality,
and identifies the nature and extent of the ozone problem.
Chapter 3, Emission Inventory, identifies the sources and quantities of reactive organic
gases, oxides of nitrogen, and carbon monoxide that contribute to ozone formation in Santa
Barbara County. This emission inventory is tailored to meet federal requirements.
Chapter 4, Emission Control Measures, provides an overview of the APCD’s control
measures. In addition, the chapter summarizes ARB’s programs for reducing emissions
from off-road mobile sources and consumer products. This chapter identifies the status of
each control measure in relation to both state and federal requirements.
Chapter 5, Transportation Control Measures, describes all transportation related control
measures, and identifies their applicability to both state and federal requirements.
Chapter 6, Emission Forecasting, details the forecast procedures used to develop future year
emission inventories for 1999 and 2005.
Chapter 7, Future Air Quality, provides an overview of the air quality information used to
demonstrate attainment of the federal 1-hour ozone standard by 1999.
Chapter 8, Implementation Support Activities, identifies and discusses other APCD program
and policies that facilitate continued progress toward attainment of state and federal ozone
standards.
1 - 7
Chapter 9, Rate-of-Progress, documents that this 1998 CAP will achieve the federally
mandated emission reduction requirements under sections 182(b) and 182(c) of the 1990
FCAAA.
Chapter 10, State and Federal Clean Air Act Requirements, provides an overview of all state
and federal Clean Air Act planning requirements and discusses how the work completed in
conjunction with this 1998 CAP complies with all applicable requirements.
Chapter 11, State Mandated Triennial Progress Report and Triennial Plan Revision,
summarizes how the development and adoption of the 1998 CAP satisfies the triennial
update requirements of the California Clean Air Act.
Chapter 12, Public Participation, summarizes all public input received during the
development of this 1998 CAP.
For continuity, all tables and figures associated with each chapter will appear at the end of
the chapter. In addition to the above chapters, four appendices document and support the
1998 CAP. These include the following:
Appendix A: Emission Inventory and Forecasting Documentation
Appendix B: Stationary Source Control Measure Working Papers
Appendix C: Transportation Control Measure Working Papers
& On-Road Mobile Source Emissions Analysis
Appendix D: Ozone Attainment Demonstration
1 - 8
REFERENCES
California Health and Safety Code: 1998 Edition.
United States Public Law 101-549, Nov. 15, 1990 104 Stat.2399.
U.S. Environmental Protection Agency: Preamble - EPA TITLE 1, General Preamble of the
Federal Clean Air Act Amendments of 1990.
U.S. Environmental Protection Agency: Guidance of the adjusted base year emissions
inventory and the 1996 Target for the 15% rate-of-progress plans. EPA-452-R-92-005,
October 1992.
U.S. Environmental Protection Agency: Guidance on growth factors, projections, and
control strategies for the 15% rate-of-progress plans. EPA-452/R-93-002, March 1993.
U.S. Environmental Protection Agency: Guidance on the post-1996 rate-of-progress plan
and the attainment demonstration. November 1993.
U.S. Environmental Protection Agency: National Ambient Air Quality Standards for Ozone;
Final Rule. 40 CFR Part 50, July 18, 1997.
U.S. Environmental Protection Agency: Clean Air Act Reclassification; California Santa
Barbara Nonattainment Area; Ozone. 40 CFR Part 81, December 10,1997.
U.S. Environmental Protection Agency: Extension of Attainment Dates for Downwind
Transport Areas. USEPA memorandum dated July 17, 1998.
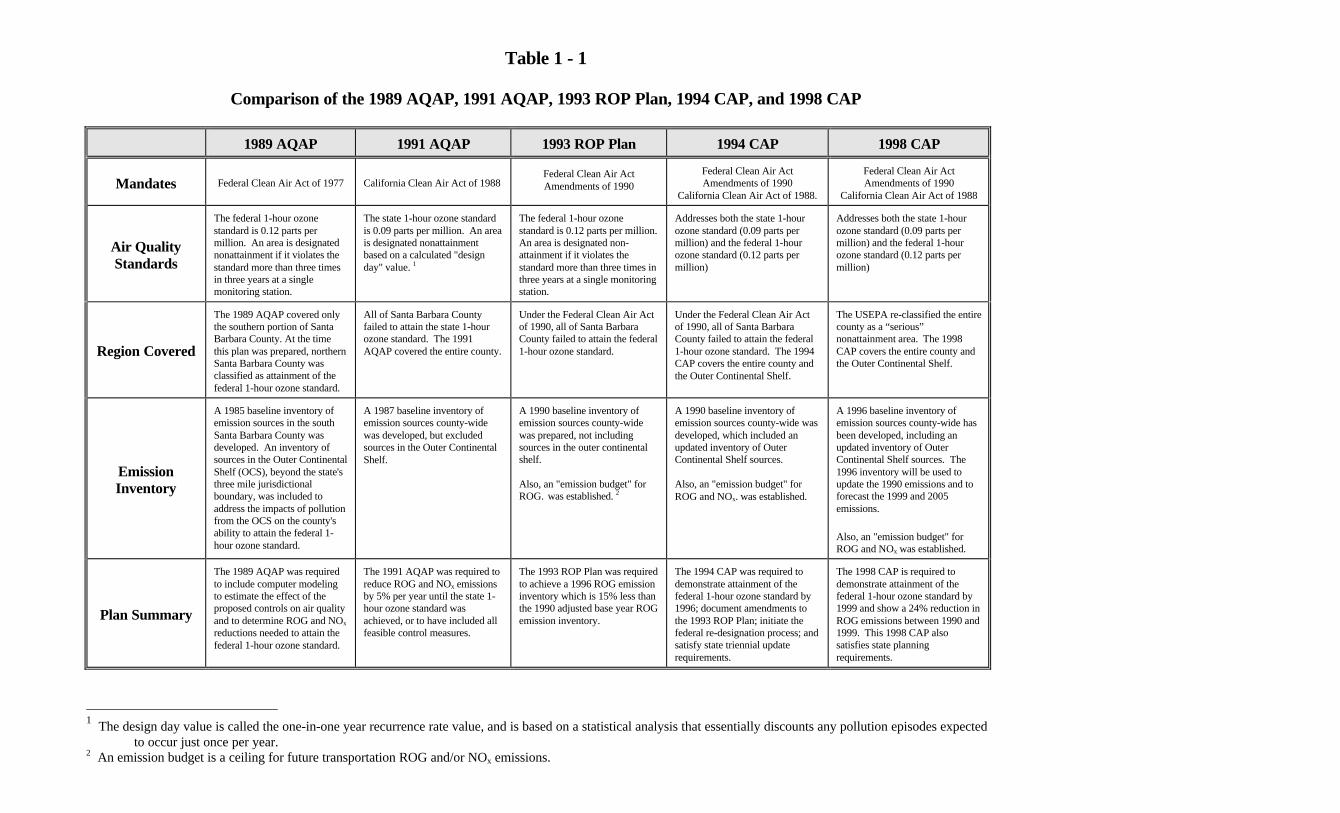
Table 1 - 1
Comparison of the 1989 AQAP, 1991 AQAP, 1993 ROP Plan, 1994 CAP, and 1998 CAP
1989 AQAP 1991 AQAP 1993 ROP Plan 1994 CAP 1998 CAP
Mandates Federal Clean Air Act of 1977 California Clean Air Act of 1988Federal Clean Air ActAmendments of 1990
Federal Clean Air ActAmendments of 1990
California Clean Air Act of 1988.
Federal Clean Air ActAmendments of 1990
California Clean Air Act of 1988
Air QualityStandards
The federal 1-hour ozonestandard is 0.12 parts permillion. An area is designatednonattainment if it violates thestandard more than three timesin three years at a singlemonitoring station.
The state 1-hour ozone standardis 0.09 parts per million. An areais designated nonattainmentbased on a calculated "designday" value. 1
The federal 1-hour ozonestandard is 0.12 parts per million.An area is designated non-attainment if it violates thestandard more than three times inthree years at a single monitoringstation.
Addresses both the state 1-hourozone standard (0.09 parts permillion) and the federal 1-hourozone standard (0.12 parts permillion)
Addresses both the state 1-hourozone standard (0.09 parts permillion) and the federal 1-hourozone standard (0.12 parts permillion)
Region Covered
The 1989 AQAP covered onlythe southern portion of SantaBarbara County. At the timethis plan was prepared, northernSanta Barbara County wasclassified as attainment of thefederal 1-hour ozone standard.
All of Santa Barbara Countyfailed to attain the state 1-hourozone standard. The 1991AQAP covered the entire county.
Under the Federal Clean Air Actof 1990, all of Santa BarbaraCounty failed to attain the federal1-hour ozone standard.
Under the Federal Clean Air Actof 1990, all of Santa BarbaraCounty failed to attain the federal1-hour ozone standard. The 1994CAP covers the entire county andthe Outer Continental Shelf.
The USEPA re-classified the entirecounty as a “serious”nonattainment area. The 1998CAP covers the entire county andthe Outer Continental Shelf.
EmissionInventory
A 1985 baseline inventory ofemission sources in the southSanta Barbara County wasdeveloped. An inventory ofsources in the Outer ContinentalShelf (OCS), beyond the state'sthree mile jurisdictionalboundary, was included toaddress the impacts of pollutionfrom the OCS on the county'sability to attain the federal 1-hour ozone standard.
A 1987 baseline inventory ofemission sources county-widewas developed, but excludedsources in the Outer ContinentalShelf.
A 1990 baseline inventory ofemission sources county-widewas prepared, not includingsources in the outer continentalshelf.
Also, an "emission budget" forROG. was established. 2
A 1990 baseline inventory ofemission sources county-wide wasdeveloped, which included anupdated inventory of OuterContinental Shelf sources.
Also, an "emission budget" forROG and NOx. was established.
A 1996 baseline inventory ofemission sources county-wide hasbeen developed, including anupdated inventory of OuterContinental Shelf sources. The1996 inventory will be used toupdate the 1990 emissions and toforecast the 1999 and 2005emissions.
Also, an "emission budget" forROG and NOx was established.
Plan Summary
The 1989 AQAP was requiredto include computer modelingto estimate the effect of theproposed controls on air qualityand to determine ROG and NOx
reductions needed to attain thefederal 1-hour ozone standard.
The 1991 AQAP was required toreduce ROG and NOx emissionsby 5% per year until the state 1-hour ozone standard wasachieved, or to have included allfeasible control measures.
The 1993 ROP Plan was requiredto achieve a 1996 ROG emissioninventory which is 15% less thanthe 1990 adjusted base year ROGemission inventory.
The 1994 CAP was required todemonstrate attainment of thefederal 1-hour ozone standard by1996; document amendments tothe 1993 ROP Plan; initiate thefederal re-designation process; andsatisfy state triennial updaterequirements.
The 1998 CAP is required todemonstrate attainment of thefederal 1-hour ozone standard by1999 and show a 24% reduction inROG emissions between 1990 and1999. This 1998 CAP alsosatisfies state planningrequirements.
1 The design day value is called the one-in-one year recurrence rate value, and is based on a statistical analysis that essentially discounts any pollution episodes expected
to occur just once per year.2 An emission budget is a ceiling for future transportation ROG and/or NOx emissions.
CHAPTER 2
LOCAL AIR QUALITY
Introduction
Climate of Santa Barbara County
Air Quality Monitoring
Air Quality Overview
Discussion of Pollutants Which Violate Standards
Conclusions
2 - 1
2. LOCAL AIR QUALITY
2.1 INTRODUCTION
This chapter provides the background for the plan by presenting an overview of the climate and current
air pollution levels in Santa Barbara County. This information is important for understanding the
factors that influence air quality in the county, and for assessing progress towards attainment of air
quality standards. The purpose of the plan is to establish a blueprint for improving air quality in the
county for those pollutants that exceed state and federal ambient air quality standards. Accordingly,
this chapter devotes greater attention to the pollutants for which the county violates federal and state
standards. There are two related terms that are used frequently in this chapter: exceedance and
violation. A standard exceedance occurs when a measured concentration exceeds any applicable air
quality standard. A standard violation occurs after a certain number of exceedances have been
measured and is dependent on the standard in question. For example, a federal 1-hour ozone standard
violation occurs when four federal ozone standard exceedances are measured during a three year
period at a single air monitoring station. Attainment and nonattainment designations are based on
violations of standards.
The next section of this chapter, Section 2.2, discusses the local climate of Santa Barbara County in
terms of precipitation, temperatures, winds, inversions and their relationship to air quality. Section 2.3
describes the air quality monitoring network in the county. An overview of the existing air quality for
all pollutants measured in the county is presented in Section 2.4. Section 2.5 examines each pollutant
that violates state or federal standards in greater detail. Finally, Section 2.6 highlights the conclusions
of the chapter.
2.2 CLIMATE OF SANTA BARBARA COUNTY
Santa Barbara County has a Mediterranean climate characterized by warm, dry summers, and cooler,
relatively damp winters. Mild temperatures occur throughout the year, particularly near the coastline.
Maximum summer temperatures average 70 degrees Fahrenheit near the coast and in the high 80s to
2 - 2
low 90s inland. During winter, average minimum temperatures range from the 40s along the coast to
the 30s inland.
The climate of Santa Barbara is strongly influenced by a persistent high pressure area which lies off the
Pacific Coast. As a result, sunny skies are common throughout most of the area. Rain storms
periodically occur, mostly from October to April, when the high pressure has shifted south. Annual
rainfall amounts range from about 10 to 18 inches along the coast, with more substantial amounts in
the higher elevations. On occasion, tropical air masses produce rainfall during the summer.
Cool, humid, marine air causes frequent fog and low clouds along the coast, generally during the night
and morning hours in the late spring and early summer. The fog and low clouds can persist for several
days at a time until broken up by a change in the weather pattern.
The airflow around the county plays an important role in the movement of pollutants. In North County
(north of the ridgeline of the Santa Ynez Mountains), the sea breeze (from sea to land) is typically
northwesterly throughout the year while the prevailing sea breeze in South County is from the
southwest. During summer months, these winds are stronger and persist later into the night. At night,
the sea breeze weakens, and as air adjacent to the surface cools, it descends down the coastal
mountains and mountain valleys resulting in light land breezes (from land to sea). This land/sea breeze
cycle combined with local topography greatly influence the direction and speed of the winds
throughout the county. In addition, the alternation of the land-sea breeze cycle can sometimes produce
a "sloshing" effect, where pollutants are swept offshore at night and subsequently carried back onshore
during the day. This effect is exacerbated during periods when wind speeds are low.
Topography also plays a role in wind patterns experienced in the county. The terrain around Point
Conception, combined with the change in orientation of the coastline from north-south to east-west
can cause counterclockwise circulation (eddies) to form east of the Point. These eddies fluctuate
temporally and spatially often leading to highly variable winds along the southern coastal strip. Point
Conception also marks the change in the prevailing surface winds from northwesterly to southwesterly.
2 - 3
The sea-breeze that persists in Santa Barbara County is common to all of California. These winds
generally carry pollutants generated in the coastal areas to areas well inland. Typically, the air quality
measured in the coastal areas of California is much better than that experienced inland. A good
example of this is found in Long Beach. Long Beach seldom exceeds state and federal ozone
standards. However, a significant amount of pollution is generated in the area and is carried inland by
the sea-breeze. This pollution impacts the inland areas and increases the number and magnitude of
ozone exceedances measured in these downwind areas. Because of this, emission controls must be
implemented in Long Beach (Long Beach is just an example, this situation exists for many areas of
California) in order to improve the air quality in the downwind areas. This same situation applies to
Santa Barbara County where pollution emitted in the coastal areas is carried by the sea-breeze to inland
areas necessitating a regional approach to address the ozone problem.
Another type of wind regime that influences air quality in Santa Barbara is the "Santa Ana" wind.
Santa Ana winds are dry northeasterly winds that occur primarily during the fall and winter months.
These are warm, dry winds blown from the high inland desert, which then descend down the slopes of
a mountain range. Wind speeds associated with Santa Ana are generally 15-20 mph, though they can
sometimes reach speeds in excess of 60 mph. During Santa Ana conditions, pollutants emitted in Santa
Barbara, Ventura County, and the South Coast Air Basin (the Los Angeles region) are moved out to
sea. These pollutants can then be moved back onshore into Santa Barbara County (via the Santa
Barbara Channel) in what is called a "post Santa Ana condition." The effects of the post Santa Ana
condition can be experienced throughout the county. However, not all post Santa Ana conditions lead
to high pollutant concentrations.
A condition similar to the "Santa Ana" can occur in our area and is commonly called a "sundowner.”
A "sundowner" condition can produce strong, hot northerly winds along the coastal area of Santa
Barbara County below the Santa Ynez Mountains. While this condition can drastically affect the local
climate (usually for short periods of time), it does not have a significant negative influence on our air
quality.
Upper-level winds in the atmosphere are also important in the air quality of Santa Barbara County.
These winds are routinely measured at Vandenberg Air Force Base once each morning and afternoon.
2 - 4
The winds at 1,000 feet and 3,000 feet are generally from the north or northwest throughout the year.
Occurrences of southerly and easterly winds are most frequent in winter, especially in the morning.
Upper-level winds from the southeast are infrequent during the summer, though when they do occur,
they are usually associated with periods of high ozone levels. As with the surface winds, upper-level
winds can move pollutants that originate in other areas into the county.
Yet another factor that affects the concentrations of pollutants in the air is the stability of the
atmosphere. Atmospheric stability regulates the amount of air exchange (referred to as mixing) both
horizontally and vertically. A high degree of atmospheric stability that restricts mixing and low wind
speeds is generally associated with higher pollutant concentrations. These conditions are typically
related to temperature inversions (temperature increase with height) which cap the pollutants that are
emitted below or within them. Ozone concentrations are frequently higher directly below the base of
elevated inversions than they are at the surface. Ozone concentrations aloft can remain higher than at
lower levels due to being separated from emissions of nitric oxide at the surface, which can react with
ozone to destroy it. For this reason, elevated monitoring sites will occasionally record higher ozone
concentrations than sites at lower elevations.
At Vandenberg Air Force Base, surface inversions (0-500 ft) are most frequent during the winter, and
subsidence inversions (1000-2000 ft) are most frequent during the summer. Generally, the lower the
inversion base height and the greater the rate of temperature increase from the base to the top, the
more pronounced effect the inversion will have on inhibiting vertical dispersion. The subsidence
inversion is very common during summer along the California coast, and is one of the principle causes
of air stagnation.
As noted above, poor air quality is often associated with "air stagnation" (high stability/restricted air
movement). Therefore, it is reasonable to expect a higher frequency of pollution events in the southern
portion of the county where light winds are frequently observed, as opposed to the North County
where the prevailing winds are strong and persistent.
In summary, the surface and upper-level wind flow varies both seasonally and geographically in the
county and inversion conditions can affect the movement and dispersion of pollutants. It should be
2 - 5
emphasized that the prevailing flow patterns in the county are not necessarily those that cause high
ozone values. On the contrary, previous studies suggest that high ozone values are associated with
unusual flow patterns (Kessler, 1988). The meteorology associated with high ozone levels in Santa
Barbara County is discussed further in Section 2.5.
2.3 AIR QUALITY MONITORING
The State of California has established ambient air quality standards to protect human health. The
federal government has also established health-based standards ("primary" standards), which are
generally less protective of public health than state standards. In addition, the federal government has
established "secondary" standards to protect public welfare. State and federal standards have been
established for ozone, carbon monoxide, nitrogen dioxide, sulfur dioxide, suspended particulate matter
10 micrometers or less in size (PM10 ), and lead. On July 18, 1997, a new federal standard was
promulgated for ozone (8-hour) and suspended particulate matter 2.5 micrometers or less in size
(PM2.5). In addition, California has standards for sulfates, hydrogen sulfide, vinyl chloride, and visibility
reducing particles. All applicable state and federal standards are shown in Table 2-1.
Monitoring of ambient air pollutant concentrations is conducted by the California Air Resources Board
(ARB), the Santa Barbara County Air Pollution Control District (APCD), and industry. Monitors
operated by the ARB and the APCD are part of the State and Local Air Monitoring System (SLAMS).
The SLAMS monitors are located to provide local and regional air quality information. Monitors
operated by industry, at the direction of the APCD, are called Prevention of Significant Deterioration
(PSD) stations. PSD stations are required by the APCD to ensure that new and modified sources
under APCD permit do not interfere with the county's ability to attain and maintain air quality
standards. Historically, ambient air quality monitoring stations have operated in North County and San
Luis Obispo by the Environmental Research Foundation (ERF) which is a non-profit organization
funded by local industry. Methods and procedures used in monitoring follow guidelines prescribed by
the ARB and the U.S. Environmental Protection Agency (EPA) to ensure consistency with the
standards.

2 - 6
Figure 2-1 shows the locations of all past and present monitoring stations that have operated in Santa
Barbara County. Many of the sites depicted in Figure 2-1 have been de-commissioned, but are
summarized here for informational purposes. The installation dates, status, and parameters measured
for all stations are listed in Table 2-2. Several of the stations have been in operation for more than 8
years and some for over 15 years. Figure 2-2 presents a summary of the current monitoring network.
2.3.1 ENHANCED MONITORING
On December 10, 1997, the USEPA reclassified the Santa Barbara County one-hour ozone non-
attainment area from “moderate” to “serious”. That action precipitated the requirement to
establish a Photochemical Assessment Monitoring Station (PAMS) program. This USEPA
funded program involves collecting low-level (3,500 feet) upper-air meteorological measurements
utilizing an upper-air radar wind profiler, ten meter wind speed and direction, atmospheric
temperature, relative humidity, total solar and sky radiation, barometric pressure, carbonyl
sampling, speciated hydrocarbon sampling (72 compounds), and oxides of nitrogen and ozone
measurements. Of the three different types of PAMS sites, the APCD will initially be required to
install a Type II site on the south coast of Santa Barbara County. The objective of a Type II site is
to monitor for maximum ozone precursor emissions. The APCD will be analyzing a variety of
existing historical data to determine the best monitoring location to address the PAMS Type II
site objective and make a recommendation for USEPA approval. If possible, an existing south
county site will be utilized.
In addition to the APCD’s PAMS program, the ARB will be conducting PM2.5 monitoring at their
downtown Santa Barbara and Santa Maria sites beginning in 1999. A third sampler is to be
installed and operated near the San Rafael Wilderness by the federal land manager in around the
year 2000. The two ARB sites were chosen by the ARB, with APCD concurrence, because it
was determined by both agencies that they best addressed the PM2.5 monitoring objectives.
With the upcoming promulgation of regional haze regulations, the USEPA is also in the process
of drafting guidance on regional haze or visibility monitoring to be instituted under the
Interagency Monitoring of Protected Visual Environments (IMPROVE) program. An IMPROVE

2 - 7
site is scheduled to be co-located with the PM2.5 site located near the San Rafael Wilderness. The
PM2.5 monitoring regulations in 40 CFR Part 58 allow the use of the IMPROVE protocol for the
purpose of characterizing background or transported levels of PM2.5.
2.4 AIR QUALITY OVERVIEW
This section provides an explanation of where each pollutant comes from, how it affects human health,
and whether state and federal standards are being met.
2.4.1 OZONE
Ozone is formed in the atmosphere through a series of chemical reactions involving oxides of nitrogen
(NOx), reactive organic gases (ROG), and sunlight occurring over a period of several hours. The
major source of NOx in the county is combustion of fossil fuels in automobiles and other mobile
sources, the petroleum industry, and channel shipping. ROG sources include natural seeps of oil and
gas, use of solvents in paints, consumer and industrial products, automobiles, natural vegetation, and
the petroleum industry. Since ozone is not emitted directly into the atmosphere, but is formed as a
result of chemical reactions in the atmosphere, it is classified as a "secondary" pollutant and is
considered "regional" because it occurs over a wider area than that in which the pollutants are emitted.
Because this ozone-forming reaction takes time, peak ozone levels are often found several miles or
more downwind of major source areas. This is particularly true when winds are persistent from one
direction.
The health effects of ozone focus on the respiratory tract. Asthma, bronchitis and other respiratory
disorders are worsened by high ozone concentrations. Eye irritation, nausea, headaches, coughing and
dizziness are other symptoms of ozone exposure. Ozone also interferes with photosynthesis, thereby
damaging ornamental plants, natural vegetation, and agricultural crops.
Figure 2-3 presents the number of state (1-hour) and federal (1-hour and 8-hour) ozone exceedances
measured in the county from 1988 through 1997 for all monitoring stations in continuous operation
during the last 10 years. As seen in the figure, both federal and state ozone standards have been

2 - 8
exceeded in recent years. In fact, the entire South Central Coast Air Basin encompassing San Luis
Obispo, Santa Barbara, and Ventura Counties has been designated nonattainment for the state ozone
standard. Santa Barbara County experiences between 10 and 42 days per year on which the state
ozone standard is exceeded and 1 to 9 days per year on which the federal 1-hour standard is exceeded.
Figure 2-3 also summarizes the number of exceedances of the new federal 8-hour ozone standard
which is shown to be more protective of public health than the existing federal 1-hour standard, but
slightly less protective of public health than the state 1-hour ozone standard.
The most striking feature of Figure 2-3 is the dramatic drop in ozone exceedances during 1997. In
fact, 1997 was the cleanest year on record in Santa Barbara County. A more detailed discussion of
ozone air quality in Santa Barbara County is provided in Section 2.5.1.
2.4.2 CARBON MONOXIDE
Carbon monoxide is formed primarily by the incomplete combustion of fossil fuels for transportation,
energy, and heat. Relatively low concentrations of this colorless, odorless gas can delay reaction time,
impair visual sensitivity in the dark, affect people's ability to estimate time intervals, and result in
headaches and fatigue. Substantially higher concentrations can cause loss of consciousness and death.
Although Santa Barbara County complies with the state and federal 1-hour carbon monoxide
standards, Figure 2-4 shows that the levels measured in downtown Santa Barbara have historically
approached the state standard of 20 ppm. High values are generally measured during winter when
dispersion is limited by morning surface inversions. Summer values are much lower due to increased
mixing. At one time the county was considered out of attainment for the state and federal 8-hour CO
standard (9 ppm). However, improvement has been steady, probably due to cleaner cars, as the last
recorded exceedance occurred in 1985 (Figure 2-4).
2.4.3 NITROGEN DIOXIDE
Nitric oxide (NO) is formed during the combustion of fossil fuels for transportation, energy, and heat.
NO then reacts with oxygen to form nitrogen dioxide (NO2). NO2 and NO are collectively referred to

2 - 9
as nitrogen oxides, or NOx. Low levels of nitrogen dioxide can irritate the nose and eyes, while higher
concentrations may exacerbate bronchitis or pneumonia. The reaction of nitrogen dioxide with water
forms nitric acid that is a constituent of acid rain. In addition, nitrogen oxides are a precursor to the
formation of ozone pollution.
Santa Barbara County complies with all state and federal nitrogen dioxide standards. The highest
nitrogen dioxide values are generally measured in urbanized areas with heavy traffic. Figure 2-5
presents the maximum recorded 1-hour nitrogen dioxide values in downtown Santa Barbara. There
have been no exceedances of the 1-hour standard during the past 15 years. Figure 2-6 shows the
annual average nitrogen dioxide concentrations measured downtown which are well below the federal
standard.
2.4.4 SULFUR DIOXIDE
Sulfur dioxide is a gas produced primarily from the combustion of fuels containing sulfur. When
combined with moisture, the gas converts into sulfuric acid which, if inhaled, can cause lung irritation
and is also a constituent of acid rain. Sulfur dioxide is especially harmful when combined with particles
small enough to enter the lung tissue.
Santa Barbara County complies with all sulfur dioxide standards. As depicted in Figures 2-7, 2-8, 2-9,
and 2-10, there have been no exceedances of the state or federal 1-hour, 3-hour, 24-hour or annual
sulfur dioxide standards over the past 15 years.
2.4.5 PM10
PM10 is particulate matter with an aerodynamic diameter of 10 microns or less. PM10 is generated by a
wide variety of sources including, wind blown dust, wildfires, dirt roads, construction sites, internal
combustion engines and agriculture. Particulate matter is a respiratory irritant. Large particles are
effectively filtered in the upper respiratory tract. However, small particles (under 10 microns) can
cause serious health effects. The chemical makeup of the particles is an important factor in determining
the health effect.

2 - 10
PM10 has been measured consistently at both SLAMS and PSD stations since 1986 with measurements
at the Santa Maria Library SLAMS site extending into 1985. Figure 2-11 presents the maximum 24-
hour average concentration measured each year and the annual geometric mean for the Santa Barbara
and Santa Maria SLAMS sites. As evidenced by the figure, both the state 24-hour and annual PM10
standards are violated in the county. However, the county is in compliance with the federal 24-hour
PM10 standard. Figure 2-12 presents the annual arithmetic mean PM10 concentrations measured in
Santa Maria which generally records the highest annual values. As shown from this figure, Santa
Barbara County complies with the federal annual PM10 standard.
Due to violations of the state standard, the APCD has undertaken a special study to investigate the
source contributions and chemical and physical characteristics of PM10 in the county. Section 2.5.2
discusses the study in greater detail. In addition, Section 2.5.3 will discuss EPA’s revisions to the
federal particulate matter standards.
2.4.6 LEAD
Lead is a heavy metal that occurs as a lead oxide aerosol or dust. Primary sources of this pollutant are
the combustion of lead containing fuels, lead processing, and the manufacturing of lead products. Lead
is a highly toxic compound and can accumulate in body organs and cause impairment of the nervous
system, bones, and kidneys. Anemia is the most common result from lead exposure in adults.
Santa Barbara County complies with the state and federal lead standards. Figure 2-13 presents the
maximum measured 30-day average concentrations of lead in the county. The figure shows that since
1980, with the phasing out of leaded gasoline, there has been a dramatic reduction in lead
concentrations. Since the federal standard is less restrictive than the state standard, Santa Barbara
County also complies with the federal standard.
2.4.7 SULFATES

2 - 11
Sulfates are particles that are formed in moist air. The primary source of sulfate is the combustion of
fuels containing sulfur. The health effects of sulfates include aggravation of respiratory diseases,
reduced lung function, eye irritation, and increased mortality. Sulfates are also a corrosive agent.
Although Santa Barbara County currently complies with the state sulfate standard, exceedances
occurred in 1980 and 1984. Figure 2-14 presents the maximum measured 24-hour sulfate
concentrations in the county since 1980. Since the last measured exceedance in 1984, there has been a
general decrease in concentrations in recent years.
2.4.8 HYDROGEN SULFIDE
Hydrogen sulfide is an odorous, toxic gas that can be smelled at very low concentrations. It is
produced during the decay of organic material and is found naturally in petroleum. The principle
health effects, depending on exposure and susceptibility, are discomfort, nausea, headaches, allergic
reactions, and loss of appetite. Higher concentrations can damage the nervous system and be fatal.
Historically, a portion of the North County violated the state hydrogen sulfide standard and was
designated as "nonattainment" for that standard. However, recent monitoring data has shown a
marked decrease in the number of hydrogen sulfide exceedances in the area prompting the California
Air Resources Board to redesignate the area to "attainment" on November 18, 1993.
2.4.9 VINYL CHLORIDE
Vinyl chloride is produced by the manufacture and decomposition of plastics and polyvinyl chloride
(PVC) products. It is currently not being monitored in the county because there are no facilities in the
county that are manufacturing products or accepting wastes that emit vinyl chloride. In the past, the
county did have one site that accepted such wastes (Casmalia Resources hazardous waste landfill), and
ambient air was monitored for vinyl chloride. These data indicated concentrations of vinyl chloride
well below the state air quality standard.

2 - 12
Vinyl chloride can cause liver damage and is suspected of causing cancer. At very high concentrations,
dizziness and disorientation have also been documented.
2.4.10 VISIBILITY REDUCING PARTICLES
The ARB has established a standard for visibility reducing particles to monitor and protect a region's
visual resources. The standard applies only when the relative humidity is less than 70 percent because
water vapor in the air can also significantly reduce visibility. Currently, Santa Barbara County is
unclassified for visibility reducing particles because the appropriate data to make a determination are
not available. The ARB plans to begin collecting the necessary measurements at various locations
around the state over the next several years. When the data become available, the visibility reducing
particle standard will be addressed.
2.4.11 REGIONAL HAZE
Regional haze is caused by numerous sources of fine particulate pollution over a broad area impacting
visibility. EPA is currently in the process of promulgating revisions to the 1980 visibility regulations as
part of the new Regional Haze Program. The revised program would apply to all states as opposed to
the current regulations which apply only to areas that contain Class I areas (designated wilderness
areas) and would require new monitoring, planning and emission reduction programs. It is anticipated
that EPA will finalize the Regional Haze Program in the Spring of 1999 with potential future
requirements for Santa Barbara County.
2.4.12 TOXIC AIR CONTAMINANTS
In recent years, our awareness of specific, highly toxic and cancer causing pollutants has increased. The
effects of these pollutants are generally limited to those people in the immediate vicinity of the emission
source. These pollutants are called Toxic Air Contaminants (TACs) by the California Air Resources
Board, and Hazardous Air Pollutants (HAPs) by the Environmental Protection Agency. Many of these
compounds can cause cancer (i.e. are carcinogens) and many can cause reproductive harm or other

2 - 13
health effects. Cancer is usually associated with long term exposure (years) while the other health
effects may be associated with short term exposure (hours or minutes).
Several state and federal laws have been passed to further our understanding of toxic air pollutants and
to reduce the health risk from these substances to the public. Under the state Air Toxic "Hot Spots"
Information and Assessment Act of 1987 (AB 2588), the APCD has quantified and assessed the health
risks associated with public exposure to toxics from individual sources in Santa Barbara County.
Sources included in the Air Toxic “Hot Spots” program include those that manufacture, formulate,
use, or release chemicals listed under AB 2588. Mobile sources, area sources (e.g., agricultural burns,
barbeques), Outer Continental Shelf platforms and sources that apply pesticides are exempt from AB
2588. Sources with cancer risks greater than 10 per million and noncancer hazard indices (the ratio of
exposure level to acceptable exposure level) greater than 1 will be required to notify businesses and
residents that are exposed to these risks. In addition, some sources will be required to reduce the
health risk posed by their operations.
State legislation (AB 2728, 1992) integrates the federal air toxics program into California's program.
The bill clarifies the state's authority to implement the federal program. It also adds all federally
classified hazardous air pollutants to the state list of toxic air contaminants and adopts the federal
emission standards as state Air Toxic Control Measures (ATCM). Local districts will be required to
adopt these ATCMs or develop rules at least as stringent as the federal standards.
Certain provisions of the federal Clean Air Act Amendments of 1990 are also directed at reducing the
public's exposure to hazardous air pollutants. Title III (Air Toxics) and Title V (Permitting) are
designed to account for and reduce the public health risk associated with 189 specific compounds. The
general approach of the federal regulation is to set industry-specific emission standards to be
implemented through the permit process.
Although this Clean Air Plan does not directly address the control of toxic and hazardous air
pollutants, it will indirectly account for the reduction of certain toxic emissions that are also reactive
organic gases.

2 - 14
2.5 DISCUSSION OF POLLUTANTS THAT VIOLATE STANDARDS
As discussed in the air quality overview, Santa Barbara County violates the state PM10 standard and
has historically violated both the state and federal ozone standards. The following sections provide a
more in-depth investigation of these pollutants.
2.5.1 OZONE
Ozone has been monitored in the county for over 20 years. Data collected at these stations, in
conjunction with the various air quality studies performed in the region, provide valuable insight into
the county's ozone problem. The following sections use this information to discuss peak ozone levels,
the geographical extent of ozone exceedances in the county, and the area's ozone classification.
2.5.1.1 Peak 1-hour Ozone Levels
Table 2-3 summarizes the four highest ozone values recorded in Santa Barbara County from 1987
through 1989 at all available monitoring locations. According to USEPA policy, the 4th highest 1-hour
ozone concentration measured at a particular monitoring station constitutes the desgn value for that
station. These design values were used to classify the county as a “moderate” nonattainment area
pursuant to the Federal Clean Air Act Amendments of 1990 as discussed in section 2.5.1.3. As seen in
the table, the maximum recorded concentrations range from 0.12 to 0.22 ppm. The highest episodic
concentrations recorded over the three year period are 0.22 ppm (April 7, 1989, at Santa Barbara),
0.21 ppm (March 8, 1989, At GTC near Gaviota), 0.20 ppm (April 8, 1989, at Gaviota West), and
0.17 ppm (October 5, 1987, at several locations along the coast). It is interesting to note that there
were three widespread episodes that accounted for a majority of the highest ozone values (October 5,
1987, March 8, 1989, and April 7,8,9, 1989). Analysis of these data suggests that some of the
pollution recorded on these days originated outside the county.
Table 2-4 presents the design value summary for 1994 through 1996 which was used to determine
whether Santa Barbara County had attained the federal 1-hour ozone standard by the statutory
attainment date of November 15, 1996. This table shows that both peak ozone concentrations and
2 - 15
design value concentrations have declined during the 1990s. However, 3 sites continued to violate the
federal 1-hour standard prompting EPA to reclassify Santa Barbara County to a “serious”
nonattainment area for purposes of the federal 1-hour ozone standard.
2.5.1.2 1-hour Ozone Standard Exceedances
The preceding section discussed peak ozone concentrations measured around the county. Another
important aspect to the ozone problem is the geographical extent of the exceedances and the associated
meteorology. This type of analysis can provide useful information on how ozone concentrations vary
throughout the county and where potential "hot spots" may be.
Figures 2-15 and 2-16 present ozone exceedance data throughout the county for selected SLAMS and
PSD stations, respectively. The majority of the SLAMS stations have been in operation since 1980,
while the PSD stations have been installed more recently. Therefore, the figures show SLAMS data
from the period 1980 to 1997, and PSD data from 1988 to 1997.
Figure 2-15 shows the variability of ozone standard exceedances at the SLAMS stations in the county.
Stations located in the South Coast area experience a greater number of exceedances compared to
North County, where the Santa Ynez station generally measures a higher number of exceedances than
other North County sites.
Figure 2-16 shows selected PSD stations around the county. This figure reveals that there are areas in
the county that experience a greater number of ozone standard exceedances than indicated by the
SLAMS stations. For example, Las Flores Canyon - Site 1, and Paradise Road experience from 3 to
24 state ozone standard exceedances and up to 6 federal standard exceedances per year.
Figure 2-17 presents a geographical summary distribution of state and federal ozone standard
exceedances recorded from 1988 through 1997. This figure clearly shows the geographic variability of
ozone exceedances in the county. In general, areas of South County experience less healthful air
quality than areas to the north and west. However, Paradise Road (at the eastern end of the Santa
Ynez Valley) experiences a significant number of days with unhealthful air quality.

2 - 16
To gain a better understanding of ozone exceedances across the county, the APCD performed a study
entitled, "Selection, Classification, and Analysis of Ozone Violations in Santa Barbara County"
(SBCAPCD, 1990). The primary focus of the study was to assess the geographical and meteorological
patterns associated with ozone standard exceedances.
Eighteen ozone exceedances were grouped into five categories based on the geographical extent of the
observed exceedance: Countywide, Paradise Road, Lompoc, South County, and Carpinteria.
Meteorological data during the ozone episodes were then compiled and the data analyzed. The five
categories and their associated characteristics are summarized below.
Countywide exceedances (exceedances recorded on the same day throughout the county) were
characterized by easterly upper-level (3,000 ft) winds during the morning, turning southerly during
afternoon hours. The exceedances occurred either as high concentrations across the whole county or
as discrete ozone parcels moving across the county. Many of these countywide exceedances appeared
to be influenced by pollutants entering from outside the county combining with locally generated
pollution.
The Paradise Road exceedances were characterized by distinct meteorological conditions. Surface
winds were light westerly or northwesterly with upper-level winds (3,000 feet) out of the southeast.
Days preceding the exceedance had easterly upper-level winds while on the exceedance day, the upper-
level winds would switch from easterly to westerly. It is difficult to identify the origin of the pollutants
contributing to these exceedances due to the complicated nature of the meteorology and topography of
the area. Possible source areas include North County (Santa Maria, Lompoc, etc.), South County,
Ventura, San Joaquin Valley, and the South Coast Air Basin. It is also possible, given the high
frequency of exceedances at Paradise Road, that each of these areas contribute to exceedances in
varying degrees on different days.
The one exceedance classified as the "Lompoc exceedance" was very localized and occurred late in the
day. It is probable that the pollutants were blown into the area with the afternoon onshore
(northwesterly) winds. The source(s) of the pollutants could not be identified.
2 - 17
South County exceedances characteristically had high ozone concentrations from Carpinteria to Point
Conception. In general, concentrations to the north of the Santa Ynez mountains were considerably
lower. Upper-level winds (3,000 feet) shifted from easterly to southerly on the day of the exceedance.
Surface winds were generally westerly, probably preventing the pollutants from entering in to North
County. It is possible that pollutants brought into the area from the south and east combined with local
sources during these exceedances.
Carpinteria exceedances were similar to South County exceedances. Upper level winds were generally
from the north possibly preventing the movement of pollutants into the rest of the county. The
pollutants in these episodes may be locally generated or associated with emissions in Ventura County
or the South Coast Air Basin.
Ozone exceedances in Santa Barbara County occur under many diverse meteorological conditions.
This is an important factor when designing emission control strategies. Given the widespread nature of
exceedances of the state ozone standard in the county, and given that the entire San Luis Obispo
County, Santa Barbara County, and Ventura County area has been designated nonattainment for the
state 1-hour ozone standard, there is little evidence to suggest that emissions from any area of the
county do not contribute to some degree to the regional problem.
2.5.1.3 Area Classification for the 1-Hour Ozone Standard
Both the state and federal clean air acts set up a method for classifying areas according to severity of its
ozone problem. These classifications determine regulatory requirements and target dates for attaining
the ozone standards. To determine an area's classification and attainment date for the federal 1-hour
ozone standard, the USEPA has developed a measure of the peak ozone levels called the "design
value" which determines the severity of ozone exceedances (EPA, 1990). The ozone design value is
2 - 18
essentially the area's fourth highest 1-hour observed concentration at one station over a 3-year period
as described in section 2.5.1.1.
Under the 1990 Federal Clean Air Act Amendments, the types of pollution controls required for each
area depend on how severe its ozone problem is. Five classifications have been mandated: marginal,
moderate, serious, severe, and extreme depending on the area's design value (FCAAA Section 181
(a)). Table 2-5 summarizes the five classifications under the amendments, the corresponding ozone
concentration design values, and the associated attainment date that is measured from the date of the
amendments (1990). Based on the information in Table 2-3, EPA originally designated Santa Barbara
County as a “moderate” non-attainment area (OAQPS, 1991) with an attainment date of November
15, 1996.
As already mentioned, Table 2-4 shows that during the 1994-1996 milestone period, 3 sites in South
County were in violation of the federal 1-hour ozone standard. Based on these concentrations,
USEPA proposed that Santa Barbara County be reclassified as a “serious” nonattainment area. During
the rulemaking process, the air quality differences between North and South County were examined for
a potential change in the nonattainment area boundary (i.e., only reclassify South County as “serious”).
In the final rulemaking, USEPA could not justify a boundary change with the available data but offered
to work with interested parties to develop the required analyses. APCD staff will continue to work
with and ARB staff on this issue, but this 1998 Clean Air Plan must address the impacts of the
reclassification to a “serious” nonattainment area countywide.
2.5.1.4 New Federal 8-Hour Ozone Standard
In addition to the federal 1-hour ozone standard, the USEPA has promulgated (July 18, 1997) a new
8-hour ozone standard (0.08 ppm) that is generally more protective of public health. Compliance with
the new standard is judged by taking the average of the 4th highest 8-hour concentration, each year, for
a 3 year period. Table 2-6 provides an example of the 8-hour ozone design value calculation using
data from 1994 through 1996 for informational purposes. As the table shows, Las Flores Canyon -

2 - 19
Site 1, and Paradise Road would be out of compliance (average greater than or equal to 0.085 ppm)
with the new 8-hour ozone standard during this period.
The transition to the new 8-hour ozone standard will occur over the next few years. Areas must first
achieve the 1-hour ozone standard before that standard is officially revoked and replaced by the new 8-
hour ozone standard. EPA is proposing to officially designate attainment and nonattainment areas in
the year 2000 with State Implementation Plan (SIP) revisions due within 3 years (2003). The USEPA
will also set attainment dates for areas based on the SIP revisions. It is anticipated that the
comprehensive emission control strategy outlined in this 1998 Clean Air Plan will provide for
continued progress toward attaining the new 8-hour ozone standard.
2.5.2 PM10 (Particulate Matter)
As mentioned in Section 2.4.5, Santa Barbara County violates both the state PM10 24-hour and annual
standards. PM10 is produced either by direct emission of particulates from a source (primary PM10), or
by formation of aerosols as a result of chemical reactions in the atmosphere involving precursor
pollutants (secondary PM10). The sources of PM10 can also be categorized as natural or resulting from
human activity. Based on emissions data, the largest single source of PM10 emissions in the county is
entrained paved road dust. Other major sources include dust from construction and demolition, tilling
dust (agricultural), entrained road dust from unpaved roads, natural dust and sea-salt, and particulate
matter released during fuel combustion.
To investigate the county's PM10 problem, the APCD started a specialized sampling and analysis study
in 1989 called the Santa Barbara County Particulate Matter Emission Reduction Study. The study
collected and analyzed ambient samples of PM10 at a number of sites located throughout the county to
identify chemical constituents. The study identified potential source characteristics and assessed
control strategies for reducing PM10 concentrations. The major finds of the study include: 1)
background sources (primarily sea-salt) are a major contributor to PM10 concentrations; 2) on average,
70% of the locally generated PM10 (primary) is directly emitted; 3) locally generated geological dust
and motor vehicle exhaust are the most significant sources of primary PM10 in the county; and 4)
potential control measures should concentrate on these primary sources of PM10.

2 - 20
Although Santa Barbara County has developed an excellent data base for PM10 attainment, there is
much additional work to be performed. Non-traditional controls (e.g., controls for fugitive dust) will
have to be evaluated along with the more traditional controls. Therefore, attainment of the state PM10
standards may be dependent on the development of innovative control technologies and their
effectiveness upon implementation. In any case, implementation of ozone control measures adopted in
this 1998 Clean Air Plan, and ozone precursor (ROG and NOx) emissions reductions required by the
California Clean Air Act will result in PM10 air quality benefits by reducing secondary PM10. Some
progress is already underway, but additional steps will have to be taken to attain the state PM10
standards.
2.5.3 PM2.5 (Fine Particulate Matter)
On July 18, 1997, EPA revised the primary and secondary air quality standards for particulate matter
by establishing annual and 24-hour PM2.5 standards and revising the form of the existing 24-hour PM10
standard. The new standards for PM2.5 are set at 65 ug/m3 for 24-hour and 15 ug/m3 for an annual
average.
The characteristics, sources, and potential health effects associated with larger or “coarse” particles
(from 2.5 to 10 micrometers in diameter) and smaller or “fine” (smaller than 2.5 micrometers) can be
very different. Coarse particulates generally come from windblown dust and dust kicked up from
mobile sources. Fine particulates are generally associated with combustion processes as well as being
formed in the atmosphere as a secondary pollutant through chemical reactions. From a health
perspective, fine particles are more likely to penetrate deeply into the lungs and increase respiratory
symptoms and disease, decrease lung function, and alter lung tissues and structures and respiratory
tract defense mechanisms.
Since PM2.5 is not currently being monitored in Santa Barbara County (or throughout the nation), the
first step in addressing the new standard is the establishment of a monitoring program which will be
funded by the USEPA. Once the data have been collected and processed, USEPA will be designating

2 - 21
attainment and nonattainment areas (action expected between 2002 and 2005) with State
Implementation Plans due starting in the year 2005.
2.6 CONCLUSIONS
Santa Barbara County has historically violated both state and federal health standards for ozone and
state standards for PM10 and hydrogen sulfide. The county continues to violate the state 1-hour ozone
standard and PM10 standards, but has been redesignated by the ARB as attainment for the state
hydrogen sulfide standard.
For the 1994 through 1996 period, 3 sites in South County were in violation of the federal 1-hour
ozone standard prompting USEPA to reclassify all of Santa Barbara County as a “serious”
nonattainment area. In addition, USEPA has promulgated a new 8-hour ozone standards and revised
the standards for particulate mater. These actions by USEPA will require additional monitoring and
planning activities for Santa Barbara County.
While 1997 was the cleanest year on record, additional efforts are needed to continue progress toward
the goal of providing clean air for the residents of Santa Barbara County by achieving attainment for all
applicable state and federal ambient air quality standards.
REFERENCES
ARB, 1989: California Air Resources Board, 1989. Crop Loss From Air Pollution
Assessment Programs - Status Report, Thompson and Olszyk, ARB Contract
No. 76-052-33.
ARB, 1990: California Air Resources Board, 1990. Guidance on Estimating Emission
Reductions Needed to Attain the State Standards and for Determining Area

2 - 22
Classifications in Response to the California Clean Air Act. Prepared by the
Office of Strategic Planning.
ARB, 1990, 1993, 1996:
California Air Resources Board, 1990. Assessment and Mitigation of the
Impacts of Transported Pollutants on Ozone Concentrations Within California.
Report prepared by the Technical Support Division and Office of Air Quality
Planning and Liaison.
ARB, 1991: California Air Resources Board, 1991. Prospects of Attaining the State
Ambient Air Quality Standards for Suspended Particulate Matter (PM10),
Visibility Reducing Particles, Sulfates, Lead, and Hydrogen Sulfide. Report
prepared by the Technical Support Division.
ARB, 1993: California Air Resources Board, 1993. Proposed Amendments to the Criteria
for Designating Areas of California as Nonattainment, Attainment, or
Unclassified and to the Area Designations for State Ambient Air Quality
Standards. Report prepared by the Technical Support Division.
DeMarrais, 1965: DeMarrais, G. A., Holzworth, G. C., and Hosler, C. R., 1965. Meteorological
Summaries Pertinent to Atmospheric Transport and Dispersion Over Southern
California. Weather Bureau Technical Paper No. 54.
Kessler, 1988: Kessler, R. C., Schulman, L. L., Douglas, S. G., and Hovind, E. L., 1988:
Analysis of Wind Fields For the SCCCAMP 1985 Intensive Measurement
Periods. Report prepared for MMS Contract No. 14-12-0001-30329.
OAQPS, 1991: Office of Air Quality Planning and Standards, 1991. Ozone and
Carbon Monoxide: Regional Maps of Classified Nonattainment Areas and
Background Information. Prepared by Kimber Smith, Ozone and Carbon
Monoxide Branch, Air Quality Management Division.
2 - 23
SBCAPCD, 1990: Santa Barbara County Air Pollution Control District, 1990. Selection,
Classification, and Analysis of Ozone Violations in Santa Barbara County.
Report Prepared by the Technical Support Division.
USEPA, 1997: 40 CFR Part 50, Part II, July 18, 1997. National Ambient Air Quality
Standards for Particulate Matter; Final Rule
USEPA, 1997: 40 CFR Part 50, Part V, July 18, 1997. National Ambient Air Quality
Standards for Ozone; Final Rule
General: Scire, J. S., Hanna, S. R., Murphy, D. J., and Chanj, J., 1989. Characterization
of Historical Ozone Episodes and Comparisons with the SCCCAMP 1985
Field Study. Report prepared by Sigma Research Corporation for the U. S.
Department of the Interior - MMS Contract No. 14-12-0001-30329, Project
A034-500.
Smith, T. B., and Lehrman, D. E., 1987. Meteorological Conditions
Associated with Ozone Exceedances in Santa Barbara County. Report by
T. B. Smith and associates for WOGA Contract No. T-002-01-00.

Past and Present Santa Barbara County Air Quality Monitoring Network
Figure 2-1Past and Present Air Quality Monitoring Stations
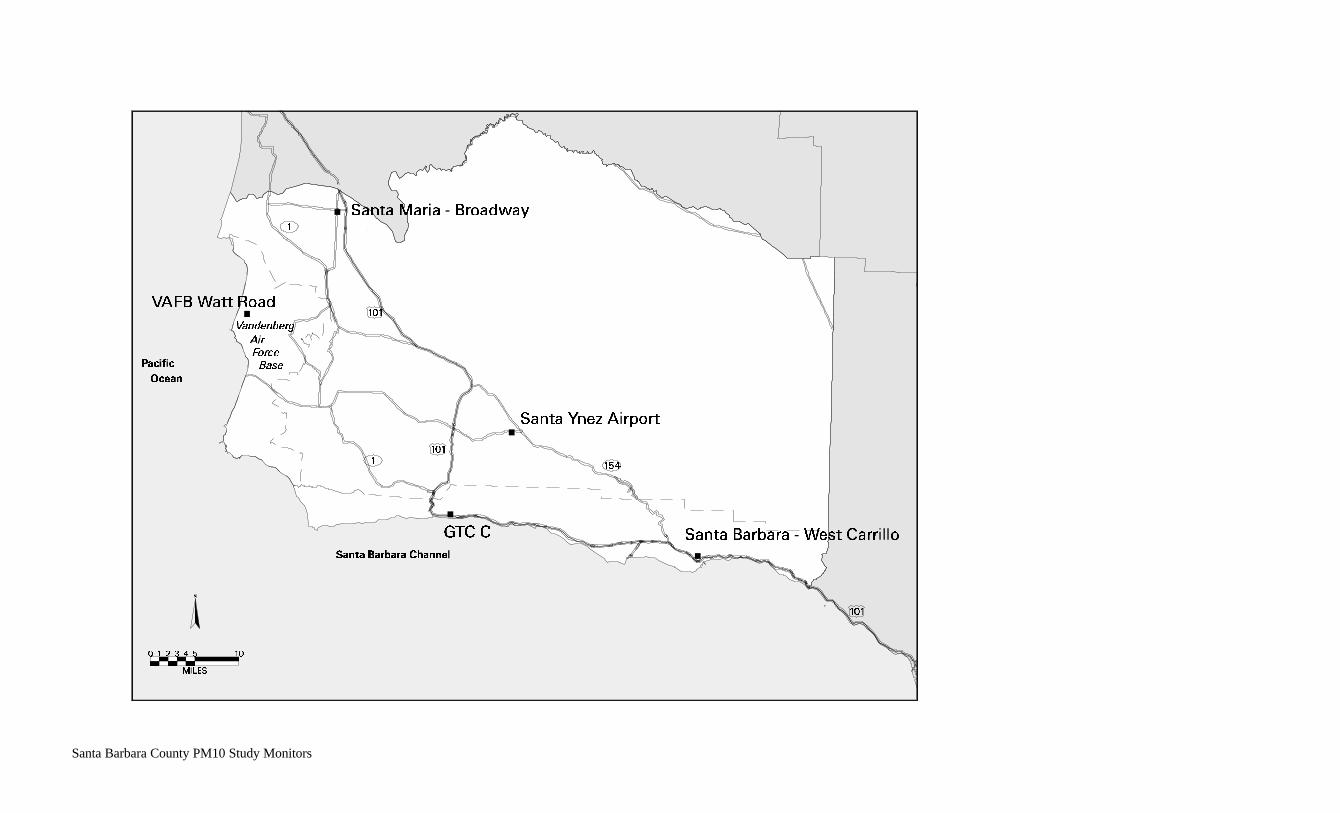
Santa Barbara County PM10 Study Monitors

Exceedances of Ambient Air Quality Standards (1988 to 1997)
Figure 2-17Exceedances of the California and National Ozone Standards: 1988-1997
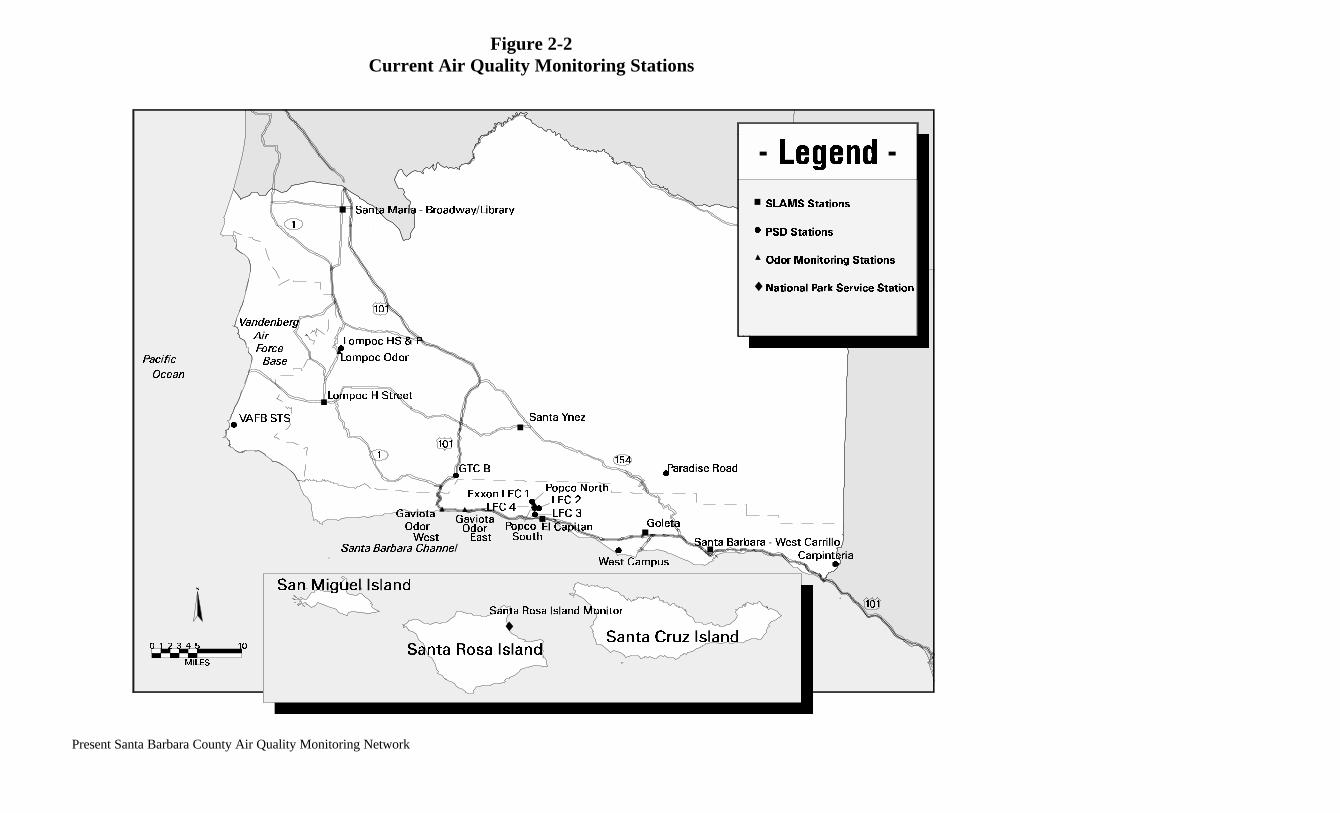
Present Santa Barbara County Air Quality Monitoring Network
Figure 2-2Current Air Quality Monitoring Stations
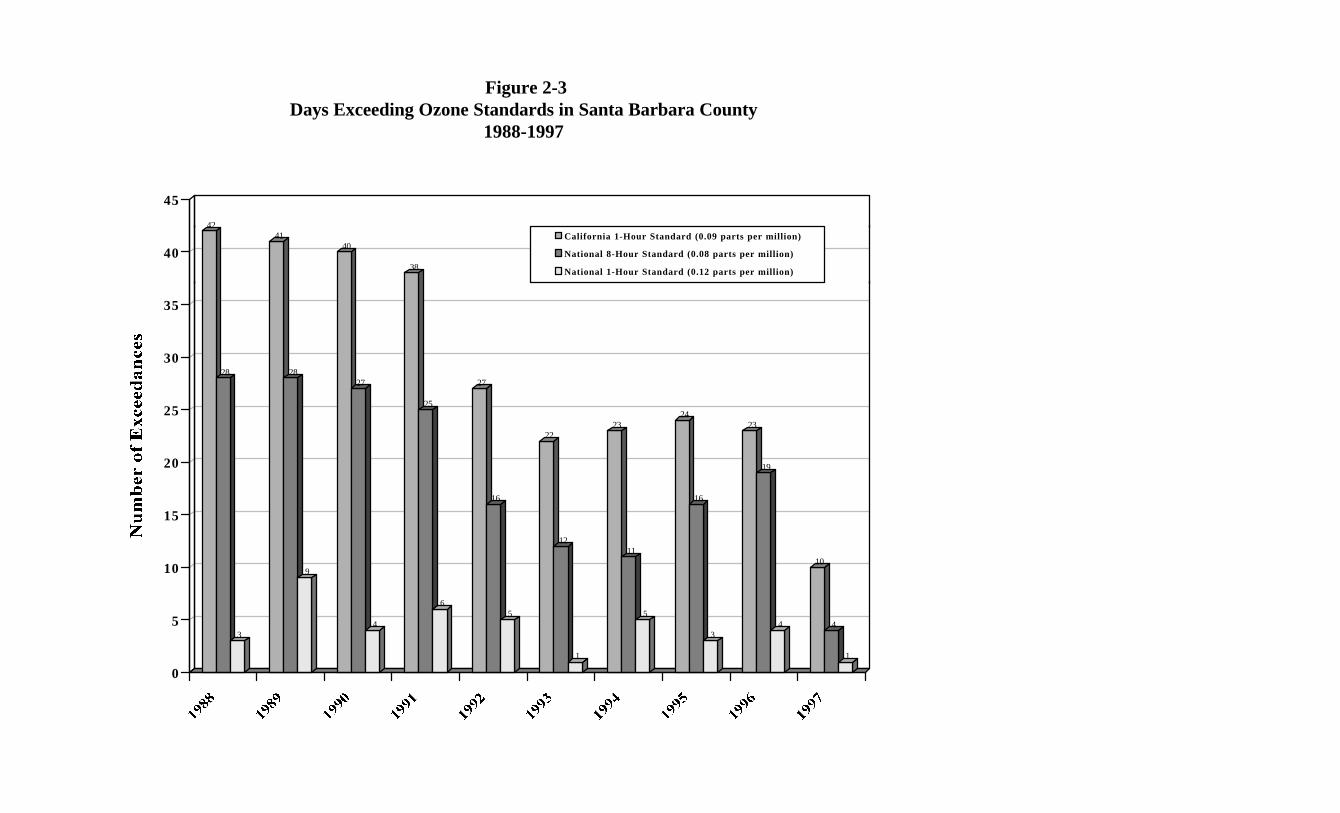
Figure 2-3Days Exceeding Ozone Standards in Santa Barbara County
1988-1997
42
28
3
41
28
9
40
27
4
38
25
6
27
16
5
22
12
1
23
11
5
24
16
3
23
19
4
10
4
1
0
5
10
15
20
25
30
35
40
45
California 1-Hour Standard (0.09 parts per million)
National 8-Hour Standard (0.08 parts per million)
National 1-Hour Standard (0.12 parts per million)
Figure 2-4
Maximum 1-Hour and 8-Hour Carbon Monoxide ConcentrationsAt Santa Barbara 1980-1997
California and National Standard 9.0 PPM
National Standard 35 PPM
State Standard 20 PPM

Figure 2-5Maximum 1-Hour Nitrogen Dioxide Concentrations
At Santa Barbara 1980-1997
Figure 2-6Annual Average Nitrogen Dioxide Concentrations
At Santa Barbara 1980-1997
California Standard 25 pphm
2.7
2.32.4
2.8
3.1 3
2.22.4
2.7 2.7
2.22.4
2.2 2.2 2.22.1
1.9 1.9
0
1
2
3
4
5
6
Ann
ual A
vera
ge N
O2
Con
cent
rati
on (
pphm
)
1980
1981
1982
1983
1984
1985
1986
1987
1988
1989
1990
1991
1992
1993
1994
1995
1996
1997
National Standard 5.3 pphm
16
12
1413
1716
9
14
10
1211
16
9 910
1110
7
0
5
10
15
20
25
30
1-H
our
NO
2 C
once
ntra
tion
(pp
hm)
1980
1981
1982
1983
1984
1985
1986
1987
1988
1989
1990
1991
1992
1993
1994
1995
1996
1997
California Standard 25 pphm
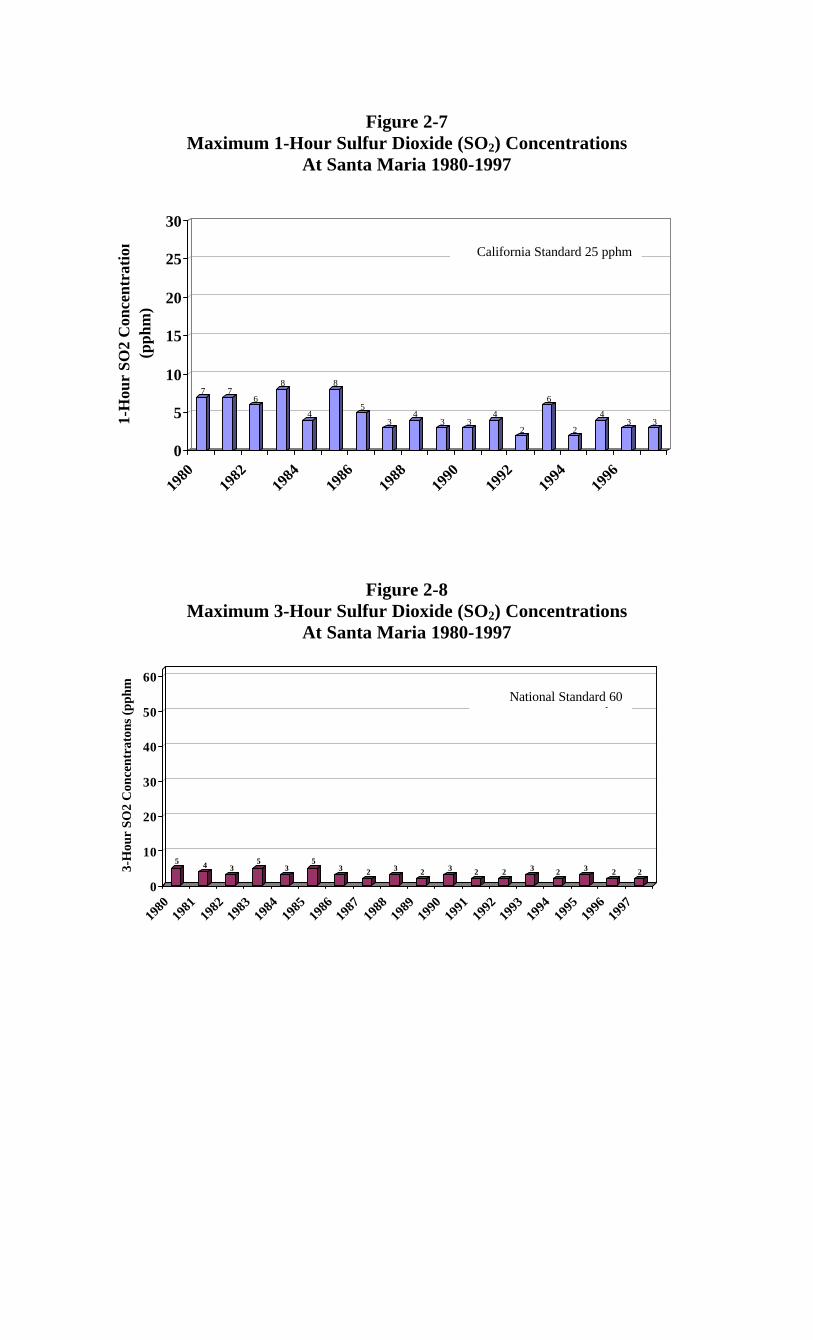
Figure 2-7Maximum 1-Hour Sulfur Dioxide (SO2) Concentrations
At Santa Maria 1980-1997
Figure 2-8Maximum 3-Hour Sulfur Dioxide (SO2) Concentrations
At Santa Maria 1980-1997
5 4 35
35
3 2 3 2 3 2 2 3 2 3 2 2
0
10
20
30
40
50
60
3-H
our
SO2
Con
cent
rato
ns (
pphm
)
1980
1981
1982
1983
1984
1985
1986
1987
1988
1989
1990
1991
1992
1993
1994
1995
1996
1997
7 76
8
4
8
5
34
3 34
2
6
2
43 3
0
5
10
15
20
25
30
1-H
our
SO2
Con
cent
rati
on
(pph
m)
1980
1982
1984
1986
1988
1990
1992
1994
1996
California Standard 25 pphm
National Standard 60pphm
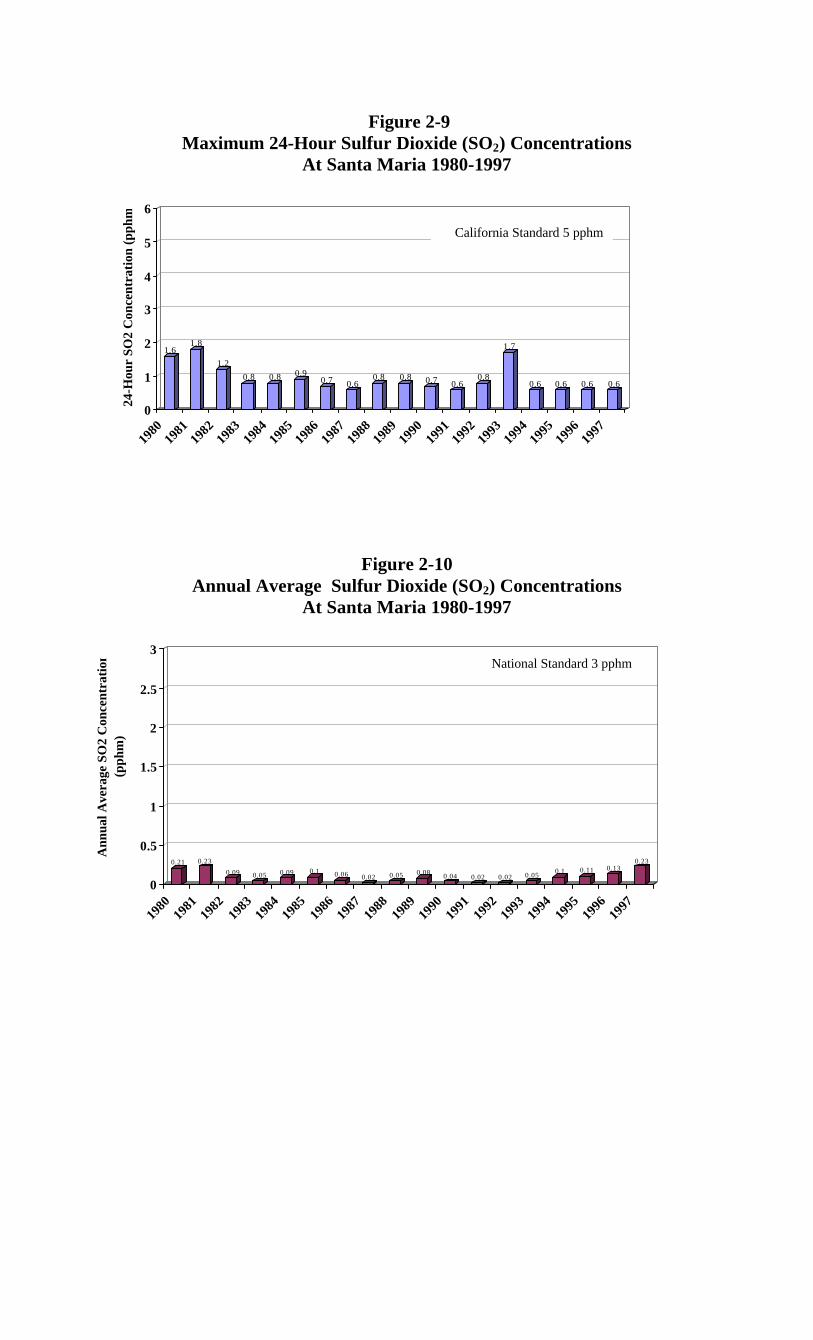
Figure 2-9Maximum 24-Hour Sulfur Dioxide (SO2) Concentrations
At Santa Maria 1980-1997
Figure 2-10Annual Average Sulfur Dioxide (SO2) Concentrations
At Santa Maria 1980-1997
1.61.8
1.2
0.8 0.8 0.90.7 0.6
0.8 0.8 0.7 0.60.8
1.7
0.6 0.6 0.6 0.6
0
1
2
3
4
5
6
24-H
our
SO2
Con
cent
rati
on (
pphm
)
1980
1981
1982
1983
1984
1985
1986
1987
1988
1989
1990
1991
1992
1993
1994
1995
1996
1997
0.21 0.23
0.09 0.05 0.09 0.1 0.06 0.02 0.05 0.08 0.04 0.02 0.02 0.050.1 0.11 0.13
0.23
0
0.5
1
1.5
2
2.5
3
Ann
ual A
vera
ge S
O2
Con
cent
rati
on
(pph
m)
1980
1981
1982
1983
1984
1985
1986
1987
1988
1989
1990
1991
1992
1993
1994
1995
1996
1997
National Standard 3 pphm
California Standard 5 pphm

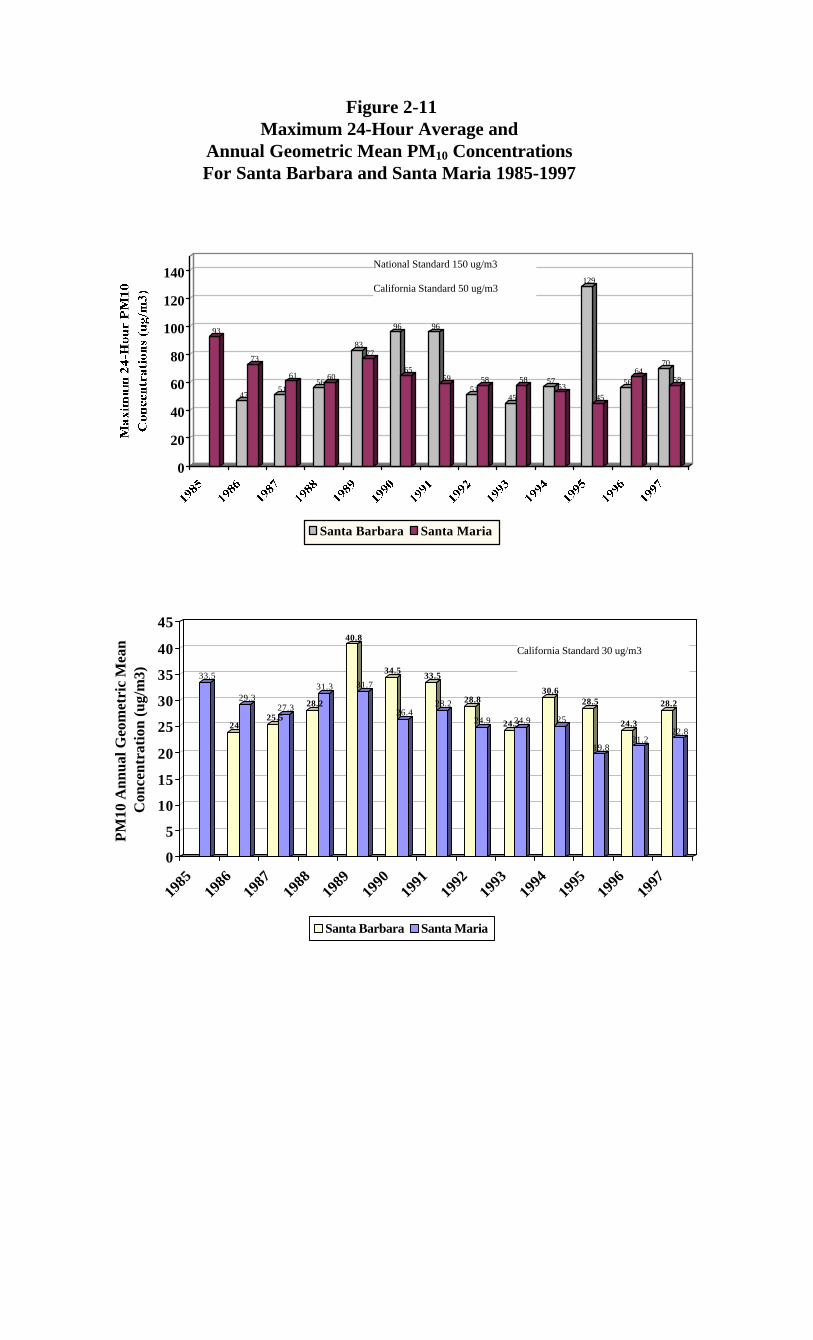
Figure 2-11Maximum 24-Hour Average and
Annual Geometric Mean PM10 ConcentrationsFor Santa Barbara and Santa Maria 1985-1997
93
47
73
51
6156
60
8377
96
65
96
5951
58
45
58 5753
129
45
5664
70
58
0
20
40
60
80
100
120
140
Santa Barbara Santa Maria
National Standard 150 ug/m3
California Standard 50 ug/m3
33.5
24
29.3
25.527.3 28.2
31.3
40.8
31.7
34.5
26.4
33.5
28.2 28.8
24.9 24.324.9
30.6
25
28.5
19.8
24.3
21.2
28.2
22.8
0
5
10
15
20
25
30
35
40
45
PM
10 A
nnua
l Geo
met
ric
Mea
n C
once
ntra
tion
(ug
/m3)
1985
1986
1987
1988
1989
1990
1991
1992
1993
1994
1995
1996
1997
Santa Barbara Santa Maria
California Standard 30 ug/m3
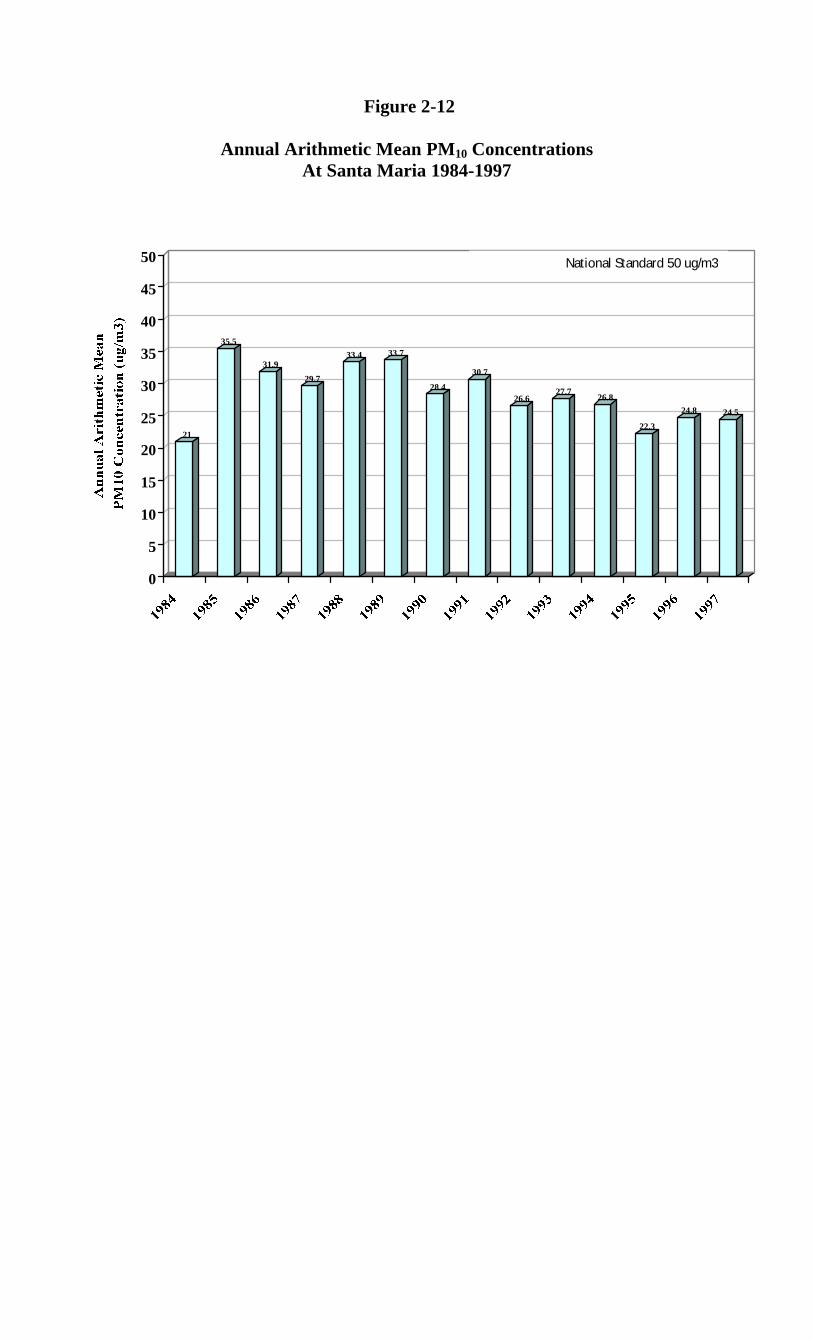
Figure 2-12
Annual Arithmetic Mean PM10 ConcentrationsAt Santa Maria 1984-1997
21
35.5
31.9
29.7
33.4 33.7
28.4
30.7
26.627.7
26.8
22.3
24.8 24.5
0
5
10
15
20
25
30
35
40
45
50 National Standard 50 ug/m3

Figure 2-13Maximum 30-day Average Lead Concentrations
At Santa Barbara 1980-1989
No lead analysis performed after 1989.
Figure 2-14Maximum 24-Hour Sulfate Concentrations
At Santa Barbara 1980-1990
No sulfate analysis performed after 1990.
1.36
0.9
0.097
0.76
0.43
0.33
0.180.09 0.06 0.07
0
0.2
0.4
0.6
0.8
1
1.2
1.4
1.6
30-D
ay A
vera
ge L
ead
Con
cent
rati
on (
ug/m
3)
1980
1981
1982
1983
1984
1985
1986
1987
1988
1989
California Standard 1.5 ug/m3
29.3
22.7 22.121.3
27.7
23.5
21.4 22
15.7
13
15.6
0
5
10
15
20
25
30
24-H
our
Ave
rage
Sul
fate
C
once
ntra
tion
s (u
g/m
3)
1980
1981
1982
1983
1984
1985
1986
1987
1988
1989
1990
California Standard 25 ug/m3
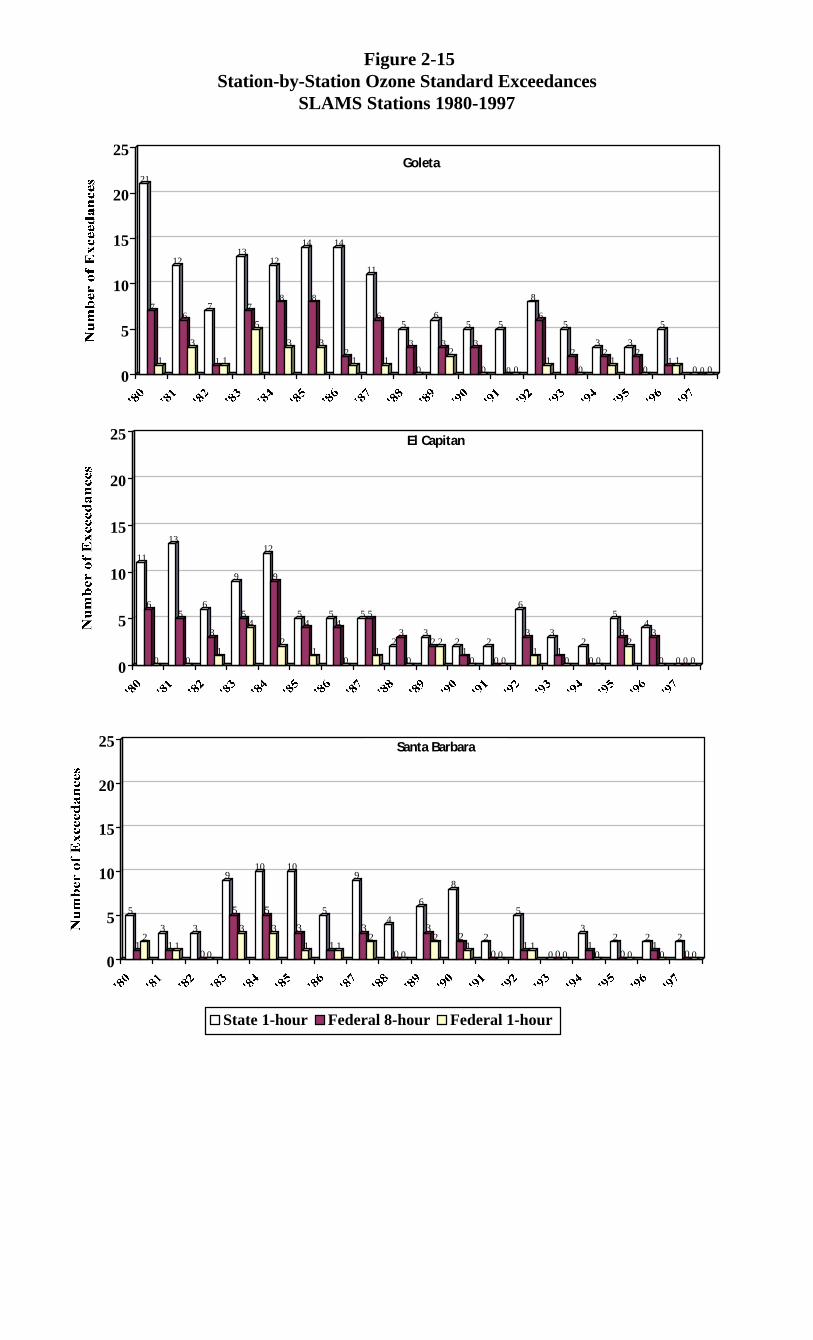
Figure 2-15Station-by-Station Ozone Standard Exceedances
SLAMS Stations 1980-1997
21
7
1
12
6
3
7
1 1
13
7
5
12
8
3
14
8
3
14
21
11
6
1
5
3
0
6
32
5
3
0
5
0 0
8
6
1
5
2
0
32
1
32
0
5
1 10 0 00
5
10
15
20
25Goleta
11
6
0
13
5
0
6
3
1
9
54
12
9
2
54
1
54
0
5 5
12
3
0
32 2 2
10
2
0 0
6
3
1
3
10
2
0 0
5
32
43
0 0 0 00
5
10
15
20
25
5
12
3
1 1
3
0 0
9
5
3
10
5
3
10
3
1
5
1 1
9
32
4
0 0
6
32
8
21
2
0 0
5
1 10 0 0
3
10
2
0 0
21
0
2
0 00
5
10
15
20
25
State 1-hour Federal 8-hour Federal 1-hour
El Capitan
Santa Barbara
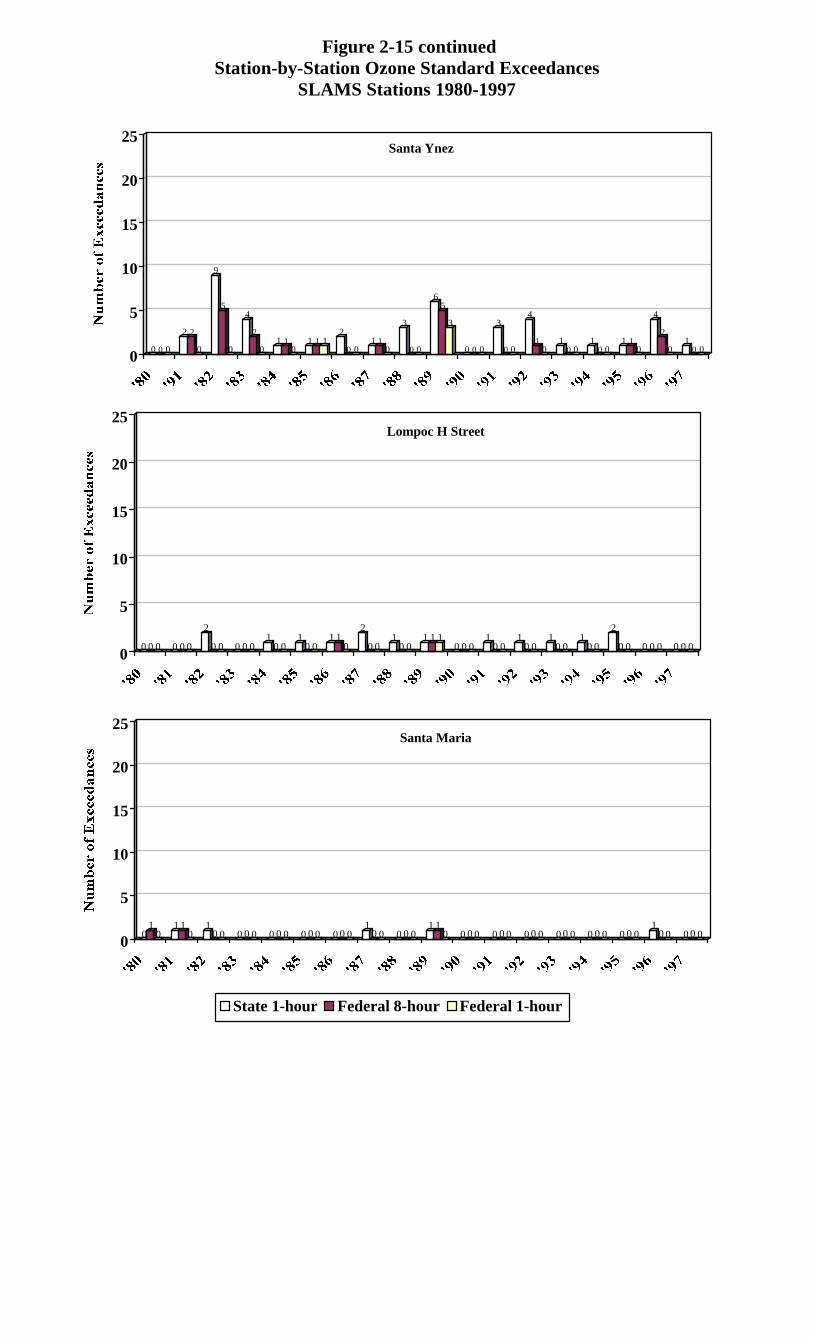
Figure 2-15 continuedStation-by-Station Ozone Standard Exceedances
SLAMS Stations 1980-1997
0 0 0
2 2
0
9
5
0
4
2
01 1
01 1 1
2
0 01 1
0
3
0 0
65
3
0 0 0
3
0 0
4
10
10 0
10 0
1 10
4
2
01
0 00
5
10
15
20
25Santa Ynez
0 0 0 0 0 0
2
0 0 0 0 01
0 01
0 01 1
0
2
0 01
0 01 1 1
0 0 01
0 01
0 01
0 01
0 0
2
0 0 0 0 0 0 0 00
5
10
15
20
25
01
01 1
01
0 0 0 0 0 0 0 0 0 0 0 0 0 01
0 0 0 0 01 1
0 0 0 0 0 0 0 0 0 0 0 0 0 0 0 0 0 0 01
0 0 0 0 00
5
10
15
20
25
State 1-hour Federal 8-hour Federal 1-hour
Lompoc H Street
Santa Maria
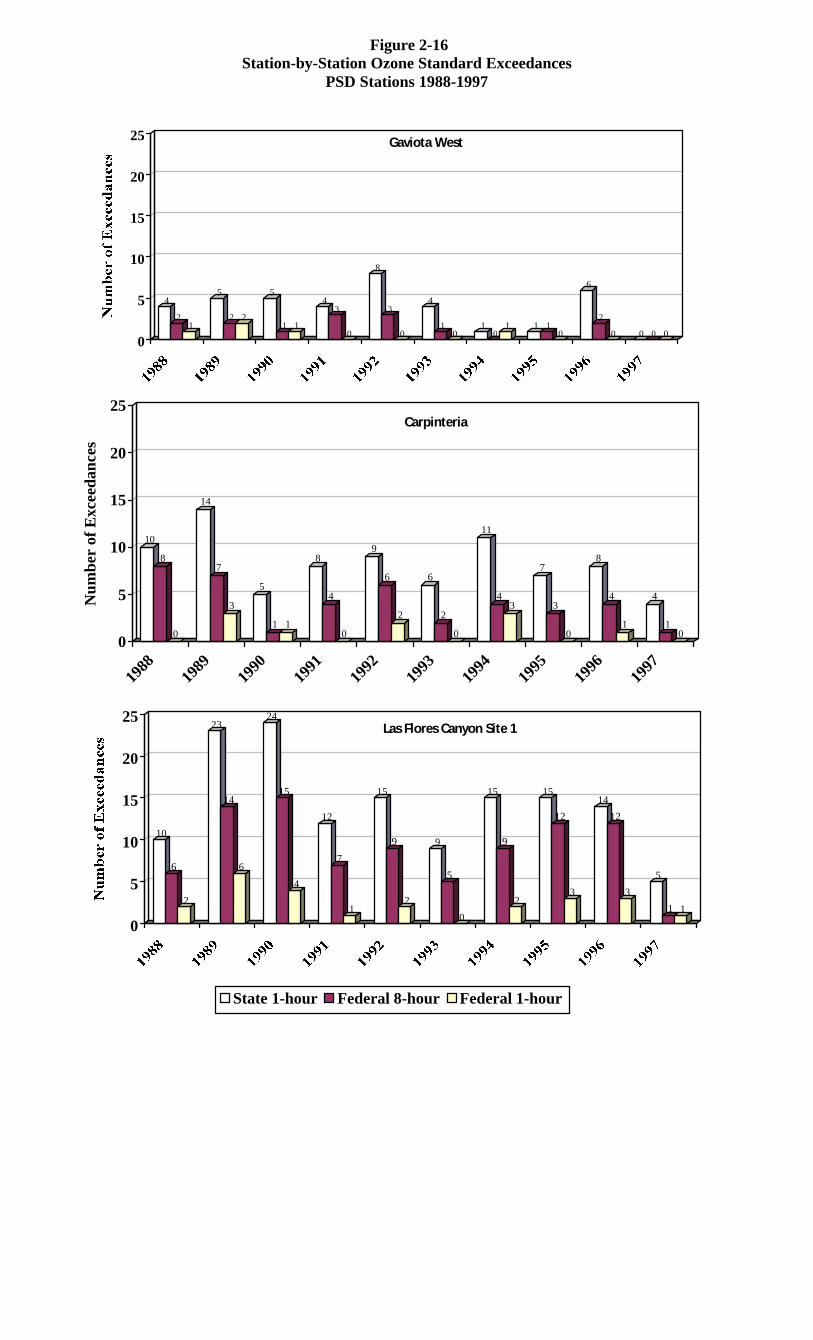
Figure 2-16Station-by-Station Ozone Standard Exceedances
PSD Stations 1988-1997
4
21
5
2 2
5
1 1
43
0
8
3
0
4
10
10
1 1 10
6
2
0 0 0 00
5
10
15
20
25 Gaviota West
10
8
0
14
7
3
5
1 1
8
4
0
9
6
2
6
2
0
11
43
7
3
0
8
4
1
4
10
0
5
10
15
20
25
Num
ber
of E
xcee
danc
es
1988
1989
1990
1991
1992
1993
1994
1995
1996
1997
10
6
2
23
14
6
24
15
4
12
7
1
15
9
2
9
5
0
15
9
2
15
12
3
14
12
3
5
1 1
0
5
10
15
20
25
State 1-hour Federal 8-hour Federal 1-hour
Carpinteria
Las Flores Canyon Site 1
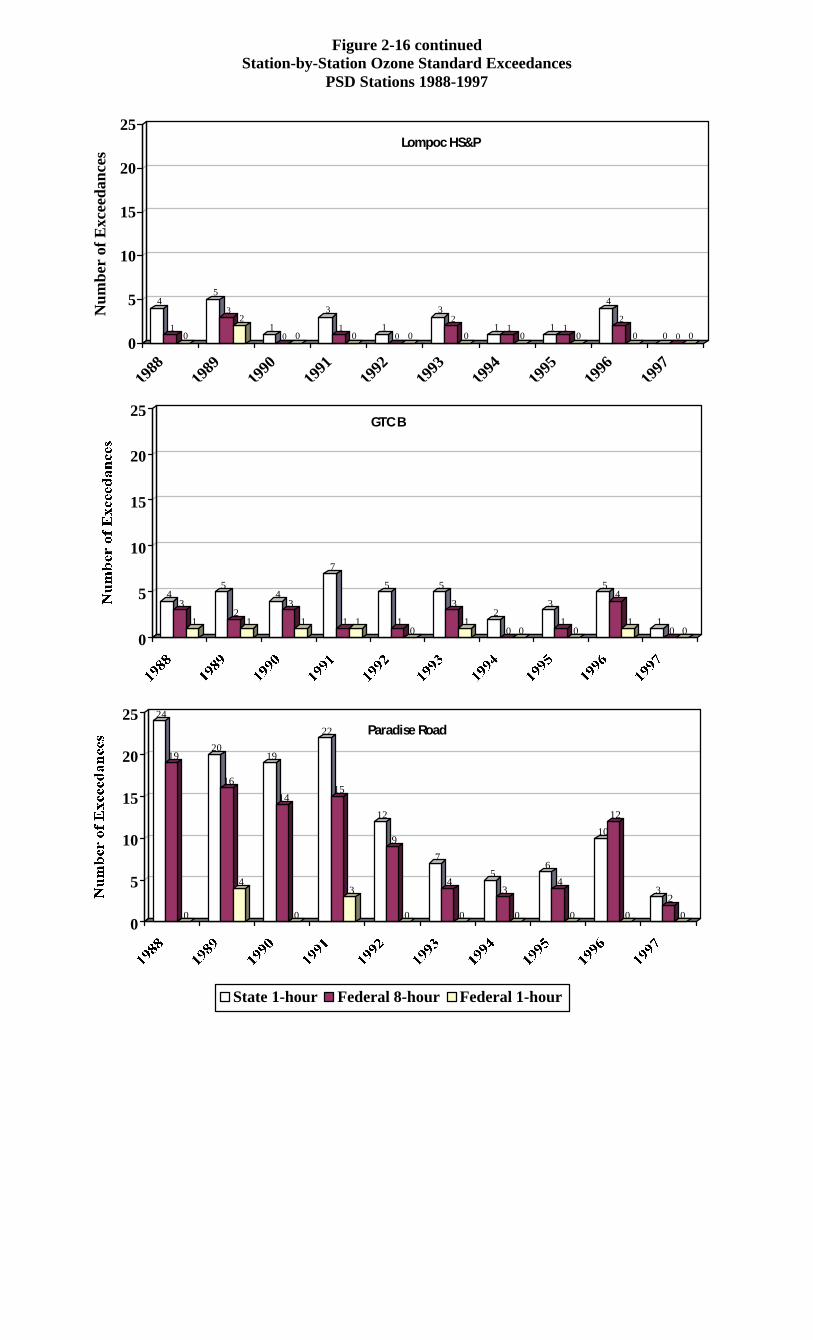
Figure 2-16 continuedStation-by-Station Ozone Standard Exceedances
PSD Stations 1988-1997
4
10
5
32
10 0
3
10
10 0
32
01 1
01 1
0
4
2
0 0 0 00
5
10
15
20
25
Num
ber
of E
xcee
danc
es
1988
1989
1990
1991
1992
1993
1994
1995
1996
1997
Lompoc HS&P
43
1
5
21
43
1
7
1 1
5
10
5
3
12
0 0
3
10
54
1 10 0
0
5
10
15
20
25
24
19
0
20
16
4
19
14
0
22
15
3
12
9
0
7
4
0
5
3
0
6
4
0
10
12
0
32
00
5
10
15
20
25
State 1-hour Federal 8-hour Federal 1-hour
GTC B
Paradise Road
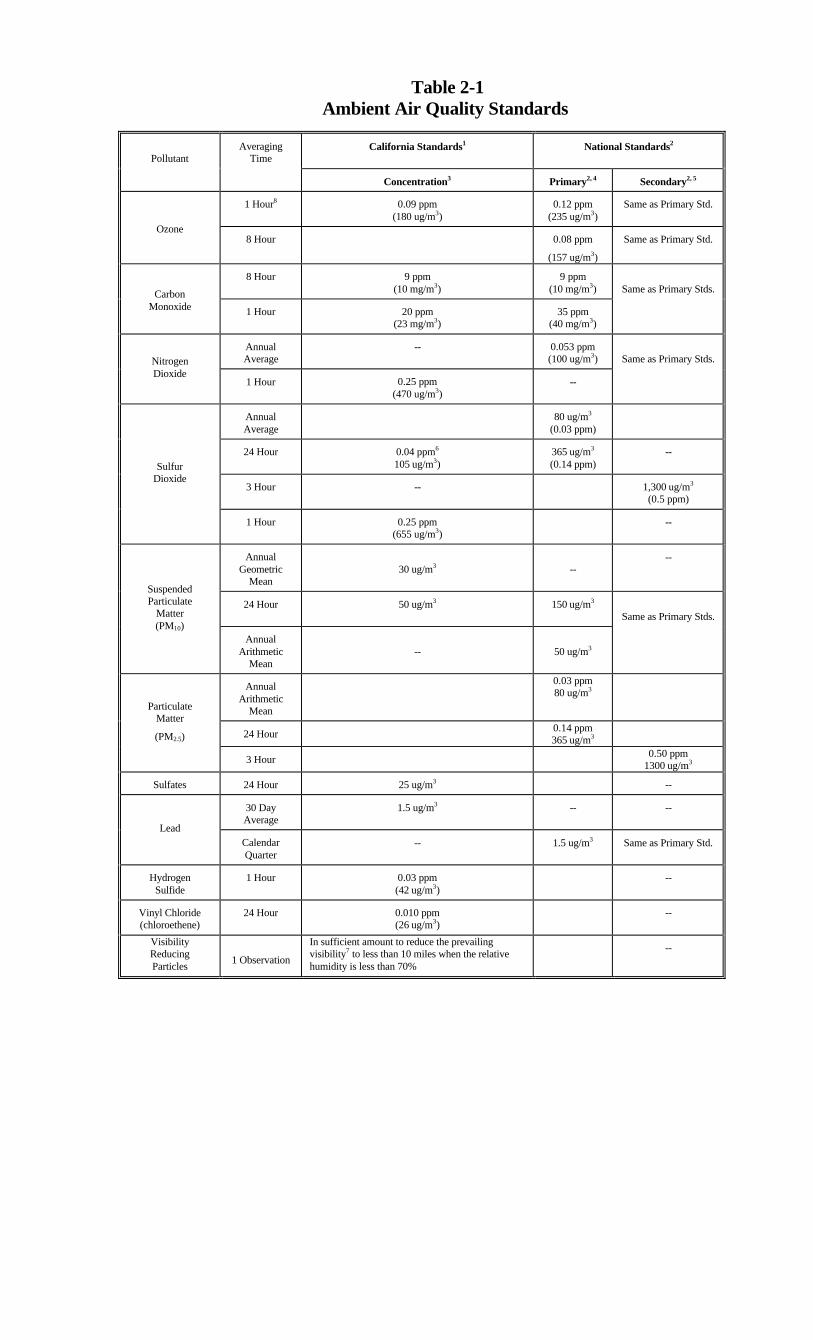
Table 2-1Ambient Air Quality Standards
PollutantAveraging
TimeCalifornia Standards1 National Standards2
Concentration3 Primary2, 4 Secondary2, 5
1 Hour8 0.09 ppm(180 ug/m3)
0.12 ppm(235 ug/m3)
Same as Primary Std.
Ozone8 Hour 0.08 ppm
(157 ug/m3)
Same as Primary Std.
8 Hour 9 ppm(10 mg/m3)
9 ppm(10 mg/m3) Same as Primary Stds.Carbon
Monoxide 1 Hour 20 ppm(23 mg/m3)
35 ppm(40 mg/m3)
AnnualAverage
-- 0.053 ppm(100 ug/m3) Same as Primary Stds.Nitrogen
Dioxide1 Hour 0.25 ppm
(470 ug/m3)--
AnnualAverage
80 ug/m3
(0.03 ppm)
24 Hour 0.04 ppm6
105 ug/m3)365 ug/m3
(0.14 ppm)--
3 Hour -- 1,300 ug/m3
(0.5 ppm)
SulfurDioxide
1 Hour 0.25 ppm(655 ug/m3)
--
AnnualGeometric
Mean30 ug/m3 --
--
24 Hour 50 ug/m3 150 ug/m3
Same as Primary Stds.
SuspendedParticulate
Matter(PM10)
AnnualArithmetic
Mean-- 50 ug/m3
AnnualArithmetic
Mean
0.03 ppm80 ug/m3
24 Hour0.14 ppm365 ug/m3
ParticulateMatter
(PM2.5)
3 Hour0.50 ppm
1300 ug/m3
Sulfates 24 Hour 25 ug/m3 --
30 DayAverage
1.5 ug/m3 -- --
LeadCalendarQuarter
-- 1.5 ug/m3 Same as Primary Std.
HydrogenSulfide
1 Hour 0.03 ppm(42 ug/m3)
--
Vinyl Chloride(chloroethene)
24 Hour 0.010 ppm(26 ug/m3)
--
VisibilityReducingParticles
1 Observation
In sufficient amount to reduce the prevailingvisibility7 to less than 10 miles when the relativehumidity is less than 70%
--
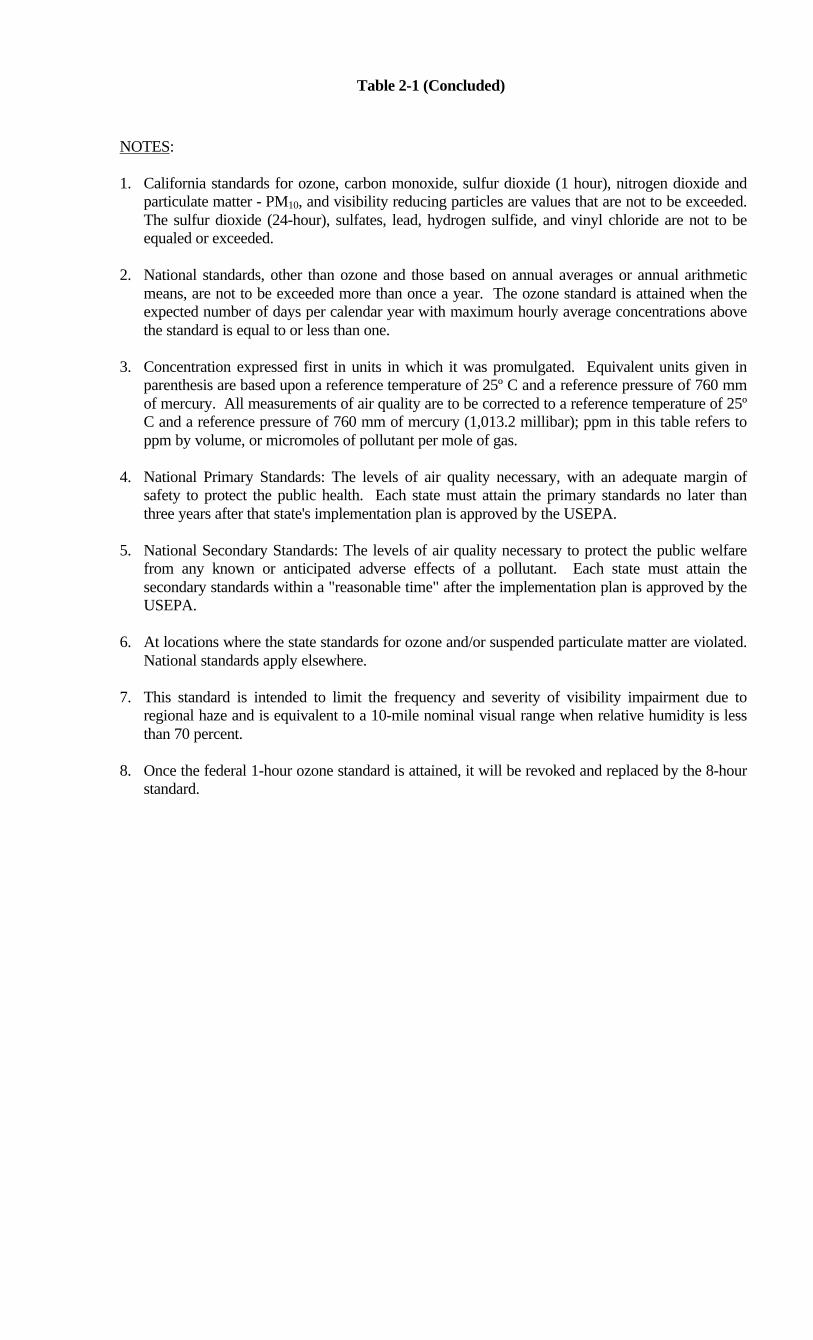
Table 2-1 (Concluded)
NOTES:
1. California standards for ozone, carbon monoxide, sulfur dioxide (1 hour), nitrogen dioxide andparticulate matter - PM10, and visibility reducing particles are values that are not to be exceeded.The sulfur dioxide (24-hour), sulfates, lead, hydrogen sulfide, and vinyl chloride are not to beequaled or exceeded.
2. National standards, other than ozone and those based on annual averages or annual arithmeticmeans, are not to be exceeded more than once a year. The ozone standard is attained when theexpected number of days per calendar year with maximum hourly average concentrations abovethe standard is equal to or less than one.
3. Concentration expressed first in units in which it was promulgated. Equivalent units given inparenthesis are based upon a reference temperature of 25º C and a reference pressure of 760 mmof mercury. All measurements of air quality are to be corrected to a reference temperature of 25ºC and a reference pressure of 760 mm of mercury (1,013.2 millibar); ppm in this table refers toppm by volume, or micromoles of pollutant per mole of gas.
4. National Primary Standards: The levels of air quality necessary, with an adequate margin ofsafety to protect the public health. Each state must attain the primary standards no later thanthree years after that state's implementation plan is approved by the USEPA.
5. National Secondary Standards: The levels of air quality necessary to protect the public welfarefrom any known or anticipated adverse effects of a pollutant. Each state must attain thesecondary standards within a "reasonable time" after the implementation plan is approved by theUSEPA.
6. At locations where the state standards for ozone and/or suspended particulate matter are violated.National standards apply elsewhere.
7. This standard is intended to limit the frequency and severity of visibility impairment due toregional haze and is equivalent to a 10-mile nominal visual range when relative humidity is lessthan 70 percent.
8. Once the federal 1-hour ozone standard is attained, it will be revoked and replaced by the 8-hourstandard.

TABLE 2-2AIR QUALITY MONITORING STATIONS - OPERATIONAL STATUS AND PARAMETERS MEASURED
SITE TYPE START END P A R A M E T E R S
O3 NO2 SO2 CO THC H2S TSP PM10 ROC WS VWS WD AMT TRS
N 1N 2N 3N 4N 5
Santa Maria RefineryBonita School RoadWest Main StreetGuadalupeCasmalia Hills
PSDPSDPSDPSDPSD
2-1-872-1-872-1-872-1-872-1-87
10-31-9210-31-9211-1-8911-1-89
10-31-92
nnnn
nnnnn
nnnnn
N 6
N 7N 8N 9
N 10
Santa Maria (SM) Values for SM include these sites
Main StreetMcClellandBroadway
BattlesSanta Maria - BriarwoodSanta Maria - Glacier Ln.Airox Road
SLAMSSLAMSSLAMS
PSDERFERFPSD
Pre-198001-8209-8709-853-1-793-1-7909-86
10-8109-87
*11-30-9512-31-9012-31-90
11-87
nnnn
n
nn
nn
nnn
nnn
n
n
n
nn
n
n
n
n
n
n
n
n
n
n
n
n
n
n
n
N 11
N 12N 13N 14N 15
Watt RoadVAFB Watt RoadLompoc HS & PLompoc HS & P OdorHerado RoadLompoc (LOM) Values for LOM include these sitesLompoc - G StreetLompoc - H Street
SLAMSPSDPSDPSD
SLAMS
SLAMSSLAMS
01-8305-01-92
09-851-1-8803-82
07-8006-83
05-883-1-97
**
10-86
04-83*
nnn
n
nn
nnn
n
n
nnn
n
nn
nn
n
n
nn
n
n
n
nn
n
n
nn
nnnnn
nn
nn
nnnnn
nn
nnn n
N 16N 17N 18S 19S 20
VAFB STSPoint ArguelloLompoc - JalamaJalama BeachPt. Conception
PSDPSDERFPSDPSD
02-8709-853-1-7911-8512-86
*11-30-9512-31-9011-30-953-31-98
nn
nn
nn
nn
n
nnn
n nn
n
n
nnn
n
nn
nn
n
nnnnn
nn
nn
nnnnn
nn
nn
S 21N 22S 23S 24S 25
Government Pt.GTC BGaviota WestGaviota Odor WestGTC A
PSDPSDPSDPSDPSD
02-8506-8709-847-1-8809-85
01-31-92*
3-31-98*
11-30-95
nnn
n
nnn
n
n
n
n
n n
nn
n
n
n
n
n
n
n
n
nnnnn
nnn
n
nnnnn
nnnnn
n
S 26S 27S 28S 29N 30
Gaviota EastGTC CGaviota Odor EastMolinoSanta Ynez Airport
PSDPSDPSDPSD
SLAMS
12-8706-877-1-8804-8409-80
3-31-984-30-98
*06-87
*
nn
nn
nn
n
nn
n
nn
nn
nn
n
nn
n
nn
n
nnnnn
nn
nn
nnnnn
nnnnn
n
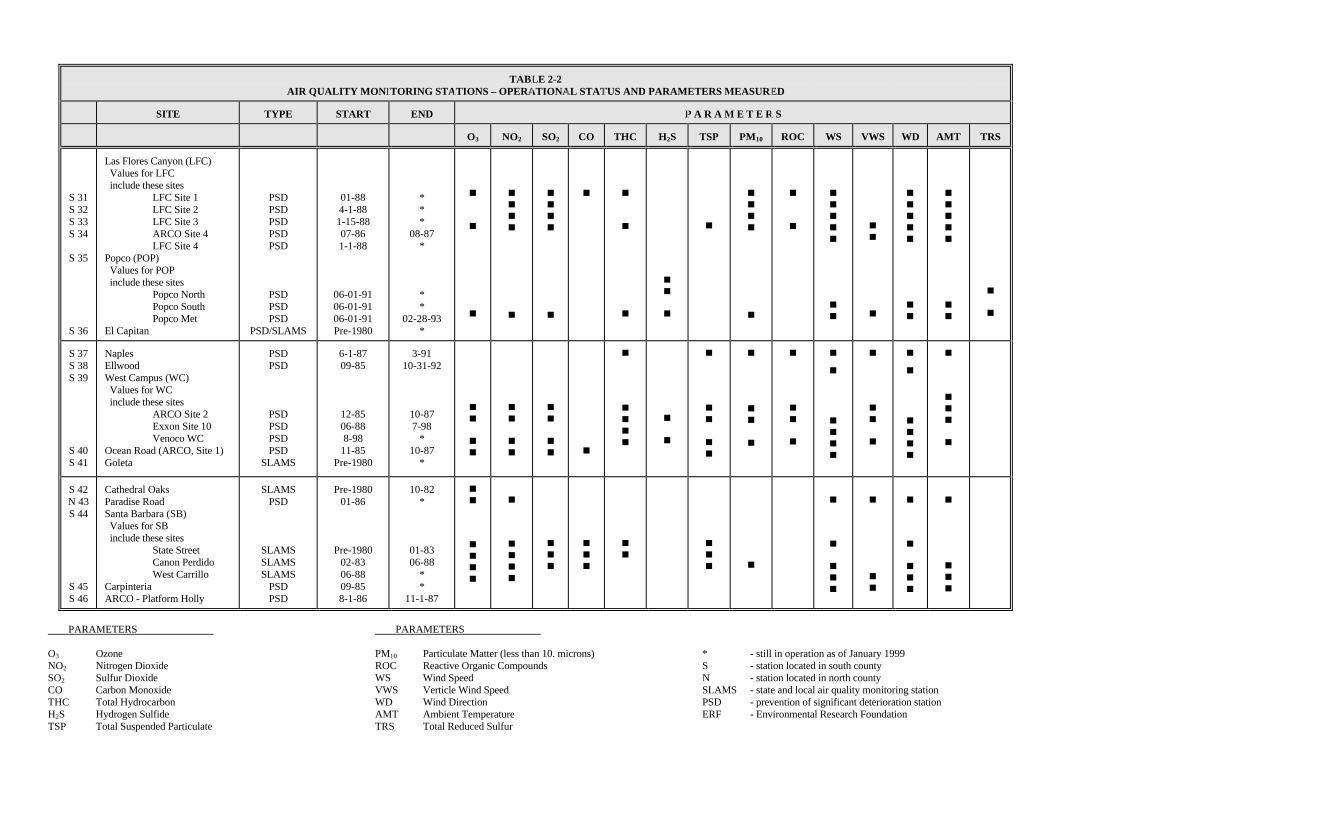
TABLE 2-2AIR QUALITY MONITORING STATIONS – OPERATIONAL STATUS AND PARAMETERS MEASURED
SITE TYPE START END P A R A M E T E R S
O3 NO2 SO2 CO THC H2S TSP PM10 ROC WS VWS WD AMT TRS
S 31S 32S 33S 34
S 35
S 36
Las Flores Canyon (LFC) Values for LFC include these sites
LFC Site 1LFC Site 2LFC Site 3ARCO Site 4LFC Site 4
Popco (POP) Values for POP include these sites
Popco NorthPopco SouthPopco Met
El Capitan
PSDPSDPSDPSDPSD
PSDPSDPSD
PSD/SLAMS
01-884-1-881-15-8807-861-1-88
06-01-9106-01-9106-01-91Pre-1980
***
08-87*
**
02-28-93*
n
n
n
nnnn
n
nnnn
n
n n
n
n
nn
n
n
nnnn
n
n
n
nnnnn
nn
nn
n
nnnnn
nn
nnnnn
nn
n
n
S 37S 38S 39
S 40S 41
NaplesEllwoodWest Campus (WC) Values for WC include these sites
ARCO Site 2Exxon Site 10Venoco WC
Ocean Road (ARCO, Site 1)Goleta
PSDPSD
PSDPSDPSDPSD
SLAMS
6-1-8709-85
12-8506-888-98
11-85Pre-1980
3-9110-31-92
10-877-98
*10-87
*
nn
nn
nn
nn
nn
nn n
n
nnnn
n
n
n
nn
nn
n
nn
n
n
nn
n
n
n
nnnn
n
nn
n
n
n
nnnn
n
nnn
n
S 42N 43S 44
S 45S 46
Cathedral OaksParadise RoadSanta Barbara (SB) Values for SB include these sites
State StreetCanon PerdidoWest Carrillo
CarpinteriaARCO - Platform Holly
SLAMSPSD
SLAMSSLAMSSLAMS
PSDPSD
Pre-198001-86
Pre-198002-8306-8809-858-1-86
10-82*
01-8306-88
**
11-1-87
nn
nnnn
n
nnnn
nnn
nnn
nn
nnn n
n
n
nnn
n
nn
n
n
nnn
n
nnn
PARAMETERS
O3 OzoneNO2 Nitrogen DioxideSO2 Sulfur DioxideCO Carbon MonoxideTHC Total HydrocarbonH2S Hydrogen SulfideTSP Total Suspended Particulate
PARAMETERS
PM10 Particulate Matter (less than 10. microns)ROC Reactive Organic CompoundsWS Wind SpeedVWS Verticle Wind SpeedWD Wind DirectionAMT Ambient TemperatureTRS Total Reduced Sulfur
* - still in operation as of January 1999S - station located in south countyN - station located in north countySLAMS - state and local air quality monitoring stationPSD - prevention of significant deterioration stationERF - Environmental Research Foundation

2-25

2-26
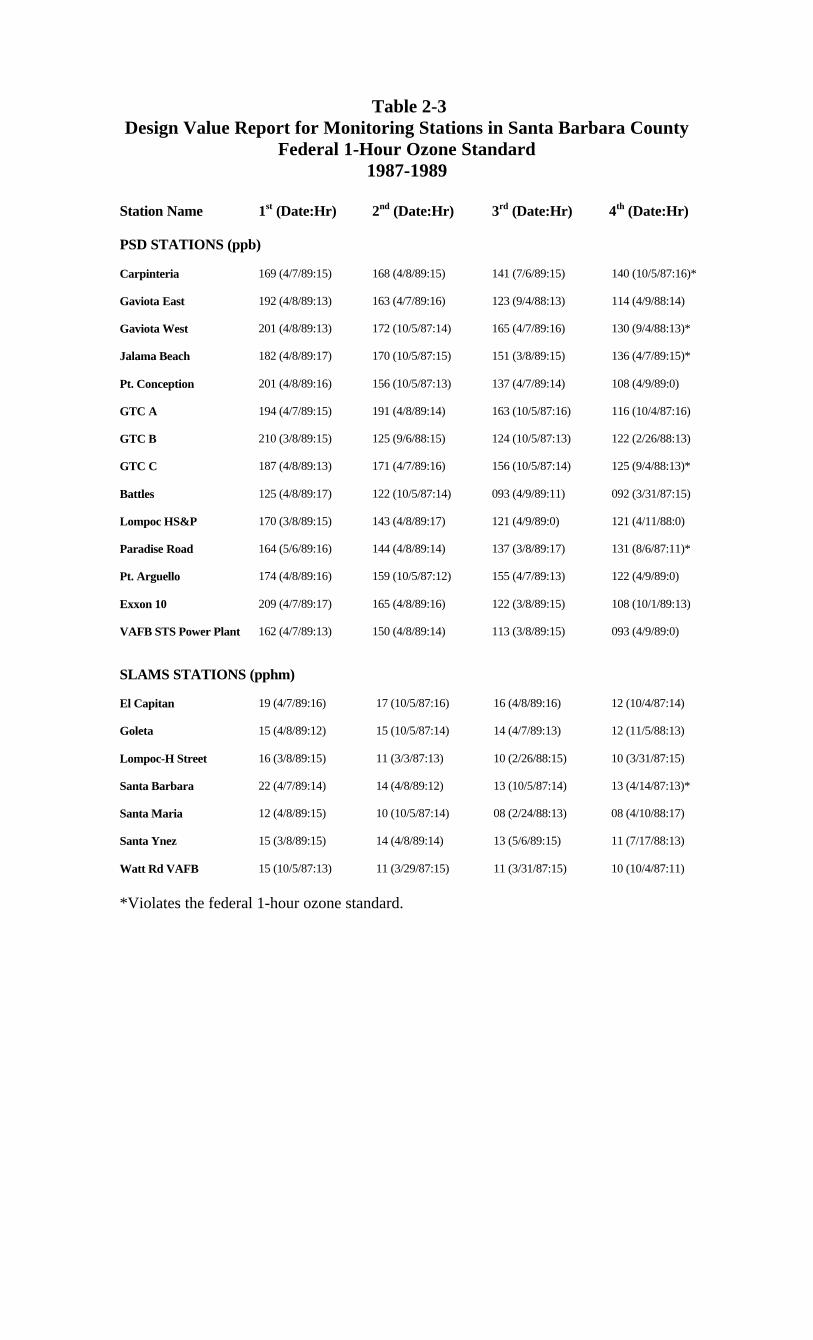
Table 2-3Design Value Report for Monitoring Stations in Santa Barbara County
Federal 1-Hour Ozone Standard1987-1989
Station Name 1st (Date:Hr) 2nd (Date:Hr) 3rd (Date:Hr) 4th (Date:Hr)
PSD STATIONS (ppb)
Carpinteria 169 (4/7/89:15) 168 (4/8/89:15) 141 (7/6/89:15) 140 (10/5/87:16)*
Gaviota East 192 (4/8/89:13) 163 (4/7/89:16) 123 (9/4/88:13) 114 (4/9/88:14)
Gaviota West 201 (4/8/89:13) 172 (10/5/87:14) 165 (4/7/89:16) 130 (9/4/88:13)*
Jalama Beach 182 (4/8/89:17) 170 (10/5/87:15) 151 (3/8/89:15) 136 (4/7/89:15)*
Pt. Conception 201 (4/8/89:16) 156 (10/5/87:13) 137 (4/7/89:14) 108 (4/9/89:0)
GTC A 194 (4/7/89:15) 191 (4/8/89:14) 163 (10/5/87:16) 116 (10/4/87:16)
GTC B 210 (3/8/89:15) 125 (9/6/88:15) 124 (10/5/87:13) 122 (2/26/88:13)
GTC C 187 (4/8/89:13) 171 (4/7/89:16) 156 (10/5/87:14) 125 (9/4/88:13)*
Battles 125 (4/8/89:17) 122 (10/5/87:14) 093 (4/9/89:11) 092 (3/31/87:15)
Lompoc HS&P 170 (3/8/89:15) 143 (4/8/89:17) 121 (4/9/89:0) 121 (4/11/88:0)
Paradise Road 164 (5/6/89:16) 144 (4/8/89:14) 137 (3/8/89:17) 131 (8/6/87:11)*
Pt. Arguello 174 (4/8/89:16) 159 (10/5/87:12) 155 (4/7/89:13) 122 (4/9/89:0)
Exxon 10 209 (4/7/89:17) 165 (4/8/89:16) 122 (3/8/89:15) 108 (10/1/89:13)
VAFB STS Power Plant 162 (4/7/89:13) 150 (4/8/89:14) 113 (3/8/89:15) 093 (4/9/89:0)
SLAMS STATIONS (pphm)
El Capitan 19 (4/7/89:16) 17 (10/5/87:16) 16 (4/8/89:16) 12 (10/4/87:14)
Goleta 15 (4/8/89:12) 15 (10/5/87:14) 14 (4/7/89:13) 12 (11/5/88:13)
Lompoc-H Street 16 (3/8/89:15) 11 (3/3/87:13) 10 (2/26/88:15) 10 (3/31/87:15)
Santa Barbara 22 (4/7/89:14) 14 (4/8/89:12) 13 (10/5/87:14) 13 (4/14/87:13)*
Santa Maria 12 (4/8/89:15) 10 (10/5/87:14) 08 (2/24/88:13) 08 (4/10/88:17)
Santa Ynez 15 (3/8/89:15) 14 (4/8/89:14) 13 (5/6/89:15) 11 (7/17/88:13)
Watt Rd VAFB 15 (10/5/87:13) 11 (3/29/87:15) 11 (3/31/87:15) 10 (10/4/87:11)
*Violates the federal 1-hour ozone standard.
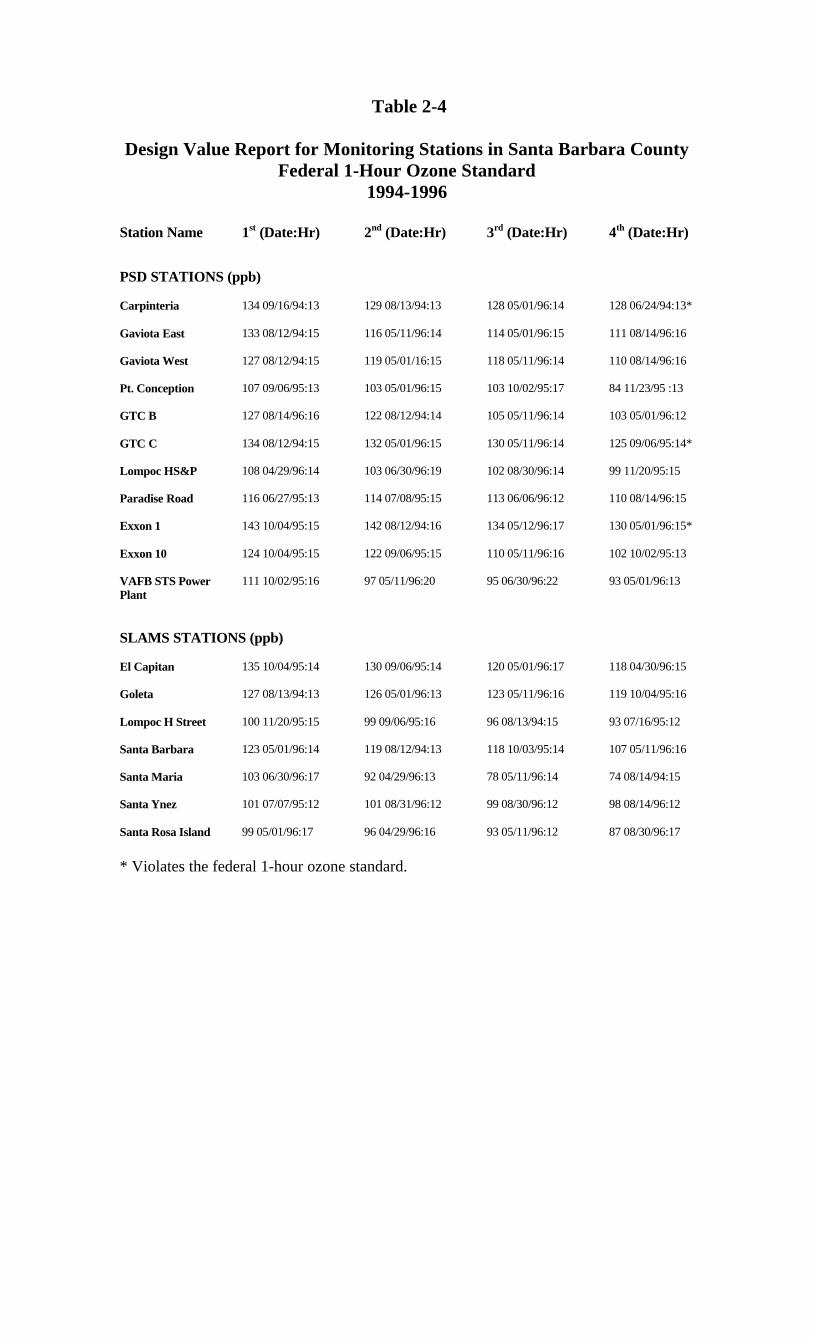
Table 2-4
Design Value Report for Monitoring Stations in Santa Barbara CountyFederal 1-Hour Ozone Standard
1994-1996
Station Name 1st (Date:Hr) 2nd (Date:Hr) 3rd (Date:Hr) 4th (Date:Hr)
PSD STATIONS (ppb)
Carpinteria 134 09/16/94:13 129 08/13/94:13 128 05/01/96:14 128 06/24/94:13*
Gaviota East 133 08/12/94:15 116 05/11/96:14 114 05/01/96:15 111 08/14/96:16
Gaviota West 127 08/12/94:15 119 05/01/16:15 118 05/11/96:14 110 08/14/96:16
Pt. Conception 107 09/06/95:13 103 05/01/96:15 103 10/02/95:17 84 11/23/95 :13
GTC B 127 08/14/96:16 122 08/12/94:14 105 05/11/96:14 103 05/01/96:12
GTC C 134 08/12/94:15 132 05/01/96:15 130 05/11/96:14 125 09/06/95:14*
Lompoc HS&P 108 04/29/96:14 103 06/30/96:19 102 08/30/96:14 99 11/20/95:15
Paradise Road 116 06/27/95:13 114 07/08/95:15 113 06/06/96:12 110 08/14/96:15
Exxon 1 143 10/04/95:15 142 08/12/94:16 134 05/12/96:17 130 05/01/96:15*
Exxon 10 124 10/04/95:15 122 09/06/95:15 110 05/11/96:16 102 10/02/95:13
VAFB STS PowerPlant
111 10/02/95:16 97 05/11/96:20 95 06/30/96:22 93 05/01/96:13
SLAMS STATIONS (ppb)
El Capitan 135 10/04/95:14 130 09/06/95:14 120 05/01/96:17 118 04/30/96:15
Goleta 127 08/13/94:13 126 05/01/96:13 123 05/11/96:16 119 10/04/95:16
Lompoc H Street 100 11/20/95:15 99 09/06/95:16 96 08/13/94:15 93 07/16/95:12
Santa Barbara 123 05/01/96:14 119 08/12/94:13 118 10/03/95:14 107 05/11/96:16
Santa Maria 103 06/30/96:17 92 04/29/96:13 78 05/11/96:14 74 08/14/94:15
Santa Ynez 101 07/07/95:12 101 08/31/96:12 99 08/30/96:12 98 08/14/96:12
Santa Rosa Island 99 05/01/96:17 96 04/29/96:16 93 05/11/96:12 87 08/30/96:17
* Violates the federal 1-hour ozone standard.

Table 2-5
1990 Clean Air Act Amendment Attainment Target Dates
AREA CLASS DESIGN VALUE* ATTAINMENT TARGET DATE
Marginal 0.121 up to 0.138 3 years after enactment (1993)
Moderate 0.138 up to 0.160 6 years after enactment (1996)
Serious** 0.160 up to 0.180 9 years after enactment (1999)
Severe 0.180 up to 0.280 15 years after enactment (2005)
Extreme 0.280 and above 20 years after enactment (2010)
* The design value is measured in parts per million (ppm).** This is Santa Barbara County’s current classification.

Table 2-6
Design Value Report for Monitoring Stations in Santa Barbara CountyFederal 8-Hour Ozone Standard
1994-1996
Station Name 1994 4th High 1995 4th High 1996 4th High Average
PSD STATIONS (ppb)
Carpinteria 86 09/15/94:11 82 10/03/95:10 86 05/11/96:11 84
Gaviota East 79 10/31/94:10 72 03/31/95:18 79 04/30/96:11 76
Gaviota West 76 09/15/94:10 65 03/31/95:19 83 08/14/96:12 74
Pt. Conception 67 08/13/94:13 71 10/19/95:00 69 05/11/96:18 69
GTC B 68 08/06/94:11 74 07/15/95:15 85 05/11/96:12 75
GTC C 80 09/15/94:09 79 10/02/95:09 83 05/11/96:10 80
Lompoc HS&P 69 06/09/94:10 72 07/30/95:11 80 08/30/96:09 73
Paradise Road 82 09/16/94:10 85 08/03/95:11 94 04/29/96:14 87*
Exxon 1 94 06/23/94:13 91 07/14/95:11 98 06/30/96:10 94*
Exxon 10 71 08/14/94:09 75 11/20/95:10 71 08/30/96:10 72
VAFB STS PowerPlant
66 10/23/94:10 75 11/20/95:12 76 05/11/96:13 72
SLAMS STATIONS (ppb)
El Capitan 72 10/23/94:10 84 11/20/95:11 80 04/29/96:12 78
Goleta 77 08/14/94:09 79 10/03/95:09 78 06/30/96:10 78
Lompoc H Street 60 09/15/94:10 64 03/31/95:13 67 06/30/96:12 63
Santa Barbara 62 07/10/94:09 69 09/16/95:09 72 05/12/96:09 67
Santa Maria 53 09/15/94:09 55 10/19/95:11 63 05/11/96:11 57
Santa Ynez 76 06/09/94:09 77 06/23/95:10 83 04/29/96:11 78
*Violates the federal 8-hour ozone standard.
CHAPTER 3
EMISSION INVENTORY
Introduction
Pollutants
Emission Inventory Hierarchy
1996 Annual Emission Inventory
1990 Base-Year Annual Emission Inventory
Conclusion

3 - 1
3. EMISSION INVENTORY
3.1 INTRODUCTION
This chapter describes the baseline emission inventories used in the development of this 1998
Clean Air Plan (1998 CAP). Emission inventories are estimates of the amounts and types of
pollutants emitted from a variety of sources including motor vehicles, industrial facilities, coating
application, consumer product usage and natural sources. Emission inventories are used to:
describe and compare contributions from air pollution sources, evaluate control measures,
schedule rule adoptions, forecast future pollution, perform air quality modeling, and prepare clean
air plans.
The emission inventories are divided into two geographical regions: Santa Barbara County and
the Outer Continental Shelf (OCS). The Santa Barbara County emission inventory encompasses
all on-shore sources of air pollution in Santa Barbara County and in the State Tidelands (within
three miles of the shoreline). This constitutes the ozone nonattainment area subject to federal
Rate-of-Progress requirements (Rate-of-Progress is discussed in Chapter 9). The OCS emission
inventory includes pollution sources from three to twenty five miles offshore of Santa Barbara
County.
This chapter presents both the 1990 Base-Year Annual Emission Inventory for Santa Barbara
County only, as required by the Federal Clean Air Act Amendments of 1990 (FCAAA) and the
1996 Annual Emission Inventory for both Santa Barbara County and the OCS (Both of these
inventories are listed in Tables 3-1, 3-2, and 3-3, and displayed in Figures 3-1 to 3-3).
The 1996 Annual Emission Inventory is our most current data available and utilizes the most
reliable emission estimation techniques. A modified version of the 1996 Annual Emission
Inventory, known as a “Planning Emission Inventory”, will be used as the baseline to forecast
emissions for the years 1999 and 2005. Please refer to Chapter 6 for the discussion on the 1996
Planning Emission Inventory and the forecasting of future emissions.

3 - 2
A Planning Emission Inventory (PEI) is essentially a modified subset of an Annual Emission
Inventory (AEI). The PEI basically differs from an AEI in four ways. First, an AEI contains the
ozone precursor pollutants of ROG, NOx, and CO. It is also comprised of the pollutants of SOx
and PM. The PEI only contains the three ozone precursor pollutants (ROG, NOx and CO).
Second, the creation of the PEI involves adjusting the AEI to account for seasonal variation
because most exceedances of the federal 1-hour ozone standard occur during the April to October
ozone season. Third, the emissions from natural sources such as biogenics, oil and gas seeps, and
wildfires that are in the AEI are excluded from the PEI since they are not currently regulated
through implementation of emission control measures. And lastly, the annual emissions in the
AEI are converted to daily emissions in the PEI.
Besides being used to develop the PEI and forecast future inventories, the 1996 AEI was also
used to update 1990 Base-Year AEI. Updating of the 1990 Base-Year AEI is consistent with the
policy of the California Air Resources Board. The 1990 Base-Year AEI has been revised to
incorporate the most reliable emission factors, emission calculation methods, and estimation
techniques to make it as accurate as the 1996 AEI. Additional adjustments were made to the
1990 Base-Year AEI to incorporate the revised definition of reactive organic gases, which now
excludes ethane, acetone and perchloroethylene.
The 1994 Clean Air Plan (1994 CAP) also used the 1990 Base-Year AEI. However, the
adjustments already mentioned and further detailed in Section 3.5 make the 1990 Base-Year AEI
in the 1998 CAP distinctly different from the version used in the 1994 CAP.
The 1990 Base-Year AEI is an important element in this plan. A modified version of it known as
a “1990 Base-Year Rate-of-Progress Emission Inventory” will be used as the reference point or
base-year to determine emission reductions in relation to the target level of 1999 emissions. This
will demonstrate our compliance with federal Rate-of-Progress requirements. The 1990 Base-
Year Rate-of-Progress Emission Inventory is similar to the Planning Inventory, with the exception
that only reactive organic gases (ROG) are taken into account. Please refer to Chapter 9 for a
detailed discussion of the Rate-of-Progress requirements.
3 - 3
Both the 1990 and 1996 emission inventories are comprised of specific pollutants and display a
three-tiered hierarchy. Section 3.2 discusses the pollutants and Section 3.3 describe the hierarchy
used in these inventories. Section 3.4 discusses the 1996 AEI and Section 3.5 details the 1990
Base-Year AEI.
3.2 POLLUTANTS
The Annual Emission Inventory includes the pollutants contributing to ozone formation, referred
to as ozone precursors. These pollutants are reactive organic gases (ROG), oxides of nitrogen
(NOx), and carbon monoxide (CO). The definition of ROG used in this plan is equivalent to the
USEPA's definition of Volatile Organic Compounds (VOC), and does not include ethane, acetone
or perchloroethylene as reactive organic chemical species. Other primary pollutants (those
emitted directly into the atmosphere) presented in the Annual Emission Inventory are particulate
matter (PM) and oxides of sulfur (SOx).
3.3 EMISSION INVENTORY HIERARCHY
The emission inventory data structure in this chapter is presented by using a new tiered hierarchy
to categorize all of the air pollution sources. This hierarchy, which was revised in 1994 by the
California Air Resources Board (ARB), consists of four main divisions in the first tier. These
divisions are: Stationary Sources (individual facilities and aggregated point sources); Area-Wide
Sources (geographically dispersed area sources), Mobile Sources (both on-road vehicles and off-
road sources) and Natural Sources (non-anthropogenic, i.e., not man-made). In the second tier,
each of the four divisions is sub-divided into major source categories. The third tier divides the
major source categories into summary categories. Please refer to Appendix A for a
comprehensive listing of the entire emission inventory.
In the 1994 CAP, the emission inventory hierarchy was comprised of only two main divisions:
Stationary Sources and Mobile Sources. The division of Area-Wide Sources in this 1998 CAP
was contained as part of the Stationary Sources in the 1994 CAP. Also, emissions from Natural
Sources were previously contained in the Stationary Sources division, Miscellaneous Processes

3 - 4
major source category in the 1994 CAP. In the 1998 CAP, they are contained in a separate
emission inventory division, Natural Sources. Other notable differences from the 1994 CAP to
the 1998 CAP include the following:
• Waste Burning was changed from a major source category to a summary category.
• Landfill Gas emissions and Incineration emissions are now contained within a new major
source category, Waste Disposal.
The following four sub-sections will take a closer look at each of the emission inventory divisions
individually. The first is Stationary Sources, followed by Area-Wide Sources, Mobile Sources,
and finally Natural Sources.
3.3.1 STATIONARY SOURCES
The Stationary Sources emission inventory division is comprised of five major source categories:
1) Fuel Combustion,
2) Waste Disposal,
3) Cleaning and Surface Coatings,
4) Petroleum Production and Marketing, and
5) Industrial Processes.
The specific summary categories and sources of emissions associated with these major categories
are identified and described below.
3.3.1.1 FUEL COMBUSTION
This major source category contains emissions produced by stationary fossil fuel combustion
equipment such as boilers and engines. Fuel combustion is the greatest source of NOx and CO
emissions within the Stationary Sources division. Emissions in the Fuel Combustion major source
category are produced in the following seven summary categories:

3 - 5
1. Electric Utilities: Diesel and natural gas turbines used at electrical generation facilities.
2. Cogeneration: Natural gas combustion used in the production of electrical energy and
useful thermal energy.
3. Oil and Gas Production: Stationary internal combustion engines, boilers, process heaters,
turbines, steam generators and drilling rigs at facilities engaged in the extraction and
processing of petroleum products for shipment, using fuels such as natural gas, distillate
oil, and liquefied petroleum gas (LPG). Most of the emissions in this subcategory are
produced from natural gas fired internal combustion engines used in oil production
operations.
4. Petroleum Refining: Natural gas, distillate and residual oil burning equipment such as
boilers and process heaters located at refineries.
5. Manufacturing and Industrial: The same type of equipment as listed under Oil and Gas
Production, but used in other industrial and manufacturing activities such as: sand, rock,
and gravel processing; concrete and asphalt production; mineral processing; and surgical
appliance manufacturing.
6. Food and Agricultural Processing: Diesel fired internal combustion engines used for
agricultural irrigation, natural gas fired boilers, oil fired boilers, and process heaters at
food processing and feed preparation facilities, and orchard heaters.
7. Service and Commercial: Fuel combustion equipment burning natural gas, distillate and
residual oil and LPG, including commercial space and water heaters and small boilers and
engines at non-industrial facilities.
3.3.1.2 WASTE DISPOSAL
This major source category contains emissions associated with municipal landfills and process gas
incineration.
1. Landfills: Decomposition of waste material at class II landfill sites. Landfill gas emissions
are the result of natural biodegradation and emissions are predominantly non-reactive
organic gases.
3 - 6
2. Incineration: Incinerators burning process gas.
3.3.1.3 CLEANING AND SURFACE COATINGS
This major source category consists entirely of evaporative ROG emissions from solvents and
coatings, in five summary categories.
1. Laundering: Use of petroleum based solvents at dry cleaning facilities.
2. Degreasing: Petroleum and synthetic solvents used to clean parts and material at industrial
and commercial facilities, such as surgical appliance and semi-conductor manufacturers.
3. Coatings and Related Process Solvents: Automotive, aerospace, metal parts, furniture and
wood product coatings and associated solvent and thinner use.
4. Printing: Inks, solvents and cleaning agents.
5. Other: Solvent and water-based adhesives and sealants used in various commercial and
industrial applications.
3.3.1.4 PETROLEUM PRODUCTION AND MARKETING
This major source emission category includes emissions resulting from the handling of petroleum
liquids and gases at petroleum extraction, processing, transport, and marketing facilities. This
category is comprised primarily of ROG emissions and is the most significant source of ROG
emissions in the Stationary Sources division. The emissions are produced from processes in three
summary categories.
1. Oil and Gas Production: Fugitive hydrocarbon emissions from oil wells, valves and
fittings, compressor seals, flanges, fixed and floating roof tanks, crude oil sumps, pits and
well cellars, glycol regenerator vents, tank car and truck loading operations, and
combustion emissions from flares at oil and gas extraction and processing facilities.
2. Petroleum Refining: Fugitive hydrocarbon emissions from valves, fittings, storage tanks
and loading racks at asphalt refining facilities.

3 - 7
3. Petroleum Marketing: Fugitive hydrocarbon emissions from crude oil storage tanks
affiliated with pipelines, and loading of marine vessels and tank cars and trucks with crude
oil, natural gas transmission losses, refined fuel vapor losses from underground storage
tanks, vehicle refueling facilities, (i.e., gas stations), and bulk fuel storage plants.
3.3.1.5 INDUSTRIAL PROCESSES
The Industrial Processes major source category pertains to industries other than the petroleum
industry. Although Industrial Processes produce only a small fraction of the county's ROG and
NOx emissions, they are the most significant contributors of SOx and PM within the Stationary
Sources division. They include following summary categories.
1. Chemical: ROG emissions from fiberglass operations and plastic product manufacturing.
2. Food and Agriculture: Primarily SOx and PM emissions from sugar beet and other
agricultural processing; ROG emissions from wine fermentation and aging.
3. Mineral Processes: Substantial PM as well as other pollutant emissions from crushed rock,
diatomaceous earth processing, asphaltic and cement concrete production and limestone
processing.
4. Other: CO and PM emissions resulting form aerospace operations (missile launches).
3.3.2 AREA-WIDE SOURCES
The Area-Wide Sources emission inventory division is composed entirely of emissions from
sources that are not subject to APCD permitting requirements. Emissions are geographically
dispersed throughout the county but are aggregated into two major source emission categories:
1) Solvent Evaporation and
2) Miscellaneous Processes.
3.3.2.1 SOLVENT EVAPORATION
3 - 8
The Solvent Evaporation major source category consists entirely of evaporative ROG emissions
from consumer product use, architectural coatings, and pesticide use. Emissions in the Solvent
Evaporation major source category are produced in five summary categories.
1. Consumer Products: Solvents used in antiperspirants and deodorants, air fresheners,
automotive windshield wiper fluids, bathroom cleaners, consumer engine cleaners,
barbecue lighter fluid; aerosol paint and product propellants, and solvents.
2. Architectural Coatings and Related Process Solvents: Oil and water-based paints and
thinners used to paint commercial and residential buildings and other structures.
3. Pesticides/Fertilizers: Pesticides used in agricultural, structural and consumer product
applications.
4. Asphalt Paving: Cutback asphalt, emulsified asphalt, hot-mix asphalt, and road oils.
5. Other: Asphalt roofing.
3.3.2.2 MISCELLANEOUS PROCESSES
Large quantities of CO and PM emissions are produced by combustion and fugitive dust
producing processes and are listed in ten summary categories.
1. Residential Fuel Combustion: Significant CO, PM and NOx emissions from natural gas,
distillate oil, LPG and wood combustion used for cooking, space and water heating.
2. Farming Operations: Fugitive dust PM emissions from tilling, harvest season operations
and cattle feedlots.
3. Construction and Demolition: Fugitive dust PM emissions from residential, commercial
and industrial building and demolition; road construction.
4. Paved Road Dust: Fugitive dust PM emissions from vehicular travel on paved roads,
including freeways, major roads, and local streets.
5. Unpaved Road Dust: Fugitive dust PM emissions from vehicular travel on unpaved roads,
including city and county, farm and federal land roads.
6. Fugitive Windblown Dust: Fugitive dust PM emissions from wind erosion of agricultural
fields, pastures, and unpaved roads.
3 - 9
7. Fires: Primarily CO emissions from automobile and structural fires.
8. Waste Burning and Disposal: Burning of agricultural debris, weed abatement and range
management burning, prescribed forest management burning and fire fighting training
resulting in CO and PM emissions.
9. Utility Equipment: Combustion CO and ROG emissions from small horsepower two and
four stroke utility engines driving chainsaws, lawn mowers, leaf blowers, portable
compressors and generators used in residential and commercial applications.
10. Other: Commercial charbroiling, producing mostly PM emissions.
3.3.3 MOBILE SOURCES
The Mobile Sources emission inventory division is composed of emissions related to on-road
motor vehicles and a variety of off-road vehicles and equipment, including aircraft, recreational
vehicles and marine vessels. Mobile Sources consists of two major source categories: On-Road
Motor Vehicles and Other Mobile Sources. The Mobile Sources emission inventory division
produces most of the NOx and CO emissions, and appreciable amounts of the ROG emissions in
the county’s on-shore inventory.
3.3.3.1 ON-ROAD MOTOR VEHICLES
The On-Road Motor Vehicles major source category includes gasoline and diesel light-duty
passenger vehicles (automobiles), light-duty trucks (pick-up trucks) and medium-duty trucks,
gasoline and diesel heavy-duty trucks, motorcycles, and heavy-duty diesel buses. The On-Road
Motor Vehicles emission inventory is estimated using a group of models developed by ARB
known as the Motor Vehicle Emission Inventory 7G1.0corrected (MVEI7G1.0c) model.
MVEI7G1.0c is an update of the MVEI7.0G model released by ARB in October 1996 and
features technical improvements and improved estimates of regional vehicular usage. The
MVEI7G1.0c model merges vehicle-specific emission factors, adjusted for non-standard driving
conditions, while accounting for the vehicle population by model year and vehicle activity data.
The Santa Barbara County Association of Governments (SBCAG) transportation model generates
this data. SBCAG coordinates with Caltrans and the ARB to estimate vehicle emissions by

3 - 10
vehicle class. The 1994 CAP utilized a previous version of the MVEI model, known as 7F
version 1.1. In this plan, we have employed the most current emission estimation techniques
available along with activity data from our county-specific transportation model and updated
vehicle demographic data from the Department of Motor Vehicles (DMV). We will continue to
use techniques that are the most technically sound and acceptable to both the ARB and the
USEPA.
The On-Road Motor Vehicles major source category produces most of the ROG, NOx, and CO
emissions in the Mobile Sources emission inventory element, with the majority attributable to
light-duty passenger vehicles. Light-duty and medium-duty trucks also generate appreciable
amounts of ROG, NOx and CO, while heavy-duty diesel trucks are significant generators of NOx.
On-road vehicle emissions include exhaust emissions resulting from fuel combustion (ROG, NOx
and CO), and fuel evaporative emissions (ROG). Evaporative emissions can occur during vehicle
operation (running losses) or when the vehicle is not being operated (diurnal, hot soak and resting
losses). For example, evaporative emissions occur when increasing temperatures cause the vapor
in gasoline fuel tanks and fuel systems to expand, displacing ROG vapors into the atmosphere
unless they are contained by an on-board vapor recovery system.
The ten On-Road Motor Vehicles summary categories are described below.
1. Light Duty Passenger: Catalytic and non-catalytic converter equipped gasoline engine and
diesel engine automobiles designed primarily for transportation and having a design
capacity of 12 persons or less.
2. Light Duty Trucks: Catalytic and non-catalytic converter equipped gasoline engine and
diesel engine trucks rated at less than or equal to 6,000 pounds gross vehicle weight
designed primarily for transportation of property but also including most Sport Utility
Vehicles (SUV).
3. Medium Duty Trucks: Catalytic and non-catalytic converter equipped gasoline engine and
diesel engine trucks from 6,001 to 8,500 pounds gross vehicle weight. Some larger SUV
are included in this vehicle class.
3 - 11
4. Light Heavy Duty Gas Trucks: Catalytic and non-catalytic converter equipped gasoline
engine trucks from 8,501 to 14,000 pounds gross vehicle weight.
5. Medium Heavy Duty Gas Trucks: Catalytic and non-catalytic converter equipped gasoline
engine trucks from 14,001 to 33,000 pounds gross vehicle weight.
6. Light Heavy Duty Diesel Trucks: Diesel engine trucks from 8,501 to 14,000 pounds gross
vehicle weight.
7. Medium Heavy Duty Diesel Trucks: Diesel engine trucks from 14,001 to 33,000 pounds
gross vehicle weight.
8. Heavy Heavy Duty Diesel Trucks: Diesel engine trucks greater than 33,000 pounds gross
vehicle weight.
9. Motorcycles: Non-catalytic converter equipped gasoline engines in vehicles with not more
than three wheels and weighing less than 1,500 pounds.
10. Heavy Duty Diesel Urban Buses: Diesel engine buses typically used for municipal
transportation.
One current issue that demands discussion is the surging popularity of Sport Utility Vehicles
(SUV). The SUV that were traditionally used as work utility vehicles are now more commonly
being used for personal transportation. SUV are classified as either light or medium duty trucks
and are subject to less stringent emission standards than light duty automobiles (passenger
vehicles). It is possible that the population of these vehicles and their emission impact is
underestimated in the On-Road Motor Vehicles emission inventory, an issue ARB is currently
evaluating. Any revisions to current emission estimation techniques will be included in future
plans.
3.3.3.2 OTHER MOBILE SOURCES
The Other Mobile Sources major source category pertains to emission sources that do not
produce their emissions on roads and highways, such as ships, boats, airplanes, trains, residential
utility equipment, and construction equipment. Although the ARB has the primary responsibility
for estimating the emissions from these categories, the APCD currently estimates the emissions
from ships and aircraft. Virtually all emissions are related to fuel combustion in engines. Marine
3 - 12
vessel emissions occur in the State Tidelands and the Outer Continental Shelf, where they are a
very significant source of NOx and SOx emissions. The seven summary categories are as follows:
1. Aircraft: Primarily CO and ROG emissions from piston and jet powered commercial, civil,
and military aircraft, and agricultural crop dusting.
2. Trains: Primarily NOx combustion emissions from locomotives on the railway line linking
the Los Angeles area with the San Francisco Bay area.
3. Ships and Commercial Boats: Tankers operating in the State Tidelands, a variety of large
tanker and cargo vessels traversing the Santa Barbara Channel, and crew and supply boats
servicing offshore oil production platforms produce significant quantities of NOx, SOx and
CO emissions.
4. Recreational Boats: CO and ROG emissions from gasoline and diesel powered boats.
5. Off-Road Recreational Vehicles: CO and ROG emissions from four-wheel drive all-terrain
and off-road passenger vehicles, and off-road motorcycles.
6. Commercial/Industrial Mobile Equipment: Substantial CO and NOx emissions from
gasoline, diesel and LPG powered construction and industrial equipment. Light duty
equipment with engines less than 175 horsepower, such as forklifts, mobile cranes, airport
ground support equipment, portable generators, compressors, and pumps. Heavy-duty
non-farm equipment with engines greater than or equal to 175 horsepower including
construction equipment such as pavers, scrapers, loaders and mining equipment. This
category also includes diesel powered refrigeration units on trucks and trailers.
7 Farm Equipment: CO and NOx emissions from gasoline and diesel heavy duty farm
equipment, including tractors, mowers, combines and other mobile agricultural equipment.
One Other Mobile Sources emission category of particular interest is related to construction
equipment. This emission category is diverse in terms of equipment types and sizes, and includes
gas and diesel engines in a vast horsepower range, from under 15 to over 500 horsepower.
Construction equipment emissions are estimated by the ARB for the APCD, but are not contained
in any single emission category. Instead, they are represented as a component of more
generalized emission categories related to engine type and size, i.e. Light Duty Diesel Industrial
Equipment, Light Duty Gasoline Industrial Equipment and Heavy Duty Non-Farm Equipment
3 - 13
(Diesel or Gasoline powered). Although construction equipment undoubtedly is a significant
emission source, it is problematic to extract a definitive estimate of construction equipment
emissions. A generalized, qualitative estimate can be made based on a study performed for ARB
in 1992, in which statewide construction equipment emissions were allocated to the county level
using construction permit valuation data obtained from the State Department of Finance. This
estimate indicates NOx emissions in the range of 450-525 tons per year, CO emissions of 350-600
tons per year and ROG emissions of 40-50 tons per year. The APCD, using construction permit
data obtained from the SBCAG, also developed an estimate of construction emissions, which
suggests construction NOx emissions in the range of 300-450 tons per year. An improved
construction emission estimate may be available in the future, using a model being developed by
ARB for off-road emission sources. Any improvements in the estimation of construction related
emissions would be included in future plan revisions.
3.3.4 NATURAL SOURCES
The Natural Sources emission inventory division consists of emissions that are non-
anthropogenic, or not man-made. Emission estimates for these categories tend to be difficult to
quantify with any degree of certainty. Non-anthropogenic emissions are excluded from the PEI
used in Chapter 9 for federal Rate-of-Progress calculations, but they are included in the AEI for
photochemical modeling and attainment demonstration purposes. There is only one major source
category.
3.3.4.1 NATURAL SOURCES
There are three summary categories of Natural Sources emissions.
1. Biogenic Sources: ROG emissions from vegetation, typically estimated using a complex
regional model incorporating biomass types and distribution, plant species emission factors
and climate correction factors. Soil microorganisms contribute some NOx emissions.
2. Geogenic Sources: ROG emissions from naturally occurring oil and gas seeps located off
the southern coast of Santa Barbara County. Seep emissions flow out from subsurface
3 - 14
sources on the ocean floor, primarily in the State Tidelands and exhibit a high degree of
temporal and spatial variability.
3. Wildfires: Timber, grass and brush wildfires. This is different from the planned or
prescribed burn fires that are part of the Area-Wide Source division, Miscellaneous
Processes major source category, Waste Burning and Disposal summary category. CO
and PM are the most significant pollutants.
Now that the pollutants and hierarchy have been established, the two specific annual emission
inventories, the 1996 AEI and the 1990 Base-Year AEI, will be described in the following
sections. These two inventories will form the basis for determining emission reductions,
forecasting future inventories, and performing Rate-of-Progress calculations.
3.4 1996 ANNUAL EMISSION INVENTORY
The 1996 AEI contains the most recent data and emission estimation methods, including utilizing
the latest On-Road Motor Vehicle activity data and emission estimation models. The 1996 AEI
for Santa Barbara County and the Outer Continental Shelf documents the current sources of air
pollution, both in quantity and relative contribution. The 1996 AEI was used to upgrade the 1990
Base-Year Annual Emission, which is discussed in section 3.5.
Also, a modified version of the 1996 AEI, described as a Planning Emission Inventory, as
mentioned earlier in this chapter, will serve as the baseline to forecast emission inventories for the
years 1999 and 2005. This is discussed in Chapter 6.
The Santa Barbara County 1996 annual emissions inventory of ROG, NOx, CO, SOx and PM in
tons per year is presented in Table 3-1. The Santa Barbara County emissions inventory represents
on-shore and State Tidelands emission sources, i.e. the Santa Barbara County ozone
nonattainment area, and includes Natural Sources (i.e., non-anthropogenic emissions related to oil
and gas seeps, vegetation, and wildfires).
3.4.1 SANTA BARBARA COUNTY EMISSIONS
3 - 15
The 1996 Santa Barbara County AEI for ozone precursor pollutants is 44,460 tons per year
ROG, 16,589 tons per year NOx and 103,369 tons per year CO. Also, the inventory contains 865
tons of SOx and 13,553 tons of PM. Figure 3-1 shows each major source’s relative contribution
for each pollutant during 1996. The largest sources of each pollutant and their percent of
contribution are as follows:
1996 Santa Barbara County ROG Emissions: 44,460 tons
• 6% Stationary Sources: 2,838 tons
0.5% Fuel Combustion: (65% from Oil and Gas Production)
0.3% Waste Disposal: (99% from Landfills)
2.6% Cleaning and Surface Coatings: (44% from Coatings and Process Solvents)
2.5% Petroleum Production and Marketing: (77% from Oil and Gas Production)
0.1% Industrial Processes: (88% from Food and Agriculture)
• 8% Area-Wide Sources: 3,420 tons
6% Solvent Evaporation: (42% Consumer Products; and 34% Pesticides/Fertilizers)
2% Miscellaneous: (43% Waste Burning and Disposal; and 27% Residential Fuel Use)
• 20% Mobile Sources: 8,907 tons
18% On-Road Motor Vehicles: (66% Light Duty Passenger; 27% Light Duty Trucks)
2% Other Mobile Sources: (28% from Commercial/Industrial Mobile Equipment)
• 66% Natural Sources: 29,295 tons
51% Biogenic Sources
14% Geogenic Sources
1% Wildfires
1996 Santa Barbara County NOx Emissions: 16,589 tons
• 13% Stationary Sources: 2,159 tons
13% Fuel Combustion: (52% Oil and Gas Production; 27% Food and Ag. Processing)
• 3% Area-Wide Sources: 494 tons
3% Miscellaneous: (73% from Residential Fuel Combustion)
3 - 16
• 78% Mobile Sources: 12,878 tons
57% On-Road Motor Vehicles: (45% Light Duty Passenger; 26% Light Duty Trucks)
21% Other Mobile Sources: (38% from Commercial/Industrial Mobile Equipment)
• 6% Natural Sources: 1,058 tons
5% Biogenic Sources
1% Geogenic Sources
1996 Santa Barbara County CO Emissions: 103,369 tons
• 2% Stationary Sources: 1,551 tons
1.8% Fuel Combustion: (75% from Oil and Gas Production)
0.1% Petroleum Production and Marketing: (100% from Oil and Gas Production)
0.1% Industrial Processes: (100% from Other Industrial Processes)
• 8% Area-Wide Sources: 7,882 tons
8% Miscellaneous: (45% from Residential Fuel Combustion; 30% from Waste Burning
and Disposal; and 24% from Utility Equipment)
• 80% Mobile Sources: 82,532 tons
70% On-Road Motor Vehicles: (66% Light Duty Passenger; 27% Light Duty Trucks)
10% Other Mobile Sources: (44% from Commercial/Industrial Mobile Equipment)
• 11% Natural Sources: 11,404 tons
11% Wildfires
1996 Santa Barbara County SOx Emissions: 865 tons
• 64% Stationary Sources: 552 tons
11% Fuel Combustion: (40% from Oil and Gas Production)
1% Petroleum Production and Marketing: (100% from Oil and Gas Production)
52% Industrial Processes: (100% from Mineral Processes)
• 1% Area-Wide Sources: 8 tons
1% Miscellaneous: (93% from Residential Fuel Combustion)
• 35% Mobile Sources: 305 tons
15% On-Road Motor Vehicles: (37% from Heavy Heavy Duty Diesel Trucks)

3 - 17
20% Other Mobile Sources: (46% from Ships and Commercial Boats)
1996 Santa Barbara County PM Emissions: 13,553 tons
• 4% Stationary Sources: 554 tons
0.7% Fuel Combustion: (75% from Oil and Gas Production)
0.1% Petroleum Production and Marketing: (100% from Oil and Gas Production)
3.2% Industrial Processes: (100% from Other Industrial Processes)
• 78% Area-Wide Sources: 10,584 tons
78% Miscellaneous: (30% from Paved Road Dust; 20% from Construction and
Demolition; 18% from Farming Operations; and 18% from Unpaved Road Dust)
• 4% Mobile Sources: 572 tons
3% On-Road Motor Vehicles: (36% Light Duty Passenger; 29% Heavy Heavy Duty
Diesel Trucks)
1% Other Mobile Sources: (40% from Farm Equipment; and 39% from
Commercial/Industrial Mobile Equipment)
• 14% Natural Sources: 1,843 tons
14% Wildfires
In summary, the most significant impact on ROG emissions are from Natural Sources, primarily
Biogenics. On-Road Motor Vehicles, particularly Light Duty Passenger and Light Duty Trucks
contribute the most NOx and CO emissions. The majority of the SOx emissions are from Mineral
Processes, specifically diatomaceous earth processing, and a large portion of the PM emissions
are from Road Dust, both Paved and Unpaved.
The next section will continue the discussion of the 1996 AEI, focusing specifically on the Outer
Continental Shelf (OCS) sources.
3.4.2 OCS EMISSIONS
Regulatory authority of certain emissions on the Outer Continental Shelf (OCS), specifically the
oil and gas platforms, was delegated to Santa Barbara County in September 1994. The 1996
OCS emission inventory is presented in Table 3-2. The OCS emissions are summarized separately
3 - 18
from the on-shore emission inventory for clarity. OCS emissions are used as input to air
chemistry modeling as part of the county's comprehensive air pollution control strategy but are
not included in Rate-of-Progress calculations per USEPA guidance, which is calculated in
Chapter 9.
The 1996 OCS AEI for ozone precursor pollutants is 1,535 tons per year ROG, 8,458 tons per
year NOx and 1,512 tons per year CO. Also, the inventory contains 5,368 tons of SOx and 666
tons of PM. Figure 3-2 shows each major source’s relative contribution for each pollutant during
1996. The largest sources of each pollutant and their percent of contribution are discussed below.
1996 OCS ROG Emissions: 1,535 tons
• 25% Stationary Sources: 382 tons
1% Fuel Combustion: (100% from Oil and Gas Production)
1% Cleaning and Surface Coatings: (100% from Coatings and Process Solvents)
23% Petroleum Production and Marketing: (100% from Oil and Gas Production)
• 30% Mobile Sources: 468 tons
30% Other Mobile Sources: (78% from Ships and Commercial Boats; and 21% from
Recreational Boats)
• 45% Natural Sources: 685 tons
45% Geogenic Sources
1996 OCS NOx Emissions: 8,458 tons
• 4% Stationary Sources: 316 tons
3.6% Fuel Combustion: (100% from Oil and Gas Production)
0.4% Petroleum Production and Marketing: (100% from Oil and Gas Production)
• 96% Mobile Sources: 8,142 tons
96% Other Mobile Sources: (99% from Ships and Commercial Boats)
1996 OCS CO Emissions: 1,512 tons
• 15% Stationary Sources: 227 tons
12% Fuel Combustion: (100% from Oil and Gas Production)
3 - 19
3% Petroleum Production and Marketing: (100% from Oil and Gas Production)
• 85% Mobile Sources: 1,285 tons
85% Other Mobile Sources: (76% from Ships and Commercial Boats; and 24% from
Recreational Boats)
1996 OCS SOx Emissions: 5,368 tons
• 2% Stationary Sources: 91 tons
0.3% Fuel Combustion: (100% from Oil and Gas Production)
1.7% Petroleum Production and Marketing: (100% from Oil and Gas Production)
• 98% Mobile Sources: 5,276 tons
98% Other Mobile Sources: (99% from Ships and Commercial Boats)
1996 OCS PM Emissions: 666 tons
• 3% Stationary Sources: 19 tons
2.4% Fuel Combustion: (100% from Oil and Gas Production)
0.4% Petroleum Production and Marketing: (100% from Oil and Gas Production)
0.2% Industrial Processes: (100% from Mineral Processes)
• 97% Mobile Sources: 647 tons
97% Other Mobile Sources: (99% from Ships and Commercial Boats)
In summary, almost half of the ROG emissions in the OCS are from Natural Sources, specifically
offshore oil and gas seeps. Ships and Commercial Boats in transit, and Oil and Gas Production,
primarily offshore platform fugitive hydrocarbons, contribute the largest remaining portions of
ROG emissions to the OCS inventory. Ships and Commercial Boats also account for almost all of
the NOx, CO, SOx, and PM emissions.
3.5 1990 BASE-YEAR ANNUAL EMISSION INVENTORY
Along with the 1996 AEI, this chapter also presents the 1990 Base-Year AEI. This 1990
inventory is important because 1990 is the inventory year that will be used to determine how we
will achieve our Rate-of-Progress emission reductions requirement by 1999. However, according

3 - 20
to USEPA guidance, the 1990 Base-Year AEI is not to be used to calculate emission reductions,
but instead, an adjusted annual inventory, or Rate-of-Progress Emission Inventory will be used.
As mentioned earlier in this chapter, the 1990 Base-Year Rate-of-Progress Emission Inventory is
similar to a Planning Emission Inventory, with the exception that instead of listing the ozone
precursors of ROG, NOx, and CO, only ROG is listed. The 1990 Rate-of-Progress Emission
Inventory is presented in Chapter 9 will discuss how we will achieve our Rate-of-Progress
requirement.
Before discussing the development of the 1990 Base-Year AEI, the adjustments that will be
performed to derive a 1990 Base-Year Rate-of-Progress Emission Inventory need to be briefly
mentioned. The 1990 Base-Year Rate-of-Progress Emission Inventory is similar to the Planning
Emission Inventory that was explained in this chapter’s introduction. The main difference
between the PEI and the 1990 Base-Year Rate-of-Progress Emission Inventory is that only ROG
needs to be addressed. Just like the PEI, seasonal variations are factored into the Rate-of-
Progress Emission Inventory because most exceedances of the federal ozone standard occur
during the April to October ozone season. Second, by definition, the 1990 Base-Year Rate-of-
Progress Emission Inventory is to exclude emissions from natural sources such as biogenics, oil
and gas seeps, and wildfires, since they are not regulated or controlled. Third, since the 1990
Base-Year Rate-of-Progress Emission Inventory is limited to the ozone nonattainment area
defined by the USEPA, only the Santa Barbara County emission inventory region was used, thus
excluding the OCS emissions.
In the interval since the 1990 Base-Year AEI was developed for the 1994 CAP, the methods used
to calculate emissions for several types of emission sources have been updated. New emission
estimation methodologies, improved data sources and revised emission factors have become
available and are reflected in the 1996 AEI. In order to ensure consistency and comparability to
the 1996 AEI, and also forecasted emissions estimates of 1999 and 2005 found in Chapter 6, it is
necessary to recalculate the 1990 Base-Year emissions using the new methods, where
appropriate.
3 - 21
Several necessary revisions, specifically emission factors, were made to update the 1990 Base-
Year inventory. The emission factors for all emission inventory processes were compared
between 1990 and 1996. For some emission processes, the original emission factor was revised in
favor of using more recent emission factor data. For processes that didn’t change the nature of
their operations, but which had updated emission factors, the 1990 emissions were recalculated
using new factors while retaining their original 1990 process rates. Two examples of emission
categories that had this done are diesel internal combustion engines and gas stations.
In some cases, the technique or methodology used to estimate emissions for a given process has
changed. Emissions from processes for which new calculation methods were introduced were
recalculated using the revised methods and the 1990 process rate data. For example, significant
changes have been made to the estimation of fugitive hydrocarbon emissions from oil and natural
gas extraction and processing facilities. For several types of fugitive hydrocarbon emission
sources, the standard method of multiplying a process rate by an emission factor has been
replaced by more accurate methods that incorporate a number of additional variable input
parameters. These sources include sumps, pits, wastewater tanks, well cellars; valves and fittings;
pumps and compressors; loading racks; and fixed roof tanks.
For other emission categories, new sources of process data have become available for use in
calculating emission estimates. This applies to a variety of Area-Wide source categories
estimated by ARB, including Pesticides, Commercial & Industrial Mobile Equipment and Farm
Equipment, as well as some categories estimated by the APCD, most notably the Municipal
Landfills and Industrial/Commercial Combustion categories.
In still other cases, when better data was available in 1996 than in 1990, the 1996 emissions were
“backcasted” to 1990 using socioeconomic and control factors specific to the particular emission
category. Also, new emission categories were created in the 1996 inventory.
Finally, 1990 ROG emissions were adjusted to remove chemical species that the USEPA and
ARB decided have negligible photochemical reactivity, specifically ethane, acetone and
perchloroethylene. ROG emissions are calculated by applying a fraction representing the
proportion of reactive chemical species to the estimated Total Organic Gas emissions. The values
3 - 22
for the fraction of ROG have been revised in the 1990 Base-Year inventory to reflect this new
definition.
As shown in Table 3-3, the 1990 Santa Barbara County Base-Year AEI for ozone precursor
pollutants is 56,128 tons per year ROG, 23,301 tons per year NOx and 194,442 tons per year CO.
Also, the inventory contains 1,243 tons of SOx and 14,018 tons of PM. Figure 3-3 shows each
major source’s relative contribution for each pollutant during 1990. The largest sources of each
pollutant and their percent of contribution are discussed below.
1990 Base-Year ROG Emissions: 56,128 tons
• 10% Stationary Sources: 5,754 tons
0.6% Fuel Combustion: (78% from Oil and Gas Production)
0.2% Waste Disposal: (100% from Landfills)
2.8% Cleaning and Surface Coatings: (52% from Coatings and Process Solvents)
6.3% Petroleum Production and Marketing: (92% from Oil and Gas Production)
0.1% Industrial Processes: (53% from Chemical Processes)
• 7% Area-Wide Sources: 4,028 tons
6% Solvent Evaporation: (36% from Consumer Products; and 36% from
Pesticides/Fertilizers)
1% Miscellaneous: (46% from Utility Equipment; 36% from Residential Fuel Use)
• 33% Mobile Sources: 18,176 tons
31% On-Road Motor Vehicles: (68% Light Duty Passenger; 26% Light Duty Trucks)
2% Other Mobile Sources: (34% from Aircraft)
• 50% Natural Sources: 28,170 tons
40% Biogenic Sources
9% Geogenic Sources
1% Wildfires
1990 Base-Year NOx Emissions: 23,301 tons
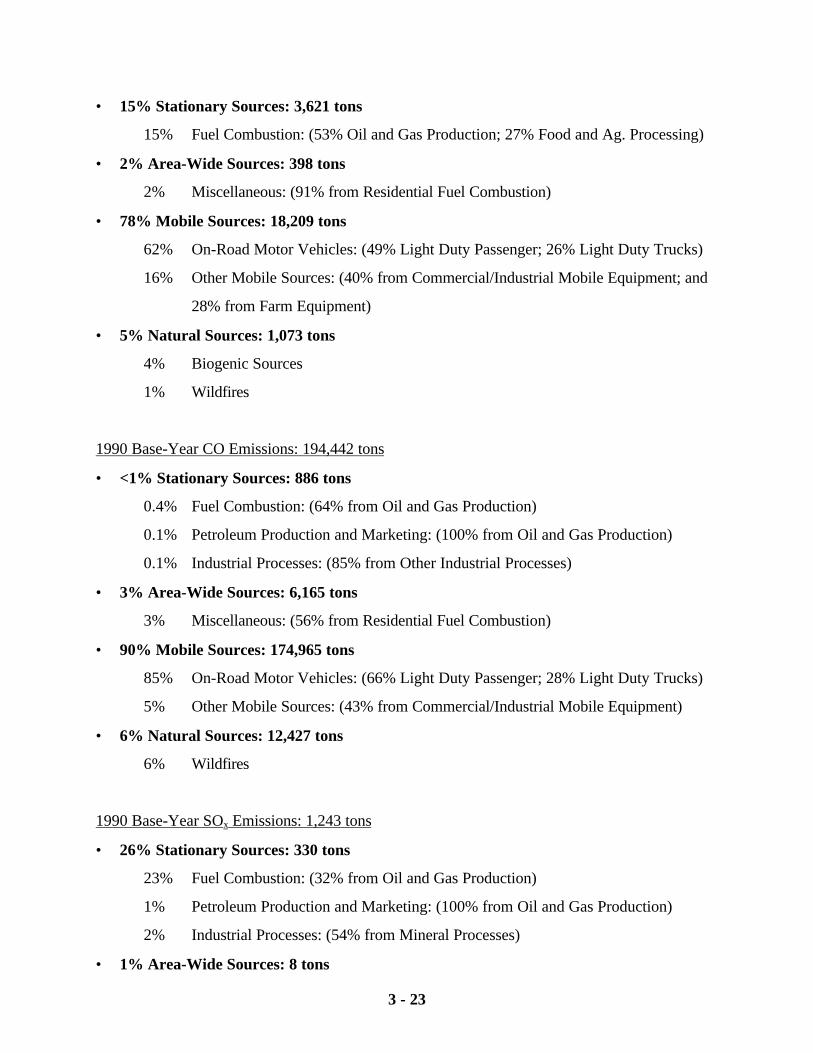
3 - 23
• 15% Stationary Sources: 3,621 tons
15% Fuel Combustion: (53% Oil and Gas Production; 27% Food and Ag. Processing)
• 2% Area-Wide Sources: 398 tons
2% Miscellaneous: (91% from Residential Fuel Combustion)
• 78% Mobile Sources: 18,209 tons
62% On-Road Motor Vehicles: (49% Light Duty Passenger; 26% Light Duty Trucks)
16% Other Mobile Sources: (40% from Commercial/Industrial Mobile Equipment; and
28% from Farm Equipment)
• 5% Natural Sources: 1,073 tons
4% Biogenic Sources
1% Wildfires
1990 Base-Year CO Emissions: 194,442 tons
• <1% Stationary Sources: 886 tons
0.4% Fuel Combustion: (64% from Oil and Gas Production)
0.1% Petroleum Production and Marketing: (100% from Oil and Gas Production)
0.1% Industrial Processes: (85% from Other Industrial Processes)
• 3% Area-Wide Sources: 6,165 tons
3% Miscellaneous: (56% from Residential Fuel Combustion)
• 90% Mobile Sources: 174,965 tons
85% On-Road Motor Vehicles: (66% Light Duty Passenger; 28% Light Duty Trucks)
5% Other Mobile Sources: (43% from Commercial/Industrial Mobile Equipment)
• 6% Natural Sources: 12,427 tons
6% Wildfires
1990 Base-Year SOx Emissions: 1,243 tons
• 26% Stationary Sources: 330 tons
23% Fuel Combustion: (32% from Oil and Gas Production)
1% Petroleum Production and Marketing: (100% from Oil and Gas Production)
2% Industrial Processes: (54% from Mineral Processes)
• 1% Area-Wide Sources: 8 tons

3 - 24
1% Miscellaneous: (94% from Residential Fuel Combustion)
• 73% Mobile Sources: 905 tons
33% On-Road Motor Vehicles: (50% from Light Duty Passenger)
40% Other Mobile Sources: (39% from Commercial/Industrial Mobile Equipment)
1990 Base-Year PM Emissions: 14,018 tons
• 4% Stationary Sources: 583 tons
0.7% Fuel Combustion: (42% from Food and Agricultural Processing)
0.1% Petroleum Production and Marketing: (100% from Oil and Gas Production)
3.2% Industrial Processes: (89% from Mineral Processes)
• 76% Area-Wide Sources: 10,635 tons
76% Miscellaneous: (30% from Paved Road Dust; 24% from Construction and
Demolition; 18% from Farming Operations; and 18% from Unpaved Road Dust)
• 6% Mobile Sources: 793 tons
4% On-Road Motor Vehicles: (39% from Heavy Heavy Duty Diesel Trucks; and 30%
from Light Duty Passenger)
2% Other Mobile Sources: (40% from Commercial/Industrial Mobile Equipment; and
29% from Farm Equipment)
• 14% Natural Sources: 2,007 tons
14% Wildfires
In summary, for the 1990 Base-Year AEI, the most significant impact on ROG emissions is from
Natural Sources, primarily Biogenics. On-Road Motor Vehicles, particularly Light Duty
Passenger and Light Duty Trucks contribute the most NOx , CO, and SOx emissions. The
majority of the PM emissions are from Road Dust, both Paved and Unpaved, along with large
contributions from Construction and Demolition, Farming Operations, and Wildfires.
3.6 CONCLUSION
The 1996 AEI contains the most recent data and emission estimation methods, including the latest
on-road motor vehicle activity data and emission estimation models. The 1996 AEI for Santa

3 - 25
Barbara County and Outer Continental Shelf documents the current sources of air pollution, both
in quantity and relative contribution. This emission inventory serves as the baseline to forecast
emission inventories in 1999 and 2005. The 1996 AEI is also used to improve and contemporize
the 1990 Base-Year AEI and the 1990 Base-Year Rate-of-Progress Emission Inventory that are
essential elements in this 1998 CAP to meet federal Clean Air Act Rate-of-Progress requirements.
In this chapter, we have described how emission sources are categorized as either Stationary
Sources, Area-Wide Sources, Mobile Sources or Natural Sources. Since the focus of this plan is
attainment of the federal one-hour ozone standard, the emphasis in the 1998 CAP is on the ozone
precursors: ROG, NOx and CO. However, the 1996 AEI and 1990 Base-Year AEI provided
details on all sources of air pollution, including the Natural Sources that cannot be regulated or
controlled.
For additional information on the 1990 Base-Year AEI or the 1996 AEI, please refer to Appendix
A. The 1996 AEI was used in the development of the 1996 Planning Emission Inventory. This
inventory was used to forecast the 1999 and 2005 emission inventories that are discussed in
Chapter 6. Finally, Chapter 9 focuses on presenting our Rate-of-Progress calculations along with
details of the 1990, 1996, and 1999 Base-Year Rate-of-Progress Emission Inventories.
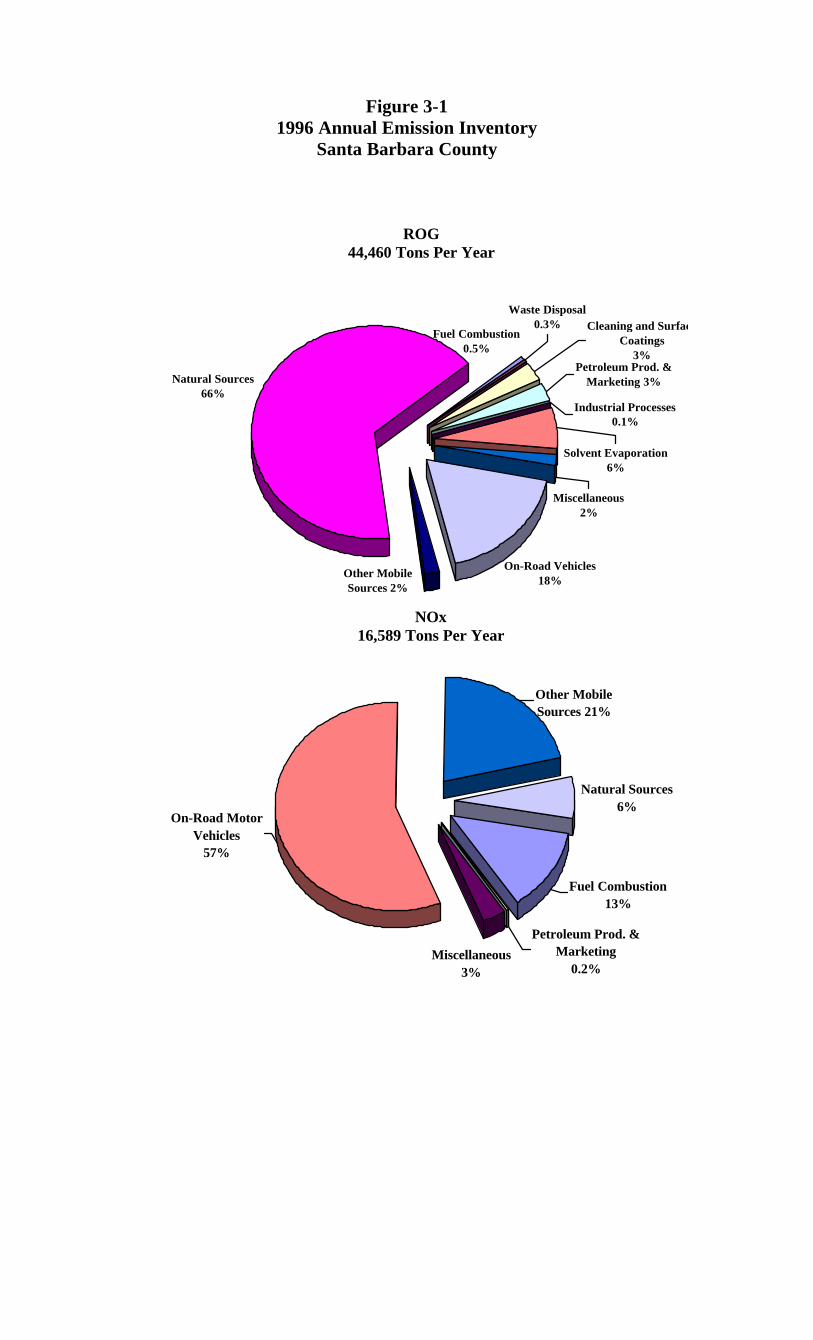
Figure 3-11996 Annual Emission Inventory
Santa Barbara County
Natural Sources66%
Fuel Combustion0.5%
Solvent Evaporation6%
Industrial Processes0.1%
Petroleum Prod. & Marketing 3%
Cleaning and Surface Coatings
3%
Waste Disposal0.3%
Miscellaneous2%
On-Road Vehicles18%
Other Mobile Sources 2%
ROG44,460 Tons Per Year
NOx16,589 Tons Per Year
Natural Sources6%
Other Mobile Sources 21%
On-Road Motor Vehicles
57%
Miscellaneous3%
Petroleum Prod. & Marketing
0.2%
Fuel Combustion13%

Figure 3-1 Continued1996 Annual Emission Inventory
Santa Barbara County
Other Mobile Sources
10%
On-Road Motor Vehicles
70%
Fuel Combustion1%
Industrial Processes
<1%Petroleum Prod. &
Marketing<1%
Miscellaneous8%
Natural Sources 11%
CO103,369 Tons Per Year
Other Mobile Sources
20%
On-Road Motor Vehicles 15%
Fuel Combustion11%
Industrial Processes
52%
Petroleum Prod. & Marketing
<1%
Miscellaneous1%
SOx865 Tons Per Year
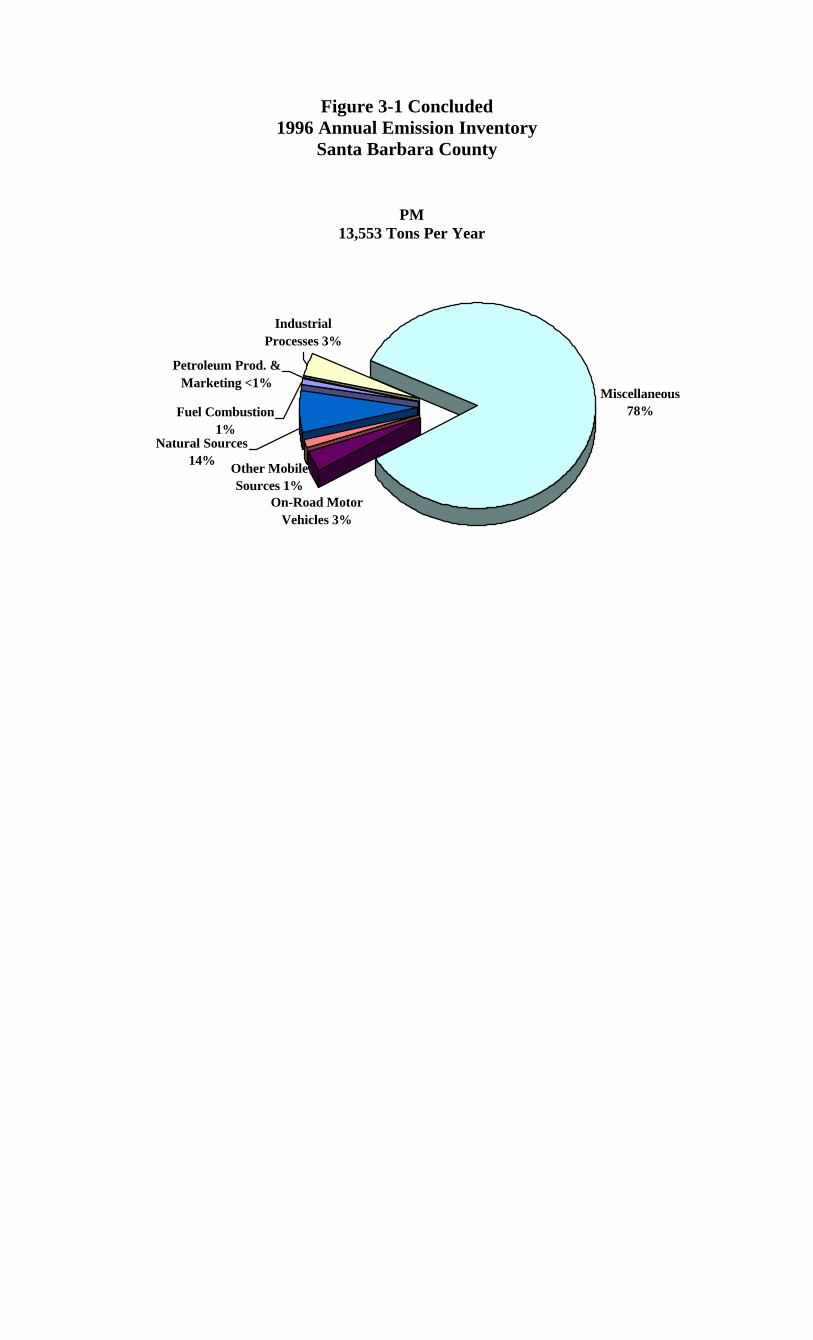
Figure 3-1 Concluded1996 Annual Emission Inventory
Santa Barbara County
PM13,553 Tons Per Year
Natural Sources 14%
Miscellaneous78%
Petroleum Prod. & Marketing <1%
Industrial Processes 3%
Fuel Combustion 1%
On-Road Motor Vehicles 3%
Other Mobile Sources 1%
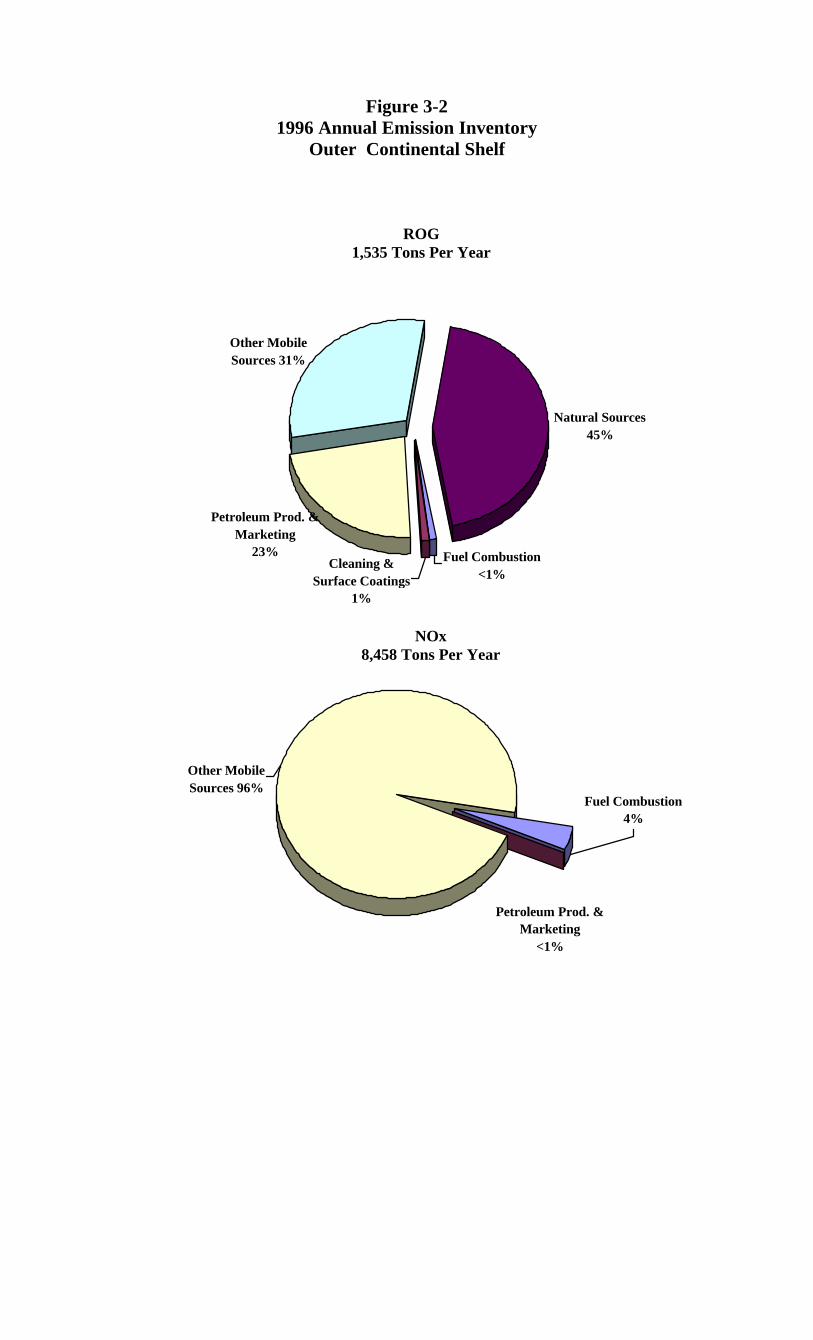
Figure 3-21996 Annual Emission Inventory
Outer Continental Shelf
Natural Sources45%
Petroleum Prod. & Marketing
23%
Other Mobile Sources 31%
Fuel Combustion<1%
Cleaning & Surface Coatings
1%
ROG1,535 Tons Per Year
NOx8,458 Tons Per Year
Petroleum Prod. & Marketing
<1%
Other Mobile Sources 96%
Fuel Combustion4%
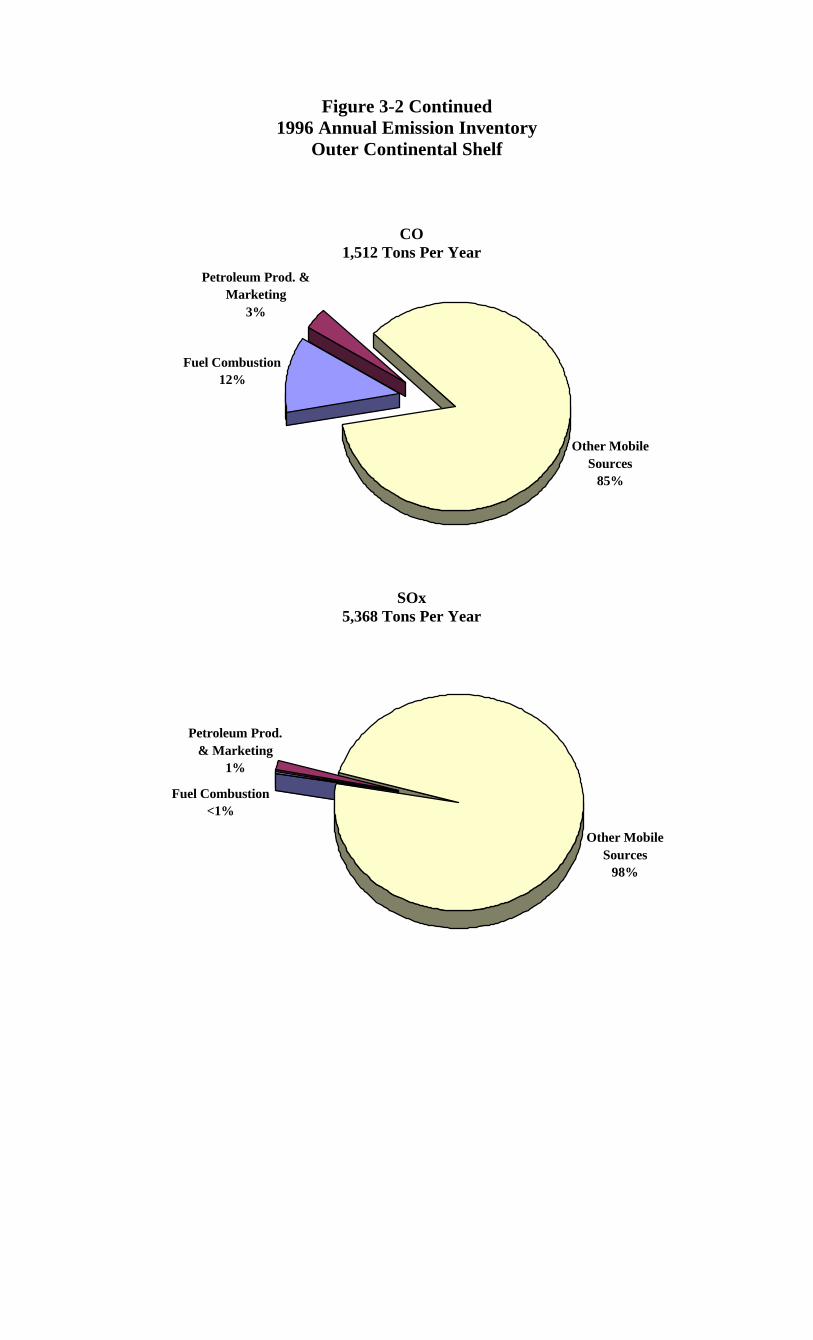
Figure 3-2 Continued1996 Annual Emission Inventory
Outer Continental Shelf
Fuel Combustion12%
Petroleum Prod. & Marketing
3%
Other Mobile Sources
85%
CO1,512 Tons Per Year
Other Mobile Sources
98%
Fuel Combustion<1%
Petroleum Prod. & Marketing
1%
SOx5,368 Tons Per Year

Figure 3-2 Concluded1996 Annual Emission Inventory
Outer Continental Shelf
PM666 Tons Per Year
Other Mobile Sources
97%
Fuel Combustion2%
Petroleum Prod. & Marketing <1%
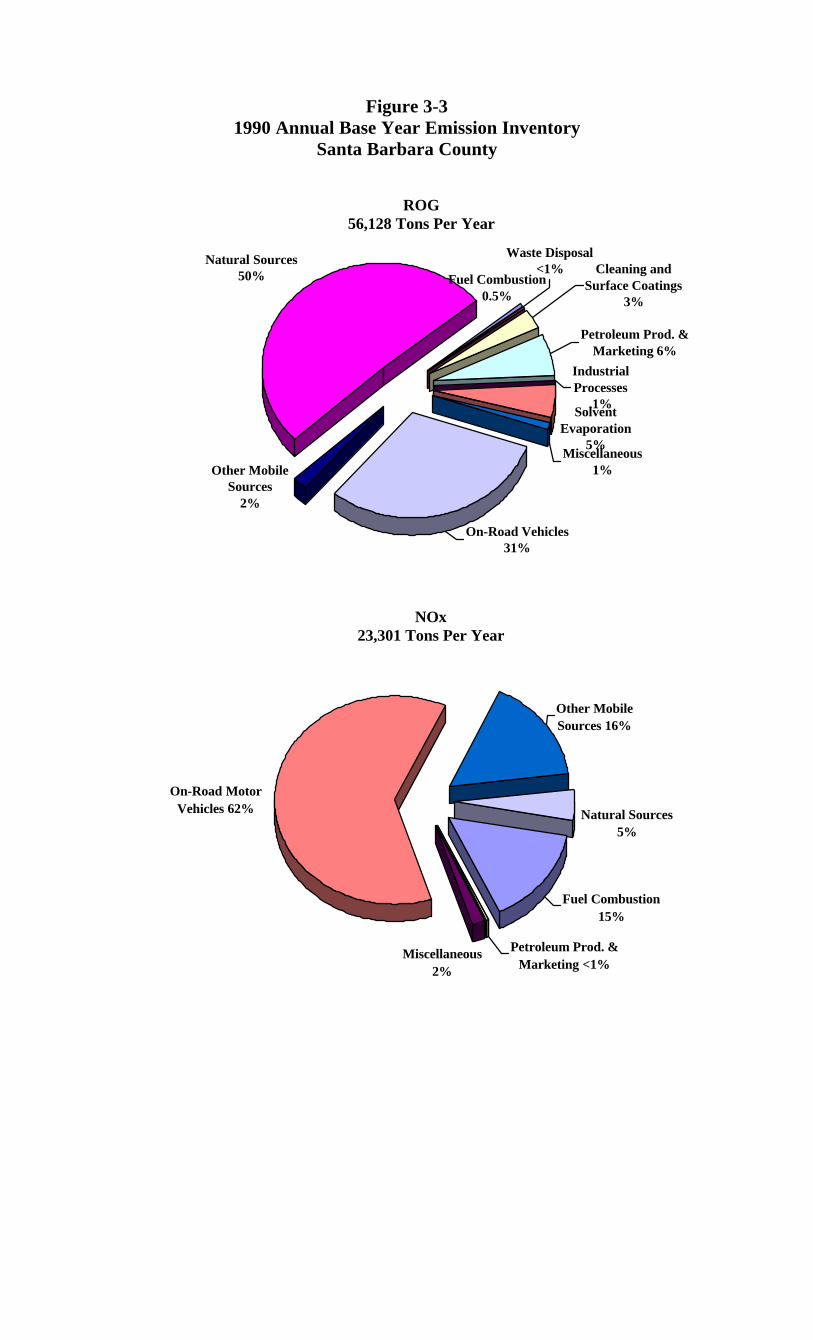
Figure 3-31990 Annual Base Year Emission Inventory
Santa Barbara County
Natural Sources50% Fuel Combustion
0.5%
Solvent Evaporation
5%
Industrial Processes
.1%
Petroleum Prod. & Marketing 6%
Cleaning and Surface Coatings
3%
Waste Disposal<1%
Miscellaneous1%
On-Road Vehicles31%
Other Mobile Sources
2%
ROG56,128 Tons Per Year
NOx23,301 Tons Per Year
Natural Sources5%
Other Mobile Sources 16%
On-Road Motor Vehicles 62%
Miscellaneous2%
Petroleum Prod. & Marketing <1%
Fuel Combustion15%
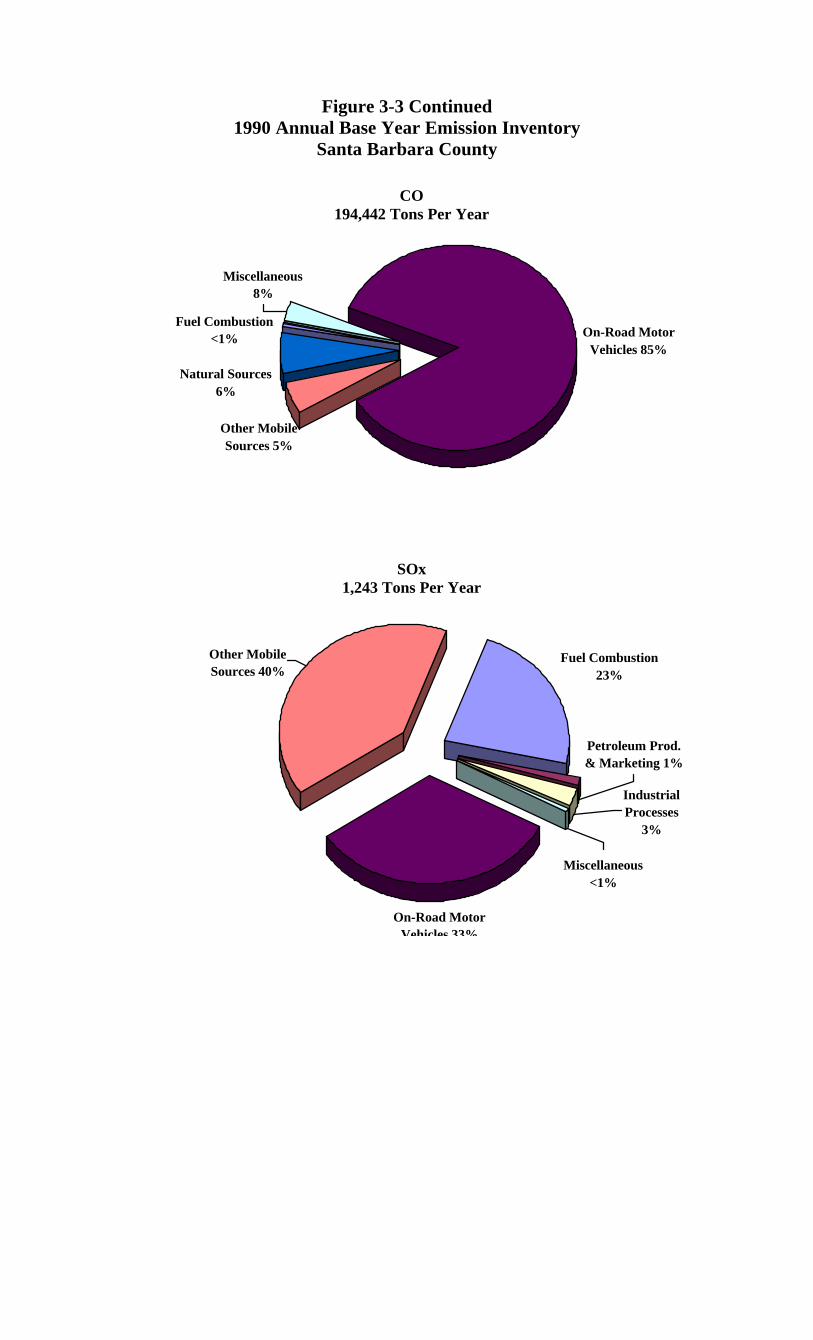
Figure 3-3 Continued1990 Annual Base Year Emission Inventory
Santa Barbara County
Other Mobile Sources 5%
On-Road Motor Vehicles 85%
Fuel Combustion<1%
Miscellaneous8%
Natural Sources 6%
CO194,442 Tons Per Year
Other Mobile Sources 40%
On-Road Motor Vehicles 33%
Fuel Combustion23%
Industrial Processes
3%
Petroleum Prod. & Marketing 1%
Miscellaneous<1%
SOx1,243 Tons Per Year
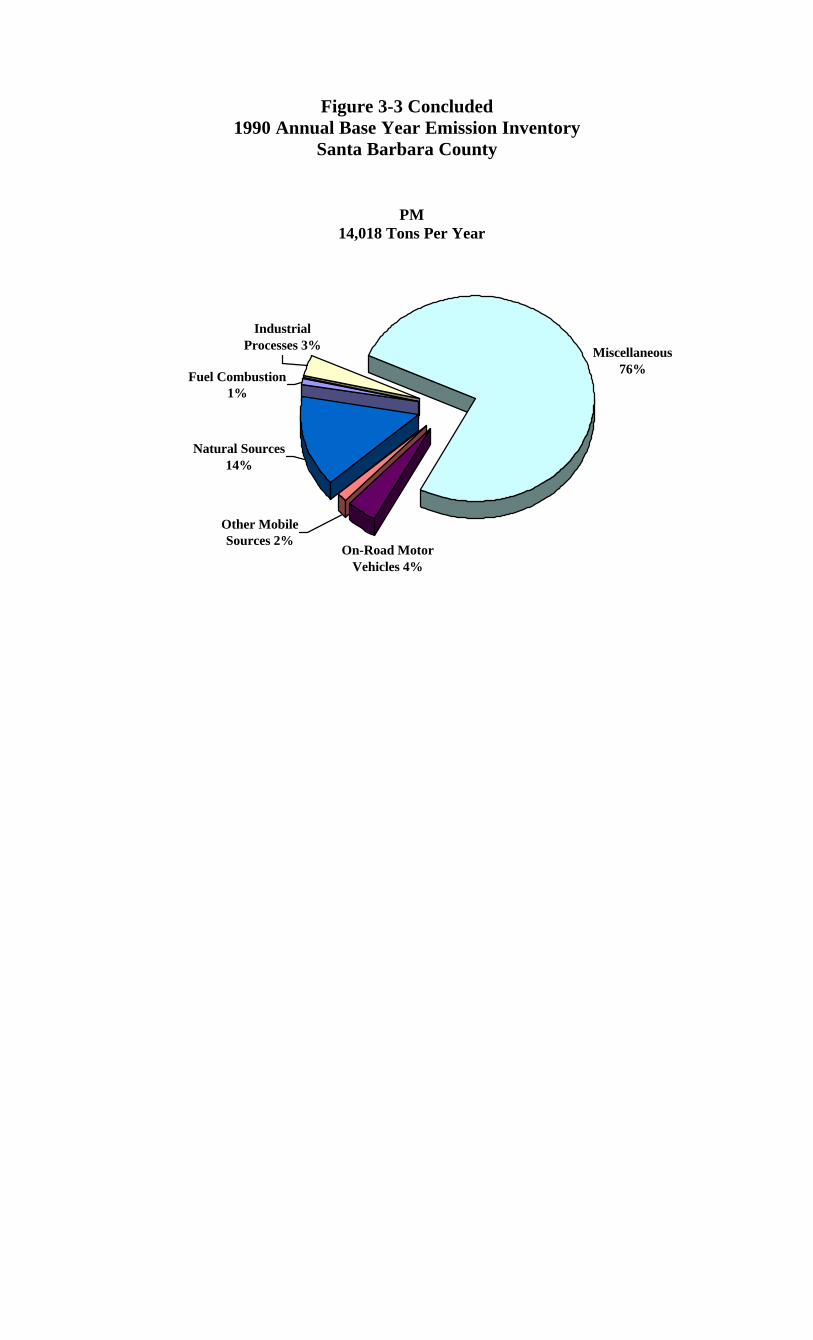
Figure 3-3 Concluded1990 Annual Base Year Emission Inventory
Santa Barbara County
PM14,018 Tons Per Year
Natural Sources 14%
Miscellaneous76%
Industrial Processes 3%
Fuel Combustion 1%
On-Road Motor Vehicles 4%
Other Mobile Sources 2%
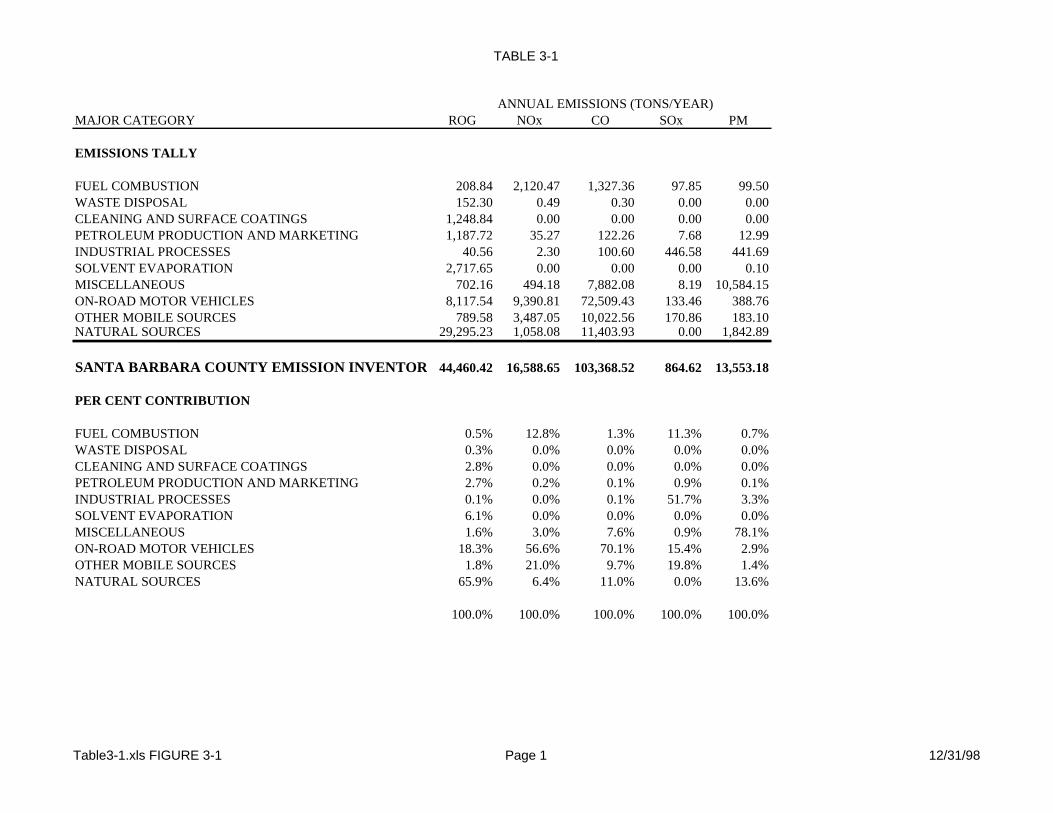
TABLE 3-1
ANNUAL EMISSIONS (TONS/YEAR)MAJOR CATEGORY ROG NOx CO SOx PM
EMISSIONS TALLY
FUEL COMBUSTION 208.84 2,120.47 1,327.36 97.85 99.50WASTE DISPOSAL 152.30 0.49 0.30 0.00 0.00CLEANING AND SURFACE COATINGS 1,248.84 0.00 0.00 0.00 0.00PETROLEUM PRODUCTION AND MARKETING 1,187.72 35.27 122.26 7.68 12.99INDUSTRIAL PROCESSES 40.56 2.30 100.60 446.58 441.69SOLVENT EVAPORATION 2,717.65 0.00 0.00 0.00 0.10MISCELLANEOUS 702.16 494.18 7,882.08 8.19 10,584.15ON-ROAD MOTOR VEHICLES 8,117.54 9,390.81 72,509.43 133.46 388.76OTHER MOBILE SOURCES 789.58 3,487.05 10,022.56 170.86 183.10NATURAL SOURCES 29,295.23 1,058.08 11,403.93 0.00 1,842.89
SANTA BARBARA COUNTY EMISSION INVENTORY TOTALS44,460.42 16,588.65 103,368.52 864.62 13,553.18
PER CENT CONTRIBUTION
FUEL COMBUSTION 0.5% 12.8% 1.3% 11.3% 0.7%WASTE DISPOSAL 0.3% 0.0% 0.0% 0.0% 0.0%CLEANING AND SURFACE COATINGS 2.8% 0.0% 0.0% 0.0% 0.0%PETROLEUM PRODUCTION AND MARKETING 2.7% 0.2% 0.1% 0.9% 0.1%INDUSTRIAL PROCESSES 0.1% 0.0% 0.1% 51.7% 3.3%SOLVENT EVAPORATION 6.1% 0.0% 0.0% 0.0% 0.0%MISCELLANEOUS 1.6% 3.0% 7.6% 0.9% 78.1%ON-ROAD MOTOR VEHICLES 18.3% 56.6% 70.1% 15.4% 2.9%OTHER MOBILE SOURCES 1.8% 21.0% 9.7% 19.8% 1.4%NATURAL SOURCES 65.9% 6.4% 11.0% 0.0% 13.6%
100.0% 100.0% 100.0% 100.0% 100.0%
Table3-1.xls FIGURE 3-1 Page 1 12/31/98
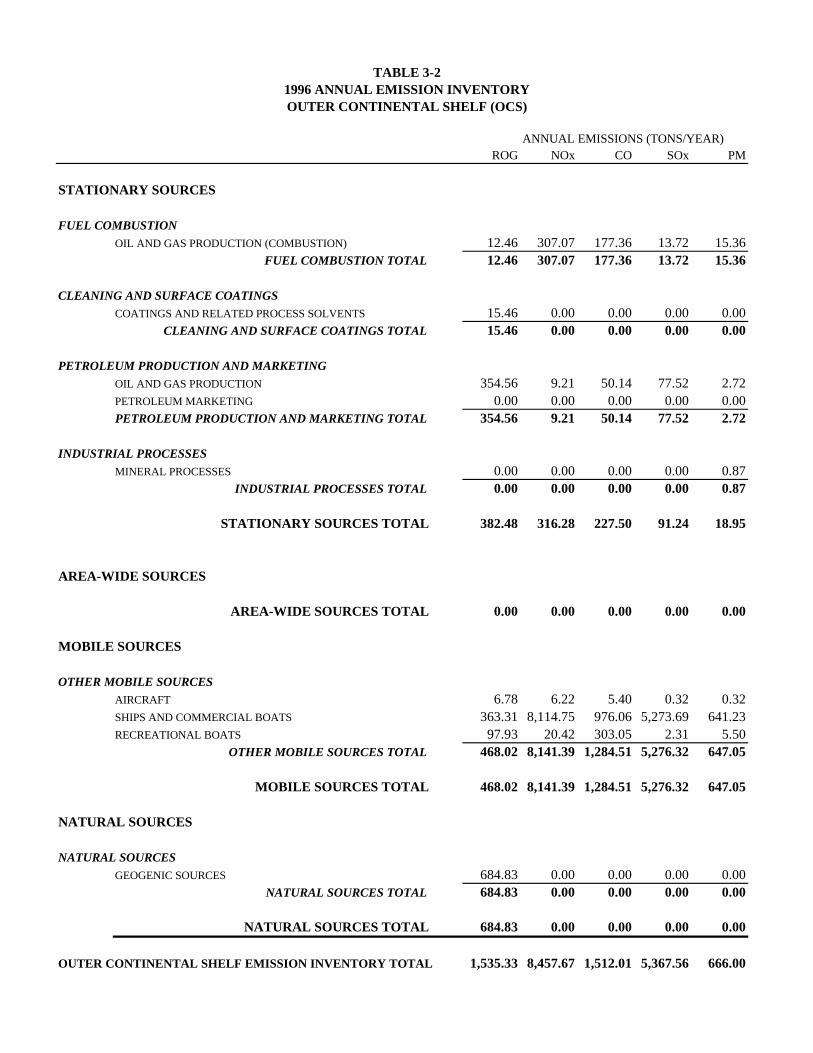
TABLE 3-21996 ANNUAL EMISSION INVENTORYOUTER CONTINENTAL SHELF (OCS)
ANNUAL EMISSIONS (TONS/YEAR)ROG NOx CO SOx PM
STATIONARY SOURCES
FUEL COMBUSTIONOIL AND GAS PRODUCTION (COMBUSTION) 12.46 307.07 177.36 13.72 15.36
FUEL COMBUSTION TOTAL 12.46 307.07 177.36 13.72 15.36
CLEANING AND SURFACE COATINGSCOATINGS AND RELATED PROCESS SOLVENTS 15.46 0.00 0.00 0.00 0.00
CLEANING AND SURFACE COATINGS TOTAL 15.46 0.00 0.00 0.00 0.00
PETROLEUM PRODUCTION AND MARKETINGOIL AND GAS PRODUCTION 354.56 9.21 50.14 77.52 2.72PETROLEUM MARKETING 0.00 0.00 0.00 0.00 0.00PETROLEUM PRODUCTION AND MARKETING TOTAL 354.56 9.21 50.14 77.52 2.72
INDUSTRIAL PROCESSESMINERAL PROCESSES 0.00 0.00 0.00 0.00 0.87
INDUSTRIAL PROCESSES TOTAL 0.00 0.00 0.00 0.00 0.87
STATIONARY SOURCES TOTAL 382.48 316.28 227.50 91.24 18.95
AREA-WIDE SOURCES
AREA-WIDE SOURCES TOTAL 0.00 0.00 0.00 0.00 0.00
MOBILE SOURCES
OTHER MOBILE SOURCESAIRCRAFT 6.78 6.22 5.40 0.32 0.32SHIPS AND COMMERCIAL BOATS 363.31 8,114.75 976.06 5,273.69 641.23RECREATIONAL BOATS 97.93 20.42 303.05 2.31 5.50
OTHER MOBILE SOURCES TOTAL 468.02 8,141.39 1,284.51 5,276.32 647.05
MOBILE SOURCES TOTAL 468.02 8,141.39 1,284.51 5,276.32 647.05
NATURAL SOURCES
NATURAL SOURCESGEOGENIC SOURCES 684.83 0.00 0.00 0.00 0.00
NATURAL SOURCES TOTAL 684.83 0.00 0.00 0.00 0.00
NATURAL SOURCES TOTAL 684.83 0.00 0.00 0.00 0.00
OUTER CONTINENTAL SHELF EMISSION INVENTORY TOTAL 1,535.33 8,457.67 1,512.01 5,367.56 666.00
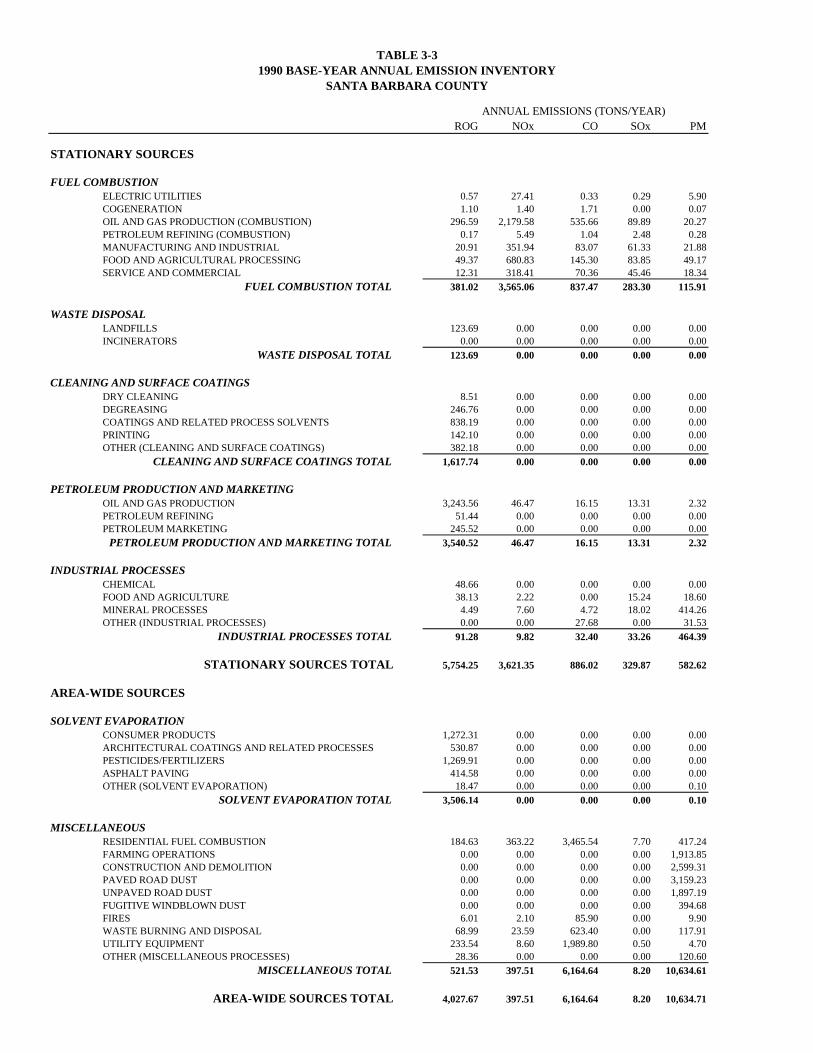
TABLE 3-31990 BASE-YEAR ANNUAL EMISSION INVENTORY
SANTA BARBARA COUNTY
ANNUAL EMISSIONS (TONS/YEAR)ROG NOx CO SOx PM
STATIONARY SOURCES
FUEL COMBUSTIONELECTRIC UTILITIES 0.57 27.41 0.33 0.29 5.90COGENERATION 1.10 1.40 1.71 0.00 0.07OIL AND GAS PRODUCTION (COMBUSTION) 296.59 2,179.58 535.66 89.89 20.27PETROLEUM REFINING (COMBUSTION) 0.17 5.49 1.04 2.48 0.28MANUFACTURING AND INDUSTRIAL 20.91 351.94 83.07 61.33 21.88FOOD AND AGRICULTURAL PROCESSING 49.37 680.83 145.30 83.85 49.17SERVICE AND COMMERCIAL 12.31 318.41 70.36 45.46 18.34
FUEL COMBUSTION TOTAL 381.02 3,565.06 837.47 283.30 115.91
WASTE DISPOSALLANDFILLS 123.69 0.00 0.00 0.00 0.00INCINERATORS 0.00 0.00 0.00 0.00 0.00
WASTE DISPOSAL TOTAL 123.69 0.00 0.00 0.00 0.00
CLEANING AND SURFACE COATINGSDRY CLEANING 8.51 0.00 0.00 0.00 0.00DEGREASING 246.76 0.00 0.00 0.00 0.00COATINGS AND RELATED PROCESS SOLVENTS 838.19 0.00 0.00 0.00 0.00PRINTING 142.10 0.00 0.00 0.00 0.00OTHER (CLEANING AND SURFACE COATINGS) 382.18 0.00 0.00 0.00 0.00
CLEANING AND SURFACE COATINGS TOTAL 1,617.74 0.00 0.00 0.00 0.00
PETROLEUM PRODUCTION AND MARKETINGOIL AND GAS PRODUCTION 3,243.56 46.47 16.15 13.31 2.32PETROLEUM REFINING 51.44 0.00 0.00 0.00 0.00PETROLEUM MARKETING 245.52 0.00 0.00 0.00 0.00
PETROLEUM PRODUCTION AND MARKETING TOTAL 3,540.52 46.47 16.15 13.31 2.32
INDUSTRIAL PROCESSESCHEMICAL 48.66 0.00 0.00 0.00 0.00FOOD AND AGRICULTURE 38.13 2.22 0.00 15.24 18.60MINERAL PROCESSES 4.49 7.60 4.72 18.02 414.26OTHER (INDUSTRIAL PROCESSES) 0.00 0.00 27.68 0.00 31.53
INDUSTRIAL PROCESSES TOTAL 91.28 9.82 32.40 33.26 464.39
STATIONARY SOURCES TOTAL 5,754.25 3,621.35 886.02 329.87 582.62
AREA-WIDE SOURCES
SOLVENT EVAPORATIONCONSUMER PRODUCTS 1,272.31 0.00 0.00 0.00 0.00ARCHITECTURAL COATINGS AND RELATED PROCESSES 530.87 0.00 0.00 0.00 0.00PESTICIDES/FERTILIZERS 1,269.91 0.00 0.00 0.00 0.00ASPHALT PAVING 414.58 0.00 0.00 0.00 0.00OTHER (SOLVENT EVAPORATION) 18.47 0.00 0.00 0.00 0.10
SOLVENT EVAPORATION TOTAL 3,506.14 0.00 0.00 0.00 0.10
MISCELLANEOUSRESIDENTIAL FUEL COMBUSTION 184.63 363.22 3,465.54 7.70 417.24FARMING OPERATIONS 0.00 0.00 0.00 0.00 1,913.85CONSTRUCTION AND DEMOLITION 0.00 0.00 0.00 0.00 2,599.31PAVED ROAD DUST 0.00 0.00 0.00 0.00 3,159.23UNPAVED ROAD DUST 0.00 0.00 0.00 0.00 1,897.19FUGITIVE WINDBLOWN DUST 0.00 0.00 0.00 0.00 394.68FIRES 6.01 2.10 85.90 0.00 9.90WASTE BURNING AND DISPOSAL 68.99 23.59 623.40 0.00 117.91UTILITY EQUIPMENT 233.54 8.60 1,989.80 0.50 4.70OTHER (MISCELLANEOUS PROCESSES) 28.36 0.00 0.00 0.00 120.60
MISCELLANEOUS TOTAL 521.53 397.51 6,164.64 8.20 10,634.61
AREA-WIDE SOURCES TOTAL 4,027.67 397.51 6,164.64 8.20 10,634.71
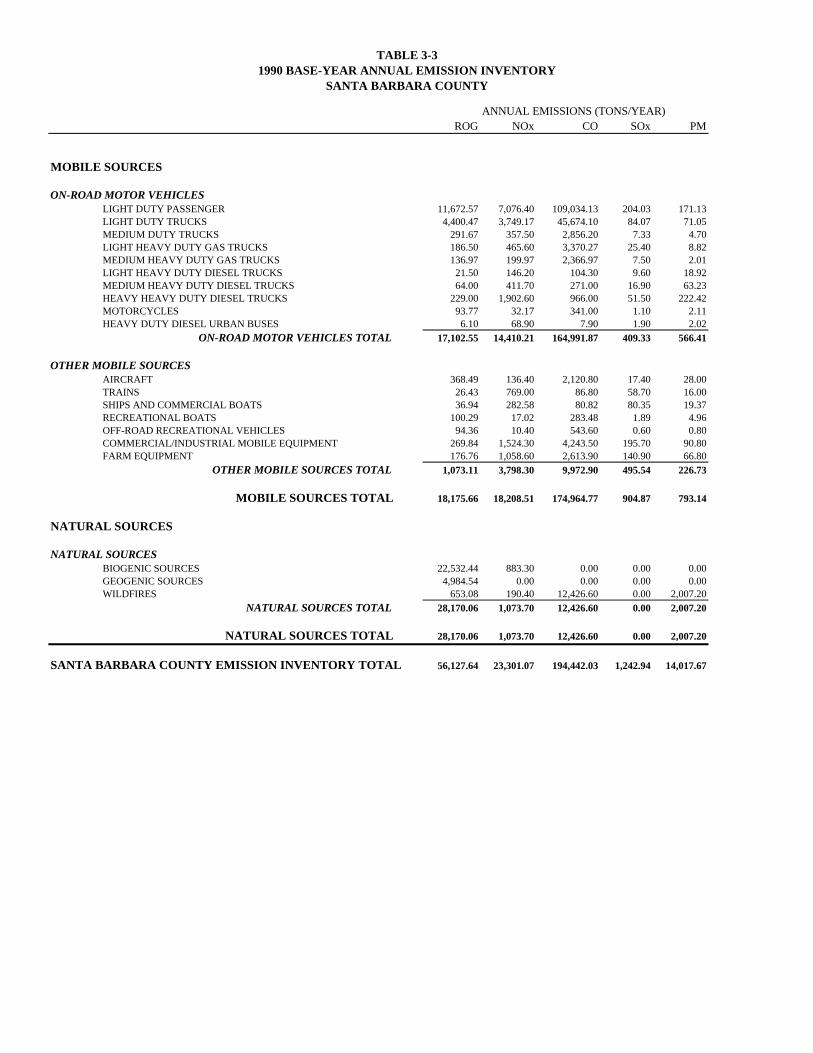
TABLE 3-31990 BASE-YEAR ANNUAL EMISSION INVENTORY
SANTA BARBARA COUNTY
ANNUAL EMISSIONS (TONS/YEAR)ROG NOx CO SOx PM
MOBILE SOURCES
ON-ROAD MOTOR VEHICLESLIGHT DUTY PASSENGER 11,672.57 7,076.40 109,034.13 204.03 171.13LIGHT DUTY TRUCKS 4,400.47 3,749.17 45,674.10 84.07 71.05MEDIUM DUTY TRUCKS 291.67 357.50 2,856.20 7.33 4.70LIGHT HEAVY DUTY GAS TRUCKS 186.50 465.60 3,370.27 25.40 8.82MEDIUM HEAVY DUTY GAS TRUCKS 136.97 199.97 2,366.97 7.50 2.01LIGHT HEAVY DUTY DIESEL TRUCKS 21.50 146.20 104.30 9.60 18.92MEDIUM HEAVY DUTY DIESEL TRUCKS 64.00 411.70 271.00 16.90 63.23HEAVY HEAVY DUTY DIESEL TRUCKS 229.00 1,902.60 966.00 51.50 222.42MOTORCYCLES 93.77 32.17 341.00 1.10 2.11HEAVY DUTY DIESEL URBAN BUSES 6.10 68.90 7.90 1.90 2.02
ON-ROAD MOTOR VEHICLES TOTAL 17,102.55 14,410.21 164,991.87 409.33 566.41
OTHER MOBILE SOURCESAIRCRAFT 368.49 136.40 2,120.80 17.40 28.00TRAINS 26.43 769.00 86.80 58.70 16.00SHIPS AND COMMERCIAL BOATS 36.94 282.58 80.82 80.35 19.37RECREATIONAL BOATS 100.29 17.02 283.48 1.89 4.96OFF-ROAD RECREATIONAL VEHICLES 94.36 10.40 543.60 0.60 0.80COMMERCIAL/INDUSTRIAL MOBILE EQUIPMENT 269.84 1,524.30 4,243.50 195.70 90.80FARM EQUIPMENT 176.76 1,058.60 2,613.90 140.90 66.80
OTHER MOBILE SOURCES TOTAL 1,073.11 3,798.30 9,972.90 495.54 226.73
MOBILE SOURCES TOTAL 18,175.66 18,208.51 174,964.77 904.87 793.14
NATURAL SOURCES
NATURAL SOURCESBIOGENIC SOURCES 22,532.44 883.30 0.00 0.00 0.00GEOGENIC SOURCES 4,984.54 0.00 0.00 0.00 0.00WILDFIRES 653.08 190.40 12,426.60 0.00 2,007.20
NATURAL SOURCES TOTAL 28,170.06 1,073.70 12,426.60 0.00 2,007.20
NATURAL SOURCES TOTAL 28,170.06 1,073.70 12,426.60 0.00 2,007.20
SANTA BARBARA COUNTY EMISSION INVENTORY TOTAL 56,127.64 23,301.07 194,442.03 1,242.94 14,017.67
CHAPTER 4
EMISSION CONTROL MEASURES
Introduction
Emission Control Measure Mandates
Emission Reduction Overview
Adopted Control Measures
Proposed Control Measures
Contingency Measures
California Air Resources Board Control Measures
4 - 1
4. EMISSION CONTROL MEASURES
4.1 INTRODUCTION
The purpose of this chapter is to update non-transportation related emission control measures to be
included in Santa Barbara County’s Attainment Strategy. Local emission control measures can be
generally classified in two groups:
1) APCD rules; and
2) Transportation Control Measures (TCMs).
APCD rules are formally adopted by the Santa Barbara County Air Pollution Control District
(APCD) Board of Directors in a public process, and generally impose emission limits and other
requirements applicable to stationary sources of air pollution (businesses and industry). These
control rules are enforced by the APCD.
TCMs are essentially measures that seek to reduce air pollution by encouraging alternatives to using
single passenger automobile and/or improving the efficiency of the transportation system. These
measures are implemented by a number of local agencies including the Santa Barbara County
Association of Governments, cities and the County of Santa Barbara. Transportation related control
measures are presented and discussed in Chapter 5.
The following sections identify each of the non-transportation related control measures that
contribute or will contribute to the reduction of ozone precursors: reactive organic gases (ROG) and
nitrogen oxides (NOx). The control measures identified were fully examined in the Santa Barbara
County 1989 Air Quality Attainment Plan (1989 AQAP), the 1991 Air Quality Attainment Plan
(1991 AQAP), the 1993 Rate-of-Progress (1993 ROP) Plan, and the 1994 Clean Air Plan (1994
CAP) which were prepared in response to state and federal mandates. The 1991 AQAP included
"all feasible" measures for reducing ROG and NOx emissions based on the 1989 AQAP control
4 - 2
strategy. The ROG control measures were updated as part of the 1993 ROP Plan and again as part
of the 1994 Clean Air Plan, which also evaluated our NOx measures. These measures were
developed and evaluated with extensive public participation.
This chapter also identifies all feasible measures for Santa Barbara County as required under the
California Clean Air Act. In order to reasonably assure that the APCD has adopted or proposed to
adopt all feasible measures APCD staff compared the District’s Rules to those of other California
Air Districts as summarized in the draft ARB document, Identification of Achievable Performance
Standards and Emerging Technologies for Stationary Sources. Any feasible measures that are not
already included in Santa Barbara County’s Rules and Regulations are proposed in this document.
4.2 EMISSION CONTROL MEASURE MANDATES
Santa Barbara County's comprehensive Air Pollution Control Strategy must meet several different
federal and state mandates. The status and applicability of each control measure varies with the
specific requirements of the following federal and state mandates:
1. Federal Clean Air Act Amendments, 1998 Rate-of-Progress Plan (Federal 1-hour): Section
182(c) of the FCAAA requires that serious nonattainment areas reduce ROG emissions by 3%
per year from 1996 through 1999 (9% total). This requirement, combined with the 15%
requirement under Section 182(b) requires a total emission reduction of 24% between 1990 and
1999. If an area cannot achieve this mandate with ROG, NOx reductions can be credited toward
the nine percent. Applicable control measures include ROG emission reduction measures
implemented by the 1999 smog season, with no credit allowed for specific federal measures.
Outer continental shelf (OCS) source reductions do not count toward the 9% reduction pursuant
to USEPA directions. In addition, contingency measures are identified to provide for an
additional reduction in ROG emissions beginning in 2000 if the federal 1-hour ozone standard is
not attained.
4 - 3
2. Federal Clean Air Act Amendments, Demonstration of Attainment by 1999 (federal 1-hour
ozone standard): As described in Chapter 7, the APCD is required to demonstrate through the
use of computer modeling (or other analytical techniques) that the county will attain the federal
1-hour ozone standard by November 1999. The attainment demonstration includes emission
reductions resulting from ROG and NOx emission control measures implemented by the 1999
ozone season, including measures and reductions achieved from OCS sources.
3. California Clean Air Act Triennial Update (state update): Chapter 10 describes state triennial
update mandates. This plan includes "all feasible" measures for reducing ROG and NOx
emissions in Santa Barbara County.
4. New Federal 8-Hour Ozone Standard (federal 8-hour ozone standard): On July 18, 1997, the
USEPA published final revisions to the National Ambient Air Quality Standards (NAAQS) for
Ozone and Particulate Matter. This Chapter will identify Local and State measures that will be
implemented between 2000 and 2005 to attain this new standard. The 8-hour standard is
addressed primarily for informational purposes. A plan to specifically address the new 8-hour
standard will be prepared and submitted to the USEPA in 2003.
Table 4-1 presents a summary of the control measures evaluated by the APCD for this 1998 CAP.
The combination of the measures listed in Table 4-1 with those presented in Chapter 5 document
Santa Barbara County's comprehensive Air Pollution Control Strategy. The APCD control
measures are founded on the 1989 AQAP, the 1991 AQAP, 1993 ROP Plan and the 1994 CAP.
Control measures are classified as adopted, proposed, contingency, study, deleted, or not applicable
for each of the mandates listed above. Adopted measures are those that have been formally adopted
as APCD rules and included in the State Implementation Plan (SIP); proposed measures for federal
1-hour standard are measures that will be adopted and implemented by the 1999 smog season.
Proposed measures for federal eight-hour standard are measures that are proposed but will not
necessarily be in effect before 1999. For state requirements, proposed measures are measures for
which the district has plans to adopt a rule. Contingency measures are used to satisfy federal
mandates. Study measures are those that require additional investigation before a commitment is
4 - 4
made to adopt them; and deleted measures have been found to be infeasible and removed from
consideration. Measures which are not applied toward federal mandates are listed as not applicable
(N/A) in columns 4 and 5.
4.3 EMISSION REDUCTION OVERVIEW
Table 4-2 summarizes the estimated emission reductions expected from the adopted and proposed
emission control measures from Table 4-1 (Federal 1-hour and Federal 8-hour) that will be credited
towards federal mandates. For estimated emission reductions from other proposed measures, see
the 1991 AQAP. Emission reductions from the transportation control measures are summarized in
Chapter 5. As can be seen from this summary, for those measures under local authority, the largest
ROG emission reductions result from Rule 341, Landfill Gas Emissions (R-GN-1); Rule 331 (R-
PG-1), Fugitive Emissions Inspection and Maintenance; Rule 329 (R-SL-3), and Rule 344 (R-PP-1)
Petroleum Sumps, Pits, and Well Cellars. It is estimated that in 1999, emission reductions of
approximately 7.96 tons per average summer day from onshore sources will result from
implementation of all the control measures with an additional 2.56 tons of ROG per day expected to
be reduced from OCS sources.
Significant reductions in NOx emissions are anticipated with implementation of adopted Rule 333
(N-IC-1 and N-IC-3), Stationary Internal Combustion Engines. This measure, however, will most
likely result in an increase in ROG emissions because some of the control techniques (such as
leaning out fuel mixture) increase ROG emissions while decreasing NOx. Table 4-2 shows this
increase as a negative value in the Adopted ROG Emission Control Measure section. A reduction
in NOx emissions of 2.96 tons per day will occur as a result of both adopted and proposed emission
control measures. Another 0.43 tons per day are attributable to OCS sources.
ARB emission control measures for NOx and ROG are also shown in Table 4-2. ARB-S1,
Consumer Products, achieves 1.12 tons per day ROG reduction and ARB’s off-road mobile source
measures, known as the “M-measures”, achieve 0.54 tons per day of NOx reductions. Although the
4 - 5
off-road measures achieve little for the 1999 attainment year they will provide greater emission
reductions for later years. These are state-wide control measures that were incorporated in the 1994
ozone SIP, implemented at the state and federal level.
The remainder of this chapter is devoted to an overview of adopted and proposed control measures.
Section 4.4 describes all adopted control measures that are existing APCD rules. Section 4.5
describes proposed control measures that will be adopted before the 1999 smog season and
therefore apply to the federal ROP Plan and attainment demonstration. Section 4.6 describes
proposed measures that will be adopted after November 1999, and therefore do not apply to the
federal ROP Plan or attainment demonstration. However these measures do meet state
requirements and serve as Federal contingency measures for the 1-hour standard. Section 4.7
describes measures adopted by the California Air Resources Board.
The following discussion provides a description of emitting activities and the major features of each
control measure. Emission reductions from OCS sources are included in the totals, and identified in
parenthesis for each applicable control measure. The numbers assigned to each emission control
program refer to the number sequence used in the 1991 AQAP. For example, the "R" in R-PG-5
indicates that the measure is a ROG control measure, the PG indicates that this is a Petroleum
General measure (for example, as opposed to a solvent measure, tank measure, etc), and the "N" in
N-XC-6 denotes a NOx control measure. Please refer to the 1991 AQAP and Appendix B of this
1998 CAP for further details.
4.4 ADOPTED CONTROL MEASURES
This section describes existing APCD rules, not including those implemented prior to 1990.

4 - 6
4.4.1 Rules 341 and 901 (R-GN-1) Control of Landfill Gas Emissions
1999 Emission Reductions: 0.1032 tons ROG per average summer weekday
2005 Emission Reductions: 0.1861 tons ROG per average summer weekday
Source Characteristics: Landfill gas is produced naturally by the aerobic and anaerobic
decomposition of refuse in municipal solid waste disposal sites. This gas consists primarily of
carbon dioxide and methane with smaller amounts of non-methane organic compounds (NMOCs).
The gas produced from this decomposition also contains small amounts of ROG (normally less than
2%) that migrate through the layers of waste and soil until it reaches the surface and is emitted to the
atmosphere.
Rule Description: Rule 341 implements the Emission Guidelines (EG) for Municipal Solid Waste
Landfills (40 CFR 60 Cc). Rule 901 adopted the New Source Performance Standards (NSPS) for
Municipal Solid Waste Landfills (40 CFR 60 WWW) by reference. These regulations require
landfills with waste design capacities exceeding 2.5 million megagrams (2.75 million tons) and
estimated emissions greater that 50 megagrams (55 tons) per year of NMOC to control gas
emissions by installing a landfill gas collection and disposal system.
Schedule: Rule 341 was adopted in 1997 with full implementation in 2001. Rule 901 was adopted
in 1996 with full implementation required by December 1998.
4.4.2 Rule 331 (R-PG-1) Fugitive Emissions Inspection and Maintenance
1999 Emission Reductions: 2.3689 tons ROG per average summer weekday
2.4037 tons ROG per average summer weekday OCS
2005 Emission Reductions: 1.8981 tons ROG per average summer weekday
2.4037 tons ROG per average summer weekday OCS
4 - 7
Source Characteristics: The operation of gas and crude oil production and processing facilities
requires a large number and variety of components such as pumps, compressors, flanges, fittings,
valves, pressure relief valves and other components. In the course of operation, these components
can leak process fluids and gases. For most facilities, the actual percentage of leaking components
is small; however, due to the large number of components used at such facilities, the resulting
emissions of reactive organic gases (ROG) are significant.
Rule Description: Rule 331 is complex. Briefly, it requires the periodic inspection of devices such
as pressure relief valves, pump seals, compressor seals, and connections. It also requires that
components found to be leaking be repaired within specified time periods. At the time of
replacement and repair, certain components are required to be replaced with components that do not
leak or leak less. Rule 331 was revised consistent with the ARB's "Determination of Reasonably
Available Control Technology for Control of Fugitive Emissions of Volatile Organic Compounds
from Oil and Gas Production and Processing Facilities," (December, 1992).
Schedule: Rule 331 was adopted in December 1991 with full implementation in 1992. OCS
implementation occurred during 1995.
4.4.3 Rule 316 (R-PM-1, R-PM-2, R-PM-3) Storage and Transfer of Gasoline
1999 Emission Reductions: 0.3258 tons ROG per average summer weekday
2005 Emission Reductions: 0.5614 tons ROG per average summer weekday
Source Characteristics: Rule 316 limits emissions from gasoline bulk plants and dispensing
facilities. Gasoline bulk plants are facilities that transfer gasoline into delivery trucks for
distribution to motor vehicle fueling facilities (gas stations). In the process of gasoline transfer,
vapors are displaced into the atmosphere, either when bulk plant tanks are loaded, or when trucks
are loaded from the bulk plant storage tanks.

4 - 8
Gasoline dispensing facilities produce emissions in two ways. During the loading of gasoline
storage tanks, gasoline vapors are displaced with gasoline and if unrestricted, are released to the
atmosphere. A vapor recovery system to control these emissions is called "Phase I Vapor
Recovery." Second, during vehicle refueling, gasoline vapors are displaced with gasoline in vehicle
gas tanks and escape into the atmosphere. The control of these vapors is referred to as "Phase II
Vapor Recovery."
Rule Description: The APCD revised its gasoline storage and dispensing rule during July, 1990.
This revision deleted the bulk plant exemption for most of the bulk plants in the county. Prior to the
rule change, bulk plants with a daily throughput of 20,000 gallons or less or an annual throughput of
3,000,000 gallons or less had been exempt from Rule 316. The July, 1990 revision deleted this
exemption effective January, 1992.
The July, 1990 revision also changed the exemption limits for dispensing facilities subject to Phase I
and Phase II vapor recovery. Prior to the revision, retail facilities with tanks larger than 250 gallons
were required to have Phase I and II Vapor Recovery. The July, 1990 revision changed this
exemption from retail to retail and non-retail dispensing facilities. This modification resulted in the
application of Phase I and II to a substantial number of previously uncontrolled facilities.
Schedule: Rule 316 was adopted in November 1990. The rule revision required full
implementation by 1992.
4.4.4 Rule 344 (R-PP-1) - Petroleum Sumps, Pits and Well Cellars
1999 Emission Reduction: 0.8518 tons ROG per average summer weekday
1999 Emission Reduction: 0.0049 tons ROG per average summer weekday OCS
2005 Emission Reductions: 0.9293 tons ROG per average summer weekday
2005 Emission Reductions: 0.0142 tons ROG per average summer weekday OCS

4 - 9
Source Characteristics: Sumps, pits and well cellars are open impoundments, usually in the ground,
although some are located on platforms such as offshore oil rigs. When in use, they contain a
combination of crude oil and water. There are three main types of sumps. Primary sumps hold
liquid from oil production wells or a field gathering system. A secondary sump holds the oily water
from a previous separation process, and a tertiary sump holds wastewater that has undergone
secondary separation or the equivalent. Uncontrolled sumps emit ROG vapors as a consequence of
evaporation of reactive organic compounds from the surface.
Rule Description: Rule 344 reduces emissions from petroleum sumps, pits and well cellars. The rule
prohibits the use of primary sumps and pits. It also requires owners or operators of post-primary
sumps and pits with a surface area of greater than 1000 square feet to install controls to reduce the
emissions of ROG into the atmosphere by at least 80 percent. Choices for control include replacing
the sump or pit with a tank, rigid and flexible floating covers, and fixed covers in combination with
vapor recovery. The rule also requires owners and operators to prevent the buildup of crude oil in
well cellars. This encourages proper maintenance of components at the well head in order to avoid
repeated pumping of crude oil from well cellars.
Schedule: Rule 344 was adopted in November 1994 with full implementation required by October
1997.
4.4.5 Rule 346 (R-PP-9) Loading of Organic Liquid Cargo Vessels
1999 Emission Reduction: 0.0555 tons ROG per average summer weekday
2005 Emission Reductions: 0.0312 tons ROG per average summer weekday
Source Characteristics: A variety of vessels are used to transport organic liquids, primarily crude
oil, including marine tankers, rail tank cars, and tanker trucks. ROG emissions are generated during
vessel loading or unloading as the organic liquid displaces vapors in the transport vessel (loading) or
storage tank (unloading). Emissions are also caused by spillage. This measure affects the loading
of tanker trucks with crude oil at production facilities. Emissions from the loading and unloading of
4 - 10
other vessels such as marine tankers and from products such as gasoline, are covered by other
APCD rules.
Rule Description: Rule 346 requires submerged filling of the transfer vessel (as opposed to "splash"
loading), a vapor recovery system compatible with the loading facility, and an overfill protection
system. This has a design efficiency of 90% in reducing ROG emissions.
Schedule: Rule 346 was adopted in October 1992 with full implementation required by 1995.
4.4.6 Rule 343 (R-PT-1) Petroleum Storage Tank Degassing.
1999 Emission Reduction: 0.0000 tons ROG per average summer weekday
2005 Emission Reductions: 0.0000 tons ROG per average summer weekday
Source Characteristics: Tanks containing liquid petroleum products must be opened periodically for
various purposes such as cleaning to prevent the buildup of sludge that can affect the quality of the
stored product, the capacity of the tank, and the ease of removing product from the tank. ROG
emissions result from venting empty tank vapors using an exhaust fan. Venting is required so that
maintenance personnel can safely enter the tank for cleaning. Tanks are opened every 3 to 5 five
years depending on the size and use of the tank.
Rule Description: Rule 343 requires recovery or control of vapors that would otherwise be vented
to the atmosphere during tank degassing operations for certain tanks.
Schedule: Rule 343 was adopted in December 1993, with full implementation required by 1994.
4 - 11
4.4.7 Rule 325 (R-PT-2) Crude Oil Production and Separation.
Rule 326 (R-PT-2) Storage of Reactive Organic Compound Liquids.
1999 Emission Reduction: 0.1161 tons ROG average summer weekday
1999 Emission Reduction: 0.0108 tons ROG average summer weekday OCS
2005 Emission Reductions: 0.0737 tons ROG per average summer weekday
2005 Emission Reductions: 0.0140 tons ROG per average summer weekday OCS
Source Characteristics: Fixed-roof petroleum storage tanks and wastewater separators emit ROG,
H2S and other toxic pollutants from fixtures such as pressure vacuum relief valves (PVRV) and
unsealed openings. Disturbances, such as filling and temperature fluctuations, result in emissions.
The estimated control efficiency of a floating roof versus an uncontrolled fixed-roof tank is 90%.
Several technologies improve the control efficiencies achievable from both kinds of tanks. These
include submerged fill, sealed roofs, and PVRVs. Also, carbon adsorption, thermal oxidation, and
vapor recovery systems can increase control efficiency to above 95%. Secondary seals on floating
roof tanks can improve control efficiency to 95%.
Rule Description: Rule 325 requires several relatively complex changes. In general, Rule 325
requires improved vapor control on tanks and wastewater separators that were previously exempt
under APCD rules. Rule 326 applies to organic liquid storage tanks that are not used for crude oil
and natural gas production and separation, and is modeled after Ventura County Rule 71.2.
Schedule: Rule 325 was adopted in January 1994, with full implementation required by 1996. Rule
326 was adopted in December 1993, with full implementation required by 1995.
4.4.8 Rule 323 (R-SC-1) Architectural Coatings
1999 Emission Reduction: 0.1168 tons ROG per average summer weekday
2005 Emission Reductions: 0.1222 tons ROG per average summer weekday
4 - 12
Source Characteristics: During the painting of structures, ROG emissions are released from paints
and thinners. In addition, some toxic compounds, specifically benzene, toluene, and xylene are also
emitted. Due to the small scale and infrequent nature of architectural coating operations, emissions
from this category of sources are difficult to control by addition of control equipment.
Reformulation of the coatings with water or low solvent bases is currently the most practical and
efficient way to reduce ROG emissions from these sources.
Rule Description: Rule 323 limits the amount of ROG per liter in various architectural coatings that
may be supplied, sold, offered for sale, applied, solicited for application, or manufactured within
Santa Barbara County. The ROG content varies depending on coating application (e.g., primers,
enamels, and stains).
Schedule: Rule 323 was adopted in February 1990 with full compliance required by 1994.
4.4.9 Rule 330 (R-SC-2) Surface Coating of Metal Parts and Products
1999 Emission Reduction: 0.1649 tons ROG per average summer weekday
2005 Emission Reductions: 0.1774 tons ROG per average summer weekday
Source Characteristics: These coatings are applied to metal products to provide protection from
environmental elements and improve appearance. The coating process generally involves several
steps, including surface preparation, base and topcoat application, and clean-up. Evaporative ROG
solvent emissions occur from the application and drying of the coating, the use of reduction and
clean-up solvents, and from unused coating and solvent products stored at the facility.
Rule Description: Rule 330 establishes limits on the ROG content of solvents used in metal parts
and products surface coatings. The ROG content varies depending on the type of coating
application (e.g., primer, topcoat, rust preventers). Rule 330 is consistent with the ARB's "Draft
4 - 13
Proposed Determination of Reasonably Available Control Technology and Best Available Retrofit
Control Technology for Metal Parts and Products Coating Operations," (June 1992).
Schedule: Rule 330 was adopted in November 1990 with full implementation required by 1992.
4.4.10 Rule 337 (R-SC-2) Surface Coating of Aircraft or Aerospace Vehicle Parts and
Products.
Emission Reduction: Please see emission reductions listed under Rule 330, (also R-SC-2) above.
Source Characteristics: Coatings are applied to aircraft and aerospace products to provide
protection from environmental elements, reduce drag resistance, and improve appearance. The
coating process generally involves several steps, including surface preparation, base and topcoat
application, and clean-up. Evaporative ROG solvent emissions occur from the application and
drying of the coating, the use of reduction and clean-up solvents, and from unused coating and
solvent products stored at the facility.
Rule Description: Rule 337 establishes limits on the ROG content of solvents used in aircraft or
aerospace vehicle parts and products surface coatings. The ROG limits vary depending on the type
of coating (e.g., primer, topcoat, rust preventers). Rule 337 is consistent with the ARB's "Draft
Proposed Determination of Reasonably Available Control Technology and Best Available Retrofit
Control Technology for Metal Parts and Products Coating Operations," (June 1992).
Schedule: Rule 337 was adopted in July 1990 with full implementation required by 1992.
4.4.11 Rule 339 (R-SC-4) Motor Vehicle and Mobile Equipment Coating Operations.
1999 Emission Reduction: 0.5370 tons ROG per average summer weekday
2005 Emission Reductions: 0.5929 tons ROG per average summer weekday
4 - 14
Source Characteristics: ROG emissions are released during the use and application of automobile
refinishing products. In addition, some toxic compounds may be emitted. The sources of ROG
emissions affected by this control measure are automobile body repair and paint shops, automobile
dealers, "do-it-yourselfers", and illegal operators commonly known as "wildcatters". Product
manufacturers and their representatives are also subject to provisions of the control measures related
to product formulation.
Rule Description: Rule 339 requires the use of low ROG coatings and the use of an application
method that reduces over-spray (increases transfer efficiency) by at least 65%. Add-on exhaust
control equipment, such as afterburners or carbon adsorbers, may be used to attain an equivalent
amount of emissions reduction. The add-on equipment must capture at least 90% of the emissions
generated, and reduce these emissions by at least 95%. Rule 339 was based on ARB's
"Determination of Reasonably Available Control Technology and Best Available Retrofit Control
Technology for Automotive Refinishing Operations," which was approved on January 8, 1991.
Schedule: Rule 339 was adopted in November 1991 with full implementation required by 1996.
4.4.12 Rule 351 (R-SC-5) Surface Coating of Wood Products.
1999 Emission Reduction: 0.0070 tons ROG per average summer weekday
2005 Emission Reductions: 0.0194 tons ROG per average summer weekday
Source Characteristics: Coatings applied to wood products usually contain a high percentage of
volatile ROG bearing solvents that are used as carriers for binders, sealers, pigments, and adhesives.
ROG emissions occur during coating application, drying, or cleaning of application equipment.
Sources affected by a wood products coatings rule would typically be household and office furniture
manufacturers. It is assumed that any wood furniture coating in Santa Barbara County occurs at
small wood refinishing shops or retail stores.
4 - 15
Rule Description: Rule 351 requires the use of low ROG wood coatings products used or sold in
Santa Barbara County. ROG limits vary depending on the type of application (e.g., stains, fillers,
and coatings).
Schedule: Rule 351 was adopted in August 1993 with full implementation required by 1999. A
modification of the rule was completed in August 1998 to delay final implementation to 2005. The
impacts of this modification on the emission reductions are minimal and are included with the
emission reductions for the control measure.
4.4.13 Rule 321 (R-SL-2) Control of Degreasing Operations.
1999 Emission Reduction: 0.0592 tons ROG per average summer weekday
2005 Emission Reductions: 0.0633 tons ROG per average summer weekday
Source Characteristics: Solvent degreasing is practiced throughout Santa Barbara County in many
locations, mainly in operations such as automotive repair shops, oil well field operations, and
aerospace and electronic industries. Degreasing precedes operations such as painting, plating,
repair, assembly, and machining; it is normally done using synthetic solvent or petroleum-based
solvent in which objects to be cleaned are exposed to the solvent or the solvent vapor in tanks, trays,
drums, or other containers. Solvent emissions containing ROG can occur due to direct evaporation
from tanks or spills, and by evaporation of small amounts of liquid solvent remaining in cracks,
crevices, and indentations, or remaining as a thin surface film after removal of the cleaned part from
the degreasing area.
Rule Description: Rule 321 contains a number of provisions that reduce ROG emissions from
degreasing operations. Rule 321 complies with the "Draft Proposed Determination of Reasonably
Available Control Technology and Best Available Retrofit Control Technology for Organic Solvent
Cleaning/Degreasing Operations," which was approved by the state's Technical Review Group,
Solvents Committee, during July of 1991. Rule 321 was revised in 1997 to correct USEPA noted
rule deficiencies. These revisions did not change the emission reductions expected from this rule.

4 - 16
Schedule: Rule 321 was adopted in July 1990 with full implementation required by 1991. Rule 321
was revised in 1997 but did not affect implementation.
4.4.14 Rule 329 (R-SL-3) Cutback and Emulsified Asphalt Paving Materials.
1999 Emission Reduction: 0.8455 tons ROG per average summer weekday
2005 Emission Reductions: 0.9042 tons ROG per average summer weekday
Source Characteristics: Asphalt is used in paving and roadway maintenance. The general types of
asphalt include: cutback asphalt, road oils, paving asphalt, and emulsified asphalt. Cutback asphalt
contains a relatively large amount of petroleum solvents to keep the asphalt pliable. Road oils are
similar to cutback asphalt, except the petroleum solvents used are much less volatile, and require
longer to cure. Paving asphalt relies on heat to keep the asphalt pliable for application. Finally, in
emulsified asphalt, water and some limited amount of petroleum solvents in an emulsion are used to
keep the asphalt pliable for application. The petroleum solvents contain ROG that evaporates as the
asphalt cures. The asphalt contains higher and more volatile solvents and emits more ROG than
other types of asphalt.
Rule Description: Rule 329 lowered the permissible ROG content of asphalt, and expanded the
prohibition of cutback asphalt to include residential (driveway) and commercial (parking lot) uses.
Schedule: Rule 329 was adopted in February 1992 with full implementation required by 1992.
4.4.15 Rule 349 (R-SL-5) Polyester Resin Operations.
1999 Emission Reductions: 0.0023 tons ROG per average summer weekday
2005 Emission Reductions: 0.0025 tons ROG per average summer weekday
4 - 17
Source Characteristics: The production of reinforced plastic materials through the process of
combining polyester resin/styrene mixtures and glass fibers results in the release of styrene, a
photochemically reactive compound, to the atmosphere. The potential for ROG emissions from
fiberglass fabrication varies with the manner in which the resin is mixed, poured, manipulated, and
cast. Sources of emissions include ovens (where the fiberglass is cured) and spray booths or other
areas where the resin is applied. Activities using polyester resin/styrene mixtures include boat
building and repair, as well as the manufacture of synthetic marble, spas/hot tubs, surfboards,
bathroom fixtures, panels, and swimming pools.
Rule Description: Rule 349 follows ARB's "Determination of Reasonably Available Control
Technology and Best Available Retrofit Control Technology for Polyester Resin Operations,"
(January 1991). Rule 349 requires the use of low ROG resins, or the use of closed-mold systems
and high transfer efficiency spray guns; or (2) the use of add-on control devices that can achieve an
efficiency as effective as the control efficiency of complying resins.
Schedule: Rule 349 was adopted in April 1993 with full implementation required by 1994.
4.4.16 Rule 354 (R-SL-7) Graphic Arts - Letter/Offset Printing.
1999 Emission Reduction: 0.0042 tons ROG per average summer weekday
2005 Emission Reductions: 0.0045 tons ROG per average summer weekday
The federal clean air act required adoption of this rule before November 15, 1992 because the
USEPA established control technology guidelines for the subject source category. Thus, this rule is
categorized as a RACT catch-up. According to the act, the emission reductions should have
occurred before November 1990 and thus are subtracted from the emission inventory baseline and
do not count towards the mandated ROP reductions.
Source Characteristics: This control measure addresses emissions from graphic arts operations,
including letterpress, offset lithography, gravure, screen printing and flexography. The primary
4 - 18
sources of ROG emissions from graphic arts operations in Santa Barbara County are from
letterpress and lithography. In letterpress, image areas are raised relative to the blank or non-image
areas, similar to the keys on a typewriter. Ink is then applied to the raised area and then transferred
directly to the paper or other printing substrate. In offset lithography (or printing), the image and
non-image surface of the printing plate are on the same plane (no raised surfaces). The image area
of the plate is made of a material that is ink-receptive and water repellant, whereas the non-image
area is of material which can be made water-receptive. The image plate is wrapped around a
cylinder (the plate cylinder) and is turned. In every revolution, the plate is wetted with an aqueous
solution (called a fountain solution) by a dampening system. The ink is then applied to the wetted
plate, adhering only to the image area. The ink is transferred, or "offset," to a rubber-covered
blanket cylinder and the blanket cylinder transfers the image to the print surface. ROG emissions
from printing processes occur mainly from the evaporation of solvents in inks, dampening solutions,
and cleaning solutions.
Control Measure Description: The rule limits ROG emissions from printing operations. The rule
includes the following provisions: (1) limitations on the ROG content of inks, fountain solutions,
and solvents; (2) required use of closed containers for the disposal of cloth or paper used for
cleaning; and (3) restrictions on the application, storage, and disposal of solvent. In lieu of the
above requirements, an approved control system may be operated that will achieve equivalent levels
of control. The rule is based on ARB's "Draft Determination of Reasonably Available Control
Technology and Best Available Retrofit Control Technology for Graphic Art Operations." This rule
is classified as a "RACT catch-up" by the USEPA and cannot be applied to the rate-of-progress
emission reductions in 1999 or 2005.
Schedule: Rule adoption occurred in June 1994 with full implementation required by 1995. The
adopted rule applies to rotogravure and flexographic operations. Letterpress and lithographic
operations will be addressed in a revised rule once the USEPA finalizes Control Technology
Guidelines for these emission sources.

4 - 19
4.4.17 Rule 333 (N-IC-1, N-IC-3) Control of Emissions from Internal Combustion Engines.
1999 Emission Reduction: 0.9721 tons NOx per average summer weekday
1999 Emission Reduction: -0.1488 tons ROG per average summer weekday
1999 Emission Reduction: 0.3394 tons NOx per average summer weekday OCS
1999 Emission Reduction: -0.0014 tons ROG per average summer weekday OCS
2005 Emission Reduction: 0.8624 tons NOx per average summer weekday
2005 Emission Reduction: -0.1367 tons ROG per average summer weekday
2005 Emission Reduction: 0.3669 tons NOx per average summer weekday OCS
2005 Emission Reduction: -0.0014 tons ROG per average summer weekday OCS
Source Characteristics: This rule is directed at controlling NOx emissions from gas-fired (N-IC-1)
and diesel-fired (N-IC-3) internal combustion engines. Gas-fired combustion is typical of piston
type engines with spark ignition. There are primarily two different types of gas-fired engines: lean
burn and rich burn. Diesel engines operate differently in that the combustion process is not initiated
until the compression stroke where fuel is injected into the combustion chamber. Upon injection,
the diesel fuel mixes with the hot air and burns. Both types of engines are typically used to drive
rotating equipment in remote locations, and range in size from less than 50 to over 1,000 BHP.
Rule Description: Rule 333 affects both gas-fired and diesel-fired internal combustion engines with
a horsepower rating greater than or equal to 50 BHP by requiring at least 80% reductions in NOx
emissions. These reductions can be accomplished by a number of control options, including
switching to electric motors, installing selective and non-selective catalytic reduction, pre-stratified
charge systems, and retarding diesel injection timing.
Schedule: Rule 333 was adopted in December 1991, with full implementation in 1994. OCS
implementation occurred in 1995. A revision to Rule 333 is scheduled for 1999 with
implementation in 2001 (see Section 4.6.1).

4 - 20
4.4.18 Rule 342 (N-XC-4, N-XC-5, N-XC-6) Control of NOx from Boilers, Steam Generators
and Process Heaters.
1999 Emission Reductions: 0.2385 tons NOx per average summer weekday
1999 Emission Reductions: 0.0125 tons NOx per average summer weekday OCS
2005 Emission Reductions: 0.2061 tons NOx per average summer weekday
2005 Emission Reductions: 0.0125 tons NOx per average summer weekday OCS
Source Characteristics: In Santa Barbara County, commercial and industrial boilers, steam
generators, and process heaters are used to produce heat, steam and hot water for industrial,
institutional and commercial facilities. These units emit significant amounts of oxides of nitrogen
(NOx), which can react in the atmosphere to from ozone and particulate matter.
Rule Description: Rule 342 affects boilers, steam generators, and process heaters with rated heat
inputs of greater than or equal to 5 million Btu per hour. For units with annual heat inputs greater
than or equal to 9 billion Btu's per year, NOx emission levels shall not exceed 30 parts per million
by volume (ppmv) when operated on natural gas and 40 ppmv when operated on oil. For units with
annual heat inputs of less than 9 billion Btu's per year, the rule requires boilers to be operated at or
below 3 percent excess oxygen, or be tuned at least once per year, or be operated in compliance
with the emission levels specified above.
Schedule: Rule 342 was adopted in March 1992, with full implementation in 1996.
4.4.19 Rule 359 (N-XC-8) Petroleum Flares and Relief Gas Oxidizers.
Emission Reductions: This rule is primarily a SOx emission control rule. While we expect ROG and
NOx emission reductions, they are difficult to quantify.
Source Characteristics: Flaring (or thermal oxidizing) is a combustion process used to destroy
reactive organic gases (ROG) in a high-temperature flame. In the oil and gas production industry,
4 - 21
flares are used to oxidize the extremely hazardous hydrogen sulfide (H2S) present in a sour gas
stream to sulfur dioxide (SO2) and water prior to its release. Flares are also used to dispose of
excess produced gas that cannot be consumed either at the operation or elsewhere.
Rule Description: The rule exclusively affects oil and gas production, refining and transportation
industries. It relieves operators from some of the sulfur control requirements of District Rule 311,
particularly those that occur during emergency flaring, while requiring additional emission controls
during planned flaring. It requires flare operators to minimize flare gas volume, use technology
standards and limit fuel sulfur content for OCS sources to existing prohibitory rule limits.
Schedule: Rule 359 was adopted in June 1994, with full implementation in 1999.
4.5 PROPOSED CONTROL MEASURES - FEDERAL ROP AND ATTAINMENT
DEMONSTRATION.
Proposed control measures are emission control programs that have been developed and which the
APCD has committed to implement, but that have not yet adopted as rules. The following measures
will be adopted by the 1999 smog season and are included as measures to achieve the Federal 1-
hour standard.
4.5.1 Rule 353 (R-SL-9) Control of ROG Emissions from Adhesives and Sealants.
1999 Emission Reduction: 0.4228 tons of ROG per average summer weekday
2005 Emission Reductions: 0.4523 tons ROG per average summer weekday
Source Characteristics: Adhesive and sealant ROG emissions result from evaporation of solvents
during transfer, drying, surface preparation, and cleanup operations. These solvents are the media
used to make the adhesive or sealant soluble material so that it may be applied. The solvent is also
used to completely wet the surface to provide a stronger bond. In plastic pipe bonding, the solvent

4 - 22
dissolves the polyvinyl chloride pipe and reacts with the pipe to form a bond. Solvents used to
clean the surface before bonding and to clean the application equipment also contribute to
emissions.
Rule Description: This control measure proposes to reduce ROG emissions by adopting a Rule to
set ROG limits for adhesives, adhesive primers, sealants, sealant primers and preparation and
cleanup solvents. These limits will be based on the limits found in the Draft RACT/BARCT
Determination and limits in other air districts’ adhesives rules. As an alternative to low-ROG
materials, the rule could allow for add-on control equipment. The Rule should also include a
prohibition of sale of materials that do not comply with the ROG limits.
Rule Schedule: The rule is scheduled for adoption in April 1999 with Implementation by June
1999.
4.5.2 Rule 352 (N-XC-1, N-XC-2, N-XC-3) - Residential and Commercial Space and Water
Heaters.
1999 Emission Reduction: 0.0047 tons of NOx per average summer weekday
2005 Emission Reductions: 0.0265 tons NOx per average summer weekday
Source Characteristics: Residential type water heaters are used to supply hot water for use in
residences and businesses. Water is heated in these devices by controlled external combustion of
utility grade natural gas, or liquefied petroleum gases (LPG). This rule will apply to residential type
water heaters rated up to 75,000 Btu/hr gross heat input duty. The NOx emissions from the devices
currently in use averages approximately 0.1 lb per million Btu (MMBtu) of net heat output.
Residential and commercial space heaters are used to provide space heating of buildings,
warehouses, and other structures. This measure will apply to new fan-forced draft space heaters that
burn natural gas, or liquified petroleum gases (LPG) rated up to 175,000 Btu/hr gross heat input
duty. Typical NOx emission rates from existing space heaters already in place range up to 0.080 lb

4 - 23
per million Btu (MMBtu) gross heat input (0.13 lb/MMBtu of useful heat output assuming 60%
recovery efficiency).
Rule Description: This control measure is included to meet the requirements for all feasible
measures under the California Clean Air Act. Although the emission reductions round down to
0.0000 when expressed in tons per day, the measure is still cost effective since the technology is
standard equipment available in California for no additional cost to the purchaser. Rule 352 will
require any new residential-type water heaters and space heaters to meet the same NOx emission
standards as required in the South Coast AQMD and Ventura APCD. Space heaters and water
heaters that comply with these specifications are currently manufactured and available and
predominate in the California market.
Rule Schedule: The rule is scheduled for adoption in April 1999 with Implementation by June
1999.
4.6 CONTINGENCY MEASURES (Post 1999).
The following proposed control measures are scheduled for implementation after the November 15,
1999, federal 1-hour standard attainment deadline for “serious” non-attainment areas. Therefore,
these measures do not apply to the federal 1-hour standard, but meet state requirements and serve as
contingency measures for the federal 1-hour standard and proposed measures to meet the federal 8-
hour standard and State 1-hour ozone standard.
4.6.1 Revision to Rule 333 (N-IC-1, N-IC-3) - Control of Emissions from Reciprocating
Internal Combustion Engines
1999 Emission Reduction: 0.0000 tons of NOx per average summer weekday
1999 Emission Reduction: 0.0000 tons of NOx per average summer weekday OCS
2005 Emission Reductions: 1.3656 tons NOx per average summer weekday
4 - 24
2005 Emission Reduction: 0.0000 tons of NOx per average summer weekday OCS
Source Characteristics: Reciprocating internal combustion engines generate power by combusting a
mixture of fuel and air. Combustion in an engine is generated by either a spark plug or compression
heating. Operators use stationary engines to power electrical generators, pumps, compressors, rock
crushers, cranes, blowers, fans, and other devices. Industries using internal combustion engines
include: agriculture, military, water transport, oil and gas pipelines, oil and gas production, general
industrial (including construction), and electrical power generation. Engine fuel can be Public
Utility Commission-quality natural gas, gasoline, diesel, liquid petroleum gas, landfill gas, digester
gas, process gas, methanol, waste gas (e.g., from degassing), other hydrocarbon fuels, and
combinations thereof.
Rule Description: The District is studying different control options for the revised Rule 333. The
California Air Resources Board expects to complete its guidance document on RACT/BARCT for
stationary internal combustion engines in the near future. The final form and content of proposed
Rule 333 revision will likely depend on this guidance. Please refer to the control measure working
papers in Appendix B for more details.
Rule Schedule: The rule is scheduled for adoption in April 1999 with implementation scheduled for
April 2001.
4.7 CALIFORNIA AIR RESOURCES BOARD CONTROL MEASURES
The ARB has adopted regulations that reduce pollution from consumer products and mobile
sources. The following sections summarize the ARB control measures emission reductions from
these adopted control measures are creditable towards the federal 1-hour and 8-hour standards. The
mobile source control measures, or “M” measures, are presented as in California’s 1994 State
Implementation Plan (SIP) for Ozone, adopted by the Air Resources Board (ARB or Board) on
November 15, 1994. Only measures that apply to Santa Barbara County are discussed.
4 - 25
4.7.1 ARB R001 - California Diesel Fuel Regulations (1994 CAP ARB-S4)
1999 Emission Reduction: 0.0076 tons ROG per average summer weekday
1999 Emission Reduction: 0.0835 tons NOx per average summer weekday
1999 Emission Reduction: 0.0000 tons ROG per average summer weekday OCS
1999 Emission Reduction: 0.0000 tons NOx per average summer weekday OCS
2005 Emission Reduction: 0.0605 tons ROG per average summer weekday
2005 Emission Reduction: 0.7064 tons NOx per average summer weekday
2005 Emission Reduction: 0.0047 tons ROG per average summer weekday OCS
2005 Emission Reduction: 0.0677 tons NOx per average summer weekday OCS
Source Characteristics: There is an extensive variety of diesel/distillate oil fuel combustion
processes subject to this state regulation. Stationary sources include asphalt heating and other in-
process fuel use, such as dryers, furnaces and kilns. Mobile sources include railroad locomotives,
heavy-duty construction and farm equipment, and refrigeration units on trucks.
Control Measure Description: The ARB Diesel Fuel Regulations apply to sulfur and aromatic
content of fuel and result in both ROG and NOx emission reductions. An increase in CO emissions
of 0.50 tons per day is expected to occur in the short term, primarily from heavy duty non-farm
equipment, until the regulation is more fully implemented (by year 2000).
Schedule: The regulations (Title 13, California Code of Regulations, sections 2281-2282) were
adopted by ARB in November 1988. Implementation of the Diesel Fuel Regulations began in
October 1993.

4 - 26
4.7.2 ARB R002 - California Phase II Reformulated Gasoline Regulations (1994 CAP ARB-
S5)
1999 Emission Reduction: 0.4005 tons ROG per average summer weekday
1999 Emission Reduction: -0.0091 tons NOx per average summer weekday
1999 Emission Reduction: 0.0400 tons ROG per average summer weekday OCS
1999 Emission Reduction: -0.0003 tons NOx per average summer weekday OCS
2005 Emission Reduction: 0.4240 tons ROG per average summer weekday
2005 Emission Reduction: -0.0095 tons NOx per average summer weekday
2005 Emission Reduction: 0.0401 tons ROG per average summer weekday OCS
2005 Emission Reduction: -0.0004 tons NOx per average summer weekday OCS
Source Characteristics: Mobile gasoline combustion sources (other than on-road vehicles) affected
by the regulations include heavy duty farm equipment, light duty industrial equipment (i.e. forklifts)
and recreational vehicles such as motorcycles and All Terrain Vehicles.
Control Measure Description: The reformulated gasoline regulations require modifications to
physical properties and chemical composition of gasoline . Reduced vapor pressure has a direct
effect on evaporative ROG emissions. Reformulated fuel composition will lower exhaust and
evaporative emissions. Of particular importance is the lowering of the aromatic and olefinic
fractions of gasoline because these chemical species are the most photochemically reactive in the
atmosphere after evaporation. The content of benzene, an aromatic hydrocarbon component of
gasoline and a toxic compound, will be specifically reduced. A further air quality benefit is realized
by requiring reductions in fuel sulfur content, which results in improved catalytic converter
efficiency in reducing ROG, NOx and CO emissions.
Schedule: The regulations (Title 13, California Code of Regulations, sections 2260-2272) were
adopted by ARB in November 1991. Implementation of the Reformulated Gasoline regulations
began in March 1996.
4 - 27
4.7.3 ARB R003 - CONSUMER PRODUCTS (1994 CAP ARB-S1)
1996 Emission Reduction: 1.1198 tons ROG per average summer weekday
2005 Emission Reductions: 2.2438 tons ROG per average summer weekday
Source Characteristics: Many consumer products contain ROG which either evaporate or are
propelled into the air. The California Air Resources Board (ARB) is in the process of regulating
several of these products, particularly antiperspirants and deodorants, air fresheners, automotive
windshield wiper fluids, bathroom and tile cleaners, charcoal lighter material, engine degreasers,
floor polishes, furniture maintenance products, general purpose cleaners, glass cleaners, hair
mousse, hair spray, hair styling gels, aerosol insect repellents, laundry pre-wash products, nail
polish removers, oven cleaners, and shaving creams. In the future, ARB plans to regulate aerosol
paints.
Control Measure Description: The effect of the consumer product regulation is to limit, and in some
cases phase out, the use of ROG in consumer products listed above.
Schedule: The ARB adopted Consumer Products regulations (Title 17, California Code of
Regulations, sections 94500 - 94517) in 1989, 1990 and 1992 with full implementation by 1999.
4.7.4 ARB-R004 - Utility Equipment Emission Limits (1994 CAP ARB-S3)
1999 Emission Reduction: 0.3976 ROG tons per average summer weekday
1999 Emission Reduction: -0.0230 NOx tons per average summer weekday
2005 Emission Reduction: 0.6023 ROG tons per average summer weekday
2005 Emission Reduction: -0.0447 NOx tons per average summer weekday
Source Characteristics: Utility engines include a large and diverse range of portable equipment
powered by gasoline, diesel or alternate fuel two and four stroke air or liquid cooled engines. Utility
4 - 28
engines are defined as engines designed for powering residential and commercial lawn and garden
equipment and implements, and also include small horsepower electric generators, pumps,
compressors and welding machines. ARB has classified utility equipment in two ways: (1) hand-
held equipment; and (2) non-hand-held equipment. Examples of hand-held equipment include
chain saws, leaf blowers, and string trimmers. Walk-behind and riding mowers, garden tractors and
generators are examples of non-hand-held utility equipment.
Control Measure Description: The utility engine regulations consist of exhaust emission limits, test
procedures, standardized emission control system labeling requirements, emission-related
component defect warranty provisions and quality-audit and compliance procedures for
manufacturers. Exhaust emission standards will be implemented in two tiers for both ARB engine
classifications. Tier I hydrocarbon NOx, CO and PM emission standards apply to new utility
engines produced on or after January 1, 1995, and achieve emission reductions through simple
engine modifications such as calibrations and component tolerances. More stringent Tier II
emission standards apply to new utility engines produced on or after January 1, 1999, and
incorporate advanced control technology such as catalytic converters to achieve emission
reductions. Farm and construction equipment less than 175 hp preempted from state or local
emission regulations by the federal Clean Air Act Amendments of 1990 are not subject to this ARB
regulation.
Schedule: ARB adopted regulations applicable to new utility engines less than 25 hp in December
1990 (California Code of Regulations sections 2400 - 2407). These regulations took effect January
1, 1995.
4.7.5 ARB R005 - Heavy Duty Off-Road Diesel Engines (1994 CAP ARB-S8)
1999 Emission Reduction: 0.0070 tons ROG per average summer weekday
1999 Emission Reduction: 1.8460 tons NOx per average summer weekday
2005 Emission Reduction: 0.0238 tons ROG per average summer weekday
2005 Emission Reduction: 2.6703 tons NOx per average summer weekday
4 - 29
Source Characteristics: Heavy duty off-road diesel engines are used in construction, farming,
mining, forestry and industrial equipment. These engines generate significant quantities of NOx and
appreciable ROG and PM emissions. This category does not included locomotives, marine vessels
or stationary engines.
Control Measure Description: The regulation applies to new, non-farm engines 175 horsepower
(hp) or greater. California is preempted by the Federal Clean Air Act Amendments from adopting
regulations for new engines less than 175 hp that power farm or construction equipment. The
regulation consists of exhaust emission standards and testing procedures for new 1996 or later diesel
cycle engines regardless of fuel used. Exhaust standards for new engines will be implemented in
1996, with a second more stringent set of standards taking effect in 2001. Exhaust standards should
be achievable using adapted heavy duty on-road diesel control technology, including injection
timing retard, turbocharging, and aftercooling for NOx and fuel injection and combustion
modification for ROG and PM. Potential emission reductions from subject engines of 65 percent
for NOx, 32 percent for ROG and 40 percent for PM could be realized upon full implementation.
Schedule: The regulations were adopted by ARB in January 1992 (title 13 California Code of
Regulations, sections 2420-2427). The first tier of exhaust standards was implemented in 1996 with
a second tier of implementation due in 2001.
4.7.6 ARB R006 - Off-Highway Recreational Vehicles And Engines (1994 CAP ARB-S9)
1999 Emission Reduction: 0.1440 ROG tons per average summer weekday
1999 Emission Reduction: 0.0000 NOx tons per average summer weekday
2005 Emission Reduction: 0.2509 ROG tons per average summer weekday
2005 Emission Reduction: 0.0000 NOx tons per average summer weekday
Source Characteristics: Off-highway recreational vehicles include off-road motorcycles, all-terrain
vehicles (ATVs), golf carts and "specialty" carriers such as personnel carriers and transport vehicles.

4 - 30
Engines consist of two and four stroke configurations and range from 8 horsepower (hp) to 30 hp.
Most of the smaller engines are gasoline powered and are relatively simple, although some of the
larger engines utilize more advanced designs such as fuel injection and alternate fuels. Some of
these vehicles are designed for competition purposes. CO is the primary pollutant emitted from
these engines, followed by ROG and a small amount of NOx emissions.
Control Measure Description: The regulation contains two major provisions: exhaust emission
standards for non-competition vehicles and limitations on use of competition-designed vehicles for
recreational purposes. Exhaust standards will be required for new 1997 or later non-competition
vehicles (ATVs and off-road motorcycles). All new 1997 and later golf carts will have to meet
zero-emission standards. All new 1995 and later specialty vehicles less than 25 hp (go-karts) will
conform with utility engine emission regulations (see control measure ARB- S3) while those 25 hp
or greater will have to comply with the second tier 1999 utility engine standards beginning in 1997.
Upon full implementation, this regulation is expected to achieve up to 81% reduction in ROG and
38% reduction in CO from off-highway recreational vehicles. A slight increase (6%) in NOx
emissions could also result.
Schedule: The regulation was adopted by ARB in January 1994 (Title 13, California Code of
Regulations, sections 2111-2140) and will be fully implemented in 1999.
4.7.7 ARB-R007 Consumer Products – Aerosol Coatings
1999 Emission Reduction: 0.0501 tons ROG per average summer weekday
2005 Emission Reduction: 0.0532 tons ROG per average summer weekday
Source Characteristics: This category consists of paint, varnish, and related products dispensed
from disposable aerosol containers. Emissions from aerosol paints come from the solvents and
propellants used in these products, which are primarily ROG.
4 - 31
Control Measure Description: The proposed regulation would establish VOC (ROG) content limits
specified for 35 different categories of aerosol paint. The term VOC as used in this description is
synonymous with the term ROG as used in the rest of the Clean Air Plan. There are two tiers of
standards. The first tier of standards was put in place for January 1, 1996, and the second is slated
for December 31, 1999. A special recognition program which would recognize low-VOC aerosol
paints is also being explored as a voluntary program that would augment the aerosol paint
regulation. Such a program would be used to reward aerosol paints, which achieve early compliance
or lower their VOC content below the requirements in the aerosol paint regulation.
To realize additional emission reductions from aerosol paints, technologies that are not currently
available will need to be developed and deployed. For example, aerosol paints may eventually be
able to be formulated with VOC contents at or near zero, if major breakthroughs in resin
technology, non-VOC solvent and propellant systems, and valve design occur. Currently, some
"brush-on" paints already have reached VOC levels at or near zero VOC. However, formulating
zero VOC aerosol spray paints may pose unique challenges different from those encountered in the
development of near-zero VOC "brush- on" paints. Market incentive approaches may also be
explored as a vehicle to spur the development of low-and zero-VOC aerosol paints. Market
incentive approaches may also be explored as a vehicle to spur the development of low-and zero-
VOC aerosol paints. Overall, if the short and long-term measures are implemented, the emissions
from aerosol paints will be reduced by approximately 85 percent relative to 2010 uncontrolled
emissions. While the cost effectiveness of these measures is not currently known, it is expected that
the cost effectiveness will be similar to other measures adopted around the turn of the century. As
the measures are developed, the ARB staff will analyze the potential cost impact and provide the
information as it becomes available.
Schedule: Adoption in 1996 with implementation in 1996, 1999 and beyond.

4 - 32
4.7.8 M9, M10 - Off-Road Industrial Equipment (Diesel)
2.5 G/BHP-HR NOx; California - Measure M9
2.5 G/BHP-HR NOx; Federal - Measure M10
1999 Emission Reduction: 0.0000 ROG tons per average summer weekday
1999 Emission Reduction: 0.5381 NOx tons per average summer weekday
2005 Emission Reduction: 0.0000 ROG tons per average summer weekday
2005 Emission Reduction: 0.5381 NOx tons per average summer weekday
Description of the Category
This category includes off-road diesel equipment, including farm and construction equipment.
Existing Control Program
The ARB has adopted HC, NOx and PM standards for equipment 175 horsepower and above. By
1996, these sources will have to comply with a NOx standard of 6.9 g/bhp-hr. Effective in 2001,
the NOx standard for engines 175 to 750 horsepower will be reduced to 5.8 g/bhp-hr. Engine
technology used to meet the NOx standard of 5.8 g/bhp-hr will also reduce ROG emissions from
post-2001 new engines by 50 percent. The USEPA has sole authority to control new farm and
construction equipment less than 175 horsepower, which accounts for 68 percent of the 2010
baseline NOx emissions of the under 175 hp subcategory. The USEPA has adopted a nationwide
NOx emission standard of 6.9 g/bhp-hr for compression-ignition (diesel) engines 50 horsepower
and greater, to be phased-in beginning in 1997. The measure affects all equipment in this category,
including the preempted farm and construction equipment.
Additional Emission Reduction Measures
M9 - 2.5 g/bhp-hr NOx; California
M10 - 2.5 g/bhp-hr NOx; Federal
4 - 33
Transfer of cost-effective on-road diesel engine control technology to new off-road engines will
allow most engines to meet more stringent standards in the 2005 and later time frame. That control
technology includes improved engine design (especially in fuel/air management and delivery),
exhaust gas recirculation, and exhaust gas aftertreatment.
With these technologies, an emission standard for new engines not primarily used in construction or
farm equipment of 2.5 g/bhp-hr NOx will be adopted for year 2005 models. This would be a
reduction of 64 percent from the new engine emission standard for engines 50 to 175 horsepower,
which is being phased-in nationally beginning in 1997. The reduction would be 57 percent from the
California 2001 new engine emission standard for engines 175 horsepower or greater. The
technology used to meet these standards will also further reduce ROG emissions from post-2005
new engines.
Because over one half of the emissions of engines in this category cannot be regulated by California
due to federal preemption, it is necessary that the USEPA also adopt and implement the 2.5 g/bhp-
hr NOx standard in the same time frame. Since much off-road equipment is used regionally,
including states other than California, adoption of this standard by the USEPA on a nationwide
basis is necessary to achieve the emission reductions upon which the plan is predicated.
Responsible Agency: USEPA, ARB
4.7.9 M11, M12 - GAS AND LPG EQUIPMENT 25 - 175 HORSEPOWER
Three-Way Catalyst Technology; California - Measure M11
Three-Way Catalyst Technology; Federal - Measure M12
1999 Emission Reduction: 0.0000 ROG tons per average summer weekday
1999 Emission Reduction: 0.0000 NOx tons per average summer weekday
2005 Emission Reduction: 0.1944 ROG tons per average summer weekday
2005 Emission Reduction: 0.0981 NOx tons per average summer weekday

4 - 34
Description of the Category
The category consists of off-road gasoline and LPG equipment greater than 25 horsepower and less
than 175 horsepower, including forklifts, pumps, compressors, farm equipment, and construction
equipment. The USEPA has the sole authority to control new farm and construction equipment less
than 175 horsepower, whose 2010 baseline emissions account for approximately 43 percent of ROG
and NOx from this category.
Existing Control Program
The ARB and the USEPA currently have no emission standards for these sources.
Additional Emission Reduction Measures
M11 - Three-Way Catalyst Technology; California
M12 - Three-Way Catalyst Technology; Federal
Many engines in the category are similar to, or derived from, early 1980s automobile engines.
Emission standards for new engines not primarily used in construction or farm equipment will be
phased-in beginning in 2000, based on use of closed-loop three-way catalyst systems. The catalyst
systems are expected to reduce ROG by 75 percent, and NOx by at least 50 percent.
Because over 40 percent of the emissions of engines in this category cannot be regulated by
California due to federal preemption, it is necessary that the USEPA also adopt and implement
catalyst system technology requirements in the same time frame. Since much equipment in this
category is used regionally, including states other than California, adoption of this standard by the
USEPA on a nationwide basis is necessary to achieve the emission reductions upon which the plan
is predicated.
Responsible Agency: USEPA, ARB
4 - 35
4.7.10 M13 - MARINE VESSELS National and International Emission Standards -
Measure M13
1999 Emission Reduction: No reductions claimed
1999 Emission Reduction: No reductions claimed
Description of the Category
Ocean-going marine vessels, and harbor vessels exclusive of those used in recreational activities,
are included in this category. Included are all naval and commercial marine vessels like tugs,
crew/supply boats, fishing boats, as well as cruise ships, roll-ons/roll-offs (RO-ROs), container
ships, and tankers. The marine vessel fleet ranges in power from approximately 500 horsepower to
67,000 horsepower, and is propelled by diesel engines, steam turbines, or gas turbines.
Existing Control Program
The ARB and USEPA currently have no emission standards or operational control measures for
these sources although some operational controls have been implemented by local districts.
Additional Emission Reduction Measure
M13 - National and International Emission Standards
Many ocean-going vessels are registered in foreign countries, and most use engines produced
outside the U.S. Emissions from new engines used in these vessels can be most effectively reduced
by establishing international emission standards, and the USEPA and the International Maritime
Organization have begun to address appropriate requirements. The proposed control measure would
reduce NOx emissions from new diesel engines used in ocean-going vessels by 30 percent.
Assuming a 30 year life expectancy for ocean-going ships, the proposed international standards
would result in an overall NOx emission reduction of 10 percent for ocean-going ships in 2010.
Commercial ship traffic control measures can be utilized to further reduce ocean-going ship
emissions. Relocation of the Southern California shipping channel to outside the Channel Islands

4 - 36
would reduce the impact of ship emissions in both the Ventura and South Coast Air Basins.
Reduction in ship speeds may also reduce ship emissions.
Emission reductions achieved by the proposed ocean-going ship control measures are dependent
upon actual ship operations and associated emissions. Uncertainty remains regarding the actual
emissions of this previously unregulated source and the emission inventory is under review. It is,
however, estimated that the proposed ocean-going ship international engine standards and ship
traffic control measures combined could reduce emissions by approximately 25 percent in the year
2010.
Many non-ocean going vessels (captive fleet vessels) use engines derived from heavy-duty truck or
locomotive engines, and NOx emissions can be reduced by at least 65 percent by the USEPA
establishing emission limits for new engines used in these vessels.
Technology being developed to meet more stringent standards for on-road diesel trucks and
locomotives would be used. Assuming a life expectancy of 16 years for the captive fleet, the
proposed measure would result in an overall NOx emission reduction of approximately 50 percent
in 2010.
Further reductions can be achieved through locally adopted/enforced measures which encourage the
use of cleaner/newer engines in nonattainment areas, or provide incentives to reduce emissions at
the ports. The degree to which these and other similar approaches can contribute to lower emissions
by 2010 has not yet been assessed.
Additionally, as part of USEPA’s consultative process on Measure M-13 of the 1994 California
ozone SIP, ARB has convened a technical working group which includes the Santa Barbara County
APCD to assess the onshore impact of relocating the shipping channel and vessel speed reduction.
We will continue to work with ARB and the USEPA through this consultative process to develop
viable control measures and to identify any appropriate emission reductions.
4 - 37
Responsible Agency: USEPA/International Maritime Organization, U.S. Coast Guard
4.7.11 M14 - Locomotives National Emission Standards - Measure M14
1999 Emission Reduction: 0.0000 ROG tons per average summer weekday
1999 Emission Reduction: 0.0000 NOx tons per average summer weekday
2005 Emission Reduction: 0.0000 ROG tons per average summer weekday
2005 Emission Reduction: 0.7454 NOx tons per average summer weekday
Description of the Category
This category includes new and in-use locomotives used in line-haul, local, and switch yard service.
Federal law preempts California from setting standards for new locomotives and new engines used
in locomotives.
Existing Control Program
The ARB and the USEPA currently have no emission standards for these sources.
Additional Emission Reduction Measure
M14 - National Emission Standards
Section 213 of the federal Clean Air Act directs the USEPA to adopt emission standards applicable
to new locomotives and new engines used in locomotives by 1995, and a proposed rulemaking is
expected to be published early next year. The ARB plans to take credit for the locomotive emission
reductions that will result due to the promulgation of the Section 213 rules by the USEPA.
The ARB expects that as part of the USEPA’s Section 213 authority, the USEPA will adopt national
emission standards, which are the most stringent, feasible standards possible. Moreover, the ARB
anticipates that locomotive engine emission standards will be met primarily through the use of
diesel fuel and the transfer of emission control technologies from clean truck engines. The control
technology needed to achieve these reductions has not yet been developed commercially; it might

4 - 38
include diesel engine modifications, electronic fuel injection, improved cooling, after-treatment,
and/or use of EGR.
The 1994 SIP assumes that the USEPA will adopt a two-tiered national NOx standard for new
locomotives, which will decrease the standard on average by 58 percent effective in 2000, and by 67
percent effective in 2005. In addition, the ARB anticipates that the USEPA will propose a national
emission standard for remanufactured engines which reduces emissions on average by 33 percent
for this class of engines, beginning in 2000.
If the USEPA adopts a different 2005 emission standard than the standard on which the ARB has
based its 1994 SIP revisions, the fleet average requirement and reduction assumptions would have
to be revisited.
The national Section 213 emission standards for new locomotives and new engines used in
locomotives will lead to significant emission reductions throughout the state as newer and lower
emitting locomotive engines are purchased and as in-use locomotives are remanufactured.
Accordingly, the ARB intends to take credit for a near-term 42 percent NOx reduction by 2005.
This reduction level is consistent with the USEPA’s published estimates of the emission reduction
impact of the phase-in of locomotives meeting the national emission standards to be adopted by the
USEPA under its Section 213 standard setting authority. The ARB will also consider operational
controls, such as reduced idling and use of California diesel fuel, if, based on the USEPA final rule,
additional emission reductions are needed.
Responsible Agency: USEPA, ARB
4.7.12 M16 - Pleasure Craft Nationwide Emission Standards - Measure M16
1999 Emission Reduction: 0.0000 ROG tons per average summer weekday
1999 Emission Reduction: 0.0000 NOx tons per average summer weekday
1999 Emission Reduction: 0.0000 ROG tons per average summer weekday OCS
4 - 39
1999 Emission Reduction: 0.0000 NOx tons per average summer weekday OCS
2005 Emission Reduction: 0.0990 ROG tons per average summer weekday
2005 Emission Reduction: 0.0000 NOx tons per average summer weekday
2005 Emission Reduction: 0.0990 ROG tons per average summer weekday OCS
2005 Emission Reduction: 0.0000 NOx tons per average summer weekday OCS
Description of the Category
Pleasure craft are recreational boats and personal watercraft used in inland waterways and coastal
areas. Gasoline engines, including 2-stroke and 4-stroke, are most often used in this application, but
diesel engines are also used.
Existing Control Program
These sources are currently uncontrolled.
Additional Emission Reduction Measure
M16 - Nationwide Emission Standards
The USEPA has proposed nationwide regulations that would reduce ROG emissions of new
outboard and personal watercraft gasoline equipment in this category by 75 percent, with an
emission cap for all other watercraft to be phased-in beginning in 1998. In addition, standards of
8.0 g ROG/kw-hr and 6.5 g NOx/kw-hr are being considered by the USEPA with a five year phase-
in beginning in 1998 for inboard and stern-drive gasoline engines. Emission reductions will be
obtained using carburetor modifications, fuel injection, improved calibration and fueling systems,
and possibly aftertreatment. In addition, since 4-stroke engines are significantly cleaner than 2-
stroke engine configurations, a usage shift, which is expected, would result in substantial ROG
emission reductions. Additional reductions of ROG emissions from current 4-stroke gasoline
equipment are expected as well due to advancement in technology.
Responsible Agency: USEPA
4 - 40
4.7.13 Consumer Products – SIP Reductions.
1999 Emission Reduction: 0.0000 tons ROG per average summer weekday
2005 Emission Reduction: 1.2543 tons ROG per average summer weekday
Source Characteristics: Many consumer products contain ROG, which either evaporate or are
propelled into the air. The California Air Resources Board (ARB) is in the process of regulating
several of these products, namely: antiperspirants and deodorants, air fresheners, automotive
windshield wiper fluids, bathroom and tile cleaners, charcoal lighter material, engine degreasers,
floor polishes, furniture maintenance products, general purpose cleaners, glass cleaners, hair
mousse, hair spray, hair styling gels, aerosol insect repellents, laundry pre-wash products, nail
polish removers, oven cleaners and shaving creams. In the future, ARB plans to regulate aerosol
paints.
Control Measure Description: This measure is a continuation of the state consumer regulation as
described in ARB-S1 above. This regulation achieves greater reductions by reducing ROG from
more categories than originally covered in the original consumer product rule. This measure
includes categories for mid-term and long-term reductions.
Schedule: Full implementation by 2005
4.7.14 ARB-Pesticides Measure -Proposed (1994 CAP S2)
1999 Emission Reduction: No reductions claimed.
2005 Emission Reductions: No reductions claimed.
Source Characteristics: Pesticides are chemicals used to control plant or animal pests and for the
regulation of plant growth and plant defoliation. There are various formulations of pesticides,
including aerosols, dusts, flowables, granulars, solutions, and wettable powders applied by means of
aircraft spraying, ground-rig spraying and soil injection. ROG emissions result from evaporation of
4 - 41
reactive organic compounds in both active and inactive ingredients, including carriers, diluents,
emulsifiers, inhibitors, fillers, and propellants.
Control Measure Description: The proposed regulation would apply to agricultural and commercial
structural pesticides. Home-use pesticides are already subject to ARB's Consumer Product
Regulation (see ARB control measure ARB-S1). Currently there are no statewide regulations to
control agricultural and commercial structural pesticide use as ROG sources. The strategy to reduce
pesticide ROG emissions entails the California Department of Pesticide Regulation (DPR)
establishing a 1990 baseline pesticide emission inventory and target reduction goals in three year
milestone increments beginning with 1996. It is expected that most of the reductions will be
voluntary and occur as a result of ongoing activities such as integrated pest management (IPM)
programs, low ROG reformulated products, and introduction of products designed with very low
usage rates. If targeted ROG emission reductions are not achieved through voluntary controls,
already-adopted mandatory measures would go into effect to achieve the needed emission
reductions. The goal of the program is to reduce subject pesticide ROG emissions by 20 to 45%
statewide by 2005. Since the program is voluntary and was developed for areas designated as
serious ozone non-attainment areas developing their 1994 Clean Air Plans, Santa Barbara cannot
opt into the measure for emission reduction credit. However, the air in Santa Barbara will still
benefit from any emission reductions that do occur.
Schedule: Adoption by the California Department of Pesticide Regulation is ongoing, with full,
statewide implementation by 2005.
4.8 CONCLUSIONS
The APCD, SBCAG, county, and cities have developed a comprehensive "Air Pollution Control
Strategy" for Santa Barbara County that identifies all feasible measures available to bring the county
into compliance with both the state and federal ozone standard. These measures include controls on
all inventory categories contributing ROG and NOx emissions: industrial processes, combustion

4 - 42
sources, petroleum handling, solvent use, consumer products, waste burning, automobiles and other
mobile sources. Some measures are not credited towards the federal 24% ROG Rate-of-Progress or
attainment demonstration requirements. The APCD's strategy, combined with emission reductions
to be realized from on-road mobile sources described in detail in Chapter 5, will bring Santa
Barbara County into compliance with all applicable state and federal mandates.
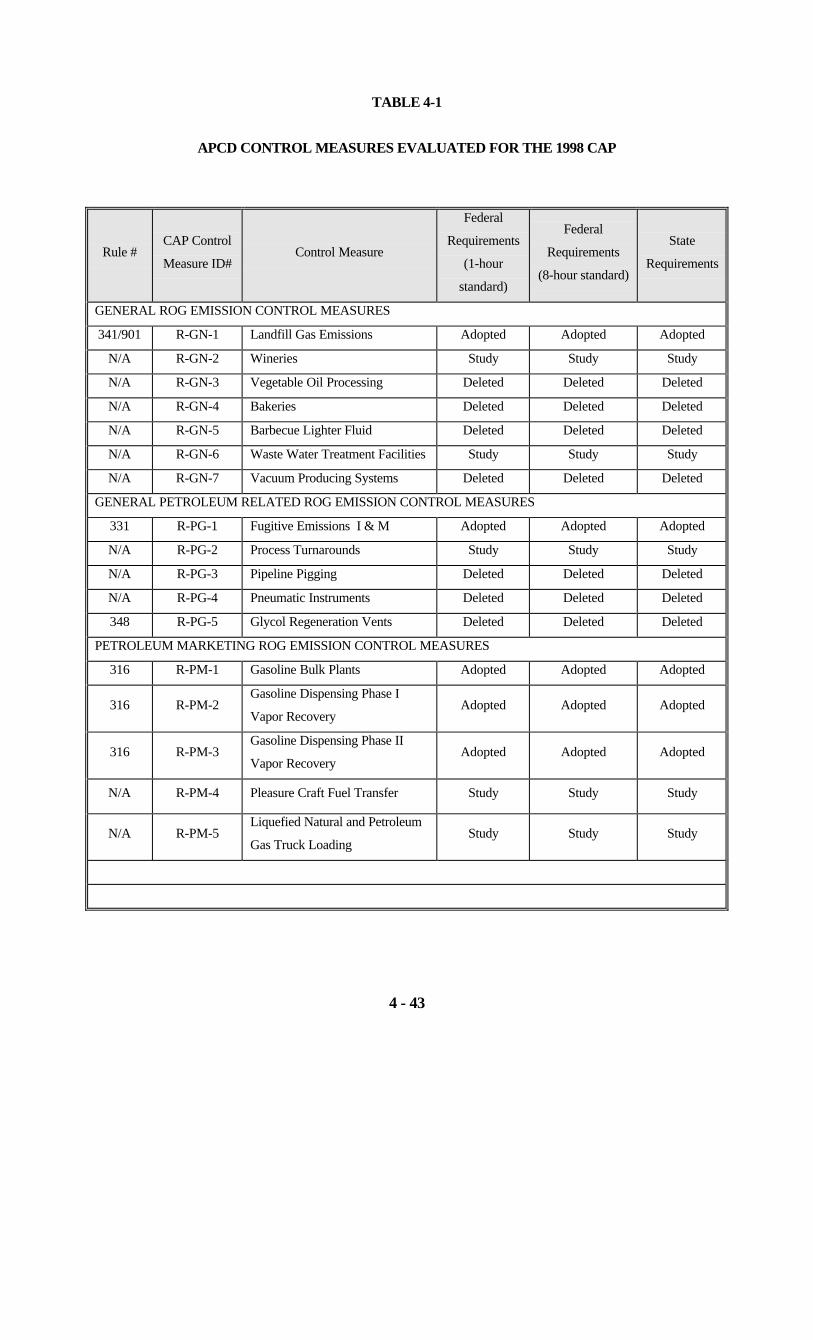
TABLE 4-1
APCD CONTROL MEASURES EVALUATED FOR THE 1998 CAP
4 - 43
Rule #CAP Control
Measure ID#Control Measure
Federal
Requirements
(1-hour
standard)
Federal
Requirements
(8-hour standard)
State
Requirements
GENERAL ROG EMISSION CONTROL MEASURES
341/901 R-GN-1 Landfill Gas Emissions Adopted Adopted Adopted
N/A R-GN-2 Wineries Study Study Study
N/A R-GN-3 Vegetable Oil Processing Deleted Deleted Deleted
N/A R-GN-4 Bakeries Deleted Deleted Deleted
N/A R-GN-5 Barbecue Lighter Fluid Deleted Deleted Deleted
N/A R-GN-6 Waste Water Treatment Facilities Study Study Study
N/A R-GN-7 Vacuum Producing Systems Deleted Deleted Deleted
GENERAL PETROLEUM RELATED ROG EMISSION CONTROL MEASURES
331 R-PG-1 Fugitive Emissions I & M Adopted Adopted Adopted
N/A R-PG-2 Process Turnarounds Study Study Study
N/A R-PG-3 Pipeline Pigging Deleted Deleted Deleted
N/A R-PG-4 Pneumatic Instruments Deleted Deleted Deleted
348 R-PG-5 Glycol Regeneration Vents Deleted Deleted Deleted
PETROLEUM MARKETING ROG EMISSION CONTROL MEASURES
316 R-PM-1 Gasoline Bulk Plants Adopted Adopted Adopted
316 R-PM-2Gasoline Dispensing Phase I
Vapor RecoveryAdopted Adopted Adopted
316 R-PM-3Gasoline Dispensing Phase II
Vapor RecoveryAdopted Adopted Adopted
N/A R-PM-4 Pleasure Craft Fuel Transfer Study Study Study
N/A R-PM-5Liquefied Natural and Petroleum
Gas Truck LoadingStudy Study Study

TABLE 4-1
APCD CONTROL MEASURES EVALUATED FOR THE 1998 CAP
4 - 44
Rule #CAP Control
Measure ID#Control Measure
Federal
Requirements
(1-hour
standard)
Federal
Requirements
(8-hour standard)
State
Requirements
PETROLEUM PRODUCTION ROG EMISSION CONTROL MEASURES
344 R-PP-1Petroleum Sumps, Pits, and Well
CellarsAdopted Adopted Adopted
N/A R-PP-3 Abandoned Well Vents Deleted Deleted Deleted
N/A R-PP-4 Petroleum Vacuum Trucks Deleted Deleted Deleted
361 R-PP-5Cyclic Steam Injection Oil Well
VentsDeleted Deleted Deleted
N/A R-PP-6 Pseudocyclic Oil Well Vents Deleted Deleted Deleted
N/A R-PP-7 Heavy Oil Test Stations Deleted Deleted Deleted
N/A R-PP-8 Wet Gas Combustion Deleted Deleted Deleted
346 R-PP-9Loading of Organic Liquid Cargo
VesselsAdopted Adopted Adopted
PETROLEUM STORAGE TANKS ROG EMISSION CONTROL MEASURES
343 R-PT-1Petroleum Storage Tank
DegassingAdopted Adopted Adopted
325 R-PT-2
Crude Oil Production and
Separation Adopted Adopted Adopted
326 R-PT-2
Storage of Reactive Organic
Compound Liquids Adopted Adopted Adopted
SURFACE COATING ROG EMISSION CONTROL MEASURES
323 R-SC-1Architectural Coatings
Architectural Coatings (revision)
Adopted
Study
Adopted
Study
Adopted
Study
337 &
330R-SC-2
Surface Coating of Aerospace and
Metal Parts and ProductsAdopted Adopted Adopted

TABLE 4-1
APCD CONTROL MEASURES EVALUATED FOR THE 1998 CAP
4 - 45
Rule #CAP Control
Measure ID#Control Measure
Federal
Requirements
(1-hour
standard)
Federal
Requirements
(8-hour standard)
State
Requirements
N/A R-SC-3Surface Coatings – Industrial
MaintenanceDeleted Deleted Deleted
339 R-SC-4Motor Vehicle & Mobile
Equipment Coating OperationsAdopted Adopted Adopted
351 R-SC-5
Surface Coating Wood Product
Surface Coating Wood Products
(revision)
Adopted
Proposed
Adopted
Proposed
Adopted
Proposed
355 R-SC-6 Plastics Deleted Deleted Deleted
SOLVENT ROG EMISSION CONTROL MEASURES
320 R-SL-1 Dry Cleaning Study Study Study
321
321
R-SL-2
R-SL-2
Degreasing Operations
Degreasing (revision)
Adopted
Study
Adopted
Study
Adopted
Study
329 R-SL-3 Cutback and Emulsified Asphalt Adopted Adopted Adopted
358 R-SL-4 Electronics Industry Study Study Study
349 R-SL-5 Polyester Resin Operations Adopted Adopted Adopted
347 R-SL-6Solvent Using Industrial and
Commercial ProcessesDeleted Deleted Deleted
354 R-SL-7Graphic Arts – Letter/Offset
PrintingN/A N/A Adopted
N/A R-SL-8 Asphalt Roofing Deleted Deleted Deleted
353 R-SL-9 Adhesives Proposed Proposed Proposed
INTERNAL COMBUSTION NOx EMISSION CONTROL MEASURES
333
333
N-IC-1
N-IC-1
I/C Engines (Gas-Fired)
I/C Engines (Revision)
Adopted
Contingency
Adopted
Proposed
Adopted
Proposed
353 N-IC-2 Gas Fired Turbines Deleted Deleted Deleted
333
333
N-IC-3
N-IC-3
I/C Engines (Diesel-Fired)
I/C Engines (Revision)
Adopted
Study
Adopted
Study
Adopted
Study

TABLE 4-1
APCD CONTROL MEASURES EVALUATED FOR THE 1998 CAP
4 - 46
Rule #CAP Control
Measure ID#Control Measure
Federal
Requirements
(1-hour
standard)
Federal
Requirements
(8-hour standard)
State
Requirements
N/A N-IC-4 Fuel Burning Platform Equipment Deleted Deleted Deleted
N/A N-IC-5 Exploratory Drilling Vessels Deleted Deleted Deleted
N/A N-IC-6 Marine Tankers Deleted Deleted Deleted
NA N-IC-7 Lawn and Garden Equipment Study Study Study
NA N-IC-8Airport Ground Support
EquipmentStudy Study Study
EXTERNAL COMBUSTION NOx EMISSION CONTROL MEASURES
352 N-XC-1 Residential Water Heaters Proposed Proposed Proposed
352 N-XC-2 Commercial Water Heaters Proposed Proposed Proposed
352 N-XC-3Residential & Commercial Space
HeatersProposed Proposed Proposed
342
342
N-XC-4
N-XC-4
Small Industrial / Commercial
Boilers
(revision)
Adopted
Study
Adopted
Study
Adopted
Study
342 N-XC-5Large Industrial /
Commercial BoilersAdopted Adopted Adopted
342 N-XC-6 Process Heaters Adopted Adopted Adopted
356 N-XC-7 Tail Gas Incinerators Study Study Study
359 N-XC-8Petroleum Flares & Relief Gas
OxidizersAdopted Adopted Adopted
N/A N-XC-9 Solar Water Heaters Deleted Deleted Deleted
342 N-XC-10 Tank Heaters Adopted Adopted Adopted
342 N-XC-11 Steam Generators Adopted Adopted Adopted
345 N-XC-12Direct Fired External Combustion
UnitsStudy Study Study
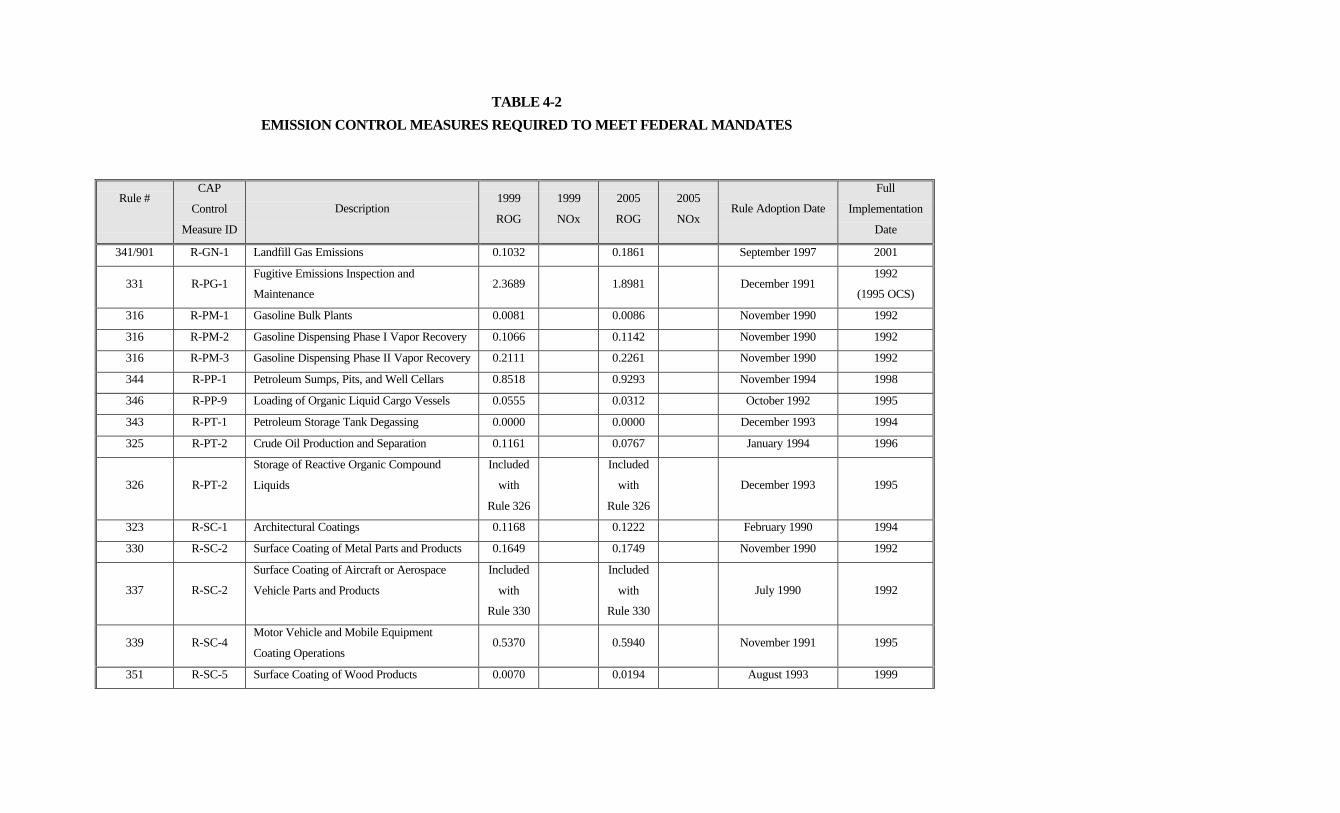
TABLE 4-2
EMISSION CONTROL MEASURES REQUIRED TO MEET FEDERAL MANDATES
Rule #CAP
Control
Measure ID
Description1999
ROG
1999
NOx
2005
ROG
2005
NOxRule Adoption Date
Full
Implementation
Date
341/901 R-GN-1 Landfill Gas Emissions 0.1032 0.1861 September 1997 2001
331 R-PG-1Fugitive Emissions Inspection and
Maintenance2.3689 1.8981 December 1991
1992
(1995 OCS)
316 R-PM-1 Gasoline Bulk Plants 0.0081 0.0086 November 1990 1992
316 R-PM-2 Gasoline Dispensing Phase I Vapor Recovery 0.1066 0.1142 November 1990 1992
316 R-PM-3 Gasoline Dispensing Phase II Vapor Recovery 0.2111 0.2261 November 1990 1992
344 R-PP-1 Petroleum Sumps, Pits, and Well Cellars 0.8518 0.9293 November 1994 1998
346 R-PP-9 Loading of Organic Liquid Cargo Vessels 0.0555 0.0312 October 1992 1995
343 R-PT-1 Petroleum Storage Tank Degassing 0.0000 0.0000 December 1993 1994
325 R-PT-2 Crude Oil Production and Separation 0.1161 0.0767 January 1994 1996
326 R-PT-2
Storage of Reactive Organic Compound
Liquids
Included
with
Rule 326
Included
with
Rule 326
December 1993 1995
323 R-SC-1 Architectural Coatings 0.1168 0.1222 February 1990 1994
330 R-SC-2 Surface Coating of Metal Parts and Products 0.1649 0.1749 November 1990 1992
337 R-SC-2
Surface Coating of Aircraft or Aerospace
Vehicle Parts and Products
Included
with
Rule 330
Included
with
Rule 330
July 1990 1992
339 R-SC-4Motor Vehicle and Mobile Equipment
Coating Operations0.5370 0.5940 November 1991 1995
351 R-SC-5 Surface Coating of Wood Products 0.0070 0.0194 August 1993 1999
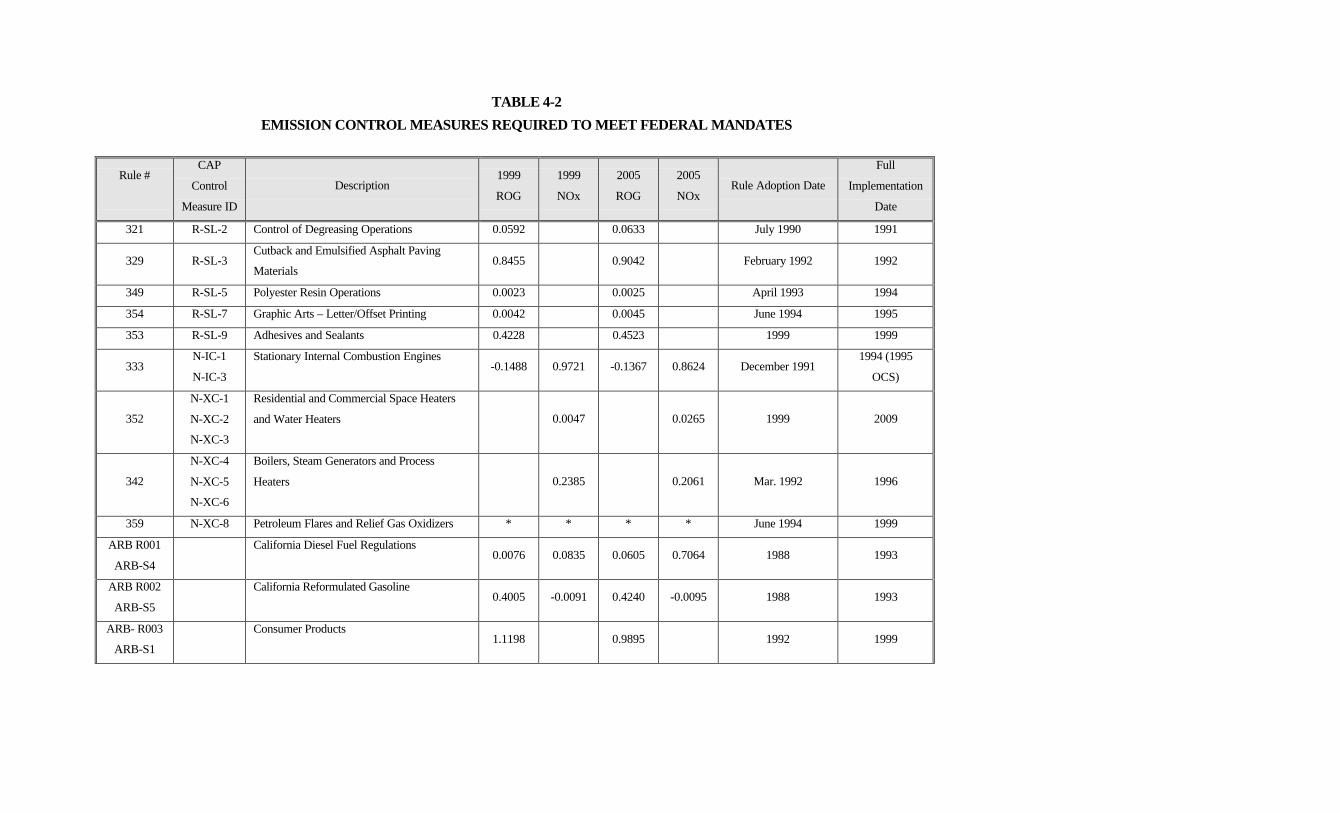
TABLE 4-2
EMISSION CONTROL MEASURES REQUIRED TO MEET FEDERAL MANDATES
Rule #CAP
Control
Measure ID
Description1999
ROG
1999
NOx
2005
ROG
2005
NOxRule Adoption Date
Full
Implementation
Date
321 R-SL-2 Control of Degreasing Operations 0.0592 0.0633 July 1990 1991
329 R-SL-3Cutback and Emulsified Asphalt Paving
Materials0.8455 0.9042 February 1992 1992
349 R-SL-5 Polyester Resin Operations 0.0023 0.0025 April 1993 1994
354 R-SL-7 Graphic Arts – Letter/Offset Printing 0.0042 0.0045 June 1994 1995
353 R-SL-9 Adhesives and Sealants 0.4228 0.4523 1999 1999
333N-IC-1
N-IC-3
Stationary Internal Combustion Engines-0.1488 0.9721 -0.1367 0.8624 December 1991
1994 (1995
OCS)
352
N-XC-1
N-XC-2
N-XC-3
Residential and Commercial Space Heaters
and Water Heaters 0.0047 0.0265 1999 2009
342
N-XC-4
N-XC-5
N-XC-6
Boilers, Steam Generators and Process
Heaters 0.2385 0.2061 Mar. 1992 1996
359 N-XC-8 Petroleum Flares and Relief Gas Oxidizers * * * * June 1994 1999
ARB R001
ARB-S4
California Diesel Fuel Regulations0.0076 0.0835 0.0605 0.7064 1988 1993
ARB R002
ARB-S5
California Reformulated Gasoline0.4005 -0.0091 0.4240 -0.0095 1988 1993
ARB- R003
ARB-S1
Consumer Products1.1198 0.9895 1992 1999
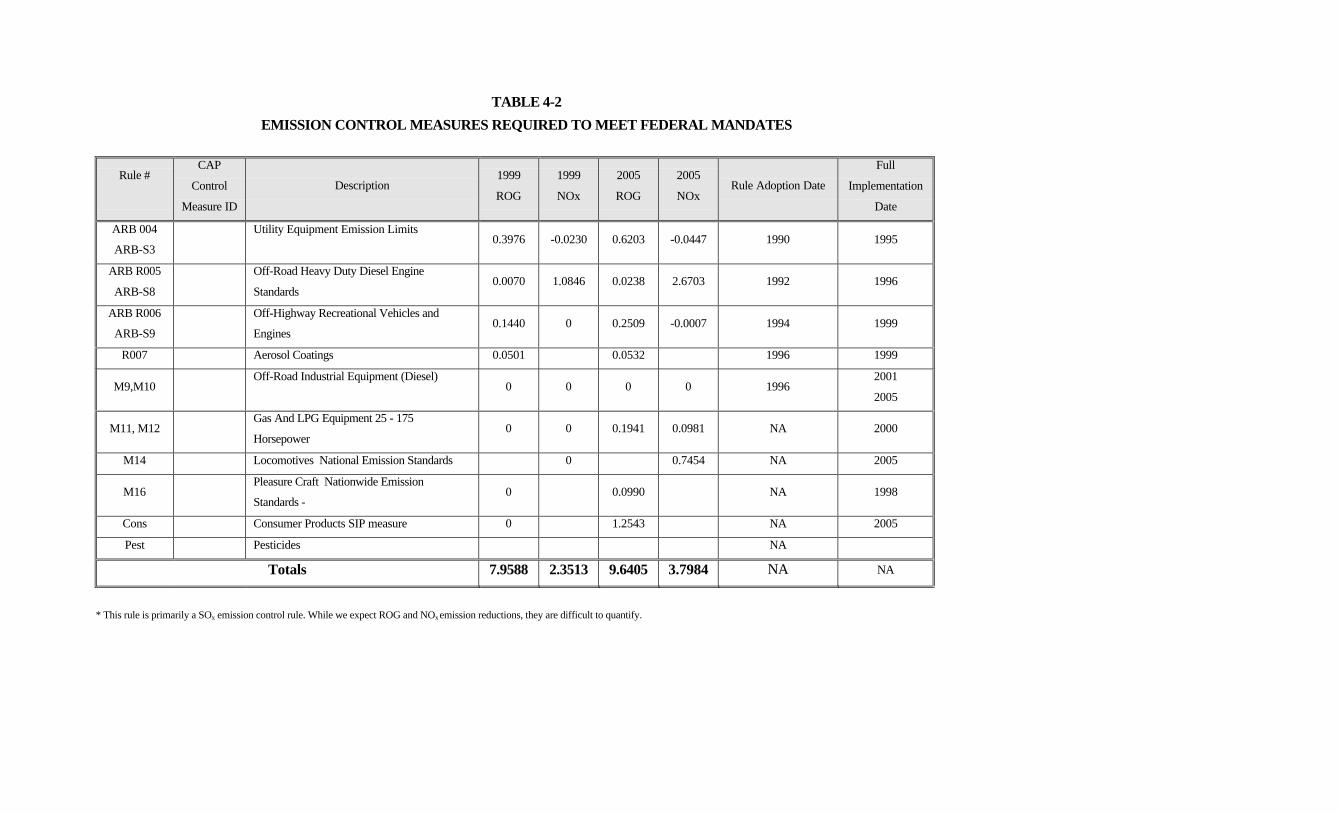
TABLE 4-2
EMISSION CONTROL MEASURES REQUIRED TO MEET FEDERAL MANDATES
Rule #CAP
Control
Measure ID
Description1999
ROG
1999
NOx
2005
ROG
2005
NOxRule Adoption Date
Full
Implementation
Date
ARB 004
ARB-S3
Utility Equipment Emission Limits0.3976 -0.0230 0.6203 -0.0447 1990 1995
ARB R005
ARB-S8
Off-Road Heavy Duty Diesel Engine
Standards0.0070 1.0846 0.0238 2.6703 1992 1996
ARB R006
ARB-S9
Off-Highway Recreational Vehicles and
Engines0.1440 0 0.2509 -0.0007 1994 1999
R007 Aerosol Coatings 0.0501 0.0532 1996 1999
M9,M10Off-Road Industrial Equipment (Diesel)
0 0 0 0 19962001
2005
M11, M12Gas And LPG Equipment 25 - 175
Horsepower0 0 0.1941 0.0981 NA 2000
M14 Locomotives National Emission Standards 0 0.7454 NA 2005
M16Pleasure Craft Nationwide Emission
Standards -0 0.0990 NA 1998
Cons Consumer Products SIP measure 0 1.2543 NA 2005
Pest Pesticides NA
Totals 7.9588 2.3513 9.6405 3.7984 NA NA
* This rule is primarily a SOx emission control rule. While we expect ROG and NOx emission reductions, they are difficult to quantify.
CHAPTER 5
TRANSPORTATION CONTROL MEASURES
Introduction
Memorandum of Understanding
Transportation Control Measures
Emission Reduction Overview
Adopted Measures
Contingency Measures
California Air Resources Board Control Measures
1998 Clean Air Plan TCM Projects
Conclusions
5 - 1
5. TRANSPORTATION CONTROL MEASURES
5.1 INTRODUCTION
Transportation control measures (TCMs) are programs or activities that states and localities can
implement to encourage the travelling public to rely less on the automobile or to use the
automobile more efficiently. TCMs reduce emissions from on-road motor vehicles and trucks by:
improving the existing transportation system to allow motor vehicles to operate more efficiently;
inducing people to change their travel behavior to less polluting modes; or, ensuring emission
control technology improvements in the motor vehicle fleet are fully and expeditiously realized.
TCMs can have benefits beyond emissions reductions by relieving congestion and improving
energy efficiency. During the public participation process of the Clean Air Plan for Santa Barbara
County, representatives of the business and environmental community emphasized the need for
everyone to do their part to clean the air. TCMs address the need for the travelling public to: 1)
carefully consider the implications of continued reliance on the single occupant vehicle as the
major source of commute trips; 2) the need to provide and promote alternatives to single
occupant vehicle travel; and, 3) the need to consider regulating those factors which promote
single occupant vehicle travel.
As discussed in preceding chapters, the Federal Clean Air Act Amendments (FCAAA) requires
"serious" nonattainment areas to develop an emissions control strategy which can: demonstrate a
9% reduction in reactive organic gases (ROG) between 1996 to 1999; establish new on-road
mobile source emission budgets for ROG and NOx; and, demonstrate through photochemical
modeling (or another suitable method approved by EPA) attainment of the federal 1-hour ozone
standard by 1999. The purpose of this chapter is to identify those TCMs relied upon to help
accomplish these planning mandates.
In case the county fails to achieve the federal 1-hour standard for ozone by 1999, the FCAAA
also require the implementation of contingency measures. This chapter presents the TCMs that
are included in the county's contingency plan.
5 - 2
5.2 MEMORANDUM OF UNDERSTANDING
The Santa Barbara County Air Pollution Control District (APCD) entered into a Memorandum of
Understanding (MOU) with the Santa Barbara County Association of Governments (SBCAG) in
May, 1993. The agreement evolved out of recognition that there were common planning
responsibilities shared between the two agencies.
SBCAG is the agency responsible for all transportation planning and programming activities under
federal law. SBCAG also serves as the Congestion Management Agency and is responsible for
multi-modal transportation planning, programming, and fund allocation required under state
statutes.
Federal and state air quality legislation has placed greater emphasis on reducing on-road mobile
source pollution and likewise, the federal and state transportation laws recognize the need to
preserve and/or enhance mobility without sacrificing ambient air quality. To ensure coordination
of plans and consistency between the APCD and SBCAG, the MOU specifies that SBCAG will
develop and approve the transportation control measures and the APCD will adopt the air quality
plans required under state and federal law.
5.3 TRANSPORTATION CONTROL MEASURES
The 1994 CAP evaluated every feasible transportation control measure for reducing ROG and
NOx emissions. These measures were evaluated with the participation of interested members of
the public. The 1998 CAP TCMs are identical to the 1994 CAP TCMs except for those measures
which are comprised of specific programmed projects. Hence, the 1998 CAP does not propose
any "new" TCMs, but identifies new projects within several of the established TCM categories.
Table 5-1 lists all those TCMs currently being implemented in the county and summarizes the
implementation characteristics of each, namely: the type of TCM; the adopting agency/agencies;
the agency/agencies responsible for implementing the TCM; the formal agreements between the
5 - 3
adopting and implementing agencies; and, how TCM implementation will be monitored and by
whom.
5.4 EMISSION REDUCTIONS OVERVIEW
During 1992-1993, SBCAG participated with the APCD in a cooperative effort to develop the
Santa Barbara Travel Model using the SYSTEM2 software developed by JHK & Associates. In
preparation of the 1994 CAP, a 1990 baseline travel estimate and a 1996 travel forecast was
developed for the purpose of generating the following three emission estimates: a 1990 baseline
on-road mobile source inventory; a 1996 on-road mobile source emissions forecast without
controls; and, a 1996 on-road mobile source emissions forecast with controls (TCMs). For the
1998 CAP, a revised 1990 baseline travel estimate and a new 1996 base year travel estimate were
developed using the recently re-calibrated Santa Barbara Travel Model. In addition, travel
forecasts for 1999 and 2005, with and without controls, were developed. The transportation
activity data (e.g., regional vehicle miles of travel (VMT), a VMT by speed class distribution, and
regional vehicle trips) generated by the Santa Barbara Travel Model provided the basis for these
on-road mobile source emission estimates. County specific vehicle registration data from the
DMV was also acquired to update the county's vehicle fleet age demographic profile for light duty
autos and trucks.
Calculation of emission reductions from the TCMs for the 1998 Clean Air Plan were analyzed, in
aggregate, using the California Air Resources Board's (ARB) MVEI7G on-road emissions model.
MVEI7G, the successor to the 7F family of emission models used as part of the 1994 CAP, was
approved for use in California by EPA in April 1998. According to the MVEI7G emissions
analysis, implementation of the 1998 CAP TCMs will result in a reduction of .11 tons/day and .09
tons/day of ROG and NOx respectively between 1996 and 1999. A more detailed description of
the emissions analysis is provided in Appendix C.
The ROG emission estimate of 17.42 tons/day and the NOx emission estimate of 22.07 tons/day
establish the new emission budgets for these two ozone precursors. As required by the 1990
CAAA, a comparison of regional on-road mobile source emissions to these budgets will occur
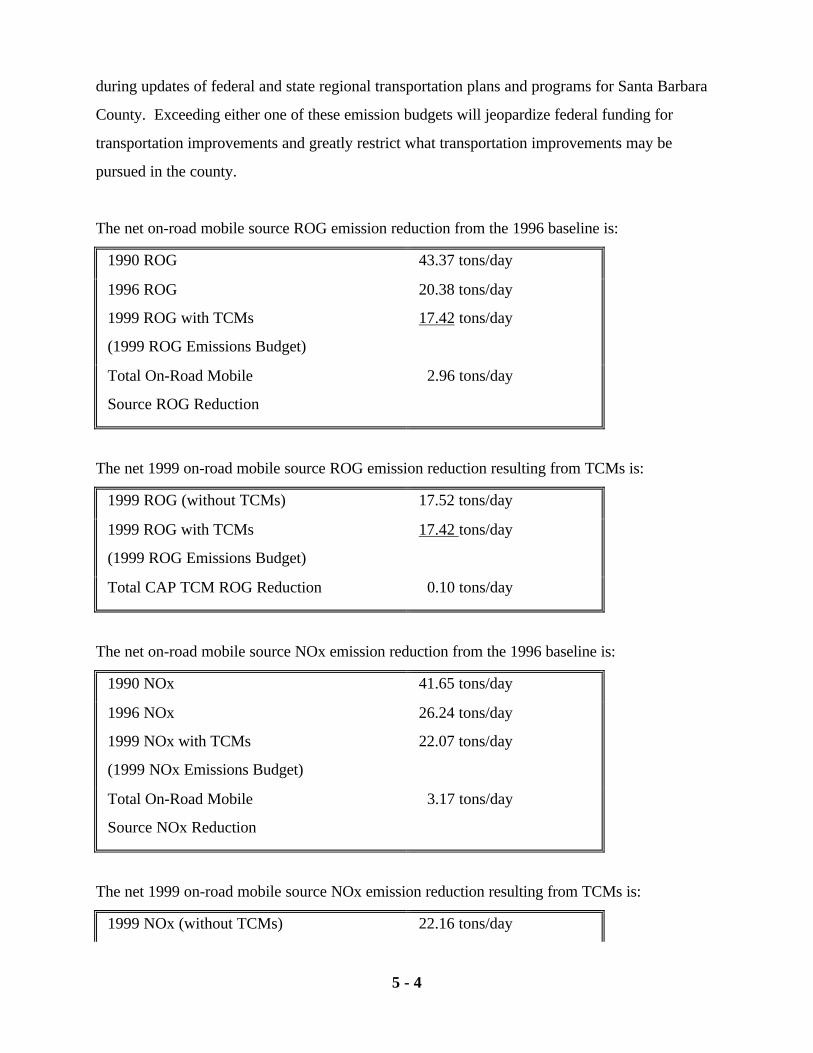
5 - 4
during updates of federal and state regional transportation plans and programs for Santa Barbara
County. Exceeding either one of these emission budgets will jeopardize federal funding for
transportation improvements and greatly restrict what transportation improvements may be
pursued in the county.
The net on-road mobile source ROG emission reduction from the 1996 baseline is:
1990 ROG 43.37 tons/day
1996 ROG
1999 ROG with TCMs
(1999 ROG Emissions Budget)
20.38 tons/day
17.42 tons/day
Total On-Road Mobile
Source ROG Reduction
2.96 tons/day
The net 1999 on-road mobile source ROG emission reduction resulting from TCMs is:
1999 ROG (without TCMs) 17.52 tons/day
1999 ROG with TCMs
(1999 ROG Emissions Budget)
17.42 tons/day
Total CAP TCM ROG Reduction 0.10 tons/day
The net on-road mobile source NOx emission reduction from the 1996 baseline is:
1990 NOx 41.65 tons/day
1996 NOx
1999 NOx with TCMs
(1999 NOx Emissions Budget)
26.24 tons/day
22.07 tons/day
Total On-Road Mobile
Source NOx Reduction
3.17 tons/day
The net 1999 on-road mobile source NOx emission reduction resulting from TCMs is:
1999 NOx (without TCMs) 22.16 tons/day
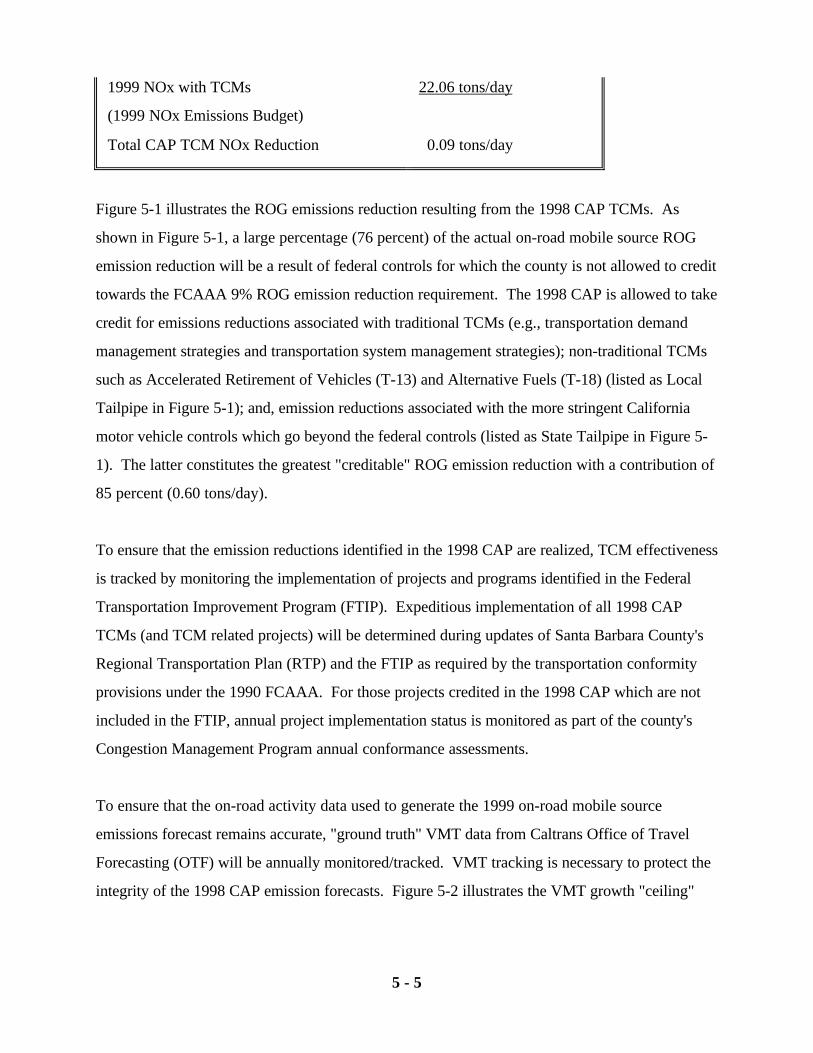
5 - 5
1999 NOx with TCMs
(1999 NOx Emissions Budget)
22.06 tons/day
Total CAP TCM NOx Reduction 0.09 tons/day
Figure 5-1 illustrates the ROG emissions reduction resulting from the 1998 CAP TCMs. As
shown in Figure 5-1, a large percentage (76 percent) of the actual on-road mobile source ROG
emission reduction will be a result of federal controls for which the county is not allowed to credit
towards the FCAAA 9% ROG emission reduction requirement. The 1998 CAP is allowed to take
credit for emissions reductions associated with traditional TCMs (e.g., transportation demand
management strategies and transportation system management strategies); non-traditional TCMs
such as Accelerated Retirement of Vehicles (T-13) and Alternative Fuels (T-18) (listed as Local
Tailpipe in Figure 5-1); and, emission reductions associated with the more stringent California
motor vehicle controls which go beyond the federal controls (listed as State Tailpipe in Figure 5-
1). The latter constitutes the greatest "creditable" ROG emission reduction with a contribution of
85 percent (0.60 tons/day).
To ensure that the emission reductions identified in the 1998 CAP are realized, TCM effectiveness
is tracked by monitoring the implementation of projects and programs identified in the Federal
Transportation Improvement Program (FTIP). Expeditious implementation of all 1998 CAP
TCMs (and TCM related projects) will be determined during updates of Santa Barbara County's
Regional Transportation Plan (RTP) and the FTIP as required by the transportation conformity
provisions under the 1990 FCAAA. For those projects credited in the 1998 CAP which are not
included in the FTIP, annual project implementation status is monitored as part of the county's
Congestion Management Program annual conformance assessments.
To ensure that the on-road activity data used to generate the 1999 on-road mobile source
emissions forecast remains accurate, "ground truth" VMT data from Caltrans Office of Travel
Forecasting (OTF) will be annually monitored/tracked. VMT tracking is necessary to protect the
integrity of the 1998 CAP emission forecasts. Figure 5-2 illustrates the VMT growth "ceiling"
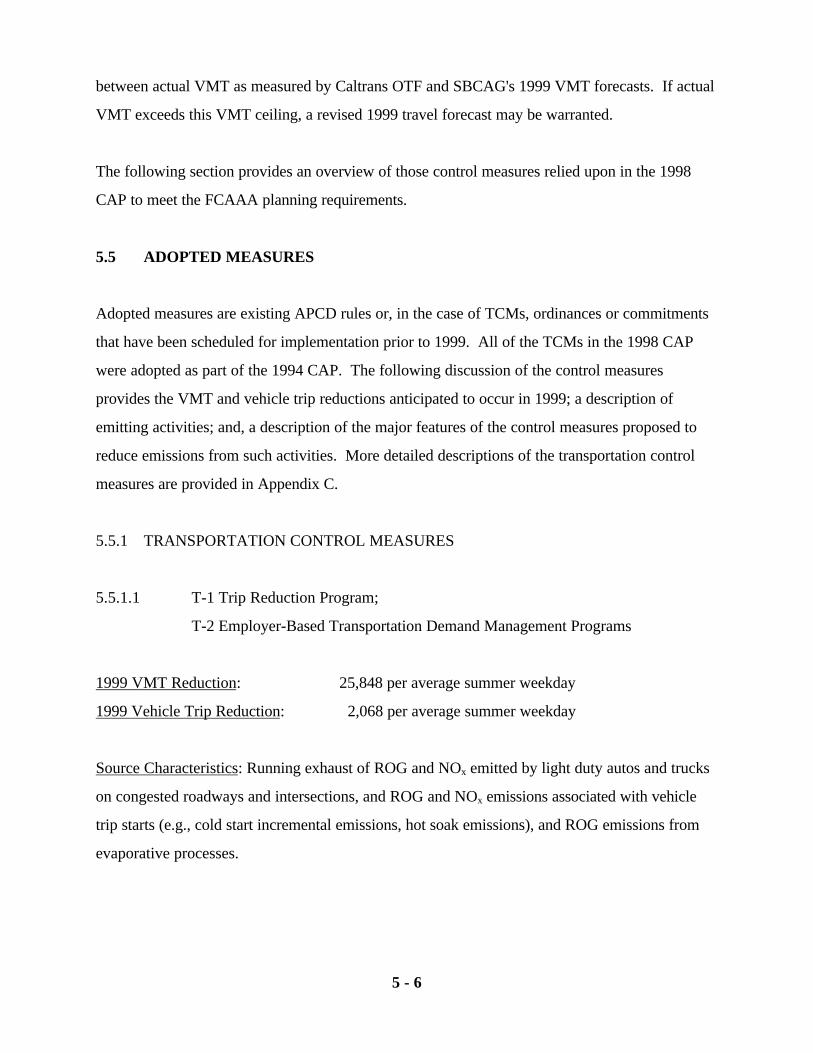
5 - 6
between actual VMT as measured by Caltrans OTF and SBCAG's 1999 VMT forecasts. If actual
VMT exceeds this VMT ceiling, a revised 1999 travel forecast may be warranted.
The following section provides an overview of those control measures relied upon in the 1998
CAP to meet the FCAAA planning requirements.
5.5 ADOPTED MEASURES
Adopted measures are existing APCD rules or, in the case of TCMs, ordinances or commitments
that have been scheduled for implementation prior to 1999. All of the TCMs in the 1998 CAP
were adopted as part of the 1994 CAP. The following discussion of the control measures
provides the VMT and vehicle trip reductions anticipated to occur in 1999; a description of
emitting activities; and, a description of the major features of the control measures proposed to
reduce emissions from such activities. More detailed descriptions of the transportation control
measures are provided in Appendix C.
5.5.1 TRANSPORTATION CONTROL MEASURES
5.5.1.1 T-1 Trip Reduction Program;
T-2 Employer-Based Transportation Demand Management Programs
1999 VMT Reduction: 25,848 per average summer weekday
1999 Vehicle Trip Reduction: 2,068 per average summer weekday
Source Characteristics: Running exhaust of ROG and NOx emitted by light duty autos and trucks
on congested roadways and intersections, and ROG and NOx emissions associated with vehicle
trip starts (e.g., cold start incremental emissions, hot soak emissions), and ROG emissions from
evaporative processes.
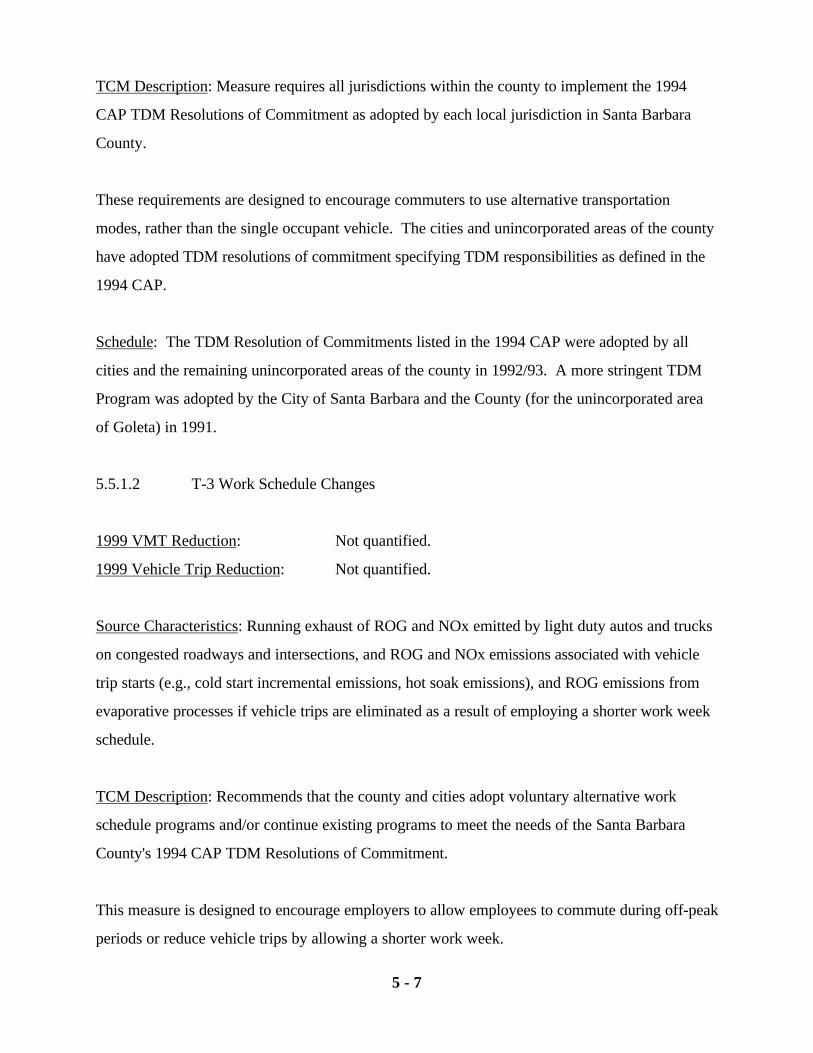
5 - 7
TCM Description: Measure requires all jurisdictions within the county to implement the 1994
CAP TDM Resolutions of Commitment as adopted by each local jurisdiction in Santa Barbara
County.
These requirements are designed to encourage commuters to use alternative transportation
modes, rather than the single occupant vehicle. The cities and unincorporated areas of the county
have adopted TDM resolutions of commitment specifying TDM responsibilities as defined in the
1994 CAP.
Schedule: The TDM Resolution of Commitments listed in the 1994 CAP were adopted by all
cities and the remaining unincorporated areas of the county in 1992/93. A more stringent TDM
Program was adopted by the City of Santa Barbara and the County (for the unincorporated area
of Goleta) in 1991.
5.5.1.2 T-3 Work Schedule Changes
1999 VMT Reduction: Not quantified.
1999 Vehicle Trip Reduction: Not quantified.
Source Characteristics: Running exhaust of ROG and NOx emitted by light duty autos and trucks
on congested roadways and intersections, and ROG and NOx emissions associated with vehicle
trip starts (e.g., cold start incremental emissions, hot soak emissions), and ROG emissions from
evaporative processes if vehicle trips are eliminated as a result of employing a shorter work week
schedule.
TCM Description: Recommends that the county and cities adopt voluntary alternative work
schedule programs and/or continue existing programs to meet the needs of the Santa Barbara
County's 1994 CAP TDM Resolutions of Commitment.
This measure is designed to encourage employers to allow employees to commute during off-peak
periods or reduce vehicle trips by allowing a shorter work week.
5 - 8
Schedule: This measure was adopted in 1994 and has been a County policy since 1988. Greater
opportunities and incentives for implementation of this TCM have been realized through the
City/County TDM Ordinance (T-1,2) implementation efforts.
5.5.1.3 T-4 Areawide Ridesharing
1999 VMT Reduction: Not Quantified (see T-1,2)
1999 Vehicle Trip Reduction: Not Quantified (see T-1,2)
Source Characteristics: Running exhaust of ROG and NOx emitted by light duty autos and trucks
on congested roadways and intersections, and ROG and NOx emissions associated with vehicle
trip starts (e.g., cold start incremental emissions, hot soak emissions), and ROG emissions from
evaporative processes.
TCM Description: Requires the continued operation of SBCAG's Traffic Solutions Division to
meet the increased rideshare demand resulting from the implementation of the Santa Barbara
County's 1994 CAP TDM Resolutions of Commitment.
This measure is designed to increase the use of carpools and vanpools by commuters.
Schedule: This measure was adopted as part of the 1994 CAP and has been actively implemented
in Santa Barbara County since 1982.
5.5.1.4 T-5 Improve Commuter Public Transit Service
1999 VMT Reduction: 3,510 per average summer weekday
1999 Vehicle Trip Reduction: 145 per average summer weekday
Source Characteristics: Running exhaust of ROG emissions emitted by light duty autos and trucks
on congested roadways and intersections, and ROG and NOx emissions associated with vehicle
5 - 9
trip starts (e.g., cold start incremental emissions, hot soak emissions), and ROG emissions from
evaporative processes.
TCM Description: Recommends short range commuter transit service expansion and operational
changes for the Santa Barbara Metropolitan Transit District (SBMTD), Santa Maria Area Transit,
Lompoc Transit, and Santa Ynez Valley Transit, and, continued efforts to provide regional
commuter transit service and expand inter-city passenger rail service in Santa Barbara County.
This measure encourages transit providers to pursue ways to increase the utilization of short
range (bus) and long range commuter oriented public transit systems serving Santa Barbara
County. This is dependent upon the transit providers maintaining and expanding their current
programs.
Schedule: This measure was adopted as part of the 1994 CAP.
5.5.1.5 T-7 Traffic Flow Improvements
1999 VMT Reduction: 0 per average summer weekday
1999 Vehicle Trip Reduction: 0 per average summer weekday
Source Characteristics: Running exhaust of ROG and NOx emitted by light duty autos and trucks
on congested roadways and intersections.
TCM Description: Requires the continuing commitments from the cities and the county in their
efforts toward signal synchronization and road improvements included in the regions Regional
Transportation Plan. Additionally, the measure requires the City and County of Santa Barbara to
consult with SBMTD regarding bus pullouts in the course of planning expansions of any surface
street where average daily traffic is projected to be greater than 10,000 vehicles.
Schedule: This measure was adopted as part of the 1994 CAP.

5 - 10
5.5.1.6 T-8 Parking Management
1999 VMT Reduction: Not Quantified
1999 Vehicle Trip Reduction: Not Quantified
Source Characteristics: Running exhaust of ROG and NOx emitted by light duty autos and trucks
on congested roadways and intersections, and from vehicle trip starts (e.g., cold start incremental
emissions, hot soak emissions), and ROG emissions from evaporative processes.
TCM Description: Recommends that the City of Santa Barbara continue to enforce its current
parking management program and evaluate additional time of day parking restrictions, including
fines and fees, to discourage single occupant vehicle commute parking and 90 minute re-parking
activity by downtown employees.
Schedule: This measure was adopted as part of the 1994 CAP.
5.5.1.7 T-9 Park & Ride and Fringe Parking
1999 VMT Reduction: 3,628 per average summer weekday
1999 Vehicle Trip Reduction: 0 per average summer weekday
Source Characteristics: Running exhaust of ROG and NOx emitted by light duty autos and trucks
on congested roadways and intersections, and ROG and NOx emissions associated with vehicle
trip starts (e.g., cold start incremental emissions, hot soak emissions), and ROG emissions from
evaporative processes.
TCM Description: Recommends the establishment of parking lots on the fringe of urbanized areas
or at remote sites along freeways within Santa Barbara County in order to promote higher
commuter vehicle occupancies and reduce trips.
Schedule: This measure was adopted as part of the 1994 CAP.
5 - 11
5.5.1.8 T-10 Bicycling
1999 VMT Reduction: 426 per average summer weekday
1999 Vehicle Trip Reduction: 142 per average summer weekday
Source Characteristics: Running exhaust of ROG and NOx emitted by light duty autos and trucks
on congested roadways and intersections, and ROG and NOx emissions associated with vehicle
trip starts (e.g., cold start incremental emissions, hot soak emissions), and ROG emissions from
evaporative processes.
TCM Description: Recommends that the county and cities ensure that bicycle needs are integrated
into local planning efforts, including local plans and ordinances, and encourages that federal, state,
and local funding be expeditiously pursued for purposes of completing missing commuter oriented
bikeway segments identified in SBCAG's Regional Bikeway Study and the cities and county's
local Bicycle Master Plans and/or Bikeway Elements of their General Plans.
This measure promotes a shift from auto to bicycle use by either expanding the current bikeway
system or maintaining/upgrading existing facilities. The measure recommends the county and
cities ensure that bicycle needs are integrated into local planning efforts and encourages that
funding sources for bikeway improvements be actively pursued.
Schedule: This measure was adopted as part of the 1994 CAP.
5.5.1.9 T-13 Accelerated Retirement of Vehicles
1999 Emission Reduction: 0.06 tons of ROG per summer weekday
0.02 tons of NOx per summer weekday
Source Characteristics: Running exhaust of ROG and NOx emitted by light duty autos and trucks
on congested roadways and intersections, and ROG and NOx emissions associated with vehicle

5 - 12
trip starts (e.g., cold start incremental emissions, hot soak emissions), and ROG emissions from
evaporative processes.
TCM Description: Recommends that the APCD re-establish the Old Car Buyback Program and
continue efforts to secure funding for its continued implementation after 1999.
This measure allows older more polluting cars to be retired faster than the normal attrition rate for
such vehicles. Removing older vehicles will provide short term (three to five years) emissions
benefits given that older cars are more polluting than newer vehicles.
Schedule: This measure was adopted as part of the 1994 CAP. The program was implemented
between 1993 and 1996 until funding for the program ceased at the end of 1996. This measure
re-establishes the program in 1999.
5.5.1.10 T-17 Telecommunications
1999 VMT Reduction: 2,760 per average summer weekday
1999 Vehicle Trip Reduction: 60 per average summer weekday
Source Characteristics: Running exhaust ROG and NOx emissions emitted by light duty autos and
trucks on congested roadways and intersections, and ROG and NOx emissions associated with
vehicle trip starts (e.g., cold start incremental emissions, hot soak emissions), and ROG emissions
from evaporative processes.
TCM Description: Recommends that city and county agencies and private employers be
encouraged to replace work related travel with teleconferencing, telecommuting, and tele-
education.
Schedule: This measure was adopted as part of the 1994 CAP.

5 - 13
5.5.1.11 T-18 Alternative Fuels
1999 Emission Reduction: 0.0002 tons of ROG per summer weekday
0.002 tons of NOx per summer weekday.
Source Characteristics: Running exhaust of ROG and NOx emitted by heavy and medium duty
urban buses and light duty vehicles.
TCM Description: Recommends an alternate fuel program consisting of four different elements
which demonstrate the applicability of alternative fuels. The first is aimed at demonstrating light
duty vehicle compressed natural gas (CNG), the second is a diesel engine emission reduction
study, the third, a transit bus CNG demonstration program, and the fourth consists of the
operational use of 8 to 10 SBMTD's passenger vans using battery power as the primary fuel
source as a pilot program for electric vehicles.
This measure promotes the use of alternative "clean fuels" as a replacement for conventional
automotive fuels by demonstrating the applicability of these fuels with real-world, on-road
applications.
Schedule: This measure was adopted as part of the 1994 CAP.
5.5.1.12 T-19 Public Education Program
1999 VMT Reduction: Not quantified.
1999 Vehicle Trip Reduction: Not quantified.
Source Characteristics: Running exhaust of ROG and NOx emitted by light duty autos and trucks
on congested roadways and intersections, and ROG and NOx emissions associated with vehicle
trip starts (e.g., cold start incremental emissions, hot soak emissions) and ROG emissions from
evaporative processes.
5 - 14
TCM Description: Requires that the APCD, SBCAG, the cities and the county provide public
education functions/activities to promote public support, cooperation, and compliance with those
measures which reduce ozone precursor gas emissions (e.g., ROG and NOx).
Schedule: This measure was adopted as part of the 1994 CAP.
5.6 CONTINGENCY MEASURES
Contingency measures are emission control programs to be implemented if the county does not
achieve attainment of the federal 1-hour ozone standard by 1999.
5.6.1 TRANSPORTATION CONTROL MEASURES
5.6.1.1 T-21 Enhanced Inspection and Maintenance Program
2005 Emission Reduction1: 4.29 tons of ROG per summer weekday
3.07 tons of NOx per summer weekday
Source Characteristics: This emission control program is designed to reduce running emissions of
ROG and NOx from gasoline powered on-road motor vehicles.
Program Description: Requires restructuring the Inspection Maintenance (Smog Check II)
program currently being implemented in Santa Barbara County and throughout much of the State
of California to meet federal requirements for implementing an Enhanced I/M program. For Santa
Barbara County, restructuring of the current I/M program entails upgrading its decentralized
program to allow: testing fuel system evaporative emission controls; NOx emission testing; using
recently developed high technology testing equipment; additional enforcement capabilities through
1 Emission reduction estimates from this measure were generated by the MVEI7G model which does not reflect recent legislativechanges to the Enhanced I/M Program. Given that several elements of the Enhanced I/M Program have been relaxed, these reductionsshould be considered overly optimistic.

5 - 15
roadside testing of emissions; and, a high emitter profile element which will include checks at "test
only" stations.
The current Smog Check Program as implemented in Santa Barbara County is a decentralized
program comprised of visual inspections of emission components and tailpipe emission tests.
Legislative and executive passage of a federally approved Enhanced Inspection and Maintenance
bill was passed in April 1994 in California. The Enhance I/M bill was amended in October 1997
delaying implementation in Serious and above nonattainment areas until May 1998. The Bureau
of Automotive Repair, the implementing agency of this measure, has tiered its implementation
towards those areas with the worst air quality first. Consequently, Santa Barbara County is not
scheduled for Enhanced I/M implementation. Depending if the 1-hour ozone standard is achieved
by 1999, the APCD will choose whether to opt-in to an upgraded decentralized program.
Schedule: This measure was adopted as a contingency measure in the 1994 CAP. Due to delays
in program implementation at the state level, this measure is not scheduled for implementation
until the emission reductions and cost effectiveness of the program is first demonstrated in the
more polluted areas of the state (e.g., Los Angeles, Ventura).
5.6.1.2 T-22 Mandatory Employer Trip Reduction Program
2005 Emission Reduction: 30,840 per average summer weekday
5,140 per average summer weekday
Source Characteristics: This emission control program is designed to reduce running emissions of
ROG and NOx from gasoline powered on-road motor vehicles.
Program Description: Running exhaust of ROG and NOx emitted by light duty autos and trucks
on congested roadways and intersections, and ROG and NOx emissions associated with vehicle
trip starts (e.g., cold start incremental emissions, hot soak emissions), and ROG emissions from
evaporative processes.
5 - 16
TCM Description: Measure requires all employers within the county with 100 employees or more
to implement an employee trip reduction program consistent with the federal Employee Commute
Option (ECO) requirements for severe and worse nonattainment areas. Amendments to the ECO
requirements of the Clean Air Act does allow affected employers to implement alternative
measures that will achieve equivalent or greater emission reductions anticipated from the ECO
program. If pursued by affected employers, alternative emission reduction plans will be evaluated
on a case by case basis.
This program is designed to encourage commuters to use alternative transportation modes, rather
than the single occupant vehicle.
Schedule: This measure is scheduled for implementation 1999 with full implementation by 2000
if the county does not achieve attainment of the 1-hour federal ozone standard.
5.7 CALIFORNIA AIR RESOURCES BOARD CONTROL MEASURES
The ARB has adopted regulations that reduce pollution from mobile sources. The following
sections summarize these ARB control measures. This discussion emphasizes only those
programs that will reduce emissions by the end of 1999.
5.7.1 ARB EMISSION STANDARDS FOR ON-ROAD VEHICLES
1999 ROG Emission Reduction: .60 tons per average summer weekday
Note that the reductions above can be credited under the FCAAA. That is, under the Act, credit
can be taken for emission reductions over and above those that would be realized by the federal
emission standards.
Source Characteristics: ARB regulations apply to all on-road motor vehicles, including cars,
trucks, and buses.
5 - 17
Program Description: The state of California has led the nation in controlling pollution from
automobiles. Cars manufactured for sale in California are required to meet more stringent
emission limits than those manufactured for sale in the rest of the nation. As a result, air quality
has improved substantially in most areas of the state despite large increases in population. This
emphasis will continue as a result of California's recent adoption of more aggressive auto
pollution standards. State regulation will require the use of vehicles using alternative fuels. Other
states have opted to follow California's lead. The elements of California's vehicle emission
controls are listed below.
1. Enhanced Vehicle Inspection and Maintenance (Smog Check II)
2. On-board Diagnostic Systems (Phases 1 and 2)
3. Expanded Compliance Testing
4. Certification of Aftermarket Catalytic Converters
5. Revised In-Use Recall Regulations
6. Emission Control System Warranty Requirements
7. Light-Duty Vehicle Aftermarket Parts Program
8. Heavy-Duty Vehicle Smoke Enforcement Program
9. New and Used Import Vehicle Certification Regulations
10. Standards for Gas and Diesel-Powered Heavy-Duty Engines
11. Standards of 0.4 Gram NOx per Mile for Light- and Medium-Duty Vehicles
12. Lower HC and CO Standard for Light-Duty Vehicles
13. New Diesel Fuel Quality Standard
14. Revised Standards and Tests for Medium- and Light-Heavy-Duty Engines
15. Revised Evaporative Emission Test Procedures
16. Low Emission Vehicles and Clean Fuels Program
17. Methanol, LPG, and CNG Emission Standards (1989/1990)
18. Improved Certification Requirements for Alternate Fuels Retrofit
19. New Gasoline Specifications
20. Enhancement to Smog Check Program
21. Smog Check for Light-Duty Diesel Vehicles
22. Smog Check for Fleet Heavy-Duty Trucks
5 - 18
23. Heavy-Duty Bus Particulate Trap Retrofit
24. Control of Off-Cycle Emissions
25. Low Emission Vehicle Standards for Heavy-Duty Engines
5.8 1998 CLEAN AIR PLAN TCM PROJECTS
The remainder of this chapter describes the specific programmed projects identified in the 1998
CAP. These projects augment the emission reduction benefits of those projects implemented as
part of the 1994 CAP.
5.8.1 1994 Clean Air Plan
The most recent EPA-approved State Implementation Plan (SIP) for Santa Barbara County is the
1994 CAP. Given that some 1994 TCMs were based on the implementation of specific
programmed projects and that implementation of those projects effectively renders them obsolete
with respect to achieving "new" emission reductions, additional projects are needed to reduce
emissions from on-road mobile sources for the 1998 CAP. A description of the 1994 CAP
TCMs, the specific programmed projects implemented to promote the TCMs, and their
implementation status is provided in Table 5-2. Table 5-3 lists the TCM projects relied upon in
the 1998 CAP. For a more detailed description of the 1998 CAP TCMs and TCM related
programmed projects, refer to Appendix C.
5.9 CONCLUSIONS
This chapter has presented the transportation control measure portion of Santa Barbara County's
Comprehensive Air Pollution Control Strategy. These measures are designed to help reduce
ozone levels to meet the federal 1-hour ozone standard by 1999; establish ROG and NOx
emission budgets for transportation conformity purposes; and, help demonstrate compliance with
the 9% ROG emission reduction requirement.

5 - 19

5 - 20

5 - 21

5 - 22

5 - 23

5 - 24
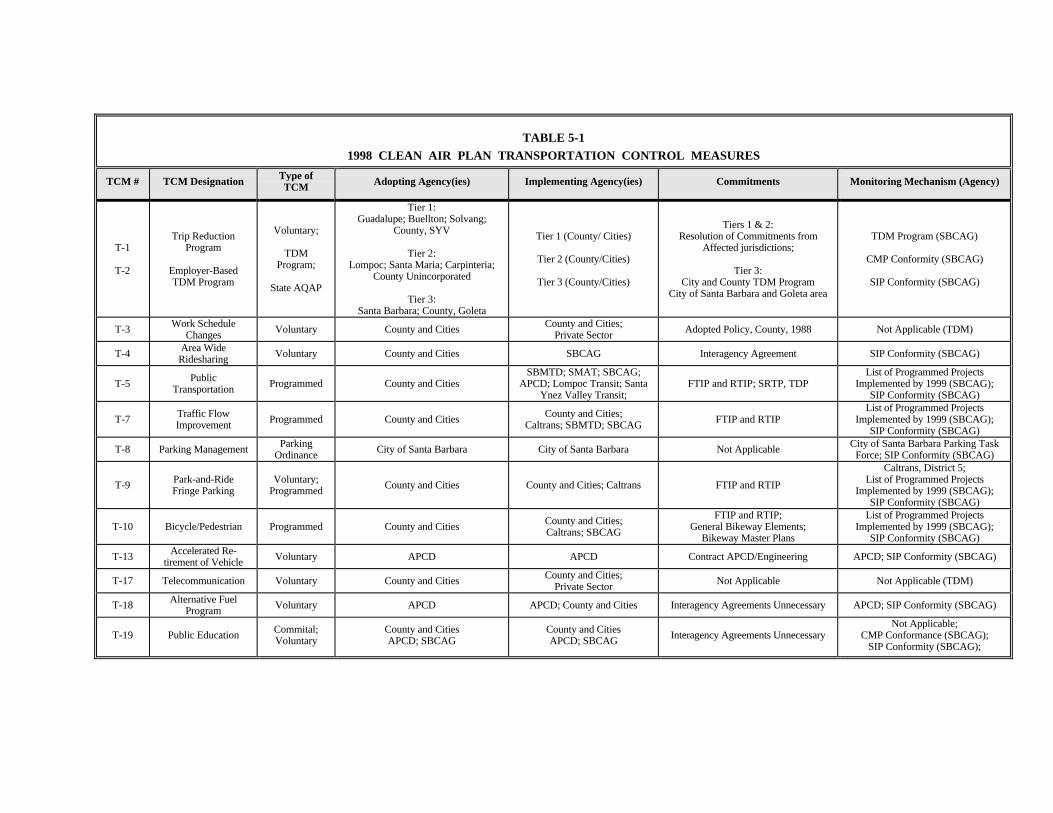
TABLE 5-11998 CLEAN AIR PLAN TRANSPORTATION CONTROL MEASURES
TCM # TCM Designation Type ofTCM Adopting Agency(ies) Implementing Agency(ies) Commitments Monitoring Mechanism (Agency)
T-1
T-2
Trip ReductionProgram
Employer-BasedTDM Program
Voluntary;
TDMProgram;
State AQAP
Tier 1:Guadalupe; Buellton; Solvang;
County, SYV
Tier 2:Lompoc; Santa Maria; Carpinteria;
County Unincorporated
Tier 3:Santa Barbara; County, Goleta
Tier 1 (County/ Cities)
Tier 2 (County/Cities)
Tier 3 (County/Cities)
Tiers 1 & 2:Resolution of Commitments from
Affected jurisdictions;
Tier 3:City and County TDM Program
City of Santa Barbara and Goleta area
TDM Program (SBCAG)
CMP Conformity (SBCAG)
SIP Conformity (SBCAG)
T-3 Work ScheduleChanges Voluntary County and Cities County and Cities;
Private Sector Adopted Policy, County, 1988 Not Applicable (TDM)
T-4 Area WideRidesharing Voluntary County and Cities SBCAG Interagency Agreement SIP Conformity (SBCAG)
T-5 PublicTransportation Programmed County and Cities
SBMTD; SMAT; SBCAG;APCD; Lompoc Transit; Santa
Ynez Valley Transit;FTIP and RTIP; SRTP, TDP
List of Programmed ProjectsImplemented by 1999 (SBCAG);
SIP Conformity (SBCAG)
T-7 Traffic FlowImprovement Programmed County and Cities County and Cities;
Caltrans; SBMTD; SBCAG FTIP and RTIPList of Programmed Projects
Implemented by 1999 (SBCAG);SIP Conformity (SBCAG)
T-8 Parking Management ParkingOrdinance City of Santa Barbara City of Santa Barbara Not Applicable City of Santa Barbara Parking Task
Force; SIP Conformity (SBCAG)
T-9 Park-and-RideFringe Parking
Voluntary;Programmed County and Cities County and Cities; Caltrans FTIP and RTIP
Caltrans, District 5;List of Programmed Projects
Implemented by 1999 (SBCAG);SIP Conformity (SBCAG)
T-10 Bicycle/Pedestrian Programmed County and Cities County and Cities;Caltrans; SBCAG
FTIP and RTIP;General Bikeway Elements;
Bikeway Master Plans
List of Programmed ProjectsImplemented by 1999 (SBCAG);
SIP Conformity (SBCAG)
T-13 Accelerated Re-tirement of Vehicle Voluntary APCD APCD Contract APCD/Engineering APCD; SIP Conformity (SBCAG)
T-17 Telecommunication Voluntary County and Cities County and Cities;Private Sector Not Applicable Not Applicable (TDM)
T-18 Alternative FuelProgram Voluntary APCD APCD; County and Cities Interagency Agreements Unnecessary APCD; SIP Conformity (SBCAG)
T-19 Public Education Commital;Voluntary
County and CitiesAPCD; SBCAG
County and CitiesAPCD; SBCAG Interagency Agreements Unnecessary
Not Applicable;CMP Conformance (SBCAG);
SIP Conformity (SBCAG);

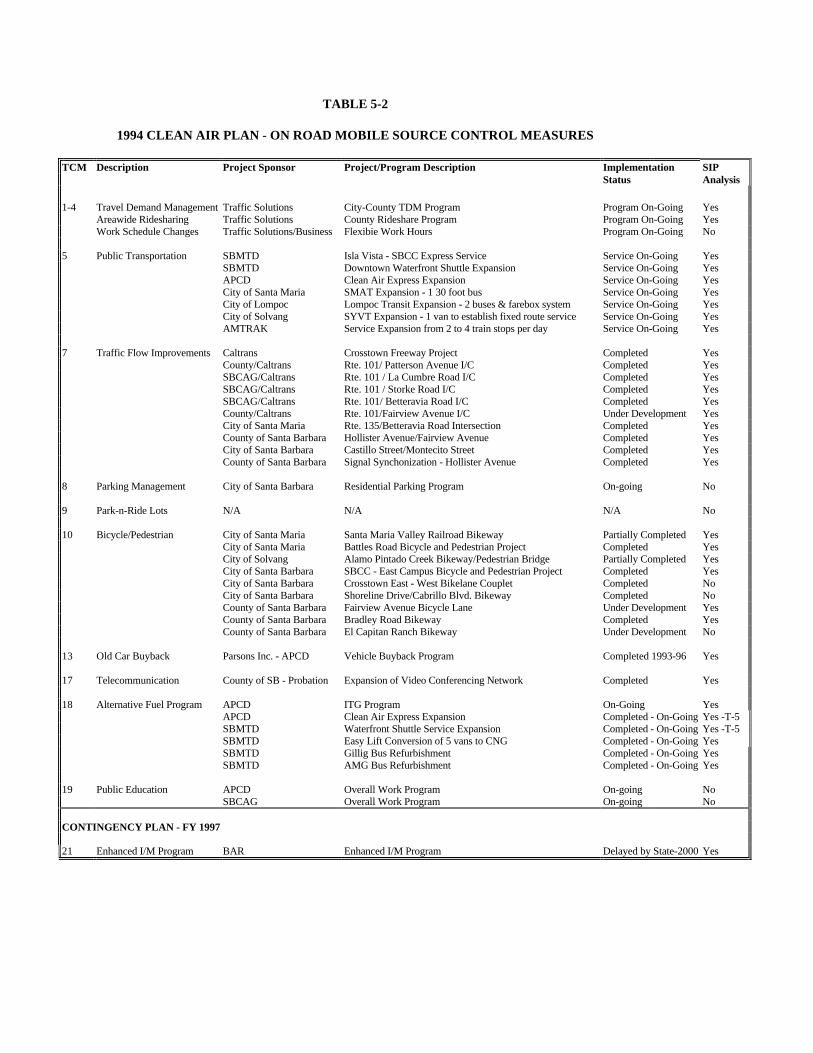
TABLE 5-2
1994 CLEAN AIR PLAN - ON ROAD MOBILE SOURCE CONTROL MEASURES
TCM Description Project Sponsor Project/Program Description Implementation SIPStatus Analysis
1-4 Travel Demand Management Traffic Solutions City-County TDM Program Program On-Going YesAreawide Ridesharing Traffic Solutions County Rideshare Program Program On-Going YesWork Schedule Changes Traffic Solutions/Business Flexibie Work Hours Program On-Going No
5 Public Transportation SBMTD Isla Vista - SBCC Express Service Service On-Going YesSBMTD Downtown Waterfront Shuttle Expansion Service On-Going YesAPCD Clean Air Express Expansion Service On-Going YesCity of Santa Maria SMAT Expansion - 1 30 foot bus Service On-Going YesCity of Lompoc Lompoc Transit Expansion - 2 buses & farebox system Service On-Going YesCity of Solvang SYVT Expansion - 1 van to establish fixed route service Service On-Going YesAMTRAK Service Expansion from 2 to 4 train stops per day Service On-Going Yes
7 Traffic Flow Improvements Caltrans Crosstown Freeway Project Completed YesCounty/Caltrans Rte. 101/ Patterson Avenue I/C Completed YesSBCAG/Caltrans Rte. 101 / La Cumbre Road I/C Completed YesSBCAG/Caltrans Rte. 101 / Storke Road I/C Completed YesSBCAG/Caltrans Rte. 101/ Betteravia Road I/C Completed YesCounty/Caltrans Rte. 101/Fairview Avenue I/C Under Development YesCity of Santa Maria Rte. 135/Betteravia Road Intersection Completed YesCounty of Santa Barbara Hollister Avenue/Fairview Avenue Completed YesCity of Santa Barbara Castillo Street/Montecito Street Completed YesCounty of Santa Barbara Signal Synchonization - Hollister Avenue Completed Yes
8 Parking Management City of Santa Barbara Residential Parking Program On-going No
9 Park-n-Ride Lots N/A N/A N/A No
10 Bicycle/Pedestrian City of Santa Maria Santa Maria Valley Railroad Bikeway Partially Completed YesCity of Santa Maria Battles Road Bicycle and Pedestrian Project Completed YesCity of Solvang Alamo Pintado Creek Bikeway/Pedestrian Bridge Partially Completed YesCity of Santa Barbara SBCC - East Campus Bicycle and Pedestrian Project Completed YesCity of Santa Barbara Crosstown East - West Bikelane Couplet Completed NoCity of Santa Barbara Shoreline Drive/Cabrillo Blvd. Bikeway Completed NoCounty of Santa Barbara Fairview Avenue Bicycle Lane Under Development YesCounty of Santa Barbara Bradley Road Bikeway Completed YesCounty of Santa Barbara El Capitan Ranch Bikeway Under Development No
13 Old Car Buyback Parsons Inc. - APCD Vehicle Buyback Program Completed 1993-96 Yes
17 Telecommunication County of SB - Probation Expansion of Video Conferencing Network Completed Yes
18 Alternative Fuel Program APCD ITG Program On-Going YesAPCD Clean Air Express Expansion Completed - On-Going Yes -T-5SBMTD Waterfront Shuttle Service Expansion Completed - On-Going Yes -T-5SBMTD Easy Lift Conversion of 5 vans to CNG Completed - On-Going YesSBMTD Gillig Bus Refurbishment Completed - On-Going YesSBMTD AMG Bus Refurbishment Completed - On-Going Yes
19 Public Education APCD Overall Work Program On-going NoSBCAG Overall Work Program On-going No
CONTINGENCY PLAN - FY 1997
21 Enhanced I/M Program BAR Enhanced I/M Program Delayed by State-2000 Yes
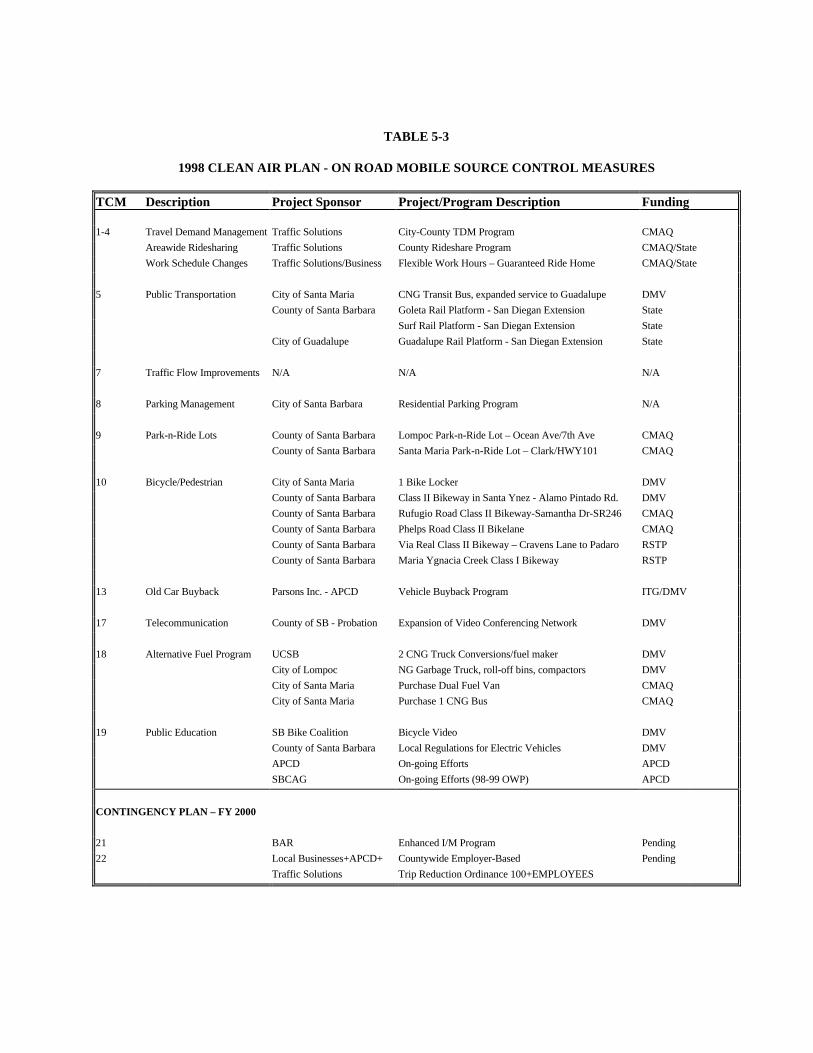
TABLE 5-3
1998 CLEAN AIR PLAN - ON ROAD MOBILE SOURCE CONTROL MEASURES
TCM Description Project Sponsor Project/Program Description Funding
1-4 Travel Demand Management Traffic Solutions City-County TDM Program CMAQ
Areawide Ridesharing Traffic Solutions County Rideshare Program CMAQ/State
Work Schedule Changes Traffic Solutions/Business Flexible Work Hours – Guaranteed Ride Home CMAQ/State
5 Public Transportation City of Santa Maria CNG Transit Bus, expanded service to Guadalupe DMV
County of Santa Barbara Goleta Rail Platform - San Diegan Extension State
Surf Rail Platform - San Diegan Extension State
City of Guadalupe Guadalupe Rail Platform - San Diegan Extension State
7 Traffic Flow Improvements N/A N/A N/A
8 Parking Management City of Santa Barbara Residential Parking Program N/A
9 Park-n-Ride Lots County of Santa Barbara Lompoc Park-n-Ride Lot – Ocean Ave/7th Ave CMAQ
County of Santa Barbara Santa Maria Park-n-Ride Lot – Clark/HWY101 CMAQ
10 Bicycle/Pedestrian City of Santa Maria 1 Bike Locker DMV
County of Santa Barbara Class II Bikeway in Santa Ynez - Alamo Pintado Rd. DMV
County of Santa Barbara Rufugio Road Class II Bikeway-Samantha Dr-SR246 CMAQ
County of Santa Barbara Phelps Road Class II Bikelane CMAQ
County of Santa Barbara Via Real Class II Bikeway – Cravens Lane to Padaro RSTP
County of Santa Barbara Maria Ygnacia Creek Class I Bikeway RSTP
13 Old Car Buyback Parsons Inc. - APCD Vehicle Buyback Program ITG/DMV
17 Telecommunication County of SB - Probation Expansion of Video Conferencing Network DMV
18 Alternative Fuel Program UCSB 2 CNG Truck Conversions/fuel maker DMV
City of Lompoc NG Garbage Truck, roll-off bins, compactors DMV
City of Santa Maria Purchase Dual Fuel Van CMAQ
City of Santa Maria Purchase 1 CNG Bus CMAQ
19 Public Education SB Bike Coalition Bicycle Video DMV
County of Santa Barbara Local Regulations for Electric Vehicles DMV
APCD On-going Efforts APCD
SBCAG On-going Efforts (98-99 OWP) APCD
CONTINGENCY PLAN – FY 2000
21 BAR Enhanced I/M Program Pending
22 Local Businesses+APCD+ Countywide Employer-Based Pending
Traffic Solutions Trip Reduction Ordinance 100+EMPLOYEES
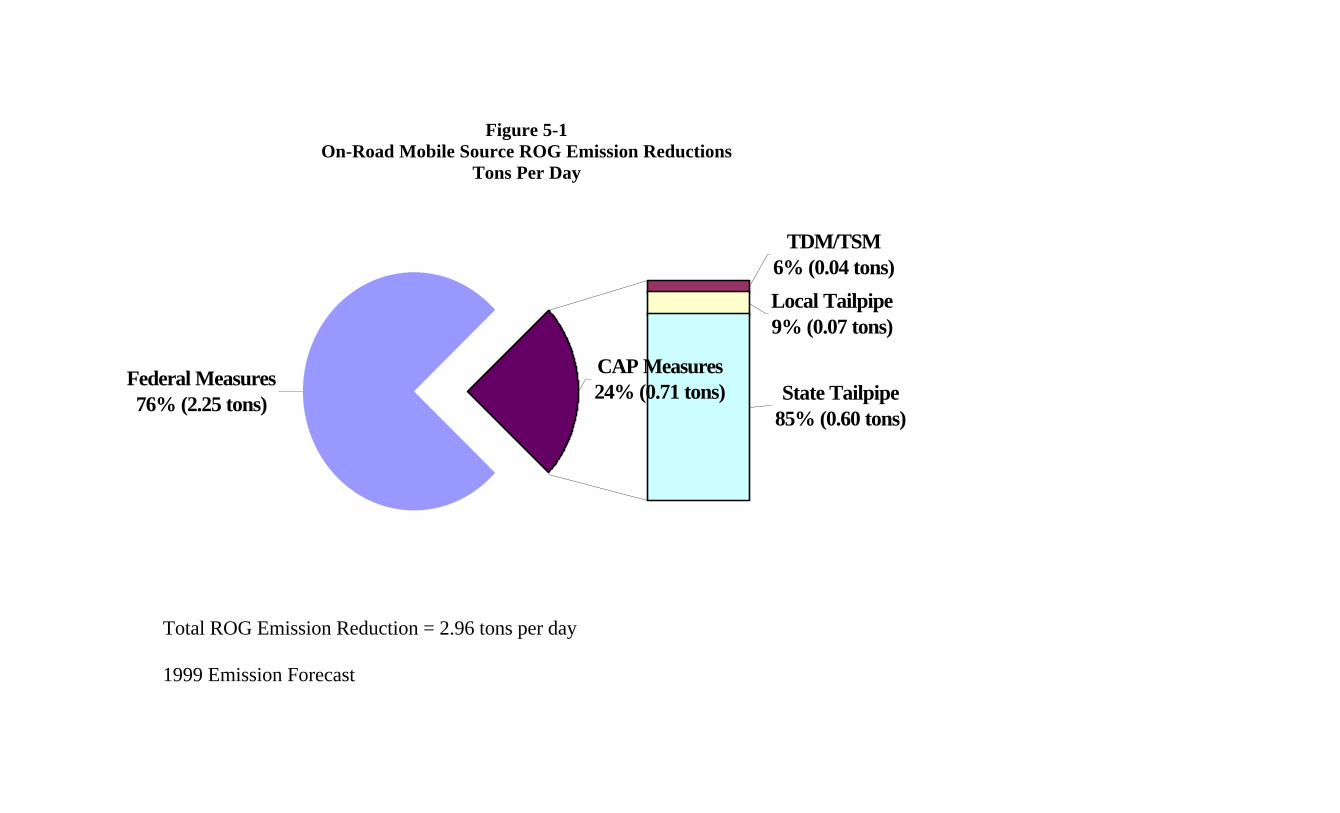
Figure 5-1On-Road Mobile Source ROG Emission Reductions
Tons Per Day
CAP Measures24% (0.71 tons)
TDM/TSM6% (0.04 tons)
Local Tailpipe9% (0.07 tons)
State Tailpipe85% (0.60 tons)
Federal Measures76% (2.25 tons)
Total ROG Emission Reduction = 2.96 tons per day
1999 Emission Forecast
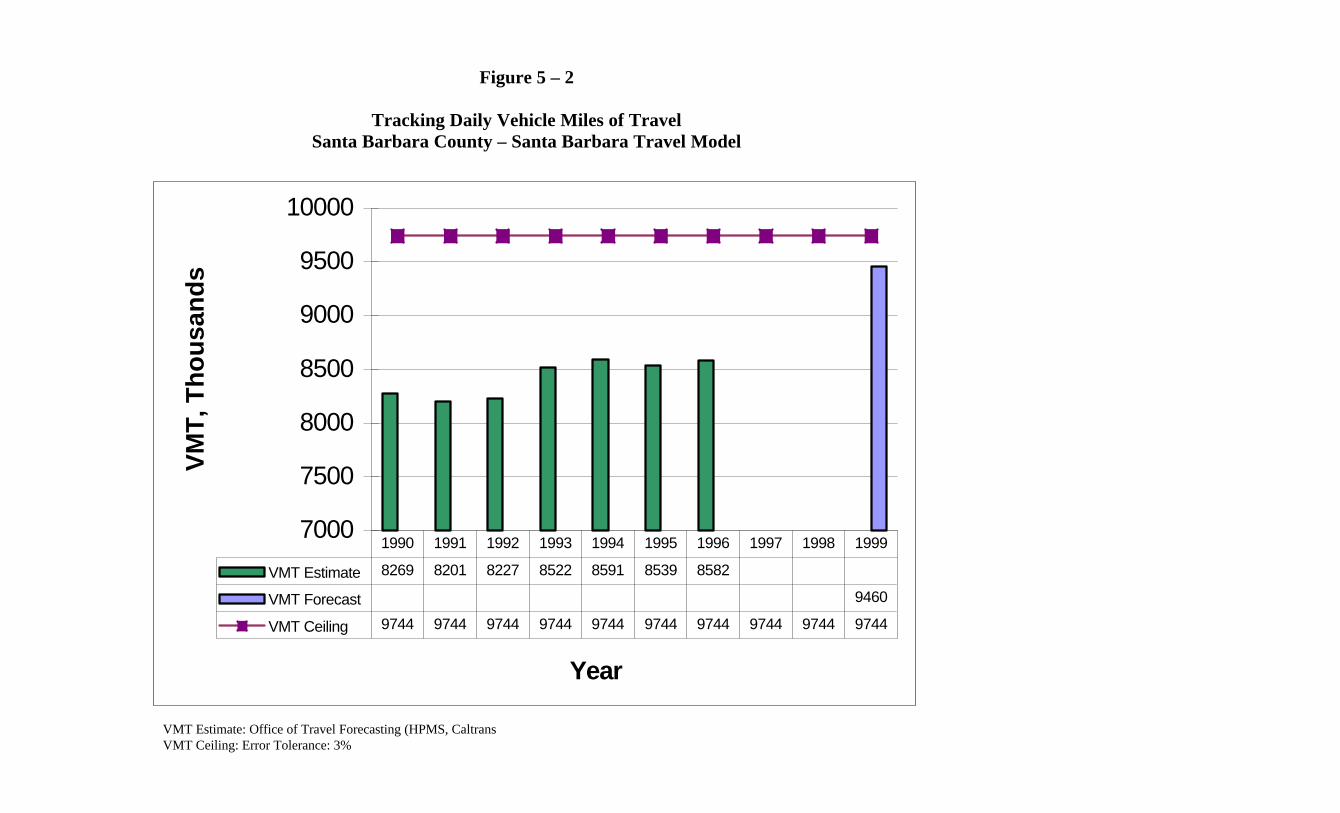
Figure 5 – 2
Tracking Daily Vehicle Miles of TravelSanta Barbara County – Santa Barbara Travel Model
7000
7500
8000
8500
9000
9500
10000
Year
VM
T, T
ho
usa
nd
s
VMT Estimate 8269 8201 8227 8522 8591 8539 8582
VMT Forecast 9460
VMT Ceiling 9744 9744 9744 9744 9744 9744 9744 9744 9744 9744
1990 1991 1992 1993 1994 1995 1996 1997 1998 1999
VMT Estimate: Office of Travel Forecasting (HPMS, CaltransVMT Ceiling: Error Tolerance: 3%
CHAPTER 6
EMISSION FORECASTING
Introduction
Emission Forecast
Emission Inventories
Conclusions

6 - 1
6. EMISSION FORECASTING
6.1 INTRODUCTION
This chapter presents emission inventories for reactive organic gases (ROG), oxides of nitrogen (NOx),
and carbon monoxide (CO) emissions in Santa Barbara County and the Outer Continental Shelf
(OCS), offshore of Santa Barbara County. These inventories are the 1996 Planning Emission
Inventory, 1999 Planning Emission Inventory Forecast, and 2005 Planning Emission Inventory
Forecast.
The 1999 Planning Emission Inventory Forecast is used to determine if the Clean Air Plan’s (CAP)
emission control strategies will achieve a 24% reduction in ROG emissions between 1990 and 1999.
Per USEPA guidance, the 24% reduction in ROG emissions represents a combination of the 15%
ROG emission reduction required by 1996 under Section 182(b) plus a 9% ROG emission reduction
required by 1999 under Section 182(c). The 1999 Planning Emission Inventory Forecast is also used
to corroborate emission ratio techniques used by the ARB in photochemical modeling to demonstrate
attainment of the 1-hour federal ozone standard by 1999.
The 2005 Planning Emission Inventory Forecast is prepared to assess emission trends at the attainment
date specified for “severe” nonattainment areas (“severe” is the next higher classification beyond our
current status of “serious”.) This inventory provides an advanced view of future emission levels that
we may have to analyze if we fail to attain the 1-hour federal ozone standard by 1999 and to assess
emission reductions needed to attain the new federal 8-hour ozone standard. Thus, the 2005 Planning
Emission Inventory Forecast is informational in nature and has no specific regulatory requirement at
this time.
Both the 1999 and 2005 Planning Emission Inventory Forecasts are based on the 1996 Annual
Emission Inventory. As discussed in Chapter 3, numerous changes, specifically updated emission
factors and calculation methodologies, were implemented between 1990 and 1996. The 1996 Annual
Emission Inventory is the most current and accurate inventory available. This inventory was used for
6 - 2
the forecasts, and has been converted to the 1996 Planning Emission Inventory. A Planning Emission
Inventory (PEI) is essentially a modified subset of an Annual Emission Inventory (AEI) and
contains the following differences. First, annual emissions from the AEI are converted to daily
emissions in the PEI. Second, an AEI contains the ozone precursor pollutants of ROG, NOx, and
CO, as well as SOx and PM. The PEI only contains the three ozone precursor pollutants, (ROG,
NOx, and CO). Third, the creation of the PEI involves adjusting the AEI to account for seasonal
variation because most exceedances of the federal 1-hour ozone standard occur during the April
to October ozone season. And lastly, the emissions from natural sources such as biogenics, oil
and gas seeps, and wildfires that are in the AEI are excluded from the PEI since they are not
currently regulated through implementation of emission control measures.
6.2 EMISSION FORECAST
To forecast future year emissions, estimates of the changes in the level of pollution producing activities
are applied to the 1996 Planning Emission Inventory. In addition, emission reductions resulting from
local controls adopted by the APCD Board of Directors after 1990 and from state-wide regulations
adopted by the California Air Resources Board (ARB) are estimated and subtracted from the emission
inventory.
The 1999 Planning Emission Inventory Forecast of emissions is used to demonstrate that the emission
control measures, described in Chapters 4 and 5 of this plan, will reduce enough emissions to achieve
the Rate-of-Progress target level and federal 1-hour ozone standard in 1999. (Future Air Quality is
discussed in Chapter 7 and the Rate-of-Progress is discussed in Chapter 9.)
One special adjustment that is made to the forecast inventories is the accounting of emission reduction
credits (ERCs) that were banked prior to 1990. ERC’s are previous reductions in emissions that can
be credited to allow increased emissions from a new or modified stationary source. USEPA policy
mandates that pre-1990 ERC’s must be treated as potential growth in forecast years. Currently, only
Vandenberg Air Force Base has banked ERC’s that may be used toward future growth. Total
available ERC’s from Vandenberg Air Force Base as of the 4th quarter 1996 were 0.003 tons per day
6 - 3
ROG, 0.173 tons per day NOx, 0.01 tons per day SOx, 0.049 tons per day CO, and 0.054 tons per day
PM.
6.2.1 ACTIVITY INDICATORS
Forecasting quantities of pollution in future years is accomplished by assuming that the amount of
pollution is related to activity levels of selected activity indicators. Examples of activity indicators
include population, housing, employment, oil production, number of producing oil wells, daily vehicle
miles traveled, and daily vehicle starts. The Santa Barbara County Association of Governments
(SBCAG) was the source for several of the activity indicator estimates. The California Air Resources
Board, and other state and local agencies also contributed activity data. These data represent the best
available estimates of future activity levels for the county. The activity factor is the ratio of the 1999
and 2005 forecast levels of activity to the 1996 level of activity. An activity factor greater than one
indicates an increase in growth, while an activity factor of less than one indicates a decline in growth
for each activity relative to 1996. Table 6-7 provides the 1996 level of activity, the predicted 1999 and
2005 levels of activity, the activity factors, and the source of the forecast for each of the activity
indicators.
An activity indicator was assigned to each Stationary Source and Area-Wide Source category
described in Chapter 3, with the exception of the On-Road Motor Vehicle source category. To
forecast future year emissions, the quantity of emissions from each source in 1996 is multiplied by the
activity factor of its assigned activity indicator. The resulting quantities predict the future year
emissions that would result if no additional controls were implemented after 1990. The assignments of
activity indicators to emission sources are documented in Appendix A, Emission Inventory and
Forecasting Documentation.
The forecasting of On-Road Motor Vehicle emissions was conducted differently from the other
components of the inventory. On-Road Motor Vehicles emissions are forecast by SBCAG for each
class of vehicle using activity data generated by the SBCAG Travel Model. This vehicle activity data is
then used as input to other emission models to estimate the On-Road Motor Vehicle Emission
Inventory for the forecast years.
6 - 4
6.2.2 CONTROL MEASURES
The next step in forecasting future year emissions is to account for regulations and control measures
scheduled for implementation since 1990. Emission reductions are achieved through implementation of
federal, state and local controls on a variety of pollution sources, including Stationary Sources, Area-
Wide Sources, and Mobile Sources.
The emissions from each source were reduced according to the expected efficiency of any control
measures that apply to that source, taking into account any existing level of control. The efficiencies
for each control measure and how they are calculated are provided in Appendix B, Stationary Source
Emission Control Documentation. Estimated efficiencies take into account equipment (design)
efficiencies, exemptions, phased implementations, and expected rates of compliance (assumed to be a
default 80%, as recommended in USEPA guidelines). The resulting emissions after the application of
control measures represent a forecast seasonally adjusted emission inventory. A detailed accounting of
forecast emissions after control measure implementation for each source category is presented in
Appendix A.
6.3 EMISSION INVENTORIES
The following is a summary of the 1996 Planning Emission Inventory, the 1999 Planning Emission
Inventory Forecast, and the 2005 Planning Emission Inventory Forecast for both Santa Barbara
County and the Outer Continental Shelf (OCS).
6.3.1 1996 PLANNING EMISSION INVENTORY: SANTA BARBARA COUNTY
ROG Emissions: 41.37 tons per day
• 22.4% Stationary Sources: 9.27 tons per day
1.9% Fuel Combustion
1.0% Waste Disposal
10.5% Cleaning and Surface Coatings
6 - 5
8.7% Petroleum Production and Marketing
0.3% Industrial Processes
• 22.0% Area-Wide Sources: 9.09 tons per day
19.4% Solvent Evaporation
2.6% Miscellaneous
• 55.6% Mobile Sources: 23.00 tons per day
49.3% On-Road Motor Vehicles
6.3% Other Mobile Sources
NOx Emissions: 45.54 tons per day
• 19.4% Stationary Sources: 8.85 tons per day
19.0% Fuel Combustion
0.1% Waste Disposal
0.3% Petroleum Production and Marketing
• 1.3% Area-Wide Sources: 0.58 tons per day
1.3% Miscellaneous
• 79.3% Mobile Sources: 36.11 tons per day
55.4% On-Road Motor Vehicles
23.9% Other Mobile Sources
CO Emissions: 235.99 tons per day
• 2.9% Stationary Sources: 6.77 tons per day
2.6% Fuel Combustion
0.2% Petroleum Production and Marketing
0.1% Industrial Processes
• 4.7% Area-Wide Sources: 11.15 tons per day
4.7% Miscellaneous
• 92.4% Mobile Sources: 218.06 tons per day
78.9% On-Road Motor Vehicles
13.5% Other Mobile Sources
6 - 6
6.3.2 1999 PLANNING EMISSION INVENTORY FORECAST: SANTA BARBARA COUNTY
ROG Emissions: 38.93 tons per day
• 22.6% Stationary Sources: 8.79 tons per day
2.2% Fuel Combustion
1.0% Waste Disposal
10.4% Cleaning and Surface Coatings
8.6% Petroleum Production and Marketing
0.4% Industrial Processes
• 26.1% Area-Wide Sources: 10.14 tons per day
20.5% Solvent Evaporation
5.6% Miscellaneous
• 51.4% Mobile Sources: 20.04 tons per day
44.8% On-Road Motor Vehicles
6.6% Other Mobile Sources
NOx Emissions: 43.15 tons per day
• 22.4% Stationary Sources: 9.70 tons per day
20.2% Fuel Combustion
0.2% Waste Disposal
2.0% Petroleum Production and Marketing
• 2.6% Area-Wide Sources: 1.11 tons per day
2.6% Miscellaneous
• 75.0% Mobile Sources: 32.30 tons per day
51.3% On-Road Motor Vehicles
23.7% Other Mobile Sources
CO Emissions: 216.94 tons per day
• 3.7% Stationary Sources: 8.01 tons per day
3.3% Fuel Combustion
6 - 7
0.1% Waste Disposal
0.2% Petroleum Production and Marketing
0.1% Industrial Processes
• 9.1% Area-Wide Sources: 19.65 tons per day
9.1% Miscellaneous
• 87.2% Mobile Sources: 189.28 tons per day
72.1% On-Road Motor Vehicles
15.1% Other Mobile Sources
6.3.3 2005 PLANNING EMISSION INVENTORY FORECAST: SANTA BARBARA COUNTY
ROG Emissions: 32.08 tons per day
• 27.3% Stationary Sources: 8.75 tons per day
2.6% Fuel Combustion
1.2% Waste Disposal
13.6% Cleaning and Surface Coatings
9.4% Petroleum Production and Marketing
0.5% Industrial Processes
• 29.5% Area-Wide Sources: 9.45 tons per day
20.5% Solvent Evaporation
9.0% Miscellaneous
• 43.2% Mobile Sources: 13.81 tons per day
36.1% On-Road Motor Vehicles
7.1% Other Mobile Sources
NOx Emissions: 34.69 tons per day
• 25.5% Stationary Sources: 8.83 tons per day
23.9% Fuel Combustion
0.3% Waste Disposal
1.3% Petroleum Production and Marketing
• 4.3% Area-Wide Sources: 1.50 tons per day

6 - 8
4.3% Miscellaneous
• 70.1% Mobile Sources: 24.25 tons per day
48.1% On-Road Motor Vehicles
22.0% Other Mobile Sources
CO Emissions: 172.86 tons per day
• 4.5% Stationary Sources: 7.65 tons per day
3.9% Fuel Combustion
0.2% Waste Disposal
0.2% Petroleum Production and Marketing
0.2% Industrial Processes
• 14.8% Area-Wide Sources: 25.95 tons per day
14.8% Miscellaneous
• 80.7% Mobile Sources: 140.52 tons per day
60.4% On-Road Motor Vehicles
20.3% Other Mobile Sources
6.3.4 1996 PLANNING EMISSION INVENTORY: OUTER CONTINENTAL SHELF
ROG Emissions: 5.62 tons per day
• 68.9% Stationary Sources: 3.87 tons per day
4.1% Fuel Combustion
1.8% Cleaning and Surface Coatings
63.0% Petroleum Production and Marketing
• 31.1% Mobile Sources: 1.75 tons per day
31.1% Other Mobile Sources
NOx Emissions: 29.04 tons per day
• 80.0% Mobile Sources: 23.24 tons per day
80.0% Other Mobile Sources
• 20.0% Stationary Sources: 5.80 tons per day

6 - 9
13.4% Fuel Combustion
6.6% Petroleum Production and Marketing
CO Emissions: 17.37 tons per day
• 73.4% Stationary Sources: 12.74 tons per day
13.5% Fuel Combustion
59.9% Petroleum Production and Marketing
• 26.7% Mobile Sources: 4.63 tons per day
26.7% Other Mobile Sources
6.3.5 1999 PLANNING EMISSION INVENTORY: OUTER CONTINENTAL SHELF
ROG Emissions: 5.63 tons per day
• 68.2% Stationary Sources: 3.84 tons per day
4.1% Fuel Combustion
1.4% Cleaning and Surface Coatings
62.7% Petroleum Production and Marketing
• 31.8% Mobile Sources: 1.79 tons per day
31.8% Other Mobile Sources
NOx Emissions: 29.31 tons per day
• 80.1% Mobile Sources: 23.46 tons per day
80.1% Other Mobile Sources
• 19.9% Stationary Sources: 5.83 tons per day
13.2% Fuel Combustion
6.7% Petroleum Production and Marketing
CO Emissions: 17.45 tons per day
• 73.0% Stationary Sources: 12.74 tons per day
13.4% Fuel Combustion
6 - 10
59.6% Petroleum Production and Marketing
• 27.0% Mobile Sources: 4.71 tons per day
27.0% Other Mobile Sources
6.3.6 2005 PLANNING EMISSION INVENTORY: OUTER CONTINENTAL SHELF
ROG Emissions: 5.61 tons per day
• 69.0% Stationary Sources: 3.87 tons per day
4.1% Fuel Combustion
1.8% Cleaning and Surface Coatings
63.1% Petroleum Production and Marketing
• 31.0% Mobile Sources: 1.74 tons per day
31.0% Other Mobile Sources
NOx Emissions: 26.28 tons per day
• 77.9% Mobile Sources: 20.48 tons per day
77.9% Other Mobile Sources
• 22.1% Stationary Sources: 5.80 tons per day
14.8% Fuel Combustion
7.3% Petroleum Production and Marketing
CO Emissions: 17.61 tons per day
• 72.4% Stationary Sources: 12.74 tons per day
13.3% Fuel Combustion
59.1% Petroleum Production and Marketing
• 27.7% Mobile Sources: 4.87 tons per day
27.7% Other Mobile Sources

6 - 11
6.4 CONCLUSIONS
This chapter presents the 1996 Planning Emission Inventory, and the 1999 and 2005 Planning Emission
Inventory Forecasts. The 1996 Planning Emission Inventory was used as the basis to calculate the
1999 and 2005 forecasts. The 1999 Planning Emission Inventory Forecast is the most significant, as
this forecast will be used to determine Rate-of-Progress emission reductions. This is more fully
discussed in Chapter 9.
The following tables and figures detail the emissions in Santa Barbara County and the Outer
Continental Shelf for the years 1996, 1999, and 2005. Tables 6-1, 6-2, and 6-3 show the Santa
Barbara County emission inventories for the years 1996, 1999 and 2005, respectively. Mobile
Sources, primarily On-Road Motor Vehicles (Light-Duty Passenger and Light-Duty Trucks) produce
the majority of ROG, NOx, and CO for each of these years, although the trend shows a large decline in
these emissions from 1996 to 2005. Tables 6-4, 6-5, and 6-6 show the same data for the Outer
Continental Shelf, offshore of the county. The majority of the ROG and CO emissions are Stationary
Sources, primarily Oil and Gas Production, with the bulk of NOx emissions from Other Mobile
Sources, specifically Ship and Commercial Boats. The emission trend for the Outer Continental Shelf
also shows a more gradual emission decline compared to the Santa Barbara County emissions. Since
the OCS doesn’t include the large quantity of emissions from On-Road Motor Vehicles, the decline
that is evident onshore is not as dramatic.
Figures 6-1, 6-2, and 6-3 graphically illustrate the relative contributions of the major emission
categories to the emissions of ROG, NOX, and CO in the county in 1996, 1999, and 2005, respectively.
Figures 6-4, 6-5, and 6-6 illustrate the same data for the Outer Continental Shelf offshore of the
county. Refer to Appendix A for additional forecast information.
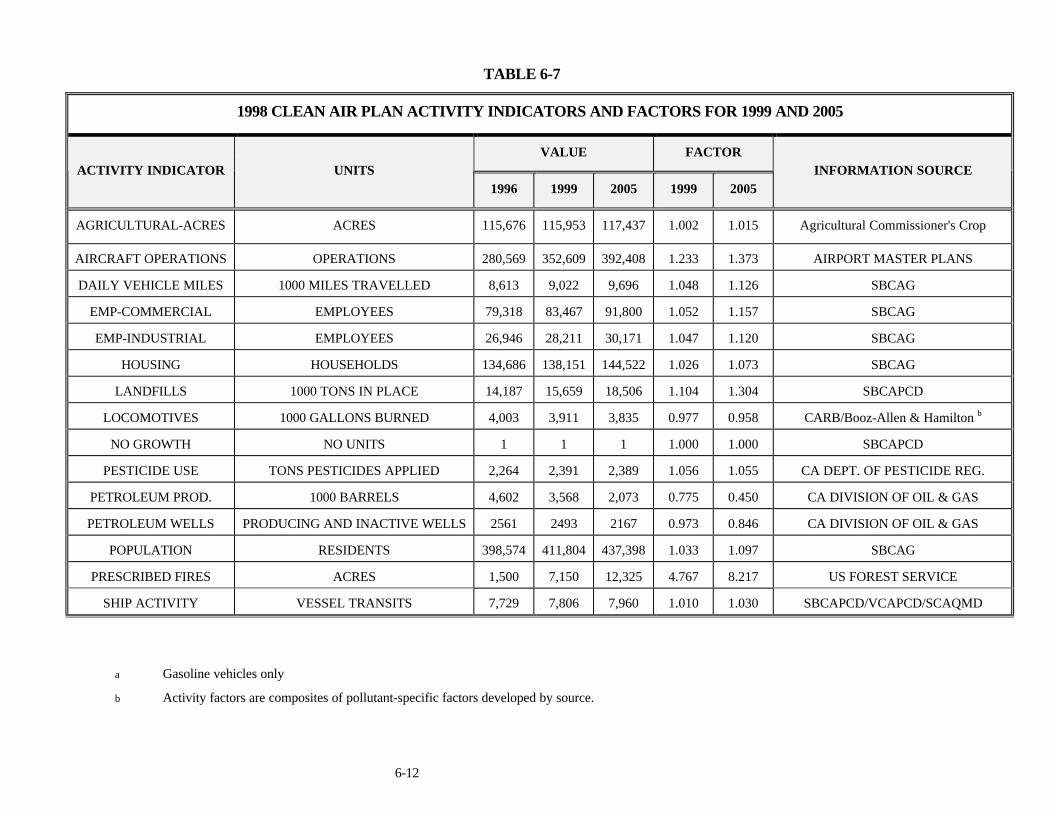
6-12
TABLE 6-7
1998 CLEAN AIR PLAN ACTIVITY INDICATORS AND FACTORS FOR 1999 AND 2005
VALUE FACTORACTIVITY INDICATOR UNITS
1996 1999 2005 1999 2005INFORMATION SOURCE
AGRICULTURAL-ACRES ACRES 115,676 115,953 117,437 1.002 1.015 Agricultural Commissioner's Crop
ReportAIRCRAFT OPERATIONS OPERATIONS 280,569 352,609 392,408 1.233 1.373 AIRPORT MASTER PLANS
DAILY VEHICLE MILES 1000 MILES TRAVELLED 8,613 9,022 9,696 1.048 1.126 SBCAG
EMP-COMMERCIAL EMPLOYEES 79,318 83,467 91,800 1.052 1.157 SBCAG
EMP-INDUSTRIAL EMPLOYEES 26,946 28,211 30,171 1.047 1.120 SBCAG
HOUSING HOUSEHOLDS 134,686 138,151 144,522 1.026 1.073 SBCAG
LANDFILLS 1000 TONS IN PLACE 14,187 15,659 18,506 1.104 1.304 SBCAPCD
LOCOMOTIVES 1000 GALLONS BURNED 4,003 3,911 3,835 0.977 0.958 CARB/Booz-Allen & Hamilton b
NO GROWTH NO UNITS 1 1 1 1.000 1.000 SBCAPCD
PESTICIDE USE TONS PESTICIDES APPLIED 2,264 2,391 2,389 1.056 1.055 CA DEPT. OF PESTICIDE REG.
PETROLEUM PROD. 1000 BARRELS 4,602 3,568 2,073 0.775 0.450 CA DIVISION OF OIL & GAS
PETROLEUM WELLS PRODUCING AND INACTIVE WELLS 2561 2493 2167 0.973 0.846 CA DIVISION OF OIL & GAS
POPULATION RESIDENTS 398,574 411,804 437,398 1.033 1.097 SBCAG
PRESCRIBED FIRES ACRES 1,500 7,150 12,325 4.767 8.217 US FOREST SERVICE
SHIP ACTIVITY VESSEL TRANSITS 7,729 7,806 7,960 1.010 1.030 SBCAPCD/VCAPCD/SCAQMD
a Gasoline vehicles only
b Activity factors are composites of pollutant-specific factors developed by source.

Figure 6-11996 Santa Barbara CountyPlanning Emission Inventory
NOx (45.54 Tons Per Day)
On-Road Vehicles56%
Fuel Combustion19%
Petroleum Production
& Marketing <1%
Other Mobile24%
Miscellaneous1%
CO(235.99 Tons Per Day)
Fuel Combustion3%
On-Road Vehicles
79%
Other Mobile 13%
Miscellaneous5%
ROG(41.37 Tons Per Day)
Petroleum Prod. &
Marketing9%
Solvent Evaporation
19%
Miscellaneous3%
Fuel Combustion
2%
Cleaning and Surface Coatings
10%
Waste Disposa 1%
Other Mobile6%On-Road
Vehicles50%
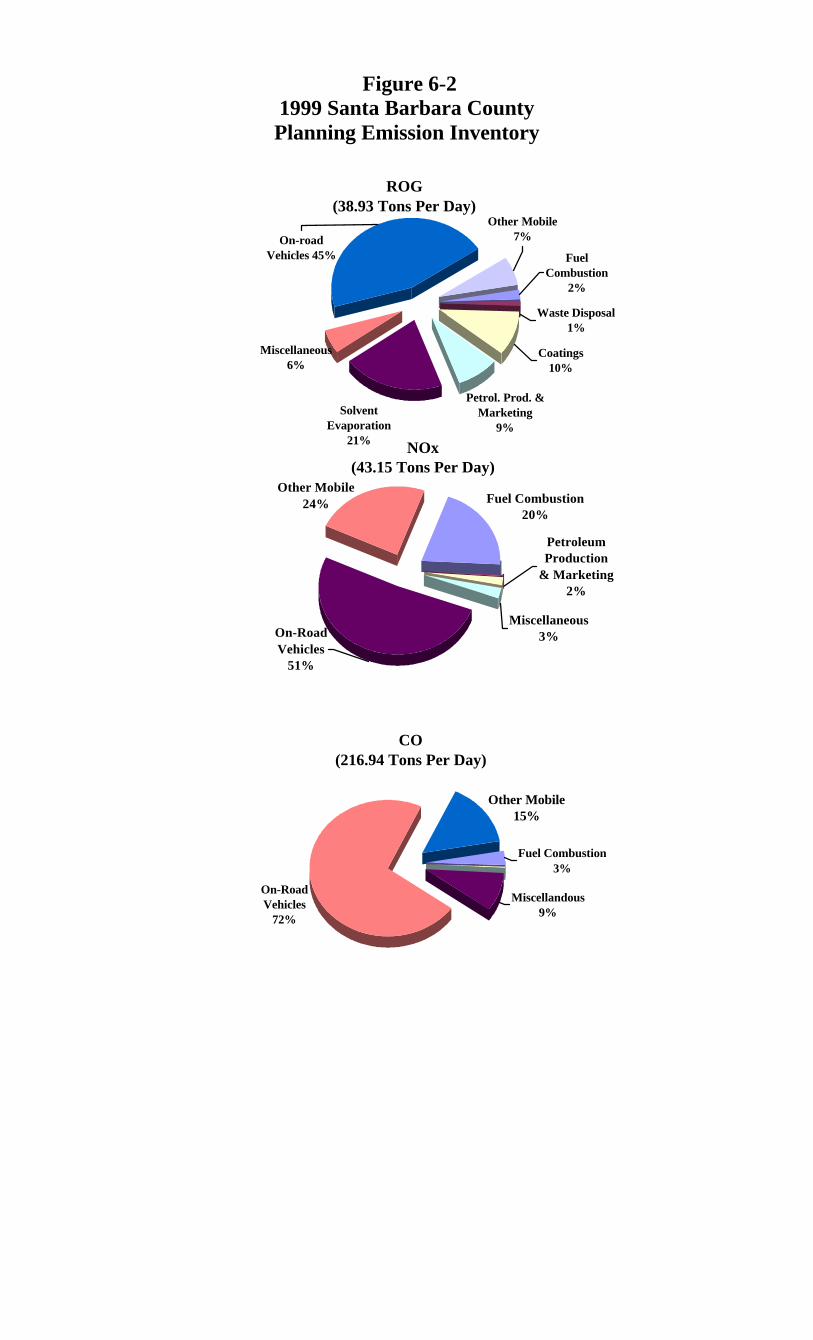
Figure 6-21999 Santa Barbara CountyPlanning Emission Inventory
NOx (43.15 Tons Per Day)
Fuel Combustion20%
Petroleum Production
& Marketing 2%
On-Road Vehicles
51%
Other Mobile24%
Miscellaneous3%
CO(216.94 Tons Per Day)
On-Road Vehicles
72%
Miscellandous9%
Fuel Combustion3%
Other Mobile15%
ROG(38.93 Tons Per Day)
Other Mobile7%
Miscellaneous6%
Fuel Combustion
2%
Waste Disposal1%
Coatings10%
Petrol. Prod. & Marketing
9%Solvent
Evaporation21%
On-road Vehicles 45%

Figure 6-32005 Santa Barbara CountyPlanning Emission Inventory
NOx (34.69 Tons Per Day)
On-Road Vehicles48%
Miscellaneous5%
Other Mobile22%
Fuel Combustion24%
Petroleum Production
& Marketing 1%
CO172.86 Tons Per Day)
On-Road Vehicles
61%
Fuel Combustion4%
Miscellaneous15%
Other Mobile20%
ROG(32.08 Tons Per Day)
Cleaning and Surface
Coatings14%
On-Road Vehicles
36%
Other Mobile7%
Waste Disposal1%
Miscellaneous9%
Solvent Evaporation
21%
Petroleum Prod. &
Marketing9%
Fuel Combustion
3%

Figure 6-41996 Outer Continental ShelfPlanning Emission Inventory
NOx (29.04 Tons Per Day)
Fuel Combustion13%
Petroleum Production
& Marketing 7%
Other Mobile80%
CO(17.37 Tons Per Day)
Other Mobile27%
Petroleum Prod. & Marketing
60%
Fuel Combustion13%
ROG(5.62 Tons Per Day)
Fuel Combustion
4%
Cleaning and Surface Coating
2%
Petroleum Production &
Marketing 63 %
Other Mobile 31%
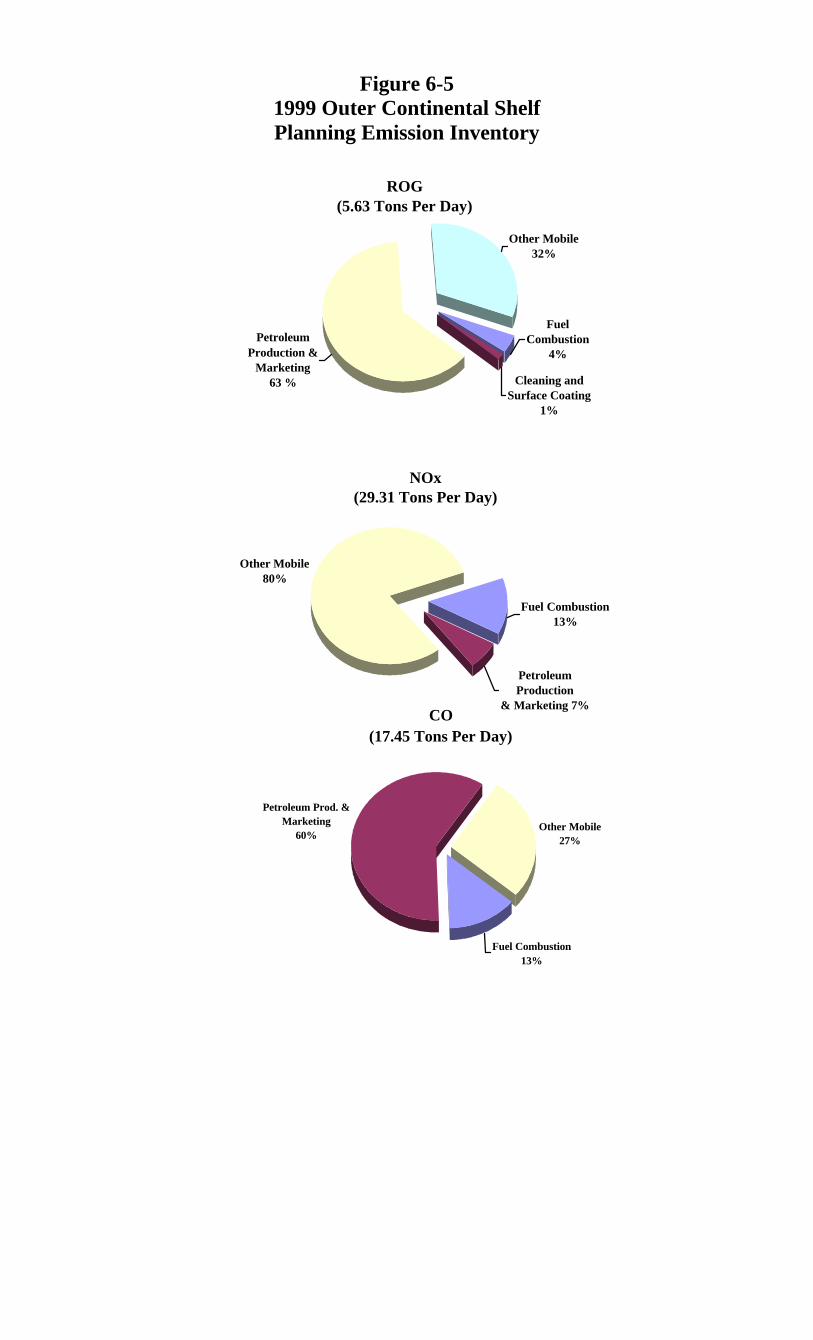
Figure 6-51999 Outer Continental ShelfPlanning Emission Inventory
NOx (29.31 Tons Per Day)
Fuel Combustion13%
Petroleum Production
& Marketing 7%
Other Mobile80%
CO(17.45 Tons Per Day)
Other Mobile27%
Petroleum Prod. & Marketing
60%
Fuel Combustion13%
ROG(5.63 Tons Per Day)
Other Mobile 32%
Petroleum Production &
Marketing 63 % Cleaning and
Surface Coating1%
Fuel Combustion
4%
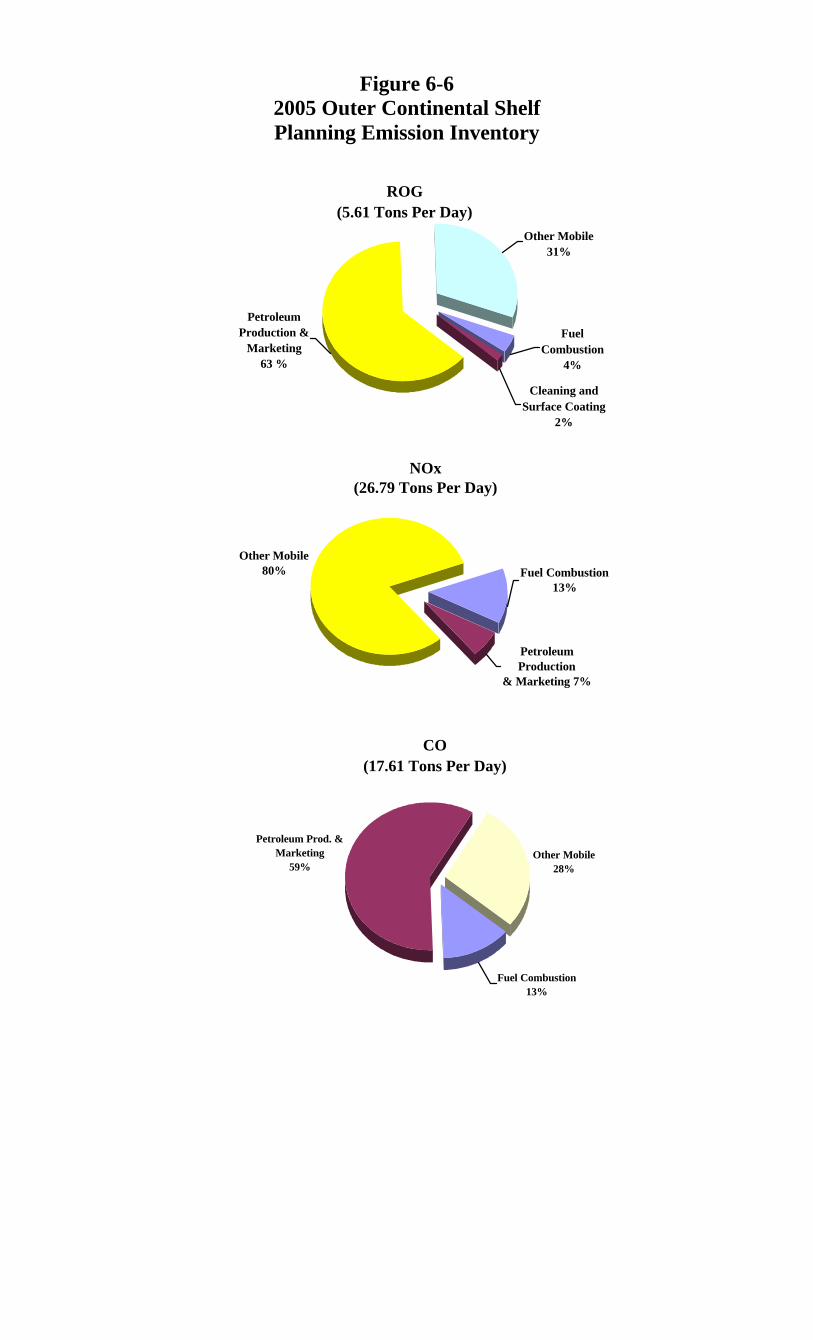
Figure 6-62005 Outer Continental ShelfPlanning Emission Inventory
NOx (26.79 Tons Per Day)
Fuel Combustion13%
Petroleum Production
& Marketing 7%
Other Mobile80%
CO(17.61 Tons Per Day)
Other Mobile28%
Petroleum Prod. & Marketing
59%
Fuel Combustion13%
ROG(5.61 Tons Per Day)
Fuel Combustion
4%
Cleaning and Surface Coating
2%
Petroleum Production &
Marketing 63 %
Other Mobile 31%
CHAPTER 7
FUTURE AIR QUALITY
Introduction
Modeling Objectives
Model Input Preparation
Model Performance Evaluation
Model Results
Data Access
Impacts of Pollution Transport
on Santa Barbara County
Conclusions

7 - 1
7. FUTURE AIR QUALITY
7.1 INTRODUCTION
Air quality modeling is a computer simulation of the atmospheric processes that govern the quality of
the air we breathe. This type of modeling is performed to estimate the air quality impact from existing
sources of air pollutants. Models are also useful for planning purposes as they can assess the relative
changes in ambient air quality from future levels of emissions. This chapter describes how air quality
modeling is used to demonstrate that the county will attain the federal 1-hour ozone standard by 1999
and how pollutants transported from areas outside Santa Barbara County influence our local air
quality.
The outline of this chapter is as follows: Section 7.2 discusses the modeling objectives and
methodology used for the demonstration of attainment. Section 7.3 describes the input preparation
required to execute the model. Section 7.4 documents the procedures for evaluating the performance
of the model. Modeling results and the attainment demonstration are presented in Section 7.5 with
data access procedures outlined in Section 7.6. Section 7.7 discusses the impacts of transported
pollutants on local air quality. And finally, Section 7.8 summarizes the conclusions derived from the
modeling and transport analyses. Technical documentation of the attainment demonstration modeling is
available from the California Air Resources Board through a written request to the Santa Barbara
County APCD.
7.2 MODELING OBJECTIVES AND METHODLOGY
Section 182(b)(1)(A) of the federal Clean Air Act Amendments (FCAAA) requires that "moderate"
nonattainment areas develop plans to "provide for such specific annual reductions in emission of
volatile organic compounds and oxides of nitrogen as necessary to attain the national primary ambient
air quality standard for ozone" by 1996. To satisfy this requirement, the Santa Barbara County APCD
and the Ventura County APCD jointly prepared an ozone attainment demonstration for the southern
region of the South Central Coast Air Basin using ozone episodes collected during the South Central
Coast Cooperative Aerometric Monitoring Program (SCCCAMP). The analyses were conducted with
7 - 2
the Urban Airshed Model (UAM) and carbon bond IV chemistry. The primary objectives of this effort
were to demonstrate attainment of the federal ozone standard in Santa Barbara County by 1996 and in
Ventura County by 2005. The effort was also coordinated with the current Federal Implementation
Plan (FIP) modeling for Ventura County. A joint modeling protocol was developed and forwarded to
the USEPA and ARB in June 1992. Alpine Geophysics also developed a modeling protocol for the
FIP modeling for Ventura County (using the same SCCCAMP episodes) in February 1993.
Although the use of photochemical grid modeling was not specifically mandated for “moderate”
nonattainment areas, it was mutually agreed upon by the USEPA, ARB, and the APCD that the joint
Santa Barbara/Ventura modeling effort, supplemented with a countywide investigation, would satisfy
the attainment demonstration requirement.
As already discussed, while our local air quality has improved, it did not improve enough to comply
with the federal 1-hour ozone standard by 1996. On December 10, 1997, the USEPA recognized this
fact and reclassified the entire county as a “serious” nonattainment area. This action mandates that a
revision to the Clean Air Plan be developed and submitted within 12 months (by January 9, 1999) to
comply with Section 182(c) of the FCAAA . Section 182(c)(2)(A) requires that “serious”
nonattainment areas demonstrate attainment of the 1-hour ozone standard by November 15, 1999.
The act also specifies that the attainment demonstration must be based on photochemical modeling or
any other analytical method that is at least as effective.
The modeling analysis and attainment demonstration provided in this chapter are based on work
performed previously for the 1994 planning mandates for both Santa Barbara County and Ventura
County. Emission inventories for 1984, 1996, and 1999 were developed for the modeling by the
California Air Resources Board. The ratio of the peak simulated ozone concentrations within Santa
Barbara County between 1996 and 1999 is used to scale the maximum design value recorded from
1994 through 1996 as a demonstration of attainment. While there is a significant degree of uncertainty
associated with this analysis, it provides the basis for a “weight of evidence” determination that is
consistent with the analytical requirements of Section 182(c)(A)(2).
7 - 3
7.2.1 THE URBAN AIRSHED MODEL
Photochemical models are designed to simulate the transport and diffusion of pollutants in the
atmosphere and the chemical transformations and removal processes these compounds are subject to.
The results provide estimates of ozone concentrations at various locations (known as grid cells) within
the modeling domain.
Of the various photochemical models available for assessing ozone air quality impacts, both the Urban
Airshed Model (UAM) and the Empirical Kinetic Modeling Approach (EKMA) have been given
guideline status by the USEPA. Of these two models, the UAM was used for this attainment
demonstration because it represents the best available analytical technique to evaluate the impact of
ROG and NOx emissions on ozone concentrations. The UAM is a photochemical grid model as
required for the demonstration of attainment for “serious” nonattainment areas under Section
182(c)(A)(2).
The UAM is based on a stationary three-dimensional array of grid cells. Each grid cell has a constant
horizontal dimension, while the vertical dimension varies depending on meteorological conditions.
Pollutants are emitted within the grid cells, transported from cell to cell, diffused by turbulence,
exchanged between adjacent cells, and removed from the grid region by deposition or by other means.
The UAM predicts ozone concentrations for every grid cell within the domain and for all hours of the
simulation period. Generally, to test the applicability of the model, a base case episode is simulated
using emissions and meteorological data from a specific date which had experienced ozone
concentrations similar to the area's design value. If the model successfully reproduces the observed
ozone concentrations within a set criteria, the base case emissions can then be modified and re-run to
estimate ozone concentrations in the future. In this case, both 1996 and 1999 simulations will be
conducted to assess the relative improvements to local air quality from this 1998 CAP.
It is important to emphasize that UAM is an ozone simulation model. Ozone formation is an
extremely complex process and our ability to reproduce and predict this process is not complete. The
model is assumed to be performing adequately when it reproduces maximum observed concentrations
7 - 4
over a region within plus or minus 30 percent. Thus, if the model predicts a peak ozone concentration
of 11 parts per hundred million (pphm), the actual observed concentration could range from 8 to 14
pphm. This uncertainty is particularly important in this analysis since the design value for the 1994
through 1996 period was 13 pphm and the next mandated attainment date is 1999. These two
variables (concentrations very close to the standard and a very short span of time) combine to
introduce a significant amount of uncertainty in the analysis.
7.2.2 MODELING DOMAIN
Figure 7-1 shows the modeling domain used for the attainment demonstration. This figure includes the
entire southern region and part of the northern portion of Santa Barbara County, the majority of
Ventura County, and the extreme western part of Los Angeles County.
The modeling domain consists of a 54 x 26 grid mesh with each grid square covering a 4 x 4 kilometer
horizontal area. Six vertical layers of grid cells, three above the inversion base and three below were
included in the simulations (the inversion base is the level above the ground at which the air
temperature begins to increase with height, thus acting as a lid to trap pollutants below this level).
7.2.3 MODEL EPISODE SELECTION
A key element in air quality modeling to predict future year ozone concentrations is the selection of the
modeling episode. The modeling episode serves as the basis from which future year emissions, and
resultant ozone concentrations, are assessed. The design episodes to be used for the attainment
demonstration in the 1994 CAP were selected based on the following factors:
1. The peak ozone concentration observed during the design episode should be greater
than the 1-hour federal standard (12 pphm) and should be greater than or equal to the
fourth highest ozone concentration recorded in the last three years.
The fourth highest ozone concentration is used as a reference point to be consistent
with the USEPA methodology for determining an area's classification (discussed in
7 - 5
detail in Chapter 2). The county's design value during the 1984-1986 (SCCCAMP was
conducted during 1984 and 1985) period was 15 pphm measured at Santa Barbara. A
valid modeling episode should have measured ozone concentrations near this level.
2. The meteorology during the design episode (surface flow and upper air analysis) should
indicate little or no pollutant transport from outside the modeling region.
Transport refers to ozone and ozone precursors generated outside the county that
affect ozone concentrations within the modeling region. An ideal modeling episode
should experience minimal transport.
3. A comprehensive and accurate set of model inputs must be available for the design
episode (these data are required to evaluate performance of the UAM).
Application of the UAM requires an extensive database for both development of the
model input and model performance evaluation. These data requirements generally
exceed those that are routinely available. Data collected during SCCCAMP provide
the intensive database required to exercise the model. In addition, extensive technical
assistance was provided during the monitoring portion of SCCCAMP, the subsequent
data analyses, and development of base case modeling episodes as part of the Santa
Barbara County 1989 AQAP.
4. It is preferable (but not imperative) that a design episode occur during the weekdays
(Monday through Friday), when better estimates of motor vehicle emissions can be
obtained.
Five candidate episodes were reviewed based on the above criteria and are documented in the Federal
Implementation Plan modeling protocol developed by Ventura County for the USEPA. The five
candidate episodes are September 5-7, 1984, September 16-17, 1984, September 11-13, 1985,
September 23-25, 1985, and October 2-3, 1985.

7 - 6
In the 1994 CAP, two episodes were selected for the modeling analyses: September 5-7, 1984 and
September 16-17, 1984. For this analysis, it was determined that the September 5-7, 1984, episode
was the most appropriate base case to use for the attainment demonstration simulations. Each of the
remaining episodes experienced significant boundary conditions influence from areas outside the
modeling domain. It should be noted that this effort should be the last time episodes from SCCCAMP
are used for an attainment demonstration. These episodes are old and will be replaced with more
recent data. APCD staff are participating in the technical working group assessment of the Southern
California Ozone Study (SCOS) which was conducted in the summer of 1997. The objective of this
effort is to develop new base case episodes to address future photochemical modeling requirements.
7.3 MODEL INPUT PREPARATION
Modeling inputs for each of the five episodes listed above have been developed under various modeling
projects using the data collected during the SCCCAMP measurement projects. Data for the
September 5-7, 1984, episode of interest were taken from the 1994 SIP modeling performed for
Ventura County and Santa Barbara County. Details of the original input development procedures are
provided in a report prepared for the USEPA (Tesche, 1988). Additional information is provided in
the modeling protocols developed for the 1994 CAP process (Reeve, 1992; Tesche, 1993; Murphy,
1993), Chapter 7 and Appendix D of the 1994 CAP.
The current modeling effort focused mainly on updating the emission inventories from the earlier work
for 1984, 1996, and 1999. Simulations were performed for 1984 to assess model performance and for
1996 and 1999 to represent the design value year and the attainment year, respectively.
7.3.1 EMISSIONS PREPARATION
As just mentioned, updated emission inventories were developed for 1984, 1996, and 1999. However,
the development of day specific inventories was not feasible due to limited resources, time constraints
and data collection efforts for SCOS. The emission inventory data collected under SCOS represent
the most up-to-date information available in a gridded format. Therefore, the 1990 gridded emissions
inventory developed with data collected for SCOS was used as the basis for the 1984, 1996, and 1999
7 - 7
emission inventories, which were then mapped into the SCCCAMP modeling domain. This exercise
required several assumptions that are documented in a Final Report prepared by the California Air
Resources Board (ARB, 1998) and included in this 1998 CAP as Appendix D. The emission inventory
ratio process was necessary to reflect emissions from Santa Barbara County, Ventura County, and part
of Los Angeles County that are within the SCCCAMP domain.
7.3.2 AIR QUALITY AND METEOROLOGICAL DATA PREPARATION
Air quality and meteorological data input files from the 1994 SIP process for Santa Barbara and
Ventura Counties were used in this analysis with only one modification. Changes to the boundary
condition files were made to the eastern side of the modeling domain to represent the decreasing
influence (and impacts) of the South Coast Air Basin (Los Angeles area) over time. Boundary
condition files for 1996 and 1999 were developed using a linear interpolation of anticipated ROG and
NOx reductions expected to occur in the South Coast Air Basin (ARB, 1998). The pollutant
concentrations on the north, south and west boundaries were not changed.
7.4 MODEL PERFORMANCE EVALUATION
Model performance for the September 5-7, 1984, episode was statistically evaluated to determine
whether the results of the UAM simulation would satisfy a list of predetermined performance
objectives developed by the USEPA (USEPA, 1991). A performance evaluation is necessary in order
to test the model's ability to duplicate measured ozone concentrations within a specified range of
uncertainty. The September 5-7, 1984, base case episodes passed the performance standards
suggested by the USEPA (with the exception of normalized bias on September 6th) and therefore the
model was used to demonstrate attainment as discussed in detail below.
7.5 MODEL RESULTS
This section summarizes the modeling results for the September 5-7, 1984, episode. First, a summary
analysis of the base case predictions will focus on how well the episode is reproduced by the model.
The analysis will focus on September 6th and 7th since the initial conditions used to start the simulation

7 - 8
on the 5th will influence predicted ozone concentrations. Then, the peak ozone concentrations
predicted in the 1996 and 1999 simulations will be used to ratio the 1994-1996 design value to
demonstrate attainment by 1999.
7.5.1 BASE CASE SIMULATIONS
It is important to understand how well the model is reproducing ozone concentrations in the base case
episode before evaluating the effects of future year emissions. Although the model predicts ozone
concentrations for each hour of the simulation at every grid cell within the modeling region, the federal
standard is expressed as a peak one-hour concentration. Therefore, consideration must be given to the
spatial and temporal reproduction of peak ozone concentrations.
To assess the merit of the approach used to scale the 1990 gridded emissions inventory for the years
1984, 1996, and 1999, the simulation results for the September 5-7, 1984, base case were compared
with actual ozone concentrations measured during SCCCAMP. The peak ozone concentrations
measured in the modeling domain were 17.0 pphm on September 6 and 18.0 pphm on September 7.
The peak ozone concentrations simulated in the base case were 18.5 pphm on September 6 and 17.6
pphm on September 7. The peak concentration measured in Santa Barbara County on September 7
was 15.0 pphm compared to a peak simulated concentration of 17.6 pphm. While the peak
concentrations are simulated within limits specified in USEPA guidelines, the model over-predicts the
maximum concentration in Santa Barbara County by 2.6 pphm.
As mentioned, the USEPA has developed guidelines for assessing the overall performance of
photochemical models (USEPA, 1991). For September 6, the peak prediction accuracy was +9%, the
normalized bias was –17%, and the gross error was 27%. For September 7, the peak prediction
accuracy was –2%, the normalized bias was –6%, and the gross error was 29%. With the exception of
the normalized bias on September 6 (-17% versus –15%), these statistical measures of the model meet
the USEPA performance guidelines.

7 - 9
7.5.2 1999 ATTAINMENT DEMONSTRATION
It is important to understand that there are a number of uncertainties associated with this analysis when
applied to the design value site located in Las Flores Canyon. First, the Las Flores Canyon site was not
in operation during the September 5-7, 1984, episode so the actual concentrations experienced at that
location during this episode are not known. Second, a design value of 13 pphm (from 1994 through
1996) is very close to the federal 1-hour ozone standard (12 pphm) and the ability of photochemical
models to resolve small differences is limited. Third, this analysis covers a very short time period
(1996-1999) for simulating reductions in ozone concentrations. And last, the primary afternoon wind-
flow during the episode is westerly which limits the influence from the major sources of anthropogenic
emissions that are east of Las Flores Canyon.
Given these limitations, the September 5-7, 1984 base case episode was run using emissions inventories
and boundary conditions derived for 1996 and 1999. For 1996, the peak simulated concentration in
Santa Barbara County was 14.8 pphm compared to a peak of 14.2 pphm simulated for 1999. Thus,
the peak simulated concentration between 1996 and 1999 was reduced by approximately 4%. As
discussed, the measured design value for ozone in Santa Barbara County from 1994 through 1996 was
13 pphm. Based on the simulation results, the projected design value for Santa Barbara County is 12
pphm (12.47 pphm) which is considered attainment of the 1-hour federal ozone standard. Therefore,
this exercise has provided a “weight of evidence” demonstration that Santa Barbara County will attain
the federal 1-hour ozone standard by 1999.
7.6 DATA ACCESS
A summary archive of all input and output files used in the modeling analyses and attainment
demonstration is available from the Air Resource Board. To obtain copies of the files, please submit a
written request to the Santa Barbara County APCD.
7.7 IMPACTS OF POLLUTION TRANPORT ON SANTA BARBARA COUNTY

7 - 10
The impacts of pollution transport from areas outside of Santa Barbara County on our local air quality
have been well documented (ARB, 1990; Hanna, 1989; Lehrman, 1981; SBCO, 1990; SBCO, 1997,
Smith, 1987). The impacts of transport on local air quality contribute to the uncertainty discussed in
the attainment demonstration in Section 7.5.2. Given the magnitude of the emissions inventories
produced by the areas to the south and east of Santa Barbara County, it is clear that local air pollution
episodes can be influenced to a significant degree by sources beyond our local control. In fact, it must
be recognized that our ability to attain the federal 1-hour standard locally depends on the ability of
neighboring areas to decrease their levels of pollution to below the applicable standards. It is very
likely that pollution originating outside of Santa Barbara County will continue to impact our local air
quality.
The USEPA has recognized that upwind areas generating higher levels of air pollution can impact
areas that are downwind and delay expeditious attainment of air quality standards (USEPA, 1994;
USEPA, 1998). On July 17, 1998, the USEPA issued a new policy memorandum to provide guidance
on extending attainment dates for ozone nonattainment areas that have been classified as “moderate” or
“serious” for the federal 1-hour ozone standard. The policy addresses the issue of pollution transport
on down-wind areas by allowing an area to extend their attainment date if certain criteria are met. To
apply for an attainment date extension an area must: 1) be identified as an area affected by pollution
transport, 2) submit an approvable attainment demonstration that shows the area will attain the federal
1-hour standard no later than the attainment date of the upwind area, 3) show that all applicable local
measures required under the current classification have been adopted, and 4) provide for the
implementation of the adopted measures as expeditiously as practicable. The 1998 USEPA
memorandum discusses the legal rationale behind the policy in detail.
This 1998 CAP demonstrates that the control strategy outlined in Chapters 4 (Emission Control
Measures) and 5 (Transportation Control Measures) will provide for attainment of the federal 1-hour
ozone standard by 1999. However, it is possible that pollution transported from areas outside Santa
Barbara County will interfere with our ability to achieve this milestone. In the event that we are unable
to demonstrate attainment of the federal 1-hour ozone standard by 1999 due to the influence of
transported pollution, supported by an analysis of monitoring and meteorological data, we may request
that the USEPA evaluate our local air quality circumstances and extend our attainment date.

7 - 11
7.8 CONCLUSIONS
Our understanding of atmospheric processes and our ability to mathematically simulate them are far
from perfect. The Urban Airshed Model is a simulation model that represents the current state-of-the-
art photochemical grid modeling for ozone. This process has many uncertainties associated with the
mathematics used in the model including, among others, the reliance on a single ozone episode to
represent future weather conditions, inaccuracies in emission inventories and meteorological data, and
uncertainties with using peak concentrations to ratio our design value. These uncertainties call for
caution when interpreting the results of the modeling. With this in mind, the conclusions of the air
quality modeling are as follows:
1. The September 5-7, 1984, ozone episode performed well enough to be used to
demonstrate attainment of the federal 1-hour ozone standard.
2. Using the ratio of peak simulated ozone concentrations for the 1996 and 1999
emissions inventories, the 1994 through 1996 design value at Las Flores Canyon, and
rolled boundary conditions, the September 5-7, 1984, episode provides a “weight of
evidence” demonstration that under similar meteorological conditions in the future,
there would be no violation of the federal 1-hour ozone standard monitored in Santa
Barbara County.
3. While the photochemical modeling summarized in this chapter demonstrates that the
control strategy presented in this 1998 Clean Air Plan will provide for attainment of the
federal 1-hour ozone standard by 1999, the potential impact of transported pollution
from areas that are beyond our local control may interfere with our ability to achieve
this milestone by 1999.
4. In the event that it is clear that Santa Barbara County was unable to achieve the federal
1-hour ozone standard by 1999 due to the influence of transported pollution, supported

7 - 12
by an analysis of monitoring and meteorological data, the USEPA should evaluate
extending our attainment date.
7 - 13
REFERENCES:
ARB, 1990 Assessment and Mitigation of the Impacts of Transported Pollutants on OzoneConcentrations in California (June 1990): Prepared by the Technical SupportDivision and Office of Air Quality Planning and Liaison, California AirResources Board, Sacramento, CA.
ARB, 1992 Technical Guidance Document: Photochemical Modeling (1992): California Air Resources Board, Sacramento, CA.
ARB, 1995 Revisions to the Base Case and Future Year Urban Airshed Model Simulationsfor Ventura County in Support of the 1994 State Implementation Plan (1995): Prepared by the Technical Support Division of the California Air ResourcesBoard, Sacramento, CA.
ARB, 1998 A Demonstration of Attainment of the Federal 1-hour Ozone Standard in SantaBarbara County in the Year 1999 (August, 1998): Prepared by the TechnicalSupport Division/Control Strategy Modeling Section, California Air ResourcesBoard, Sacramento, CA.
Hanna, 1989 South Central Coast Cooperative Aerometric Monitoring Program(SCCCAMP) (1985 Data Analysis) Overview and Discussion of Case Studies. Report No. A034-800 prepared for U.S. Dept. of Interior, Minerals Mgmt.Svc., Sigma Research Corp., Westford, MA.
Lehrman, 1981 A Study of Transport Into, Within and Out of Coastal Areas of Southern SantaBarbara County and Ventura County (1981): Report Prepared by MeteorogyResearch, Inc. for the Ventura County APCD. MRI 81-FR-1808.
Murphy, 1993 Ozone Modeling Protocol for the Santa Barbara Photochemical ModelingInvestigation. Santa Barbara County Air Pollution Control District.
Reeve, 1992 Draft Ozone Modeling Protocol for the 1994 SIP Submittals. Prepared by theVentura and Santa Barbara County Air Pollution Control Districts.
SBCO, 1990 Selection, Classification, and Analysis of Ozone Violations in SantaBarbara County (July 1990): Prepared by the Santa Barbara County AirPollution Control District.
Smith, 1987 Meteorological Conditions Associated with Ozone Exceedances in SantaBarbara County (1987): Report prepared by T.B. Smith and Associates forWOGA Contract No. T-002-01-00.
7 - 14
Tesche, 1988 Photochemical Modeling of Two SCCCAMP 1984 Oxidant Episodes: II,Modeling Procedures and Evaluation Results." Prepared for the U.S.Environmental Protection Agency by Radian Corporation, Sacramento CA.
Tesche, 1993 Ozone Modeling Protocol for the Ventura Federal Implementation Plan (FIP). Prepared for Ventura County Air Pollution Control District by AlpineGeophysics.
USEPA, 1991 Guidance on the Application of the Urban Airshed Model (UAM), DraftReport, Office of Air Quality Planning and Standards, U.S. EnvironmentalProtection Agency, Research Triangle Park, NC.
USEPA, 1993 Guidance on Urban Airshed Model (UAM) Reporting Requirements forAttainment Demonstrations, Office of Air Quality Planning and Standards,U.S. Environmental Protection Agency, Research Triangle Park, NC.
USEPA, 1994 Ozone Attainment Demonstrations for Areas Affected by Transport(August 1994): Memorandum from John S. Sietz to the Regional AirDirectors, U.S. Environmental Protection Agency.
USEPA, 1998 Extension of Attainment Dates for Downwind Transport Area (July, 1998):Memorandum from Richard D. Wilson to the Regional Air Directors, U.S.Environmental Protection Agency.

CHAPTER 8
IMPLEMENTATION SUPPORT ACTIVITIES
Introduction
APCD Permit Regulations
Conformity Regulations
Pollution Prevention Programs
APCD Environmental Review Program
Land Use Planning
Mobile Source/Transportation Control Policies
Congestion Management Program
Conclusion

8 - 1
8. IMPLEMENTATION SUPPORT ACTIVITIES
8.1 INTRODUCTION
In addition to the implementation of the control measures described in this Clean Air Plan, there
are other programs and regulations that can affect the attainment of air quality standards. These
include the APCD’s New Source Review (NSR) permitting process, the federal transportation
conformity and general conformity regulations and pollution prevention programs. In
addition, the APCD works cooperatively with other federal, state, and local agencies to reduce
emissions through the environmental review requirements of the California Environmental
Quality Act (CEQA) and the National Environmental Policy Act (NEPA). The land use
policies adopted by the county and incorporated cities under their general plans and ordinances
also serve to control emissions to some degree. Finally, programs and policies traditionally
associated with transportation planning also contribute to attaining air quality standards and
are addressed in this chapter.
8.2 APCD PERMIT REGULATIONS
The APCD’s New Source Review (NSR) permitting program is designed, through the use of
permits, to reduce air pollution by requiring Best Available Control Technology (BACT),
modeling and/or emission offsets. The intent of this permitting program is to eliminate or
reduce the number and severity of violations of the state and federal ozone standards and to help
achieve expeditious attainment of these standards. As such, businesses are issued a permit only
if their emissions would not (1) cause or contribute to any new standard violations, (2) increase
the frequency or severity of any existing standard violations, and (3) delay the timely attainment
of any standard.
In April 1997, major revisions were made to the rules governing the NSR program:
8 - 2
1. The list of equipment/activities deemed exempt from permit requirements was modified.
The aggregate exemption limit per equipment source category was reduced from 150 pounds
per day to 10 tons per year.
2. Time limits were established for permit processing depending on the size and complexity of
the source.
3. The amount of emission growth allowed by a source before Best Available Control
Technology (BACT) and emission offsets are required were modified from an hourly basis to
a daily or annual basis. Additionally, the base year from which emissions growth is
calculated was changed from 1979 to 1990.
4. Emission offset ratios for non-attainment pollutants were changed.
5. An Emissions Reduction Credit system was established to create and manage emission
reduction credits proposed for use as offsets.
With the recent change in Santa Barbara County’s federal ozone classification to “serious”
nonattainment, the current NSR program was evaluated to determine if revisions were needed to
comply with the additional requirements of the federal Clean Air Act Amendments of 1990. The
specific sections of the Act that apply to serious areas include: 1) Section182(c)(6) – De Minimis
Rule, 2) Section 182(c)(7) – Special Rule For Modifications of Sources Emitting Less Than 100
Tons, 3) Section 182(c)(8) – Special Rule For Modifications of Sources Emitting 100 Tons or
More, and 4) Section 182(c)(10) – General Offset Requirement. While the implications of these
new requirements are difficult to quantify, it appears that the provisions in our current NSR
program are at least as stringent (or more stringent) than the requirements mandated for “serious”
areas. Therefore, no revisions to the current NSR program are anticipated in this CAP.
8.3 CONFORMITY REGULATIONS
Other than emissions subject to the APCD’s NSR and PSD rules, emission increases are also
governed by two APCD rules, Transportation Conformity (Rule 701) and General Conformity
(Rule 702).

8 - 3
8.3.1 TRANSPORTATION CONFORMITY
Rule 701 as amended is, except for eight minor modifications, the federal conformity regulation
as promulgated by EPA on August 15, 1997. Its purpose is to prevent uncontrolled increases of
on-road motor vehicle emissions from undermining the strategy established in the CAP. To this
end, conformity determinations or exemptions are required for the adoption, acceptance,
approval, or support of transportation plans, programs, and projects funded or approved under
title 23, U.S.C. of the Federal Transit Act. Essentially transportation conformity ensures that
future transportation investments do not jeopardize the County’s efforts to attain the national
ambient air quality standards and makes attainment of these standards a goal of transportation
planning instead of a consequence.
In order for significant transportation improvement projects to be funded, they must be included
in a conforming Regional Transportation Plan (RTP) and federal Transportation Improvement
Program (FTIP). An RTP is a long range (20 year) multi-modal plan to improve a region’s state
highways; local streets, road and bikeways; airport and marine facilities; transit, paratransit and
passenger rail services. As a guide for the development of these systems, the RTP describes the
priorities for making investments in Santa Barbara County’s transportation system. An FTIP is a
multi-year program of transportation projects that are funded primarily from federal sources.
The FTIP is developed and adopted by the metropolitan planning organization (Santa Barbara
County Association of Governments) on a biennial basis. Once adopted, the FTIP is submitted
to the California Transportation Commission and federal funding agencies.
For a conformity determination to be made, the on-road mobile source emissions incorporating
all applicable projects in a plan (RTP) or program (FTIP), taken as a whole, cannot exceed the
maximum allowable (i.e., emissions budget) on-road mobile source emissions established in the
SIP (Clean Air Plan). To perform such an analysis, modeling must be performed to ascertain the
total vehicle activity (vehicle trips, vehicle miles of travel and vehicle speed distributions)
resulting from the implementation of the plan or program. These data are then applied to on-
road mobile source emission inventory models to generate total emissions. Rule 701 requires
that the assumptions and tools used for this modeling exercise represent the latest acceptable

8 - 4
methods as recognized by the federal transportation and air quality planning agencies (i.e.,
Federal Highway Administration and EPA).
In addition, it must be demonstrated as part of conformity that all emission reducing
transportation programs and projects that were credited in the SIP (i.e., transportation control
measures) are being expeditiously implemented. As part of the latter assessment, it must be
demonstrated that the RTP and FTIP each facilitate the implementation of air quality improving
projects and programs. If delays in project/program implementation have occurred, a description
of how the RTP or FTIP will bring the project/program back on schedule is required.
Pursuant to Rule 701, SBCAG has prepared conformity determinations for the 1993 RTP, the
1994-95 FTIP, the 1995 RTP and the 1996 FTIP. As required by Rule 701, consultation between
SBCAG, the APCD other affected federal, state and local agencies and the general public have
occurred during these conformity determinations.
8.3.2 GENERAL CONFORMITY
In order to assure that federal agencies do not take or support actions, which are in any way
inconsistent with the effort to achieve the NAAQS, EPA promulgated the federal General
Conformity Rule on November 30, 1993 (58 FR 63214). Rule 702 incorporates this federal rule
in verbatim form. General Conformity is intended to assure that a federal action does not
adversely affect the emission reduction progress plans leading to attainment by reconciling the
emissions from the federal action with the SIP. The rule covers direct and indirect emissions of
criteria pollutants or their precursors that are caused by a federal action and exceed specified de
minimis levels. Certain federal actions are not subject to conformity determinations - e.g., an
action that includes major new or modified stationary sources that require a permit under the new
source review or prevention of significant deterioration provisions of the federal Clean Air Act.
As Santa Barbara County has been designated a “serious” ozone non-attainment area, General
Conformity determinations are triggered for nonexempt federal actions whose emissions exceed
8 - 5
50 tons/year of any ozone precursor. The following criteria are used to determine the conformity
of such federal actions 1:
1. The action is in conformity if its emissions are specifically identified and accounted for in the
applicable SIP 2.
2. If the emissions from the action are fully offset so there is no net emissions increase, the
action is in conformity.
3. Where EPA has approved a revision to an area’s attainment or maintenance demonstration
after 1990, an action is in conformity if the emissions from the action, together with all other
emissions in the non-attainment or maintenance area, do not exceed the emissions budgets
specified in the applicable SIP. This criterion is known as the “budget” test.
4. Where EPA has not approved a revision to an area’s attainment or maintenance
demonstration after 1990, an action is in conformity if its emissions do not increase
emissions with respect to baseline emissions. For Santa Barbara County, the baseline
emissions reflect the historical activity levels that occurred in the geographic area affected by
the federal action in the calendar year 1990. The baseline emissions are the total direct and
indirect emissions calculated for future years using the historic activity levels and appropriate
emission factors for future years 3. This is known as the “build/no build” test.
8.4 POLLUTION PREVENTION PROGRAMS
8.4.1 INNOVATIVE TECHNOLOGY GROUP
The Innovative Technology Group (ITG) was established in 1988 in connection with conditions
of approval for the development of two new oil and gas facilities. The ITG program promotes
the development, testing, and application of clean fuels and energy projects to reduce emissions
1 For further detail, see Title 40, Code of Federal Regulations, Part 51.858.2 The applicable SIP means the portion or portions of the SIP, or its most recent revision, which has been approved by EPA under Section 110 of
the Clean Air Act.3 The future years are defined at 40 CFR 51.859(d).

8 - 6
of NOx and ROC. To date, ITG has implemented over 25 programs to demonstrate low
emissions technology for both mobile and stationary sources. Present and past projects have
included low emission natural gas engines for trucks, buses, cars and marine vessels, promoting
alternative fuels, purchasing and scrapping older and more polluting automobiles, low NOx gas
turbines, fuel cells, and low emitting agricultural boilers and booster pumps. The APCD, by
contracting with the Institute for Research and Technical Assistance (IRTA), has also sponsored
several projects as part of the pollution prevention initiative that focused on reducing the use of
ozone-depleting substances or solvents. IRTA helped fifteen regulated businesses ranging from
aerospace to biotechnology to find appropriate substitutes for polluting materials and processes.
Reductions in ozone precursors from ITG projects have amounted to over 1300 tons. Funding
for ITG programs comes from several sources, including contributions from oil and gas
development projects as part of their permitting requirements, motor vehicle surcharge fees
collected with annual vehicle registration, and from mitigation requirement associated with
CEQA. The continued success of the ITG program lies in our ability to locate and secure
additional funding mechanisms to continue implementing clean air projects and partnerships.
The APCD is committed to the continued application of innovative ways of reducing pollution
from a wide range of sources.
8.4.2 BUSINESS ASSISTANCE PROGRAM
The Business Assistance Program helps regulated businesses access various APCD resources in
order to cooperatively achieve protection of public health and the environment. The APCD has a
dedicated Business Assistance Line staffed by the Business Assistance Representative who acts a
guide to the staff and business resources within the APCD. Assistance is provided with permit
compliance, permit applications, pollution prevention and educational site visits. This service is
also provided through the Internet via electronic mail and informational brochures. Periodically,
customer service surveys are conducted to measure how effective the APCD has been in areas
such as permit processing, inspections and complaint responses, and how service can be
improved.
8 - 7
8.4.3 PUBLIC OUTREACH PROGRAM
The Public Outreach Program helps individuals, businesses and organizations understand air
pollution issues and the need for pollution control. The program provides information to
companies in regulated industries to help them meet permit requirements and appreciate the need
to comply with these requirements. Outreach efforts also help companies take voluntary actions
to reduce pollution.
In addition, information provided by the Public Outreach Program assists policy-makers,
representatives of community organizations, and individuals in the community-at-large in
making policy and consumer decisions that will result in reduced air pollution. Outreach efforts
under this program promote alternative transportation choices to reduce mobile-source pollution.
8.4.4 TAKE A VACATION FROM YOUR CAR
A new public education initiative termed Take a Vacation From Your Car: An Outreach
Program for Visitors and Tourists to Santa Barbara will promote alternative transportation
choices for tourists and visitors to the area. Working together with many partners, APCD will
develop and launch a coordinated program to encourage visitors to “take a vacation from their
cars”—both in traveling to Santa Barbara, and in traveling around the city once they have
arrived.
Potential project partners include Amtrak, the City Conference and Visitors Bureau, the local
chapter of the American Lung Association, the Santa Barbara Industrial Association, the
Metropolitan Transit District, the Santa Barbara Bicycle Coalition, the County of Santa Barbara,
the City of Santa Barbara, Traffic Solutions (a program of the Santa Barbara County Association
of Governments), bicycle rental and tour operators, shuttle operators, hotels and motels, and
other interested parties.
A key goal of the program will be to position car-free travel as an attractive feature of a vacation.
Reducing vehicle emissions from tourists and visitors is important for a number of reasons:
8 - 8
• Visitor-generated pollution occurs at the highest levels during smog season, e.g. April
through October.
• Visitor-generated pollution occurs primarily in the southern portion of the county; the portion
of the county that is in nonattainment of the federal ozone standard.
• Increased traffic from visitors contributes to congestion and additional pollution.
A 1996 study by the City Conference and Visitors Bureau found that approximately 55% of
visitors to Santa Barbara are from Southern California. Some fly into the Santa Barbara
municipal airport; some take the train. Amtrak reports the majority of train travelers to Santa
Barbara come from the Los Angeles area.
Many visitors, however, drive their own cars on Highway 101. According to a 1995 Santa
Barbara County Association of Governments (SBCAG) report, 60.9 % of traffic on Highway 101
during the Sunday peak period (when weekend travelers are returning home) is traffic from
inside Santa Barbara County to a location outside the county. Other visitors come from other
parts of California and the U.S., and a substantial number (an estimated 15%) are foreign
tourists. Many visitors in all groups rent cars when they arrive.
Santa Barbara is an ideal location for a mobile-source outreach program targeting tourists and
visitors. Mild weather conditions, attractive walking and bicycling paths, and a good bus transit
system make the city an optimal destination for visitors interested in “taking a vacation from
their cars.”
A number of diverse efforts are already underway in this area. The Bicycle Federation of
America held its biennial conference “Pro Bike, Pro Walk ‘98” in Santa Barbara in September of
1998, marking the first time this meeting has been held in California. Several local bicycle
companies offered special programs in connection with this conference, which received
international attention in the cycling community.
Traffic Solutions recently sponsored production of a Santa Barbara County Bike Map, a detailed
map of bike paths, with additional cycling information. The City of Santa Barbara has stressed
8 - 9
the need for bicycle and pedestrian paths in its Circulation Element, and in plans for the
downtown waterfront area, and encourages transit-oriented development. The Metropolitan
Transit District has one of the largest fleets of electric buses in the country; its downtown electric
shuttle has a low (25 cents) fare and a popular route. The transit district will soon unveil a new
kiosk, developed with funds from the APCD and Caltrans. The kiosk has interactive touch-
screen displays, bus maps, and visitor information. Two prototypes have been developed;
locations under consideration for permanent and/or portable installations include the airport, the
Amtrak station, and downtown shopping centers and hotels.
Amtrak has been promoting service to Santa Barbara for some time. Amtrak California (a joint
program of Amtrak and Caltrans) just began renovation of the Santa Barbara train station, with a
completion target date of April 1999. Amtrak also just announced a $100 million investment to
purchase new passenger trains for the San Diegan corridor (San Diego-Los Angeles-Santa
Barbara-San Luis Obispo). The new trains are expected to be in service in 2000.
The project began development in July of 1998 and will be designed to be supported on an
ongoing basis by partners, via incorporation of elements into existing programs.
8.4.5 CLEAN CITIES PROGRAM
The APCD is part of a local coalition working towards a Clean Cities designation issued by the
U.S. Department of Energy. The program is a voluntary, locally based government/industry
partnership that will expand the use of alternatives to gasoline and diesel fuel. Clean Cities
works directly with local businesses and government to shepherd them through the goal-setting,
coalition-building and commitment process necessary to establish the foundation for a viable
alternative fuels market. The APCD is among the stakeholders who are jointly developing a
Clean Cities program plan which will include Clean Cities Goals, organizational structure,
analysis of the local alternative fuel vehicle market, and commitments from fleet operators and
others who will purchase and maintain alternative fuel vehicles and invest in refueling
infrastructure.
8 - 10
8.5 APCD ENVIRONMENTAL REVIEW PROGRAM
The APCD's environmental review program consists of the following:
1) As a lead agency, the APCD analyzes and prepares environmental documents on its
own discretionary activities, such as, air quality plans, rule development activities and
discretionary APCD permits which do not require a land use or other agency permit.
2) As a responsible or cooperating agency, the APCD reviews environmental documents
prepared by other lead agencies or jurisdictions under CEQA or NEPA to reduce or
avoid impacts to air quality and to ensure that the lead agency’s environmental
document is adequate to fulfill the CEQA requirements for APCD permits.
3) As the local agency with jurisdiction over the air resources of the County, the APCD
is a concerned or trustee agency under CEQA and NEPA. The APCD provides
guidance to mitigate adverse impacts to air quality from development projects in the
county as well as offshore sources.
Every development project that is not exempt from CEQA must be analyzed to disclose the
potential significant adverse environmental effects of the project, to identify alternatives to the
projects and to indicate the manner in which those significant adverse effects can be mitigated or
avoided.
State guidelines implementing CEQA require all environmental impact reports to include a
discussion of any inconsistencies between a proposed project and applicable general plans and
regional plans, the latter of which include air quality management plans such as the CAP. The
discussion is intended to identify projects which would run counter to the efforts identified as
desirable by agencies in regional plans to solve large-scale environmental problems such as air
and water pollution. This analysis may lead to projects being modified to reduce any
inconsistencies. To be consistent with the CAP, the direct and indirect emissions associated with
a project subject to CEQA must be accounted for in the CAP’s emissions growth assumptions.
Additionally, the project has to be consistent with policies adopted in the CAP.
8 - 11
The determination of what constitutes a significant adverse effect is made by the jurisdiction
with the primary permitting authority over a proposed project, usually an incorporated city, a
county agency, or a state agency (implementing CEQA) or a federal agency (implementing
NEPA). The APCD, as an independent local agency, has its own environmental review
guidelines to implement CEQA. The APCD provides guidance on how to quantify and mitigate
adverse project-related air quality impacts, and how to determine consistency with the CAP.
Consistency with land use and population forecasts in local and regional plans, including the Clean
Air Plan is required under CEQA for all proposed projects subject to 1994 CAP consistency
determinations include a wide range of activities such as commercial, industrial, residential, and
transportation projects. By definition, consistency with the CAP means that direct and indirect
emissions associated with the project are accounted for in the CAP’s emissions growth assumptions
and the project is consistent with policies adopted in the CAP.
8.6 LAND USE PLANNING
Certain land use-related emissions are exempt from APCD rules and regulations but are
regulated wholly or in part by the county and incorporated cities through their General Plan
policies, zoning ordinances or by other agencies through their regulations, or indirectly through
the provisions of CEQA and NEPA.
General plans and local ordinances are guides for land use development. The APCD comments
on the draft general plan amendments, in particular the land use, circulation and housing
elements, in order to effect changes in proposed land use policies which conflict with the
APCD's policies. The APCD strongly encourages local governments to incorporate in their local
policy documents the planning and designing of communities to minimize their impacts on air
quality and to maximize the use of less polluting designs and technologies.
The County of Santa Barbara, in 1981 adopted an Air Quality Supplement to the Land Use
Element as part of the Comprehensive Plan for the unincorporated areas of the County. This
document included land use control measures and policy recommendations for reducing the use
8 - 12
of the automobile and decreasing vehicle miles traveled. In early 1993, the APCD prepared and
introduced a model Air Quality Element (AQE) to the seven cities and the County for
incorporation into their general plans. Although few jurisdictions have adopted a separate air
quality element in their general plans, policies consistent with the AQE have been adopted by
many of these jurisdictions.
These policies include promoting mixed land uses and increased land use densities in
conjunction with transit- and pedestrian-oriented designs to help reduce the number of
automobile trips and vehicle miles traveled. Energy efficiencies in project design such as low
emission construction materials, energy efficient appliances, use of solar energy and landscaping
are also encouraged not only to reduce the emissions of ozone precursors but also to reduce
stratospheric ozone depleting and green house gas emissions.
8.7 MOBILE SOURCE/TRANSPORTATION CONTROL POLICIES
With the continued growth of the number of motor vehicles, particularly registered passenger
cars, light duty trucks, commercial trucks and buses, increasing attention will have to be paid to
controlling emissions from these sources. On-road mobile source emissions will continue to
represent a large share of the County’s emission inventory relative to all other source categories.
At the heart of this problem is a highly mobile society that has become exceedingly dependent on
the private automobile for its transportation needs. Although much of this dependence can be
attributed to the inherent advantages afforded by private vehicles, the lack or absence of viable
alternatives to driving to meet the needs of our mobile society cannot be overlooked as a partial
explanation. Other contributing factors are land use and development policies that stipulate
design standards that promote auto use at the expense of other modes. In recognition of this,
federal and state legislators made some significant transportation policy changes, first in 1991
with the passage of the federal Intermodal Surface Transportation Efficiency Act (ISTEA) and
again in 1997 when the California legislature passed Senate Bill 45. ISTEA was reauthorized in
June 1998 as the Transportation Equity Act for the 21st Century (TEA-21). These bills delegate
considerably more authority to regional agencies such as SBCAG with respect to how federal
8 - 13
and state transportation dollars are spent. With these changes, a greater opportunity now exists
to more strongly tie in the on-road mobile source emission control strategy of the 1998 CAP with
the policies and goal of the Regional Transportation Plan’s transportation planning and
programming policies.
There are also several local issues related to reducing emissions from on-road mobile sources
that must be addressed as an integral part of this CAP. These issues include the need to reduce
emissions by controls on the vehicle, to promote the use of alternative fuels, to reduce vehicle
trips and improve the efficiency of the transportation system, to promote other forms of public
transit, and to address the relationship between land use decisions and air quality impacts.
These issues are discussed in greater detail below.
8.7.1 REDUCING EMISSIONS BY VEHICLE CONTROLS
As the light duty fleet becomes cleaner, there is a need to consider other on-road emission
sources and evaluate additional emission reduction strategies. Emission controls for on-road
mobile source are the responsibility of both the ARB and USEPA. As identified in Chapter 5,
there are two potential strategies that can be implemented locally to more expeditiously obtain
additional emission reductions from light duty on-road vehicles: 1) Enhanced vehicle inspection
and maintenance (Smog Check), and 2) Old car buy-back program. This plan currently identifies
enhancements to our local Smog Check program as a contingency measure and re-establishes an
old car buy-back program. In addition, given that medium and heavy-duty vehicles are a
significant source of emissions, more emphasis will be focused on programs that can reduce
emissions from these sources. As already discussed, the Innovative Technology Group has and
will continue to pursue projects and programs that will address medium and heavy duty vehicles
through both engine retrofit/replacement and the introduction and promotion of alternative fuels.

8 - 14
8.7.2 ALTERNATIVE FUELS
The application of clean fuel technologies requires an approach that addresses the distribution
and implementation challenges. Our experience over the past few years has revealed that the
promotion and integration of alternative fuels into the existing infrastructure can be difficult. For
example, the promotion of compressed natural gas technologies requires a consistent quality and
supply of the fuel in order to be successful. The infrastructure aspects of product delivery must
be dealt with up-front (i.e., CNG fueling infrastructure must be available before vehicles are
purchased). In addition, our experience with retrofitting vehicles has had limited success.
Therefore, priority should be given to transportation investments for fueling infrastructure
followed by the purchase “new” alternative fuel vehicles versus retrofit vehicles.
Public transit is also encouraged to reduce emissions of its bus fleet. The use of alternative fuels
(e.g., CNG, electric), for transit services will help achieve clean air goals. Since electric buses
for transit services emit zero emissions, it is highly desirable to encourage cost-effective fleet
acquisition strategies that replace all internal combustion engines with electric.
8.7.3 TRAVEL DEMAND MANAGEMENT AND SYSTEM EFFICIENCY
Single occupancy vehicle trips during peak traffic hours generate significant emissions and
contribute to local street congestion. The stop-and-go traffic associated with congestion further
increases the magnitude of the emissions as well as the number of incidents and accidents.
These problems can be addressed with improvements to the efficiency of the transportation
system and continued implementation of the travel demand management program. Projects such
as signal synchronization and the application of smart technology in bus routing, schedule
information, and ticket distribution can reduce congestion and the associated emissions. Travel
demand management programs such as the Traffic Solutions Rideshare program offer
alternatives to the single occupancy vehicle. Further, technological solutions (e.g.,
telecommuting) also provide alternatives to trip making. Chapter 5 of this Clean Air Plan
outlines each of these programs to reduce the impacts associated with the single occupancy and
mandates their continuation.

8 - 15
8.7.4 PROMOTING TRANSIT
A shift from single occupancy vehicles to public transit will reduce congestion. In addition, a
concurrent shift in aggregate public transit fleet fueling to alternative fuels (i.e., electric, CNG)
will also offer significant air quality benefits over time. The continued utilization of higher
emitting gasoline and diesel fueled transit vehicles will compromise transit’s contribution to air
quality improvement as the percentage of newer and cleaner passenger autos/trucks grows as a
result of fleet turnover. Hence, to reduce congestion and air pollution, efforts should be taken to
promote the eligibility of transit projects for federal Congestion Mitigation and Air Quality
(CMAQ) and state motor vehicle surcharge funds which emphasize alternative fuels. New or
expanded transit services employing alternatively fueled vehicles should be emphasized. Clean,
expanded transit operations will require additional funding. Co-operative efforts to identify
these funding sources should be undertaken.
8.7.5 LAND USE STRATEGIES
Land use and infrastructure decisions impact trip generation, trip length, mode choice, and air
quality. Local land use decisions are the purview of local agencies and is not under APCD
regulatory authority. Over the next 20 years, the population of Santa Barbara County is forecast
to increase by 22% from the existing population of 400,000. Federal law mandates the use of
consistent assumptions about future growth, developed in SBCAG’s regional growth forecast, in
the Clean Air Plan and the Regional Transportation Plan. Both the increases in local population
and the land use decisions required to accommodate the anticipated growth will significantly
impact the level of emissions in the county and the resultant air quality.
The interrelationship of transportation, land use strategies and motor vehicle emissions is
discussed in the California Air Resources Board ‘s study “Transportation-Related Land Use
Strategies to Minimize Motor Vehicle Emissions: An Indirect Source Research Project (June
1995)". Nine strategies to reduce the reliance on motor vehicles by increasing the convenience,
access to and use of public transit, walking and alternative travel modes were identified:
8 - 16
• Strong downtowns – downtowns or central business districts can become focal points
for regional transit systems and encourage pedestrian travel within the downtown.
• Concentrated activity centers – combining higher-density development appropriately
into concentrated nodes provides opportunities for pedestrian and transit travel.
• Mixed-use development – locating compatible land uses within walking distance of
each other can result in a higher level of walking and more transit use compared to
single use projects.
• Infill and redevelopment – the infill, redevelopment and reuse of vacant or underused
parcels within an already developed area encourages walking as well as higher rates
of transit use because activities are located closer together.
• Increased density near transit stations – intensifying land uses within ¼ to ½ mile of
existing or planned high-capacity transit stations and incorporating direct pedestrian
access increases transit use rates.
• Increased density near transit corridors – intensifying land uses within walking
distance of a transit corridor also encourages transit use.
• Pedestrian/bicycle facilities – increasing pedestrian accessibility by providing
adequate, direct sidewalks and paths, protection from fast vehicular traffic and other
pedestrian amenities, provides alternatives to the use of vehicles.
• Interconnected street networks –providing direct routes for vehicles, pedestrians and
bicycles can result in safer environments for bicyclists and pedestrians while
maintaining travel times for vehicles.
• Strategic parking facilities – the amount and cost of parking should vary by land use
type and proximity to transit service.
The study concludes that implementing these strategies could reduce vehicle emissions in an
urban area by as much as 30%. As an example, for an urban household whose annual vehicle
miles traveled (VMT) is 13,000 to 16,000 miles, the associated annual vehicle emissions are 40-
50 pounds of ROG and 35-43 pounds of NOx. By implementing increased mixed used
development (i.e., mixed use residential and commercial development), encouraging infill and
densification and increasing density near transit corridors (i.e., compact residential and
8 - 17
commercial uses within ¼ to ½ mile of major transit corridors), annual household VMT could be
reduced to below 10,000 miles with ROG and NOx emissions reduced to below 31 and 27
pounds per year, respectively.
To address this issue, SBCAG should continue in its role of preparing the regional growth
forecasts and producing technical studies such as the jobs-housing study. SBCAG should also
model, based on data provided by local agencies, alternative growth and development scenarios
to assess the impacts of new growth on the transportation system. To mitigate the impacts of
motor vehicle emissions from the local development process, the APCD Board should direct the
Community Advisory Council to work with APCD staff to further explore potential mitigation
options such as indirect source review and voluntary emission reduction programs. This effort
should include examining the scope, cost and effectiveness of existing mitigation programs and
result in recommendations for the APCD Board to adopt.
8.8 CONGESTION MANAGEMENT PROGRAM
With the passage of Proposition 111 in 1990, new requirements for the transportation planning
process require urbanized counties, such as Santa Barbara County, to prepare, adopt, and
biennially update a Congestion Management Program (CMP). The intent of the CMP legislation
was to address the problem of increasing congestion on California's highways and principal
arterials through a coordinated approach involving state, regional, county, and city transportation
and land use agencies, transit providers and air pollution control districts. The CMP was also
intended to facilitate an integrated approach to programming transportation improvements. By
creating a forum for state, regional, and local transportation and land use agencies to address
regional and multi-jurisdictional issues related to congestion, land development, and air quality,
the CMP ensures that limited transportation funds are more efficiently invested.
The CMP legislation requires member agencies to prepare deficiency plans for CMP system
facilities located within their jurisdictions that fail to meet the CMP traffic Level-of-Service
(LOS) standard. Santa Barbara County's CMP LOS standard is LOS D. The legislation requires
that deficiency plans to either mitigate the deficiency at its location through capital

8 - 18
improvements or alternatively, implement system-wide improvements that benefit circulation
and air quality. The APCD has developed a list of 12 strategies that may be pursued when a
jurisdiction elects to implement system-wide improvements in lieu of capital improvements. If a
CMP facility exceeds the LOS standard and does not have a Congestion Management Agency-
approved deficiency plan, then the local jurisdiction in which the facility is located is at risk of
losing new gas tax revenues provided by Proposition 111.
There are two primary purposes deficiency plans serve in the CMP process. First, they ensure a
jurisdiction will not be found in nonconformance with the CMP for exceeding the CMP traffic
LOS standard. Secondly, they serve to increase the funding priority of any improvement
identified through the deficiency planning process. This greatly increases the likelihood that a
local jurisdiction will obtain funding to implement congestion relief or air quality benefiting
projects. Some of the competitive funding programs which explicitly consider, as part of the
project selection criteria, whether proposed projects are identified in a CMP deficiency plan
include: the federal Surface Transportation Program; the federal Congestion Mitigation and Air
Quality program; the State Regional Improvement Program and, Santa Barbara County's vehicle
registration fee program administered by the Air Pollution Control District.
8.9 CONCLUSIONS
Attainment of air quality standards will not occur with only the efforts of the APCD.
Implementation of programs by the federal and state governments and a cooperative local effort
must continue. As described in this chapter, many local programs and the actions of various
jurisdictions can have both positive and negative impacts on air quality. Open communication
and agreement on the common goal of clean air must occur to maximize the community’s efforts
to meet clean air standards.

9 - 1
CHAPTER 9
RATE-OF-PROGRESS
Introduction
1990 Rate of Progress
Base Year Emission Inventory
1999 ROP Target
Forecast 1999 ROP Inventory
Conclusions
9 - 1
9. RATE-OF-PROGRESS
9.1 INTRODUCTION
This chapter documents that this 1998 CAP will achieve a 24% reduction in emissions of reactive
organic gases (ROG) in the period from 1990 to 1999, as required by the Federal Clean Air Act
Amendments (FCAAA) of 1990. The overall 24% reduction is a combination of the 15% emission
reduction requirement for the period from 1990 to 1996 for “moderate” nonattainment areas under
Section 182(b)(1) of the FCAAA and the 9% emission reduction requirement for the period from 1996
to 1999 for “serious” nonattainment areas under Section 182(c)(2)(B). This chapter describes how the
1999 ROG emission target is calculated as based upon USEPA Guidance. The conclusion of this
chapter compares the forecast of 1999 ROG emissions to the 1999 target.
9.2 1990 RATE-OF-PROGRESS BASE YEAR INVENTORY
The 1990 Rate-of-Progress Base Year Inventory is derived from the 1990 Annual Base Year
Emission Inventory using the method described in Section 1 of Chapter 6. Since most violations
of the federal ozone standard occur during summer (May through October), area source and on-
road vehicle emissions must be adjusted for seasonal variation in emission rates. The point source
annual emission inventory is also converted to an average operating day inventory by dividing the
process emissions from each facility by the number of days that the facility operated in the base
year.
As specified in the federal Clean Air Act Amendments, the Rate-of-Progress Base Year inventory
includes only anthropogenic (man-made) ozone precursor emissions occurring in the non-
attainment area. Because natural source emissions such as biogenic (vegetative) sources, oil and
gas seeps, and wildfires are not currently regulated through implementation of emission control
measures, they are removed from the seasonally adjusted emission inventory. Table 9-1 shows
the Santa Barbara County Rate-of-Progress Base Year emission inventory of ROG, NOx and CO
9 - 2
in tons per summer day for 1990. On the average, there were 79.32 tons of ROG, 62.19 tons of
NOx and 474.18 tons of CO emitted into the air in Santa Barbara County each summer day in
1990. Figure 9-1 shows the relative contribution of the major source categories to the 1990
Santa Barbara County Rate-of-Progress emission inventory.
As outlined below, On-Road Motor Vehicles are the most significant source of ozone precursor
emissions, accounting for over half of ROG emissions, almost two thirds of NOx emissions and
over 90% of CO planning day emissions in 1990. Oil and gas production fugitive hydrocarbons,
consumer products and pesticides are important sources of ROG emissions, while a significant
quantity of NOx emissions is produced by commercial and industrial mobile equipment, and oil
and gas production internal combustion engines. The following bullets highlight the major
emission sources for each pollutant.
ROG emissions:
• 60% are Mobile Sources, 26% are Stationary Sources and 14% are Area-Wide Sources.
• On-Road Motor Vehicles contribute 55%, of which 94% are from light duty passenger cars
and light duty trucks.
• 15% are related to Petroleum Production and Marketing.
• Over 13% are related to Solvent Evaporation, of which about 33% are from Consumer
Products and another 33% are from Pesticides.
NOx emissions:
• 81% are Mobile Sources, 18% are Stationary Sources.
• 62% are from On-Road Motor Vehicles, of which 75% are from light duty passenger vehicles
and light duty trucks.
• 19% are from Other Mobile Sources, of which 71% are from Commercial/Industrial Mobile
and Farm Equipment.
• 18% are from Fuel Combustion at stationary sources, of which 56% are related to Oil and Gas
Production.
9 - 3
CO emissions:
• 97% are Mobile Sources.
• Over 90% are from On-Road Motor Vehicles, of which 66% from light duty passenger cars
and 27% are from light duty trucks.
9.3 1999 ROP TARGET
To determine the emission reduction target for 1999, a series of adjustments were made to the 1990
base year ROG emission inventory. First, adjustment to the ROG emission inventory is required to
ensure that the emission reductions resulting from federal programs are not credited towards the 24%
ROG emission reduction target as per USEPA guidance. The ROG emission inventory will be reduced
by 22.60 tons per day in 1999 as a result of federal motor vehicle standards and reduced gasoline vapor
pressure. The calculation of this adjustment was performed by ARB. Those emission reductions are
subtracted from the 1990 base year ROG emission inventory of 79.32 tons of ROG per day to produce
the 1990 adjusted base year ROG emission inventory. The quantity of ROG emissions in the 1990
adjusted base year inventory is 56.72 tons per average summer weekday. This value is used to
calculate the 1999 ROG emissions target value for the 1998 Clean Air Plan.
As described in Section 1 of this chapter, the 1998 Clean Air Plan is required to demonstrate that ROG
emissions will be reduced 24% from the 1990 adjusted base year inventory. 24% of 56.72 tons of
ROG per day is 13.61 tons. Subtracting the emissions reduction target of 13.61 tons from the 1990
adjusted base year inventory of 56.72 tons produces a 1999 ROG emission target of 43.11 tons of
ROG per day, as illustrated in Table 9-2. Details of the equations used to calculate this target are
presented below.
1) Base Year Inventory = Pb + Ab + Mb + Nb
2) 1990 ROP Base Year Inventory = Pb + Ab + Mb
3) Adjusted Base Year Inventory = Pb + Ab + M1990,1999f - Crvp
9 - 4
4) 24% Reduction = Adjusted Base Year Inventory x 0.24
5) Total Reduction = 24%Reduction + (M1990,1990f - M1990,1999f) + Crvp
6) 1999 Target Value = 1990 ROP Base Year Inventory - Total Reduction
Where:
Pb = Stationary source 1990 base year inventory
Ab = Area-wide source and other mobile source 1990 base year inventory
Mb = On-road 1990 base year inventory
Nb = Natural source 1990 base year inventory
M1990,1990f = On-road inventory w/1990 activity data and 1990 federal motor vehicle controls
M1990,1999f = On-road inventory w/1990 activity data and 1999 Federal Motor Vehicle Control
Program (FMVCP)
Crvp = Emission reductions due to the Federal Reid Vapor Pressure (RVP) limits on gasoline
9.4 FORECAST 1999 ROP INVENTORY
As described in Chapter 6, the 1999 inventory of ROG emissions is forecast by applying estimates of
the changes in the level of pollution producing activities to the 1996 Planning Emission Inventory. In
addition, emission reductions resulting from local controls adopted by the APCD Board of Directors
after 1990 and from state-wide regulations adopted by the California Air Resources Board (ARB) are
estimated and subtracted from the emission inventory. All ROG Emission Reduction Credits (ERC)
which were banked before 1990 are added to the 1999 ROG emission inventory forecast. All of the
banked ROG ERC balance is from Vandenberg Air Force Base. Since the banked ROG ERC balance
is only 0.003 tons per day, it has little impact on the resulting forecast of ROG emissions. Table 6-2 in
Chapter 6 shows the 1999 Santa Barbara County Rate-of-Progress Inventory.
Figure 9-2 shows the relative contribution of the major source categories to the 1999 Santa
Barbara County Rate-of-Progress emission inventory. As outlined below, On-Road Motor
9 - 5
Vehicles are the most significant source of ozone precursor emissions, accounting for 44.8% of
ROG emissions in 1999. Oil and gas production fugitive hydrocarbons, consumer products and
pesticides are also important sources of ROG. The following bullets highlight the major emission
sources of ROG.
• 52% are Mobile Sources, 22% are Stationary Sources and 27% are Area-Wide Sources.
• On-Road Motor Vehicles contribute 45%, of which 66% are from light duty passenger cars
and 26% are from light duty trucks.
• 8% are related to Petroleum Production and Marketing.
• 21% are related to Solvent Evaporation, of which about 36% are from Consumer Products
and another 34% are from Pesticides.
Compared to the 1990 Base Year Inventory, the relative contribution of ROG emissions from
Mobile Sources is reduced from 60% to 55% of the 1999 inventory, primarily through reductions
in the On-Road Vehicles category. The relative contribution of ROG emissions from the
Petroleum Production and Marketing category is reduced from 15% to 8%. Although the total
ROG emissions from solvent evaporation decrease from 1990 to 1999, they do not decrease as
rapidly as these other categories, so the relative contribution of ROG emissions from this category
increases from 13% to 21% of the 1999 inventory.
9.5 CONCLUSIONS
Application of activity indicator forecasts and control measures to the 1996 Santa Barbara County
ROG emission inventory indicates that 1999 ROG emissions will be reduced to 38.93 tons per day.
This is below the 1999 target of 43.11 tons per day by 4.18 tons per day. The amended ROG emission
inventory is below the target value as required by the FCAAA. This process has demonstrated that the
required 24% ROG reduction will be achieved. Table 9-3 summarizes the 1999 ROG emission
forecast, and compares it to the 1999 ROG emission target.

9 - 6

9 - 7

9 - 8
TABLE 9-2
1999 ROG TARGET VALUE CALCULATION
1990 ROP Base Year ROG Planning Inventory (Tons Per Day)
Stationary Sources 20.35
Area-wide Sources 11.74
Other Mobile 3.41
On-road Vehicles (a) 43.82
Total 79.32
1990 Adjusted Base Year ROG emission inventory (TPD)
Stationary Sources 20.35
Area-wide Sources 11.74
Other Mobile 3.41
On-road Vehicles (a) 21.22
Total 56.72
Emission Reductions in 1999
24% Adjusted Base Year 13.61
FMVCP & RVP (a) 22.60
Total 36.21
1999 Target Value
1990 ROP Base Year 79.32
Emission Reductions 36.21
Target 43.11
(a) Calculation performed by ARB and SBCAG.
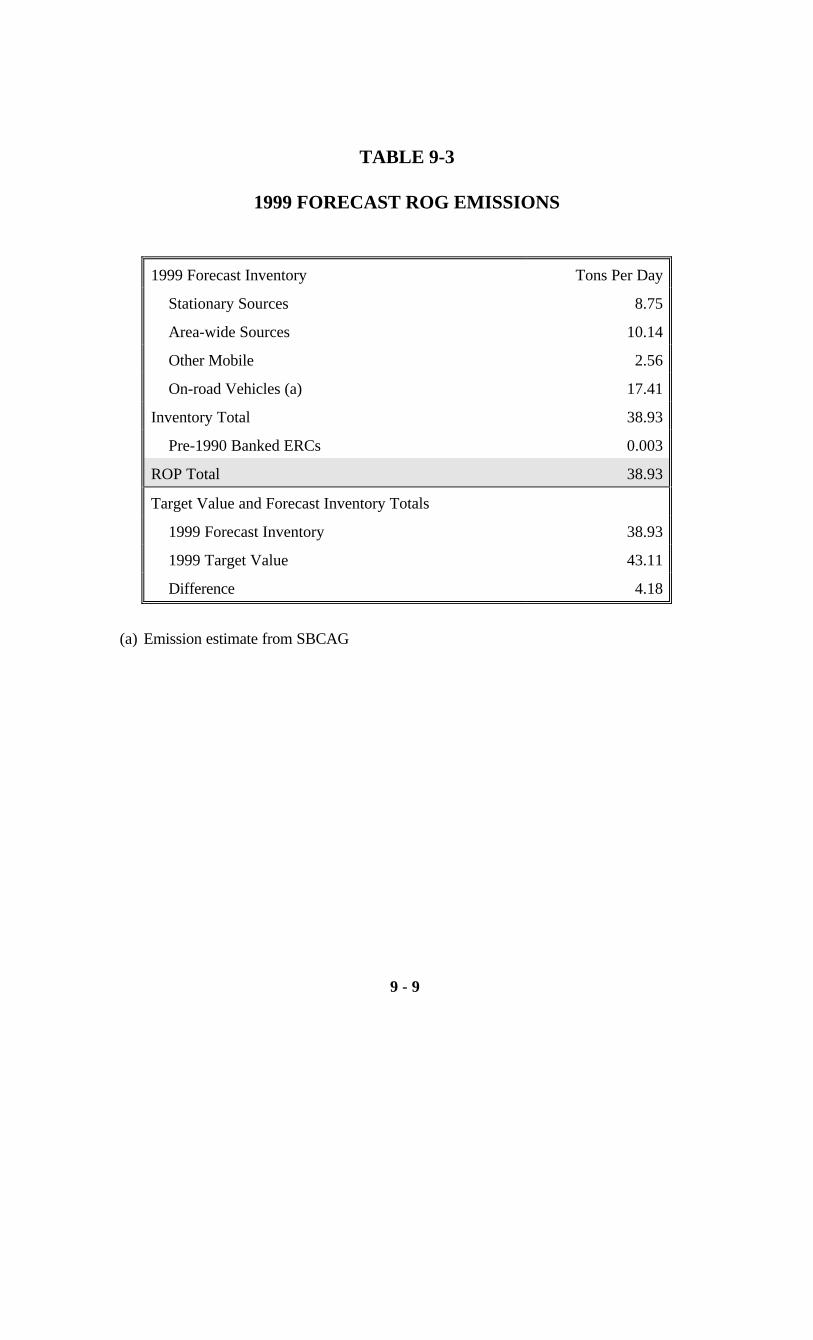
9 - 9
TABLE 9-3
1999 FORECAST ROG EMISSIONS
1999 Forecast Inventory Tons Per Day
Stationary Sources 8.75
Area-wide Sources 10.14
Other Mobile 2.56
On-road Vehicles (a) 17.41
Inventory Total 38.93
Pre-1990 Banked ERCs 0.003
ROP Total 38.93
Target Value and Forecast Inventory Totals
1999 Forecast Inventory 38.93
1999 Target Value 43.11
Difference 4.18
(a) Emission estimate from SBCAG

9 - 10
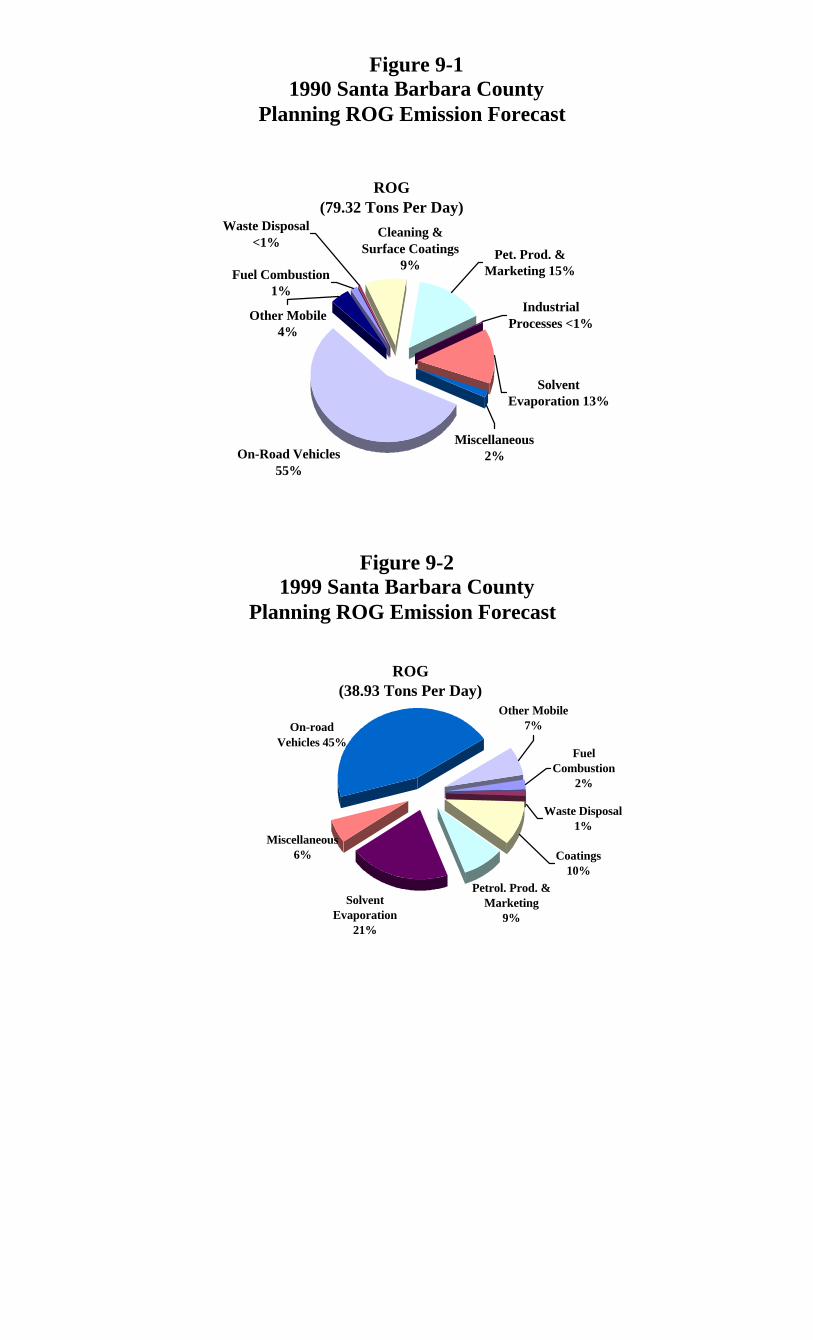
ROG(38.93 Tons Per Day)
Other Mobile7%
Miscellaneous6%
Fuel Combustion
2%
Waste Disposal1%
Coatings10%
Petrol. Prod. & Marketing
9%
Solvent Evaporation
21%
On-road Vehicles 45%
Figure 9-21999 Santa Barbara County
Planning ROG Emission Forecast
Figure 9-11990 Santa Barbara County
Planning ROG Emission Forecast
ROG(79.32 Tons Per Day)
Other Mobile4%
Pet. Prod. & Marketing 15%
Solvent Evaporation 13%
Industrial Processes <1%
Miscellaneous2%
Waste Disposal <1%
Cleaning & Surface Coatings
9%
On-Road Vehicles55%
Fuel Combustion1%
CHAPTER 10
STATE AND FEDERAL CLEAN AIR ACT REQUIREMENTS
Introduction
1990 Federal Clean Air Act Amendments
California Clean Air Act Mandates
Conclusions

10 - 1
10. STATE AND FEDERAL CLEAN AIR ACT REQUIREMENTS
10.1 INTRODUCTION
This 1998 Clean Air Plan (1998 CAP) is being prepared by the Santa Barbara County Air Pollution
Control District (APCD) to satisfy various mandates of the 1990 federal Clean Air Act
Amendments and the California Clean Air Act of 1988. This chapter presents an overview of all
state and federal clean air act requirements and discusses how the work completed in conjunction
with this 1998 CAP complies with all applicable requirements.
10.2 1990 FEDERAL CLEAN AIR ACT AMENDMENTS
This section outlines the submittals that are required from the APCD to satisfy the provisions of the
1990 federal Clean Air Act Amendments (FCAAA) as a “serious” ozone nonattainment area.
Section 176(c) Conformity – The United States Environmental Protection Agency (USEPA) was
required to develop criteria and procedures by November 15, 1991 for determining the conformity
of transportation and non-transportation (general) projects requiring federal agency approval with
applicable nonattainment plans. These criteria and procedures were intended to ensure that such
projects do not: cause or contribute to a new air quality standard violation; increase the frequency
or severity of an existing violation; or delay timely attainment of a standard or any required interim
emission reduction milestone. The USEPA promulgated the transportation conformity regulation
on November 24, 1993, and the general conformity regulation on November 30, 1993. The
transportation conformity regulation was amended in August 1995, November 1995, and August
1997.
Under the provisions of the FCAAA and the promulgated November 1993 regulations, Santa
Barbara County was required to adopt its own transportation conformity rule by November 24,
1994, and a general conformity regulation by November 30, 1994. The APCD Board of Directors
adopted Rule 701, Transportation Conformity, and Rule 702, General Conformity, on October 20,
10 - 2
1994. Rule 701 was revised in August 1998 in response to requirements in the August 1997 set of
federal transportation conformity amendments.
Section 182(a)(1) Emission Inventory - The APCD was required to prepare a comprehensive
1990 base year emission inventory and submit this inventory to the USEPA by November 15,
1992. Section 172(c)(3) also requires that any nonattainment plan must include a comprehensive
emission inventory.
ARB submitted this inventory to the USEPA on behalf of the APCD by November 15, 1992.
However, the USEPA found the submittal incomplete due to the lack of a public hearing. A 1990
baseline inventory of the sources of pollution in Santa Barbara County was prepared as part of the
1994 Clean Air Plan and submitted to the USEPA by November 15, 1994. On January 8, 1997, the
EPA approved this submittal, which satisfied the mandates of Section 182(a)(1).
This 1998 CAP uses a recently developed 1996 emissions inventory to update the 1990 inventory
and to forecast 1999 and 2005 emissions. These inventories have been through the public review
process and represent the best available current information.
Section 182(a)(3) Emission Inventory Updates - The APCD was required to adopt a rule by
November 15, 1992, requiring sources emitting 25 or more tons of volatile organic compounds
(VOC) or NOx per year to submit annual emission statements. The first emission statements were
required by November 15, 1993.
On October 20, 1992, the APCD Board adopted Rule 212, Emission Statements, which required all
stationary sources with permitted emissions, in the aggregate, of 10 tons or more of reactive
organic compounds and nitrogen oxides to submit a written statement documenting the actual
emissions of these pollutants. The first statements were required by Rule 212 to be submitted to
the APCD by July 1, 1993. These statements were submitted to the EPA by the November 15,
1993 deadline.
10 - 3
Section 182(b)(1) 1990-1996 Rate-of-Progress – This section required a plan that provided for a
minimum 15 percent reduction in VOC emissions between 1990 and 1996. These plans were due
to the USEPA by November 15, 1993. Section 172(c)(2) required that the Plan demonstrate
"reasonable further progress," defined under Section 171(1) to be annual incremental reductions as
required to ensure attainment of national air quality standards by the applicable attainment date.
The APCD submitted a 1993 Rate-of-Progress Plan to the USEPA by November 15, 1993. This
plan was found to be incomplete by USEPA and was amended as part of the 1994 Clean Air Plan,
which was approved by the USEPA on January 8, 1997.
Section 182(b)(2) and 182(f) Reasonably Available Control Technology - The APCD had to
adopt rules by November 15, 1992 requiring Reasonably Available Control Technology (RACT)
on sources of VOC emissions. On April 7, 1994, the EPA notified the APCD of the last remaining
VOC RACT deficiency – Graphic Arts. A graphic arts VOC RACT rule (Rule 354) was adopted
by the APCD and submitted to the USEPA on July 13, 1994.
As a “serious” nonattainment area, the APCD must apply NOx RACT to all sources that emit, or
have the potential to emit 25 tons per year on NOx. All review of our permitted sources indicates
that all sources that emit, or have the potential to emit 25 tons per year of NOx have been subject to
RACT under our existing rules.
Section 182(b)(3) Gasoline Vapor Recovery - This section mandated that the APCD adopt a rule
by November 15, 1992 requiring gasoline vapor recovery systems.
This requirement was satisfied by adoption of APCD Rule 316, Storage and Transfer of Gasoline,
(adopted 10/71 and most recently revised 4/97).
Section 182(c)(1) Enhanced Ozone Monitoring – The USEPA was required to promulgate
regulations for enhanced monitoring of ozone, VOC and NOx, by May 15, 1992. The EPA
adopted the required regulations on February 12, 1993.
10 - 4
Since Santa Barbara County was recently classified as a “serious” ozone nonattainment area, the
APCD is in the process of developing an enhanced monitoring program. The APCD submitted a
work-plan/proposal to the USEPA on August 7, 1998 for the enhanced ozone monitoring program,
known as the Photochemical Assessment Monitoring System (PAMS). The USEPA approved the
work-plan/proposal on August 12, 1998. The APCD is currently developing a PAMS network plan
to be submitted to the USEPA by March 1999.
Section 182(c)(2)(A) Attainment Demonstration - This 1998 CAP must demonstrate attainment
of the federal 1-hour ozone standard by November 15, 1999 based on photochemical grid
modeling. Section 172(c)(1) also requires attainment of the standard, but does not specify the
model to be used for the demonstration.
Chapter 7 and Appendix D of this 1998 CAP document the photochemical modeling conducted by
the ARB. Based on information presented in Chapter 7, the APCD has demonstrated that the
federal 1-hour ozone standard will be attained by November 15, 1999.
Section 182(c)(2)(B) Post-1996 Rate-of-Progress - The APCD must submit a plan to the USEPA
by January 9, 1999, that provides for at least a 9 % reduction in VOC emissions from 1996 through
1999. This is in addition to the 15 % reduction required by 1996 under Section 182(b)(1) for a total
reduction of 24 % by November 15, 1999.
Based on the calculations presented in Chapter 9, the APCD will be able to achieve the identified
emission reduction targets.
Section 182(c)(3) Enhanced Vehicle Inspection and Maintenance – This provision required the
state of California to submit an enhanced inspection and maintenance program to reduce ROG and
NOx emissions from on-road motor vehicles by November 15, 1992.
ARB submitted a State Implementation Plan (SIP) revision to EPA committing to adopt an
enhanced inspection and maintenance program by November 15, 1993. In March 1994, the
Governor signed into law a three-bill legislative package that met USEPA requirements. Santa

10 - 5
Barbara County does not meet the population requirements specified in the FCAAA and is not
mandated to implement this program. However, the APCD continues to monitor the
implementation of the enhancements to Smog Check II and has currently identified this as a
contingency measure in this 1998 CAP.
Sections 182(c)(4) and 246 Clean Fuel Vehicle Fleet Programs – The ARB was to submit a
program to require the use of clean fuel vehicles in centrally-fueled fleets comprising 10 or more
vehicles located in serious and above ozone nonattainment areas by May 15, 1994.
On November 13, 1992, the ARB submitted a "opt-out" request to the USEPA per Section
182(c)(4)(B), in light of California's ongoing low emission vehicle control program. The USEPA
conditionally approved this request on November 29, 1993, and indicated that the ARB needed to
submit a complete SIP revision and additional information to receive full approval. On May 11,
1994, the ARB submitted the required revision and supplemental information.
Section 182(c)(5) Transportation Control Measures - The APCD is required to demonstrate by
November 15, 1999, and each third year thereafter whether current vehicle use, emissions and
congestion levels are consistent with levels assumed in the attainment demonstration. All forecast
on-road vehicle activity estimates used as inputs to the attainment demonstration are described in
Appendix C of this 1998 CAP. Also in included in Appendix C is a discussion on how these
vehicle activity estimates will be monitored and tracked. If the actual levels exceed the projected
levels, then the APCD is required to submit, within 18 months, a plan revision to implement
additional transportation control measures to augment those described in Chapter 5. The APCD
anticipates that it will submit the required demonstration by November 15, 1999.
Sections 182(c)(9) and 172(c)(9) Contingency Measures - Nonattainment plans need to include
contingency measures to ensure that anticipated progress toward attaining national air quality
standards occurs as anticipated. Section 172(c)(9) requires contingency measures to be undertaken
if an area fails to make "reasonable further progress" or attain air quality standards by the required
target date. Section 182(c)(9) requires contingency measures be implemented in serious and above
10 - 6
ozone nonattainment areas if any emission reduction milestone is missed. Contingency measures
must be structured so that they can be implemented without additional rulemaking activities.
Contingency measures are discussed in Chapters 4 and 5.
Section 182(g)(2) and (3) Milestone Compliance Demonstration – These sections require the
APCD to submit a demonstration to the US EPA within 90 days of each emission reduction target
milestone date, indicating whether or not emissions have been reduced consistent with the targets
outlined in the 1998 CAP. If the APCD determines that any milestone has been missed, the APCD
can request reclassification as a severe ozone nonattainment area, implement appropriate
contingency measures, or adopt an economic incentive program.
The APCD anticipates that it will make the applicable submittals to the USEPA by February 15,
1999.
10.3 CALIFORNIA CLEAN AIR ACT MANDATES
As indicated previously, an integral objective of this 1998 CAP is to satisfy the requirements of the
California Clean Air Act. The APCD is required to submit a triennial progress report and a
triennial update to the 1991 Air Quality Attainment Plan under the provisions of the California
Clean Air Act (CCAA). Recognizing that many of the required submittals duplicate those
mandated by the FCAAA, the APCD has developed this 1998 CAP to address all state and federal
planning requirements.
10.3.1 TRIENNIAL PROGRESS REPORT
Section 40924(b) of the California Health and Safety Code (H&SC) requires the APCD to conduct
an assessment of its air quality control program every three years, starting in 1994. This
assessment must address the expected and revised emission reductions scheduled for adoption
during the previous three years. This triennial report must also include an assessment of progress
based on monitored pollutant levels, modeled techniques and air quality indicators.
10 - 7
The emission control measures are presented in Chapters 4 and 5. In addition, Table 10-1
summarizes the APCD’s rule activity from 1995 to 1997. A summary of ambient air quality data
for Santa Barbara County is presented in Chapter 2 and the air quality indicators report is the
responsibility of the ARB.
10.3.2 TRIENNIAL PLAN REVISION
H&SC Section 40925(a) requires the APCD to review and revise its attainment plan at least once
every three years, beginning in 1994. The review and revisions are to correct for any deficiencies
in meeting the interim measures of progress incorporated into the plan pursuant to Section 40914
[emission reductions], and to incorporate new data or projections.
Correct Deficiencies in Meeting Interim Measures of Progress: The APCD has not identified
any significant deficiencies in meeting the 1991 AQAP rule adoption schedule. Chapters 4 and 5
present a discussion of the stationary source and transportation control measures as well as an
updated adoption schedule for each proposed control measure.
Incorporate New Data and Projections: This plan includes a reassessment of emission growth
forecasts and control measure effectiveness estimates presented in Chapters 4, 5, and 6.
10.3.3 OVERALL PLAN REQUIREMENTS
Sections 40912 through 40922 of the H&SC specify overall requirements that apply to any plan
submitted to the ARB to satisfy the CCAA requirements. Those CCAA requirements applicable to
Santa Barbara County are discussed below.
Transport Mitigation (H&SC Section 40912): Santa Barbara County has been identified as a
transport contributor (as part of the South Central Coast Air Basin) to the South Coast Air Basin.
The APCD has satisfied the transport mitigation requirements through the application of Best
Available Retrofit Control Technology (BARCT) requirements by January 1, 1994.

10 - 8
Cost Effective Strategy (H&SC Section 40913(b)): A cost effectiveness analysis of the control
measures is included in Chapter 4 and Appendix C of the 1991 AQAP and Appendix B of this 1998
CAP.
Annual Emissions Reduction (H&SC Section 40914): The APCD must demonstrate a reduction
in APCD emissions of five percent or more per year for each nonattainment pollutant averaged
over every consecutive three-year period. In the 1991 AQAP, the APCD identified every feasible
control measure in lieu of the 5 % annual emission reduction requirement. This 1998 CAP also
addresses every feasible measure in Chapters 4 and 5.
Contingency Measures (H&SC Section 40915): Contingency measures are to be implemented in
the event the ARB finds that the APCD fails to meet interim goals or maintain adequate progress
towards attainment. Proposed contingency measures are discussed in Chapters 4 and 5.
Moderate Air Pollution Areas (H&SC Section 40918(a)): The attainment plan must include the
following:
(1) A stationary source control program which achieves no net emission increases for sources
which emit or have the potential to emit 25 tons per year of any nonattainment pollutant;
(2) Stationary sources which emit more than 250 tons per year must be equipped with best
available retrofit control technology;
(3) Reasonable available transportation control measures;
(4) Provisions to develop an area-wide source and indirect source programs;
(5) An emissions inventory system; and
(6) Public education programs.
APCD Regulations II (Permits) and III (Prohibitions) fulfill the first two requirements.
Transportation control measures are described in Chapter 5 of this document fulfill the third
requirement. The APCD has an inventory system in place that was utilized to prepare the
emissions inventory presented in Chapter 3 to fulfill the fifth requirement. The fourth and sixth

10 - 9
requirement are fulfilled with the APCD public education, area-wide and indirect source, and other
programs, which are described in Chapter 8.
Control Measure Cost-Effectiveness (H&SC Section 40922): Analysis of control measure cost
effectiveness was included in Chapter 4 of the 1991 AQAP and in Appendix B of this 1998 CAP.
10.4 CONCLUSIONS
This 1998 CAP was prepared by the Santa Barbara County APCD to address all applicable state
and federal mandates and to provide for expeditious attain of the state and federal 1-hour ozone
standards. Specifically, this 1998 CAP complies with Section 182(c) of the FCAAA and all
applicable sections of the California Health and Safety Code.

10 - 10

Table 10 - 1
Santa Barbara County APCD Rule Activity from 1995-1997Summary of Measures (Rules Adopted or Implemented)
Rule # CAP ID# Description AdoptionDate
ImplementationDate
Comments
331 R-PG-1 Oil and Gas Fugitive EmissionsInspection and Maintenance
December 1991 September 1995
316R-PM-1R-PM-2R-PM-3
Gasoline Bulk Plants/Phase I/Phase II November 1990 January 1992 The April 1997 Revision updated references to modifiedRegulation II/VIII .
325 R-PT-2 Crude Oil Production and Separation January 1994 July 1996
326 R-PT-2 Storage of Reactive OrganicCompound Liquids
December 1993 June 1995
323 R-SC-1 Architectural Coatings July 1996 September 1997
The March 1995 modifications:1) Added a definition of reactive organic compounds (ROC)2) Revised the equivalent source test provision regarding APCO
discretion include ARB and EPA approval.3) Added a test method for determining exempt solvents.The July 1996 revision deleted the ROC definition and added areference to Rule 102.
330 R-SC-2Surface Coating of Metal Parts andProducts
April 1995 April 1995
The April 1995 rule modifications:1) Streamlined recordkeeping provisions2) Revised the 20 gallon per coating per year exemption limiting
it to 200 gallons total3) Eliminated the 180 gram/liter limit on baked coatings
339 R-SC-4Motor Vehicle and Mobile Equipment Coating Operations April 1997 January 1996
The April 1997 Revision updated references to modifiedRegulation II/VIII. The December 1994 modification:1) Increased some of the 1995 ROC limits2) Restricted the use of precoats3) Eliminated the 5% limit on the use of specialty coatings4) Increased the maximum area that can be painted outside a
booth.The changes had a neutral effect on emissions reductionscommitted to in the SIP.
351 R-SC-5 Surface Coating of Wood ProductsSeptember 1995
August 1998(pending)
August 1999The August 1998 revision delays the 1999 limits to 2005 andprovides an exemption for coatings used on wood products used inautomobiles.
321 R-SL-2 Control of Degreasing Operations July 1997August 1997
August 1997The April 1997 revision revised a reference to Rule 205.C. to Rule102. The district made major changes to Rule 321 in July 1997 tobe consistent with the CARB RACT/BARCT guidance document
333 N-IC-1N-IC-3
Stationary IC Engines – Gas FiredStationary IC Engines – Diesel Fired
December 1991April 1997
1994(1995 for OCS)
The April 1997 Revision updated references to modifiedRegulation II/VIII.
342N-XC-4N-XC-5N-XC-6
Industrial/Commercial Boilers/ April 1997 March 1996 The April 1997 Revision updated references to modifiedRegulation II/VIII

Table 10 - 1
CHAPTER 11
_________________________________________________
STATE MANDATED TRIENNIAL PROGRESS REPORT
AND TRIENNIAL PLAN REVISION
Introduction
Triennial Progress Report
Transportation Performance Standards
Triennial Plan Revision

11 - 1
11. STATE MANDATED TRIENNIAL PROGRESS REPORT
AND TRIENNIAL PLAN REVISION
11.1 INTRODUCTION
The California Clean Air Act (CCAA) requires that we report our progress in meeting state
mandates and revise our 1991 Air Quality Attainment Plan (1991 AQAP) to reflect
changing conditions. The deadlines for both the Triennial Progress Report and the Triennial
Plan Revision generally coincide with the Federal Clean Air Act requirements detailed in
this 1998 CAP. The APCD has been working with ARB to lessen the burden of complying
with these various state and federal mandates by minimizing potential duplications of effort
and inconsistencies. This chapter reflects these efforts by summarizing how the
development and adoption of the 1998 CAP satisfies the triennial update requirements of the
California Clean Air Act. Our 1994 CAP addressed both state and federal requirements by
identifying how the work performed for our specific federal mandates also satisfied our state
mandates.
Santa Barbara County is the only area in California to have been reclassified to a “serious”
nonattainment area under Section 181 (b)(2) of the federal Clean Air Act. This new federal
mandate has placed a significant burden on the APCD’s planning resources resulting in an
increased need to address both state and federal requirements simultaneously. Although the
requirements of the CCAA are not identical to the requirements of the Federal Clean Air Act
Amendments, our federal requirements necessitate a complete revision to our 1994 Clean
Air Plan which will cover many of the state mandates to update the 1991 AQAP. And,
while the 1998 CAP does not take federal credit for certain measures documented in this
1998 CAP, the county's "Air Pollution Control Strategy" includes "all feasible measures"
pursuant to state requirements. Therefore, the planning process documented in this 1998
CAP is directly applicable to the state mandates.
This chapter will discuss each state triennial requirement and refer to the chapters in this
document where the information complying with state requirements can be found. There
are two major items required to be in the triennial update (Sections 40924 and 40925 of the
11 - 2
California Health and Safety Code): a Triennial Progress Report and a Triennial Plan
Revision. The Triennial Progress Report must assess the overall effectiveness of an air
quality program and the extent of air quality improvement resulting from the plan. The
Triennial Plan Revision must correct for deficiencies in meeting the interim measures of
progress and incorporate new data or projections into the plan.
11.2 TRIENNIAL PROGRESS REPORT
The Triennial Progress Report must assess the overall effectiveness of our air quality
program and the extent of air quality improvement resulting from the plan. This CAP
examines the emission reductions achieved from existing regulations. It also examines the
change in the rate of emissions related to changes in population, industrial activity, and
vehicle use.
The control strategy presented in the 1991 AQAP failed to produce the state mandated 5%
per year emission reductions, so the plan was approved under the "all feasible measures"
option. The most relevant measure of progress is how well the APCD has maintained the
schedule of adoption of all feasible controls as presented in that plan. Chapters 4 and 5 of
this CAP detail the County's "Air Pollution Control Strategy" documenting that all feasible
measures are being adopted as expeditiously as practicable. In addition, Table 10-1
summarizes our rule-making activity from 1995 to 1997 while Table 11-1 provides the most
recent expected emission reductions from these rules that were either adopted or
implemented between 1995 and 1997 [H&SC section 49024(b)(2)].
State law [H&SC section 40924(b)(1)] also requires that we assess the extent of air quality
improvement achieved during the preceding three years, based upon:
1) Ambient pollutant measurements,
2) Best available modeling techniques, and
3) Air quality indicators.
11 - 3
A summary of ambient air quality data for Santa Barbara County is presented in Chapter 2.
Chapter 7 includes an attainment demonstration based on the best available modeling
techniques, which covers the second measure of air quality improvement. The air quality
indicators report is the responsibility of the ARB.
11.3 TRANSPORTATION PERFORMANCE STANDARDS
The CCAA requires areas classified as having a "moderate" air quality classification for the
state one-hour ozone standard, such as Santa Barbara County, to meet the following
transportation performance standard: “substantial reduction in the rate of increase in
passenger vehicle trips and miles traveled.”1 ARB has defined substantial reduction in two
ways:
1) Holding growth in VMT and trips to the same growth rate as population; and,
2) Reducing the rate of growth in VMT 50 percent below the average annual VMT
growth rate experienced during the 1980's.
As shown in Figure 11-1, the annual VMT growth rate has been less than the annual
population growth rate experienced in Santa Barbara County since 1990 with the exception
of 1993. Also since 1990, the annual VMT growth rate has been below 50 percent of the
VMT growth rate (except 1993) experienced in Santa Barbara County during the 1980's (5.6
percent). Based on this information, Santa Barbara County is currently meeting the CCAA
transportation performance standard mandated for moderate nonattainment areas.
11.4 TRIENNIAL PLAN REVISION
To satisfy these state Triennial Plan Revision requirements, Table 11-2 identifies what is
required and how the APCD submittal complies with the requirement.
1 Recognizing the close relationship between vehicle trip making activity and VMT, VMT is considered asurrogate for vehicle trips by ARB for CCAA performance standard monitoring
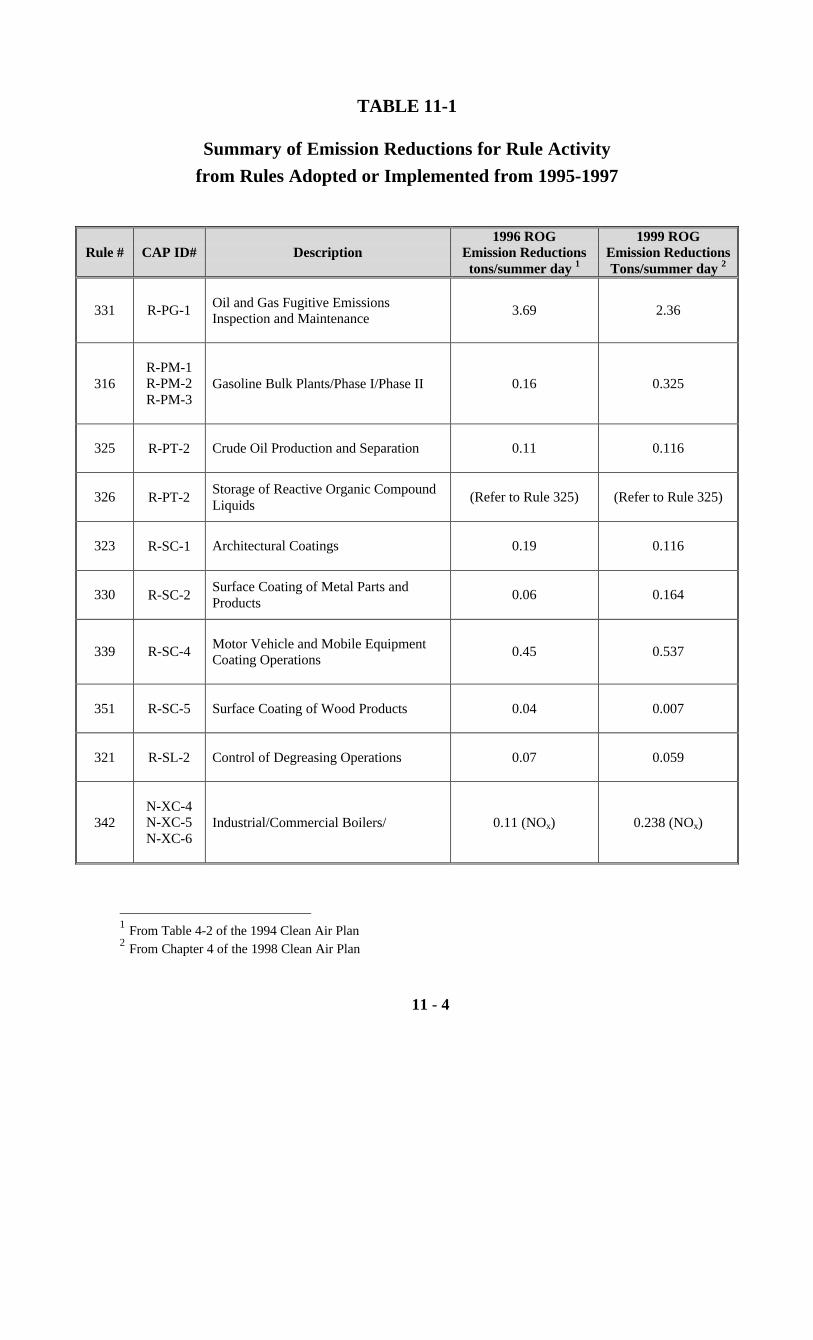
11 - 4
TABLE 11-1
Summary of Emission Reductions for Rule Activity
from Rules Adopted or Implemented from 1995-1997
Rule # CAP ID# Description1996 ROG
Emission Reductionstons/summer day 1
1999 ROGEmission ReductionsTons/summer day 2
331 R-PG-1 Oil and Gas Fugitive EmissionsInspection and Maintenance
3.69 2.36
316R-PM-1R-PM-2R-PM-3
Gasoline Bulk Plants/Phase I/Phase II 0.16 0.325
325 R-PT-2 Crude Oil Production and Separation 0.11 0.116
326 R-PT-2Storage of Reactive Organic CompoundLiquids
(Refer to Rule 325) (Refer to Rule 325)
323 R-SC-1 Architectural Coatings 0.19 0.116
330 R-SC-2Surface Coating of Metal Parts andProducts
0.06 0.164
339 R-SC-4 Motor Vehicle and Mobile EquipmentCoating Operations
0.45 0.537
351 R-SC-5 Surface Coating of Wood Products 0.04 0.007
321 R-SL-2 Control of Degreasing Operations 0.07 0.059
342N-XC-4N-XC-5N-XC-6
Industrial/Commercial Boilers/ 0.11 (NOx) 0.238 (NOx)
1 From Table 4-2 of the 1994 Clean Air Plan2 From Chapter 4 of the 1998 Clean Air Plan
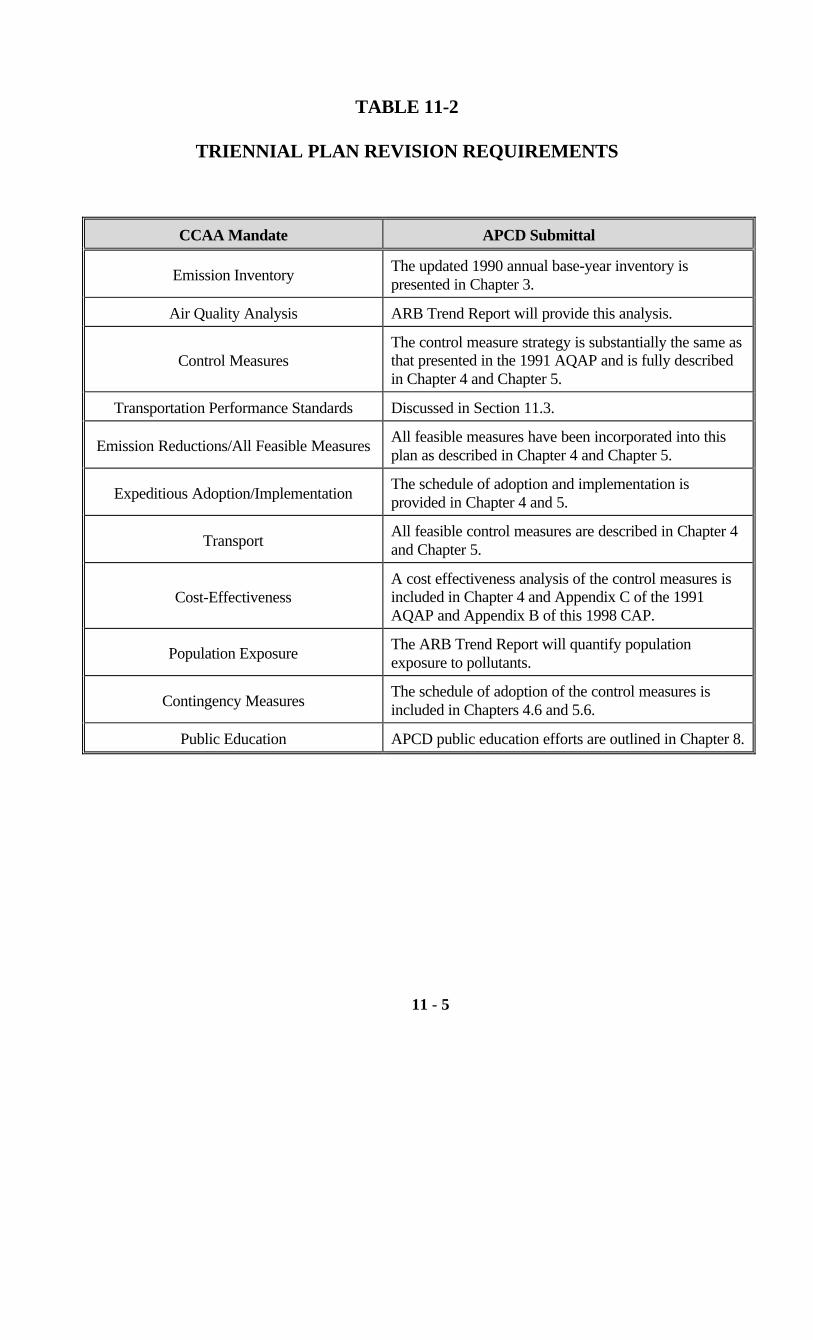
11 - 5
TABLE 11-2
TRIENNIAL PLAN REVISION REQUIREMENTS
CCAA Mandate APCD Submittal
Emission InventoryThe updated 1990 annual base-year inventory ispresented in Chapter 3.
Air Quality Analysis ARB Trend Report will provide this analysis.
Control MeasuresThe control measure strategy is substantially the same asthat presented in the 1991 AQAP and is fully describedin Chapter 4 and Chapter 5.
Transportation Performance Standards Discussed in Section 11.3.
Emission Reductions/All Feasible MeasuresAll feasible measures have been incorporated into thisplan as described in Chapter 4 and Chapter 5.
Expeditious Adoption/ImplementationThe schedule of adoption and implementation isprovided in Chapter 4 and 5.
TransportAll feasible control measures are described in Chapter 4and Chapter 5.
Cost-EffectivenessA cost effectiveness analysis of the control measures isincluded in Chapter 4 and Appendix C of the 1991AQAP and Appendix B of this 1998 CAP.
Population ExposureThe ARB Trend Report will quantify populationexposure to pollutants.
Contingency MeasuresThe schedule of adoption of the control measures isincluded in Chapters 4.6 and 5.6.
Public Education APCD public education efforts are outlined in Chapter 8.

11 - 6
PUBLIC COMMENTS
ENVIRONMENTAL DEFENSE CENTER
Marc Chytilo
OCTOBER 30, 1998
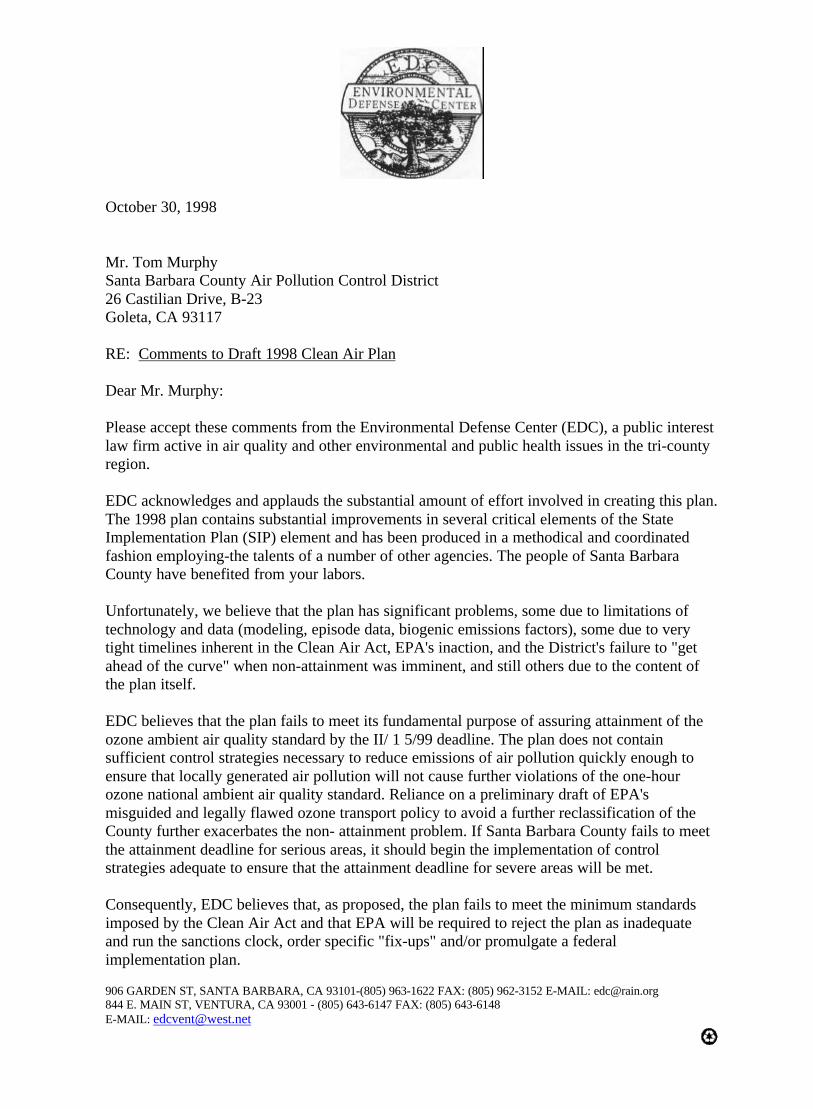
October 30, 1998
Mr. Tom MurphySanta Barbara County Air Pollution Control District26 Castilian Drive, B-23Goleta, CA 93117
RE: Comments to Draft 1998 Clean Air Plan
Dear Mr. Murphy:
Please accept these comments from the Environmental Defense Center (EDC), a public interestlaw firm active in air quality and other environmental and public health issues in the tri-countyregion.
EDC acknowledges and applauds the substantial amount of effort involved in creating this plan.The 1998 plan contains substantial improvements in several critical elements of the StateImplementation Plan (SIP) element and has been produced in a methodical and coordinatedfashion employing-the talents of a number of other agencies. The people of Santa BarbaraCounty have benefited from your labors.
Unfortunately, we believe that the plan has significant problems, some due to limitations oftechnology and data (modeling, episode data, biogenic emissions factors), some due to verytight timelines inherent in the Clean Air Act, EPA's inaction, and the District's failure to "getahead of the curve" when non-attainment was imminent, and still others due to the content ofthe plan itself.
EDC believes that the plan fails to meet its fundamental purpose of assuring attainment of theozone ambient air quality standard by the II/ 1 5/99 deadline. The plan does not containsufficient control strategies necessary to reduce emissions of air pollution quickly enough toensure that locally generated air pollution will not cause further violations of the one-hourozone national ambient air quality standard. Reliance on a preliminary draft of EPA'smisguided and legally flawed ozone transport policy to avoid a further reclassification of theCounty further exacerbates the non- attainment problem. If Santa Barbara County fails to meetthe attainment deadline for serious areas, it should begin the implementation of controlstrategies adequate to ensure that the attainment deadline for severe areas will be met.
Consequently, EDC believes that, as proposed, the plan fails to meet the minimum standardsimposed by the Clean Air Act and that EPA will be required to reject the plan as inadequateand run the sanctions clock, order specific "fix-ups" and/or promulgate a federalimplementation plan.
906 GARDEN ST, SANTA BARBARA, CA 93101-(805) 963-1622 FAX: (805) 962-3152 E-MAIL: [email protected] E. MAIN ST, VENTURA, CA 93001 - (805) 643-6147 FAX: (805) 643-6148E-MAIL: [email protected]


Mr. Tom Murphy: 1998 CAP CommentsOctober 30, 1998Page 2
I: LEGAL SUFFICIENCY ISSUES
1. Inadequate Margin of Safety for Attainment Demonstration
Sections 171 and 172 of the Clean Air Act define reasonable further progress for attainmentplanning and prediction purposes as the emissions reductions necessary to attain the relevantambient air quality standard as expeditiously as practicable, but no later than the attainment date.Section 172(c)(2) requires a § 171 RFP demonstration, specifically the annual and periodicemissions reductions that will reduce the formation of ozone in Santa Barbara County so as toprovide for" (§ 172(c)(6)) attainment of the health-based national ambient air quality standard forozone as expeditiously as practicable, but no later than November 15, 1999, based on theprevious three years' data.
For various reasons, the accuracy of the model used for the attainment demonstration is large,considerably in excess of 0.03 ppb. For all practical purposes, the model simply predicts possibleattainment of the 1 hour ozone NAAQS with absolutely no room for the slightest error, anyunanticipated conditions, any consideration of transport or nominal excess emissions.Statistically, given the large error in the model, there is a very high probability that SantaBarbara will exceed the standard. Given the fact of at least two exceedences at two separatestations as of fall 1998, and an unusually "clean" air year in 1997, the plan predicts that SantaBarbara will exceed the 1 hour ozone NAAQS and again be reclassified. The plan is legallyinadequate.
EDC contends that the plan is currently inadequate because it fails to demonstrate attainment, ifat all, with an adequate margin of safety. § 172(c)(6) mandates that the plan include sufficientcontrol measures to "provide for" attainment of the standard by the applicable date, in this case11/15/99. This is a central concept in the Clean Air Act. The United States Supreme Court ruledin the seminal case Train v. Natural Resources Defense Council, 95 S. Ct. 1470 (1975) that "theprinciple [governing the conditions for approval of the SIP] is that the plan provide for theattainment of the national primary ambient air quality standard." Train, 95 S. Ct. at 1475-1476.There are no assurances that the plan has provided for attainment, and many indications that ithas not.
Section 110(a)(1) mandates a plan which "provides for implementation, maintenance andenforcement of such" NAAQS in each district and state. Implicit in this authority is adequatecontrol strategies to ensure that the NAAQS will be attained and maintained. The 1998 SBCCAP fails to comport with this mandate in barely demonstrating attainment, which provides nobuffer or margin of safety to ensure attainment and/or continued maintenance of the standard.
EDC strongly questions whether EPA may approve a SIP which might provide for attainment, orwhich may provide for attainment. Given the central nature of the issue to CAA compliance,EDC believes that the term "provide for" connotes a certainty of actualization, not merespeculation and aspiration. In light of Santa Barbara County's previous bare demonstration ofattainment in the 1994 CAP and subsequent non-attainment, EDC believes that EPA will becompelled to disapprove the 1998 CAP if it attempts to show that it "provides for attainment" bysuch a thin margin. Thus, we urge the District to fortify the plan to provide additional emissionsreductions which ensure that the standard will be both attained and maintained.
2. The monitoring network is inadequate
The draft plan lacks an adequate discussion of the District's monitoring program, network andfuture plans. The reclassification of the County to serious requires substantial revisions to themonitoring network which should be analyzed in the plan, not deferred to future analysis.
Mr. Tom Murphy: 1998 CAP CommentsOctober 30,1998Page 3
SBCAPCD's additional duties as a serious area include the duty to enhance and improve itsmonitoring network. § 182(c)(1). This includes both SLAMS and PAMS networks. EDCbelieves that the District's SLAMS responsibilities include a duty to locate a permanentmonitoring station in the elevated foothill region of the south coast. 40 C.F.R. Part 58, appendixD, section 2.5. The urban scale criteria define the need for a station located to measure the highconcentrations downwind of the area having the highest precursor emissions. Note that thiscriteria does not define the areas of highest ozone concentrations; it is those areas of highestconcentration downwind of the highest precursor emissions. This clearly mandates a' station inthe Riviera or other elevated foothill region downwind from the City of Santa Barbara's urbancore. The 1998 CAP is deficient for its failure to include this aspect of the improved andenhanced monitoring network.
The attainment demonstration model predicts that the highest ozone concentrations in SantaBarbara County will occur east of the City of Santa Barbara. (1998 CAP Appendix D- 1). Thereis a well established (and uncontroverted) pattern a higher ozone concentrations at elevated areasin Santa Barbara County. (Various APCD staff reports on 1997 Riviera monitoring station.) TheCAP should include a more extensive monitoring network section (or separate chapter) whichaddresses - the potential sites for location of monitoring stations in conformity with state andfederal requirements and considering our unique local conditions, in particular the relationshipbetween elevation, ozone concentration and monitoring station location.
The development of the PAMS network is particularly important for the District. PAMS data isintended to assist in delineating transport factors, exposure assessment, individual sourcecontribution to exceedence episodes and in developing more accurate attainment demonstrations.40 C.F.R.Part 58,AppendixD,§ 4.1(a). PAMS data will address urban toxic air pollution controland planning for attainment of the 8 hour ozone standard, including speciation of air pollutionconstituents. The plan must include a description of this crucial program and its components.
Criteria for the PAMS network again militates towards the installation of a station downwindfrom the urbanized areas in the south county. Id., at § 4.2. Design criteria for the PAMS networkare based on selection of an array of site locations relative to ozone precursor source areas andpredominant wind directions associated with high ozone events.
3. New Source Review rule adequacy
EDC questions whether the current NSR rule is adequate to control emissions growth in SantaBarbara County, particularly with WSPA's legislation exemption for industrial abandonmentactivities from offset requirements (AI3 3047). Minimally, these emissions must be included inthe emissions inventory. Optimally, the SIP must define a method for controlling these emissionsas a matter of federal law. EDC suggests that the District direct EPA to promulgate a federal ruleto expressly preempt this odious authority and include the emissions reductions in the 1998 CAPas the South Coast Air Quality Management District did with the 1994 CAP.
Additionally, emissions reductions may be obtained simply by increasing the offset ratiosincluded in the New Source Review rule. Since the expansion of major sources typicallyinvolves substantial capitalization, it is appropriate to assign these emissions reductionsresponsibilities to those who are profiting from polluting activities and can incorporate thesecosts into their business decisions.
Mr. Tom Murphy: 1998 CAP CommentsOctober 30, 1998Page 4
II: INVENTORY ISSUES
1. Adequacy of emissions inventory
The act requires that a SIP contain "enforceable emissions limitation and other control measures,means or techniques ... as may be necessary to meet the applicable requirements of [the Act]." §110(a)(2)(A). The plan must contain a program of enforcement of these measures. §110(a)(2)(C).
While the CAP and Santa Barbara County's air pollution control strategies have relied heavily oncontrol of stationary sources in recent years, that component of the emissions inventory isdeclining in relative significance. The mobile sources sector has concomitantly increased, andthreatens to further increase as the County's population increases unchecked.
The CAP emissions inventory must be modified to include enhanced specificity of thecomponents of the mobile sources inventory. EDC is gravely concerned that rapid growth invarious portions of the County will cause exceedences of the emissions that are calculated intothe attainment model. EDC believes that the emissions inventory is an enforceable element of theSIP and should be stated with adequate detail to ensure that the public and land use planningauthorities can track progress in controlling emissions and in emissions growth.
2. Pesticide State Implementation Plan emissions inventory issues
The Santa Barbara County emissions inventory is influenced by the pesticide methyl bromide,among others. Methyl bromide emissions during the peak ozone season have the potential tosubstantially affect air quality, although there is currently considerable controversy over methylbromide's relative reactivity. While currently set at 100% reactive, it is probably much lower.Since it would be adjusted in the baseline inventory in any case, there is no demonstrationsignificance although the model would be more accurate if more accurate numbers are used.
3. Kelp Cutting ships: emissions inventory category
Substantial emissions are believed associated with periodic activities by ships engaging incutting kelp in tidelands. EDC understands that the Department of Fish and Game and/or StateLands Commission regulate these activities, and emissions inventory information may beobtained from those agencies. These emissions are believed significant since the activitiesinvolve extensive maneuvering and other internal combustion engine-intensive activities.
4. Biogenic emissions
The emissions inventory grossly overstates biogenic emissions, which then confuses decisionmakers and members of the public and regulated community. First, the biogenic emissionsignore the role of biogenics as ozone and ozone precursor sinks. Professor Tom Cahill ofUniversity of Colorado Davis opines that vegetation in California sequesters and absorbs more asozone and ozone precursors than the amount of ozone precursors generated. The emissionsinventory should reflect this dynamic rather than simply reporting the calculated emissions rate.
Second, the numbers reported as biogenic emissions in the Santa Barbara County draft emissionsinventory appear to be wildly inaccurate. While Ventura County's inventory reports-biogenicemissions of approximately 1400 tpy and San Luis Obispo's emissions inventory approximately440 tpy, the Santa Barbara County emissions inventory for this category is over 14,000 tpy.There are no distinctions between these three counties which would justify or support this levelof

Mr. Tom Murphy: 1998 CAP CommentsOctober 30, 1998Page 5
disparity. The plan drafters should secure more accurate information from CARB to enhance the.accuracy of the CAP emissions inventory.
5. On-Road mobile source emissions inventory
The 1998 CAP demonstrates that previous Clean Air Plans have seriously understated thequantity of emissions from the mobile sources sect-or. This perturbs the planning process. TheCAP must include a more detailed analysis of the inventory's model enhancements and include amargin of error or range of probable emissions if the emissions inventory cannot be moreaccurately predicted. EDC questions whether the previous underestimation of this component ofthe emissions inventory has contributed to the District's difficulty in accomplishing attainment.
III: CONTROL MEASURE ISSUES
The Plan must include additional and more effective control strategies to reduce ozone precursoremissions.
1. Offshore Seep Tents
Representatives of the offshore oil industry have highlighted the significance of "natural" seepemissions in affecting local air quality. See generally the second volume of COLAB's"Conservation Quarterly", Summer 1998, where the history of Santa Barbara channel seeps ispurportedly delineated. While EDC notes that there are questions regarding the relative reactivityof these emissions, they do appear to be significant in volume if not ozone formation potential.The benefits from controlling these emissions would be reduced exposure to toxic air pollutantsas well as enhanced ambient air quality.
A potential control strategy is to assess a severance tax upon all oil and gas production fromSanta Barbara Channel production to fund a series of tents or other seep emission controldevices. Following design development, members of the oil industry could bid competitivelyalong with anyone else considered capable of installing and operating such devices. There is alogical and legal nexus between any such assessment: the oil industry is attracted to the channelby the presence of oil deposits. These same deposits contribute to degraded onshore air qualitydue to uncontrolled seeps. Were it not for the oil and gas which coincidentally contribute to theseeps, the oil industry would not be able to accomplish their production and profits from the oil.This industry should fund the control of these sources.
2. Expedited internal combustion engine controls (Rule 333 enhancement andstrengthening)
This is a feasible and effect control measure whose implementation has been delayedinappropriately. It's adoption and implementation should be expedited as an adopted controlmeasure with enforceable adoption and implementation dates.
3. Indirect source review should be included
The Act provides clear authority for the application 'of indirect source review programs at §110(a)(5). Indirect source review is an essential element of Santa Barbara County's air pollutioncontrol strategies, yet is given minor treatment in the draft 1998 CAP. It is feasible andappropriate and provides the only meaningful means to control emissions from the fastestgrowing sector in the County. In light of the minimal margin of safety, the anticipated populationand mobile sources sector growth and the absence of alternative means to contain the emissionsfrom these types of
Mr. Tom Murphy: 1998 CAP CommentsOctober 30, 1998Page 6
sources, the plan is inadequate without an indirect source review program. Note that Californialaw requires revisions to develop an area wide source and indirect source programs. Health andSafety Code § 40918(a).
4. Land use-air quality issues
The Environmental Defense Center supports the inclusion of land use and air quality issues inthe CAP. As noted above, control of emissions growth from the mobile sources sector will onlycome through thoughtful and careful integration of air quality and land use planning principles.The California Air Resources Board and other agencies have prepared materials addressing theissue through educational materials that should be made available, along with trainings forplanners in each City in the County and the County's Planning and Development Department.Workshops with members of the development community, possibly similar to the Planning andDevelopment Department's design residential unit process this summer, could facilitate airquality sensitive project design from the conception stage, rather than after the -fact. Finally,members of the APCD Board of Directors must serve as air quality ambassadors while in theirroles as council members or supervisors and direct the planning process in favor of air qualityand air pollution sensitive project approvals.
5. Enhanced CEQA guidance and construction emissions controls.
The District may address a number of difficult air pollution generation issues by engaging moreactively in the CEQA environmental review process of all land use, regulatory and landmanagement agencies which affect air quality in the District to better accomplish mitigation ofair quality impacts. Most substantial land use projects in Santa Barbara County cause asignificant adverse environmental impact even under the current weak thresholds, but this impactis typically overridden due to the absence of an effective mitigation measure to offset orotherwise ameliorate the project's emissions. This applies to either or both the constructionand/or operational emissions from these projects. The District should develop and adopt aEmissions Mitigation Program (EMP) whereby the District may impose fees or exact conditionsfrom all projects and entitlements which will provide meaningful and effective mitigation of airpollution from growth sectors in the inventory. Developer fees are a significant source of missedopportunity for the District if an effective mitigation program is in existence.
The District should revise the threshold for construction emissions and establish a considerably smallerthreshold (zero) for the trigger point mandating mitigation of air pollution impacts.
Consistency is an essential tool for controlling emissions growth, but is incumbent upon aneffective and detailed emissions inventory to application. As noted above, the emissionsinventory must be much more detailed and speciated among the various source classifications toeffectively serve the CEQA consistency function.
6. Contingency Measures
Contingency measures have an essential role in air quality planning processes. When an area isunable to maintain reasonable further progress or accomplish attainment of a NAAQS, the Actrequires that a contingency measure come into force, without further action by the District, toaddress the shortfall in planned emissions reductions and air quality improvement. Sections172(c)(9), 182(c)(9) and 187(a)(3) state that contingency measures shall "take effect withoutfurther action by the state [or District] or Administrator." EPA anticipated that contingencymeasures would be implemented during the plan revision process following bump up. (GeneralPreamble, 57
Mr. Tom Murphy: 1998 CAP CommentsOctober 30, 1998Page 7
Federal Register 13511/2/,4/16/92.) This obviously has not been done, and the District hangs inthe balance between attainment and non-attainment as a result.
The 1994 CAP contained a contingency measure (Enhanced Inspection and Maintenance) whichwas never enforced or applied. While the District may have had good reason for the refusal toactivate the control measure, it was obligated to implement an alternative contingency measureand seek a SIP revision to incorporate that change. Neither event happened and Santa BarbaraCounty has experienced worse air quality as a result. The District cannot delete this contingencymeasure without substituting another, equally or more effective contingency measure toimplement should the next attainment date be missed. Section 110(1).
The single identified stationary source contingency measure, rule 333 revisions, is not acontingency measure, it is a currently feasible and necessary control measures to meet the federaland state ambient air quality standards. The rule 333 revisions are programmed into the District'srule promulgation schedule and clearly constitute a feasible control measure. It does not meet thecriteria for contingency measure and must be replaced by a different contingency measureadequate to address the anticipated emissions reductions shortfall in accord with EPA guidance.
6. Transportation control measures.
The CAP must more aggressively view transportation control measures as opportunities tocontrol emissions growth and accomplish emissions reductions. The new emissions inventoryinformation disclosing the larger significance of the mobile sources sector is very troubling,indicating both a substantial CAP deficiency and an essential opportunity to address the problem.The CAP must address TCMs much more aggressively and effectively. The failure to controlmobile sources emissions will result in exceeding the ceiling relatively soon and triggering around of sanctions and further planning obligations. Since this is foreseeable at this time, the1998 CAP must address these contingencies and include additional TCMs adequate to controlemissions from this sector.
7. Eliminate Exemptions
The 1997 amendments to the District New Source Review rule included the continuation and, insome cases, expansion of the categories of exemption sources of air pollution. These exemptionsshould each be reviewed and eliminated in each instance where any quantity of emissionsreductions may be accomplished through a prohibitory rule.
IV: OTHER ISSUES
1. Transport Issues
The CAP recites a flawed draft EPA policy that purports to authorize extensions in attainmentdates for areas affected by as little as a single molecule of transported air pollution. (DickWilson, EPA AA memo, 7/16/98). This policy is exempt from judicial review until applied, andthere has been no Administrative Procedures Act compliance with the announcement of thepolicy, although it has been promised. This policy clearly has little to no application to the westcoast; it was designed to address OTAG issues that are irrelevant to California's situation. It islegally infirm, will be challenged judicially if it is employed, and thus should be ignored.
Nevertheless, EDC recognizes that Santa Barbara County and other Districts are affected bytransport. In fact, Santa Barbara County is an upwind District for some areas, as well as being adownwind or receptor area. (CARB) The solution to resolving transport issues is aggressiveaction by all upwind District to control emissions, not extended attainment dates. This solutionhas
Mr. Tom Murphy: 1998 CAP CommentsOctober 30, 1998Page 8
authority in § 110(a)(2)(D), but EPA has not embraced this duty with vigor. The District has aresponsibility to go beyond those emissions reductions necessary to demonstrate attainment inSanta Barbara County but also include additional emissions reductions to reduce the District'stransport into other regions. Having demonstrated extra efforts to address transported airpollution, the District will be in a more powerful position to demand that other upwind Districtsundertake the same courtesy, or face legal action to force these additional measures.
The 1998 CAP should contain a commitment to SBCAPCD participation in the planning,permitting and enforcement activities of upwind Districts, CARB and EPA, including activitiesthrough CAPCOA. The objective of that participation should be the reduction of emissionswhich may be transported into Santa Barbara County and strengthening of air pollution controlprograms throughout the state.
2. State Measures
CARB and the South Coast Air Quality Management District were recently found to have failedin their obligations to adopt and implement various control strategies contained in the 1994California State Implementation Plan. See Coalition for Clean Air et al, v. South Coast AirQuality Management District, United States District Court, Central District of California, CV 97-6916 HLH, Order on motion for summary judgment, dated October 5, 1998. The Santa BarbaraCounty 1994 and 1998 Clean Air Plans rely upon some of these control strategies to deliveremissions reductions necessary for attainment. The 1998 CAP emissions inventory must bemodified to reflect the recently adjudicated status of these portions of the SIP.
3. Emissions Profiles and growth factors
EDC is concerned that the CAP does not accurately predict and quantify the increases inemissions associated with increased population and economic activity that appears inevitable inthe region. Sprawl is occurring, particularly in the north county, with a relatively larger amountof emissions than that which are generated with more compact development patterns. While thismay be addressed somewhat through more enlightened land use planning, the CAP shouldemploy a realistic analysis which considers the potential increases in emissions of air pollution.Additional margins of safety in emissions reductions are one mechanism to address this issue,another is to increase the anticipated emissions and impose additional control strategies.
CARB reports that patterns of air polluting behavior are changing. Previously, weekday periodshad the highest emissions profiles, but that is changing to higher total amounts of emissionsduring weekend recreational periods, particularly in areas with extensive internal combustionengine driven recreational opportunities such as Santa Barbara. The inventories and growthfactors must use the most accurate and recent data.
The Minerals Management Service has prepared a study examining development scenarios in thetri-county area. The COOGER study, which involves Santa Barbara County representatives andreportedly has included APCD input, along with the prominent involvement of Western StatesPetroleum Association and the oil industry. The COOGER study predicts substantial amounts ofnew development in this industrial sector, a conclusion very different from that relied upon in theCAP and reflected in the growth factors. EDC believes that major changes in industrial growthpatterns of this type will necessitate subsequent CAP revisions. It is preferable that this growthbe included in the CAP emissions inventory and control strategies developed to reduce thesignificance of these new activities, rather than having to attempt to obtain further controls inresponse to an oil company's development and production plans.
Mr. Tom Murphy: 1998 CAP CommentsOctober 30, 1998Page 9
4. State reclassification
The 1998 CAP must address all requirements for serious areas under the California Clean AirAct by operation of Health and Safety Code § 40918(g). References to moderate areas are notapplicable, the District must meet serious requirements. See Health and Safety Code § 40919.These include New Source Review modifications, transportation control measure commitmentsand revisions, and low emission motor vehicle use by fleets. This should include, but is notlimited to, food and other local delivery fleets.
V. CONCLUSION
While the 1998 CAP represents a considerable amount of work and strives to address and resolvedifficult air quality issues, it falls short of the level of adequacy. APCD must amend this plan todemonstrate attainment through sufficient emissions reductions of sources of air pollution.
Chief CounselEnvironmental Defense Center
Cc: Lynne Terry, California Air Resources BoardMr. David Howekamp, Region IX EPAMr. Ken Bigos, Region IX EPA

EDC COMMENTS TO 1998 CAPAPPENDIX: CONTROL MEASURES
OCTOBER 30, 1998
Additional emissions reductions are appropriate to ensure attainment and sustain progresstowards meeting all applicable standards. The District has a duty to implement 0 feasible controlmeasures. EDC has the following comment on individual control measures:
I. PROPOSED STATIONARY SOURCE CONTROL MEASURES
1. Rule 333 revisions. This is not a contingency measure, but a feasible control measure. Itshould be considered a measure for adoption and implementation. Other measures must beidentified as contingency measures.
Specific dates for the adoption and implementation of the rule revision must be identified in theCAP for the commitment to be enforceable.
2. Unadopted Statewide Measures. CARB and EPA have delayed adoption andimplementation of several of the control measures contained in the 1994 SIP, including M9, MI0, M I 1, M 12, M 1 3, M 1 4, M 1 5, M 1 6. The 1998 CAP must identify all emissionsreductions shortfalls from delayed adoption of statewide measures, identify an enforceable datefor their adoption and implementation, and deduct any interim losses in emissions reductionspreviously anticipated (in 1994 and draft 1998 CAPS) in Santa Barbara County's reasonablefurther progress and attainment demonstrations.
3. Pesticide Measures. It is unclear why the CAP states that Santa Barbara may not opt intothe Pesticide State Implementation Plan emissions reductions. The San Joaquin Valley, a seriousarea with a 1999 attainment date, takes credit for 1999 emissions reductions from the PesticideState Implementation Plan emissions reductions. While EDC has serious questions regarding theactual effectiveness of DPR's performance under the Pesticide State Implementation Plancommitments, the significance of pesticide use in Santa Barbara County warrants considerationand inclusion inthe CAP.
II. FURTHER STUDY MEASURES
1. Each further study measure should include a definite schedule for commencement andcompletion of the further study. Otherwise, these potential control strategies languish until thenext planning cycle. The process must be more aggressive and federally enforceable.
2. R-GN-2: Wineries and Breweries. Santa Barbara County is experiencing meteoric growth inthe winery population, with a significant increase in brewery numbers also likely to follow. Tensof thousands of acres of land have been converted to wine grapes, and approximately a dozennew wineries have been approved or proposed in the District over the past 18 months. The CAPshould reclassify Ns control measure and commit to an adoption schedule so that air pollutioncontrol
EDC Comments 1998 CAP Control MeasuresOctober 30, 1998Page 2
requirements can be included in site and process design, rather than added on as an afterthought.BACT is preferable to BARCT from a land use planning and air quality perspective.
3. R-GN-6: waste water treatment plants. This is a very common category of source, andone whose emissions are expected to increase as the County's population increases. Thefeasibility of air pollution control technologies should be well proven, and thus this should alsobe reclassified to an adoption measure rather than further study measure.
4. R-PG-2, R-PM-5. The CAP recites that these sources are "generally controlled" or "mostare already controlled". Additional specificity is necessary to delineate the benefits and costsassociated with further controls to determine if adoption is appropriate. EDC has learned of anumber of situations where venting occurs on a casual or periodic basis at various oil and gasplants in the District, even though the "general practice" is to route pigging venting or processmaintenance gasses through vapor recovery units. A rule may be appropriate to ensure generalindustrial conformity to appropriate practices and ensure SIP enforceability of these limitations.
5. R-SC-1. The Plan must identify more precisely the changes in VOC profiles for the revisedpaint rule and demonstrate that cumulative emissions reductions will indeed be accomplished.
6. R-SL-2. Degreasing operations. This South Coast Air Quality Management District rule hasconsiderable potential to address and control Santa Barbara sources. A definitive andaggressive schedule for review, adoption and implementation should be included as a componentof the CAP.
7. N-IC-7. Accelerate fleet turnover in 2 stroke engines. Compared to modern 4 strokeengines, 2 stroke engines emit an astronomical quantity of ROC. Some jet skis are reported toemit up to 3 gallons of unburned fuel per hour. This is an important source category for SantaBarbara County and must be controlled.
8. N-IC-8 Airports. This control strategy should be elevated to an adoption measure in light ofthe substantial increase in airport activities throughout the County. The Santa Barbara airport isin themidstofamajorexpansionandhasalargernumberofcarriersthanjust4yearsago. This trendshould be expected to increase. Each carrier may bring their own equipment, and withoutuniform standards, much higher polluting equipment may find its way to Santa Barbara. Asimilar trend can be expected to some level at each of the other commercial airports in theDistrict as well as at Vandenberg Air Force Base. Additionally, the mere increase in air trafficwill cause additional air pollution emissions. Standards for low- or no-emission airport servicevehicles should be adopted.
9. N-XC-12: Direct fired external combustion units. The District may expect a significantincrease in this category of source as growth and development increases in the region.
III. CONTROL STRATEGIES PROPOSED FOR DELETION

EDC Comments 1998 CAP Control MeasuresOctober 30, 1998Page 3
1. R-GN-7 Vacuum Producing Systems. It is unclear why this rule only applies to southcounty sources. Two new asphalt plants are proposed to construction in the north county andshould be adequately controlled through SIP enforceable control measures, including in thisaspect.
2. R-PG-3 Pipeline pigging. As noted infra, there are regularly reported releases fromroutine pigging operations, even though the practice is to route any process gasses through avapor recovery unit. This rule may still be necessary to address this deficiency through afederally enforceable rule.
3. R-PO-5 Glycol Regeneration - Vents. EDC objects to the lack of federal enforceability inthis form of emissions reduction. This emissions reduction (and several others similarly situated)can not be federally recognized as a State Implementation Plan emissions reduction unless a ruleis adopted.
4. R-PM-4 pleasure craft refueling. This category of sources should be expected to grow infuture years and this growth should be accompanied by uniformization of loading apparatus,allowing controls. The measure should not be deleted, but scheduled for further study measurestatus.
5. R-PP-3 Abandoned well vents. The County should have a mechanism for identifying thesesources. Each is a potential hazardous waste site. The California Division of Oil and Gas issupposed to monitor these sites and should have records. There are a number of collateralbenefits from securely capping these wells which, if quantified, would lead to a positive benefit-cost analysis. Deletion is inappropriate, further study measure status is justified.
6. R-PP-4 Vacuum trucks. Vacuum trucks transfer significant quantities of fluids. Volatilitymay increase as fluids are heated while in the truck tank, and sloshing and physical agitation mayincrease emissions potential. Crude oil is routinely transported in vacuum trucks in somelocations. The measure should not be deleted but moved to further study measure or active adoptclassification.
7. N-IC-5 exploratory drilling vessels. The New Source Review program does not generateemissions reductions as required by the Clean Air Act and thus this source should be covered bya prohibitive rule.
8. N-XC-9 Solar water heaters. The Santa Barbara County Board of Supervisors amended thezoning ordinance to eliminate the requirement of solar water heaters in new pools and spas. Therule must be adopted to gain this emissions reduction, or the emissions inventory must bemodified. A rule is preferred.
IV. PROPOSEID TRANSPORTATION CONTROL MFASURES
1. T-2 Transportation Demand management Program. This program should be expanded toinclude the north county, considering the amount of residential growth in the north county andjobs in the south county and thus the amount of commuting. T-22 should be an accepted controlstrategy, not a contingency measure, with a schedule for adoption and implementation.
EDC Comments 1998 CAP Control MeasuresOctober 30, 1998Page 4
2. T-7 Traffic flow improvements. Studies have shown that expanding highway capacity canlead to increased overall emissions since the improved traffic flow opens previously unavailableareas to development and commuter residences. See generally letter from Judith Katz, ActingDirector, Air Protection Division, EPA Region 111, to Mr. Arthur Hill, Federal HighwayAdministrator, attached hereto, referring to "the consensus of expert and legal opinion thatexpanded road capacity generates changes in travel and land activities". The letter refers to areport and states "[n]umerous analyses demonstrate that highway expansion is likely to increasedvehicle trips and vehicle miles traveled, and consequently vehicular emissions." The CAP mustconsider the vicarious effect of bottleneck elimination at inducing additional VMT.
3. T-10 Bicycling. The emissions reductions calculations should reflect the propensity forbicycle trip to replace short cars trips and thereby avoid cold start and hot soak emissions.
4. T- 1 3 Car retirement. CARB has not funded this control measure and any emissionsreductions are speculative. A replacement control strategy should be identified.
5. T- 1 7 Telecommunications. This program should be expanded to allow other Countydepartments and the public to use when not in use by the Probation and Public Defender's office.Substantial additional emissions reductions are available from an expanded program. Emissionsreduction credit should be taken from the use of this system before the Board of Supervisors,APCD, Santa Barbara County Association of Governments and Planning Commission.
6. T-14 Activity Centers - indirect source review. This program must be better defined anddelineated. It is a mandatory control strategy to reduce the air pollution impacts from theexplosive growth being experienced in Santa Barbara County, in particular in the north county,where distances are greater and the urban core is dissipated by sprawl. This measure should beexpanded- to include T- I 1, special events. The VMT associated with special events could beeasily mitigated.
V. CONTINGENCY MEASURE
1. T-21 Enhanced Inspection and Maintenance is a contingency measure in the 1994 CAPthat was not properly implemented. Legislative changes should be described and the forgoneemissions reductions potential quantified as best possible. The control strategy should beredesigned to a measure for adoption on a set schedule. Substitute contingency measures must beidentified. All contingency measures must identify the mechanism for their adoption andimplementation, including an enforceable schedule.
2. T-22 Trip Reduction Programs. This contingency measure must include the mechanismfor automatic adoption and implementation per EPA guidance, including an enforceableschedule. (See General preamble.)
October 30, 1998
Ms. Vijaya JammalamadakaSanta Barbara County Air Pollution Control District26 Castilian Drive, Suite B-23Goleta, California 93117
RE: Comments to ND on Draft 1998 Clean Air Plan
Dear Ms. Jammalamadaka:
Please accept these comments from the Environmental Defense Center (EDC), a public interestlaw firm active in air quality and other environmental and public health issues in the tri-countyregion.
EDC acknowledges and applauds the substantial amount of effort involved in creating this plan.We believe that the plan itself falls short of the emissions reductions necessary to provide forattainment of the national ambient air quality standard, and thus involves a significantenvironmental impact from the continued exposure of members of the public to levels of airpollution in excess of the health-based ambient air quality standard. This is a significant impact.
Similarly, the CAP fails to demonstrate attainment of the state ozone AAQS. This is asignificant impact.
Additionally, the ND fails to describe the two identified rules which are expected to involve alleast partial relaxation of existing standards, specifically the paint rule and the internalcombustion engine rule revision.
Revisions to the paint rule are expected to possibly strengthen the status quo but relax the currentAPCD rule contained in the 1994 CAP, at least in some respects. While the CAP summarilyconcludes that there will be net emissions reductions equivalency, that conclusion is notsubstantiated or quantified. Thus, the skeptical member of the public or decisionmaker cannotunderstand the logical pathway proposed by the CEQA environmental review document. Thisinformation must be explained in greater detail. If this analysis involves speculation or details arenot yet resolved, the District should employ a worst case analysis to describe potential adverseimpacts.
Revisions to rule 333 involve increases in Nox as a trade-off for ROC emissions reductions.Again, these trade-offs must be quantified and analyzed as a potentially significant impact.
906 GARDEN ST, SANTA BARBARA, CA 93101-(805) 963-1622 FAX: (805) 962-3152 E-MAIL: [email protected] E. MAIN ST, VENTURA, CA 93001 - (805) 643-6147 FAX: (805) 643-6148 E-MAIL: [email protected]

Chief CounselEnvironmental Defense Center
UNITED STATES ENVIRONMENTAL PROTECTION AGENCYREGION III
841 Chestnut BuildingPhiladelphia, Pennsylvania 19107-4431
Mr. Arthur Hill, Divisional AdministratorFederal Highway AdministrationDistrict of Columbia Division820 First Street, N.E.Washington, CA 20002
Dear Mr. Hill:
The Environmental Protection Agency (EPA) Region III has reviewed the ConformityDocumentation for the Washington region entitled “AIR QUALITY CONFOMITYDETERMINATION OF THE CONSTRAINED LONG RANGE AND THE FY98-2003TRANSPORATION IMPROVEMENT PROGRAM (TIP) FOR THE WASHINGTONMETROPOLITAN REGION.” The results of this review are detailed in Enclosure #1.
The conformity determination was reviewed in accordance with the procedures andcriteria for review in accordance with the following sections of the Conformity rule: 40 CFR Part93, Sections 93.110, 93.111, 93.112, 93.113 (b), 93.11. (c).
The EPA has the following comments on this Conformity analysis:
1. The Mass Marketing Campaign does have commitments from theMaryland Department of Transportation (MDOT), the VirginiaDepartment of Transportation (VDOT), and the District of Columbia tosupport the program: however, it is uncertain who is ultimatelyresponsible for its implementation. In addition, it does not indicate whenthe program will be evaluated to verify its claims for emissions reductions.This appears to be the case with the other projects: Employer Outreach,Guaranteed Ride Home, and the Telework Research Center.
2. The MDOT memorandum dated May 1, 1997, lists delayed CongestionMitigation Air Quality (CMAW) projects. It is uncertain if these delayshave been programmed into this plan and TIP.
3. There is some uncertainty that the emissions reductions claimed for theShady Grove West Park and Ride, and the White Oak Park and Rideprojects are claimed for the same time frame as the implementation ofthese projects.
Customer Service Hotline: 1-800-438-2474

This office has the following general comments regarding future ConformityDeterminations:
1. The EPA feels that the recent ruling of the US District Court in Illinois on January16, 1997. Illustrates the fact that a single set of socioeconomic/land use forecastsused by most agencies when they are doing a build/no build analysis appears to beinadequate because it fails to take into account the consensus of expert and legalopinion that expanded road capacity generates changes in travel and landactivities. The Illinois district court ruled the Illinois Department ofTransportation (DOT) would need to develop a separate set ofsocioeconomic/land use forecasts based on what would likely occur with vs.without construction of the proposed extension of the North-South Tollway(Interstate 355) through Will County, Illinois. A portion of the court’s opinionstates that “… the study relies on only ozone production. As a result, the studydoes not accurately depict the true ozone-producing effect construction of thetollroad would have…”
2. The 1995 TRB Special Report (SR) 245 on “Expanding Metropolitan Highways:Implications for Air Quality and Energy Use”, provides ample evidence ofinduced travel and land use effects. Numerous analyses demonstrate that highwayexpansion is likely to increase vehicle trips (VT) and vehicle miles traveled(VMT), and consequently, vehicular emissions. Robert Johnston and Raju Ceerla(“The Effects of New High-Occupancy Vehicle Lanes on Travel and Emissions,”Transportation Research A. Vol. 30, No. 1, 1996, attached), concluded that inCalifornia metropolitan areas, 60 to 90 percent of increased road capacity is filledwith new traffic within 5 years. Therefore, if a three-lane freeway is expanded tofour lanes, the 33 percent increase in capacity attracts a 20 percent to 30 percentincrease in traffic.
3. Mark Hansen (“Do New Highways Generate Traffic?,” Access, UC Berkeley,Fall 1995, attached), concluded that at the metropolitan level, 90 percent ofincreased road capacity is filled with new traffic within four years. Mark Hansenand Yuanlin Huang (“Road Supply and Traffic in California Urban Areas,”Transportation Research A. Vol. 31, No. 3, 1997, attached), found the same 90percent of increased road capacity is filled with new traffic at the metropolitanlevel. Todd Litman (“Determining Generated Traffic External Costs,” VictoriaTransport Policy Institute, March 1997), summarized the results of these andmany other studies.
4. The transportation Conformity rule, Section 93, Subsection 93.110, “Criteria andProcedures: Latest Planning Assumption” states that the conformity determinationmust be based upon the most recent planning assumptions in force at the time ofthe conformity determination. The conformity determination must satisfy therequirements of paragraphs (b) through (f) of this section which includeassumptions that must be derived from the most recent estimates of current and
future population, employment, travel, and congestion. In addition, these keyassumptions must be specified and included in the draft documents for documentsand supporting materials used for the interagency and public consultation requiredby Sec. 93.105.
In summary, based on the requirements of the Transportation Conformity rule and theabove mentioned studies, EPA Region III considers the effects of capacity expansion discussedabove significant in terms of how it affects projected VMT. In the future, the agenciesresponsible for carrying out the regional analysis for conformity should include the effects ofinduced travel demand future TIPs and regional plans.
Please feel free to call Paul Wentworth at (215) 566-2183 to discuss any aspects of thereview.
Sincerely,
Judith M. Katz, Acting DirectorAir Protection Division
Enclosures
Cc: Mr. Al Lebeau (FTA Region 3)Mr. Howard Simons (MDOT)Ms. Sandra Jackson (FHWA, D.C.)Ms. Dianne Franks (MDE)
CHAPTER 12
PUBLIC PARTICIPATION
Introduction
CAC Comments
Changes to the 1998 CAP Resulting from CAC Comments
1998 Clean Air Plan Public Workshops
Written Comments and Responses on the 1998 Clean Air
Plan
12. PUBLIC PARTICIPATION
12.1 INTRODUCTION
The public participation process used in the development of this 1998 Clean Air Plan (1998 CAP) was
implemented to assure that the demands of clean air placed on us by the plan are reasonable and capable of
being achieved. Also, it is important that members of the public, the regulated industry, and government
agencies, have an opportunity to provide input into shaping our present and future strategies to clean the air.
A specific group of people has been organized to serve the goal of providing input on the development of
clean air plans. They are known as the Community Advisory Council. On May 24, 1994, the Community
Advisory Council (CAC) was formed by the Air Pollution Control District Board of Directors (Board). The
purpose of the CAC is to provide advice to the Air Pollution Control Officer (APCO) and the Board in
matters relating to attainment planning, development and promulgation of air pollution control rules and other
associated policy issues. The CAC considers and renders advice on subjects submitted to them by the
APCO, the Board, CAC members, and the public. The CAC is chartered to consider issues related to air
pollution planning and rulemaking for which the Air Pollution Control District (APCD) has jurisdiction.
The CAC's deliberations and recommendations are to consider, to the extent feasible and reasonable, the
effects of APCD planning and rulemaking actions upon public health, the economy, the costs to industry, and
the public, along with conformance with the mandates of all applicable local, state, and federal laws. The
recommendations of the CAC are advisory in nature and neither the APCO, nor the APCD Board, are bound
by CAC recommendations.
Each Board member can appoint two representatives to the CAC. The Board was directed to select CAC
members who contain a background related to community interest, professional business, or technical
experience. For example a CAC member could have a working knowledge of land use planning, agriculture,
petroleum production, medicine, engineering, transportation, environmental conservation, public health,
business, or education. Table 12-1 lists all twelve Board members and each of their appointed CAC
representatives.
The APCD has specifically sought out input from the CAC on each element of the 1998 CAP as it was being
developed over the past year. Starting in January of 1998, APCD staff presented specific portions of the
1998 CAP for the CAC to review and comment on. The CAC also provided recommendations regarding
policy and other key issues that altered the direction, and ultimately enhanced the plan’s contents. The details
of these CAC meetings and the recommendations that occurred are listed in Section 12.2. We have described
the significant changes to the CAP pursuant to the CAC process in Section 12.3.
As part of the APCD's continuing commitment to solicit public participation and input into plan development,
a series of public workshops was also conducted to present the concepts of the 1998 CAP and the
implications of its proposed control measures on the residents and business community of Santa Barbara
County. The focus of the public workshops was to allow public commentary on the plan while allowing
APCD and SBCAG staff the opportunity to address concerns and answer questions regarding the plan and its
contents. The public comments received verbally during the workshops were responded to at that time and
are included in Section 12.4. Public notices announcing the date, time, and location of the public workshops
were published in area newspapers, including the Santa Barbara News Press, the Santa Maria Times, and the
Lompoc Record. A copy of the public notice can be can be found at the end of this chapter.
The public notice announced that the 1998 CAP was available for public review. The public view period was
from September 30, 1998, to October 30, 1998. A copy of all written comments on the 1998 CAP that have
been submitted by the public, along with the written responses to these comments, is provided in Section
12.4.
Public presentations of the 1998 CAP were conducted at the workshops, before the Board at public hearings,
and before the Community Advisory Council. A complete listing of all public workshops and plan
presentations is contained in Table 12-2.
12.2 CAC COMMENTS
This section summarizes the highlight of the CAC meetings on the 1998 CAP. For each meeting, the Chapter
or Chapters that were presented and discussed are listed, as well as the primary questions, comments,
suggestions, and policy direction that staff received from the CAC members.
January 14, 1998 Chapter 1: Introduction.
An overview of the entire 1998 CAP was provided at this first meeting. This resulted in considerable
discussion on many aspects of the plan, including Existing Air Quality; Emission Inventory; Emission Control
Measures; and Transportation Control Measures. The CAC also presented numerous ideas on how to
improve air quality, which are itemized under the specific chapters that they pertain to.
The main highlight from the discussion on the Introduction was to:
• Expand the text and Table 1-1 regarding the federal and state mandates required in the 1998 CAP.
February 11, 1998 Chapter 2: Existing Air Quality
The CAC provided comments that raised a number of important issues and led to several improvements in
this chapter. They include the following:
• Add more descriptive text to the section describing the new federal 8-hour ozone standard.
• Describe in greater detail a discussion about visibility issues in Class 1 areas.
• Add text to discuss how distribution of air pollution affects health and how the control of that air
pollution affects the economy.
April 8, 1998 Chapter 3: Emission Inventory
Based on CAC recommendations, the following enhancements were made in the emission inventory chapter.
• Planing Emission Inventories that are used for emission forecasting and rate-of-progress calculations,
should be removed and placed into Chapter 6, Emission Forecasting.
• Formatting of pie charts should include percentages for groups and sub-groups.
• The preferred format is to use bullets that display the percentage attributed to each division and major
source for each pollutant in each inventory.
June 10, 1998 Chapter 4: Emission Control Measures
Chapter 5: Transportation Control Measures
For Chapter 4, the CAC comments included the following:
• Further Study measures should have an analysis of how and why they’re included in the 1998 CAP.
There should be a description of these listed measures, what process was used to derive these
measures, and their relevance to the CAP.
• Asphalt Roofing. The APCD should investigate the VOC content, emission impacts, and AB2588
impacts of this emission source. Staff should also determine whether or not the ARB or other
APCD’s in the state have any other emission data for this source.
For Chapter 5, the CAC comments included the following:
• Use rail or other modes of alternative transportation to reduce automobile traffic and still bring
tourists into the county.
• Provide hotel room educational materials that would encourage visitors to not drive, but instead
explain other ways to get around town.
• Set up package deals that will give tourists information, discounts and incentives to use alternative
transportation, such as rail.
• Provide free bus tokens for tourists who choose to ride the bus.
• Coordinate with the transportation operators, hotels, and restaurants, to reduce traffic coming into
and going out from the county, as well as traveling within the county.
• Develop an “APCD bed tax fee” to address the environmental impacts of tourism. Possibly re-
allocate the existing city/county bed-taxes.
• Use other methods of funding taxes, such as car parking.
• Increase the usage of the electric shuttles.
• Develop free market incentives or rebates for innovative emission reductions, such as city and
county property tax credits for telecommuting.
• Promote more telecommuting, especially from the high-tech business sector. Develop the
infrastructure needed to increase telecommuting.
• The CAP needs to address emissions from indirect sources such as shopping centers/big-box malls.
• Look at the VEMP model (Voluntary Emission Mitigation Program) to address indirect sources
and to collect mitigation fees.
• Seek voluntary mobile emission credits from EPA.
• Address mobile source emissions in the CAP and place less emphasis on stationary sources. The
current and future control measures listed are slanted heavily toward reducing stationary source
emissions (e.g., Rule 333), and not enough toward mobile and area source emissions.
• Investigate reducing emission impacts from the school districts. The districts have decreased their
bus operations, which has increased private (parental) auto usage. Look into seeking funding
sources that will reverse this trend and eliminate the excessive quantity of cold starts.
• Expand the Clean Air Express service. Develop tools to do this; expand routes; improve marketing;
use incentives; work with traffic solutions. Have SBCAG provide more oversight and
responsibility.
• Have SBCAG spend more of their funding on clean air projects like the Clean Air Express.
• Bring back the Old Car Buy Back Program.
• Investigate methods to provide greater options for alternative transportation programs at UCSB and
incentives, especially to faculty and staff to reduce their VMT and daily trips.
• Pursue Enhanced I & M; Provide the CAC with more data to investigate this issue.
• The issue of Land Use and Air Quality should be included in the CAP. This discussion would
include the transit implications/impacts from various housing and commercial developments. Also,
we should be educating the county and city planners about the air quality impacts from land use
projects. APCD staff should investigate this issue and report back to the CAC, or address it in a
future chapter (i.e., Chapter 8).
August 12, 1998 Chapter 6: Emission Forecasting
Chapter 8: Implementation Support Activities
For Chapter 6, the CAC comments resulted in changes in the 1998 CAP to include the following:
• Upgrade the activity indicator for petroleum wells to include abandoned wells along with producing
wells.
For Chapter 8, the CAC comments included the following:
• The APCD should go to the incorporated cities and county for funding. Local government should
earmark monies, i.e., bed-tax.

• Develop an Indirect Source Review program as a possible control strategy.
• Should there be an opportunity in the plan to do traffic regional modeling. Seek funding for cities to
look at impacts of projects on air quality.
• Provide additional detail in plan on VEMP (voluntary emissions mitigation program - a type of ITG
program to limit impacts from land use projects).
• Develop a range of options of land use strategies to benefit air quality.
• Investigate to see if USEPA will give SIP credit for VEMP.
• Explore the relationship of land use to air quality and have staff work with the CAC to develop
control measures.
September 9, 1998 Chapter 7: Future Air Quality
Chapter 9: Rate-of-Progress
Chapter 10: State and Federal Clean Air Act Requirements
For Chapter 7, the CAC comments included the following:
• A recommendation was made to not pursue the deadline extension, but rather pressure upwind
districts (and have ARB/USEPA take more oversight).
• Revise a sentence in Section 7.7 on page 7-12.
For Chapter 9, the CAC comments included the following:
• Use bullet formatting to display the percentage attributed to each division and major source for each
pollutant in each inventory.
For Chapter 10, the CAC comments included the following:
• In the future, the CAC wants to review AQ monitoring documents, such as the Enhanced Ozone
Monitoring Plan.
October 14, 1998 Draft 1998 Clean Air Plan and Plan Appendices
Comments from this CAC at this meeting included the following:
• Suggestions to improve the format and text of the Executive Summary.
• Discussion of Biogenics, and their reduced importance to the overall strategy of the 1998 CAP.
• Discussion of Vandenberg Air Force Base and their impact upon the 1998 CAP.
• A request for staff to determine what is the relationship between elevated monitoring stations and
increases in ozone concentrations.
• A request to add a section discussing the Complaint Response Program.
12.3 CHANGES TO THE 1998 CAP RESULTING FROM CAC COMMENTS
This section summarizes the significant changes that were made to the plan pursuant to the CAC input
summarized in Section 12.2.
• Several improvements were made to the discussion in Chapter 2 of the new 8-hour federal ozone
and particulate matter standards that were promulgated by the USEPA on July 18, 1997.
• The discussion and format of the emission inventory chapters were revised significantly.
• Updated VMT and Conformity tracking commitment language was added to Chapter 5.
• An Old Car Buy Back Program is being re-established to address emissions from pre-1974 cars.
The California legislature recently exempted model year 1966 through 1973 cars from Smog Check
requirements.
• An updated activity indicator for Petroleum Wells is included in Chapter 6.
• Language in Chapter 7 was revised to address the potential for pollution transport that could
prevent attainment of the federal 1-hour ozone standard by 1999. The text now states, “…in the
event that it is clear that Santa Barbara County was unable to achieve the federal 1-hour ozone
standard by 1999 due to the influence of transported pollution, supported by an analysis of
monitoring and meteorological data, we may request that the USEPA evaluate our local air quality
circumstances and extend our attainment date.”
• The “Take a Vacation From Your Car” program is being explored and identified in Chapter 8 in
response to CAC concerns about vehicle emissions associated with tourism.
• Section 8.7.5 of the Plan was modified to ask the Board to direct the CAC to explore Indirect
Source Review (ISR) and Voluntary Emissions Mitigation Program options to address the issue of
the impacts of land use decisions on local air quality. This effort would result in specific
recommendations for the Board to consider.
• A stand-alone Chapter 10 has been added to specifically identify all mandatory requirements under
the California Clean Air Act and the Federal Clean Air Act Amendments along with a summary of
how the Plan complies with each mandate.
12.4 1998 CLEAN AIR PLAN PUBLIC WORKSHOPS
This section summarizes all public comments and staff responses from the public workshops. These were
held on October 21st and 22nd in Santa Barbara and Santa Maria, respectively. The workshop comments are
organized in this section by the chapter of the plan that they pertain to.
WORKSHOP COMMENTS
Executive Summary:
• Can you add a breakdown of the natural sources to the Executive Summary? (Tom Banigan, Santa
Barbara Industrial Association)
The Community Advisory Council (CAC) discussed this issue and approved a motion to replace
the word “locally” with the word “human” in the Executive Summary on page EX-5 and decided
not to add a chart summarizing natural sources.
Chapter 1: Introduction:
• What is the date that Santa Barbara County has to be in compliance with the federal 1-hour ozone
standard? (Kevin Wright, Torch Operating Company)
November 15, 1999

• What is the approval process of the 1998 Clean Air Plan (1998 CAP) by USEPA? (Kevin Wright,
Torch Operating Company)
The USEPA (United States Environmental Protection Agency) has 6 months completeness
review then 12 months to approve.
• Is the Air Pollution Control District (APCD) optimistic that we will achieve the standard? (Rita
Green, Citizens Planning Association)
Yes, but it will be close, as shown in the air quality modeling in Chapter 7.
• Does the APCD have an official position or opinion on Proposition 7 (The Clean Air Initiative, to be
voted upon on November 3rd)? (Tom Becker, Cars Are Basic)
We, as APCD staff, are not allowed to provide opinions on ballot measures. However, the
APCD Board of Directors has endorsed the initiative.
• If Proposition 7 passes, will the APCD receive any funds from it? (Tom Becker, Cars Are Basic)
No. Proposition 7 deals with people who receive tax credits for participating in clean fuel
projects.
• If Proposition 7 passes, what will be the APCD’s involvement? What will be the process and how
will it work? (Olga Howard, Citizens Planning Association)
The APCD’s Innovative Technologies Group will work with local partners to develop projects
that will receive the tax credits.
• Please describe the Community Advisory Council (CAC). Who are they, where and when do they
meet? (Rita Green, Citizens Planning Association)
Each of the twelve APCD board members gets to choose two representatives for the CAC, for a
total of 24 members. The CAC meets every second Wednesday of each month to provide input
on APCD rules and plans.
• How does VAFB’s ENVVEST program relate to the CAP? (Rita Green, Citizens Planning
Association)

ENVVEST is not specifically dealt with in the CAP; however their emissions are reflected in our
emission inventories in Chapters 3 and 6.
Chapter 2: Existing Air Quality:
• What percentage of all pollutants is from transported into our air basin on a typical summer day?
(Tom Becker, Cars Are Basic)
At this time, there is insufficient information to quantify a percentage.
• How do we influence the USEPA to extend the attainment deadline beyond 1999 if we can’t
quantify transport-related emissions? (Tom Becker, Cars Are Basic)
We will provide a summary of the information available to document the impacts of transport.
This may also be supplemented with data collected during the 1997 Southern California Ozone
Study (SCOS).
• Does the federal government give us any credit for dealing with the transport emissions in the
shipping lanes in the Outer Continental Shelf (OCS)? (Tom Becker, Cars Are Basic)
No. The issue is currently being debated by an ARB task force set up to discuss channel
shipping.
• Has the APCD added any new monitoring stations? (Rita Green, Citizens Planning Association)
No.
• Is the air quality monitoring station at Paradise Road still active? (Rita Green, Citizens Planning
Association)
Yes.
• How many PM 2.5 stations does Santa Barbara County have? (Tom Becker, Cars Are Basic)
Zero. However, two stations have been scheduled for installation in 1999.
• How soon is the impact of wildfires addressed in air quality monitoring? (Tom Banigan, Santa
Barbara Industrial Association)
PM10 monitoring is on a six-day cycle, which provides evidence of the impact of fires on air
quality. It can take a couple of weeks to process the PM10 data. Fires are intermittent and very
difficult to track and quantify.
• The CAP states that the SCCCAMP (South Central Coast Cooperative Aerometric Monitoring
Program) data was used for the air quality modeling in the plan. Does this model address the North
County, and if not, how will the North County be addressed? (Kevin Wright, Torch Operating
Company)
Only a portion of the North County was addressed by SCCCAMP, but the entire county will be
addressed by SCOS. These data will be used in developing the next federal clean air plan due in
2003.
• Was data from the 1984 SCCCAMP study used in the COOGER (California Offshore Oil and Gas
Energy Resources) study? (Rita Green, Citizens Planning Association)
No. The COOGER Study is based on socio-economics.
Chapter 3: Emission Inventory:
• Assuming that the 1994 CAP was written to attain the standard in 1996 and the 1998 CAP meant to
attain the standard in 1999, what emission inventories were used in each plan to determine their
attainment? (Kevin Wright, Torch Operating Company)
The 1994 CAP used 1990 to forecast 1996 and 2006. The 1998 CAP uses 1996 to adjust 1990
and forecast 1999 and 2005.
• What was the impact of recalculating the 1990 base year emission inventory using 1996 data? (Tom
Banigan, Santa Barbara Industrial Association)
Mobile source emissions increased due to more accurate motor vehicle inventory and estimation
of motor vehicle emissions. The stationary source emissions did not change very much.

• Was the new CAPCOA (California Air Pollution Control Officers Association) fugitive hydrocarbon
emission factor methodology included in the plan? (Suzanne Noble, Western States Petroleum
Association)
No. The implementation of the Correlation Equation methodology for quantification of fugitive
emissions from valves and connections in hydrocarbon service in the petroleum production and
processing industry requires that sources submit data (e.g., revised component counts and leak
rates). The sources have not yet collected this data and submitted it to the APCD.
• What % of ROG from natural sources was from biogenics and from seeps? (Tom Becker, Cars Are
Basic)
The total Natural Sources emission estimate for 1996 was 29,295 tons of ROG. Biogenic ROG
emissions are estimated to be 22,532 tons per year or 77%; geogenic emissions are estimated to
be 6,163 tons per year or 21%; emissions from wildfires are estimated to be 599 tons per year or
2%.
• Has the pumping of oil and gas reduced the seeps? (Tom Becker, Cars Are Basic)
There is insufficient evidence to conclusively make a correlation with oil production and seep
emissions.
• What is the reactivity of biogenics and seeps compared to something such as gasoline? (Tom Becker,
Cars Are Basic)
Reactivity varies for all ROG species. Please refer to the ARB reactivity profiles.
• Where do I find information on reactivity? (Tom Becker, Cars Are Basic)
ARB speciation profiles are the most appropriate source of information.
• What methodology was used to calculate seep emissions? (Suzanne Noble, Western States
Petroleum Association)
We did an exhaustive literature review and developed our best estimate of seep emissions.
• The seep calculation appears to be extremely low. WSPA believes additional high quality data was
available to be used. (Suzanne Noble, Western States Petroleum Association)
We have reviewed all available data to our knowledge.
• The CAP states how the most recent emission inventory techniques and information available is
being used. Is this true for calculating the emissions from the seeps? What data is this based upon?
Did it take into account the extensive study recently done by UCSB (University California at Santa
Barbara)? (Kevin Wright, Torch Operating Company)
The APCD staff has reviewed recent information that has been produced by UCSB’s Institute
for Crustal Studies and was unable to glean any additional information on seep emission
estimates.
• What are the seep emissions data based upon? (Kevin Wright, Torch Operating Company)
Primarily the Coal Oil Point Project Environmental Impact Report, prepared September 1986.
• What study was used? (Suzanne Noble, Western States Petroleum Association)
Refer to the previous response.
• How were the solvent evaporation emissions developed in the emission inventory? Did we use
permitted or actual data? (Charles Lester, Nusil Technology)
The 1996 emission inventory is based on actual data.
• Why was there an increase in solvent evaporation emissions from 13% in Figure 9-1 to 21% in
Figure 9-2? (Charles Lester, Nusil Technology)
The actual amount of evaporation was roughly the same in both pie charts, however the relative
contribution changed due to changes made in other categories.
Chapter 4: Emission Control Measures:
• Will the APCD have to wait for EPA to adopt the CAP before we can implement any of the new
rules that are included in the CAP? (Kevin Wright, Torch Operating Company)
No. We will be going forward with the proposed control measures once our Board adopts the
plan.
• Is it really going to do any good trying to implement this emission reduction strategy since the
natural source emissions are so large and uncontrollable. (Tom Becker, Cars Are Basic)
We feel that the emission reduction strategies that have been implemented pursuant to the
California Clean Air Act and the Federal Clean Air Act Amendments of 1990 have be very
effective in improving air quality. While the air quality (ozone) has been steadily improving in
Santa Barbara County, the best example of the effectiveness of controlling anthropogenic
emissions is in the Los Angeles area where air quality has improved tremendously since the
1950’s.
• The CARB control measures M13, M14, and M15 are not applicable to your plan and should be
deleted. These measures are only applicable to areas classified as Extreme (i.e., South Coast Air
Quality Management District). (Ron Nunes, California Air Resources Board)
We have requested ARB to provide us with guidance of the statewide measures. These
measures will be revised appropriately, as information becomes available.
• Are the M16 ROG and NOx emission data reversed for 2005? (Ron Nunes, California Air
Resources Board)
The change has been noted and corrected.
• Verify ROG and NOx data for 1999 and 2005 for M9 and M10. (Ron Nunes, California Air
Resources Board)
The data has been verified.
• What is the latest information on the revised version of Rule 333? (Suzanne Noble, Western States
Petroleum Association)
The draft rule and staff report will be available November 1998. This will only affect 2005 data
only (not 1999 due to a two year implementation period).
• Since we have CO levels well below the standard, could the APCD implement rules that could
aggressively reduce NOx at the expense of increasing CO? (Tom Becker, Cars Are Basic)
This has already been done in the implementation of Rule 333, Control of IC Engines, where
NOx controls have resulted in increases in CO. However, it’s best to minimize these “trade-
offs” when proposing control measures.
• Clarify the use of Reasonably Available Control Technology (RACT) and Best Available Control
Technology (BACT) vs. “all feasible measures.” (Tom Banigan, Santa Barbara Industrial
Association)
All feasible controls relate to the overall air pollution control strategy to examine every cost-
effective and appropriate measure in the Clean Air Plan. RACT, BARCT (Best Available
Retrofit Control Technology), and BACT are assessed on a case-by-case basis as part of the
NSR permitting process while RACT and BARCT are implemented through specific stationary
source control measures. The APCD does BARCT for any source greater than 250 tons per
year, otherwise we use RACT.
Chapter 5: Transportation Control Measures:
• What was the change in motor vehicle population and the change in the SBCAG (Santa Barbara
Association of Governments) inputs used to develop the Motor Vehicle Emission Inventory?
(Suzanne Noble, Western States Petroleum Association)
The fleet demographics (i.e., vehicle age distribution) for the county’s light-duty auto and light-
duty truck population were updated using actual Santa Barbara County DMV data.
• Are SUVs, (Sport Utility Vehicles), considered to be classified as medium-duty trucks or light-duty
trucks? (Tom Becker, Cars Are Basic)
ARB is currently investigating the need to create a new vehicle type category within the on-road
mobile source inventory to specifically identify the emission contribution of SUVs. Currently,
SUVs are part of the inventory but not identified specifically as its own category. Depending
on a SUVs gross vehicle weight and configuration, it could be classified within the 1998 CAP
on-road emission inventory as either a medium-duty or a light-duty truck.
• Is the light-duty auto category affected by the SUV population increase? (Tom Becker, Cars Are
Basic)
No. SUVs are classified as either light-duty and medium-duty trucks.
• Regarding TCM #7; where is the list of traffic improvements in Santa Barbara County and what
improvements are planning to done? (Tom Becker, Cars Are Basic)
A total of ten, regionally significant traffic flow improvements projects were credited towards
the 1994 Clean Air Plan as part of this TCM (Transportation Control Measure). In order for
the 1998 CAP to benefit from this TCM, new traffic flow improvement projects that could be
completed by 1999 had to be identified. Although there are approximately 20 such projects
currently programmed, none of them will be fully constructed and operational by 1999. Hence,
no traffic flow improvements were credited in this 1998 CAP.
• What is the amount of money allocated for traffic flow improvements? (Tom Becker, Cars Are
Basic)
According to the RTP (Regional Transportation Plan), there is $187,240,000 programmed and
an additional $329,158,000 planned for road and bikeway system improvement projects over the
next 20 years. Taken as a whole, there is approximately $1,000,000,000 of total physical
improvements for road, transit, airport, and railway system projects scheduled over the next 20
years. However, the funding depends on TEA-21 (Transportation Equity Act), and is subject to
change.
• Why doesn’t Goleta or Santa Barbara have a public CNG (Compressed Natural Gas) fueling
facility? (Tom Becker, Cars Are Basic)
So Cal Gas is currently installing a public facility in downtown Santa Barbara.
• Have the safety concerns of high-pressure CNG tanks been addressed? (Tom Becker, Cars Are
Basic)
Yes they have. Safety issues are addressed during the permitting process.
• What is being done about the issue of MTBE (Methyl Tertiary-Butyl Ether) in reformulated gas,
especially in light of the leak that recently took place in Santa Monica and contaminated the ground
water there? (Tom Becker, Cars Are Basic)
ARB is working to change the gas oxygenate standards to allow alternatives to MTBE.
• How successful is the Old Car Buy Back (OCBB) program and how do you measure it’s success?
(Tom Becker, Cars Are Basic)
From 1993 to 1996, the OCBB program was very successful as estimated on a cost per ton
basis. Of the 1,191 vehicles that were scrapped, 528 (44 percent) were determined to be
“gross” emitters – typically emitting 6 to 10 times the normal amount of pollutants.
• Who is “Parson’s, Inc.”? (Tom Becker, Cars Are Basic)
The APCD’s OCBB program consultant.
• Does the oil and gas industry receive offset credits for contributing to the OCBB program? (Tom
Becker, Cars Are Basic)
No. All benefits from the OCBB program go to clean air.
• Why is there a difference in the estimated emission reductions in measure T-21 in the 1994 CAP
compared with the 1998 CAP? (Tom Becker, Cars Are Basic)
The ARB estimated the effectiveness of T-21 for the 1994 CAP for a 1997 implementation year.
The MVEI7G 1.0c model, developed by the California Air Resources Board, was used to
estimate T-21 for the 1998 CAP for a 2005 implementation year. Also, the MVEI7G 1.0c
model does not reflect the legislative changes made to the Inspection and Maintenance Bill,
which may reduce the effectiveness of the original program. Consequently, using the MVEI7G
1.0c model exaggerates the benefits of this program. This shortcoming is stated in the draft
document. These data will be revised when the data are available.
• Do the 2005 mobile source emission inventory emission reductions include contingency measures?
(Tom Becker, Cars Are Basic)
No.
• Does the mobile source emission inventory include tourist vehicles? (Tom Becker, Cars Are Basic)
Yes.
• What is the percentage of tourist vehicles compared to the total number of cars? (Tom Becker, Cars
Are Basic)
On an average summer weekday, SBCAG’s Santa Barbara Traffic Model calculated
approximately 11%.
• If a summer weekend model was used then what % from tourist vehicles (Tom Becker, Cars Are
Basic)
Given that the SBCAG travel model was not designed to address this question it is difficult to
say. However, a traffic license plate video survey in 1994, revealed that 60% of vehicles headed
south-bound on Highway 101 at San Ysidro Road on a summer Sunday afternoon were from
areas south of Santa Barbara.
• Will controlling transportation emissions be more of a problem since the population of cars and
VMT continues to increase? (Olga Howard, Citizens Planning Association)
In some areas, the emissions attributable to growth in vehicle activity is estimated to outpace the
emissions savings accrued from the cleaner vehicle fleet after the year 2005. Past modeling
performed for Santa Barbara County by SBCAG reveals that NOx emissions from motor
vehicles will begin to rise again after 2010 while ROG will continue to decrease but a much
slower rate. These trends will definitely place more importance on controlling transportation-
related emissions especially in terms of future transportation conformity determinations. If
regional transportation planning agencies (SBCAG) can not demonstrate that future year
emissions from on-road mobiles sources are within the limits established by Clean Air Plan
(called emission budgets), federal transportation dollars for new road capacity projects identified
in regional transportation plans and programs will be withheld.
• What is the percentage of diesel emissions that contribute to our air pollution problems? (Olga
Howard, Citizens Planning Association)
Based on the 1996 on-road mobile source emission inventory, approximately 23 percent of the
NOx emissions are from diesel.
• What more can we do about it? (Olga Howard, Citizens Planning Association)
Included as part of Chapter 8 is a Mobile Source Control Policy section, which describes long
term directives to reduce on-road mobile sources of pollution including diesel emissions.
Specifically, the policies support the continued work of the APCD’s Innovative Technology
Group (ITG) to pursue projects and programs that will reduce emission from medium and heavy
duty diesel vehicles through both engine retrofit/replacement and the introduction and
promotion of alternative fuels. Chapter 8 also includes policies, which promote expanded transit
services that use alternative fuels (e.g., electric, CNG). These policies are anticipated to provide
direction to both public and private agencies to pursue non-diesel fueled vehicle projects as well
as potentially influence funding decisions that implement these policy directives.
• Is it likely that the APCD get more authority or control over mobile sources? (Tom Becker, Cars
Are Basic)
No.
• Are mandatory ride share programs going to come back? (Tom Banigan, Santa Barbara Industrial
Association)
No. However, large employers (those with 100+ employees) located in “severe” or “extreme”
nonattainment areas must reduce emissions from their workforce equivalent to what would have
been achieved if a mandatory employer-based trip reduction program was in place. To achieve
this goal, an employer could always voluntarily implement such a program. If Santa Barbara
County does not achieve the federal 1-hour ozone standard by November 1999, EPA may bump
the county’s nonattainment designation from “serious” to “severe” thus triggering the need for
large employers countywide to address this requirement. This measure is described in the 1998
CAP as contingency measure T-22.

• Are the current problems with diesel fuel addressed in the plan? How is it regulated in this plan?
How does it affect achieving air quality standards? (Rita Green, Citizens Planning Association)
Oxides of Nitrogen (NOx) and Reactive Organic Gases (ROG) emissions from diesel powered
vehicles are addressed in the plan. Particulate emissions and air toxics from diesel vehicles are
not. Emissions from diesel vehicles are controlled through the ARB via vehicle emission
technology measures and typical local demand management strategies that reduce the need to
take a vehicle trip.
• Was a cost-effective analysis done on Enhanced Inspection & Maintenance? (Tom Becker, Cars Are
Basic)
No. Please refer to the ARB and BAR (Bureau of Automotive Repair) for information on this
program.
• Since my 1972 Volkswagon Bug is no longer required to comply with the Smog Check, are the
emissions from my car not accounted for in the plan? It doesn’t seem to be any dirtier when I used
to have Smog Check done then compared to now. Why is it assumed that my car is getting dirtier?
(Olga Howard, Citizens Planning Association)
Although pre-1973 vehicle model years are now exempt from smog check, your vehicle’s
emissions are still accounted for in the plan. Generally, as vehicles age the emission control
devices will degrade causing the vehicle to emit more. However, proper care and maintenance
should allow a vehicle to run cleaner longer, as demonstrated by your vehicle’s good
performance.
• Are newer model years exempt as well? (Carolyn Einung)
No. However, smog checks will not be required for the first four years of a new vehicle’s life.
So for instance, a 1997 model year vehicle would not be required to have its first smog check
until the year 2001.
• How does the SBCAPCD compare with other air pollution control districts in regards to the level of
regulatory authority upon land use planning? (Tom Banigan, Santa Barbara Industrial Association)
We would characterize our level of effort as being typical of other Air Districts. However, some
do go further such as the San Luis Obispo Air Pollution Control District whose efforts are
exemplary in the area of land use design guidelines.
• The Orcutt Community Plan has a built-in growth cap to limit housing. However, recent growth
and plans for additional housing has exceeded this cap. Local officials explained that cap will need
to be revised to allow for more growth. How can this be allowed? What will be done about this?
(Olga Howard, Citizens Planning Association)
Like the APCD, SBCAG has little authority over land use decisions. SBCAG develops the
county’s regional growth forecasts in a bottom-up fashion basing its growth assumptions on
local area general plans and input from the local jurisdictions. Like all forecasts, it is a snapshot
and is based on the most recent information available. SBCAG does monitor the accuracy of its
regional growth forecasts by tracking actual data on population, employment, and housing, as it
becomes available. As of 1998, the 1994 Regional Growth Forecasts is tracking quite well.
However, as local land use policies change by altering the maximum allowable growth or the
rate at which growth will be allowed, the need to revise these forecasts may be warranted.
Historically, SBCAG has updated its regional growth forecasts every five to six years. SBCAG
is currently in the process of updating its growth forecasts and is anticipating a draft document
in late 1999. Consequently, this 1998 Clean Air Plan is based on the growth assumptions of the
1994 Regional Growth Forecast, which does not reflect recent changes to the Orcutt
Community Plan. However, staff does not consider this to be problematic in terms of emission
forecast validity/accuracy given that the 1998 Clean Air Plan only forecasts out to 1999 and the
ramifications of the revised Orcutt Community Plan will probably not have an impact for a
number of years.
• ARB needs documentation for changes in MVEI inputs done by SBCAG. (Ron Nunes, California
Air Resources Board)
This documentation has been included as part of Appendix C (Page C-32; model enhancement
#1-4). However, text will be added to further clarify what modifications were made by SBCAG.
Chapter 6: Emission Forecasting:
• How good was the last forecast in the 1994 Clean Air Plan? (Charles Lester, Nusil Technology)
The emission reductions were greater than we predicted in the 1994 plan. The inventory data
and methodologies have changed considerably since the last plan. Remember that the inventory
is just a “snap-shot” viewpoint.
• Is there any future OCS activity that is detailed in the Forecast Chapter? (Kevin Wright, Torch
Operating Company)
We applied an activity factor of unity (1) to the future OCS emissions.
• Is the forecast of OCS a flat, declining or increasing projection? (Suzanne Noble, Western States
Petroleum Association)
Refer to the previous response.
• Were the Point Arguello emission reductions taken into account into the forecasting of emissions?
(Suzanne Noble, Western States Petroleum Association)
No. These emissions were grown with the activity indicators documented in Chapter 6 of the
1998 Clean Air Plan.
• Is OCS drilling and exploration accounted for anywhere in the CAP? (Kevin Wright, Torch
Operating Company)
No.
Chapter 7: Future Air Quality:
• Is there any way in the future that the northern and southern portions of Santa Barbara County
could become reclassified as different attainment classifications? Is there any current political
movement happening? (Tom Becker, Cars Are Basic)
This issue was addressed by the APCD during our recent reclassification to “Serious”
nonattainment for the federal 1-hour ozone standard. EPA denied our request and reclassified
the entire county as a Serious nonattainment area. However, APCD staff will continue to
negotiate with EPA on this issue.
• Are there any other districts with a split attainment classifications (Tom Becker, Cars Are Basic)
Yes.
Chapter 8: Implementation Support Activities:
• Has a cost-benefit analysis been done on the APCD’s pollution prevention programs? How much
time, money, and tons of pollution have been reduced? (Suzanne Noble, Western States Petroleum
Association)
Pollution prevention programs are difficult to quantify. However, all Innovative Technology
Group programs quantify reductions on a cost per ton basis.
• Are there any plans for expansion of re-power programs for boats and booster pumps? (Tom
Becker, Cars Are Basic)
Yes. New plans include Clean Air Express buses, marine vessels, boilers, booster pumps; and
other clean fuel vehicle programs. We are currently prioritizing these programs for cost-
effectiveness.
• How does conformity affect Vandenberg Air Force Base (VAFB) after the attainment date of
November 15, 1999 passes? (Kevin Wright, Torch Operating Company)
The general conformity requirements of the 1990 Clean Air Act will not change for Santa
Barbara County after 1999. The federal conformity regulation will be applicable to all of Santa
Barbara County until the county is formally designated by EPA as an attainment area (not to be
confused with a maintenance area) of all federal air quality standards.
If we attain the federal 1-hour ozone standard, then the emissions contained in the plan for
VAFB will remain valid. If we don’t attain the federal 1-hour ozone standard, then we might
have to prepare another plan, which would have to address VAFB emissions.
• What was the significance and reasons why VAFB identified their emissions in the CAP? (Kevin
Wright, Torch Operating Company)

The primary motivation for VAFB to fully disclose its expected future emissions is to reduce the risk
of violating conformity. Incorporation of this new information will not compromise the 1998 CAP
from meeting the rate-of-progress requirement.
• Will OCS drilling and exploration after 1999 involve general conformity? (Kevin Wright, Torch
Operating Company)
No. General conformity applies only to federal funded projects.
Chapter 9: Rate-of-Progress:
• Is the calculation to achieve Rate-of-Progress (ROP) taking the total reactive organic gases minus
federal controls and subtracting 24% off the remainder? (Tom Becker, Cars Are Basic)
This is generally correct. We can take credit for state motor vehicle controls, but not federal
controls.
• If the requirement of a 24% reduction is exceeded, then do we get credit/rewarded? Are there
incentives for exceeding the 24%?(Tom Becker, Cars Are Basic)
Rate-of-Progress is a minimum reduction for ROG specified by the Federal Clean Air Act
Amendments. There are no incentives for exceeding this requirement besides improving our
ability to actually attain the federal 1-hour ozone standard.
• Is there a penalty for not meeting the 24% rate-of-progress requirements? (Tom Becker, Cars Are
Basic)
Yes. These penalties include sanctions, federal implementation plans, or offsets.
• Has the rate-of-progress from the 1994 CAP been included into this plan? (Rita Green, Citizens
Planning Association)
This plan combines the 15% requirement in the 1994 CAP with the 9% requirement for serious
areas for a total required reduction of 24%
• Where are we now and how do we look for making the Rate-of-Progress by 1999? (Tom Becker,
Cars Are Basic)
Chapter 9 documents our Rate-of-Progress calculations documenting that we exceeded our
statutory requirement for a 24% reduction in emissions of reactive organic gases.
• Why not worry about controlling NOx instead of focusing only on ROG for the Rate-of-Progress
calculations? (Tom Becker, Cars Are Basic)
The Federal Clean Air Act Amendments of 1990 mandated specific reductions in ROG
according to an area’s nonattainment classification. However, our overall emission reduction
strategy implements reductions for both ROG and NOx.
• Does the ROP calculation include the Outer Continental Shelf emissions? (Suzanne Noble, Western
States Petroleum Association)
No. EPA directed us not to include emissions from the OCS in the ROP calculations.
Chapter 10: State and Federal Clean Air Act Requirements:
• For the CCAA Triennial Update, the ARB requests the APCD to place all of the components into
one chapter for an easier review to determine compliance. (Ron Nunes, California Air Resources
Board)
The CCAA is addressed throughout the plan and specifically in Chapter 10. However, to
address this concern, we will prepare an additional new chapter in the plan to deal with this
issue. Chapter 11 will address the state mandated Triennial Progress Report and plan revision
requirements.
12.5 WRITTEN COMMENTS AND RESPONSES ON THE 1998 CLEAN AIR PLAN
This section provides all written comments received on the 1998 Clean Air Plan and accompanying staff
responses to these comments.
PUBLIC COMMENTS
ENVIRONMENTAL DEFENSE CENTER
Marc Chytilo
OCTOBER 30, 1998

October 30, 1998
Mr. Tom MurphySanta Barbara County Air Pollution Control District26 Castilian Drive, B-23Goleta, CA 93117
RE: Comments to Draft 1998 Clean Air Plan
Dear Mr. Murphy:
Please accept these comments from the Environmental Defense Center (EDC), a public interest law firmactive in air quality and other environmental and public health issues in the tri-county region.
EDC acknowledges and applauds the substantial amount of effort involved in creating this plan. The1998 plan contains substantial improvements in several critical elements of the State ImplementationPlan (SIP) element and has been produced in a methodical and coordinated fashion employing-thetalents of a number of other agencies. The people of Santa Barbara County have benefited from yourlabors.
Unfortunately, we believe that the plan has significant problems, some due to limitations of technologyand data (modeling, episode data, biogenic emissions factors), some due to very tight timelines inherentin the Clean Air Act, EPA's inaction, and the District's failure to "get ahead of the curve" when non-attainment was imminent, and still others due to the content of the plan itself.
EDC believes that the plan fails to meet its fundamental purpose of assuring attainment of the ozoneambient air quality standard by the II/ 1 5/99 deadline. The plan does not contain sufficient controlstrategies necessary to reduce emissions of air pollution quickly enough to ensure that locally generatedair pollution will not cause further violations of the one-hour ozone national ambient air qualitystandard. Reliance on a preliminary draft of EPA's misguided and legally flawed ozone transport policyto avoid a further reclassification of the County further exacerbates the non- attainment problem. IfSanta Barbara County fails to meet the attainment deadline for serious areas, it should begin theimplementation of control strategies adequate to ensure that the attainment deadline for severe areaswill be met.
Consequently, EDC believes that, as proposed, the plan fails to meet the minimum standards imposed

by the Clean Air Act and that EPA will be required to reject the plan as inadequate and run the
sanctions clock, order specific "fix-ups" and/or promulgate a federal implementation plan.
906 GARDEN ST, SANTA BARBARA, CA 93101-(805) 963-1622 FAX: (805) 962-3152 E-MAIL: [email protected] E. MAIN ST, VENTURA, CA 93001 - (805) 643-6147 FAX: (805) 643-6148 E-MAIL: [email protected]
Mr. Tom Murphy: 1998 CAP CommentsOctober 30, 1998Page 2
I: LEGAL SUFFICIENCY ISSUES
1. Inadequate Margin of Safety for Attainment Demonstration
Sections 171 and 172 of the Clean Air Act define reasonable further progress for attainmentplanning and prediction purposes as the emissions reductions necessary to attain the relevantambient air quality standard as expeditiously as practicable, but no later than the attainment date.Section 172(c)(2) requires a § 171 RFP demonstration, specifically the annual and periodicemissions reductions that will reduce the formation of ozone in Santa Barbara County so as toprovide for" (§ 172(c)(6)) attainment of the health-based national ambient air quality standard forozone as expeditiously as practicable, but no later than November 15, 1999, based on theprevious three years' data.
For various reasons, the accuracy of the model used for the attainment demonstration is large,considerably in excess of 0.03 ppb. For all practical purposes, the model simply predicts possibleattainment of the 1 hour ozone NAAQS with absolutely no room for the slightest error, anyunanticipated conditions, any consideration of transport or nominal excess emissions. Statistically,given the large error in the model, there is a very high probability that Santa Barbara will exceedthe standard. Given the fact of at least two exceedences at two separate stations as of fall 1998,and an unusually "clean" air year in 1997, the plan predicts that Santa Barbara will exceed the 1hour ozone NAAQS and again be reclassified. The plan is legally inadequate.
EDC contends that the plan is currently inadequate because it fails to demonstrate attainment, if atall, with an adequate margin of safety. § 172(c)(6) mandates that the plan include sufficientcontrol measures to "provide for" attainment of the standard by the applicable date, in this case11/15/99. This is a central concept in the Clean Air Act. The United States Supreme Court ruledin the seminal case Train v. Natural Resources Defense Council, 95 S. Ct. 1470 (1975) that "theprinciple [governing the conditions for approval of the SIP] is that the plan provide for theattainment of the national primary ambient air quality standard." Train, 95 S. Ct. at 1475-1476.There are no assurances that the plan has provided for attainment, and many indications that it hasnot.
Section 110(a)(1) mandates a plan which "provides for implementation, maintenance andenforcement of such" NAAQS in each district and state. Implicit in this authority is adequatecontrol strategies to ensure that the NAAQS will be attained and maintained. The 1998 SBC CAPfails to comport with this mandate in barely demonstrating attainment, which provides no bufferor margin of safety to ensure attainment and/or continued maintenance of the standard.
EDC strongly questions whether EPA may approve a SIP which might provide for attainment, orwhich may provide for attainment. Given the central nature of the issue to CAA compliance, EDCbelieves that the term "provide for" connotes a certainty of actualization, not mere speculationand aspiration. In light of Santa Barbara County's previous bare demonstration of attainment inthe 1994 CAP and subsequent non-attainment, EDC believes that EPA will be compelled todisapprove the 1998 CAP if it attempts to show that it "provides for attainment" by such a thinmargin. Thus, we urge the District to fortify the plan to provide additional emissions reductionswhich ensure that the standard will be both attained and maintained.
2. The monitoring network is inadequate
The draft plan lacks an adequate discussion of the District's monitoring program, network andfuture plans. The reclassification of the County to serious requires substantial revisions to themonitoring network which should be analyzed in the plan, not deferred to future analysis.
Mr. Tom Murphy: 1998 CAP CommentsOctober 30,1998Page 3
SBCAPCD's additional duties as a serious area include the duty to enhance and improve itsmonitoring network. § 182(c)(1). This includes both SLAMS and PAMS networks. EDC believesthat the District's SLAMS responsibilities include a duty to locate a permanent monitoring stationin the elevated foothill region of the south coast. 40 C.F.R. Part 58, appendix D, section 2.5. Theurban scale criteria define the need for a station located to measure the high concentrationsdownwind of the area having the highest precursor emissions. Note that this criteria does notdefine the areas of highest ozone concentrations; it is those areas of highest concentrationdownwind of the highest precursor emissions. This clearly mandates a station in the Riviera orother elevated foothill region downwind from the City of Santa Barbara's urban core. The 1998CAP is deficient for its failure to include this aspect of the improved and enhanced monitoringnetwork.
The attainment demonstration model predicts that the highest ozone concentrations in SantaBarbara County will occur east of the City of Santa Barbara. (1998 CAP Appendix D- 1). Thereis a well established (and uncontroverted) pattern a higher ozone concentrations at elevatedareas in Santa Barbara County. (Various APCD staff reports on 1997 Riviera monitoringstation.) The CAP should include a more extensive monitoring network section (or separatechapter) which addresses the potential sites for location of monitoring stations in conformitywith state and federal requirements and considering our unique local conditions, in particularthe relationship between elevation, ozone concentration and monitoring station location.
The development of the PAMS network is particularly important for the District. PAMS data isintended to assist in delineating transport factors, exposure assessment, individual sourcecontribution to exceedence episodes and in developing more accurate attainment demonstrations.40 C.F.R. Part 58,Appendix D,§ 4.1(a). PAMS data will address urban toxic air pollution controland planning for attainment of the 8 hour ozone standard, including speciation of air pollutionconstituents. The plan must include a description of this crucial program and its components.
Criteria for the PAMS network again militates towards the installation of a station downwindfrom the urbanized areas in the south county. Id., at § 4.2. Design criteria for the PAMS networkare based on selection of an array of site locations relative to ozone precursor source areas andpredominant wind directions associated with high ozone events.
3. New Source Review rule adequacy
EDC questions whether the current NSR rule is adequate to control emissions growth in SantaBarbara County, particularly with WSPA's legislation exemption for industrial abandonmentactivities from offset requirements (AB 3047). Minimally, these emissions must be included in theemissions inventory. Optimally, the SIP must define a method for controlling these emissions as amatter of federal law. EDC suggests that the District direct EPA to promulgate a federal rule toexpressly preempt this odious authority and include the emissions reductions in the 1998 CAP asthe South Coast Air Quality Management District did with the 1994 CAP.
Additionally, emissions reductions may be obtained simply by increasing the offset ratios includedin the New Source Review rule. Since the expansion of major sources typically involvessubstantial capitalization, it is appropriate to assign these emissions reductions responsibilities tothose who are profiting from polluting activities and can incorporate these costs into theirbusiness decisions.
Mr. Tom Murphy: 1998 CAP CommentsOctober 30, 1998Page 4
II: INVENTORY ISSUES
1. Adequacy of emissions inventory
The act requires that a SIP contain "enforceable emissions limitation and other control
measures, means or techniques ... as may be necessary to meet the applicable requirements of
[the Act]." § 110(a)(2)(A). The plan must contain a program of enforcement of these measures.
§ 110(a)(2)(C).
While the CAP and Santa Barbara County's air pollution control strategies have relied heavilyon control of stationary sources in recent years, that component of the emissions inventory isdeclining in relative significance. The mobile sources sector has concomitantly increased, andthreatens to further increase as the County's population increases unchecked.
The CAP emissions inventory must be modified to include enhanced specificity of the componentsof the mobile sources inventory. EDC is gravely concerned that rapid growth in various portionsof the County will cause exceedences of the emissions that are calculated into the attainmentmodel. EDC believes that the emissions inventory is an enforceable element of the SIP and shouldbe stated with adequate detail to ensure that the public and land use planning authorities can trackprogress in controlling emissions and in emissions growth.
2. Pesticide State Implementation Plan emissions inventory issues
The Santa Barbara County emissions inventory is influenced by the pesticide methyl bromide,among others. Methyl bromide emissions during the peak ozone season have the potential tosubstantially affect air quality, although there is currently considerable controversy over methylbromide's relative reactivity. While currently set at 100% reactive, it is probably much lower.Since it would be adjusted in the baseline inventory in any case, there is no demonstrationsignificance although the model would be more accurate if more accurate numbers are used.
3. Kelp Cutting ships: emissions inventory category
Substantial emissions are believed associated with periodic activities by ships engaging in cuttingkelp in tidelands. EDC understands that the Department of Fish and Game and/or State LandsCommission regulate these activities, and emissions inventory information may be obtained fromthose agencies. These emissions are believed significant since the activities involve extensivemaneuvering and other internal combustion engine-intensive activities.
4. Biogenic emissions
The emissions inventory grossly overstates biogenic emissions, which then confuses decisionmakers and members of the public and regulated community. First, the biogenic emissions ignorethe role of biogenics as ozone and ozone precursor sinks. Professor Tom Cahill of University ofColorado Davis opines that vegetation in California sequesters and absorbs more as ozone andozone precursors than the amount of ozone precursors generated. The emissions inventory shouldreflect this dynamic rather than simply reporting the calculated emissions rate.
Second, the numbers reported as biogenic emissions in the Santa Barbara County draft emissionsinventory appear to be wildly inaccurate. While Ventura County's inventory reports biogenicemissions of approximately 1400 tpy and San Luis Obispo's emissions inventory approximately440 tpy, the Santa Barbara County emissions inventory for this category is over 14,000 tpy. Thereare no distinctions between these three counties which would justify or support this level of
Mr. Tom Murphy: 1998 CAP CommentsOctober 30, 1998Page 5
disparity. The plan drafters should secure more accurate information from CARB to enhance the.accuracy of the CAP emissions inventory.
5. On-Road mobile source emissions inventory
The 1998 CAP demonstrates that previous Clean Air Plans have seriously understated thequantity of emissions from the mobile sources sect-or. This perturbs the planning process. TheCAP must include a more detailed analysis of the inventory's model enhancements and include amargin of error or range of probable emissions if the emissions inventory cannot be moreaccurately predicted. EDC questions whether the previous underestimation of this component ofthe emissions inventory has contributed to the District's difficulty in accomplishing attainment.
III: CONTROL MEASURE ISSUES
The Plan must include additional and more effective control strategies to reduce ozone precursoremissions.
1. Offshore Seep Tents
Representatives of the offshore oil industry have highlighted the significance of "natural" seepemissions in affecting local air quality. See generally the second volume of COLAB's"Conservation Quarterly", Summer 1998, where the history of Santa Barbara channel seeps ispurportedly delineated. While EDC notes that there are questions regarding the relative reactivityof these emissions, they do appear to be significant in volume if not ozone formation potential.The benefits from controlling these emissions would be reduced exposure to toxic air pollutants aswell as enhanced ambient air quality.
A potential control strategy is to assess a severance tax upon all oil and gas production fromSanta Barbara Channel production to fund a series of tents or other seep emission control devices.Following design development, members of the oil industry could bid competitively along withanyone else considered capable of installing and operating such devices. There is a logical andlegal nexus between any such assessment: the oil industry is attracted to the channel by thepresence of oil deposits. These same deposits contribute to degraded onshore air quality due touncontrolled seeps. Were it not for the oil and gas which coincidentally contribute to the seeps,the oil industry would not be able to accomplish their production and profits from the oil. Thisindustry should fund the control of these sources.
2. Expedited internal combustion engine controls (Rule 333 enhancement andstrengthening)
This is a feasible and effect control measure whose implementation has been delayedinappropriately. It's adoption and implementation should be expedited as an adopted controlmeasure with enforceable adoption and implementation dates.
3. Indirect source review should be included
The Act provides clear authority for the application of indirect source review programs at §110(a)(5). Indirect source review is an essential element of Santa Barbara County's air pollutioncontrol strategies, yet is given minor treatment in the draft 1998 CAP. It is feasible andappropriate and provides the only meaningful means to control emissions from the fastest growingsector in the County. In light of the minimal margin of safety, the anticipated population andmobile sources sector growth and the absence of alternative means to contain the emissions fromthese types of
Mr. Tom Murphy: 1998 CAP CommentsOctober 30, 1998Page 6
sources, the plan is inadequate without an indirect source review program. Note that Californialaw requires revisions to develop an area wide source and indirect source programs. Health andSafety Code § 40918(a).
4. Land use-air quality issues
The Environmental Defense Center supports the inclusion of land use and air quality issues in theCAP. As noted above, control of emissions growth from the mobile sources sector will only comethrough thoughtful and careful integration of air quality and land use planning principles. TheCalifornia Air Resources Board and other agencies have prepared materials addressing the issuethrough educational materials that should be made available, along with trainings for planners ineach City in the County and the County's Planning and Development Department. Workshopswith members of the development community, possibly similar to the Planning and DevelopmentDepartment's design residential unit process this summer, could facilitate air quality sensitiveproject design from the conception stage, rather than after the fact. Finally, members of the APCDBoard of Directors must serve as air quality ambassadors while in their roles as council membersor supervisors and direct the planning process in favor of air quality and air pollution sensitiveproject approvals.
5. Enhanced CEQA guidance and construction emissions controls.
The District may address a number of difficult air pollution generation issues by engaging moreactively in the CEQA environmental review process of all land use, regulatory and landmanagement agencies which affect air quality in the District to better accomplish mitigation of airquality impacts. Most substantial land use projects in Santa Barbara County cause a significantadverse environmental impact even under the current weak thresholds, but this impact is typicallyoverridden due to the absence of an effective mitigation measure to offset or otherwise amelioratethe project's emissions. This applies to either or both the construction and/or operationalemissions from these projects. The District should develop and adopt a Emissions MitigationProgram (EMP) whereby the District may impose fees or exact conditions from all projects andentitlements which will provide meaningful and effective mitigation of air pollution from growthsectors in the inventory. Developer fees are a significant source of missed opportunity for theDistrict if an effective mitigation program is in existence.
The District should revise the threshold for construction emissions and establish a considerably smallerthreshold (zero) for the trigger point mandating mitigation of air pollution impacts.
Consistency is an essential tool for controlling emissions growth, but is incumbent upon aneffective and detailed emissions inventory to application. As noted above, the emissions inventorymust be much more detailed and speciated among the various source classifications to effectivelyserve the CEQA consistency function.
6. Contingency Measures
Contingency measures have an essential role in air quality planning processes. When an area isunable to maintain reasonable further progress or accomplish attainment of a NAAQS, the Actrequires that a contingency measure come into force, without further action by the District, toaddress the shortfall in planned emissions reductions and air quality improvement. Sections172(c)(9), 182(c)(9) and 187(a)(3) state that contingency measures shall "take effect withoutfurther action by the state [or District] or Administrator." EPA anticipated that contingencymeasures would be implemented during the plan revision process following bump up. (GeneralPreamble, 57
Mr. Tom Murphy: 1998 CAP CommentsOctober 30, 1998Page 7
Federal Register 13511/2/,4/16/92.) This obviously has not been done, and the District hangs inthe balance between attainment and non-attainment as a result.
The 1994 CAP contained a contingency measure (Enhanced Inspection and Maintenance) whichwas never enforced or applied. While the District may have had good reason for the refusal toactivate the control measure, it was obligated to implement an alternative contingency measureand seek a SIP revision to incorporate that change. Neither event happened and Santa BarbaraCounty has experienced worse air quality as a result. The District cannot delete this contingencymeasure without substituting another, equally or more effective contingency measure toimplement should the next attainment date be missed. Section 110(1).
The single identified stationary source contingency measure, rule 333 revisions, is not acontingency measure, it is a currently feasible and necessary control measures to meet the federaland state ambient air quality standards. The rule 333 revisions are programmed into the District'srule promulgation schedule and clearly constitute a feasible control measure. It does not meet thecriteria for contingency measure and must be replaced by a different contingency measureadequate to address the anticipated emissions reductions shortfall in accord with EPA guidance.
6. Transportation control measures.
The CAP must more aggressively view transportation control measures as opportunities tocontrol emissions growth and accomplish emissions reductions. The new emissions inventoryinformation disclosing the larger significance of the mobile sources sector is very troubling,indicating both a substantial CAP deficiency and an essential opportunity to address the problem.The CAP must address TCMs much more aggressively and effectively. The failure to controlmobile sources emissions will result in exceeding the ceiling relatively soon and triggering a roundof sanctions and further planning obligations. Since this is foreseeable at this time, the 1998 CAPmust address these contingencies and include additional TCMs adequate to control emissionsfrom this sector.
7. Eliminate Exemptions
The 1997 amendments to the District New Source Review rule included the continuation and, insome cases, expansion of the categories of exemption sources of air pollution. These exemptionsshould each be reviewed and eliminated in each instance where any quantity of emissionsreductions may be accomplished through a prohibitory rule.
IV: OTHER ISSUES
1. Transport Issues
The CAP recites a flawed draft EPA policy that purports to authorize extensions in attainmentdates for areas affected by as little as a single molecule of transported air pollution. (DickWilson, EPA AA memo, 7/16/98). This policy is exempt from judicial review until applied, andthere has been no Administrative Procedures Act compliance with the announcement of thepolicy, although it has been promised. This policy clearly has little to no application to the westcoast; it was designed to address OTAG issues that are irrelevant to California's situation. It islegally infirm, will be challenged judicially if it is employed, and thus should be ignored.
Nevertheless, EDC recognizes that Santa Barbara County and other Districts are affected bytransport. In fact, Santa Barbara County is an upwind District for some areas, as well as beinga downwind or receptor area. (CARB) The solution to resolving transport issues is aggressiveaction by all upwind District to control emissions, not extended attainment dates. This solutionhas

12 - 1
Mr. Tom Murphy: 1998 CAP CommentsOctober 30, 1998Page 8
authority in § 110(a)(2)(D), but EPA has not embraced this duty with vigor. The District has aresponsibility to go beyond those emissions reductions necessary to demonstrate attainment in SantaBarbara County but also include additional emissions reductions to reduce the District's transport intoother regions. Having demonstrated extra efforts to address transported air pollution, the District will bein a more powerful position to demand that other upwind Districts undertake the same courtesy, or facelegal action to force these additional measures.
The 1998 CAP should contain a commitment to SBCAPCD participation in the planning, permitting andenforcement activities of upwind Districts, CARB and EPA, including activities through CAPCOA. Theobjective of that participation should be the reduction of emissions which may be transported into SantaBarbara County and strengthening of air pollution control programs throughout the state.
2. State Measures
CARB and the South Coast Air Quality Management District were recently found to have failed in theirobligations to adopt and implement various control strategies contained in the 1994 California StateImplementation Plan. See Coalition for Clean Air et al, v. South Coast Air Quality ManagementDistrict, United States District Court, Central District of California, CV 97-6916 HLH, Order onmotion for summary judgment, dated October 5, 1998. The Santa Barbara County 1994 and 1998 CleanAir Plans rely upon some of these control strategies to deliver emissions reductions necessary forattainment. The 1998 CAP emissions inventory must be modified to reflect the recently adjudicatedstatus of these portions of the SIP.
3. Emissions Profiles and growth factors
EDC is concerned that the CAP does not accurately predict and quantify the increases in emissionsassociated with increased population and economic activity that appears inevitable in the region. Sprawlis occurring, particularly in the north county, with a relatively larger amount of emissions than thatwhich are generated with more compact development patterns. While this may be addressed somewhatthrough more enlightened land use planning, the CAP should employ a realistic analysis which considersthe potential increases in emissions of air pollution. Additional margins of safety in emissions reductionsare one mechanism to address this issue, another is to increase the anticipated emissions and imposeadditional control strategies.
CARB reports that patterns of air polluting behavior are changing. Previously, weekday periodshad the highest emissions profiles, but that is changing to higher total amounts of emissions duringweekend recreational periods, particularly in areas with extensive internal combustion engine drivenrecreational opportunities such as Santa Barbara. The inventories and growth factors must use the mostaccurate and recent data.
The Minerals Management Service has prepared a study examining development scenarios in the tri-county area. The COOGER study, which involves Santa Barbara County representatives and reportedlyhas included APCD input, along with the prominent involvement of Western States PetroleumAssociation and the oil industry. The COOGER study predicts substantial amounts of new developmentin this industrial sector, a conclusion very different from that relied upon in the CAP and reflected in thegrowth factors. EDC believes that major changes in industrial growth patterns of this type will
12 - 2
necessitate subsequent CAP revisions. It is preferable that this growth be included in the CAPemissions inventory and control strategies developed to reduce the significance of these new activities,rather than having to attempt to obtain further controls in response to an oil company's developmentand production plans.

12 - 3
Mr. Tom Murphy: 1998 CAP CommentsOctober 30, 1998Page 9
4. State reclassification
The 1998 CAP must address all requirements for serious areas under the California Clean Air Act byoperation of Health and Safety Code § 40918(g). References to moderate areas are not applicable, theDistrict must meet serious requirements. See Health and Safety Code § 40919. These include NewSource Review modifications, transportation control measure commitments and revisions, and lowemission motor vehicle use by fleets. This should include, but is not limited to, food and other localdelivery fleets.
V. CONCLUSION
While the 1998 CAP represents a considerable amount of work and strives to address and resolvedifficult air quality issues, it falls short of the level of adequacy. APCD must amend this plan todemonstrate attainment through sufficient emissions reductions of sources of air pollution.
Chief CounselEnvironmental Defense Center
Cc: Lynne Terry, California Air Resources BoardMr. David Howekamp, Region IX EPAMr. Ken Bigos, Region IX EPA

12 - 4
EDC COMMENTS TO 1998 CAPAPPENDIX: CONTROL MEASURES
OCTOBER 30, 1998
Additional emissions reductions are appropriate to ensure attainment and sustain progress towardsmeeting all applicable standards. The District has a duty to implement all feasible control measures.EDC has the following comment on individual control measures:
I. PROPOSED STATIONARY SOURCE CONTROL MEASURES
1. Rule 333 revisions. This is not a contingency measure, but a feasible control measure. It shouldbe considered a measure for adoption and implementation. Other measures must be identified ascontingency measures.
Specific dates for the adoption and implementation of the rule revision must be identified in the CAP forthe commitment to be enforceable.
2. Unadopted Statewide Measures. CARB and EPA have delayed adoption and implementation ofseveral of the control measures contained in the 1994 SIP, including M9, M10, M11, M12, M13, M14,M15, M16. The 1998 CAP must identify all emissions reductions shortfalls from delayed adoption ofstatewide measures, identify an enforceable date for their adoption and implementation, and deduct anyinterim losses in emissions reductions previously anticipated (in 1994 and draft 1998 CAPS) in SantaBarbara County's reasonable further progress and attainment demonstrations.
3. Pesticide Measures. It is unclear why the CAP states that Santa Barbara may not opt intothe Pesticide State Implementation Plan emissions reductions. The San Joaquin Valley, a serious areawith a 1999 attainment date, takes credit for 1999 emissions reductions from the Pesticide StateImplementation Plan emissions reductions. While EDC has serious questions regarding the actualeffectiveness of DPR's performance under the Pesticide State Implementation Plan commitments, thesignificance of pesticide use in Santa Barbara County warrants consideration and inclusion inthe CAP.
II. FURTHER STUDY MEASURES
12 - 5
1. Each further study measure should include a definite schedule for commencement and completionof the further study. Otherwise, these potential control strategies languish until the next planning cycle.The process must be more aggressive and federally enforceable.
2. R-GN-2: Wineries and Breweries. Santa Barbara County is experiencing meteoric growth in thewinery population, with a significant increase in brewery numbers also likely to follow. Tens ofthousands of acres of land have been converted to wine grapes, and approximately a dozen newwineries have been approved or proposed in the District over the past 18 months. The CAP shouldreclassify this control measure and commit to an adoption schedule so that air pollution control
12 - 6
EDC Comments 1998 CAP Control MeasuresOctober 30, 1998Page 2
requirements can be included in site and process design, rather than added on as an afterthought. BACTis preferable to BARCT from a land use planning and air quality perspective.
3. R-GN-6: waste water treatment plants. This is a very common category of source, and one whose emissions areexpected to increase as the County's population increases. The feasibility of air pollution control technologies shouldbe well proven, and thus this should also be reclassified to an adoption measure rather than further study measure.
4. R-PG-2, R-PM-5. The CAP recites that these sources are "generally controlled" or "most arealready controlled". Additional specificity is necessary to delineate the benefits and costs associated withfurther controls to determine if adoption is appropriate. EDC has learned of a number of situationswhere venting occurs on a casual or periodic basis at various oil and gas plants in the District, eventhough the "general practice" is to route pigging venting or process maintenance gasses through vaporrecovery units. A rule may be appropriate to ensure general industrial conformity to appropriatepractices and ensure SIP enforceability of these limitations.
5. R-SC-1. The Plan must identify more precisely the changes in VOC profiles for the revised paintrule and demonstrate that cumulative emissions reductions will indeed be accomplished.
6. R-SL-2. Degreasing operations. This South Coast Air Quality Management District rule hasconsiderable potential to address and control Santa Barbara sources. A definitive andaggressive schedule for review, adoption and implementation should be included as a component of theCAP.
7. N-IC-7. Accelerate fleet turnover in 2 stroke engines. Compared to modern 4 stroke engines, 2stroke engines emit an astronomical quantity of ROC. Some jet skis are reported to emit up to 3 gallonsof unburned fuel per hour. This is an important source category for Santa Barbara County and must becontrolled.
8. N-IC-8 Airports. This control strategy should be elevated to an adoption measure in light of thesubstantial increase in airport activities throughout the County. The Santa Barbara airport is inthemidstofamajorexpansionandhasalargernumberofcarriersthanjust4yearsago. This trend should beexpected to increase. Each carrier may bring their own equipment, and without uniform standards,much higher polluting equipment may find its way to Santa Barbara. A similar trend can be expectedto some level at each of the other commercial airports in the District as well as at Vandenberg AirForce Base. Additionally, the mere increase in air traffic will cause additional air pollution emissions.Standards for low- or no-emission airport service vehicles should be adopted.
9. N-XC-12: Direct fired external combustion units. The District may expect a significant increase inthis category of source as growth and development increases in the region.
III. CONTROL STRATEGIES PROPOSED FOR DELETION
12 - 7
EDC Comments 1998 CAP Control MeasuresOctober 30, 1998Page 3
1. R-GN-7 Vacuum Producing Systems. It is unclear why this rule only applies to south countysources. Two new asphalt plants are proposed to construction in the north county and should beadequately controlled through SIP enforceable control measures, including in this aspect.
2. R-PG-3 Pipeline pigging. As noted infra, there are regularly reported releases from routinepigging operations, even though the practice is to route any process gasses through a vapor recoveryunit. This rule may still be necessary to address this deficiency through a federally enforceable rule.
3. R-PO-5 Glycol Regeneration - Vents. EDC objects to the lack of federal enforceability in thisform of emissions reduction. This emissions reduction (and several others similarly situated) can not befederally recognized as a State Implementation Plan emissions reduction unless a rule is adopted.
4. R-PM-4 pleasure craft refueling. This category of sources should be expected to grow in futureyears and this growth should be accompanied by uniformization of loading apparatus, allowing controls.The measure should not be deleted, but scheduled for further study measure status.
5. R-PP-3 Abandoned well vents. The County should have a mechanism for identifying these sources.Each is a potential hazardous waste site. The California Division of Oil and Gas is supposed to monitorthese sites and should have records. There are a number of collateral benefits from securely cappingthese wells which, if quantified, would lead to a positive benefit-cost analysis. Deletion is inappropriate,further study measure status is justified.
6. R-PP-4 Vacuum trucks. Vacuum trucks transfer significant quantities of fluids. Volatility mayincrease as fluids are heated while in the truck tank, and sloshing and physical agitation may increaseemissions potential. Crude oil is routinely transported in vacuum trucks in some locations. Themeasure should not be deleted but moved to further study measure or active adopt classification.
7. N-IC-5 exploratory drilling vessels. The New Source Review program does not generate emissionsreductions as required by the Clean Air Act and thus this source should be covered by a prohibitive rule.
8. N-XC-9 Solar water heaters. The Santa Barbara County Board of Supervisors amended the zoningordinance to eliminate the requirement of solar water heaters in new pools and spas. The rule must beadopted to gain this emissions reduction, or the emissions inventory must be modified. A rule ispreferred.
IV. PROPOSEID TRANSPORTATION CONTROL MFASURES
1. T-2 Transportation Demand management Program. This program should be expanded to includethe north county, considering the amount of residential growth in the north county and jobs in the southcounty and thus the amount of commuting. T-22 should be an accepted control strategy, not acontingency measure, with a schedule for adoption and implementation.
12 - 8
EDC Comments 1998 CAP Control MeasuresOctober 30, 1998Page 4
2. T-7 Traffic flow improvements. Studies have shown that expanding highway capacity can lead toincreased overall emissions since the improved traffic flow opens previously unavailable areas todevelopment and commuter residences. See generally letter from Judith Katz, Acting Director, AirProtection Division, EPA Region III, to Mr. Arthur Hill, Federal Highway Administrator, attachedhereto, referring to "the consensus of expert and legal opinion that expanded road capacity generateschanges in travel and land activities". The letter refers to a report and states "[n]umerous analysesdemonstrate that highway expansion is likely to increased vehicle trips and vehicle miles traveled, andconsequently vehicular emissions." The CAP must consider the vicarious effect of bottleneckelimination at inducing additional VMT.
3. T-10 Bicycling. The emissions reductions calculations should reflect the propensity for bicycle tripto replace short cars trips and thereby avoid cold start and hot soak emissions.
4. T- 13 Car retirement. CARB has not funded this control measure and any emissions reductionsare speculative. A replacement control strategy should be identified.
5. T- 17 Telecommunications. This program should be expanded to allow other County departmentsand the public to use when not in use by the Probation and Public Defender's office. Substantialadditional emissions reductions are available from an expanded program. Emissions reduction creditshould be taken from the use of this system before the Board of Supervisors, APCD, Santa BarbaraCounty Association of Governments and Planning Commission.
6. T-14 Activity Centers - indirect source review. This program must be better defined anddelineated. It is a mandatory control strategy to reduce the air pollution impacts from the explosivegrowth being experienced in Santa Barbara County, in particular in the north county, wheredistances are greater and the urban core is dissipated by sprawl. This measure should be expanded-to include T-11, special events. The VMT associated with special events could be easily mitigated.
V. CONTINGENCY MEASURE
1. T-21 Enhanced Inspection and Maintenance is a contingency measure in the 1994 CAP that wasnot properly implemented. Legislative changes should be described and the forgone emissionsreductions potential quantified as best possible. The control strategy should be redesigned to a measurefor adoption on a set schedule. Substitute contingency measures must be identified. All contingencymeasures must identify the mechanism for their adoption and implementation, including an enforceableschedule.
2. T-22 Trip Reduction Programs. This contingency measure must include the mechanism forautomatic adoption and implementation per EPA guidance, including an enforceable schedule. (SeeGeneral preamble.)
12 - 9
October 30, 1998
Ms. Vijaya JammalamadakaSanta Barbara County Air Pollution Control District26 Castilian Drive, Suite B-23Goleta, California 93117
RE: Comments to ND on Draft 1998 Clean Air Plan
Dear Ms. Jammalamadaka:
Please accept these comments from the Environmental Defense Center (EDC), a public interest law firmactive in air quality and other environmental and public health issues in the tri-county region.
EDC acknowledges and applauds the substantial amount of effort involved in creating this plan. Webelieve that the plan itself falls short of the emissions reductions necessary to provide for attainment ofthe national ambient air quality standard, and thus involves a significant environmental impact from thecontinued exposure of members of the public to levels of air pollution in excess of the health-basedambient air quality standard. This is a significant impact.
Similarly, the CAP fails to demonstrate attainment of the state ozone AAQS. This is a significantimpact.
Additionally, the ND fails to describe the two identified rules which are expected to involve al leastpartial relaxation of existing standards, specifically the paint rule and the internal combustion enginerule revision.
Revisions to the paint rule are expected to possibly strengthen the status quo but relax the currentAPCD rule contained in the 1994 CAP, at least in some respects. While the CAP summarily concludesthat there will be net emissions reductions equivalency, that conclusion is not substantiated orquantified. Thus, the skeptical member of the public or decisionmaker cannot understand the logicalpathway proposed by the CEQA environmental review document. This information must be explained ingreater detail. If this analysis involves speculation or details are not yet resolved, the District shouldemploy a worst case analysis to describe potential adverse impacts.

12 - 10
Revisions to rule 333 involve increases in Nox as a trade-off for ROC emissions reductions. Again,these trade-offs must be quantified and analyzed as a potentially significant impact.
906 GARDEN ST, SANTA BARBARA, CA 93101-(805) 963-1622 FAX: (805) 962-3152 E-MAIL: [email protected] E. MAIN ST, VENTURA, CA 93001 - (805) 643-6147 FAX: (805) 643-6148 E-MAIL: [email protected]
12 - 11
Chief CounselEnvironmental Defense Center
12 - 12
UNITED STATES ENVIRONMENTAL PROTECTION AGENCYREGION III
841 Chestnut BuildingPhiladelphia, Pennsylvania 19107-4431
Mr. Arthur Hill, Divisional AdministratorFederal Highway AdministrationDistrict of Columbia Division820 First Street, N.E.Washington, CA 20002
Dear Mr. Hill:
The Environmental Protection Agency (EPA) Region III has reviewed the ConformityDocumentation for the Washington region entitled “AIR QUALITY CONFOMITYDETERMINATION OF THE CONSTRAINED LONG RANGE AND THE FY98-2003TRANSPORATION IMPROVEMENT PROGRAM (TIP) FOR THE WASHINGTONMETROPOLITAN REGION.” The results of this review are detailed in Enclosure #1.
The conformity determination was reviewed in accordance with the procedures and criteria forreview in accordance with the following sections of the Conformity rule: 40 CFR Part 93, Sections93.110, 93.111, 93.112, 93.113 (b), 93.11. (c).
The EPA has the following comments on this Conformity analysis:
1. The Mass Marketing Campaign does have commitments from the MarylandDepartment of Transportation (MDOT), the Virginia Department ofTransportation (VDOT), and the District of Columbia to support the program:however, it is uncertain who is ultimately responsible for its implementation. Inaddition, it does not indicate when the program will be evaluated to verify itsclaims for emissions reductions. This appears to be the case with the otherprojects: Employer Outreach, Guaranteed Ride Home, and the TeleworkResearch Center.
2. The MDOT memorandum dated May 1, 1997, lists delayed CongestionMitigation Air Quality (CMAQ) projects. It is uncertain if these delays have beenprogrammed into this plan and TIP.
3. There is some uncertainty that the emissions reductions claimed for the ShadyGrove West Park and Ride, and the White Oak Park and Ride projects are

12 - 13
claimed for the same time frame as the implementation of these projects.
Customer Service Hotline: 1-800-438-2474
12 - 14
This office has the following general comments regarding future Conformity Determinations:
1. The EPA feels that the recent ruling of the US District Court in Illinois on January 16, 1997.Illustrates the fact that a single set of socioeconomic/land use forecasts used by mostagencies when they are doing a build/no build analysis appears to be inadequate becauseit fails to take into account the consensus of expert and legal opinion that expanded roadcapacity generates changes in travel and land activities. The Illinois district court ruledthe Illinois Department of Transportation (DOT) would need to develop a separate set ofsocioeconomic/land use forecasts based on what would likely occur with vs. withoutconstruction of the proposed extension of the North-South Tollway (Interstate 355)through Will County, Illinois. A portion of the court’s opinion states that “… the studyrelies on only ozone production. As a result, the study does not accurately depict thetrue ozone-producing effect construction of the tollroad would have…”
2. The 1995 TRB Special Report (SR) 245 on “Expanding Metropolitan Highways: Implications for Air Quality and Energy Use”, provides ample evidence of induced traveland land use effects. Numerous analyses demonstrate that highway expansion is likely toincrease vehicle trips (VT) and vehicle miles traveled (VMT), and consequently,vehicular emissions. Robert Johnston and Raju Ceerla (“The Effects of New High-Occupancy Vehicle Lanes on Travel and Emissions,” Transportation Research A. Vol.30, No. 1, 1996, attached), concluded that in California metropolitan areas, 60 to 90percent of increased road capacity is filled with new traffic within 5 years. Therefore, ifa three-lane freeway is expanded to four lanes, the 33 percent increase in capacityattracts a 20 percent to 30 percent increase in traffic.
3. Mark Hansen (“Do New Highways Generate Traffic?,” Access, UC Berkeley, Fall 1995,attached), concluded that at the metropolitan level, 90 percent of increased road capacityis filled with new traffic within four years. Mark Hansen and Yuanlin Huang (“RoadSupply and Traffic in California Urban Areas,” Transportation Research A. Vol. 31, No.3, 1997, attached), found the same 90 percent of increased road capacity is filled withnew traffic at the metropolitan level. Todd Litman (“Determining Generated TrafficExternal Costs,” Victoria Transport Policy Institute, March 1997), summarized theresults of these and many other studies.
4. The transportation Conformity rule, Section 93, Subsection 93.110, “Criteria andProcedures: Latest Planning Assumption” states that the conformity determination mustbe based upon the most recent planning assumptions in force at the time of theconformity determination. The conformity determination must satisfy the requirementsof paragraphs (b) through (f) of this section which include assumptions that must bederived from the most recent estimates of current and

12 - 15
Future population, employment, travel, and congestion. In addition, these key assumptions must be specified andincluded in the draft documents for documents and supporting materials used for the interagency and public consultationrequired by Sec. 93.105.
In summary, based on the requirements of the Transportation Conformity rule and the above mentioned studies,EPA Region III considers the effects of capacity expansion discussed above significant in terms of how it affectsprojected VMT. In the future, the agencies responsible for carrying out the regional analysis for conformity shouldinclude the effects of induced travel demand future TIPs and regional plans.
Please feel free to call Paul Wentworth at (215) 566-2183 to discuss any aspects of the review.
Sincerely,
Judith M. Katz, Acting DirectorAir Protection Division
Enclosures
Cc: Mr. Al Lebeau (FTA Region 3)Mr. Howard Simons (MDOT)Ms. Sandra Jackson (FHWA, D.C.)Ms. Dianne Franks (MDE)
12 - 16
APCD RESPONSE TO PUBLIC COMMENTS
ENVIRONMENTAL DEFENSE CENTER
Marc Chytilo
• Comments on the Draft 1998 Clean Air Plan
1. Comment: Page 1: Plan Approval
Response: This 1998 Clean Air Plan (1998 CAP) has received extensive input from our
Community Advisory Council (CAC) and addresses the specific requirements of
Section 182(c) for serious nonattainment areas. In addition, the Plan complies
with the California Clean Air Act requirements for attaining the state ozone
standard that is more protective of public health. The Plan identifies every
feasible measure that can be implemented in the county within the timelines
imposed by both state and federal requirements. While there are many
uncertainties in the methodologies outlined in the Plan, they represent our best
estimates available and they comply with state and federal guidelines.
2. Comment: Page 2: I: Legal Sufficiency Issues
Section: 1. Inadequate Margin of Safety for Attainment Demonstration
Response: The attainment demonstration is provided in Chapter 7. Photochemical modeling
performed for this Plan provides a “weight of evidence” demonstration that the
strategy proposed in this Plan will provide attainment by the statutory date of
1999. Further, the APCD continues to develop and implement additional
measures to continue to reduce emissions toward achieving both the new federal
8-hour standard and the existing 1-hour state ozone standard. APCD staff
believe that this Plan provides for expeditious attainment of the federal 1-hour
ozone standard.

12 - 17
3. Comment: Pages 2 and 3 I: Legal Sufficiency Issues
Section 2. The Monitoring Network is Inadequate: (1st and 2nd Paragraphs)
Response: The enhanced monitoring referred to in § 182(c)(1) is the Photochemical
Assessment Monitoring Station program the APCD is in the process of
developing. The USEPA has scheduled us to begin monitoring July 1, 1999 in
accordance with the statewide California Alternative Program recommended by
the ARB and approved by the USEPA. The only mention of SLAMS in the
PAMS Implementation Manual relates to collecting PAMS data in accordance
with SLAMS/NAMS requirements and the fact that a PAMS site maybe located
within a SLAMS station if it is appropriately located to meet the PAMS site
objective.
The APCD submitted a SLAMS/PSD Network Review to the USEPA as
required in 40 CFR § 58.20(d) in January of 1994. The review, network, and
quality assurance procedures have been used by the USEPA as examples for
other agencies to follow. In July of this year, the APCD submitted an update to
our 1994 Network Review due to a number of station closures and mothballing.
We are currently awaiting the USEPA’s comments. The review and update
include the monitoring being performed at the elevated Las Flores Canyon (LFC)
Site 1. The Riviera monitoring study conducted during the 1997 ozone season,
in concert with the SCOS, showed that LFC Site 1 had comparable and/or
slightly higher ozone readings than the Riviera monitor. Based on that study, the
APCD’s conclusion was that the LFC Site 1 data could be used in lieu of
simultaneously collecting ozone data at an elevated Riviera site. However,
should the LFC Site 1 be closed, the APCD would need to site another elevated
ozone monitoring station to address that SLAMS monitoring objective.
4. Comment: Page 3 I: Legal Sufficiency Issues
Section 2. PAMS Monitoring Network: (3rd and 4th Paragraphs)

12 - 18
Response: The APCD is in agreement with EDC’s statement that the PAMS
program is particularly important to the APCD and is in the process of developing a program that
addresses our PAMS monitoring mandate. The APCD has already been
collecting upper air radar wind profiler data at the Santa Barbara Airport since
July 1, 1998, as part of the PAMS program.
The PAMS implementation timeline calls for completing a review of existing
VOC, ambient air, meteorological, and emissions inventory data by the end of
January 1999 to determine site location. We will also be reviewing several
sampling methodologies to determine an appropriate monitoring scheme. A
PAMS network plan will be prepared and equipment purchased by the end of
March 1999 with monitoring commencing on July 1, 1999. The APCD intends
to keep the Community Advisory Council regularly apprised of our progress in
order to allow input to the PAMS implementation process.
5. Comment: Page 3: I: Legal Sufficiency Issues
Section 3. New Source Review Rule Adequacy: (1st Paragraph)
Response: Pursuant to §42301.13 of the California Health and Safety Code, the APCD may
not require offsets through the New Source Review permitting process or
otherwise for emissions resulting from any activity related to, or involved in, the
demolition or removal of a stationary source. Notwithstanding this requirement,
equipment used in demolition activities may require permits and emission
controls. Also, nothing in this law prohibits other agencies from requiring offsets
to mitigate environmental impacts identified through the CEQA process. Finally,
offsets may be required under the provisions of federally enforceable New Source
Review rules. The inconsistency between state and federal law makes it difficult
to determine with certainty whether or not offsets would be required.
The APCD’s NSR rule was revised extensively in 1997 during an extensive
public participation process, which involved the CAC. The environmental
documentation for this revision concluded the revisions did not constitute a rule
12 - 19
relaxation and in some cases, required stricter controls.
6. Comment: Page 3: I: Legal Sufficiency Issues
Section 3. New Source Review Rule Offset Ratios: (2nd Paragraph)
Response: As generally applied, the offset ratios in the APCD New Source Review rule are
the most stringent in the State. We allow an offset ratio of 1.2:1, (which is less
stringent than Ventura County APCD’s offset ration of 1.3:1), if the offset
providing source is within 7.5 miles of the source requiring offsets. However, all
other emissions subject to the offset provisions of NSR must be offset at a ratio
of at least 1.5:1. Offsets traded between areas located on opposite sides of the
Santa Ynez Mountains are applied at a ratio of 6:1.
7. Comment: Page 4: II: Inventory Issues
Section 1. Adequacy of Emissions Inventory: (1st and 2nd Paragraphs)
Response: The on-road mobile source portion of the inventory was prepared using the most
recently ARB/USEPA approved emissions model (MVEI 7G) as well as updated
transportation activity data and vehicle speed profiles (i.e., VMT by speed class
distributions) from SBCAG’s travel demand model. In addition, Santa Barbara
County specific light-duty auto and truck model year age distribution data from
the DMV were included to improve the accuracy of the emission estimates.
8. Comment: Page 4: II: Inventory Issues
Section 1: Adequacy of Emissions Inventory: (3rd Paragraph)
Response: The 1998 CAP emissions inventory satisfies state and federal emission inventory
requirements. Additionally, SBCAG’s regional growth forecasts that form the
basis for the area and on-road mobile source portions of the inventory are
annually tracked. As of 1997/98, the population and employment projections are
tracking extremely well on a countywide basis. The growth implications from
12 - 20
recent changes to local jurisdiction general plans although not reflected in the current growth forecast,
should not have an impact until after 1999 given the lag between permitting and project completion.
SBCAG will incorporate all the recent growth policy changes countywide when
it updates its growth forecast in 1999 which will be incorporated in future SIP
updates (i.e., 2003).
9. Comment: Page 4: II: Inventory Issues
Section 2. Pesticide State Implementation Plan emissions inventory issues
Response: The pesticides portion of the inventory was provided by the Department of
Pesticide Regulation. The reactivity emissions of the pesticides are consistent
with the profiles provided by ARB.
10. Comment: Page 4: II: Inventory Issues
Section 3. Kelp Cutting ships: emissions inventory category
Response: Emissions from kelp cutting vessels are not specifically accounted for in the
inventory. Due to the periodic nature of this activity, it may not be feasible to
accurately estimate future emissions from these vessels. However, the APCD
will request ARB to look into these emissions.
11. Comment: Page 4: II: Inventory Issues
Section 4. Biogenic emissions: (Biogenics as Ozone Sinks - 1st paragraph )
Response: EDC is correct in asserting that biogenics can act as ozone precursors sinks.
However, there is no accepted methodology to accurately account for this effect.
12. Comment: Pages 4 and 5 II: Inventory Issues
Section 4. Biogenic emissions: (Inventory - 2nd paragraph )

12 - 21
Response: The biogenics inventory was develop using a biogenic emission inventory system
(BEIS) with county specific data. These estimates reflect the most recently accepted estimation
methodology, but are subject to a high degree of uncertainty. However,
discussions with Ventura APCD staff indicate that their most recent estimate of
biogenic emissions for Ventura County is 21,400 tons which relates much more
closely to our estimate. It is also possible that new emission estimates will result
from the Southern California Ozone Study (SCOS). When and if new emission
estimates are available, they will be included in future Plan updates.
13. Comment: Page 5: II: Inventory Issues
Section 5. On-Road mobile source emissions inventory: (1st – 3rd sentences)
Response: See Response to Comment #7
14. Comment: Page 5: II: Inventory Issues
Section 5. On-Road mobile source emissions inventory: (4th sentence)
Response: A more detailed description of the methodological and data enhancements used
by SBCAG to improve the accuracy of the on-road mobile source inventory will
be incorporated into Appendix C. The past underestimation of motor vehicle
emissions has long been suspected as a reason for the attainment problems for
many areas statewide. The continued refinement of this very important aspect of
the county’s planning inventory will remain an on-going priority of the
APCD/SBCAG and ARB. Clearly, the more accurate the planning inventory is,
the more effective the planning process will be in developing a comprehensive
control strategy which best addresses the air quality problem.
15. Comment: Page 5: III: Control Measure Issues
Section 1. Offshore Seep Tents: (Control of Seep Emissions)
Response: The knowledge of emissions from offshore seeps is inadequate for the

12 - 22
development of strategies to control that source of air pollution emissions. The emissions from the
seeps vary widely, both spatially and temporally. Furthermore, there are no scientific studies published
that quantify the emissions from seeps with any amount of certainty. Finally,
once seep emissions are captured, they must be transported onshore and there
processed, (e.g., sulfur removal, de-hydration, CO2 removal, compression,
odorizing, and metering). The siting and design of any such processing facility
presents another host of air quality and land use issues. Considering the above
noted limitations in our knowledge of seep generated air pollution emission, it is
not recommended that control strategy development be attempted.
16. Comment: Page 5: III: Control Measure Issues
Section 2: Expedited Internal Combustion Engine Controls
(Rule 333 enhancement and strengthening)
Response: Indeed, the proposed revisions to Rule 333 (Control of Emission from
Reciprocating Internal Combustion Engines) represent a control strategy that is
both feasible and cost effective. However, implementation this rule cannot occur
by 1999 and therefore cannot be relied upon as a control strategy for attainment
of the federal standard by 1999. The currently rule development schedule for
Rule 333 calls for adoption of this control measure in April of 1999 and
implementation phased over a two-year period, delivering the emission
reductions by the spring of 2001.
17. Comment: Pages 5 and 6: III: Control Measure Issues
Section 3: Indirect Source Review Should Be Included
Response: Chapter 8 addresses the potential development of an indirect source review rule.
18. Comment: Page 6: III: Control Measure Issues
Section 4: Land Use-Air Quality Issues
12 - 23
Response: Refer to Chapter 8. Additionally, the APCD provides County and city planning
staff training on ARB’s land use-transportation program URBEMIS as well as mitigation measures
which can be implemented during the planning and CEQA process. Also, as part
of the development of the 1998 CAP, the APCD’s Community Advisory
Committee recommended that the APCD board direct the CAC to develop
specific policies to address land use and air quality.
19. Comment: Page 6: III: Control Measure Issues
Section 5: Enhanced CEQA Guidance and Construction Emissions Controls: (1st
paragraph)
Response: Refer to Chapter 8 for information about the potential development of a
voluntary emission reduction program. The APCD’s CEQA Guidelines,
including significant thresholds for construction and operation phase emissions
are scheduled to be revised in 1999. The CAC CEQA Subcommittee will be
intimately involved in this process.
20. Comment: Page 6: III: Control Measure Issues
Section 5: Enhanced CEQA Guidance and Construction Emissions Controls:
(Threshold of Significance - 2nd paragraph)
Response: See response to Comment #19.
21. Comment: Page 6: III: Control Measure Issues
Section 5: Enhanced CEQA Guidance and Construction Emissions Controls: (
CEQA Consistency - 3rd paragraph)
Response: See Response to Comment #8.
22. Comment: Pages 6 and 7: III: Control Measure Issues
Section 6: Contingency Measures: (1st and 2nd paragraphs)
12 - 24
Response: During the development of any air quality plan, we look at the entire realm of
control strategies necessary to comply with the statutory requirements. For this
1998 CAP, we assessed the feasibility of implementing Enhanced I/M for Santa
Barbara County and found that it had just recently been implemented in the more
polluted portions of California (July 1998) after much delay and legislative
changes. Because of these factors, there are no program specific data available
to address the cost effectiveness associated with implementing this program in
Santa Barbara County. Therefore this measure has been retained as a
contingency measure until these data are available.
23. Comment: Page 7: III: Control Measure Issues
Section 6: Contingency Measures:
(IC Engine Rule as a Contingency Measure - 3rd paragraph)
Response: Staff agree that a revision to our Internal Combustion Engine rule is feasible and
necessary to attain the state 1-hour ozone standard. A draft Rule 333 staff report
will be released for public comment at the end of November 1998. After
adoption in April 1999, Rule 333 will include a 2-year implementation schedule.
While the APCD is clearly pursuing a revision to this rule, the timing of the
emission reductions (post 1999) do not allow us to take credit for the serious
area attainment requirements.
24. Comment: Page 7: III: Control Measure Issues
Section 6: Transportation control measures (TCM obligations)
Response: The TCMs identified in the 1998 CAP summarizes all the current projects and
programs that can be credited towards the serious area requirements. Delays in
the reauthorization of TEA-21 at the federal level combined with the short
planning horizon of the plan (i.e., 1996 to 1999) inhibited our ability to solicit

12 - 25
and fund new transportation programs. APCD staff will continue to work with SBCAG during the
development of the 1999 FTIP process to identify new TCM projects.
25. Comment: Page 7: III: Control Measure Issues
Section 7: Eliminate Exemptions (NSR Exemptions)
Response: The impacts of the exemptions were examined when the APCD’s NSR rule wasrevised in 1997.
26. Comment: Page 7: IV: Other Issues
Section 1: Transport Issues (Pollution Transport - 1st paragraph)
Response: Chapter 7 does reflect the draft EPA policy (Dick Wilson EPA memo 7/16/98)
that allows for the extension of the attainment dates if there is a clear impact
from pollution transported outside an area’s jurisdiction. However, the language
clearly says that we may ask EPA to consider the impacts of transport but we do
not ask that they take any action at this point. This language was specifically
identified in a motion approved by our CAC and was included in Chapter 7
verbatim.
27. Comment: Pages 7 and 8: IV: Other Issues
Section 1: Transport Issues: (2nd paragraph)
Response: Pursuant to the California Clean Air Act, Santa Barbara County must implement
all feasible measures to address the state 1-hour ozone standard. This 1998 CAP
represents our assessment and scheduling of every feasible measure to implement
to attain and maintain all applicable state and federal standards.
28. Comment: Page 8: IV: Other Issues
Section 1: Transport Issues: (Air Quality Coordination - 3rd paragraph)
Response: Staff agree with EDC’s assertion that we should participate in the planning,
12 - 26
permitting and enforcement activities of upwind and downwind districts and are indeed actively
involved in these activities. Currently our Planning and Technology Supervisor is the Chair of the
CAPCOA Planning Managers Committee. Our General Source Division Manager
is the Chair of the CAPCOA Engineering Managers Committee. And, our APCO
will be the President of CAPCOA for 1999. In addition, APCD staff participate
in several CAPCOA committees including, enforcement, vapor recovery, public
outreach, fiscal, attorney, and legislature. Clearly APCD staff are active locally
and statewide on a range of clean air issues.
29. Comment: Page 8: IV: Other Issues
Section 2: State Measures (1994 California SIP Measures)
Response: Staff are aware of the changing nature of the 1994 SIP measures. In this 1998
CAP we are using the most current control factors reflecting the status of the
1994 SIP measures.
30. Comment: Page 8: IV: Other Issues
Section 3. Emissions Profiles and growth factors:
(Growth Forecast - 1st paragraph)
Response: The 1998 CAP relies upon the 1994 Regional Growth forecast developed by
SBCAG. While SBCAG is currently in the process of updating their growth
forecast, an analysis of the 1994 RGF indicates that the near term growth
assumptions, (i.e., 1999), are reasonable. The revision being developed by
SBCAG will be used in future CAP updates.
31. Comment: Page 8: IV: Other Issues
Section 3: Emissions Profiles and growth factors:
(Changing Pollution Characteristics - 2nd paragraph)
Response: Staff acknowledges the variability of emission profiles from weekdays to
12 - 27
weekends. Our inventories are based on an average summer weekday as per USEPA and ARB
guidance.
32. Comment: Page 8: IV: Other Issues
Section 3: Emissions Profiles and growth factors:
(COOGER Study - 3rd paragraph)
Response: The COOGER study deals with several development scenarios and the onshore
constraints for those scenarios. To our understanding, the COOGER study does
not specifically forecast growth in onshore oil and gas processing. The 1998
CAP does not assume any growth or decline in offshore oil and gas related
emission for 1999 and 2005 since there are no current land use applications filed
with the County.
33. Comment: Page 9: IV: Other Issues
Section 4: State Reclassification
Response: Pursuant to HSC Section 40918(b) the State Board must take an action to
reclassify Santa Barbara County as a serious nonattainment are for the state
standard. Since the ARB has taken no such action, Santa Barbara County
remains classified as moderate nonattainment area for the state ozone standard
subject to the requirements of HSC Section 40918 (Moderate Area).
• Comments on Appendix B: Stationary Source Control Measure Working Papers
34. Comment: I: Proposed Stationary Source Control Measures
1. Rule 333 revisions: Stationary Internal Combustion Engines
Response: Due to the timing of the adoption and implementation of Rule 333 (post-1999), it
must be identified as a contingency measure for the purposes of this 1998 Clean Air
Plan. The Plan identifies April 1999 as the adoption date with implementation in
2001.
12 - 28
35. Comment: I: Proposed Stationary Source Control Measures
2. Unadopted Statewide Measures
Response: Staff are aware in the delay of some statewide measures and will only be taking credit
for those measures which will be implemented by the milestone dates (i.e., 1999,
2005). The ARB has provided us the most recent control factors for these measures
and has indicated which measures we cannot take any SIP credit for in this 1998
CAP.
36. Comment: I: Proposed Stationary Source Control Measures
3. Pesticide Measures
Response: We have been advised not to opt into the state pesticide implementation plan by the
ARB. The methods used as part of this measure will most likely benefit Santa
Barbara County but they are difficult to quantify and therefore are not credited in this
1998 CAP.
37. Comment: II: Further Study Measures
1. General comment
Response: Further study measures are evaluated on an annual basis when allocating assignments
to various rules staff. Multiple rules priorities make it difficult to identify when a
“further study” measure will be specifically addressed.
38. Comment: II: Further Study Measures
2. R-GN-2: Wineries and Breweries
Response: The APCD is studying the feasibility of promulgating a rule to regulate the
emissions from wineries and breweries. In order for such a control measure to be

12 - 29
practical, it would have to achieve significant emission reductions relative to the planning emission
inventory. Regardless of its relative effectiveness, any control measure developed for wineries could
not be implemented in the time frame required for this plan. Wineries and
breweries are not categorically exempt from the provisions of the APCD New
Source Review Rules. However, a winery or brewery may qualify for an
exemption from permit under the provisions of a general exemption for sources
that emit one ton or less of any affected pollutant. Any new or modified facility
that would have the potential to emit 25 lbs. per day of any non-attainment
pollutant would be required to install the Best Available Control Technology
(BACT) level of air pollution control. Likewise, should a new or modified
winery or brewery have a potential to emit of 10 tons or more per year of any
non-attainment pollutant, such a facility would be require to provide mitigating
emission offsets.
It is unlikely that any Further Study Measure could be implemented on a schedule
sufficient to be counted on for attainment in 1999. All the further study measures
will be considered for future rule development actions.
39. Comment: II: Further Study Measures
3. R-GN-6: Waste water treatment facilities
Response: Staff are still evaluating the feasibility of implementing this measure.
40. Comment: II: Further Study Measures
4. R-PG-2: Process Turnarounds, R-PM-5: Glycol Regeneration Vents
Response: Staff are still evaluating the feasibility of implementing this measure.
41. Comment: II: Further Study Measures
5. R-SC-1: Architectural Coatings
12 - 30
Response: Staff are working with the ARB to determine the most appropriate emission limits
for this measures.
42. Comment: II: Further Study Measures
6. R-SL-2: Degreasing Operations
Response: The are many implementation issues associated with this measure. As the South
Coast AQMD will be implementing this measure starting January, 1999, staff will be
addressing the effectiveness of low-ROG solvents (aqueous systems) as the rule is
implemented. Further, our Innovative Technology Group is coordinating with the
Institute for Research and Technical Assistance on the evaluation of aqueous systems
at a test site in Santa Barbara County. The results of this work will be used to
evaluated the feasibility of these systems in the county.
43. Comment: II: Further Study Measures
7. N-IC-7: Lawn and Garden Equipment
Response: Jet Skis are not lawn and garden equipment. The ARB and the USEPA already have
proposed measures to control lawn and garden equipment which are most effectively
controlled at the state and federal level. However, staff will continue to evaluate the
merits of establishing a buy-back program for this equipment.
44. Comment: II: Further Study Measures
8. N-IC-8: Airport Ground Support Equipment
Response: The emissions from airport ground support equipment in Santa Barbara County are
generally small. However, staff from the Innovative Technology Group are working
with Southern California Edison to evaluate electrifying equipment where possible.
Rules staff will continue to work with ARB and the USEPA on the implementation of
emission control measure M15, which will include strategies for controlling this
12 - 31
equipment.
45. Comment: II: Further Study Measures
9. N-XC-12: Direct Fired External Combustion Units
Response: Staff are evaluating this measure from adoption and implementation.
46. Comment: III: Control Strategies Proposed for Deletion
1. R-GN-7: Vacuum Producing Systems
Response: Staff believe the emissions that would be subject to this rule would be quite small and
recommend this measure for deletion. It must be noted that if information or new
technologies become available that make any deleted measure feasible and cost-
effective, staff will consider changing the classification and status of the measure as
appropriate.
47. Comment: III: Control Strategies Proposed for Deletion
2. R-PG-3: Pipeline Pigging
Response: There would be few emissions subject to this rule and it has been recommended for
deletion.
48. Comment: III: Control Strategies Proposed for Deletion
3. R-PG-5: Glycol Regeneration Vents
Response: The emissions from these sources are already controlled with vapor recovery as part
of AB2588.
49. Comment: III: Control Strategies Proposed for Deletion
4. R-PM-4: Pleasure Craft Fuel Transfer
12 - 32
Response: This measure has many obstacles with implementation combined with relatively
small emissions. Staff recommends that this measure be deleted.
50. Comment: III: Control Strategies Proposed for Deletion
5. R-PP-3: Abandoned Well Vents
Response: If a mechanism for identifying and quantifying these emissions is established, staff
will re-evaluated the cost-effectiveness of this measure.
51. Comment: III: Control Strategies Proposed for Deletion
6. R-PP-4: Petroleum Vacuum Trucks
Response: Staff anticipate that the emissions associated with this control measure are small due
to low vapor pressures and recommend this measure for deletion.
52. Comment: III: Control Strategies Proposed for Deletion
7. N-IC-5: Exploratory Drilling Vessels
Response: Emissions from exploratory drilling vessels in excess of 25 tons per year are subject
to BACT and offsets under the APCD’s NSR rule. Exploratory drilling vessels with
emissions less than 25 tons per year are exempt.
53. Comment: III: Control Strategies Proposed for Deletion
8. N-XC-9: Solar Water Heaters
Response: Staff will evaluate the potential emissions from this source and consider future
actions.

12 - 33
• Comments on Appendix C: Transportation Control Measures and On-Road Mobile Source
Emissions Analysis
54. Comment: IV: Proposed Transportation Control Measures
1. T-2: Employer-Based Transportation Demand Management Program
Response: SBCAG’s Traffic Solutions Division which implements the county rideshare
program and the City/County TDM Program provides outreach service to
employers in North County. Traffic Solutions also provides assistance to North
County jurisdictions and transit agencies upon request. As part of the annual
TDM survey, several North County employers participated in 1998 for the first
time. These activities were not credited towards the plan. However, as greater
participation from North County employers occurs and more survey information
is analyzed, SBCAG will consider quantifying these benefits.
55. Comment: IV: Proposed Transportation Control Measures
2. T-7: Traffic Flow Improvement
Response: The APCD and SBCAG continue to review the literature and analyze existing
local data that may provide some insights on this topic. The current literature
generally indicates that new highway facilities, which open up previously
unavailable areas to development, can in some cases, spur additional travel
demand and development. However, the literature is less conclusive about the
induced impact of expanding existing highway facilities within already developed
areas. Nonetheless, given that T-7 addresses “spot” intersection improvements
and signal coordination improvements as opposed to adding new highway
capacity, the transferability of these studies to T-7 types of improvements is
questionable given issues of scale and the magnitude of the travel time savings
involved. In general, beneficial traffic flow improvements are those, which
moderate speeds between 25 and 40 mph while reducing hard acceleration events
which cause a vehicle to emit disproportionately greater emissions.

12 - 34
56. Comment: IV: Proposed Transportation Control Measures
3. T-10: Bicycle/Pedestrian
Response: The emission reduction calculations do reflect both vehicle trip reductions as well
as VMT reductions. See Appendix C under T-10.
57. Comment: IV: Proposed Transportation Control Measures
4. T-13: Accelerated Retirement of Vehicles
Response: This measure is being funded by the APCD. The state is endeavoring to
implement a vehicle buyback program for the South Coast Air Basin.
58. Comment: IV: Proposed Transportation Control Measures
5. T-17: Telecommunication
Response: The monthly meetings of the APCD and SBCAG board are too few (12 days a
year) and public participation too sporadic to take SIP credit. The potential for
additional departments and the public to share the telecommunication equipment
needs to be brought to the attention of County officials.
59. Comment: IV: Proposed Transportation Control Measures
6. T-14: Activity Centers
Response: T-14 Activity Centers and T-11 Special Events are both measures that are
proposed for further study. At this time, the APCD’s Community Advisory
Council is awaiting direction from the APCD board to investigate and develop
policies or programs related to indirect source review. A cost-benefit analysis
was performed in 1996/97 for T-11, which entailed transit service to festivals at
Oak Park within the City of Santa Barbara. This service was determined not to
be cost-effective in terms of cost per ton of emissions reduced. Other
12 - 35
opportunities or applications to implement T-11, in some form, will continue to be evaluated. For a
general description of these measures, the reader is referred to the 1994 CAP – Appendix C.
60. Comment: V: Contingency Measure
1. T-21: Enhanced Inspection and Maintenance (I & M) Program
Response: The legislative changes to the I/M bill will be described in greater detail in
Chapter 5. APCD/SBCAG have requested ARB to quantify the impact of these
program changes for Santa Barbara County. The mechanism by which an
Enhanced I/M program is to be implemented in Santa Barbara County is by a
formal request from the APCD board to the Bureau of Automotive Repair
(BAR). BAR is the implementing agency for this measure.
61. Comment: V: Contingency Measure
2. T-22: Countywide Implementation of Tier III TDM Program
Response: Pursuant to the 1990 Federal Clean Air Act, T-22 is required for nonattainment
areas designated as “severe” or “extreme. Given that state law prohibits public
agencies from imposing employer-based trip reduction programs, the county
would need to be reclassified as a “severe” nonattainment area to legally impose
such a program. This measure is therefore appropriately included as a
contingency measure. SBCAG continues to encourage North County
participation in its City/County TDM program as in our response to Comment
#54.
The mechanism to implement this measure is already in place. Over 70 percent
of the county’s largest employers are already participating in the City/County
TDM Program implemented by Traffic Solutions. Those employers with over
100 employees who currently are not participating in the program will be brought
into the program if EPA reclassifies Santa Barbara County to “severe”.
Pursuant to federal law, employers can choose not to implement a trip reduction

12 - 36
program if they can achieve emission reductions through other means (e.g., funding alternative fuel
conversions, old car buyback programs etc.) equivalent or greater than would be expected from a trip
reduction program.
• Comments on the Initial Study/Mitigated Negative Declaration
1. Comment: Attainment of the federal air quality standards
Response: The 1998 CAP demonstrates that the control strategy outlined in Chapter 4
(Emission Control measures) and Chapter 5 (Transportation Control Measures)
supported by the air quality modeling shown in Chapter 7 and the
Implementation Support Activities described in Chapter 8, will provide sufficient
emissions reductions necessary to provide for the attainment of the federal 1-hour
ozone standard by the year 1999. This constitutes substantial evidence to show
that the impact on public health is expected to be insignificant.
2. Comment: Attainment of the State Ozone Standard
Response: Through implementation of the Plan the air quality in the county will improve.
While unfortunately the state standard will not necessarily attainment through
implementation of the plan, there have been absolutely no adverse environmental
impacts identified due to implementation of the plan. Therefore the environmental
document is adequate. It is true that Santa Barbara County is not predicted to
attain the state AAQS by 1999, the 1998 CAP meets all feasible mandates of the
California Clean Air Act.
3. Comment: Relaxation of Two Rules
Response: The APCD has several rules related to paints. We are uncertain which "paint
rule" is referred to in the comments. We assume it is a reference to Rule 323
(Control Measure R-SC-1, Architectural Coatings). This rule was adopted in

12 - 37
February 1990. It reduces ROG emissions. This rule was adequately analyzed in previous
environmental documents for the 1991 AQAP and the 1994 CAP. Impacts were found to be
insignificant. No additional revisions to this rule which involve relaxation of
existing standards are planned and no additional credit is taken in the 1998 CAP.
Therefore, the ND for the 1998 CAP did not analyze this rule.
Control of Emissions from Reciprocating Internal Combustion Engines) was
listed in the 1998 CAP as a contingency measure to be adopted in 1999. No
emission reduction credit was taken for this measure. A draft staff report on
revisions to Rule 333 is expected to be released in late November. As discussed
in the 1998 CAP, this rule will result in substantial NOx emission reductions.
The methods expected to be used to comply with the rule were listed in the ND
and have been examined in previous environmental documents for the 1991
AQAP and the 1994 CAP. Impacts were found to be insignificant.
4. Comment: Worst Case Analysis
Response: The comments state that if the analysis involves speculation or details are not yet
resolved, the District should employ a worst-case analysis to describe the
potential adverse impacts. After examining the impacts of the compliance
methods to be used in complying with the requirements of the 1998 CAP as
described in previous environmental documents, the APCD concluded that
additional discussion of future control measures would be too speculative.
Therefore, these impacts were not discussed further pursuant to the authority
provided in CEQA Section 15145.
There has been no relaxation from the 1994 CAP.
5. Comment: Revisions to Rule 333
Response: The comments state that Revisions to Rule 333 will involve increases in NOx as a
trade-off for ROC emissions reductions. On the contrary, as described in the
12 - 38
1998 CAP, revisions to Rule 333 will result in substantial decreases in NOx emissions.

12 - 39
TABLE 12-1
SANTA BARBARA COUNTY
AIR POLLUTION CONTROL DISTRICT BOARD
BOARD APPOINTED COMMUNITY ADVISORY COUNCIL (CAC) MEMBERS
BOARD MEMBER TITLE CAC APPOINTEE(S)
NAOMI SCHWARTZ Supervisor, First District Marc Chytilo & John Robinson
JEANNE GRAFFY Supervisor, Second District Maria Raso
GAIL MARSHALL Supervisor, Third District Dave Pierce & Deborah Weeks
JONI GRAY Supervisor, Fourth District John Gunderson & Patrice Surmeier
TOM URBANSKE Supervisor, Fifth District John Deacon & Kevin Wright
RUSS HICKS Councilmember, City of Buellton Robert Hall
RICHARD WEINBERG Councilmember, City of Carpinteria Tom Banigan & Doug Marsh
KEN WESTALL Councilmember, City of Guadalupe Bob Kober & James Porter
WILLIAM SCHUYLER Councilmember, City of Lompoc Harley Santos & John Silva
ELINOR LANGER Councilmember, City of Santa Barbara Lee Moldaver & Dave Hofstatter
LARRY LAVAGNINO Councilmember, City of Santa Maria Conrad Calderon & Gary Winters
NANCY ORCHARD Mayor, City of Solvang No Appointees Selected Yet

12 - 40
TABLE 12-2
SANTA BARBARA COUNTY
AIR POLLUTION CONTROL DISTRICT
CLEAN AIR PLAN PUBLIC PRESENTATIONS
PRESENTATION LOCATION DATE
Public Workshops
County Administrators Office
Board of Supervisors Hearing Room
Santa Barbara
October 21, 19981:00 PM & 7:00 PM
Public Workshops
Betteravia Government CenterBoard of Supervisors Hearing Room
Santa Maria
October 22, 19981:00 PM & 7:00 PM
APCD Monthly Board Meeting
Santa Barbara CountyAir Pollution Control District Board
Lompoc City Council ChambersLompoc
November 12, 1998
APCD Monthly Board Meeting
Santa Barbara CountyAir Pollution Control District Board
Board of Supervisors Hearing RoomSanta Barbara
December 17, 1998

12 - 41

12 - 42

12 - 43