2019 The Clean Air Company - Nederman
148
Annual Report and Sustainability Report 2019 The Clean Air Company
-
Upload
khangminh22 -
Category
Documents
-
view
0 -
download
0
Transcript of 2019 The Clean Air Company - Nederman

Annual Report and Sustainability Report2019
The Clean Air Company

The Clean Air Company
Clean airClean air was Nederman’s business concept from the very beginning, more than 75 years ago. Today, demands to contribute actively to more efficient production and reduced emissions are more relevant than ever before. And Nederman is at the forefront of this development.
Nederman Annual Report and Sustainability Report 20192

The Clean Air Company
3The Clean Air Company

Sources: Health Effects Institute, Health Effects Institute. 2019. State of Global Air 2019
Poor air quality affects us allAir pollution is currently one of the most common causes of a shortened lifespan. On average, poor air quality reduces every person’s life expectancy by 20 months – worldwide.
The Health Effects Institute (HEI) is an independent air pollution and global health research organisation and is the principal behind the State of Global Air, an annual report that monitors the trend in air pollution and its causes all over the world.
HEI estimates that more than 90 percent of the world’s population lives in areas where air pollution exceeds the WHO’s guidelines for healthy air.
Microscopic airborne particles called PM2.5 are the most common indicator. The sources of emissions vary, but within many areas, industrial production is one of the most import-ant.
While the facts appear alarming, there are rays of hope. China, the world’s most popu-lated country and historically one of the largest sources of emissions, is gradually intro-ducing stricter regulatory frameworks, which are resulting in considerable improve-ments.
At Nederman, we see it as our role to actively inform, influence and offer solutions that enable industrial production to reduce its share of emissions.
Nederman Annual Report and Sustainability Report 20194

Sweden leading the way Average annual PM2.5, population weighted
100 908070605040302010
0
China’s emissions are decreasing faster than those of the rest of the world
1990 1995 2000 2005 2010 2015
5 millionNumber of people who died prematurely of
causes related to air pollution in 2017
1 year 8 monthsLife expectancy is expected to be reduced by
this much due to air pollution
90%
ChinaIndia
China
The US
Sweden
2005 2010 2015
Globally
WHO interim target - 1
WHO interim target - 2
WHO interim target - 3
WHO Air Quality Guide
Share of people who live in areas with poor air quality
Diet-related
Cancer (all forms)
Tobacco
Air pollution
Poor water quality
Lung cancer
Unprotected sex
Breast cancer
Common risk factors reduce life expectancy by
0 12Months 24 36
Globally
70
60
50
40
30
20
10
0
5The Clean Air Company

We protect people, production and our planet Nederman’s promise – to protect people, production and our planet from the harmful effects of industrial processes – is a unique decla-ration of our ambition to always stand alongside our customers as they take new steps towards tomorrow’s production solutions.
Growing populations, expanding trade and ever-faster advances in technology will inevitably lead to greater demand for goods and products that involve industrial production. Clean air is one of the cornerstones of our customers’ efforts to supply a growing global economy with efficient and sustainable production solutions.
Nederman Annual Report and Sustainability Report 20196

Efficient and sustainable production – today and tomorrowGreater demands for efficient and sustainable production are a part of our customers’ daily lives. Our solutions to safeguard clean air aim to make everyday life easier, safer and more economical. Reliability and productivity are key concepts for the success and profitability of our customers when they choose to collaborate with us.
■ Health and safetyToday, a clean and safe work envi-ronment is more than a statutory requirement in most parts of the world. It is also a profitable invest-ment for the employer. Stud-ies indicate that a clean and safe environment, free from hazard-ous fumes, particles and the risk of explosions, leads to lower absence due to illness. It also makes the workplace more attractive in the race for highly qualified workers.
■ Product qualityDust, smoke and other airborne particles contribute to wear and tear, and shorten the service life of production equipment. Clean air is also paramount to guarantee-ing even and high product quality. Disruptions in production, product rejection and delayed deliveries are costly effects of poor air quality.
■ RecyclingGreater demand, rising prices and, in some instances, a lack of valu-able input materials are leading to a greater need for more efficient recycling of materials. Cutting flu-ids, wood and metal shavings are a few examples where optimised use and increased recycling lead to financial and environmental gains.
■ Energy consumptionIn many instances, the produc-tion industry is a major energy consumer. Rising prices and a lack of access to virtually all types of energy are an incentive for ener-gy-efficient solutions and increased use of renewable sources of energy. Greater knowledge about the production process, coupled with support from new digi-tal technologies, are key factors for the solutions of tomorrow.
■ RegulatoryGovernment authorities in virtu-ally all markets now require that the environmental effects of production processes on the surrounding envi-ronment be continually measured and reported. Air pollution is one of the primary causes of premature death worldwide, which has resulted in new requirements and challenges for the manufacturing industry.
7The Clean Air Company

COMPETITIVE PRODUCTSAll of Nederman’s products are developed for the purpose of promoting health and safety, enhancing production efficiency and minimising the custom-ers’ environmental impact. Today, we are leaders in the development of digital products and solutions to safeguard the future for our customers in energy use, recycling and compliance with regulatory require-ments. Sales of individual products, small and medi-um-sized systems, and major system solutions with a high degree of customisation comprise the majority of the Group’s sales. The sale of products and solutions provides a broad customer base that drives our service sales.
FULL-SERVICE OFFERINGA key feature of our offering is the ability to guaran-tee our customers the highest possible availability for their solutions. Our starting point is that we must be the alternative that offers the customer the lowest total cost over the life cycle of the solution. In addition to high-quality products, this means that we offer qual-ified service with a high level of availability to ensure continuous operation. The offering includes technical service, service contracts, spare parts and consum-ables.
Service sales are a priority area. In 2019, service grew and made up 17% of total sales.
MARKET-LEADING POSITIONSSince establishment 75 years ago, Nederman has developed a broad and competitive product pro-gramme. This programme, combined with a compre-hensive sales network and significant investments in new technology, is the foundation for our leading posi-tion in a global market. Size and market breadth give us economies of scale in terms of product development, purchasing and production. Nederman is already the segment leader in EMEA, but is now also second-larg-est in the vital Americas market and in the top five in APAC. This provides a strong platform on which to build further.
STRONG BRANDS Today, Nederman addresses its market with a strong portfolio of brands. Our strategy is that each individ-ual brand is to bring cutting-edge competence to the Group in a specific product area or market segment. Accordingly, we have the possibility to meet many dif-ferent customer needs and market segments, in both mature and emerging markets. In recent years, we have devoted a great deal of energy in the brands NEO Moni-tors and Auburn FilterSense as a base for the devel-opment of an entirely new digital offering, which will secure the Group’s future positions. The brand portfo-lio is continuously evaluated, while we simultaneously actively analyse potential acquisitions.
A global groupNederman is one of the world’s leading developers of products and solutions for advanced air filtration in demanding industrial environments. Our offering comprises individual products, complete solutions, project design, installation, commissioning and service.
Our head office is located in Helsingborg and we currently have about 2,400 employees, with manufacturing in 13 countries and sales in more than 50 markets through our own sales organisation, agents or resellers.
Nederman Annual Report and Sustainability Report 20198
Share of sales per market
32% 51% 17%
Share of sales per sales portfolio Share of sales per division
Solutions 47%
Duct & Filter Technology 11%
Products 36%
Monitoring & Control Technology 6%
Service & Aftermarket 17%
Extraction & Filtration Technology 45%
Process Technology 38%
AMERICAS EMEA APAC
Filter Elements
A global groupNederman is one of the world’s leading developers of products and solutions for advanced air filtration in demanding industrial environments. Our offering comprises individual products, complete solutions, project design, installation, commissioning and service.
Our head office is located in Helsingborg and we currently have about 2,400 employees, with manufacturing in 13 countries and sales in more than 50 markets through our own sales organisation, agents or resellers.
9The Clean Air Company
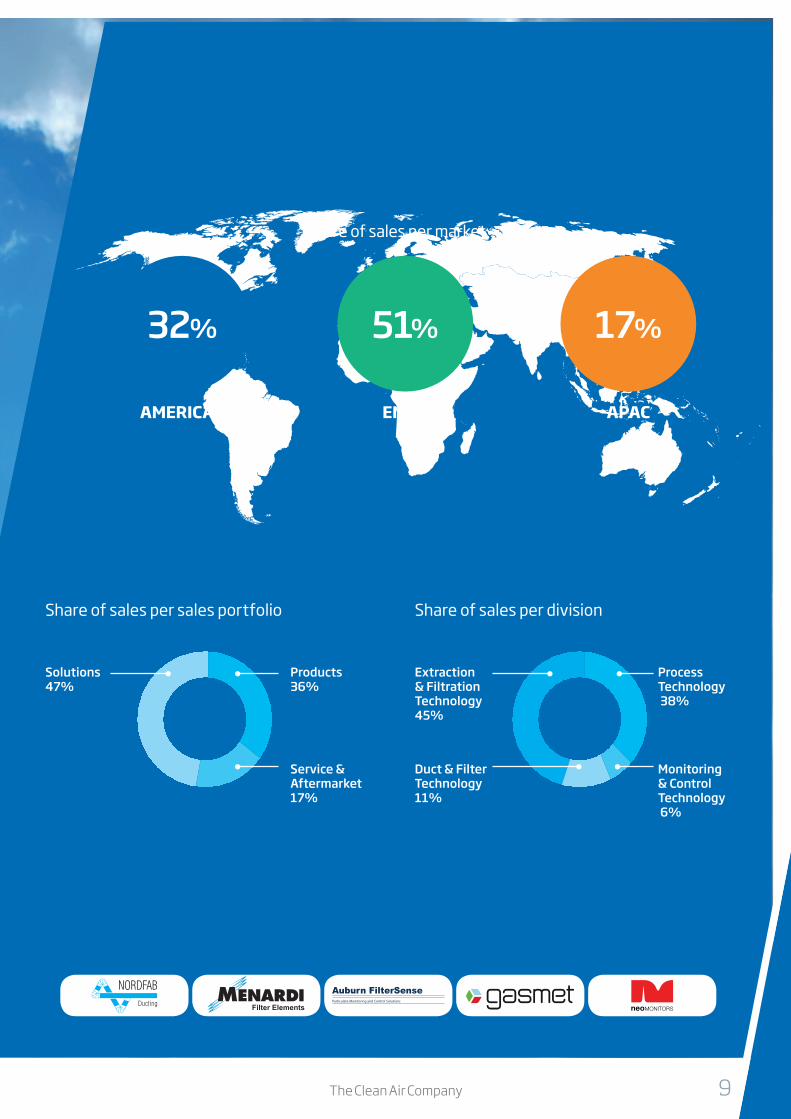
Development by quarter■■ The first quarter of the year was stable for Nederman. Orders received
during the quarter grew to SEK 1,019.0m (781.7), equivalent to cur-rency-neutral growth of 22.9 percent. Sales also displayed positive growth in the quarter and amounted to SEK 1,036.4m (785.8), equiva-lent to currency-neutral growth of 24.4 percent.■■ The second quarter of the year was strong for Nederman as a whole.
Orders received during the quarter grew to SEK 1,044.1m (912.1), equivalent to currency-neutral growth of 10.3 percent. Sales also dis-played positive growth in the quarter and amounted to SEK 1,096.2m (863.9), equivalent to currency-neutral growth of 22.2 percent. ■■ Nederman performed well in the third quarter of the year. Total orders
received amounted to SEK 964.6m (817.9), equivalent to currency-neu-tral growth of 10.0 percent. Sales totalled SEK 1,088.6m (835.2), equiv-alent to currency-neutral growth of 22.4 percent. ■■ Nederman performed favourably in the fourth quarter of the year.
Total orders received amounted to SEK 1,140.7m (967.8), equivalent to currency-neutral growth of 18.1 percent. Organic growth amounted to 11.4 percent. Sales totalled SEK 1,086.5m (1,069.0), equivalent to cur-rency-neutral growth of 1.8 percent.
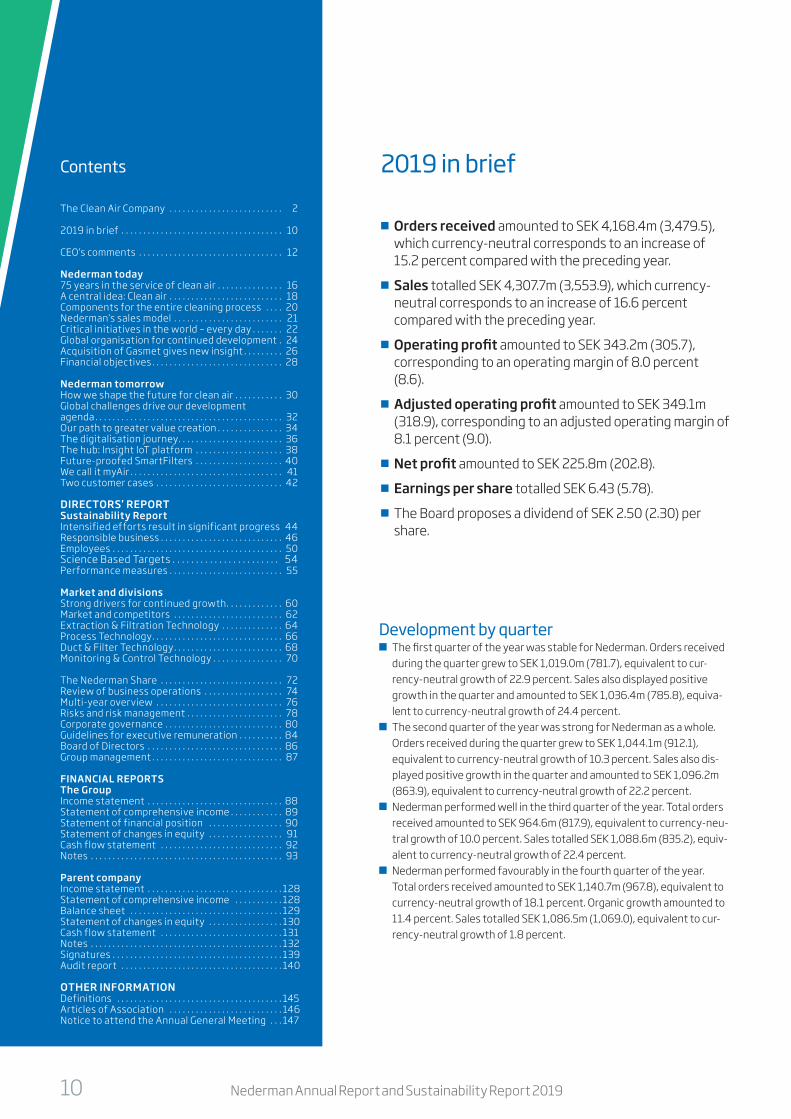
2019 in brief
The Clean Air Company . . . . . . . . . . . . . . . . . . . . . . . . . . 2
2019 in brief . . . . . . . . . . . . . . . . . . . . . . . . . . . . . . . . . . . . . 10
CEO’s comments . . . . . . . . . . . . . . . . . . . . . . . . . . . . . . . . . 12
Nederman today75 years in the service of clean air . . . . . . . . . . . . . . . 16A central idea: Clean air . . . . . . . . . . . . . . . . . . . . . . . . . . 18Components for the entire cleaning process . . . . 20Nederman’s sales model . . . . . . . . . . . . . . . . . . . . . . . . . 21Critical initiatives in the world – every day . . . . . . . 22Global organisation for continued development . 24Acquisition of Gasmet gives new insight . . . . . . . . . 26Financial objectives . . . . . . . . . . . . . . . . . . . . . . . . . . . . . . 28
Nederman tomorrowHow we shape the future for clean air . . . . . . . . . . . 30Global challenges drive our development agenda . . . . . . . . . . . . . . . . . . . . . . . . . . . . . . . . . . . . . . . . . . . 32Our path to greater value creation . . . . . . . . . . . . . . . 34The digitalisation journey . . . . . . . . . . . . . . . . . . . . . . . . 36The hub: Insight IoT platform . . . . . . . . . . . . . . . . . . . . 38Future-proofed SmartFilters . . . . . . . . . . . . . . . . . . . . 40We call it myAir . . . . . . . . . . . . . . . . . . . . . . . . . . . . . . . . . . . 41Two customer cases . . . . . . . . . . . . . . . . . . . . . . . . . . . . . 42
DIRECTORS’ REPORTSustainability ReportIntensified efforts result in significant progress 44Responsible business . . . . . . . . . . . . . . . . . . . . . . . . . . . . 46Employees . . . . . . . . . . . . . . . . . . . . . . . . . . . . . . . . . . . . . . . 50Science Based Targets . . . . . . . . . . . . . . . . . . . . . . . 54Performance measures . . . . . . . . . . . . . . . . . . . . . . . . . . 55
Market and divisionsStrong drivers for continued growth . . . . . . . . . . . . . 60Market and competitors . . . . . . . . . . . . . . . . . . . . . . . . . 62Extraction & Filtration Technology . . . . . . . . . . . . . . 64Process Technology . . . . . . . . . . . . . . . . . . . . . . . . . . . . . . 66Duct & Filter Technology . . . . . . . . . . . . . . . . . . . . . . . . . 68Monitoring & Control Technology . . . . . . . . . . . . . . . . 70
The Nederman Share . . . . . . . . . . . . . . . . . . . . . . . . . . . . 72Review of business operations . . . . . . . . . . . . . . . . . . 74Multi-year overview . . . . . . . . . . . . . . . . . . . . . . . . . . . . . 76Risks and risk management . . . . . . . . . . . . . . . . . . . . . . 78Corporate governance . . . . . . . . . . . . . . . . . . . . . . . . . . . 80Guidelines for executive remuneration . . . . . . . . . . 84Board of Directors . . . . . . . . . . . . . . . . . . . . . . . . . . . . . . . 86Group management . . . . . . . . . . . . . . . . . . . . . . . . . . . . . . 87
FINANCIAL REPORTS The GroupIncome statement . . . . . . . . . . . . . . . . . . . . . . . . . . . . . . . 88Statement of comprehensive income . . . . . . . . . . . . 89Statement of financial position . . . . . . . . . . . . . . . . . 90Statement of changes in equity . . . . . . . . . . . . . . . . . 91Cash flow statement . . . . . . . . . . . . . . . . . . . . . . . . . . . . 92Notes . . . . . . . . . . . . . . . . . . . . . . . . . . . . . . . . . . . . . . . . . . . . 93
Parent companyIncome statement . . . . . . . . . . . . . . . . . . . . . . . . . . . . . . . 128Statement of comprehensive income . . . . . . . . . . . 128Balance sheet . . . . . . . . . . . . . . . . . . . . . . . . . . . . . . . . . . . 129Statement of changes in equity . . . . . . . . . . . . . . . . . 130Cash flow statement . . . . . . . . . . . . . . . . . . . . . . . . . . . . 131Notes . . . . . . . . . . . . . . . . . . . . . . . . . . . . . . . . . . . . . . . . . . . . 132Signatures . . . . . . . . . . . . . . . . . . . . . . . . . . . . . . . . . . . . . . . 139Audit report . . . . . . . . . . . . . . . . . . . . . . . . . . . . . . . . . . . . . 140
OTHER INFORMATIONDefinitions . . . . . . . . . . . . . . . . . . . . . . . . . . . . . . . . . . . . . . 145Articles of Association . . . . . . . . . . . . . . . . . . . . . . . . . . 146Notice to attend the Annual General Meeting . . . 147
Contents
■■ Orders received amounted to SEK 4,168.4m (3,479.5), which currency-neutral corresponds to an increase of 15.2 percent compared with the preceding year.
■■ Sales totalled SEK 4,307.7m (3,553.9), which currency-neutral corresponds to an increase of 16.6 percent compared with the preceding year.
■■ Operating profit amounted to SEK 343.2m (305.7), corresponding to an operating margin of 8.0 percent (8.6).
■■ Adjusted operating profit amounted to SEK 349.1m (318.9), corresponding to an adjusted operating margin of 8.1 percent (9.0).
■■ Net profit amounted to SEK 225.8m (202.8).
■■ Earnings per share totalled SEK 6.43 (5.78).
■■ The Board proposes a dividend of SEK 2.50 (2.30) per share.
Nederman Annual Report and Sustainability Report 201910

Key figures
SEKm 2019 2018 2017*
Net sales 4,307.7 3,553.9 3,148.5Adjusted EBITDA 495.8 440.1 338.5Adjusted EBITDA margin, % 11.5 12.4 10.8Operating profit 343.2 305.7 278.1Operating margin, % 8.0 8.6 8.8Adjusted operating profit 349.1 318.9 285.8Adjusted operating margin, % 8.1 9.0 9.1Profit before tax 307.3 267.5 260.1Net profit 225.8 202.8 186.3Earnings per share, SEK 6.43 5.78 5.31Return on equity, % 17.3 17.7 18.1Return on operating capital, % 14.1 16.5 18.0Net debt 1,564.1 787.6 585.3Net debt/equity ratio, % 113.5 63.8 54.4Net debt/Adjusted EBITDA, multiple 3.2 1.8 1.7Interest cover ratio, multiple 8.1 7.5 11.8
* Nederman Group applies the retroactive approach in relation to IFRS 16 Leases and figures for 2018 are there-fore restated pursuant to the new standard. For earlier financial years, IAS 17 Leases was applied in accor-dance with the accounting policies that applied through 2017. See also accounting policies on pages 93-98.
Annual General Meeting to be held on 27 April 2020 The Annual General Meeting of Nederman Holding AB (publ) will take place on Monday, 27 April 2020 at the Hotel Marina Plaza, Kungstorget 6 in Helsingborg. See page 147 for further information.
Information on data in this reportFigures in brackets refer to business activities in 2018 unless otherwise stated. The currency used throughout is Swedish krona (SEK). Millions of Swedish kronor is abbreviated to SEKm and thousands of Swedish kronor to SEKt. The information presented in the Annual Report concerning markets, compe-tition and future growth are Nederman’s assessments based primarily on material compiled internally within the Group.
Distribution policyThe printed version of Nederman’s Annual Report will be distributed to those shareholders who have specifically requested a copy. The Annual Report is also available in its entirety on the Group’s website: www.nedermangroup.com
11The Clean Air Company
CEO’s comments
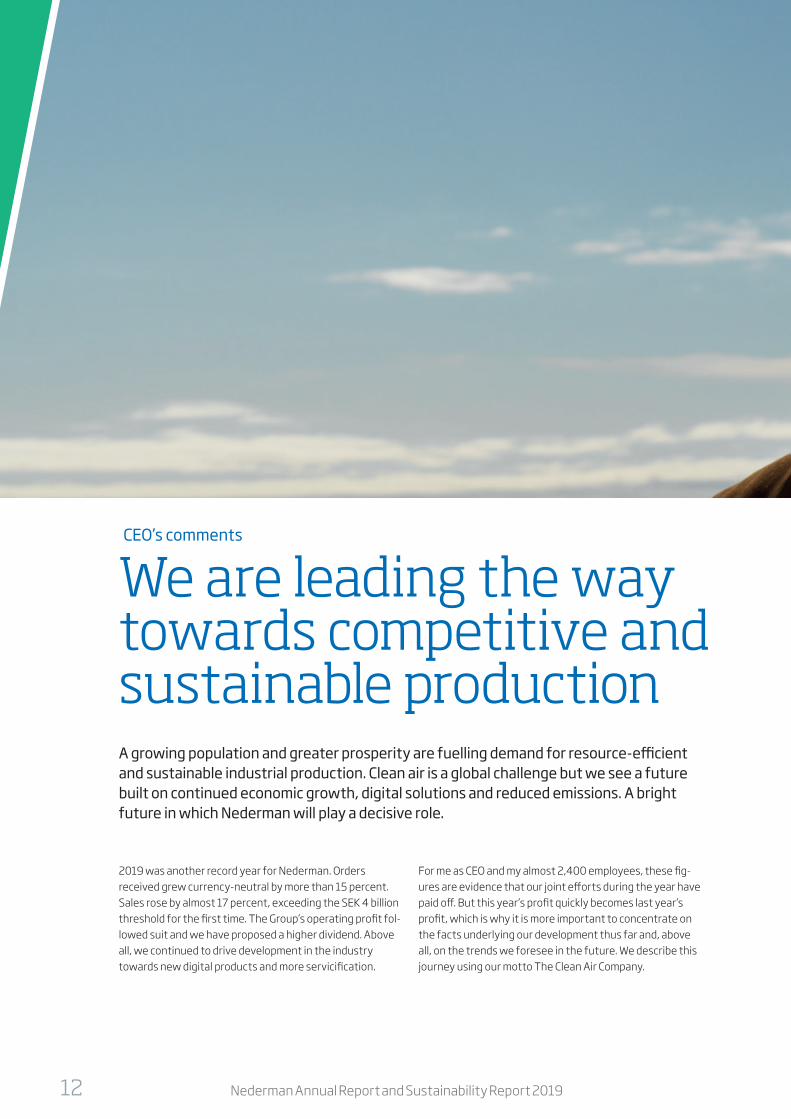
We are leading the way towards competitive and sustainable productionA growing population and greater prosperity are fuelling demand for resource-efficient and sustainable industrial production. Clean air is a global challenge but we see a future built on continued economic growth, digital solutions and reduced emissions. A bright future in which Nederman will play a decisive role.
2019 was another record year for Nederman. Orders received grew currency-neutral by more than 15 percent. Sales rose by almost 17 percent, exceeding the SEK 4 billion threshold for the first time. The Group’s operating profit fol-lowed suit and we have proposed a higher dividend. Above all, we continued to drive development in the industry towards new digital products and more servicification.
For me as CEO and my almost 2,400 employees, these fig-ures are evidence that our joint efforts during the year have paid off. But this year’s profit quickly becomes last year’s profit, which is why it is more important to concentrate on the facts underlying our development thus far and, above all, on the trends we foresee in the future. We describe this journey using our motto The Clean Air Company.
Nederman Annual Report and Sustainability Report 201912

Clean air is a global challengeMost of us consider access to clean air to be a free and infinite product. But that’s not reality. Quite the contrary. More than 90 percent of the world’s population lives in areas with poor air quality. This not only contributes to a lower quality of life, but also major costs that must be borne by society, one way or another. Within the EU alone, poor air quality is estimated to account for about 400,000 premature deaths per year, at an annual cost for society of between EUR 250 billion and EUR 1,000 billion.
And the challenge is increasing. A growing population and rising standard of living are leading to more industrial pro-duction and potentially larger amounts of emissions and air pollution. The sources of emissions vary, but within many areas, industrial production is one of the most important.
Growth is not a limitationVoices have been raised demanding what appears to be a simple solution: limit production, limit growth. But contrary to popular belief, economic growth is not automatically associated with a greater environmental impact. Statis-tics from the Swedish Environmental Protection Agency show that GDP in the EU region grew by almost 50 percent during a 20-year period up until 2010. Meanwhile, pollu-tion dropped by about 60 percent. All while the population remained stable. The reason? Tougher requirements and more efficient solutions.
Source: The Swedish Environmental Protection Agency, 2019
Growth is something we should perceive as positive. A larger economy and increased profitability paired with tougher sustainability requirements from government agencies and consumers create the prerequisites for investments in more efficient production methods.
This is where Nederman comes in. A global, growing market with a common problem where we – with 75 years of expe-rience, extensive product and application expertise, and a clear agenda for the future – can show the way to a sustain-able future.
GDP index Population index Pollution index
180 %
160 %
140 %
120 %
100 %
80 %
60 %
40 %
20 %
20001990 1995 2005 2010
Index 1990 = 100%
13CEO’s comments

Industry does not need to contribute negativelyOur starting point is simple: industry does not need to con-tribute to more emissions. Today, we have access to the technical solutions needed to help our customers real-ise sustainable production. Much is built around capturing emissions at source, and then filtering, cleaning and recy-cling particles, gases, etc. before the purified air is released in the local environment. In this way, production is not only approved in accordance with all regulatory requirements. Increased recycling and decreased energy consumption also contribute to better production efficiency and greater profitability. There are solutions for new installations or upgrades of existing solutions (retro-fit) and the advan-tages are so great that there really is no reason not to take advantage of this offering, particularly given that rising con-sumer pressure that has emerged for sustainable products.
“ Our customers help society to develop. We help through clean air solutions.”
Increased digitalisation means greater customer valueThe key to the future is digitalisation. As in other areas of society, AI, cloud services, etc. are impacting everyday industrial operations. For Nederman, this is a challenge. But more than that, it is opening up completely new opportu-nities for development. Digitalisation of filters provides us with data. Data that is first used to measure and control operations, and then to optimise the solution to achieve the best performance and financial result. But there is also another aspect. For Nederman, data allows us to “know” what is needed and deliver a more precise solution already in the design phase of individual products or solutions. In other words, data gives us a competitive advantage, which is why we deliberately invest in launching new solutions before our competitors.
“ The more connected filters there are, the better we become.”
Clear agenda for the future: Vision 2025Another clear aspect of digitalisation is the potential for servicification, a central Industry 4.0 concept. It is clear that customers are looking for a greater supplier commit-ment. For Nederman, this is an opportunity to considerably increase the earning potential in every customer order. With “analogue” filters, our business is built largely on supplying new or upgraded filter solutions that generate non-recur-ring revenue as well as continuous sales of spare parts and
Nederman Annual Report and Sustainability Report 201914
other service and maintenance. However, the aftermarket segment is exposed to tough competition from small, local service companies as well as from customers themselves that have their own service teams.
With digital filter solutions, we – and the customer – gain access to data that strengthens our position, both in rela-tion to the customer but also in relation to our competitors. Based on our filtration knowledge, product base and avail-able data, we will be able to offer the customer a subscrip-tion service in which we assume responsibility for filtration operations, guarantee compliance and more in accordance with predefined parameters. The customer receives an all-inclusive service solution and Nederman receives guar-anteed revenue over an extended period.
Our vision is to be able to offer clean air as a service some time around 2025. On the basis of the Group’s current cus-tomer base, the revenue potential for this is substantial.
“ Environmental engineering is the next great Swedish export.”
Important milestones in 2019 ■ As already mentioned, 2019 was another record year for
Nederman, financially but perhaps even more so in terms of development.
■ 75 years From the first unsteady steps in Helsingborg in 1944 to a world-leading position 75 years later. We had every reason to celebrate and to be proud.
■ All acquisitions fully integrated Our high acquisition rate is placing extreme demands on the organisation. All divisions have done a great job, both in implementing the new global organisation and in developing the latest acquisitions which are now fully integrated into their respective division.
■ Our first digital products During the year, develop-ment was completed of our digital filter series (SmartFil-ters) and myAir, our first premium digital service offering that is built on our Insight IoT platform and SmartFilters. Launch is under way.
■ New acquisitions Acquisitions are, and will in all likeli-hood continue to be, a key component of our develop-ment. At the close of the year, we acquired the Finnish company Gasmet, which specialises in gas analysis. Gas-met adds new technology, a new customer base and a greater market presence.
■ Intensified sustainability agenda Nederman will lead the development of sustainable solutions for industrial air filtration. This requires that we are also a leader in our own sustainability agenda. To this end, we carried out a number of new initiatives to advance our positions.
In summary: A strong position in a growing global marketAs we wrap yet another year in the Company’s 75-year his-tory, we do so in a stronger position that we have ever had before. Strong brands, strong finances and strong devel-opment. We have every reason to call ourselves a product leader and market leader. During the year, we also launched a new initiative: Nederman Future Days. An initiative to stress that we are not content with what we are today. We also want to play a part in influencing the future. We want to assume a position as a thought leader in clean air and sus-tainable industrial development. It is precisely this quality – the desire to lead the way – that distinguishes a true leader. Nederman Future Days will be back in 2020, stronger and with more ideas.
“ The Clean Air Company. It can’t be said any clearer.”
Outlook for 2020Many of Nederman’s markets, not least the US and China, and recently also Germany to a certain extent, are charac-terised by uncertainty, not least from the recent devel-opment of the corona virus. Trade conflicts and financial uncertainty mean that decisions on major investments are being prolonged and that large projects are often being postponed, resulting in considerable volatility in Neder-man’s orders received. Increasing signs of a general slow-down in the world economy have also been noted. Despite these challenges, Nederman’s basic view is one of cautious optimism. Environmental issues will remain important for the Group’s customers, which can be expected to soften the effects of a weaker economy to a certain degree, and the Group is continuing to strengthen its positions in sev-eral key areas where future growth will occur. In Europe and North America, the Group will build on Nederman’s strengths as a leading environmental technology company. In regard to the developments in Asia, which are not aligned with the Group’s ambitions, intensive efforts to reverse the trend will continue.
Our progress in 2019 was the result of a favourable eco-nomic trend and our own efforts. I am very proud of the hard, conscientious work of all my colleagues within the Group, but also of our resellers, suppliers and other business partners. It gives me reason to feel confident and the moti-vation to engage in new initiatives as we go forward. It is up to us to shape the future for clean air. We are The Clean Air Company.
Sven KristenssonPresident and CEO
15CEO’s comments

75 years in the service of clean air!Our experience makes us the perfect partner for the future
Clean air begins with capturing and extracting poor-quality air. Here, and throughout the ensuing air filtration chain, Nederman’s products make a decisive difference. Our product programme and our customer base provide us with probably the most complete foundation on which to build solutions.
Knowledge – our most valuable asset
It takes a long time to acquire knowledge and an understanding of the customers’ problems. The mass of knowledge that has been handed down in Nederman’s organisation is perhaps our most valuable asset. We know which parameters are decisive, we know which solutions work, and we know where the problems lie. No one else has the same knowledge base.
Nederman Annual Report and Sustainability Report 201916

Nederman – always aware of the present, always with one eye on the future From the very beginning in Helsingborg in 1944 to today’s global corporation, Ned-erman has been a pioneer in the industry. Always focusing on clean air, and often the first to deliver solutions to meet the latest requirements. We celebrated our first 75 years as a company in 2019.
Four videos that reflect Nederman’s work and the industry’s development, from the 1950s to the future, are available at nedermangroup.com
The Welder Play
The Mechanic Play
The Technician Play
The Future Play
17Nederman today

A central idea: Clean air
MissionTO SHAPE THE FUTURE FOR CLEAN AIR
Nederman’s mission is an expression of our ambition to act as a company that in its words and actions strives to make one of our most important resources available to as many people as possible at a quality that is as good as possible. To accom-plish this, we aim to collaborate with all of the stakeholders that can actively influence the situation – politicians and other decision-makers, scientists and lobbyists – while also developing new products and services that enable our cus-tomers to limit the effects of their production.
VisionTO BE SEEN AS THE GLOBAL LEADER IN SOLUTIONS THAT PROTECT PEOPLE, PRODUCTION AND OUR PLANET FROM THE HARMFUL EFFECTS OF INDUSTRIAL PRODUCTION
Our vision is to be the most respected and successful devel-oper of products and services for industrial air filtration. Industrial production is one of the most common sources of air pollution. Our task is to help industries to reduce their emissions and thereby reduce their impact on people, production and our planet. Along with our employees, our products enable us to build the trust and the relationships required to realise this vision.
Code of ConductBUILDING TRUST IN OUR OPERATING ENVIRONMENTThe Group’s joint Code of Conduct summarises the Company’s policies related to social conditions, employees, human rights and corruption. All employees and business partners are required to comply with the Code. Both current employees and new recruits receive continuous training in the area. Ned-erman also has an internal process for reporting suspected violations of the Code, with every report investigated and
followed up through relevant measures. Nederman’s Code of Conduct also requires that our suppliers run their operations in accordance with the Code. To this end, we make regular audits in line with an established method.
This report is a condensed version. More information is avail-able at nedermangroup.com.
Nederman Annual Report and Sustainability Report 201918

AmbitionsGUIDING OUR LONG-TERM EFFORTS
Our success relies on our ability to earn the respect of others. For this reason, it is paramount that we succeed in meeting their expectations at every level. Three areas stand out moving forward.
■ Sustainability as an integral part of the business. Sustainability, both internally and externally, is a critical factor if the world is to continue to develop, if we as a com-pany are to defend our business, and if we are to justify to our customers and other stakeholders why they should choose us as their long-term partner.
■ Utilise all the potential of digitalisation. Digitalisation at every level is the basis for the ongoing industrial revolu-tion. By leading developments within our own industry, we will be able to advance the industry-leading positions of all our brands.
■ Lasting profitability. It is only with sufficient and lasting profitability that we can invest in products, people and acquisitions – and thereby secure our own development.
ValuesBUILDING A STRONG CULTURE
Our values symbolise the spirit of the company we want to be. They are to guide us in our daily work, particularly in deci-sion-making situations in which the course of action is not perfectly clear.
■ Profitable customer relationships are about focusing on the customer’s needs and developing solutions that add value, but also being clear that we too must be profit-able if we are to remain a partner in the future.
■ Showing respect for the environment and each other comes naturally for an environmental engineering com-pany, but it also means that we must combat all forms of discrimination, show respect for the opinions of others and treat others in our operating environment as we want to be treated.
■ Courage and initiative involve fostering open and hon-est communication, taking initiative and responsibility, encouraging new thinking and driving change.
Every company is driven forward by a mission. Our mis-sion is to help to improve the status of clean air as a natu-ral resource. We contribute to the success of our custom-ers through our solutions to protect people, production and our planet from the harmful effects of industrial pro-duction.
19Nederman today

Expertise for the entire cleaning process
Extraction/captureThe first step in the cleaning process involves the capture of fumes, dust and particles. Capture directly at source (for welding, for example), extraction to remove exhaust fumes (automotive workshops) or specially designed cowls for fumes and particles are a few examples.
DuctingDucting for the removal of captured air requires the right solution to prevent dust from building up in the system, resulting in reduced efficiency and lower pro-ductivity. The costs for wear and maintenance are important parameters.
FiltrationThe right choice of filters and filter media is a key fac-tor in optimising filtration and the lifespan of the sys-tem. Small mobile solutions or large plants with several dust collectors in combination with the best choice of filter media.
Safety componentsProducts for the safe handling of, for example, com-bustible dust are a key competence for Nederman. Minimising the risks when handling hazardous waste and equipment to reduce the risk of accidents during installation and maintenance work.
System components and optimisationThe need to optimise performance, simplify operation, reduce energy consumption and extend maintenance intervals is increasing. Operating and service costs are a large part of the investment cost for an air filtration system.
Measure and controlDigital solutions, based on the Nederman Insight IoT platform, make it possible to measure and steer the filtration system’s capacity and performance during operation. Streamlines and optimises work levels, energy consumption, and more. Facilitates subscrip-tion services.
Nederman Annual Report and Sustainability Report 201920

Nederman’s sales model
Product salesThe basis of Nederman’s business. A broad range of standard products that solve common problems related to smoke, gas, dust, material recycling, work environment and efficient produc-tion. Product sales are made primarily via distributors and resellers.
Service and aftermarketQualified service with a high availability aims to ensure continuous operation without costly interruptions in produc-tion. Includes technical service, contract service, spare parts and consumables. Service is provided by the Company’s own service organisation or via autho-rised subcontractors.
SolutionsRequired to solve more complex tasks. Either individual standard products that are assembled together to form small and mid-sized systems or large-scale system solutions with a high element of customisation. Sales are always through Nederman’s own sales organi-sation.
Share of Group sales 2019, %
Share of Group sales 2019, %
Share of Group sales 2019, %
Sales
SEK 1,536m 2019 SEK 1,240m 2015
+ 6.0% annual growth (ø)
Sales
SEK 2,052m 2019 SEK 1,396m 2015
+ 11.7% annual growth (ø)
Sales
SEK 720m 2019 SEK 562m 2015
+ 7.0% annual growth (ø)
36%
47%
17%
21Nederman today

Critical initiatives in the world – every day
MetalworkingAir pollution is a common problem in metalworking. The particles are hazardous for employees, but they also contaminate surfaces and damage electronic compo-nents. Recycling of cutting fluids, abrasives and metal shavings also drive demand for our solutions.
Need ■ eliminate welding fumes and oil mist ■ recycle waste products ■ compliance with requirements and standards
Solution ■ Capture welding fumes, oil mist and other particles directly at the source
Fibre-based industriesTextiles, wood and composite processing, pharmaceutical manufacturing and food processing are examples of indus-tries that have strict hygiene and safety requirements. Unwanted particles affect product quality, are harmful to inhale and may pose a fire and explosion risk.
Need ■ handle particles, fumes and gas ■ separate waste products for recycling ■ minimise the risk of fire and explosion
SolutionEquipment integrated into the customer’s process to ensure efficient energy consumption
Nederman Annual Report and Sustainability Report 201922
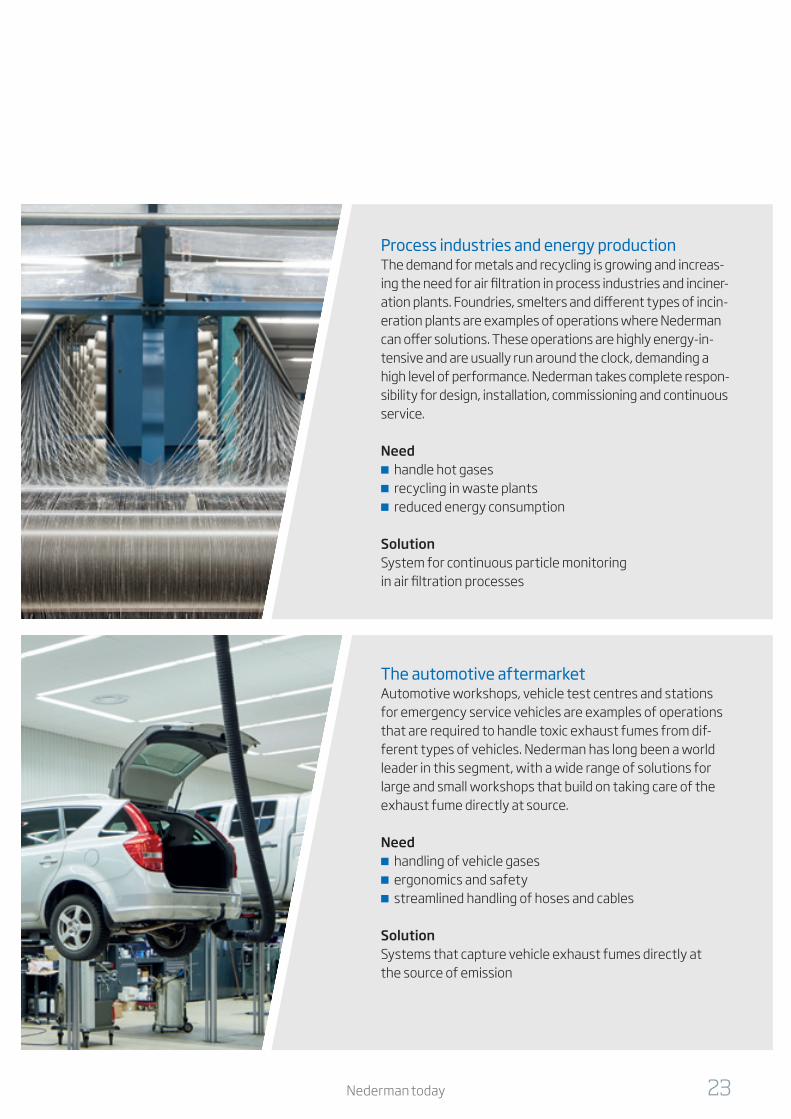
Process industries and energy productionThe demand for metals and recycling is growing and increas-ing the need for air filtration in process industries and inciner-ation plants. Foundries, smelters and different types of incin-eration plants are examples of operations where Nederman can offer solutions. These operations are highly energy-in-tensive and are usually run around the clock, demanding a high level of performance. Nederman takes complete respon-sibility for design, installation, commissioning and continuous service.
Need ■ handle hot gases ■ recycling in waste plants ■ reduced energy consumption
SolutionSystem for continuous particle monitoring in air filtration processes
The automotive aftermarketAutomotive workshops, vehicle test centres and stations for emergency service vehicles are examples of operations that are required to handle toxic exhaust fumes from dif-ferent types of vehicles. Nederman has long been a world leader in this segment, with a wide range of solutions for large and small workshops that build on taking care of the exhaust fume directly at source.
Need ■ handling of vehicle gases ■ ergonomics and safety ■ streamlined handling of hoses and cables
SolutionSystems that capture vehicle exhaust fumes directly at the source of emission
23Nederman today

Global organisation for continued development
2007
Nederman is listed on Nasdaq Stockholm Small Cap.
2010
Acquisition of Dan-therm Filtration which, in one stroke, doubles the Group’s sales and kick starts an expan-sive phase of strategic acquisitions.
2011
Nederman surpasses SEK 2 billion in sales The number of employees is almost 1,500.
2012
Environmental Fil-tration Technologies (EFT), with almost 400 employees, becomes part of the Nederman Group and opens the way to a growing US market.
2015
Nederman acquires Filtac. National Con-veyors Company is also acquired during the year.
2017
NEO Monitors, involved in the development of gas measurement solutions, becomes the first cornerstone in Nederman’s initiative to develop a digital offering.
Following a long period including several significant acquisitions, we decided to carry out a major reorganisation in 2018. The new organisation includes four global divisions with a continued focus on customer needs. Extraction & Filtration Technology focuses on capture; Process Technology works with advanced filter solutions; Duct & Filter Technology offers ducting, valves and filter elements; and Monitoring & Control Technology has digital solutions based on the Company’s in-house designed IoT platform.
Acquisitions add necessary sizeThe Company’s acquisitions are based on an active acquisition strategy aimed at providing Nederman with sufficient size to achieve the necessary economies of scale in product devel-opment, production and procurement. Between 2010 and 2019, the Group more than doubled its sales to today’s level. In the future, acquisitions will also play an important role in the Group’s continued development, not least when it comes to establishing and strengthening our positions in attractive mar-ket and product segments.
Better focusThe current organisation took effect in 2018 and is driven by simplicity and focus. The divisions are global and have their brands as their starting point. Market-driven product develop-ment utilising the potential of digitalisation is a priority. The divisions also aim to improve their organic growth. Overall, the new organisation means that the Group as a whole wins by eliminating overlapping responsibilities and reducing structure costs.
Nederman Annual Report and Sustainability Report 201924
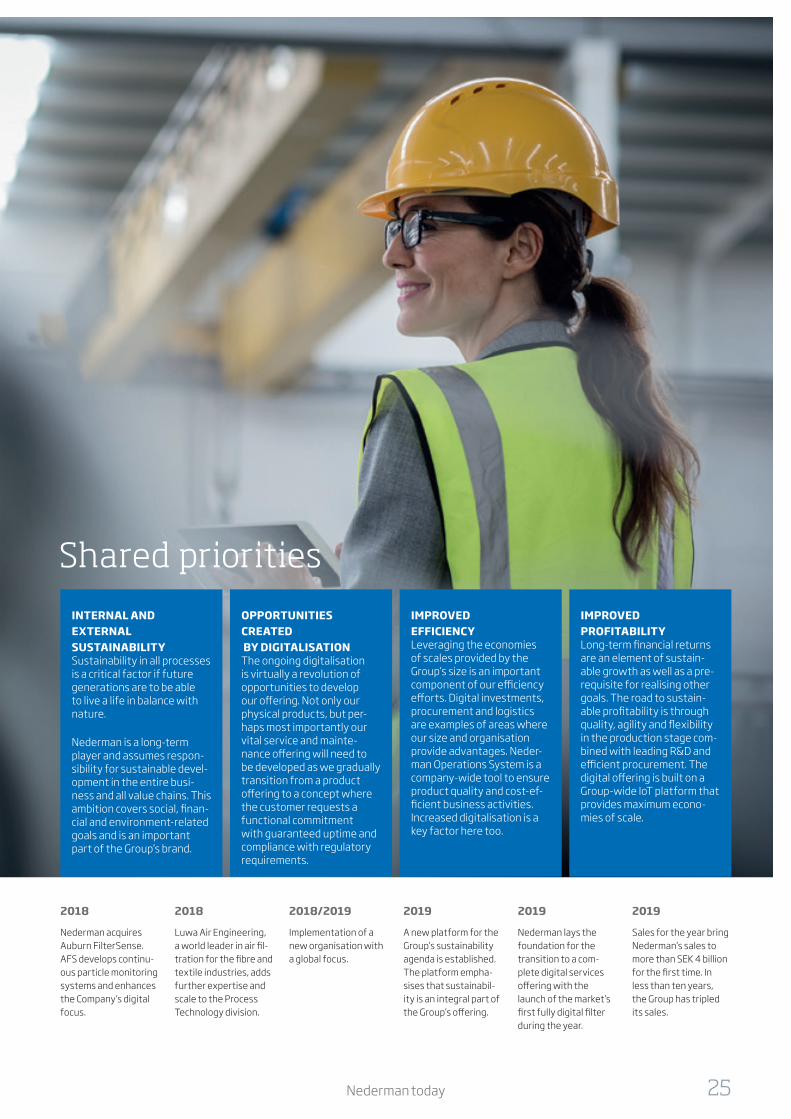
INTERNAL AND EXTERNAL SUSTAINABILITYSustainability in all processes is a critical factor if future generations are to be able to live a life in balance with nature.
Nederman is a long-term player and assumes respon-sibility for sustainable devel-opment in the entire busi-ness and all value chains. This ambition covers social, finan-cial and environment-related goals and is an important part of the Group’s brand.
OPPORTUNITIES CREATED BY DIGITALISATIONThe ongoing digitalisation is virtually a revolution of opportunities to develop our offering. Not only our physical products, but per-haps most importantly our vital service and mainte-nance offering will need to be developed as we gradually transition from a product offering to a concept where the customer requests a functional commitment with guaranteed uptime and compliance with regulatory requirements.
IMPROVED EFFICIENCYLeveraging the economies of scales provided by the Group’s size is an important component of our efficiency efforts. Digital investments, procurement and logistics are examples of areas where our size and organisation provide advantages. Neder-man Operations System is a company-wide tool to ensure product quality and cost-ef-ficient business activities. Increased digitalisation is a key factor here too.
IMPROVED PROFITABILITYLong-term financial returns are an element of sustain-able growth as well as a pre-requisite for realising other goals. The road to sustain-able profitability is through quality, agility and flexibility in the production stage com-bined with leading R&D and efficient procurement. The digital offering is built on a Group-wide IoT platform that provides maximum econo-mies of scale.
Shared priorities
2018
Nederman acquires Auburn FilterSense. AFS develops continu-ous particle monitoring systems and enhances the Company’s digital focus.
2018
Luwa Air Engineering, a world leader in air fil-tration for the fibre and textile industries, adds further expertise and scale to the Process Technology division.
2018/2019
Implementation of a new organisation with a global focus.
2019
A new platform for the Group’s sustainability agenda is established. The platform empha-sises that sustainabil-ity is an integral part of the Group’s offering.
2019
Nederman lays the foundation for the transition to a com-plete digital services offering with the launch of the market’s first fully digital filter during the year.
2019
Sales for the year bring Nederman’s sales to more than SEK 4 billion for the first time. In less than ten years, the Group has tripled its sales.
Global organisation for continued development
25Nederman today

Acquisition of Gasmet gives new insight
Monitoring and emission control of gases and particles in the local environment is subject to strict rules. In recent years, Nederman has built up an extensive product programme based on unique technologies. The latest addition to the family is the Finnish company Gasmet, which specialises in gas analysis. Acquired in 2019, Gasmet is part of the Monitoring & Control Tech-nology division, along with NEO Monitors and Auburn FilterSense.
Gasmet is a technology company that develops, manufac-tures and markets gas analysers and monitoring systems for a variety of industrial, environmental and safety applications.
Like dust and particles, gas is common in industrial airflows. Gas is produced during, for example, the production of alumin-ium, cement and artificial fertilizer as well as waste incinera-tion. Many gases are hazardous and are subject to strict emis-sion standards. Carbon dioxide (CO2), nitric oxide (NOx), sulphur dioxide (SO2) and hydrochloric acid (HCl) are examples of such gases. Also present are heavy metals such as mercury. These gases are not only toxic, but can also be combustible.
POWERFUL TECHNOLOGYFTIR (Fourier Transform Infrared) spectroscopy is a powerful technology that can simultaneously measure up to 50 dif-ferent gases in one flow. The ability to discover and measure basically all gases makes the technology suitable for many complex applications.
Gasmet’s operations rest on its proprietary portable gas anal-yser, comprised of infrared scanning hardware connected to software for estimating gas traces. Since it was founded in 1993, Gasmet has delivered more than 4,000 portable units.
Gasmet also develops fully automatic stationary systems for continuous monitoring of hot, wet and corrosive gas streams.
The company also has a system specially designed to monitor mercury.
As with Nederman, service and the aftermarket are priority functions. The organisation covers some 70 markets with technical support and spare parts sales.
Examples of customer groups include energy production, waste incineration, and fire and rescue services as well as universities and research organisations.
Nederman Annual Report and Sustainability Report 201926

Other Nederman technologies for gas and particle monitoring NEO MONITORSNEO Monitors’ portfolio includes different solutions for the measurement of numerous gases. The solutions are based on laser technology, an area where the company has been a pioneer for several industrial applications. NEO Monitors was acquired in 2017.
AUBURN FILTERSENSEAuburn FilterSense’s (AFS) products and systems for con-tinuous particle monitoring include sensors, control units, monitoring units, and detection and diagnostics software for increased process control, maintenance planning and compliance with regulatory requirements. The company was acquired in 2018 and is based in Boston in the US.
Gasmet in brief ■ Headquartered in Helsinki, Finland ■ Business activities in Germany, the UK, Can-ada, Hong Kong and Austria
■ Sales of approximately EUR 23m (2019) ■ Approximately 100 employees
■ The market’s largest portfolio of installations for FTIR gas analysis with some 4,000 units installed in about 80 markets
■ Part of Nederman Monitoring & Control Tech-nology since December 2019
27Nederman today

Financial objectives
Continued growth and strengthened marginThe long-term work of developing the Group in line with our prioritised strategies is based largely on the fact that we are active in a mature industry with limited potential for organic growth. Acquisition-based growth is therefore paramount in achieving the size needed to realise economies of scale in the business.
In parallel with growth, the efficiency of the business, measured as the adjusted operat-ing margin, is a vital parameter in managing the day-to-day operations of the operating units.
Nederman Annual Report and Sustainability Report 201928

0
5
10
15
20
25
30
35
40
20192018201720162015 0
5
10
15
20
20192018201720162015
-5
0
5
10
15
20
201920182017201620150
2
4
6
8
10
20192018201720162015
Sales growth, % Adjusted operating margin, %*
Group objective: The adjusted operating margin is to be at least 10 per-cent.
Target realisation: In 2019, the adjusted operating margin was 8.1 per-cent. The average for the last five-year period was 8.5 percent.
Group objective: Annual sales growth over a business cycle is to amount to 10 percent.
Target realisation: In 2019, sales growth amounted to 21 percent. Aver-age growth during the last five-year period totalled 9 percent.
Dividend policy,percent of net profit after tax
Group objective: Dividends are to amount to between 30 and 50 percent of net profit after tax with consideration given to the capital structure and acquisition plans.
Target realisation: For 2019, the dividend proposed by the Board amounted to 39 percent of net profit. The average for the last five-year period was 38 percent.
Return on operating capital, %*
Group objective: The return on operating capital is to be at least 15 per-cent.
Target realisation: In 2019, the return on operating capital was 14.1 per-cent. Average annual growth during the last five-year period was 16.9 percent.
* Nederman Group applies the retroactive approach in relation to IFRS 16 Leases and figures for 2018 are there-fore restated pursuant to the new standard. For earlier financial years, IAS 17 Leases was applied in accor-dance with the accounting policies that applied through 2017. See also accounting policies on pages 93-98.
29Nederman today

How we shape the future for clean air
Nederman Annual Report and Sustainability Report 201930

In its State of Global Air report, HEI states that “Clean air is becoming a rare luxury: only 5% of the world’s population breathes clean air.”
These are of course alarming figures, but for Nederman, this signifies that our business is more important than ever and that the demand for solutions for efficient cleaning of air will continue.
This gives us the energy to make further investments in research, development and acquisitions in order to maintain our position as the world leader in our industry.
Nederman Future Days In 2019, the first Nederman Future Days was held to shine the spotlight on the global problem of poor air quality and how Neder-man can become an integrated part of the solution. The list of speakers was impres-sive. Robert O’Keefe from HEI spoke about air quality and health from a global perspec-tive. Connie Hedegaard, former European Commissioner for Climate Action and Danish Minister for Climate and Energy, spoke about the next steps towards a more sustain-able world and who must do what. Anders Borg, former Swedish Minister for Finance, described how digitalisation and globali-sation will transform our economy and our future.
Robert O’Keefe
Connie Hedegaard
Anders Borg
Nederman Future Days will return in 2020. More information is available at nederman-futuredays.com. Videos of the year’s presen-tations can also be found on the website.
31Nederman tomorrow

Global challenges drive our development agenda
In order for our society to continue to develop and evolve with-out having to forsake growth, we need to balance increased pro-duction with a greater consideration for our finite resources and demands for sustainable solutions.
Global perspectiveGreater prosperity, in every sense of the word, demands that we weigh the environ-mental impact and use of society’s finite resources in our economic models. The tra-ditional measure of GDP must increasingly yield to, or be complemented with, other measures of prosperity that better take into account the environment, sustainabil-ity and social factors.
For Nederman’s customers, this means that a growing population and greater pros-perity will give rise to more consumption and, consequently, greater demand for higher production capacity. As a direct result of this, the air in and around the pro-duction environments will be negatively affected. Nederman’s solutions aim to reduce these effects. Our development work is carried out on the basis of a few clear industrial and social drivers.
Nederman Annual Report and Sustainability Report 201932

9.7 billion
Expected population in 2050, billion people
(today: 7.7 billion)
130%How much the world’s
collective GDP is expected to increase between
2016 and 2050
65%Share of people
considered middle class in 2030 (today: 50%)
Sources: FN, Homi Kharas, Global Econ-omy and Development at Brookings, Pwc: The World in 2050.
ECONOMIC VOLATILITYMacroeconomic trends no longer tend to be cyclical but are instead unpredictable. This will affect our customers’ ability to plan investments and create long-term value.
ACCESS TO CLEAN AIRAccess to clean air is a central part of Ned-erman’s promise. This applies not least to growth markets, such as China, where questions regarding clean air can often be the trigger for local stakeholders’ interest in sustainable operations.
STRICTER LEGISLATIONThere is evidence in several countries of emerging legislation in terms of CO2 and other emissions into the air. Stricter legis-lation is also being introduced in such areas as human rights, anti-corruption and trans-parency.
ACCESS TO ENERGYChanges in the energy mix being imple-mented in order to mitigate climate change will lead to price volatility in the market for fossil fuels. For a period of time, the transi-tion to renewable energy sources may lead to an energy shortage for both Nederman’s own business and for the Group’s custom-ers’ operations.
URBANISATIONThe ongoing urbanisation and constant expansion of cities means that production will rapidly be localised along with other activities and the tolerance for emissions will be even lower. A growing middle class is expected to lead to higher consumption, particularly in growth markets, which will impact both economic growth and access to resources.
A CONNECTED WORLDThanks to the internet’s global communi-cation capacity, events in one part of the world can have an immediate impact on how Nederman is perceived by all of the Company’s stakeholders. Thanks to the emergence of connected products, all com-panies are able to gain a greater insight into how well their products function when used by customers. This will generate new opportunities and increase demands on transparency.
TRUST AND INTEGRITYTrust and integrity are relevant to every aspect of Nederman’s business activi-ties. The Company’s ability to build sound and fruitful customer relationships and to attract, retain and develop talented and driven employees depends on the Com-pany being transparent, honest and confi-dence-inspiring.
AWARENESSConsumers are showing a growing ten-dency to base their purchasing decisions on how various products have been produced. This increasing awareness affects both our customers and our relationships with local stakeholders. By extension, legislation may also be affected.
33Nederman tomorrow
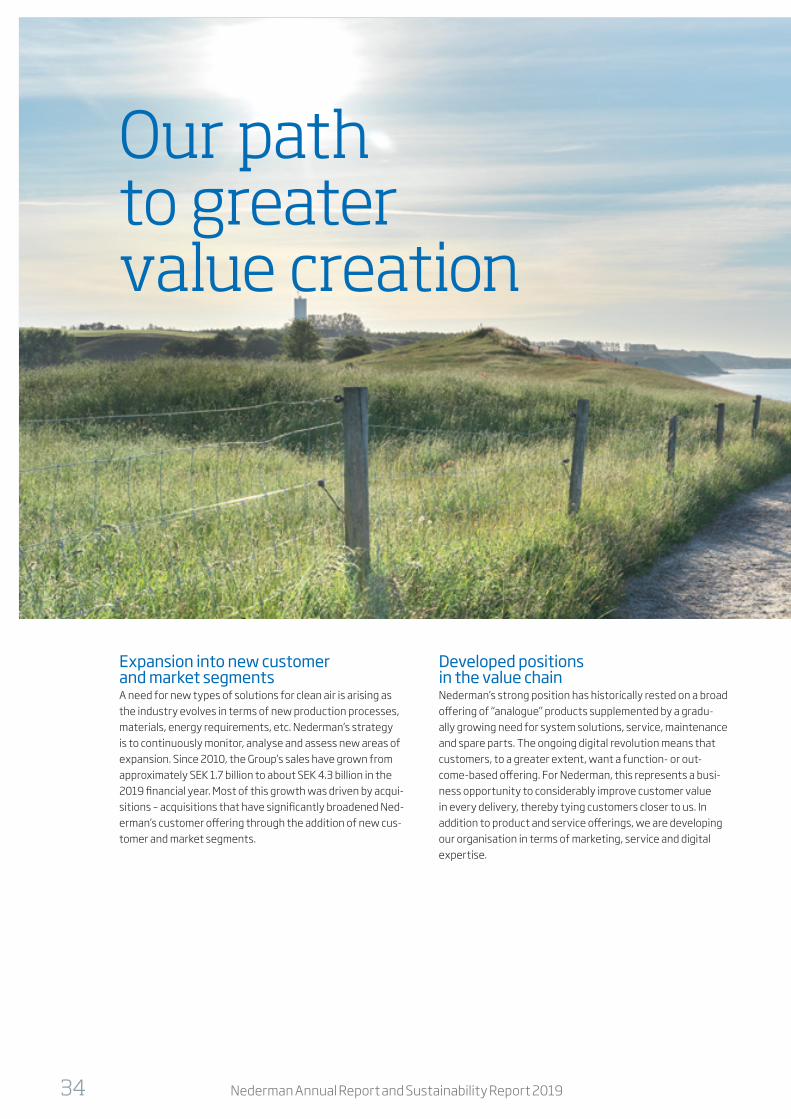
Our path to greater value creation
Expansion into new customer and market segmentsA need for new types of solutions for clean air is arising as the industry evolves in terms of new production processes, materials, energy requirements, etc. Nederman’s strategy is to continuously monitor, analyse and assess new areas of expansion. Since 2010, the Group’s sales have grown from approximately SEK 1.7 billion to about SEK 4.3 billion in the 2019 financial year. Most of this growth was driven by acqui-sitions – acquisitions that have significantly broadened Ned-erman’s customer offering through the addition of new cus-tomer and market segments.
Developed positions in the value chainNederman’s strong position has historically rested on a broad offering of “analogue” products supplemented by a gradu-ally growing need for system solutions, service, maintenance and spare parts. The ongoing digital revolution means that customers, to a greater extent, want a function- or out-come-based offering. For Nederman, this represents a busi-ness opportunity to considerably improve customer value in every delivery, thereby tying customers closer to us. In addition to product and service offerings, we are developing our organisation in terms of marketing, service and digital expertise.
Nederman Annual Report and Sustainability Report 201934

The basis of Nederman’s strategy is to generate value for our customers by supplying solutions for clean air that make their operations more efficient, profitable and sustainable.
Within the Group, we work with a broad product and service programme that targets a multitude of applications and market segments. We have comprehensive strategies in place in order to steer the organisation in its long-term development. These strategies are not to be viewed as a detailed action plan set for a specific time period.
We prioritise four areas in which we believe that further progress will gen-erate the greatest benefit – for both Nederman and for our customers.
Development of new products and solutionsContinuous development and adaptation of the product range to meet new requirements in terms of energy con-sumption, maintenance costs and recycling of material is nec-essary if we are to maintain our strong positions and develop our brand. In recent years, Nederman has also prioritised the development of a completely new digital product portfolio.
Geographic expansionNederman is currently the market leader in EMEA, sec-ond-largest in the Americas, and one of the top five in APAC, the market expected to grow fastest in the future. Industrial production is markedly affected by the globalisation trend, and it is therefore important to have a presence in markets where we can expect an increase in industrial production. Acquisitions often mean that the Group gains new customer or market segments, but also a presence in new geographic markets. For example, the acquisition of Luwa in 2018 con-siderably strengthened our presence and brand in APAC. It is equally important to continuously develop business activities in existing markets by adding new or complementary sales offices, resellers and agents.
35Nederman tomorrow
The digitalisationjourney
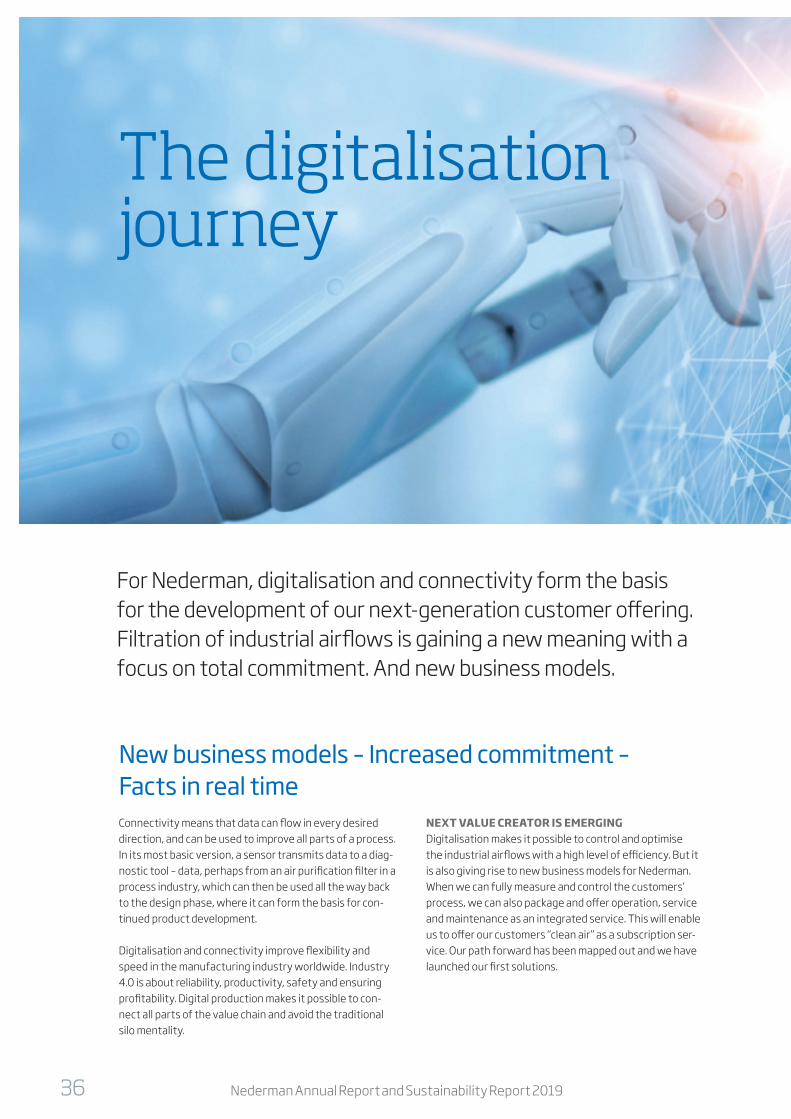
For Nederman, digitalisation and connectivity form the basis for the development of our next-generation customer offering. Filtration of industrial airflows is gaining a new meaning with a focus on total commitment. And new business models.
New business models – Increased commitment – Facts in real timeConnectivity means that data can flow in every desired direction, and can be used to improve all parts of a process. In its most basic version, a sensor transmits data to a diag-nostic tool – data, perhaps from an air purification filter in a process industry, which can then be used all the way back to the design phase, where it can form the basis for con-tinued product development.
Digitalisation and connectivity improve flexibility and speed in the manufacturing industry worldwide. Industry 4.0 is about reliability, productivity, safety and ensuring profitability. Digital production makes it possible to con-nect all parts of the value chain and avoid the traditional silo mentality.
NEXT VALUE CREATOR IS EMERGINGDigitalisation makes it possible to control and optimise the industrial airflows with a high level of efficiency. But it is also giving rise to new business models for Nederman. When we can fully measure and control the customers’ process, we can also package and offer operation, service and maintenance as an integrated service. This will enable us to offer our customers “clean air” as a subscription ser-vice. Our path forward has been mapped out and we have launched our first solutions.
Nederman Annual Report and Sustainability Report 201936

Vision 2025: Clean air as a service
Connectivity & Service commitment
Control system Uptime commitment
Compliance
Filtration as a service
Clean air as a service
Smart connected filter
Smart filterProduct-based o�ering Solutions-based o�ering Funtion-based o�ering Outcomes-based o�ering
Digital drivers ■ Analysis capability. Smarter production plan-ning based on technical, financial and social parameters.
■ Flexibility. The option to adapt to changing demand patterns.
■ Streamlined distribution chain. Vast quan-tities of data make it possible to predict the need for a certain component as well as where and when it must be available.
■ Servicification. Focus on delivering target realisation in a long-term commitment.
37Nederman tomorrow

IoT
Nederman Insight
YieldMaintenance Energy consumption UptimeSustainability System performance
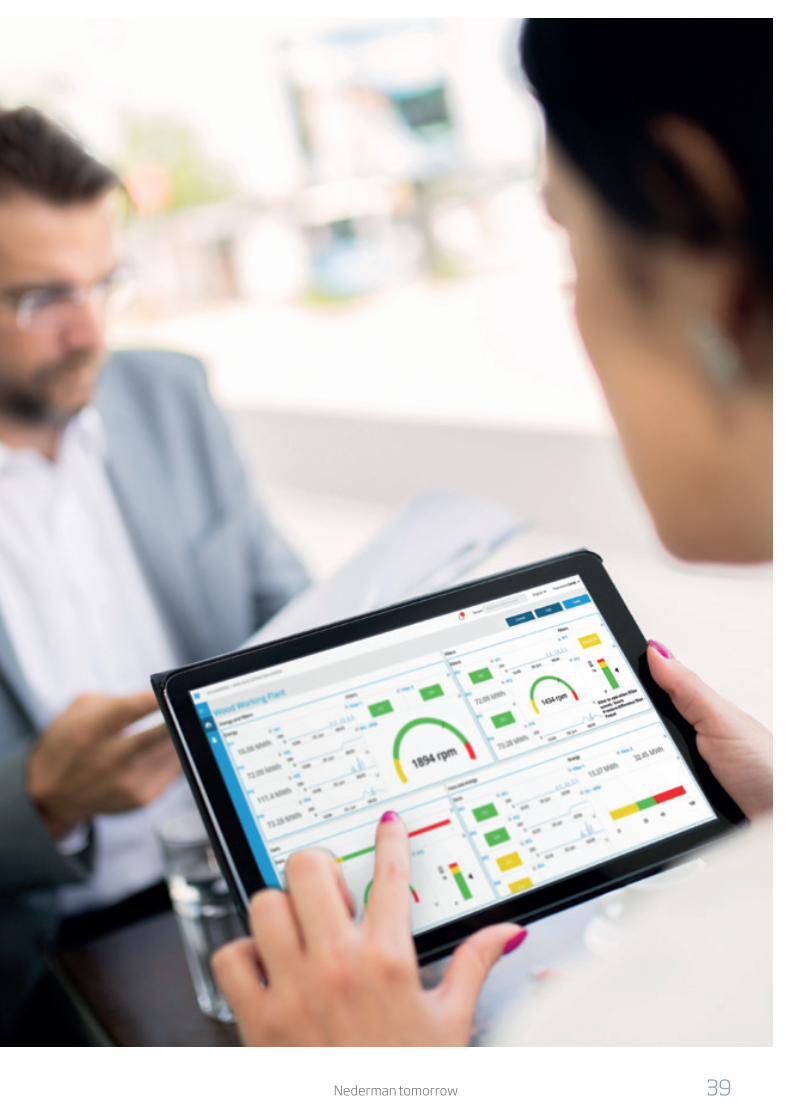
The hub: Nederman Insight IoT platformInsight is a cloud-based IoT platform specifically designed by Nederman for filtration systems. It offers real-time visualisation and monitoring of system performance, including customised dashboards, alerts and alarms. All data is securely stored and accessible online and in mobile devices. The platform enables the user to optimise the system’s performance, plan mainte-nance better and generate filtration reports.
What Nederman Insight offers
REMOTE MONITORING: ■ Control the filter remotely, either inside
or outside the plant ■ Access the filtration system at any time
and from anywhere to make smart and informed decisions
PERFORMANCE OPTIMISATION: ■ Historical filter data and trends help to
improve performance ■ Minimise the risk of unscheduled downtime
Sensors: Assembled throughout the system to monitor parameters and functionalities such as vacuum levels, EX safety components, temperatures, pressure drops, dust bin level and compressed air.
Communication kits: A gateway securely delivers data in real time to the Nederman Insight cloud so that the system can be monitored remotely.
Data storage: Operational data is securely stored in the cloud and is always accessible.
Dashboards: User-friendly visualisation of the system’s performance.
Nederman Annual Report and Sustainability Report 201938
39Nederman tomorrow

Future-proofed SmartFilters
Insight ready, steady, go!We launched our first SmartFilters in 2019. SmartFilters are based on our market-lead-ing analogue filter solutions which are now supplemented with digital components. We call the solution “Insight ready”, with links to our Insight IoT platform. SmartFilters are the necessary first step in enabling a digital air filtration flow. As of 2020, all standardised Nederman filter solutions will be delivered Insight ready.
FILTER + NEDERMAN INSIGHT ■ operation optimisation ■ longer filter lifespan ■ performance data ■ reduces unscheduled maintenance ■ better safety for staff and equipment ■ energy efficiency
Our SmartFilters MCP AND MEP SMARTFILTERSMCP and MEP SmartFilters represent the latest solutions in industrial air from Nederman. The filters capture dust and fumes from welding and industrial processes. They are also designed for safe handling of combustible dust.
FLEXPAK INSIGHTThe market-leading, high-vacuum solution for handling weld-ing fumes, dust, metal shavings, composites, etc. in many applications.
Nederman Annual Report and Sustainability Report 201940

Others call it air purification. We call it myAir.
Control over the air flow with the market’s first subscription offering. Nederman myAir is a solution-based sub-scription service based on Nederman’s SmartFilters and Insight IoT platform. As the name implies, we can now measure, anal-yse and optimise the filtration process and thereby enable customers to fully utilise and take responsibility for their air. myAir will be launched on a large scale in 2020.
■ Process data ■ Operation optimisation ■ All applications, all industries
MYAIR COMBINES ■ Filtration solution: IoT-compatible filter solution with
filters, pipe systems, fans, control units, control panels and accessories. The solution includes cloud-based soft-ware for filter analysis and alert functions, and facilitates remote monitoring and active problem solving.
■ Two levels of monitoring modules: Perform and Per-form Plus.
■ Service and support package: Two versions depending on the customer’s needs and technical solution – “On-site,” in which Nederman is responsible for service activities on site, and “Online,” in which Nederman offers a help desk service for proactive monitoring of the system based on real-time data.
Nederman myAir will be launched in 2020. The offering will initially include products and services supplied by the Extraction & Filtration Technology division under the Ned-erman brand. In a later phase, we will also launch a version of myAir based on the Process Technology division’s range under the MikroPul and Luwa brands.
More information about Nederman’s philosophy, products and solutions can be found in our Knowledge Centre at ned-erman.com
41Nederman tomorrow

MikroPul-Assist optimises operation and minimises maintenance for Victaulic Drezdenkos MikroPul-Assist is a service offering designed by Nederman’s Process Technology divi-sion that combines remote monitoring with on-site maintenance service. One of the first deliveries was carried out in 2019 and went to the piping systems company Victaulic Drezdenko.
The Beijing Olympics Stadium and the Eiffel Tower are two of the famous projects that Victaulic Drezdenko helped to realise.
Nederman delivers filtration solutions to Victaulic Drezdenko’s new foundry in Poland.
Nederman Annual Report and Sustainability Report 201942

Six PLC-controlled filters, specially designed to minimise the need for maintenance, are the hub in Nederman’s solution.
MikroPul optimises energy consumption for ScaniaScania, a Swedish icon in heavy transport with many legendary models on its list of merits, is one of the leaders in the indus-try’s transition to sustainable transport systems. Management of air emissions from the company’s own production oper-ations is one component of this transition, and Nederman MikroPul is an important partner.
The foundry in Södertälje, where it all once started, is undergoing a large-scale expansion. The goal is to triple production capacity. The requirement specification includes a reduction in energy consump-tion compared with the Group’s existing plants plus an increase in the share of renewable energy.
Control of the industrial airflow is a key factor in realising the company’s goals, and the choice fell to Nederman MikroPul’s solution featuring six FS filtration units reinforced by heat exchangers. The FS filters are energy efficient and simultane-ously guarantee a good work environment and emissions control. Heat exchangers installed throughout the plant recover warm surplus air and transfer it back to the process, resulting in optimal energy use.
The plant is under construction and will be delivered during the third quarter of 2020.
Nederman optimises energy consumption for Scania.
Victaulic Drezdenko is the world leader in solutions for mechani-cal piping applications. Its operations include design, development, manufacturing and service of solutions for ducting of advanced pip-ing systems for the construction, shipbuilding, mining and process industries. The company is headquartered in Easton, Pennsylvania in the US, and has 13 manufacturing plants and some 3,000 employ-ees worldwide.
Tough requirement specificationsNederman has partnered with Victaulic Drezdenko in the past concerning solutions for advanced air filtration in their production plants. When Victaulic Drezdenko decided to expand its iron foundry in Poland, Nederman was the company’s preferred filtration solu-tion supplier. The operations are carried out using grinding products and the company has strict requirements in terms of a safe work environment and compliance with environmental rules.
Nederman’s solution is built on extensive applications expertise and experience of foundry operations. Design and planning were carried out in close collaboration with the customer. The solution is based on six PLC-monitored MJB-G filters which Nederman customised to minimise on-site maintenance needs. The system’s total cleaning capacity corresponds to 190,000 m3/h. The Process Technology and Extraction & Filtration Technology divisions collaborated on deliv-ery, and operation is scheduled to begin during the first quarter of 2020.
MikroPul-Assist optimises operationThe plant is the first in which Nederman has installed MikroPul-As-sist. MikroPul-Assist is a service package based on the Nederman Insight IoT platform that enables remote monitoring of operations in real time via built-in sensors and a cloud solution. Operating data is presented on mobile devices and provides the basis for informed decisions regarding operation optimisation and compliance with regulatory requirements. Service and maintenance are carried out by local technicians with a minimum of downtime.
Nederman delivers filtration solutions to Victaulic Drezdenko’s new foundry in Poland.
43Two customer cases

SustainabilityIntensified efforts result in significant progress
Sustainable development and production are natural elements of Nederman’s business activities. Although the greatest environmen-tal impact stems from our customers when they use our air filtra-tion solutions during extended operations, it is essential that we can show tangible progress in our own business. In 2019, we revised our sustainability strategy and expanded the targets and key figures. For the first time, we are now reporting our climate emissions in accordance with the Science Based Targets initiative (SBTi).
Milestones in 2019• Revised sustainability strategy• Climate impact report in accordance with Scope 1–3• Expanded commitments and targets
The sustainability report that follows on pages 44–59 is a summary of the most important elements. For a complete report, refer to the Sustainability section on our website, nedermangroup.com.
Nederman Annual Report and Sustainability Report 201944

“ We view sustainability and climate commitment as business critical, both for our customers and for us. Being an indus-try leader gives us a definite competitive advantage and we want to be able to present tangible figures for the results that we achieve.”
Sven Kristensson, President and CEO
45Sustainability Report

Responsible businessNederman’s sustainability agenda is built on responsible business, high transparency and sound business ethics. It is vital that we continuously improve our products’ environmen-tal performance and minimise the negative impact of our own business activities. Through resource-efficient production and innovative clean air solutions, we contribute to creating growth and value for all stakeholders throughout the entire value chain.
Sustainable value creationThe UN Sustainable Development Goals (SDGs) form the framework for our efforts to meet future financial, social and environmental challenges. Nederman can help to achieve many of the SDGs with the help of our products and solutions. The benefits and value offered by Nederman’s solutions are created in cooperation with the customers and enable them to reduce their climate burden and achieve set sustainabil-ity goals. Innovations based on digital technology provide us with more opportunities to measure and steer the custom-er’s air filtration process, resulting in substantial resource efficiency enhancements.
Our views on sustainable developmentBased on our business concept, Nederman has a long tradi-tion of responsible business. Our philosophy is to strive for constant improvements that can be measured over time.
In 2019, a new strategy for the Group’s sustainability agenda was prepared. The strategy is for the 2020–2022 period and is an extension of the previous model that applied for the 2013–2020 period.
Nederman’s promise – to protect people, our planet and pro-duction – is the foundation of our sustainability agenda. The objective is to minimise negative social, environmental and financial effects of industrial production within our own busi-ness activities as well as those of our stakeholders, focusing on those areas where we can do most good.
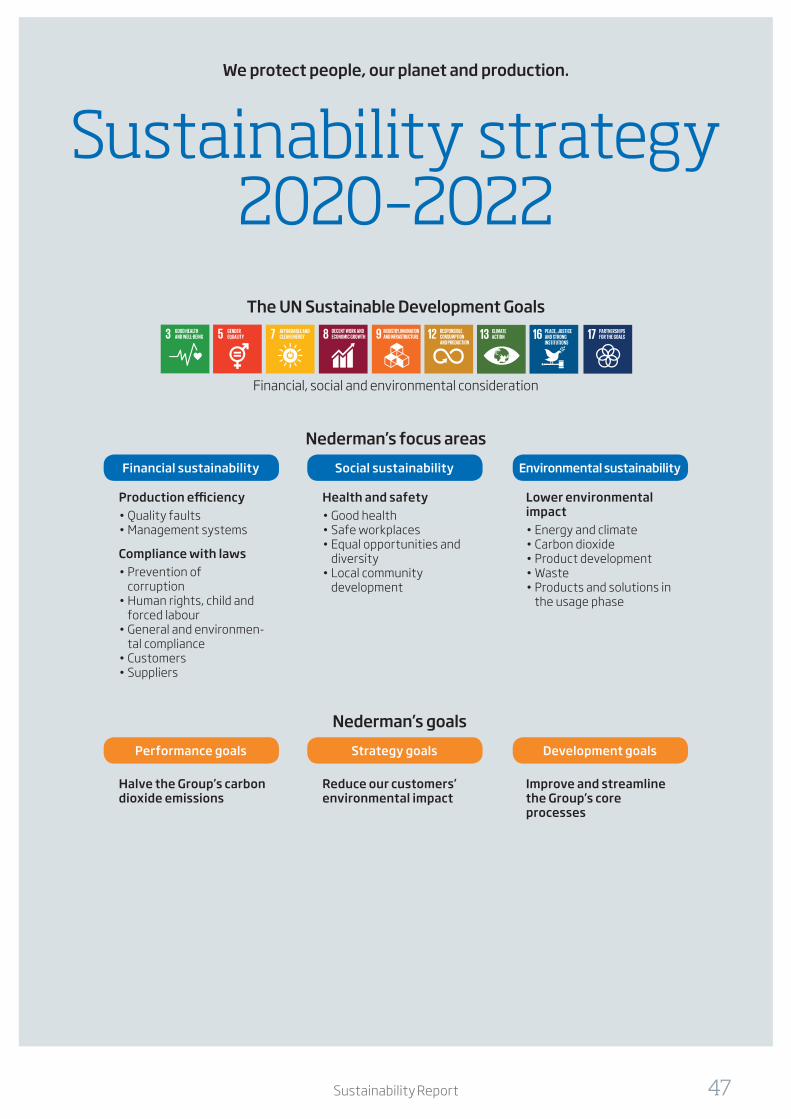
The strategy covers four focus areas:
■ Production efficiency (financial sustainability) ■ Compliance with laws (financial sustainability) ■ Health and safety (social sustainability) ■ Lower environmental impact (environmental sustainabil-
ity) There are commitments and targets affiliated with each area that aim to either maximise the business activities’ positive effects or minimise the negative. The overall targets for the 2020–2022 period are to:
■ Halve the Group’s carbon dioxide emissions ■ Reduce our customers’ environmental impact ■ Improve and streamline the Group’s core processes, includ-
ing those that are customer related
Updated performance measuresAs a result of the process of revising the sustainability strategy during the past year, we have also introduced new performance measures that apply for all divisions. We also updated the relevant methods and ownership in order to measure and assess process performance, ensure reliable results, share best practice and identify improvement needs.
Nederman Annual Report and Sustainability Report 201946
Sustainability strategy 2020–2022
The UN Sustainable Development Goals
Production efficiency• Quality faults• Management systems
Compliance with laws• Prevention of
corruption• Human rights, child and
forced labour• General and environmen-
tal compliance• Customers• Suppliers
Health and safety• Good health• Safe workplaces• Equal opportunities and
diversity• Local community
development
Lower environmental impact• Energy and climate• Carbon dioxide• Product development• Waste • Products and solutions in
the usage phase
Financial sustainability Social sustainability Environmental sustainability
Performance goals Strategy goals Development goals
Halve the Group’s carbon dioxide emissions
Reduce our customers’ environmental impact
Improve and streamline the Group’s core processes
Nederman’s focus areas
Nederman’s goals
We protect people, our planet and production.
Financial, social and environmental consideration
47Sustainability Report

Sustainability as part of the Group’s governance modelAs part of our overall governance model, sustainability con-stitutes an integral part of the Group’s strategy and business processes. These processes apply to all divisions and cus-tomer offerings, and are aimed at long-term value creation for all our stakeholders.
During the year, the governance model and meeting struc-ture have been reinforced with an additional decision-mak-ing forum (boards) in priority areas, which are the basis for ensuring the operations are governed and run correctly, effi-ciently and ethically.
The governance model provides a base from which to develop and cement the Group’s strategies, goals and plans. By includ-ing sustainability issues in the governance model, we ensure that these issues are integrated into all significant decisions within our operations.
Leadership with a focus on process governance, communi-cation and training is an important factor when it comes to improving knowledge and achieving expected results in the area of sustainability, both internally and externally.
Shared approachA global management system provides us with a shared approach and a consistent global application of how we conduct our business activities. In addition to business pro-cesses, there are a number of comprehensive policy docu-ments – such as Nederman’s Code of Conduct – and docu-ments that provide guidance on matters that concern the environment, social responsibility and business ethics.
Long-term goals and performance measures are defined for every division and are part of the business plan for each division. Group management is responsible for follow-up and development based on the Group’s governance model. Sup-plementary internal controls are carried out to assess busi-ness processes and policies in order to ensure that our busi-ness activities are conducted according to the guidelines.
Data collection and reportingThe internal collection of data is mandatory for all production units and is primarily carried out through quarterly reports and reviews.
Sustainability reporting based on environmental certification (ISO 14001) and quality certification (ISO 9001) is carried out in the same system as the financial reporting.
External reports on our sustainability efforts are published via nedermangroup.com, where developments are regularly updated. Condensed reporting is also performed in conjunc-tion with the annual report and interim reports.
Nederman Annual Report and Sustainability Report 201948

Agenda 2030 – The UN Sustainable Development Goals
Within the framework of Agenda 2030, the UN presented its Sustainable Development Goals in 2015. The 17 SDGs provide a clear and applicable framework for meeting global chal-lenges and have had a major impact on society.
At the same time, they are an invitation to sustainable inno-vations and business opportunities. Private and public organ-isations have an important role to play, and the business community is expected to contribute through responsible business, transparent reporting of its own goals and results, and the development of products and solutions for custom-ers that contribute to sustainable development.
The SDGs have provided support for Nederman as we iden-tified areas within sustainable development that are clearly
linked to our business activities and where we can play an active part. Based on the SDGs, we see the potential to reduce our environmental impact and to create business opportunities.
The goals we identified as relevant are SDGs 3, 5, 7, 8, 9, 12, 13, 16 and 17.
An important starting point in achieving the goals is to mini-mise Nederman’s use of resources. We do so by working with innovations, efficiency enhancements, investments in new technology and increased use of renewable energy. The SDGs also inspire measures within social responsibility, community involvement and business ethics.
49Sustainability Report

Knowledgeable and dedi-cated employees who deliver in their roles Every successful company is built on the same foundation – talented employees who drive the business forward every day. Nederman is no exception, and the rapid progress that the Group is experiencing through digitalisation, globalisation and frequent acquisitions is plac-ing demands on an employee culture to attract, retain and develop people who deliver when it comes to commitment and performance.
ON ROUTE TO A COMMON VISIONImagine a world without clean air. That is the easiest way to understand the importance of what we do on a daily basis – in our development departments, production plants and ser-vice organisations. Working for a company that has a vision that is not based solely on financial goals is a deciding factor for many employees. Being part of building a future charac-terised by the vision of clean air requires conscientious and consistent work based on shared values. Profitable customer focus, respect for the environment and each other, and hav-ing the courage to act are core values that serve as a founda-tion as we build The Clean Air Company.
VALUES THAT UNITE US ■ Profitable customer focus ■ Respect for the environment and each other ■ The courage to act
DEDICATED EMPLOYEES LEAD TO IMPROVED CUSTOMER SATISFACTION AND PROFITABILITYStrong dedication among our employees is vital if Nederman is to develop and improve. Dedication results in customer sat-isfaction and profitability, and is built on an open and honest dialogue between the Company and its employees.
Well functioning teams & a good psychosocial work environment
Growth & Pro�tability
Promoters
Engaged employees
Leadership & Management
Culture & Values
© Brilliant Future.
Nederman Annual Report and Sustainability Report 201950

It is fundamental for Nederman to cultivate a sound psychosocial work environment with a well-functioning team where employees who are seen and heard grow and develop.
Based on a shared culture, and with supportive leadership, our objective is to cultivate individual dedication in every employee, and make everyone feel that they are ambassadors for the Company. Good relationships between the Company and its employees gen-erate better conditions for Nederman to successfully attract the talent needed to further develop the Company.
HOW WE BUILD THE CULTURE OF THE CLEAN AIR COMPANYProud and talented employees who deliver in their roles. This is the vision for the Group’s HR agenda and it permeates our efforts related to our corporate culture, employer branding, leadership and recruitment. Our success is dependent on clear roles and conditions for each employee so that they are able to perform and deliver in their respective roles. HR’s task is to cultivate these conditions. To reinforce these efforts, the previous strategy for the 2020–2022 period was further developed. The strategy covers guidelines for governance, management, systems/tools and KPIs.
Build capabilities Create engagement Streangthen
the
team
51Sustainability Report

NEW TOOLS FOR IMPROVED EFFICIENCYnGage and myLearning are new digital tools that were introduced in 2019 with the aim of promoting engagement and strategic skills development, supporting managers and supervisors, and streamlining administration and follow-up. Nederman currently has about 2,400 employees who rep-resent many different cultures from around the world. This places significant demands on speed, simplicity and trans-parency. HR tools that are user friendly and engaging, with a modern look and feel, and adapted for use on all digital platforms increase usage. Support for managers in their work related to results, action plans and follow-up has also guided the choice of new platform tools.
MYLEARNING – SKILLS DEVELOPMENT WITH POWERFUL MANAGER SUPPORTmyLearning, a learning management platform for continuous skills development within the Group, was introduced during the year. The system contains powerful manager support and even provides the option of role-based training. myLearning is designed for all digital environments, and makes it possible, for example, to quickly integrate new
employees in conjunction with acquisitions. One example is Gasmet, where all employees attended a compulsory intro-duction course within one month from the date of acquisi-tion. Courses in compliance with regulatory requirements are also carried out in myLearning. All new employees receive an invitation to the compulsory courses in the mail when they start work. Once fully implemented, the programme will also include Nederman’s partner and distribution network.
PROCESS TECHNOLOGY ACADEMYIn 2019, the Process Technology division started a new case-based training programme for skills development with a com-mercial focus called the Process Technology Academy. The training is primarily targeted at employees in sales-oriented positions and covers, among other topics, training in market analysis, segmentation and value-based customer offerings. It covers all markets, and some 20 employees completed the training in 2019. To make it possible for employees from the different countries within the division to participate, the programme is fully digital and includes webinars and Skype meetings.
Engagement
IndexBenchmark Industry 75
Nederman Group
82
nGage – increased employee engagement Nederman’s annual employee satisfaction survey measures the overall engagement and satisfaction of our employees in a simple and quick man-ner. The survey has been carried out since 2013 and is currently offered to all employees.
In 2019, 79 percent of all Group employees responded to the survey. The overall Engagement Index was 82 (on a scale of 1 to 100), which is higher than the corresponding index for the comparison groups Global Bench-mark and Industry. Other indexes also revealed better results for Neder-man than for the comparison groups.
Nederman Annual Report and Sustainability Report 201952

Compulsory coursesCompliance with regulatory requirements
■ Code of Conduct ■ Anti-corruption, anti-trust, anti-fraud ■ GDPR (for Europe) ■ Policy for export controls and sanctions (new 2019) ■ IT security (to be launched in 2020)
Global introduction ■ Core values ■ You@Nederman ■ Sustainability@Nederman (launched in 2020)
31 Dec 2019 31 Dec 2018
Number of employees 2,370 2,305
Of whom, consultants and hourly paid employees 199 260
53Sustainability Report

Climate report in accordance with Science Based TargetsSCIENCE BASED TARGETSThe Science Based Targets initiative is a partnership between CDP, the UN Global Compact, the World Resources Institute, WWF and other organisations. Its aim is to show companies how to conduct their business activities to prevent global warming in excess of 2 degrees Celsius in accordance with the 2015 Paris Climate Agree-ment.
NEDERMAN’S COMMITMENT ■ Scope 1 and 2: Reduce our direct climate impact related to
energy use and purchased electricity for the Group’s own manu-facturing units.
■ Scope 3: Reduce our indirect climate impact related to emissions from suppliers, business travel and customer solutions pertain-ing to materials, components, goods transports and waste man-agement.
STARTING LEVELS AND TARGETSNederman aims to reduce the Group’s Scope 1 and 2 climate impact by 20 percent by 2020 and by a total of 50 percent by 2022. The starting level is based on emissions in 2014.
REPORTING AND METHOD DEVELOPMENTData on energy and related greenhouse gas emissions is reported and followed up quarterly by Nederman’s Group management. Con-densed reporting is also performed in conjunction with the annual report and interim reports and is available on the Group’s website.
Methods for following up and reporting on Scope 3 are continuously being developed. The focus is on defining performance measures to measure the effects of our products and solutions when used by customers and following up on our suppliers’ emissions.
BASIS FOR CALCULATION OF SCOPE 1 AND 2To calculate Scope 1 and 2 emissions, a market-based method (pur-suant to the GHG Protocol, 2015) is used wherever possible. Com-parative data is not adjusted for acquisitions.
Reports are presented in CO2 equivalents (CO2e). The reported data for Scope 1 is based on energy use and related emission factors. Generally accepted country and region-specific emission factors are used in the calculation of Scope 2 emission data. These factors reflect each country’s average energy mix: sun, wind and hydro-power generate lower emissions, while higher use of fossil fuel, such as coal and oil, generates higher emissions. District cooling is not currently included in the reporting of greenhouse gas emis-sions, since its impact on the total carbon footprint is regarded as insignificant.
BASIS FOR CALCULATION OF SCOPE 3A general analysis of Scope 3 emissions along Nederman’s value chain indicates that the sourcing of materials and components com-prises the single largest emissions category. This is followed by pur-chased goods transports, business travel and waste.
The analysis is based on the Group’s own estimates and not on data from suppliers. The margins for error are significant and the Group’s Scope 3 emissions reporting is therefore limited to carbon dioxide emissions from goods transports and waste.
CLIMATE IMPACT IN 2019 IN ACCORDANCE WITH SCIENCE BASED TARGETS
Emissions to air, tonnes Outcome 2019
Outcome 2018
Outcome 2017
CO2-e Scope 11 810 571 560CO2-e Scope 22 5,023 5,054 5,106CO2-e Scope 33 8,252 4 7,027 4 6,709 4
Emissions, Scope 1+2 5,833 5,625 5,666
1 Scope 1: Total greenhouse gas emissions from fuel combustion in manufacturing, tonnes
2 Scope 2: Total greenhouse gas emissions from purchased electricity in manufactur-ing, tonnes
3 Scope 3: Greenhouse gas emissions from sources not owned or controlled by Neder-man, tonnes
4 For Scope 3 emissions, carbon dioxide emissions from goods transports and waste are reported. This is only part of Nederman’s Scope 3 emissions. A significant share of the emissions comes from materials. These emissions cannot currently be reported due to difficulties in collecting exact data.
ENERGY INTENSITYMWh/SEK billion 2019 2018 2017Total energy use (MWh) 14,870 14,694 14,948Sales, net sales (SEK billion) 1,489 1,438 1 398Energy intensity (kWh/SEK billion x 1,000) 9.99 10.22 10.69
BASIS FOR CALCULATIONPertains to all of the Group’s energy-generating emissions in accordance with Scope 1 and 2 in relation to net sales. Comparative data is not adjusted for acquisitions.
Nederman Annual Report and Sustainability Report 201954

Goal: Reduce energy consumption in production by 20 percent by 2020 compared with 2013. Outcome: The accumulated reduction of energy consumption in 2014–2019 was 20.5 percent.
Goal: Achieve 95 percent recycling of waste in production by 2020. Outcome: At the end of 2019, recycling amounted to 92.1 percent.
Goal: Reduce carbon dioxide emissions from air transport of goods by 20 percent by 2020 com-pared with 2014.Outcome: The accumulated reduction of carbon dioxide emissions was 16.8 percent.
Goal: 100 percent of the Company’s external suppliers will comply with Nederman’s Code of Conduct for suppliers by 2020.Outcome: At the end of 2019, the figure was 93 percent.
-20%
95%
-20%
100%
Energy consumption
Recycling
Carbon dioxide emissions
Code of Conduct
Nederman’s sustainability goals 2013–2020
Performance measures for sustainable developmentIn 2019, the strategy for the Group’s continued sustainability efforts underwent an extensive review and revision. The new sustainability strategy covers the period 2020-2022 and will therefore overlap with the reporting of the earlier strategy, which applied up until the end of 2020. Goals and goal realisation for both periods are presented on the following pages.
Global perspectiveThe Group has applied the UN Sustainable Development Goals (SDGs) and the Ten Principles for Sustainable Develop-ment in the UN Global Compact since 2015. The results are presented in accordance with the Global Reporting Initia-tive (GRI*). Furthermore, reporting of the climate agenda is adapted to the regulatory framework for sustainability reporting in accordance with the Swedish Annual Accounts Act (Chapter 6, Section 12).
*The comprehensive GRI Index, with reference to the UN Global Compact, is available at nedermangroup.com
External auditEY has reviewed and verified the Sustainability Report, focusing on the most material areas. Read their Assurance Report on page 144. All production units, apart from three from the most recent acquisitions, are certified in accordance with the ISO 14001 environmental management standard. All production units, apart from one, are certified in accordance with the ISO 9001 quality management standard.
The complete Sustainability Report is available at nederman-group.com
55Sustainability Report

Production efficiency
AGENDA 2030.
Nederman strives to use all resources more efficiently. We work actively to maximise the positive impact and minimise the negative impact throughout the value chain. In order to pursue changes where they make the most difference, col-laboration with business partners and other stakeholders is paramount.
QUALITY PROBLEMSGoal: More efficient use of resources. Costs related to quality problems in production, in relation to sales, compared with 2013 are to be <0.3% in 2020.Outcome: In 2019, the value was 0.35% (compared with 0.39 in 2018). The negative trend since 2016 has been broken. Next step: Failure to realise the goal has a negative impact on other sustainability goals due to such factors as increased electricity consumption as a result of reworking, increased carbon dioxide emissions from air transport to correct the error and delayed delivery times. Increased resource effi-ciency is therefore a priority.
MANAGEMENT SYSTEMGoal: All production units, and the parent company, are to have a management system that is certified according to ISO 9001 and ISO 14001. Acquired companies are to be certified within a two-year period.Outcome: At the end of 2019, all production units were cer-tified according to ISO 9001 except one (total 15 of 16, includ-ing acquisitions), and 13 of 16 units were certified according to ISO 14001. Furthermore, the parent company and a sales company were certified according to ISO 9001 and ISO 14001. All processes were assessed and modified in 2019 based on the new organisation. Over the past year, shared perfor-mance measures for all divisions were updated with the rele-vant methods and ownership in order to measure and assess process performance, ensure reliable results, share best practice and identify improvement needs.Next step: Yet another sales company and its related man-ufacturing operations and warehouse will undergo certifica-tion in 2020. The remaining production units are working on achieving certification.
0,0
0,1
0,2
0,3
0,4
201920182017201620152014
Quality failure costsQuality failure costs in production in rela-tion to turnover, %Objective 2020: 0,30 %
Nederman Annual Report and Sustainability Report 201956

Compliance with laws
AGENDA 2030
Nederman’s business principles are characterised by integ-rity, responsibility and sound ethics – fundamental principles that we share with our suppliers, customers and other stake-holders. The prevention of corruption is a top priority. The UN Global Compact serves as an ethical compass that provides support to the employees and generates business benefits in interactions with customers and other stakeholders.Goal: Nederman has zero tolerance for bribery, corruption, cartels or other criminal conduct, and actively provides infor-mation to the employees and training programmes for all sales and purchasing staff as well as managers.Outcome: Zero (zero) cases of significant violations of laws and agreements that have lead to legal action or fines were reported in 2019. A few reports were received in 2019 con-cerning suspected breaches of the Code of Conduct. Each report has been carefully investigated to discover any pos-sible shortcomings in compliance and has been followed up with relevant and proportional measures. The Group’s whistleblower system was revised and rein-forced during the year, enabling every employee, customer, partner and supplier to report suspicions of legal or judicial violations. Next step: Within the Group, companies, management and employees will collaborate on measures to prevent cor-ruption. Reccurring training programmes, information and discussions are vital tools in these efforts, particularly with regard to the whistleblower system.
HUMAN RIGHTS, CHILD LABOUR AND FORCED LABOURGoal: No violations of human rights, discrimination or forced labour will be tolerated. The right to freedom of association, trade union representation or other personnel representa-tion as well as collective bargaining in accordance with the Code of Conduct is clear, and Nederman actively provides information to employees and new recruits. Outcome: During the year, employees participated in training programmes with a particular focus on new recruits. Continu-ous efforts including preventative training of both manag-ers and employees, to prevent discrimination are carried out. Preventive training of both managers and employees. Zero (zero) cases of child labour or forced labour were reported. No units have been deemed to be at serious risk of violating the right of association. However, there are certain legal limita-tions to the right of association in China.Next step: Realising our “zero vision” in terms of offensive discrimination requires ongoing training, information and dis-cussions. Access to the necessary communication channels, such as a whistleblower system, when the need arises.
GENERAL AND ENVIRONMENTAL COMPLIANCEGoal: Ensure good governance in terms of general compli-ance to prevent legal sanctions or fines.Outcome: Zero (zero) cases of significant violations of laws and permits, including environmental compliance, that have led to legal sanctions were reported in 2019.Next step: Nederman’s success relies on its ability to con-duct legitimate business in accordance with applicable laws. Local governance follows the Code of Conduct and local leg-islation.
CUSTOMERSGoal: Customer requirements and social responsibility are to be satisfied by a healthy margin.Outcome: A large portion of Nederman’s customers have detailed requirements concerning sustainable development. During the year, assessments and audits were carried out at sales companies, among other places. None of these assess-ments and audits have prevented the customers from doing business with Nederman. Next step: Increased initiatives in sustainable development to improve customer value.
SUPPLIERSGoal: Work only with suppliers that ascribe to the applicable sections of Nederman’s Code of Conduct for Suppliers (100 percent in 2020). Outcome: At the close of 2019, the share of suppliers that have ascribed to Nederman’s Code of Conduct for Suppliers was 93 percent (compared with 86 percent in 2018). Sup-pliers’ compliance with this requirement is checked through audits and other measures. Some 56 (50) supplier audits were carried out in 2019. During the year, Nederman’s Code of Conduct has been evaluated and strengthend.Next step: Develop methods to assess suppliers’ sustain-ability efforts in order to promote accountability in the value chain.
0
20
40
60
80
100
20192018201720162015
Code of Conduct in the supply chainShare of external suppliers that has signed Nederman’s Code of Conduct for suppliers, %Objective 2020: 100 %
57Sustainability Report

Health and safety
AGENDA 2030
Nederman’s Code of Conduct is adopted by all companies in the Group and the values contribute to attracting, retain-ing and developing dedicated and skilled employees. The long-term goals for social responsibility cover measures that contribute to a sound and safe work environment, employee training and respect for human rights. Community involve-ment is gradually expanding in the countries where the Group operates.
GOOD HEALTHGoal: The goal for absence due to illness is set at <2.5 per-cent.Outcome: Statistics pertaining to absence due to illness indicate a positive trend since 2017, even when taking acqui-sitions into account. At the end of 2019, the rate of absence due to illness averaged 1.6 percent – well below our goal, in other words.Next step: Knowledgeable and dedicated employees who deliver in their roles are vital to Nederman’s success. Initia-tives are focused on helping our employees to be healthy, motivated and feel satisfied in their respective roles.
SAFE WORKPLACESGoal: The number of workplace accidents is to be minimised and we have a “zero vision” in this area. All units are to have functioning systems for reporting and addressing accidents and incidents. Outcome: From an industrial perspective, our accident fre-quency rate is low. In 2019, there were 38 accidents, none of which had a fatal outcome or resulted in lifelong injuries. Next step: Realising our “zero vision” requires constant tech-nical and organisational initiatives.
EQUAL OPPORTUNITIES AND DIVERSITYGoal: Nederman strives to achieve a balanced mix of ages, ethnicities and genders within the Group. The goal is to increase the share of women at all levels in the Group.Outcome: The share of women in the organisation as a whole is 20 percent (20). In a technical sector like the one in which we operate, it is a challenge to realise the goal of increasing the share of women. The share of women on the Board is 33 percent (33), and the share of women in Group management is 12 percent (12). The recruitment of women managers remains a key issue for Nederman. Next step: Management and HR will collaborate on measures locally and centrally in the Group companies.
LOCAL COMMUNITY DEVELOPMENTGoal: The ambition is to contribute to vocational introduc-tions by arranging thesis work and internships as well as initiating and participating in local networks and discussion forums. Outcome: During the year, we collaborated with various uni-versities on topics such as an analysis of Nederman’s internal sustainability communications, and with the Chamber of Commerce and Industry of Southern Sweden on targeted projects and activities. Next step: Nederman’s business activities concern and affect many people, sometimes entire local communities. Our ambition is to contribute to the local business community, social initiatives and the development of solutions for health and sustainable development for more people.
0,0
0,5
1,0
1,5
2,0
2,5
2019201820172016201520140
5
10
15
20
25
30
35
40
201920182017201620152014 0
20
40
60
80
100
Women
Men
01920182017201620152014
Sick leave, % Accidents Equality
Sick leaveresulting in at least one day’s abscence from workObjective: <2,5 %
Number of accidents resulting in at least one day of sick leaveObjective: 0 (zero)
Share of women and men in the organisation, %The objective is to increase the number of women at all levels in the company
Nederman Annual Report and Sustainability Report 201958

Lower environmental impact
AGENDA 2030
Climate change affects Nederman in several ways, and the transition to a society with a lower carbon footprint creates risks but also opportunities for the Group. By increasing our energy efficiency and phasing out fossil fuels, we are reduc-ing our own carbon footprint. These measures will also pre-pare us for potentially higher fees and taxes on activities that have a climate impact. Digitalisation and innovation are prior-ity areas where Nederman can contribute to our customers’ climate and environment agendas.
ENERGY AND CLIMATEGoal: More efficient energy use, enabling consumption to decline by 20 percent by 2020, compared with the average for 2013. The Group-wide performance measure is kWh/net sales, and the production units work with locally adapted goals and performance measures. All production units must present an activity plan for reduced energy consumption.Outcome: The accumulated reduction between 2014 and 2019 was just over 20 percent. In other words, already on par with the goal. The installation of a solar cell system on one of the production units (an application has been filed for yet another) is one example of an activity intended to further enhance efficiency.Next step: Energy mapping and tangible investments are planned at more units. Focus on switchover, the share of renew-able energy is expected to increase from 2020 and onwards.
CARBON DIOXIDEGoal: Emissions of the climate-affecting gas carbon dioxide are to decline by 20 percent by 2020, compared with the average for 2014. This goal refers to carbon dioxide emis-sions from goods transports by air.Outcome: The reduction of carbon dioxide emissions from air transports showed a continued positive trend. The accumu-lated reduction between 2014 and 2019 was 16.8 percent.
Next step: Achieving the 2020 goal will require strategic efforts and tangible measures at a few units that consider-ably deviate from the average.
PRODUCT DEVELOPMENTGoal: Environmental impact is to be assessed and minimised for 100 percent of all new products according to the Group’s product strategy plan. Outcome: All launches in 2019 are deemed to have achieved the goal of a reduced environmental impact.Next step: Nederman works actively to develop products and solutions that are as efficient as possible, with a reduced environmental impact and the lowest total ownership cost for the product’s entire service life.
WASTEGoal: The amount of waste is to continuously decline in rela-tion to net sales. The share of recycled waste is to increase by 95 percent by 2020, compared with the average for 2013. Outcome: The outcome for 2019 shows a continued negative trend. The degree of recycling amounted to 92.1 percent (93.7), compared with the target of 94.5. The total amount of waste in relation to net sales increased, partly because previously stored waste was discarded at a few units during the year. Next step: Develop a lifecycle perspective for waste issues and tangible measures at individual units that deviate con-siderably from the average in order to reduce scrapping and improve sorting of waste at source.
CUSTOMER USE Goal: The greatest environmental impact from Nederman’s products and solutions occurs when the products are used in customer applications. The goal is to support and facilitate a reduction in environmental impact for the Group’s customers. Outcome: Performances measures have been defined to follow up sales of Nederman’s digital solutions when used in customer applications. Next step: Implementation of digital solutions in priority segments. Define performance measures to measure the effect of products and solutions when used by customers.
0
3
6
9
12
15
201920182017201620152014 0
20
40
60
80
100
201920182017201620152014
0
10
20
30
40
50
60
70 Sea and land
Air
201920182017201620152014
Total energy consumption, kWh/SEK t
Waste recovery in production, %
Carbon dioxide emissions per transport mode, %
Total energy consumption in production in relation to sales (kWh/SEK t)Objective 2020: Reduce energy consumption in production with 20% by 2020 compared with 2013.
Waste for recycling or incineration in relation to total waste, %Objective 2020: >95 %
Estimated carbon dioxide emissions per transport mode, boat and truck vs air, %
59Sustainability Report

Strong drivers for continued growth
Since establishment in 1944, Nederman has evolved into one of the foremost players in industrial air filtration. We have grown with new products, applications, segments and markets. A growing population, consumption, globalisation and regulatory requirements have driven the market to its current size of approximately USD 5 billion.
2019 was also a year of strong market growth. The digitalisation trend indicates continued strong growth, and Nederman is well positioned for the next phase.
Nederman Annual Report and Sustainability Report 201960

Strong drivers for continued growth
61Market and divisions

The global market for applications in industrial air filtration is growing in pace with more advanced needs and a greater focus on environmental and health issues. The market is also being driven by an increase in industrial production. It is our opinion that Nederman’s mar-ket amounts to approximately USD 5 billion in annual investments, but inadequate statistics make this estimate uncertain.
SALES ORGANISATIONThe Group has its own sales companies in approximately 25 countries and distributors in more than 30 other countries. A strong local presence is vital when it comes to responding to changes in the market and delivering comprehensive solu-tions. Distributors add further market coverage for individual products or small systems.
Nederman continuously develops its sales organisation to strengthen its positions through, for example, technical sup-port and digital expertise.
Nederman is organised in four operating segments. The organisation is driven by simplicity and focus, and has the Group’s brands as its starting point. This means that the divi-sions are global and have an explicit focus on the customer. The organisation has four overriding priorities: strengthened profitability, improved efficiency, utilisation of all the pos-sibilities offered by digitalisation, and internal and external sustainability.
The most important tasks for the new organisation include establishing a market-driven product development and util-ising all the possibilities, internal and external, offered by digitalisation. Acquisitions will play an important role in effec-tively establishing leading positions within attractive mar-kets or product segments.
Market and competitors
AS A GLOBAL PLAYER, NEDERMAN FACES COMPETITION AT SEVERAL LEVELS.
Local competitors: Narrow product programme with limited geographic coverage.
Regional competitors: Fewer players, focus on individual application and product areas.
Global competitors:Few global operations with a broad offering. Often part of large corporations that have activities beyond industrial air filtration.
Nederman Annual Report and Sustainability Report 201962

• Sales: SEK 1,380m (1,247)• Share of Group sales: 32% (35)• Average number of employees:
514 (495)• Share of the Group’s average num-
ber of employees: 23% (27)• Significant markets: The US, Can-
ada, Brazil, Mexico
AMERICAS – Improving profitability
Sales
SEK 1,380m 2019SEK 1,380m 2015
+ 0.0% annual growth (ø)
• Sales: SEK 737m (539)• Share of Group sales: 17% (15)• Average number of employees:
615 (372)• Share of the Group’s average num-
ber of employees: 28% (20)• Significant markets: China, India,
Australia, Southeast Asia
APAC – Lower investment level
Sales
SEK 737m 2019SEK 363m 2015
+ 25.8% annual growth (ø)
Adjusted operating profit
SEK 129m 2019SEK 164m 2015
- 5.3% annual growth (ø)
Adjusted operating margin
9.3% 201911.9% 2015
• Sales: SEK 2,190m (1,768)• Share of Group sales: 51% (50)• Average number of employees:
1,066 (985)• Share of the Group’s average num-
ber of employees: 49% (53)• Significant markets: The Nordics,
Germany, Poland, the UK, Benelux, France, Switzerland, Spain
EMEA – Continued growth
Sales
SEK 2,190m 2019SEK 1,456m 2015
+ 12.6% annual growth (ø)
Adjusted operating profit
SEK 311m 2019SEK 169m 2015
+ 21.0% annual growth (ø)
Adjusted operating margin
14.2% 201911.6% 2015
Adjusted operating profit
SEK 33m 2019SEK - 6m 2015
+ 162.5% annual growth (ø)
Adjusted operating margin
4.5% 2019-1.6% 2015
63Market and divisions
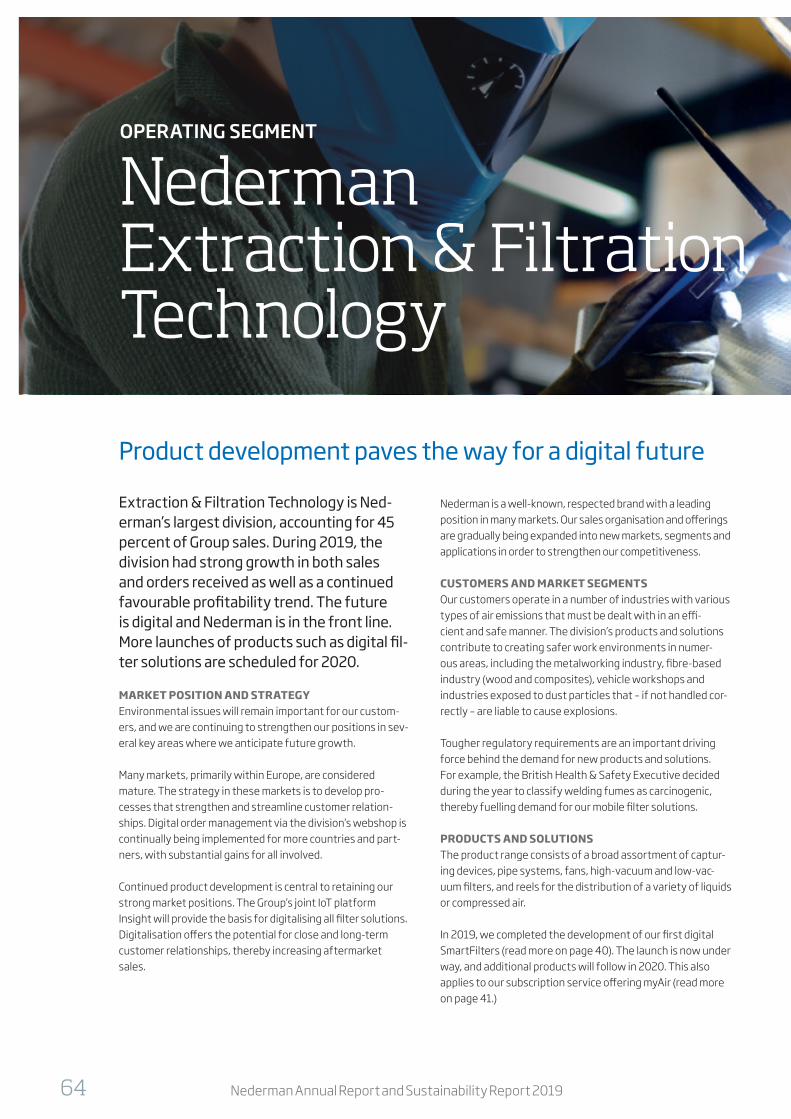
Product development paves the way for a digital future
Extraction & Filtration Technology is Ned-erman’s largest division, accounting for 45 percent of Group sales. During 2019, the division had strong growth in both sales and orders received as well as a continued favourable profitability trend. The future is digital and Nederman is in the front line. More launches of products such as digital fil-ter solutions are scheduled for 2020.
MARKET POSITION AND STRATEGYEnvironmental issues will remain important for our custom-ers, and we are continuing to strengthen our positions in sev-eral key areas where we anticipate future growth.
Many markets, primarily within Europe, are considered mature. The strategy in these markets is to develop pro-cesses that strengthen and streamline customer relation-ships. Digital order management via the division’s webshop is continually being implemented for more countries and part-ners, with substantial gains for all involved.
Continued product development is central to retaining our strong market positions. The Group’s joint IoT platform Insight will provide the basis for digitalising all filter solutions. Digitalisation offers the potential for close and long-term customer relationships, thereby increasing aftermarket sales.
Nederman is a well-known, respected brand with a leading position in many markets. Our sales organisation and offerings are gradually being expanded into new markets, segments and applications in order to strengthen our competitiveness.
CUSTOMERS AND MARKET SEGMENTSOur customers operate in a number of industries with various types of air emissions that must be dealt with in an effi-cient and safe manner. The division’s products and solutions contribute to creating safer work environments in numer-ous areas, including the metalworking industry, fibre-based industry (wood and composites), vehicle workshops and industries exposed to dust particles that – if not handled cor-rectly – are liable to cause explosions.
Tougher regulatory requirements are an important driving force behind the demand for new products and solutions. For example, the British Health & Safety Executive decided during the year to classify welding fumes as carcinogenic, thereby fuelling demand for our mobile filter solutions.
PRODUCTS AND SOLUTIONSThe product range consists of a broad assortment of captur-ing devices, pipe systems, fans, high-vacuum and low-vac-uum filters, and reels for the distribution of a variety of liquids or compressed air.
In 2019, we completed the development of our first digital SmartFilters (read more on page 40). The launch is now under way, and additional products will follow in 2020. This also applies to our subscription service offering myAir (read more on page 41.)
OPERATING SEGMENT
Nederman Extraction & Filtration Technology
Nederman Annual Report and Sustainability Report 201964

SALES AND MARKET TRENDSales are carried out both through our own sales companies and through an extensive network of partners. The division also has significant aftermarket sales in the form of spare parts and service. Business activities are conducted under the Nederman brand.
Europe and the Americas exhibited strong growth while sev-eral APAC countries declined. Growth was primarily driven by system sales, although product and service sales also increased. Large markets such as the Nordic countries, the UK and the US reported double-digit growth while Ger-many reported weak growth for the year as a whole. Brazil performed well, as did most other European markets, while Poland declined largely due to lower activity in the wood industry. Improved margins and higher efficiency resulted in favourable developments in profitability.
Milestones in 20191. STRONG GROWTH IN ORDERS VIA DIGITAL CHANNELSContinued focus on digitalisation and e-commerce. New users, new markets and new services caused the division’s orders received via Nederman PartnerShop to increase by approximately 16 percent during the year.
2. LAUNCH OF OUR FIRST DIGITAL PRODUCTS AND SOLUTIONSIn 2019, the first products in Nederman’s SmartFilters series were launched. SmartFilters enable the customer to monitor the filter’s function and performance in real time.
3. CERTIFIED OFFERING FOR HANDLING COMBUSTIBLE DUSTNederman is the market leader in safe and reliable solu-tions for handling combustible dust. Based on extensive tests and subsequent certification, a unique product family was launched during the year that builds on our proprietary CARZ isolation valve solution. The products are intended for extremely demanding customer environments and increase our market potential.
2019
External orders received, SEKm 1,962Sales, SEKm 1,940Adjusted EBITA, SEKm 263Adjusted EBITA margin, % 13.6
Extraction & Filtration Technology in briefHead of Division: Hans DahlénBrands: Nederman
Share of Group sales
Average number of employees, approx.
1,000
45%
OPERATING SEGMENT
Nederman Extraction & Filtration Technology
65Market and divisions

Increased profitability in a challenging market
Nederman Process Technology is in charge of the Group’s offerings in air filtration, air conditioning, process equipment and emis-sion control. In 2019, the first digital solu-tions were launched, and additional ven-tures are planned for the year to come.
The division’s market-leading solutions are directed primarily at customers in metalworking, mining operations and energy production as well as the chemicals and textile industries. 2019 was a year of robust sales growth and increased profit-ability within specialised products, while sales of more stan-dardised solutions declined. This trend was particularly evi-dent in the US where standardised solutions have historically made up a substantial share of the business activities. The market in China also showed a general decline in willingness to invest due to geopolitical unrest. The important textile industry characterised by overcapacity.
Orders received during the year were considerably lower than in the preceding year, largely due to a weaker demand from the textile industry and lower sales of more standardised solutions. By focusing on attractive segments and solutions as well as significant productivity improvements, the divi-sion’s operating profit nonetheless improved by about 15 per-cent on an annual basis.
Significant progress was also made in the IoT area. As of 2019, all of the division’s solutions are delivered with the option of digitalisation and remote monitoring. In combina-tion with an extended service and aftermarket offering, this enables Nederman to support the customer throughout the entire product life cycle.
MARKET POSITION AND STRATEGYNederman Process Technology is benefiting from the grow-ing trend of climate awareness. This trend is fuelling demand for solutions for safe workspaces, energy savings and emis-sion control. At the same time, the customer base, mostly comprising large multinational companies, is continuing to integrate and streamline its global production activities. This is leading to a greater need for suppliers that can provide services throughout the product’s entire life cycle. Requests for smaller in-house organisations and increasingly complex products are also boosting the need for outsourced services.
The division’s strategy to respond to these developments rests on four cornerstones:
■ Globalisation: Nederman is currently one of a few suppli-ers that can offer services on a global basis. This gives us a good position in our key segments. Increased technology and knowledge transfer between the division’s different regions facilitate considerable growth.
■ Service and digitalisation: MikroPul-Assist, a digital concept for operational monitoring and diagnostics, was launched during the year. In combination with a complete ser-vice and aftermarket offering, this enables Nederman to fol-low the customer throughout the entire product life cycle.
■ Productivity: The division’s Performance System soft-ware, designed to improve processes within the entire organisation, has generated substantial efficiency and cost savings.
■ Employee development: Engineering, applications expertise and project management are key components in producing results in every customer project. Extensive training initiatives coupled with investments in sales, mar-keting and support functions will lead to better customer service and better internal efficiency.
OPERATING SEGMENT
Nederman Process Technology
Nederman Annual Report and Sustainability Report 201966

CUSTOMERS AND MARKET SEGMENTSCustomers consist of large companies in a wide range of industries. The division’s most important customer segment is the textile industry, which continues to be characterised by overcapacity and low investment volumes. The acquisition of Luwa during the final quarter of 2018 strengthened Ned-erman’s position – particularly in Asia where Luwa is a strong brand – and could help to further advance the division’s posi-tions, thus also benefiting other market segments.
In addition to Luwa, business activities are carried out under the brands MikroPul, Pneumafil and LCI.
PRODUCTS AND SOLUTIONSThe division’s solutions form an integral part of the custom-ers’ manufacturing process and are crucial for creating safe work environments and stable production conditions, and managing emissions to the local environment. During the year, the offering expanded from advanced filter solutions to include digital monitoring and diagnostics systems.
Most of the solutions are based on tried-and-tested products and components, but with a high degree of customisation. The results rely completely on our in-depth knowledge of the industry and the current situation.
Product development that focuses on digital solutions for continuous plant monitoring and control is a priority. The first offerings based on the Group’s IoT platform were intro-duced in 2019, and the initiative will intensify in 2020 with the launch of further commitment offerings. During the year, a number of patents were registered for new applications in several segments.
SALES AND MARKET TRENDSales activities are conducted by our own sales organisation or agents that have direct contact with the division’s cus-tomers. The number of orders are few compared with sales in Nederman Extraction & Filtration Technology, but the indi-vidual order value is high. Process Technology works with a number of the world's leading companies and its relationships with customers are often deep and long lasting.
Milestones in 2019
1. INTEGRATION OF LUWALuwa is the market leader in air conditioning and filtration for the fibre and textile industries. Luwa was acquired in 2018 and was fully integrated in 2019, including the establishment of a joint management team and sales process.
2. LAUNCH OF MIKROPUL-ASSISTMikroPul-Assist was launched in North America, Europe and APAC in 2019. MikroPul-Assist is a system for monitoring the status and performance of filter elements. By presenting information using clear graphics, MikroPul-Assist contributes to stable production without unscheduled disruptions.
3. CONTINUED STREAMLINING PROGRAMME ■ The organisation was modified in order to better leverage
global business opportunities and minimise the division’s overheads.
■ Sales strategy with greater focus on profitability and selective initiatives to avoid volume projects with low margins.
■ Productivity improvements for increased margins.
2019
External orders received, SEKm 1,462Sales, SEKm 1,633Adjusted EBITA, SEKm 102Adjusted EBITA margin, % 6.2
Process Technology in briefHead of Division: Tomas HagströmBrands: MikroPul, Luwa, Pneumafil, LCI
Share of Group sales
Average number of employees, approx.
800
38%
67Market and divisions

Focus on increased market coverage
Pipe systems, valves and filter elements are important components for ensuring the best air filtration and play a decisive role in Nederman’s solutions. Sales and profitabil-ity for Nederman Duct & Filter Technology were satisfactory in relation to the market’s total development. During the year, a num-ber of activities were carried out to create the conditions for increased profitability and growth within new markets and segments.
MARKET POSITION AND STRATEGYFilter elements are a central component in effective air filtra-tion. As in its other product ranges, Nederman’s philosophy is to deliver the best life cycle cost for the customer. Together with a complete programme of pipe systems, our filter solu-tions are built on technical solutions that guarantee a long life with a minimum of maintenance.
Productivity and efficiency throughout the entire value chain are critical issues for the market. Duct & Filter Technology’s strong position is therefore based on the continuous devel-opment of products, design and configuration tools, and logistics solutions paired with in-depth application and engi-neering expertise.
The division also runs the Nederman Filter Competence Cen-tre to support other divisions with product development, knowledge and expert advice. Activities in 2019 included the development of a completely new filter cartridge concept (The Squircle), which boosts capacity in existing systems by 30 percent.
CUSTOMERS AND MARKET SEGMENTSCustomers are found in a wide range of industries, such as woodworking, metalworking, cement and concrete produc-tion, recycling, energy production, the automotive industry, plastics manufacturing and the chemicals industry.
Sales are mainly conducted through distributors and OEM customers, but Duct & Filter Technology also has substantial internal sales to Nederman’s other divisions.
PRODUCTS AND SOLUTIONSThe division carries out its business activities under two brands: Nordfab (pipe systems) and Menardi (filter solutions).
Nordfab is a global leader in pipe systems for dust, fume, gas and smoke extraction as well as industrial ventilation, headed by its proprietary Quick-Fit system. The system is based on a clip solution that eliminates the need for screws, rivets or welding and reduces installation and downtime by up to 50 percent. With advanced tools for design and configuration, lead times from the planning phase to installation can be fur-ther reduced.
Menardi bases its business activities on meticulous pre-stud-ies and filters that have a longer lifespan (up to 20 percent lower life cycle cost). Its operations are characterised by long-standing customer relationships based on a high degree of customisation and in-depth process expertise. During the year, a filter solution that provides up to four times cleaner air was launched. A strategic collaboration was initiated with the engineering company Valtria at the European level within the expansive cleanroom segment.
OPERATING SEGMENT
Nederman Duct & Filter Technology
Nederman Annual Report and Sustainability Report 201968

SALES AND MARKET TRENDTo strengthen its external market position, the division has continued to expand its reseller network, primarily in North America but also within EMEA. The sales organisation has been strengthened, and the division has increased its activi-ties at several industrial trade shows.
Market trends during the year largely followed the trends in other parts of the Nederman Group. Developments in Europe remained strong, except for the UK where the Brexit situ-ation has delayed investments. Demand for pipe systems in the US was largely positive. Demand in Asia was weaker, prompting adjustments and streamlining of the organisation.
The division also focused on monitoring and responding to developments in the price of steel and filter media, which has a major impact on pricing and margins. The favourable prog-ress experienced during the first three quarters of the year came to a halt during the fourth quarter, due in part to post-poned pipe projects within EMEA and weaker developments in the US filter market.
Milestones in 2019
1. LAUNCH OF MENARDI HPF TECHNOLOGYNew technology that provides up to four times cleaner air than traditional filter media.
2. PRODUCTION EQUIPMENT UPGRADE WITHIN NORDFABInstallation of new cutting equipment based on fibre lasers and implementation of a new ERP system within Nordfab’s production plants resulted in increased digitalisation of the supply chain flow.
3. NORDFAB’S LEAK-FREE SYSTEMThe development of an improved leak-free system strength-ened Nordfab’s market-leading position within installation security.
2019
External orders received, SEKm 474Sales, SEKm 555Adjusted EBITA, SEKm 70Adjusted EBITA margin, % 12.5
Duct & Filter Technology in briefHead of Division: Jeppe RasmussenBrands: Nordfab, Menardi
Share of Group sales
Average number of employees, approx.
300
11%
69Market and divisions

Product development and acquisitions drive expansion
Nederman Monitoring & Control Technology focuses on the development of digital prod-ucts and services to improve the Group’s collective customer offering. Stricter legisla-tion and access to data are fuelling demand. The division reported a sharp increase in sales and orders received, and the acquisi-tion of Gasmet promises new advances in 2020.
MARKET POSITION AND STRATEGYThe vision is to create a digital flow from filter to facts. A digi-tal process gives customers greater potential to optimise the air filtration process in real time, and thereby better produc-tion efficiency, reduced maintenance costs and guaranteed compliance with regulatory requirements. For Nederman, the process means access to vast amounts of data that can be used to improve customer-specific service and maintenance as well as general product development.
Combined with in-depth application and engineering exper-tise in the Group’s organisation, Nederman is playing mar-ket-leading role in the change currently facing the industry.
Stricter regulations and legislation introduced worldwide is a decisive driver in terms of the division’s development. Dig-ital solutions are often a deciding factor when it comes to enabling customers to comply with statutory requirements. New requirements from the US Environmental Protection Agency (EPA) and stricter Chinese environmental legislation are behind several of the year’s large orders.
The pace of innovation is high and the division is undergoing rapid development. Acquisitions will also be a priority for con-tinued global expansion.
CUSTOMERS AND MARKET SEGMENTSMonitoring & Control Technology works with a broad spec-trum of industries that need to continuously monitor and control their production and processes.
Nederman Insight was upgraded during the year to include new functions, and the offering now covers a large portion of the Group’s customer and industry segment.
PRODUCTS AND SOLUTIONSNederman Monitoring & Control Technology’s digital offering is built on a proprietary IoT platform (Nederman Insight) that consists of hardware installed in Nederman’s products and solutions, and software that communicates with the cloud and provides customers with information and insight into critical parameters and processes.
In addition to Nederman Insight, the division develops and sells products and systems for laser-based measurement of gases (NEO Monitors) and continuous particle monitoring systems under the Auburn FilterSense (AFS) brand. The final quarter of the year also saw the acquisition of Gasmet, which complements the division’s offering of world-leading gas analysis products and systems based on FTIR (Fourier Transform Infrared) technology.
OPERATING SEGMENT
Nederman Monitoring & Control Technology
Nederman Annual Report and Sustainability Report 201970
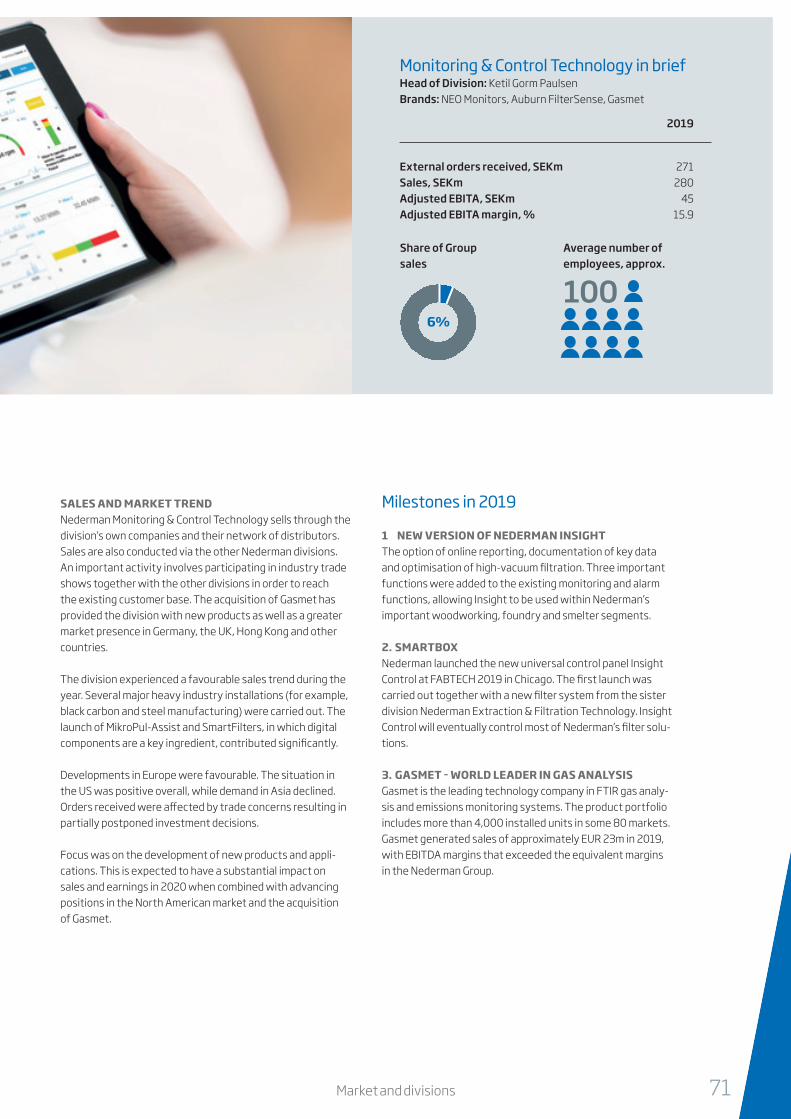
SALES AND MARKET TRENDNederman Monitoring & Control Technology sells through the division’s own companies and their network of distributors. Sales are also conducted via the other Nederman divisions. An important activity involves participating in industry trade shows together with the other divisions in order to reach the existing customer base. The acquisition of Gasmet has provided the division with new products as well as a greater market presence in Germany, the UK, Hong Kong and other countries.
The division experienced a favourable sales trend during the year. Several major heavy industry installations (for example, black carbon and steel manufacturing) were carried out. The launch of MikroPul-Assist and SmartFilters, in which digital components are a key ingredient, contributed significantly.
Developments in Europe were favourable. The situation in the US was positive overall, while demand in Asia declined. Orders received were affected by trade concerns resulting in partially postponed investment decisions.
Focus was on the development of new products and appli-cations. This is expected to have a substantial impact on sales and earnings in 2020 when combined with advancing positions in the North American market and the acquisition of Gasmet.
Milestones in 2019
1 NEW VERSION OF NEDERMAN INSIGHTThe option of online reporting, documentation of key data and optimisation of high-vacuum filtration. Three important functions were added to the existing monitoring and alarm functions, allowing Insight to be used within Nederman’s important woodworking, foundry and smelter segments.
2. SMARTBOXNederman launched the new universal control panel Insight Control at FABTECH 2019 in Chicago. The first launch was carried out together with a new filter system from the sister division Nederman Extraction & Filtration Technology. Insight Control will eventually control most of Nederman’s filter solu-tions.
3. GASMET – WORLD LEADER IN GAS ANALYSISGasmet is the leading technology company in FTIR gas analy-sis and emissions monitoring systems. The product portfolio includes more than 4,000 installed units in some 80 markets. Gasmet generated sales of approximately EUR 23m in 2019, with EBITDA margins that exceeded the equivalent margins in the Nederman Group.
2019
External orders received, SEKm 271Sales, SEKm 280Adjusted EBITA, SEKm 45Adjusted EBITA margin, % 15.9
Monitoring & Control Technology in briefHead of Division: Ketil Gorm PaulsenBrands: NEO Monitors, Auburn FilterSense, Gasmet
Share of Group sales
Average number of employees, approx.
100
6%
OPERATING SEGMENT
Nederman Monitoring & Control Technology
71Market and divisions

Nederman Annual Report and Sustainability Report 201972
Nederman’s ambition is to continuously provide the financial markets, shareholders and other stakeholders with accurate, consistent and relevant information in order to increase understand-ing of the Group and comply with the regulations for listed companies. The Nederman share has been listed on Nasdaq Stockholm under the NMAN ticker since 16 May 2007. Since January 2014, the share has been listed on Nasdaq Stockholm Mid Cap. A brief history of the Company and its share is shown on the next page.
The parent company’s equity at year-end was SEK 1,378.2m (1,234.9). The market capitalisation was SEK 4,721.9m (3,163.1).
MARKET COMMUNICATIONNederman’s representatives meet regularly with analysts, credit providers and shareholders to give a continuous picture of devel-opments during the financial year. Interim reports, year-end reports and annual reports are distributed to shareholders who so wish. These reports, together with the company’s press releases, are also available on the website in Swedish and English.
OWNERSHIP STRUCTUREThe number of shareholders at year-end was 3,928 (3,373). Each share in Nederman entitles the holder to one vote. The share of Swedish ownership was 93.7 percent (93.0). The ten largest shareholders accounted for 79.6 percent (80.3) of the total number of shares. The largest individual shareholder is Invest-ment AB Latour. The table on the next page shows Nederman’s ownership structure at 31 December 2019.
SHARE SPLITAs a result of the share split (3:1) approved by the 2018 Annual General Meeting, the number of shares issued increased by 23,430,680. On 31 December 2019, the total number of shares amounted to 35,146,020. The company’s share capital is unchanged at SEK 1,171,534, and the par value of the share was changed from SEK 0.1 to SEK 0.03. The earnings per share in pre-vious years have been adjusted based on the number of shares outstanding after the share split.
DIVIDEND AND DIVIDEND POLICYNederman’s dividend policy is to pay a dividend amounting to 30–50 percent of net profit after tax, taking into account the capital structure and acquisition plans. For the 2019 financial year, the Board of Directors proposes a dividend of SEK 2.50 per share (2.30).
ANALYSTS WHO FOLLOW NEDERMANDaniel Lindkvist from Handelsbanken,[email protected]
The Nederman Share
0
20
40
60
80
100
120
140
160
180
200
Share turnover per month, 000
DECNOVOCTSEPAUGJULJUNMAYAPRMARFEBJAN40
50
60
70
80
90
100
110
120
130
140
OMX Stockholm PI
Nederman
SEK No.
PRIS- OCH VOLYMUTVECKLING 2019
Källa:
0
100
200
300
400
500
600
700
800
900
1000
Share turnover per month, 000
201920182017201620150
15
30
45
60
75
90
105
120
135
150
OMX Stockholm PI
Nederman
SEK No.
PRIS- OCH VOLYMUTVECKLING 2015-2019
Källa:
Price and volume trend 2019 Price and volume trend 2015-2019

73The Nederman share
History1944 Company founded by Phillip Nederman.1983 Listing on the Stockholm Stock Exchange.1985 Active becomes the new majority shareholder.
The Company is delisted.
1991 Nederman sold to Esab.1994 Charter acquires Esab and becomes the new majority shareholder.1999 Venture capital company EQT acquires Nederman.2007 Listing on Nasdaq Stockholm.2010 Acquisition of Dantherm Filtration.2012 Acquisition of Environmental Filtration Technologies.2013 Nederman qualifies for Nasdaq Stockholm Mid Cap.2014 Nederman is moved to Nasdaq Stockholm Mid Cap.2017 Acquisition of NEO Monitors AS.2018 Acquisitions of Auburn FilterSense LLC and Luwa Air Engineering AG.
Kr
0
1
2
3
20192018201720162015
Kr
0
1
2
3
4
5
6
7
20192018201720162015 0
1000
2000
3000
4000
5000
20192018201720162015
Dividend per share, SEK Earnings per share, SEK Market capitalisation, SEKmThe 2019 dividend refers to the Board's proposed
dividend
Data per share 2019 2018 2017* 2016* 2015*Earnings per share after tax, SEK 6.43 5.78 5.31 4.91 4.36Share price as at 31 December, SEK 134.4 90.0 83.3 62.5 85.2Market capitalisation, SEKm 4,721.9 3,163.1 2,928.8 2,196.6 2,993.3Cash flow, SEKm -20.2 87.7 79.3 19.2 -68.4Proposed dividend per share, SEK 2.50 2.30 2.00 1.83 1.67Dividend growth, % 8.7 15.0 9.1 10.0 25.0Yield, % 1.86 2.56 2.40 2.93 1.96P/E ratio 20.9 15.6 15.7 12.7 19.5Profit distributed as dividend, % 39 40 38 37 38Equity, SEKm 1,378.2 1,234.9 1,075.8 982.2 837.1Issued no. of shares, 31 Dec 35,146,020 35,146,020 11,715,340 11,715,340 11,715,340Proposed dividend as a percentage of equity, % 6.4 6.5 6.5 6.5 7.0
Nederman’s major shareholders Shareholding Votes, %Investment AB Latour 10,538,487 29.98Ernstrom Kapitalpartner AB 3,525,000 10.03IF Skadeförsäkring AB (publ) 3,481,200 9.90Swedbank Robur småbolagsfond Sverige 2,632,929 7.49Fjarde AP-fonden 1,953,334 5.56Lannebo Microcap II 1,859,114 5.29Tredje AP-fonden 1,285,066 3.66Lannebo Micro cap. 1,216,103 3.46Handelsbankens Nordiska, småbolagsfond 841,603 2.39UN Joint staff 641,599 1.83Other shareholders 7,171,585 20.41Total 35,146,020 100.00
Shareholders by category, %Financial companies 65.55
Other Swedish legal entities 10.94
Social security funds 9.21
Private Swedish individuals 7.66
Foreign domiciled owners 6.27
Non profit organisations 0.37
Total 100.00
Shareholders per country, %Sweden 93.73
Finland 3.50
Luxembourg 0.80
France 0.70
UK 0.66
US 0.26
Germany 0.11
Denmark 0.10
Other 0.14
Total 100.00
* Nederman Group applies the retroactive approach in relation to IFRS 16 Leases and figures for 2018 are therefore restated pursuant to the new stan-dard. For earlier financial years, IAS 17 Leases was applied in accordance with the accounting policies that applied through 2017. See also accounting policies on pages 93-98.

Nederman Annual Report and Sustainability Report 201974
Review of business operationsThe Board and CEO of Nederman Holding AB (publ), corporate registration number 556576-4205, hereby submit their annual report for the 2019 financial year.
BUSINESSNederman is one of the world’s leading suppliers of products and solutions for advanced air filtration in demanding industrial envi-ronments. Our offering comprises individual products, complete solutions, project design, installation, commissioning and service. Nederman’s business concept is clean air. The company's products contribute to reducing the environmental impact from industrial manufacturing, creating clean and safe working environments, and increasing production efficiency. The organisation has four overriding priorities: strengthened profitability, improved effi-ciency, utilisation of all the possibilities offered by digitalisation, and internal and external sustainability. All production units, apart from one, are certified according to ISO 9001 and 13 production units out of 16 are certified according to ISA 14001. The parent company and one sale company are also certified according to ISO 9001 and ISO 14001. Units for production and assembly are located in Australia, Brazil, Denmark, Finland, India, China, Norway, Poland, the UK, Sweden, Thailand, Germany and the US. Sales are conducted through our own sales companies and distributors in over 50 countries. Most sales take place in Europe and North America, although Nederman is also active in a number of growth markets. The Group had 2,370 (2,305) employees at year-end.
GROUP STRUCTURENederman Holding AB (publ) is the parent company of the Group with directly or indirectly wholly owned subsidiaries as stated in Note 20.
As of 2019, the Group’s operations are conducted in four operating segments: Nederman Extraction & Filtration Technology, Neder-man Process Technology, Nederman Duct & Filter Technology and Nederman Monitoring & Control Technology. This organisation is based on technology, customers and business logic. The operating segments are global and have an explicit focus on the customer. Nederman Extraction & Filtration Technology’s product range consists of a broad range of capturing devices, fans, high-vacuum products and reels for the distribution of a variety of liquids or compressed air. Nederman Process Technology’s products include, among other things, advanced filter solutions that are integrated into the customers’ production processes where they catch harm-ful particles and gases as well as other process-critical equipment. Nederman Duct & Filter Technology works with different types of pipe systems, valves and filter elements to ensure good air quality in a number of industries. Nederman Monitoring & Control Technol-ogy's digital offering includes advanced measuring technology and a platform that consists of hardware installed in Nederman’s prod-ucts and solutions, and software that communicates with the cloud and provides customers with information and insight into critical parameters and processes. On a secondary level, the operations are monitored based on the following regions, which comprised the
Group’s operating segments until the end of 2018: EMEA (Europe, Middle East and Africa), Americas (North and South America) and APAC (Asia-Pacific).
Operations is responsible for manufacturing, distribution, prod-uct care, logistics, purchasing and quality systems. Manufactur-ing, assembly and distribution are carried out in 13 countries on five continents. The operating segments are mainly responsible for the operating units within each segment.
Finance, IT and Human Resources are Group functions with the task of supporting operational activities and being responsi-ble for global coordination within each function.
STOCK EXCHANGE LISTINGThe Nederman share has been listed on Nasdaq Stockholm under the NMAN ticker since 16 May 2007. Since January 2014, the share has been listed on Nasdaq Stockholm Mid Cap. The Mid Cap segment includes companies that have a market capitalisa-tion between EUR 150 million and EUR 1 billion. As of 31 Decem-ber 2019, there were 3,928 (3,373) shareholders.
ACQUISITIONS DURING THE YEAROn 9 December 2019, Nederman acquired 100% of the shares in the Finnish company Gasmet Technologies Oy (Gasmet). Gasmet is a world-leading supplier of FTIR (Fourier Transform Infrared Spectroscopy) gas analysis solutions and supplies system solu-tions for continuous emission, mercury and dioxin monitoring systems and portable gas analysers. Today, the company has the market’s largest project portfolio of FTIR analysis solutions, with more than 4,000 installed units in approximately 80 markets. The company is based in Helsinki, Finland, and also has a global presence through wholly owned subsidiaries in Germany, the UK, Canada, Hong Kong and Austria. Gasmet had approximately 100 employees and sales of about EUR 23m for the 2019 financial year. Gasmet is included in the Nederman Monitoring & Control Technology operating segment.
ORDER INTAKE AND SALES IN 2019Order intake amounted to SEK 4,168.4m (3,479.5), which currency-neutral corresponds to an increase of 15.2 percent compared with 2018. Net sales amounted to SEK 4,307.7m (3,553.9), which currency-neutral corresponds to an increase of 16.6 percent compared with 2018.
PROFIT/LOSSConsolidated operating profit for 2019 totalled SEK 343.2m (305.7), corresponding to an operating margin of 8.0 percent (8.6). Adjusted operating profit amounted to SEK 349.1m (318.9). Adjusted operating margin was 8.1 percent (9.0). Profit before tax amounted to SEK 307.3m (267.5). Net profit totalled SEK 225.8m (202.8), corresponding to earnings per share of SEK 6.43 (5.78).

75Review of business operations
PRODUCT DEVELOPMENTThe Group's expenses for development of the existing product range and new products amounted to SEK 65.2m (44.1). SEK 15.6m (5.7) was capitalised in the consolidated statement of financial position. The increase in research and development expenses and capitalised development expenditure are mainly attributable to IoT and Nederman’s digital offering.
INVESTMENTS AND DEPRECIATION/AMORTISATIONThe Group’s capital investments in intangible assets for the year amounted to SEK 50.1m (38.8). Amortisation of intangible assets for the year totalled SEK 44.9m (35.1). The Group's investments in tangible assets for the year amounted to SEK 43.5m (24.0). The increase is mainly related to efficiency enhancements in production equipment. Depreciation of tangible assets for the year was SEK 34.7m (28.8).
CASH FLOWCash flow for the year amounted to SEK -20.2m (87.7) and cash flow from operating activities to SEK 321.3m (271.4). The neg-ative cash flow for the year was primarily attributable to the acquisition of Gasmet and increased investments in product development and production equipment. Compared with the preceding year, cash flow from operating activities was posi-tively impacted by changes in working capital.
LIQUIDITY AND FINANCIAL POSITIONAt the end of the period, the Group had SEK 445.3m in cash and cash equivalents as well as SEK 94.2m in unutilised overdraft facilities. In 2019, the Group refinanced its external loans and entered into a revolving credit facility of SEK 1,500m with SEB and SHB. In addition, the Group entered into a bilateral loan agreement with Svensk Export Kredit of SEK 500m. The agree-ments have a three year maturity with extension options for two additional years. At the end of the period, the Group had a credit facility of SEK 420m within Nederman’s loan agreement with SEB and SHB.
Net debt amounted to SEK 1,564.1m (787.6). Equity amounted to SEK 1,378.2m (1,234.9), corresponding to an equity/assets ratio of 29.0 percent (30.7) and a net debt/equity ratio of 113.5 percent (63.8). Net debt was primarily negatively impacted by the increased debt resulting from the acquisition of Gasmet. Net debt was also negatively impacted by the higher lease lia-bility attributable to the lease of properties in Gasmet and the Group’s increased pension liability. The increased pension liabil-ity is mainly attributable to lower discount rates on the Group’s defined-benefit pension plans.
EMPLOYEESThe average number of employees during the year was 2,195 (1,852). Other personnel data is shown in Note 7.
PARENT COMPANYThe activities of the parent company comprise Group functions. The parent company also owns and manages shares in the sub-sidiaries.
PROPOSED APPROPRIATION OF PROFITThe following amounts are at the disposal of the Annual General Meeting of Nederman Holding AB (publ):
Share premium reserve 5,866,700Retained earnings 494,865,542Net profit for the year 96,372,679Total SEK 597,104,921
The Board of Directors proposes thata dividend of SEK 2.50 per share be paid to the shareholders 87,732,740to be transferred to the share premium reserve 5,866,700 to be transferred to retained earnings 503,505,481Total SEK 597,104,921
* Based on the number of shares outstanding as of 31 December 2019. Number of shares amounted to 35,146,020 and number of treasury shares held amounted to 52,924 giving 35,093,096 in number of shares outstanding, see also note 19. The divi-dend amount may be subject to change as treasury shares may be traded up to the record date of 21 April 2020.
OUTLOOKMany of Nederman’s markets, not least the US and China, and recently also Germany to a certain extent, are characterised by uncertainty, not least from the recent development of the corona virus. Trade conflicts and financial uncertainty mean that decisions on major investments are being prolonged and that large projects are often being postponed, resulting in consider-able volatility in Nederman’s orders received. Increasing signs of a general slowdown in the world economy have also been noted. Despite these challenges, Nederman’s basic view is one of cau-tious optimism. Environmental issues will remain important for the Group’s customers, which can be expected to soften the effects of a weaker economy to a certain degree, and the Group is continuing to strengthen its positions in several key areas where future growth will occur. In Europe and North America, the Group will build on Nederman’s strengths as a leading envi-ronmental technology company. In regard to the developments in Asia, which are not aligned with the Group’s ambitions, inten-sive efforts to reverse the trend will continue.
NOTICE OF ANNUAL GENERAL MEETINGThe notice to attend the Annual General Meeting is to be issued no earlier than six weeks and no later than four weeks prior to the Meeting.
POST BALANCE SHEET EVENTSNo significant events have occurred.
*

Nederman Annual Report and Sustainability Report 201976
Multi-year overview
SEKm 2019 2018 2017* 2016* 2015*
Operating revenue and earningsNet sales 4,307.7 3,553.9 3,148.5 3,107.3 3,198.0
EBITDA 489.9 426.9 330.8 298.0 289.9
Adjusted EBITDA 495.8 440.1 338.5 298.0 311.0
Operating profit 343.2 305.7 278.1 250.3 242.0
Adjusted operating profit 349.1 318.9 285.8 250.3 263.1
Profit before tax 307.3 267.5 260.1 231.7 214.9
Net profit 225.8 202.8 186.3 172.1 152.8
Assets, equity and liabilitiesFixed assets 2,643.9 2,000.2 1,471.3 1,157.8 1,135.2
Current assets 2,102.6 2,020.3 1,499.6 1,495.6 1,430.6
Cash and cash equivalents 445.3 463.9 360.9 287.8 261.4
Equity 1,378.2 1,234.9 1,075.8 982.2 837.1
Interest-bearing liabilities 2,009.4 1,251.5 946.2 812.1 897.0
Non-interest-bearing liabilities and provisions 1,358.9 1,534.1 948.9 859.1 831.7
Balance sheet total 4,746.5 4,020.5 2,970.9 2,653.4 2,565.8
ProfitabilityEBITDA margin, % 11.4 12.0 10.5 9.6 9.1
Adjusted EBITDA-margin, % 11.5 12.4 10.8 9.6 9.7
Operating margin, % 8.0 8.6 8.8 8.1 7.6
Adjusted operating margin, % 8.1 9.0 9.1 8.1 8.2
Return on equity, % 17.3 17.7 18.1 18.9 19.5
Return on operating capital, % 14.1 16.5 18.0 16.8 19.0
Capital turnover rate, multiple 1.7 1.8 2.0 2.1 2.3
Capital structureNet debt 1,564.1 787.6 585.3 524.3 635.6
Net debt/equity ratio, % 113.5 63.8 54.4 53.4 75.9
Net debt/adjusted EBITDA, multiple 3.2 1.8 1.7 1.8 2.0
Adjusted EBITDA/net financial items, multiple 13.8 11.5 18.8 16.0 11.5
Interest cover ratio, multiple 8.1 7.5 11.8 11.8 8.9
Equity/assets ratio, % 29.0 30.7 36.2 37.0 32.6
Operating capital 2,942.3 2,022.5 1,661.1 1,506.5 1,472.7
Share dataNumber of shares on closing date 35,146,020 35,146,020 11,715,340 11,715,340 11,715,340
Average no. of shares during the year, before dilution 35,093,096 35,088,753 11,696,251 11,691,969 11,681,340
Average no. of shares during the year, after dilution 35,093,096 35,088,753 11,696,251 11,691,969 11,725,969
Equity per share, before dilution, SEK 39.27 35.19 30.66 28.00 23.89
Equity per share, after dilution, SEK 39.27 35.19 30.66 28.00 23.80
Earnings per share, before dilution, SEK 6.43 5.78 5.31 4.91 4.36
Earnings per share, after dilution, SEK 6.43 5.78 5.31 4.91 4.34
Proposed dividend per share, SEK 2.50 2.30 2.00 1.83 1.67
EmplyeesAverage numbers of emplyees 2,195 1,852 1,757 1,760 1,833
* Nederman Group applies the retroactive approach in relation to IFRS 16 Leases and figures for 2018 are therefore restated pursuant to the new standard. For earlier financial years, IAS 17 Leases was applied in accordance with the accounting policies that applied through 2017. See also accounting policies on pages 93-98.

77Multi-year overview
0
1000
2000
3000
4000
5000
20192018201720162015
0
500
1000
1500
2000
2500
20192018201720162015
0
100
200
300
400
20192018201720162015
0
2
4
6
8
10
20192018201720162015
0
50
100
150
200
250
300
350
20192018201720162015
0
20
40
60
80
100
120
20192018201720162015
Sales, SEKm Adjusted operating profit, SEKm*
Cash flow, SEKm*
Adjusted operating margin, %*
Net debt/equity ratio, %*
Earnings per share, SEK
0
200
400
600
800
1000
1200
IndiaUKGermanyChinaUS
Largest markets in 2019, SEKmSales
Average no. of employees
From operating activities
Return on operating capital, %*
10
15
20
20192018201720162015
0
1
2
3
4
5
6
7
20192018201720162015
* Nederman Group applies the retroactive approach in relation to IFRS 16 Leases and figures for 2018 are therefore restated pursuant to the new standard. For earlier financial years, IAS 17 Leases was applied in accordance with the accounting policies that applied through 2017. See also accounting policies on pages 93-98.

Nederman Annual Report and Sustainability Report 201978
Risks and risk management
Risks that could significantly impact the GroupNederman is exposed to a number of risks that could signifi-cantly impact the Group’s operations, earnings and financial position. Nederman conducts continuous risk assessments that include identifying the risks that impact the Group and taking measures to manage these risks.
Nederman does not calculate the economic value of all risks because many of them are highly complex and interrelated. However, the practical management of these risks is facilitated in several different ways, including through Group-wide policies, business processes, training, internal controls, and processes for the audit and approval of reports, which are all coordinated and monitored by each Group function. The risks are summarised below.
STRATEGIC RISKSCustomer offerings, succession planning, official or sector regu-lations, fluctuations in the global market.
OPERATING RISKSDemands on the products’ function or quality, competition or technology shifts, IT systems, and production or delivery disrup-tions.
COMPLIANCE RISKSCompliance with laws, regulations and Group policies relating to, for example, data confidentiality, competition legislation, cor-ruption, health and safety.
FINANCIAL RISKSCurrency, interest, credit, liquidity, fraud and accounting risks.
Managing the main risksThe main risks described in this report are managed in accor-dance with Nederman’s framework for risk management, which is integrated with the company’s business processes. The Board of Directors also reviews the company’s risk management.

79Risks and risk management
Strategic risks Management
Loss of key individuals Continued succession planning. Management and employee development in order to proactively secure the correct competence and capacity for the future.
Acquisition-related risks Professional due diligence, division structure to clarify the acquired company's position in the Group, standard onboarding procedures for IT and finance.
Operating risks Management
Disruptions to critical IT systems Security upgrades and backups.
Production risks at key sites Global management system, standardisation of processes – condition for ERP roll-out, update of product documentation, update of IT hardware/software.
Delivery risk for key components Production rationalisation project, audits of critical suppliers, increased inventory of key components.
IT projects in progress Systematic planning, secured internal competence (ERP project), update of outdated hardware and software.
Inferior and inappropriate agreements Confirm Nederman’s contract terms and conditions, training in contract issues, legal review and evaluation of contracts.
External factors, such as fire, extreme weather conditions, natural disasters, war or pandemics
This is managed through preparedness planning and ensuring that vital materials are not purchased from only one supplier.
Compliance risks Management
Corruption and fraud • Established policies and internal control.• Acceptance letter issued by the CEO, whereby the employee in question
confirms in writing, on an annual basis, their knowledge of the Code of Conduct and compliance with the Group’s internal control instruments.
• Nederman’s whistleblower system, which entails that each employee is entitled to report any suspicions of legal or regulatory breaches without reprisal.
• Review and evaluation of partner and distribution agreements.
Disregard of laws and permits • Training in policies and regulations.• Formalisation and expansion of the Group’s internal control, with a focus
on compliance (see above).• Export control process, with a focus on embargoes and trade restrictions.
Health and safety risks relating to, for example, technical defects or deficiencies in Nederman's products
Nederman's overall commitment to quality assurance ensures product quality and function. Ensuring that legal requirements regarding safety, such as the Machinery Directive and the ATEX Directive, are complied with in full.
Financial risks Management
Underlying weakening of the economy Preparedness planning.
Price pressure Differentiation, including digitalisation, logistics rationalisation project.
Currency status Continued regional balancing of income and expenses, assets and liabilities, currency hedging for major projects.
Brexit Regular contact between UK sales and EU operations to ensure adequate inventory levels.
Nederman Annual Report and Sustainability Report 201980
Corporate GovernanceNederman Holding AB (publ) is a Swedish public limited company with its registered office in Helsingborg, Sweden. Nederman was listed on the Nasdaq Stockholm Small Cap list in 2007 and has been registered on the Nasdaq Stockholm Mid Cap list since 1 January 2014.
As a listed company, Nederman applies the Swedish Corporate Gov-ernance Code (the Code). The Corporate Governance Report has been prepared in accordance with the Swedish Annual Accounts Act and the Swedish Companies Act, Nasdaq Stockholm’s Rule Book for Issuers, the Code, and other applicable Swedish laws and regulations. In addition to rules pursuant to laws or other legisla-tion, Nederman uses internal control instruments that are also the basis for the Group's corporate governance, including the Articles of Association, rules of procedure for the Board of Directors, the terms of reference for the CEO, policy documents and the Group’s Code of Conduct.
Governance of the Nederman Group takes place through the shareholders via the General Meeting of Shareholders, the Board of Directors, the CEO and Group management of Nederman in accordance with, among other things, the Swedish Companies Act, other laws and regulations, the Articles of Association and the rules of procedure for the Board of Directors. Considering Nederman's Group structure, the composition of the boards of its operating subsidiaries, which often include representatives from Group man-agement, constitute another element of governance for the Group.
Shareholders At the end of 2019, the company had 3,928 shareholders. Invest-ment AB Latour was the largest shareholder with 29.98 percent of the shares, while Lannebo Fonder owned 11.03 percent, Ernstrom Kapitalpartner AB owned 10.03 percent and IF Skadeförsäkring AB (publ) owned 9.90 percent. The ten largest shareholders had a total holding corresponding to 79.60 percent of the shares. Foreign investors held 6.27 percent of the shares. For further information about the share and shareholders, see pages 72-73.
Annual General Meeting The General Meeting of Shareholders is the highest decision-mak-ing body, in which the shareholders can exercise their influence by voting on key issues, such as the adoption of the income statement and balance sheet, appropriation of the Company’s profit, discharge from liability of Board members and the CEO, the election of Board members, the Chairman of the Board and auditors, and remuner-ation to the Board of Directors and auditors. The Annual General Meeting was held in Helsingborg on 29 April 2019. A total of 40 shareholders were in attendance at the Meeting, representing 74.60 percent of the shares and votes in the company.
The Meeting adopted the income statement and balance sheet, and the consolidated income statement and balance sheet, resolved to distribute the profit according to the proposal for the
appropriation of profit entailing that a dividend of SEK 2.30 per share be paid for the 2018 financial year, and granted discharge from liability for the Board members and CEO.
The Meeting also authorised the Board to decide that the Company may issue new shares or repurchase the Company’s own shares.
The Meeting decided in accordance with the proposal in the noti-fication of the Meeting to elect six Board members, that the fees to be paid to the Board would total SEK 1,580,000, of which SEK 540,000 to the Chairman and SEK 260,000 to each of the other Board members, except the CEO. The fees to the Audit Commit-tee were set at SEK 75,000 to the Chairman and SEK 50,000 to the other committee member. It was furthermore decided that no fees would be paid to the Remuneration Committee and that the auditors would be remunerated on a current account basis. In accordance with the proposal of the Nomination Committee, Johan Hjertonsson, Ylva op den Velde Hammargren, Gunilla Fransson, Johan Menckel and Sven Kristensson were re-elected to the Board, and Sam Strömerstén was elected as a new Board member. Johan Hjertonsson was elected Chairman of the Board.
Nomination Committee The 2019 Annual General Meeting decided to establish instructions for the Nomination Committee concerning the composition of the committee and its assignments. According to the instructions, the Nomination Committee is to consist of one representative from each of the four largest shareholders and the Chairman of the Board. If any of the four largest shareholders waives their right to appoint a representative to the Nomination Committee, the right will pass to the next largest shareholder. The Nomination Com-mittee’s tasks are to prepare proposals, ahead of the next Annual General Meeting, concerning the election of the Chairman of the Board and other Board members, the election of the Chairman of the Meeting, remuneration issues and related issues, and, where applicable, the election of auditors.
According to the guidelines approved by the Annual General Meet-ing concerning the work of the Nomination Committee, the follow-ing individuals have been appointed to the Nomination Committee ahead of the 2020 Annual General Meeting: Anders Mörck (Invest-ment AB Latour), Chairman; Claes Murander (Lannebo Fonder); Henrik Forsberg Schoultz (Ernström & Co); and Fredrik Ahlin (IF Skadeförsäkring AB (publ)). Johan Hjertonsson, Chairman of Neder-man’s Board of Directors, is a co-opted member of the Nomination Committee. For questions concerning the work of the Nomination Committee, contact [email protected].
Board of Directors The Board of Directors is the second highest decision-making body after the General Meeting of Shareholders. The overall assign-ment of the Board is to decide on the Company’s business direction, its resources and capital structure as well as its organisation and

81Corporate Governance
management. The Board’s general obligations also include contin-uously evaluating the Company’s financial situation and approving the Company’s business plan. In its general undertaking, the Board addresses overall issues such as the Company's strategy, acquisi-tions, major investments, divestments, the publication of annual reports and interim reports, and the appointment of the CEO, etc.
The Board of Directors follows written rules of procedure that are adopted annually at the first Board meeting following elec-tion. The rules of procedure stipulate how work is to be divided between Board members, how often the Board is to meet and to what extent deputies are to participate in the work of the Board and attend meetings. The rules of procedure also regulate the Board’s obligations, the establishment of a quorum, the division of responsibilities between the Board and the CEO, etc. The Board meets according to an annual schedule that is decided in advance. Extraordinary meetings may be called to address events of unusual importance. In addition to Board meetings, the Chairman of the Board and the CEO conduct an ongoing dialogue with respect to the management of the Company.
Once a year, the entire Board conducts a systematic evaluation of the Company’s senior executives. In this context, “senior execu-tives” includes certain deputy managers, meaning a broader group of employees.
In recent financial years, the Board has made decisions concerning several matters of strategic importance. In 2019, special focus was devoted to acquisitions, continued adaptation of the Group’s capac-ity, the Group’s strategy for continued expansion and the Group’s financial framework and objectives. In 2019, the Board held five minuted meetings. To date, one minuted meeting has been held in 2020. The 2019 Annual General Meeting resolved that a total of SEK 1,580,000 would be paid in directors’ fees, with SEK 540,000
paid to the Chairman of the Board and SEK 260,000 to each of the other members elected by the Annual General Meeting, with the exception of the CEO. It was furthermore resolved that a fee of SEK 75,000 would be paid to the Chairman of the Audit Committee and SEK 50,000 to the other committee member, and that the auditors would be remunerated on a current account basis. No fees are paid to the Remuneration Committee.
The Annual General Meeting elects Board members annually for the period until the next Annual General Meeting is held. The Board of Directors is to consist of at least three and no more than eight ordi-nary members and may be supplemented with a maximum of three deputies. In addition, there may be employee representatives. The members elected by the Annual General Meeting are all indepen-dent in relation to the major shareholders and, with the exception of the CEO, in relation to the Company and Company management. The Board meets the requirements of the Code with respect to independent members. The members are presented on page 86 and at nedermangroup.com.
The main shareholders and Board members carry out a detailed annual evaluation of the Board. Among other things, the evaluation includes the Board’s composition, individual Board members and the Board’s work and procedures. The Nomination Committee has reviewed the written evaluation of the work of the Board and has received a report on the work of the Board from the Chairman of the Board.
Nederman’s Board of Directors consists of six members elected by the 2019 Annual General Meeting. The CEO is a member of the Board. The CFO is not a member of the Board but, as a rule, partici-pates in Board meetings by presenting information. The Chairman of the Board does not participate in the operational management of the Company.
Overall structure of corporate governance in Nederman
Preparing function
Decision-making function
Controlling function
General Meeting of Shareholders
Board of Directors
CEO
Nomination Committee
Remuneration Committee
Auditor
Audit Committee

Nederman Annual Report and Sustainability Report 201982
Attendance at Board meetings Johan Hjertonsson 5 of 5 Ylva op den Velde Hammargren 4 of 5Gunilla Fransson 5 of 5Johan Menckel 5 of 5Sam Strömerstén 3 of 3Sven Kristensson 5 of 5
CEO The division of activities between the Board and the CEO is regu-lated by the rules of procedure for the Board and in the terms of reference for the CEO. The CEO is responsible for implementing the business plan as well as the day-to-day management of the Com-pany’s affairs and the daily operations of the Company. This means that the CEO makes decisions on those issues that can be consid-ered to fall under the day-to-day management of the Company. The CEO may also take action without the authorisation of the Board in matters which, considering the scope and nature of the Company’s business, are unusual or of great importance, which cannot await a decision by the Board without seriously compromising the Com-pany’s business activities. The terms of reference for the CEO also regulate the CEO’s responsibility for reporting to the Board. The Board receives a monthly written report containing a follow-up of the Company’s order statistics, sales, operating results, working capital developments, income statement, financial position and cash flow statement. The report also contains comments from the CEO and CFO, for example, regarding the various markets.
Every year, the senior executives formulate a strategy proposal, which is discussed and adopted at the Board meeting held about halfway through the year. Work on the business plan (including the budget for the coming year) is usually carried out from the bottom up and based on the strategy adopted by the Board of Directors. The CEO and the CFO present the business plan proposal to the Board of Directors. After the Board discusses the business plan, it is usually adopted at the last meeting during the autumn. Moreover, the Company usually issues an updated forecast at the end of each quarter in conjunction with the quarterly reports.
Committees Questions about salary and benefits for the CEO and management are addressed and approved by a Remuneration Committee. This committee consists of Johan Hjertonsson and Johan Menckel. The committee is a body within the Company’s Board assigned to draft matters for the Board related to remuneration and other terms of employment for Company management. The committee is also tasked with preparing guidelines regarding remuneration for senior executives, which the Board then presents as a proposal to the Annual General Meeting. The Remuneration Committee held one minuted meeting in 2019.
The 2019 Annual General Meeting resolved on principles for remu-neration to the CEO and Company management, which is presented in greater detail in the section “Remuneration to the Board of Direc-tors and senior executives” below.
The 2019 Annual General Meeting resolved that Nederman is to have an Audit Committee. The main purpose of the Audit Commit-tee is to supervise the Group’s financial accounting and reporting and the audit of the annual accounts. The Audit Committee’s tasks
include, among other things, responsibility for the preparation of the Board’s work to ensure the quality of the financial reporting by reviewing the interim reports, annual report and consolidated financial statements. The Audit Committee is also tasked with pre-paring matters regarding the procurement of audit services and other services from the auditor and preparing certain accounting and audit matters to be dealt with by the Board. The work of the Audit Committee is governed by rules of procedure adopted by the Board of Directors. The Committee convened on five occasions in 2019. The Company’s auditor participated on these occasions. The Company’s auditor informed the Board of the results of its work and presented report on the year’s audit and its view of the Company’s internal control system without the presence of any members of Company management. In 2019, the Audit Committee consisted of Board members Ylva op den Velde Hammargren and Sam Strömer-stén. The Annual General Meeting resolved that the fees to the Audit Committee would be set at SEK 75,000 to the Chairman and SEK 50,000 to the other committee member.
The 2019 Annual General Meeting decided to establish instructions for the Nomination Committee concerning the composition of the committee and its assignments. The Nomination Committee is to comprise the Chairman of the Board and four representatives. Once a year the committee is to convene the major shareholders well in advance of the Annual General Meeting in order to gain support for proposals concerning the Annual General Meeting’s election of a new Board of Directors.
Auditor The auditor audits the Company’s annual report and accounting as well as the management of the Board of Directors and the CEO. The auditor submits an audit report to the General Meeting of Share-holders after each financial year. From 2011, the Annual General Meeting appoints an auditor for a period of one year. At the Annual General Meeting on 29 April 2019, Ernst & Young AB was elected until the close of the 2020 Annual General Meeting, with Staffan Landén as lead auditor. Staffan Landén is an Authorised Public Accountant and member of FAR, the Swedish Institute of Autho-rised Public Accountants. Staffan Landén has many years of experi-ence in auditing listed companies and major international assign-ments. He is currently lead auditor for Vattenfall AB, Alfa Laval AB, Ambea AB, Moment Group AB, Polygon AB and Thomas Concrete Group AB, among others. Staffan Landén is an appointed Exchange Auditor by Nasdaq Stockholm. The Company’s auditor audits the annual accounts and financial statements and the Company’s ongoing operations and procedures to provide an opinion on the accounting and management of the Board of Directors and the CEO. The annual accounts and financial statements are reviewed during January and February. Staffan Landén does not have any assign-ments in companies over which Nederman’s principal shareholders, Board members or CEO have any material influence. Fees to Ernst & Young AB for assignments other than auditing amounted to SEK 0.3m in 2019 and pertains mainly to tax consultancy and audit-ing-related services.
Remuneration to the Board of Directors and senior executives The 2019 Annual General Meeting adopted a policy regarding remuneration and employment terms for 2019. The following main principles are applied: Fixed salary is paid for work performed. In
83Corporate Governance
addition, variable remuneration may be earned that is linked to the Company’s performance and tied-up capital. Variable remuneration can amount to a maximum of 30 to 50 percent of the annual fixed salary, depending on the individual’s position in the Company.
The CEO’s pension plan is premium-based and the annual premium corresponds to maximum 35 percent of the pension based salary. Pension payments for other senior executives is based on a con-tractual ITP plan with exception for three member where the pre-miums corresponds to maximum 30 percent of the fixed salary, the individual concerned is subject to defined benefit pension or under mandatory collective agreement provisions. Variable remuneration shall qualify for pension benefits. If the CEO resigns, the term of notice is six months. If dismissed by the Company, the CEO has the right to receive an amount corresponding to 18 to 24 months’ salary (the final six months are dependent on new employment). For oth-ers members of management, the term of notice is 12 months if the Company gives notice of dismissal, and six months if the employee resigns. There are no agreements between Board members or senior executives and Nederman or any of its subsidiaries concern-ing benefits after the end of their employment.
The Annual General Meeting held on 29 April 2019 approved the Board’s proposal that the annual programmes for variable remu-neration should be supplemented with a long-term incentive (LTI) programme. Consequently, the 2019-2020 LTI programme has been established for a period of two years and is targeted in a way that makes it particularly favourable for the Company’s sharehold-ers. The outcome of the LTI programme for senior executives (net of income tax) is to be reinvested in the warrants in Nederman or in Nederman shares on the stock exchange. Warrants or Neder-man shares are subject to approval by the relevant future Annual General Meeting of Nederman. The reinvested shares and warrants are expected be retained by the senior executive during his or her term of employment and for at least three years. The 2019-2020 LTI programme covers two years and may amount to a maximum of 35 percent of annual salary for the CEO and 20 percent of annual salary for other senior executives.
Internal control Control environment. Operational decisions are made at the com-pany or business area level, while decisions about strategy, aims, acquisitions and comprehensive financial issues are made by the parent company's Board and Group management. The internal con-trols within the Group are designed to function in this organisation. The Group has clear rules and regulations for delegating responsi-bility and authority in accordance with the Group’s structure. The
platform for internal controls of financial reporting consists of the comprehensive control environment and organisation, decision processes, authorisations and responsibilities which have been documented and communicated. In the Group, the most significant components are documented in the form of instructions and pol-icies, including a financial manual, ethics policy (Code of Conduct), communication policy, IT policy, financial policy, privacy policy and authorisation lists. Nederman has a simple legal and operational structure and established management and internal control sys-tems. The Board of Directors follows up on the assessment of the internal control, including through contacts with the Nederman’s auditors. The Board of Directors has chosen not to have a special internal audit.
Control activities. To safeguard the internal controls, there are both automated controls, such as authorisation controls in the IT system and approval controls, as well as manual controls such as auditing and stock-taking. Financial analyses of the results as well as follow-up of plans and forecasts are used to supplement the controls and give a comprehensive confirmation of the quality of the reporting.
Information and communication. Documentation of governing policies and instructions are continuously updated and commu-nicated in electronic or printed format. For communications with external parties, there is a communication policy that contains guidelines for ensuring that the Company’s information obligations are applied fully and correctly.
Follow-up. The CEO is responsible for ensuring that the internal controls are organised and followed up according to the guidelines decided on by the Board. Financial management and control is car-ried out by the Group’s finance function. Financial reporting is ana-lysed monthly and at a detailed level. The Board has addressed the Company’s financial position at its meetings and has also received reports and observations from the Company’s auditor.
Articles of Association The Articles of Association stipulate the Company’s activities, the number of Board members and auditors, how notification of the Annual General Meeting is to be made, the matters to be addressed at the Annual General Meeting and where the Meeting is to be held. The current Articles of Association were adopted at the Annual General Meeting on 26 April 2011, and can be found on the Compa-ny’s website at www.nedermangroup.com and in the annual report for 2019 on page 146.

Nederman Annual Report and Sustainability Report 201984
The Board of Directors’ proposal for guidelines for executive remunerationThe Board of Directors of Nederman Holding Aktiebolag (“Nederman” or the “company”) proposes that the annual gen-eral meeting 2020 resolves on the following guidelines for exec-utive remuneration.
Nederman’s Group management fall within the provisions of these guidelines. The guidelines are forward-looking and as such are applicable to remuneration agreed, and amendments to remuneration already agreed, after adoption of the guidelines by the annual general meeting 2020. These guidelines do not apply to any remuneration decided or approved by the general meeting.
The guidelines’ promotion of Nederman’s business strategy, long-term interests and sustainabilityIn short, the company’s business strategy is to be “the Clean Air Company”, and to use Nederman’s industrial air filtration exper-tise and solutions and services to protect people, planet and production from the harmful effects of industrial processes. In this way, Nederman helps to create safer workplaces, efficient production and provide significant environmental benefits. A prerequisite for the successful implementation of the company’s business strategy and safeguarding of its long-term interests, including its sustainability, is that the company is able to recruit and retain qualified personnel. The objective of Nederman’s guidelines for executive remuneration is therefore to offer competitive remuneration on market terms, so that competent and skillful personnel can be attracted, motivated and retained. These guidelines enable the company to offer the executive management competitive total remuneration. For more infor-mation regarding the company’s business strategy, please see www.nedermangroup.com.
A long-term share-related incentive plan has been implemented in the company. The plan has been proposed to and resolved by the general meeting every other year, and was last resolved by the 2019 general meeting and is therefore excluded from these guidelines. The plan incorporates Group management members. The performance criteria used to assess the outcome of the plan is total earnings per share and is thereby distinctly linked to the business strategy and the company’s long-term value creation, including its sustainability. The plan is further conditional upon a holding period of at least three years.
Types of remuneration, etc. The remuneration shall be on market terms and may consist of the following components: fixed salary, variable remuneration, pension benefits and other benefits. Additionally, the general
meeting may – irrespective of these guidelines – resolve on, among other things, share-related or share price-related remu-neration. The remuneration committee shall monitor and eval-uate remuneration for the executive management however all remuneration for the CEO is approved by the Board of Directors.
FIXED SALARYFixed salary is paid for satisfactory work.
VARIABLE REMUNERATIONThe variable remuneration shall be linked to predetermined, well-defined and measurable financial criteria. The satisfaction of criteria for awarding variable remuneration shall be mea-sured over a period of one year. The variable remuneration may amount to not more than 50 per cent of the total fixed salary under the measurement period for the CEO and not more than 30 per cent of the total fixed salary under the measurement period for other senior executives. The criteria for variable remuneration shall mainly relate to the Group’s profitability and working capital development. In addition, individual criteria may be established. The criteria shall be designed so as to contrib-ute to the company’s business strategy and long-term interests, including its sustainability and since Nederman’s business strat-egy is to be “the Clean Air Company” by protecting people, planet and production from the harmful effects of industrial processes, the criteria for variable remuneration, which are connected to the sale of the company’s solutions and services within indus-trial air filtration, will inevitably contribute to the company’s long-term interest and sustainability.
OTHER VARIABLE REMUNERATIONFurther variable remuneration may be awarded in extraordinary circumstances, provided that such extraordinary arrangements are limited in time and only made on an individual basis, either for the purpose of recruiting or retaining executives, or as remu-neration for extraordinary performance beyond the individual’s ordinary tasks. Such remuneration may not exceed an amount corresponding to 50 per cent of the fixed annual salary and may not be paid more than once each year per individual. Any resolu-tion on such remuneration shall be made by the Board of Direc-tors based on a proposal from the remuneration committee.
PENSION BENEFITSFor the CEO, pension benefits shall be premium defined. The pension premiums for premium defined pension shall amount to not more than 35 per cent of the pension based salary. For other executives, pension benefits shall be based on a contractual ITP plan or be premium defined, unless the individual concerned is subject to defined benefit pension under mandatory collective

85Board of Directors
agreement provisions. Variable cash remuneration shall qualify for pension benefits. Pension premiums that follow from the contractual ITP plan or are premium defined, shall amount to not more than 35 per cent of the pension based salary, unless other premium levels apply according to applicable ITP plan.
For employment governed by rules other than Swedish, pension benefits and other benefits may be duly adjusted for compliance with mandatory rules or established local practice, taking into account, to the extent possible, the overall purpose of these guidelines.
OTHER BENEFITSOther benefits may include, for example, life insurance, health and medical insurance and company cars. Such benefits may amount to not more than 20 per cent of the fixed annual salary.
Criteria for awarding variable remuneration, etc. The remuneration committee shall monitor and evaluate pro-grams for variable remuneration for the executive management. To which extent the criteria for awarding variable remuneration has been satisfied shall be evaluated when the measurement period has ended. The remuneration committee is responsible for the evaluation so far as it concerns variable remuneration to the CEO. For variable remuneration to other executives, the CEO is responsible for the evaluation. For financial criteria, the evaluation shall be based on the latest financial information made public by the company. Variable cash remuneration can be paid after the completion of a measurement period or be sub-ject to deferred payment. The Board of Directors shall have the possibility, under applicable law or contractual provisions, to in whole or in part reclaim variable remuneration paid on incorrect grounds (claw-back).
Termination of employmentThe notice period may not exceed twenty four months if notice of termination of employment is made by the company for the CEO and twelve months for other executives. Fixed salary during the period of notice and severance pay may together not exceed an amount equivalent to the CEO’s fixed salary for two years, and one year for other executives. When termination is made by the executive, the notice period may not exceed six months, without any right to severance pay.
Salary and employment conditions for employeesIn the preparation of the Board of Directors’ proposal for these remuneration guidelines, salary and employment conditions
for employees of the company have been taken into account by including information on the employees’ total income, the com-ponents of the remuneration and increase and growth rate over time, in the remuneration committee’s and the Board of Direc-tors’ basis of decision when evaluating whether the guidelines and the limitations set out herein are reasonable.
The decision-making process to determine, review and implement the guidelinesThe Board of Directors has previously established a remuner-ation committee. The committee’s tasks include preparing the Bboard of Directors’ decision to propose guidelines for executive remuneration. The Board of Directors shall prepare a proposal for new guidelines at least every fourth year and submit it to the general meeting. The guidelines shall be in force until new guidelines are adopted by the general meeting. The remuner-ation committee shall also monitor and evaluate programs for variable remuneration for the executive management, the appli-cation of the guidelines for executive remuneration as well as the current remuneration structures and compensation levels in the company. The members of the remuneration committee are independent of the company and its executive management. The CEO and other members of the executive management do not participate in the Board of Directors’ processing of and reso-lutions regarding remuneration-related matters in so far as they are affected by such matters.
Derogation from the guidelinesThe Board of Directors may temporarily resolve to derogate from the guidelines, in whole or in part, if in a specific case there is special cause for the derogation and a derogation is neces-sary to serve the company’s long-term interests, including its sustainability, or to ensure the company’s financial viability. As set out above, the remuneration committee’s tasks include pre-paring the Board of Directors’ resolutions in remuneration-re-lated matters. This includes any resolutions to derogate from the guidelines.
Transitional provisions applicable for annual general meeting 2020The total expensed remuneration to senior executives, including previous commitments not yet due for payment is reported in the Annual Report 2019 in note 22.

YLVA OP DEN VELDE HAMMARGREN (1966)M.Sc. Eng. Mining EngineeringSwedish citizenElected by the Annual General Meeting. Elected 2011.Chairman of the Audit Committee.Current activities: Manager Product Line Management Engine, Vehicle Service Market at AB SKF.Member of the Board of Södra since 2017.Previous key roles: –Shareholding: Does not hold shares in Nederman.Dependency: Independent.
GUNILLA FRANSSON (1960)M.Sc. Eng. and Licentiate Technology. Swedish citizenElected by the Annual General Meeting. Elected 2016.Current activities: Chairman of NetInsight AB.Member of the Board of Dunkerintressena, Eltel AB, Enea AB, Trelleborg AB, Permobil AB, Weibel ScientificA/S and Nilar AB.Previous key roles: Various management positions within Saab AB and Ericsson AB.Shareholding: Holds 800 shares in Nederman.Dependency: Independent.
JOHAN HJERTONSSON (1968)M.Sc. in Business AdministrationSwedish citizenChairman of the Board since 2019. Elected 2018.Member of the Remuneration Committee.Current activities: President and CEO and member of the Board of Investment AB Latour. Chairman of Swegon Group AB, Hultafors Group AB, Nord-Lock International AB, Caljan AS and Latour Industries AB.Member of the Board of Sweco AB. Previous key roles: President and CEO of AB Fagerhult.Shareholding: Holds 5,000 shares in Nederman.Dependency: Dependent in relation to the Company’s major shareholders.
Board of Directors
SVEN KRISTENSSON (1962)The Swedish Air Force. University of Linköping.Swedish citizenElected by the Annual General Meeting. Elected 2008.Current activities: President and CEO of Nederman Holding AB. Chairman of the Board of BK Pac AB, Diedenporten AB, Scanbur A/S and Kristensson Holding AB. Vice Chairman of the Board of Dr P Håkonssons stiftelser.Member of the Board of Swegon AB.Previous key roles: Various positions in medical technology (Group management of Getinge AB), and packaging (Group management of AB Åkerlund & Rausing), among others.Shareholding: Holds 332,158 shares in Nederman.Dependency: Dependent in relation to the Company.
JOHAN MENCKEL (1971)M.Sc. Industrial Economics, RoyalInstitute of Technology (KTH)Swedish citizenElected by the Annual General Meeting. Elected 2016.Member of the Remuneration Committee.Current activities: President and CEO ofGränges AB.Member of the Board of Saab AB.Member of the Steering Committee of the World Materials Forum.Previous key roles:Member of the Board of the Swedish Chamber of Commerce in China. CEO of Sapa Heat Transfer. Management Consultant at Accenture and founder of addnature.com.Shareholding: Holds 4,000 shares inNederman.Dependency: Independent
SAM STRÖMERSTÉN (1955)M.Sc. Eng. Mechanical Engineering LTH80Swedish citizenElected by the Annual General Meeting. Elected 2019.Member of the Audit Committee.Current activities: - Previous key roles: CEO & President of Sidel, EVP Supply Chain at Tetra Pak and EVP Processing Systems at Tetra PakShareholding: Does not hold shares in Nederman.Dependency: Independent.
Nederman Annual Report and Sustainability Report 201986

Group management
SVEN KRISTENSSON (1962)President and CEOEmployed 2001. Swedish citizen.Education: The Swedish Air Force. University of Linköping.Current activities: President and CEO of Nederman Holding AB. Chairman of the Board of BK Pac AB, Diedenporten AB, Scanbur A/S and Kristensson Holding AB. Vice Chairman of the Board of Dr P Håkonssons stiftelser. Member of the Board of Swegon AB.Shareholding: 332,158
TOMAS HAGSTRÖM (1976)SVP, Head of Division Process TechnologyEmployed 2017. Swedish/US citizen.Education: M.Sc. Eng. Electrical Engineering, B.Sc. in Business Economics and MBACurrent activities: No other activitiesShareholding: Holds 540 shares in Nederman.
MATTHEW CUSICK (1977)SVP, CFOEmployed 2011. Swedish/UK citizen.Education: B.A. Accounting and FinanceCurrent activities: No other activitiesShareholding: 1,406
HANS DAHLÉN (1968)SVP, Head of Division Extraction & Filtration Technology Employed 2013. Swedish citizen.Education: M.Sc. Eng. Chemical EngineeringCurrent activities: No other activitiesShareholding: 3,860
JEPPE RASMUSSEN (1962)SVP, Head of Division Duct & Filter TechnologyEmployed 2019. Danish citizen.Education: M.Sc. Ph.D. Marine EngineeringCurrent activities: Member of the Board of Norlys Energi A/S, Grafisk Maskinfabrik A/S and New Nordic Engineering A/S.Shareholding: Does not hold shares in Nederman.
KRISTIAN LEXANDER (1975)SVP, CIO Employed 2018. Swedish citizen.Education: International Business College, Napier University EdinburghCurrent activities: No other activitiesShareholding: 966
EVA CARIN SVENSSON (1964)SVP, Human ResourcesEmployed 2009. Swedish citizen.Education: B.Sc. Human Resources Management & Labour RelationsCurrent activities: No other activitiesShareholding: 4,975
ERIK WAHN (1980)SVP, Corporate Strategy & Business DevelopmentEmployed 2019. Swedish citizen.Education: MBA, Economics and ManagementCurrent activities: Chairman of the Board of pej AB. Member of the Board of Senzum ABShareholding: Does not hold shares in Nederman.
KETIL GORM PAULSEN (1961)SVP, Head of Division Monitoring & Control TechnologyEmployed 2020. Norwegian citizen.Education: M.Sc. Physics/Civil Engineer, Master of ManagementCurrent activities: Member of the Board of Northern Lights Sensors ASShareholding: Does not hold shares in Nederman.
87Group management

Nederman’s 2019 Annual Report and Sustainability Report88
Consolidated income statement
1 January - 31 DecemberSEKm Note 2019 2018Net sales 2, 3 4,307.7 3,553.9Cost of goods sold 10 -2,716.4 -2,221.9Gross profit 1,591.3 1,332.0
Other operating income 5 15.4 22.3Selling expenses 10 -828.8 -730.6Administrative expenses 10 -342.8 -252.1Research and developement expenses 10 -65.2 -44.1Acquisition costs 4, 10 -5.9 -13.2Other operating expenses 6, 10 -20.8 -8.6Operating profit 3, 7, 8, 9, 22 343.2 305.7
Financial income 8.4 5.0Financial expenses -44.3 -43.2Net financial items 11 -35.9 -38.2
Profit before tax 307.3 267.5Taxes 12 -81.5 -64.7Net profit for the year 225.8 202.8
Net profit attributable to:Parent company’s shareholders 225.8 202.8
Earnings per share 20
before dilution (SEK) 6.43 5.78after dilution (SEK) 6.43 5.78

89Consolidated financial statements
Consolidated statement of comprehensive income
1 January - 31 DecemberSEKm Note 2019 2018Net profit for the year 225.8 202.8Other comprehensive incomeItems that cannot be reclassified to the income statementRevaluation of defined-benefit pension plans 22 -62.4 -15.5Tax attributable to items that cannot be reclassified to net profit 13.5 3.8
-48.9 -11.7Items that have been or can be reclassified to net profitExchange differences arising on translation of foreign operations 46.8 54.3Cash flow hedging 19 0.0 -0.1Tax relating to items that can be reclassified to the income statement 19 - 0.0
46.8 54.2Other comprehensive income for the year, net after tax -2.1 42.5Total comprehensive income for the year 223.7 245.3
Total comprehensive income attributable to:Parent company’s shareholders 223.7 245.3

Nederman’s 2019 Annual Report and Sustainability Report90
Consolidated statement of financial position
SEKm Note 2019 2018Assets 4, 27
Intangible fixed assets 13 2,037.4 1,444.9Tangible fixed assets 14 335.3 311.6Right-of-use assets 15 257.7 211.0Long-term receivables 5.3 12.3Deferred tax assets 12 8.2 20.4Total fixed assets 2,643.9 2,000.2
Inventories 17 610.3 562.0Tax assets 12 82.8 75.7Accounts receivable 26 619.3 578.8Prepaid expenses and accrued income 18 61.6 34.4Other receivables 16 283.3 305.5Cash and cash equivalents 29 445.3 463.9Total current assets 2,102.6 2,020.3Total assets 3 4,746.5 4,020.5
Equity 19
Share capital 1.2 1.2Other capital contributed 345.9 345.9Reserves 134.0 87.2Retained earnings including net profit 897.1 800.6Equity attributable to the parent company's shareholders 1,378.2 1,234.9Total equity 1,378.2 1,234.9
Liabilities 4, 27
Long-term interest-bearing liabilities 21, 26 1,575.6 917.4Long-term lease liabilities 21, 26 208.4 174.6Other long-term liabilities 24 4.9 231.7Pension provisions 22 153.1 90.9Other provisions 23 21.0 17.1Deferred tax liabilities 12 22.9 29.4Total long-term liabilities 1,985.9 1,461.1
Current interest-bearing liabilities 21, 26 5.0 8.1Current lease liabilities 21, 26 67.3 60.5Accounts payable 26 423.2 444.6Current tax liabilities 12 105.5 88.1Other liabilities 24 553.4 533.1Accrued expenses and prepaid income 25 201.8 162.0Provisions 23 26.2 28.1Total current liabilities 1,382.4 1,324.5Total liabilities 3 3,368.3 2,785.6Total equity and liabilities 4,746.5 4,020.5
For information on the Group's pledged assets and contingent liabilities, see note 27.

91Consolidated financial statements
Consolidated statement of changes in equity
Equity attributable to the parent company's shareholdersRetained
Other earningsShare contributed Translation Hedging incl. this Total
SEKm capital capital reserve reserve year's profit equityOpening equity 2018-01-01 1.2 345.9 31.7 1.3 695.7 1,075.8Transition effect IFRS 16 -15.0 -15.0Net profit for the year – – – – 202.8 202.8Other comprehensive incomeChange in translation reserve for the year – – 54.3 – – 54.3Cash flow hedging after tax – – – -0.1 – -0.1Revaluation of defined- benefit pension plans, net after tax – – – – -11.7 -11.7Total other comprehensive income – – 54.3 -0.1 -11.7 42.5Total comprehensive income for the year – – 54.3 -0.1 176.1 230.3Transactions with Group's ownersDividend paid – – – – -70.2 -70.2Share-based remuneration – – – – -1.0 -1.0Closing equity 2018-12-31 1.2 345.9 86.0 1.2 800.6 1,234.9
Opening equity 2019-01-01 1.2 345.9 86.0 1.2 800.6 1,234.9Net profit for the year – – – – 225.8 225.8Other comprehensive incomeChange in translation reserve for the year – – 46.8 – – 46.8Cash flow hedging after tax – – – 0.0 – 0.0Revaluation of defined- benefit pension plans, net after tax – – – – -48.9 -48.9Total other comprehensive income – – 46.8 0.0 -48.9 -2.1Total comprehensive income for the year – – 46.8 0.0 176.9 223.7Transactions with Group's ownersDividend paid – – – – -80.7 -80.7Share-based remuneration – – – – 0.3 0.3Closing equity 2019-12-31 1.2 345.9 132.8 1.2 897.1 1,378.2

Nederman’s 2019 Annual Report and Sustainability Report92
Consolidated cash flow statement
1 January - 31 DecemberSEKm Note 2019 2018Operating activitiesOperating profit 343.2 305.7Adjustment for:
Depreciation and amortisation of fixed assets 146.7 121.2Other adjustments 29 -0.8 -10.4
Interest received 4.0 4.7Interest paid -40.5 -41.3Income tax paid -77.8 -36.0Cash flow from operating activities before changes in working capital 374.8 343.9
Cash flow from changes in working capitalIncrease (-)/Decrease (+) of inventories 22.2 -54.0Increase (-)/Decrease (+) of operating receivables 28.2 -40.4Increase (-)/Decrease (+) of operating liabilities -103.9 21.9
-53.5 -72.5Cash flow from operating activities 321.3 271.4
Investing activitiesCapital expenditure for tangible fixed assets -42.8 -23.7Sales of tangible fixed assets 2.4 11.9Capital expenditure for capitalised development costs -15.6 -5.7Capital expenditure for other intangible fixed assets -34.5 -33.1Acquisition of subsidies/business, net of cash 4 -656.6 -66.7Change in financial assets 0.9 -Cash flow from investing activities -746.2 -117.3
Financial activitiesNew loans 1,689.1 223.0Change in interest-bearing liabilities 0.4 -0.6Amortisation of loans -1,137.1 -161.8Amortisation of lease liabilities -67.0 -56.8Dividend paid to parent company shareholders -80.7 -70.2Cash flow from financing activities 404.7 -66.4
Cash flow for the year -20.2 87.7Cash and cash equivalents at the beginning of the year 463.9 360.9Translation differences 1.6 15.3Cash and cash equivalents at the end of the year 29 445.3 463.9

93Notes to Consolidated financial statements
1 Accounting policies
Nederman Holding AB (publ), corporate registration number 556576-4205, which is the parent company of the Nederman Group, has its registered office in Helsing-borg, Sweden.
COMPLIANCE WITH LAWS AND STANDARDSThe consolidated financial statements have been prepared in accordance with In-ternational Financial Reporting Standards (IFRS) issued by the International Ac-counting Standards Board (IASB). In addition, RFR 1 Supplementary Accounting Rules for Groups, issued by the Swedish Financial Reporting Board, has been ap-plied. Nederman Holding AB’s annual accounts and consolidated financial state-ments were approved and signed by the Board on 11 March 2020. The income statement, balance sheet and statement of comprehensive income for the parent company, and the consolidated income statement, statement of comprehensive in-come and consolidated statement of financial position will be subject to adoption by the Annual General Meeting to be held on 27 April 2020.
CHANGES THAT HAVE BEEN APPLIED SINCE 1 JANUARY 2019In this annual report, the Group has applied for the first time the new and amended standards and interpretations that are to be applied for financial years beginning 1 January 2019 or later. No new or amended IFRS has been applied in advance.
IFRS 16 Leases IFRS 16, which is to be applied for financial years commencing on 1 January 2019, su-persedes IAS 17 Leases and related interpretations. IFRS 16 establishes policies for the recognition, measurement, presentation and disclosure of leases and states that les-sees must report leases in the statement of financial position. This recognition model is based on the view that the lessee has a right to use an asset for a specific period of time and at the same time an obligation to pay for that right. This means that at the ini-tial date, a right-of-use asset that represents the right to use the underlying asset dur-ing the lease term and a lease liability that represents the present value of future lease payments are to be recognised. Depreciation for the right-of-use assets and interest expenses for the lease liability are recognised in the consolidated income statement and in other comprehensive income. After the initial date, the lease liability is remeas-ured so that it reflects changes in the lease payments, such as a change in the lease term or a change in future lease payments resulting from indexation. The remeasure-ment amount is recognised as an adjustment of the right-of-use asset.
Nederman’s primary asset class is properties, such as factories and offices, but also machinery, vehicles and equipment. The standard contains two exceptions for re-porting in the statement of financial position, which Nederman applies: short-term leases (lease term of 12 months or less) and leases for which the underlying asset has a low value (USD 5,000). These lease payments are recognised as operating ex-penses in the income statement and are therefore not included in the right-of-use asset or the lease liability.
The definitions according to IFRS 16 are applied when assessing whether a contract contains a leased asset. A right-of-use asset is defined as an identified asset for which Nederman essentially is entitled to the economic benefits arising from the use of the asset and where Nederman has the right to control the use of the asset. The lease term is determined on the basis of the non-cancellable period according to the lease. If the lease contains an extension option and there is reasonable cer-tainty that this will be utilised, the lease term applied consists of the non-cancella-ble period plus the assessed period of extension. In assessing the period of exten-sion, circumstances are taken into consideration such as financial incentives in such a manner that existing lease terms are compared with estimated market rents, whether significant improvements have been made to the property and whether costs would arise in relation to any move to new premises.
The discount rate primarily consists of the rate implicit in the lease if it is available according to the lease. For other leases, the discount rate is the incremental bor-rowing rate. The incremental borrowing rate consists of an interest margin based on the lessee’s (subsidiary within the Group) credit rating and an interest rate benchmark (IBOR) for the specific currency and the term of the lease asset. Leases for which the underlying asset is sublet to a third party, and the main lease between Nederman and the principal lessor continues to apply, are recognised as a financial asset, which comprises a receivable from a third party, and a lease liability, which comprises a liability to the principal lessor.
In the transition to IFRS 16, the Group has applied a retrospective approach, which means that the figures for the 2018 financial year have been restated in accordance with the new standard. Thus, the opening balances for 2018 have been restated and the cumulative effect of applying IFRS 16 retrospectively is recognised as of 1 January 2018 as a transition effect in equity. The transition to IFRS 16 has had the following effect on the Group's income statement, statement of financial position, cash flow and performance measures:
1 Jan-31 Dec, 2018
Effect on the colsolidated income statement, SEKmPreviously
published accountsIFRS 16
adjustementsRestated accounts
Net sales 3,553.9 - 3,553.9Cost of goods sold -2,227.0 5.1 -2,221.9Gross profit 1,326.9 5.1 1,332.0Selling expenses -735.2 4.6 -730.6Administrative expenses -253.0 0.9 -252.1Research and development expenses -44.3 0.2 -44.1Other operating income/expenses 0.5 - 0.5Operating profit 294.9 10.8 305.7Net financial items -26.9 -11.3 -38.2Profit before tax 268.0 -0.5 267.5Taxes -64.8 0.1 -64.7Net profit 203.2 -0.4 202.8
1 January, 2018 31 December, 2018Effect on the consolidated financial position, SEKm
Previously published accounts
IFRS 16 adjustements
Restated accounts
Previously published accounts
IFRS 16 adjustements
Restated accounts
AssetsRight-of-use assets - 179.0 179.0 - 211.0 211.0Long-term receivables 5.4 6.6 12.0 6.6 5.7 12.3Deferred tax assets 16.8 - 16.8 20.3 0.1 20.4Other fixed assets 1,449.1 - 1,449.1 1,755.5 1.0 1,756.5Total fixed assets 1,471.3 185.6 1,656.9 1,782.4 217.8 2,000.2
Other current receivables 222.4 1.2 223.6 414.3 1.3 415.6Other current assets 1,277.2 - 1,277.2 1,604.7 - 1,604.7Total current assets 1,499.6 1.2 1,500.8 2,019.0 1.3 2,020.3Total assets 2,970.9 186.8 3,157.7 3,801.4 219.1 4,020.5
Equity 1,075.8 -15.0 1,060.8 1,250.3 -15.4 1,234.9
LiabilitiesLong-term lease liabilities 0.3 152.0 152.3 0.4 174.2 174.6Other long-term liabilities 1,125.8 - 1,125.8 1,286.5 - 1,286.5Total long-term liabilities 1,126.1 152.0 1,278.1 1,286.9 174.2 1,461.1
Current lease liabilities 0.1 49.8 49.9 0.2 60.3 60.5Other current liabilities 768.9 - 768.9 1,264.0 - 1,264.0Total current liabilities 769.0 49.8 818.8 1,264.2 60.3 1,324.5Total liabilities 1,895.1 201.8 2,096.9 2,551.1 234.5 2,785.6Total equity and liabilities 2,970.9 186.8 3,157.7 3,801.4 219.1 4,020.5
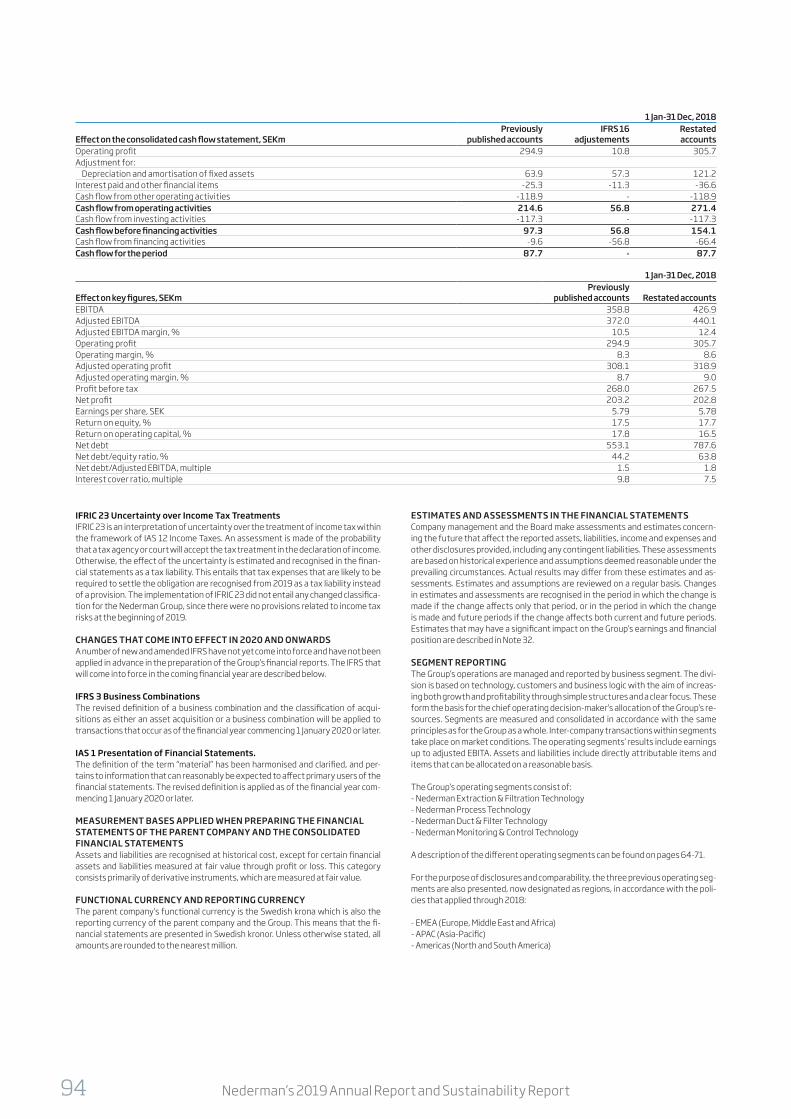
Nederman’s 2019 Annual Report and Sustainability Report94
1 Jan-31 Dec, 2018
Effect on the consolidated cash flow statement, SEKmPreviously
published accountsIFRS 16
adjustementsRestated accounts
Operating profit 294.9 10.8 305.7Adjustment for: Depreciation and amortisation of fixed assets 63.9 57.3 121.2Interest paid and other financial items -25.3 -11.3 -36.6Cash flow from other operating activities -118.9 - -118.9Cash flow from operating activities 214.6 56.8 271.4Cash flow from investing activities -117.3 - -117.3Cash flow before financing activities 97.3 56.8 154.1Cash flow from financing activities -9.6 -56.8 -66.4Cash flow for the period 87.7 - 87.7
1 Jan-31 Dec, 2018
Effect on key figures, SEKmPreviously
published accounts Restated accountsEBITDA 358.8 426.9Adjusted EBITDA 372.0 440.1Adjusted EBITDA margin, % 10.5 12.4Operating profit 294.9 305.7Operating margin, % 8.3 8.6Adjusted operating profit 308.1 318.9Adjusted operating margin, % 8.7 9.0Profit before tax 268.0 267.5Net profit 203.2 202.8Earnings per share, SEK 5.79 5.78Return on equity, % 17.5 17.7Return on operating capital, % 17.8 16.5Net debt 553.1 787.6Net debt/equity ratio, % 44.2 63.8Net debt/Adjusted EBITDA, multiple 1.5 1.8Interest cover ratio, multiple 9.8 7.5
IFRIC 23 Uncertainty over Income Tax Treatments IFRIC 23 is an interpretation of uncertainty over the treatment of income tax within the framework of IAS 12 Income Taxes. An assessment is made of the probability that a tax agency or court will accept the tax treatment in the declaration of income. Otherwise, the effect of the uncertainty is estimated and recognised in the finan-cial statements as a tax liability. This entails that tax expenses that are likely to be required to settle the obligation are recognised from 2019 as a tax liability instead of a provision. The implementation of IFRIC 23 did not entail any changed classifica-tion for the Nederman Group, since there were no provisions related to income tax risks at the beginning of 2019.
CHANGES THAT COME INTO EFFECT IN 2020 AND ONWARDSA number of new and amended IFRS have not yet come into force and have not been applied in advance in the preparation of the Group’s financial reports. The IFRS that will come into force in the coming financial year are described below.
IFRS 3 Business CombinationsThe revised definition of a business combination and the classification of acqui-sitions as either an asset acquisition or a business combination will be applied to transactions that occur as of the financial year commencing 1 January 2020 or later.
IAS 1 Presentation of Financial Statements.The definition of the term “material” has been harmonised and clarified, and per-tains to information that can reasonably be expected to affect primary users of the financial statements. The revised definition is applied as of the financial year com-mencing 1 January 2020 or later.
MEASUREMENT BASES APPLIED WHEN PREPARING THE FINANCIAL STATEMENTS OF THE PARENT COMPANY AND THE CONSOLIDATED FINANCIAL STATEMENTSAssets and liabilities are recognised at historical cost, except for certain financial assets and liabilities measured at fair value through profit or loss. This category consists primarily of derivative instruments, which are measured at fair value.
FUNCTIONAL CURRENCY AND REPORTING CURRENCYThe parent company’s functional currency is the Swedish krona which is also the reporting currency of the parent company and the Group. This means that the fi-nancial statements are presented in Swedish kronor. Unless otherwise stated, all amounts are rounded to the nearest million.
ESTIMATES AND ASSESSMENTS IN THE FINANCIAL STATEMENTSCompany management and the Board make assessments and estimates concern-ing the future that affect the reported assets, liabilities, income and expenses and other disclosures provided, including any contingent liabilities. These assessments are based on historical experience and assumptions deemed reasonable under the prevailing circumstances. Actual results may differ from these estimates and as-sessments. Estimates and assumptions are reviewed on a regular basis. Changes in estimates and assessments are recognised in the period in which the change is made if the change affects only that period, or in the period in which the change is made and future periods if the change affects both current and future periods. Estimates that may have a significant impact on the Group’s earnings and financial position are described in Note 32.
SEGMENT REPORTINGThe Group’s operations are managed and reported by business segment. The divi-sion is based on technology, customers and business logic with the aim of increas-ing both growth and profitability through simple structures and a clear focus. These form the basis for the chief operating decision-maker’s allocation of the Group’s re-sources. Segments are measured and consolidated in accordance with the same principles as for the Group as a whole. Inter-company transactions within segments take place on market conditions. The operating segments' results include earnings up to adjusted EBITA. Assets and liabilities include directly attributable items and items that can be allocated on a reasonable basis.
The Group’s operating segments consist of:- Nederman Extraction & Filtration Technology- Nederman Process Technology- Nederman Duct & Filter Technology- Nederman Monitoring & Control Technology
A description of the different operating segments can be found on pages 64-71.
For the purpose of disclosures and comparability, the three previous operating seg-ments are also presented, now designated as regions, in accordance with the poli-cies that applied through 2018:
- EMEA (Europe, Middle East and Africa)- APAC (Asia-Pacific)- Americas (North and South America)

95Notes to Consolidated financial statements
CLASSIFICATIONSFixed assets and non-current liabilities essentially consist of amounts expected to be recovered or settled after more than 12 months calculated from the balance sheet date. Current assets and current liabilities consist essentially of amounts ex-pected to be recovered or settled within 12 months calculated from the balance sheet date and amounts where the Group has an unconditional right to defer set-tlement of the liability for at least 12 months after the end of the reporting period.
CONSOLIDATION PRINCIPLESSubsidiariesSubsidiaries are the companies over which Nederman Holding AB has a controlling influence. Controlling influence exists if Nederman Holding AB has an influence over the investment object, is exposed to or has rights to variable returns from its in-volvement and can use its influence over the investment to affect these returns. When determining whether a controlling influence exists, potential voting shares are taken into consideration. Business acquisitions are recognised according to the acquisition method. The cost of acquiring a business or company consists of the fair value determined on the acquisition date of the acquired identifiable assets and as-sumed liabilities and contingent liabilities and any non-controlling interest. The dif-ference between the consideration transferred and the fair value of the acquired identifiable assets and assumed liabilities and contingent liabilities is recognised as goodwill if the difference is positive. If the difference is negative, this amount is rec-ognised directly in the income statement. Transaction costs, such as fees for legal advice, legal assistance and due diligence, are expensed in the periods in which they arise. Financial reports from the acquired businesses are included in the consolidat-ed financial statements from the date of acquisition. Divested operations are con-solidated until the date on which the controlling influence ceases. The accounting policies have been consistently applied by the Group companies.
Transactions that are eliminated on consolidationInter-company receivables and liabilities, revenue and expenses, and unrealised gains or losses arising from inter-company transactions between Group companies are eliminated in their entirety when preparing the consolidated financial state-ments.
Financial reports of foreign entitiesAssets and liabilities of foreign entities (none of which has a hyperinflationary cur-rency), including goodwill and other consolidated surplus values and deficits, are translated from the foreign entity’s functional currency to the Group's reporting currency at the exchange rate prevailing on the balance sheet date. Revenue and expenses of foreign entities are translated to Swedish kronor at an average ex-change rate. Translation differences arising from currency translation of foreign subsidiaries are recognised in other comprehensive income and accumulated in a separate component of equity designated as the translation reserve. On dispos-al, the hereto attributable accumulated translation differences, previously recog-nised in the consolidated statement of total comprehensive income, are realised in the consolidated income statement in the same period as the profit or loss on the sale.
TRANSACTIONS AND BALANCE SHEET ITEMS IN FOREIGN CURRENCIESTransactions in foreign currencies are translated into the functional currency at the exchange rate prevailing on the transaction date. Monetary assets and liabilities in foreign currencies are translated into the functional currency at the exchange rate prevailing on the balance sheet date. Gains and losses attributable to operating re-ceivables and liabilities are recognised as other operating income and other operat-ing expenses, respectively, in operating profit/loss, while gains and losses on finan-cial assets and liabilities are recognised in net financial items.
REVENUENederman’s customer offering encompasses everything from individual products, total solutions, design, installation, and commissioning to service. Based on these customer offerings, Nederman’s sales model is divided into three sales groups: Products, Solutions, and Service and Aftermarket. Within the Products sales group, Nederman offers a wide range of standard products that solve common problems related to smoke, gas, dust, materials recycling, work environment and efficient production. The Solutions sales group consists either of individual products in the Nederman range which are assembled to build small and medium-sized systems, or large system solutions with a high element of customisation. The task of both vari-ants is to solve more complex tasks. The Service and Aftermarket sales group offers qualified service in order to ensure continuous operation without interruptions to customers' production. In addition to technical service, this area also includes ser-vice contracts, spare parts and consumables.
Revenue from sales within Products and Service and Aftermarket is recognised at a given point in time when the promised goods or service is transferred to the cus-tomer and the customer obtains control over the goods or service. The customer obtains control when they receive the goods or service, can control their use and
obtain financial benefits from the asset or service. For products, this normally oc-curs when the goods are made available to the customer at the agreed time and place. For services, this occurs when the service is performed and the customer can benefit from the service provided. When it comes to sales within Solutions, which contain a significant element of customisation, Nederman’s promise to customers is to deliver integrated system solutions, and not individual goods or services sepa-rately. It is the total performance to which the customer has agreed. When it comes to sales within the Solutions segment, this means that separate performance ob-ligations cannot be identified and sales are therefore recognised as revenue over time.
For sales recognised over time, the progress towards full completion of the per-formance obligation is measured. This is carried out on the basis of project costs incurred in relation to total costs for goods and services that have been promised according to the agreement. Project costs incurred are determined either on the basis of the value of the goods or services that have been transferred to date or on the basis of customer measurements, such as achieved milestones. The choice of method is consistent within individual projects. Revenue recognition from Solu-tions includes certain assessments in the form of measuring the progress towards full completion of the performance obligation. Estimates that may have a signifi-cant impact on the Group’s earnings and financial position are described in Note 32. Solutions are recognised in the balance sheet either as contract assets or as con-tract liabilities when Nederman or the customer has fulfilled a commitment, de-pending on the relationship between Nederman’s performance and the customer’s payment. Contract liabilities are recognised as revenue when the performance ob-ligation is fulfilled.
The transaction price is the compensation that Nederman expects to be entitled to in exchange for transferring the promised goods or services to the customer in accordance with the contract. Expected credit losses are expensed immediately.
For sales of products and solutions, warranties are provided depending on the nature and use of the product. The warranty conditions provided ensure that the product or solution concerned will function as the parties intended and that it meets the agreed specifications. No warranties are sold separately and no warran-ties are provided to the customer as a separate service. On the basis of what the warranty covers and with requirements as to how the product is to be used/main-tained, none of the warranties given are regarded as separate performance obliga-tions in accordance with IFRS 15, and are instead recognised in accordance with IAS 37 Provisions, Contingent Liabilities and Contingent Assets.
RESTRUCTURING RESERVE/RESTRUCTURING COSTSReserves for planned restructuring are recognised when a detailed plan exists for the implementation of the measures and when this plan has been communicated to those affected. Restructuring costs are recognised as a separate item in the in-come statement when these are attributable to a significant change in the Group structure. Restructuring costs are otherwise recognised as an element of other op-erating expenses.
FINANCIAL INCOME AND EXPENSESFinancial income and expenses consist of interest income on bank deposits and in-terest-bearing financial assets, interest expenses on loans, dividend income, for-eign exchange differences on interest-bearing financial assets and liabilities, and the results of forward contracts used in financial operations. Interest income on interest-bearing financial receivables and interest expenses on interest-bearing financial liabilities are calculated using the effective interest method. This means that interest income and interest expenses include accrued transaction costs and any discounts, premiums and other differences between the initial carrying amount of the receivable or liability and the estimated future receipts and payments dur-ing the contract period. The interest component related to lease payments is rec-ognised in the income statement through the application of the effective interest method. Dividend income is recognised when the shareholder’s right to receive payment is established.
FINANCIAL INSTRUMENTSFinancial instruments recognised in the balance sheet include, on the asset side, cash and cash equivalents, accounts receivable and derivative assets. The liabili-ty side includes accounts payable, borrowings, pension liabilities and derivative li-abilities. Financial assets or liabilities are recognised in the balance sheet when the Company becomes a party according to the instrument’s contract terms. Accounts receivable are recorded in the balance sheet when the invoice has been sent. Li-abilities are recognised when the counterparty has performed and a contractual obligation to pay exists, even if the invoice has not yet been received. Accounts pay-able are recognised when the invoice has been received. A financial liability is derec-ognised in the balance sheet when the contractual obligation is fulfilled, expires or the Company loses control over it. The same applies to part of a financial asset. A financial liability is derecognised in the balance sheet when the obligation specified

Nederman’s 2019 Annual Report and Sustainability Report96
in the contract is discharged or otherwise expires. The same applies to part of a fi-nancial liability. Financial assets and liabilities are offset and recognised at the net amount presented in the balance sheet when there is a legally enforceable right to offset the amount and when the intention is to settle items on a net basis, or to re-alise the asset and settle the liability simultaneously. Acquisitions and divestments of financial assets are recognised on the transaction date, which is the date that the Company undertakes to acquire or divest the asset.
Recognition and measurementA financial instrument is classified based on the purpose of the acquisition. A finan-cial asset’s classification determines how it is measured after initial recognition. Financial instruments that are not derivatives are initially recognised at cost, cor-responding to the instrument’s fair value plus transaction costs, for all financial in-struments that are recognised at fair value excluding transaction costs. Accounts receivable and accounts payable have a short expected maturity and are measured at a nominal amount.
Financial assets measured at fair value through profit or loss Assets in this category are measured on an ongoing basis at fair value, with chang-es in fair value recognised in profit or loss. Derivatives that are not used for hedge accounting are also measured on an ongoing basis at fair value, with changes in fair value recognised in profit or loss. Derivative trading is carried out to hedge the Group’s currency and interest rate risks. Derivatives with positive values (unreal-ised gains) are recognised as other non-current or current receivables. Changes in fair value in regard to derivatives where the underlying transactions relate to oper-ations are recognised under other operating income/other operating expenses in the income statement. Changes in the fair value of derivatives where the underly-ing transactions are financial are recognised in net financial items.
Receivables measured at amortised costAccounts receivable and other receivables are financial assets that have defined or definable payments and that are not listed on an active market. These assets are measured at amortised cost. Amortised cost is determined according to the effec-tive interest rate and calculated as of the acquisition date. Accounts receivable are recognised at the amount that is expected to be received, meaning after deduc-tions for bad debts. Provisions for bad debts are recognised based on expected credit losses for their remaining time to maturity. Impairment losses on accounts receivable are recognised in other operating expenses. Impairment testing is car-ried out on an individual basis.
Cash and cash equivalentsCash and cash equivalents consist of cash and immediately available balances with banks and similar institutions.
Financial liabilities measured at fair value through profit or loss Changes in fair value in regard to derivatives where the underlying transactions re-late to operations are recognised under other operating income/other operating expenses in the income statement. Changes in the fair value of derivatives where the underlying transactions are financial are recognised in net financial items.
Other financial liabilitiesFinancial liabilities included in this category, such as accounts payable and loans, are measured at amortised cost. Loans and other financial liabilities are initially recog-nised at the loan amount received after deductions for transaction costs. After the acquisition date, loans are measured at amortised cost using the effective interest method.
Hedge accountingIf the criteria for hedge accounting, in respect of cash flow hedging, are met, the effective part of the change in the fair value of the derivative is recognised in other comprehensive income and accumulated in the hedging reserve in equity. The cu-mulative gains or losses recognised in the hedging reserve are reversed to earnings in the same period as the hedged cash flow affects earnings. Any ineffective por-tion of the change in value is recognised directly in earnings. If the hedging relation-ship is interrupted and cash flow is still expected to occur, the accumulated change in value is recognised in the hedging reserve until the cash flow attributable to the hedged item affects earnings. In cases where the forecast cash flow underlying the hedging transaction is no longer expected to occur, the cumulative change in value recognised in the hedging reserve is transferred directly to the income statement.
INTANGIBLE ASSETSGoodwillGoodwill represents the difference between the consideration transferred for the business and the fair value of acquired identifiable assets, assumed liabilities and any contingent liabilities. Goodwill is allocated to the cash-generating units or groups of cash-generating units that are expected to benefit from synergies from
the acquisition, and is tested for impairment requirements annually and in the event of an indication of a reduction in value. Any impairment losses are not reversed.
Research and developmentCosts for development, where research results or other knowledge is applied to achieve new or improved products or processes, are recognised as an asset in the balance sheet if the product or process is technically and commercially feasible and the Company has sufficient resources to complete development and thereafter use or sell the intangible asset. The carrying amount includes the cost of materi-als and other direct expenses that can be attributed to the asset in a reasonable and consistent manner. Development costs are recognised in the balance sheet at cost less accumulated amortisation and any impairment losses. Expenditure on re-search aimed at obtaining new scientific or technical knowledge is recognised as an expense in the income statement when incurred.
Brands with an indefinite lifeBrands acquired through business combinations are recognised at fair value at the acquisition date. Brands with an indefinite life are allocated to the cash-generat-ing units or groups of cash generating units that are expected to benefit from the brand’s cash-generating units and are tested for impairment requirements annual-ly and in the event of a reduction in value.
Customer relationships with a finite lifeCustomer relationships acquired through business combinations are recognised at fair value at the acquisition date. Customer relationships with a finite life are meas-ured at cost less amortisation and any accumulated impairment losses.
Other intangible assetsOther intangible assets acquired by the Group are recognised at cost less accumu-lated amortisation and impairment losses.
Additional expensesAdditional expenses for capitalised intangible assets are recognised as an asset in the balance sheet only when they increase the future economic benefits of the specific asset to which they relate. All other expenses are expensed when they arise.
AmortisationAmortisation is recognised in the income statement on a straight-line basis over the intangible assets’ estimated useful life unless such useful life is indefinite.
The following estimated useful lives are applied:
- Capitalised development expenditure 5 years– Software 3–5 years– Customer relationships 10 years
The amortisation methods, residual values and useful life used are reviewed at each year-end.
TANGIBLE ASSETSAssets ownedTangible assets are recognised within the Group at cost less accumulated depreci-ation and any impairment. The cost includes the purchase price and expenses di-rectly attributable to the asset to bring it on site and in the condition to be used in accordance with its intended purpose. The cost of assets produced by the Compa-ny includes the cost of materials, cost of employee benefits and, if applicable, oth-er manufacturing costs considered directly attributable to the asset. The carrying amount of a tangible asset is derecognised in the balance sheet on disposal or re-tirement, or when no future economic benefit is expected to derive from the use or sale/disposal of the asset. Gains or losses arising on the disposal or retirement of an asset comprise the difference between the sales price and the asset’s carrying amount less direct selling expenses. Gains and losses are recognised as other oper-ating income/expense.
Additional expensesAdditional expenses are only added to the cost if it is probable that the future eco-nomic benefits associated with the asset will accrue to the Company and the cost can be measured reliably. All other additional expenses are recognised as costs in the period in which they arise. The decisive factor for assessment of whether an additional expense is added to cost is whether the expense refers to the replace-ment of components or parts thereof, whereby such costs will be capitalised. Even in cases where new components are added to the asset, the expense will be added to cost. Any non-depreciated carrying values of replaced components, or parts of components, are disposed of and expensed in connection with replacement. Re-pairs and maintenance are expensed on an ongoing basis.

97Notes to Consolidated financial statements
DepreciationDepreciation takes place on a straight-line basis over the useful life of the asset. The Group applies component depreciation, which means that the components’ es-timated useful life forms the basis for depreciation.
The following estimated useful lives are applied:– buildings, property used in business operations 15-30 years– plant and machinery 3-8 years– equipment, tools, fixtures and fittings 3-10 years– land is not depreciated
Depreciation of components is based on each component's estimated useful life. The depreciation methods, residual values and useful life used are reviewed at each year-end.
RIGHT-OF-USE ASSETS Pursuant to IFRS 16, leases are recognised in the statement of financial position. This recognition model is based on the view that the lessee has a right to use an asset for a specific period of time and at the same time an obligation to pay for that right. This means that at the initial date, a right-of-use asset that represents the right to use the underlying asset during the lease term and a lease liability that rep-resents the present value of future lease payments are to be recognised. Deprecia-tion for the right-of-use assets and interest expenses for the lease liability are rec-ognised in the consolidated income statement and in other comprehensive income. After the initial date, the lease liability is remeasured so that it reflects changes in the lease payments, such as a change in the lease term or a change in future lease payments resulting from indexation. The remeasurement amount is recognised as an adjustment of the right-of-use asset.
Nederman’s primary asset class is properties, such as factories and offices, but also machinery, vehicles and equipment. The standard contains two exceptions for re-porting in the statement of financial position, which Nederman applies: short-term leases (lease term of 12 months or less) and leases for which the underlying asset has a low value (USD 5,000). These lease payments are recognised as operating ex-penses in the income statement and are therefore not included in the right-of-use asset or the lease liability.
The definitions according to IFRS 16 are applied when assessing whether a contract contains a leased asset. A right-of-use asset is defined as an identified asset for which Nederman essentially is entitled to the economic benefits arising from the use of the asset and where Nederman has the right to control the use of the asset. The lease term is determined on the basis of the non-cancellable period according to the lease. If the lease contains an extension option and there is reasonable cer-tainty that this will be utilised, the lease term applied consists of the non-cancella-ble period plus the assessed period of extension. In assessing the period of exten-sion, circumstances are taken into consideration such as financial incentives in such a manner that existing lease terms are compared with estimated market rents, whether significant improvements have been made to the property and whether costs would arise in relation to any move to new premises.
The discount rate primarily consists of the rate implicit in the lease if it is available according to the lease. For other leases, the discount rate is the incremental bor-rowing rate. The incremental borrowing rate consists of an interest margin based on the lessee’s (subsidiary within the Group) credit rating and an interest rate benchmark (IBOR) for the specific currency and the term of the lease asset.
Leases for which the underlying asset is sublet to a third party, and the main lease between Nederman and the principal lessor continues to apply, are recognised as a financial asset, which comprises a receivable from a third party, and a lease liability, which comprises a liability to the principal lessor.
IMPAIRMENT AND REVERSALS OF IMPAIRMENTImpairment losses are charged to the income statement. Impairment of financial, tangible and intangible assets as well as right-of-use assets affects operating prof-it. Previously recognised impairment losses are reversed if the reasons for the ear-lier impairment no longer exist. However, reversal will not be for an amount that is greater than that which the carrying amount would have been if the impairment had not been recognised in previous periods. Impairment of goodwill is not re-versed.
Impairment testing for tangible assets and intangible assetsImpairment testing is carried out if any event occurs or circumstances change that indicate that the carrying amount may have decreased. Testing is carried out on the cash-generating unit to which the asset belongs. The cash-generating units com-prise the Group’s operating segments. For goodwill, other intangible assets with an indefinite useful life and intangible assets not yet ready for use, the recoverable amount is calculated annually. An impairment loss is recognised when an asset’s or
cash-generating unit’s carrying amount exceeds its recoverable amount. The re-coverable amount is the higher of fair value less selling expenses and value in use. When calculating the value in use, future cash flows are discounted using a discount rate that reflects a risk-free interest rate and the risk associated with the specific asset. Impairment of assets attributable to a cash-generating unit is first allocat-ed to goodwill. A proportional impairment of other assets in the unit is then made. An impairment loss is reversed, except for goodwill impairment, if there has been a positive change in the recoverable amount.
Impairment testing for financial assetsAn impairment requirement is deemed to exist for a financial asset if objective evi-dence indicates that one or more events have had a negative impact on the asset’s estimated future cash flows. An impairment of a financial asset measured at amor-tised cost is calculated as the difference between its carrying amount and the pres-ent value of the estimated future cash flows discounted at the original effective interest rate. Previous impairment of financial assets is reversed when evidence shows that the previous impairment is no longer justified.
Impairment testing of right-of-use assetsIn accordance with IAS 36, impairment testing is carried out for right-of-use assets, and any identified impairment losses are recognised in the income statement. Im-pairment testing is carried out if any event occurs or circumstances change that in-dicate that the carrying amount of the underlying asset may have decreased. An impairment loss is recognised when the carrying amount of an asset or a cash-gen-erating unit exceeds the present value of future lease payments or of the fair value of the underlying asset less divestment expenses. In the calculation of the present value of future lease payments, future cash flows are discounted, primarily on the basis of the implicit interest rate and, otherwise, by the incremental borrowing rate. An impairment loss is reversed if a positive change has occurred in the present val-ue of the lease payments or the fair value of the underlying asset.
INVENTORYInventory is measured at the lower of cost and net realisable value on the balance sheet date. Cost is calculated using the first-in, first-out (FIFO) method and includes expenses incurred in acquiring the inventory and bringing it to its present location and condition. For finished goods and work in progress, cost includes an appropri-ate share of indirect expenses based on normal capacity. Borrowing costs are not included. Net realisable value is the estimated sales price less applicable variable selling expenses.
DIVIDENDSDividends are recognised as a liability after the Annual General Meeting has ap-proved the dividend payment.
EARNINGS PER SHAREThe calculation of earnings per share is based on consolidated net profit for the year attributable to parent company shareholders and on the weighted average number of shares outstanding during the year.
EMPLOYEE BENEFITSShort-term benefitsShort-term employee benefits are recognised as costs on receipt of the related ser-vices. A provision for expected bonus payments is recognised when the Group has an obligation to make such payments as a result of corresponding services being received or other contractual conditions being met.
Defined-contribution pension plansDefined-contribution pension plans are plans where the Company’s obligation is limited to the contributions the Company has undertaken to pay. The size of the employee’s pension depends on the contributions paid by the Company and the return on capital that the contributions provide. The Group’s obligations for de-fined-contribution plans are recognised as expenses in the income statement as they are earned. The part of the Swedish ITP plan that is financed through Alecta is a defined-benefit pension plan. At present, Alecta is unable to provide the required information, which is why the above pension plan is reported as a defined-contri-bution plan, which means that the premiums paid to Alecta are recognised in the period they relate to.
Defined-benefit pension plansDefined-benefit plans are plans for post-employment benefits other than de-fined-contribution plans. The Group’s net liability in respect of defined-benefit plans is calculated separately for each plan by estimating the future benefits that employees have earned through their employment in both current and prior peri-ods; this benefit is discounted to its present value. The discount rate is the interest rate at the balance sheet date on first-class corporate bonds, including mortgage bonds, with a maturity corresponding to the Group’s pension obligations. When there is not a viable market for such corporate bonds, the market rate of interest for

Nederman’s 2019 Annual Report and Sustainability Report98
government bonds with a similar maturity is used instead. The calculation is per-formed by a qualified actuary using the projected unit credit method. The Group’s net liability is the present value of the liability less the fair value of the plan assets, adjusted for any asset restrictions. The net interest income/expense of the de-fined-benefit liability/asset is recognised in the income statement under net finan-cial items. The net interest income/expense is based on the interest generated by discounting the net liability, meaning the interest on the liability, the plan assets and the interest on the effect of any asset restrictions. Other components are rec-ognised in operating income. Revaluation differences consist of actuarial gains and losses, the difference between the actual return on plan assets and the amount in-cluded in net interest income and any changes in the effect of asset restrictions (ex-cluding interest included in net interest income/expense). Revaluation differenc-es are recognised in other comprehensive income. Changes to or curtailment of a defined-benefit plan are recognised on the earliest of the following dates: a) when the change in the plan or reduction occurs, or b) when the Company recognises re-lated restructuring costs and redundancy payments. The changes/reductions are recognised immediately in net profit for the year. This special employer’s contribu-tion is part of the actuarial assumptions and is recognised as part of the net liabil-ity/asset. The part of the special employer’s contribution that is calculated based on the Swedish Pension Obligations Vesting Act in the legal entity is recognised for reasons of simplification as an accrued expense rather than as part of the net liabil-ity/asset. Tax on the return on pension funds is recognised in profit for the period to which the tax relates, and is therefore not included in the debt calculation. For funded plans, the tax is charged to the return on plan assets and is recognised in other comprehensive income. For unfunded or partially unfunded plans, the tax is charged to net profit for the year. When there is a difference between how pension costs are determined in a legal entity and a group, a provision or receivable is recog-nised for the special employer’s contribution based on this difference. The provision or receivable is not discounted.
PROVISIONSProvisions are recognised in the balance sheet when the Group has an existing legal or informal obligation as a result of a past event, and it is probable that an outflow of financial resources will be required to settle the obligation, and when the amount can be estimated reliably. Provisions are reviewed at each balance sheet date. Pro-visions are divided into long-term and short-term provisions.
Provisions for guaranteesA provision for product warranties is recognised when the underlying products or services are sold. The provision is based on historical warranty data and a weighting of possible outcomes in relation to the probabilities associated with the outcomes.
Provisions for restructuring and redundancy paymentsA restructuring provision is recognised when the Group has approved a detailed and formal restructuring plan, and the restructuring has either begun or been publicly announced. Provisions for restructuring often include termination benefits, which can be either voluntary or involuntary. Termination benefits are recognised accord-ing to the same principles as provisions for restructuring, except in cases where there are requirements to work during the notice period. The cost of this work is al-located over the period in which the services were performed. No provision is made for future operating expenses.
TAXESIncome tax consists of the sum of current tax and deferred tax. Income tax is rec-ognised in the income statement except when the underlying transaction is recog-nised under other comprehensive income or directly against equity, in which case the associated tax effect is recognised in the equivalent way. Current tax is the tax payable or refundable for the current year, applying the tax rates enacted or sub-stantively enacted at the balance sheet date. This includes any adjustment of cur-rent tax attributable to prior periods. A current tax liability or asset is recognised for the estimated tax to be paid or received for the current or prior years. Deferred tax is calculated using the balance sheet method on the basis of temporary differences between the tax values of assets and liabilities and the carrying amounts recog-nised in the Group. Temporary differences that arise on initial recognition of an as-set or liability, and are neither related to a takeover or other acquisition nor affect the recognised or taxable profit, do not give rise to any deferred tax asset or liability. Deferred tax is calculated at a nominal amount applying the tax rates and tax laws that are enacted or substantively enacted on the balance sheet date. Temporary differences in participations in subsidiaries are not taken into account as the Group can control the time of reversal of these and it is likely that they will not be reversed in the foreseeable future. Nor are temporary differences in goodwill taken into ac-count. Deferred tax assets in regard to deductible temporary differences and loss carryforwards are only recognised to the extent it is probable they will be able to be utilised. The value of deferred tax assets is reduced when it is no longer con-sidered likely that they can be utilised. Deferred tax assets and liabilities are offset when there is a legal right to offset current tax assets and liabilities and when the deferred income taxes relate to the same taxation authority.
Wherever uncertainty occurs in the treatment of income tax, an assessment is made of the probability that the tax agency or court will accept the tax treatment in the declaration of income, and the effect of the uncertainty is estimated and recog-nised in the financial statements as a tax liability in accordance with IFRIC 23.
CONTINGENT LIABILITIESA contingent liability is recognised when there is a possible liability that arises from past events, that is not recognised as a liability or provision because it is not proba-ble that an outflow of resources will be required.
PARENT COMPANY ACCOUNTING POLICIESThe parent company has prepared its annual accounts in accordance with the Swedish Annual Accounts Act (1995:1554) and RFR 2 Accounting for Legal Entities issued by the Swedish Financial Reporting Board. This means that the parent com-pany applies in its financial reporting, as far as possible, all EU-approved IFRS under the Swedish Annual Accounts Act and that it takes into account the connection be-tween accounting and taxation. The parent company applies the same accounting policies as the Group except in the cases listed below. The deviations between the policies of the parent company and the Group are due to limitations in the opportu-nities to apply IFRS in the parent company as a consequence of the Swedish Annual Accounts Act and the Swedish Pension Obligations Vesting Act, and in certain cases to tax legislation.
SubsidiariesParticipations in subsidiaries are recognised in the parent company in accordance with the cost method. All expenses incurred in connection with business combi-nations, including acquisition-related expenses, are capitalised in the parent com-pany’s financial statements as part of the cost of subsidiaries’ shares. Revenue from dividends is recognised when the right to receive dividends has been estab-lished. Dividends received are recognised as revenue regardless of whether or not the dividends relate to profit earned before the acquisition date. Shares in subsid-iaries and receivables from subsidiaries are tested for impairment annually and in the event of an indication of impairment. Impairment testing is carried out by com-paring the parent company’s recognised cost with the subsidiaries’ net asset value, including their long-term earning capacity. Any impairment losses are not reversed.
Net salesThe parent company's revenue consists of inter-company management fees. Rev-enue from management fees is recognised at a point in time, which is usually when the service is performed and the subsidiaries can benefit from the service provided.
TaxesThe parent company recognises untaxed reserves including deferred tax liability, unlike in the consolidated accounts where untaxed reserves are divided into de-ferred tax liability and equity. The parent company therefore makes no allocation of appropriations to deferred tax expense.
LeasesIn accordance with RFR 2, the parent company applies the exemption in IFRS 16 as of 1 January 2019. This entails that the parent company recognises lease payments as operating expenses in the income statement on a straight-line basis over the lease term for all leases.
Group contributions and shareholders’ contributions for legal entities Shareholders’ contributions are added to the value of shares and participations in the balance sheet, after which impairment testing is carried out. Group contribu-tions are recognised as an appropriation in the income statement.
Capitalised development expendituresDevelopment expenditures capitalized during the year, for development work per-formed within the Nederman Group on intangible assets, the amount is transferred from unrestricted equity to a reserve for development expenditures pertaining to restricted equity.
Financial guaranteesThe parent company's financial guarantees consist mainly of guarantees on behalf of subsidiaries. Financial guarantees mean that the Company has an obligation to compensate the owner of a debt instrument for losses that the owner may incur because a specified debtor fails to make payment when due under the contract terms. The parent company recognises financial guarantee agreements as a provi-sion in the balance sheet when the Company has a commitment for which payment will probably be required in order to settle the obligation.
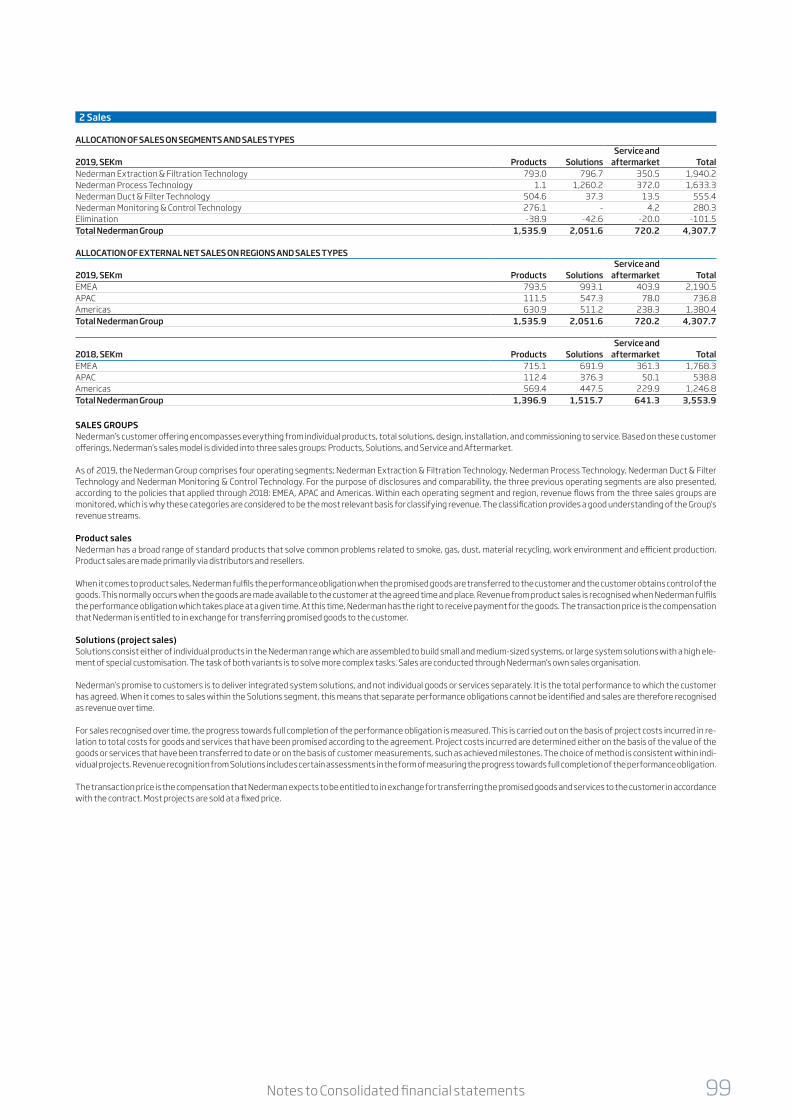
99Notes to Consolidated financial statements
2 Sales
ALLOCATION OF SALES ON SEGMENTS AND SALES TYPESService and
2019, SEKm Products Solutions aftermarket Total Nederman Extraction & Filtration Technology 793.0 796.7 350.5 1,940.2Nederman Process Technology 1.1 1,260.2 372.0 1,633.3Nederman Duct & Filter Technology 504.6 37.3 13.5 555.4Nederman Monitoring & Control Technology 276.1 - 4.2 280.3Elimination -38.9 -42.6 -20.0 -101.5Total Nederman Group 1,535.9 2,051.6 720.2 4,307.7
ALLOCATION OF EXTERNAL NET SALES ON REGIONS AND SALES TYPESService and
2019, SEKm Products Solutions aftermarket Total EMEA 793.5 993.1 403.9 2,190.5APAC 111.5 547.3 78.0 736.8Americas 630.9 511.2 238.3 1,380.4Total Nederman Group 1,535.9 2,051.6 720.2 4,307.7
Service and2018, SEKm Products Solutions aftermarket Total EMEA 715.1 691.9 361.3 1,768.3APAC 112.4 376.3 50.1 538.8Americas 569.4 447.5 229.9 1,246.8Total Nederman Group 1,396.9 1,515.7 641.3 3,553.9
SALES GROUPSNederman’s customer offering encompasses everything from individual products, total solutions, design, installation, and commissioning to service. Based on these customer offerings, Nederman’s sales model is divided into three sales groups: Products, Solutions, and Service and Aftermarket.
As of 2019, the Nederman Group comprises four operating segments; Nederman Extraction & Filtration Technology, Nederman Process Technology, Nederman Duct & Filter Technology and Nederman Monitoring & Control Technology. For the purpose of disclosures and comparability, the three previous operating segments are also presented, according to the policies that applied through 2018: EMEA, APAC and Americas. Within each operating segment and region, revenue flows from the three sales groups are monitored, which is why these categories are considered to be the most relevant basis for classifying revenue. The classification provides a good understanding of the Group's revenue streams.
Product salesNederman has a broad range of standard products that solve common problems related to smoke, gas, dust, material recycling, work environment and efficient production. Product sales are made primarily via distributors and resellers.
When it comes to product sales, Nederman fulfils the performance obligation when the promised goods are transferred to the customer and the customer obtains control of the goods. This normally occurs when the goods are made available to the customer at the agreed time and place. Revenue from product sales is recognised when Nederman fulfils the performance obligation which takes place at a given time. At this time, Nederman has the right to receive payment for the goods. The transaction price is the compensation that Nederman is entitled to in exchange for transferring promised goods to the customer.
Solutions (project sales)Solutions consist either of individual products in the Nederman range which are assembled to build small and medium-sized systems, or large system solutions with a high ele-ment of special customisation. The task of both variants is to solve more complex tasks. Sales are conducted through Nederman’s own sales organisation.
Nederman’s promise to customers is to deliver integrated system solutions, and not individual goods or services separately. It is the total performance to which the customer has agreed. When it comes to sales within the Solutions segment, this means that separate performance obligations cannot be identified and sales are therefore recognised as revenue over time.
For sales recognised over time, the progress towards full completion of the performance obligation is measured. This is carried out on the basis of project costs incurred in re-lation to total costs for goods and services that have been promised according to the agreement. Project costs incurred are determined either on the basis of the value of the goods or services that have been transferred to date or on the basis of customer measurements, such as achieved milestones. The choice of method is consistent within indi-vidual projects. Revenue recognition from Solutions includes certain assessments in the form of measuring the progress towards full completion of the performance obligation.
The transaction price is the compensation that Nederman expects to be entitled to in exchange for transferring the promised goods and services to the customer in accordance with the contract. Most projects are sold at a fixed price.

Nederman’s 2019 Annual Report and Sustainability Report100
3 Operating segments
Service and aftermarketBy offering qualified service with good availability, Nederman helps to ensure continuous operation without expensive interruptions to customers’ production. In addition to technical service, this area also includes service contracts, spare parts and consumables.
When it comes to service and aftermarket sales, Nederman fulfils the performance obligation when the promised goods or service are transferred to the customer and the customer obtains control of the goods or services. In regard to products, control is normally transferred when the product is delivered to the customer. With respect to service, control is normally transferred when the service is performed and the customer can benefit from the service provided. Revenue from service and aftermarket sales is recog-nised when Nederman fulfils the performance obligation which takes place at a given time. The transaction price is the compensation that Nederman is entitled to in exchange for transferring promised goods or services to the customer.
Accounts receivable, contract assets and contract liabilitiesWhen Nederman is entitled to unconditional compensation from the customer, this is recognised as a receivable. When it comes to sales within Products and Service and Af-termarket, an account receivable arises when control has been transferred to the customer and the invoice has been sent. When it comes to sales within Solutions, Nederman recognises a contract asset or contract liability in the statement of financial position when Nederman or the customer has fulfilled an obligation, depending on the relationship between Nederman’s performance and the customer’s payment. Contract liabilities are reported as revenue when the performance obligation is fulfilled. At the beginning of 2019, contract liabilities amounted to SEK 440.3m (167.6), of which SEK 315.7m (137.4) was recognised as revenue in the current year. At the end of 2019, contract liabilities amounted to SEK 379.9m.
Terms of paymentFor new customers and new markets, letters of credit or advance payments normally apply. For established customer relationships, credit limits are carefully monitored to lim-it the risk. For project sales recognised as contract assets or contract liabilities, payment terms with a fixed payment plan are applied, with payments based on the degree of completion.
WarrantiesFor sales of products and solutions, warranties are provided depending on the nature and use of the product. The warranty conditions provided ensure that the product or solu-tion concerned will function as the parties intended and that it meets the agreed specifications. No warranties are sold separately and no warranties are provided to the cus-tomer as a separate service. Based on what the warranty covers and with requirements as to how the product is to be used/maintained, no warranties provided are regarded as separate performance obligations but are recognised instead as a provision. Warranty provisions are based on estimations based on historical experience and assumptions deemed reasonable under the prevailing circumstances for the individual case. Actual results may differ from these estimates and assessments. Estimates and assumptions are reviewed on a regular basis.
2 Sales, cont'd
Segment reporting is based on reports submitted to the chief operating decision-maker in order to assess performance and allocation of resources to the segments. The op-erating segments consist of different business operations that are affected by revenue and expenses. Segments are measured and consolidated in accordance with the same principles as for the Group as a whole.
Nederman is one of the world’s leading suppliers of products and solutions for advanced air filtration in demanding industrial environments. Our offering comprises individual products, complete solutions, project design, installation, commissioning and service. Nederman’s business concept is clean air. The Company’s products contribute to reducing the environmental impact from industrial production, creating clean and safe working environments, and increasing production efficiency.
OPERATING SEGMENTSAs of 2019, Nederman Group comprises four operating segments:- Nederman Extraction & Filtration Technology- Nederman Process Technology- Nederman Duct & Filter Technology- Nederman Monitoring & Control Technology
The division is based on technology, customers and business logic with the aim of increasing both growth and profitability through simple structures and a clear focus. The operating segments are presented on pages 64-71 of the annual report. The Group’s internal reporting system is built up in order to make it possible to follow the operating segments’ sales and operating profit. Joint operating expenses are allocated to the operating segments as appropriate. Assets and liabilities that are part of working capital are recognised separately, where possible. Earnings, assets and liabilities for the segments include directly attributable items plus items that can be allocated to the segments in an appropriate way. Items that are recognised as “Other – non-allocated” pertain mostly to expenses related to the parent company Nederman Holding AB, which includes the cen-tral main office functions, such as Group Management, Group Finance, Group IT and Group HR. The item “Other – non-allocated” also pertains to acquisition costs, restructuring costs, financial income and expenses, and tax expenses. Assets and liabilities that have not been allocated between the segments are fixed assets, cash and cash equivalents, tax receivables and tax liabilities (current and deferred), financial investments and financial liabilities, provisions and pension liabilities. Assets included in working capital are defined as inventory, accounts receivable, contract assets, other receivables and prepaid expenses and accrued income. Liabilities included in working capital are defined as accounts payable, contract liabilities, other operating liabilities, and accrued expenses and prepaid income. The segments’ capital expenditure in fixed assets includes all capital expenditures in tangible and intangible fixed assets except expendable equipment, equipment of minor value and goodwill.
REGIONSFor the purpose of disclosures and comparability, the three previous operating segments are also presented, now designated as regions, in accordance with the policies that applied through 2018:
- EMEA (Europe, Middle East and Africa)- APAC (Asia-Pacific)- Americas (North and South America)
Assets and liabilities that have not been allocated between the regions include tax receivables and tax liabilities (current and deferred), financial investments and financial liabilities, and pension liabilities. Operating assets are defined as total assets with deductions for cash and cash equivalents, tax receivables (current and deferred) and finan-cial investments. Operating liabilities are defined as total liabilities less financial investments, tax liabilities (current and deferred), financial liabilities, and pension liabilities. The regions’ capital expenditure in tangible and intangible fixed assets includes all capital expenditure except expendable equipment, equipment of minor value and goodwill.
GEOGRAPHIC AREASThe Group is divided into ten geographic regions: Sweden, Germany, the UK, other EMEA, the US, other Americas, China, India, other APAC and rest of the world. The information presented concerning the revenue for each region is grouped according to the geographic area where the customers are located. Information concerning operating assets, fixed assets excluding goodwill and capital expenditure for the period in tangible and intangible assets, with the exception of goodwill, is based on the geographic regions where the assets are located. Fixed assets are defined as total assets less goodwill, non-current receivables and deferred tax assets.

101Notes to Consolidated financial statements
3 Operating segments, cont'd
OPERATING SEGMENTSExtraction & Duct & Monitoring Other Total
Filtration Process Filter & Control non- Nederman2019, SEKm Technology Technology Technology Technology allocated Elimination GroupNet sales, external customers 1,934.5 1,621.8 472.0 279.4 - - 4,307.7Net sales, internal between operating segments 5.7 11.5 83.4 0.9 - -101.5 -Net sales 1,940.2 1,633.3 555.4 280.3 - -101.5 4,307.7
Adjusted EBITA 263.2 101.6 69.6 44.6 -85.0 - 394.0Amortisation of intangible assets -44.9Acquisition costs -5.9Operating profit 343.2Net financial items -35.9Taxes -81.5Net profit for the year 225.8
Assets included in working capital 669.4 623.2 126.2 193.1 101.7 -140.2 1,573.4Goodwill 473.7 345.8 19.0 773.7 - - 1,612.2Non-allocated assets - - - - 1,560.9 - 1,560.9Total assets 1,143.1 969.0 145.2 966.8 1,662.6 -140.2 4,746.5
Liabilities included in working capital 435.9 568.2 68.6 64.8 107.7 -140.2 1,105.0Non-allocated liabilities - - - - 2,263.3 - 2,263.3Total liabilities 435.9 568.2 68.6 64.8 2,371.0 -140.2 3,368.3
Other segment informationCapital expenditures 18.1 6.5 14.8 3.2 51.0 - 93.6Entered lease agreements during the year 26.6 7.1 1.4 40.5 0.8 - 76.4Depreciation/Amortisation and impairment -63.0 -29.8 -13.2 -28.4 -12.3 - -146.7Items not affecting cash flow other than depreciation/amortisation 1.9 -2.3 0.8 -0.0 -1.2 - -0.8
REGIONS2019 2018
Other OtherSEKm EMEA APACAmericas not allocated Total EMEA APAC Americas not allocated TotalNet sales 2,190.5 736.8 1,380.4 - 4,307.7 1,768.3 538.8 1,246.8 - 3,553.9Adjusted operating profit 310.6 33.2 128.6 -123.3 349.1 266.2 18.3 123.1 -88.7 318.9Acquistion costs - - - -5.9 -5.9 - - - -13.2 -13.2Operating profit/loss 310.6 33.2 128.6 -129.2 343.2 266.2 18.3 123.1 -101.9 305.7Financial income - - - 8.4 8.4 - - - 5.0 5.0Financial expenses - - - -44.3 -44.3 - - - -43.2 -43.2Tax expenses - - - -81.5 -81.5 - - - -64.7 -64.7Net profit for the year 225.8 202.8
Operating assets 3,228.0 537.8 1,053.9 -613.1 4,206.6 2,420.9 514.1 1,138.3 -617.5 3,455.8Other assets - - - 539.9 539.9 - - - 564.7 564.7Total assets 3,228.0 537.8 1,053.9 -73.2 4,746.5 2,420.9 514.1 1,138.3 -52.8 4,020.5
Operating liabilities 549.3 427.1 482.1 -227.9 1,230.6 582.6 427.7 458.8 -52.5 1,416.6Other libilities - - - 2,137.7 2,137.7 - - - 1,369.0 1,369.0Total liabilities 549.3 427.1 482.1 1,909.8 3,368.3 582.6 427.7 458.8 1,316.5 2,785.6
Capital expenditures 25.9 3.5 13.2 51.0 93.6 14.2 2.4 8.3 37.9 62.8Depreciation and amortisation -76.3 -22.4 -28.1 -19.9 -146.7 -66.0 -14.6 -24.0 -16.6 -121.2
GEOGRAPHIC AREASOther Other Other Rest of Not
2019, SEKm Sweden Germany UK EMEA US Americas China India APAC the World allocated TotalNet sales 122.8 404.7 214.6 1,092.3 1,078.7 275.7 457.7 139.8 375.2 146.2 - 4,307.7Operting assets 712.6 505.2 143.1 1,863.2 978.4 111.3 358.2 91.2 125.3 - -681.9 4,206.6Capital expenditures 5.7 2.0 0.6 17.6 11.8 1.4 1.3 1.5 0.7 - 51.0 93.6Fixed assets 91.0 53.9 16.3 444.6 186.3 7.8 47.6 66.5 32.5 - 71.7 1,018.2
Other Other Other Rest of Not2018, SEKm Sweden Germany UK EMEA US Americas China India APAC the World allocated TotalNet sales 119.8 352.3 161.8 961.2 1,004.6 184.1 266.2 67.3 180.1 256.5 - 3,553.9Operting assets 724.7 411.3 101.6 1,144.7 1,078.2 82.4 387.5 117.2 78.1 - -669.9 3,455.8Capital expenditures 5.8 1.9 1.5 5.0 7.4 0.9 1.0 1.3 0.1 - 37.9 62.8Fixed assets 92.5 51.6 13.6 220.0 186.3 7.9 56.9 65.2 35.1 - 55.1 784.2

Nederman’s 2019 Annual Report and Sustainability Report102
4 Acquisition of business operations
ACQUISITION 2019
Gasmet Technologies OyOn December 9, Nederman acquired 100% of the shares in the Finish group Gasmet Technologies Oy (Gasmet). Gasmet is a world leader of FTIR (Fourier Transform Infrared Spectroscopy) gas analysis solutions for both continuous emission and mercury monitoring systems and portable gas analysers. Today, the company has the largest project portfolio of FTIR analysis solutions, with more than 4,000 installed units in approximately 80 markets. The company is based in Helsinki, Finland, and has global presence through wholly owned entities in Germany, the UK, Canada, Hong Kong and Austria. Gasmet had with some 120 employes and sales of more than EUR 21m in the 2018 financial year.
The acquisition price amounted to SEK 508.9m. Acquired net assets amounted to SEK 14.1m and the transaction resulted in an increased goodwill of SEK 386.6m. Goodwill is mainly related to the strong market position of Gasmet, especially with a leading global position in the FTIR analysis market, and to highly skilled and knowledgeable workforce, new customers and to synergies with the Nederman Group. Effect of the acquisition on the Group’s cash and cash equivalents is SEK 497.1m. The acquisition analysis is prelim-inary.
Of the total intangible fixed assets, SEK 81.1m relates to capitalised development expenditures, SEK 52.6m to customer contracts, SEK 19.0m to the brand and SEK 3.7m to computer programs. Acquisition related costs amounted to SEK 4.5m and relateto fees paid to consultants in connection with the transaction, including due diligence and legal advice. These expenses have been charged to operating profit.
SEKm TotalAcquisition price 508.9
Identifiable acquaired assets and liabilities, SEKm
Carrying amount upon the moment
of acquisitionAdjustment to fair value
Fair value/ Total
Intangible fixed assets 21.7 134.7 156.4Tangible fixed assets 7.4 - 7.4Right-of-use assets 51.4 - 51.4Inventories 58.9 - 58.9Accounts receivables and other receivables 50.0 - 50.0Tax assets 0.9 - 0.9Cash and cash equivalent 11.8 - 11.8Interest-bearing liabilities -90.0 - -90.0Lease liabilities -51.4 - -51.4Accounts payable and other operating libilities -45.6 - -45.6Current tax liabilities -1.0 - -1.0Defferd tax liabilities -0.0 -26.5 -26.5Total indentifiable net assets 14.1 108.2 122.3Goodwill 386.6Total 508.9Transferred remuneration -508.9Acquired cash and cash equivalents 11.8Effect on consolidated cash and cash equivalents -497.1
Net sales during holding time 39.4Net sales 2019 before acquisition 206.9
Net profit during holding time 12.3Net profit 2019 before acquisition 10.9
Effect on consolidated cash and cash equivalents, SEKm 2019 2018Gasmet Technologies Oy -497.1 - Luwa Air Engineering AG - -28.2Auburn FilterSense LLC -4.1 -42.5NEO Monitors AS -155.4 4.0Total effect on consolidated cash and cash equivalents -656.6 -66.7

103Notes to Consolidated financial statements
4 Acquisition of business operations, cont'd
ACQUISITIONS 2018
Luwa Air Engineering AGOn 17 October, 2018, Nederman acquired 100% of the shares in the Swiss group Luwa Air Engineering AG (Luwa). Luwa is a global manufacturer and supplier of customised systems for air filtration, waste management and heat recovery systems for fibre applications. Luwa was funded in 1935 and is a global market leader in air filtration for lead-ing-quality fibre and textiles and with a global brand in the fibres industry. The Luwa Group’s activities include the design and engineering of single components and whole sys-tems as well as manufacturing, assembly, installation and after sales services. Manufacturing and assembly facilities are situated in India and China and the group has a signifi-cant global installed base that is the source of Luwa’s deep understanding of the technical demands as well as the local requirements of customers. Luwa is part of the division Nederman Process Technology. Luwa s high quality solutions will add to the Nederman Group’s capabilities in the strategically important global fibre and textile market. Luwa is based in Uster, Switzerland and has also operations in China, India, Singapore, USA and Turkey.
The purchase price amounted to SEK 258.7m, of which SEK 51.7m will be paid two years after the date of acquisition. According to the original acquisition analysis, the acquired net assets were valued at SEK 172.7m, which in the third quarter of 2019 were adjusted by SEK 11.2m net after tax, following the final valuation of the carrying amount at the date of acquisition. The adjustment increased goodwill by a corresponding amount.
Acquisition related costs amounted to SEK 1.4m (8.1). These expenses have been charged to operating profit. The acquisition analysis is final.
Auburn FilterSense LLCThe Group acquired the US company Auburn FilterSense LLC (AFS) on 5 April, 2018. AFS is a leading provider of particulate monitors and filter control solutions. AFS holds sever-al decades of experience and application knowledge from more than 75,000 units and installations sold, bringing technology and support to help customers worldwide reduce emissions and improve operations. The company manufactures continuous particulate monitors incorporating triboelectric and charge induction particulate sensing technol-ogies, intelligent controls, including real-time diagnostics and software for filter leak detectors, process control, maintenance planning, regulatory compliance and increased production efficiency. AFS is based in Beverly, Massachusetts, USA and is part of the operating segment Nederman Monitoring & Control Technology.
The purchase price amounted to SEK 65.0m, of which SEK 20.7m constitutes a possible additional purchase price based on profitability in 2018 and 2019. During 2019, SEK 4.1m of the total additional purchase price has been paid and during the first quarter 2020 the rest of the total additional purchase price will be paid. Acquisition related costs amounted to SEK 0.0m (4.4). The acquisition analysis is final.
ACQUISITION 2017
NEO Monitors ASOn 7th November 2017, Nederman acquired 100 percent of the shares in NEO Monitors AS. The acquisition price amounted to SEK 407.5 m and during 2018 it was adjusted by SEK 4.0 m, related to an updated calculation of net working capital. The purchase price was divided into two parts, whereof the first part of SEK 256.1 m was paid on the date of the takeover and the second part of SEK 155.4m was paid in the fourth quarter 2019. Acquisition related costs amounted to SEK 0.0m (0.7). The acquisition analysis is final.

Nederman’s 2019 Annual Report and Sustainability Report104
5 Other operating income
SEKm 2019 2018Profit from sale of fixed assets 2.4 9.4Recovered bad debt losses 2.8 1.2Exchange gains on operating receivables/liabilities 3.3 6.7Other 6.9 5.0Total 15.4 22.3
For further information about the credit loss reserve, see note 26.
6 Other operating expenses
SEKm 2019 2018Loss from sales of fixed assets -1.0 -2.6Bad debt losses -11.0 -2.6Exchange losses on operating receivables/liabilities - -0.5Other -8.8 -2.9Total -20.8 -8.6
For further information about the credit loss reserve, see note 26.
7 Employees and Staff Expenses
2019 2018Average number of emplyees Women Men Total Women Men TotalAustralia 4 18 22 3 17 20Belgium 3 17 20 3 13 16Brazil 6 19 25 5 18 23Denmark 9 69 78 10 65 75England 16 82 98 15 81 96Finland 2 5 7 - - -France 6 12 18 5 14 19Hong Kong - 1 1 - - -India 10 224 234 5 74 79Indonesia 1 11 12 2 8 10Canada 6 23 29 5 22 27China 65 224 289 43 140 183Malaysia 1 5 6 1 5 6Mexico 3 7 10 7 11 18Netherlands 1 26 27 2 29 31Norway 10 55 65 8 58 66Poland 33 204 237 27 205 232Russia 1 4 5 2 3 5Switzerland 8 46 54 2 10 12Singapore 3 6 9 1 1 2Spain 2 13 15 2 13 15Sweden 63 157 220 54 149 203Thailand 13 29 42 20 52 72Czech Republic 2 17 19 2 16 18Turkey 4 17 21 3 10 13Germany 38 139 177 36 142 178Hungary - 2 2 - 2 2USA 122 328 450 112 315 427Austria - 3 3 - 4 4Total 432 1,763 2,195 375 1,477 1,852Of whom, senior executives 28 135 163 23 82 105
Gender breakdown of senior executives, percentage of women 2019 2018Board of Directors 11% 12%Other senior executives 17% 22%
Expenses for remuneration to employees, SEKm 2019 2018Salaries and other remuneration 1,074.9 898.0Pension expenses, defined-benefit plans (see also note 22) 15.2 5.8Pension expenses, defined-contribution plans (see also note 22) 1) 49.6 47.1Social security expenses 146.5 121.6
1,286.2 1072.5
Salaries and other remuneration allocated between the Board of Directors and other employees, SEKm 2019 2018Board of Directors, CEO and senior executives (see also note 22) 74.7 64.4(of which variable compensation) (10.3) (7.0)Other employees 1,000.2 833.6
1,074.9 898.0
1) Of the parent company’s pension costs SEK 1.4m (1.4) concern the Board of Directors and the CEO for the parent company. There are no outstandning pension obligations to the Group’s Board of Directors, CEO and senior executives.

105Notes to Consolidated financial statements
9 Fees and expenses to auditors
SEKm 2019 2018EYAudit assignment 6.7 6.0Tax advice 0.1 0.4Other assignments 0.2 0.1
Other auditorsAudit assignment 1.2 1.3Tax advice 0.1 0.2Other assignments 0.4 0.5
Audit assignments refer to the statutory audit of annual and consolidated accounts, the administration of the Board of Directors and CEO, and auditing and other verifications as agreed. Other audit assignments include other duties incumbent on the company’s auditors and advice or other assistance required by the findings in the audit or perfor-mance of other tasks.
10 Operating expenses
SEKm 2019 2018Costs of operations allocated on cost typeCost of material -2,047.2 -1,658.3Cost of remuneration to staff -1,286.2 -1,072.5Other external costs and other personnel costs -473.1 -396.7Acquisition costs -5.9 -13.2Depreciation and amortisation -146.7 -121.2Other operating expenses -20.8 -8.6Total -3,979.9 -3,270.5
8 Lease agreements
Lease expenses, SEKm 2019 2018Depreciation of right-of-use assets -67.1 -57.3Interest expense on lease liabilities -12.8 -11.2Short term leases -0.9 -0.3Lease assets of low value -1.9 -1.3Variable lease expenses -0.2 -0.2Total -82.9 -70.3
Revenue from subleases, SEKm 2019 2018Revenue from subleases 1.7 1.5

Nederman’s 2019 Annual Report and Sustainability Report106
12 Taxes
REPORTED IN THE CONSOLIDATED INCOME STATEMENT, SEKm 2019 2018Current tax expense (-)Tax expense for the period -88.5 -62.0Adjustment of tax relating to previous years -1.8 5.1Total -90.3 -56.9Deferred tax expense (-) /tax income (+)Deferred tax concerning temporary differences -3.6 -5.6Utilisation of previously activated loss carryforwards -2.1 -6.4Revaluation of loss carryforwards 8.8 0.1Deferred tax income in tax loss carryforwards capitalised during the year 5.7 4.1Total 8.8 -7.8Total consolidated tax expenses -81.5 -64.7
Reconciliation of effective taxThe Swedish corporate income tax rate is 21.4 percent. The primary reasons for the difference in tax rate between Swedish income tax and the Group’s tax rate based on the earnings after financial items are indicated in the table below.
2019, % 2019, SEKm 2018, % 2018, SEKmProfit before tax 307.3 267.5Tax according to the applicable tax rate for the Parent company 21.4 -65.8 22.0 -59.0Effect of other tax rates for foreign subsidiaries 0.0 -0.1 5.1 -13.6Non-taxable income -0.4 1.2 -0.4 1.0Non-tax deductible expenses 4.2 -12.7 2.2 -5.8Revaluation of temporary differences -0.9 2.7 -1.1 3.0Increase of tax loss carryforwards without corresponding capitalisation of deferred tax 2.1 -6.5 2.3 -6.3Utilisation or revaluation of previously non-capitalised tax loss carryforwards -0.9 2.8 -4.0 10.8Tax relating to previous years 0.9 -2.9 -1.7 4.7Effect of changes in tax rates and tax rules 0.1 -0.2 -0.2 0.5Reported effective tax 26.5 -81.5 24.2 -64.7
Current tax assets amount to SEK 82.8m (75.7) and represent the recoverable amount of current tax on the result for the year.
REPORTED IN CONSOLIDATED STATEMENT OF FINANCIAL POSITION2019 2018
Deferred tax assets and deferred tax liabilities, SEK m Assets Liabilities Net Assets Liabilities NetDeferred tax assets and deferred tax liabilities relate to:Tangible fixed assets 19.0 33.7 -14.7 27.0 30.9 -3.9Intangible fixed assets 5.0 79.7 -74.7 5.6 50.5 -44.9Financial assets - 1.7 -1.7 0.7 0.2 0.5Inventories 16.6 1.1 15.5 13.6 1.2 12.4Accounts receivable 3.8 1.4 2.4 1.7 7.9 -6.2Provision for pensions 17.6 0.2 17.4 18.6 9.1 9.5Provisions 15.2 - 15.2 13.4 1.2 12.2Long term liabilities - - - 0.1 3.3 -3.2Short term liabilities 10.3 - 10.3 10.2 - 10.2Loss carryforwards 16.1 0.5 15.6 4.4 - 4.4Tax assets/liabilities 103.6 118.3 -14.7 95.3 104.3 -9.0Netting -95.4 -95.4 - -74.9 -74.9 - Deferred tax assets/liabilities according to consolidated statement of financial position
8.2 22.9 -14.7 20.4 29.4 -9.0
Recognised loss carryforwards are not time limited except for losses in Turky amounting to SEK 0.9m, the Netherlands amounting to SEK 6.9m, Poland amounting to SEK 4.5m and China amounting to SEK 12.9m that are mainly valid until 2021-2023.
Deferred tax assets on tax loss carryforwards have been reported to the extent that it is considered probable that the losses can be set off against future profits.
Deferred tax assets and liabilities are offset where there is a legal offsetting right for the current tax assets and liabilities, and when the deferred taxes pertain to the same tax authority.
11 Net financial items
SEKm 2019 2018Financial incomeInterest income on bank deposits 3.5 2.7Other interest income 0.5 1.9Exchange rate changes 4.4 0.4Total 8.4 5.0
Financial expensesInterest expenses, credit institutions -24.3 -23.3Interest expenses, leasing liabilities -12.8 -11.3Interest expenses, other -7.2 -7.0Exchange rate changes - -1.6Total -44.3 -43.2
Net financial items -35.9 -38.2
All interest income/expense derive from financial assets and liabilities which are measured at amortised cost.

107Notes to Consolidated financial statements
12 Taxes, cont'd
UNRECOGNISED TAX LOSS CARRYFORWARDSDeductible temporary differences and loss carryforwards for which deferred tax assets have not been reported in the consolidated statement of financial position:
SEKm 2019 2018Unrecognised tax loss carryforwards 243.0 252.3
Unrecognised tax loss carryforwards would correspond to a deferred tax asset of SEK 58.1m. Unrecognized tax loss carryforwards are mainly related to losses in France, India, Canada, the Netherlands, Thailand, Turkey, Germany and the USA which will probably not be used for settlement of future taxable gains. The majority of the unrecognised tax loss carryforwards have a time limit to 2022-2024 and the remaining portion is mainly not time limited.
CHANGE IN DEFERRED TAX ON TEMPORARY DIFFERENCES AND LOSSES CARRIED FORWARDRecorded
in other Balance
as of 1 JanRecorded
over incomecomprehen-
sive Translation AcquisitionsBalance
as of 31 DecSEKm 2019 statement income difference of business 2019Tangible fixed assets -3.9 -11.3 - 0.5 -0.0 -14.7Intangible fixed assets -44.9 -3.3 - - -26.5 -74.7Financial assets 0.5 -2.5 - 0.3 - -1.7Inventories 12.4 3.3 - -0.2 - 15.5Accounts receivable -6.2 10.0 - -1.4 - 2.4Provision for pensions 9.5 -6.4 13.5 0.8 - 17.4Provisions 12.2 3.4 - -0.4 - 15.2Long term liabilities -3.2 3.1 - 0.1 - - Short term liabilities 10.2 0.1 - -0.0 - 10.3Loss carryforwards 4.4 12.4 - -1.2 -0.0 15.6Total -9.0 8.8 13.5 -1.5 -26.5 -14.7
Recordedin other
Balance as of 1 Jan
Recorded over income
comprehen-sive Translation Acquisitions
Balance as of 31 Dec
SEKm 2018 statement income difference of business 2018Tangible fixed assets -2.0 -1.7 - -0.2 0.0 -3.9Intangible fixed assets -38.8 -0.7 - -0.1 -5.3 -44.9Financial assets 0.5 -0.0 - 0.0 - 0.5Inventories 10.2 1.0 - 0.1 1.1 12.4Accounts receivable -1.7 -3.8 - -0.4 -0.3 -6.2Provision for pensions 16.6 1.6 - 0.2 -8.9 9.5Provisions 7.6 3.2 - 0.3 1.1 12.2Long term liabilities -1.4 -1.7 - -0.1 - -3.2Short term liabilities 4.3 -3.5 - -0.3 9.7 10.2Loss carryforwards 4.5 -2.2 - -0.2 2.3 4.4Total -0.2 -7.8 - -0.7 -0.3 -9.0

Nederman’s 2019 Annual Report and Sustainability Report108
13 Intanglible fixed assets
2019Capitalised
Customer Trade- development ComputerSEKm relations marks expenditures Goodwill programs TotalAccumulated costOpening balance 62.9 149.1 231.9 1,183.3 171.0 1,798.2Business acquisition 52.6 19.0 78.7 397.8 4.6 552.7Internally developed assets - - 15.6 - - 15.6Other capital expenditures - - - - 34.5 34.5Sold and scrapped - - -5.9 - -0.9 -6.8Translation differences 1.8 5.9 3.9 31.1 1.0 43.7Closing balance 117.3 174.0 324.2 1,612.2 210.2 2,437.9
Accumulated amortisation and impairmentOpening balance -15.1 -56.6 -169.1 - -112.5 -353.3Business acquisition - - -0.7 - -0.9 -1.6Sold and scrapped - - 6.1 - 0.9 7.0Amortisation -8.2 -0.1 -12.8 - -23.8 -44.9Translation differences -0.4 -2.9 -3.5 - -0.9 -7.7Closing balance -23.7 -59.6 -180.0 - -137.2 -400.5
Carrying amountOpening balance 47.8 92.5 62.8 1,183.3 58.5 1,444.9Closing balance 93.6 114.4 144.2 1,612.2 73.0 2,037.4
2018Capitalised
Customer Trade- development ComputerSEKm relations marks expenditures Goodwill programs TotalAccumulated costOpening balance 42.6 44.1 212.7 969.9 125.6 1,394.9Business acquisition 17.9 100.1 57.4 137.6 11.2 324.2Internally developed assets - - 5.7 - - 5.7Other capital expenditures - - 0.1 - 33.0 33.1Sold and scrapped - - -0.1 - - -0.1Reclassifications - -0.3 -51.0 40.1 - -11.2Translation differences 2.4 5.2 7.1 35.7 1.2 51.6Closing balance 62.9 149.1 231.9 1,183.3 171.0 1,798.2
Accumulated amortisation and impairmentOpening balance -9.2 - -107.4 - -81.6 -198.2Business acquisition - -55.7 -48.9 - -10.2 -114.8Sold and scrapped - - 0.1 - - 0.1Amortisation -5.4 - -10.2 - -19.5 -35.1Translation differences -0.5 -0.9 -2.7 - -1.2 -5.3Closing balance -15.1 -56.6 -169.1 - -112.5 -353.3
Carrying amountOpening balance 33.4 44.1 105.3 969.9 44.0 1,196.7Closing balance 47.8 92.5 62.8 1,183.3 58.5 1,444.9
The Group’s expenses for developement of the existing product range and new products amounted to SEK 65.2m (44.1). SEK 15.6m was capitalised in the consolidated state-ment of financial position.

109Notes to Consolidated financial statements
13 Intanglible fixed assets, cont'd
Amortisation and impairment, SEKm 2019 2018Amortisation is included in the following rows in the income statement:Cost of sold goods -19.0 -13.8Selling expenses -6.5 -5.5Administrative expenses -19.4 -15.8Total -44.9 -35.1
The amount of goodwill represents the future economic benefits arising from the busienss acquisitions that are not individually identified and separately recognised and the value being established on the market with a functioning market organisation. The goodwill is split per operating segment. From 2019 the Nederman Group is divided into four operating segments; Nederman Extraction & Filtration Technology, Nederman Process Technology, Nederman Duct & Filter Technology and Nederman Monitoring & Control Technology.
Goodwill per operating segment, SEKm 2019 2018Nederman Extraction & Filtration Technology 473.7 465.2Nederman Process Technology 345.8 321.8Nederman Duct & Filter Technology 19.0 18.6Nederman Monitoring & Control Technology 773.7 377.7Total 1,612.2 1,183.3
Cash generating unitAnnual growth during the forecast period, %
Annual growth after forecast period, %
Discount rate before tax, %*
Nederman Extraction & Filtration Technology 3.0 (3.0) 2.0 (2.0) 13.57 (10.95)Nederman Process Technology 4.0 (5.0) 3.0 (3.0) 13.48 (10.57)Nederman Duct & Filter Technology 3.0 (3.0) 1.0 (1.0) 13.74 (11.06)Nederman Monitoring & Control Technology 14.0 (12.0) 8.0 (5.0) 10.83 (10.13)
Trademarks 2.0 (2.0) 2.0 (2.0) 12.92 (12.66)
*Discount rates before tax for 2018, stated in brackets, are excluding IFRS 16.
IMPAIRMENT TESTS FOR CASH-GENERATING UNITS CONTAINING GOODWILL AND TRADEMARKS WITH INDETERMINABLE LIFETIME
GOODWILLGoodwill is tested annually for impairment, or more frequently if there are indica-tions of a reduction in value. The test is based on defined cash-generating units, which are the same as the operating segment and the values are based on dis-counted cash flows. The recoverable amounts have been determined on the basis of calculations of value in use. These calculations are based on projected cash flows by the management for a period of five years. The growth for the cash-generating units is based on historical growth, estimated market growth and expected price development. The forecasts reflect previous experience and external sources of information. Assumed growth is based on a cautious assumption and does not ex-ceed the long-term growth of the industry as a whole.
Sensitivity analysis:Sensitivity in all calculations means that the goodwill value will be defended even if the discount rate is raised by one percentage point or if long-term growth would fall by a percentage point. The annual test of goodwill did not reveal an impairment requirement. The senior executives are of the opinion however that no reasonable changes in important assumptions at the impairment test of the cash-generating units will result in a recoverable value lower than the carrying amount.
TRADEMARKSIn addition to goodwill there are acquired trademarks which are considered to have an indefinite useful life. The useful life is deemed indefinite if it is a question of a well-established brand in its market, which the Group intends to maintain and de-velop further. The brands that have been identified and valued were established in connection with the 2012 acquisition of EFT, 2018 year s acquisition of Auburn FilterSense and Luwa, and this year s acquisition of Gasmet. The cost of the trade-marks were established at the time of the acquisition under the so-called relief from royalty method. Impairment testing is performed annually. The test includes an assessment of the royalty rate on the acquisition date and estimated future sales performance for five years. Sustained growth of 2 percent has been used. Cash flow for the period beyond five years has been calculated using a multiple applied to estimated sustainable cash flow. When calculating the present value of expected future cash flows, the current weighted average capital cost (WACC) for the market is used. For 2019, the discount rate amounts to 12.92 percent (12.66). Impairment testing is done in the forth quarter, or whenever the need arises, and with the assumptions used showed there was no need for any impairment of trade-marks with an indefinite useful life. The book value of trademarks with an indefinite useful life amounted to SEK 114.4m (92.5).

Nederman’s 2019 Annual Report and Sustainability Report110
14 Tangible fixed assets
2019
Land Plant Equipment, and and tools and
SEKm buildings machinery fixtures TotalAccumulated costOpening balance 451.5 233.4 346.1 1,031.0Business acquisition 1.3 0.1 10.6 12.0Capital expenditure 4.0 19.1 20.4 43.5Sold and scrapped -0.2 -10.7 -20.5 -31.4Translation differences 12.0 6.7 4.1 22.8Closing balance 468.6 248.6 360.7 1,077.9
Accumulated depreciation and impairmentOpening balance -239.4 -173.4 -306.6 -719.4Business acquisition -0.4 -0.1 -4.1 -4.6Depreciation -11.4 -10.5 -12.8 -34.7Sold and scrapped 0.0 9.3 19.7 29.0Translation differences -4.7 -4.9 -3.3 -13.0Closing balance -255.9 -179.6 -307.1 -742.6
Carrying amountsOpening balance 212.1 60.0 39.5 311.6Closing balance 212.7 69.0 53.6 335.3
2018
Land Plant Equipment, and and tools and
SEKm buildings machinery fixtures TotalAccumulated costOpening balance 379.7 201.7 309.6 891.0Business acquisition 44.9 20.7 27.3 92.9Capital expenditure 9.3 6.2 8.5 24.0Sold and scrapped -3.6 -8.4 -5.4 -17.4Reclassification - 1.1 0.8 1.9Translation differences 21.2 12.1 5.3 38.6Closing balance 451.5 233.4 346.1 1,031.0
Accumulated depreciation and impairmentOpening balance -210.2 -152.6 -275.8 -638.6Business acquisition -11.3 -8.5 -20.7 -40.5Depreciation -9.9 -9.3 -9.6 -28.8Sold and scrapped 1.6 6.3 4.5 12.4Reclassifications -0.0 -1.1 -0.4 -1.5Translation differences -9.6 -8.2 -4.6 -22.4Closing balance -239.4 -173.4 -306.6 -719.4
Carrying amountsOpening balance 169.5 49.1 33.8 252.4Closing balance 212.1 60.0 39.5 311.6
Depreciation and impairment, SEKm 2019 2018Depreciation is included in the following rows in the income statement:Cost of goods sold -23.5 -18.3Selling expenses -6.0 -6.1Administrative expenses -5.2 -4.4
-34.7 -28.8
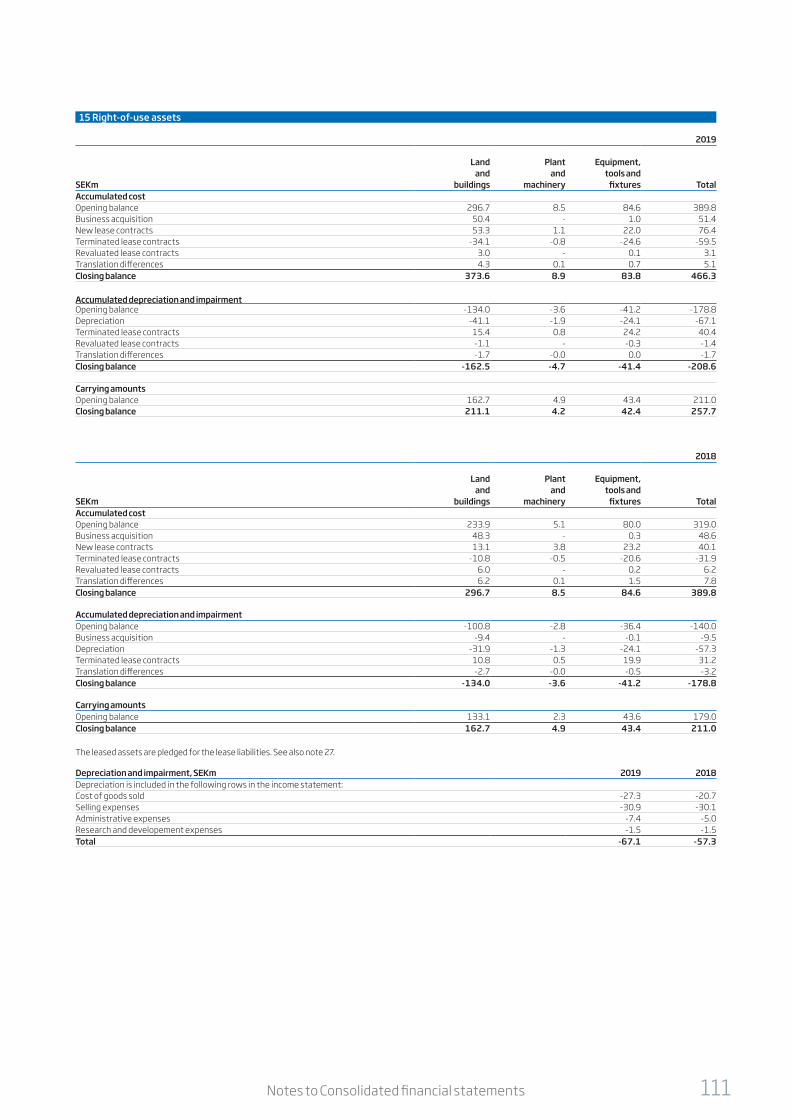
111Notes to Consolidated financial statements
15 Right-of-use assets
2019
Land Plant Equipment, and and tools and
SEKm buildings machinery fixtures TotalAccumulated costOpening balance 296.7 8.5 84.6 389.8Business acquisition 50.4 - 1.0 51.4New lease contracts 53.3 1.1 22.0 76.4Terminated lease contracts -34.1 -0.8 -24.6 -59.5Revaluated lease contracts 3.0 - 0.1 3.1Translation differences 4.3 0.1 0.7 5.1Closing balance 373.6 8.9 83.8 466.3
Accumulated depreciation and impairmentOpening balance -134.0 -3.6 -41.2 -178.8Depreciation -41.1 -1.9 -24.1 -67.1Terminated lease contracts 15.4 0.8 24.2 40.4Revaluated lease contracts -1.1 - -0.3 -1.4Translation differences -1.7 -0.0 0.0 -1.7Closing balance -162.5 -4.7 -41.4 -208.6
Carrying amountsOpening balance 162.7 4.9 43.4 211.0Closing balance 211.1 4.2 42.4 257.7
2018
Land Plant Equipment, and and tools and
SEKm buildings machinery fixtures TotalAccumulated costOpening balance 233.9 5.1 80.0 319.0Business acquisition 48.3 - 0.3 48.6New lease contracts 13.1 3.8 23.2 40.1Terminated lease contracts -10.8 -0.5 -20.6 -31.9Revaluated lease contracts 6.0 - 0.2 6.2Translation differences 6.2 0.1 1.5 7.8Closing balance 296.7 8.5 84.6 389.8
Accumulated depreciation and impairmentOpening balance -100.8 -2.8 -36.4 -140.0Business acquisition -9.4 - -0.1 -9.5Depreciation -31.9 -1.3 -24.1 -57.3Terminated lease contracts 10.8 0.5 19.9 31.2Translation differences -2.7 -0.0 -0.5 -3.2Closing balance -134.0 -3.6 -41.2 -178.8
Carrying amountsOpening balance 133.1 2.3 43.6 179.0Closing balance 162.7 4.9 43.4 211.0
The leased assets are pledged for the lease liabilities. See also note 27.
Depreciation and impairment, SEKm 2019 2018Depreciation is included in the following rows in the income statement:Cost of goods sold -27.3 -20.7Selling expenses -30.9 -30.1Administrative expenses -7.4 -5.0Research and developement expenses -1.5 -1.5Total -67.1 -57.3

Nederman’s 2019 Annual Report and Sustainability Report112
16 Other receivables
SEKm 2019 2018Other receivables which are current assetsVAT receivables 35.3 26.3Contract assets 191.8 205.0Fair value of foreign exchange forward contracts 1.2 1.9Sub lease contracts 1.1 1.3Other receivables 53.9 71.0Total 283.3 305.5
17 Inventory
SEKm 2019 2018Raw materials and consumables 273.6 248.9Work in progress 157.0 135.9Finished goods and tradable goods 179.7 177.2Total 610.3 562.0
Impairment of inventory value reported gross 123.0 103.1
Change of obsolescence provision, SEKm 2019 2018Opening balance 103.1 80.3Business acquisition - 20.9Change in obsolencence reported in the income statement 20.7 2.8Disposals -2.7 -2.4Reclassifications - -0.9Effect of changes in currency exchange rates 1.9 2.4Obsolencence provision at 31 December 123.0 103.1
18 Prepaid expenses and accrued income
SEKm 2019 2018Rent/leasing 6.7 6.5Computer/license costs 9.5 6.0Insurance 3.5 1.3Bank costs 0.2 1.2Other 41.7 19.4Total 61.6 34.4
Information about the Group’s financial assets recognised as carrying amounts or as fair value, see note 26.
Contract assetsWith sales of Solutions, Nederman recognises a contract asset, previously referred to as an “project work in progress, not invoiced”, or a contract liability, previously referred to as ”invoiced income not yet recognised concerning projects”, in the statement of financial position when Nederman or the customer has fulfilled an obligation, depending on the relationship between Nederman’s performance and the customer’s payment. For information on sales of solutions, see Note 2 and for contract liabilities see Note 24.

113Notes to Consolidated financial statements
19 Equity
Share capital and number of shares 2019 2018Number of shares 35,146,020 35,146,020Registered share capital, SEK 1,171,534 1,171,534
The par value of the shares is SEK 0.03.
Number of treasury shares held 2019 2018Opening number of treasury shares held 57,267 19,089Effect of share-related remuneration -4,343 - Effect of share split - 38,178Closing number of treasury shares held 52,924 57,267
DividendThe Board of Directors propose a dividend of SEK 2.50 (2.30) per share, in total SEK 87.7m* (80.7). The dividend amount will be adopted by the AGM on 27 April 2020.
* Based on the number of shares outstanding on 31 December 2019. The dividend amount may be subject to change as treasury shares may be sold up to the record day of 21 April 2020.
Hedging reserve, SEKm 2019 2018Cash flow hedgingValue at the beginning of the year 1.2 1.3Changes in fair value of cash flow hedges 0.0 -0.1Tax relating to cash flow hedges - 0.0Value at the end of the period 1.2 1.2
Capital manageentAccording to the Board’s policy, the Group’s financial objective is to achieve a good capital structure and financial stability in order to maintain the trust of investors, creditors and the market, and to form a good base for continued development of the business, while the long-term return generated for shareholders remains satisfactory.
Capital defined as total equity, SEKm 2019 2018Total equity 1,378.2 1,234.9
Net debt/equity ratio, % 2019 2018Interest-bearing liabilities and provisions 2,009.4 1,251.5Cash and cash equivalents -445.3 -463.9Net debt 1,564.1 787.6
Net debt/equity ratio, % 113.5 63.8
The net debt/equity ratio increased compared with the preceding year as a result of increased net debt. Net debt was primarily negatively impacted by the increased debt resulting from the acquisition of Gasmet. Net debt was also negatively impacted by the higher lease liability attributable to the lease of properties in Gasmet and the Group’s increased pension liability. The increased pension liability is mainly attributable to lower discount rates on the Group’s defined-benefit pension plans. Net debt also increased due to currency effects from the external loans in USD and EUR. Equity was strengthened during the year due to improved profitability but was also positively affected by the translation reserve, mainly related to US dollar and euro. A favourable net debt/equity ratio and ample access to cash and cash equivalents provides an opportunity to take advantage of the growth prospects anticipated in the coming years, while the level of the ordinary dividend is expected to be maintained. For the same reason, issues of new shares will probably not be needed in the coming years, except in the event of major acquisitions.
The Group seeks to pay an ordinary dividend each year amounting to 30-50 percent of net profit for the year. The Board has proposed a dividend of SEK 2.50 per share to the Annual General Meeting in 2020, representing 6.4 percent of equity. In the past five years, the ordinary dividend has averaged around 6.6 percent of equity. This has meant that 39 percent of earnings per share has been distributed in ordinary dividends.
20 Earnings per share
Earnings per share, SEK 2019 2018Earnings per share before dilution 6.43 5.78Earnings per share after dilution 6.43 5.78
Net profit for the year, SEKm 2019 2018This year’s earnings attributable to the parent company’s shareholders 225.8 202.8
Weighted average number of shares outstanding 2019 2018Issued number of shares as of 31 December 35,146,020 35,146,020Weighted average number of shares prior to dilution 35,093,096 35,088,753Weighted average number of shares after dilution 35,093,096 35,088,753
Number of treasury shares held 2019 2018Opening number of treasury shares held 57,267 19,089Effect of share-related remunerations -4,343 -Effect of share split - 38,178Closing number of treasury shares held 52,924 57,267
For information about the Group s share-related remunerations, see note 22.

Nederman’s 2019 Annual Report and Sustainability Report114
21 Interest-bearing liabilities
For more information about the company’s exposure to interest rate risks and currency risks, see note 26.
Long-term liabilities, SEKm 2019 2018Bank loans 1,575.6 917.4Lease liabilities 208.4 174.6Total 1,784.0 1,092.0
Current liabilities, SEKm 2019 2018Current part of bank loan 5.0 8.1Current part of lease liabilities 67.3 60.5Total 72.3 68.6
Total interest-bearing liabilities 1,856.3 1,160.6
Terms and repayment due datesFor terms and repayments due dates see the table below. No security for the bank loans has been provided.
NominalNominal
intererst, %amount Recorded
2019, SEKm Currency Due date original currency amountBank loan (revolving) SEK 0.700 2022-05-24 110.0 109.7Bank loan (revolving) SEK 0.700 2022-05-24 450.0 448.8Bank loan (revolving) SEK 0.764 2022-05-24 46.5 46.4Bank loan (revolving) EUR 0.700 2022-05-24 14.2 147.7Bank loan (revolving) EUR 0.700 2022-05-24 7.7 80.1Bank loan (revolving) USD 2.714 2022-05-24 26.3 244.3Bank loan SEK 0.764 2022-05-24 300.0 299.3Bank loan SEK 0.564 2022-05-24 200.0 199.4Bank loan (revolving) USD 0.037 2020-01-08 0.5 4.9Lease liabilities 275.7Total interest bearing liabilities 1,856.3
NominalNominal
intererst, %amount Recorded
2018, SEKm Currency Due date original currency amountBank loan (revolving) USD 4.320 2019-03-26 0.4 3.6Bank loan (revolving) USD 3.910 2019-01-07 0.5 4.5Bank loan (revolving) SEK 0.900 2020-12-28 57.5 57.5Bank loan (revolving) SEK 0.900 2020-12-28 215.0 214.9Bank loan (revolving) USD 3.406 2020-12-28 25.1 225.2Bank loan (revolving) EUR 0.900 2020-12-28 14.2 146.0Bank loan (revolving) SEK 0.750 2020-06-01 274.0 273.8Lease liabilities 235.1Total interest bearing liabilities 1,160.6
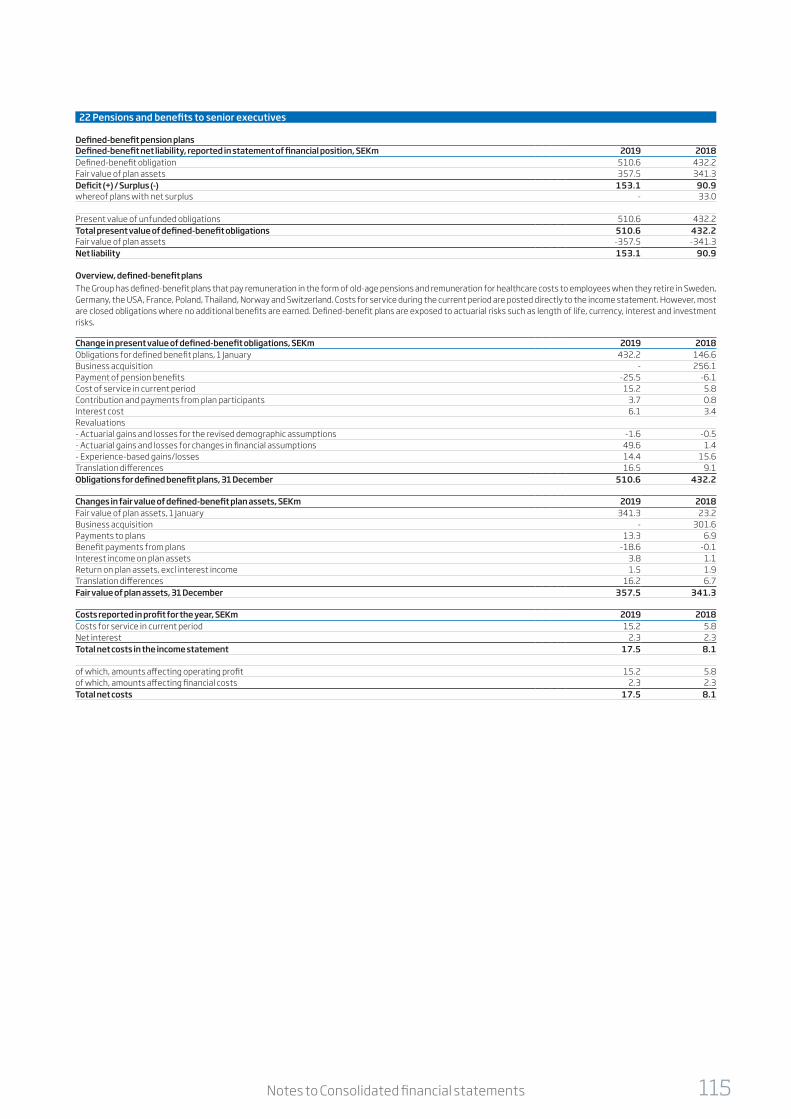
115Notes to Consolidated financial statements
22 Pensions and benefits to senior executives
Defined-benefit pension plansDefined-benefit net liability, reported in statement of financial position, SEKm 2019 2018Defined-benefit obligation 510.6 432.2Fair value of plan assets 357.5 341.3Deficit (+) / Surplus (-) 153.1 90.9whereof plans with net surplus - 33.0
Present value of unfunded obligations 510.6 432.2Total present value of defined-benefit obligations 510.6 432.2Fair value of plan assets -357.5 -341.3Net liability 153.1 90.9
Overview, defined-benefit plansThe Group has defined-benefit plans that pay remuneration in the form of old-age pensions and remuneration for healthcare costs to employees when they retire in Sweden, Germany, the USA, France, Poland, Thailand, Norway and Switzerland. Costs for service during the current period are posted directly to the income statement. However, most are closed obligations where no additional benefits are earned. Defined-benefit plans are exposed to actuarial risks such as length of life, currency, interest and investment risks.
Change in present value of defined-benefit obligations, SEKm 2019 2018Obligations for defined benefit plans, 1 January 432.2 146.6Business acquisition - 256.1Payment of pension benefits -25.5 -6.1Cost of service in current period 15.2 5.8Contribution and payments from plan participants 3.7 0.8Interest cost 6.1 3.4Revaluations- Actuarial gains and losses for the revised demographic assumptions -1.6 -0.5- Actuarial gains and losses for changes in financial assumptions 49.6 1.4- Experience-based gains/losses 14.4 15.6Translation differences 16.5 9.1Obligations for defined benefit plans, 31 December 510.6 432.2
Changes in fair value of defined-benefit plan assets, SEKm 2019 2018Fair value of plan assets, 1 January 341.3 23.2Business acquisition - 301.6Payments to plans 13.3 6.9Benefit payments from plans -18.6 -0.1Interest income on plan assets 3.8 1.1Return on plan assets, excl interest income 1.5 1.9Translation differences 16.2 6.7Fair value of plan assets, 31 December 357.5 341.3
Costs reported in profit for the year, SEKm 2019 2018Costs for service in current period 15.2 5.8Net interest 2.3 2.3Total net costs in the income statement 17.5 8.1
of which, amounts affecting operating profit 15.2 5.8of which, amounts affecting financial costs 2.3 2.3Total net costs 17.5 8.1
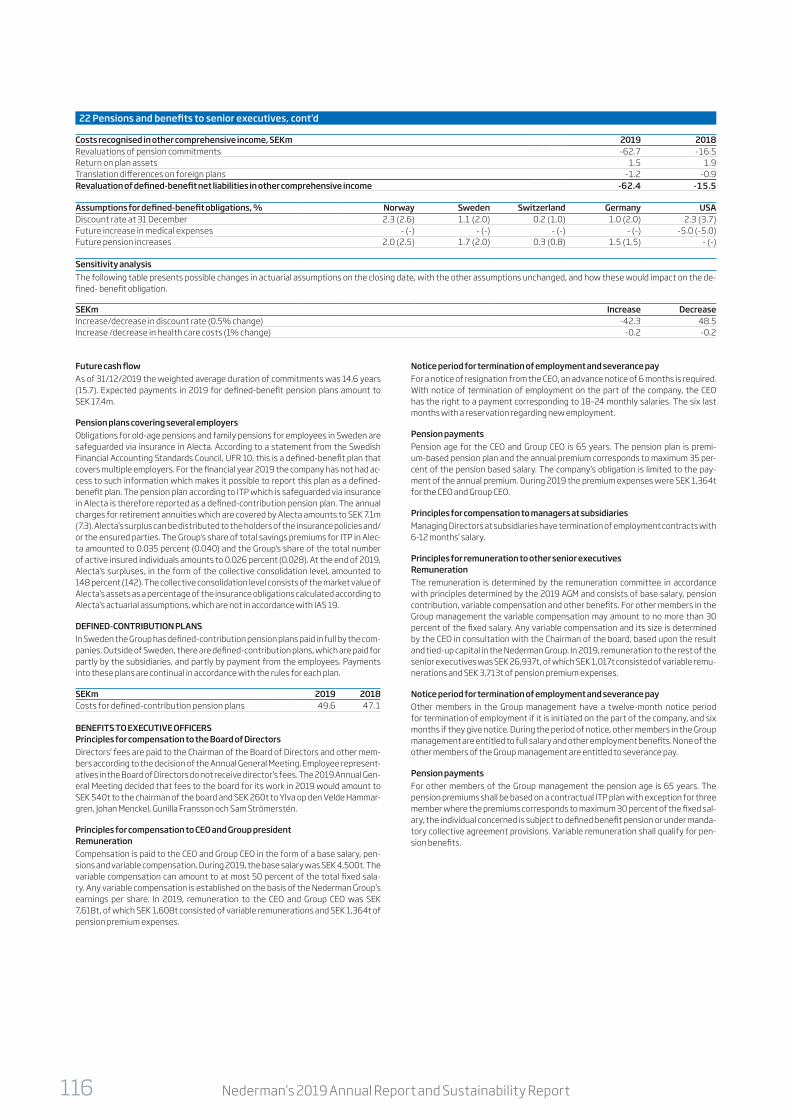
Nederman’s 2019 Annual Report and Sustainability Report116
22 Pensions and benefits to senior executives, cont'd
Costs recognised in other comprehensive income, SEKm 2019 2018Revaluations of pension commitments -62.7 -16.5Return on plan assets 1.5 1.9Translation differences on foreign plans -1.2 -0.9Revaluation of defined-benefit net liabilities in other comprehensive income -62.4 -15.5
Future cash flowAs of 31/12/2019 the weighted average duration of commitments was 14.6 years (15.7). Expected payments in 2019 for defined-benefit pension plans amount to SEK 17.4m.
Pension plans covering several employersObligations for old-age pensions and family pensions for employees in Sweden are safeguarded via insurance in Alecta. According to a statement from the Swedish Financial Accounting Standards Council, UFR 10, this is a defined-benefit plan that covers multiple employers. For the financial year 2019 the company has not had ac-cess to such information which makes it possible to report this plan as a defined- benefit plan. The pension plan according to ITP which is safeguarded via insurance in Alecta is therefore reported as a defined-contribution pension plan. The annual charges for retirement annuities which are covered by Alecta amounts to SEK 7.1m (7.3). Alecta’s surplus can be distributed to the holders of the insurance policies and/or the ensured parties. The Group's share of total savings premiums for ITP in Alec-ta amounted to 0.035 percent (0.040) and the Group's share of the total number of active insured individuals amounts to 0.026 percent (0.028). At the end of 2019, Alecta’s surpluses, in the form of the collective consolidation level, amounted to 148 percent (142). The collective consolidation level consists of the market value of Alecta’s assets as a percentage of the insurance obligations calculated according to Alecta’s actuarial assumptions, which are not in accordance with IAS 19.
DEFINED-CONTRIBUTION PLANSIn Sweden the Group has defined-contribution pension plans paid in full by the com-panies. Outside of Sweden, there are defined-contribution plans, which are paid for partly by the subsidiaries, and partly by payment from the employees. Payments into these plans are continual in accordance with the rules for each plan.
SEKm 2019 2018Costs for defined-contribution pension plans 49.6 47.1
Assumptions for defined-benefit obligations, % Norway Sweden Switzerland Germany USADiscount rate at 31 December 2.3 (2.6) 1.1 (2.0) 0.2 (1.0) 1.0 (2.0) 2.3 (3.7)Future increase in medical expenses - (-) - (-) - (-) - (-) -5.0 (-5.0)Future pension increases 2.0 (2.5) 1.7 (2.0) 0.3 (0.8) 1.5 (1.5) - (-)
Sensitivity analysisThe following table presents possible changes in actuarial assumptions on the closing date, with the other assumptions unchanged, and how these would impact on the de-fined- benefit obligation.
SEKm Increase DecreaseIncrease/decrease in discount rate (0.5% change) -42.3 48.5Increase /decrease in health care costs (1% change) -0.2 -0.2
BENEFITS TO EXECUTIVE OFFICERSPrinciples for compensation to the Board of DirectorsDirectors’ fees are paid to the Chairman of the Board of Directors and other mem-bers according to the decision of the Annual General Meeting. Employee represent-atives in the Board of Directors do not receive director’s fees. The 2019 Annual Gen-eral Meeting decided that fees to the board for its work in 2019 would amount to SEK 540t to the chairman of the board and SEK 260t to Ylva op den Velde Hammar-gren, Johan Menckel, Gunilla Fransson och Sam Strömerstén.
Principles for compensation to CEO and Group presidentRemunerationCompensation is paid to the CEO and Group CEO in the form of a base salary, pen-sions and variable compensation. During 2019, the base salary was SEK 4,500t. The variable compensation can amount to at most 50 percent of the total fixed sala-ry. Any variable compensation is established on the basis of the Nederman Group’s earnings per share. In 2019, remuneration to the CEO and Group CEO was SEK 7,618t, of which SEK 1,608t consisted of variable remunerations and SEK 1,364t of pension premium expenses.
Notice period for termination of employment and severance payFor a notice of resignation from the CEO, an advance notice of 6 months is required. With notice of termination of employment on the part of the company, the CEO has the right to a payment corresponding to 18–24 monthly salaries. The six last months with a reservation regarding new employment.
Pension paymentsPension age for the CEO and Group CEO is 65 years. The pension plan is premi-um-based pension plan and the annual premium corresponds to maximum 35 per-cent of the pension based salary. The company’s obligation is limited to the pay-ment of the annual premium. During 2019 the premium expenses were SEK 1,364t for the CEO and Group CEO.
Principles for compensation to managers at subsidiariesManaging Directors at subsidiaries have termination of employment contracts with 6-12 months’ salary.
Principles for remuneration to other senior executivesRemunerationThe remuneration is determined by the remuneration committee in accordance with principles determined by the 2019 AGM and consists of base salary, pension contribution, variable compensation and other benefits. For other members in the Group management the variable compensation may amount to no more than 30 percent of the fixed salary. Any variable compensation and its size is determined by the CEO in consultation with the Chairman of the board, based upon the result and tied-up capital in the Nederman Group. In 2019, remuneration to the rest of the senior executives was SEK 26,937t, of which SEK 1,017t consisted of variable remu-nerations and SEK 3,713t of pension premium expenses.
Notice period for termination of employment and severance payOther members in the Group management have a twelve-month notice period for termination of employment if it is initiated on the part of the company, and six months if they give notice. During the period of notice, other members in the Group management are entitled to full salary and other employment benefits. None of the other members of the Group management are entitled to severance pay.
Pension paymentsFor other members of the Group management the pension age is 65 years. The pension premiums shall be based on a contractual ITP plan with exception for three member where the premiums corresponds to maximum 30 percent of the fixed sal-ary, the individual concerned is subject to defined benefit pension or under manda-tory collective agreement provisions. Variable remuneration shall qualify for pen-sion benefits.

117Notes to Consolidated financial statements
22 Pensions and benefits to senior executives, cont'd
Provisions included in long-term liabilities, SEKm 2019 2018Restructuring /severance pay 0.3 0.3Warranty commitments 13.5 12.0Loss contracts 2.8 0.7Other 4.4 4.1Total 21.0 17.1
Provisions included in current liabilities, SEKm 2019 2018Warranty commitments 22.4 24.1Loss contracts - 0.4Other 3.8 3.6Total 26.2 28.1
Restructuring /severance pay, SEKm 2019 2018Reported value, opening balance 0.3 0.4Translation differences -0.0 -0.1Total 0.3 0.3
Warranty commitments, SEKm 2019 2018Reported value, opening balance 36.1 26.1Provisions during the period 12.0 11.0Utilised during the period -8.6 -10.5Business acquisition - 10.9Reclassifications -0.5 2.0Unutilised amount reversed during the period -3.9 -4.5Translation differences 0.8 1.1Total 35.9 36.1
23 Provisions
Compensation and other benefits during 2019
Base salary Variable Other Pension SEKt Board fees remuneration LTI benefits expenses TotalChairman of the board Johan Hjertonsson 540 - - - - 540Member of the board Ylva op den Velde Hammargren 260 - - - - 260Member of the board Gunilla Fransson 260 - - - - 260Member of the board Johan Menckel 260 - - - - 260Member of the board Sam Strömerstén 260 - - - - 260CEO Sven Kristensson 4,500 1,608 - 146 1,364 7,618Other senior executives (10 individuals) 21,127 1,017 - 1,080 3,713 26,937Total 27,207 2,625 - 1,226 5,077 36,135of which subsidiaries (6 individuals) 14,948 415 - 723 1,881 17,967
Compensation and other benefits during 2018
Base salary Variable Other Pension SEKt Board fees remuneration LTI benefits expenses TotalChairman of the board Jan Svensson 500 - - - - 500Member of the board Johan Hjertonsson 250 - - - - 250Member of the board Ylva op den Velde Hammargren 250 - - - - 250Member of the board Gunilla Fransson 250 - - - - 250Member of the board Johan Menckel 250 - - - - 250CEO Sven Kristensson 4,492 932 485 164 1,357 7,430Other senior executives (8 individuals) 14,956 2,260 781 1,361 3,488 22,846Total 20,948 3,192 1,266 1,525 4,845 31,776of which subsidiaries (4 individuals) 9,485 1,573 496 1,026 1,578 14,158
LTI (LONG TERM INCENTIVE)The Annual General Meeting held on 29 April 2019 approved the Board's proposal that the annual programmes for variable remuneration shall be able to be supplemented by a programme for long-term bonuses (LTI). Consequently, the 2019-2020 LTI programme has been established for a period of two years and is targeted in a way that makes it particularly favourable for the company’s shareholders. The result of the LTI programme for the senior executives (net after income tax), shall be reinvested in share warrants in Nederman or in Nederman shares. Share warrants require the approval upon a relevant future AGM at Nederman. The reinvested shares and warrants are expected to be maintained by the senior executive during his time of employment, but at least three years. The 2019-2020 LTI programme covers two years and can be a maximum of 35 per-cent of an annual salary for the CEO, and 20 percent of an annual salary for other senior executives.
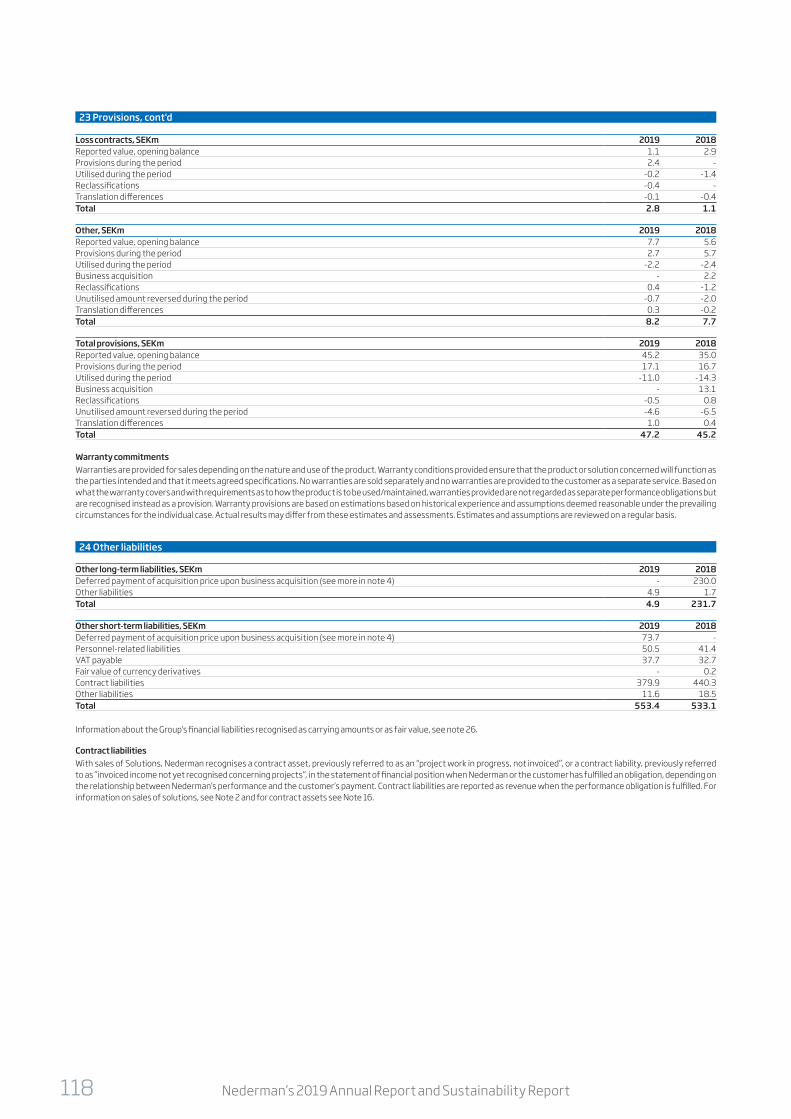
Nederman’s 2019 Annual Report and Sustainability Report118
24 Other liabilities
Other long-term liabilities, SEKm 2019 2018Deferred payment of acquisition price upon business acquisition (see more in note 4) - 230.0Other liabilities 4.9 1.7Total 4.9 231.7
Other short-term liabilities, SEKm 2019 2018Deferred payment of acquisition price upon business acquisition (see more in note 4) 73.7 - Personnel-related liabilities 50.5 41.4VAT payable 37.7 32.7Fair value of currency derivatives - 0.2Contract liabilities 379.9 440.3Other liabilities 11.6 18.5Total 553.4 533.1
23 Provisions, cont'd
Information about the Group’s financial liabilities recognised as carrying amounts or as fair value, see note 26.
Contract liabilitiesWith sales of Solutions, Nederman recognises a contract asset, previously referred to as an “project work in progress, not invoiced”, or a contract liability, previously referred to as ”invoiced income not yet recognised concerning projects”, in the statement of financial position when Nederman or the customer has fulfilled an obligation, depending on the relationship between Nederman’s performance and the customer’s payment. Contract liabilities are reported as revenue when the performance obligation is fulfilled. For information on sales of solutions, see Note 2 and for contract assets see Note 16.
Loss contracts, SEKm 2019 2018Reported value, opening balance 1.1 2.9Provisions during the period 2.4 - Utilised during the period -0.2 -1.4Reclassifications -0.4 - Translation differences -0.1 -0.4Total 2.8 1.1
Other, SEKm 2019 2018Reported value, opening balance 7.7 5.6Provisions during the period 2.7 5.7Utilised during the period -2.2 -2.4Business acquisition - 2.2Reclassifications 0.4 -1.2Unutilised amount reversed during the period -0.7 -2.0Translation differences 0.3 -0.2Total 8.2 7.7
Total provisions, SEKm 2019 2018Reported value, opening balance 45.2 35.0Provisions during the period 17.1 16.7Utilised during the period -11.0 -14.3Business acquisition - 13.1Reclassifications -0.5 0.8Unutilised amount reversed during the period -4.6 -6.5Translation differences 1.0 0.4Total 47.2 45.2
Warranty commitmentsWarranties are provided for sales depending on the nature and use of the product. Warranty conditions provided ensure that the product or solution concerned will function as the parties intended and that it meets agreed specifications. No warranties are sold separately and no warranties are provided to the customer as a separate service. Based on what the warranty covers and with requirements as to how the product is to be used/maintained, warranties provided are not regarded as separate performance obligations but are recognised instead as a provision. Warranty provisions are based on estimations based on historical experience and assumptions deemed reasonable under the prevailing circumstances for the individual case. Actual results may differ from these estimates and assessments. Estimates and assumptions are reviewed on a regular basis.

119Notes to Consolidated financial statements
25 Accrued Expenses and Prepaid Income
SEKm 2019 2018Personnel-related expenses 140.7 111.0Interest expenses 1.4 0.1Audit expenses 5.3 4.4Sales expenses 7.1 9.0Freight and customs expenses 0.8 0.2Other 46.5 37.3Total 201.8 162.0
26 Financial risks and financial policies
RISKS AND UNCERTAINTIES – FINANCIAL POLICYThe Nederman Group is exposed to a number of risks that arise mainly due to the fact that the Group purchases and sells products in foreign currencies. Exchange rates and interest rate levels affect the Group’s earnings and cash flows. The Nederman Group is also exposed to refinancing and liquidity risk as well as credit and counterparty risk. It is the Board of Directors that determines the policies for risk management. The Nederman Group has a central finance function which is re-sponsible for identifying and effectively limiting the Group’s financial risks. The fi-nance function reports via the CFO to the Board of Directors.
LIQUIDITY RISKSThe liquidity in the Group is not exposed to large seasonal fluctuations. In 2019, the Group refinanced its external loans and entered into a revolving credit facility of SEK 1,500m with SEB and SHB. In addition, the Group entered into a bilateral loan agreement with Svensk Export Kredit of SEK 500m. The agreements have a three year maturity with extension options for two additional years. At the end of the pe-riod, the Group had a credit facility of SEK 420m within the framework of Neder-man’s loan agreement with SEB and SHB. The Group also has a revolving short-term credit facility with SHB for USD 0.5m, equivalent to SEK 5.0m. At year-end, SEK 5m of this credit facility had been utilised. During the year, borrowing totalled SEK 1,689m (223) and repayments of SEK 1,137m (162) were made. In the event of a change of ownership where one or more parties acting together acquires shares representing more than 50 percent of the votes in the Company, the banks have the right under certain conditions to terminate the contract prematurely.
INTEREST RATE RISKSThe Nederman Group is exposed to interest rate risk through its net debt. The Group’s interest-bearing assets and liabilities have floating interest rates or a max-imum term of three months, according to the funding agreement with the Group’s lenders. A change in the interest rate of 1 percentage point would have affected net financial items in 2019 by SEK 11.8m (7.9), calculated on average net debt for the year. The Nederman Group has determined that reasonable changes in inter-est rates do not affect the Group’s earnings to such a material extent that there is a need to secure interest rates through financial instruments. This assessment is updated on an ongoing basis.
EFFECTIVE RATES OF INTEREST AND MATURITY STRUCTUREThe table below shows the effective rate of interest on the balance sheet date and the financial liabilities’ maturity structure/interest rate negotiations. The effective rate of interest is 1.83 percent (1.77).
NominalInterest amount Between 3
Interest extension in original Within 3 and 12 Between 1 Between 3 Later than2019, SEKm rate, % Time Currency currency Total months months and 3 yrs and 5 yrs 5 yrsBank loan (revolving) 0.700 2020-02-03 SEK 110.0 114.9 0.5 1.5 112.9 - - Bank loan (revolving) 0.700 2020-01-07 SEK 450.0 470.0 2.1 6.2 461.7 - - Bank loan (revolving) 0.764 2020-02-28 SEK 46.5 48.5 0.2 0.6 47.7 - - Bank loan (revolving) 0.700 2020-02-28 EUR 14.2 154.7 0.7 2.0 152.0 - - Bank loan (revolving) 0.700 2020-03-19 EUR 7.7 83.9 0.4 1.1 82.4 - - Bank loan (revolving) 2.714 2020-02-28 USD 26.3 255.9 1.1 3.4 251.4 - - Bank loan 0.764 2020-02-28 SEK 300.0 313.3 1.4 4.1 307.8 - - Bank loan 0.564 2020-02-28 SEK 200.0 208.8 0.9 2.7 205.2 - - Bank loan (revolving) 0.037 2020-01-08 USD 0.5 4.7 4.7 - - - - Lease liabilities 275.7 17.9 49.4 107.3 53.3 47.8Accounts payable 423.2 367.5 55.7 - - - Derivatives 1.2 - 1.2 - - - Total 2,354.8 397.4 127.9 1,728.4 53.3 47.8
2018, SEKmBank loan (revolving) 4.320 2019-03-26 USD 0.4 3.6 3.6 - - - - Bank loan (revolving) 3.910 2019-01-07 USD 0.5 4.5 4.5 - - - - Bank loan (revolving) 0.900 2019-03-29 SEK 57.5 59.6 0.3 0.8 58.5 - - Bank loan (revolving) 0.900 2019-03-29 SEK 215.0 222.7 1.0 2.9 218.8 - - Bank loan (revolving) 3.406 2019-01-31 USD 25.1 233.3 1.0 3.0 229.3 - - Bank loan (revolving) 0.900 2019-03-29 EUR 14.2 151.1 0.6 1.9 148.6 - - Bank loan (revolving) 0.750 2019-03-29 SEK 274.0 280.8 1.2 3.6 276.0 - - Lease liabilities 235.1 15.6 44.9 94.4 59.9 20.3Accounts payable 444.6 389.7 54.9 - - - Derivatives 1.7 0.0 1.9 -0.2 - - Total 1,637.0 417.5 113.9 1,025.4 59.9 20.3

Nederman’s 2019 Annual Report and Sustainability Report120
26 Financial risks and financial policies. cont'd
2019 2018Accounts receivable maturity structure, SEKm
Not Overdue accounts receivable, days Not Overdue accounts receivable, daysyet due 1-30 31-90 >90 Total yet due 1-30 31-90 >90 Total
Accounts receivable, gross 403.9 126.2 57.4 60.0 647.5 402.3 93.0 46.1 66.3 607.7Expected credit losses -0.2 -0.1 -0.8 -27.1 -28.2 -4.6 2.4 -0.1 -26.6 -28.9Accounts receivable, net 403.7 126.1 56.6 32.9 619.3 397.7 95.4 46.0 39.7 578.8Credit loss level, % 0.0 0.1 1.4 45.2 4.3 1.1 -2.6 0.2 40.1 4.8
The Group’s agreements with SEB and SHB as well as Svensk Export Kredit concern-ing bank loans contain net debt covenants whereby the net debt/EBITDA ratio may not exceed 3.5 times and the interest cover ratio may not be less than 3.75. All cov-enants were fulfilled on the balance sheet date.
The interest rate on the loans changes on an ongoing basis, but normally every three months.
According to the Group’s financial policy, the Board of Directors will determine from time to time whether interest rate swaps will be used to hedge interest rate levels. Currently, there are no interest rate hedges in accordance with the Board’s decision. This decision may be reviewed in the event of an increase in loan exposure.
The Group’s financial liabilities, excluding pension provisions, at year-end totalled SEK 1,856.3m, of which SEK 1,580.6m in revolving credit facilities and SEK 275.7m in lease liabilities. The overdraft facilities were not utilised.
The Group had SEK 445.3m in cash and cash equivalents and SEK 94.2m in availa-ble but unutilised overdraft facilities. In addition, there was a further credit facility of SEK 420.0m within the framework of Nederman’s loan agreement with SEB and SHB. Accordingly, there were available funds totalling SEK 959.5m on 31 December 2019.
CREDIT RISKSCredit risks in accounts receivable and contract assets. The risk that the Group’s customers might not pay their accounts receivable and contract assets constitutes a customer credit risk. To limit this risk, the Nederman Group employs credit policies that limit outstanding amounts and the credit period for different customers. For new customers and new markets, letters of credit or advance payments normally apply. For established customer relationships, credit limits are carefully monitored to limit the risk. In some cases, credit insurance is used to secure accounts receivable. The Group’s largest individual customer accounted for 1.4 percent of sales. The five largest customers accounted for 4.6 percent of sales. The Company’s risk spread can thus be regarded as very good. Ongoing risk assessments are carried out of accounts receivable and contract assets, and giv-en that customers operate in several different industries and markets, the risks are deemed to be low.
Provisions for bad debts are based on expected credit losses for their remaining time to maturity. Impairment is carried out on an individual case assessment basis. The Group’s bad debt losses in 2019 amounted to SEK 11.0m. Of the Group’s total account receivables of SEK 619.3m, net of impairment, 5.3 percent (6.9) comprise accounts receivable overdue by more than 90 days. Provisions for credit losses amounted to SEK 28.2m (28.9) at 31 December 2019, equivalent to 4.3 percent (4.8) of the gross total accounts receivable.
In major projects recognised as contract assets or contract liabilities, payment terms with a fixed payment plan are applied, with the payments based on the de-gree of completion. Expected losses are expensed as soon as they are known.
Change in credit loss provision 2019 2018Opening balance -28.9 -25.7Business acquisition -1.4 -5.2Provisions for uncertain receivables -10.5 -3.2Receivables written off and not recoverable 10.3 0.4Reversed provisions 2.9 4.3Translation differences -0.6 0.5Closing balance -28.2 -28.9
Other counterpartiesCredit exposure arises when cash and cash equivalents are invested and in conjunc-tion with trading in derivatives. The risk of a counterparty not fulfilling its commit-ment is limited by selecting creditworthy counterparties. According to the Group’s financial policy, cash and cash equivalents are deposited only in reputable banks (“first-class banks”).
Foreign currency risksThrough its international operations, the Nederman Group is exposed to currency risk since exchange rate fluctuations affect the Group’s income statement and bal-ance sheet. The Group’s currency exposure includes both transaction exposure and translation exposure.
Transaction exposureTransaction exposure arises when the Group’s companies buy in one currency and sell in another currency. In order to limit transaction exposure in the Nederman Group, the general rule is that supply companies sell to sales companies in the sales companies’ local currencies. In this way, the transaction exposure in sales compa-nies is low.
The largest supply company is located in Sweden and 57 percent of purchases from this supply company are made in SEK. Other purchases are mainly in EUR and to a lesser extent in USD.
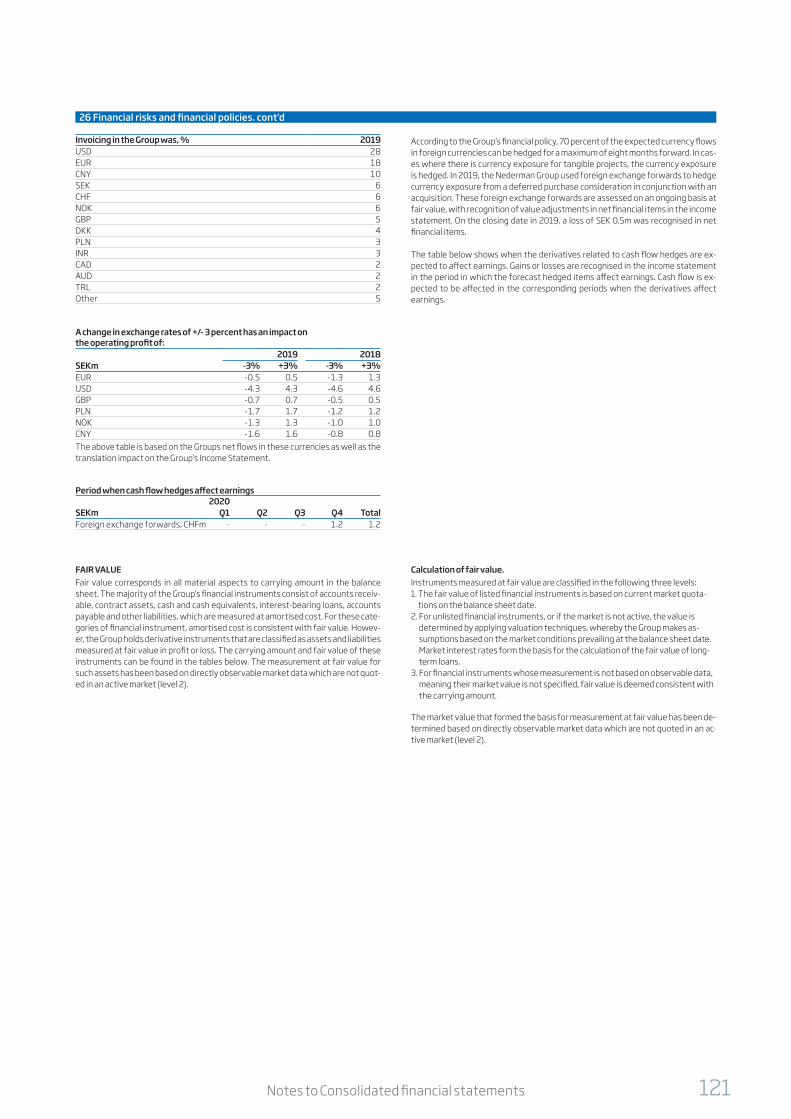
121Notes to Consolidated financial statements
26 Financial risks and financial policies. cont'd
Invoicing in the Group was, % 2019USD 28EUR 18CNY 10SEK 6CHF 6NOK 6GBP 5DKK 4PLN 3INR 3CAD 2AUD 2TRL 2Other 5
According to the Group’s financial policy, 70 percent of the expected currency flows in foreign currencies can be hedged for a maximum of eight months forward. In cas-es where there is currency exposure for tangible projects, the currency exposure is hedged. In 2019, the Nederman Group used foreign exchange forwards to hedge currency exposure from a deferred purchase consideration in conjunction with an acquisition. These foreign exchange forwards are assessed on an ongoing basis at fair value, with recognition of value adjustments in net financial items in the income statement. On the closing date in 2019, a loss of SEK 0.5m was recognised in net financial items.
The table below shows when the derivatives related to cash flow hedges are ex-pected to affect earnings. Gains or losses are recognised in the income statement in the period in which the forecast hedged items affect earnings. Cash flow is ex-pected to be affected in the corresponding periods when the derivatives affect earnings.
Period when cash flow hedges affect earnings2020
SEKm Q1 Q2 Q3 Q4 TotalForeign exchange forwards, CHFm - - - 1.2 1.2
A change in exchange rates of +/- 3 percent has an impact on the operating profit of:
2019 2018SEKm -3% +3% -3% +3%EUR -0.5 0.5 -1.3 1.3USD -4.3 4.3 -4.6 4.6GBP -0.7 0.7 -0.5 0.5PLN -1.7 1.7 -1.2 1.2NOK -1.3 1.3 -1.0 1.0CNY -1.6 1.6 -0.8 0.8The above table is based on the Groups net flows in these currencies as well as the translation impact on the Group’s Income Statement.
FAIR VALUEFair value corresponds in all material aspects to carrying amount in the balance sheet. The majority of the Group’s financial instruments consist of accounts receiv-able, contract assets, cash and cash equivalents, interest-bearing loans, accounts payable and other liabilities, which are measured at amortised cost. For these cate-gories of financial instrument, amortised cost is consistent with fair value. Howev-er, the Group holds derivative instruments that are classified as assets and liabilities measured at fair value in profit or loss. The carrying amount and fair value of these instruments can be found in the tables below. The measurement at fair value for such assets has been based on directly observable market data which are not quot-ed in an active market (level 2).
Calculation of fair value.Instruments measured at fair value are classified in the following three levels:1. The fair value of listed financial instruments is based on current market quota-
tions on the balance sheet date. 2. For unlisted financial instruments, or if the market is not active, the value is
determined by applying valuation techniques, whereby the Group makes as-sumptions based on the market conditions prevailing at the balance sheet date. Market interest rates form the basis for the calculation of the fair value of long-term loans.
3. For financial instruments whose measurement is not based on observable data, meaning their market value is not specified, fair value is deemed consistent with the carrying amount.
The market value that formed the basis for measurement at fair value has been de-termined based on directly observable market data which are not quoted in an ac-tive market (level 2).
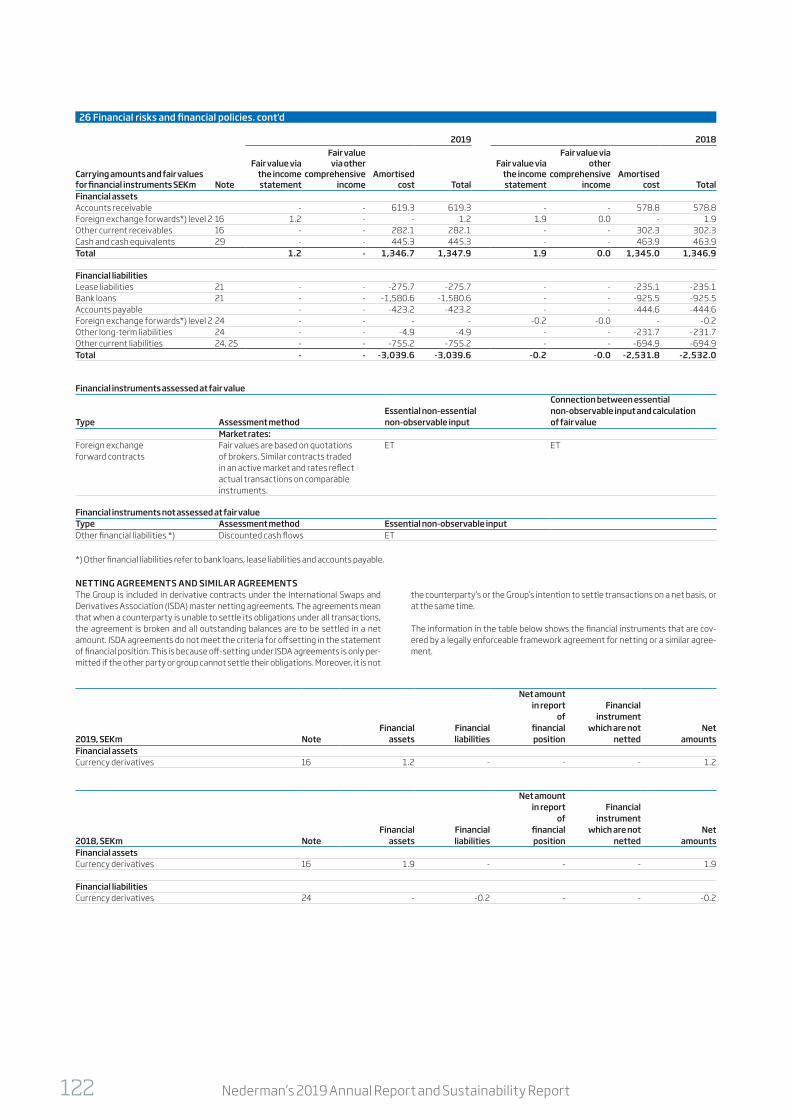
Nederman’s 2019 Annual Report and Sustainability Report122
26 Financial risks and financial policies. cont'd
Financial instruments assessed at fair value Connection between essential
Essential non-essential non-observable input and calculationType Assessment method non-observable input of fair value
Market rates:Foreign exchange forward contracts
Fair values are based on quotations of brokers. Similar contracts traded in an active market and rates reflect actual transactions on comparable instruments.
ET ET
Financial instruments not assessed at fair value Type Assessment method Essential non-observable inputOther financial liabilities *) Discounted cash flows ET
*) Other financial liabilities refer to bank loans, lease liabilities and accounts payable.
NETTING AGREEMENTS AND SIMILAR AGREEMENTSThe Group is included in derivative contracts under the International Swaps and Derivatives Association (ISDA) master netting agreements. The agreements mean that when a counterparty is unable to settle its obligations under all transactions, the agreement is broken and all outstanding balances are to be settled in a net amount. ISDA agreements do not meet the criteria for offsetting in the statement of financial position. This is because off-setting under ISDA agreements is only per-mitted if the other party or group cannot settle their obligations. Moreover, it is not
the counterparty’s or the Group’s intention to settle transactions on a net basis, or at the same time.
The information in the table below shows the financial instruments that are cov-ered by a legally enforceable framework agreement for netting or a similar agree-ment.
2019 2018
Carrying amounts and fair values for financial instruments SEKm Note
Fair value via the income statement
Fair value via other
comprehensive income
Amortised cost Total
Fair value via the income statement
Fair value via other
comprehensive income
Amortised cost Total
Financial assetsAccounts receivable - - 619.3 619.3 - - 578.8 578.8Foreign exchange forwards*) level 2 16 1.2 - - 1.2 1.9 0.0 - 1.9Other current receivables 16 - - 282.1 282.1 - - 302.3 302.3Cash and cash equivalents 29 - - 445.3 445.3 - - 463.9 463.9Total 1.2 - 1,346.7 1,347.9 1.9 0.0 1,345.0 1,346.9
Financial liabilitiesLease liabilities 21 - - -275.7 -275.7 - - -235.1 -235.1Bank loans 21 - - -1,580.6 -1,580.6 - - -925.5 -925.5Accounts payable - - -423.2 -423.2 - - -444.6 -444.6Foreign exchange forwards*) level 2 24 - - - - -0.2 -0.0 - -0.2Other long-term liabilities 24 - - -4.9 -4.9 - - -231.7 -231.7Other current liabilities 24, 25 - - -755.2 -755.2 - - -694.9 -694.9Total - - -3,039.6 -3,039.6 -0.2 -0.0 -2,531.8 -2,532.0
Net amountin report Financial
of instrumentFinancial Financial financial which are not Net
2019, SEKm Note assets liabilities position netted amountsFinancial assetsCurrency derivatives 16 1.2 - - - 1.2
Net amountin report Financial
of instrumentFinancial Financial financial which are not Net
2018, SEKm Note assets liabilities position netted amountsFinancial assetsCurrency derivatives 16 1.9 - - - 1.9
Financial liabilitiesCurrency derivatives 24 - -0.2 - - -0.2
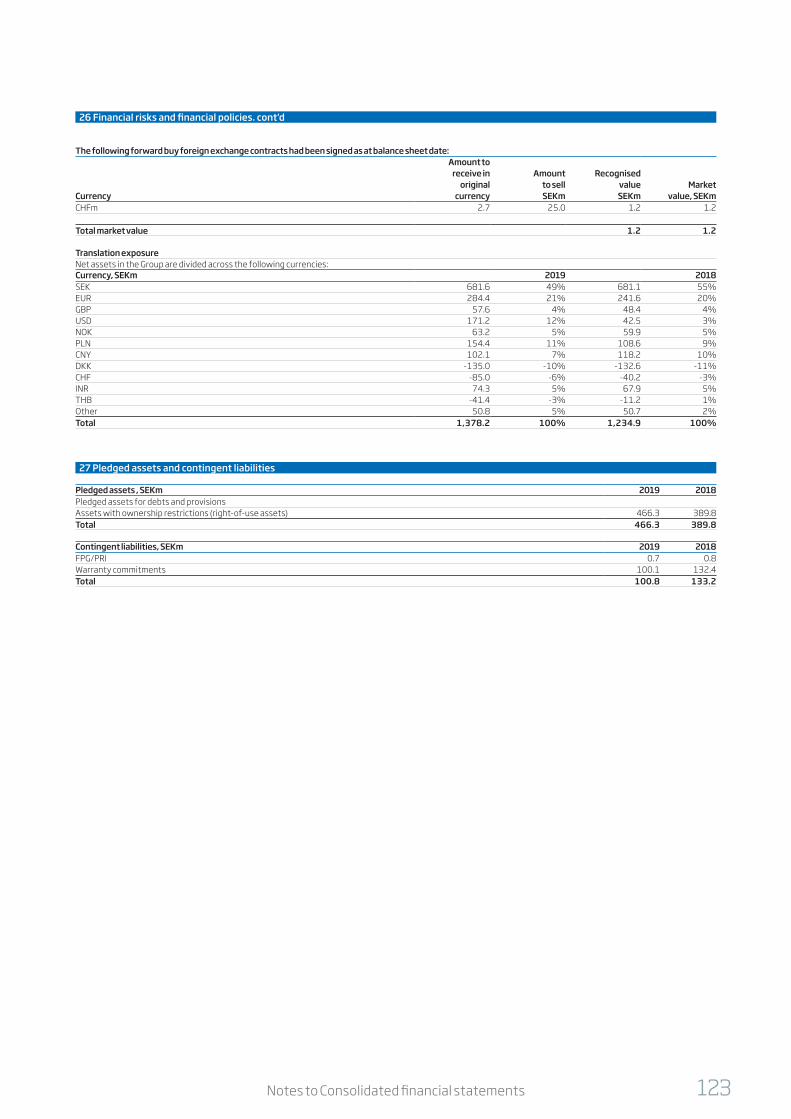
123Notes to Consolidated financial statements
26 Financial risks and financial policies. cont'd
27 Pledged assets and contingent liabilities
Pledged assets , SEKm 2019 2018Pledged assets for debts and provisionsAssets with ownership restrictions (right-of-use assets) 466.3 389.8Total 466.3 389.8
Contingent liabilities, SEKm 2019 2018FPG/PRI 0.7 0.8Warranty commitments 100.1 132.4Total 100.8 133.2
The following forward buy foreign exchange contracts had been signed as at balance sheet date:Amount to
receive in Amount Recognisedoriginal to sell value Market
Currency currency SEKm SEKm value, SEKmCHFm 2.7 25.0 1.2 1.2
Total market value 1.2 1.2
Translation exposure Net assets in the Group are divided across the following currencies:Currency, SEKm 2019 2018SEK 681.6 49% 681.1 55%EUR 284.4 21% 241.6 20%GBP 57.6 4% 48.4 4%USD 171.2 12% 42.5 3%NOK 63.2 5% 59.9 5%PLN 154.4 11% 108.6 9%CNY 102.1 7% 118.2 10%DKK -135.0 -10% -132.6 -11%CHF -85.0 -6% -40.2 -3%INR 74.3 5% 67.9 5%THB -41.4 -3% -11.2 1%Other 50.8 5% 50.7 2%Total 1,378.2 100% 1,234.9 100%

Nederman’s 2019 Annual Report and Sustainability Report124
29 Statement of cash flow
Liquid funds, SEKm 2019 2018Subcomponents of cash and cash equivalents:Cash and cash equivalents 445.3 463.9Total according to statement of financial position 445.3 463.9
Adjustments for items not included in cash flow, SEKm 2019 2018Capital gain/loss on sale of tangible assets -0.6 -7.0Capital gain/loss on terminated lease contracts before the end date -1.2 - Provisions 1.0 -3.4Total -0.8 -10.4
Unused credits, SEKm 2019 2018Disposable funds 959,5 1 027,1
FINANCIAL ACTIVITIESThe below table shows changes in liabilities included in financial activities.
28 Related parties
No member of the Board of Directors or senior executives have or have had any direct or indirect participation in any business transaction with Group companies which is or was of an exceptional character with regard to terms and conditions that occurred during the year or in any previous year. Nor has any Group company provid-ed any loan, given any guarantees or entered into any surety relationships for any of the members of the Board of Directors or senior executives. For intercompany transactions see, accounting principles note 1.
TRANSACTIONS WITH KEY PERSONS IN LEADING POSITIONSRegarding the salaries and other remuneration, costs and commitments for pen-sions and similar benefits, and severance payment agreements, for Board mem-bers, the CEO and other senior executives, see note 22.
Items not affecting cash flow
2019, SEKm
Amount beginning
of the year Cash flowBusiness
acquisitionInterest
and feesExchange rate
gains/lossesChange in
lease liabilitiesAmount
at year endLong-term interest-bearing liabilities - bank loans 917.4 555.7 90.0 - 12.5 - 1,575.6Short-term interest-bearing liabilities - bank loans 8.1 -3.7 - - 0.6 - 5.0Lease liabilities 235.1 -67.0 51.4 - 4.3 51.9 275.7Other 0.4Total 485.4
Items not affecting cash flow
2018, SEKm
Amount beginning
of the year Cash flowBusiness
acquisitionInterest
and feesExchange rate
gains/lossesChange in
lease liabilitiesAmount
at year endLong-term interest-bearing liabilities - bank loans 822.2 53.1 5.1 0.5 36.5 917.4Short-term interest-bearing liabilities - bank loans 0.2 8.1 - - -0.2 8.1Lease liabilities 202.2 -56.8 40.9 - 5.0 43.8 235.1Other -0.6Total 3.8
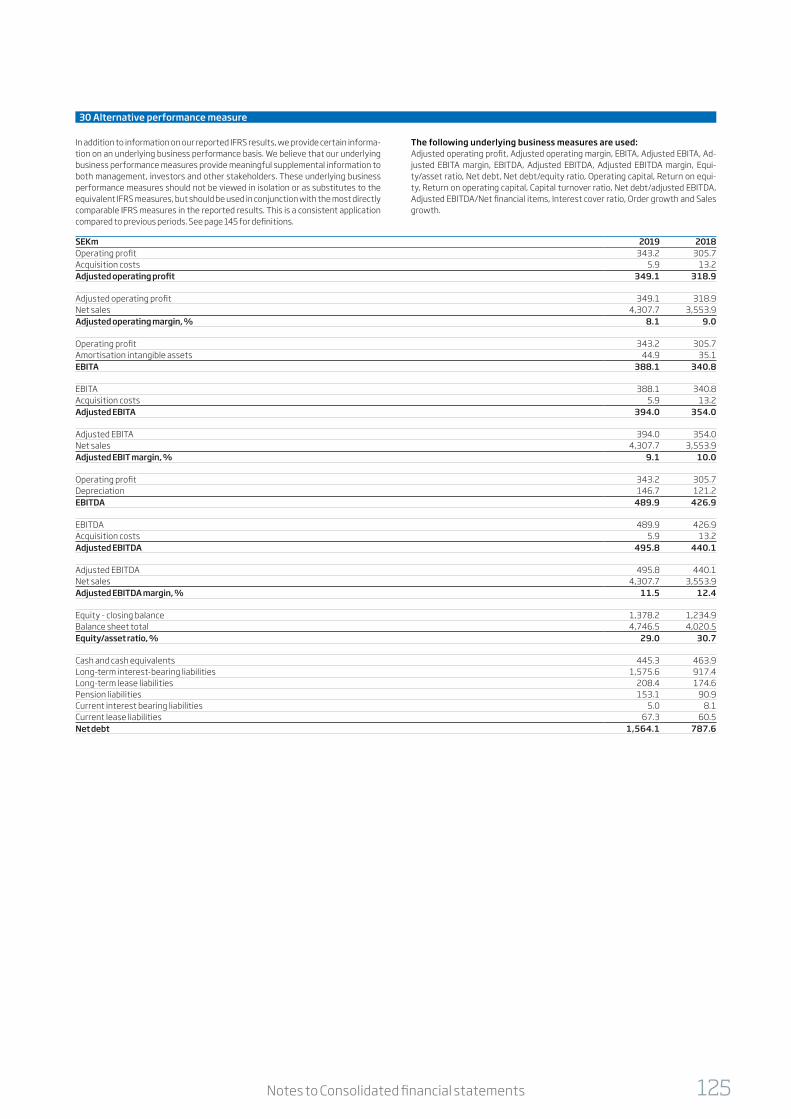
125Notes to Consolidated financial statements
30 Alternative performance measure
In addition to information on our reported IFRS results, we provide certain informa-tion on an underlying business performance basis. We believe that our underlying business performance measures provide meaningful supplemental information to both management, investors and other stakeholders. These underlying business performance measures should not be viewed in isolation or as substitutes to the equivalent IFRS measures, but should be used in conjunction with the most directly comparable IFRS measures in the reported results. This is a consistent application compared to previous periods. See page 145 for definitions.
The following underlying business measures are used:Adjusted operating profit, Adjusted operating margin, EBITA, Adjusted EBITA, Ad-justed EBITA margin, EBITDA, Adjusted EBITDA, Adjusted EBITDA margin, Equi-ty/asset ratio, Net debt, Net debt/equity ratio, Operating capital, Return on equi-ty, Return on operating capital, Capital turnover ratio, Net debt/adjusted EBITDA, Adjusted EBITDA/Net financial items, Interest cover ratio, Order growth and Sales growth.
SEKm 2019 2018Operating profit 343.2 305.7Acquisition costs 5.9 13.2Adjusted operating profit 349.1 318.9
Adjusted operating profit 349.1 318.9Net sales 4,307.7 3,553.9Adjusted operating margin, % 8.1 9.0
Operating profit 343.2 305.7Amortisation intangible assets 44.9 35.1EBITA 388.1 340.8
EBITA 388.1 340.8Acquisition costs 5.9 13.2Adjusted EBITA 394.0 354.0
Adjusted EBITA 394.0 354.0Net sales 4,307.7 3,553.9Adjusted EBIT margin, % 9.1 10.0
Operating profit 343.2 305.7Depreciation 146.7 121.2EBITDA 489.9 426.9
EBITDA 489.9 426.9Acquisition costs 5.9 13.2Adjusted EBITDA 495.8 440.1
Adjusted EBITDA 495.8 440.1Net sales 4,307.7 3,553.9Adjusted EBITDA margin, % 11.5 12.4
Equity - closing balance 1,378.2 1,234.9Balance sheet total 4,746.5 4,020.5Equity/asset ratio, % 29.0 30.7
Cash and cash equivalents 445.3 463.9Long-term interest-bearing liabilities 1,575.6 917.4Long-term lease liabilities 208.4 174.6Pension liabilities 153.1 90.9Current interest bearing liabilities 5.0 8.1Current lease liabilities 67.3 60.5Net debt 1,564.1 787.6

Nederman’s 2019 Annual Report and Sustainability Report126
30 Alternative performance measure, cont'd
SEKm 2019 2018Net debt 1,564.1 787.6Equity - closing balance 1,378.2 1,234.9Net debt/ equity ratio, % 113.5 63.8
Net debt 1,564.1 787.6Equity - closing balance 1,378.2 1,234.9Operating capital 2,942.3 2,022.5
Equity - opening balance 1,234.9 1,060.8Equity - closing balance 1,378.2 1,234.9Equity - average 1,306.6 1,147.9Net profit/loss for the period 225.8 202.8Return on equity, % 17.3 17.7
Equity - average 1,306.6 1,147.9Net Debt - opening balance 787.6 791.3Net Debt - closing balance 1,564.1 787.6Net debt - average 1,175.9 789.5Operating capital - average 2,482.5 1,937.4Adjusted operating profit 349.1 318.9Return on capital, % 14.1 16.5
Net sales 4,307.7 3,553.9Operating capital - average 2,482.5 1,937.4Capital turnover rate, multiple 1.7 1.8
Net debt 1,564.1 787.6Adjusted EBITDA 495.8 440.1Net debt/Adjusted EBITDA, multiple 3.2 1.8
Adjusted EBITDA 495.8 440.1Net financial items -35.9 -38.2Adjusted EBITDA/net financial items, multiple 13.8 11.5
Profit before tax 307.3 267.5Financial expenses 44.3 43.2Acquisition costs 5.9 13.2EBT excluding financial expenses and acquisition costs 357.5 323.9Financial expenses 44.3 43.2Interest cover ratio, multiple 8.1 7.5
Incoming orders, same period in previous year 3,479.5 3,157.3Change in incoming orders, organic 102.3 -9.4Change in incoming orders, currency effects 158.9 87.7Change in incoming orders, acquisitions 427.7 243.9Incoming orders 4,168.4 3,479.5
Order growth, %, organic 2.9 -0.3Order growth, %, currency effect 4.6 2.8Order growth, %, acquisitions 12.3 7.7Order growth, % 19.8 10.2
Net sales, comperative period previous year 3,553.9 3,148.5Change in net sales, organic -39.5 -4.1Change in net sales, currency effects 163.4 88.4Change in net sales, acquisitions 629.9 321.1Net sales 4,307.7 3,553.9
Sales growth, %, organic -1.1 -0.1Sales growth, %, currency effect 4.6 2.8Sales growth, %, acquisitions 17.7 10.2Sales growth, % 21.2 12.9

127Notes to Consolidated financial statements
32 Important estimations and assessments
Certain assumptions about the future and certain estimations and assessments as of the close of the reporting period have special importance for the value of the as-sets and liabilities in the balance sheet. Presented below are the areas where the risk of changes in value during the subsequent year is significant because the as-sumptions or estimations may need to be changed.
SOLUTION SALES (PROJECT SALES)Revenue recognition relating to sales of solutions (project sales) which is recog-nised over time is done by measuring the progress towards completion of the per-formance obligation. This is done on the basis of project costs incurred in relation to total costs for products and services that have been promised according to the agreement. Project costs incurred are determined either on the basis of the value of the goods or services that have been transferred to date or on the basis of meas-urements at the customer such as achieved milestones. The choice of method is consistent within individual projects. Revenue recognition from Solutions includes elements of assessments in the form of measuring the progress towards comple-tion of the performance obligation, i.e. assessing the extent to which accrual of the projects has occurred. Sales from Solutions accounted for 48% of the Group's total sales in 2019.
INVENTORY ACCOUNTINGInventory is posted at the lower figure between the acquisition value and the net realisable value. Valuation and assessment with regard to inventories are gov-erned through internal regulations, which is obligatory to follow for all companies within the Group. The aim is to ensure that the Inventory is valued at the lower fig-ure between the acquisition value and the net realisable value. When calculating the net sales value, assumptions are made concerning outgoing items, items with over-resistance, damaged goods and estimated sales value based on the available information. Inventory reserves as of 31 December 2019 amounted to SEK 123.0m (103.1), see note 17.
33 Information about the parent company
Nederman Holding AB (publ) is a Swedish registered limited company with its registered office in Helsingborg, Sweden. The parent company’s shares are registered on the Nasdaq Stockholm Mid Cap list.
The address of the main office isP.O. Box 602, SE-251 06 Helsingborg, Sweden. Visiting adress is Sydhamnsgatan 2.
The consolidated reporting for 2019 comprises the parent company and its subsidiaries, collectively referred to as the Group.
31 Occurrences following the balance sheet date
No significant events have occurred after the balance sheet date.
INCOME TAXESWhen estimating deferred tax assets and tax liabilities an assessment is made con-cerning the probability of whether the deferred tax assets will be utilised for set-tlement against future taxable profit. The fair value of these future taxable profits may deviate in terms of the future business climate and earnings capability or due to changed tax rules, see note 12.
ACQUISITIONOn December 9, Nederman acquired 100 percent of the shares in the Finnish group Gasmet Technologies Oy (Gasmet). The acquisition price amounted to SEK 508.9m and acquired net assets amounted to SEK 14.1m. Adjusted to fair value, identifiable net assets were estimated at the date of acquisition to SEK 108.2m, net after tax, and were related to Gasmet s customer contracts, brand and technology. Goodwill amounted to SEK 386.6m and was mainly related to the strong market position of Gasmet, especially with a leading global position in the FTIR analysis market, and to a highly skilled and knowledgeable workforce, new customers and to synergies with the Nederman Group. Identifying acquired assets and the adjustment to fair value of these assets required several assessments and estimates concerning fu-ture conditions such as cash flow, growth, discount rate as well as estimates of pa-rameters and method for valuation. When accounting for the acquisition, the man-agement made their best estimates regarding assumptions which were the base for allocation of the acquisition price, taking materiality into account, and deemed these assumptions of future conditions reasonable. See also note 4.
EXAMINATION FOR IMPAIRMENT OF GOODWILLThe book value of goodwill is reviewed at least once a year with respect to the pos-sible need for impairment. The review requires an assessment of the value in use of the cash-generating unit, or group of cash-generating units, to which the good-will value relates. This requires that several assumptions about the future situa-tion and estimates of parameters have been made. A report of these are found in note 13. As described in note 13 a change during 2019 in the conditions for these assumptions and estimations might have an effect on the value of the goodwill. The senior executives are of the opinion that no reasonable changes in important as-sumptions at the impairment test of the cash-generating units will result in a recov-erable value lower than the carrying amount.

Nederman’s 2019 Annual Report and Sustainability Report128
Income statement for the Parent company
1 January - 31 DecemberSEKm Note 2019 2018Net sales 1, 17 26.9 24.1Administrative expenses 3, 4, 12, 15 -117.4 -105.9Reseach and developement expenses - -1.1Other operating revenue and expenses 2 0.3 0.6Operating profit -90.2 -82.3
Earnings from particiations in Group companies 5, 17 72.6 63.5Interest income and similar items 5, 17 7.2 13.0Interest expenses and similar items 5, 17 -23.3 -20.5Profit after financial items -33.7 -26.3
Group contribution 6, 17 144.0 143.6Profit before tax 110.3 117.3
Taxes 7 -13.9 -13.0Net profit for the year 96.4 104.3
Statement of comprehensive income for the Parent company
1 January - 31 DecemberSEKm Note 2019 2018Net profit for the year 96.4 104.3Other comprehensive income - - Items that cannot be reclassified to the income statement - -
Items that have been or can be reclassified to net profit - -
Other compehensive income for the year, net after tax - - Total comprehensive income for the year 96.4 104.3

129Parent company’s statement
Balance sheet for the Parent company
31 DecemberSEKm Note 2019 2018
AssetsIntangible fixed assets 8 95.8 75.9Tangible fixed assets 9 3.5 0.8Financial fixed assets Participations in Group companies 20 2,027.3 1,526.5 Other long-term receivables 0.3 0.3Total financial fixed assets 2,027.6 1,526.8Total fixed assets 2,126.9 1,603.5
Current assetsReceivables from Group companies 17 375.2 319.0Other receivables 10 9.0 7.0Prepaid expenses and accrued income 11 13.5 6.2Cash and cash equivalents 18 0.4 0.3Total current assets 398.1 332.5Total assets 2,525.0 1,936.0
EquityRestricted equityShare capital 1.2 1.2
Reserves 292.5 292.5Fund for development expenditures 27.1 16.5Total restricted equity 320.8 310.2Unrestricted equity 19
Share premium reserve 5.9 5.9Retained earnings 494.8 481.5Net profit for the year 96.4 104.3Total unrestricted equity 597.1 591.7Total equity 917.9 901.9
Untaxed reserves 6 - 1.4
LiabilitiesLiabilities to Group companies 17 1,170.9 474.8Other long-term liabilities 13 - 207.6Total long-term liabilities 1,170.9 682.4
Accounts payable 19.1 19.5Tax liabilties 7 8.6 9.7Liabilities to Group companies 17 339.1 305.8Other liabilities 13 56.1 1.5Accrued expenses and prepaid income 14 13.3 13.8Total current liabilities 436.2 350.3Total equity and liabilities 2,525.0 1,936.0
For information on the parent company’s pledged assets and contingent liabilities, see note 16.

Nederman’s 2019 Annual Report and Sustainability Report130
Statement of changes in equity for the Parent company
Restricted equity Unrestricted equity Total equity
Fund for ShareRetained
earnings, incl.development premium net profit for
Share capital Reserves expenses reserve the yearOpening equity 2018-01-01 1.2 292.5 13.0 5.9 556.2 868.8Net profit for the year – – – – 104.3 104.3Transfer to development fund – – 3.5 – -3.5 –Other comprehensive incomeTotal other comprehensive income for the year
– – – – – –
Total comprehensive income – – 3.5 – 100.8 104.3Transactions with Group’s ownersDividend – – – – -70.2 -70.2Share-based remuneration – – – – -1.0 -1.0Closing equity 2018-12-31 1.2 292.5 16.5 5.9 585.8 901.9
Opening equity 2019-01-01 1.2 292.5 16.5 5.9 585.8 901.9Net profit for the year – – – – 96.4 96.4Transfer to development fund – – 10.6 – -10.6 – Other comprehensive incomeTotal other comprehensive income for the year
– – – – – –
Total comprehensive income – – 10.6 – 85.8 96.4Transactions with Group’s ownersDividend – – – – -80.7 -80.7Share-based remuneration – – – – 0.3 0.3Closing equity 2019-12-31 1.2 292.5 27.1 5.9 591.2 917.9

131Parent company’s statement
Cash flow statement for the Parent company
1 January - 31 DecemberSEKm Note 2019 2018Operating activitiesOperating profit/loss -90.2 -82.3Adjustment for items not included in cash flow 18 34.3 22.1Dividends received 17 84.6 63.5Interest received and other financial items 0.5 12.7Interest paid and other financial items -10.9 -16.2Income tax paid -15.4 - Cash flow from operating activities before changes in working capital 2.9 -0.2
Cash flow from changes in working capitalIncrease (-)/Decrease(+) of operating receivables 133.3 151.3Increase (+)/Decrease (-) of operating liabilities -3.3 2.9
130.0 154.2Cash flow from operating activities 132.9 154.0
Investment activitiesCapital expenditure for tangible fixed assets -3.4 -0.7Capital expenditure for intangible fixed assets -47.5 -37.3Acquisition, subsidiaries -667.9 -163.3Write-down of participations in Group companies -12.0 -Cash flow from investment activities -730.8 -201.3
Financial activitiesNew loans 796.1 296.3Amortisation of loans -100.0 -798.9Change in interest-bearing receivables/liabilities -17.7 494.3Share-based remuneration 0.3 -1.0Dividend paid -80.7 -70.2Cash flow from financing activities 598.0 -79.5
Cash flow for the year 0.1 -126.8Cash and cash equivalents at the beginning of the year 0.3 127.1Cash and cash equivalents at the end of the year 18 0.4 0.3

Notes to Parent company’s statementNederman’s 2019 Annual Report and Sustainability Report 133132
1 Net sales
SEKm 2019 2018Management charges, debited to subsidiaries 26.9 24.1Total 26.9 24.1
2 Other operating income and expenses
SEKm 2019 2018Exchange gains and losses on operating receivables/liabilities 0.3 0.6Total 0.3 0.6
3 Employees and staff expenses
2019 2018Average number of employees Women Men Total Women Men TotalSweden 11 16 27 9 12 21Total 11 16 27 9 12 21
Distribution according to gender in senior management, percentage of women 2019 2018Board of Directors, proportion of women 33% 33%Other senior executives 20% 25%
Salaries, other remuneration and social security expenses, SEKm 2019 2018Salaries and other remuneration 28.1 28.3Social security expenses 16.2 16.6(of which pension expenses) 1) (5.6) (5.8)
1) Of the company's pension costs SEK 1.4m (1.4) concerns the CEO for the parent company. There are no outstanding pension obligations to the Group’s Board of Directors, CEO and senior executives.
Salaries and other remuneration allocated between the Board of Directors and other employees, SEKm 2019 2018Board of Directors, CEO and senior executives 8.0 8.2(of which variable compensation) (1.4) (1.9)Other employees 20.1 20.1Total 28.1 28.3
4 Fees and Expenses to Auditors
SEKm 2019 2018EYAudit assignment 1.2 1.2Other assignment 0.0 0.0Total 1.2 1.2
Audit assignments refer to the statutory audit of annual and consolidated accounts, the administration of the Board of Directors and CEO, and auditing and other verifications as agreed. Other audit assignments include other duties incumbent on the company’s auditors and advice or other assistance required by the findings in the audit or perfor-mance of other tasks.
5 Net financial items
SEKm 2019 2018Earnings from participations in Group companiesDividend 84.6 63.5Impairment of book value of shares in subsidiaries -12.0 -Total 72.6 63.5
Interest income and similar itemsInterest income, credit institutions - 0.8Other financial income, Group companies 0.5 11.8Exchange rate changes 6.7 0.4Total 7.2 13.0
Interest expenses and similar itemsInterest expenses, credit institutions -1.1 -13.3Other financial expenses, Group companies -16.4 -3.3Exchange rate changes -5.8 -3.9Total -23.3 -20.5

Notes to Parent company’s statementNederman’s 2019 Annual Report and Sustainability Report 133132
2018Capitalised Computer
SEKm development expenditures programs TotalAccumulated costOpening balance 23.8 78.0 101.8Internally developed assets 5.7 - 5.7Capital expenditure - 31.5 31.5Closing balance 29.5 109.5 139.0
Accumulated amortisation and impairmentOpening balance -4.8 -36.6 -41.4Amortisation -3.9 -17.8 -21.7Closing balance -8.7 -54.4 -63.1
Carrying amountOpening balance 19.0 41.4 60.4Closing balance 20.8 55.1 75.9
Amortisation and impairments, SEK m 2019 2018Amortisation is included in the following lines in the income statement:Cost of goods sold -5.6 -4.0Administrative expenses -22.0 -17.7Total -27.6 -21.7
8 Intangible fixed assets
2019Capitalised Computer
SEKm development expenditures programs TotalAccumulated costOpening balance 29.5 109.5 139.0Internally developed assets 14.6 - 14.6Capital expenditure - 32.9 32.9Closing balance 44.1 142.4 186.5
Accumulated amortisation and impairmentOpening balance -8.7 -54.4 -63.1Amortisation -5.6 -22.0 -27.6Closing balance -14.3 -76.4 -90.7
Carrying amountOpening balance 20.8 55.1 75.9Closing balance 29.8 66.0 95.8
6 Appropriations
SEKm 2019 2018Group contribution 142.6 145.0Temporary differences 1.4 -1.4Total 144.0 143.6
7 Taxes
REPORTED IN INCOME STATEMENTCurrent tax expense (-)/tax income (+), SEKm 2019 2018Tax expense for the period -12.9 -10.7Adjustment of tax relating to previous years -1.4 -0.2Total -14.3 -10.9
Deferred tax expense (–) /tax income (+)Deferred tax concerning temporary differences 0.4 -2.1Total reported tax expense -13.9 -13.0
Reconciliation of effective tax, SEKm 2019 2018Profit before tax 110.3 117.3Tax according to the applicable tax rate -23.6 -25.8Non-tax deductible expenses -7.0 -0.4Non-taxable income 18.1 13.9Tax relating to previous years -1.4 -0.7Reported effective tax -13.9 -13.0
POSTED IN STATEMENT OF FINANCIAL POSITIONDeferred tax assets, SEKm 2019 2018Deferred tax assets relate to the following:Intangible assets 0.3 - Tax assets according to statement of financial position 0.3 -

Notes to Parent company’s statementNederman’s 2019 Annual Report and Sustainability Report 135134
9 Tangible fixed assets
2019 2018
Equipment, Equipment, SEKm tools, fixtures Total tools, fixtures TotalAccumulated costOpening balance 6.7 6.7 6.1 6.1Capital expenditure 3.4 3.4 0.6 0.6Closing balance 10.1 10.1 6.7 6.7
Accumulated depreciation and impairmentOpening balance -5.9 -5.9 -5.7 -5.7Depreciation -0.7 -0.7 -0.2 -0.2Closing balance -6.6 -6.6 -5.9 -5.9
Carrying amountOpening balance 0.8 0.8 0.4 0.4Closing balance 3.5 3.5 0.8 0.8
Depreciation and impairments, SEKm 2019 2018Depreciation is included in the following rows in the income statement:Administrative expenses -0.7 -0.2Total -0.7 -0.2
12 Pensions
DEFINED-CONTRIBUTION PLANSIn Sweden the Group has defined-contribution pension plans paid in full by the companies. Payments into these plans are continual in accordance with the rules for each plan.
SEKm 2019 2018Costs for defined-contribution pension plans 5.6 5.8Total 5.6 5.8
For more information about handling of pensions, see Group note 22.
10 Other receivables
Other receivables which are current assets, SEKm 2019 2018VAT receivable 9.0 7.0Total 9.0 7.0
11 Prepaid expenses and accrued income
SEKm 2019 2018Computer/license costs 8.6 4.1Insurance 1.7 0.4Bank costs - 1.0Other 3.2 0.7Total 13.5 6.2
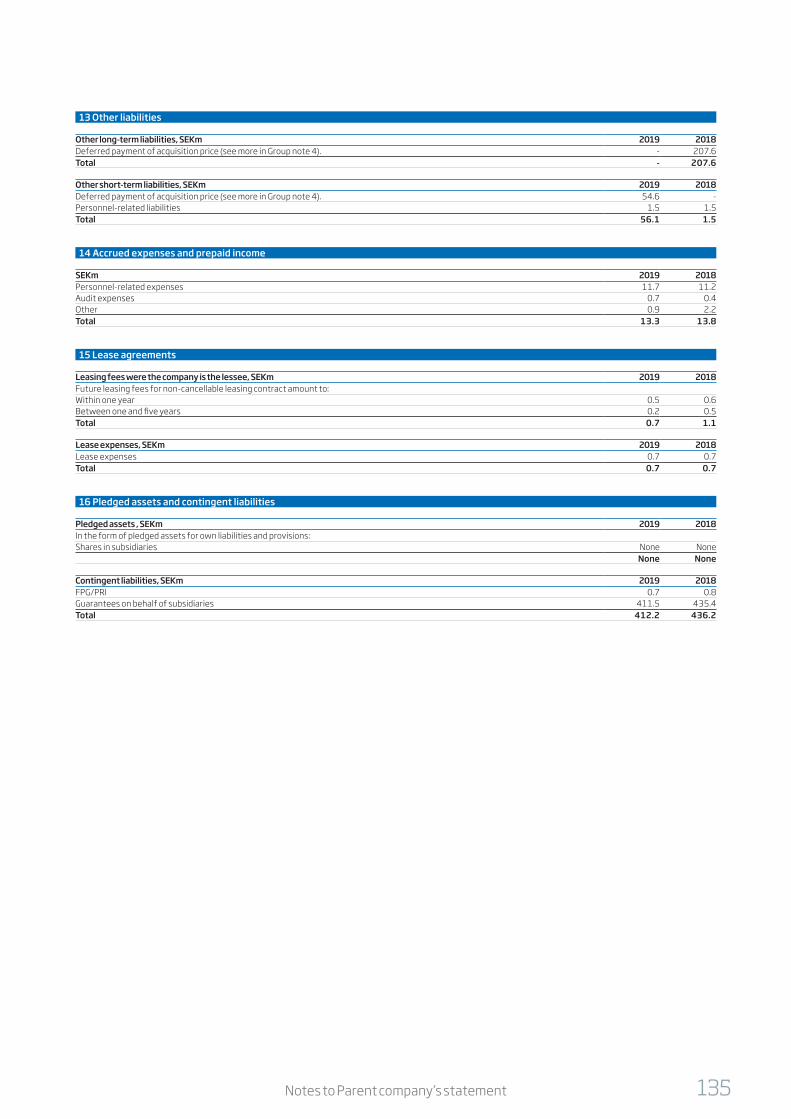
Notes to Parent company’s statementNederman’s 2019 Annual Report and Sustainability Report 135134
14 Accrued expenses and prepaid income
SEKm 2019 2018Personnel-related expenses 11.7 11.2Audit expenses 0.7 0.4Other 0.9 2.2Total 13.3 13.8
15 Lease agreements
Leasing fees were the company is the lessee, SEKm 2019 2018Future leasing fees for non-cancellable leasing contract amount to:Within one year 0.5 0.6Between one and five years 0.2 0.5Total 0.7 1.1
Lease expenses, SEKm 2019 2018Lease expenses 0.7 0.7Total 0.7 0.7
13 Other liabilities
Other long-term liabilities, SEKm 2019 2018Deferred payment of acquisition price (see more in Group note 4). - 207.6Total - 207.6
Other short-term liabilities, SEKm 2019 2018Deferred payment of acquisition price (see more in Group note 4). 54.6 - Personnel-related liabilities 1.5 1.5Total 56.1 1.5
16 Pledged assets and contingent liabilities
Pledged assets , SEKm 2019 2018In the form of pledged assets for own liabilities and provisions:Shares in subsidiaries None None
None None
Contingent liabilities, SEKm 2019 2018FPG/PRI 0.7 0.8Guarantees on behalf of subsidiaries 411.5 435.4Total 412.2 436.2

Notes to Parent company’s statementNederman’s 2019 Annual Report and Sustainability Report 137136
17 Related parties
The parent company has a closely related relationship with its subsidiaries, see note 20.
No member of the Board of Directors or senior executives have or have had any direct or indirect participation in any business transaction with Group companies which is or was of an exceptional character with regard to terms and conditions that occurred during the year or in any previous year. Nor has any Group company provid-ed any loan, given any guarantees or entered into any surety relationships for any of the members of the Board of Directors or senior executives. For intercompany transactions see, accounting principles note 1. Loans to subsidiaries are made on market terms.
Related party transactions, subsidiaries, SEKm 2019 2018Net sales - Management charges 26.9 24.1Dividends received 84.6 63.5Group contribution received 142.6 145.0Financial income 0.5 11.8Financial expenses -16.4 -3.3Receivables, 31 December 375.2 319.0Liabilities, 31 December 1,510.0 780.6
Transactions with key persons in leading positionsRegarding the salaries and other remuneration, costs and commitments for pen-sions and similar benefits, and severance payment agreements, for Board mem-bers, the CEO and other senior executives, see Group note 22.
18 Statement of cash flow
Liquid funds , SEKm 2019 2018Subcomponents in cash and cash equivalents:Cash and cash equivalents 0.4 0.3Total 0.4 0.3
Adjustments for items not included in cash flow, SEKm 2019 2018Depreciation 28.3 22.0Unrealised translation differences -6.0 0.1Impairment of shares in subsidiaries 12.0 - Total 34.3 22.1
Unused credits, SEKm 2019 2018Disposable funds 0.4 0.3
19 Appropriation of profit or loss
The following is at the disposal of the Annual General Meeting of Nederman Holding AB (publ):SEK 2019 2018Share premium reserve 5,866,700 5,866,700Retained earnings 494,865,542 481,579,660Net profit for the year 96,372,679 104,346,889Total 597,104,921 591,793,249
The Board of Directors proposea dividend to shareholders of SEK 2.50 (2.30) per share* 87,732,740 80,704,132to be transferred to the share premium reserve 5,866,700 5,866,700to be transferred to retained earnings 503,505,481 505,222,417Total 597,104,921 591,793,249
*Based on number of shares outstanding as of December 31. The dividend amount may be subject to change as treasury shares may be sold up to the record day of April 21, 2020.
2019, SEKm
Amount at beginning
of the yearCash flow
Exchange rate gains/
lossesAmount
at year endLong-term interest-bearing liabilities Group companies 474.8 696.8 -0.7 1,170.9Short-term interest-bearing assets (-) & liabilites (+) Group companies -10.5 -16.9 -0.8 -28.2Total 679.9

Notes to Parent company’s statementNederman’s 2019 Annual Report and Sustainability Report 137136
20 Group Companies
Parent company’s shareholdings and participations in subsidiaries2019 2018
Number OwnerCarrying amount
Carrying amount
Subsidiary Corp. ID. no. Domicile / Country of shares Share, % SEKm SEKmAB Ph. Nederman & Co 556089-2951 Helsingborg, Sweden 550,000 100 236.6 236.6Nederman S.A.S. 434134615.0 Paris, France - -* - - Nederman Distribution Sales AB 556272-9854 Helsingborg, Sweden - -* - - Nederman Ibérica S.A. A79441762 Madrid, Spain - -* - - Nederman Logistics North America Ltd 426065-1 Mississauga, Canada - -* - - Töredal Verkstad AB 556199-7601 Kvänum, Sweden - -* - - Nederman (Shanghai) Co Ltd 9131000067113929XX Shanghai, China - -* - - Nederman International Trading Shanghai Co. Ltd 91310115688759399Y Shanghai, China - -* - - Nederman Magyarorszag Kft 01-09-874950 Budapest, Hungary - 100 0.2 0.2Nederman Nordic AB 556426-7358 Helsingborg, Sweden 2,000 100 110.6 110.6Nederman Norge, Filial til Nederman Nordic 914149762.0 Skedsmo, Norway - -* - - Nederman Danmark, Filial af Nederman Nordic AB 36414642.0 Mariager, Denmark - -* - - Nederman N.V./S.A. 428727.0 Brussels, Belgium 4,000 100 30.4 30.4Nederman GmbH HRB225315 Stuttgart, Germany - 100 19.2 19.2Nederman GmbH (Austria) FN2315530k Vienna, Austria - -* - - Nederman Ltd 1393492.0 Preston, UK 10,000 100 49.3 49.3Nederman Filtration Ltd 562216.0 Preston, UK - -* - - Nederman CR s.r.o. 25634364.0 Prague, Czech Republic 1 100 0,0 0,0 Nederman Holding USA Inc 80-0699546 Wilmington, DE USA - 100 106.5 106.5Nederman Manufacturing & Logistics LLC 90-0676051 Wilmington, DE USA - -* - - Nordfab LLC 56-1230979 Wilmington, DE USA - -* - - Nederman Shared Services LLC 46-4172135 Wilmington, DE USA - -* - - Nederman MikroPul Holding Inc 04-3833071 Wilmington, DE USA - -* - - Nederman Corporation 56-0488262 Wilmington, DE USA - -* - - National Conveyors Company Inc. 22-1547550 New York, NY USA - -* - - LCI Corporation International 56-0732889 Charlotte, NC USA - -* - - Menardi LLC 56-2173466 Wilmington, DE USA - -* - - Nederman Mikropul Canada Inc. 56-2172876 Wilmington, DE USA - -* - - Nederman S. de R.L. de C.V MIK0001128K6 Col Juarez, Mexico - -* - - Nederman Services S. de R.L. de C.V MIK0001128K6 Col Juarez, Mexico - -* - - Nederman Mikropul LLC 46-4352369 Wilmington, DE USA - -* - - Auburn FilterSense LLC 6543811.0 Wilmington, DE USA -* - - Nederman Canada Ltd 105836613.0 Mississauga, Canada 1 100 32.1 32.1Nederman do Brasil Comércio de Produtos de Exaustao Ltda 05.880.850/0001-45 Sao Paulo, Brazil 3,365 100 6.1 6.1Arboga-Darenth Ltd 1048823.0 Preston, UK 10 100 0,0 0,0 Nederman India Private Limited U74900PN2008FTC144278 Pune, India 100,000 100 10.6 10.6Nederman Makine Sanayi Ve Ticaret Limited Sirketi 647743.0 Istanbul, Turkey - 53 7.6 7.6Nederman Holding Danmark A/S 28301650.0 Mariager, Denmark 60,500 100 231.3 231.3Nederman Filtration GmbH HRB391382 Freiburg, Germany - -* - - Nederman Holding Germany GmbH HRB701805 Freiburg, Germany - -* - - Nederman MikroPul GmbH HRB 33261 Cologne, Germany - -* - - Nederman OOO 1082468018511.0 Moscow, Russia - -* - - Nederman Manufacturing Poland Sp. z o.o. 50307.0 Marki, Poland - -* - - Nederman Polska Sp. z o.o. 109291.0 Marki, Poland - -* - - Nederman SEA Co Ltd - Chonburi, Thailand - -* - - Nederman (Malaysia) Sdn Bhd. 892768T Selangor, Malaysia - -* - - PT Nederman Indonesia - Jakarta, Indonesia - 10* 0.2 0.2Nederman Filtration AB 556609-6177 Malmö, Sweden - -* - - Nederman Manufacturing (Suzhou) Co Ltd 9132050578206245 93 Suzhou, China - -* - - Nordfab Europe AS 17011405.0 Mariager, Denmark - -* - - Lebon & Gimbrair Beheer N.V. 31033906.0 Amersfoort, the Netherlands - 100 26.7 26.7Nederman Nederland BV 58655360.0 Amersfoort, the Netherlands - -* - - Mikropul Holding BV 17119906.0 Amersfoort, the Netherlands - 100 - 11.9EFT France Holding 429043276.0 Pontcharra, France - -* - - MikroPul France SAS 303573307.0 Pontcharra, France - -* - - Nordfab Ducting Co Ltd - Chonburi, Thailand - 51 0.2 0.2Nederman MikroPul Pty Ltd - Bayswater, Victoria, Australia - 100 14.4 14.4Filtac AB 556652-2750 Kinna, Sweden - 100 12.2 12.2Menardi Filters Europe A/S 38209205.0 Mariager, Denmark - 100 0.7 0.7Nederman MikroPul Poland Sp. z o.o. 617869.0 Marki, Poland - -* - - NEO Monitors AS 986076832.0 Skedsmo, Norway 147,076 100 415.9 415.9Nederman Finance AB 559160-6081 Helsingborg, Sweden 1,000 100 0.5 0.5Luwa Air Engineering AG CHE-112.154.099 Zurich, Switzerland 950,000 100 203.2 203.2Luwa India Private Limited U01711KA1993FTC014292 Bangalore, India - -* - - Luwa America, Inc C201412600738 Greensboro, NC USA - -* - - Luwa Havalandirma Teknikleri Sanayi ve Ticaret Limited Sirketi
826319.0 Istanbul, Turkey - -* - -
Luwa Air Engineering (Shanghai) Co., Ltd. 913100006073822526 Shanghai, China - -* - - Luwa Air Engineering (Pte.) Ltd. 197400205K Singapore, Singapore - -* - - Nederman Insight AB 559175-9468 Helsingborg, Sweden 1,000 100 0.1 0.1Gasmet Technologies Oy 2681803-8 Helsinki, Finland 31,403 100 512.8 - Gasmet Technologies GmbH HRB 105091 Karlsruhe, Germany - -* - - Gasmet Technologies (Asia) Ltd 950990 Hong Kong - -* - - Gasmet Technologies Inc. 707771-8 Toronto, Canada - -* - - Gasmet Technologies (UK) Ltd 2301809 Naseby, UK - -* - - MonitoringSystems GmbH FN 211207 z Mauerbach, Austria - -* - - Total 2,027.3 1,526.5
*) 100% owned by the Group

Notes to Parent company’s statementNederman’s 2019 Annual Report and Sustainability Report MB138
20 Group companies, cont’d
Accumulated cost, SEK m 2019 2018Opening balance 1,526.5 1,311.8Acquisition of Group companies 512.8 203.7Formation of subsidiary - 0.6Capital contribution - 10.4Impairment of book value -12.0 - Closing balance at December 31 2,027.3 1,526.5
21 Occurrences following the balance sheet date
No significant events have occurred after the balance sheet date.

139Signatures
Signatures
The consolidated accounts and the annual report have been prepared in accordance with international accounting standards as prescribed in Regulation (EC) no. 1606/2002 of the European Parliament and of the Council dated 19 July 2002 concerning the application of international accounting standards and good accounting practice in Sweden, and give a fair picture of the Group’s and parent company’s position and results.
The Directors’ Report for the Group and parent company provides a fair overview of the Group’s and parent company’s activities, position and results and describe the main risks and uncertainties facing the parent company and Group companies. The annual report and consolidated accounts will be subject to adoption by the Annual General Meeting on 27 April 2020.
Helsingborg, 11 March 2020
Johan HjertonssonChairman
Gunilla Fransson Sven KristenssonBoard member Board member and CEO
Johan Menckel Ylva op den Velde HammargrenBoard member Board member
Sam StrömersténBoard member
Our audit report was issued on 13 March 2020
Ernst & Young AB
Staffan LandénAuthorised Public Accountant
Nederman Annual Report and Sustainability Report 2019140
Auditor’s reportTo the general meeting of the shareholders of Nederman Holding AB (publ), corporate identity number 556576-4205
REPORT ON THE ANNUAL ACCOUNTS AND CONSOLIDATED ACCOUNTS
OpinionsWe have audited the annual accounts and consolidated accounts of Nederman Holding AB (publ) except for the corporate gover-nance statement on pages 80-83, 86-87 and the statutory sus-tainability report on pages 44-59 for the financial year 2019. The annual accounts and consolidated accounts of the company are included on pages 44-139 in this document.
In our opinion, the annual accounts have been prepared in ac-cordance with the Annual Accounts Act and present fairly, in all material respects, the financial position of the parent company as of 31 December 2019 and its financial performance and cash flow for the year then ended in accordance with the Annual Ac-counts Act. The consolidated accounts have been prepared in accordance with the Annual Accounts Act and present fairly, in all material respects, the financial position of the group as 31 De-cember 2019 and their financial performance and cash flow for the year then ended in accordance with International Financial Reporting Standards (IFRS), as adopted by the EU, and the Annu-al Accounts Act. Our opinions do not cover the corporate gover-nance statement on pages 80-83, 86-87 and the statutory sus-tainability report on pages 44-59. The statutory administration report is consistent with the other parts of the annual accounts and consolidated accounts.
We therefore recommend that the general meeting of share-holders adopts the income statement and balance sheet for the parent company and the group.
Our opinions in this report on the annual accounts and consoli-dated accounts are consistent with the content of the additional report that has been submitted to the parent company’s audit committee in accordance with the Audit Regulation (537/2014) Article 11.
Basis for OpinionsWe conducted our audit in accordance with International Stan-dards on Auditing (ISA) and generally accepted auditing stan-dards in Sweden. Our responsibilities under those standards are further described in the Auditor’s Responsibilities section. We are independent of the parent company and the group in accor-dance with professional ethics for accountants in Sweden and have otherwise fulfilled our ethical responsibilities in accordance with these requirements. This includes that, based on the best of our knowledge and belief, no prohibited services referred to in the Audit Regulation (537/2014) Article 5.1 have been provided to the audited company or, where applicable, its parent company or its controlled companies within the EU.
We believe that the audit evidence we have obtained is sufficient and appropriate to provide a basis for our opinions.
Key Audit Matters
Key audit matters of the audit are those matters that, in our professional judgment, were of most significance in our audit of the annual accounts and consolidated accounts of the current period. These matters were addressed in the context of our au-dit of, and in forming our opinion thereon, the annual accounts and consolidated accounts as a whole, but we do not provide a separate opinion on these matters. For each matter below, our description of how our audit addressed the matter is provided in that context.
We have fulfilled the responsibilities described in the Auditor’s responsibilities for the audit of the financial statements section of our report, including in relation to these matters. Accordingly, our audit included the performance of procedures designed to respond to our assessment of the risks of material misstatement of the financial statements. The results of our audit procedures, including the procedures performed to address the matters be-low, provide the basis for our audit opinion on the accompanying financial statements.

141Revisionsberättelse
Valuation of Goodwill
DescriptionThe carrying value of goodwill at 31 December 2019 was SEK 1,612.2 million which corresponds to 34 % of the company’s total assets in the group. The company conducts an annu-al review and in the event of an indication of impairment, to assure that the carrying value does not exceed the estimated recoverable value. The recoverable amount is determined for each cash generating unit by calculating the present value of future cash flows. Future cash flows are based on manage-ment’s business plans and forecasts, and include a number of assumptions, including on earnings performance, growth, investment requirements and the discount rate.
Changes in assumptions have a great impact on the calculation of the recoverable value and the assumptions that the compa-ny makes will be of great importance when determining if there is a need for impairment. We have therefore considered that the valuation of goodwill is a key audit matter in the audit.
A description of the impairment test is presented in Note 13 “Intangible assets” and in Note 32 “Significant estimates and judgements”.
How our audit addressed this key audit matterIn our audit, we have evaluated and tested the company’s process to establish the impairment test, including by eval-uating past accuracy of forecasts and assumptions. We also made comparisons with other companies in order to evaluate the reasonableness of future cash flows and growth assump-tions, and with the help from our valuation specialists exam-ined the selected discount rate and assumptions about long term growth. We have also reviewed the company’s model and method for carrying out impairment testing and evaluated the company’s sensitivity analyses. We have also reviewed the disclosures in the financial statements.
Revenue relating to Solutions (project sales)
DescriptionNet sales for 2019 amounts to total SEK 4,307.7 million and of this SEK 2,051.6 million relates to solutions (project sales), representing 48 % of total net sales. The accounting policies that the company applies for revenue recognition attributable to solutions is described on page 99 of the annual report, in Note 2 “Sales” and in Note 32 “Important estimations and as-sessments”. The revenue of solutions is accounted for over time by measuring the current fulfillment of the performance obligation and comparing it to the complete fulfillment of the performance obligation. This is done by putting the accrued expenses in relation to the total projected expenses of goods or services that have been agreed upon. Revenue recognition of solutions requires estimates in measuring the current ful-fillment of the performance obligation and comparing it to the complete fulfillment of the performance obligation. Changes in these estimations can have a material impact on the result of the company, and we have therefore considered revenue recognition related to solutions to be a key audit matter in the audit.
Hur detta område beaktades i revisionenWe have reviewed the company’s process for revenue recog-nition of the segment solutions and assessed the company’s estimation of the grade of fulfillment of the performance ob-ligation. We have by testing samples reviewed the company’s assessments of expected profit or loss of the project by com-parisons with agreements, historical results and budget. The assessments made by the company regarding the risk of loss have also been reviewed. We have also reviewed the disclo-sures in the financial statements.

Nederman Annual Report and Sustainability Report 2019142
Other Information than the annual accounts and consolidated accountsThis document also contains other information than the annual accounts and consolidated accounts and is found on pages 1-43 and 145-147. The Board of Directors and the Managing Director are responsible for this other information.
Our opinion on the annual accounts and consolidated accounts does not cover this other information and we do not express any form of assurance conclusion regarding this other information.
In connection with our audit of the annual accounts and con-solidated accounts, our responsibility is to read the information identified above and consider whether the information is mate-rially inconsistent with the annual accounts and consolidated accounts. In this procedure we also take into account our knowl-edge otherwise obtained in the audit and assess whether the information otherwise appears to be materially misstated.
If we, based on the work performed concerning this information, conclude that there is a material misstatement of this other in-formation, we are required to report that fact. We have nothing to report in this regard.
Responsibilities of the Board of Directors and the Managing DirectorThe Board of Directors and the Managing Director are responsi-ble for the preparation of the annual accounts and consolidated accounts and that they give a fair presentation in accordance with the Annual Accounts Act and, concerning the consolidat-ed accounts, in accordance with IFRS as adopted by the EU. The Board of Directors and the Managing Director are also responsi-ble for such internal control as they determine is necessary to enable the preparation of annual accounts and consolidated ac-
counts that are free from material misstatement, whether due to fraud or error.
In preparing the annual accounts and consolidated accounts, The Board of Directors and the Managing Director are responsi-ble for the assessment of the company’s and the group’s ability to continue as a going concern. They disclose, as applicable, mat-ters related to going concern and using the going concern basis of accounting. The going concern basis of accounting is however not applied if the Board of Directors and the Managing Director intends to liquidate the company, to cease operations, or has no realistic alternative but to do so.
Auditor’s responsibilityOur objectives are to obtain reasonable assurance about wheth-er the annual accounts and consolidated accounts as a whole are free from material misstatement, whether due to fraud or error, and to issue an auditor’s report that includes our opinions. Reasonable assurance is a high level of assurance, but is not a guarantee that an audit conducted in accordance with ISAs and generally accepted auditing standards in Sweden will always de-tect a material misstatement when it exists. Misstatements can arise from fraud or error and are considered material if, individ-ually or in the aggregate, they could reasonably be expected to influence the economic decisions of users taken on the basis of these annual accounts and consolidated accounts.
As part of an audit in accordance with ISAs, we exercise profes-sional judgment and maintain professional skepticism through-out the audit. We also:
• Identify and assess the risks of material misstatement of the annual accounts and consolidated accounts, whether due to fraud or error, design and perform audit procedures respon-
Acquisition of Gasmet Technologies Oy
DescriptionThe Group has during 2019 acquired Gasmet Technologies Oy, where the acquisition price for all shares has been calcu-lated to SEK 508.9 million, of which goodwill is SEK 386.6 mil-lion. The company´s disclosures about acquisitions are stat-ed in Note 4 ”Acquisition of business operations” and Note 1 ”Accounting policies” section ”Consolidation Principles”.
Accounting for the acquisition of Gasmet Technologies Oy has required estimates from the company. The most significant estimate refers to the assessment of fair values of separately identifiable assets when allocating the purchase price. When preparing the preliminary purchase price analysis, the compa-ny has made several assumptions including future cash flows, growth, discount rate and choice of model for valuation. We have therefore assessed the reporting of this acquisition to be a key audit matter in the audit.
How our audit addressed this key audit matterIn our audit, we evaluated and tested the company´s process for preparing the preliminary purchase price analysis, includ-ing evaluating the reasonableness of future cash flows and growth assumptions. We have also evaluated the assessment of assessed values performed by external advisors. Together with our valuation specialists, we examined the company´s models and methods for preparing the purchase price analy-sis and the reasonableness of the choice of valuation model, assumptions including discount rate and future cash flows to determine the fair values of acquired assets and liabilities and useful lives for the assets. We have also reviewed the disclo-sures in the financial statements.

143Revisionsberättelse
sive to those risks, and obtain audit evidence that is sufficient and appropriate to provide a basis for our opinions. The risk of not detecting a material misstatement resulting from fraud is higher than for one resulting from error, as fraud may involve collusion, forgery, intentional omissions, misrepresentations, or the override of internal control.
• Obtain an understanding of the company’s internal control rel-evant to our audit in order to design audit procedures that are appropriate in the circumstances, but not for the purpose of expressing an opinion on the effectiveness of the company’s internal control.
• Evaluate the appropriateness of accounting policies used and the reasonableness of accounting estimates and related dis-closures made by the Board of Directors and the Managing Di-rector.
• Conclude on the appropriateness of the Board of Directors’ and the Managing Director’s use of the going concern basis of accounting in preparing the annual accounts and consolidated accounts. We also draw a conclusion, based on the audit evi-dence obtained, as to whether any material uncertainty exists related to events or conditions that may cast significant doubt on the company’s and the group’s ability to continue as a going concern. If we conclude that a material uncertainty exists, we are required to draw attention in our auditor’s report to the related disclosures in the annual accounts and consolidated accounts or, if such disclosures are inadequate, to modify our opinion about the annual accounts and consolidated accounts. Our conclusions are based on the audit evidence obtained up to the date of our auditor’s report. However, future events or conditions may cause a company and a group to cease to con-tinue as a going concern.
• Evaluate the overall presentation, structure and content of the annual accounts and consolidated accounts, including the disclosures, and whether the annual accounts and consoli-dated accounts represent the underlying transactions and events in a manner that achieves fair presentation.
• Obtain sufficient and appropriate audit evidence regarding the financial information of the entities or business activities within the group to express an opinion on the consolidated ac-counts. We are responsible for the direction, supervision and performance of the group audit. We remain solely responsible for our opinions.
We must inform the Board of Directors of, among other matters, the planned scope and timing of the audit. We must also inform of significant audit findings during our audit, including any signif-icant deficiencies in internal control that we identified.
We must also provide the Board of Directors with a statement that we have complied with relevant ethical requirements re-garding independence, and to communicate with them all rela-tionships and other matters that may reasonably be thought to bear on our independence, and where applicable, related safe-guards.
From the matters communicated with the Board of Directors, we determine those matters that were of most significance in the audit of the annual accounts and consolidated accounts, including the most important assessed risks for material mis-statement, and are therefore the key audit matters. We describe these matters in the auditor’s report unless law or regulation precludes disclosure about the matter.
REPORT ON OTHER LEGAL AND REGULATORY REQUIREMENTS
OpinionsIn addition to our audit of the annual accounts and consolidated accounts, we have also audited the administration of the Board of Directors and the Managing Director of Nederman Holding AB (publ) for the financial year 2019 and the proposed appropria-tions of the company’s profit or loss.
We recommend to the general meeting of shareholders that the profit be appropriated (loss be dealt with) in accordance with the proposal in the statutory administration report and that the members of the Board of Directors and the Managing Director be discharged from liability for the financial year.
Basis for opinionsWe conducted the audit in accordance with generally accepted auditing standards in Sweden. Our responsibilities under those standards are further described in the Auditor’s Responsibilities
section. We are independent of the parent company and the group in accordance with professional ethics for accountants in Sweden and have otherwise fulfilled our ethical responsibilities in accordance with these requirements.
We believe that the audit evidence we have obtained is sufficient and appropriate to provide a basis for our opinions.
Responsibilities of the Board of Directors and the Managing DirectorThe Board of Directors is responsible for the proposal for ap-propriations of the company’s profit or loss. At the proposal of a dividend, this includes an assessment of whether the dividend is justifiable considering the requirements which the company’s and the group’s type of operations, size and risks place on the size of the parent company’s and the group’s equity, consolida-tion requirements, liquidity and position in general.

Nederman Annual Report and Sustainability Report 2019144
The Board of Directors is responsible for the company’s orga-nization and the administration of the company’s affairs. This includes among other things continuous assessment of the company’s and the group’s financial situation and ensuring that the company’s organization is designed so that the accounting, management of assets and the company’s financial affairs oth-erwise are controlled in a reassuring manner. The Managing Di-rector shall manage the ongoing administration according to the Board of Directors’ guidelines and instructions and among other matters take measures that are necessary to fulfill the compa-ny’s accounting in accordance with law and handle the manage-ment of assets in a reassuring manner.
Auditor’s responsibilityOur objective concerning the audit of the administration, and thereby our opinion about discharge from liability, is to obtain audit evidence to assess with a reasonable degree of assurance whether any member of the Board of Directors or the Managing Director in any material respect:
• has undertaken any action or been guilty of any omission which can give rise to liability to the company, or
• in any other way has acted in contravention of the Companies Act, the Annual Accounts Act or the Articles of Association.
Our objective concerning the audit of the proposed appropri-ations of the company’s profit or loss, and thereby our opinion about this, is to assess with reasonable degree of assurance whether the proposal is in accordance with the Companies Act.
Reasonable assurance is a high level of assurance, but is not a guarantee that an audit conducted in accordance with generally accepted auditing standards in Sweden will always detect ac-tions or omissions that can give rise to liability to the company, or that the proposed appropriations of the company’s profit or loss are not in accordance with the Companies Act.
As part of an audit in accordance with generally accepted au-diting standards in Sweden, we exercise professional judgment and maintain professional skepticism throughout the audit. The examination of the administration and the proposed appropri-ations of the company’s profit or loss is based primarily on the audit of the accounts. Additional audit procedures performed are based on our professional judgment with starting point in risk and materiality. This means that we focus the examination on such actions, areas and relationships that are material for the operations and where deviations and violations would have particular importance for the company’s situation. We examine and test decisions undertaken, support for decisions, actions taken and other circumstances that are relevant to our opinion concerning discharge from liability. As a basis for our opinion on the Board of Directors’ proposed appropriations of the compa-ny’s profit or loss we examined the Board of Directors’ reasoned
statement and a selection of supporting evidence in order to be able to assess whether the proposal is in accordance with the Companies Act.
The auditor’s examination of the corporate governance statementThe Board of Directors is responsible for that the corporate gov-ernance statement on pages 80-83 and 86-87 has been pre-pared in accordance with the Annual Accounts Act.
Our examination of the corporate governance statement is con-ducted in accordance with FAR´s auditing standard RevU 16 The auditor´s examination of the corporate governance statement. This means that our examination of the corporate governance statement is different and substantially less in scope than an audit conducted in accordance with International Standards on Auditing and generally accepted auditing standards in Sweden. We believe that the examination has provided us with sufficient basis for our opinions.
A corporate governance statement has been prepared. Disclo-sures in accordance with chapter 6 section 6 the second para-graph points 2-6 of the Annual Accounts Act and chapter 7 section 31 the second paragraph the same law are consistent with the other parts of the annual accounts and consolidated accounts and are in accordance with the Annual Accounts Act.
The auditor´s opinion regarding the statutory sustainability reportThe Board of Directors is responsible for the statutory sustain-ability report on pages 44-59, and that it is prepared in accor-dance with the Annual Accounts Act.
Our examination has been conducted in accordance with FAR’s auditing standard RevR 12 The auditor´s opinion regarding the statutory sustainability report. This means that our examination of the statutory sustainability report is different and substan-tially less in scope than an audit conducted in accordance with International Standards on Auditing and generally accepted au-diting standards in Sweden. We believe that the examination has provided us with sufficient basis for our opinion.
A statutory sustainability report has been prepared.
Ernst & Young AB, Box 7850 103 99 Stockholm, was appointed auditor of Nederman Holding AB by the general meeting of the shareholders on the 29 April 2019 and has been the company’s auditor since the 22 April 2015.
Helsingborg 13 March, 2020 Ernst & Young AB
Staffan LandénAuthorized Public Accountant

145Definitions
DefinitionsAdjusted EBITAOperating profit before amortisation and impairment of intangible assets, excluding acquisition and restructuring costs.
Adjusted EBITA marginAdjusted EBITA as a percentage of sales.
Adjusted EBITDAOperating profit before depreciation, amortisation and im-pairment, excluding acquisition and restructuring costs.
Adjusted EBITDA marginAdjusted EBITDA as percentage of sales.
Adjusted operating profitOperating profit excluding acquisition and restructuring costs.
Adjusted operating marginAdjusted operating profit as a percentage of net sales.
Annual averageAverage of balance at the beginning and end of the year.
Capital turnover rateNet sales divided by average operating capital.
Currency-neutral growthCurrency-neutral growth is the growth rate that does not come from currency effects, compared with the correspond-ing period in the preceding year.
Earnings per share (after dilution)Net profit for the year attributable to parent company shareholders in relation to the average number of shares outstanding plus the average number of convertibles and warrants, as calculated in accordance with IAS 33.
Earnings per share (before dilution)Net profit for the year attributable to parent company shareholders in relation to the average number of shares outstanding.
EBITAOperating profit before amortisation and impairment of intangible assets.
EBITA marginEBITA as a percentage of sales.
EBITDAOperating profit before depreciation, amortisation and impairment.
EBITDA marginEBITDA as a percentage of net sales.
Equity/assets ratioEquity divided by total assets (balance sheet total).
Equity per shareEquity divided by the average number of shares outstanding.
Interest cover ratioProfit before tax with a reversal of financial expenses in relation to financial expenses.
Net debtInterest-bearing liabilities (including pensions) less cash and cash equivalents.
Net debt/equity ratioNet debt divided by equity.
Operating capitalEquity plus net debt.
Operating marginOperating profit as a percentage of net sales.
Operating profitOperating profit after depreciation, amortisation and impair-ment.
Organic growthGrowth rate that does not come from acquisitions or curren-cy effects, compared with the corresponding period in the preceding year.
Return on equityNet profit for the year after tax divided by average equity.
Return on operating capitalAdjusted operating profit as a percentage of average operat-ing capital.
Nederman Annual Report and Sustainability Report 2019146
Articles of Association
1 § Company name. The name of the Company is Nederman Holding Aktiebolag. The Company is a public company (publ).
2 § Registered office. The registered office of the Board of Directors is in Helsingborg municipality.
3 § Company’s operations. The object of the Company’s operations is to directly or through subsidiaries produce and market products to improve the industrial workplace environment and to own and manage enterprises as well as real estate and personal property, and to engage in compatible operations.
4 § Share capital. The Company’s share capital shall not be lower than seven hundred and fifty thousand (SEK 750,000) and shall not exceed three million (SEK 3,000,000).
5 § Number of shares. The number of shares shall be no lower than ten million (10,000,000) and shall not exceed forty million (40,000,000).
6 § VPC-registered company. The Company’s shares shall be registered in a CSD register in accordance with the Swedish Financial Instruments Accounts Act (1998:1479).
7 § Financial year. The Company’s financial year shall be the calendar year.
8 § Board of Directors. The Board of Directors shall consist of at least three (3) and not more than eight (8) members with a maximum of three (3) deputies. Board members will be elected annually at the Annual General Meeting for the period extending until the close of the next Annual General Meeting.
9 § Auditor. The firm shall have at least one (1) and no more than two (2) auditors, without or with no more than one (1) deputy auditor. An approved or authorized public accountant or a registered auditing firm shall be appoint-ed auditor and, where appropriate, deputy auditor.
10 § Notice of Annual General Meeting. Notice of the Annual General Meeting and Extraordinary General Meetings where an issue concerning amendment of the Articles of Association shall be considered, must be issued no earlier than six weeks and no later than four weeks before the date of the meeting. Notice of other Extraordinary General Meetings shall be issued not earlier than six weeks and not later than two weeks prior to the meeting. Notice of Annual General Meeting shall be given in the Swedish Official Gazette (Post- och Inrikes Tidnin-gar) as well as on the company’s website. It shall be adver-tised in Svenska Dagbladet or, if publication is cancelled,
in Dagens Industri instead, that notice of the meeting has been given.
11 § Right to participate in Annual General Meeting. Shareholders who wish to participate in proceedings at the Annual General Meeting must be included in the transcript of the entire share register pertaining to the situation no later than five (5) weekdays before the annual general meeting, and they must register with the Company no later than 4 p.m. of the day specified in the notice of the annual general meeting. This day may not be a Sunday, other general holiday, Saturday, Mid-summer Eve, Christmas Eve, or New Year’s Eve, nor may it fall earlier than the fifth weekday before the annual general meeting. Shareholders or representatives may be accompanied by a maximum of two assistants at a annual general meeting, but only if the shareholder has notified the Company of the number of assistants in accordance with the preceding paragraph.
12 § Location of Annual General Meeting. The Annual General Meeting may be held in Helsingborg or Stockholm.
13 § Annual General Meeting. The Annual General Meet-ing shall address the following matters: 1. Election of the chairperson of the meeting; 2. Preparation and approval of the voting list; 3. Approval of the agenda; 4. Election of one or two persons to verify the minutes; 5. Determination of whether the meeting has been duly
convened 6. Presentation of the annual report and the auditors’
report and report on the consolidated accounts; 7. Resolution to adopt the income statement and
balance sheet as well as the consolidated income statement and consolidated balance sheet;
8. Resolutions on appropriation of the Company’s profit or loss according to the adopted balance sheet;
9. Resolution to discharge members of the Board of Di-rectors and the Chief Executive Officer from liability;
10. Determination of the number of board members and deputies, as well as, where appropriate, auditors and deputy auditors;
11. Establishment of remuneration to the Board of Direc-tors and, where applicable, the auditors;
12. Election of members of the board and any deputy board members as well as, where appropriate, audi-tors and any deputy auditors,
Other items brought before the general meeting or shareholders according to the Swedish Companies Act or the Articles of Association.
These articles of association were adopted by the Annual General Meeting on 26 April 2011.

147Notification to attend the Annual General Meeting
Notice to attend the Annual General Meeting
The Annual General Meeting of Nederman Holding AB (publ) will take place on Monday, 27 April 2020 at the Hotel Marina Plaza, Kungstorget 6, 251 10 Helsingborg.
Schedule:4:00 p.m. Registration starts4:30 p.m. Meeting room opens5:00 p.m. Meeting startsCoffee and refreshments will be served before the Meeting.
Right to participate in the MeetingShareholders wishing to participate in the Annual General Meeting must be recorded in the sharehold-ers’ register maintained by Euroclear Sweden by Tuesday, 21 April 2020 and must notify the Company of their intention to participate in the Meeting no later than Tuesday, 21 April 2020. Shareholders whose shares are registered in the name of a trustee must have their shares temporarily registered in their own name in the shareholders’ register maintained by Euroclear Sweden in order to participate in the Meeting. This registration, known as voting right registration, must take place by 21 April 2020, meaning that the shareholder should notify the trustee of his or her intention to participate in the Meeting in due time before that date.
Notificationcan be carried out in one of the following ways:– by e-mail: [email protected]– by telephone: +46 (0)42 18 87 00– by post: Nederman Holding AB (publ), “Årsstämma” Box 602, 251 06 Helsingborg.
The notification should include the shareholder’s name, personal identity number/corporate identi-ty number, address, telephone number, registered shareholding and any advisers. The information is solely used for the requisite registration and for preparing the voting list. For shareholders represent-ed by proxy, the original proxy form must be sent to the Company along with the notification to attend the Meeting. Individuals representing a legal entity must have a copy of the registration certificate or equivalent documentation indicating the authorised signatory. The Company will provide proxy forms for shareholders who so wish. The form is also available for download on Nederman’s website, www.nedermangroup.com.
DividendsThe Board and CEO propose a dividend for the 2019 financial year of SEK 2.50 per share.
Interim reportsQ1 report: 21 April 2020Q2 report: 14 July 2020Q3 report: 23 October 2020

Nederman Holding AB (publ.) Box 602, SE-252 28 Helsingborg
Visiting address: Sydhamnsgatan 2Tel: +46 (0)42 18 87 00
www.nedermangroup.com