Metals for Clean Energy: - Eurometaux
117
Metals for Clean Energy: Pathways to solving Europe’s raw materials challenge
-
Upload
khangminh22 -
Category
Documents
-
view
1 -
download
0
Transcript of Metals for Clean Energy: - Eurometaux
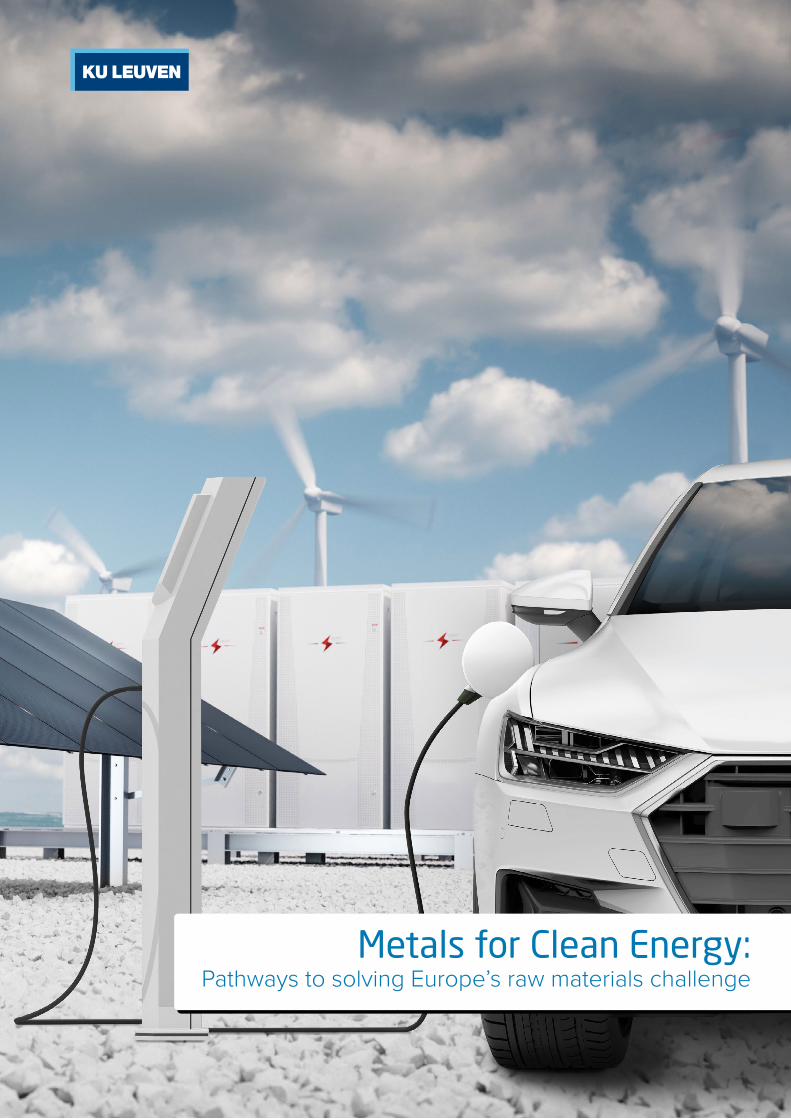
Metals for Clean Energy: Pathways to solving Europe’s raw materials challenge
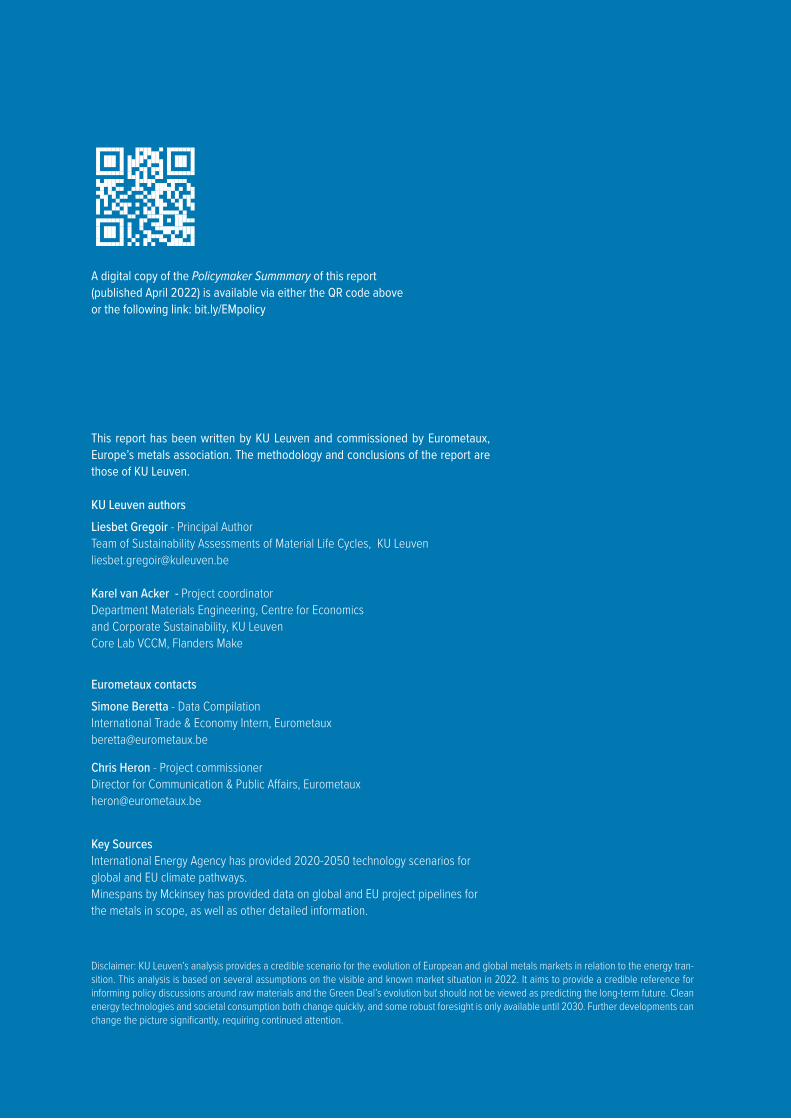
KU Leuven authorsLiesbet Gregoir - Principal AuthorTeam of Sustainability Assessments of Material Life Cycles, KU Leuven [email protected]
Karel van Acker - Project coordinatorDepartment Materials Engineering, Centre for Economics and Corporate Sustainability, KU LeuvenCore Lab VCCM, Flanders Make
Eurometaux contactsSimone Beretta - Data CompilationInternational Trade & Economy Intern, [email protected]
Chris Heron - Project commissioner Director for Communication & Public Affairs, Eurometaux [email protected]
Key Sources International Energy Agency has provided 2020-2050 technology scenarios for global and EU climate pathways. Minespans by Mckinsey has provided data on global and EU project pipelines for the metals in scope, as well as other detailed information.
Disclaimer: KU Leuven’s analysis provides a credible scenario for the evolution of European and global metals markets in relation to the energy tran-sition. This analysis is based on several assumptions on the visible and known market situation in 2022. It aims to provide a credible reference for informing policy discussions around raw materials and the Green Deal’s evolution but should not be viewed as predicting the long-term future. Clean energy technologies and societal consumption both change quickly, and some robust foresight is only available until 2030. Further developments can change the picture significantly, requiring continued attention.
A digital copy of the Policymaker Summmary of this report (published April 2022) is available via either the QR code above or the following link: bit.ly/EMpolicy
This report has been written by KU Leuven and commissioned by Eurometaux, Europe’s metals association. The methodology and conclusions of the report are those of KU Leuven.
ContentsIntroduction 5
Units and glossary 6
Abbreviations 8
1 The energy transition and its impact on commodity demand 9
1.1 The energy transition requires the roll-out of clean energy technologies 9
1.1.1 IEA technology scenarios 9
1.1.2 Clean energy technology requirements 11
1.1.3 European clean energy technology production chains 12
1.2 Commodity demand projections 15
1.2.1 Metal requirements for the production of clean energy technologies 16
1.2.2 Transition commodity demand 19
1.2.3 Commodity demand projections 20
1.2.4 Commodity deep dives (Tier 1 commodities) 22
1.2.5 Commodity deep dives (Tier 2 commodities) 31
2 Commodity supply potential 33
2.1 Primary supply potential 34
2.1.1 Primary supply potential: 2020-2030 34
2.1.2 Commodity deep dives (Tier 1 commodities) 36
2.1.3 Global primary supply potential: 2030-2050 44
2.2 Secondary supply potential 46
2.2.1 End-of-life recycling 46
2.2.2 Secondary supply potential and the impact on primary demand 47
2.2.3 Commodity deep dives (Tier 1 commodities) 48
3 Supply-Demand market conclusions 58
3.1.1 Global conclusions 58
3.1.2 European conclusions 59
3.1.3 Commodity deep dives (Tier 1 commodities) 61
4 How can Europe ensure sustainable metal supply chains? 70
4.1 Understanding the current situation: sustainability assessment of primary metal production 70
4.1.1 Sustainability metrics 70
4.1.2 The interconnectedness of metal production 72
4.1.3 Commodity deep dives (Tier 1 commodities) 73
4.1.4 European analysis 82
4.2 Levers to increase sustainability in metal supply chains 85
4.2.1 The role of recycling 85
4.2.2 The role of responsible management and certification schemes 86
4.2.3 The role of legislation 90
Metals for Clean Energy - Pathways to solving Europe’s raw materials challenge3
4.3 Conclusions: Implications of sustainability mapping for European supply chains 91
4.3.1 Commodity deep dives (Tier 1 commodities) 91
Appendix: Background on global sustainability metrics analysis and methodology followed 95
1.1 Greenhouse gas emissions and energy 91
1.2 Water 97
1.3 Waste 99
1.4 Biodiversity 101
1.5 Environmental impact 103
1.6 Human rights 102
1.7 Employment 103
1.8 Health & safety 106
1.9 Economic benefits 107
1.10 Governance 108
References 109
Metals for Clean Energy - Pathways to solving Europe’s raw materials challenge4
Introduction
Metals for Clean Energy - Pathways to solving Europe’s raw materials challenge5
Metals will play a central role in successfully building Europe’s clean technology value chains and meeting the EU’s 2050 climate-neutrality goal. In the wake of supply disruptions from the COVID-19 pandemic and Russia's invasion of Ukraine, Europe’s lack of resilience for its growing metals needs has become a strategic concern.
This study evaluates how Europe can fulfil its goal of “achieving resource security” and “reducing strategic dependencies” for its energy transition metals, through a demand, supply, and sustainability assessment of the EU Green Deal and its resource needs .
It concludes that Europe has a window of opportunity to lay the foundation for a higher level of strate-gic autonomy and sustainability for its strategic metals through optimised recycling, domestic value chain investment, and more active global sourcing. But firm action is needed soon to avoid bottlenecks for several materials that risk being in global short supply at the end of this decade.
UnitsQuantities are expressed in metric tonnes (t), kilo metric tonnes (kt) and million metric tonnes (Mt). Quantities refer to metal content except for lithium, for which Lithium Carbonate Equivalent is used (unless specified differently).
Power capacity is expressed in watts (W), kilowatts (kW), megawatts (MW) or gigawatts (GW). Batteries’ ca-pacity is expressed in watt-hours (Wh), kilowatt-hours (kWh), megawatt-hours (MWh) or gigawatt-hours (GWh).
Energy is expressed in joules (J), kilojoules (kJ), megajoules (MJ) or gigajoules (GJ).
GlossaryAcidification: Acidification potential is connected to acid deposition of acidifying contaminants on soil, groundwater, surface waters, biological organisms, ecosystems, and substances. It’s a parameter used in life cycle assessments (LCA), and this study refers specifically to the emissions of SO2.
Base demand: Market demand driven by applications unrelated to the green transition’s current technologies.
End-of-Life Recycling Rate (EoL RR): A measure of the efficiency with which the metal contained in EoL products is collected, pre-treated, and finally recycled.
Energy transition: in this study, it is intended as the decarbonisation of the energy sector. As such, other processes (e.g., improved building efficiency) which will also play a role in the green transition are not included.
Europe: Under the definition of Europe, this study refers to the 27 European Union Members States, the United Kingdom, and EFTA member States (Iceland, Liechtenstein, Norway and Switzerland). The only exception is the supply section where, complying with Minespans (our data provider) criteria, we consider all the European mining/refining projects planned in geographical Europe.
Eutrophication: Eutrophication potential leads to an increase in aquatic plant growth attributable of nutrients left by over-fertilization of water and soil. This enrichment can be due to nitrogen and phos-phorus from polluting emissions, wastewater, and fertilizers, originating excessive development of algae and plants. It’s a parameter used in life cycle assessments (LCA) and this study refers specifically to the emissions of ion PO43- .
Green Deal: A set of policy initiatives by the European Commission with the overarching aim of making the European Union (EU) climate neutral in 2050.
Greenfield project: A greenfield project develops a mine facility on a vacant site, starting from scratch and not leveraging previous extraction processes. Greenfield exploration relies on the predictive power of ore genesis models to find mineral deposits in previously unexplored area.
New scrap: Scrap material that is generated during the manufacturing process, before having reached the consumer stage.
Old scrap: Scrap material that is collected at the end of its life cycle, after having served its useful life for consumers.
Primary supply: Supply of metals deriving from mining and extracting resources.
Rare earth elements (REE): This study refers to the rare earth elements dysprosium, neodymium, praseo-dymium and terbium.
Units and glossary
Metals for Clean Energy - Pathways to solving Europe’s raw materials challenge6
SDS: Sustainable Development Scenario, as developed by the International Energy Agency (IEA). This charts a pathway that meets in full the world’s goals to tackle climate change in line with the Paris Agree-ment while meeting universal energy access and significantly reducing air pollution. In this scenario, all current net zero pledges are achieved in full and there are extensive efforts to realise near-term emis-sions reductions; advanced economies reach net zero emissions by 2050, China around 2060, and all other countries by 2070 at the latest.
Secondary supply: Supply of metals derived from recycling resources.
STEPS: Stated Policies Scenario, as developed by the International Energy Agency (IEA). This reflects current policy settings based on a sector-by-sector assessment of the specific policies that are in place, as well as those that have been announced by governments around the world. It provides an indication of where today’s policy measures and plans lead the energy sector.
Tier 1: Metals selected as the fundamental drivers of the energy transition, in terms of volumes required and/or overall importance for key technologies. Fully assessed in the report, including demand, supply, and sustainability sections.
Tier 2: Metals partially analysed in the report, which provides a demand projection for each Tier 2 metal (but no assessment on supply or sustainability).
Transition demand: Market demand driven by technology applications strictly related to the energy transition.
Metals for Clean Energy - Pathways to solving Europe’s raw materials challenge7
ASM: Artisanal and small-scale mining
BEV: Battery electric vehicle
CAGR: Compound annual growth rate
CSP: Concentrated Solar Power technology
DRC: Democratic Republic of Congo
DSO: Direct Shipping Ore
EAF: Electric Arc Furnace
EoL: End-of-Life
EU: European Union
EV(s): Electric vehicle(s)
FCEV: Fuel cell electric vehicle
FTE: Full-time equivalent
GHG: Greenhouse Gas
GWP: Global Warming Potential
ICE: Internal combustion engine
IEA: International Energy Agency
K: Thousand
LCA: Life cycle assessment
LCE: Lithium Carbonate Equivalent
LCO: Lithium Cobalt Oxide
LFP: Lithium iron phosphate
M: Million
NCA: Nickel Cobalt Aluminium
NMC: Nickel Manganese Cobalt
PHEV: Plug-in hybrid electric vehicle
PM: Permanent magnet
REE: Rare earth elements
REO: Rare earth oxide
RR: Recycling Rate
Solar PV: Solar Photovoltaic
VRFB: Vanadium Red Flow Batteries
Abbreviations
Metals for Clean Energy - Pathways to solving Europe’s raw materials challenge8
• The global energy transition is metal intensive. Electric vehicles, batteries, solar photovoltaic sys-tems, wind turbines, and hydrogen technologies all require significantly more metals than their conventional alternatives to replace fossil fuel needs.
• Electric car production is the major driver for energy transition metals demand (responsible for 50-60% of the overall), followed by electricity networks and solar photovoltaics production (35-45%), and then other technologies the remaining 5%.
• Lithium, cobalt, nickel, rare earth elements and copper are the higher volume metals that will experience the strongest acceleration in demand growth. Iridium, scandium and tellurium are the low volume commodities most impacted by the energy transition.
• Europe’s plans to establish domestic production for clean energy technologies will increase its demand for a wide range of metals. This includes growth in mature base metals markets (alumini-um, copper, nickel) and the initiation of new commodity markets (lithium, rare earth elements).
1.1 The energy transition requires the roll-out of clean energy technologiesDecarbonising the global economy and energy sector requires the massive deployment of clean energy technologies within the next three decades.
• Wind turbines and solar panels provide key renewable sources of energy • Batteries will be needed to replace the use of fossil fuels in vehicles and support the electricity grid
when using intermittent renewable energy sourcesa • Electricity networks will be expanded and upgraded as the world electrifies • Hydrogen is expected to play a more prominent role as an alternative renewable energy source• Nuclear power is expected to remain a valid alternative for low carbon energy
In the following analysis, we will discuss more in detail the series of clean energy technologies that are needed to support the decarbonisation of the European energy system.
1.1.1 IEA technology scenarios
The International Energy Agency (IEA) has developed long-term scenarios to explore possible decarbon-isation pathways for the energy sector. This study is based on the IEA’s two main technology scenarios, which are developed both at global and regional levels.
The Stated Policies Scenario (STEPS) reflects current policy settings based on a sector-by-sector assess-ment of the specific policies that are in place, as well as those that have been announced by govern-ments around the world. It provides an indication of where today’s policy measures and plans lead the energy sector.
The Sustainable Development Scenario (SDS) charts a pathway that meets in full the world’s goals to tackle climate change in line with the Paris Agreement while meeting universal energy access and signif-icantly reducing air pollution. In this scenario, all current net zero pledges are achieved in full and there are extensive efforts to realise near-term emissions reductions; advanced economies reach net zero emissions by 2050, China around 2060, and all other countries by 2070 at the latest.
1. The energy transition and its impact on commodity demand
Metals for Clean Energy - Pathways to solving Europe’s raw materials challenge9
The EU’s Green Deal commits to a climate-neutral economy by 2050. The IEA’s SDS scenario aligns with this ambition, and so the study uses it as a reference scenario for Europe.
The speed of climate action in the rest of the world varies. For this reason, both the STEPS and SDS sce-narios are quantified and assessed for the global level analysis. The world’s climate trajectory will likely go between the two scenarios. In the IEA’s technology outlook, 11 clean energy technologies are considered.
• Renewable power: solar photovoltaic, onshore and offshore wind, concentrating solar power, hydro, geothermal and biomass
• Nuclear power• Electricity networks: transmission and distribution• Battery storage• Electric vehicles• Hydrogen: electrolysers and fuel cells
This list captures the main energy transition technologies but is not exhaustive. Energy optimization efforts in buildings or other sectors are not included in the IEA’s analysis, neither are infrastructure needs such as transport and storage facilities for CO2, hydrogen and other. They are therefore not explicitly assessed in the study’s analysis. The study builds on the IEA’s pathways with an evaluation of metals concentration and requirements across each clean energy technology. The IEA’s scenarios do not correlate with the world’s real-life situa-tion or progress, but provide the direction of travel for meeting different goals.
The study’s analysis is therefore not an attempt to forecast the future, but builds on today’s knowledge and available foresight to indicate the direction in which metals & mining markets could evolve as a result of the energy transition.
Europe’s clean energy technology requirements largely follow the IEA’s SDS global profile, with some distinct differences.
Metals for Clean Energy - Pathways to solving Europe’s raw materials challenge10
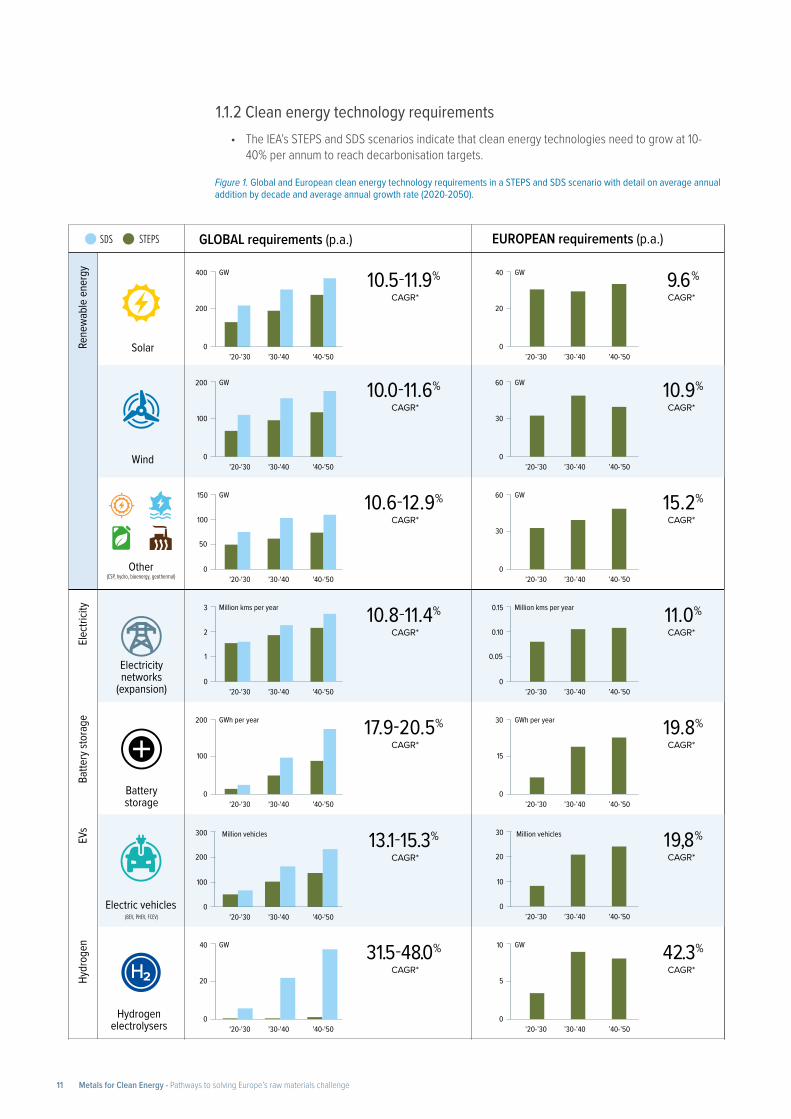
Figure 1. Global and European clean energy technology requirements in a STEPS and SDS scenario with detail on average annual addition by decade and average annual growth rate (2020-2050).
1.1.2 Clean energy technology requirements• The IEA’s STEPS and SDS scenarios indicate that clean energy technologies need to grow at 10-
40% per annum to reach decarbonisation targets.
150
50
100
GLOBAL requirements (p.a.) EUROPEAN requirements (p.a.)
Rene
wabl
e en
ergy
Hydr
ogen
EVs
Batte
ry st
orag
eEle
ctric
ity
Solar
Wind
Other
Electric vehicles
Hydrogenelectrolysers
(CSP, hydro, bioenergy, geothermal)
(BEV, PHEV, FCEV)
Electricity networks
(expansion)
Battery storage
400
200
0
GW GW
'20-'30 '30-'40 '40-'50
40
20
0’20-’30 ’30-’40 ’40-’50
SDS STEPS
CAGR*9.6%
’20-’30 ’30-’40 ’40-’50
CAGR*19,8%
CAGR*10.5-11.9%
200
100
0
GW GW
'20-'30 '30-'40 '40-'50
60
30
0’20-’30 ’30-’40 ’40-’50
CAGR*10.9%
CAGR*10.0-11.6%
300
100
200
0
Million vehicles Million vehicles
'20-'30 '30-'40 '40-'50
CAGR*13.1-15.3% 30
10
20
0
0
GW GW
'20-'30 '30-'40 '40-'50
60
30
0’20-’30 ’30-’40 ’40-’50
CAGR*15.2%
CAGR*10.6-12.9%
3
1
2
0
Million kms per year Million kms per year
'20-'30 '30-'40 '40-'50 0
’20-’30 ’30-’40 ’40-’50
CAGR*11.0%
CAGR*10.8-11.4%
200
100
0
GWh per year GWh per year
'20-'30 '30-'40 '40-'50
30
15
0’20-’30 ’30-’40 ’40-’50
CAGR*19.8%
CAGR*17.9-20.5%
40
20
0
GW GW
'20-'30 '30-'40 '40-'50
10
5
0’20-’30 ’30-’40 ’40-’50
CAGR*42.3%
CAGR*31.5-48.0%
0.15
0.05
0.10
Metals for Clean Energy - Pathways to solving Europe’s raw materials challenge11
Wind and solar more important: In Europe and globally, the key renewable energy sources are solar pho-tovoltaic and wind turbines. But alternative sources like concentrated solar power (CSP) or hydro energy will be less relevant for Europe, because its climate isn’t well-fitted for producing large volumes of energy with heat and water.
Faster action between now and 2030: Compared to the world requirements, Europe’s energy transition pathway has a high intensity in the next decade. The deployment of clean energy technologies will shift rapidly between 2020 and 2030 to meet the EU’s 2030 climate targets and stabilize thereafter, whereas the global efforts are expected to grow more consistently through time.
Hydrogen focus: Europe’s decarbonization scenario includes hydrogen technology as an important lever, but there is today uncertainty to what extent it will be rolled out in the rest of the world
1.1.3 European clean energy technology production chains
The European Commission has expressed its ambition to establish competitive value chains for producing a great share of Europe’s clean energy technologies domestically, to increase strategic autonomy. This ambition will require support to grow existing industries (automotive and wind industry), to restore lost industries (solar PV industry) and to develop new industries (battery and permanent magnet industry).
Europe will only require a direct metals supply for the clean energy technologies it produces domestically. The technologies it still imports will already contain their metals.
This study develops three scenarios to quantify the uncertain potential for European domestic clean energy technology production. For each technology an assessment was made to define a low, medium and high value, based on the ambitions that Europe has expressed.
• Low scenario: Announced political ambitions are only partially achieved • Medium scenario: Announced political ambitions are successful • Higher value: Announced political ambitions are successful and expanded upon up to 2050
Solar Photovoltaics
Europe has a small and incomplete solar PV production chain. Historically, there was a full production chain, but this got economically unviable for European producers due to competition conditions with imports of low cost and subsidised Chinese products. Europe currently has 26 GW capacity of polysilicon production. This key material is exported to China for further processing, rather than staying in Europe.
The European Solar Initiative was issued in 2021 with backing from the European Commission to redevel-op a complete domestic solar PV production chain. It aims at restoring and scaling up the solar PV indus-trial ecosystem in Europe to 20 GW per year (2025). Because there are options for restarting brownfield facilities, the scale-up could be efficient.
Wind Turbines
Europe is a significant producer of wind turbines (excluding the permanent magnets and the composite material blades) and even a net exporter of components. The current capacity amounts to 15 GW per year. The European Commission expressed the ambition to grow the wind energy sector. The ETIP Wind Roadmap is developed to set out Research & Innovation to de-risk technology development and acceler-ate large-scale deployment.
Other renewable power – Hydro, Bio-energy and Geothermal
Hydro, Bio-Energy and Geothermal energy projects are currently not actively built at a high scale and fre-quency. It is assumed that Europe will not take a very active role in the production of these technologies, but is likely a partial supplier of metals for these large installations
Metals for Clean Energy - Pathways to solving Europe’s raw materials challenge12
Other renewable power – Concentrated Solar Power (CSP)
A limited number of CSP projects are being started in Southern Europe, but most development is in other world regions. As CSP is also not going to be a major clean energy technology in Europe, it is assumed that no active European research & development will be taking place in this sector.
Nuclear power
Nuclear energy projects are currently not built at a high scale and frequency, but projects are being an-nounced. It is assumed that Europe will be a partial supplier of metals for these large installations
Electricity networks
Electricity networks require significant volumes of copper and aluminium. It is assumed that most metals are supplied from European markets, and that this will remain.
Electric vehicles
The European automotive industry is a mature net export market. As electric vehicles will replace traditional ICE cars, it is assumed that Europe’s current automotive capacity remains available for future production of the electrified fleet.
Hydrogen - Electrolysers
Renewables based hydrogen production is not happening at great scale yet. However, it is expected that Europe takes a leading role in the R&D of this clean energy technology (for example through the European Clean Hydrogen Alliance). It is therefore assumed that a considerable share of Europe’s hydrogen technol-ogy needs will be produced domestically.
Permanent magnets – for EVs and wind turbines
Europe hardly produces any of the permanent magnets needed to make its wind turbines and electric vehicles operational. Magnets are imported mainly from China, which has an almost global monopoly on production. Europe has expressed ambitions to create a rare earth elements and permanent magnet industry in Europe, given their criticality to the energy transition.
The European Raw Materials Alliance (ERMA) finalized in 2021 an investment pipeline for supplying 20% of Europe’s rare earth elements magnet needs by 2030 (all types of permanent magnets, not only for clean energy technologies). About 1000t of permanent magnets are today already produced in Europe.
Lithium-ion batteries – for EVs and battery storage
Europe currently imports most of its lithium-ion batteries, used in electric vehicles and grid storage. Today less than 3% of battery production happens in Europe. China, Korea and Japan account for more than 90% of worldwide production
The European Commission aims to fully cover its needs through domestic batteries production from 2025. Significant actions have been taken in the last five years, and the European Battery Alliance (EBA) now reports projects amounting to 310 GWh of gigacell production per year. More projects are in the pipeline to grow the capacity to 540 GWh per year. This would provide batteries for 5 million – 9 million vehicles per year (at a 60 kWh average battery size).
A direct metals supply will be required for battery cathode production, earlier in the value chain. Europe’s cathode production plans are also ramping up, though at a slower pace.
The assumptions that are considered by technology and by scenario are summarized in the table on the following page.
Metals for Clean Energy - Pathways to solving Europe’s raw materials challenge13
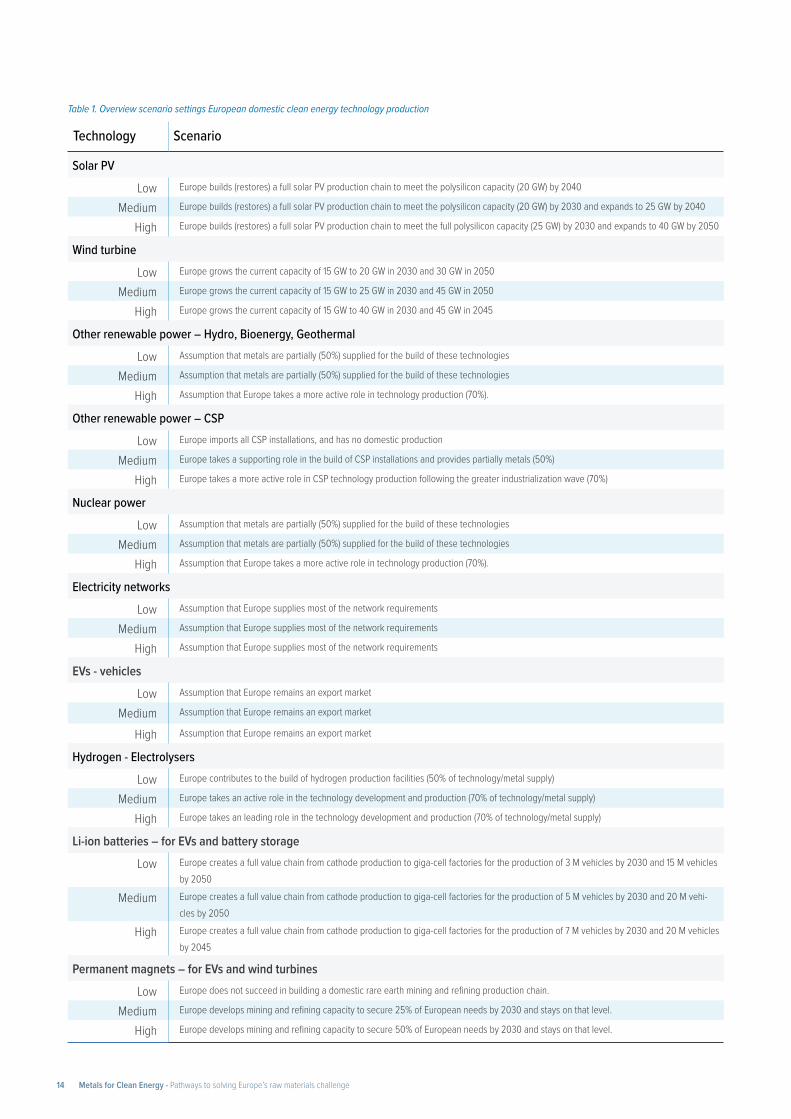
Table 1. Overview scenario settings European domestic clean energy technology production
Technology Scenario
Solar PV
Low Europe builds (restores) a full solar PV production chain to meet the polysilicon capacity (20 GW) by 2040
Medium Europe builds (restores) a full solar PV production chain to meet the polysilicon capacity (20 GW) by 2030 and expands to 25 GW by 2040
High Europe builds (restores) a full solar PV production chain to meet the full polysilicon capacity (25 GW) by 2030 and expands to 40 GW by 2050
Wind turbine
Low Europe grows the current capacity of 15 GW to 20 GW in 2030 and 30 GW in 2050
Medium Europe grows the current capacity of 15 GW to 25 GW in 2030 and 45 GW in 2050
High Europe grows the current capacity of 15 GW to 40 GW in 2030 and 45 GW in 2045
Other renewable power – Hydro, Bioenergy, Geothermal
Low Assumption that metals are partially (50%) supplied for the build of these technologies
Medium Assumption that metals are partially (50%) supplied for the build of these technologies
High Assumption that Europe takes a more active role in technology production (70%).
Other renewable power – CSP
Low Europe imports all CSP installations, and has no domestic production
Medium Europe takes a supporting role in the build of CSP installations and provides partially metals (50%)
High Europe takes a more active role in CSP technology production following the greater industrialization wave (70%)
Nuclear power
Low Assumption that metals are partially (50%) supplied for the build of these technologies
Medium Assumption that metals are partially (50%) supplied for the build of these technologies
High Assumption that Europe takes a more active role in technology production (70%).
Electricity networks
Low Assumption that Europe supplies most of the network requirements
Medium Assumption that Europe supplies most of the network requirements
High Assumption that Europe supplies most of the network requirements
EVs - vehicles
Low Assumption that Europe remains an export market
Medium Assumption that Europe remains an export market
High Assumption that Europe remains an export market
Hydrogen - Electrolysers
Low Europe contributes to the build of hydrogen production facilities (50% of technology/metal supply)
Medium Europe takes an active role in the technology development and production (70% of technology/metal supply)
High Europe takes an leading role in the technology development and production (70% of technology/metal supply)
Li-ion batteries – for EVs and battery storage
Low Europe creates a full value chain from cathode production to giga-cell factories for the production of 3 M vehicles by 2030 and 15 M vehicles by 2050
Medium Europe creates a full value chain from cathode production to giga-cell factories for the production of 5 M vehicles by 2030 and 20 M vehi-cles by 2050
High Europe creates a full value chain from cathode production to giga-cell factories for the production of 7 M vehicles by 2030 and 20 M vehicles by 2045
Permanent magnets – for EVs and wind turbines
Low Europe does not succeed in building a domestic rare earth mining and refining production chain.
Medium Europe develops mining and refining capacity to secure 25% of European needs by 2030 and stays on that level.
High Europe develops mining and refining capacity to secure 50% of European needs by 2030 and stays on that level.
Metals for Clean Energy - Pathways to solving Europe’s raw materials challenge14
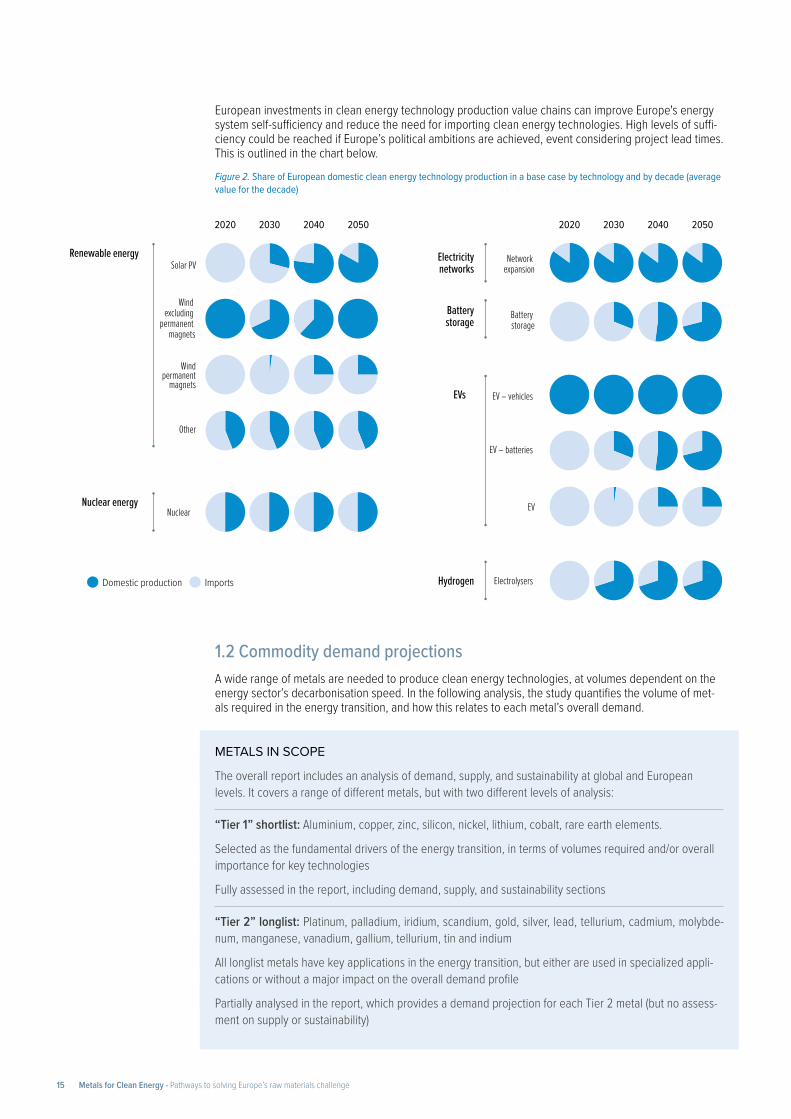
European investments in clean energy technology production value chains can improve Europe's energy system self-sufficiency and reduce the need for importing clean energy technologies. High levels of suffi-ciency could be reached if Europe’s political ambitions are achieved, event considering project lead times. This is outlined in the chart below.
Figure 2. Share of European domestic clean energy technology production in a base case by technology and by decade (average value for the decade)
1.2 Commodity demand projectionsA wide range of metals are needed to produce clean energy technologies, at volumes dependent on the energy sector’s decarbonisation speed. In the following analysis, the study quantifies the volume of met-als required in the energy transition, and how this relates to each metal’s overall demand.
METALS IN SCOPE
The overall report includes an analysis of demand, supply, and sustainability at global and European levels. It covers a range of different metals, but with two different levels of analysis:
“Tier 1” shortlist: Aluminium, copper, zinc, silicon, nickel, lithium, cobalt, rare earth elements.
Selected as the fundamental drivers of the energy transition, in terms of volumes required and/or overall importance for key technologies
Fully assessed in the report, including demand, supply, and sustainability sections
“Tier 2” longlist: Platinum, palladium, iridium, scandium, gold, silver, lead, tellurium, cadmium, molybde-num, manganese, vanadium, gallium, tellurium, tin and indium
All longlist metals have key applications in the energy transition, but either are used in specialized appli-cations or without a major impact on the overall demand profile
Partially analysed in the report, which provides a demand projection for each Tier 2 metal (but no assess-ment on supply or sustainability)
2050204020302020 2050204020302020
Renewable energySolar PV Network
expansion
EVs
NuclearNuclear energy
Electricitynetworks
Battery storage
Batterystorage
Electrolysers Hydrogen
Other
Wind excluding
permanent magnets
Domestic production Imports
EV – vehicles
EV – batteries
EV
Wind permanent
magnets
Metals for Clean Energy - Pathways to solving Europe’s raw materials challenge15
DEMAND METHODOLOGY
TRANSITION DEMAND
Global transition demand is calculated by applying the study’s clean energy technology forecasts with the metal’s average intensity across each application.
Example: The global energy transition demand for copper is estimated by quantifying the amount of cop-per needed across the IEA’s forecasts for electric cars, solar panels, wind turbines, hydrogen, batteries, and grid infrastructure.
The intensity that is used in the calculation represents the full intensity for the application. For example, the aluminium intensity for an EV is the amount of aluminium needed to produce the EV. It does not repre-sent the additional demand that is used for an EV compared to an ICE vehicle.
European transition demand is calculated by combing the European requirements for clean energy technologies with the assumptions on how much of each technology is likely to be produced domestically in Europe. Europe will only require metals for the technologies it produces domestically, otherwise metals will be imported in the products themselves.
Example: Europe’s energy transition demand for copper is estimated by quantifying the amount of copper needed for the clean energy technologies projected to be produced in Europe.
TOTAL DEMAND
Total commodity demand is calculated by combining the transition demand outlook with the demand outlook for current applications (non-energy transition applications). The demand outlook for current applications is developed by applying realistic growth rates by application and by commodity.
Example: Global and European total demand evolution for copper is estimated by adding copper’s pro-jected transition demand on top of assumptions on copper’s projected demand in other applications (i.e. construction, electronics etc.).
1.2.1 Metal requirements for the production of clean energy technologiesMetal requirements
The energy transition is metal intensive. The figure below summarizes the metals needs by technology, as they are know today.
Base metals have widespread uses: Aluminium, copper, nickel and zinc are strategic to the produc-tion of most technologies (solar photovoltaics, wind, electric cars, electricity networks, etc.).
Other metals have specific uses: A group of metals are essential to one or a few technologies; rare earth elements for permanent magnets, silicon and tellurium for solar panels, lithium and cobalt for batteries, platinum group metals and scandium for hydrogen.
Alloying metals less certain: Alloying metals such as vanadium, molybdenum and manganese are harder to assess. They are mostly used to alloy steel, and while steel will be needed also in many clean energy technologies it is not always clear what types of alloyed steel are required for each application.
New technologies and changes to current technologies are to be expected, especially in scenarios up to 2050.
Metals for Clean Energy - Pathways to solving Europe’s raw materials challenge16
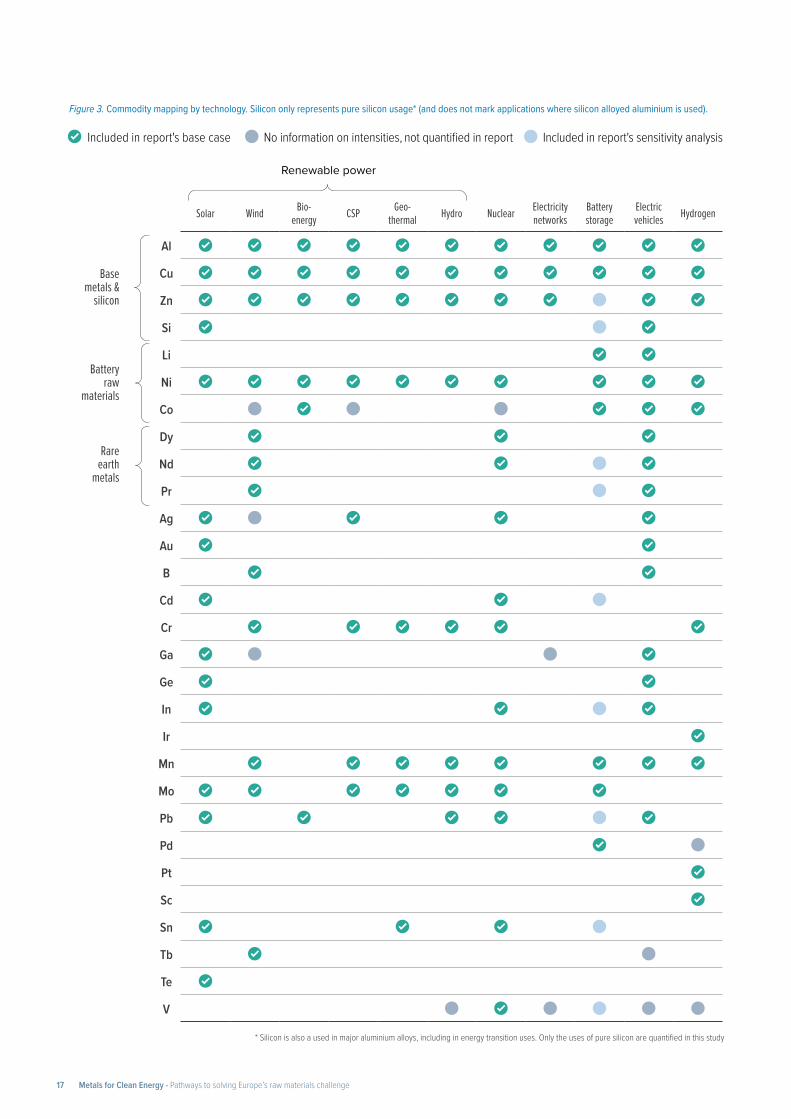
Figure 3. Commodity mapping by technology. Silicon only represents pure silicon usage* (and does not mark applications where silicon alloyed aluminium is used).
Renewable power
Solar Wind Bio- energy CSP Geo-
thermal Hydro Nuclear Electricity networks
Battery storage
Electric vehicles Hydrogen
Base metals &
silicon
Al
Cu
Zn
Si
Battery raw
materials
Li
Ni
Co
Rare earth
metals
Dy
Nd
Pr
Ag
Au
B
Cd
Cr
Ga
Ge
In
Ir
Mn
Mo
Pb
Pd
Pt
Sc
Sn
Tb
Te
V
Included in report's base case No information on intensities, not quantified in report Included in report's sensitivity analysis
* Silicon is also a used in major aluminium alloys, including in energy transition uses. Only the uses of pure silicon are quantified in this study
Metals for Clean Energy - Pathways to solving Europe’s raw materials challenge17
A prominent example is the fast-evolving market of long duration grid storage. Currently, our analysis con-siders lithium-ion battery as the main technology for grid storage. But other technologies like vanadium redox flow, zinc batteries or lead-acid batteries may grow in importance and penetration rates. This could lead to additional demand pulls for the associated metals (vanadium, zinc, lead, etc.).
Metal intensity optimization
Each metal is used in different concentrations across its applications. These concentrations are expected to change over time. Technology producers continually optimize their metals intensities to save costs and resources, and technologies keep on evolving. When there are robust public forecasts available, the study implements expected metals optimisation into its scenarios.
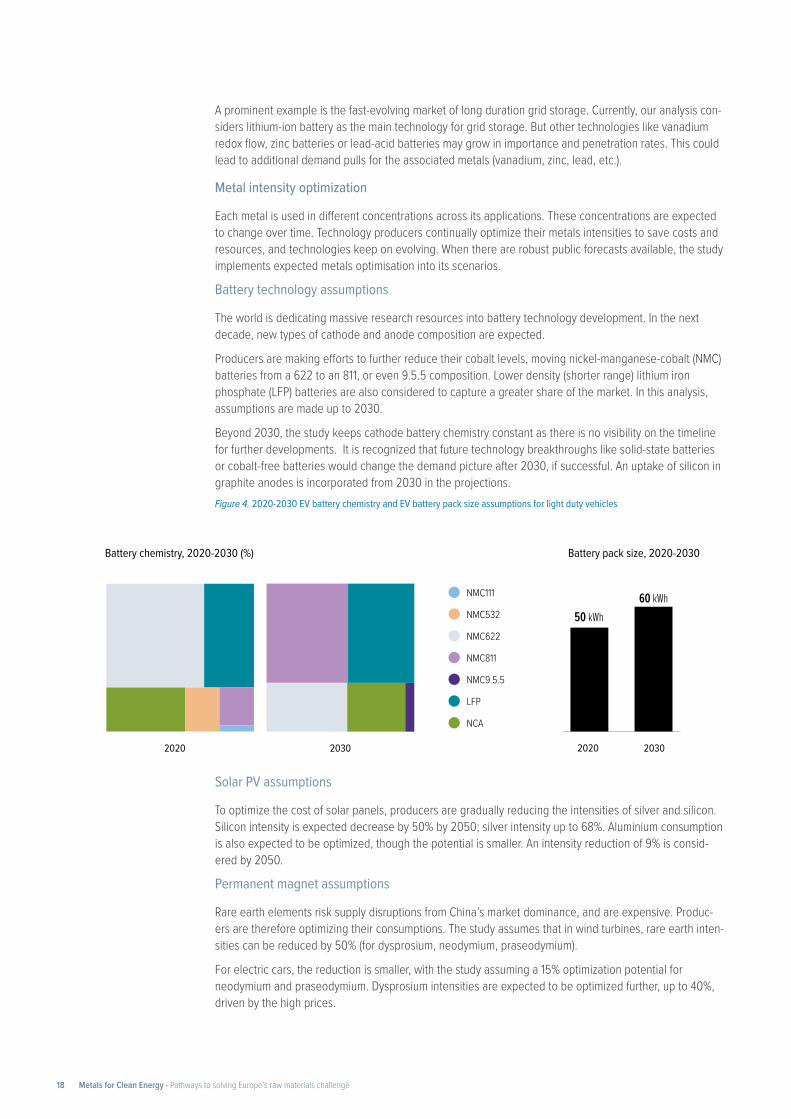
Battery technology assumptions
The world is dedicating massive research resources into battery technology development. In the next decade, new types of cathode and anode composition are expected.
Producers are making efforts to further reduce their cobalt levels, moving nickel-manganese-cobalt (NMC) batteries from a 622 to an 811, or even 9.5.5 composition. Lower density (shorter range) lithium iron phosphate (LFP) batteries are also considered to capture a greater share of the market. In this analysis, assumptions are made up to 2030.
Beyond 2030, the study keeps cathode battery chemistry constant as there is no visibility on the timeline for further developments. It is recognized that future technology breakthroughs like solid-state batteries or cobalt-free batteries would change the demand picture after 2030, if successful. An uptake of silicon in graphite anodes is incorporated from 2030 in the projections. Figure 4. 2020-2030 EV battery chemistry and EV battery pack size assumptions for light duty vehicles
Solar PV assumptions
To optimize the cost of solar panels, producers are gradually reducing the intensities of silver and silicon. Silicon intensity is expected decrease by 50% by 2050; silver intensity up to 68%. Aluminium consumption is also expected to be optimized, though the potential is smaller. An intensity reduction of 9% is consid-ered by 2050.
Permanent magnet assumptions
Rare earth elements risk supply disruptions from China’s market dominance, and are expensive. Produc-ers are therefore optimizing their consumptions. The study assumes that in wind turbines, rare earth inten-sities can be reduced by 50% (for dysprosium, neodymium, praseodymium).
For electric cars, the reduction is smaller, with the study assuming a 15% optimization potential for neodymium and praseodymium. Dysprosium intensities are expected to be optimized further, up to 40%, driven by the high prices.
2020
NMC111
LFP
NMC622
NMC9.5.5
NMC532
NMC811
NCA
2030 2020 2030
Battery chemistry, 2020-2030 (%) Battery pack size, 2020-2030
50 kWh60 kWh
Metals for Clean Energy - Pathways to solving Europe’s raw materials challenge18
There is also research on other types of motors without use of permanent magnets, which would reduce the need for rare earth metals. This would have as trade-off effect that the demand for other metals would rise (copper, aluminium). As there is no clarity yet on possible developments, this is not considered in this study.
Electrolyser assumptions
Platinium and scandium are key minerals for the electrolysers to produce hydrogen. It is assumed these have an optimization potential of 80-90% compared to today’s intensities.
1.2.2 Transition commodity demand
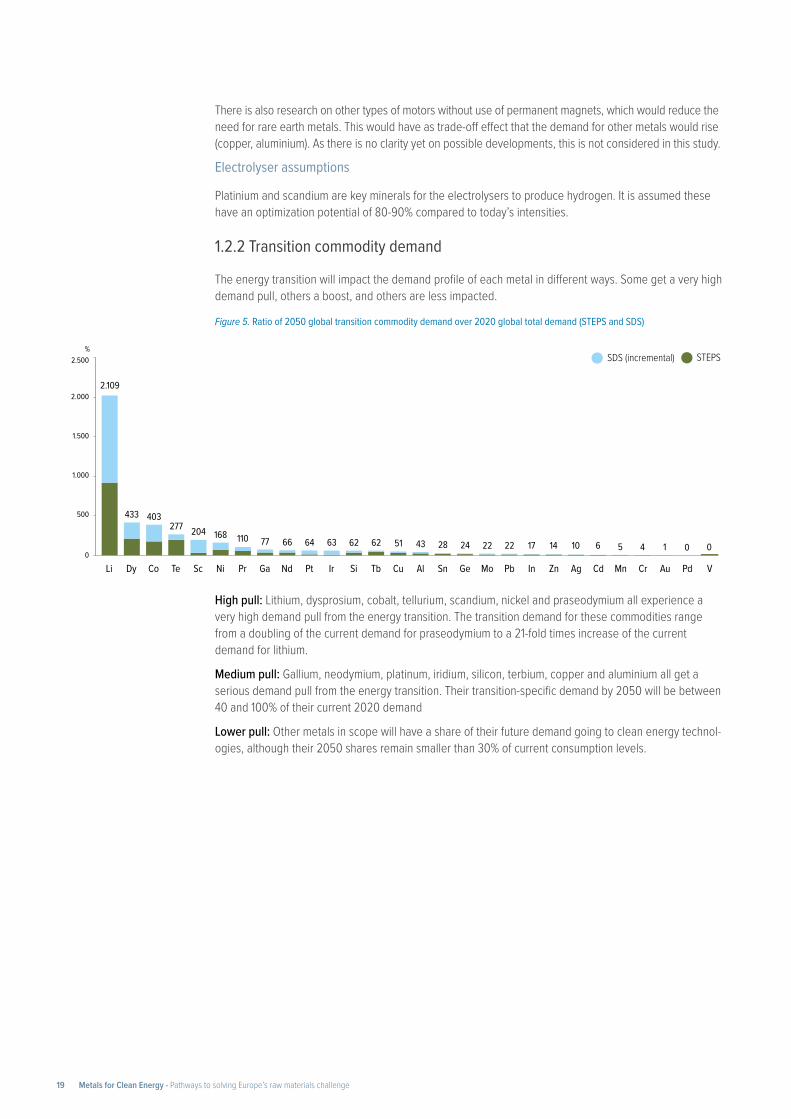
The energy transition will impact the demand profile of each metal in different ways. Some get a very high demand pull, others a boost, and others are less impacted.
Figure 5. Ratio of 2050 global transition commodity demand over 2020 global total demand (STEPS and SDS)
High pull: Lithium, dysprosium, cobalt, tellurium, scandium, nickel and praseodymium all experience a very high demand pull from the energy transition. The transition demand for these commodities range from a doubling of the current demand for praseodymium to a 21-fold times increase of the current demand for lithium.
Medium pull: Gallium, neodymium, platinum, iridium, silicon, terbium, copper and aluminium all get a serious demand pull from the energy transition. Their transition-specific demand by 2050 will be between 40 and 100% of their current 2020 demand
Lower pull: Other metals in scope will have a share of their future demand going to clean energy technol-ogies, although their 2050 shares remain smaller than 30% of current consumption levels.
%
0
500
1.000
1.500
2.000
2.500
VPdAuCrMnCdAgZnInPbMoGeSnAlCuTbSiIrPtNdGaPrNiScTeCoDyLi
SDS (incremental) STEPS
2.109
433 403277 204 168 110 77 66 64 63 62 62 51 43 28 24 22 22 17 14 10 6 5 4 1 0 0
Metals for Clean Energy - Pathways to solving Europe’s raw materials challenge19
1.2.3 Commodity demand projections
This section provides 2020-2050 demand projections for the range of metals in scope. Four scenarios are made for each metal:
1. Global transition demand
2. Global total demand
3. European transition demand
4. European total demand
Global transition demand
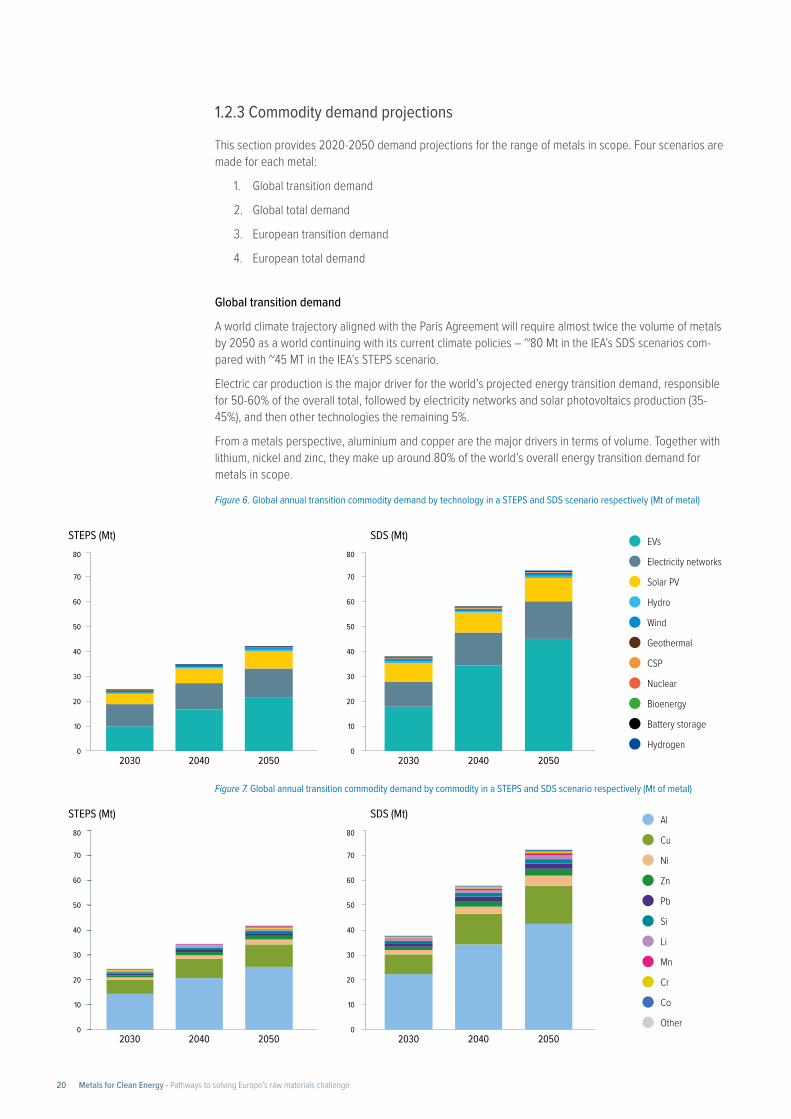
A world climate trajectory aligned with the Paris Agreement will require almost twice the volume of metals by 2050 as a world continuing with its current climate policies – ~80 Mt in the IEA’s SDS scenarios com-pared with ~45 MT in the IEA’s STEPS scenario.
Electric car production is the major driver for the world’s projected energy transition demand, responsible for 50-60% of the overall total, followed by electricity networks and solar photovoltaics production (35-45%), and then other technologies the remaining 5%.
From a metals perspective, aluminium and copper are the major drivers in terms of volume. Together with lithium, nickel and zinc, they make up around 80% of the world’s overall energy transition demand for metals in scope.
Figure 6. Global annual transition commodity demand by technology in a STEPS and SDS scenario respectively (Mt of metal)
Figure 7. Global annual transition commodity demand by commodity in a STEPS and SDS scenario respectively (Mt of metal)
Geothermal
Electricity networks
EVs
CSP
Wind
Solar PV
Hydro
Battery storage
Hydrogen
Bioenergy
Nuclear
0
80
70
60
50
40
30
20
10
0
80
70
60
50
40
30
20
10
STEPS (Mt) SDS (Mt)
2030 2040 2050 2030 2040 2050
Si
Cu
Al
Li
Pb
Ni
Zn
Co
Other
Cr
Mn
0
80
70
60
50
40
30
20
10
0
80
70
60
50
40
30
20
10
STEPS (Mt) SDS (Mt)
2030 2040 2050 2030 2040 2050
Metals for Clean Energy - Pathways to solving Europe’s raw materials challenge20
European transition demand
The drivers for European transition demand are very similar to the global drivers. However, there is more uncertainty on whether Europe will be successful in developing its own clean energy technology produc-tion chains, such as the battery industry and the permanent magnet industry.
If these are not developed (at component level), certain transition metals would not be required in signif-icant new volumes by European markets (e.g. rare earth elements, lithium, cobalt, silicon), but would be imported in products.
Global Total demand
The impact of the global energy transition differs by metal.
Copper, lithium, cobalt, nickel and rare earth elements (dysprosium) face the strongest acceleration in demand. Their projected 2020-2050 average growth rates required in both the STEPS and SDS scenario are stronger than their historical growth rates.
Aluminium, silicon, and zinc will grow at a more consistent rate when compared to historic growth rates.
The next decade (2020-2030) is the decisive period for ramping up global minerals supply. The world needs to accelerate its clean energy technology deployment is needed to reach decarbonization targets. This results in a very strong commodity pull that would then continue at lower growth rates from 2030 onwards.
European total demand
The energy transition will be the main future demand driver for European metals markets.
Mature and existing markets such as the aluminium, copper, and zinc markets get a supportive to strong push from the energy transition under any scenario.
Lithium, rare earth elements, cobalt, nickel and silicon demand requirements will be very strong if Europe is successful in building up a domestic battery value chain (including cathode and anode production), a permanent magnet industry, and restored solar photovoltaics production.
Metals for Clean Energy - Pathways to solving Europe’s raw materials challenge21
45
0
10152025303540
5
20402030 2050
Solar2050 SDS
2040 SDS Electricity networks
EVs
Other*
Fig.08
*Wind, Hydro, BioEnergy, CSP, Geothermal, Nuclear, Battery Storage, Hydrogen.
Mt
2030 SDS
2
4
3
1
5
020402030 2050
High
Medium
Low
*Wind, Hydro, BioEnergy, CSP, Geothermal, Nuclear, Battery Storage, Hydrogen.
Mt
250
200
150
100
50
01990 2010 2030 2050
SDS
STEPS
Base
*CAGR 2020-2050**CAGR 1990-2020
3.1%* 3.0%*
4.5%**
Mt
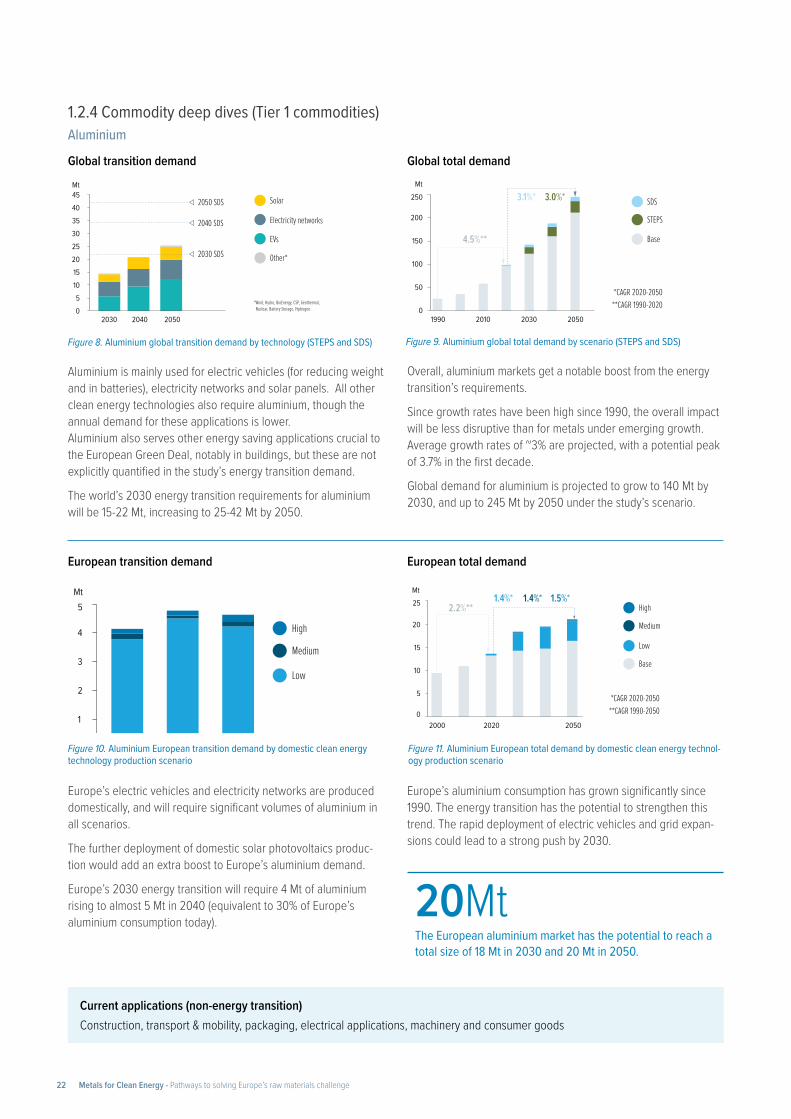
Figure 8. Aluminium global transition demand by technology (STEPS and SDS)
Figure 10. Aluminium European transition demand by domestic clean energy technology production scenario
Figure 9. Aluminium global total demand by scenario (STEPS and SDS)
0
5
10
15
20
25 High
Medium
Low
Base
1.4%* 1.4%* 1.5%*
*CAGR 2020-2050**CAGR 1990-2050
2.2%**
Mt
2000 2020 2050
Figure 11. Aluminium European total demand by domestic clean energy technol-ogy production scenario
20MtThe European aluminium market has the potential to reach a total size of 18 Mt in 2030 and 20 Mt in 2050.
1.2.4 Commodity deep dives (Tier 1 commodities)
Aluminium is mainly used for electric vehicles (for reducing weight and in batteries), electricity networks and solar panels. All other clean energy technologies also require aluminium, though the annual demand for these applications is lower. Aluminium also serves other energy saving applications crucial to the European Green Deal, notably in buildings, but these are not explicitly quantified in the study’s energy transition demand.
The world’s 2030 energy transition requirements for aluminium will be 15-22 Mt, increasing to 25-42 Mt by 2050.
Europe’s electric vehicles and electricity networks are produced domestically, and will require significant volumes of aluminium in all scenarios.
The further deployment of domestic solar photovoltaics produc-tion would add an extra boost to Europe’s aluminium demand.
Europe’s 2030 energy transition will require 4 Mt of aluminium rising to almost 5 Mt in 2040 (equivalent to 30% of Europe’s aluminium consumption today).
Overall, aluminium markets get a notable boost from the energy transition’s requirements.
Since growth rates have been high since 1990, the overall impact will be less disruptive than for metals under emerging growth. Average growth rates of ~3% are projected, with a potential peak of 3.7% in the first decade.
Global demand for aluminium is projected to grow to 140 Mt by 2030, and up to 245 Mt by 2050 under the study’s scenario.
Europe’s aluminium consumption has grown significantly since 1990. The energy transition has the potential to strengthen this trend. The rapid deployment of electric vehicles and grid expan-sions could lead to a strong push by 2030.
Aluminium
Global transition demand
European transition demand
Global total demand
European total demand
Current applications (non-energy transition)Construction, transport & mobility, packaging, electrical applications, machinery and consumer goods
Metals for Clean Energy - Pathways to solving Europe’s raw materials challenge22
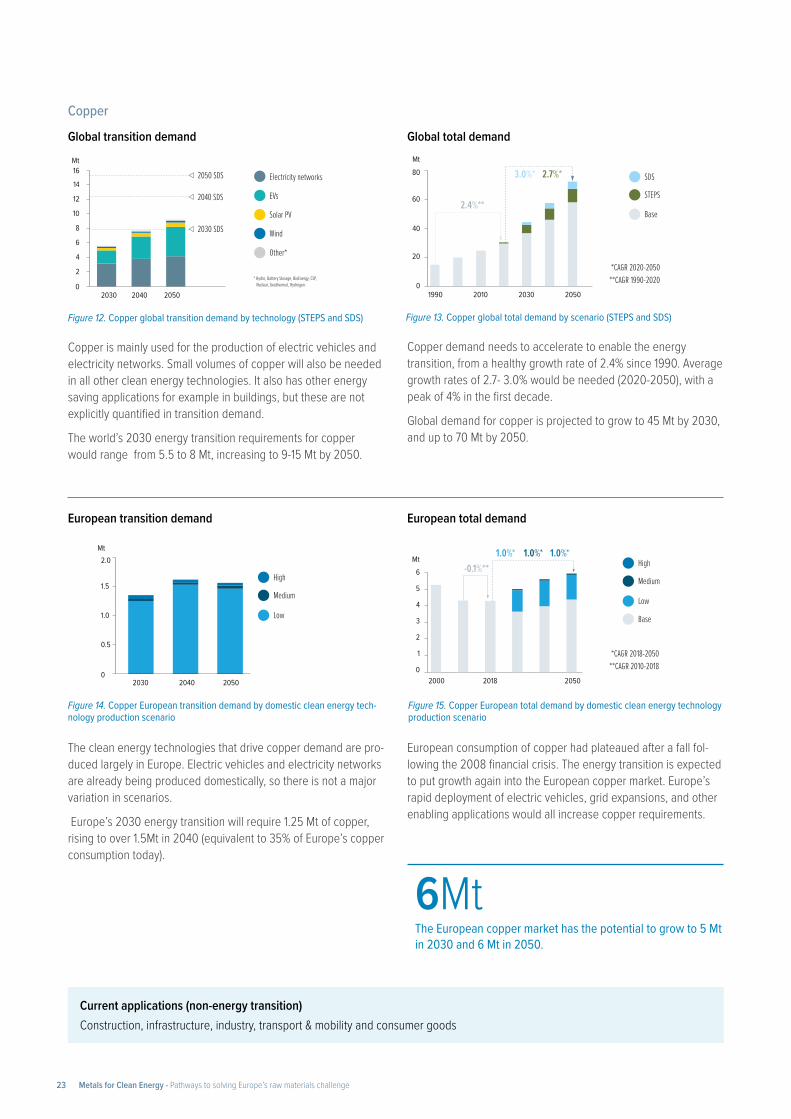
6MtThe European copper market has the potential to grow to 5 Mt in 2030 and 6 Mt in 2050.
Copper
16
14
12
10
8
6
4
2
020402030 2050
Solar PV
Electricity networks
EVs
Wind
Other*
2050 SDS
2040 SDS
Fig.12
* Hydro, Battery Storage, BioEnergy, CSP, Nuclear, Geothermal, Hydrogen.
Mt
2030 SDS
2.0
1.5
1.0
0.5
020402030 2050
High
Medium
Low
* Hydro, Battery Storage, BioEnergy, CSP, Nuclear, Geothermal, Hydrogen.
Mt
80
60
40
20
01990 2010 2030 2050
SDS
STEPS
Base
*CAGR 2020-2050**CAGR 1990-2020
3.0%* 2.7%*
2.4%**
Mt
Figure 12. Copper global transition demand by technology (STEPS and SDS)
Figure 14. Copper European transition demand by domestic clean energy tech-nology production scenario
Figure 13. Copper global total demand by scenario (STEPS and SDS)
0
1
2
3
5
4
6High
Medium
Low
Base
*CAGR 2018-2050**CAGR 2010-2018
-0.1%**1.0%* 1.0%* 1.0%*
2000 2018 2050
Mt
Figure 15. Copper European total demand by domestic clean energy technology production scenario
Copper is mainly used for the production of electric vehicles and electricity networks. Small volumes of copper will also be needed in all other clean energy technologies. It also has other energy saving applications for example in buildings, but these are not explicitly quantified in transition demand.
The world’s 2030 energy transition requirements for copper would range from 5.5 to 8 Mt, increasing to 9-15 Mt by 2050.
The clean energy technologies that drive copper demand are pro-duced largely in Europe. Electric vehicles and electricity networks are already being produced domestically, so there is not a major variation in scenarios.
Europe’s 2030 energy transition will require 1.25 Mt of copper, rising to over 1.5Mt in 2040 (equivalent to 35% of Europe’s copper consumption today).
Copper demand needs to accelerate to enable the energy transition, from a healthy growth rate of 2.4% since 1990. Average growth rates of 2.7- 3.0% would be needed (2020-2050), with a peak of 4% in the first decade.
Global demand for copper is projected to grow to 45 Mt by 2030, and up to 70 Mt by 2050.
European consumption of copper had plateaued after a fall fol-lowing the 2008 financial crisis. The energy transition is expected to put growth again into the European copper market. Europe’s rapid deployment of electric vehicles, grid expansions, and other enabling applications would all increase copper requirements.
Global transition demand
European transition demand
Global total demand
European total demand
Current applications (non-energy transition)Construction, infrastructure, industry, transport & mobility and consumer goods
Metals for Clean Energy - Pathways to solving Europe’s raw materials challenge23
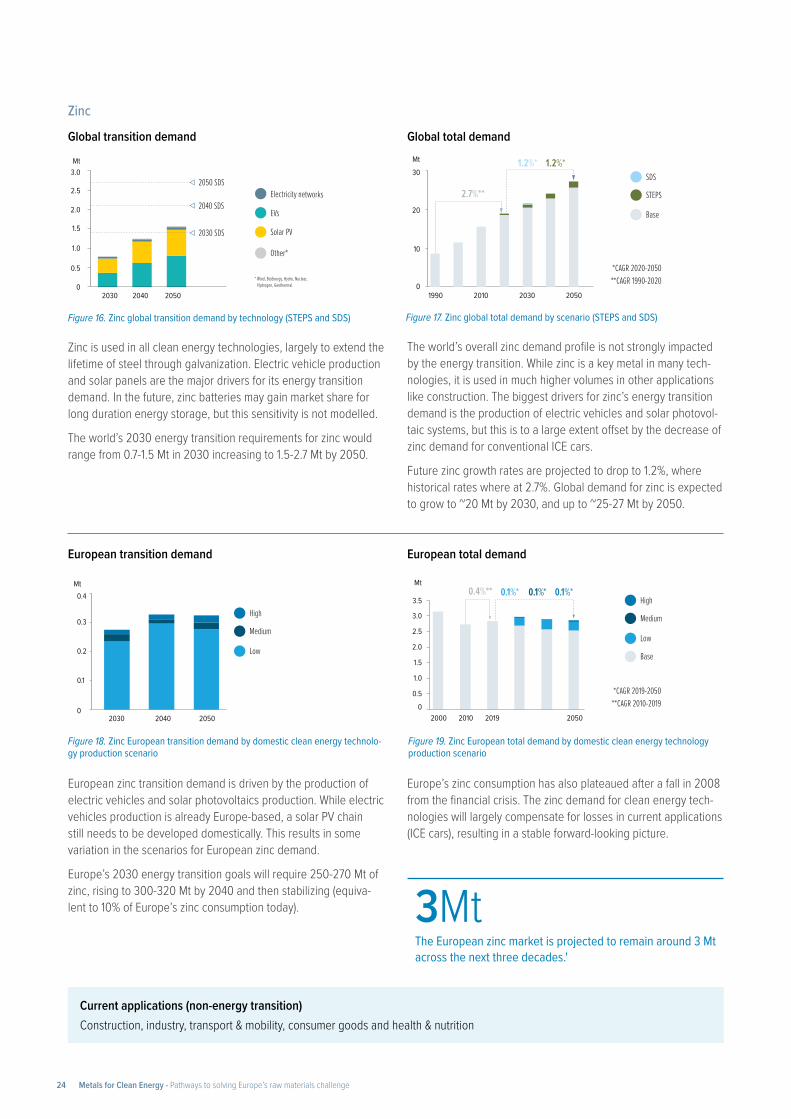
3MtThe European zinc market is projected to remain around 3 Mt across the next three decades.'
Zinc
3.0
2.5
2.0
1.5
1.0
0.5
020402030 2050
Solar PV
Electricity networks
EVs
Other*
2050 SDS
2040 SDS
2030 SDS
Fig.16
* Wind, BioEnergy, Hydro, Nuclear, Hydrogen, Geothermal.
Mt
0.4
0.3
0.2
0.1
020402030 2050
High
Medium
Low
* Wind, BioEnergy, Hydro, Nuclear, Hydrogen, Geothermal.
Mt
30
20
10
01990 2010 2030 2050
SDS
STEPS
Base
*CAGR 2020-2050**CAGR 1990-2020
1.2%* 1.2%*
2.7%**
Mt
Figure 16. Zinc global transition demand by technology (STEPS and SDS)
Figure 18. Zinc European transition demand by domestic clean energy technolo-gy production scenario
Figure 17. Zinc global total demand by scenario (STEPS and SDS)
0.4%**
0
3.5
3.0
2.5
2.0
1.5
1.0
0.5
High
Medium
Low
Base
*CAGR 2019-2050**CAGR 2010-2019
0.1%* 0.1%* 0.1%*
2000 20192010 2050
Mt
Figure 19. Zinc European total demand by domestic clean energy technology production scenario
Zinc is used in all clean energy technologies, largely to extend the lifetime of steel through galvanization. Electric vehicle production and solar panels are the major drivers for its energy transition demand. In the future, zinc batteries may gain market share for long duration energy storage, but this sensitivity is not modelled.
The world’s 2030 energy transition requirements for zinc would range from 0.7-1.5 Mt in 2030 increasing to 1.5-2.7 Mt by 2050.
European zinc transition demand is driven by the production of electric vehicles and solar photovoltaics production. While electric vehicles production is already Europe-based, a solar PV chain still needs to be developed domestically. This results in some variation in the scenarios for European zinc demand.
Europe’s 2030 energy transition goals will require 250-270 Mt of zinc, rising to 300-320 Mt by 2040 and then stabilizing (equiva-lent to 10% of Europe’s zinc consumption today).
The world’s overall zinc demand profile is not strongly impacted by the energy transition. While zinc is a key metal in many tech-nologies, it is used in much higher volumes in other applications like construction. The biggest drivers for zinc’s energy transition demand is the production of electric vehicles and solar photovol-taic systems, but this is to a large extent offset by the decrease of zinc demand for conventional ICE cars.
Future zinc growth rates are projected to drop to 1.2%, where historical rates where at 2.7%. Global demand for zinc is expected to grow to ~20 Mt by 2030, and up to ~25-27 Mt by 2050.
Europe’s zinc consumption has also plateaued after a fall in 2008 from the financial crisis. The zinc demand for clean energy tech-nologies will largely compensate for losses in current applications (ICE cars), resulting in a stable forward-looking picture.
Global transition demand
European transition demand
Global total demand
European total demand
Current applications (non-energy transition)Construction, industry, transport & mobility, consumer goods and health & nutrition
Metals for Clean Energy - Pathways to solving Europe’s raw materials challenge24
Current applications (non-energy transition)Electrical applications (including semiconductors), chemicals and aluminium industry
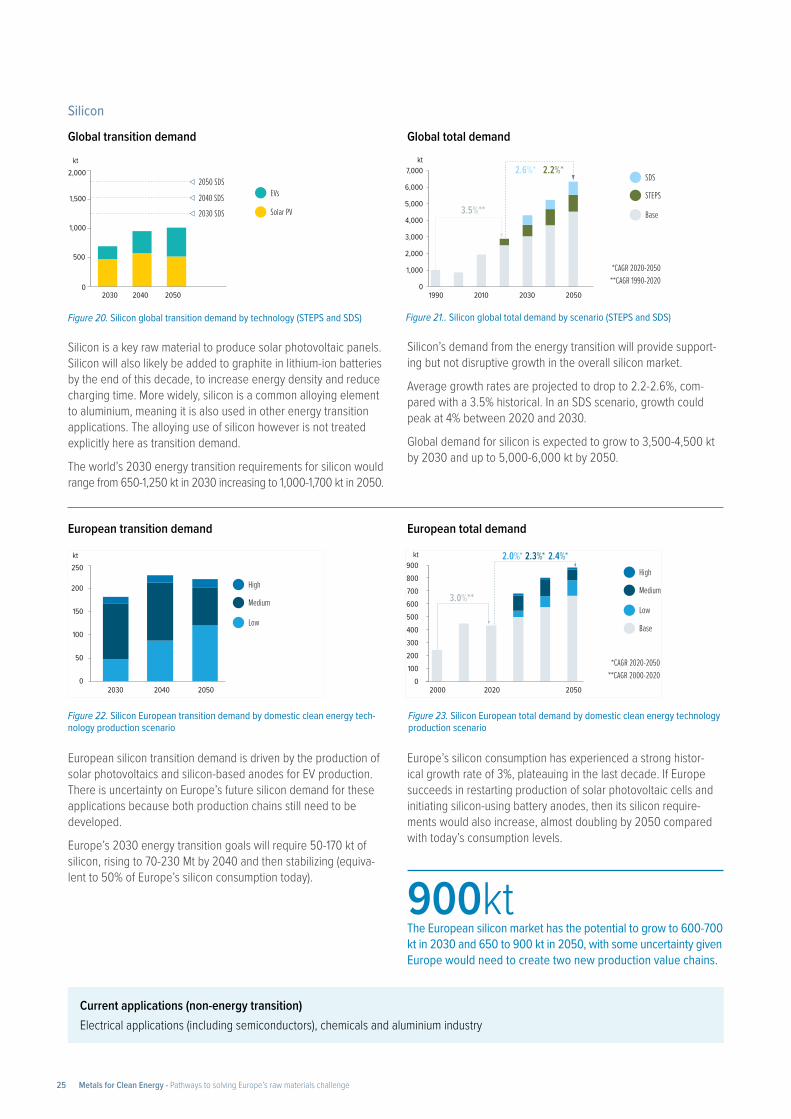
900ktThe European silicon market has the potential to grow to 600-700 kt in 2030 and 650 to 900 kt in 2050, with some uncertainty given Europe would need to create two new production value chains.
Silicon
20402030 2050
Solar PV
EVs2050 SDS
2040 SDS2030 SDS
Fig.20kt
2,000
1,500
1,000
500
0
20402030 2050
High
Medium
Low
kt250
200
150
100
50
0
1990 2010 2030 2050
SDS
STEPS
Base
*CAGR 2020-2050**CAGR 1990-2020
2.6%* 2.2%*
3.5%**
kt7,000
6,000
5,000
4,000
3,000
2,000
1,000
0
High
Medium
Low
Base
*CAGR 2020-2050**CAGR 2000-2020
3.0%**
2.0%* 2.3%* 2.4%*
2000 2020 2050
kt900
0
200300400500600700800
100
Figure 20. Silicon global transition demand by technology (STEPS and SDS)
Figure 22. Silicon European transition demand by domestic clean energy tech-nology production scenario
Figure 21.. Silicon global total demand by scenario (STEPS and SDS)
Figure 23. Silicon European total demand by domestic clean energy technology production scenario
Silicon is a key raw material to produce solar photovoltaic panels.Silicon will also likely be added to graphite in lithium-ion batteries by the end of this decade, to increase energy density and reduce charging time. More widely, silicon is a common alloying element to aluminium, meaning it is also used in other energy transition applications. The alloying use of silicon however is not treated explicitly here as transition demand.
The world’s 2030 energy transition requirements for silicon would range from 650-1,250 kt in 2030 increasing to 1,000-1,700 kt in 2050.
European silicon transition demand is driven by the production of solar photovoltaics and silicon-based anodes for EV production. There is uncertainty on Europe’s future silicon demand for these applications because both production chains still need to be developed.
Europe’s 2030 energy transition goals will require 50-170 kt of silicon, rising to 70-230 Mt by 2040 and then stabilizing (equiva-lent to 50% of Europe’s silicon consumption today).
Silicon’s demand from the energy transition will provide support-ing but not disruptive growth in the overall silicon market.
Average growth rates are projected to drop to 2.2-2.6%, com-pared with a 3.5% historical. In an SDS scenario, growth could peak at 4% between 2020 and 2030.
Global demand for silicon is expected to grow to 3,500-4,500 kt by 2030 and up to 5,000-6,000 kt by 2050.
Europe’s silicon consumption has experienced a strong histor-ical growth rate of 3%, plateauing in the last decade. If Europe succeeds in restarting production of solar photovoltaic cells and initiating silicon-using battery anodes, then its silicon require-ments would also increase, almost doubling by 2050 compared with today’s consumption levels.
Global transition demand
European transition demand
Global total demand
European total demand
Metals for Clean Energy - Pathways to solving Europe’s raw materials challenge25
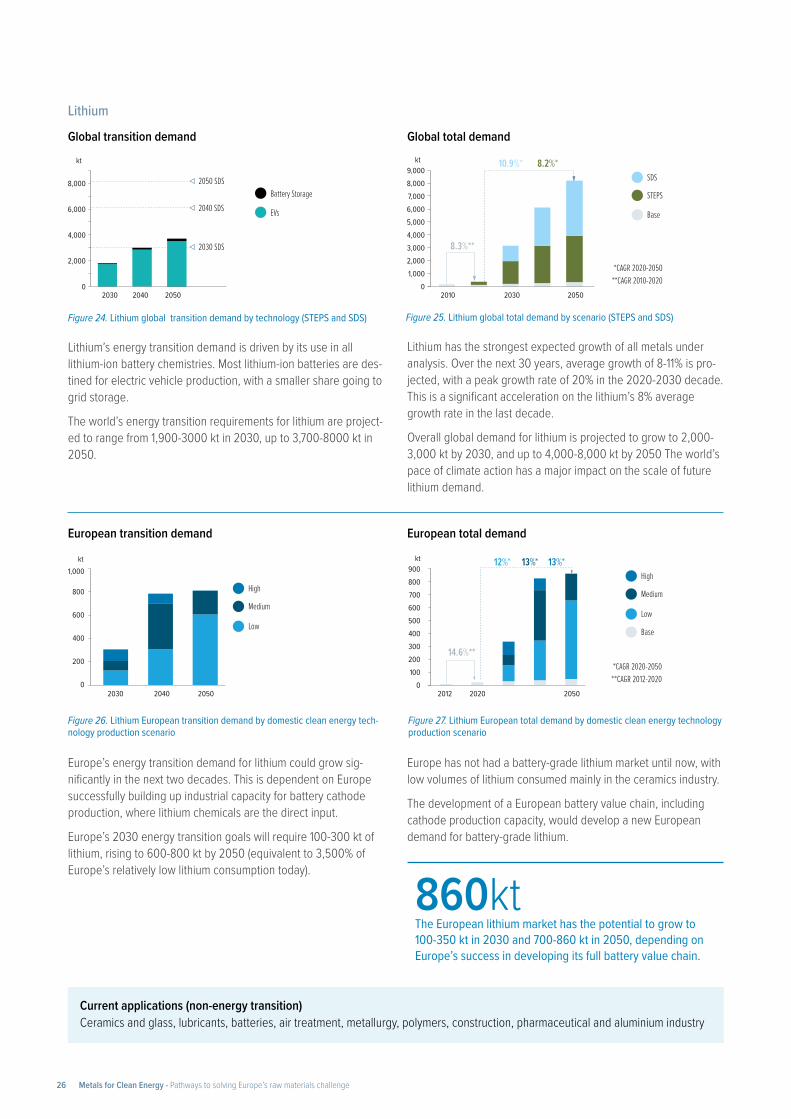
860ktThe European lithium market has the potential to grow to 100-350 kt in 2030 and 700-860 kt in 2050, depending on Europe’s success in developing its full battery value chain.
Lithium
Figure 24. Lithium global transition demand by technology (STEPS and SDS)
Figure 26. Lithium European transition demand by domestic clean energy tech-nology production scenario
Figure 25. Lithium global total demand by scenario (STEPS and SDS)
Figure 27. Lithium European total demand by domestic clean energy technology production scenario
Lithium’s energy transition demand is driven by its use in all lithium-ion battery chemistries. Most lithium-ion batteries are des-tined for electric vehicle production, with a smaller share going to grid storage.
The world’s energy transition requirements for lithium are project-ed to range from 1,900-3000 kt in 2030, up to 3,700-8000 kt in 2050.
Europe’s energy transition demand for lithium could grow sig-nificantly in the next two decades. This is dependent on Europe successfully building up industrial capacity for battery cathode production, where lithium chemicals are the direct input.
Europe’s 2030 energy transition goals will require 100-300 kt of lithium, rising to 600-800 kt by 2050 (equivalent to 3,500% of Europe’s relatively low lithium consumption today).
Lithium has the strongest expected growth of all metals under analysis. Over the next 30 years, average growth of 8-11% is pro-jected, with a peak growth rate of 20% in the 2020-2030 decade. This is a significant acceleration on the lithium’s 8% average growth rate in the last decade.
Overall global demand for lithium is projected to grow to 2,000-3,000 kt by 2030, and up to 4,000-8,000 kt by 2050 The world’s pace of climate action has a major impact on the scale of future lithium demand.
Europe has not had a battery-grade lithium market until now, with low volumes of lithium consumed mainly in the ceramics industry.
The development of a European battery value chain, including cathode production capacity, would develop a new European demand for battery-grade lithium.
Global transition demand
European transition demand
Global total demand
European total demand
Current applications (non-energy transition)Ceramics and glass, lubricants, batteries, air treatment, metallurgy, polymers, construction, pharmaceutical and aluminium industry
20402030 2050
Battery Storage
EVs
2050 SDS
2040 SDS
2030 SDS
kt9.000
0
2,0003.0004,0005.0006,0007.0008,000
1.000
20402030 2050
High
Medium
Low
kt1,000
800
600
400
200
0
2010 2030 2050
SDS
STEPS
Base
*CAGR 2020-2050**CAGR 2010-2020
10.9%* 8.2%*
8.3%**
kt9,000
0
2,0003,0004,0005,0006,0007,0008,000
1,000
High
Medium
Low
Base
*CAGR 2020-2050**CAGR 2012-2020
14.6%**
12%* 13%* 13%*
2012 2020 2050
kt900
0
200300400500600700800
100
Metals for Clean Energy - Pathways to solving Europe’s raw materials challenge26
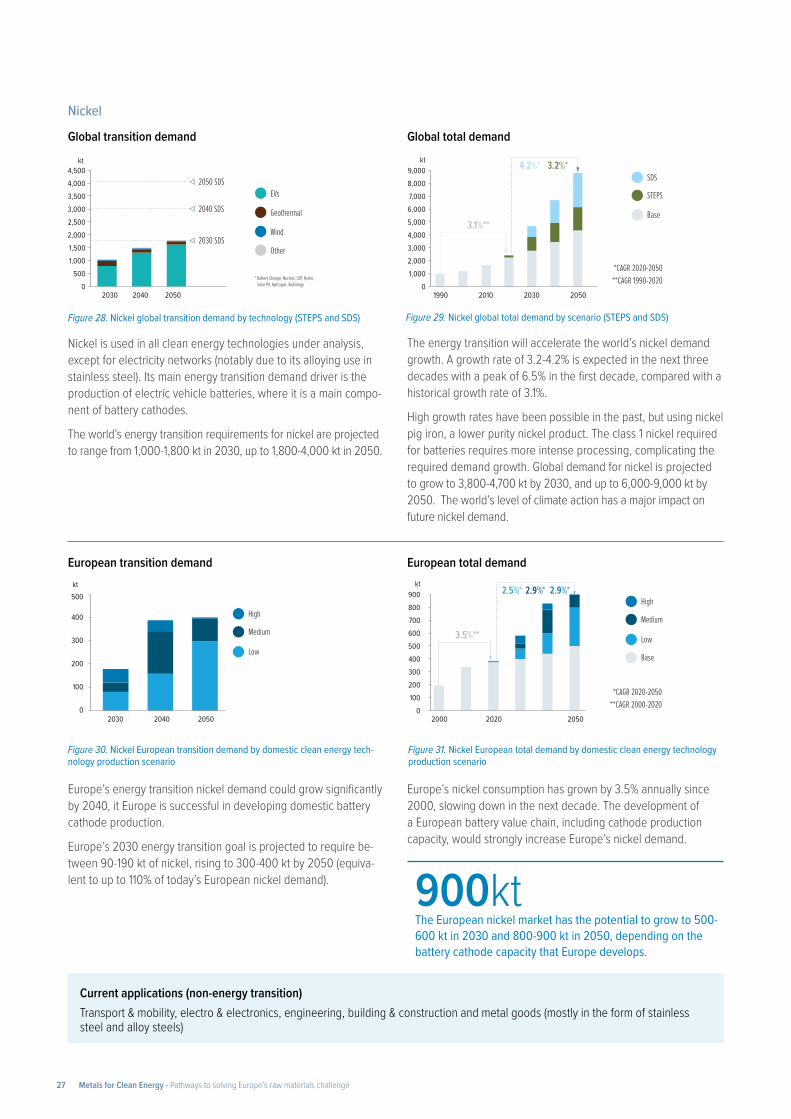
900ktThe European nickel market has the potential to grow to 500-600 kt in 2030 and 800-900 kt in 2050, depending on the battery cathode capacity that Europe develops.
Nickel
Figure 28. Nickel global transition demand by technology (STEPS and SDS)
Figure 30. Nickel European transition demand by domestic clean energy tech-nology production scenario
Figure 29. Nickel global total demand by scenario (STEPS and SDS)
Figure 31. Nickel European total demand by domestic clean energy technology production scenario
Nickel is used in all clean energy technologies under analysis, except for electricity networks (notably due to its alloying use in stainless steel). Its main energy transition demand driver is the production of electric vehicle batteries, where it is a main compo-nent of battery cathodes.
The world’s energy transition requirements for nickel are projected to range from 1,000-1,800 kt in 2030, up to 1,800-4,000 kt in 2050.
Europe’s energy transition nickel demand could grow significantly by 2040, it Europe is successful in developing domestic battery cathode production.
Europe’s 2030 energy transition goal is projected to require be-tween 90-190 kt of nickel, rising to 300-400 kt by 2050 (equiva-lent to up to 110% of today’s European nickel demand).
The energy transition will accelerate the world’s nickel demand growth. A growth rate of 3.2-4.2% is expected in the next three decades with a peak of 6.5% in the first decade, compared with a historical growth rate of 3.1%.
High growth rates have been possible in the past, but using nickel pig iron, a lower purity nickel product. The class 1 nickel required for batteries requires more intense processing, complicating the required demand growth. Global demand for nickel is projected to grow to 3,800-4,700 kt by 2030, and up to 6,000-9,000 kt by 2050. The world’s level of climate action has a major impact on future nickel demand.
Europe’s nickel consumption has grown by 3.5% annually since 2000, slowing down in the next decade. The development of a European battery value chain, including cathode production capacity, would strongly increase Europe’s nickel demand.
Global transition demand
European transition demand
Global total demand
European total demand
Current applications (non-energy transition)Transport & mobility, electro & electronics, engineering, building & construction and metal goods (mostly in the form of stainless steel and alloy steels)
20402030 2050
EVs
Geothermal
Wind
Other
2050 SDS
2040 SDS
* Battery Storage, Nuclear, CSP, Hydro, Solar PV, Hydrogen, BioEnergy
kt4,500
0
1,0001,5002,0002,5003,0003,5004,000
500
2030 SDS
20402030 2050
High
Medium
Low
kt500
400
300
200
100
0
1990 2010 2030 2050
SDS
STEPS
Base
*CAGR 2020-2050**CAGR 1990-2020
4.2%* 3.2%*
3.1%**
kt9,000
0
2,0003,0004,0005,0006,0007,0008,000
1,000
High
Medium
Low
Base
*CAGR 2020-2050**CAGR 2000-2020
3.5%**
2.5%* 2.9%* 2.9%*
2000 2020 2050
kt900
0
200300400500600700800
100
Metals for Clean Energy - Pathways to solving Europe’s raw materials challenge27
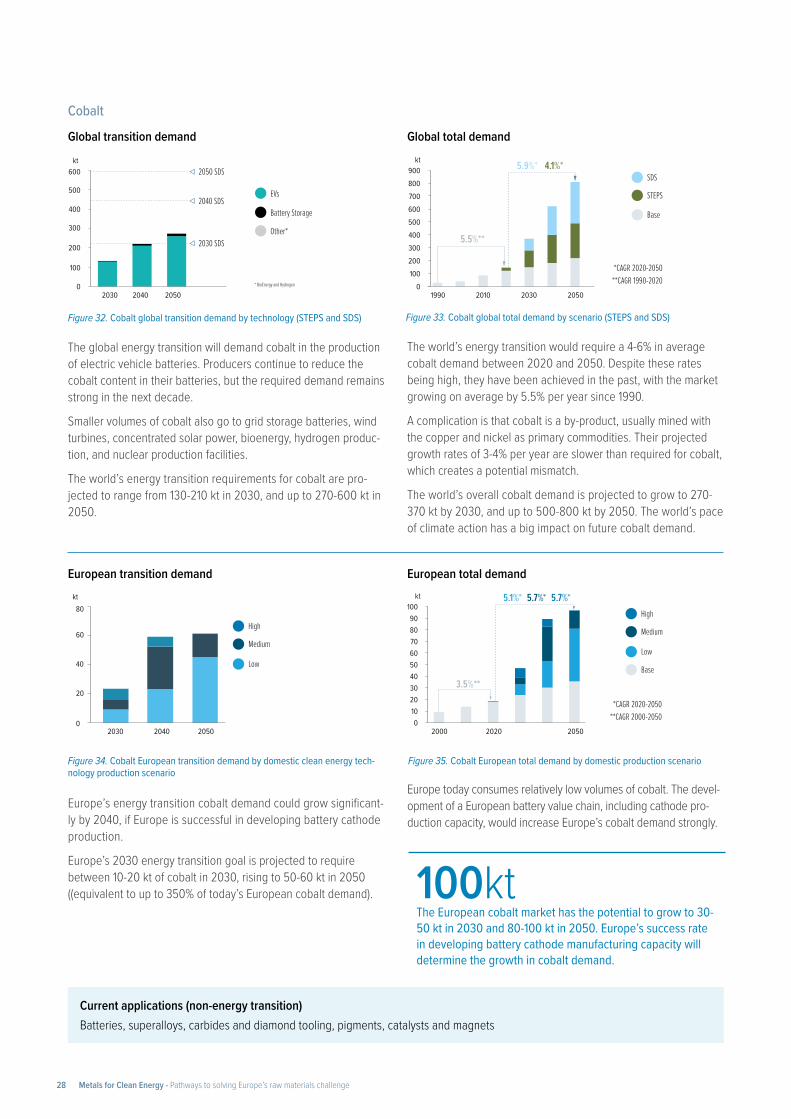
100ktThe European cobalt market has the potential to grow to 30-50 kt in 2030 and 80-100 kt in 2050. Europe’s success rate in developing battery cathode manufacturing capacity will determine the growth in cobalt demand.
Cobalt
Figure 32. Cobalt global transition demand by technology (STEPS and SDS)
Figure 34. Cobalt European transition demand by domestic clean energy tech-nology production scenario
Figure 33. Cobalt global total demand by scenario (STEPS and SDS)
Figure 35. Cobalt European total demand by domestic production scenario
The global energy transition will demand cobalt in the production of electric vehicle batteries. Producers continue to reduce the cobalt content in their batteries, but the required demand remains strong in the next decade.
Smaller volumes of cobalt also go to grid storage batteries, wind turbines, concentrated solar power, bioenergy, hydrogen produc-tion, and nuclear production facilities.
The world’s energy transition requirements for cobalt are pro-jected to range from 130-210 kt in 2030, and up to 270-600 kt in 2050.
Europe’s energy transition cobalt demand could grow significant-ly by 2040, if Europe is successful in developing battery cathode production.
Europe’s 2030 energy transition goal is projected to require between 10-20 kt of cobalt in 2030, rising to 50-60 kt in 2050 ((equivalent to up to 350% of today’s European cobalt demand).
The world’s energy transition would require a 4-6% in average cobalt demand between 2020 and 2050. Despite these rates being high, they have been achieved in the past, with the market growing on average by 5.5% per year since 1990.
A complication is that cobalt is a by-product, usually mined with the copper and nickel as primary commodities. Their projected growth rates of 3-4% per year are slower than required for cobalt, which creates a potential mismatch.
The world’s overall cobalt demand is projected to grow to 270-370 kt by 2030, and up to 500-800 kt by 2050. The world’s pace of climate action has a big impact on future cobalt demand.
Europe today consumes relatively low volumes of cobalt. The devel-opment of a European battery value chain, including cathode pro-duction capacity, would increase Europe’s cobalt demand strongly.
Global transition demand
European transition demand
Global total demand
European total demand
Current applications (non-energy transition)Batteries, superalloys, carbides and diamond tooling, pigments, catalysts and magnets
20402030 2050
EVs
Battery Storage
Other*
2050 SDS
2040 SDS
* BioEnergy and Hydrogen
kt600
500
400
300
200
100
0
2030 SDS
20402030 2050
High
Medium
Low
kt80
60
40
20
0
1990 2010 2030 2050
SDS
STEPS
Base
*CAGR 2020-2050**CAGR 1990-2020
5.9%* 4.1%*
5.5%**
kt900
0
200300400500600700800
100
High
Medium
Low
Base
*CAGR 2020-2050**CAGR 2000-2050
3.5%**
5.1%* 5.7%* 5.7%*
2000 2020 2050
kt100
0
203040506070
90
10
80
Metals for Clean Energy - Pathways to solving Europe’s raw materials challenge28
Rare earth elements
Nuclear
Wind
EVs
20402030 2050
2050 SDS2040 SDS
7
6
5
4
3
2
1
0
2030 SDS
20402030 2050
2050 SDS
2040 SDS
2030 SDS
20402030 2050
2050 SDS
2040 SDS
Dysprosium (kt) Neodymium (kt) Praseodymium (kt)
60
50
40
30
20
10
0
18
0
468
10121416
2
2030 SDS
60
50
40
30
20
10
0
200
150
100
50
0
16
14
12
10
8
6
4
2
0
Dysprosium (kt) Neodymium (kt) Praseodymium (kt)
1990 2010 2030 2050
SDS
STEPS
Base
*CAGR 2020-2050 **CAGR 1990-2020
6.0%* 5.2%*
5.2%* 6.0%*
5.2%**
1990 2010 2030 2050
5.4%* 4.8%*
5.2%**
1990 2010 2030 2050
5.4%* 4.8%*
5.2%**
Figure 36. REE (dysprosium, neodymium and praseodymium) global transition demand by technology (STEPS and SDS)
Figure 37. REE (dysprosium, neodymium, praseodymium) global total demand by scenario (STEPS and SDS)
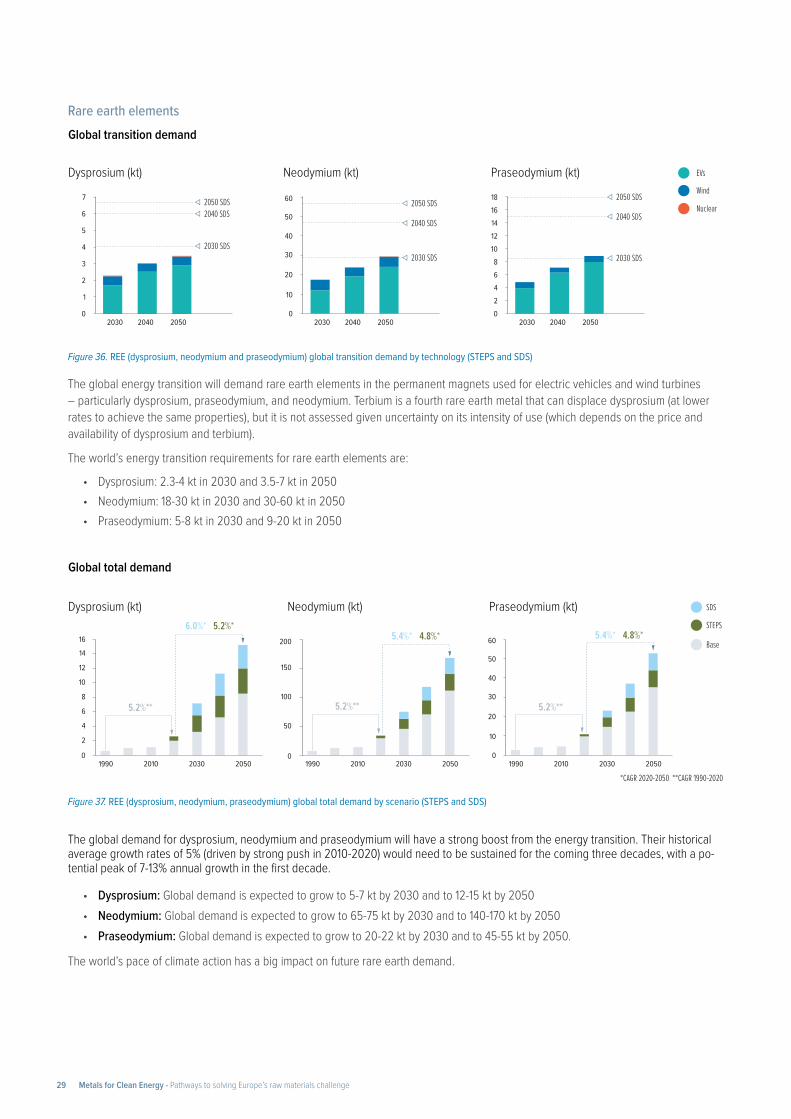
The global energy transition will demand rare earth elements in the permanent magnets used for electric vehicles and wind turbines – particularly dysprosium, praseodymium, and neodymium. Terbium is a fourth rare earth metal that can displace dysprosium (at lower rates to achieve the same properties), but it is not assessed given uncertainty on its intensity of use (which depends on the price and availability of dysprosium and terbium).
The world’s energy transition requirements for rare earth elements are:
• Dysprosium: 2.3-4 kt in 2030 and 3.5-7 kt in 2050• Neodymium: 18-30 kt in 2030 and 30-60 kt in 2050• Praseodymium: 5-8 kt in 2030 and 9-20 kt in 2050
The global demand for dysprosium, neodymium and praseodymium will have a strong boost from the energy transition. Their historical average growth rates of 5% (driven by strong push in 2010-2020) would need to be sustained for the coming three decades, with a po-tential peak of 7-13% annual growth in the first decade.
• Dysprosium: Global demand is expected to grow to 5-7 kt by 2030 and to 12-15 kt by 2050 • Neodymium: Global demand is expected to grow to 65-75 kt by 2030 and to 140-170 kt by 2050• Praseodymium: Global demand is expected to grow to 20-22 kt by 2030 and to 45-55 kt by 2050.
The world’s pace of climate action has a big impact on future rare earth demand.
Global transition demand
Global total demand
Metals for Clean Energy - Pathways to solving Europe’s raw materials challenge29
High
Medium
Low
0.7
0.6
0.5
0.4
0.3
0.2
0.1
0
Dysprosium (kt)
20402030 2050
Neodymium (kt)
5
4
3
2
1
020402030 2050
1.4
1.2
1.0
0.8
0.6
0.4
0.2
0
Praseodymium (kt)
20402030 2050
2.0%** 2.0%**
5
4
3
2
1
0
Dysprosium (kt) Neodymium (kt) Praseodymium (kt)
*CAGR 2020-2050 **CAGR 2010-2020
1.5
1.0
0.5
02010 2030 20502010 2030 2050 2010 2030 2050
High
Medium
Low
Base
2.0%* 11.8%* 14.3%* 2.0%* 7.0%* 9.1%*
2.0%**
2.0%* 8.0%* 10.2%*0.7
0.6
0.5
0.4
0.3
0.2
0.1
0
Figure 38. REE (dysprosium, neodymium and praseodymium) European transition demand by domestic clean energy technology production scenario
Figure 39. REE (dysprosium, neodymium and praseodymium) European total demand by domestic clean energy technology production scenario
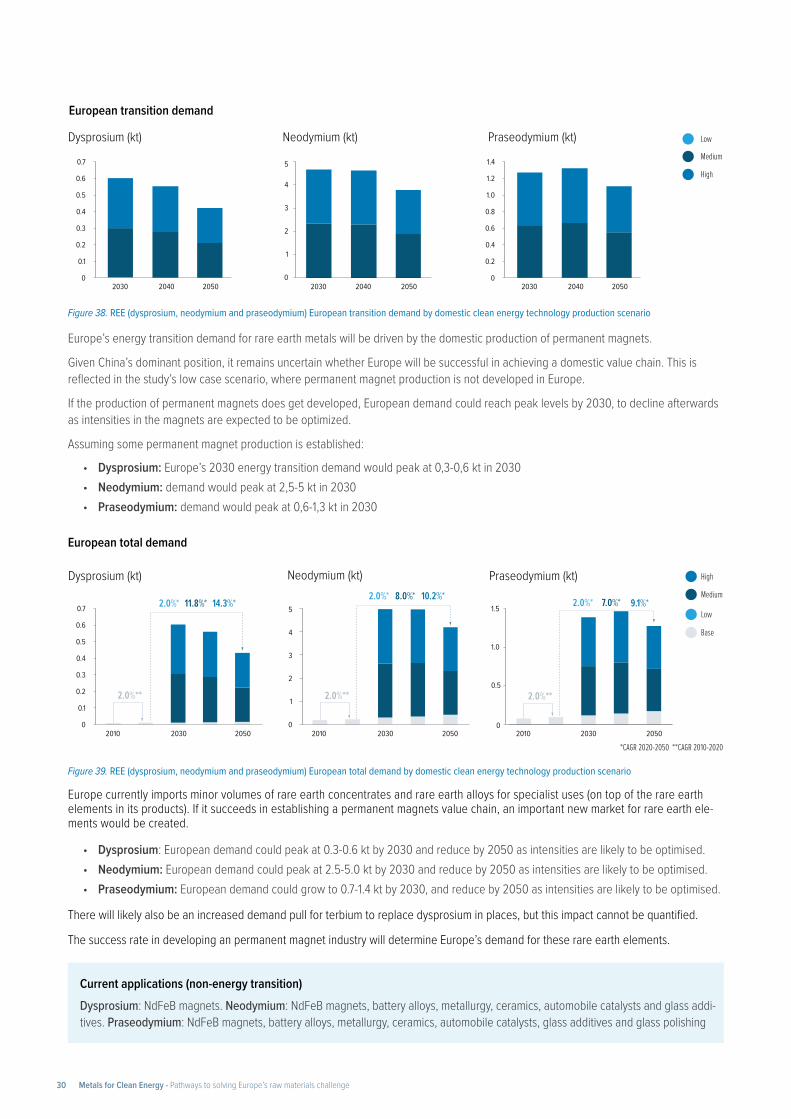
Europe’s energy transition demand for rare earth metals will be driven by the domestic production of permanent magnets.
Given China’s dominant position, it remains uncertain whether Europe will be successful in achieving a domestic value chain. This is reflected in the study’s low case scenario, where permanent magnet production is not developed in Europe.
If the production of permanent magnets does get developed, European demand could reach peak levels by 2030, to decline afterwards as intensities in the magnets are expected to be optimized.
Assuming some permanent magnet production is established:
• Dysprosium: Europe’s 2030 energy transition demand would peak at 0,3-0,6 kt in 2030• Neodymium: demand would peak at 2,5-5 kt in 2030 • Praseodymium: demand would peak at 0,6-1,3 kt in 2030
Europe currently imports minor volumes of rare earth concentrates and rare earth alloys for specialist uses (on top of the rare earth elements in its products). If it succeeds in establishing a permanent magnets value chain, an important new market for rare earth ele-ments would be created.
• Dysprosium: European demand could peak at 0.3-0.6 kt by 2030 and reduce by 2050 as intensities are likely to be optimised. • Neodymium: European demand could peak at 2.5-5.0 kt by 2030 and reduce by 2050 as intensities are likely to be optimised.• Praseodymium: European demand could grow to 0.7-1.4 kt by 2030, and reduce by 2050 as intensities are likely to be optimised.
There will likely also be an increased demand pull for terbium to replace dysprosium in places, but this impact cannot be quantified.
The success rate in developing an permanent magnet industry will determine Europe’s demand for these rare earth elements.
Current applications (non-energy transition)Dysprosium: NdFeB magnets. Neodymium: NdFeB magnets, battery alloys, metallurgy, ceramics, automobile catalysts and glass addi-tives. Praseodymium: NdFeB magnets, battery alloys, metallurgy, ceramics, automobile catalysts, glass additives and glass polishing
European transition demand
European total demand
Metals for Clean Energy - Pathways to solving Europe’s raw materials challenge30
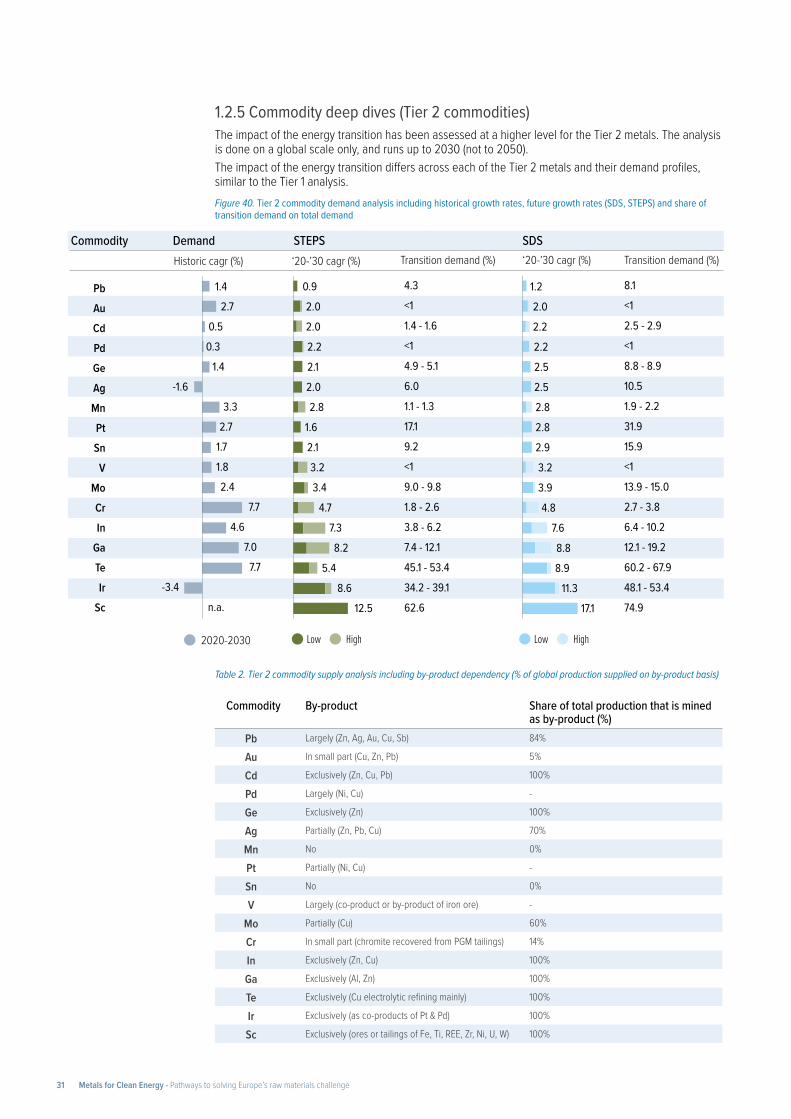
Figure 40. Tier 2 commodity demand analysis including historical growth rates, future growth rates (SDS, STEPS) and share of transition demand on total demand
PbAuCdPdGeAgMnPtSn
VMoCrIn
GaTeIr
Sc
4.3
<1
1.4 - 1.6
<1
4.9 - 5.1
6.0
1.1 - 1.3
17.1
9.2
<1
9.0 - 9.8
1.8 - 2.6
3.8 - 6.2
7.4 - 12.1
45.1 - 53.4
34.2 - 39.1
62.6
8.1
<1
2.5 - 2.9
<1
8.8 - 8.9
10.5
1.9 - 2.2
31.9
15.9
<1
13.9 - 15.0
2.7 - 3.8
6.4 - 10.2
12.1 - 19.2
60.2 - 67.9
48.1 - 53.4
74.9
1.4 0.9
2.0
2.0
2.2
2.1
2.8
1.6
2.1
3.2
3.4
4.7
7.3
8.2
5.4
8.6
12.5
2.0
2.7
0.5
0.3
1.4
3.3
2.7
1.7
1.8
2.4
7.7
4.6
7.0
7.7
-3.4
n.a.
-1.6
Commodity Demand‘20-’30 cagr (%)Historic cagr (%)
2020-2030
‘20-’30 cagr (%)Transition demand (%) Transition demand (%)STEPS SDS
Low High Low High
1.2
2.0
2.2
2.2
2.5
2.5
2.8
2.8
2.9
3.2
3.9
4.8
7.6
8.8
8.9
11.3
17.1
1.2.5 Commodity deep dives (Tier 2 commodities)The impact of the energy transition has been assessed at a higher level for the Tier 2 metals. The analysis is done on a global scale only, and runs up to 2030 (not to 2050).The impact of the energy transition differs across each of the Tier 2 metals and their demand profiles, similar to the Tier 1 analysis.
Table 2. Tier 2 commodity supply analysis including by-product dependency (% of global production supplied on by-product basis)
Commodity By-product Share of total production that is mined as by-product (%)
Pb Largely (Zn, Ag, Au, Cu, Sb) 84%
Au In small part (Cu, Zn, Pb) 5%
Cd Exclusively (Zn, Cu, Pb) 100%
Pd Largely (Ni, Cu) -
Ge Exclusively (Zn) 100%
Ag Partially (Zn, Pb, Cu) 70%
Mn No 0%
Pt Partially (Ni, Cu) -
Sn No 0%
V Largely (co-product or by-product of iron ore) -
Mo Partially (Cu) 60%
Cr In small part (chromite recovered from PGM tailings) 14%
In Exclusively (Zn, Cu) 100%
Ga Exclusively (Al, Zn) 100%
Te Exclusively (Cu electrolytic refining mainly) 100%
Ir Exclusively (as co-products of Pt & Pd) 100%
Sc Exclusively (ores or tailings of Fe, Ti, REE, Zr, Ni, U, W) 100%
Metals for Clean Energy - Pathways to solving Europe’s raw materials challenge31
• Accelerating growth rates
− Tellurium, iridium and scandium are expected to have over 50% of their 2030 demand going to clean energy technologies and have 2020-2030 growth rates accelerating compared to historic growth rates.
− Gallium, germanium, indium, and tin are also at potential risk. Their expected growth rates could potentially exceed historical growth rates, but this depends to a great extent also on how their current digital uses evolve. The world’s digitalization has led to strong historical growth rates for these metals and demands from the energy transition would add on top.
• More stable growth rates
− Cadmium, silver, platinum could experience an additional push for transition technologies in the next decade (for example silver in solar PV and electric vehicles, platinum in hydrogen technologies). The impact will differ by scenario; in a STEPS most commodities would stay on a historical growth rate, an SDS scenario it could lead to an acceleration. Thrifting potential (like on silver and platinum) and a decline in current applications (platinum & palladium demand in ICE vehicles) could soften the impact.
− Gold, and lead are not expected to have a strong pull from the energy transition, and potential demand pressure would be reduced by the phase out of conventional ICE cars where they have major uses today.
− The Tier 2 commodities that are mainly used as a steel alloying element (chromium, manga-nese, vanadium, molybdenum) don’t have a high demand pull from potential growth in steel applications. The exception is in applications requiring a specific purity of these metals; for example high purity manganese for lithium-ion batteries could lead to additional demand but such sensitivities are not analysed in detail in this study.
• Scenario sensitivities Vanadium, lead, … could experience an additional push from battery storage alternatives. Currently, the study assumes lithium-ion batteries as key technology, however alternatives are being explored. Vanadium Redox Flow Batteries (VRFB) for example, might reach penetration rates of 20%. In such a case, it could lead to disruptive growth for vanadium (+117 kt by 2030, an increase equivalent to +110% of current demand). Such sensitivities are not analysed in detail in this study.
Many of these metals are extracted exclusively as by-products. This makes potential supply challeng-es higher, as by-product metals supply can only grow as fast as the production of the primary metal. However, there are also routes forward to secure additional supply of these minor metals, including more efficient extraction methods, extraction of lower content concentrates (if more economically attractive), and the development of recycling routes.
Metals for Clean Energy - Pathways to solving Europe’s raw materials challenge32
From this section onwards, the report only focuses on its Tier 1 metals: aluminium, copper, zinc, silicon, lithium, cobalt, rare earth elements.
• The rapid increase in global metals demand in the next 15 years needs to be supplied mostly by new primary metal as secondary supply can only take a more prominent role as of 2030/2040.
• Global primary supply outlooks indicate there is growth potential across all commodities: lithium, cobalt, nickel, rare earth elements and copper have the strongest project pipelines. Reserves and resources indicate there are no concerns on material availability.
• Secondary supply is limited by the volume of material in circulation. Once clean energy technol-ogies are available to recycle, primary demand will be softened.
• Europe has an uncertain pipeline for new mining and refining projects. There is theoretical potential for new projects to soften demand in the next 15 years, but also challenges from local opposition, technical uncertainties, and unsupportive framework conditions.
• Europe’s secondary supply is expected to grow significantly after 2040, leading to a major softening of primary demand by 2050 for battery metals and rare earth elements in particular.
The global and European demand for metals quantified in chapter 1 can be supplied through two routes:
1. Primary supply, which is metal production from raw ore through mining and processing2. Secondary supply, which is metal production from recycled products
Recycling of end-of-life products is already an important driver for supply in established base metals mar-kets. But the energy transition will not benefit from recycled materials from new applications at the start of clean energy technology deployment. The secondary supply potential is limited by the volume of material already in circulation. Once the supply potential from this stream is reached, additional supply needs to be provided through primary supply.
SUPPLY METHODOLOGY
PRIMARY SUPPLY
Primary supply is assessed on two levels: a medium-term view up to 2030 based on capacity announce-ments, and a long-term view up to 2050 assessing growth trends, reserves, and resources.
Medium-term view
The medium-term primary supply perspectives are sourced from MineSpans by McKinsey.
MineSpans projections are made bottom up, allowing to differentiate two scenarios: a base case and a full potential. The base case includes projects that are well advanced and have good economics. These projects are expected to be realized, potentially with some delay. The full potential also includes projects that are not so well advanced. There is more uncertainty on the realization likelihood and the timing of these projects.
Long-term view
A long-term primary supply perspective cannot be made bottom up, as there is no visibility that far out on projects as they are not discovered yet or announced. Hence, the long-term view up to 2050 is assessed by looking at historical growth rates, reserves and resources. This gives an indication of potential future growth rate limitations and material availability.
2. Commodity supply potential
Metals for Clean Energy - Pathways to solving Europe’s raw materials challenge33
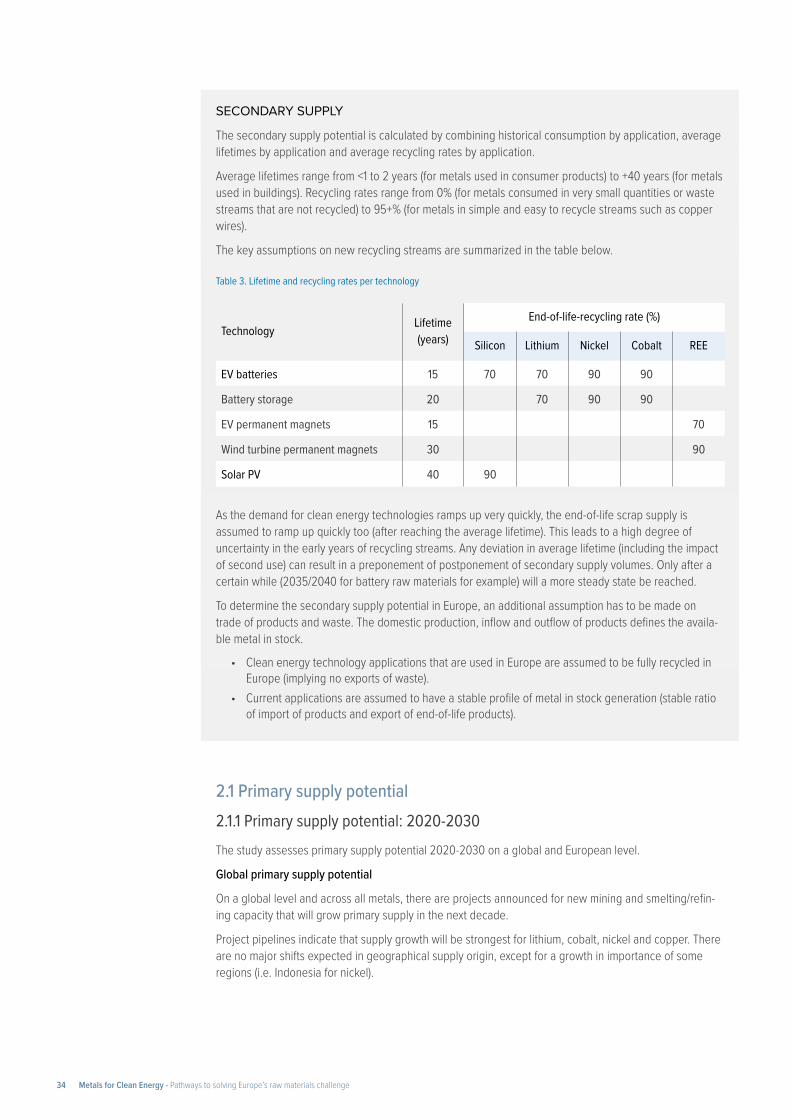
SECONDARY SUPPLY
The secondary supply potential is calculated by combining historical consumption by application, average lifetimes by application and average recycling rates by application.
Average lifetimes range from <1 to 2 years (for metals used in consumer products) to +40 years (for metals used in buildings). Recycling rates range from 0% (for metals consumed in very small quantities or waste streams that are not recycled) to 95+% (for metals in simple and easy to recycle streams such as copper wires).
The key assumptions on new recycling streams are summarized in the table below.
Table 3. Lifetime and recycling rates per technology
Technology Lifetime (years)
End-of-life-recycling rate (%)
Silicon Lithium Nickel Cobalt REE
EV batteries 15 70 70 90 90
Battery storage 20 70 90 90
EV permanent magnets 15 70
Wind turbine permanent magnets 30 90
Solar PV 40 90
As the demand for clean energy technologies ramps up very quickly, the end-of-life scrap supply is assumed to ramp up quickly too (after reaching the average lifetime). This leads to a high degree of uncertainty in the early years of recycling streams. Any deviation in average lifetime (including the impact of second use) can result in a preponement of postponement of secondary supply volumes. Only after a certain while (2035/2040 for battery raw materials for example) will a more steady state be reached.
To determine the secondary supply potential in Europe, an additional assumption has to be made on trade of products and waste. The domestic production, inflow and outflow of products defines the availa-ble metal in stock.
• Clean energy technology applications that are used in Europe are assumed to be fully recycled in Europe (implying no exports of waste).
• Current applications are assumed to have a stable profile of metal in stock generation (stable ratio of import of products and export of end-of-life products).
2.1 Primary supply potential2.1.1 Primary supply potential: 2020-2030The study assesses primary supply potential 2020-2030 on a global and European level.
Global primary supply potential
On a global level and across all metals, there are projects announced for new mining and smelting/refin-ing capacity that will grow primary supply in the next decade.
Project pipelines indicate that supply growth will be strongest for lithium, cobalt, nickel and copper. There are no major shifts expected in geographical supply origin, except for a growth in importance of some regions (i.e. Indonesia for nickel).
Metals for Clean Energy - Pathways to solving Europe’s raw materials challenge34
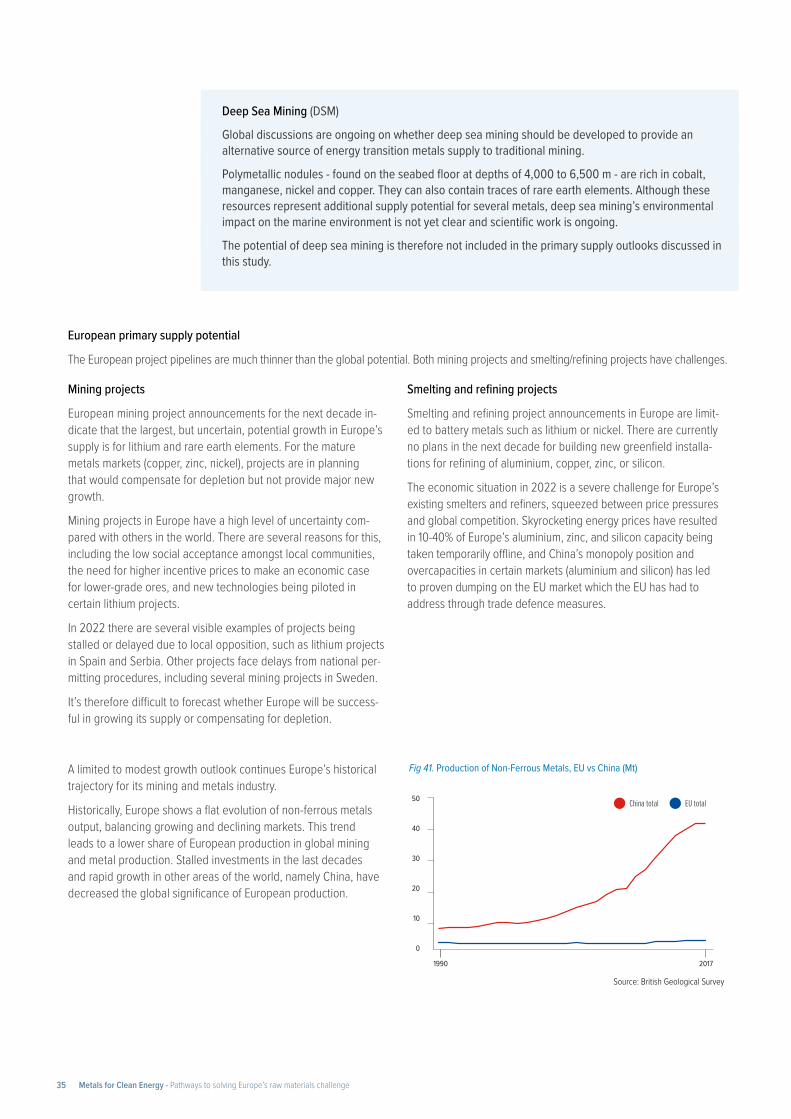
Deep Sea Mining (DSM)
Global discussions are ongoing on whether deep sea mining should be developed to provide an alternative source of energy transition metals supply to traditional mining.
Polymetallic nodules - found on the seabed floor at depths of 4,000 to 6,500 m - are rich in cobalt, manganese, nickel and copper. They can also contain traces of rare earth elements. Although these resources represent additional supply potential for several metals, deep sea mining’s environmental impact on the marine environment is not yet clear and scientific work is ongoing.
The potential of deep sea mining is therefore not included in the primary supply outlooks discussed in this study.
A limited to modest growth outlook continues Europe’s historical trajectory for its mining and metals industry.
Historically, Europe shows a flat evolution of non-ferrous metals output, balancing growing and declining markets. This trend leads to a lower share of European production in global mining and metal production. Stalled investments in the last decades and rapid growth in other areas of the world, namely China, have decreased the global significance of European production.
Fig 41. Production of Non-Ferrous Metals, EU vs China (Mt)
1990
50
40
30
20
10
0
2017
China total EU total
Source: British Geological Survey
Mining projects
European mining project announcements for the next decade in-dicate that the largest, but uncertain, potential growth in Europe’s supply is for lithium and rare earth elements. For the mature metals markets (copper, zinc, nickel), projects are in planning that would compensate for depletion but not provide major new growth.
Mining projects in Europe have a high level of uncertainty com-pared with others in the world. There are several reasons for this, including the low social acceptance amongst local communities, the need for higher incentive prices to make an economic case for lower-grade ores, and new technologies being piloted in certain lithium projects.
In 2022 there are several visible examples of projects being stalled or delayed due to local opposition, such as lithium projects in Spain and Serbia. Other projects face delays from national per-mitting procedures, including several mining projects in Sweden.
It’s therefore difficult to forecast whether Europe will be success-ful in growing its supply or compensating for depletion.
Smelting and refining projects
Smelting and refining project announcements in Europe are limit-ed to battery metals such as lithium or nickel. There are currently no plans in the next decade for building new greenfield installa-tions for refining of aluminium, copper, zinc, or silicon.
The economic situation in 2022 is a severe challenge for Europe’s existing smelters and refiners, squeezed between price pressures and global competition. Skyrocketing energy prices have resulted in 10-40% of Europe’s aluminium, zinc, and silicon capacity being taken temporarily offline, and China’s monopoly position and overcapacities in certain markets (aluminium and silicon) has led to proven dumping on the EU market which the EU has had to address through trade defence measures.
European primary supply potential
The European project pipelines are much thinner than the global potential. Both mining projects and smelting/refining projects have challenges.
Metals for Clean Energy - Pathways to solving Europe’s raw materials challenge35
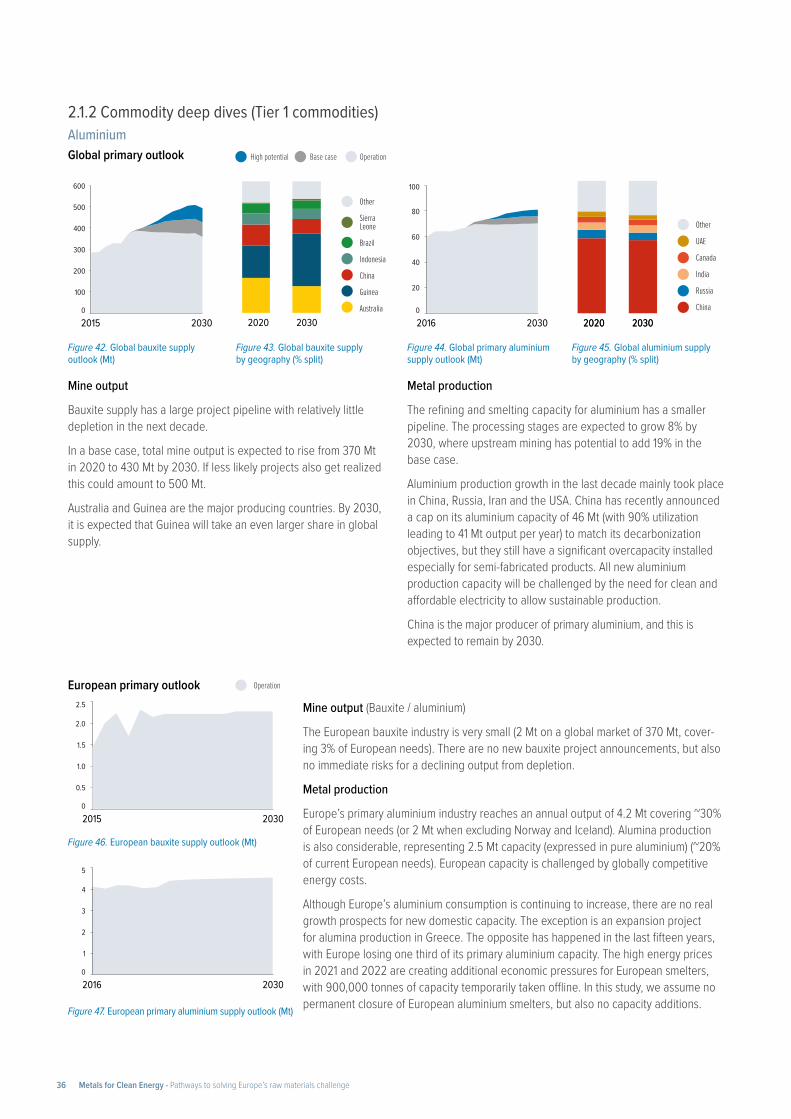
Figure 42. Global bauxite supply outlook (Mt)
Figure 46. European bauxite supply outlook (Mt)
Figure 47. European primary aluminium supply outlook (Mt)
Figure 43. Global bauxite supply by geography (% split)
Figure 44. Global primary aluminium supply outlook (Mt)
Figure 45. Global aluminium supply by geography (% split)
2.1.2 Commodity deep dives (Tier 1 commodities)Aluminium Global primary outlook
European primary outlook
Mine output
Bauxite supply has a large project pipeline with relatively little depletion in the next decade.
In a base case, total mine output is expected to rise from 370 Mt in 2020 to 430 Mt by 2030. If less likely projects also get realized this could amount to 500 Mt.
Australia and Guinea are the major producing countries. By 2030, it is expected that Guinea will take an even larger share in global supply.
Metal production
The refining and smelting capacity for aluminium has a smaller pipeline. The processing stages are expected to grow 8% by 2030, where upstream mining has potential to add 19% in the base case.
Aluminium production growth in the last decade mainly took place in China, Russia, Iran and the USA. China has recently announced a cap on its aluminium capacity of 46 Mt (with 90% utilization leading to 41 Mt output per year) to match its decarbonization objectives, but they still have a significant overcapacity installed especially for semi-fabricated products. All new aluminium production capacity will be challenged by the need for clean and affordable electricity to allow sustainable production.
China is the major producer of primary aluminium, and this is expected to remain by 2030.
Mine output (Bauxite / aluminium)
The European bauxite industry is very small (2 Mt on a global market of 370 Mt, cover-ing 3% of European needs). There are no new bauxite project announcements, but also no immediate risks for a declining output from depletion.
Metal production
Europe’s primary aluminium industry reaches an annual output of 4.2 Mt covering ~30% of European needs (or 2 Mt when excluding Norway and Iceland). Alumina production is also considerable, representing 2.5 Mt capacity (expressed in pure aluminium) (~20% of current European needs). European capacity is challenged by globally competitive energy costs.
Although Europe’s aluminium consumption is continuing to increase, there are no real growth prospects for new domestic capacity. The exception is an expansion project for alumina production in Greece. The opposite has happened in the last fifteen years, with Europe losing one third of its primary aluminium capacity. The high energy prices in 2021 and 2022 are creating additional economic pressures for European smelters, with 900,000 tonnes of capacity temporarily taken offline. In this study, we assume no permanent closure of European aluminium smelters, but also no capacity additions.
200
400
300
100
500
600
0
2015 2030 20302020
Other
Sierra Leone
Brazil
Indonesia
China
Guinea
Australia
20
40
60
80
100
0
2016 2030 20302020
Other
UAE
Canada
India
Russia
China
20302020
47
0.5
1.0
1.5
2.0
0
2015 2030
2.5
1
2
3
4
0
2016 2030
5
High potential Base case Operation
Operation
Metals for Clean Energy - Pathways to solving Europe’s raw materials challenge36
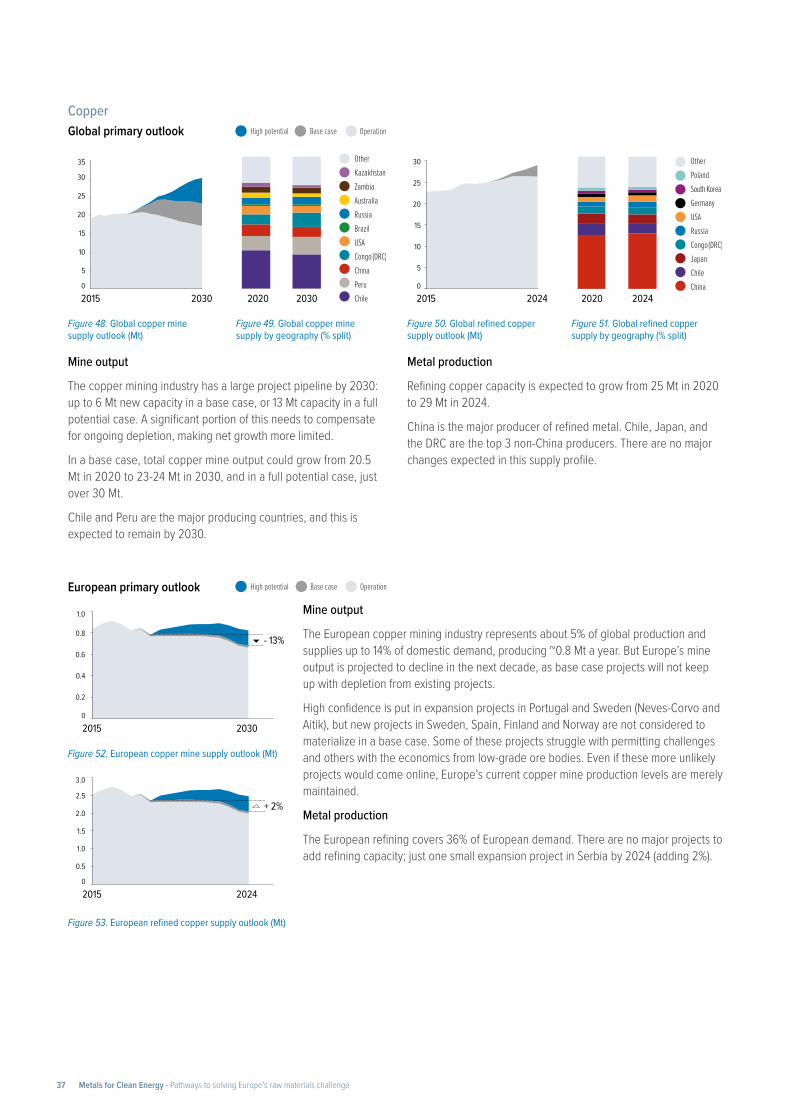
Figure 48. Global copper mine supply outlook (Mt)
Figure 52. European copper mine supply outlook (Mt)
Figure 53. European refined copper supply outlook (Mt)
Figure 49. Global copper mine supply by geography (% split)
Figure 50. Global refined copper supply outlook (Mt)
Figure 51. Global refined copper supply by geography (% split)
CopperGlobal primary outlook
European primary outlook
Mine output
The copper mining industry has a large project pipeline by 2030: up to 6 Mt new capacity in a base case, or 13 Mt capacity in a full potential case. A significant portion of this needs to compensate for ongoing depletion, making net growth more limited.
In a base case, total copper mine output could grow from 20.5 Mt in 2020 to 23-24 Mt in 2030, and in a full potential case, just over 30 Mt.
Chile and Peru are the major producing countries, and this is expected to remain by 2030.
Metal production
Refining copper capacity is expected to grow from 25 Mt in 2020 to 29 Mt in 2024.
China is the major producer of refined metal. Chile, Japan, and the DRC are the top 3 non-China producers. There are no major changes expected in this supply profile.
Mine output
The European copper mining industry represents about 5% of global production and supplies up to 14% of domestic demand, producing ~0.8 Mt a year. But Europe’s mine output is projected to decline in the next decade, as base case projects will not keep up with depletion from existing projects.
High confidence is put in expansion projects in Portugal and Sweden (Neves-Corvo and Aitik), but new projects in Sweden, Spain, Finland and Norway are not considered to materialize in a base case. Some of these projects struggle with permitting challenges and others with the economics from low-grade ore bodies. Even if these more unlikely projects would come online, Europe’s current copper mine production levels are merely maintained.
Metal production
The European refining covers 36% of European demand. There are no major projects to add refining capacity; just one small expansion project in Serbia by 2024 (adding 2%).
2015 2030
10
20
15
5
25
30
35
0
20302020
OtherKazakhstanZambiaAustraliaRussiaBrazilUSACongo (DRC)ChinaPeruChile
10
20
15
5
25
30
0
2015 2024 20242020
OtherPolandSouth KoreaGermanyUSARussiaCongo (DRC)JapanChileChina
53
0
2015 2030
0.2
0.4
0.6
0.8
1.0
- 13%
2015 2024
+ 2%
1.0
2.0
1.5
0.5
2.5
3.0
0
High potential Base case Operation
High potential Base case Operation
Metals for Clean Energy - Pathways to solving Europe’s raw materials challenge37
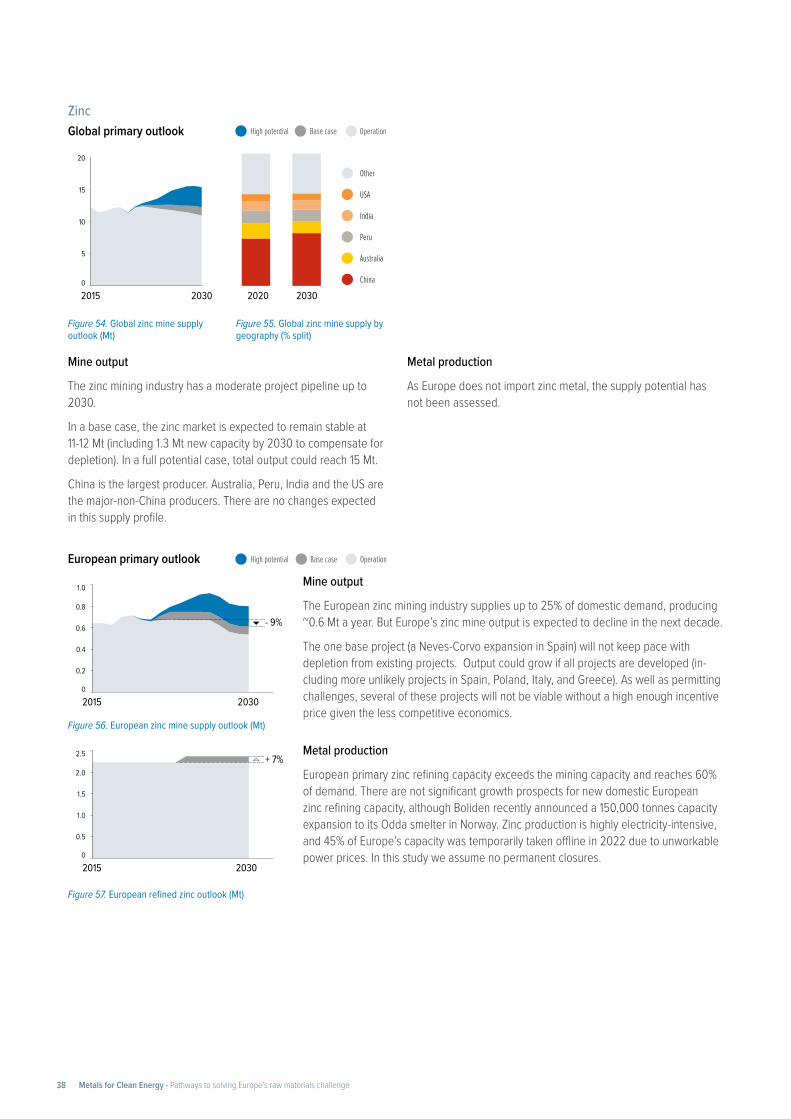
Figure 54. Global zinc mine supply outlook (Mt)
Figure 56. European zinc mine supply outlook (Mt)
Figure 57. European refined zinc outlook (Mt)
Figure 55. Global zinc mine supply by geography (% split)
ZincGlobal primary outlook
European primary outlook
Mine output
The zinc mining industry has a moderate project pipeline up to 2030.
In a base case, the zinc market is expected to remain stable at 11-12 Mt (including 1.3 Mt new capacity by 2030 to compensate for depletion). In a full potential case, total output could reach 15 Mt.
China is the largest producer. Australia, Peru, India and the US are the major-non-China producers. There are no changes expected in this supply profile.
Metal production
As Europe does not import zinc metal, the supply potential has not been assessed.
Mine output
The European zinc mining industry supplies up to 25% of domestic demand, producing ~0.6 Mt a year. But Europe’s zinc mine output is expected to decline in the next decade.
The one base project (a Neves-Corvo expansion in Spain) will not keep pace with depletion from existing projects. Output could grow if all projects are developed (in-cluding more unlikely projects in Spain, Poland, Italy, and Greece). As well as permitting challenges, several of these projects will not be viable without a high enough incentive price given the less competitive economics.
Metal production
European primary zinc refining capacity exceeds the mining capacity and reaches 60% of demand. There are not significant growth prospects for new domestic European zinc refining capacity, although Boliden recently announced a 150,000 tonnes capacity expansion to its Odda smelter in Norway. Zinc production is highly electricity-intensive, and 45% of Europe’s capacity was temporarily taken offline in 2022 due to unworkable power prices. In this study we assume no permanent closures.
10
20
15
5
0
2015 2030 20302020
Other
USA
India
Peru
Australia
China
56
2015 2030
- 9%
0.2
0.4
0.6
0.8
0
1.0
57
0.5
1.0
1.5
2.0
0
2015 2030
2.5 + 7%
High potential Base case Operation
High potential Base case Operation
Metals for Clean Energy - Pathways to solving Europe’s raw materials challenge38
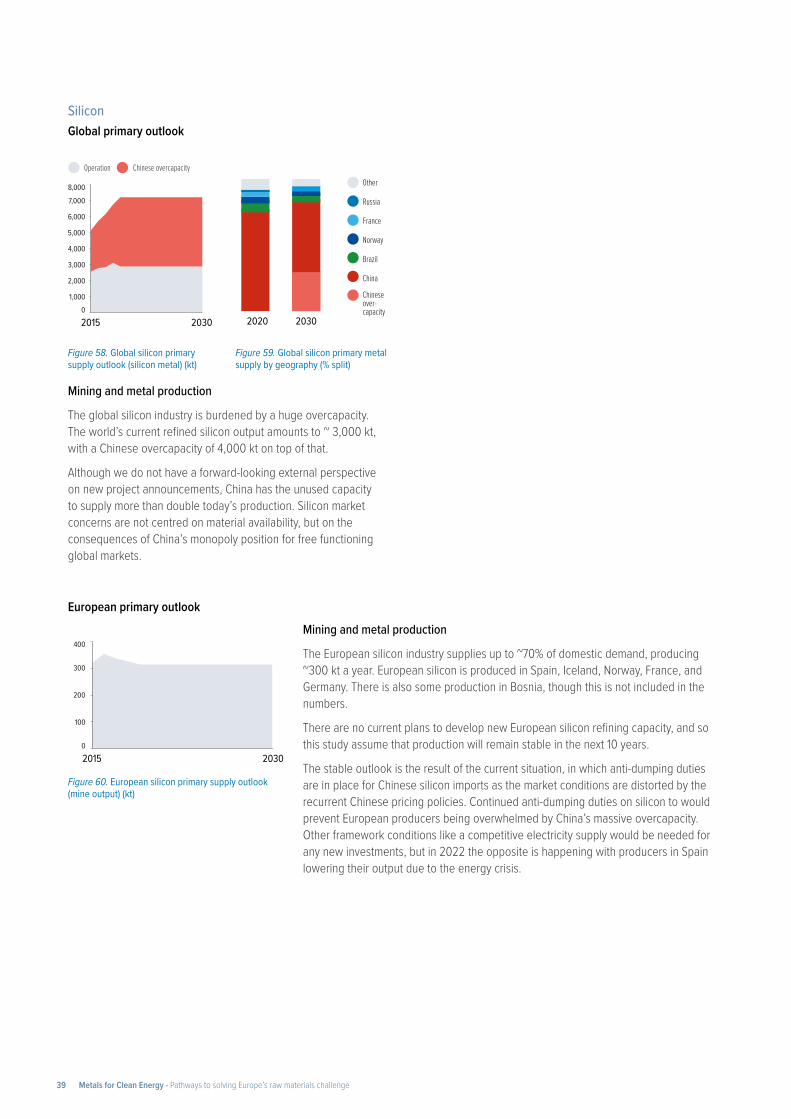
Figure 58. Global silicon primary supply outlook (silicon metal) (kt)
Figure 60. European silicon primary supply outlook (mine output) (kt)
Figure 59. Global silicon primary metal supply by geography (% split)
Silicon Global primary outlook
European primary outlook
Mining and metal production
The global silicon industry is burdened by a huge overcapacity. The world’s current refined silicon output amounts to ~ 3,000 kt, with a Chinese overcapacity of 4,000 kt on top of that.
Although we do not have a forward-looking external perspective on new project announcements, China has the unused capacity to supply more than double today’s production. Silicon market concerns are not centred on material availability, but on the consequences of China’s monopoly position for free functioning global markets.
Mining and metal production
The European silicon industry supplies up to ~70% of domestic demand, producing ~300 kt a year. European silicon is produced in Spain, Iceland, Norway, France, and Germany. There is also some production in Bosnia, though this is not included in the numbers.
There are no current plans to develop new European silicon refining capacity, and so this study assume that production will remain stable in the next 10 years.
The stable outlook is the result of the current situation, in which anti-dumping duties are in place for Chinese silicon imports as the market conditions are distorted by the recurrent Chinese pricing policies. Continued anti-dumping duties on silicon to would prevent European producers being overwhelmed by China’s massive overcapacity. Other framework conditions like a competitive electricity supply would be needed for any new investments, but in 2022 the opposite is happening with producers in Spain lowering their output due to the energy crisis.
2015 2030
2,000
4,000
3,000
1,000
5,000
6,000
7,000
8,000
020302020
Other
Russia
France
Norway
Brazil
China
Chineseover-capacity
61
2015 2030
100
200
300
0
400
Operation Chinese overcapacity
Metals for Clean Energy - Pathways to solving Europe’s raw materials challenge39
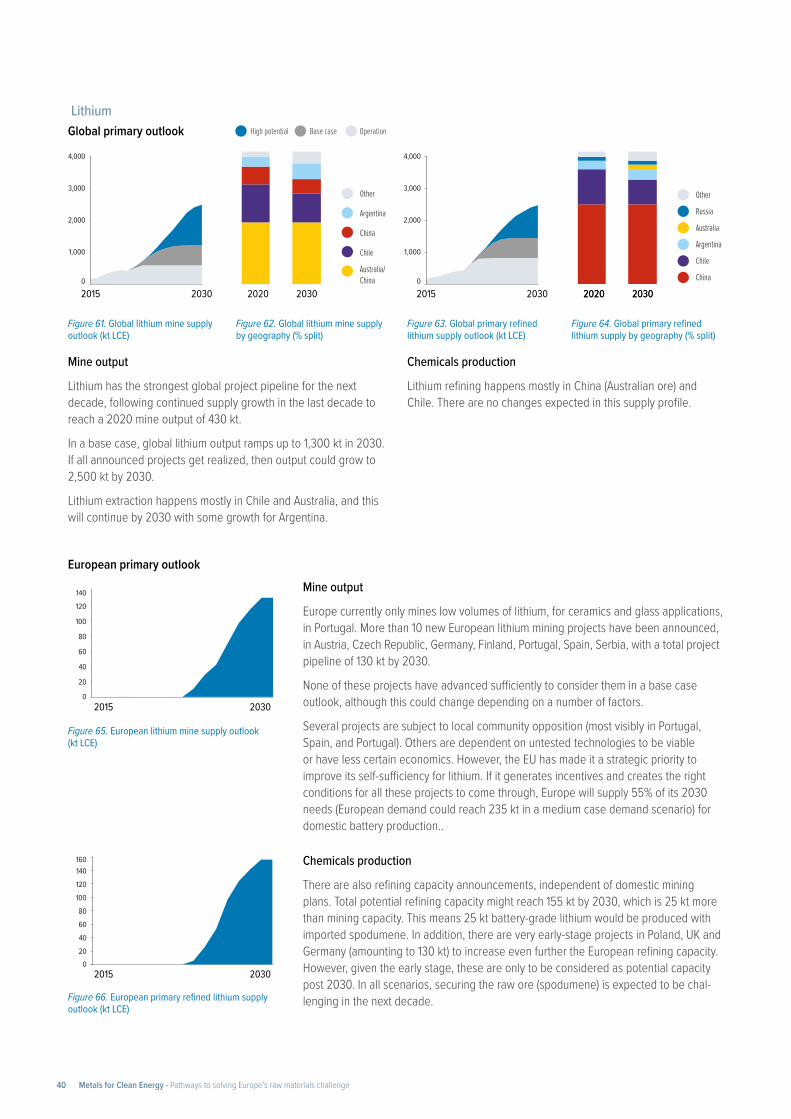
Figure 61. Global lithium mine supply outlook (kt LCE)
Figure 65. European lithium mine supply outlook (kt LCE)
Figure 66. European primary refined lithium supply outlook (kt LCE)
Figure 62. Global lithium mine supply by geography (% split)
Figure 63. Global primary refined lithium supply outlook (kt LCE)
Figure 64. Global primary refined lithium supply by geography (% split)
LithiumGlobal primary outlook
European primary outlook
Mine output
Lithium has the strongest global project pipeline for the next decade, following continued supply growth in the last decade to reach a 2020 mine output of 430 kt.
In a base case, global lithium output ramps up to 1,300 kt in 2030. If all announced projects get realized, then output could grow to 2,500 kt by 2030.
Lithium extraction happens mostly in Chile and Australia, and this will continue by 2030 with some growth for Argentina.
Chemicals production
Lithium refining happens mostly in China (Australian ore) and Chile. There are no changes expected in this supply profile.
Mine output
Europe currently only mines low volumes of lithium, for ceramics and glass applications, in Portugal. More than 10 new European lithium mining projects have been announced, in Austria, Czech Republic, Germany, Finland, Portugal, Spain, Serbia, with a total project pipeline of 130 kt by 2030.
None of these projects have advanced sufficiently to consider them in a base case outlook, although this could change depending on a number of factors.
Several projects are subject to local community opposition (most visibly in Portugal, Spain, and Portugal). Others are dependent on untested technologies to be viable or have less certain economics. However, the EU has made it a strategic priority to improve its self-sufficiency for lithium. If it generates incentives and creates the right conditions for all these projects to come through, Europe will supply 55% of its 2030 needs (European demand could reach 235 kt in a medium case demand scenario) for domestic battery production..
Chemicals production
There are also refining capacity announcements, independent of domestic mining plans. Total potential refining capacity might reach 155 kt by 2030, which is 25 kt more than mining capacity. This means 25 kt battery-grade lithium would be produced with imported spodumene. In addition, there are very early-stage projects in Poland, UK and Germany (amounting to 130 kt) to increase even further the European refining capacity. However, given the early stage, these are only to be considered as potential capacity post 2030. In all scenarios, securing the raw ore (spodumene) is expected to be chal-lenging in the next decade.
2015 2030
2,000
4,000
3,000
1,000
0
20302020
Other
Argentina
China
Chile
Australia/China
2015 2030
2,000
4,000
3,000
1,000
0
20302020
Other
Russia
Australia
Argentina
Chile
China
20302020
20302015
40
80
60
20
100
120
140
0
66
2030
40
80
60
20
100
120
140160
02015
High potential Base case Operation
Metals for Clean Energy - Pathways to solving Europe’s raw materials challenge40
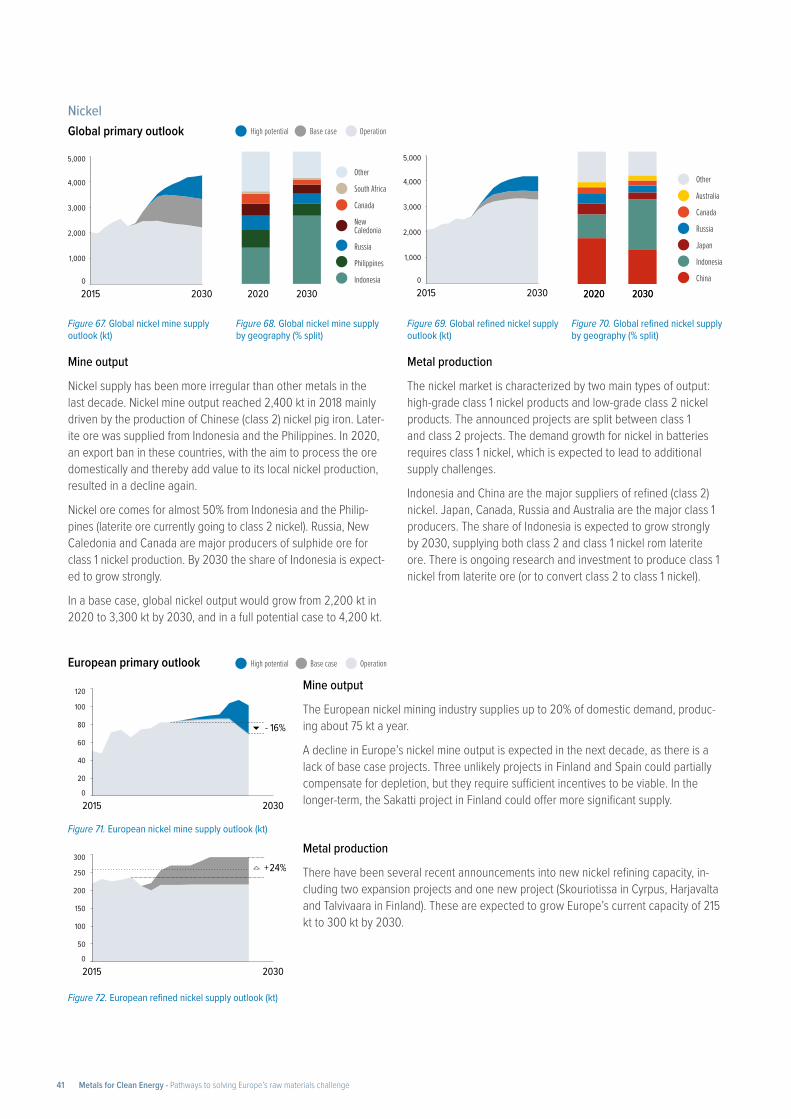
Figure 67. Global nickel mine supply outlook (kt)
Figure 71. European nickel mine supply outlook (kt)
Figure 72. European refined nickel supply outlook (kt)
Figure 68. Global nickel mine supply by geography (% split)
Figure 69. Global refined nickel supply outlook (kt)
Figure 70. Global refined nickel supply by geography (% split)
NickelGlobal primary outlook
European primary outlook
Mine output
Nickel supply has been more irregular than other metals in the last decade. Nickel mine output reached 2,400 kt in 2018 mainly driven by the production of Chinese (class 2) nickel pig iron. Later-ite ore was supplied from Indonesia and the Philippines. In 2020, an export ban in these countries, with the aim to process the ore domestically and thereby add value to its local nickel production, resulted in a decline again.
Nickel ore comes for almost 50% from Indonesia and the Philip-pines (laterite ore currently going to class 2 nickel). Russia, New Caledonia and Canada are major producers of sulphide ore for class 1 nickel production. By 2030 the share of Indonesia is expect-ed to grow strongly.
In a base case, global nickel output would grow from 2,200 kt in 2020 to 3,300 kt by 2030, and in a full potential case to 4,200 kt.
Metal production
The nickel market is characterized by two main types of output: high-grade class 1 nickel products and low-grade class 2 nickel products. The announced projects are split between class 1 and class 2 projects. The demand growth for nickel in batteries requires class 1 nickel, which is expected to lead to additional supply challenges.
Indonesia and China are the major suppliers of refined (class 2) nickel. Japan, Canada, Russia and Australia are the major class 1 producers. The share of Indonesia is expected to grow strongly by 2030, supplying both class 2 and class 1 nickel rom laterite ore. There is ongoing research and investment to produce class 1 nickel from laterite ore (or to convert class 2 to class 1 nickel).
Mine output
The European nickel mining industry supplies up to 20% of domestic demand, produc-ing about 75 kt a year.
A decline in Europe’s nickel mine output is expected in the next decade, as there is a lack of base case projects. Three unlikely projects in Finland and Spain could partially compensate for depletion, but they require sufficient incentives to be viable. In the longer-term, the Sakatti project in Finland could offer more significant supply.
Metal production
There have been several recent announcements into new nickel refining capacity, in-cluding two expansion projects and one new project (Skouriotissa in Cyrpus, Harjavalta and Talvivaara in Finland). These are expected to grow Europe’s current capacity of 215 kt to 300 kt by 2030.
67
2015 2030
1,000
2,000
3,000
4,000
0
5,000
68
20302020
Other
South Africa
Canada
NewCaledonia
Russia
Philippines
Indonesia2015 2030
1,000
2,000
3,000
4,000
0
5,000
20302020 20302020
Other
Australia
Canada
Russia
Japan
Indonesia
China
72
2015 2030
20
40
60
80
0
120
100
- 16%
+ 24%
2015 2030
50
100
150
200
0
300
250
High potential Base case Operation
High potential Base case Operation
Metals for Clean Energy - Pathways to solving Europe’s raw materials challenge41
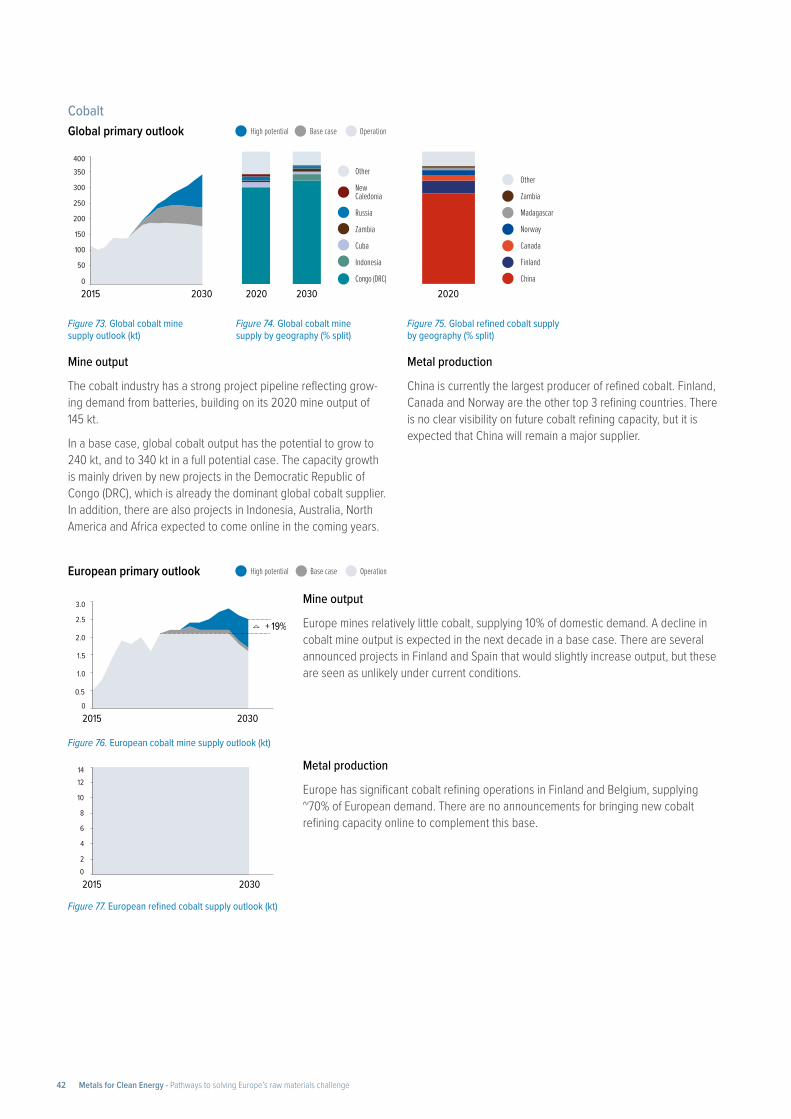
Figure 73. Global cobalt mine supply outlook (kt)
Figure 76. European cobalt mine supply outlook (kt)
Figure 77. European refined cobalt supply outlook (kt)
Figure 74. Global cobalt mine supply by geography (% split)
Figure 75. Global refined cobalt supply by geography (% split)
CobaltGlobal primary outlook
European primary outlook
Mine output
The cobalt industry has a strong project pipeline reflecting grow-ing demand from batteries, building on its 2020 mine output of 145 kt.
In a base case, global cobalt output has the potential to grow to 240 kt, and to 340 kt in a full potential case. The capacity growth is mainly driven by new projects in the Democratic Republic of Congo (DRC), which is already the dominant global cobalt supplier. In addition, there are also projects in Indonesia, Australia, North America and Africa expected to come online in the coming years.
Metal production
China is currently the largest producer of refined cobalt. Finland, Canada and Norway are the other top 3 refining countries. There is no clear visibility on future cobalt refining capacity, but it is expected that China will remain a major supplier.
Mine output
Europe mines relatively little cobalt, supplying 10% of domestic demand. A decline in cobalt mine output is expected in the next decade in a base case. There are several announced projects in Finland and Spain that would slightly increase output, but these are seen as unlikely under current conditions.
Metal production
Europe has significant cobalt refining operations in Finland and Belgium, supplying ~70% of European demand. There are no announcements for bringing new cobalt refining capacity online to complement this base.
2015 2030
100
200
150
50
250
300
350
400
0
20302020
Other
New Caledonia
Russia
Zambia
Cuba
Indonesia
Congo (DRC)
Other
Zambia
Madagascar
Norway
Canada
Finland
China
2020
77
2015 2030
1.0
1.5
2.0
2.5
3.0
0.5
0
+ 19%
2015 2030
4
8
6
2
10
1214
0
High potential Base case Operation
High potential Base case Operation
Metals for Clean Energy - Pathways to solving Europe’s raw materials challenge42
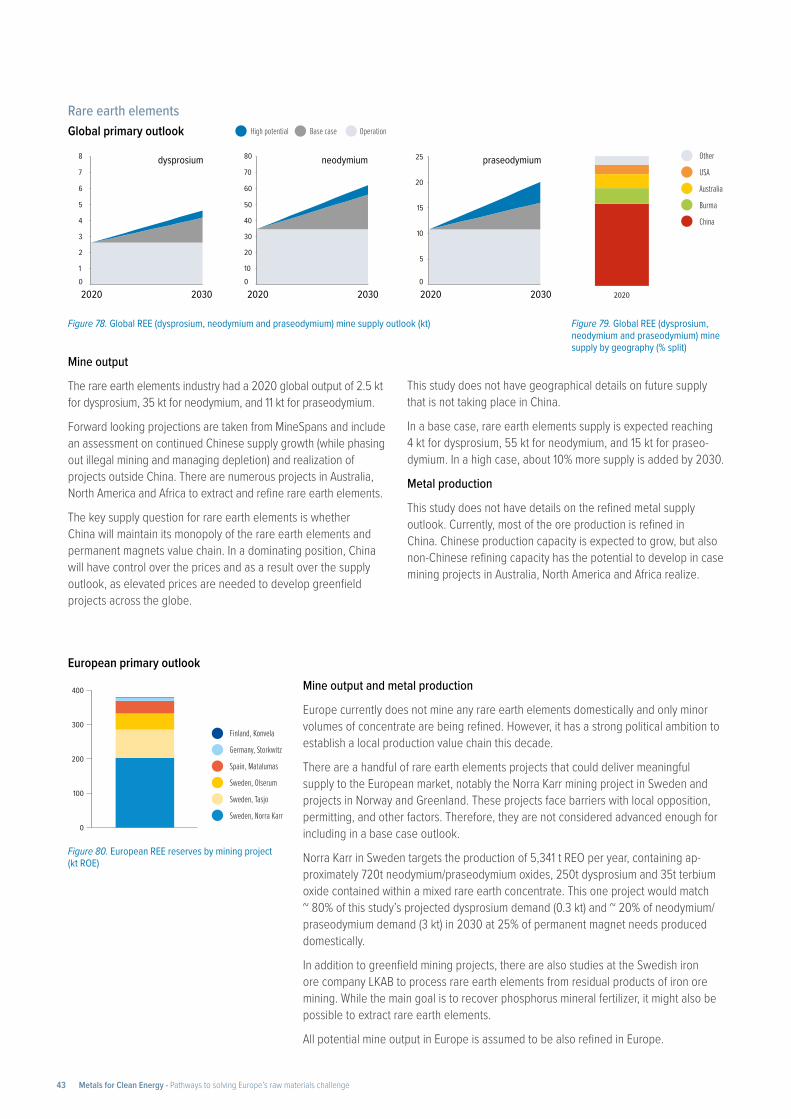
Figure 78. Global REE (dysprosium, neodymium and praseodymium) mine supply outlook (kt)
Figure 80. European REE reserves by mining project (kt ROE)
Figure 79. Global REE (dysprosium, neodymium and praseodymium) mine supply by geography (% split)
Rare earth elementsGlobal primary outlook
European primary outlook
Mine output
The rare earth elements industry had a 2020 global output of 2.5 kt for dysprosium, 35 kt for neodymium, and 11 kt for praseodymium.
Forward looking projections are taken from MineSpans and include an assessment on continued Chinese supply growth (while phasing out illegal mining and managing depletion) and realization of projects outside China. There are numerous projects in Australia, North America and Africa to extract and refine rare earth elements.
The key supply question for rare earth elements is whether China will maintain its monopoly of the rare earth elements and permanent magnets value chain. In a dominating position, China will have control over the prices and as a result over the supply outlook, as elevated prices are needed to develop greenfield projects across the globe.
This study does not have geographical details on future supply that is not taking place in China.
In a base case, rare earth elements supply is expected reaching 4 kt for dysprosium, 55 kt for neodymium, and 15 kt for praseo-dymium. In a high case, about 10% more supply is added by 2030.
Metal production
This study does not have details on the refined metal supply outlook. Currently, most of the ore production is refined in China. Chinese production capacity is expected to grow, but also non-Chinese refining capacity has the potential to develop in case mining projects in Australia, North America and Africa realize.
Mine output and metal production
Europe currently does not mine any rare earth elements domestically and only minor volumes of concentrate are being refined. However, it has a strong political ambition to establish a local production value chain this decade.
There are a handful of rare earth elements projects that could deliver meaningful supply to the European market, notably the Norra Karr mining project in Sweden and projects in Norway and Greenland. These projects face barriers with local opposition, permitting, and other factors. Therefore, they are not considered advanced enough for including in a base case outlook.
Norra Karr in Sweden targets the production of 5,341 t REO per year, containing ap-proximately 720t neodymium/praseodymium oxides, 250t dysprosium and 35t terbium oxide contained within a mixed rare earth concentrate. This one project would match ~ 80% of this study’s projected dysprosium demand (0.3 kt) and ~ 20% of neodymium/praseodymium demand (3 kt) in 2030 at 25% of permanent magnet needs produced domestically.
In addition to greenfield mining projects, there are also studies at the Swedish iron ore company LKAB to process rare earth elements from residual products of iron ore mining. While the main goal is to recover phosphorus mineral fertilizer, it might also be possible to extract rare earth elements.
All potential mine output in Europe is assumed to be also refined in Europe.
Finland, Konvela
Germany, Storkwitz
Spain, Matalumas
Sweden, Olserum
Sweden, Tasjo
Sweden, Norra Karr
400
300
200
100
0
2020
Other
USA
Australia
Burma
China
2
4
3
1
5
6
7
8
0
2020 2030 2020 2030
20
40
30
10
50
60
70
80
0
dysprosium neodymium
2020 2030
10
20
15
5
25
0
praseodymium
High potential Base case Operation
Metals for Clean Energy - Pathways to solving Europe’s raw materials challenge43
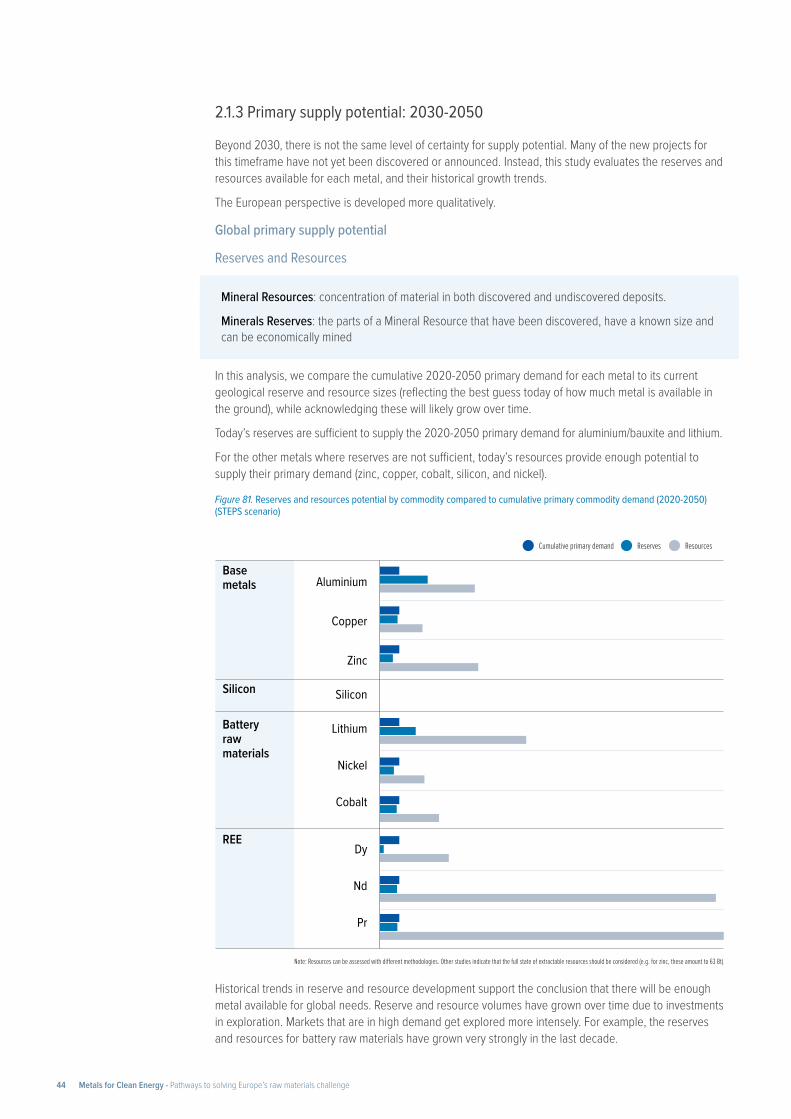
2.1.3 Primary supply potential: 2030-2050
Beyond 2030, there is not the same level of certainty for supply potential. Many of the new projects for this timeframe have not yet been discovered or announced. Instead, this study evaluates the reserves and resources available for each metal, and their historical growth trends.
The European perspective is developed more qualitatively.
Global primary supply potential
Reserves and Resources
Mineral Resources: concentration of material in both discovered and undiscovered deposits.
Minerals Reserves: the parts of a Mineral Resource that have been discovered, have a known size and can be economically mined
In this analysis, we compare the cumulative 2020-2050 primary demand for each metal to its current geological reserve and resource sizes (reflecting the best guess today of how much metal is available in the ground), while acknowledging these will likely grow over time.
Today’s reserves are sufficient to supply the 2020-2050 primary demand for aluminium/bauxite and lithium.
For the other metals where reserves are not sufficient, today’s resources provide enough potential to supply their primary demand (zinc, copper, cobalt, silicon, and nickel).
Figure 81. Reserves and resources potential by commodity compared to cumulative primary commodity demand (2020-2050) (STEPS scenario)
Historical trends in reserve and resource development support the conclusion that there will be enough metal available for global needs. Reserve and resource volumes have grown over time due to investments in exploration. Markets that are in high demand get explored more intensely. For example, the reserves and resources for battery raw materials have grown very strongly in the last decade.
Cumulative primary demand Reserves Resources
Aluminium
Copper
Zinc
Silicon
Lithium
Nickel
Cobalt
Dy
Nd
Pr
Base metals
Silicon
Battery raw materials
REE
Note: Resources can be assessed with di�erent methodologies. Other studies indicate that the full state of extractable resources should be considered (e.g. for zinc, these amount to 63 Bt).
Metals for Clean Energy - Pathways to solving Europe’s raw materials challenge44
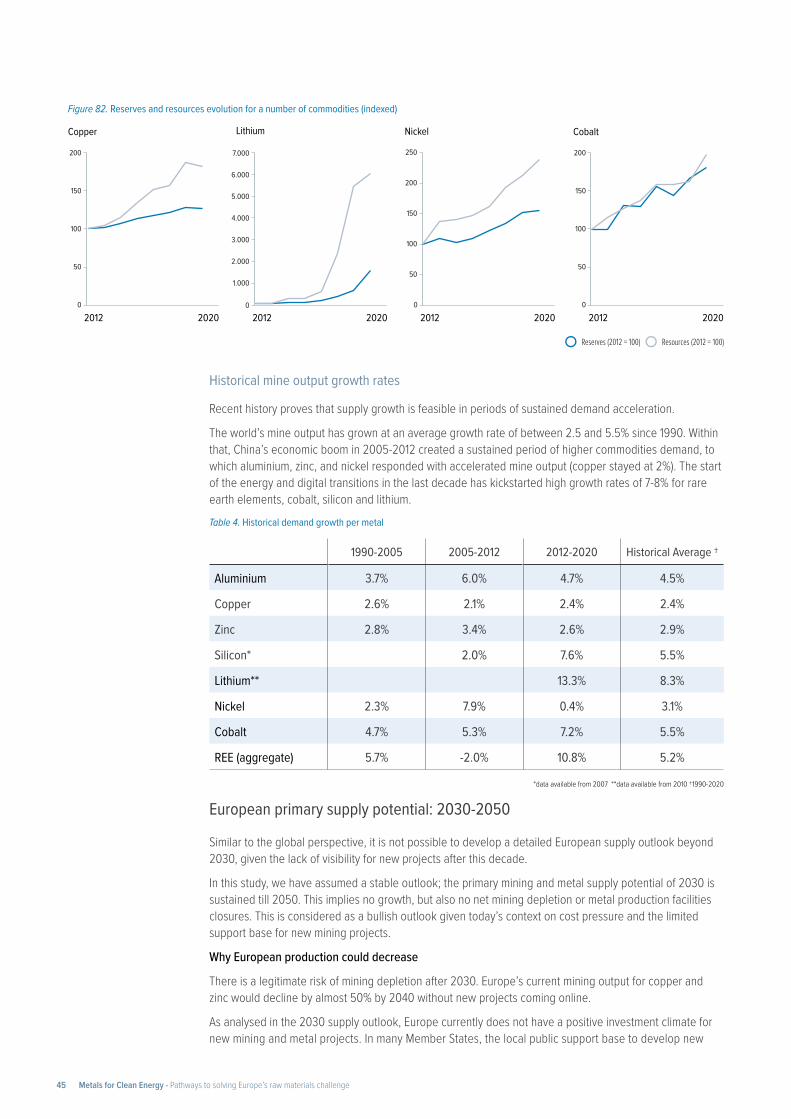
Figure 82. Reserves and resources evolution for a number of commodities (indexed)
Reserves (2012 = 100) Resources (2012 = 100)
Copper Lithium Nickel Cobalt
200
150
100
50
0
2012 2020
200
250
150
100
50
0
2012 2020
4.000
5.000
6.000
7.000
3.000
2.000
1.000
02012 2020
200
150
100
50
0
2012 2020
Historical mine output growth rates
Recent history proves that supply growth is feasible in periods of sustained demand acceleration.
The world’s mine output has grown at an average growth rate of between 2.5 and 5.5% since 1990. Within that, China’s economic boom in 2005-2012 created a sustained period of higher commodities demand, to which aluminium, zinc, and nickel responded with accelerated mine output (copper stayed at 2%). The start of the energy and digital transitions in the last decade has kickstarted high growth rates of 7-8% for rare earth elements, cobalt, silicon and lithium. Table 4. Historical demand growth per metal
1990-2005 2005-2012 2012-2020 Historical Average †
Aluminium 3.7% 6.0% 4.7% 4.5%
Copper 2.6% 2.1% 2.4% 2.4%
Zinc 2.8% 3.4% 2.6% 2.9%
Silicon* 2.0% 7.6% 5.5%
Lithium** 13.3% 8.3%
Nickel 2.3% 7.9% 0.4% 3.1%
Cobalt 4.7% 5.3% 7.2% 5.5%
REE (aggregate) 5.7% -2.0% 10.8% 5.2%
*data available from 2007 **data available from 2010 †1990-2020
European primary supply potential: 2030-2050
Similar to the global perspective, it is not possible to develop a detailed European supply outlook beyond 2030, given the lack of visibility for new projects after this decade.
In this study, we have assumed a stable outlook; the primary mining and metal supply potential of 2030 is sustained till 2050. This implies no growth, but also no net mining depletion or metal production facilities closures. This is considered as a bullish outlook given today’s context on cost pressure and the limited support base for new mining projects.
Why European production could decrease
There is a legitimate risk of mining depletion after 2030. Europe’s current mining output for copper and zinc would decline by almost 50% by 2040 without new projects coming online.
As analysed in the 2030 supply outlook, Europe currently does not have a positive investment climate for new mining and metal projects. In many Member States, the local public support base to develop new
Metals for Clean Energy - Pathways to solving Europe’s raw materials challenge45
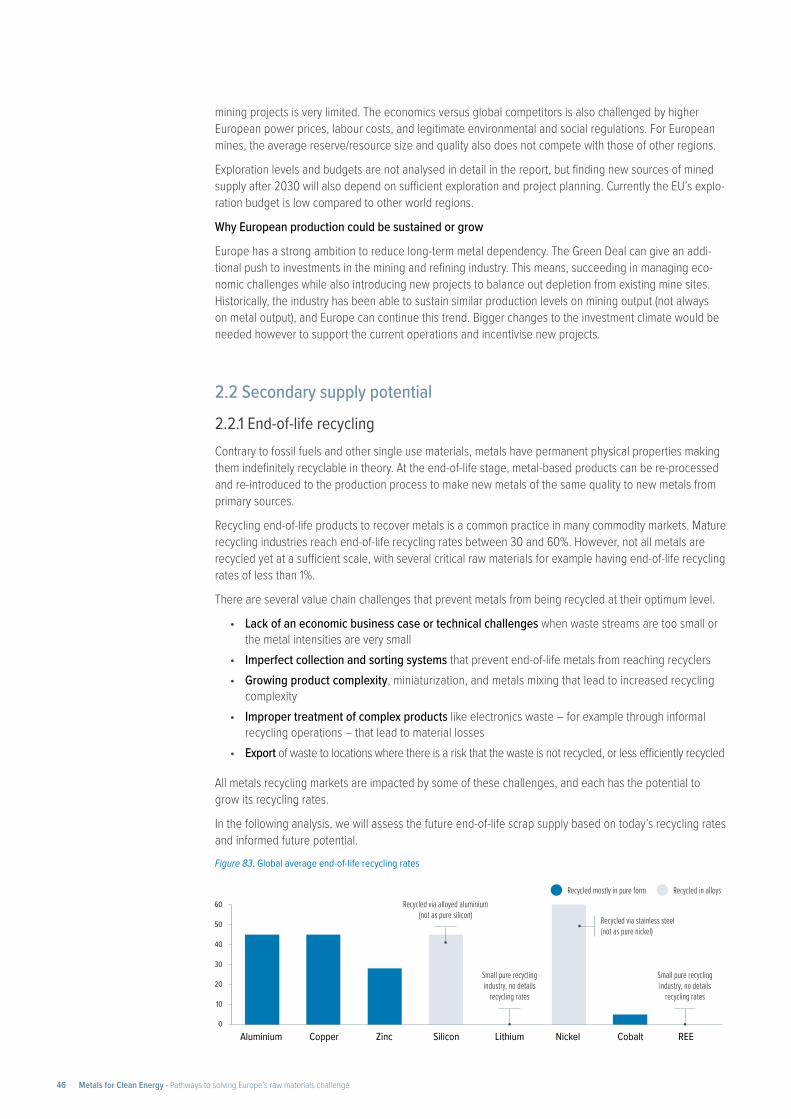
mining projects is very limited. The economics versus global competitors is also challenged by higher European power prices, labour costs, and legitimate environmental and social regulations. For European mines, the average reserve/resource size and quality also does not compete with those of other regions.
Exploration levels and budgets are not analysed in detail in the report, but finding new sources of mined supply after 2030 will also depend on sufficient exploration and project planning. Currently the EU’s explo-ration budget is low compared to other world regions.
Why European production could be sustained or grow
Europe has a strong ambition to reduce long-term metal dependency. The Green Deal can give an addi-tional push to investments in the mining and refining industry. This means, succeeding in managing eco-nomic challenges while also introducing new projects to balance out depletion from existing mine sites. Historically, the industry has been able to sustain similar production levels on mining output (not always on metal output), and Europe can continue this trend. Bigger changes to the investment climate would be needed however to support the current operations and incentivise new projects.
2.2 Secondary supply potential
2.2.1 End-of-life recyclingContrary to fossil fuels and other single use materials, metals have permanent physical properties making them indefinitely recyclable in theory. At the end-of-life stage, metal-based products can be re-processed and re-introduced to the production process to make new metals of the same quality to new metals from primary sources.
Recycling end-of-life products to recover metals is a common practice in many commodity markets. Mature recycling industries reach end-of-life recycling rates between 30 and 60%. However, not all metals are recycled yet at a sufficient scale, with several critical raw materials for example having end-of-life recycling rates of less than 1%.
There are several value chain challenges that prevent metals from being recycled at their optimum level.
• Lack of an economic business case or technical challenges when waste streams are too small or the metal intensities are very small
• Imperfect collection and sorting systems that prevent end-of-life metals from reaching recyclers• Growing product complexity, miniaturization, and metals mixing that lead to increased recycling
complexity• Improper treatment of complex products like electronics waste – for example through informal
recycling operations – that lead to material losses • Export of waste to locations where there is a risk that the waste is not recycled, or less efficiently recycled
All metals recycling markets are impacted by some of these challenges, and each has the potential to grow its recycling rates.
In the following analysis, we will assess the future end-of-life scrap supply based on today’s recycling rates and informed future potential.
Figure 83. Global average end-of-life recycling rates
Recycled mostly in pure form Recycled in alloys60
50
40
30
20
10
0Aluminium Copper Zinc Silicon Lithium Nickel Cobalt REE
Small pure recycling industry, no details
recycling rates
Recycled via alloyed aluminium (not as pure silicon) Recycled via stainless steel
(not as pure nickel)
Small pure recycling industry, no details
recycling rates
Metals for Clean Energy - Pathways to solving Europe’s raw materials challenge46
The recycling process consists of different steps.
• Collection of the end-of-life products
• Sorting and pre-processing of the waste streams. End-of-life products need to be broken (or cut, crushed etc.) up into small pieces to liberate and sort the different mixed materials. Sometimes pure streams can be separated, but often metals & materials are functionally attached to each other and can only be split via a metallurgical process. However, metals do not always need to be recovered on a pure commodity basis; alloyed metals will often be recycled as alloyed metal (stainless steel, galvanized steel, aluminium alloys, brass, …)
• End-processing of metals by metallurgical processing of the sorted waste streams. Pyrometallur-gical and hydrometallurgical technologies are used to separate the different metals. The flowsheet will depend on the type of waste stream and the metals that are recovered. Often economic choic-es are made on which materials to recover, and which not.
2.2.2 Secondary supply potential and the impact on primary demand
In this section, the secondary supply and primary metal demand projections are developed for the com-modities in scope. Four scenarios are made for each metal:
1. Global secondary supply potential2. Impact on global primary demand3. European secondary supply potential4. Impact on European primary demand
Between now and 2050, the end-of-life secondary supply for all metals is expected to grow. This is driven by two factors:
• The world’s historically growing metal consumption is leading to an ever-growing metal-in-use stock and more scrap available to recycle each year
• Continued optimisation to collection and processing leading to higher end-of-life recycling rates
Secondary metals supply is limited by the amount of metal that will be available in scrap or end-of-life pro-duction, as well as the effectiveness of the recycling system. Metals have a varying average lifetime in the economy (e.g. 30 years for copper) and given their historical growth rates there remains a gap between available secondary material and demand.
To maximise supply potential, global and European actors must overcome several bottlenecks in the collection, sorting, and recycling systems for all existing and emerging metals waste streams.
Global secondary supply potential
• For mature base metals recycling markets (i.e. aluminium, copper, zinc), major recycling growth will mainly be driven by optimisation of the existing recycling value chain (collection, sorting, and recycling improvements).
• New recycling industries (i.e. silicon, lithium, pure cobalt and nickel, rare earth elements) will grow rapidly once clean energy technology waste starts to become available in meaningful volumes post 2035-2040, when the first generation of technologies start to be replaced at scale.
Across metals, the growth of secondary supply has the potential to mitigate further demand growth once it reaches meaningful volumes.
Impact on global primary demand
Across metals, the projected supply growth of end-of-life scrap softens the demand for primary metals and ore. For battery metals and rare earth elements, increased scrap supply post-2040 has the potential to limit the need for further primary demand growth (for cobalt), or even result in a decline of primary demand (for lithium).
Metals for Clean Energy - Pathways to solving Europe’s raw materials challenge47
European secondary supply potential
European secondary supply is expected to grow across all metals in the next three decades.
• For the mature base metals markets (aluminium, copper, zinc), the main lever Europe has to increase its current recycling rates is to continue recycling optimisation (collection and sorting), on top of some more metal in stock becoming available to recycle.
• For high growth markets (silicon in solar photovoltaics, battery raw materials in electric vehicle bat-teries; rare earth elements in permanent magnets), Europe will need to start/scale up new recycling processes and capacity for treating clean energy technologies waste.
2.2.3 Commodity deep dives (Tier 1 commodities)
For base metals the secondary supply potential is quantified for new scrap (production scrap or pre-con-sumer scrap) and old scrap (end-of-life scrap or post-consumer scrap).
For the other metals, the perspective is limited to end-of-life scrap as industry statistics are not complete yet on a global level to make a full analysis possible.
For batteries and other emerging waste streams, a high percentage of today’s scrap is from the produc-tion process (e.g. production scrap represents over 90% of total scrap availability in the next five years). This evolution is hard to quantify, as producers will become more efficient as their technology production ramps up. The study’s focus remains on end-of-life scrap which has the biggest long-term impact.
Metals for Clean Energy - Pathways to solving Europe’s raw materials challenge48
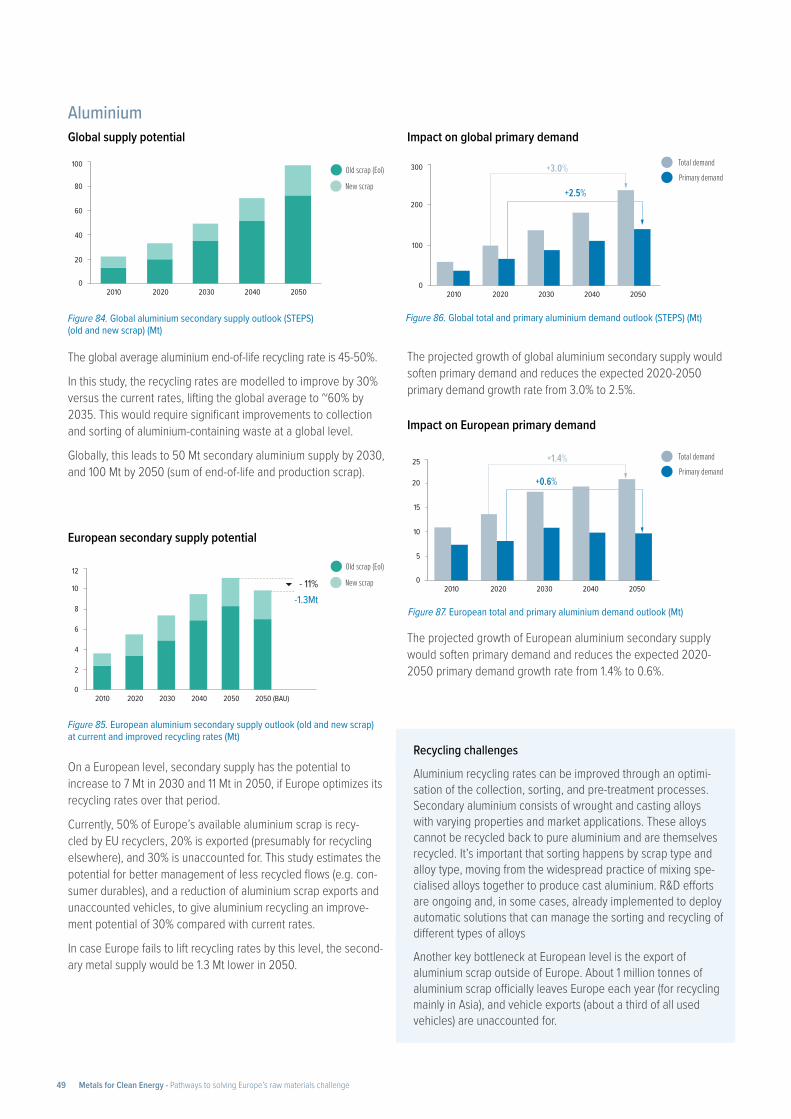
100
80
40
20
0
60
2010 2020 2030 2040 2050
12
10
2
0
8
6
4
2010 2020 2030 2040 2050 2050 (BAU)
- 11%-1.3Mt
200
300
100
02010 2020 2030 2040 2050
+3.0%
+2.5%
Figure 84. Global aluminium secondary supply outlook (STEPS) (old and new scrap) (Mt)
Figure 85. European aluminium secondary supply outlook (old and new scrap) at current and improved recycling rates (Mt)
Figure 86. Global total and primary aluminium demand outlook (STEPS) (Mt)
20
15
25
5
10
02010 2020 2030 2040 2050
+1.4%
+0.6%
Figure 87. European total and primary aluminium demand outlook (Mt)
The global average aluminium end-of-life recycling rate is 45-50%.
In this study, the recycling rates are modelled to improve by 30% versus the current rates, lifting the global average to ~60% by 2035. This would require significant improvements to collection and sorting of aluminium-containing waste at a global level.
Globally, this leads to 50 Mt secondary aluminium supply by 2030, and 100 Mt by 2050 (sum of end-of-life and production scrap).
On a European level, secondary supply has the potential to increase to 7 Mt in 2030 and 11 Mt in 2050, if Europe optimizes its recycling rates over that period.
Currently, 50% of Europe’s available aluminium scrap is recy-cled by EU recyclers, 20% is exported (presumably for recycling elsewhere), and 30% is unaccounted for. This study estimates the potential for better management of less recycled flows (e.g. con-sumer durables), and a reduction of aluminium scrap exports and unaccounted vehicles, to give aluminium recycling an improve-ment potential of 30% compared with current rates.
In case Europe fails to lift recycling rates by this level, the second-ary metal supply would be 1.3 Mt lower in 2050.
The projected growth of global aluminium secondary supply would soften primary demand and reduces the expected 2020-2050 primary demand growth rate from 3.0% to 2.5%.
The projected growth of European aluminium secondary supply would soften primary demand and reduces the expected 2020-2050 primary demand growth rate from 1.4% to 0.6%.
Recycling challenges
Aluminium recycling rates can be improved through an optimi-sation of the collection, sorting, and pre-treatment processes. Secondary aluminium consists of wrought and casting alloys with varying properties and market applications. These alloys cannot be recycled back to pure aluminium and are themselves recycled. It’s important that sorting happens by scrap type and alloy type, moving from the widespread practice of mixing spe-cialised alloys together to produce cast aluminium. R&D efforts are ongoing and, in some cases, already implemented to deploy automatic solutions that can manage the sorting and recycling of different types of alloys
Another key bottleneck at European level is the export of aluminium scrap outside of Europe. About 1 million tonnes of aluminium scrap officially leaves Europe each year (for recycling mainly in Asia), and vehicle exports (about a third of all used vehicles) are unaccounted for.
AluminiumGlobal supply potential
European secondary supply potential
Impact on global primary demand
Impact on European primary demand
Old scrap (Eol)
Old scrap (Eol)
New scrap
New scrap
Total demand
Total demand
Primary demand
Primary demand
Metals for Clean Energy - Pathways to solving Europe’s raw materials challenge49
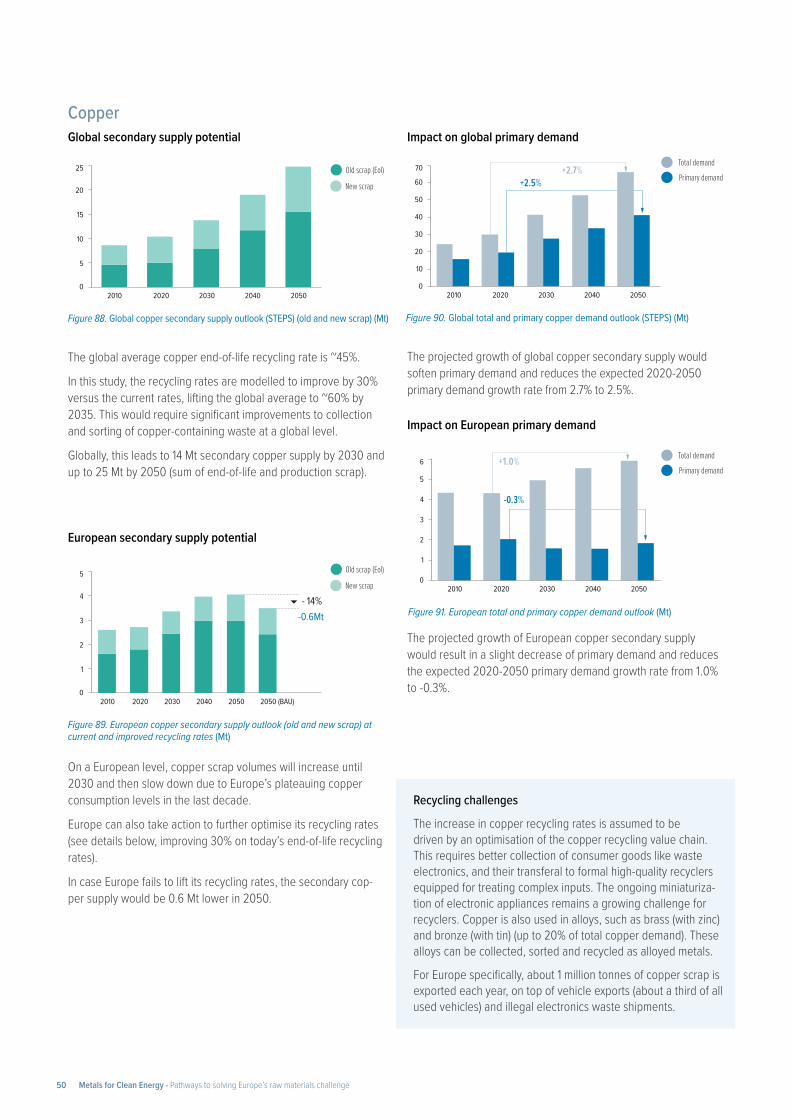
25
20
10
5
0
15
2010 2020 2030 2040 2050
2010 2020 2030 2040 2050 2050 (BAU)
- 14%-0.6Mt
5
4
2
1
0
3
60
70
10
0
20
30
40
50
2010 2020 2030 2040 2050
+2.7% +2.5%
Figure 88. Global copper secondary supply outlook (STEPS) (old and new scrap) (Mt)
Figure 89. European copper secondary supply outlook (old and new scrap) at current and improved recycling rates (Mt)
Figure 90. Global total and primary copper demand outlook (STEPS) (Mt)
5
4
6
2
3
0
1
2010 2020 2030 2040 2050
+1.0%
-0.3%
Figure 91. European total and primary copper demand outlook (Mt)
The global average copper end-of-life recycling rate is ~45%.
In this study, the recycling rates are modelled to improve by 30% versus the current rates, lifting the global average to ~60% by 2035. This would require significant improvements to collection and sorting of copper-containing waste at a global level.
Globally, this leads to 14 Mt secondary copper supply by 2030 and up to 25 Mt by 2050 (sum of end-of-life and production scrap).
On a European level, copper scrap volumes will increase until 2030 and then slow down due to Europe’s plateauing copper consumption levels in the last decade.
Europe can also take action to further optimise its recycling rates (see details below, improving 30% on today’s end-of-life recycling rates).
In case Europe fails to lift its recycling rates, the secondary cop-per supply would be 0.6 Mt lower in 2050.
The projected growth of global copper secondary supply would soften primary demand and reduces the expected 2020-2050 primary demand growth rate from 2.7% to 2.5%.
The projected growth of European copper secondary supply would result in a slight decrease of primary demand and reduces the expected 2020-2050 primary demand growth rate from 1.0% to -0.3%.
Recycling challenges
The increase in copper recycling rates is assumed to be driven by an optimisation of the copper recycling value chain. This requires better collection of consumer goods like waste electronics, and their transferal to formal high-quality recyclers equipped for treating complex inputs. The ongoing miniaturiza-tion of electronic appliances remains a growing challenge for recyclers. Copper is also used in alloys, such as brass (with zinc) and bronze (with tin) (up to 20% of total copper demand). These alloys can be collected, sorted and recycled as alloyed metals.
For Europe specifically, about 1 million tonnes of copper scrap is exported each year, on top of vehicle exports (about a third of all used vehicles) and illegal electronics waste shipments.
Copper Global secondary supply potential
European secondary supply potential
Impact on global primary demand
Impact on European primary demand
Old scrap (Eol)
New scrap
Total demandPrimary demand
Old scrap (Eol)
New scrap
Total demandPrimary demand
Metals for Clean Energy - Pathways to solving Europe’s raw materials challenge50
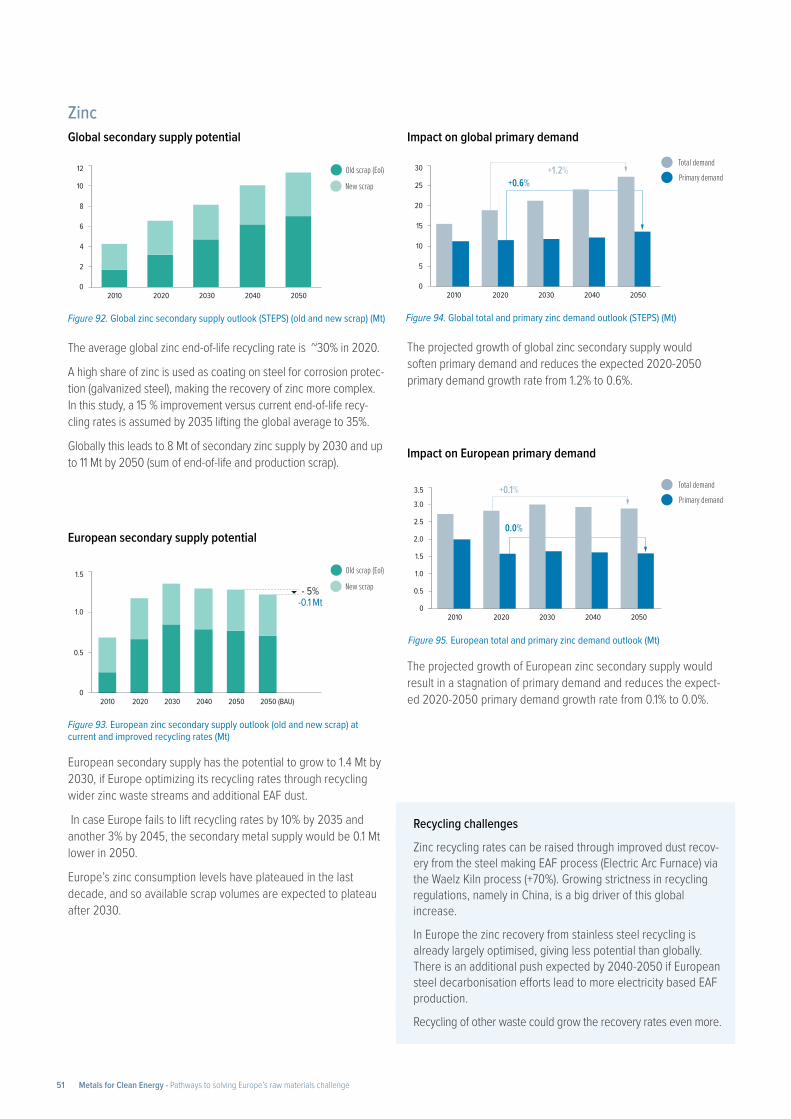
2010 2020 2030 2040 2050
10
8
12
4
6
0
2
2010 2020 2030 2040 2050 2050 (BAU)
- 5%-0.1 Mt
1.0
1.5
0.5
0
25
20
30
10
15
0
5
2010 2020 2030 2040 2050
+1.2% +0.6%
Figure 92. Global zinc secondary supply outlook (STEPS) (old and new scrap) (Mt)
Figure 93. European zinc secondary supply outlook (old and new scrap) at current and improved recycling rates (Mt)
Figure 94. Global total and primary zinc demand outlook (STEPS) (Mt)
2010 2020 2030 2040 2050
+0.1%
0.0%
3.0
3.5
0.5
0
1.0
1.5
2.0
2.5
Figure 95. European total and primary zinc demand outlook (Mt)
The average global zinc end-of-life recycling rate is ~30% in 2020.
A high share of zinc is used as coating on steel for corrosion protec-tion (galvanized steel), making the recovery of zinc more complex. In this study, a 15 % improvement versus current end-of-life recy-cling rates is assumed by 2035 lifting the global average to 35%.
Globally this leads to 8 Mt of secondary zinc supply by 2030 and up to 11 Mt by 2050 (sum of end-of-life and production scrap).
European secondary supply has the potential to grow to 1.4 Mt by 2030, if Europe optimizing its recycling rates through recycling wider zinc waste streams and additional EAF dust.
In case Europe fails to lift recycling rates by 10% by 2035 and another 3% by 2045, the secondary metal supply would be 0.1 Mt lower in 2050.
Europe’s zinc consumption levels have plateaued in the last decade, and so available scrap volumes are expected to plateau after 2030.
The projected growth of global zinc secondary supply would soften primary demand and reduces the expected 2020-2050 primary demand growth rate from 1.2% to 0.6%.
The projected growth of European zinc secondary supply would result in a stagnation of primary demand and reduces the expect-ed 2020-2050 primary demand growth rate from 0.1% to 0.0%.
Recycling challenges
Zinc recycling rates can be raised through improved dust recov-ery from the steel making EAF process (Electric Arc Furnace) via the Waelz Kiln process (+70%). Growing strictness in recycling regulations, namely in China, is a big driver of this global increase.
In Europe the zinc recovery from stainless steel recycling is already largely optimised, giving less potential than globally. There is an additional push expected by 2040-2050 if European steel decarbonisation efforts lead to more electricity based EAF production.
Recycling of other waste could grow the recovery rates even more.
ZincGlobal secondary supply potential
European secondary supply potential
Impact on global primary demand
Impact on European primary demand
Old scrap (Eol)
New scrap
Total demandPrimary demand
Old scrap (Eol)
New scrap
Total demandPrimary demand
Metals for Clean Energy - Pathways to solving Europe’s raw materials challenge51
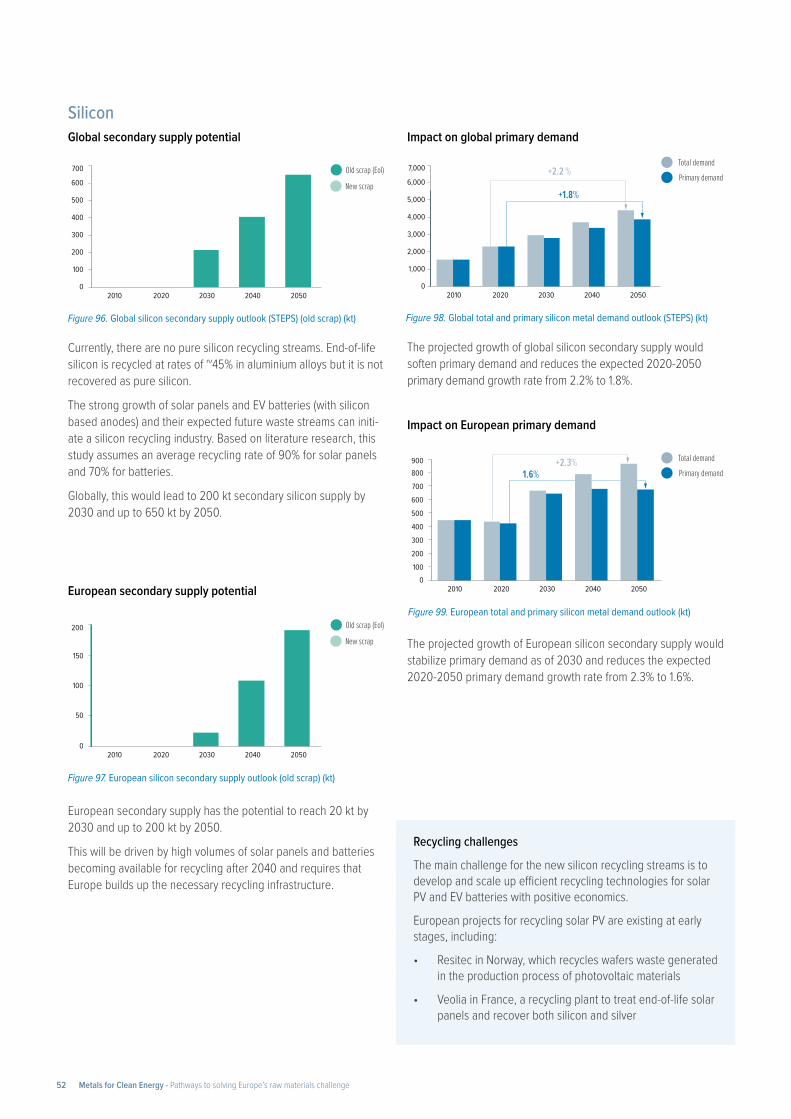
2010 2020 2030 2040 2050
600
700
100
0
200
300
400
500
100
200
50
0
150
2010 2020 2030 2040 2050
2010 2020 2030 2040 2050
+2.2 %
+1.8% 6,000
7,000
1,000
0
2,000
3,000
4,000
5,000
Figure 96. Global silicon secondary supply outlook (STEPS) (old scrap) (kt)
Figure 97. European silicon secondary supply outlook (old scrap) (kt)
Figure 98. Global total and primary silicon metal demand outlook (STEPS) (kt)
2010 2020 2030 2040 2050
+2.3% 1.6% 800
900
300
0
200
100
400
500
600
700
Figure 99. European total and primary silicon metal demand outlook (kt)
Currently, there are no pure silicon recycling streams. End-of-life silicon is recycled at rates of ~45% in aluminium alloys but it is not recovered as pure silicon.
The strong growth of solar panels and EV batteries (with silicon based anodes) and their expected future waste streams can initi-ate a silicon recycling industry. Based on literature research, this study assumes an average recycling rate of 90% for solar panels and 70% for batteries.
Globally, this would lead to 200 kt secondary silicon supply by 2030 and up to 650 kt by 2050.
European secondary supply has the potential to reach 20 kt by 2030 and up to 200 kt by 2050.
This will be driven by high volumes of solar panels and batteries becoming available for recycling after 2040 and requires that Europe builds up the necessary recycling infrastructure.
The projected growth of global silicon secondary supply would soften primary demand and reduces the expected 2020-2050 primary demand growth rate from 2.2% to 1.8%.
The projected growth of European silicon secondary supply would stabilize primary demand as of 2030 and reduces the expected 2020-2050 primary demand growth rate from 2.3% to 1.6%.
Recycling challenges
The main challenge for the new silicon recycling streams is to develop and scale up efficient recycling technologies for solar PV and EV batteries with positive economics.
European projects for recycling solar PV are existing at early stages, including:
• Resitec in Norway, which recycles wafers waste generated in the production process of photovoltaic materials
• Veolia in France, a recycling plant to treat end-of-life solar panels and recover both silicon and silver
SiliconGlobal secondary supply potential
European secondary supply potential
Impact on global primary demand
Impact on European primary demand
Old scrap (Eol)
New scrap
Total demandPrimary demand
Old scrap (Eol)
New scrap
Total demandPrimary demand
Metals for Clean Energy - Pathways to solving Europe’s raw materials challenge52
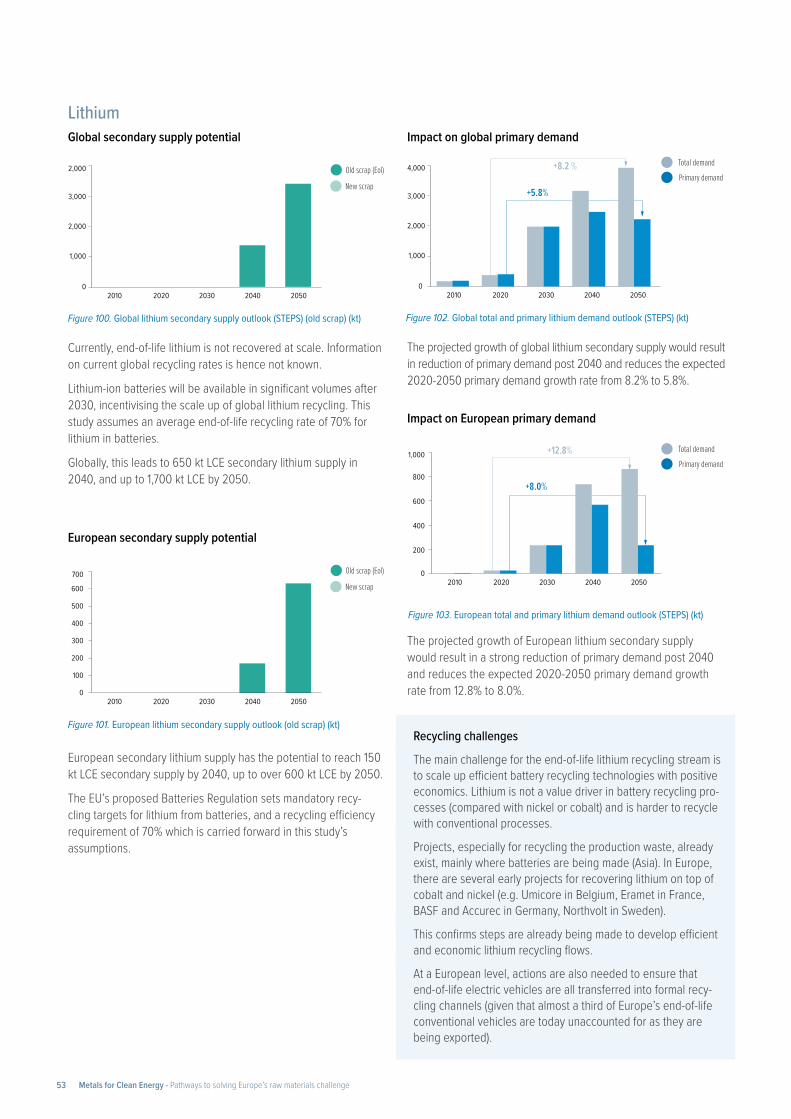
2010 2020 2030 2040 2050
2,000
2,000
1,000
0
3,000
2010 2020 2030 2040 2050
600
700
100
0
200
300
400
500
2010 2020 2030 2040 2050
+8.2 %
+5.8%
2,000
4,000
1,000
0
3,000
Figure 100. Global lithium secondary supply outlook (STEPS) (old scrap) (kt)
Figure 101. European lithium secondary supply outlook (old scrap) (kt)
Figure 102. Global total and primary lithium demand outlook (STEPS) (kt)
2010 2020 2030 2040 2050
+12.8%
+8.0%
1,000
800
400
200
0
600
Figure 103. European total and primary lithium demand outlook (STEPS) (kt)
Currently, end-of-life lithium is not recovered at scale. Information on current global recycling rates is hence not known.
Lithium-ion batteries will be available in significant volumes after 2030, incentivising the scale up of global lithium recycling. This study assumes an average end-of-life recycling rate of 70% for lithium in batteries.
Globally, this leads to 650 kt LCE secondary lithium supply in 2040, and up to 1,700 kt LCE by 2050.
European secondary lithium supply has the potential to reach 150 kt LCE secondary supply by 2040, up to over 600 kt LCE by 2050.
The EU’s proposed Batteries Regulation sets mandatory recy-cling targets for lithium from batteries, and a recycling efficiency requirement of 70% which is carried forward in this study’s assumptions.
The projected growth of global lithium secondary supply would result in reduction of primary demand post 2040 and reduces the expected 2020-2050 primary demand growth rate from 8.2% to 5.8%.
The projected growth of European lithium secondary supply would result in a strong reduction of primary demand post 2040 and reduces the expected 2020-2050 primary demand growth rate from 12.8% to 8.0%.
Recycling challenges
The main challenge for the end-of-life lithium recycling stream is to scale up efficient battery recycling technologies with positive economics. Lithium is not a value driver in battery recycling pro-cesses (compared with nickel or cobalt) and is harder to recycle with conventional processes.
Projects, especially for recycling the production waste, already exist, mainly where batteries are being made (Asia). In Europe, there are several early projects for recovering lithium on top of cobalt and nickel (e.g. Umicore in Belgium, Eramet in France, BASF and Accurec in Germany, Northvolt in Sweden).
This confirms steps are already being made to develop efficient and economic lithium recycling flows.
At a European level, actions are also needed to ensure that end-of-life electric vehicles are all transferred into formal recy-cling channels (given that almost a third of Europe’s end-of-life conventional vehicles are today unaccounted for as they are being exported).
LithiumGlobal secondary supply potential
European secondary supply potential
Impact on global primary demand
Impact on European primary demand
Old scrap (Eol)
New scrap
Total demandPrimary demand
Old scrap (Eol)
New scrap
Total demandPrimary demand
Metals for Clean Energy - Pathways to solving Europe’s raw materials challenge53
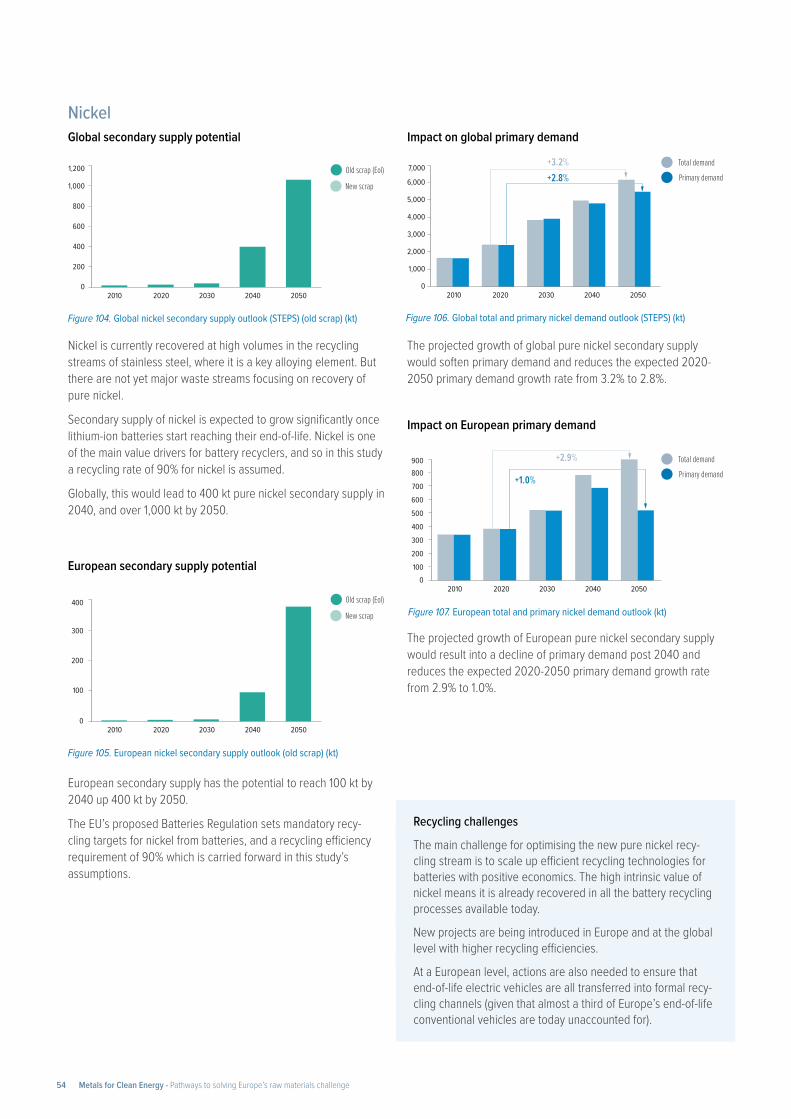
2010 2020 2030 2040 2050
1,000
800
1,200
400
600
0
200
2010 2020 2030 2040 2050
200
400
100
0
300
2010 2020 2030 2040 2050
+3.2% +2.8% 6,000
7,000
1,000
0
2,000
3,000
4,000
5,000
Figure 104. Global nickel secondary supply outlook (STEPS) (old scrap) (kt)
Figure 105. European nickel secondary supply outlook (old scrap) (kt)
Figure 106. Global total and primary nickel demand outlook (STEPS) (kt)
2010 2020 2030 2040 2050
+2.9%
+1.0% 800900
300
0
200
100
400
500
600
700
Figure 107. European total and primary nickel demand outlook (kt)
Nickel is currently recovered at high volumes in the recycling streams of stainless steel, where it is a key alloying element. But there are not yet major waste streams focusing on recovery of pure nickel.
Secondary supply of nickel is expected to grow significantly once lithium-ion batteries start reaching their end-of-life. Nickel is one of the main value drivers for battery recyclers, and so in this study a recycling rate of 90% for nickel is assumed.
Globally, this would lead to 400 kt pure nickel secondary supply in 2040, and over 1,000 kt by 2050.
European secondary supply has the potential to reach 100 kt by 2040 up 400 kt by 2050.
The EU’s proposed Batteries Regulation sets mandatory recy-cling targets for nickel from batteries, and a recycling efficiency requirement of 90% which is carried forward in this study’s assumptions.
The projected growth of global pure nickel secondary supply would soften primary demand and reduces the expected 2020-2050 primary demand growth rate from 3.2% to 2.8%.
The projected growth of European pure nickel secondary supply would result into a decline of primary demand post 2040 and reduces the expected 2020-2050 primary demand growth rate from 2.9% to 1.0%.
Recycling challenges
The main challenge for optimising the new pure nickel recy-cling stream is to scale up efficient recycling technologies for batteries with positive economics. The high intrinsic value of nickel means it is already recovered in all the battery recycling processes available today.
New projects are being introduced in Europe and at the global level with higher recycling efficiencies.
At a European level, actions are also needed to ensure that end-of-life electric vehicles are all transferred into formal recy-cling channels (given that almost a third of Europe’s end-of-life conventional vehicles are today unaccounted for).
NickelGlobal secondary supply potential
European secondary supply potential
Impact on global primary demand
Impact on European primary demand
Old scrap (Eol)
New scrap
Total demandPrimary demand
Old scrap (Eol)
New scrap
Total demandPrimary demand
Metals for Clean Energy - Pathways to solving Europe’s raw materials challenge54
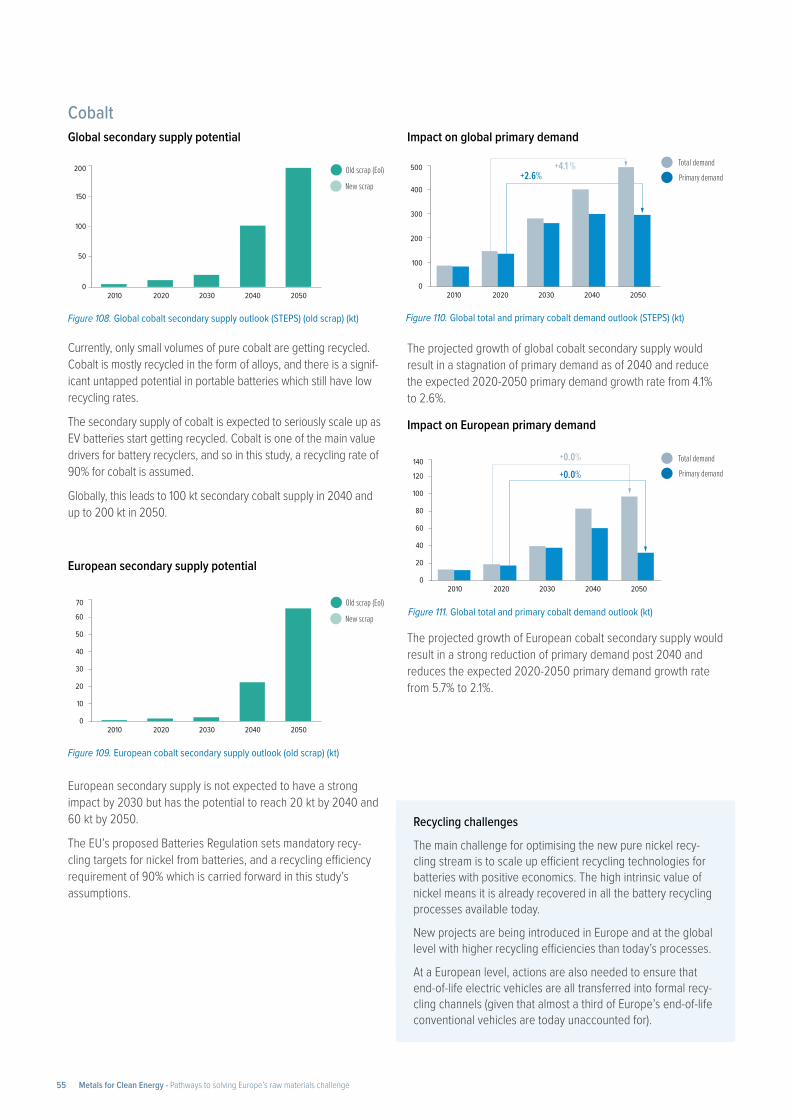
2010 2020 2030 2040 2050
100
200
50
0
150
2010 2020 2030 2040 2050
60
70
10
0
20
30
40
50
2010 2020 2030 2040 2050
+4.1 % +2.6%
500
400
200
100
0
300
Figure 108. Global cobalt secondary supply outlook (STEPS) (old scrap) (kt)
Figure 109. European cobalt secondary supply outlook (old scrap) (kt)
Figure 110. Global total and primary cobalt demand outlook (STEPS) (kt)
2010 2020 2030 2040 2050
+0.0% +0.0% 120
140
20
0
40
60
80
100
Figure 111. Global total and primary cobalt demand outlook (kt)
Currently, only small volumes of pure cobalt are getting recycled. Cobalt is mostly recycled in the form of alloys, and there is a signif-icant untapped potential in portable batteries which still have low recycling rates.
The secondary supply of cobalt is expected to seriously scale up as EV batteries start getting recycled. Cobalt is one of the main value drivers for battery recyclers, and so in this study, a recycling rate of 90% for cobalt is assumed.
Globally, this leads to 100 kt secondary cobalt supply in 2040 and up to 200 kt in 2050.
European secondary supply is not expected to have a strong impact by 2030 but has the potential to reach 20 kt by 2040 and 60 kt by 2050.
The EU’s proposed Batteries Regulation sets mandatory recy-cling targets for nickel from batteries, and a recycling efficiency requirement of 90% which is carried forward in this study’s assumptions.
The projected growth of global cobalt secondary supply would result in a stagnation of primary demand as of 2040 and reduce the expected 2020-2050 primary demand growth rate from 4.1% to 2.6%.
The projected growth of European cobalt secondary supply would result in a strong reduction of primary demand post 2040 and reduces the expected 2020-2050 primary demand growth rate from 5.7% to 2.1%.
Recycling challenges
The main challenge for optimising the new pure nickel recy-cling stream is to scale up efficient recycling technologies for batteries with positive economics. The high intrinsic value of nickel means it is already recovered in all the battery recycling processes available today.
New projects are being introduced in Europe and at the global level with higher recycling efficiencies than today’s processes.
At a European level, actions are also needed to ensure that end-of-life electric vehicles are all transferred into formal recy-cling channels (given that almost a third of Europe’s end-of-life conventional vehicles are today unaccounted for).
CobaltGlobal secondary supply potential
European secondary supply potential
Impact on global primary demand
Impact on European primary demand
Old scrap (Eol)
New scrap
Total demandPrimary demand
Old scrap (Eol)
New scrap
Total demandPrimary demand
Metals for Clean Energy - Pathways to solving Europe’s raw materials challenge55
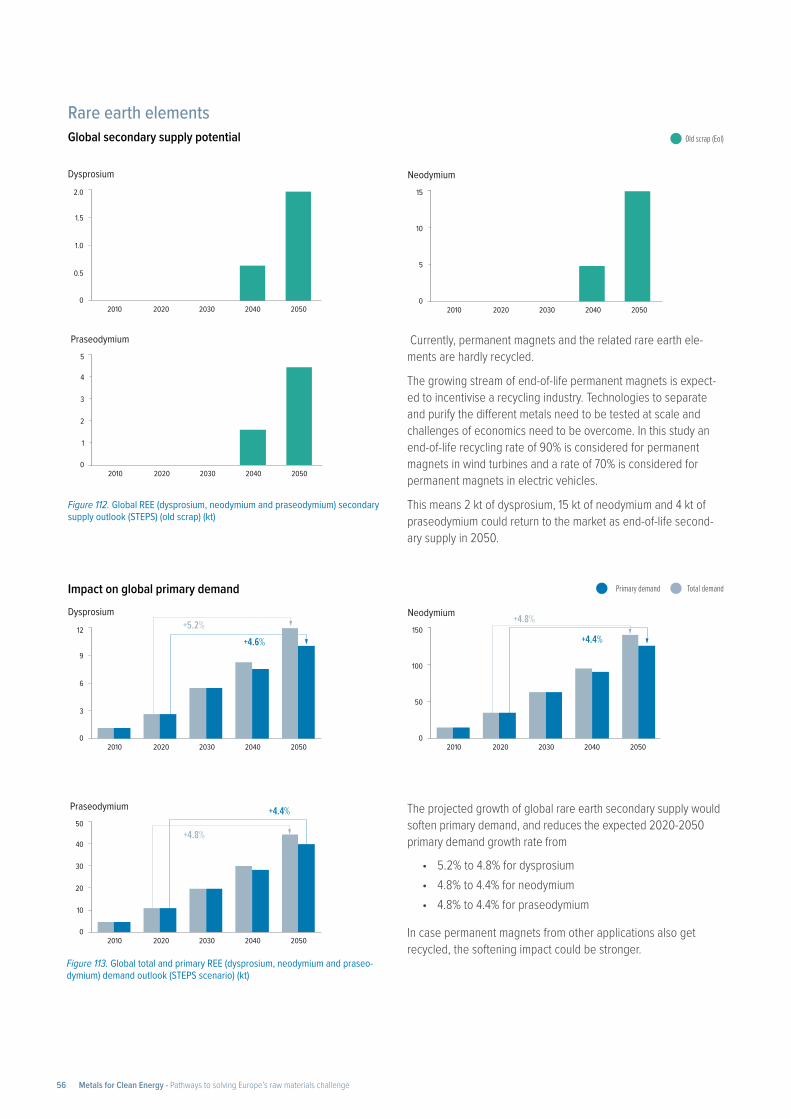
+5.2% +4.6%
12
6
3
0
9
Dysprosium
2010 2020 2030 2040 2050
20
40
50
10
0
30
Praseodymium
+4.8%
+4.4%
2010 2020 2030 2040 2050
Neodymium 150
100
50
0
+4.8%
+4.4%
2010 2020 2030 2040 2050
2.0
1.0
0.5
0
1.5
Dysprosium
2010 2020 2030 2040 2050
Neodymium15
10
5
02010 2020 2030 2040 2050
2
4
5
1
0
3
Praseodymium
2010 2020 2030 2040 2050
Figure 112. Global REE (dysprosium, neodymium and praseodymium) secondary supply outlook (STEPS) (old scrap) (kt)
Figure 113. Global total and primary REE (dysprosium, neodymium and praseo-dymium) demand outlook (STEPS scenario) (kt)
Currently, permanent magnets and the related rare earth ele-ments are hardly recycled.
The growing stream of end-of-life permanent magnets is expect-ed to incentivise a recycling industry. Technologies to separate and purify the different metals need to be tested at scale and challenges of economics need to be overcome. In this study an end-of-life recycling rate of 90% is considered for permanent magnets in wind turbines and a rate of 70% is considered for permanent magnets in electric vehicles.
This means 2 kt of dysprosium, 15 kt of neodymium and 4 kt of praseodymium could return to the market as end-of-life second-ary supply in 2050.
The projected growth of global rare earth secondary supply would soften primary demand, and reduces the expected 2020-2050 primary demand growth rate from
• 5.2% to 4.8% for dysprosium• 4.8% to 4.4% for neodymium• 4.8% to 4.4% for praseodymium
In case permanent magnets from other applications also get recycled, the softening impact could be stronger.
Rare earth elements Global secondary supply potential
Impact on global primary demand
Old scrap (Eol)
Total demandPrimary demand
Metals for Clean Energy - Pathways to solving Europe’s raw materials challenge56
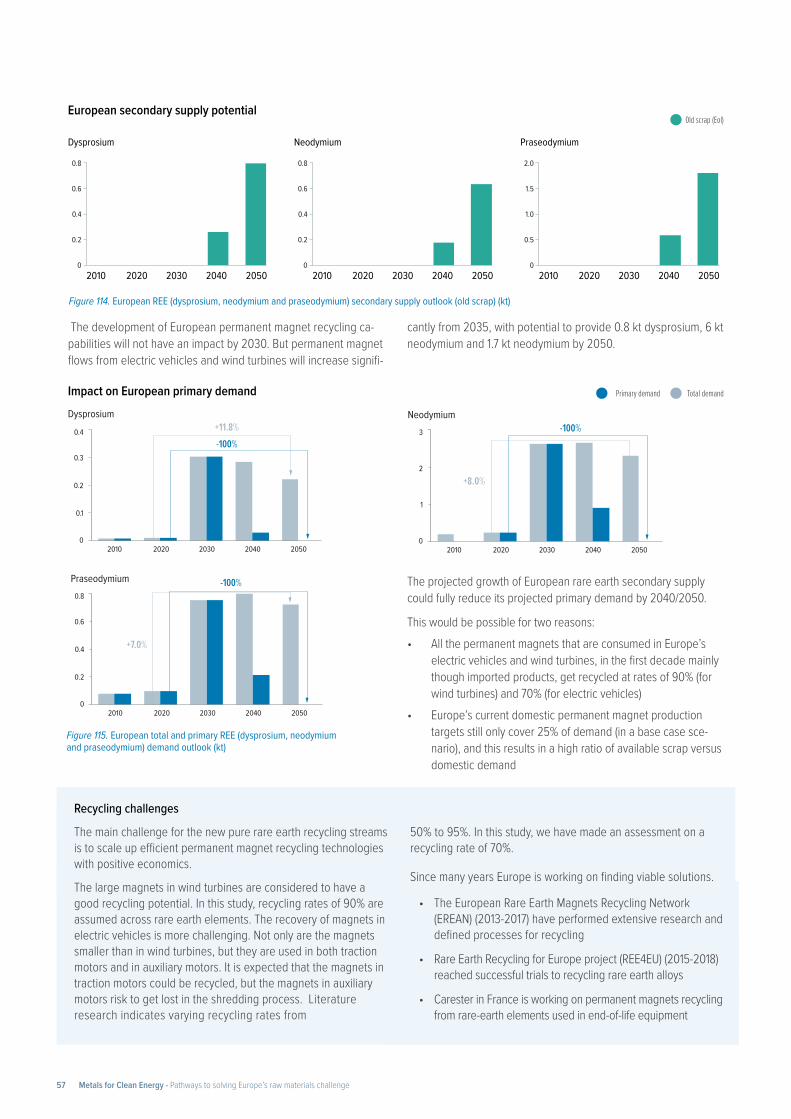
Dysprosium
0.8
0.6
0.4
0.2
02010 2020 2030 2040 2050
Neodymium
0.8
0.6
0.4
0.2
02010 2020 2030 2040 2050
Praseodymium
2.0
1.5
1.0
0.5
02010 2020 2030 2040 2050
Figure 114. European REE (dysprosium, neodymium and praseodymium) secondary supply outlook (old scrap) (kt)
The development of European permanent magnet recycling ca-pabilities will not have an impact by 2030. But permanent magnet flows from electric vehicles and wind turbines will increase signifi-
cantly from 2035, with potential to provide 0.8 kt dysprosium, 6 kt neodymium and 1.7 kt neodymium by 2050.
Recycling challenges
The main challenge for the new pure rare earth recycling streams is to scale up efficient permanent magnet recycling technologies with positive economics.
The large magnets in wind turbines are considered to have a good recycling potential. In this study, recycling rates of 90% are assumed across rare earth elements. The recovery of magnets in electric vehicles is more challenging. Not only are the magnets smaller than in wind turbines, but they are used in both traction motors and in auxiliary motors. It is expected that the magnets in traction motors could be recycled, but the magnets in auxiliary motors risk to get lost in the shredding process. Literature research indicates varying recycling rates from
50% to 95%. In this study, we have made an assessment on a recycling rate of 70%.
Since many years Europe is working on finding viable solutions.
• The European Rare Earth Magnets Recycling Network (EREAN) (2013-2017) have performed extensive research and defined processes for recycling
• Rare Earth Recycling for Europe project (REE4EU) (2015-2018) reached successful trials to recycling rare earth alloys
• Carester in France is working on permanent magnets recycling from rare-earth elements used in end-of-life equipment
European secondary supply potential
+11.8% -100%
0.4
0.2
0.1
0
0.3
Dysprosium
2010 2020 2030 2040 2050
+7.0%
-100%
0.4
0.6
0.8
0.2
0
Praseodymium
2010 2020 2030 2040 2050
+8.0%
-100% Neodymium
3
2
1
02010 2020 2030 2040 2050
Figure 115. European total and primary REE (dysprosium, neodymium and praseodymium) demand outlook (kt)
The projected growth of European rare earth secondary supply could fully reduce its projected primary demand by 2040/2050.
This would be possible for two reasons: • All the permanent magnets that are consumed in Europe’s
electric vehicles and wind turbines, in the first decade mainly though imported products, get recycled at rates of 90% (for wind turbines) and 70% (for electric vehicles)
• Europe’s current domestic permanent magnet production targets still only cover 25% of demand (in a base case sce-nario), and this results in a high ratio of available scrap versus domestic demand
Impact on European primary demand
Old scrap (Eol)
Total demandPrimary demand
Metals for Clean Energy - Pathways to solving Europe’s raw materials challenge57
• The 2020-2030 decade is the most challenging for global metals supply to keep up with demand. Serious supply risks are identified for copper, lithium, nickel, cobalt, and rare earth elements.
• The demand pull is expected to soften beyond 2030 and then again after 2040 as the de-ployment of clean energy technologies slows down, and more metals become available from secondary supply.
• Europe will be impacted by global supply constraints due to its import reliance for several ores and metals. Europe has the potential to change this picture through recycling, but only after 2040.
• European primary metal requirements are expected to peak around 2040, after which second-ary supply will grow significantly. By 2050, secondary supply can deliver 45-65% of Europe’s demand for most analysed metals, and over 75% for lithium and rare earth elements.
• Metals supply bottlenecks in the next 15 years would complicate the energy transition and encourage further reactions. Potential impacts include commodity price fly ups, innovation & substitution, consumption changes and a delay of technology uptake.
This chapter brings together the demand and supply analyses from earlier in the study. Chapter 1 conclud-ed that the energy transition results in an additional demand pull for most non-ferrous metals. Chapter 2 analysed the supply potential for a selection of key metals for this decade and beyond.
3.1.1 Global conclusions
The rapid global deployment of renewable energy technologies and electric vehicles in the 2020-2030 decade is expected to result in a very strong demand pull for several metals that could be difficult to meet with available primary and secondary supply.
For some metals, the impact on demand is so strong that it is expected to be disruptive. Copper, lithium, nickel, cobalt, and potentially rare earth elements are most at risk of supply constraints by the end of this decade. This is not due to a lack of resources in the ground, but a mismatch between the global mining project pipeline and the speed of the energy transition.
Across all metals, the global demand pull will soften beyond 2030 and then again after 2040. By then, the deployment of clean energy technologies has a slower growth rate, and more metals will be available from secondary supply. Increased primary mining and refining requirements are the reality for the next two decades. After 2040, new sources of secondary supply from end-of-life batteries and renewable energy technologies will start to reduce primary demand in key areas.
The serious supply concerns in the 2020-2030 decade are expected to lead to a combination of effects in order to match supply with demand.
• In a first step, supply tightness for a metal would lead to commodity price fly-ups that incentivize the development of more mining projects and grow the mine supply
• Elevated commodity prices and material tightness would also incentivise actions to reduce metal demand where feasible:
− Technological innovation and substitution to reduce and optimize metal intensities in existing clean energy technologies.
− Changes in technology consumption patterns to reduce metals demand further, for example in the transport sector (reduced battery size, shared economy etc).
Supply issues that result in material shortages for the planned roll-out of clean technologies would result in a delay of the energy transition. Besides material shortages, also prohibitive price rises for clean energy technologies could stall the energy transition.
3. Supply-demand market conclusions
Metals for Clean Energy - Pathways to solving Europe’s raw materials challenge58
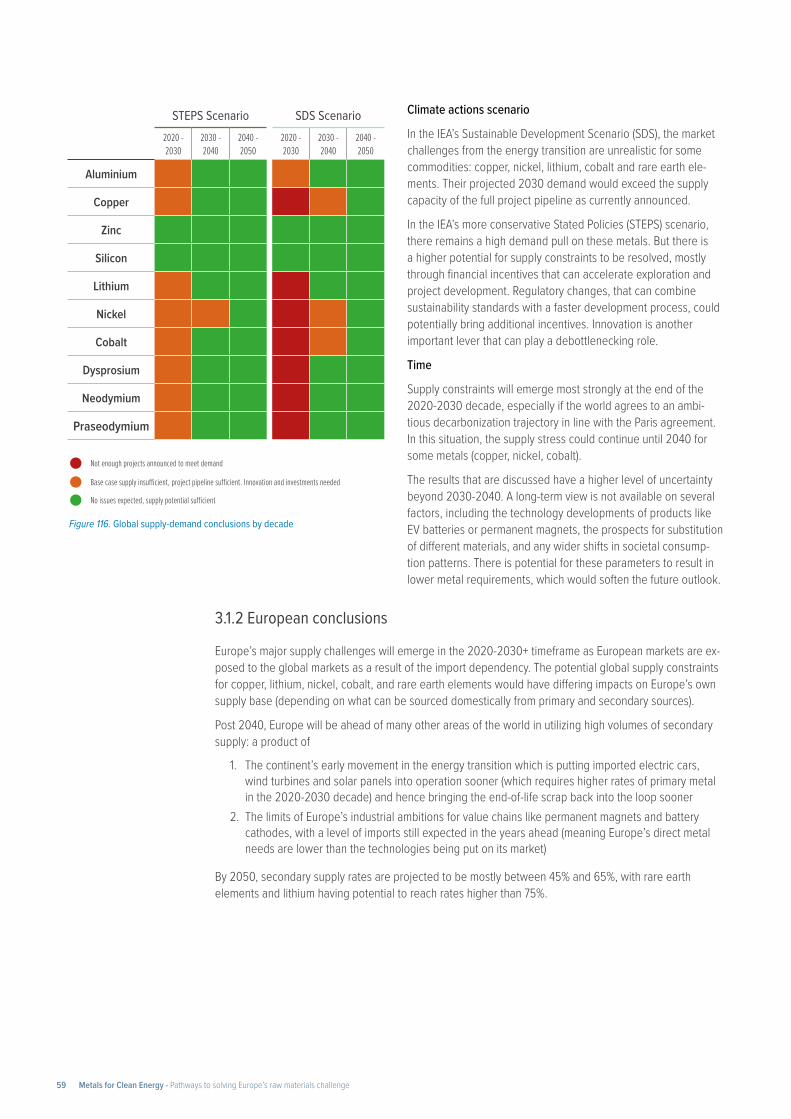
3.1.2 European conclusions
Europe’s major supply challenges will emerge in the 2020-2030+ timeframe as European markets are ex-posed to the global markets as a result of the import dependency. The potential global supply constraints for copper, lithium, nickel, cobalt, and rare earth elements would have differing impacts on Europe’s own supply base (depending on what can be sourced domestically from primary and secondary sources).
Post 2040, Europe will be ahead of many other areas of the world in utilizing high volumes of secondary supply: a product of
1. The continent’s early movement in the energy transition which is putting imported electric cars, wind turbines and solar panels into operation sooner (which requires higher rates of primary metal in the 2020-2030 decade) and hence bringing the end-of-life scrap back into the loop sooner
2. The limits of Europe’s industrial ambitions for value chains like permanent magnets and battery cathodes, with a level of imports still expected in the years ahead (meaning Europe’s direct metal needs are lower than the technologies being put on its market)
By 2050, secondary supply rates are projected to be mostly between 45% and 65%, with rare earth elements and lithium having potential to reach rates higher than 75%.
Climate actions scenario
In the IEA’s Sustainable Development Scenario (SDS), the market challenges from the energy transition are unrealistic for some commodities: copper, nickel, lithium, cobalt and rare earth ele-ments. Their projected 2030 demand would exceed the supply capacity of the full project pipeline as currently announced.
In the IEA’s more conservative Stated Policies (STEPS) scenario, there remains a high demand pull on these metals. But there is a higher potential for supply constraints to be resolved, mostly through financial incentives that can accelerate exploration and project development. Regulatory changes, that can combine sustainability standards with a faster development process, could potentially bring additional incentives. Innovation is another important lever that can play a debottlenecking role.
Time
Supply constraints will emerge most strongly at the end of the 2020-2030 decade, especially if the world agrees to an ambi-tious decarbonization trajectory in line with the Paris agreement. In this situation, the supply stress could continue until 2040 for some metals (copper, nickel, cobalt).
The results that are discussed have a higher level of uncertainty beyond 2030-2040. A long-term view is not available on several factors, including the technology developments of products like EV batteries or permanent magnets, the prospects for substitution of different materials, and any wider shifts in societal consump-tion patterns. There is potential for these parameters to result in lower metal requirements, which would soften the future outlook.
STEPS Scenario SDS Scenario2020 - 2030
2030 - 2040
2040 - 2050
2020 - 2030
2030 - 2040
2040 - 2050
Aluminium
Copper
Zinc
Silicon
Lithium
Nickel
Cobalt
Dysprosium
Neodymium
Praseodymium
Figure 116. Global supply-demand conclusions by decade
Not enough projects announced to meet demand
Base case supply insufficient, project pipeline sufficient. Innovation and investments needed
No issues expected, supply potential sufficient
Metals for Clean Energy - Pathways to solving Europe’s raw materials challenge59
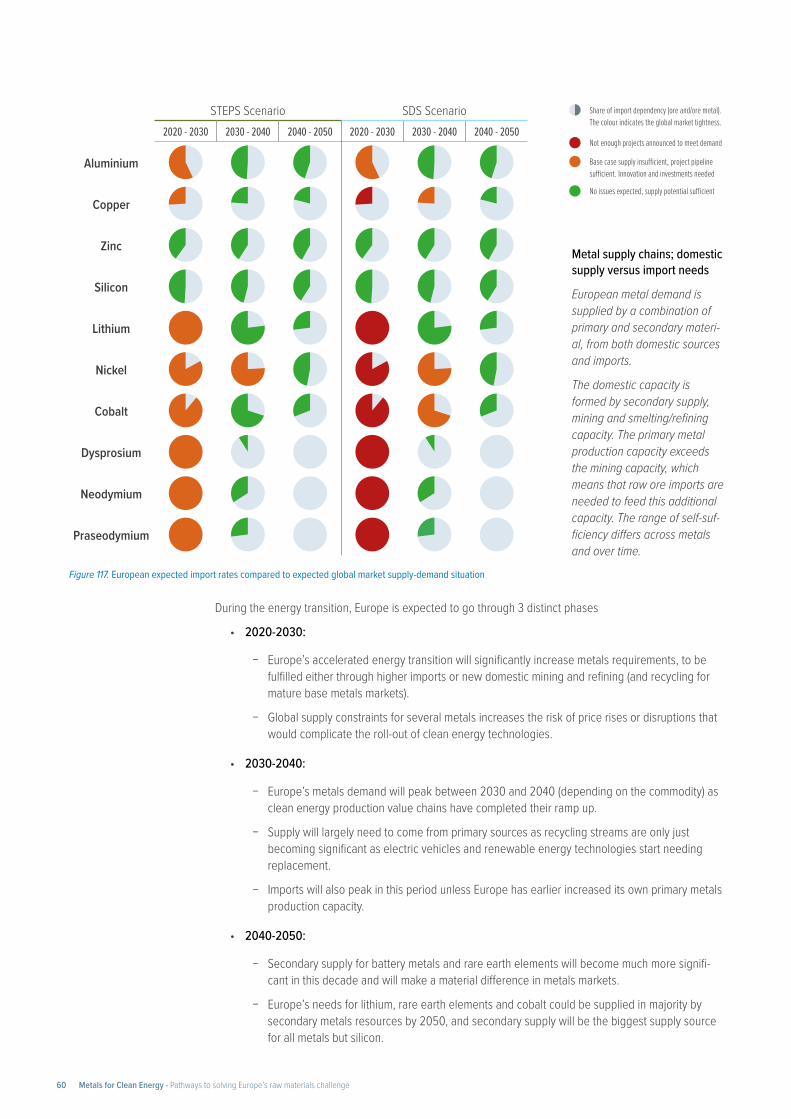
During the energy transition, Europe is expected to go through 3 distinct phases
• 2020-2030:
− Europe’s accelerated energy transition will significantly increase metals requirements, to be fulfilled either through higher imports or new domestic mining and refining (and recycling for mature base metals markets).
− Global supply constraints for several metals increases the risk of price rises or disruptions that would complicate the roll-out of clean energy technologies.
• 2030-2040:
− Europe’s metals demand will peak between 2030 and 2040 (depending on the commodity) as clean energy production value chains have completed their ramp up.
− Supply will largely need to come from primary sources as recycling streams are only just becoming significant as electric vehicles and renewable energy technologies start needing replacement.
− Imports will also peak in this period unless Europe has earlier increased its own primary metals production capacity.
• 2040-2050:
− Secondary supply for battery metals and rare earth elements will become much more signifi-cant in this decade and will make a material difference in metals markets.
− Europe’s needs for lithium, rare earth elements and cobalt could be supplied in majority by secondary metals resources by 2050, and secondary supply will be the biggest supply source for all metals but silicon.
STEPS Scenario SDS Scenario2020 - 2030 2030 - 2040 2040 - 2050 2020 - 2030 2030 - 2040 2040 - 2050
Aluminium
Copper
Zinc
Silicon
Lithium
Nickel
Cobalt
Dysprosium
Neodymium
Praseodymium
Figure 117. European expected import rates compared to expected global market supply-demand situation
Not enough projects announced to meet demand
Base case supply insufficient, project pipeline sufficient. Innovation and investments needed
No issues expected, supply potential sufficient
Share of import dependency (ore and/ore metal). The colour indicates the global market tightness.
Metal supply chains; domestic supply versus import needs
European metal demand is supplied by a combination of primary and secondary materi-al, from both domestic sources and imports.
The domestic capacity is formed by secondary supply, mining and smelting/refining capacity. The primary metal production capacity exceeds the mining capacity, which means that raw ore imports are needed to feed this additional capacity. The range of self-suf-ficiency differs across metals and over time.
Metals for Clean Energy - Pathways to solving Europe’s raw materials challenge60
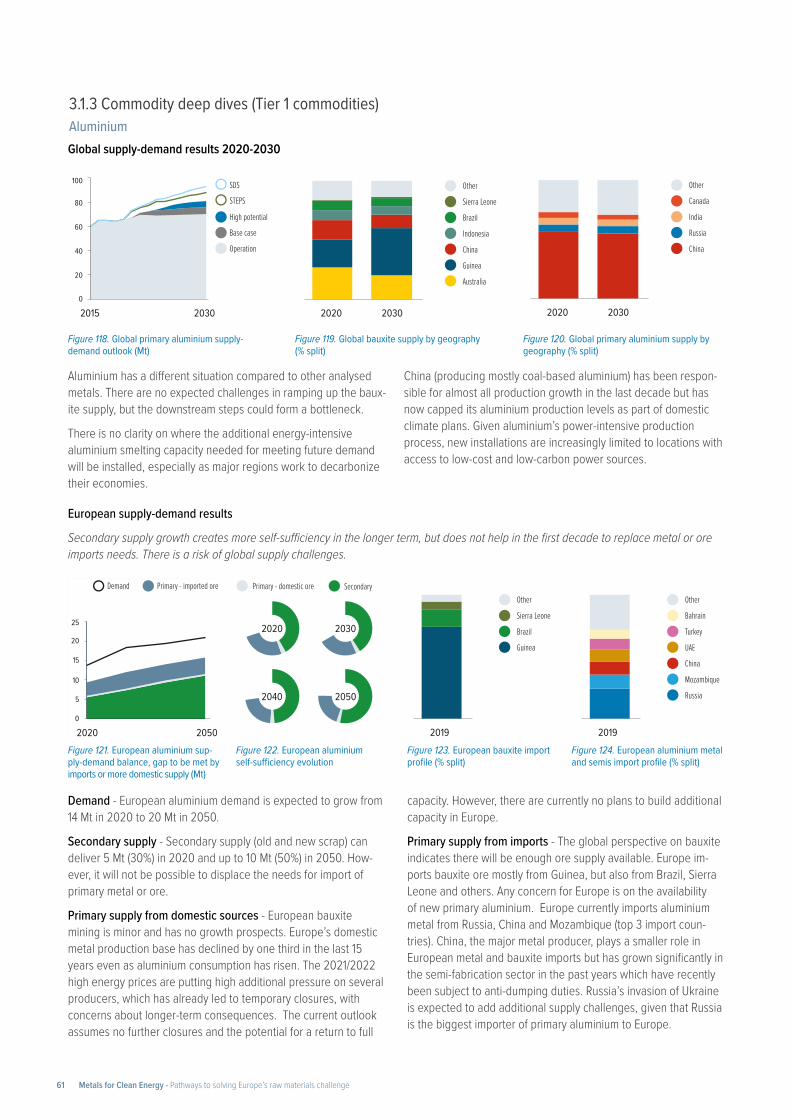
Figure 118. Global primary aluminium supply-demand outlook (Mt)
Figure 119. Global bauxite supply by geography (% split)
Figure 120. Global primary aluminium supply by geography (% split)
3.1.3 Commodity deep dives (Tier 1 commodities)Aluminium Global supply-demand results 2020-2030
Aluminium has a different situation compared to other analysed metals. There are no expected challenges in ramping up the baux-ite supply, but the downstream steps could form a bottleneck.
There is no clarity on where the additional energy-intensive aluminium smelting capacity needed for meeting future demand will be installed, especially as major regions work to decarbonize their economies.
China (producing mostly coal-based aluminium) has been respon-sible for almost all production growth in the last decade but has now capped its aluminium production levels as part of domestic climate plans. Given aluminium’s power-intensive production process, new installations are increasingly limited to locations with access to low-cost and low-carbon power sources.
European supply-demand results
Secondary supply growth creates more self-sufficiency in the longer term, but does not help in the first decade to replace metal or ore imports needs. There is a risk of global supply challenges.
80
100
0
20
40
60
2015 2030
SDS
High potential
STEPS
Base case
Operation
119
Other
Sierra Leone
Brazil
Indonesia
China
Guinea
Australia
2020 2030
120
Other
Canada
India
Russia
China
2020 2030
Figure 121. European aluminium sup-ply-demand balance, gap to be met by imports or more domestic supply (Mt)
Figure 122. European aluminium self-sufficiency evolution
Figure 123. European bauxite import profile (% split)
Figure 124. European aluminium metal and semis import profile (% split)
25
0
5
10
15
20
2020 2050
Demand Primary - imported ore SecondaryPrimary - domestic ore
2020 2030
20502040
Other
Sierra Leone
Brazil
Guinea
2019
Other
Bahrain
Turkey
UAE
China
Mozambique
Russia
2019
Demand - European aluminium demand is expected to grow from 14 Mt in 2020 to 20 Mt in 2050.
Secondary supply - Secondary supply (old and new scrap) can deliver 5 Mt (30%) in 2020 and up to 10 Mt (50%) in 2050. How-ever, it will not be possible to displace the needs for import of primary metal or ore.
Primary supply from domestic sources - European bauxite mining is minor and has no growth prospects. Europe’s domestic metal production base has declined by one third in the last 15 years even as aluminium consumption has risen. The 2021/2022 high energy prices are putting high additional pressure on several producers, which has already led to temporary closures, with concerns about longer-term consequences. The current outlook assumes no further closures and the potential for a return to full
capacity. However, there are currently no plans to build additional capacity in Europe.
Primary supply from imports - The global perspective on bauxite indicates there will be enough ore supply available. Europe im-ports bauxite ore mostly from Guinea, but also from Brazil, Sierra Leone and others. Any concern for Europe is on the availability of new primary aluminium. Europe currently imports aluminium metal from Russia, China and Mozambique (top 3 import coun-tries). China, the major metal producer, plays a smaller role in European metal and bauxite imports but has grown significantly in the semi-fabrication sector in the past years which have recently been subject to anti-dumping duties. Russia’s invasion of Ukraine is expected to add additional supply challenges, given that Russia is the biggest importer of primary aluminium to Europe.
Metals for Clean Energy - Pathways to solving Europe’s raw materials challenge61
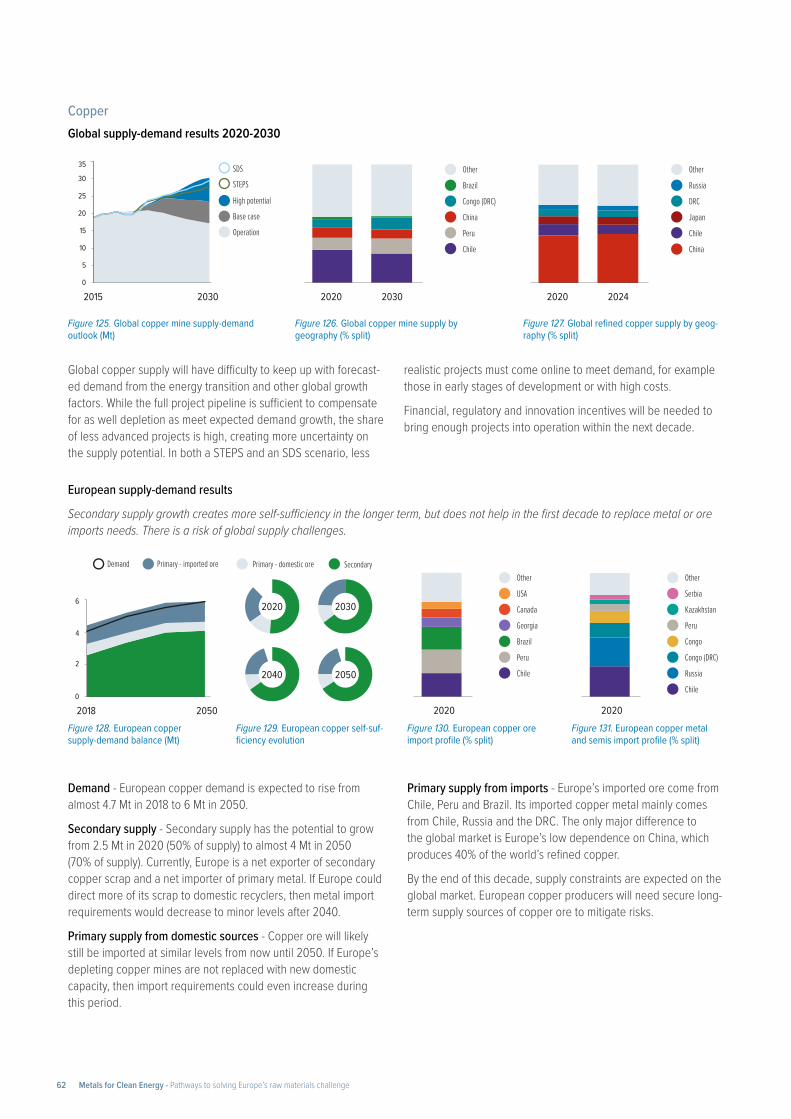
Figure 125. Global copper mine supply-demand outlook (Mt)
Figure 126. Global copper mine supply by geography (% split)
Figure 127. Global refined copper supply by geog-raphy (% split)
CopperGlobal supply-demand results 2020-2030
Global copper supply will have difficulty to keep up with forecast-ed demand from the energy transition and other global growth factors. While the full project pipeline is sufficient to compensate for as well depletion as meet expected demand growth, the share of less advanced projects is high, creating more uncertainty on the supply potential. In both a STEPS and an SDS scenario, less
realistic projects must come online to meet demand, for example those in early stages of development or with high costs.
Financial, regulatory and innovation incentives will be needed to bring enough projects into operation within the next decade.
European supply-demand results
Secondary supply growth creates more self-sufficiency in the longer term, but does not help in the first decade to replace metal or ore imports needs. There is a risk of global supply challenges.
30
35
5
0
10
15
20
25
2015 2030
SDS
High potential
STEPS
Base case
Operation
Other
Brazil
Congo (DRC)
China
Peru
Chile
2020 2030
Other
Russia
DRC
Japan
Chile
China
2020 2024
Figure 128. European copper supply-demand balance (Mt)
Figure 129. European copper self-suf-ficiency evolution
Figure 130. European copper ore import profile (% split)
Figure 131. European copper metal and semis import profile (% split)
0
2
4
6
2018 2050
Demand Primary - imported ore SecondaryPrimary - domestic ore
2020 2030
20502040
Other
USA
Canada
Georgia
Brazil
Peru
Chile
2020
Other
Serbia
Kazakhstan
Peru
Congo
Congo (DRC)
Russia
Chile
2020
Demand - European copper demand is expected to rise from almost 4.7 Mt in 2018 to 6 Mt in 2050.
Secondary supply - Secondary supply has the potential to grow from 2.5 Mt in 2020 (50% of supply) to almost 4 Mt in 2050 (70% of supply). Currently, Europe is a net exporter of secondary copper scrap and a net importer of primary metal. If Europe could direct more of its scrap to domestic recyclers, then metal import requirements would decrease to minor levels after 2040.
Primary supply from domestic sources - Copper ore will likely still be imported at similar levels from now until 2050. If Europe’s depleting copper mines are not replaced with new domestic capacity, then import requirements could even increase during this period.
Primary supply from imports - Europe’s imported ore come from Chile, Peru and Brazil. Its imported copper metal mainly comes from Chile, Russia and the DRC. The only major difference to the global market is Europe’s low dependence on China, which produces 40% of the world’s refined copper.
By the end of this decade, supply constraints are expected on the global market. European copper producers will need secure long-term supply sources of copper ore to mitigate risks.
Metals for Clean Energy - Pathways to solving Europe’s raw materials challenge62
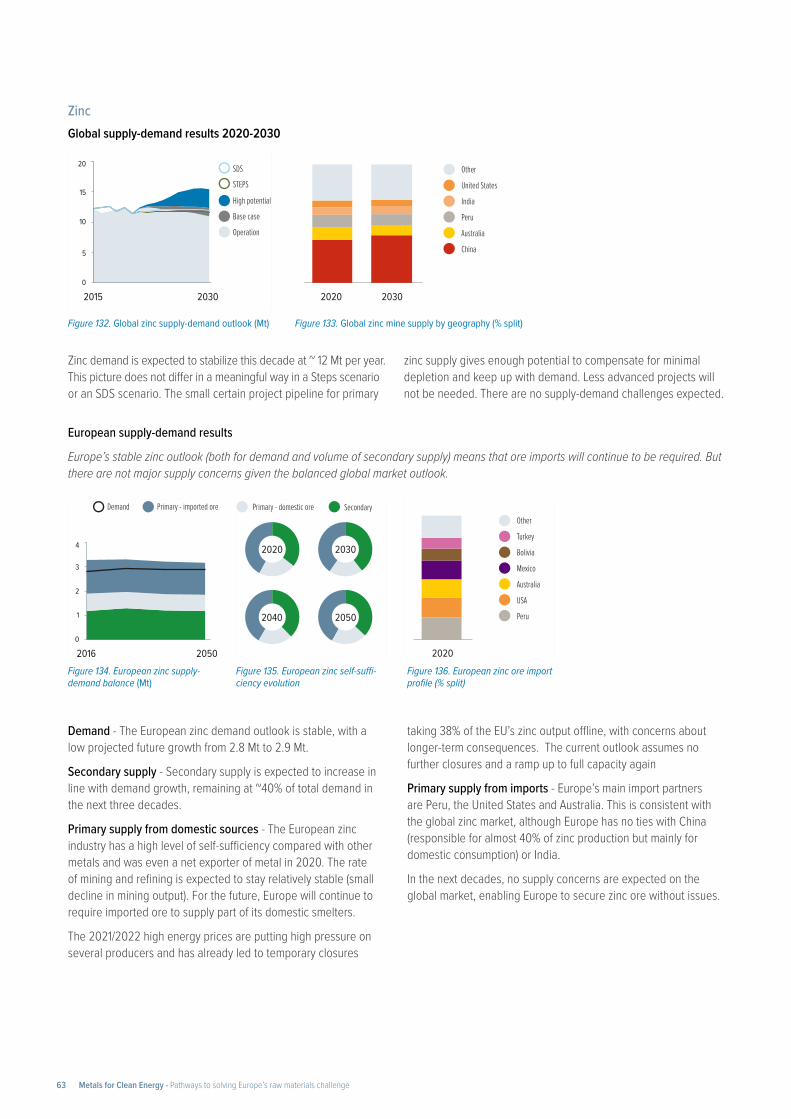
Figure 132. Global zinc supply-demand outlook (Mt) Figure 133. Global zinc mine supply by geography (% split)
ZincGlobal supply-demand results 2020-2030
Zinc demand is expected to stabilize this decade at ~ 12 Mt per year. This picture does not differ in a meaningful way in a Steps scenario or an SDS scenario. The small certain project pipeline for primary
zinc supply gives enough potential to compensate for minimal depletion and keep up with demand. Less advanced projects will not be needed. There are no supply-demand challenges expected.
European supply-demand results
Europe’s stable zinc outlook (both for demand and volume of secondary supply) means that ore imports will continue to be required. But there are not major supply concerns given the balanced global market outlook.
5
0
10
15
20
2015 2030
SDS
High potential
STEPS
Base case
Operation
Other
United States
India
Peru
Australia
China
2020 2030
Figure 134. European zinc supply-demand balance (Mt)
Figure 135. European zinc self-suffi-ciency evolution
Figure 136. European zinc ore import profile (% split)
0
1
2
3
4
2016 2050
Demand Primary - imported ore SecondaryPrimary - domestic ore
2020 2030
20502040
Other
Turkey
Bolivia
Mexico
Australia
USA
Peru
2020
Demand - The European zinc demand outlook is stable, with a low projected future growth from 2.8 Mt to 2.9 Mt.
Secondary supply - Secondary supply is expected to increase in line with demand growth, remaining at ~40% of total demand in the next three decades.
Primary supply from domestic sources - The European zinc industry has a high level of self-sufficiency compared with other metals and was even a net exporter of metal in 2020. The rate of mining and refining is expected to stay relatively stable (small decline in mining output). For the future, Europe will continue to require imported ore to supply part of its domestic smelters.
The 2021/2022 high energy prices are putting high pressure on several producers and has already led to temporary closures
taking 38% of the EU’s zinc output offline, with concerns about longer-term consequences. The current outlook assumes no further closures and a ramp up to full capacity again
Primary supply from imports - Europe’s main import partners are Peru, the United States and Australia. This is consistent with the global zinc market, although Europe has no ties with China (responsible for almost 40% of zinc production but mainly for domestic consumption) or India.
In the next decades, no supply concerns are expected on the global market, enabling Europe to secure zinc ore without issues.
Metals for Clean Energy - Pathways to solving Europe’s raw materials challenge63
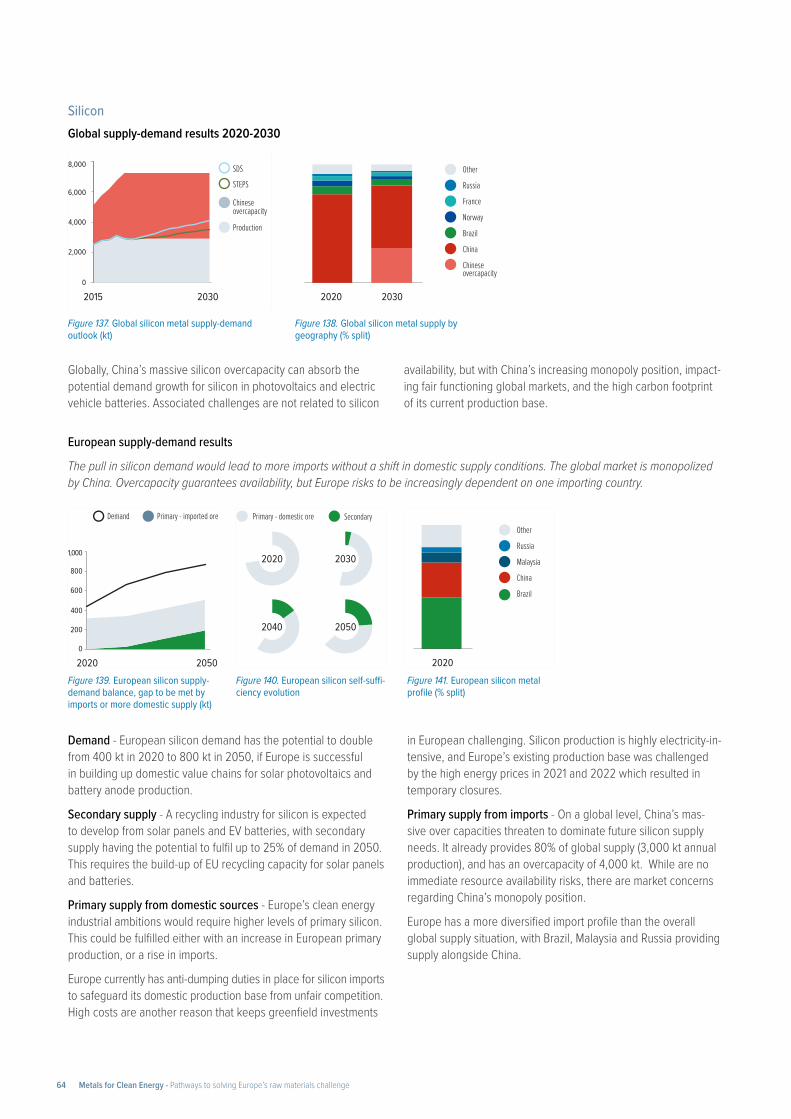
Figure 137. Global silicon metal supply-demand outlook (kt)
Figure 138. Global silicon metal supply by geography (% split)
SiliconGlobal supply-demand results 2020-2030
Globally, China’s massive silicon overcapacity can absorb the potential demand growth for silicon in photovoltaics and electric vehicle batteries. Associated challenges are not related to silicon
availability, but with China’s increasing monopoly position, impact-ing fair functioning global markets, and the high carbon footprint of its current production base.
European supply-demand results
The pull in silicon demand would lead to more imports without a shift in domestic supply conditions. The global market is monopolized by China. Overcapacity guarantees availability, but Europe risks to be increasingly dependent on one importing country.
4,000
8,000
2,000
0
6,000
2015 2030
SDS
STEPS
Chinese overcapacity
Production
Other
Russia
France
Norway
Brazil
China
Chinese overcapacity
2020 2030
Figure 139. European silicon supply-demand balance, gap to be met by imports or more domestic supply (kt)
Figure 140. European silicon self-suffi-ciency evolution
Figure 141. European silicon metal profile (% split)
1,000
0
200
400
600
800
2020 2050
Demand Primary - imported ore SecondaryPrimary - domestic ore
2020 2030
20502040
Other
Russia
Malaysia
China
Brazil
2020
Demand - European silicon demand has the potential to double from 400 kt in 2020 to 800 kt in 2050, if Europe is successful in building up domestic value chains for solar photovoltaics and battery anode production.
Secondary supply - A recycling industry for silicon is expected to develop from solar panels and EV batteries, with secondary supply having the potential to fulfil up to 25% of demand in 2050. This requires the build-up of EU recycling capacity for solar panels and batteries.
Primary supply from domestic sources - Europe’s clean energy industrial ambitions would require higher levels of primary silicon. This could be fulfilled either with an increase in European primary production, or a rise in imports.
Europe currently has anti-dumping duties in place for silicon imports to safeguard its domestic production base from unfair competition. High costs are another reason that keeps greenfield investments
in European challenging. Silicon production is highly electricity-in-tensive, and Europe’s existing production base was challenged by the high energy prices in 2021 and 2022 which resulted in temporary closures.
Primary supply from imports - On a global level, China’s mas-sive over capacities threaten to dominate future silicon supply needs. It already provides 80% of global supply (3,000 kt annual production), and has an overcapacity of 4,000 kt. While are no immediate resource availability risks, there are market concerns regarding China’s monopoly position.
Europe has a more diversified import profile than the overall global supply situation, with Brazil, Malaysia and Russia providing supply alongside China.
Metals for Clean Energy - Pathways to solving Europe’s raw materials challenge64
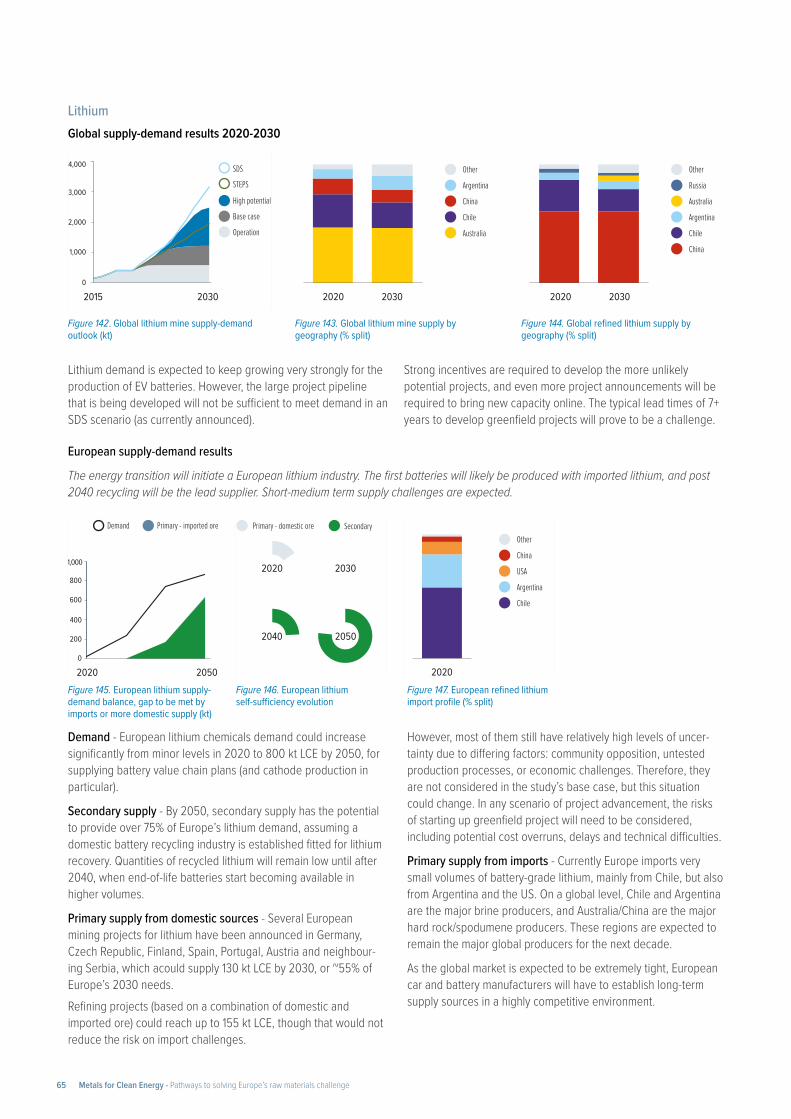
Figure 142. Global lithium mine supply-demand outlook (kt)
Figure 143. Global lithium mine supply by geography (% split)
Figure 144. Global refined lithium supply by geography (% split)
LithiumGlobal supply-demand results 2020-2030
Lithium demand is expected to keep growing very strongly for the production of EV batteries. However, the large project pipeline that is being developed will not be sufficient to meet demand in an SDS scenario (as currently announced).
Strong incentives are required to develop the more unlikely potential projects, and even more project announcements will be required to bring new capacity online. The typical lead times of 7+ years to develop greenfield projects will prove to be a challenge.
European supply-demand results
The energy transition will initiate a European lithium industry. The first batteries will likely be produced with imported lithium, and post 2040 recycling will be the lead supplier. Short-medium term supply challenges are expected.
2,000
4,000
1,000
0
3,000
2015 2030
SDS
High potential
STEPS
Base case
Operation
Other
Argentina
China
Chile
Australia
2020 2030
Other
Russia
Australia
Argentina
Chile
China
2020 2030
Figure 145. European lithium supply-demand balance, gap to be met by imports or more domestic supply (kt)
Figure 146. European lithium self-sufficiency evolution
Figure 147. European refined lithium import profile (% split)
1,000
0
200
400
600
800
2020 2050
Demand Primary - imported ore SecondaryPrimary - domestic ore
2020 2030
20502040
Other
China
USA
Argentina
Chile
2020
Demand - European lithium chemicals demand could increase significantly from minor levels in 2020 to 800 kt LCE by 2050, for supplying battery value chain plans (and cathode production in particular).
Secondary supply - By 2050, secondary supply has the potential to provide over 75% of Europe’s lithium demand, assuming a domestic battery recycling industry is established fitted for lithium recovery. Quantities of recycled lithium will remain low until after 2040, when end-of-life batteries start becoming available in higher volumes.
Primary supply from domestic sources - Several European mining projects for lithium have been announced in Germany, Czech Republic, Finland, Spain, Portugal, Austria and neighbour-ing Serbia, which acould supply 130 kt LCE by 2030, or ~55% of Europe’s 2030 needs. Refining projects (based on a combination of domestic and imported ore) could reach up to 155 kt LCE, though that would not reduce the risk on import challenges.
However, most of them still have relatively high levels of uncer-tainty due to differing factors: community opposition, untested production processes, or economic challenges. Therefore, they are not considered in the study’s base case, but this situation could change. In any scenario of project advancement, the risks of starting up greenfield project will need to be considered, including potential cost overruns, delays and technical difficulties.
Primary supply from imports - Currently Europe imports very small volumes of battery-grade lithium, mainly from Chile, but also from Argentina and the US. On a global level, Chile and Argentina are the major brine producers, and Australia/China are the major hard rock/spodumene producers. These regions are expected to remain the major global producers for the next decade.
As the global market is expected to be extremely tight, European car and battery manufacturers will have to establish long-term supply sources in a highly competitive environment.
Metals for Clean Energy - Pathways to solving Europe’s raw materials challenge65
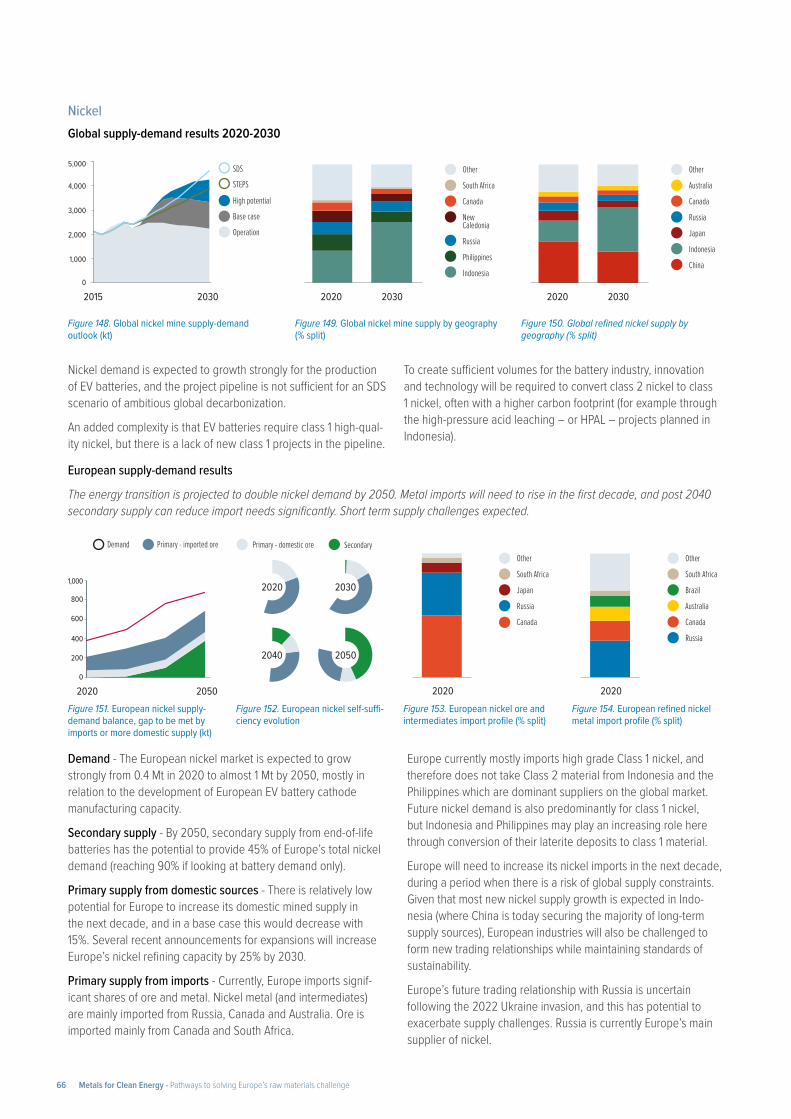
Figure 148. Global nickel mine supply-demand outlook (kt)
Figure 149. Global nickel mine supply by geography (% split)
Figure 150. Global refined nickel supply by geography (% split)
Nickel Global supply-demand results 2020-2030
Nickel demand is expected to growth strongly for the production of EV batteries, and the project pipeline is not sufficient for an SDS scenario of ambitious global decarbonization.
An added complexity is that EV batteries require class 1 high-qual-ity nickel, but there is a lack of new class 1 projects in the pipeline.
To create sufficient volumes for the battery industry, innovation and technology will be required to convert class 2 nickel to class 1 nickel, often with a higher carbon footprint (for example through the high-pressure acid leaching – or HPAL – projects planned in Indonesia).
European supply-demand results
The energy transition is projected to double nickel demand by 2050. Metal imports will need to rise in the first decade, and post 2040 secondary supply can reduce import needs significantly. Short term supply challenges expected.
5,000
4,000
2,000
1,000
0
3,000
2015 2030
SDS
High potential
STEPS
Base case
Operation
Other
South Africa
Canada
New Caledonia
Russia
Philippines
Indonesia
2020 2030
Other
Australia
Canada
Russia
Japan
Indonesia
China
2020 2030
Figure 151. European nickel supply-demand balance, gap to be met by imports or more domestic supply (kt)
Figure 152. European nickel self-suffi-ciency evolution
Figure 153. European nickel ore and intermediates import profile (% split)
Figure 154. European refined nickel metal import profile (% split)
1,000
0
200
400
600
800
2020 2050
Demand Primary - imported ore SecondaryPrimary - domestic ore
2020 2030
20502040
Other
South Africa
Japan
Russia
Canada
2020
Other
South Africa
Brazil
Australia
Canada
Russia
2020
Demand - The European nickel market is expected to grow strongly from 0.4 Mt in 2020 to almost 1 Mt by 2050, mostly in relation to the development of European EV battery cathode manufacturing capacity.
Secondary supply - By 2050, secondary supply from end-of-life batteries has the potential to provide 45% of Europe’s total nickel demand (reaching 90% if looking at battery demand only).
Primary supply from domestic sources - There is relatively low potential for Europe to increase its domestic mined supply in the next decade, and in a base case this would decrease with 15%. Several recent announcements for expansions will increase Europe’s nickel refining capacity by 25% by 2030.
Primary supply from imports - Currently, Europe imports signif-icant shares of ore and metal. Nickel metal (and intermediates) are mainly imported from Russia, Canada and Australia. Ore is imported mainly from Canada and South Africa.
Europe currently mostly imports high grade Class 1 nickel, and therefore does not take Class 2 material from Indonesia and the Philippines which are dominant suppliers on the global market. Future nickel demand is also predominantly for class 1 nickel, but Indonesia and Philippines may play an increasing role here through conversion of their laterite deposits to class 1 material.
Europe will need to increase its nickel imports in the next decade, during a period when there is a risk of global supply constraints. Given that most new nickel supply growth is expected in Indo-nesia (where China is today securing the majority of long-term supply sources), European industries will also be challenged to form new trading relationships while maintaining standards of sustainability.
Europe’s future trading relationship with Russia is uncertain following the 2022 Ukraine invasion, and this has potential to exacerbate supply challenges. Russia is currently Europe’s main supplier of nickel.
Metals for Clean Energy - Pathways to solving Europe’s raw materials challenge66
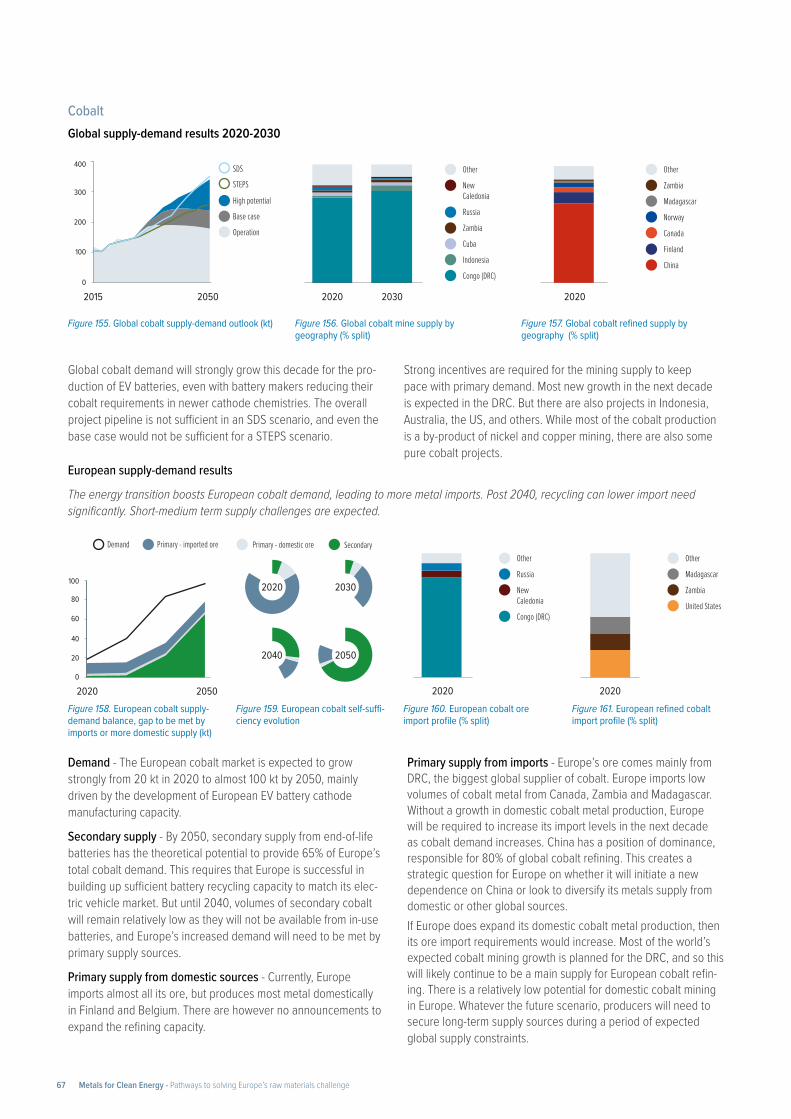
Figure 155. Global cobalt supply-demand outlook (kt) Figure 156. Global cobalt mine supply by geography (% split)
Figure 157. Global cobalt refined supply by geography (% split)
Cobalt Global supply-demand results 2020-2030
Global cobalt demand will strongly grow this decade for the pro-duction of EV batteries, even with battery makers reducing their cobalt requirements in newer cathode chemistries. The overall project pipeline is not sufficient in an SDS scenario, and even the base case would not be sufficient for a STEPS scenario.
Strong incentives are required for the mining supply to keep pace with primary demand. Most new growth in the next decade is expected in the DRC. But there are also projects in Indonesia, Australia, the US, and others. While most of the cobalt production is a by-product of nickel and copper mining, there are also some pure cobalt projects.
European supply-demand results
The energy transition boosts European cobalt demand, leading to more metal imports. Post 2040, recycling can lower import need significantly. Short-medium term supply challenges are expected.
200
400
100
0
300
2015 2050
SDS
High potential
STEPS
Base case
Operation
Other
New Caledonia
Russia
Zambia
Cuba
Indonesia
Congo (DRC)
2020 2030
Other
Zambia
Madagascar
Norway
Canada
Finland
China
2020
Figure 158. European cobalt supply-demand balance, gap to be met by imports or more domestic supply (kt)
Figure 159. European cobalt self-suffi-ciency evolution
Figure 160. European cobalt ore import profile (% split)
Figure 161. European refined cobalt import profile (% split)
100
0
20
40
60
80
2020 2050
Demand Primary - imported ore SecondaryPrimary - domestic ore
2020 2030
20502040
Other
Russia
New Caledonia
Congo (DRC)
2020
Other
Madagascar
Zambia
United States
2020
Demand - The European cobalt market is expected to grow strongly from 20 kt in 2020 to almost 100 kt by 2050, mainly driven by the development of European EV battery cathode manufacturing capacity.
Secondary supply - By 2050, secondary supply from end-of-life batteries has the theoretical potential to provide 65% of Europe’s total cobalt demand. This requires that Europe is successful in building up sufficient battery recycling capacity to match its elec-tric vehicle market. But until 2040, volumes of secondary cobalt will remain relatively low as they will not be available from in-use batteries, and Europe’s increased demand will need to be met by primary supply sources.
Primary supply from domestic sources - Currently, Europe imports almost all its ore, but produces most metal domestically in Finland and Belgium. There are however no announcements to expand the refining capacity.
Primary supply from imports - Europe’s ore comes mainly from DRC, the biggest global supplier of cobalt. Europe imports low volumes of cobalt metal from Canada, Zambia and Madagascar. Without a growth in domestic cobalt metal production, Europe will be required to increase its import levels in the next decade as cobalt demand increases. China has a position of dominance, responsible for 80% of global cobalt refining. This creates a strategic question for Europe on whether it will initiate a new dependence on China or look to diversify its metals supply from domestic or other global sources. If Europe does expand its domestic cobalt metal production, then its ore import requirements would increase. Most of the world’s expected cobalt mining growth is planned for the DRC, and so this will likely continue to be a main supply for European cobalt refin-ing. There is a relatively low potential for domestic cobalt mining in Europe. Whatever the future scenario, producers will need to secure long-term supply sources during a period of expected global supply constraints.
Metals for Clean Energy - Pathways to solving Europe’s raw materials challenge67
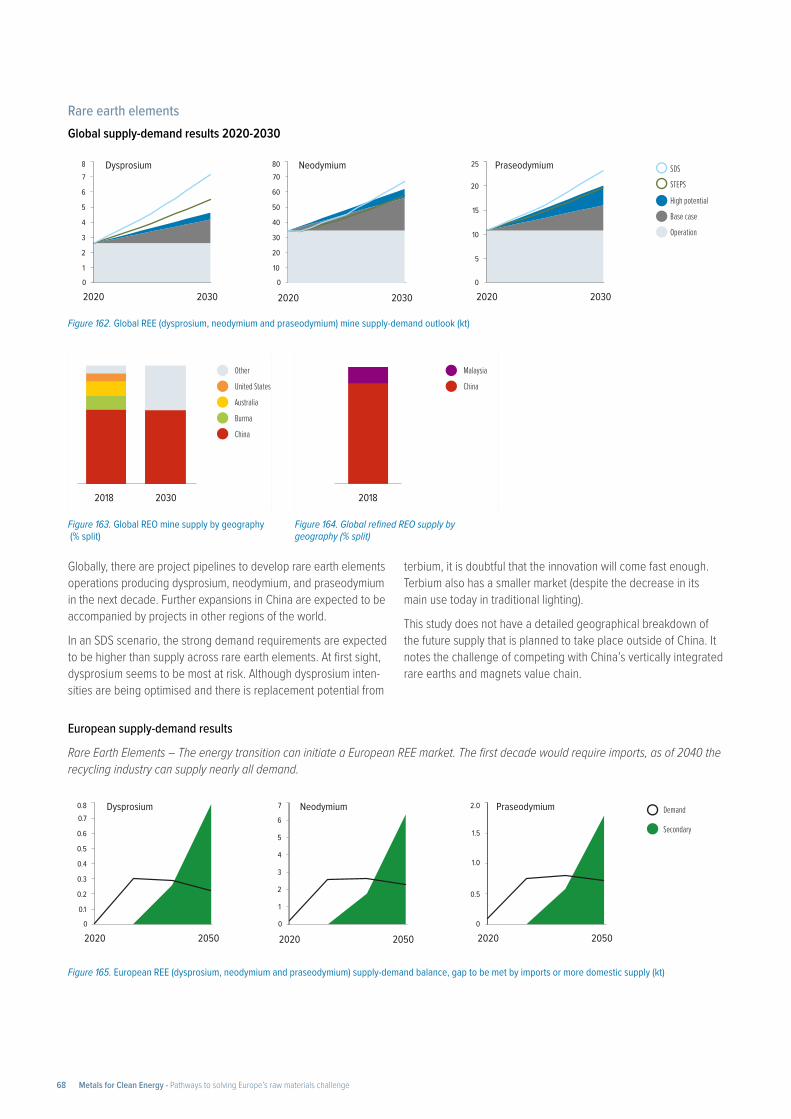
Figure 162. Global REE (dysprosium, neodymium and praseodymium) mine supply-demand outlook (kt)
Figure 163. Global REO mine supply by geography (% split)
Figure 164. Global refined REO supply by geography (% split)
Rare earth elements Global supply-demand results 2020-2030
Globally, there are project pipelines to develop rare earth elements operations producing dysprosium, neodymium, and praseodymium in the next decade. Further expansions in China are expected to be accompanied by projects in other regions of the world.
In an SDS scenario, the strong demand requirements are expected to be higher than supply across rare earth elements. At first sight, dysprosium seems to be most at risk. Although dysprosium inten-sities are being optimised and there is replacement potential from
terbium, it is doubtful that the innovation will come fast enough. Terbium also has a smaller market (despite the decrease in its main use today in traditional lighting).
This study does not have a detailed geographical breakdown of the future supply that is planned to take place outside of China. It notes the challenge of competing with China’s vertically integrated rare earths and magnets value chain.
European supply-demand results
Rare Earth Elements – The energy transition can initiate a European REE market. The first decade would require imports, as of 2040 the recycling industry can supply nearly all demand.
6
78
1
0
2
3
4
5
2020 2030
SDS
High potential
STEPS
Base case
Operation
60
7080
10
0
20
30
40
50
2020 2030
5
0
10
15
20
25
2020 2030
Dysprosium Neodymium Praseodymium
Secondary
Demand
0.6
0.70.8
0.1
0
0.2
0.3
0.4
0.5
2020 2050
6
7
1
0
2
3
4
5
2020 2050
0.5
0
1.0
1.5
2.0
2020 2050
Dysprosium Neodymium Praseodymium
Other
United States
Australia
Burma
China
2018 2030
Malaysia
China
2018
Figure 165. European REE (dysprosium, neodymium and praseodymium) supply-demand balance, gap to be met by imports or more domestic supply (kt)
Metals for Clean Energy - Pathways to solving Europe’s raw materials challenge68
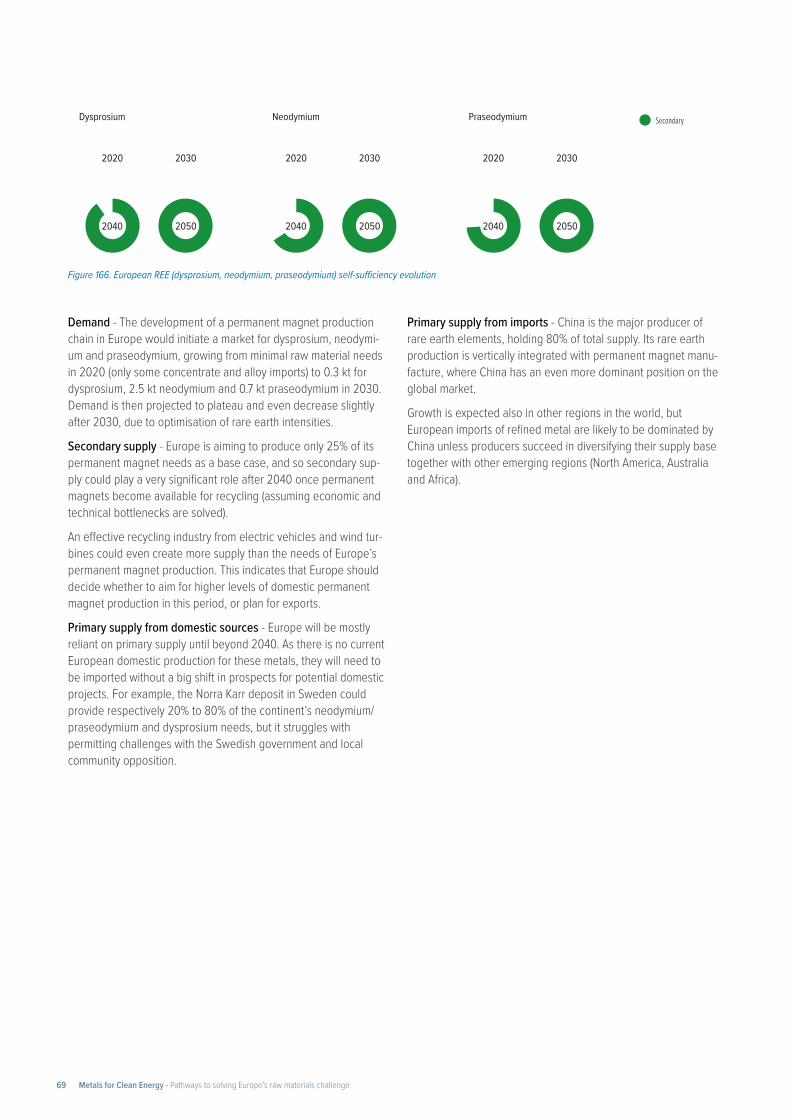
Figure 166. European REE (dysprosium, neodymium, praseodymium) self-sufficiency evolution
Secondary
2020 2030
20502040
2020 2030
20502040
2020 2030
20502040
Dysprosium Neodymium Praseodymium
Demand - The development of a permanent magnet production chain in Europe would initiate a market for dysprosium, neodymi-um and praseodymium, growing from minimal raw material needs in 2020 (only some concentrate and alloy imports) to 0.3 kt for dysprosium, 2.5 kt neodymium and 0.7 kt praseodymium in 2030. Demand is then projected to plateau and even decrease slightly after 2030, due to optimisation of rare earth intensities.
Secondary supply - Europe is aiming to produce only 25% of its permanent magnet needs as a base case, and so secondary sup-ply could play a very significant role after 2040 once permanent magnets become available for recycling (assuming economic and technical bottlenecks are solved).
An effective recycling industry from electric vehicles and wind tur-bines could even create more supply than the needs of Europe’s permanent magnet production. This indicates that Europe should decide whether to aim for higher levels of domestic permanent magnet production in this period, or plan for exports.
Primary supply from domestic sources - Europe will be mostly reliant on primary supply until beyond 2040. As there is no current European domestic production for these metals, they will need to be imported without a big shift in prospects for potential domestic projects. For example, the Norra Karr deposit in Sweden could provide respectively 20% to 80% of the continent’s neodymium/praseodymium and dysprosium needs, but it struggles with permitting challenges with the Swedish government and local community opposition.
Primary supply from imports - China is the major producer of rare earth elements, holding 80% of total supply. Its rare earth production is vertically integrated with permanent magnet manu-facture, where China has an even more dominant position on the global market.
Growth is expected also in other regions in the world, but European imports of refined metal are likely to be dominated by China unless producers succeed in diversifying their supply base together with other emerging regions (North America, Australia and Africa).
Metals for Clean Energy - Pathways to solving Europe’s raw materials challenge69
• Sustainability risk profiles differ across transition metals, resulting in different focus areas that companies need to address to guarantee responsible mining and metal production.
• European metals & mining sustainability performance scores better or equal to average global performance, supported by legislation.
• The European metals supply chains are actively working on lifting their sustainability. This requires optimising recycling levels and active import choices. Domestic primary production can also posi-tively contribute, though the impact will be more limited given the possible size of this industry.
The energy transition requires certain specific metals for the development of clean energy technologies, leading to substantially more production of those metals compared to today. More mining and metal processing activities inherently lead to environmental and social sustainability impacts and risks, which require management as part of the transition.
Growth in clean energy technology metals enables a decrease in resource extraction of coal, natural gas and oil. As a result, current sustainability impacts of these fossil fuel operations will be avoided. Mining of coal for example, an ~ 8 Bn ton market in 2021, will largely be displaced by renewables produced with an additional ~ 75 Mt of metals (2050 annual demand).
As such, not only CO2 emissions will be lowered significantly, but also wider sustainability impacts related to the extractive sector will decrease overall. Material efficiency will also increase, because the metals mined for the transition can stay in the economy for multiple use cycles (unlike fossil fuels), due to their permanent properties.
Despite overall mining activity decreasing, the additional impacts of clean energy technology metals are expected to be clearly defined and managed. This section provides a global sustainability assessment of the metals under scope, and then provides key conclusions for Europe’s own metal supply chains, cover-ing recycling supply, domestic production and imports.
4.1 Understanding the current situation: sustainability assessment of primary metal production
4.1.1 Sustainability metrics
In order to map the global sustainability profile of the current metal supply chains, this study evaluates the global average performance along number of key environmental, social and governance metrics.
The following metrics are assessed in detail; greenhouse gas emissions and energy, environmental impact, biodiversity, waste, water (scarcity), human rights, employment, economic benefits and health & safety.
There are other important dimensions to environmental and social sustainability which are outside of the scope of this assessment due to the lack of robust metrics for making industry level insights: human toxicity, dust and other pollution, noise, local and indigenous community rights, employee well-being.
The single commodity sustainability assessments are based on a mixture of sources, including lifecycle assessments for climate/energy and environment; Minespans industry data for waste, spatial impact, employment and artisanal and small-scale mining; and third-party sources for water scarcity, human rights, and biodiversity risk.
This mixture of sources is used to give general global profiles for the metals under scope.
4. How can Europe ensure sustainable metal supply chains?
Metals for Clean Energy - Pathways to solving Europe’s raw materials challenge70
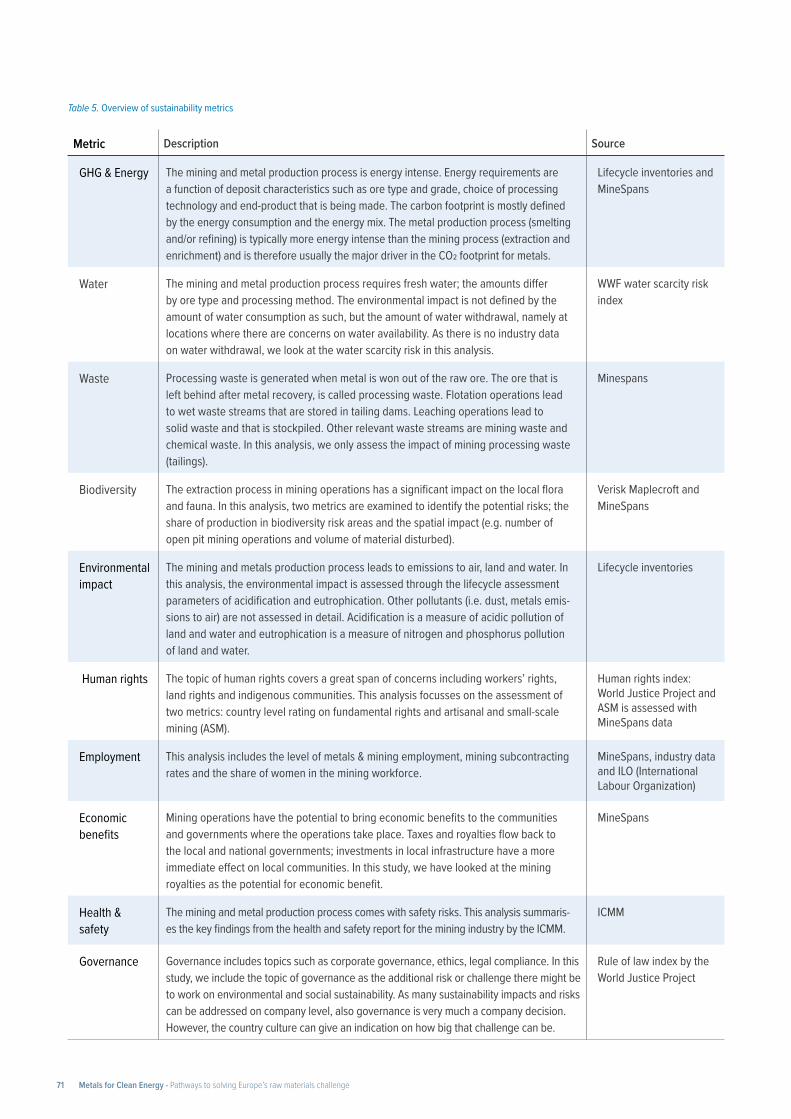
Table 5. Overview of sustainability metrics
Metric Description Source
GHG & Energy The mining and metal production process is energy intense. Energy requirements are a function of deposit characteristics such as ore type and grade, choice of processing technology and end-product that is being made. The carbon footprint is mostly defined by the energy consumption and the energy mix. The metal production process (smelting and/or refining) is typically more energy intense than the mining process (extraction and enrichment) and is therefore usually the major driver in the CO2 footprint for metals.
Lifecycle inventories and MineSpans
Water The mining and metal production process requires fresh water; the amounts differ by ore type and processing method. The environmental impact is not defined by the amount of water consumption as such, but the amount of water withdrawal, namely at locations where there are concerns on water availability. As there is no industry data on water withdrawal, we look at the water scarcity risk in this analysis.
WWF water scarcity risk index
Waste Processing waste is generated when metal is won out of the raw ore. The ore that is left behind after metal recovery, is called processing waste. Flotation operations lead to wet waste streams that are stored in tailing dams. Leaching operations lead to solid waste and that is stockpiled. Other relevant waste streams are mining waste and chemical waste. In this analysis, we only assess the impact of mining processing waste (tailings).
Minespans
Biodiversity The extraction process in mining operations has a significant impact on the local flora and fauna. In this analysis, two metrics are examined to identify the potential risks; the share of production in biodiversity risk areas and the spatial impact (e.g. number of open pit mining operations and volume of material disturbed).
Verisk Maplecroft and MineSpans
Environmental impact
The mining and metals production process leads to emissions to air, land and water. In this analysis, the environmental impact is assessed through the lifecycle assessment parameters of acidification and eutrophication. Other pollutants (i.e. dust, metals emis-sions to air) are not assessed in detail. Acidification is a measure of acidic pollution of land and water and eutrophication is a measure of nitrogen and phosphorus pollution of land and water.
Lifecycle inventories
Human rights The topic of human rights covers a great span of concerns including workers’ rights, land rights and indigenous communities. This analysis focusses on the assessment of two metrics: country level rating on fundamental rights and artisanal and small-scale mining (ASM).
Human rights index: World Justice Project and ASM is assessed with MineSpans data
Employment This analysis includes the level of metals & mining employment, mining subcontracting rates and the share of women in the mining workforce.
MineSpans, industry data and ILO (International Labour Organization)
Economic benefits
Mining operations have the potential to bring economic benefits to the communities and governments where the operations take place. Taxes and royalties flow back to the local and national governments; investments in local infrastructure have a more immediate effect on local communities. In this study, we have looked at the mining royalties as the potential for economic benefit.
MineSpans
Health & safety
The mining and metal production process comes with safety risks. This analysis summaris-es the key findings from the health and safety report for the mining industry by the ICMM.
ICMM
Governance Governance includes topics such as corporate governance, ethics, legal compliance. In this study, we include the topic of governance as the additional risk or challenge there might be to work on environmental and social sustainability. As many sustainability impacts and risks can be addressed on company level, also governance is very much a company decision. However, the country culture can give an indication on how big that challenge can be.
Rule of law index by the World Justice Project
Metals for Clean Energy - Pathways to solving Europe’s raw materials challenge71
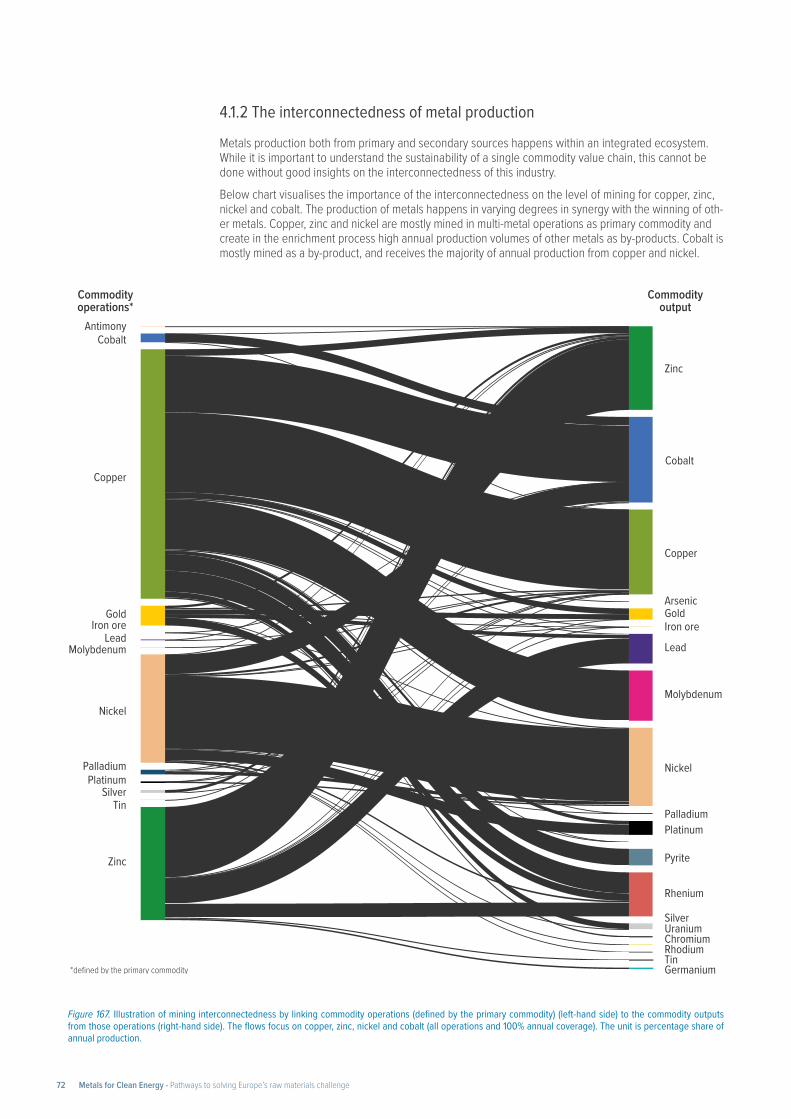
4.1.2 The interconnectedness of metal production
Metals production both from primary and secondary sources happens within an integrated ecosystem. While it is important to understand the sustainability of a single commodity value chain, this cannot be done without good insights on the interconnectedness of this industry.Below chart visualises the importance of the interconnectedness on the level of mining for copper, zinc, nickel and cobalt. The production of metals happens in varying degrees in synergy with the winning of oth-er metals. Copper, zinc and nickel are mostly mined in multi-metal operations as primary commodity and create in the enrichment process high annual production volumes of other metals as by-products. Cobalt is mostly mined as a by-product, and receives the majority of annual production from copper and nickel.
Figure 167. Illustration of mining interconnectedness by linking commodity operations (defined by the primary commodity) (left-hand side) to the commodity outputs from those operations (right-hand side). The flows focus on copper, zinc, nickel and cobalt (all operations and 100% annual coverage). The unit is percentage share of annual production.
AntimonyCobalt
Copper
GoldIron ore
LeadMolybdenum
Nickel
PalladiumPlatinum
SilverTin
Zinc
Zinc
Cobalt
Copper
Arsenic Gold Iron ore
Lead
Molybdenum
Nickel
Palladium Platinum
Pyrite
Rhenium
Silver Uranium
Tin Germanium
Rhodium Chromium
Commodity operations*
Commodity output
*defined by the primary commodity
Metals for Clean Energy - Pathways to solving Europe’s raw materials challenge72
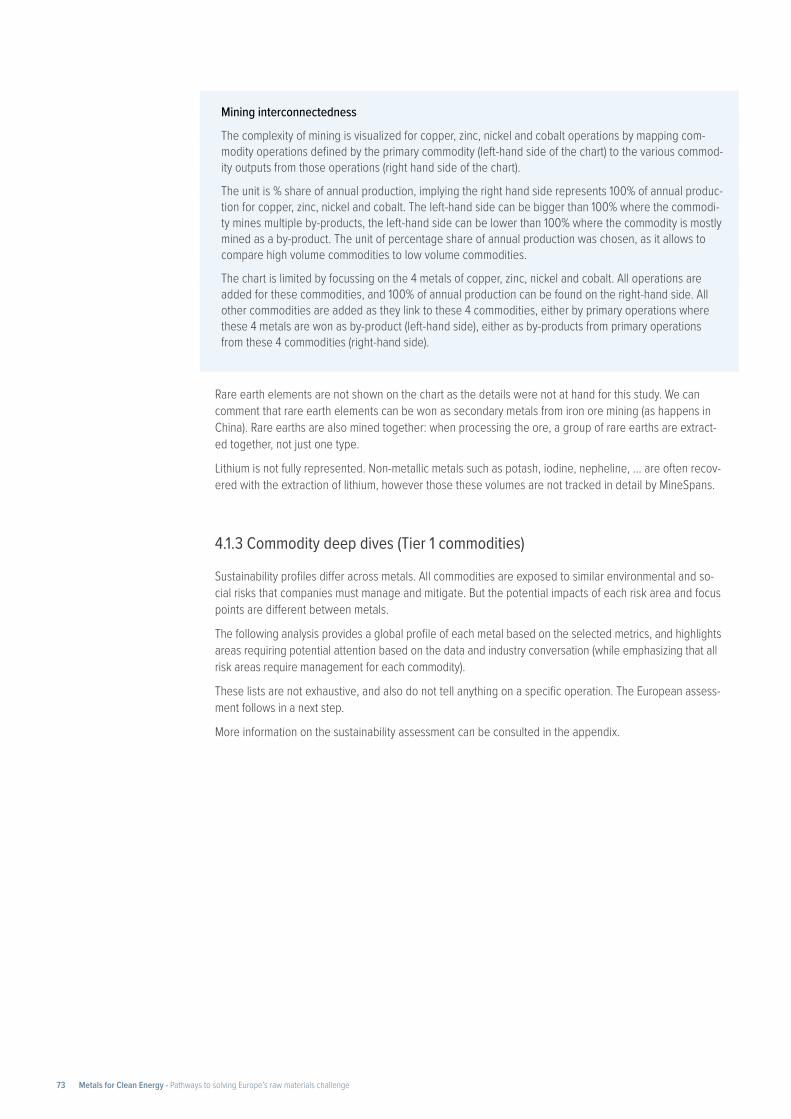
Mining interconnectedness
The complexity of mining is visualized for copper, zinc, nickel and cobalt operations by mapping com-modity operations defined by the primary commodity (left-hand side of the chart) to the various commod-ity outputs from those operations (right hand side of the chart).
The unit is % share of annual production, implying the right hand side represents 100% of annual produc-tion for copper, zinc, nickel and cobalt. The left-hand side can be bigger than 100% where the commodi-ty mines multiple by-products, the left-hand side can be lower than 100% where the commodity is mostly mined as a by-product. The unit of percentage share of annual production was chosen, as it allows to compare high volume commodities to low volume commodities.
The chart is limited by focussing on the 4 metals of copper, zinc, nickel and cobalt. All operations are added for these commodities, and 100% of annual production can be found on the right-hand side. All other commodities are added as they link to these 4 commodities, either by primary operations where these 4 metals are won as by-product (left-hand side), either as by-products from primary operations from these 4 commodities (right-hand side).
Rare earth elements are not shown on the chart as the details were not at hand for this study. We can comment that rare earth elements can be won as secondary metals from iron ore mining (as happens in China). Rare earths are also mined together: when processing the ore, a group of rare earths are extract-ed together, not just one type.
Lithium is not fully represented. Non-metallic metals such as potash, iodine, nepheline, … are often recov-ered with the extraction of lithium, however those these volumes are not tracked in detail by MineSpans.
4.1.3 Commodity deep dives (Tier 1 commodities)
Sustainability profiles differ across metals. All commodities are exposed to similar environmental and so-cial risks that companies must manage and mitigate. But the potential impacts of each risk area and focus points are different between metals.
The following analysis provides a global profile of each metal based on the selected metrics, and highlights areas requiring potential attention based on the data and industry conversation (while emphasizing that all risk areas require management for each commodity).
These lists are not exhaustive, and also do not tell anything on a specific operation. The European assess-ment follows in a next step.
More information on the sustainability assessment can be consulted in the appendix.
Metals for Clean Energy - Pathways to solving Europe’s raw materials challenge73
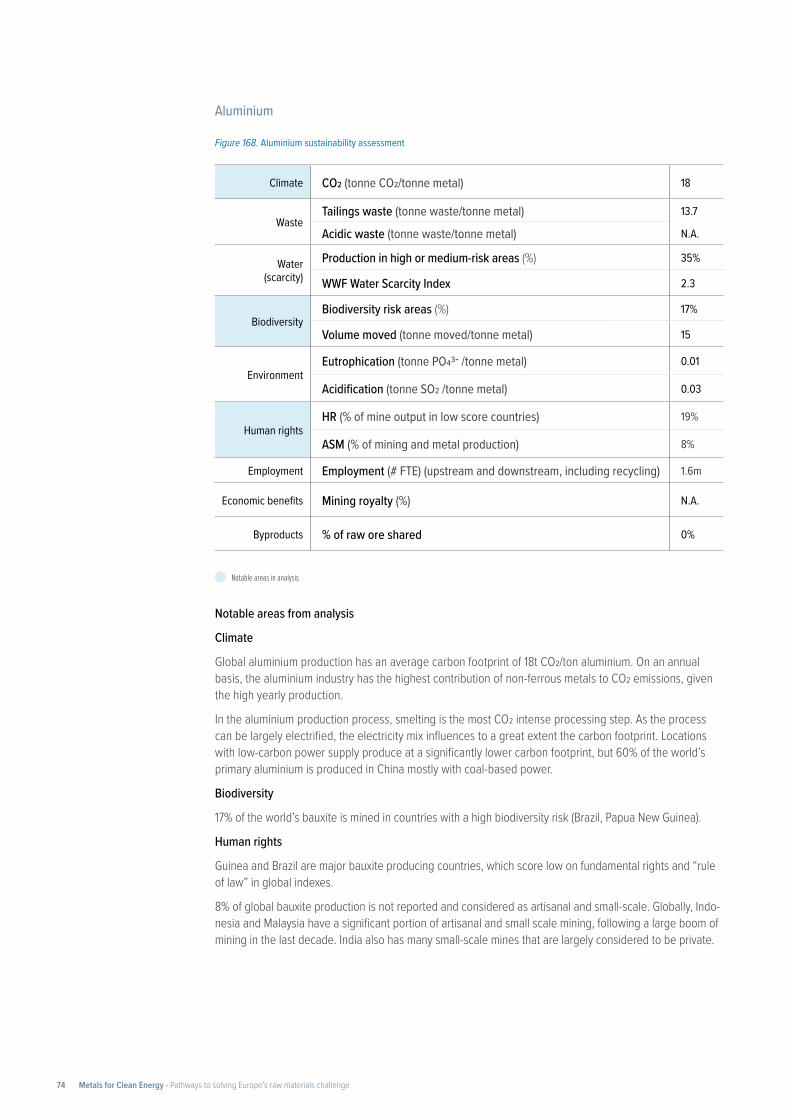
Aluminium
Notable areas from analysis
Climate
Global aluminium production has an average carbon footprint of 18t CO2/ton aluminium. On an annual basis, the aluminium industry has the highest contribution of non-ferrous metals to CO2 emissions, given the high yearly production.
In the aluminium production process, smelting is the most CO2 intense processing step. As the process can be largely electrified, the electricity mix influences to a great extent the carbon footprint. Locations with low-carbon power supply produce at a significantly lower carbon footprint, but 60% of the world’s primary aluminium is produced in China mostly with coal-based power.
Biodiversity
17% of the world’s bauxite is mined in countries with a high biodiversity risk (Brazil, Papua New Guinea).
Human rights
Guinea and Brazil are major bauxite producing countries, which score low on fundamental rights and “rule of law” in global indexes.
8% of global bauxite production is not reported and considered as artisanal and small-scale. Globally, Indo-nesia and Malaysia have a significant portion of artisanal and small scale mining, following a large boom of mining in the last decade. India also has many small-scale mines that are largely considered to be private.
Figure 168. Aluminium sustainability assessment
Climate CO2 (tonne CO2/tonne metal) 18
Waste Tailings waste (tonne waste/tonne metal) 13.7
Acidic waste (tonne waste/tonne metal) N.A.
Water (scarcity)
Production in high or medium-risk areas (%) 35%
WWF Water Scarcity Index 2.3
Biodiversity Biodiversity risk areas (%) 17%
Volume moved (tonne moved/tonne metal) 15
Environment Eutrophication (tonne PO43- /tonne metal) 0.01
Acidification (tonne SO2 /tonne metal) 0.03
Human rights HR (% of mine output in low score countries) 19%
ASM (% of mining and metal production) 8%
Employment Employment (# FTE) (upstream and downstream, including recycling) 1.6m
Economic benefits Mining royalty (%) N.A.
Byproducts % of raw ore shared 0%
Notable areas in analysis
Metals for Clean Energy - Pathways to solving Europe’s raw materials challenge74
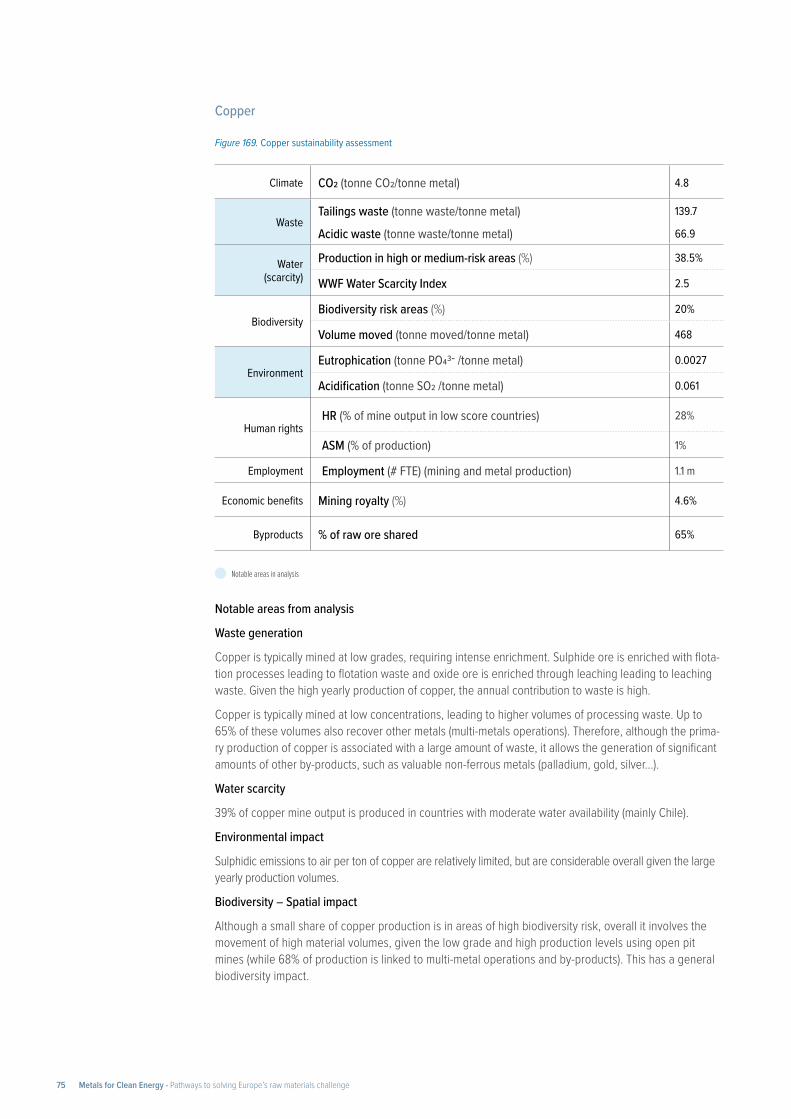
Copper
Notable areas from analysis
Waste generation
Copper is typically mined at low grades, requiring intense enrichment. Sulphide ore is enriched with flota-tion processes leading to flotation waste and oxide ore is enriched through leaching leading to leaching waste. Given the high yearly production of copper, the annual contribution to waste is high.
Copper is typically mined at low concentrations, leading to higher volumes of processing waste. Up to 65% of these volumes also recover other metals (multi-metals operations). Therefore, although the prima-ry production of copper is associated with a large amount of waste, it allows the generation of significant amounts of other by-products, such as valuable non-ferrous metals (palladium, gold, silver…).
Water scarcity
39% of copper mine output is produced in countries with moderate water availability (mainly Chile).
Environmental impact
Sulphidic emissions to air per ton of copper are relatively limited, but are considerable overall given the large yearly production volumes.
Biodiversity – Spatial impact
Although a small share of copper production is in areas of high biodiversity risk, overall it involves the movement of high material volumes, given the low grade and high production levels using open pit mines (while 68% of production is linked to multi-metal operations and by-products). This has a general biodiversity impact.
Figure 169. Copper sustainability assessment
Climate CO2 (tonne CO2/tonne metal) 4.8
Waste Tailings waste (tonne waste/tonne metal) 139.7
Acidic waste (tonne waste/tonne metal) 66.9
Water (scarcity)
Production in high or medium-risk areas (%) 38.5%
WWF Water Scarcity Index 2.5
Biodiversity Biodiversity risk areas (%) 20%
Volume moved (tonne moved/tonne metal) 468
Environment Eutrophication (tonne PO43- /tonne metal) 0.0027
Acidification (tonne SO2 /tonne metal) 0.061
Human rights HR (% of mine output in low score countries) 28%
ASM (% of production) 1%
Employment Employment (# FTE) (mining and metal production) 1.1 m
Economic benefits Mining royalty (%) 4.6%
Byproducts % of raw ore shared 65%
Notable areas in analysis
Metals for Clean Energy - Pathways to solving Europe’s raw materials challenge75
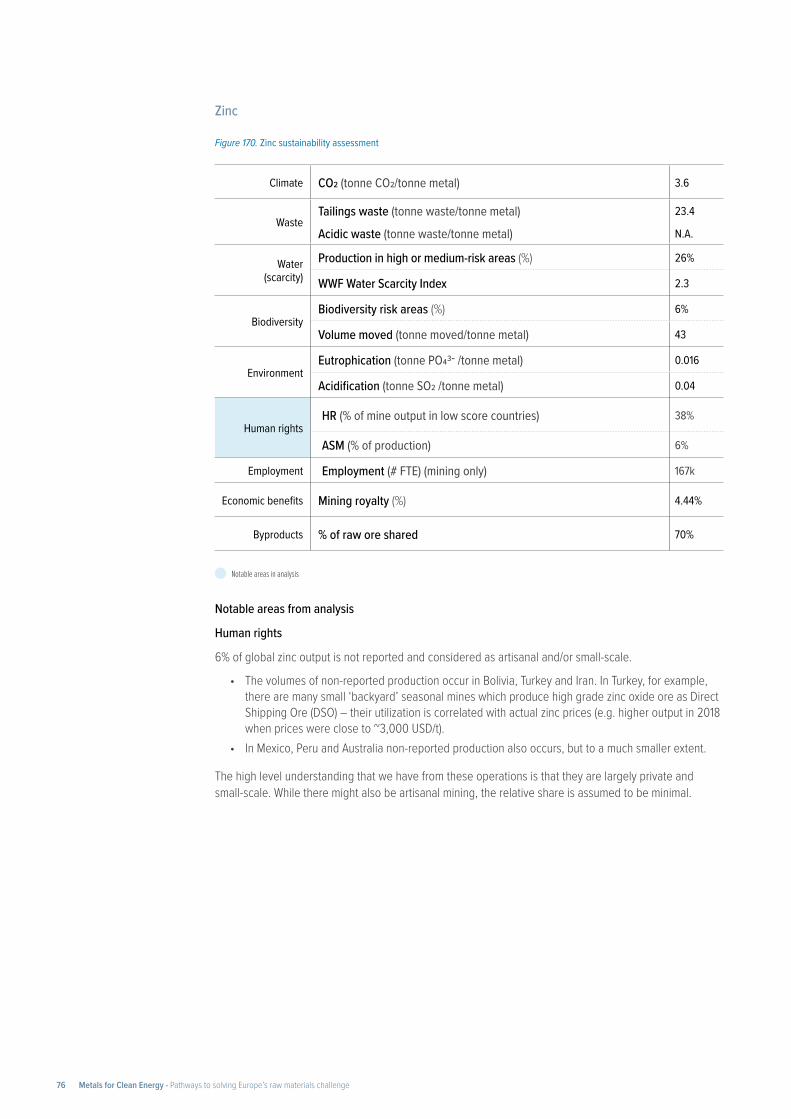
Zinc
Notable areas from analysis
Human rights
6% of global zinc output is not reported and considered as artisanal and/or small-scale.
• The volumes of non-reported production occur in Bolivia, Turkey and Iran. In Turkey, for example, there are many small ‘backyard’ seasonal mines which produce high grade zinc oxide ore as Direct Shipping Ore (DSO) – their utilization is correlated with actual zinc prices (e.g. higher output in 2018 when prices were close to ~3,000 USD/t).
• In Mexico, Peru and Australia non-reported production also occurs, but to a much smaller extent.
The high level understanding that we have from these operations is that they are largely private and small-scale. While there might also be artisanal mining, the relative share is assumed to be minimal.
Figure 170. Zinc sustainability assessment
Climate CO2 (tonne CO2/tonne metal) 3.6
Waste Tailings waste (tonne waste/tonne metal) 23.4
Acidic waste (tonne waste/tonne metal) N.A.
Water (scarcity)
Production in high or medium-risk areas (%) 26%
WWF Water Scarcity Index 2.3
Biodiversity Biodiversity risk areas (%) 6%
Volume moved (tonne moved/tonne metal) 43
Environment Eutrophication (tonne PO43- /tonne metal) 0.016
Acidification (tonne SO2 /tonne metal) 0.04
Human rights HR (% of mine output in low score countries) 38%
ASM (% of production) 6%
Employment Employment (# FTE) (mining only) 167k
Economic benefits Mining royalty (%) 4.44%
Byproducts % of raw ore shared 70%
Notable areas in analysis
Metals for Clean Energy - Pathways to solving Europe’s raw materials challenge76
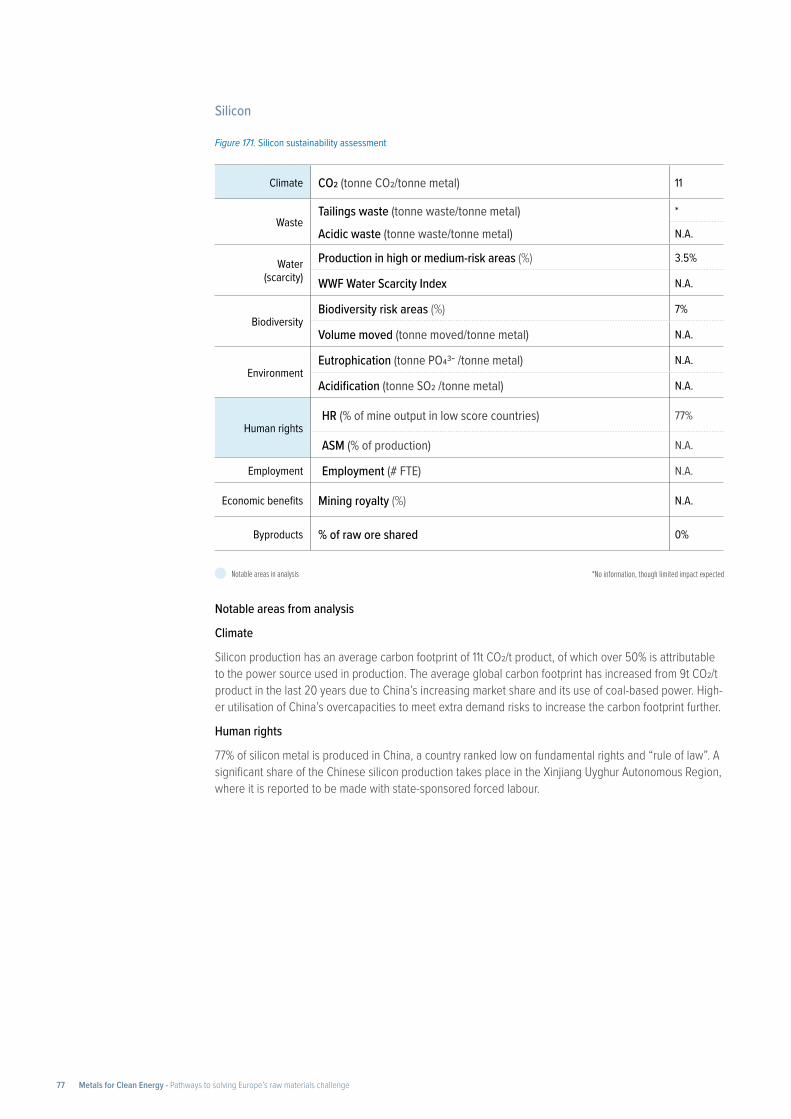
*No information, though limited impact expected
Silicon
Notable areas from analysis
Climate
Silicon production has an average carbon footprint of 11t CO2/t product, of which over 50% is attributable to the power source used in production. The average global carbon footprint has increased from 9t CO2/t product in the last 20 years due to China’s increasing market share and its use of coal-based power. High-er utilisation of China’s overcapacities to meet extra demand risks to increase the carbon footprint further.
Human rights
77% of silicon metal is produced in China, a country ranked low on fundamental rights and “rule of law”. A significant share of the Chinese silicon production takes place in the Xinjiang Uyghur Autonomous Region, where it is reported to be made with state-sponsored forced labour.
Figure 171. Silicon sustainability assessment
Climate CO2 (tonne CO2/tonne metal) 11
Waste Tailings waste (tonne waste/tonne metal) *
Acidic waste (tonne waste/tonne metal) N.A.
Water (scarcity)
Production in high or medium-risk areas (%) 3.5%
WWF Water Scarcity Index N.A.
Biodiversity Biodiversity risk areas (%) 7%
Volume moved (tonne moved/tonne metal) N.A.
Environment Eutrophication (tonne PO43- /tonne metal) N.A.
Acidification (tonne SO2 /tonne metal) N.A.
Human rights HR (% of mine output in low score countries) 77%
ASM (% of production) N.A.
Employment Employment (# FTE) N.A.
Economic benefits Mining royalty (%) N.A.
Byproducts % of raw ore shared 0%
Notable areas in analysis
Metals for Clean Energy - Pathways to solving Europe’s raw materials challenge77

Lithium (on an LCE basis)
Notable areas from analysis
Climate
The energy requirements and carbon footprint for lithium chemicals production depend highly on the ore type and the end product. Brine operations that produce lithium carbonate have a footprint of 3.5t CO2/t LCE, producing lithium hydroxide runs op to 8.2 t CO2/t LCE. Hard rock operations are more energy intense and produce lithium at an average carbon footprint of 18-22.5 tCO2/t LCE (for hydroxide and car-bonate respectively). 60% of lithium refining takes place in China where coal is the majority power source.
Water scarcity
Up to 75% of lithium extraction happens in countries with a moderate water scarcity risk (Chile, Austral-ia), although it is recognised that within these countries many variations can and do occur. The share of refined production drops to 45%.
Lithium production consumes fresh water and brine. Fresh water consumption is on the low end of the range for processing metals. About half of all lithium production is extracted from brines by evaporation. Lithium brines are highly saline underground solutions (7 to 10 times saltier than seawater), which contain ~70% water (Salar de Atacama). The extremely high salinity (30% salts) of the solution make it today technologically very challenging and uneconomical to extract fresh water. Due to its extreme salinity, brine cannot be used for any human or agricultural activity. Therefore, life cycle assessment methodologies do not consider brine as a source of fresh water footprint (ISO 14046).
Figure 172. Lithium sustainability assessment
Climate CO2 (tonne CO2/tonne metal LCE) 3.5 - 8.2 (brine) 17.8 - 22.5 (hard rock)
Waste Tailings waste (tonne waste/tonne metal LCE) 20.5
Acidic waste (tonne waste/tonne metal LCE) 2.0
Water (scarcity)
Production in high or medium-risk areas (%) 75%
WWF Water Scarcity Index 2.5
Biodiversity Biodiversity risk areas (%) 2%
Volume moved (tonne moved/tonne metal LCE) 359
Environment Eutrophication (tonne PO43- /tonne metal LCE) 0.019
Acidification (tonne SO2 /tonne metal LCE) 0.038
Human rights HR (% of mine output in low score countries) 14%
ASM (% of production) 0%
Employment Employment (# FTE) (mining only) 8.4k
Economic benefits Mining royalty (%) 7.63%
Byproducts % of raw ore shared 0%
Notable areas in analysis
Metals for Clean Energy - Pathways to solving Europe’s raw materials challenge78
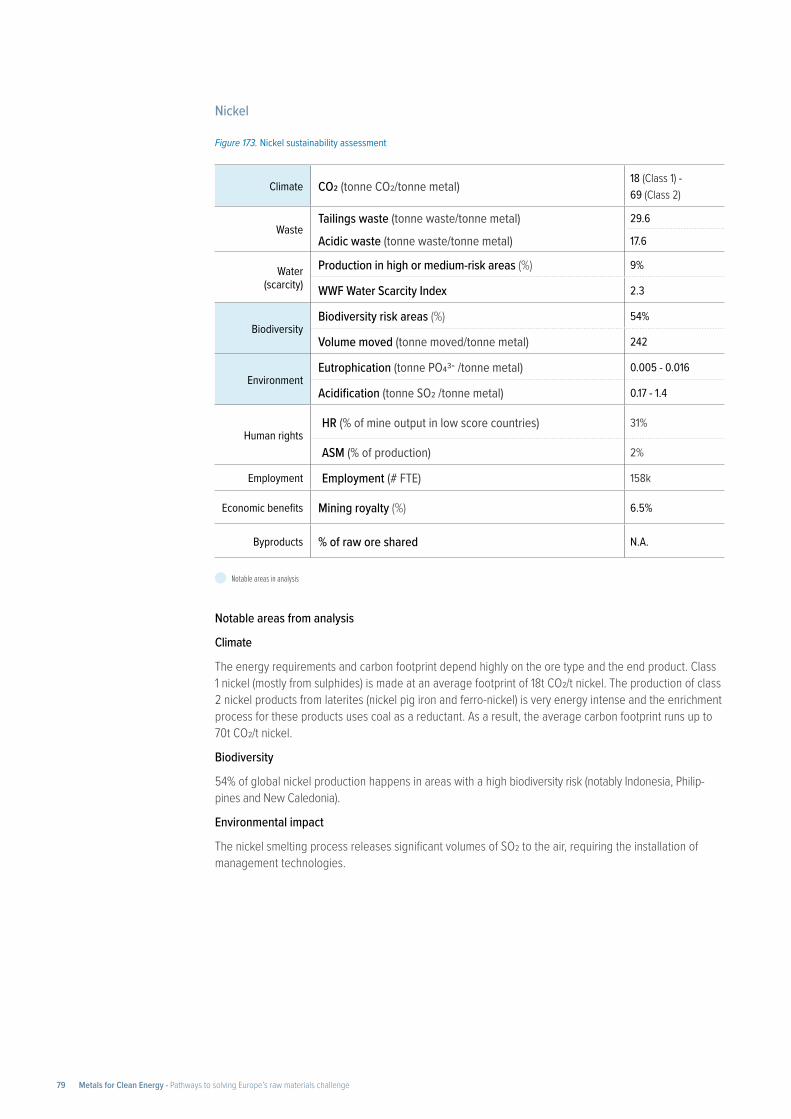
Nickel
Notable areas from analysis
Climate
The energy requirements and carbon footprint depend highly on the ore type and the end product. Class 1 nickel (mostly from sulphides) is made at an average footprint of 18t CO2/t nickel. The production of class 2 nickel products from laterites (nickel pig iron and ferro-nickel) is very energy intense and the enrichment process for these products uses coal as a reductant. As a result, the average carbon footprint runs up to 70t CO2/t nickel.
Biodiversity
54% of global nickel production happens in areas with a high biodiversity risk (notably Indonesia, Philip-pines and New Caledonia).
Environmental impact
The nickel smelting process releases significant volumes of SO2 to the air, requiring the installation of management technologies.
Figure 173. Nickel sustainability assessment
Climate CO2 (tonne CO2/tonne metal) 18 (Class 1) - 69 (Class 2)
Waste Tailings waste (tonne waste/tonne metal) 29.6
Acidic waste (tonne waste/tonne metal) 17.6
Water (scarcity)
Production in high or medium-risk areas (%) 9%
WWF Water Scarcity Index 2.3
Biodiversity Biodiversity risk areas (%) 54%
Volume moved (tonne moved/tonne metal) 242
Environment Eutrophication (tonne PO43- /tonne metal) 0.005 - 0.016
Acidification (tonne SO2 /tonne metal) 0.17 - 1.4
Human rights HR (% of mine output in low score countries) 31%
ASM (% of production) 2%
Employment Employment (# FTE) 158k
Economic benefits Mining royalty (%) 6.5%
Byproducts % of raw ore shared N.A.
Notable areas in analysis
Metals for Clean Energy - Pathways to solving Europe’s raw materials challenge79
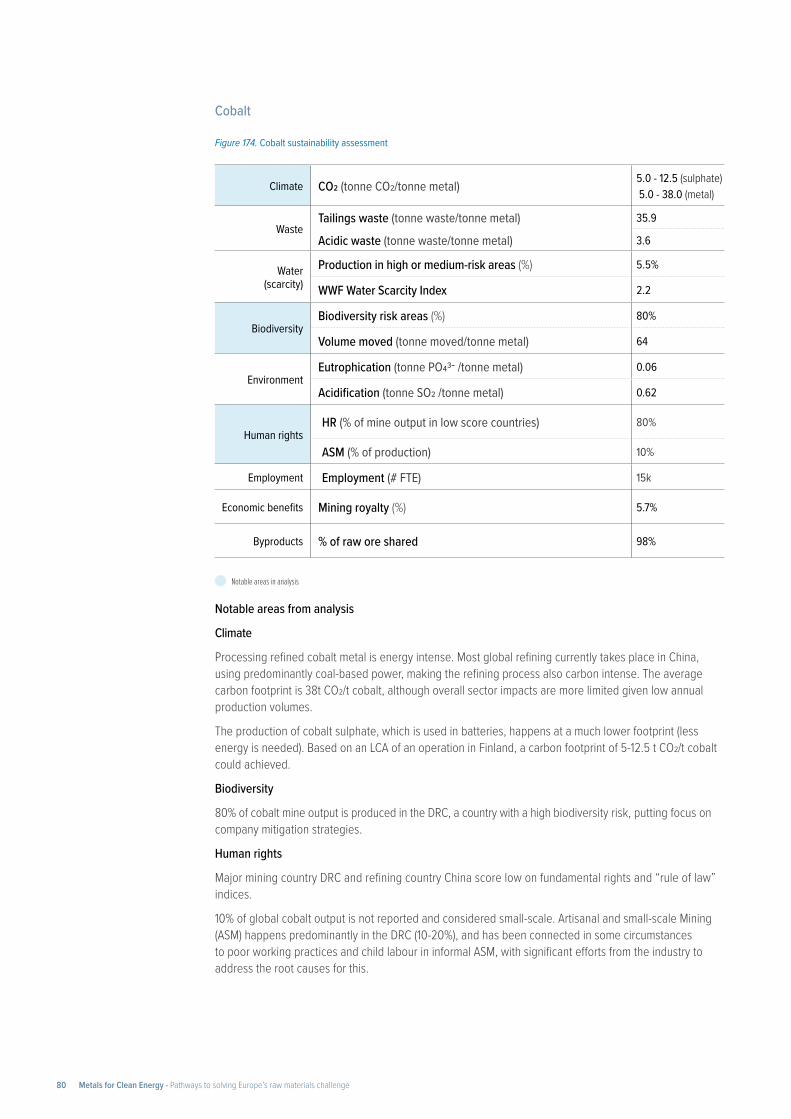
Cobalt
Notable areas from analysis
Climate
Processing refined cobalt metal is energy intense. Most global refining currently takes place in China, using predominantly coal-based power, making the refining process also carbon intense. The average carbon footprint is 38t CO2/t cobalt, although overall sector impacts are more limited given low annual production volumes.
The production of cobalt sulphate, which is used in batteries, happens at a much lower footprint (less energy is needed). Based on an LCA of an operation in Finland, a carbon footprint of 5-12.5 t CO2/t cobalt could achieved.
Biodiversity
80% of cobalt mine output is produced in the DRC, a country with a high biodiversity risk, putting focus on company mitigation strategies.
Human rights
Major mining country DRC and refining country China score low on fundamental rights and “rule of law” indices.
10% of global cobalt output is not reported and considered small-scale. Artisanal and small-scale Mining (ASM) happens predominantly in the DRC (10-20%), and has been connected in some circumstances to poor working practices and child labour in informal ASM, with significant efforts from the industry to address the root causes for this.
Figure 174. Cobalt sustainability assessment
Climate CO2 (tonne CO2/tonne metal) 5.0 - 12.5 (sulphate) 5.0 - 38.0 (metal)
Waste Tailings waste (tonne waste/tonne metal) 35.9
Acidic waste (tonne waste/tonne metal) 3.6
Water (scarcity)
Production in high or medium-risk areas (%) 5.5%
WWF Water Scarcity Index 2.2
Biodiversity Biodiversity risk areas (%) 80%
Volume moved (tonne moved/tonne metal) 64
Environment Eutrophication (tonne PO43- /tonne metal) 0.06
Acidification (tonne SO2 /tonne metal) 0.62
Human rights HR (% of mine output in low score countries) 80%
ASM (% of production) 10%
Employment Employment (# FTE) 15k
Economic benefits Mining royalty (%) 5.7%
Byproducts % of raw ore shared 98%
Notable areas in analysis
Metals for Clean Energy - Pathways to solving Europe’s raw materials challenge80
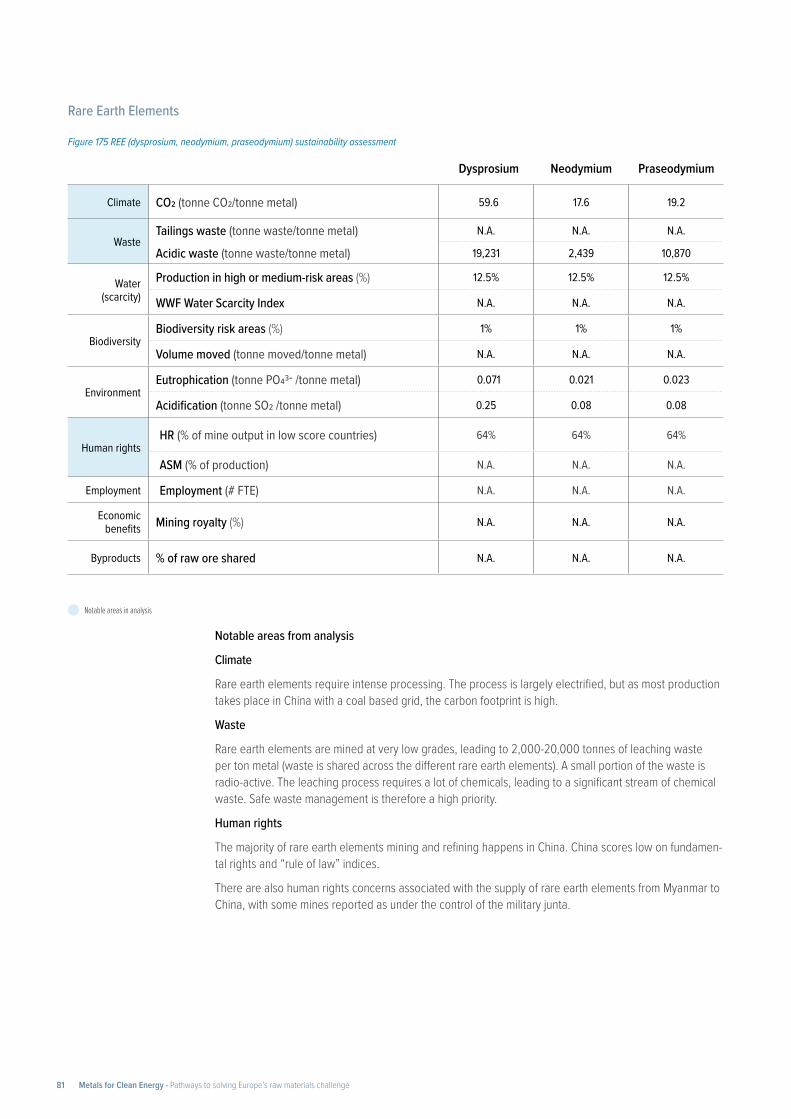
Figure 175 REE (dysprosium, neodymium, praseodymium) sustainability assessment
Dysprosium Neodymium Praseodymium
Climate CO2 (tonne CO2/tonne metal) 59.6 17.6 19.2
Waste Tailings waste (tonne waste/tonne metal) N.A. N.A. N.A.
Acidic waste (tonne waste/tonne metal) 19,231 2,439 10,870
Water (scarcity)
Production in high or medium-risk areas (%) 12.5% 12.5% 12.5%
WWF Water Scarcity Index N.A. N.A. N.A.
Biodiversity Biodiversity risk areas (%) 1% 1% 1%
Volume moved (tonne moved/tonne metal) N.A. N.A. N.A.
Environment Eutrophication (tonne PO43- /tonne metal) 0.071 0.021 0.023
Acidification (tonne SO2 /tonne metal) 0.25 0.08 0.08
Human rights HR (% of mine output in low score countries) 64% 64% 64%
ASM (% of production) N.A. N.A. N.A.
Employment Employment (# FTE) N.A. N.A. N.A.
Economic benefits Mining royalty (%) N.A. N.A. N.A.
Byproducts % of raw ore shared N.A. N.A. N.A.
Rare Earth Elements
Notable areas from analysis
Climate
Rare earth elements require intense processing. The process is largely electrified, but as most production takes place in China with a coal based grid, the carbon footprint is high.
Waste
Rare earth elements are mined at very low grades, leading to 2,000-20,000 tonnes of leaching waste per ton metal (waste is shared across the different rare earth elements). A small portion of the waste is radio-active. The leaching process requires a lot of chemicals, leading to a significant stream of chemical waste. Safe waste management is therefore a high priority.
Human rights
The majority of rare earth elements mining and refining happens in China. China scores low on fundamen-tal rights and “rule of law” indices.
There are also human rights concerns associated with the supply of rare earth elements from Myanmar to China, with some mines reported as under the control of the military junta.
Notable areas in analysis
Metals for Clean Energy - Pathways to solving Europe’s raw materials challenge81
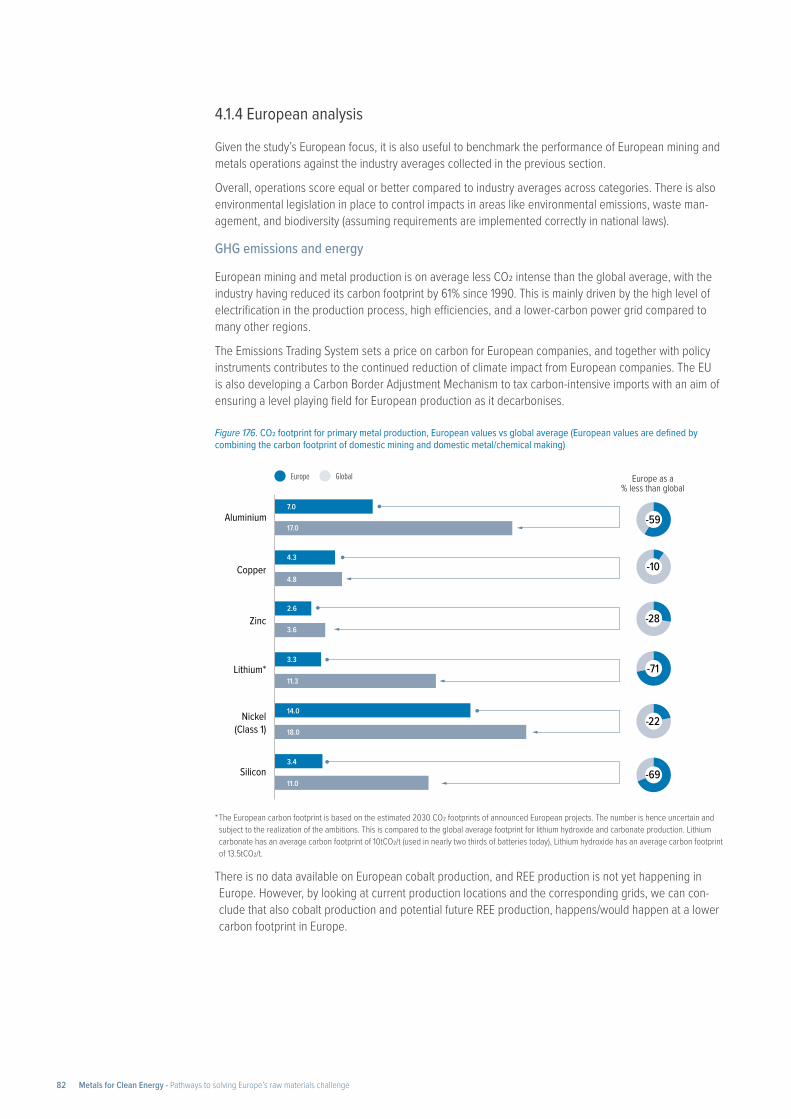
4.1.4 European analysis
Given the study’s European focus, it is also useful to benchmark the performance of European mining and metals operations against the industry averages collected in the previous section.
Overall, operations score equal or better compared to industry averages across categories. There is also environmental legislation in place to control impacts in areas like environmental emissions, waste man-agement, and biodiversity (assuming requirements are implemented correctly in national laws).
GHG emissions and energy
European mining and metal production is on average less CO2 intense than the global average, with the industry having reduced its carbon footprint by 61% since 1990. This is mainly driven by the high level of electrification in the production process, high efficiencies, and a lower-carbon power grid compared to many other regions.
The Emissions Trading System sets a price on carbon for European companies, and together with policy instruments contributes to the continued reduction of climate impact from European companies. The EU is also developing a Carbon Border Adjustment Mechanism to tax carbon-intensive imports with an aim of ensuring a level playing field for European production as it decarbonises.
Figure 176. CO2 footprint for primary metal production, European values vs global average (European values are defined by combining the carbon footprint of domestic mining and domestic metal/chemical making)
* The European carbon footprint is based on the estimated 2030 CO2 footprints of announced European projects. The number is hence uncertain and subject to the realization of the ambitions. This is compared to the global average footprint for lithium hydroxide and carbonate production. Lithium carbonate has an average carbon footprint of 10tCO2/t (used in nearly two thirds of batteries today), Lithium hydroxide has an average carbon footprint of 13.5tCO2/t.
There is no data available on European cobalt production, and REE production is not yet happening in Europe. However, by looking at current production locations and the corresponding grids, we can con-clude that also cobalt production and potential future REE production, happens/would happen at a lower carbon footprint in Europe.
Europe Global
Aluminium7.0
17.0-59
Zinc 2.6
3.6-28
4.3
4.8-10Copper
Nickel (Class 1)
14.0
18.0-22
Silicon3.4
11.0-69
Lithium*3.3
11.3-71
Europe as a % less than global
Aluminium7.0
17.0-59
Zinc 2.6
3.6-28
4.3
4.8-10Copper
Nickel (Class 1**)
14.0
18.0-22
Silicon3.4
11.0-69
Lithium*3.3
11.3-71
Europe as a % less than global
Metals for Clean Energy - Pathways to solving Europe’s raw materials challenge82
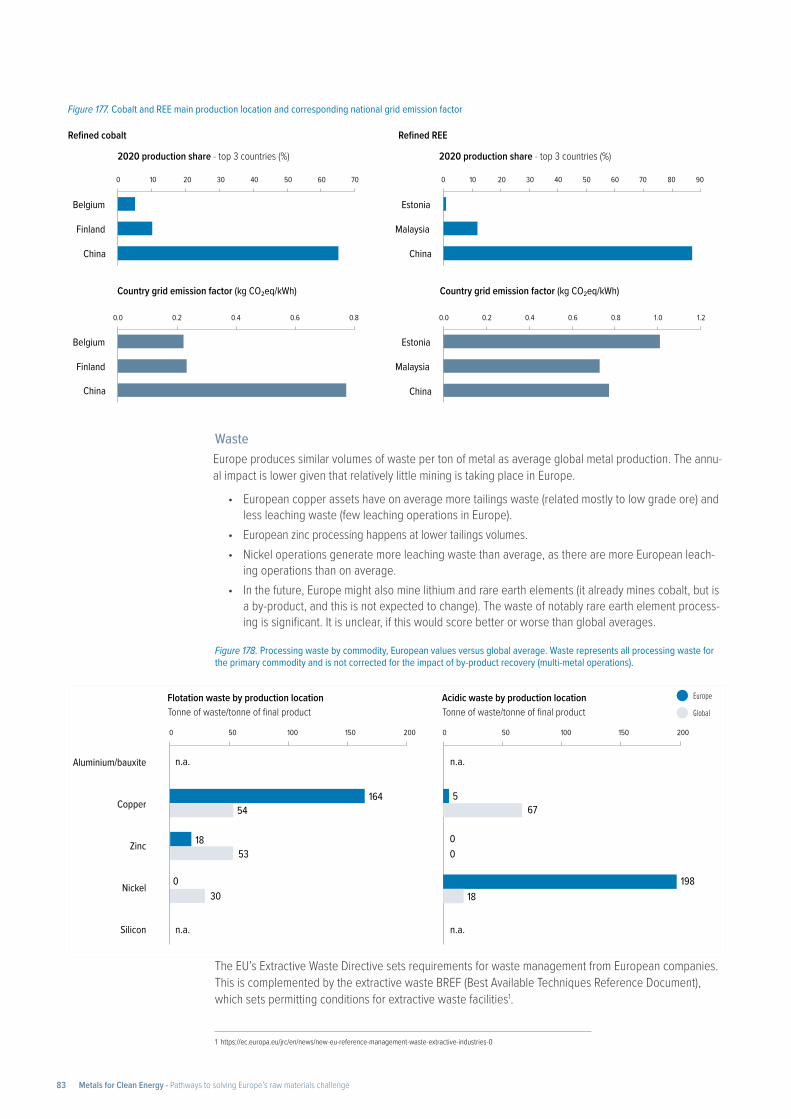
164
18
54
53
30
0 50 100 150 200 0 50 100 150 200
0
Zinc
Copper
Silicon
Nickel
Aluminium/bauxite
Flotation waste by production location
5
198
67
18
n.a.
n.a.
00
n.a.
n.a.
Tonne of waste/tonne of final productAcidic waste by production location Tonne of waste/tonne of final product
Europe
Global
Figure 177. Cobalt and REE main production location and corresponding national grid emission factor
Figure 178. Processing waste by commodity, European values versus global average. Waste represents all processing waste for the primary commodity and is not corrected for the impact of by-product recovery (multi-metal operations).
Refined cobalt
0 10 20 30 40 50 60 70
Finland
China
Belgium
0.2 0.80.40.0 0.6
China
Finland
Belgium
Refined REE
0 10 20 30 40 50 60 70 80 90
China
Malaysia
Estonia
1.21.00.80.60.0 0.40.2
Malaysia
Estonia
China
2020 production share - top 3 countries (%) 2020 production share - top 3 countries (%)
Country grid emission factor (kg CO₂eq/kWh) Country grid emission factor (kg CO₂eq/kWh)
Waste
The EU’s Extractive Waste Directive sets requirements for waste management from European companies. This is complemented by the extractive waste BREF (Best Available Techniques Reference Document), which sets permitting conditions for extractive waste facilities1.
1 https://ec.europa.eu/jrc/en/news/new-eu-reference-management-waste-extractive-industries-0
Europe produces similar volumes of waste per ton of metal as average global metal production. The annu-al impact is lower given that relatively little mining is taking place in Europe.
• European copper assets have on average more tailings waste (related mostly to low grade ore) and less leaching waste (few leaching operations in Europe).
• European zinc processing happens at lower tailings volumes. • Nickel operations generate more leaching waste than average, as there are more European leach-
ing operations than on average.• In the future, Europe might also mine lithium and rare earth elements (it already mines cobalt, but is
a by-product, and this is not expected to change). The waste of notably rare earth element process-ing is significant. It is unclear, if this would score better or worse than global averages.
Metals for Clean Energy - Pathways to solving Europe’s raw materials challenge83
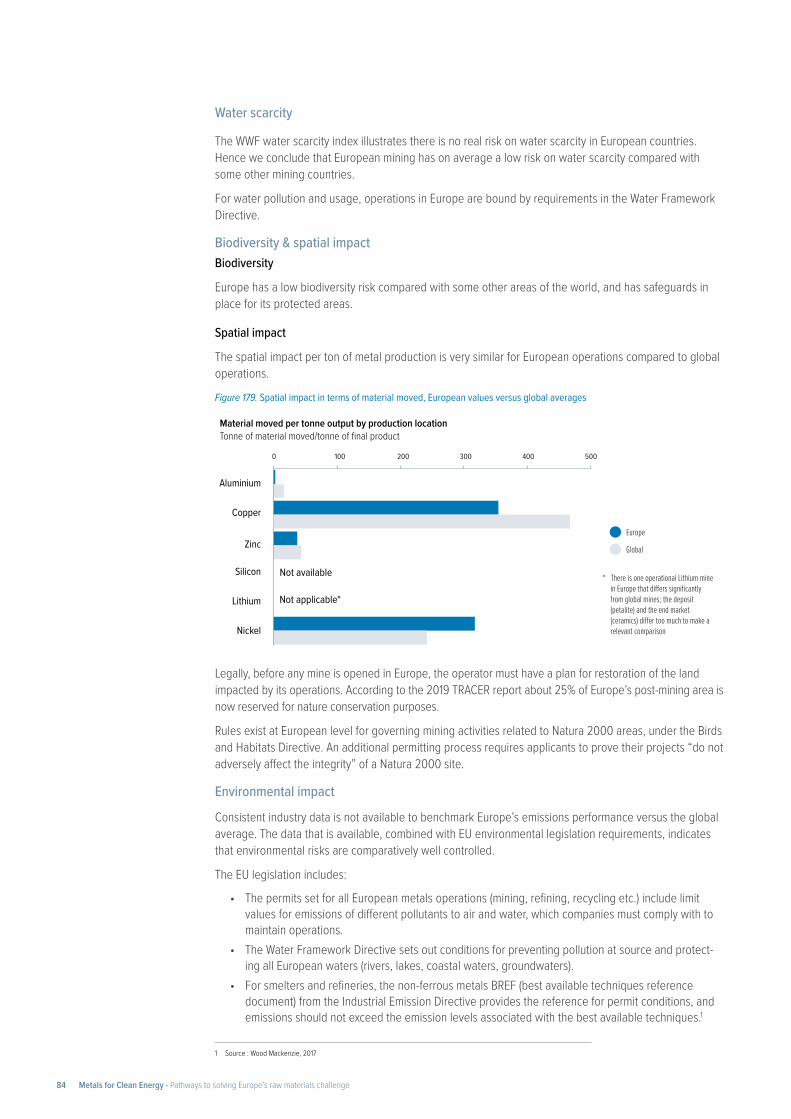
Spatial impact
The spatial impact per ton of metal production is very similar for European operations compared to global operations.
Figure 179. Spatial impact in terms of material moved, European values versus global averages
Legally, before any mine is opened in Europe, the operator must have a plan for restoration of the land impacted by its operations. According to the 2019 TRACER report about 25% of Europe’s post-mining area is now reserved for nature conservation purposes.
Rules exist at European level for governing mining activities related to Natura 2000 areas, under the Birds and Habitats Directive. An additional permitting process requires applicants to prove their projects “do not adversely affect the integrity” of a Natura 2000 site.
Environmental impact
Consistent industry data is not available to benchmark Europe’s emissions performance versus the global average. The data that is available, combined with EU environmental legislation requirements, indicates that environmental risks are comparatively well controlled.
The EU legislation includes:
• The permits set for all European metals operations (mining, refining, recycling etc.) include limit values for emissions of different pollutants to air and water, which companies must comply with to maintain operations.
• The Water Framework Directive sets out conditions for preventing pollution at source and protect-ing all European waters (rivers, lakes, coastal waters, groundwaters).
• For smelters and refineries, the non-ferrous metals BREF (best available techniques reference document) from the Industrial Emission Directive provides the reference for permit conditions, and emissions should not exceed the emission levels associated with the best available techniques.1
1 Source : Wood Mackenzie, 2017
Water scarcity
The WWF water scarcity index illustrates there is no real risk on water scarcity in European countries. Hence we conclude that European mining has on average a low risk on water scarcity compared with some other mining countries.
For water pollution and usage, operations in Europe are bound by requirements in the Water Framework Directive.
Biodiversity & spatial impactBiodiversity
Europe has a low biodiversity risk compared with some other areas of the world, and has safeguards in place for its protected areas.
* There is one operational Lithium mine in Europe that di�ers significantly from global mines; the deposit (petalite) and the end market (ceramics) di�er too much to make a relevant comparison
Material moved per tonne output by production locationTonne of material moved/tonne of final product
Europe
Global
0 100 200 300 400 500
Lithium
Aluminium
Silicon
Zinc
Nickel
Copper
Not available
Not applicable*
Metals for Clean Energy - Pathways to solving Europe’s raw materials challenge84
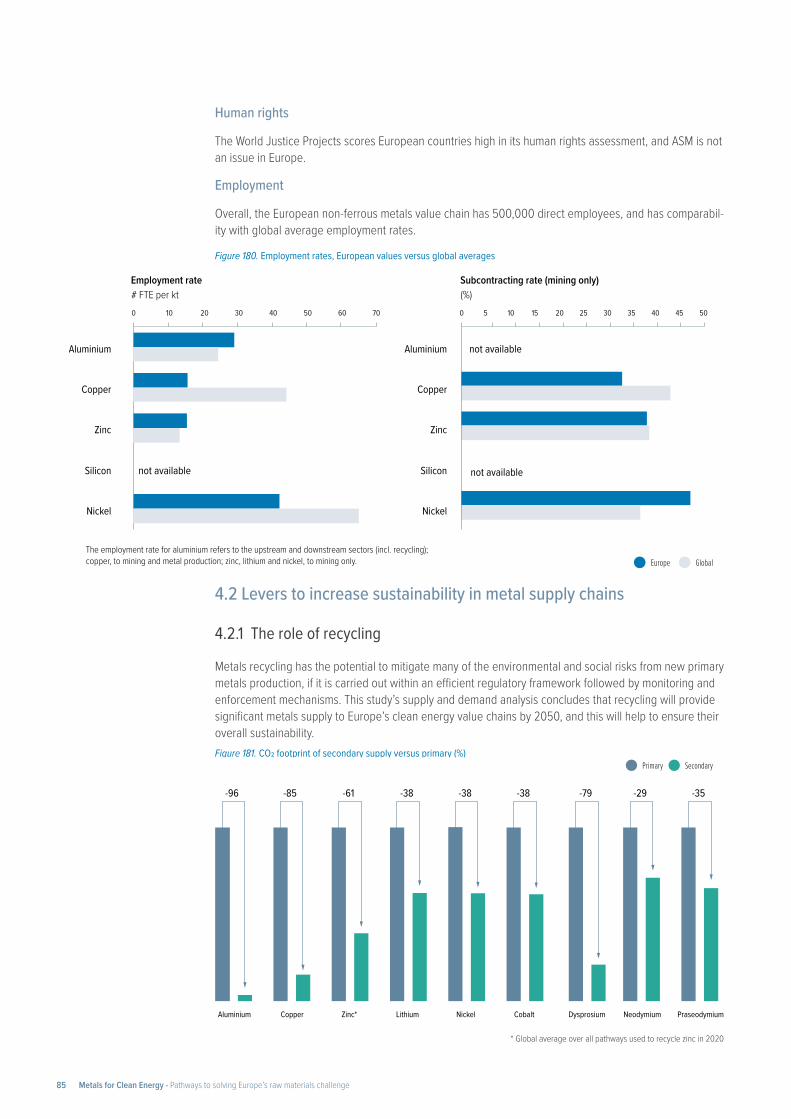
Human rights
The World Justice Projects scores European countries high in its human rights assessment, and ASM is not an issue in Europe.
Employment
Overall, the European non-ferrous metals value chain has 500,000 direct employees, and has comparabil-ity with global average employment rates.
Figure 180. Employment rates, European values versus global averages
4.2 Levers to increase sustainability in metal supply chains
4.2.1 The role of recycling
Metals recycling has the potential to mitigate many of the environmental and social risks from new primary metals production, if it is carried out within an efficient regulatory framework followed by monitoring and enforcement mechanisms. This study’s supply and demand analysis concludes that recycling will provide significant metals supply to Europe’s clean energy value chains by 2050, and this will help to ensure their overall sustainability. Figure 181. CO2 footprint of secondary supply versus primary (%)
Aluminium
-96
Copper
-85
Zinc*
-61
Nickel
-38
Lithium
-38
Cobalt
-38
Dysprosium
-79
Neodymium
-29
Praseodymium
-35
Primary Secondary
Employment rate
not available not available
not available
# FTE per ktSubcontracting rate (mining only)(%)
Europe Global
0 10 20 30 40 50 60 70
Nickel
Zinc
Silicon
Copper
Aluminium
Nickel
Zinc
Silicon
Copper
Aluminium
0 5 10 15 20 25 30 35 40 45 50
The employment rate for aluminium refers to the upstream and downstream sectors (incl. recycling); copper, to mining and metal production; zinc, lithium and nickel, to mining only.
* Global average over all pathways used to recycle zinc in 2020
Metals for Clean Energy - Pathways to solving Europe’s raw materials challenge85
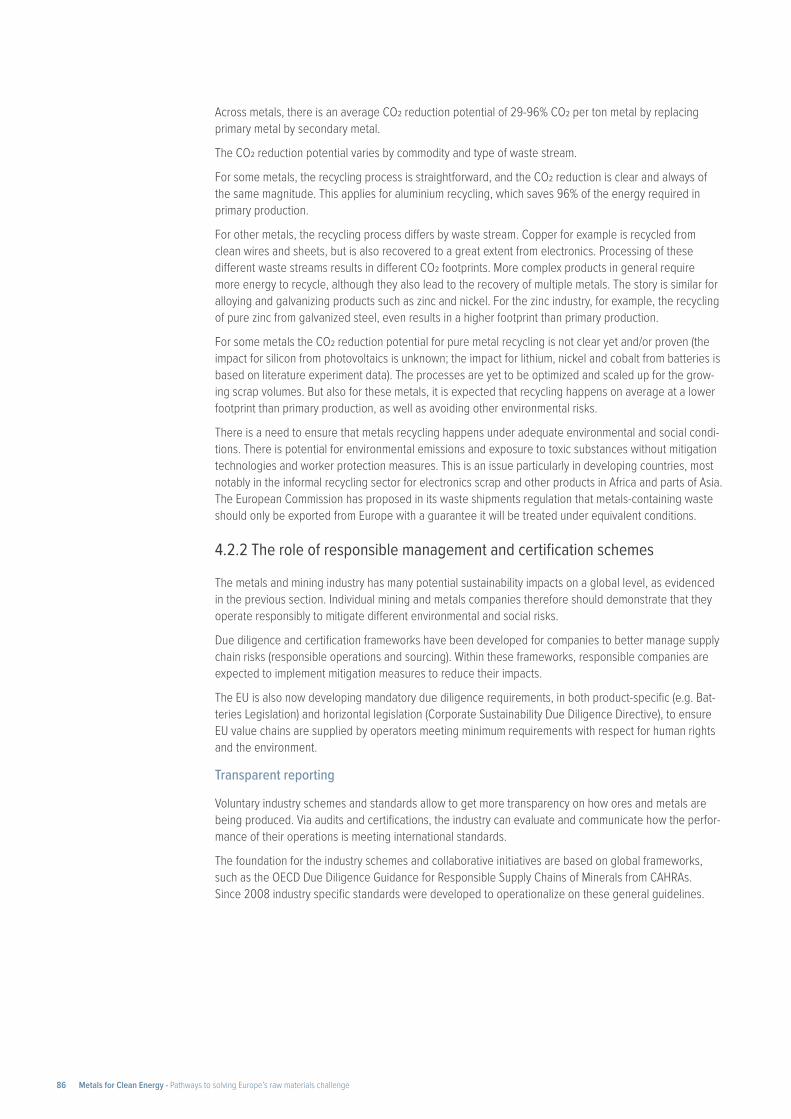
Across metals, there is an average CO2 reduction potential of 29-96% CO2 per ton metal by replacing primary metal by secondary metal.
The CO2 reduction potential varies by commodity and type of waste stream.
For some metals, the recycling process is straightforward, and the CO2 reduction is clear and always of the same magnitude. This applies for aluminium recycling, which saves 96% of the energy required in primary production.
For other metals, the recycling process differs by waste stream. Copper for example is recycled from clean wires and sheets, but is also recovered to a great extent from electronics. Processing of these different waste streams results in different CO2 footprints. More complex products in general require more energy to recycle, although they also lead to the recovery of multiple metals. The story is similar for alloying and galvanizing products such as zinc and nickel. For the zinc industry, for example, the recycling of pure zinc from galvanized steel, even results in a higher footprint than primary production.
For some metals the CO2 reduction potential for pure metal recycling is not clear yet and/or proven (the impact for silicon from photovoltaics is unknown; the impact for lithium, nickel and cobalt from batteries is based on literature experiment data). The processes are yet to be optimized and scaled up for the grow-ing scrap volumes. But also for these metals, it is expected that recycling happens on average at a lower footprint than primary production, as well as avoiding other environmental risks.
There is a need to ensure that metals recycling happens under adequate environmental and social condi-tions. There is potential for environmental emissions and exposure to toxic substances without mitigation technologies and worker protection measures. This is an issue particularly in developing countries, most notably in the informal recycling sector for electronics scrap and other products in Africa and parts of Asia. The European Commission has proposed in its waste shipments regulation that metals-containing waste should only be exported from Europe with a guarantee it will be treated under equivalent conditions.
4.2.2 The role of responsible management and certification schemes
The metals and mining industry has many potential sustainability impacts on a global level, as evidenced in the previous section. Individual mining and metals companies therefore should demonstrate that they operate responsibly to mitigate different environmental and social risks.
Due diligence and certification frameworks have been developed for companies to better manage supply chain risks (responsible operations and sourcing). Within these frameworks, responsible companies are expected to implement mitigation measures to reduce their impacts.
The EU is also now developing mandatory due diligence requirements, in both product-specific (e.g. Bat-teries Legislation) and horizontal legislation (Corporate Sustainability Due Diligence Directive), to ensure EU value chains are supplied by operators meeting minimum requirements with respect for human rights and the environment.
Transparent reporting
Voluntary industry schemes and standards allow to get more transparency on how ores and metals are being produced. Via audits and certifications, the industry can evaluate and communicate how the perfor-mance of their operations is meeting international standards.
The foundation for the industry schemes and collaborative initiatives are based on global frameworks, such as the OECD Due Diligence Guidance for Responsible Supply Chains of Minerals from CAHRAs. Since 2008 industry specific standards were developed to operationalize on these general guidelines.
Metals for Clean Energy - Pathways to solving Europe’s raw materials challenge86
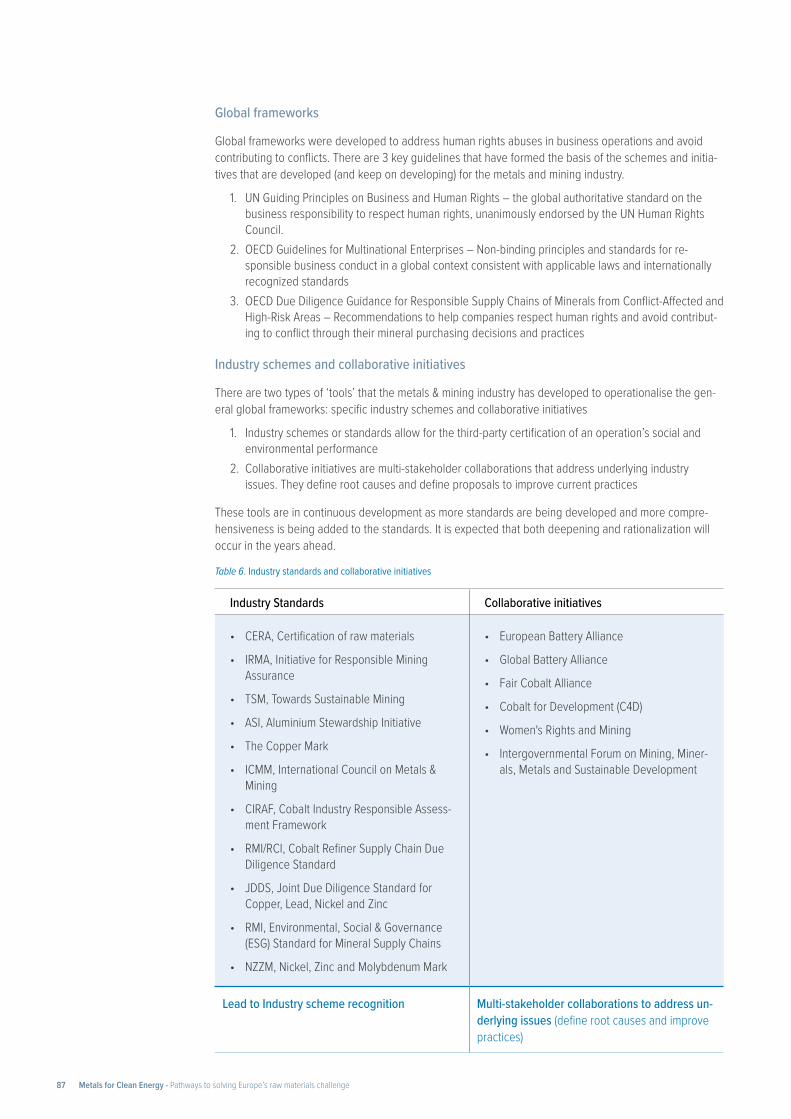
Global frameworks
Global frameworks were developed to address human rights abuses in business operations and avoid contributing to conflicts. There are 3 key guidelines that have formed the basis of the schemes and initia-tives that are developed (and keep on developing) for the metals and mining industry.
1. UN Guiding Principles on Business and Human Rights – the global authoritative standard on the business responsibility to respect human rights, unanimously endorsed by the UN Human Rights Council.
2. OECD Guidelines for Multinational Enterprises – Non-binding principles and standards for re-sponsible business conduct in a global context consistent with applicable laws and internationally recognized standards
3. OECD Due Diligence Guidance for Responsible Supply Chains of Minerals from Conflict-Affected and High-Risk Areas – Recommendations to help companies respect human rights and avoid contribut-ing to conflict through their mineral purchasing decisions and practices
Industry schemes and collaborative initiatives
There are two types of ‘tools’ that the metals & mining industry has developed to operationalise the gen-eral global frameworks: specific industry schemes and collaborative initiatives
1. Industry schemes or standards allow for the third-party certification of an operation’s social and environmental performance
2. Collaborative initiatives are multi-stakeholder collaborations that address underlying industry issues. They define root causes and define proposals to improve current practices
These tools are in continuous development as more standards are being developed and more compre-hensiveness is being added to the standards. It is expected that both deepening and rationalization will occur in the years ahead.
Table 6. Industry standards and collaborative initiatives
Industry Standards Collaborative initiatives
• CERA, Certification of raw materials
• IRMA, Initiative for Responsible Mining Assurance
• TSM, Towards Sustainable Mining
• ASI, Aluminium Stewardship Initiative
• The Copper Mark
• ICMM, International Council on Metals & Mining
• CIRAF, Cobalt Industry Responsible Assess-ment Framework
• RMI/RCI, Cobalt Refiner Supply Chain Due Diligence Standard
• JDDS, Joint Due Diligence Standard for Copper, Lead, Nickel and Zinc
• RMI, Environmental, Social & Governance (ESG) Standard for Mineral Supply Chains
• NZZM, Nickel, Zinc and Molybdenum Mark
• European Battery Alliance
• Global Battery Alliance
• Fair Cobalt Alliance
• Cobalt for Development (C4D)
• Women's Rights and Mining
• Intergovernmental Forum on Mining, Miner-als, Metals and Sustainable Development
Lead to Industry scheme recognition Multi-stakeholder collaborations to address un-derlying issues (define root causes and improve practices)
Metals for Clean Energy - Pathways to solving Europe’s raw materials challenge87
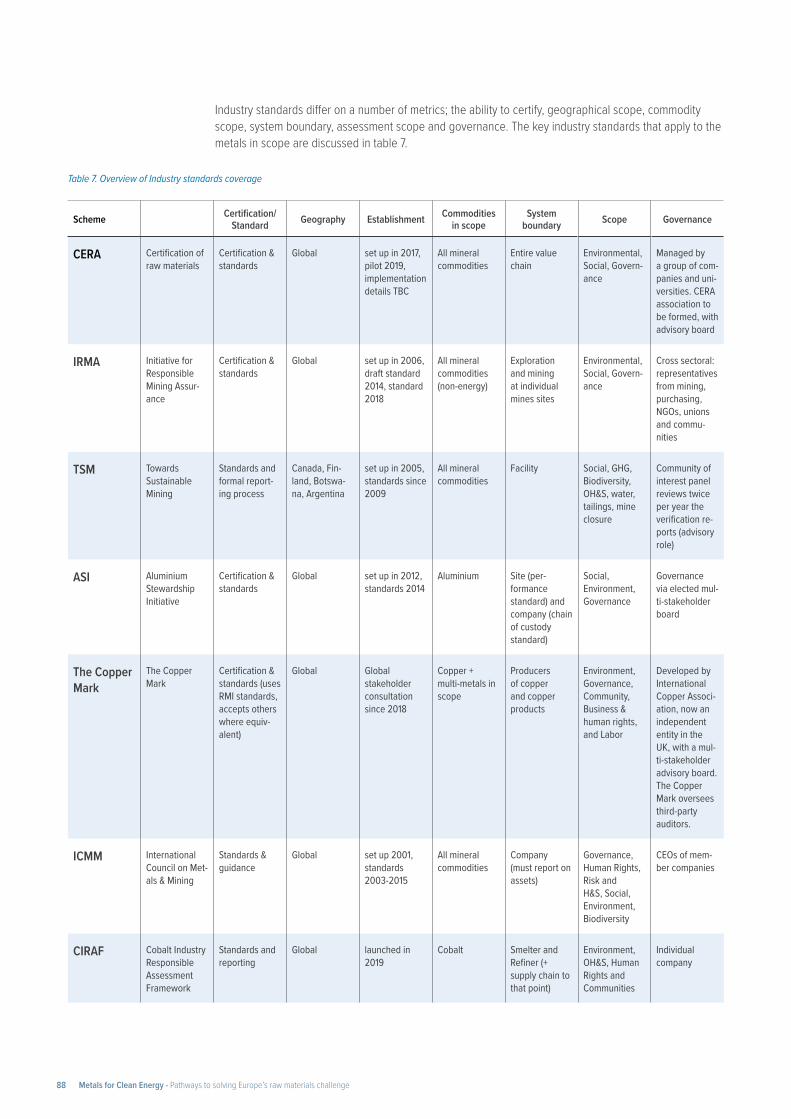
Table 7. Overview of Industry standards coverage
Scheme Certification/Standard Geography Establishment Commodities
in scopeSystem
boundary Scope Governance
CERA Certification of raw materials
Certification & standards
Global set up in 2017, pilot 2019, implementation details TBC
All mineral commodities
Entire value chain
Environmental, Social, Govern-ance
Managed by a group of com-panies and uni-versities. CERA association to be formed, with advisory board
IRMA Initiative for Responsible Mining Assur-ance
Certification & standards
Global set up in 2006, draft standard 2014, standard 2018
All mineral commodities (non-energy)
Exploration and mining at individual mines sites
Environmental, Social, Govern-ance
Cross sectoral: representatives from mining, purchasing, NGOs, unions and commu-nities
TSM Towards Sustainable Mining
Standards and formal report-ing process
Canada, Fin-land, Botswa-na, Argentina
set up in 2005, standards since 2009
All mineral commodities
Facility Social, GHG, Biodiversity, OH&S, water, tailings, mine closure
Community of interest panel reviews twice per year the verification re-ports (advisory role)
ASI Aluminium Stewardship Initiative
Certification & standards
Global set up in 2012, standards 2014
Aluminium Site (per-formance standard) and company (chain of custody standard)
Social, Environment, Governance
Governance via elected mul-ti-stakeholder board
The Copper Mark
The Copper Mark
Certification & standards (uses RMI standards, accepts others where equiv-alent)
Global Global stakeholder consultation since 2018
Copper + multi-metals in scope
Producers of copper and copper products
Environment, Governance, Community, Business & human rights, and Labor
Developed by International Copper Associ-ation, now an independent entity in the UK, with a mul-ti-stakeholder advisory board. The Copper Mark oversees third-party auditors.
ICMM International Council on Met-als & Mining
Standards & guidance
Global set up 2001, standards 2003-2015
All mineral commodities
Company (must report on assets)
Governance, Human Rights, Risk and H&S, Social, Environment, Biodiversity
CEOs of mem-ber companies
CIRAF Cobalt Industry Responsible Assessment Framework
Standards and reporting
Global launched in 2019
Cobalt Smelter and Refiner (+ supply chain to that point)
Environment, OH&S, Human Rights and Communities
Individual company
Industry standards differ on a number of metrics; the ability to certify, geographical scope, commodity scope, system boundary, assessment scope and governance. The key industry standards that apply to the metals in scope are discussed in table 7.
Metals for Clean Energy - Pathways to solving Europe’s raw materials challenge88
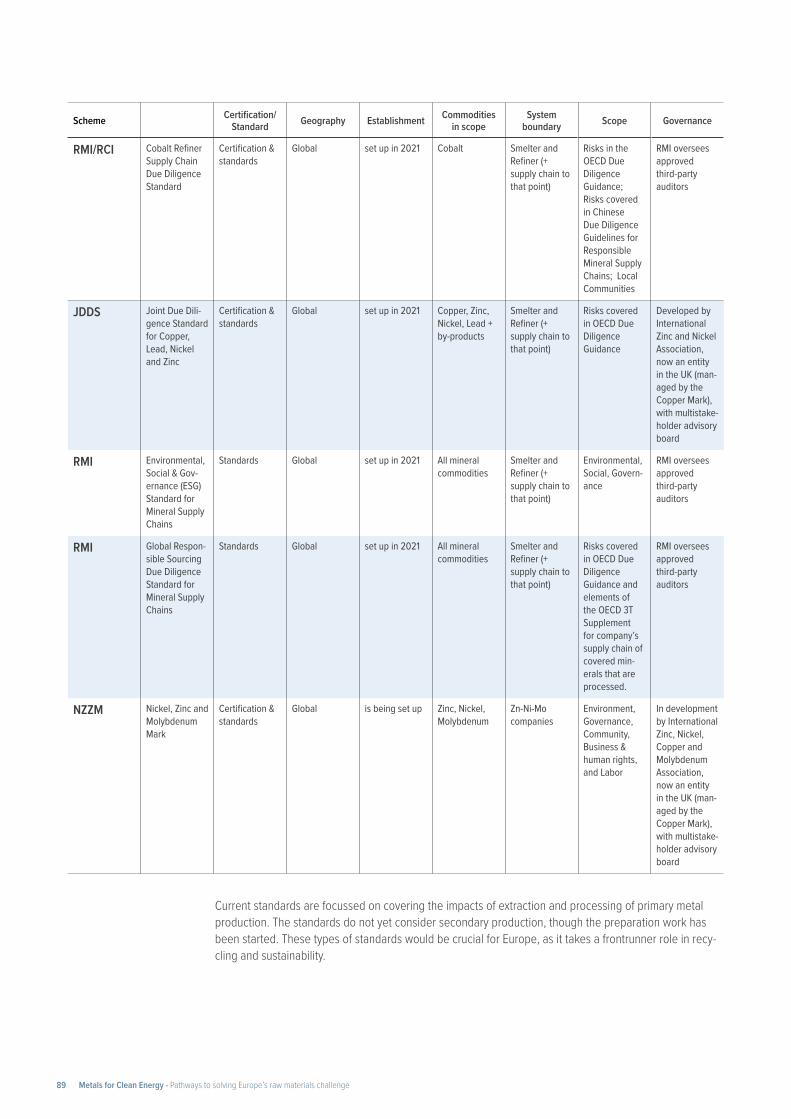
Current standards are focussed on covering the impacts of extraction and processing of primary metal production. The standards do not yet consider secondary production, though the preparation work has been started. These types of standards would be crucial for Europe, as it takes a frontrunner role in recy-cling and sustainability.
Scheme Certification/Standard Geography Establishment Commodities
in scopeSystem
boundary Scope Governance
RMI/RCI Cobalt Refiner Supply Chain Due Diligence Standard
Certification & standards
Global set up in 2021 Cobalt Smelter and Refiner (+ supply chain to that point)
Risks in the OECD Due Diligence Guidance; Risks covered in Chinese Due Diligence Guidelines for Responsible Mineral Supply Chains; Local Communities
RMI oversees approved third-party auditors
JDDS Joint Due Dili-gence Standard for Copper, Lead, Nickel and Zinc
Certification & standards
Global set up in 2021 Copper, Zinc, Nickel, Lead + by-products
Smelter and Refiner (+ supply chain to that point)
Risks covered in OECD Due Diligence Guidance
Developed by International Zinc and Nickel Association, now an entity in the UK (man-aged by the Copper Mark), with multistake-holder advisory board
RMI Environmental, Social & Gov-ernance (ESG) Standard for Mineral Supply Chains
Standards Global set up in 2021 All mineral commodities
Smelter and Refiner (+ supply chain to that point)
Environmental, Social, Govern-ance
RMI oversees approved third-party auditors
RMI Global Respon-sible Sourcing Due Diligence Standard for Mineral Supply Chains
Standards Global set up in 2021 All mineral commodities
Smelter and Refiner (+ supply chain to that point)
Risks covered in OECD Due Diligence Guidance and elements of the OECD 3T Supplement for company’s supply chain of covered min-erals that are processed.
RMI oversees approved third-party auditors
NZZM Nickel, Zinc and Molybdenum Mark
Certification & standards
Global is being set up Zinc, Nickel, Molybdenum
Zn-Ni-Mo companies
Environment, Governance, Community, Business & human rights, and Labor
In development by International Zinc, Nickel, Copper and Molybdenum Association, now an entity in the UK (man-aged by the Copper Mark), with multistake-holder advisory board
Metals for Clean Energy - Pathways to solving Europe’s raw materials challenge89
4.2.3 The role of legislation
Europe is working on legislation to ensure sustainable production of ore, metals and products in Europe via the Battery Regulation and the Corporate Sustainability Due Diligence Directive.
Battery RegulationCommodities in scope
Cobalt, lithium, nickel, natural graphite, and chemical compounds necessary to manufacture the active materials of batteries.
Aim
Modernize the EU legislative framework for batteries. Batteries placed on the EU market will become more sustainable, high-performing and safe all along their entire life cycle.
Key requirements
Due diligence based on several risks*: air, water, soil , biodiversity, human health, occupational health and safety, labour rights, human rights, community life.
Carbon footprint transparency: from 1 July 2024, only rechargeable industrial and electric vehicles bat-teries for which a carbon footprint declaration has been established, can be placed on the market.
End-of-life management: new requirements and targets on the content of recycled materials and col-lection, treatment and recycling of batteries at the end-of-life part (e.g. current figure of 45% collection rate should rise to 65 % in 2025 and 70% in 2030). The proposed regulation defines a framework that will facilitate the re-purposing of batteries from electric vehicles so that they can have a second life, for example as stationary energy storage systems, or integration into electricity grids.
Compliance
Existing industry schemes may be officially recognized upon request from governments, industry associations and groupings of interested organizations that have developed and oversee due diligence schemes (“scheme owners”).
Timing
The legislative proposal will be adopted and published in the EU Official Journal in the second half of 2022. Some of the provisions will be applicable only after a certain time, e.g. 12 or 24 months after the Regulation enters into force.
General regulation: Corporate Sustainability Due Diligence DirectiveCommodities in scope
All commodities
Aim
Introduce new rules on how sustainability should be incorporated into long-term business strategies, by introducing:
• due diligence rules to cover human rights and environmental violations in corporate value chains.
• corporate directors’ duties to integrate sustainability criteria into their decision-making: “Directors should […] contribute to the company’s business strategy and long-term interests and sustainabil-ity” adding that “comprehensive and varied criteria are established for the award of any variable remuneration”. Moreover: “Member States shall ensure that directors adopt a plan to ensure that the business model and strategy of the company are compatible with the transition to a sustainable economy and with the limiting of global warming to 1.5 °C in line with the Paris Agreement”.
*applies to rechargeable industrial batteries and electric-vehicle batteries with internal storage and a capacity above 2 kWh.
Metals for Clean Energy - Pathways to solving Europe’s raw materials challenge90
Compliance No recognition of industry-specific schemes. Member States will designate an authority to supervise and impose effective, proportionate and dissuasive sanctions, including fines and compliance orders, ensur-ing that victims get compensation for damages resulting from the failure to comply with the obligations of the new proposals.
TimingThe European Commission’s proposal has been published on February 23rd. It will then be examined and amended by the Parliament and Council throughout 2022. The proposal is early stage: discussion and changes are expected.
4.3 Conclusions: Implications of sustainability mapping for European supply chainsIn this conclusion section, the study’s supply-demand analysis is combined with insights from this section’s sustainability analysis to make overall conclusions for Europe’s metal supply chains. For each commodity, the study evaluates the evolution of three key components for overall sustainability:
1. Recycling, which will mitigate the need for extra primary production 2. Domestic primary production, which would give more control on supply chains and more certainty
on the sustainability performance 3. Imports, where any identified risks would need to be managed through responsible sourcing
mechanisms
4.3.1 Commodity deep dives (Tier 1 commodities)Aluminium
1. Secondary supply: Europe’s secondary aluminium supply will increase and could provide 50-55% of supply in 2050 (from 41% today).
2. Domestic primary production: If Europe’s primary production remains flat in the next three dec-ades in a base case, its share of European aluminium supply would drop from 29% in 2020 to ~20% in 2050.
3. Imports: Import requirements are expected to increase, as secondary supply cannot keep up fully with demand growth.
− Aluminium metal comes from China, Russia and Mozambique (top 3 countries). The carbon footprint of imports is the predominant concern, notably for Chinese imports which are three times more carbon-intensive than aluminium produced in Europe. The implications of Russia’s current actions in Ukraine also need to be assessed.
− Europe’s bauxite comes mainly from Guinea. Biodiversity and human rights are potential con-cerns, requiring individual company attention and due diligence
− The Aluminium Stewardship Initiative certifies operators across ESG parameters
Copper
1. Recycling: Europe’s secondary copper supply could increase to over 65% of supply by 2050 (from 52% today). Its higher contribution would mitigate the need for extra primary metal.
2. Domestic primary production: Domestic primary copper mine output will decrease without new projects, lowering its share of supply from 39% in 2020 to 30% in 2050, but this loss is compensat-ed with more secondary supply. Domestic mining output is expected to decrease from 15% to 10%. This leads to more concentrate imports to feed a stable domestic smelting and refining capacity.
Metals for Clean Energy - Pathways to solving Europe’s raw materials challenge91
Zinc1. Recycling: Europe’s share of secondary zinc supply is projected to remain flat, accounting for a
relatively stable 40% from 2020 to 2050 in terms of demand coverage. 2. Domestic primary production: Domestic primary mining and refining remain flat in the study’s
base case, accounting for 60% from 2020 to 2050 in terms of demand coverage. There is potential to increase this further (small mining project pipeline). At the same, time, any primary production closure would require new imports of zinc metal (noting that in 2022, 45% of Europe’s zinc capacity was taken temporarily offline due to high energy prices).
3. Imports:
− Zinc ore is imported mainly from Peru, USA and Australia (top 3 countries) and projected to continue at similar levels. ASM mining in the zinc industry a potential concern, but sits largely outside of Europe’s import partners.
− Zinc metal will not be imported unless Europe’s zinc capacity reduces in the future (a risk given that in 2022, 38% of Europe’s zinc capacity was taken temporarily offline due to high energy prices)
− The Joint Due Diligence and the future Zinc Mark allow/will allow operators to certify their operations across ESG parameters.
Silicon1. Recycling: From 2040, Europe will have a new secondary supply of silicon from its waste photovol-
taic panels and potentially EV battery anodes. Its contribution to the silicon market will grow from 0% in 2020 to 25% in 2050, reducing some of the need for extra primary supply.
2. Domestic primary production: Potential new Solar PV and battery anode value chains would require new supply sources for primary silicon metal. A base case is that Europe’s domestic primary production remains flat, in which case its supply contribution would fall from 73% in 2020 to 40% in 2050. The extra demand for silicon metal would in this case need to be met by extra imports, unless Europe creates the framework conditions for new domestic primary silicon production. However, there is also a risk of Europe’s primary production contracting further, which would further raise import dependency (in 2022, operators have temporarily ramped down due to the power crisis).
3. Imports: Silicon metal is today imported from Brazil, China, Malaysia, and Russia. The main concern is the carbon footprint of imports, as the world average CO2 footprint is three times higher than in Europe. There also human rights concerns associated with China’s silicon and solar PV value chain, requiring individual company attention and due diligence. Also the Russian invasion in Ukraine needs to be further assessed.
− There are no dedicated certification schemes yet for the silicon industry.
Lithium1. Recycling: From 2040, Europe will have a significant supply of secondary lithium from end-of-life
EV batteries. Its contribution can grow to supply up to 77% of Europe’s needs in 2050, significantly reducing the need for extra primary metal in the longer-term perspective
2. Domestic primary production: European battery cathode manufacturing will require high volumes of primary lithium chemicals with demand increasing rapidly until 2040, when secondary sources become available. In the currently unrealistic case that all of today’s mining potential projects (130 kt LCE) realize, they could supply 55% of Europe’s 2030 demand and 15% in 2050. A realization of the refining projects (with a total capacity of 155 kt LCE) could supply 65% in 2030 and 20% in 2050.
3. Imports:
− Copper ore is imported mainly from Chile and Peru (top 2 countries). Ore imports need to rise to compensate for domestic depletion. Environmental emissions, the impact on water scarcity, and the generation of large waste volumes are potential concerns , requiring individual compa-ny attention and due diligence.
− The Copper Mark certifies operators across ESG parameters, alongside overall schemes like IRMA and ICMM).
Metals for Clean Energy - Pathways to solving Europe’s raw materials challenge92
3. Imports: Low volumes of battery-grade lithium are currently mainly imported from Chile and Argen-tina, but European industries will likely also need other supply sources in the next decade given the scale of future demand.
− For lithium brine production in Chile, there are potential concerns from the impact of water scarcity, requiring individual company attention and due diligence (Chile’s major lithium pro-ducers are working with IRMA to certify their operations)
− For hard rock production, the potential risks are higher given that not only mining happens in a water scarce country (Australia), but most lithium refining happens in China using coal-based power leading to high carbon footprints.
− The certification scheme of IRMA is currently being implemented by the Chilean brine produc-ers to certify their operations across ESG parameters.
Nickel
1. Recycling: From 2040, Europe will have a significant supply of pure secondary nickel from end-of-life EV batteries. This will be new for the European nickel market (on top of the nickel recycled in stainless steel) and could supply 40-45% of Europe’s overall needs by 2050 – starting to mitigate the need for extra primary metal.
2. Domestic primary production: European battery cathode manufacturing will require high volumes of Class 1 primary nickel with demand increasing rapidly until 2040 when secondary sources will start being available
− Domestic primary production of nickel metal is expected to increase in the next decade (+25%), but there is less potential for new nickel mining (reduction of 15%). The domestic contribution to Europe’s overall supply will decrease given the high volumes of extra material needed (from 55% in 2020 to 35% in 2050 in a base case)
− There is potential for new nickel refineries to open in the next decade, and longer-term mines like Anglo American’s Sakatti deposit; but these cannot yet be considered in a base case.
3. Imports: Without new domestic capacity, Europe’s imports of primary nickel metal will need to more than double in the next 20 years in a period where global supply will be constrained.
− Nickel metal is currently imported from Russia, Canada, and Australia, and nickel ore/interme-diate mainly comes from Canada and Russia. Only Russia has identified concerns:
• Wider geopolitical concerns in the context of its 2022 invasion of Ukraine • Environmental concerns related to SO2 emissions during nickel production
− European industries will likely need to find new trade partnerships in the next decade to fulfil increasing demand requirements. For nickel supply from major producers Indonesia and Philip-pines, risks have been identified for carbon footprint, biodiversity, and environmental impact.
− The Joint Due Diligence and the future Nickel Mark allow/will allow operators to certify their operations across ESG parameters.
Cobalt
1. Recycling: From 2040, Europe will have a significant supply of secondary cobalt from end-of-life EV batteries. This could supply 65% of Europe’s overall needs by 2050, starting to mitigate the need for extra primary metal.
2. Domestic primary: European battery cathode manufacturing will require high volumes of primary cobalt with demand increasing rapidly until 2040 when secondary sources will start being availa-ble. Currently there are no announced plans to increase Europe’s cobalt refining capacity and only minor extra volumes of cobalt could be mined domestically.
3. Imports: Cobalt ore and metals imports will both be needed in the next two decades. Without new cobalt refining capacity, Europe’s cobalt metal imports will require a tenfold increase in a period when global supply will be constrained.
Metals for Clean Energy - Pathways to solving Europe’s raw materials challenge93
− Europe’s cobalt ore is supplied mainly from the DRC, and this situation is expected to continue. There are concerns on human rights and biodiversity in the DRC, which continue to require robust due diligence and collaborative multi-stakeholder efforts to address their root causes.
− Europe’s new cobalt metal requirements would likely need to be supplied to an extent from China given it has a 70% share of the global market. There are concerns regarding the carbon footprint of Chinese cobalt production given it is produced with coal-based power, and individ-ual company practices on human rights must be assessed.
− The creation of the CIRAF (Cobalt Industry Responsible Assessment Framework) and the RMI/RCI (Cobalt Refiner Supply Chain Due Diligence Standard) allow operators to report on and certify their operations across ESG parameters.
Rare earth elements1. Recycling: From 2040, Europe will have a significant supply of secondary rare earth elements
available from its end-of-life permanent magnets. This has potential to supply all of Europe’s needs if recycling bottlenecks are overcome, given the relatively small size of any future domestic perma-nent magnets value chain.
2. Domestic primary production: Europe will need rising volumes of primary rare earth elements until 2040 to feeds its ambition for a domestic permanent magnets value chain. A base case is that Europe’s domestic primary production does not materialize, given the issues associated with local acceptance and permitting. There are however projects that if realized could reduce import de-pendency; Norra Karr in Sweden could supply 80% of 2030 dysprosium demand and 20% of 2030 neodymium and praseodymium demand.
3. Imports: Without the development of domestic primary production, Europe would need to imports all of its rare earth elements in the next decade and beyond.
− The major supplying country of refined rare earth elements is China, which will continue to be Europe’s main import source unless other countries can start up rare earth elements projects and offer diversification opportunities. Rare earth elements supply from China has concerns related to carbon footprint, waste management, and human rights, which requires individual company attention and due diligence.
− There are currently no dedicated industry schemes for the rare earth elements industry.
Metals for Clean Energy - Pathways to solving Europe’s raw materials challenge94
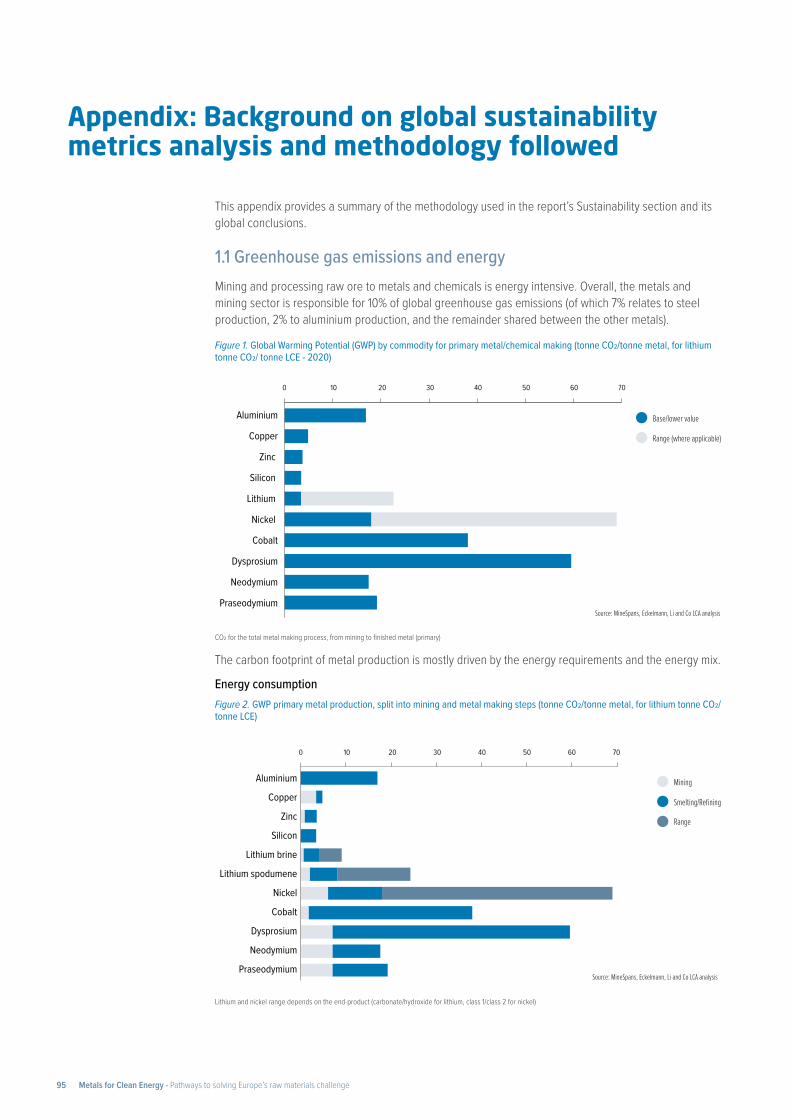
This appendix provides a summary of the methodology used in the report’s Sustainability section and its global conclusions.
1.1 Greenhouse gas emissions and energyMining and processing raw ore to metals and chemicals is energy intensive. Overall, the metals and mining sector is responsible for 10% of global greenhouse gas emissions (of which 7% relates to steel production, 2% to aluminium production, and the remainder shared between the other metals).
Figure 1. Global Warming Potential (GWP) by commodity for primary metal/chemical making (tonne CO2/tonne metal, for lithium tonne CO2/ tonne LCE - 2020)
CO2 for the total metal making process, from mining to finished metal (primary)
The carbon footprint of metal production is mostly driven by the energy requirements and the energy mix.
Energy consumption Figure 2. GWP primary metal production, split into mining and metal making steps (tonne CO2/tonne metal, for lithium tonne CO2/ tonne LCE)
Lithium and nickel range depends on the end-product (carbonate/hydroxide for lithium, class 1/class 2 for nickel)
Appendix: Background on global sustainability metrics analysis and methodology followed
Source: MineSpans, Eckelmann, Li and Co LCA analysis
0 10 20 30 40 50 60 70
Aluminium
Copper
Zinc
Silicon
Lithium
Nickel
Cobalt
Dysprosium
Neodymium
Praseodymium
Range (where applicable)
Base/lower value
0 10 20 30 40 50 60 70
Praseodymium
Neodymium
Nickel
Dysprosium
Zinc
Lithium spodumene
Lithium brine
Silicon
Copper
Aluminium
Cobalt
Range
Source: MineSpans, Eckelmann, Li and Co LCA analysis
Smelting/Refining
Mining
Metals for Clean Energy - Pathways to solving Europe’s raw materials challenge95
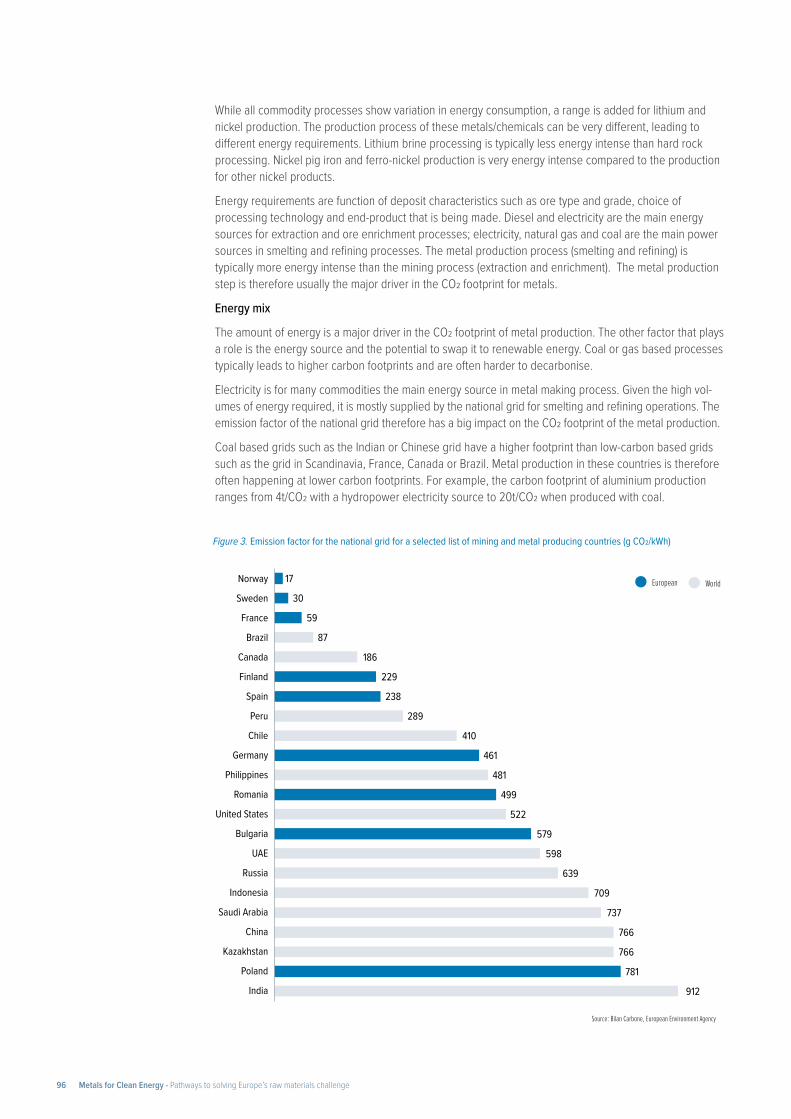
While all commodity processes show variation in energy consumption, a range is added for lithium and nickel production. The production process of these metals/chemicals can be very different, leading to different energy requirements. Lithium brine processing is typically less energy intense than hard rock processing. Nickel pig iron and ferro-nickel production is very energy intense compared to the production for other nickel products.
Energy requirements are function of deposit characteristics such as ore type and grade, choice of processing technology and end-product that is being made. Diesel and electricity are the main energy sources for extraction and ore enrichment processes; electricity, natural gas and coal are the main power sources in smelting and refining processes. The metal production process (smelting and refining) is typically more energy intense than the mining process (extraction and enrichment). The metal production step is therefore usually the major driver in the CO2 footprint for metals.
Energy mix
The amount of energy is a major driver in the CO2 footprint of metal production. The other factor that plays a role is the energy source and the potential to swap it to renewable energy. Coal or gas based processes typically leads to higher carbon footprints and are often harder to decarbonise.
Electricity is for many commodities the main energy source in metal making process. Given the high vol-umes of energy required, it is mostly supplied by the national grid for smelting and refining operations. The emission factor of the national grid therefore has a big impact on the CO2 footprint of the metal production.
Coal based grids such as the Indian or Chinese grid have a higher footprint than low-carbon based grids such as the grid in Scandinavia, France, Canada or Brazil. Metal production in these countries is therefore often happening at lower carbon footprints. For example, the carbon footprint of aluminium production ranges from 4t/CO2 with a hydropower electricity source to 20t/CO2 when produced with coal.
Figure 3. Emission factor for the national grid for a selected list of mining and metal producing countries (g CO2/kWh)
European World
Source: Bilan Carbone, European Environment Agency
579
522
766
481
410
289
238
59
461
30
Poland
Kazakhstan
China
766
598
Saudi Arabia
Russia
Sweden
Bulgaria
639
87
Spain
UAE
912
Romania
781
Chile
Philippines
17
United States
737
Peru
Norway
499
Indonesia
Canada
Brazil
186
Germany
France
709
229
India
Finland
Metals for Clean Energy - Pathways to solving Europe’s raw materials challenge96
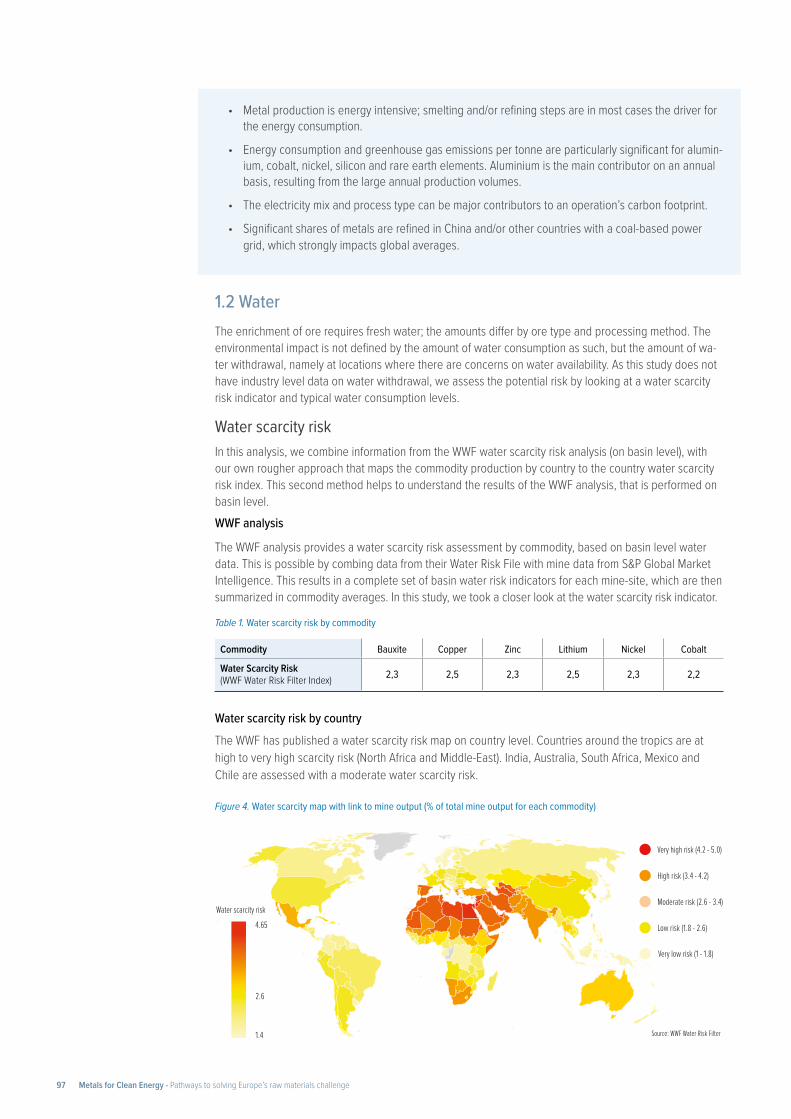
1.2 WaterThe enrichment of ore requires fresh water; the amounts differ by ore type and processing method. The environmental impact is not defined by the amount of water consumption as such, but the amount of wa-ter withdrawal, namely at locations where there are concerns on water availability. As this study does not have industry level data on water withdrawal, we assess the potential risk by looking at a water scarcity risk indicator and typical water consumption levels.
Water scarcity riskIn this analysis, we combine information from the WWF water scarcity risk analysis (on basin level), with our own rougher approach that maps the commodity production by country to the country water scarcity risk index. This second method helps to understand the results of the WWF analysis, that is performed on basin level.WWF analysis
The WWF analysis provides a water scarcity risk assessment by commodity, based on basin level water data. This is possible by combing data from their Water Risk File with mine data from S&P Global Market Intelligence. This results in a complete set of basin water risk indicators for each mine-site, which are then summarized in commodity averages. In this study, we took a closer look at the water scarcity risk indicator.
Table 1. Water scarcity risk by commodity
Commodity Bauxite Copper Zinc Lithium Nickel Cobalt
Water Scarcity Risk (WWF Water Risk Filter Index) 2,3 2,5 2,3 2,5 2,3 2,2
Water scarcity risk by country The WWF has published a water scarcity risk map on country level. Countries around the tropics are at high to very high scarcity risk (North Africa and Middle-East). India, Australia, South Africa, Mexico and Chile are assessed with a moderate water scarcity risk.
Source: WWF Water Risk Filter
Very low risk (1 - 1.8)
Low risk (1.8 - 2.6)
Moderate risk (2.6 - 3.4)
High risk (3.4 - 4.2)
Very high risk (4.2 - 5.0)
1.4
2.6
4.65Water scarcity risk
Figure 4. Water scarcity map with link to mine output (% of total mine output for each commodity)
• Metal production is energy intensive; smelting and/or refining steps are in most cases the driver for the energy consumption.
• Energy consumption and greenhouse gas emissions per tonne are particularly significant for alumin-ium, cobalt, nickel, silicon and rare earth elements. Aluminium is the main contributor on an annual basis, resulting from the large annual production volumes.
• The electricity mix and process type can be major contributors to an operation’s carbon footprint.
• Significant shares of metals are refined in China and/or other countries with a coal-based power grid, which strongly impacts global averages.
Metals for Clean Energy - Pathways to solving Europe’s raw materials challenge97
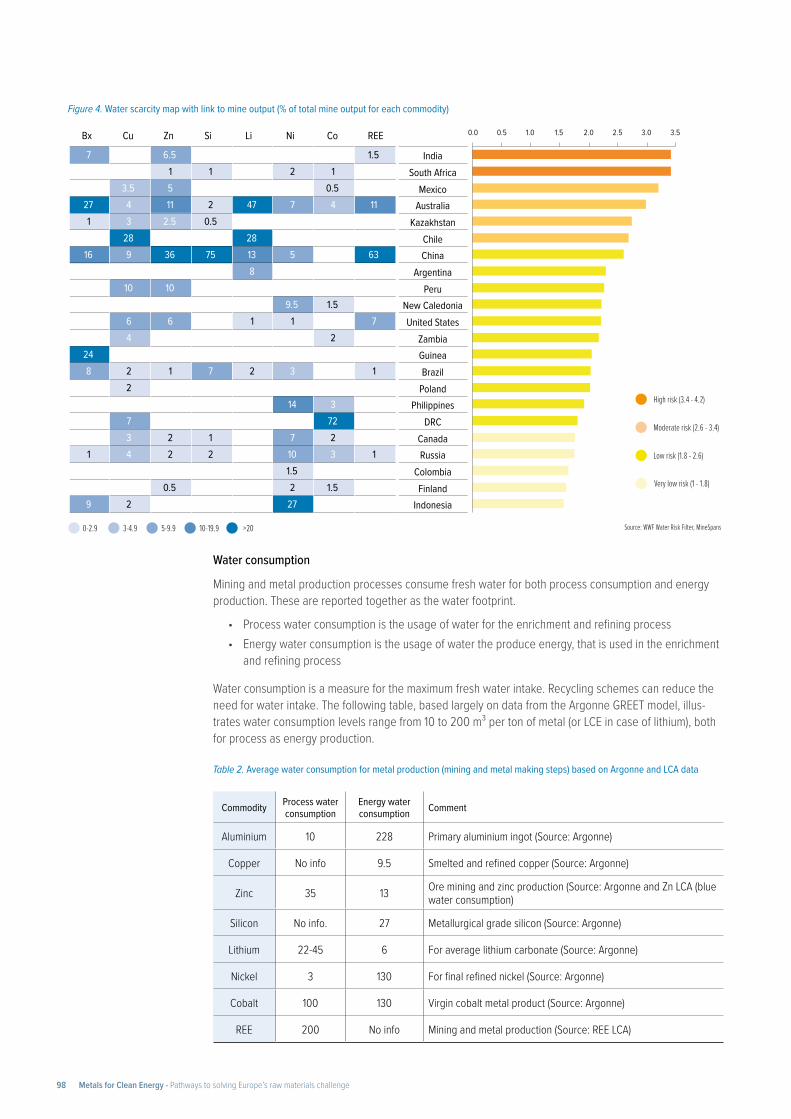
Source: WWF Water Risk Filter, MineSpans
Very low risk (1 - 1.8)
Low risk (1.8 - 2.6)
Moderate risk (2.6 - 3.4)
High risk (3.4 - 4.2)
0-2.9 3-4.9 5-9.9 10-19.9 >20
2.52.01.51.00.0 3.0 3.50.5
GuineaBrazil
ZambiaUnited States
New Caledonia
Argentina
DRC
Colombia
ChinaChile
Peru
Poland
Kazakhstan
Canada
Mexico
Finland
South AfricaIndia
Australia
Indonesia
Philippines
Russia
Bx Cu Zn Si Li Ni Co REE
7 6.5 1.51 1 2 1
3.5 5 0.527 4 11 2 47 7 4 111 3 2.5 0.5
28 2816 9 36 75 13 5 63
810 10
9.5 1.56 6 1 1 74 2
248 2 1 7 2 3 1
214 3
7 723 2 1 7 2
1 4 2 2 10 3 11.5
0.5 2 1.59 2 27
Water consumption
Mining and metal production processes consume fresh water for both process consumption and energy production. These are reported together as the water footprint.
• Process water consumption is the usage of water for the enrichment and refining process• Energy water consumption is the usage of water the produce energy, that is used in the enrichment
and refining process
Water consumption is a measure for the maximum fresh water intake. Recycling schemes can reduce the need for water intake. The following table, based largely on data from the Argonne GREET model, illus-trates water consumption levels range from 10 to 200 m³ per ton of metal (or LCE in case of lithium), both for process as energy production.
Table 2. Average water consumption for metal production (mining and metal making steps) based on Argonne and LCA data
Commodity Process water consumption
Energy water consumption Comment
Aluminium 10 228 Primary aluminium ingot (Source: Argonne)
Copper No info 9.5 Smelted and refined copper (Source: Argonne)
Zinc 35 13 Ore mining and zinc production (Source: Argonne and Zn LCA (blue water consumption)
Silicon No info. 27 Metallurgical grade silicon (Source: Argonne)
Lithium 22-45 6 For average lithium carbonate (Source: Argonne)
Nickel 3 130 For final refined nickel (Source: Argonne)
Cobalt 100 130 Virgin cobalt metal product (Source: Argonne)
REE 200 No info Mining and metal production (Source: REE LCA)
Figure 4. Water scarcity map with link to mine output (% of total mine output for each commodity)
Metals for Clean Energy - Pathways to solving Europe’s raw materials challenge98
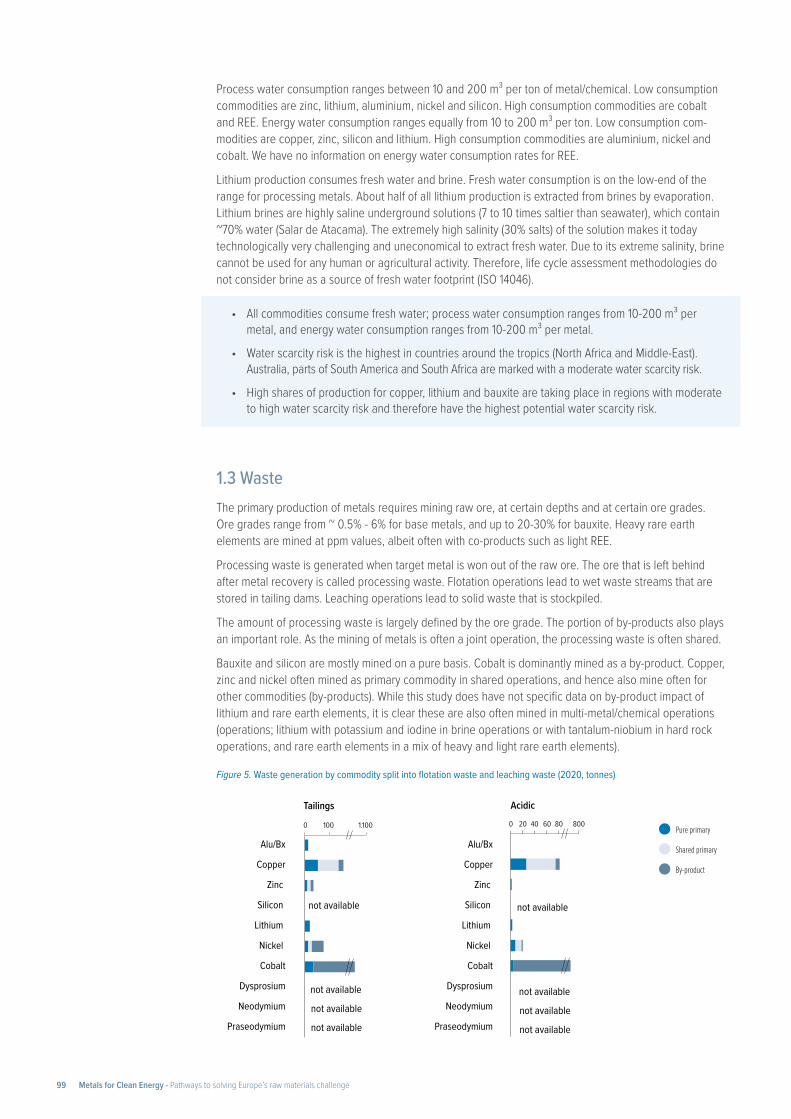
Process water consumption ranges between 10 and 200 m³ per ton of metal/chemical. Low consumption commodities are zinc, lithium, aluminium, nickel and silicon. High consumption commodities are cobalt and REE. Energy water consumption ranges equally from 10 to 200 m³ per ton. Low consumption com-modities are copper, zinc, silicon and lithium. High consumption commodities are aluminium, nickel and cobalt. We have no information on energy water consumption rates for REE.
Lithium production consumes fresh water and brine. Fresh water consumption is on the low-end of the range for processing metals. About half of all lithium production is extracted from brines by evaporation. Lithium brines are highly saline underground solutions (7 to 10 times saltier than seawater), which contain ~70% water (Salar de Atacama). The extremely high salinity (30% salts) of the solution makes it today technologically very challenging and uneconomical to extract fresh water. Due to its extreme salinity, brine cannot be used for any human or agricultural activity. Therefore, life cycle assessment methodologies do not consider brine as a source of fresh water footprint (ISO 14046).
• All commodities consume fresh water; process water consumption ranges from 10-200 m³ per metal, and energy water consumption ranges from 10-200 m³ per metal.
• Water scarcity risk is the highest in countries around the tropics (North Africa and Middle-East). Australia, parts of South America and South Africa are marked with a moderate water scarcity risk.
• High shares of production for copper, lithium and bauxite are taking place in regions with moderate to high water scarcity risk and therefore have the highest potential water scarcity risk.
1.3 WasteThe primary production of metals requires mining raw ore, at certain depths and at certain ore grades. Ore grades range from ~ 0.5% - 6% for base metals, and up to 20-30% for bauxite. Heavy rare earth elements are mined at ppm values, albeit often with co-products such as light REE.
Processing waste is generated when target metal is won out of the raw ore. The ore that is left behind after metal recovery is called processing waste. Flotation operations lead to wet waste streams that are stored in tailing dams. Leaching operations lead to solid waste that is stockpiled.
The amount of processing waste is largely defined by the ore grade. The portion of by-products also plays an important role. As the mining of metals is often a joint operation, the processing waste is often shared.
Bauxite and silicon are mostly mined on a pure basis. Cobalt is dominantly mined as a by-product. Copper, zinc and nickel often mined as primary commodity in shared operations, and hence also mine often for other commodities (by-products). While this study does have not specific data on by-product impact of lithium and rare earth elements, it is clear these are also often mined in multi-metal/chemical operations (operations; lithium with potassium and iodine in brine operations or with tantalum-niobium in hard rock operations, and rare earth elements in a mix of heavy and light rare earth elements).
Figure 5. Waste generation by commodity split into flotation waste and leaching waste (2020, tonnes)
Shared primary
By-product
Pure primaryAlu/Bx
Copper
Zinc
Silicon
Lithium
Nickel
Cobalt
Dysprosium
Neodymium
Praseodymium
Alu/Bx
Copper
Zinc
Silicon
Lithium
Nickel
Cobalt
Dysprosium
Neodymium
Praseodymium
Acidic
40 806020 8000
not available
not available
not available
0 100 1.100
Tailings
not available
not available
not available
not available not available
Metals for Clean Energy - Pathways to solving Europe’s raw materials challenge99
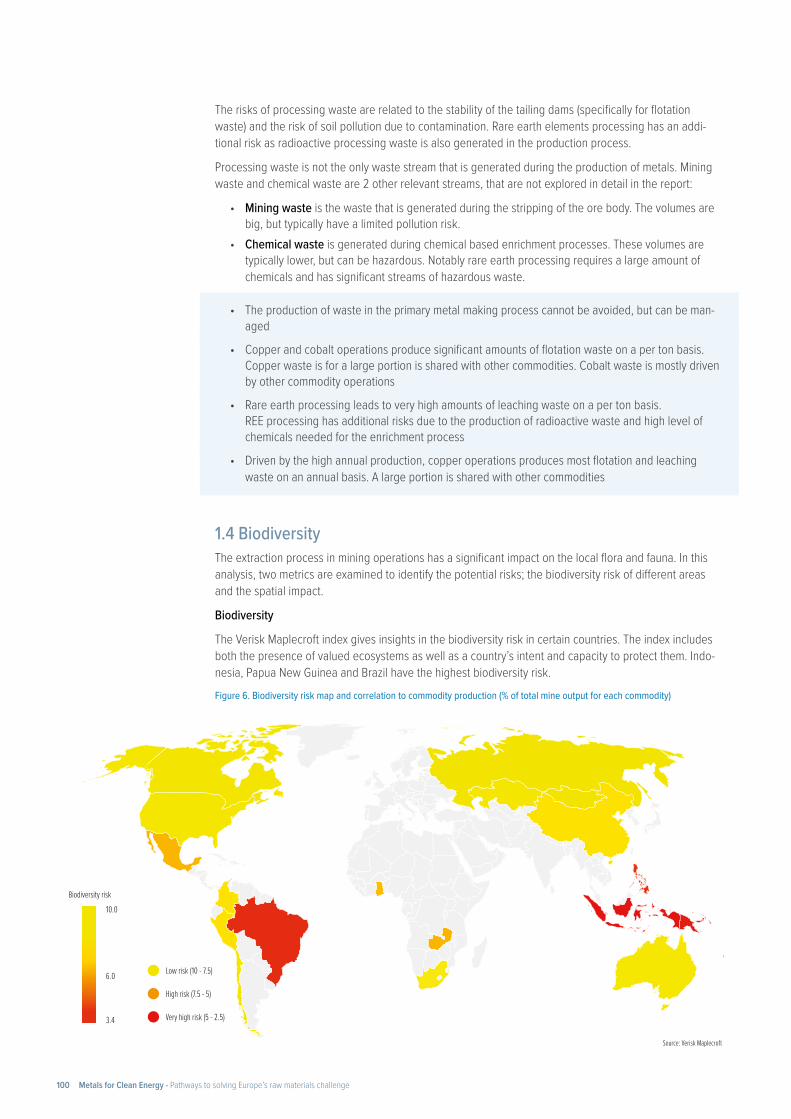
The risks of processing waste are related to the stability of the tailing dams (specifically for flotation waste) and the risk of soil pollution due to contamination. Rare earth elements processing has an addi-tional risk as radioactive processing waste is also generated in the production process.
Processing waste is not the only waste stream that is generated during the production of metals. Mining waste and chemical waste are 2 other relevant streams, that are not explored in detail in the report:
• Mining waste is the waste that is generated during the stripping of the ore body. The volumes are big, but typically have a limited pollution risk.
• Chemical waste is generated during chemical based enrichment processes. These volumes are typically lower, but can be hazardous. Notably rare earth processing requires a large amount of chemicals and has significant streams of hazardous waste.
• The production of waste in the primary metal making process cannot be avoided, but can be man-aged
• Copper and cobalt operations produce significant amounts of flotation waste on a per ton basis. Copper waste is for a large portion is shared with other commodities. Cobalt waste is mostly driven by other commodity operations
• Rare earth processing leads to very high amounts of leaching waste on a per ton basis. REE processing has additional risks due to the production of radioactive waste and high level of chemicals needed for the enrichment process
• Driven by the high annual production, copper operations produces most flotation and leaching waste on an annual basis. A large portion is shared with other commodities
1.4 BiodiversityThe extraction process in mining operations has a significant impact on the local flora and fauna. In this analysis, two metrics are examined to identify the potential risks; the biodiversity risk of different areas and the spatial impact.
Biodiversity
The Verisk Maplecroft index gives insights in the biodiversity risk in certain countries. The index includes both the presence of valued ecosystems as well as a country’s intent and capacity to protect them. Indo-nesia, Papua New Guinea and Brazil have the highest biodiversity risk.Figure 6. Biodiversity risk map and correlation to commodity production (% of total mine output for each commodity)
Source: Verisk Maplecroft
Low risk (10 - 7.5)
High risk (7.5 - 5)
Very high risk (5 - 2.5) 3.4
6.0
10.0Biodiversity risk
Metals for Clean Energy - Pathways to solving Europe’s raw materials challenge100
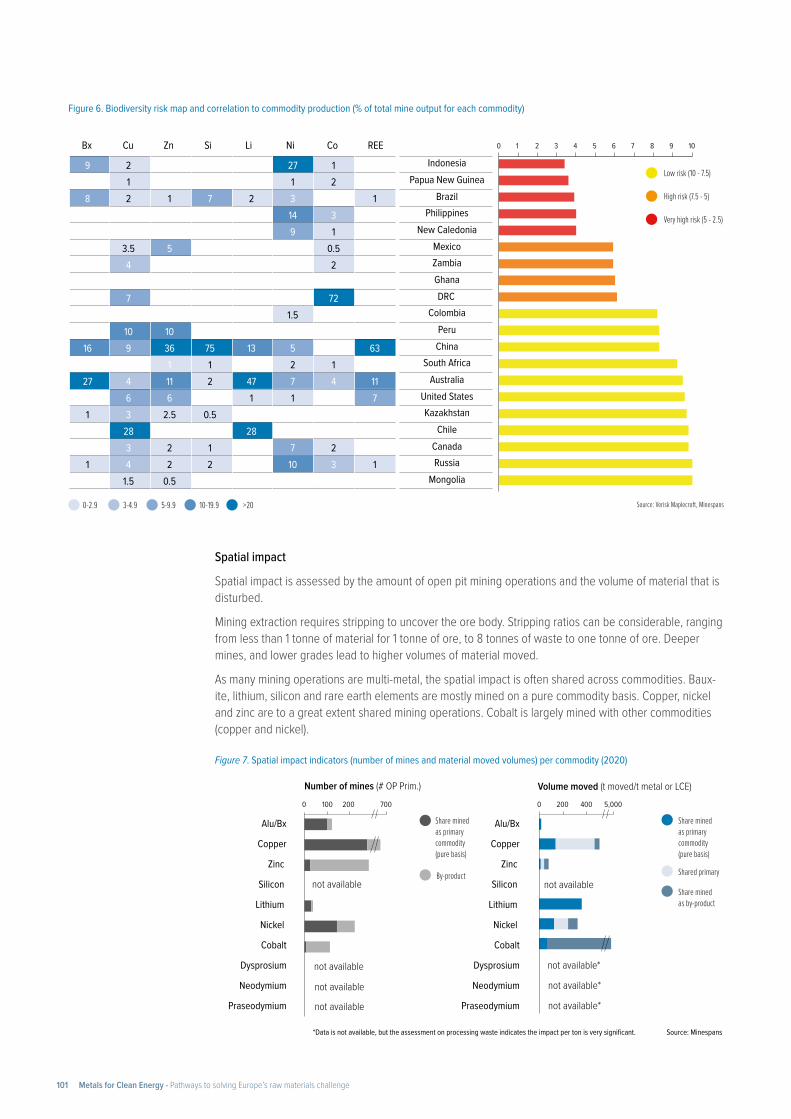
Figure 6. Biodiversity risk map and correlation to commodity production (% of total mine output for each commodity)
Low risk (10 - 7.5)
High risk (7.5 - 5)
Very high risk (5 - 2.5)
Source: Verisk Maplecroft, Minespans
Bx Cu Zn Si Li Ni Co REE
ChileKazakhstan
United States
Russia
PeruColombia
DRC
China
Ghana
Mongolia
ZambiaMexico
Papua New Guinea
Philippines
Indonesia
Brazil
Canada
AustraliaSouth Africa
New Caledonia
0-2.9 3-4.9 5-9.9 10-19.9 >20
9 2 27 11 1 2
8 2 1 7 2 3 114 39 1
3.5 5 0.54 2
7 721.5
10 1016 9 36 75 13 5 63
1 1 2 127 4 11 2 47 7 4 11
6 6 1 1 71 3 2.5 0.5
28 283 2 1 7 2
1 4 2 2 10 3 11.5 0.5
0 1 2 3 4 5 6 7 8 9 10
Spatial impact
Spatial impact is assessed by the amount of open pit mining operations and the volume of material that is disturbed.
Mining extraction requires stripping to uncover the ore body. Stripping ratios can be considerable, ranging from less than 1 tonne of material for 1 tonne of ore, to 8 tonnes of waste to one tonne of ore. Deeper mines, and lower grades lead to higher volumes of material moved.
As many mining operations are multi-metal, the spatial impact is often shared across commodities. Baux-ite, lithium, silicon and rare earth elements are mostly mined on a pure commodity basis. Copper, nickel and zinc are to a great extent shared mining operations. Cobalt is largely mined with other commodities (copper and nickel).
Figure 7. Spatial impact indicators (number of mines and material moved volumes) per commodity (2020)
*Data is not available, but the assessment on processing waste indicates the impact per ton is very significant. Source: Minespans
Shared primary
Share mined as by-product
Share mined as primary commodity (pure basis)
Share mined as primary commodity (pure basis)
Alu/Bx
Copper
Zinc
Silicon
Lithium
Nickel
Cobalt
Dysprosium
Neodymium
Praseodymium
Volume moved (t moved/t metal or LCE)
not available*
not available*
not available*
not available
400 5,0002000
By-product
Alu/Bx
Copper
Zinc
Silicon
Lithium
Nickel
Cobalt
Dysprosium
Neodymium
Praseodymium
Number of mines (# OP Prim.)
not available
not available
not available
not available
100 200 7000
Metals for Clean Energy - Pathways to solving Europe’s raw materials challenge101
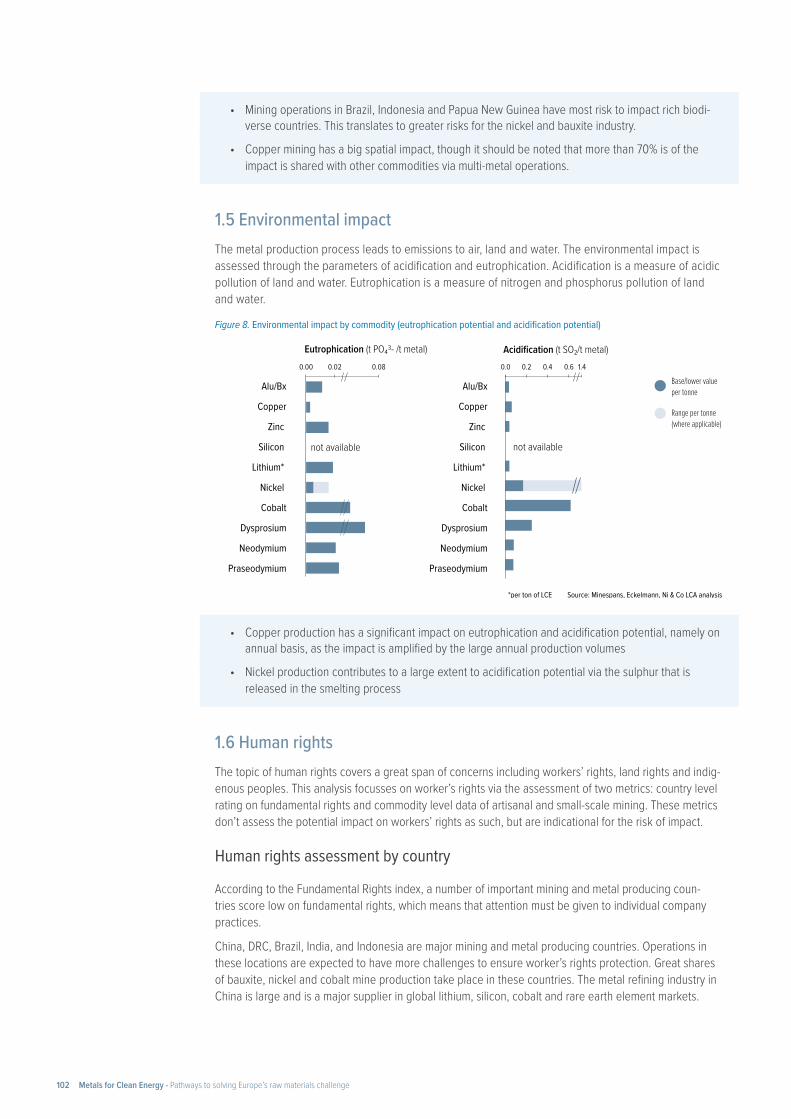
• Mining operations in Brazil, Indonesia and Papua New Guinea have most risk to impact rich biodi-verse countries. This translates to greater risks for the nickel and bauxite industry.
• Copper mining has a big spatial impact, though it should be noted that more than 70% is of the impact is shared with other commodities via multi-metal operations.
1.5 Environmental impactThe metal production process leads to emissions to air, land and water. The environmental impact is assessed through the parameters of acidification and eutrophication. Acidification is a measure of acidic pollution of land and water. Eutrophication is a measure of nitrogen and phosphorus pollution of land and water.
Figure 8. Environmental impact by commodity (eutrophication potential and acidification potential)
• Copper production has a significant impact on eutrophication and acidification potential, namely on annual basis, as the impact is amplified by the large annual production volumes
• Nickel production contributes to a large extent to acidification potential via the sulphur that is released in the smelting process
1.6 Human rightsThe topic of human rights covers a great span of concerns including workers’ rights, land rights and indig-enous peoples. This analysis focusses on worker’s rights via the assessment of two metrics: country level rating on fundamental rights and commodity level data of artisanal and small-scale mining. These metrics don’t assess the potential impact on workers’ rights as such, but are indicational for the risk of impact.
Human rights assessment by country
According to the Fundamental Rights index, a number of important mining and metal producing coun-tries score low on fundamental rights, which means that attention must be given to individual company practices.
China, DRC, Brazil, India, and Indonesia are major mining and metal producing countries. Operations in these locations are expected to have more challenges to ensure worker’s rights protection. Great shares of bauxite, nickel and cobalt mine production take place in these countries. The metal refining industry in China is large and is a major supplier in global lithium, silicon, cobalt and rare earth element markets.
Alu/Bx
Copper
Zinc
Silicon
Lithium*
Nickel
Cobalt
Dysprosium
Neodymium
Praseodymium
Alu/Bx
Copper
Zinc
Silicon
Lithium*
Nickel
Cobalt
Dysprosium
Neodymium
Praseodymium
Eutrophication (t PO₄3- /t metal)
not available not available
*per ton of LCE Source: Minespans, Eckelmann, Ni & Co LCA analysis
0.080.020.00 1.40.60.0 0.40.2
Range per tonne(where applicable)
Base/lower value per tonne
Acidification (t SO₂/t metal)
Metals for Clean Energy - Pathways to solving Europe’s raw materials challenge102
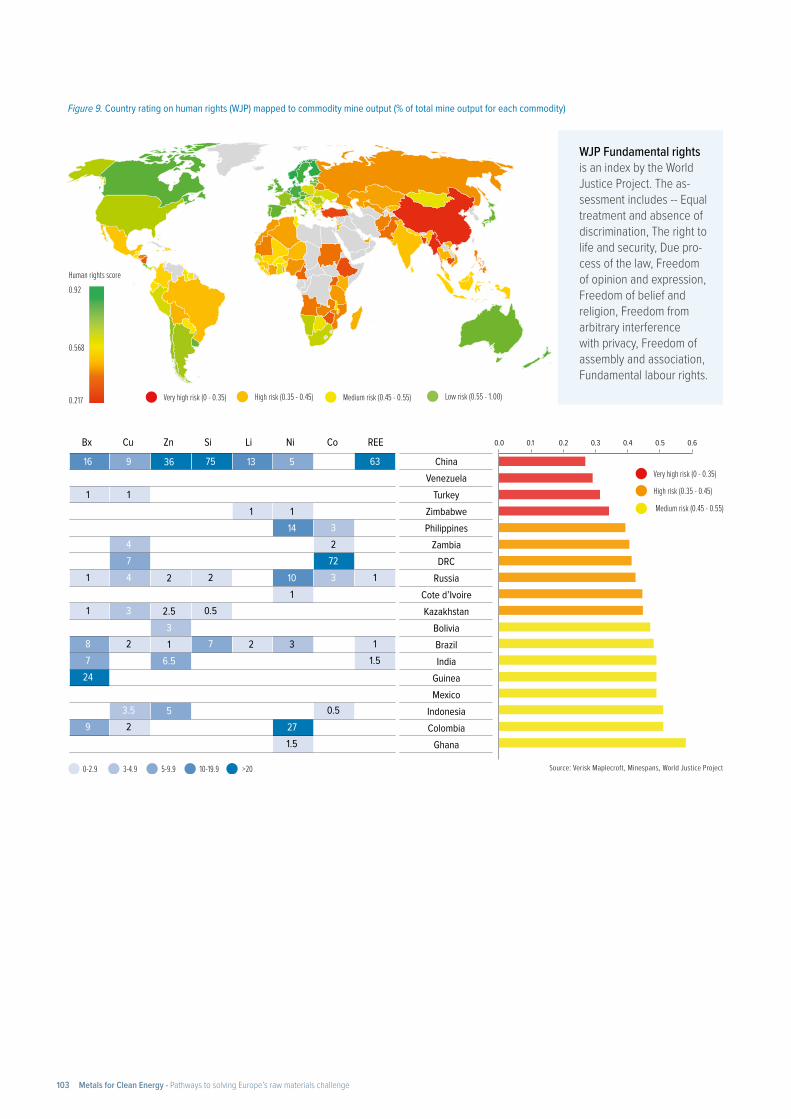
Figure 9. Country rating on human rights (WJP) mapped to commodity mine output (% of total mine output for each commodity)
WJP Fundamental rights is an index by the World Justice Project. The as-sessment includes -- Equal treatment and absence of discrimination, The right to life and security, Due pro-cess of the law, Freedom of opinion and expression, Freedom of belief and religion, Freedom from arbitrary interference with privacy, Freedom of assembly and association, Fundamental labour rights.
Low risk (0.55 - 1.00) Medium risk (0.45 - 0.55) High risk (0.35 - 0.45) Very high risk (0 - 0.35) 0.217
0.568
0.92Human rights score
Source: Verisk Maplecroft, Minespans, World Justice Project
High risk (0.35 - 0.45)
Bx Cu Zn Si Li Ni Co REE
Very high risk (0 - 0.35)
Medium risk (0.45 - 0.55)
0-2.9 3-4.9 5-9.9 10-19.9 >20
16 9 36 75 13 5 63
1 11 1
14 34 27 72
1 4 2 2 10 3 11
1 3 2.5 0.53
8 2 1 7 2 3 17 6.5 1.5
24
3.5 5 0.59 2 27
1.5
0.60.0 0.30.1 0.2 0.4 0.5
IndonesiaMexico
GhanaColombia
Bolivia
Guinea
Brazil
Cote d’Ivoire
Zimbabwe
Russia
Philippines
DRCZambia
VenezuelaChina
Kazakhstan
India
Turkey
Metals for Clean Energy - Pathways to solving Europe’s raw materials challenge103
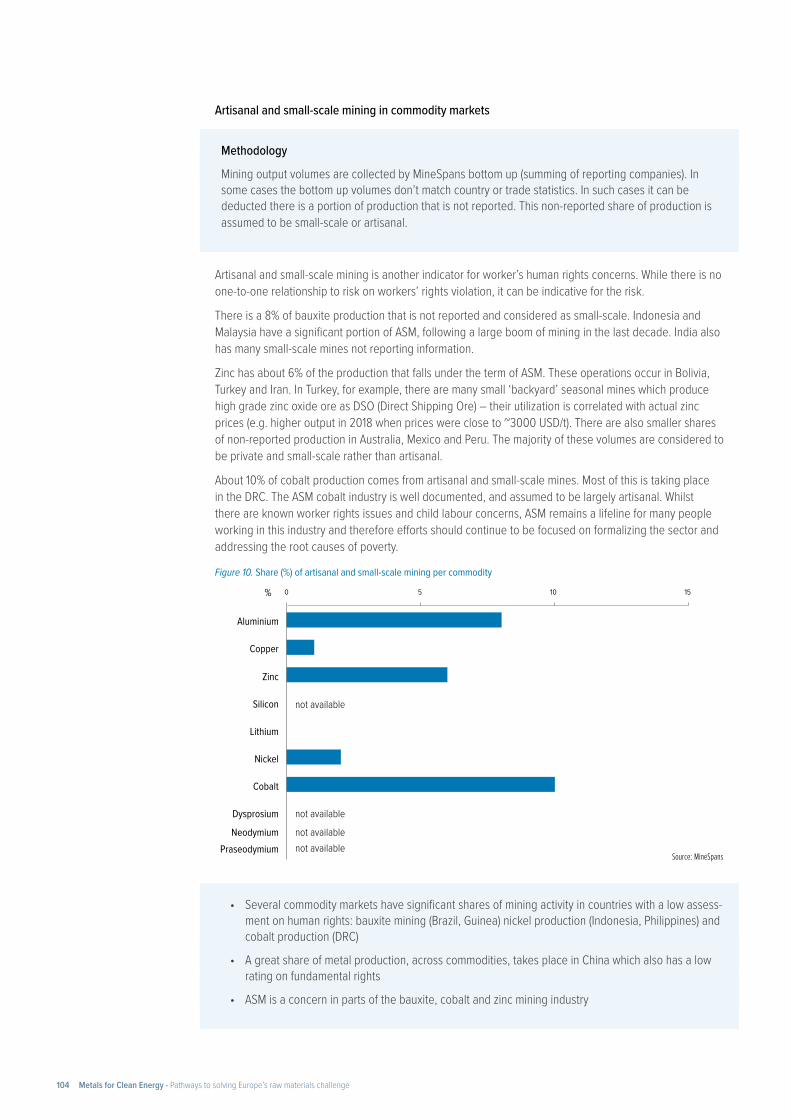
Artisanal and small-scale mining in commodity markets
Methodology
Mining output volumes are collected by MineSpans bottom up (summing of reporting companies). In some cases the bottom up volumes don’t match country or trade statistics. In such cases it can be deducted there is a portion of production that is not reported. This non-reported share of production is assumed to be small-scale or artisanal.
Artisanal and small-scale mining is another indicator for worker’s human rights concerns. While there is no one-to-one relationship to risk on workers’ rights violation, it can be indicative for the risk.
There is a 8% of bauxite production that is not reported and considered as small-scale. Indonesia and Malaysia have a significant portion of ASM, following a large boom of mining in the last decade. India also has many small-scale mines not reporting information.
Zinc has about 6% of the production that falls under the term of ASM. These operations occur in Bolivia, Turkey and Iran. In Turkey, for example, there are many small ‘backyard’ seasonal mines which produce high grade zinc oxide ore as DSO (Direct Shipping Ore) – their utilization is correlated with actual zinc prices (e.g. higher output in 2018 when prices were close to ~3000 USD/t). There are also smaller shares of non-reported production in Australia, Mexico and Peru. The majority of these volumes are considered to be private and small-scale rather than artisanal.
About 10% of cobalt production comes from artisanal and small-scale mines. Most of this is taking place in the DRC. The ASM cobalt industry is well documented, and assumed to be largely artisanal. Whilst there are known worker rights issues and child labour concerns, ASM remains a lifeline for many people working in this industry and therefore efforts should continue to be focused on formalizing the sector and addressing the root causes of poverty.
Figure 10. Share (%) of artisanal and small-scale mining per commodity
• Several commodity markets have significant shares of mining activity in countries with a low assess-ment on human rights: bauxite mining (Brazil, Guinea) nickel production (Indonesia, Philippines) and cobalt production (DRC)
• A great share of metal production, across commodities, takes place in China which also has a low rating on fundamental rights
• ASM is a concern in parts of the bauxite, cobalt and zinc mining industry
0% 5 10 15
Neodymium
Dysprosium
Praseodymium
Cobalt
Lithium
Nickel
Silicon
Zinc
Copper
Aluminium
not available
not available
not availablenot available
Source: MineSpans
Metals for Clean Energy - Pathways to solving Europe’s raw materials challenge104
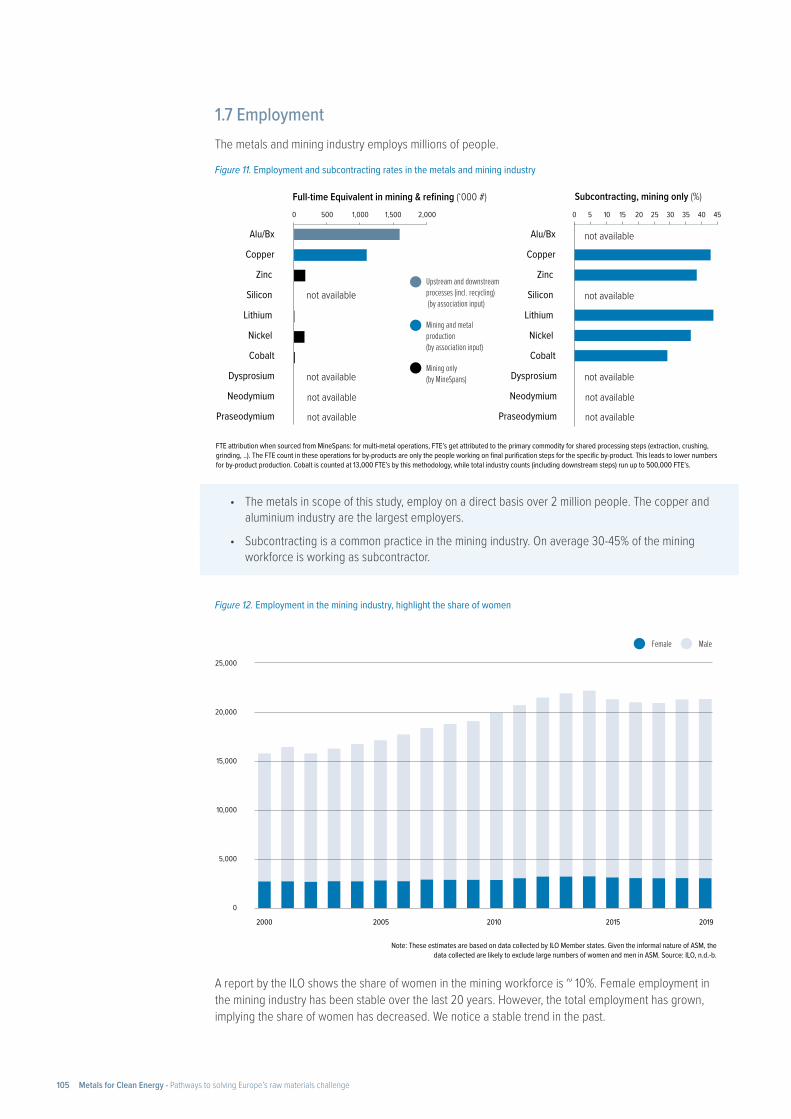
1.7 EmploymentThe metals and mining industry employs millions of people.
Figure 11. Employment and subcontracting rates in the metals and mining industry
• The metals in scope of this study, employ on a direct basis over 2 million people. The copper and aluminium industry are the largest employers.
• Subcontracting is a common practice in the mining industry. On average 30-45% of the mining workforce is working as subcontractor.
Figure 12. Employment in the mining industry, highlight the share of women
A report by the ILO shows the share of women in the mining workforce is ~ 10%. Female employment in the mining industry has been stable over the last 20 years. However, the total employment has grown, implying the share of women has decreased. We notice a stable trend in the past.
not available
not availableAlu/Bx
Copper
Zinc
Silicon
Lithium
Nickel
Cobalt
Alu/Bx
Copper
Zinc
Silicon
Lithium
Nickel
Cobalt
Dysprosium
Neodymium
Praseodymium
Dysprosium
Neodymium
Praseodymium
Subcontracting, mining only (%)
not available
not available
not available
not available
not available
not available
not available
Full-time Equivalent in mining & refining (‘000 #)
FTE attribution when sourced from MineSpans: for multi-metal operations, FTE’s get attributed to the primary commodity for shared processing steps (extraction, crushing, grinding, ..). The FTE count in these operations for by-products are only the people working on final purification steps for the specific by-product. This leads to lower numbers for by-product production. Cobalt is counted at 13,000 FTE’s by this methodology, while total industry counts (including downstream steps) run up to 500,000 FTE’s.
2,000500 1,5001,0000 0 5 10 15 20 25 30 35 40 45
Mining only (by MineSpans)
Mining and metal production (by association input)
Upstream and downstream processes (incl. recycling) (by association input)
25,000
20,000
15,000
10,000
5,000
0
Note: These estimates are based on data collected by ILO Member states. Given the informal nature of ASM, the data collected are likely to exclude large numbers of women and men in ASM. Source: ILO, n.d.-b.
MaleFemale
2000 2005 2010 2015 2019
Metals for Clean Energy - Pathways to solving Europe’s raw materials challenge105
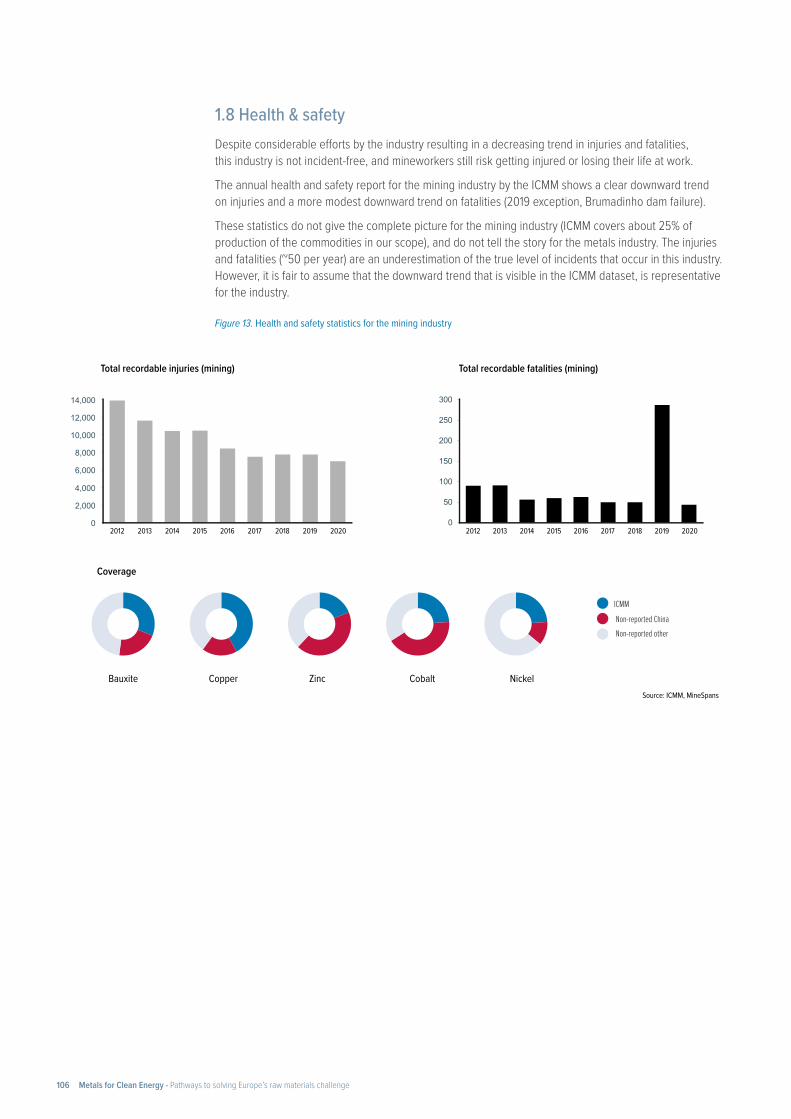
1.8 Health & safetyDespite considerable efforts by the industry resulting in a decreasing trend in injuries and fatalities, this industry is not incident-free, and mineworkers still risk getting injured or losing their life at work.
The annual health and safety report for the mining industry by the ICMM shows a clear downward trend on injuries and a more modest downward trend on fatalities (2019 exception, Brumadinho dam failure).
These statistics do not give the complete picture for the mining industry (ICMM covers about 25% of production of the commodities in our scope), and do not tell the story for the metals industry. The injuries and fatalities (~50 per year) are an underestimation of the true level of incidents that occur in this industry. However, it is fair to assume that the downward trend that is visible in the ICMM dataset, is representative for the industry.
Figure 13. Health and safety statistics for the mining industry
Source: ICMM, MineSpans
10,000
8,000
6,000
4,000
2,000
14,000
12,000
020192018 2020201720162013 20152012 2014
Total recordable injuries (mining)
0
50
100
150
200
250
300
2016 20202015 20182014 2019201720132012
Total recordable fatalities (mining)
Coverage
Bauxite
ICMM
Copper Zinc Cobalt Nickel
Non-reported ChinaNon-reported other
Metals for Clean Energy - Pathways to solving Europe’s raw materials challenge106
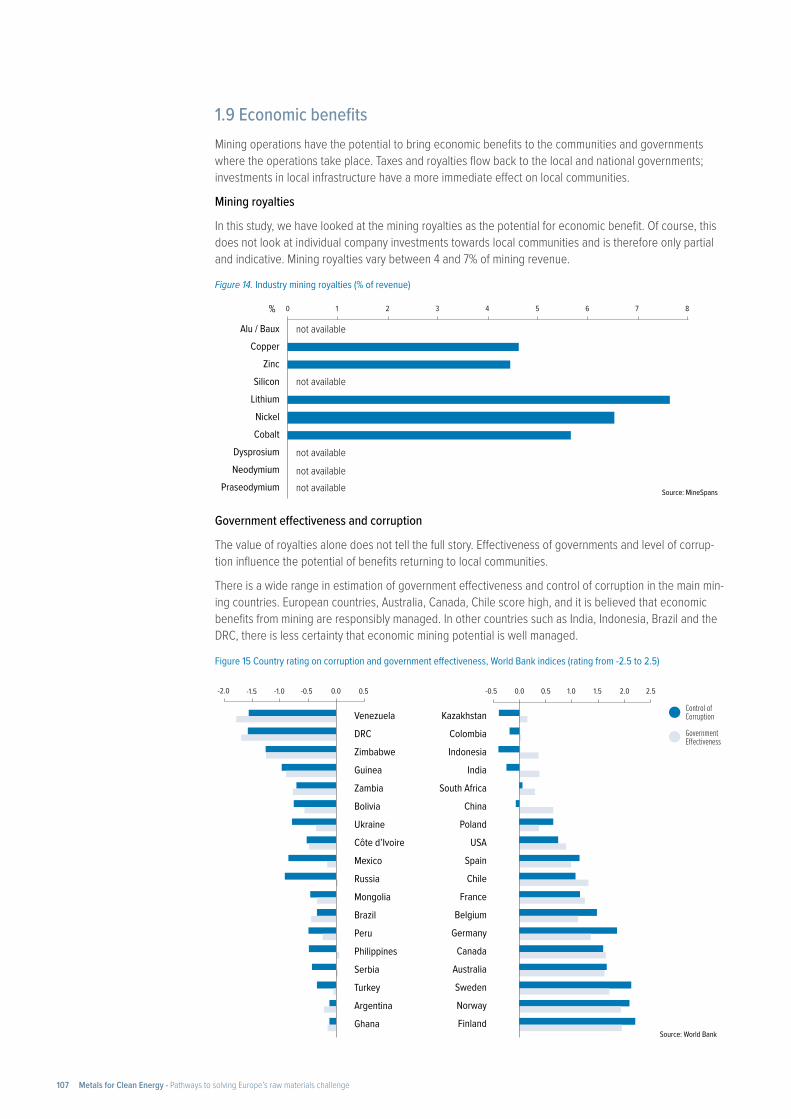
1.9 Economic benefitsMining operations have the potential to bring economic benefits to the communities and governments where the operations take place. Taxes and royalties flow back to the local and national governments; investments in local infrastructure have a more immediate effect on local communities.
Mining royalties
In this study, we have looked at the mining royalties as the potential for economic benefit. Of course, this does not look at individual company investments towards local communities and is therefore only partial and indicative. Mining royalties vary between 4 and 7% of mining revenue.
Figure 14. Industry mining royalties (% of revenue)
Government effectiveness and corruption
The value of royalties alone does not tell the full story. Effectiveness of governments and level of corrup-tion influence the potential of benefits returning to local communities.
There is a wide range in estimation of government effectiveness and control of corruption in the main min-ing countries. European countries, Australia, Canada, Chile score high, and it is believed that economic benefits from mining are responsibly managed. In other countries such as India, Indonesia, Brazil and the DRC, there is less certainty that economic mining potential is well managed.
Figure 15 Country rating on corruption and government effectiveness, World Bank indices (rating from -2.5 to 2.5)
%
NeodymiumDysprosium
Praseodymium
Alu / Baux
Silicon not available
not available
not available
not availablenot available Source: MineSpans
CobaltNickel
Lithium
ZincCopper
0 1 2 3 4 5 6 7 8
Source: World Bank
0.0-0.5-2.0 -1.5 0.5-1.0
Ghana
Argentina
Turkey
Ukraine
Guinea
Serbia
Zambia
Brazil
Bolivia
Russia
Mexico
Peru
Zimbabwe
Mongolia
Côte d’Ivoire
DRC
Philippines
VenezuelaGovernment E�ectiveness
Control of Corruption
2.52.01.0-0.5 0.5 1.50.0
Belgium
South Africa
USA
Canada
Norway
Sweden
France
Poland
Finland
China
Australia
Germany
Indonesia
Spain
India
Colombia
Kazakhstan
Chile
Metals for Clean Energy - Pathways to solving Europe’s raw materials challenge107
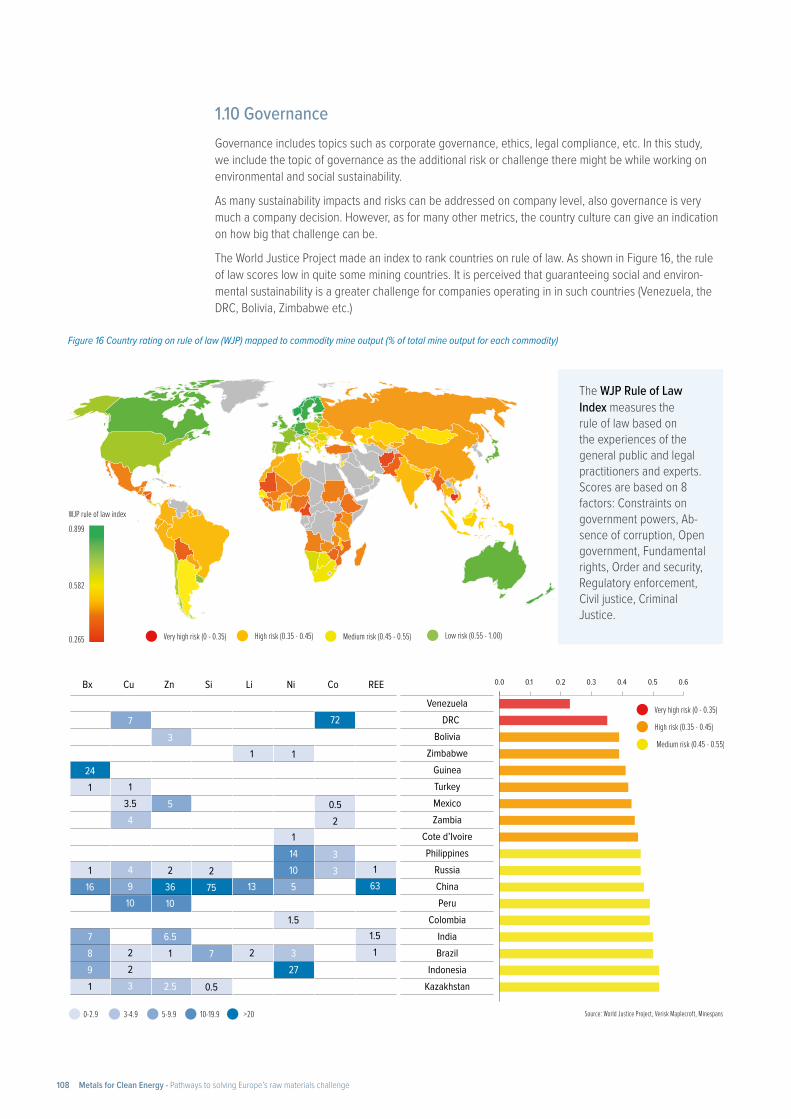
Figure 16 Country rating on rule of law (WJP) mapped to commodity mine output (% of total mine output for each commodity)
The WJP Rule of Law Index measures the rule of law based on the experiences of the general public and legal practitioners and experts. Scores are based on 8 factors: Constraints on government powers, Ab-sence of corruption, Open government, Fundamental rights, Order and security, Regulatory enforcement, Civil justice, Criminal Justice.
16Low risk (0.55 - 1.00) Medium risk (0.45 - 0.55) High risk (0.35 - 0.45) Very high risk (0 - 0.35) 0.265
0.582
0.899WJP rule of law index
Source: World Justice Project, Verisk Maplecroft, Minespans
High risk (0.35 - 0.45)
Bx Cu Zn Si Li Ni Co REE
Very high risk (0 - 0.35)
Medium risk (0.45 - 0.55)
0-2.9 3-4.9 5-9.9 10-19.9 >20
241
116
7891
72
0.52
33
1
13
2
163
1.51
1
114105
1.5
327
7
13.54
4910
223
3
5
23610
6.51
2.5
275
7
0.5
0.40.0 0.20.1 0.60.50.3
ColombiaPeruChinaRussia
Philippines
IndiaBrazil
Venezuela
Mexico
Cote d’Ivoire
Zimbabwe
Zambia
Bolivia
Turkey
Indonesia
DRC
Kazakhstan
Guinea
1.10 GovernanceGovernance includes topics such as corporate governance, ethics, legal compliance, etc. In this study, we include the topic of governance as the additional risk or challenge there might be while working on environmental and social sustainability.
As many sustainability impacts and risks can be addressed on company level, also governance is very much a company decision. However, as for many other metrics, the country culture can give an indication on how big that challenge can be.
The World Justice Project made an index to rank countries on rule of law. As shown in Figure 16, the rule of law scores low in quite some mining countries. It is perceived that guaranteeing social and environ-mental sustainability is a greater challenge for companies operating in in such countries (Venezuela, the DRC, Bolivia, Zimbabwe etc.)
Metals for Clean Energy - Pathways to solving Europe’s raw materials challenge108
Chapter 1
Ashby, M. F. (2013), Materials and the Environment.
Ballentine, P., Duran, L., Anderson, E. (2008), CleanTX Analysis on Semiconductors.
Batteries Europe (2020), Strategic Research Agenda for batteries 2020.
Bundesanstalt für Geowissenschaften und Rohstoffe (2020), Informationen zur Nachhaltigkeit.
Bundesanstalt für Geowissenschaften und Rohstoffe (2015), Rohstoffrisikobewertung – Lithium.
Ciacci, L., Fishman, T., Elshkaki, A., Graedel, T. E., Vassura, I., Passarini, F. (2020), Exploring future copper demand, recycling and associated greenhouse gas emissions in the EU-28.
Cobalt Institute (2019), Cobalt Value Chain - Final Summary Report.
Cobalt Institute (2021), ‘State of the Cobalt market’ report.
Cobalt Institute (2021), consulted for production statistics.
Cochilco (2021), Yearbook: Copper and Other Mineral Statistics.
CRU International (2018), The Role of Silver in the Green Revolution.
Euroalliages (2021), consulted for production statistics.
Euroalliages (2019), 2050 Vision for the European Ferro-alloys and Silicon sector.
European Aluminium (2021), consulted for production statistics.
European Commission (2020), Study on the EU's List of Critical Raw Materials - Critical Raw Materials Factsheets.
European Commission (2021), EU Reference Scenario 2020: Energy, transport and GHG emissions - Trends to 2050.
European Commission (2021), Raw Materials Scoreboard.
European Copper Institute (2021), consulted for production and metal intensity statistics.
European Precious Metals Federation (2021), Final Infosheets on Gold, Palladium, Platinum, Rhodium and Silver.
Flow Batteries Europe (2022), Flow Batteries as a Contributor to the Security of Supply.
Guidehouse Insights & Vanitec (2022), Vanadium Redox Flow Batteries: Identifying Market Opportunities and Enablers.
Harvey, L. D. D. (2018), Resource implications of alternative strategies for achieving zero greenhouse gas emissions from light-duty vehicles by 2060.
Institute for Sustainable Futures (2019), Responsible minerals sourcing for renewable energy.
Institute for Sustainable Futures (2021), Reducing new mining for electric vehicle battery metals: respon-sible sourcing through demand reduction strategies and recycling.
International Aluminium Institute (2021), consulted for production statistics at: https://international-alu-minium.org/.
International Copper Study Group (2021), The World Copper Factbook 2021.
International Energy Agency (2021), The Role of Critical World Energy Outlook Special Report Minerals in Clean Energy Transitions.
International Energy Agency (2021), Global Hydrogen Review.
References
Metals for Clean Energy - Pathways to solving Europe’s raw materials challenge109
International Energy Agency (2020), Life Cycle Inventories and Life Cycle Assessments of Photovoltaic Systems.
International Lead and Zinc Study Group (2020), The World Zinc Factbook 2020.
International Lead and Zinc Study Group (2021), consulted for production statistics at: https://www.ilzsg.org/static/statistics.aspx.
International Molybdenum Association (2021), consulted for supply-demand statistics.
International Nickel Study Group (2021), consulted for production statistics.
International Platinum Group Metals Association (2017), The Environmental Profile of Platinum Group Metals (PGMs) - A Cradle-to-gate Life Cycle Assessment of the Production of PGMs and the Benefits of Their Use in a Selected Application .
International Zinc Association (2021), consulted for production and metal intensity statistics.
Johnson Matthey (2021), PGM Market reports at https://platinum.matthey.com/market-research.
Joint Research Centre (2020), The Role of Rare Earth Elements in Wind Energy and Electric Mobility.
Joint Research Centre (2013), Critical Metals in the Path Towards the Decarbonisation of the EU Energy Sector.
Joint Research Centre (2020), Raw materials demand for wind and solar PV technologies in the transition towards a decarbonised energy system.
Joint Research Centre (2011), Critical Metals in Strategic Energy Technologies.
Kiemel, S., Smolinka, T., Lehner, F., Full, J., Sauer, A., Miehe, R. (2021), Critical materials for water electrolysers at the example of the energy transition in Germany.
Månberger, A., Stenqvist, B. (2018), Global metal flows in the renewable energy transition: Exploring the effects of substitutes, technological mix and development.
McKinsey & Company (2022), The raw-materials challenge: How the metals and mining sector will be at the core of enabling the energy transition.
Minke, C., Suermann, M., Bensmann, B., Hanke-Rauschenbach, R. (2021), Is iridium demand a potential bottleneck in the realization of large-cale PEM water electrolysis.
Nickel Institute (2021), Nickel in low carbon electricity provision.
Nickel Institute (2021), Infographic, Nickel Energizing Batteries.
Nickel Magazine, vol. 36 (2021), Critical nickel: providing sustainable solutions.
Rieger et al. (2021), Residue Valorization in the Iron and Steel Industries: Sustainable Solutions for a Cleaner and More Competitive Future Europe.
Roskill (2019), Socio-economic analysis of the cobalt industry in the EEA, 2010-2017.
SolarPower Europe (2021), Global Market Outlook for Solar Power 2021-2025.
SolarPower Europe (2021), Solar Sustainability: Best Practices Benchmark.
SolarPower Europe & LUT University (2020), 100% Renewable Europe: How to Make Europe's Energy System Climate-Neutral Before 2050.
Swann, W., Hanus, F., Vasart, O., Knight, A. (2021), Steel: friend or foe in the face of the climate emergency?.
The Silver Institute (2021), World Silver Survey.
TNO (2018), Global Energy Transition and Metal Demand - An Introduction and Circular Economy Perspectives.
Tokimatsu et al. (2018), Energy modeling approach to the global energy-mineral nexus: Exploring metal requirements and the well-below 2 °C target with 100 percent renewable energy.
United States Geological Survey (1990-2021), Mineral Commodity Summaries.
Metals for Clean Energy - Pathways to solving Europe’s raw materials challenge110
Valero et al. (2018), Global material requirements for the energy transition. An energy flow analysis of decarbonisation pathways.
Vanadium Consortium (2021), Vanadium & Divanadium pentaoxide (V2O5) – Benefits for a greener Europe.
Vanitec (2021), consulted for metal intensity and technology assumptions.
Welzel, L. (2019), End-Of-Life Wind Turbines in the EU: An Estimation of the NdFeB-Magnets and Contain-ing Rare Earth Elements in the Anthropogenic Stock of Germany and Denmark.
Wirtschafts Woche, article by S. Hajek (2020), Lithium: Ist das E-Auto schuld an Wassernot in Südamerika?.
World Bank (2017), The Growing Role of Minerals and Metals for a Low Carbon Future.
World Platinum Investment Council (2021), consulted at: https://platinuminvestment.com/supply-and-de-mand/demand-drivers.
Chapter 2
Bundesanstalt für Geowissenschaften und Rohstoffe (2015), Rohstoffrisikobewertung – Lithium.
Bureau of International Recycling (2008), Report on the Environmental Benefits of Recycling.
Ciacci, L., Fishman, T., Elshkaki, A., Graedel, T. E., Vassura, I., Passarini, F. (2020), Exploring future copper demand, recycling and associated greenhouse gas emissions in the EU-28.
Cobalt Institute (2019), Cobalt Value Chain - Final Summary Report.
Cobalt Institute (2021), ‘State of the Cobalt market’ report.
Deng et al. (2019), A techno-economic review of silicon photovoltaic module recycling.
Euroalliages (2021), consulted for silicon metal trade flows.
European Aluminium (2021), consulted for recycling statistics.
European Commission (2020), Study on the EU's List of Critical Raw Materials - Critical Raw Materials Factsheets.
European Commission (2021), Raw Materials Scoreboard.
European Copper Institute (2021), consulted for recycling statistics.
European Raw Materials Alliance (2021), Rare Earth Magnets and Motors: A European Call for Action.
Federal Ministry Republic of Austria, Agriculture, Regions and Tourism (2021), World Mining Data 2021.
Fraunhofer ISI (2021), input received for Zinc Global Stocks and Flows.
General Motors (2021), https://media.gm.com/media/us/en/gm/home.detail.html/content/Pages/news/us/en/2021/oct/1006-mou.html.
Glöser, S., Soulier, M., Tercero Espinoza, L. A. (2013), A dynamic analysis of global copper flows. Global stocks, postconsumer material flows, recycling indicators & uncertainty evaluation.
Greenmatch (2021), https://www.greenmatch.co.uk/blog/2017/10/the-opportunities-of-solar-panel-re-cycling#:~:text=Silicon%20Based%20Solar%20Panel%20Recycling,for%20re%2Dmolding%20cell%20frames.
Institute for Sustainable Futures (2021), Reducing new mining for electric vehicle battery metls: responsi-ble sourcing through demand reduction strategies and recycling.
International Copper Association (2020), Global and EU copper stocks and flows at: https://copperalli-ance.org/policy-focus/society-economy/circular-economy/stocks-flows/.
International Energy Agency (2021), The Role of Critical World Energy Outlook Special Report Minerals in Clean Energy Transitions.
International Zinc Association (2021), consulted for production and recycling statistics .
Joint Research Centre (2020), The Role of Rare Earth Elements in Wind Energy and Electric Mobility.
Metals for Clean Energy - Pathways to solving Europe’s raw materials challenge111
https://media.gm.com/media/us/en/gm/home.detail.html/content/Pages/news/us/en/2021/oct/1006-mou.html
Nickel Institute (2021), consulted for production and recycling statistics .
Piçarra, A., Annesley, I. R., Otsuki, A., de Waard, R. (2021), Market assessment of cobalt: Identification and evaluation of supply risk patterns.
Pirard, E. (2021), Zinc Resources - A State of Knowledge.
PV magazine (2021), Un nouveau procédé pour recycler le silicium, l’argent et le verre des panneaux photovoltaïques en fin de vie.
Rieger et al. (2021), Residue Valorization in the Iron and Steel Industries: Sustainable Solutions for a Cleaner and More Competitive Future Europe.
SolarPower Europe (2021), Solar Sustainability: Best Practices Benchmark.
Soulier et al. (2018), Dynamic analysis of European copper flows.
Umweltbundesamt (2020), Impacts of climate change on mining, related environmental risks and raw material supply - Case studies on copper and lithium mining in Ch.
UN Comtrade (2021), consulted dataset at: https://comtrade.un.org/.
United Nations Environment Programme (2011), Recycling Rates of Metals: a Status Report.
United States Geological Survey (1990-2021), Mineral Commodity Summaries.
Welzel, L. (2019), End-Of-Life Wind Turbines in the EU: An Estimation of the NdFeB-Magnets and Contain-ing Rare Earth Elements in the Anthropogenic Stock of Germany and Denmark.
Chapter 3
Ashby, M. F. (2013), Materials and the Environment.
Ballentine, P., Duran, L., Anderson, E. (2008), CleanTX Analysis on Semiconductors.
Batteries Europe (2020), Strategic Research Agenda for batteries 2020.
Bundesanstalt für Geowissenschaften und Rohstoffe (2020), Informationen zur Nachhaltigkeit.
Bundesanstalt für Geowissenschaften und Rohstoffe (2015), Rohstoffrisikobewertung – Lithium.
Bureau of International Recycling (2008), Report on the Environmental Benefits of Recycling.
Ciacci, L., Fishman, T., Elshkaki, A., Graedel, T. E., Vassura, I., Passarini, F. (2020), Exploring future copper demand, recycling and associated greenhouse gas emissions in the EU-28.
Cobalt Institute (2019), Cobalt Value Chain - Final Summary Report.
Cobalt Institute (2021), ‘State of the Cobalt market’ report.
Cobalt Institute (2021), consulted for production statistics.
Cochilco (2021), Yearbook: Copper and Other Mineral Statistics.
Deng et al. (2019), A techno-economic review of silicon photovoltaic module recycling.
Euroalliages (2019), 2050 Vision for the European Ferro-alloys and Silicon sector.
Euroalliages (2021), consulted for production statistics.
European Aluminium (2021), consulted for production and recycling statistics.
European Commission (2020), Study on the EU's List of Critical Raw Materials - Critical Raw Materials Factsheets.
European Commission (2021), EU Reference Scenario 2020: Energy, transport and GHG emissions - Trends to 2050.
European Commission (2021), Raw Materials Scoreboard.
European Copper Institute (2021), consulted for production, metal intensity and recycling statistics.
Metals for Clean Energy - Pathways to solving Europe’s raw materials challenge112
European Raw Materials Alliance (2021), Rare Earth Magnets and Motors: A European Call for Action.
Federal Ministry Republic of Austria, Agriculture, Regions and Tourism (2021), World Mining Data 2021.
Fraunhofer ISI (2021), input received for Zinc Global Stocks and Flows.
General Motors (2021), https://media.gm.com/media/us/en/gm/home.detail.html/content/Pages/news/us/en/2021/oct/1006-mou.html.
Glöser, S., Soulier, M., Tercero Espinoza, L. A. (2013), A dynamic analysis of global copper flows. Global stocks, postconsumer material flows, recycling indicators & uncertainty evaluation.
Greenmatch (2021), https://www.greenmatch.co.uk/blog/2017/10/the-opportunities-of-solar-panel-re-cycling#:~:text=Silicon%20Based%20Solar%20Panel%20Recycling,for%20re%2Dmolding%20cell%20frames.
Harvey, L. D. D. (2018), Resource implications of alternative strategies for achieving zero greenhouse gas emissions from light-duty vehicles by 2060.
Institute for Sustainable Futures (2019), Responsible minerals sourcing for renewable energy.
Institute for Sustainable Futures (2021), Reducing new mining for electric vehicle battery metals: responsi-ble sourcing through demand reduction strategies and recycling.
International Aluminium Institute (2021), consulted for production statistics at: https://international-alumin-ium.org/.
International Copper Association (2020), Global and EU copper stocks and flows at: https://copperalliance.org/policy-focus/society-economy/circular-economy/stocks-flows/.
International Copper Study Group (2021), The World Copper Factbook 2021.
International Energy Agency (2021), The Role of Critical World Energy Outlook Special Report Minerals in Clean Energy Transitions.
International Energy Agency (2021), Global Hydrogen Review .
International Energy Agency (2020), Life Cycle Inventories and Life Cycle Assessments of Photovoltaic Systems.
International Lead and Zinc Study Group (2020), The World Zinc Factbook 2020.
International Lead and Zinc Study Group (2021), consulted for production statistics at: https://www.ilzsg.org/static/statistics.aspx.
International Nickel Study Group (2021), consulted for production statistics.
International Zinc Association (2021), consulted for production, metal intensity and recycling statistics.
Joint Research Centre (2020), The Role of Rare Earth Elements in Wind Energy and Electric Mobility.
Joint Research Centre (2013), Critical Metals in the Path Towards the Decarbonisation of the EU Energy Sector.
Joint Research Centre (2020), Raw materials demand for wind and solar PV technologies in the transition towards a decarbonised energy system.
Joint Research Centre (2011), Critical Metals in Strategic Energy Technologies.
Månberger, A., Stenqvist, B. (2018), Global metal flows in the renewable energy transition: Exploring the effects of substitutes, technological mix and development.
Nickel Institute (2021), Nickel in low carbon electricity provision.
Nickel Institute (2021), Infographic, Nickel Energizing Batteries.
Nickel Institute (2021), consulted for production statistics.
Nickel Magazine, vol. 36 (2021), Critical nickel: providing sustainable solutions.
Piçarra, A., Annesley, I. R., Otsuki, A., de Waard, R. (2021), Market assessment of cobalt: Identification and evaluation of supply risk patterns.
Metals for Clean Energy - Pathways to solving Europe’s raw materials challenge113
https://www.greenmatch.co.uk/blog/2017/10/the-opportunities-of-solar-panel-recycling#:~:text=Silicon
https://www.greenmatch.co.uk/blog/2017/10/the-opportunities-of-solar-panel-recycling#:~:text=Silicon
PV magazine (2021), Un nouveau procédé pour recycler le silicium, l’argent et le verre des panneaux photovoltaïques en fin de vie.
Rinne et al. (2021), Life cycle assessment and process simulation of prospective battery-grade cobalt sulfate production from Co-Au ores in Finland.
Roskill (2019), Socio-economic analysis of the cobalt industry in the EEA, 2010-2017.
SolarPower Europe (2021), Global Market Outlook for Solar Power 2021-2025.
SolarPower Europe (2021), Solar Sustainability: Best Practices Benchmark.
SolarPower Europe & LUT University (2020), 100% Renewable Europe: How to Make Europe's Energy System Climate-Neutral Before 2050.
Soulier et al. (2018), Dynamic analysis of European copper flows.
TNO (2018), Global Energy Transition and Metal Demand - An Introduction and Circular Economy Perspectives.
Tokimatsu et al. (2018), Energy modeling approach to the global energy-mineral nexus: Exploring metal requirements and the well-below 2 °C target with 100 percent renewable energy.
Umweltbundesamt (2020), Impacts of climate change on mining, related environmental risks and raw material supply - Case studies on copper and lithium mining in Ch.
UN Comtrade (2021), consulted dataset at: https://comtrade.un.org/.
United Nations Environment Programme (2011), Recycling Rates of Metals: a Status Report.
United States Geological Survey (1990-2021), Mineral Commodity Summaries.
University of Nottingham (2022), The Energy of Freedom? Solar energy, modern slavery and the Just Transition.
Valero et al. (2018), Global material requirements for the energy transition. An energy flow analysis of decarbonisation pathways.
Welzel, L. (2019), End-Of-Life Wind Turbines in the EU: An Estimation of the NdFeB-Magnets and Contain-ing Rare Earth Elements in the Anthropogenic Stock of Germany and Denmark.
Wirtschafts Woche, article by S. Hajek (2020), Lithium: Ist das E-Auto schuld an Wassernot in Südamerika?.
World Bank (2017), The Growing Role of Minerals and Metals for a Low Carbon Future.
Chapter 4
Awuah-Offei, K., Adekpedjou, A. (2010), Application of life cycle assessment in the mining industry.
Beylot, A., Villeneuve, J. (2017), Accounting for the environmental impacts of sulfidic tailings storage in the Life Cycle Assessment of copper production: A case study.
Bureau of International Recycling (2008), Report on the Environmental Benefits of Recycling.
Buxmann, K., Koehler, A., Thylmann, D. (2016), Water scarcity footprint of primary aluminium.
Ciacci, L., Fishman, T., Elshkaki, A., Graedel, T. E., Vassura, I., Passarini, F. (2020), Exploring future copper demand, recycling and associated greenhouse gas emissions in the EU-28.
Cobalt Development Institute (2016), The Environmental Performance of Refined Cobalt.
Euroalliages (2019), 2050 Vision for the European Ferro-alloys and Silicon sector.
European Aluminium (2021), consulted for sustainability data.
European Aluminiun (2018), Environmental Profile Report.
European Commission (2021), Raw Materials Scoreboard.
European Copper Institute (2021), consulted for sustainability data.
European Environment Agency (2021), Consulted dataset at: www.eea.europa.eu/data-and-maps/daviz/co2-emission-intensity-9#tab-googlechartid_googlechartid_googlechartid_googlechartid_chart_11111.
Metals for Clean Energy - Pathways to solving Europe’s raw materials challenge114
Farjana, S. H., Huda, N., Mahmud, M. A. P. (2019), Life cycle assessment of cobalt extraction process.
Global Silicones Council (2012), Silicon-chemistry Carbon Balance - An Assessment of Greenhouse Gas Emissions and Reductions.
Grant. A., Deak, D., Pell, R. (2020), The CO2 Impact of the 2020s Battery Quality Lithium Hydroxide Supply Chain.
ICMM (2020), Safety Data - Benchmarking Progress of ICMM company members in 2020.
ICMM (2020), Future of Jobs in Mining Regions.
ICMM (2019), Adapting to a Changing Climate.
ICMM (2021), Tailings Management - Good Practice Guide.
ICMM (2017), A Practical Guide to Consistent Water Reporting.
ICMM (2014), Water Stewardship Framework.
ICMM, Business Fights Poverty & TPI (2021), Mining as a partenr in Supporting More Inclusive and Resil-ient Societies.
Initiative for Responsible Mining Assurance (2021), Mine Site Assessment - Public Summary Report.
Institute for European Studies (2019), Metals for Climate Neutral Europe - A 2050 Blueprint.
International Aluminium Institute (2021), Employment in the Global Aluminium Industry.
International Copper Association Australia (2020), Zero Emission Copper Mine of the Future - The Water Report.
International Labour Organization (ILO) (2021), Women in Mining - Towards Gender Equality.
International Molybdenum Association (2021), consulted for the sustainability review.
International Zinc Association (2015), Zinc Environmental Profile - 2015 Update.
International Zinc Association (2021), consulted for sustainability data.
Jin et al. (2016), Comparative Life Cycle Assessment of NdFeB Magnets: Virgin Production versus Mag-net-to-Magnet Recycling.
Joint Research Centre (2022), https://joint-research-centre.ec.europa.eu/jrc-news_en.
Joint Research Centre (2021), Sustainability aspects of Bauxite and Aluminium.
Joint Research Centre (2020), Responsible and sustainable sourcing of battery raw materials.
Kelly et al. (2021), Energy, greenhouse gas, and water life cycle analysis of lithium carbonate and lithium hydroxide monohydrate from brine and ore resources and their use in lithium ion battery cathodes and lithium ion batteries.
Kero, I., Gradahl, S., Tranell, G. (2017), Airborne Emissions from Si/FeSi Production.
Latunussa, C. E. L., Ardente, F., Blengini, G. A., Mancini, L. (2016), Life Cycle Assessment of an innova-tive recycling process for crystalline silicon photovoltaic panels.
Mancini, L., Sala, S. (2018), Social impact assessment in the mining sector: Review and comparison of indicators frameworks.
Meißner, S. (2021), The Impact of Metal Mining on Global Water Stress and Regional Carrying Capaci-ties—A GIS-Based Water Impact Assessment.
Neumann, F., Reuter, M. A. (2021), Simulation-based calculation of the environmental impact of zinc die casting when using primary and secondary raw materials for alloy production.
Nickel Institute (2021), consulted for sustainability data.
Norgate, T. E., Jahanshahi, S., Rankin, W. J. (2006), Assessing the environmental impact of metal pro-duction processes.
Metals for Clean Energy - Pathways to solving Europe’s raw materials challenge115
Nuss, P., Eckelman, M. J. (2014), Life Cycle Assessment of Metals: A Scientific Synthesis.
OECD (2019), Reducing the health risks of the copper, rare earth and cobalt industries.
Pell et al. (2021), Towards sustainable extraction of technology materials through integrated approaches.
Rinne et al. (2021), Life cycle assessment and process simulation of prospective battery-grade cobalt sulfate production from Co-Au ores in Finland.
Saevarsdottir, G. Kvande, H., Magnusson, T. (2021), Greenhouse gas emissions from silicon production - development of carbon footprint with changing energy systems.
Schreiber, A., Marx, J., Zapp, P. (2021), Life Cycle Assessment studies of rare earths production - findings from a systematic review.
SolarPower Europe (2021), Solar Sustainability: Best Practices Benchmark.
SQM (2021), Sustainability of lithium production in Chile.
SQM (2021), consulted for sustainability data.
Umweltbundesamt (2020), Impacts of climate change on mining, related environmental risks and raw material supply - Case studies on copper and lithium mining in Ch.
Van Genderen, E., Wildnauer, M., Santero, N., Sidi, N. (2016), A global life cycle assessment for primary zinc production.
Verisk Maplecroft (2021), Mining operations face growing biodiversity risks, www.maplecroft.com/in-sights/analysis/mining-operations-face-growing-biodiversity-risks/.
Verisk Maplecroft (2021), Biodiversity risk is the new ESG elephant in the room, www.maplecroft.com/insights/analysis/biodiversity-risk-is-the-new-esg-elephant-in-the-room/.
Werker et al. (2019), Social LCA for rare earth NdFeB permanent magnets.
World Bank (2021), consulted dataset at: https://databank.worldbank.org/databases/control-of-corruption.
World Gold Council (2021), Gold and climate change - decarbonising investment portfolios.
World Justice Project (2021), consulted dataset at: https://worldjusticeproject.org/rule-of-law-index/.
WWF Water Risk Filter (2021), consulted dataset at: https://waterriskfilter.org/explore/map.
WWF Water Risk Filter (2020), An analysis of water risk in the mining sector.
Metals for Clean Energy - Pathways to solving Europe’s raw materials challenge116
Step
hens
onD
esig
n.eu