
CLEAN AIR ADVOCATES' EXHIBIT 1 - Mission
361
CLEAN AIR ADVOCATES’ EXHIBIT 1
-
Upload
khangminh22 -
Category
Documents
-
view
0 -
download
0
Transcript of CLEAN AIR ADVOCATES' EXHIBIT 1 - Mission

CLEAN AIR ADVOCATES’ EXHIBIT 1

JOINT PROPOSED AMENDMENTS TO PROPOSED 20.2.50 NMAC FROM
ENVIRONMENTAL DEFENSE FUND
AND
CONSERVATION VOTERS NEW MEXICO, DINÉ C.A.R.E., EARTHWORKS, NATURAL
RESOURCES DEFENSE COUNCIL, SAN JUAN CITIZENS ALLIANCE, SIERRA CLUB,
350 NEW MEXICO, AND 350 SANTA FE
AND
CENTER FOR CIVIL POLICY AND NAVA EDUCATION PROJECT
JOINT PROPOSED AMENDMENTS TO PROPOSED 20.2.50 NMAC July 28, 2021
1
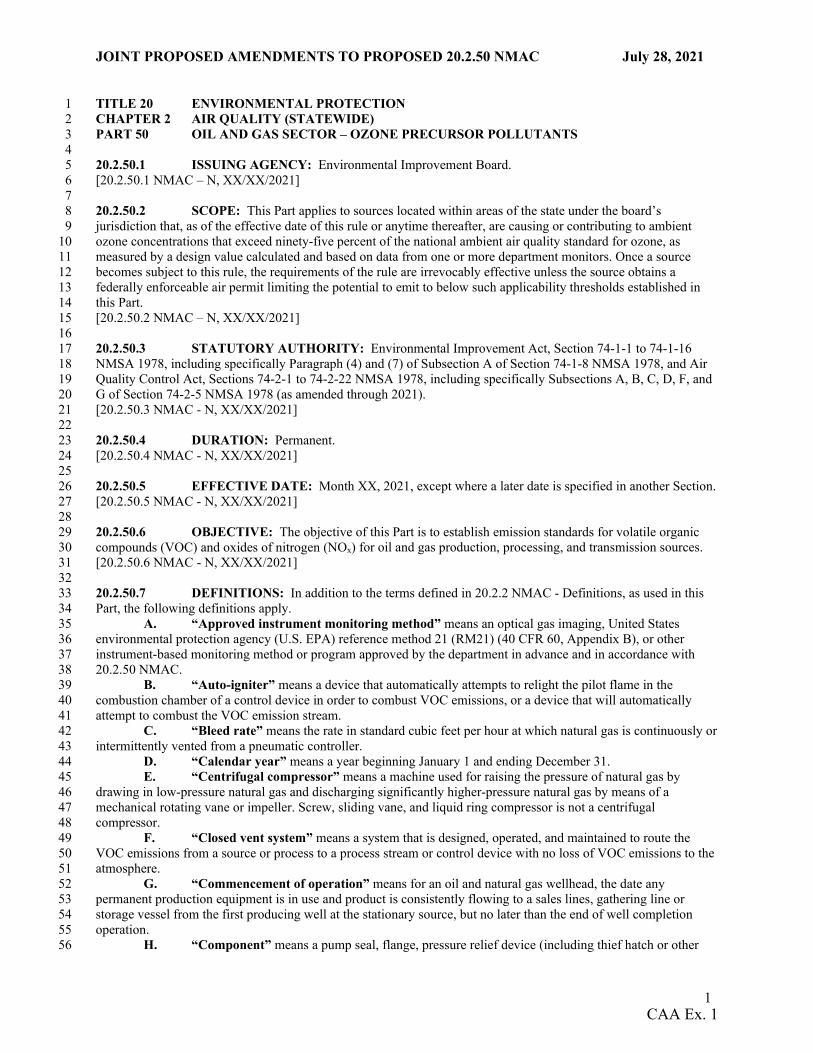
TITLE 20 ENVIRONMENTAL PROTECTION 1 CHAPTER 2 AIR QUALITY (STATEWIDE) 2 PART 50 OIL AND GAS SECTOR – OZONE PRECURSOR POLLUTANTS 3
4 20.2.50.1 ISSUING AGENCY: Environmental Improvement Board. 5 [20.2.50.1 NMAC – N, XX/XX/2021] 6
7 20.2.50.2 SCOPE: This Part applies to sources located within areas of the state under the board’s 8 jurisdiction that, as of the effective date of this rule or anytime thereafter, are causing or contributing to ambient 9 ozone concentrations that exceed ninety-five percent of the national ambient air quality standard for ozone, as 10 measured by a design value calculated and based on data from one or more department monitors. Once a source 11 becomes subject to this rule, the requirements of the rule are irrevocably effective unless the source obtains a 12 federally enforceable air permit limiting the potential to emit to below such applicability thresholds established in 13 this Part. 14 [20.2.50.2 NMAC – N, XX/XX/2021] 15
16 20.2.50.3 STATUTORY AUTHORITY: Environmental Improvement Act, Section 74-1-1 to 74-1-16 17 NMSA 1978, including specifically Paragraph (4) and (7) of Subsection A of Section 74-1-8 NMSA 1978, and Air 18 Quality Control Act, Sections 74-2-1 to 74-2-22 NMSA 1978, including specifically Subsections A, B, C, D, F, and 19 G of Section 74-2-5 NMSA 1978 (as amended through 2021). 20 [20.2.50.3 NMAC - N, XX/XX/2021] 21
22 20.2.50.4 DURATION: Permanent. 23 [20.2.50.4 NMAC - N, XX/XX/2021] 24
25 20.2.50.5 EFFECTIVE DATE: Month XX, 2021, except where a later date is specified in another Section. 26 [20.2.50.5 NMAC - N, XX/XX/2021] 27
28 20.2.50.6 OBJECTIVE: The objective of this Part is to establish emission standards for volatile organic 29 compounds (VOC) and oxides of nitrogen (NOx) for oil and gas production, processing, and transmission sources. 30 [20.2.50.6 NMAC - N, XX/XX/2021] 31
32 20.2.50.7 DEFINITIONS: In addition to the terms defined in 20.2.2 NMAC - Definitions, as used in this 33 Part, the following definitions apply. 34
A. “Approved instrument monitoring method” means an optical gas imaging, United States35 environmental protection agency (U.S. EPA) reference method 21 (RM21) (40 CFR 60, Appendix B), or other 36 instrument-based monitoring method or program approved by the department in advance and in accordance with 37 20.2.50 NMAC. 38
B. “Auto-igniter” means a device that automatically attempts to relight the pilot flame in the39 combustion chamber of a control device in order to combust VOC emissions, or a device that will automatically 40 attempt to combust the VOC emission stream. 41
C. “Bleed rate” means the rate in standard cubic feet per hour at which natural gas is continuously or42 intermittently vented from a pneumatic controller. 43
D. “Calendar year” means a year beginning January 1 and ending December 31.44 E. “Centrifugal compressor” means a machine used for raising the pressure of natural gas by45
drawing in low-pressure natural gas and discharging significantly higher-pressure natural gas by means of a 46 mechanical rotating vane or impeller. Screw, sliding vane, and liquid ring compressor is not a centrifugal 47 compressor. 48
F. “Closed vent system” means a system that is designed, operated, and maintained to route the49 VOC emissions from a source or process to a process stream or control device with no loss of VOC emissions to the 50 atmosphere. 51
G. “Commencement of operation” means for an oil and natural gas wellhead, the date any52 permanent production equipment is in use and product is consistently flowing to a sales lines, gathering line or 53 storage vessel from the first producing well at the stationary source, but no later than the end of well completion 54 operation. 55
H. “Component” means a pump seal, flange, pressure relief device (including thief hatch or other56
CAA Ex. 1

JOINT PROPOSED AMENDMENTS TO PROPOSED 20.2.50 NMAC July 28, 2021
2
opening on a storage vessel), connector or valve that contains or contacts a process stream with hydrocarbons, 1 except for components where process streams consist solely of glycol, amine, produced water or methanol. 2 I. “Connector” means flanged, screwed, or other joined fittings used to connect pipe line segments, 3 tubing, pipe components (such as elbows, reducers, “T's” or valves) to each other; or a pipe line to a piece of 4 equipment; or an instrument to a pipe, tube or piece of equipment. A common connector is a flange. Joined fittings 5 welded completely around the circumference of the interface are not considered connectors for the purpose of this 6 Part. 7 J. “Construction” means fabrication, erection, installation or relocation of a stationary source, 8 including but not limited to temporary installations and portable stationary sources. 9 K. “Custody transfer” means the transfer of oil or natural gas after processing or treatment in the 10 producing operation, or from a storage vessel or automatic transfer facility or other processing or treatment 11 equipment including product loading racks, to a pipeline or any other form of transportation. 12 L. “Control device” means air pollution control equipment or emission reduction technologies that 13 thermally combust, chemically convert, or otherwise destroy or recover air contaminants. Examples of control 14 devices include but are not limited to open flares, enclosed combustion devices (ECDs), thermal oxidizers (TOs), 15 vapor recovery units (VRUs), fuel cells, condensers, air fuel ratio controllers (AFRs), catalytic converters (oxidative, 16 selective, and non-selective), or other emission reduction equipment. A control device may also include any other air 17 pollution control equipment or emission reduction technologies approved by the department to comply with 18 emission standards in this Part. 19 M. “Department” means the New Mexico environment department. 20 N. “Downtime” means the period of time when equipment is not in operation, or when a well is 21 producing, and the control device is not in operation. 22 O. “Drilling” or “drilled” means the process to bore a hole to create a well for oil and/or natural gas 23 production. 24 P. “Drill-out” means the process of removing the plugs placed during hydraulic fracturing or 25 refracturing. Drill-out ends after the removal of all stage plugs and the initial wellbore cleanup. 26 Q. “Enclosed combustion device” means a combustion device where gaseous fuel is combusted in 27 an enclosed chamber. This may include, but is not limited to an enclosed flare, reboiler, and heater. 28 PR. “Existing” means constructed or reconstructed before the effective date of this Part and has not 29 since been modified or reconstructed. 30 S. “Flowback” means the process of allowing fluids and entrained solids to flow from a well 31 following stimulation, either in preparation for a subsequent phase of treatment or in preparation for cleanup and 32 placing the well into production. The term flowback also means the fluids and entrained solids flowing from a well 33 after drilling or hydraulic fracturing or refracturing. Flowback ends when all temporary flowback equipment is 34 removed from service. Flowback does not include drill-out. 35 T. “Flowback vessel” means a vessel that contains flowback. 36 QU. “Gathering and boosting station” means a permanent combination of equipment that collects or 37 moves natural gas, crude oil, condensate, or produced water between a wellhead site and a midstream oil and natural 38 gas collection or distribution facility, such as a storage vessel battery or compressor station, or into or out of storage. 39 V. “Hydraulic fracturing” means the process of directing pressurized fluids containing any 40 combination of water, proppant, and any added chemicals to penetrate tight formations, such as shale, coal, and tight 41 sand formations, that subsequently require flowback to expel fracture fluids and solids. 42 W. “Hydraulic refracturing” means conducting a subsequent hydraulic fracturing operation at a well 43 that has previously undergone a hydraulic fracturing operation. 44 RX. “Glycol dehydrator” means a device in which a liquid glycol absorbent, including ethylene 45 glycol, diethylene glycol, or triethylene glycol, directly contacts a natural gas stream and absorbs water. 46 SY. “Hydrocarbon liquid” means any naturally occurring, unrefined petroleum liquid and can 47 include oil, condensate, and intermediate hydrocarbons. 48 TZ. “Liquid unloading” means the removal of accumulated liquid from the wellbore that reduces or 49 stops natural gas production. 50 UAA. “Liquid transfer” means the loading and unloading of a hydrocarbon liquid or produced water 51 between a storage vessel and tanker truck or tanker rail car for transport. 52 VBB. “Local distribution company custody transfer station” means a metering station where the 53 local distribution (LDC) company receives a natural gas supply from an upstream supplier, which may be an 54 interstate transmission pipeline or a local natural gas producer, for delivery to customers through the LDC's 55 intrastate transmission or distribution lines. 56
CAA Ex. 1

JOINT PROPOSED AMENDMENTS TO PROPOSED 20.2.50 NMAC July 28, 2021
3
WCC. “Natural gas compressor station” means one or more compressors designed to compress natural 1 gas from well pressure to gathering system pressure before the inlet of a natural gas processing plant, or to move 2 compressed natural gas through a transmission pipeline. 3 XDD. “Natural gas-fired heater” means an enclosed device using a controlled flame and with a 4 primary purpose to transfer heat directly to a process material or to a heat transfer material for use in a process. 5 YEE. “Natural gas processing plant” means the processing equipment engaged in the extraction of 6 natural gas liquid from natural gas or fractionation of mixed natural gas liquid to a natural gas product, or both. A 7 Joule-Thompson valve, a dew point depression valve, or an isolated or standalone Joule-Thompson skid is not a 8 natural gas processing plant. 9 ZFF. “New” means constructed or reconstructed on or after the effective date of this Part. 10 GG. "Occupied area" means (1) a building or structure designed for use as a place of residency by a 11 person, a family, or families. The term includes manufactured, mobile, and modular homes, except to the extent that 12 any such manufactured, mobile, or modular home is intended for temporary occupancy or for business purposes; (2) 13 indoor or outdoor spaces associated with a school that students use commonly as part of their curriculum or 14 extracurricular activities; (3) five thousand (5,000) or more square feet of building floor area in commercial facilities 15 that are operating and normally occupied during working hours; and (4) an outdoor venue or recreation area, such as 16 a playground, permanent sports field, amphitheater, or other similar place of outdoor public assembly. 17 HH. “Pre-production operations” means the drilling through the hydrocarbon bearing zones, 18 hydraulic fracturing or refracturing, drill-out, and flowback of an oil and/or natural gas well. 19 AAII. “Operator” means the person or persons responsible for the overall operation of a stationary 20 source. 21 BBJJ. “Optical gas imaging (OGI)” means an imaging technology that utilizes a high-sensitivity 22 infrared camera designed for and capable of detecting hydrocarbons. 23 CCKK. “Owner” means the person or persons who own a stationary source or part of a stationary source. 24 DDLL. “Permanent pit” means a pit used for collection, retention, or storage of produced water or brine 25 and is installed for longer than one year. 26 EEMM. “Pneumatic controller” means an instrument that is actuated using pressurized gas and used to 27 control or monitor process parameters such as liquid level, gas level, pressure, valve position, liquid flow, gas flow, 28 and temperature. 29 FFNN. “Pneumatic diaphragm pump” means a positive displacement pump powered by pressurized 30 natural gas that uses the reciprocating action of flexible diaphragms in conjunction with check valves to pump a 31 fluid. A pump in which a fluid is displaced by a piston driven by a diaphragm is not considered a diaphragm pump. 32 A lean glycol circulation pump that relies on energy exchange with the rich glycol from the contactor is not 33 considered a diaphragm pump. 34 GGOO. “Potential to emit (PTE)” means the maximum capacity of a stationary source to emit an air 35 contaminant under its physical and operational design. The physical or operational limitation on the capacity of a 36 source to emit an air pollutant, including air pollution control equipment and a restriction on the hours of operation 37 or on the type or amount of material combusted, stored or processed, shall be treated as part of its design if the 38 limitation is federally enforceable. The PTE for nitrogen dioxide shall be based on total oxides of nitrogen. 39 HHPP. “Produced water” means a fluid that is an incidental byproduct from drilling for or the 40 production of oil and gas. 41 IIQQ. “Produced water management unit” means a recycling facility or a permanent pit that is a 42 natural topographical depression, man-made excavation, or diked area formed primarily of earthen materials 43 (although it may be lined with man-made materials), which is designed to accumulate produced water and has a 44 design storage capacity equal to or greater than 50,000 barrels. 45 JJRR. “Qualified Professional Engineer” means an individual who is licensed by a state as a 46 professional engineer to practice one or more disciplines of engineering and who is qualified by education, technical 47 knowledge, and experience to make the specific technical certifications required under this Part. 48 KKSS. “Reciprocating compressor” means a piece of equipment that increases the pressure of process 49 gas by positive displacement, employing linear movement of a piston rod. 50 LLTT. “Reconstruction” means a modification that results in the replacement of the components or 51 addition of integrally related equipment to an existing source, to such an extent that the fixed capital cost of the new 52 components or equipment exceeds fifty percent of the fixed capital cost that would be required to construct a 53 comparable entirely new facility. 54
CAA Ex. 1

JOINT PROPOSED AMENDMENTS TO PROPOSED 20.2.50 NMAC July 28, 2021
4
MMUU. “Recycling facility” means a stationary or portable facility used exclusively for the treatment, re-1 use, or recycling of produced water and does not include oilfield equipment such as separators, heater treaters, and 2 scrubbers in which produced water may be used. 3 NNVV. “Responsible official” means one of the following: 4 (1) for a corporation: president, secretary, treasurer, or vice-president of the corporation in 5 charge of a principal business function, or any other person who performs similar policy or decision-making 6 functions for the corporation, or a duly authorized representative of the corporation if the representative is 7 responsible for the overall operation of the source. 8 (2) for a partnership or sole proprietorship: a general partner or the proprietor, respectively. 9 OOWW. “Small business facility” means, for the purposes of this Part, a source that is 10 independently owned or operated by a company that is a not a subsidiary or a division of another business, that 11 employs no more than 10 employees at any time during the calendar year, and that has a gross annual revenue of 12 less than $250,000. Employees include part-time, temporary, or limited service workers. 13 PPXX. “Startup” means the setting into operation of air pollution control equipment or process 14 equipment. 15 QQYY. “Stationary Source” or "source" means any building, structure, equipment, facility, installation 16 (including temporary installations), operation, process, or portable stationary source that emits or may emit any air 17 contaminant. Portable stationary source means a source that can be relocated to another operating site with limited 18 dismantling and reassembly. 19 RRZZ. “Storage vessel” means a single tank or other vessel that is designed to contain an accumulation 20 of hydrocarbon liquid or produced water and is constructed primarily of non-earthen material including wood, 21 concrete, steel, fiberglass, or plastic, which provide structural support, or a process vessel such as a surge control 22 vessel, bottom receiver, or knockout vessel. A well completion vessel that receives recovered liquid from a well 23 after commencement of operation for a period that exceeds 60 days is considered a storage vessel. A storage vessel 24 does not include a vessel that is skid-mounted or permanently attached to a mobile source and located at the site for 25 less than 180 consecutive days, such as a truck railcar, or a pressure vessel designed to operate in excess of 204.9 26 kilopascals without emissions to the atmosphere. 27 AAA. “Vessel measurement system” means equipment and methods used to determine the quantity of 28 the liquids inside a vessel (including a flowback vessel) without requiring direct access through the vessel thief 29 hatch or other opening. 30 SSBBB. “Well workover” means the repair or stimulation of an existing production well for the purpose 31 of restoring, prolonging, or enhancing the production of hydrocarbons. 32 TTCCC. “Wellhead site” means the equipment directly associated with one or more oil wells or 33 natural gas wells upstream of the natural gas processing plant. A wellhead site may include equipment used for 34 extraction, collection, routing, storage, separation, treating, dehydration, artificial lift, combustion, compression, 35 pumping, metering, monitoring, and product piping. 36 [20.2.50.7 NMAC - N, XX/XX/2021] 37 38 20.2.50.8 SEVERABILITY: If any provision of this Part, or the application of this provision to any person 39 or circumstance is held invalid, the remainder of this Part, or the application of this provision to any person or 40 circumstance other than those as to which it is held invalid, shall not be affected thereby. 41 [20.2.50.8 NMAC - N, XX/XX/2021] 42 43 20.2.50.9 CONSTRUCTION: This Part shall be liberally construed to carry out its purpose. 44 [20.2.50.9 NMAC - N, XX/XX/2021] 45 46 20.2.50.10 SAVINGS CLAUSE: Repeal or supersession of prior versions of this Part shall not affect 47 administrative or judicial action initiated under those prior versions. 48 [20.2.50.10 NMAC - N, XX/XX/2021] 49 50 20.2.50.11 COMPLIANCE WITH OTHER REGULATIONS: Compliance with this Part does not relieve 51 a person from the responsibility to comply with other applicable federal, state, or local laws, rules or regulations, 52 including more stringent controls. 53 [20.2.50.11 NMAC - N, XX/XX/2021] 54 55 20.2.50.12 DOCUMENTS: Documents incorporated and cited in this Part may be viewed at the New 56
CAA Ex. 1

JOINT PROPOSED AMENDMENTS TO PROPOSED 20.2.50 NMAC July 28, 2021
5
Mexico environment department, air quality bureau. 1 [20.2.50.12 NMAC - N, XX/XX/2021] 2 [The Air Quality Bureau is located at 525 Camino de los Marquez, Suite 1, Santa Fe, New Mexico 87505.] 3 4 20.2.23.13-20.2.23.110 [RESERVED] 5 6 20.2.50.111 APPLICABILITY: 7 A. This Part applies to crude oil and natural gas production and processing equipment and operations 8 that extract, collect, separate, dehydrate, store, process, transport, transmit, or handle hydrocarbon liquid or 9 produced water in the areas specified in 20.2.50.2 NMAC and are located at wellhead sites, tank batteries, gathering 10 and boosting sites, natural gas processing plants, and transmission compressor stations, up to the point of the local 11 distribution company custody transfer station. 12 B. In determining if any source is subject to this Part, including a small business facility as defined in 13 this Part, the owner or operator shall calculate the Potential to Emit (PTE) of such source and shall have the PTE 14 calculation certified by a qualified professional engineer. The calculation shall be kept on file for a minimum of five 15 years and shall be provided to the department upon request. 16 C. An owner or operator of a small business facility as defined in this Part shall comply with the 17 requirements of this Part as specified in 20.2.50.125 NMAC. 18 D. Oil refinery and transmission pipelines are not subject to this Part. 19 [20.2.50.111 NMAC - N, XX/XX/2021] 20 21 20.2.50.112 GENERAL PROVISIONS: 22 A. General requirements: 23 (1) Sources subject to emissions standards and requirements under this Part shall be operated 24 and maintained consistent with manufacturer specifications, and good engineering and maintenance practices. The 25 owner or operator shall keep manufacturer specifications and maintenance practices on file and make them available 26 upon request by the department. For sources constructed prior to 1980 for which no manufacturer specifications and 27 maintenance practices are available, the owner or operator shall develop and follow a maintenance schedule 28 sufficient to operate and maintain such units in good working order. The owner or operator shall keep such 29 maintenance schedules on file and make them available to the department upon request. 30 (2) Sources subject to emission standards or requirements under this Part shall be operated to 31 minimize emissions of air contaminants, including VOC and NOx. 32 (3) Within two years of the effective date of this Part, owners and operators of a source 33 requiring an Equipment Monitoring Tag (EMT) shall physically tag each unit with an EMT, the format of which 34 shall be either RFID, QR, or bar code such that, when scanned it provides a unique identifier of the source. This 35 unique identifier shall act as an index to the source’s record of the data required by this Part. The EMT shall be 36 maintained by the owner or operator, and data in the EMT shall provide at a minimum, the following information: 37 (a) unique unit identification number; 38 (b) location of the source; 39 (c) type of source (e.g., tank, VRU, dehydrator, pneumatic controller, etc.); 40 (d) for each source, the VOC (and NOx, if applicable) PTE in lbs./hr. and tpy; 41 (e) for a control device, the controlled VOC and NOx PTE in lbs./hr. and tpy; 42 (f) make, model, and serial number; and 43 (g) a link to the manufacturer’s maintenance schedule or repair recommendations. 44 (4) The EMT shall be installed and maintained by the owner or operator of the facility. 45 (5) The EMT shall be of a format scannable by an owner or operator’s authorized 46 representatives and, upon scanning, shall provide unique identifier that shall index the source’s record of the data 47 required by this Part. 48 (6) The owner or operator shall manage the source’s record of data in a database that is able 49 to generate a Compliance Database Report (CDR). The CDR is an electronic report generated by the owner or 50 operator’s database and submitted to the department upon request. The format of the CDR shall be determined by 51 the department. 52 (7) The CDR is a report distinct from the owner or operator’s database. The department does 53 not require access to the owner or operator’s database, only the CDR. 54 (8) If read by the owner or operator’s authorized representative, the EMT shall access the 55 owner or operator’s database record for that source. 56
CAA Ex. 1

JOINT PROPOSED AMENDMENTS TO PROPOSED 20.2.50 NMAC July 28, 2021
6
(9) The owner or operator shall contemporaneously track each compliance event for each 1 source subject to the EMT requirements of this Part, and shall comply with the following: 2 (a) data gathered during each monitoring or testing event shall be 3 contemporaneously uploaded into the database as soon as practicable, but no later than three business days of each 4 compliance event. 5 (b) data required by this Part shall be maintained in the database for at least five 6 years. 7 (10) The department may request that an owner or operator retain a third party at their own 8 expense to verify any data or information collected, reported, or recorded pursuant to this Part, and make 9 recommendations to correct or improve the collection of data or information. The owner or operator shall submit a 10 report of the verification and any recommendations made by the third party to the department by a date specified and 11 implement the recommendations in the manner approved by the department. 12 B. Monitoring requirements: 13 (1) Sources subject to emission standards and monitoring (e.g. inspection, testing, parametric 14 monitoring) requirements under this Part shall be inspected monthly to ensure proper maintenance and operation, 15 unless a different schedule is specified in the Section applicable to that source type. If the equipment is shut down at 16 the time of required periodic testing, monitoring, or inspection, the owner or operator shall not be required to restart 17 the unit for the sole purpose of performing the testing, monitoring, or inspection, but shall note the shut down in the 18 records kept for that equipment for that monitoring event. 19 (2) An owner or operator may submit for the department’s review and approval an equally 20 effective, enforceable, and equivalent alternative monitoring strategy. Such requests shall be made on an application 21 form provided by the department. The department shall issue a letter approving or denying the requested alternative 22 monitoring strategy. An owner or operator shall comply with the default monitoring requirements required under the 23 applicable Section and shall not operate under an alternative monitoring strategy until it has been approved by the 24 department. 25 (3) Each monitoring event (e.g. testing, inspection, parametric monitoring) shall be initiated 26 by an initial scanning of the EMT, the results of which shall then be directly uploaded into the database or 27 temporarily into the handheld or other device. Upon completion of the monitoring event, a final scanning of the 28 EMT shall terminate the monitoring event. At a minimum, the uploaded data shall include: 29 (a) date and time of the testing, monitoring, or inspection event; 30 (b) name of the personnel conducting the testing, monitoring, or inspection; 31 (c) identification number and type of unit; 32 (d) a description of any maintenance or repair activity conducted; and 33 (e) results of testing, monitoring, or inspection as required under this Part. 34 C. Recordkeeping requirements: 35 (1) Within three business days of a monitoring event, an electronic record shall be made of 36 the monitoring event and shall include the following data: 37 (a) date and time of the testing, monitoring, or inspection event; 38 (b) name of the personnel conducting the testing, monitoring, or inspection; 39 (c) identification number and type of unit; 40 (d) a description of any maintenance or repair activity conducted; and 41 (e) results of any testing, monitoring, or inspections required under this Part. 42 (2) The owner or operator shall keep an electronic record required by this Part for five years. 43 The department may treat loss of data or failure to maintain a record, including failure to transfer a record upon sale 44 or transfer of ownership or operating authority, as a failure to collect the data. 45 (3) Before the transfer of ownership of equipment subject to this Part, the current owner or 46 operator shall conduct and document a full compliance evaluation of such equipment. The documentation shall 47 include a certification by a responsible official as to whether the equipment is in compliance with the requirements 48 of this Part. The compliance determination shall be conducted no earlier than three months before the transfer of 49 ownership. The owner or operator shall keep the full compliance evaluation and certification by the responsible 50 official for for five years. 51 D. Reporting requirements: Within 24 hours of a request by the department, the owner or operator 52 shall for each unit subject to the request, provide the requested information either by electronically submitting a 53 CDR to the department’s Secure Extranet Portal (SEP), or by other means and formats specified by the department 54 in its request. 55 [20.2.50.112 NMAC - N, XX/XX/2021] 56
CAA Ex. 1

JOINT PROPOSED AMENDMENTS TO PROPOSED 20.2.50 NMAC July 28, 2021
7
1 20.2.50.113 ENGINES AND TURBINES: 2 A. Applicability: Portable and stationary natural gas-fired spark ignition engines, compression 3 ignition engines, and natural gas-fired combustion turbines located at wellhead sites, tank batteries, gathering and 4 boosting sites, natural gas processing plants, and transmission compressor stations, with a rated horsepower greater 5 than the horsepower ratings of Table 1, 2, and 3 of 20.2.50.113 NMAC are subject to the requirements of 6 20.2.50.113 NMAC. 7 B. Emission standards: 8 (1) The owner or operator of a portable or stationary natural gas-fired spark-ignition engine, 9 compression ignition engine, or natural gas-fired combustion turbine shall ensure compliance with the emission 10 standards by the dates specified in Subsection B of 20.2.50.113 NMAC. 11 (2) The owner or operator of an existing natural gas-fired spark-ignition engine shall 12 complete an inventory of all existing engines by January 1, 2023, and shall prepare a schedule to ensure that each 13 existing engine does not exceed the emission standards in table 1 of Paragraph (2) of Subsection B of 20.2.50.113 14 NMAC as follows: 15 (a) by January 1, 2025, the owner or operator shall ensure at least thirty percent of 16 the company’s existing engines meet the emission standards. 17 (b) by January 1, 2027, the owner or operator shall ensure at least an additional 18 thirty-five percent of the company’s existing engines meets the emission standards. 19 (c) by January 1, 2029, the owner or operator shall ensure that the remaining thirty-20 five percent of the company’s existing engines meets the emission standards. 21 (d) in lieu of meeting the emission standards for an existing natural gas-fired spark 22 ignition engine, an owner or operator may reduce the annual hours of operation of an engine such that the annual 23 NOx and VOC emissions are reduced by at least ninety-five percent per year. 24 25 Table 1 - EMISSION STANDARDS FOR NATURAL GAS-FIRED SPARK-IGNITION ENGINES 26 CONSTRUCTED, RECONSTRUCTED, OR INSTALLED BEFORE THE EFFECTIVE DATE OF 20.2.50 27 NMAC. 28
Engine Type Rated bhp NOx CO NMNEHC (as propane)
Lean-burn >1,000 0.50 g/bhp-hr 47 ppmvd @ 15% O2 or 93% reduction 0.70 g/bhp-hr
Rich-burn >1,000 0.50 g/bhp-hr 0.60 g/bhp-hr 0.70 g/bhp-hr 29 (3) The owner or operator of a new natural gas-fired spark ignition engine shall ensure the 30 engine does not exceed the emission standards in table 2 of Paragraph (3) of Subsection B of 20.2.50.113 NMAC 31 upon startup. 32 33 Table 2 - EMISSION STANDARDS FOR NATURAL GAS-FIRED SPARK-IGNITION ENGINES 34 CONSTRUCTED, RECONSTRUCTED, OR INSTALLED AFTER THE EFFECTIVE DATE OF 20.2.50 NMAC. 35
Engine Type Rated bhp NOx CO NMNEHC (as propane) Lean-burn >500 - <1,000 0.50 g/bhp-hr 0.60 g/bhp-hr 0.70 g/bhp-hr
Lean-burn ≥1,000
0.30 g/bhp-hr uncontrolled or
0.05 g/bhp-hr with control
0.60 g/bhp-hr 0.70 g/bhp-hr
Rich-burn >500 0.50 g/bhp-hr 0.60 g/bhp-hr 0.70 g/bhp-hr 36
(4) The owner or operator of a natural gas-fired spark ignition engine with NOx emission 37 control technology that uses ammonia or urea as a reagent shall ensure that the exhaust ammonia slip is limited to 10 38 ppmvd or less, corrected to fifteen percent oxygen. 39 (5) The owner or operator of a compression ignition engine shall ensure compliance with the 40 following emission standards: 41 (a) a new portable or stationary compression ignition engine with a maximum 42 design power output equal to or greater than 500 horsepower that is not subject to the emission standards under 43 Subparagraph (b) of Paragraph (5) of Subsection B of 20.2.50.113 NMAC shall limit NOx emissions to not more 44
CAA Ex. 1

JOINT PROPOSED AMENDMENTS TO PROPOSED 20.2.50 NMAC July 28, 2021
8
than nine g/bhp-hr upon startup. 1 (b) a stationary compression ignition engine that is subject to and complying with 2 Subpart IIII of 40 CFR Part 60, Standards of Performance for Stationary Compression Ignition Internal Combustion 3 Engines, is not subject to the requirements of Subparagraph (a) of Paragraph (5) of Subsection B of 20.2.50.113 4 NMAC. 5 (6) The owner or operator of a portable or stationary compression ignition engine with NOx 6 emission control technology that uses ammonia or urea as a reagent shall ensure that the exhaust ammonia slip is 7 limited to 10 ppmvd or less, corrected to fifteen percent oxygen. 8 (7) The owner or operator of a stationary natural gas-fired combustion turbine with a 9 maximum design rating equal to or greater than 1,000 bhp shall comply with the applicable emission standards for 10 an existing, new, or reconstructed turbine listed in table 3 of Paragraph (7) of Subsection B of 20.2.50.113 NMAC. 11 12 Table 3 - EMISSION STANDARDS FOR STATIONARY COMBUSTION TURBINES 13
For each natural gas-fired combustion turbine constructed or reconstructed and installed before the effective date of 20.2.50 NMAC, the owner or operator shall ensure the turbine does not exceed the following emission standards no later than two years from the effective date of this Part:
Turbine Rating (bhp) NOx (ppmvd @15% O2) CO (ppmvd @ 15% O2) NMNEHC (as propane, ppmvd @15% O2)
≥1,000 and <5,000 50 50 9
≥5,000 and <15,000 50 50 9
≥15,000 50 50 or 93% reduction 5 or 50% reduction
For each natural gas-fired combustion turbine constructed or reconstructed and installed on or after the effective date of 20.2.50 NMAC, the owner or operator shall ensure the turbine does not exceed the following emission standards upon startup:
Turbine Rating (bhp) NOx (ppmvd @15% O2) CO (ppmvd @ 15% O2) NMNEHC (as propane, ppmvd @15% O2)
≥1,000 and <5,000 25 25 9 ≥5,000 and <15,900 15 10 9
≥15,900 9.0 Uncontrolled or 2.0 with Control
10 Uncontrolled or 1.8 with Control 5
14 (8) The owner or operator of a stationary natural gas-fired combustion turbine with NOx 15 emission control technology that uses ammonia or urea as a reagent shall ensure that the exhaust ammonia slip is 16 limited to 10 ppmvd or less, corrected to fifteen percent oxygen. 17 (9) The owner or operator of an engine or turbine shall install an EMT on the engine or 18 turbine in accordance with 20.2.50.112 NMAC. 19 (10) The owner or operator of an emergency use engine that is operated less than 100 hours 20 per year is not subject to the emissions standards in this Part but shall be equipped with a non-resettable hour meter 21 to monitor and record any hours of operation. 22 C. Monitoring requirements: 23 (1) Maintenance and repair for a spark-ignition engine, compression-ignition engine, and 24 stationary combustion turbine shall meet the minimum manufacturer recommended maintenance schedule. The 25 following maintenance, adjustment, replacement, or repair events for engines and turbines shall be documented as 26 they occur: 27 (a) routine maintenance that takes a unit out of service for more than two hours 28 during any 24-hour period; and 29 (b) unscheduled repairs that require a unit to be taken out of service for more than 30 two hours during any 24-hour period. 31 (2) Catalytic converters (oxidative, selective and non-selective) and AFR controllers shall be 32 maintained according to manufacturer or supplier recommended maintenance schedules, including replacement of 33
CAA Ex. 1

JOINT PROPOSED AMENDMENTS TO PROPOSED 20.2.50 NMAC July 28, 2021
9
oxygen sensors as necessary for oxygen-based controllers. During periods of catalytic converter or AFR controller 1 maintenance, the owner or operator shall shut down the engine or turbine until the catalytic converter or AFR 2 controller can be replaced with a functionally equivalent spare to allow the engine or turbine to return to operation. 3 (3) For equipment operated for 500 hours per year or more, compliance with the emission 4 standards in Subsection B of 20.2.50.113 NMAC shall be demonstrated by performing an initial emissions test, 5 followed by annual tests, for NOx, CO, and non-methane non-ethane hydrocarbons (NMNEHC) using a portable 6 analyzer or U.S. EPA reference method. For units with g/hp-hr emission standards, the engine load shall be 7 calculated using the following equations: 8 9
Load Hp Fuel consumption scf/hr x Measured fuel heating value LHV btu/scfManufacturer’s rated BSFC btu/bhp-hr at 100% load or best efficiency
10
11
Load Hp Fuel consumption gal/hr x Measured fuel heating value LHV btu/galManufacturer’s rated BSFC btu/bhp-hr at 100% load or best efficiency
12
13 Where: LVH = lower heating value, btu/scf, or btu/gal, as appropriate; and 14
BSFC = brake specific fuel consumption 15 16 (a) emissions testing events shall be conducted at ninety percent or greater of the 17 unit’s capacity. If the ninety percent capacity cannot be achieved, the monitoring and testing shall be conducted at 18 the maximum achievable capacity or load under prevailing operating conditions. The load and the parameters used 19 to calculate it shall be recorded to document operating conditions at the time of testing and shall be included with 20 the test report. 21 (b) emissions testing utilizing a portable analyzer shall be conducted in accordance 22 with the requirements of the current version of ASTM D 6522. If a portable analyzer has met a previously approved 23 department criterion, the analyzer may be operated in accordance with that criterion until it is replaced. 24 (c) the default time period for a test run shall be at least 20 minutes. 25 (d) an emissions test shall consist of three separate runs, with the arithmetic mean of 26 the results from the three runs used to determine compliance with the applicable emission standard. 27 (e) during emissions tests, pollutant and diluent concentration shall be monitored 28 and recorded. Fuel flow rate shall be monitored and recorded if stack gas flow rate is determined utilizing U.S. EPA 29 reference method 19. This information shall be included with the periodic test report. 30 (f) stack gas flow rate shall be calculated in accordance with U.S. EPA reference 31 method 19 utilizing fuel flow rate (scf) determined by a dedicated fuel flow meter and fuel heating value (Btu/scf). 32 The owner or operator shall provide a contemporaneous fuel gas analysis (preferably on the day of the test, but no 33 earlier than three months before the test date) and a recent fuel flow meter calibration certificate (within the most 34 recent quarter) with the final test report. Alternatively, stack gas flow rate may be determined by using U.S. EPA 35 reference methods 1 through 4 or through the use of manufacturer provided fuel consumption rates. 36 (g) upon request by the department, an owner or operator shall submit a notification 37 and protocol for an initial or annual emissions test. 38 (h) emissions testing shall be conducted at least once per calendar year. Emission 39 testing required by Subparts GG, IIII, JJJJ, or KKKK of 40 CFR 60, or Subpart ZZZZ of 40 CFR 63, may be used to 40 satisfy the emissions testing requirements if it meets the requirements of 20.2.50.113 NMAC and is completed at 41 least once per calendar year. 42 (4) The owner or operator of equipment operated less than 500 hours per year shall monitor 43 the hours of operation using a non-resettable hour meter and shall test the unit at least once per 8760 hours of 44 operation in accordance with the emissions testing requirements in Paragraph (3) of Subsection C of 20.2.50.113 45 NMAC. 46 (5) An owner or operator of an emergency use engine operated for less than 100 hours per 47 year shall monitor the hours of operation by a non-resettable hour meter. 48 (6) An owner or operator limiting the annual operating hours of an engine to meet the 49 requirements of Paragraph (2) of Subsection B of 20.2.50.113 NMAC shall monitor the hours of operation by a non-50 resettable hour meter. 51 (7) Prior to monitoring, testing, inspection, or maintenance of an engine or turbine, the owner 52 or operator shall scan the EMT, and the monitoring data entry shall be made in accordance with the requirements of 53 20.2.50.112 NMAC. 54
CAA Ex. 1
JOINT PROPOSED AMENDMENTS TO PROPOSED 20.2.50 NMAC July 28, 2021
10
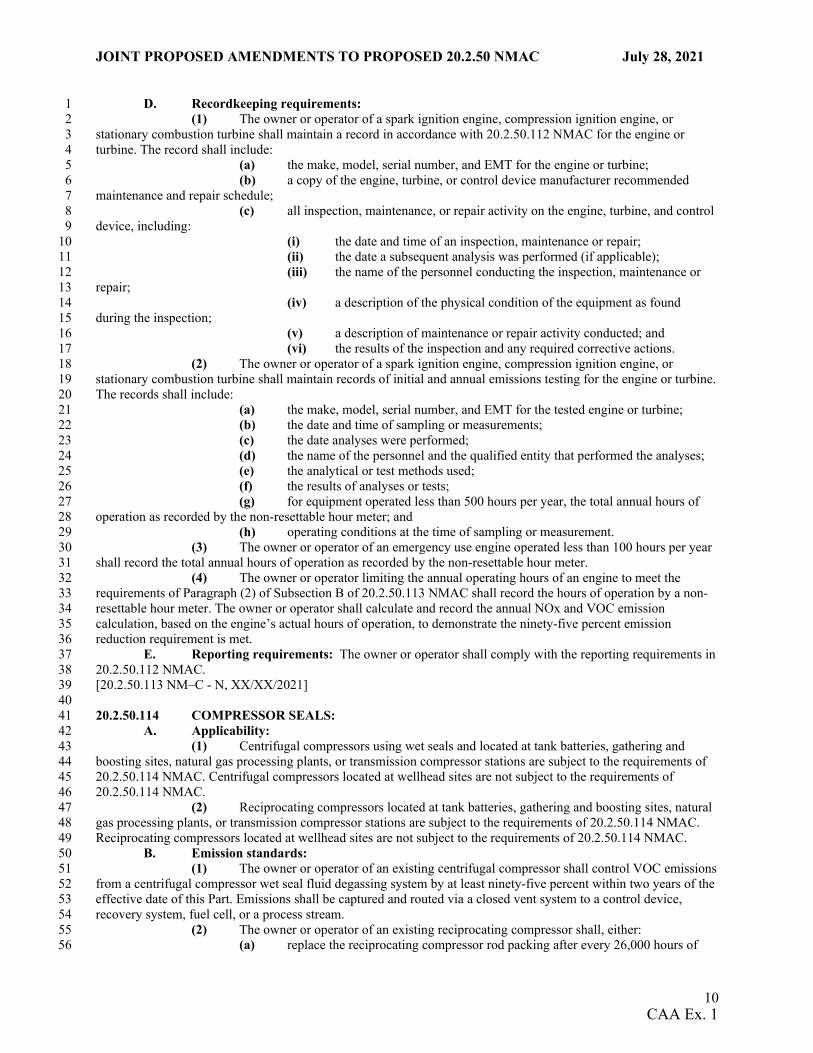
D. Recordkeeping requirements: 1 (1) The owner or operator of a spark ignition engine, compression ignition engine, or 2 stationary combustion turbine shall maintain a record in accordance with 20.2.50.112 NMAC for the engine or 3 turbine. The record shall include: 4 (a) the make, model, serial number, and EMT for the engine or turbine; 5 (b) a copy of the engine, turbine, or control device manufacturer recommended 6 maintenance and repair schedule; 7 (c) all inspection, maintenance, or repair activity on the engine, turbine, and control 8 device, including: 9 (i) the date and time of an inspection, maintenance or repair; 10 (ii) the date a subsequent analysis was performed (if applicable); 11 (iii) the name of the personnel conducting the inspection, maintenance or 12 repair; 13 (iv) a description of the physical condition of the equipment as found 14 during the inspection; 15 (v) a description of maintenance or repair activity conducted; and 16 (vi) the results of the inspection and any required corrective actions. 17 (2) The owner or operator of a spark ignition engine, compression ignition engine, or 18 stationary combustion turbine shall maintain records of initial and annual emissions testing for the engine or turbine. 19 The records shall include: 20 (a) the make, model, serial number, and EMT for the tested engine or turbine; 21 (b) the date and time of sampling or measurements; 22 (c) the date analyses were performed; 23 (d) the name of the personnel and the qualified entity that performed the analyses; 24 (e) the analytical or test methods used; 25 (f) the results of analyses or tests; 26 (g) for equipment operated less than 500 hours per year, the total annual hours of 27 operation as recorded by the non-resettable hour meter; and 28 (h) operating conditions at the time of sampling or measurement. 29 (3) The owner or operator of an emergency use engine operated less than 100 hours per year 30 shall record the total annual hours of operation as recorded by the non-resettable hour meter. 31 (4) The owner or operator limiting the annual operating hours of an engine to meet the 32 requirements of Paragraph (2) of Subsection B of 20.2.50.113 NMAC shall record the hours of operation by a non-33 resettable hour meter. The owner or operator shall calculate and record the annual NOx and VOC emission 34 calculation, based on the engine’s actual hours of operation, to demonstrate the ninety-five percent emission 35 reduction requirement is met. 36 E. Reporting requirements: The owner or operator shall comply with the reporting requirements in 37 20.2.50.112 NMAC. 38 [20.2.50.113 NM–C - N, XX/XX/2021] 39 40 20.2.50.114 COMPRESSOR SEALS: 41 A. Applicability: 42 (1) Centrifugal compressors using wet seals and located at tank batteries, gathering and 43 boosting sites, natural gas processing plants, or transmission compressor stations are subject to the requirements of 44 20.2.50.114 NMAC. Centrifugal compressors located at wellhead sites are not subject to the requirements of 45 20.2.50.114 NMAC. 46 (2) Reciprocating compressors located at tank batteries, gathering and boosting sites, natural 47 gas processing plants, or transmission compressor stations are subject to the requirements of 20.2.50.114 NMAC. 48 Reciprocating compressors located at wellhead sites are not subject to the requirements of 20.2.50.114 NMAC. 49 B. Emission standards: 50 (1) The owner or operator of an existing centrifugal compressor shall control VOC emissions 51 from a centrifugal compressor wet seal fluid degassing system by at least ninety-five percent within two years of the 52 effective date of this Part. Emissions shall be captured and routed via a closed vent system to a control device, 53 recovery system, fuel cell, or a process stream. 54 (2) The owner or operator of an existing reciprocating compressor shall, either: 55 (a) replace the reciprocating compressor rod packing after every 26,000 hours of 56
CAA Ex. 1

JOINT PROPOSED AMENDMENTS TO PROPOSED 20.2.50 NMAC July 28, 2021
11
compressor operation or every 36 months, whichever is reached later. The owner or operator shall begin counting 1 the hours of compressor operation toward the first replacement of the rod packing upon the effective date of this 2 Part; or 3 (b) beginning no later than two years from the effective date of this Part, collect 4 emissions from the rod packing under negative pressure and route them via a closed vent system to a control device, 5 recovery system, fuel cell, or a process stream. 6 (3) The owner or operator of a new centrifugal compressor shall control VOC emissions 7 from the centrifugal compressor wet seal fluid degassing system by at least ninety-eight percent upon startup. 8 Emissions shall be captured and routed via a closed vent system to a control device, recovery system, fuel cell, or 9 process stream. 10 (4) The owner or operator of a new reciprocating compressor shall, upon startup, either: 11 (a) replace the reciprocating compressor rod packing after every 26,000 hours of 12 compressor operation, or every 36 months, whichever is reached later; or 13 (b) collect emissions from the rod packing under negative pressure and route them 14 via a closed vent system to a control device, a recovery system, fuel cell or a process stream. 15 (5) The owner or operator of a centrifugal or reciprocating compressor shall install an EMT 16 on the compressor in accordance with 20.2.50.112 NMAC. 17 (6) The owner or operator complying with the emission standards in Subsection B of 18 20.2.50.114 NMAC through use of a control device shall comply with the control device requirements in 19 20.2.50.115 NMAC. 20 C. Monitoring requirements: 21 (1) The owner or operator of a centrifugal compressor complying with Paragraph (1) or (3) 22 of Subsection B of 20.2.50.114 NMAC shall maintain a closed vent system encompassing the wet seal fluid 23 degassing system that complies with the monitoring requirements in 20.2.50.115 NMAC. 24 (2) The owner or operator of a reciprocating compressor complying with Subparagraph (a) of 25 Paragraph (2) or Subparagraph (a) of Paragraph (4) of Subsection B of 20.2.50.114 NMAC shall continuously 26 monitor the hours of operation with a non-resettable hour meter and track the number of hours since initial startup or 27 since the previous reciprocating compressor rod packing replacement. 28 (3) The owner or operator of a reciprocating compressor complying with Subparagraph (b) of 29 Paragraph (2) or Subparagraph (b) of Paragraph (4) of Subsection B of 20.2.50.114 NMAC shall monitor the rod 30 packing emissions collection system semiannually to ensure that it operates under negative pressure and routes 31 emissions through a closed vent system to a control device, recovery system, fuel cell, or process stream. 32 (4) The owner or operator of a centrifugal or reciprocating compressor complying with the 33 requirements in Subsection B of 20.2.50.114 NMAC through use of a closed vent system or control device shall 34 comply with the monitoring requirements in 20.2.50.115 NMAC. 35 (5) The owner or operator of a centrifugal or reciprocating compressor shall comply with the 36 monitoring requirements in 20.2.50.112 NMAC. 37 D. Recordkeeping requirements: 38 (1) The owner or operator of a centrifugal compressor using a wet seal fluid degassing 39 system shall maintain a record of the following: 40 (a) the location of the centrifugal compressor; 41 (b) the date of construction, reconstruction, or modification of the centrifugal 42 compressor; 43 (c) the monitoring required in Subsection C of 20.2.50.114 NMAC, including the 44 time and date of the monitoring, the personnel conducting the monitoring, a description of any problem observed 45 during the monitoring, and a description of any corrective action taken; and 46 (d) the type, make, model, and identification number of a control device used to 47 comply with the control requirements in Subsection B of 20.2.50.114 NMAC. 48 (2) The owner or operator of a reciprocating compressor shall maintain a record of the 49 following: 50 (a) the location of the reciprocating compressor; 51 (b) the date of construction, reconstruction, or modification of the reciprocating 52 compressor; and 53 (c) the monitoring required in Subsection C of 20.2.50.114 NMAC, including: 54 (i) the number of hours of operation since initial startup or the last rod 55 packing replacement; 56
CAA Ex. 1

JOINT PROPOSED AMENDMENTS TO PROPOSED 20.2.50 NMAC July 28, 2021
12
(ii) the records of pressure in the rod packing emissions collection system; 1 and 2 (iii) the time and date of the inspection, the personnel conducting the 3 inspection, a notation of which checks required in Subsection C of 20.2.50.114 NMAC were completed, a 4 description of problems observed during the inspection, and a description and date of corrective actions taken. 5 (3) The owner or operator of a centrifugal or reciprocating compressor complying with the 6 requirements in Subsection B of 20.2.50.114 NMAC through use of a control device or closed vent system shall 7 comply with the recordkeeping requirements in 20.2.50.115 NMAC. 8 (4) The owner or operator of a centrifugal or reciprocating compressor shall comply with the 9 recordkeeping requirements in 20.2.50.112 NMAC. 10 E. Reporting requirements: The owner or operator of a centrifugal or reciprocating compressor 11 shall comply with the reporting requirements in 20.2.50.112 NMAC. 12 [20.2.50.114 NM–C - N, XX/XX/2021] 13 14 20.2.50.115 CONTROL DEVICES: 15 A. Applicability: These requirements apply to control devices as defined in 20.2.50.7 NMAC and 16 used to comply with the emission standards and emission reduction requirements in this Part. 17 B. General requirements: 18 (1) Control devices used to demonstrate compliance with this Part shall be installed, 19 operated, and maintained consistent with manufacturer specifications, and good engineering and maintenance 20 practices. 21 (2) Control devices shall be adequately designed and sized to achieve the control efficiency 22 rates required by this Part and to handle fluctuations in emissions of VOC or NOx. 23 (3) The owner or operator of a control device used to comply with the emission standards in 24 this Part shall install an EMT on the control device in accordance with 20.2.50.112 NMAC. 25 (4) The owner or operator shall inspect control devices used to comply with this Part at least 26 monthly to ensure proper maintenance and operation. Prior to an inspection or monitoring event, the owner or 27 operator shall scan the EMT and the required monitoring data shall be electronically captured in accordance with 28 this Part. 29 (5) The owner or operator shall ensure that a control device used to comply with emission 30 standards in this Part operates as a closed vent system that captures and routes VOC emissions to the control device, 31 and that unburnt gas is not directly vented to the atmosphere. 32 (6) The owner or operator of a closed vent system for a centrifugal compressor wet seal fluid 33 degassing system, reciprocating compressor, pneumatic controller or pump, or storage vessel, or flowback vessel 34 using a control device or routing emissions to a process shall: 35 (a) ensure the control device or process is of sufficient design and capacity to 36 accommodate all emissions from the affected sources; 37 (b) conduct an assessment to confirm that the closed vent system is of sufficient 38 design and capacity to ensure that all emissions from the affected equipment are routed to the control device or 39 process; and 40 (c) have the closed vent system certified by a qualified professional engineer or an 41 in-house engineer with expertise regarding the design and operation of the closed vent system in accordance with 42 Paragraphs (c)(i) and (ii) of this Section. 43 (i) The assessment of the closed vent system shall be prepared under the 44 direction or supervision of a qualified professional engineer or an in-house engineer who signs the certification in 45 Paragraph (c)(ii) of this Section. 46 (ii) the owner or operator shall provide the following certification, signed 47 and dated by a qualified professional engineer or an in-house engineer: “I certify that the closed vent system design 48 and capacity assessment was prepared under my direction or supervision. I further certify that the closed vent system 49 design and capacity assessment was conducted, and this report was prepared pursuant to the requirements of this 50 Part. Based on my professional knowledge and experience, and inquiry of personnel involved in the assessment, the 51 certification submitted herein is true, accurate, and complete.” 52 (7) The owner or operator shall keep manufacturer specifications for all control devices on 53 file. The information shall include: 54 (a) manufacturer name, make, and model; 55 (b) maximum heating value for an open flare, ECD, or TO; 56
CAA Ex. 1

JOINT PROPOSED AMENDMENTS TO PROPOSED 20.2.50 NMAC July 28, 2021
13
(c) maximum rated capacity for an open flare, ECD/TO, or VRU; 1 (d) gas flow range for an open flare, ECD, or TO; and 2 (e) designed destruction or vapor recovery efficiency. 3 C. Requirements for open flares: 4 (1) Emission standards: 5 (a) the flare shall combust the gas sent to the flare and combustion shall be 6 maintained for the duration of time that gas is sent to the flare. The owner or operator shall not send gas to the flare 7 in excess of the manufacturer maximum rated capacity. 8 (b) the owner or operator shall equip each new and existing flare (except those 9 flares required to meet the requirements of Paragraph (C) of this Subsection) with a continuous pilot flame, an 10 operational auto-igniter, or require manual ignition, and shall comply with the following: 11 (i) a flare with a continuous pilot flame or an auto-igniter shall be 12 equipped with a system to ensure the flare is operated with a flame present at all times when gas is being sent to the 13 flare. 14 (ii) the owner or operator of a flare with manual ignition shall inspect and 15 ensure a flame is present upon initiating a flaring event. 16 (iii) a new flare controlling a continuous gas stream shall be equipped with 17 a continuous pilot flame upon startup. 18 (iv) an existing flare controlling a continuous gas stream constructed before 19 the effective date of this Part shall be equipped with a continuous pilot no later than one year after the effective date 20 of this Part. 21 (c) an existing flare located at a site with an annual average daily production of 22 equal to or less than 10 barrels of oil per day or an average daily production of 60,000 standard cubic feet of natural 23 gas shall be equipped with an auto-ignitor, continuous pilot, or technology (e.g. alarm) that alerts the owner or 24 operator of a flare malfunction, if replaced or reconstructed after the effective date of this Part. 25 (d) the owner or operator shall operate a flare with no visible emissions, except for 26 periods not to exceed a total of 30 seconds during any 15 consecutive minutes. The flare shall be designed so that an 27 observer can, by means of visual observation from the outside of the flare or by other means such as a continuous 28 monitoring device, determine whether it is operating properly. 29 (e) the owner or operator shall repair the flare within three business days of any 30 alarm activation. 31 (2) Monitoring requirements: 32 (a) the owner or operator of a flare with a continuous pilot or auto igniter shall 33 continuously monitor the presence of a pilot flame, or presence of flame during flaring if using an auto igniter, using 34 a thermocouple equipped with a continuous recorder and alarm to detect the presence of a flame. An alternative 35 equivalent technology alerting the owner or operator of failure of ignition of the gas stream may be used in lieu of a 36 continuous recorder and alarm, if approved by the department; 37 (b) the owner or operator of a manually ignited flare shall monitor the presence of a 38 flame using continuous visual observation during a flaring event; 39 (c) the owner or operator shall, at least quarterly, and upon observing visible 40 emissions, perform a U.S. EPA method 22 observation while the flare pilot or auto igniter flame is present to certify 41 compliance with visible emission requirements. The observation period shall be a minimum of 15 consecutive 42 minutes; 43 (d) prior to an inspection or monitoring event, the EMT on the flare shall be 44 scanned and the required monitoring data shall be electronically captured during the event in accordance with the 45 monitoring requirements of 20.2.50.112 NMAC; and 46 (e) the owner or operator shall monitor the technology that alerts the owner or 47 operator of a flare malfunction and any instances of technology or alarm activation. 48 (3) Recordkeeping requirements: The owner or operator of an open flare shall keep a record 49 of the following: 50 (a) any instance of alarm activation, including the date and cause of alarm 51 activation, action taken to bring the flare into a normal operating condition, the name of the personnel conducting 52 the inspection, and any maintenance activity performed; 53 (b) the results of the U.S. EPA method 22 observations; 54 (c) the monitoring of the presence of a flame on a manual flare during a flaring 55 event as required under Subparagraph (b) of Paragraph (2) of Subsection C of 20.2.50.115 NMAC; 56
CAA Ex. 1
JOINT PROPOSED AMENDMENTS TO PROPOSED 20.2.50 NMAC July 28, 2021
14
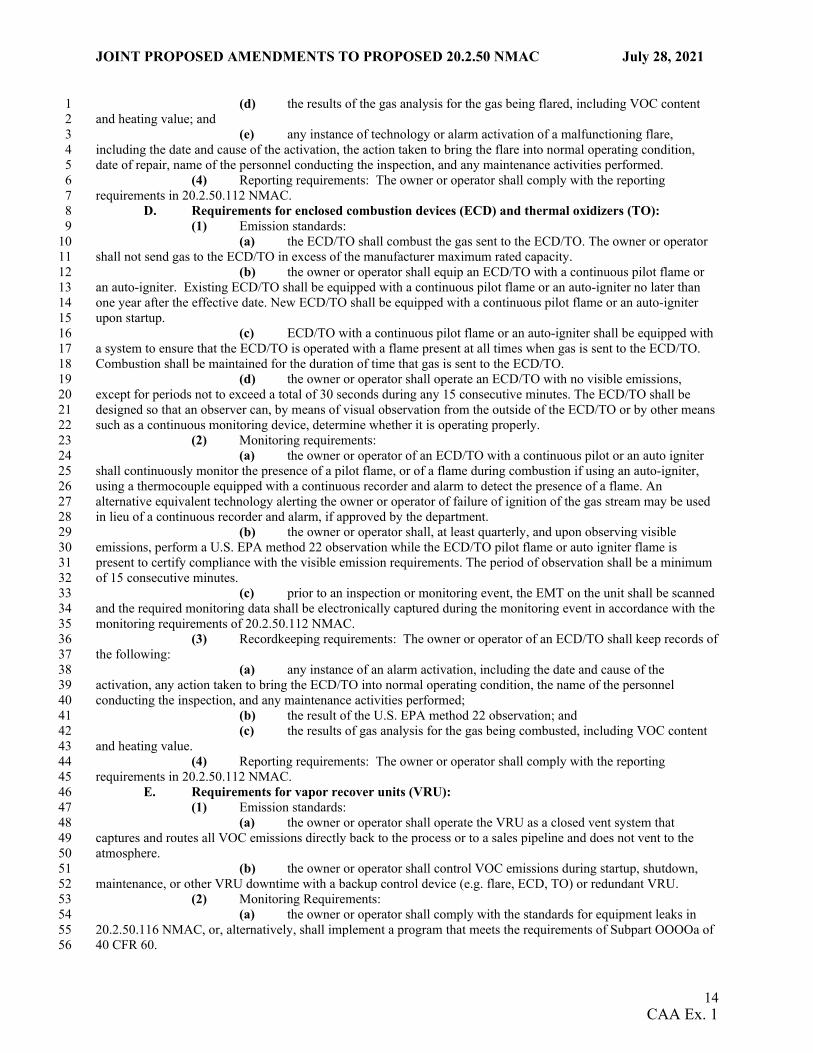
(d) the results of the gas analysis for the gas being flared, including VOC content 1 and heating value; and 2 (e) any instance of technology or alarm activation of a malfunctioning flare, 3 including the date and cause of the activation, the action taken to bring the flare into normal operating condition, 4 date of repair, name of the personnel conducting the inspection, and any maintenance activities performed. 5 (4) Reporting requirements: The owner or operator shall comply with the reporting 6 requirements in 20.2.50.112 NMAC. 7 D. Requirements for enclosed combustion devices (ECD) and thermal oxidizers (TO): 8 (1) Emission standards: 9 (a) the ECD/TO shall combust the gas sent to the ECD/TO. The owner or operator 10 shall not send gas to the ECD/TO in excess of the manufacturer maximum rated capacity. 11 (b) the owner or operator shall equip an ECD/TO with a continuous pilot flame or 12 an auto-igniter. Existing ECD/TO shall be equipped with a continuous pilot flame or an auto-igniter no later than 13 one year after the effective date. New ECD/TO shall be equipped with a continuous pilot flame or an auto-igniter 14 upon startup. 15 (c) ECD/TO with a continuous pilot flame or an auto-igniter shall be equipped with 16 a system to ensure that the ECD/TO is operated with a flame present at all times when gas is sent to the ECD/TO. 17 Combustion shall be maintained for the duration of time that gas is sent to the ECD/TO. 18 (d) the owner or operator shall operate an ECD/TO with no visible emissions, 19 except for periods not to exceed a total of 30 seconds during any 15 consecutive minutes. The ECD/TO shall be 20 designed so that an observer can, by means of visual observation from the outside of the ECD/TO or by other means 21 such as a continuous monitoring device, determine whether it is operating properly. 22 (2) Monitoring requirements: 23 (a) the owner or operator of an ECD/TO with a continuous pilot or an auto igniter 24 shall continuously monitor the presence of a pilot flame, or of a flame during combustion if using an auto-igniter, 25 using a thermocouple equipped with a continuous recorder and alarm to detect the presence of a flame. An 26 alternative equivalent technology alerting the owner or operator of failure of ignition of the gas stream may be used 27 in lieu of a continuous recorder and alarm, if approved by the department. 28 (b) the owner or operator shall, at least quarterly, and upon observing visible 29 emissions, perform a U.S. EPA method 22 observation while the ECD/TO pilot flame or auto igniter flame is 30 present to certify compliance with the visible emission requirements. The period of observation shall be a minimum 31 of 15 consecutive minutes. 32 (c) prior to an inspection or monitoring event, the EMT on the unit shall be scanned 33 and the required monitoring data shall be electronically captured during the monitoring event in accordance with the 34 monitoring requirements of 20.2.50.112 NMAC. 35 (3) Recordkeeping requirements: The owner or operator of an ECD/TO shall keep records of 36 the following: 37 (a) any instance of an alarm activation, including the date and cause of the 38 activation, any action taken to bring the ECD/TO into normal operating condition, the name of the personnel 39 conducting the inspection, and any maintenance activities performed; 40 (b) the result of the U.S. EPA method 22 observation; and 41 (c) the results of gas analysis for the gas being combusted, including VOC content 42 and heating value. 43 (4) Reporting requirements: The owner or operator shall comply with the reporting 44 requirements in 20.2.50.112 NMAC. 45 E. Requirements for vapor recover units (VRU): 46 (1) Emission standards: 47 (a) the owner or operator shall operate the VRU as a closed vent system that 48 captures and routes all VOC emissions directly back to the process or to a sales pipeline and does not vent to the 49 atmosphere. 50 (b) the owner or operator shall control VOC emissions during startup, shutdown, 51 maintenance, or other VRU downtime with a backup control device (e.g. flare, ECD, TO) or redundant VRU. 52 (2) Monitoring Requirements: 53 (a) the owner or operator shall comply with the standards for equipment leaks in 54 20.2.50.116 NMAC, or, alternatively, shall implement a program that meets the requirements of Subpart OOOOa of 55 40 CFR 60. 56
CAA Ex. 1

JOINT PROPOSED AMENDMENTS TO PROPOSED 20.2.50 NMAC July 28, 2021
15
(b) prior to a VRU inspection or monitoring event, the EMT on the unit shall be 1 scanned and the required monitoring data shall be electronically captured during the monitoring event in accordance 2 with the monitoring requirements of 20.2.50.112 NMAC. 3 (3) Recordkeeping requirements: For a VRU inspection or monitoring event, the owner or 4 operator shall record the result of the event in accordance with 20.2.50.112 NMAC, including the name of the 5 personnel conducting the inspection, and any maintenance or repair activities required. The owner or operator shall 6 record the type of redundant control device used during VRU downtime. 7 (4) Reporting requirements: The owner or operator shall comply with the reporting 8 requirements in 20.2.50.112 NMAC. 9 F. Recordkeeping requirements: The owner or operator of a control device shall maintain a record 10 of the following: 11 (1) the certification of the closed vent system as required by this Part; and 12 (2) the information required in Paragraph (7) of Subsection B of 20.2.50.115 NMAC. 13 G. Reporting requirements: The owner or operator shall comply with the reporting requirements in 14 20.2.50.112 NMAC. 15 H. Requirements for flowback vessels and preproduction operations: 16 (1) Emissions standards: 17 (a) the owner or operator of a well that begins flowback on or after the effective 18 date of this Part must collect and control emissions from each flowback vessel on and after the date flowback is 19 routed to the flowback vessel by routing emissions to an operating control device that achieves a hydrocarbon 20 control efficiency of at least 95 percent. If a TO or ECD is used, it must have a design destruction efficiency of at 21 least 98 percent for hydrocarbons. 22 (i) the owner or operator shall use enclosed, vapor-tight flowback vessels 23 with an appropriate pressure relief system to be used only as necessary to ensure safety. 24 (ii) flowback vessels must be inspected, tested, and refurbished where 25 necessary to ensure the flowback vessel is vapor-tight prior to receiving flowback. 26 (iii) the owner or operator shall use a vessel measurement system to 27 determine the quantity of liquids in the flowback vessel(s). 28 (A) Thief hatches or other access points to the flowback vessel 29 must remain closed and latched during activities to determine the quantity of liquids in the flowback vessel(s). 30 (B) Opening the thief hatch or other access point if required to 31 inspect, test, or calibrate the vessel measurement system or to add biocides or chemicals is not a violation of 32 20.2.50.115.H(1)(a)(i) NMAC. 33 (2) Monitoring 34 (a) Owners and or operators of a well with flowback that begins on or after the 35 effective date of 20.2.50 NMAC, must conduct daily visual inspections of the flowback vessel and any associated 36 equipment, including 37 (i) visual inspection of any thief hatch, pressure relief valve, or other 38 access point to ensure that they are closed and properly seated. 39 (ii) visual inspection or monitoring of the control device to ensure that it is 40 operating. 41 (iii) visual inspection of the control device to ensure that the valves for the 42 piping from the flowback vessel to the control device are open. 43 (3) Recordkeeping 44 (a) The owner or operator of each flowback vessel subject to Paragraph (1) of 45 Subsection H of Section 20.2.50.115 NMAC must maintain records for a period of five (5) years and make them 46 available to the NMED upon request, including 47 (i) the API number of the well and the associated facility location, 48 including latitude and longitude coordinates. 49 (ii) the date and time of the onset of flowback. 50 (iii) the date and time the flowback vessels were permanently disconnected, 51 if applicable. 52 (iv) the date and duration of any period where the control device is not 53 operating. 54 (v) records of the inspections required in Paragraph (2) of Subsection H of 55 Section 20.2.50.115 NMAC, including the time and date of each inspection, a description of any problems observed, 56
CAA Ex. 1

JOINT PROPOSED AMENDMENTS TO PROPOSED 20.2.50 NMAC July 28, 2021
16
a description and date of any corrective action(s) taken, and the name of the employee or third party performing 1 corrective action(s). 2 [20.2.50.115 NM–C - N, XX/XX/2021] 3 4 20.2.50.116 EQUIPMENT LEAKS AND FUGITIVE EMISSIONS: 5 A. Applicability: Wellhead sites, tank batteries, gathering and boosting sites, gas processing plants, 6 transmission compressor stations, and associated piping and components are subject to the requirements of 7 20.2.50.116 NMAC. 8 B. Emission standards: The owner or operator of oil and gas production and processing equipment 9 located at wellhead sites, tank batteries, gathering and boosting sites, gas processing plants, or transmission 10 compressor stations shall demonstrate compliance with this Part by performing the monitoring, recordkeeping, and 11 reporting requirements specified in 20.2.50.116 NMAC. 12 C. Default Monitoring requirements: Owners and operators shall comply with the following 13 monitoring requirements and the monitoring requirements in 20.2.50.112 NMAC: 14 (1) The owner or operator of a facility with an annual average daily production of greater 15 than 10 barrels of oil per day or an average daily production of greater than 60,000 standard cubic feet per day of 16 natural gas shall, at least weekly, conduct audio, visual, and olfactory (AVO) inspections of thief hatches, closed 17 vent systems, pumps, compressors, pressure relief devices, open-ended valves or lines, valves, flanges, connectors, 18 piping, and associated equipment to identify defects and leaking components as follows: 19 (a) conduct a visual inspection for: cracks, holes, or gaps in piping or covers; loose 20 connections; liquid leaks; broken or missing caps; broken, cracked or otherwise damaged seals or gaskets; broken or 21 missing hatches; or broken or open access covers or other closure or bypass devices; 22 (b) conduct an audio inspection for pressure leaks and liquid leaks; 23 (c) conduct an olfactory inspection for unusual or strong odors; 24 (d) any positive detection during the AVO inspection shall be considered a leak; and 25 (e) a leak discovered by an AVO inspection shall be tagged with a visible tag and 26 reported to management or their designee within three calendar days. 27 (2) The owner or operator of a facility with an annual average daily production of equal to or 28 less than 10 barrels of oil per day or an average daily production of equal to or less than 60,000 standard cubic feet 29 per day of natural gas shall, at least monthly, conduct an audio, visual, and olfactory (AVO) inspection of thief 30 hatches, closed vent systems, pumps, compressors, pressure relief devices, open-ended valves or lines, valves, 31 flanges, connectors, piping, and associated equipment to identify a defect and leaking component as specified in 32 Subparagraphs (a) through (e) of Paragraph (1) of Subsection (C) of 20.2.50.116 NMAC. 33 (3) The owner or operator of the following facilities shall conduct an inspection using U.S. 34 EPA method 21 or optical gas imaging (OGI) of thief hatches, closed vent systems, pumps, compressors, pressure 35 relief devices, open-ended valves or lines, valves, flanges, connectors, piping, and associated equipment to identify 36 leaking components at a frequency determined according to the following schedules: 37 (a) for wellhead sites or tank battery facilities: 38 (i) annually at facilities with a PTE less than two tpy VOC; 39 (ii) semi-annually at facilities with a PTE equal to or greater than two tpy 40 and less than five tpy VOC; and 41 (iii) quarterly at facilities with a PTE equal to or greater than five tpy VOC. 42 (b) for gathering and boosting sites, gas processing plants, and transmission 43 compressor stations: 44 (i) quarterly at facilities with a PTE less than 25 tpy VOC; and 45 (ii) monthly at facilities with a PTE equal to or greater than 25 tpy VOC. 46 (c) for wellhead sites within 1,000 feet of an occupied area: 47 (i) quarterly at facilities with a PTE less than 5 tpy VOC; and 48 (ii) monthly at facilities with a PTE equal to or greater than 5 tpy VOC. 49 (4) Inspections using U.S. EPA method 21 shall meet the following requirements: 50 (a) the instrument shall be calibrated before each day of its use by the procedures 51 specified in U.S. EPA method 21; 52 (b) the instrument shall be calibrated with zero air (less than 10 ppm of hydrocarbon 53 in air), and a mixture of methane or n-hexane and air at a concentration near, but nor more than, 10,000 ppm 54 methane or n-hexane; and 55 (c) a leak is detected if the instrument records a measurement of 500 ppm or greater 56
CAA Ex. 1

JOINT PROPOSED AMENDMENTS TO PROPOSED 20.2.50 NMAC July 28, 2021
17
of hydrocarbon and the measurement is not associated with normal equipment operation, such as pneumatic device 1 actuation and crank case ventilation. 2 (5) Inspections using OGI shall meet the following requirements: 3 (a) the instrument shall comply with the specifications, daily instrument checks, and 4 leak survey requirements set forth in Subparagraphs (1) through (3) of Paragraph (i) of 40 CFR 60.18; 5 (b) a leak is detected if the emission images recorded by the OGI instrument are not 6 associated with normal equipment operation, such as pneumatic device actuation or crank case ventilation. 7 (6) Components that are difficult, unsafe, or inaccessible to monitor, as determined by the 8 following conditions, are not required to be inspected until it becomes feasible to do so: 9 (a) difficult to monitor components are those that require elevating the monitoring 10 personnel more than two meters above a supported surface, or that cannot be reached via a wheeled scissor-lift or 11 hydraulic type scaffold that allows access to components up to seven and six tenths meters (25 feet) above the 12 ground; 13 (b) unsafe to monitor components are those that cannot be monitored without 14 exposing monitoring personnel to an immediate danger as a consequence of completing the monitoring; and 15 (c) inaccessible to monitor components are those that are buried, insulated, or 16 obstructed by equipment or piping that prevents access to the components by monitoring personnel. 17 D. Alternative equipment leak monitoring plans: As an equivalent means of compliance with 18 Subsection C of 20.2.50.116 NMAC, an owner or operator may comply with the equipment leak requirements 19 through an alternative monitoring plan as follows: 20
(1) An owner or operator may comply with an individual alternative monitoring plan, subject 21 to the following requirements: 22 (a) the proposed alternative monitoring plan shall be submitted to and approved by 23 the department prior to conducting monitoring under that plan. 24 (b) the department may terminate an approved alternative monitoring plan if the 25 department finds that the owner or operator failed to comply with a provision of the plan and failed to correct and 26 disclose the violation to the department within 15 calendar days of identifying the violation. 27 (c) upon department denial or termination of an approved alternative monitoring 28 plan, the owner or operator shall comply with the default monitoring requirements under Subsection C of 29 20.2.50.116 NMAC within 15 days. 30 (2) An owner or operator may comply with a pre-approved monitoring plan maintained by 31 the department, subject to the following requirements: 32 (a) the owner or operator shall notify the department of the intent to conduct 33 monitoring under a pre-approved monitoring plan, and identify which pre-approved plan will be used, at least 15 34 days prior to conducting monitoring under that plan. 35 (b) the department may terminate the use of a pre-approved monitoring plan by the 36 owner or operator if the department finds that the owner or operator failed to comply with the provision of the plan 37 and failed to correct and disclose the violation to the department within 15 calendar days of identifying the violation. 38 (c) upon department denial or termination of an approved alternative monitoring 39 plan, the owner or operator shall comply with the default monitoring requirements under of Subsection C of 40 20.2.50.116.C NMAC within 15 days. 41 E. Repair requirements: For a leak detected pursuant to monitoring conducted under 20.2.50.116 42 NMAC: 43 (1) the owner or operator shall place a visible tag on the leaking component until the 44 component has been repaired; 45 (2) leaks shall be repaired within 15 days of discovery, except for leaks detected using OGI, 46 which shall be repaired within seven days of discovery; 47 (3) the equipment must be re-monitored no later than 15 days after discovery of the leak to 48 demonstrate that it has been repaired; and 49 (4) if the leak cannot be repaired within 15 days of discovery, or within seven days for a leak 50 detected using OGI, without a process unit shutdown, the leak may be designated “Repair delayed,” and must be 51 repaired before the end of the next process unit shutdown. 52 F. Recordkeeping requirements: 53 (1) The owner or operator shall keep a record of the following for all AVO, RM21, OGI, or 54 alternative equipment leak monitoring inspection conducted as required under 20.2.50.116 NMAC, and shall 55 provide the record to the department upon request: 56
CAA Ex. 1

JOINT PROPOSED AMENDMENTS TO PROPOSED 20.2.50 NMAC July 28, 2021
18
(a) facility location; 1 (b) date of inspection; 2 (c) monitoring method (e.g. AVO, RM 21, OGI, alternative method approved by the 3 department); 4 (d) name of the personnel performing the inspection; 5 (e) a description of any leak requiring repair or a note that no leak was found; and 6 (f) whether a visible flag was placed on the leak or not; 7 (2) The owner or operator shall keep the following record for any leak that is detected: 8 (a) the date the leak is detected; 9 (b) the date of attempt to repair; 10 (c) for a leak with a designation of “repair delayed” the following shall be recorded: 11 (i) reason for delay if a leak is not repaired within the required number of 12 days after discovery; 13 (ii) signature of the authorized representative who determined that the 14 repair could not be implemented without a process unit shutdown; 15 (d) date of successful leak repair; 16 (e) date the leak was monitored after repair and the results of the monitoring; and 17 (f) a description of the component that is designated as difficult, unsafe, or 18 inaccessible to monitor, an explanation stating why the component was so designated, and the schedule for repairing 19 and monitoring the component. 20 (3) For a leak detected using OGI, the owner or operator shall keep records of the 21 specifications, the daily instrument check, and the leak survey requirements specified at 40 CFR 60.18(i)(1)-(3). 22 (4) The owner or operator shall comply with the recordkeeping requirements in 20.2.50.112 23 NMAC. 24 G. Reporting requirements: 25 (1) The owner or operator shall certify the use of an alternative equipment leak monitoring 26 plan under Subsection D of 20.2.50.116 NMAC to the department annually, if used. 27 (2) The owner or operator shall comply with the reporting requirements in 20.2.50.112 28 NMAC. 29 [20.2.50.116 NMAC - N, XX/XX/2021] 30 31 20.2.50.117 NATURAL GAS WELL LIQUID UNLOADING: 32 A. Applicability: Liquid unloading operations including down-hole well maintenance events at 33 natural gas wells are subject to the requirements of 20.2.50.117 NMAC. 34 B. Emission standards: 35 (1) The owner or operator of a natural gas well shall use best management practices during 36 the life of the well to avoid the need for liquid unloading. 37 (2) The owner or operator of a natural gas well shall use the following best management 38 practices during liquid unloading to minimize emissions, consistent with well site conditions and good engineering 39 practices: 40 (a) reduce wellhead pressure before blowdown; 41 (b) monitor manual liquid unloading in close proximity to the well or via remote 42 telemetry; and 43 (c) close well head vents to the atmosphere and return the well to normal production 44 operation as soon as practicable. 45 (3) The owner or operator of a natural gas well shall use one of the following methods to 46 reduce emissions during an unloading event: 47 (a) installation and use of a plunger lift; 48 (b) installation and use of an artificial lift engine; or 49 (c) installation and use of a control device. 50 (4) The owner or operator of a natural gas well shall install an EMT on the natural gas well 51 in accordance with 20.2.50.112 NMAC. 52 C. Monitoring requirements: 53 (1) The owner or operator shall monitor the following parameters during liquid unloading: 54 (a) wellhead pressure; 55 (b) flow rate of the vented natural gas (to the extent feasible); and 56
CAA Ex. 1

JOINT PROPOSED AMENDMENTS TO PROPOSED 20.2.50 NMAC July 28, 2021
19
(c) duration of venting to the storage vessel or atmosphere. 1 (2) The owner or operator shall calculate the volume and mass of VOC vented during a 2 liquid unloading event. 3 (3) A liquid unloading event shall include the scanning of the EMT and monitoring data 4 entry in accordance with the requirements of 20.2.50.112 NMAC. 5 (4) The owner or operator shall comply with the monitoring requirements in 20.2.50.112 6 NMAC. 7 D. Recordkeeping requirements: 8 (1) The owner or operator shall keep the following records for liquid unloading: 9 (a) identification number and location of the well; 10 (b) date the liquid unloading was performed; 11 (c) wellhead pressure; 12 (d) flow rate of the vented natural gas (to the extent feasible. If not feasible, the 13 owner or operator shall use the maximum potential flow rate in the emission calculation); 14 (e) duration of venting to the storage vessel or atmosphere; 15 (f) a description of the management practice used to minimize release of VOC 16 emissions before and during the liquid unloading; 17 (g) the type of control device used to control VOC emissions during the liquid 18 unloading; and 19 (h) a calculation of the VOC emissions vented during the liquid unloading based on 20 the duration, volume, and mass of VOC. 21 (2) The owner or operator shall comply with the recordkeeping requirements in 20.2.50.112 22 NMAC. 23 E. Reporting requirements: The owner or operator shall comply with the reporting requirements in 24 20.2.50.112 NMAC. 25 [20.2.50.117 NMAC - N, XX/XX/2021] 26 27 20.2.50.118 GLYCOL DEHYDRATORS: 28 A. Applicability: Glycol dehydrators with a PTE equal to or greater than two tpy of VOC and 29 located at wellhead sites, tank batteries, gathering and boosting sites, natural gas processing plants, and transmission 30 compressor stations are subject to the requirements of 20.2.50.118 NMAC. 31 B. Emission standards: 32 (1) Existing glycol dehydrators with a PTE equal to or greater than two tpy of VOC shall 33 achieve a minimum combined capture and control efficiency of ninety-five percent of VOC emissions from the still 34 vent and flash tank no later than two years after the effective date. If a combustion control device is used, the 35 combustion control device shall have a minimum design combustion efficiency of ninety-eight percent. 36 (2) New glycol dehydrators with a PTE equal to or greater than two tpy of VOC shall 37 achieve a minimum combined capture and control efficiency of ninety-five percent of VOC emissions from the still 38 vent and flash tank upon startup. If a combustion control device is used, the combustion control device shall have a 39 minimum design combustion efficiency of ninety-eight percent. 40 (3) The owner or operator of a glycol dehydrator shall comply with the following 41 requirements: 42 (a) still vent and flash tank emissions shall be routed at all times to the reboiler 43 firebox, condenser, combustion control device, fuel cell, to a process point that either recycles or recompresses the 44 emissions or uses the emissions as fuel, or to a VRU that reinjects the VOC emissions back into the process stream 45 or natural gas gathering pipeline; 46 (b) if a VRU is used, it shall consist of a closed loop system of seals, ducts and a 47 compressor that reinjects the natural gas into the process or the natural gas pipeline. The VRU shall be operational at 48 least ninety-five percent of the time the facility is in operation, resulting in a minimum combined capture and control 49 efficiency of ninety-five percent. The VRU shall be installed, operated, and maintained according to the 50 manufacturer’s specifications; 51 (c) still vent and flash tank emissions shall not be vented to the atmosphere; and 52 (d) the owner or operator of a glycol dehydrator shall install an EMT on the glycol 53 dehydrator in accordance with 20.2.50.112 NMAC. 54 (4) an owner or operator complying with the requirements in Subsection B of 20.2.50.118 55 NMAC through use of a control device shall comply with the requirements in 20.2.50.115 NMAC. 56
CAA Ex. 1

JOINT PROPOSED AMENDMENTS TO PROPOSED 20.2.50 NMAC July 28, 2021
20
(5) The requirements of Subsection B of 20.2.50.118 NMAC cease to apply when the 1 uncontrolled actual annual VOC emissions from a new or existing glycol dehydrator are less than two tpy VOC. 2 C. Monitoring requirements: 3 (1) The owner or operator of a glycol dehydrator shall conduct an annual extended gas 4 analysis on the dehydrator inlet gas and calculate the uncontrolled and controlled VOC emissions in tpy. 5 (2) The owner or operator of a glycol dehydrator shall inspect the glycol dehydrator, 6 including the reboiler and regenerator, and the control device or process the emissions are being routed, semi-7 annually to ensure it is operating as initially designed and in accordance with the manufacturer recommended 8 operation and maintenance schedule. 9 (3) An owner or operator complying with the requirements in Subsection B of 20.2.50.118 10 NMAC through the use of a control device shall comply with the monitoring requirements in 20.2.50.115 NMAC. 11 (4) Owners and operators shall comply with the monitoring requirements in 20.2.50.112 12 NMAC. 13 D. Recordkeeping requirements: 14 (1) The owner or operator of a glycol dehydrator shall maintain a record of the following: 15 (a) dehydrator location and identification number; 16 (b) glycol circulation rate, monthly natural gas throughput, and the date of the most 17 recent throughput measurement; 18 (c) data and methodology used to estimate the PTE of VOC (must be a department 19 approved calculation methodology); 20 (d) amount of controlled and uncontrolled VOC emissions in tpy; 21 (e) type, make, model, and identification number of the control device or process 22 the emissions are being routed; 23 (f) date and results of any equipment inspection, including maintenance or repair 24 activities required to bring the glycol dehydrator into compliance; and 25 (g) a copy of the glycol dehydrator manufacturer operation and maintenance 26 recommendations. 27 (2) An owner or operator complying with the requirements in Paragraph (1) or (2) of 28 Subsection B of 20.2.50.118 NMAC through use of a control device as defined in this Part shall comply with the 29 recordkeeping requirements in 20.2.50.115 NMAC. 30 (3) The owner or operator shall comply with the recordkeeping requirements in 20.2.50.112 31 NMAC. 32 E. Reporting requirements: The owner or operator shall comply with the reporting requirements in 33 20.2.50.112 NMAC. 34 [20.2.50.118 NMAC - N, XX/XX/2021] 35 36 20.2.50.119 HEATERS: 37 A. Applicability: Natural gas-fired heaters with a rated heat input equal to or greater than 10 38 MMBtu/hour including heater treaters, heated flash separators, evaporator units, fractionation column heaters, and 39 glycol dehydrator reboilers in use at wellhead sites, tank batteries, gathering and boosting sites, natural gas 40 processing plants, and transmission compressor stations are subject to the requirements of 20.2.50.119 NMAC. 41 B. Emission standards: 42 (1) Natural gas-fired heaters shall comply with the emission limits in table 1 of 20.2.50.119 43 NMAC. 44 45 Table 1 - EMISSION STANDARDS FOR NOx AND CO 46
Date of Construction: NOx (ppmvd @ 3% O2)
CO (ppmvd @ 3% O2)
Constructed or reconstructed before the effective date of 20.2.50 NMAC 30 300
Constructed or reconstructed on or after the effective date of 20.2.50 NMAC 30 130
47 (2) Existing natural gas-fired heaters shall comply with the requirements of 20.2.50.119 48 NMAC no later than one year after the effective date of this Part. 49 (3) New natural gas-fired heaters shall comply with the requirements of 20.2.50.119 NMAC 50
CAA Ex. 1

JOINT PROPOSED AMENDMENTS TO PROPOSED 20.2.50 NMAC July 28, 2021
21
upon startup. 1 (4) The owner or operator of a natural gas-fired heater shall install an EMT on the heater in 2 accordance with 20.2.50.112 NMAC. 3 C. Monitoring requirements: 4 (1) The owner or operator shall: 5 (a) conduct emission testing for NOx and CO within 180 days of the compliance 6 date specified in Paragraph (2) or (3) of Subsection B of 20.2.50.119 NMAC and at least every two years thereafter. 7 (b) inspect, maintain, and repair the heater in accordance with the manufacturer 8 specifications at least once every two years following the applicable compliance date specified in 20.2.50.119 9 NMAC. The inspection, maintenance, and repair shall include the following: 10 (i) inspecting the burner and cleaning or replacing components of the 11 burner as necessary; 12 (ii) inspecting the flame pattern and adjusting the burner as necessary to 13 optimize the flame pattern consistent with the manufacturer specifications and good engineering practices; 14 (iii) inspecting the AFR controller and ensuring it is calibrated and 15 functioning properly; 16 (iv) optimizing total emissions of CO consistent with the NOx requirement, 17 manufacturer specifications, and good combustion engineering practices; and 18 (v) measuring the concentrations in the effluent stream of CO in ppmvd 19 and O2 in volume percent before and after adjustments are made in accordance with Subparagraph (c) of Paragraph 20 (2) of Subsection C of 20.2.50.119 NMAC. 21 (2) The owner or operator shall comply with the following periodic testing requirements: 22 (a) conduct three test runs of at least 20-minutes duration within ten percent of one-23 hundred percent peak, or the highest achievable, load; 24 (b) determine NOX and CO emissions and O2 concentrations in the exhaust with a 25 portable analyzer used and maintained in accordance with the manufacturer specifications and following the 26 procedures specified in the current version of ASTM D6522; 27 (c) if the measured NOX or CO emissions concentrations are exceeding the 28 emissions limits of table 1 of 20.2.50.119 NMAC, the owner or operator shall repeat the inspection and tune-up in 29 Subparagraph (b) of Paragraph (1) of Subsection C of 20.2.50.119 NMAC within 30 days of the periodic testing; 30 and 31 (d) if at any time the heater is operated in excess of the highest achievable load plus 32 ten percent, the owner or operator shall perform the testing specified in Subparagraph (a) of Paragraph (2) of 33 Subsection C of 20.2.50.119 NMAC within 60 days from the anomalous operation. 34 (3) When conducting periodic testing of a heater, the owner or operator shall follow the 35 procedures in Paragraph (2) of Subsection C of 20.2.50.119 NMAC. An owner or operator may deviate from those 36 procedures by submitting a written request to use an alternative procedure to the department at least 60 days before 37 performing the periodic testing. In the alternative procedure request, the owner or operator must demonstrate the 38 alternative procedure’s equivalence to the standard procedure. The owner or operator must receive written approval 39 from the department prior to conducting the periodic testing using an alternative procedure. 40 (4) Prior to a monitoring, inspection, maintenance, or repair event, the owner or operator 41 shall scan the EMT and the required monitoring data shall be captured in accordance with this Part. 42 D. Recordkeeping requirements: The owner or operator shall maintain a record of the following: 43 (1) location of the heater; 44 (2) summary of the complete test report and the results of periodic testing; and 45 (3) inspections, testing, maintenance, and repairs, which shall include at a minimum: 46 (a) the date the inspection, testing, maintenance, or repair was conducted; 47 (b) name of the personnel conducting the inspection, testing, maintenance, or repair; 48 (c) concentrations in the effluent stream of CO in ppmv and O2 in volume percent; 49 and 50 (d) the results of the inspections and any the corrective action taken. 51 E. Reporting requirements: The owner or operator shall comply with the reporting requirements in 52 20.2.50.112 NMAC. 53 [20.2.50.119 NMAC - N, XX/XX/2021] 54 55 20.2.50.120 HYDROCARBON LIQUID TRANSFERS: 56
CAA Ex. 1

JOINT PROPOSED AMENDMENTS TO PROPOSED 20.2.50 NMAC July 28, 2021
22
A. Applicability: Hydrocarbon liquid transfers located at wellhead sites, tank batteries, gathering 1 and boosting sites, natural gas processing plants, or transmission compressor stations are subject to the requirements 2 of 20.2.50.120 NMAC beginning one year from the effective date of this Part. 3 B. Emission standards: 4 (1) The owner or operator of a hydrocarbon liquid transfer operation shall use vapor balance, 5 vapor recovery, or a control device to control VOC emissions by at least ninety-eight percent when transferring 6 liquid from a storage vessel to a transfer vessel, or when transferring liquid from a transfer vessel to a storage vessel. 7 (2) An owner or operator using vapor balance during a liquid transfer operation shall: 8 (a) transfer the vapor displaced from the vessel being loaded back to the vessel 9 being emptied via a pipe or hose connected before the start of the transfer operation; 10 (b) ensure that the transfer does not begin until the vapor collection and return 11 system is properly connected; 12 (c) ensure that connector pipes, hoses, couplers, valves, and pressure relief devices 13 are maintained in a leak-free condition; 14 (d) check the liquid and vapor line connections for proper connections before 15 commencing the transfer operation; and 16 (e) operate transfer equipment at a pressure that is less than the pressure relief valve 17 setting of the receiving transport vehicle or storage vessel. 18 (3) Bottom loading or submerged filling shall be used for the liquid transfer. 19 (4) Connector pipes and couplers shall be maintained in a leak-free condition. 20 (5) Connections of hoses and pipes used during liquid transfer operations shall be supported 21 on drip trays that collect any leaks, and the materials collected shall be returned to the process or disposed of in a 22 manner compliant with state law. 23 (6) Liquid leaks that occur shall be cleaned and disposed of in a manner that prevents 24 emissions to the atmosphere, and the material collected shall be returned to the process or disposed of in a manner 25 compliant with state law. 26 (7) An owner or operator complying with Paragraph (1) of Subsection B of 20.2.50.120 27 NMAC through use of a control device shall comply with the control device requirements in 20.2.50.115 NMAC. 28 C. Monitoring requirements: 29 (1) The owner or operator shall visually inspect the transfer equipment during a transfer 30 operation to ensure that liquid transfer lines, hoses, couplings, valves, and pipes are not dripping or leaking. 31 Leaking components shall be repaired to prevent dripping or leaking before the next transfer operation. 32 (2) The owner or operator of a liquid transfer operation controlled by a control device must 33 follow manufacturer recommended operation and maintenance procedures for the device. 34 (3) Tanker trucks and tanker rail cars used in liquid transfer service shall be tested annually 35 for vapor tightness in accordance with the following test methods and vapor tightness standards: 36 (a) method 27 of appendix A of 40 CFR Part 60. Conduct the test using a time 37 period (t) for the pressure and vacuum tests of five minutes. The initial pressure (Pi) for the pressure test shall be 38 460 mm H2O (18 inches H2O), gauge. The initial vacuum (Vi) for the vacuum test shall be 150 mm H2O (six inches 39 H2O) gauge. The maximum allowable pressure and vacuum changes (Δp, Δv) are shown in table 1 of 20.2.50.120 40 NMAC. 41 42 Table 1 - ALLOWABLE CARGO TANK TEST PRESSURE OR VACUUM CHANGE 43
Cargo tank or compartment capacity, liters (gallons)
Allowable vacuum change (Δv) in five minutes, mm H2O (inches H2O)
Allowable pressure change (Δp) in five minutes, mm H2O (inches H2O)
< 3,785 (< 1,000) 64 (2.5) 102 (4.0) 3,785 < 5,678 (1,000 < 1,500) 51 (2.0) 89 (3.5) 5,678 < 9,464 (1,500 < 2,500) 38 (1.5) 76 (3.0) > 9,464 (> 2,500) 25 (1.0) 64 (2.5)
44 (b) pressure test the tanker truck or tanker railcar tank’s internal vapor valve as 45 follows: 46 (i) after completing the tests under Subparagraph (a) of Paragraph (3) of 47 Subsection C of 20.2.50.120 NMAC, use the procedures in method 27 to re-pressurize the tank to 460 mm H2O (18 48 inches H2O) gauge. Close the tank’s internal vapor valve, thereby isolating the vapor return line and manifold from 49 the tank. 50
CAA Ex. 1

JOINT PROPOSED AMENDMENTS TO PROPOSED 20.2.50 NMAC July 28, 2021
23
(ii) relieve the pressure in the vapor return line to atmospheric pressure, 1 then reseal the line. After five minutes, record the gauge pressure in the vapor return line and manifold. The 2 maximum allowable five-minute pressure increase is 130 mm H2O (five inches H2O). 3 (4) Owners and operators complying with Paragraph (1) of Subsection B of 20.2.50.120 4 NMAC through use of a control device shall comply with the monitoring requirements in 20.2.50.115 NMAC. 5 (5) Owners and operators shall comply with the monitoring requirements in 20.2.50.112 6 NMAC. 7 D. Recordkeeping requirements: 8 (1) The owner or operator shall maintain a record of the location of the storage vessel and if 9 using a control device, the type, make, and model of the control device: 10 (2) The owner or operator shall maintain a record of the inspections and testing required in 11 Subsection C of 20.2.50.120 NMAC and shall include the following: 12 (a) the time and date of the inspection and testing; 13 (b) the name of the personnel conducting the inspection and testing; 14 (c) a description of any problem observed during the inspection and testing; and 15 (d) the results of the inspection and testing and a description of any repair or 16 corrective action taken. 17 (3) The owner or operator shall maintain a record for each site of the annual total 18 hydrocarbon liquid transferred and annual total VOC emissions. Each calendar year, the owner or operator shall 19 create a company-wide record summarizing the annual total hydrocarbon liquid transferred and the annual total 20 calculated VOC emissions. 21 (4) The owner or operator shall comply with the recordkeeping requirements in 20.2.50.112 22 NMAC. 23 E. Reporting requirements: The owner or operator shall comply with the reporting requirements in 24 20.2.50.112 NMAC. 25 [20.2.50.120 NMAC - N, XX/XX/2021] 26 27 20.2.50.121 PIG LAUNCHING AND RECEIVING: 28 A. Applicability: Pipeline pig launching and receiving operations located within or outside of the 29 property boundary of wellhead sites, tank batteries, gathering and boosting sites, natural gas processing plants, and 30 transmission compressor stations are subject to the requirements of 20.2.50.121 NMAC. 31 B. Emission standards: 32 (1) Owners and operators of pipeline pig launching and receiving operations with a PTE 33 equal to or greater than one tpy of VOC shall capture and reduce VOC emissions by at least ninety-eight percent, 34 beginning on the effective date of this Part. 35 (2) The owner or operator conducting the pig launching and receiving operation shall: 36 (a) employ best management practices to minimize the liquid present in the pig 37 receiver chamber and to prevent emissions from the pig receiver chamber to the atmosphere after receiving the pig 38 in the receiving chamber and before opening the receiving chamber to the atmosphere; 39 (b) employ a method to prevent emissions, such as installing a liquid ramp or drain, 40 routing a high-pressure chamber to a low-pressure line or vessel, using a ball valve type chamber, or using multiple 41 pig chambers; 42 (c) recover and dispose of receiver liquid in a manner that prevents emissions to the 43 atmosphere; and 44 (d) ensure that the material collected is returned to the process or disposed of in a 45 manner compliant with state law. 46 (3) The emission standards in Paragraphs (1) and (2) of Subsection B of 20.2.50.121 NMAC 47 cease to apply to a pipeline pig launching and receiving operation if the uncontrolled actual annual VOC emissions 48 of the operation are less than one half ton per year of VOC. 49 (4) An owner or operator complying with Paragraph (2) of Subsection B of 20.2.50.121 50 NMAC through use of a control device shall comply with the control device requirements in 20.2.50.115 NMAC. 51 C. Monitoring requirements: 52 (1) The owner or operator of pig launching and receiving operations shall monitor the type 53 and volume of liquid cleared. 54 (2) The owner or operator of pig launching and receiving operations shall inspect the 55 equipment for a leak using RM 21 or OGI immediately before the commencement and immediately after the 56
CAA Ex. 1

JOINT PROPOSED AMENDMENTS TO PROPOSED 20.2.50 NMAC July 28, 2021
24
conclusion of the pig launching or receiving operation, and according to the requirements in 20.2.50.116 NMAC. 1 (3) An owner or operator complying with Paragraph (1) of Subsection B of 20.2.50.121 2 NMAC through use of a control device shall comply with the monitoring requirements in 20.2.50.115 NMAC. 3 (4) The owner or operator shall comply with the monitoring requirements in 20.2.50.112 4 NMAC. 5 D. Recordkeeping requirements: 6 (1) The owner or operator of pig launching and receiving operations shall maintain a record 7 of the following: 8 (a) the pigging operation, including the date and time of the pigging operation and 9 the type and volume of liquid cleared; 10 (b) the data and methodology used to estimate the actual emissions to the 11 atmosphere and used to estimate the PTE; and 12 (c) the type of control device and its location, make, and model. 13 (2) The owner or operator shall comply with the recordkeeping requirements in 20.2.50.112 14 NMAC. 15 E. Reporting requirements: The owner or operator shall comply with the reporting requirements in 16 20.2.50.112 NMAC. 17 [20.2.50.121 NMAC - N, XX/XX/2021] 18 19 20.2.50.122 PNEUMATIC CONTROLLERS AND PUMPS: 20 A. Applicability: Natural gas-driven pneumatic controllers and pumps located at wellhead sites, 21 tank batteries, gathering and boosting sites, natural gas processing plants, and transmission compressor stations are 22 subject to the requirements of 20.2.50.122 NMAC. 23 B. Emission standards: 24 (1) A new natural gas-driven pneumatic controller or pump shall comply with the 25 requirements of 20.2.50.122 NMAC upon startup. 26 (2) An existing natural gas-driven pneumatic pump shall comply with the requirements of 27 20.2.50.122 NMAC within three years of the effective date of this Part. 28 (3) An existing natural gas-driven pneumatic controller at a site with access to commercial line 29 electrical power, and any existing natural-gas driven pneumatic controller at a transmission compressor station or a 30 natural gas processing plant, shall comply with this Section within six months of the effective date of this Part. 31 (4) At sites that do not have access to commercial line electrical power, owners and operators 32 shall retrofit their fleet of existing natural gas-driven pneumatic controllers according to the following schedule:shall 33 comply with the requirements of 20.2.50.122 NMAC according to the following schedule: 34 35 TABLE 1. REQUIREMENTS FOR EXISTING NATURAL GAS-DRIVEN PNEUMATIC CONTROLLERS 36
Total Historic Percentage of Non-Emitting Controllers
Additional Percentage Required by May 1, 2023
Maximum Percentage Required by May 1, 2023
Additional Percentage Required by May 1, 2025
Maximum Percentage Required by May 1, 2025
> 75 % +15% 97% +5% 98% > 60-75% +20% 90% +10% 98% > 40-60 % +25% 75% +20% 95% > 20-40 % +35% 65% +25% 90% 0-20 % +40% 55% +35% 90%
37 38 Table 1 – WELLHEAD SITES, TANK BATTERIES, GATHERING AND BOOSTING FACILITIES 39
Total Historic Percentage of Non-Emitting Controllers
Total Required Percentage of Non-Emitting Controllers by January 1, 2024
Total Required Percentage of Non-Emitting Controllers by January 1, 2027
Total Required Percentage of Non-Emitting Controllers by January 1, 2030
CAA Ex. 1

JOINT PROPOSED AMENDMENTS TO PROPOSED 20.2.50 NMAC July 28, 2021
25
> 75 % 80% 85% 90% > 60-75 % 80% 85% 90% > 40-60 % 65% 70% 80% > 20-40 % 45% 70% 80%
0-20 % 25% 65% 80% 1 Table 2 – NATURAL GAS COMPRESSOR STATIONS AND GAS PROCESSING PLANTS 2
Total Historic Percentage of Non-Emitting Controllers
Total Required Percentage of Non-Emitting Controllers by January 1, 2024
Total Required Percentage of Non-Emitting Controllers by January 1, 2027
Total Required Percentage of Non-Emitting Controllers by January 1, 2030
> 75 % 80% 95% 98% > 60-75 % 80% 95% 98% > 40-60 % 65% 95% 98% > 20-40 % 50% 95% 98%
0-20 % 35% 95% 98% 3 (45) Standards for natural gas-driven pneumatic controllers. 4 (a) new pneumatic controllers shall have an emission rate of zero. 5 (b) existing pneumatic controllers at sites with access to commercial line electrical 6 power, and any existing pneumatic controller at a transmission compressor station or a natural gas processing plant, 7 shall have an emission rate of zero. 8 (c) At sites without access to commercial line electrical power, existing pneumatic 9 controllers shall meet the required percentage of non-emitting controllers within the deadlines in tables 1 and 2 of 10 Paragraph (34) of Subsection B of 20.2.50.122 NMAC, and shall comply with the following: 11 (i) by January 1, 2023, the owner or operator shall determine the total 12 controller count for all controllers at all of the owner or operator’s affected facilities that commenced construction 13 before the effective date of this Part. The total controller count must include all emitting pneumatic controllers and 14 all non-emitting pneumatic controllers, except that pneumatic controllers that are permitted under Subparagraph (d) 15 of Paragraph (4) of Subsection B of 20.2.50.122 NMAC,necessary for a safety or process purpose that cannot 16 otherwise be met without emitting natural gas shall not be included in the total controller count. 17 (ii) determine which controllers in the total controller count are non-18 emitting and sum the total number of non-emitting controllers and designate those as total historic non-emitting 19 controllers. 20 (iii) determine the total historic non-emitting percent of controllers by 21 dividing the total historic non-emitting controller count by the total controller count and multiplying by 100. 22 (iv) based on the percent calculated in (iii) above, the owner or operator 23 shall determine which provisions of tables 1 and 2 of Paragraph (34) of Subsection B of 20.2.50.122 NMAC apply 24 and the replacement schedule the owner or operator must meet. 25 (v) if an owner or operator meets at least seventy-five percent total non-26 emitting controllers by January 1, 2025, the owner or operator has satisfied the requirements of tables 1 and 2 of 27 Paragraph (3) of Subsection B of 20.2.50.122 NMAC. 28 (vi) if after January 1, 2027, an owner or operator’s remaining pneumatic 29 controllers are not cost-effective to retrofit, the owner or operator shall submit a cost analysis of retrofitting those 30 remaining units to the department. The department shall review the cost analysis and determine whether those units 31 qualify for a waiver from meeting additional retrofit requirements. 32 (d) a pneumatic controller with a bleed rate greater than six standard cubic feet per 33 hourzero is permitted when the owner or operator has demonstrated that a higher bleed rate is required based on 34 functional needs, including response time, safety, and positive actuation. An owner or operator that seeks to 35 maintain operation of an emitting pneumatic controller must prepare and document the justification for the safety or 36 process purposes prior to the installation of a new emitting controller or the retrofit of an existing controller. The 37 justification shall be certified by a qualified professional engineer. 38 (56) Standards for natural gas-driven pneumatic pumps. 39 (a) pneumatic pumps located at a natural gas processing plants shall have an 40 emission rate of zero. 41
CAA Ex. 1

JOINT PROPOSED AMENDMENTS TO PROPOSED 20.2.50 NMAC July 28, 2021
26
(b) pneumatic pumps located at a wellhead sites, tank batteries, gathering and 1 boosting sites, or transmission compressor stations with access to commercial line electrical power shall have an 2 emission rate of zero. 3 (c) owners and operators of pneumatic pumps located at wellhead sites, tank 4 batteries, gathering and boosting sites, or transmission compressor stations without access to commercial line 5 electrical power shall reduce VOC emissions from the pneumatic pumps by ninety-five percent if it is technically 6 feasible to route emissions to a control device, fuel cell, or process. If there is a control device available onsite but it 7 is unable to achieve a ninety-five percent emission reduction, and it is not technically feasible to route the pneumatic 8 pump emissions to a fuel cell or process, the owner or operator shall route the pneumatic pump emissions to the 9 control device. 10 (6) The owner or operator of a pneumatic controller or pump shall install an EMT on the 11 controller or pump in accordance with 20.2.50.112 NMAC. 12 C. Monitoring requirements: 13 (1) Pneumatic controllers or pumps with a natural gas bleed rate equal to zero are not subject 14 to the monitoring requirements in Subsection C of 20.2.5.122 NMAC. 15 (2) The owner or operator of a pneumatic controller subject to the deadlines set forth in 16 tables 1 and 2 of Paragraph (34) of Subsection B of 20.2.50.122 NMAC shall monitor the compliance status of each 17 subject controller at each facility. 18 (3) The owner or operator of a pneumatic controller with a bleed rate greater than zero shall, 19 on a monthly basis, scan the controller and conduct an AVO inspection, and shall also inspect the pneumatic 20 controller, perform necessary maintenance (such as cleaning, tuning, and repairing a leaking gasket, tubing fitting 21 and seal; tuning to operate over a broader range of proportional band; eliminating an unnecessary valve positioner), 22 and maintain the pneumatic controller according to manufacturer specifications to ensure that the VOC emissions 23 are minimized. 24 (4) The owner or operator of a pneumatic controller with a bleed rate greater than zero shall 25 comply with the requirements in Paragraph (3) of Subsection C or Subsection D of 20.2.50.116 NMAC. During 26 instrumental inspections, operators shall use Method 21, OGI, or alternative instruments used under Subsection D of 27 20.2.50.116 to verify that intermittent controllers are not emitting when not actuating. Any intermittent controller 28 emitting when not actuating shall be repaired consistent with Subsection E of 20.2.50.116 NMAC. 29 (5) The EMT shall be linked to a database that contains the following: 30 (a) pneumatic controller identification number; 31 (b) type of controller (continuous or intermittent); 32 (c) if continuous, design continuous bleed rate in standard cubic feet per hour; 33 (d) if intermittent, bleed volume per intermittent bleed in standard cubic feet; and 34 (e) design annual bleed in standard cubic feet per year. 35 (56) The owner or operator of a pneumatic pump with a bleed rate greater than zero shall, on a 36 monthly basis, scan the pump and conduct an AVO inspection and shall also inspect the pneumatic pump and 37 perform necessary maintenance, and maintain the pneumatic pump according to manufacturer specifications to 38 ensure that the VOC emissions are minimized. 39 (67) The owner or operator shall comply with the monitoring requirements in 20.2.50.112 40 NMAC. 41 D. Recordkeeping requirements: 42 (1) Pneumatic controllers and pumps with a natural gas bleed rate equal to zero are not 43 subject to the recordkeeping requirements in Subsection D of 20.2.5.122 NMAC. 44 (2) The owner or operator shall maintain a record of the total controller count for all 45 controllers at all of the owner’s or operator’s affected facilities that commenced operation before the effective date 46 of this Part. The total controller count must include all emitting and non-emitting pneumatic controllers. 47 (3) The owner or operator shall maintain a record of the total count of pneumatic controllers 48 necessary for a safety or process purpose that cannot otherwise be met without emitting VOC. 49 (4) The owner or operator of a pneumatic controller subject to the requirements in tables 1 50 and 2 of Paragraph (34) of shall generate a schedule for meeting the compliance deadlines for each pneumatic 51 controller. The owner or operator shall keep a record of the compliance status of each subject controller. 52 (5) The owner or operator shall maintain an electronic record for each pneumatic controller 53 with a natural gas bleed rate greater than zero. The record shall include the following: 54 (a) pneumatic controller identification number; 55 (b) inspection dates; 56
CAA Ex. 1

JOINT PROPOSED AMENDMENTS TO PROPOSED 20.2.50 NMAC July 28, 2021
27
(c) name of the personnel conducting the inspection; 1 (d) AVO inspection result; 2 (e) AVO level discrepancy in continuous or intermittent bleed rate; 3 (f) maintenance date and maintenance activity; and 4 (g) a record of the justification and certification required in Subparagraph (d) of 5 Paragraph (4) of Subsection B of 20.2.50.122 NMAC. 6 (6) The owner or operator of a natural gas-driven pneumatic controller with a bleed rate 7 greater than six standard cubic feet per hourzero shall maintain a record in the EMT database of the pneumatic 8 controller documenting why a bleed rate greater than six scf/hrzero is necessary, as required in Subsection B of 9 20.2.50.122 NMAC. 10 (7) The owner or operator shall maintain a record in the EMT database for a natural gas-11 driven pneumatic pump with an emission rate greater than zero and the associated pump number at the facility. The 12 record shall include: 13 (a) for a natural gas-driven pneumatic pump in operation less than 90 days per 14 calendar year, a record for each day of operation during the calendar year. 15 (b) a record of any control device designed to achieve at least a ninety-five percent 16 emission reduction, including an evaluation or manufacturer specifications indicating the percentage reduction the 17 control device is designed to achieve. 18 (c) records of the engineering assessment and certification by a qualified 19 professional engineer that routing pneumatic pump emissions to a control device, fuel cell, or process is technically 20 infeasible. 21 (8) The owner or operator shall comply with the recordkeeping requirements in 20.2.50.112 22 NMAC. 23 (9) The owner or operator of a pneumatic controller with a bleed rate greater than zero shall 24 comply with the requirements in Subsection F of 20.2.50.116 NMAC. 25 E. Reporting requirements: The owner or operator shall comply with the reporting requirements in 26 20.2.50.112 NMAC. 27 [20.2.50.122 NMAC - N, XX/XX/2021] 28 29 20.2.50.123 STORAGE VESSELS 30 A. Applicability: Storage vessels with an uncontrolled PTE equal to or greater than two tpy of VOC 31 and located at wellhead sites, tank batteries, gathering and boosting sites, natural gas processing plants, or 32 transmission compressor stations are subject to the requirements of 20.2.50.123 NMAC. 33 B. Emission standards: 34 (1) An existing storage vessel with a PTE equal to or greater than two tpy and less than 10 35 tpy of VOC shall have a combined capture and control of VOC emissions of at least ninety-five percent no later than 36 three years after the effective date of this Part. 37 (2) An existing storage vessel with a PTE equal to or greater than 10 tpy of VOC shall have a 38 combined capture and control of VOC emissions of at least ninety-eight percent no later than one year after the 39 effective date of this Part. 40 (3) A new storage vessel with a PTE equal to or greater than two tpy and less than 10 tpy of 41 VOC shall have a combined capture and control of VOC emissions of at least ninety-five percent upon startup. 42 (4) A new storage vessel with a PTE equal to or greater than 10 tpy of VOC shall have a 43 combined capture and control of VOC emissions of at least ninety-eight percent upon startup. 44 (5) The emission standards in Subsection B of 20.2.50.123 NMAC cease to apply to a 45 storage vessel if the uncontrolled actual annual VOC emissions decrease to less than two tpy. 46 (6) If a control device is not installed by the date specified in Paragraphs (1) through (4) of 47 Subsection B of 20.2.50.123 NMAC, an owner or operator may comply with Subsection B of 20.2.50.123 NMAC 48 by shutting in the well supplying the storage vessel by the applicable date, and not resuming production from the 49 well until the control device is installed and operational. 50 (7) The owner or operator of a new or existing storage vessel with a thief hatch shall install a 51 control device that allows the thief hatch to open sufficiently to relieve overpressure in the vessel and to 52 automatically close once the vessel overpressure is relieved. The thief hatch shall be equipped with a manual lock-53 open safety device to ensure positive hatch opening during times of human ingress. The lock-open safety device 54 shall only be engaged when an owner or operator are present and during an active ingress activity. 55 (8) The owner or operator of a new or existing storage vessel shall install an EMT on the 56
CAA Ex. 1

JOINT PROPOSED AMENDMENTS TO PROPOSED 20.2.50 NMAC July 28, 2021
28
storage vessel in accordance with 20.2.50.112 NMAC. 1 (9) An owner or operator complying with Paragraphs (1) through (4) of Subsection B of 2 20.2.50.123 NMAC through use of a control device shall comply with the control device operational requirements in 3 20.2.50.115 NMAC. 4
C. Storage Vessel Measurement Requirements 5 (1) The owners and operators of controlled storage tanks at well production facilities, natural 6 gas compressor stations, or natural gas processing plants constructed on or after the effective date of this Part, and at 7 any facilities that are modified on or after the effective date of this Part such that an additional controlled storage 8 vessel is constructed to receive an anticipated increase in throughput of hydrocarbon liquids or produced water, must 9 use a storage vessel measurement system to determine the quantity of liquids in the storage tank(s). 10
(2) Owners and operators subject to the storage vessel measurement system requirements in 11 this Subsection must keep thief hatches (or other access points to the tank) and pressure relief devices on storage 12 tanks closed and latched during activities to determine the quality and/or quantity of liquids in the storage vessel(s). 13
(3) Operators may inspect, test, and calibrate the storage vessel measurement system semi-14 annually, or as directed by the Bureau of Land Management (see 43 CFR Section 3174.6(b)(5)(ii)(B) (November 17, 15 2016)) or system manufacturer. Opening the thief hatch if required to inspect, test, or calibrate the system is not a 16 violation of Paragraph (1) of this Subsection. 17
(4) The owner or operator must install signage at or near the storage vessel that indicates 18 which equipment and method(s) are used and the appropriate and necessary operating procedures for that system. 19
(5) The owner or operator must develop and implement an annual training program for 20 employees and third parties conducting activities subject to this Subsection that includes, at a minimum, operating 21 procedures for each type of system. 22
(6) Owner or operators must retain records for at least two (2) years and make such records 23 available to the department upon request, including: 24 (a) Date of construction of the storage vessel or facility; 25 (b) Description of the storage vessel measurement system used to comply with this 26 Subsection; 27 (c) Date(s) of storage vessel measurement system inspections, testing, and 28 calibrations pursuant to Paragraph (3) of this Subsection; 29 (d) Manufacturer specifications regarding storage vessel measurement system 30 inspections, and/or calibrations, if followed pursuant to Paragraph (3) of this Subsection; and 31 (e) Records of the annual training program, including the date and names of persons 32 trained. 33
DC. Monitoring requirements: The owner or operator of a storage vessel shall: 34 (1) monitor on a monthly basis the total monthly liquid throughput (in barrels) and the 35 upstream separator pressure (in psig). When a storage vessel is unloaded less frequently than monthly, the 36 throughput and separator pressure monitoring shall be conducted before the storage vessel is unloaded; 37 (2) conduct an AVO inspection on a weekly basis. If the storage vessel is unloaded less 38 frequently than weekly, the AVO inspection shall be conducted before the storage vessel is unloaded; 39 (3) inspect the vessel monthly to ensure compliance with the requirements of 20.2.50.123 40 NMAC. The inspection shall include a check to ensure the vessel does not have a leak; 41 (4) scan the EMT and enter the required monitoring data in accordance with the requirements 42 of 20.2.50.112 NMAC; 43 (5) comply with the monitoring requirements in 20.2.50.115 NMAC if using a control device 44 to comply with the requirements in Paragraphs (1) through (4) of Subsection B of 20.2.50.123 NMAC; and 45 (6) comply with the monitoring requirements in 20.2.50.112 NMAC. 46 ED. Recordkeeping requirements: 47 (1) The owner or operator shall, on a monthly basis, maintain a record in accordance with 48 20.2.50.112 NMAC for a storage vessel. The record shall include: 49 (a) the vessel location and identification number; 50 (b) monthly liquid throughput and the most recent date of measurement; 51 (c) the average monthly upstream separator pressure; 52 (d) the data and methodology used to calculate the PTE of VOC (the calculation 53 methodology shall be department approved); 54 (e) the controlled and uncontrolled VOC emissions (tpy); and 55 (f) the type, make, model, and identification number of any control device. 56
CAA Ex. 1

JOINT PROPOSED AMENDMENTS TO PROPOSED 20.2.50 NMAC July 28, 2021
29
(2) A record of liquid throughput in shall be verified by a dated delivery receipt from the 1 purchaser of the hydrocarbon liquid, the metered volume of hydrocarbon liquid sent downstream, or other proof of 2 transfer. 3 (3) A record of the inspection required in Subsection C of 20.2.50.123 NMAC shall include: 4 (a) the time and date of the inspection; 5 (b) the personnel conducting the inspection; 6 (c) a notation that the required leak check was completed; 7 (d) a description of any problem observed during the inspection; and 8 (e) a description and date of any corrective action taken. 9 (4) An owner or operator complying with the requirements in Paragraphs (1) through (4) of 10 Subsection B of 20.2.50.123 NMAC through use of a control device shall comply with the recordkeeping 11 requirements in 20.2.50.115 NMAC. 12 (5) The owner or operator shall comply with the recordkeeping requirements in 20.2.50.112 13 NMAC. 14 FE. Reporting requirements: 15 (1) An owner or operator complying with the requirements in Paragraphs (1) through (4) of 16 Subsection B of 20.2.50.123 NMAC through use of a control device shall comply with the reporting requirements in 17 20.2.50.15 NMAC. 18 (2) The owner or operator shall comply with the reporting requirements in 20.2.50.112 19 NMAC. 20 [20.2.50.123 NMAC - N, XX/XX/2021] 21 22 20.2.50.124 WELL WORKOVERS 23 A. Applicability: Workovers performed at oil and natural gas wells are subject to the requirements 24 of 20.2.50.124 NMAC as of the effective date of this Part. 25 B. Emission standards: The owner or operator of an oil or natural gas well shall use the following 26 best management practices during a workover to minimize emissions, consistent with the well site condition and 27 good engineering practices: 28 (1) reduce wellhead pressure before blowdown to minimize the volume of natural gas 29 vented; 30 (2) monitor manual venting at the well until the venting is complete; and 31 (3) route natural gas to the sales line, if possible. 32 C. Monitoring requirements: 33 (1) The owner or operator shall monitor the following parameters during a workover: 34 (a) wellhead pressure; 35 (b) flow rate of the vented natural gas (to the extent feasible); and 36 (c) duration of venting to the atmosphere. 37 (2) The owner or operator shall calculate the volume and mass of VOC vented during a 38 workover. 39 (3) The owner or operator shall comply with the monitoring requirements in 20.2.50.112 40 NMAC. 41 D. Recordkeeping requirements: 42 (1) The owner or operator shall keep the following record for a workover: 43 (a) identification number and location of the well; 44 (b) date the workover was performed; 45 (c) wellhead pressure; 46 (d) flow rate of the vented natural gas to the extent feasible, and if measurement of 47 the flow rate is not feasible, the owner or operator shall use the maximum potential flow rate in the emission 48 calculation; 49 (e) duration of venting to the atmosphere; 50 (f) description of the management practices used to minimize release of VOC 51 before and during the workover; and 52 (g) calculation of the VOC emissions vented during the workover based on the 53 duration, volume, and mass of VOC. 54 (2) The owner or operator shall comply with the recordkeeping requirements in 20.2.50.112 55 NMAC. 56
CAA Ex. 1

JOINT PROPOSED AMENDMENTS TO PROPOSED 20.2.50 NMAC July 28, 2021
30
E. Reporting requirements 1 (1) The owner or operator shall comply with the reporting requirements in 20.2.50.112 2 NMAC. 3 (2) If it is not feasible to prevent VOC emissions from being emitted to the atmosphere from 4 a workover event, the owner or operator shall notify by certified mail all residents located within one-quarter mile of 5 the well of the planned workover at least three calendar days before the workover event. 6 [20.2.50.124 NMAC - N, XX/XX/2021] 7 8 20.2.50.125 SMALL BUSINESS FACILITIES 9 A. Applicability: Small business facilities as defined in this Part are subject to the requirements of 10 20.2.50.125 NMAC. 11 B. General requirements: 12 (1) The owner or operator shall ensure that all equipment is operated and maintained 13 consistent with manufacturer specifications, and good engineering and maintenance practices. The owner or operator 14 shall keep manufacturer specifications and maintenance practices on file and make them available to the department 15 upon request. 16 (2) The owner or operator shall calculate the VOC and NOx emissions from the facility on an 17 annual basis. The calculation shall be based on the actual production or processing rates of the facility. 18 (3) The owner or operator shall maintain a database of company-wide VOC and NOx 19 emission calculations for all subject facilities and associated equipment and shall update the database annually. 20 (4) The owner or operator shall comply with Paragraph (10) of Subsection A of 20.2.50.112 21 NMAC if requested by the department. 22 C. Monitoring requirements: The owner or operator shall comply with the requirements in 23 Subsections C or D of 20.2.50.116 NMAC. 24 D. Repair requirements: The owner or operator shall comply with the requirements of Subsection 25 E of 20.2.50.116 NMAC. 26 E. Recordkeeping requirements: The owner or operator shall maintain the following electronic 27 records for each facility: 28 (1) annual certification that the small business facility meets the definition in this Part; 29 (2) calculated VOC and NOx emissions from each facility and the company-wide VOC and 30 NOx emissions for all subject facilities; 31 (3) records as required under Subsection F of 20.2.50.116 NMAC. 32 F. Reporting requirements: The owner or operator shall submit to the department an initial small 33 business certification within sixty days of the effective date of this Part, and by March 1 each calendar year 34 thereafter. The certification shall be made on a form provided by the department. The owner or operator shall 35 comply with the reporting requirements in 20.2.50.112 NMAC. 36
G. Failure to comply with 20.2.50.125 NMAC: Notwithstanding the provisions of Section 37 20.2.50.125 NMAC, a source that meets the definition of a small business facility can be required to comply with 38 the other Sections of 20.2.50 NMAC if the Secretary finds based on credible evidence that the source (1) presents an 39 imminent and substantial endangerment to the public health or welfare or to the environment; (2) is not being 40 operated or maintained in a manner that minimizes emissions of air contaminants; or (3) has violated any other 41 requirement of 20.2.50.125 NMAC. 42 [20.2.50.125 NMAC - N, XX/XX/2021] 43 44 20.2.50.126 PRODUCED WATER MANAGEMENT UNITS 45 A. Applicability: Produced water management units as defined in this Part are subject to 46 20.2.50.126 NMAC and shall comply with these requirements no later than 180 days after the effective date of this 47 Part. 48 B. Emission standards: 49 (1) The owner or operator shall use best management and good engineering practices to 50 minimize emissions of VOC from produced water management units. 51 (2) The owner or operator shall control VOC emissions from each produced water 52 management unit to less than two tons per year. 53 C. Monitoring requirements: The owner or operator shall: 54 (1) calculate the monthly rolling 12-month total of VOC emissions in tons from each unit; 55 (2) monthly, monitor the best management and engineering practices implemented to reduce 56
CAA Ex. 1

JOINT PROPOSED AMENDMENTS TO PROPOSED 20.2.50 NMAC July 28, 2021
31
emissions at each unit to ensure their effectiveness; and 1 (3) comply with the monitoring requirements in 20.2.50.112 NMAC. 2 D. Recordkeeping requirements: 3 (1) The owner or operator shall maintain the following electronic records for each produced 4 water management unit: 5 (a) name or identification of the unit and UTM coordinates of the unit and county; 6 (b) a description of the best management and engineering practices used to 7 minimize release of VOC at the unit; and 8
(c) a record of the monthly rolling 12-month total VOC emissions from each unit. 9 (2) The owner or operator shall comply with the recordkeeping requirements in 20.2.50.112 10 NMAC. 11 E. Reporting requirements: The owner or operator shall comply with the reporting requirements in 12 20.2.50.112 NMAC. 13 [20.2.50.126 NMAC - N, XX/XX/2021] 14 15 20.2.50.127 PROHIBITED ACTIVITY AND CREDIBLE INFORMATION PRESUMPTION 16 A. Failure to comply with the emissions standards, monitoring, recordkeeping, reporting or other 17 requirements of this Part within the timeframes specified shall constitute a violation of this Part subject to 18 enforcement action under Section 74-2-12 NMSA 1978. 19 B. If credible information obtained by the department indicates that a source is not in compliance 20 with the provisions of this Part, the source shall be presumed to be in violation of this Part unless and until the owner 21 or operator provides credible evidence or information demonstrating otherwise. 22 C. If credible information provided to the department by a member of the public indicates that a 23 source is not in compliance with the provisions of this Part, the source shall be presumed to be in violation of this 24 Part unless and until the owner or operator provides credible evidence or information demonstrating otherwise. 25 [20.2.50.127 NMAC - N, XX/XX/2021] 26 27 HISTORY OF 20.2.50 NMAC: [RESERVED] 28
CAA Ex. 1

CLEAN AIR ADVOCATES’ EXHIBIT 2

D.C. McCabe 1
David C. McCabe Atmospheric Scientist Clean Air Task Force
[email protected] 626-710-6542
EDUCATION
Ph.D. University of Colorado 2004 Physical Chemistry, with research focused on Atmospheric Kinetics Research: Vibrational Quenching Kinetics of the OH radical Advisor: A.R. Ravishankara (NOAA)
A.B. University of Chicago 1994 Chemistry; also fulfilled requirements for A.B. in Geography General Honors and Honors in Chemistry
PROFESSIONAL EXPERIENCE
Atmospheric Scientist Clean Air Task Force 2010 - present Coordinate research on methane emissions from oil and gas operations in United States; Analyze US emissions data to
understand uncertainties in current emissions inventories and the differences between official inventories and findings from ambient air measurements; Coordinate with advocacy staff at CATF and partner groups to develop policy goals and prepare technical information for legal, advocacy, and public outreach materials.
AAAS Science & Technology Policy Fellow
US EPA Office of Research and Development
2007 - 2009
Coordinated and promoted work at US EPA and elsewhere to develop GEOSS, a global effort to improve Earth science data availability and usability.
Postdoctoral Research Fellow California Institute of Technology 2004 - 2007 Research: Built and operated an aircraft-based chemical ionization mass spectrometry system to measure trace species
(acids and peroxides) in the remote and polluted troposphere Advisor: Paul Wennberg
SELECTED REFEREED PUBLICATIONS
Weyant, C.L., P.B. Shepson, R. Subramanian, M.O.L. Cambaliza, A. Heimburger, D. McCabe, et al. (2016) “Black Carbon Emissions from Associated Natural Gas Flaring,” Environ. Sci. Technol. 50, 2075, doi:10.1021/acs.est.5b04712.
Kleinman, M.T., J.D. Bachmann, H.J. Feldman, D. McCabe, J.J. West, and A.F. Fiore (2015) “Connecting air quality and climate change,” J. Air Waste Manage. 65, 1283, doi: 10.1080/10962247.2015.1095599.
Swarthout, R.F., R.S. Russo, Y. Zhou, B.M. Miller, B. Mitchell, E. Horsman, E. Lipsky, D.C. McCabe, et al. (2015) “Impact of Marcellus Shale natural gas development in southwest Pennsylvania on volatile organic compound emissions and regional air quality.” Environ. Sci. Technol. 49, 3175, doi:10.1021/es504315f.
Caulton, D.R., P.B. Shepson, M.O.L. Cambaliza, D. McCabe, E. Baum, and B.H. Stirm (2014) “Methane destruction efficiency of natural gas flares associated with shale formation wells,” Environ. Sci. Technol. 48, 9548, doi:10.1021/es500511w.
St. Clair, J.M., D.C. McCabe, J.D. et al. (2010) “Chemical ionization tandem mass spectrometer for the in situ measurement of methyl hydrogen peroxide,” Rev. Sci. Instru. 81, 094102, doi:10.1063/1.3480552.
CAA Ex. 2

D.C. McCabe 2
Avery, M., C. Twohy, D. McCabe, et al. (2010) “Convective distribution of tropospheric ozone and tracers in the Central American ITCZ region: Evidence from observations during TC4,” J. Geophys. Res., 115, D00J21, doi:10.1029/2009JD013450.
Spencer, K.M., D.C. McCabe, et al. (2009) “Inferring ozone production in an urban atmosphere using measurements of peroxynitric acid,” Atmos. Chem. Phys., 9, 3697, doi:10.5194/acp-9-3697-2009.
McCabe, D.C., et al. (2006) “The relaxation of OH (v = 1) and OD (v = 1) by H2O and D2O at temperatures from 251 to 390 K,” Phys. Chem. Chem. Phys., 8, 4563, doi:10.1039/B609330B.
McCabe, D.C., et al. (2003) “Kinetics of the Removal of OH (v = 1) and OD (v = 1) by HNO3 and DNO3 from 253 to 383 K,” J. Phys. Chem. A, 107, 7762, doi:10.1021/jp0346413.
McCabe, D.C., T. Gierczak, R.K. Talukdar, and A.R. Ravishankara (2001) “Kinetics of the reaction OH + CO under atmospheric conditions,” Geophys. Res. Lett., 28, 3135, doi:10.1029/2000GL012719.
SELECTED CONFERENCE PRESENTATIONS (ORAL AND POSTER)Fleischman, L., D. McCabe, D. Lyon, M. D’Antoni, J. Anhalt, “Tank Emissions from Controlled Tanks,”
Stakeholder Workshop on EPA GHG Data for Petroleum and Natural Gas Systems, Oct. 2017, Houston, TX.
Field, R., J. Soltis, D. Snare, R. Edie, D. McCabe, S. Murphy, “Reconciling Airborne Basin Scale Methane Flux Estimates with Ground Based Quantification of Methane and VOC Emissions from Well Pads,” American Geophysical Union Fall Meeting, Presentation A11L-03, Dec. 2014, San Francisco, CA, USA.
McCabe, D.C., E. Baum, S. Saunier, “Quantifying Methane Mitigation Costs from US Oil and Natural Gas,” Air and Waste Management Association, Climate Change: Impacts, Policy, and Regulation Conference, Presentation 11, Sept. 2013, Herndon, VA, USA.
McCabe, D., P. Groisman, et al., “Open Burning and the Arctic: Current Knowledge and Priorities for Future Research,” European Geophysical Union General Assembly 2011, Presentation EGU2011-12855, Apr. 2011, Vienna, Austria.
Dickerson, P., J. Szykman, D. McCabe, “Integrating Satellite Observations into AIRNow: Providing Real Time Air Quality and Forecasts in the US and Elsewhere,” CEOS Atmospheric Composition Constellation Workshop on Air Quality, June 2009, Frascati, Italy.
McCabe, D.C., et al., “Measurements of Isotopic Composition of Water Vapor Using CIMS From the NASA DC-8 During TC4,” American Geophysical Union Fall Meeting, Presentation A31C-0114, Dec. 2008, San Francisco, CA, USA.
PROFESSIONAL ACTIVITIES
Expert Testimony Colorado Air Quality Control Commission, Oil and Gas Rulemakings, February 2014 and October 2017
Invited Reviewer Referred Journals: Environmental Science and Technology, Atmospheric Chemistry and Physics, Environmental
Research Letters, Journal of Industrial Ecology EPA’s Methodologies for U.S. Greenhouse Gas Emissions Projections: Non-CO2 and Non-Energy CO2 Sources,
Natural Gas Systems and Petroleum Systems Sections, 2013, 2014. EPA’s Global Mitigation of Non-CO2 Greenhouse Gases, Natural Gas and Oil Systems Section, 2013. EPA’s Inventory of US Greenhouse Gas Emissions and Sinks. 2013 – 2018.
CAA Ex. 2

CLEAN AIR ADVOCATES’ EXHIBIT 3

1
2
3
4
5
6
7
8
9
10
11
12
13
14
15
16
17
18
19
20
21
22
23
24
25
26
27
1
STATE OF NEW MEXICO ENVIRONMENTAL IMPROVEMENT BOARD
IN THE MATTER OF PROPOSED NEW REGULATION, 20.2.50 NMAC – Oil and Gas Sector – Ozone Precursor Pollutants No. EIB 21-27 (R)
DIRECT TESTIMONY OF DAVID MCCABE, PH.D.
Q: Please state your name.
A: My name is Dr. David McCabe.
Q: What is your educational background?
A: I have a Bachelor of Arts in chemistry from the University of Chicago, and a Ph.D. in
physical chemistry from the University of Colorado.
Q: What is your work background?
A: I am an atmospheric scientist with the Clean Air Task Force (CATF). I have ten years of
experience studying emissions controls for the oil and gas sector. I have designed several studies
on emissions of air pollutants from oil and gas facilities, and I am a co-author on a number of
peer-reviewed publications describing those studies and their findings. I have provided expert
advice on technical comments submitted on oil and gas emissions controls and waste prevention
measures proposed by the U.S. Environmental Protection Agency (EPA), the Bureau of Land
Management, the states of California, Pennsylvania, and Colorado, and internationally in Mexico
and Canada. Here in New Mexico, I presented to the Methane Advisory Panel in 2019, and also
testified before the Oil Conservation Commission earlier this year regarding the waste prevention
rule. My curriculum vitae is attached as Clean Air Advocates’ Exhibit 2.
Q: What is Clean Air Task Force?
A: CATF is a nonprofit organization dedicated to reducing atmospheric pollution through
research and analysis, public advocacy leadership, and partnership with the private sector.
CAA Ex. 3

1
2
3
4
5
6
7
8
9
10
11
12
13
14
15
16
17
18
19
20
21
22
23
24
25
26
27
2
CATF also works to safeguard against the worst impacts of climate change by catalyzing the
rapid global development of low carbon energy and other climate-protecting technologies.
CATF staff consists of senior engineers, MBAs, scientists, attorneys, and communications
specialists. Our record of providing non-partisan, data-driven analysis helps identify and defend
policy designs that will achieve the greatest climate benefit at the least cost. An American
Association for the Advancement of Science publication has called CATF “a well-respected
public health and environment advocacy group.”
Q: Dr. McCabe, can you please summarize the opinions you will give in your
testimony?
A: My testimony addresses two sections of the rule: proposed 20.2.50.122 NMAC, which
sets forth proposed regulations for pneumatic devices, and proposed 20.2.50.123 NMAC, which
sets forth proposed regulations for storage vessels.
With respect to pneumatic devices, I explain why Clean Air Advocates support the New
Mexico Environment Department’s (NMED) proposals (1) to immediately require the use of
zero-emission pneumatic controllers at all new sites and all sites that have access to electricity
and (2) to replace pneumatic controllers that are designed to emit air pollutants with zero-
emission alternatives. I further explain that we propose to strengthen NMED’s proposal and
make it more effective. In general, we propose modeling New Mexico’s rule after one recently
adopted in Colorado, with the support of the oil and gas industry. Among other things, we
proposethat operators be required to achieve a fixed increase in the percentage of non-emitting
controllers, rather than reaching a fixed end point. This makes the rule more effective, more
equitable, and less arbitrary. We also propose that the transition to zero-emission pneumatics
occur more rapidly than NMED has proposed, to ensure that New Mexico is not needlessly
CAA Ex. 3

1
2
3
4
5
6
7
8
9
10
11
12
13
14
15
16
17
18
19
20
21
22
23
24
25
26
27
3
delaying the important environmental benefits that can be obtained by transitioning to zero-
emission controllers.
With respect to storage vessels, I explain why Clean Air Advocates propose to require
use of a “storage vessel measurement system” for storage vessels installed at new or modified
facilities. Operators must frequently measure and sample the liquids inside a storage vessel.
Typically, operators open a hatch on the vessel, releasing significant quantities of volatile
organic compounds (VOCs) and methane, in order to conduct these measurements. Our proposal
would eliminate these emissions by requiring operators to employ an alternative system that
allows for measurement and sampling without venting (for example, implementation of Chapter
18.2 of American Petroleum Institute’s Manual of Petroleum Measurement Standards, or
installation of a Lease Automatic Custody Transfer unit). Our proposal is basically identical to
an amendment adopted by the Colorado Air Pollution Control Division in December 2019,
which the Division found to be cost-effective and which has been implemented without
difficulty.
PNEUMATIC DEVICES
Q: Dr. McCabe, what are pneumatic controllers?
A: Pneumatic controllers are a type of process controller. A process controller is a device
that senses a physical state and then operates automatically to regulate that state. Process
controllers can regulate a variety of physical parameters—or process variables—including fluid
pressure, liquid level, fluid temperature, and differential pressure. Process controllers can be
electric, hydraulic, pneumatic, mechanical, or a combination of these.
A pneumatic controller is a type of process controller that uses gas pressure to open or
close a mechanical device, such as a valve, when it senses the need to regulate a process
CAA Ex. 3

1
2
3
4
5
6
7
8
9
10
11
12
13
14
15
16
17
18
19
20
21
22
23
24
25
26
27
4
condition such as liquid level, pressure, temperature, or flow. Historically, most pneumatic
controllers at oil and natural gas sites were operated with pressurized natural gas, exploiting the
pressure energy present in that natural gas. Thus, these controllers were configured to release the
natural gas, and the pollutants it contains, into the atmosphere as they operated. Increasingly,
operators are shifting to zero-emission alternatives that perform the same function, using
electricity or compressed “instrument” air. Accelerating this transition can provide important
environmental and public health benefits.
Q: How are pneumatic controllers used in oil-and-gas operations?
A: Pneumatic controllers are used to automate and control various process throughout the
oil-and-gas industry. These controllers are used at wellsites, gathering and boosting stations,
transmission compressor stations, and gas-processing plants. An example of a common usage is
a separator dump valve controller, which causes a dump valve to open when it senses that liquid
in the separator has reached a certain level.
Q: Are there different types of natural gas-driven pneumatic devices?
A: Yes, natural gas-driven pneumatic devices may be either continuous bleed, which means
they emit gas continuously by design, or they may be intermittent bleed, which means they are
designed to emit gas only when they actuate. Continuous-bleed pneumatic devices are classified
as high-bleed if they are designed to emit more than 6 standard cubic feet per hour (scfh), or low-
bleed if they are designed to emit less than this amount.
Q: Do pneumatic controllers emit air pollutants?
A: Yes, they do, if they are operated with natural gas. Natural gas is primarily composed of
methane, a potent greenhouse gas. Other pollutants, including ozone-forming VOCs and toxic or
cancer-causing hazardous air pollutants (HAPs) are typically present in natural gas at sites such
CAA Ex. 3
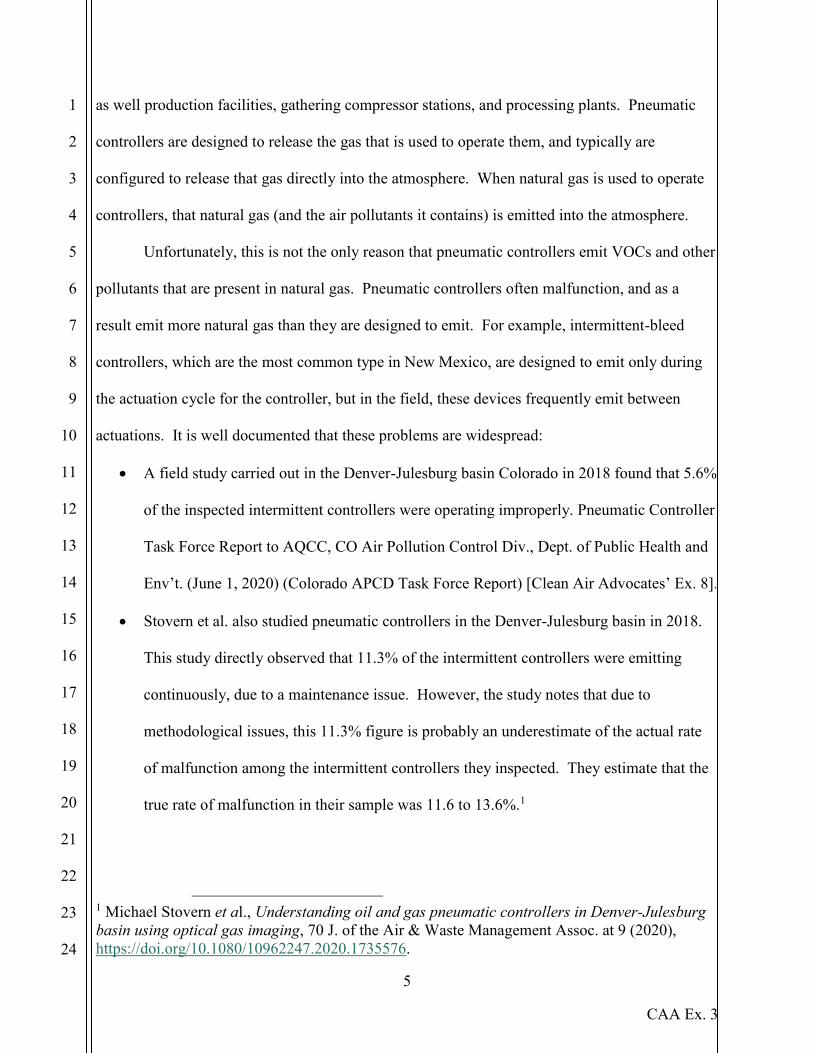
1
2
3
4
5
6
7
8
9
10
11
12
13
14
15
16
17
18
19
20
21
22
23
24
25
26
27
5
as well production facilities, gathering compressor stations, and processing plants. Pneumatic
controllers are designed to release the gas that is used to operate them, and typically are
configured to release that gas directly into the atmosphere. When natural gas is used to operate
controllers, that natural gas (and the air pollutants it contains) is emitted into the atmosphere.
Unfortunately, this is not the only reason that pneumatic controllers emit VOCs and other
pollutants that are present in natural gas. Pneumatic controllers often malfunction, and as a
result emit more natural gas than they are designed to emit. For example, intermittent-bleed
controllers, which are the most common type in New Mexico, are designed to emit only during
the actuation cycle for the controller, but in the field, these devices frequently emit between
actuations. It is well documented that these problems are widespread:
A field study carried out in the Denver-Julesburg basin Colorado in 2018 found that 5.6%
of the inspected intermittent controllers were operating improperly. Pneumatic Controller
Task Force Report to AQCC, CO Air Pollution Control Div., Dept. of Public Health and
Env’t. (June 1, 2020) (Colorado APCD Task Force Report) [Clean Air Advocates’ Ex. 8].
Stovern et al. also studied pneumatic controllers in the Denver-Julesburg basin in 2018.
This study directly observed that 11.3% of the intermittent controllers were emitting
continuously, due to a maintenance issue. However, the study notes that due to
methodological issues, this 11.3% figure is probably an underestimate of the actual rate
of malfunction among the intermittent controllers they inspected. They estimate that the
true rate of malfunction in their sample was 11.6 to 13.6%.1
1 Michael Stovern et al., Understanding oil and gas pneumatic controllers in Denver-Julesburg basin using optical gas imaging, 70 J. of the Air & Waste Management Assoc. at 9 (2020), https://doi.org/10.1080/10962247.2020.1735576.
CAA Ex. 3

1
2
3
4
5
6
7
8
9
10
11
12
13
14
15
16
17
18
19
20
21
22
23
24
25
26
27
6
Luck et al. extensively measured emissions from 72 controllers at 16 natural gas
compressor stations, recording consumption of gas by the controllers for multi-day
periods. They found that a very large portion of controllers were operating abnormally,
leading to emissions substantially higher than emissions from normal operating
controllers. Of the overall pool of controllers, 42% were operating abnormally. Of the
40 intermittent controllers they studied, 25 (63%) were operating abnormally.2
Allen et al. concluded that among controllers with the highest emissions rate, many
suffered from easily reparable issues, and “many of the devices in the high emitting
group were behaving in a manner inconsistent with the manufacturer’s design.”3
A City of Fort Worth study that examined emissions from 489 intermittent-bleed devices
using infrared cameras and other methods found that many controllers were emitting
constantly and at very high rates, even though they were being used to operate separator
dump valves and were not designed to emit between actuations.4
At the same time, a number of studies have documented problems with low-bleed
controllers, the second most common type of controller. Low-bleed controllers emit
2 Benjamin Luck et al., Multiday Measurements of Pneumatic Controller Emissions Reveal the Frequency of Abnormal Emissions Behavior at Natural Gas Gathering Stations, Environ. Sci. Technol. Letters 6, 348–52 (2019). https://pubs.acs.org/doi/10.1021/acs.estlett.9b00158. 3 David T. Allen, et al., Methane Emissions from Process Equipment at Natural Gas Production Sites in the United States: Pneumatic Controllers, 49 Envtl. Sci. Tech. 633 (2015), http://pubs.acs.org/doi/abs/10.1021/es5040156, at 639. 4 E. Research Grp., Inc. & Sage Envtl. Consulting, LP, City of Fort Worth Natural Gas Air Quality Study at 3-100 (July 13, 2011), https://www.fortworthtexas.gov/files/assets/public/development-services/documents/gaswells/ergreport-section-3.pdf (“Under normal operation a pneumatic valve controller is designed to release a small amount of natural gas to the atmosphere during each unloading event. Due to contaminants in the natural gas stream, however, these controllers eventually fail (often within six months of installation) and begin leaking natural gas continually.”).
CAA Ex. 3

1
2
3
4
5
6
7
8
9
10
11
12
13
14
15
16
17
18
19
20
21
22
23
24
25
26
27
7
continuously by design. Additionally, they often do not function as designed or otherwise emit
more than designed: a significant number of controllers designated as low-bleed by operators or
manufacturers have been observed to emit above the 6 scfh threshold which is defined as the
upper limit for acceptable emissions from low-bleed controllers. For example, the 32 pneumatic
controllers measured by Allen et al. (2015) which operators categorized as “low-bleed” had an
average emissions rate of 10.8 scfh,5 clearly indicating that many low-bleed controllers emit over
6 scfh. An earlier study by Allen et al. published in 2013 reported a lower emissions factor for
low-bleed controllers (5.1 scfh),6 but that emissions factor indicates that some low-bleed
controllers emit over 6 scfh, since presumably some controllers emit lower amounts consistent
with the low bleed rates (~3 scfh or less) specified for many controllers.
Q: What do we know about the extent of emissions from pneumatic controllers at oil
and gas facilities?
A: Given the extent to which pneumatic devices malfunction and emit more than they are
designed to emit, it is difficult to precisely quantify emissions from these devices. However,
based on our analysis of data collected for the Permian and San Juan basins in EPA’s
Greenhouse Gas Reporting program, we estimate that there are over 118,000 pneumatic
controllers in New Mexico that collectively emit about 108,000 metric tons of methane.7 These
5 Based on analysis by CATF of Table S4-1 in the Supporting information for Allen et al (2015), supra n.4. 6David T. Allen, et al., Measurements of methane emissions at natural gas production sites in the United States, 110 Proc. Natl. Acad. Sciences (USA) 17768 (2013), www.pnas.org/cgi/doi/10.1073/pnas.1304880110. 7 Analysis by Clean Air Task Force of USEPA Greenhouse Gas Reporting Program (GHGRP) data. Since GHGRP data for pneumatic controllers at production or gathering and boosting facilities is only provided at the production basin level, and both the Permian and San Juan basins extend beyond New Mexico’s borders, we reduced the counts and emission volumes for pneumatic controllers for each basin by the fraction of wells in each basin that are in New Mexico. Since smaller operators do not report emissions (or equipment counts) to GHGRP, the figures are underestimates.
CAA Ex. 3

1
2
3
4
5
6
7
8
9
10
11
12
13
14
15
16
17
18
19
20
21
22
23
24
25
26
27
8
devices emit an estimated 30,000 metric tons of VOC.8 Analysis from the Environmental
Defense Fund indicates that pneumatic devices are the second largest source of methane
emissions from the oil and gas industry in New Mexico.9
Q: Can pneumatic controllers that emit methane and VOCs be replaced with
controllers than do not emit at all?
A: Yes. Several cost-effective technologies are available that can entirely eliminate
emissions from gas-driven pneumatic controllers, at new and existing sites, with and without
electricity available. These options were mapped out in a report that Clean Air Task Force
published a few years ago, which we have submitted as Clean Air Advocates’ Exhibit 4 [Carbon
Limits (2016), Zero emission technologies for pneumatic controllers in the USA].10 I will briefly
summarize the findings of that report here, including some updates to the report.
One approach is to use compressed air instead of pressurized natural gas to operate
controllers. These compressed air systems are often referred to as “instrument air” systems and
they have been in use at oil and gas sites for years. Recently, several systems for utilizing solar
power to compress air on well-pads with no other available electrical power have come to the
market.11
8 Analysis by Clean Air Task Force of GHGRP data. VOC volume was estimated by multiplying the methane volumes presented above by standard VOC/methane ratios US EPA has used in rulemaking analyses. See U.S. EPA. “Regulatory Impact Analysis Proposed New Source Performance Standards and Amendments to the National Emissions Standards for Hazardous Air Pollutants for the Oil and Natural Gas Industry” (July 2011) Table 3-3. Available at: https://www3.epa.gov/ttn/ecas/regdata/RIAs/oilnaturalgasfinalria.pdf. 9 EDF, New Mexico Oil & Gas Data, https://www.edf.org/nm-oil-gas/emissions/. 10 Available at https://www.catf.us/resource/zero-emission-technologies-for-pneumatic-controllers-usa/. 11 See for example: https://www.airworkscompressors.com/aurora-instrument-air-package/; https://westgentech.com/epod/; and https://lcotechnologies.com/products-crossfire.html.
CAA Ex. 3

1
2
3
4
5
6
7
8
9
10
11
12
13
14
15
16
17
18
19
20
21
22
23
24
25
26
27
9
A second approach is to use electric controllers, avoiding the use of pneumatic operation.
Electric controllers suitable for solar power/battery systems have been developed for the
upstream oil and gas industry.12 As discussed in the New Mexico Methane Advisory Panel
Report, solar-powered pneumatic devices are a technically and economically feasible alternative
to continuous-bleed devices.13 These systems have been proven in production regions of
Alberta—a location far harsher for utilization of solar than New Mexico.14 Calscan, an Alberta
vendor of packages that utilize solar-power and batteries to power electric actuators and
instrumentation for zero emission separators,15 estimates that it has sold about 400 of these
packages in Canada (mainly in Alberta).16
Instrument air systems and electric controllers have been implemented widely in British
Columbia (BC) and Alberta in particular. A 2018 study provides useful data on the penetration
of these technologies at wellsites in BC. Cap-On British Columbia Oil and Gas Methane
Emissions Field Study (2019) [Clean Air Advocates’ Ex. 7.] The study provides statistics on
controllers and pumps at over 260 production sites (well pads and tank batteries) in BC. The
study counted 2,120 controllers and pumps at these sites. Notably, more controllers and pumps
at these sites were air-driven (891 units, 42%) than natural gas-driven (725 units, 34%).
Additionally, the study noted that electric controllers and pumps were also widespread (419
units, 20%). Solar-powered pumps (59 units, roughly 15% of all pumps) were also present in
significant numbers. (Note that solar-pumps were a separate category from electric pumps and
12 See for example http://www.calscan.net/products_bearcontrol.html, and more generally, Carbon Limits (2016), Section 3.2 [Clean Air Advocates’ Ex. 4]. 13 MAP Report at 19, 23. 14 See Colorado APCD Task Force Report at 37-38 [Clean Air Advocates’ Ex. 8] and Carbon Limits (2016) at 15 (footnote 6) [Clean Air Advocates’ Ex. 4]. 15 See Calscan, Zero GHG Venting Controls for Separators, http://www.calscan.net/solutions_ZeroGHGVenting.html (last visited July 24, 2021). 16 Conversation with Henri Tessier, Calscan (Oct. 30, 2020).
CAA Ex. 3

1
2
3
4
5
6
7
8
9
10
11
12
13
14
15
16
17
18
19
20
21
22
23
24
25
26
27
10
that only integrated solar equipment was classified as “solar” in this study.) Instrument air was
very common (more than 50% of units) for level controllers, transducers, pressure controllers,
and positioners. Electric controllers account for more than 50% of units for level switches and
high-level shut downs, and over 30% of pumps (in addition to the 15% of pumps that are
integrated solar pumps).
In short, multiple vendors provide zero-emission alternatives to gas-driven controllers,
and numerous operators are using them on (at least) hundreds of sites in the United States and
Canada. Carbon Limits accordingly concluded that “[o]verall . . . zero-emission solutions are
available today and are cost-effective to implement in nearly every situation.”17
Q: In general, is retrofitting natural-gas driven pneumatic controllers with zero-
emission alternatives a cost-effective method for reducing emissions?
A. Yes. We conducted analysis as part of a recent rulemaking in Colorado that
demonstrated that the use of these technologies, instead of gas-driven controllers, at new and
existing well-pads and compressor stations is a cost-effective mitigation approach for reducing
VOC and methane emissions. See Conservation Groups’ Initial Economic Impact Analysis.
(2020) [Clean Air Advocates’ Ex. 5]. In order to facilitate calculation of the costs and benefits
of retrofitting sites with non-emitting controllers, Carbon Limits also created a spreadsheet tool
that can be used to calculate cost at a given site. This tool is attached as Exhibit 6..
This conclusion is well supported by a number of recent regulations that prohibit
installation of new gas-driven pneumatic controllers (unless their emissions are
captured/controlled) at certain facilities:
17 Carbon Limits (2016) at 4 [Clean Air Advocates’ Ex. 4].
CAA Ex. 3

1
2
3
4
5
6
7
8
9
10
11
12
13
14
15
16
17
18
19
20
21
22
23
24
25
26
27
11
Alberta will prohibit the installation of any new gas-driven pneumatic controllers that vent to the atmosphere, beginning on January 1, 2022.18
British Columbia prohibits the use of any venting pneumatic controller at any new site, effective January 1, 2021.19
Earlier this year, Colorado’s Air Quality Control Commission approved a rule that prohibits installation of any venting controllers at all new or modified facilities statewide after May 1, 2021, and requires operators to replace a significant portion of venting gas-driven controllers at existing facilities statewide.20 An existing well pad will be considered to be “modified” if a new well is drilled or an existing well is re-completed. I discuss the Colorado retrofit program in more detail below.
Finally, California prohibited installation of new continuous-bleed controllers (whether “high-bleed” or “low-bleed”) several years ago.21 However, considering that intermittent-bleed controllers are far more common than continuous bleed controllers, and the fact that zero-emitting technologies such as utilizing instrument air or solar-generated electricity can be used to replace intermittent-bleed controllers, the California approach is not adequate.
Q: Please describe the retrofit program for venting pneumatic controllers
required by Colorado’s Air Quality Control Commission’s regulations.
A: Colorado’s Air Quality Control Commission’s regulations for pneumatic
controllers at well production facilities and gathering compressor stations require
operators to retrofit a substantial portion of facilities to use non-emitting controllers over
18 Alberta Energy Regulator, Directive 060, § 8.6.1. Available at https://static.aer.ca/prd/2020-10/Directive060.pdf. 19 B.C. Rule § 52.05. Available at https://www.canlii.org/en/bc/laws/regu/bc-reg-282-2010/latest/bc-reg-282-2010.html. 20 5 Colo. Code Regs. § 1001-9:D.III.C.4. Note that the rules allow operators to install venting controllers if necessary “for a safety or process purpose.” 5 Colo. Code Regs. § 1001-9:D.III.C.4.e(i)(A). We do not expect operators to attempt to utilize that provision with any frequency, based on past implementation of other pneumatics provisions of Colorado’s air quality regulations. For example, see McCabe et al. (2014), Waste Not: Common Sense Ways to Reduce Methane Pollution from the Oil and Natural Gas Industry, https://www.catf.us/resource/waste-not-reduce-methane-pollution at 26 (documenting that no operator even requested an exemption under a similar provision in a parallel Colorado regulation that required replacement of high-bleed controllers). 21 Cal. Code Regs. tit. 17, § 95668(e)(2).
CAA Ex. 3

1
2
3
4
5
6
7
8
9
10
11
12
13
14
15
16
17
18
19
20
21
22
23
24
25
26
27
12
the next 2 years. The programs are somewhat complex; my description is only a general
overview. The program is designed somewhat differently for well production facilities
and for gathering compressor stations. I will describe the gathering compressor station
rules first.
Upon passage of the rule, each operator of gathering compressor stations in Colorado was
required to determine the aggregate number of emitting and non-emitting controllers it was
operating at the time at all of its compressor stations in the state. Operators then determined
what percentage of their controllers were non-emitting (this value is referred to as the “Total
Historic Percentage of Non-Emitting Controllers,” below I refer to this as the “Historic
Percentage” for brevity). Operators are grouped into cohorts according to their Historic
Percentage, and each operator is required to comply with a schedule for replacement of venting
controllers with non-emitting controllers, with requirements to replace a fixed portion of venting
controllers by May 1, 2022, and a second fixed portion of venting controllers by May 1, 2023.
The portion of venting controllers each operator is required to replace for each deadline is
determined by the operator’s Historic Percentage cohort: Operators in lower cohorts (with lower
portions of non-emitting controllers today) need to replace higher portions of controllers, but all
operators have to replace some controllers, unless they have already eliminated emitting
controllers at their gathering compressor stations.
For example, operators with Historic Percentages of 0-20% are required to retrofit 20%
of their controllers, statewide, to non-emitting controllers by May 1, 2022, and to retrofit an
additional 25% of controllers to non-emitting controllers by May 1, 2023. So, an operator which
had 10% non-emitting controllers at the passage of the rule must convert additional controllers so
that their fleet is 30% non-emitting controllers by May 1, 2022 and 55% non-emitting controllers
CAA Ex. 3

1
2
3
4
5
6
7
8
9
10
11
12
13
14
15
16
17
18
19
20
21
22
23
24
25
26
27
13
by May 1, 2023. However, no operator in this cohort is required to go beyond 35% non-emitting
by the 2022 deadline, or 60% non-emitting by the 2023 deadline.
Oil and gas producers are also required to convert to non-emitting controllers according
to a schedule, with the same timelines, and a similar cohort structure requiring operators with
lower portions of non-emitting controllers at the time the rule was passed to replace a higher
portion of their controllers than operators who had more non-emitting controllers at that time
(but all operators need to replace a portion of their controllers, unless they are at a very high
level of non-emitting controllers). However, for oil and gas production, the rules do not require
operators to retrofit a given percentage of their inventory of controllers. Instead, operators are
required to retrofit a portion of their facilities, converting all controllers (with limited exceptions)
at the retrofitted facilities to non-emitting devices. Specifically, operators must convert facilities
that account for a certain percentage of the operator’s total liquids production (liquid
hydrocarbons plus produced water) in the state by each date. For example, an operator that
currently produces 10% of its statewide liquids at well pads with no emitting pneumatics must
convert well pads that account for 15% of the operator’s total statewide liquids to non-emitting
by May 1, 2022, and then must convert additional well pads that account for 25% of the
operator’s total statewide liquids to non-emitting by May 1, 2023.
The rules that NMED has proposed have a similar structure, with important differences
we discuss below.
Q: What is NMED’s current proposal at 20.2.50.122 NMAC with respect to requiring
operators to retrofit pneumatic controllers?
A: NMED has proposed several provisions that would require operators to replace venting
gas-driven controllers at existing oil and natural gas facilities.
CAA Ex. 3

1
2
3
4
5
6
7
8
9
10
11
12
13
14
15
16
17
18
19
20
21
22
23
24
25
26
27
14
First, at sites with commercial line electrical power, NMED requires that pneumatic
controllers have an emission rate of zero. Operators of these sites must convert any emitting
controllers to instrument air, electric controllers/actuators, capture emissions from controllers, or
otherwise prevent emissions. My understanding is that NMED intends for retrofits at these sites
to occur upon the effective date of the rule.
Second, and most important, NMED requires operators of sites without commercial line
electrical power to convert a portion of their fleets of pneumatic controllers to non-emitting
controllers (i.e., air-driven or electric controllers). Operators are required to convert controllers
according to two schedules provided in the proposal. One schedule applies to production
facilities and gathering compressor stations. The second schedule applies to gas processing
plants and transmission compressor stations. Both schedules require operators to increase
portions of their fleets by three deadlines: January 1, 2024, January 1, 2027, and January 1, 2030.
For both schedules, the portion of controllers that operators are required to convert to
non-emitting technologies depends upon the portion of the operator’s controllers that are already
non-emitting. Under this approach, all operators (with the exception of those that already have a
very high portion of controllers that are non-emitting) are required to convert a significant
number of their controllers to non-emitting technology, but as the fraction of non-emitting
controllers an operator already utilizes increases, the portion that the operator needs to convert
by each deadline decreases. This is a logical approach because operators with a lower fraction of
non-emitting controllers have more controllers that are still emitting harmful pollutants, so they
should be moving faster to convert them to zero-emitting.
Q: Do you support the goal of 20.2.50.122 NMAC of replacing emitting pneumatic
controllers with zero-emission controllers?
CAA Ex. 3

1
2
3
4
5
6
7
8
9
10
11
12
13
14
15
16
17
18
19
20
21
22
23
24
25
26
27
15
A: Yes. As discussed above, our analysis has shown that utilizing electric controllers and
instrument air systems, instead of gas-driven controllers, at new and existing well pads and
compressor stations is a cost-effective mitigation approach for reducing VOC and methane
emissions.
Q: Clean Air Advocates have proposed changes to NMED’s approach to make it more
effective and to accelerate the schedule, correct?
A: Correct. Our approach differs from the approach taken in the NMED proposal in several
important ways. First, we propose that any gas driven controllers at gas processing plants or
transmission compressor stations should be converted to non-emitting within six months. Under
our proposal, Table 2 of 20.2.50.122 NMAC (regulating gas processing plants and transmission
compressor stations) is unneeded.
Second, we propose to require operators in each cohort to increase their fraction of non-
emitting controllers by a fixed percentage, rather than requiring all operators in each cohort to
increase their fraction of non-emitting controllers to a fixed percentage.
Third, our proposal would accelerate the compliance timeline, while setting two
deadlines (May 1, 2023 and May 1, 2025) instead of three deadlines in the NMED proposal
(January 1, 2024, January 1, 2027, and January 1, 2030).
Fourth, our proposal would strike the provision that would release an operator that
converted 75% of its pneumatic controllers to non-emitting by January 1, 2025 from any further
requirements to convert to non-emitting controllers.
Q: Why do Clean Air Advocates propose that gas driven controllers at gas processing
plants or transmission compressor stations should be converted to non-emitting within six
months?
CAA Ex. 3

1
2
3
4
5
6
7
8
9
10
11
12
13
14
15
16
17
18
19
20
21
22
23
24
25
26
27
16
A: NMED’s technical analysis shows that all gas processing plants in New Mexico are
already using non-emitting controllers, and all of them have access to commercial line electric
power. Further, NMED’s analysis finds that all transmission compressor stations have access to
electric power. Assuming this is accurate, all transmission compressor stations would be
required to convert to zero-emitting technologies under NMED’s proposed 20.2.50.122.B(4)(b)
NMAC. In other words, under NMED’s proposal, all pneumatic devices at transmission
compressor stations and gas processing plants would be zero-emitting upon the effective date of
the rule. We support this outcome, but believe the rule should be clarified so that all
stakeholders understand that all controllers at these facilities must be non-emitting, and to give
operators with venting gas-driven controllers at transmission compressor stations adequate time
to convert them to non-emitting.
Additionally, based on my professional experience working with activity data for
midstream facilities from several states, I believe that NMED’s inventory and knowledge of
these facilities could be incomplete.22 If this should be the case, there may be processing plants
or transmission compressor stations that currently have venting gas-driven pneumatics but do not
have access to commercial electric power. These facilities can still convert quickly and easily to
a non-emitting technology and should be required to do so.
NMED’s proposed approach would give operators of these facilities many years to only
partially convert controllers at these facilities (following Table 2 of proposed 20.2.50.122
NMAC). There is no need to wait years to convert these large facilities, which typically use
instrument air systems, to non-emitting controllers. For example, in December 2017, Colorado
22 For example, see the discussion of the challenges in producing complete lists of midstream facilities in Anthony J. Marchese et al., “Methane Emissions from United States Natural Gas Gathering and Processing,” Environ. Sci. Technol. 49, 10718−10727 (2015). https://pubs.acs.org/doi/10.1021/acs.est.5b02275.
CAA Ex. 3

1
2
3
4
5
6
7
8
9
10
11
12
13
14
15
16
17
18
19
20
21
22
23
24
25
26
27
17
required operators of gas processing plants in the Front Range Nonattainment Area to convert to
non-emitting pneumatic controllers by May 1, 2018 (i.e., within six months).23
Therefore, to make the rule clearer and ensure that all processing plants and transmission
compressor stations are converted to non-emitting controllers in a timely fashion, consistent with
precedent from Colorado, we propose simply requiring that all of these facilities be converted to
non-emitting controllers within six months. Consistent with this proposal, we propose removing
Table 2, which is not needed because all facilities described in that Table 2 would need to
convert to zero-emitting controllers within 6 months.
Q: Why are Clean Air Advocates proposing that each operator be required to achieve a
particular increase in the percentage of zero-emission controllers, as opposed to requiring
that operators achieve a particular percentage?
A: Requiring operators to achieve a fixed percentage, no matter where they lie within their
cohort, is less efficient, less equitable for operators, and creates arbitrary outcomes. For
example, under Table 1 as proposed by NMED, an operator starting at 19% is in the bottom
cohort, meaning the operator must to get to 25% non-emitting controllers by 2024. That
amounts to a 6% increase. But an operator starting at 21% is in the fourth cohort, meaning the
operator must get to 45% by 2024. That’s a 24% increase.
In this example, the second operator is actually cleaner to start with. Yet the operator has
to replace four times as many controllers by over the next two and a half years as the first
operator. In addition to being arbitrary and less fair for some operators, this structure also makes
the rule less effective, because the required percentage must be feasible for an operator at the
23 See 5 Colo. Code Regs. § 1001-9:D.III.C.2.
CAA Ex. 3

1
2
3
4
5
6
7
8
9
10
11
12
13
14
15
16
17
18
19
20
21
22
23
24
25
26
27
18
bottom of the cohort, greatly limiting the amount of conversion required for an operator near the
top of the cohort.
Finally, the approach proposed by NMED creates an incentive for operators to
undercount the number of existing pneumatic devices, or perversely, to delay retrofits so they
remain in a favorable position (i.e., immediately below a threshold for inclusion in the next
higher cohort).
Rather than requiring operators to achieve a fixed percentage, we propose to require
operators to achieve a fixed increase in the percentage. This is the approach Colorado took in its
recent pneumatic retrofit rule. Under that rule, all operators in a given cohort are subject to the
same requirements. Thus, an operator that starts at 1% must convert an additional 20% of its
controllers. An operator starting at 15% must also convert an additional 20%.
We further propose that, as in Colorado, New Mexico include a Maximum Required
Percentage for each cohort. These maximum required percentages are needed because without
them, operators at the top of a given cohort would be required to pass operators in the bottom of
the next higher cohort, an arbitrary outcome. For example, under our proposal, an operator in the
bottom cohort would be required to convert an additional 40% of controllers by the first deadline
(May 1, 2023), while an operator in the second-to-last cohort would be required to convert 35%
of controllers. This could lead to arbitrary results at the margins. For example, an operator
starting at 19% non-emitting controllers would be in the bottom cohort, and thus would be
required to increase the percentage of non-emitting controllers by 40%, arriving at 59%. Yet an
operator starting at 21% would be in the second-to-last cohort, and required to increase its
percentage by 35%, arriving at 56%. The Maximum Required Percentage table avoids this
CAA Ex. 3

1
2
3
4
5
6
7
8
9
10
11
12
13
14
15
16
17
18
19
20
21
22
23
24
25
26
27
19
arbitrary result, by providing that no one in the bottom cohort needs to achieve a total percentage
greater than 55% by the first deadline. This ensures that the rule is equitable and efficient.
Q: Why do the Clean Air Advocates propose an accelerated timeline for replacement of
venting gas-driven controllers, relative to the NMED proposal?
A: Simply stated, NMED’s proposed timeline is too slow, given the feasibility of the
technologies for replacement of gas-driven venting pneumatic controllers, the precedent from
Colorado, and the urgency to rapidly reduce methane pollution to stem the climate crisis. We
propose a more aggressive program, that is consistent with the approach and level of ambition
taken by Colorado.
As I have discussed above, technologies to control valves without the use of venting gas-
driven controllers are well established, and in widespread use. In the context of the Colorado
rulemaking, we demonstrated that retrofitting a wide swath of sites to eliminate venting gas-
driven controllers would be cost-effective; NMED has also shown that their proposed approach
would be cost-effective.
Recognizing this, industry, environmental organizations, local governments, and
Colorado Department of Public Health and Environment negotiated and jointly proposed a set of
regulations that require industry to replace a significant portion of the pneumatic controller that
each firm is operating at well sites and/or gathering compressor stations. These regulations were
unanimously adopted by the Colorado Air Quality Control Commission in February 2021.
As discussed above, Colorado’s rules and the NMED proposal both require operators to
comply with a schedule for replacing pneumatic controllers. The specific requirements for an
operator depend on the fraction of the operator’s valve controllers that are already non-emitting,
with operators assigned to one of five cohorts determined by this fraction.
CAA Ex. 3

1
2
3
4
5
6
7
8
9
10
11
12
13
14
15
16
17
18
19
20
21
22
23
24
25
26
27
20
Colorado’s schedule for operators of gathering compressor stations is the most direct
analogue of the schedules proposed by NMED. This table (Table 2 in the Colorado rules) is
reproduced here:
Here, I will focus on the conversions required by May 1, 2023 for operators with various
levels of non-emitting controllers.
An operator with no non-emitting controllers now would have to convert 45% of its controllers by May 1, 2023.
An operator with 15% non-emitting controllers now would also have to convert an additional 45% of its controllers by May 1, 2023.
An operator with 18% non-emitting controllers now would have to convert an additional 42% of its controllers by May 1, 2023. This operator’s conversion requirement in the initial period (with the deadline of May 1, 2022) is limited by the “Maximum Required Percentage” column for that period.
An operator with 25% non-emitting controllers now would have to convert an additional 40% of its controllers by May 1, 2023.
For convenience, I have reproduced table 1 from the NMED proposal, which I
understand is to apply to gathering compressor stations, here:
CAA Ex. 3
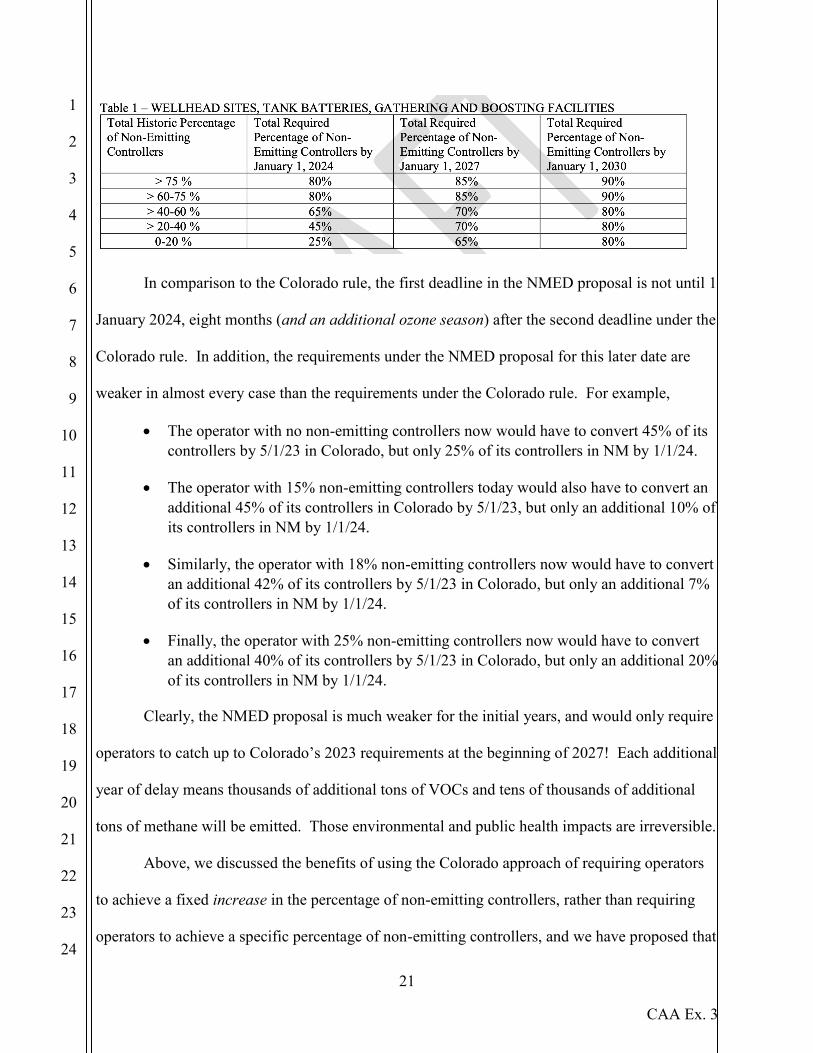
1
2
3
4
5
6
7
8
9
10
11
12
13
14
15
16
17
18
19
20
21
22
23
24
25
26
27
21
In comparison to the Colorado rule, the first deadline in the NMED proposal is not until 1
January 2024, eight months (and an additional ozone season) after the second deadline under the
Colorado rule. In addition, the requirements under the NMED proposal for this later date are
weaker in almost every case than the requirements under the Colorado rule. For example,
The operator with no non-emitting controllers now would have to convert 45% of its controllers by 5/1/23 in Colorado, but only 25% of its controllers in NM by 1/1/24.
The operator with 15% non-emitting controllers today would also have to convert an additional 45% of its controllers in Colorado by 5/1/23, but only an additional 10% of its controllers in NM by 1/1/24.
Similarly, the operator with 18% non-emitting controllers now would have to convert an additional 42% of its controllers by 5/1/23 in Colorado, but only an additional 7% of its controllers in NM by 1/1/24.
Finally, the operator with 25% non-emitting controllers now would have to convert an additional 40% of its controllers by 5/1/23 in Colorado, but only an additional 20% of its controllers in NM by 1/1/24.
Clearly, the NMED proposal is much weaker for the initial years, and would only require
operators to catch up to Colorado’s 2023 requirements at the beginning of 2027! Each additional
year of delay means thousands of additional tons of VOCs and tens of thousands of additional
tons of methane will be emitted. Those environmental and public health impacts are irreversible.
Above, we discussed the benefits of using the Colorado approach of requiring operators
to achieve a fixed increase in the percentage of non-emitting controllers, rather than requiring
operators to achieve a specific percentage of non-emitting controllers, and we have proposed that
CAA Ex. 3

1
2
3
4
5
6
7
8
9
10
11
12
13
14
15
16
17
18
19
20
21
22
23
24
25
26
27
22
New Mexico adopt this approach. However, it is important to note that under the NMED
proposal, even the operators at the bottom of a cohort who therefore need to do the most under
that proposal’s structure have to do significantly less by January 1, 2024 than they would have
to do under Colorado’s proposal by May 1, 2023. For example,
As mentioned above, the operator without any non-emitting controllers now would have to convert 45% of its controllers by 5/1/23 in Colorado, but only 25% of its controllers in NM by 1/1/24.
An operator with just over 20% of non-emitting controllers now would have to convert an additional 40% of its controllers by 5/1/23 in Colorado, but only about 25% of its controllers in NM by 1/1/24.
An operator with just over 40% of non-emitting controllers now would have to convert an additional 35% of its controllers by 5/1/23 in Colorado, but only about 25% of its controllers in NM by 1/1/24.
Again, these are the operators required to do the most under NMED’s proposal, but they have to
do significantly less, by a later date, than they would be required to do in Colorado.
Given these shortcomings in the NMED proposal, we have proposed changes to the
pneumatics retrofit provisions that would:
Adopt the Colorado structure, which requires operators to achieve a fixed increase in the percentage of non-emitting controllers, rather than requiring operators to achieve a specific percentage of non-emitting controllers.
Move the first deadline to May 1, 2023, which is also consistent with Colorado’s rules.
Strengthen the required conversion percentages for the first deadline, to requirements that are in line with those from Colorado for well production facilities for May 1, 2023.
After 2024, the NMED proposal would require operators to achieve further conversions
of emitting pneumatic controllers by January 1, 2027, and January 1, 2030. Given the feasibility
of the alternative technologies we have described here, these long timeframes are inappropriate.
CAA Ex. 3

1
2
3
4
5
6
7
8
9
10
11
12
13
14
15
16
17
18
19
20
21
22
23
24
25
26
27
23
As such, we propose a second deadline of May 1, 2025, by which date operators would need to
convert a significant portion of their remaining controllers.
Q: Did NMED estimate the costs of retrofitting pneumatic controllers?
A: Yes, NMED prepared cost estimates for the pneumatic controller retrofit provisions,
which I am copying here:
Q: Are NMED’s cost estimates reasonable?
A: NMED’s estimates generally are reasonable, but we note that they have overestimated the
net costs of pneumatic controller retrofits for several reasons.
First, NMED’s estimates omit the increased revenues that operators receive because, after
retrofitting facilities to eliminate venting pneumatic controllers, they are able to sell the gas that
the pneumatic controllers would otherwise vent.
Second, NMED’s estimates omit the maintenance savings that operators realize when
they convert from gas-driven controllers to instrument air or electric controllers. The natural gas
used to operate pneumatic controllers at production sites and natural gas processing plants has
constituents that can interfere with the performance of the controllers in two ways. First, some
Segment # of Sites
Sum of Emissions
After NSPS Regulations (tpy VOC)
Annual costs of NMED
Rule
Emissions after
NMED Rule
control changes
tpy VOC Reductions
Cost per ton
VOC Reduced
Gathering and Boosting 915 3,899 $3,001,042 2,743 1,156 $
$2,596 Natural Gas Processing 48 - $- -
Transmission Compressor Station
68 77 $386,682 - 77 $5,023
Wellhead/Tank Battery 47,937 30,631 $82,650,426 517 30,114 $2,745
Grand Total 34,607 $86,038,149 3,260 31,347 $2,745
CAA Ex. 3

1
2
3
4
5
6
7
8
9
10
11
12
13
14
15
16
17
18
19
20
21
22
23
24
25
26
27
24
constituents can condense in the controllers, forming droplets of liquid that can interfere with the
operation of the controller.24 Second, some constituents can be chemically incompatible with
seals and other components of the controller.25 Operators have reported significant cost savings
after converting to instrument air and electric systems, as these problems are entirely avoided.26
Third, NMED estimates the costs for retrofitting all sites with access to electricity by
modeling costs for instrument air systems. For smaller sites, electric controllers will often be
more cost effective.27
Fourth, NMED estimates costs by estimating costs for each device type (P. Control –
Low; P. Control – Int.; P. Control – High; and Pump), at each site type (Wellhead/Tank Battery;
Gathering and Boosting; Natural Gas Processing; and Transmission Compression Station). In
order to achieve the standard, the model turns controls on or off for specific device type/site type
combinations.28 That is, the model is calculating costs and benefits for partial retrofits of sites.
However, it is more cost effective to retrofit all devices at a site, since non-emitting controllers
utilize common equipment at pads, such as air compressors and tanks for instrument air systems,
and solar panels, batteries, and control panels for electric controllers.29 Therefore, operators will
replace all controllers and pumps at a given site, which is a more cost-effective approach. If costs
24 See Carbon Limits (2016) at 18, 26 [Clean Air Advocates’ Ex. 4]. 25 See City of Fort Worth Natural Gas Air Quality Study at 3-100. 26 See Carbon Limits (2016) at 18, 26. 27 See id. at 23. 28 See “Read Me” tab: “The choices made in Columns S and W are targeting an implementation/installation of 85% non-emitting controllers for wellheads, tank batteries, and gathering boosting stations, based on the requirements in Table 1 of 20.2.50.122 NMAC. The choices made in Columns S and W are targeting an implementation/installation of 98% non-emitting controllers for gas processing plants and compression stations based on Table 2 of 20.2.50.122 NMAC.” 29 See Carbon Limits (2016) [Clean Air Advocates’ Ex. 4].
CAA Ex. 3

1
2
3
4
5
6
7
8
9
10
11
12
13
14
15
16
17
18
19
20
21
22
23
24
25
26
27
25
were to be estimated on a site-basis, rather than component by component, the cost estimate
would be lower.
Q: How would the changes that the Climate Advocates propose for the pneumatic
controller retrofit provisions change the costs of the program?
A: The changes that we propose for the pneumatic controller retrofit provisions simply
accelerate the transition already required by NMED’s proposal. The required pace of retrofits
under the program would still be very reasonable and similar to that required in Colorado. This
accelerated schedule would therefore not increase overall costs in any significant way; at most, it
would require owners and operators to incur some of these costs sooner than they otherwise
might (while also increasing cumulative environmental benefits and ensuring that these benefits
accrue sooner). Therefore, the changes we propose would not materially change the overall cost
effectiveness of the program.
Q: Why do Clean Air Advocates recommend deletion of the provision that would
exempt an operator from performing any additional retrofits if at least 75% of the
operator’s pneumatic devices are non-emitting by 2025?
A: Proposed 20.2.50.122.B(4)(c)(v) NMAC states: “if an owner or operator meets at least
seventy-five percent total non-emitting controllers by January 1, 2025, the owner or operator has
satisfied the requirements of table 1 and 2”. This provision should be deleted, for several
reasons.
First, the provision creates internal inconsistency in the rule text. The first row of Table 1
provides that an operator with a total historic percentage of non-emitting controllers of 75% or
greater must achieve 80% by 2024, 85% by 2027, and 90% by 2030. The first row of Table 2
likewise sets forth targets for operators with a total historic percentage of non-emitting
CAA Ex. 3

1
2
3
4
5
6
7
8
9
10
11
12
13
14
15
16
17
18
19
20
21
22
23
24
25
26
27
26
controllers of 75% or greater. Yet the proposed 20.2.50.122.B(4)(c)(v) NMAC states that
operators don’t have to perform any more retrofits if they reach 75% before 2025. This is
tantamount to striking the first row of Table 1 and Table 2. It is unclear to us if NMED intended
to do that, or if 20.2.50.122.B(4)(c)(v) NMAC is a vestige of a prior draft that should have been
deleted.
Second, this provision makes the rule less effective, because it could result in a large
number of pneumatic devices not being converted, even where it would be technically feasible
and cost-effective to do so.
Third, NMED has not set forth any technical or economic basis for this exemption.
NMED’s analysis shows that is technically feasible to retrofit emitting controllers with zero-
emission controllers and that the cost per ton of VOCs abated is reasonable. The incremental
benefits of an additional retrofit are the same regardless of what the operator’s historic
percentage is.
While NMED may be interested in this provision as a way to encourage some operators
to more rapidly a large portion their existing controllers so that they can exploit this provision,
such an incentive approach is not needed. As discussed throughout my testimony, these retrofits
are cost-effective and feasible. The proper approach is for the retrofit program to be accelerated
so that all operators diligently work to eliminate this harmful and wasteful source of emissions,
rather than allowing some operators to continue operating a significant portion of their gas-
driven controllers indefinitely as an incentive for them to speed up out these straightforward,
low-cost retrofits.
CAA Ex. 3

1
2
3
4
5
6
7
8
9
10
11
12
13
14
15
16
17
18
19
20
21
22
23
24
25
26
27
27
STORAGE VESSEL MEASURING SYSTEMS
Q: What changes are Clean Air Advocates proposing to the section of the proposed rule
regulating storage vessels?
A: Clean Air Advocates propose to add a new subsection C to 20.2.50.123 NMAC, entitled
“Storage Vessel Measurement Requirements.” This provision mirrors almost word for word an
amendment to Regulation 7 adopted by the Colorado Air Quality Control Commission (AQCC)
in December 2019. That amendment appears at 5 Colo. Code Regs. § 1001-9:D.II.C.4.
Q: What is the purpose of this new subsection?
The new subsection would reduce emissions from storage vessels installed at new
or modified facilities by requiring those tanks to employ a “storage vessel measurement system”
to determine the quantity and quality of liquids inside a storage vessel. Typically, in order to
measure the level of liquid in a tank, operators open a thief hatch on the top of the tank in order
to insert a gauging device. Operators also typically collect samples of the liquid in the vessel
through the hatch. When the hatch is opened, air pollutants, including methane, VOCs, and
cancer-causing HAPs like benzene, are released. Since gauging is often performed frequently,
and the hatch is opened every time a measurement is taken, these emissions can be significant.
Operators can avoid these emissions by employing an alternative system to measure and
sample the liquids in the vessel. Examples of alternative systems that do not require venting
include systems that comply with Chapter 18.2 of American Petroleum Institute (API)’s Manual
of Petroleum Measurement Standards, or by installing a Lease Automatic Custody Transfer
(LACT) unit. In 2019, the Colorado AQCC required operators to employ these types of
alternative systems for new or modified storage vessels. Clean Air Advocate’s proposal would
impose the same requirements in New Mexico.
CAA Ex. 3

1
2
3
4
5
6
7
8
9
10
11
12
13
14
15
16
17
18
19
20
21
22
23
24
25
26
27
28
Q: What are the benefits of Clean Air Advocates’ storage vessel measurement
proposal?
A: Clean Air Advocates’ proposal reduces emissions, using systems that have been used for
years in the field, at a reasonable cost to industry. It also has important safety benefits, which I
will discuss.
The Colorado Air Pollution Control Division (APCD) included an analysis of its storage
vessel measurement system regulation in its December 5, 2019 Regulatory Analysis for
Regulation Number 7 Revisions. Using cost data from a leading manufacturer of equipment
used to facilitate the use of API Method 18.2, this analysis showed that use of a storage vessel
measurement system is generally cost-effective, with cost-effectiveness increasing the more
often measurement (which is carried out each time liquid is transferred from the tank to a truck, a
process referred to as “loadout”) occurs.
Loadout frequency Cost per ton VOC TPY VOC reduced (per 8-tank battery)
100 loads per year $3,447/ton VOC 5.1 365 loads per year $944/ton VOC 18.6
See December 5, 2019, Regulatory Analysis for Regulation 7 Revisions at 19.30
The Colorado APCD stated that these numbers were “extremely conservative, insofar as
the new and modified facilities that will be subject to these requirements will likely have
production at such a level where loadout happens more often than even one time per day.” Id.
In addition, the APCD found that equipment costs would be lower for owners and operators who
used storage vessel measurement systems at multiple facilities, and that the use of a storage
30 https://www.edf.org/sites/default/files/content/Attachment%20B%20-%20Regulatory%20Analysis%2C%20Colorado%20Dep%E2%80%99t%20of%20Public%20Health%20and%20the%20Environment%20%28Dec.%205%2C%202019%29.pdf.
CAA Ex. 3

1
2
3
4
5
6
7
8
9
10
11
12
13
14
15
16
17
18
19
20
21
22
23
24
25
26
27
29
vessel measurement system would provide a benefit to owners and operators by increasing the
accuracy of the measurement, something that would payback over time. Id. at 20.
Q: Will Clean Air Advocates’ proposal have safety co-benefits?
A: Yes. The National Institute of Occupational Safety and Health and the Occupational
Safety and Health Administration issued a Hazard Alert in February 2016, explaining that the
agencies had “identified health and safety risks to workers who manually gauge or sample fluids
on production and flowback tanks from exposure to hydrocarbon gases and vapors, exposure to
oxygen-deficient atmospheres, and the potential for fires and explosions.” NIOSH/OSHA
Hazard Alert: Health and Safety Risks for Workers Involved in Manual Tank Gauging and
Sampling at Oil and Gas Extraction Sites, at 1.31 The Hazard Alert explained that “[o]pening
tank hatches, often referred to as ‘thief hatches,’ can result in the release of high concentrations
of hydrocarbon gases and vapors” which “can have immediate health effects, including loss of
consciousness and death.” Id. It went on to survey nine cases between 2010 and 2014 where a
worker died while performing manual tank gauging. Id. at 11. The agencies recommended use
of “alternative tank gauging and sampling procedures that enable workers to monitor tank fluid
levels and take samples without operating the tank hatch” to reduce occupational hazards
associated with manual gauging. Id. at 6. Clean Air Advocates’ proposal would require exactly
that at new and modified facilities, creating an important co-benefit in terms of occupational
safety at the same time as it reduces emissions of ozone-forming VOCs and other dangerous
pollutants.
This concludes my testimony, which is accurate to the best of my knowledge.
/s/ David McCabe July 28, 2021
31 https://www.osha.gov/sites/default/files/publications/OSHA3843.pdf.
CAA Ex. 3

1
2
3
4
5
6
7
8
9
10
11
12
13
14
15
16
17
18
19
20
21
22
23
24
25
26
27
30
____________________________________ _________________ David McCabe, Ph.D. Date
CAA Ex. 3

CLEAN AIR ADVOCATES’ EXHIBIT 4

Zero emission technologies for pneumatic controllers in the USA
Applicability and cost effectiveness
CAA Ex. 4

Zero emission technologies for pneumatic controllers in the USA 1
This report was prepared by Carbon Limits AS. Project title: Zero emission technologies for pneumatic controllers in the USA
Client: CATF Project leader: Stephanie Saunier Project members: Hesam Darani, Anders Pederstad Report title: Zero emission controllers in the USA Version 2.0 Finalized: 1st August 2016
Øvre Vollgate 6
NO-0158 Oslo
Norway
carbonlimits.no
Registration/VAT no.: NO 988 457 930
Carbon Limits is a consulting company with long standing experi-
ence in supporting energy efficiency measures in the petroleum
industry. In particular, our team works in close collaboration with
industries, government, and public bodies to identify and address
inefficiencies in the use of natural gas and through this to
achieve reductions in greenhouse gas emissions and other air
pollutants.
CAA Ex. 4
Zero emission technologies for pneumatic controllers in the USA 2
Table of contents
Executive Summary.............................................................................................................................3
Abbreviations and Notes on Units ........................................................................................................5
1. Introduction .....................................................................................................................................6
1.1 What is the problem? ...................................................................................................................... 6
1.2 Objective of this project ................................................................................................................... 6
1.3 Approach and methodology ............................................................................................................. 7
2. Gas Driven Pneumatic controllers – What are we talking about? ......................................................7
2.1 Definition ......................................................................................................................................... 7
2.2 Typology of controllers .................................................................................................................... 8
2.3 Number of controllers and emission factors – Brief literature review. ................................................ 9
3. Zero emission technologies – Description and technical applicability .............................................. 12
3.1 Overview of the zero emission technology presented. ................................................................... 12
3.2 Electronic controllers (solar powered and grid powered) ................................................................ 13
3.3 Instrument air ................................................................................................................................ 17
3.4 Other technologies ........................................................................................................................ 19
4. Cost effectiveness of electronic controllers and instrument air ........................................................ 20
4.1 Analytical approach ....................................................................................................................... 20
4.2 Main findings – electronic controllers ............................................................................................. 23
4.3 Main findings – Instrument air ........................................................................................................ 29
4.4 Summary of the analysis ............................................................................................................... 33
5. Reference list ................................................................................................................................ 36
6. Appendix ....................................................................................................................................... 37
6.1 Quantitative assumptions for the model ......................................................................................... 37
6.2 Other assumptions for the model ................................................................................................... 38
6.3 Detailed sensitivity analysis ........................................................................................................... 39
6.4 List of site configurations with abatement cost superior to the social cost of methane .................... 41
CAA Ex. 4

Zero emission technologies for pneumatic controllers in the USA 3
Executive Summary
Natural gas-driven pneumatic controllers are used widely in the oil and natural gas industry to control liquid
level, temperature, and pressure during the production, processing, transmission, and storage of natural
gas and petroleum products. However, these devices release methane into the atmosphere. Pneumatic
controllers are the second-largest source of methane from the US oil and gas industry, behind only
component leaks, according to US EPA’s Greenhouse Gas Inventory.
US Federal rules require that new continuous-bleed controllers be low-bleed (defined as designed to emit
less than six standard cubic feet/hour) at production sites and compressor stations and be zero-bleed at
processing plants. Unfortunately, recent measurements have demonstrated that many controllers currently
in field use are emitting more than would be expected based on design specifications.
This study was undertaken to determine whether cost-effective non-emitting technologies are available to
eliminate this major emissions source. We find that these technologies have evolved considerably over the
past decade and are now available and actively in use in oil and gas fields in the United States and
Canada. Two technologies are mature, proven, and in relatively wide use, and as we discuss in this report,
these technologies provide a cost-effective way to eliminate emissions of methane and other pollutants
from pneumatic controllers.
Major findings include:
• Zero emission technologies can virtually eliminate emissions from pneumatic devices.
• A number of technologies are available. The two most promising, which this report focuses on, are
electronic controllers – both solar and grid powered – and instrument air.
Electronic controllers can be installed both at sites connected to the electric grid and at
sites isolated from the grid.
Instrument air technology is a well-established, mature solution to run pneumatic control
systems and is widely applied globally. The technology requires a reliable power supply,
either from the grid or from generators on the site.
• Currently, electronic controllers are generally used at smaller sites while instrument air is used at
larger sites, due to the technical limitations of air compressors. These two technologies are on the
market today, from multiple suppliers.
• Due to the market conditions, providers of electronic controllers have so far focused mainly on the
development of solutions for small sites in remote locations. There thus seems to be much less
field experience with using electronic controllers at medium and large sites; however, no technical
barriers were identified for this type of installation.
• A number of other zero emission solutions are available today with more limited applicability (e.g.
self-contained devices) or fewer documented implementations (e.g. solar-powered instrument air).
Depending on the site specificities, these options can represent useful alternatives to instrument
air or electronic controllers.
• Operators have successfully installed hundreds of systems. They report positive experiences on
both new and retrofit sites, valuing zero emission solutions for their low maintenance costs and
reliability.
• An economic analysis, assuming conservative average emission factors for pneumatic controllers,
was performed for 2032 site configurations with 1 to 40 controllers (excluding emergency
CAA Ex. 4

Zero emission technologies for pneumatic controllers in the USA 4
shutdown devices). Both retrofit and new installations, with and without electricity on-site, were
considered.
o Zero emission solutions have abatement costs below the social cost of methane used by
US EPA ($1354/tCH4, mean value calculated for 2020 with a 3% discount rate in 2016
USD) in the vast majority of the site configurations considered (2008 out of 2032 site
configurations).
o The abatement costs, calculated as described above, exceed the social cost of methane
used by US EPA primarily at very small sites – those with less than three controllers
(excluding emergency shutdown devices). However, if higher emission factors, as
reported from recent field measurements, are used, the abatement costs at even the very
small sites will fall below the social cost of methane.
Overall, we find that zero emission solutions are available today and are cost effective to implement in
nearly every situation.
The following table presents a summary of both the technical applicability and economic attractiveness of
the different zero emission technologies under different categories of sites. Though this analysis does not
provide a detailed evaluation of the distribution of the sites in the US for each of the below categories,
existing studies have suggested that the vast majority of the sites have less than 20 controllers.
*Emissions factors threshold listed are determined for the site configuration with the highest abatement cost within the category. ** Based on other solar applications. No fundamental barrier identified.
Typ
eo
f o
f s
ite Both retrofit and new sites
Number of controllers (excl. ESDs)
1- 3 4-20 21-40
Electricity on-site? Yes No Yes No Yes No
Main
op
tio
ns:
Ele
ctr
ic c
on
tro
ller
Ins
tru
me
nt
air
Description( of the most economic option which is technically feasible)
Grid connectedelectric controller
Solar powered electriccontroller
Grid connectedelectric controller
Solar powered electric controller
Instrument air
Number of cases not cost effective (i.e. abatement cost >
social cost of methane) undercentral assumptions
6 / 36 11 / 36 0 / 308 2 / 308 5/ 328
Cost effective for every site configuration if emissions factors are:*
> 5.6 scfh for retrofit> 2.8 scfh for new sites
> 7.2 scfh for retrofit> 4.4 scfh for new sites
> 3.6 scfh for retrofit> 1.4 scfh for new sites
> 4.2 scfh for retrofit> 1.8 scfh for new sites
> 4.5 scfh for retrofit> 1.8 scfh for new sites
Oth
er
op
tio
ns
po
ten
tia
lly
ap
plic
ab
le d
ep
en
din
g o
n t
he lo
cal
co
nd
itio
ns L
imit
ed
ap
plic
ab
ilit
y Vent gas recovery ✓✓✓✓ ✓✓✓✓ ✓✓✓✓ ✓✓✓✓ ✓✓✓✓ ✓✓✓✓
Instrument air powered by gas Not relevant Not relevant Not relevant Not relevant Not relevant ✓✓✓✓
Self contained controllers ✓✓✓✓ ✓✓✓✓ ✓✓✓✓ ✓✓✓✓ ✓✓✓✓ ✓✓✓✓
Lim
ite
d k
no
wn
imp
lem
en
tati
on
s
Solar powered instrument air Not relevant ✓✓✓✓ Not relevant ✓✓✓✓ ✗ ✗
Electric controllers powered by other power sources (TEG, fuelcell)
Not relevant Not relevant Not relevant Not relevant Not relevant ✓✓✓✓
Large solar powered electric controller (no knownimplementations)
Not relevant Not relevant Not relevant Not relevant Not relevantPotential solution,**
but no exampleknown.
CAA Ex. 4

Zero emission technologies for pneumatic controllers in the USA 5
Abbreviations and Notes on Units
CAPEX Capital Expenditure
CH4 Methane
CO2eq Carbon dioxide equivalent
EF Emission Factor
ESD Emergency shut down
GHGRP Greenhouse Gas Reporting Program – US EPA
GOR Gas/oil ratio
Mscf Thousands standard cubic feet
MMscf Million standard cubic feet
MMscfd Million standard cubic feet per day
MMT Million tons
OPEX Operational expenditure
SCADA Supervisory Control and Data Acquisition
Scfh Standard cubic feet/hour
USD US dollars
VOC Volatile Organic compound
VRU Vapor Recovery Unit
Notes on units:
All the data are presented in metric tons
All monetary figures are presented in US dollars, denoted as $
Social Cost of Methane: This report uses the social cost of methane, as reported by US EPA in recent
regulatory analyses, as a benchmark for the cost-effectiveness of measures to abate methane emissions.
We use the mean value calculated at the 3% discount rate for emissions in year 2020. EPA calculates this
as $1300 per metric ton in 2012 USD. We have converted this to $1354 per metric ton in 2016 USD, using
a cumulative rate of inflation of 4.2%.
CAA Ex. 4

Zero emission technologies for pneumatic controllers in the USA 6
1. Introduction
1.1 What is the problem?
Natural gas-driven pneumatic controllers are used widely in the oil and natural gas industry to control liquid
level, temperature, and pressure during the production, processing, transmission, and storage of natural
gas and petroleum products. However, these devices vent methane into the atmosphere. Pneumatic
controllers are the second-largest source of methane from the US oil and gas industry, behind only
component leaks, according to US EPA’s Greenhouse Gas Inventory [1].
Over the last few years, regulators have worked to reduce the emission of methane and volatile organic
compounds (VOCs) from pneumatic controllers. US Federal rules require that new continuous-bleed
controllers be low-bleed (defined as designed to emit less than 6 scfh) at production sites and compressor
stations and zero-bleed at processing plants. Wyoming goes further to include intermittent-vent controllers
in its requirement that all new controllers are designed to emit less than 6 scfh. It also requires the
replacement of existing high-emitting controllers in some areas and caps allowable emissions in other
areas. Recently Colorado required that existing high-continuous-bleed controllers be replaced with low-
bleed controllers statewide, and other states are currently considering similar measures. Finally, some
operators have reported voluntary replacements of high-bleed controllers with low-bleed controllers to
programs such as US EPA’s Natural Gas STAR.
Unfortunately, recent measurement studies [2,3,4] have reported higher emissions from low-bleed
controllers than expected. Some controllers that are considered low-bleed according to manufacturer
specifications actually bleed above the low-bleed threshold of 6 scfh. Indeed, a number of controllers
appear to malfunction, emitting significantly more than they are designed to emit.
Moreover, as a class, intermittent-vent controllers, which are largely unregulated, far outnumber
continuous-bleed controllers, and EPA estimates that emissions from intermittent-vent controllers are
considerably higher than emissions from continuous-bleed controllers [1]. Recent work has demonstrated
that some controllers designed to emit intermittently fail and begin leaking natural gas continually [2,5].
Given the wide range of applications of pneumatic controllers, their typical installation in remote,
unmanned sites, and the limited resources of air quality regulators, it is very challenging for air quality
regulators to ensure compliance to emissions standards for pneumatic controllers. Currently, new
continuous-bleed controllers are in compliance with EPA rules, if they are designed to emit below the EPA
threshold of six cubic feet per hour. In practice, they may emit more depending on installation parameters
(such as the pressure of the supply-gas), malfunctions, or even tampering, e.g. production workers modify
controllers bleed rates when they believe that it will improve reliability [9]. Finally, it is inherently difficult to
quantify the emissions from intermittent-vent controllers, as their actuation frequency is variable and may
change over time.
1.2 Objective of this project
Zero emission technologies have the potential to virtually eliminate this emission source. They have
evolved extensively over the last few years, as operators have gained experience using them. Yet,
although zero emission technologies are often mentioned in best practices documentation and reports,
there is very limited information on overall applicability and costs (with the exception of instrument air).
CAA Ex. 4

Zero emission technologies for pneumatic controllers in the USA 7
This report documents how zero emission technologies are being used in gas and oil fields, and discusses
the zero emissions technologies that are suitable for wide usage in common applications at oil and gas
production facilities and compressor stations. The main objectives include:
• Presentation of zero emission technologies that are currently available on the market.
• Discussion of the applicability and the technical barriers to the implementation of these
technologies.
• Estimates of implementation and methane abatement costs of these technologies for new
installations and retrofits.
1.3 Approach and methodology
In addition to a comprehensive literature review, this report relies on interviews with a number of relevant
stakeholders and a detailed cost-benefit analysis.
Interviews: Seventeen interviews were conducted. Nine were with technology providers, and eight with
both small and large oil and gas companies. The interviews gathered information on field experience with
the implementation of zero emission technologies, in particular on their applicability, technical barriers
experienced, and actual costs and benefits.
Cost-benefit analysis of zero emission technology implementation: Based on the information
gathered during the interviews, literature reviews, and online equipment quotes, a cost-benefit analysis
was performed covering a wide range of possible site configurations.
The cost-benefit analysis is presented in section 4 of this report. Prior to that, section 2 includes an
introduction to controller typologies, followed by a brief literature review of emissions from controllers.
Section 3 presents the different zero emission controller technologies and includes a description of field
experiences with these technologies. The report concludes with a brief overview of existing applicability
and costs under a range of circumstances.
2. Gas Driven Pneumatic controllers – What are we talking about?
2.1 Definition
A process controller is a device that senses a physical state and then operates automatically to regulate
that state1, based on an established set-point in its control logic. Process controllers can regulate a variety
of physical parameters – or process variables – including fluid pressure, liquid level, fluid temperature, and
differential pressure. An example of a common type is a separator dump valve controller, which operates
when it senses that liquid has reached a certain level. Process controllers can be electric, hydraulic,
pneumatic or a combination of them. An example of a combination controller would be an electrohydraulic
controller operating an electric valve to send liquid pressure to a hydraulic end-device.
Pneumatic controllers convert an input signal to a pneumatic pressure output using gas pressure. The
end-device, i.e. the control valve, is adjusted by the actuator in response to signal from the controller.
A pneumatic controller uses gas pressure to open or close a mechanical device, such as a valve, when it
senses the need to regulate a process condition such as liquid level, pressure, temperature, or flow.
1 In complex control systems, other process control variables might be modulated to regulate the state of that process variable.
CAA Ex. 4
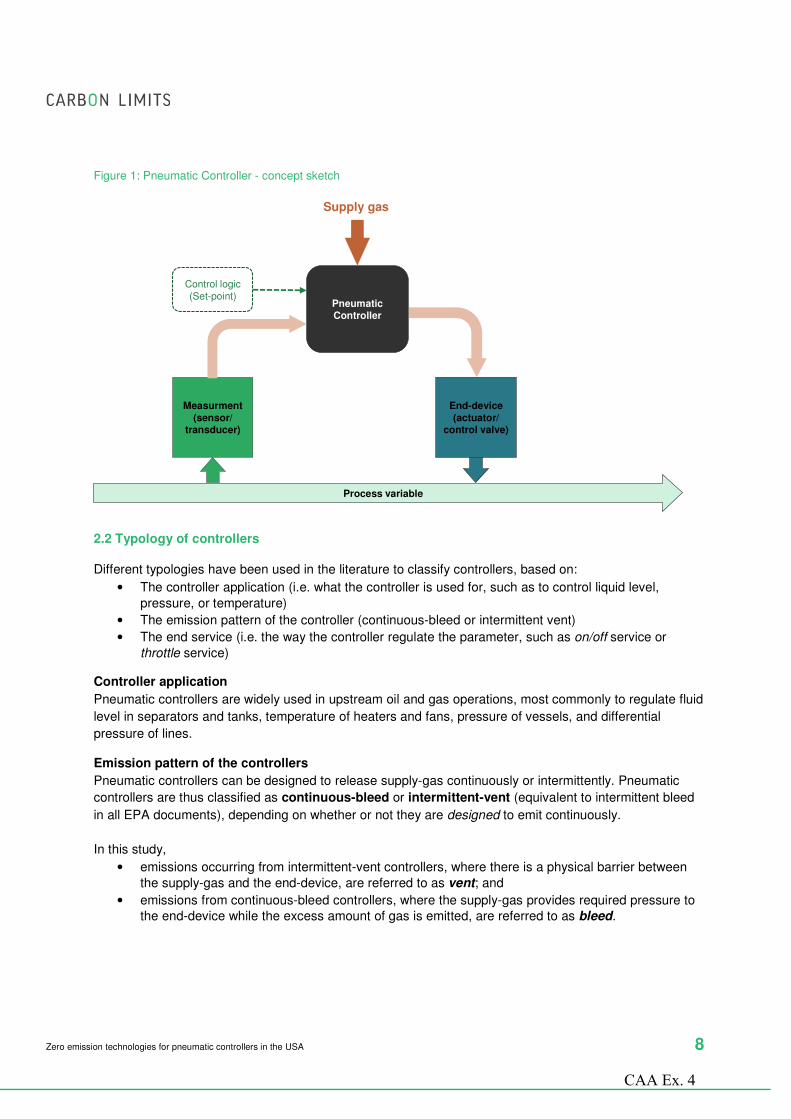
Zero emission technologies for pneumatic controllers in the USA 8
Figure 1: Pneumatic Controller - concept sketch
2.2 Typology of controllers
Different typologies have been used in the literature to classify controllers, based on:
• The controller application (i.e. what the controller is used for, such as to control liquid level,
pressure, or temperature)
• The emission pattern of the controller (continuous-bleed or intermittent vent)
• The end service (i.e. the way the controller regulate the parameter, such as on/off service or
throttle service)
Controller application
Pneumatic controllers are widely used in upstream oil and gas operations, most commonly to regulate fluid
level in separators and tanks, temperature of heaters and fans, pressure of vessels, and differential
pressure of lines.
Emission pattern of the controllers
Pneumatic controllers can be designed to release supply-gas continuously or intermittently. Pneumatic
controllers are thus classified as continuous-bleed or intermittent-vent (equivalent to intermittent bleed
in all EPA documents), depending on whether or not they are designed to emit continuously.
In this study,
• emissions occurring from intermittent-vent controllers, where there is a physical barrier between
the supply-gas and the end-device, are referred to as vent; and
• emissions from continuous-bleed controllers, where the supply-gas provides required pressure to the end-device while the excess amount of gas is emitted, are referred to as bleed.
Process variable
Pneumatic Controller
Measurment (sensor/
transducer)
End-device(actuator/
control valve)
Control logic(Set-point)
Supply gas
CAA Ex. 4

Zero emission technologies for pneumatic controllers in the USA 9
The continuous-bleed controllers are classified into high-bleed and low-bleed in this report, depending on
whether or not the controller is deemed to have a bleed rate above or below 6 scfh, in line with EPA
regulations.2
The typology used in this report differs from the one presented in Allen et al. [2] where controllers are
classified depending on their measured emissions pattern as opposed to their designed emissions pattern.
End-service typology
The end-device can be in on/off service or throttle service, depending on the process requirements. An
example of on/off service is a dump-valve that controls the level of a vessel. In the “on” state, the valve is
completely open to “dump” liquid. When the desired level has been achieved, the valve completely closes
to its “off” state. An example of throttle service is a pressure control valve, which increases or decreases
the flow of gas as needed to maintain line pressure at a fixed value. Both continuous-bleed and
intermittent-vent controllers are commonly used to perform both on/off and throttling services.
A summary of pneumatic controller typology is presented in the table below. As this study focuses on
eliminating emissions from these devices, only the emission pattern typology is used in the rest of the
report.
Table 1: Summary of controller typology (mainly based on [6])
Type of Service
On/Off Throttling
Em
issio
n c
hara
cte
risti
cs
Intermittent-vent
- Gas vented at de-actuation
- Designed to emit no gas between de-actuation instances
- De-actuation frequency depends on process variability
- Gas vented when end-device needs to throttle-off
- Designed to emit no gas between throttle-off instances
- Throttling frequency depends on process fluctuations
High-bleed continuous controller
- Gas emitted continuously with higher bleed rates when end-device needs “off” service
- Nevertheless, the average bleed amount is constant
- Bleed rates are by definition deemed to be higher than 6 scfh
- Gas emitted continuously with higher bleed rates end-device needs to throttle-off
- Nevertheless, the average bleed amount is constant
- Bleed rates are by definition deemed to be higher than 6 scfh
Low-bleed continuous controller
- Gas emitted continuously with higher bleed rates when end-device needs “off” service
- Nevertheless, the average bleed amount is constant
- Bleed rates are by definition deemed to be lower than 6 scfh
- Gas emitted continuously with higher bleed rates end-device needs to throttle-off
- Nevertheless, the average bleed amount is constant
- Bleed rates are by definition deemed to be lower than 6 scfh
2.3 Number of controllers and emission factors – Brief literature review.
Important work has been taking place over the last few years to measure and understand methane and
VOC emissions from pneumatic controllers. This work includes measurement surveys [2,3,4,7], count of
controllers per facility [1,2,8], and engineering calculations [8]. The methodology and the sampling
approach vary significantly between different sources of information; thus comparisons should be made
with particular care [8].
2 It should be noted that the bleed rate is not a specification of the controller only, but also depends on the pressure and flow-rate of the supply-gas in addition to the size of the restriction orifice.
CAA Ex. 4

Zero emission technologies for pneumatic controllers in the USA 10
How many controllers per site?
The number of controllers per site varies depending on the number of wells and more generally the
number and type of equipment used. Recent studies have demonstrated that the vast majority of sites
have less than 20 controllers.
Most of the existing studies have focused only on emitting controllers [3,5,7], thus underestimating the
number of controllers reported for each site, since some intermittent-bleed controllers actuate infrequently
(e.g., controllers for emergency shut-down valves) and are unlikely to do so while a site is being surveyed.
Two studies have performed a thorough count of the number of controllers per site [2,8]. The distribution of
controller functions reported by these studies varied, perhaps due to differences in the types of sites
sampled in the studies, but the overall distribution of controller counts at production sites were quite similar
(Figures 2 and 3):
• Very small and medium sites (with less than 20 controllers) account for the vast majority (97%) of
the sites evaluated in both studies (Figure 2)
• These sites represent 85% of the controllers (Figure 3)
Figure 2: Share of the sites depending on the total number of controllers per site
Figure 3: Share of the controllers depending on the total number of controllers per site
How much do controllers emit?
Despite the important work performed over the last few years, there is still significant uncertainty regarding
emissions factors from controllers. The following figure summarizes the current emission estimates
available for the different categories of controllers.
0%
10%
20%
30%
40%
50%
60%
1 - 3 cont. 4 - 10 cont. 11 - 20 cont. More than 20cont.
Sh
are
of
the
sites e
valu
ate
d
Number of controllers per site
[8] (Oklahoma study) [2] (Allen et al, 2015) [2] and [8] combined
0%
10%
20%
30%
40%
50%
60%
1 - 3 cont. 4 - 10 cont. 11 - 20 cont. More than 20cont.
Share
of
the c
ontr
ole
lrs
Number of controllers per site
[8] (Oklahoma study) [2] (Allen et al, 2015) [2] and [8] combined
CAA Ex. 4

Zero emission technologies for pneumatic controllers in the USA 11
Figure 4: Emissions factors by controller category from different information sources3
A number of important conclusions can be drawn from the review of existing publications:
• Emissions from controllers vary between controller models and, for some models, for the same
controller model between sites [2,4,7]
• A small subset of the controllers account for the vast majority of the emissions [2,7]
• Overall, recent research has demonstrated that a number of controllers behave differently than
originally designed. In particular,
o Average emission rates exceed the manufacturers’ specifications [4], including some
controllers designated low-bleed which emit above the threshold rate of 6 scfh [4,7]
o Some controllers designed to emit intermittently fail and begin emitting natural gas
continually [2,5]
In the analysis presented in the report, we have very conservatively adopted the lowest of the above
average EFs for low-bleed in new installations and for intermittent-vent controllers. For continuous bleed
controllers at existing sites, we have used the results of the recent measurement [2]. This average is
consistent with a mix of low- and high-bleed in the field. The EFs are illustrated in Figure 4 and are
described further in Section 4.1.
Do controllers from smaller sites emit more?
There is very little information available on how emission factors vary depending on the site’s size.
Analysis of recent measurements [2] suggests, however, that controllers are likely to emit much more in
small than in large sites.
The following graph, plotting the mean and the eightieth percentile emission factors, shows a clear
downward trend as the number of controllers per site increases. This trend could potentially be explained
by the difference in terms of maintenance practices for small sites (typically unmanned and in remote
area) and larger sites. In the follow-up analysis, a constant emission factor is assumed for both small and
large sites.
3 The data from [3] and [4] have been categorized and presented as described in [8]. The data from [2] have been categorized based on the “company classification into EPA category” (excluding ESD) and not based on the measured emission typology.
0
5
10
15
20
25
30
35
40
Intermittent- vent controllers Low bleed continuous controller High bleed continuous controller Continuous-bleed controllers onexisting sites
All measurements combined
EF
(scfh
/contr
olle
r)
[16] (Subpart W) [3] (Allen et al. 2013) - 305 measurements
[4] (Prasino) - 81 measurements [2] (Allen et al 2015) - 377 measurements
[7] (Carbon Limits) - 7048 measurements [5] (Fort worth)
Central assumption- section 4
CAA Ex. 4

Zero emission technologies for pneumatic controllers in the USA 12
Figure 5: Average emission factors depending on the number of controllers per site [2]
3. Zero emission technologies – Description and technical applicability
This section provides an overview of a number of zero emission technologies available as an alternative to
gas driven pneumatic controllers, based primarily on interviews and on a general literature review. A
technology is considered “zero emission” if there is no methane or VOC emissions associated with its
utilization.
3.1 Overview of the zero emission technology presented.
Five different technologies have been reviewed: Electronic controllers, instrument air provided by
compressors (with electric power from the grid or existing on-site generation), solar-powered instrument
air, vent recovery, and self-contained pneumatic controllers. Of these five different zero emission
technologies, two – electronic controllers and instrument air – have reached a reliable level of maturity and
are widely applicable. The remaining three technologies are either less mature (solar-powered instrument)
or are applicable only in certain circumstances (self-contained pneumatic controllers and vent recovery).
The economic feasibility of the two mature and widely applicable technologies, electronic controllers and
instrument air, is evaluated in detail in section 4 of this report.
The following table presents a brief summary of the different technologies evaluated.
Table 2: overview of the zero emission technologies presented
Technology Maturity of the
technology
Technical applicability limitations Main strengths
Electronic
controllers (ref
section 3.2)
The technology has reached a reliable level of maturity, with hundreds of installations identified throughout this study.
Operators interviewed continue to use pneumatic ESDs.
Some limitations with large numbers of controllers or high power demand chemical injection pumps.
• Can operate off grid
• Reduced maintenance costs, in particular compared to wet gas driven controllers
• Enables or simplifies automation of systems
0
5
10
15
20
25
30
35
40
45
1 - 3 cont. 4 - 10 cont. 11 - 20 cont. More than 20 cont.
Em
issio
n p
er
co
ntr
olle
r (s
cfh
)
Mean Percentile 80%
CAA Ex. 4

Zero emission technologies for pneumatic controllers in the USA 13
Instrument air
(ref section 3.3)
Extensive global experience for many years
Requires a reliable source of power
Limited to installations with an air compressor > 5 HP
• Reliability
• Reduced maintenance costs, in particular compared to wet gas driven controllers
Solar-powered
Instrument air
(ref section 3.4)
Less than 100 installations identified
Compressor up to ~20 scfh • Operates off grid
• Reduced maintenance costs, in particular compared to wet gas driven controllers
Vent Recovery
(ref section 3.4)
The study identified less
than 100 installations, with
uncertain performance
Requires the presence of a VRU or a
gas engine on site
• Reliability
Self-contained
pneumatic
controllers (aka
“Bleed to Pressure”
or integral
controllers)
(ref section 3.4)
Although this solution has
been deployed since early
2000s and is considered a
relatively well-developed
technology, controllers of
this type are only available
for certain specific
applications
Applicability is limited by a number of
conditions (e.g. pressure differential,
downstream pressure, etc.)
• Low-cost solution
3.2 Electronic controllers (solar powered and grid powered)
Electronic controllers adjust the position of the end-device by sending an electric signal to an electric
actuator or positioner (as compared to pneumatic controllers which send a pneumatic signal to a
pneumatic actuator or positioner). A motor powers the electric actuator to adjust the control valve to the
desired position.
This section provides a description of the benefits, costs, and applicability of electronic controllers to both
new sites and existing sites, where retrofits would be required. The description is based mainly on
interviews with four oil and gas production companies that have installed these systems in their operations
(from 3 to 40 installations per operator interviewed), complemented by interviews with technology
providers.
Description of the technology
Electronic controllers can be installed both at sites connected to the electric grid, and at remote sites
isolated from the grid. These systems typically include a control panel, electric actuators, electronic
controllers, control valves, relevant switches (e.g. pressure, level or temperature switch) and a power
source – connection to the grid, solar panels and batteries, or power generation on site. An electronic
control system is generally designed to completely replace all pneumatically powered devices with
electronic controls (with the exception of ESD, see below).
Electrically powered sites: Electronic controllers can be powered using 120 VAC or 220 VAC input from
the grid or from on-site generation (three-phase power is not needed).
Remote sites: Solar control systems are driven by solar power cells that actuate mechanical devices using
electric power. Systems can be customized for every application; those installed to date include up to
three solar panels and eight batteries [9]. Use of solar-powered chemical injection pumps has become
widespread over the past years.
CAA Ex. 4

Zero emission technologies for pneumatic controllers in the USA 14
Rationale for the use of electronic controllers: For the operators interviewed, the two main drivers for
project implementation were (i) to reduce methane
and VOC emissions and conserve gas otherwise
emitted and (ii) to reduce maintenance costs.
Electronic systems have much lower maintenance
costs than traditional gas-driven controller systems
[10], in particular if the gas used is not perfectly dry
and sweet.
Higher operating costs are also experienced for gas
driven controller systems on sites where there is a
need to purchase fuel gas from another source or use
imported propane. These include sites with overly sour
or wet gas, or with drastic drop in gas supply due to
low gas/oil ratio (GOR) /low production.
Investment Costs Each electronic control system is designed on a case-
by-case basis. The investment costs depend on the
number of controllers/pumps, but also on other factors
such as pressure differential, pipeline diameter, and
methanol volume requirement, which varies according
to such factors as climate and production patterns4.
The following table summarizes typical equipment
costs for the cases evaluated:
Figure 6- Calscan pictures- Bear solar control system: Top: solar panel and control panel, bottom: Electric Actuator
Table 3: Electronic controllers – Typical investment costs for main equipment
Main items Approximate unit costs USD
Level Controller & Level Control Valve 4000
Pressure Controller & Control Valve 4000
Chemical injection Pump 6000
Control panel 4000
Solar panel (140W unit) 500
Battery (100 Ah unit) 500
The operators interviewed experienced fairly smooth installations, with installation costs decreasing as
they gained experience with the technology5. The installation costs vary by site, estimated at between
$5000 and $8000 per well site. For a retrofit project, the well needs to be shut in for one or two days;
4 Chemical injection pumps (e.g. methanol pumps) usually are the most important power consumer. Sites requiring high volumes of methanol volume injection would cause higher costs for scaled-up solar panel and batteries. 5 After the first few sites installations.
CAA Ex. 4

Zero emission technologies for pneumatic controllers in the USA 15
retrofit will generally take place when other maintenance is scheduled, to take advantage of that shut-
down time. Solar powered electric systems do not require back-up generators6.
Maintenance costs
The major maintenance costs include the replacement of batteries and panels. Most batteries last three to
six years, while solar panels last twenty to thirty years. The operators interviewed highlighted that they
experienced minimal maintenance costs on the sites converted to electronic controllers over the last five
years.
Benefits of electronic controllers
Operators highlighted a number of benefits:
• Revenue from the sale of gas: Electronic controllers eliminate methane and VOC emissions and
thus increase the volume of gas available for sale.
• Automation: Electronic control systems can provide additional benefits by enabling or simplifying
the installation of automation systems (SCADA, Supervisory Control and Data Acquisition), though
these systems are not required in order to use electronic controllers. This can potentially reduce
the need for site inspections, reducing those costs for operators. For example, an alarm can be
programmed to warn the operator if the dump has been open for more than 10 min. The system
can be as sophisticated or as simple as required. (Note that we have not included any estimate of
these cost reductions in the calculations of cost-effectiveness discussed in Section 4.)
• Reliability: As highlighted above, operators report that the electronic system is more reliable than a
gas driven pneumatic control system, as operation of the latter with even slightly wet gas can lead
to condensation issues, which over time will impact the performance of the system. One operator
reported corrosion issues with sour gas used for pneumatic controllers and pumps.
Technical challenges with electronic controllers
• Snow: One operator reported that snow can be a problem with solar panel and battery lifetime.
• Theft or damage: Solar panels have reportedly been stolen or used as targets for shooting.
• Chemical injection pumps: Pumps consume far more energy than controllers/actuators. Sites with
a large number of pumps or with pumps with high energy or power demand may represent a
challenge for 100% solar powered electric systems. In addition, shortly after completion, some
wells may require high volumes of methanol injection, and powering pumps to inject this high
volume can strain these systems. Some of the operators interviewed reported that this technical
barrier can be solved by bringing a portable stand-alone generator to the site for a few weeks to
ensure that the power requirement is met.
• Safety considerations: Due to the very low voltage of the system, the safety risks are considered
acceptable by the operator who evaluated this risk.
Applicability of electronic controllers
According to interviews with operators, this solution can technically be implemented on any well site.
Generally, for the sites with these systems in place, the pressure differential is up to 2000 psi and the pipe
diameters are between 2- 3 inches, but the system can be designed for larger pressure drops and larger
diameters as required.
6 When properly designed (e.g. with sufficient reserve margin in the batteries), recent solar powered electric systems do not require back-up generators, due to the reduced cost of solar-panels and the availability of low-power components. These systems are routinely installed without back-up generators in North America, including in Northern Canada where in winter there is only 1 to 2 hours of full sunlight a day. [9]
CAA Ex. 4

Zero emission technologies for pneumatic controllers in the USA 16
The only general limitation is the incremental costs. According to the operators, given the current gas
prices, implementation costs are not compensated by the value of the gas saved. The project can be
economical when other factors such as lower maintenance costs improve the return on investment.
Note on Emergency Shut-Down Valves (ESD): As a rule, electric controllers/actuators will stay in position
if the system fails and power is lost, wires are cut, or other failures occur. This differs from some other
solutions that can be designed so that valves close (or open) if the system fails (for example if the supply
gas pressure is lost). Although Calscan is developing a “fail safe” electric ESD, operators have reportedly
been using pneumatic or hydraulic ESD valves, as they are “fail-safe”.
Sunlight: In northern latitudes (e.g. northern Alberta) and when the energy demand is high (e.g. several
pumps), solar panels may not generate enough power, in particular for chemical injection pumps. Other
power sources such as thermal electric generators or methanol fuel cells have been used in pilot
implementations.
Electronic controllers at medium and large sites: Due to the market conditions, providers have so far
focused mainly on the development of solutions for small sites in remote locations. There thus seems to
be much less field experience with using electronic controllers at medium and large sites. No technical
barriers were identified for the installation of electronic controllers in sites with available electricity. Given
the recent progress in both solar panel technologies and large battery solutions, solar-powered solutions
may also be appropriate for large sites without available power. However, we are not aware of any such
installations. Therefore, to be conservative, we do not examine the use of electronic controllers at large
sites without electricity available.
Medium or large sites may also be the result of a combination of a number of small sites (e.g. several well
pads). In practice, several small independent electronic controller installations can thus be installed on one
medium to large site.
Suppliers
The following table presents a non-exhaustive list of relevant providers:
Table 4: Non-exhaustive list of relevant providers:
Name of the suppliers
Website Offer Comments
Calscan http://www.calscan.net/products_bearcontrol.html
Provide full customized system
Cascan’s Bear Solar Electric Control System is designed mainly for well head separators, but it can also be used in other applications. It includes solar panels, batteries, electric actuators, control valves, switches, control panels and other control equipment.
Spartan http://www.spartancontrols.com/
Provide full customized system
Spartan designs electronic control systems assembling a number of components including Emerson/Fisher electronic controllers and actuators.
Ameresco http://www.amerescosolar.com/solar-power-solutions-oil-and-gas-industry
Provide full customized systems
Amaresco Solar designs customized off-grid solar power systems.
Emerson/ Fisher
Manufacture elec. controllers and actuators
Different brands under Emerson Process Management (including Fisher, EIM) supply electronic and electro-pneumatic control components (controllers, positioners, actuators, control valves, transducers, etc.)
Exlar http://exlar.com/ Manufacture elec. actuators
Exlar currently offer electric actuators that can replace pneumatic actuators.
CAA Ex. 4

Zero emission technologies for pneumatic controllers in the USA 17
3.3 Instrument air
Instrument air controllers are systems where pressurized natural gas is replaced with compressed air as a
source of energy and signaling medium for pneumatic controllers and pneumatic actuators. Since
controllers use air, instead of natural gas, they only vent air to the atmosphere, eliminating emissions from
pneumatic controllers. Instrument air controllers are applicable to both new sites and existing sites;
however, the technology can only be implemented when a reliable power supply is available.
This section provides a description of the benefits, the costs, and the applicability of instrument air
controllers and is mainly based on interviews with oil companies, reviewing their recent experience
installing instrument air systems.
Description of the technology
Instrument air technology is a well-established mature solution to run pneumatic control systems and is
widely applied globally. In many countries (e.g. Norway, Iran, Kazakhstan [11]), the majority of the
pneumatic control systems run on instrument air.
Systems typically include:
• Heavy-duty industrial air compressors. Two compressors are generally installed for redundancy,
but for cost reasons, an operator has reported using only one.
• Air dryers - part of the air compressor package.
• Wet air receiver tank - part of the air compressor package.
• Dry air receiver tank - helps provide a buffer to secure longer system autonomy in the event of a
power outage or demand surge.
Investment costs
Interviewers highlighted that the investment costs for instrument air installation vary significantly from site
to site, depending on the layout and the type of equipment already on site. Investment costs can be
classified as follows:
• Air compressor package: This includes the purchase of the main equipment (compressors, dryers
and air receiver tanks). The size of compressors, dryers, and other equipment depends on the
number of pneumatic controllers to be supplied with compressed air, and on their specifications
(i.e., their demand for compressed air). A small compressor station would require around 5 HP of
air compression capacity, while a larger facility would require up to 20 HP. This system can be
purchased as individual components or as a package, for between $20,000 and $70,000 [12].
• Mechanical & installation costs: Mechanical and civil work may be required, depending on the
layout of the existing facility. These costs are often higher for older facilities and can include:
o Pipe cleaning and upgrades.
o Trenching and tubing installation, since large sites may have several independent natural
gas supply systems for controllers and pumps, and air would need to be piped through
the full site.
• Electrical/instrumentation equipment and supplies: Depending on the site and the specific project
requirement, this category may include:
o Remote terminal unit or SCADA system installation or upgrade. The control system for
some plants (e.g. shutdown/start-up, safety systems etc.) may have to be upgraded to
accommodate the air compressor package.
o Upgrades and wiring needed to add the additional electrical loads from the air
compressor motors.
o Repair/replacement of a controller in case of malfunctioning controller.
• Engineering/consulting: The site might require additional expenditures for electrical engineering
and consulting.
CAA Ex. 4
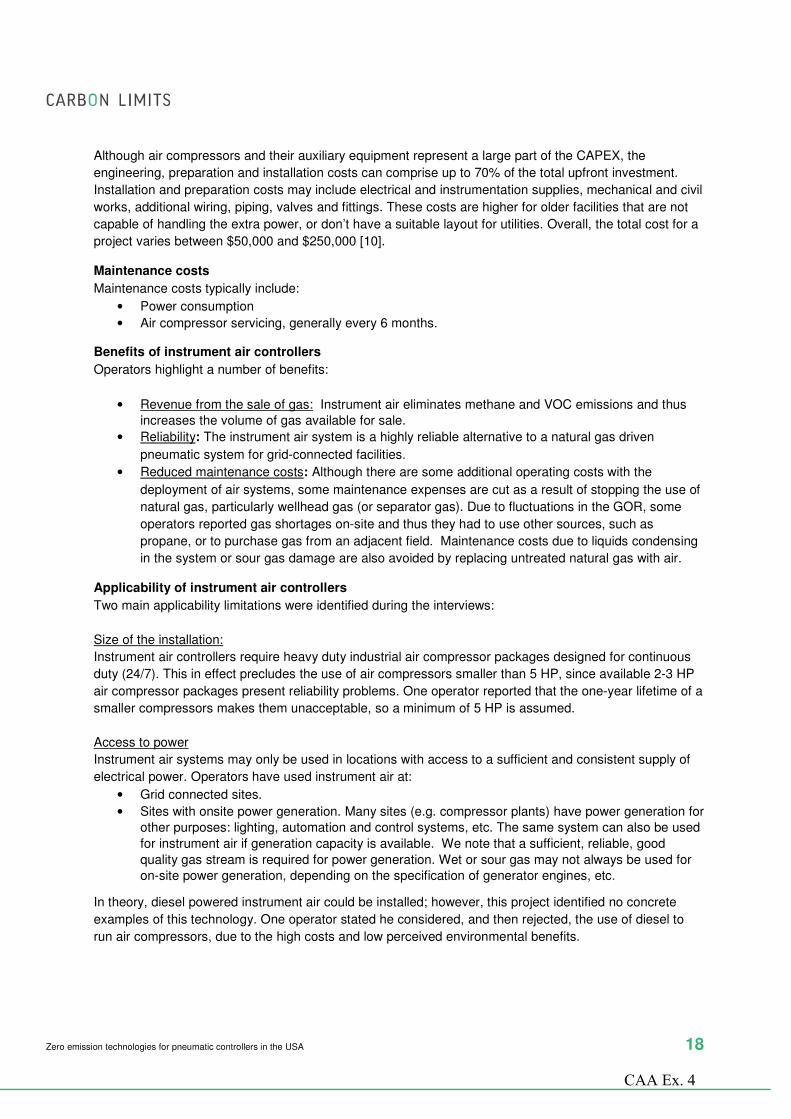
Zero emission technologies for pneumatic controllers in the USA 18
Although air compressors and their auxiliary equipment represent a large part of the CAPEX, the
engineering, preparation and installation costs can comprise up to 70% of the total upfront investment.
Installation and preparation costs may include electrical and instrumentation supplies, mechanical and civil
works, additional wiring, piping, valves and fittings. These costs are higher for older facilities that are not
capable of handling the extra power, or don’t have a suitable layout for utilities. Overall, the total cost for a
project varies between $50,000 and $250,000 [10].
Maintenance costs
Maintenance costs typically include:
• Power consumption
• Air compressor servicing, generally every 6 months.
Benefits of instrument air controllers
Operators highlight a number of benefits:
• Revenue from the sale of gas: Instrument air eliminates methane and VOC emissions and thus
increases the volume of gas available for sale.
• Reliability: The instrument air system is a highly reliable alternative to a natural gas driven
pneumatic system for grid-connected facilities.
• Reduced maintenance costs: Although there are some additional operating costs with the
deployment of air systems, some maintenance expenses are cut as a result of stopping the use of
natural gas, particularly wellhead gas (or separator gas). Due to fluctuations in the GOR, some
operators reported gas shortages on-site and thus they had to use other sources, such as
propane, or to purchase gas from an adjacent field. Maintenance costs due to liquids condensing
in the system or sour gas damage are also avoided by replacing untreated natural gas with air.
Applicability of instrument air controllers
Two main applicability limitations were identified during the interviews:
Size of the installation:
Instrument air controllers require heavy duty industrial air compressor packages designed for continuous
duty (24/7). This in effect precludes the use of air compressors smaller than 5 HP, since available 2-3 HP
air compressor packages present reliability problems. One operator reported that the one-year lifetime of a
smaller compressors makes them unacceptable, so a minimum of 5 HP is assumed.
Access to power
Instrument air systems may only be used in locations with access to a sufficient and consistent supply of
electrical power. Operators have used instrument air at:
• Grid connected sites.
• Sites with onsite power generation. Many sites (e.g. compressor plants) have power generation for
other purposes: lighting, automation and control systems, etc. The same system can also be used
for instrument air if generation capacity is available. We note that a sufficient, reliable, good
quality gas stream is required for power generation. Wet or sour gas may not always be used for
on-site power generation, depending on the specification of generator engines, etc.
In theory, diesel powered instrument air could be installed; however, this project identified no concrete
examples of this technology. One operator stated he considered, and then rejected, the use of diesel to
run air compressors, due to the high costs and low perceived environmental benefits.
CAA Ex. 4

Zero emission technologies for pneumatic controllers in the USA 19
3.4 Other technologies
This section reviews other “zero emission” technologies at various stages of maturity. In general these
technical options are either (i) not widely applicable (such as self-contained controllers and vent gas
recovery) or (ii) fewer than 100 installations were identified as part of this project (such as solar powered
instrument air).
Solar powered instrument air
This study identified about 40 installations of small, energy efficient motor-compressors powered by solar
panels/batteries, to replace natural gas with instrument air as the pneumatic medium. TRIDO industries,
the technology provider interviewed as part of this study, indicated that these systems have a maximum
capacity of ~20 scfh, making them suitable for some small to medium sites which use a few low-emitting
controllers. High-bleed controllers have to be retrofitted to reduce air consumption in order to reach the
feasible level. Despite the lack of extensive deployment so far, an attraction of this solution lies in the fact
that controllers and actuators do not need to be replaced.
Instrument air powered by other power sources
Other power sources, such as thermal electric generators or methanol fuel cells, have been used in pilot
implementations to power traditional instrument air systems.
Vent Gas Recovery
Re-routing to VRU
Vapor Recovery Units (VRUs) have a long, well-established track record in the upstream oil and gas
industry to recover VOCs and methane from vented sources. Typically, they consist of capturing and
piping equipment, a de-liquefaction drum, and compressor(s) to inject the recovered gas into pipelines. In
theory, all vent lines can be connected to the VRU, including pneumatic controllers’ lines.
Nevertheless, there have been limited implementations (only one example identified in this study) of well-
site vent gas recovery projects using the recovered gas from pneumatic controllers in non-engine
applications. SlipStream®, as further presented below, is a technology that facilitates recovery of the gas
and use of it in gas-fired engines. Another technology, Cata-Dyne™, utilizes the recovered gas as a feed
to a small, flameless appliance that converts natural gas or propane into infrared radiant heat that is
usable if industrial heating is required.
SlipStream®
Spartan’s SlipStream® system captures vented hydrocarbons and uses them as a supplementary fuel
source for natural gas-fired engines, reducing fuel consumption. This technology can thus be applied only
to sites with gas-fired engines, e.g. compressor engines. Despite concerns about costs, one operator
emphasized specifically the reliability of the technology, as it reportedly does not interfere with normal
operations. Nevertheless, if the volume of gas emitted by the combined vents (including the controllers)
exceeds the engine fuel requirements, natural gas would still be vented or otherwise controlled.
Self-contained (aka Bleed-to-Pressure or Integral Pneumatic Controllers)
Self-contained systems are designed to contain the gas typically vented from controllers and then
discharge it to the control valve’s downstream piping, thus resulting in zero emission.
A number of operational requirements limit the applicability of self-contained systems, the most important
of which is the need for a high differential pressure across the control valve [6,13]. For instance, GE’s
Bleed-to-Pressure system requires more than 80 psi, and both GE and VRG Controls require a
downstream pressure of maximum 300 psi [13]. Also, sour or untreated gas could cause disturbances in
CAA Ex. 4

Zero emission technologies for pneumatic controllers in the USA 20
the operation of self-contained controllers. Nevertheless, if applicable, the technology may be cost-
effective or economical in cases where the total baseline emissions are high.7
Due to the limited applicability or the lack of widespread field experience, the technologies described
above are not further analyzed in this report. However, depending on the site specifics, these options may
be applicable and cost-effective, and can represent useful alternatives to instrument air or electronic
controllers; thus they are presented as potential alternative options in section 4.4.
4. Cost effectiveness of electronic controllers and instrument air
This section presents an analysis of the cost-effectiveness – net cost in USD per ton of avoided pollution –
of employing the two main zero emission technologies, air-driven pneumatic controllers and electronic
controllers, instead of natural gas-driven pneumatic controllers at new and existing sites. These results are
applicable at both oil and gas production sites (well pads) and compressor stations.
4.1 Analytical approach
The cost-effectiveness of zero emission technologies will vary with the number and type of controllers at a
site, in addition to many other factors, as we discuss below. Given the variety of site configurations
(number and type of controllers per site, connection to the grid, type of gas handled) across the US, and
the lack of information on the frequency of occurrence of these configurations, we opted to carry out cost-
effectiveness assessments for both electronic and instrument air controllers for a broad spectrum of
permutations of those site configuration parameters.
A number of assumptions have been made for the analysis. Key assumptions are discussed in the section
below; all assumptions are detailed in the Appendix.
Figure 7: Overview of the methodology
For each permutation of the site configuration parameters, a CH4 abatement cost (cost per metric ton of
avoided pollution) was estimated.
7 A technology provider reports an average of less than $3000 per Bleed-to-Pressure control system, leading to a payback period of less than 2 years for replacing 8 controllers.
Emissions factors
Electric controllers costs
Instrument air costs
ASSUMPTIONSSITE CONFIGURATIONS
Abatement cost estimates
Other assumptions (gas composition, gas price, etc..)
Number continuous bleed controllers?
Retrofit or new site?
Number intermittent bleed controllers?
Is there electricity on site?
What is the quality of the gas used?
Sensitivity analysis2032 site configurations evaluated
CAA Ex. 4

Zero emission technologies for pneumatic controllers in the USA 21
For this analysis, a zero emission technology implementation is considered • “economical” if the CH4 abatement cost is negative (i.e. if the project NPV is positive) • “cost effective” if the CH4 abatement cost (net cost per ton of abated pollution) is lower than
the social cost of methane that EPA has used in recent regulatory analyses [19] (Social cost of methane for 2020, calculated with a 3% discount rate, $1354 (2016 USD). 8
The following sections provide more insight on:
• The abatement cost calculation
• The main assumptions
• The site configurations evaluated.
Abatement cost calculation – methodology
For each site configuration, the following were estimated:
• The CAPEX and OPEX of the zero emission technology implementation (either electronic
controllers or instrument air)
• The CAPEX and OPEX of the baseline scenario (i.e. the cost incurred by the operator if the
conventional pneumatic technology had been used instead of zero emission systems)
• The emissions of CH4 and VOC under the baseline scenario
Since methane and VOC emissions will be zero if the zero emission technology is used, the abatement
cost (in $/t CH4) is then estimated as follows:
����������� = −���(���ℎ������������������ �!" − ���ℎ���#$��%����!$�����)
���('�(��(�#$��%����!$�����)
This approach, and its underlying assumptions, is compared to the annualized cost approach typically
used by EPA in the appendix.
Main assumptions
The following table provides a list of the main assumptions applied. A full list of assumptions is available in
the Appendix.
Table 5: Central assumptions
Description Central
Assumption Comment
Gas price 2 $/Mscf
The value of recovered gas has been assumed to be similar for all emission sources, independent of the composition of the gas. Gas values from 1 to 3 $/Mcf have been assessed in sensitivity analyses.
Discount rate 7%
A 7% per year real term discount rate has been assumed. A sensitivity is presented for a 3% per year real term discount rate. This approach is consistent with EPA/BLM practice.
Remaining lifetime for a new project 15 years
The lifetime for new controller installation is assumed to be 15 years in line with EPA practice.
Remaining lifetime for retrofit project
10 years The remaining lifetime for existing sites is assumed to be 10 years. A sensitivity is presented for a 5 years remaining lifetime.
Gas composition 0.0167 tCH4/Mscf Gas composition assumptions for dry gas
(wet gas assumptions are presented in the Appendix) 0.0046 tVOC/Mscf
8 EPA reports that the 2020 social cost of methane (mean value at 3% discount rate) is $1300 / metric ton of methane in 2012 USD; this is adjusted to $1354 / metric ton of methane in 2016 USD using a 4.2% cumulative inflation rate.
CAA Ex. 4
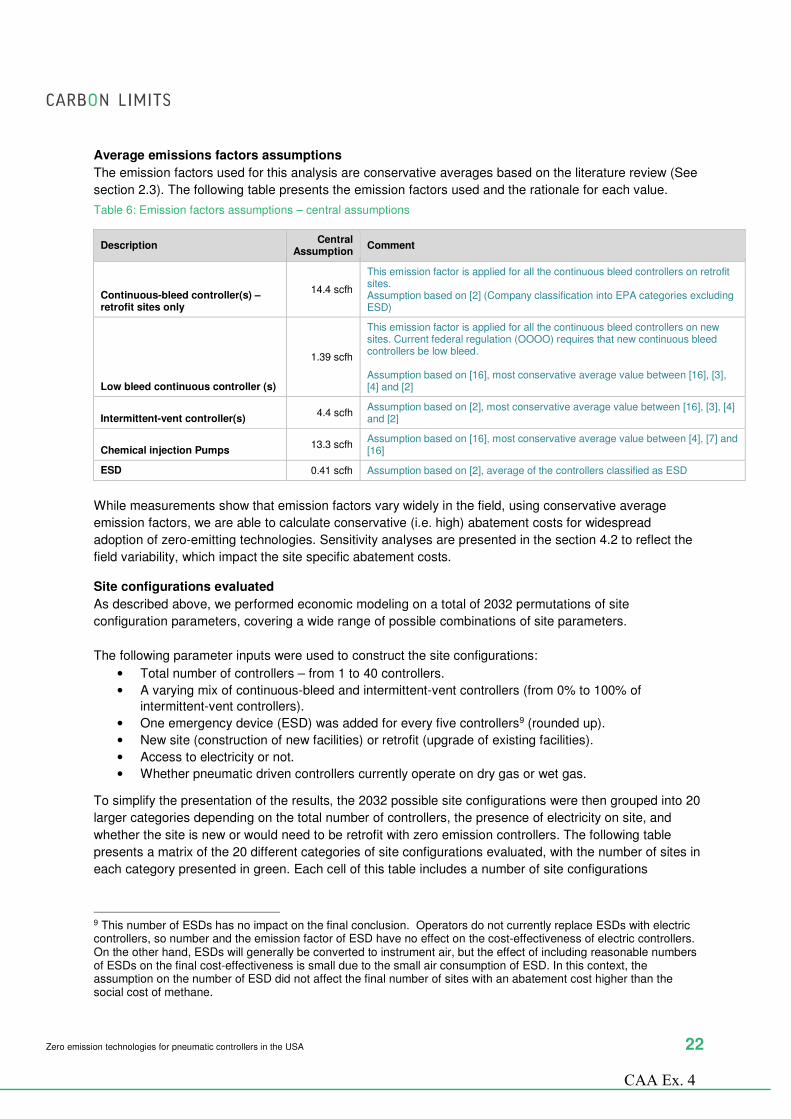
Zero emission technologies for pneumatic controllers in the USA 22
Average emissions factors assumptions
The emission factors used for this analysis are conservative averages based on the literature review (See
section 2.3). The following table presents the emission factors used and the rationale for each value.
Table 6: Emission factors assumptions – central assumptions
Description Central
Assumption Comment
Continuous-bleed controller(s) – retrofit sites only
14.4 scfh
This emission factor is applied for all the continuous bleed controllers on retrofit sites. Assumption based on [2] (Company classification into EPA categories excluding ESD)
Low bleed continuous controller (s)
1.39 scfh
This emission factor is applied for all the continuous bleed controllers on new sites. Current federal regulation (OOOO) requires that new continuous bleed controllers be low bleed. Assumption based on [16], most conservative average value between [16], [3], [4] and [2]
Intermittent-vent controller(s) 4.4 scfh
Assumption based on [2], most conservative average value between [16], [3], [4] and [2]
Chemical injection Pumps 13.3 scfh
Assumption based on [16], most conservative average value between [4], [7] and [16]
ESD 0.41 scfh Assumption based on [2], average of the controllers classified as ESD
While measurements show that emission factors vary widely in the field, using conservative average
emission factors, we are able to calculate conservative (i.e. high) abatement costs for widespread
adoption of zero-emitting technologies. Sensitivity analyses are presented in the section 4.2 to reflect the
field variability, which impact the site specific abatement costs.
Site configurations evaluated
As described above, we performed economic modeling on a total of 2032 permutations of site
configuration parameters, covering a wide range of possible combinations of site parameters.
The following parameter inputs were used to construct the site configurations:
• Total number of controllers – from 1 to 40 controllers.
• A varying mix of continuous-bleed and intermittent-vent controllers (from 0% to 100% of
intermittent-vent controllers).
• One emergency device (ESD) was added for every five controllers9 (rounded up).
• New site (construction of new facilities) or retrofit (upgrade of existing facilities).
• Access to electricity or not.
• Whether pneumatic driven controllers currently operate on dry gas or wet gas.
To simplify the presentation of the results, the 2032 possible site configurations were then grouped into 20
larger categories depending on the total number of controllers, the presence of electricity on site, and
whether the site is new or would need to be retrofit with zero emission controllers. The following table
presents a matrix of the 20 different categories of site configurations evaluated, with the number of sites in
each category presented in green. Each cell of this table includes a number of site configurations
9 This number of ESDs has no impact on the final conclusion. Operators do not currently replace ESDs with electric controllers, so number and the emission factor of ESD have no effect on the cost-effectiveness of electric controllers. On the other hand, ESDs will generally be converted to instrument air, but the effect of including reasonable numbers of ESDs on the final cost-effectiveness is small due to the small air consumption of ESD. In this context, the assumption on the number of ESD did not affect the final number of sites with an abatement cost higher than the social cost of methane.
CAA Ex. 4
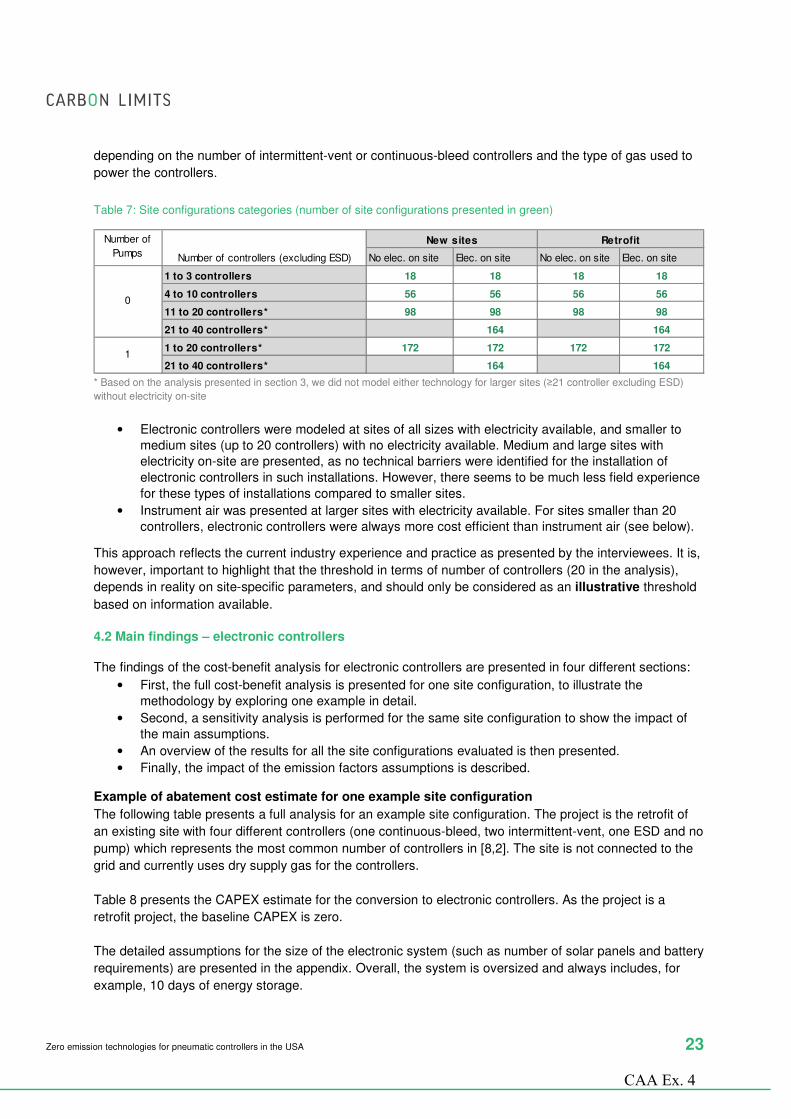
Zero emission technologies for pneumatic controllers in the USA 23
depending on the number of intermittent-vent or continuous-bleed controllers and the type of gas used to
power the controllers.
Table 7: Site configurations categories (number of site configurations presented in green)
* Based on the analysis presented in section 3, we did not model either technology for larger sites (≥21 controller excluding ESD)
without electricity on-site
• Electronic controllers were modeled at sites of all sizes with electricity available, and smaller to
medium sites (up to 20 controllers) with no electricity available. Medium and large sites with
electricity on-site are presented, as no technical barriers were identified for the installation of
electronic controllers in such installations. However, there seems to be much less field experience
for these types of installations compared to smaller sites.
• Instrument air was presented at larger sites with electricity available. For sites smaller than 20
controllers, electronic controllers were always more cost efficient than instrument air (see below).
This approach reflects the current industry experience and practice as presented by the interviewees. It is,
however, important to highlight that the threshold in terms of number of controllers (20 in the analysis),
depends in reality on site-specific parameters, and should only be considered as an illustrative threshold
based on information available.
4.2 Main findings – electronic controllers
The findings of the cost-benefit analysis for electronic controllers are presented in four different sections:
• First, the full cost-benefit analysis is presented for one site configuration, to illustrate the
methodology by exploring one example in detail.
• Second, a sensitivity analysis is performed for the same site configuration to show the impact of
the main assumptions.
• An overview of the results for all the site configurations evaluated is then presented.
• Finally, the impact of the emission factors assumptions is described.
Example of abatement cost estimate for one example site configuration
The following table presents a full analysis for an example site configuration. The project is the retrofit of
an existing site with four different controllers (one continuous-bleed, two intermittent-vent, one ESD and no
pump) which represents the most common number of controllers in [8,2]. The site is not connected to the
grid and currently uses dry supply gas for the controllers.
Table 8 presents the CAPEX estimate for the conversion to electronic controllers. As the project is a
retrofit project, the baseline CAPEX is zero.
The detailed assumptions for the size of the electronic system (such as number of solar panels and battery
requirements) are presented in the appendix. Overall, the system is oversized and always includes, for
example, 10 days of energy storage.
No elec. on site Elec. on site No elec. on site Elec. on site
1 to 3 controllers 18 18 18 18
4 to 10 controllers 56 56 56 56
11 to 20 controllers* 98 98 98 98
21 to 40 controllers* 164 164
1 to 20 controllers* 172 172 172 172
21 to 40 controllers* 164 164
0
1
Number of
Pumps Number of controllers (excluding ESD)
New sites Retrofit
CAA Ex. 4

Zero emission technologies for pneumatic controllers in the USA 24
Table 8: CAPEX estimates for electronic controller implementation (central assumptions)
Item Assumption # Total USD
Controllers $ 4000/unit 3 12 000
Control Panel $ 4000/unit 1 4 000
140 W Solar Panel
$500 /Unit 1 500
100 Amh battery
$400 /Unit 3 1 200
Installation and
engineering costs
20% of equipment
costs NA 3 540
Total CAPEX 21 240
Table 9: Emissions estimates (central assumptions, new sites)
Whole gas emissions in scfh EF
assumption # Total
Intermittent – vent controllers 4.43 2 8.9
Continuous –bleed controller 14.4 1 14.4
Total gas emissions 23.3
In terms of OPEX, it is assumed that batteries are replaced every 4 years and solar panels every 10 years.
Given the operators’ reports of minimal maintenance for electronic controllers, it has thus been assumed,
conservatively, that general maintenance costs for are similar to those for continuous-bleed controllers
functioning properly10. We do not include any estimate of savings in inspection costs due to automation
(conservative assumption). Table 9 above presents emission estimates for the baseline scenario and
finally Table 10 includes the abatement costs estimated.
Table 10: Final results – central assumptions
Item Unit Value USD
CAPEX $ 21 240
Value of the gas saved $/year 408
NPV of the OPEX $ 1 672
NPV $ -19 266
ABATEMENT COSTS $/tCH4 751
As presented in Table 10, for the small and remote site configuration presented, the abatement costs is
well below the social cost of methane as defined above. The abatement cost for same site configuration,
but at a new facility, as opposed to a retrofit, is estimated to be $847/ton CH4. The difference is due to the
difference in baseline costs and baseline emissions between new and retrofit sites (see below).
10 Which is lower than the maintenance costs for continuous bleed controllers operating with wet supply gas.
CAA Ex. 4

Zero emission technologies for pneumatic controllers in the USA 25
Info Box 1: Electric conversion of pneumatic pumps
Pumps at well sites and well pads are typically used for methanol, corrosion inhibitor, de-waxing agents, or soap injection. Federal regulation (OOOOa) rules already require that emissions from new and modified chemical injection pumps be controlled in a number of circumstances.
As highlighted in Section 3, conversion of chemical injection pumps to electric is both a mature and a cost effective technology.
In the analysis presented in this section, the conversion of one chemical injection pump per site is presented as a potential added benefit for the project developer. In cases with many pumps, or of major energy requirements for the pumps, the conversion of pumps to zero emission technologies could be assessed as a separate emission reduction project.
Sensitivity analysis for one example site configuration
In this analysis, a number of assumptions have been made which impact the abatement cost. The
following figures present sensitivity analyses for the site configuration described in the previous section, for
both the retrofit case and the new site case. We examine the sensitivity of the abatement cost to changes
to a few key sensitivities. A more exhaustive sensitivity analysis is presented in the appendix.
Figure 8: sensitivity analysis – electronic controllers - retrofit
The next figure presents a similar sensitivity for the same site configuration, but at a new facility as
opposed to a retrofit.
0 200 400 600 800 1000 1200 1400
One pump converted
Wet supply gas
Electricity available on-site
Sensitivity on gas price
Sensitivity on emission factorfor intermittent-vent cont.
Abatement cost in USD/t CH4
8.6 scfh
$ 3 $ 1/Mscf
Social cost of methane($1354/ton)
Central case ($751/ton)
4.43 scfh
$ 2
No elec. on siteElec. on site
Dry gasWet gas
0 Pump1 Pump
0.1 scfh4.43 scfh
$ 2
CAA Ex. 4

Zero emission technologies for pneumatic controllers in the USA 26
Figure 9: sensitivity analysis – electronic controllers - new
The emission factor has by far the largest impact on the abatement cost and clearly heavily impacts the
cost effectiveness of the option for retrofit sites. Excluding the emission factors, the other assumptions
impact up to +33% of the abatement costs and no sensitivity leads to an abatement cost higher than the
social cost of methane (see appendix).
In general terms, the abatement cost is more sensitive to changes for new sites than for retrofit sites. This
is due to the fact that both the incremental costs and the emissions reductions are much smaller for new
sites than for retrofit sites. A small change in either of these is thus relatively larger for new sites than for
retrofit sites.
The following few paragraphs describes in more detail the impact of the main assumptions:
Electricity on site
The investment costs for sites without an electricity supply are higher than for sites with electricity due to
the need to install solar panels and batteries. As a result, the abatement cost for site configurations with
electricity is generally ten to one hundred percent lower than for site configurations without power. In a few
site configurations the abatement cost is negative (i.e. NPV>0).
Wet versus dry supply gas
Operators have reported that the quality of the supply gas affects maintenance costs. Even slightly wet (or
sour) gas can lead to condensation (or corrosion) issues, which over time will impact the performance of
the system. The maintenance cost for sites with wet supply gas is estimated at $200/year/controller [10]
compared to $80/year/controller for dry supply gas [18]. As a result, sites with wet gas have an abatement
cost generally 5 to 100 % lower than sites with dry gas, and, in a few site configurations, the abatement
cost is negative (i.e. NPV>0). Gas quality is also likely to impact the average emission rate. Due to the lack
of quantitative data on this impact, however, this factor has not been taken into consideration during the
analysis, but it would reduce the abatement costs of sites with wet gas even lower.
Chemical injection pumps
As pumps have high emissions factors, sites where one pump (or several) can be converted to electric
power have much lower abatement costs than sites without. All the sites with one pump have an
0 200 400 600 800 1000 1200 1400
One pump converted
Wet supply gas
Electricity available on-site
Sensitivity on gas price
Sensitivity on emission factorfor low bleed cont.
Abatement cost USD/t CH4
Central case ($847/ton)
$ 3 $ 1/Mscf
4.43 scfh
$ 2
No elec. on site
Dry gasWet gas
0 Pump
$ 2
6 scfh 0.1 scfh1.39 scfh
Elec. on site
1 Pump
Wet gas
Social cost of methane($1354/ton)
CAA Ex. 4

Zero emission technologies for pneumatic controllers in the USA 27
abatement cost lower than the social cost of methane. In addition, the abatement cost of converting a
single chemical injection pump (without any controller) to a solar powered electric pump is lower than the
social cost of methane in all the sites configurations evaluated.
New versus retrofit sites
The costs and the emissions abatement structures differ greatly for new and for retrofit sites. The main
differences include:
• The incremental CAPEX (i.e. the difference between the zero emission technology CAPEX and
the baseline CAPEX) for a retrofit site is usually much higher than for a new site.
• Given the current regulatory framework, it is assumed that new sites use low-bleed continuous
controllers as a default, and we conservatively use the EPA emissions factor [1] for these
controllers, despite measurements showing higher emissions for low-bleed controllers [3,4]. The
emissions reduction for retrofit sites is higher than for new sites, as we use an emissions factor
based on actual measurement [2] for continuous-bleed controllers at existing sites.
The first difference makes the abatement cost higher for retrofit sites than new sites, while the second
difference has the opposite effect. Overall, in the vast majority of the site configurations evaluated, the
abatement cost for new sites is higher than for the equivalent retrofit site configuration.
Overview of the results for all the site configurations
Overall, the abatement costs for electronic controller installations at 2032 site configurations were
estimated during this project. Under the central assumptions, 20 of the 2032 site configurations evaluated
have abatement costs higher than the social cost of methane, $1354/t. The following table shows in red
the number of site configurations with abatement costs higher than that figure for each category.
Table 11: Number of site configurations with abatement costs superior to the social cost of methane – central assumptions
* Sites with more than 10 controllers were presented for the installation of electronic controllers. However, there seems to be much
less field experience for this type of installation, compared to smaller sites. Sites with more than 20 controllers and without electricity
on-site were not modelled. Though no major technical barriers were identified, we could identify no examples of installations of solar
powered electronic controllers on very large sites.
A number of conclusions can be drawn from this analysis. Under the central assumptions:
• For almost all the site configurations evaluated with four or more controllers (excluding ESDs), it is
cost-effective to install electronic controllers.
• For all site configurations evaluated with one chemical injection pump, it is cost effective to install
electronic controllers.
A site configuration is not cost effective if the volume of gas saved does not justify the cost of
implementation. In general, for a given type of site configuration (wet/dry, on or off grid, new or existing,
share of intermittent controllers), the cost-effectiveness improves (fewer $/ton) with the number of
controllers.
No elec. on site Elec. On site No elec. on site Elec. On site
1 to 3 controllers 6 / 18 4 / 18 5 / 18 2 / 18
4 to 10 controllers 2 / 56 0 / 56 0 / 56 0 / 56
11 to 20 controllers* 0 / 98 0 / 98 0 / 98 0 / 98
21 to 40 controllers* 0 / 164 0 / 164
1 to 20 controllers* 0 / 172 0 / 172 0 / 172 0 / 172
21 to 40 controllers* 0 / 164 0 / 164
0
Number of
Pumps
1
New sites RetrofitNumber of controllers (excluding ESD)
CAA Ex. 4

Zero emission technologies for pneumatic controllers in the USA 28
In addition, we can highlight the following patterns for the site configurations with abatement costs higher
than the social cost of methane:
• For new facilities, these sites have only low-bleed continuous controllers (5 or fewer). The low
bleed emission factor assumption has an important impact on the conclusion (see below).
• For retrofit facilities, these sites have only intermittent-vent controllers (3 or fewer). For retrofit
sites, the emissions factor used for intermittent-vent controllers is less than that used for
continuous bleed controllers (see section 4.1)
The full list of site configurations with an abatement cost higher than the social cost of methane is
presented in the appendix.
Impact of the emission factors assumptions
The results of the analysis are quite dependent on the emissions factors used for the various types of
pneumatic controllers.
The following graph illustrates the impact of the continuous low-bleed emission factor on the cost
effectiveness of new sites with at least one continuous low-bleed device. This represents 12 of the 19 site
configurations deemed not cost effective. The central assumption for the low-bleed emission factor is 1.39
scfh. But an emission factor of 4 scfh would make all sites with at least one continuous bleed controller
cost effective. It is interesting to compare this figure to the results of past measurement campaigns
presented in the Figure 4, which suggest that average emission factors for low-bleed devices are likely
higher than 5 scfh.
Figure 10: Impact of the continuous low bleed emission factor on the cost effectiveness of new sites with at least one continuous low bleed device.
In a site without an electricity supply and with just a single controller, an electronic controller is cost-
effective if the emissions from that single controller are more than 4.4 scfh for a new site and more than
7.2 scfh for a retrofit site. The point of cost-effectiveness is lower for sites with 2 or more controllers, for
sites using wet supply gas, or for sites with on-site electricity. These thresholds should be compared with
emissions factors observed in Figure 5 for small and very small sites.
0
5
10
15
20
25
1 2 3 4 5 6
Nu
mb
er
of
ca
se
s w
ith a
bate
me
nt
co
st >
socia
l cost
of
meth
ane
(out
of
160 c
ases)
Low continuous bleed emission factor assumption (scfh)
Centr
al assum
ption
Low
est
avera
ge
betw
en
[2],[3
] an
d [
4]
CAA Ex. 4
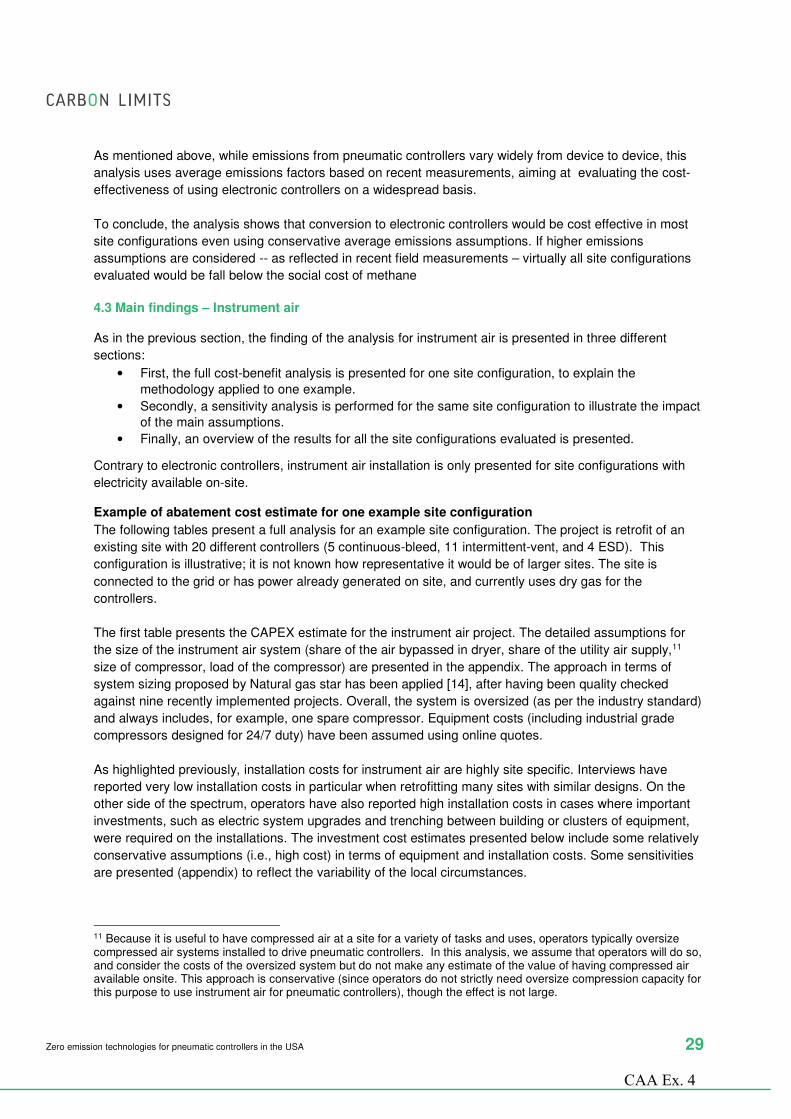
Zero emission technologies for pneumatic controllers in the USA 29
As mentioned above, while emissions from pneumatic controllers vary widely from device to device, this
analysis uses average emissions factors based on recent measurements, aiming at evaluating the cost-
effectiveness of using electronic controllers on a widespread basis.
To conclude, the analysis shows that conversion to electronic controllers would be cost effective in most
site configurations even using conservative average emissions assumptions. If higher emissions
assumptions are considered -- as reflected in recent field measurements – virtually all site configurations
evaluated would be fall below the social cost of methane
4.3 Main findings – Instrument air
As in the previous section, the finding of the analysis for instrument air is presented in three different
sections:
• First, the full cost-benefit analysis is presented for one site configuration, to explain the
methodology applied to one example.
• Secondly, a sensitivity analysis is performed for the same site configuration to illustrate the impact
of the main assumptions.
• Finally, an overview of the results for all the site configurations evaluated is presented.
Contrary to electronic controllers, instrument air installation is only presented for site configurations with
electricity available on-site.
Example of abatement cost estimate for one example site configuration
The following tables present a full analysis for an example site configuration. The project is retrofit of an
existing site with 20 different controllers (5 continuous-bleed, 11 intermittent-vent, and 4 ESD). This
configuration is illustrative; it is not known how representative it would be of larger sites. The site is
connected to the grid or has power already generated on site, and currently uses dry gas for the
controllers.
The first table presents the CAPEX estimate for the instrument air project. The detailed assumptions for
the size of the instrument air system (share of the air bypassed in dryer, share of the utility air supply,11
size of compressor, load of the compressor) are presented in the appendix. The approach in terms of
system sizing proposed by Natural gas star has been applied [14], after having been quality checked
against nine recently implemented projects. Overall, the system is oversized (as per the industry standard)
and always includes, for example, one spare compressor. Equipment costs (including industrial grade
compressors designed for 24/7 duty) have been assumed using online quotes.
As highlighted previously, installation costs for instrument air are highly site specific. Interviews have
reported very low installation costs in particular when retrofitting many sites with similar designs. On the
other side of the spectrum, operators have also reported high installation costs in cases where important
investments, such as electric system upgrades and trenching between building or clusters of equipment,
were required on the installations. The investment cost estimates presented below include some relatively
conservative assumptions (i.e., high cost) in terms of equipment and installation costs. Some sensitivities
are presented (appendix) to reflect the variability of the local circumstances.
11 Because it is useful to have compressed air at a site for a variety of tasks and uses, operators typically oversize compressed air systems installed to drive pneumatic controllers. In this analysis, we assume that operators will do so, and consider the costs of the oversized system but do not make any estimate of the value of having compressed air available onsite. This approach is conservative (since operators do not strictly need oversize compression capacity for this purpose to use instrument air for pneumatic controllers), though the effect is not large.
CAA Ex. 4

Zero emission technologies for pneumatic controllers in the USA 30
Table 12: CAPEX estimates for instrument air controller implementation – central assumptions
Item Assumption Sizing /# Value USD
Controllers and installation costs for the controllers
NA retrofit projects (it is assumed that controller can be re-used)
0
Compressor package (Assuming 2 compressors, air drying unit and wet air receiver unit)
See list of assumption in the appendix [12]
10 HP 32 000
Other supplies costs (Instrumentation Supplies & Pipe/Valve/Fittings, electrical supplies, etc..)
1400 $/cont 20 28 000
Electrical, mechanical & civil Installation Costs, engineering
Retrofit: 100% New: 50% of equipment
costs NA 60 000
Total CAPEX 120 000
In terms of OPEX, it is assumed that compressors are replaced every 6 years. In addition, 4% of the
equipment costs are accounted for normal compressor maintenance (typically every 6 months). Other
OPEX costs include, for example, electricity costs.
Table 13 presents the emissions estimates while Table 14 present the final results.
Table 13: Emission estimates – central assumptions
Emissions is scfh EF
assumption
# total
Intermittent-vent Controllers 4.43 11 48.7
Continuous-bleed controllers 14.43 5 72.1
ESD 0.41 4 1.64
Total gas emissions 122.5
Table 14: Final results for the site configuration analyzed – central assumptions
Item Unit Value USD
CAPEX $ 120 000
Value of the gas saved
$/year 1073
NPV (Opex) $ 24 683
NPV $ -121 652
ABATEMENT COSTS
$/tCH4 972
The abatement cost for the same site configuration, but at a new facility, as opposed to a retrofit, is
estimated to be $886/ton CH4. The difference is because the baseline costs are higher and the baseline
emissions are lower for new sites than for retrofits.
CAA Ex. 4

Zero emission technologies for pneumatic controllers in the USA 31
Info Box 2: Conversion of pneumatic pumps to instrument air
Pneumatic pumps typically emit more per device than pneumatic controllers, so converting pumps to air can represent a large emission reduction and potentially reduce significantly the abatement cost of conversion. However converting pumps to instrument air is not always technically and/or economically feasible. For sites with access to reliable source of electricity, conversion to air is applicable and cost-effective for the majority of chemical injection pumps. However, even for grid-connected sites, conversion to instrument air is not always the preferred option, as electric pumps are proven effective and low-cost.
In summary, in a number of cases, emissions reduction for pumps could be considered as a separate project from controllers. In the follow up analysis, conversion of 1 pump to instrument air is only presented as part of the sensitivity analysis.
Sensitivity analysis for one example site configuration
The following figures present a sensitivity analysis for the same site configuration as in the section above.
The CH4 abatement cost for a few key sensitivities is compared to the abatement cost with the central
assumptions. A more detailed sensitivity assessment is presented in the appendix.
Figure 11: Sensitivity analysis – instrument air - retrofit
The next figure presents a similar sensitivity for the same site configuration but at a new facility.
0 200 400 600 800 1000 1200 1400 1600 1800
Wet supply gas
Sensitivity on gas price
Sensitivity on emission factorfor intermittent-vent cont.
Abatement cost (in USD/t CH4)
Social cost of methane($1354/ton)
Central case ($972/ton)
8.6 scfh
$ 3 $ 1/Mscf
Dry gasWet gas
$ 2$ 2
4.43 scfh 0.1 scfh
CAA Ex. 4

Zero emission technologies for pneumatic controllers in the USA 32
Figure 12: Sensitivity analysis – instrument air - new site
As with the electronic controllers, the emission factor heavily impacts the attractiveness of the option.
Excluding the emission factor, no other assumption affects the abatement cost per ton by more than 30%
(see appendix).
Wet versus dry supply gas
As with electronic controllers, sites with wet gas have an abatement cost generally 5% to 50 % lower than
sites with dry gas due to the difference in maintenance costs.
Overview of the results for all the site configurations
The overall abatement costs for about 328 site configurations, all with an electricity supply and no
pneumatic pump conversions, were estimated, with a total number of controllers ranging from 21 to 50 (in
various permutations of intermittent-vent and continuous-bleed controllers). Sites with fewer than 20
controllers are not presented, as conversion to electric is cheaper (on a per ton basis) in most of the site
configurations with fewer than 20 controllers.
In terms of CAPEX, the total investment for retrofit sites varies between $90,000 and $230,000, while the
investment (excluding controllers and their installation) for new sites varies between $60,000 and
$120,000.
Under the central assumptions, 5 of the 328 site configurations evaluated have abatement costs higher
than the social cost of methane. The following table shows in red the number of sites with abatement costs
higher than $1354 /tCH4 for each category of sites.
Table 15: Number of site configurations with abatement costs higher than the social cost of methane – central assumptions
A number of conclusions can be drawn from this analysis. Under the central assumptions:
0 200 400 600 800 1000 1200 1400
Wet supply gas
Sensitivity on gas price
Sensitivity on emission factorfor low-bleed cont.
Abatement cost in USD/t CH4
Social cost of methane($1354/ton)
Central case ($886/ton)
$ 3 $ 1/Mscf
4.43 scfh
$ 2
Dry gas
$ 2
6 scfh 0.1 scfh1.39 scfh
Wet gas
Number of
PumpsNumber of controllers (Excluding ESD)
New Sites Retrofit
21 to 25 controllers 3 / 42 0 / 42
26 to 30 controllers 2 / 40 0 / 40
31 to 40 controllers 0 / 82 0 / 82
0
CAA Ex. 4

Zero emission technologies for pneumatic controllers in the USA 33
• For almost all the site configurations evaluated with more than 21 controllers (excluding ESDs), it
is cost effective to install instrument air.
• For all the retrofit site configurations evaluated, it is cost effective to install instrument air.
• In a few of the new site configurations considered, it is not cost effective to install instrument air.
A site configuration is not cost effective if the volume of gas saved does not justify the cost of
implementation. The new site configurations with abatement costs greater than the social cost of methane
have a vast majority of low bleed continuous controllers, which we have conservatively assumed have
very low emissions (1.39 scfh emission factor, see Section 4.1).
The full list of site configurations with abatement costs higher than the social cost of methane is presented
in the appendix.
4.4 Summary of the analysis
As described in the section above, an economic analysis assuming conservative average emission factors
was performed for 2032 permutations of site configurations with 1 to 50 controllers. Both retrofit and new
installations, with or without electricity, were considered. A number of key conclusions can be drawn:
• Zero emission solutions had abatement costs below the social cost of methane (for 2020)
described in the EPA 2015 Regulatory Impact Analysis in the vast majority of site configurations
considered.
• The abatement costs exceeded the social cost of methane mostly for small sites – those with less
than three controllers (excluding ESDs). If higher emission factors, as reflected in field
measurements, are used, the abatement costs at even the very small sites fall below the social
cost of methane.
The following figure presents a summary of both the technical applicability and economic attractiveness of
the different zero emission technologies under different categories of sites. Though this analysis does not
provide a detailed evaluation of the distribution of the sites in the US for each of the categories below,
existing studies have suggested that the vast majority of the sites have less than 20 controllers.
CAA Ex. 4

Zero emission technologies for pneumatic controllers in the USA 34
Table 16: Summary table
* Emissions factors thresholds listed are determined for the site configuration with the highest abatement cost within the category. ** Based on other solar applications.
The applicability of electronic controllers for small sites and instrument air for large sites reflects the
current industry experience and practice as presented by the interviewees. It is, however, important to
highlight that the threshold in terms of number of controllers (20 in the analysis), depends in reality on site-
specific parameters, and should only be considered as an illustrative threshold based on information
available.
Due to the market conditions, electronic controller providers have so far focused mainly on the
development of solutions for small sites in remote locations. There thus seems to be much less field
experience with using electronic controllers at medium and large sites; however, no technical barriers were
identified for this type of installation.
These analyses indicate that the widespread adoption of zero-emitting technologies is cost effective in the
vast majority of the site configurations considered. Furthermore, several factors listed should be
considered:
• Conservative (low) average emissions factors have been used for low-bleed pneumatic
controllers, even though recent research indicates that actual average emissions from those
pneumatic controllers may be higher.
• Some of the important benefits of switching to zero-emitting technology, such as the ease of
automation or remote operations associated with electrifying pneumatic controllers, are not
included in our analysis of the cost-effectiveness of using zero emission technologies.
• Finally, pneumatic controllers emit natural gas, which includes (in varying amounts) other
pollutants aside from methane, such as volatile organic compounds (VOCs), which are precursors
to ground level smog, and toxic hazardous air pollutants (HAPs). Replacing natural-gas driven
pneumatic controllers with zero-emitting technologies will eliminate emissions of these other
Typ
eo
f o
f sit
e Both retrofit and new sites
Number of controllers (excl. ESDs)
1- 3 4-20 21-40
Electricity on-site? Yes No Yes No Yes No
Ma
in o
pti
on
s:
Ele
ctr
ic c
on
tro
ller
Instr
um
en
tair
Description( of the most economic option which is technically feasible)
Grid connectedelectric controller
Solar powered electriccontroller
Grid connectedelectric controller
Solar powered electric controller
Instrument air
Number of cases not cost effective (i.e. abatement cost >
social cost of methane) undercentral assumptions
6 / 36 11 / 36 0 / 308 2 / 308 5/ 328
Cost effective for every site configuration if emissions factors are:*
> 5.6 scfh for retrofit> 2.8 scfh for new sites
> 7.2 scfh for retrofit> 4.4 scfh for new sites
> 3.6 scfh for retrofit> 1.4 scfh for new sites
> 4.2 scfh for retrofit> 1.8 scfh for new sites
> 4.5 scfh for retrofit> 1.8 scfh for new sites
Oth
er
op
tio
ns p
ote
nti
ally
ap
plica
ble
dep
en
din
g o
n t
he lo
cal
co
nd
itio
ns L
imit
ed
ap
plic
ab
ilit
y Vent gas recovery ✓✓✓✓ ✓✓✓✓ ✓✓✓✓ ✓✓✓✓ ✓✓✓✓ ✓✓✓✓
Instrument air powered by gas Not relevant Not relevant Not relevant Not relevant Not relevant ✓✓✓✓
Self contained controllers ✓✓✓✓ ✓✓✓✓ ✓✓✓✓ ✓✓✓✓ ✓✓✓✓ ✓✓✓✓
Lim
ited
kn
ow
nim
ple
men
tati
on
s
Solar powered instrument air Not relevant ✓✓✓✓ Not relevant ✓✓✓✓ ✗ ✗
Electric controllers powered by other power sources (TEG, fuelcell)
Not relevant Not relevant Not relevant Not relevant Not relevant ✓✓✓✓
Large solar powered electric controller (no knownimplementations)
Not relevant Not relevant Not relevant Not relevant Not relevantPotential solution,**
but no exampleknown.
CAA Ex. 4

Zero emission technologies for pneumatic controllers in the USA 35
pollutants, in addition to emissions of methane, but we have not included the benefits of VOC or
HAP abatement in our calculation of abatement costs for methane.
CAA Ex. 4

Zero emission technologies for pneumatic controllers in the USA 36
5. Reference list
[1] Inventory of U.S. Greenhouse Gas Emissions and Sinks: 1990-2014 EPA, 2016 https://www3.epa.gov/climatechange/ghgemissions/usinventoryreport.html
[2] Methane Emissions from Process Equipment at Natural Gas Production Sites in the United States: Pneumatic Controllers Allen et al., 2015 http://pubs.acs.org/doi/abs/10.1021/es5040156
[3] Measurements of methane emissions at natural gas production sites in the United States. Allen, David, T., et al. 2013. www.pnas.org/content/early/2013/09/10/1304880110.full.pdf+html
[4]
Determining Bleed Rates for Pneumatic Devices in British Columbia; Final Report. The Prasino Group. 2013. http://www2.gov.bc.ca/assets/gov/environment/climate-change/stakeholder-support/reporting-regulation/pneumatic-devices/prasino_pneumatic_ghg_ef_final_report.pdf
[5] Fort Worth Natural Gas Air Quality Study ERG2012 https://www3.epa.gov/ttnchie1/conference/ei20/session6/mpring.pdf
[6] API Comments on Oil & Natural Gas Sector Pneumatic Devices by EPA Office of Air Quality Planning and Standards, June 2014
[7]
Quantifying cost-effectiveness of systematic Leak Detection (LDAR) using infrared cameras, Carbon limits, 2014 (including the database used for the analysis) http://www.carbonlimits.no/project/quantifying-cost-effectiveness-of-systematic-leak-detection-ldar-using-infrared-cameras/
[8] Pneumatic Controller Emissions from a Sample of 172 Production Facilities Prepared by Oklahoma Independent Petroleum Association, 2014 http://www.oipa.com/page_images/1418911081.pdf
[9] Information provided by technologies suppliers.
[10] Information provided by operators.
[11] Methane abatement potential from oil and gas systems in Kazakhstan Carbon Limits, 2016 http ://www.carbonlimits.no/project/methane-abatement-potential-from-oil-and-gas-systems-in-kazakhstan/
[12] Online quotes for equipment purchase March – April 2016
[13] Reducing Emissions Through Retrofitting of High Bleed Devices – GE 2012 https://www.epa.gov/gasstar/documents/workshops/2012-annual-conf/giernoth.pdf
[14] Convert Gas Pneumatic Controls To Instrument Air Natural Gas Star Program 2006 https://www3.epa.gov/gasstar/documents/ll_instrument_air.pdf
[15] CarbonLimits – expert opinion
[16] Subpart W rulemaking and summary results https://www.law.cornell.edu/cfr/text/40/part-98/subpart-W/appendix-TableW-1A
[17]
Oil and Natural Gas Sector: Standards for Crude Oil and Natural Gas Facilities – Background Technical Support Document for the Proposed New Source Performance Standards EPA, 2015 https://www.regulations.gov/#!documentDetail;D=EPA-HQ-OAR-2015-0216-0101
[18] INITIAL ECONOMIC IMPACT ANALYSIS For proposed revisions to Colorado Air Quality Control Commission Regulation Number 7
[19] Regulatory Impact Analysis of the Proposed Emission Standards for New and Modified Sources in the Oil and Natural Gas Sector, EPA 2015 https://www3.epa.gov/airquality/oilandgas/pdfs/og_prop_ria_081815.pdf
CAA Ex. 4

Zero emission technologies for pneumatic controllers in the USA 37
6. Appendix
6.1 Quantitative assumptions for the model
Table 17: Quantative assumptions for the model
Description Central
Assumption Unit Source
GENERAL ASSUMPTIONS
Gas price 2 $/Mscf [15]
Interest Rate 7% % NA
Share methane in the gas – Dry gas 0.0167 tCH4/Mscf [15]
Share of VOC in the gas – Dry gas 0.0046 tVOC/Mscf [15]
Share methane in the gas – wet gas 0.0150 tCH4/Mscf [15]
Share of VOC in the gas – wet gas 0.0050 tVOC/Mscf [15]
Remaining lifetime for retrofit 10 years [15]
Remaining lifetime for new site 15 years [15]
EMISSION FACTORS
Continuous Controller (s) 14.43 cf/h [2] (Company classification into EPA
categories excluding ESD)
Intermittent Controller (s) 4.43 cf/h [2] (Company classification into EPA
categories excluding ESD)
Chemical Pumps 13.3 cf/h [16]
ESD 0.41 cf/h [2]
Continuous Controller (s) 1.39 cf/h [16]
Intermittent Controller (s) 4.43 cf/h [2]
Chemical Pumps 13.3 cf/h NA
ESD 0.41 cf/h [2]
INSTRUMENT AIR – ENGINEERING ASSUMPTIONS
Share of the air bypassed in dryer 17% % [14,10]
Share of the utility air supply 200% % [14,10] Sizing of compressor - variable component 0.2026 HP/cfm [14,10] Sizing of compressor - constant component 4.2356 HP [14,10]
Load of the compressor (main) 50% % [14,10]
Sizing of the tank 6 gallon/cfm [10]
Lifetime of the compressors 6 years [10,14]
ELEC CONTROLLER - COST ASSUMPTIONS
Continuous Controller (s) + control valve 4000 $/unit [9,10] Intermittent Controller (s) + control valve 4000 $/unit [9,10]
Chemical injection pump 6000 $/unit [9,10]
Control Panel 4000 $/unit [9,10]
Solar Panel 500 $/unit [9,12]
Battery 400 $/unit [9,12]
Installation Costs 20% of Equipment
costs [9,10]
Annual check up 80 $/controller/year [15]
CAA Ex. 4

Zero emission technologies for pneumatic controllers in the USA 38
ELEC CONTROLLER - ENGINEERING ASSUMPTIONS
Battery replacement frequency 4 years [9,10]
Solar Panel replacement frequency 10 years [9,10]
Continuous Controller (s) 0.08 Amps/unit [9]
Chemical injection pumps 0.17 Amps/pump [9]
ESD 0.16 Amps/unit [9]
Other systems 0.29 Amps/site [9]
System Voltage 12 V [9,12]
Battery Average Efficiency 85% % [9,12]
Avg. Peak Sun 4 h/days [9,10] (Confirmed with NREL) Battery - At Maximum Depth of Discharge 80% % [9]
Days of Energy Storage 10 days [9]
Rating of the solar panel 140 W [9,12]
Rating of the battery 100 Ah [9,12]
Oversizing of the solar panel 50% % [9,10]
INSTRUMENT AIR - COST ASSUMPTION
Compressor Package – Main -5 HP 22000 $ [12,10]
Compressor Package – Main -10 HP 32000 $ [12,10]
Compressor Package – Main -15 HP 48000 $ [12,10]
Compressor Package – Main -20 HP 70000 $ [12,10]
Compressor - Unit cost - 5 HP 7000 $ [12]
Compressor - Unit cost - 10HP 10000 $ [12]
Compressor - Unit cost - 15 HP 15000 $ [12]
Compressor - Unit cost - 20 HP 23000 $ [12]
Other supply 1400 $/controller [10]
Other supply 1000 $/controller [10]
Installation 100% % [10]
Installation 50% % [10]
Compressor maintenance 4% % of Capex [10,15]
BASELINE - COST ASSUMPTION Continuous Controller (s) + control valve 2698 $/cont. [17] Intermittent Controller (s) + control valve 2471 $/cont. [17]
Chemical injection Pump 1500 $/unit [12]
Labor - installation - Controller 387 $/unit [18] Maintenance costs - Controller- wet gas sites 200 $/cont./year [10] Maintenance costs - Controller- dry gas sites 80 $/cont./year [18]
6.2 Other assumptions for the model
• General assumptions
CAA Ex. 4

Zero emission technologies for pneumatic controllers in the USA 39
o Retrofitting is assumed to be performed during a planned maintenance, hence retrofit
activities do not cause production losses; thus, no potential revenue losses are accounted
for in the estimates presented.
• Electronic controllers:
o In all the site configurations, it is assumed that ESDs are gas driven pneumatic controllers.
o Electronic controllers can reduce the need for site inspections. The subsequent reduced
labour costs have not, however, been taken into consideration in the analysis.
(conservative assumption)
• Instrument air
o CO2 emissions from power consumption (for non-solar powered options) have been
neglected; this represents a very small volume of emissions compared to the CH4
emissions (typically a few per cent, assuming a GWP of methane of 21).
6.3 Detailed sensitivity analysis
In the analysis presented, a number of assumptions have been made which affect the abatement cost.
The following sections present the detailed sensitivity analysis performed.
Electronic controller – Retrofit
The following table presents a sensitivity analysis for the site configuration described in the section 4.2
(site with four controllers). The CH4 abatement costs for a few key sensitivities should be compared to the
abatement costs under the central assumption: $751/t CH4. The abatement cost under all the sensitivities
is below the social cost of methane.
Table 18: Sensitivity analysis – retrofit site with 4 controllers– results
Name of the parameter Central assumption Sensitivity value Abatement cost in $/t CH4
Number of pumps 0 pump 1 pump 614
Type of supply gas Dry supply gas Wet supply gas 702
Power on-site No power on-site Power on-site 611
Gas price 2 $/Mscf
1 $/Mscf 811
Gas price 3 $/Mscf 692
Discount rate 7% 3% 635
Emission factors intermittent-vent cont.
4.43 scfh 8.6 scfh 522
0.1 scfh 1267
Control Panel equipment cost
$4000 $6000 845
Installation Costs 20% of Equipment Costs 40% of Equipment Costs 889
Battery replacement freq. 4 years 2 years 823
Average peak sun 4 hours 2 hours 775
Electronic controller – New
The following table presents a sensitivity analysis for the site configuration described in the section 4.2
(site with four controllers). The CH4 abatement cost for a few key sensitivities should be compared to the
CAA Ex. 4

Zero emission technologies for pneumatic controllers in the USA 40
abatement costs under the central assumption: $847/t CH4. The abatement costs for all the sensitivities
are below the social cost of methane.
Table 19: Sensitivity analysis – New site with 4 controllers– results
Name of the parameter Central assumption Sensitivity value Abatement cost in $/t CH4
Number of pumps 0 pump 1 pump 459
Type of supply gas Dry supply gas Wet supply gas 624
Power on-site No power on-site Power on-site 548
Gas price 2 $/Mscf
1 $/Mscf 906
Gas price 3 $/Mscf 787
Discount rate 7% 3% 680
Emission factors low bleed controllers
1.39 scfh 6 scfh 547
0.1 scfh 986
Control Panel equipment cost
$4000 $6000 1011
Installation Costs 20% of Equipment Costs 40% of Equipment Costs 1089
Battery replacement freq. 4 years 2 years 1046
Average peak sun 4 hours 2 hours 905
Low Bleed Cont. - Equipment cost
$2698 per controller $554 per controller 993
Intermittent Cont. - Equipment cost
$2471 per controller $387 per controller 1131
Instrument air – Retrofit
The following table presents a sensitivity analysis for the site configuration described in the section 4.3
(site with twenty controllers). The CH4 abatement costs for a few key sensitivities should be compared to
the abatement costs under the central assumption: $972/t CH4.
Table 20: Sensitivity analysis – retrofit site with 4 controllers– results
Name of the parameter Central assumption Sensitivity value Abatement cost in $/t CH4
Type of supply gas Dry supply gas Wet supply gas 945
Gas price 2 $/Mscf
1 $/Mscf 1037
Gas price 3 $/Mscf 908
Discount rate 7% 3% 848
Emission factors intermittent-vent cont.
4.43 scfh 8.6 scfh 679
0.1 scfh 1656
Other supplies costs $1400/controller $1800 /controller 1100
$1000 /controller 844
Electrical, mechanical & civil installation costs
100% of equipment and supplies costs
150% of equipment and supplies costs
1212
50% of equipment and supplies costs
732
CAA Ex. 4

Zero emission technologies for pneumatic controllers in the USA 41
Instrument air – New site
The following table presents a sensitivity analysis for the site configuration described in the section 4.3
(site with twenty controllers). The CH4 abatement costs for a few key sensitivities should be compared to
the abatement costs under the central assumption: $886/t CH4.
Table 21: Sensitivity analysis – retrofit site with 4 controllers– results
Name of the parameter Central assumption Sensitivity value Abatement cost in $/t CH4
Type of supply gas Dry supply gas Wet supply gas 690
Gas price 2 $/Mscf
1 $/Mscf 949
Gas price 3 $/Mscf 824
Discount rate 7% 3% 734
Other supplies costs $1000/controller $1200 /controller 963
Electrical, mechanical & civil installation costs
50% of equipment and supplies costs
100% of equipment and supplies costs
1154
Emission factors low bleed controllers
1.39 scfh 6 scfh 800
0.1 scfh 1011
6.4 List of site configurations with abatement cost superior to the social cost of methane
The following table presents a complete list of all the site configurations with an abatement cost higher
than the social cost of methane.
Electronic controller – New sites
The abatement cost is presented for the central assumptions, but also (right column) for a low-bleed
emission factor of 5 scfh (compared to 1.39 in the central assumption).
Table 22: Site configurations with abatement cost superior to $1354/ton - Electric controller – New sites
Site configuration
ID
New/ retrofit
Electricity on site?
Supply gas
Pump # Continuous
Cont. # Intermittent
Cont. # ESD
#
Abatement costs – central
assumptions
Abatement costs –
Higher EF assumption
13 New Electricity Wet 0 1 0 1 1985 456 349 New Electricity Dry 0 1 0 1 2838 703 355 New Electricity Dry 0 2 0 1 1793 412 361 New Electricity Dry 0 3 0 1 1445 315 685 New No electricity Wet 0 1 0 1 3777 954 691 New No electricity Wet 0 2 0 1 2009 462 697 New No electricity Wet 0 3 0 1 1643 361 1021 New No electricity Dry 0 1 0 1 4446 1150 1027 New No electricity Dry 0 2 0 1 2595 635 1033 New No electricity Dry 0 3 0 1 2179 520 1039 New No electricity Dry 0 4 0 1 1820 420 1045 New No electricity Dry 0 5 0 1 1605 360
Electronic controller – Retrofit sites
The abatement cost is presented for the central assumptions, but also (right column) for an intermittent-
vent controller emission factor of 7 scfh (compared to 4.43 in the central assumption).
CAA Ex. 4

Zero emission technologies for pneumatic controllers in the USA 42
Table 23: Site configurations with abatement cost superior to $1354/ton - Electric controller – Retrofit
Site configuration
ID
New/ retrofit
Electricity on site?
Supply gas
Pump # Continuous
Cont. # Intermittent
Cont. # ESD
#
Abatement costs – central
assumptions
Abatement costs –
Higher EF assumption
1345 Retrofit Electricity Wet 0 0 1 1 1593 960 1681 Retrofit Electricity Dry 0 0 1 1 1750 1064 2017 Retrofit No electricity Dry 0 0 1 1 2282 1400 2018 Retrofit No electricity Dry 0 0 2 1 1573 952 2019 Retrofit No electricity Dry 0 0 3 1 1406 846 2353 Retrofit No electricity Wet 0 0 1 1 2186 1335 2354 Retrofit No electricity Wet 0 0 2 1 1486 891
Instrument air – Retrofit sites
The abatement cost is presented for the central assumptions, but also (right column) for a low-bleed
emission factor of 5 scfh (compared to 1.39 in the central assumption).
Table 24: Site configurations with abatement cost superior to $1354/ton – Instrument air – Retrofit
Site configuration
ID
New/ retrofit
Electricity on site?
Supply gas
Pump # Continuous
Cont. # Intermittent
Cont. # ESD
#
Abatement costs – central
assumptions
Abatement costs –
Higher EF assumption
437 New Electricity Dry 0 20 1 5 1651 612 438 New Electricity Dry 0 20 2 5 1466 589 447 New Electricity Dry 0 25 0 5 1595 515 448 New Electricity Dry 0 25 1 6 1426 501 457 New Electricity Dry 0 30 0 6 1392 436
CAA Ex. 4

CLEAN AIR ADVOCATES’ EXHIBIT 5

1
Conservation Groups’ Initial Economic Impact Analysis Non-Emitting Pneumatics - 2020
Natural Gas Compressor Stations Non-Emitting Pneumatic Controllers
Sierra Club and Earthworks (collectively, “Conservation Groups”) propose to strengthen the Division’s proposal for pneumatic controllers by requiring the elimination of venting of natural gas from all pneumatic controllers at compressor stations. As we show below, non-emitting controllers are cost-effective at the average compressor station, which has 9 intermittent-bleed pneumatic controllers and 1 continuous-bleed pneumatic controllers.
Based on the Division’s EIA for the 2019 revisions to Regulation 7, we estimate that there are 188 gathering and boosting compressor stations outside the nonattainment area (“rest of state” or “ROS”).1 In the Nonattainment Area (“NAA”), the Division recently estimated that there are 58 gathering and boosting compressor stations, but the Division found that by summer 2018, at least 48 of them had been converted, or were in the process of being converted, to non-emitting controllers.2 Therefore, we calculate the benefits and costs for converting the balance of NAA gathering and boosting compressor stations – 10 stations – to non-emitting controllers.
The costs of converting to non-emitting controllers varies depending on a number of characteristics. We calculate costs using the Pneumatics Cost Tool developed by Carbon Limits.3 Among other things, the cost depends upon the number of controllers of each type at the facility. Based on the U.S. Environmental Protection Agency’s (EPA) Greenhouse Gas Reporting Program (GHGRP) data about pneumatic controller counts at compressor stations and the number of compressor stations reported by CDPHE in the ROS, Conservation Groups estimate that there are an average of 9 intermittent bleed pneumatic controllers and 1 continuous bleed pneumatic controllers per compressor station.4 We used those figures, conservative emissions factors for pneumatic controllers,5 and values for the price of conserved gas and the VOC and methane-ethane content of gas consistent with those used by the Division.6 Using these parameters, we calculated the following abatement tonnages and costs for retrofitting a compressor station which does not have electricity available on-site (this is conservative, since some stations will have sufficient electricity to operate zero-emitting controllers available).
1 CDPHE Air Pollution Control Division, Regulation Number 7 Economic Impact Analysis, (November 5, 2019), table 24. 2 Colo. Air Pollution Control Div., Pneumatic Controller Task Force Report to the Air Quality Control Commission at 10 (June 1, 2020) (SC&E_ALT_EX-001). 3 Carbon Limits, Zero Bleed Pneumatic Cost Spreadsheet Tool (Aug. 1, 2016) (SC&E_ALT_EX-002). 4 See Appendix. 5 3.5 scfh for intermittent-bleed controllers; 5.1 scfh for continuous-bleed controllers. See David McCabe, et al., Memorandum: Average Emissions from Intermittent-Vent Pneumatic Controllers as Reported by Allen, et al. (2015) (SC&E_ALT_EX-003). 6 Value of conserved gas: $1.87 / Mcf (average Henry Hub price Jan – Sept 2020). Gas composition (wet gas): 5.77 kg VOC/Mscf in the NAA and 4.80 kg VOC/Mscf in the ROS; 15.4 kg CH4/Mscf in the NAA and 16.3 kg CH4/Mscf in the ROS. Calculated from 24.4 weight % VOC for the NAA and 20.3 weight % VOC for ROS, based on Division model data from 2017 for VOC content of leaking gas in those areas.
CAA Ex. 5

2
Table 1: Costs of non-emitting conversion at average compressor station in NAA and ROS
Number of Compressor
Stations
Intermittent Controllers
On-site
Continuous Controllers
On-site
Equipment Cost
Install Cost
Net Ongoing
cost7
Value of Saved Gas
Annual Cost per
Station
Total Annual
Cost
NAA 10 9 1 $46,100 $9,220 -$847 $600 $3,883 $38,834 ROS 188 9 1 $46,100 $9,220 -$847 $600 $3,883 $38,834
Table 2: Reductions (in tons per year) and abatement cost of non-emitting conversion at average compressor station in NAA and ROS
VOC savings
per comp. station
Methane-ethane savings per CS
Total VOC Savings in
area VOC Abatement Cost ($/short ton)
Total Methane-
Ethane Savings in area
Methane-ethane Abatement Cost
($/short ton)8 NAA 2.0 6.3 20 $1,904 63 $615 ROS 1.7 6.7 319 $2,289 1,257 $581
Abatement costs per ton of pollutant will be lower at larger compressor stations with more pneumatic equipment. Well Production Facilities Zero Bleed Pneumatic Equipment Conservation Groups propose to strengthen the Division’s proposal for pneumatic controllers by requiring the elimination of venting of natural gas from all pneumatic controllers at larger well production facilities. As we show below, non-emitting controllers are cost-effective at well pads with 4 or more wells in both the NAA and the ROS.
Strengthen to require non-emitting pneumatic controllers at well production facilities with 4 or more wells in the NAA
We calculated that the average annualized cost of our proposal in the NAA is $7,793 per pad, and the average VOC abatement cost is $1,534/short ton.
The costs of converting to non-emitting pneumatic controllers varies depending on a number of characteristics. We calculate costs using the Pneumatics Cost Tool developed by Carbon Limits.9 Among other things, the cost depends upon the number of controllers of each type and pumps at the facility. For wellpads, the number of controllers and pumps will generally vary with the number of wells. We used data from the GHGRP to estimate the number of pneumatic controllers and pumps per well in NAA.10 We found that there are 2.44 intermittent-bleed
7 Ongoing cost of zero bleed system minus cost of maintaining natural gas-powered system with wet gas. 8 To convert from methane to methane-ethane we assume gas is 65.7% methane and 10.6% ethane. See Memorandum from Heather P. Brown, P.E. to Bruce Moore, EPA/OAQPS/SPPD re: Composition of Natural Gas for use in the Oil and Natural Gas Sector Rulemaking (July 28, 2011), https://beta.regulations.gov/document/EPA-HQ-OAR-2010-0505-4908 (SC&E_ALT_EX-004). 9 Carbon Limits, Zero Bleed Pneumatic Cost Spreadsheet Tool, supra n.3. 10 See Appendix.
CAA Ex. 5

3
pneumatic controllers and 0.68 continuous-bleed controllers per well, and 0.017 pneumatic pumps. We used these factors to estimate the number of controllers per pad for pads with various numbers of wells. We then analyzed oil and gas well data from the Colorado Oil and Gas Conservation Commission (“COGCC”) to determine the number of well pads at various sizes in the NAA.11 Based on this analysis, we found that there are 10,552 wells in the NAA, on 4,403 pads. 6,029 (57%) of these wells are on 796 pads with four or more wells, but these 796 pads represent only 18% of pads in the NAA. Since the cost of non-emitting equipment varies with the number of controllers – and therefore wells – at a facility, we calculated the costs for each size wellpad, and then calculate overall cost using the figures for each size. Average costs are weighted by the number of pads of each size. We used conservative emissions factors for pneumatic controllers based on measurements in the peer-reviewed literature,12 values for the VOC and methane-ethane content of gas consistent with those used by the Division,13 and a value for the price of conserved gas calculated using the Division’s methodology.14 Using these parameters, we calculated the abatement tonnages and costs for retrofitting wellpads in the NAA displayed in Tables 3 and 4 below. For wellpads with less than 30 controllers, we present cost calculations calculated for the installation of electric controllers powered by solar panels (as opposed to calculating the cost of installing an instrument air system, for example). Due to limitations in the Carbon Limits cost tool used to calculate costs for replacing pneumatic equipment, we are unable to provide specific cost or cost-effectiveness estimates for wellpads with more than 30 controllers at this time. Therefore, the cost and cost-effectiveness numbers for those wellpads are not shown in Tables 3 and 4 below. However, there is a clear trend of improving cost-effectiveness (decreasing cost per ton of avoided pollutants) as the number of wells/controllers increases, as seen in Table 4. This arises because non-emitting solutions such as solar-powered electric controllers entail significant common equipment used for all the controllers on the pad, such as solar panels, batteries, and control panels. As more controllers share the use of the centralized equipment, the cost per ton of avoided pollution drops. Therefore, we are confident that the overall cost-effectiveness figure we calculate (based on pads with fewer than 30 controllers) is a conservative estimate of overall program cost-effectiveness. Additionally, we note that we are providing specific cost effectiveness data for 616 of the 796 estimated wellpads (77%) covered by our Alternative Proposal in the NAA. 11 We downloaded data from COGCC’s website, http://cogcc.state.co.us/documents/data/downloads/gis/WELLS_SHP.ZIP. We then exported Shapefile data for analysis. We sorted wells into NAA and ROS based on county, and location for wells in Larimer and Weld counties and included only “producing” wells. We then sorted wells into pads using the parameter “Loc_ID.” 12 3.5 scfh for intermittent-bleed controllers; 5.1 scfh for continuous-bleed controllers. See McCabe et al., supra n.5. 13 Gas composition (wet gas): 5.77 kg VOC/Mscf in the NAA; 15.4 kg CH4/Mscf in the NAA. Calculated from 24.4 weight % VOC for the NAA, based on Division model data for VOC content of leaking gas in the NAA. 14 Value of conserved gas: $1.87 / Mcf (average Henry Hub price Jan – Sept 2020).
CAA Ex. 5

4
Table 3: Costs of non-emitting conversion at various well sizes in NAA
Wells per Pad
# pads
# wells
Cont Controllers
On-site
Int. Controllers
On-site
Equip. Cost
Install Cost
Net Ongoing
cost15
Value of
Saved Gas
Annualized Cost per
Pad
Total Annualized
Cost in NAA
4 211 844 3 10 $58,600 $11,720 -$1,173 $824 $4,777 $1,008,049 5 109 545 3 12 $67,000 $13,400 -$1,333 $939 $5,474 $596,660 6 95 570 4 15 $83,400 $16,680 -$1,733 $1,194 $6,714 $637,869 7 77 539 5 17 $95,800 $19,160 -$2,013 $1,392 $7,670 $590,573 8 93 744 5 20 $108,300 $21,660 -$2,340 $1,564 $8,616 $801,310 9 31 279 6 22 $120,700 $24,140 -$2,620 $1,763 $9,572 $296,720 10 35 350 7 24 -- -- -- -- -- -- 11 33 363 7 27 -- -- -- -- -- -- 12 34 408 8 29 -- -- -- -- -- -- 13 17 221 9 32 -- -- -- -- -- -- 14 6 84 10 34 -- -- -- -- -- -- 15 7 105 10 37 -- -- -- -- -- -- 16 6 96 11 39 -- -- -- -- -- -- 17 3 51 12 42 -- -- -- -- -- -- 18 8 144 12 44 -- -- -- -- -- -- 19 6 114 13 46 -- -- -- -- -- -- 20 9 180 14 49 -- -- -- -- -- -- 21 4 84 14 51 -- -- -- -- -- -- 22 2 44 15 54 -- -- -- -- -- -- 23 1 23 16 56 -- -- -- -- -- -- 24 3 72 16 59 -- -- -- -- -- -- 25 2 50 17 61 -- -- -- -- -- -- 27 2 54 18 66 -- -- -- -- -- -- 29 1 29 20 71 -- -- -- -- -- -- 36 1 36 24 88 -- -- -- -- -- --
Totals for all covered pads (4-36 wells per pad): 796 6,029
Cost averages for pads with 4-9 wells per pad:
$79,189 $15,838 -$1,642 $1,131 $6,382 $3,931,180
Table 4: Reductions (in tons per year) and abatement cost of non-emitting conversion at various well sizes in NAA
Wells per Pad
VOC savings per pad
Methane-ethane savings per pad
Total VOC Savings in
NAA VOC Abatement Cost ($/short ton)
Total Methane-Ethane Savings
in NAA Methane-ethane Abatement
Cost ($/short ton)16 4 2.8 8.7 591 $1,705 1,832 $550 5 3.2 9.9 348 $1,715 1,078 $553 6 4.1 12.6 386 $1,653 1,196 $533 7 4.7 14.7 365 $1,619 1,130 $523 8 5.3 16.5 495 $1,619 1,533 $523 9 6.0 18.6 186 $1,597 576 $515 10 6.7 20.7 233 -- 723 -- 11 7.3 22.5 239 -- 742 -- 12 7.9 24.6 270 -- 835 -- 13 8.8 27.3 150 -- 463 --
15 Ongoing cost of zero bleed system minus cost of maintaining natural gas-powered system with wet gas. 16 To convert from methane to methane-ethane we assume gas is 65.7% methane and 10.6% ethane by weight. See Memorandum from Heather P. Brown, supra n.8.
CAA Ex. 5
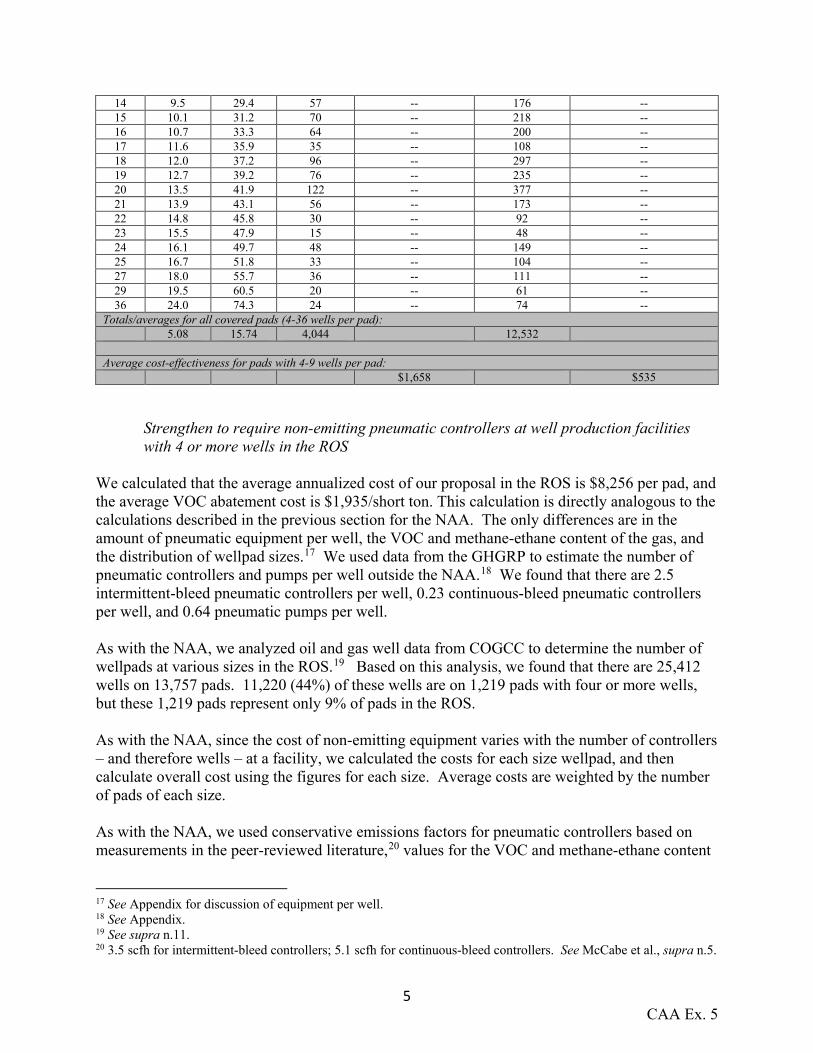
5
14 9.5 29.4 57 -- 176 -- 15 10.1 31.2 70 -- 218 -- 16 10.7 33.3 64 -- 200 -- 17 11.6 35.9 35 -- 108 -- 18 12.0 37.2 96 -- 297 -- 19 12.7 39.2 76 -- 235 -- 20 13.5 41.9 122 -- 377 -- 21 13.9 43.1 56 -- 173 -- 22 14.8 45.8 30 -- 92 -- 23 15.5 47.9 15 -- 48 -- 24 16.1 49.7 48 -- 149 -- 25 16.7 51.8 33 -- 104 -- 27 18.0 55.7 36 -- 111 -- 29 19.5 60.5 20 -- 61 -- 36 24.0 74.3 24 -- 74 --
Totals/averages for all covered pads (4-36 wells per pad): 5.08 15.74 4,044 12,532
Average cost-effectiveness for pads with 4-9 wells per pad:
$1,658 $535
Strengthen to require non-emitting pneumatic controllers at well production facilities with 4 or more wells in the ROS
We calculated that the average annualized cost of our proposal in the ROS is $8,256 per pad, and the average VOC abatement cost is $1,935/short ton. This calculation is directly analogous to the calculations described in the previous section for the NAA. The only differences are in the amount of pneumatic equipment per well, the VOC and methane-ethane content of the gas, and the distribution of wellpad sizes.17 We used data from the GHGRP to estimate the number of pneumatic controllers and pumps per well outside the NAA.18 We found that there are 2.5 intermittent-bleed pneumatic controllers per well, 0.23 continuous-bleed pneumatic controllers per well, and 0.64 pneumatic pumps per well. As with the NAA, we analyzed oil and gas well data from COGCC to determine the number of wellpads at various sizes in the ROS.19 Based on this analysis, we found that there are 25,412 wells on 13,757 pads. 11,220 (44%) of these wells are on 1,219 pads with four or more wells, but these 1,219 pads represent only 9% of pads in the ROS. As with the NAA, since the cost of non-emitting equipment varies with the number of controllers – and therefore wells – at a facility, we calculated the costs for each size wellpad, and then calculate overall cost using the figures for each size. Average costs are weighted by the number of pads of each size. As with the NAA, we used conservative emissions factors for pneumatic controllers based on measurements in the peer-reviewed literature,20 values for the VOC and methane-ethane content
17 See Appendix for discussion of equipment per well. 18 See Appendix. 19 See supra n.11. 20 3.5 scfh for intermittent-bleed controllers; 5.1 scfh for continuous-bleed controllers. See McCabe et al., supra n.5.
CAA Ex. 5

6
of gas consistent with those used by the Division,21 and a value for the price of conserved gas calculated using the Division’s methodology.22 Using these parameters, we calculated the abatement tonnages and costs for retrofitting wellpads in the ROS displayed on Tables 5 and 6 below. For wellpads with less than 30 controllers, we present cost calculations calculated for the installation of electric controllers powered by solar panels (as opposed to calculating the cost of installing an instrument air system, for example). Due to limitations in the Carbon Limits cost tool used to calculate costs for replacing pneumatic equipment, we are unable to provide specific cost or cost-effectiveness estimates for wellpads with more than 30 controllers at this time. Therefore, the cost and cost-effectiveness numbers for those wellpads are not shown in Tables 5 and 6 below. However, there is a clear trend of improving cost-effectiveness (decreasing cost per ton of avoided pollutants) as the number of wells/controllers increases, as seen in Table 6. This arises because non-emitting solutions such as solar-powered electric controllers entail significant common equipment used for all the controllers on the pad, such as solar panels, batteries, and control panels. As more controllers share the use of the centralized equipment, the cost per ton of avoided pollution drops. Therefore, we are confident that the overall cost-effectiveness figure we calculate (based on pads with fewer than 30 controllers) is a conservative estimate of overall program cost-effectiveness. Additionally, we note that we are providing specific cost effectiveness data for 862 of the 1,219 estimated wellpads (71%) covered by our Alternative Proposal in the ROS. Table 5: Costs of non-emitting conversion at various well sizes in ROS
Wells per Pad
# pads
# wells
Int. Cont. On-site
Cont. Cont. On-Site
Equip. Cost
Install Cost
Net Ongoing
cost23
Value of Saved Gas
Annual. Cost per
Pad
Total Annual. Cost in ROS
4 269 1,076 1 10 $50,600 $10,120 -$933 $657 $4,260 $1,145,855 5 172 860 1 13 $63,000 $12,600 -$1,213 $829 $5,241 $901,496 6 118 708 1 15 $71,000 $14,200 -$1,453 $944 $5,811 $685,754 7 82 574 2 18 $87,400 $17,480 -$1,853 $1,199 $7,052 $578,259 8 105 840 2 20 $95,800 $19,160 -$2,013 $1,314 $7,748 $813,582 9 64 576 2 23 $108,300 $21,660 -$2,340 $1,486 $8,695 $556,472 10 52 520 2 25 $116,700 $23,340 -$2,500 $1,600 $9,391 $488,349 11 33 363 3 28 -- -- -- -- -- -- 12 41 492 3 30 -- -- -- -- -- -- 13 33 429 3 33 -- -- -- -- -- -- 14 31 434 3 35 -- -- -- -- -- -- 15 33 495 3 38 -- -- -- -- -- -- 16 48 768 4 40 -- -- -- -- -- -- 17 18 306 4 43 -- -- -- -- -- -- 18 18 324 4 45 -- -- -- -- -- -- 19 11 209 4 48 -- -- -- -- -- -- 20 17 340 5 50 -- -- -- -- -- -- 21 11 231 5 53 -- -- -- -- -- --
21 Gas composition (wet gas): 4.80 kg VOC/Mscf in the ROS; 16.3 kg CH4/Mscf in the ROS. Calculated from 20.3 weight % VOC for ROS, based on Division model data for VOC content of leaking gas in the ROS. 22 $1.87 / Mcf. See supra n.14. 23 Ongoing cost of zero bleed system minus cost of maintaining natural gas-powered system with wet gas.
CAA Ex. 5

7
22 13 286 5 55 -- -- -- -- -- -- 23 7 161 5 58 -- -- -- -- -- -- 24 13 312 6 60 -- -- -- -- -- -- 25 2 50 6 63 -- -- -- -- -- -- 26 2 52 6 65 -- -- -- -- -- -- 27 2 54 6 68 -- -- -- -- -- -- 28 7 196 6 70 -- -- -- -- -- -- 29 3 87 7 73 -- -- -- -- -- -- 30 3 90 7 75 -- -- -- -- -- -- 31 4 124 7 78 -- -- -- -- -- -- 32 2 64 7 80 -- -- -- -- -- -- 33 1 33 8 83 -- -- -- -- -- -- 34 1 34 8 85 -- -- -- -- -- -- 40 1 40 9 101 -- -- -- -- -- -- 41 1 41 9 103 -- -- -- -- -- -- 51 1 51 12 128 -- -- -- -- -- --
Totals for all covered pads (4-51 wells per pad): 1,219 11,220
Cost averages for pads with 4-10 wells per pad:
$73,145 $14,629 -$1,478 $981 $5,997 $5,169,767
Table 6: Reductions (in tons per year) and abatement cost of non-emitting conversion at various well sizes in ROS
Wells per Pad
VOC savings per pad
Methane-ethane savings per pad
Total VOC Savings in
ROS
VOC Abatement Cost ($/short ton)
Total Methane-Ethane Savings
in ROS
Methane-ethane Abatement Cost ($/short ton)24
4 1.9 7.3 500 $2,292 1,971 $581 5 2.3 9.2 403 $2,235 1,590 $567 6 2.7 10.5 315 $2,177 1,242 $552 7 3.4 13.4 278 $2,078 1,097 $527 8 3.7 14.7 390 $2,084 1,539 $529 9 4.2 16.6 269 $2,068 1,061 $525 10 4.5 17.9 235 $2,074 928 $526 11 5.3 20.7 173 -- 683 -- 12 5.6 22.0 229 -- 901 -- 13 6.1 23.9 200 -- 789 -- 14 6.4 25.2 198 -- 781 -- 15 6.9 27.1 227 -- 894 -- 16 7.4 29.3 357 -- 1,407 -- 17 7.9 31.2 143 -- 562 -- 18 8.2 32.5 148 -- 585 -- 19 8.7 34.4 96 -- 379 -- 20 9.3 36.6 158 -- 623 -- 21 9.8 38.6 108 -- 424 -- 22 10.1 39.8 131 -- 518 -- 23 10.6 41.8 74 -- 292 -- 24 11.2 44.0 145 -- 572 -- 25 11.6 45.9 23 -- 92 -- 26 12.0 47.2 24 -- 94 -- 27 12.4 49.1 25 -- 98 -- 28 12.8 50.4 89 -- 353 -- 29 13.5 53.2 40 -- 160 -- 30 13.8 54.5 41 -- 163 --
24 To convert from methane to methane-ethane we assume gas is 65.7% methane and 10.6% ethane by weight. See Memorandum from Heather P. Brown, supra n.8 at tbl. 5.
CAA Ex. 5

8
31 14.3 56.4 57 -- 226 -- 32 14.6 57.7 29 -- 115 -- 33 15.4 60.5 15 -- 61 -- 34 15.7 61.8 16 -- 62 -- 40 18.5 73.0 19 -- 73 -- 41 18.8 74.3 19 -- 74 -- 51 23.6 93.0 24 -- 93 --
Totals/averages for all covered pads (4-51 wells per pad): 4.27 16.82 5,200 20,502
Average cost-effectiveness for pads with 4-10 wells per pad:
$2,162 $548
Extend requirement for non-emitting pneumatic controllers at new/modified well production facilities in the NAA and ROS
We calculated the costs of requiring non-emitting pneumatic controllers at new/modified wellpads with 2 and 3 wells in the NAA and ROS using the same assumptions about pneumatic controllers per well, gas composition, and gas price as in analysis above. The only change in calculating costs using the Zero-Bleed Pneumatics tool for these “modified” sites was to use the “New Site” option rather than “retrofit”. We do not present the cost results for wellpads with 4 or more wells; Tables 3 and 5 show that retrofit with non-emitting controllers at these sites is cost-effective, and costs for new sites are always lower than costs for retrofits. Table 7: Costs of non-emitting conversion for new/modified sites in ROS and NAA
NAA or
ROS
Wells per Pad
Int. Cont. On-site
Cont. Cont. On-Site
Equip. Cost
Install Cost
Net Ongoing
cost25
Value of Saved Gas
Annual. Cost per
Pad
NAA 2 5 1 $14,647 $3,618 -$447 $370 $943 NAA 3 7 2 $19,407 $4,937 -$727 $568 $1,050 ROS 2 5 0 $13,345 $3,205 -$327 $287 $981 ROS 3 8 1 $19,634 $4,937 -$727 $542 $1,098
Table 8: Reductions (tons per year) and abatement cost of non-emitting conversion for new/modified sites in ROS and NAA
NAA or
ROS
Wells per Pad
VOC savings per pad
Methane-ethane savings per pad
VOC Abatement Cost ($/short ton)
Methane-ethane Abatement Cost ($/short
ton)26
NAA 2 1.3 3.9 $749 $242 NAA 3 1.9 6.0 $543 $175 ROS 2 0.8 3.2 $1,210 $307 ROS 3 1.5 6.0 $716 $182
25 Ongoing cost of zero bleed system minus cost of maintaining natural gas-powered system with wet gas. 26 To convert from methane to methane-ethane we assume gas is 65.7% methane and 10.6% ethane by weight. See Memorandum from Heather P. Brown, supra n.8 at tbl. 5.
CAA Ex. 5
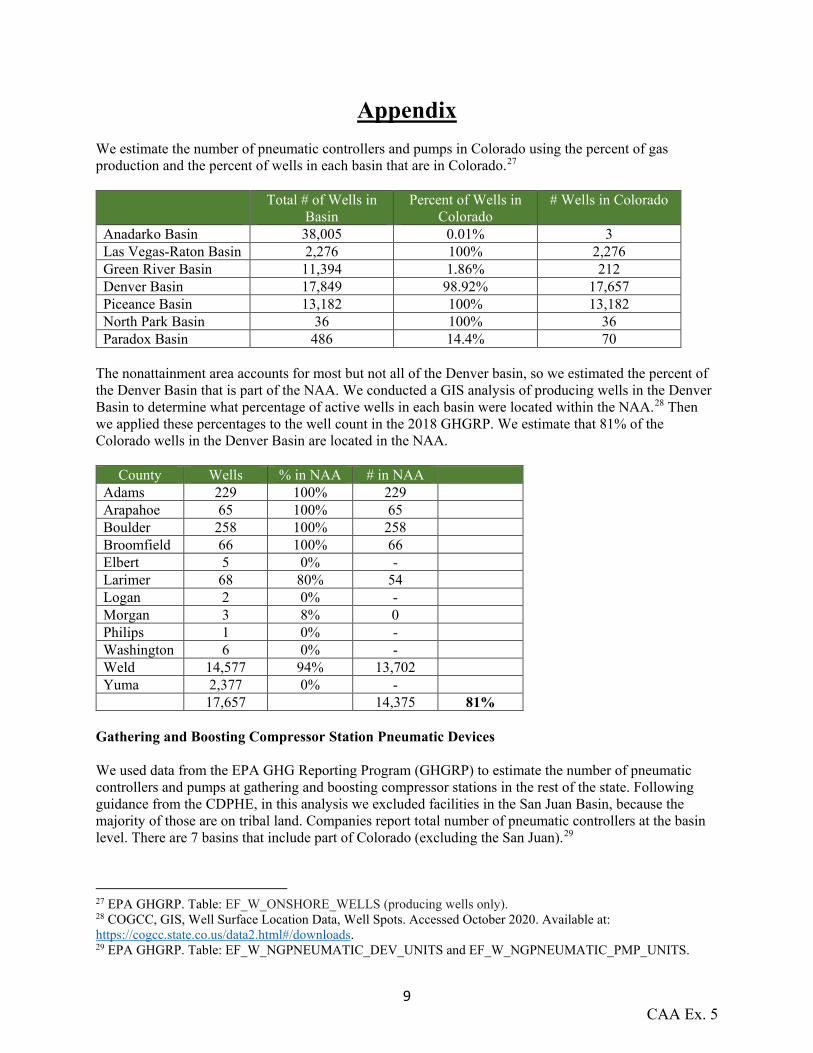
9
Appendix We estimate the number of pneumatic controllers and pumps in Colorado using the percent of gas production and the percent of wells in each basin that are in Colorado.27
Total # of Wells in
Basin Percent of Wells in
Colorado # Wells in Colorado
Anadarko Basin 38,005 0.01% 3 Las Vegas-Raton Basin 2,276 100% 2,276 Green River Basin 11,394 1.86% 212 Denver Basin 17,849 98.92% 17,657 Piceance Basin 13,182 100% 13,182 North Park Basin 36 100% 36 Paradox Basin 486 14.4% 70
The nonattainment area accounts for most but not all of the Denver basin, so we estimated the percent of the Denver Basin that is part of the NAA. We conducted a GIS analysis of producing wells in the Denver Basin to determine what percentage of active wells in each basin were located within the NAA.28 Then we applied these percentages to the well count in the 2018 GHGRP. We estimate that 81% of the Colorado wells in the Denver Basin are located in the NAA.
County Wells % in NAA # in NAA Adams 229 100% 229 Arapahoe 65 100% 65 Boulder 258 100% 258 Broomfield 66 100% 66 Elbert 5 0% - Larimer 68 80% 54 Logan 2 0% - Morgan 3 8% 0 Philips 1 0% - Washington 6 0% - Weld 14,577 94% 13,702 Yuma 2,377 0% - 17,657 14,375 81%
Gathering and Boosting Compressor Station Pneumatic Devices We used data from the EPA GHG Reporting Program (GHGRP) to estimate the number of pneumatic controllers and pumps at gathering and boosting compressor stations in the rest of the state. Following guidance from the CDPHE, in this analysis we excluded facilities in the San Juan Basin, because the majority of those are on tribal land. Companies report total number of pneumatic controllers at the basin level. There are 7 basins that include part of Colorado (excluding the San Juan).29
27 EPA GHGRP. Table: EF_W_ONSHORE_WELLS (producing wells only). 28 COGCC, GIS, Well Surface Location Data, Well Spots. Accessed October 2020. Available at: https://cogcc.state.co.us/data2.html#/downloads. 29 EPA GHGRP. Table: EF_W_NGPNEUMATIC_DEV_UNITS and EF_W_NGPNEUMATIC_PMP_UNITS.
CAA Ex. 5

10
Basin
High-bleed Pneumatic Devices*
Intermittent Bleed Pneumatic
Devices
Low-Bleed Pneumatic Devices
Total Pneumatic Controllers
Pneumatic Pumps
Anadarko Basin 1,054 8,044 5,223 14,321 2,068 Las Vegas-Raton Basin 314 314 12 Green River Basin 173 991 58 1,222 150 Denver Basin 0 7,016 1,137 8,153 112 Piceance Basin 7 365 112 484 45 North Park Basin 69 69 Paradox Basin Total 1,234 16,799 6,530 24,563 2,387
Using the distribution of wells by basin in and out of Colorado (and assuming that the number of gathering and boosting compressor stations is proportional to the number of wells), we calculate the total number of controllers and pumps in the ROS. There are 188 gathering and boosting compressor stations in the ROS,30 so we use this to estimate the average number of controllers and pumps per station.
ROS Intermittent Bleed Pneumatic Devices 1,745 Low-Bleed Pneumatic Devices 227 Pumps 42 Compressor Stations 188 Intermittent Bleed Pneumatic Devices per station 9 Low-Bleed Pneumatic Devices per station 1 Pumps per station 0.2
This approach does not produce credible results for the NAA. This is likely due to the fact that the conversion of gathering and boosting compressor stations to non-emitting controllers noted above31 was underway in the most recent years for which GHGRP data is available, making those data inaccurate. Therefore, we assume that the number of controllers per station is the same in ROS and NAA. Well Production Facility Pneumatic Devices We used data from the EPA GHG Reporting Program (GHGRP) to estimate the number of pneumatic controllers and pumps at well production facilities in the nonattainment area and in the rest of the state. Following guidance from the CDPHE, in this analysis we excluded wells in the San Juan Basin, because the majority of those are on tribal land. Companies report total number of pneumatic controllers and pumps at the basin level. There are 7 basins that include part of Colorado (excluding the San Juan).32
Basin
High-bleed Pneumatic Devices*
Intermittent Bleed Pneumatic
Devices
Low-Bleed Pneumatic Devices
Total Pneumatic Controllers
Pneumatic Pumps
Anadarko Basin 8,470 67,311 15,691 91,472 10,839 Las Vegas-Raton Basin 260 260 Green River Basin 98 41,344 6,762 48,204 7,287 Denver Basin 43,624 12,137 55,761 200
30 Supra n.1. 31 Supra n.2. 32 EPA GHGRP. Table: EF_W_NGPNEUMATIC_DEV_UNITS and EF_W_NGPNEUMATIC_PMP_UNITS.
CAA Ex. 5

11
Piceance Basin 38,637 2,065 40,702 992 North Park Basin 65 65 Paradox Basin 266 266 20 Total 8,568 191,176 36,655 236,399 21,705
*We assume that the High-bleed pneumatic controllers found in Anadarko and Green River Basins are outside of Colorado and exclude them from this analysis. Using the above data on pneumatic pumps and controllers per basin, and the details of the percent of the basins in/out of Colorado and in/out of the NAA within the Denver Basin, we arrive at the following estimates of pneumatic controllers and pumps per well.
Controllers per Well NAA ROS Intermittent Bleed Pneumatic Devices 35,133 47,796 Low-Bleed Pneumatic Devices 9,775 4,424 Wells 14,375 19,061 Intermittent per well 2.44 2.51 Low per well 0.68 0.23
Pumps per well NAA ROS Pumps 161 1,168 Wells 14,375 19,061 Pumps per well 0.011 0.061
Because pumps per well in both NAA and ROS are so small, we do not include these in calculates of zero bleed pneumatic costs.
CAA Ex. 5

CLEAN AIR ADVOCATES’ EXHIBIT 6
[Pneumatics Cost Spreadsheet, Carbon Limits,
attached separately as Excel spreadsheet]

CLEAN AIR ADVOCATES’ EXHIBIT 7

Cap-Op Energy British Columbia Oil and
Gas Methane Emissions Field StudyPrepared For: BC CAS ECCC BC OGC BC MEMPR
Prepared By: Cooper Robinson Keith Driver Mike D’Antoni
Ryan Liu Brenna Barlow Wes Funk Arvind Ravikumar
DISCLAIMER
While reasonable effort has been made to ensure the accuracy, reliability and completeness of the
information presented herein, this report is made available without any representation as to its use in
any particular situation and on the strict understanding that each reader accepts full liability for the
application of its contents, regardless of any fault or negligence of Cap-Op Energy, Inc.
Executive Summary
The British Columbia Methane Emissions Field Study was undertaken in order to inform the modeling
parameters used in time-series methane emission modeling. An advisory team comprising the British
Columbia Ministry of Environment and Climate Change Strategy – Climate Action Secretariat (BC CAS), the
British Columbia Oil and Gas Commission (BC OGC), Environment and
Climate Change Canada (ECCC), and the Ministry of Energy, Mines and
Petroleum Resources (MEMPR) was established in order to engage
directly with the project team comprising Cap-Op Energy, Greenpath
Energy, DXD Consulting and Dr. Arvind Ravikumar. BC OGC inspectors
also contributed to the data collection.
The study gathered a broad spectrum of methane emissions data at 266
locations (wells and batteries) across British Columbia, encompassing
fugitive emissions, equipment venting emissions, pneumatic inventory
and emissions estimates, as well as episodic and other sources of
methane emissions. The data were compiled and analyzed to characterize British Columbia’s oil and gas
operations from a methane emissions perspective. In order to align with current and projected production
centres, coverage of tight wells and batteries in the Montney was prioritized. The collection of sites
1 Some sources were quantified using visual estimation (e.g. inaccessible fugitives), or factors (e.g. pneumatic control instruments). Methane content of sources was not determined.
Scope of Field Survey
Total Sites Visited 266
Production/Facility Types Represented
12
Total Quantifiable Methane Emission Sources (#, volume)1
1,000 sources,
362 m3/hour
CAA Ex. 7

British Columbia Oil and Gas Methane Emissions Field Study
Page 2 of 70
sampled was determined to be representative of the available population, based on recent production
rates – both within each production/facility type category as well as overall.
Analysis of field survey results identified key similarities as well as key differences between British
Columbia and other jurisdictions.
The findings from the field survey aligned with other similar studies where a small number of sources were
found to be responsible for a large portion of the methane releases.3 Specifically, 51% of emissions
resulted from the top 8.7% of equipment fugitives. Excluding pneumatic venting, 43% (114 of 266) of
visited sites had no venting or fugitives detected.
Methane emissions from natural gas-driven pneumatic devices (67% of total) represent significant sources
methane emissions at BC wells and batteries. Non-emitting control instruments and chemical injection
pumps (e.g. solar electric or air-driven) were observed to be very common in BC. Of all pneumatic or
pneumatic-equivalent devices observed in the study, 65% were non-emitting; a recent pneumatic
inventory in Alberta found <5% non-emitting.
Tanks contributed a significant proportion of total emissions (12% including
vents and leaks). Tanks were responsible for 65% of total non-pneumatic
venting emissions (2 other equipment types, Reciprocating Compressor and
Surface Casing Vents, combined with tanks represent 94% of overall non-
pneumatic venting emissions). This includes hydrocarbon venting from
Produced Water Tanks (25% of total tank venting).4 Thief Hatches, a tank-
specific component, also have the highest average, median, and site level leak
rates which suggests that Thief Hatches are currently responsible for a
significant portion of methane leak emissions (3% of overall leak sources, 17%
of overall leak emissions).
While compressor stations were not a specific focus of the study, 69
compressors units were observed at batteries. These were catalogued and
found to exhibit average emission rates consistent with population-wide
figures from the US Greenhouse Gas Inventory (see Sections 2.1.3 and 1.2.5.2).
In addition to the field survey, a Corporate Data Request was distributed in
order to solicit additional insight into data that are not possible to observe with
a one-time site visit, including fugitive survey and repair history, and episodic or other sources of methane
emissions. These data were used to develop time series modeling parameters such as the Leak Occurrence
Rate. These parameters are derived by combining historical data with direct observations from the field
survey in order to better characterize the temporal aspect of methane emissions.
2 Excluding pneumatic venting 3 Brandt, A.R., G.A. Heath, D. Cooley (2016). Methane leaks from natural gas systems follow extreme distributions. Environmental Science & Technology. DOI: 10.1021/acs.est.6b04303 4 Compositional data was not obtained for any emission sources; venting from Produced Water Tanks may include significantly less methane than other vent sources and are distinguished within the scope of this report.
Summary of Field Survey Findings
Total Leak-free and Vent-free Sites2 Surveyed
114 (43%)
Total Natural Gas-Driven Pneumatic Devices
725 (34%) (242
m3/hour est.)
Venting Emissions
101 (63 m3/hour)
Equipment Fugitive Emissions
284 (57 m3/hour)
CAA Ex. 7

British Columbia Oil and Gas Methane Emissions Field Study
Page 3 of 70
In January 2019, following the presentation of the draft study results, a workshop led by DXD Consulting
Inc. (DXD) was conducted to consider the experience of oil and gas industry experts on factors that could
influence certain parameters of interest. Input was solicited from these representatives for the purposes
of adding context to numerical results of forecasting and backcasting time-series methane modeling.
Three temporal states – distant past, recent past, and future – were interrogated across six specific focus
areas in terms of the direction and relative magnitude of change from the “present” observed in the field
study. The workshop sought to bring context and industry experience to the forefront to guide changes to
modeling parameters over different time periods. The principal objective of the industry workshop was to
solicit expert feedback on operator practices and historical and future design considerations that may
impact methane emissions from upstream facilities. This uniquely collaborative session between industry
and regulators was intended as an opportunity to extract technical feedback from industry experts on how
their operations have evolved over time. Insights into key drivers that might influence parameters of
interest for time-series modelling was determined through focused small-group discussions. It is expected
that others can benefit from these insights when completing emissions modelling assessments over
various time periods.
The data generated by the BC Methane Emissions Field Study encompass varied geographic, facility,
production, and temporal coverage and were analyzed using transparent methodologies. The insights and
results are presented herein with additional commentary and context, along with the anonymized raw
data.
CAA Ex. 7

British Columbia Oil and Gas Methane Emissions Field Study
Page 4 of 70
1 Table of Contents
DISCLAIMER ................................................................................................................................................ 1
Executive Summary ....................................................................................................................................... 1
Glossary......................................................................................................................................................... 6
Background and Context ............................................................................................................................. 10
Scope ........................................................................................................................................................... 11
Facility Types ........................................................................................................................................... 11
Production Types ..................................................................................................................................... 11
Source Types ........................................................................................................................................... 12
Time Period .............................................................................................................................................. 12
Approach ..................................................................................................................................................... 12
Site Selection ........................................................................................................................................... 12
Representativeness.............................................................................................................................. 14
Target and Actual Sample Sets ........................................................................................................... 17
Field Data Collection ................................................................................................................................ 17
Data Schema ........................................................................................................................................ 18
Use of Existing Factors ........................................................................................................................ 19
Fugitive History and Repair Data Collection ............................................................................................ 19
Episodic and Other Sources of Methane Emissions Data Collection ...................................................... 19
Temporal Trends ...................................................................................................................................... 20
Workshop Objectives ........................................................................................................................... 20
Workshop Methodology ....................................................................................................................... 20
1 Chapter 1: Field Observations ............................................................................................................. 22
1.1 Analytical Approach ..................................................................................................................... 22
1.2 Results ......................................................................................................................................... 26
1.2.1 Major Equipment Counts ..................................................................................................... 26
1.2.2 Component Counts .............................................................................................................. 28
1.2.3 Pneumatic Devices .............................................................................................................. 33
1.2.4 Equipment Fugitive Emissions ............................................................................................ 38
1.2.5 Vents .................................................................................................................................... 48
1.3 Chapter 1 Summary .................................................................................................................... 52
2 Chapter 2: Comparison to Contemporary Studies ............................................................................... 52
2.1.1 Estimated Pneumatic Venting Emissions ............................................................................ 52
2.1.2 Fugitive Emissions ............................................................................................................... 53
2.1.3 Compressor Emissions ........................................................................................................ 54
2.1.4 Pneumatic Demographics ................................................................................................... 55
CAA Ex. 7
British Columbia Oil and Gas Methane Emissions Field Study
Page 5 of 70
2.2 Chapter 2 Summary .................................................................................................................... 55
3 Chapter 3: Fugitive and Episodic Emissions Management Practices .................................................. 56
3.1 Leak Repair Times ...................................................................................................................... 56
3.2 Leak Occurrence Rate ................................................................................................................. 57
3.3 Other Sources and Controls ........................................................................................................ 59
3.4 Chapter 3 Summary .................................................................................................................... 60
4 Chapter 4: Long Term Methane Emission Drivers ............................................................................... 60
4.1 Temporal State Definition ............................................................................................................ 60
4.1.1 Distant Past ......................................................................................................................... 60
4.1.2 Recent Past ......................................................................................................................... 61
4.1.3 Future .................................................................................................................................. 61
4.2 Assessment of Drivers ................................................................................................................. 61
4.2.1 Equipment to Facility Ratios ................................................................................................ 62
4.2.2 LDAR Inspection Frequency ................................................................................................ 63
4.2.3 Prevalence of High Bleed Pneumatics ................................................................................ 64
4.2.4 Prevalence of Methane Mitigation Technologies ................................................................. 65
4.2.5 Level of Preventative Maintenance ..................................................................................... 66
4.2.6 Prevalence of Non-Emitting Pneumatic Devices ................................................................. 67
4.3 Potential for Incentivization .......................................................................................................... 68
4.4 Chapter 4 Summary .................................................................................................................... 69
Closing ......................................................................................................................................................... 69
Appendix A: Data Tables ............................................................................................................................. 70
CAA Ex. 7

British Columbia Oil and Gas Methane Emissions Field Study
Page 6 of 70
Glossary
• Advisory Team: Project representatives from BC CAS, BC OGC, MEMPR, ECCC
• BC CAS: British Columbia Ministry of Environment and Climate Change Strategy – Climate Action Secretariat
• BC OGC: British Columbia Oil and Gas Commission
• CAPP: Canadian Association of Petroleum Producers
• Components: Relevant to the classification and attribution of methane emission sources; in order to enable application of component-to-equipment ratios from previous research, definitions and component types match those employed by Clearstone et al (2018):5
o Compressor Seals: ▪ Reciprocating: Packing systems (seals) are used on reciprocating compressors to
control leakage around the piston rod on each cylinder. A reciprocating compressor is deemed to have one seal associated with each compressor cylinder regardless of whether it is a single or tandem seal.
▪ Centrifugal: Centrifugal compressors generally require shaft-end seals between the compressor and bearing housings. Either face-contact oil-lubricated mechanical seals or oil-ring shaft seals, or dry-gas shaft seals are used. A centrifugal compressor has two seals, one on each side of the housing where the shaft penetration occurs.
o Connector: Each threaded, flanged, mating surface (cover) or mechanical connection is counted as a single connector. Welded or backwelded connections are not counted.
o Control Valve: A valve equipped with an actuator for automated operation to control flow, pressure, liquid level or other process parameter.
o Meter: A flow measurement device is counted as a single component. The connections on the upstream and downstream sides of the device are counted as separate components.
o Open-Ended Line: Each valve in hydrocarbon service that has process fluid on one side and is open to the atmosphere on the other (either directly or through a line) is counted as an open-ended line. If the open side of the valve is fitted with a properly installed cap, plug, blind flange or second closed block valve, or is connected to a control device, then it is no longer considered to be open-ended.
o Pressure Relief Valves and Pressure Safety Valves (PRV/PSV): Each pressure-relief valve that discharges directly to the atmosphere or through a vent system is counted as a single component.
o Pump Seal: Each pump in hydrocarbon service may leak from around the pump shaft and is typically controlled by a packing material, with or without a sealant. It may be used on both the rotating and reciprocating pumps (and includes pneumatic injection pumps). Specially designed packing materials are available for different types of service. The selected material is placed in a stuffing box and the packing gland is tightened to compress the packing around the shaft.
5 Clearstone Update of Equipment Component and Fugitive Emission Factors for Alberta Upstream Oil and Gas Study (https://www.aer.ca/documents/UpdateofEquipmentComponentandFugitiveEmissionFactorsforAlber-1.pdf). See Section 8.3 for additional detail on components.
CAA Ex. 7

British Columbia Oil and Gas Methane Emissions Field Study
Page 7 of 70
o Regulator: Most regulators are equipped with a vent where gas is released in the event the diaphragm inside becomes damaged.
o Thief Hatch: Storage tanks connected to a VRU or flare do not emit gas unless the internal tank pressure exceeds the PRV or thief hatch set pressures (and intermittent venting occurs). When the tank pressure drops, the PRVs return to a closed position and typically don’t leak. However, once opened, thief hatches remain partially open until an operator closes the hatch. Gas loss from partially open thief hatches is unintentional and therefore classified as a leak. Gas losses from storage tanks open to the atmosphere (i.e., not connected to a VRU or flare) are classified as a process vent (not a leak).
o Valve: A valve that is not a control valve.
• Control Instrument: Any device used for process control (measurement and control of process variables) such as switches and controllers; predominantly includes the classifications:
o Pressure controller: a device which continuously monitors pressure and outputs a corrective signal to the final control element based on the deviation from set point pressure
o Pressure switch: a sub-type of pressure controller, capable of on/off output at preset pressure
o Level controller: a device which continuously monitors fluid level and outputs a corrective signal to the final control element based on the deviation from set point level
o Level switch: a sub-type of level controller, capable of on/off output at preset level o Positioner: a device which modulates the supply pressure to the control valve actuator to
maintain a position based on the control signal o Temperature controller: a device which continuously monitors temperature and outputs
a corrective signal to the final control element based on the deviation from desired temperature
o Transducer: a combination of a sensor and a transmitter; converts physical signal (e.g. pressure) into electric signal (e.g. millivolts)
• Crude Oil Single-Well Battery: A production facility for a single oil well.6
• Crude Oil Multiwell Group Battery: A production facility consisting of two or more flow-lined oil wells having individual separation and measuring equipment but with all equipment sharing a common surface location.6
• Crude Oil Multiwell Proration Battery: A production facility consisting of two or more flow-lined oil wells having common separation and measuring equipment. Total production is prorated to each well based on individual well tests. Individual well production tests can occur at the central site or at remote satellite facilities. 6
• ECCC: Environment and Climate Change Canada
• Excessive Pneumatic Venting: includes any gas release from pneumatic equipment that does not reflect normal operation, such as a release from the seal on the device casing. These types of releases were isolated during analysis as a separate category since they are treated differently under different regulations.
• Facility: Any site/location may be considered a facility within this report, including wellsites, but for analytical purposes facilities are batteries.
• Fuel Gas: See natural gas as the same definition was used for the purpose of this study.
6 Facility definitions excerpted from the Petrinex British Columbia Inclusion Project – Industry Readiness Handbook available at https://www.petrinex.ca/Initiatives/Documents/PBCIP_Industry_Readiness_Handbook.pdf
CAA Ex. 7

British Columbia Oil and Gas Methane Emissions Field Study
Page 8 of 70
• Fugitive Emissions (Equipment Fugitives): The field collection team employed the following definition for distinguishing equipment fugitives (leaks) from vents: “A leak is the unintentional loss of process fluid past a seal, mechanical connection or minor flaw at a rate that is in excess of normal tolerances allowed by the manufacturer or applicable health, safety and environmental standards. An equipment component in hydrocarbon service is commonly deemed to be leaking when the emitted gas can be visualized with an infrared (IR) leak imaging camera or detected by other techniques with similar or better detection capabilities.”5 OGI was the only detection technology used in this study. Equipment fugitives were attributed to component types listed above including connectors, valves, control valves, PRV/PSV, meters, regulators, pump seals, thief hatches. During analysis some equipment fugitives were further sub-classified (e.g. Excessive Pneumatic Venting).
• Gas Multiwell Effluent Measurement Battery: A production reporting entity consisting of two or more gas wells where estimated production from gas wells in the battery is determined by the continuous measurement of multiphase fluid from each well (effluent measurement). Commingled production is separated and measured then prorated back to wells based on the estimated production. 6
• Gas Multiwell Group Battery: A production reporting entity consisting of two or more gas wells where production components are separated and measured at each wellhead. Production from all wells in the group is combined after measurement and then delivered to a gas gathering system or other disposition. 6
• Gas Single Well Battery: A production facility for a single gas well where production is measured at the wellhead. Production is delivered directly and is not combined with production from other wells prior to delivery to a gas gathering system or other disposition. 6
• Heavy Liquid: Process fluid that is a hydrocarbon liquid at the operating conditions and has a vapour pressure of less than 0.3 kPa at 15◦C.5 No heavy liquid service was encountered in the study.
• Large Facility: Refers to Compressor Stations and Gas Plants. 6
• LDAR: Leak Detection and Repair
• Leak Occurrence Rate: An important parameter used in time-series modeling to establish the fugitive emission factor magnitude, which considers the number of detected leaking components by type, the number of leaks detected but not repaired from the previous survey, the number of months since the last survey, and the number of components and facilities of each type. See Section 3.2 for calculation details.
• Light Liquid: Process fluid that is a hydrocarbon liquid at the operating conditions and has a vapour pressure of 0.3 kPa or greater at 15◦C. Light/medium crude oil, condensate and natural gas liquids (NGLs) fall into this category. 5
• MEMPR: British Columbia Ministry of Energy, Mines, and Petroleum Resources
• Natural Gas: The Petroleum and Natural Gas Act (PNG) defines as all fluid hydrocarbons, before and after processing, that are not defined as petroleum, and includes hydrogen sulfide, carbon dioxide, and helium produced from a well.7 In the scope of this study, typically refers to fuel gas or instrument gas that is (or was assumed to be) predominantly methane.
• Pneumatics (Pneumatic Devices): Refers to control instruments and pumps, including non-pneumatic (e.g. electric drive) equipment according to the classifications above.
7 Oil and gas Glossary and Definitions Version 1.11: February 2019, BC OGC (Available at https://www.bcogc.ca/node/11467/download)
CAA Ex. 7

British Columbia Oil and Gas Methane Emissions Field Study
Page 9 of 70
• Pneumatic Pump: Any device used for chemical injection at wellsites, compressor stations, batteries or gas plants; no sub-classification was employed in this report although the observed pump types include diaphragm positive displacement pumps and electric drive positive displacement pumps.
• Process Gas: Process fluid that is a hydrocarbon gas at the subject operating condition.5 For the purpose of the analysis process gas was defined as natural gas.
• Project Team: Cap-Op Energy, including its subcontractors Greenpath Energy, DXD Consulting, and Dr. Arvind Ravikumar
• OGI: optical gas imaging using infrared (IR) leak imaging camera
• Reporting Facility: Refers to a facility with a Reporting Facility ID from the BC OGC.
• Site Classification (or Facility Types): Sites, or facilities, were classified according to existing BC OGC classification schemes including gas wells, oil wells, single well batteries, and others as further delineated in Facility Types
• Venting Emissions: An intentional release of hydrocarbon gas directly to the atmosphere. Venting does not include partial products of combustion that might occur during flaring or other combustion activities. Vents were attributed to component types including open-ended line, compressor seal, and thief hatch.
CAA Ex. 7

British Columbia Oil and Gas Methane Emissions Field Study
Page 10 of 70
Background and Context British Columbia (BC) launched its Climate Action Plan in 2008 as one of the first jurisdictions in North
America to formally address anthropogenic climate change with GHG emission reduction targets and a
suite of programs to achieve them.8 In 2016, BC’s Climate Action Plan included programs launched to
specifically target methane emissions from upstream natural gas production, including a reduction target
of 45% by 2025 and a commitment to investing in infrastructure to power natural gas projects with clean
electricity.9 In December 2018, BC confirmed their methane emissions reduction target in the CleanBC
Plan.10 At a high level, BC’s upstream methane emission reduction target is aligned with sub-national
policies in neighbouring Alberta,11 states including Colorado, California,12 Ohio, Pennsylvania, and
Wyoming as well as federally in Canada, the US, and Mexico.13
Methodologies have been established to model methane emission sources, including certain defined
parameters (e.g. facility types, and equipment types). Inputs for these modelling methodologies should
represent local operating configurations and production types, however they are often generic historical
factors, developed in different jurisdictions. This study aimed to develop modelling parameters specific to
BC operations.
The Province of British Columbia along with Environment and Climate Change Canada proposed and
supported the field study and subsequent analysis to translate observations from the field to the defined
time-series modeling parameters.
Following a description of the scope and approach, reporting of results is structured as follows:
CHAPTER TITLE SOURCE OF INFORMATION
CHAPTER 1 Field Observations Field Survey Data CHAPTER 2 Comparison to Contemporary Studies Field Survey Data, Other Studies CHAPTER 3 Fugitive and Episodic Emission Management
Practices Field Survey Data, Corporate Data Request
CHAPTER 4 Long Term Methane Emission Drivers Expert Workshop
8 British Columbia Climate Action Plan, 2008 (Available at https://www2.gov.bc.ca/assets/gov/environment/climate-change/action/cap/climateaction_plan_web.pdf) 9 British Columbia Climate Leadership Plan, August 2018 (Available at https://www2.gov.bc.ca/assets/gov/environment/climate-change/action/clp/clp_booklet_web.pdf) 10 CleanBC, March 2019 (Available at https://blog.gov.bc.ca/app/uploads/sites/436/2019/02/CleanBC_Full_Report_Updated_Mar2019.pdf) 11 Alberta Climate Leadership Plan, Implementation Plan 2018-2019 (Available at https://open.alberta.ca/dataset/da6433da-69b7-4d15-9123-01f76004f574/resource/b42b1f43-7b9d-483d-aa2a-6f9b4290d81e/download/clp_implementation_plan-jun07.pdf) 12 Proposed Short-Lived Climate Pollutant Reduction Strategy, California Air Resources Board, April 2016 (Available at https://www.arb.ca.gov/cc/shortlived/meetings/04112016/proposedstrategy.pdf) 13 Joint Statement on North American Climate Leadership, Environment and Climate Change Canada, September 2018 (Available at https://www.canada.ca/en/environment-climate-change/news/2018/09/joint-statement-on-north-american-climate-leadership1.html)
CAA Ex. 7

British Columbia Oil and Gas Methane Emissions Field Study
Page 11 of 70
Scope Facility Types
Upstream oil and gas production is generally comprised of wells, batteries, gathering and transportation
systems, and upstream processing facilities. Since facility sizes tend to increase further down the supply
chain, the upstream sector is characterized by large numbers of small facilities (9,191 active wells and 327
active batteries)14 which can be highly diverse in their operating practices and the type of equipment found
on site. Diversity at upstream sites is also a result of diverse operators, design and operating practices,
facility ages, and product characteristics. For example, the presence of liquids can alter the equipment
and operating practices of upstream sites.
Characterizing the upstream sector accurately is challenging because large sample sizes are required for
statistical significance but field data collection costs scale with both sample size and facility
size/complexity. In order to ensure sufficient sample sizes, Compressor Stations and Gas Plants (Large
Facilities) were excluded in order to focus on wells and batteries, however some compressors were
observed at smaller facilities. Specifically, the study considered the following facility types (consistent with
Petrinex definitions):
• Wells (W)
• Single-Well Batteries (SWB)
• Multiwell Group Batteries (MGB)
• Multiwell Proration Batteries (MPB)
• Multiwell Effluent Measurement Batteries (MEM)
Production Types British Columbia produces oil and gas from the northwest end of the Western Canadian Sedimentary
Basin. Oil production, comprising light crude oil and natural gas condensates, is secondary to gas
production in most areas, and both are produced from a mix of older legacy wells (“Conventional”) as well
as newer Shale and Tight wells. Based on the BC OGC records, very few facilities are classified as producing
“Shale Gas” as distinct from “Tight Gas” and so these were combined to form a single production category
(Tight Gas (T)). Tight Gas was distinguished from Conventional Gas (C), and a single Oil (O) category was
considered to include sites classified as either Tight Oil or Conventional Oil.
Specifically, the study considered the following categories of facility and production types:
• Well Site
• Gas Single Well Battery
• Gas Multiwell Group Battery
• Gas Multiwell Effluent Measurement Battery
• Crude Oil Single-Well Battery
• Crude Oil Multiwell Proration Battery
• Crude Oil Multiwell Group Battery
14 “Active” was defined based on May 2018 production reporting.
CAA Ex. 7

British Columbia Oil and Gas Methane Emissions Field Study
Page 12 of 70
Source Types Upstream methane sources result from intentional or unintentional releases to atmosphere, or from
combustion. Combustion emission sources such as flares were considered outside the scope of the study.
Intentional (venting) sources of emissions were attributed to pneumatic devices and other specific pieces
of equipment wherever possible (see Sections 1.2.5.2 and 1.2.4.2, respectively). Unintentional (equipment
fugitive) emissions were attributed to specific components (see Section 1.2.3.2 for examples).
Time Period Field data collection occurred during the month of September 2018, with a single inspection at each
location (snapshot survey). Between October 2018 and February 2019, historical site-level data was
acquired concerning emissions and activities that occurred between 2016 and February 2019. In January
2019, expert opinion was solicited regarding past, present, and future time trends and their impacts on
emissions (see Chapter 4).
Approach A field protocol and sampling plan were developed to facilitate the development of numerical results on
a per-facility basis (emitting and non-emitting equipment counts), per-component basis (fugitives, where
possible) and including the quantification of emitting equipment.
Greenpath lead the development of the field protocol for on-site data collection methodologies, in
consultation with Cap-Op and the advisory team, with particular focus on:
1) Methodology employed to estimate equipment and component counts/inventories where applicable
2) Methodology employed to quantify emissions from fugitives and emitting equipment
The protocol that was selected balanced time and resource constraints with the granularity and accuracy
of data collected. The protocol required a two-person team, including contractors and BC OGC Inspectors,
who were tasked with the following:
• Inventory of pneumatic devices, process equipment and other potential vent sources and fate of vent sources (compressor packing, tank controls)
• Inspection via OGI Camera and quantification of leaks and vents via High Flow Sampler
• Collection of supplemental information to aid in quantification
Concurrently, Cap-Op lead the development of the sampling plan, in consultation with Greenpath and the
advisory team, with particular focus on:
3) Types of facilities to be considered for study (e.g. Wells, Batteries) 4) Production types to be considered for study (e.g. Tight Gas, Conventional Oil) 5) Representation of the population using randomly selected sample sets of sites
Site Selection Participation in the study was voluntary, but was structured as “opt-out” instead of opt-in. This allowed
the project team to select sites randomly in order to form a robust sample. The sites visited were selected
CAA Ex. 7

British Columbia Oil and Gas Methane Emissions Field Study
Page 13 of 70
through the process detailed below before any contact with producers. All but one producer selected
allowed the field survey to take place which prevented or minimized a “coalition of the willing” effect that
may introduce bias to studies relying only on voluntary participation.
Site selection was done using a quasi-random process, seeking to balance the statistical benefits of
random selection with logistical challenges presented by visiting a large number of geographically
dispersed locations, and the limited amount of time available for both site selection and field data
collection. Filtered data were provided by BC OGC which contained records of the most recent available
month of production reporting, the facility type categories and production type categories as well as other
identifying information.
The approach involved filtering the population of wells and batteries in BC before applying random
selection procedures. The populations in each facility-production type category were filtered according to
the principles outlined in Table 1:
Table 1: Well and battery population filters Filter Applied Rationale
Active (or recently active) operations only Inactive (shut-in) locations are out of scope.
Exclude extremely remote locations (e.g. Horn River)
Focused on Montney due to provincial production and forecasts.
Battery not co-located with another battery in the same LSD
Co-located facilities, or those with multiple permits at the same location, require manual review of metering schematics in order to correctly attribute emissions and equipment. This level of manual review was out of scope of the study.
Wells geographically proximate to batteries (3 km) Improve efficiency of transportation logistics.
While it is acknowledged that each of the filters applied to the population introduces bias to the results,
the filtering also increased the sample size by allowing the field team to visit more locations. This trade-
off was considered in the context of the advisory team’s objective of focusing on most sensitive
parameters for time-series modeling. The focus was to characterize smaller sites in BC which were
believed to differ from Alberta sites covered by most other research. In this context, observing a significant
cross-section of well and battery facility/production categories was prioritized.
A randomized selection process was then applied to the filtered list of facilities and wells resulting in a set
of sites that could be tested for whether it was representative of the overall population. The process is
summarized in Figure 1:
CAA Ex. 7
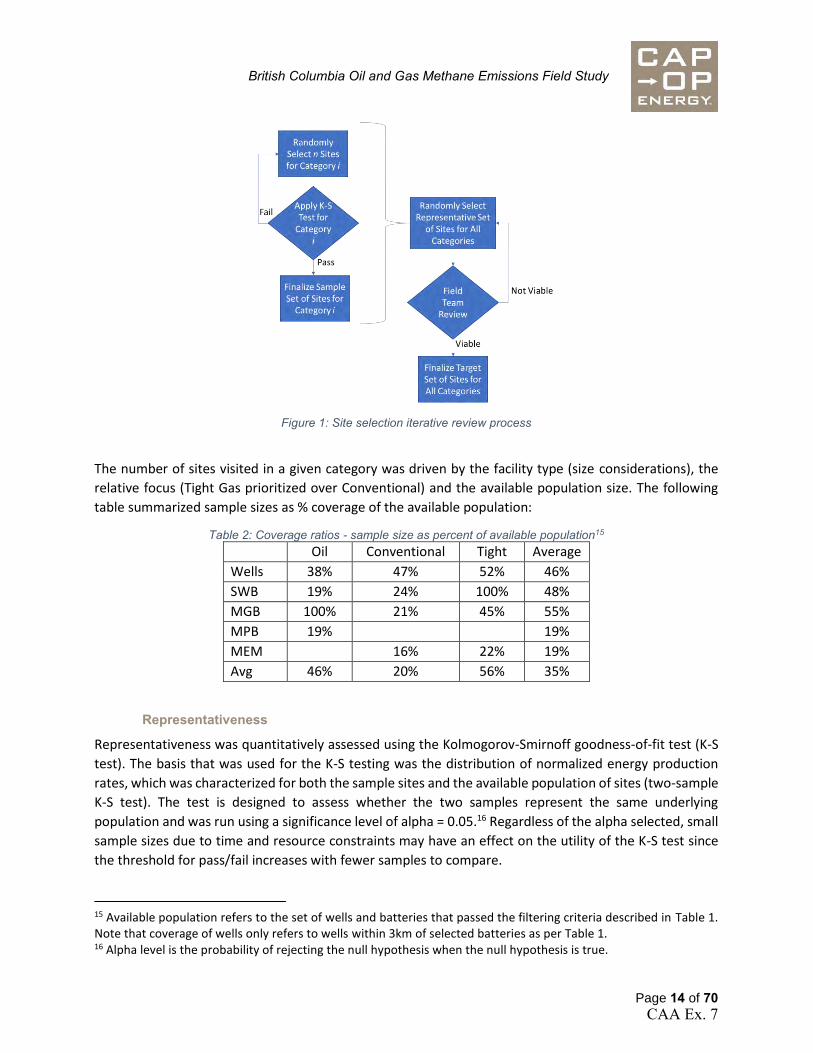
British Columbia Oil and Gas Methane Emissions Field Study
Page 14 of 70
Figure 1: Site selection iterative review process
The number of sites visited in a given category was driven by the facility type (size considerations), the
relative focus (Tight Gas prioritized over Conventional) and the available population size. The following
table summarized sample sizes as % coverage of the available population:
Table 2: Coverage ratios - sample size as percent of available population15 Oil Conventional Tight Average
Wells 38% 47% 52% 46%
SWB 19% 24% 100% 48%
MGB 100% 21% 45% 55%
MPB 19%
19%
MEM
16% 22% 19%
Avg 46% 20% 56% 35%
Representativeness
Representativeness was quantitatively assessed using the Kolmogorov-Smirnoff goodness-of-fit test (K-S
test). The basis that was used for the K-S testing was the distribution of normalized energy production
rates, which was characterized for both the sample sites and the available population of sites (two-sample
K-S test). The test is designed to assess whether the two samples represent the same underlying
population and was run using a significance level of alpha = 0.05.16 Regardless of the alpha selected, small
sample sizes due to time and resource constraints may have an effect on the utility of the K-S test since
the threshold for pass/fail increases with fewer samples to compare.
15 Available population refers to the set of wells and batteries that passed the filtering criteria described in Table 1. Note that coverage of wells only refers to wells within 3km of selected batteries as per Table 1. 16 Alpha level is the probability of rejecting the null hypothesis when the null hypothesis is true.
CAA Ex. 7

British Columbia Oil and Gas Methane Emissions Field Study
Page 15 of 70
The K-S test was applied at the level of each individual combination of facility type and production type,
as well as on the entire selection. The entire selection was then assessed against the “available population”
of wells and batteries after application of the filtering criteria above. All assessments passed the K-S test.
The available population was also assessed against the overall population of all active wells and batteries
in BC. Figure 2 illustrates the effect of the filtering process:
Figure 2: Distribution of normalized energy production rates before and after application of site selection filters
Energy production rates are accessible and present as a reasonable characteristic with which to assess
representativeness, although emissions are not necessarily robustly correlated with energy production
rates, and so additional considerations for diversity were included qualitatively on the entire selection:
• Age, represented by date of first production
• Operator mix
The date of first production was determined using BC OGC records. For facilities, the available population
included first production dates covering 30 years, from 1989-2018 and the target sample included facilities
representing 22 (73%) of these first production years spanning 1989-2017. For wells, 37 distinct years
were represented from 1958 to 2017. Figure 3 shows the distribution of first production years among the
visited wells:
CAA Ex. 7
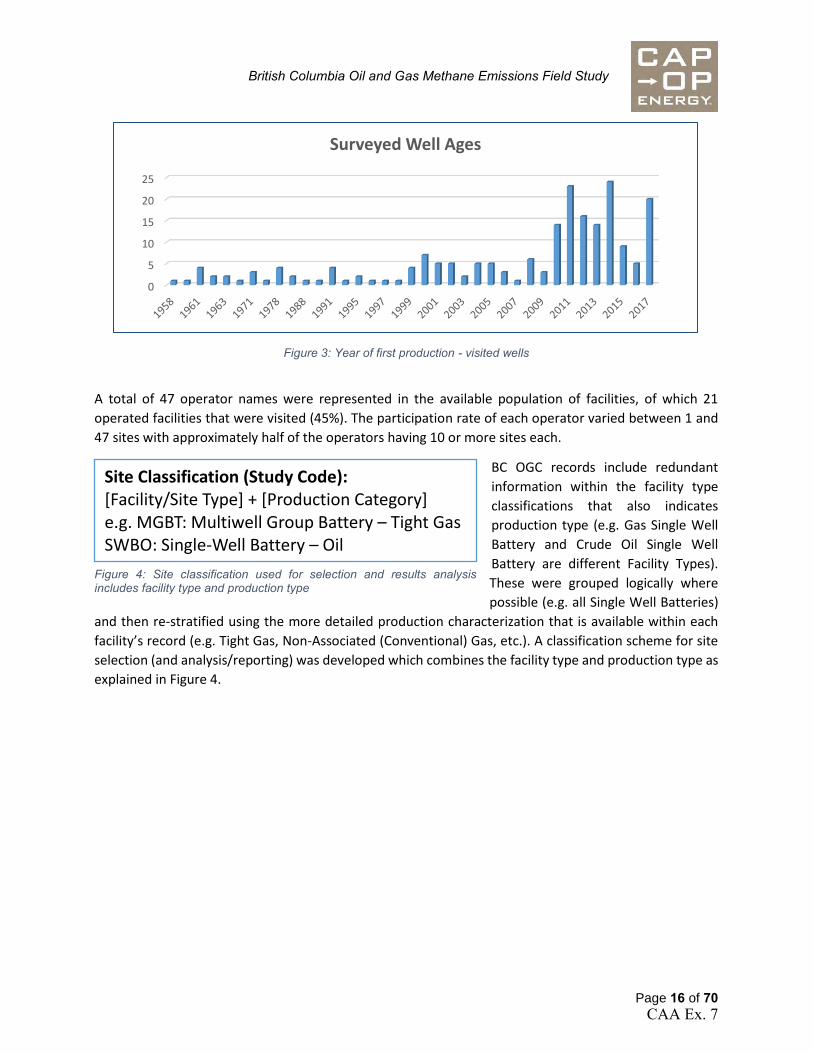
British Columbia Oil and Gas Methane Emissions Field Study
Page 16 of 70
Figure 3: Year of first production - visited wells
A total of 47 operator names were represented in the available population of facilities, of which 21
operated facilities that were visited (45%). The participation rate of each operator varied between 1 and
47 sites with approximately half of the operators having 10 or more sites each.
BC OGC records include redundant
information within the facility type
classifications that also indicates
production type (e.g. Gas Single Well
Battery and Crude Oil Single Well
Battery are different Facility Types).
These were grouped logically where
possible (e.g. all Single Well Batteries)
and then re-stratified using the more detailed production characterization that is available within each
facility’s record (e.g. Tight Gas, Non-Associated (Conventional) Gas, etc.). A classification scheme for site
selection (and analysis/reporting) was developed which combines the facility type and production type as
explained in Figure 4.
0
5
10
15
20
25
Surveyed Well Ages
Site Classification (Study Code): [Facility/Site Type] + [Production Category]
e.g. MGBT: Multiwell Group Battery – Tight Gas SWBO: Single-Well Battery – Oil
Figure 4: Site classification used for selection and results analysis includes facility type and production type
CAA Ex. 7

British Columbia Oil and Gas Methane Emissions Field Study
Page 17 of 70
Target and Actual Sample Sets
The site selection process resulted in the selection of
254 locations within the study areas outlined in
Figure 5 (266 were ultimately surveyed). The field
team, comprising Greenpath Energy staff and OGC
inspectors, was provided with the list of selected sites
and site information and instructed to visit as many
as possible.
With exceptions noted below in Table 3, the actual
sites visited matched the target sites and priority
focus points for the study. The representativeness
tests were re-run to compare the actual sample set
of sites to the available population and
representativeness was maintained both
quantitatively and qualitatively in all facility type and
production type categories.
Table 3: Actual locations sampled as percent of planned by facility and production type
Oil Conventional Tight Total
W 124% 128% 145% 137%
SWB 100% 80% 60% 82%
MGB 100% 29% 150% 100%
MPB 100% 100%
MEM 88% 120% 106%
Facility Total 100% 65% 120% 97%
All sub-categories in Table 3 with less than 100% represent categories with very small sample sizes to
begin with, for example for SWBT sub-category 3 of 5 planned facilities were visited.
Field Data Collection Equipment counts and classifications require working knowledge of oil and gas operations. Qualified
personnel are also required to properly operate specialized emissions detection and measurement
equipment and to accurately identify equipment and component types. The field team was responsible
for source identification and quantification according to the following study design elements:
• Equipment Fugitive emissions o OGI Camera, trained technician o Hi-Flow Sampler o Some visual estimation required
▪ For inaccessible methane releases detected17
17 For example, sources at height. Visual estimation employed at discretion of field team.
Figure 5: Target study areas
CAA Ex. 7

British Columbia Oil and Gas Methane Emissions Field Study
Page 18 of 70
• Venting emissions o OGI Camera, trained technician o Hi-Flow Sampler o Some visual estimation required
• Major equipment inventory o Direct observation (count) o Emitting or non-emitting determination o Emission control observation
• Pneumatic equipment inventory18 o Direct observation (inventory) o Emitting or non-emitting determination
• Component counts o Derived from Clearstone 2018 where possible o Otherwise direct observation (count)
Data Schema
Figure 6 outlines the data elements that were captured by the field team at each site:
Figure 6: Data elements collected by field team
18 Includes non-pneumatic control instruments and chemical injection pumps (e.g. electric devices)
CAA Ex. 7
British Columbia Oil and Gas Methane Emissions Field Study
Page 19 of 70
Where possible, existing component-to-equipment ratios were leveraged for this study (see below). Some
equipment was observed in BC that was not observed in Alberta during Clearstone 2018, and these
equipment types were subject to component counts on an exception basis, as further delineated below
and in Table 6 of Section 1.1. See Section 1.1 Analytical Approach for additional details.
Use of Existing Factors
The scope was determined to ensure representative results from the facility and production types visited.
Existing factors were employed for two data points (where possible): component counts and pneumatic
device vent rates.
It was determined that component-per-equipment ratios from existing literature could be combined with
observed equipment counts in order to develop results that represent BC operations. This approach
avoided the need to directly acquire component count information which is highly time consuming. The
number of components per piece of major equipment is expected to be the same in Alberta and BC. As
such, observed equipment counts were combined with published average components per major
equipment / process block to determine the total number of components per facility type. These
component counts are used in combination with the detected leaks to characterize fugitive emissions
from the facilities visited during the survey. Clearstone 2018 was used as it developed representative
component counts per major equipment type for AB.
Release rates from pneumatic control instruments and pumps were not measured during this study, but
estimated based on the observed makes and models in order to facilitate comparisons between source
release type (e.g. venting emissions and fugitive emissions) as well as comparisons to other studies. The
pneumatic controller release rates from recent studies were used; including early work by Cap-Op and
Greenpath (Prasino Study, 2014)19 as well as more recent measurements campaigns by Spartan Controls
and Greenpath Energy.20 Other meta-analysis of existing fieldwork has also been done.21
Fugitive History and Repair Data Collection A Corporate Data Request (CDR) was developed in order to obtain data needed for time-series modeling
parameter development that could not be obtained from the site visit observations.
The CDR solicited historical information regarding the most recent fugitive survey and any associated leak
repair information. Company logs were requested for the same set of sites as was visited by the field team.
Episodic and Other Sources of Methane Emissions Data Collection The Corporate Data Request solicited historical information regarding episodic and other sources of
methane emissions based in part on Cap-Op’s 2017 report for Environment and Climate Change Canada
(ECCC)22. Company logs were requested for the same set of sites as was visited by the field team.
19 Final Report For Determining Bleed Rates for Pneumatic Devices in British Columbia, The Prasino Group (now Cap-Op Energy), December 2013 (Available at http://www.bcogris.ca/sites/default/files/ei-2014-01-final-report20140131.pdf) 20 Pneumatic Vent Gas Measurement, Brian Van Vliet and Spartan Controls, April 2018 (Available at https://auprf.ptac.org/wp-content/uploads/2018/05/Pneumatic-Vent-Gas-Measurement.pdf) 21 Osman, A. (2016). Determining Pneumatic Controller and Pumps Release Rates, available by request from ECCC. 22 Available from www.capopenergy.com
CAA Ex. 7

British Columbia Oil and Gas Methane Emissions Field Study
Page 20 of 70
Episodic emissions are from non-continuous or highly variable emission sources, and include:
• Blowdown, purging, and other de-pressure events
• Liquids loading/unloading from tanks
• Compressor starts (gas starts)
• Flare operational issues (e.g. unlit flares)
Temporal Trends A variety of elements confound the acquisition of objective, accurate, comprehensive and comparable
datasets on temporal trends in methane emissions. Constraints include changes in reporting regulations
over time (and differences between jurisdictions), inaccessible or nonexistent recordkeeping, asset
acquisition/divestitures, and employee turnover. That said, for a time-series model to back-cast and
forecast methane emissions accurately it is necessary to better understand the direction and magnitude
of change.
Workshop Objectives
In January 2019, following the presentation of the draft study results, a workshop led by DXD Consulting
Inc. (DXD) was conducted to consider the experience of oil and gas industry experts on factors that could
influence certain parameters of interest. Input was solicited from these representatives for the purposes
of adding context to numerical results of forecasting and backcasting time-series methane modeling. The
incorporation of industry knowledge to the MEFS is intended to enhance stakeholder understanding of
the study results and to offer guidance on temporal implications to BC’s emissions performance for time-
series modeling applications.
The principal objective of the industry workshop was to solicit expert feedback on operator practices and
historical and future design considerations that may impact methane emissions from upstream facilities.
A key outcome of the workshop was for BC OGC, ECCC and the government of British Columbia through
BC CAS and MEMPR to gain a better understanding from industry representatives, of how British Columbia
oil and gas facilities and operating practices (regarding methane release drivers and management
practices) may have differed in the past and how they may change in the future due to various factors.
Workshop Methodology
The workshop was designed to build upon the presentation of current operational practices and emission
profiles as observed during the BC Methane Emissions Field Study. The workshop participant list targeted
oil and gas producers with operations in BC that were visited during the Study, as well as Federal and BC
provincial regulators.
The workshop focused on gaining industry insights on six factors that could influence modeling
parameters, or modeling drivers, that impact time-series methane emissions modeling. Specifically,
industry experts were asked to comment on how their facilities and operating practices (as they could
impact methane management) were different in the past and would be different in the future, with
respect to these six drivers. Participants were asked to characterize these differences in terms of
directionality (i.e., more or less than current practices) and magnitude as banded into 5 categories.
Magnitude categories ranged from not applicable to neutral (0-15%) to high (>= 100%). Table 4 shows the
six drivers considered, and Table 5 shows the scale for analysis of these drivers.
CAA Ex. 7

British Columbia Oil and Gas Methane Emissions Field Study
Page 21 of 70
Table 4: Modeling Driver 1 Equipment to Facility Ratios
2 LDAR inspection frequencies
3 Prevalence of high bleed pneumatic devices
4 Level of implementation of mitigation technologies, (for example, flares, vapour recovery)
5 Level of preventative maintenance conducted
6 Prevalence of non-emitting pneumatic devices
Table 5: Scale for characterizing the directionality and magnitude of change for each driver
Directionality and
Magnitude of Change Estimated Percent Change to Driver (or Equipment Ratios)
↑↑↑ (3) > 100%
↑↑ (2) 50% to 100%
↑ (1) 15% to 50%
--- Neutral - No Change (+/- 15%)
NA Not Applicable (doesn't exist)
↓ (-1) 15% to 50%
↓↓ (-2) 50% to 85%
↓↓↓ (-3) >85% (didn't exist in past or doesn't exist in future)
Notably, a neutral or no-change scenario was given a range of zero change to 15% change in either
direction. A change of -3 indicates that a practice essentially did not exist in the past or will not exist in the
future.
The workshop was designed to gain industry knowledge of how those drivers, with respect to operations
and practices, have changed over the past several years, and how they are expected to change, relative
to current day, in the future. To collect this information over time, the following periods were defined for
the purposes of the workshop:
Distant Past: this period is defined as pre-2009 and pre-dates the requirements for GHG reporting in
British Columbia.
Recent Past: this period is defined as 2010 to 2015 and reflects the growing influence of unconventional
gas production and potential liquefied natural gas overseas sales channels.
Current: this period is defined as 2016 to 2019. This period pre-dates the implementation of federal
methane regulations and British Columbia methane regulations.
CAA Ex. 7

British Columbia Oil and Gas Methane Emissions Field Study
Page 22 of 70
Future: this period is defined as 2020 to 2030. This period begins after the implementation of federal and
provincial methane regulations. It was not considered practical to characterize industry practices and
operations beyond 2030.
Initially, two future states were considered:
Future – Compliance: this state assumes that industry is compliant with the currently proposed provincial
and federal regulations and that market and regulatory conditions remains as they are currently.
Future – Best-In-Class Methane Emissions Reductions: this state assumes that industry is not only
compliant but exceeding the regulations and leading the world in methane emissions reductions. During
the facilitated workshop, this state was considered to be redundant, because federal and provincial
regulations is expected to position BC-based oil and gas production as leading the global industry in
methane emissions reductions.
Based on feedback during the workshop, these two future states were considered to be the same, and the
single future state in which Producers were compliant with the federal and provincial regulations was
evaluated during the workshop. Participants were asked to characterize projected operations and
behaviours for the future state, including anticipating practices or changes in operations that have no
defined certainty of occurring in the future.
The following guidance was provided:
• The magnitude and directionality of change are always in relation to the current state, and not the state before or after it.
• The future state assumes that BC is compliant with methane regulations.
• Only British Columbia oil and gas production was to be considered.
To conduct the workshop, the participants were put into three groups, with even representation of
producers and regulators/government in each group. Groups were first asked to define the conditions and
activities associated with each temporal state. This exercise ensured a common understanding of the
temporal state prior to investigating each of the six modeling drivers. Subsequently, for each model driver
noted above, the groups assigned directionality and magnitude of change relative to current operations
for all six drivers across three temporal states: distant past, recent past and future. Commentary framing
each rating was collected and results of each time period were presented and discussed as a group. Finally,
for the future state, the three groups came together to integrate diverging points of view, resulting in
workshop-wide general agreement on broad trends.
1 Chapter 1: Field Observations 1.1 Analytical Approach
1.1.1.1 Major Equipment Survey
Major equipment was counted during the field survey at all sites that were visited. The list of major
equipment considered are listed in Table 7. Recent field work to determine component counts for various
major equipment types has been undertaken in Alberta (Clearstone 2018). It is not expected that these
CAA Ex. 7

British Columbia Oil and Gas Methane Emissions Field Study
Page 23 of 70
component counts will differ between operations in BC and Alberta as the equipment shares common
manufacturers and is often designed and installed by similar firms. If major equipment was found during
the field survey which did not have associated component counts in Clearstone 2018, its components were
counted. Site-level component count averages are determined by multiplying the total major equipment
counts by their respective component count from either Clearstone 2018 or from the field survey. Further
details on major equipment types are provided in Table 6 and below. Overall component count averages
are a combination of the Clearstone 2018 study and the field survey (for unique equipment) shown in
Table 6. Note that equipment pressurization or in-service status at the time of survey was not considered
as a basis for exclusion (all equipment observed to be associated with a site is included). Appendix A
includes additional information and detail for consideration.
Table 6: Major Equipment Component Count from Survey and Clearstone 201823 Major Equipment – Component Counts from
Field Study Major Equipment – Component Counts from
Clearstone 2018
Dehydrator - Dessicant Catalytic Heater
Gas Sweetening: Sulfinol Dehydrator - Glycol
Heat Trace System Flare KnockOut Drum
Sand Separator Gas Boot
Stabilization Tower Gas Metering Building
Thermal Electric Generator Gas Pipeline Header Gas Sweetening: Amine Incinerator
LACT Unit Line Heater Liquid Pipeline Header Liquid Pump Pig Trap - Gas Service Pig Trap - Liquid Service Pop Tank Power Generator (natural gas fired) Process Boiler Production Tank Fixed Roof - Light Liquid Reciprocating Compressor Reciprocating Compressor - Electric Driver Screw Compressor Screw Compressor - Electric Driver Separator Storage Bullet Treater Well Pump
23 Equipment definitions available in Clearstone 2018 Section 8.4
CAA Ex. 7

British Columbia Oil and Gas Methane Emissions Field Study
Page 24 of 70
Wellhead (Gas Flow) Wellhead (Gas Pump) Wellhead (Oil Flow) Wellhead (Oil Pump)
Major equipment is categorized under each site classification to determine average major equipment per
site classification for the surveyed sites. Some site classifications (e.g., WT) are extensively surveyed (WT
had 123 sites surveyed), whereas some site classifications had very low sample sizes (e.g., 2 MGBC sites
visited). This will affect the accuracy and reliability of the average major equipment per site calculations
as smaller sample sizes may not accurately account the differences between sites with the same
classification.
1.1.1.2 Leaks and Vents Quantification
Leaks and vents observed during the field surveyed were measured if possible and estimated if
measurement was not possible, at the discretion of the field team based on safe operating practices. The
ambient conditions during measurement or estimation were also recorded. Using the ambient conditions
and measured/estimated volumetric rates, a corrected leaks/vent rate is calculated using the combined
gas law below.
Equation 1, 𝑃𝑖𝑉𝑖
𝑇𝑖=
𝑃𝑓𝑉𝑓
𝑇𝑓
Where,
Pi, Vi, and Ti, = the initial Pressure, Volumetric flow rate, and Temperature recorded in kPa, m3/hr, and °C
respectively (temperatures recorded in °C but converted to °K throughout)
Pf and Tf, = Pressure and Temperature at standard conditions (101.325 kPa and 15°C respectively)
Vf = Corrected volumetric flow rate in m3/hr
Leaks and vents are classified and analyzed based on source component, major equipment, site
classification, volumetric flow rate magnitude, and whether they were estimates or measurements.
Field staff classified excessive pneumatic venting as open-ended lines (OELs) during data collection. These
releases have been re-classified as excessive pneumatic venting to better represent the source of the
observed emissions. These sources may have been categorized as open ended lines in previous studies.
Therefore, for purposes of multiple different jurisdictions and differences in regulations around treatment
of these emissions, these 42 leaks have been re-assigned from open-ended lines to excessive pneumatic
venting to allow parties to determine their own methods to treat these emissions. these excessive
pneumatic venting instances could not be attributed to a specific make and model at the site for a variety
of reasons (e.g., instrument vent header leaks associated with multiple devices). Emissions categorized by
CAA Ex. 7

British Columbia Oil and Gas Methane Emissions Field Study
Page 25 of 70
the field team as open-ended line venting was not observed to be related to the operation of pneumatics.
Venting from OELs mostly resulted from wellheads (surface casing vent flows) at ~75% of OEL vent sources.
1.1.1.3 Pneumatic Count and Pneumatic Venting
Pneumatics were counted during the field survey with data on device type, drive type (e.g., electric, solar,
fuel gas (natural gas), etc.), chemical injection type, and make and model. Some limited data were also
gathered regarding flow rates and pressures, but pneumatic vents were not directly measured. Any
devices that may be pneumatically actuated (e.g. lube oil pumps) that were not classified as control
instruments or chemical injection pumps were included in the major equipment inventory and not in the
pneumatic inventory, in the same way that gas starter units would not be inventoried separately from
compressors.
Pneumatics that were not fuel gas driven were assumed not to vent methane as part of normal operation.
These pneumatics drives include electric, instrument air, solar, and propane. Pneumatic counts were
analyzed and classified based on drive type and pneumatic device type from the following list;
• Pump,
• Level Controller,
• Transducer,
• Level Switch,
• High Level Shut Down Switch,
• Positioner,
• High Pressure Shut Down Switch,
• Pressure Controller,
• Pressure Switch,
• Plunger Lift Controller,
• Temperature Switch, and
• Other
Fuel gas pneumatics makes and models were verified so that estimates for pneumatic venting could be
calculated. Pneumatic vent rates were estimated using available data from Alberta Environment and Parks
Quantification Protocol for GHG Emission Reductions from Pneumatic Devices – Table C2,24 WCI 2013,25
the Prasino Study,19 Alberta Energy Regulator’s Manual 15,26 PTAC Level Controller Study,27 and in some
cases manufacturer’s specifications. Pneumatic vent data was matched based on the make and model of
the fuel gas pneumatics surveyed. This method to estimate pneumatic venting requires reliance on
available public studies that typically have varying vent rate results for pneumatic makes and models.
24 Quantification protocol for greenhouse gas emission reductions from pneumatic devices (version 2.0), Alberta Environment and Parks, January 2017 (Available at https://open.alberta.ca/publications/9781460131633) 25 WCI Quantification Method 2013 Addendum to Canadian Harmonization Version, Western Climate Initiative, December 2013 (Available at https://www2.gov.bc.ca/assets/gov/environment/climate-change/ind/quantification/wci-2013.pdf) 26 Estimating Methane Emissions, Alberta Energy Regulator, December 2018 (Available at https://www.aer.ca/documents/manuals/Manual015.pdf) 27 Level Controller Emission Study Fisher L2 and Improved Relays, Norriseal 1001As and EVS, Greenpath Energy, October 2018 (Available at https://auprf.ptac.org/wp-content/uploads/2018/10/Final-Report-Level-Controller-V8-20181003.pdf)
CAA Ex. 7

British Columbia Oil and Gas Methane Emissions Field Study
Page 26 of 70
Other analyses can be done based on the make and models of the pneumatics determined from the field
survey and analysis in this study to determine a possible range of vent rates.
Excessive pneumatic venting is not included in this section, as it is considered in the section on fugitive
emissions. Current regulation surrounding excessive pneumatic venting varies across jurisdictions and
excessive pneumatic venting is classified as either a vent or a leak in different regulations. This study
adopts BC’s requirements under the Drilling and Production Regulation by classifying this source as a
fugitive emission.
1.2 Results 1.2.1 Major Equipment Counts
Major equipment in hydrocarbon service were counted for each location surveyed. The counts included
both operating and pressurized non-operating equipment from the list in Table 7 and Table 8. The average
(mean) process equipment count for a given facility subtype or well status is determined using the
following relation:
Equation 2, �̅�M𝐸 = 𝑁M𝐸 /𝑁F/W
Where,
N̅ME = average (mean) major equipment count for a given site classification,
NME = total number of process equipment surveyed for a given site classification,
NF/W = total number of sites visited of the considered site classification (12 site classifications)
Average and total major equipment counts per facility subtype are presented in Table 7 and Table 8
respectively.
Table 7: Average Major Equipment per Facility Type
Site Classification (Number of Sites Surveyed)
Major Equipment List WT (123)
WO (31)
WC (51)
SWBT (3)
SWBO (7)
SWBC (4)
MPBO (7)
MGBT (15)
MGBO (4)
MGBC (2)
MEMT (12)
MEMC (7)
Catalytic Heater 1.50 0.52 2.00 2.00 1.71 1.75 7.29 5.93 4.00 1.00 15.75 4.29
Catalytic Incinerator 0.02 0.14 0.07
Dehydrator - Dessicant 0.25 0.20 0.29
Dehydrator - Glycol 0.02 0.25 0.57 0.40 1.17 0.29
Expansion Tank 0.14
Flare KnockOut Drum 0.04 0.39 0.33 0.29 0.25 1.43 0.93 0.75 1.50 0.86
Gas Boot 0.14 0.07 0.08
Gas Metering Building 0.01 0.06 0.14
Gas Pipeline Header 0.03 0.02 0.14 0.25 0.57 0.40 0.75 0.50 0.17 0.14
Gas Sample and Analysis System
0.02 0.07 0.25 0.29
Gas Sweetening Scavenger 0.02
Gas Sweetening: Amine 0.07 0.08
Gas Sweetening: Sulfinol 0.13
Heat Trace System 0.01 0.33 0.25
Incinerator 0.29 0.20 0.25 0.08
LACT Unit 0.29
Line Heater 0.08 0.03 0.31 0.14 0.50 0.07 0.17 0.14
CAA Ex. 7

British Columbia Oil and Gas Methane Emissions Field Study
Page 27 of 70
Site Classification (Number of Sites Surveyed)
Major Equipment List WT (123)
WO (31)
WC (51)
SWBT (3)
SWBO (7)
SWBC (4)
MPBO (7)
MGBT (15)
MGBO (4)
MGBC (2)
MEMT (12)
MEMC (7)
Liquid Pipeline Header 0.02 0.13 0.71 0.20 0.08
Liquid Pump 3.57 0.73 0.42 0.43
Lube Oil Tank 0.14
Meter Building 0.10 0.37 0.25 0.14 0.20 0.50 0.17 0.14
Pig Trap - Gas Service 0.19 0.47 0.67 0.43 0.50 1.00 2.87 0.75 0.50 3.08 1.00
Pig Trap - Liquid Service 0.05 0.32 0.02 0.14 0.25 0.86 0.50 0.08 0.14
Pneumatic Panel 0.14
Pop Tank 0.01 0.13 0.43 0.71 0.07 0.75
Power Generator (natural gas fired)
0.02 0.25 0.43 0.67 0.50 1.33 1.00
Process Boiler 0.43 0.13 0.43
Production Tank - Water 0.04 0.43 0.25 1.14 2.20 0.75 2.75 0.57
Production Tank Fixed Roof - Light Liquid
0.03 0.13 0.02 0.67 0.86 0.25 3.57 0.73 1.50 1.67 0.71
PumpJack 0.03
Reciprocating Compressor - Electric Driver 0.14 0.27 0.14
Reciprocating Compressor –
Natural Gas 0.03 0.14 0.86 0.67 1.83 1.29
Sand Separator 0.15 0.03 0.33 0.33
Screw Compressor - Electric Driver
0.33
Screw Compressor - Natural
Gas 0.71 0.20 0.17
Separator 0.31 0.26 0.10 0.33 0.86 1.50 3.43 2.33 1.50 0.50 2.75 1.86
Shipping Pump 0.14
Stabilization Tower 0.07
Storage Bullet 0.03 0.10 0.27 0.29 0.14 0.17
Thermal Electric Generator 0.15 0.10 0.49 0.67 0.43 0.27 0.50 0.50 0.17 0.43
Treater 0.86 0.07
Unit Heater 0.01
Water Storage Unit 0.03
Well Pump 0.68 0.02 0.71 0.50 0.14
Wellhead (Gas Flow) 1.01 0.16 1.14 0.33 0.14 0.43 0.60 0.08
Wellhead (Gas Pump) 0.03
Wellhead (Oil Flow) 0.26 0.43 0.50 0.14
Wellhead (Oil Pump) 0.58 0.02 0.43 0.14
Wellhead (Water Injection) 0.07
Table 8: Total Major Equipment by Facility Type
Site Classification (Number of Sites Surveyed)
Major Equipment List WT (123)
WO (31)
WC (51)
SWBT (3)
SWBO (7)
SWBC (4)
MPBO (7)
MGBT (15)
MGBO (4)
MGBC (2)
MEMT (12)
MEMC (7)
Catalytic Heater 185 16 102 6 12 7 51 89 16 2 189 30
Catalytic Incinerator 1 1 1
Dehydrator - Dessicant 1 3 2
Dehydrator - Glycol 2 1 4 6 14 2
Expansion Tank 1
Flare KnockOut Drum 5 20 1 2 1 10 14 3 18 6
Gas Boot 1 1 1
Gas Metering Building 1 3 1
Gas Pipeline Header 4 1 1 1 4 6 3 1 2 1
Gas Sample and Analysis System 2 1 3 2
Gas Sweetening Scavenger 2
Gas Sweetening: Amine 1 1
Gas Sweetening: Sulfinol 2
Heat Trace System 1 5 3
Incinerator 2 3 1 1
LACT Unit 2
Line Heater 10 1 16 1 2 1 2 1
Liquid Pipeline Header 3 4 5 3 1
Liquid Pump 25 11 5 3
CAA Ex. 7

British Columbia Oil and Gas Methane Emissions Field Study
Page 28 of 70
Site Classification (Number of Sites Surveyed)
Major Equipment List WT (123)
WO (31)
WC (51)
SWBT (3)
SWBO (7)
SWBC (4)
MPBO (7)
MGBT (15)
MGBO (4)
MGBC (2)
MEMT (12)
MEMC (7)
Lube Oil Tank 1
Meter Building 12 19 1 1 3 1 2 1
Pig Trap - Gas Service 23 24 2 3 2 7 43 3 1 37 7
Pig Trap - Liquid Service 6 10 1 1 1 6 2 1 1
Pneumatic Panel 1
Pop Tank 1 4 3 5 1 3
Power Generator (natural gas fired)
2 1 3 10 2 16 7
Process Boiler 3 2 3
Production Tank - Water 5 3 1 8 33 3 33 4
Production Tank Fixed Roof - Light Liquid
4 4 1 2 6 1 25 11 6 20 5
PumpJack 1
Reciprocating Compressor - Electric Driver
1 4 1
Reciprocating Compressor – Natural Gas
4 1 6 10 22 9
Sand Separator 18 1 1 5
Screw Compressor – Natural Gas 1
Screw Compressor - Electric Driver
5 3 2
Separator 38 8 5 1 6 6 24 35 6 1 33 13
Shipping Pump 1
Stabilization Tower 1
Storage Bullet 4 3 14 2 1 2
Thermal Electric Generator 19 3 25 2 3 4 2 1 2 3
Treater 6 1
Unit Heater 1
Water Storage Unit 1
Well Pump 21 1 5 2 1
Wellhead (Gas Flow) 124 5 58 1 1 3 9 1
Wellhead (Gas Pump) 4
Wellhead (Oil Flow) 8 3 2 1
Wellhead (Oil Pump) 18 1 3 1
Wellhead (Water Injection) 1
1.2.2 Component Counts
Major equipment counts were matched with average component-to-equipment ratios. Component-to-
equipment ratios were derived either from Clearstone 2018 or actual component counts on major
equipment for which there were no existing ratios (as outlined in Table 6). This approach was used to
determine average component counts for the various site types considered in this study. Component
counts in the field were acquired for process equipment observed in the field that was not in Clearstone
2018. Some components serviced different gas and liquid types (process gas, fuel gas, light liquid, and
heavy liquid), which is differentiated in Table 9 and Table 10. No heavy liquid service was encountered in
the study. Below is the list of all component types considered:
• Compressor Seals,
• Connector,
• Control Valve,
• Meter,
• Open-Ended Line,
CAA Ex. 7

British Columbia Oil and Gas Methane Emissions Field Study
Page 29 of 70
• Pressure Relief Valves and Pressure Safety Valves (PRV/PSV),
• Pump Seal,
• Regulator,
• Thief Hatch, and
• Valve.
The thief hatch component type was added because their emission release characteristics are poorly
represented by other component types. It was observed that the leaker and population leak factors
differed significantly from connectors and OELs resulting in the creation of a separate component
category. This component type may not be considered in other, similar studies. Historically, thief hatches
were counted as a valve or a PRV. Because the leaker and population leak factors presented below for
thief hatches are different than connectors and OELs (excessive pneumatic venting), separate components
types are justifiable.
Gas component services included fuel gas and process gas, but fuel gas is aggregated with process gas.
This is consistent with methods used in other fugitive emission factor studies.28 Average (mean)
component counts are calculated for each process equipment type using Equation 3 and are presented in
Table 9 and Table 10.
Equation 3, �̅�𝐶𝐶 = 𝑁𝐶𝐶/𝑁F/W
Where,
N̅𝐶𝐶 = average component count for a given facility subtype or well status,
NCC = total number of components for a given facility subtype or well status (Clearstone 2018 or field
survey),
NF/W = total number of a given facility subtype or well status surveyed.
Clearstone 2018 provides ranges for confidence intervals for their average components per major
equipment type calculations, which are particularly wide for major equipment with few sample sizes.
Some major equipment component counts, such as catalytic heaters (650 observed in Clearstone 2018),
have tight confidence intervals ranging from 7-29% and 8-32% for lower and upper confidence intervals
of multiple component types. These tighter confidence intervals are due to large sample sizes and less
variation in component accounts across all catalytic heaters. However, there are also examples of large
confidence intervals such as flare knockout drums (29 observed in Clearstone 2018), which have
confidence intervals ranging from 45-100% and 58-308% for lower and upper confidence intervals of
multiple component types. Which is a due to a combination of smaller sample sizes and large variability
28 Update of Fugitive Equipment Leak Emission Factors, CAPP 2014 (https://www.capp.ca/-/media/capp/customer-portal/publications/238773.pdf?modified=20180910181053)
CAA Ex. 7

British Columbia Oil and Gas Methane Emissions Field Study
Page 30 of 70
between component counts for individual flare knockout drums. The confidence intervals from the
Clearstone study would conceptually carry over to the estimates of component counts for this study.
As an example, current average gas connecter counts for wells (WT, WO, WC) are at 90-135 connectors
per well. The factors that went into estimating the connectors for wells from the Clearstone 2018 study
and the average major equipment per site classification. In the Clearstone 2018 study, a wellhead (which
should be present at every well location) has 44 connectors, and accounts for ~30-40% of total connectors
at a well (WT, WO, WC) in this study. Other major equipment that accounts for a significant portion of the
average connector count for wells in this study include separators (25-30%), line heaters (4-24%), Flare
Knockout Drum (16% for WC), and some reciprocating compressors (16% for WT). In the Clearstone 2018
study, there are 2 reciprocating and 3 screw compressors that were determined to be located on well sites
for comparison. Clearstone 2018 surveyed 440 unique wells. This suggests that outliers may have
significant impacts on average component calculations and qualitatively confirms the wide confidence
intervals determined by others.
CAA Ex. 7

British Columbia Oil and Gas Methane Emissions Field Study
Page 31 of 70
Table 9: Average Component Counts for Site Classifications Site Classification (Number of Sites Surveyed)
Average Component Counts WT
(123)
WO
(31)
WC
(51)
SWBT
(3)
SWBO
(7)
SWBC
(4)
MPBO
(7)
MGBT
(15)
MGBO
(4) MGBC (2)
MEMT
(12) MEMC (7)
Compressor Seal Process Gas 0.121
0.533
3.984 3.274
6.940 5.154
Connector Fuel Gas 0.014 0.003 0.015 0.021 0.016 5.958 0.016 11.158 0.016 0.016 0.318 6.848
Connector Light Liquid 33.551 87.356 43.051 58.709 156.122 149.706 896.869 353.374 166.894 37.203 427.718 263.286
Connector Process Gas 128.750 94.786 136.466 207.814 307.817 397.255 1730.206 1,230.841 378.599 119.572 2,075.041 1,323.392
Control Valve Fuel Gas
0.042
0.033
0.048
Control Valve Light Liquid 0.389 0.469 0.667 0.708 1.340 1.270 6.088 3.152 1.119 0.364 4.157 2.697
Control Valve Process Gas 0.451 0.243 0.297 1.078 1.226 2.142 8.988 5.866 2.703 0.672 9.608 5.713
Meter Fuel Gas
0.042
0.033
0.048
Meter Light Liquid 0.152 0.120 0.065 0.180 0.360 0.631 4.742 1.405 0.631 0.210 1.351 1.033
Meter Process Gas 0.498 0.342 0.358 0.731 1.151 2.204 6.278 3.927 2.062 0.813 5.170 3.124
Open-Ended Line Fuel Gas 0.016
0.667
0.500
Open-Ended Line Light Liquid 0.037 0.132 0.270 0.245 0.645 0.178 2.393 0.773 1.301
1.070 0.017
Open-Ended Line Process Gas 0.111 0.067 0.038 0.447 0.239 0.326 1.764 1.032 0.285 0.104 1.993 1.135
PRV/PSV Fuel Gas 0.008
0.125
0.433
0.250 0.143
PRV/PSV Light Liquid 0.000 0.002 0.000 0.008 0.010 0.003 2.519 0.459 0.018
0.275 0.271
PRV/PSV Process Gas 0.961 0.747 0.611 2.422 2.629 3.960 15.587 10.182 3.323 1.039 15.840 10.074
Pump Seal Light Liquid
0.631 0.021
0.466
3.889 0.767
0.436 0.448
Regulator Fuel Gas 0.117 0.052 0.222 0.382 0.194 0.083
0.749 0.227 0.227 0.437 0.289
Regulator Light Liquid 0.018 0.004
0.040
0.040
Regulator Process Gas 3.710 2.948 4.868 3.837 7.734 11.473 36.953 24.572 12.551 2.809 49.472 24.608
Thief Hatch Light Liquid 0.013 0.052 0.008 0.267 0.343 0.100 1.429 0.293 0.600
0.667 0.286
Thief Hatch Process Gas 0.008 0.033 0.005 0.173 0.222 0.065 0.924 0.190 0.388
0.431 0.185
Valve Fuel Gas
1.000
2.267
1.143
Valve Light Liquid 6.949 19.933 9.491 11.618 32.151 28.580 189.719 69.018 33.655 7.000 76.025 45.945
Valve Process Gas 27.673 18.226 31.738 25.024 50.185 72.769 223.016 170.630 78.501 30.277 244.432 136.396
CAA Ex. 7

British Columbia Oil and Gas Methane Emissions Field Study
Page 32 of 70
Table 10: Total Component Counts for Site Classifications Site Classification (Number of Sites Surveyed)
Total Component
Counts WT (123) WO (31) WC (51)
SWBT
(3)
SWBO
(7)
SWBC
(4)
MPBO
(7)
MGBT
(15)
MGBO
(4)
MGBC
(2)
MEMT
(12)
MEMC
(7)
Compressor Seal Process
Gas
15
4
28 49
83 36
Connector Fuel Gas 2 0 1 0 0 24 0 167 0 0 4 48
Connector Light Liquid 4,127 2,708 2,196 176 1,093 599 6,278 5,301 668 74 5,133 1,843
Connector Process Gas 15,836 2,938 6,960 623 2,155 1,589 12,111 18,463 1,514 239 24,900 9,264
Control Valve Fuel Gas
0
1
0
Control Valve Light Liquid 48 15 34 2 9 5 43 47 4 1 50 19
Control Valve Process Gas 55 8 15 3 9 9 63 88 11 1 115 40
Meter Fuel Gas
0
1
0
Meter Light Liquid 19 4 3 1 3 3 33 21 3 0 16 7
Meter Process Gas 61 11 18 2 8 9 44 59 8 2 62 22
Open-Ended Line Fuel Gas 2
10
6
Open-Ended Line Light
Liquid
5 4 14 1 5 1 17 12 5
13 0
Open-Ended Line Process
Gas
14 2 2 1 2 1 12 15 1 0 24 8
PRV/PSV Fuel Gas 1
1
7
3 1
PRV/PSV Light Liquid 0 0 0 0 0 0 18 7 0
3 2
PRV/PSV Process Gas 118 23 31 7 18 16 109 153 13 2 190 71
Pump Seal Light Liquid
20 1
3
27 12
5 3
Regulator Fuel Gas 14 2 11 1 1 0
11 1 0 5 2
Regulator Light Liquid 2 0
0
1
Regulator Process Gas 456 91 248 12 54 46 259 369 50 6 594 172
Thief Hatch Light Liquid 2 2 0 1 2 0 10 4 2
8 2
Thief Hatch Process Gas 1 1 0 1 2 0 6 3 2
5 1
Valve Fuel Gas
4
34
8
Valve Light Liquid 855 618 484 35 225 114 1,328 1,035 135 14 912 322
Valve Process Gas 3,404 565 1,619 75 351 291 1,561 2,559 314 61 2,933 955
CAA Ex. 7

British Columbia Oil and Gas Methane Emissions Field Study
Page 33 of 70
1.2.3 Pneumatic Devices
1.2.3.1 Pneumatic Device Counts
Pneumatic devices driven by natural gas, propane, instrument air, solar, and electric were inventoried
at each location surveyed during the study. 2120 pneumatic devices were observed in the field survey
and inventoried, with 725 gas driven pneumatics, 891 instrument air, 419 electric, 11 propane, 59 solar,
and 6 were classified as ‘other’. Figure 7 below delineates the pneumatic inventory by device type and
driver type. The majority (1395 of 2120) of devices are not driven by natural gas and as such will not
contribute to site or facility level methane emissions. The pneumatic device types considered are the
following:
• Pump,
• Level Controller,
• Transducer,
• Level Switch,
• High Level Shut Down Switch,
• Positioner,
• High Pressure Shut Down Switch,
• Pressure Controller,
• Pressure Switch,
• Plunger Lift Controller,
• Temperature Switch, and
• Other
Figure 7 and Figure 8 presents the distribution of pneumatics by drive and device type. The most
common pneumatic device types are pumps, level controllers, and transducers, with a majority of them
running on instrument air or electric drives.
CAA Ex. 7

British Columbia Oil and Gas Methane Emissions Field Study
Page 34 of 70
Figure 7: Observed Pneumatic Devices and Equivalents
Figure 8: Pneumatic Device Distribution by Drive Type
Table 11 and Table 14 present the average pneumatic devices per site type for all, high bleed gas, low
bleed gas, and no bleed (electric, solar, propane, air, other) drive type pneumatics. The majority (65%)
of pneumatics are no bleed and are assumed to not emit natural gas from normal operation. For the
no bleed pneumatics, 16 were fueled by propane, and are aggregated with no-bleed pneumatics as
0
50
100
150
200
250
300
350
400
450
Electric Instrument Air Fuel Gas Propane Propane/Fuel Gas Solar Other
Instrument Air Fuel Gas (Natural Gas) Electric Solar Propane Other
CAA Ex. 7

British Columbia Oil and Gas Methane Emissions Field Study
Page 35 of 70
they would not emit methane. The make and models of all fuel gas pneumatics are included in
Appendix A: Data Tables.
High and low bleed designations were based on the vent rate used, and not necessarily manufacturer
specifications. The latest studies such as Spartan 2018 re-affirm manufacturer static bleed rates, but
quantification of release rates using other than manufacturer specifications was included for
completeness and comparison to other studies (see Section 2.1.4).
Table 11: Average Pneumatic Types by Site Classification (All Drives) Site Classification (Number of Sites Surveyed)
Site Average Pneumatic Device Types WT
(123)
WO
(31)
WC
(51)
SWBT
(3)
SWBO
(7)
SWBC
(4)
MPBO
(7)
MGBT
(15)
MGBO
(4)
MGBC
(2)
MEMT
(12)
MEMC
(7)
Level Controller 0.55 0.32 0.18 1.33 1.43 1.50 8.00 5.60 2.25 9.67 3.71
Transducer 0.49 0.07 0.41 1.67 2.25 5.29 5.53 1.50 6.17 6.43
Level Switch 0.30 0.13 0.24 0.67 0.43 1.50 0.57 2.27 1.00 4.50 5.43
Pump 1.04 0.58 1.57 2.33 1.29 1.25 4.14 4.20 2.00 1.00 4.92 2.14
High Level Shut Down 0.25 0.03 0.18 0.67 0.43 0.25 0.86 3.40 6.67 0.57
Positioner 0.25 0.07 0.12 1.00 2.86 1.93 1.25 2.75 1.43
High Pressure Shut Down 0.10 0.48 0.10 0.67 1.86 0.25 0.71 1.53 0.50 0.33 0.43
Pressure Controller 0.13 0.13 0.10 1.57 0.75 5.71 1.13 1.00 2.67 2.43
Pressure Switch 0.32 0.03 0.57 0.43 1.13 0.25 0.27
Plunger Lift Controller 0.01 0.03 0.06 0.13
Temperature Switch 0.11 0.03 0.39 0.14 1.25 1.14 0.27 2.00 1.14
Other 0.02 0.07 0.04 0.14
Table 12: Average High Bleed Pneumatics by Site Classification (Natural Gas Drive Only) Site Classification (Number of Sites Surveyed)
Site Average HB Pneumatics WT
(123)
WO
(31)
WC
(51)
SWBT
(3)
SWBO
(7)
SWBC
(4)
MPBO
(7)
MGBT
(15)
MGBO
(4)
MGBC
(2)
MEMT
(12)
MEMC
(7)
Level Controller 0.35 0.13 0.12 1.33 0.86 0.57 1.40 0.75
Transducer 0.29 0.03 0.26 0.33 0.25 0.13 1.25 0.43
Level Switch 0.03 0.33 0.29
High Level Shut Down 0.02 0.14
Positioner 0.21 0.03 0.08 0.40
High Pressure Shut Down
Pressure Controller 0.12 0.07 0.06 1.43 0.75 0.86 0.60 0.50 0.50
Pressure Switch
Plunger Lift Controller
Temperature Switch
Other 0.02
Table 13: Average Low Bleed Pneumatics by Site Classification (Natural Gas Drive Only) Site Classification (Number of Sites Surveyed)
Site Average LB Pneumatics WT
(123)
WO
(31)
WC
(51)
SWBT
(3)
SWBO
(7)
SWBC
(4)
MPBO
(7)
MGBT
(15)
MGBO
(4)
MGBC
(2)
MEMT
(12)
MEMC
(7)
Level Controller 0.07 0.13 0.04 0.29 0.75 0.29 0.87 0.50 1.00
Transducer 0.13 0.03 0.08 1.33 0.73
Level Switch 0.02 0.06 0.25 0.07 0.50
High Level Shut Down 0.07 0.03 0.16 0.14 0.25 0.14 0.07 0.50
Positioner
High Pressure Shut Down 0.07 0.45 0.06 0.67 1.29 0.47
Pressure Controller
Pressure Switch 0.28 0.45 0.07
Plunger Lift Controller
Temperature Switch 0.11 0.03 0.35 0.14 1.00 0.07
Other
Table 14: Average No Bleed Pneumatics by Site Classification Site Classification (Number of Sites Surveyed)
CAA Ex. 7

British Columbia Oil and Gas Methane Emissions Field Study
Page 36 of 70
Site Average NB29 Pneumatics WT
(123)
WO
(31)
WC
(51)
SWBT
(3)
SWBO
(7)
SWBC
(4)
MPBO
(7)
MGBT
(15)
MGBO
(4)
MGBC
(2)
MEMT
(12)
MEMC
(7)
Level Controller 0.07 0.13 0.02 0.29 0.75 7.14 3.20 0.75 8.67 3.71
Transducer 0.07 0.03 0.06
2.00 5.14 4.67
6.17 6.00
Level Switch 0.25 0.13 0.10 0.33 0.14 1.00 0.57 2.07 1.00
4.00 5.43
Pump 0.53 0.36 1.14 0.67 0.57 1.00 2.14 1.40 0.75 1.00 2.17 0.86
High Level Shut Down 0.16
0.02 0.67 0.14
0.71 3.20
6.17 0.57
Positioner 0.03
0.02
2.86 1.53 0.25
2.75 1.43
High Pressure Shut Down 0.01 0.03 0.02
0.29
0.29 0.67 0.50
0.33 0.43
Pressure Controller 0.01
0.02
0.14
4.86 0.53 0.50
2.17 2.43
Pressure Switch 0.04 0.03 0.10
0.43 1.07
0.25 0.29
Plunger Lift Controller
Temperature Switch
0.25 1.14 0.20
2.00 1.14
Other 0.01 0.07 0.14
Figure 9 compares high and low bleed pneumatics by controller type. High bleed are assumed for
pneumatic makes and models with vent rates over 0.17 m3/hour, with low bleed being below 0.17
m3/hour. As outlined above, a similar methodology to determine vent rates used in Clearstone 2018
was applied. There are a total of 725 gas-driven pneumatics, with 403 high bleed, 321 low bleed, and
one was unknown as the make and model was not discernable.
Figure 9: High Bleed and Low Bleed Pneumatics by Control Instrument Type
1.2.3.2 Pneumatics Control Instrument Venting
In this study, vented emissions from pneumatic devices were not measured during the field study.
Pneumatic venting was calculated using available literature and publicly available data on normal
operational vent rates based on the make and model of the pneumatics which provides a method to
29 Drive Types: Electric, Solar, Propane, Air
0
10
20
30
40
50
60
70
80
90
100
Level Controller Transducer Level Switch High Level ShutDown
Positioner High PressureShut Down
PressureController
Pressure Switch Plunger LiftController
TemperatureSwitch
High Bleed Low Bleed
CAA Ex. 7

British Columbia Oil and Gas Methane Emissions Field Study
Page 37 of 70
perform site level comparisons. This method is similar compared to other studies such as Clearstone
2018 and Greenpath 2016. There are a wide variety of published pneumatic device vent rates. The
pneumatic venting results below are based on the considered sources described in Section 1.1. Only
fuel gas pneumatics were assumed to vent methane as part of normal operations. Pneumatic venting
rates are summarized below in Table 15 which indicates the weighted average of the estimated vent
rates for each type of device and site.
Table 15: Average Natural Gas Pneumatic Device Vent Rates (m3/hour) Site Classification (Number of Sites Surveyed)
Average Estimated Pneumatic
Venting (m3/hour)
WT
(123)
WO
(31)
WC
(51)
SWBT
(3)
SWBO
(7)
SWBC
(4)
MPBO
(7)
MGBT
(15)
MGBO
(4)
MGBC
(2)
MEMT
(12) MEMC (7)
Level Controller 0.21 0.14 0.36 0.26 0.20 0.01 0.18 0.16 0.16 0.01 Transducer 0.31 0.26 0.47 0.17 0.37 0.14 0.15 0.33 0.51
Level Switch 0.19 0.00 0.10 0.26 0.05 0.09 0.09 0.01 Pump 0.73 0.71 0.44 0.47 0.77 0.14 0.67 0.61 0.58 0.75
High Level Shut Down 0.03 0.01 0.02 0.05 0.05 0.01 0.09 0.01 Positioner 0.51 0.40 0.55 0.14 0.54 0.14 High Pressure Shut Down 0.06 0.06 0.05 0.05 0.06 0.14 0.14 0.09 Pressure Controller 0.67 0.17 0.58 0.91 1.09 1.53 0.36 0.21 0.21 Pressure Switch 0.04 0.05 0.02 Plunger Lift Controller 0.14 0.14 0.14 0.14 Temperature Switch 0.04 0.04 0.05 0.04 0.04 0.04 Other 0.14 0.14 0.14 Overall Average 0.35 0.22 0.24 0.25 0.40 0.27 0.64 0.27 0.30 0.10 0.65
1.2.3.3 Pneumatic Pumps
Table 16 and below present data on average pneumatic pumps per site classification. Due to limitations
during the field survey, the chemical injection rates were not available (for example, many inactive
pumps during September). The average vent rate for pneumatic pumps was determined in the same
method as the other pneumatic devices described in Section 1.1 as no vent rates were measured during
the field survey. This was done to facilitate comparison of site level vent rates from pneumatic pumps.
The type of chemical injected is available and summarized in Table 17 and Table 18 below by the
number of pumps observed per chemical injection and site classification. Chemical type may imply
whether pumps are seasonal or continuous, but this was not been quantitatively assessed within the
scope of this study.
Table 16: Average Chemical Injection Pumps per Site Site Classification (Number of Sites Surveyed)
Average Pumps per Site WT
(123) WO (31)
WC (51)
SWBT (3)
SWBO (7)
SWBC (4)
MPBO (7)
MGBT (15)
MGBO (4)
MGBC (2)
MEMT (12)
MEMC (7)
Total Methanol Pumps 0.68 0.19 0.90 1.00 0.86 0.75 0.71 1.00 1.50 0.50 1.00 0.43
Total Other Chemical Pumps 0.33 0.35 0.65 1.33 0.43 0.50 1.43 1.47 0.50 0.50 1.42 1.00
Gas Driven Methanol Pumps 0.28 0.16 0.29 1.00 0.71 0.25 0.60 1.25 0.08 0.29
Gas Driven Other Chemical Pumps 0.20 0.03 0.14 0.67 0.47 0.17 0.29
No Bleed Methanol Pumps 0.40 0.03 0.61 0.14 0.50 0.71 0.40 0.25 0.50 0.92 0.14
No Bleed Other Chemical Pumps 0.13 0.32 0.51 0.67 0.43 0.50 1.43 1.00 0.50 0.50 1.25 0.71
Table 17: Overall Number of Pneumatic Pumps by Chemical Injection Type Chemical Type Injected Number of Gas Driven Pumps Number of Non-Emitting Pumps
Corrosion Inhibitor 20 55
Methanol/Corrosion Inhibitor mix 13 4
Methanol 69 105
Other 23 50
Scale Inhibitor 0 1
CAA Ex. 7
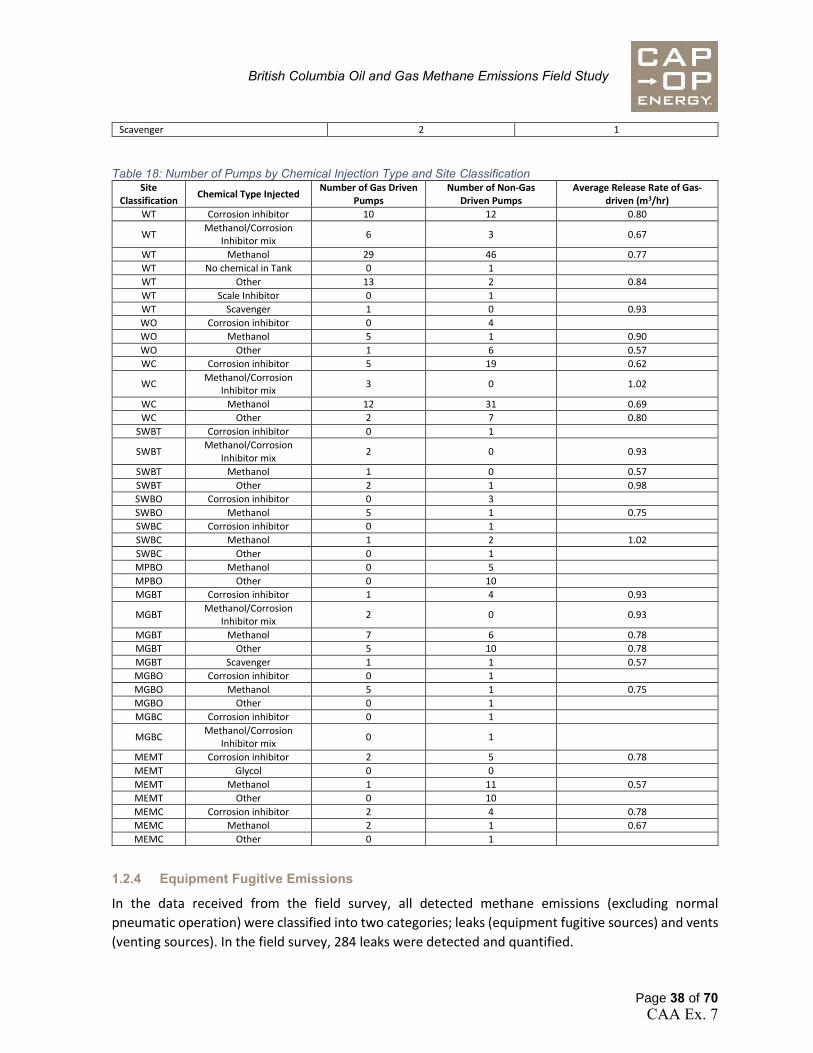
British Columbia Oil and Gas Methane Emissions Field Study
Page 38 of 70
Scavenger 2 1
Table 18: Number of Pumps by Chemical Injection Type and Site Classification Site
Classification Chemical Type Injected
Number of Gas Driven Pumps
Number of Non-Gas Driven Pumps
Average Release Rate of Gas-driven (m3/hr)
WT Corrosion inhibitor 10 12 0.80
WT Methanol/Corrosion
Inhibitor mix 6 3 0.67
WT Methanol 29 46 0.77
WT No chemical in Tank 0 1
WT Other 13 2 0.84
WT Scale Inhibitor 0 1
WT Scavenger 1 0 0.93
WO Corrosion inhibitor 0 4
WO Methanol 5 1 0.90
WO Other 1 6 0.57
WC Corrosion inhibitor 5 19 0.62
WC Methanol/Corrosion
Inhibitor mix 3 0 1.02
WC Methanol 12 31 0.69
WC Other 2 7 0.80
SWBT Corrosion inhibitor 0 1
SWBT Methanol/Corrosion
Inhibitor mix 2 0 0.93
SWBT Methanol 1 0 0.57
SWBT Other 2 1 0.98
SWBO Corrosion inhibitor 0 3
SWBO Methanol 5 1 0.75
SWBC Corrosion inhibitor 0 1
SWBC Methanol 1 2 1.02
SWBC Other 0 1
MPBO Methanol 0 5
MPBO Other 0 10
MGBT Corrosion inhibitor 1 4 0.93
MGBT Methanol/Corrosion
Inhibitor mix 2 0 0.93
MGBT Methanol 7 6 0.78
MGBT Other 5 10 0.78
MGBT Scavenger 1 1 0.57
MGBO Corrosion inhibitor 0 1
MGBO Methanol 5 1 0.75
MGBO Other 0 1
MGBC Corrosion inhibitor 0 1
MGBC Methanol/Corrosion
Inhibitor mix 0 1
MEMT Corrosion inhibitor 2 5 0.78
MEMT Glycol 0 0
MEMT Methanol 1 11 0.57
MEMT Other 0 10
MEMC Corrosion inhibitor 2 4 0.78
MEMC Methanol 2 1 0.67
MEMC Other 0 1
1.2.4 Equipment Fugitive Emissions
In the data received from the field survey, all detected methane emissions (excluding normal
pneumatic operation) were classified into two categories; leaks (equipment fugitive sources) and vents
(venting sources). In the field survey, 284 leaks were detected and quantified.
CAA Ex. 7

British Columbia Oil and Gas Methane Emissions Field Study
Page 39 of 70
A summary of the equipment fugitives detected and quantified at different site types is outlined in
Table 19.
Table 19: Equipment Fugitives Summary by Site Type
Site Class-
ification
Number of Sites Visited
Sites with one or more leaks
Average Leak Rate
(Leaker Population)
Average Leak Rate (General
Population)
Main Contributor to
Leak Rate
Most Common Leak Type
(%) (m3/day/site)
WT 123 17% 8.98 1.54
Open-ended Lines
(Excessive Pneumatic Venting)
Connectors
WO 31 39% 8.39 3.25 Thief Hatches Connectors
WC 51 55% 5.41 2.97 Valves Connectors
SWBT 3 67% 29.86 19.91 Valves
Valves and Open-ended
Lines (Excessive Pneumatic Venting)
SWBO 7 57% 13.66 7.81
Open-ended Lines
(Excessive Pneumatic Venting)
Open-ended Lines
(Excessive Pneumatic Venting),
Connectors, and Valves
SWBC 4 75% 6.93 5.20 Valves Valves
MPBO 7 71% 32.86 23.47 Thief Hatches Valves and Connectors
MGBT 15 67% 19.65 13.10
Open-ended Lines
(Excessive Pneumatic Venting)
Connectors
MGBO 4 25% 17.33 4.33
Open-ended Lines
(Excessive Pneumatic Venting)
Open-ended Lines
(Excessive Pneumatic
Venting) and Connectors
MGBC 2 0% 0.00 0.00
MEMT 12 83% 32.56 27.14 Connectors Connectors
CAA Ex. 7

British Columbia Oil and Gas Methane Emissions Field Study
Page 40 of 70
Site Class-
ification
Number of Sites Visited
Sites with one or more leaks
Average Leak Rate
(Leaker Population)
Average Leak Rate (General
Population)
Main Contributor to
Leak Rate
Most Common Leak Type
(%) (m3/day/site)
MEMC 7 71% 19.03 13.60 Connectors Connectors
1.2.4.1 Leak Distribution
Figure 10 presents the number of leaks detected per site. 165 of the 266 sites surveyed had no leaks
detected. And most (88 of 101) of the remaining sites had fewer than 4 leaks per site. 13 sites had 5 or
more leaks per site, with 3 sites having more than 10 leaks (11, 11, and 16 leaks for those 3 sites).
Figure 10: Distribution of leaks observed per facility survey
Figure 11 presents the maximum, minimum, and average leaks detected per site type. The two average
bars indicate the average per leaking site and the average per site type overall which includes sites with
no leaks. The average amount of leaks per site classification (where leaks are detected) is under 5 for
all site types with an overall average of 2.8 leaks per site where leaks are detected, or an overall average
of 1.1 leaks per site (includes sites with no leaks detected).
0
20
40
60
80
100
120
140
160
180
0 1 2 3 4 5 6 7 8 9 10+
# o
f Si
tes
# of Leaks
CAA Ex. 7
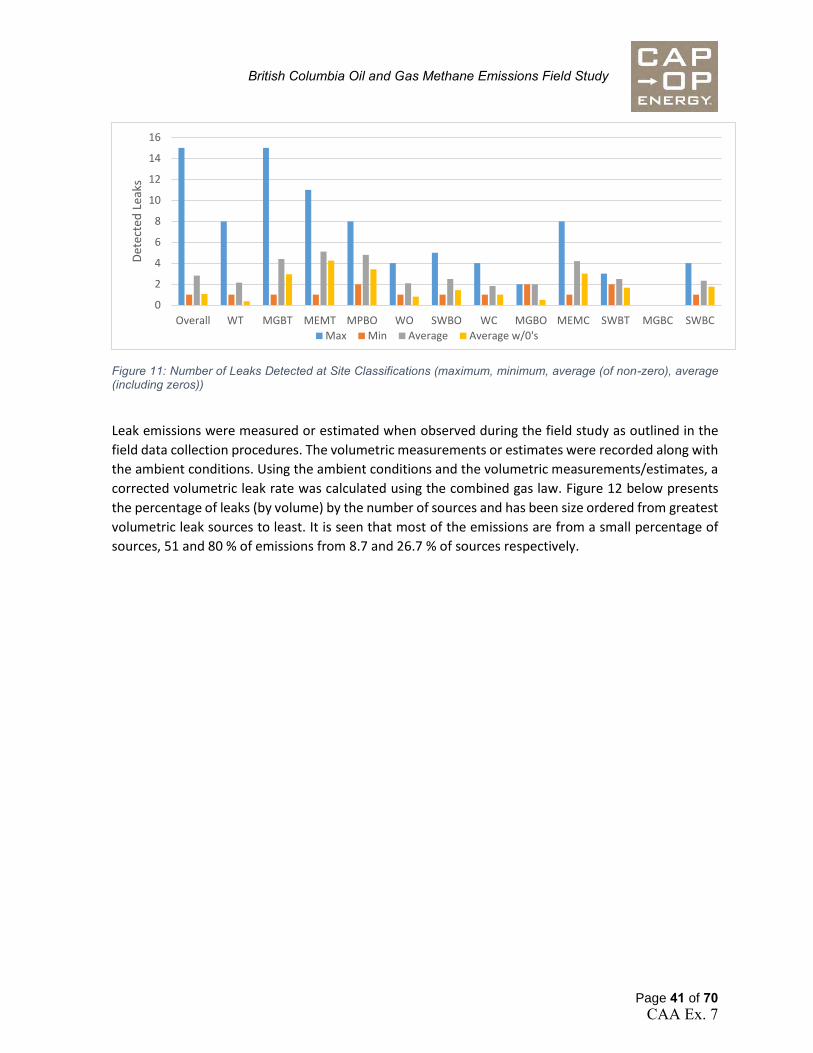
British Columbia Oil and Gas Methane Emissions Field Study
Page 41 of 70
Figure 11: Number of Leaks Detected at Site Classifications (maximum, minimum, average (of non-zero), average (including zeros))
Leak emissions were measured or estimated when observed during the field study as outlined in the
field data collection procedures. The volumetric measurements or estimates were recorded along with
the ambient conditions. Using the ambient conditions and the volumetric measurements/estimates, a
corrected volumetric leak rate was calculated using the combined gas law. Figure 12 below presents
the percentage of leaks (by volume) by the number of sources and has been size ordered from greatest
volumetric leak sources to least. It is seen that most of the emissions are from a small percentage of
sources, 51 and 80 % of emissions from 8.7 and 26.7 % of sources respectively.
0
2
4
6
8
10
12
14
16
Overall WT MGBT MEMT MPBO WO SWBO WC MGBO MEMC SWBT MGBC SWBC
Det
ecte
d L
eaks
Max Min Average Average w/0's
CAA Ex. 7

British Columbia Oil and Gas Methane Emissions Field Study
Page 42 of 70
Figure 12: Observed Leak Distribution by Emission Magnitude per Source
Figure 13 below presents leak volumetric data by magnitude of the leak to the overall percentage of
leak emissions detected. In the field survey, sources that were not able to be measured due to leak
source location were estimated which is differentiated in Figure 13. It is seen that the majority of the
larger emissions sources (7 of top 10 sources) were not measured directly as per Field Data Collection.
Figure 13: Magnitude of Leak Measurements and Estimates
0
10
20
30
40
50
60
70
80
90
100
0 10 20 30 40 50 60 70 80 90 100
% o
f to
tal l
eaks
Size ordered % of sources
Observed Leaks Distribution
51% emissions from 8.7% of sources
80.2% emissions from 26.7% of sources
0
10
20
30
40
50
60
70
80
90
100
0.010.1110
% o
f Em
issi
on
s
Rate of Emissions (m3/hr)
Measured Estimated
n = 284 leaks
CAA Ex. 7

British Columbia Oil and Gas Methane Emissions Field Study
Page 43 of 70
Table 20 below presents the number of leaks per component type surveyed. There are two types of gas
and liquid services (Process Gas & Fuel Gas, Light Liquid & Heavy Liquid although Heavy Liquid was not
observed). There were only 4 emissions that were categorized as fuel gas. Therefore, fuel gas and
process gas fugitive emissions were combined as ‘gas’ component service. There was no information
collected which could offer insight into sour and sweet gas fugitives as it was out of the scope of the
study. No leaks were detected for heavy liquid component service, and therefore all liquid service leaks
(only connectors) are in light liquid service.
The leaker factor, total leakage, and average/median leak magnitude are also presented in Table 20.
The median is shown to illustrate that the majority of leaks are smaller than the average, but large leaks
significantly increase the average leak rate which is shown in Figure 12 and Figure 13. Leaker factor is
the ratio of the number of leaks detected over the estimated total amount of the considered
component type. An estimated 38% of thief hatches were leaking, whereas all other component types
are under 6%, with the lowest leaker factor being .007% (liquid connectors). Thief Hatches also have
the highest average, median, and site level leak rates which suggests that Thief Hatches are currently
responsible for a significant portion of overall methane leak emissions (3% of overall leak sources, 17%
of overall leak emissions).
Table 20: Summary of Leak Field Survey and Results
Component
Type
Component
Service
Total
Components
Number of
Leaks
Leaker
Factor
Total
Leakage
(m3/hr)
Avg Leak
rate
(m3/hr)
Median
Leak
(m3/hr)
Connector Gas 96,823 154 0.0016 17.36 0.12 0.05
Connector Liquid 30,259 2 0.00007 0.24 0.12 0.12
Control
Valve Gas 420 18 0.04
5.64 0.31 0.19
Meter Gas 307 6 0.02 1.18 0.19 0.03
Excessive
Pneumatic
Venting Gas 725 42 0.06
14.06 0.34 0.16
PRV/PSV Gas 764 2 0.002 1.16 0.58 0.58
Regulator Gas 2,405 24 0.01 5.16 0.21 0.13
Thief Hatch Gas 21 8 0.38 9.73 1.22 0.60
Valve Gas 14,776 22 0.001 2.16 0.10 0.07
Pump Seal Gas 71 4 0.06 0.42 0.11 0.07
CAA Ex. 7

British Columbia Oil and Gas Methane Emissions Field Study
Page 44 of 70
1.2.4.2 Leak Emissions Intensity
Methane emissions from the field survey, other than regular pneumatic operations, are classified as either leaks or vents. The results from
the leaks are summarized below in Table 21 classified by component type and component service. Component service has been summarized
as either gas or liquid (process and fuel gas are combined as gas; only light liquid component service leaks were observed). Table 22
summarizes the leak rate results into five considered components for time series modeling parameters, the mapping to these five components
is displayed in the third column. Table 23 splits the results of Table 22 for each site classification. Confidence intervals were not determined
for Table 23 as sample sizes were too small to confidently determine confidence intervals.
Confidence intervals for leaking components were determined using an empirical bootstrap analysis. This analysis is based on the principle
that as the sample size increases, the histogram of many samples from a population converges to the probability histogram for that
population. Consequently, the confidence interval bands narrow as the sample size increases. In this analysis, we use 10,000 bootstrapped
samples (sampling with replacement) to calculate the 95% confidence interval around the sample mean. The results are presented in the
tables below.
Table 21: Component Leak Rate Results and Component Mapping
Component Type
Component
Service
Modeling
Parameter
Component
Mapping
Total
Components
Number of
Leaks
Total Leakage
(m3/hr)
Avg Leak
rate
(m3/hr)
Median
Leak
(m3/hr)
CI Low (2.5th
percentile)
(m3/hr)
CI High
(97.5th
Percentile)
(m3/hr)
Connector Gas Connector 96,823 154 17.36 0.12 0.05 0.09 0.16
Connector Liquid Connector 30,259 2 0.24 0.12 0.12 0.12 0.13
Control Valve Gas Valve 420 18 5.64 0.31 0.19 0.17 0.57
Meter Gas Connector 307 6 1.18 0.19 0.03 0.04 0.84
Open-Ended
Line* Gas
Excessive
Pneumatic
Venting N/A* 42
14.06 0.34 0.16 0.24 0.49
PRV/PSV Gas PRV/PSV 764 2 1.16 0.58 0.58 0.33 0.82
Regulator Gas Valve 2,405 24 5.16 0.21 0.13 0.06 0.19
Thief Hatch Gas Valve 21 8 9.73 1.22 0.60 0.15 0.33
Valve Gas Valve 14,776 22 2.16 0.10 0.07 0.53 2.35
Pump Seal Gas Connector 71 4 0.42 0.11 0.07 0.06 0.17
*The Open-Ended Line category was exclusively used to characterize excessive or exceptional pneumatic venting, so calculating the number of components is not meaningful
CAA Ex. 7

British Columbia Oil and Gas Methane Emissions Field Study
Page 45 of 70
Table 22: Component Leak Rate Results – Mapped
Component
Total
Components
Number of
Leaks
Total
Leakage
(m3/hr)
Avg Leak rate
(m3/hr)
Median
Leak rate
(m3/hr)
CI Low (2.5%,
m3/hr)
CI High
(97.5%, m3/hr)
Connector 127,502 166 17.93 0.12 0.05 0.09 0.15
Valve 23,948 66 12.17 0.18 0.08 0.14 0.28
Excessive Pneumatic
Venting N/A 42 13.13 0.32 0.15 0.23 0.47
PRV/PSV 794 2 1.08 0.54 0.54 0.32 0.80
Thief Hatch 54 8 9.08 1.14 0.56 0.51 2.26
Table 23: Mapped Component Leak Rate Results by Site Classification Site
Classification Component Type
Total
Components
Number of
Leaks
Total Leakage
(m3/hr)
Avg Leak Rate
(m3/hr)
Median Leak
(m3/hr)
WT
Compressor Seal 14.9 0
Connector 15,899.2 24 1.38 0.06 0.05
Valve 3,459.2 8 0.74 0.09 0.07
Excessive Pneumatic
Venting 177.0 13 5.74 0.44 0.45
PRV/PSV 589.9 0
Thief Hatch 2.7 0
WO
Compressor Seal 0.0 0
Connector 2,945.2 12 0.74 0.06 0.05
Valve 572.1 7 0.92 0.13 0.03
Excessive Pneumatic
Venting 13.0 4 0.47 0.12 0.02
PRV/PSV 115.9 0
Thief Hatch 2.0 2 2.07 1.03 1.03
WC
Compressor Seal 0.0 0
Connector 6,978.8 33 2.50 0.08 0.07
Valve 1,633.8 15 2.65 0.17 0.07
Excessive Pneumatic
Venting 36.0 3 1.16 0.39 0.44
PRV/PSV 290.7 0
Thief Hatch 0.7 0
CAA Ex. 7

British Columbia Oil and Gas Methane Emissions Field Study
Page 46 of 70
Site
Classification Component Type
Total
Components
Number of
Leaks
Total Leakage
(m3/hr)
Avg Leak Rate
(m3/hr)
Median Leak
(m3/hr)
SWBT
Compressor Seal 0.0 0
Connector 625.7 1 0.05 0.05 0.05
Valve 78.3 2 1.74 0.87 0.87
Excessive Pneumatic
Venting 8.0 2 0.70 0.35 0.35
PRV/PSV 19.9 0
Thief Hatch 1.3 0
SWBO
Compressor Seal 3.7 0
Connector 2,162.8 3 0.73 0.24 0.13
Valve 359.9 3 0.37 0.13 0.08
Excessive Pneumatic
Venting 20.0 3 0.85 0.28 0.16
PRV/PSV 73.9 0
Thief Hatch 4.0 1 0.32 0.32 0.32
SWBC
Compressor Seal 0.0 0
Connector 1,621.8 1 0.11 0.11 0.11
Valve 303.8 6 0.75 0.13 0.03
Excessive Pneumatic
Venting 4.0 0
PRV/PSV 62.6 0
Thief Hatch 0.7 0
MPBO
Compressor Seal 27.9 0
Connector 12,147.6 7 0.53 0.08 0.05
Valve 1,623.1 7 1.31 0.18 0.03
Excessive Pneumatic
Venting 10.0 4 0.30 0.08 0.06
PRV/PSV 367.3 2 1.16 0.58 0.58
Thief Hatch 15.3 4 3.55 0.89 0.48
MGBT
Compressor Seal 49.1 0
Connector 18,689.3 33 2.83 0.09 0.02
Valve 2,681.9 4 1.93 0.48 0.53
Excessive Pneumatic
Venting 49.0 7 3.42 0.49 0.19
PRV/PSV 539.1 0
Thief Hatch 7.3 0
MGBO
Compressor Seal 0.0 0
Connector 1,518.8 1 0.03 0.03 0.03
Valve 324.4 0
CAA Ex. 7
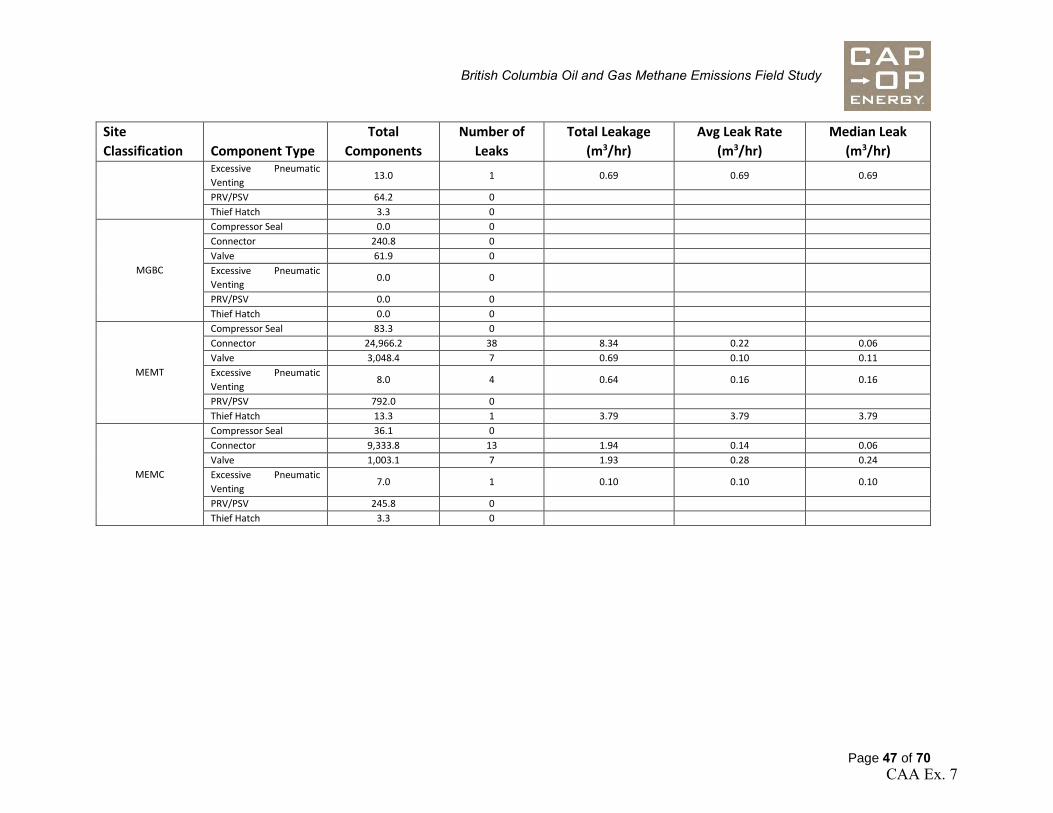
British Columbia Oil and Gas Methane Emissions Field Study
Page 47 of 70
Site
Classification Component Type
Total
Components
Number of
Leaks
Total Leakage
(m3/hr)
Avg Leak Rate
(m3/hr)
Median Leak
(m3/hr) Excessive Pneumatic
Venting 13.0 1 0.69 0.69 0.69
PRV/PSV 64.2 0
Thief Hatch 3.3 0
MGBC
Compressor Seal 0.0 0
Connector 240.8 0
Valve 61.9 0
Excessive Pneumatic
Venting 0.0 0
PRV/PSV 0.0 0
Thief Hatch 0.0 0
MEMT
Compressor Seal 83.3 0
Connector 24,966.2 38 8.34 0.22 0.06
Valve 3,048.4 7 0.69 0.10 0.11
Excessive Pneumatic
Venting 8.0 4 0.64 0.16 0.16
PRV/PSV 792.0 0
Thief Hatch 13.3 1 3.79 3.79 3.79
MEMC
Compressor Seal 36.1 0
Connector 9,333.8 13 1.94 0.14 0.06
Valve 1,003.1 7 1.93 0.28 0.24
Excessive Pneumatic
Venting 7.0 1 0.10 0.10 0.10
PRV/PSV 245.8 0
Thief Hatch 3.3 0
CAA Ex. 7
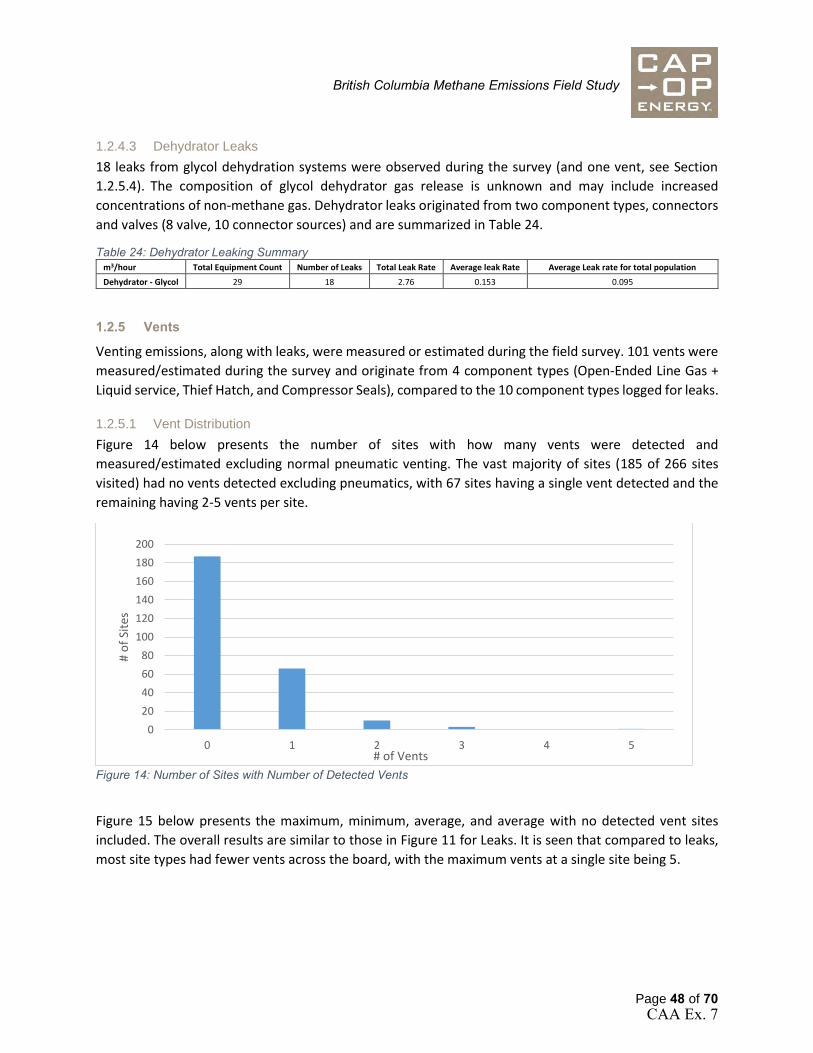
British Columbia Methane Emissions Field Study
Page 48 of 70
1.2.4.3 Dehydrator Leaks
18 leaks from glycol dehydration systems were observed during the survey (and one vent, see Section
1.2.5.4). The composition of glycol dehydrator gas release is unknown and may include increased
concentrations of non-methane gas. Dehydrator leaks originated from two component types, connectors
and valves (8 valve, 10 connector sources) and are summarized in Table 24.
Table 24: Dehydrator Leaking Summary m3/hour Total Equipment Count Number of Leaks Total Leak Rate Average leak Rate Average Leak rate for total population
Dehydrator - Glycol 29 18 2.76 0.153 0.095
1.2.5 Vents
Venting emissions, along with leaks, were measured or estimated during the field survey. 101 vents were
measured/estimated during the survey and originate from 4 component types (Open-Ended Line Gas +
Liquid service, Thief Hatch, and Compressor Seals), compared to the 10 component types logged for leaks.
1.2.5.1 Vent Distribution
Figure 14 below presents the number of sites with how many vents were detected and
measured/estimated excluding normal pneumatic venting. The vast majority of sites (185 of 266 sites
visited) had no vents detected excluding pneumatics, with 67 sites having a single vent detected and the
remaining having 2-5 vents per site.
Figure 14: Number of Sites with Number of Detected Vents
Figure 15 below presents the maximum, minimum, average, and average with no detected vent sites
included. The overall results are similar to those in Figure 11 for Leaks. It is seen that compared to leaks,
most site types had fewer vents across the board, with the maximum vents at a single site being 5.
0
20
40
60
80
100
120
140
160
180
200
0 1 2 3 4 5
# o
f Si
tes
# of Vents
CAA Ex. 7

British Columbia Methane Emissions Field Study
Page 49 of 70
Figure 15: Number of Observed Vents
The source of vents is summarized by major equipment in Figure 16. Four major equipment types (Light
Liquid and Water Production Tanks, Reciprocating Compressor, and Gas Flow Wellheads (Surface Casing
Vents)) are responsible for ~94% of overall venting emissions with Tanks being the largest major
equipment emitter (at 65% of total venting emissions, 25% of which were from Water Production Tanks).
All other major equipment that perform regular venting that were captured during the survey did not
contribute significantly to overall venting emissions. What is not reflected in this data are operations that
release methane episodically unless an episodic release was occurring during the survey. Episodic
methane venting emissions by nature are not continuous, and difficult to measure and quantify through
surveys such as the one performed in this study as they are snapshots at a point in time, not continuous
monitoring.
0
1
2
3
4
5
6
Overall WT MGBT MEMT MPBO WO SWBO WC MGBO MEMC SWBT MGBC SWBC
Nu
mb
er o
f V
ents
Max Min Average Average w/0's
CAA Ex. 7
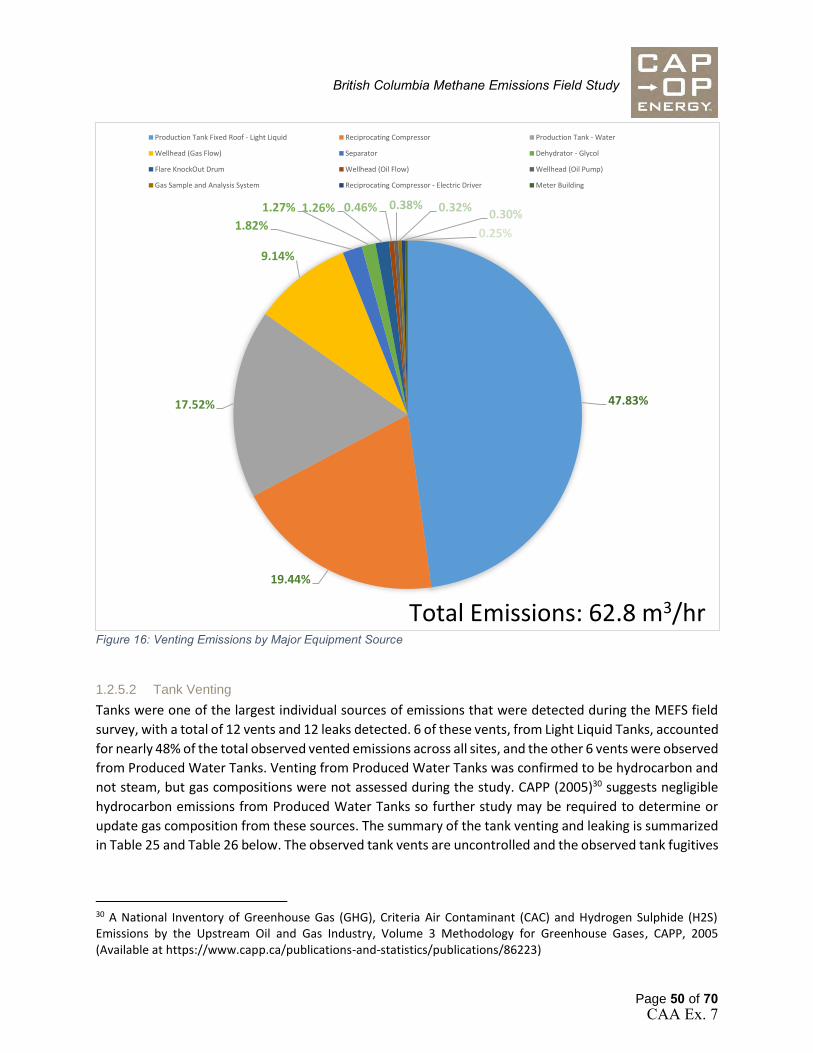
British Columbia Methane Emissions Field Study
Page 50 of 70
Figure 16: Venting Emissions by Major Equipment Source
1.2.5.2 Tank Venting
Tanks were one of the largest individual sources of emissions that were detected during the MEFS field
survey, with a total of 12 vents and 12 leaks detected. 6 of these vents, from Light Liquid Tanks, accounted
for nearly 48% of the total observed vented emissions across all sites, and the other 6 vents were observed
from Produced Water Tanks. Venting from Produced Water Tanks was confirmed to be hydrocarbon and
not steam, but gas compositions were not assessed during the study. CAPP (2005)30 suggests negligible
hydrocarbon emissions from Produced Water Tanks so further study may be required to determine or
update gas composition from these sources. The summary of the tank venting and leaking is summarized
in Table 25 and Table 26 below. The observed tank vents are uncontrolled and the observed tank fugitives
30 A National Inventory of Greenhouse Gas (GHG), Criteria Air Contaminant (CAC) and Hydrogen Sulphide (H2S) Emissions by the Upstream Oil and Gas Industry, Volume 3 Methodology for Greenhouse Gases, CAPP, 2005 (Available at https://www.capp.ca/publications-and-statistics/publications/86223)
47.83%
19.44%
17.52%
9.14%
1.82%
1.27% 1.26% 0.46% 0.38% 0.32%0.30%
0.25%
Production Tank Fixed Roof - Light Liquid Reciprocating Compressor Production Tank - Water
Wellhead (Gas Flow) Separator Dehydrator - Glycol
Flare KnockOut Drum Wellhead (Oil Flow) Wellhead (Oil Pump)
Gas Sample and Analysis System Reciprocating Compressor - Electric Driver Meter Building
Total Emissions: 62.8 m3/hr
CAA Ex. 7

British Columbia Methane Emissions Field Study
Page 51 of 70
are from controlled tanks. Of the 12 leaks detected, 8 were from thief hatches, with 2 from PRV/PSV and
2 from connectors.
Table 25: Tank Venting Results m3/hour
Total Equipment
Count
Number of
Vents
Total Vent
Rate
Average Vent Rate
per Source
Average Vent Rate for Total Equipment
Population
Production Tank Fixed Roof -
Light Liquid 85 6 29.99 45.00 0.35
Production Tank - Water 90 6 10.98 1.83 0.12
Table 26: Tank Leaks Summary m3/hour
Total Equipment
Count
Number of
Leaks
Total Leak
Rate
Average Leak Rate per
Source
Average Leak Rate for Total Equipment
Population
Production Tank Fixed Roof -
Light Liquid 85 12 11.12 0.93 0.13
1.2.5.3 Compressor Seal Venting
There were 18 instances of compressor seal venting that were observed during the study. The vent rate
and source of these vents are summarized in Table 27 and
Table 28 below. Table 27 presents the overall vent rate averages and median in m3/hr of gas.
Table 28 presents the amount of each type of compressor at the site classifications, along with how many
vents were observed to be tied to flare.
Table 27: Compressor Seal Vent Rate Results
Component
Service
Total
Compressors
Total Compressor
Seal Components # of Vents
Total Vent
Rate
Average Vent
Rate (per Vent)
Average Vent
Rate Per
Compressor
Median Vent
Rate (Of
Sources)
Compressor
Seal Gas 69 215 18 12.25 0.68 0.18 0.17
Table 28: Compressor Count and Compressor Vent Controls by Site Classification Site Classification (Number of Sites Surveyed)
Total Compressors (Compressors
Tied into Flare) by Type WT WO WC SWBT SWBO SWBC MPBO MGBT MGBO MGBC MEMT MEMC Total
Reciprocating Compressor 4 1 6(1) 10 (5) 22 (8) 9 52
Screw Compressor - Electric Driver 5 (1) 3 2 10
Reciprocating Compressor - Electric
Driver 1 4 (1) 1 (1) 6
Screw Compressor 1 1
1.2.5.4 Dehydrator Vents
Only a single instance of dehydrator venting was captured during the MEFS field survey. Table 29
summarizes the results from Dehydrator venting. The composition of glycol dehydrator gas release is
unknown and may include increased concentrations of non-methane gas. The single vent case component
source was an OEL.
CAA Ex. 7

British Columbia Methane Emissions Field Study
Page 52 of 70
Table 29: Dehydrator Venting Summary m3/hour
Total Equipment
Count Vents
Total Vent
Rate
Average Vent Rate per
Source Average Vent Rate over Total Equipment Population
Dehydrator -
Glycol 29 1 0.797 0.797 0.027
1.3 Chapter 1 Summary Upstream oil and gas wells and batteries in BC share certain characteristics with other jurisdictions,
including the most common methane emission sources in pneumatic control instruments, chemical
injection pumps, tanks and compressors. As has been found elsewhere, the distribution of methane
emissions among BC operations is highly skewed, with small numbers of sources contributing a large
proportion of total emissions and wide confidence intervals on average values.
For a variety of potential reasons, BC operations also exhibit particular unique characteristics including a
significant population of non-emitting process control and chemical injection equipment. Routine venting
does not appear to occur at most wells and batteries in BC.
2 Chapter 2: Comparison to Contemporary Studies Comparing emissions across components and equipment between different studies is difficult for two
main reasons. First, survey practices and operators use different definitions and categorization of
components that are not standardized across studies. Second, source detection technologies exhibit
significant performance variations based on weather conditions and operator expertise. Studies done with
the same technology but under varying seasonal weather will exhibit different leak-size distributions.
Due to methodological similarities a comparison to Clearstone 2018 is more adjacent than some other
studies. Total natural gas released from all sources in that study comprised 33% pneumatics, 28% from
production tanks, 20% from equipment fugitives, and 16% from heavy oil well casing vents in Alberta. This
compares with the results of this study corresponding to 66% from pneumatics, 15% from production
tanks,31 and 17% from other equipment fugitives. Note: the remaining emissions were from other sources
(e.g. non-tank venting).
2.1.1 Estimated Pneumatic Venting Emissions
Figure 17 shows the device-level emissions in this study (red) compared to the Greenpath 201632 study
(blue). While most vented emissions are similar, two components stand out – the pressure controller
where BC has almost double the emissions of AB, and pump-related emissions where BC has 40% lower
emissions than AB. In addition, many pneumatic device types in AB were assumed to emit “significantly
lower” than 0.17 m3/hr, while the BC data implies that these small sources can have non-trivial emissions
(e.g., plunger lift controllers).
31 15% comprises 9% venting from light liquids tanks, 3% venting from produced water tanks, and 3% tank fugitives. 32 Greenpath 2016 Alberta Fugitive and Vented Emissions Inventory Study, Greenpath Energy, 2016 (Available at https://www.aer.ca/documents/GreenPathAER%20Survey-Methane.pdf)
CAA Ex. 7

British Columbia Methane Emissions Field Study
Page 53 of 70
Figure 17: Comparison of vented emissions between this study (red) and Greenpath 2016 study in AB (blue).
2.1.2 Fugitive Emissions
Leaks or fugitive emissions exhibit varied behavior. Across all component types analyzed, BC emissions
are uniformly lower than AB emissions. However, it should be noted that fugitive emissions that were
unable to be measured directly were estimated, which can lead to significant discrepancies in total
emissions measurements. This is mitigated to the extent possible by the fact that the same contractor
(Greenpath Energy) conducted both surveys and employed the same estimation methodology.
Furthermore, the error bars for each component-level emissions source is large (2 – 3x the measured
emissions) because of two reasons – (a) the sample size is typically small, and (b) total emissions are
dominated by a few very large emitters, resulting in a larger upper bound on the estimates.
CAA Ex. 7

British Columbia Methane Emissions Field Study
Page 54 of 70
Figure 18: Comparison of fugitive emissions between this study (red) and Clearstone 2018 study in AB (blue).
2.1.3 Compressor Emissions
There have been many recent studies in the US and Canada that measured emissions associated with
compressor stations. While some studies report emissions factors which typically represented population-
averaged emissions, others report average emission rate from emitting compressors. Table 30 shows the
population-averaged emissions factors comparison from four recent studies. It is important to note that
although population averaged emissions factor in the US GHG inventory is similar to that observed during
this field campaign, other peer-reviewed study published in the US often show significantly higher
emissions (see for e.g., Mitchell et al.).33 Further research is required to better understand the emission
size distributions across compressor emissions.
Compressor emissions from this study are estimated at approximately the same value as EPA GHGI for
small reciprocating compressors across a population of nearly 36,000 units.
Table 30: Population-Average Emissions Factor Study Region Equipment
type Emission counts
Component Counts
Emissions Factor type
Emissions Factor (kg/h/source)
Clearstone AB (2018) RC 139 Population 0.206
Clearstone AB (2018) RC 27 Emitting 1.082
EPA GHGI US (2016) RC (small) 35930 Population 0.141
EPA GHGI US (2016) RC (large) 136 Population 8.099
Mitchell et al33 US (2015) RC 34 Emitting 27.512
Greenpath AB (2017) RC 296 Population 2.459
33 Mitchell et al. (2015) Environ. Sci. Technol. 49 3219.
CAA Ex. 7
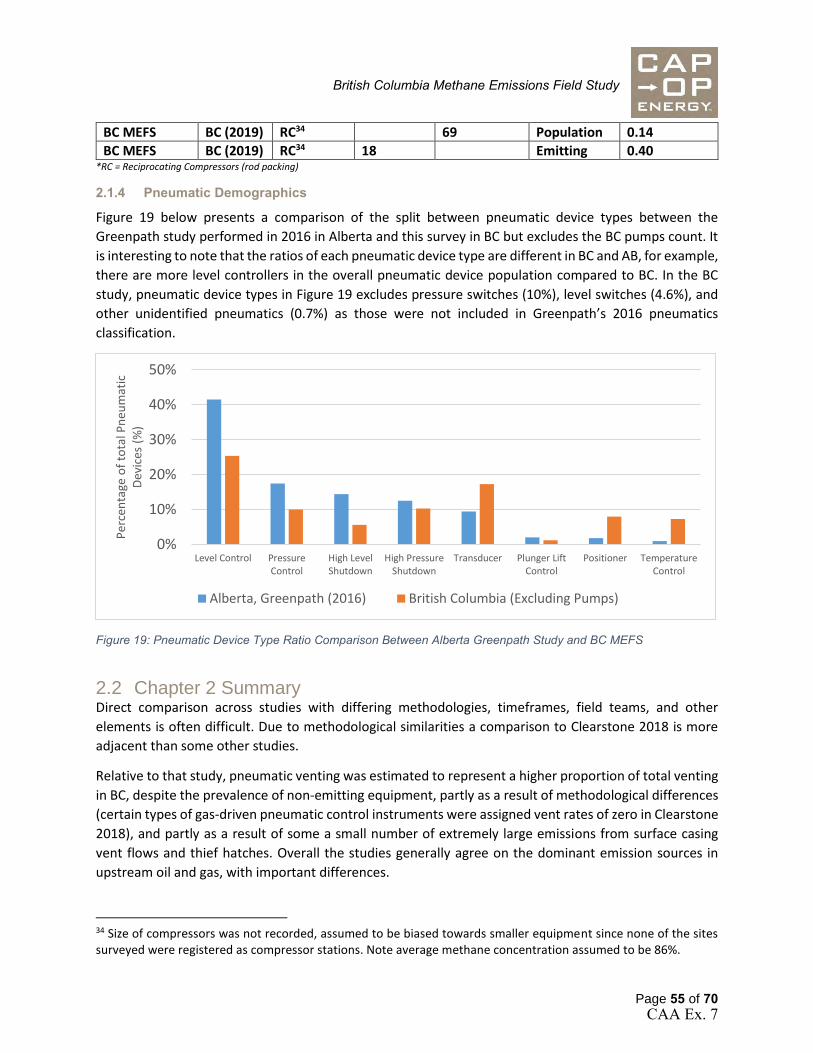
British Columbia Methane Emissions Field Study
Page 55 of 70
BC MEFS BC (2019) RC34 69 Population 0.14
BC MEFS BC (2019) RC34 18 Emitting 0.40 *RC = Reciprocating Compressors (rod packing)
2.1.4 Pneumatic Demographics
Figure 19 below presents a comparison of the split between pneumatic device types between the
Greenpath study performed in 2016 in Alberta and this survey in BC but excludes the BC pumps count. It
is interesting to note that the ratios of each pneumatic device type are different in BC and AB, for example,
there are more level controllers in the overall pneumatic device population compared to BC. In the BC
study, pneumatic device types in Figure 19 excludes pressure switches (10%), level switches (4.6%), and
other unidentified pneumatics (0.7%) as those were not included in Greenpath’s 2016 pneumatics
classification.
Figure 19: Pneumatic Device Type Ratio Comparison Between Alberta Greenpath Study and BC MEFS
2.2 Chapter 2 Summary Direct comparison across studies with differing methodologies, timeframes, field teams, and other
elements is often difficult. Due to methodological similarities a comparison to Clearstone 2018 is more
adjacent than some other studies.
Relative to that study, pneumatic venting was estimated to represent a higher proportion of total venting
in BC, despite the prevalence of non-emitting equipment, partly as a result of methodological differences
(certain types of gas-driven pneumatic control instruments were assigned vent rates of zero in Clearstone
2018), and partly as a result of some a small number of extremely large emissions from surface casing
vent flows and thief hatches. Overall the studies generally agree on the dominant emission sources in
upstream oil and gas, with important differences.
34 Size of compressors was not recorded, assumed to be biased towards smaller equipment since none of the sites surveyed were registered as compressor stations. Note average methane concentration assumed to be 86%.
0%
10%
20%
30%
40%
50%
Level Control PressureControl
High LevelShutdown
High PressureShutdown
Transducer Plunger LiftControl
Positioner TemperatureControl
Per
cen
tage
of
tota
l Pn
eum
atic
D
evic
es (
%)
Alberta, Greenpath (2016) British Columbia (Excluding Pumps)
CAA Ex. 7

British Columbia Methane Emissions Field Study
Page 56 of 70
Fugitive emissions are inherently difficult to compare due to large confidence intervals in most datasets,
but again generally agrees across many component types.
Compressor emissions from this study were estimated at approximately the same value as EPA GHGI for
small reciprocating compressors across a population of nearly 36,000 units.
3 Chapter 3: Fugitive and Episodic Emissions Management Practices
In Chapter 1, modeling parameters that could be determined from the field survey data were developed.
Supplementing snapshot field observations with historical records was included in the study design in
order to support the development and refinement of policy/scenario modeling parameters. Temporal
variation and impacts to emission sources over time should be accounted for when parameters are
developed. The modeling parameters for certain emission sources can have an explicit temporal
component that considers emissions variation over time (e.g. months/years), which would not be
observed by the snapshot exercise of field observation.
To obtain these data on longer term variations a voluntary Corporate Data Request (CDR) was prepared
for the participating companies to provide historical fugitive emission management data, as well as other
types of methane emission information that was not possible to observe while on-site. The data that were
received included information on fugitive repair times, fugitive history, and other sources of methane
emissions (including information on episodic emissions and emission control systems). This information
supplemented the field observations, where applicable, in order to account for temporal variations in
modeling parameter development.
The analytical approach largely follows the description in Section 1.1 Analytical Approach, in addition to
the descriptions provided herein.
3.1 Leak Repair Times A total of 11 CDR responses were received which covered 51 of the 266 locations surveyed in this study’s
survey. A histogram of repair times for leaks is presented in Figure 20. Not all facilities from the CDR
included repair times, 12 sites, which represented repair intervals from a total of 36 repairs. The most
common timeframe to perform a repair is within 16 days, with the average repair time of the reported
facilities at 45 days. The data provided, while it offers insight into timeframe to perform repairs, may not
be representative of broader industry practices due to a small sample size and limited information
contextualizing the types of repairs required.
CAA Ex. 7

British Columbia Methane Emissions Field Study
Page 57 of 70
Figure 20: Histogram of Reported Repair Times from CDR
3.2 Leak Occurrence Rate The leak occurrence rate was calculated based on the facilities that reported a ‘last Fugitive Survey’ in the
CDR. The following equation was used to calculate the leak occurrence rate;
(𝐿𝑀𝐸𝐹𝑆 − 𝐿𝐿𝐿)
𝑀𝑀𝐸𝐹𝑆−𝐿𝐿
Where,
LMEFS = Number of leaks detected during the MEFS field survey
LLL = Number of leaks detected and not repaired during the previous LDAR survey
MMEFS-LL = Months between the MEFS field survey and the previous LDAR survey
The results of the leak occurrence rate by facility is presented in Table 31 below. All leaker factors labelled
as ‘Negative’ in Table 31 have a negative leaker factor because the non-repaired leaks from the previous
LDAR survey is more than the number of leaks detected during the MEFS field survey. This likely reflects
a limitation of the repair information provided. There are 4 instances where the leaker factor is not
calculated, and the cell has been left blank. These 4 facilities either performed their “previous” LDAR
survey after the MEFS field survey or reported the MEFS field survey as their last LDAR survey.
CAA Ex. 7

British Columbia Methane Emissions Field Study
Page 58 of 70
Table 31: Leak Occurrence Rate based on CDR Reported Facilities
Anonymous
Identifier
Facility
Type
Leaks from
BC MEFS
Study
Leaks Detected
from CDR
Responses
Leaks Repaired
from CDR
Responses
Leaks Not
Repaired from
CDR Responses
Months between
Last LDAR and BC
CAS Survey
Leaker Factor
(leaks/month)
188 MPBO 0 0 0 0 2 Negative35
252 MPBO 7 2 0 2 23 0.22
55 MEMC 8 7 0 7 0
125 WC 2 0 0 0 24 0.08
25 WC 3 0 0 0 23.5 0.13
17 MPBO 3 2 0 2 0.5 2.00
192 MEMT 3 1 0 1 21 0.10
111 MEMC 7 3 0 3 19 0.21
44 MEMT 11 17 0 17 9.5 Negative
72 WC 1 4 0 4 20 Negative
169 WC 0 0 0 0 23.5 Negative
102 MEMC 0 1 0 1 1 Negative
107 MEMT 2 4 4 0 17 0.12
152 MEMT 4 4 3 1 0
14 MEMT 5 4 4 0 7 0.71
15 MEMT 11 7 0 7 1 4.00
69 MEMT 6 4 0 4 13 0.15
143 MGBT 1 2 2 0 9 0.11
145 MGBT 1 2 2 0 18 0.06
245 MEMT 1 4 0 4 23 Negative
71 MEMT 3 1 0 1 1 2.000
162 MGBT 2 4 3 1 0
253 WC 0 0 0 0 25 Negative
80 WC 4 0 0 0 24 0.17
167 WC 2 0 0 0 26 0.08
86 WC 2 0 0 0 26 0.08
172 WC 3 1 0 1 24 0.08
88 WC 1 1 0 1 23 Negative
33 MGBO 0 7 7 0 7 Negative
224 MGBT 2 3 2 1 5 0.20
165 SWBO 2 7 4 3 7 Negative
178 MGBT 4 3 3 0 2 2.00
133 WT 0 6 1 5 21 Negative
186 WT 1 5 5 0 7 0.14
225 WC 0 0 0 0 25 Negative
45 WT 1 1 1 0 7 0.14
6 MGBC 0 1 0 1 22 Negative
42 SWBT 0 0 0 0 23.5 Negative
240 WT 0 1 1 0 17 Negative
103 WT 3 0 0 0 23 0.13
249 WT 0 2 2 0 7 Negative
223 WT 0 9 7 2 5 Negative
190 WT 0 1 0 1 18 Negative
251 WT 3 3 3 0 0
Generally, component-specific detail was not provided but if we assume that all leaks from the previous
LDAR survey to the MEFS survey are repaired, it is possible to calculate a leak occurrence rate based on
35 Indicates likely repair data gap – number of unrepaired leaks from prior survey higher than observed number of leaks in subsequent (MEFS) survey
CAA Ex. 7

British Columbia Methane Emissions Field Study
Page 59 of 70
the equation below by component type, as those data are available from the MEFS survey.36 A leak
occurrence rate for PRV/PSV’s was not able to be calculated as no leaks were detected during the MEFS
field survey at the 51 facilities that provided CDR responses.
Equation 4,
𝐿𝑒𝑎𝑘 𝑂𝑐𝑐𝑢𝑟𝑒𝑛𝑐𝑒 𝑅𝑎𝑡𝑒𝑏𝑦 𝑐𝑜𝑚𝑝𝑜𝑛𝑒𝑛𝑡 𝑡𝑦𝑝𝑒 = ∑ (𝐶𝑙𝑖 − 𝐶𝑙𝑖,𝑡−1)/𝑀𝑖
𝑁𝑖=1
∑ 𝐶𝑡𝑖𝑁𝑖=1
Where, 𝐶𝑙𝑖 = are the number of leaking components by type detected from the ith facility inspection, 𝐶𝑙𝑖,𝑡−1 = are the number leaks detected but not repaired from the inspection previous to the ith
facility inspection. Note: (𝐶𝑙𝑖 − 𝐶𝑙𝑖,𝑡−1)>=0,
𝑀𝑖 = is the number of months since the last inspection from the ith facility, 𝐶𝑡𝑖 = is the total number of components by type at the ith facility, and
N = is the total number of facilities for which field study data is available. The leak occurrence factors by each component type are presented in Table 32 below. The calculation assumes that Cli,t-1 is equal to 0 (all previously detected repairs were repaired) to be able to calculate a leak occurrence rate with the available responses. The sample size is also provided for context. Table 32: Leak Occurrence Rate by Component Type*
Thief
Hatch PRV/PSV Valve Connector
Excessive Pneumatic Venting
(Previously OELs)
Leaker Factor (Leaks/Month) 0.0115 0 0.0013 0.0004 0.0064
Sample Size (# of leaks used for
calculation) 4 0 16 67 5
*These results assume that all leaks from the previous LDAR survey to the MEFS survey are repaired and that all detected leaks during the MEFS survey are new.
3.3 Other Sources and Controls In Cap-Op’s 2017 report Other Sources of Methane Emissions in the Oil and Gas Sector a number of less
significant methane sources were identified.37 The CDR included information on these, including episodic
emissions such as depressure events and compressor gas starts, as well as information regarding emission
control systems associated with these events. Very few responses provided information so these data are
summarized at a very high level as follows:
• More compressor gas start systems were controlled than not o Control via tie-in to flare, air-start (instrument air) or electric drive
• Wide variability in number of compressor starts per year
• More dehydrators were controlled than not o Control via flare, vapor recovery unit
36 This assumption is supported by the company reported information as it typically reported the same number of leaks detected as leaks repaired, when information was available, however these data represent a very small subset of the study sites. 37 Other Sources of Methane Emissions in the Oil and Gas Sector, Cap-Op Energy, 2017. Available by request from ECCC or Cap-Op Energy.
CAA Ex. 7

British Columbia Methane Emissions Field Study
Page 60 of 70
• More depressure events were controlled than not o Control via flare
• Average reported volume per depressure event was less than 10 m3/event
3.4 Chapter 3 Summary Obtaining highly specific historical data on fugitive and episodic emissions is influenced by a number of
factors including a wide variety of emission management practices and reporting systems. By matching
voluntarily provided corporate historical data with field observations a high-level characterization of the
performance of fugitive emissions management at specific sites can be understood over time.
Understanding episodic emissions and the different ways they are being managed by companies provides
an additional layer of context for time-series modeling.
4 Chapter 4: Long Term Methane Emission Drivers Note: All results are based on discussions from the workshop participants as Cap-Op and DXD intentionally
assumed an objective, observational role in the working discussions. Cap-Op and DXD input to the sessions
was limited to clarification, facilitation and guidance.
4.1 Temporal State Definition 4.1.1 Distant Past
The distant past temporal state was defined as pre-2009 and, importantly, this was effectively prior to the
current level of greenhouse gas reporting in British Columbia. Participants broadly viewed this period as
the “single well pad era” and agreed that production in British Columbia was dominated by single-well oil
and gas production. While some groups accounted for production in the 1980s and 1990s, others provided
their experience from the 2000s. Less pipeline infrastructure was in place and conventional production
(without hydraulic fracturing) was most common. This period was also characterized by appraisal and
exploration of the natural fields in British Columbia (especially the Horn and Montney basins). While
individual companies may have piloted certain methane abatement technologies and CAPP Best
Management Practice for Fugitive Emissions Management (CAPP BMP)38 was beginning to be used
(around 2007), focused attention to methane management across industry was limited. Sour gas
management and facilities design, not methane emissions awareness, drove conservation behaviour that
may have otherwise been absent in sweet gas regions. Production was driven by economics and basic
compliance with the regulations of the day. This was noted in slight contrast to current conditions, where
more comprehensive consideration is also given to regulations, emissions, climate change and social
factors that may have a future impact on operations. Participants agreed that the regulatory environment
was very different than the one observed in today’s production. Dry gas, not wet gas, was the dominant
product and, relative to today, more field compression and less processing occurred. It was also noted
that some drivers may have counter-balanced influence, for example the prevalence of single-well pads
would drive up equipment to facilities ratios but lower numbers of processing facilities and gas plants in
the field would drive ratios down.
38 Best Management Practice for Fugitive Emissions Management, CAPP, 2007. Available at https://www.capp.ca/publications-and-statistics/publications/116116
CAA Ex. 7

British Columbia Methane Emissions Field Study
Page 61 of 70
4.1.2 Recent Past
The recent past temporal state was defined as the period from 2010 to 2015. This period was marked by
a shift from dry gas to liquids rich gas and the development of the Montney. Horizontal drilling technology
had significantly improved, and very little conventional drilling was occurring. This period, referred to as
the “multi well pad era,” also saw dramatic increases in the use of multi-well pads, driving down
equipment to facility ratios. Pipeline infrastructure increased to meet development needs and Producers
began to pilot programs and design infrastructure to drive efficiencies. In contrast to the distant past, this
period saw that factors beyond economics had to be given consideration. Social issues, movements
against hydraulic fracturing, environmental activism and climate change began to impact the industry.
Leak Detection and Repair (LDAR) had been implemented at some large facilities and some producers had
implemented full LDAR programs across their fleets, in part driven by CAPP BMP and other publications.
This period was also volatile economically. By 2010/2011, the industry had begun to recover from the
global economic crash in the late 2000s and by 2012, the industry in BC was seeing an increase in
exploration and drilling. However, 2014 saw another economic downtown in the oil and gas industry of
Western Canada that impacted BC producers. Opportunities surrounding coastal liquefied natural gas
(LNG) facilities grew and contracted with the market; several proposed LNG projects extended into the
current and future time periods.
4.1.3 Future
The future temporal state was defined as a post-methane regulation implementation scenario, between
2020 and 2030, where all producers would be operating to achieve compliance with applicable
regulations, and that equivalency of provincial programs has been completed and approved. LNG and the
potential growth of the industry associated with it dominates this period. In addition to being a driver for
new assets, LNG development could bring legacy assets back online. Producers will continue to maximize
the efficiency of multi-well pad design, further decoupling production and footprint. Liquids rich
production and horizontal drilling practices are expected to continue, with even better horizontal drilling
technology coming online. There is the potential that the Clean Fuel Standard (CFS) may drive the
stabilization of domestic demand and the price of natural gas. As producers consistently show proactive
compliance with the regulations, the focused interest that Non-Governmental Organizations (NGOs) and
governments currently have on methane emissions from oil and gas operations may begin to ease.
Additionally, as producers and regulators see full implementation of the regulations, year over year, there
is the potential that LDAR requirements may decrease, as more data is available to inform efficient yet
effective emissions reductions.
4.2 Assessment of Drivers Results of the workshop were assessed for each modeling driver. Each group’s assessment was plotted
over time, showing their interpretation of the directionality and magnitude of change of these drivers for
each temporal period.
Issues that make temporal forecasting difficult include acquisitions/sales, as well as change in ownership
and working interest partners. In addition to making factors like equipment counts and prevalence of low
bleed pneumatics (in other words, physical factors), changes in ownership also generally result in “legacy
CAA Ex. 7

British Columbia Methane Emissions Field Study
Page 62 of 70
staff” no longer being associated with sites and facilities. For example, while field assets may be acquired,
it is not always the case that the operators working on those sites go with the sale.
4.2.1 Equipment to Facility Ratios
Participants identified multiple factors that impact equipment to facility ratios:
• Level of gas processing required, related to dry gas vs. wet gas;
• Prevalence of gas plant facilities;
• Trend from single-well pads in the past to multi-well pads (i.e., concentration of equipment and/or prevalence of larger pad-level equipment);
• Amount of compression occurring in the field; and
• Fundamentally different equipment for different products (sweet or sour; dry gas or wet gas).
Distant Past: some characteristics of pre-2009 operations would translate to more distinct pieces of
equipment, and some would translate to fewer. In general, the consensus was that the dominance of
single-well pads meant more equipment in the field, per well pad.
Recent Past: this period saw a concentration of equipment on smaller footprints with the shift to multi-
well pads and industry participants generally felt that equipment to facility ratios were lower than the
pre-2009 period. However, in general, equipment to facility ratios were higher relative to current
operations with a shift to wet gas from dry gas, as field processing facilities became more prevalent.
Future: future operations will continue to see a trend towards centralized facilities, which will result in
more and larger equipment per facility, but fewer facilities. If growth is seen due to LNG, absolute amounts
of equipment in the field will increase. Electrification (dual feed) will require more processing and
abatement equipment. Increased processing and fractionation will result in increased equipment, as more
oil and water are handled. On a per-well basis, amount of equipment will decrease; however, more
intense processing will result in larger equipment and likely higher equipment ratios.
Workshop consensus on directionality and magnitude of change in the future: ↑(1)
3
1
0
1
PRE-2009 2010-2015 TODAY 2020-2030
Particpant Group 1
3
10
-1PRE-2009 2010-2015 TODAY 2020-2030
Participant Group 2
CAA Ex. 7

British Columbia Methane Emissions Field Study
Page 63 of 70
4.2.2 LDAR Inspection Frequency
Broadly, and with a high degree of consensus, implementation of LDAR programs was lower in the past
than today and will be higher in the future than currently.
Distant Past: effectively no LDAR programs were in place. CAPP published the Best Management Practice
for Fugitive Emissions in 2007 with implementation beginning in the following years, so LDAR guidance
and definitions had not yet achieved wide awareness.
Recent Past: LDAR implementation varies with each Producer but was generally lower than currently.
Risk-based LDAR was conducted for gas plants and larger facilities, but not individual well sites. The
guidance in BMP was not prescriptive or required by regulation, and some Producers conducted no LDAR.
Future: implementation of the regulations will result in an increase in LDAR programs. Mandatory LDAR
will drive the development of cost-effective emissions detection programs. Following implementation of
regulations for 2 – 5 years, a decrease in frequency may be observed as regulations accommodate and
approve alternative LDAR programs. Despite a reduction in frequency, emission reductions will remain
stable.
Workshop consensus on directionality and magnitude of change in the future: ↑↑↑(3)
0
-1
0
1
PRE-2009 2010-2015 TODAY 2020-2030
Participant Group 3
-3
-10
3
PRE-2009 2010-2015 TODAY 2020-2030
Participant Group 1
-3-2
0
3
PRE-2009 2010-2015 TODAY 2020-2030
Particpant Group 2
CAA Ex. 7

British Columbia Methane Emissions Field Study
Page 64 of 70
4.2.3 Prevalence of High Bleed Pneumatics
The prevalence of high bleed pneumatics was much higher in the distant past relative to current
operations, and Participants were aligned on this model driver.
Distant Past: far more high bleed pneumatics were in operation than current practices, as they were cost
effective and no regulation in place to limit their use. In a number of applications, low-bleed pneumatics
were not commercially available. However, some participants noted that in the past, more sour gas was
being produced, and, due to safety concerns, sour production is often no-bleed; this consideration shifted
one group’s rating from a magnitude of 3 to 2.
Recent Past: use of high bleed pneumatics in recent years had decreased as new builds began to include
low bleed pneumatics and energy efficient programs/pilots were implemented. Retro-fits were not yet
common. One market-dominant supplier of control instruments began manufacturing high-quality low
bleed pneumatics, which became increasingly cost effective, and towards the end of the time period some
high-bleed models were phased out entirely.
Future: once the regulations have been implemented, only certain legacy high bleed pneumatics will be
in operation. The absolute magnitude of the reduction of high bleed use depends on any given producer’s
inventory. For producers with low numbers of high bleed pneumatics, the absolute magnitude will be
small but the relative magnitude will approach 100%. Participant Group 1 intentionally left this blank but
discussed the context of their answer with the group.
Workshop consensus on directionality and magnitude of change in the future: ↓↓↓(-3)
-2-1
0
3
PRE-2009 2010-2015 TODAY 2020-2030
Particpant Group 3
CAA Ex. 7

British Columbia Methane Emissions Field Study
Page 65 of 70
4.2.4 Prevalence of Methane Mitigation Technologies
Broadly, there was good consensus that focus on methane mitigation has generally increased over time.
Distant Past: Generally, less mitigation was conducted than currently, and flaring was more prevalent.
Less vapour recovery occurred than in current operations, and commercially available technologies were
more limited.
Recent Past: increasingly, instrument air devices were being used and vapour recovery units were
installed. Flaring and venting were both more prevalent relative to current operations. Technologies like
VRUs and incinerators were not cost effective.
Future: Implementation of the regulations will result in an increase in mitigation and may also drive the
development of more efficient or cost-effective technologies. Participants expect an increased use of
vapour recovery units (VRUs), vent gas capture (for conservation or destruction) and enclosed
combustors. However, given that many technologies are currently already in use on some facilities, the
magnitude of change will not be 3.
Workshop consensus on directionality and magnitude of change in the future: ↑↑(2)
21
0
-3PRE-2009 2010-2015 TODAY 2020-2030
Particpant Group 2
3
10
-2PRE-2009 2010-2015 TODAY 2020-2030
Particpant Group 3
0 0 0
2
PRE-2009 2010-2015 TODAY 2020-2030
Participant Group 1
CAA Ex. 7

British Columbia Methane Emissions Field Study
Page 66 of 70
4.2.5 Level of Preventative Maintenance
Participants identified that the level of preventative maintenance any given Producer achieves will not
likely change over time as it is typically driven by things like safety as opposed to emissions. Preventative
maintenance will vary from Producer to Producer, but any given Producers maintenance program will
generally remain constant over time. Regular turnarounds have always occurred and will continue, for a
variety of reasons unrelated to methane emission reductions.
Distant Past: no change.
Recent Past: no change.
Future: Only within the context of the future did Participants anticipate a change in preventative
maintenance programs. As new technologies are brought in to service a growing industry, preventative
maintenance programs may increase in magnitude. Additionally, mandatory LDAR may be an incentive
for Producers to implement regular maintenance in advance of detection surveys. The use of big data
management and analytics was seen as a potential shift that would create more efficient preventative
maintenance.
Workshop consensus on directionality and magnitude of change in the future: ↑(1)
-2 -2
01
PRE-2009 2010-2015 TODAY 2020-2030
Particpant Group 3
CAA Ex. 7

British Columbia Methane Emissions Field Study
Page 67 of 70
4.2.6 Prevalence of Non-Emitting Pneumatic Devices
There was broad consensus in the workshop that the prevalence of non-emitting pneumatic devices
increases through time, although magnitude of change can depend on many factors, including operations
of individual Producers.
Distant Past: Significantly fewer non-emitting pneumatic devices were in operation pre-2009. Some
Participant Groups indicated that, generally, non-emitting pneumatics were not in operation at all.
Recent Past: Over this period, well electrification projects became more prevalent, as did solar-powered
devices and other remote power options such as thermoelectric generators.
Future: Most new builds will have non-emitting pneumatics. Having access to cost-competitive electricity
from the grid is a significant consideration in increasing non-emitting pneumatics. Assuming that by 2022,
pneumatics will be switched out, this driver will only experience a small magnitude increase as new
technologies come online. Most new facilities will be non-emitting in their control and chemical injection
systems, equivalent to a magnitude of 3 decrease; however, legacy facilities with some emitting
pneumatic devices will continue to exist resulting in a magnitude of 2 decrease.
0 0 0
1
PRE-2009 2010-2015 TODAY 2020-2030
Participant Group 1
0 0 0 0PRE-2009 2010-2015 TODAY 2020-2030
Particpant Group 2
0 0 0
1
PRE-2009 2010-2015 TODAY 2020-2030
Particpant Group 3
CAA Ex. 7

British Columbia Methane Emissions Field Study
Page 68 of 70
Workshop consensus on directionality and magnitude of change in the future: ↑↑(2)
4.3 Potential for Incentivization In closing the afternoon, participants were individually asked to provide general opinions on potential
types of future market conditions or incentives that may drive implementation or a reduction technology
or method sooner than the implementation of regulations, or to a magnitude that goes beyond what is
required for compliance.
Electricity
- Collaboration between Producers and various levels of government to get Producers access to cost-competitive electricity; and
- Access to cost-competitive electricity from the grid is a key component of success and growth in the BC fields.
Incentives
-3-2
0
3
PRE-2009 2010-2015 TODAY 2020-2030
Participant Group 1
-3
-10
2
PRE-2009 2010-2015 TODAY 2020-2030
Particpant Group 2
-1 -1
0
1
PRE-2009 2010-2015 TODAY 2020-2030
Particpant Group 3
CAA Ex. 7

British Columbia Methane Emissions Field Study
Page 69 of 70
• Offer carbon offsets as an incentive;
• Use programming structures already utilized by other programs, such as the Clean Infrastructure Royalty Credit Program;
• Expand the flexibility of current and future incentives to allow for the combination of different incentives programs to drive increase in participation;
• Offer incentives for condensing wells to superpads (lower footprint);
• Offer incentives for research and development that will drive lower production costs; and
• Offer incentives for early adopters of technology or programs.
4.4 Chapter 4 Summary Three temporal states – distant past, recent past, and future – were interrogated across six specific focus
areas in terms of the direction and relative magnitude of change from the “present” observed in the field
study. The workshop leveraged industry experience to guide subjective changes to modeling parameters
over different time periods, including forecasting and backcasting of methane emissions in British
Columbia.
Broad agreement, especially with historical time periods, was achieved within the workshop in terms of
defining a narrative of oil and gas production in the province and defining a potential future scenario.
Assessment of methane emission modeling drivers was evaluated from a variety of perspectives, and
insights into key drivers that might influence parameters of interest for time-series modelling was
determined.
Closing The British Columbia Methane Emissions Field Study incorporated a broad scope of field data, corporate
data, and temporal trends in order to inform time-series modeling of methane emissions in British
Columbia. The development of BC-specific methane emissions parameters can also improve
understanding of the characteristics that make the province unique, those which are consistent with other
jurisdictions, and can elicit the next round of questions to be answered for further improvement.
CAA Ex. 7

British Columbia Methane Emissions Field Study
Page 70 of 70
Appendix A: Data Tables See supplemental attachment.
Cap-Op Energy
1930-401 9th Ave SW
Calgary, AB, Canada
T2P 3C5
CAA Ex. 7

CLEAN AIR ADVOCATES’ EXHIBIT 8

Dedicated to protecting and improving the health and environment of the people of Colorado
Pneumatic Controller Task Force Report to the Air Quality Control Commission
Pneumatic Controller Field Study and Recommendations
June 1, 2020
CAA Ex. 8

ii
TABLE OF CONTENTS
1 INTRODUCTION ....................................................................................... 1
1.1 2017 AQCC REG 7 OIL AND GAS CTG RULEMAKING AND PNEUMATIC INSPECTION PROGRAM ........ 2 1.1.1 Background ................................................................................................. 2 1.1.2 PC Find and Fix program ................................................................................ 3 1.1.3 Reassessment Provision ................................................................................. 3 1.1.4 2019 Rulemaking Directives .............................................................................. 4
2 PNEUMATIC CONTROLLERS ......................................................................... 5
2.1 WHAT IS A PC, WHAT DOES IT DO? .................................................................. 5 2.2 TYPES OF PCS ....................................................................................... 5 2.3 IMPROPER OPERATION ............................................................................... 6
2.3.1 Causes ........................................................................................................ 6 2.3.2 Effects and Indicators ..................................................................................... 6
3 PC TASK FORCE ....................................................................................... 7
3.1 PCTF GOALS........................................................................................ 7 3.2 IMPLEMENTATION PLAN .............................................................................. 7
4 PC FIELD STUDY ...................................................................................... 7
4.1 PARTICIPATING STAKEHOLDERS ...................................................................... 7 4.2 STUDY DESIGN ...................................................................................... 8
4.2.1 PC Inspection Method Utilized........................................................................... 8 4.2.2 Field Data Form Development ........................................................................... 8 4.2.3 Facility Selection ........................................................................................... 8
4.3 FIELD CAMPAIGN SUMMARY ......................................................................... 10 4.3.1 Field Data Compilation ................................................................................. 10 4.3.2 Completeness and Consistency Review .............................................................. 10
4.4 PCTF STUDY DATA ................................................................................ 11 4.4.1 Oil and Gas Production Facility Data ................................................................. 11 4.4.2 Midstream Data .......................................................................................... 14
4.5 PCTF STUDY FINDINGS AND CONCLUSIONS ......................................................... 14 4.5.1 Key Findings ............................................................................................... 14 4.5.2 Conclusions ................................................................................................ 16
4.6 SEPARATE EPA/CDPHE STUDY ON PCS IN DENVER-JULESBURG BASIN ............................. 16 4.6.1 Overview ................................................................................................... 16 4.6.2 Study Design .............................................................................................. 17 4.6.3 Findings .................................................................................................... 18 4.6.4 Conclusions ................................................................................................ 20
4.7 COMPARISON OF PCTF STUDY AND EPA/CDPHE STUDY FINDINGS AND CONCLUSIONS .............. 21 4.7.1 Findings .................................................................................................... 21 4.7.2 Conclusions ................................................................................................ 22
5 INDUSTRY SURVEYS ................................................................................. 23
5.1 EFFECTIVENESS AND COSTS OF INSPECTION TECHNIQUES (NAA ONLY) .............................. 23 5.2 EFFECTIVENESS AND COSTS OF REPAIRS (NAA ONLY) ............................................... 24 5.3 USE OF SELF-CONTAINED AND NO-BLEED PCS (STATE-WIDE SURVEY) ............................... 25 5.4 ELECTRICAL INFRASTRUCTURE FOR OIL AND GAS DEVELOPMENT .................................... 30
6 GOOD ENGINEERING AND MAINTENANCE PRACTICES ......................................... 32 6.1.1 The Environmental Partnership ....................................................................... 32
CAA Ex. 8

iii
7 RECOMMENDATIONS ................................................................................ 33
7.1 EFFECTIVENESS OF CURRENT PROGRAM (NAA ONLY) ................................................ 33 7.2 DEFINITION APPROPRIATENESS ...................................................................... 35 7.3 NO-BLEED AND SELF-CONTAINED PCS .............................................................. 36
7.3.1 Current applications..................................................................................... 36 7.3.2 Effectiveness of devices ................................................................................ 38 7.3.3 Costs for new and retrofit facilities ................................................................. 38 7.3.4 Limitations and Barriers to expanded use ........................................................... 39 7.3.5 Opportunities for expanded use ...................................................................... 40
8 ACKNOWLEDGMENTS ............................................................................... 40
CAA Ex. 8

1
1 Introduction
This report was developed in response to a December 2017 rulemaking, in which the Colorado Air Quality Control Commission (AQCC) established a pneumatic controller (PC) ‘Find and Fix’ program for oil and gas well production facilities and natural gas compressor stations located in the ozone non-attainment area (NAA). The AQCC recognized that continuous bleed and intermittent pneumatic controllers are designed to have emissions but these emissions can be excessive when the controllers are not operating properly. The AQCC adopted the Find and Fix program to reduce excess emissions from such natural gas-driven pneumatic controllers. As part of the Statement of Basis and Purpose (SBAP), and at the request of industry and other stakeholders, the AQCC adopted a “reassessment” provision for the Find and Fix program. The reassessment was to follow an Air Pollution Control Division (Division) led study of pneumatic controller emission reduction options, including the rate, type, application, and causes of pneumatic controllers found operating improperly; inspection and repair techniques and costs; available preventative maintenance methods; appropriateness of the definitions of enhanced response, intermittent pneumatic controller, no-bleed pneumatic controller, self-contained pneumatic controller, and pneumatic controller; and other related information. The AQCC also directed that more information on “good engineering and maintenance practices” should be gathered during the pneumatic controller study and implementation of the Find and Fix program to inform the reassessment. As part of the reassessment, industry agreed to participate in a study focused on the Denver-Julesburg (DJ) Basin that would collect data on the types of PCs in service, those PCs determined to be operating improperly, what caused the PCs to not operate properly, and the repairs taken to return the PCs to proper operation across a representative cross section of well production facilities and natural gas compressor stations in the NAA. The AQCC directed the creation of a Pneumatic Controller Task Force (PCTF) comprised of representatives of the Division, operators and industry trade groups, local governments, and conservation groups. The PCTF was to brief the AQCC annually and make recommendations in this report, and each participant was to have the opportunity to contribute to the briefings and report. The AQCC also recognized that the pneumatic controller study and inspection program might inform the strategies for cost-effective hydrocarbon emission reductions for pneumatic controllers, including zero emission pneumatic controllers, under consideration by the Statewide Hydrocarbon Emission Reduction (SHER) team. The AQCC also established the SHER team through the SBAP for the December 2017 rulemaking. The PCTF convened for the first time on January 25, 2018. The group held bi-weekly meetings for several months to develop and design the study. Field inspections of production facilities selected for the study started on May 1, 2018. Afterwards, meetings were held bi-monthly to check on the progress of field inspections and updates on data management until the data was submitted to the Division in December 2018. The group met in January 2019 to discuss initial data analysis, finalize the project plan, and revisit goals. The PCTF briefed the AQCC on February 21, 2019 on its progress. Throughout the spring of 2019, industry PCTF members developed and responded to questionnaires to document and assess the effectiveness and costs of inspection techniques as well as to understand opportunities for expanded use of no-bleed PCs. The PCTF and the SHER team held a joint meeting on June 11, 2019, to hear presentations on Canadian regulation of pneumatic controllers.
CAA Ex. 8

2
In April 2019, the legislature adopted Senate Bill 19-181, which directs the AQCC to “review its rules for oil and natural gas well production facilities and compressor stations and specifically consider adopting more stringent provisions, including . . . a requirement to reduce emissions from pneumatic devices. The AQCC shall consider requiring oil and gas operators, under appropriate circumstances, to use pneumatic devices that do not vent natural gas.” The PCTF was effectively put on hold in the summer of 2019 to allow its members to focus on regulatory proposals to be addressed during the December 2019 SB 19-181 Rulemaking. In that rulemaking, the AQCC adopted the SHER team’s proposal to (1) expand the Find and Fix program statewide, (2) include language in the SBAP directing continued work to evaluate the use of zero-bleed pneumatic devices, and (3) provide for a compliance assistance approach for operators outside the nonattainment area while those operators get up to speed on the Find and Fix program. In the SBAP, the AQCC directed the SHER team and PCTF to continue their work on the mandates established in 2017, and to bring back to the AQCC in 2020 their recommendations on the use of zero-bleed pneumatic devices. Members of the PCTF were requested in April 2020 to review and complete this report.
1.1 2017 AQCC Reg 7 Oil and Gas CTG Rulemaking and Pneumatic Inspection Program
Below is a summary from the Statement of Basis and Purpose prepared for the 2017 AQCC Regulation 7 rulemaking that explains the actions taken by the AQCC for the 2017 rulemaking and the direction given to the Division to convene a PCTF.
1.1.1 Background
On May 4, 2016, the U.S. Environmental Protection Agency (“EPA”) published a final rule that determined that Colorado’s Marginal ozone NAA failed to attain the 2008 8-hour Ozone National Ambient Air Quality Standard (“NAAQS”). EPA, therefore, reclassified the Denver Metro North Front Range (“DMNFR”) area to Moderate and required attainment of the NAAQS no later than July 20, 2018, based on 2015-2017 ozone data. As a result of the reclassification, on May 31, 2017, Colorado submitted to EPA revisions to its State Implementation Plan (“SIP”) to address the Clean Air Act’s (“CAA”) Moderate NAA requirements, as set forth in CAA § 182(b) and the final SIP Requirements Rule for the 2008 Ozone NAAQS (See 80 Fed. Reg. 12264 (March 6, 2015)). As a Moderate NAA, Colorado revised its SIP to include Reasonably Available Control Technology (“RACT”) requirements for each category of volatile organic compound (“VOC”) sources covered by a Control Technique Guidelines (“CTG”) for which Colorado has sources in the DMNFR that EPA finalized prior to a NAA’s attainment date. EPA finalized the CTG for the Oil and Natural Gas Industry (“Oil and Gas CTG”) on October 27, 2016, with a state SIP submittal deadline of October 27, 2018. Given this timing, the November 2016, SIP revisions did not include RACT for the oil and natural gas source category and Colorado needed to further revise its SIP. The Oil and Gas CTG recommends controls that are presumptively approvable as RACT and provide guidance to states in developing RACT for their specific sources. In many cases, Colorado had similar, or more stringent, regulations comparable to the recommendations in the Oil and Gas CTG, though many of these provisions were not currently in Colorado’s Ozone SIP. Therefore, on November 16, 2017, the AQCC adopted RACT for the oil and gas sources covered by the Oil and Gas CTG (CTG as of October 27, 2016) into the Ozone SIP. In order to make additional progress towards attainment of the NAAQS, the AQCC also adopted State Only revisions to require owners or operators of oil and gas well production facilities and
CAA Ex. 8

3
compressor stations with natural gas-driven PCs in the DMNFR area to inspect and maintain these PCs.
1.1.2 PC Find and Fix program
The AQCC adopted an inspection and enhanced response (e.g., maintenance) program for natural gas-driven PCs. While the Oil and Gas CTG notes the value of PC inspection and maintenance, the Oil and Gas CTG does not specify PC inspection and maintenance as presumptive RACT. The AQCC therefore created a new program that requires that natural gas-driven PCs at well production facilities and natural gas compressor stations in the DMNFR be inspected periodically to determine whether the PC is operating properly. The program requires that owners or operators inspect PCs for proper operation as part of routine LDAR regulatory programs at well production facilities annually, semi-annually, quarterly, or monthly, depending on the well production facility VOC emissions, and at natural gas compressor stations quarterly or monthly, depending on the natural gas compressor station fugitive emissions. This PC inspection and enhanced response process was intended to be a multi-step process. First, the owner or operator must inspect all natural gas-driven PC using an approved instrument monitoring method (AIMM) to screen for detectable emissions. This first step allows owners or operators to narrow potential response efforts to only those PCs with detected emissions. Second, the owner or operator must determine whether the PCs with detected emissions are operating properly. Use of an AIMM is not required during this second step; the AQCC did not lay out a process for how owners or operators are to determine if their PCs are operating properly. During this second step, if an owner or operator determines that the PC is operating properly, no further action is necessary. Third, where an owner or operator determines the PC is not operating properly, the owner or operator must take actions to return an improperly operating PC to proper operation. Fourth, general recordkeeping and reporting requirements apply broadly to the number of facilities inspected and number of inspections. More detailed recordkeeping and reporting is required for those PCs that the owner or operator determined not to be operating properly. Similar to the LDAR records, owners or operators must keep records of the date the PC was returned to proper operation and a description of the types of actions taken.
1.1.3 Reassessment Provision
The reassessment provision is explained as follows in the SBAP for the 2017 Reg 7 CTG rulemaking. The AQCC adopted a “reassessment” provision for this inspection and enhanced response program following a Division led study of PC emission reduction options, including the rate, type, application, and causes of PCs found operating improperly; inspection and repair techniques and costs; available preventative maintenance methods; appropriateness of the definitions of enhanced response, intermittent pneumatic controller, no-bleed pneumatic controller, self-contained pneumatic controller, and pneumatic controller; and other related information. The AQCC also recognized that owners and operators may have limited information on “good engineering and maintenance practices” for PCs and intended that more information on these practices are gathered during the pneumatic study and implementation to inform the reassessment of the inspection and enhanced response program. The data collection effort will include data from a representative cross-section of well production facilities and natural gas compressor stations in the DMNFR. In accordance with industry’s proposal, a task force was directed to convene by January 30, 2018, consisting of
CAA Ex. 8

4
representatives from industry, the Division, local governments, environmental groups, and other interested parties. Data collection was scheduled to commence no later than by May 1, 2018. The task force will brief the AQCC annually and make any recommendations on its findings in a report (this document) to the AQCC due May 1, 2020. The AQCC intends that the Division, industry, local government, and environmental group task force participants each have the opportunity to contribute to the final report and provide one representative to speak during the briefings to the AQCC. The AQCC intended that this information be used to reassess the natural gas-driven PC requirements of Regulation Number 7 that will remain in effect until rescinded, superseded, or revised.
1.1.4 2019 Rulemaking Directives
Below is an excerpt from the Statement of Basis and Purpose prepared for the 2019 AQCC Regulation 7 rulemaking that explains the actions taken by the AQCC for the 2019 rulemaking and the direction given to the PCTF and SHER Team:
“Pneumatic Controllers (Part D, Section III.) SB 19-181 also directed the Commission to consider a requirement to reduce emissions from pneumatic devices. In the 2017 emissions inventory for the Moderate area ozone nonattainment SIP, pneumatic devices were identified as the second largest oil and gas area source (after tanks). In 2017, the Commission convened the Statewide Hydrocarbon Emission Reduction (SHER) team, to consider measures – both regulatory and voluntary – to reduce hydrocarbon emissions from the oil and gas sector. The Commission, at the same time, also established the Pneumatic Controller Task Force (PCTF), with a mission to collect and review data about pneumatic controllers and identify ways to reduce emissions from that equipment. After almost two years of work, the SHER team developed an early recommendation concerning pneumatic controllers, which the Commission has now adopted. The SHER team supported a three-prong approach. First, the expansion of the pneumatic controller inspection and enhanced response program state-wide. Second, the SHER team recommended including language in this Statement of Basis and Purpose, directing the continued work to evaluate the use of zero-bleed pneumatic devices. Third, the SHER team supported a compliance assistance approach for operators outside the nonattainment area, while those operators get up to speed on the pneumatic controller inspection and enhanced response program that has been implemented in the nonattainment area since 2018. The Commission approves of this approach and commends both the SHER team and PCTF for their work since 2017, building the knowledge that informed provisions of this rulemaking. The Commission has therefore expanded the pneumatic controller inspection and enhanced response program state-wide. At the same time, the Commission recognizes that there is much to learn about the inspection and maintenance of natural gas-driven pneumatic controllers outside the nonattainment area, which highlights the need for enforcement discretion. The Commission intends that for operations outside the nonattainment area, the determination of whether a pneumatic controller is operating properly will be made by the owner or operator, with minimal oversight by the Division for the first year of implementation.
CAA Ex. 8

5
The Commission further directs the SHER team and PCTF to continue their work on the mandates established in 2017, and to bring back to the Commission in 2020 their recommendations on the use of zero-bleed pneumatic devices. Specifically, the Commission continues to direct the PCTF to make recommendations on its findings in a report to the Commission in May 2020. However, the Commission revises its directive to the SHER team to present recommendations by no later than January 2020, to by no later than July 2020. This revised timeline will provide additional time for the SHER team to make any additional recommendations on cost-effective hydrocarbon emission reduction strategies evaluated by the SHER team. The Commission anticipates that the SHER team will also evaluate continuous methane emission monitoring and engage in discussions to determine actual leak rate percentages of components at oil and gas facilities for use in future rulemakings.”
2 Pneumatic Controllers
This section provides some basic information regarding PCs, with a focus on the PCs studied recently in Colorado.
2.1 What is a PC, what does it do?
PCs are found widely on oil and natural gas production facilities in Colorado. PCs are used to automate and regulate process control variables such as temperature, pressure, liquid level, and to maintain critical safety fail-safe functions. PCs operate by sensing a condition and then sending a signal to a valve actuator that in turn controls a valve that controls the process parameter in question. For instance, a liquid level controller will sense liquid levels in a separator and send a signal (in the form of natural gas pressure) to a valve actuator on a dump valve which in turn opens the dump valve and lowers the liquid level in the separator. It is important to note that the PC, the valve actuator, and the valve are all different components of the control system. It is not uncommon for the PC to be located several feet away from the valve actuator and the valve it is controlling. Finally, it is important to realize that the valve being controlled by the PC is a component that is already subject to the LDAR provisions of Regulation Number 7. Similarly, there are many connectors associated with PCs and valve actuators - each of which is also a component subject to the LDAR provisions. As such, it is important to distinguish emissions from leaking components that are routinely found and repaired in an LDAR program, from emissions caused by an improperly operating PC.
2.2 Types of PCs
As part of their normal function, PCs emit natural gas when they actuate, either intermittently or continuously. Continuous and intermittent PCs are the two broad categorizations of PCs that were the focus of the 2018 PCTF field study. The categorization refers to how the PC is expected to emit under normal operation. A continuous PC is designed to emit at a steady rate, commonly referred to as a bleed rate. The bleed rate may change during actuation. Contrastingly, an intermittent PC is only expected to emit above a de minimis level during actuations and hence they do not have a bleed rate per se. Some intermittent PCs actuate very frequently and some only rarely. For instance, a liquid-level
CAA Ex. 8

6
controller on a new high producing well may actuate many times within an hour. There may be significant emissions associated with this normal, intended operation.1 There are also non-emitting controllers, often referred to as “no-bleed,” “zero-bleed” or “zero-emitting”2 PCs. These devices do not emit natural gas to the atmosphere during any phase of normal operation. Many of these devices are inherently non-emitting because they are driven by electricity or pressurized air, rather than pressurized natural gas. Since the intent of this field study was to examine emissions associated with natural gas-driven PCs, non-emitting PCs were not included in the scope of the 2018 PCTF field study. Contained within the continuous PC category are high-bleed and low-bleed PCs. High-bleed PCs are designed to emit over 6 standard cubic feet per hour (scf/hr) of gas between actuations. Low-bleed devices emit less than 6 scf/hr. As of 2020, the Division believes that there are no high-bleed devices in use within the State of Colorado and all continuous-bleed PCs reported during this study were low-bleed.
2.3 Improper operation
Numerous studies have identified that a small number of improperly operating PCs are typically responsible for the majority of emissions from the PC population3,4,5. This information is what originally prompted the AQCC to adopt a PC find and fix program. The PCTF took a similar approach with the field study by focusing on “proper” vs “improper” operation.
2.3.1 Causes
Improper operation could be caused by any number of issues affecting a PC. These causes range from small amounts of debris keeping the controller from reseating properly to broken internal parts or defects in the housing for the PC. The causes specifically identified in the field study included: abnormal operation parameters, corrosion, debris, diaphragm failure, seal failure, spring failure, and wet supply gas.
2.3.2 Effects and Indicators
Operator personnel utilize AIMM (typically an OGI camera) to detect emissions from production facilities during LDAR inspections. Identification of a PC that is not operating properly requires additional knowledge regarding the types of PCs and their emission characteristics during normal operation in order to distinguish improper operation with an OGI camera. Common tell-tale signs of PC improper operation include: loss of or improper control of the process parameter the PC is supposed to control; continuous emissions from an intermittent PC; excess emissions, as compared to normal operation, as identified via audio, visual, and olfactory (AVO) inspections or AIMM, from a controller; or obvious signs of significant staining 1 Stovern, 2020: Understanding oil and gas pneumatic controllers in the Denver-Julesburg basin using optical gas imaging, Journal of the Air & Waste Management Association. 2 Simpson, 2014. Pneumatic controllers in upstream oil and gas. Oil Gas Facil. 3(5):83–96. 3 Allen, 2014. CH4 emissions from process equipment at natural gas production sites in the United States: Pneumatic controllers. Environ. Sci. Technol. 49 (1):633–40. 4 Luck, 2019. Multi-day measurements of pneumatic controller emissions reveal frequency of abnormal emissions behavior at natural gas gathering stations. Environ. Sci. Technol. Letters 6:348–52. 5 Thoma, 2017. Assessment of Uinta basin oil and natural gas well pad pneumatic controller emissions. J. Environ. Prot. 8:394.
CAA Ex. 8

7
or corrosion. A subset of improperly operating PCs may also be able to be identified by field personnel using their AVO senses; however, all inspections in this study used AIMM and did not solely rely on AVO observations.
3 PC Task Force
3.1 PCTF Goals
The PCTF members established the following goals for the PC study: ● Identify and collect natural gas-actuated PC data from a representative subset of well
production facilities and compressor stations in the NAA o Set parameters of “improper operation” for each type of PC o Develop, document, and assess the effectiveness and costs of inspection
techniques o Document malfunction rates and causes for types, makes, and models of PCs in
different types of service o Document the effectiveness and costs of repair techniques and preventative
maintenance o Estimate the number of PCs typically associated with a separator or other
grouping of equipment
● Gather information regarding “good engineering and maintenance” practices
● Evaluate the appropriateness of the definitions in Regulation No. 7 for enhanced response, intermittent pneumatic controller, no-bleed pneumatic controller, self-contained pneumatic controller, and pneumatic controller
● Gather information about the current applications, cost, effectiveness, current applications and opportunities for expanded use for no-bleed and self-contained PCs
● Produce timely annual presentations and a report to the AQCC
3.2 Implementation Plan
The PCTF formed three distinct groups to address different elements of designing the field study: a main core group and two subgroups. One subgroup selected representative facilities and the second subgroup developed a field data form. Members of the PCTF provided several technical presentations to grow the shared knowledge base during the study development phase. Once the field inspection campaign commenced on May 1, 2018, bimonthly meetings were held to check on the progress of field inspection and subsequent data management until the compiled and blinded data was submitted to the Division in December 2018. The two subgroups disbanded once 2018 sampling began while the main core group continued to meet.
4 PC Field Study
4.1 Participating Stakeholders
The field study was designed with the help of all PCTF stakeholders. These stakeholders include: the Division, the American Petroleum Institute (API), the Colorado Oil and Gas
CAA Ex. 8

8
Association (COGA), nine upstream oil and gas well production operators, one midstream operator, the Clean Air Task Force (CATF), Earthjustice (EJ), the Environmental Defense Fund (EDF), Boulder County Public Health (BCPH), Denver Public Health and Environment (DDPHE), Colorado Communities for Climate Action (CC4CA), and the Regional Air Quality Council (RAQC). The field study was implemented and conducted with the participation of nine upstream oil and gas well production facility operators in the DJ Basin. The study also surveyed PCs at the only two known natural gas compressor stations within the DJ Basin that operate natural gas-actuated PCs.
4.2 Study Design
4.2.1 PC Inspection Method Utilized
All PC inspections conducted at the facilities selected for this field study utilized an OGI camera to monitor and identify improperly operating PCs. Some operators also noted whether an improperly operating PC could have been identified using only AVO methods (e.g. visible staining or corrosion or audible hissing when not actuating).
4.2.2 Field Data Form Development
A subgroup was formed to develop the field data forms (Attachment A) that would be used by operators during PC inspections of the selected facilities to collect consistent metadata across operators and facilities. These forms were based on forms utilized by the Stovern et al (2020) study and amended to reflect the different data collection goals of the PCTF inspection process. The final data forms include general, inventory, inspection, and repair information. The data form options include PC type (including manufacturer and model), function, application, depressurization method, and type of service. The forms determine “improper operation” causes, including description(s). The forms note primary causes of improper operation such as debris, corrosion, equipment failures, broken or missing parts, or abnormal operational parameters; there is also an option for other causes. Industry representatives provided extensive instructions (Attachment B) for field staff that detailed each item on the form step-by-step. The final data forms were available in paper and electronic form. Operators that utilized paper forms tabulated the data into the electronic form once the paper forms were returned to office staff. All data was submitted to the Division in electronic form.
4.2.3 Facility Selection
The PCTF extensively examined appropriate cross-sectional data for well production facilities and natural gas compressor stations. For well production facilities, the Division initially estimated about 7,000 well production facilities in the NAA counties. The group discussed how to appropriately divide the facilities into cohorts in order to identify which facilities should be sampled for the study. The factors discussed included type of drilling (horizontal vs. vertical), operation size based on production levels, facility age, and separator types. Ultimately, the subgroup decided that production level (barrels/day) was most appropriate and representative of the other variables being considered. Industry then provided “snapshot” daily average production data from December 2017 for each of the nine participating operators to the Division on February 21, 2018, with subsequent updates based on stakeholder meeting discussions. This snapshot dataset for the nine participating operators represented approximately 80% of all well production facilities located
CAA Ex. 8

9
in the NAA. The original dataset was grouped by level of production (barrels/day), and a 50 percent “Plug and Abandon” (P&A) rate for wells in the 0 - 10 bbls production level cohort was assumed, as these wells were largely older vertical wells likely to be shut-in or scheduled for P&A. This P&A rate assumption is based on multiple factors including, but not limited to, line pressure, economic considerations, lease agreement issues, and land use matters.
Industry updated the dataset on March 21, 2018, with more accurate information from the two largest participating operators, which decreased the P&A rate and provided a conservatively low estimate of the number of PCs to be surveyed at each well production facility, based on its level of production. This analysis was conducted to demonstrate that the study would sample a sufficient number of selected facilities in each production cohort, to provide an adequate data set for the study.
After further meetings and discussion, the PCTF decided on the following cross-sectional sample of well production facilities to be subject to PC inspections starting May 1, 2018, shown in Table 1:
Table 1: Preliminary DMNFR Ozone NAA Well Production Facility Dataset (2018 Sampling Estimate)
Production Buckets
Estimated number of
controllers per facility
Total No. of Facilities
Proposed Sample %
Proposed No. of Sample Facilities
Estimated # of controllers
>250 bbls/day
50 104 13 14 700
10-250 bbls/day
20 553 7 39 780
0-10 bbls/day
5 2,509 5 125 625
TOTAL 3,166 178 2,105
The actual sampling that took place resulted in one extra facility inadvertently being surveyed by one of the operators. Additionally, because operator PC count estimates were intentionally conservative, a significantly higher number of controllers were actually surveyed during the study. The actual final 2018 well sampling facility and PC numbers inspected are shown below in Table 2.
CAA Ex. 8

10
Table 2: Final DMNFR Ozone NAA Well Production Facility Dataset (May - October 2018)
Production Buckets
Average number of controllers per
facility
Total No. of Facilities
Proposed Sample %
Proposed No. of Sample Facilities
Final # of controllers
>250 bbls/day
98 104 13 14 1,378
10-250 bbls/day
34 553 7 39 1,319
0-10 bbls/day
9 2,509 5 126 1,141
TOTAL 3,166 179 3,838
For natural gas compressor stations, the Division initially requested industry feedback on potential data for inclusion in the May 2018 sampling. After further stakeholder discussion, the Division conducted an independent analysis using its databases to determine the number of active natural gas compressor stations in the NAA and gathered industry feedback by facility. The final analysis showed 58 active natural gas compressor stations operated by eight companies. The Division received feedback on 86% of the stations (50 stations) by June 2018 (four out of eight operators). Of these, 48 stations are currently operating or under construction to operate on instrument air, or have been depressurized and are not included in the field inspections. Two natural gas compressor stations were confirmed to use natural gas-driven PCs and were included in the study. These two natural gas compressor stations were sampled in the summer of 2018. Nine compressor stations are operated by non-participating operators and are of an unknown status at the time of the study. It is likely that at least some of these natural gas compressor stations are operated on instrument air since 4% (two out of 50) of the participating stations use natural gas-driven PCs; however, this is assumed and not verified.
4.3 Field Campaign Summary
The PCTF field study began in May 2018 and data collection was finished by October 2018. On August 1, 2018, and September 11, 2018, Patrick Murphy (formerly of Boulder County) and Jeramy Murray (APCD) attended field surveys at four Noble Energy and two PDC Energy facilities to observe how industry field staff were implementing the study design.
4.3.1 Field Data Compilation
Spirit Environmental (Spirit) was retained by COGA to assist with implementation of the PCTF study plan, including facility selection, field data form development, and data validation and compilation. Once the representative cross-section criteria was developed, Spirit generated a randomly selected list of facilities to be inspected by participating operators. If a facility was not available for inspection, Spirit randomly chose a replacement facility that met the original criteria for that operator. Reasons for assigning a designating a site as unavailable included: depressurized, shut-in, P&A, divested sites, sites operating with instrument air, sites with landowner access restrictions, or incorrectly categorized sites.
4.3.2 Completeness and Consistency Review
All data collected by operators was compiled and blinded by Spirit Environmental before electronic submission to the Division. The data also went through a completeness and consistency check performed by Spirit, where operators were consulted to complete missing
CAA Ex. 8

11
data fields and to better account for information provided, thereby improving field data reporting consistency between operators. For transparency, industry provided the compiled field data in both uncorrected and corrected spreadsheets that were made available to all stakeholders in the PCTF.
4.4 PCTF Study Data
The following sections contain summaries of key data collected during the PCTF field study. A full spreadsheet with all data collected in the program is available to stakeholders for analysis through the Division.
4.4.1 Oil and Gas Production Facility Data
The study resulted in data points based on inspections for over 3800 PCs in the DJ Basin. Of the PCs observed, approximately 5% were observed to be improperly operating.
Figure 1. Surveyed PCs proper operation rate
This data was also broken down by the three predetermined inventory production buckets. In the 0-10 bbl/day production bucket, 3.2% of all PCs were improperly operating. In the 10-250 and 250+ bbl/day buckets, 6.5 and 5.1% of PCS respectively were found to be improperly operating.
3645, (95%)
193, 5%
Operating Properly? (all Surveyed controllers)
Yes No
CAA Ex. 8

12
Figure 2. Proper Operation rate by inventory production bucket
Breaking down the data by PC type (continuous vs. Intermittent) is also a useful way to look at the data. Continuous PCs were found to have an improper operation rate of 3.5% and intermittent controllers had a rate of 5.6%.
Figure 3. Proper Operation rate by PC type
Operators tracked the facility equipment associated with each PC in the study. The majority of PCs are in-service on separation vessels. About 5% of PCs on separators were found to be improperly operating. The second most common PC equipment location was on the compressor engines. PCs on compressor engines had a relatively high improper rate of 12.3%. PCs found on all other equipment had a 2% improper operation rate.
130
123
110
70
86
37
0 200 400 600 800 1000 1200 1400
250+
10-250
0-10
Number of PCs
Proc
utio
n Bu
cket
(bb
l/da
y)
Operating Properly?Yes No
305
593
172
21
0 500 1000 1500 2000 2500 3000 3500
Intermittent PC
Continuous PCs
Number of PCs
PC V
ent
Type
Operating Properly?Yes No
CAA Ex. 8

13
Figure 4. Proper Operation rate by equipment location
The study revealed that there were a myriad of reasons that a PC might operate in an improper manner. The four largest causes were attributed to corrosion, diaphragm failure, seal failure, and debris blocking the internal mechanism from reseating.
Figure 5. Causes of improper operation
Operators made attempts to return all PCs to proper operation at the time of inspection if possible. Fifty (26%) of the 193 improperly operating PCs were repaired immediately. Ninety-
325
278
114
156
35
2
0 500 1000 1500 2000 2500 3000 3500 4000
Separator
Compressor Engine
Other
Number of PCs
Equi
pmen
t Lo
cati
onOperating Properly?
Yes No
4121%
3820%
3619%
3418%
2111%
116%
42%
21%
21%Corrosion
Diaphragm Failure
Seal Failure
Debris
Unkown
Unknown: Vendor Repair
Scrubber Leaks
Abnormal operational parameters
Wet supply gas
Pilot valve was cross threaded
Spring failure
Switch failure
Tightened nut on selector switch
CAA Ex. 8
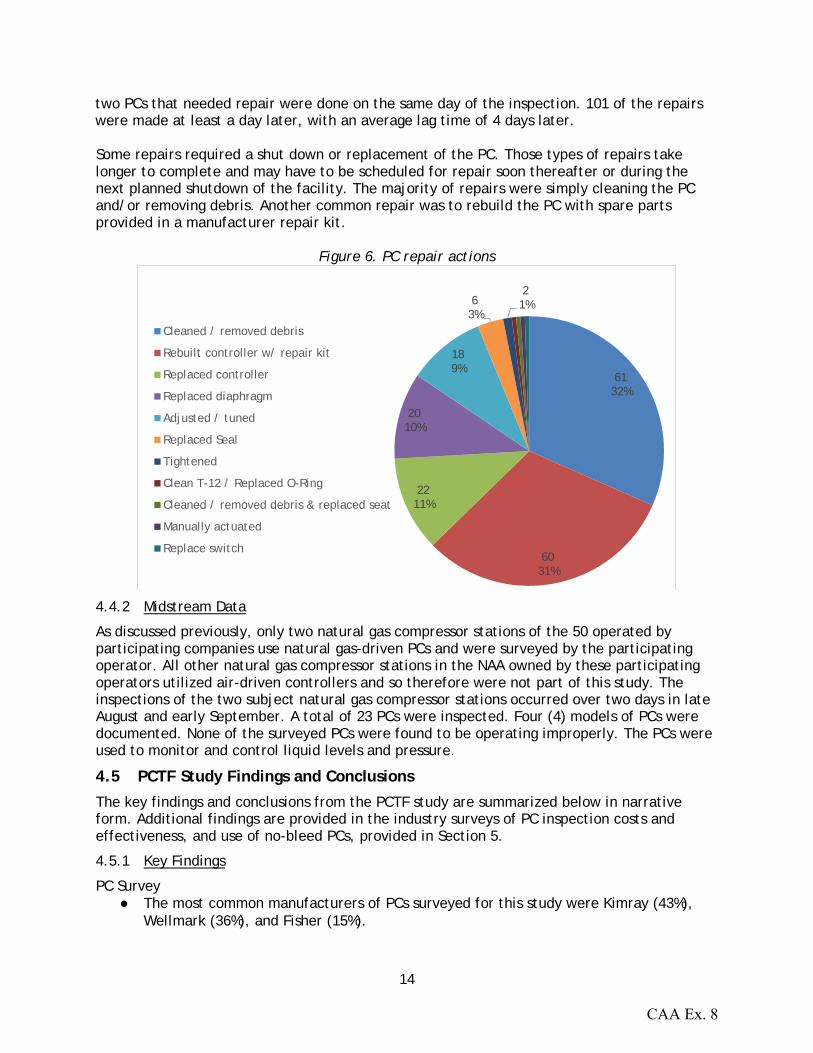
14
two PCs that needed repair were done on the same day of the inspection. 101 of the repairs were made at least a day later, with an average lag time of 4 days later. Some repairs required a shut down or replacement of the PC. Those types of repairs take longer to complete and may have to be scheduled for repair soon thereafter or during the next planned shutdown of the facility. The majority of repairs were simply cleaning the PC and/or removing debris. Another common repair was to rebuild the PC with spare parts provided in a manufacturer repair kit.
Figure 6. PC repair actions
4.4.2 Midstream Data
As discussed previously, only two natural gas compressor stations of the 50 operated by participating companies use natural gas-driven PCs and were surveyed by the participating operator. All other natural gas compressor stations in the NAA owned by these participating operators utilized air-driven controllers and so therefore were not part of this study. The inspections of the two subject natural gas compressor stations occurred over two days in late August and early September. A total of 23 PCs were inspected. Four (4) models of PCs were documented. None of the surveyed PCs were found to be operating improperly. The PCs were used to monitor and control liquid levels and pressure.
4.5 PCTF Study Findings and Conclusions
The key findings and conclusions from the PCTF study are summarized below in narrative form. Additional findings are provided in the industry surveys of PC inspection costs and effectiveness, and use of no-bleed PCs, provided in Section 5.
4.5.1 Key Findings
PC Survey ● The most common manufacturers of PCs surveyed for this study were Kimray (43%),
Wellmark (36%), and Fisher (15%).
6132%
6031%
2211%
2010%
189%
63%
21%
Cleaned / removed debris
Rebuilt controller w/ repair kit
Replaced controller
Replaced diaphragm
Adjusted / tuned
Replaced Seal
Tightened
Clean T-12 / Replaced O-Ring
Cleaned / removed debris & replaced seat
Manually actuated
Replace switch
CAA Ex. 8

15
● The most common models of PCs surveyed for this study were Wellmark 7400 Snaptrol (32%), Kimray T-12 (21%), Fisher 4660 (14%), Kimray 230 SGT (7%), Murphy LS200N (3%), and Norriseal 1001A (2%).
● Intermittent PCs comprise 84% and low bleed, continuous PCs comprise 16% of the 3838 PCs surveyed for this study.
● For equipment location, the PCs surveyed were found as follows: o 89% on separators o 8% on compressor engines o 1.4% on liquid knockouts o <1% on various equipment
PC Improper Operation ● The rate of PC improper operation varied:
o by facility production: ▪ Ranging from 5.1% for greater than 250 bbl/day, to 6.5% for 10-250
bbl/day, and 3.2% for 0-10 bbl/day. o by controller type:
▪ 4.3% for pilot PCs and 8.0% for integrated PCs. o by controller vent type:
▪ 5.3% for intermittent PCs and 3.4% for continuous PCs. o by controller enclosure:
▪ 3.1% for enclosed PCs and 7.9% for non-enclosed PCs o by equipment location:
▪ 4.9% for separators, 11% for compressor engines, 0% for liquid knockouts, and varying percentages for those few PCs that serviced various types of equipment.
● Overall, the observed rate of improper operation for all surveyed PCs was 5%. ● Actuations of PCs were observed only for 33% of the PCs surveyed. ● PC emissions were observed at the following locations and frequencies:
o Vent port – 79% o Body – 20% o Vent port and body – 1%
● The following frequencies of common indicators of PC improper operations were reported.
o 86% - Continuous bleed from vent port of intermittent PC o 11% - More venting than normal from continuous PC based on inspector’s
judgement o 1% - Continuous bleed from vent port of intermittent PC and PC was making
unusual sound
Causes of PC Improper Operation ● The following frequencies of common causes of PC improper operations were
reported: o Corrosion – 21% o Diaphragm failure - 20% o Seal failure – 19% o Debris – 18% o Other: Unknown - - 11% o Other: Vendor repair – 6%
CAA Ex. 8

16
o Other: Scrubber leaks – 2% o Abnormal operations parameters – 1% o Other: Wet supply gas – 1% o Various - <1%
PC Repairs ● The following frequencies of common types of repairs of PCs that were not operating
properly were reported: o Cleaned/removed debris – 32% o Rebuilt PC – 31% o Replaced PC – 11% o Replaced diaphragm – 10% o Adjusted/tuned PC – 9% o Replaced seal – 3% o Tightened – 1% o Various - <1%
● Double block and bleed was performed for 36% of the PC repairs. ● Equipment shutdown was performed for 37% of the PC repairs. Shutdown of a well was
performed for 24% of the repairs. ● The time to make a PC repair varied by the type of repair, yet the average time for all
types of repairs was less than 30 minutes.
4.5.2 Conclusions
This PCTF study represents the largest sample set of PC inspections in the nation to date, with 3838 PCs surveyed during the facility inspections conducted during the spring and summer of 2018. The 5% rate of improper PC operation found in the 3838 PCs inspected for this study based on emissions observed using an OGI camera demonstrates that typically (~95% of the time) PCs sampled in this study were found to be operating properly. This study also demonstrated that an OGI camera can identify improperly operating natural gas-driven PCs. Detection of improper operation of an intermittent PC is largely determined by the observation of continuous emissions between actuations. Given that 84% of the PCs surveyed consist of intermittent PCs, the use of an IR camera is particularly effective in identifying excess emissions from intermittent PCs. Discerning improper operation of a low bleed continuous PC is less straightforward and is subject to the experience and judgement of the inspector in discerning excess emissions from improper operation. Additionally, where an existing LDAR program exists for fugitive leaks, adding the inspection of natural gas-driven PCs to the inspections adds minimal incremental inspection costs. Repairs of improperly operating PCs are readily made by cleaning the PC of corrosion and debris, replacing broken parts and adjusting/tuning the PC and the supply gas pressure.
4.6 Separate EPA/CDPHE Study on PCs in Denver-Julesburg Basin
4.6.1 Overview
Over a similar time period as the PCTF inspection study, EPA and CDPHE conducted a parallel study on natural-gas actuated PC emissions in the DJ Basin. The results of this parallel study were published in early 2020 in the Journal of the Air and Waste Management Association in a
CAA Ex. 8

17
paper by Stovern et al. entitled “Understanding oil and gas pneumatic controllers in the Denver-Julesburg basin using optical gas imaging.” Briefly, the Stovern et al. paper focused on a smaller sample size of PCs (500 controllers servicing 102 wells at 31 facilities operated by seven different companies) and included counts and observations of intermittent and continuous low bleed PCs. The PCs were inspected with OGI, and the emission rate from a small subset of the inspected PCs was quantified using high-volume sampling. Although measurements required to quantify actuation volumes were outside the scope of this study, the OGI camera survey provided limited information on the frequency of occurrence for actuations. This study was performed in the spring 2018 over a period of 10 field days.
4.6.2 Study Design
Stovern et al identify two objectives for this study: 1) gather information on the types and uses of PCs employed by randomly selecting facilities representative of the overall basin and 2) investigate the use of an expeditious and less invasive PC emissions survey approach based on optical gas imaging (OGI) camera that could help inform PC operational and maintenance states. An important aspect of the PC survey was to confirm that the exhaust port of the PC was visible during the OGI inspection so that any continuous emission through the PC pilot could be assessed. A FLIR GF320 camera was utilized to monitor emission profiles of PC for this study, which has a normal or “auto” imaging mode and a high sensitivity mode (HSM), where onboard differential image processing can enhance an operator’s ability to identify lower emission rates approaching 0.5 scf/hr natural gas or even lower under ideal conditions. Comparisons between the auto and high sensitivity mode imaging were made in monitoring PC emissions to explore their differences in detection capability as a rough indicator of emission level. An extended OGI observation time of 60 sec for each PC was used to enhance detection capability, to look for anomalous temporal emission profiles indicative of potential malfunctions, and to document short time duration PC actuation events as activity data where possible. If an actuation event or unusual temporal profile was observed, the observation time was increased to 120 seconds to bound actuation frequency and further diagnose potential malfunction issues. The well production facilities ranged in production and complexity from small facilities with minimal equipment (such as one wellhead, one separator, and one or two tanks) to larger facilities with multiple wellheads, separators including second and third stage separation vessels, complex tank batteries with vapor capture systems, multiple control devices, gas lift compressor engines, and vapor recovery units. Of the 31 well production facilities selected, the wells were 50.0% vertical, 33.3% horizontal and 16.7% directional. This distribution is consistent with the overall well type distribution for the 24,220 actively producing wells in the basin of 42.1% vertical, 38.9% horizontal, and 19% directional. Information gathered for each pneumatic system (PS)/PC included: process working status (in use or shut-in), PS/PC identification (make/model), motive gas type, PC configuration and operational mode, process function (control, safety, or both), process equipment application (separator, combustor, compressor, etc.), and sensed process variables (e.g. temperature, pressure, and liquid level). PC-specific information such as model configuration variables, retrofit status, installation date, actuator components, and supply line pressures were also documented to the extent possible.
CAA Ex. 8

18
4.6.3 Findings
Stovern et al. (2020) reported the following findings for the EPA/CDPHE PC study:
Survey of PCs at Facilities
● A total of 615 process control pneumatic systems (PSs) were found at the 31 facilities with 59 of these being of the electronic variety that does not use gas-emitting PC pilots.
● Of the 556 PSs with gas-emitting PC pilots, 38 of these were instrument air-driven. Natural gas was found to be the exclusive motive gas type at 30 of the 31 facilities surveyed. One facility used instrument air on 38 out of 52 PCs with the natural gas models at that facility primarily serving back pressure regulation functions. Operations of instrument air-driven PCs were not further studied by Stovern et al.
● Of the 518 natural gas-driven PCs, 18 (3.5%) of these comprised a “no-vent” design where the natural gas emitted from the pilot is fully captured. These integrated pilot-actuator PCs have the potential to emit natural gas only by diaphragm or connector leaks that would be classified as equipment leaks and therefore were not further studied by Stovern et al.
● A total of 500 natural gas emitting PCs were found at 31 facilities servicing 102 wells (average of 4.9 PCs/well).
● A total of 453 of the 500 natural gas-driven PCs were found to be in service (i.e. not shut-in or depressurized); this number represents the primary count of the PCs assessed for proper operation. Of this total, 377 (83%) of the PCs were intermittent and 76 (17%) were continuous.
● A total of 447 PCs were monitored with an OGI camera for emissions as six intermittent PCs were not surveyed due to wind speeds exceeding the 9 m/s method limit.
PCs with Maintenance Issues
● Of the 371 intermittent PCs monitored, 42 (11.3%) were observed with continuous emissions and 22 were observed with actuations (5.9%). This 11.3% represent intermittent PCs experiencing some level of maintenance issue. The severity of the maintenance issues is unknown without emission rate measurement. The authors note that due to the fact that some controllers were observed in the less sensitive “auto” mode of the OGI camera (see below), the true level of maintenance issues among the intermittent PCs they surveyed was probably higher. They estimate that the true frequency of maintenance issues in this population was 11.6 to 13.6%.
● Of the 76 continuous PCs, 28 (37%) were found to have continuous emissions. Yet, it is unknown what portion of these emitting continuous PCs reflect a potential maintenance issue, since they may have been operating as designed. As described below, at least one continuous PC had measured emissions above the State regulatory standard (6 scf/hr).
● It was critical to determine the design type of the PC (intermittent or continuous) during the on-site survey because the type assignment played a role in the assessment of potential maintenance issue conditions.
CAA Ex. 8

19
PC Emission Measurements
● Emission measurements were conducted on 18 total PCs (14 intermittent PCs and 4 continuous PCs) with continuous emissions detected during the OGI camera survey. In general, the measurements were conducted on PCs that appeared to have the most significant gas signature.
● 36.8% of continuous low-bleed PCs (28 controllers) had continuous emissions that were observable with the OGI camera. Emissions were measured from four of these continuous PCs with a high-flow sampler. Measured emission rates ranged from 0.7 to 9.9 scf/hr with an average ER of 4.2 scf/hr. Three of the continuous PCs exhibited emission rates above 1.39 scf/hr; one was considered to be malfunctioning as it was emitting in excess of the 6 scf/hr State regulatory limit. Two of the measured continuous PCs had measured emissions above 1.39 scf/hr and below 6 scf/hr.
● Snapshot measurements were conducted on 14 intermittent PCs that were observed using an OGI camera to have continuous emissions (not including actuations). Three of the measurements were near or below the estimated method detection limit of the technique at (0.1 scf/hr). Observed emissions rates ranged from 0.1 up to 31.3 scf/hr (mean = 2.8 scf/hr).
● In two cases, the intermittent PCs were cycling between actuations with the OGI camera video showing steadily increasing emissions prior to actuating, followed by a sharp drop in emissions below the OGI detection threshold. These significantly variable (heavy ramping and temporally sustained) emissions were categorized as maintenance issues for these snap-acting intermittent PCs.
● The highest measured intermittent PC emission rate (31.3 scf/hr) was caused by a process issue. This PC managed back pressure on the low-pressure side of a high-low pressure separator. A suspected process control issue was identified where a bleeding valve upstream of the low-pressure vessel caused the PC to continuously actuate because the low-pressure vessel was continually exceeding the pressure set point of the PC. In this situation, the intermittent PC itself was not malfunctioning.
Auto vs. High Sensitivity Mode
● The initial protocol for the OGI camera included evaluating only auto imaging mode (the less-sensitive mode for the OGI camera used in the study) at 85 PCs that serviced 26 wells at 9 facilities. Later, both high sensitivity mode (HSM) imaging and auto mode (HSM/auto) were used for most of the PC assessments (N= 362 PCs, 22 facilities, and 76 wells).
● The continuous PC emission detection rates for the auto-only versus the HSM/auto subgroups differed significantly. For the auto-only mode subgroup, 1 of 16 continuous PC (6.3%) and 1 of the 69 intermittent PCs (1.4%) exhibited continuous emissions. For the HSM/auto subgroup, 27 of 60 continuous PCs (45%) and 41 of 302 intermittent PCs (13.6%) exhibited continuous emissions.
● OGI camera imaging modes were observed to have a significant effect on emission detectability with HSM mode detection rates being approximately 2 times higher compared to auto mode.
Actuations
CAA Ex. 8

20
● A total of 33 actuation events (AEs) were observed from 22 different PCs in the 447 monitored for this study. Based on observed emissions, only a few percent of intermittent PCs in this basin appear to have actuation frequencies greater than 1/min, with many PCs (e.g. safety category) very infrequently actuating.
● AEs were observed at only 9 of 31 facilities with the top two highest oil producing facilities accounting for 54.5% (12 of 22) of the PCs with actuations. The highest producing facilities had five separate intermittent PCs exhibiting AEs with a total of 13 observed, whereas the second-highest producing facilities had 7 PCs and 8 total AEs. There were a total of six PCs surveyed that had multiple actuations observed during the OGI survey (extended up to 2 min). Three of those PCs were located at the highest producing facility, and one PC with multiple actuations was located at the second, fifth, and sixteenth highest producers.
● The OGI camera survey indicates an expected relationship between normalized oil production and observed actuations. At a high producing facility, the same PC and process will require more actuations than at a lower producing facility. However, PCs with a maintenance issue do not show the same correlation with facility production.
● Estimated actuation volumes ranged from 0.005 to 0.185 scf per actuation event, which indicates that potential emissions from continuous emissions due to a maintenance issue may often be the dominant factor in overall emission rates for infrequently actuating PC populations. At lower producing facilities, the continuous emission component of emissions for intermittent PCs with maintenance issues becomes a more significant factor affecting average PC emissions rates for lower producing facilities.
4.6.4 Conclusions
● Although the findings of this study are representative of the DJ Basin, they are not intended to be representative of PC operating characteristics at a national level and therefore should be used with caution at that scale.
● The observed PCs per well are reasonably consistent with the 2018 data from EPA’s Greenhouse Gas Reporting program for the Denver Basin with an average of 3.1 PCs per well and are significantly higher than the national average of 1.6 PCs per well (U.S. EPA 2019c).
● 83% of the PCs surveyed for this study were intermittent PCs, which is consistent with the 91% reported by Allen et al. (2014) for PCs in the Rocky Mountain region.
● The use of an OG camera to profile PC emissions was found to be a helpful approach to inform PC maintenance issues.
● Observing continuous emissions from a PC with an OGI camera on a snap-acting intermittent PC is indicative of emissions beyond the designed shut-off rate and is indicative of a maintenance issue.
● The identification of actuation events for continuous PCs and throttling process control applications was more challenging than those for intermittent PCs in snap acting applications.
● For a low bleed CPC, continuous emissions observed with an OGI camera was not informative to detect a potential maintenance issue unless in the OGI operator’s judgment the emission appeared abnormally large compared to typical operation.
● 11.3% of intermittent PCs surveyed were directly observed with OGI to have continuous emissions. Due to an issue with the use of the OGI camera at some sites, this figure probably represents an underestimate of the frequency of continuous
CAA Ex. 8
21
emissions from these controllers. Stovern et al. estimate that the true frequency of continuous emissions in this population was 11.6% to 13.6%. These observations may reflect maintenance issues since these emissions were likely above the designed seepage rate of these intermittent PCs.
● As opposed to intermittent PCs, it is unknown what portion of continuous PCs were experiencing a potential maintenance issue, without measurement. One of the four continuous PCs measured was classified as malfunctioning with a measured emission rate of 9.9 scf/hr, above the 6.0 scf/hr State regulatory limit.
● The type of imaging mode (i.e. auto vs high sensitivity) utilized during the OGI camera survey was observed to significantly affect the detection rate of continuous emissions. The detection rate of continuous emissions using high sensitivity mode was 1.6 and 2.1 times higher than when using auto-mode imaging for intermittent PCs and continuous PCs, respectively. The difference between observation capabilities in high sensitivity vs. auto modes could be used in an inspection approach to approximately separate the PC populations (e.g. minor maintenance issues and significant malfunctions), so that repairs can be prioritized to minimize unnecessary emissions.
● PC actuations from process control-based PCs correlate with facility production. Facilities with lower production will have lower actuation emissions rates among its PC population and continuous emissions from PCs with maintenance issues will therefore be the controlling factor for the average operational PC emission rate. For higher producing facilities that cause PCs to actuate much more frequently, actuations will be a significant contributor to the overall average operational PC emission rate
4.7 Comparison of PCTF Study and EPA/CDPHE Study Findings and Conclusions
The following statements offer key comparisons between the findings and conclusions for the PCTF Study and EPA/CDPHE Study.
4.7.1 Findings
● Both field inspections of PCs were conducted in the DJ Basin during the spring/summer of 2018.
● Both studies focused on identifying improper operation (aka maintenance issues) of PCs using an OGI camera by trained and experienced personnel during facility inspections.
● Facility selection for each of these studies was done randomly for the operators participating in each study.
● Both studies found that the majority of natural gas-driven PCs observed consisted of intermittent PCs (PCTF – 84% vs EPA – 83%)
● The EPA/CDPHE study estimated that 11-14% of the intermittent PCs inspected were not operating properly, while the PCTF study found 5.3% of intermittent PCs were not operating properly.
● The EPA/CDPHE study found that using a camera in high sensitivity mode was more effective in finding smaller emissions from intermittent PCs.
● The EPA/CDPHE study did not evaluate whether continuous PCs were operating properly based on emissions observed with an OGI camera. The PCTF study found 3.4% of continuous PCs were not operating properly. Emissions measurements were performed by EPA/CDPHE on four continuous PCs, finding one of these PCs to have emissions in excess of the 6 scf/hr regulatory limit.
● The EPA/CDPHE study measured 14 intermittent PCs that were observed using an OGI camera to have continuous emissions. Observed emissions rates ranged from 0.1 up to
CAA Ex. 8

22
31.3 scf/hr. The elevated reading of 31.3 scf/hr was attributed to a process issue and not PC improper operation.
A significant contrast between the PCTF study and the EPA/CDPHE study is related to how integrated pilot-actuator devices were classified. Simpson (2014)6 defines an integral PC as a PC that is built into an end device (i.e. valve) and does not require an external source of gas, nor does it release actuation gas to the atmosphere. Rather, it releases actuation gas into the process downstream. Similarly, Simpson defines a local controller is also defined as one built into the end device, but it exhausts gas to the atmosphere to move the process valve toward closed. In contrast, remote pilot controllers are PCs that are not integrated into the end device. Note that “integral” controllers, as defined by Simpson, would be considered “Self-contained PCs” under Regulation 7. Additionally, note that Stovern et al. refer to both integral and local PCs as “integrated” PCs, and they use the term “no-vent” for PCs that Simpson defines as “integral” – those that release gas into a process downstream. The discussion below uses Simpson’s terminology.
● The EPA/CDPHE study did not include integral devices in their assessment of PCs. EPA stated in its report that integral PCs have the potential to emit natural gas only by diaphragm or connector leaks and that any such leakage should be classified as an LDAR component leak, rather than as a PC that is operating improperly.
● For the PCTF study, integral devices were classified as a type of PC. 59 (8%) of the 740 integral PCs surveyed were determined to be not operating properly, compared to 134 (4.3%) of the 3,098 pilot PCs surveyed. Presumably, these devices were leaking from the diaphragm or connector, as described above.
● Since the PCTF study included integral controllers, while the EPA/CDPHE study did not, and integral controllers were operating improperly at a relatively high rate in the PCTF study, this suggests that the inclusion of integral controllers in the PCTF study skewed the improper operation rate slightly higher.
● Regardless if classified as a PC or not, integral controllers are included as a component in a LDAR program for equipment leaks and will therefore be assessed for leakage and repaired as needed to ensure proper operation.
4.7.2 Conclusions
● The Stovern et al. study found that using the high sensitivity mode of the OGI camera resulted in a nearly 2 times higher emission detectability compared to the auto mode. This might explain why Stovern et al found more than twice the percentage of intermittent PCs that were not operating properly compared to the PCTF study (11-14% vs 5%).
● The Stovern et al. study used a set observation time of 60-120 seconds for every PC/PS. The PCTF study did not have this requirement and if the OGI camera operator did not detect emissions within a few seconds, they would move on with the inspection. These varying approaches were utilized because each study had a different objective. The PCTF study set out, in part, to determine the effectiveness of the find and fix program, so inspection protocols were adapted to current industry practices.
6 Simpson (2014), Pneumatic Controllers in Upstream Oil and Gas. https://pubs.spe.org/en/ogf/ogf-article-detail/?art=238.
CAA Ex. 8

23
The longer observation time used by Stovern et al. may also be a contributing factor to the discrepancy between the proper operation rates.
● Both studies concluded that using an OGI camera to profile PC emissions was an effective method to inform possible improper operation of intermittent PCs. However, the use of this method for identifying improper operation of continuous PCs is more challenging, except when the emissions appear to be abnormally large compared to normal operation.
5 Industry Surveys
In order to achieve the goals established by the PCTF for reassessment of the Find and Fix program, additional information needed to be gathered on the effectiveness and costs related to inspection of PCs under the find and fix program and to better understand the use of self-contained and no bleed PCs. A series of questions were developed and incorporated into survey questionnaires that operators were requested to complete. A total of three surveys were developed:
1. The effectiveness and costs of PC inspection techniques 2. The effectiveness and costs of PC repairs 3. The use of self-contained and no bleed PCs.
The surveys were completed in confidence, and then blinded and compiled by API and COGA to address industry anti-trust concerns before being shared with the PCTF in presentations that summarized the survey responses. The first two surveys were to be completed by the nine operators participating in the PCTF study within the ozone NAA. The third survey was distributed to COGA and API members with oil and gas production operations in the state. As described below, the second survey was developed but not completed.
5.1 Effectiveness and Costs of Inspection Techniques (NAA only)
Highlights from the results of survey questions provided to the nine operators participating in the PCTF study on the effectiveness and costs of PC inspection techniques are provided in the following bullets.
● The majority of operators use a combination of employees and contractors to conduct PC inspections. Some operators use employees only.
● The majority of operators use the same party for both LDAR and PC inspections. ● Operators typically conduct LDAR and PC inspections during the same facility visit. ● Operators generally replied that it can be helpful to know in advance whether the PC
is an intermittent or low bleed in order to understand if emissions are expected between actuations (low bleed) or not (intermittent).
● Operators also indicated that understanding the process the PC is controlling is beneficial in making a determination whether a PC is operating properly or not.
● For intermittent PCs, operators typically look for continuous emissions between actuations. For continuous bleed PCs, operators typically look for emissions that appear abnormal for that type and application of controller.
● Operators found using OGI camera inspections along with AVO indicators was effective, although OGI cameras are more effective at finding smaller leaks. Soapy water may be used to further pinpoint a leak location.
CAA Ex. 8

24
● AVO indicators such as the presence of liquids at or around/below the vent and whether dependent processes are operating properly can be useful to determine whether a PC is operating properly or not.
● Safety limitations in the use of OGI cameras are largely driven by whether the OGI camera is intrinsically safe or not. An intrinsically safe camera does not pose a potential ignition source and can be used in Class 1 Division 2 areas as defined by OSHA in CFR 1926.449. OGI cameras that are not intrinsically safe may require a hot work permit to be allowed on site at a facility or the camera operator may have to maintain a minimum safe distance from the equipment being observed.
● Responses on the average time to inspect a PC varied depending on the experience of the inspector and included various caveats including weather conditions. The inspection time varies and is dependent on the type of PC and if emissions are observed. If no emissions are observed, then only a few to several seconds is generally sufficient to determine that the controller is operating properly. If emissions are observed, then the time to make this determination is dependent on whether the controller is actuating or not, the type of controller, and the characteristics of emissions observed. It could take up to several minutes to make this determination.
● The costs to conduct PC inspections are variable and likely highly dependent on the size and makeup of facilities of operators and internal programs and processes. Some operators indicated that the incremental equipment costs are not significant since this equipment is required for LDAR inspections. Other operators estimated that incremental annual equipment costs for PC inspections represent a small percent of LDAR related equipment costs. Ultimately, incremental annual equipment costs for PC inspections are dependent on the number of PC inspections performed.
5.2 Effectiveness and Costs of Repairs (NAA only)
Due to the need to focus on regulatory proposals to be considered for the December 2019 AQCC rulemaking, and the willingness of operators to expand the PC “find and fix program” statewide, it was not necessary to complete the planned repair cost survey. Separately, the PCTF study results indicated that those PCs found to be improperly operating were successfully repaired and the majority of repairs were completed either immediately, the same day of the inspection, or within a few days of the inspection. Operators seek to repair PCs in order to return them to proper operation since it is in their interest to maintain and optimize production operations. The cost of repairs is considered a normal operation and maintenance cost. The ability to more readily identify PCs that are not operating properly using an OGI camera allows earlier detection of those PCs needing repair that would otherwise eventually fail to control their intended process function and need subsequent repair. The repair costs range in regard to the extent of the repair. These repairs can range from cleaning the PC of debris or residue that collects over time, replacing worn parts, or replacing the entire controller. Operators stock spare parts, repair kits or extra PCs that are then used to repair or replace the defective PC as a means to promptly make a repair. The costs of repairs was not considered an impediment to supporting expansion of the PC “find and fix” program from the NAA to statewide during the AQCC December 2019 rulemaking.
CAA Ex. 8
25
5.3 Use of Self-contained and No-Bleed PCs (State-wide survey)
COGA developed and distributed a survey to better understand the use of self-contained and no-bleed PCs. The survey utilized the following definitions in order to establish a common understanding in completing the questions.
o Instrument air-driven PC: Any PC that is uses compressed air as the valve's actuating gas. Known as “no-bleed” under CO Regulation 7.
o Natural gas-driven PC with exhaust routed to process/sales: Any PC that directs gas to a process or sales line instead of to the atmosphere. Known as “self-contained” under CO Regulation 7.
o Natural gas-driven PC with exhaust routed to combustion control: Any PC that directs gas to a combustion control device instead of to the atmosphere.
o Non-pneumatic mechanical controllers: Any controller that uses mechanical force (not a pressurized gas) to trigger actuation.
o Non-pneumatic electric controllers: Any controller that uses an electrical signal (not a pressurized gas) and motor to trigger actuation.
The survey results are summarized below:
o 12 Operator Responses for production facilities o 3 Operators in Piceance, 9 in DJ.
>5,400 Total Production Facilities: ~4,200 DJ NAA, ~100 DJ AA & ~1,200 Piceance
>22,400 total wells: ~15,700 DJ NAA, ~500 DJ AA & ~6,200 Piceance Percentage of facilities where on-site electrical grid power is used:
• 19% DJ NAA • 63% DJ AA • 4% Piceance
o Operator Responses for compressor stations o 4 Operators in Piceance, 1 in DJ responded.
16 Compressors stations in DJ NAA, 38 in Piceance Percentage of compressor stations where on-site electrical grid power is
used: • 100% in DJ NAA • 76% in Piceance
o DJ NAA - 1 operator 16 compressor stations All use instrument air-driven PCs (11 new, 5 retrofitted)
o DJ AA - No compressor station operator responded o Piceance Basin - 4 operators responded
38 compressor stations 9 new stations use instrument air-driven PCs
o Summary of Usage o The majority of PCs in use in Colorado are conventional natural gas-driven PCs o Most of the non-conventional controllers in use in the state are located
In the DJ NAA At new facilities receiving production from horizontal wells
o The most commonly used non-conventional controllers are air-driven PCs o Other non-conventional controller technologies usually only replace a fraction
of the PCs at a site
CAA Ex. 8

26
o Consideration for Use o Safety
Instrument air-driven PCs • Some operators expressed concern with facilities using both
instrument air-driven and natural gas-driven PCs: potential risk of flammable mixtures or explosion
• One operator noted that fail-safe close valves need to be used so the site/well can shut-in in case of power loss or air compressor malfunction
Natural gas-driven PC with exhaust routed to process/sales or to combustion control
• The required additional piping/plumbing could significantly complicate work areas
• There are backpressure issues with remote PCs preventing exhaust vapors from reaching process/sales or combustion control
• Backpressure can also slow actuation and affect operation Non-pneumatic mechanical controllers
• Some operators indicated mechanical dumps are more prone to failure due to erosion.
• One operator noted that mechanical dumps may not have emergency shut down ability.
Non-pneumatic electric controllers • It was noted electrical controllers may not have a fail-safe
capability and do not return to a safe position when power is lost, unlike conventional natural gas-driven PCs. Electric fail safe close valves require programming.
• Electrical classification determines safe location on site. Overall
• Non-conventional have a positive impact on safety by reducing the quantity of hydrocarbon vapors in the atmosphere at facilities.
o Costs Instrument air-driven PCs
• New facilities: incremental capital cost of $70K - $140K (depending on production/number of wells)
o Additional piping, air compressor, supporting infrastructure, grid power/generator.
o Use of grid power is critical for most, generators also used by some.
o Additional maintenance costs required for air compressor and a desiccant air dryer.
o One operator reported reduced maintenance on instrument air-driven PCs themselves.
o One operator mentioned a backup instrument gas may be required, increasing costs.
• Existing facilities: incremental capital cost of $90K - $180K (depending on production/number of wells)
CAA Ex. 8

27
o Several operators reported that, due to declining production, retrofits are not cost effective and have primarily been done under compliance order.
o Loss of production for retrofit, in addition to reasons listed above.
o Additional incremental cost is on top of the initial cost to run instrument gas line.
o One operator reported the need to hydro vacuum instrument air lines before retrofitting
Natural gas-driven PC with exhaust routed to process/sales • Significant cost associated with design of a complex vapor
capture system. • Cost associated with compression to safely and reliably get
emissions into process lines. • Additional maintenance on vapor control system (VCS) lines.
Natural gas-driven PC with exhaust routed to combustion control • Cost associated with re-piping equipment. May be do-able for
PCs in close proximity to control device, very high cost otherwise.
• VCS: Additional maintenance on lines and may require updates to the VCS analysis.
• Some compressor stations are not equipped with ECD: high cost for low reductions.
Non-pneumatic mechanical controllers • Some mechanical dumps usually have lower upfront cost but
higher maintenance cost. • For retrofits, cost of new controllers when natural gas-driven
controllers are already in use. Non-pneumatic electrical controllers
• One operator reported an incremental cost of $7K - $10K per well.
• Controllers have a higher upfront cost and higher maintenance cost.
• Several operators reported that retrofits are not cost effective. o Technical
Instrument air-driven PC • Sufficient grid power availability (true for new and potential
retrofits). • Very frequent maintenance on air compressors required to
ensure reliability. o One operator noted liquid collection and freezing may
require backup compressors. • Considerations for power loss:
o Some operators do not have back up options and site shuts in.
o One operator reported using natural gas powered back up air compressors.
o One operator reported using pressurized air bottles. Natural gas-driven PC with exhaust routed to process/sales
CAA Ex. 8

28
• Low pressure and low volume gas needing compression to process/sales.
• Concerns with vapor collection lines such as air intrusion through components, debris and/or condensate build up, freezing, and backpressure concerns.
• Not all exhaust from natural gas-driven PCs can be captured. Natural gas-driven PCs with exhaust routed to combustion control
• Low pressure and low volume may make it difficult for gas to reach combustor.
• One operator mentioned experience indicating back pressure which affects valve actuation and maintaining stable stream to the combustor.
Non-pneumatic mechanical controllers • Generally can only replace a specific type of PC: dump
valves/liquid level. • Experience shows that mechanical controllers are not as precise
or as reliable as natural gas-driven PCs for process control. Non-pneumatic electric controllers
• Need for reliable electrical power (e.g. solar with battery and generator/grid as backup).
• There are no electric replacement options for some natural gas-driven PCs.
• There are limitations on where those controllers can be located (e.g. not compressors).
• Electric fail safe close valves requires programming knowledge. o Land/Leasehold
Instrument air-driven PCs • Ability to bring grid power may be limited: landowner
restrictions, BLM land & FS land with approval requirements, remote/mountainous locations.
• Pad size needs to be sufficient to accommodate air compressor and additional infrastructure in an area that is safe for electrical equipment.
o Especially challenging for existing facilities where land has already been reclaimed.
Natural gas-driven PC with exhaust routed to process/sales or to combustion control
• None identified Non-pneumatic mechanical controllers
• None identified Non-pneumatic electric controllers
• None identified o Other
Instrument air-driven PCs • Pros:
o Instrument air-driven PCs are a proven technology and usually use same/similar PCs.
o Instrument air-driven PCs are not subject to the find and fix program.
CAA Ex. 8

29
o Reg. 7 requires the use of no-bleed (instrument air-driven PCs) at facilities that use grid power.
• Cons: o Grid power availability is utility dependent and can be
very complex (permitting and approvals for new lines, proximity to power line does not mean availability).
o Electric generators, if used, require permitting through APCD and have extra emissions.
o Retrofits are not cost effective and primarily been done under compliance order.
Natural gas-driven PC with exhaust routed to process/sales • Reliability (operation and maintenance very complex). Other
options are more desirable. • Required by Reg. 7 once grid power is used on site and if
technically and economically feasible. • Process/sales gas line occasional downtime may require
redundancy. • Emissions associated with required additional compression.
Natural gas-driven PC with exhaust routed to combustion control • Not considered as no-bleed or self-contained under Reg. 7
definitions. • Reliability is a major concern: other options are more desirable.
Non-pneumatic mechanical controllers • None identified
Non-pneumatic electric controllers • One operator reported less maintenance needed for such
controllers. • Not a proven technology, cannot cover all functions usually
covered by natural gas-driven PCs. • Use and maintenance requires staff with knowledge related to
electrical systems. o Survey Takeaways
o Fail-safe options a concern for non-natural gas-driven technologies o Instrument air-driven PCs
Electrical grid power use is crucial, upfront cost is high Proven technology, familiar make/model of PCs, less training Safety and cost effectiveness concerns for retrofits
o Natura gas-driven PCs with exhaust routed to process/sales/control Operationally burdensome, reliability issues Only feasible for a small subset of PCs
o Mechanical controllers Can only replace very specific functions (dump valves) Cheaper upfront Reliability and precision concerns
o Electrical controllers Require reliable power Require trained staff Only feasible for a small subset of controllers
CAA Ex. 8

30
According to the industry survey on zero-emitting PCs, the practice of capturing gas and routing emissions from a self-contained PC to emission control devices (ECD) is relatively uncommon and is highly dependent upon the distance between the vent port of the PC and the ECD. The PCTF study identified 50 PCs where PC vented emissions were routed to a nearby ECD. All of these PCs that were routed to an ECD were operating properly. The majority of these 50 PCs serviced a level control for a liquid condensate burner knockout pot which was located within a few feet of the ECD. In most cases, these knockout pots are drained by gravity or manually and are not controlled by a PC. Routing to a process is relatively uncommon due to pressure differences between the vent port and the process. In general, the gas pressure from the vent port is too low to route to a facility process. The category of no-bleed PCs can be considered a misnomer as all “pneumatic” controllers bleed or vent as part of their normal operation. The term “no-bleed” usually refers to those PCs that use instrument air as a motive force, rather than natural gas. In order to utilize instrument air, an air compressor, desiccants and filters, and pressure regulators are typically installed. The power to operate the air compressor is either provided using an electrical generator that is fueled by natural gas or diesel, or by a connection to an accessible utility line that provides adequate electrical power to the facility. The use of a natural gas or diesel fuel powered generator may result in a net emissions disbenefit in providing instrument air in lieu of natural gas for operating PCs. However, the net emissions benefit or disbenefit would vary on a case-by-case basis. (Note that low power air compressors designed driving pneumatics using solar-battery systems for electricity,7 and hybrid solar-gas powered electric compression systems,8 are both available on the market in Canada.) For new development of multi-well pads, operators pursue commitments from electric utilities to provide a connection and adequate power to a planned facility for electrification of equipment including air compressors for instrument air. A number of factors, many of which are beyond the operator’s control, dictate whether the utility can provide an accessible connection and adequate power when the facility is being constructed. If the utility is not capable of meeting the requested commitment, then the operator will typically either rely on a natural gas or diesel-fired generator to power an air compressor, or utilize natural gas pressure as a conventional power source for PC operation.
5.4 Electrical Infrastructure for Oil and Gas Development
As part of the joint effort with the SHER work group, information was collected from API and COGA operators regarding the availability and planning for the use of electrical power from the grid or the use of natural gas or diesel oil powered generators to provide electrical power at oil and gas production facilities. A presentation was given during the July 12, 2019, SHER meeting which included the following talking points:
• Urban growth and development is an issue and impacts infrastructure availability
7 See https://lcotechnologies.com/crossfire-compressor.html. 8 See https://westgentech.com/.
CAA Ex. 8

31
• Federal Lands and The National Environmental Policy Act (NEPA)/ The Federal Land Policy and Management Act (FLPMA) processes in remote areas are also obstacles to the use of electrical grid power
• Colorado has public utilities and cooperatives that provide power: o Each utility has different power drop timelines (1-3 years) o Each utility has different requirements on ownership and installation
requirements between primary and secondary power lines and equipment o Primary lines are typically higher voltage lines while secondary lines are
supplying power to a location (480-120 volts) • Primary Meter – primary and secondary lines and equipment after custody transfer are
installed, owned, operated and maintained by the company. In this case the O&G Facilities owner.
Figure 7. Primary Meter Ownership
• Secondary Meter –Only secondary lines and equipment after custody transfer are owned, operated and maintained by the O&G Facility owner. Everything upstream of custody transfer is installed, owned and operated by the utility.
Figure 8. Secondary Meter Ownership
• Primary Metering o The company has the staffing and technical ability to install, own, operate and
maintain all the electrical equipment o Shorter lead times for power drop because less line and equipment needs to be
installed by the utility o Higher costs for companies that only have a few O&G facilities in an area that
requires power o Lower cost for companies with many O&G facilities in an area that requires
power o Might not be an option because of right-of-way and surface user agreements
CAA Ex. 8

32
• Secondary Metering o Longer lead times for power drop to wait for utility to install primary lines and
equipment o Costs may be higher depending on the location and amount of power needed o Some utilities require companies to perform primary metering so this might not
be an option • Challenges include:
o Slowdowns from utility companies due to increased residential development o Changes in schedule from drilling permit issuance delays, operator agreement
challenges with local governments, or right-of-way changes o Can be limited by proximity and capacity of grid power depending on utility o Power plant expansions dependent on air and other permitting o Cost may be prohibitive for operators in limited development areas o Small operators may not be able to effectively negotiate cost and availability o Contractual third party agreements may limit operator access o Timing often uncertain and power generation needed as backup
6 Good Engineering and Maintenance Practices
In 2017, the AQCC adopted Regulation 7 Part D, Section III.F.1. (formerly Section XVIII.F.1), requiring operators to operate and maintain PCs consistent with manufacturer’s specifications, if available, or utilize good engineering and maintenance practices. The SBAP recognizes the need to more fully develop and document those practices, which include but are not necessarily limited to, ensuring proper operation. Data collected by the PCTF can be used to develop and document good engineering and maintenance practices. Due to the unavailability of documentation from PC manufacturers, there are no widely agreed upon routine or preventive maintenance schedules. Individual operators have developed their own maintenance and operating plans in accordance with industry best practices and Regulation Number 7 requirements. While individual operators may have company-specific protocols for their PC program, all operators are in agreement on some key practices. The use of OGI cameras as the proper inspection tool to identify improperly operating PCs is universally accepted, at this time, by all industry members of the PCTF. However, identification of improper operation from a continuous low-bleed PC may require additional training/experience for the OGI camera operator. The findings above from the survey results on PC inspections also reflect key practices. There are some barriers to developing prescriptive PC protocols because of the wide variability in how these devices function and the wide variety of designs and specific applications that are employed. More work needs to be done if developing prescriptive maintenance protocols is a goal of the AQCC.
6.1.1 The Environmental Partnership
API established The Environmental Partnership (TEP) in 2017 to “continuously improve the industry’s environmental performance by taking action, learning about best practices and technologies, and fostering collaboration in order to responsibly develop our nation’s essential natural gas and oil resources.” TEP’s initial focus is to further reduce the industry’s air emissions in continuing to reduce methane, a greenhouse gas, and VOCs, which is one precursor to the formation of ground-level ozone. TEP hosted their first annual conference in
CAA Ex. 8

33
2018 as described in their 2019 Annual Report9. The conference focused on PCs and brought together producers, manufacturers, researchers, and regulators to discuss PC technology and how it might be improved. In addition to periodically checking for proper operation of the controller through AVO and AIMM inspections, operators participating in this study concur with the “Pneumatic Controller Maintenance Work Practices” published by TEP as a wallet card for its members to provide to field personnel responsible for inspecting and maintaining PCs for proper operation of oil and gas production facilities. This wallet card is shown below:
7 Recommendations
The PCTF offers the following recommendations for consideration by the AQCC. Where there was not consensus on specific elements assigned to the PCTF, individual stakeholder positions are presented as such.
7.1 Effectiveness of current program (NAA only)
Pursuant to AQCC Reg 7 CTG rulemaking in November 2017, the PC find and fix program that applied only to the ozone NAA took effect on June 30, 2018, which was during the same summer of the PC field surveys performed for the PCTF study. The PC find and fix program has proven effective as demonstrated in the Division’s 2018 LDAR Annual Report10, which included the results of the PC find and fix program for the NAA, as described below. The AQCC extended the PC find and fix program state-wide effective May 1, 2020, as part of the AQCC SB-181 Reg 7 rulemaking in December 2019.
9 See https://www.api.org/~/media/Files/Policy/Environment/TEP/The-Environmental-Partnership-Annual-Report-2019.pdf 10 See https://www.colorado.gov/pacific/cdphe/2018-ldar-annual-reports-regulation-7-section-xii-xvii-and-xviii
CAA Ex. 8

34
The Division’s 2018 LDAR Annual Report (pp. 4-6) summarizes the results of PC inspections performed for the PC find and fix program. Although the report does not break out the number of PC inspections using AIMM at well production facilities that were performed in the NAA in 2018, a total of 4,053 PCs were found to need repair and of these 4,015 (99%) were returned to proper operation. For natural gas compressor stations subject to PC inspections using AIMM in the NAA in 2018, a total of 7 PCs were needed to be repaired and 6 (86%) were returned to proper operation. Upon discovery of an improperly operating PC, repairs must begin no later than five working days and the PC must be returned to proper operation no later than 30 working days. A delay in a repair may be attributed to unavailability of parts, the equipment requires a scheduled shutdown to complete the repair, or other good cause. The Division developed a list of standardized enhanced response actions to repair PCs with input from the oil and gas industry to be used for recordkeeping and annual reporting purposes. These include the following options to return a natural gas-driven PC to proper operation:
1. adjusted/tuned; 2. cleaned/removed debris; 3. tightened; 4. heated/insulated; 5. replaced part(s) of controller; 6. rebuilt controller with repair kit; 7. replaced controller; and 8. other.
Below is Figure 2 from the Division’s 2018 LDAR Annual Report that shows the distribution of each type of response action, with a total of 4,060 actions reported. The two most common types of response action were to clean/remove debris, and to rebuild the pneumatic controller with a repair kit.
CAA Ex. 8

35
Although not specific to natural gas-fired PCs, the Division’s 2018 LDAR Annual Report on p.4 indicated that the use of an OGI camera was more effective than AVO observations during facility inspections for emission leaks from components. On page 4, the report states: “Based on the data reported by owners/operators, more than 90% of leaks were identified through AIMM inspections despite AIMM inspections constituting only 3% of the total number of inspections at WPFs. While AVO inspections are valuable for operations and maintenance purposes, as well as being required by other sections of Regulation No. 7, the data from this year’s LDAR annual reporting indicate that AIMM is a more effective monitoring method than AVO for detecting leaks.” Given the results from the 2018 PCTF field inspections, and the 2018 LDAR program and PC find and fix results, the PCTF believes the use of AIMM inspections using an OGI camera is an effective means for identifying both those emissions from PCs that indicate improper operation and from leaky LDAR components.
7.2 Definition Appropriateness
As discussed previously, due to the need to focus on regulatory proposals for consideration during the AQCC December 2019 rulemaking hearing, the PCTF did not complete its evaluation of the appropriateness of the current Reg 7 definitions related to PCs. However, revisions to these definitions will be included in the regulatory proposal specific to the use of no-bleed PCs (aka zero-bleed PCs). Currently, industry is developing a proposal that may be further modified through a future stakeholder and rulemaking process. Stakeholder meetings will be scheduled and facilitated by the Division staff to review and solicit comments on the no-bleed PC regulatory proposal, which will include the need to make
CAA Ex. 8

36
appropriate revisions to PC-related definitions. As such, for the purposes of completing this report, the PCTF does not recommend making any changes at this time to the definitions for “enhanced response”, “intermittent pneumatic controller”, “no-bleed pneumatic controller”, “self-contained pneumatic controller”, or “pneumatic controller”. Changes to these definitions will be considered separate from this report in vetting the regulatory proposal with stakeholders.
7.3 No-bleed and Self-contained PCs
As defined by Regulation 7 Part D Section III., a no-bleed PC is “any pneumatic controller that is not using hydrocarbon gas as the valve’s actuating gas.” Alternative actuating gases include compressor air or nitrogen, but in practice such PCs in Colorado are mainly compressed air, also known as instrument air. Instrument air systems utilize a skid-mounted compressor and often come with a dryer system to remove moisture from the air prior to compression. Once compressed, the air is routed through the same supply gas system that would otherwise contain pressurized natural gas to actuate the PCs.
As defined in Regulation 7 Part D Section III., a self-contained PC is “a pneumatic controller that releases gas to a process or sales line instead of to the atmosphere.” Such PCs utilize natural gas as the actuating gas, but have minimal emissions to atmosphere because the vent port of the controller is routed back to a process line. Likewise, although not addressed in the current Regulation 7 rule language, emissions from the vent port of the PC can be routed to a control device in some limited applications. As previously mentioned and further discussed below, the use of self-contained PCs is very limited due to technical infeasibility, safety concerns, and cost.
Additionally, mechanical or electric controllers (non-pneumatic) can be used in some very limited applications as described below. These controllers are neither no-bleed or self-contained as defined by Regulation 7 and because they have no emissions, are not subject to the regulatory requirements. However, the PCTF included these controllers in the operator survey so they are also addressed below.
BCPH, DDPHE, and CC4CA Position: SB181 directed the AQCC to consider a requirement to reduce emissions from pneumatic devices and in 2019 the AQCC directed the PCTF to develop recommendations on the use of zero-bleed pneumatic devices for rulemaking in 2020. Because the PCTF was unable to reach consensus on a recommendation, we believe the AQCC should direct the Division to continue its research and develop a proposal for the planned December 2020 rulemaking. Specifically, the Division should continue to research and put forth recommendations based on the information provided below by Earthjustice and CATF. No-bleed and self-contained PCs are a proven technology that should be implemented in Colorado. Furthermore, the successful implementation of solar-powered PCs in Canada points to the need for serious consideration of this technology in Colorado.
7.3.1 Current applications
As discussed above in Section 5.3, most of the no-bleed PCs in use in Colorado are in the DJ basin NAA and at newer multi-horizontal well pad facilities producing significant volumes of oil and gas. The PC field study also demonstrates that the majority of compressor stations in the NAA are currently operating or under construction to operate on instrument air.
Industry Position:
CAA Ex. 8

37
No-bleed controllers can generally be utilized on any piece of equipment that utilizes a natural gas actuated PC, but as detailed below, technical feasibility, safety concerns, other regulatory requirements, contractual obligations, and cost can all limit the ability of an owner or operator to utilize no-bleed PCs on some or all pieces of equipment at a facility. Solar-powered PCs have recently been utilized in Alberta, Canada under specific operating conditions for where they are included in the design for a separator equipment package. However, industry believes that the array of solar batteries and battery storage has not yet been fully demonstrated to be sufficient and reliable for the power demands of well pads with multiple horizontal wells that produce significant volumes of oil and gas. As technology advances and costs decrease, the use of solar panels and battery storage to provide electrical power at large oil and gas production facilities may become feasible. Industry is currently working on a regulatory proposal regarding the use of no-bleed PCs to be considered for a future AQCC rulemaking. This regulatory proposal will build on the work developed for a no-bleed PC emission mitigation strategy proposed under the SHER stakeholder process. CATF/EJ Position: Regulations currently in force in Alberta and British Columbia (BC) will significantly limit the use of venting gas-driven PCs moving forward. In BC, new facilities cannot use venting gas-driven PCs after January 1, 2021. Large compressor stations will require retrofit of all venting gas-driven PCs by January 1, 2022.11 In Alberta, no new gas-driven venting PCs can be installed after January 1, 2022 (this regulation was very recently tightened – previously operators were to be allowed to use gas-driven venting controllers for up to 10% of new controllers after January 1, 2022).12 Both provinces also will subject existing PCs, including intermittent PCs, to various emission limits. Solar-powered PCs have been utilized for a number of years in Alberta where they are included in the design for separator equipment packages from certain manufacturers. Other operators have utilized similar solar-powered systems in custom configurations (for example to provide more electrical power and storage than is available in standard packages). Solar systems are used on both low-production wellsites and modern, high-production tight/shale wells. This technology has proven reliable in Alberta north of 55°N latitude, where sunlight on a clear winter day is far weaker than in Colorado, snowfall is higher, winter cloud cover is much more common, and winter temperatures are much lower (affecting battery capacity). In short, CATF and EJ believe that there is no reason that this technology cannot succeed in Colorado.
11 See BC Regulation 282/2010, §52.05. http://www.bclaws.ca/civix/document/id/regulationbulletin/regulationbulletin/Reg286_2018 12 See Alberta Energy Regulator (2020), “Directive 060 - Upstream Petroleum Industry Flaring, Incinerating, and Venting,” §8.6.1. https://www.aer.ca/documents/directives/Directive060_2020.pdf
CAA Ex. 8

38
As noted above, there are also air compression systems designed for solar-powered sites on the market.
7.3.2 Effectiveness of devices
Industry Position: Industry believes that the effectiveness of a no-bleed or self-contained PC is highly dependent on the application of the controller. The scope of the PCTF study did not evaluate the effectiveness of no-bleed PCs so no conclusions can be offered in this report. The consideration of the use of no-bleed PCs is being addressed under a SHER work group regulatory proposal as directed by SB 19-181. CATF/EJ Position: CAFT and EJ believe that previous work has documented the general applicability and reliability of solar-powered electric controllers;13 this approach will be one of the key technologies allowing operators in Alberta and BC to comply with the provincial rules mentioned above.
7.3.3 Costs for new and retrofit facilities
Industry Position: Based on operator survey results, the cost of instrument air systems (no-bleed pneumatic controllers) is highly variable and significantly higher for retrofits versus new installations. The cost of self-contained PCs was not able to be ascertained through this study. However, industry has estimated that the cost to design the large and intricate vapor recovery system to capture these small emissions is significant and not cost-effective in most cases. Likewise, industry estimates that the cost of routing controllers to a combustion device is prohibitively expensive unless the controller is located in close proximity to the control device (e.g. on the inlet to the control device itself). Mechanical controllers, which can only be used for liquid level control in specific applications, were reported to have low capital costs, but higher maintenance costs than PCs based on operator survey results. Electric controllers were reported to cost significantly more, and also have higher maintenance costs, than PCs. CATF/EJ Position: The Conservation Groups’ pneumatics proposal from the 2017 oil and gas rulemaking (which was also included as a SHER team proposal) was supported by an Economic Impact Assessment (EIA) documenting the cost-effectiveness of using zero-emitting approaches instead of gas-driven venting controllers. All cost calculations included in the Conservation Group’s 2017 EIA include full costs for solar-powered electric systems, including: solar panels, batteries, and control panels and electronics; over-
13 See Carbon Limits (2016), Zero emission technologies for pneumatic controllers in the USA: Applicability and cost effectiveness. https://www.catf.us/wp-content/uploads/2019/09/CL2016-ZeroEmitting-Pneumatics-Alts-1Aug2016.pdf
CAA Ex. 8

39
capacity for solar panels and batteries to ensure power will be available during (for example) extended cloudy periods in winter; electric actuators; installation; and maintenance. Operators report lower maintenance costs with electric systems than gas-driven systems when only wet gas is available to operate PCs, due to deleterious effects of wet gas on some PC components.14 In the 2017 rulemaking and as part of the SHER team, the Conservation Groups made available spreadsheets listing parameters for calculating cost-effectiveness, such as cost estimates for various components and labor, and engineering design assumptions such as the appropriate oversizing of solar panels and maximum allowable discharge from batteries.
7.3.4 Limitations and Barriers to expanded use
Industry Position: In addition to cost, industry believes that there are technical, safety, regulatory, and land/leasehold concerns that limit the use of no-bleed and self-contained pneumatic controllers. In terms of instrument air systems, operators must have sufficient grid or other power to run the instrument air skid and associated equipment. Further, some facilities will not have sufficient area at the facility to install the instrument air skid and associated infrastructure or may have landowner or regulatory restrictions on the grid power right of way or installation of additional equipment at the facility. Additionally, even where some controllers can be converted to instrument air there may be some processes that need to be controlled with natural gas-driven PCs for safety or technical reasons. The biggest limitations to utilizing self-contained PCs or routing the vent port of the controller to a control device, aside from cost, are related to pressures. If there is not a process that is operating at a relatively low pressure then the pressure released from the vent port will not be sufficient to push the gas into the process line, potentially creating a safety hazard if a safety valve is not able to actuate against the process pressure. Additionally, beyond the cost of the amount of tubing that is required the route emissions from controllers that are located throughout a facility to a process line or control device, the longer that tubing is the more pressure differential (higher than the process or control device backpressure) is required to overcome the backpressure created by the tubing itself. As mentioned previously, industry claims that mechanical and electric controllers can only be used to control liquid level and can only be used in certain applications (such as liquid level control). Additionally, mechanical controllers have been shown to be less accurate than PCs and electric controllers cannot typically be located on compressors due to vibration and require more technical knowledge to ensure safe application. CATF/EJ Position:
14 See Carbon Limits (2016) at p. 15.
CAA Ex. 8

40
As noted above, air compressors designed for solar-powered sites are on the market, as are packages systems that provide compressed air using hybrid electrical systems utilizing solar and batteries for the majority of the power they consume, with a gas-fired generator available as backup for the solar generation and battery. CATF and EJ believe that previous work has documented the general applicability and reliability of solar-powered electric controllers.15
7.3.5 Opportunities for expanded use
Industry Position: Given the current state of technology, the use of electric and mechanical controllers is limited due to the limitation outlined in the section above. Industry believes that electric and mechanical controllers have very limited applications and cannot be used in the place of all traditional PCs at a facility. While there are extensive barriers that exist for retro-fitting existing facilities with instrument air, opportunity exists to expand the use of instrument air at new larger horizontal facilities that have sufficient grid power. Many of the land use and spacing limitations can be avoided if these systems are included during the planning phase. Additionally, there is a lower cost associated with installing a new system compared to retrofitting a location. The ability to be able to plan for and allow utilities to commit to providing access to electrical grid power with sufficient power in advance of constructing new oil and gas production facilities represents a significant opportunity to expand the use of no-bleed PCs. CATF/EJ Position: CATF and EJ believe that zero-emitting technology can cost-effectively reduce emissions in Colorado at both new and existing sites. The CATF and EJ recommend that the AQCC consider requiring operators to utilize zero emitting pneumatic controllers statewide at all natural gas compressor stations and all well production facilities with four or more wells producing hydrocarbons so long as it is technically feasible to do so. CATF and EJ have previously offered this proposal in the 2017 oil and gas rulemaking and through the SHER team process. CATF and EJ believe that it is supported by the EIA and supporting spreadsheets, as well as the documented use of zero-emitting technology in Canada and the fact that venting PCs are being phased out for new facilities in British Columbia and Alberta.
8 Acknowledgments
The Division would like to thank all of the members of the PCTF for all of their time and hard work over the last two and a half years. The input from all stakeholders was vital to develop and implement what was the largest study of PCs to date. The information contained in this report is the culmination of thousands of hours of effort. The Division would also like to recognize the high level of engagement, collaboration, and resource expenditure from the industry members on the PCTF.
15 Carbon Limits (2016).
CAA Ex. 8

ATTACHMENT A
CAA Ex. 8

Inspector Pad/Battery/Facility/Location
Date Time Ambient Temperature Wind Speed (MPH)
Manufacturer* Family (If Applicable) Model*
Other: Other:
Sensed Variable* Type* Supply Pressure (If Available) & Source
(psig) Enter 'None' if no gaugeOther: Other: Source:*
Other:
Function* Vent Type* Vent Control Type*
Equipment Location* Service Type* Name/Description
Other:
Is PC Enclosed?* Enclosure Type, If Not Exposed to Elements*
Additional Notes:
Operating Properly* Actuation Observed*
Detection Method* Emissions Location*
Other:
If not operating properly provide the following:Indicator 1
Indicator 2
Other:
Additional Notes:
Primary Cause of Improper Operation* Other:
Repair Date PC Repair Method* Did the Repair Require:*
Double block and bleedShutdown and purge equip. to atmosphere
Other: Shutdown of the well
Repair Time (Mins) Repair travel time (if required) Additional Notes:
Re‐inspection Date PC Repair Re‐inspection Method*
Repair Information
Inspection Information
Inventory Information
Pneumatic Controller (PC) Task Force Data Collection Form
General Information
Blinded ID
An asterik (*) indicates that a field has a dropdown list
CAA Ex. 8

ATTACHMENT B
CAA Ex. 8

1
INSTRUCTIONS FOR COMPLETING THE DATA COLLECTION FORM FOR APCD PNEUMATIC CONTROLLER STUDY
MAY 9, 2018
These instructions serve to assist operators participating in the APCD’s Pneumatic Controller (PC) Study specific to selected oil and gas facilities in the Front Range/Denver Metro Area Ozone Nonattainment Area (NAA) in the collection of data related to whether PCs in service at these facilities are operating properly.
It is important the persons conducting these inspections understand the focus of this study is limited to assessing the proper operation of PCs that are actuated using pressurized natural gas as a motive force and have the ability to vent to the atmosphere during normal operation. Leaks found to be originating from a component are not considered to represent improper operation of a PC. Instead, these observations should be considered leaks of components subject to a Leak Detection and Repair Program (LDAR).
Operators conducting these inspections of PCs at facilities selected for the purposes of this study will utilize concurrently an Audio, Visual and Olfactory (AVO) method along with an Approved Instrument Monitoring Method (AIMM) for each PC being inspected. Although other potential methods may be used to detect whether a PC is operating properly or not, these methods are not utilized by participating operators with facilities in the NAA and therefore will not be considered in the scope for Phase 1 of this study. Persons conducting these inspections of PCs for this study should strive to identify and document insights that were gained in applying methods in the field to determine whether a PC is properly operating or not. Although this form serves a purpose to document a specific inspection of a PC, the real value will be in being able to accurately describe what was done, observed or evaluated to determine if a PC was operating properly, along with any repairs necessary to a PC that was not operating properly.
General Instructions
• This form is to be used by an operator in conducting an inspection at a facility selected for the PC Study to document whether a PC is properly operating or not. As an option, the inspection data can also be captured using a flat table.
• If an inspector uses the form for data entry, one form is to be completed by the operator for each PC inspected at a facility. If the inspector uses the flat table rather than the form for data entry, one row in the table is to be completed for each PC inspected at a facility.
• PCs are not considered to be in service if the supply gas is depressurized; therefore, these out of service PCs are not to be inventoried or inspected for this study.
• For a PC that is found to be operating properly, the form or table row must be completed through the Inspection Information section.
• For PC that is found to be operating improperly, the entire form or table row must be completed including the Repair Information section. Neither the repair nor the Repair Information section must be completed at the time of the inspection. If the repair is not successfully completed at the time of the inspection, the details of the successful repair must be added to the form or flat table once completed.
CAA Ex. 8

2
• The confirmation of successful repair does not need to be completed at the time of the repair. The details of the repair confirmation must be added to the form or flat table once completed.
• The data collection form is provided in an Excel format tied to a flat table that can be used to compile the data for each PC inspected at a facility. Although the use of the electronic version of this form is encouraged, a hard copy of the form can be used in the field if the dropdown options are used appropriately and consistently with those in the electronic form. However, this will require that the data in the hard copy of the form be re-entered into the Excel form or flat table so that the data can be compiled for subsequent reporting.
Specific Instructions
• The specific instructions herein address the completion of individual subject fields in the data collection form or flat table.
• An asterisk symbol (*) next to the data field indicates that a dropdown menu of options exists for this specific field. To open the dropdown menu, click on the data field until the down arrow symbol is highlighted to the right of the data field and then click on this symbol. Select by clicking the option that correctly describes the characteristic specific to the PC inspected. Only one option can be selected for each data field with a dropdown menu.
• The “Other” option for a specific data field is to be used when none of the options in the dropdown menu applies to the PC. When none of the specific dropdown options apply, select the “other” option from the dropdown menu and enter as text the information in the separate “Other” data field.
• Use the additional notes data field provided in each section of the form to add free form text describing noteworthy information relevant to the inventory, inspection, or repair sections.
General Information Section
Inspector – Enter the first and last name of the person performing the inspection of the PC.
Pad/Battery/Facility/Location – Enter the operator’s designated name of the facility.
Facility ID – Enter the blinded ID designated by Spirit Env. for the facility being inspected. Each operator will be provided a list of facilities randomly selected for inspection by Spirit Env. and each facility selected will have a Blinded ID.
Date – Enter the date when the inspection of the PC was conducted using the numerical month/day/year format (xx/xx/xxxx).
Time – Enter the approximate time that the inspection of the PC started in a numerical format (xx:xx) with an AM or PM designation.
Ambient Temperature - Enter the approximate temperature at the time that the inspection started in Fahrenheit degrees.
Wind Speed - Enter the approximate wind speed at the time that the inspection started in miles per hour.
CAA Ex. 8

3
Inventory Information Section
Manufacturer* – Select the manufacturer of the PC if known. The dropdown options represent PC manufacturers that are believed to be common in the DJ Basin, yet may not cover all makes. If not listed, select “Other” as a dropdown option and enter the full manufacturer name using text in the separate “Other” data field. If the manufacturer is unknown or not certain, take a photograph of the PC and later attempt to confirm the manufacturer of the PC using available information.
Family – This data field is to be completed, as applicable, if the manufacturer of the PC uses a family classification to describe its line of PCs. If no family classification exists, leave this data field blank.
Model* – Select the model of the PC if known. The dropdown options represent PC models that are believed to be common in the DJ Basin, yet may not cover all models. If not listed, select “Other” as a dropdown option and enter the model as text in the separate “Other” data field. If the model is unknown or not certain, take a photograph of the PC and later attempt to confirm the model of the PC using available information. Please be careful in selecting the correct model as some model designations may vary slightly in their labeling.
Sensed Variable* – This data field describes the process variable that the PC is controlling. Dropdown options include pressure, temperature, position, differential pressure, and level. If the process variable is not listed, select “Other” as a dropdown option and describe the variable using text in the separate “Other” data field.
Type* – This data field distinguishes the type of PC being inspected in terms of its configuration. Only three options exist: integrated, pilot or other. An integrated PC refers to a PC that has both the sensing and actuating components contained in one housing. A pilot PC describes a PC that senses a signal and remotely actuates a device that is not contained in the same housing. If the type is not listed, select “Other” as a dropdown option and describe the type by entering text in the separate “Other” data field.
Supply Pressure & Source
• This data field records the pressure of the natural gas being applied as a motive force to the PC being inspected. If a pressure gauge exists on the supply line to the PC being inspected, record the pressure reading of the gauge. If no pressure gauge is present, then enter “None” in this data field. Do not enter “zero” or “0” instead of “None” as this suggests that there is zero pressure, or the gauge is broken.
• The data field for “Source” refers to where the source of the natural gas as a motive force originates from and the dropdown options include wellhead, separator, pipeline quality or “Other”. To confirm the source of the gas, the supply tubing to the PC being inspected may have to be followed to its point of origin. If the source of the natural gas is not listed, select “Other” as a dropdown option and describe the source using text in the separate “Other” data field.
Primary Function* – This data field describes the primary function that the PC being inspected. Only two options apply to this data field: process control or safety. An “Other” option is not
CAA Ex. 8

4
available. The safety option should be selected where the PC is used to isolate a pressure source or cease operation of a process.
Vent Type* – This data field describes how the PC being inspected vents during an actuation cycle. Three dropdown options are available: a continuous high bleed (> 6scf/hr); a continuous low bleed (< 6 scf/hr); and an intermittent bleed. An “Other” option is not available. To determine the correct vent type, the operators should research the vent type classified by the manufacturer for the model of the PC being inspected. Measurement of the actual vent rate is not required for this study.
Vent Control Type* – This data field describes whether the vent from the PC being inspected is captured and routed. Three dropdown options are available: vented to atmosphere; captured and routed to sales or process; or captured and routed to a flare/combustor header. An “Other” option is not available. To determine the correct option, the operator may need to follow the vent tubing to the point where it connects to piping and determine whether the piping connects to a process or sales line, or a flare/combustion device.
Equipment Location* – This data field describes the equipment associated with the PC being inspected in terms of its purpose to control the equipment’s operation. Available dropdown options include: wellhead, separator, heater, combustor, compressor engine, generator, dehydrator (dehydration unit), and other. If the type of equipment is not listed, select “Other” as a dropdown option and enter the type of equipment using text in the separate “Other” data field.
Service Type* – This data field describes the service of the PC being inspected in terms of how the process variable is controlled. The dropdown options are: on/off, throttling, or unknown. An “Other” option is not available. If the inspector is unsure of whether a PC is on/off or throttling, the inspector should select unknown.
Name/Description – This data field provides a more specific description of the piece of equipment so that the PC being inspected can be identified and located, especially at facilities where there is more than one of the same equipment type (i.e. heater treater 4, water dump). No dropdown menu is available.
Is PC Enclosed? – This data field provides a yes or no answer to whether the PC is located within some type of enclosure that shields the PC from the elements such as a hinged case, a cabinet, or building. Answer “No” if no enclosure exists around the PC being inspected.
Enclosure Type (If Not Exposed to Elements) – This data field is to be completed only if the PC is enclosed as indicated by a “Yes” response to the previous data field. Three dropdown options exist for a “Yes” response: inside separator cabinet, inside compressor enclosure, or inside other enclosure? An “Other” option is not available.
Additional Notes – This data field is a text box that allows additional information to be provided that are worth noting to describe conditions specific to the facility, equipment or PC being inspected.
CAA Ex. 8

5
Inspection Information Section
Operating Properly – This data field identifies whether the PC being inspected is operating properly. Two dropdown options exist: Yes or No. An “Other” option is not available. If the “Yes” option is selected because the PC is found to be operating properly, then then do not complete the Detection Method data field below must be completed. If the “No” option is selected because the PC is found to not be operating properly, then do not complete the Detection Method data field below.
Actuation Observed – This data field identifies whether the PC being inspected was observed to actuate during the inspection. Three dropdown options exist: Yes, No or Unknown. An “Other” option is not available.
Detection Method – This data field identifies the method used to detect whether a PC is not operating properly or not. This data field must be completed only if the “NoYes” option is selected for the “Operating Properly” data field above. Three dropdown options exist: Audio-Visual-Olfactory (AVO) Only, Approved Instrument Monitoring Method (AIMM) Only, and AVO/AIMM. An “Other” option is not available.
• AVO refers to hearing, seeing or smelling something that indicates a PC is not operating properly. Indicators associated with hearing may include hissing or clicking. Detection of a hydrocarbon odor near a PC may not be telltale yet could still indicate a process is not being controlled properly due to an improper operation of a PC. AVO to be selected as a dropdown option when this method was able to independently determine that a PC was not operating properly.
• AIMM refers to methods approved for use by APCD under Reg 7 such as an optical gas imaging (OGI) camera. For the purposes of this PC study for the NAA, an OGI camera will be the only AIMM used. AIMM is to be selected as a dropdown option when this method was able to identify that a PC was not operating properly and AVO was not able to independently make this determination.
• AVO/AIMM is to be selected as a dropdown option when both methods in concert were required to detect that a PC was not operating properly.
Emissions Location – This data field identifies where emissions are detected from a PC being inspected that is not operating properly. Three dropdown options exist: Vent Port, Body or “Other”. If the emission location is other than the Vent Port of Body, then select “Other” as a dropdown option and enter a description using text in the separate “Other” data field. Emissions from supply tubing connections or other components do not represent improper operation of a PC.
Indication of Proper Operation – This data field describes what indicator(s) were found that led to a determination that the PC being inspected was not operating properly. Two data fields with dropdown menus with options are provided including an “Other” option. If the indicator is not listed in the dropdown menu, then select “Other” as a dropdown option and enter a description using text in the separate “Other” data field. If there are more than two indicators, use the Other field to enter text describe any additional indicators.
CAA Ex. 8

6
Additional Notes – This data field is a text box that allows additional information worth noting specific to the PC being inspected. These notes can be used to provide further insight into what was done, observed or evaluated during the inspection to determine whether the PC was operating properly or not.
Repair Information Section
Primary Cause of Improper Operation – This data field identifies the primary cause of improper operation of the PC being inspected. Ten dropdown options are provided including an “Other” option. Select the option that is believed to be the primary cause. If the primary cause is not listed in the dropdown menu, then select “Other” as an option and enter a description using text in the separate “Other” data field.
Repair Date - Enter the date when the repair of the PC that was found to be operating improperly was successfully completed using the numerical month/day/year format (xx/xx/xxxx).
PC Repair Method – This data field identifies the method(s) applied to repair the PC that was inspected and found to be operating improperly. Eleven dropdown options are provided including an “Other” option. Select the option that best represents the repair method necessary to return the PC to proper operation. If the repair method applied is not listed in the dropdown menu, then select “Other” as an option and enter a description using text in the separate “Other” data field.
Did the Repair Require a double block and bleed? Shutdown and purge equipment to atmosphere? Shutdown of the well? - These data fields describe whether any of the listed actions were necessary to make the repair of the PC that was found to be operating improperly. A Yes or No response is needed for each of the three actions listed. An “Other” option is not available.
PC Repair Confirmation Method – This data field identifies the method used to confirm that the PC repair was successful to restore the PC to proper operation. Five dropdown options exist: AIMM, AVO, Soapy Water, Method 21, and Physical Inspection. Select the method used to confirm a successful repair. An “Other” option is not available.
Repair Time Onsite – This data field documents the amount of time needed once onsite to complete the successful repair of a PC found to be operating improperly. Enter the amount of time in hours using 15-minute increments (i.e. 0.25, 0.5, 0.75, 1.0, 1.25, 1.50, etc.). Repair Travel Time (if required) – This data field documents the travel time needed to visit the facility to make a necessary repair of a PC found to be improperly operating. This travel time information is only required if a separate trip is needed to make the repair separate from the trip made to conduct the inspection for this study. Enter the amount of time in hours using 15-minute increments (i.e. 0.25, 0.5, 0.75, 1.0, 1.25, 1.50, etc.)
Re-Inspection Date – Enter the date when re-inspection of a PC that was subject to repair was completed to confirm its proper operation using the numerical month/day/year format (xx/xx/xxxx).
CAA Ex. 8

7
PC Repair Re-Inspection Method – This data field identifies the method used to re-inspect a PC that was subject to repair. Three dropdown options are provided – AIMM, AVO or soapy water. Select the method used to confirm the successful repair. An “Other” option is not available.
Additional Notes - This data field is a text box that allows additional information worth noting specific to the PC being repaired and re-inspected. These notes can be used to provide further insight into what was done, observed or evaluated to successfully complete the repair and confirm the repair during the re-inspection to demonstrate that the PC was returned to proper operation.
PLEASE CHECK THAT THE FORM IS COMPLETE AFTER EACH INSPECTION AND IF A REPAIR IS REQUIRED.
CAA Ex. 8

CLEAN AIR ADVOCATES’ EXHIBIT 9

1
Don Schreiber Gobernador, NM | 505-320-0032 | [email protected] |
SUMMARY
Provide information to New Mexico Environmental Improvement Board regarding proposed 20.2.50 NMAC
EXPERIENCE
December 1998–Current
Owner, Operator Devil’s Spring Ranch, Gobernador, NM
— Member Lujan Grisham Energy Transition Team
— Member EMNRD/NMED Methane Advisory Panel
— Member State Land Office Oil Advisory Council
— Board Member Western Leaders Network
— Witness Subcommittee on Energy and Mineral Resources, Natural Resources Committee, US
House of Representatives field hearing on methane waste and pollution
— Witness EPA DC on methane pollution
— Declarant federal courts on methane waste and pollution
* Wyoming v. Department of Interior (D.Wyo.)
*California v. BLM (N.D. Cal.)
*California v. BLM (N.D. Cal.)
*California v. Bernhardt (N.D. Cal.)
*Clean Air Council v. Pruitt (D.C. Cir.)
*California v. Wheeler (D.C. Cir.)
*New York v. Wheeler (D.D.C.)
— Testimony Office of Management and Budget on methane waste and pollution
— Testimony Royalty Policy Committee, Interior Department on methane waste and pollution
— Evidence presentations New Mexico Oil Conservation Commission hearings on methane waste
and pollution
— Developer Open Space Pilot Project (OSPP) w/Bureau of Land Management, ConocoPhllips
and Holistic Management International for new drilling land conservation in San Juan Basin
— Developer Green Completion Initiative w/Burlington and ConocoPhillips OSPP drilling program
— Interface w/oil producers/contractors/regulators re: impacts of oil and gas drilling and production
— 122 active gas wells w/i OSPP/ranch and grazing permit
— Holistic management contract w/BLM for remediation of oil and gas surface damage using
animal impact
— Cow/calf, feeder operation using sustainable agriculture practice.
CAA Ex. 9

2
February 1976 – December 1998
Owner, Schreiber Insurance Agency, Inc., Farmington, NM
— Risk management services for oil and gas geologists, drillers, producers, transport,
service contractors
— Claims investigation and adjustment for oil and gas industry San Juan Basin
— Rig inspection for drilling, completion and workover equipment San Juan Basin
— Member national faculty for Oil and Gas, Certified Insurance Counselors
REFERENCES
https://nmpoliticalreport.com/2018/12/05/lujan-grisham-names-transition-team-for-environment-energy-
and-water-issues-en/
https://www.env.nm.gov/new-mexico-methane-strategy/methane-advisory-panel/
https://www.congress.gov/116/meeting/house/109319/documents/CHRG-116hhrg36076.pdf
https://holisticmanagement.org/images/stories/Services/ospp_brochure_51.pdf
https://www.westernleaders.org/staff-and-board
EDUCATION
1971
University of New Mexico
Bachelor of Science
1982
University of Texas
Petroleum Production Technology
Certified
CAA Ex. 9

CLEAN AIR ADVOCATES’ EXHIBIT 10

1
2
3
4
5
6
7
8
9
10
11
12
13
14
15
16
17
18
19
20
21
22
23
24
1
STATE OF NEW MEXICO ENVIRONMENTAL IMPROVEMENT BOARD
IN THE MATTER OF PROPOSED NEW REGULATION, 20.2.50 NMAC – Oil and Gas Sector – Ozone Precursor Pollutants No. EIB 21-27 (R)
DIRECT TESTIMONY OF DON SCHREIBER
Q: Please state your name.
A: Don Schreiber.
Q: What is your educational background?
A: I have a Bachelor’s of Science from the University of New Mexico.
Q: Can you describe your work experience?
A: For 22 years, from 1976 to 1998, I was the owner of Schreiber Insurance Agency in
Farmington, New Mexico, where we provided risk management services for the oil and gas
industry, including oil and gas producers, service contractors, drillers, and geologists. We
investigated, evaluated, and adjusted claims throughout the San Juan Basin, including inspecting
rigs for drilling, completion, and workovers, and processing claims arising from accidents
associated with the drilling and production of natural gas. In the course of my work, I would be
called to the scene of a rig fire or blowout while it was still in progress. Over my career, I
witnessed tremendous property damage -- including entire drilling and completion rigs, workover
rigs, and associated equipment burned to the ground – and, worse, terrible injuries and even
death to field workers.
Q: Do you have any certificates or educational experience related to the oil and gas
industry?
A: Yes, in an effort to improve safety in drilling and production operations, I attended the
University of Texas Permian Basin in Odessa, Texas and received an Elementary Drilling
CAA Ex. 10
1
2
3
4
5
6
7
8
9
10
11
12
13
14
15
16
17
18
19
20
21
22
23
24
2
Certificate that included instruction in well completions.
Q: Were you involved in any industry associations?
A: I was a member of the national faculty for Certified Insurance Counselors teaching oil
and gas risk management. Certified Insurance Counselors is a national program that certifies
insurance agents and brokers based on their expertise and commitment to the industry. At the
time, it was the largest insurance education organization in the U.S., serving 65,000 agents.
Q: What activities have you been engaged in since 1998?
A: I retired from my insurance business that year and, since then, my wife and I have
owned and operated Devil’s Spring Ranch, a 3000+ acre ranch in Gobernador, New Mexico, an
old ranching community in northwest Rio Arriba County. Our objective was to create a scalable
model for sustainable agriculture using non-traditional ranching methods. We wanted to help
address decades’ long degradation from overgrazing and surface impacts from oil and gas
drilling and production, and find a path to re-establish the once vibrant economy of the area that
was based on agriculture. Today we lease our deeded land and federal grazing allotment for
cattle operations when range conditions permit.
Q: Is Clean Air Advocates’1 Exhibit 9 an accurate copy of your resume?
A: Yes.
Q: Mr. Schreiber, are there oil and gas wells in and around your ranch?
A: Yes, currently there are about 122 gas wells on or around our ranch, including 33 wells
within one mile of our home.
1 Conservation Voters New Mexico, Diné C.A.R.E., Earthworks, Natural Resources Defense Council, San Juan Citizens Alliance, Sierra Club, 350 New Mexico, and 350 Santa Fe.
CAA Ex. 10

1
2
3
4
5
6
7
8
9
10
11
12
13
14
15
16
17
18
19
20
21
22
23
24
3
Q: After you purchased the ranch, what did you begin to learn about the oil and gas
operations there?
A: In the early 2000’s, drilling pressures in the area were on the increase. ConocoPhillips
Petroleum Co. (“ConocoPhillips”) leased the subsurface rights to our land, and wanted to drill 44
new wells on and around our ranch. We were concerned about impacts to our land and health,
including emissions from well completions, surface disturbances, and spills.
Well completions and recompletions were a particular concern. Well completions –
which is the process of taking a drilled well to a producing one – were still being done in
essentially the same as they had been for over 50 years in the San Juan Basin. This process
includes casing the hole, cementing the well, and perforating the casing and cement so the gas
enters the well bore. Before production, flowback gases, water, and debris are pushed to the
surface. Solid wastes are discharged into an earthen pit and gases are vented or burned via a line
from the wellhead called a blewie line. Clean Air Advocates’ Exhibit 11 is a picture of a blewie
line in operation in 1958 in the San Juan Basin. Clean Air Advocates’ Exhibit 12 has pictures of
blewie line completions near our ranch around 2005 or 2006.
Q: What impacts did you see from well completions on and around your land?
A: The environmental impacts of blewie line completions were obvious to us -- given all the
audio, visual and olfactory evidence before us -- as we lived and worked around our ranch. These
impacts came into especially sharp focus when one time as the flared gasses cooled, black
“snowflakes” were created and drifted onto our home from a blewie line completion about 1 1/4
mile northeast of our ranch.
Q: What actions did you take?
CAA Ex. 10

1
2
3
4
5
6
7
8
9
10
11
12
13
14
15
16
17
18
19
20
21
22
23
24
4
A: Moving away from blewie line technology and avoiding the harmful and toxic waste
from completions became a priority as we began discussing the 44 well drilling program with
ConocoPhillips, in 2008. Our concerns led us to the discovery that “reduced emissions
completions” or “RECs” or “green completions” could help prevent the harmful emissions we
worried about and were already being done in the San Juan Basin.
Q: What are reduced emissions completions?
A: According to the U.S. Environmental Protection Agency (“EPA”), reduced emissions
completions “is a term used to describe an alternate practice that captures gas produced during
well completions and well workovers following hydraulic fracturing.” See Lessons Learned from
Natural Gas STAR Partners: Reduced Emissions Completions for Hydraulically Fractured
Natural Gas Wells, EPA (2011) [Clean Air Advocates’ Ex. 13]. Reduced emissions completions
means capturing emissions during completion or recompletion or combusting emissions instead
of venting. These emissions include volatile organic compounds, including methane, and toxic
air pollutants such as benzene.
Q: How did you learn about reduced emissions completions?
A: Actually, personnel from an oil and gas company, Devon Energy Corporation (“Devon”),
introduced me to reduced emission completion equipment at their Navajo Dam yard, which is
about 30 miles from our ranch. Devon had REC equipment onsite that was owned by Williams
Companies, a pipeline service company. The Williams REC equipment at Devon was brought to
our ranch, as was other REC equipment by ConocoPhillips, and used in the completion of wells
in and around our ranch, beginning in 2008 and continuing until 2012. Before that, we didn’t
know about REC technology, but came to learn it was widely used in the industry.
As a matter of fact, the New Mexico Oil and Gas Association (“NMOGA”) and EPA had
CAA Ex. 10
1
2
3
4
5
6
7
8
9
10
11
12
13
14
15
16
17
18
19
20
21
22
23
24
5
put on a workshop for producers in Farmington in early 2006 on reduced emissions completions.
During that workshop, presenters explained that REC equipment could process gas for sale and
reduce venting and flaring, and that hundreds of millions of dollars could be recovered every
year from the billions of cubic feet of gas that would otherwise be lost to the atmosphere. See
Reduced Emissions Completions and Smart Automation, Producers and Processors Technology
Workshop, NMOGA and EPA Natural Gas STAR Program (Feb. 21, 2006) [Clean Air
Advocates’ Ex. 14]. Similarly, the New Mexico Environment Department (“NMED”) partnered
with EPA, NMOGA, and ConocoPhillips in a 2010 workshop in Farmington promoting reduced
emissions completions. Reducing Methane Emissions from Production Wells: Reduced
Emissions Completions, Producers Technology Transfer Workshop, ConocoPhillips, NMED,
and NMOGA (May 11, 2020) [Clean Air Advocates’ Ex. 15].
An example from that workshop is instructive. Weatherford International successfully
completed three wells in the Fruitland coal formation in the San Juan Basin in Durango,
Colorado, not far from our ranch. In just those three wells, Weatherford captured and sold two
million cubic feet of gas. See id. The Williams Companies identify average household use of
natural gas at 196 cubic feet per day. Williams Northeast Supply Enhancement, Natural Gas: The
Facts [Clean Air Advocates’ Ex. 16. Therefore, those three REC well completions alone would
provide year-round gas for 27.9, almost 28, households.2
Q: You said you learned of RECs from Devon. Were RECs a common practice of
Devon’s?
Yes. Devon was using REC equipment, as were many others including ExxonMobil,
ConocoPhillips, and British Petroleum, to name a few. In fact, Devon described its use of RECs
2 2,000,000 cu ft ÷ (196 cu ft x 356 days / yr) = 27.9 households / yr.
CAA Ex. 10

1
2
3
4
5
6
7
8
9
10
11
12
13
14
15
16
17
18
19
20
21
22
23
24
6
as “standard practice.”
Green completions have been Devon’s standard practice in the Barnett Shale since 2004. The company uses the same process to complete wells in New Mexico, Wyoming, Oklahoma and south Texas. Using this process, Devon has reduced methane emissions by more than 15 billion cubic feet in the Barnett Shale area of north Texas. Not long ago, green completions were so uncommon that Devon had to look as far as Wyoming to rent the necessary filtering equipment. Now, more than 2,000 green completions later, that rental equipment is available readily and locally.
“Natural Gas and Green Completions in a Nutshell,” Energy in Depth (Nov. 26, 2012) (emphasis
added) [Clean Air Advocates Ex. 17].
Q: You stated that REC equipment was used at your ranch between 2008 and 2012.
How did that come about?
A: We worked with ConocoPhillips and the U.S. Bureau of Land Management (“BLM”) to
develop a program for drilling the 44 wells that would reduce impacts to the land, water, and air.
In September 2008, we reached agreement with ConocoPhillips and BLM on the use of REC
equipment, closed loop systems, well spacing, road construction, reclamation of surface damage,
and other considerations that allowed the 44 well drilling program to begin in late 2008.
Between 2008 and 2012, 22 of the 44 wells in the program were completed or
recompleted. We visited each of the 22 drilling sites multiple times to make sure the agreement
was being followed, which it was, and we observed REC equipment in use. There were no
reported accidents or incidents from blowouts or uncontrolled methane emissions on any of the
wells completed or recompleted during the entire period of the agreed drilling and
completion/recompletion program. In 2012, natural gas prices declined and the drilling program
stopped.
Q: What happened after ConocoPhillips suspended the drilling program in 2012?
A: In August of 2017, Hilcorp Energy Company (“Hilcorp”) acquired the assets of
CAA Ex. 10

1
2
3
4
5
6
7
8
9
10
11
12
13
14
15
16
17
18
19
20
21
22
23
24
7
ConocoPhillips in the San Juan Basin, including all of the wells on and around our ranch.
Hilcorp first contacted us about new drilling through a notice we received on February 7, 2018 to
recomplete a well -- San Juan 28-6 Unit 127 (“Unit 127”) – on our federal grazing permit land.
Hilcorp set the onsite meeting for February 20. Onsite meetings were routine for my wife and
me, having attended over 100 since coming to the ranch. However, we were shocked when the
Hilcorp representative stated that he wasn’t sure that Hilcorp would use reduced emissions
completion equipment for the well, telling us that Hilcorp didn’t have REC equipment, that it
had no trained crews, and that formation pressures might be too low.
However, my wife and I knew that REC equipment was available and that highly skilled
oil field labor was readily available. Also, we had evidence that formation pressures in the area
were sufficient or, if not, gas pressure could be boosted.
Q: What was your reaction to this news?
A: We believed that Hilcorp should honor the agreement we had with ConocoPhillips to
conduct RECs. And, since 2012, emissions from hydraulically fractured natural gas wells during
completion/recompletion had been regulated by EPA under its OOOO rule, which was later
expanded with EPA’s OOOOa rule.
Q: What happened then?
A: Hilcorp removed Unit 127 from the recompletion schedule, but proceeded with
recompletion of another wellsite, San Juan 28-6 Unit 143 (“Unit 143”), approximately 1.4 miles
from our home without even giving us the benefit of an onsite meeting. We learned that the well
was to be fracked on March 7, 2018. We arrived that day, only to find out that the fracking operation
was concluding and preparations for recompletion were in place -- with flowback gasses to be
vented directly to the atmosphere, into the space where we lived and worked. Clean Air
CAA Ex. 10

1
2
3
4
5
6
7
8
9
10
11
12
13
14
15
16
17
18
19
20
21
22
23
24
8
Advocates’ Exhibit 18 has photographs of the Hilcorp Unit143 set up for flowback with no REC
equipment in place, and the gases to be vented to the atmosphere. Hilcorp has continued to
complete and recomplete wells without using REC equipment since that time.
Q: What happened next?
A: It was clear that Hilcorp was not going to comply with the intent of the 2012 EPA REC
regulations or honor the agreement we had with ConocoPhillips. We looked more closely into
EPA green completion language in its 2012 regulations. EPA’s reduced emissions completions
rules were intended to stop venting and limit flaring during completion/recompletion operations.
However, industry had exploited the regulatory language giving an out to industry if capture was
“technically infeasible” to evade the requirements. In 2020, EPA amended its regulations, but the
“technically infeasible” language remains.
Q: What’s happened more recently?
A: Hilcorp divides the San Juan Basin into five operating areas. In February 2020, we were
notified that Hilcorp intended to recomplete 22 wells in our area alone. Applying the
Weatherford gas capture ratio, using REC equipment for those recompletions would translate to
the same amount of gas used in over 200 households for an entire year.3
Q: Mr. Schreiber, you were appointed to Governor Michelle Lujan Grisham’s Energy
Transition Team in 2018, correct?
A: Yes, I was. I also served on the Methane Advisory Panel sponsored by NMED and the
Energy, Minerals and Natural Resources Department. And I was proud to be present in January
2019 when the one of the Governor’s first executive orders, Executive Order 2019-003, targeted
climate change. That order acknowledged both the potency of methane as a greenhouse gas and
3 (22 wells ÷ 3 wells) x 27.9 households / yr = 204.6 households / yr.
CAA Ex. 10

1
2
3
4
5
6
7
8
9
10
11
12
13
14
15
16
17
18
19
20
21
22
23
24
9
that the oil and gas industry is the largest industrial source of methane emissions.
The Governor has committed to passing the strongest methane rules in the nation. To
keep that commitment, the Environmental Improvement Board (“EIB”) rules must require
control of emissions during completions and recompletions. New Mexico’s rules should be at
least as strong as Colorado’s.
Q: What do you mean by that?
A: Last fall, the Colorado Air Quality Control Commission – Colorado’s analog to the EIB -
- passed regulations on completions and recompletions that closed the loopholes in EPA’s
regulations on reduced emissions completions, and generally require emissions during
completions and recompletions to be captured, with some exceptions. See 5 CCR § 1001-
9:D.VI.D and Statement of Basis [Clean Air Advocates’ Ex. 19]. The Colorado Oil and Gas
Conservation Commission – Colorado’s equivalent to New Mexico’s Oil Conservation
Commission -- adopted those same requirements this year, incorporating the air quality control
regulation by reference. See 2 CCR § 404-1:903.c and Statement of Basis for 2 CCR § 404-
1:903.c [Clean Advocates’ Exhibits 20 and 21, respectively].
I strongly support New Mexico adopting Colorado’s approach, which would close the
loopholes in EPA’s regulations and place New Mexico at the forefront of emissions control
during completions and recompletions. This proposal to reduce emissions during completions
and recompletions is set forth in the Joint Proposed Amendments from Clean Air Advocates, the
Environmental Defense Fund (“EDF”), and the Center for Civic Policy and NAVA Education
Fund, and is Clean Air Advocates’ Exhibit 1. This proposal will be supported with technical
testimony by EDF expert Tom Alexander.
There is now a gaping hole in New Mexico regulations that creates a serious issue that
CAA Ex. 10

1
2
3
4
5
6
7
8
9
10
11
12
13
14
15
16
17
18
19
20
21
22
23
24
10
has plagued my family and other families who live, work, and go to school close to where oil and
gas wells exist or may be drilled in the future.
Standing on my ranch, I can see Colorado, less than 25 miles away. To know that the same
operators that are allowed to vent ozone precursors, methane, and toxic pollutants from completions and
recompletions in New Mexico are prohibited from doing so in Colorado is deeply troubling. These
operators drill into the same formation. They vent pollutants into the same air shed. And they threaten
communities in the same region of the country.
If, unlike Colorado, New Mexico fails to adopt reduced emissions completion/recompletion
requirements – requirements that are technically feasible, reduce waste, and protect our public health and
environment – our state will have ignored, denied and discounted years of successful capture of
emissions, verified by industry and its experts. We will failed to prevent the unnecessary waste
of our natural resource and to maximize royalty and tax revenues to the State. Most importantly,
the State will have missed an opportunity to reduce emission of ozone precursors – the primary
purpose of this hearing; failed to prevent the unnecessary emission of harmful air pollutants that
threaten public health; and failed to do all it can to take on the existential threat of our time --
climate change. And rural New Mexico families like mine will continue to suffer the harmful
effects of unnecessary venting and flaring of toxic pollutants where we live and work and where our
children and grandchildren play. I urge the EIB to close the loophole for completions and
recompletions, and to require oil and gas producers to prevent unnecessary and harmful
emissions during completions and recompletions.
This ends my testimony, which is accurate to the best of my knowledge.
/s/ Don Schreiber July 26, 2021 ____________________________ _________________ Don Schreiber Date
CAA Ex. 10

CLEAN AIR ADVOCATES’ EXHIBIT 11

CAA Ex. 11

CLEAN AIR ADVOCATES’ EXHIBIT 12

CAA Ex. 12

CLEAN AIR ADVOCATES’ EXHIBIT 13
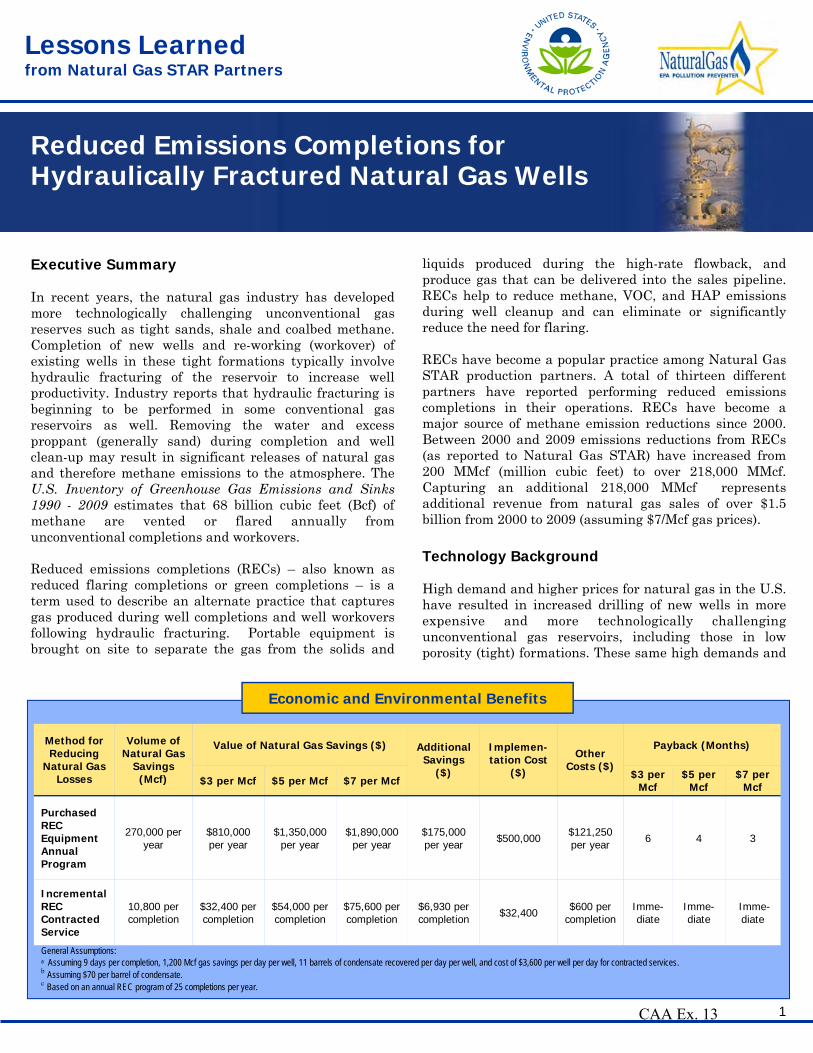
Lessons Learned from Natural Gas STAR Partners
Reduced Emissions Completions for Hydraulically Fractured Natural Gas Wells
Executive Summary
In recent years, the natural gas industry has developed more technologically challenging unconventional gasreserves such as tight sands, shale and coalbed methane. Completion of new wells and re-working (workover) of existing wells in these tight formations typically involve hydraulic fracturing of the reservoir to increase well productivity. Industry reports that hydraulic fracturing is beginning to be performed in some conventional gasreservoirs as well. Removing the water and excess proppant (generally sand) during completion and well clean-up may result in significant releases of natural gas and therefore methane emissions to the atmosphere. The U.S. Inventory of Greenhouse Gas Emissions and Sinks 1990 - 2009 estimates that 68 billion cubic feet (Bcf) of methane are vented or flared annually from unconventional completions and workovers.
Reduced emissions completions (RECs) – also known asreduced flaring completions or green completions – is a term used to describe an alternate practice that captures gas produced during well completions and well workoversfollowing hydraulic fracturing. Portable equipment isbrought on site to separate the gas from the solids and
liquids produced during the high-rate flowback, and produce gas that can be delivered into the sales pipeline.RECs help to reduce methane, VOC, and HAP emissionsduring well cleanup and can eliminate or significantlyreduce the need for flaring.
RECs have become a popular practice among Natural GasSTAR production partners. A total of thirteen different partners have reported performing reduced emissions completions in their operations. RECs have become a major source of methane emission reductions since 2000.Between 2000 and 2009 emissions reductions from RECs (as reported to Natural Gas STAR) have increased from200 MMcf (million cubic feet) to over 218,000 MMcf. Capturing an additional 218,000 MMcf represents additional revenue from natural gas sales of over $1.5billion from 2000 to 2009 (assuming $7/Mcf gas prices).
Technology Background
High demand and higher prices for natural gas in the U.S.have resulted in increased drilling of new wells in moreexpensive and more technologically challengingunconventional gas reservoirs, including those in low porosity (tight) formations. These same high demands and
Method for Reducing
Natural Gas Losses
Volume of Natural Gas
Savings (Mcf)
Value of Natural Gas Savings ($) Additional Savings
($)
Implemen-tation Cost
($)
Other Costs ($)
Payback (Months)
$3 per Mcf $5 per Mcf $7 per Mcf $3 per Mcf
$5 per Mcf
$7 per Mcf
Purchased REC Equipment Annual Program
270,000 per year
$175,000 per year $500,000 $121,250
per year $810,000 per year
$1,350,000 per year
$1,890,000 per year 6 4 3
Incremental REC Contracted Service
10,800 per completion
$32,400 per completion
$54,000 per completion
$75,600 per completion
$6,930 per completion $32,400 $600 per
completion Imme-diate
Imme-diate
Imme-diate
General Assumptions: a Assuming 9 days per completion, 1,200 Mcf gas savings per day per well, 11 barrels of condensate recovered per day per well, and cost of $3,600 per well per day for contracted services. b Assuming $70 per barrel of condensate. c Based on an annual REC program of 25 completions per year.
Economic and Environmental Benefits
1 CAA Ex. 13

Reduced Emissions Completions(Cont’d)
prices also justify extra efforts to stimulate production from existing wells in tight reservoirs where the down-hole pressure and gas production rates have declined, a process known as well workovers or well-reworking. In both cases,completions of new wells in tight formations and workovers of existing wells, one technique for improving gas production is to fracture the reservoir rock with very high pressure water containing a proppant (generally sand) that keeps the fractures “propped open” after waterpressure is reduced. Depending on the depth of the well,this process is carried out in several stages, usuallycompleting one 200- to 250-foot zone per stage.
These new and “workover” wells are completed byproducing the fluids at a high rate to lift the excess sand to the surface and clear the well bore and formation to increase gas flow. Typically, the gas/liquid separatorinstalled for normal well flow is not designed for these high liquid flow rates and three-phase (gas, liquid and sand) flow. Therefore, a common practice for this initial well completion step has been to produce the well to a pitor tanks where water, hydrocarbon liquids and sand are captured and slugs of gas vented to the atmosphere or flared. Completions can take anywhere from one day to several weeks during which time a substantial amount of gas may be released to the atmosphere or flared. Testing of production levels occurs during the well completion process, and it may be necessary to repeat the fracture process to achieve desired production levels from a particular well.
Natural gas lost during well completion and testing can beas much as 25 million cubic feet (MMcf) per well depending on well production rates, the number of zones completed,and the amount of time it takes to complete each zone. This gas is generally unprocessed and may contain volatileorganic compounds (VOCs) and hazardous air pollutants (HAPs) along with methane. Flaring gas may eliminate most methane, VOC and HAP emissions, but open flaring is not always a preferred option when the well is located near residential areas or where there is a high risk of grass or forest fires. Moreover, flaring may releaseadditional carbon dioxide and other criteria pollutants (SOx, NOx, PM and CO) to the atmosphere.
Natural Gas STAR partners have reported performingRECs that recover much of the gas that is normally ventedor flared during the completion process. This involves installing portable equipment that is specially designed and sized for the initial high rate of water, sand, and gas flowback during well completion. The objective is to capture and deliver gas to the sales line rather thanventing or flaring this gas.
Sand traps are used to remove the finer solids present inthe production stream. Plug catchers are used to removeany large solids such as drill cuttings that could damagethe other separation equipment. The piping configuration to the sand traps is critical as the abrasion from highvelocity water and sand can erode a hole in steel pipeelbows, creating a “washout” with water, sand,
Exhibit 1: Reduced Emissions Completion Equipment Layout
Adapted from BP.
2 CAA Ex. 13

Reduced Emissions Completions(Cont’d)
hydrocarbon liquids and gas in an uncontrolled flow to the pad. Depending on the gas gathering system, it may benecessary to dehydrate (remove water from) the producedgas before it enters the sales pipeline. The gas may be routed to the permanent glycol unit for dehydration or aportable desiccant/glycol dehydrator used for dehydrationduring the completion process.
Free water and condensate are removed from the gas in a three phase separator. Condensate (liquid hydrocarbons)collected during the completion process may be sold foradditional revenue. Temporary piping may be used to connect the well to the REC skid and gathering system ifthe permanent piping is not yet in place. Exhibit 1 shows atypical layout of temporary REC portable equipment, and
Energized FracturingBased on Natural Gas STAR partner experiences, RECscan also be performed in combination with energizedfracturing, wherein inert gas such as CO2 or nitrogen ismixed with the frac water under high pressure to aid inthe process of fracturing the formation. The process isgenerally the same with the additional consideration ofthe composition of the flowback gas. The percent of inertgases in the flowback gas is, at first, unsuitable fordelivery into the sales line. As the fraction of inertsdecreases, the gas can be recovered economically. Aportable membrane acid gas separation unit can further increase the amount of methane recovered for sales after a CO2 energized fracture.
Compression Two compressor applications during an REC have beenidentified or explored by Natural Gas STAR partners.
1) Gas Lift. In low pressure (i.e. low energy) reservoirsRECs are often carried out with the aid of compressors for gas lift. Gas lift is accomplished by withdrawing gas fromthe sales line, boosting its pressure, and routing it downthe well casing to push the frac fluids up the tubing. The increased pressure facilitates flow into the separator andthen the sales line where the lift gas becomes part of the normal flowback that can be recovered during an REC.
2) Boost to Sales Line. When the gas recovered in the REC separator is lower pressure than the sales line, somecompanies are experimenting with a compressor to boostflowback gas into the sales line. This technique isexperimental because of the difficulty operating acompressor on widely fluctuating flowback rate. Coal bedmethane well completion is an example where additionalcompression might be required.
Exhibit 2: Alternate Completion Procedures
Exhibit 2 explains some alternate, emerging, and/or experimental procedures for a well completion and REC.
The equipment used during RECs is only necessary for the time it takes to complete the well; therefore, it is essentialthat all the equipment can be readily transported from site to site to be used in a number of well completions. A truckmounted skid, as shown in Exhibit 3, is ideal for transporting the equipment between sites. In a large basinthat has a high level of drilling activity it may be economicfor a gas producer to build its own REC skid. Most producers may prefer contracting a third party service toperform completions.
When using a third party to perform RECs, it is most cost effective to integrate the scheduling of completions with the annual drilling program. Well completion time is another factor to consider for scheduling a contractor forRECs. Some well completions, such as coal bed methane, may take less than a day. On the other hand, completingwells which fracture various zones, such as shale gaswells, may take several weeks to complete. For most wells, it takes about 3 to 10 days to perform a well completionfollowing a hydraulic fracture, based on partner experiences.
Exhibit 3: Truck Mounted Reduced Emissions Completion Equipment
Source: Weatherford
Economic and Environmental Benefits
Gas recovered for sales
Condensate recovered for sales
Reduced methane emissions
3 CAA Ex. 13

Reduced Emissions Completions(Cont’d)
Reduced loss of a valuable hydrocarbon resource
Reduced emissions of criteria and hazardous air pollutants
Emissions from well completions can contribute to a number of environmental problems. Direct venting ofVOCs can contribute to local air pollution, HAPs aredeemed harmful to human health, and methane is a powerful greenhouse gas that contributes to climate change. Where it is safe, flaring is preferred to direct venting because methane, VOCs, and HAPs are combusted, lowering pollution levels and reducing global warming potential (GWP) of the emissions as CO2 from combustion has a lower GWP than methane. RECs allow for recovery of gas rather than venting or flaring andtherefore reduce the environmental impact of well completion and workover activities.
RECs bring economic benefits as well as environmentalbenefits. The incremental costs associated with the rental of third party equipment for performing RECs can be offset by the additional revenue from the sale of gas and condensate. As this technology is being perfected andequipment becomes commonplace, the revenues in gas and condensate sales often exceed the incremental costs.
Decision Process
Step 1: Evaluate candidate wells for Reduced Emissions Completions.
When setting up an annual RECs program it is important to examine the characteristics of the wells that are going tobe brought online in the coming year. Wells in conventional reservoirs that do not require a reservoir fracture (frac job) and will produce readily without stimulation can be cleared of drilling fluids and connected to a production line in a relatively short period of timewith minimal gas venting or flaring, and therefore usually do not economically justify Decision Process
Step 1: Evaluate candidate wells REC equipment. Wells that Step 2: Determine costs
undergo energized fracture Step 3: Estimate savings using inert gases require Step 4: Evaluate economics special considerations because the initial produced gascaptured by the REC equipment would not meet pipeline specifications due to the inert gas content. However, as the amount of inerts decreases, the quality of the gas willlikely meet pipeline specifications. In the case of CO2
energized fracks, the use of portable acid gas removal
membrane separators will improve gas quality and make itpossible to direct gas to the pipeline (see Partner Experiences section for more information).
State and Local Regulations The States of Wyoming and Colorado have regulations requiring the implementation of “flareless completions”. Operators of new wells in this region are required to complete wells without flaring or venting. These completions have reduced flaring by 70 to 90 percent.
For more information, visit: http://deq.state.wy.us http://www.cdphe.state.co.us
Exploratory and delineation wells in areas that do not yethave sales pipelines in close proximity to the wells are not candidates for RECs as the infrastructure is not in place to receive the recovered gas. In depleted or low pressurefields with low energy reservoirs, implementing a RECs program would most likely require the addition of compression to overcome the sales line pressures–an approach that is still under development and may addsignificant cost to implementation.
Wells that require hydraulic fracturing to stimulate or enhance gas production may need a lengthy completion,and therefore are good candidates for RECs. Lengthycompletions mean that a significant amount of gas may bevented or flared that could potentially be
Selecting a Basis for Costs and recovered and sold for Savings additional revenue to Estimate the number ofjustify the additional cost
producing gas wells that will of a REC. If newly drilled be drilled in the next year wells are in close proximity, they could Evaluate well depth and
reservoir characteristics share the REC equipmentto minimize transport, set Determine whether
-up, and equipment additional equipment is necessary to bring recovered rental costs. gas up to pipelinespecifications
Estimate time needed for each completion
Step 2: Determine the costs of a REC program.
Most Natural Gas STAR partners report using third party contractors to perform RECs on wells within their producing fields. It should be noted that third party contractors are also often used to perform traditional wellcompletions. Therefore, the economics presented deal with
4 CAA Ex. 13
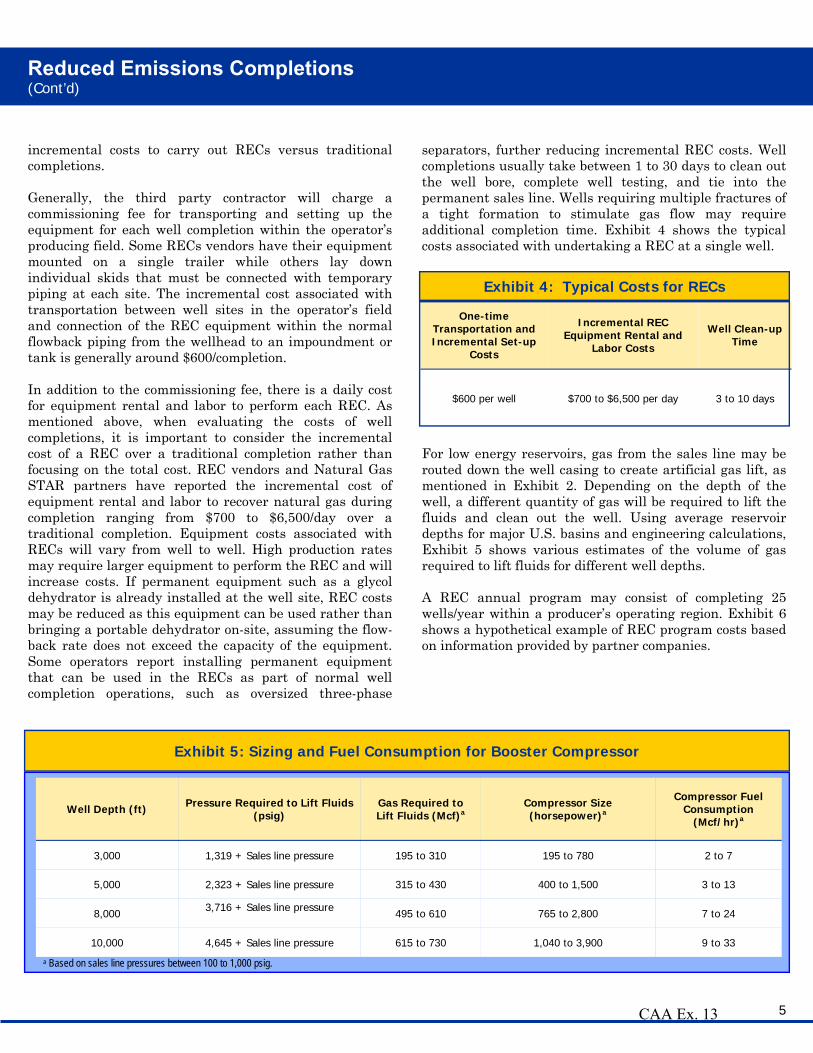
Reduced Emissions Completions(Cont’d)
incremental costs to carry out RECs versus traditionalcompletions.
Generally, the third party contractor will charge acommissioning fee for transporting and setting up the equipment for each well completion within the operator’s producing field. Some RECs vendors have their equipment mounted on a single trailer while others lay downindividual skids that must be connected with temporary piping at each site. The incremental cost associated withtransportation between well sites in the operator’s field and connection of the REC equipment within the normalflowback piping from the wellhead to an impoundment or tank is generally around $600/completion.
In addition to the commissioning fee, there is a daily costfor equipment rental and labor to perform each REC. Asmentioned above, when evaluating the costs of well completions, it is important to consider the incrementalcost of a REC over a traditional completion rather thanfocusing on the total cost. REC vendors and Natural GasSTAR partners have reported the incremental cost of equipment rental and labor to recover natural gas during completion ranging from $700 to $6,500/day over atraditional completion. Equipment costs associated with RECs will vary from well to well. High production rates may require larger equipment to perform the REC and willincrease costs. If permanent equipment such as a glycol dehydrator is already installed at the well site, REC costs may be reduced as this equipment can be used rather thanbringing a portable dehydrator on-site, assuming the flow-back rate does not exceed the capacity of the equipment.Some operators report installing permanent equipmentthat can be used in the RECs as part of normal well completion operations, such as oversized three-phase
separators, further reducing incremental REC costs. Wellcompletions usually take between 1 to 30 days to clean outthe well bore, complete well testing, and tie into the permanent sales line. Wells requiring multiple fractures ofa tight formation to stimulate gas flow may require additional completion time. Exhibit 4 shows the typicalcosts associated with undertaking a REC at a single well.
Exhibit 4: Typical Costs for RECs
One-time Transportation and Incremental Set-up
Costs
Incremental REC Equipment Rental and
Labor Costs
Well Clean-up Time
$600 per well $700 to $6,500 per day 3 to 10 days
For low energy reservoirs, gas from the sales line may be routed down the well casing to create artificial gas lift, asmentioned in Exhibit 2. Depending on the depth of the well, a different quantity of gas will be required to lift thefluids and clean out the well. Using average reservoirdepths for major U.S. basins and engineering calculations, Exhibit 5 shows various estimates of the volume of gas required to lift fluids for different well depths.
A REC annual program may consist of completing 25wells/year within a producer’s operating region. Exhibit 6 shows a hypothetical example of REC program costs based on information provided by partner companies.
Exhibit 5: Sizing and Fuel Consumption for Booster Compressor
Well Depth (ft) Pressure Required to Lift Fluids (psig)
Gas Required to Lift Fluids (Mcf)a
Compressor Size (horsepower)a
3,000 1,319 + Sales line pressure 195 to 310 195 to 780
5,000 2,323 + Sales line pressure 315 to 430 400 to 1,500
8,000 3,716 + Sales line pressure 495 to 610 765 to 2,800
10,000 4,645 + Sales line pressure 615 to 730 1,040 to 3,900
a Based on sales line pressures between 100 to 1,000 psig.
Compressor Fuel Consumption
(Mcf/hr)a
2 to 7
3 to 13
7 to 24
9 to 33
5 CAA Ex. 13

Reduced Emissions Completions(Cont’d)
Exhibit 6: Hypothetical Example Cost Calculation of a 25 Well Annual REC Program
Given W = Number of completions per year D = Well depth in feet (ft) Ps = Sales line pressure in pounds per square inch gauge (psig) Ts = Time required for transportation and set-up (days/well) Tc = Time required for well clean-up (days/well) O = Operating time for compressor to lift fluids (hr/well) F = Compressor fuel consumption rate (Mcf/hr) G = Gas from pipeline routed to casing to lift fluids (Mcf/well), typically used on low energy reservoirs Cs = Transportation and set-up cost ($/well) Ce = Equipment and labor cost ($/day) Pg = Sales line gas price ($/Mcf)
W = 25 wells/yr D = 8000 ft Ps = 100 psig Ts = 1 day/well Tc = 9 days/well O = 24 hr/well F = 10 Mcf/hr G = 500 Mcf/well (See Exhibit 5) Cs = $600/well Ce = $2,000/day Pg = $7/Mcf
Calculate Total Transportation and Set-up Cost, CTS
CTS = W * Cs
CTS = 25 wells/yr * $600/well CTS = $15,000/yr
Calculate Total Equipment Rental and Labor Cost, CEL
CEL = W * (Ts + Tc) * Ce
CEL = 25 wells/yr * (1 day/well + 9 days/well) * $2,000/day CEL = $500,000/yr
Calculate Other Costs, CO
CO = W * [(O * F) + G] * Pg
CO = 25 wells/yr * [( 24 hr/well * 10 Mcf/hr) + 500 Mcf/well] * $7/Mcf CO = $129,500/yr
Total Annual REC Program Cost, CT
CT = CTS + CEL + CO CT = $15,000/yr + $500,000/yr + $129,500/yr CT = $644,500/yr
6 CAA Ex. 13

Reduced Emissions Completions(Cont’d)
Step 3: Estimate Savings from RECs.
Gas recovered from RECs can vary widely because theamount of gas recovered depends on a number of variablessuch as reservoir pressure, production rate, amount offluids lifted, and total completion time. Exhibit 7 shows the range of recovered gas and condensate reported byNatural Gas STAR partners. Partners also have reported that not all the gas that is produced during well completions may be captured for sales. Fluids from high pressure wells are often routed directly to the frac tank in the initial stages of completion as the fluids are often beingproduced at a rate that is too high for the REC equipment. Where inert gas is used to energize the frac, the initial gasproduction may have to be flared until the gas meetspipeline specifications. Alternatively, a portable acid gasmembrane separator may be used to recover methane richgas from CO2. As the flow rate of fluids drops and gas is encountered, backflow is then switched over to the REC equipment so that the gas may be captured. Gas compressed from the sales line to lift fluids (by artificial gas lift) will also be recovered in addition to the gas produced from the reservoir. The volume of gas needed tolift fluids can be estimated based on the well depth andsales line pressure. Gas saved during RECs can be translated directly into methane emissions reductions based on the methane content of the produced gas.
In addition to gas savings, valuable condensate may alsobe recovered from the REC three-phase separator. The amount of condensate that can be recovered during a RECis dependent on the reservoir conditions and fluid
Nelson Price Indexes In order to account for inflation in equipment and operating & maintenance costs, Nelson-Farrar Quarterly Cost Indexes (available in the first issue of each quarter in the Oil and Gas Journal) are used to update costs in the Lessons Learned documents.
The “Refinery Operation Index” is used to reviseoperating costs while the “Machinery: Oilfield Itemized Refining Cost Index” is used to update equipment costs.
To use these indexes in the future, simply look up the most current Nelson-Farrar index number, divide by the February 2006 Nelson-Farrar index number, and, finally multiply by the appropriate costs in the Lessons Learned.
Exhibit 7: Ranges of Gas and Condensate Savings
Produced Gas Savings
(Mcf/day/well)
Gas-Lift Savings (Mcf/well)
Condensate Savings
(bbl/day/well)
500 to 2,000 See Exhibit 5 Zero to several hundred
compositions. Condensate may also be lost if fluids are produced directly to the frac tank before switching to the REC equipment.
Exhibit 8 shows typical values of gas and condensate savings during the REC process.
Step 4: Evaluate REC economics.
The example application of an REC program to 25 wellswithin a producing field can yield a total theoreticalrevenue of $2,152,500 based on the assumptions listed above from the sale of natural gas and condensate.Equipment rental, labor, and other costs associated with implementing this program are estimated to be $644,500 (see Exhibit 6) resulting in an annual theoretical profit of $1,508,000. To maintain a profitable REC program, it isimportant to move efficiently from well to well within a producing field so that there is little down time when paying for equipment rental and labor. Other factors thataffect the profitability of an REC program include the amount of condensate recovery and sales price, the needfor additional compressors, the amount of gas recovered,and gas sales price.
Exhibit 9 shows a five year cash flow projection for carrying out a 25 well per year REC program. In thisexample, the equipment necessary to perform RECs has been purchased by the operator rather than using a third party contractor to perform the service. The capital cost of a simple REC set-up without a portable compressor has been reported by British Petroleum (BP) to be $500,000.
Producers with high levels of localized drilling andworkover activity may benefit from constructing and operating their own REC equipment. As illustrated above,even though large capital outlay is required to construct aREC skid, a high rate of return can be achieved if the equipment is in continuous use. If the operator is unable tokeep the equipment busy on their own wells, they may
7 CAA Ex. 13

Reduced Emissions Completions(Cont’d)
Given W = Number of completions per year D = Well depth in feet (ft) Ps = Sales line pressure in pounds per square inch gage (psig) Sp = Produced gas savings (Mcf/day) Tc = Time recovered gas flows to sales line in days (days/well) Sc = Condensate savings (bbl/well) G = Gas used to lift fluids (Mcf/well), typically used on low energy reservoirs Pg = Sales line gas price ($/Mcf) Pl = Natural gas liquids price ($/bbl)
W = 25 wells/yr D = 8000 ft Ps = 100 psig Sp = 1,200 Mcf/day Tc = 9 days/well Sc = 100 bbl/well G = 500 Mcf/well (See Exhibit 5) Pg = $7/Mcf Pl = $70/bbl
Calculate Produced Gas Savings
SPG = W * (Sp * Tc) * Pg
SPG = 25 wells/yr * (1,200 Mcf/day * 9 days/well) * $7/Mcf SPG = $1,890,000/yr
Calculate Other Savings
SO = W * [(G * Pg) + (Sc * Pl)]
SO = 25 wells/yr * [(500 Mcf/well * $7/Mcf) + (100 bbl/well * $70/bbl)] SO = $262,500/yr
Total Savings, ST
ST = SPG + SO ST = $1,890,000/yr + $262,500/yr ST = $2,152,500/yr
Exhibit 8: Savings of a 25 Well Annual REC Program
8 CAA Ex. 13

Reduced Emissions Completions(Cont’d)
contract it out to other operators to maximize usage of the important to examine the economics of undertaking a REC equipment. program as natural gas prices change. Exhibit 10 shows an
economic analysis of performing the 25 well per year RECWhen assessing REC economics, the gas price may program in Exhibit 8 at different gas prices. influence the decision making process; therefore, it is
Exhibit 9: Economics for Hypothetical 25 Well Annual REC Program with Purchased Equipment
Year 0 Year 1 Year 2 Year 3 Year 4 Year 5
Volume of Natural Gas Savings (Mcf/yr)a 270,000 270,000 270,000 270,000 270,000
Value of Natural Gas Savings ($/year)a 1,890,000 1,890,000 1,890,000 1,890,000 1,890,000
Additional Savings ($/yr)a 175,000 175,000 175,000 175,000 175,000
Set-up Costs ($/yr)b (15,000) (15,000) (15,000) (15,000) (15,000)
Equipment Costs ($)b (500,000)
Net Annual Cash Flow ($) (500,000) 1,943,750 1,943,750 1,943,750 1,943,750 1,943,750
Internal Rate of Return = 389% NPV (Net Present Value)d= $6,243,947
Payback Period = 3 months a See Exhibit 8. b See Exhibit 6. c Labor costs for purchased REC equipment estimated as 50% of Equipment Rental and Labor costs in Exhibit 3. d Net present value based on 10% discount rate over five years.
Labor Costs ($/yr)c (106,250) (106,250) (106,250) (106,250) (106,250)
Exhibit 10: Gas Price Impact on Economic Analysis of Hypothetical 25 Well Annual REC Program with Purchased Equipment
$3/Mcf $5/Mcf $7/Mcf $8/Mcf $10/Mcf
Total Savings $985,000 $1,525,000 $2,065,000 $2,335,000 $2,875,000
Payback (months) 7 5 4 3 3
IRR 172% 280% 389% 443% 551%
NPV (i = 10%) $2,522,084 $4,383,015 $6,243,947 $7,174,413 $9,035,345
Gas Price
9 CAA Ex. 13

Reduced Emissions Completions(Cont’d)
Partner Experience
This section highlights specific experiences reported by Natural Gas STAR partners.
BP Experience in Green River Basin Implemented RECs in the Green River Basin of Wyoming
RECs performed on 106 wells, which consisted of high and low pressure wells
Average 3,300 Mcf of natural gas sold versus vented per well
– Well pressure will vary from reservoir to reservoir
– Reductions will vary for each particular region
– Conservative net value of gas saved is $20,000 per well
Natural gas emission reductions of 350,000 Mcf in 2002
Total of 6,700 barrels of condensate recovered per year total for 106 wells
Through the end of 2005, this partner reports a total of 4.17 Bcf of gas and more than 53,000 barrels of condensaterecovered and sold rather than flared. This is a combination of activities in the Wamsutter and Jonah/Pinedale fields.
Noble Experience in Ellis County, Oklahoma Implemented RECs on 10 wells using energized fracturing.
Employed membrane separation in which the permeate was a CO2 rich stream that was vented and the residue was primarily hydrocarbons which were recovered.
Total cost of $325,000.
Total gas savings of approximately 175 MMcf.
Estimated net profits to be $340,000
For more information, see the Partner Profile Article in the Spring 2011 Natural Gas STAR Partner Update available at: http://epa.gov/gasstar/newsroom/partnerupdatespring2011.html
Partner Company A Implemented RECs in the Fort Worth Basin of Texas
RECs performed on 30 wells, with an incremental cost of $8,700 per well
Average 11,900 Mcf of natural gas sold versus vented per well
– Natural gas flow and sales occur 9 days out of 2 to 3 weeks of well completion
– Low pressure gas sent to gas plant
– Conservative net value of gas saved is $50,000 per well
Expects total emission reduction of 1.5 to 2 Bcf in 2005 for 30 wells
10 CAA Ex. 13

Reduced Emissions Completions(Cont’d)
Lessons Learned
Incremental costs of recovering natural gas and condensate during well completions following hydraulic fracturing result from the use of additionalequipment such as sand traps, separators, portable compressors, membrane acid gas removal units anddesiccant dehydrators that are designed for high rate flowback.
During the hydraulic fracture completion process,sands, liquids, and gases produced from the well areseparated and collected individually. Natural gas and gas liquids captured during the completion may be sold for additional revenue.
Implementing a REC program will reduce flaringwhich may be a particular advantage where open flaring is undesirable (populated areas) or unsafe (risk of fire).
Wells that do not require hydraulic fracturing are notgood candidates for reduced emissions completions. Methane emissions reductions achieved through performing RECs may be reported to the Natural GasSTAR Program unless RECs are required by law (as in the Jonah-Pinedale area in WY).
References
Alberts, Jerry. Williams Company. Personal contact.
American Petroleum Institute. Basic Petroleum Data Book, Volume XXV, Number 1. February 2005.
Bylin, Carey. U.S. EPA. Gas STAR Program Manager
Department of Energy. GASIS, Gas Information System. Release 2 – June 1999.
Fernandez, Roger. U.S. EPA. Gas STAR Program Manager
McAllister, E.W., Pipeline Rules of Thumb Handbook, 4th Edition, 1998.
Middleman, Stanley. An Introduction to Fluid Dynamics, Principles of Analysis and Design. 1998.
Perry, Robert H., Don W. Green. Perry’s Chemical Engineers Handbook, 7th Edition. 1997.
Pontiff, Mike. Newfield Exploration Company. Personal contact.
Process Associates of America. “Reciprocating Compressor Sizing.” Available on the web at: http://www.processassociates.com/process/ rotating/recip_s.htm.
Smith, Reid. BP PLC. Personal contact.
Smuin, Bobby. BRECO, Incorporated. Personal contact.
U.S. EPA. “The Natural Gas STAR Partner Update – Spring 2004.” Available on the web at: http://www.epa.gov/gasstar/pdf/ partnerupdate.pdf
Wadas, Janelle. Noble Energy Inc. 2010 Annual Implementation Workshop Presentation titled “Reducing Vented Flowback Emissions from CO2 Fractured Gas Wells Using Membrane Technology”. Available on the web at: http://epa.gov/gasstar/documents/workshops/2010-annual-conf/01wadas.pdf
Waltzer, Suzanne. U.S. EPA. Gas STAR Program Manager
11 CAA Ex. 13

Reduced Emissions Completions(Cont’d)
United States Environmental Protection Agency Air and Radiation (6202J) 1200 Pennsylvania Ave., NW Washington, DC 20460
2011
EPA provides the suggested methane emissions estimating methods contained in this document as a tool to develop basic methane emissions estimates only. As regulatory reporting demands a higher-level of accuracy, the methane emission estimating methods and terminology contained in this document may not conform to the Greenhouse Gas Reporting Rule, 40 CFR Part 98, Subpart W methods or those in other EPA regulations.
12 CAA Ex. 13

CLEAN AIR ADVOCATES’ EXHIBIT 14

Lessons Learned from Natural Gas STAR
Reduced Emissions Completions and Smart Automation
Producers and Processors Technology Transfer Workshop
New Mexico Oil and Gas Association and EPA’s Natural Gas STAR Program
Farmington, NMFebruary 21, 2006
1
Agenda Reduced Emissions Completions
Methane Losses Methane Recovery Is Recovery Profitable? Industry Experience Discussion Questions
Smart Automation Well Venting Methane Losses Methane Recovery Is Recovery Profitable? Industry Experience Discussion Questions
2
1 CAA Ex. 14

Methane Losses During Well Completions
It is necessary to clean out the well bore and formation surrounding perforations
After new well completion After well workovers
Operators produce the well to an open pit or tankageto collect sand, cuttings and reservoir fluids fordisposalVent or flare the natural gas produced
Venting may lead to dangerous gas buildup Flaring is preferred where there is no fire hazard or nuisance
3
Methane Losses: Well Completions and Workovers
An estimated 44.5 Bcf of natural gas lost annuallydue to well completions and workovers1
44,000 MMcf in losses from high pressure wells 319 MMcf in losses from low pressure wells 48 MMcf in losses from workovers
An estimated total of 480,000 Bbl condensate lost annually due to venting and flaring This amounts to over $455 million2 lost due to well completions and workovers
1 - Percentage that is flared and vented unknown2 - Value of natural gas at $10/Mcf, Value of condensate at $22/bbl
4
2 CAA Ex. 14

5
Wellhead Gas Prices Gas prices have increased sharply in recent years toover $10/Mcf
Wellhead Gas Price
$0 $2 $4 $6 $8
$10 $12
Jan-
90
Jan-
91
Jan-
92
Jan-
93
Jan-
94
Jan-
95
Jan-
96
Jan-
97
Jan-
98
Jan-
99
Jan-
00
Jan-
01
Jan-
02
Jan-
03
Jan-
04
Jan-
05
Gas
Pric
e ($
/Mcf
)
Source: EIA “US Natural Gas Wellhead Price” 1990 – 2005 available at http://tonto.eia.doe.gov/dnav/ng/hist/n9190us3m.htm
Reduced Emissions Completions (REC) REC or green completions recover natural gas andcondensate produced during well completions or workovers Use portable equipment to process gas and condensate suitable for sales Send recovered gas through permanent dehydrator and meterto sales line, reducing venting and flaring An estimated 25.2 Bcf or $250 million of natural gas can be recovered annually using Green Completions
25,000 MMcf from high pressure wells181 MMcf from low pressure wells27 MMcf from workovers
6
3 CAA Ex. 14

Green Completions: Equipment Truck or trailer mounted equipment to capture produced gas during cleanup
Sand trapThree-phase separator
Use portable desiccant dehydrator for workovers requiring glycol dehydrator maintenance
Temporary, Mobile Surface Facilities Source: BP 7
Green Completions: Preconditions Must have permanent equipment on site beforecleanup
Piping from well-head to sales line Dehydrator Lease meter Stock tank
Sales line gas can be used for fuel and/ or gas lift inlow pressure wells
8
4 CAA Ex. 14

Green Completions:Low Pressure Wells
Can use portable compressors to start-upthe well when reservoir pressure is low
Artificial gas lift to clear fluids Boost gas to sales line
Higher cost to amortizeinvestment in portableequipment
Portable Compressors, Separator and Other Equipment on a trailer Source: Herald
9
Is Recovery Profitable? Partners report recovering an average of 53% of totalgas produced during well completions and workovers
Estimate an average of 3,000 Mcf1 of natural gas canbe recovered from each cleanup
Estimate 1- 580 Bbl of condensate can be recovered from each cleanup
1 - Values for high pressure wells
10
5 CAA Ex. 14

Green Completions: Benefits Reduced methane emissions during completions andworkovers Sales revenue from recovered gas and condensate Improved relations with state agencies and publicneighbors Improved safety Reduced disposal costs
11
BP Experience Capital investment ~ $1.4 million on portable three-phase separators, sand traps and tanks Used Green Completions on 106 wells Total natural gas recovered ~ 350 MMcf/year Total condensate recovered ~ 6,700 Bbl/year
12
6 CAA Ex. 14

BP Experience Total value of natural gas and condensate recovered~ $840,000 per year Investment recovered in 2+ years
Three Phase Separator, Source: BP
Note: - Value of natural
gas at $1.99/Mcf - Value of
condensate at $22/bbl
13
Weatherford Durango Experience Successfully completed pilot project in the Fruitlandcoal formations in Durango, Colorado
Well depth: 2,700 to 3,200 feet Pore pressure: estimated at 80 pounds per square inchgauge (psig)Well type: coal bed methaneHole size: 5 ½ inchesNo. of wells: 3 well pilots
Captured 2 MMcf of gas and sold by client
14
7 CAA Ex. 14

15
Weatherford Portable Equipment
Weatherford Green Completions Use pipeline gas with proprietary foaming agent ascompressible fluid to initiate cleanout System includes
Wet screw compressor when well pressure is less than 80psig Booster compressor, three phase separator and sand trap
Estimate cleanup pressure of 300 to 400 psig at awell depth of 8000 feet Suggest use in all kinds of completion and
workover cleanup operations
16
8 CAA Ex. 14

Discussion Questions To what extent are you implementing thisopportunity?Can you suggest other approaches for reducing wellcompletion venting?How could this opportunity be improved upon oraltered for use in your operation?What are the barriers (technological, economic, lackof information, regulatory, focus, manpower, etc.)that are preventing you from implementing thispractice?
17
Smart Automation Well Venting Automation can enhance the performance of plungerlifts by monitoring wellhead parameters such as:
Tubing and casing pressure Flow rate Plunger travel time
Using this information, the system is able to optimizeplunger operations
To minimize well venting to atmosphere Recover more gas Further reduce methane emissions
18
9 CAA Ex. 14

Methane Losses There are 360,000 natural gas and condensate wells(on and offshore) in the US1
Accumulation of liquid hydrocarbons or water in the well bores reduces, and can halt, production Common “blow down” practices to temporarily restore production can vent 80 to 1600 Mcf/yr2 to the atmosphere per well Estimate 7 Bcf/yr methane emissions from U.S.onshore well venting1
1 - Inventory of U.S. Greenhouse Gas Emissions and Sinks 1990 - 2003 2 – Mobil Big Piney Case Study 1997
19
What is the Problem? Conventional plunger lift systems usegas pressure buildups to repeatedlylift columns of fluid out of well Fixed timer cycles may not matchreservoir performance
Cycle too frequently (high plungervelocity)
Plunger not fully loaded Cycle too late (low plunger velocity)
Shut-in pressure can’t lift fluid to top May have to vent to atmosphere to lift plunger
Source: Weatherford 20
10 CAA Ex. 14

Conventional Plunger Lift Operations Manual, on-site adjustments tune plunger cycle time to well’s parameters
Not performed regularly Do not account for gathering line pressure fluctuations,declining well performance, plunger wear
Results in manual venting to atmosphere when plunger lift is overloaded
21
Methane Recovery: How Smart Automation Reduces Methane Emissions
Smart automation continuously varies plunger cyclesto match key reservoir performance indicators
Well flow rate Measuring pressure
Successful plunger cycle Measuring plunger travel time
Plunger lift automation allows producer to vent well to atmosphere less frequently
22
11 CAA Ex. 14

Automated Controllers
Low-voltage; solar recharged battery power Monitor well parameters Adjust plunger cycling
Source: Weatherford
Remote well management Continuous data logging
Remote data transmission
Receive remote instructions Source: Weatherford
Monitor other equipment 23
24
Plunger Lift Cycle
12 CAA Ex. 14

Methane Savings Methane emissions savings a secondary benefit
Optimized plunger cycling to remove liquids increases well production by 10 to 20%1
Additional 10%1 production increase from avoided venting 500 Mcf/yr methane emissions savings for averageU.S. well
1 – Reported by Weatherford
25
Other Benefits Reduced manpower cost per well Continuously optimized production conditions Remotely identify potential unsafe operatingconditions Monitor and log other well site equipment
Glycol dehydrator Compressor Stock Tank VRU
26
13 CAA Ex. 14

Is Recovery Profitable? Smart automation controller installed cost: ~$11,000
Conventional plunger lift timer: ~$5,000 Personnel savings: double productivity Production increases: 10% to 20% increased production
Savings = (Mcf/yr) x (10% increased production) x (gas price)
+ (Mcf/yr) x (1% emissions savings) x (gas price) + (personnel hours/yr) x (0.5) x (labor rate)
$ savings per year
27
Economic Analysis
Non-discounted savings for average U.S. Well =
(50,000 Mcf/yr) x (10% increased production) x ($10/Mcf) + (50,000 Mcf/yr) x (1% emissions savings) x ($10/Mcf) + (500 personnel hours/yr) x (0.5) x ($30/hr) - ($11,000) cost
$51,500 savings in first year
3 month simple payback
28
14 CAA Ex. 14

Industry Experience BP reported installing plunger lifts with automatedcontrol systems on ~2,200 wells
900 Mcf reported annual savings per well $12 million costs including equipment and labor $6 million total annual savings
Another company shut in mountaintop wellsinaccessible during winter
Installed automated controls allowed continuous production throughout the year1
1 - Morrow, Stan and Stan Lusk, Ferguson Beauregard, Inc. Plunger-Lift: Automated Control Via Telemetry. 2000.
29
Discussion Questions To what extent are you implementing thisopportunity?Can you suggest other approaches for reducing wellventing?How could this opportunity be improved upon oraltered for use in your operation?What are the barriers (technological, economic, lackof information, regulatory, focus, manpower, etc.)that are preventing you from implementing thispractice?
30
15 CAA Ex. 14

CLEAN AIR ADVOCATES’ EXHIBIT 15

Lessons Learned from the Natural Gas STAR Program
Reducing Methane Emissions fromProduction Wells: Reduced
Emission Completions
Producers Technology Transfer Workshop
ConocoPhillips Petroleum Company,
New Mexico Environment Department,
New Mexico Oil & Gas Association
Farmington, New Mexico
May 11, 2010
epa.gov/gasstar
Agenda Reduced Emissions Completions
Methane Losses Methane Recovery Is Recovery Profitable? Partner Experience
Discussion
1
1 CAA Ex. 15

U.S. Production Sector Methane Emissions (2007) Storage Tank Note: Bcf = billion cubic feet
Other SourcesVenting 5 Bcf27 Bcf
and Pumps 29 Bcf12 Bcf 3 Bcf
EPA. Inventory of U.S. Greenhouse Gas Emissions and Sinks 1990 – 2007. April, 2009. Available on the web at:
epa.gov/climatechange/emissions/usinventoryreport.html. Updated with revised emissions estimates for glycol 2dehydrators, well venting, pneumatic devices, and storage tanks.
Pneumatic
Devices
79 Bcf
Dehydrators
Meters and
Pipeline Leaks
8 Bcf Compressors
Offshore
Operations
Well Venting and Flaring
86 Bcf
Methane Losses During Gas WellCompletions
Gas wells in tight formations and coal beds require hydraulic fracture
It is necessary to clean out the well bore and formation After new completion
After well refracturing workovers
Operators produce to an open pit or tank to collect sand, cuttings, and fluids for disposal Vent or flare the natural gas produced 54 Bcf1 of methane is vented or flared from completions and workovers in the U.S., 27 Bcf of methane isemitted
Williams E&P, Glenwood Springs, CO
1 – EPA estimate – well completions and workovers only. Bcf = billion cubic feet 3
2 CAA Ex. 15

Methane Recovery by ReducedEmission Completions
Recover natural gas and condensate produced during flow-back following hydraulic fracture Portable equipment separates sand and water, processes gas and condensate for sales Route recovered gas through dehydrator and meter to sales line, reducing venting and flaring
4Portable REC Equipment Source: Weatherford
Reduced Emission Completions: Preconditions
Permanent equipment required on site beforecleanup
Piping from well head to sales line
Dehydrator
Lease meter
Stock tanks for wells producing significant amounts of condensate
Sales line gas can be used for compressor fueland/ or gas lift in low pressure wells
5
3 CAA Ex. 15

Reduced Emission Completions: Equipment Skid or trailer mounted portable equipment to capture produced gas during cleanup
Sand trap Three-phase separator
Use portable desiccant dehydrator for workovers requiring glycol dehydrator maintenance
6Temporary, Mobile Surface Facilities,
Source: BP Source: Williams
Reduced Emission Completions: Low Pressure Wells
Partners and vendors are perfecting the use ofportable compressors when pressure in reservoir istoo low to enter sales line
Artificial gas lift to clear fluids Boost gas to sales line Manage slug flow Adds cost to project
Source: Herald
7
4 CAA Ex. 15

Reduced Emission Completions: Benefits
Reduced methane emissions during completions andworkovers
Sales revenue from recovered gas and condensate
Improved relations with government agencies andpublic neighbors
Reduced environmental impact
Improved safety
Reduced disposal costs
8
Is Recovery Profitable? Partners report recovering 2% - 89% (average of 53%) of total gas produced during well completions and workovers
Estimate 7,000 – 12,500 thousand cubic feet (Mcf) of natural gas can be recovered from each cleanup
$50,000 to $85,000 savings at $7/Mcf
Estimate 1 – 580 barrels (bbls) of condensate can be recovered from each cleanup
Up to $30,000 additional revenue at $50/barrel
Incremental contracted cost of typical REC is $700 to $6,500/day for 3 to 10 days of well cleanup Purchase of REC equipment costs $500,000
Payback in 3 to 5 months for 25 well/year drilling program
Assuming gas prices of $7 and $3/Mcf, respectively 9
5 CAA Ex. 15

REC Partner Experience: BP Capital investment of about $500,000 per skid on portable three-phase separators, sand traps, and tanks in the Rocky Mountain Region
Used Green Completions on 106 wells
Total natural gas recovered about 350 million cubic feet per year (MMcf/year)
3.3 MMcf per well average
Conservative net value of gas saved is $20,000 per well1
6,700 barrels/year condensate recovered
1.5 year payback based on British Petroleum’s prices fornatural gas and condensate
1 Natural gas valued by company to be $7/Mcf 10
REC Partner Experience: BP Through the end of 2005 British Petroleum reports:
4.1 Bcf of gas and
53,000 barrels of condensate recovered1
Portable Three Phase Separator, Source: BP
1 Combination of activities in Montana and Wyoming, U.S. 11
6 CAA Ex. 15

REC Partner Experience: Williams
Williams Fork Formation (Piceance Basin) – low permeability, tight, lenticular sandstone (10% porosity, permeability range of 1 to 10 microdarcies.
Wells drilled to depths of 6,500 ft to 9,000 ft
Flow pressures range from 1,500 to 2,500 psi
Fracture stimulation needed to make wells economical
Frac about 5 to 6 stages per well
BRECO flowback skids used to separate sand, water and gasduring initial flowback BRECO flowback skid resides on typical 4 well pad for 32 days
1 Natural gas valued by company to be $7/Mcf 12
REC Partner Experience: Williams Piceance Well Completions
Well Completion Type = Mechanical Isolation
Perforate casing prior to Stage 1 – makes fracture stimulation possible
Frac Stage 1
Flow back well, first 12 hours is water, afterwards routed to BRECO skid
Set plug to isolate frac stage
REPEAT for each stage (avg. 5 to 6 stages/well)
Plugs drilled out by workover rig
Producing to flowback skid after frac’ing and before plugs drilled out
13
7 CAA Ex. 15

REC Partner Experience: Williams BRECO Flowback Skid
Sand Vessel Gas Vessel
14
REC Partner Experience: Williams How BRECO Works?
Sand vessel separates sand from backflow fluids
Gas vessel separates gas from water used forhydraulic fracturing
Gas routed to sales line Sand is dumped to reserve pit manually Water dumps to holding tanks automatically
Water is filtered and reused for future frac jobs
Flowback skid operates at 20 to 40 psi greater thangas gathering line pressure which is about 260 to320 psi in Piceance Basin
15
8 CAA Ex. 15

REC Partner Experience: Williams Flowback Skid – When Is It Used?
Used after each zone is fracture stimulated (frac’d)
Used when all zones are fractured and waiting forworkover rig to drill out plugs for final completion (Up to 10 days) Production well must be located near gathering system Wildcat and step-out wells are not completed withGreen Completion Technology One Month = time wells at typical 4-well pad arerouted to flowback skid
16
17
REC Partner Experience: Williams
Source: Williams Two rows of four wells closely spaced.
9 CAA Ex. 15

18
Estimated Mean Methane Concentration Gas: 89.043 vol. %
Green Completion Economics
$1.3 to $1.5 MMAverage Cost Drill/Complete Well ($) =
$11,855 Average Cost Per Flowback ($) =
$129,510 Average Net Saving Per Flowback ($) =
5982 MMscf or
16 MMscf/day
CH4 recovered in 2005 =
$139,941 Average Revenue Per Flowback ($) =
0.71Average MMcf Gas Flowback Recovered/Day =
23Average MMcf Gas Recovered During Flowback =
32Average Number of Days of Flowback =
AVERAGE PER WELL FLOWBACK STATISTICS
Conclusions Reduces methane emissions, a potent greenhousegas (GHG)
Well completion type determines viability of greencompletion technologies
Produced water and stimulation fluids from greencompletions are recycled
Eliminates emissions, noise and citizen complaintsassociated with flaring
Increases economic value added
19
10 CAA Ex. 15

Discussion Questions What industry experiences do you have applyingthese technologies and practices?
What are your limitations on applying thesetechnologies and practices?
Actual costs and benefits
20
11 CAA Ex. 15

CLEAN AIR ADVOCATES’ EXHIBIT 16

NATURAL GAS: THE FACTS
Northeast Supply Enhancement
CAA Ex.16

Natural Gas: The Facts 2016
Natural Gas Customers Natural gas serves nearly 66.7 million homes; 5.4 million
businesses like hotels, restaurants, hospitals, schools and supermarkets; 192,000 factories; and 1,900 electric generating units. On a daily basis, the average U.S. home uses 196 cubic feet of natural gas.
Natural gas comprises almost one-fourth of all primary energy used in the U.S. and is directly linked to jobs and economic health. The natural gas industry supports the employment of nearly 3 million Americans in all 50 states.
Residential space heating and water heating cost analyses show that natural gas costs less to use than other major home energy sources. Households that use natural gas appliances for heating, water heating, cooking and clothes drying spend an average of $840 less per year than homes using electric appliances.
Fertilizer used to grow crops is composed almost entirely of natural gas components, so U.S. agricultural producers rely on an affordable, stable supply of natural gas.
Natural gas utilities do not earn a profit on the natural gas they deliver. They earn their revenues from the service and delivery fees they charge customers to transport the natural gas to them. This fee is directly linked to the volume of natural gas consumed, rather than the price of natural gas being delivered.
Environmental Benefits Washington State University conducted a nationwide field study
in 2015 that found that as little as 0.1 percent of the natural gas delivered nationwide is emitted from local distribution systems.
Due to the higher efficiency of natural gas combined cycle generation compared with coal-fired boilers, natural gas emits 52 to 56 percent less GHG than coal for the same amount of electricity.
Natural gas is the cleanest fossil fuel on the market today because it produces much lower emissions than those of other fossil fuels like coal or oil. It is also extraordinarily efficient.
“Natural gas
comprises almost
one-fourth of all
primary energy
used in the U.S.
and supports the
employment of
nearly 3 million
Americans in all 50
states.”
72 MILLION
There are more than 72 million natural gas customers in the United States.
CAA Ex.16
Charlene
Highlight
Charlene
Highlight

Natural Gas: The Facts 2016
Efficiency The direct use of natural gas in America’s homes and businesses
achieves 92 percent energy efficiency. The average American home consumes 40 percent less natural
gas than it did 40 years ago. By funding natural gas efficiency programs, natural gas utilities
helped customers save 175 trillion Btu of energy and offset 9.1 million metric tons of carbon dioxide emissions in 2014.
Domestically Abundant Domestic gas production accounts for nearly 93 percent of all
natural gas consumed in the United States and shale gas production now accounts for about 50 percent of gas produced.
According to the Energy Information Administration and the Potential Gas Committee, the U.S. estimated future supply of natural gas stood at 2,884 trillion cubic feet (Tcf) at year end 2014 – enough to meet America’s energy needs for more than 100 years.
Safe and Reliable According to the U.S. Department of Transportation, pipelines
are the safest form of energy transportation. Safety is the number one priority for America’s natural gas utilities.
There are more than 2.5 million miles of pipeline that transport natural gas to more than 177 million Americans throughout the U.S.
Natural gas utilities spend more than $22 billion annually to help enhance the safety of natural gas distribution and transmission systems.
The dedicated efforts of natural gas utilities over the past decade have led to an approximately 40 percent decline in serious pipeline incidents throughout the natural gas distribution system.
There are nearly 1.3 million miles of plastic pipe – the leading edge of advanced utility pipeline materials. In the past decade, natural gas utilities have installed updated plastic lines at a rate of 30,000 miles per year.
To Learn More Visit or connect with us on Twitter @AGA_naturalgas and facebook.com/naturalgas
2.5 MILLION
There are more than 2.5 million miles of pipeline that transport natural gas to more than 177 million Americans.
“The U.S.
estimated future
supply of natural
gas stood at
2,884 Tcf at year
end 2014 –
enough to meet
America’s energy needs for more
than 100 years.”
www.aga.org
CAA Ex.16

CLEAN AIR ADVOCATES’ EXHIBIT 17

CAA Ex. 17

CAA Ex. 17

CAA Ex. 17

CLEAN AIR ADVOCATES’ EXHIBIT 18

CAA Ex. 18

CAA Ex. 18

CLEAN AIR ADVOCATES’ EXHIBIT 19

CAA Ex. 19

CAA Ex. 19

CAA Ex. 19

CAA Ex. 19

CAA Ex. 19

CAA Ex. 19

CAA Ex. 19

CAA Ex. 19

CAA Ex. 19

CLEAN AIR ADVOCATES’ EXHIBIT 20

CAA Ex. 20

CAA Ex. 20

CAA Ex. 20

CLEAN AIR ADVOCATES’ EXHIBIT 21

CAA Ex. 21

CAA Ex. 21

CAA Ex. 21

CAA Ex. 21
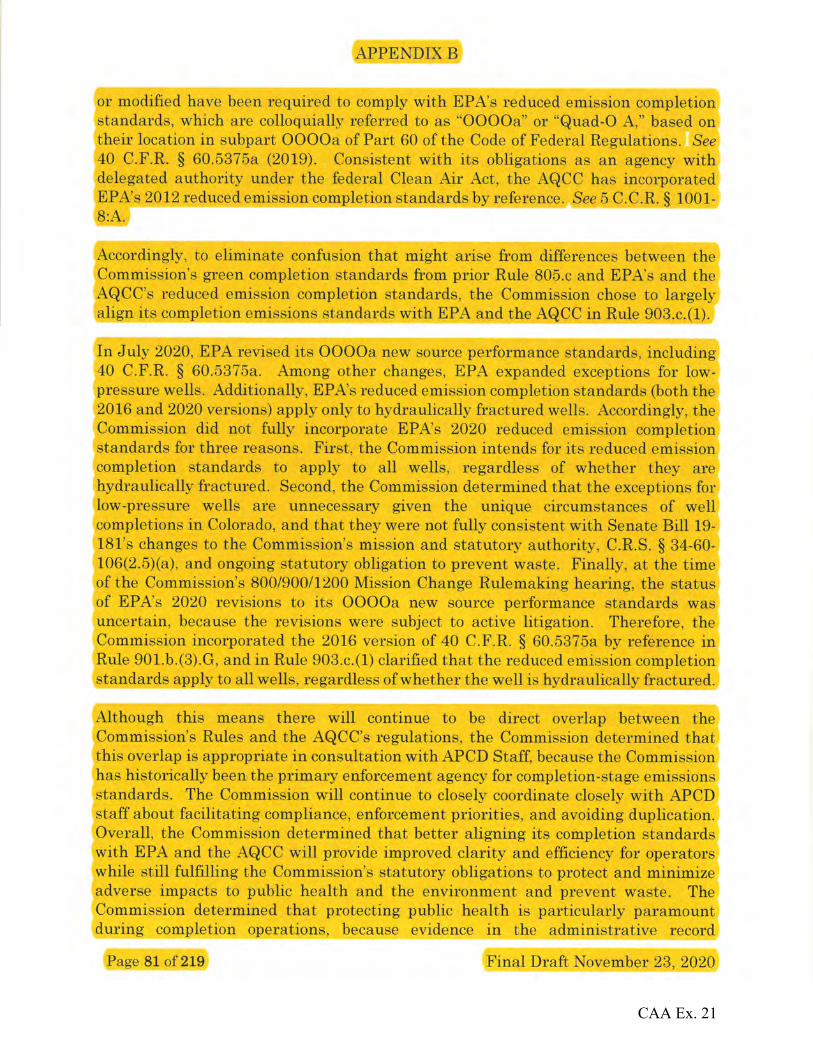
CAA Ex. 21
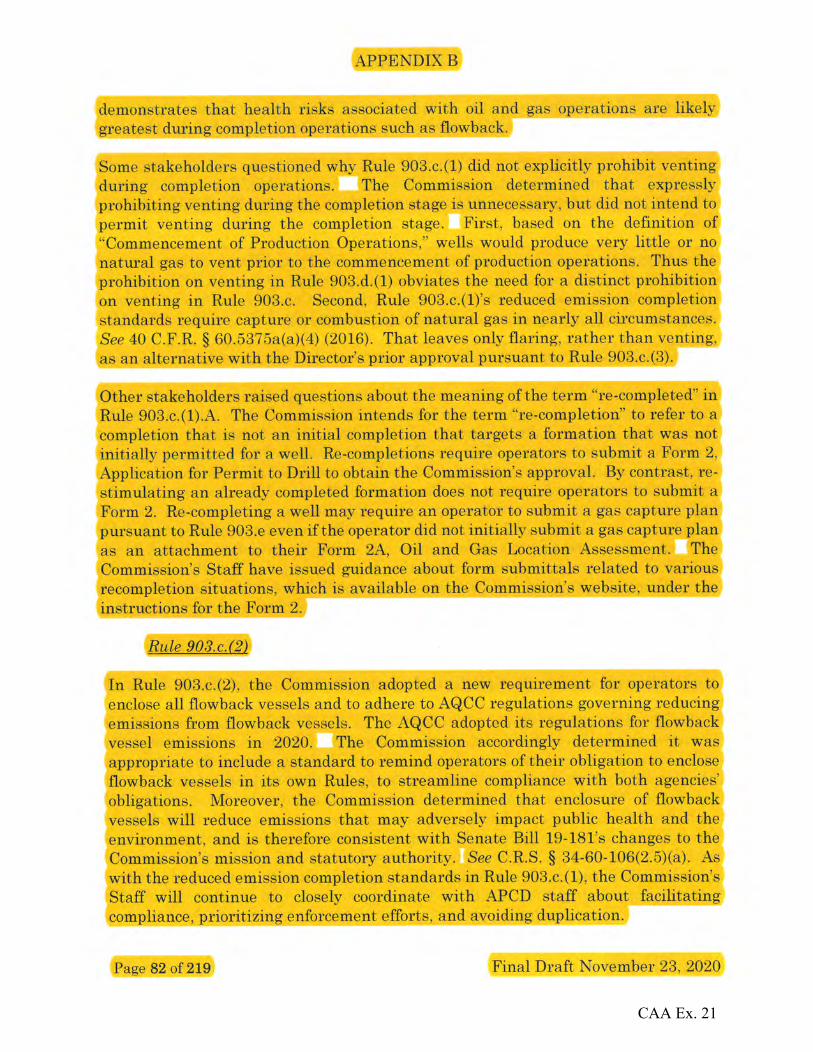
CAA Ex. 21

CAA Ex. 21

Calculation SheetThe calculation process of project and baseline costs, gas savings and emissions
DESCRIPTION OF THE CASE
EMISSIONS ESTIMATE - BASELINE (i.e. current situation)
UnitContinuous Controller (s)Intermittent Controller (s) Chemical PumpsESD
Total gas emissionsTotal gas emissions
Share methane in the Gas-NAA Share methane in the GasShare of VOC in the gas-NAA Share of VOC in the gas
Total methane emissions
EMISSIONS ESTIMATE - ELECTRIC CONTROLER
Note: It is assumed that pneumatic ESD are used
ESD
Total gas emissionsTotal gas emissionsTotal methane emissions
PROJECT COSTS - ELECTRONIC CONTROLLER
SIZING
UnitContinuous Controller (s)Intermittent Controller (s) Chemical PumpsESDOthers requirementsTotal
Key assumptions (from assumptions sheet)System VoltageBattery Average EfficiencyAvg. Peak Sun
Back to HOME tab

At Maximum Depth of DischargeDays of Energy StorageRating of the solar panelRating of the battery
Sizing calculationLoadEnergy to Be GeneratedPV Array RequiredRequires Battery Bank ofAnnual Electricity demand - grid
CAPEX
Continuous Controller (s)Intermittent Controller (s) Chemical PumpControl PanelSolar Panel (only when no electricity on-site)Battery (only when no electricity on-site)ESD (pneumatic ESD) -(similar to baseline)Installation costs - ESD -(similar to baseline)Installation CostsTotal CAPEX
OPEX
Battery replacement costSolar panel replacement costsElectricity cost LabourTotal OPEX
PROJECT COSTS - BASELINE
CAPEX (only relevant when the site is new, the CAPEX for retrofit site is 0)
Continuous Controller (s)Intermittent Controller (s) Chemical PumpESDLabour - installation - ControllerLabour - installation - PumpTotal
OPEXMaintenance costs - wet gas sitesMaintenance costs - dry gas sitesMaintenance costs - Total
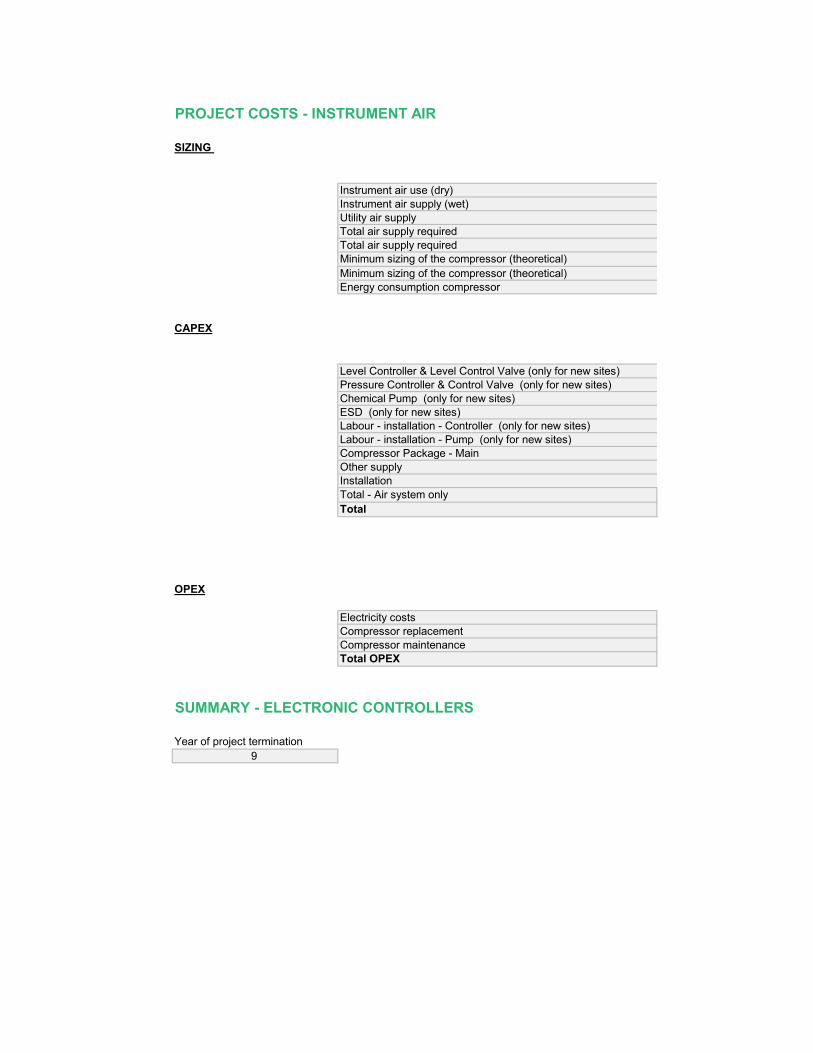
PROJECT COSTS - INSTRUMENT AIR
SIZING
Instrument air use (dry)Instrument air supply (wet)Utility air supply Total air supply requiredTotal air supply requiredMinimum sizing of the compressor (theoretical)Minimum sizing of the compressor (theoretical)Energy consumption compressor
CAPEX
Level Controller & Level Control Valve (only for new sites)Pressure Controller & Control Valve (only for new sites)Chemical Pump (only for new sites)ESD (only for new sites)Labour - installation - Controller (only for new sites)Labour - installation - Pump (only for new sites)Compressor Package - Main
Other supply-R Other supplyInstallation-R Installation Total - Air system only
Total
OPEX
Electricity costsCompressor replacementCompressor maintenanceTotal OPEX
SUMMARY - ELECTRONIC CONTROLLERS
Year of project termination9

SUMMARY - INSTRUMENT AIR

s is presented below.
NEW/RETROFIT (N for New and R for Retrofit)
ELECTRICITY_ON_SITE? (E for Electricity and NE
for No Electricity)R E
Emission Factor Number of devices Total Emissionscf/h # cf/h5.10 10 51.003.50 10 35.0013.30 1 13.300.41 0 0.00
99.30870
0.01540.005813.40
Emission Factor Number of devices Total Emissionscf/h # cf/h0.41 0.00 0.00
0.000.000.0
Number of devices Requirement per unit Total # Amp Amp10 0.08 0.8010 0.08 0.801 0.17 0.170 0.16 0.001 0.29 0.29
2.06
12.00 V85% %4.00 h/days

80% %10.00 days140.00 W100.00 Ah
593 Wh/day698 Wh262 W618 Ah217 kWh/year
Unit Cost Number of units TotalUSD/Unit # USD
4000 10 40,0004000 10 40,0006000 1 6,0004000 1 4,000
0 2 00 7 00 0 00 0 0
20% 18,000108,000
Unit Cost FrequencyUSD/unit every X years
$0 4$0 1022 1
$1,680 1
Unit Cost Number TotalUSD/Unit # USD
0 10 00 10 00 1 00 0 00 20 00 1 0
0
Unit Cost Number TotalUSD/controller # USD
200 21 4,20080 0 0
4,200

Value Unit99 cf/h120 cf/h199 cf/h318 cf/h5 cfm
5.3 HP4 kW
17344 kWh
Unit Cost Unit Number0 USD/Unit 100 USD/Unit 100 USD/Unit 10 USD/Unit 00 USD/Unit 200 USD/Unit 1
32000 USD/package 101400 USD/controller 20100% % 60,000
Unit Cost FrequencyUSD/year every X years
1,734 110,000 61,280 1
CAPEX - PROJECT USDCAPEX - BASELINE USD
DIFFERENCE USD
OPEX - PROJECT USDOPEX - BASELINE USD
DIFFERENCE USDTOTAL COSTS USD
GAS SAVING MscfGAS SAVING USDVOC Saving tVOCCH4 Saving tCH4
CASH FLOW USD

KEY RESULTSCAPEX USD
NPV USDABATEMENT COSTS USD/tCH4ABATEMENT COSTS USD/tVOC
CAPEX - PROJECT USDCAPEX - BASELINE USD
DIFFERENCE USD
OPEX - PROJECT USDOPEX - BASELINE USD
DIFFERENCE USDTOTAL COSTS USD
GAS SAVING MscfGAS SAVING USDVOC Saving tCH4 Saving tCH4
CASH FLOW USD
KEY RESULTSCAPEX USD
NPV USDABATEMENT COSTS USD/tCH4ABATEMENT COSTS USD/tVOC

TYPE OF GAS (D fro Dry and W for Wet)
Number of Continuous
Controller (s)
Number of Intermittent
Controller (s)
Number of Chemical Pumps
Number of ESD(s)
NAA 10 10 1 0
cf/hMscf/YeartCH4/MscftVOC/MscftCH4/year
cf/hMscftCH4

$0 $0
OPEX OVER TIME
Year 0 Year 1 Year 2 Year 3 Year 4USD USD USD USD USD
0 0 0 0 00 0 0 0
22 22 22 22 221680 1680 1680 1680
22 1702 1702 1702 1702
OPEX OVER TIME
Year 0 Year 1 Year 2 Year 3 Year 4USD USD USD USD USD
4,200 4,200 4,200 4,200

Unit TotalUnits 0Units 0Units 0Units 0Units 0Units 0HP 32,000
Units 28,000USD 60,000
120,000120,000
OPEX OVER TIME
Year 0 Year 1 Year 2 Year 3 Year 4USD USD USD USD USD1,734 1,734 1,734 1,734 1,734
0 0 0 01,280 1,280 1,280 1,280
1,734 3,014 3,014 3,014 3,014
Year 0 Year 1 Year 2 Year 3 Year 4108,000
0108,000
22 1,702 1,702 1,702 1,7020 4,200 4,200 4,200 4,20022 -2,498 -2,498 -2,498 -2,498
108,022 -2,498 -2,498 -2,498 -2,498
870 870 870 870 8701,627 1,627 1,627 1,627 1,627
5 5 5 5 513 13 13 13 13
-106,395 4,125 4,125 4,125 4,125

108,000-74,649 20,699
641 1161,207 64
Year 0 Year 1 Year 2 Year 3 Year 4120,000
0120,000
1,734 3,014 3,014 3,014 3,0140 4,200 4,200 4,200 4,200
1,734 -1,186 -1,186 -1,186 -1,186121,734 -1,186 -1,186 -1,186 -1,186
870 870 870 870 8701,627 1,627 1,627 1,627 1,627
5 5 5 5 513 13 13 13 13
-120,108 2,812 2,812 2,812 2,812
120,000-105,896 20,699
995 1061,799 64


Year 5 Year 6 Year 7 Year 8 Year 9 Year 10 Year 11USD USD USD USD USD USD USD
0 0 0 0 0 0 00 0 0 0 0 0 022 22 22 22 22 22 22
1680 1680 1680 1680 1680 1680 16801702 1702 1702 1702 1702 1702 1702
Year 5 Year 6 Year 7 Year 8 Year 9 Year 10 Year 11USD USD USD USD USD USD USD4,200 4,200 4,200 4,200 4,200 4,200 4,200

Year 5 Year 6 Year 7 Year 8 Year 9 Year 10 Year 11USD USD USD USD USD USD USD1,734 1,734 1,734 1,734 1,734 1,734 1,734
0 10,000 0 0 0 0 01,280 0 1,280 1,280 1,280 1,280 1,2803,014 11,734 3,014 3,014 3,014 3,014 3,014
Year 5 Year 6 Year 7 Year 8 Year 9 Year 10 Year 11
1,702 1,702 1,702 1,702 1,702 1,702 1,7024,200 4,200 4,200 4,200 4,200 4,200 4,200-2,498 -2,498 -2,498 -2,498 -2,498 -2,498 -2,498-2,498 -2,498 -2,498 -2,498 -2,498 -2,498 -2,498
870 870 870 870 870 870 8701,627 1,627 1,627 1,627 1,627 1,627 1,627
5 5 5 5 5 5 513 13 13 13 13 0 0
4,125 4,125 4,125 4,125 4,125 0 0

Year 5 Year 6 Year 7 Year 8 Year 9 Year 10 Year 11
11,734 3,014 3,014 3,014 3,014 3,014 11,7344,200 4,200 4,200 4,200 4,200 4,200 4,2007,534 -1,186 -1,186 -1,186 -1,186 -1,186 7,5347,534 -1,186 -1,186 -1,186 -1,186 -1,186 7,534
870 870 870 870 870 870 8701,627 1,627 1,627 1,627 1,627 1,627 1,627
5 5 5 5 5 5 513 13 13 13 0 0 0
-5,908 2,812 2,812 2,812 2,812 0 0


Year 12 Year 13 Year 14 Year 15USD USD USD USD
0 0 0 00 0 0 022 22 22 22
1680 1680 1680 16801702 1702 1702 1702
Year 12 Year 13 Year 14 Year 15USD USD USD USD4,200 4,200 4,200 4,200

Year 12 Year 13 Year 14 Year 15USD USD USD USD1,734 1,734 1,734 1,73410,000 0 0 0
0 1,280 1,280 1,28011,734 3,014 3,014 3,014
Year 12 Year 13 Year 14 Year 15
1,702 1,702 1,702 1,7024,200 4,200 4,200 4,200-2,498 -2,498 -2,498 -2,498-2,498 -2,498 -2,498 -2,498
870 870 870 8701,627 1,627 1,627 1,627
5 5 5 50 0 0 0
0 0 0 0

Year 12 Year 13 Year 14 Year 15
3,014 3,014 3,014 04,200 4,200 4,200 4,200-1,186 -1,186 -1,186 -4,200-1,186 -1,186 -1,186 -4,200
870 870 870 8701,627 1,627 1,627 1,627
5 5 5 50 0 0 0
0 0 0 0